Filed by Ocean Shore Holding Co.
Pursuant to Rule 425 under the
Securities Act of 1933 and deemed
filed pursuant to Rule 14a-12 of
the Securities Exchange Act of 1934
Subject Company: Ocean Shore Holding Co.
Commission File No.: 000-51000
 1 OCEAN SHORE HOLDING COMPANY SECOND-STEP CONVERSION January 2009 |
 2 Ocean Shore Holding has filed a registration statement (including a prospectus) with the SEC for the offering to which this communication relates. Before you invest, you should read the prospectus in that registration statement and other documents the issuer has filed with the SEC for more complete information about the issuer and this offering. You may get these documents for free by visiting EDGAR on the SEC Web site at www.sec.gov. Alternatively, the issuer, any underwriter or any dealer participating in the offering will arrange to send you the prospectus if you request it by calling toll-free 1-866-805-4128. |
 3 This presentation may contain “forward-looking statements” within the meaning of the federal securities laws. These statements are not historical facts, rather statements based on the current expectations of Ocean Shore Holding Co. (the “Company”) regarding its business strategies, intended results and future performance. Forward-looking statements are preceded by terms such as “expects,” “believes,” “anticipates,” “intends” and similar expressions. Management’s ability to predict results or the effect of future plans or strategies is inherently uncertain. Factors that could affect actual results include interest rate trends, general economic conditions nationally and in the market area in which the Company operates, the Company’s ability to control costs and expenses, competitive products and pricing, loan delinquency rates, changes in federal and state legislation and regulation and other factors that are described in the Company's prospectus and prospectus supplement as filed with the Securities and Exchange Commission. These factors should be considered in evaluating the forward-looking statements and undue reliance should not be placed on such statements. The Company assumes no obligation to update any forward-looking statements. Ocean Shore Holding has filed a proxy statement/prospectus concerning the conversion with the Securities and Exchange Commission. Shareholders of Ocean Shore Holding are urged to read the proxy statement/prospectus because it contains important information. Investors are able to obtain all documents filed with the SEC by new Ocean Shore Holding free of charge at the SEC’s web site, www.sec.gov. In addition, documents filed with the SEC by new Ocean Shore Holding are available free of charge from the Corporate Secretary of Ocean Shore Holding at 1001 Asbury Avenue, Ocean City, New Jersey 08226, telephone (609) 399-0012. The directors, executive officers, and certain other members of management and employees of Ocean Shore Holding are participants in the solicitation of proxies in favor of the conversion from the shareholders of Ocean Shore Holding. Information about the directors and executive officers of Ocean Shore Holding is included in the proxy statement/prospectus filed with the SEC. The shares of common stock of new Ocean Shore Holding are not savings accounts or savings deposits, may lose value and are not insured by the Federal Deposit Insurance Corporation or any other government agency. |
 4 TRANSACTION STRUCTURE: Second-Step Conversion ISSUER: Ocean Shore Holding Co. PRICE PER $9.00 SHARES OFFERED: 4,037,500 (minimum) to 4,750,000 (midpoint) GROSS PROCEEDS: $36.3 million to $42.8 million PRO FORMA SHARES OUTSTANDING: 7,058,522 (minimum) to 8,304,143 (midpoint) EXCHANGE / SYMBOL: NASDAQ Global Market / OSHC SELLING AGENT: Sandler O’Neill + Partners, L.P. EXPECTED PRICING: January 2009 |
 5 Newly-organized company that will become the publicly-owned parent company of Ocean City Home Bank, a $700 million¹ community-oriented bank headquartered in Ocean City, NJ Mutual holding company reorganization completed in 1998 and initial public offering completed in December 2004 Public shareholders currently own 42.8% of the common shares outstanding Nine full service branches in Atlantic (7) and Cape May (2) counties in southern New Jersey We serve the Atlantic City and southern NJ shore communities Our market is proximate to both Philadelphia (65 miles west) and New York (130 miles north) Experienced management team – a combined 70 years of service with the Bank Steven E. Brady, President and Chief Executive Officer since 1991 Kim M. Davidson, Executive Vice President since 2005 Employed by the Bank since 1994 Donald F. Morgenweck, Senior Vice President and Chief Financial Officer since 2001 Anthony J. Rizzotte, Executive Vice President and Chief Lending Officer since 1991 Janet Bossi, Senior Vice President of Loan Administration since 2002 Employed by the Bank since 1993 Significant investment by Board of Directors, management and employees Pro ownership of >11%, inclusive of ESOP ¹ Financial information as of September 30, 2008 INTRODUCTION TO OCEAN SHORE HOLDING CO. forma |
 6 Emphasis on the origination of residential mortgage loans Pursuit of opportunities to increase commercial lending in our market area Maintain quality of loan portfolio through conservative underwriting practices Transition to a service/sales culture within the organization Aggressive marketing for core deposits Attract and retain customers by providing exceptional service Expansion of branch network Our goal is to create value for our shareholders by serving our customers and communities OUR MISSION IS TO CONTINUE TO BE A PROFITABLE COMMUNITY-ORIENTED FINANCIAL INSTITUTION. OPERATING STRATEGY |
 7 Ranked 7 th out of 21 banks in our market area with a 6.4% deposit market share Total deposits of $6.6 billion in the market¹ Competitors include both large banks and other community banks Economy driven by density, domestic travel and demographics Tourism and vacation homes continue to be the primary driver of local economy Employment dominated by the service sector, most prominently the gaming industry in nearby Atlantic City Recent casino expansion, along with new retail centers and entertainment venues, have led to job growth and an increase in housing development Influx of retirees relocating to the shore area compliments the growth stemming from the gaming industry MARKET AREA AND COMPETITIVE POSITION Note: Deposit and market share data as of June 30, 2008 ¹ Total deposits in Atlantic and Cape May Counties Source: SNL Financial; ESRI |
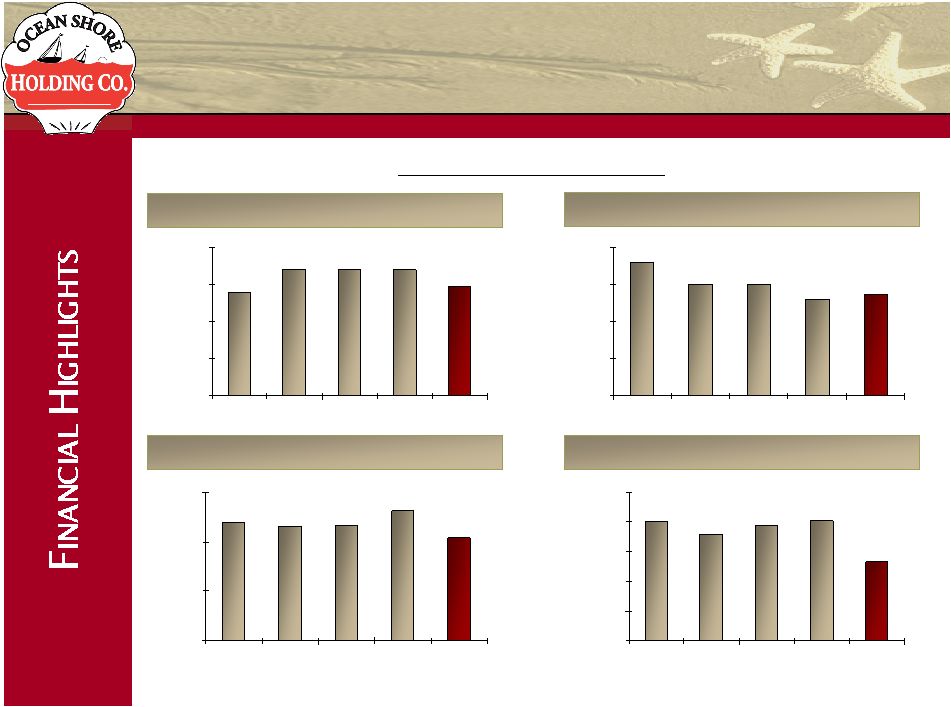
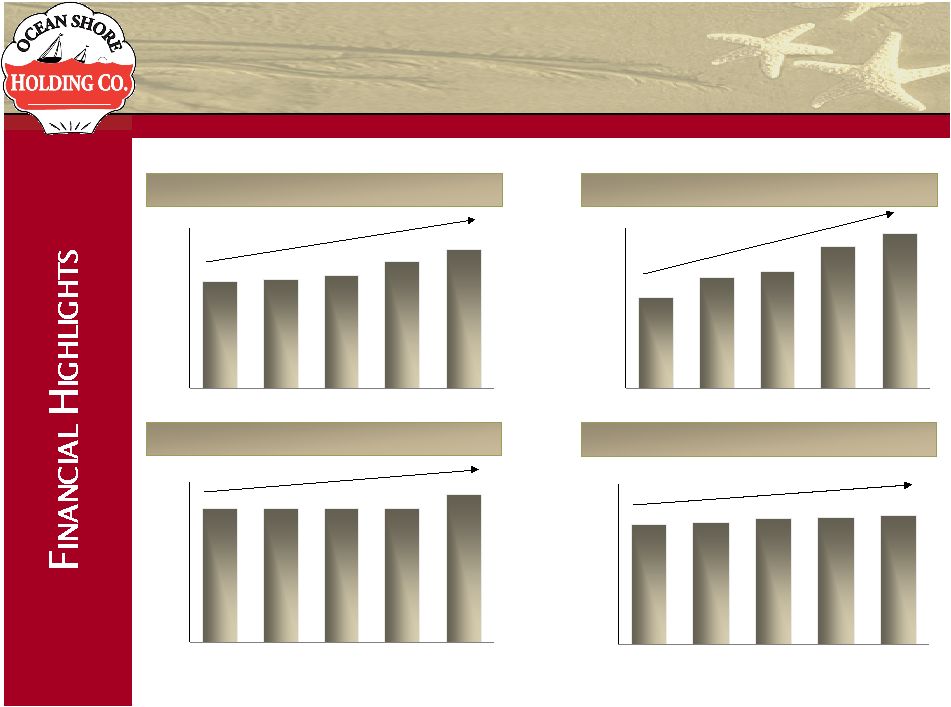 8 Financial Results Total Assets ($mm) $528 $544 $562 $630 $696 $0 $200 $400 $600 $800 2004 2005 2006 2007 YTD 2008 Gross Loans ($mm) $342 $414 $435 $530 $582 $0 $200 $400 $600 2004 2005 2006 2007 YTD 2008 CAGR = 7.6% CAGR = 15.2% Note: CAGR for the 3.75 year period ended September 30, 2008 Company completed initial public offering in December 2004 Source: SNL Financial Deposits ($mm) $415 $417 $417 $415 $461 $0 $100 $200 $300 $400 $500 2004 2005 2006 2007 YTD 2008 CAGR = 2.8% Total Equity ($mm) $60 $61 $63 $63 $64 $0 $20 $40 $60 $80 2004 2005 2006 2007 YTD 2008 CAGR = 1.9% |
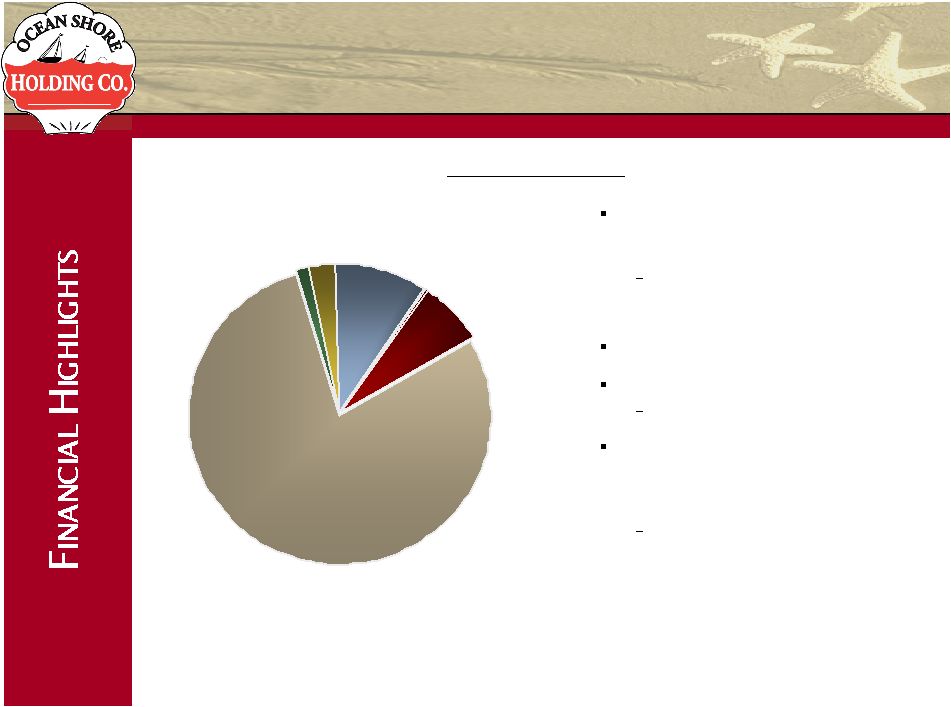 9 Construction 1.3% Commercial and Multi-family 7.0% Other Consumer Loans 0.1% Home Equity 10.1% Commercial 2.8% One-to-four Family Residential 78.7% Note: Data as of September 30, 2008 ¹ CAGR for the 9.75 year period ended September 30, 2008 LOAN PORTFOLIO Primary lending activity is origination of one-to-four family residential and home equity loans One-to-four family residential and home equity loans comprise approximately 90% of total loans No subprime loans in portfolio Strong, steady loan growth Ten-year CAGR¹ of 12.6% Because of our location, many of the properties securing residential mortgages are second homes or rental properties Approximately 39% of one-to-four family residential loans were secured by second homes and 10% were secured by investment properties at September 30, 2008 |
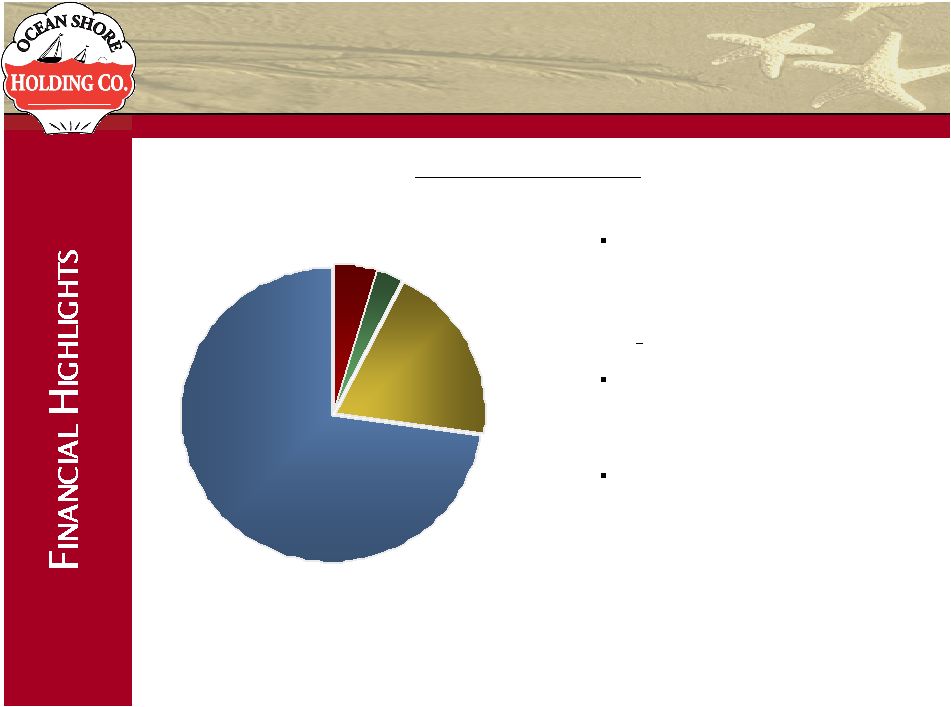 10 SECURITIES PORTFOLIO Federal Agencies 2.7% Pass-Through Mortgage- Backed Securities 72.7% Equity Securities 0.1% Corporate 19.7% Municipal Securities 4.8% At September 30, 2008, approximately 73% of our investment portfolio consisted of pass-through mortgage- backed securities issued by Fannie Mae, Freddie Mac and Ginnie Mae No subprime collateral Remainder of portfolio consisted primarily of corporate securities, US agency securities and municipal securities Other-than-temporary impairment charge of $1.7 million recorded in 2008 ($0.3 million in Q1 and $1.3 million in Q3) Note: Data as of September 30, 2008 |
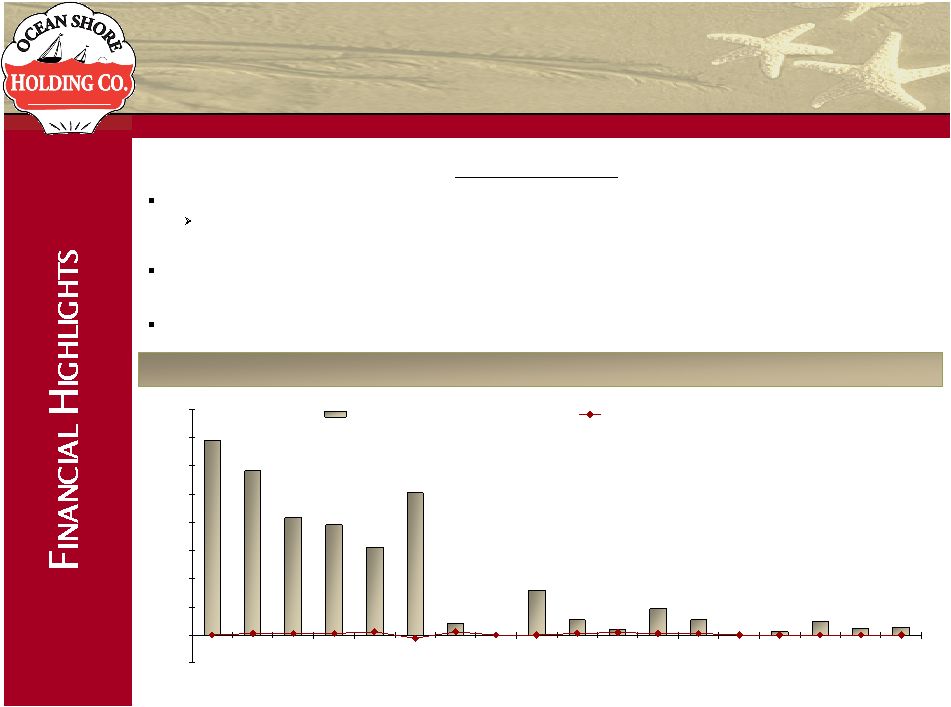 11 ASSET QUALITY 1.73% 1.46% 1.04% 0.78% 1.26% 0.10% 0.00% 0.40% 0.13% 0.05% 0.23% 0.13% 0.00% 0.02% 0.12% 0.06% 0.07% 0.98% (0.25%) 0.00% 0.25% 0.50% 0.75% 1.00% 1.25% 1.50% 1.75% 2.00% 1991 1992 1993 1994 1995 1996 1997 1998 1999 2000 2001 2002 2003 2004 2005 2006 2007 YTD 2008 Non-Performing Loans / Total Loans Net Charge-Offs / Average Loans Historical Asset Quality Strong credit quality history over credit cycles During the 17 years ended December 31, 2007, period-end average non-performing loans totaled $698,000 and average net charge-offs totaled $51,000 At September 30, 2008, non-performing loans totaled $406,000, or 0.07% of total loans; no net charge-offs YTD 2008 Loan loss reserves to gross loans of 0.44% at September 30, 2008 |
 12 Trust Preferred 2.5% Interest- bearing Demand 25.4% FHLB Borrowings 23.3% Noninterest- bearing Demand 8.4% Savings Accounts 8.7% CDs 31.7% Note: Data as of September 30, 2008; excludes $2.3 million of securities sold under agreements to repurchase ¹ CAGR for the 9.75 year period ended September 30, 2008 ² Core deposits defined as demand and savings accounts FUNDING SOURCES Deposits account for approximately 74% of our funding Steady growth in deposits Ten-year CAGR¹ of 7.2% since 1998 Core deposits² comprised 57.3% of total deposits at September 30, 2008 No brokered deposits Approximately 22% of our deposits at September 30, 2008 were municipal deposits Total borrowings of $162.7 million at September 30, 2008, including $15.5 million of trust preferred |
 13 $13,324 $15,255 $15,219 $15,138 $13,821 $5,000 $8,000 $11,000 $14,000 $17,000 2004 2005 2006 2007 YTD 2008 HISTORICAL PROFITABILITY Other Income ($000) Net Interest Income ($000) Note: YTD data as of September 30, 2008 Other Expenses ($000) Provision ($000) $273 $261 $300 $300 $360 $0 $100 $200 $300 $400 2004 2005 2006 2007 YTD 2008 $2,389 $2,316 $2,331 $2,622 $2,074 $0 $1,000 $2,000 $3,000 2004 2005 2006 2007 YTD 2008 $10,320 $13,069 $12,806 $12,201 $13,002 $5,000 $7,000 $9,000 $11,000 $13,000 $15,000 2004 2005 2006 2007 YTD 2008 |
 14 $0.00 $0.00 $0.00 $0.10 $0.00 $0.05 $0.10 $0.15 2005 2006 2007 YTD 2008 Dividends Per Share ($) Note: YTD data as of September 30, 2008; Company completed mutual holding company reorganization and initial public offering in December 2004 ¹ Core earnings defined as net income before extraordinary items less the after-tax portion of income from investment securities and nonrecurring items Dividend Yield (%) 2.67% 0.00% 0.00% 0.00% 0.00% 0.50% 1.00% 1.50% 2.00% 2.50% 3.00% 2005 2006 2007 YTD 2008 Tangible Book Value Per Share ($) $6.91 $7.28 $7.54 $7.72 $0.00 $2.00 $4.00 $6.00 $8.00 $10.00 2005 2006 2007 YTD 2008 Core Earnings Per Share¹ ($) $0.36 $0.37 $0.34 $0.40 $0.00 $0.10 $0.20 $0.30 $0.40 $0.50 2005 2006 2007 YTD 2008 BUILDING SHAREHOLDER VALUE |
 15 REASONS FOR THE CONVERSION AND OFFERING While currently well-capitalized, additional capital raised will allow us to continue to grow and expand our franchise The increase in shares outstanding and change in corporate structure should improve the liquidity of our shares The full stock company corporate structure will improve future access to capital markets and provide more operating/strategic flexibility Current market conditions provide the opportunity to transition the company for the future without raising excessive capital |
 16 Note: LTM data as of period ended September 30, 2008 ¹ Core earnings defined as net income before extraordinary items less the after-tax portion of income from investment securities and nonrecurring items ² Peer group selected by independent appraiser; consists of ESSA, ESBK, EFSBI, FKFS, HARL, PBCI, ROME, THRD, WVFC; pricing data as of December 22, 2008 3,554,143 0.9977x 3,021,022 0.8480x Number of Shares Issued to Existing Shareholders Exchange Ratio 15.30x 13.38x Price/Pro Forma LTM Core Earnings¹ 74.65% 67.18% Price/Pro Forma Tangible Book Value $11.98 $13.30 Pro Forma Tangible Book Value Per Share ($) $99,454 $93,898 Pro Forma Tangible Stockholder’s Equity ($000) 8,304,143 7,058,522 Pro Forma Shares Outstanding 4,750,000 4,037,500 Number of Shares Offered MIDPOINT MINIMUM PRO FORMA FINANCIAL INFORMATION 11.23x Price/Pro Forma LTM Core Earnings¹ 97.21% Price/Pro Forma Tangible Book Value Peers² |
 17 Growing franchise in attractive markets throughout southern New Jersey’s shore communities Local, experienced Board of Directors and management team Proven track record of growth and profitability Opportunity to purchase stock at an attractive valuation Attractive dividend payment and yield HIGHLIGHTS |
 18 OCEAN SHORE HOLDING COMPANY |