Exhibit 99.1
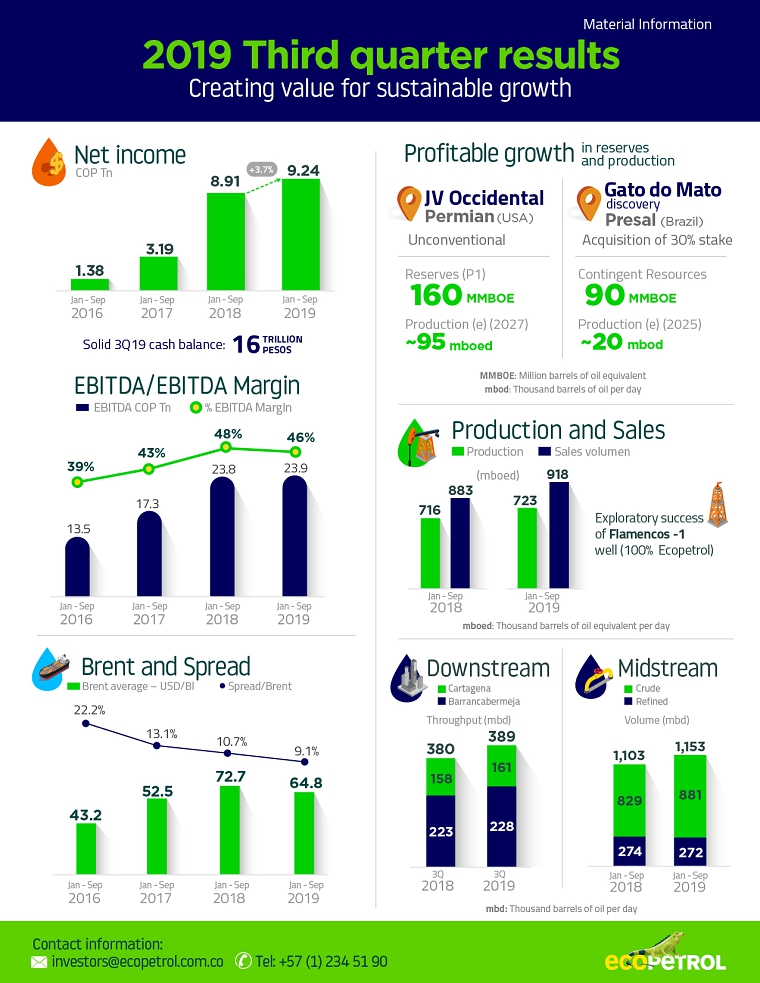
The Ecopetrol Group achieved sound operational and financial results during the first nine months of the year, in particular net profit of 9.2 trillion pesos and EBITDA of 23.9 trillion pesos, equivalent to an EBITDA margin of 46%.
As of the close of the quarter, we reported a solid cash position of 16 trillion pesos, even after paying the third installment of dividends to the government on 2018 earnings, totaling 2.7 trillion pesos.
These results demonstrate the good operational performance in all segments and the positioning of our crudes in markets that generate greater value. The above, coupled with the devaluation of the average exchange rate, the financial savings associated with the prepayment of the debt and the lower nominal tax rate. All this allowed to compensate, the lower Brent price, which went from USD 76 per barrel in the third quarter of 2018 to USD 62 per barrel at the end of this quarter. We positively highlight the spread of crude oil basket of -5 USD/bl in the third quarter compared to -8.4 USD/bl for the same period of 2018.
On the international arena, I am pleased to highlight two very important milestones: the first, our entry to the Midland in the Permian basin, the most prolific in the world, through a Joint Venture (JV) with Occidental, to participate in the exploitation of unconventional resources. The JV would allow the company to incorporate proven reserves (P1) of around 160 million barrels of oil equivalent and increase production progressively until 2027, when it would contribute a net production for Ecopetrol estimated at about 95 thousand barrels of oil equivalent per day. The JV will also allow Ecopetrol to strengthen its knowledge in the evaluation, development and exploitation of unconventional resources.
Second, the execution of an agreement with Shell Brasil Petróleo Ltda. to acquire 30% stake in the “Gato do Mato” discovery, located in two offshore areas of Brazil’s Santos basin, in the so-called Pre-Salt.
Under this agreement, Shell will reduce its stake from 80% to 50% and continue as operator, while the French oil company Total will retain the remaining 20%. With this purchase, Ecopetrol deepen its strategic position in Brazil’s Santos basin.
It is important to note that these invesments are aligned with the strategic priorities of the 2019-2021 business plan, focused on the growth of reserves and production under strict capital discipline. The transactions will be paid with our cash.
On the other hand, we receive in a respectful, prudent and responsible manner, the provision of the State Council that allows us to advance to a research stage through the Pilot Projects (PPII, by its acronym in Spanish) recommended by the Experts Committee.
We believe that advancing to a research stage is a key opportunity to rigorously evaluate the possibility of developing unconventionals in Colombia. For Ecopetrol, this is a step forward that will be assuming responsibly, in strict compliance with the regulations and provisions of the authorities, while ensuring deep respect for the environment and communities.
In the production segment, during the quarter we faced a challenging environment and some operational limitations that forced us to temporarily shut down our Tibú, Caño Limón and Gibraltar fields, causing our average production for the quarter to be at 720 thousand barrels of oil-equivalent per day. However, accumulated average production to September was 723 thousand barrels of oil-equivalent per day, 8 thousand barrels higher than in the same period last year, in line with the 2019 target.
We note the positive results of the Group’s subsidiaries, which contributed more than 60 thousand barrels of oil-equivalent per day during the first nine months of the year, some 8.4% of total production. The recovery program, which is the strategic pillar for adding hydrocarbon reserves, contributed 30% of the Group’s daily production.
In the exploration campaign, the Group and its partners completed the drilling of 13 exploratory wells, exceeding the goal of 12 wells for the year, with a success rate of 38%. We note the success of the Flamencos-1 well, in the Valle Medio del Magdalena basin, 100% operated by Ecopetrol. This discovery forms part of the Near Field exploration strategy, which consists in identifying and testing opportunities in the vicinity of already existing fields and facilities.
In the transport segment, we highlight the higher volumes of crude transported. It is also worth to highlight the logistical improvements made at Buenaventura, facilitating the port’s use as an alternate route for supplying fuels to the country’s south western region, as well as the commissioning of the Chinchiná-Pereira bypass. This project demonstrate our commitment to emphasizing safety as a pillar of our operations.
During the third quarter, the oil pipeline network continued to suffer from attacks by third parties; nevertheless, contingent operations on the Bicentenario oil pipeline have succeeded in mitigating these impacts.
In the Downstream segment, during the third quarter of the year we achieved a new historic maximum average throughput of 389 thousand barrels per day for the two refineries, thus demonstrating their effective performance despite unscheduled operating events. Gross combined refining margin was 10.2 USD/bl, impacted mainly due to lower product prices and the strengthening of medium and heavy crudes, consistent with the behavior of the international market.
With regards the investment plan, between January and September 2019 the Group executed investments totaling USD 2,317 million, up 29% versus the same period in 2018. Eighty-one percent of investments were concentrated in the upstream segment, in line with the Group’s strategic priorities.
As part of our efforts to contribute to preserving the environment, we have committed to reducing greenhouse gas emissions by 20% by the year 2030, and reducing our operational vulnerability to climate change. It is important to highlight that Ecopetrol S.A. was the first company in Colombia’s Oil and Gas sector to verify its reduction in greenhouse gas emissions from operating processes. The firm Ruby Canyon Engineering verified the reduction of over one million tons of CO2-equivalent between 2013 and 2017.
Along these same lines, Ecopetrol has entered into an agreement with the Colombian Ministry of Environment and Sustainable Development to improve the country’s environmental quality and sustainable development, in areas such as water resources, biodiversity, climate change, circular economy and improved air quality.
In addition to the above, we have met an important milestone in our energy transition process. On October 18th, we inaugurated the largest solar farm for self-generation of energy in Colombia, located in the city of Castilla La Nueva, in the Department of Meta. It has installed capacity of 21 peak megawatts and will supply energy for the next 15 years to the Castilla field, Ecopetrol’s second largest. The tariff of the energy produced by the solar farm represents savings of more than 30% compared to that supplied by the national electricity grid.
The entry into solar energy demonstrates Ecopetrol’s commitment to renewable energies. This operation will prevent the emission of over 154,000 tons of CO2 into the atmosphere.
Over the year, we have focused our efforts on activities such as water recycling. During the third quarter, we reused some 66 million cubic meters of water, up 4% versus the same period the year.
We maintain our commitment to profitable growth in production and reserves with sustainable results, reducing the impacts of our operations, encouraging good environmental practices and promoting the socio-environmental development of the regions in which we are active.

Felipe Bayón Pardo
CEO, Ecopetrol S.A.
Bogotá, October 29, 2019. Ecopetrol S.A. (BVC: ECOPETROL; NYSE: EC) announced today the Ecopetrol Group’s financial results for the third quarter and the first nine months of 2019, prepared in accordance with International Financial Reporting Standards applicable in Colombia.
Between January and September 2019 the Business Group earned net profit of COP 9.2 trillion and EBITDA of COP 23.9 trillion, higher than in the previous year, even with a reduction of 7.9 USD/bl in average Brent prices and lower refining margins. These results are a reflection of good operating performance in all segments, the commercial positioning of our crudes, financial savings associated with prepayment on our debt, and a lower nominal tax rate.
The strong internal cash generation allowed us to meet the investment commitments, pay out the latest installment of dividends to the government, and close out the period with a solid cash position equivalent to COP 16 trillion.
Table 1: Income Statement Financial Summary – Ecopetrol Group
| Billion (COP) | | 3Q 2019 | | | 3Q 2018 | | | ∆ ($) | | | ∆ (%) | | | 9M 2019 | | | 9M 2018 | | | ∆ ($) | | | ∆ (%) | |
| Total sales | | | 18,014 | | | | 17,876 | | | | 138 | | | | 0.8 | % | | | 52,266 | | | | 49,506 | | | | 2,760 | | | | 5.6 | % |
| Depreciation and amortization | | | 2,166 | | | | 2,053 | | | | 113 | | | | 5.5 | % | | | 6,189 | | | | 5,723 | | | | 466 | | | | 8.1 | % |
| Variable cost | | | 6,735 | | | | 6,342 | | | | 393 | | | | 6.2 | % | | | 19,629 | | | | 17,361 | | | | 2,268 | | | | 13.1 | % |
| Fixed cost | | | 2,339 | | | | 2,228 | | | | 111 | | | | 5.0 | % | | | 6,870 | | | | 6,143 | | | | 727 | | | | 11.8 | % |
| Cost of sales | | | 11,240 | | | | 10,623 | | | | 617 | | | | 5.8 | % | | | 32,688 | | | | 29,227 | | | | 3,461 | | | | 11.8 | % |
| Gross income | | | 6,774 | | | | 7,253 | | | | (479 | ) | | | (6.6 | %) | | | 19,578 | | | | 20,279 | | | | (701 | ) | | | (3.5 | %) |
| Operating and exploratory expenses | | | 1,062 | | | | 1,600 | | | | (538 | ) | | | (33.6 | %) | | | 2,952 | | | | 3,062 | | | | (110 | ) | | | (3.6 | %) |
| Operating income | | | 5,712 | | | | 5,653 | | | | 59 | | | | 1.0 | % | | | 16,626 | | | | 17,217 | | | | (591 | ) | | | (3.4 | %) |
| Financial income (loss) | | | (648 | ) | | | (521 | ) | | | (127 | ) | | | 24.4 | % | | | (1,426 | ) | | | (1,710 | ) | | | 284 | | | | (16.6 | %) |
| Share of profit of companies | | | 56 | | | | 57 | | | | (1 | ) | | | (1.8 | %) | | | 290 | | | | 239 | | | | 51 | | | | 21.3 | % |
| Income before income tax | | | 5,120 | | | | 5,189 | | | | (69 | ) | | | (1.3 | %) | | | 15,490 | | | | 15,746 | | | | (256 | ) | | | (1.6 | %) |
| Income tax | | | (1,770 | ) | | | (2,182 | ) | | | 412 | | | | (18.9 | %) | | | (5,315 | ) | | | (6,155 | ) | | | 840 | | | | (13.6 | %) |
| Net income consolidated | | | 3,350 | | | | 3,007 | | | | 343 | | | | 11.4 | % | | | 10,175 | | | | 9,591 | | | | 584 | | | | 6.1 | % |
| Non-controlling interest | | | (339 | ) | | | (232 | ) | | | (107 | ) | | | 46.1 | % | | | (932 | ) | | | (682 | ) | | | (250 | ) | | | 36.7 | % |
| Net income attributable to owners of Ecopetrol | | | 3,011 | | | | 2,775 | | | | 236 | | | | 8.5 | % | | | 9,243 | | | | 8,909 | | | | 334 | | | | 3.7 | % |
| | | | | | | | | | | | | | | | | | | | | | | | | | | | | | | | | |
| EBITDA | | | 8,270 | | | | 7,997 | | | | 273 | | | | 3.4 | % | | | 23,934 | | | | 23,756 | | | | 178 | | | | 0.7 | % |
| EBITDA Margin | | | 45.9 | % | | | 44.7 | % | | | - | | | | 1.2 | % | | | 45.8 | % | | | 48.0 | % | | | - | | | | (2.2 | %) |
The figures included in this report are unaudited. Financial information is expressed in billions of Colombian pesos (COP), or US dollars (USD), or thousands of barrels of oil-equivalent per day (mboed) or tons, and this is indicated where applicable. For presentation purposes, certain figures of this report were rounded to the nearest decimal place.
Future projection statements. This press release may contain future projection statements related to business prospects, estimates of operating and financial results, and Ecopetrol’s growth. These are projections and, as such, are based solely on management’s expectations with respect to the company’s future and its continuing access to capital to finance the Company’s business plan. These future statements basically depend on changes in market conditions, government regulations, competitive pressures, the performance of the Colombian economy and industry, and other factors; therefore, they are subject to change without prior notice.
| I. | Ecopetrol Group Financial and Operating Results |
Increase of 0.8% in sales revenue in 3Q19 versus 3Q18, as a combined result of:
| a) | Positive overall sales (+ COP 0.7 trillion, + 29.9 mboed). In 3Q19 volumes sold totaled 927.7 mboed, up 3.3% over 3Q18, due primarily to: i) increased crude availability given the strategy of domestic purchases from third parties, ii) higher diesel exports associated with greater available volumes from the Cartagena Refinery due to lower destination to the local market, iii) higher domestic sales of liquid fuels due to greater demand, and iv) increased requirements from border regions. |
| b) | A decrease of the weighted average basket of crude oils, natural gas and refined products, of -10.4 USD/bl (COP -2.8 trillion), largely due to the decline in Brent crude benchmark prices, partially offset by better spreads on crudes and diesel versus Brent. |
| c) | Appreciation in the average exchange rate, positively impacting total revenue (COP +2.1 trillion). |
| d) | An increase in revenues for transport and other services (COP +0.1 trillion), largely due to greater volumes transported. |
Table 2: Sales Volume - Ecopetrol Group
| Local Sales Volume - mboed | | 3Q 2019 | | | 3Q 2018 | | | ∆ (%) | | | 9M 2019 | | | 9M 2018 | | | ∆ (%) | |
| Medium Distillates | | | 157.6 | | | | 151.5 | | | | 4.0 | % | | | 154.9 | | | | 149.8 | | | | 3.4 | % |
| Gasoline | | | 114.4 | | | | 110.4 | | | | 3.6 | % | | | 114.2 | | | | 110.3 | | | | 3.5 | % |
| Natural Gas | | | 79.0 | | | | 78.3 | | | | 0.9 | % | | | 77.5 | | | | 75.6 | | | | 2.5 | % |
| Industrials and Petrochemicals | | | 23.0 | | | | 20.8 | | | | 10.6 | % | | | 22.5 | | | | 20.9 | | | | 7.7 | % |
| LPG and Propane | | | 16.0 | | | | 15.6 | | | | 2.6 | % | | | 15.3 | | | | 16.4 | | | | (6.7 | %) |
| Crude Oil | | | 5.2 | | | | 16.7 | | | | (68.9 | %) | | | 6.4 | | | | 9.6 | | | | (33.3 | %) |
| Fuel Oil | | | 0.9 | | | | 7.4 | | | | (87.8 | %) | | | 2.0 | | | | 9.0 | | | | (77.8 | %) |
| Total Local Volumes | | | 396.1 | | | | 400.7 | | | | (1.1 | %) | | | 392.8 | | | | 391.6 | | | | 0.3 | % |
| Export Sales Volume - mboed | | 3Q 2019 | | | 3Q 2018 | | | ∆ (%) | | | 9M 2019 | | | 9M 2018 | | | ∆ (%) | |
| Crude Oil | | | 402.5 | | | | 380.4 | | | | 5.8 | % | | | 402.2 | | | | 383.2 | | | | 5.0 | % |
| Products | | | 127.9 | | | | 115.9 | | | | 10.4 | % | | | 121.6 | | | | 107.2 | | | | 13.4 | % |
| Natural Gas* | | | 1.2 | | | | 0.8 | | | | 50.0 | % | | | 1.4 | | | | 1.3 | | | | 7.7 | % |
| Total Export Volumes | | | 531.6 | | | | 497.1 | | | | 6.9 | % | | | 525.2 | | | | 491.7 | | | | 6.8 | % |
| | | | | | | | | | | | | | | | | | | | | | | | | |
| Total Sales Volumes | | | 927.7 | | | | 897.8 | | | | 3.3 | % | | | 918.0 | | | | 883.3 | | | | 3.9 | % |
*Natural gas exports correspond to local sales of Ecopetrol America Inc.
Local sales (43%): A decrease versus 3Q18, primarily due to:
| · | Lower fuel oil sales due to fulfillment of domestic sales agreement as of March 2019. |
| · | Lower sales of crude oils to third parties due to termination of the agreement in the domestic market and allocation of crude for throughput of the Barrancabermeja and Cartagena refineries. |
| · | Higher gasoline sales due to economic growth and increased demand in the border region, given the decrease in the supply of Venezuelan gasoline. |
| · | Higher sales of medium distillates as a result of greater movement of freight to the inner part the country, increased air transportation and change in the bio-fuel blend to 2% from 12% in September 2019. |
International (57%): An increase versus 3Q18, primarily due to:
| · | An increase in crude exports, primarily as a result of the commercial strategy of domestic purchases of crude from third parties. |
| · | Higher diesel exports given the lower allocation of production from the Cartagena Refinery to the local market, which was supplied by imported products. |
Table 3: Export Destinations – Ecopetrol Group
| Crudes - mboed | | 3Q 2019 | | | 3Q 2018 | | | % Share | | | 9M 2019 | | | 9M 2018 | | | % Share | |
| Asia | | | 232.4 | | | | 171.4 | | | | 57.7 | % | | | 175.5 | | | | 142.6 | | | | 43.6 | % |
| U.S. Gulf Coast | | | 123.5 | | | | 125.3 | | | | 30.7 | % | | | 149.4 | | | | 136.2 | | | | 37.1 | % |
| Europe | | | 21.6 | | | | 21.2 | | | | 5.4 | % | | | 23.7 | | | | 14.1 | | | | 5.9 | % |
| Central America / Caribbean | | | 13.7 | | | | 11.5 | | | | 3.4 | % | | | 26.0 | | | | 30.9 | | | | 6.5 | % |
| Others | | | 7.9 | | | | 22.3 | | | | 2.0 | % | | | 4.6 | | | | 19.8 | | | | 1.1 | % |
| South America | | | 3.1 | | | | 10.0 | | | | 0.8 | % | | | 2.3 | | | | 5.8 | | | | 0.6 | % |
| U.S. West Coast | | | 0.3 | | | | 13.3 | | | | 0.1 | % | | | 9.7 | | | | 28.2 | | | | 2.4 | % |
| U.S. East Coast | | | 0.0 | | | | 5.4 | | | | 0.0 | % | | | 11.0 | | | | 5.5 | | | | 2.7 | % |
| Total | | | 402.5 | | | | 380.4 | | | | 100.0 | % | | | 402.2 | | | | 383.1 | | | | 100.0 | % |
| Products - mboed | | 3Q 2019 | | | 3Q 2018 | | | % Share | | | 9M 2019 | | | 9M 2018 | | | % Share | |
| U.S. East Coast | | | 50.5 | | | | 33.4 | | | | 39.5 | % | | | 45.0 | | | | 25.0 | | | | 37.0 | % |
| Central America / Caribbean | | | 35.7 | | | | 36.3 | | | | 27.9 | % | | | 35.7 | | | | 27.6 | | | | 29.3 | % |
| Asia | | | 24.6 | | | | 32.7 | | | | 19.2 | % | | | 21.5 | | | | 25.5 | | | | 17.7 | % |
| South America | | | 10.6 | | | | 7.9 | | | | 8.3 | % | | | 8.8 | | | | 8.4 | | | | 7.2 | % |
| U.S. Gulf Coast | | | 6.4 | | | | 5.1 | | | | 5.0 | % | | | 7.3 | | | | 18.0 | | | | 6.0 | % |
| Europe | | | 0.0 | | | | 0.1 | | | | 0.0 | % | | | 1.2 | | | | 1.6 | | | | 1.0 | % |
| U.S. West Coast | | | 0.0 | | | | 0.4 | | | | 0.0 | % | | | 2.2 | | | | 1.1 | | | | 1.8 | % |
| Others | | | 0.0 | | | | 0.0 | | | | 0.0 | % | | | 0.0 | | | | 0.0 | | | | 0.0 | % |
| Total | | | 127.8 | | | | 115.9 | | | | 100.0 | % | | | 121.7 | | | | 107.2 | | | | 100.0 | % |
Note: Information is subject to subsequent change at the close of the quarter, as some destinations might be reclassified according to export results.
Exports
Crudes:In 3Q19, 88% of oil cargos were exported to Asia and the US Gulf Coast.
| · | Asia: Increased its share vs. 3T 2018 due to the strategy focused on capturing commercial opportunities in China’s independent refining segment. |
| · | US Coasts: Decrease in the share vs. 3T 2018 of sales to the US in 3Q19 due to i) greater supply of Canadian crude oils and Maya crude at more discounted prices, and ii) Ecopetrol’s initiative to concentrate its exports on developing higher-value Asia markets. |
| · | Central America /Caribbean: Share remained vs. 3T 2018 given the blending with other crude flows in the Atlantic basin made by the purchasers. |
Refined Products: In 3Q19, 87% of product cargos were exported to Asia, the US East Coast and Central America.
| · | US East Coast: Increased its share vs. 3T 2018 largely due to i) higher exports of ultra-low sulfur diesel (ULSD) given greater product availability, and increased demand after the closure of thePhiladelphia Energy Solutions refinery - PES ii) higher volumes of fuel oil due to lower supply in the area given the imminent entry into force of the IMO 2020 regulation. |
| · | Asia: Lower share vs. 3T 2018 due to the re-allocation of fuel oil and coke deliveries from Asia to the US East Coast and South America, respectively. |
Prices and Spreads Performance
Table 4: Average Basket Prices and Spreads - Ecopetrol Group
| USD/Bl | | 3Q 2019 | | | 3Q 2018 | | | ∆ (%) | | | 9M 2019 | | | 9M 2018 | | | ∆ (%) | |
| Brent | | | 62.0 | | | | 75.8 | | | | (18.2 | %) | | | 64.8 | | | | 72.7 | �� | | | (10.9 | %) |
| Natural Gas Basket | | | 22.9 | | | | 21.7 | | | | 5.5 | % | | | 23.6 | | | | 22.5 | | | | 4.9 | % |
| | | | | | | | | | | | | | | | | | | | | | | | | |
| Crude Oil Basket Spread | | | (5.0 | ) | | | (8.4 | ) | | | 40.5 | % | | | (5.9 | ) | | | (7.8 | ) | | | 24.4 | % |
| Crude Oil Basket | | | 57.0 | | | | 67.4 | | | | (15.4 | %) | | | 58.9 | | | | 64.9 | | | | (9.2 | %) |
| % Spread Crude Oil Basket vs. Brent | | | (8.1 | %) | | | (11.1 | %) | | | 27.0 | % | | | (9.1 | %) | | | (10.7 | %) | | | 15.0 | % |
| | | | | | | | | | | | | | | | | | | | | | | | | |
| Products Basket Spread | | | 6.6 | | | | 5.5 | | | | 20.0 | % | | | 5.8 | | | | 5.6 | | | | 3.6 | % |
| Products Basket | | | 68.6 | | | | 81.3 | | | | (15.6 | %) | | | 70.6 | | | | 78.3 | | | | (9.8 | %) |
| % Spread Products Basket vs. Brent | | | 10.6 | % | | | 7.2 | % | | | 47.2 | % | | | 9.0 | % | | | 7.7 | % | | | 16.9 | % |
Crudes:The spread on the crude oils basket was strengthened as a result of lower supplies of heavy crudes, as well as the commercial strategy of directing our crudes towards high-value markets.
Commercial strategy have been focused on positioning Castilla crude in Asian market, primarily among China’s independent refineries. The strategy also includes preserving sales to high-value customers in high-conversion refining markets, such as the US.
The better spreads and the positioning of our crudes are due to Ecopetrol’s efforts throughout the supply chain to ensure stable quality and delivery of its crudes to the market.
Refined Products: In 3Q19 the price of the products basket versus Brent strengthened over 3Q18, as a result of stronger diesel prices and better sales prices for asphalt.
Gas Natural:The price per barrel-equivalent was up versus 3Q18, due to the renewal of contracts as a result from the bidding process of natural gas from larger fields and incremental sales at higher sales prices than in 2018.
Depreciation and amortization: Increase of 5.5% in 3Q19 versus 3Q18, was primarily due to the net effect of:
| a) | Greater levels of investment associated with the results of the drilling campaign and an improved recovery factor from our fields. |
| b) | Higher average exchange rate with a negative effect on the depreciation cost of Subsidiaries using the US dollar as functional currency, given the peso’s devaluation against US dollar. |
| c) | The above factors were partially offset by the greater incorporation of reserves in 2018 versus 2017, yielding a lower depreciation rate. |
Variable costs:Increase of 6.2% in 3Q19 versus 3Q18, largely as a result of:
| a) | Higher cost of crude purchases, natural gas and refined products (COP +0.5 trillion), due to the net effect of: |
| · | Increased volumes purchased (COP +1.1 trillion, + 51.9 mboed) due to: i) greater purchases of domestic crudes (+ 27.4 mboed), ii) imports of diesel (+ 27.5 mboed) to supply the local market, and iii) lower purchase volumes of natural gas (- 3.0 mboed). |
| · | Decline in the average prices of domestic purchases and imports of crudes, refined products and natural gas (COP -1.3 trillion). |
| · | Higher average exchange rate on purchases (COP +0.7 trillion). |
| b) | Other minor changes totaling (COP -0.09 trillion). |
Table 5: Local Purchases and Imports – Ecopetrol Group
| Local Purchases - mboed | | 3Q 2019 | | | 3Q 2018 | | | ∆ (%) | | | 9M 2019 | | | 9M 2018 | | | ∆ (%) | |
| Crude Oil | | | 196.1 | | | | 152.3 | | | | 28.8 | % | | | 174.0 | | | | 159.6 | | | | 9.0 | % |
| Gas | | | 3.0 | | | | 6.0 | | | | (50.0 | %) | | | 2.3 | | | | 5.9 | | | | (61.0 | %) |
| Products | | | 3.1 | | | | 2.8 | | | | 10.7 | % | | | 3.1 | | | | 3.1 | | | | 0.0 | % |
| Diluent | | | 0.3 | | | | 0.6 | | | | (50.0 | %) | | | 0.4 | | | | 0.5 | | | | (20.0 | %) |
| Total | | | 202.5 | | | | 161.7 | | | | 25.2 | % | | | 179.8 | | | | 169.1 | | | | 6.3 | % |
| Imports - mboed | | 3Q 2019 | | | 3Q 2018 | | | ∆ (%) | | | 9M 2019 | | | 9M 2018 | | | ∆ (%) | |
| Crude Oil | | | 16.8 | | | | 33.2 | | | | (49.4 | %) | | | 28.9 | | | | 38.5 | | | | (24.9 | %) |
| Products | | | 65.1 | | | | 41.8 | | | | 55.7 | % | | | 78.7 | | | | 44.7 | | | | 76.1 | % |
| Diluent | | | 55.2 | | | | 51.0 | | | | 8.2 | % | | | 53.8 | | | | 50.4 | | | | 6.7 | % |
| Total | | | 137.1 | | | | 126.0 | | | | 8.8 | % | | | 161.4 | | | | 133.6 | | | | 20.8 | % |
| | | | | | | | | | | | | | | | | | | | | | | | | |
| Total | | | 339.6 | | | | 287.7 | | | | 18.0 | % | | | 341.2 | | | | 302.7 | | | | 12.7 | % |
Fixed Costs:Increase of 5.0% in 3Q19 versus 3Q18, due primarily to:
| a) | Higher costs of maintenance and contracted and services (COP +61 billion) due to greater operational activity as a result of: i) higher costs associated with incremental production, ii) commissioning of new wells, and iii) larger share in fields, among others. |
| b) | Higher labor costs (COP +47 billion), primarily a result of wage increases versus previous year and higher headcount. |
| c) | Other minor changes totaling (COP +3 billion). |
| c) | Operating and Exploratory Expenses |
Operating and exploratory expenses in 3Q19 declined 33.6% compared to 3Q18, due to: i) lower exploratory expenses given the 3Q18 recognition of the expense of exploratory activity in Ecopetrol America LLC’s León 1 and 2 wells, and Hocol’s Bonifacio, Hurón and Payero wells, partially offset by ii) revenue recognized in 2018 given the reversal of the provision for resolution of the dispute related to the P135 project, iii) higher labor expenses due to wage increases versus the previous year and higher headcount, and iv) higher social investment expenses, among others.
| d) | Financial (Non-Operating) Results |
The change in financial expenses in 3Q19 versus 3Q18 corresponds to the net effect of:
| a) | Higher spending due to the exchange rate difference (COP -251 billion), given the impact of the peso’s devaluation against the US dollar over the net liability position in dollars in 2019 versus a net asset position in dollars in 2018. |
| b) | The increase of financial interest on dollar-denominated debt due to the peso’s devaluation against the US dollar (COP -50 billion) |
| c) | Savings on the debt’s financial cost (COP +111 billion), associated primarily with loan prepayments made the previous year. |
| d) | Higher revenue due to the portfolio valuation, increased yields and other (COP +63 billion). |
Theeffective tax rate for 3Q19 was 34.6%, versus 42.1% in 3Q18. The reduction occurred primarily due to better results at Ecopetrol America LLC., which is taxed at a 0% rate, and a reduction of 4% in the nominal tax rate as set in the Colombian Financing Law.
| 2. | Statement of Financial Position |
Increase of 4.7% in assets in 3Q19 versus 2Q19, due largely to the net effect of:
| a) | Increasedproperty, plant and equipment, natural resources and intangibles(+COP 3.8 trillion) due to the net effect of: i) higher investment during the period, ii) the effect of the devaluation occurred during the third quarter over the conversion of assets from subsidiaries using a functional currency other than the Colombian peso, partially offset by iii) higher depreciation and amortization. |
| b) | Increase inother financial assets and cash equivalents (+COP 3.3 trillion), largely due to the combined effect of: i) cash flow generated from operations (+COP 9.3 trillion), ii) outflow of funds for investment
(-COP 3.2 trillion), iii) portfolio assets and others (+0.4 trillion), iv) payment of the last installment of dividends (-COP 2.7 trillion) to the Nation and non-controlling shareholders in the midstream segment (-COP 0.4 trillion), v) payment of principal and debt service (-COP 0.5 trillion), and vi) positive effect of the Colombian peso’s devaluation against the dollar (+COP 0.4 trillion). At the close of 3Q19 the cash composition was 58% in dollars and 42% in Colombian pesos. |
| c) | Increase of (+COP 0.5 trillion) indeferred taxes, generated primarily by differences in calculating the income provision between tax and accounting items. |
| d) | Reduction intrade accounts receivable(-COP 2.0 trillion), largely due to the payment received from the Fuel Prices Stabilization Fund (+COP 1.9 trillion). |
| e) | Other changes in assets (+COP 0.3 trillion). |
Table 6: Cash Position – Ecopetrol Group
| Billion (COP) | | 3Q 2019 | | | 3Q 2018 | | | 9M 2019 | | | 9M 2018 | |
| Initial cash and cash equivalents | | | 5,524 | | | | 6,337 | | | | 6,312 | | | | 7,946 | |
| (+) Cash flow from operations | | | 9,309 | | | | 8,554 | | | | 20,147 | | | | 17,868 | |
| (-) CAPEX | | | (3,213 | ) | | | (2,161 | ) | | | (7,354 | ) | | | (5,113 | ) |
| (+/-) Investment portfolio movement | | | 459 | | | | (1,485 | ) | | | 1,442 | | | | (4,376 | ) |
| (+) Other investment activities | | | 115 | | | | 42 | | | | 426 | | | | 347 | |
| (-) Borrowings and interest payments | | | (452 | ) | | | (2,526 | ) | | | (2,262 | ) | | | (5,255 | ) |
| (-) Dividend payments | | | (3,082 | ) | | | (1,832 | ) | | | (10,057 | ) | | | (4,287 | ) |
| (+/-) Exchange difference (cash impact) | | | 401 | | | | 192 | | | | 407 | | | | (9 | ) |
| Final cash and cash equivalents | | | 9,061 | | | | 7,121 | | | | 9,061 | | | | 7,121 | |
| Investment portfolio | | | 6,906 | | | | 10,931 | | | | 6,906 | | | | 10,931 | |
| Total cash | | | 15,967 | | | | 18,052 | | | | 15,967 | | | | 18,052 | |
Note: Cash corresponds to available funds in the form of cash and cash equivalents and investments in financial securities, regardless of maturity.
Increase of 2.1% in 3Q19 versus 2Q19, generated by:
| a) | Increased in the lineloans and financing(+COP 2.9 trillion), primarily due to the effect of the Colombian peso’s devaluation against the dollar and its impact on dollar debt, whose exchange effect is recognized in other comprehensive income, under equity, given the application of hedge accounting. As of September 30, 2019, the Group’s debt was COP 40.4 trillion, 90% of which is denominated in foreign currency (USD) and 10% in domestic currency (COP). |
| b) | Increase intaxes payable(+COP 0.6 trillion) associated with the quarter’s improved results. |
| c) | Loweraccounts payable (-COP 2.0 trillion) due to the combined effect of i) payment of the latest installment of dividends to the Nation (-COP 2.7 trillion), as decreed by the general shareholders meeting on 2018 profits, and ii) higher accounts payable to suppliers. |
| d) | Other changes in liabilities (-COP 0.1 trillion). |
Net equityincreased 7.8% in 3Q19 versus 2Q19, as a result of the combined effect of: i) quarterly earnings, ii) the increase by conversion of assets and liabilities of subsidiaries with functional currency different from the Colombian peso, due to the peso’s devaluation against the US dollar, and iii) the results of the exchange rate difference on US dollar debt used as hedging instrument for cash flow and net investment, also given the peso’s devaluation against the US dollar.
| 3. | Mergers and Acquisitions (M&A) |
Joint Venture with Occidental Petroleum Corporation
On July 2019, we announced a joint venture (JV) with Occidental Petroleum Corporation in order to execute a plan to developing unconventional resources in the Midland of the Permian Basin in the state of Texas (USA).
At the close of the transaction, estimated before the end of 2019, the JV would allow the company to incorporate proven reserves (1P) of around 160 million barrels of oil equivalent, contributing to Ecopetrol's growth and financial sustainability.
Likewise, this alliance would enable Ecopetrol’s Group to increase production progressively until 2027, when an estimated of 95 thousand barrels equivalent per day net production would be achieved by Ecopetrol in the JV.
This business will contribute to the diversification of the portfolio thanks to the incorporation of short-cycle assets. It also allows increasing the participation of light crudes, close to 40 API degrees on average, to balance the production matrix of the Ecopetrol’s Group, currently concentrated in heavy crudes.
The JV will also allow Ecopetrol to strengthen its knowledge in the evaluation, development and exploitation of unconventional resources. The alliance contemplates a strong knowledge and technology transfer component given Ecopetrol’s workers will participate directly in the activities in the US that has successfully developed such technology.
For this partnership, which marks a new milestone in the relationship of more than 40 years between the two companies, Occidental will have 51% of the JV, will contribute its experience as an operator and about 97,000 acres to be developed in an area with high potential in hydrocarbons in the Permian Midland.
Ecopetrol will have a 49% stake and will make a 50% upfront payment at the close of the transaction and the remaining 50% in carry (deferred investment over time in activities contemplated in the development plan in the next 3 to 4 years). During the carry period, Ecopetrol will pay 75% of Occidental's share of the JV's investments.
Operation progress: Currently, there are 2 rigs operating in Midland Basin and we expect to have 4 rigs operating in 2020. To date, 2 wells have reached total depth (TD); completion of these 2 wells is expected to start in November.
30% acquisition of Gato do Mato discovery
Ecopetrol Óleo e Gás do Brasil Ltda. has entered into an agreement with Shell Brasil Petróleo Ltda. to acquire 30% of the interests, rights and obligations in two areas corresponding to the BM-S-54 Concession Agreement and the Sul de Gato do Mato Shared Production Agreement, located offshore in Brazil’s Santos basin, in the so-called Pre-Salt, where a hydrocarbon deposit known as “Gato do Mato” was discovered.
Under this agreement, Shell will reduce its stake from 80% to 50% and continue as operator, while the French company Total will retain the remaining 20%. In addition to these oil companies, the Brazilian government also participates in the Shared Production Agreement, through Pré-Sal Petróleo S.A. (PPSA). After discounting this share, the consortium will proportionally maintain the above percentages.
Three wells that have discovered light hydrocarbons have been drilled in these two blocks. The consortium will continue executing activities and operations in order to initiate production in coming years.
According to Ecopetrol’s estimates, the company could incorporate some 90 million barrels of crude in contingent resources from 2020, which will be gradually added to its balance of reserves. Ecopetrol also estimates that its share of production could go to a maximum of 20,000 barrels per day of crude in 2025.
This agreement is in line with the company’s strategy of capital discipline and sustainable growth in reserves and production. The Gato do Mato stake will add to our current position at Pau-Brasil and Saturno blocks. With this agreement, Ecopetrol deepen its strategic position in the Santos basin in Brazil.
The agreement signed by Ecopetrol Óleo e Gás do Brasil Ltda. and Shell Brasil Petróleo Ltda. is subject to the respective approvals of assignment to Ecopetrol by Brazil’s Ministry of Mines and Energy, the country’s National Agency of Petroleum, Natural Gas and Biofuels and other customary transaction conditions.
| 4. | Results by Business Segment |
EXPLORATION
In 3Q19 we completed the drilling of three exploratory wells, for a total of 13 year to date, exceeding the goal of 12 set for 2019.
| · | The Flamencos-1 well, located in the Middle Magdalena Valley basin, confirmed the presence of hydrocarbons. The discovery was recorded at a depth of 8,561 feed (2,620 meters). From the initial production tests in the La Paz formation, a flow of 600 barrels of oil per day of light crude oil of 30º API was obtained. The production unit is the same as for the Cantagallo and Las Garzas fields, and Flamenco’s proximity to those receiving stations and to the Barrancabermeja refinery will afford a competitive and operational advantage. |
| · | The Boranda-3 well, located in the Middle Magdalena Valley, is in the evaluation stage after having completed initial production testing. |
| · | The Hocol subsidiary drilled the Bullerengue SW-1 well, located in the Lower Magdalena Valley (Sinú-San Jacinto sub basin), which is currently under evaluation. |
Additionally, during this period we confirmed the presence of hydrocarbons in the Cosecha CW-1-ST-1 well in the Llanos Orientales basin, which is under extensive production testing at the Cretaceous, with an average rate of 2,727 barrels of oil per day of light crude of 36.7 API.
In sum, during the first nine months of the year, five successful wells have been drilled: Jaspe-8, Andina Norte-1, Cosecha CW-1-ST-1, Boranda-2 ST and Flamencos-1, discoveries that fall within the Near Field exploration strategy, which consists in identifying and testing opportunities near already existing fields and infrastructure.
Regarding seismic activities, we obtained the permits for the acquisition of 2,000 km² of 3D seismic in the Col-5 block of the Colombian offshore.
With respect to acquiring new exploratory areas, Ecopetrol is evaluating to participate in the upcoming Round 6 and in the Transfer of Rights Round of the Brazilian National Oil Agency (ANP) in Brazil, and in Cycle 2 of the Permanent Area Assignment Process (PPAA) of the National Hydrocarbon Agency (ANH) of Colombia.
Table 7: Exploratory Wells Breakdown – Ecopetrol Group
| # | | Quarter | | Name | | Initial Well Classification (Lahee) | | Block | | Name | | Operator/Partner | | Status | | TD Date (dd/mm/yyyy) |
| 1 | | First | | Jaspe-8 | | A1 | | Quifa | | Llanos Orientales | | FRONTERA (70%)
ECP (30%) | | Successful | | 14//01/2019 |
| 2 | | First | | Cira 7000 ST | | A2C | | La Cira Infantas | | Valle Medio del Magdalena | | OXY (52%)
ECP (48%) | | Dry | | 27/01/2019 |
| 3 | | First | | Provenza-1 | | A3 | | CPO-8 | | Llanos Orientales | | ECP (100%) | | Dry | | 5/03/2019 |
| 4 | | First | | Mamey West-1 | | A2C | | Samán | | Valle Inferior del Magdalena | | Hocol (100%) | | Dry | | 5/03/2019 |
| 5 | | Second | | Andina Norte-1 | | A3 | | Capachos | | Llanos Orientales | | Parex (50%)
ECP (50%) | | Successful | | 3/05/2019 |
| 6 | | Second | | Pastora Sur-1 | | A3 | | Chipiron | | Llanos Orientales | | Oxy (70%)
ECP /30%) | | Dry | | 19/05/2019 |
| 7 | | Second | | Boranda-2 ST | | A1 | | Playón | | Valle Medio del Magdalena | | Parex (50%)
ECP (50%) | | Successful | | 21/05/2019 |
| 8 | | Second | | Cosecha CW-01 | | A3 | | Cosecha | | Llanos Orientales | | Oxy (70%)
ECP /30%) | | Dry | | 26/05/2019 |
| 9 | | Second | | Cosecha CW-01-ST-1 | | A3 | | Cosecha | | Llanos Orientales | | Oxy (70%)
ECP /30%) | | Successful | | 9/06/2019 |
| 10 | | Second | | Habanero-1 | | A3 | | Fortuna | | Valle Medio del Magdalena | | Parex (80%)
ECP (20%) | | Under Evaluation | | 11/06/2019 |
| 11 | | Third | | Bullerengue SW-1 | | A1 | | SSJN-1 | | Sinu-San Jacinto | | Lewis (50%) Hocol (50%) | | Under Evaluation | | 4/08/2019 |
| 12 | | Third | | Boranda-3 | | A2B | | Playón | | Valle Medio del Magdalena | | Parex (50%)
ECP (50%) | | Under Evaluation | | 26/08/2019 |
| 13 | | Third | | Flamencos-1 | | A3 | | VMM | | Valle Medio del Magdalena | | ECP (100%) | | Successful | | 27/08/2019 |
PRODUCTION
In 3Q19 the Ecopetrol Group’s average production was 720 mboed, while from January to September 2019 it was 723 mboed. Compared to 3Q18, 3Q19 production is down 0.7%, while versus 2Q19 is down 0.5%. Although production is within the range of the target, 3Q19 saw an impact on production of -8.4 mboed due to external events. Such events included the closure of the Caño Limón, Gibraltar and Tibú fields as a result of attacks on the Caño Limón Coveñas oil pipeline and other public security events. There was also electrical outages caused by the rainy weather in the Llanos Orientales, affecting the Castilla, Chichimene and Rubiales fields.
Late September we had the production of the first incremental barrels of the Apiay project and the start of the commissioning and stabilization phase of the NGL plant at Cupiagua. These projects, together with the positive results expected at the Rubiales and Caño Limón fields, will keep 2019 production in the range of 720–730 mboed, as provided in the plan.
Ecopetrol Group subsidiaries in the upstream segment contributed 59 mboed in 3Q2019, increasing 0.9 mboed versus the same period in 2018, leveraged primarily by the positive results of Ecopetrol America LLC.
To date, 464 wells have been drilled and completed, 157 of which correspond to activity executed during 3Q19, with average occupation of 41 rigs.
Table 8: Gross Production* - Ecopetrol Group
| Production - mboed | | 3Q 2019 | | | 3Q 2018 | | | ∆ (%) | | | 9M 2019 | | | 9M 2018 | | | ∆ (%) | |
| Crude Oil | | | 543.1 | | | | 551.9 | | | | (1.6 | %) | | | 548.3 | | | | 545.5 | | | | 0.5 | % |
| Natural Gas | | | 117.6 | | | | 114.6 | | | | 2.6 | % | | | 114.6 | | | | 111.9 | | | | 2.4 | % |
| Total Ecopetrol S.A. | | | 660.7 | | | | 666.5 | | | | (0.9 | %) | | | 662.9 | | | | 657.4 | | | | 0.8 | % |
| Crude Oil | | | 20.6 | | | | 21.6 | | | | (4.6 | %) | | | 20.8 | | | | 20.7 | | | | 0.5 | % |
| Natural Gas | | | 8.6 | | | | 7.2 | | | | 19.4 | % | | | 8.6 | | | | 7.1 | | | | 21.1 | % |
| Total Hocol | | | 29.2 | | | | 28.8 | | | | 1.4 | % | | | 29.4 | | | | 27.8 | | | | 5.8 | % |
| Crude Oil | | | 7.9 | | | | 8.8 | | | | (10.2 | %) | | | 8.1 | | | | 9.1 | | | | (11.0 | %) |
| Natural Gas | | | 5.0 | | | | 4.9 | | | | 2.0 | % | | | 5.0 | | | | 5.0 | | | | 0.0 | % |
| Total Equion** | | | 12.9 | | | | 13.7 | | | | (5.8 | %) | | | 13.1 | | | | 14.1 | | | | (7.1 | %) |
| Crude Oil | | | 3.5 | | | | 3.9 | | | | (10.3 | %) | | | 3.6 | | | | 3.9 | | | | (7.7 | %) |
| Natural Gas | | | 1.3 | | | | 1.4 | | | | (7.1 | %) | | | 1.2 | | | | 1.1 | | | | 9.1 | % |
| Total Savia** | | | 4.8 | | | | 5.3 | | | | (9.4 | %) | | | 4.8 | | | | 5.0 | | | | (4.0 | %) |
| Crude Oil | | | 10.3 | | | | 8.4 | | | | 22.6 | % | | | 11.4 | | | | 9.7 | | | | 17.5 | % |
| Natural Gas | | | 1.6 | | | | 1.7 | | | | (5.9 | %) | | | 1.8 | | | | 1.9 | | | | (5.3 | %) |
| Total Ecopetrol America | | | 11.9 | | | | 10.1 | | | | 17.8 | % | | | 13.2 | | | | 11.6 | | | | 13.8 | % |
| Crude Oil | | | 585.4 | | | | 594.6 | | | | (1.5 | %) | | | 592.2 | | | | 588.9 | | | | 0.6 | % |
| Natural Gas | | | 134.1 | | | | 129.8 | | | | 3.3 | % | | | 131.2 | | | | 127.0 | | | | 3.3 | % |
| Total Ecopetrol Group | | | 719.5 | | | | 724.4 | | | | (0.7 | %) | | | 723.4 | | | | 715.9 | | | | 1.0 | % |
* Gross production includes royalties and is prorated for Ecopetrol’s share in each company.
** Equion and Savia are included in the Financial Statements through the equity method.
Note: Natural gas production includes white products.
Recovery Program
Currently, the fields where pilot tests and projects to increase the recovery factor are underway contribute 30% of the Group’s daily production.
At the close of 3Q19, four projects had evolved to the execution stage and two to the maturity stage, and therefore there are 12 projects in execution, 11 in maturation and 10 pilots. The water injection projects that have progressed to the execution stage are Las Monas, Akacias, La Cira Zone C and Caño Limón. The developments that have entered the maturing stage for expanding improved recovery through water injection are Galán and Yaguará.
Lifting and Dilution Cost
Table 9: Lifting and Dilution Cost - Ecopetrol Group
| USD/Bl | | 3Q 2019 | | | 3Q 2018 | | | ∆ (%) | | | 9M 2019 | | | 9M 2018 | | | ∆ (%) | | | % USD | |
| Lifting Cost* | | | 8.53 | | | | 8.74 | | | | (2.4 | %) | | | 8.79 | | | | 8.45 | | | | 4.0 | % | | | 17.0 | % |
| Dilution Cost** | | | 4.00 | | | | 4.85 | | | | (17.5 | %) | | | 4.32 | | | | 4.65 | | | | (7.1 | %) | | | 100.0 | % |
* Calculated based on barrels produced without royalties
** Calculated based on barrels sold
The increase of 0.34 USD/bl observed in lifting cost between the accumulated as of September 2019 and the same period in 2018 is largely due to the following:
Cost Effect (+1.53 USD/bl):
| · | Higher energy consumption due to: i) an increase of approximately 16% in the non-regulated energy rate due to the effect of the El Niño Phenomenon and the non-entry of Hidroituango, ii) increased barrels of production and injection water, iii) increased number of wells drilled, partially mitigated by 0.09 USD/bl in consumption optimization efficiencies, demand planning and optimization of the energy matrix. |
| · | Greater execution cost in subsoil maintenance due to the higher number and complexity of interventions and well services. |
| · | Higher labor cost, due to increased headcount required for a larger activity. |
| · | Increase in contracted services in the association contracts. |
Exchange rate effect (-1.08 USD/bl): higher exchange rate of +353.59 pesos/US dollar when re-stating Colombian pesos into US dollars.
Volume effect (-0.11 USD/bl): lower cost due to increased production versus last year.
Lifting cost fell slightly versus 2Q19, due largely to the decline in well interventions in some fields located in the Meta region.
Dilution Cost
Decrease in the year-to-date dilution cost, due to the lower purchase price of naphtha (-13 USD/bl). Also, we continued the strategy of optimizing diluent by transporting at maximum possible viscosity, as reflected in the dilution factor of 14.76% as of September 2019.
Financial Results for the Segment
Table 10: Profit and Loss Statement – Upstream
| Billion (COP) | | 3Q 2019 | | | 3Q 2018 | | | ∆ ($) | | | ∆ (%) | | | 9M 2019 | | | 9M 2018 | | | ∆ ($) | | | ∆ (%) | |
| Total revenue | | | 13,260 | | | | 14,285 | | | | (1,025 | ) | | | (7.2 | %) | | | 38,389 | | | | 36,654 | | | | 1,735 | | | | 4.7 | % |
| Depreciation, amortization and depletion | | | 1,522 | | | | 1,451 | | | | 71 | | | | 4.9 | % | | | 4,288 | | | | 3,961 | | | | 327 | | | | 8.3 | % |
| Variable costs | | | 5,422 | | | | 5,722 | | | | (300 | ) | | | (5.2 | %) | | | 15,131 | | | | 13,248 | | | | 1,883 | | | | 14.2 | % |
| Fixed costs | | | 2,417 | | | | 2,044 | | | | 373 | | | | 18.2 | % | | | 7,106 | | | | 6,163 | | | | 943 | | | | 15.3 | % |
| Total cost of sales | | | 9,361 | | | | 9,217 | | | | 144 | | | | 1.6 | % | | | 26,525 | | | | 23,372 | | | | 3,153 | | | | 13.5 | % |
| Gross income | | | 3,899 | | | | 5,068 | | | | (1,169 | ) | | | (23.1 | %) | | | 11,864 | | | | 13,282 | | | | (1,418 | ) | | | (10.7 | %) |
| Operating and exploratory expenses | | | 559 | | | | 1,339 | | | | (780 | ) | | | (58.3 | %) | | | 1,615 | | | | 2,100 | | | | (485 | ) | | | (23.1 | %) |
| Operating income | | | 3,340 | | | | 3,729 | | | | (389 | ) | | | (10.4 | %) | | | 10,249 | | | | 11,182 | | | | (933 | ) | | | (8.3 | %) |
| Financial result, net | | | (480 | ) | | | (143 | ) | | | (337 | ) | | | 235.7 | % | | | (314 | ) | | | (660 | ) | | | 346 | | | | (52.4 | %) |
| Share of profit of companies | | | 50 | | | | 51 | | | | (1 | ) | | | (2.0 | %) | | | 154 | | | | 215 | | | | (61 | ) | | | (28.4 | %) |
| Income before income tax | | | 2,910 | | | | 3,637 | | | | (727 | ) | | | (20.0 | %) | | | 10,089 | | | | 10,737 | | | | (648 | ) | | | (6.0 | %) |
| Provision for income tax | | | (1,013 | ) | | | (1,565 | ) | | | 552 | | | | (35.3 | %) | | | (3,365 | ) | | | (4,123 | ) | | | 758 | | | | (18.4 | %) |
| Net income consolidated | | | 1,897 | | | | 2,072 | | | | (175 | ) | | | (8.4 | %) | | | 6,724 | | | | 6,614 | | | | 110 | | | | 1.7 | % |
| Non-controlling interest | | | 15 | | | | 15 | | | | 0 | | | | 0.0 | % | | | 44 | | | | 44 | | | | 0 | | | | 0.0 | % |
| Net income attributable to owners of Ecopetrol | | | 1,912 | | | | 2,087 | | | | (175 | ) | | | (8.4 | %) | | | 6,768 | | | | 6,658 | | | | 110 | | | | 1.7 | % |
| | | | | | | | | | | | | | | | | | | | | | | | | | | | | | | | | |
| EBITDA | | | 5,010 | | | | 5,335 | | | | (325 | ) | | | (6.1 | %) | | | 14,979 | | | | 15,602 | | | | (623 | ) | | | (4.0 | %) |
| EBITDA Margin | | | 37.8 | % | | | 37.3 | % | | | - | | | | 0.5 | % | | | 39.0 | % | | | 42.6 | % | | | - | | | | (3.6 | %) |
3Q19 revenue declined versus 3Q18, primarily due to: i) lower prices in the average weighted crude oil basket, ii) lower production volumes due to public security events, primarily in the Caño Limón, Tibú and Gibraltar fields, partially offset by: iii) greater volumes of crude sales to third parties associated with higher levels of purchases, iv) higher volumes of sales of natural gas and services to third parties, v) increased average exchange rate on revenue, and vi) better crude spreads versus Brent.
The cost of sales in 3Q19 increased versus 3Q18 due to the combined effect of: i) higher transport costs associated to the increase in the reversion cycles to allow for the moving of crude from the Caño Limón field through the Bicentenario oil pipeline, ii) higher purchase volumes of crude oil from third parties, and iii) higher operating costs on subsoil activities: increased well work, increased recording and integrity activities, and greater number of contracted services related to well interventions. The above was partially offset by lower purchase prices, in line with the behavior of international hydrocarbon prices.
Operational and exploratory expenses in 3Q19 declined versus 3Q18, primarily as a result of recognition of the exploratory activity expense on Ecopetrol America LLC’s León 1 and 2 wells and Hocol’s Bonifacio, Hurón and Payero wells the previous year.
Net financial income (non-operational) for 3Q19 versus 3Q18 reflects the effect of greater exchange rate exposure resulting from the Colombian peso’s devaluation against the U.S. dollar and its effect on the segment’s net dollar position.
Volumes
Table 11: Volumes Transported – Midstream
| mbd | | 3Q 2019 | | | 3Q 2018 | | | ∆ (%) | | | 9M 2019 | | | 9M 2018 | | | ∆ (%) | |
| Crude Oil | | | 883.9 | | | | 849.0 | | | | 4.1 | % | | | 880.9 | | | | 829.0 | | | | 6.3 | % |
| Products | | | 277.0 | | | | 277.1 | | | | (0.0 | %) | | | 272.2 | | | | 274.0 | | | | (0.7 | %) |
| Total | | | 1,160.9 | | | | 1,126.1 | | | | 3.1 | % | | | 1,153.1 | | | | 1,103.0 | | | | 4.5 | % |
Crude:In 3Q19 crude volumes transported increased 4.1% versus 3Q18 due to: i) increased national production, and (ii) largest local purchases of third-party crude for refineries. We also achieved higher levels of transport by oil pipeline due to: i) the commercial efforts to boost the transport by pipeline instead of by truck, and ii) crude injection at the Acordeonero field in Ayacucho. In September, Ocensa achieved a historic record of the highest daily pumping, at 751 mbod (September 28, 2019) and a monthly average of 704 mbod.
The third quarter saw 27 attacks on infrastructure, 56% more than in 3Q18. Moreover, the installation of illegal valves for crude increased 32%, while for refined products remained constant.
During the quarter, 17 reversion cycles were carried out, with 4.4 million barrels moved, versus five cycles with 1.1 million barrels in 2018, including a higher production from the Arauca fields (+7.5 mbod), which also had to be transported in a contingent way.
Refined Products: During the quarter, the same quantity of refined products was transported as in 3Q18 due to the combined effect of: i) higher demand in the border region, and ii) less transport from the Barrancabermeja Refinery, due to the fact that in 2018 larger volumes were transported due to the building of inventories.
Looking for a safest and efficient operation as well as for ensuring fuel supply to the country’s western region, we highlight the following milestones during the quarter: i) commissioning of the Chinchiná-Pereira bypass of the Salgar – Cartago – Yumbo polyduct, ii) the installation of flexible pipeline in the Copacabana sector of the Sebastopol-Yumbo polyduct, two projects that mitigate the landslide integrity risk, and iii) the use of the Buenaventura port to provide for the continuous supply of fuels to the country’s southwestern region, thanks to the redesign of the supply chain.
Cost per Barrel Transported
Table 12: Cost per Transported Barrel – Midstream
| USD/Bl | | 3Q 2019 | | | 3Q 2018 | | | ∆ (%) | | | 9M 2019 | | | 9M 2018 | | | ∆ (%) | | | % USD | |
| Cost per Transported Barrel | | | 3.04 | | | | 3.26 | | | | (6.7 | %) | | | 3.01 | | | | 3.18 | | | | (5.3 | %) | | | 0.0 | % |
Decrease of 0.17 USD/bl in the accumulated cost as of September 2019 versus the same period in 2018, as a result of:
Cost Effect (+0.34 USD/bl):
| · | Additional costs and expenses to address damage caused by third parties. |
| · | Higher depreciation associated with the revised useful life of the infrastructure. |
| · | Increased regulated energy rates. |
Volume Effect (-0.13 USD/bl): Lower cost per barrel for additional volumes transported versus 2018 associated with higher production.
Exchange rate effect (-0.38 USD/bl): higher exchange rate of +353.59 pesos/ US dollars when re-stating Colombian pesos into US dollars.
Financial Results of the Segment
Table 13: Income Statement – Midstream
| Billion (COP) | | 3Q 2019 | | | 3Q 2018 | | | ∆ ($) | | | ∆ (%) | | | 9M 2019 | | | 9M 2018 | | | ∆ ($) | | | ∆ (%) | |
| Total revenue | | | 3,455 | | | | 2,558 | | | | 897 | | | | 35.1 | % | | | 9,719 | | | | 8,170 | | | | 1,549 | | | | 19.0 | % |
| Depreciation, amortization and depletion | | | 315 | | | | 289 | | | | 26 | | | | 9.0 | % | | | 918 | | | | 846 | | | | 72 | | | | 8.5 | % |
| Variable costs | | | 179 | | | | 156 | | | | 23 | | | | 14.7 | % | | | 520 | | | | 440 | | | | 80 | | | | 18.2 | % |
| Fixed costs | | | 394 | | | | 418 | | | | (24 | ) | | | (5.7 | %) | | | 1,130 | | | | 1,096 | | | | 34 | | | | 3.1 | % |
| Total cost of sales | | | 888 | | | | 863 | | | | 25 | | | | 2.9 | % | | | 2,568 | | | | 2,382 | | | | 186 | | | | 7.8 | % |
| Gross income | | | 2,567 | | | | 1,695 | | | | 872 | | | | 51.4 | % | | | 7,151 | | | | 5,788 | | | | 1,363 | | | | 23.5 | % |
| Operating expenses | | | 208 | | | | 28 | | | | 180 | | | | 642.9 | % | | | 389 | | | | 289 | | | | 100 | | | | 34.6 | % |
| Operating income | | | 2,359 | | | | 1,667 | | | | 692 | | | | 41.5 | % | | | 6,762 | | | | 5,499 | | | | 1,263 | | | | 23.0 | % |
| Financial result, net | | | 397 | | | | (33 | ) | | | 430 | | | | (1,303.0 | %) | | | 44 | | | | (350 | ) | | | 394 | | | | (112.6 | %) |
| Share of profit of companies | | | 1 | | | | 0 | | | | 1 | | | | - | | | | 2 | | | | 1 | | | | 1 | | | | 100.0 | % |
| Income before income tax | | | 2,757 | | | | 1,634 | | | | 1,123 | | | | 68.7 | % | | | 6,808 | | | | 5,150 | | | | 1,658 | | | | 32.2 | % |
| Provision for income tax | | | (903 | ) | | | (623 | ) | | | (280 | ) | | | 44.9 | % | | | (2,255 | ) | | | (1,946 | ) | | | (309 | ) | | | 15.9 | % |
| Net income consolidated | | | 1,854 | | | | 1,011 | | | | 843 | | | | 83.4 | % | | | 4,553 | | | | 3,204 | | | | 1,349 | | | | 42.1 | % |
| Non-controlling interest | | | (354 | ) | | | (247 | ) | | | (107 | ) | | | 43.3 | % | | | (978 | ) | | | (727 | ) | | | (251 | ) | | | 34.5 | % |
| Net income attributable to owners of Ecopetrol | | | 1,500 | | | | 764 | | | | 736 | | | | 96.3 | % | | | 3,575 | | | | 2,477 | | | | 1,098 | | | | 44.3 | % |
| | | | | | | | | | | | | | | | | | | | | | | | | | | | | | | | | |
| EBITDA | | | 2,721 | | | | 1,976 | | | | 745 | | | | 37.7 | % | | | 7,795 | | | | 6,421 | | | | 1,374 | | | | 21.4 | % |
| EBITDA Margin | | | 78.8 | % | | | 77.2 | % | | | - | | | | 1.6 | % | | | 80.2 | % | | | 78.6 | % | | | - | | | | 1.6 | % |
3Q19 revenue increased over 3Q18 due primarily to: i) higher volumes of crude transported associated with increased national production and the commercial management efforts carried out on the unloading platforms to reduce kilometers transported in tanker cars and increase transport by pipeline, and ii) higher average exchange rate versus the comparison period.
The 3Q19 cost of sales rose versus 3Q18 as a result of: i) higher consumption of materials and supplies to address transport services, associated with higher transported volumes, ii) increased energy costs consistent with higher market rates, and iii) higher depreciation and amortization as a consequence of the change in the useful lives of some systems, resulting from the update carried out in late 2018.
3Q19 operating expenses rose versus 3Q18 as a result of the one-off recovery of the provision related to the dispute around P135 project in 3Q18, which was finalized by means of an agreement between the parties.
Net financial (non-operational) income in 3Q19 versus 3Q18 reflects the effect of higher exchange rate exposure as a result of the Colombian peso’s devaluation against the U.S. dollar and its effect on the segment’s net asset position in dollars.
Cartagena Refinery
Table 14: Throughput, Utilization Factor, Production and Refining Margin– Cartagena Refinery
| Cartagena Refinery | | 3Q 2019 | | | 3Q 2018 | | | ∆ (%) | | | 9M 2019 | | | 9M 2018 | | | ∆ (%) | |
| Throughput* (mbod) | | | 160.5 | | | | 157.6 | | | | 1.8 | % | | | 154.9 | | | | 151.7 | | | | 2.1 | % |
| Utilization Factor (%) | | | 88.3 | % | | | 92.4 | % | | | (4.4 | %) | | | 86.2 | % | | | 89.4 | % | | | (3.6 | %) |
| Production (mbod) | | | 155.3 | | | | 152.3 | | | | 2.0 | % | | | 149.3 | | | | 147.2 | | | | 1.4 | % |
| Gross Margin (USD/Bl) | | | 8.4 | | | | 12.1 | | | | (30.6 | %) | | | 8.7 | | | | 11.6 | | | | (25.0 | %) |
* Corresponds to volumes effectively loaded, not received
In 3Q19 the refinery achieved throughput of 160.5 mbod, the best quarterly result since its commissioning, and in September it achieved its highest throughput of the year, with 160.9 mbod. During this quarter the throughput of domestic crude rose to 88%, with 12% imported crude, versus 80% domestic crude and 20% imported in 3Q18.
This increase in the proportion of domestic crudes significantly benefited the cost of the refinery’s diet, offsetting the higher prices of heavy and medium crudes in the international market.
In 3Q19, the utilization factor declined 4.4% versus the same quarter in 2018, mainly due to unscheduled operational events in both the Alkylation Unit and the Diesel Hydrotreating Unit. These events have now been corrected, and reliability has been ensured.
In 3Q19, gross refining margin strengthened 1.8 USD/bl vs 2Q19, to 8.4 USD/bl. During the year the international market environment for the refining segment has been weaker versus 2018, especially in refined products such as full-range naphtha and gasoline, which presented margin declines of -6.6 USD/bl and -2.3 USD/bl, respectively, and in the cost of the crude diet, which strengthened +1.4 USD/bl. These factors, added to certain operational events, have affected the refining gross margin results.
Barrancabermeja Refinery
Table 15: Throughput, Utilization Factor, Production and Refining Margin – Barrancabermeja Refinery
| Barrancabermeja Refinery | | 3Q 2019 | | | 3Q 2018 | | | ∆ (%) | | | 9M 2019 | | | 9M 2018 | | | ∆ (%) | |
| Throughput* (mbod) | | | 228.0 | | | | 222.7 | | | | 2.4 | % | | | 217.5 | | | | 219.6 | | | | (1.0 | %) |
| Utilization Factor (%) | | | 85.3 | % | | | 85.8 | % | | | (0.6 | %) | | | 82.1 | % | | | 86.1 | % | | | (4.7 | %) |
| Production (mbod) | | | 233.0 | | | | 226.3 | | | | 3.0 | % | | | 220.1 | | | | 222.2 | | | | (0.9 | %) |
| Gross Margin (USD/Bl) | | | 11.5 | | | | 13.9 | | | | (17.3 | %) | | | 10.8 | | | | 12.1 | | | | (10.7 | %) |
* Corresponds to volumes actually loaded, not received
In 3Q19, the refinery maintained stable operating performance. It achieved throughput of 228 mbod, in line with the figure reported for 2Q19. Moreover, throughput increased in 5.3 mbod versus 3Q18 as a result of the commercial strategy of third party purchases, which allowed to take advantage of the greater availability of national light and intermediate crude.
In 3Q19 scheduled maintenance took place at the Alkylation, Aromatics and Acid Units; the utilization factor remained at levels of 85.3% during the quarter.
The refinery’s positive operational performance in 3Q19 allowed it to increase the yields of gasolines and medium distillates, favoring the gross refining margin versus the previous quarter (+1.2 USD/bl). Compared to 2018, the international market for the refining segment remains weaker in refined products, such as USGC naphtha and gasoline, which have shown declines in margins of -7.2 USD/bl and -2.3 USD/bl, respectively; and the cost of the crude diet has strengthened by +1.6 USD/bl. These factors have affected gross refining margin results despite the positive operating performance, which favored higher yields for medium distillates.
Refining Cash Cost
Table 16: Cash Cost of Refining* – Downstream
| USD/Bl | | 3Q 2019 | | | 3Q 2018 | | | ∆ (%) | | | 9M 2019 | | | 9M 2018 | | | ∆ (%) | | | % USD | |
| Refining Cash Cost | | | 4.21 | | | | 4.80 | | | | (12.3 | %) | | | 4.55 | | | | 4.82 | | | | (5.6 | %) | | | 9.8 | % |
* Includes the Barrancabermeja and Cartagena refineries and Esenttia
As of September 30, 2019, the cash cost declined -0.27 USD/bl versus the same period in 2018, explained by:
Cost Effect(+ 0.30 USD/bl): Higher cost of fuels (gas) and industrial services.
Volume Effect(- 0.03 USD/bl): Higher throughput of crude at the Cartagena Refinery (+ 3.2 mbod),
Exchange Rate Effect (- 0.54 USD/bl): higher exchange rate of +353.59 pesos/US dollar when re-stating Colombian pesos into U.S. dollars.
Financial Results of the Segment
Table 17: Income Statement – Downstream
| Billion (COP) | | 3Q 2019 | | | 3Q 2018 | | | ∆ ($) | | | ∆ (%) | | | 9M 2019 | | | 9M 2018 | | | ∆ ($) | | | ∆ (%) | |
| Total revenue | | | 9,951 | | | | 9,803 | | | | 148 | | | | 1.5 | % | | | 28,728 | | | | 26,809 | | | | 1,919 | | | | 7.2 | % |
| Depreciation and amortization | | | 329 | | | | 313 | | | | 16 | | | | 5.1 | % | | | 983 | | | | 916 | | | | 67 | | | | 7.3 | % |
| Variable costs | | | 8,762 | | | | 8,519 | | | | 243 | | | | 2.9 | % | | | 25,660 | | | | 23,288 | | | | 2,372 | | | | 10.2 | % |
| Fixed costs | | | 545 | | | | 479 | | | | 66 | | | | 13.8 | % | | | 1,502 | | | | 1,383 | | | | 119 | | | | 8.6 | % |
| Total cost of sales | | | 9,636 | | | | 9,311 | | | | 325 | | | | 3.5 | % | | | 28,145 | | | | 25,587 | | | | 2,558 | | | | 10.0 | % |
| Gross income | | | 315 | | | | 492 | | | | (177 | ) | | | (36.0 | %) | | | 583 | | | | 1,222 | | | | (639 | ) | | | (52.3 | %) |
| Operating expenses | | | 302 | | | | 236 | | | | 66 | | | | 28.0 | % | | | 886 | | | | 686 | | | | 200 | | | | 29.2 | % |
| Operating income (loss) | | | 13 | | | | 256 | | | | (243 | ) | | | (94.9 | %) | | | (303 | ) | | | 536 | | | | (839 | ) | | | (156.5 | %) |
| Financial result, net | | | (566 | ) | | | (344 | ) | | | (222 | ) | | | 64.5 | % | | | (1,114 | ) | | | (698 | ) | | | (416 | ) | | | 59.6 | % |
| Share of profit of companies | | | 5 | | | | 6 | | | | (1 | ) | | | (16.7 | %) | | | 12 | | | | 22 | | | | (10 | ) | | | (45.5 | %) |
| Loss before income tax | | | (548 | ) | | | (82 | ) | | | (466 | ) | | | 568.3 | % | | | (1,405 | ) | | | (140 | ) | | | (1,265 | ) | | | 903.6 | % |
| Provision for income tax | | | 147 | | | | 6 | | | | 141 | | | | 2,350.0 | % | | | 305 | | | | (87 | ) | | | 392 | | | | (450.6 | %) |
| Consolidated net loss | | | (401 | ) | | | (76 | ) | | | (325 | ) | | | 427.6 | % | | | (1,100 | ) | | | (227 | ) | | | (873 | ) | | | 384.6 | % |
| | | | | | | | | | | | | | | | | | | | | | | | | | | | | | | | | |
| EBITDA | | | 539 | | | | 686 | | | | (147 | ) | | | (21.4 | %) | | | 1,121 | | | | 1,733 | | | | (612 | ) | | | (35.3 | %) |
| EBITDA Margin | | | 5.4 | % | | | 7.0 | % | | | - | | | | (1.6 | %) | | | 3.9 | % | | | 6.5 | % | | | - | | | | (2.6 | %) |
3Q19 revenue increased versus 3Q18, primarily due to: i) higher volumes of diesel exports, given the better economic returns of these volumes in the international market, and ii) the positive exchange rate effect. These factors were offset by the negative effect of lower prices on the basket of products, given the decline in international benchmarks.
Cost of sales increased in 3Q19 versus 3Q18, primarily due to i) the increase in diesel imports for supplying the domestic market and making blendings to comply quality specifications at the Barrancabermeja Refinery, ii) higher crude purchases associated with increased throughput at the refineries, iii) the negative effect of the increased exchange rate, and iv) the strengthening of crude spreads vs. Brent, which was partially offset by a lower Brent price, in line with the behavior of international prices.
Operating expenses increased in 3Q19 versus 3Q18, largely due to the effect of maintenance associated with the unscheduled operating event at the Alkylation Unit at the Cartagena Refinery.
Financial (non-operating) income in 3Q19 versus 3Q18 showed higher expenses due to the exchange rate difference associated with greater devaluation of the peso exchange rate against the US dollar in 3Q19 vs 3Q18 on the segment’s dollar position.
Table 18: Main Structural Saving Initiatives - Ecopetrol Group
| Billion (COP) | | 3Q 2019 | | | 3Q 2018 | | | 9M 2019 | | | 9M 2018 | |
| Optimization of drilling costs and facilities construction | | | 448.5 | | | | 387.4 | | | | 984.4 | | | | 636.7 | |
| Improvement of the commercial strategy | | | 132.6 | | | | 78.2 | | | | 270.0 | | | | 127.0 | |
| Improvement in refineries revenues/margins | | | 138.7 | | | | 211.7 | | | | 226.1 | | | | 394.4 | |
| Reduction of O&M Midstream costs | | | 39.9 | | | | 60.5 | | | | 93.5 | | | | 89.8 | |
| Energy strategy - Surplus sales - Cost optimization | | | 30.6 | | | | 47.6 | | | | 77.2 | | | | 92.1 | |
| Savings on staff, logistics and other areas | | | 9.8 | | | | 17.6 | | | | 37.5 | | | | 32.4 | |
| Reduction of deferred production | | | 31.9 | | | | 6.9 | | | | 44.6 | | | | 253.2 | |
| Operating optimization | | | (18.4 | ) | | | 36.6 | | | | 17.3 | | | | 60.6 | |
| Refining cash cost optimization | | | 0.0 | | | | 14.4 | | | | 0.0 | | | | 30.6 | |
| Dilution and evacuation of heavy and extra heavy crude oil | | | (33.5 | ) | | | 37.7 | | | | (12.8 | ) | | | 63.3 | |
| Total | | | 780.0 | | | | 898.6 | | | | 1,737.8 | | | | 1,780.1 | |
At the close of September, year-to-date efficiencies were at COP 1.74 trillion pesos, leveraged primarily by: i) drilling, completion and facilities-construction initiatives, which were focused on ensuring the profitability of investments in development, ii) commercial operations, and iii) higher production of medium distillates and gasolines at the refineries, oriented toward increased revenues and/or margins for both operations. These three major levers contributed 85% of total efficiencies during the period (COP 1.48 trillion). The difference compared to 2018, are associated with greater activity of the period both in maintenance interventions for completed operation cycles, as well as in progress in investment projects.
Table 19: Investments January to September 2019 – Ecopetrol Group
| Million (USD) | | Ecopetrol S.A. | | | Affiliates and Subsidiaries | | | Total | | | % Share | |
| Production | | | 1,526 | | | | 132 | | | | 1,658 | | | | 71.6 | % |
| Downstream | | | 121 | | | | 111 | | | | 232 | | | | 10.0 | % |
| Exploration | | | 78 | | | | 151 | | | | 229 | | | | 9.9 | % |
| Midstream* | | | 1 | | | | 157 | | | | 158 | | | | 6.8 | % |
| Corporate | | | 40 | | | | 0 | | | | 40 | | | | 1.7 | % |
| Total | | | 1,766 | | | | 551 | | | | 2,317 | | | | 100.0 | % |
* Includes total investments of each company of the Ecopetrol Group (Ecopetrol S.A. stake and non-controlling interest)
The Ecopetrol Group executed investments totaling USD 924 million in 3Q19 and as of September USD 2,317 million. The above represents an increase of 29% in the accumulated investment versus the same period in 2018. Execution to date shows savings of USD -24 million due to the exchange rate and USD -42 million in tax benefits.
Further, 81% of the investment executed in the year’s third quarter remained concentrated in the Upstream segment, in line with the business group’s strategic growth priorities.
Production:The Ecopetrol drilling campaign was concentrated in the fields of Castilla, Rubiales, Apiay, La Cira Infantas, Casabe, Yariguí-Cantagallo, Tisquirama and Llanito. In the subsidiaries, investment continues to be led by Ecopetrol America LLC and Hocol. To date, 464 development wells have been drilled and 310 capitalizable workovers completed.
Another notable fact is the continuing maturing of projects that contribute to the company’s growth. Specifically, the year’s third quarter saw approval of the start of execution for projects in the Rubiales, Área Sur and Caño Limón fields totaling more than USD 300 million and 100 wells, in addition to approval of a workover campaign to increase production in the Castilla field.
Exploration:Investments in exploration have resulted in the drilling of 13 wells. To date, 2D and 3D seismics have been acquired for 173,344 km in Brazil and Mexico. In addition, in July a payment was made of approximately USD 90 million to enter the Saturno block of the Santos basin in Brazil.
Refining, Petrochemicals and Biofuels: Execution of investments in operational continuity to maintain efficiency, reliability and integrity of operations at the Barrancabermeja and Reficar plants.
Transport:Operational continuity activities (major maintenance, mechanical repairs and geotechnical activities) in the various oil pipeline and poly-duct systems of Cenit and its subsidiaries.
III. Environmental, Social and Corporate Responsibility – Ecopetrol S.A.
Table 20: HSE (Health, Safety and Environmental) Performance
| HSE Indicators* | | 3Q 2019 | | | 3Q 2018 | | | 9M 2019 | | | 9M 2018 | |
| Frequency of total registrable injuries (No. Recordable cases / Million man hours) | | | 0.55 | | | | 0.51 | | | | 0.57 | | | | 0.59 | |
| Environmental incidents** | | | 3 | | | | 3 | | | | 7 | | | | 11 | |
* The results of the indicators are subject to subsequent change at the close of the quarter because some accidents and incidents are reclassified according to the final results of the investigations. ** Environmental incidents are hydrocarbon spills greater than 1 barrel, with an environmental impact.
During 3Q19, no accidents occurred involving serious injury to individuals, nor process safety incidents affecting operational continuity. Compared with the previous year’s cutoff, safety incidents declined by 126 in medium and light processes (15%), which in turn reflects a decline in environmental impact.
| 2. | Environment and Social Investment, and Corporate Governance |
Environment:
| a) | Ecopetrol has been committed to reducing its Greenhouse Gas emissions by 20% by the year 2030, a goal in line with the commitment Colombia acquired in the 2015 Paris Agreement. |
With a view to fulfilling the commitment of a 20% reduction in emissions by 2030, Ecopetrol has set a de-carbonization plan with specific actions to reduce emissions from fugitive sources and venting, reduced flaring, energy efficiency and renewable energy. It is also working on developing a portfolio of emission-offset initiatives based on activities such as reforestation and nature conservation, among other activities.
Internationally, in December 2018 Ecopetrol joined the Climate and Clean Air Coalition, an initiative sponsored by the United Nations, which purpose is to reduce methane emissions, and is in the process of joining the Zero Routine Flaring by 2030 initiative, sponsored by the World Bank, to reduce natural gas flaring.
The solar farm in the Department of Meta was implemented in October, with an installed capacity of 21 MW, which will supply part of the energy required by some of the company’s operations in that region. Its operation will prevent the emission of over 154,000 tons of CO2 into the atmosphere in the next 15 years.
Likewise, on October 23, Ecopetrol ratified the commitment to Colombia's energy transition thanks to the allocation of 30 megawatts of energy, between solar and wind, in the renewable energy auction of the Energy Mining Planning Unit of Colombia.
| b) | In 3Q19 Ecopetrol reused 21.8 million m3 of water, thanks to good water reuse and recycling practices at the Barrancabermeja and Cartagena refineries and at the La Cira Infantas, San Francisco, Chichimene and other production fields. Year to date as of September 2019, over 66 million m3 of water have been reused, up 4% compared to the same period in 2018. |
| c) | Additionally, in 3Q19, 139,000 m3 of treated production water were reused in agricultural and livestock activities in the Agro-Energy Sustainability Area (ASA) of Castilla field. Year to date 2019, over 465,000 m3 have been reused in these activities. |
| d) | Signing of the “Socioecological Planning in Ecopetrol’s Operational and Projected Areas, Contributing to a Transition Toward Sustainability” agreement with the Alexander Von Humboldt Biological Resources Research Institute. The alliance will benefit the regions of Magdalena Medio and Orinoquía, through the identification and use of plant resources for edible purposes, promoting the bioeconomy, trade, the development of expeditions and the strengthening of knowledge in biological diversity and its sustainable use. |
Socio-Environmental Investment:
| a) | In 3Q19 resources were allocated to socio-environmental investment projects, which form part of the Sustainable Development portfolio, totaling COP 32.07 billion. Investments year to date as of the third quarter of 2019 were COP 60.41 billion. For social investment, COP 55.44 billion were allocated, corresponding to: i) Strategic Investment (COP 52.69 billion); ii) Community Benefit Programs (COP 2.14 billion) and iii) Mandatory investment (COP 602 million); and for investment in Strategic Environmental Management, COP 4.97 billion. |
| b) | In Tax Projects, involving taxes for the 2017 fiscal year, seven projects were developed totaling COP 94 billion. Three of these projects were completed in the third quarter of 2019: i) School endowments in the city of Tumaco (Nariño); ii) School endowments in the city of Barbacoas (Nariño); and iii) Construction of urban road facilities in San Martín (Meta). The four (4) remaining projects correspond to road infrastructure that commenced execution in May 2019 and are in course. |
Region:
| a) | The local and regional relationship plan was implemented with institutions, government, NGOs, pre-candidates, academia and community leaders in the cities of Barrancabermeja and Puerto Wilches (Santander), as part of the Pilot Projects for Comprehensive Non-Conventional Deposits Research. |
| b) | Ecopetrol participated in workshops convened by the Colombian Ministry of Labor for the amendment of Decree 1668 of 2016, which contains special measures for the prioritization of local labor in areas influenced by the hydrocarbons sector. |
| c) | It initiated the phase of contacts with the Uwa (Asouwa) community, to generate dialog space and strengthen relationships of trust, promoting the identification of opportunities for the entry of new projects in the Sarare region. |
IV. Presentation of Results
Ecopetrol management will hold two online presentations to review 3Q19 results:
| Spanish | English |
| October 30, 2019 | October 30, 2019 |
| 8:00 a.m. Colombia | 9:30 a.m. Colombia |
| 9:00 a.m. New York | 10:30 a.m. New York |
Online streaming will be available on the Ecopetrol website: www.ecopetrol.com.co
The presentation via webcast will be available at the following links:
https://event.on24.com/wcc/r/2104281/3AD1B259354A60DA139521B483BFC956 (Spanish)
https://event.on24.com/wcc/r/2104367/9282D876BB266F2D0B10AD27078FF208 (English)
Please verify that your browser allows for normal operation of the online presentation. We recommend the latest versions of Internet Explorer, Google Chrome and Mozilla Firefox.
Contact Information:
Capital Markets Manager (e)
Fernando Alexander Suarez
Telephone: +571-234-5190 - Email: investors@ecopetrol.com.co
Media Relations (Colombia)
Jorge Mauricio Tellez
Telephone: + 571-234-4329 - Email: mauricio.tellez@ecopetrol.com.co
Ecopetrol Group Appendices
Table 1: Income Statement – Ecopetrol Group
| Billion (COP) | | 3Q 2019 | | | 3Q 2018 | | | ∆ (%) | | | 9M 2019 | | | 9M 2018 | | | ∆ (%) | |
| Revenue | | | | | | | | | | | | | | | | | | | | | | | | |
| Local | | | 8,715 | | | | 8,671 | | | | 0.5 | % | | | 25,213 | | | | 24,378 | | | | 3.4 | % |
| Export | | | 9,299 | | | | 9,205 | | | | 1.0 | % | | | 27,053 | | | | 25,128 | | | | 7.7 | % |
| Total revenue | | | 18,014 | | | | 17,876 | | | | 0.8 | % | | | 52,266 | | | | 49,506 | | | | 5.6 | % |
| Cost of sales | | | | | | | | | | | | | | | | | | | | | | | | |
| Depreciation, amortization and depletion | | | 2,166 | | | | 2,053 | | | | 5.5 | % | | | 6,189 | | | | 5,723 | | | | 8.1 | % |
| Variable depreciation, amortization and depletion | | | 1,481 | | | | 1,416 | | | | 4.6 | % | | | 4,158 | | | | 3,859 | | | | 7.7 | % |
| Fixed cost depreciation | | | 685 | | | | 637 | | | | 7.5 | % | | | 2,031 | | | | 1,864 | | | | 9.0 | % |
| Variable costs | | | 6,735 | | | | 6,342 | | | | 6.2 | % | | | 19,629 | | | | 17,361 | | | | 13.1 | % |
| Imported products | | | 2,788 | | | | 2,778 | | | | 0.4 | % | | | 9,806 | | | | 8,167 | | | | 20.1 | % |
| Local purchases | | | 3,131 | | | | 2,659 | | | | 17.8 | % | | | 8,261 | | | | 7,571 | | | | 9.1 | % |
| Hydrocarbon transportation services | | | 208 | | | | 212 | | | | (1.9 | %) | | | 598 | | | | 563 | | | | 6.2 | % |
| Inventories and others | | | 608 | | | | 693 | | | | (12.3 | %) | | | 964 | | | | 1,060 | | | | (9.1 | %) |
| Fixed costs | | | 2,339 | | | | 2,228 | | | | 5.0 | % | | | 6,870 | | | | 6,143 | | | | 11.8 | % |
| Contracted services | | | 753 | | | | 708 | | | | 6.4 | % | | | 2,173 | | | | 1,965 | | | | 10.6 | % |
| Maintenance | | | 584 | | | | 568 | | | | 2.8 | % | | | 1,802 | | | | 1,503 | | | | 19.9 | % |
| Labor costs | | | 560 | | | | 513 | | | | 9.2 | % | | | 1,679 | | | | 1,515 | | | | 10.8 | % |
| Other | | | 442 | | | | 439 | | | | 0.7 | % | | | 1,216 | | | | 1,160 | | | | 4.8 | % |
| Total cost of sales | | | 11,240 | | | | 10,623 | | | | 5.8 | % | | | 32,688 | | | | 29,227 | | | | 11.8 | % |
| Gross income | | | 6,774 | | | | 7,253 | | | | (6.6 | %) | | | 19,578 | | | | 20,279 | | | | (3.5 | %) |
| Operating expenses | | | 1,062 | | | | 1,600 | | | | (33.6 | %) | | | 2,952 | | | | 3,062 | | | | (3.6 | %) |
| Administration expenses | | | 1,006 | | | | 594 | | | | 69.4 | % | | | 2,589 | | | | 2,017 | | | | 28.4 | % |
| Exploration and projects expenses | | | 58 | | | | 1,006 | | | | (94.2 | %) | | | 367 | | | | 1,194 | | | | (69.3 | %) |
| (Recovery) expense for impairment long-term assets | | | (2 | ) | | | 0 | | | | - | | | | (4 | ) | | | (149 | ) | | | (97.3 | %) |
| Operating income | | | 5,712 | | | | 5,653 | | | | 1.0 | % | | | 16,626 | | | | 17,217 | | | | (3.4 | %) |
| Finance result, net | | | (648 | ) | | | (521 | ) | | | 24.4 | % | | | (1,426 | ) | | | (1,710 | ) | | | (16.6 | %) |
| Foreign exchange, net | | | (190 | ) | | | 61 | | | | (411.5 | %) | | | (104 | ) | | | 132 | | | | (178.8 | %) |
| Interest, net | | | (368 | ) | | | (447 | ) | | | (17.7 | %) | | | (1,052 | ) | | | (1,448 | ) | | | (27.3 | %) |
| Financial income/loss | | | (90 | ) | | | (135 | ) | | | (33.3 | %) | | | (270 | ) | | | (394 | ) | | | (31.5 | %) |
| Share of profit of companies | | | 56 | | | | 57 | | | | (1.8 | %) | | | 290 | | | | 239 | | | | 21.3 | % |
| Income before income tax | | | 5,120 | | | | 5,189 | | | | (1.3 | %) | | | 15,490 | | | | 15,746 | | | | (1.6 | %) |
| Income tax | | | (1,770 | ) | | | (2,182 | ) | | | (18.9 | %) | | | (5,315 | ) | | | (6,155 | ) | | | (13.6 | %) |
| Net income consolidated | | | 3,350 | | | | 3,007 | | | | 11.4 | % | | | 10,175 | | | | 9,591 | | | | 6.1 | % |
| Non-controlling interest | | | (339 | ) | | | (232 | ) | | | 46.1 | % | | | (932 | ) | | | (682 | ) | | | 36.7 | % |
| Net income attributable to owners of Ecopetrol | | | 3,011 | | | | 2,775 | | | | 8.5 | % | | | 9,243 | | | | 8,909 | | | | 3.7 | % |
| | | | | | | | | | | | | | | | | | | | | | | | | |
| EBITDA | | | 8,270 | | | | 7,997 | | | | 3.4 | % | | | 23,934 | | | | 23,756 | | | | 0.7 | % |
| EBITDA margin | | | 45.9 | % | | | 44.7 | % | | | 2.7 | % | | | 45.8 | % | | | 48.0 | % | | | (4.6 | %) |
Table 2: Statement of Financial Situation / Balance Sheet – Ecopetrol Group
| Billion (COP) | | September 30, 2019 | | | June 30, 2019 | | | ∆ (%) | |
| Current assets | | | | | | | | | | | | |
| Cash and cash equivalents | | | 9,061 | | | | 5,524 | | | | 64.0 | % |
| Trade and other receivables | | | 6,216 | | | | 8,221 | | | | (24.4 | %) |
| Inventories | | | 5,907 | | | | 5,854 | | | | 0.9 | % |
| Current tax assets | | | 781 | | | | 787 | | | | (0.8 | %) |
| Other financial assets | | | 2,452 | | | | 3,358 | | | | (27.0 | %) |
| Other assets | | | 1,293 | | | | 1,256 | | | | 2.9 | % |
| | | | 25,710 | | | | 25,000 | | | | 2.8 | % |
| Non-current assets held for sale | | | 29 | | | | 30 | | | | (3.3 | %) |
| Total current assets | | | 25,739 | | | | 25,030 | | | | 2.8 | % |
| | | | | | | | | | | | | |
| Non-current assets | | | | | | | | | | | | |
| Investments in associates and joint ventures | | | 2,047 | | | | 1,885 | | | | 8.6 | % |
| Trade and other receivables | | | 745 | | | | 777 | | | | (4.1 | %) |
| Property, plant and equipment | | | 64,406 | | | | 61,814 | | | | 4.2 | % |
| Natural and environmental resources | | | 24,829 | | | | 23,660 | | | | 4.9 | % |
| Assets by right of use | | | 495 | | | | 497 | | | | (0.4 | %) |
| Intangibles | | | 397 | | | | 395 | | | | 0.5 | % |
| Deferred tax assets | | | 5,892 | | | | 5,373 | | | | 9.7 | % |
| Other financial assets | | | 4,454 | | | | 3,794 | | | | 17.4 | % |
| Other assets | | | 1,992 | | | | 1,893 | | | | 5.2 | % |
| Total non-current assets | | | 105,257 | | | | 100,088 | | | | 5.2 | % |
| | | | | | | | | | | | | |
| Total assets | | | 130,996 | | | | 125,118 | | | | 4.7 | % |
| | | | | | | | | | | | | |
| Current liabilities | | | | | | | | | | | | |
| Loans and borrowings | | | 4,525 | | | | 4,088 | | | | 10.7 | % |
| Trade and other payables | | | 9,863 | | | | 11,825 | | | | (16.6 | %) |
| Provision for employees benefits | | | 1,824 | | | | 1,718 | | | | 6.2 | % |
| Current tax liabilities | | | 1,749 | | | | 1,126 | | | | 55.3 | % |
| Accrued liabilities and provisions | | | 520 | | | | 673 | | | | (22.7 | %) |
| Other liabilities | | | 382 | | | | 463 | | | | (17.5 | %) |
| Total current liabilities | | | 18,863 | | | | 19,893 | | | | (5.2 | %) |
| | | | | | | | | | | | | |
| Non-current liabilities | | | | | | | | | | | | |
| Loans and borrowings | | | 35,882 | | | | 33,379 | | | | 7.5 | % |
| Trade and other payables | | | 28 | | | | 25 | | | | 12.0 | % |
| Provision for employees benefits | | | 6,273 | | | | 6,513 | | | | (3.7 | %) |
| Deferred tax liabilities | | | 764 | | | | 783 | | | | (2.4 | %) |
| Accrued liabilities and provisions | | | 7,213 | | | | 7,025 | | | | 2.7 | % |
| Other liabilities | | | 609 | | | | 566 | | | | 7.6 | % |
| Total non-current liabilities | | | 50,769 | | | | 48,291 | | | | 5.1 | % |
| | | | | | | | | | | | | |
| Total liabilities | | | 69,632 | | | | 68,184 | | | | 2.1 | % |
| | | | | | | | | | | | | |
| Equity | | | | | | | | | | | | |
| Equity attributable to owners of the company | | | 59,211 | | | | 54,739 | | | | 8.2 | % |
| Non-controlling interests | | | 2,153 | | | | 2,195 | | | | (1.9 | %) |
| Total equity | | | 61,364 | | | | 56,934 | | | | 7.8 | % |
| | | | | | | | | | | | | |
| Total liabilities and equity | | | 130,996 | | | | 125,118 | | | | 4.7 | % |
Table 3: Free Cash Flow Statement – Ecopetrol Group
| Billion (COP) | | 3Q 2019 | | | 3Q 2018 | | | 9M 2019 | | | 9M 2018 | |
| Cash flow provided by operating activities | | | | | | | | | | | | | | | | |
| Net income attributable to owners of Ecopetrol S.A. | | | 3,011 | | | | 2,775 | | | | 9,243 | | | | 8,909 | |
| Adjustments to reconcile net income to cash provided by operating activities | | | | | | | | | | | | | | | | |
| Non-controlling interests | | | 339 | | | | 232 | | | | 932 | | | | 682 | |
| Income tax | | | 1,770 | | | | 2,182 | | | | 5,315 | | | | 6,155 | |
| Depreciation, depletion and amortization | | | 2,206 | | | | 2,070 | | | | 6,290 | | | | 5,778 | |
| Foreign exchange (gain) loss | | | 190 | | | | (61 | ) | | | 104 | | | | (132 | ) |
| Finance costs recognized in profit or loss | | | 662 | | | | 748 | | | | 1,972 | | | | 2,326 | |
| Dry wells | | | 0 | | | | 825 | | | | 154 | | | | 873 | |
| Loss (gain) on disposal of non-current assets | | | 33 | | | | (3 | ) | | | 78 | | | | (24 | ) |
| Impairment of current and non-current assets | | | (2 | ) | | | (7 | ) | | | 32 | | | | (138 | ) |
| Fair value (gain) on financial assets valuation | | | 134 | | | | 2 | | | | 45 | | | | (55 | ) |
| Profit in acquisition of participations in joint operations | | | 0 | | | | 0 | | | | 0 | | | | 12 | |
| Gain on assets for sale | | | 3 | | | | 0 | | | | 0 | | | | 1 | |
| (Gain) loss on share of profit of associates and joint ventures | | | (56 | ) | | | (57 | ) | | | (290 | ) | | | (239 | ) |
| Realized foreign exchange cash flow hedges | | | 207 | | | | 152 | | | | 891 | | | | 386 | |
| Others minor items | | | 5 | | | | (2 | ) | | | 6 | | | | (5 | ) |
| Net changes in operating assets and liabilities | | | 1,503 | | | | 316 | | | | (151 | ) | | | (2,154 | ) |
| Income tax paid | | | (696 | ) | | | (618 | ) | | | (4,474 | ) | | | (4,507 | ) |
| Cash provided by operating activities | | | 9,309 | | | | 8,554 | | | | 20,147 | | | | 17,868 | |
| | | | | | | | | | | | | | | | | |
| Cash flows from investing activities | | | | | | | | | | | | | | | | |
| Investment in property, plant and equipment | | | (1,201 | ) | | | (816 | ) | | | (2,529 | ) | | | (1,926 | ) |
| Investment in natural and environmental resources | | | (1,992 | ) | | | (1,291 | ) | | | (4,772 | ) | | | (3,113 | ) |
| Payments for intangibles | | | (20 | ) | | | (54 | ) | | | (53 | ) | | | (74 | ) |
| Sale of assets held for sale and equity instruments | | | (3 | ) | | | 0 | | | | 0 | | | | 0 | |
| (Purchases) sales of other financial assets | | | 459 | | | | (1,485 | ) | | | 1,442 | | | | (4,376 | ) |
| Interest received | | | 106 | | | | 89 | | | | 356 | | | | 247 | |
| Dividends received | | | 13 | | | | 1 | | | | 47 | | | | 54 | |
| Proceeds from sales of assets | | | (1 | ) | | | (48 | ) | | | 23 | | | | 46 | |
| Net cash used in investing activities | | | (2,639 | ) | | | (3,604 | ) | | | (5,486 | ) | | | (9,142 | ) |
| | | | | | | | | | | | | | | | | |
| Cash flows from financing activities | | | | | | | | | | | | | | | | |
| Proceeds (repayment of) from borrowings | | | (187 | ) | | | (1,934 | ) | | | (993 | ) | | | (3,487 | ) |
| Interest paid | | | (265 | ) | | | (592 | ) | | | (1,269 | ) | | | (1,768 | ) |
| Dividends paid | | | (3,082 | ) | | | (1,832 | ) | | | (10,057 | ) | | | (4,287 | ) |
| Net cash used in financing activities | | | (3,534 | ) | | | (4,358 | ) | | | (12,319 | ) | | | (9,542 | ) |
| | | | | | | | | | | | | | | | | |
| Exchange difference in cash and cash equivalents | | | 401 | | | | 192 | | | | 407 | | | | (9 | ) |
| Net (decrease) increase in cash and cash equivalents | | | 3,537 | | | | 784 | | | | 2,749 | | | | (825 | ) |
| Cash and cash equivalents at the beginning of the period | | | 5,524 | | | | 6,337 | | | | 6,312 | | | | 7,946 | |
| Cash and cash equivalents at the end of the period | | | 9,061 | | | | 7,121 | | | | 9,061 | | | | 7,121 | |
| | | | | | | | | | | | | | | | | |
| Non-cash transactions | | | | | | | | | | | | | | | | |
| Recognition of assets for right of use and liabilities for lease | | | 609 | | | | 0 | | | | 609 | | | | 0 | |
Table 4: EBITDA Reconciliation – Ecopetrol Group
| Billion (COP) | | 3Q 2019 | | | 3Q 2018 | | | 9M 2019 | | | 9M 2018 | |
| Net income attributable to the owners of Ecopetrol | | | 3,011 | | | | 2,775 | | | | 9,243 | | | | 8,909 | |
| (+) Depreciation, amortization and depletion | | | 2,206 | | | | 2,070 | | | | 6,290 | | | | 5,778 | |
| (+/-) Impairment of long-term assets | | | (2 | ) | | | 0 | | | | (4 | ) | | | (149 | ) |
| (+/-) Gain in acquisition of shares in joint operations | | | 0 | | | | 0 | | | | 0 | | | | 12 | |
| (+/-) Financial result, net | | | 648 | | | | 521 | | | | 1,426 | | | | 1,710 | |
| (+) Income tax | | | 1,770 | | | | 2,182 | | | | 5,315 | | | | 6,155 | |
| (+) Taxes and others | | | 298 | | | | 217 | | | | 732 | | | | 659 | |
| (+/-) Non-controlling interest | | | 339 | | | | 232 | | | | 932 | | | | 682 | |
| Consolidated EBITDA | | | 8,270 | | | | 7,997 | | | | 23,934 | | | | 23,756 | |
Table 5: EBITDA Reconciliation by Segment (3Q 2019)
| Billion (COP) | | Upstream | | | Downstream | | | Midstream | | | Eliminations | | | Consolidated | |
| Net income attributable to the owners of Ecopetrol | | | 1,912 | | | | (401 | ) | | | 1,500 | | | | 0 | | | | 3,011 | |
| (+) Depreciation, amortization and depletion | | | 1,531 | | | | 351 | | | | 324 | | | | 0 | | | | 2,206 | |
| (+/-) Impairment of long-term assets | | | 0 | | | | (2 | ) | | | 0 | | | | 0 | | | | (2 | ) |
| (+/-) Financial result, net | | | 480 | | | | 566 | | | | (397 | ) | | | (1 | ) | | | 648 | |
| (+) Income tax | | | 1,013 | | | | (147 | ) | | | 903 | | | | 1 | | | | 1,770 | |
| (+) Other taxes | | | 89 | | | | 172 | | | | 37 | | | | 0 | | | | 298 | |
| (+/-) Non-controlling interest | | | (15 | ) | | | 0 | | | | 354 | | | | 0 | | | | 339 | |
| Consolidated EBITDA | | | 5,010 | | | | 539 | | | | 2,721 | | | | 0 | | | | 8,270 | |
Annexes, Ecopetrol S.A.
Following are the Income Statement and Statement of Financial Position of Ecopetrol S.A.
Table 6: Income Statement
| Billion (COP) | | 3Q 2019 | | | 3Q 2018 | | | ∆ (%) | | | 9M 2019 | | | 9M 2018 | | | ∆ (%) | |
| Local | | | 8,820 | | | | 8,940 | | | | (1.3 | %) | | | 25,074 | | | | 24,505 | | | | 2.3 | % |
| Exports | | | 7,227 | | | | 7,153 | | | | 1.0 | % | | | 21,086 | | | | 19,809 | | | | 6.4 | % |
| Total revenue | | | 16,047 | | | | 16,093 | | | | (0.3 | %) | | | 46,160 | | | | 44,314 | | | | 4.2 | % |
| Variable costs | | | 9,148 | | | | 8,411 | | | | 8.8 | % | | | 25,821 | | | | 23,110 | | | | 11.7 | % |
| Fixed costs | | | 2,935 | | | | 2,527 | | | | 16.1 | % | | | 8,539 | | | | 7,591 | | | | 12.5 | % |
| Total cost of sales | | | 12,083 | | | | 10,938 | | | | 10.5 | % | | | 34,360 | | | | 30,701 | | | | 11.9 | % |
| Gross income | | | 3,964 | | | | 5,155 | | | | (23.1 | %) | | | 11,800 | | | | 13,613 | | | | (13.3 | %) |
| Operating expenses | | | 629 | | | | 450 | | | | 39.8 | % | | | 1,753 | | | | 1,261 | | | | 39.0 | % |
| Operating income | | | 3,335 | | | | 4,705 | | | | (29.1 | %) | | | 10,047 | | | | 12,352 | | | | (18.7 | %) |
| Financial income/loss | | | (878 | ) | | | (476 | ) | | | 84.5 | % | | | (1,599 | ) | | | (1,395 | ) | | | 14.6 | % |
| Share of profit of companies | | | 1,443 | | | | 59 | | | | 2,345.8 | % | | | 3,647 | | | | 1,936 | | | | 88.4 | % |
| Income before income tax | | | 3,900 | | | | 4,288 | | | | (9.0 | %) | | | 12,095 | | | | 12,893 | | | | (6.2 | %) |
| Income tax | | | (889 | ) | | | (1,513 | ) | | | (41.2 | %) | | | (2,852 | ) | | | (3,984 | ) | | | (28.4 | %) |
| Net income consolidated | | | 3,011 | | | | 2,775 | | | | 8.5 | % | | | 9,243 | | | | 8,909 | | | | 3.7 | % |
| | | | | | | | | | | | | | | | | | | | | | | | | |
| EBITDA | | | 5,100 | | | | 6,314 | | | | (19.2 | %) | | | 14,826 | | | | 16,705 | | | | (11.2 | %) |
| EBITDA margin | | | 31.8 | % | | | 39.2 | % | | | (7.4 | %) | | | 32.1 | % | | | 37.7 | % | | | (5.6 | %) |
Table 7: Statement of Financial Position / Balance Sheet
| Billion (COP) | | September 30, 2019 | | | June 30, 2019 | | | ∆ (%) | |
| Current assets | | | | | | | | | | | | |
| Cash and cash equivalents | | | 4,494 | | | | 2,001 | | | | 124.6 | % |
| Trade and other receivables | | | 6,271 | | | | 8,531 | | | | (26.5 | %) |
| Inventories | | | 4,070 | | | | 3,968 | | | | 2.6 | % |
| Current tax assets | | | 484 | | | | 318 | | | | 52.2 | % |
| Other financial assets | | | 3,770 | | | | 5,715 | | | | (34.0 | %) |
| Other assets | | | 1,021 | | | | 1,081 | | | | (5.6 | %) |
| | | | 20,110 | | | | 21,614 | | | | (7.0 | %) |
| Non-current assets held for sale | | | 23 | | | | 24 | | | | (4.2 | %) |
| Total current assets | | | 20,133 | | | | 21,638 | | | | (7.0 | %) |
| | | | | | | | | | | | | |
| Non-current assets | | | | | | | | | | | | |
| Investments in associates and joint ventures | | | 47,649 | | | | 43,473 | | | | 9.6 | % |
| Trade and other receivables | | | 601 | | | | 632 | | | | (4.9 | %) |
| Property, plant and equipment | | | 21,523 | | | | 21,089 | | | | 2.1 | % |
| Natural and environmental resources | | | 20,764 | | | | 20,228 | | | | 2.6 | % |
| Assets by right of use | | | 3,571 | | | | 3,640 | | | | (1.9 | %) |
| Intangibles | | | 225 | | | | 236 | | | | (4.7 | %) |
| Deferred tax assets | | | 2,391 | | | | 1,888 | | | | 26.6 | % |
| Other financial assets | | | 3,914 | | | | 3,292 | | | | 18.9 | % |
| Other assets | | | 1,098 | | | | 1,075 | | | | 2.1 | % |
| Total non-current assets | | | 101,736 | | | | 95,553 | | | | 6.5 | % |
| | | | | | | | | | | | | |
| Total assets | | | 121,869 | | | | 117,191 | | | | 4.0 | % |
| | | | | | | | | | | | | |
| Current liabilities | | | | | | | | | | | | |
| Loans and borrowings | | | 2,971 | | | | 2,738 | | | | 8.5 | % |
| Trade and other payables | | | 8,412 | | | | 10,933 | | | | (23.1 | %) |
| Provision for employees benefits | | | 1,766 | | | | 1,673 | | | | 5.6 | % |
| Current tax liabilities | | | 903 | | | | 711 | | | | 27.0 | % |
| Accrued liabilities and provisions | | | 439 | | | | 595 | | | | (26.2 | %) |
| Other liabilities | | | 266 | | | | 391 | | | | (32.0 | %) |
| Total current liabilities | | | 14,757 | | | | 17,041 | | | | (13.4 | %) |
| | | | | | | | | | | | | |
| Non-current liabilities | | | | | | | | | | | | |
| Loans and borrowings | | | 35,925 | | | | 33,334 | | | | 7.8 | % |
| Provision for employees benefits | | | 6,273 | | | | 6,513 | | | | (3.7 | %) |
| Deferred tax liabilities | | | 144 | | | | 144 | | | | 0.0 | % |
| Accrued liabilities and provisions | | | 5,535 | | | | 5,396 | | | | 2.6 | % |
| Other liabilities | | | 24 | | | | 24 | | | | 0.0 | % |
| Total non-current liabilities | | | 47,901 | | | | 45,411 | | | | 5.5 | % |
| | | | | | | | | | | | | |
| Total liabilities | | | 62,658 | | | | 62,452 | | | | 0.3 | % |
| | | | | | | | | | | | | |
| Equity | | | | | | | | | | | | |
| Equity attributable to owners of the company | | | 59,211 | | | | 54,739 | | | | 8.2 | % |
| Total equity | | | 59,211 | | | | 54,739 | | | | 8.2 | % |
| | | | | | | | | | | | | |
| Total liabilities and equity | | | 121,869 | | | | 117,191 | | | | 4.0 | % |