SECURITIES AND EXCHANGE COMMISSION
Washington, D.C. 20549
FORM 6-K
REPORT OF FOREIGN PRIVATE ISSUER
PURSUANT TO RULE 13a-16 OR 15d-16 OF THE
SECURITIES EXCHANGE ACT OF 1934
February 2010
Commission File Number: 333-153452
ECOPETROL S.A.
(Exact name of registrant as specified in its Charter)
Carrera 7 No. 37 – 69
BOGOTA – COLOMBIA
(Address of registrant’s principal executive offices)
Indicate by check mark whether the registrant files or will file annual reports under cover Form 20-F or Form 40-F.
| Form 20-F | x | Form 40-F | o |
Indicate by check mark if the registrant is submitting the Form 6-K in paper as permitted by Regulation S-T Rule 101(b)(1):
| Yes | o | No | x |
Indicate by check mark if the registrant is submitting the Form 6-K in paper as permitted by Regulation S-T Rule 101(b)(7):
| Yes | o | No | x |
Indicate by check mark whether by furnishing the information contained in this Form, the registrant is also thereby furnishing the information to the Commission pursuant to Rule 12g3-2(b) under the Securities Exchange Act of 1934.
| Yes | o | No | x |
If “Yes” is marked, indicate below the file number assigned to the registrant in connection with Rule 12g3-2(b): 82- N/A
| PRESS RELEASE | |
Ecopetrol presents its fourth quarter and full year 2009 results
| · | Ecopetrol S.A. (“Ecopetrol” or the “Company”) and its affiliated companies had gross proved reserves1 of 1,878 MBOE and a reserves replacement rate of 359%2. |
| · | Ecopetrol´s group gross crude oil and natural gas production for 2009 increased by 17% from 447 Mboed to 520.6 Mboed. During the fourth quarter of 2009, production grew 26.4%* from 455.7 Mboed to 575.9 Mboed. |
| · | Sales volumes in 2009 increased by 18.8% compared to 2008, and by 24%* in the fourth quarter of 2009. |
| · | Unconsolidated operating profit for 2009 was COP$8,083 billion for the full year 2009 and COP$2,706 billion during the fourth quarter. |
| · | Unconsolidated net profit was COP$5,256 billion, or COP$129.87 per share, for the full year 2009 and COP$1,691 billion during the fourth quarter. |
| · | Consolidated net profit was COP$5,132 billion for the full year 2009 and COP$1,721 billion during the fourth quarter. |
* Results for the fourth quarter of 2009 as compared to results for the fourth quarter of 2008
BOGOTA, Feb. 15, 2010. Ecopetrol S.A. (BVC: ECOPETROL; NYSE: ECa; BVL: EC) announced today its non audited unconsolidated and consolidated financial results3 for the fourth quarter and full year 2009 in Colombian pesos (COP$), prepared and filed in accordance with the Régimen de Contabilidad Publica (Regime of Public Accounting or RCP) of the National Accounting Office.
This current report on Form 6-k, except any information included herein relating to the calculation of our EBITDA (earnings before interest, taxes, depreciation and amortization), is hereby incorporated by reference into our registration statement on Form F-3 filed with the U.S. Securities and Exchange Commission on February 12, 2010.
1 References to gross reserves and gross production include royalties.
2 Reserves calculated according to the methodology set forth by the U.S. Securities and Exchange Commission.
3 Under the RCP, companies are only required to consolidate their financial statements annually at the end of each fiscal year. Therefore, the interim consolidated figures presented in this report do not constitute a formal consolidation of the financial statements, neither of Ecopetrol nor of its subsidiaries, in such quarters, but are adjusted in accordance with the methodology defined for such purpose.
1
| PRESS RELEASE |
Highlights of Ecopetrol´s financial results
| Unconsolidated | Unconsolidated | Consolidated | ||||||||||||||||||||||||||||||||||
| (COP$ Billion) | 4Q 2009 | 4Q 2008 | % | 2009 | 2008 | % | 2009 | 2008 | % | |||||||||||||||||||||||||||
| Total sales | 8,505.7 | 6,135.9 | 38.6 | % | 27,674.0 | 32,749.4 | (15.5 | %) | 30,404.4 | 33,896.7 | (10.3 | %) | ||||||||||||||||||||||||
| Operating profit | 2,706.1 | 714.6 | 278.7 | % | 8,083.5 | 12,883.3 | (37.3 | %) | 7,873.4 | 12,657.4 | (37.8 | %) | ||||||||||||||||||||||||
| Net Income | 1,691.4 | 2,052.3 | (17.6 | %) | 5,256.2 | 11,630.7 | (54.8 | %) | 5,132.1 | 11,629.7 | (55.9 | %) | ||||||||||||||||||||||||
| Earnings per share (COP$) | 41.79 | 50.71 | (17.6 | %) | 129.87 | 287.37 | (54.8 | %) | ||||||||||||||||||||||||||||
| EBITDA | 2,963.6 | 1,150.9 | 157.5 | % | 10,438.0 | 14,758.9 | (29.3 | %) | 11,429.9 | 14,571.4 | (21.6 | %) | ||||||||||||||||||||||||
| EBITDA Margin | 35 | % | 19 | % | 38 | % | 45 | % | 38 | % | 43 | % | ||||||||||||||||||||||||
Javier Gutierrez, Chief Executive Officer of Ecopetrol, highlighted that “I am very pleased with 2009´s results. We ended the year with great achievements in the execution of our growth strategy: strengthened our balance of reserves, ending the year with 1,878 m BOE, a 35.5% growth when compared to 2008, Group’s production rose 17%, made advances in the development of key projects, including the expansion of our heavy crude transportation capacity and the fuel hydro-treatment project and started to deliver cleaner diesel, which shows our commitment of improving the quality of air and the environment.”
Gutierrez added, “our Group grew with the acquisition of four companies, the expansion of our international activity with 25 new exploration blocks, and our commercial operation was strengthened with higher exports of crude and product to Europe, Africa and Asia.”
“Additionally, the strength of our financial results allowed us to raise COP 5.4 trillion in the Colombian and international capital markets, in order to finance our Capex investments. Our company continues to have strong cash flow generation, as well as the solid capital structure. These strengths were one of the elements considered by Moody´s when rating our international bonds as investment grade.”
2
| PRESS RELEASE |
I. Financial and Operating Results
Sales Volumes
| Local Sales Volume (mboed) | 4Q 2009 | 4Q 2008 | % | 2009 | 2008 | % | ||||||||||||||||||
| Crude Oil | 81.0 | 79.8 | 1.5 | % | 80.1 | 73.7 | 8.6 | % | ||||||||||||||||
| Natural Gas | 102.8 | 66.2 | 55.2 | % | 78.2 | 68.1 | 14.8 | % | ||||||||||||||||
| Gasoline | 59.2 | 62.5 | (5.2 | %) | 59.1 | 61.6 | (4.1 | %) | ||||||||||||||||
| Medium Distillates | 101.1 | 89.6 | 12.8 | % | 95.7 | 92.8 | 3.2 | % | ||||||||||||||||
| LPG and fuel oil | 18.4 | 18.7 | (1.8 | %) | 19.3 | 20.1 | (3.6 | %) | ||||||||||||||||
| Industrial and Petrochemical | 16.8 | 13.2 | 27.1 | % | 15.3 | 14.2 | 7.5 | % | ||||||||||||||||
| Total Local Sales | 379.3 | 330.1 | 14.9 | % | 347.7 | 330.5 | 5.2 | % | ||||||||||||||||
Export Sales Volume (mboed) | 4Q 2009 | 4Q 2008 | % | 2009 | 2008 | % | ||||||||||||||||||
| Crude Oil | 281.2 | 167.5 | 67.8 | % | 232.8 | 149.2 | 56.0 | % | ||||||||||||||||
| Products | 45.4 | 56.4 | (19.5 | %) | 49.4 | 50.9 | (3.0 | %) | ||||||||||||||||
| Natural Gas | 7.5 | 21.4 | (65.0 | %) | 19.9 | 16.4 | 21.2 | % | ||||||||||||||||
| Total Export Sales | 334.0 | 245.3 | 36.2 | % | 302.0 | 216.5 | 39.5 | % | ||||||||||||||||
| Total Sales Volume | 713.3 | 575.3 | 24.0 | % | 649.8 | 547.0 | 18.8 | % | ||||||||||||||||
Market conditions
In 2009, our local sales grew 5.2% in average, mainly in crude oil, natural gas, industrial and petrochemical products. Local demand for liquid fossil fuels decreased due to the mandatory blend with biofuels (7% for diesel and 8% for gasoline).
Domestic sales grew by 14.9% in the last quarter of 2009 driven by the increase in diesel and natural gas sales to thermal power generators which increased their energy production as a result of the “El Niño” phenomenom, which resulted in less hydroelectric power generation due to drought. The rise in demand for natural gas led to national production of 1,037 Gbtud, the highest level of production in Colombia’s history, of which Ecopetrol produced 64%.
Sales of petrochemical and industrial products rose 27.1% in the last quarter of 2009 as compared to the fourth quarter of 2008 and 7.5% year-over-year as a result of the general economic recovery, which resulted in higher industrial demand for aromatic solvents, lubricants and paraffin.
In the development of its export markets, the Company advanced in its market diversification strategy by increasing its exports of crude oil and products to Europe, Africa and Asia. In that way, we made asphalt exports to Nigeria and Angola and signed a long-term contract to sell crude to India, which allowed shipments for $100 million in 2009
3
| PRESS RELEASE |
In the fourth quarter of 2009, products exports decreased as a result of (i) higher local demand for naphtha (which is used as a diluter for the increasing production of heavy crudes) and (ii) a decrease in exports of natural gas to Venezuela as a result the higher Colombian demand for natural gas which was given priority to supply, in order to support local thermal power generation.
Availability of crude oil and products
Ecopetrol´s sources of crude oil and products included the following:
| Corporate group | ||||||||||||||||||||||||
| Gross oil and gas production* | ||||||||||||||||||||||||
| (mboed) | 4Q 2009 | 4Q 2008 | % | 2009 | 2008 | % | ||||||||||||||||||
| Crude Oil | 472.9 | 371.0 | 27.5 | % | 426.04 | 361.6 | 17.8 | % | ||||||||||||||||
| Natural Gas | 103.0 | 84.7 | 21.6 | % | 94.60 | 85.4 | 10.8 | % | ||||||||||||||||
| Total | 575.9 | 455.7 | 26.4 | % | 520.65 | 447.0 | 17.0 | % | ||||||||||||||||
* Includes royalties
| Ecopetrol | ||||||||||||||||||||||||
| Purchase volume (mboed) | 4Q 2009 | 4Q 2008 | % | 2009 | 2008 | % | ||||||||||||||||||
| Crude Oil | 182.6 | 148.0 | 23.4 | % | 168.0 | 143.3 | 17.3 | % | ||||||||||||||||
| Products | 8.7 | 3.0 | 185.3 | % | 8.3 | 3.3 | 146.8 | % | ||||||||||||||||
| Natural Gas | 39.9 | 33.9 | 17.6 | % | 37.7 | 32.5 | 15.9 | % | ||||||||||||||||
| Total Purchases | 231.1 | 184.9 | 25.0 | % | 214.0 | 179.1 | 19.5 | % | ||||||||||||||||
| Ecopetrol | ||||||||||||||||||||||||
| Imports volume (mbd) | 4Q 2009 | 4Q 2008 | % | 2009 | 2008 | % | ||||||||||||||||||
| Crude Oil | - | - | 0.0 | % | - | 0.9 | (100.0 | %) | ||||||||||||||||
| Products | 42.5 | 29.6 | 43.3 | % | 38.8 | 26.8 | 44.6 | % | ||||||||||||||||
| Total imports | 42.5 | 29.6 | 43.3 | % | 38.8 | 27.8 | 39.7 | % | ||||||||||||||||
Price trends
The average price of WTI in 2009 was 38% lower than the average price en 2008. However, during 2009 WTI experienced a rising trend and was 30% higher in the fourth quarter of 2009 compared to the same quarter in 2008.
| Average price export basket | 4Q 2009 | 4Q 2008 | % | 2009 | 2008 | % | ||||||||||||||||||
| WTI (average) | 76.19 | 58.80 | 29.6 | % | 61.80 | 99.67 | (38.0 | %) | ||||||||||||||||
| Export crude oil basket | 69.24 | 41.41 | 67.2 | % | 56.17 | 94.88 | (40.8 | %) | ||||||||||||||||
| Export products basket | 68.40 | 41.19 | 66.0 | % | 52.47 | 80.82 | (35.1 | %) | ||||||||||||||||
4
| PRESS RELEASE |
Financial Results of Ecopetrol S.A. (unconsolidated)
| Income Statement (COP$ Billion) | 4Q 2009 | 4Q 2008 | % | 2009 | 2008 | % | ||||||||||||||||||
| Local Sales | 4,113.0 | 3,775.9 | 8.9 | % | 14,441.8 | 20,254.7 | (28.7 | %) | ||||||||||||||||
| Export Sales | 4,124.1 | 2,096.7 | 96.7 | % | 12,248.4 | 11,573.0 | 5.8 | % | ||||||||||||||||
| Sales of services | 268.6 | 263.3 | 2.0 | % | 983.8 | 921.7 | 6.7 | % | ||||||||||||||||
| Total Sales | 8,505.7 | 6,135.9 | 38.6 | % | 27,674.0 | 32,749.4 | (15.5 | %) | ||||||||||||||||
| Variable Costs | 2,950.5 | 2,701.5 | 9.2 | % | 11,401.5 | 12,482.1 | (8.7 | %) | ||||||||||||||||
| Fixed Costs | 2,172.8 | 2,025.9 | 7.3 | % | 6,029.1 | 5,572.6 | 8.2 | % | ||||||||||||||||
| Cost of Sales | 5,123.3 | 4,727.4 | 8.4 | % | 17,430.6 | 18,054.7 | (3.5 | %) | ||||||||||||||||
| Gross profit | 3,382.4 | 1,408.5 | 140.1 | % | 10,243.3 | 14,694.7 | (30.3 | %) | ||||||||||||||||
| Operating Expenses | 676.3 | 693.9 | (2.5 | %) | 2,159.8 | 1,811.4 | 19.2 | % | ||||||||||||||||
| Operating Profit | 2,706.1 | 714.6 | 278.7 | % | 8,083.5 | 12,883.3 | (37.3 | %) | ||||||||||||||||
| Non Operating Profit/(Loss) | (455.5 | ) | 1,988.8 | (122.9 | %) | (881.1 | ) | 3,121.6 | (128.2 | %) | ||||||||||||||
| Income tax | 559.2 | 651.1 | (14.1 | %) | 1,946.2 | 4,374.2 | (55.5 | %) | ||||||||||||||||
| Net Income | 1,691.4 | 2,052.3 | (17.6 | %) | 5,256.2 | 11,630.7 | (54.8 | %) | ||||||||||||||||
| Earnings per share (COP$) | $ | 41.79 | $ | 50.71 | (17.6 | %) | $ | 129.87 | $ | 287.37 | (54.8 | %) | ||||||||||||
| EBITDA | 2,963.6 | 1,150.9 | 157.5 | % | 10,438.0 | 14,758.9 | (29.3 | %) | ||||||||||||||||
| EBITDA Margin | 35 | % | 19 | % | 38 | % | 45 | % | ||||||||||||||||
Ecopetrol´s financial results showed a positive trend throughout the year, with quarterly growth in total sales, operating profit and EBITDA.
In the fourth quarter of 2009, higher oil prices and export volumes generated a 38.6% increase in total sales, when compared to the same period in 2008. The Company had sustained sales growth in every quarter. Nonetheless, when compared to 2008, revenues full year 2009 decreased by 15.5% when compared to as a result of lower crude oil and products prices.
In the fourth quarter of 2009, variable costs grew 9.2%, when compared to the same period in 2008. This increase was mainly due to higher average prices for purchases of crude oil (which rose from US$66.20/barrel to US$70.14/barrel) and to higher volumes of low-sulfur diesel imports in the last quarter of 2009 to meet the low-sulfur requirements effective on January 1, 2010. For 2009 the decrease in variable cost was 8.7% compared to 2008. On the other hand, amortizations and depletions were reduced in 99.7% due to the recalculation as of December 31 of 2009 with a higher hydrocarbon reserves base. Regarding full year 2009, variable costs declined 8.7% when compared to 2008.
Fixed costs increased by 7.3% in the fourth quarter of 2009 when compared to the same quarter in 2008, due mainly to an higher contracted services and maintenance needed to support increasing production levels as well as higher labor costs. For the full year 2009, fixed costs increased by 8.2% compared to the same period in 2008. In addition to the fourth quarter items mentioned above, the full year growth in fixed costs is also a result of rising hydrocarbon transportation costs, due to the use of trucks for transporting hydrocarbons, and transportation costs for the delivery of natural gas form the Guajira pipeline to the Barrancabermeja refinery.
5
| PRESS RELEASE |
Ecopetrol continued its procurement cost saving strategies (including tax exemptions and negotiation options) which lead to savings of COP$288.7 billion during the fourth quarter of 2009, compared to COP$95 billion in the fourth quarter of 2008. For the full year 2009 the savings amounted to COP$607.6 billion, compared to COP$272 billion in 2008. These strategies also allowed to the Company to avoid COP$202 billion in expenses during 2009.
Operating expenses decreased by 2.5% in the fourth quarter of 2009 when compared to the fourth quarter of 2008. This reduction is principally due to a 20.6% decrease in exploration and project expenses. This is mainly due to the reduction of 20.6% in exploration and project expenses because of: 1) Lower seismic activity in the fourth quarter of 2009 as compared to the same quarter of 2008 and; 2) Lower amortization of wells for the fourth quarter of 2009 as compared to the same period of 2008.
For full year 2009, operating expenses increased by 19.2% when compared to 2008, due to higher expenses resulting from unsuccessful exploratory activities and the amortization of the goodwill of the companies acquired during 2009.
Non-operating profit decreased in the fourth quarter of 2009 compared to the same quarter in 2008, amounting to a loss of COP$455.5 billion in 2009 compared to a profit of COP$1,988.8 billion in the fourth quarter of 2008. This loss was primarily due to the impact of the Colombian peso revaluation during the fourth quarter of 2009 on the dollar-denominated investments in the Company’s financial portfolio which generated a book net loss. Additionally, during 2009 the Company accounted for interest expenses relating to indebtedness incurred in 2009.
For full year 2009, the Company had a COP$23.4 billion loss in non-operating results; again due to the Colombian peso revaluation. It is worth mentioning that exchange rate risk in dollar-denominated assets has been partially offset by the dollar-denominated debt raised in 2009.
Net profit for the fourth quarter of 2009 amounted to COP$1,691.4 billion, or COP$41.79 pesos per share, a 17.6% decrease compared to the net profit reported for the fourth quarter of 2008 which amounted to COP$2,052.3 billion, or a profit of COP$50.71 pesos per share. Nonetheless, net profit rose 42% when compared to the third quarter of 2009 when net profit was COP$1,193.5 billion.
For full year 2009, net profit amounted to COP5,256.2 billion, or COP$129.87 per share, a 54.8% decrease when compared to the same period in 2008, mainly due to the decrease in WTI prices.
6
| PRESS RELEASE |
EBITDA for the fourth quarter of 2009 was COP$2,963.6 billion, 158% higher compared to COP$1,150.9 billion during the same quarter of 2008 and a 2.4% decrease compared to the third quarter of 2009. EBITDA margin was 35%, compared to a 19% margin in the fourth quarter of 2008 and a 41% margin in the third quarter for 2009. The growth between fourth quarter of 2009 and 2008 EBITDA was due to a higher crude production, as well as the cost saving measures meant to decrease operating costs.
Balance Sheet (Unconsolidated)
| December 31, | September 30, | |||||||||||
| Balance Sheet (COP$ Billion) | 2009 | 2009 | % | |||||||||
| Current Assets | 9,596.5 | 14,242.3 | (32.6 | %) | ||||||||
| Long Term Assets | 43,495.9 | 37,383.9 | 16.3 | % | ||||||||
| Total Assets | 53,092.4 | 51,626.2 | 2.8 | % | ||||||||
| Current Liabilities | 6,772.0 | 9,918.5 | (31.7 | %) | ||||||||
| Long Term Liabilities | 13,617.2 | 12,262.8 | 11.0 | % | ||||||||
| Total Liabilities | 20,389.2 | 22,181.2 | (8.1 | %) | ||||||||
| Equity | 32,703.2 | 29,445.0 | 11.1 | % | ||||||||
| Total Liabilities and Shareholders´ Equity | 53,092.4 | 51,626.2 | 2.8 | % | ||||||||
| Memorandum accounts | 138,150.6 | 134,943.3 | ||||||||||
As of December 31, 2009, Ecopetrol´s assets amounted to COP$53,092 billion compared to COP$51,626 billion as of September 30, 2009. During the fourth quarter cash (and cash equivalents) decreased in order to pay suppliers as well as the payment of third installment of the 2009 dividend. Long-term assets rose as a result of the capitalization of property, plant and equipment, as well as to capitalizations in subsidiaries.
Liabilities amounted to COP$20,389 billion as of December 31, 2009 compared to COP$22,181 billion as of September 30 of 2009. The decrease in current liabilities was due to the payment of the third installment of the 2009 dividend payment, which amounted to COP$2.938 billion. Long-term liabilities increased mainly as a result of recognized provisions for abandonment costs of COP$1,008 billion.
Shareholders’ equity increased from COP$29,445 billion at September 30, 2009 to COP$32,703 billion at December 31, 2009, as a result of (1) a COP $1,691 billion growth in net income and (2) a COP$712 billion reversal of a provision relating to technical asset assessment.
7
| PRESS RELEASE |
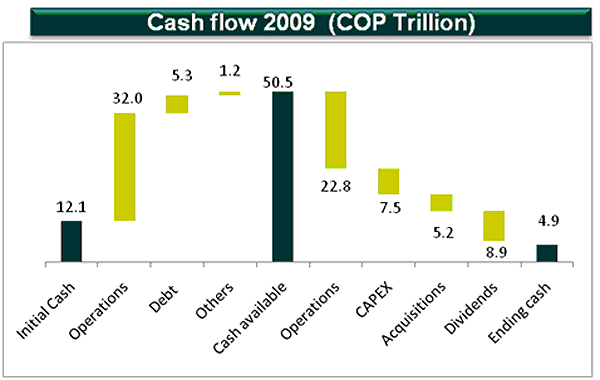
Cash Balance
Ecopetrol´s starting cash balance as of January 1, 2009 amounted to COP$12.1 trillion. Cash generated from operating activities during 2009 amounted to COP$32.04 trillion while cash generated from financing activities amounted COP$5.4 trillion. These sources were sufficient to fund the following: 1) operations for COP$22.83 trillion, 2) capital expenditures for COP$7.55 trillion, 3) acquisitions for COP$5.15 trillion, and 4) 2009 dividend payment for COP$8.9 trillion.
As of December 31, 2009, Ecopetrol´s cash position amounted to COP$4.9 trillion (including cash, cash equivalents and investments). This balance includes investments in portfolios held to maturity for COP$138.3 billion.
Below is summary of Ecopetrol´s cash flow in 2009.
8
| PRESS RELEASE |
Segment Results
COP$ Billion
| E&P | Refining | Transportation | Sales and Marketing | Corporate | Ecopetrol | |||||||||||||||||||||||||||||||||||||||||||
| 4Q 2009 | 2009 | 4Q 2009 | 2009 | 4Q 2009 | 2009 | 4Q 2009 | 2009 | 4Q 2009 | 2009 | 4Q 2009 | 2009 | |||||||||||||||||||||||||||||||||||||
| Domestic Sales | 2,786.5 | 9,706.9 | 3,123.1 | 10,974.6 | 588.5 | 2,106.9 | 1,266.9 | 4,373.8 | (3,383.4 | ) | (11,736.7 | ) | 4,381.6 | 15,425.6 | ||||||||||||||||||||||||||||||||||
| International Sales | 1,803.3 | 5,744.5 | 566.9 | 1,944.7 | - | - | 1,754.4 | 4,559.7 | - | - | 4,124.6 | 12,248.9 | ||||||||||||||||||||||||||||||||||||
| Total Sales | 4,589.8 | 15,451.4 | 3,689.9 | 12,919.4 | 588.5 | 2,106.9 | 3,021.3 | 8,933.5 | (3,383.4 | ) | (11,736.7 | ) | 8,506.2 | 27,674.5 | ||||||||||||||||||||||||||||||||||
| Operating Revenues | 2,646.3 | 7,975.0 | (88.4 | ) | (493.1 | ) | 165.0 | 553.5 | 38.3 | 133.2 | (55.7 | ) | (84.7 | ) | 2,705.5 | 8,083.9 | ||||||||||||||||||||||||||||||||
| Net Income | 1,945.5 | 5,707.1 | (103.9 | ) | (489.0 | ) | 90.2 | 291.2 | 38.7 | 132.2 | (279.2 | ) | (385.4 | ) | 1,691.4 | 5,256.2 | ||||||||||||||||||||||||||||||||
Note: This segment analysis is calculated based on transfer prices between business units, using export parity prices as reference.
The Exploration and Production segment generated COP$1,945.5 billion to the Company’s net income in the fourth quarter of 2009 and COP$5,707.1 billion for full year 2009, mainly driven by the growth in the production of heavy crude oil for export.
The Refining and Petrochemical segment accumulated net losses of COP$103.9 billion during the fourth quarter and COP$489 billion for full year 2009. The losses were due to the narrowing of the crack spreads when compared to 2008, which decreased the refining margin.
The hydrocarbon Transportation segment generated net income for the fourth quarter of 2009 of COP$291.2 billion, mainly due to the revenues from higher transported volumes during the fourth quarter of 2009, which reached 859.5 Mbod compared to 785.7 Mbod in the third quarter of 2009. For the full year 2009, the transported volume was 799.5 Mbod, a 47.7 Mbod increase when compared to 751.8 Mbod in 2008.
The Marketing and Sales segment had net income of COP$132.2 billion in 2009, as a result of the improvement of the hydrocarbon sales margin during the fourth quarter of 2009.
The Corporate segment generated an accumulated net loss of COP$385.4 billion in 2009, mainly due to other non-operating expenses, such as interest payments, net worth tax and retiree expenses.
Starting 2010 our segment reporting methodology will be modified. The primary modification refers to changes for the reporting of the Sales and Marketing segment, as it will no longer take “theoretical ownership” of crudes and products from the Exploration & Production and Refining & Petrochemical segments. In summary: revenues, costs, and expenses related to commercialization and delivery to end client (exports or refined), will be allocated to their respective segments. Under the current methodology these items are allocated to the Sales and Marketing segment. Additionally, Corporate segment costs will be gradually allocated among other segments, and we anticipate that in the future this segment will be eliminated and will no longer be included in the report.
9
| PRESS RELEASE |
II. Business Highlights
1P Proved Reserves
At December 31, 2009 Ecopetrol and its subsidiaries´ 1P proved reserves amounted to 1.88 billion barrels oil equivalent (BOE), including royalties, based on SEC standards and prices. This represented a 35.5% in proved reserves when compared to 1.38 billion BOE at the end of 2008. 71% of the reserves correspond to crude oil and 29% to natural gas.
The reserves replacement ratio was 359% for 2009 compared to 37.3% for 2008. At the end of 2009, the consolidated reserves-to-production ratio (assuming future production will remain at 2009 levels) was 9.9 years. The Company added a total of 682 million BOE of proved reserves.
The growth in proved reserves was a result of the following:
| · | Field Production Revaluation: 572 million BOE |
| · | 2009 Acquisitions: 108.5 million BOE |
| · | New Discoveries : 63 million BOE |
| · | Price Variation: Negative 61 million BOE |
The largest reserves addition came from the Central Region (37%), mainly from the Castilla and Chichimene fields, both located in the Meta province and operated by Ecopetrol. The North East region was second largest in reserves addition (29%), the main contributor of which was the Pauto field located in the Casanare province and operated by BP.
At December 31, 2009, applying company prices to SEC technical standard, Ecopetrol and its subsidiaries´ proved reserves amounted to 1.79 billion BOE, a 22% increase compared to 1.47 billion BOE in 2008.
10
| PRESS RELEASE |
Ecopetrol´s group - Gross proved reserves balance as of December 31, 2009 *
| Company price | SEC price | |||||||||||||||||||||||
| Oil Million | Gas Billion | Equiv. Oil | Oil Million | Gas Billion | Equiv. Oil | |||||||||||||||||||
| BALANCE | Bbls | scf | Million Bbls | Bbls | scf | Million Bbls | ||||||||||||||||||
| Proved reserves 2008 | 986 | 2,743 | 1,474 | 953 | 2,425 | 1,385 | ||||||||||||||||||
| Production/Sales 2009 | 155 | 196 | 190 | 155 | 196 | 190 | ||||||||||||||||||
| 2008 Adjustments | 1 | - | 1 | - | - | - | ||||||||||||||||||
| Additions | 433 | 434 | 510 | 538 | 811 | 682 | ||||||||||||||||||
| Proved reserves 2009 | 1,263 | 2,980 | 1,793 | 1,336 | 3,040 | 1,878 | ||||||||||||||||||
| Reserves Replacement Ratio (%) | 279 | % | 221 | % | 269 | % | 347 | % | 413 | % | 359 | % | ||||||||||||
| Proved reserves increase (%) | 28 | % | 9 | % | 22 | % | 40 | % | 25 | % | 36 | % | ||||||||||||
* Royalties included
Ecopetrol´s group - - Net proved reserves balance as of December 31, 2009 **
| SEC price | ||||||||||||
| Oil Million | Gas Billion | Equiv. Oil | ||||||||||
| Bbls | scf | Million Bbls | ||||||||||
| Proved reserves 2009 | 1,123 | 2,329 | 1,538 | |||||||||
** Net of royalties
Exploration
19 exploratory wells were drilled during 2009 (16 in Colombia, 2 in the US Gulf Coast and 1 in Brazil). Five wells exhibited preliminary evidence of hydrocarbons: the Quriyana-1 and Tempranillo-1 wells (operated by Ecopetrol), and the Quifa-7, Quifa-8 and Quifa-9 wells operated by Meta Petroleum LTD. Since five of the 19 drilled wells were successful, the global exploratory success rate was 26% in 2009 compared to 33% in 2008 (5 successful wells out of 15 drilled wells).
Out of the 19 exploratory wells drilled in 2009, 7 were drilled during the last quarter of 2009 (6 in Colombia and 1 in Brazil) as compared to the 6 exploratory wells drilled during the fourth quarter of 2008, when 2 wells proved successful.
11
| PRESS RELEASE |
In 2009, Ecopetrol acquired 5,060 kilometers equivalent of seismic in Colombia (3,095 kilometers directly, 1,338 kilometers under partnership contracts, and 627 kilometers under association contracts), and 4,810 kilometers equivalent of seismic were acquired abroad, for a total amount of 9,870 kilometers equivalent of seismic. In comparison, during 2008, Ecopetrol acquired 6,435 kilometers of equivalent seismic in Colombia (3,236 kilometers directly, 2,094 kilometers under Colombian risk share contracts and 1,105 kilometers under association contracts) and 354 kilometers equivalent of seismic were acquired abroad, for a total amount of 6,789 kilometers equivalent of seismic.
During the fourth quarter of 2009, Ecopetrol acquired 2,445 kilometers of seismic in Colombia (1,238 kilometers directly and 1,207 kilometer under participation contracts) and 4,561 kilometers equivalent of seismic were acquired abroad, for a total of 7,006 kilometers. In comparison, during the last quarter of 2008, Ecopetrol acquired 4,352 kilometers equivalent of seismic in Colombia (2,857 kilometers directly, 858 kilometers under partnership contracts and 637 Kilometers under association contracts) and 354 kilometers of seismic were acquired abroad for a total amount of 4.706 kilometers.
Ecopetrol continued with its effort to acquire exploration areas. In 2009, 5 blocks were granted in Colombia and 25 abroad, which increased the granted area in 3,460,713 hectares.
With respect to international exploratory activity, Ecopetrol America Inc., a foreign subsidiary of Ecopetrol which leads the deep water drilling expansion strategy in the Gulf of Mexico (USA), was granted 22 blocks in the USGoM Lease 2008 round, and acquired 4,561 kilometer equivalent of seismic.
Ecopetrol Oleo e Gas do Brasil Ltd., ended the year with partnerships in 7 blocks in Brazil, including block BMC-29 (CM 202) under an agreement with a subsidiary of Andarko. In this block, 249 2D kilometers of seismic were acquired.
As of December 31 2009, Ecopetrol del Peru had 4 blocks in the Maranon basin and 1 block in the Ucayali basin, acting as a non-operating partner together with Talisman and Petrobras. Three of these participations were acquired in 2009 through agreements with Talisman (Block 158) and Petrobras (Blocks 110 and 117).
Additionally, Ecopetrol del Peru participated together with Petrobras and Petroperu in the initial exploration of 6 blocks of Technical Evaluation (TEAS) in the Peruvian jungle. The results did not merit entering into an Exploration and Production contract. Block 90 (partnership with Repsol) was relinquished as well.
In Colombia, Ecopetrol and Reliance Exploration and Production DMCC, the Colombian subsidiary of Reliance Industries Limited, entered into an agreement pursuant to which Reliance assigned a 20 % interest to Ecopetrol in the Borojó Norte and Borojó Sur blocks, which are located at the Colombian Pacific offshore,. The blocks are located in a region where Ecopetrol is already conducting exploratory activities under the Egoro and Merayana Technical Evaluation Contracts. This agreement is awaiting authorization from the Agencia Nacional de Hidrocarburos (“National Hydrocarbons Agency” or the “ANH”)
12
| PRESS RELEASE |
Production
2009 was an important year for this segment, not only because of the incorporation of hydrocarbon reserves (mainly as a result of projects allowing the revaluation of existing fields), but also because of the growth in crude oil and natural gas production.
The annual average gross equivalent production of crude oil and natural gas of the Ecopetrol´s Group grew by 17% in 2009 from 447 Mboed (361.6 Mbod of crude oil and 85.4 Mboed of natural gas) in 2008 to 520.6 Mboed (426.04 Mbod of crude oil and 94.6 Mboed of natural gas) in 2009. Production in 2009 includes 0.99 Mboed from the K2 field in the US Gulf Cost.
During December 2009, the Ecopetrol Group’s average gross production reached 549.4 Mboed (449.8 Mbod of crude oil and 99.6 Mboed of natural gas), an increase of 32% compared to the 440.4 Mboed (360.5 Mbod of crude oil and 79.9 Mboed of natural gas) reported in December 2008. This growth is largely the result of: (1) a 38% increase in the production of heavy crudes, mainly in the Central region (Chichimene and Castilla fields), (2) the successful water injection projects in mature fields which led to a 11% growth, and 3) the higher demand for natural gas demand which led to a 9% increase.
The Company participated in the drilling of 162 development wells in the fourth quarter of 2009 (52 directly and 110 in partnership) compared to 185 development wells in the fourth quarter of 2008. In 2009, 587 development wells were drilled, compared to 618 in 2008.
Ecopetrol´s average lifting cost for the year 2009 was USD$7.23/barrel, compared to USD$8.32/barrel in 2008. This cost reduction was mainly due to higher production.
Refining and Petrochemicals
During 2009 Ecopetrol finalized the acquisition of 51% of Reficar, which is key in the integration of the modernization projects for the Barrancabermeja and Cartagena refineries. The modernization plans in both refineries will generate potential estimated configuration and construction savings of US$0.91 billion.
As of December 31 2009, the hydro-treatment project at the Barrancabermeja refinery was 94.4% complete, and operations are expected to start during the first half of 2010.
As part of the petrochemical development plan for Ecopetrol, the Barrancabermeja refinery rose its polyethylene production capacity by 10,695 tons/year, a 19% growth. Likewise, propylene deliveries increased by 31,970 tons/year (36% increase). However, Barrancabermeja refinery’s load decreased during 2009 due to unfavorable market conditions.
13
| PRESS RELEASE |
| Refinery runs | ||||||||||||||||||||||||
| Mbod | 4Q 2009 | 4Q 2008 | % | 2009 | 2008 | % | ||||||||||||||||||
| Barrancabermeja | 229,2 | 232,1 | (1,3 | )% | 217,1 | 232,1 | (6,5 | )% | ||||||||||||||||
During the fourth quarter of 2009, the prices of products were negatively impacted by the worldwide growth in inventories, especially gasoline, as a result of stockpiling for the hurricane season in the Gulf Coast, which ended up being slower than anticipated. Consequently the increase in supply of products was exacerbated by depressed demand as a result of the unfavorable economic conditions.
The accumulated refining gross margin4 for 2009 in the Barrancabermeja refinery amounted to US$4.41/barrel, an increase from the US$3.53/barrel reported in 2008, mainly due to: (a) the improvement in margins for fuel oil, whose differential was approximately 97% of the WTI price for 2009, compared to 76% in 2008, and (b) the lower average cost of raw materials (U$56.25 as compared to 96.24 US$/Barrel in 2008).
Refining cash cost in 2009 amounted to US$5.95/barrel, US$0.18 higher than the US$5.77/barrel reported for 2008. The increase was due to higher consumption and price of the catalysts, higher labor costs, and a load reduction.
Cleaner Fuels
As a result of the strategy undertaken by Ecopetrol in order to improve the quality of fuels, starting in July 2009, sulfur content in diesel fuels was reduced from 1,000 ppm to 500 ppm in Bogota, and from 3,000 to 2,500 ppm in the rest of the country. Subsequently, on January 1, 2010, sulfur contents in diesel fuels were reduced from 2,500 parts per million to 500 ppm for the rest of the country. For Bogota, and for the mass transportation systems in Bucaramanga, Pereira and Cali, Ecopetrol began delivering diesel fuels with less than 50 ppm of sulfur, demonstrating our commitment to improve the quality of air in Colombia.
4 2008 and 2009 margins were calculated based on accounting information, which includes inventory adjustments.
14
| PRESS RELEASE |
Transportation
During 2009, Ecopetrol achieved significant progress in the consolidation of the heavy crudes transportation system in the Llanos Orientales, undertaking several projects to increase the transportation capacity of the Araguaney-Porvenir, Ocensa, and the Oleoducto Colombia pipelines. Additionally, the Apiay-Porvenir pipeline began operations with a capacity of 160 Mbod.
Likewise, the Poliducto de Oriente transportation system, which runs from Sebastopol to Tocancipá, commenced operations. This transportation system delivers naphtha to Tocancipa. The naphtha is then moved to the Llanos Orientales (Eastern Plains) in order to facilitate the transport of heavy crude oil through the oil pipeline system. Additionally, the capacity of the Pozos Colorados – Galan line rose by 45 thousand BPD. Furthermore, 50% of the Caño Limon-Coveñas pipeline, one of the main transport systems in Colombia, reverted back to Ecopetrol in 2009.
During 2009, 501 kilometers were added to Ecopetrol´s pipelines, representing a 6% growth compared to 2008. 126 kilometers were added to the Apiay-Porvenir line, 140 kilometers were added to the Pozos Colorados – Galán line, and 235 kilometers were added to the Rubiales-Monterrey pipeline.
Transportation costs in 2009 were COP$9.13/barrel-kilometer compared to COP$9.70 in 2008 due to the 12.4% growth in transported volumes in 2009 as compared to 2008.
Investments
In 2009 total capital expenditures (CAPEX) investment amounted to COP$13.578 billion, of which COP$5.087 billion were allocated to acquisitions and COP$8.491 billion to organic investments. In comparison, total capital expenditures investment amounted to COP$9.489 billion in 2008, of which COP$7.924 billion were allocated to organic investments and COP$1.565 billion were allocated to acquisitions. 38% of total investment in 2009 was allocated to acquisitions and new business, 42% to Upstream projects, 18% to Downstream projects, and the remaining 2% to corporate internal initiatives.
Total CAPEX investment for the fourth quarter of 2009, including acquisitions, reached COP$3.424 billion, compared to COP$3.445 billion in the fourth quarter of 2008.
Financing
As part of the growth strategy, in 2009 Ecopetrol began leveraging its balance sheet in order to finance its investment plan and optimize its capital structure. In June 2009, a seven-year COP$2.2 trillion syndicated loan was entered into with eleven local banks. The repayment terms under this loan include bi-annual amortizations, a two year grace period for the repayment of principal, and an interest rate of DTF (Colombian banking system reference rate) + 4%. As security under the loan, the Company granted the lenders a pledge on a percentage of the Company’s shares in of Oleoducto Central S.A. (OCENSA), Reficar S.A. and Polipropileno del Caribe S.A. (Propilco).
15
| PRESS RELEASE |
On July 23, 2009, Ecopetrol issued US$1.5 billion aggregate principal amount of its 7.625% Notes due 2019. The issue price was 99.642. The offering was six times oversubscribed. This bond issuance was rated Baa2 (investment grade) by Moody, and BB+ by each of Fitch Ratings and Standard & Poors. The Notes were issued with registration rights. The exchange offer to implement the registration rights was completed on October 5, 2009 and the Notes were exchanged and the registered Notes were listed on the New York Stock Exchange. Latin Finance awarded Ecopetrol as cuasi-sovereign issuer for 2009 due to the successful bond issuance.
III. Corporate Social Responsibility
Corporate Reputation
| · | For the second year in a row, Ecopetrol was ranked as number one in the Merco corporate reputation survey (Corporate Reputation Monitor), which evaluates the corporate responsibility efforts and results of Colombia´s largest corporations. |
| · | Ecopetrol was ranked second among 20 of the State-owned industrial and commercial companies (including mixed economy companies) in the area of corporate transparency, according to Corporacion Transparencia por Colombia. |
| · | Ecopetrol joined to the United Nations’ Global Compact Initiative and committed itself to support global principles in respect to human rights, labor, environment and anti-corruption. |
Human Talent
During 2009, management focused on building trust relations, ensuring competitiveness in compensation and strengthening corporate values and culture, with the goal of making Ecopetrol one of the preferred corporations in Colombia by workers. These efforts resulted in a 6.8 point improvement, when compared to 2008, in a labor climate survey. There was an improvement across the 13 categories of the survey.
With respect to labor relations, three important milestones in 2009 are: (1) Entering into a trust agreement with the Unión Sindical Obrera (USO) labor union, (2) Negotiating a new five-year Collective Bargain Agreement with all of the union organizations present at Ecopetrol (USO, Adeco, and Sindispetrol) and (3) Reaching an agreement with the Unión Sindical Obrera (USO) to improve the Company’s productivity.
16
| PRESS RELEASE |
Social Responsibility Endeavors
Ecopetrol’s budget for social projects in 2009 amounted to COP$135.6 billion (compared to COP$126 billion in 2008) was earmarked to: 1) Development in regions: COP$87.4 billion; 2) Social investment projects: COP$28.6 billion; 3) Science and technology: COP$14.8 billion; 4) Retraining: COP$3.7 billion and; 5) Local supplier’s development: COP$1.1 billion.
Initiatives for environmental conservation and community relations
| · | Ten projects were selected to benefit from a COP$2,500 million grant from Ecopetrol´s National Biodiversity Program, in partnership with the Ministry of Housing, Territory Development and the Environment. |
| · | The Company made advances in its evaluation of the 2006-2007 emissions inventories, as part of its environmental initiatives. |
HSE (HEALTH, SAFETY AND ENVIRONMENT)
During 2009 the accident frequency index decreased by 28% from 1.73 (number of accidents / million of labor hours) in 2008 to 1.24 in 2009. This important milestone was achieved as a result of the strong effort the Company made to promote the safety across all areas of operations, ratifying its commitment to the “cero accidentes” initiative.
17
| PRESS RELEASE |
IV. Consolidated Financial Results of Ecopetrol and its Subsidiaries5
| (COP$ Billion) | 4Q 2009* | 4Q 2008* | % | 2009 | 2008 | % | ||||||||||||||||||
| Local Sales | 2,896.5 | 3,626.3 | (20.1 | )% | 12,945.5 | 20,675.9 | (37.4 | )% | ||||||||||||||||
| Export Sales | 5,691.8 | 2,818.4 | 102.0 | % | 16,345.9 | 12,298.7 | 32.9 | % | ||||||||||||||||
| Sales of services | 397.7 | 263.7 | 50.8 | % | 1,113.1 | 922.1 | 20.7 | % | ||||||||||||||||
| Total Sales | 8,986.0 | 6,708.4 | 34.0 | % | 30,404.4 | 33,896.7 | (10.3 | )% | ||||||||||||||||
| Variable Costs | 2,957.0 | 2,902.5 | 1.9 | % | 12,743.3 | 13,424.3 | (5.1 | )% | ||||||||||||||||
| Fixed Costs | 2,434.8 | 2,356.5 | 3.3 | % | 7,162.7 | 5,660.1 | 26.5 | % | ||||||||||||||||
| Cost of Sales | 5,391.8 | 5,259.0 | 2.5 | % | 19,906.0 | 19,084.4 | 4.3 | % | ||||||||||||||||
| Gross profit | 3,594.2 | 1,449.4 | 148.0 | % | 10,498.4 | 14,812.3 | (29.1 | )% | ||||||||||||||||
| Operating Expenses | 1,214.7 | 872.3 | 39.3 | % | 2,625.0 | 2,154.9 | 21.8 | % | ||||||||||||||||
| Operating Profit | 2,379.5 | 577.1 | 312.3 | % | 7,873.4 | 12,657.4 | (37.8 | )% | ||||||||||||||||
| Non Operating Profit/(Loss) | (38,4 | ) | 2,130.2 | (101.8 | )% | (622.5 | ) | 3,353.8 | (118.6 | )% | ||||||||||||||
| Income tax | 606.3 | 649.8 | (6.7 | )% | 2,114.0 | 4,382.0 | (51.8 | )% | ||||||||||||||||
| Minority interest | 13.4 | (0.5 | ) | 4.8 | (0.5 | ) | ||||||||||||||||||
| Net Income | 1,721.4 | 2,058.0 | (16.4 | )% | 5,132.1 | 11,629.7 | (55.9 | )% | ||||||||||||||||
| EBITDA | 3,327.8 | 865.0 | 284.7 | % | 11,429.9 | 14,571.4 | (21.6 | )% | ||||||||||||||||
| EBITDA Margin | 37 | % | 13 | % | 38 | % | 43 | % | ||||||||||||||||
Among Ecopetrol´s subsidiaries, Reficar S.A. (“Reficar”) reported the highest revenues in 2009 with COP$3,944.96 billion (prior to eliminations from consolidation), followed by Hocol S.A. (“Hocol”) with COP$1,888.5 billion, Propilco S.A. (“Propilco”) with COP$1,040.7 billion, and Ocensa S.A. (“Ocensa”) with COP$705.9 billion.
The subsidiaries reporting the highest net income in 2009 were: Hocol with COP$330.6 billion, Propilco S.A. with COP$47.7 billion, ODL Finance S.A. with COP$12.4 billion and Black Gold Re Ltd. with COP$14.7 billion.
Subsidiaries that reported net losses in 2009 were Ecopetrol Global Energy (which includes losses of Ecopetrol America Inc.) with COP$316.9 billion, Refineria de Cartagena with COP$ 127.87 billion, Andean Chemicals Limited with COP$65.6 billion (which under the equity method includes 50% of Propilco’s profit and 51% of Reficar’s losses from Reficar), Ecopetrol Oleo e Gas do Brasil with COP$ 139.7 billion, and Ecopetrol del Peru with COP$ 3.3 billion.
5 For purposes of preparing the estimated consolidated financial results for the fourth quarter of 2009 and for the full year 2009, in addition to the results of Ecopetrol, the results of the following subsidiaries have also been included: Ecopetrol Oleo e Gas Do Brasil, Ecopetrol America Inc, Ecopetrol del Peru S.A. , Hocol, Bioenergy S.A., Andean Chemicals Limited, ECP Global Energy, Propilco S.A., Comai, ODL Finance S.A., Ecopetrol Transportation Company, Oleoducto de Colombia, Ocensa S.A., Reficar S.A. and Black Gold Re Ltd.
For the estimated consolidated fourth quarter and audited consolidated full year 2008 results included the following subsidiaries: Ecopetrol S.A., Black Gold Re Ltd, Ecopetrol Oleo e Gas Do Brasil, Ecopetrol America Inc, Ecopetrol del Peru S.A., Andean Chemicals Ltd, Propilco S.A., Comai, and ODL Finance S.A..
6 Should not be the same number shown in Reficar’s income statement because that number (COP$3.944,9 billion) includes eliminations and different account’s classifications for consolidation effects.
18
| PRESS RELEASE |
It is worth mentioning that Ecopetrol America Inc., Ecopetrol Oleo e Gas do Brasil and Ecopetrol del Peru S.A., were incorporated as part of the Company’s internationalization strategy and are in the exploratory phase Hence, these companies did not report a profit for 2009.
According to the equity method, Offshore International Group (“OIG”) generated net income of COP$31.5 billion, and Invercolsa generated net income of COP$22.8 billion.
EBITDA for the full year 2009 amounted to COP$11,429.9 billion, of which 90% was generated by Ecopetrol S.A., 5% by Hocol, 4% by Ocensa, and 1% by other subsidiaries.
Below is summary of the highlights of Ecopetrol´s subsidiaries in 2009.
Propilco
During 2009 Propilco increased its production capacity by 50,000 tons/year reaching a total capacity of 455,000 tons/year. Its market share for polypropylene is 95%.
Ecopetrol´s supply of raw material amounted to 120,300 tons of propylene during 2009, approximately 30% of Propilco’s total consumption, reducing its polypropylene production costs.
In January 2010 Vicente Noero, the former Chief Financial Officer of Propilco, was appointed as its Chief Executive Officer.
Below is the summary of Propilco´s operational and financial results in 2009:
| Sales volume (tons) | 4Q 2009 | 4Q 2008 | 2009 | 2008 | ||||||||||||
| Polypropylene | 86,779 | 86,279 | 390,394 | 374,774 | ||||||||||||
| Polypropylene marketing for COMAI | 2,120 | 2.468 | 8,988 | 9,852 | ||||||||||||
| Total | 88,899 | 88,747 | 399,382 | 384,626 | ||||||||||||
Note: Propilco commercializes the products manufactured by COMAI, due to Propilco’s sales force and storage capacity allow it to undertake the sales, resulting in synergies and cost savings.
7 Should not be the same number shown in Reficar’s income statement because that number (COP$127,8 billion) includes eliminations and differenr account’s classifications for consolidation effects.
19
| PRESS RELEASE |
| Income Statement | ||||||||||||||||
| (COP$ Billion) | 4Q 2009 | 4Q 2008 | 2009 | 2008 | ||||||||||||
| Local Sales | 125.2 | 154.5 | 483.0 | 660.3 | ||||||||||||
| Export Sales | 131.6 | 132.9 | 557.7 | 707.2 | ||||||||||||
| Total Sales | 256.8 | 287.5 | 1,040.7 | 1,367.4 | ||||||||||||
| Variable Costs | 204.7 | 249.0 | 807.6 | 1,125.9 | ||||||||||||
| Fixed Costs | 24.9 | 24.5 | 100.6 | 97.7 | ||||||||||||
| Cost of Sales | 229.5 | 273.5 | 908.2 | 1,223.6 | ||||||||||||
| Gross profit | 27.2 | 14.0 | 132.5 | 143.9 | ||||||||||||
| Operating Expenses | 19.6 | 21.9 | 86.8 | 92.1 | ||||||||||||
| Operating Profit | 7.7 | (7.9 | ) | 45.7 | 51.8 | |||||||||||
| Non Operating Profit/(Loss) | 1.0 | (1.7 | ) | 9.4 | 16.3 | |||||||||||
| Income tax | 2.3 | (6.2 | ) | 7.4 | 14.8 | |||||||||||
| Minority interest | - | - | - | - | ||||||||||||
| Net Income/Loss | 6.3 | (3.3 | ) | 47.7 | 53.3 | |||||||||||
| Balance Sheet | ||||||||
| COP$ Billion | 2009 | 2008 | ||||||
| Current Assets | 452.0 | 527.2 | ||||||
| Long Term Assets | 531.2 | 432.3 | ||||||
| Total Assets | 983.2 | 959.5 | ||||||
| Current Liabilities | 325.5 | 373.2 | ||||||
| Long Term Liabilities | 29.1 | 26.4 | ||||||
| Total Liabilities | 354.7 | 399.6 | ||||||
| Equity | 628.6 | 559.9 | ||||||
| Total Liabilities and Shareholders´ Equity | 983.2 | 959.5 | ||||||
Reficar
During 2009, Reficar made advances in all areas of its modernization and expansion projects, all within the established schedule. Some of the major milestones were: finalizing the basic engineering phase, signing an Engineering Procurement and Construction contract, undertaking initial negotiation of required financing for the project, beginning the purchase of long-term delivery machinery, and beginning the preparation of land where the new plants are to be built.
The final configuration of the refinery was optimized under an integration model with the Barrancabermeja refinery, thus maximizing value for Ecopetrol.
On September 22, 2009 Orlando Cabrales, former CEO of Propilco, was appointed as CEO of Reficar by its Board of Directors.
Later, in October 2009, the Board of Directors of Ecopetrol S.A. agreed to guarantee resources needed by Reficar in order to complete the refinery’s expansion.
20
| PRESS RELEASE |
Although the operation of the Cartagena refinery benefited from a lighter load of crude oil (Vasconia y Caño Limon), the reduction in margins resulted in a loss for the fourth quarter and full year 2009.
Below is the summary of Reficar´s operational results and financial statements for the fourth quarter and full year 2009:
| Sales Volume (Mbd) | 4Q 2009 | 4q 2008 | 2009 | 2008 | ||||||||||||
| Local | 44.35 | 36.91 | 42.75 | 39.45 | ||||||||||||
| International | 40.07 | 50.24 | 38.17 | 39.99 | ||||||||||||
| Total | 84.42 | 87.15 | 80.91 | 79.44 | ||||||||||||
Refinery run (Mbd) | 4Q 2009 | 4q 2008 | 2009 | 2008 | ||||||||||||
| 78.31 | 78.33 | 78.92 | 78.01 | |||||||||||||
| Income Statement | ||||||||||||||||
| (COP$ Billion) | 4Q 2009 | 4Q 2008 | 2009 | 2008 | ||||||||||||
| Local Sales | 618.3 | 681.1 | 2,164.7 | 3,144.2 | ||||||||||||
| Export Sales | 550.5 | 529.9 | 1,782.4 | 2,407.5 | ||||||||||||
| Sales of services | 7.4 | 7.2 | 26.9 | 31.3 | ||||||||||||
| Total Sales | 1,176.2 | 1,218.2 | 3,973.9 | 5,582.9 | ||||||||||||
| Cost of Sales | (1,177.2 | ) | (1,177.7 | ) | (4,002.2 | ) | (5,541.9 | ) | ||||||||
| Gross profit | (1.0 | ) | 40.5 | (28.3 | ) | 41.0 | ||||||||||
| Operating Expenses | (27.6 | ) | (12.9 | ) | (67.5 | ) | (47.3 | ) | ||||||||
| Operating Profit | (28.6 | ) | 27.6 | (95.7 | ) | (6.3 | ) | |||||||||
| Non Operating income | 26.9 | 184.9 | 211.2 | 344.0 | ||||||||||||
| Non Operating expenses | (12.8 | ) | (207.2 | ) | (235.4 | ) | (350.9 | ) | ||||||||
| Non Operating Profit/(Loss) | 14.1 | (22.2 | ) | (24.2 | ) | (6.9 | ) | |||||||||
| Income tax | 6.8 | (4.5 | ) | (10.5 | ) | (18.2 | ) | |||||||||
| Minority interest | - | - | - | - | ||||||||||||
| Net Income/Loss | (7.7 | ) | 0.8 | (130.4 | ) | (31.4 | ) | |||||||||
| Balance Sheet | ||||||||
| COP$ Billion | 2009 | 2008 | ||||||
| Current Assets | 997.3 | 1,492.4 | ||||||
| Long Term Assets | 2,046.3 | 1,618.3 | ||||||
| Total Assets | 3,043.5 | 3,110.6 | ||||||
| Current Liabilities | 572.1 | 508.4 | ||||||
| Long Term Liabilities | 0.4 | 0.6 | ||||||
| Total Liabilities | 572.5 | 509.0 | ||||||
| Equity | 2,471.0 | 2,601.6 | ||||||
| Total Liabilities and Shareholde | 3,043.5 | 3,110.6 | ||||||
21
| PRESS RELEASE |
Ecodiesel S.A.
Ecodiesel Colombia S.A., a subsidiary which is part of the Groups´s diversification strategy into the biofuels segment, made significant progress in civil works for the Refining and Biodiesel plants. The tests began (pre-commissioning and commissioning) in December 2009 and the commercial operation of the plants is expected to start during the first half of 2010. Ecopetrol has a 50% interest in this subsidiary.
Ecodiesel is still in pre operating phase. Its financial statements do not reflect significant variations in the income statement. Investments and expenses related to the project are registered in the balance sheet as assets.
Bioenergy S.A.
During 2009, Bioenergy S.A. acquired land for the first phase of its agricultural development project. The development of the basic seedbed (100 hectares) was completed, which will allow for planting of the commercial seedbed during 2010. Additionally, progress was made in the EPC (Engineering, Procurement & Construction) selection process for the construction of the plant (mill and distillery) as well as to define the most adequate technology. In addition, Free Trade Zone status was granted, which will lead to material tax benefits as well as an environmental license to operate the Ethanol producing plant. Ecopetrol has an 80.2% interest in this subsidiary.
Given that the company is still in pre operating phase. Its financial statements do not reflect significant variations in the income statement. Investments and part of the expenses related to the project are registered in the balance sheet as assets.
Ocensa
During 2009, Ocensa’s average daily transported volume amounted to 380 Mbod (up from 270 Mbod in the first half of the year) due to the growth in production of the Apiay and Rubiales fields. In 2009, the total transportation capacity for heavy crude oil increased to 420 Mbod compared to 330 Mbod of capacity in 2008.
Taking into account the expected growth of the crude oil production in the Eastern Plains region, Ocensa has estimated investments of US$200 million in order to expand its current capacity to 560 Mbod in 2010.
Oscar Trujillo, former vice president of transportation in Ecopetrol, was appointed Chief Executive Officer of Ocensa.
22
| PRESS RELEASE |
Below is a summary of Ocensa´s operational results and financial statements for the fourth quarter and full year 2009:
| Transported volumes (Mbod) | 4Q 2009 | 4Q 2008 | 2009 | 2008 | ||||||||||||
| Cusiana-Porvenir | 57.9 | 69.0 | 60.5 | 71.5 | ||||||||||||
| Porvenir-Vasconia | 373.7 | 262.2 | 303.1 | 253.0 | ||||||||||||
| Vasconia-Coveñas | 237.4 | 182.7 | 202.5 | 162.9 | ||||||||||||
| Coveñas-Export Port | 268.0 | 212.9 | 239.5 | 183.9 | ||||||||||||
| Income Statement | ||||||||||||||||
| (COP$ Billion) | 4Q 2009 | 4Q 2008 | 2009 | 2008 | ||||||||||||
| Sales of services | 196.8 | 193.9 | 705.9 | 696.0 | ||||||||||||
| Total Sales | 196.8 | 193.9 | 705.9 | 696.0 | ||||||||||||
| Variable Costs | (3.7 | ) | (2.1 | ) | (8.8 | ) | (7.0 | ) | ||||||||
| Fixed Costs | (157.6 | ) | (158.0 | ) | (579.1 | ) | (566.0 | ) | ||||||||
| Cost of Sales | (161.2 | ) | (160.0 | ) | (587.9 | ) | (573.0 | ) | ||||||||
| Gross profit | 35.6 | 33.8 | 117.9 | 123.0 | ||||||||||||
| Operating Expenses | (15.1 | ) | (21.1 | ) | (49.6 | ) | (63.3 | ) | ||||||||
| Operating Profit | 20.5 | 12.7 | 68.3 | 59.7 | ||||||||||||
| Non Operating Profit/(Loss) | 53.0 | 15.6 | 18.3 | 86.0 | ||||||||||||
| Income tax | (4.6 | ) | (4.2 | ) | (18.3 | ) | (38.2 | ) | ||||||||
| Minority interest | - | - | - | - | ||||||||||||
| Net Income | 48.4 | 11.4 | - | 47.8 | ||||||||||||
| Balance Sheet | ||||||||
| COP$ Billion | 2009 | 2008 | ||||||
| Current Assets | 499.4 | 309.6 | ||||||
| Long Term Assets | 1,256.0 | 1,625.8 | ||||||
| Total Assets | 1,755.5 | 1,935.4 | ||||||
| Current Liabilities | 43.3 | 82.2 | ||||||
| Long Term Liabilities | 2.3 | 3.1 | ||||||
| Total Liabilities | 45.5 | 85.3 | ||||||
| Equity | 1,710.0 | 1,850.1 | ||||||
| Total Liabilities and Shareholders´ Equity | 1,755.5 | 1,935.4 | ||||||
ODL
Oleoducto de los Llanos Orientales (“ODL”) began operating in September 2009, transporting 62.9 Mbod of crude during the last quarter of 2009.
ODL raised COP$ 500 million of financing in the local capital markets, using future funds as security. Additionally, it expects to continue with the expansion of the Rubiales-Monterrey line to a capacity of 160 Mbod. ODL will also continue to monitor business opportunities in order to improve the crude oil transportation network.
23
| PRESS RELEASE |
ODL´s Board of Directors appointed Nelson Moyano as its Chief Executive Officer.
Below is the summary of ODL´s financial statements for the fourth quarter and full year 2009:
| Income Statement | ||||||||
| (COP$ Billion) | 4Q 2009 | 2009 | ||||||
| Local Sales | 23.73 | 23.73 | ||||||
| Total Sales | 23.73 | 23.73 | ||||||
| Variable Costs | - | - | ||||||
| Fixed Costs | 11.21 | 11.21 | ||||||
| Cost of Sales | 11.21 | 11.21 | ||||||
| Gross profit | 12.52 | 12.52 | ||||||
| Operating Expenses | 19.34 | 19.34 | ||||||
| Operating Profit | (6.83 | ) | (6.83 | ) | ||||
| Non Operating Profit/(Loss) | 19.25 | 19.25 | ||||||
| Income tax | - | - | ||||||
| Minority interest | - | - | ||||||
| Net Income/Loss | 12.42 | 12.42 | ||||||
| Balance Sheet | ||||
| COP$ Billion | 2009 | |||
| Current Assets | 205.39 | |||
| Long Term Assets | 1,160.51 | |||
| Total Assets | 1,365.89 | |||
| Current Liabilities | 180.58 | |||
| Long Term Liabilities | 777.66 | |||
| Total Liabilities | 958.24 | |||
| Equity | 407.65 | |||
| Total Liabilities and Shareholders´ Equity | 1,365.89 | |||
Hocol
Hocol´s 2009 gross production amounted to 24.87 Mboed, a 41% growth compared to 2008. The majority of the production came from the Palermo and Ocelote fields. Hocol’s contribution to the Ecopetrol Group gross annual production in 2009 amounted to 14.76 Mboed, since it was acquired by Ecopetrol in May 2009.
Hocol’s production is expected to reach 35 Mboed by December 2010, and 50 Mboed by 2015, as part Ecopetrol’s goal of producing 1 million barrels of oil equivalent per day.
24
| PRESS RELEASE |
In June 2009, an important discovery of gas condensate was announced in the Hurón 1 exploratory well, which is located in the Niscota block. Hocol (being the operator) has a 20% interest, together with Total (50% interest) and Talisman Energy Inc. (30%). The discovery is currently in the evaluation phase and additional seismic is scheduled in the area between the years 2010 and 2011.
In August 2009 the Board of Directors of Hocol S.A. appointed Alvaro Vargas as Chief Executive Officer. Mr. Vargas is a former Vice-president of Strategy and Growth of Ecopetrol S.A.
Below is a summary of Hocols´s financial statements and operating results for 2009:
| Production (Mboed) | 4Q 2009 | 4Q 2008 | 2009 | 2008 | ||||||||||||
| Crude oil | 25.01 | 18.70 | 23.70 | 17.05 | ||||||||||||
| Natural gas | 1.36 | 1.52 | 1.16 | 0.54 | ||||||||||||
| Total | 26.38 | 20.22 | 24.87 | 17.59 | ||||||||||||
| Exploration activity | 4Q 2009 | 4Q 2008 | 2009 | 2008 | ||||||||||||
| Seismic (KM equivalent) | 680 | 314 | 853 | 1.195 | ||||||||||||
| Wells | 0 | 4 | 3 | 15 | ||||||||||||
| Income Statement | ||||
| (COP$ Billion) | 2009 | |||
| Local Sales | 37.5 | |||
| Export Sales | 1,851.1 | |||
| Total Sales | 1,888.5 | |||
| Variable Costs | 362.2 | |||
| Fixed Costs | 1,045.4 | |||
| Cost of Sales | 1,407.6 | |||
| Gross profit | 481.0 | |||
| Operating Expenses | 122.4 | |||
| Operating Profit | 358.5 | |||
| Non Operating Profit/(Loss) | 456.6 | |||
| Income tax | 126.0 | |||
| Minority interest | - | |||
| Net Income/Loss | 330.6 | |||
25
| PRESS RELEASE |
| Balance Sheet | ||||
| COP$ Billion | 2009 | |||
| Current Assets | 933.7 | |||
| Long Term Assets | 967.6 | |||
| Total Assets | 1,901.3 | |||
| Current Liabilities | 503.7 | |||
| Long Term Liabilities | 105.0 | |||
| Total Liabilities | 608.7 | |||
| Equity | 1,292.6 | |||
| Total Liabilities and Shareholders´ Equity | 1,901.3 | |||
Offshore International Group (OIG)
Following its acquisition of Offshore International Group (“OIG”), Ecopetrol acquired a 50% interest in SAVIA8, the main asset of OIG. SAVIA increased its gross production of crude oil by 16.4% from 12.2 Mboed in February 2009 (when acquired) to 14.2 Mboed in December 2009. SAVIA’s contribution to the Ecopetrol Group gross annual production amounted to 6.2 Mboed.
In addition to strengthening of the internal organization under its new brand name, SAVIA expects to reach a production of 18 Mboed in 2010. In 2009, SAVIA announced a new strategic plan, which includes investments of over US$2,500 million for the next eight years, with an aim to rise production to 50 Mboed by 2016 to take advantage of exploration opportunities on the Peruvian coast.
Below is the summary of SAVIA´s financial statements and operating results for the fourth quarter and full year 2009:
| Production (Mboed) | 4Q 2009 | 4Q 2008 | 2009 | 2008 | ||||||||||||
| Crude oil | 11.2 | 11.1 | 11.0 | 11.1 | ||||||||||||
| Natural gas | 2.2 | 2.2 | 2.0 | 2.5 | ||||||||||||
| Other | 1.3 | - | 0.5 | - | ||||||||||||
| Total | 14.7 | 13.3 | 13.5 | 13.6 | ||||||||||||
| Exploration activity | 4Q 2009 | 4Q 2008 | 2009 | 2008 | ||||||||||||
| Seismic (KM equivalent) | 3,463.0 | 461.0 | 11,049.0 | 2,062.0 | ||||||||||||
| Wells | 1 | - | 2 | 3 | ||||||||||||
8 SAVIA is the new corporate name of Petro-Tech Peruana. The change was announced in February 4, 2010.
26
| PRESS RELEASE |
| Income Statement | ||||||||||||||||
| US$ million | 4Q 2009 | 4Q 2008 | 2009 | 2008 | ||||||||||||
| Local Sales | 77.5 | 48.5 | 235.5 | 357.3 | ||||||||||||
| Sales of services | 1.0 | 4.6 | 2.8 | (15.2 | ) | |||||||||||
| Total Sales | 78.5 | 53.1 | 238.3 | 342.2 | ||||||||||||
| Cost of Sales | 59.3 | 47.5 | 163.6 | 142.8 | ||||||||||||
| Gross profit | 19.2 | 5.6 | 74.7 | 199.4 | ||||||||||||
| Operating Expenses | 6.5 | 21.8 | 34.7 | 45.8 | ||||||||||||
| Operating Profit | 12.7 | (16.2 | ) | 40.1 | 153.7 | |||||||||||
| Non Operating Profit/(Loss) | 16.1 | 46.2 | 0.6 | 11.6 | ||||||||||||
| Income tax | 16.2 | 45.8 | 16.2 | 45.9 | ||||||||||||
| Employee profit sharing | 2.8 | 8.0 | 2.8 | 8.0 | ||||||||||||
| Deferred taxes | (1.1 | ) | 1.9 | (1.1 | ) | 2.0 | ||||||||||
| Minority interest | - | - | - | - | ||||||||||||
| Net Income/Loss | (1.8 | ) | (9.5 | ) | 22.7 | 109.4 | ||||||||||
| Balance Sheet | ||||||||
| US$ million | 2,009 | 2,008 | ||||||
| Current Assets | 132.8 | 156.1 | ||||||
| Long Term Assets | 210.7 | 231.3 | ||||||
| Total Assets | 343.5 | 387.4 | ||||||
| Current Liabilities | 42.3 | 76.2 | ||||||
| Long Term Liabilities | - | - | ||||||
| Deferred taxes | 14.9 | 16.0 | ||||||
| Total Liabilities | 57.2 | 92.2 | ||||||
| Equity | 286.3 | 295.2 | ||||||
| Total Liabilities and Shareholders´ Equity | 343.5 | 387.4 | ||||||
Presentation of results
On Wednesday, February 17, Ecopetrol's senior management will be offering two on-line presentations to discuss the fourth quarter and full year 2009 results:
In Spanish February 17, 2010 10:30 a.m. Bogota | In English February 17, 2010 12 p.m. Bogota |
The webcast will be available on Ecopetrol's website: www.ecopetrol.com.co
27
| PRESS RELEASE |
Please access the site 10 minutes prior to the scheduled time in order to download the necessary software. Copies of the webcast will be available for one year after the live event.
About Ecopetrol S.A.
Ecopetrol S.A. (BVC: ECOPETROL; NYSE EC; BVL: EC) is Colombia’s largest company in terms of billing, profit, assets and owners equity. Ecopetrol is the only vertically integrated crude oil and natural gas company with operations in Colombian Brazil, Peru and the United States (Gulf of Mexico). Ecopetrol’s subsidiaries include the largest producer of petrochemicals in Colombia, Propilco, as well as Black Gold Re Ltd., Ecopetrol Oleo e Gas do Brazil Ltd., Ecopetrol America Inc., Ecopetrol del Peru S.A., Hocol S.A., Andean Chemicals Limited, COMAI, Bioenergy S.A., ODL Finance S.A., ECP Global Energy, Ecopetrol Transportation Company, Ocensa S.A. and Refinería de Cartagena. Ecopetrol is among the top 40 oil companies in the world and the four largest oil companies in Latin America. Ecopetrol is majority owned by the Republic of Colombia and its shares are traded in the Colombian Stock Exchange (BVC) under the symbol ECOPETROL and in the NYSE through its ADR under the ticker symbol EC. The company divides its operations in five business segments that include Exploration and Production; Transport; Refinery; Marketing and Sales of Crude Oil, Natural Gas and Refined Products; and Corporate Center.
For additional information please visit our website at www.ecopetrol.com.co.
Forward looking statements
This release contains forward-looking statements relating to the prospects of the business, estimates for operating and financial results, and those related to growth prospects of Ecopetrol. These are merely projections and, as such, are based exclusively on the expectations of management concerning the future of the Company and its continued access to capital to fund the Company’s business plan. Such forward-looking statements depend, substantially, on changes in market conditions, government regulations, competitive pressures, the performance of the Colombian economy and the industry, among other factors; therefore, they are subject to change without prior notice.
ECOPETROL S.A.
Director of Investor Relations
Alejandro Giraldo
Phone: +571-234-5190
Fax:+571-2345628
Email: investors@ecopetrol.com.co
28
| PRESS RELEASE |
Media Relations (Colombia)
Jorge Mauricio Téllez
Phone: + 571-2345377
Fax: +571-2344480
Email: mauricio.tellez@ecopetrol.com.co
Bogota, Colombia, February 15 of 2010
------------------------------------------
Ecopetrol is Colombia’s largest integrated oil company and is among the top 40 oil companies in the world and the four largest oil companies in Latin America. Besides Colombia, where it accounts for 60% of total production, the Company is involved in exploration and production activities in Brazil, Peru and the United States (Gulf of Mexico). Ecopetrol has the principal refinery in Colombia, most of the network of oil and multiple purpose pipelines in the country, and it is considerably increasing its participation in biofuels.
This release contains forward-looking statements relating to the prospects of the business, estimates for operating and financial results, and those related to growth prospects of Ecopetrol. These are merely projections and, as such, are based exclusively on the expectations of management concerning the future of the business and its continued access to capital to fund the Company’s business plan. Such forward-looking statements depend, substantially, on changes in market conditions, government regulations, competitive pressures, the performance of the Colombian economy and the industry, among other factors; therefore, they are subject to change without prior notice.
Contact us for any additional information:
Investor Relations
Alejandro Giraldo
Phone: +571-234-5190
Email: investors@ecopetrol.com.co
Media Relations (Colombia)
Mauricio Téllez
Phone: + 571-2345377
Fax: +571-2344480
Email: mtellez@ecopetrol.com.co
Website: www.ecopetrol.com.co
29
| PRESS RELEASE |
Non audited Income Statement
Ecopetrol S.A.
| COP$ Million | December 31, | December 31, | ||||||||||||||||||||||||||
| Q4-09 | Q4-08* | % | Q3-09 | 2009 | 2008 * | % | ||||||||||||||||||||||
| Income | ||||||||||||||||||||||||||||
| Local Sales | 4,113,008 | 3,775,862 | 8.9 | % | 3,736,434 | 14,441,804 | 20,254,702 | (28.7 | )% | |||||||||||||||||||
| Export Sales | 4,124,082 | 2,096,748 | 96.7 | % | 3,385,940 | 12,248,369 | 11,572,989 | 5.8 | % | |||||||||||||||||||
| Sale of Services | 268,618 | 263,278 | 2.0 | % | 247,647 | 983,818 | 921,652 | 6.7 | % | |||||||||||||||||||
| Total Income | 8,505,708 | 6,135,888 | 38.6 | % | 7,370,021 | 27,673,991 | 32,749,343 | (15.5 | )% | |||||||||||||||||||
| Cost of Sales | - | |||||||||||||||||||||||||||
| Variable Costs | - | |||||||||||||||||||||||||||
| Purchase of Hydrocarbons | 2,410,852 | 1,676,560 | 43.8 | % | 1,979,904 | 7,506,985 | 8,778,164 | (14.5 | )% | |||||||||||||||||||
| Amortization and Depletion | 783 | 225,088 | (99.7 | )% | 530,033 | 1,354,674 | 1,087,583 | 24.6 | % | |||||||||||||||||||
| Imported products | 677,132 | 192,455 | 251.8 | % | 605,998 | 2,251,983 | 2,552,231 | (11.8 | )% | |||||||||||||||||||
| Inventories | (110,048 | ) | 388,872 | (128.3 | )% | (65,002 | ) | (126,642 | ) | (227,236 | ) | 44.3 | % | |||||||||||||||
| Other | (28,217 | ) | 218,528 | (112.9 | )% | 140,199 | 414,537 | 291,331 | 42.3 | % | ||||||||||||||||||
| Fixed Costs | 0.0 | % | $ | 0 | ||||||||||||||||||||||||
| Depreciation | 167,076 | 167,518 | (0.3 | )% | 158,983 | 639,793 | 642,830 | (0.5 | )% | |||||||||||||||||||
| Contracted Services | 579,033 | 525,576 | 10.2 | % | 371,622 | 1,625,937 | 1,482,645 | 9.7 | % | |||||||||||||||||||
| Maintenance | 378,509 | 364,614 | 3.8 | % | 221,867 | 900,554 | 821,489 | 9.6 | % | |||||||||||||||||||
| Labor Costs | 265,553 | 228,492 | 16.2 | % | 240,383 | 872,595 | 734,089 | 18.9 | % | |||||||||||||||||||
| Transportation Cost for Refineries | 173,548 | 161,498 | 7.5 | % | 188,873 | 723,209 | 581,945 | 24.3 | % | |||||||||||||||||||
| Other | 609,059 | 578,194 | 5.3 | % | 257,774 | 1,267,019 | 1,309,637 | (3.3 | )% | |||||||||||||||||||
| Total Cost of Sales | 5,123,280 | 4,727,395 | 8.4 | % | 4,630,634 | 17,430,644 | 18,054,708 | (3.5 | )% | |||||||||||||||||||
| Gross Profits | 3,382,428 | 1,408,493 | 140.1 | % | 2,739,387 | 10,243,347 | 14,694,635 | (30.3 | )% | |||||||||||||||||||
| Operating Expenses | ||||||||||||||||||||||||||||
| Administration | 164,738 | 126,321 | 30.4 | % | 146,866 | 528,676 | 366,097 | 44.4 | % | |||||||||||||||||||
| Selling expenses | 235,553 | 220,001 | 7.1 | % | 200,502 | 845,506 | 809,472 | 4.5 | % | |||||||||||||||||||
| Exploration and Projects | 276,015 | 347,542 | (20.6 | )% | 167,829 | 785,628 | 635,784 | 23.6 | % | |||||||||||||||||||
| Operating Income | 2,706,122 | 714,629 | 278.7 | % | 2,224,190 | 8,083,537 | 12,883,282 | (37.3 | )% | |||||||||||||||||||
| Non Operating Income (expenses) | ||||||||||||||||||||||||||||
| Financial Income | 993,416 | 4,887,913 | (79.7 | )% | 1,645,756 | 7,217,180 | 13,164,177 | (45.2 | )% | |||||||||||||||||||
| Financial Expenses | (1,070,366 | ) | (3,273,121 | ) | 67.3 | % | (1,827,099 | ) | (6,867,407 | ) | (9,293,891 | ) | 26.1 | % | ||||||||||||||
| Non Financial Income | 278,526 | 671,504 | (58.5 | )% | 119,279 | 718,359 | 1,243,257 | (42.2 | )% | |||||||||||||||||||
| Non Financial Expenses | (657,076 | ) | (297,520 | ) | 120.9 | % | (526,803 | ) | (1,949,262 | ) | (1,991,914 | ) | 2.1 | % | ||||||||||||||
| Income before income tax | 2,250,622 | 2,703,405 | (16.7 | )% | 1,635,323 | 7,202,407 | 16,004,911 | (55.0 | )% | |||||||||||||||||||
Provision for Income Tax | 559,180 | 651,103 | (14.1 | )% | 441,803 | 1,946,175 | 4,374,195 | (55.5 | )% | |||||||||||||||||||
| Minority interest | - | - | 0.0 | % | - | |||||||||||||||||||||||
| Net Income | 1,691,442 | 2,052,302 | (17.6 | )% | 1,193,520 | 5,256,232 | 11,630,716 | (54.8 | )% | |||||||||||||||||||
| EBITDA | 2,963,597 | 1,150,941 | 157.5 | % | 3,037,569 | 10,438,034 | 14,758,939 | (29.3 | )% | |||||||||||||||||||
| EBITDA MARGIN | 35 | % | 19 | % | 41 | % | 38 | % | 45 | % | ||||||||||||||||||
| EARNINGS PER SHARE | $ | 41.79 | $ | 50.71 | (17.6 | )% | $ | 29.49 | $ | 129.87 | $ | 287.37 | (54.8 | )% | ||||||||||||||
Notes
* In the fourth quarter of 2008, the following reclassifications were made: from cost of sales to commercialization expenses for COP$36,608 million for freight costs; from commercialization expenses to cost of sales for COP$97,395 million for non-discountable VAT, and from commercialization expenses to other expenses - social investment expenses- for COP$20 million.
For the year 2008 the following reclassifications were made: commercialization expenses to other expenses for COP$236,933 million for the availability of BOMT contracts, and from commercialization expenses to other expenses -social investment expenses- for COP$2,056 million
30
| PRESS RELEASE |
Non audited Income Statement
Ecopetrol S.A. and Subsidiaries *
| COP$ Million | December 31, | December 31, | ||||||||||||||||||||||||||
| Q4-09 | Q4-08 ** | % | Q3-09 | 2009 | 2008 ** | % | ||||||||||||||||||||||
| Income | ||||||||||||||||||||||||||||
| Local Sales | 2,896,486 | 3,626,254 | (20.1 | )% | 3,361,491 | 12,945,459 | 20,675,899 | (37.4 | )% | |||||||||||||||||||
| Export Sales | 5,691,798 | 2,818,424 | 101.9 | % | 5,292,486 | 16,345,856 | 12,298,670 | 32.9 | % | |||||||||||||||||||
| Sale of Services | 397,692 | 263,727 | 50.8 | % | 247,829 | 1,113,075 | 922,100 | 20.7 | % | |||||||||||||||||||
| Total Income | 8,985,976 | 6,708,405 | 34.0 | % | 8,901,806 | 30,404,390 | 33,896,669 | (10.3 | )% | |||||||||||||||||||
| Cost of Sales | ||||||||||||||||||||||||||||
| Variable Costs | ||||||||||||||||||||||||||||
| Purchase of Hydrocarbons | 2,658,955 | 1,468,297 | 81.1 | % | 2,660,045 | 8,488,524 | 8,778,164 | (3.3 | )% | |||||||||||||||||||
| Amortization and Depletion | 11,546 | 225,088 | (94.9 | )% | 569,576 | 1,474,918 | 1,087,583 | 35.6 | % | |||||||||||||||||||
| Imported products | 720,564 | 768,052 | (6.2 | )% | 964,901 | 2,739,681 | 3,470,987 | (21.1 | )% | |||||||||||||||||||
| Inventories | (3,769 | ) | (523,865 | ) | 99.3 | % | (99,681 | ) | (55,042 | ) | (239,033 | ) | 77.0 | % | ||||||||||||||
| Other | (430,309 | ) | 964,962 | (144.6 | )% | 361,667 | 95,255 | 326,618 | (70.8 | )% | ||||||||||||||||||
| Fixed Costs | - | - | 0.0 | % | ||||||||||||||||||||||||
| Depreciation | 235,703 | (447,206 | ) | 152.7 | % | 441,920 | 1,239,846 | 670,279 | 85.0 | % | ||||||||||||||||||
| Contracted Services | 662,878 | 816,290 | (18.8 | )% | 369,474 | 1,741,399 | 1,482,645 | 17.5 | % | |||||||||||||||||||
| Maintenance | 605,415 | 831,553 | (27.2 | )% | 284,409 | 1,274,618 | 831,553 | 53.3 | % | |||||||||||||||||||
| Labor Costs | 278,485 | 331,379 | (16.0 | )% | 253,347 | 918,264 | 751,826 | 22.1 | % | |||||||||||||||||||
| Transportation Cost for Refineries | 139,192 | 581,945 | (76.1 | )% | 137,049 | 637,029 | 581,945 | 9.5 | % | |||||||||||||||||||
| Other | 513,106 | 242,587 | 111.5 | % | 128,898 | 1,351,581 | 1,341,869 | 0.7 | % | |||||||||||||||||||
| Total Cost of Sales | 5,391,766 | 5,259,082 | 2.5 | % | 6,071,605 | 19,906,073 | 19,084,436 | 4.3 | % | |||||||||||||||||||
| Gross Profits | 3,594,210 | 1,449,323 | 148.0 | % | 2,830,201 | 10,498,317 | 14,812,233 | (29.1 | )% | |||||||||||||||||||
| Operating Expenses | ||||||||||||||||||||||||||||
| Administration | 208,764 | 134,567 | 55.1 | % | 167,060 | 662,336 | 382,101 | 73.3 | % | |||||||||||||||||||
| Selling expenses | 160,948 | 113,388 | 41.9 | % | 123,736 | 566,510 | 860,023 | (34.1 | )% | |||||||||||||||||||
| Exploration and Projects | 844,971 | 624,309 | 35.3 | % | 209,087 | 1,396,132 | 912,751 | 53.0 | % | |||||||||||||||||||
| Operating Income | 2,379,527 | 577,059 | 312.4 | % | 2,330,318 | 7,873,339 | 12,657,358 | (37.8 | )% | |||||||||||||||||||
| Non Operating Income (expenses) | ||||||||||||||||||||||||||||
| Financial Income | 1,873,170 | 5,102,957 | (63.3 | )% | 3,513,002 | 15,568,920 | 13,341,200 | 16.7 | % | |||||||||||||||||||
| Financial Expenses | (1,651,026 | ) | (3,349,083 | ) | 50.7 | % | (3,789,805 | ) | (15,073,087 | ) | (9,239,948 | ) | 63.1 | % | ||||||||||||||
| Non Financial Income | 392,702 | 595,501 | (34.1 | )% | 131,279 | 876,608 | 1,246,704 | (29.7 | )% | |||||||||||||||||||
| Non Financial Expenses | (653,218 | ) | (219,202 | ) | 198.0 | % | (543,935 | ) | (1,994,936 | ) | (1,994,110 | ) | 0.0 | % | ||||||||||||||
| - | - | 0.0 | % | |||||||||||||||||||||||||
| Income before income tax | 2,341,155 | 2,707,232 | (13.5 | )% | 1,640,859 | 7,250,844 | 16,011,204 | (54.7 | )% | |||||||||||||||||||
| Provision for Income Tax | 606,310 | 649,768 | (6.7 | )% | 532,408 | 2,114,029 | 4,381,982 | (51.8 | )% | |||||||||||||||||||
| Minority interest | 13,366 | (455 | ) | 3,037.6 | % | (1,414 | ) | 4,761 | (455 | ) | 1,146.4 | % | ||||||||||||||||
| Net Income | 1,721,479 | 2,057,919 | (16.3 | )% | 1,109,865 | 5,132,054 | 11,629,677 | (55.9 | )% | |||||||||||||||||||
| EBITDA | 3,327,844 | 865,000 | 284.7 | % | 3,212,357 | 11,429,867 | 14,571,418 | (21.6 | )% | |||||||||||||||||||
| EBITDA MARGIN | 37 | % | 13 | % | 36 | % | 38 | % | 43 | % | ||||||||||||||||||
Notes
* According to the Public Accounting Framework, Colombian companies only have the obligation to consolidate their financial statements at the end of each fiscal year, wherefore the quarterly figures in this report do not constitute a formal consolidation of Ecopetrol's financial statement, though they do adjust to the methodology defined for this purpose.
** In the fourth quarter of 2008, the following reclassifications were made: from cost of sales to commercialization expenses for COP$36,608 million for freight costs; from commercialization expenses to cost of sales for COP$97,395 million for non-discountable VAT, and from commercialization expenses to other expenses - social investment expenses- for COP$20 million.
For the year 2008 the following reclassifications were made: commercialization expenses to other expenses for COP$236,933 million for the availability of BOMT contracts, and from commercialization expenses to other expenses -social investment expenses- for COP$2,056 million
31
| PRESS RELEASE |
Non audited Balance Sheet
| Ecopetrol S.A. | Ecopetrol S.A. and Subsidiaries | |||||||||||||||||||||||
| December 31, | September 30, | December 31, | September 30, * | |||||||||||||||||||||
| COP$ Million | 2009 | 2009 | % | 2009 | 2009 | % | ||||||||||||||||||
| Assets | ||||||||||||||||||||||||
| Current Assets | ||||||||||||||||||||||||
| Cash and cash equivalents | 2,286,996 | 5,599,125 | (59.2 | )% | 3,562,119 | 6,386,247 | (44.2 | )% | ||||||||||||||||
| Investments | 384,329 | 685,105 | (43.9 | )% | 462,258 | 1,126,012 | (58.9 | )% | ||||||||||||||||
| Accounts and notes receivable | 2,550,251 | 3,717,350 | (31.4 | )% | 2,969,120 | 4,295,176 | (30.9 | )% | ||||||||||||||||
| Other | 4,374,917 | 4,240,749 | 3.2 | % | 5,124,291 | 4,854,505 | 5.6 | % | ||||||||||||||||
| Total Current Assets | 9,596,493 | 14,242,329 | (32.6 | )% | 12,117,788 | 16,661,940 | (27.3 | )% | ||||||||||||||||
| Non Current Assets | 0.0 | % | ||||||||||||||||||||||
| Investments | 10,087,993 | 8,989,920 | 12.2 | % | 3,710,739 | 2,861,001 | 29.7 | % | ||||||||||||||||
| Accounts and notes receivable | 1,353,935 | 1,271,983 | 6.4 | % | 226,781 | 238,990 | (5.1 | )% | ||||||||||||||||
| Property, plant and equipment, net | 11,696,921 | 9,929,143 | 17.8 | % | 16,782,503 | 15,775,446 | 6.4 | % | ||||||||||||||||
| Natural and environmental properties, Net | 9,325,116 | 6,846,906 | 36.2 | % | 11,155,381 | 7,596,885 | 46,8 | % | ||||||||||||||||
| Other | 11,031,963 | 10,345,957 | 6.6 | % | 11,566,325 | 10,568,272 | 9.4 | % | ||||||||||||||||
| Total Non Current Assets | 43,495,928 | 37,383,909 | 16.3 | % | 43,441,729 | 37,040,594 | 17.3 | % | ||||||||||||||||
| Total Assets | 53,092,421 | 51,626,238 | 2.8 | % | 55,559,517 | 53,702,534 | 3.5 | % | ||||||||||||||||
| Liabilities and Equity | ||||||||||||||||||||||||
| Current Liabilities | ||||||||||||||||||||||||
| Financial obligations | 134,908 | 112,623 | 19.8 | % | 437,081 | 287,056 | 52.3 | % | ||||||||||||||||
| Accounts payable and related parties | 3,421,264 | 7,354,758 | (53.5 | )% | 3,280,232 | 7,266,657 | (54.9 | )% | ||||||||||||||||
| Estimated liabilities and provisions | 957,432 | 720,364 | 32.9 | % | 1,154,415 | 1,011,155 | 14.2 | % | ||||||||||||||||
| Other | 2,258,367 | 1,730,721 | 30.5 | % | 2,598,485 | 1,957,728 | 32.7 | % | ||||||||||||||||
| Total Current Liabilities | 6,771,971 | 9,918,466 | (31.7 | )% | 7,470,213 | 10,522,596 | (29.0 | )% | ||||||||||||||||
| Long Term Liabilities | ||||||||||||||||||||||||
| Financial obligations | 5,286,545 | 5,103,200 | 3.6 | % | 5,714,354 | 5,629,692 | 0,0 | % | ||||||||||||||||
| Labor and pension plan obligations | 2,660,943 | 2,427,337 | 9.6 | % | 2,669,331 | 2,464,668 | 8.3 | % | ||||||||||||||||
| Estimated liabilities and provisions | 3,331,867 | 2,475,242 | 34.6 | % | 3,411,977 | 2,557,838 | 33.4 | % | ||||||||||||||||
| Other | 2,337,862 | 2,256,984 | 3.6 | % | 2,782,374 | 2,339,751 | 18.9 | % | ||||||||||||||||
| Total Long Term Liabilities | 13,617,217 | 12,262,763 | 11.0 | % | 14,578,036 | 12,991,949 | 12.2 | % | ||||||||||||||||
| Total Liabilities | 20,389,188 | 22,181,229 | (8.1 | )% | 22,048.249 | 23,514,545 | (6,2 | )% | ||||||||||||||||
| Minoritary Interest | 941,311 | 887,686 | 6.0 | % | ||||||||||||||||||||
| Equity | 32,703,233 | 29,445,009 | 11.1 | % | 32,569,957 | 29,300,303 | 11.2 | % | ||||||||||||||||
| Total Liabilities and Shareholders' Equity | 53,092,421 | 51,626,238 | 2.8 | % | 55,559,517 | 53,702,534 | 3.5 | % | ||||||||||||||||
| Memorandum Accounts ** | 138,150,625 | 134,943,313 | 140,136,272 | 135,663,946 | ||||||||||||||||||||
Notes
* According to the Public Accounting Framework, Colombian companies only have the obligation to consolidate their financial statements at the end of each fiscal year, wherefore the figures for interim periods in this report do not constitute a formal consolidation of Ecopetrol's financial statement, though they do adjust to the methodology defined for this purpose.
**Under Colombian GAAP, Ecopetrol must maintain in its accounting the recording of financial information and transactions not reflected in financial statements
32
| PRESS RELEASE |
Non audited Cash Flow Statement
Ecopetrol S.A.
| As of December 31, | As of December 31, | |||||||||||||||||||||||||||
| COP$ million | 4Q 2009 | 4Q 2008 | % | 3Q 2009 | 2009 | 2008 | % | |||||||||||||||||||||
| Cash flow provided by operating activities: | ||||||||||||||||||||||||||||
| Net income | 1,691,442 | 2,052,302 | (17.6 | )% | 1,193,520 | 5,256,232 | 11,630,716 | (54.8 | )% | |||||||||||||||||||
Adjustments to reconcile net income to cash provided by operating activities: | ||||||||||||||||||||||||||||
| Depreciation, depletion and amortization | 1,237,729 | 733,961 | 68.6 | % | 597,660 | 2,890,743 | 3,242,115 | (10.8 | )% | |||||||||||||||||||
| Provisions | 137,928 | (478,514 | ) | 128.8 | % | 427,390 | 238,693 | (782,769 | ) | 130.5 | % | |||||||||||||||||
| Net changes in operating assets and liabilities: | ||||||||||||||||||||||||||||
| Accounts and notes receivable | 798,272 | 10,192,963 | (92.2 | )% | 1,204,911 | 1,131,982 | 6,197,470 | (81.7 | )% | |||||||||||||||||||
| Inventories | (97,304 | ) | 392,428 | (124.8 | )% | (81,582 | ) | (137,716 | ) | (225,865 | ) | 39.0 | % | |||||||||||||||
| Deferred and other assets | (72,166 | ) | (370,799 | ) | 80.5 | % | (423,243 | ) | (2,788,093 | ) | (757,692 | ) | 268.0 | % | ||||||||||||||
| Accounts payable and related parties | (1,237,270 | ) | (1,855,707 | ) | 33.3 | % | 92,925 | 1,633,738 | 646,365 | 152.8 | % | |||||||||||||||||
| Taxes payable | 513,565 | (230,141 | ) | 323.2 | % | (168,826 | ) | (1,771,648 | ) | 988,347 | (279.3 | )% | ||||||||||||||||
| Labor obligations | (518,231 | ) | (8,544,454 | ) | 93.9 | % | 410,456 | 15,100 | (9,246,938 | ) | 100.2 | % | ||||||||||||||||
| Estimated liabilities and provisions | 218,374 | (1,251,507 | ) | 117.4 | % | (262,174 | ) | 10,499 | (746,794 | ) | 101.4 | % | ||||||||||||||||
| Cash provided by operating activities | 2,672,339 | 640,532 | 317.2 | % | 2,991,037 | 6,479,530 | 10,944,955 | (40.8 | )% | |||||||||||||||||||
| Cash flows from investing activities: | ||||||||||||||||||||||||||||
| Purchase of investment securities | (3,331,893 | ) | (82,319 | ) | 3,947.5 | % | (2,075,607 | ) | (7,939,870 | ) | (27,801,568 | ) | 71.4 | % | ||||||||||||||
| Redemption of investment securities | 2,776,424 | (111,669 | ) | 2,586.3 | % | 1,841,823 | 12,630,117 | 24,442,990 | (48.3 | )% | ||||||||||||||||||
| Investment in natural and environmental resources - R | (1,492,768 | ) | (519,824 | ) | 187.2 | % | (592,436 | ) | (2,885,430 | ) | (1,792,085 | ) | 61.0 | % | ||||||||||||||
| Additions to property, plant and equipment | (1,288,033 | ) | (1,731,241 | ) | 25.6 | % | (939,905 | ) | (4,426,141 | ) | (3,565,240 | ) | 24.1 | % | ||||||||||||||
| Net cash used in investing activities | (3,336,270 | ) | (2,445,053 | ) | 36.4 | % | (1,766,125 | ) | (2,621,324 | ) | (8,715,903 | ) | 69.9 | % | ||||||||||||||
| Cash flows financing activities: | ||||||||||||||||||||||||||||
| Financial obligations | 284,814 | - | 3,317,172 | 5,388,014 | - | |||||||||||||||||||||||
| Proceeds from financial obligations | (79,184 | ) | - | 112,623 | 33,439 | (3,569 | ) | |||||||||||||||||||||
| Proceeds from issuance of shares | 5,981 | 138,727 | (95.7 | )% | 29,664 | 41,044 | 832,919 | (95.1 | )% | |||||||||||||||||||
| Dividends paid | (2,939,612 | ) | (2,327,170 | ) | 26.3 | % | (2,938,156 | ) | (8,903,953 | ) | (4,654,340 | ) | 91.3 | % | ||||||||||||||
| Net cash used in financing activities | (2,728,001 | ) | (2,188,443 | ) | 24.7 | % | 521,303 | (3,441,456 | ) | (3,824,990 | ) | 10.0 | % | |||||||||||||||
| Net increase in cash and cash equivalent | (3,312,129 | ) | (3,671,326 | ) | 9.8 | % | 1,702,385 | 416,750 | (1,595,938 | ) | 126.1 | % | ||||||||||||||||
| Cash and cash equivalent at beginnig of year | 5,599,125 | 5,541,572 | 1.0 | % | 3,896,740 | 1,870,246 | 3,466,184 | (46.0 | )% | |||||||||||||||||||
| Cash and cash equivalent at end of year | 2,286,996 | 1,870,246 | 22.3 | % | 5,599,125 | 2,286,996 | 1,870,246 | 22.3 | % | |||||||||||||||||||
33
| PRESS RELEASE |
Non audited Cash Flow Statement
Ecopetrol S,A, and subdiaries
| As of December 31, | As of December 31, | |||||||||||||||||||||||||||
| COP$ million | 4Q 2009 * | 4Q 2008 * | % | 3Q 2009 * | 2009 | 2008 | % | |||||||||||||||||||||
| Cash flow provided by operating activities: | ||||||||||||||||||||||||||||
| Net income | 1,721,479 | 2,057,919 | (16.3 | )% | 1,109,865 | 5,132,054 | 11,629,677 | (55.9 | )% | |||||||||||||||||||
Adjustments to reconcile net income to cash provided by operating activities: | ||||||||||||||||||||||||||||
| Depreciation, depletion and amortization | 1,003,484 | 198,597 | 405.3 | % | 1,172,048 | 3,629,604 | 3,276,169 | 10.8 | % | |||||||||||||||||||
| Provisions | 49,208 | 16,193 | 203.9 | % | 216,512 | 238,247 | (782,769 | ) | 130.4 | % | ||||||||||||||||||
| Net changes in operating assets and liabilities: | ||||||||||||||||||||||||||||
| Accounts and notes receivable | 401,147 | 254,820 | 57.4 | % | 1,626,752 | 2,030,376 | 5,946,536 | (65.9 | )% | |||||||||||||||||||
| Inventories | (78,869 | ) | 469,323 | (116.8 | )% | (17,273 | ) | (291,819 | ) | (237,710 | ) | 22.8 | % | |||||||||||||||
| Deferred and other assets | (208,691 | ) | 9,764,482 | (102.1 | )% | 2,698,116 | (1,408,834 | ) | (865,556 | ) | 62.8 | % | ||||||||||||||||
| Accounts payable and related parties | (1,646,201 | ) | (1,884,313 | ) | 12.6 | % | 1,814,682 | 1,536,580 | 423,182 | 263.1 | % | |||||||||||||||||
| Taxes payable | 622,018 | (220,466 | ) | 382.1 | % | (143,587 | ) | (1,473,446 | ) | 988,828 | (249.0 | )% | ||||||||||||||||
| Labor obligations | (16,010 | ) | (8,553,552 | ) | 99.8 | % | 418,009 | 37,684 | (9,246,210 | ) | 100.4 | % | ||||||||||||||||
| Estimated liabilities and provisions | (82,969 | ) | (1,172,965 | ) | 92.9 | % | (2,768,693 | ) | (24,809 | ) | (697,407 | ) | 96.4 | % | ||||||||||||||
| Cash provided by operating activities | 1,764,596 | 930,038 | 89.7 | % | 6,126,431 | 9,405,637 | 10,434,740 | (9.9 | )% | |||||||||||||||||||
| Cash flows from investing activities: | ||||||||||||||||||||||||||||
| Payment for purchase of Companies, net of cash acquired | 144,077 | 1,254,647 | (88.5 | )% | - | (1,082,580 | ) | (1,275,049 | ) | 15.1 | % | |||||||||||||||||
| Purchase of investment securities | (3,331,893 | ) | (82,319 | ) | 3,947.5 | % | (2,075,607 | ) | (7,939,870 | ) | (27,801,568 | ) | 71.4 | % | ||||||||||||||
| Redemption of investment securities | 3,651,552 | (2,991,657 | ) | 222.1 | % | 700,446 | 15,917,196 | 27,054,516 | (41.2 | )% | ||||||||||||||||||
| Investment in natural and environmental resources - Reserves | (2,187,386 | ) | (507,954 | ) | 330.6 | % | (575,849 | ) | (3,613,355 | ) | (1,469,648 | ) | 145.9 | % | ||||||||||||||
| Additions to property, plant and equipment | (933,996 | ) | (1,731,241 | ) | 46.1 | % | (4,084,040 | ) | (9,237,307 | ) | (5,236,336 | ) | 76.4 | % | ||||||||||||||
| Efectivo neto usado en las actividades de inversión | (2,657,646 | ) | (4,058,524 | ) | 34.5 | % | (6,035,050 | ) | (5,955,916 | ) | (8,728,085 | ) | 31.8 | % | ||||||||||||||
| Cash flows financing activities: | ||||||||||||||||||||||||||||
| Minority interest | 53,625 | (1 | ) | 644,735 | 698,360 | 242,950 | 187.5 | % | ||||||||||||||||||||
| Financial obligations | 366,536 | - | 3,593,973 | 6,140,588 | 106,942 | 5,642.0 | % | |||||||||||||||||||||
| Proceeds from financial obligations | 21,205 | - | - | 21,205 | 128,778 | (83.5 | )% | |||||||||||||||||||||
| Proceeds from issuance of shares | 5,981 | 138,725 | (95.7 | )% | 29,664 | 41,044 | 832,919 | (95.1 | )% | |||||||||||||||||||
| Dividends paid | (2,584,866 | ) | (2,327,170 | ) | 11.1 | % | (3,275,110 | ) | (8,902,602 | ) | (4,654,340 | ) | 91.3 | % | ||||||||||||||
| Net cash used in financing activities | (2,137,519 | ) | (2,188,446 | ) | 2.3 | % | 993,262 | (2,001,405 | ) | (3,342,751 | ) | 40.1 | % | |||||||||||||||
| Net increase in cash and cash equivalent | (2,824,128 | ) | (4,994,254 | ) | 43.5 | % | 1,084,643 | 1,448,316 | (1,636,096 | ) | 188.5 | % | ||||||||||||||||
| Cash and cash equivalent at beginnig of year | 6,386,247 | 7,108,057 | (10.2 | )% | 5,301,604 | 2,113,803 | 3,749,899 | (43.6 | )% | |||||||||||||||||||
| Cash and cash equivalent at end of year | 3,562,119 | 2,113,803 | 68.5 | % | 6,386,247 | 3,562.119 | 2.113.803 | 68.5 | % | |||||||||||||||||||
Notes
* According to the Public Accounting Framework, Colombian companies only have the obligation to consolidate their financial statements at the end of each fiscal year, wherefore the quarterly figures in this report do not constitute a formal consolidation of Ecopetrol's financial statement, though they do adjust to the methodology defined for this purpose.
34
SIGNATURE
Pursuant to the requirements of the Securities Exchange Act of 1934, the Registrant has duly caused this report to be signed on its behalf by the undersigned, thereto duly authorized.
Date: February 16, 2010
| Ecopetrol S.A. | |||
| By: | /s/ Adriana M. Echeverri | ||
| Name: | Adriana M. Echeverri | ||
| Title: | Chief Financial Officer | ||