SECURITIES AND EXCHANGE COMMISSION
Washington, D.C. 20549
FORM 6-K
REPORT OF FOREIGN PRIVATE ISSUER
PURSUANT TO RULE 13a-16 OR 15d-16 OF THE
SECURITIES EXCHANGE ACT OF 1934
July 2010
Commission File Number: 333-153452
ECOPETROL S.A.
(Exact name of registrant as specified in its Charter)
Carrera 7 No. 37 – 69
BOGOTA – COLOMBIA
(Address of registrant’s principal executive offices)
Indicate by check mark whether the registrant files or will file annual reports under cover Form 20-F or Form 40-F.
| Form 20-F | x | Form 40-F | o |
Indicate by check mark if the registrant is submitting the Form 6-K in paper as permitted by Regulation S-T Rule 101(b)(1):
| Yes | o | No | x |
Indicate by check mark if the registrant is submitting the Form 6-K in paper as permitted by Regulation S-T Rule 101(b)(7):
| Yes | o | No | x |
Indicate by check mark whether by furnishing the information contained in this Form, the registrant is also thereby furnishing the information to the Commission pursuant to Rule 12g3-2(b) under the Securities Exchange Act of 1934.
| Yes | o | No | x |
If “Yes” is marked, indicate below the file number assigned to the registrant in connection with Rule 12g3-2(b): 82- N/A
| PRESS RELEASE |
Ecopetrol S.A. Announces Results for the
Second Quarter and First Half of 2010
| · | Production for the Ecopetrol Corporate group was 593.9 mboed in second quarter and 589.3 mboed for the first half of the year, an increase of 14.5% and 17.1% compared to the same periods of 2009. |
| · | Net income for the second quarter of 2010 of COL$1.8 trillion with a 136.8% increase over the second quarter of 2009; EBITDA of COL$3.6 trillion for the second quarter of 2010 with a 29% increase over the same period in 2009, with an EBITDA margin of 40%. Net income for the first half of 2010 amounted to COL$3.9 trillion. |
| · | Revised and expanded strategic plan for 2020 was presented calling for a production goal of 1.3 “clean” mmboed. |
BOGOTA, July 28 /PRNewswire/ — Ecopetrol S.A. (BVC: ECOPETROL; NYSE: EC; BVL: EC) (“Ecopetrol” or the “Company”) announced today its unaudited unconsolidated and consolidated financial results for the second quarter and first half of 2010, prepared and filed in accordance with the Public Accountancy Legal Framework (Regimen de Contabilidad Publica -RCP) of the Colombian General Accounting office, in Colombian pesos (COL$).
This current report on Form 6-k is hereby incorporated by reference into the Company’s registration statement on Form F-3 filed with the U.S. Securities and Exchange Commission on February 12, 2010.
The table below sets forth the highlights of Ecopetrol’s financial results for the periods indicated:
Highlights of Ecopetrol’s financial results
| Unconsolidated | Consolidated | |||||||||||||||||||||||||||||||||||||||||||||||
| (COP$ Billion) | 2Q 2010 | 2Q 2009 | % | As of june 2010 | As of june 2009 | % | 2Q 2010 | 2Q 2009 | % | As of june 2010 | As of june 2009 | % | ||||||||||||||||||||||||||||||||||||
| Total sales | 9,133.1 | 6,685.6 | 36.6 | % | 17,874.8 | 11,798.3 | 51.5 | % | 10,214.3 | 7,276.5 | 40.4 | % | 20,432.1 | 12,516.6 | 63.2 | % | ||||||||||||||||||||||||||||||||
| Operating profit | 2,693.1 | 2,132.4 | 26.3 | % | 5,891.4 | 3,153.3 | 86.8 | % | 2,543.4 | 2,100.9 | 21.1 | % | 6,160.0 | 3,163.5 | 94.7 | % | ||||||||||||||||||||||||||||||||
| Net Income | 1,805.0 | 762.1 | 136.8 | % | 3,901.7 | 2,371.4 | 64.5 | % | 1,767.1 | 692.1 | 155.3 | % | 3,721.4 | 2,300.7 | 61.8 | % | ||||||||||||||||||||||||||||||||
| Earnings per share (COP$) | 44.60 | 18.83 | 96.40 | 58.59 | ||||||||||||||||||||||||||||||||||||||||||||
| EBITDA | 3,635.7 | 2,807.6 | 29.5 | % | 7,742.1 | 4,436.9 | 74.5 | % | 3,579.6 | 3,134.1 | 14.2 | % | 8,034.4 | 4,889.7 | 64.3 | % | ||||||||||||||||||||||||||||||||
| EBITDA Margin | 40 | % | 42 | % | 43 | % | 38 | % | 35 | % | 43 | % | 39 | % | 39 | % | ||||||||||||||||||||||||||||||||
Ecopetrol’s CEO, Javier Gutierrez, said, “The second quarter was positive for the company operationally, financially and strategically. In terms of operations, key investments have allowed us to continue to increase production, improve our transportation infrastructure, and continue upgrading and expanding our refineries. In addition, the national and international outlook remains favorable, allowing us to strengthen and diversify markets for our crude oil and products.
In the financial area, I would like to emphasize that our results for the first half of the year greatly exceeded those of the same period of 2009, with earnings of COL$3.9 trillion and EBITDA at COL$7.7 trillion, a 64% and 74% increase, respectively, over a year ago.
“Strategically, we presented an expanded plan that calls for production of 1.3 million barrels by 2020.” Gutierrez continued, “In summary, we are on the right path toward reaching the goals of our strategic plan and generating value for our shareholders.”
| PRESS RELEASE |
Ecopetrol S.A. Announces Results for the Second Quarter and First Half of 2010
Table of contents
| I. Financial and operating results of Ecopetrol S.A. | 3 | ||||
| a. | Availability of crude oil and products | 3 | |||
| b. | Sales volumes | 4 | |||
| c. | Price behavior | 5 | |||
| d. | Financial Results | 5 | |||
| e. | Balance Sheet (unconsolidated) | 8 | |||
| f. | Cash flow | 9 | |||
| g. | Segment results | 10 | |||
| II. Aspects of the Business (unconsolidated) | 11 | ||||
| a. | Exploration | 11 | |||
| b. | Production | 13 | |||
| c. | Refining | 16 | |||
| d. | Petrochemicals | 17 | |||
| e. | Transportation | 17 | |||
| f. | Biofuels | 18 | |||
| g. | Hedging | 19 | |||
| h. | Investment plan 2010 | 19 | |||
| i. | Financing of the Investment Plan 2010 | 20 | |||
| III. Investment Plan 2011-2020 | 20 | ||||
| a. | Main Goals of the Business Plan | 21 | |||
| b. | 2011-2020 Strategic Plan Investments | 26 | |||
| c. | Financing the 2011-2020 Strategic Plan: | 28 | |||
| IV. Corporate Social Responsibility (CSR) | 29 | ||||
| a. | Human talent and recognitions | 29 | |||
| b. | Science and technology | 29 | |||
| c. | Social investment | 29 | |||
| d. | HSE (Health, Safety & Environment) | 30 | |||
| V. Financial results for Ecopetrol and its Subsidiaries(Consolidated) | 31 | ||||
| a. | Exploration and production | 33 | |||
| 1. | Hocol | 33 | |||
| 2. | Offshore International Group (OIG) | 35 | |||
| b. | Refining and Petrochemicals | 37 | |||
| 1. | Propilco | 37 | |||
| 2. | Reficar S.A. | 38 | |||
| c. | Transportation | 39 | |||
| 1. | Ocensa | 39 | |||
| 2. | ODL | 41 | |||
| d. | Bio fuels | 42 | |||
| 1. | Ecodiesel | 42 | |||
| 2. | Bioenergy | 42 | |||
| VI. Presentation of results | 43 | ||||
| VII. Tables | 45 | ||||
2
| PRESS RELEASE |
I. Financial and operating results of Ecopetrol S.A.
| a. | Availability of crude oil and products |
The availability of Ecopetrol crude and products is summarized in the following table of volumes produced, purchased and imported:
Ecopetrol S.A. (does not include subsidiaries)
Gross oil and gas production
| (MBOED) | 2Q 2010 | 2Q 2009 | % | As of june 2010 | As of june 2009 | % | ||||||||||||||||||
| Crude Oil | 464.4 | 394.3 | 17.8 | % | 458.3 | 384.8 | 19.1 | % | ||||||||||||||||
| Natural Gas | 94.9 | 93.1 | 1.9 | % | 97.1 | 87.5 | 10.9 | % | ||||||||||||||||
| Total | 559.3 | 487.4 | 14.7 | % | 555.3 | 472.3 | 17.6 | % | ||||||||||||||||
(-) Royalties
| (MBOED) | 2Q 2010 | 2Q 2009 | % | As of june 2010 | As of june 2009 | % | ||||||||||||||||||
| Crude Oil | 68.6 | 59.9 | 14.5 | % | 68.0 | 58.8 | 15.6 | % | ||||||||||||||||
| Natural Gas | 18.8 | 18.5 | 1.6 | % | 19.3 | 17.4 | 10.9 | % | ||||||||||||||||
| Total | 87.4 | 78.4 | 11.5 | % | 87.3 | 76.2 | 14.6 | % | ||||||||||||||||
(=) Net oil and gas production
| (MBOED) | 2Q 2010 | 2Q 2009 | % | As of june 2010 | As of june 2009 | % | ||||||||||||||||||
| Crudo | 395.9 | 334.4 | 18.4 | % | 390.3 | 326.0 | 19.7 | % | ||||||||||||||||
| Gas natural | 76.0 | 74.6 | 1.9 | % | 77.8 | 70.1 | 10.9 | % | ||||||||||||||||
| Total | 471.9 | 409.1 | 15.4 | % | 468.1 | 396.2 | 18.2 | % | ||||||||||||||||
| Purchase volume (mboed)* | 2Q 2010 | 2Q 2009 | % | As of june 2010 | As of june 2009 | % | ||||||||||||||||||
| Crude Oil | 177.7 | 165.4 | 7.4 | % | 175.5 | 162.7 | 7.9 | % | ||||||||||||||||
| Products | 2.8 | 9.8 | -71.4 | % | 6.0 | 8.5 | (29.4 | )% | ||||||||||||||||
| Natural Gas | 37.7 | 37.6 | 0.3 | % | 38.6 | 36.0 | 7.2 | % | ||||||||||||||||
| Total Purchases | 218.2 | 212.8 | 2.5 | % | 220.1 | 207 | 6.2 | % | ||||||||||||||||
| Imports volume (mbd) | 2Q 2010 | 2Q 2009 | % | As of june 2010 | As of june 2009 | % | ||||||||||||||||||
| Products | 67.2 | 37.5 | 79.2 | % | 65.3 | 35.5 | 83.9 | % | ||||||||||||||||
| Total imports | 67.2 | 37.5 | 79.2 | % | 65.3 | 35.5 | 83.9 | % | ||||||||||||||||
| 2Q 2010 | 2Q 2009 | % | As of june 2010 | As of june 2009 | % | |||||||||||||||||||
| Total available** | 757.3 | 659.4 | 14.9 | % | 753.5 | 638.9 | 17.9 | % | ||||||||||||||||
* Purchase volume includes royalties from Ecopetrol and other companies
** Does not include inventories variations
Ecopetrol's gross oil and gas production (excluding that of subsidiaries) was 559.3 mboed in the second quarter 2010 and 555.3 mboed in the first half 2010.
After deducting royalties, net production in the second quarter 2010 was 471.9 mboed, an increase of 15.4% over the second quarter 2009. Net production for the first half of 2010 was 468.1 mboed 18.2% more than the first half of 2009.
Volumes purchased increased 2.5% and imports increased 79.2% compared to second quarter 2009, due to: 1) an increase in the country's crude production that raised royalty purchase volumes; 2) an increase in natural gasoline imports (solvents for heavy crude); and 3) an increase in imports of diesel with low sulphur content to provide the country with cleaner fuels.
3
| PRESS RELEASE |
| b. | Sales volumes |
The table below summarizes the Company’s sales volumes during the second quarter and first half of 2010 as compared to the same periods of 2009:
| Local Sales Volume (mboed) | 2Q 2010 | 2Q 2009 | % | As of june 2010 | As of june 2009 | % | ||||||||||||||||||
| Crude Oil | 3.5 | 0.2 | 1,650.0 | % | 3.0 | 0.3 | 900.0 | % | ||||||||||||||||
| Natural Gas | 99.0 | 67.1 | 47.5 | % | 100.6 | 64.1 | 56.9 | % | ||||||||||||||||
| Gasoline | 61.7 | 74.6 | (17.3 | )% | 63.1 | 74.2 | (15.0 | )% | ||||||||||||||||
| Medium Distillates | 100.8 | 77.5 | 30.1 | % | 102.6 | 77.2 | 32.9 | % | ||||||||||||||||
| LPG and fuel oil | 17.6 | 19.3 | (8.8 | )% | 18.0 | 20.1 | (10.4 | )% | ||||||||||||||||
| Industrial and Petrochemical | 12.7 | 11.9 | 6.7 | % | 13.9 | 11.9 | 16.8 | % | ||||||||||||||||
| Total Local Sales | 295.3 | 250.6 | 17.8 | % | 301.2 | 247.8 | 21.5 | % | ||||||||||||||||
| Export Sales Volume (mboed) | 2Q 2010 | 2Q 2009 | % | As of june 2010 | As of june 2009 | % | ||||||||||||||||||
| Crude Oil | 304.5 | 216.7 | 40.5 | % | 289.5 | 200.4 | 44.5 | % | ||||||||||||||||
| Products | 56.0 | 55.5 | 0.9 | % | 48.4 | 56.0 | (13.6 | )% | ||||||||||||||||
| Natural Gas | - | 26.4 | (100.0 | )% | 1.2 | 24.7 | (95.1 | )% | ||||||||||||||||
| Total Export Sales | 360.5 | 298.6 | 20.7 | % | 339.1 | 281.1 | 20.6 | % | ||||||||||||||||
| Sales to Free Trade Zone (mboed) | 2Q 2010 | 2Q 2009 | % | As of june 2010 | As of june 2009 | % | ||||||||||||||||||
| Crude Oil | 77.5 | 78.9 | (1.8 | )% | 78.3 | 81.1 | (3.5 | )% | ||||||||||||||||
| Products | 2.0 | 2.2 | (9.1 | )% | 2.6 | 2.1 | 23.8 | % | ||||||||||||||||
| Natural Gas | 3.0 | 2.0 | 50.0 | % | 2.0 | 1.9 | 5.3 | % | ||||||||||||||||
| Total Sales to Free Trade Zone | 82.5 | 83.1 | (0.7 | )% | 82.9 | 85.1 | (2.6 | )% | ||||||||||||||||
| Total Sales Volume | 738.3 | 632.3 | 16.8 | % | 723.2 | 614.0 | 17.8 | % | ||||||||||||||||
In first quarter 2010, Ecopetrol sales increased 16.8% compared to the same period of 2009, driven by higher volumes sold locally as well as an increase in exports.
Local market
Products representing the highest growth in local sales volume were natural gas and medium distillates, which increased 47.5% and 30.1%, respectively. The demand for natural gas increased because of the needs from power plants caused by the El Niño phenomenon resulting in drought conditions, and sales to Chevron. Demand for medium distillates increased due to: 1) more deliveries of premium diesel to mass transportation systems, and 2) higher demand for jet fuel caused by convenient domestic prices versus international fuel prices.
Gasoline sales fell when compared to the second quarter of 2009, primarily because of an increase in the use of ethanol mix along Colombia’s northern coast (mix of 8%).
International market
Within exports, the volume of crude oil sales increased 40.5% during the second quarter of 2010 compared to the second quarter of 2009 due mainly to a 40.4% increase in exports of Castilla crude. In fact, in April 2010, crude and refined exports set a new record of an average of more than 400 mboed, the main destinations of which were the U.S. Gulf coast and the Far East. The main export destinations during the quarter were:
4
| PRESS RELEASE |
| Export destinations | ||||||||
| Destination | Crudes | Products | ||||||
| US Gulf Coast | 62.1 | % | 39.0 | % | ||||
| Far east | 20.4 | % | 29.0 | % | ||||
| Central America / Caribbean | 6.5 | % | 28.6 | % | ||||
| South America | 5.4 | % | 3.4 | % | ||||
| US East Coast | 3.8 | % | 0.0 | % | ||||
| Canada | 1.8 | % | 0.0 | % | ||||
| 100.0 | % | 100.0 | % | |||||
| c. | Price behavior |
The table below summarizes the crude and product price behavior during the second quarter of 2010 and the first half of 2010 as compared to the corresponding periods of 2009:
| Average price export basket | 2Q 2010 | 2Q 2009 | % | As of june 2010 | As of june 2009 | % | ||||||||||||||||||
| WTI (average) | 78.0 | 59.6 | 30.9 | % | 78.4 | 51.4 | 52.5 | % | ||||||||||||||||
| Export crude oil basket | 68.9 | 54.2 | 27.1 | % | 70.7 | 42.9 | 64.8 | % | ||||||||||||||||
| Export products basket | 66.8 | 52.6 | 27.0 | % | 67.9 | 42.7 | 59.0 | % | ||||||||||||||||
| Natural gas basket | 3.8 | 3.3 | 15.2 | % | 3.5 | 3.6 | (2.8 | )% | ||||||||||||||||
The average price of WTI petroleum during second quarter 2010 was US$78.0 per barrel, 30.9% higher than in the same period of 2009. This benchmark price experienced higher volatility during the period due to fluctuations in both demand and expectations about the performance of the world economy. In particular, between April and May of 2010, the European crisis caused the WTI to fall US$10 per barrel.
Crude and product differentials increased compared to the second quarter 2009 and the first half of 2010. The crude differential has been affected mainly by: 1) the increased availability of Canadian heavy crude resulting from higher production and the opening of new oil pipelines to transport crude within the United States, and 2) Colombian exports of Castilla heavy crude have doubled in the past year.
The product differential deteriorated primarily because of the following: 1) fuel oil exports, whose price is closely correlated to that of heavy crude, which, as mentioned, increased its differential compared to WTI; 2) the lack of gasoline exports in the basket for 2010 due to greater nafta (raw material of gasoline) requirements as a solvent for heavy crude; and 3) higher inventories of crudes and products in the US Gulf Coast which reduced demand and increased spreads.
| d. | Financial Results |
The table below summarizes Ecopetrol’s financial results for the second quarter and first half of 2010 as compared to the same periods in 2009:
5
| PRESS RELEASE |
| Unconsolidated | ||||||||||||||||||||||||
| Income Statement (COP$ Billion) | 2Q 2010 | 2Q 2009 | % | As of june 2010 | As of june 2009 | % | ||||||||||||||||||
| Local Sales | 3,372.8 | 3,438.6 | (1.9 | )% | 6,755.6 | 6,592.4 | 2.5 | % | ||||||||||||||||
| Export Sales | 5,437.5 | 3,015.3 | 80.3 | % | 10,477.7 | 4,738.3 | 121.1 | % | ||||||||||||||||
| Sales of services | 322.8 | 231.7 | 39.3 | % | 641.5 | 467.6 | 37.2 | % | ||||||||||||||||
| Total Sales | 9,133.1 | 6,685.6 | 36.6 | % | 17,874.8 | 11,798.3 | 51.5 | % | ||||||||||||||||
| Variable Costs | 4,499.6 | 2,880.7 | 56.2 | % | 8,318.1 | 5,625.8 | 47.9 | % | ||||||||||||||||
| Fixed Costs | 1,367.1 | 1,119.9 | 22.1 | % | 2,599.4 | 2,050.9 | 26.7 | % | ||||||||||||||||
| Cost of Sales | 5,866.7 | 4,000.6 | 46.6 | % | 10,917.5 | 7,676.7 | 42.2 | % | ||||||||||||||||
| Gross profit | 3,266.4 | 2,685.0 | 21.7 | % | 6,957.3 | 4,121.6 | 68.8 | % | ||||||||||||||||
| Operating Expenses | 573.3 | 552.6 | 3.7 | % | 1,065.9 | 968.3 | 10.1 | % | ||||||||||||||||
| Operating Profit | 2,693.1 | 2,132.4 | 26.3 | % | 5,891.4 | 3,153.3 | 86.8 | % | ||||||||||||||||
| Non Operating Profit/(Loss) | (285.7 | ) | (1,030.3 | ) | (72.3 | )% | (611.0 | ) | 163.3 | (474.2 | )% | |||||||||||||
| Income tax | (602.4 | ) | (340.0 | ) | 77.2 | % | (1,378.7 | ) | (945.2 | ) | 45.9 | % | ||||||||||||
| Net Income | 1,805.0 | 762.1 | 136.8 | % | 3,901.7 | 2,371.4 | 64.5 | % | ||||||||||||||||
| Earnings per share (COP$) | 44.6 | 18.8 | 136.9 | % | 96.4 | 58.6 | 64.5 | % | ||||||||||||||||
| EBITDA | 3,635.7 | 2,807.6 | 29.5 | % | 7,742.1 | 4,436.9 | 74.5 | % | ||||||||||||||||
| EBITDA Margin | 40 | % | 42 | % | 43 | % | 38 | % | ||||||||||||||||
Ecopetrol’s financial results for second quarter 2010 were better than the same quarter a year ago. The increase in net income and ebitda primarily was the result of higher prices and sales volume, and better non-operating results over the same period last year. These increases were partially offset, by higher costs mainly from an increase in the Company’s purchases and imports, as well as an increase in maintenance, depreciation and contracted services due to the higher activity during 2010.
A breakdown of the principle line items in the Company’s unconsolidated financial statements is set forth below:
Total sales for the quarter and the semester grew in 2010 due mainly to: 1) an increase in sales volume and 2) an increase in crude and product prices. The effect is mainly explained by the increase in WTI price, US$27 above the average for the first semester of 2009.
Local sales were COL$163.5 billion higher than the same period of 2009. The price effect explains the growth offset by a decrease in local sales volume and the revaluation of the Colombian peso.
Exports expansion is explained by increasing sales volume of crudes, which account for 46.5% of the growth. On the other hand, 88.2% of the increase is explained by better oil prices. The above-mentioned factors offset the negative impact of Colombian peso revaluation on exports.
Cost of sales of COL$5,866.7 billion for the second quarter of 2010 was 46.6% greater than for the second quarter 2009. Variable costs rose primarily by: 1) increases in hydrocarbon purchases (which increased 28.5% as a result of higher volume and price; 2) imports (which increased 125.1% due to low-sulphur diesel and nafta imports) and; 3) amortization and depletion (which increased 49.6% as a result of new capital expenditures and higher production). The increase in the Company’s cost of sales was partially offset by the positive effect of the revaluation of the peso against the U.S. dollar.
Crude purchases from third parties and royalties grew as compared to 2009, increasing variable cost by COL$180 billion. Of this amount, more than 50% is attributable to the crude price increase, which was partially offset by the revaluation of the Colombian peso against the U.S. dollar.
6
| PRESS RELEASE |
The growth in refined products imports in order to deliver cleaner fuels to the country (mainly diesel ULS to blend with the diesel produced in the Barrancabermeja refinery) led to cost increases which were affected by the same price and exchange effects as crude purchases.
The variation in final crude and product inventories at the close of June 2010 offset the positive transitory effect on cost of sales of the previous quarter because of a decline in cost and volumes. Still in transit are 475 thousand barrels of Castilla crude exports, which were sold and still pending delivery in Texas, at the buyer's port (DES -Delivered ExShip).
During the first half of 2010, variable costs increased mainly because of higher crude and import purchases and higher amortization and depletion caused by new capital expenditures and production.
Fixed costs rose in 2010 due to an increase in contract sales related to direct operation as well as an increase in the maintenance and workovers.
Cumulative through June 2010, fixed costs increased 26.7% over the same period in 2009, mainly because of 1) depreciations; 2) contracted services and; 3) maintenance and labor costs.
Operating costs increased slightly when compared to second quarter 2009, driven mainly by a 65.1% increase in marketing expenses as well as the recognition of a loss related to nonfulfillment of natural gas as a result of operational and weather factors, partially offset by a 40.0% decrease in exploration and project expenditures.
The exploration and project expenditures amounted to COL$146 billion for the second quarter of 2010 and include unsuccessful exploration activities for COL$39 billion related to dry well charges for the Lisama Norte 1P well (in an amount totaling COL$16.5 billion), the Merey well (COL$16 billion), the Merecure well (COL$12 billion), offset by a lower cost adjustment for the Lisama Este 2P well of COL$5.7 billion.
Regarding seismic activity and studies, COL$71.6 billion were allocated to seismic acquisition and COL$36 billion to research and development of scientific projects in the ICP (Instituto Colombiano del Petróleo) as well as new businesses.
During the first semester, operational expenses grew driven by marketing expenses, higher transportations costs of crude, and costs arousing from nonfulfillment of gas deliveries.
In the supply chain area, active measures were taken in terms of using options, negotiating contractual conditions, generating savings by means of tariff, VAT or tax exemptions, and optimizing purchases, altogether generating a savings of COL$341 billion, higher than the savings of the COL$253 billion recorded during the same period last year. Savings are based on cost reductions strategies , and avoided costs.
The Operating margin for the second quarter 2010 was 29.5% versus 31.9% for second quarter 2009. Despite higher crude and product prices, the margin was impacted by 1) increase in crude purchase costs of COL$504.1 billion, 2) an increase in nafta imports of COL$638.3 billion, 3) an increase in maintenance costs of COL$62.3 billion, and 4) an increase in contracted services of COL$77.9 billion.
7
| PRESS RELEASE |
The non-operating result showed a loss of COL$285.7 billion in second quarter 2010, due mainly to:
| · | Financial income of COL$84.5 billion corresponding to interest and investment portfolio valuation. |
| · | Net income from an exchange difference of COL$45.8 billion due to the effect of the peso revaluation on the financial portfolio of dollar-denominated investments. |
| · | Net effect of non financial revenues and expenses for COL$3.0 billion. |
| · | Loss in registered partnerships, according to the equity method, of COL$113.9 billion. |
| · | Other financial expenses for COL$0.7 billion. |
| · | Net allowances for COL$43.2 billion. |
| · | Pension expenses for COL$111.3 billion. |
| · | Results for prior year periods of COL$149.9 trillion |
Net income for the second quarter 2010 was COL$1,805.0 billion, a 136.8% increase over the same period 2009. This increase is attributed to higher volumes sold at better prices and better non-operating result, with fewer financial expenditures during the second quarter 2010 compared to 2009, resulting mainly from the revaluation of the peso against the U.S. dollar as well as the effect of the net dollar position, which amounted to US$817 million.
Net income for second quarter 2010 fell 13.9% from the first quarter of 2010 to COL$1,805.0 billion mainly because of: 1) costs associated with higher volumes sold, 2) imports, 3) amortization and depletion, itself the product of new capitalizations and increased production, and 4) increase in maintenance. The increase in marketing expenditures stems from higher deliveries by oil pipeline, payment for nonfulfillment of gas deliveries, all of which was offset by less recognition of dry wells during second quarter 2010.
Net margin for the first quarter of 2010 was improved when compared to the first half of 2009, due to 1) better operating and non-operating results and 2) a lower effective tax rate, which, as of June 2010, was 26.1% compared to 28.5% a year ago.
Ebitda improved when compared to 2009 (second quarter and first semester) but fell in relation to first quarter of 2010, primarily because of the increase in costs mentioned previously and the COL$80.7 billion increase in operating expenditures.
EBITDA margin profited mainly from the higher operating income generated by the increase in both volumes and international prices, partially offset by the revaluation of the Colombian peso against the dollar.
| e. | Balance Sheet (unconsolidated) |
The following table sets forth a summary of Ecopetrol’s unconsolidated balance sheet as compared to the first quarter of 2010:
8
| PRESS RELEASE |
| Unconsolidated | ||||||||||||
| Balance Sheet (COP$ Billion) | As of June 30, 2010 | As of March 31, 2010 | % | |||||||||
| Current Assets | 11,252.0 | 10,988.0 | 2.4 | % | ||||||||
| Long Term Assets | 47,842.7 | 45,039.0 | 6.2 | % | ||||||||
| Total Assets | 59,094.7 | 56,027.0 | 5.5 | % | ||||||||
| Current Liabilities | 11,211.5 | 11,665.3 | (3.9 | )% | ||||||||
| Long Term Liabilities | 13,358.1 | 13,334.2 | 0.2 | % | ||||||||
| Total Liabilities | 24,569.6 | 24,999.5 | (1.7 | )% | ||||||||
| Equity | 34,525.1 | 31,027.5 | 11.3 | % | ||||||||
| Total Liabilities and Shareholders´ Equity | 59,094.7 | 56,027.0 | 5.5 | % | ||||||||
| Debit Memorandum accounts | 88,299.8 | 85,599.7 | ||||||||||
| Credit Memorandum accounts | 62,875.8 | 57,736.5 | ||||||||||
Assets increase to COL$59,094.7 billion in during the second quarter of 2010 as a result of 1) an increase in valuations, mainly of lands, stemming from the Company’s general appraisal in compliance with existing law; 2) an increase in good will for Hocol and Offshore International Group because of the earn-out provision in the Company’s purchase contracts for these subsidiaries; 3) an increase in the amount of temporary investments — Fixed Term Certificates of Deposit; and 4) lower income tax prepayments and advances.
As of June 30, 2010, liabilities totaled COL$24,569.6 billion decreasing mainly due to the payment of the first dividend in April for COL$1,255.1 billion, or $31 per share, with two other dividend payments pending for a total of COL$2,432 billion. Long-term financial debt was COL$5.1 trillion, which includes a COL$2.2 trillion syndicated loan with local banks entered into in May 2009 and a US$1.5 billion dollar issuance of the Company’s 7.625% Notes due 2019 in July 2009.
The Company’s net worth was COL$34,646.6 billion at June 2010, compared to COL$31,027.5 billion at the close of the first quarter. The increase is mainly attributed to recognition of the revaluation surplus and the period’s earnings.
| f. | Cash flow |
The table below summarizes the movement in the Company’s cash flow for the periods indicated:
| Col$ Billion* | 2Q 2010 | 2Q 2009 | 1Q 2010 | |||||||||
| Initial Cash | 6,751 | 10,920 | 4,840 | |||||||||
| Cash generated from operations (+) | 9,474 | 7,548 | 8,246 | |||||||||
| Cash used in operations (-) | (5,534 | ) | (6,679 | ) | (5,473 | ) | ||||||
| Capex (-) | (1,638 | ) | (1,819 | ) | (1,077 | ) | ||||||
| Acquisitions (-) | - | (2,729 | ) | - | ||||||||
| Dividend payments (-) | (1,255 | ) | (3,026 | ) | - | |||||||
| New debt (+) | - | 1,765 | - | |||||||||
| Other inflows (+/-) | 231 | 221 | 379 | |||||||||
| Fx differences (+) | (10 | ) | (666 | ) | (247 | ) | ||||||
| Final Cash | 8,019 | 5,535 | 6,668 | |||||||||
9
| PRESS RELEASE |
* For registration purposes, dollar amounts are converted to pesos at the monthly average exchange rate. The beginning cash balance each quarter is calculated at the average rate for the first month of the quarter and the final cash, at the last month of the quarter’s average rate.
During second quarter 2010, net cash produced by operating activities was COL$3,940 billion, including cash inflows of COL$9,474 billion and outflows of COL$5,534 billion. This compares with COL$869 billion in second quarter 2009 and COL$2,773 billion in first quarter 2010.
During the second quarter of 2010, disbursements of COL$1,638 billion related to capital expenditure investments were made, and the first dividend payment to shareholder corresponding to fiscal year 2009 in the amount of COL$1,255 billion.
As of June 30, 2010, Ecopetrol had COL$8,019 billion in cash, cash equivalents and investments, including investments held to maturity amounting to COL$125.6 trillion.
| g. | Segment results |
The following table summarizes our financial results by segment for the second quarter and first half of 2010:
| COP$ Billion | ||||||||||||||||||||||||||||||||||||||||||||||||
| E&P | Refining | Transportation | Sales and Marketing | Eliminations | Ecopetrol | |||||||||||||||||||||||||||||||||||||||||||
| 2Q-10 | As of june 2010 | 2Q-10 | As of june 2010 | 2Q-10 | As of june 2010 | 2Q-10 | As of june 2010 | 2Q-10 | As of june 2010 | 2Q-10 | As of june 2010 | |||||||||||||||||||||||||||||||||||||
| Domestic Sales | 2,310.7 | 4,748.9 | 2,766.6 | 6,101.2 | 735.3 | 1,456.7 | 1,103.5 | 1,980.2 | (3,220.5 | ) | (6,889.9 | ) | 3,695.6 | 7,397.1 | ||||||||||||||||||||||||||||||||||
| International Sales | 3,112.4 | 5,942.5 | 712.0 | 1,244.7 | - | - | 1,613.1 | 3,290.5 | 5,437.5 | 10,477.7 | ||||||||||||||||||||||||||||||||||||||
| Total Sales | 5,423.1 | 10,691.4 | 3,478.6 | 7,345.9 | 735.3 | 1,456.7 | 2,716.6 | 5,270.7 | (3,220.5 | ) | (6,889.9 | ) | 9,133.1 | 17,874.8 | ||||||||||||||||||||||||||||||||||
| Operating Revenues | 2,687.5 | 5,752.1 | (183.8 | ) | (338.2 | ) | 121.7 | 345.4 | 67.6 | 132.1 | 2,693.1 | 5,891.4 | ||||||||||||||||||||||||||||||||||||
| Operating Margin | 49.6 | % | 53.8 | % | -5.3 | % | -4.6 | % | 16.6 | % | 23.7 | % | 2.5 | % | 2.5 | % | 29.5 | % | 33.0 | % | ||||||||||||||||||||||||||||
| Net Income | 1,945.3 | 3,989.6 | (187.7 | ) | (397.0 | ) | 106.5 | 324.3 | (59.1 | ) | (15.2 | ) | 1,805.0 | 3,901.7 | ||||||||||||||||||||||||||||||||||
| Net Margin | 35.9 | % | 37.3 | % | -5.4 | % | -5.4 | % | 14.5 | % | 22.3 | % | -2.2 | % | -0.3 | % | 19.8 | % | 21.8 | % | ||||||||||||||||||||||||||||
| EBITDA | 3,484.6 | 7,303.3 | (107.3 | ) | (181.3 | ) | 190.1 | 487.4 | 68.2 | 132.8 | 3,635.7 | 7,742.1 | ||||||||||||||||||||||||||||||||||||
| Ebitda Margin | 64.3 | % | 68.3 | % | -3.1 | % | -2.5 | % | 25.9 | % | 33.5 | % | 2.5 | % | 2.5 | % | 39.8 | % | 43.3 | % | ||||||||||||||||||||||||||||
Note: The report by segment is calculated based on transfer prices among business segments, using a reference export parity prices.
Methodology for 2010
The methodology applied to segment reporting changed in 2010. Most importantly, the Exploration and Production and Refining segments now own products until they reach the customer, including associated costs. According to the previous methodology, the sales and marketing segment was the owner of crudes and products once produced and revenues, costs and expenses related to the commercialization of those products were assigned to that segment. With the new model, the Sales and Marketing segment only reflects revenues, costs and expenses related with the purchases and sales with third parties. . The corporate segment has been reallocated across the other segments.
Results for the Exploration and Production Segment
In the second quarter of 2010, the Exploration and Production Segment contributed COL$1,945.3 billion to the Ecopetrol’s net earnings, as a result of the increased production of crude, mainly for export, offset by a slight decrease in the direct production of gas. Also impacting the result was the revaluation of the peso against the U.S. dollar and a slight decrease in the WTI price as compared to the first quarter of 2010. Net income corresponding to this segment totaled COL$3,989.6 billion for the first half of 2010.
10
| PRESS RELEASE |
Results for the Refining Segment
The Refining Segment showed a net loss of COL$187.7 billion during the second quarter of 2010 and a net loss of COL$397 billion (or US$-3.8/Barrel) during the first half of 2010. These decreases resulted primarily from the Company’s increased imports of premium diesel (with low sulphur content) to comply with environmental regulations. The opening of the water treatment plant at the Barrancabermeja refinery is expected to have a positive impact on results during the third quarter of 2010.
Results for the Transportation Segment:
The Transportation Segment generated net income of COP$106.5 billion during the [second] quarter of 2010 and COL$324.3 billion for the first half of the year, primarily driven by an increase in the volume of products transported. Results for the quarter were also affected by a quarterly adjustment taken for third party oil pipelines, primarily the Ocensa pipeline.
Results for the Supply and Marketing Segment
The Supply and Marketing segment had an operational result of COP$67.6 billion, given the outstanding trading activity, with favorable margins in buy and sell hydrocarbon margins.
However, the segment had a net loss of COL$59.1 billion for the second quarter of 2010 due to an accounting adjustment during the quarter impacting the non operating results. The adjustment originated in an error during 2009, when COL$67 billion were mistakenly accounted in favor of Ecopetrol, but really belonged to the ANH. Due to this adjustment, there was a net loss in the segment for the first half of the year of COP$15.2 billion.
Its worth highlighting that ss a result of the new methodology for segment reporting, key improvement opportunities have been identified for each of the business units. Action plans have been developed in order to improve the profitability of the company in the short term.
II. Aspects of the Business (unconsolidated)
| a. | Exploration |
Drilling in Colombia
Through June 2010, 7 of the 13 wells budgeted for the year were drilled in Colombia with the following results:
11
| PRESS RELEASE |
| 1st Half 2010 | ||||||||
| Type of well | Number of wells | Hydrocarbon Presence | In evaluation | Dry | ||||
| A-3 | 7 | 1 | 1 | 5 | ||||
| Stratigraphic | 8 | 4 | 0 | 4 | ||||
During second quarter 2010, the following exploratory drilling activity took place in Colombia:
| 2nd Quarter 2010 | ||||||||
| Kind of well | Number of wells | Hydrocarbon Presence | In evaluation | Dry | ||||
| A-3 | 1 | 0 | 0 | 1 | ||||
| Stratigraphic | 5 | 2 | 0 | 3 | ||||
As of june 2010, Ecopetrol was drilling the Oripaya well in Colombia
International Drilling:
Drilling for the first half of the year included two wells along the U.S. Gulf coast (Palomino and Saluki), which were dry wells. The Company is currently is in the process of drilling a well in Brazil (Malbec).
| 1st Half 2010 | ||||||||
| Type of well | Number of wells | Hydrocarbon Presence | In evaluation | Dry | ||||
| A-3 | 2 | 0 | 0 | 2 | ||||
Due to a moratorium declared by the United States Minerals Managing Service in May 2010, the drilling of a well on the U.S. Gulf coast was halted (Krakatoa) and the commencement of drilling of two other exploratory wells planned for 2010 (the Logan and Cobra wells) was postponed. However, it is important to highlight that the moratorium does not apply to production activities, which Ecopetrol is undertaking in the U.S. Gulf Coast through its subsidiary Ecopetrol America Inc. Ecopetrol is not the operator of the abovementioned wells.
The consequences of the moratorium on the assets located in the U.S. Gulf coast are still uncertain. Regulatory changes may delay the returns of investments and decrease the profitability of projects as a result of potential additional safety requirements.
Seismic Activity
Seismic activity at the Company’s fields has increased significantly, mainly at international fields where information was gathered on 4,539 kilometers equivalent of seismic, of which 4,270 kilometers were along the U.S. Gulf coast and 269 kilometers in Brazil. During the same period in 2009, no such information was acquired outside Colombia.
12
| PRESS RELEASE |
The following table summarizes the Company’s seismic activity for the periods indicated:
| Seismic Activity KM Eq | ||||||||||||||||||||||||
| 2Q09 | 2Q10 | % | 1H09 | 1H10 | % | |||||||||||||||||||
| Direct | 534 | 841 | 57 | % | 1,119 | 1,295 | 16 | % | ||||||||||||||||
| Joint ventures | - | 209 | 100 | % | 130 | 2,473 | 1802 | % | ||||||||||||||||
| Association contracts | 204 | - | -100 | % | 490 | - | -100 | % | ||||||||||||||||
| International | - | 4,539 | 100 | % | 249 | 11,022 | 4327 | % | ||||||||||||||||
| Total | 738 | 5,589 | 657 | % | 1,988 | 14,790 | 644 | % | ||||||||||||||||
During the second quarter of 2010, Ecopetrol continued implementing initiatives designed to expand its local and international exploratory portfolio. The following are the highlights of the quarter:
| · | Participation in the Colombian Round 2010 of the ANH |
Ecopetrol presented the highest bids for nine blocks representing approximately 2.8 million hectares. Ecopetrol has 100% participation in five of the bids presented. Of these, four are located in the Llanos Orientales region and one in the Tumaco basin located in the Pacific coast.
In partnership with the Spanish company Repsol and the Argentine company YPF, Ecopetrol made the highest bid for the Cayos 1 and Cayos 5 blocks located in the Colombian Caribbean coast. Exploration in this part of the Colombian Offshore is part of Ecopetrol’s strategy of strengthening its offshore presence in partnership with other oil companies with extensive experience in this activity.
In partnership with SK Energy of Korea, Ecopetrol made the highest bid for the Sinu-San Jacinto (SSJS-1) block. Together with Cementaciones Petroleras de Venezuela, Ecopetrol submitted the highest bid for the VMM 32 block.
Ecopetrol’s estimates that its investment in developing the nine blocks will be approximately US$102 million over the next three years, which corresponds to the first phase of the exploration period.
These bids place Ecopetrol in first position in terms of eligibility for the respective contracts to be awarded by the ANH.
| · | Partnership with Talisman in the CPO 9 block |
Ecopetrol began participating with 55% rights in the CPO 9 block (located in the province of Meta) in partnership with Talisman. Ecopetrol will be the operator of this block.
| b. | Production |
Ecopetrol’s gross production of crude and gas equivalent during the second quarter of 2010 increased 14.7% over the same period last year to 559.3 mboed (83% crude and 17% gas). During the first half of 2010, production increased 17.6% over the same period last year to 555.3 mboed (83% crude and 17% gas). Ecopetrol’s direct production accounted for 40% of total production.
13
| PRESS RELEASE |
| Production per crude | ||||||||||||||||||||||||
| 2Q 2010 | 2Q 2009 | % | 1H 10 | 1H 09 | % | |||||||||||||||||||
| Light crudes | 40.2 | 45.4 | -11.4 | % | 41.0 | 44.2 | -7.1 | % | ||||||||||||||||
| Medium crudes | 224.4 | 212.8 | 5.5 | % | 222.5 | 207.9 | 7.0 | % | ||||||||||||||||
| Heavy crudes | 199.8 | 136.1 | 46.8 | % | 194.8 | 132.7 | 46.7 | % | ||||||||||||||||
| Total | 464.4 | 394.3 | 17.8 | % | 458.3 | 384.8 | 19.1 | % | ||||||||||||||||
| Does not include subsidiary companies | ||||||||||||||||||||||||
During the first quarter 2010, heavy crude represented 43.0% of Ecopetrol's crude production compared to 34.5% a year ago. In fact, the growth of the Company’s production segment is mainly the result of developments in heavy crude projects whose production increased approximately 47% compared to second quarter 2009.
In the Castilla field (operated directly by Ecopetrol) the production rose 29% when compared to the first half of 2009. 17 development wells were drilled in the first half of the year, and the Company plans to drill 69 wells overall in 2010. Production in the Chichimene field has been growing also, reaching an average of 14 mboed during the first half of 2010, a 24% increase as compared to the first half of 2009,and could reach 40 mboed by the end of the year.
Regarding the heavy crude fields in the Magdalena Medio area of the Nare system, 37 wells were drilled in Moriche and Girasol areas during the first half of 2010, and production grew by 7%, which is more than the average growth for the first half of 2009 and reached 6.2 mboed.
Regarding mature fields operated by Ecopetrol, the Casabe’s field production which grew 35% when compared to the first half of 2009, reaching a production of 16.4 mboed. In the first half of 2010, 8 wells were drilled and another 19 are planned for remainder of 2010 in this field. Additionally, 77 wells were drilled in the first half of the year on the La Cira-Infantas field, which reached a production level of 16.5 mboed in the first half of the year, an increase of 24% as compared to the same period of 2009.
In the Rubiales field, during the first half of 2010, 81 development wells were drilled and Ecopetrol’s proprietary production of this business has doubled since 2009 to an average of 65 mboed during the first half of 2010. During the second quarter of 2010, approval was granted for expansion of the Rubiales field commercial area, following an evaluation of the potential that an additional area could have and the positive results obtained from the appraisal of wells drilled as part of projects currently in progress.
Additionally, the Quifa field, which borders the Rubiales field and in which Ecopetrol and Pacific Rubiales (owner and operator of Meta Petroleum) participate, was proven commercially viable. The Quifa Suroeste field has a commercial area of approximately 40 thousand hectares and, to date, has 11 production wells that produce more than 2,300 barrels of heavy crude per day. Development plans call for an average daily production of 30,000 barrels by 2011.
The following table summarizes the Company’s development well activity for the periods indicated:
14
| PRESS RELEASE |
| Development wells | ||||||||||||||||||||||||
| 2Q 2010 | 2Q 2009 | % | 1H 10 | 1H 09 | % | |||||||||||||||||||
| Directly | 37 | 34 | 8.8 | % | 62 | 67 | -7.5 | % | ||||||||||||||||
| In partnership | 136 | 108 | 25.9 | % | 245 | 221 | 10.9 | % | ||||||||||||||||
| Total | 173 | 142 | 21.8 | % | 307 | 288 | 6.6 | % | ||||||||||||||||
Development wells drilled in the first half of the year reached 307, a 6.6% increase when compared to the same period of 2009. In the second quarter of the year, 173 wells were drilled, 21.8% more than the second quarter of 2009. The following table provides a breakdown of development wells per region:
| Development wells | ||||||||
| Region | Direct wells | Asociated wells | ||||||
| Magdalena | 24 | 133 | ||||||
| Central | 32 | 86 | ||||||
| North east | 0 | 3 | ||||||
| Catatumbo Orinoquía | 0 | 3 | ||||||
| South | 6 | 20 | ||||||
| Total | 62 | 245 | ||||||
Finally, below are additional highlights of the Company’s production activity during the first half of the year:
(1) Ecopetrol assumed direct operation of the Cupiagua and Cupiagua Sur fields, located in the municipality of Aguazul in the province of Casanare, as of midnight on June 30, 2010. Current production at the Cupiagua and Cupiagua Sur fields is approximately 26 mboed.
The northern section of Cusiana field, which is governed by the Santiago de las Atalayas Association Contract, will continue to be operated by BP until 2016 when the Tauramena Association contract expires.
(2) In May 2010, Ecopetrol also assumed sole operation of the TECA field following a February ruling in Ecopetrol's favor by an arbitration court returning the field to the company stemming from an association contract with Mansarover. Production at this field is approximately 1.4 mboed.
Production Costs
The lifting costs per barrel produced by Ecopetrol was 7.16 US$/BL for the period from January 2010 to June 2010, which compares to 5.77 US$/BL in the same period in 2009, a net increase of 1.39 US$/BL. The reasons for the increase are as follows:
| · | A revaluation of the Colombian peso vs the U.S. dollar of COL$370.16, which implies a higher value of of COL$ costs when converted to U.S. dollars. |
| · | (a) Higher energy and unitary costs as a result of higher production levels, (b) higher maintenance costs for growing production and handling facilities for crudes, and c) joint operation costs. |
15
| PRESS RELEASE |
This increasing trend in costs is expected to continue in 2010 given the higher execution of investments in production during the second half of previous years.
| c. | Refining |
Barrancabermeja Refinery
The throughput at the Barrancabermeja refinery during second quarter of 2010 was 218.3 mbdc, a 2.2% increase from the same period in 2009. Refinery's conversion factor decreased from 79.8% and 79.3% in the second quarter and first half of 2009, to 78.8% and 78.7% in the first quarter and first half of 2010, respectively due to scheduled work stoppages at tank bottom processing units.
The following table summarizes the refinery runs at the Barrancabermeja refinery for the periods indicated:
| Refinery runs Barrancabermeja | ||||||||||||||||||||||||
| Mbod | 2Q 2010 | 2Q 2009 | % | As of june 2010 | As of june 2009 | % | ||||||||||||||||||
| Barrancabermeja | 218.3 | 213.7 | 2.2 | % | 216.9 | 213.5 | 1.6 | % | ||||||||||||||||
With respect to the Barrancabermeja refinery upgrade project –PMRB-, the development of basic expanded engineering continued, the environmental management plan was assigned to the Ministry of the Environment, and the Corporacion Autonoma Regional de Santander - CAS granted the first permit to utilize forest resources in the area of the PMRB within the refinery’s installations.
Cleaner fuels
In accordance with Ecopetrol’s policy of improving the quality of fuels and commitment to the environment, on July 1st, 2010, the Company began delivery of diesel with 50 ppm sulphur content in Medellin and surrounding municipalities. The Hydro-treatment project is 98% complete; units are expected to arrive gradually, with operations in full swing by mid-August.
Margins and costs
The cash operating cost indicator for the Barrancabermeja Refinery for the period from January 2010 to June 2010 was US$5.49/BL, compared to US$5.33/BL1 for the same period a year ago, a difference of US$0.16/BL attributed to the decrease in the exchange rate and lower run. The cost increased despite a decrease in costs for the semester, which resulted from savings in unit costs and consumption of chemicals and catalysts, fuel savings and savings in support, labor expenditures and general expenditure processes).
1 The preliminary cash cost per refined barrel indicator reported in the second quarter of 2009 was USD$ 4.49 /Bl, which was revised to USD$ 5.33 /bl following the final cost determination and volume adjustments
16
| PRESS RELEASE |
The refining margin for the Barrancabermeja Refinery (defined as average sale price minus average purchase price) in first half of 2010 was US$3.85/BL, compared to US$3.40/BL for first half 2009. This increase was due to the higher average cost of the basket of products sold (US$79.51/BL vs US$52.62/BL) and the increase in cost crude and product purchases (diesel imports mainly), which increased from US$49.22/BL to US$75.66/BL.
| d. | Petrochemicals |
With the assistance of engineering consulting companies, development of our petrochemical infrastructure growth project continued, with an analysis made of the economics of various possible business cases and respective structures in order to choose the best option for implementing the project. By the end of the second quarter the conceptual engineering phase was 68% completed and COL$21 billion had been invested. A company with expertise in the area was contracted as a project management consultant to help streamline the next stages while making the best use of resources.
| e. | Transportation |
Transported volumes
Volumes in the second quarter of 2010 grew 287.5 mbod (38%) to 1,043.4 mbod compared to the same period in 2009 (755.9 mbod). Volume in the second quarter 2010 is split between 263.0 mbod (25%) of refined products and 780.4 mbod (75%) of crudes.
Infrastructure expansion
As in the first quarter, investments in the second quarter 2010 have mainly been allocated to expanding capacity of the infrastructure of the country’s oil and multi-purpose pipelines, increasing and improving the storage capacity of intermediate stations, improving the capacity of maritime and waterway docks, replacing some sections and building alternate routes on oil and multi-purpose pipelines, allowing stations and projects that improve industrial safety and protect the environment to continue operating.
In the case of crude evacuation, between 2008 and 2010 USD$1,129 million were invested by Ecopetrol, its partners and third parties in the following projects: 1) increasing the capacity of Vasconia – Coveñas (Oleoducto de Colombia - ODC); 2) Increasing the capacity of Ocensa Segment III (Vasconia – Coveñas); 3) increasing the capacity of Araguaney – Porvenir pipeline; 4) building the new Rubiales – Monterrey pipeline (Oleoducto de los Llanos –ODL-); 5) Increasing the segment Ayacucho – Coveñas; 6) Optimization of the segment Vasconia – Galan – Ayacucho – Coveñas; 7) Increasing the capacity of the unload facilities of Castilla and Vasconia; 8) Building of the Monterrey unload facility; 9) Building of the Altos del Porvenir station and; 10) Building of two tanks in Vasconia.
In the short term, Ecopetrol and its partners are executing the following projects for US$960 million: 1) Increasing the evacuation capacity of Caño Limon – Coveñas and Ayacucho – Coveñas to 240 mbod; 2) Increasing the capacity of Ocensa to 560 mbod; 3) Building the multi-purpose pipeline Sebastopol – Tocancipá (Poliducto Andino) with a capacity of 53 mbod for nafta transportation; 4) Increasing the capacity of Vasconia – Coveñas in 220 mbod (Oleoducto de Colombia – ODC); 5) increasing the capacity of Rubiales – Monterrey in 200 mbod; 6) Increasing the capacity of Vasconia – Barrancabermeja in 60 mbod; 7) Increasing the capacity of the Ayacucho unload facility in 15 mbod; 8) Building the Banadia unload facility with a capacity of 40mbod; 9) Installing new buoys in Coveñas and; 10) Building new tanks in Vasconia, Altos del Porvenir and Ayacucho totaling additional 510 mbls of storage capacity.
17
| PRESS RELEASE |
The following projects for the future are in engineering and economic feasibility stages: 1) Increasing capacity of Apiay-Porvenir pipeline; 2) Increasing capacity of the Castilla–Chichimene–Apiay line; 3) Increasing capacity for diluents transportation (Polioriente); 4) Increasing capacity of the Orito-Tumaco pipeline; 5) Building the Casanare-Coveñas pipeline (Oleoducto Bicentenario) and; 6) Increasing the storage capacity of Coveñas station.
The Crude Extraction Program 2010-2012 helped increase crude oil transports to the port of Covenas in the second quarter of 2010 by 30 mbod. This milestone was possible thanks to the building of a new Diesel Pumping unit in Castilla, optimization of the ODL Pipeline and injection of crude into the 24” Cano Limon-Covenas line in Ayacucho. Upon the completion and beginning of operations of the second tank at Vasconia Plant, crude storage capacity for the country’s central region increased by 120 thousand barrels.
One of the most important achievements of second quarter 2010 has been completion of the nafta loading platform at Tocancipa station, which can dispatch 30 mbod. Also noteworthy was the beginning of work on widening waterway (Barrancabermeja) and maritime (Cartagena) docks and the optimization of the Vasconia-Galán-Ayacucho-Coveñas segment.
In regards to projects in progress, the building of the 170 thousand barrel tank at Altos del Porvenir station is 25% complete and construction of the Poliducto Andino (multi-purpose line) is 34% complete. In addition, the Pozos Galan multi-purpose line, which will increase pumping capacity from 60 mbod to 120 mbod, is 67% complete.
Important progress has been made in environmental studies and the culmination of concept engineering projects for the integral development of the crude evacuation program that includes, among others, the systems Casanare-Covenas (Oleoducto Bicentenario), Castilla-Chichimene-Apiay, Apiay-Monterrey, and Orito-Tumaco for transporting to the export port of Coveñas.
Costs
The Barrel/Kilometer Transported indicator shows a real result for the period January-June 2010 of 7.93 $/BKM, which, compared to the result for the same period a year ago (8.09), shows a difference of -0/16 $/BKM, the product of lower material costs, maintenance contracts and corporate designations.
| f. | Biofuels |
Committed to the government's Biofuel program, Ecopetrol finalized activities contemplated in its project, Transporting biodiesel and diesel mixtures via the multi-purpose lines network. During 2010, certain required infrastructure improvements of the Multi-purpose lines Network were completed. The improvements generated the required operational and maintenance practices to ensure there would be no deterioration in the quality of products entering into contact with biofuels while being transported.
18
| PRESS RELEASE |
The company is ready to begin transporting Biodiesel mixtures through the multipurpose lines out of the Barrancabermeja refinery, once the government passed the required authorization.
Currently, B4 (4% B100 mixture) is being transported through the Cartagena-Baranoa multi-use pipeline, and beginning July 2010, 100% of biodiesel delivered by Ecopetrol will be transported through the Multi-Use Pipeline Network with a mixture of 2% B100 (B2).
| g. | Hedging |
Ecopetrol has a portfolio of derivative instruments which seek to ensure refining margins, as well as competitive discount factors in the purchase of crude and marketing of refined products. The volume covered during the second quarter of 2010 were distributed among refining margin, index management and storage cost management.
| h. | Investment plan 2010 |
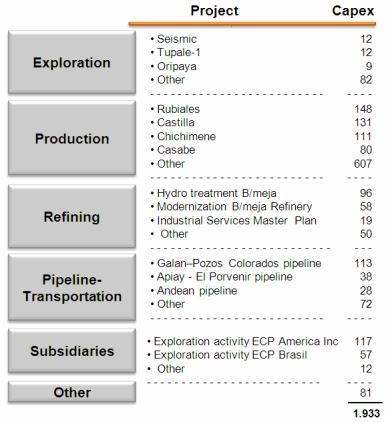
During the first half of 2010, Ecopetrol’s investments totaled US$1,933 million, an increase of 31% compared to the Company’s investments of US$1,475 million in the same period of 2009. During first half 2010, no acquisitions were made, compared to US$2,226 million in acquisitions made the first half of 2009.
Of the total amount invested in the first half of the year, 56% was allocated to production (US$1,075 million), 13% to transport (US$251 million), 12% to refining and petrochemicals (US$224 million), 10% to subsidiary companies (US$186 million), 6% to exploration (US$115 million) and the remaining 3% to corporate consolidation and others (US$82 million).
The details of the Company’s investments per project are presented below:
19
| PRESS RELEASE |
| i. | Financing of the Investment Plan 2010 |
The investment plan for the first half of the year was financed in whole by cash coming from the Company's operations. Due to the dynamics of higher oil prices during the year, as well as greater production, the revenues generated by the Company were sufficient to meet cash needs associated with operating costs and expenditures as well as those of the Company’s investment plan. If current prices for WTI continue, the Company may not have to raise debt during the second half of 2010 inorder to fund organic capex.
As announced at the end of the first quarter, Ecopetrol continues taking steps to secure different sources that will satisfy financing needs for 2010 and subsequent years. In this measure, the Company has continued its process for obtaining authorizations from internal management (Board of Directors and Shareholder Assembly) as well as governmental entities (Treasury Ministry, National Department of Planning and the Finance Superintendency). These authorizations pertain to the Company’s global financing plan and their implementation bears no direct relation to the timing of any possible transaction. The Company also continues to monitor the evolution of the local and international capital and credit markets to carry out financing.
III. Investment Plan 2011-2020
On July 9 the Board of Directors of Ecopetrol approved the strategic plan of the companies making up the Ecopetrol Corporate group for the period 2011-2020.
20
| PRESS RELEASE |
The plan was prepared from the perspective of new business targets, with a focus on sustainable development and a clear market orientation, resulting in profit-linked value goals.
According to the strategic plan, the Corporate group will operate in accordance with the following strategic guidelines: 1) Profitable Growth, 2) Organizational Consolidation and 3) Corporate Responsibility. For 2020, the company assumes the commitment to obtain economic, social and environmental results that allow meeting the expectations of shareholders and interested parties. It also clearly defines the strategic focus, which we will develop as a Corporate group to meet growth targets with profitability by 2020 and organizational consolidation and corporate responsibility by 2015.
The mission of the Ecopetrol Corporate group is maintained: "We find and converted energy sources into value for our customers and shareholders, ensuring the integrity of peoples, the safety of processes and protection of the environment, contributing to the welfare of the areas where we work, by means of committed personnel who seek excellence, integral development and the development of long-term relations with interested parties." New challenges for Ecopetrol have been identified for 2020 whose objective it is that “Ecopetrol, corporate group, focused on petroleum, gas, petrochemicals and alternative fuels, become one of the 30 largest oil companies in the world, recognized for its international positioning, its innovation and its commitment to sustainable development."
In addition, the strategy maintains the culture element as part of our model of behavior, principally defined as values (responsibility, integrity and respect) and organizational competencies (commitment to life, passion for excellence and team spirit).
| a. | Main Goals of the Business Plan |
Profitable Growth Guideline
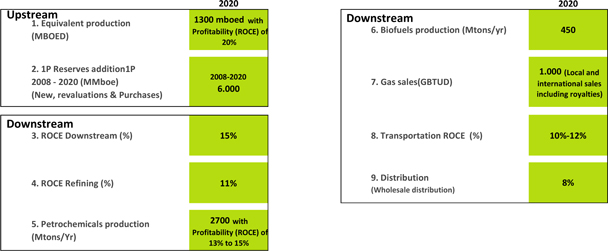
The principle goal as a Corporate group is to produce 1.3 million barrels equivalent of clean crude2, with a ROCE of 17%, made possible by improvements in organizational consolidation processes and by operating according to defined criteria for corporate responsibility in the group's strategy.
Exploration and Production
The major challenge of Exploration and Production is to become an international player capable of incorporating reserves and increasing oil and gas production in a sustained manner. The 2015 target is to produce one million barrels equivalent of crude per day, while increased effort is expected toward reaching 1.3 million barrels equivalent of crude a day by 2020, with a ROCE forecast of 20%.
The strategic targets are maintained and clarified in order to be able to reach production, reserve incorporation and profitability goals:
2 The goal of producing “clean barrels” means without any accidents or environmental incidents and in harmony with interested parties.
21
| PRESS RELEASE |
In Exploration:
| a) | Achieve a more robust and diversified portfolio, wherein the corporate group can consolidate itself in target countries where it is currently present, such as Colombia, Brazil, the United States and Peru, without losing site of continuous monitoring of other countries in order to capture new exploratory opportunities. The strategy focuses on increasing and obtaining the necessary know how to ensure the probability of findings in basins and target plays. |
| b) | Exploration of unconventional resources and frontier areas. Colombia's potential in unconventional hydrocarbons must be leveraged, with the help of E&P technologies that allow for development of gas associated with coal and shale gas. In addition, the corporate group must develop the exploration capability for basins located offshore and for unconventional hydrocarbon exploration. |
In production:
| a) | The development of heavy crude, based on leveraging the potential of the country's reserves, mainly in the Eastern Plains (Llanos Orientales), also by using appropriate extraction methods for this type of crude that allow for development of these productive fields. |
| b) | Increase in reserves and maximization of production in conventional fields, based primarily on use of applied technologies to augment the recovery factor in unconventional fields. |
c) Development of gas and unconventional hydrocarbons, mainly focused on leveraging the potential of the corporate group's gas reserves and developing the potential of unconventional hydrocarbons in Colombia.
E&P transversals
a) Synergies with the corporate group, focused on achieving a unified E&P portfolio, a strategic target of the companies making up the corporate group, and technological synergies that leverage production and incorporation of reserves.
| b) | Business Excellence is a very important focus in reaching Exploration and Production goals where permanent optimization of the costs of development and extraction must be achieved. In addition, the strategy focuses on management of assets with the purpose of attaining the most profitable assets, and on energy optimization that allows for cost reductions. |
Downstream
It is our goal for the Downstream to add value to the products and services of the Corporate group and/or third parties, with clear market and customer orientation. The strategy focuses mainly on value generation, market requirements and customer needs, operational excellence, and growth with profitability, with a 2020 ROCE target of 15%.
Given this perspective and realization that customers and markets are the foundations of growth, we have included in the strategy for 2011-2020, and across all segments, the strategic guideline for Marketing focused on the importance of the market and customers, a definition of products and key markets for the Corporate group.
22
| PRESS RELEASE |
Refining
The strategic guideline for Refining calls for a goal of increasing clean and valuable products, leveraging synergies and ensuring profitability. Contrary to the 2015 strategy focused on growth in refining capability, the 2011-2020 strategic target sets forth new focuses and targets aligned with the value generation and operational excellence of refineries. The goal for ROCE is 11%, while to become a refining leader in Latin America. The definition of leader in refining means in three consecutive Solomon studies, being in quartiles one and two for seven out of thirteen indicators (cash operating costs, utilization of refining, return on investment, mechanical availability, energy intensity index, maintenance index and personnel index).
In order to reach these goals in refining, the following strategic targets have been clearly defined:
| a) | Operational excellence, it is necessary to ensure the safe and environmentally responsible operation of refineries, their culture and organizational efficiency, reliability of the operation, cost efficiencies and use of technologies in conjunction with first-level partners. |
| b) | Focus on the market. Local and international market opportunities must be identified developed and leveraged, with adequate market planning wherein products satisfy market and customer needs. This involves clean production and making sure there is a supply of raw material for the petrochemical business. |
| c) | Generation of refining margin requiring excellent planning and scheduling of refinery processes, with optimization of the supply chain and ensuring a regulatory framework that adequately remunerates the business. |
| d) | Growth with profitability, including efficient project management, efficient planning and implementation of impact management plans with interested parties, process fulfillment, competent personnel and conditions that ensure the viability of the future operation and projects. |
Petrochemicals
The strategic guideline for Petrochemicals has as its challenge to leverage market opportunities by adding greater value to refining streams. The production volume goal is 2.73 million tons by 2020, and ROCE of between 13% and 15%. In order to reach these goals, the Corporate Group should focus on:
| a) | Making growth with strategic partners viable, mainly making it necessary to ensure development of the project with a potential ideal partner, including a profitable partnership agreement that allows for governability of the corporate group and transfer of petrochemical knowledge. |
3 The goal of producing 2.7 million tons of petrochemical products is pending further definition that will depend on market analyses, concept engineering and the project's financial feasibility.
23
| PRESS RELEASE |
| b) | Profitable consolidation of the regional market, whereby the group must ensure and maximize on profitable participation in the local and regional market, while managing the petrochemical margin per product and market. |
| c) | Efficient project management whose purpose is to efficiently plan and carry out projects related to petrochemicals, taking into account accomplishment of the plan, process fulfillment, best practices and competent personnel. |
| d) | Operational excellence, focused on the safe and environmentally responsible operation, with cost efficiencies, optimal chain planning that can add value to refining streams and reliability in supplying the final product. |
The petrochemical strategy will also make it possible to take advantage of a clear market opportunity to assume regional leadership and ensure the profitable growth of Propilco by supplying its own raw material.
Biofuels
The Biofuel strategic guideline calls for a 2020 goal of developing and consolidating the Corporate group's basket of products with alternative energies. Accomplishment of this biofuel goal focuses on the production of 450 thousand tons a year that will primarily come from biofuel production in Ecodiesel and ethanol in Bioenergy. Biofuel strategies will focus on:
| a) | Profitable consolidation in the local market, designed to fortify the mixture percentage, diversify the supply source and develop Ecodiesel and Bioenergy expansion in a sustainable manner, as well as continue studying and monitoring new efficient raw materials. |
| b) | High potential international market, with a focus on countries in the region with favorable regulations to be able to penetrate and serve the main markets, as well as continue to monitor access to new markets such as tariffs, life cycle analysis and green seal, among others. |
| c) | Competitiveness of the Biofuel value chain, wherein it is necessary to ensure profitability and opportunity, with adequate process insurability, best practices, technologies, competent personnel and efficient project management. |
| d) | Management of the regulatory framework, in order to ensure the permanency of a favorable regulation benefiting the development of biofuel projects, and to count on an adequate regulation on refinery mixture percentages. |
Gas Marketing
The strategic guideline for Gas has as its major challenge to strengthen the national gas market and develop business in the region, with a sales goal by 2015 of 1,000 Gbtud, which includes the Corporate group's national and international sales as well as royalty sales. With the target of maintaining leadership in the national market and achieving the opening of new markets in the Caribbean and Central America, the gas strategy must focus on:
24
| PRESS RELEASE |
| a) | Monetizing gas reserves at a regional level, attainable by exporting to regional markets, pursuing leadership in the local market, focusing on profitable segments and strengthening client relations. |
| b) | Managing the regulatory framework, where the goal is for there to be stable, clear regulations than ensure future production and its marketing, as well as to be able to develop E&P regulations and policies for unconventional gas. |
| c) | Ensuring conventional and unconventional gas availability and reserves by the timely development of the productive capability of the resources. |
| d) | Capital, cost and technology efficiencies, HSE for clean barrels, that should be achieved by ensuring reliability of supply, permanently optimizing costs and leveraging technology synergies among Corporate group companies. |
Transport & Logistics
The strategic guideline for Transport & Logistics is presented in the strategic plan as an enabler for the integral development of the Corporate group's value chain, with growth in profitability and ROCE of between 10% and 12%. To meet this strategic challenge and the profitability goal, the Transport & Logistics strategy will focus on:
| a) | Providing logistically profitable and integral solutions, centered on the local market, wherein the guideline primarily must guarantee the transport and storage capacity of crude, fuels and biofuels of the Corporate group, diversifying transport methods and consolidating the best practices of operations, services and group maintenance. |
| b) | Ensuring sustainable growth by evaluating diversified investment plans, with social responsibility, competent human talent and technological innovation. |
| c) | Efficient management of projects, ensuring fulfillment, profitability and opportunity, and adequate planning and efficient execution of impact management plans in interested parties. |
| d) | A responsible, efficient operationthat can provide a clean, safe operation, with cost efficiencies and centralized operation, operational reliability and infrastructure integrity. |
To summarize, our primary goals for complying with the 2020 Profitable Growth guideline are:
25
| PRESS RELEASE |
| b. | 2011-2020 Strategic Plan Investments |
The 2011-2020 strategy calls for the Corporate group to invest approximately US$80 billion, allocated as follows:
| · | Exploration and Production, with an investment of US$64 billion representing 80% of the total invested, of which US$44 billion is for Production and US$20 billion for Exploration. |
| · | Downstream investments of approximately US$16 billion, allocated as $5.5 billion for refining (7%), US$5.5 billion for petrochemicals (7%) and US$5 billion for transport (6%). |
| · | US$250 million will be invested in Organizational Consolidation. |
| · | 78% of the investment will be for Colombia and 22% for target countries (Brazil, United States, Peru) |
The key projects that will be carried out in 2011-2020 by segment are the following:
Exploration:
| · | National portfolio (base portfolio, new activity in existing blocks and new activity in new blocks), with an investment of US$4.2 billion. |
| · | New international exploratory activity, an investment of US$11.5 billion. |
| · | Exploration by subsidiaries, namely Ecopetrol Brazil, Ecopetrol America y Ecopetrol Peru, an investment of US$3.8 billion. |
26
| PRESS RELEASE |
Production:
| · | Increase in the recovery factor, involving an investment of US$10 billion, of which 50% will be for heavy crude fields, 30% for conventional fields, and 20% for gas fields. |
| · | An additional investment is needed, estimated in US$31 billion distributed as follows: |
| o | Development in unconventional resource fields, with an investment of US$1.6 billion. |
| o | Development of heavy crude, with an investment of US$8.5 billion |
| o | Development of medium crude, with an investment of US$8 billion |
| o | Technology to raise the recovery factor from secondary to tertiary, with an investment of US$13 billion |
| · | Development of Hocol and Savia's production, with an investment of US$3.8 billion |
Refining:
| · | Barrancabermeja Master Refining Plan, with an investment of US$ 2.9 billion. |
| · | Cartagena Master Refining Plan, with an investment of US$1.3 billion (40% of the total investment required) |
Petrochemicals:
| · | Petrochemical Complex Integration Project, with an investment of US$5.5 billion |
Transport:
| · | Casanare-Covenas Bicentenario Oil Pipeline, with an investment of US$3.4 billion |
| · | Apiay-Porvenir expansion, with an investment of US$430 million |
| · | Covenas storage expansion, with an investment of US$370 million |
| · | Chichimene-Castilla-Apiay Expansion, with an investment of US$200 million. |
27
| PRESS RELEASE |
The following is the strategic investment plan defined for 2011-2015 and 2016-2020:
| (US$ Bn) | ||||||||||||
| 2011-2015 | 2016-2020 | Total 2011-2020 | ||||||||||
| Production | 24.5 | 19.5 | 44.0 | |||||||||
| Exploration | 9.5 | 10.5 | 20.0 | |||||||||
| Refining | 5.2 | 0.3 | 5.5 | |||||||||
| Transportation | 4.2 | 0.8 | 5.0 | |||||||||
| Petrochemicals | 0.7 | 4.8 | 5.5 | |||||||||
| Organizational Consolidation | 0.1 | 0.1 | 0.3 | |||||||||
| Total | 44.2 | 36.0 | 80.3 | |||||||||
| c. | Financing the 2011-2020 Strategic Plan: |
The resources to be able to invest US$80 billion and achieve the desired results in the 2011-2020 strategy will come from:
| · | Cash generation of US$514 billion in the period 2011-2020. |
| · | Debt raising for US$23 billion. |
| · | 9.9% capitalization share offering (rounds 2 and 3) of US$6 billion (estimate based on current prices). |
As we have seen, each element of the 2011-2020 strategic plan contains a clear, precise message that establishes the standards for implementing the strategy, the definition of our plans and projects, and alignment of our activities, processes and resources with expected performance. This strategy of the Corporate group is framed in such a manner as to direct our focus toward growing with profitability, generating sustainable development and a vision for 2020.
| 4 | Amount calculated at Nymex prices through 2013 + Normalized Pr. fpr 2014-2015 + US$ 60 LP |
28
| PRESS RELEASE |
IV. Corporate Social Responsibility (CSR)
| a. | Human talent and recognitions |
During the second quarter of 2010, there were many achievements in carrying out the goals of Human Talent, including the launching of several campaigns within the Company as well as leadership and organizational culture management through various initiatives. Significant progress was achieved in terms of developing the required skills of employees, and closing of technical gaps in skills for the organization's leaders.
Ecopetrol also obtained the following recognitions:
| · | Ecopetrol was recognized as the most admired, best managed company in Colombia, according to the study Business Elite conducted by the survey company Datexco for the newspaper Portafolio (June 2010). |
| · | The Spanish company Merco named Ecopetrol the best Colombian corporation to work for in Colombia (April 2010). |
| · | Ecopetrol’s web page (www.ecopetrol.com.co) was named the best in the nation, according to the first Internet Awards granted by the Colombian Association of Internet Users in May 2010. |
| · | Ecopetrol became the first company in South America to receive the Chartered Institute of Purchasing & Supply (CIPS) organizational certification. This certification allows benchmarking versus world standards of excellence, and highlights Ecopetrol as an organization that guarantees excellence in its supply resources. |
Additionally, under the heading “Corporate social responsibility an Ecopetrol commitment,” an agreement was signed with Confecamaras with the purpose of offering Ecopetrol’s micro, small and mid-size service providers with the necessary knowledge and tools focused on sustainable development and corporate social responsibility. Through this initiative, 15 local and regional companies in nine areas of the country have been impacted to date.
| b. | Science and technology |
Ecopetrol has been nominated for a Most Admired Knowledge Enterprises (MAKE) award at the global level for 2010, which recognizes companies that are leaders in knowledge management. The nomination was made, among others, by Lawrence Prusak and Nancy Dixon, world experts in knowledge management.
| c. | Social investment |
A total of COL$11.2 billion during the first half of the year correspond to social investment agreements signed in January 2010. In addition, planning and restructuring continued for social investment projects, which will defined during the second half the year.
The following are highlights of the progress the Company has made in the area of social investment:
1. Education and Culture
Ecopetrol partnered with the National Museum to take the bicentennial exhibit to every municipality in Colombia and thus participate in this national celebration.
29
| PRESS RELEASE |
Furthermore, the Company carried out the process for choosing new recipients of the program “High school students for Colombia,” which annually recognizes the top two students from each province for outstanding academic performance.
2. Regional competition
With the purpose of supporting projects that have a major impact on the income generation for the inhabitants of the regions where the Company operates, the Company continued characterizing, diagnosing and selecting seven strategic productive projects.
3. Citizenry and Democracy
On June 30, 2010, the Royalty Investment Follow-up Committee was launched in the Magdalena Medio region. The first meeting of the committee will be held on July 23, 2010 in the city of Barrancabermeja. Additionally, the Company continued its efforts at assisting 10 municipalities in preparing projects using royalties.
On April 29, 2010, the event “Business Alliance for Colombia” was held an initiative spearheaded by Ecopetrol and designed to strengthen network-based alliances and management-building processes, thus maximizing the Company’s impact on the Country’s development.
Implementation of the Community Relations Management System, begun during the first quarter of 2010 with the support of the Asociación Regional de Empresas de Petróleo y Gas de Latinoamérica y el Caribe (ARPEL), continued.
| d. | HSE (Health, Safety & Environment) |
Within the framework of the Program for Re-use of Recyclable Materials, during the first four months of 2010, Ecopetrol recycled 77 tons of paper, preventing the cutting down of 540 trees. The use of these residuals is a practice that helps meet the Company's commitment to the preservation of the ecosystem.
During the first half of 2010, Ecopetrol successfully managed to reduce the number of environmental incidents, demonstrating the Company’s commitment to environmental safety. At the end of June, a total of 18 incidents of this nature had been reported, compared to 39 during the same period last year.
During the second quarter of 2010, the frequency of accidents (number of accidents/million man hours) was 1,45 compared to 0,98 in the second quarter of 2009. The Company has launched campaigns to prevent accidents and improved management’s control of identified failures.
30
| PRESS RELEASE |
V. Financial results for Ecopetrol and its Subsidiaries(Consolidated)5
In 2007, we began the consolidation of the Ecopetrol Corporate Group, which now has operations in every link of the crude oil production chain and the natural gas industry. Since 2008, we have acquired five companies and made significant strides in the consolidation of these companies into the Ecopetrol Corporate group.
For the second quarter of 2010, over 34 mboed of the 593.9 mboed of daily production came from our subsidiary upstream companies: Hocol, and Savia Peru. Similarly subsidiaries like Ocensa and ODL made significant contributions to the Ecopetrol Corporate group’s revenue, EBITDA and net income results.
However, there are some subsidiary companies, such as Ecopetrol del Peru, Ecopetrol de Brasil, Ecodiesel and Bionergy, that do not yet make any financial contribution to the results of the Ecopetrol Corporate group as these are still in a pre-operating stage or are conducting exploratory activities but do not yet have production.
Similarly, the Company’s crude oil transportation subsidiaries are not expected to generate any profit for the Ecopetrol Corporate Group, but are expected to provide solutions for the transportation of refined products. Thus, the benefits of these subsidiaries to the Ecopetrol group are reflected in transportation costs.
On the other hand, in order to optimize the Ecopetrol Corporate Group’s financial resources and transfer excess cash from one subsidiary to another, Ecopetrol’s Board of Directors approved the constitution of a financial vehicle for the Ecopetrol’s Corporate group. This should happen before the end of the year.
The table below presents a summary of the results of our consolidated subsidiaries for the second quarter and first half of 2010 as compared to the same periods of 2009:
5 For purposes of preparing the estimated consolidated financial results for the second quarter of 2010, in addition to the results of Ecopetrol, the results of the following subsidiaries have also been included:
Ecopetrol Oleo e Gas Do Brasil, Ecopetrol America Inc, Ecopetrol del Peru S.A., ECP Global Energy, and Hocol, Bioenergy S.A., Andean Chemicals Limited, Propilco S.A., Comai, ODL Finance S.A., Ecopetrol Transportation Company, Oleoducto de Colombia, Ocensa S.A. and Reficar S.A. and Black Gold Re Ltd.
The estimated consolidated results for the second quarter 2009 included the following subsidiaries: Ecopetrol Oleo e Gas Do Brasil, Ecopetrol America Inc, Ecopetrol del Peru S.A.,Hocol, Bioenergy S.A., Andean Chemicals Limited, ECP Global Energy, Propilco S.A., Comai, ODL Finance S.A., Black Gold Re Ltd., Ecopetrol Transportation Company, Oleoducto de Colombia, Ocensa S.A., and Reficar S.A.
31
| PRESS RELEASE |
Consolidated Income Statement
| (COP$ Billion) | 2Q 2010 | * | 2Q 2009 | * | % | As of june 2010* | As of june 2009* | % | ||||||||||||||||
| Local Sales | 4,102.4 | 3,500.3 | 17.2 | % | 7,983.5 | 6,687.5 | 19.4 | % | ||||||||||||||||
| Export Sales | 5,783.2 | 3,544.5 | 63.2 | % | 11,323.4 | 5,361.6 | 111.2 | % | ||||||||||||||||
| Sales of services | 328.8 | 231.7 | 41.9 | % | 1,125.2 | 467.6 | 140.7 | % | ||||||||||||||||
| Total Sales | 10,214.4 | 7,276.5 | 40.4 | % | 20,432.1 | 12,516.6 | 63.2 | % | ||||||||||||||||
| Variable Costs | 5,631.5 | 2,943.7 | 91.3 | % | 10,124.7 | 5,690.6 | 77.9 | % | ||||||||||||||||
| Fixed Costs | 1,172.1 | 1,741.1 | (32.7 | %) | 2,673.3 | 2,752.1 | (2.9 | %) | ||||||||||||||||
| Cost of Sales | 6,803.6 | 4,684.8 | 45.2 | % | 12,798.0 | 8,442.7 | 51.6 | % | ||||||||||||||||
| Gross profit | 3,410.8 | 2,591.7 | 31.6 | % | 7,634.1 | 4,073.9 | 87.4 | % | ||||||||||||||||
| Operating Expenses | 867.4 | 490.8 | 76.7 | % | 1,474.1 | 910.4 | 61.9 | % | ||||||||||||||||
| Operating Profit | 2,543.4 | 2,100.9 | 21.1 | % | 6,160.0 | 3,163.5 | 94.7 | % | ||||||||||||||||
| Non Operating Profit/(Loss) | (159.8 | ) | (1,067.3 | ) | (85.0 | %) | (803.1 | ) | 105.3 | (862.7 | %) | |||||||||||||
| Income tax | 618.7 | 348.7 | 77.4 | % | 1,531.5 | 975.3 | 57.0 | % | ||||||||||||||||
| Minority interest | (2.2 | ) | (7.2 | ) | (69.4 | %) | 104.0 | (7.2 | ) | (1,544.4 | %) | |||||||||||||
| Net Income | 1,767.1 | 692.1 | 155.3 | % | 3,721.4 | 2,300.7 | 61.8 | % | ||||||||||||||||
| EBITDA | 3,579.6 | 3,134.1 | 14.2 | % | 8,034.4 | 4,889.7 | 64.3 | % | ||||||||||||||||
| EBITDA Margin | 35 | % | 43 | % | 39 | % | 39 | % | ||||||||||||||||
* For ilustration purposes only
| Consolidated Balance Sheet | ||||||||||||
Balance Sheet (COP$ Billion) | As of June 30, 2010 | As of March 31, 2010 | % | |||||||||
| Current Assets | 14,359.2 | 14,293.5 | 0.5 | % | ||||||||
Long Term Assets | 47,922.5 | 44,750.2 | 7.1 | % | ||||||||
Total Assets | 62,281.7 | 59,043.7 | 5.5 | % | ||||||||
| Current Liabilities | 11,957.6 | 12,926.2 | (7.5 | )% | ||||||||
Long Term Liabilities | 15,006.6 | 14,189.2 | 5.8 | % | ||||||||
Total Liabilities | 26,964.2 | 27,115.4 | (0.6 | )% | ||||||||
Equity | 34,348.7 | 30,876.1 | 11.2 | % | ||||||||
Minority interest | 968.8 | 1,052.2 | (7.9 | )% | ||||||||
Total Liabilities and Shareholders´ Equity | 62,281.7 | 59,043.7 | 5.5 | % | ||||||||
| Debit Memorandum accounts | 89,667.0 | 86,927.6 | ||||||||||
| Credit Memorandum accounts | 63,812.0 | 58,657.8 | ||||||||||
The subsidiaries that contributed the most to total sales in the first half of 2010 (without taking into account the impact of eliminations) were the Cartagena Refinery with COL$2,234.5 billion, Hocol with COL$ 1,136.3 billion, Ocensa S.A. with COL$810.4 billion, and Propilco S.A. and Comai with COL$854.6 billion.
Among subsidiaries, the highest contributors to the Group’s net income during the first half of 2010 were Ocensa S.A. with COL$310.0 billion, Hocol with COL$146.7 billion, Ecopetrol Transportation Company with COL$100.0 billion, and Propilco and Comai with COL$59.1 billion. On the other hand, subsidiaries with the highest net losses were Ecopetrol America Inc. with a net loss of COL$250.4 billion, Andean Chemicals Limited with a net loss of COL$38.9 billion and Ecopetrol de Brasil with a net loss of COL$11.9 billion.
Under the equity method, Offshore International Group contributed net income of COL$31.5 billion during the first half of 2010.
Consolidated Ebitda for the first half of the year was COL$8,034.4 billion, which represents an Ebitda margin of 39%, driven mainly by outstanding operating results.
32
| PRESS RELEASE |
In the second quarter of 2010, the subsidiaries with the highest net income were Hocol with a net income of COL$46.2 billion and Ocensa with a net income of COL$32.5 billion. The subsidiaries with the highest net losses were Ecopetrol America Inc. with a net loss of COL$223.9 billion and Andean Chemicals Limited with a net loss of COL$15.9 billion.
Consolidated Ebitda for the second quarter of 2010 was COL$3,579.6 billion, which represents an Ebitda margin of 35%. This margin represents a decrease in the 43% margin reported for the second quarter of 2009, resulting mainly from the recognition of dry wells and the increase in the seismic acquisition of the Group.
| a. | Exploration and production |
Ecopetrol Corporate group’s production
The following table summarizes the Ecopetrol Corporate group’s production for the periods indicated:
Ecopetrol S.A. gross oil and gas production (mboed) | 2Q 2010 | 2Q 2009 | % | As of june 2010 | As of june 2009 | % | ||||||||||||||||||
| Crude Oil | 464.4 | 394.3 | 17.8 | % | 458.3 | 384.8 | 19.1 | % | ||||||||||||||||
Natural Gas | 94.9 | 93.1 | 1.9 | % | 97.1 | 87.5 | 10.9 | % | ||||||||||||||||
Total | 559.3 | 487.4 | 14.7 | % | 555.3 | 472.3 | 17.6 | % | ||||||||||||||||
Hocol | 2Q 2010 | 2Q 2009 | As of june 2010 | As of june 2009 | ||||||||||||||||||||
| Crude Oil | 25.1 | 23.5 | 6.8 | % | 24.5 | 23.30 | 5.2 | % | ||||||||||||||||
Natural Gas | 1.1 | 1.0 | 10.0 | % | 1.1 | 1.10 | 0.0 | % | ||||||||||||||||
Total | 26.2 | 24.5 | 6.9 | % | 25.6 | 24.4 | 4.9 | % | ||||||||||||||||
| * Includes royalties | ||||||||||||||||||||||||
Savia | 2Q 2010 | 2Q 2009 | As of june 2010 | As of june 2009 | ||||||||||||||||||||
| Crude Oil | 5.5 | 5.0 | 10.0 | % | 5.5 | 5.4 | 1.9 | % | ||||||||||||||||
Natural Gas | 0.9 | 0.9 | 0.0 | % | 0.9 | 0.7 | 28.6 | % | ||||||||||||||||
Total | 6.4 | 5.9 | 8.5 | % | 6.4 | 6.1 | 4.9 | % | ||||||||||||||||
Ecopetrol America INC (K2) | 2Q 2010 | 2Q 2009 | As of june 2010 | As of june 2009 | ||||||||||||||||||||
| Crude Oil | 1.8 | 0.7 | 157.1 | % | 1.8 | 0.4 | 350.0 | % | ||||||||||||||||
Natural Gas | 0.2 | - | 0.2 | - | ||||||||||||||||||||
Total | 2.0 | 0.7 | 185.7 | % | 2.0 | 0.4 | 400.0 | % | ||||||||||||||||
Total Group's production | 593.9 | 518.5 | 14.5 | % | 589.3 | 503.2 | 17.1 | % | ||||||||||||||||
| 1. | Hocol |
Hocol’s average gross production for the quarter was 26.2 mboed (96% crude, 4% gas), 6.9% above second quarter 2009. Average gross production for the first half of 2010 was 25.6 mboed (96% crude, 4% gas), 5% higher than the first half of 2009.
In June 2010, Hocol submitted the highest bids for five blocks in the Colombia Round 2010 (VIM 6, CPO 16, VSM 9, LLA 13, LLA 39), equivalent to 6,000 square kilometers. These blocks are pending ANH approval.
33
| PRESS RELEASE |
In the exploratory area, Hocol is drilling the Balcon 27 and La Hocha 23 and 22 wells and is planning to drill an additional five wells during the remainder of 2010?. Polymers are being injected to control water at the Balcon and Palermo wells.
The following table provides a breakdown of Hocol’s production by crude and gas for the periods indicated:
| Production (MBOED) | 2Q 2010 | 2Q 2009 | As of june 2010 | As of june 2009 | ||||||||||||
| Crude oil | 25.1 | 23.5 | 24.5 | 23.3 | ||||||||||||
| Natural gas | 1.1 | 1.0 | 1.1 | 1.1 | ||||||||||||
| Total | 26.2 | 24.5 | 25.6 | 24.4 | ||||||||||||
| Production Royalties (MBOED) | 2Q 2010 | 2Q 2009 | As of june 2010 | As of june 2009 | ||||||||||||
| Crude oil | 3.0 | 3.1 | 2.9 | 3.1 | ||||||||||||
| Natural gas | 0.1 | 0.1 | 0.1 | 0.1 | ||||||||||||
| Total | 3.1 | 3.2 | 3.0 | 3.2 | ||||||||||||
| Production Net (MBOED) | 2Q 2010 | 2Q 2009 | As of june 2010 | As of june 2009 | ||||||||||||
| Crude oil | 22.1 | 20.4 | 21.6 | 20.2 | ||||||||||||
| Natural gas | 1.0 | 0.9 | 1.0 | 1.0 | ||||||||||||
| Total | 23.1 | 21.3 | 22.6 | 21.2 | ||||||||||||
The following tables set forth Hocol’s financial results and balance sheets for the periods indicated:
| Income Statement | ||||||||
| US$ million | 2Q 2010 | As of june 2010 | ||||||
| Local Sales | 8.7 | 17.3 | ||||||
| Export Sales | 533.6 | 1,119.0 | ||||||
| Total Sales | 542.3 | 1,136.3 | ||||||
| Variable Costs | 391.6 | 727.5 | ||||||
| Fixed Costs | 41.0 | 147.6 | ||||||
| Cost of Sales | 432.6 | 875.1 | ||||||
| Gross profit | 109.7 | 261.2 | ||||||
| Operating Expenses | 40.7 | 46.6 | ||||||
| Operating Profit | 69.0 | 214.6 | ||||||
| Non Operating Profit/(Loss) | (21.4 | ) | (25.4 | ) | ||||
| Income tax | 10.9 | 57.0 | ||||||
| Deferred taxes | (9.5 | ) | (14.6 | ) | ||||
| Net Income/Loss | 46.2 | 146.8 | ||||||
| EBITDA | 197.1 | 328.4 | ||||||
| EBITDA Margin | 33 | % | 29 | % | ||||
34
| PRESS RELEASE |
| Balance Sheet | ||||||||
| US$ million | As of June 30, 2010 | As of March 31, 2010 | ||||||
| Current Assets | 884.3 | 865.4 | ||||||
| Long Term Assets | 1,115.4 | 1,016.2 | ||||||
| Total Assets | 1,999.7 | 1,881.6 | ||||||
| Current Liabilities | 437.6 | 409.2 | ||||||
| Long Term Liabilities | 148.1 | 104.3 | ||||||
| Total Liabilities | 585.7 | 513.5 | ||||||
| Equity | 1,414.0 | 1,368.1 | ||||||
| Total Liabilities and Shareholders´ Equity | 1,999.7 | 1,881.6 | ||||||
| Memorandum Accounts | 105.8 | 105.8 | ||||||
| 2. | Offshore International Group (OIG) |
During the second quarter of 2010, the Offshore International Group (OIG), whose principal business is Savia Peru, continued to carry out its investment plan to increase the company’s production in 2010. US$46 million have been invested as of June 2010.
The following table provides a summary of OIG’s capital expenditures during the periods indicated:
| Investments | ||||||||||||||||
| Capex 2010 (USD millions) | 2Q 2010 | 2Q 2009 | As of June 2010 | As of June 2009 | ||||||||||||
| Executed | 26.4 | 6.2 | 46.0 | 19.3 | ||||||||||||
On June 10, 2010, Perupetro S.A was granted authorization by the Peruvian government to sign licensing contracts with Savia Peru S.A. for the exploration and exploitation of Hydrocarbons in Blocks Z51 and Z52 located in Peru.
OIG’s average gross production for the quarter was 12.6 mboed (86% crude, 14% gas), 8% higher than the second quarter of 2009. OIG’s average gross production for the first half of 2010 was 12.9 mboed (86% crude and 14% gas), 5.7% higher than the first half of 2009. Ecopetrol accounts for 50% of OIG’s production.
The following table provides a breakdown of OIG’s production by crude and gas for the periods indicated:
35
| PRESS RELEASE |
| Production (MBOED) | 2Q 2010 | 2Q 2009 | As of june 2010 | As of june 2009 | ||||||||||||
| Crude oil | 10.9 | 10.0 | 11.1 | 10.8 | ||||||||||||
| Natural gas | 1.7 | 1.7 | 1.8 | 1.4 | ||||||||||||
| Total | 12.6 | 11.7 | 12.9 | 12.2 | ||||||||||||
| Production Royalties (MBOED) | 2Q 2010 | 2Q 2009 | As of june 2010 | As of june 2009 | ||||||||||||
| Crude oil | 1.7 | 1.6 | 1.8 | 1.7 | ||||||||||||
| Natural gas | 0.3 | 0.3 | 0.3 | 0.2 | ||||||||||||
| Total | 2.0 | 1.9 | 2.1 | 1.9 | ||||||||||||
| Production Net (MBOED) | 2Q 2010 | 2Q 2009 | As of june 2010 | As of june 2009 | ||||||||||||
| Crude oil | 9.2 | 8.4 | 9.3 | 9.1 | ||||||||||||
| Natural gas | 1.4 | 1.4 | 1.5 | 1.2 | ||||||||||||
| Total | 10.6 | 9.8 | 10.8 | 10.3 | ||||||||||||
The following tables set forth OIG’s financial results and balance sheets for the periods indicated:
| Income Statement | ||||||||
US$ million | 2Q 2010 | As of june 2010 | ||||||
| Local Sales | 74.5 | 148.2 | ||||||
Sales of services | - | 1.6 | ||||||
Total Sales | 74.5 | 149.8 | ||||||
| Variable Costs | 40.4 | 71.3 | ||||||
Fixed Costs | 11.1 | 22.0 | ||||||
Cost of Sales | 51.5 | 93.3 | ||||||
Operating Profit | 23.0 | 56.5 | ||||||
Non Operating Profit/(Loss) | 16.3 | 45.0 | ||||||
| Income tax | 4.0 | 11.7 | ||||||
| Employee profit sharing | 0.7 | 2.0 | ||||||
| Deferred taxes | 1.1 | 2.0 | ||||||
Net Income/Loss | 10.5 | 29.3 | ||||||
| Balance Sheet | ||||||||
| US$ million | As of June 30, 2010 | As of March 31, 2010 | ||||||
| Current Assets | 150.1 | 137.7 | ||||||
| Long Term Assets | 225.2 | 212.6 | ||||||
| Total Assets | 375.3 | 350.3 | ||||||
| Current Liabilities | 49.5 | 36.0 | ||||||
| Deferred taxes | 15.9 | 14.8 | ||||||
| Total Liabilities | 65.4 | 50.8 | ||||||
| Equity | 309.9 | 299.5 | ||||||
| Total Liabilities and Shareholders´ Equity | 375.3 | 350.3 | ||||||
36
| PRESS RELEASE |
| b. | Refining and Petrochemicals |
| 1. | Propilco |
Propilco celebrated its 20th anniversary and the completion of its plan to expand production of polypropylene to 500,000 tons a year. In addition, the Colombian Safety Counsel awarded Propilco the Merito Cruz Esmeralda medal in the excellence category (the highest distinction given by such counsel) for Propilco’s high standards in this area.
The following table summarizes Propilco’s sales for the periods indicated:
| Sales volume (tons) | 2Q 2010 | 2Q 2009 | As of june 2010 | As of june 2009 | ||||||||||||
| Polypropilyne | 89,513 | 103,970 | 198,350 | 203,940 | ||||||||||||
| Sales of COMAI's polypropylene | 2,497 | 2,247 | 4,971 | 4,598 | ||||||||||||
| Total | 92,010 | 106,217 | 203,321 | 208,538 | ||||||||||||
The following tables set forth Propilco’s financial results and balance sheets for the periods indicated:
| Income Statement | ||||||||||||||||
| (COP$ Billion) | 2Q 2010 | 2Q 2009 | As of june 2010 | As of june 2009 | ||||||||||||
| Local Sales | 141.8 | 114.9 | 285.6 | 229.1 | ||||||||||||
| Export Sales | 174.8 | 140.9 | 386.4 | 273.1 | ||||||||||||
| Total Sales | 316.6 | 255.8 | 672.0 | 502.2 | ||||||||||||
| Variable Costs | 275.3 | 200.0 | 577.3 | 386.8 | ||||||||||||
| Fixed Costs | 26.7 | 24.7 | 51.3 | 50.5 | ||||||||||||
| Cost of Sales | 302.0 | 224.7 | 628.6 | 437.3 | ||||||||||||
| Gross profit | 14.6 | 31.0 | 43.5 | 64.9 | ||||||||||||
| Operating Expenses | 22.9 | 21.6 | 46.0 | 46.2 | ||||||||||||
| Operating Profit | (8.3 | ) | 9.4 | (2.6 | ) | 18.7 | ||||||||||
| Non Operating Profit/(Loss) | 27.5 | (2.5 | ) | 39.6 | 4.2 | |||||||||||
| Income tax | 0.7 | 0.6 | 2.7 | 2.5 | ||||||||||||
| Net Income/Loss | 18.5 | 6.3 | 34.3 | 20.4 | ||||||||||||
| EBITDA | 1.4 | 18.8 | 16.8 | 36.8 | ||||||||||||
| EBITDA margin | 0 | % | 7 | % | 2 | % | 7 | % | ||||||||
In the second quarter of 2010 total sales increased 24% in comparison with the same period of 2009. Nevertheless, cost of sales grew 34% diminishing the gross margin by 53%. The price of propylene was very volatile during the quarter, which impacted the demand for the product, margins, and prices of polypropylene.
The increase in non-operating profit was due to the growth in the net income of Comai, a subsidiary of Propilco which owns a polypropylene purifier facility in charge of cleaning and providing the raw materials supplied by Ecopetrol. Comai’s margin increased significantly in the second quarter improving the margins and net income.
37
| PRESS RELEASE |
| Balance Sheet | ||||||||
| COP$ Billion | As of June 30, 2010 | As of March 31, 2010 | ||||||
| Current Assets | 521.8 | 414.0 | ||||||
| Long Term Assets | 526.8 | 432.8 | ||||||
| Total Assets | 1,048.6 | 846.8 | ||||||
| Current Liabilities | 404.0 | 277.9 | ||||||
| Long Term Liabilities | 30.3 | 27.8 | ||||||
| Total Liabilities | 434.3 | 305.7 | ||||||
| Equity | 614.3 | 541.1 | ||||||
| Total Liabilities and Shareholders´ Equity | 1,048.6 | 846.8 | ||||||
| Memorandum accounts | $ | 213.3 | $ | 224.9 | ||||
| 2. | Reficar S.A. |
On June 15, the Cartagena Refinary entered into an EPC contract with the company CB&I Engineering aimed at expanding and modernizing the Refinery. According to initial estimates, the date for mechanical completion would be February 28, 2013.
The following table summarizes the Cartagena Refinery’s runs during the periods indicated:
| 2Q 2010 | 2Q 2009 | As of june 2010 | As of june 2009 | |||||||||||||
| Refinery runs (MBD) | 78.4 | 78.7 | 78.6 | 78.6 | ||||||||||||
The Cartagena Refinery’s crude run was 78.4 mbod in second quarter of 2010. During the first half of the year, an average crude run of 7% was maintained, producing a conversion factor of approximately 75%. The gross margin for refining increased 108% over the first quarter 2010 as a result of increased crude price and product price stability, but was 10% below the second quarter 2009. The increase in the margin for the second quarter versus the first quarter of 2010 was due to the volatility of crude prices with a decreasing trend in the second quarter versus the stability in product prices during the same period.
The following table summarizes the Cartagena Refinery’s sales for the periods indicated:
| Sales Volume (MBD) | 2Q 2010 | 2Q 2009 | As of june 2010 | As of june 2009 | ||||||||||||
| Local | 39.1 | 43.9 | 42.3 | 42.6 | ||||||||||||
| International | 50.8 | 35.8 | 48.4 | 38.4 | ||||||||||||
| Total | 89.9 | 79.7 | 90.7 | 81 | ||||||||||||
Sales increased 13% in the second quarter of 2010 compared to the same period of 2009. In the second quarter of 2009, local sales represented 55% of total sales volume and exports represented 45%. These breakdown changed in second quarter 2010 when exports accounted for 57% of total sales volumes and local sales represented only 43% of total sales volumes of total sales volume, due mainly to; 1) Higher exports of diesel with high sulfur content given the new environmental regulations; and 2) Commercialization of ethanol mix in the northern region of the country which decreased internal fuel sales.
38
| PRESS RELEASE |
The following tables set forth the Cartagena Refinery’s financial results and balance sheets for the periods indicated:
| Income Statement | ||||||||
| (COP$ Billion) | 2Q 2010 | As of june 2010 | ||||||
| Local Sales | 730.4 | 1,093.2 | ||||||
| Export Sales | 653.9 | 1,141.3 | ||||||
| Total Sales | 1,384.3 | 2,234.5 | ||||||
| Cost of Sales | 1,398.9 | 2,205.5 | ||||||
| Gross profit | (14.6 | ) | 29.0 | |||||
| Operating Expenses | 15.8 | 28.8 | ||||||
| Operating Profit | (30.4 | ) | 0.2 | |||||
| Non Operating income | 22.8 | 30.8 | ||||||
| Non Operating expenses | (13.9 | ) | (31.6 | ) | ||||
| Income before tax | (21.5 | ) | (0.5 | ) | ||||
| Income tax | 2.0 | 3.4 | ||||||
| Net Income/Loss | (23.5 | ) | (4.0 | ) | ||||
| EBITDA | $ | ( 20.2 | ) | $ | 2.3 | |||
| EBITDA Margin | -1.5 | % | 0.1 | % | ||||
| Balance Sheet | ||||||||
| COP$ Billion | As of june 30 2010 | As of March 31 2010 | ||||||
| Current Assets | 1,048.6 | 928.7 | ||||||
| Long Term Assets | 2,319.3 | 2,093.3 | ||||||
| Total Assets | 3,367.9 | 3,022.0 | ||||||
| Current Liabilities | 884.8 | 541.5 | ||||||
| Long Term Liabilities | 16.0 | 18.2 | ||||||
| Total Liabilities | 900.8 | 559.7 | ||||||
| Equity | 2,467.1 | 2,462.3 | ||||||
| Total Liabilities and Shareholders´ Equity | 3,367.9 | 3,022.0 | ||||||
| Debit memorandum accounts | 592.1 | 592.1 | ||||||
| Credit memorandum accounts | 417.7 | 417.7 | ||||||
| c. | Transportation |
| 1. | Ocensa |
During the first half of 2010, Ocensa’s project to increase capacity to 560 mbod continued. In addition, Ocensa began studies aimed at increasing future capacity above 560 mbod.
The following table summarizes Ocensa’s volumes transported for the periods indicated:
39
| PRESS RELEASE |
| Transported volumes (MBOD) | 2Q 2010 | 2Q 2009 | As of june 2010 | As of june 2009 | ||||||||||||
| Cusiana-Porvenir | 52.5 | 60.9 | 53.3 | 61.9 | ||||||||||||
| Porvenir-Vasconia | 464.2 | 272.4 | 447.2 | 270.1 | ||||||||||||
| Vasconia-Coveñas | 286.4 | 188.3 | 277.9 | 187.7 | ||||||||||||
| Coveñas-Export Port | 253.6 | 234.6 | 260.3 | 225.4 | ||||||||||||
During the second quarter of 2010, the growth trend in volume transported by Ocensa’s various systems continued as a result of growing production. The volume of crude transported through the Porvenir-Vasconia system during the second quarter was 70% higher than the same period a year ago. Additionally, the volumes transported through the Vasconia-Covenas and Covenas-Export facility systems increased 52% and 8%, respectively.
The following tables set forth Ocensa’s financial results and balance sheets for the periods indicated:
| Income Statement | ||||||||||||||||
| (COP$ Billion) | 2Q 2010 | 2Q 2009 | As of june 2010 | As of june 2009 | ||||||||||||
| Total Sales | 217.9 | 228.1 | 810.4 | 345.2 | ||||||||||||
| Cost of Sales | 155.9 | 187.3 | 313.5 | 283.8 | ||||||||||||
| Gross profit | 62.0 | 40.8 | 496.9 | 61.4 | ||||||||||||
| Operating Expenses | 13.1 | 26.8 | 21.3 | 26.8 | ||||||||||||
| Operating Profit | 48.9 | 14.0 | 475.6 | 34.6 | ||||||||||||
| Non Operating Profit/(Loss) | (0.7 | ) | (63.2 | ) | (61.0 | ) | (44.0 | ) | ||||||||
| Income tax | 15.6 | (11.5 | ) | 104.6 | 9.2 | |||||||||||
| Net Income | 32.6 | (37.7 | ) | 310.0 | (18.6 | ) | ||||||||||
| EBITDA | $ | 29.9 | $ | 163.2 | $ | 286.0 | $ | 163.2 | ||||||||
| EBITDA Margin | -8.0 | % | 71.5 | % | 35.3 | % | 47.3 | % | ||||||||
| Balance Sheet | ||||||||
| COP$ Billion | As of June 30, 2010 | As of March 31, 2010 | ||||||
| Current Assets | 1,105.2 | 1,258.0 | ||||||
| Long Term Assets | 1,094.9 | 1,160.3 | ||||||
| Total Assets | 2,200.1 | 2,418.3 | ||||||
| Current Liabilities | 186.6 | 168.9 | ||||||
| Long Term Liabilities | 243.3 | 262.0 | ||||||
| Total Liabilities | 429.9 | 430.9 | ||||||
| Equity | 1,770.2 | 1,987.4 | ||||||
| Total Liabilities and Shareholders´ Equity | 2,200.1 | 2,418.3 | ||||||
| Debit memorandum accounts | 81.1 | 81.2 | ||||||
| Credit memorandum accounts | 174.8 | 174.8 | ||||||
40
| PRESS RELEASE |
| 2. | ODL |
On May 21, 2010, ODL entered into a second COL$800,000 million (approximately US$406 million) loan facility with Grupo Aval (comprised of Banco de Bogota S.A., Banco de Occidente S.A., Banco Popular S.A. and Banco AV Villas S.A.). All funds were disbursed in June 2010 and the proceeds were used to fully pay an existing COL$520,000 million (approximately US$200 million) loan facility with Grupo Aval and any remaining amount was allocated to finance part of the Rubiales pipeline, particularly the expansion and construction of the Viento-Cusiana line. Proceeds were disbursed on June 1st.
During the first half of 2010, ODL began projects to expand the oil pipeline and build the Viento-Cusiana line. Preparations are currently underway at the EBR (Rubiales Pumping Station) site, the civil tank project, and the hiring process has begun to prepare the site and install inline pumping stations. The Environmental License for this project is still pending.
The following table summarizes ODL’s expected expansion projects for the periods indicated:
Projects 2010 | Increases in capacity | Cost USD MM | % completed | |||||||
| Expansion | 340 MBD | 174 | 29 | % | ||||||
| El Viento-Cusiana | 176 MBD | 58 | 37 | % | ||||||
| Total investments | 232 | |||||||||
During the second quarter of 2010, an average of 141.5 mbod was transported through the Llanos oil pipeline, representing an increase of 22% compared to the 116.4 mbod transported during in first quarter 2010.
The following tables set forth ODL’s volumes transported for the periods indicated:
| 2Q 2010 | 2Q 2009 | As of june 2010 | As of june 2009 | |||||||||||||
| Transported volumes (MBOD) | 141.5 | 0.0 | 129.1 | 0.0 | ||||||||||||
The following tables set forth ODL’s financial results and balance sheets for the periods indicated:
41
| PRESS RELEASE |
| Income Statement | ||||||||
| (COP$ Billion) | 2Q 2010 | As of june 2010 | ||||||
| Domestic sales | 37.8 | 70.9 | ||||||
| Total Sales | 37.8 | 70.9 | ||||||
| Variable Costs | 4.9 | 11.2 | ||||||
| Fixed Costs | 20.2 | 33.5 | ||||||
| Cost of Sales | 25.1 | 44.7 | ||||||
| Gross profit | 12.7 | 26.2 | ||||||
| Operating Expenses | 1.5 | 2.8 | ||||||
| Operating Profit | 11.2 | 23.4 | ||||||
| Non Operating Profit/(Loss) | (5.9 | ) | (17.8 | ) | ||||
| Income tax | (2.0 | ) | (2.0 | ) | ||||
| Net Income | 3.3 | 3.6 | ||||||
| EBITDA Millardos de COP$ | 14.3 | 29.0 | ||||||
| Margen EBITDA | 37.8 | % | 41.0 | % | ||||
| Balance Sheet | ||||||||
| COP$ Billion | As of June 30, 2010 | As of March 31, 2010 | ||||||
| Current Assets | 542.9 | 156.1 | ||||||
| Long Term Assets | 1,251.1 | 1,201.8 | ||||||
| Total Assets | 1,794.0 | 1,357.9 | ||||||
| Current Liabilities | 163.0 | 514.0 | ||||||
| Long Term Liabilities | 1,206.3 | 422.5 | ||||||
| Total Liabilities | 1,369.3 | 936.5 | ||||||
| Equity | 424.7 | 421.4 | ||||||
| Total Liabilities and Shareholders´ Equity | 1,794.0 | 1,357.9 | ||||||
| d. | Bio fuels |
| 1. | Ecodiesel |
During second quarter 2010, the pre-commissioning and commissioning of Ecodiesel’s Refino and Biodiesel plants, as well as lab tests, took place, resulting in the first drop of biodiesel in specifications on June 12, 2010. Certification was also granted by the Mining Ministry, proving that the Ecodiesel plant meets requirements for the next step of being declared an official producer of biodiesel.
| 2. | Bioenergy |
Bionergy continues its progress towards the preparation of agricultural lands and irrigation system and the planting of a commercial seedbed. To date, 500 hectares have been cultivated. Also, progress was made in defining the technology and in the company’s negotiations with the contractor who will be in charge of engineering works and building the plant.
42
| PRESS RELEASE |
VI. Presentation of results
On Thursday, July 29, 2010, Ecopetrol’s management will offer two presentations on the Web to discuss the results of the second quarter and first half of 2010:
| In Spanish | In English |
| July 29, 2010 | July 29, 2010 |
| 1:30 p.m. Bogotá | 3:00 pm Bogotá |
| 2:30 p.m. New York | 4:00 p.m. New York |
The webcast will be available on Ecopetrol’s site www.ecopetrol.com.co
Please log in to the site 10 minutes beforehand in order to download the necessary software. A copy of the webcast will be available throughout the year following the live event.
About Ecopetrol S.A.
Ecopetrol S.A. (BVC: ECOPETROL; NYSE: EC; BVL: EC) is Colombia’s largest company in terms of billing, profit, assets and owners equity. Ecopetrol is the only vertically integrated crude oil and natural gas company with operations in Colombian Brazil, Peru and the United States (Gulf of Mexico). Ecopetrol’s subsidiaries include the largest producer of petrochemicals in Colombia, Propilco, as well as Black Gold Re Ltd., Ecopetrol Oleo e Gas do Brazil Ltd., Ecopetrol America Inc., Ecopetrol del Peru S.A., Hocol S.A., Andean Chemicals Limited, COMAI, Bioenergy S.A., ODL Finance S.A., ECP Global Energy, Ecopetrol Transportation Company, Ocensa S.A. and Refinería de Cartagena. Ecopetrol is among the top 40 oil companies in the world and the four largest oil companies in Latin America. Ecopetrol is majority owned by the Republic of Colombia and its shares are traded in the Colombian Stock Exchange (BVC) under the symbol ECOPETROL and in the NYSE through its ADR under the ticker symbol EC. The company divides its operations in five business segments that include Exploration and Production; Transport; Refinery; Marketing and Sales of Crude Oil, Natural Gas and Refined Products; and Corporate Center.
For additional information please visit our website at www.ecopetrol.com.co
Forward looking statements
This release contains forward-looking statements relating to the prospects of the business, estimates for operating and financial results, and those related to growth prospects of Ecopetrol. These are merely projections and, as such, are based exclusively on the expectations of management concerning the future of the Company and its continued access to capital to fund the Company’s business plan. Such forward-looking statements depend, substantially, on changes in market conditions, government regulations, competitive pressures, the performance of the Colombian economy and the industry, among other factors; therefore, they are subject to change without prior notice.
43
| PRESS RELEASE |
ECOPETROL S.A.
Director of Investor Relations
Alejandro Giraldo
Phone: +571-234-5190
Fax:+571-2345628
Email: investors@ecopetrol.com.co
Media Relations (Colombia)
Jorge Mauricio Téllez
Phone: + 571-2345377
Fax: +571-2344480
Email: mauricio.tellez@ecopetrol.com.co
Bogota, Colombia, July 28 of 2010
Ecopetrol is Colombia’s largest integrated oil company and is among the top 40 oil companies in the world and the four largest oil companies in Latin America. Besides Colombia, where it accounts for 60% of total production, the Company is involved in exploration and production activities in Brazil, Peru and the United States (Gulf of Mexico). Ecopetrol has the principal refinery in Colombia, most of the network of oil and multiple purpose pipelines in the country, and it is considerably increasing its participation in biofuels.
This release contains forward-looking statements relating to the prospects of the business, estimates for operating and financial results, and those related to growth prospects of Ecopetrol. These are merely projections and, as such, are based exclusively on the expectations of management concerning the future of the business and its continued access to capital to fund the Company’s business plan. Such forward-looking statements depend, substantially, on changes in market conditions, government regulations, competitive pressures, the performance of the Colombian economy and the industry, among other factors; therefore, they are subject to change without prior notice.
44
| PRESS RELEASE |
VII. Tables
Unaudited Income Statement
Ecopetrol S.A.
| COP$ Million | 2Q-10 | 2Q-09 | % | 1Q-10 | As of June 30, 2010 | As of June 30, 2009 | % | |||||||||||||||||||||
| Income | ||||||||||||||||||||||||||||
| Local Sales | 3,372,841 | 3,438,558 | (1.9 | )% | 3,382,757 | 6,755,598 | 6,592,361 | 2.5 | % | |||||||||||||||||||
| Export Sales | 5,437,495 | 3,015,286 | 80.3 | % | 5,040,247 | 10,477,742 | 4,738,347 | 121.1 | % | |||||||||||||||||||
| Sale of Services | 322,847 | 231,665 | 39.4 | % | 318,603 | 641,450 | 467,554 | 37.2 | % | |||||||||||||||||||
| Total Income | 9,133,183 | 6,685,509 | 36.6 | % | 8,741,607 | 17,874,790 | 11,798,262 | 51.5 | % | |||||||||||||||||||
| Cost of Sales | - | |||||||||||||||||||||||||||
| Variable Costs | - | |||||||||||||||||||||||||||
| Purchase of Hydrocarbons | 2,273,654 | 1,769,551 | 28.5 | % | 2,166,418 | 4,440,072 | 3,141,235 | 41.3 | % | |||||||||||||||||||
| Amortization and Depletion | 642,430 | 429,339 | 49.6 | % | 605,407 | 1,247,837 | 823,858 | 51.5 | % | |||||||||||||||||||
| Imported products | 1,148,515 | 510,167 | 125.1 | % | 1,009,671 | 2,158,186 | 946,515 | 128.0 | % | |||||||||||||||||||
| Transportation Cost for Refineries | 162,254 | 201,207 | (19.4 | )% | 195,475 | 357,729 | 360,788 | (0.8 | )% | |||||||||||||||||||
| Inventories | 114,515 | (303,108 | ) | 137.8 | % | (286,486 | ) | (171,971 | ) | (63,103 | ) | 172.5 | % | |||||||||||||||
| Other | 158,210 | 273,544 | (42.2 | )% | 128,030 | 286,240 | 416,514 | (31.3 | )% | |||||||||||||||||||
| Fixed Costs | 0.0 | % | $ | 0 | ||||||||||||||||||||||||
| Depreciation | 199,801 | 162,104 | 23.3 | % | 193,637 | 393,438 | 313,734 | 25.4 | % | |||||||||||||||||||
| Contracted Services | 439,635 | 361,707 | 21.5 | % | 397,002 | 836,637 | 677,666 | 23.5 | % | |||||||||||||||||||
| Maintenance | 239,121 | 176,810 | 35.2 | % | 169,065 | 408,186 | 300,178 | 36.0 | % | |||||||||||||||||||
| Labor Costs | 232,742 | 174,290 | 33.5 | % | 251,295 | 484,037 | 364,274 | 32.9 | % | |||||||||||||||||||
| Other | 255,831 | 244,948 | 4.4 | % | 221,305 | 477,136 | 395,071 | 20.8 | % | |||||||||||||||||||
| Total Cost of Sales | 5,866,708 | 4,000,559 | 46.6 | % | 5,050,819 | 10,917,527 | 7,676,730 | 42.2 | % | |||||||||||||||||||
| Gross Profits | 3,266,475 | 2,684,950 | 21.7 | % | 3,690,788 | 6,957,263 | 4,121,532 | 68.8 | % | |||||||||||||||||||
| Operating Expenses | ||||||||||||||||||||||||||||
| Administration | 120,311 | 123,044 | (2.2 | )% | 93,163 | 213,474 | 217,072 | (1.7 | )% | |||||||||||||||||||
| Selling expenses | 306,721 | 185,729 | 65.1 | % | 219,005 | 525,726 | 409,485 | 28.4 | % | |||||||||||||||||||
| Exploration and Projects | 146,284 | 243,862 | (40.0 | )% | 180,410 | 326,694 | 341,784 | (4.4 | )% | |||||||||||||||||||
| Operating Income | 2,693,159 | 2,132,315 | 26.3 | % | 3,198,210 | 5,891,369 | 3,153,191 | 86.8 | % | |||||||||||||||||||
| Non Operating Income (expenses) | ||||||||||||||||||||||||||||
| Financial Income | 1,207,951 | 1,387,816 | (13.0 | )% | 962,180 | 2,170,131 | 4,478,628 | (51.5 | )% | |||||||||||||||||||
| Financial Expenses | (1,078,370 | ) | (2,091,875 | ) | 48.4 | % | (1,005,879 | ) | (2,084,249 | ) | (3,906,535 | ) | 46.6 | % | ||||||||||||||
| Non Financial Income | 173,142 | 117,871 | 46.9 | % | 192,810 | 365,952 | 320,554 | 14.2 | % | |||||||||||||||||||
| Non Financial Expenses | (474,533 | ) | (431,231 | ) | 10.0 | % | (712,337 | ) | (1,186,870 | ) | (765,349 | ) | 55.1 | % | ||||||||||||||
| Income before income tax | 2,407,435 | 1,101,984 | 118.5 | % | 2,872,932 | 5,280,367 | 3,316,462 | 59.2 | % | |||||||||||||||||||
| Provision for Income Tax | 602,437 | 339,975 | 77.2 | % | 776,266 | 1,378,703 | 945,192 | 45.9 | % | |||||||||||||||||||
| Minority interest | - | - | 0.0 | % | - | |||||||||||||||||||||||
| Net Income | 1,804,998 | 762,009 | 136.9 | % | 2,096,666 | 3,901,664 | 2,371,270 | 64.5 | % | |||||||||||||||||||
| EBITDA | 3,635,691 | 2,807,640 | 29.5 | % | 4,106,450 | 7,742,141 | 4,436,868 | 74.5 | % | |||||||||||||||||||
| EBITDA MARGIN | 40 | % | 42 | % | 47 | % | 43 | % | 38 | % | ||||||||||||||||||
| EARNINGS PER SHARE | $ | 44.60 | $ | 18.83 | 136.9 | % | $ | 51.80 | $ | 96.40 | $ | 58.59 | 64.5 | % | ||||||||||||||
45
| PRESS RELEASE |
Unaudited Income Statement
Ecopetrol S.A. and Subsidiaries *
| COP$ Million | 2Q-10 | 2Q-09 | % | 1Q-10 | As of June 30, 2010 | As of June 30, 2009 | % | |||||||||||||||||||||
| Income | ||||||||||||||||||||||||||||
| Local Sales | 4,102,371 | 3,500,327 | 17.2 | % | 3,881,148 | 7,983,519 | 6,687,482 | 19.4 | % | |||||||||||||||||||
| Export Sales | 5,783,161 | 3,544,496 | 63.2 | % | 5,540,256 | 11,323,417 | 5,361,572 | 111.2 | % | |||||||||||||||||||
| Sale of Services | 328,811 | 231,666 | 41.9 | % | 796,367 | 1,125,178 | 467,554 | 140.7 | % | |||||||||||||||||||
| Total Income | 10,214,343 | 7,276,489 | 40.4 | % | 10,217,771 | 20,432,114 | 12,516,608 | 63.2 | % | |||||||||||||||||||
| Cost of Sales | ||||||||||||||||||||||||||||
| Variable Costs | ||||||||||||||||||||||||||||
| Purchase of Hydrocarbons | 3,146,209 | 1,716,256 | 83.3 | % | 2,772,527 | 5,918,736 | 3,116,229 | 89.9 | % | |||||||||||||||||||
| Amortization and Depletion | 783,941 | 499,277 | 57.0 | % | 638,305 | 1,422,246 | 893,796 | 59.1 | % | |||||||||||||||||||
| Imported products | 1,445,074 | 424,803 | 240.2 | % | 1,107,238 | 2,552,312 | 968,853 | 163.4 | % | |||||||||||||||||||
| Transportation Cost for Refineries | 14,094 | 201,207 | (93.0 | %) | 211,665 | 225,759 | 360,788 | (37.4 | %) | |||||||||||||||||||
| Inventories | 176,537 | (191,597 | ) | (192.1 | %) | (279,420 | ) | (102,883 | ) | 48,408 | (312.5 | %) | ||||||||||||||||
| Other | 65,599 | 293,749 | (77.7 | %) | 42,944 | 108,543 | 302,555 | (64.1 | %) | |||||||||||||||||||
| Fixed Costs | - | - | 0.0 | % | ||||||||||||||||||||||||
| Depreciation | 170,816 | 339,643 | (49.7 | %) | 265,431 | 436,247 | 562,223 | (22.4 | %) | |||||||||||||||||||
| Contracted Services | 205,393 | 301,072 | (31.8 | %) | 403,734 | 609,127 | 675,282 | (9.8 | %) | |||||||||||||||||||
| Maintenance | 289,360 | 235,232 | 23.0 | % | 210,015 | 499,375 | 300,178 | 66.4 | % | |||||||||||||||||||
| Labor Costs | 244,832 | 176,530 | 38.7 | % | 263,786 | 508,618 | 366,659 | 38.7 | % | |||||||||||||||||||
| Other | 261,655 | 688,589 | (62.0 | %) | 358,243 | 619,898 | 847,731 | (26.9 | %) | |||||||||||||||||||
| Total Cost of Sales | 6,803,510 | 4,684,761 | 45.2 | % | 5,994,468 | 12,797,978 | 8,442,702 | 51.6 | % | |||||||||||||||||||
| Gross Profits | 3,410,833 | 2,591,728 | 31.6 | % | 4,223,303 | 7,634,136 | 4,073,906 | 87.4 | % | |||||||||||||||||||
| Operating Expenses | ||||||||||||||||||||||||||||
| Administration | 154,387 | 186,084 | (17.0 | %) | 127,454 | 281,841 | 286,512 | (1.6 | %) | |||||||||||||||||||
| Selling expenses | 321,795 | 44,570 | 622.0 | % | 260,825 | 582,620 | 281,827 | 106.7 | % | |||||||||||||||||||
| Exploration and Projects | 391,249 | 260,131 | 50.4 | % | 218,437 | 609,686 | 342,073 | 78.2 | % | |||||||||||||||||||
| Operating Income | 2,543,402 | 2,100,943 | 21.1 | % | 3,616,587 | 6,159,989 | 3,163,494 | 94.7 | % | |||||||||||||||||||
| Non Operating Income (expenses) | ||||||||||||||||||||||||||||
| Financial Income | 2,410,906 | 6,981,821 | (65.5 | %) | 1,583,627 | 3,994,533 | 10,182,748 | (60.8 | %) | |||||||||||||||||||
| Financial Expenses | (2,268,341 | ) | (7,757,423 | ) | (70.8 | %) | (1,689,672 | ) | (3,958,013 | ) | (9,632,256 | ) | 58.9 | % | ||||||||||||||
| Non Financial Income | 203,012 | 149,617 | 35.7 | % | 206,767 | 409,779 | 352,627 | 16.2 | % | |||||||||||||||||||
| Non Financial Expenses | (505,387 | ) | (441,267 | ) | 14.5 | % | (744,045 | ) | (1,249,432 | ) | (797,783 | ) | 56.6 | % | ||||||||||||||
| - | - | 0.0 | % | |||||||||||||||||||||||||
| Income before income tax | 2,383,592 | 1,033,691 | 130.6 | % | 2,973,264 | 5,356,856 | 3,268,830 | 63.9 | % | |||||||||||||||||||
| Provision for Income Tax | 618,731 | 348,656 | 77.5 | % | 912,759 | 1,531,490 | 975,311 | 57.0 | % | |||||||||||||||||||
| Minority interest | (2,205 | ) | (7,241 | ) | (69.5 | %) | 106,175 | 103,970 | (7,191 | ) | 1,545.8 | % | ||||||||||||||||
| Net Income | 1,767,066 | 692,276 | 155.3 | % | 1,954,330 | 3,721,396 | 2,300,710 | 61.7 | % | |||||||||||||||||||
| EBITDA | 3,579,622 | 3,134,115 | 14.2 | % | 4,454,732 | 8,034,354 | 4,889,666 | 64.3 | % | |||||||||||||||||||
| EBITDA MARGIN | 35 | % | 43 | % | 44 | % | 39 | % | 39 | % | ||||||||||||||||||
Notes
* According to the Public Accounting Framework, Colombian companies only have the obligation to consolidate their financial statements at the end of each fiscal year, wherefore the quarterly figures in this report do not constitute a formal consolidation of Ecopetrol's financial statement, though they do adjust to the methodology defined for this purpose.
46
| PRESS RELEASE |
Unaudited Balance Sheet
| Ecopetrol S.A. | Ecopetrol S.A. and Subsidiaries | |||||||||||||||||||||||
| As of June 30, | As of March 31, | As of June 30, | As of March 31, | |||||||||||||||||||||
| COP$ Million | 2010 | 2010 | % | 2010 | 2010 | % | ||||||||||||||||||
| Assets | ||||||||||||||||||||||||
| Current Assets | ||||||||||||||||||||||||
| Cash and cash equivalents | 3,427,341 | 2,696,818 | 27.1 | % | 4,867,304 | 4,363,506 | 11.5 | % | ||||||||||||||||
| Investments | 1,243,708 | 370,196 | 236.0 | % | 1,924,788 | 658,167 | 192.4 | % | ||||||||||||||||
| Accounts and notes receivable | 2,721,980 | 2,975,763 | (8.5 | )% | 2,849,060 | 3,565,295 | (20.1 | )% | ||||||||||||||||
| Other | 3,858,983 | 4,945,174 | (22.0 | )% | 4,718,082 | 5,706,500 | (17.3 | )% | ||||||||||||||||
| Total Current Assets | 11,252,012 | 10,987,951 | 2.4 | % | 14,359,234 | 14,293,468 | 0.5 | % | ||||||||||||||||
| Non Current Assets | ||||||||||||||||||||||||
| Investments | 11,440,259 | 11,668,511 | (2.0 | )% | 4,819,758 | 5,086,189 | (5.2 | )% | ||||||||||||||||
| Accounts and notes receivable | 1,293,639 | 1,305,739 | (0.9 | )% | 163,680 | 189,633 | (13.7 | )% | ||||||||||||||||
| Property, plant and equipment, net | 12,447,635 | 12,071,817 | 3.1 | % | 19,029,927 | 17,224,434 | 10.5 | % | ||||||||||||||||
| Natural and environmental properties, Net | 9,094,740 | 9,013,416 | 0.9 | % | 9,803,951 | 10,745,025 | (8.8 | )% | ||||||||||||||||
| Other | 13,566,478 | 10,979,585 | 23.6 | % | 14,105,183 | 11,504,927 | 22.6 | % | ||||||||||||||||
| Total Non Current Assets | 47,842,751 | 45,039,068 | 6.2 | % | 47,922,499 | 44,750,208 | 7.1 | % | ||||||||||||||||
| Total Assets | 59,094,763 | 56,027,019 | 5.5 | % | 62,281,733 | 59,043,676 | 5.5 | % | ||||||||||||||||
| Liabilities and Equity | ||||||||||||||||||||||||
| Current Liabilities | ||||||||||||||||||||||||
| Financial obligations | 125,422 | 101,098 | 24.1 | % | 523,299 | 431,142 | 21.4 | % | ||||||||||||||||
| Accounts payable and related parties | 7,832,596 | 8,255,289 | (5.1 | )% | 5,143,659 | 4,762,880 | 8.0 | % | ||||||||||||||||
| Estimated liabilities and provisions | 1,341,710 | 913,132 | 46.9 | % | 1,682,844 | 1,186,183 | 41.9 | % | ||||||||||||||||
| Other | 1,911,804 | 2,395,786 | (20.2 | )% | 4,607,796 | 6,545,979 | (29.6 | )% | ||||||||||||||||
| Total Current Liabilities | 11,211,532 | 11,665,305 | (3.9 | )% | 11,957,598 | 12,926,184 | (7.5 | )% | ||||||||||||||||
| Long Term Liabilities | ||||||||||||||||||||||||
| Financial obligations | 5,094,890 | 5,113,085 | (0.4 | )% | 6,043,270 | 5,800,119 | 4.2 | % | ||||||||||||||||
| Labor and pension plan obligations | 2,911,912 | 2,817,967 | 3.3 | % | 2,920,183 | 2,826,299 | 3.3 | % | ||||||||||||||||
| Estimated liabilities and provisions | 3,127,565 | 3,132,633 | (0.2 | )% | 3,201,613 | 3,217,730 | (0.5 | )% | ||||||||||||||||
| Other | 2,223,756 | 2,270,556 | (2.1 | )% | 2,841,507 | 2,345,037 | 21.2 | % | ||||||||||||||||
| Total Long Term Liabilities | 13,358,123 | 13,334,241 | 0.2 | % | 15,006,573 | 14,189,185 | 5.8 | % | ||||||||||||||||
| Total Liabilities | 24,569,655 | 24,999,546 | (1.7 | )% | 26,964,171 | 27,115,369 | (0.6 | )% | ||||||||||||||||
| Minoritary Interest | 968,792 | 1,052,216 | (7.9 | )% | ||||||||||||||||||||
| Equity | 34,525,108 | 31,027,473 | 11.3 | % | 34,348,770 | 30,876,092 | 11.2 | % | ||||||||||||||||
| Total Liabilities and Shareholders' Equity | 59,094,763 | 56,027,019 | 5.5 | % | 62,281,733 | 59,043,676 | 5.5 | % | ||||||||||||||||
| Memorandum Debtor Accounts ** | 88,299,767 | 85,599,685 | 89,666,986 | 86,927,633 | ||||||||||||||||||||
| Memorandum Creditor Accounts ** | 62,875,849 | 57,736,540 | 63,812,042 | 58,657,762 | ||||||||||||||||||||
Notes
* According to the Public Accounting Framework, Colombian companies only have the obligation to consolidate their financial statements at the end of each fiscal year, wherefore the figures for interim periods in this report do not constitute a formal consolidation of Ecopetrol's financial statement, though they do adjust to the methodology defined for this purpose.
**Under Colombian GAAP, Ecopetrol must maintain in its accounting the recording of financial information and transactions not reflected in financial statements
47
| PRESS RELEASE |
Unaudited Cash Flow Statement
Ecopetrol S.A.
| COP$ million | 2Q 2010 | 2Q 2009 | % | 1Q 2010 | As of June 30, 2010 | As of June 30, 2009 | % | |||||||||||||||||||||
| Cash flow provided by operating activities: | ||||||||||||||||||||||||||||
| Net income | 1,804,998 | 762,009 | 136.9 | % | 2,096,666 | 3,901,664 | 2,371,270 | 64.5 | % | |||||||||||||||||||
| Adjustments to reconcile net income to cash provided by operating activities: | ||||||||||||||||||||||||||||
| Depreciation, depletion and amortization | 942,531 | 675,325 | 39.6 | % | 908,240 | 1,850,771 | 1,283,643 | 44.2 | % | |||||||||||||||||||
| Provisions | 43,231 | (19,325 | ) | 323.7 | % | 14,711 | 57,942 | (87,812 | ) | 166.0 | % | |||||||||||||||||
| Net changes in operating assets and liabilities: | ||||||||||||||||||||||||||||
| Accounts and notes receivable | 1,133,196 | (426,203 | ) | 365.9 | % | (620,570 | ) | 512,626 | (1,085,729 | ) | 147.2 | % | ||||||||||||||||
| Inventories | 217,268 | (193,353 | ) | 212.4 | % | (281,161 | ) | (63,893 | ) | 50,343 | (226.9 | )% | ||||||||||||||||
| Deferred and other assets | (448,463 | ) | (347,256 | ) | 29.1 | % | 36,447 | (412,016 | ) | (2,216,549 | ) | 81.4 | % | |||||||||||||||
| Accounts payable and related parties | 831,935 | 254,421 | 227.0 | % | 1,147,524 | 1,979,459 | 2,532,537 | (21.8 | )% | |||||||||||||||||||
| Taxes payable | (470,553 | ) | (2,519,476 | ) | 81.3 | % | 153,210 | (317,343 | ) | (2,116,387 | ) | 85.0 | % | |||||||||||||||
| Labor obligations | (12,210 | ) | (10,357 | ) | 17.9 | % | (14,763 | ) | (26,973 | ) | (29,146 | ) | 7.5 | % | ||||||||||||||
| Estimated liabilities and provisions | 377,526 | (376,932 | ) | 200.2 | % | (75,557 | ) | 301,970 | (222,877 | ) | 235.5 | % | ||||||||||||||||
| Cash provided by operating activities | 4,462,155 | (1,924,199 | ) | 331.9 | % | 3,487,592 | 7,949,748 | 813,995 | 876.6 | % | ||||||||||||||||||
| Cash flows from investing activities: | ||||||||||||||||||||||||||||
| Purchase of investment securities | (2,025,193 | ) | (466,587 | ) | 334.0 | % | (3,592,441 | ) | (5,617,634 | ) | (865,979 | ) | 548.7 | % | ||||||||||||||
| Redemption of investment securities | 1,333,241 | 4,341,832 | (69.3 | )% | 1,930,232 | 3,263,473 | 6,309,506 | (48.3 | )% | |||||||||||||||||||
| Investment in natural and environmental resources | (746,399 | ) | (600,772 | ) | (24.2 | )% | (462,080 | ) | (1,208,479 | ) | (800,226 | ) | 51.0 | % | ||||||||||||||
| Additions to property, plant and equipment | (1,043,957 | ) | (1,116,212 | ) | 6.5 | % | (750,876 | ) | (1,794,833 | ) | (2,198,202 | ) | 18.3 | % | ||||||||||||||
| Net cash used in investing activities | (2,482,308 | ) | 2,158,261 | (215.0 | )% | (2,875,165 | ) | (5,357,473 | ) | 2,445,099 | (319.1 | )% | ||||||||||||||||
| Cash flows from financing activities: | ||||||||||||||||||||||||||||
| Financial obligations | (13,526 | ) | 1,764,700 | (100.8 | )% | (173,460 | ) | (186,986 | ) | 1,764,700 | 0.0 | % | ||||||||||||||||
| Debts from credit and financing operations | 19,655 | 21,328 | (7.8 | )% | (33,810 | ) | (14,155 | ) | 21,328 | (166.4 | )% | |||||||||||||||||
| Received from associates - capitalization | (826 | ) | (4,522 | ) | 81.7 | % | 1,163 | 337 | 5,399 | (93.8 | )% | |||||||||||||||||
| Payment of dividends | (1,254,628 | ) | (3,024,027 | ) | 58.5 | % | 3,502 | (1,251,126 | ) | (3,024,027 | ) | 58.6 | % | |||||||||||||||
| Net cash used in financing activities | (1,249,325 | ) | (1,242,521 | ) | 0.5 | % | (202,605 | ) | (1,451,930 | ) | (1,232,600 | ) | 17.8 | % | ||||||||||||||
| Net increase in cash and cash equivalent | 730,523 | (1,008,459 | ) | 172.4 | % | 409,822 | 1,140,345 | 2,026,494 | (43.7 | )% | ||||||||||||||||||
| Cash and cash equivalent at beginnig of year | 2,696,818 | 4,905,199 | (45.0 | )% | 2,286,996 | 2,286,996 | 1,870,246 | 22.3 | % | |||||||||||||||||||
| Cash and cash equivalent at end of year | 3,427,341 | 3,896,740 | (12.0 | )% | 2,696,818 | 3,427,341 | 3,896,740 | (12.0 | )% | |||||||||||||||||||
48
| PRESS RELEASE |
Unaudited Cash Flow Statement
Ecopetrol S.A. and subdiaries
| COP$ million | 2Q 2010 | * | 2Q 2009 | * | % | 1Q 2010* | As of June 30, 2010 | As of June 30, 2009 | % | |||||||||||||||||||
| Cash flow provided by operating activities: | ||||||||||||||||||||||||||||
| Net income | 1,767,065 | 692,276 | 155.3 | % | 1,954,330 | 3,721,395 | 2,300,710 | 61.7 | % | |||||||||||||||||||
| Adjustments to reconcile net income to cash provided by operating activities: | ||||||||||||||||||||||||||||
| Depreciation, depletion and amortization | 1,056,806 | 1,033,170 | 2.3 | % | 1,018,980 | 2,075,786 | 1,726,172 | 20.3 | % | |||||||||||||||||||
| Provisions | 67,232 | (19,325 | ) | 447.9 | % | 19,201 | 86,433 | (87,812 | ) | 198.4 | % | |||||||||||||||||
| Net changes in operating assets and liabilities: | ||||||||||||||||||||||||||||
| Accounts and notes receivable | 1,506,742 | 655,994 | (129.7 | )% | (820,324 | ) | 686,418 | (148,202 | ) | 563.2 | % | |||||||||||||||||
| Inventories | 178,967 | (511,202 | ) | 135.0 | % | (264,324 | ) | (85,357 | ) | (195,677 | ) | 56.4 | % | |||||||||||||||
| Deferred and other assets | 1,891,753 | (431,595 | ) | 538.3 | % | 109,325 | 2,001,078 | (1,137,912 | ) | 275.9 | % | |||||||||||||||||
| Accounts payable and related parties | 848,588 | 419,010 | 102.5 | % | 1,467,836 | 2,316,424 | 410,167 | 464.8 | % | |||||||||||||||||||
| Taxes payable | (2,066,133 | ) | (2,407,500 | ) | 14.2 | % | 1,438,747 | (627,386 | ) | (1,951,877 | ) | 67.9 | % | |||||||||||||||
| Labor obligations | (9,731 | ) | 32,389 | (130.0 | )% | (21,334 | ) | (31,065 | ) | (364,315 | ) | 91.5 | % | |||||||||||||||
| Estimated liabilities and provisions | 440,586 | (101,825 | ) | 532.7 | % | (1,506,828 | ) | (1,066,242 | ) | 2,637,198 | (140.4 | )% | ||||||||||||||||
| Cash provided by operating activities | 5,724,095 | (361,660 | ) | 1,682.7 | % | 3,518,454 | 9,242,549 | 3,523,154 | 162.3 | % | ||||||||||||||||||
| Cash flows from investing activities: | ||||||||||||||||||||||||||||
| Payment for purchase of Companies, net of cash acquired | - | - | #DIV/0! | - | - | (1,082,580 | ) | 100.0 | % | |||||||||||||||||||
| Purchase of investment securities | (2,025,193 | ) | (466,587 | ) | (334.0 | )% | (3,592,441 | ) | (5,617,634 | ) | (865,979 | ) | 548.7 | % | ||||||||||||||
| Redemption of investment securities | 1,003,682 | 6,068,701 | (83.5 | )% | 2,060,745 | 3,064,427 | 9,643,383 | (68.2 | )% | |||||||||||||||||||
| Investment in natural and environmental resources - Reserves | (746,399 | ) | (1,059,157 | ) | 29.5 | % | (462,080 | ) | (1,208,479 | ) | (1,552,787 | ) | 22.2 | % | ||||||||||||||
| Additions to property, plant and equipment | (2,448,817 | ) | (3,488,558 | ) | 29.8 | % | (918,687 | ) | (3,367,504 | ) | (6,334,786 | ) | 46.8 | % | ||||||||||||||
| Efectivo neto usado en las actividades de inversión | (4,216,727 | ) | 1,054,399 | 499.9 | % | (2,912,463 | ) | (7,129,190 | ) | (192,749 | ) | 3,598.7 | % | |||||||||||||||
| Cash flows financing activities: | ||||||||||||||||||||||||||||
| Minority interest | (83,424 | ) | 39,386 | (311.8 | )% | 110,905 | 27,481 | 714,544 | (96.2 | )% | ||||||||||||||||||
| Financial obligations | 247,820 | 2,302,392 | (89.2 | )% | 85,765 | 333,585 | 2,307,302 | (85.5 | )% | |||||||||||||||||||
| Debts from credit and financing operations | 87,488 | (26,190 | ) | 434.0 | % | (5,939 | ) | 81,549 | (127,223 | ) | 164.1 | % | ||||||||||||||||
| Received from associates - capitalization | (826 | ) | (4,522 | ) | 81.7 | % | 1,163 | 337 | 5,399 | (93.8 | )% | |||||||||||||||||
| Payment of dividends | (1,254,628 | ) | (3,042,626 | ) | 100.0 | % | 3,502 | (1,251,126 | ) | (3,042,626 | ) | 58.9 | % | |||||||||||||||
| Net cash used in financing activities | (1,003,571 | ) | (731,560 | ) | 37.2 | % | 195,396 | (808,175 | ) | (142,604 | ) | 466.7 | % | |||||||||||||||
| Net increase in cash and cash equivalent | 503,798 | (38,821 | ) | 1,397.8 | % | 801,387 | 1,305,185 | 3,187,801 | (59.1 | )% | ||||||||||||||||||
| Cash and cash equivalent at beginnig of year | 4,363,506 | 5,340,425 | (18.3 | )% | 3,562,119 | 3,562,119 | 2,113,803 | 68.5 | % | |||||||||||||||||||
| Cash and cash equivalent at end of year | 4,867,304 | 5,301,604 | -8.2 | % | 4,363,506 | 4,867,304 | 5,301,604 | -8.2 | % | |||||||||||||||||||
Notes
* According to the Public Accounting Framework, Colombian companies only have the obligation to consolidate their financial statements at the end of each fiscal year, wherefore the quarterly figures in this report do not constitute a formal consolidation of Ecopetrol's financial statement,
49
| PRESS RELEASE |
Calculation and Reconciliation of EBITDA
Ecopetrol S.A.
| COP$ Millions | ||||||||||||||||||||||||||||
2Q 2010 | 2Q 2009 | % | 1Q 2010 | As of June 30 2010 | As of June 30 2009 | % | ||||||||||||||||||||||
| EBITDA CALCULATION | ||||||||||||||||||||||||||||
| Operating income | 2,693,160 | 2,132,315 | 26.3 | % | 3,198,210 | 5,891,370 | 3,153,225 | 86.8 | % | |||||||||||||||||||
| Plus: Depreciations, depletions and amortizations | 942,531 | 675,325 | 39.6 | % | 908,240 | 1,850,771 | 1,283,643 | 44.2 | % | |||||||||||||||||||
| NON CONSOLIDATED EBITDA | 3,635,691 | 2,807,640 | 29.5 | % | 4,106,450 | 7,742,141 | 4,436,868 | 74.5 | % | |||||||||||||||||||
| RECONCILIATION NET INCOME TO EBITDA | - | - | 0.0 | % | - | - | - | 0.0 | % | |||||||||||||||||||
| Net Income | 1,804,998 | 762,009 | 136.9 | % | 2,096,666 | 3,901,664 | 2,371,270 | 64.5 | % | |||||||||||||||||||
| Depreciations, depletions and amortizations | 942,531 | 675,325 | 39.6 | % | 908,240 | 1,850,771 | 1,283,643 | 44.2 | % | |||||||||||||||||||
| Financial income | (1,207,951 | ) | (1,387,816 | ) | -13.0 | % | (962,180 | ) | (2,170,131 | ) | (4,478,627 | ) | -51.5 | % | ||||||||||||||
| Financial expenses | 1,078,370 | 2,091,875 | -48.4 | % | 1,005,879 | 2,084,249 | 3,906,534 | -46.6 | % | |||||||||||||||||||
| Non financial income | (173,142 | ) | (117,871 | ) | 46.9 | % | (192,810 | ) | (365,952 | ) | (320,554 | ) | 14.2 | % | ||||||||||||||
| Non financial expenses | 474,533 | 431,231 | 10.0 | % | 712,337 | 1,186,870 | 765,383 | 55.1 | % | |||||||||||||||||||
| Results in subsidiaries | 113,914 | 12,912 | 782.2 | % | (237,948 | ) | (124,034 | ) | (35,973 | ) | 244.8 | % | ||||||||||||||||
| Provision for income tax | 602,438 | 339,975 | 77.2 | % | 776,266 | 1,378,704 | 945,192 | 45.9 | % | |||||||||||||||||||
| NON CONSOLIDATED EBITDA | 3,635,691 | 2,807,640 | 29.5 | % | 4,106,450 | 7,742,141 | 4,436,868 | 74.5 | % | |||||||||||||||||||
Ecopetrol and Subsidiaries
2Q 2010 | 2Q 2009 | % | 1Q 2010 | As of June 30 2010 | As of June 30 2009 | % | ||||||||||||||||||||||
| EBITDA CALCULATION | ||||||||||||||||||||||||||||
| Operating income | 2,543,402 | 2,100,943 | 21.1 | % | 3,616,587 | 6,159,989 | 3,163,494 | 94.7 | % | |||||||||||||||||||
| Plus: Depreciations, depletions and amortizations | 1,056,806 | 1,033,172 | 2.3 | % | 1,018,980 | 2,075,786 | 1,726,172 | 20.3 | % | |||||||||||||||||||
| Minority interest | (20,586 | ) | - | (180,835 | ) | (201,421 | ) | - | ||||||||||||||||||||
| CONSOLIDATED EBITDA | 3,579,622 | 3,134,115 | 14.2 | % | 4,454,732 | 8,034,354 | 4,889,666 | 64.3 | % | |||||||||||||||||||
| RECONCILIATION NET INCOME TO EBITDA | - | - | 0.0 | % | - | - | - | |||||||||||||||||||||
| Net income | 1,767,065 | 692,274 | 155.3 | % | 1,954,330 | 3,721,395 | 2,300,710 | 61.7 | % | |||||||||||||||||||
| Depreciations, depletions and amortizations | 1,056,806 | 1,033,172 | 2.3 | % | 1,018,980 | 2,075,786 | 1,726,172 | 20.3 | % | |||||||||||||||||||
| Financial income | (2,410,906 | ) | (6,981,821 | ) | -65.5 | % | (1,583,627 | ) | (3,994,533 | ) | (10,182,748 | ) | -60.8 | % | ||||||||||||||
| Financial expenses | 2,268,340 | 7,757,424 | -70.8 | % | 1,689,672 | 3,958,012 | 9,632,256 | -58.9 | % | |||||||||||||||||||
| Non financial income | (203,011 | ) | (149,617 | ) | 35.7 | % | (206,767 | ) | (409,778 | ) | (352,627 | ) | 16.2 | % | ||||||||||||||
| Non financial expenses | 505,388 | 441,268 | 14.5 | % | 744,045 | 1,249,433 | 797,783 | 56.6 | % | |||||||||||||||||||
| Minority interest on net income | (2,205 | ) | (7,241 | ) | -69.5 | % | 106,175 | 103,970 | (7,191 | ) | -1545.8 | % | ||||||||||||||||
| Provision for income taxes | 618,731 | 348,656 | 77.5 | % | 912,759 | 1,531,490 | 975,311 | 57.0 | % | |||||||||||||||||||
| Minority interest on Ebitda | (20,586 | ) | - | (180,835 | ) | (201,421 | ) | - | ||||||||||||||||||||
| TOTAL EBITDA | 3,579,622 | 3,134,115 | 14.2 | % | 4,454,732 | 8,034,354 | 4,889,666 | 64.3 | % | |||||||||||||||||||
50
Date: July 29, 2010
| Ecopetrol S.A. | |||
| By: | /s/ Adriana M. Echeverri | ||
| Name: | Adriana M. Echeverri | ||
| Title: | Chief Financial Officer | ||