UNITED STATES
SECURITIES AND EXCHANGE COMMISSION
Washington, D.C. 20549
FORM 6-K
REPORT OF FOREIGN PRIVATE ISSUER
PURSUANT TO RULE 13a-16 OR 15d-16 UNDER
THE SECURITIES EXCHANGE ACT OF 1934
For the month of August, 2015
Commission File Number 001-34175
| ECOPETROL S.A. |
(Exact name of registrant as specified in its charter)
|
| N.A. |
(Translation of registrant’s name into English)
|
| COLOMBIA |
(Jurisdiction of incorporation or organization)
|
| Carrera 13 No. 36 – 24 |
| BOGOTA D.C. – COLOMBIA |
| (Address of principal executive offices) |
Indicate by check mark whether the registrant files or will file annual reports under cover of Form 20-F or Form 40-F.
Form 20-FxForm 40-F¨
Indicate by check mark if the registrant is submitting the Form 6-K in paper as permitted by Regulation S-T Rule 101(b)(1)
Yes¨ Nox
Indicate by check mark if the registrant is submitting the Form 6-K in paper as permitted by Regulation S-T Rule 101(b)(7)
Yes¨ Nox
Indicate by check mark whether the registrant by furnishing the information contained in this form is also thereby furnishing the information to the Commission pursuant to Rule 12g3-2(b) under the Securities Exchange Act of 1934.
Yes¨ Nox
If “Yes” is marked, indicate below the file number assigned to the registrant in connection with Rule 12g3-2(b): 82-N/A

Ecopetrol Corporate Group Announces Its Results for
the Second Quarter and the First Half of 2015
| · | The Group’s consolidated net earnings1 was COP$1.5 trillion in the second quarter of 2015, a substantial increase when compared with the previous quarter. |
| · | The Corporate Group’s production grew 5% compared with the second quarter of 2014, reaching an average of 768 mboed. |
| · | The Barrancabermeja refinery’s refining margin reached US$17.2 per barrel. |
Bogota, August 5, 2015. Ecopetrol S.A. (BVC: ECOPETROL; NYSE: EC; TSX: ECP) announced today Ecopetrol Corporate Group’s financial results for the second quarter and the first half of 2015, prepared and filed in Colombian pesos (COP$) and on the basis of International Financial Reporting Standards (IFRS).
According to Article 3 of Decree 2784 of December 28, 2012, the application date of the new technical framework is December 31, 2015, therefore, the financial information presented prior to this date is subject to adjustments.
As indicated in paragraphs 9 and 18 of International Accounting Standard 27 “Consolidated and Separated Financial Statements,” Ecopetrol and its Corporate Group must present their financial information on a consolidated basis, combining the financial statements of the parent company and its subsidiaries line by line, adding assets, liabilities, shareholder’s equity, revenues and expenses of a similar nature, removing the reciprocal items between the Corporate Group and recognizing the non-controlling interest.
The financial results in this report are not comparable line by line with the previously issued financial results for the second quarter of 2014, which were prepared in accordance with the Public Accounting Regime (Régimen de Contabilidad Pública) as adopted by the Colombian National Accounting Office. For the sake of comparison, the financial results that were already reported in the second quarter of 2014 are presented in this report under IFRS.
Some figures in this release are presented in U.S. dollars (US$) as indicated. The exhibits in the main body of this report have been rounded to one decimal. Figures expressed in billions of COP$ are equal to COP$1 thousand million.
Table 1: Summary of the Group’s Consolidated Financial Results
| A | B | C | D | E | F | G | H | I | J | |||||||||||||||||||||||||||
| (COP$ Billion) | 2Q 2015* | 2Q 2014* | ∆ ($) | ∆ (%) | 1Q 2015* | 1H 2015* | 1H 2014* | ∆ ($) | ∆ (%) | |||||||||||||||||||||||||||
| Total sales | 14,009.6 | 16,932.2 | (2,922.6 | ) | (17.3 | )% | 12,300.9 | 26,310.5 | 34,903.5 | (8,593.0 | ) | (24.6 | )% | |||||||||||||||||||||||
| Operating profit | 3,549.2 | 4,912.2 | (1,363.0 | ) | (27.7 | )% | 2,357.9 | 5,907.1 | 11,176.8 | (5,269.7 | ) | (47.1 | )% | |||||||||||||||||||||||
| Net Income Consolidated | 1,695.5 | 2,758.7 | (1,063.2 | ) | (38.5 | )% | 355.9 | 2,051.5 | 6,823.6 | (4,772.1 | ) | (69.9 | )% | |||||||||||||||||||||||
| Non-controlling interest | (188.9 | ) | (161.9 | ) | (27.0 | ) | 16.7 | % | (195.9 | ) | (384.9 | ) | (338.6 | ) | (46.3 | ) | 13.7 | % | ||||||||||||||||||
| Equity holders of Ecopetrol** | 1,506.6 | 2,596.8 | (1,090.2 | ) | (42.0 | )% | 160.0 | 1,666.6 | 6,485.0 | (4,818.4 | ) | (74.3 | )% | |||||||||||||||||||||||
| Other comprehensive income | 459.1 | (421.6 | ) | 880.7 | (208.9 | )% | 710.9 | 1,170.1 | (288.9 | ) | 1,459.0 | (505.0 | )% | |||||||||||||||||||||||
| EBITDA | 4,508.0 | 6,519.8 | (2,011.8 | ) | (30.9 | )% | 3,058.5 | 7,566.5 | 14,217.9 | (6,651.4 | ) | (46.8 | )% | |||||||||||||||||||||||
| EBITDA Margin | 32 | % | 39 | % | 25 | % | 29 | % | 41 | % | ||||||||||||||||||||||||||
* These figures are included for illustration purposes only. Unaudited.
** According to IAS-1, “Presentation of financial statements”, paragraph 83, the company must include in the statement of comprehensive results the results attributable to non-controlling interest (minority interest) and the results attributable to shareholders of the controlling company.
1 Net income attributable to Ecopetrol´s shareholders under IFRS.
| 1 |
In the opinion of Ecopetrol’s CEO Juan Carlos Echeverry G.:
“Ecopetrol is disciplined with its costs adjustment program, aimed to gain efficiencies in different areas. Thus, we have already obtained savings of COP$0.6 trillion. These savings are mainly the result of renegotiations with our contractors. We have solidified our long term relationship; our allies understand that the current circumstances call for extraordinary actions, and the mutual commitment to mitigate the effects of this scenario of low oil prices.
The Barrancabermeja refinery is now more efficient, thanks to the operation of the new turbo gas unit, which will translate into efficiencies in the energy generation cycle and a lower emission of greenhouse effect gases of 200 thousand tons equivalent per year. We also improved the cost of drilling by lowering the average number of days required by well, in Castilla and Chichimene fields, from 34 days in 2014 to 28 in 2015.
Facing a challenging oil price scenario, the Company is adopting the adjustments required, based on its recently announced strategy, to continue searching for efficient and profitable barrels.
In our transformation plan we identified 630 initiatives throughout the Company, aiming at savings of COP$ 1.4 trillion in 2015. We are promoting ethic and transparency in our purchase and contracting processes, and investment projects.
We continue to prioritize the lives of people and workers, the well-being of the communities in which we operate and the environment. The accident frequency index in Ecopetrol was reduced by 38% between the second quarter of 2014 and the same period of 2015, from 0.77 to 0.49 accidents per million hours of labor, reflecting improved labor conditions.
On another front, Ecopetrol was subject of an irrational wave of attacks against our transportation infrastructure in June, in some provinces located next to Venezuela and Ecuador´s borders. The Company demonstrated, once again, its capacity to face the crisis by deploying 500 workers to stop the leakage in the Mira River and do all the cleaning tasks necessary to mitigate the damage caused.
In the finance area, this quarter was better than the previous due to the growth trend shown by crude and product prices, while the exchange rate, which holds a negative correlation to these, reversed part of the trend toward devaluation shown in the first quarter. This was achieved despite the deterioration in environment conditions around June of this year, stemming from attacks on transport infrastructure, which as we have repeatedly said, not only affected operations but caused irreparable damages to the environment and surrounding communities.
Production in the second quarter reached 768 thousand barrels equivalent a day, in line with the goal of 760 thousand barrels equivalent a day, announced for 2015, representing an increase of 5% compared to production in the second quarter of 2014. This was the result of the opening of new facilities and the new drilling campaigns in the fields Castilla and Chichimene, as well as the normal operation of Caño Limón field throughout most of the quarter.
In exploration, drilling continued on the well Kronos, located offshore in the southern Caribbean (operated 50-50 by Anadarko in partnership with Ecopetrol), and drilling began on the well Sea Eagle in the U.S. Gulf of Mexico (operated by Murphy, 35%; Petrovietnam, 15%; and Ecopetrol America Inc, 50%). In July, Kronos well confirmed the presence of gas in ultra-deep waters. The discovery proves the geological model proposed for an unexplored area, with high hydrocarbon potential.
| 2 |
The refining margin of the Barrancabermeja refinery was 17.20 US$ per barrel in second quarter 2015, 58% more than in the same period of 2014 (10.9 US$ per barrel). This was the result of better prices of refined products compared to crude and the higher yield of medium distillates.
The volume of crude transported in the second quarter of 2015 declined by 4% compared to the first quarter of this year, due to the increased number of attacks on transport infrastructure, with 2 in the first quarter and 44 in the second, 36 of these in the month of June. Compared to the second quarter of 2014, volume transported increased by 7.8%.
In our commercial activity, in line with our strategy of diversifying the destination of our products, we exported to South Korea and the U.S. East coast. Also, with the purpose of increasing our footprint in the Asian market, we announced our first shipment of crude to Japan, following the conclusion of negotiations with the company JX Nippon, which bought 2 million barrels of Castilla crude to supply its refining systems.
The improved financial result in the second quarter of 2015 compared to the first quarter of 2015 is the outcome of better crude realization prices, which increased from 43 US$ per barrel in the first quarter to 53 US$ per barrel in the second. Although cost of sales showed an increase of 10% compared to the first quarter, given the higher costs of maintenance, purchases and product imports, when compared to the same period of 2014 we had a reduction of 11%, reflecting the cost optimization strategies that are gradually beginning to materialize. In line with this, we achieved a 2.32 US$ per barrel reduction of our lifting cost, as a result of optimizations, between the second quarter of 2015 and the same period of 2014.
Our operating expenditures continued under control. Although in the first quarter of 2015 we recorded the applicable wealth tax for year 2015, in the second quarter of 2015 financial expenses were also reduced due to a lower impact of the exchange rate difference.
Thus, in the second quarter of 2015, the Corporate Group’s net revenue, attributable to Ecopetrol shareholders, was COP$1.5 trillion pesos, compared to COP$0.16 trillion in the first quarter of 2015 and COP$2.6 trillion in the second quarter of 2014.
On another note, this past May 26, we announced to the market our new 2015-2020 strategy, aimed at profitable growth in exploration and production and maximization of efficiencies in transport and refining.
The strategy prioritizes value over volume, with emphasis on financial discipline, streamlining investments and divestment of non-strategic assets. The plan also foresees profound transformations within the organization, both in the business segments as well as in project management, technology, environment relations and investment portfolio management.
One month after launching our strategy, we successfully placed bonds in the international market for US$1.5 billion, with an 11-year term and 3 times oversubscribed. The issue demonstrated, once again, the appetite and confidence of institutional investors in our company.
Also during the quarter, the risk rating agencies Fitch Ratings, Standard & Poor’s Ratings Services and Moody’s Investors Service, confirmed Ecopetrol’s ratings of BBB, BBB and Baa2, respectively, all with stable outlook, providing us the support needed to continue with our strategic plans as an investment grade issuer in the international capital market.
We remain focused on generating value for our stakeholders and we work every day to generate clean, profitable barrels.”
| 3 |
Ecopetrol Corporate Group Announces Its Results for the Second
Quarter and the First Half of 2015
Table of Contents
| 4 |
| I. | Consolidated Financial Results |
The following results are presented on the basis of International Financial Reporting Standards (IFRS).
| a. | Sales Volume |
The following table summarizes our sales volumes for the periods indicated:
Table 2: Sales Volume
| A | B | C | D | E | F | G | ||||||||||||||||||
| Ecopetrol S.A. (consolidated) | ||||||||||||||||||||||||
| Sales Volume | ||||||||||||||||||||||||
| Local Sales Volume (mboed) | 2Q 2015 | 2Q 2014 | ∆ (%) | 1H 2015 | 1H 2014 | ∆ (%) | ||||||||||||||||||
| Crude Oil | 7.0 | 24.3 | (71.2 | )% | 13.5 | 27.2 | (50.4 | )% | ||||||||||||||||
| Natural Gas | 87.7 | 81.9 | 7.1 | % | 84.6 | 80.9 | 4.6 | % | ||||||||||||||||
| Gasoline | 92.5 | 86.1 | 7.4 | % | 92.5 | 85.1 | 8.7 | % | ||||||||||||||||
| Medium Distillates | 142.1 | 141.1 | 0.7 | % | 142.0 | 140.7 | 0.9 | % | ||||||||||||||||
| LPG and Propane | 15.5 | 14.3 | 8.4 | % | 15.5 | 14.7 | 5.4 | % | ||||||||||||||||
| Fuel Oil | 5.9 | 2.9 | 103.4 | % | 5.6 | 3.1 | 80.6 | % | ||||||||||||||||
| Industrial and Petrochemical | 20.1 | 19.4 | 3.6 | % | 20.7 | 20.7 | 0.0 | % | ||||||||||||||||
| Total Local Sales | 370.8 | 370.0 | 0.2 | % | 374.4 | 372.4 | 0.5 | % | ||||||||||||||||
| Export Sales Volume (mboed) | 2Q 2015 | 2Q 2014 | ∆ (%) | 1H 2015 | 1H 2014 | ∆ (%) | ||||||||||||||||||
| Crude Oil | 577.6 | 502.4 | 15.0 | % | 574.0 | 512.0 | 12.1 | % | ||||||||||||||||
| Products | 61.1 | 70.1 | (12.8 | )% | 66.9 | 89.1 | (24.9 | )% | ||||||||||||||||
| Natural Gas | 9.2 | 17.5 | (47.4 | )% | 12.7 | 20.7 | (38.6 | )% | ||||||||||||||||
| Total Export Sales | 647.9 | 590.0 | 9.8 | % | 653.6 | 621.8 | 5.1 | % | ||||||||||||||||
| Total Sales Volume | 1,018.7 | 960.0 | 6.1 | % | 1,028.0 | 994.2 | 3.4 | % | ||||||||||||||||
b.1) Market in Colombia (36% of total sales in the second quarter of 2015):
Local sales in the second quarter of 2015 remained relatively stable:
| · | Lower sales of local crude because of the higher export evacuation capacity. |
| · | Increased gasoline sales due to 1) higher local demand, and 2) reduction in the price differential between gasoline and diesel. |
b.2) International Market (64% of total sales in the second quarter of 2015):
Export volumes increased 9.8% in the second quarter of 2015 as compared to the second quarter of 2014, mainly as a result of the net effect of:
| · | Increase in crude exports due to: 1) higher Group production and higher royalties purchases in line with the higher production; and 2) higher availability of the transportation systems for exporting crude. |
| · | Decreased exports of refined products, especially fuel oil, due to lower throughput at the Barrancabermeja refinery which resulted in a production decrease. This effect was partially offset by increased exports by Propilco and Comai. |
| 5 |
| · | Decreased natural gas exports due to the natural decline in production at the Guajira fields and maintenance of the Riohacha well. |
Export markets:
Table 3: Export Markets
| A | B | C | D | E | F | G | H | I | J | |||||||||||||||||||||||||
| Export destinations - Crudes (mbod) | Export destinations - Products (mboed) | |||||||||||||||||||||||||||||||||
| Destination | 2Q 2015 | 2Q 2014 | 1H 2015 | 1H 2014 | Destination | 2Q 2015 | 2Q 2014 | 1H 2015 | 1H 2014 | |||||||||||||||||||||||||
| Asia | 162.8 | 201.3 | 158.9 | 206.1 | Asia | 27.4 | 19.0 | 21.2 | 20.6 | |||||||||||||||||||||||||
| U.S. Gulf Coast | 129.4 | 130.4 | 140.1 | 127.2 | U.S. Gulf Coast | 4.8 | 1.8 | 9.8 | 14.2 | |||||||||||||||||||||||||
| U.S. West Coast | 42.0 | 26.0 | 47.0 | 38.0 | U.S. West Coast | 0.0 | 0.0 | 3.9 | 0.0 | |||||||||||||||||||||||||
| U.S. East Coast | 42.0 | 0.0 | 24.0 | 5.5 | U.S. East Coast | 3.5 | 9.7 | 5.7 | 12.5 | |||||||||||||||||||||||||
| Europe | 82.5 | 91.2 | 81.9 | 84.0 | Europe | 1.1 | 0.2 | 2.9 | 5.5 | |||||||||||||||||||||||||
| Central America / Caribbean | 94.6 | 44.5 | 102.3 | 42.2 | Central America / Caribbean | 18.6 | 33.4 | 17.3 | 30.3 | |||||||||||||||||||||||||
| South America | 13.0 | 9.0 | 10.0 | 9.0 | South America | 5.7 | 6.0 | 6.1 | 6.0 | |||||||||||||||||||||||||
| Other | 11.3 | 0.0 | 9.8 | 0.0 | Other | 0.0 | 0.0 | 0.0 | 0.0 | |||||||||||||||||||||||||
| Total | 577.6 | 502.4 | 574.0 | 512.0 | Total | 61.1 | 70.1 | 66.9 | 89.1 | |||||||||||||||||||||||||
| · | Crude oil: An increased share of our crude oil exports were destined for the East and West Coasts of the United States resulting from attractive refining margins and a higher interest in our crudes due to the lower competitiveness of U.S. domestic crude. Conversely, the increase in exports to the East and West Coasts of the United States also led to a reduction in the share of our crude oil exports destined for Asia. Exports also increased to Central America as that market is a transit point for exports bound for other markets. |
In line with our strategy of diversifying the destination of our exports and increasing our footprint in the Asian market, Ecopetrol will deliver its first crude oil cargo to Japan in August after closing negotiations with the company JX Nippon for the sale of 2 million barrels of Castilla crude to feed that company’s refinery system.
During the second quarter of 2015, our crude export basket was indexed as follows: Brent (70.5%), Maya (29.1%) and WTI (0.4%).
| · | Refined Products: Exports of fuel oil to Asia increased due to the opening of high conversion refineries in Saudi Arabia and the United Arab Emirates which decreased Middle Eastern fuel oil supplies. |
| b. | Crude, Refined Products and Gas Prices |
The following table shows the average prices of Brent, Maya and Texas light sweet (WTI) crude for the second quarter of 2015 and the first half of 2015.
Table 4: Price of Crude References
| A | B | C | D | E | F | G | ||||||||||||||||||
| Prices of crude references (Average, US$/Bl) | 2Q 2015 | 2Q 2014 | ∆ (%) | 1H 2015 | 1H 2014 | ∆ (%) | ||||||||||||||||||
| Brent | 63.4 | 109.8 | (42.3 | )% | 59.1 | 108.8 | (45.7 | )% | ||||||||||||||||
| MAYA | 55.3 | 95.8 | (42.3 | )% | 49.6 | 92.5 | (46.4 | )% | ||||||||||||||||
| WTI | 57.8 | 103.0 | (43.9 | )% | 53.2 | 100.7 | (47.2 | )% | ||||||||||||||||
| 6 |
The following table shows the average sales prices of our crude oil basket, refined products basked and natural gas basket during the second quarter of 2015 and the first half of 2015.
Table 5: Average Sales Price
| A | B | C | D | E | F | G | H | I | ||||||||||||||||||||||||
| Average Sales Price | Sales Volume (mboed) | Sales Volume (mboed) | ||||||||||||||||||||||||||||||
| (US$/Bl) | 2Q 2015 | 2Q 2014 | ∆ (%) | 2Q 2015 | 1H 2015 | 1H 2014 | ∆ (%) | 1H 2015 | ||||||||||||||||||||||||
| Crude oil basket | 53.0 | 97.0 | (45.4 | )% | 584.6 | 47.9 | 94.0 | (49.0 | )% | 587.5 | ||||||||||||||||||||||
| Products basket | 66.9 | 114.5 | (41.6 | )% | 337.2 | 67.5 | 116.9 | (42.3 | )% | 343.2 | ||||||||||||||||||||||
| Natural gas basket | 21.1 | 24.5 | (13.9 | )% | 96.9 | 22.4 | 24.4 | (8.2 | )% | 97.3 | ||||||||||||||||||||||
Crude:
International crude oil prices sharply decreased during the second quarter of 2015 (Brent -US$46.4/Bl, Maya -US$40.5/Bl and WTI –US$45.2/Bl) as a result of the oversupply in the market and high levels of crude inventory worldwide.
The crude oil basket price decreased during the second quarter of 2015 reflecting the behavior of the indexes used in the term contracts and spot contracts, with a price decrease of -US$44.0/Bl.
The differential between the crude oil basket price and the Brent crude price narrowed by US$2.3/Bl (2Q-2015: –US$10.4/Bl vs. 2Q-2014: -US$12.8/Bl) due to the aforementioned higher demand from refineries in the United States and lower participation of heavier crude.
Refined Products:
The refined products sale basket price fell by US$47.6 per barrel during the second quarter of 2015 as compared to the second quarter of 2014 due to the drop in international benchmarks prices: gasoline (-US$39.6/Bl), diesel (-US$45.7/Bl) and jet (-US$46.9/Bl), consistent with Brent prices during the same period.
Natural gas:
During the second quarter of 2015, natural gas prices decreased due to: 1) decrease in the real price of the gas from La Guajira (4.53 USD/MBTU compared to 5.05 USD/MBTU during the same period of 2014) due to market conditions, 2) decrease in the real price of the Cusiana-Cupiagua gas (2.99 USD/MBTU compared to 3.29 USD/MBTU in the same period a year ago) due to the new commercial agreements, and 3) a revised benchmark price based on regulated formula linked to fuel oil that applies to exports (5.67 USD/MBTU in 2014 compared to 4.08 USD/MBTU in 2015).
| 7 |
| c. | Financial results |
Table 6: Consolidated Income Statement
| A | B | C | D | E | F | G | H | I | ||||||||||||||||||||||||
| Consolidated Income Statement | ||||||||||||||||||||||||||||||||
| COP$ Billion | 2Q 2015* | 2Q 2014* | ∆ ($) | ∆ (%) | 1H 2015* | 1H 2014* | ∆ ($) | ∆ (%) | ||||||||||||||||||||||||
| Local Sales | 5,340.3 | 6,233.4 | (893.1 | ) | (14.3 | )% | 10,057.3 | 12,692.6 | (2,635.3 | ) | (20.8 | )% | ||||||||||||||||||||
| Export Sales | 7,799.9 | 9,798.2 | (1,998.3 | ) | (20.4 | )% | 14,273.9 | 20,499.1 | (6,225.2 | ) | (30.4 | )% | ||||||||||||||||||||
| Sale of services | 869.4 | 900.6 | (31.2 | ) | (3.5 | )% | 1,979.3 | 1,711.8 | 267.5 | 15.6 | % | |||||||||||||||||||||
| Total Sales | 14,009.6 | 16,932.2 | (2,922.6 | ) | (17.3 | )% | 26,310.5 | 34,903.5 | (8,593.0 | ) | (24.6 | )% | ||||||||||||||||||||
| Variable Costs | 7,077.4 | 8,051.3 | (973.9 | ) | (12.1 | )% | 13,513.9 | 16,670.9 | (3,157.0 | ) | (18.9 | )% | ||||||||||||||||||||
| Fixed Costs | 2,343.9 | 2,547.2 | (203.3 | ) | (8.0 | )% | 4,462.0 | 4,696.5 | (234.5 | ) | (5.0 | )% | ||||||||||||||||||||
| Cost of Sales | 9,421.3 | 10,598.5 | (1,177.2 | ) | (11.1 | )% | 17,975.9 | 21,367.4 | (3,391.5 | ) | (15.9 | )% | ||||||||||||||||||||
| Gross Profits | 4,588.3 | 6,333.7 | (1,745.4 | ) | (27.6 | )% | 8,334.6 | 13,536.1 | (5,201.5 | ) | (38.4 | )% | ||||||||||||||||||||
| Operating Expenses | 1,039.1 | 1,421.5 | (382.4 | ) | (26.9 | )% | 2,427.5 | 2,359.3 | 68.2 | 2.9 | % | |||||||||||||||||||||
| Operating Income/Loss | 3,549.2 | 4,912.2 | (1,363.0 | ) | (27.7 | )% | 5,907.1 | 11,176.8 | (5,269.7 | ) | (47.1 | )% | ||||||||||||||||||||
| Financial Income/Loss | (779.0 | ) | (87.0 | ) | (692.0 | ) | 795.4 | % | (2,309.3 | ) | (207.9 | ) | (2,101.4 | ) | 1,010.8 | % | ||||||||||||||||
| Results from Subsidiaries | 46.6 | 127.4 | (80.8 | ) | (63.4 | )% | 47.4 | 142.8 | (95.4 | ) | (66.8 | )% | ||||||||||||||||||||
| Provision for Income Tax | (1,121.3 | ) | (2,193.9 | ) | 1,072.6 | (48.9 | )% | (1,593.7 | ) | (4,288.1 | ) | 2,694.4 | (62.8 | )% | ||||||||||||||||||
| Net Income Consolidated | 1,695.5 | 2,758.7 | (1,063.2 | ) | (38.5 | )% | 2,051.5 | 6,823.6 | (4,772.1 | ) | (69.9 | )% | ||||||||||||||||||||
| Non-controlling interests | (188.9 | ) | (161.9 | ) | (27.0 | ) | 16.7 | % | (384.9 | ) | (338.6 | ) | (46.3 | ) | 13.7 | % | ||||||||||||||||
| Equity holders of Ecopetrol** | 1,506.6 | 2,596.8 | (1,090.2 | ) | (42.0 | )% | 1,666.6 | 6,485.0 | (4,818.4 | ) | (74.3 | )% | ||||||||||||||||||||
| Other comprehensive income | 459.1 | (421.6 | ) | 880.7 | (208.9 | )% | 1,170.1 | (288.9 | ) | 1,459.0 | (505.0 | )% | ||||||||||||||||||||
| EBITDA | 4,508.0 | 6,519.8 | (2,011.8 | ) | (30.9 | )% | 7,566.5 | 14,217.9 | (6,651.4 | ) | (46.8 | )% | ||||||||||||||||||||
| EBITDA Margin | 32.2 | % | 38.5 | % | 28.8 | % | 40.7 | % | ||||||||||||||||||||||||
* Figures are unaudited
** According to IAS-1, “Presentation of financial statements”, paragraph 83, the company must include in the statement of comprehensive results the results attributable to non-controlling interest (minority interest) and the results attributable to shareholders of the controlling company.
Sales revenues decreased by COP$2,923 billion, or 17.3%, during the second quarter of 2015 as compared to the same period of 2014, as a combined result of:
| · | A US$44 per barrel reduction in the price of our crude basket, resulting in a decrease of COP$7,042 billion. |
| · | The effects of the devaluation of the Colombian peso against the U.S. dollar that went from an average of COP$ 1,914/US in the second quarter of 2014 to COP$ 2,501/US in the second quarter of 2015, resulting in a COP$3,098 billion increase in sales revenues. |
| · | A 58.7 mboed increase in sales volume resulting in a COP$1,021 billion rise in sales revenues, mainly representing increased crude exports due to higher availability in the transport system. |
Cost of sales in second quarter 2015 declined by 11% (-COP$1,177 billion) as a result of:
| · | Variable costs:decrease by 12% (-COP$974 billion), resulting from: |
a) A COP$1,366 billion reduction in the purchase prices of crude, gas and refined products due to the net effect of:
| o | Reduced average purchase price given international benchmark prices: -COP$2,880 billion. |
| o | A 31% devaluation of the average exchange rate of the Colombian peso against the U.S. dollar: +COP$1,065 billion. |
| o | An increase in purchased volumes of diluent due to increased heavy crude production and third-party crude because of higher availability of the Oleoducto Trasandino pipeline due to fewer public order incidents, and higher gasoline imports because of greater internal demand: +COP$449 billion. |
| 8 |
| b) | A COP$167 billion reduction in transport costs resulting from an optimization in the use of tanker trucks due to more stable operating conditions and the reduced number of attacks on our infrastructure in 2015. |
| c) | A decrease in inventory valuations because of the drop in international price indexes, which generates lower value of inventories and increment in the cost: +COP$385 billion. |
| d) | A COP$117 billion increase in amortizations, depreciations and depletions due to capitalizations and increased production by Ecopetrol S.A. and Ecopetrol America Inc. due to the beginning of operations at the Dalmatian well in the second quarter of 2014. |
| e) | Other variable items: +COP$57 billion. |
| · | Fixed costs:a decline of 8% (-COP$203 billion), as a result of: |
| a) | A COP$144 billion decrease in contracted services due primarily to operating cost optimization by Ecopetrol S.A. in its contracts relating to the Rubiales, Nare and Quifa fields, as well as due to the application of a high price clause in the Cravo Norte field in 2014. |
| b) | A COP$54 billion decrease in maintenance costs as a result of optimization by Ecopetrol S.A. by means of: services and quantities re-structuring, as well as renegotiation of fees in production field´s maintenance contracts. |
| c) | Other items: -COP$5 billion |
Attacks to our infrastructure negatively impacted our results for the first half of 2015 in the amount of COP$33 billion, including costs associated with frequent repairs of the South and Caño Limon systems, dismantling of illicit connections, resumption of pipelines operations and area decontamination but excluding costs associated with deferred production and reduced sales.
Operating expenses decreased 27% (-COP$382 billion), as a combined result of:
| · | A COP$260 billion decrease in exploratory expenditures due to decreased seismic activity and fewer dry wells reported in the period. |
| · | A COP$52 billion decrease in provisions mainly of Ecopetrol S.A. related to contingencies for legal proceedings. |
| · | A COP$33 billion decrease in accrued taxes, mainly Industry and Commerce and Financial Transaction taxes. |
| · | A COP$20 billion decline in losses due to theft and attacks because of fewer public order incidents in 2015. |
| · | Other operating items: -COP$17 billion. |
Operating margindecreasedto 25% in the second quarter of 2015 as compared to 29% in the same period of 2014.
Net financial (non-operating) loss recorded a higher loss of COP$692 billion in the second quarter of 2015 as compared to the same period of 2014, as a net result of:
| 9 |
| · | A COP$617 billion loss on exchange rate differences: income of COP$166 billion was recorded in the second quarter of 2014, while in the same period of 2015, an expense of COP$451 billion was recorded. |
The exchange rate difference expense was generated mainly by Ecopetrol S.A. with COP$650 billion, because of its net liability position of US$8,202 million at the end of June 2015.
| · | A COP$64 billion increased interest expense due to the company’s increased leverage. |
| · | Other financial expenditures for: +COP$11 billion. |
Affiliated company results decreased by COP$81 billion in the second quarter of 2015, primarily due to a decrease in net income by Equión and Savia as a consequence of decreased international crude oil prices.
The 49% decrease (-COP$1,073 billion) in theincome tax expenditure is largely explained by the lower profit in the period.
As a result of the above, the quarter’snet result of the equity holders of Ecopetrol was a profit of COP$1,507 billion, 42% less than the corresponding net result of the second quarter of 2014.
EBITDA decreased by 31% to COP$4,508 billion in the second quarter of 2015 as compared to the same period of 2014 andEBITDAmargin was 32% in the second quarter of 2015 as compared to 39% in the second quarter of 2014.
| d. | Balance Sheet |
Table 7: Balance Sheet
| A | B | C | D | E | ||||||||||||
| Consolidated Balance Sheet | ||||||||||||||||
| (COP$ Billion) | June 30, 2015 | March 31, 2015 | ∆ ($) | ∆ (%) | ||||||||||||
| Current Assets | 27,523.1 | 25,481.8 | 2,041.3 | 8.0 | % | |||||||||||
| Non Current Assets | 98,647.5 | 95,707.5 | 2,940.0 | 3.1 | % | |||||||||||
| Total Assets | 126,170.6 | 121,189.3 | 4,981.3 | 4.1 | % | |||||||||||
| Current Liabilities | 21,381.5 | 22,873.2 | (1,491.7 | ) | (6.5 | )% | ||||||||||
| Long Term Liabilities | 55,651.5 | 51,436.1 | 4,215.4 | 8.2 | % | |||||||||||
| Total Liabilities | 77,033.0 | 74,309.3 | 2,723.7 | 3.7 | % | |||||||||||
| Equity | 49,137.6 | 46,880.0 | 2,257.6 | 4.8 | % | |||||||||||
| Non controlling interest | 1,710.0 | 1,471.8 | 238.2 | 16.2 | % | |||||||||||
| Total Liabilities and Shareholders' Equity | 126,170.6 | 121,189.3 | 4,981.3 | 4.1 | % | |||||||||||
The main variations in the Balance Sheet during the second quarter of 2015 compared to the end of March 2015 can be explained by:
| · | A COP$2,041 billion increase in current assets resulting primarily from the proceeds from a bond issue in June 2015 in the amount of US$1.5 billion maintained in short term investments, cash and equivalents. |
| · | Non-current assets increased by +COP$2,940 billion, due mainly to the increases in: |
| 10 |
| o | Construction in progress:A COP$883 billion increase, of which Reficar accounted for COP$840 billion as a result of project capitalizations associated with the new refinery, and other lesser capitalizations in affiliates of +COP$43 billion. |
| o | Pipelines and networks: A COP$527 billion increase, of which Ecopetrol S.A. accounted for COP$205 billion resulting from the acquisition of facilities to bring the terminal Nestor Pineda into line, in Cenit for +COP192 billion, in Ocensa for COP$81 billion, and other minor increases in affiliates of +COP$49 billion. |
| o | Plant and equipment: A COP$495 billion increase primarily due to the capitalization of Cenit in the amount of COP$217 billion; Ecopetrol S.A. COP$150 billion; Reficar COP$92 billion; and other minor increases in affiliates COP$36 billion. |
| o | Natural resources:A COL$950 billion increase, mainly due to capitalizations of Ecopetrol field projects in the amounts COP$698 billion, in Ecopetrol America Inc for +COP$267 billion, and other minor variations in affiliates for -COP$15 billion. |
| o | Other variations for +COP$85 billion. |
| · | Current liabilities declined by -COP$1,492 billion versus last year due to -COP$828 billion in dividend payments to minority shareholders, payment of the second income tax installment and CREE for -COP$290 billion, wealth tax payable of –COP$239 billion, and other minor variations for –COL$135 billion. |
| · | Long-term liabilities increased by COP$4,215 billion mainly as a result of the Ecopetrol’s international bond issuance in June 2015 in the amount of US$1.5 billion. |
| · | The Group’sequity without taking into account the non-controlling interest2was COP$47,428 billion, an increase of +COP$2,019 billion compared to end of March 2015 mainly as a result of the quarter’s profit and the other integral result associated with the conversion adjustment due to functional currency of affiliates Hocol Petroleum Limited and Reficar. |
In accordance with IFRS-1 (Adoption for the first time) 2015 is the year of transition. Then adjustments have been made in the opening balance that do not exceed 1% of the values reported in the first quarter of 2015.
| e. | Credit Rating |
Ecopetrol’s S.A. credit ratings were reviewed and ratified by three credit rating agencies during the second quarter of 2015, as follows:
| · | Moody’s Investors Services affirmed Ecopetrol’s long-term international rating at Baa2 with a stable outlook. |
| · | Fitch Ratings affirmed Ecopetrol’s international and local ratings at BBB and BBB+, respectively. It reaffirmed the long-term local rating at AAA(col) and the short-term local rating at F1+(col). All ratings maintained their stable outlook. |
| · | Standard & Poor’s maintained Ecopetrol’s long-term international rating at BBB with a stable outlook. |
2The consolidation method of global integration applied to Ecopetrol adds each of the lines of the P&L and the Balance sheet of all of the Group companies. The stake that does not belong to the Corporate Group should be recognized in a separate line (minority interest or non-controlling interest).
| 11 |
| f. | Financing |
Ecopetrol carried out an international bond issuance with settlement date on June 26th of 2015, with the following terms:
Table 8: International Bond Issuance
| Summary of June 2015 International Bond Issuance | |
| Term: | 11 years |
| Maturity date: | June 26, 2026 |
| Amount: | US$1,500,000,000 |
| Price: | 99.328 |
| Yield: | 5.457% |
| Amortization: | Bullet |
| Coupon Rate: | 5.375% |
| g. | Results by Business Segment |
The following table presents our business segment results for the periods indicated:
Table 9: Quarterly Results by Segment
| A | B | C | D | E | F | G | H | I | J | K | ||||||||||||||||||||||||||||||
| Quarterly Results by Segment | E&P | Refining & Petrochem. | Transportation and Logistics | Eliminations | Ecopetrol Consolidated | |||||||||||||||||||||||||||||||||||
| COP$ Billion | 2Q 2015 | 2Q 2014 | 2Q 2015 | 2Q 2014 | 2Q 2015 | 2Q 2014 | 2Q 2015 | 2Q 2014 | 2Q 2015 | 2Q 2014 | ||||||||||||||||||||||||||||||
| Local Sales | 2,289 | 3,104 | 4,954 | 5,619 | 82 | 37 | (1,983 | ) | (2,527 | ) | 5,342 | 6,233 | ||||||||||||||||||||||||||||
| Export Sales | 6,953 | 8,592 | 787 | 1,171 | - | - | 59 | 35 | 7,799 | 9,798 | ||||||||||||||||||||||||||||||
| Sales of services | 2 | 17 | 60 | 8 | 2,385 | 1,908 | (1,578 | ) | (1,032 | ) | 869 | 901 | ||||||||||||||||||||||||||||
| Total Sales | 9,244 | 11,713 | 5,801 | 6,798 | 2,467 | 1,945 | (3,502 | ) | (3,524 | ) | 14,010 | 16,932 | ||||||||||||||||||||||||||||
| Variable Costs | 5,099 | 5,025 | 4,668 | 5,922 | 31 | 49 | (2,721 | ) | (2,945 | ) | 7,077 | 8,051 | ||||||||||||||||||||||||||||
| Fixed Costs | 1,713 | 1,708 | 428 | 462 | 778 | 857 | (575 | ) | (480 | ) | 2,344 | 2,547 | ||||||||||||||||||||||||||||
| Cost of Sales | 6,812 | 6,733 | 5,096 | 6,384 | 809 | 906 | (3,296 | ) | (3,425 | ) | 9,421 | 10,598 | ||||||||||||||||||||||||||||
| Gross profit | 2,433 | 4,980 | 705 | 415 | 1,659 | 1,038 | (208 | ) | (98 | ) | 4,589 | 6,334 | ||||||||||||||||||||||||||||
| Operating Expenses | 727 | 885 | 285 | 396 | 91 | 193 | (63 | ) | (53 | ) | 1,040 | 1,421 | ||||||||||||||||||||||||||||
| Operating Profit | 1,706 | 4,095 | 420 | 19 | 1,568 | 845 | (145 | ) | (45 | ) | 3,549 | 4,913 | ||||||||||||||||||||||||||||
| Non Operating Profit/Loss | (610 | ) | 30 | 30 | (32 | ) | (287 | ) | (98 | ) | 88 | 13 | (779 | ) | (87 | ) | ||||||||||||||||||||||||
| Results from Subsidiaries | 38 | 120 | 9 | 7 | - | - | - | - | 47 | 127 | ||||||||||||||||||||||||||||||
| Income tax benefits (expense) | (496 | ) | (1,852 | ) | (163 | ) | (22 | ) | (462 | ) | (320 | ) | - | - | (1,121 | ) | (2,194 | ) | ||||||||||||||||||||||
| Net Income Consolidated | 638 | 2,393 | 296 | (28 | ) | 819 | 427 | (57 | ) | (32 | ) | 1,696 | 2,759 | |||||||||||||||||||||||||||
| Non-controlling interest | - | - | - | - | 189 | 162 | - | - | 189 | 162 | ||||||||||||||||||||||||||||||
| Equity holders of Ecopetrol | 638 | 2,393 | 296 | (28 | ) | 630 | 265 | (57 | ) | (32 | ) | 1,507 | 2,597 | |||||||||||||||||||||||||||
| EBITDA | 2,699 | 5,667 | 672 | 217 | 1,193 | 668 | (56 | ) | (32 | ) | 4,508 | 6,520 | ||||||||||||||||||||||||||||
| EBITDA Margin | 29.2 | % | 48.4 | % | 11.6 | % | 3.2 | % | 48.4 | % | 34.3 | % | 1.6 | % | 0.9 | % | 32.2 | % | 38.5 | % | ||||||||||||||||||||
Table 10: Accumulated Results by Segment
| A | B | C | D | E | F | G | H | I | J | K | ||||||||||||||||||||||||||||||
| Results by Segment | E&P | Refining & Petrochem. | Transportation and Logistics | Eliminations | Ecopetrol Consolidated | |||||||||||||||||||||||||||||||||||
| COP$ Billion | 1H 2015 | 1H 2014 | 1H 2015 | 1H 2014 | 1H 2015 | 1H 2014 | 1H 2015 | 1H 2014 | 1H 2015 | 1H 2014 | ||||||||||||||||||||||||||||||
| Local Sales | 4,168 | 6,336 | 9,159 | 11,186 | 153 | 65 | (3,423 | ) | (4,894 | ) | 10,057 | 12,693 | ||||||||||||||||||||||||||||
| Export Sales | 12,597 | 18,060 | 1,677 | 3,109 | - | - | (1 | ) | (670 | ) | 14,274 | 20,499 | ||||||||||||||||||||||||||||
| Sales of services | 34 | 51 | 72 | 104 | 4,806 | 3,810 | (2,933 | ) | (2,253 | ) | 1,979 | 1,712 | ||||||||||||||||||||||||||||
| Total Sales | 16,800 | 24,447 | 10,908 | 14,399 | 4,959 | 3,874 | (6,356 | ) | (7,817 | ) | 26,310 | 34,904 | ||||||||||||||||||||||||||||
| Variable Costs | 9,332 | 10,640 | 8,847 | 12,567 | 246 | 199 | (4,912 | ) | (6,735 | ) | 13,514 | 16,671 | ||||||||||||||||||||||||||||
| Fixed Costs | 3,336 | 3,249 | 896 | 909 | 1,461 | 1,458 | (1,231 | ) | (919 | ) | 4,462 | 4,697 | ||||||||||||||||||||||||||||
| Cost of Sales | 12,668 | 13,889 | 9,744 | 13,475 | 1,707 | 1,657 | (6,143 | ) | (7,654 | ) | 17,976 | 21,367 | ||||||||||||||||||||||||||||
| Gross profit | 4,132 | 10,558 | 1,165 | 924 | 3,252 | 2,218 | (214 | ) | (163 | ) | 8,335 | 13,536 | ||||||||||||||||||||||||||||
| Operating Expenses | 1,458 | 1,557 | 727 | 640 | 371 | 267 | (129 | ) | (105 | ) | 2,427 | 2,359 | ||||||||||||||||||||||||||||
| Operating Profit | 2,673 | 9,001 | 438 | 284 | 2,881 | 1,950 | (85 | ) | (58 | ) | 5,907 | 11,177 | ||||||||||||||||||||||||||||
| Non Operating Profit/Loss | (1,814 | ) | (9 | ) | (339 | ) | (81 | ) | (140 | ) | (106 | ) | (17 | ) | (12 | ) | (2,309 | ) | (208 | ) | ||||||||||||||||||||
| Resultado de participación en asociadas | 39 | 132 | 9 | 10 | - | - | - | - | 47 | 143 | ||||||||||||||||||||||||||||||
| Income tax benefits (expense) | (427 | ) | (3,516 | ) | (112 | ) | (125 | ) | (1,055 | ) | (648 | ) | - | - | (1,594 | ) | (4,288 | ) | ||||||||||||||||||||||
| Ganancia Neta Consolidada | 471 | 5,609 | (5 | ) | 88 | 1,687 | 1,197 | (102 | ) | (70 | ) | 2,051 | 6,824 | |||||||||||||||||||||||||||
| Minority interest | - | - | (2 | ) | (2 | ) | 387 | 341 | - | - | 385 | 339 | ||||||||||||||||||||||||||||
| Net Income | 471 | 5,609 | (2 | ) | 91 | 1,300 | 856 | (102 | ) | (70 | ) | 1,667 | 6,485 | |||||||||||||||||||||||||||
| EBITDA | 4,239 | 11,863 | 744 | 745 | 2,686 | 1,681 | (102 | ) | (70 | ) | 7,566 | 14,218 | ||||||||||||||||||||||||||||
| EBITDA Margin | 25.2 | % | 48.5 | % | 6.8 | % | 5.2 | % | 54.2 | % | 43.4 | % | 1.6 | % | 0.9 | % | 28.8 | % | 40.7 | % | ||||||||||||||||||||
| 12 |
Exploration and Production
Although there was an increase of 9% in the volumes of crude sold, revenues for the second quarter of 2015 decreased 21% when compared to the same period of last year. The decrease in revenues is attributable to the net effect of the falling prices of the crude export basket of Ecopetrol, which decrease by 46.3%, and the 31% increase in the average exchange rate.
Cost of sales in the segment increased by 1% mainly due to: 1) A 26% increase in the costs of crude transportation services as a result of the effect of the devaluation of the exchange rate on dollar-denominated transport rates, 2) A 25% decrease in costs of contracted services, maintenance and supplies resulting from renegotiations of contracts, and 3) Reduction in crude purchasing costs due to the decrease in international prices.
Operating expenses decreased by 18% during the second quarter of 2015 when compared to the same period of 2014 mainly due to a 51% decrease in exploration costs owing to lower seismic activity and fewer drilling campaigns.
The (non-operating) net financial result presented a loss when compared to the second quarter of 2014, mainly due to the effect of exchange rate difference on the net liability position of Ecopetrol.
As a net result, the segment had a profit of COP$638 billion in the second quarter of 2015 versus a profit in the same period of 2014 of COP$2.393 billion.
Refining and Petrochemicals
Revenues for the second quarter of 2015 decreased 15% when compared to the same period of last year mainly due to the fall in international indexes of refined product prices.
Cost of sales in the segment declined 20% due to the lower cost of raw materials, in line with lower international crude prices.
The gross sales margin increased to 12% during the second quarter of 2015 from 6% on the same period of 2014. This increase was a result of 1) a smaller decrease in the sales price of refining products as compared to the drop in cost of raw materials. 2) increased recovery of valuable products by implementing initiatives to rise the production of middle distillates which offset the lower availability of light and medium crudes in the feedstock, and 3) lower operating costs as a result of optimization strategies.
Operating expenses decreased 28% mainly due to lower value of tax expense (industry and commerce and financial transaction taxes), project expenditures and general expenses in 2015 compared to 2014.
The consolidated segment operating income increased by COP$401 billion.
Thus, the segment posted a net income of COP$296 billion, compared with a loss in the same quarter of last year of COP$28 billion.
Transport and Logistics
Revenues for the second quarter of 2015 increased 27% due to: 1) higher volumes transported to third parties by Cenit, Ocensa and ODL, and 2) the positive effect of the devaluation of the exchange rate on the dollar-denominated tariffs.
| 13 |
Cost of sales and contracted services decreased by 11% mainly due to the efforts carried out by the companies of the segment to reduce operating and maintenance cost.
Operating expenses decreased compared to the second quarter of last year by COP$102 billion, mainly due to the decrease in losses from attacks.
The (non-operating) net financial result was lower compared to the second quarter of last year, mainly due to the recording of higher interest expenses and the effect of the exchange rate difference over the net position of the transportation companies.
As a result of the above, the segment posted a net income of COP$630 billion versus COP$265 billion in the second quarter of 2014.
| h. | Saving initiatives |
As of June 30, 2015, Ecopetrol S.A. reports a reduction of COP$0.6 trillion in cost and expenditures, compared with those reported in the first half of 2014. The breakdown by business segments is as follows:
Graph 1- Savings in Cost and Expenditures of Ecopetrol S.A.
Trillion pesos
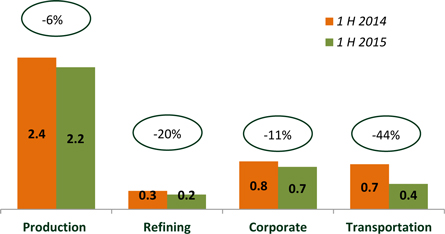
The main aspects optimized in each business segment are:
Production: contract renegotiation (lower fees and quantities) and improved maintenance strategy.
Refining: higher efficiencies in maintenance, and lower expenses, due to the renegotiation of product purchases and import fees.
Corporate: optimization of health, transportation, and maintenance of non-operational and information technology services.
Transport: following the new strategy, the maintenance contracts were transferred to Cenit, generating savings for Ecopetrol via renegotiation with contractors and prioritization of maintenance activities, according with the assessed level of risk.
Ecopetrol is looking for higher efficiencies aimed at obtaining savings of COP$1.4 trillion in 2015 and structural efficiencies in line with the long-term savings target of COP$6 trillion between 2015 and 2020.
| 14 |
| II. | Operating Results |
| a. | Investments* |
Table 11: Investments by Ecopetrol´s Corporate Group
| A | B | C | D | E | ||||||||||||
| 1H 2015 (US$ million) | ||||||||||||||||
| Segment | Ecopetrol S.A. | Affiliates and Subsidiaries** | Total | Allocation by segment | ||||||||||||
| Production | 1,335.2 | 235.5 | 1,570.7 | 50.3 | % | |||||||||||
| Refining, Petrochemicals and Biofuels | 73.6 | 817.6 | 891.2 | 28.5 | % | |||||||||||
| Exploration | 124.4 | 109.9 | 234.3 | 7.5 | % | |||||||||||
| Transportation | 16.4 | 384.0 | 400.4 | 12.8 | % | |||||||||||
| Corporate | 25.8 | 0.0 | 25.8 | 0.8 | % | |||||||||||
| New Business*** | 2.5 | 0.0 | 2.5 | 0.1 | % | |||||||||||
| Supply and Marketing | 0.8 | 0.0 | 0.8 | 0.0 | % | |||||||||||
| Total | 1,578.7 | 1,547.0 | 3,125.7 | 100.0 | % | |||||||||||
*Figures in this table differ from the capital expenditure figures presented in the Consolidated Statement of Cash Flows on page 27 because the figures in this table include both operating expenditures and capital expenditure outflows of investment projects, while the investment line of the Consolidated Statement of Cash Flows includes capital expenditures only.
**Prorated according to Ecopetrol’s stake.
***Corresponds to our new organizational structure and refers to investments approved by the Office of Mergers and Acquisitions and New Business Management. These funds were part of the Corporate segment until 2014.
Investments in the first half of 2015 were US$3,125.7 million (Ecopetrol S.A. itself accounting for 50.5% of that amount while affiliates and subsidiaries accounted for 49.5%). These investments were distributed as follows:
| · | Production (50.3%): The drilling campaign, especially in the fields Chichimene, Rubiales and La Cira-Infantas, and expansion of the Acacias and Chichimene stations. |
| · | Refining, Petrochemicals and Biofuels (28.5%): the Industrial Services Master Plan of the Barrancabermeja refinery and the Cartagena refinery modernization project. |
| · | Transport (12.8%): the Reficar logistics project, to ensure the supply of crude and liquid products for the refinery and the development of the Ocensa P135 project. |
| · | Exploration (7.5%): Drilling of the Kronos exploratory well and the appraisal well Oripaya-3. |
| b. | Exploration |
Exploration in Colombia:
The following table summarizes the results of our exploration activities in Colombia for the periods indicated:
Table 12: Wildcats in Colombia
| A | B | C | D | E | F | G | H | I | ||||||||||||||||||||||||
| 2Q 2015 | 1H 2015 | |||||||||||||||||||||||||||||||
| Company | Drilled | Hydrocarbon Presence* | Under Evaluation | Dry | Drilled | Hydrocarbon Presence* | Under Evaluation | Dry | ||||||||||||||||||||||||
| Ecopetrol S.A. | 0 | 0 | 0 | 0 | 0 | 0 | 0 | 0 | ||||||||||||||||||||||||
| Hocol S.A. | 0 | 0 | 0 | 0 | 1 | 1 | 0 | 0 | ||||||||||||||||||||||||
| Total | 0 | 0 | 0 | 0 | 1 | 1 | 0 | 0 | ||||||||||||||||||||||||
*geological success
| 15 |
During the second quarter of 2015, Ecopetrol drilled the appraisal well Oripaya-3. The Kronos exploratory well located in ultra-deep waters off the Colombian Caribbean was being drilled at the end of the second quarter of 2015. Ecopetrol holds a 50% stake in this well, along with the operator, Anadarko Petroleum Corporation, which holds the remaining 50% stake.
On July 28, Kronos well confirmed the presence of gas in ultra-deep waters. The discovery proves the geological model proposed for an unexplored area, with high hydrocarbon potential.
International exploration:
During the second quarter of 2015, Ecopetrol America Inc. began drilling the exploratory well Sea Eagle in deep waters off the Gulf of Mexico. Ecopetrol America Inc. holds a 50% stake in this well, along with the operator, Murphy Oil Corporation, which holds 35% stake, and PetroVietnam with 15%. This well was closed and abandoned on July, 2015.
| c. | Production |
The following table summarizes the results of our oil and gas production activities for the periods indicated:
Table 13: Gross* Oil and Gas Group´s Production**
| A | B | C | D | E | F | G | H | I | ||||||||||||||||||||||||
| Ecopetrol S.A. (mboed) | 2Q 2015 | 2Q 2014 | ∆ (%) | ∆ (bls) | 1H 2015 | 1H 2014 | ∆ (%) | ∆ (bls) | ||||||||||||||||||||||||
| Crude Oil | 593.3 | 561.4 | 5.7 | % | 31.9 | 595.6 | 574.7 | 3.6 | % | 20.9 | ||||||||||||||||||||||
| Natural Gas*** | 120.9 | 123.5 | (2.1 | )% | (2.6 | ) | 122.5 | 126.5 | (3.2 | )% | (4.0 | ) | ||||||||||||||||||||
| Total | 714.2 | 684.9 | 4.3 | % | 29.3 | 718.1 | 701.2 | 2.4 | % | 16.9 | ||||||||||||||||||||||
| Hocol (mboed) | 2Q 2015 | 2Q 2014 | ∆ (%) | ∆ (bls) | 1H 2015 | 1H 2014 | ∆ (%) | ∆ (bls) | ||||||||||||||||||||||||
| Crude Oil | 21.1 | 22.2 | (5.0 | )% | (1.1 | ) | 20.6 | 22.4 | (8.0 | )% | (1.8 | ) | ||||||||||||||||||||
| Natural Gas | 0.1 | 0.1 | 0.0 | % | 0.0 | 0.1 | 0.2 | (50.0 | )% | (0.1 | ) | |||||||||||||||||||||
| Total | 21.2 | 22.3 | (4.9 | )% | (1.1 | ) | 20.7 | 22.6 | (8.4 | )% | (1.9 | ) | ||||||||||||||||||||
| Savia (mboed) | 2Q 2015 | 2Q 2014 | ∆ (%) | ∆ (bls) | 1H 2015 | 1H 2014 | ∆ (%) | ∆ (bls) | ||||||||||||||||||||||||
| Crude Oil | 5.0 | 5.5 | (9.1 | )% | (0.5 | ) | 5.0 | 5.4 | (7.4 | )% | (0.4 | ) | ||||||||||||||||||||
| Natural Gas | 1.2 | 1.0 | 20.0 | % | 0.2 | 1.2 | 1.1 | 9.1 | % | 0.1 | ||||||||||||||||||||||
| Total | 6.2 | 6.5 | (4.6 | )% | (0.3 | ) | 6.2 | 6.5 | (4.6 | )% | (0.3 | ) | ||||||||||||||||||||
| Equion (mboed)**** | 2Q 2015 | 2Q 2014 | ∆ (%) | ∆ (bls) | 1H 2015 | 1H 2014 | ∆ (%) | ∆ (bls) | ||||||||||||||||||||||||
| Crude Oil | 11.5 | 9.1 | 26.4 | % | 2.4 | 10.7 | 9.2 | 16.3 | % | 1.5 | ||||||||||||||||||||||
| Natural Gas | 8.8 | 8.4 | 4.8 | % | 0.4 | 8.8 | 8.4 | 4.8 | % | 0.4 | ||||||||||||||||||||||
| Total | 20.3 | 17.5 | 16.0 | % | 2.8 | 19.5 | 17.6 | 10.8 | % | 1.9 | ||||||||||||||||||||||
| Ecopetrol America-K2 (mboed) | 2Q 2015 | 2Q 2014 | ∆ (%) | ∆ (bls) | 1H 2015 | 1H 2014 | ∆ (%) | ∆ (bls) | ||||||||||||||||||||||||
| Crude Oil | 2.8 | 1.0 | 180.0 | % | 1.8 | 3.1 | 1.3 | 138.5 | % | 1.8 | ||||||||||||||||||||||
| Natural Gas | 2.9 | 1.9 | 52.6 | % | 1.0 | 3.0 | 1.0 | 200.0 | % | 2.0 | ||||||||||||||||||||||
| Total | 5.7 | 2.9 | 96.6 | % | 2.8 | 6.1 | 2.3 | 165.2 | % | 3.8 | ||||||||||||||||||||||
| Ecopetrol Corporate Group (mboed) | 2Q 2015 | 2Q 2014 | ∆ (%) | ∆ (bls) | 1H 2015 | 1H 2014 | ∆ (%) | ∆ (bls) | ||||||||||||||||||||||||
| Crude Oil | 633.7 | 599.2 | 5.8 | % | 34.5 | 635.0 | 613.0 | 3.6 | % | 22.0 | ||||||||||||||||||||||
| Natural Gas | 133.9 | 134.9 | (0.7 | )% | (1.0 | ) | 135.6 | 137.2 | (1.2 | )% | (1.6 | ) | ||||||||||||||||||||
| Total Group's production | 767.6 | 734.1 | 4.6 | % | 33.5 | 770.6 | 750.2 | 2.7 | % | 20.4 | ||||||||||||||||||||||
* Gross production includes royalties and prorated according to Ecopetrol´s stake in each company
** Equion and Savia do not consolidate within the Corporate Group
*** Gas production includes white products
*** The production breakdown of crude oil and gas for 2014 was modified in order to reflect the production of white products in the production of gas
| 16 |
In comparison with the second quarter of 2014, the Group’s production increased by 33.5 mboed, or 4.6%, during the second quarter of 2015. The increase was driven by improved production at the Castilla and Chichimene fields following the start-up of operations at the new facilities and the current drilling campaign in those fields. In addition, production at the Caño-Limón field increased by 15 mboed during the second quarter of 2015, due to a lower impact of attacks on infrastructure during the second quarter of 2015 compared with the second quarter of last year.
The increase in production helped to counteract certain operating restrictions, especially those related to our water disposal capacity in the Rubiales field, the natural decline of the Guajira fields and the reduction of Ecopetrol’s production due to the high price clause of certain contracts.
With respect to the previous quarter, production decreased 5.8 mboed (0.7%), mainly due to the attacks of June that affected the Caño Limón, Gibraltar and Southeast fields as well as the effect of the decrease in prices over Ecopetrol’s share in contracts that include the high price clause, mainly Quifa and La Cira - Infantas.
Projects to increase the recovery factor:
During the second quarter of 2015, two pilot projects were launched to increase the recovery factor, a water injection project at the Suria field and a chemical injection project at the Caracara field. A third pilot project, a water injection pilot at the Tisquirama field, is in the startup testing stage and is expected to begin operations at the end of July 2015. In addition, we made progress in well drilling and construction of facilities required to launch four other pilot projects that are part of our objectives for this year.
The air injection pilot program at the Chichimene field reached 80% completion in the building of surface facilities and 95% completion in the development of the connectivity test, with favorable results to date. The company has executed 21 recovery pilot programs to date, with total injection of 12 million barrels of water, 8 million barrels of improved water and 67 million cubic meters of gas since the beginning of the recovery pilot programs in 2013. Twelve pilot programs have yielded increases in well pressure and 11 increases in crude production in their respective areas.
The following table summarizes the average production of our main fields by region for the periods indicated:
| 17 |
Table 14: Average Production Main Fields by Region – Ecopetrol´s Net Interest
| A | B | C | D | E | F | G | ||||||||||||||||||
| 2Q 2015 | 2Q 2014 | ∆ (%) | 1H 2015 | 1H 2014 | ∆ (%) | |||||||||||||||||||
| Central Region | 98.0 | 92.6 | 5.8 | % | 99.2 | 94.6 | 4.9 | % | ||||||||||||||||
| 1) La Cira - Infantas | 22.9 | 24.2 | (5.4 | )% | 23.9 | 24.6 | (2.8 | )% | ||||||||||||||||
| 2) Casabe | 22.6 | 22.0 | 2.7 | % | 23.2 | 21.7 | 6.9 | % | ||||||||||||||||
| 3) Yarigui | 17.4 | 17.6 | (1.1 | )% | 17.1 | 17.3 | (1.2 | )% | ||||||||||||||||
| 4) Other | 35.1 | 28.8 | 21.9 | % | 35.0 | 31.0 | 12.9 | % | ||||||||||||||||
| Orinoquia Region | 259.9 | 218.7 | 18.8 | % | 259.2 | 218.3 | 18.7 | % | ||||||||||||||||
| 1) Castilla | 123.1 | 103.0 | 19.5 | % | 120.6 | 103.4 | 16.6 | % | ||||||||||||||||
| 2) Chichimene | 77.8 | 49.3 | 57.8 | % | 78.9 | 48.3 | 63.4 | % | ||||||||||||||||
| 3) Cupiagua | 36.6 | 39.1 | (6.4 | )% | 36.0 | 39.0 | (7.7 | )% | ||||||||||||||||
| 4) Other | 22.4 | 27.3 | (17.9 | )% | 23.7 | 27.6 | (14.1 | )% | ||||||||||||||||
| South Region | 32.9 | 35.3 | (6.8 | )% | 33.8 | 35.8 | (5.6 | )% | ||||||||||||||||
| 1) San Francisco | 8.3 | 9.3 | (10.8 | )% | 8.4 | 9.5 | (11.6 | )% | ||||||||||||||||
| 2) Huila Area | 8.7 | 9.3 | (6.5 | )% | 9.0 | 9.4 | (4.3 | )% | ||||||||||||||||
| 3) Tello | 4.9 | 4.5 | 8.9 | % | 4.9 | 4.5 | 8.9 | % | ||||||||||||||||
| 4) Other | 11.0 | 12.2 | (9.8 | )% | 11.5 | 12.4 | (7.3 | )% | ||||||||||||||||
| Associated Operations | 295.7 | 308.0 | (4.0 | )% | 297.3 | 321.9 | (7.6 | )% | ||||||||||||||||
| 1) Rubiales | 94.3 | 109.1 | (13.6 | )% | 93.9 | 109.9 | (14.6 | )% | ||||||||||||||||
| 2) Guajira | 44.1 | 51.3 | (14.0 | )% | 45.7 | 53.5 | (14.6 | )% | ||||||||||||||||
| 3) Quifa | 23.8 | 31.4 | (24.2 | )% | 24.8 | 33.3 | (25.5 | )% | ||||||||||||||||
| 4) Caño Limón | 30.6 | 15.4 | 98.7 | % | 31.3 | 24.5 | 27.8 | % | ||||||||||||||||
| 5) Cusiana | 32.8 | 33.9 | (3.2 | )% | 32.8 | 33.6 | (2.4 | )% | ||||||||||||||||
| 6) Other | 70.1 | 66.9 | 4.8 | % | 68.8 | 67.1 | 2.5 | % | ||||||||||||||||
| Minor Fields | 27.7 | 30.3 | (8.6 | )% | 28.6 | 30.6 | (6.5 | )% | ||||||||||||||||
| Direct Operation | 4.6 | 4.0 | 15.0 | % | 4.6 | 3.6 | 27.8 | % | ||||||||||||||||
| Associated Operation | 23.1 | 26.3 | (12.2 | )% | 24.0 | 27.0 | (11.1 | )% | ||||||||||||||||
| Total | 714.2 | 684.9 | 4.3 | % | 718.1 | 701.2 | 2.4 | % | ||||||||||||||||
| Direct Operation | 395.4 | 350.6 | 12.8 | % | 396.8 | 352.3 | 12.6 | % | ||||||||||||||||
| Associated Operation | 318.8 | 334.3 | (4.6 | )% | 321.3 | 348.9 | (7.9 | )% | ||||||||||||||||
| Hocol | ||||||||||||||||||||||||
| 1) Ocelote | 13.7 | 15.2 | (9.9 | )% | 13.7 | 14.9 | (8.1 | )% | ||||||||||||||||
| 2) Other | 7.5 | 7.2 | 4.2 | % | 7.0 | 7.6 | (7.9 | )% | ||||||||||||||||
| Equion* | ||||||||||||||||||||||||
| 1) Piedemonte | 14.5 | 11.4 | 27.2 | % | 13.7 | 11.5 | 19.1 | % | ||||||||||||||||
| 2) Tauramena / Chitamena | 4.5 | 4.7 | (4.3 | )% | 4.5 | 4.7 | (4.3 | )% | ||||||||||||||||
| 3) Other | 1.3 | 1.4 | (7.1 | )% | 1.3 | 1.4 | (7.1 | )% | ||||||||||||||||
| Savia* | ||||||||||||||||||||||||
| 1) Lobitos | 2.2 | 2.5 | (12.0 | )% | 2.2 | 2.4 | (8.3 | )% | ||||||||||||||||
| 2) Peña Negra | 1.8 | 1.8 | 0.0 | % | 1.8 | 1.8 | 0.0 | % | ||||||||||||||||
| 3) Other | 1.0 | 1.2 | (16.7 | )% | 1.0 | 1.2 | (16.7 | )% | ||||||||||||||||
| Ecopetrol America Inc. | ||||||||||||||||||||||||
| 1) Dalmatian | 4.5 | 2.2 | 104.5 | % | 4.8 | 1.1 | 336.4 | % | ||||||||||||||||
| 2) k2 | 1.2 | 0.7 | 71.4 | % | 1.3 | 1.2 | 8.3 | % | ||||||||||||||||
*Equión and Savia are not consolidated in the Ecopetrol Group.
| 18 |
The following table summarizes the results of our crude oil production by type of crude for the periods indicated:
Table 15: Corporate Group Production per Type of Crude
| A | B | C | D | E | F | G | ||||||||||||||||||
| 2Q 2015 | 2Q 2014 | ∆ (%) | 1H 2015 | 1H 2014 | ∆ (%) | |||||||||||||||||||
| Light | 63.9 | 60.0 | 6.5 | % | 62.0 | 61.1 | 1.5 | % | ||||||||||||||||
| Medium | 214.3 | 211.8 | 1.2 | % | 217.5 | 222.7 | (2.3 | )% | ||||||||||||||||
| Heavy | 355.5 | 327.4 | 8.6 | % | 355.5 | 329.2 | 8.0 | % | ||||||||||||||||
| Total | 633.7 | 599.2 | 5.8 | % | 635.0 | 613.0 | 3.6 | % | ||||||||||||||||
Lifting Cost
The lifting cost per barrel produced by the Group, not including production corresponding to royalties, was US$7.47 per barrel for the second quarter of 2015, which represented a US$4.88 per barrel reduction when compared with US$12.35 for the same period of 2014. This reduction was primarily due to:
| · | The effects of the devaluation of the average exchange rate of Colombian peso against the U.S. dollar resulting in a US$2.29 per barrel decrease due to the re-expression of peso-denominated cost in US dollars at a higher exchange rate (COP$2,501.05/US in the second quarter of 2015 versus COP$1,913.61/US in the same quarter of 2014). |
| · | A cost effect resulting in a US$2.27/Bl decrease in lifting costs due to the combined effects of: |
| o | Cost optimization strategies in Ecopetrol and Hocol operations resulting in a US$2.32 reduction. These strategies included 1) fewer number of well interventions as a result of subsoil strategies, 2) improvements in maintenance routines and equipment reliability and 3) replacement of half of our electricity consumption with diesel. |
| o | A US$0.05 per barrel cost increase at Ecopetrol America Inc. due to the start of operations and repairs of the Dalmatian well. |
| · | Volume effect: (US$-0.32/Bl): higher production volume in the period under analysis. |
The lifting cost per barrel produced by the Group for the first half of 2015 was US$7.53/BL.
| d. | Transport |
The following table summarizes our volumes transported for the periods indicated:
Table 16: Volumes Transported
| A | B | C | D | E | F | G | ||||||||||||||||||
| 2Q 2015 | 2Q 2014 | ∆ (%) | 1H 2015 | 1H 2014 | ∆ (%) | |||||||||||||||||||
| Crude | 979.4 | 908.2 | 7.8 | % | 1000.7 | 930.2 | 7.6 | % | ||||||||||||||||
| Refined Products | 250 | 248.0 | 0.8 | % | 251.5 | 247.8 | 1.5 | % | ||||||||||||||||
| Total | 1,229.4 | 1,156.2 | 6.3 | % | 1,252.2 | 1,178.0 | 6.3 | % | ||||||||||||||||
Note: figures correspond to volumes transported by the Ecopetrol Group and by third parties.
The volume of crude transported by the main Cenit S.A.S. system and those of its affiliates increased 7.8% in the second quarter of 2015 when compared to the same period of 2014, primarily due to higher availability in the Caño Limón - Coveñas and Oleoducto Transandino systems. Ecopetrol S.A. crude accounted for approximately 69.1% of the total volume of crude transported by Cenit oil pipelines.
| 19 |
The volumes of refined products transported by the main Cenit S.A.S systems increased 0.8% in the second quarter of 2015 when compared to the same period of 2014. This increase was due to a larger volume of fuel transported by the Cartagena – Barranquilla system and higher transported volumes of naphtha in the Pozos Colorados – Galán and Galán – Apiay systems to dilute heavy crude. Ecopetrol S.A. refined products accounted for approximately 17.8% of the total volume of refined products transported through Cenit pipelines.
Projects:
In June 2015, we finalized the construction and fitting of a loop in the Apiay–Monterrey system to upgrade the capacity of that system to 300 mbod. During the third quarter of 2015, we expect the pipeline filling activities to be carried out. These works are part of the San Fernando-Monterrey project that aims to increase the transport capacity of that system to 390 mbod.
Cost per barrel transported
The average cost per barrel transported for the companies within the Group during the period April to June of 2015 was US$4.84/BL, representing a US$0.03 per barrel decrease as compared to US$4.87 per barrel for the same period of 2014. The average cost per barrel transported during the first half of 2015 was US$4.99/BL.
The calculation methodology for this index has been modified since the first quarter of 2015 due to our transition to IFRS reporting standard.
| e. | Refining |
e.1) Barrancabermeja refinery:
The following table summarizes the results of our refining activities for the periods indicated:
Table 17: Refinery Runs and Utilization Factor
| A | B | C | D | E | F | G | ||||||||||||||||||
| 2Q 2015 | 2Q 2014 | ∆ (%) | 1H 2015 | 1H 2014 | ∆ (%) | |||||||||||||||||||
| Refinery runs* (mbod) | 226.1 | 230.7 | (2.0 | )% | 225.4 | 227.0 | (0.7 | )% | ||||||||||||||||
| Utilization factor (%) | 77.1 | % | 81.9 | % | (5.9 | )% | 78.7 | % | 82.4 | % | (4.5 | )% | ||||||||||||
* Includes volumes loaded in the refinery, not total volumes received.
The throughput of Barrancabermeja refinery decreased by 4.6 mbod when compared to the second quarter of 2014, due to a lower availability of light and medium crude oil.
The Utilities Master Plan, which aims to increase the reliability and efficiency of the industrial services operations of the Barrancabermeja refinery, reached 98.6% physical completion, including the start-up of the Power Generator unit U-5100.
Costs and margins of the refining segment
The cash operating cost for the Group, which includes the operation of the Barrancabermeja refinery and Propilco for the second quarter of 2015 was US$4.55/BL, which when compared to the same period in 2014 (US$6.67/BL) presents a decrease of US$2.12/BL, as a result of:
| 20 |
| · | The effects of the devaluation of the average exchange rate of Colombian peso against the U.S. dollar resulting in a US$1.40 per barrel decrease due to the re-expression of peso-denominated cost in US dollars at a higher exchange rate (COP$2,501.05/US in the second quarter of 2015 versus COP$1,913.61/US in the same quarter of 2014). |
| · | A cost effect due to optimization strategies in maintenance and support services resulting in a US$0.79 decrease in our variable costs per barrel loaded in Barrancabermeja. |
| · | A volume effect due to lower recorded throughput resulting in a US$0.07 per barrel increase in cash operating costs. |
The cash operating cost for the first half of 2015 was US$4.63/BL.
The following table summarizes the results of our refining margin for the periods indicated:
Table 18: Refining Margin
| A | B | C | D | E | F | G | ||||||||||||||||||
| 2Q 2015 | 2Q 2014 | ∆ (%) | 1H 2015 | 1H 2014 | ∆ (%) | |||||||||||||||||||
| Refining Margin (USD/bl) | 17.2 | 10.9 | 57.8 | % | 17.8 | 13.5 | 31.9 | % | ||||||||||||||||
The increase in the gross refining margin in Barrancabermeja during the second quarter of 2015 as compared to the second quarter of 2014 was primarily the result of: 1) an increase in the yield of medium distillates, 2) implementation of initiatives to increase the value of LPG and residual streams and 3) more attractive international prices for refined products as compared to crude.
e.2)Reficar (Cartagena Refinery):
The Topping Unit and the Visbraker Unit have been shut down since March 2014, while the Catalytic Cracking Unit has not been in operation since October 2013 in order to facilitate the start-up of the new plants. The expansion and modernization project reached 98.6% physical completion as of June 30, 2015. We also reported 63% progress in the pre commissioning and commissioning processes, and the crude unit is expected to be ready for start-up during the last quarter of 2015.
| 21 |
| III. | Organizational Consolidation, Corporate Responsibility and Corporate Governance (Ecopetrol S.A.) |
| a. | Organizational Consolidation |
The following table summarizes our HSE record for the periods indicated:
Table 19: Health, Safety and the Environment (HSE)
| A | B | C | D | E | ||||||||||||
| HSE* | 2Q 2015 | 2Q 2014 | 1H 2015 | 1H 2014 | ||||||||||||
| Accident frequency index (accidents per million labor hours) | 0.49 | 0.79 | 0.41 | 0.93 | ||||||||||||
| Environmental incidents (operational cause) | 1 | 9 | 4 | 16 | ||||||||||||
*Results are subject to revision due to the fact that some figures may be reclassified, depending on the final results of the respective investigations.
Recognitions:
Ecopetrol was recognized by LatinFinance magazine’s “Best Corporates in the Capital Markets 2015” annual awards as the company that made “The best strategy for financing”' and “The best strategy in the capital market in the Andean region”.
The awards received in both categories highlighted Ecopetrol’s debt offerings carried out between May 2014 and February 2015, a period in which Ecopetrol raised more than US$ 5 billion at competitive interest rates and amid a sharp decline international oil prices.
Science and technology:
During the second quarter of 2015, the Superintendent of Industry and Commerce, on behalf of the Colombian government, granted a patent to Ecopetrol for the invention of a system for raising mechanical, electrical, electronic or similar components to the top of a pole. The uniqueness of the patented system is that it allows maintenance to be carried out on equipment from ground level, thereby reducing the risk associated with heights.
| b. | Corporate Responsibility |
Social investment:
In the first half of 2015, we invested COP$5,154 million in regional competitiveness programs, COP$4,863 million in education and cultural programs and COP$2,634 million for citizenship and democracy programs, amounting to a total investment of COP$12,651 million.
| 22 |
| IV. | Presentations of Second Quarter Results |
Ecopetrol’s management will host two conference calls to review our results for the second quarter of 2015:
| Spanish | English |
| August 6, 2015 | August 6, 2015 |
| 8:00 a.m. Bogotá | 9:30 a.m. Bogotá |
| 9:00 a.m. New York and Toronto (EDT) | 10:30 a.m. New York and Toronto (EDT) |
The webcast will be available on Ecopetrol’s website:www.ecopetrol.com.co
Please log on in advance to download the necessary software and check the proper operation of the webcast in your browser. We recommend using the latest versions of Internet Explorer, Google Chrome or Mozilla Firefox.
About Ecopetrol S.A.
Ecopetrol S.A. (BVC: ECOPETROL; NYSE: EC; TSX: ECP) is one of the 40 largest oil companies in the world and one of the four main oil companies in Latin America. It is the largest company in Colombia based on revenue, profit, assets and net worth. Ecopetrol is the only vertically integrated Colombian oil and gas company with stakes in operations in Colombia, Brazil, Peru and the United States (Gulf of Mexico).
Ecopetrol is majority-owned by the Republic of Colombia (88.5%) and its shares are traded on the Colombian Stock Exchange (Bolsa de Valores de Colombia S.A.) under the ticker symbol ECOPETROL, on the New York Stock Exchange under the ticker symbol EC, and on the Toronto Stock Exchange under the ticker symbol ECP. Ecopetrol has three business segments: 1) exploration and production, 2) transport and logistics and 3) refining, petrochemicals and biofuels. Its subsidiaries include the following companies: Andean Chemicals Limited, Bioenergy S.A., Bionergy Zona Franca S.A.S., Black Gold Re Ltd, Cenit Transporte y Logística de Hidrocarburos S.A.S., Ecopetrol America Inc, Ecopetrol del Perú S.A., Ecopetrol Oleo e Gas do Brasil Ltda, Ecopetrol Germany GmbH, Ecopetrol Capital AG, Ecopetrol Global Energy S.L.U., Ecopetrol Global Capital S.L.U., Equion Energía Limited, Hocol Petroleum Limited, Hocol S.A., Oleoducto de los Llanos Orientales S.A., Propilco S.A., Compounding and Masterbatching Industry Ltda - COMAI, Oleoducto Bicentenario de Colombia S.A.S, Oleoducto Central S.A. - OCENSA, Oleoducto de Colombia S.A. - ODC, Refinería de Cartagena S.A., Santiago Oil Company and Colombia Pipelines Limited.
Forward-looking Statements
This release may contain forward-looking statements related to the prospects of the business, estimates of operating and financial results, and growth forecasts for Ecopetrol. These are projections, and, as such, are based solely on the expectations of management with regard to the future of the company and its continuous access to capital to finance the company’s business plan. Such forward-looking statements depend essentially on changes in market conditions, government regulations, competitive pressures, and the performance of the Colombian economy and industry, among other factors. Therefore, they are subject to change without prior notice.
Contacts:
Director of Corporate Finance and Investor Relations (A)
Maria Catalina Escobar
Telephone: +571-234-5190
E-mail:investors@ecopetrol.com.co
Media Relations (Colombia)
Jorge Mauricio Tellez
Telephone: + 571-234-4329
Fax: +571-234-4480
E-mail:mauricio.tellez@ecopetrol.com.co
| 23 |
| V. | Ecopetrol´s Group Exhibits |
Availability of Crude, Natural Gas and Refined Products
| A | B | C | D | E | F | G | ||||||||||||||||||
| Ecopetrol S.A. (consolidated) (1) | ||||||||||||||||||||||||
| 1) Crude Oil (mbod) | 2Q 2015 | 2Q 2014 | ∆ (%) | 1H 2015 | 1H 2014 | ∆ (%) | ||||||||||||||||||
| (+) Net Production (2) | 534.7 | 505.6 | 5.8 | % | 536.5 | 517.2 | 3.7 | % | ||||||||||||||||
| (+) Purchases (3) | 179.4 | 174.8 | 2.6 | % | 185.0 | 174.8 | 5.8 | % | ||||||||||||||||
| (+) Diluent | 73.9 | 59.2 | 24.8 | % | 71.6 | 60.1 | 19.1 | % | ||||||||||||||||
| Total | 788.0 | 739.6 | 6.5 | % | 793.1 | 752.1 | 5.4 | % | ||||||||||||||||
| 2) Natural Gas (mboed) | 2Q 2015 | 2Q 2014 | ∆ (%) | 1H 2015 | 1H 2014 | ∆ (%) | ||||||||||||||||||
| (+) Production (4) | 94.9 | 98.5 | (3.7 | )% | 96.1 | 100.2 | (4.0 | )% | ||||||||||||||||
| (+) Purchases (5) | 1.9 | 2.5 | (24.0 | )% | 2.0 | 2.5 | (20.0 | )% | ||||||||||||||||
| Total | 96.8 | 101.0 | (4.2 | )% | 98.1 | 102.7 | (4.4 | )% | ||||||||||||||||
| 3) Refined Products (mbd) | 2Q 2015 | 2Q 2014 | ∆ (%) | 1H 2015 | 1H 2014 | ∆ (%) | ||||||||||||||||||
| (+) Production (6) | 227.0 | 233.3 | (2.7 | )% | 226.5 | 232.9 | (2.8 | )% | ||||||||||||||||
| (+) Local Purchases (7) | 8.6 | 6.5 | 32.3 | % | 10.5 | 9.6 | 9.4 | % | ||||||||||||||||
| (+) Imports (8) | 132.1 | 127.2 | 3.9 | % | 165.8 | 157.3 | 5.4 | % | ||||||||||||||||
| Total | 367.7 | 367.0 | 0.2 | % | 402.8 | 399.8 | 0.7 | % | ||||||||||||||||
(1) Does not include variation in inventories.
(2) Does not include royalties.
(3) Includes royalties purchased from the National Hydrocarbon Agency (Agencia Nacional de Hidrocarburos, or ANH), royalties from Ecopetrol and other companies, and purchases from third parties.
(4) Includes royalties.
(5) Includes purchases from third parties only.
(6) Excludes figures for diluent production and products used as diluents in 2014 as those figures are already included under the “Diluent” line item in the “Crude Oil” section.
(7) Excludes figures for local diluent purchases in 2014 as those figures are already included under the “Diluent” line item in the “Crude Oil” section.
(8) Excludes figures for diluent imports as those figures are already included under the “Diluent” line item in the “Crude Oil” section. The figures of imports reported in 1Q-2015 were adjusted by 78.5 mboed in order to include products imported by Propilco.
The main variations during the second quarter of 2015 as compared to the second quarter of 2014 were as follows:
| · | Increased crude oil production primarily due to production increase in the Castilla and Chichimene fields. |
| · | Higher crude oil purchases mainly as a result of increased purchases from the ANH because of increased national crude oil production. |
| · | Increased diluent purchases due to increased production of heavy crude. |
| · | Decreased natural gas production due to the natural decline in production of the Guajira fields and the maintenance of the Riohacha well. |
| · | Increased imports of: |
| o | Gasoline due to: 1) higher local demand, and 2) decrease in diesel consumption for vehicles. |
| o | Increased imports of jet fuel due to increases in the number of air passengers and flight routes. |
The diesel imports decreased as the company’s own product was used to meet the demand and also due to the reduction in local consumption.
| 24 |
Income Statement
Ecopetrol Consolidated
| COP$ Million | 2Q 2015* | 2Q 2014* | 1Q 2015* | 1H 2015* | 1H 2014* | |||||||||||||||
| Income | ||||||||||||||||||||
| Local Sales | 5,340,342 | 6,233,420 | 4,716,959 | 10,057,301 | 12,692,625 | |||||||||||||||
| Export Sales | 7,799,849 | 9,798,215 | 6,474,087 | 14,273,936 | 20,499,114 | |||||||||||||||
| Sale of Services | 869,438 | 900,566 | 1,109,809 | 1,979,247 | 1,711,787 | |||||||||||||||
| Total Sales | 14,009,629 | 16,932,201 | 12,300,855 | 26,310,484 | 34,903,526 | |||||||||||||||
| Cost of Sales | ||||||||||||||||||||
| Variable Costs | ||||||||||||||||||||
| Imported products | 2,918,685 | 3,243,200 | 2,764,883 | 5,683,568 | 6,546,190 | |||||||||||||||
| Purchase of Hydrocarbons | 1,870,088 | 2,911,148 | 1,661,442 | 3,531,530 | 5,865,153 | |||||||||||||||
| Depreciation, Amortization and Depletion | 1,311,582 | 1,198,849 | 1,179,080 | 2,490,662 | 2,422,640 | |||||||||||||||
| Hydrocarbon Transportation Services | 206,789 | 374,172 | 320,471 | 527,260 | 759,687 | |||||||||||||||
| Inventories and other | 770,222 | 323,903 | 510,683 | 1,280,905 | 1,077,186 | |||||||||||||||
| Fixed Costs | ||||||||||||||||||||
| Depreciation | 321,059 | 252,813 | 331,182 | 652,241 | 531,499 | |||||||||||||||
| Contracted Services | 635,809 | 819,901 | 659,531 | 1,295,340 | 1,516,923 | |||||||||||||||
| Maintenance | 546,774 | 599,969 | 401,334 | 948,108 | 1,063,137 | |||||||||||||||
| Labor Costs | 398,934 | 405,861 | 376,134 | 775,068 | 746,133 | |||||||||||||||
| Other | 441,374 | 468,665 | 349,897 | 791,271 | 838,869 | |||||||||||||||
| Total Cost of Sales | 9,421,316 | 10,598,481 | 8,554,637 | 17,975,953 | 21,367,417 | |||||||||||||||
| Gross Profits | 4,588,313 | 6,333,720 | 3,746,218 | 8,334,531 | 13,536,109 | |||||||||||||||
| Operating Expenses | ||||||||||||||||||||
| Administration | 235,369 | 226,342 | 819,030 | 1,054,399 | 425,066 | |||||||||||||||
| Selling and operational expenses | 553,833 | 623,137 | 520,420 | 1,074,253 | 1,056,558 | |||||||||||||||
| Exploration and Projects | 251,537 | 511,285 | 84,533 | 336,070 | 874,858 | |||||||||||||||
| Other operational (income) expenses | (1,664 | ) | 60,787 | (35,613 | ) | (37,277 | ) | 2,792 | ||||||||||||
| Operating Income/Loss | 3,549,238 | 4,912,169 | 2,357,848 | 5,907,086 | 11,176,835 | |||||||||||||||
| Financial Income/Loss | (779,024 | ) | (86,975 | ) | (1,530,274 | ) | (2,309,298 | ) | (207,887 | ) | ||||||||||
| Results from Subsidiaries | 46,618 | 127,442 | 744 | 47,362 | 142,756 | |||||||||||||||
| Income before income tax | 2,816,832 | 4,952,636 | 828,318 | 3,645,150 | 11,111,704 | |||||||||||||||
| Provision for Income Tax | (1,121,300 | ) | (2,193,911 | ) | (472,376 | ) | (1,593,676 | ) | (4,288,140 | ) | ||||||||||
| Net Income Consolidated | 1,695,532 | 2,758,725 | 355,942 | 2,051,474 | 6,823,564 | |||||||||||||||
| Non-controlling interests | (188,976 | ) | (161,865 | ) | (195,912 | ) | (384,888 | ) | (338,603 | ) | ||||||||||
| Equity holders of Ecopetrol*** | 1,506,556 | 2,596,860 | 160,030 | 1,666,586 | 6,484,961 | |||||||||||||||
| Other comprenhensive income | 459,113 | (421,583 | ) | 710,940 | 1,170,053 | (288,905 | ) | |||||||||||||
| EBITDA | 4,508,014 | 6,519,840 | 3,058,483 | 7,566,497 | 14,217,934 | |||||||||||||||
| EBITDA MARGIN | 32 | % | 39 | % | 25 | % | 29 | % | 41 | % | ||||||||||
Notes
* The quarterly figures in this report are not audited.
** Includes exchange difference.
*** According to IAS-1, “Presentation of financial statements”, paragraph 83, the company must include in the statement of comprehensive income results attributable to non-controlling interests (minority interest) and results attributable to shareholders of the controlling company.
| 25 |
Balance sheet
Ecopetrol consolidated
| COP$ Million | June 30, 2015 | March 31, 2015 | ||||||
| Assets | ||||||||
| Current Assets | ||||||||
| Cash and cash equivalents | 9,285,236 | 10,941,003 | ||||||
| Trade and other receivables | 4,668,367 | 4,403,743 | ||||||
| Inventories | 2,905,021 | 2,804,040 | ||||||
| Current tax assets | 3,690,713 | 1,858,426 | ||||||
| Non-current assets held for sale | 1,440,846 | 1,464,788 | ||||||
| Other assets | 5,532,925 | 4,009,776 | ||||||
| Total Current Assets | 27,523,108 | 25,481,776 | ||||||
| Non Current Assets | ||||||||
| Investments in associates and joint ventures | 2,499,397 | 2,441,497 | ||||||
| Trade and other receivables | 435,925 | 469,301 | ||||||
| Property, plant and equipment | 62,352,315 | 60,753,896 | ||||||
| Natural and environmental resources | 26,541,945 | 25,592,235 | ||||||
| Intangibles | 244,908 | 215,924 | ||||||
| Deferred tax assets | 3,454,215 | 3,058,059 | ||||||
| Other non-current assets | 3,118,817 | 3,176,605 | ||||||
| Total Non Current Assets | 98,647,522 | 95,707,517 | ||||||
| Total Assets | 126,170,630 | 121,189,293 | ||||||
| Liabilities | ||||||||
| Current Liabilities | ||||||||
| Loans and borrowings | 4,220,309 | 4,611,531 | ||||||
| Trade and other payables | 12,907,459 | 12,920,633 | ||||||
| Labor and pension plan obligations | 1,309,233 | 1,308,514 | ||||||
| Current tax liabilities | 1,890,913 | 2,599,679 | ||||||
| Estimated liabilities and provisions | 908,961 | 901,527 | ||||||
| Other liabilities | 144,586 | 531,334 | ||||||
| Total Current Liabilities | 21,381,461 | 22,873,218 | ||||||
| Long Term Liabilities | ||||||||
| Loans and borrowings | 41,755,963 | 38,114,386 | ||||||
| Trade and other payables | 26,317 | 140,673 | ||||||
| Labor and pension plan obligations | 4,461,073 | 4,192,293 | ||||||
| Deferred tax liabilities | 3,598,739 | 3,787,949 | ||||||
| Estimated liabilities and provisions | 5,282,595 | 4,842,089 | ||||||
| Other long-term liabilities | 526,855 | 358,740 | ||||||
| Total non-current liabilities | 55,651,542 | 51,436,130 | ||||||
| Total liabilities | 77,033,003 | 74,309,348 | ||||||
| Equity | ||||||||
| Equity attributable to owners of the Company | 47,427,640 | 45,408,136 | ||||||
| Non-controlling interests | 1,709,987 | 1,471,809 | ||||||
| Total Equity | 49,137,627 | 46,879,945 | ||||||
| Total Liabilities and Shareholders' Equity | 126,170,630 | 121,189,293 | ||||||
| 26 |
Cash Flow Statement
Ecopetrol Consolidated
| COP$ Million | 2Q 2015 | 2Q 2014 | 1Q 2015 | 1H 2015 | 1H 2014 | |||||||||||||||
| Cash flow provided by operating activities: | ||||||||||||||||||||
| Net income Equity holders of Ecopetrol | 1,506,556 | 2,596,860 | 160,030 | 1,666,586 | 6,484,961 | |||||||||||||||
| Adjustments to reconcile net income to cash provided by operating activities: | ||||||||||||||||||||
| Non-controlling interests | 188,976 | 161,865 | 195,912 | 384,888 | 338,603 | |||||||||||||||
| Income tax | 1,121,300 | 2,193,911 | 472,376 | 1,593,676 | 4,288,140 | |||||||||||||||
| Depreciation, depletion and amortization | 1,661,244 | 1,475,075 | 1,586,918 | 3,248,162 | 3,050,014 | |||||||||||||||
| Foreign exchange loss (gain) | 451,181 | (165,972 | ) | 1,174,852 | 1,626,033 | (188,965 | ) | |||||||||||||
| Finance costs recognised in profit or loss | 441,137 | 319,861 | 426,105 | 867,242 | 615,076 | |||||||||||||||
| Gain on disponsal of non-current assets | 18,998 | 50,577 | 494 | 19,492 | 46,621 | |||||||||||||||
| Impairment of assets | 114,213 | 129,236 | 41,748 | 155,961 | 131,312 | |||||||||||||||
| Fair value loss (gain) on financial assets valuation | (63,014 | ) | (9,114 | ) | 60,563 | (2,451 | ) | (14,989 | ) | |||||||||||
| Share or profit os associates | (46,618 | ) | (127,442 | ) | (744 | ) | (47,362 | ) | (142,756 | ) | ||||||||||
| Net changes in operating assets and liabilities | (1,542,525 | ) | (399,985 | ) | (694,149 | ) | (2,236,674 | ) | (2,617,424 | ) | ||||||||||
| Income tax paid | (3,245,689 | ) | (3,309,510 | ) | (125,109 | ) | (3,370,798 | ) | (4,677,067 | ) | ||||||||||
| Cash provided by operating activities | 605,759 | 2,915,362 | 3,298,996 | 3,904,755 | 7,313,526 | |||||||||||||||
| Cash flows from investing activities: | ||||||||||||||||||||
| Investment in property, plant and equipment | (1,395,974 | ) | (3,276,465 | ) | (2,089,147 | ) | (3,485,121 | ) | (4,747,507 | ) | ||||||||||
| Investment in natural and environmental resources | (1,813,855 | ) | (1,184,210 | ) | (890,524 | ) | (2,704,379 | ) | (2,023,924 | ) | ||||||||||
| Payments for intangibles | (30,284 | ) | (24,625 | ) | (6,973 | ) | (37,257 | ) | (108,459 | ) | ||||||||||
| (Purchases) sales of other financial assets | (1,358,756 | ) | (3,015,782 | ) | (869,689 | ) | (2,228,445 | ) | (2,638,830 | ) | ||||||||||
| Interest received | 107,669 | 69,132 | 73,690 | 181,359 | 179,122 | |||||||||||||||
| Dividends received | 110,832 | 41,811 | - | 110,832 | 41,811 | |||||||||||||||
| Proceeds from sales of property, plant and equipment | 10,099 | 547,030 | 15,285 | 25,384 | 679,431 | |||||||||||||||
| Net cash generated by investing activities | (4,370,269 | ) | (6,843,109 | ) | (3,767,358 | ) | (8,137,627 | ) | (8,618,356 | ) | ||||||||||
| Cash flows from financing activities: | ||||||||||||||||||||
| Financial obligations | 2,803,018 | 5,377,457 | 4,495,419 | 7,298,437 | 5,444,087 | |||||||||||||||
| Interest paid | (301,618 | ) | (387,966 | ) | (403,071 | ) | (704,689 | ) | (736,218 | ) | ||||||||||
| Capitalizations | (8 | ) | - | 11 | 3 | 43 | ||||||||||||||
| Dividends paid | (645,817 | ) | (1,315,376 | ) | (181,704 | ) | (827,521 | ) | (2,643,420 | ) | ||||||||||
| Net cash used in financing activities | 1,855,575 | 3,674,115 | 3,910,655 | 5,766,230 | 2,064,492 | |||||||||||||||
| Exchange difference in cash and cash equivalents | 253,168 | (182,014 | ) | 482,979 | 736,147 | (100,088 | ) | |||||||||||||
| Net increase (decrease) in cash and cash equivalents | (1,655,767 | ) | (435,646 | ) | 3,925,272 | 2,269,505 | 659,574 | |||||||||||||
| Cash and cash equivalents at the beginning of the year | 10,941,003 | 9,900,750 | 7,015,731 | 7,015,731 | 8,805,530 | |||||||||||||||
| Cash and cash equivalents at the end of the year | 9,285,236 | 9,465,104 | 10,941,003 | 9,285,236 | 9,465,104 | |||||||||||||||
| 27 |
Reconciliation of EBITDA
Ecopetrol Consolidated
| COP$ Millions | 2Q 2015 | 2Q 2014 | 1H 2015 | 1H 2014 | ||||||||||||
| RECONCILIATION NET INCOME TO EBITDA | ||||||||||||||||
| Net Income | 1,506,556 | 2,596,860 | 1,666,586 | 6,484,961 | ||||||||||||
| Depreciations, depletions and amortizations | 1,661,244 | 1,475,075 | 3,248,162 | 3,050,014 | ||||||||||||
| Net Interest | 155,596 | 91,197 | 373,691 | 123,225 | ||||||||||||
| Other Taxes | 258,665 | 282,401 | 1,089,912 | 528,146 | ||||||||||||
| Provision for income tax, net | 1,121,300 | 2,193,911 | 1,593,676 | 4,288,140 | ||||||||||||
| Non-controlling interest | (195,347 | ) | (119,604 | ) | (405,530 | ) | (256,552 | ) | ||||||||
| CONSOLIDATED EBITDA | 4,508,014 | 6,519,840 | 7,566,497 | 14,217,934 | ||||||||||||
| 28 |
| VI. | Exhibits of Subsidiary Results and Shareholder Interest |
Note: The financial results of subsidiary companies have not been audited
Exploration and Production
| 1. | Hocol |
Income Statement
| COP$ Billion | 2Q 2015 | 2Q 2014 | 1H 2015 | 1H 2014 | ||||||||||||
| Local Sales | 92 | - | 112 | 1 | ||||||||||||
| Export Sales | 154 | 317 | 361 | 799 | ||||||||||||
| Sale of services | 66 | 70 | 119 | 98 | ||||||||||||
| Total Sales | 312 | 387 | 592 | 898 | ||||||||||||
| Variable Costs | 122 | 63 | 271 | 244 | ||||||||||||
| Fixed Costs | 120 | 154 | 204 | 282 | ||||||||||||
| Cost of Sales | 242 | 217 | 475 | 526 | ||||||||||||
| Gross Profits | 70 | 170 | 117 | 372 | ||||||||||||
| Operating Expenses | 42 | 36 | 91 | 81 | ||||||||||||
| Operating Income/Loss | 28 | 134 | 26 | 291 | ||||||||||||
| Financial Income/Loss | 2 | (1 | ) | 24 | 7 | |||||||||||
| Profit/(Loss) before taxes | 30 | 133 | 50 | 298 | ||||||||||||
| Provision for Income Tax | (3 | ) | (154 | ) | (40 | ) | (209 | ) | ||||||||
| Net Income | 27 | (21 | ) | 10 | 89 | |||||||||||
| EBITDA | 145 | 252 | 259 | 524 | ||||||||||||
| EBITDA Margin | 47 | % | 65 | % | 44 | % | 58 | % | ||||||||
Consolidated Balance Sheet
| (COP$ Billion) | June 30, 2015 | March 31, 2015 | ||||||
| Current Assets | 1,250 | 1,227 | ||||||
| Non Current Assets | 2,383 | 2,347 | ||||||
| Total Assets | 3,633 | 3,574 | ||||||
| Current Liabilities | 1,161 | 1,039 | ||||||
| Long Term Liabilities | 476 | 496 | ||||||
| Total Liabilities | 1,637 | 1,535 | ||||||
| Equity | 1,996 | 2,039 | ||||||
| Total Liabilities and Shareholders' Equity | 3,633 | 3,574 | ||||||
| 29 |
| 2. | Savia Peru |
| Income Statement | ||||||||||||||||
| US$ million | 2Q 2015* | 2Q 2014* | 1H 2015* | 1H 2014* | ||||||||||||
| Local Sales | 50.2 | 138.7 | 77.1 | 198.0 | ||||||||||||
| Total Sales | 50.2 | 138.7 | 77.1 | 198.0 | ||||||||||||
| Variable Costs | 26.4 | 36.5 | 40.0 | 54.0 | ||||||||||||
| Fixed Costs | 23.2 | 37.2 | 41.0 | 52.0 | ||||||||||||
| Cost of Sales | 49.6 | 73.7 | 81.0 | 106.0 | ||||||||||||
| Gross Profits | 0.6 | 65.0 | (3.9 | ) | 92.0 | |||||||||||
| Operating Expenses | 10.5 | 20.4 | 20.0 | 28.0 | ||||||||||||
| Operating Income/Loss | (9.9 | ) | 44.6 | (23.9 | ) | 64.0 | ||||||||||
| Financial Income/Loss | (0.7 | ) | (1.5 | ) | (1.0 | ) | (2.0 | ) | ||||||||
| Profit/(Loss) before taxes | (10.6 | ) | 43.1 | (24.9 | ) | 62.0 | ||||||||||
| Provision for Income Tax | 5.1 | (17.6 | ) | 6.0 | (26.0 | ) | ||||||||||
| Net Income | (5.5 | ) | 25.5 | (18.9 | ) | 36.0 | ||||||||||
| EBITDA | 13.3 | 66.8 | 17.0 | 101.0 | ||||||||||||
| EBITDA Margin | 26 | % | 48 | % | 22 | % | 51 | % | ||||||||
* As of May 2015
Consolidated Balance Sheet
| US$ million | May 31, 2015 | March 31, 2015 | ||||||
| Current Assets | 134.8 | 123.5 | ||||||
| Non Current Assets | 747.8 | 766.1 | ||||||
| Total Assets | 882.6 | 889.6 | ||||||
| Current Liabilities | 189.3 | 187.8 | ||||||
| Long Term Liabilities | 149.5 | 153.1 | ||||||
| Total Liabilities | 338.8 | 340.9 | ||||||
| Equity | 543.8 | 548.7 | ||||||
| Total Liabilities and Shareholders' Equity | 882.6 | 889.6 | ||||||
| 30 |
| 3. | Equion |
Income Statement
| COP$ Billion | 2Q 2015 | 2Q 2014 | 1H 2015 | 1H 2014 | ||||||||||||
| Local Sales | 82 | 69 | 156 | 137 | ||||||||||||
| Export Sales | 239 | 254 | 407 | 519 | ||||||||||||
| Total Sales | 321 | 323 | 563 | 656 | ||||||||||||
| Variable Costs | 171 | 92 | 326 | 182 | ||||||||||||
| Fixed Costs | 51 | 46 | 90 | 87 | ||||||||||||
| Cost of Sales | 222 | 138 | 416 | 269 | ||||||||||||
| Gross Profits | 99 | 185 | 147 | 387 | ||||||||||||
| Operating Expenses | 20 | (4 | ) | (11 | ) | 9 | ||||||||||
| Operating Income/Loss | 119 | 181 | 136 | 396 | ||||||||||||
| Financial Income/Loss | 1 | 5 | 20 | 17 | ||||||||||||
| Profit/(Loss) before taxes | 120 | 186 | 156 | 413 | ||||||||||||
| Provision for Income Tax | (40 | ) | (56 | ) | (56 | ) | (130 | ) | ||||||||
| Net Income | 80 | 130 | 100 | 283 | ||||||||||||
| EBITDA | 245 | 261 | 422 | 536 | ||||||||||||
| EBITDA Margin | 76 | % | 81 | % | 75 | % | 82 | % | ||||||||
Consolidated Balance Sheet
| (COP$ Billion) | June 30, 2015 | March 31, 2015 | ||||||
| Current Assets | 1,225 | 1,184 | ||||||
| Non Current Assets | 1,891 | 2,007 | ||||||
| Total Assets | 3,116 | 3,191 | ||||||
| Current Liabilities | 638 | 802 | ||||||
| Long Term Liabilities | 254 | 253 | ||||||
| Total Liabilities | 892 | 1,055 | ||||||
| Equity | 2,224 | 2,136 | ||||||
| Total Liabilities and Shareholders' Equity | 3,116 | 3,191 | ||||||
| 31 |
Refining and Petrochemical
| 1. | Essentia (Propilco) |
| Sales volumes (tons) | 2Q 2015 | 2Q 2014 | 1H 2015 | 1H 2014 | ||||||||||||
| Polypropylene | 105,651 | 94,610 | 206,665 | 185,644 | ||||||||||||
| Masterbatch | 2,998 | 2,772 | 6,376 | 5,892 | ||||||||||||
| Polyethylene | 9,960 | 7,083 | 17,804 | 12,301 | ||||||||||||
| Total | 118,609 | 104,465 | 230,845 | 203,837 | ||||||||||||
Income Statement
| COP$ Billion | 2Q 2015 | 2Q 2014 | 1H 2015 | 1H 2014 | ||||||||||||
| Local Sales | 178 | 156 | 344 | 305 | ||||||||||||
| Export Sales | 256 | 229 | 517 | 464 | ||||||||||||
| Total Sales | 434 | 385 | 861 | 769 | ||||||||||||
| Variable Costs | 341 | 334 | 710 | 656 | ||||||||||||
| Fixed Costs | 20 | 20 | 44 | 47 | ||||||||||||
| Cost of Sales | 361 | 354 | 754 | 703 | ||||||||||||
| Gross Profits | 73 | 31 | 107 | 66 | ||||||||||||
| Operating Expenses | 35 | 29 | 74 | 57 | ||||||||||||
| Operating Income/Loss | 38 | 2 | 33 | 9 | ||||||||||||
| Financial Income/Loss | - | 4 | 22 | 26 | ||||||||||||
| Profit/(Loss) before taxes | 38 | 6 | 55 | 35 | ||||||||||||
| Provision for Income Tax | (15 | ) | 1 | (8 | ) | - | ||||||||||
| Net Income | 23 | 7 | 47 | 35 | ||||||||||||
| EBITDA | 12 | 14 | 42 | 29 | ||||||||||||
| EBITDA Margin | 3 | % | 4 | % | 5 | % | 4 | % | ||||||||
Consolidated Balance Sheet
| (COP$ Billion) | June 30, 2015 | March 31, 2015 | ||||||
| Current Assets | 788 | 894 | ||||||
| Non Current Assets | 812 | 813 | ||||||
| Total Assets | 1,600 | 1,707 | ||||||
| Current Liabilities | 465 | 578 | ||||||
| Long Term Liabilities | 121 | 127 | ||||||
| Total Liabilities | 586 | 705 | ||||||
| Equity | 1,014 | 1,002 | ||||||
| Total Liabilities and Shareholders' Equity | 1,600 | 1,707 | ||||||
| 32 |
| 2. | Reficar |
| Sales Volume (mbd) | 2Q 2015 | 2Q 2014 | 1H 2015 | 1H 2014 | ||||||||||||
| Local | 38.8 | 34.6 | 38.6 | 34.8 | ||||||||||||
| International | 0.0 | 0.0 | 0.0 | 19.4 | ||||||||||||
| Total | 38.8 | 34.6 | 38.6 | 54.2 | ||||||||||||
Income Statement
| COP$ Billion | 2Q 2015 | 2Q 2014 | 1H 2015 | 1H 2014 | ||||||||||||
| Local Sales | 692 | 769 | 1,320 | 1,556 | ||||||||||||
| Export Sales | - | - | - | 737 | ||||||||||||
| Total Sales | 692 | 769 | 1,320 | 2,293 | ||||||||||||
| Variable Costs | 670 | 728 | 1,238 | 2,118 | ||||||||||||
| Fixed Costs | 42 | 44 | 88 | 101 | ||||||||||||
| Cost of Sales | 712 | 772 | 1,326 | 2,219 | ||||||||||||
| Gross Profits | (20 | ) | (3 | ) | (6 | ) | 74 | |||||||||
| Operating Expenses | 143 | 149 | 339 | 212 | ||||||||||||
| Operating Income/Loss | (163 | ) | (152 | ) | (345 | ) | (138 | ) | ||||||||
| Financial Income/Loss | 45 | (42 | ) | 44 | (43 | ) | ||||||||||
| Profit/(Loss) before taxes | (118 | ) | (194 | ) | (301 | ) | (181 | ) | ||||||||
| Provision for Income Tax | 6 | 63 | 32 | 25 | ||||||||||||
| Net Income | (112 | ) | (131 | ) | (269 | ) | (156 | ) | ||||||||
| EBITDA | (75 | ) | (154 | ) | (149 | ) | (88 | ) | ||||||||
| EBITDA Margin | (11 | )% | (20 | )% | (11 | )% | (4 | )% | ||||||||
Consolidated Balance Sheet
| (COP$ Billion) | June 30, 2015 | March 31, 2015 | ||||||
| Current Assets | 1,381 | 1,621 | ||||||
| Non Current Assets | 22,263 | 21,338 | ||||||
| Total Assets | 23,644 | 22,959 | ||||||
| Current Liabilities | 1,274 | 1,393 | ||||||
| Long Term Liabilities | 13,209 | 13,467 | ||||||
| Total Liabilities | 14,483 | 14,860 | ||||||
| Equity | 9,161 | 8,099 | ||||||
| Total Liabilities and Shareholders' Equity | 23,644 | 22,959 | ||||||
| 33 |
Transportation
| 1. | Cenit |
Income Statement
| COP$ Billion | 2Q 2015 | 2Q 2014 | 1H 2015 | 1H 2014 | ||||||||||||
| Local Sales | 4 | 5 | 8 | 12 | ||||||||||||
| Sale of services | 905 | 728 | 1,802 | 1,467 | ||||||||||||
| Total Sales | 909 | 733 | 1,810 | 1,479 | ||||||||||||
| Variable Costs | (22 | ) | 26 | 70 | 54 | |||||||||||
| Fixed Costs | 593 | 562 | 948 | 971 | ||||||||||||
| Cost of Sales | 571 | 588 | 1,018 | 1,025 | ||||||||||||
| Gross Profits | 338 | 145 | 792 | 454 | ||||||||||||
| Operating Expenses | 32 | 16 | 154 | 35 | ||||||||||||
| Operating Income/Loss | 306 | 129 | 638 | 419 | ||||||||||||
| Financial Income/Loss | (61 | ) | 8 | 502 | 258 | |||||||||||
| Profit/(Loss) before taxes | 245 | 137 | 1,140 | 677 | ||||||||||||
| Provision for Income Tax | (32 | ) | (88 | ) | (235 | ) | (166 | ) | ||||||||
| Net Income | 213 | 49 | 905 | 511 | ||||||||||||
| EBITDA | 344 | 215 | 1,033 | 579 | ||||||||||||
| EBITDA Margin | 38 | % | 29 | % | 57 | % | 39 | % | ||||||||
Consolidated Balance Sheet
| (COP$ Billion) | June 30, 2015 | March 31, 2015 | ||||||
| Current Assets | 1,398 | 3,013 | ||||||
| Non Current Assets | 16,002 | 15,691 | ||||||
| Total Assets | 17,400 | 18,704 | ||||||
| Current Liabilities | 801 | 2,444 | ||||||
| Long Term Liabilities | 952 | 1,167 | ||||||
| Total Liabilities | 1,753 | 3,611 | ||||||
| Equity | 15,647 | 15,092 | ||||||
| Total Liabilities and Shareholders' Equity | 17,400 | 18,703 | ||||||
| 34 |
Biofuels
| 1. | Ecodiesel |
| Sales volume (mboed) | 2Q 2015 | 2Q 2014 | 1H 2015 | 1H 2014 | ||||||||||||
| Biodiesel | 2.4 | 2.3 | 2.3 | 2.3 | ||||||||||||
| Glycerin | 0.2 | 0.2 | 0.2 | 0.2 | ||||||||||||
| Total | 2.6 | 2.5 | 2.5 | 2.5 | ||||||||||||
Income Statement
| COP$ Billion | 2Q 2015* | 2Q 2014* | 1H 2015* | 1H 2014* | ||||||||||||
| Local Sales | 90.4 | 82.8 | 148.5 | 161.0 | ||||||||||||
| Total Sales | 90.4 | 82.8 | 148.5 | 161.0 | ||||||||||||
| Variable Costs | 79.1 | 72.2 | 129.8 | 139.3 | ||||||||||||
| Fixed Costs | - | - | - | - | ||||||||||||
| Cost of Sales | 79.1 | 72.2 | 129.8 | 139.3 | ||||||||||||
| Gross Profits | 11.3 | 10.6 | 18.7 | 21.7 | ||||||||||||
| Operating Expenses | 3.8 | 2.7 | 5.7 | 5.4 | ||||||||||||
| Operating Income/Loss | 7.5 | 7.9 | 13.0 | 16.3 | ||||||||||||
| Financial Income/Loss | (0.8 | ) | (0.6 | ) | (1.3 | ) | (1.1 | ) | ||||||||
| Profit/(Loss) before taxes | 6.7 | 7.3 | 11.7 | 15.2 | ||||||||||||
| Provision for Income Tax | (1.4 | ) | (1.2 | ) | (2.5 | ) | (2.6 | ) | ||||||||
| Net Income | 5.3 | 6.1 | 9.2 | 12.6 | ||||||||||||
| EBITDA | 6.4 | 9.4 | 15.7 | 19.0 | ||||||||||||
| EBITDA Margin | 7 | % | 11 | % | 11 | % | 12 | % | ||||||||
* As of May 2015
Consolidated Balance Sheet
| (COP$ Billion) | May 31, 2015 | March 31, 2015 | ||||||
| Current Assets | 61.0 | 61.0 | ||||||
| Non Current Assets | 74.0 | 76.0 | ||||||
| Total Assets | 135.0 | 137.0 | ||||||
| Current Liabilities | 53.0 | 55.0 | ||||||
| Long Term Liabilities | 26.0 | 29.0 | ||||||
| Total Liabilities | 79.0 | 84.0 | ||||||
| Equity | 56.0 | 53.0 | ||||||
| Total Liabilities and Shareholders' Equity | 135.0 | 137.0 | ||||||
| 35 |
| VII. | Corporate Group´s Financial indebtedness |
Long-term Indebtedness by Entity
| Entity | Denominated in U.S. Dollars(1) | Denominated in Colombian Pesos(1) | Total(1) | |||||||||
| Ecopetrol | 10,958 | 1,446 | 12,405 | |||||||||
| Reficar | 3,205 | 0 | 3,205 | |||||||||
| Bicentario | 0 | 707 | 707 | |||||||||
| ODL | 0 | 325 | 325 | |||||||||
| Bioenergy | 0 | 191 | 191 | |||||||||
| Ocensa | 500 | 0 | 500 | |||||||||
| Propilco | 18 | 0 | 18 | |||||||||
| Total | 14,681 | 2,669 | 17,350 | |||||||||
| % | 85 | % | 15 | % | 100 | % | ||||||
| Subordinated Debt(2) | 1,657 | 487 | 2,144 | |||||||||
Notes:
(1) Nominal value of debt as of June 30, 2015, excluding accrued interests
Figures expressed in thousands of US dollars converted using the Representative Market Exchange Rate as of June 30, 2015
(2) Subordinated debt l does not consolidate in financial statements of Ecopetrol
| 36 |
SIGNATURES
Pursuant to the requirements of the Securities Exchange Act of 1934, the registrant has duly caused this report to be signed on its behalf by the undersigned, thereunto duly authorized.
| Ecopetrol S.A. | ||||
| By: | /s/ Magda Manosalva | |||
| Name: | Magda Manosalva | |||
| Title: | Chief Financial Officer | |||
Date: August 6, 2015