Exhibit 99.1

Ecopetrol Group Announces its Results of the Fourth Quarter and the Year Ended December 31st, 2016
| · | The Group´s production reached 718 thousand equivalent barrels per day in 2016, exceeding in 3 thousand barrels the target set for the year. |
| · | The solid operational results led to an EBITDA of COP 18 trillion (EBITDA margin 38%) despite having 43 thousand equivalent barrels per day of less production and a 16% drop in the average Brent price, versus 2015. |
| · | The net profit of the Group for 2016 amounted COP 1.6 trillion, the net profit before“impairments” is COP 2.3 trillion. These results reflect the efficiencies and structural cost savings totaling COP 2.2 trillion. |
Bogota, March 6, 2017. Ecopetrol S.A. (“Ecopetrol” or the “Company”) (BVC: ECOPETROL; NYSE: EC) announced the Ecopetrol Group’s financial results for the fourth quarter and full year 2016, prepared and expressed in billions of Colombian pesos (COP) pursuant to International Financial Reporting Standards applicable in Colombia.
Table 1: Ecopetrol Group’s Consolidated Financial Results
| A | | B | | | C | | | D | | | E | | | F | | | G | | | H | | | I | |
| COP Billion | | 4Q 2016* | | | 4Q 2015* | | | ∆ ($) | | | ∆ (%) | | | 2016* | | | 2015* | | | ∆ ($) | | | ∆ (%) | |
| Total Sales | | | 13,313 | | | | 12,777 | | | | 536 | | | | 4.2 | % | | | 47,732 | | | | 52,091 | | | | (4,359 | ) | | | (8.4 | )% |
| Operating Profit | | | 1,633 | | | | (7,301 | ) | | | 8,934 | | | | >100 | % | | | 8,253 | | | | 1,456 | | | | 6,797 | | | | >100 | % |
| Net Income Consolidated | | | 358 | | | | (6,021 | ) | | | 6,379 | | | | >100 | % | | | 2,404 | | | | (3,083 | ) | | | 5,487 | | | | >100 | % |
| Non-Controlling Interests | | | (172 | ) | | | (287 | ) | | | 115 | | | | (40.1 | )% | | | (839 | ) | | | (905 | ) | | | 66 | | | | (7.3 | )% |
| Net Income Attributable to Owners of Ecopetrol | | | 186 | | | | (6,308 | ) | | | 6,494 | | | | >100 | % | | | 1,565 | | | | (3,988 | ) | | | 5,553 | | | | >100 | % |
| | | | | | | | | | | | | | | | | | | | | | | | | | | | | | | | | |
| EBITDA | | | 4,474 | | | | 3,083 | | | | 1,391 | | | | 45.1 | % | | | 18,018 | | | | 18,087 | | | | (69 | ) | | | (0.4 | )% |
| EBITDA Margin | | | 33.6 | % | | | 24.1 | % | | | | | | | | | | | 37.7 | % | | | 34.7 | % | | | | | | | | |
* These figures are included for illustration purposes only. Unaudited.
Certain explanatory figures in this report are stated in US dollars (USD) and are indicated as such when applicable.
Juan Carlos Echeverry G., CEO of Ecopetrol S.A., commented:
“2016 was a year of enormous challenges for Ecopetrol. The oil industry experienced the lowest crude prices in 12 years, thus resulting in cuts in investment.
The quest for efficiencies and liquidity became the mantra in surviving the crisis. Added to this scenario were the challenges raised by the peace negotiation process, the closure of the border with Venezuela, El Niño climate Phenomenon, completion of the Reficar and Bioenergy projects, and approval of the tax reform.
Ecopetrol focused its efforts on reducing costs, producing profitable barrels, prioritizing investments, strengthening cash flow and, at the same time, maintaining its investment-grade rating.
Investment in 2016 totaled USD 2.5 billion. The company’s operating and financial performance was solid, as a result of the adjustment measures. EBITDA and EBITDA margin rose to 18 trillion pesos and 38% respectively; EBITDA margin grew 3 percentage points over 2015, and is one of the highest in oil and gas industry.
At 718 thousand barrels of oil-equivalent per day, the company exceeded its 2016 production target by 3 thousand barrels. This was despite a drop in production by 25 thousand barrels of oil-equivalent per day for 45 days, due to the closure of the Caño Limón Coveñas oil pipeline; and a 16% drop in Brent prices.
The fourth quarter closed with a robust cash position of 14 trillion pesos (approximately USD 4.7 billion), reducing financial leverage and allowing opportunities for inorganic growth.
The resumption and operation of the Rubiales and Cusiana fields demonstrated our operating capacity, which has benefited from the efficiencies and structural changes achieved in practically every business line. Ecopetrol is currently operating at over 500 thousand barrels of oil-equivalent per day directly.
The improved recovery program is a reality. Eighteen pilot projects were active in 2016, 12 of which showed production increases. In this phase, the program has contributed 1.65 million barrels of accumulated reserves of oil. A significant share of these results was achieved in large fields such as Castilla and Chichimene.
The discovery of oil in the Warrior well, in the United States’ Gulf of Mexico, is the result of Ecopetrol’s new exploration strategy, which includes joint ventures with top-tier companies to diversify risk, engage in further exploration and increase the probability of discoveries. Warrior is Ecopetrol Group’s fifth discovery in this prosperous oil region, and is contributing to increasing the company’s contingent resources.
The exploration campaign has also yielded good results in the Lower Magdalena Valley (Bullerengue) and Middle Magdalena Valley (Boranda).
Colombia’s offshore is a region of high potential. During the fourth quarter, two wells, Purple Angle (Kronos appraisal well) and Gorgon, were being drilled to have a better assessment of the potential of the Colombian Caribbean.
In refining, the greatest achievement was the startup of the 34 Reficar units, giving way to the stabilization and testing period. December saw a record load of crude for refining: Reficar, with 150 thousand barrels of oil, and Barrancabermeja, with 230 thousand barrels of oil per day, for 21 days. Average margin per barrel of Reficar rose from USD 2.8 per barrel between January and July to USD 8.4 since August, once all the units were fired up. In the future we will continue stabilizing and optimizing Reficar’s load and margin.
Another refining milestone was the change in Barrancabermeja’s operating layout, which stabilized operations and yielded an average conversion factor of 73%. This refinery’s EBITDA also rose to 2.1 trillion pesos, two times higher than in 2014.
The company’s priority is to extract greater value from the crude it markets. 2016 saw higher sales referenced to more liquid indicators, strengthening the crude basket. The Brent-basket spread for Ecopetrol’s crude in 2016 was -9.4 dollars, 3 cents less than in 2015.
The quality and consistency of our crude is a significant value lever. As part of our dilution efficiencies strategy, we improved crude transport viscosity from 200 to 400 centistokes (cSt). Since the fourth quarter, the Ocensa oil pipeline has increased its viscosity handling capacity to 600 cSt. This has contributed to lower costs and a lower dilution factor, which fell from 19% to 17% between 2015 and 2016, and saved the Ecopetrol Group near one trillion pesos.
Consolidated savings for the year totaled 2.5 trillion pesos, exceeding the savings target of 1.6 trillion pesos set for 2016. Out of this, 2.2 trillion were structural savings. The principal savings levers were lower dilution of heavy crude by approximately 660 billion pesos, and 375 billion pesos in operating and maintaining transportation assets.
These greater efficiencies were critical for mitigating the impact of lower crude prices on the 2016 proven reserves balance. Reserves are at 1,598 million barrels of oil-equivalent, 14% less than the 1,849 million figure in 2015.
We estimate the price impact negatively affected reserves by 202 million barrels of oil-equivalent. In 2016, the SEC price used for valuation fell 20% versus 2015, from 55.6 dollars per barrel to 44.5 dollars per barrel. This decline in reserves, due to the price effect, was offset by an addition of 186 million barrels of oil-equivalent attributable to efficiencies and new drilling projects, among other factors.
Net profit attributable to Ecopetrol Group shareholders totaled 1.6 trillion pesos, versus a 2015 loss of 3.9 trillion pesos. This was despite of 6.8 trillion pesos in lower revenue during the year due to lower crude prices. The higher profits were due to savings and efficiencies. Not counting the impairment impact, the company saw earnings of 2.3 trillion pesos in 2016.
Challenges in 2017 are no less serious. Adding reserves and maintaining the pace of production are the Company’s focus. The exploration campaign will be stepped up significantly in regions of high prospectivity. Investment in exploration will rise from USD 280 million to USD 650 million, thus increasing offshore wells from 2 to 6 and onshore wells from 5 to 11 from 2016 to 2017. Enhanced recovery will continue to leverage additional reserves in mature fields. We stress that a strong cash position allows us to assess opportunities for inorganic growth in the Ecopetrol Business Group’s reserves.
The company will continue to pursue its Transformation to ensure operational and financial sustainability. We have named Phase 3.0 of the business Transformation plan Ecopetrol’s New Frontier. It will focus on opening up new markets; multi-year field development plans; improved return on assets; attracting and retaining the best human talent; and committing ourselves to integrity, respect for the environment and shared prosperity with the communities in which we operate.
The 3.5-billion-dollar 2017 investment plan will focus on opportunities to generate value for the Business Group.
As for Reficar, the stabilization stage will be completed, and in the second half of the year global performance will be tested. Efforts will focus on improving margins and load, and on adding value.
The Company has launched a new Corporate Stakeholder´s Management strategy, seeking sustainable and shared prosperity with communities in the operating regions, the development of local governability, and contributions to the country’s peace agreement. It has also strengthened its leadership in every area, its commitment to life and the effective mitigation of risks to individuals, facilities and processes.
Ecopetrol has once again addressed the challenges imposed by the price environment. It has ended the year as a transformed, operationally sustainable and financially robust company. The breakeven for the operational profit was reduced due to the efficiencies achieved over the past years.
The future looks promising. The 2020 Business Plan is based on three fundamental pillars: i) protection of cash and cost efficiency; ii) strict capital discipline; and iii) growth in reserves and production; these pillars will strengthen the company’s financial sustainability and afford it opportunities for both organic and inorganic growth, generating value and profitability for its shareholders.”
Ecopetrol Group Announces its Results of the Fourth Quarter and the Year Ended December 31st, 2016
| I. | Consolidated Financial Results | 5 |
| | | |
| a. | Sales Volume | 5 |
| | | |
| b. | Crude Oil, Products and Gas Prices: | 7 |
| | | |
| c. | Income Statement | 7 |
| | | |
| d. | Balance Sheet (Statement of Financial Position) | 11 |
| | | |
| e. | Impairment of Long Term Assets | 12 |
| | | |
| f. | Results by Segments | 13 |
| | | |
| g. | Result of Cost and Expense Reduction Initiatives | 15 |
| | | |
| II. | Operating Results | 17 |
| | | |
| a. | Investments | 17 |
| | | |
| b. | Exploration | 18 |
| | | |
| c. | Reserves | 19 |
| | | |
| d. | Production | 20 |
| | | |
| e. | Transportation | 24 |
| | | |
| f. | Refining | 25 |
| | | |
| III. | Organizational Consolidation, Corporate Responsibility and Corporate Governance (Ecopetrol S.A.) | 28 |
| | | |
| a. | HSE Performance | 28 |
| | | |
| b. | Corporate Responsibility | 28 |
| | | |
| IV. | Discussion of Quarterly Results | 28 |
| | | |
| V. | Ecopetrol Group Exhibits | 30 |
| | | |
| VI. | Income Statements of Subsidiaries and Equity Interest | 35 |
| | | |
| VII. | Group Debt | 40 |
| I. | Consolidated Financial Results |
Table 2 – Sales Volume–Ecopetrol Group
| A | | B | | | C | | | D | | | E | | | F | | | G | |
| Local Sales Volume (mboed) | | 4Q 2016 | | | 4Q 2015 | | | ∆ (%) | | | 2016 | | | 2015 | | | ∆ (%) | |
| Crude Oil | | | 13.3 | | | | 16.8 | | | | (20.8 | )% | | | 14.4 | | | | 13.4 | | | | 7.5 | % |
| Natural Gas | | | 73.3 | | | | 89.2 | | | | (17.8 | )% | | | 75.3 | | | | 84.5 | | | | (10.9 | )% |
| Gasoline | | | 110.5 | | | | 109.9 | | | | 0.5 | % | | | 108.3 | | | | 98.0 | | | | 10.5 | % |
| Medium Distillates | | | 146.6 | | | | 162.4 | | | | (9.7 | )% | | | 142.6 | | | | 148.5 | | | | (4.0 | )% |
| LPG and Propane | | | 16.4 | | | | 16.4 | | | | 0.0 | % | | | 16.5 | | | | 16.2 | | | | 1.9 | % |
| Fuel Oil | | | 7.2 | | | | 4.5 | | | | 60.0 | % | | | 6.4 | | | | 5.0 | | | | 28.0 | % |
| Industrial and Petrochemical | | | 19.2 | | | | 23.4 | | | | (17.9 | )% | | | 19.2 | | | | 21.7 | | | | (11.5 | )% |
| Total Local Sales | | | 386.5 | | | | 422.6 | | | | (8.5 | )% | | | 382.7 | | | | 387.3 | | | | (1.2 | )% |
| Export Sales Volume (mboed) | | 4T 2016 | | | 4T 2015 | | | ∆ (%) | | | 2016 | | | 2015 | | | ∆ (%) | |
| Crude Oil | | | 442.4 | | | | 505.5 | | | | (12.5 | )% | | | 435.3 | | | | 537.3 | | | | (19.0 | )% |
| Products | | | 127.6 | | | | 95.4 | | | | 33.8 | % | | | 142.0 | | | | 73.3 | | | | 93.7 | % |
| Natural Gas | | | 4.1 | | | | 0.6 | | | | 583.3 | % | | | 2.5 | | | | 8.0 | | | | (68.8 | )% |
| Total Export Sales | | | 574.1 | | | | 601.5 | | | | (4.6 | )% | | | 579.8 | | | | 618.6 | | | | (6.3 | )% |
| | | | | | | | | | | | | | | | | | | | | | | | | |
| Total Sales Volume (mboed) | | | 960.6 | | | | 1,024.1 | | | | (6.2 | )% | | | 962.5 | | | | 1,005.9 | | | | (4.3 | )% |
The production of the Group fell 43 thousand barrels of oil equivalent per day in 2016, which caused a reduction in sales volume to 962.5 mboed, equivalent to 96% of 2015 volumes. A breakdown of this 2016 volume by destination shows that 40% went to the domestic market and the remaining 60% to the international market.
The commissioning of the new Cartagena refinery (Reficar) increased the share of products sold within the total, from 36% in 2015 to 45% in 2016. This increase led to a smaller share of crude among total sales, which dropped from 55% to 47% over the past year.
Colombian Market: In 2016 local sales declined slightly from the previous year. The most important aspects to be noted are the following:
| · | Reduced demand for natural gas due to the: i) the occurrence of the El Niño phenomenon only in the first 3 months of 2016, and ii) the slowing of demand in the manufacturing and vehicular natural gas (VNG) sectors, |
| · | Lower demand for asphalt due to delays in road infrastructure construction and lower local sales by Propilco. |
These declines were offset by:
| · | Higher gasoline sales, due to increased vehicle sales and a lower rate of conversion of gasoline vehicles to VNG, by approximately 35%. |
| · | Higher sales of fuel oil, due to the reactivation of the marine bunker fuels market. |
International Market: Export volumes in 2016 were 579.8 mboed, down 6.3% from 2015, which is largely explained by the following:
| · | Allocation of a portion of the crude export basket to deliveries to Reficar for its operations. |
| · | Lower production and domestic purchases of crude by third parties. |
| · | Finalization of natural gas exports due to the termination of the contract with Venezuela in 2015. |
| · | New barrels contributed by Ecopetrol America Inc. (EAI) from its Gunflint field. |
The lower crude and gas exports were offset by higher exports of refined products, which increased 94% in 2016, as a result of the commissioning of the new Cartagena refinery.
Table 3 – Export Destinations–Ecopetrol Group
| A | | B | | | C | | | D | | | E | | | F | | | G | |
| Crude (mbod) | | 4Q 2016 | | | 4Q 2015 | | | ∆ (%) | | | 2016 | | | 2015 | | | ∆ (%) | |
| Asia | | | 71.2 | | | | 173.4 | | | | 16.1 | % | | | 64.8 | | | | 166.3 | | | | 14.9 | % |
| U.S. Gulf Coast | | | 137.8 | | | | 108.4 | | | | 31.1 | % | | | 169.7 | | | | 124.8 | | | | 39.0 | % |
| U.S. West Coast | | | 53.4 | | | | 30.0 | | | | 12.1 | % | | | 42.8 | | | | 46.5 | | | | 9.8 | % |
| U.S. East Coast | | | 27.4 | | | | 17.6 | | | | 6.2 | % | | | 28.0 | | | | 20.8 | | | | 6.4 | % |
| Europe | | | 32.1 | | | | 53.6 | | | | 7.3 | % | | | 52.3 | | | | 80.1 | | | | 12.0 | % |
| Central America / Caribbean | | | 90.4 | | | | 121.6 | | | | 20.4 | % | | | 57.8 | | | | 89.2 | | | | 13.3 | % |
| South America | | | 11.9 | | | | 0.0 | | | | 2.7 | % | | | 7.9 | | | | 5.2 | | | | 1.8 | % |
| Other | | | 18.2 | | | | 0.9 | | | | 4.1 | % | | | 12.0 | | | | 4.4 | | | | 2.8 | % |
| Total | | | 442.4 | | | | 505.5 | | | | 100.0 | % | | | 435.3 | | | | 537.3 | | | | 100.0 | % |
| H | | I | | | J | | | K | | | L | | | M | | | N | |
| Products (mboed) | | 4Q 2016 | | | 4Q 2015 | | | ∆ (%) | | | 2016 | | | 2015 | | | ∆ (%) | |
| Asia | | | 10.4 | | | | 4.2 | | | | 8.1 | % | | | 13.8 | | | | 9.0 | | | | 9.7 | % |
| U.S. Gulf Coast | | | 13.3 | | | | 29.7 | | | | 10.4 | % | | | 21.9 | | | | 14.4 | | | | 15.4 | % |
| U.S. West Coast | | | 10.0 | | | | 0.0 | | | | 7.9 | % | | | 2.5 | | | | 0.0 | | | | 1.8 | % |
| U.S. East Coast | | | 27.5 | | | | 24.8 | | | | 21.6 | % | | | 33.1 | | | | 15.8 | | | | 23.3 | % |
| Europe | | | 3.6 | | | | 0.5 | | | | 2.8 | % | | | 15.1 | | | | 1.7 | | | | 10.6 | % |
| Central America / Caribbean | | | 49.1 | | | | 28.1 | | | | 38.5 | % | | | 41.5 | | | | 25.8 | | | | 29.2 | % |
| South America | | | 11.9 | | | | 5.3 | | | | 9.3 | % | | | 7.9 | | | | 5.0 | | | | 5.6 | % |
| Other | | | 1.8 | | | | 2.7 | | | | 1.4 | % | | | 6.2 | | | | 1.6 | | | | 4.4 | % |
| Total | | | 127.6 | | | | 95.4 | | | | 100.0 | % | | | 142.0 | | | | 73.4 | | | | 100.0 | % |
Note: This information is subject to change after quarter close, given that some destinations are reclassified based on the final export results.
Crude: Ecopetrol decided to focus its crude exports on the U.S. market, particularly Gulf Coast refineries, allowing it to increase exports to this region to 39%. This strategy was supported by the tightening of the WTI-Brent spread after the release of US crude exports, which made our crude more competitive and ensured the narrowing of the Brent- Heavy Crude spread. Furthermore, refining margins in the US remained stable due to the positive performance of gasoline demand, which in turn allowed for high refining flows, leading to increased demand for intermediate and heavy crude.
The Group’s crude export basket, which had been referenced to the indicators Brent (86.6%), Maya (13.4%) and other (0.03%), reduced its referencing to the Maya, and consequently increased its referencing to Brent versus 2015 (Brent: 69.7%, Maya 29.8%, and other 0.5%).
Products: Central America and the Caribbean were the destinations with the highest shares (29%), as they are regional centers for blending marine bunker fuels to further consumption in regions such as Asia. Moreover, destinations such as the US East Coast and Europe showed significant increases in the share of exports due to the allocation of Reficar´s products.
| b. | Crude Oil, Products and Gas Prices: |
Table 4 – Benchmark Crude Prices
| A | | B | | | C | | | D | | | E | | | F | | | G | |
| USD/Bl | | 4Q 2016 | | | 4Q 2015 | | | ∆ (%) | | | 2016 | | | 2015 | | | ∆ (%) | |
| Brent | | | 51.1 | | | | 44.7 | | | | 14.3 | % | | | 45.1 | | | | 53.6 | | | | (15.8 | )% |
| MAYA | | | 42.8 | | | | 34.4 | | | | 24.3 | % | | | 36.5 | | | | 44.1 | | | | (17.2 | )% |
| WTI | | | 49.3 | | | | 42.2 | | | | 16.9 | % | | | 43.5 | | | | 48.8 | | | | (10.8 | )% |
Source: Platts y Bloomberg.
Table 5 –Weighted Average Sales Price – Ecopetrol Group
| A | | B | | | C | | | D | | | E | | | F | | | G | | | H | | | I | |
| USD/Bl | | 4Q 2016 | | | 4Q 2015 | | | ∆ (%) | | | Volume
(mboed)
4Q 2016 | | | 2016 | | | 2015 | | | ∆ (%) | | | Volume
(mboed)
2016 | |
| Crude Oil Basket | | | 41.9 | | | | 34.2 | | | | 22.5 | % | | | 455.7 | | | | 35.7 | | | | 43.9 | | | | (18.6 | )% | | | 449.7 | |
| Refined Products Basket | | | 57.0 | | | | 53.1 | | | | 7.2 | % | | | 427.6 | | | | 50.1 | | | | 62.3 | | | | (19.5 | )% | | | 434.9 | |
| Natural Gas Basket | | | 21.9 | | | | 21.9 | | | | 0.0 | % | | | 77.3 | | | | 23.5 | | | | 22.1 | | | | 6.6 | % | | | 77.9 | |
| | | | | | | | | | | | | | | | 960.6 | | | | | | | | | | | | | | | | 962.5 | |
Crude: As a result of the strategy of selling to higher-value markets for the company, with a focus on US refineries, sales were referenced to the market’s most liquid indicators, and thus the spread in the crude exports basket vis-à-vis Brent for 2016 was strengthened versus the 2015 results (2016: -9.4 USD/Bl vs. 2015: -9.7 USD/Bl).
Products: The spread in the product sales basket versus Brent fell 3.7 USD/Bl in 2016 compared to the previous year, due largely to the lower spreads versus Brent in the international gasoline (-2.7 USD/Bl) and diesel (-2.3 USD/Bl) indicators.
Natural Gas: Natural gas sales prices in 2016 contracts in the thermal power sector were indexed to stock market prices at the close of 2015, which were higher given the greater thermal generation due to the presence of El Niño phenomenon.
The Ecopetrol Group’s net income in the fourth quarter was COP 186 billion compared to a net loss of COP 6.3 trillion in the same period of 2015. The Group reported a net income attributable to Ecopetrol´s shareholders of COP 1.57 trillion for the whole year 2016, in spite of the lower international prices and the decline in production. The optimizations achieved through the Transformation Plan allowed us to increase EBITDA margin by 3% in 2016, up to 37.7%.
Table 6 – Income Statement – Ecopetrol Group
| A | | B | | | C | | | D | | | E | | | F | | | G | | | H | | | I | |
| COP Billion | | 4Q 2016* | | | 4Q 2015* | | | ∆ ($) | | | ∆ (%) | | | 2016 | | | 2015 | | | ∆ ($) | | | ∆ (%) | |
| Local Sales | | | 6,550 | | | | 7,115 | | | | (565 | ) | | | (7.9 | )% | | | 24,745 | | | | 26,068 | | | | (1,323 | ) | | | (5.1 | )% |
| Export Sales | | | 6,763 | | | | 5,662 | | | | 1,101 | | | | 19.4 | % | | | 22,987 | | | | 26,023 | | | | (3,036 | ) | | | (11.7 | )% |
| Total Sales | | | 13,313 | | | | 12,777 | | | | 536 | | | | 4.2 | % | | | 47,732 | | | | 52,091 | | | | (4,359 | ) | | | -8.4 | % |
| DD&A Costs | | | 1,873 | | | | 1,800 | | | | 73 | | | | 4.1 | % | | | 7,370 | | | | 6,599 | | | | 771 | | | | 11.7 | % |
| Variable Costs | | | 5,573 | | | | 5,759 | | | | (186 | ) | | | (3.2 | )% | | | 19,626 | | | | 22,203 | | | | (2,577 | ) | | | (11.6 | )% |
| Fixed Costs | | | 2,259 | | | | 2,397 | | | | (138 | ) | | | (5.8 | )% | | | 7,240 | | | | 8,193 | | | | (953 | ) | | | (11.6 | )% |
| Cost of Sales | | | 9,705 | | | | 9,956 | | | | (251 | ) | | | -2.5 | % | | | 34,236 | | | | 36,995 | | | | (2,759 | ) | | | -7.5 | % |
| Gross Profits | | | 3,608 | | | | 2,821 | | | | 787 | | | | 27.9 | % | | | 13,496 | | | | 15,096 | | | | (1,600 | ) | | | -10.6 | % |
| Operating Expenses | | | 1,193 | | | | 1,855 | | | | (662 | ) | | | (35.7 | )% | | | 4,401 | | | | 5,356 | | | | (955 | ) | | | (17.8 | )% |
| Impairment | | | 782 | | | | 8,267 | | | | (7,485 | ) | | | (90.5 | )% | | | 842 | | | | 8,284 | | | | (7,442 | ) | | | (89.8 | )% |
| Operating Income | | | 1,633 | | | | (7,301 | ) | | | 8,934 | | | | >100 | % | | | 8,253 | | | | 1,456 | | | | 6,797 | | | | 466.8 | % |
| Financial Income (Loss) | | | 221 | | | | (964 | ) | | | 1,185 | | | | >100 | % | | | (1,183 | ) | | | (3,967 | ) | | | 2,784 | | | | (70.2 | )% |
| Share of Profit of Companies | | | (24 | ) | | | 24 | | | | (48 | ) | | | (200.0 | )% | | | (10 | ) | | | 35 | | | | (45 | ) | | | (128.6 | )% |
| Income Before Income Tax | | | 1,830 | | | | (8,241 | ) | | | 10,071 | | | | >100 | % | | | 7,060 | | | | (2,476 | ) | | | 9,536 | | | | >100 | % |
| Provision for Income Tax | | | (1,472 | ) | | | 2,220 | | | | (3,692 | ) | | | (166.3 | )% | | | (4,656 | ) | | | (607 | ) | | | (4,049 | ) | | | >100 | % |
| Net Income Consolidated | | | 358 | | | | (6,021 | ) | | | 6,379 | | | | >100 | % | | | 2,404 | | | | (3,083 | ) | | | 5,487 | | | | >100 | % |
| Non-Controlling Interests | | | (172 | ) | | | (287 | ) | | | 115 | | | | | | | | (839 | ) | | | (905 | ) | | | 66 | | | | (7.3 | )% |
| Net Income Attributable to Owners of Ecopetrol | | | 186 | | | | (6,308 | ) | | | 6,494 | | | | >100 | % | | | 1,565 | | | | (3,988 | ) | | | 5,553 | | | | >100 | % |
| | | | | | | | | | | | | | | | | | | | | | | | | | | | | | | | | |
| EBITDA | | | 4,474 | | | | 3,083 | | | | 1,391 | | | | 45.1 | % | | | 18,018 | | | | 18,087 | | | | (69 | ) | | | (0.4 | )% |
| EBITDA Margin | | | 33.6 | % | | | 24.1 | % | | | | | | | | | | | 37.7 | % | | | 34.7 | % | | | | | | | | |
*Unaudited Figures. Some amounts of 2015 have been changed or reclassified for comparison purposes.
According NIC 1, “Presentation of financial statements”, paragraph 83, the company must include in the statement of comprehensive results the results attributable to non-controlling interest (minority interest) and the results attributable to shareholders of the controlling company.
Sales income for the fourth quarter of 2016, versus the same period the previous year, increased 4.2% (+COP 536 billion) as a combined result of:
| a) | Higher price of the weighted average basket of crude, natural gas and products +USD 7.2/Bl (+COP 1.67 trillion), largely a reflection of the behavior of Brent crude. |
| b) | Lower peso average exchange rate for revenue received, from COP 3,053/USD (Q4 2015) to COP 3,027/USD (Q4 2016), negatively affecting total revenue (-COP 144 billion). |
| c) | Effect of sales volumes (-COP 581 billion), due primarily to: |
| · | Lower crude sales volumes by -67 mbod (–COP 605 billion) due to: i) lower production, ii) reduced purchases by third parties, iii) lower availability of crude due to its use for feedstock at the Cartagena Refinery, and iv) greater production at America Inc. due to the commissioning of the Gunflint field. |
| · | Higher volumes sold of refined and petrochemical products +16 mboed (+COP 104 billion), due to growth in the automotive fleet. |
| · | Lower volume of natural gas sales -13 mboed (–COP 80 billion), given the country’s lower thermal demand as a result of the end of the El Niño phenomenon. |
| d) | Revenue from transport services was down (–COP 409 billion), due to the fact that in 2015 the Company earned revenue for services provided to Pacific E&P in the Rubiales field, and once the contract expired in July 2016, those services were no longer invoiced to third parties, as well as lower volumes transported due to the decline in nationwide production. |
Thecost of sales in the fourth quarter of 2016 fell 2.5% (-COP 251 billion) versus the same period the previous year, as a result of:
| · | Variable costs:Decrease of 0.9%, including DD&A charges, (-COP 64 billion): |
| a) | Lower cost of purchases of crude, gas and products (-COP 79 billion), due to the net effect of: |
| · | Lower purchase volumes (-COP 610 billion) due to: i) lower fuel imports -64 mbod (–COP 1.08 trillion) at Reficar and Ecopetrol as a result of the commissioning of Reficar, ii) greater imports of crude by +60 mbod (+COP 828 billion) at Reficar for its operations, iii) lower purchases of diluting agent -15 mboed (-COP 199 billion), associated with lower production and optimization measures implemented through the Transformation Plan, and from petrochemicals and other products (-COP 165 billion). |
| · | Average price effect of domestic purchases and imports of crude and products (+COP 588 billion). |
| · | Lower peso average exchange rate for purchases (-COP 57 billion), from COP 3,059/USD (Q4 2015) to COP 3,027/USD (Q4 2016). |
| b) | Higher cost of depreciation, amortization and depletion (+COP 122 billion): Primarily due to the commissioning of the Gunflint field at America Inc. since August 2016, the startup of operations at Cartagena refinery, offset by lower depreciation at Ecopetrol associated with lower production. |
| c) | Lower cost of transportation services (-COP 261 billion) due to the optimization of the transport of tanker cars at Ecopetrol S.A. and Hocol S.A. |
| d) | Other (+COP 154 billion), largely due to the commissioning of Reficar and the increase in energy and materials costs related to our larger share of operations at Rubiales and Cusiana. |
| · | Fixed costs:Decrease of 6.7%, including DD&A charges, (-COP 187 billion), mainly due to: |
| a) | Decline in maintenance costs (-COP 186 billion), largely due to the capitalization of major maintenance in the transportation segment. |
Costs in the fourth quarter of 2016 included the seasonal effects of the Company’s operations and the costs increase due to the resume of operations at Rubiales and Cusiana fields as of July 1, 2016. Further, the percentage of royalties from the Rubiales field rose from 20% to 32% on the occasion of the reversion.
In the fourth quarter of 2016 the results were affected by COP 22 billion due to attacks on infrastructure. These attacks led to the repair of transportation systems, the removal of illegal connections, the resumption of oil pipeline operations and the decontamination of some areas.
Gross margin for the fourth quarter of 2016 was 27.1% (5% higher than in the fourth quarter of the previous year), due to cost-reduction efforts that mitigated the impact of the decrease in our revenue.
Operating expenses, including exploratory expenses, fell 35.7% (-COP 662 billion), largely due to: i) lower exploratory expenses as a result of fewer dry wells recorded during the period and less seismic activity, ii) decrease in the environmental provision allocated for projects, and iii) increase in labor expenses due to recognition of the 2016 voluntary retirement plan.
Theimpairment expense for long-term assets fell 90.5% (-COP 7.48 trillion) explained by: i) fixed assets and petroleum investments (-COP 6.25 trillion), and ii) investments in companies and goodwill (-COP 1.2 trillion), largely due to the better pricing scenario projected in 2016 versus 2015 (please refer to the sectionImpairment of Long Term Assets).
Net financial income (non-operational) presented a variation of +COP 1.18 trillion (+COP 221 billion versus –COP 964 billion during the last quarter of 2015), as a net result of:
| a) | Change in income due to exchange rate fluctuations (+COP 336 billion): a profit of COP 138 billion was posted in the fourth quarter of 2016 versus a loss of COP 198 billion during the same period the previous year, due to the positive impact of the 4.2% devaluation of the Colombian peso against the dollar in the net dollar asset position. |
The adoption of cash flow hedge accounting and hedging of net investment allowed us to neutralize, overall, the effect of the exchange rate fluctuation over 88% of the dollar debt of Ecopetrol S.A., since exchange rate changes are recognized under Other Comprehensive Income (OCI), within net equity.
| b) | Lower net financial expense (+COP 95 billion), largely due to: i) higher financial returns given the Company’s liquidity position, ii) lower interest rate on local loans associated with IPC and DTF, iii) the effect of the decline in the exchange rate on interest associated with the foreign currency debt, and partially offset by iv) the recognition of interest on the Reficar debt which, up to 2015, had been capitalized. |
| c) | Recovery of a fund created to backup the legal dispute of Santiago de las Atalayas and Pueblo Viejo de Cusiana (+COP 689 billion). |
| d) | Mark to market of exchange rate derivative instruments and other minor items (+COP 65 billion). |
Income from theequity method declined (-COP 48 billion), largely due to Equión’s lower results compared to the fourth quarter of 2015
Theeffective rate of return for the fourth quarter of 2016 was 80%, higher than the level posted during the same quarter the previous year (27%), largely due: i) expenses due to lower recovery of deferred tax asset, ii) effect of the adjustment in deferred tax resulting from the application of the Tax Reform, and iii) recognition of the presumptive tax on subsidiaries posting tax losses.
Net profit attributable to Company shareholders in the fourth quarter of 2016 rose to COP 186 billion versus a loss of COP 6.3 trillion in the same period last year. Net profit attributable to Ecopetrol shareholders for all of 2016 totaled COP 1.6 trillion.
EBITDA for the fourth quarter of 2016 was COP 4.5 trillion, yielding an EBITDA margin of 33.6%, versus COP 3.1 trillion (margin of 24.1%) in Q4 2015.
EBITDA for the fourth quarter of 2016 was COP 4.47 trillion, with anEBITDA margin of 33.6%. This result compares with COP 3.08 trillion (margin of 24.1%) in Q4 2015. The increase inEBITDA is explained by: i) (+ COP 0.95 trillion) better sales prices, in line with market behavior, ii) (+ COP 0.85 trillion) lower costs and expenses thanks to our cost reduction program and greater efficiencies, as well as the decrease in dry wells and lower exploration activity, among others; and iii) (-COP 0.41 trillion) lower revenues from transportation services that decreased mainly at Ocensa when the invoicing to Pacific E & P Rubiales was changed to Ecopetrol, with the termination of the contract.
| d. | Balance Sheet (Statement of Financial Position) |
Table 7 – Balance Sheet –Ecopetrol Group
| A | | B | | | C | | | D | | | E | |
| COP Billion | | 2016 | | | 2015 | | | ∆ ($) | | | ∆ (%) | |
| Current Assets | | | 24,129 | | | | 20,113 | | | | 4,016 | | | | 20.0 | % |
| Non Current Assets | | | 97,178 | | | | 102,883 | | | | (5,705 | ) | | | (5.5 | )% |
| Total Assets | | | 121,307 | | | | 122,996 | | | | (1,689 | ) | | | -1.4 | % |
| | | | | | | | | | | | | | | | | |
| Current Liabilities | | | 16,387 | | | | 17,443 | | | | (1,056 | ) | | | (6.1 | )% |
| Non-Current Liabilities | | | 59,601 | | | | 60,321 | | | | (720 | ) | | | (1.2 | )% |
| Total Liabilities | | | 75,988 | | | | 77,764 | | | | (1,776 | ) | | | -2.3 | % |
| Equity | | | 45,319 | | | | 45,232 | | | | 87 | | | | 0.2 | % |
| Non-Controlling Interests | | | 1,646 | | | | 1,875 | | | | (229 | ) | | | (12.2 | )% |
| Total Liabilities and Equity | | | 121,307 | | | | 122,996 | | | | (1,689 | ) | | | -1.4 | % |
Assetsdeclined by COP 1.69 trillion versus the previous year, largely due to the net effect of:
| · | Decline incurrent tax assets (-COP 3.37 trillion); in 2015 the Company generated a positive balance in income tax due to the tax loss. In 2016, the Company recognized an income tax balance payable. |
| · | Decrease inproperty, plant and equipment, natural resources and intangibles(-COP 4.58 trillion), largely due to: i) depreciation and amortization posted during the year, ii) decrease in the value assets of subsidiaries with functional currencies other than the Colombian peso as a result of the appreciation of the Colombian peso, and iii) investments made during the year. |
| · | Decrease in thedeferred asset tax(-COP 1.06 trillion) due largely to differences in calculation of the income provision between tax and accounting items and the impact of the Tax Reform in reducing future tax rates. |
| · | Increase inother financial current assets (+COP 4.98 trillion) largely due to funds received in the form of tax refund certificates (TIDIS) as part of the return on the positive balance of 2015 income and the investment of surplus liquidity due to the recovery of oil prices. |
| · | Increase incash and cash equivalents (+ COP 1.86 trillion) mainly due to: i) resources from operating activities (+ COP 14.44 trillion), ii) outflow of resources from investment in Capex and investment portfolio (-COP 9.59 trillion ), iii) a net decrease in financing resources (-COP 2.76 trillion), mainly due to: a) payment of interest associated with the Group's debt (-COP 2.50 trillion), b) payment of dividends to non-controlling shareholders in our transportation subsidiaries (-COP 1.7 trillion), and (c) net increase in loans and debt financing (+ COP 1.44 trillion) - and (iv) negative impact (-COP 226 billion) on the revaluation of the peso against the US dollar of 4.7% . |
Cash and cash equivalents (COP 8.4 trillion) and other current financial assets (COP 5.3 trillion), that are considered liquid investments, add a total available cash to close to COP 14 trillion by the end of 2016.
| · | Net increase incommercial accounts receivable(+COP 930 billion) largely due to the increase in accounts receivable by the price stabilization fund for gasoline and diesel, as a result of the increase in international prices. |
| · | Minor changes in other assets (-COP 445 billion). |
Totalliabilities fell COP 1.77 trillion versus the previous year, largely due to the effect of:
| · | Decrease in the group’s debt level (-COP 1 trillion) as a result of the combined effect of: i) the appreciation of the exchange rate applied to debt denominated in foreign currency, and ii) an increase in debt. In 2016 international bonds were issued totaling USD 500 million and commercial loans were entered into totaling USD 475 million. |
| · | As of December 31, 2016, the group’s debt level totaled COP 52.22 trillion, 87% of which was denominated in foreign currency and 13% in domestic currency. Of the total foreign currency debt, USD 10.51 billion are a financial hedging instruments, the exchange rate appreciation of which affects net equity. |
| · | Reduction indeferred liability tax(-COP 1.07 trillion), caused primarily by differences in calculating the provision for income between tax and accounting items. |
| · | Decrease intrade accounts and other accounts payable(-COP 879 billion) given that at the close of 2015 the final installment of dividends to the national government remained pending. |
| · | Decrease intaxes payable(-COP 673 billion) largely due to the lower income tax associated with companies in the transportation sector. |
| · | Increase in provisions for employee benefits (+COP 2.02 trillion) largely due to the discounting of long-term actuarial liabilities as an effect of the decrease in the discount rate. |
| · | Other minor changes in liabilities totaling –COP 172 billion. |
Total equity was COP 45.32 trillion, COP 43.67 trillion of which was attributable to Ecopetrol shareholders and COP 1.64 trillion to non-controlling shareholders. This was up +COP 87 billion over the previous year due to the combined effect of: i) income during the period, ii) exchange rate appreciation of debt designated as a hedging instrument, iii) discounting of the actuarial calculation and iv) adjustment for the conversion of assets and liabilities of subsidiaries with functional currencies other than the Colombian peso.
| e. | Impairment of Long Term Assets |
The concept ofimpairment seeks to reflect in accounting terms the difference between the book value of an asset or cash-generating unit as opposed to its theoretical valuation, and this valuation uses particular assumptions that should reflect market conditions. The valuation is done based on the free cash flow method, discounted at a certain rate as the weighted average capital cost (WACC).
Whenimpairment is generated, an expense is recognized that affects a company’s result for the period butwhich does not involve cash outlays. Thisimpairment is susceptible to reversion when the valuation of the asset exceeds its book value.
At least once a year (or when there is indication), the Company should ascertain whether there are signs ofimpairment to its assets or cash-generating units. In 2016, the following types ofimpairment were recognized:
| · | Impairment of property, plant and equipment, and natural resources |
| · | Impairment of investments |
1)Impairment of property, plant and equipment, and natural resources.
Based on impairment tests conducted by the Company, the book value of certain assets exceeds their valuation, which led to recognition of an expense for impairment in the statement of results of COP 801 billion in 2016 and COP 7.01 trillion in 2015.
2)Impairment of investments and goodwill
Impairment to the value of investments of the Exploration and Production segment was recognized in the amount of COP 41 billion in 2016 and COP 1.27 trillion in 2015.
Table 8 – Quarterly Results by Segment
| A | | B | | | C | | | D | | | E | | | F | | | G | | | H | | | I | | | J | | | K | |
| | | E&P | | | Refining & Petrochem. | | | Transportation & Logistics | | | Eliminations | | | Ecopetrol Consolidated | |
| COP Billion | | 4Q 2016 | | | 4Q 2015 | | | 4Q 2016 | | | 4Q 2015 | | | 4Q 2016 | | | 4Q 2015 | | | 4Q 2016 | | | 4Q 2015 | | | 4Q 2016 | | | 4Q 2015 | |
| Local Sales | | | 2,528 | | | | 2,521 | | | | 4,953 | | | | 5,173 | | | | 2,518 | | | | 3,023 | | | | (3,449 | ) | | | (3,602 | ) | | | 6,550 | | | | 7,115 | |
| Export Sales | | | 5,702 | | | | 4,942 | | | | 1,770 | | | | 1,009 | | | | 0 | | | | 0 | | | | (709 | ) | | | (289 | ) | | | 6,763 | | | | 5,662 | |
| Total Sales | | | 8,230 | | | | 7,463 | | | | 6,723 | | | | 6,182 | | | | 2,518 | | | | 3,023 | | | | (4,158 | ) | | | (3,891 | ) | | | 13,313 | | | | 12,777 | |
| | | | 1,542 | | | | 1,400 | | | | 93 | | | | 166 | | | | 238 | | | | 234 | | | | 0 | | | | 0 | | | | 1,873 | | | | 1,800 | |
| Variable Costs | | | 3,225 | | | | 3,358 | | | | 5,590 | | | | 5,385 | | | | 148 | | | | 140 | | | | (3,390 | ) | | | (3,124 | ) | | | 5,573 | | | | 5,759 | |
| Fixed Costs | | | 1,878 | | | | 2,062 | | | | 514 | | | | 386 | | | | 514 | | | | 801 | | | | (647 | ) | | | (852 | ) | | | 2,259 | | | | 2,397 | |
| Cost of Sales | | | 6,645 | | | | 6,820 | | | | 6,197 | | | | 5,937 | | | | 900 | | | | 1,175 | | | | (4,037 | ) | | | (3,976 | ) | | | 9,705 | | | | 9,956 | |
| Gross profit | | | 1,585 | | | | 643 | | | | 526 | | | | 245 | | | | 1,618 | | | | 1,848 | | | | (121 | ) | | | 85 | | | | 3,608 | | | | 2,821 | |
| Operating Expenses | | | 498 | | | | 1,246 | | | | 473 | | | | 598 | | | | 290 | | | | 62 | | | | (68 | ) | | | (51 | ) | | | 1,193 | | | | 1,855 | |
| Operating Profit | | | 1,087 | | | | (603 | ) | | | 53 | | | | (353 | ) | | | 1,328 | | | | 1,786 | | | | (53 | ) | | | 136 | | | | 2,415 | | | | 966 | |
| Financial Income (Loss) | | | 509 | | | | (888 | ) | | | (314 | ) | | | (80 | ) | | | (27 | ) | | | 98 | | | | 53 | | | | (95 | ) | | | 221 | | | | (965 | ) |
| Share of profit of companies | | | (31 | ) | | | 16 | | | | 7 | | | | 8 | | | | 0 | | | | 1 | | | | 0 | | | | 0 | | | | (24 | ) | | | 25 | |
| Provision for Income Tax | | | (960 | ) | | | 371 | | | | (138 | ) | | | 555 | | | | (453 | ) | | | (634 | ) | | | 0 | | | | 0 | | | | (1,551 | ) | | | 292 | |
| Net Income Consolidated | | | 605 | | | | (1,104 | ) | | | (392 | ) | | | 130 | | | | 848 | | | | 1,251 | | | | 0 | | | | 41 | | | | 1,061 | | | | 318 | |
| Non-controlling interests | | | 0 | | | | 0 | | | | 3 | | | | 3 | | | | (175 | ) | | | (290 | ) | | | 0 | | | | 0 | | | | (172 | ) | | | (287 | ) |
| Net income attributable to owners of Ecopetrol before impairment | | | 605 | | | | (1,104 | ) | | | (389 | ) | | | 133 | | | | 673 | | | | 961 | | | | 0 | | | | 41 | | | | 889 | | | | 31 | |
| Impairment after income tax | | | | | | | | | | | | | | | | | | | | | | | | | | | | | | | | | | | (703 | ) | | | (6,339 | ) |
| Net income attributable to owners of Ecopetrol | | | | | | | | | | | | | | | | | | | | | | | | | | | | | | | | | | | 186 | | | | (6,308 | ) |
| | | | | | | | | | | | | | | | | | | | | | | | | | | | | | | | | | | | | | | | | |
| EBITDA* | | | 2,615 | | | | 897 | | | | 319 | | | | 7 | | | | 1,593 | | | | 2,044 | | | | (53 | ) | | | 135 | | | | 4,474 | | | | 3,083 | |
| EBITDA Margin | | | 31.8 | % | | | 12.0 | % | | | 4.7 | % | | | 0.1 | % | | | 63.3 | % | | | 67.6 | % | | | 1.3 | % | | | -3.5 | % | | | 33.6 | % | | | 24.1 | % |
For the sake of presentation and comparison the impairment expense is showed at the consolidated level, not at the segment level.
Table 9 – 2016 Financial Results by Segment
| A | | B | | | C | | | D | | | E | | | F | | | G | | | H | | | I | | | J | | | K | |
| | | E&P | | | Refining & Petrochem. | | | Transportation & Logistics | | | Eliminations | | | Ecopetrol Consolidated | |
| COP Billion | | 2016 | | | 2015 | | | 2016 | | | 2015 | | | 2016 | | | 2015 | | | 2016 | | | 2015 | | | 2016 | | | 2015 | |
| Local Sales | | | 8,290 | | | | 8,663 | | | | 18,477 | | | | 19,710 | | | | 10,649 | | | | 10,845 | | | | (12,671 | ) | | | (13,150 | ) | | | 24,745 | | | | 26,068 | |
| Export Sales | | | 19,178 | | | | 22,814 | | | | 6,347 | | | | 3,536 | | | | 0 | | | | 0 | | | | (2,538 | ) | | | (327 | ) | | | 22,987 | | | | 26,023 | |
| Total Sales | | | 27,468 | | | | 31,477 | | | | 24,824 | | | | 23,246 | | | | 10,649 | | | | 10,845 | | | | (15,209 | ) | | | (13,477 | ) | | | 47,732 | | | | 52,091 | |
| | | | 5,454 | | | | 5,299 | | | | 950 | | | | 436 | | | | 966 | | | | 864 | | | | 0 | | | | 0 | | | | 7,370 | | | | 6,599 | |
| Variable Costs | | | 10,701 | | | | 13,334 | | | | 20,384 | | | | 18,856 | | | | 488 | | | | 440 | | | | (11,947 | ) | | | (10,427 | ) | | | 19,626 | | | | 22,203 | |
| Fixed Costs | | | 6,803 | | | | 7,076 | | | | 1,510 | | | | 1,467 | | | | 1,896 | | | | 2,441 | | | | (2,969 | ) | | | (2,791 | ) | | | 7,240 | | | | 8,193 | |
| Cost of Sales | | | 22,958 | | | | 25,709 | | | | 22,844 | | | | 20,759 | | | | 3,350 | | | | 3,745 | | | | (14,916 | ) | | | (13,218 | ) | | | 34,236 | | | | 36,995 | |
| Gross profit | | | 4,510 | | | | 5,768 | | | | 1,980 | | | | 2,487 | | | | 7,299 | | | | 7,100 | | | | (293 | ) | | | (259 | ) | | | 13,496 | | | | 15,096 | |
| Operating Expenses | | | 2,140 | | | | 3,301 | | | | 1,802 | | | | 1,729 | | | | 751 | | | | 575 | | | | (292 | ) | | | (249 | ) | | | 4,401 | | | | 5,356 | |
| Operating Profit | | | 2,370 | | | | 2,467 | | | | 178 | | | | 758 | | | | 6,548 | | | | 6,525 | | | | (1 | ) | | | (10 | ) | | | 9,095 | | | | 9,740 | |
| Financial Income (Loss) | | | (118 | ) | | | (3,032 | ) | | | (811 | ) | | | (703 | ) | | | (243 | ) | | | (96 | ) | | | (11 | ) | | | (136 | ) | | | (1,183 | ) | | | (3,967 | ) |
| Share of profit of companies | | | (32 | ) | | | 11 | | | | 23 | | | | 23 | | | | (1 | ) | | | 1 | | | | 0 | | | | 0 | | | | (10 | ) | | | 35 | |
| Provision for Income Tax | | | (1,387 | ) | | | (312 | ) | | | (694 | ) | | | 204 | | | | (2,653 | ) | | | (2,437 | ) | | | 0 | | | | 0 | | | | (4,734 | ) | | | (2,545 | ) |
| Net Income Consolidated | | | 833 | | | | (866 | ) | | | (1,304 | ) | | | 282 | | | | 3,651 | | | | 3,993 | | | | (12 | ) | | | (146 | ) | | | 3,168 | | | | 3,263 | |
| Non-controlling interests | | | 0 | | | | 0 | | | | 8 | | | | 5 | | | | (847 | ) | | | (910 | ) | | | 0 | | | | 0 | | | | (839 | ) | | | (905 | ) |
| Net income attributable to owners of Ecopetrol before impairment | | | 833 | | | | (866 | ) | | | (1,296 | ) | | | 287 | | | | 2,804 | | | | 3,083 | | | | (12 | ) | | | (146 | ) | | | 2,329 | | | | 2,358 | |
| Impairment after income tax | | | | | | | | | | | | | | | | | | | | | | | | | | | | | | | | | | | (764 | ) | | | (6,346 | ) |
| Net income attributable to owners of Ecopetrol | | | | | | | | | | | | | | | | | | | | | | | | | | | | | | | | | | | 1,565 | | | | (3,988 | ) |
| | | | | | | | | | | | | | | | | | | | | | | | | | | | | | | | | | | | | | | | | |
| EBITDA* | | | 8,383 | | | | 8,494 | | | | 1,848 | | | | 1,907 | | | | 7,788 | | | | 7,696 | | | | (1 | ) | | | (10 | ) | | | 18,018 | | | | 18,087 | |
| EBITDA Margin | | | 30.5 | % | | | 27.0 | % | | | 7.4 | % | | | 8.2 | % | | | 73.1 | % | | | 71.0 | % | | | 0.0 | % | | | 0.1 | % | | | 37.7 | % | | | 34.7 | % |
For the sake of presentation and comparison the impairment expense is showed at the consolidated level, not at the segment level.
Exploration and Production
Revenue for the fourth quarter of 2016 was up 10% (+COP 767 billion) versus the same period the previous year, largely due to: i) the higher price of the crude basket, at USD 41.9/Bl versus USD 34.2/Bl, in line with international price behavior, and ii) recovery of the average exchange rate. This offset the lower volumes sold associated with the Business Group’s decline in production.
The segment’s cost of sales fell 2.6% (-COP 175 billion) versus the fourth quarter of the previous year, as a result of: i) efforts to optimize costs and operating efficiencies, primarily in contracted services and the dilution factor, reducing imported volumes of naphtha; and ii) lower costs of transportation by tanker cars. These reductions helped offset the higher cost of depreciation and amortization due to the start of operations of Ecopetrol America Inc.’s Gunflint field.
Operating expenses saw a 60% reduction (-COP 758 billion) versus the fourth quarter of 2015, largely because of lower expenses of dry wells as a result of reduced exploratory activity in 2016. Thus, the segment reported an operating margin of 13.2% versus a negative margin in 2015 of 8.1%.
Net financial income is a revenue of COP 509 billion, COP 1.40 trillion over the fourth quarter of 2015, the change largely due to: i) recovery of a fund created to backup the legal dispute of Santiago de las Atalayas and Pueblo Viejo de Cusiana (+COP 689 billion), ii) the effect of the lower closing exchange rate versus the same period the previous year (+COP 542 billion).
The net result before impairments (net of taxes) of the fourth quarter of 2016 yielded net profit attributable to Ecopetrol shareholders of COP 605 billion, versus a loss of COP 1.10 trillion during the same period of 2015.
EBITDA for the segment in the fourth quarter of 2016 totaled COP 2.6 trillion (EBITDA margin 32%), versus COP 897 billion (EBITDA margin 12%) during the same period in 2015.
Refining and Petrochemicals
Fourth quarter 2016 revenue rose 9% (+COP 541 billion) versus the same period the previous year, due primarily to the star up of the Cartagena refinery. The Barrancabermeja refinery also highlighted the positive impact of the implementation of operational initiatives that facilitated the maximization of diesel production.
The segment’s cost of sales rose (+COP 260 billion) due to the operation of all units of the Cartagena refinery, resulting in increased costs for maintenance, energy and contracted services, as well as higher consumption of inventory and depreciation charges in the last quarter of 2016.
Operating expenses fell 21% (-COP 125 billion) in the fourth quarter of 2016 versus the same period the previous year, due primarily to the allocation of such expenses directly to the cost of the products following the start of operations of the Cartagena refinery.
The segment reported an operating income of COP 53 billion in the fourth quarter of 2016 compared with a loss of COP 353 billion in the fourth quarter last year.
Financial net result is a loss of COP 314 billion mainly due to a higher expenditure (+COP 234 billion) versus the fourth quarter of 2015, as a result of the recognition of interest expense of Reficar, while in 2015 such interest was being capitalized during construction.
The increased expense for the provision for income tax (+COP 138 billion) may be explained largely by the impact on the deferred tax associated with the recognition of lower recovery of the deferred tax, and tax losses of Reficar under presumptive tax.
As a result, the segment posted a net loss before impairments (net of taxes) attributable to shareholders of COP 389 billion in the fourth quarter of 2016.
The segment’s EBITDA for this quarter totaled COP 319 billion (EBITDA margin 4.7%), versus COP 7 billion in the fourth quarter of 2015, reflecting the positive impact of the startup of the Cartagena refinery and the improvement of the operational layout at Barrancabermeja refinery.
Transportation and Logistics
Revenue for the fourth quarter of 2016 fell 17% (-COP 505 billion) due primarily to lower volumes transported in oil pipelines as a result of the country’s decline in crude production and the effect of the lower average peso exchange rate on dollar transportation rates.
Cost of sales declined 23% (-COP 275 billion) due to the ongoing program to optimize operating and maintenance costs, offsetting the increase in crude purchasing costs for energy generation at pumping stations associated with the increase in crude prices.
Operating expenses rose (+COP 228 billion) versus the same period last year, due largely to the recovery of environmental provisions made in the fourth quarter of 2015.
Net financial income showed a loss (-COP 27 billion) compared to the net income of COP 98 billion in the same period last year, primarily due to the impact of the exchange rate difference on the segment’s net asset position.
As a final result, the segment posted net profit attributable to Ecopetrol shareholders before impairments (net of taxes) of COP 673 billion, versus COP 961 billion during the same period of 2015.
The segment’s EBITDA for the fourth quarter totaled COP 1.6 trillion (EBITDA margin of 63%), versus +COP 2.04 trillion (EBITDA margin of 68%) in the same period of last year. Approximately 37% of total EBITDA in this segment is generated through third-party transactions.
| g. | Result of Cost and Expense Reduction Initiatives |
Continuing with the savings plan established by the company, a goal was set of COP 1.6 trillion for 2016, leveraged primarily on the management of procurement and contracting, and the cost optimization measures of the business transformation plan.
These efficiency initiatives include measures affecting: i) the fixed cost and expenses lines on the profit and loss statement, ii) variable cost items such as dilution and transportation, iii) higher revenue, iv) CAPEX efficiencies, and v) efficiencies at subsidiaries.
Total savings and efficiencies in 2016 amounted to COP 2.47 trillion, corresponding to the following: i) the business transformation plan yielded efficiencies of COP 0.64 trillion in the fourth quarter of 2016, for a total for the year of COP 2.24 trillion in structural efficiencies; and ii) the result of austerity measures and reduced activity, totaling COP 0.23 trillion in non-structural savings over the course of the year.
The levers that generated the greatest savings in 2016 were:
Dilution (COP 658 billion): Less use of diluting agent; the dilution factor dropped from 18.5% in 2015 to 16.8% in 2016. Reduced use of tanker cars and logistical savings due to higher transport viscosity, from 300 cSt to 405 cSt.
Operation and Maintenance of Transportation Assets (COP 375 billion): Renegotiation of contracts, application of operating and maintenance strategies, and operational synergies between subsidiaries in the transportation segment.
Procurement (COP 292 billion): The contract management model optimized contracted resources, reducing headcount from 2,043 in 2015 to 428 in 2016, with no increase in headquarters’ staff. Consolidation of facilities and ground transportation contracts (from 265 contracts to 135).
Chart 1 – Reduction of Costs and Expenses – Ecopetrol Group
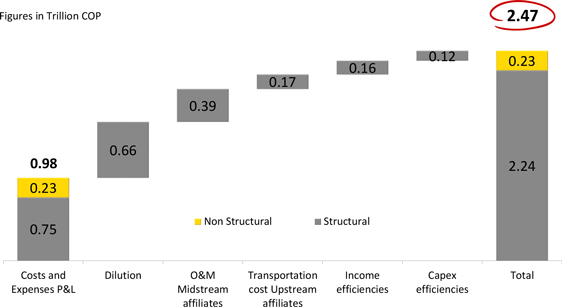
Of the savings obtained in 2016, the profit and loss statement reflects that total costs were COP 977 billion lower than in 2015. Comparable items in the transformation show COP 745 billion that are structural, with the remainder corresponding to other initiatives, thus explaining the additional COP 232 billion.
Table 10 – Reduction of Costs and Expenses in the Income Statement – Ecopetrol Group
| A | | B | | | C | | | D | | | E | |
| COP Billion | | 2016 | | | 2015 | | | ∆ ($) | | | ∆ (%) | |
| Association Services (1) | | | 1,081 | | | | 1,399 | | | | (318 | ) | | | (22.7 | )% |
| Maintenance | | | 895 | | | | 1,026 | | | | (131 | ) | | | (12.8 | )% |
| Contracted Services | | | 905 | | | | 1,304 | | | | (399 | ) | | | (30.6 | )% |
| Operational Supplies | | | 241 | | | | 282 | | | | (41 | ) | | | (14.5 | )% |
| Labor Cost | | | 1,498 | | | | 1,463 | | | | 35 | | | | 2.4 | % |
| General Cost | | | 115 | | | | 125 | | | | (10 | ) | | | (8.0 | )% |
| Fixed Costs | | | 4,735 | | | | 5,599 | | | | (864 | ) | | | -15.4 | % |
| | | | | | | | | | | | | | | | | |
| Association Services (1) | | | 318 | | | | 563 | | | | (245 | ) | | | (43.5 | )% |
| Process' Materials | | | 720 | | | | 460 | | | | 260 | | | | 56.5 | % |
| Variable Costs | | | 1,038 | | | | 1,023 | | | | 15 | | | | 1.5 | % |
| | | | | | | | | | | | | | | | | |
| Labor | | | 659 | | | | 573 | | | | 86 | | | | 15.0 | % |
| Commissions, Fees and Serv. | | | 260 | | | | 382 | | | | (122 | ) | | | (31.9 | )% |
| Customs | | | 196 | | | | 204 | | | | (8 | ) | | | (3.9 | )% |
| General | | | 314 | | | | 398 | | | | (84 | ) | | | (21.1 | )% |
| Operating Expenses | | | 1,429 | | | | 1,557 | | | | (128 | ) | | | -8.2 | % |
| | | | | | | | | | | | | | | | | |
| Total Costs and Expenses (2) | | | 7,202 | | | | 8,179 | | | | (977 | ) | | | -11.9 | % |
| (1) | Effect of the Rubiales reversion as of July 2016 and the reduction in association services that affect other direct cost lines. |
| (2) | Does not include variable cost headings such as dilution and transportation, among others, which require standardization for price, exchange rate and utilization factor for optimization analysis. |
Table 11 – Investments* by segment – Ecopetrol Group
| A | | B | | | C | | | D | | | E | |
| 2016 - USD millones | | Ecopetrol S.A. | | | Affiliates and
Subsidiaries** | | | Total | | | Share | |
| Production | | | 748.5 | | | | 150.7 | | | | 899.2 | | | | 36.3 | % |
| Refining, Petrochemicals and Biofuels | | | 79.3 | | | | 777.3 | | | | 856.6 | | | | 34.6 | % |
| Exploration | | | 98.9 | | | | 180.1 | | | | 279.0 | | | | 11.3 | % |
| Transportation | | | 2.0 | | | | 399.6 | | | | 401.6 | | | | 16.2 | % |
| Corporate | | | 34.7 | | | | 0.0 | | | | 34.7 | | | | 1.4 | % |
| New Businesses | | | 1.3 | | | | 0.0 | | | | 1.3 | | | | 0.1 | % |
| Supply and Marketing | | | 3.5 | | | | 0.0 | | | | 3.5 | | | | 0.1 | % |
| Total | | | 968.2 | | | | 1,507.7 | | | | 2,475.9 | | | | 100.0 | % |
*The investments differ from the Capex in the Cash Flow Statement in the Annex of this report. The investments in this table include and Capex and some Opex flows for the investment projects, while the investment line in the Cash Flow Statement only includes Capex.
**Prorated by the participation of Ecopetrol.
Investments at the close of 2016 totaled USD 2.5 billion (39% in Ecopetrol S.A. and 61% in affiliates and subsidiaries). This represents a drop of 62% (USD 6.5 billion) from the previous year, a decrease caused by the drop in oil prices, which was reflected in lower exploration and development expenses (-69%) and lower downstream investment (-52%).
Production: Ecopetrol S.A. drilled 126 wells and 434 workovers. The drilling campaign focused largely on the Castilla field, with 42 wells, Rubiales with 36 wells, La Cira with 20 wells, Quifa with 19 wells and Chichimene with three wells. Civil construction was also undertaken to expand locations and surface facilities. For their part, the workovers were concentrated primarily at La Cira Infantas, Huila, Chichimene, Casabe and Palagua. In the case of Ecopetrol America Inc. (EAI), the most significant works were executed at Gunflint field.
Exploration: in 2016, the drilling of six A3 wells was completed (two from Ecopetrol S.A., three from Hocol S.A. and one from Ecopetrol America Inc). In the last quarter of 2016 the drilling operations began in Purple Angel-1 and Gorgon-1 wells at the Colombian Caribbean offshore, works that extended to 2017. Additionally, in February 2016 it ended the drilling of León 2 appraisal well at US Gulf Coast. The seismic program acquired 2,105 kilometers-equivalent, mostly 3D (Brazil offshore).
Refining, Petrochemicals and Biofuels: Investments are represented largely in the Barrancabermeja Industrial Services Master Plan (PMSI), the execution of which was completed, and in maintenance that can be capitalized. For its part, in the case of Reficar, investments were concentrated in the completion, startup and stabilization of the refinery (USD 615 million).
Transportation: Investments were concentrated in the Ocensa P135 and San Fernando-Monterrey projects.
Table 12 – Exploratory Wells – Ecopetrol Group
| A | | B | | | C | | | D | | | E | | | F | | | G | | | H | | | I | | | J | | | K | |
| | | 4Q 2016 | | | 2016 | |
| Company | | Drilled | | | Hydrocarbon
Presence | | | Suspended | | | Under
Evaluation | | | Dry | | | Drilled | | | Hydrocarbon
Presence | | | Suspended | | | Under
Evaluation | | | Dry | |
| Ecopetrol S.A | | | 2 | | | | 0 | | | | 1 | | | | 0 | | | | 1 | | | | 2 | | | | 0 | | | | 1 | | | | 0 | | | | 1 | |
| Ecopetrol America (EAI) | | | 1 | | | | 1 | | | | 0 | | | | 0 | | | | 0 | | | | 1 | | | | 1 | | | | 0 | | | | 0 | | | | 0 | |
| Hocol S.A | | | 3 | | | | 1 | | | | 0 | | | | 1 | | | | 1 | | | | 3 | | | | 1 | | | | 0 | | | | 1 | | | | 1 | |
| Total | | | 6 | | | | 2 | | | | 1 | | | | 1 | | | | 2 | | | | 6 | | | | 2 | | | | 1 | | | | 1 | | | | 2 | |
In the fourth quarter of 2016, Ecopetrol S.A. drilled the Boranda and Chimu 1 ST1 wells. Boranda (Playón Block), in joint venture with Parex (operator) and Ecopetrol (50% interest) was suspended upon termination of the year and a work plan is under negotiation. The Chimu 1 ST1 well, located in the Caño Sur Block and operated 100% by Ecopetrol, was also capped and abandoned.
In addition, in the fourth quarter our subsidiary Hocol S.A. initiated drilling of the Bullerengue Sur (SSJN1 Block) and Pegaso (CPO 16 Block) wells, both reaching TD in December. The Bullerengue Sur well, operated by Lewis (50% interest), and Hocol S.A. (50% interest), was successful. The Pegaso well, operated 100% by Hocol, in addition to the technical challenges involved in drilling a highly deviating well, represented a special socio-environmental challenge. As of year-end it was under evaluation.
Hocol S.A. completed drilling the Payero 1 exploratory well operated by Equión in the Niscota block, in the Piedemonte Llanero (Hocol S.A. 20%, Total 50% and Repsol 30%), which was capped and abandoned.
In turn, Ecopetrol America Inc. drilled the Warrior well in the Green Canyon area in the Gulf of Mexico (United States); drilling operations were initiated in August and completed in November. Participants in this well are EAI at 20%, JX Nippon Oil & Gas Exploration at 15% and the operator Anadarko Petroleum Corporation at 65%; this well confirmed the presence of hydrocarbons, and although it was considered successful, it was capped and temporarily abandoned until facilities are developed.
At year-end 2016 two offshore projects were in the process of drilling: Purple Angel-1 (appraisal well for Kronos) and Gorgon-1, both operated by Anadarko (50%) in which Ecopetrol has 50% interest. These two projects will afford us higher certainty as to the potential of the Colombian Caribbean.
Following is a breakdown of the exploratory wells drilled in 2016:
Table 13 – Detail of Exploratory Wells – Ecopetrol Group
| A | | B | | C | | D | | E | | F |
| Quarter | | Basin | | Operator | | Block | | Well | | Status |
| 4 | | VMM | | Parex | | Playon | | Boranda | | Suspendido |
| 4 | | Piedemonte | | Equión | | Niscota | | Payero | | T&A |
| 4 | | VIM | | Lewis | | SSJN1 | | Bullerengue Sur | | Exitoso |
| 4 | | Llanos | | Ecopetrol | | Caño Sur | | Chimu 1 ST1 | | T&A |
| 4 | | Llanos | | Hocol | | CPO 16 | | Pegaso | | Evaluación |
| 4 | | GOM | | Anadarko | | GOM | | Warrior | | Exitoso |
For appraisal wells, February 2016 saw the completion of drilling of the well León 2 in the Gulf of Mexico, operated by Repsol (60%) and Ecopetrol America Inc.(40%). The results contributed to the addition of contingent resources to the initial discoveries of the exploratory well León-1 in 2014.
In the asset dilution process, and thanks to the 1/2016 round, approval was achieved for four dilution offers: LLA 39, LLA 52, VMM 32 and CPO-11.
In 2016 seismic acquisition programs were advanced locally (VMM, Llanos and Caguán Putumayo) and internationally (Brazil). During the period, 2,105 kilometers-equivalent were recorded, which were acquired to a greater percentage in 3D seismic (Brazil Offshore).
At the close of 2016, Ecopetrol’s net proven reserves were 1,598 million barrels of petroleum equivalent, 14% fewer than the 1,849 million barrels of petroleum equivalent recorded at the close of 2015. It is estimated that the price drop caused a reduction on proven reserves of 202 mmboe. In 2016, the SEC price used for the valuation fell 20% versus 2015, from USD 55.57 per barrel to USD 44.49 per barrel and 56% versus 2014, when the price was USD 101.80 per barrel.
This effect was largely countered by an addition of 186 mmboe, attributable to the ongoing optimization of operating costs, greater efficiencies, lower transportation cost, new drilling projects such as the one planned in the Palagua-Caipal fields, and extensions of the proven area to fields such as Castilla, Rubiales and Chichimene, among others. The reserve replacement index, not including the price effect, was 79%. Taking into account the price effect, the reserve replacement index was minus 7%. The average life of the reserves was 6.8 years.
Fields operated directly by Ecopetrol, such as Rubiales and Chichimene, showed upward revisions of reserves due to good production performance and optimization of their conditions, among other factors. 95% of proven reserves are owned by Ecopetrol S.A., while Hocol, Ecopetrol America and the stakes in Equión and Savia Perú contributed 5%.
Table 14 – Proven Reserves - Ecopetrol Business Group
| A | | B | |
| Proven Reserves (1P) | | Oil Equivalent
(MMBOE) | |
| Proved Reserves as of Dec 31 of 2015 | | | 1,849 | |
| Production 2016 | | | -235 | |
| Hydrocarbon Price Effect | | | -202 | |
| Cost optimization, management and others | | | 186 | |
| Proved Reserves as of Dec 31 of 2016 | | | 1,598 | |
Table 15 – Gross Production* - Ecopetrol Group
| A | | B | | | C | | | D | | | E | | | F | | | G | |
| Mboed | | 4Q 2016 | | | 4Q 2015 | | | ∆ (%) | | | 2016 | | | 2015 | | | ∆ (%) | |
| Crude Oil | | | 549.8 | | | | 583.4 | | | | (5.8 | )% | | | 552.1 | | | | 586.2 | | | | (5.8 | )% |
| Natural Gas | | | 113.8 | | | | 123.9 | | | | (8.2 | )% | | | 116.0 | | | | 121.2 | | | | (4.3 | )% |
| Total Ecopetrol S.A. | | | 663.6 | | | | 707.3 | | | | (6.2 | )% | | | 668.1 | | | | 707.4 | | | | (5.6 | )% |
| | | | | | | | | | | | | | | | | | | | | | | | | |
| Crude Oil | | | 18.5 | | | | 22.4 | | | | (17.4 | )% | | | 18.0 | | | | 21.4 | | | | (15.9 | )% |
| Natural Gas | | | 1.1 | | | | 0.5 | | | | 120.0 | % | | | 0.8 | | | | 0.2 | | | | 300.0 | % |
| Total Hocol | | | 19.6 | | | | 22.9 | | | | (14.4 | )% | | | 18.8 | | | | 21.6 | | | | (13.0 | )% |
| | | | | | | | | | | | | | | | | | | | | | | | | |
| Crude Oil | | | 12.0 | | | | 12.6 | | | | (4.8 | )% | | | 12.4 | | | | 11.6 | | | | 6.9 | % |
| Natural Gas | | | 4.6 | | | | 9.4 | | | | (51.1 | )% | | | 6.5 | | | | 9.0 | | | | (27.8 | )% |
| Total Equion** | | | 16.6 | | | | 22.0 | | | | (24.5 | )% | | | 18.9 | | | | 20.6 | | | | (8.3 | )% |
| | | | | | | | | | | | | | | | | | | | | | | | | |
| Crude Oil | | | 4.3 | | | | 4.5 | | | | (4.4 | )% | | | 4.1 | | | | 4.8 | | | | (14.6 | )% |
| Natural Gas | | | 1.3 | | | | 1.2 | | | | 8.3 | % | | | 1.3 | | | | 1.2 | | | | 8.3 | % |
| Total Savia** | | | 5.6 | | | | 5.7 | | | | (1.8 | )% | | | 5.4 | | | | 6.0 | | | | (10.0 | )% |
| | | | | | | | | | | | | | | | | | | | | | | | | |
| Crude Oil | | | 9.4 | | | | 1.4 | | | | 571.4 | % | | | 5.5 | | | | 2.5 | | | | 120.0 | % |
| Natural Gas | | | 2.1 | | | | 2.0 | | | | 5.0 | % | | | 1.2 | | | | 2.6 | | | | (53.8 | )% |
| Total Ecopetrol America | | | 11.5 | | | | 3.4 | | | | 238.2 | % | | | 6.7 | | | | 5.1 | | | | 31.4 | % |
| | | | | | | | | | | | | | | | | | | | | | | | | |
| Crude Oil | | | 594.0 | | | | 624.3 | | | | (4.9 | )% | | | 592.1 | | | | 626.5 | | | | (5.5 | )% |
| Natural Gas | | | 122.9 | | | | 137.0 | | | | (10.3 | )% | | | 125.8 | | | | 134.2 | | | | (6.3 | )% |
| Total Group's Production | | | 717 | | | | 761 | | | | (5.8 | )% | | | 718 | | | | 761 | | | | (5.6 | )% |
*Gross production includes royalties and is prorated by Ecopetrol’s participation in each company.
**Equion and Savia are not consolidated in the Ecopetrol Group.
Note: natural gas production includes white products.
In the final quarter of 2016, the business group’s production fell some 5.8% versus the same quarter the previous year, to 717 mboed. The reduction is explained primarily by: i) the remaining effects of the rationalization of drilling activity due to lower investment because of falling oil prices; ii) operating maintenance in the last quarter; and iii) the impact of lower sales and scheduled maintenance in the gas fields. At our subsidiaries, fourth-quarter production remained steady compared to the same period the previous year, with a decline of less than 1 mboed.
Similarly, the business group’s average production in 2016 was on the order of 718 mboed, three mboed above the target of 715 mboed set for 2016. Compared to 2015, it was down 5.6% (43 mboed). Ecopetrol S.A.’s lower production may be explained largely by the effects of the slowdown on investment during the first half of the year, reflected in the natural decline of the fields. This was offset by our receiving of 100% from the Rubiales field and our increased stake in the Cusiana field. In the second half of 2016, investments were approved and developed that reduced the decline in some of the assets and improved production in the last two quarters of the year, compared to the second quarter, by some 20 mboed. We note that the Castilla field posted a reduction in its production of only 1%, thanks to maintenance of the investments in that field over the entire year.
Average production performance in 2016 fell by 6.6% versus the average for 2015. The reasons for this decline were primarily the temporary closure of Hocol’s Ocelote field in March and termination of the Tauramena joint venture agreement in the Cusiana field, which affected Equión’s production; all this was partially offset by the commissioning of Ecopetrol America’s Gunflint in the second half of the year.
Table 16 – Net Production* - Ecopetrol Group**
| A | | B | | | C | | | D | | | E | | | F | | | G | |
| mboed | | 4Q 2016 | | | 4Q 2015 | | | ∆ (%) | | | 2016 | | | 2015 | | | ∆ (%) | |
| Crude Oil | | | 498.5 | | | | 538.3 | | | | (7.4 | )% | | | 503.0 | | | | 540.4 | | | | (6.9 | )% |
| Natural Gas*** | | | 94.5 | | | | 116.0 | | | | (18.5 | )% | | | 97.7 | | | | 113.0 | | | | (13.5 | )% |
| Total | | | 593.0 | | | | 654.3 | | | | (9.4 | )% | | | 600.7 | | | | 653.4 | | | | (8.1 | )% |
*Net production does not include royalties and is prorated by Ecopetrol’s participation in each company.
**Equión and Savia are not consolidated in the Ecopetrol Group. 2015 figures for Equion were adjusted to remove partner´s production.
***Gas production includes white products.
Projects to increase the Recovery Factor:
Ecopetrol currently has 18 active pilots and one in development, to increase the recovery factor, 63% of which are operated directly while the others remain operated by partners. In 2016, 12 showed production increases, with a total of 1.65 million barrels of oil between 2015 and 2016. The company also has 13 projects that have completed their pilot phase, and is working on structuring the business cases for three expansions of water injection and improved water.
Table 17 – Gross Average Production by Region – Ecopetrol Group Participation
| A | | B | | | C | | | D | | | E | | | F | | | G | |
| mboed | | 4Q 2016 | | | 4Q 2015 | | | ∆ (%) | | | 2016 | | | 2015 | | | ∆ (%) | |
| La Cira-Infantas | | | 20.5 | | | | 21.7 | | | | (5.5 | )% | | | 19.3 | | | | 23.0 | | | | (16.1 | )% |
| Casabe | | | 16.2 | | | | 20.3 | | | | (20.2 | )% | | | 17.8 | | | | 21.9 | | | | (18.7 | )% |
| Yarigui | | | 16.0 | | | | 19.7 | | | | (18.8 | )% | | | 17.2 | | | | 18.4 | | | | (6.5 | )% |
| Other | | | 31.4 | | | | 36.3 | | | | (13.5 | )% | | | 32.3 | | | | 34.5 | | | | (6.4 | )% |
| Total Central Region | | | 84.1 | | | | 98.0 | | | | (14.2 | )% | | | 86.6 | | | | 97.8 | | | | (11.5 | )% |
| | | | �� | | | | | | | | | | | | | | | | | | | | | |
| Castilla | | | 115.7 | | | | 126.0 | | | | (8.2 | )% | | | 121.3 | | | | 122.5 | | | | (1.0 | )% |
| Chichimene | | | 71.3 | | | | 76.6 | | | | (6.9 | )% | | | 74.0 | | | | 78.0 | | | | (5.1 | )% |
| Cupiagua | | | 36.6 | | | | 41.8 | | | | (12.4 | )% | | | 40.0 | | | | 38.1 | | | | 5.0 | % |
| Cusiana (2) | | | 39.3 | | | | 0.0 | | | | N/A | | | | 19.3 | | | | 0.0 | | | | N/A | |
| Other (3) | | | 16.1 | | | | 19.7 | | | | (18.3 | )% | | | 16.5 | | | | 22.2 | | | | (25.7 | )% |
| Total Orinoquía Region | | | 279.0 | | | | 264.1 | | | | 5.6 | % | | | 271.1 | | | | 260.8 | | | | 3.9 | % |
| | | | | | | | | | | | | | | | | | | | | | | | | |
| Huila Area (4) | | | 3.4 | | | | 8.5 | | | | (60.0 | )% | | | 3.4 | | | | 8.7 | | | | (60.9 | )% |
| San Francisco Area | | | 6.1 | | | | 7.6 | | | | (19.7 | )% | | | 6.6 | | | | 8.1 | | | | (18.5 | )% |
| Tello Area | | | 4.4 | | | | 4.8 | | | | (8.3 | )% | | | 4.7 | | | | 4.9 | | | | (4.1 | )% |
| Other | | | 13.7 | | | | 10.4 | | | | 31.7 | % | | | 14.1 | | | | 11.0 | | | | 28.2 | % |
| Total South Region | | | 27.6 | | | | 31.3 | | | | (11.8 | )% | | | 28.8 | | | | 32.6 | | | | (11.7 | )% |
| | | | | | | | | | | | | | | | | | | | | | | | | |
| Rubiales (1) | | | 117.3 | | | | 0.0 | | | | N/A | | | | 61.5 | | | | 0.0 | | | | N/A | |
| Caño Sur (3) | | | 1.0 | | | | 0.0 | | | | N/A | | | | 0.4 | | | | 0.0 | | | | N/A | |
| Total East Region | | | 118.3 | | | | 0.0 | | | | N/A | | | | 61.9 | | | | 0.0 | | | | N/A | |
| | | | | | | | | | | | | | | | | | | | | | | | | |
| Rubiales (1) | | | 0.0 | | | | 94.6 | | | | (100.0 | )% | | | 41.4 | | | | 94.3 | | | | (56.1 | )% |
| Cusiana (2) | | | 0.0 | | | | 31.3 | | | | (100.0 | )% | | | 15.2 | | | | 32.2 | | | | (52.8 | )% |
| Guajira | | | 29.5 | | | | 39.6 | | | | (25.5 | )% | | | 33.3 | | | | 42.7 | | | | (22.0 | )% |
| Caño Limón | | | 23.4 | | | | 28.0 | | | | (16.4 | )% | | | 23.3 | | | | 25.6 | | | | (9.0 | )% |
| Piedemonte | | | 29.8 | | | | 31.6 | | | | (5.7 | )% | | | 30.4 | | | | 29.0 | | | | 4.8 | % |
| Quifa | | | 17.3 | | | | 23.4 | | | | (26.1 | )% | | | 19.6 | | | | 24.2 | | | | (19.0 | )% |
| Nare | | | 14.7 | | | | 17.5 | | | | (16.0 | )% | | | 15.9 | | | | 18.0 | | | | (11.7 | )% |
| Other | | | 39.9 | | | | 47.9 | | | | (16.7 | )% | | | 40.6 | | | | 50.2 | | | | (19.1 | )% |
| Total Associated Operations* | | | 154.6 | | | | 313.9 | | | | (50.7 | )% | | | 219.7 | | | | 316.2 | | | | (30.5 | )% |
| | | | | | | | | | | | | | | | | | | | | | | | | |
| Total Ecopetrol S.A. | | | 663.6 | | | | 707.3 | | | | (6.2 | )% | | | 668.1 | | | | 707.4 | | | | (5.6 | )% |
| | | | | | | | | | | | | | | | | | | | | | | | | |
| Direct Operation | | | 512.2 | | | | 397.1 | | | | 29.0 | % | | | 451.6 | | | | 395.6 | | | | 14.2 | % |
| Associated Operation | | | 151.4 | | | | 310.2 | | | | (51.2 | )% | | | 216.5 | | | | 311.7 | | | | (30.5 | )% |
| | | | | | | | | | | | | | | | | | | | | | | | | |
| Ocelote | | | 11.4 | | | | 15.0 | | | | (24.0 | )% | | | 11.2 | | | | 14.4 | | | | (22.2 | )% |
| Other | | | 8.2 | | | | 7.9 | | | | 3.8 | % | | | 7.6 | | | | 7.2 | | | | 5.6 | % |
| Total Hocol | | | 19.6 | | | | 22.9 | | | | (14.4 | )% | | | 18.8 | | | | 21.6 | | | | (13.0 | )% |
| | | | | | | | | | | | | | | | | | | | | | | | | |
| Piedemonte | | | 15.1 | | | | 16.0 | | | | (5.6 | )% | | | 15.4 | | | | 14.7 | | | | 4.8 | % |
| Tauramena/Rio Chitamena | | | 0.3 | | | | 3.5 | | | | (91.4 | )% | | | 2.3 | | | | 4.2 | | | | (45.2 | )% |
| Other | | | 1.2 | | | | 2.5 | | | | (52.0 | )% | | | 1.2 | | | | 1.7 | | | | (29.4 | )% |
| Total Equión** | | | 16.6 | | | | 22.0 | | | | (24.5 | )% | | | 18.9 | | | | 20.6 | | | | (8.3 | )% |
| | | | | | | | | | | | | | | | | | | | | | | | | |
| Lobitos | | | 2.7 | | | | 2.2 | | | | 22.7 | % | | | 2.3 | | | | 2.5 | | | | (8.0 | )% |
| Peña Negra | | | 1.8 | | | | 2.3 | | | | (21.7 | )% | | | 2.0 | | | | 2.3 | | | | (13.0 | )% |
| Other | | | 1.1 | | | | 1.2 | | | | (8.3 | )% | | | 1.1 | | | | 1.2 | | | | (8.3 | )% |
| Total Savia** | | | 5.6 | | | | 5.7 | | | | (1.8 | )% | | | 5.4 | | | | 6.0 | | | | (10.0 | )% |
| | | | | | | | | | | | | | | | | | | | | | | | | |
| Dalmatian | | | 1.5 | | | | 2.8 | | | | (46.4 | )% | | | 1.5 | | | | 4.0 | | | | (62.5 | )% |
| K2 | | | 1.9 | | | | 0.6 | | | | 216.7 | % | | | 1.8 | | | | 1.1 | | | | 63.6 | % |
| Gunflint | | | 8.1 | | | | 0.0 | | | | N/A | | | | 3.4 | | | | 0.0 | | | | N/A | |
| Total Ecopetrol America Inc. | | | 11.5 | | | | 3.4 | | | | 238.2 | % | | | 6.7 | | | | 5.1 | | | | 31.4 | % |
| | | | | | | | | | | | | | | | | | | | | | | | | |
| Total Affiliates | | | 53.3 | | | | 54.0 | | | | (1.3 | )% | | | 49.8 | | | | 53.3 | | | | (6.6 | )% |
| | | | | | | | | | | | | | | | | | | | | | | | | |
| Total Group's Production | | | 717 | | | | 761 | | | | (5.8 | )% | | | 718 | | | | 761 | | | | (5.6 | )% |
*The fields previously classified as Minor Assets belong to the Vice Presidency of Assets with Partners, regardless of the operation type.
**Equión and Savia are not consolidated in the Ecopetrol Group.
(1) Rubiales: This field belonged to the Vice Presidency of Assets with Partners until the close of the first semester of 2016. As of July 1, it belongs to the new Regional Vice Presidency of Oriente.
(2) Cusiana: This field belonged to the Vice Presidency of Assets with Partners until June 30, 2016. Thereafter, it belongs to the new Regional Vice Presidency of Orinoquia.
(3) Caño Sur: This field belonged to the Regional Vice Presidency of Orinoquia until June 30, 2016. Thereafter, it belongs to the new Regional Vice Presidency of Oriente.
(4) Huila: Some of its assets were administratively reclassified and are now reported as part of other fields at the Regional South Vice Presidency.
Table 18 – Gross Production - Ecopetrol Group (By type of Crude)
| A | | B | | | C | | | D | | | E | | | F | | | G | |
| mbod | | 4Q 2016 | | | 4Q 2015 | | | ∆ (%) | | | 2016 | | | 2015 | | | ∆ (%) | |
| Light | | | 69.3 | | | | 65.1 | | | | 6.5 | % | | | 66.6 | | | | 63.5 | | | | 4.9 | % |
| Medium | | | 175.1 | | | | 206.3 | | | | (15.1 | )% | | | 179.5 | | | | 208.5 | | | | (13.9 | )% |
| Heavy | | | 349.6 | | | | 352.9 | | | | (0.9 | )% | | | 346.0 | | | | 354.5 | | | | (2.4 | )% |
| Total | | | 594.0 | | | | 624.3 | | | | (4.9 | )% | | | 592.1 | | | | 626.5 | | | | (5.5 | )% |
Lifting Cost of the Group
Table 19 – Lifting Cost - Ecopetrol Group
| A | | B | | | C | | | D | | | E | |
| USD/Bl | | 4Q 2016 | | | 4Q 2015 | | | 2016 | | | 2015 | |
| Lifting Cost | | | 8.63 | | | | 7.67 | | | | 6.49 | | | | 7.39 | |
The lifting cost per barrel produced in 2016, not counting royalties, yielded a result of USD 6.49/Bl, down from the year 2015 (USD 7.39/Bl) by 12.2%, the net effect of which may be explained by the following:
| · | Volume effect (+USD 0.38/Bl): Due to lower production volumes during 2016. |
| · | Cost effect: (-USD 0.56/Bl): Due to the effect of strategies for cost optimization and increased efficiencies: |
| o | Sub-Soil Maintenance: Fewer services due to equipment failure, re-use of equipment for electro-submersible pumping, reduced maintenance and well-monitoring crews, renegotiation of sub-soil maintenance fees and reduced well intervention times. |
| o | Surface Maintenance: Renegotiation of maintenance framework contract fees, cost reduction due to adjustment of the reliability strategy, extension of equipment inspection periods depending on condition, reduction in administrative fees and prioritization of interventions. |
| o | Energy: Reduced fees, reduced generation using liquid fuels (Diesel – Fuel Oil No. 4) and increased efficiency due to commissioning of self-generation facilities and higher electrical reliability. |
| o | Fluids Treatment: Fewer chemicals applied due to increased efficiency in the fluids treatment process; reduced production, transportation and disposal of oily residue; and reduced contracting, inspection, repair fees due to contract renegotiations. |
| · | Exchange rate effect (-USD 0.72/Bl): Due to the effect of a higher exchange rate, which increased by COP 308/USD (COP 3,051/USD in 2016 vs COP 2,743/USD in 2015). |
The lifting cost per barrel produced in the fourth quarter of 2016, not counting royalties, yielded a result of USD 8.63/Bl, which when compared to the final quarter of 2015 (USD 7.67/Bl) was up 12.5%, the net effect of which is explained by the following:
| · | Volume effect (+USD 0.61/Bl): As a consequence of lower production volumes. |
| · | Cost effect (+USD 0.23/Bl): Due to the effect of greater seasonal cost and expenses during the quarter. |
| · | Exchange rate effect (+USD 0.12/Bl): Due to the effect of a lower exchange rate, which fell in COP 44/USD (COP 3,015/USD in 4Q 2016 vs COP 3,059/USD in 4Q 2015). |
The dollar share in the lifting cost was 14%.
Table 20 – Volumes Transported
| A | | B | | | C | | | D | | | E | | | F | | | G | |
| mbod | | 4Q 2016 | | | 4Q 2015 | | | ∆ (%) | | | 2016 | | | 2015 | | | ∆ (%) | |
| Crude | | | 828.2 | | | | 963.9 | | | | (14.1 | )% | | | 867.0 | | | | 978.0 | | | | (11.3 | )% |
| Refined Products | | | 263.5 | | | | 264.5 | | | | (0.4 | )% | | | 263.1 | | | | 253.8 | | | | 3.7 | % |
| Total | | | 1,091.7 | | | | 1,228.4 | | | | (11.1 | )% | | | 1,130.1 | | | | 1,231.8 | | | | (8.3 | )% |
Note: The transported volumes correspond to companies of the Ecopetrol Group and to third parties.
The volumes of crude transported through the main systems of Cenit S.A.S. and its subsidiaries in the fourth quarter of 2016 fell 14.1% from the same quarter the previous year, due to the country’s lower crude production volume. Of the total volume of crude transported by oil pipelines, approximately 67% corresponds to crude owned by Ecopetrol.
In 2016, the volume of crude transported fell by 11.3% compared to the previous year, which was also due to the country’s lower crude production volume.
As for refined products, the volumes transported by Cenit S.A.S. in the fourth quarter of the year fell by 0.4% versus the same period last year, due to lower use of the Buenaventura-Yumbo and Cartagena-Barranquilla systems, which were used for fuel imports in the last quarter of 2015. There was a similar decline in the Galán-Bucaramanga system, which in 2015 was used to supply fuels to the border region with Venezuela. Of the total volume of products transported by multipurpose pipelines, some 19% corresponded to products owned by Ecopetrol.
In 2016, the volume of refined products transported rose by 3.7% over 2015, due primarily to the large volumes transported on the Galán-Sebastopol system to meet the demand for fuel in the country’s interior and the start-up of Reficar.
Project progress during 2016:
| · | SAN FERNANDO – MONTERREY: Progress was achieved on construction of the San Fernando station, especially with regard to assembly of the pumping system units. It culminated in construction of the lines between San Fernando and Apiay, and the branch lines between San Fernando and the Castilla and Chichimene stations. The filling of tanks to initiate the system commissioning tests is expected to begin in 1Q 2017. |
| · | HIGHER-VISCOSITY CRUDE TRANSPORT INITIATIVE: In 2016 crude was transported at viscosities greater than 405 cSt on the principal systems, and particularly in Ocensa since the 4Q 2016 the ability has existed to transport crudes at viscosities of up to 600 cSt. Adaptations were also made to one of the single buoy moorings of the Coveñas terminal to permit the importation of naphtha for dilution at this terminal. Integral capacity tests are scheduled to be executed in 1Q 2017 for the transport of crude with this viscosity, and transport will begin in 2Q 2017. |
| · | OCENSA P135: Late in 4Q 2016, Ocensa notified dispatchers the project completion, pending the closure of some activities that do not compromise operations. For project operations and capacity commissioning, measures are being taken with the Ministry of Mines and Energy to issue the order to initiate operations, which are scheduled for 2Q 2017. |
Cost per Barrel Transported
Table 21 – Cost per Barrel Transported - Ecopetrol Business Group
| A | | B | | | C | | | D | | | E | |
| USD/Bl | | 4Q 2016 | | | 4Q 2015 | | | 2016 | | | 2015 | |
| Cost per Barrel Transported | | | 2.43 | | | | 1.88 | | | | 3.31 | | | | 3.37 | |
The cost per barrel transported in 2016 was USD 3.31/Bl, which compared to the result in 2015 (USD 3.37/Bl) shows a reduction of 1.8%, which may be explained by the following:
| · | Volume effect (+USD 0.30/Bl): Due to lower volumes transported as a result of lower volumes produced. |
| · | Cost effect (+USD 0.02/Bl): Higher maintenance costs. |
| · | Exchange rate effect (-USD 0.38/Bl): Due to the effect of a higher exchange rate, which increased by COP 308/USD (COP 3,051/USD in 2016 vs COP 2,743/USD in 2015). |
The indicator of cost per barrel transported for the fourth quarter of 2016 was USD 2.43/Bl, which when compared to the results for the same period of 2015 (USD 1.88/Bl) shows an increase of 29.3% explained mainly by:
| · | Volume effect (+USD 0.29/Bl): Due to lower volumes transported as a result of lower volumes produced |
| · | Cost effect (+USD 0.23/Bl): Due to the effect of greater seasonal cost and expenditures during the quarter. |
| · | Exchange rate effect (+USD 0.03/Bl): Due to the effect of a lower exchange rate, which fell in COP 44/USD (COP 3,015/USD in 4Q 2016 vs COP 3,059/USD in 4Q 2015). |
The dollar share of the cost per barrel transported was 10%.
Cartagena Refinery:
July 2016 saw completion of the startup of all units of the complex, with the commissioning of the alkylation unit, thus advancing to the start of the stabilization phase, which is believed will end in the second half of 2017 with the global performance testing.
As the stabilization process has advanced, the process units have been closing their gaps vis-à-vis design, identifying the limits of each. To this end, acceptance and performance tests have been carried out, showing progress of 62%, i.e., tests have been completed on 21 of the 34 units of the new refinery. One of the pending units is the alkylation unit, which had problems associated with the cooling water system, because of which it was necessary to suspend operations since last October. This unit is expected to be in operation in 2Q 2017.
During the startup process, the Cartagena refinery gradually increased its load, achieving an average of 109 mbd in the period from January to July 2016. Now in the stabilization and performance testing phase (August-December), the refinery achieved an average load of 128 mbd, and in December it recorded an average of 144 mbd. After completion of the stabilization and performance testing stage, the refinery will be operating at optimal load levels.
In terms of gross refining margin, the refinery advanced from an average of some USD 3/Bl between January and July, to around USD 9/Bl in the stabilization and performance testing period (August-December), with expectations that in 2017 the margin will be in line with the market trend for highly complex refineries.
In 2016, Reficar’s volume of local sales was 50.7 mbd (including sales to Group companies), 23% more than in 2015 (41.1 mbd). This growth is largely due to sales of: i) diesel, jet fuel, kerosene and regular gasoline; and ii) petrochemicals such as sulfur, light cycle oil, arotar and propylene, which were not sold in 2015.
During the course of the year 81 mbd were exported, including 27.3 mbd of diesel, 20.9 mbd of naphtha and gasolines, 16.6 mbd of fuel oil, 8.8 mbd of coke and 7.4 mbd of other (gas-oil, butane, light cycle oil, etc.). To loading the refinery, 60.1 mbd of crude were imported, and 58.9 mbd purchased on the domestic market, mostly supplied by Ecopetrol. 22.8 mbd of products were also imported.
Barrancabermeja Refinery:
Table 22 – Load, Use Factor and Production – Barrancabermeja Refinery
| A | | B | | | C | | | D | | | E | | | F | | | G | |
| | | 4Q 2016 | | | 4Q 2015 | | | ∆ (%) | | | 2016 | | | 2015 | | | ∆ (%) | |
| Refinery runs* (mbod) | | | 208.7 | | | | 229.0 | | | | (8.9 | )% | | | 213.1 | | | | 221.9 | | | | (4.0 | )% |
| Utilization factor (%) | | | 75.4 | % | | | 81.0 | % | | | (6.9 | )% | | | 75.4 | % | | | 79.6 | % | | | (5.3 | )% |
| Production (mboed) | | | 209.3 | | | | 230.2 | | | | (9.1 | )% | | | 214.2 | | | | 223.2 | | | | (4.0 | )% |
*Corresponds to volumes actually loaded, not to those received.
When comparing the fourth quarter of 2016 versus the same period of 2015, both the crude load and the use factor and production of refined products decreased, due to the fact that this period of 2016 saw the scheduled maintenance of the U-2100 crude unit. In 2016 the same indicators fell versus 2015 largely due to the higher composition of heavy crudes in the processed crude diet and the scheduled maintenance of the U-2100 crude unit.
Costs and margins of the Refining segment
Table 23 – Refining Cash Cost - Ecopetrol Business Group
| A | | B | | | C | | | D | | | E | |
| USD/Bl | | 4Q 2016 | | | 4Q 2015 | | | 2016 | | | 2015 | |
| Refining Operating Cash Cost | | | 4.09 | | | | 4.00 | | | | 4.11 | | | | 4.37 | |
The cash operating cost of the refining segment for 2016 was USD 4.11/Bl, down 5.9% from 2015 (USD 4.37/Bl), for the following reasons:
| · | Volume effect (+USD 0.14/Bl): Higher costs associated with a lower load, due to an increase of heavy crudes in the feedstock. However, Propilco maintained higher production and sales volumes in 2016 versus 2015. |
| · | Cost effect (+USD 0.06/Bl): i) lower fixed costs associated with optimization strategies for maintenance, operating costs and support services, ii) lower consumption of industrial services and optimization of power generation fees through efficient performance of industrial services, and iii) lower gas consumption due to technical-economic dispatch efficiency. |
| · | Exchange rate effect (-USD 0.46/Bl): Due to the effect of a higher exchange rate, which increased by COP 308/USD (COP 3,051/USD in 2016 vs COP 2,743/USD in 2015). |
The cash operating cost for the refining segment in the fourth quarter of 2016 was USD 4.09/Bl, which was up 2.2% over the same period in 2015 (USD 4.00/Bl), due to the following:
| · | Volume effect (+USD 0.40/Bl): Higher costs associated with a lower load due to the shutdown of a crude unit at Barrancabermeja and the change in feedstock due to a higher composition of heavy crudes. |
| · | Cost effect (-USD 0.37/Bl): The ongoing trend of lower fixed costs remains due to: i) optimization strategies, ii) lower gas consumption, and iii) lower costs due to improved contracts and consumption of quantities required to operate, despite the seasonal cost and expenditures execution in the last quarter of the year. |
| · | Exchange rate effect (+USD 0.06/Bl): Due to the effect of a lower exchange rate, which fell in COP 44/USD (COP 3,015/USD in 4Q 2016 vs COP 3,059/USD in 4Q 2015). |
The dollar share corresponding to the cash cost of the refining segment was 19%.
Table 24 – Refining Margin – Barrancabermeja Refinery
| A | | B | | | C | | | D | | | E | | | F | | | G | |
| USD/Bl | | 4Q 2016 | | | 4Q 2015 | | | ∆ (%) | | | 2016 | | | 2015 | | | ∆ (%) | |
| Refining Margin | | | 14.8 | | | | 15.0 | | | | (1.3 | )% | | | 14.0 | | | | 16.8 | | | | (16.7 | )% |
The reduction in the Barrancabermeja gross refining margin between the fourth quarter of 2016 and the fourth quarter of 2015 corresponds primarily to a more expensive feedstock in the last quarter of 2016, as a result of higher international crude prices.
In 2016, the margin declined vs 2015 primarily due to lower spreads in product prices versus crude, in line with the behavior of international markets. This impact was mitigated by: i) higher yields from medium distillates, ii) higher polyethylene production, and iii) lower fuel oil production. These was possible due to the implementation of operating initiatives to add value to intermediate streams.
| III. | Organizational Consolidation, Corporate Responsibility and Corporate Governance (Ecopetrol S.A.) |
Table 25 – HSE Performance (Health, Safety and Environment)
| A | | B | | | C | | | D | | | E | |
| HSE Index* | | 4Q 2016 | | | 4Q 2015 | | | 2016 | | | 2015 | |
| Accident Frequency Index (accidents per million labor hours) | | | 0.51 | | | | 0.50 | | | | 0.48 | | | | 0.49 | |
| Environmental Incidents | | | 3 | | | | 5 | | | | 8 | | | | 11 | |
*The results of the indicators are subject to change after quarter-end given that some of the accidents and incidents are reclassified according to the final result of the analyses.
Milestones:
| · | A 27% reduction in environmental incidents compared to 2015. |
| · | The performance of the Total Recordable Frequency Index in 2016 (1.09) allows the Company to maintain within the world´s oil & gas industry average. |
In 2016 the new corporate stakeholders’ management strategy of Ecopetrol was launched. It seeks to contribute to the Colombian peace agreement, and the development of safe and peaceful conditions in the regions where the company has traditionally operated. This strategy also aims at the creation of prosperity and shared value in the areas of influence of our operations. Ecopetrol considers peace, local prosperity and shared value as fundamental and strategic components for our growth strategy.
The significant reduction of alarms and social conflicts (40%) related to our operations observed in 2016 in relation to 2015, is an indication of the effectiveness of the newly adopted stakeholders’ management strategy. Strict technical and administrative procedures were adopted during 2016 to improve the quality and pertinence of our social and environmental voluntary investments. Our relations with local communities have evolved towards relations based on mutual trust. In addition, the capacity of our regional teams responsible for the stakeholders’ management was strengthened.
| b. | Corporate Responsibility |
Social Investment:
During 2016, resources for social investments were deployed in the amount of COP 14,855 million, allocated as follows: COP 7,308 million for health and education programs, COP 4,079 million for sustainable projects, COP 1,849 million in infrastructure and COP 1,619 million for institutional development.
| IV. | Discussion of Quarterly Results |
Ecopetrol Management will host two online presentations to review and discuss the fourth quarter and full year 2016 results:
| Spanish | English |
| March 6, 2017 | March 6, 2017 |
| 8:30 a.m. Bogota | 10:00 a.m. Bogota |
| 8:30 a.m. New York | 10:00 a.m. New York |
The webcast will be available on the Ecopetrol website:www.ecopetrol.com.co.
Please make sure that your browser supports ordinary online presentations. We recommend the latest versions of Internet Explorer, Google Chrome and Mozilla Firefox.
Forward-looking Statements
This release may contain forward-looking statements related to the business prospects, estimates of operating and financial results, and growth forecasts for Ecopetrol. These are projections, and, as such, are based solely on the expectations of management with regard to the Company’s future and continuous access to capital to finance the company’s business plan. Such forward-looking statements depend essentially on changes in market conditions such as government regulations, competitive pressures, and the performance of the Colombian economy and industry, among other factors. Therefore, they are subject to change without prior notice.
Contact Information:
Head of Corporate Finance and Investor Relations
María Catalina Escobar
Tel.: +571-234-5190
E-mail:investors@ecopetrol.com.co
Media Relations (Colombia)
Jorge Mauricio Tellez
Tel.: + 571-234-4329
Fax: +571-234-4480
E-mail:mauricio.tellez@ecopetrol.com.co
| V. | Ecopetrol Group Exhibits |
Table 1 – Domestic Purchases and Imports – Ecopetrol Group
| A | | B | | | C | | | D | | | E | | | F | | | G | |
| Local Purchases (mboed) | | 4Q 2016 | | | 4Q 2015 | | | ∆ (%) | | | 2016 | | | 2015 | | | ∆ (%) | |
| Crude Oil | | | 155.5 | | | | 157.9 | | | | (1.5 | )% | | | 159.3 | | | | 167.8 | | | | (5.1 | )% |
| Natural Gas | | | 2.7 | | | | 1.8 | | | | 50.0 | % | | | 2.2 | | | | 1.8 | | | | 22.2 | % |
| Refined Products | | | 3.9 | | | | 11.4 | | | | (65.8 | )% | | | 4.7 | | | | 5.8 | | | | (19.0 | )% |
| Diluent | | | 2.1 | | | | 3.2 | | | | (34.4 | )% | | | 0.7 | | | | 1.9 | | | | (63.2 | )% |
| Total | | | 164.2 | | | | 174.3 | | | | (5.8 | )% | | | 166.9 | | | | 177.3 | | | | (5.9 | )% |
| Imports (mboed) | | 4Q 2016 | | | 4Q 2015 | | | ∆ (%) | | | 2016 | | | 2015 | | | ∆ (%) | |
| Crude Oil | | | 73.9 | | | | 14.4 | | | | 413.2 | % | | | 60.1 | | | | 4.9 | | | | 1,126.5 | % |
| Refined Products | | | 89.2 | | | | 159.1 | | | | (43.9 | )% | | | 101.5 | | | | 137.2 | | | | (26.0 | )% |
| Diluent | | | 61.2 | | | | 75.7 | | | | (19.2 | )% | | | 56.6 | | | | 64.6 | | | | (12.4 | )% |
| Total | | | 224.3 | | | | 249.2 | | | | (10.0 | )% | | | 218.2 | | | | 206.7 | | | | 5.6 | % |
* Includes purchases of royalties and purchases from third parties.
** The 2015 figures present a trade-off between imports of Refined products and Diluent products due to internal reclassification of products.
Table 2 –Statement of Profit or Loss – Ecopetrol Group
| A | | B | | | C | | | D | | | E | |
| COP Billion | | 4Q 2016* | | | 4Q 2015* | | | 2016* | | | 2015* | |
| Revenue | | | | | | | | | | | | | | | | |
| Local Sales | | | 6,550 | | | | 7,115 | | | | 24,745 | | | | 26,068 | |
| Export Sales | | | 6,763 | | | | 5,662 | | | | 22,987 | | | | 26,023 | |
| Total Revenue | | | 13,313 | | | | 12,777 | | | | 47,732 | | | | 52,091 | |
| Cost of Sales | | | | | | | | | | | | | | | | |
| Variable Costs | | | 7,093 | | | | 7,157 | | | | 24,945 | | | | 27,369 | |
| Imported products | | | 3,395 | | | | 3,629 | | | | 12,049 | | | | 12,936 | |
| Purchase of Hydrocarbons | | | 1,610 | | | | 1,455 | | | | 5,215 | | | | 6,373 | |
| Depreciation, Amortization and Depletion | | | 1,520 | | | | 1,398 | | | | 5,319 | | | | 5,166 | |
| Hydrocarbon Transportation Services | | | 148 | | | | 409 | | | | 783 | | | | 1,381 | |
| Inventories and others | | | 420 | | | | 266 | | | | 1,579 | | | | 1,513 | |
| Fixed Costs | | | 2,612 | | | | 2,799 | | | | 9,291 | | | | 9,626 | |
| Depreciation | | | 353 | | | | 402 | | | | 2,051 | | | | 1,433 | |
| Contracted Services | | | 721 | | | | 810 | | | | 2,344 | | | | 2,717 | |
| Maintenance | | | 636 | | | | 822 | | | | 1,998 | | | | 2,334 | |
| Labor Costs | | | 473 | | | | 377 | | | | 1,572 | | | | 1,543 | |
| Other | | | 429 | | | | 388 | | | | 1,326 | | | | 1,599 | |
| Total Cost of Sales | | | 9,705 | | | | 9,956 | | | | 34,236 | | | | 36,995 | |
| Gross Income | | | 3,608 | | | | 2,821 | | | | 13,496 | | | | 15,096 | |
| Operating Expenses | | | 1,193 | | | | 1,855 | | | | 4,401 | | | | 5,356 | |
| Administration expenses | | | 900 | | | | 864 | | | | 3,673 | | | | 3,772 | |
| Exploration and Projects expenses | | | 293 | | | | 991 | | | | 728 | | | | 1,584 | |
| Impairment | | | 782 | | | | 8,267 | | | | 842 | | | | 8,284 | |
| Operating Income | | | 1,633 | | | | (7,301 | ) | | | 8,253 | | | | 1,456 | |
| Finance result, net | | | 221 | | | | (964 | ) | | | (1,183 | ) | | | (3,967 | ) |
| Foreign exchange, net | | | 138 | | | | (198 | ) | | | 968 | | | | (1,870 | ) |
| Interest, net | | | (588 | ) | | | (683 | ) | | | (2,378 | ) | | | (1,592 | ) |
| Financial Income (Loss) | | | 671 | | | | (83 | ) | | | 227 | | | | (505 | ) |
| Share of profit of companies | | | (24 | ) | | | 24 | | | | (10 | ) | | | 35 | |
| Income before income tax | | | 1,830 | | | | (8,241 | ) | | | 7,060 | | | | (2,476 | ) |
| Income Tax | | | (1,472 | ) | | | 2,220 | | | | (4,656 | ) | | | (607 | ) |
| Net Income Consolidated | | | 358 | | | | (6,021 | ) | | | 2,404 | | | | (3,083 | ) |
| Non-controlling interest | | | (172 | ) | | | (287 | ) | | | (839 | ) | | | (905 | ) |
| Net income attributable to Owners of Ecopetrol | | | 186 | | | | (6,308 | ) | | | 1,565 | | | | (3,988 | ) |
| | | | | | | | | | | | | | | | | |
| EBITDA | | | 4,474 | | | | 3,083 | | | | 18,018 | | | | 18,087 | |
| EBITDA Margin | | | 33.6 | % | | | 24.1 | % | | | 37.7 | % | | | 34.7 | % |
*Unaudited Information.
Some figures shown in prior periods were reclassified for comparison purposes.
Table 3 – Consolidated Statement of Financial Position – Ecopetrol Group
| A | | B | | | C | | | D | |
| COP Billion | | 2016 | | | 2015 | | | ∆ (%) | |
| Current assets | | | | | | | | | | | | |
| Cash and cash equivalents | | | 8,410 | | | | 6,550 | | | | 28.4 | % |
| Trade and other receivables | | | 4,212 | | | | 3,427 | | | | 22.9 | % |
| Inventories | | | 3,842 | | | | 3,058 | | | | 25.6 | % |
| Current tax assets | | | 1,129 | | | | 4,502 | | | | -74.9 | % |
| Financial assets held for sale | | | 52 | | | | 913 | | | | -94.3 | % |
| Other financial assets | | | 5,316 | | | | 330 | | | | 1510.9 | % |
| Other assets | | | 1,036 | | | | 1,090 | | | | -5.0 | % |
| | | | 23,997 | | | | 19,870 | | | | 20.8 | % |
| Non-current assets held for sale | | | 132 | | | | 243 | | | | -45.7 | % |
| Total current assets | | | 24,129 | | | | 20,113 | | | | 20.0 | % |
| | | | | | | | | | | | | |
| Non-current assets | | | | | | | | | | | | |
| Investments in associates and joint ventures | | | 1,553 | | | | 1,932 | | | | -19.6 | % |
| Trade and other receivables | | | 730 | | | | 585 | | | | 24.8 | % |
| Property, plant and equipment | | | 62,269 | | | | 65,031 | | | | -4.2 | % |
| Natural and environmental resources | | | 22,341 | | | | 24,044 | | | | -7.1 | % |
| Intangibles | | | 272 | | | | 388 | | | | -29.9 | % |
| Deferred tax assets | | | 6,896 | | | | 7,962 | | | | -13.4 | % |
| Other financial assets | | | 1,746 | | | | 1,686 | | | | 3.6 | % |
| Other non-current assets | | | 1,371 | | | | 1,255 | | | | 9.2 | % |
| Total non-current assets | | | 97,178 | | | | 102,883 | | | | -5.5 | % |
| | | | | | | | | | | | | |
| Total assets | | | 121,307 | | | | 122,996 | | | | -1.4 | % |
| | | | | | | | | | | | | |
| Liabilities | | | | | | | | | | | | |
| Current liabilities | | | | | | | | | | | | |
| Loans and borrowings | | | 4,126 | | | | 4,574 | | | | -9.8 | % |
| Trade and other payables | | | 6,855 | | | | 7,757 | | | | -11.6 | % |
| Provision for employees benefits | | | 1,974 | | | | 1,392 | | | | 41.8 | % |
| Current tax liabilities | | | 2,131 | | | | 2,804 | | | | -24.0 | % |
| Accrued liabilities and provisions | | | 822 | | | | 653 | | | | 25.9 | % |
| Other liabilities | | | 439 | | | | 245 | | | | 79.2 | % |
| Total current liabilities | | | 16,347 | | | | 17,425 | | | | -6.2 | % |
| Liabilities related to non-current assets held for sale | | | 40 | | | | 18 | | | | 122.2 | % |
| Total current liabilities | | | 16,387 | | | | 17,443 | | | | -6.1 | % |
| | | | | | | | | | | | | |
| Non-current liabilities | | | | | | | | | | | | |
| Loans and borrowings | | | 48,096 | | | | 48,650 | | | | -1.1 | % |
| Trade and other payables | | | 24 | | | | 0 | | | | N/A | |
| Provision for employees benefits | | | 3,901 | | | | 2,460 | | | | 58.6 | % |
| Deferred tax liabilities | | | 2,229 | | | | 3,303 | | | | -32.5 | % |
| Accrued liabilities and provisions | | | 5,096 | | | | 5,424 | | | | -6.0 | % |
| Other long-term liabilities | | | 255 | | | | 484 | | | | -47.3 | % |
| Total non-current liabilities | | | 59,601 | | | | 60,321 | | | | -1.2 | % |
| | | | | | | | | | | | | |
| Total liabilities | | | 75,988 | | | | 77,764 | | | | -2.3 | % |
| | | | | | | | | | | | | |
| Equity | | | | | | | | | | | | |
| Equity attributable to owners of the Company | | | 43,673 | | | | 43,357 | | | | 0.7 | % |
| Non-controlling interests | | | 1,646 | | | | 1,875 | | | | -12.2 | % |
| Total Equity | | | 45,319 | | | | 45,232 | | | | 0.2 | % |
| | | | | | | | | | | | | |
| Total liabilities and equity | | | 121,307 | | | | 122,996 | | | | -1.4 | % |
*Unaudited Information.
Some figures shown in prior periods were reclassified for comparison purposes.
Table 4 – Comprehensive Income Statement – Ecopetrol Group
| A | | B | | | C | | | D | | | E | |
| COP Billion | | 4Q 2016* | | | 4Q 2015* | | | 2016 | | | 2015 | |
| Net income consolidated | | | 358 | | | | (6,021 | ) | | | 2,404 | | | | (3,083 | ) |
| Components of other comprehensive income, net of taxes | | | | | | | | | | | | | | | | |
| Accumulated foreign currency translation | | | 847 | | | | 14 | | | | (983 | ) | | | 6,121 | |
| Net fair value gain (Loss) on available-for-sale financial assets | | | (62 | ) | | | 8 | | | | 58 | | | | (126 | ) |
| Cash flow hedges for future exports | | | (312 | ) | | | (119 | ) | | | 990 | | | | (2,432 | ) |
| Hedge of a net investment in foreign operation | | | (416 | ) | | | 0 | | | | (155 | ) | | | 0 | |
| Cash flow hedges - derivative financial instruments | | | (1 | ) | | | (6 | ) | | | 34 | | | | (60 | ) |
| Measurement of defined benefit obligation | | | (1,506 | ) | | | 1,515 | | | | (1,153 | ) | | | 1,404 | |
| Others | | | (50 | ) | | | 59 | | | | (47 | ) | | | 59 | |
| Total other comprehensive income | | | (1,500 | ) | | | 1,471 | | | | (1,256 | ) | | | 4,966 | |
| Total Comprehensive income | | | (1,142 | ) | | | (4,550 | ) | | | 1,148 | | | | 1,883 | |
| Attributable to: | | | | | | | | | | | | | | | | |
| Shareholders | | | (1,336 | ) | | | (4,891 | ) | | | 341 | | | | 804 | |
| Non-controlling interests | �� | | 194 | | | | 341 | | | | 807 | | | | 1,079 | |
| Total Comprehensive income | | | (1,142 | ) | | | (4,550 | ) | | | 1,148 | | | | 1,883 | |
*These amounts are included for illustrative purposes only. Unaudited.
Table 5 – Statement of Cash Flow– Ecopetrol Group
| A | | B | | | C | | | D | | | E | |
| COP Billion | | 4Q 2016* | | | 4Q 2015* | | | 2016 | | | 2015 | |
| Cash flow provided by operating activities: | | | | | | | | | | | | | | | | |
| Net income attributable to Owners of Ecopetrol S.A. | | | 186 | | | | (6,308 | ) | | | 1,565 | | | | (3,988 | ) |
| Adjustments to reconcile net income to cash provided by operating activities: | | | | | | | | | | | | | | | | |
| Non-controlling interests | | | 172 | | | | 288 | | | | 839 | | | | 905 | |
| Income tax | | | 1,472 | | | | (2,221 | ) | | | 4,656 | | | | 607 | |
| Depreciation, depletion and amortization | | | 1,922 | | | | 1,849 | | | | 7,592 | | | | 6,770 | |
| Foreign exchange (gain) loss | | | (138 | ) | | | 198 | | | | (968 | ) | | | 1,870 | |
| Finance costs recognised in profit or loss | | | 816 | | | | 792 | | | | 3,345 | | | | 2,396 | |
| Loss (Gain) on disponsal of non-current assets | | | 67 | | | | 48 | | | | 79 | | | | 60 | |
| Impairment of assets | | | 807 | | | | 8,373 | | | | 916 | | | | 8,275 | |
| Fair value (gain) on financial assets valuation | | | (16 | ) | | | (42 | ) | | | (60 | ) | | | (110 | ) |
| Share or profit os associates and joint ventures | | | 24 | | | | (24 | ) | | | 10 | | | | (35 | ) |
| Dry wells | | | 189 | | | | 1,018 | | | | 343 | | | | 1,266 | |
| (Gain) loss on sale of equity instruments measured at fair value | | | (60 | ) | | | 0 | | | | (47 | ) | | | (72 | ) |
| Realized foreign exchange cash flow hedges | | | 206 | | | | 82 | | | | 720 | | | | 249 | |
| Net changes in operating assets and liabilities | | | (1,021 | ) | | | (461 | ) | | | (206 | ) | | | (3,368 | ) |
| Income tax paid | | | (602 | ) | | | (13 | ) | | | (4,347 | ) | | | (3,148 | ) |
| Cash provided by operating activities | | | 4,024 | | | | 3,579 | | | | 14,437 | | | | 11,677 | |
| | | | | | | | | | | | | | | | | |
| Cash flows from investing activities: | | | | | | | | | | | | | | | | |
| Investment in property, plant and equipment | | | (1,424 | ) | | | (3,104 | ) | | | (3,647 | ) | | | (8,549 | ) |
| Investment in natural and environmental resources | | | (805 | ) | | | (1,884 | ) | | | (2,121 | ) | | | (6,856 | ) |
| Payments for intangibles | | | (23 | ) | | | (36 | ) | | | (69 | ) | | | (112 | ) |
| Proceeds from sales of equity instruments measured at fair value | | | 242 | | | | 0 | | | | 967 | | | | 633 | |
| (Purchases) sales of other financial assets | | | (654 | ) | | | 2,147 | | | | (5,448 | ) | | | 1,189 | |
| Interest received | | | 99 | | | | (2 | ) | | | 386 | | | | 294 | |
| Dividends received | | | 37 | | | | 303 | | | | 233 | | | | 424 | |
| Proceeds from sales of assets | | | 0 | | | | 108 | | | | 110 | | | | 166 | |
| Net cash used in investing activities | | | (2,528 | ) | | | (2,468 | ) | | | (9,589 | ) | | | (12,811 | ) |
| | | | | | | | | | | | | | | | | |
| Cash flows from financing activities: | | | | | | | | | | | | | | | | |
| Proceeds (repayment of) from borrowings | | | (154 | ) | | | 1,093 | | | | 1,445 | | | | 6,082 | |
| Interest paid | | | (478 | ) | | | (665 | ) | | | (2,495 | ) | | | (1,981 | ) |
| Dividends paid | | | (319 | ) | | | (4,281 | ) | | | (1,712 | ) | | | (5,493 | ) |
| Net cash provided (used) in financing activities | | | (951 | ) | | | (3,853 | ) | | | (2,762 | ) | | | (1,392 | ) |
| | | | | | | | | | | | | | | | | |
| Exchange difference in cash and cash equivalents | | | 154 | | | | (24 | ) | | | (226 | ) | | | 1,458 | |
| Net increase in cash and cash equivalents | | | 699 | | | | (2,766 | ) | | | 1,860 | | | | (1,068 | ) |
| Cash and cash equivalents at the beginning of the period | | | 7,711 | | | | 9,316 | | | | 6,550 | | | | 7,618 | |
| Cash and cash equivalents at the end of the period | | | 8,410 | | | | 6,550 | | | | 8,410 | | | | 6,550 | |
*These amounts are included for illustrative purposes only. Unaudited.
Some figures shown in prior periods were reclassified for comparison purposes.
Table 6 – EBITDA Reconciliation – Ecopetrol Group
| A | | B | | | C | | | D | | | E | |
| COP$ Billion | | 4Q 2016* | | | 4Q 2015* | | | 2016 | | | 2015 | |
| RECONCILIATION NET INCOME TO EBITDA | | | | | | | | | | | | | | | | |
| Net income attributable to Ecopetrol's owners | | | 186 | | | | (6,308 | ) | | | 1,565 | | | | (3,988 | ) |
| + Depreciation, depletion and amortization | | | 1,922 | | | | 1,849 | | | | 7,592 | | | | 6,770 | |
| +/- Impairment of non-current assets | | | 782 | | | | 8,267 | | | | 842 | | | | 8,284 | |
| +/- Finance results, net | | | (221 | ) | | | 964 | | | | 1,183 | | | | 3,967 | |
| + Income tax | | | 1,472 | | | | (2,220 | ) | | | 4,656 | | | | 607 | |
| + Other taxes | | | 161 | | | | 244 | | | | 1,341 | | | | 1,542 | |
| +/-Non-controlling interest | | | 172 | | | | 287 | | | | 839 | | | | 905 | |
| CONSOLIDATED EBITDA | | | 4,474 | | | | 3,083 | | | | 18,018 | | | | 18,087 | |
*These amounts are included solely for illustrative purposes. Unaudited.
Table 7 – EBITDA Reconciliation by Segment – 4Q 2016
| A | | B | | | C | | | D | | | E | | | F | |
| COP Billion | | E&P | | | Refining &
Petrochemicals | | | Transportation
and Logistics | | | Eliminations | | | Consolidated | |
| RECONCILIATION NET INCOME TO EBITDA | | | | | | | | | | | | | | | | | | | | |
| Net income attributable to Ecopetrol's owners | | | 516 | | | | (1,032 | ) | | | 702 | | | | 0 | | | | 186 | |
| + Depreciation, depletion and amortization | | | 1,537 | | | | 142 | | | | 243 | | | | 0 | | | | 1,922 | |
| +/- Impairment of non-current assets | | | 112 | | | | 712 | | | | (42 | ) | | | 0 | | | | 782 | |
| +/- Finance results, net | | | (509 | ) | | | 314 | | | | 27 | | | | (53 | ) | | | (221 | ) |
| + Income tax | | | 937 | | | | 69 | | | | 466 | | | | 0 | | | | 1,472 | |
| + Other taxes | | | 22 | | | | 117 | | | | 22 | | | | 0 | | | | 161 | |
| +/-Non-controlling interest | | | 0 | | | | (3 | ) | | | 175 | | | | 0 | | | | 172 | |
| CONSOLIDATED EBITDA | | | 2,615 | | | | 319 | | | | 1,593 | | | | (53 | ) | | | 4,474 | |
These amounts are included solely for illustrative purposes. Unaudited.
Table 8 – EBITDA Reconciliation by Segment – 4Q 2015
| A | | B | | | C | | | D | | | E | | | F | |
| COP Billion | | E&P | | | Refining &
Petrochemicals | | | Transportation
and Logistics | | | Eliminations | | | Consolidated | |
| RECONCILIATION NET INCOME TO EBITDA | | | | | | | | | | | | | | | | | | | | |
| Net income attributable to Ecopetrol's owners | | | (4,577 | ) | | | (2,684 | ) | | | 911 | | | | 42 | | | | (6,308 | ) |
| + Depreciation, depletion and amortization | | | 1,403 | | | | 207 | | | | 240 | | | | (1 | ) | | | 1,849 | |
| +/- Impairment of non-current assets | | | 4,916 | | | | 3,269 | | | | 82 | | | | 0 | | | | 8,267 | |
| +/- Finance results, net | | | 888 | | | | 80 | | | | (98 | ) | | | 94 | | | | 964 | |
| + Income tax | | | (1,815 | ) | | | (1,007 | ) | | | 602 | | | | 0 | | | | (2,220 | ) |
| + Other taxes | | | 82 | | | | 145 | | | | 17 | | | | 0 | | | | 244 | |
| +/-Non-controlling interest | | | 0 | | | | (3 | ) | | | 290 | | | | 0 | | | | 287 | |
| CONSOLIDATED EBITDA | | | 897 | | | | 7 | | | | 2,044 | | | | 135 | | | | 3,083 | |
These amounts are included solely for illustrative purposes. Unaudited.
Table 9 – EBITDA Reconciliation by Segment - 2016
| A | | B | | | C | | | D | | | E | | | F | |
| COP Billion | | E&P | | | Refining &
Petrochemicals | | | Transportation
and Logistics | | | Eliminations | | | Consolidated | |
| RECONCILIATION NET INCOME TO EBITDA | | | | | | | | | | | | | | | | | | | | |
| Net income attributable to Ecopetrol's owners | | | 745 | | | | (2,000 | ) | | | 2,832 | | | | (12 | ) | | | 1,565 | |
| + Depreciation, depletion and amortization | | | 5,466 | | | | 1,147 | | | | 979 | | | | 0 | | | | 7,592 | |
| +/- Impairment of non-current assets | | | 110 | | | | 773 | | | | (41 | ) | | | 0 | | | | 842 | |
| +/- Finance results, net | | | 118 | | | | 811 | | | | 243 | | | | 11 | | | | 1,183 | |
| + Income tax | | | 1,365 | | | | 625 | | | | 2,666 | | | | 0 | | | | 4,656 | |
| + Other taxes | | | 579 | | | | 500 | | | | 262 | | | | 0 | | | | 1,341 | |
| +/-Non-controlling interest | | | 0 | | | | (8 | ) | | | 847 | | | | 0 | | | | 839 | |
| CONSOLIDATED EBITDA | | | 8,383 | | | | 1,848 | | | | 7,788 | | | | (1 | ) | | | 18,018 | |
These amounts are included solely for illustrative purposes. Unaudited.
Table 10 – EBITDA Reconciliation by Segment – 2015
| A | | B | | | C | | | D | | | E | | | F | |
| COP Billion | | E&P | | | Refining &
Petrochemicals | | | Transportation
and Logistics | | | Eliminations | | | Consolidated | |
| RECONCILIATION NET INCOME TO EBITDA | | | | | | | | | | | | | | | | | | | | |
| Net income attributable to Ecopetrol's owners | | | (4,335 | ) | | | (2,541 | ) | | | 3,034 | | | | (146 | ) | | | (3,988 | ) |
| + Depreciation, depletion and amortization | | | 5,318 | | | | 570 | | | | 882 | | | | 0 | | | | 6,770 | |
| +/- Impairment of non-current assets | | | 4,924 | | | | 3,279 | | | | 81 | | | | 0 | | | | 8,284 | |
| +/- Finance results, net | | | 3,032 | | | | 703 | | | | 96 | | | | 136 | | | | 3,967 | |
| + Income tax | | | (1,143 | ) | | | (655 | ) | | | 2,405 | | | | 0 | | | | 607 | |
| + Other taxes | | | 698 | | | | 556 | | | | 288 | | | | 0 | | | | 1,542 | |
| +/-Non-controlling interest | | | 0 | | | | (5 | ) | | | 910 | | | | 0 | | | | 905 | |
| CONSOLIDATED EBITDA | | | 8,494 | | | | 1,907 | | | | 7,696 | | | | (10 | ) | | | 18,087 | |
These amounts are included solely for illustrative purposes. Unaudited.
| VI. | Income Statements of Subsidiaries and Equity Interest |
Production
Table 11 – Income Statement1
| A | | B | | | C | | | D | | | E | |
| COP Billion | | 4Q 2016* | | | 4Q 2015* | | | 2016 | | | 2015 | |
| Local sales | | | 66 | | | | 129 | | | | 283 | | | | 473 | |
| Export sales | | | 135 | | | | 184 | | | | 625 | | | | 726 | |
| Total Sales | | | 201 | | | | 313 | | | | 908 | | | | 1,199 | |
| Variable costs | | | 80 | | | | 155 | | | | 494 | | | | 607 | |
| Fixed costs | | | 82 | | | | 101 | | | | 276 | | | | 391 | |
| Cost of Sales | | | 162 | | | | 256 | | | | 770 | | | | 998 | |
| Gross Profits | | | 39 | | | | 57 | | | | 138 | | | | 201 | |
| Operating Expenses | | | 200 | | | | 260 | | | | 302 | | | | 361 | |
| Operating Income | | | (161 | ) | | | (203 | ) | | | (164 | ) | | | (160 | ) |
| Financial income (loss) | | | (5 | ) | | | (87 | ) | | | 19 | | | | (116 | ) |
| Share of profit of companies | | | 11 | | | | 15 | | | | 56 | | | | 56 | |
| Income before Income Tax | | | (155 | ) | | | (275 | ) | | | (89 | ) | | | (220 | ) |
| Income tax | | | 35 | | | | 16 | | | | 25 | | | | (11 | ) |
| Net Income | | | (120 | ) | | | (259 | ) | | | (64 | ) | | | (231 | ) |
| | | | | | | | | | | | | | | | | |
| EBITDA | | | 74 | | | | 41 | | | | 331 | | | | 467 | |
| EBITDA Margin | | | 36.8 | % | | | 13.1 | % | | | 36.5 | % | | | 38.9 | % |
*These amounts are included for illustrative purposes only. Unaudited.
1For the purposes of comparison of the 2016 figures, the net profit shown for the 2015 periods includes the equity method, the application of which took effect in December 2015 pursuant to Decree 2496 dated Dec. 23/2015.
Table 12 – Balance Sheet
| A | | B | | | C | |
| COP Billion | | Dic 16 | | | Dic 15 | |
| Current assets | | | 787 | | | | 1,371 | |
| Non current assets | | | 2,203 | | | | 2,195 | |
| Total Assets | | | 2,990 | | | | 3,566 | |
| Current liabilities | | | 934 | | | | 931 | |
| Non current liabilities | | | 297 | | | | 174 | |
| Total Liabilities | | | 1,231 | | | | 1,105 | |
| Equity | | | 1,759 | | | | 2,461 | |
| Total Liabilities and Equity | | | 2,990 | | | | 3,566 | |
Table 13 – Income Statement*
| A | | B | | | C | | | D | | | E | |
| USD Million | | 4Q 2016* | | | 4Q 2015* | | | 2016* | | | 2015* | |
| Local sales | | | 56.3 | | | | 30.3 | | | | 124.9 | | | | 161.4 | |
| Export sales | | | 0.0 | | | | 0.0 | | | | 0.0 | | | | 0.0 | |
| Total Sales | | | 56.3 | | | | 30.3 | | | | 124.9 | | | | 161.4 | |
| Variable costs | | | 43.2 | | | | 8.1 | | | | 86.2 | | | | 80.8 | |
| Fixed costs | | | 23.0 | | | | 28.2 | | | | 78.8 | | | | 87.7 | |
| Cost of Sales | | | 66.2 | | | | 36.3 | | | | 165.0 | | | | 168.5 | |
| Gross Profits | | | -9.9 | | | | -6.0 | | | | -40.1 | | | | -7.1 | |
| Operating Expenses | | | -64.0 | | | | -68.5 | | | | -72.7 | | | | -104.2 | |
| Operating Income | | | -73.9 | | | | -74.5 | | | | -112.8 | | | | -111.3 | |
| Financial income (loss) | | | -2.8 | | | | -0.5 | | | | -3.9 | | | | -2.7 | |
| Income before Income Tax | | | -76.7 | | | | -75.0 | | | | -116.7 | | | | -114.0 | |
| Income tax | | | 27.7 | | | | 22.2 | | | | 35.3 | | | | 31.3 | |
| Net Income | | | -49.0 | | | | -52.8 | | | | -81.4 | | | | -82.7 | |
| | | | | | | | | | | | | | | | | |
| EBITDA | | | 9.2 | | | | -10.9 | | | | 9.5 | | | | 27.7 | |
| EBITDA Margin | | | 16.3 | % | | | -36.0 | % | | | 7.6 | % | | | 17.2 | % |
*These amounts are included for illustrative purposes only. Unaudited.
Table 14 – Balance Sheet
| A | | B | | | C | |
| USD Million | | Dic 16 | | | Dic 15 | |
| Current assets | | | 106 | | | | 99 | |
| Non current assets | | | 565 | | | | 664 | |
| Total Assets | | | 671 | | | | 763 | |
| Current liabilities | | | 49 | | | | 152 | |
| Non current liabilities | | | 224 | | | | 130 | |
| Total Liabilities | | | 273 | | | | 282 | |
| Equity | | | 398 | | | | 481 | |
| Total Liabilities and Equity | | | 671 | | | | 763 | |
Table 15 – Income Statement*
| A | | B | | | C | | | D | | | E | |
| COP Billion | | 4Q 2016* | | | 4Q 2015* | | | 2016 | | | 2015 | |
| Local sales | | | 50 | | | | 74 | | | | 264 | | | | 354 | |
| Export sales | | | 278 | | | | 222 | | | | 941 | | | | 865 | |
| Total Sales | | | 328 | | | | 296 | | | | 1,205 | | | | 1,219 | |
| Variable costs | | | 172 | | | | 217 | | | | 803 | | | | 763 | |
| Fixed costs | | | 53 | | | | 56 | | | | 166 | | | | 196 | |
| Cost of Sales | | | 225 | | | | 273 | | | | 969 | | | | 959 | |
| Gross Profits | | | 103 | | | | 23 | | | | 236 | | | | 260 | |
| Operating Expenses | | | (14 | ) | | | (57 | ) | | | (45 | ) | | | (74 | ) |
| Operating Income | | | 89 | | | | (34 | ) | | | 191 | | | | 186 | |
| Financial income (loss) | | | 11 | | | | 2 | | | | 59 | | | | 38 | |
| Income before Income Tax | | | 100 | | | | (32 | ) | | | 250 | | | | 224 | |
| Income tax | | | (48 | ) | | | 192 | | | | (144 | ) | | | (49 | ) |
| Net Income | | | 52 | | | | 160 | | | | 106 | | | | 175 | |
| | | | | | | | | | | | | | | | | |
| EBITDA | | | 241 | | | | 196 | | | | 912 | | | | 891 | |
| EBITDA Margin | | | 73.5 | % | | | 66.2 | % | | | 75.7 | % | | | 73.1 | % |
*These amounts are included for illustrative purposes only. Unaudited.
*Modification and reclassifications are included for approval of the accounting rules of the Ecopetrol Group.
Table 16– Balance Sheet
| A | | B | | | C | |
| COP Billion | | Jun 16 | | | Sep 16 | |
| Current assets | | | 712 | | | | 854 | |
| Non current assets | | | 1,550 | | | | 2,261 | |
| Total Assets | | | 2,262 | | | | 3,115 | |
| Current liabilities | | | 417 | | | | 549 | |
| Non current liabilities | | | 96 | | | | 110 | |
| Total Liabilities | | | 513 | | | | 659 | |
| Equity | | | 1,749 | | | | 2,456 | |
| Total Liabilities and Equity | | | 2,262 | | | | 3,115 | |
Refinery and Petrochemicals
Table 17 – Sales Volume
| A | | B | | | C | | | D | | | E | |
| Sales volumes (tons) | | 4Q 2016 | | | 4Q 2015 | | | 2016 | | | 2015 | |
| Polypropylene | | | 101,068 | | | | 113,341 | | | | 450,029 | | | | 433,845 | |
| Masterbatch | | | 3,271 | | | | 3,635 | | | | 14,140 | | | | 13,706 | |
| Polyethylene | | | 6,421 | | | | 6,335 | | | | 26,831 | | | | 32,485 | |
| Total | | | 110,760 | | | | 123,311 | | | | 491,001 | | | | 480,036 | |
Table 18 – Income Statement1
| A | | B | | | C | | | D | | | E | |
| COP Billion | | 4Q 2016* | | | 4Q 2015* | | | 2016 | | | 2015 | |
| Local sales | | | 180 | | | | 186 | | | | 716 | | | | 713 | |
| Export sales | | | 262 | | | | 278 | | | | 1,186 | | | | 1,106 | |
| Total Sales | | | 442 | | | | 464 | | | | 1,902 | | | | 1,819 | |
| Variable costs | | | 326 | | | | 331 | | | | 1,362 | | | | 1,383 | |
| Fixed costs | | | 45 | | | | 16 | | | | 121 | | | | 81 | |
| Cost of Sales | | | 371 | | | | 347 | | | | 1,483 | | | | 1,464 | |
| Gross Profits | | | 71 | | | | 117 | | | | 419 | | | | 355 | |
| Operating Expenses | | | 45 | | | | 51 | | | | 168 | | | | 164 | |
| Operating Income | | | 26 | | | | 66 | | | | 251 | | | | 191 | |
| Financial income (loss) | | | 0 | | | | (7 | ) | | | 0 | | | | (29 | ) |
| Share of profit of companies | | | 25 | | | | 15 | | | | 105 | | | | 51 | |
| Income before Income Tax | | | 51 | | | | 74 | | | | 356 | | | | 213 | |
| Income tax | | | (10 | ) | | | (55 | ) | | | (102 | ) | | | (94 | ) |
| Net Income | | | 41 | | | | 19 | | | | 254 | | | | 119 | |
| | | | | | | | | | | | | | | | | |
| EBITDA | | | 55 | | | | 74 | | | | 312 | | | | 224 | |
| EBITDA Margin | | | 12.4 | % | | | 15.9 | % | | | 16.4 | % | | | 12.3 | % |
*These amounts are included for illustrative purposes only. Unaudited.
1 For the purposes of comparison of the 2016 figures, the net profit shown for the 2015 periods include the equity method, the application of which took effect in December 2015 pursuant to Decree 2496 dated Dec. 23/2015.
Table 19 – Balance Sheet
| A | | B | | | C | |
| COP Billion | | Dic 16 | | | Dic 15 | |
| Current assets | | | 833 | | | | 794 | |
| Non current assets | | | 976 | | | | 980 | |
| Total Assets | | | 1,809 | | | | 1,774 | |
| Current liabilities | | | 347 | | | | 386 | |
| Non current liabilities | | | 94 | | | | 94 | |
| Total Liabilities | | | 441 | | | | 480 | |
| Equity | | | 1,368 | | | | 1,294 | |
| Total Liabilities and Equity | | | 1,809 | | | | 1,774 | |
Table 20 – Sales Volume
| A | | B | | | C | | | D | | | E | |
| Sales Volume (mboed) | | 4Q 2016 | | | 4Q 2015 | | | 2016 | | | 2015 | |
| Local | | | 52.9 | | | | 45.0 | | | | 50.7 | | | | 41.1 | |
| International | | | 82.6 | | | | 27.7 | | | | 81.0 | | | | 7.0 | |
| Total | | | 135.5 | | | | 72.7 | | | | 131.7 | | | | 48.0 | |
Table 21 – Income Statement
| A | | B | | | C | | | D | | | E | |
| COP Billion | | 4Q 2016* | | | 4Q 2015* | | | 2016 | | | 2015 | |
| Local sales | | | 868 | | | | 798 | | | | 3,022 | | | | 2,945 | |
| Export sales | | | 1,097 | | | | 312 | | | | 3,488 | | | | 312 | |
| Ventas Totales | | | 1,965 | | | | 1,110 | | | | 6,510 | | | | 3,257 | |
| Variable costs | | | 1,762 | | | | 1,027 | | | | 6,097 | | | | 3,019 | |
| Fixed costs | | | 254 | | | | 64 | | | | 1,014 | | | | 198 | |
| Cost of Sales | | | 2,016 | | | | 1,091 | | | | 7,111 | | | | 3,217 | |
| Gross Profits | | | (51 | ) | | | 19 | | | | (601 | ) | | | 40 | |
| Operating expenses | | | 740 | | | | 3,531 | | | | 1,447 | | | | 4,110 | |
| Operating Income | | | (791 | ) | | | (3,512 | ) | | | (2,048 | ) | | | (4,070 | ) |
| Financial income (loss) | | | (226 | ) | | | (70 | ) | | | (635 | ) | | | (74 | ) |
| Income before Income Tax | | | (1,017 | ) | | | (3,582 | ) | | | (2,683 | ) | | | (4,144 | ) |
| Income tax | | | 165 | | | | 955 | | | | 236 | | | | 987 | |
| Net Income | | | (852 | ) | | | (2,627 | ) | | | (2,447 | ) | | | (3,157 | ) |
| | | | | | | | | | | | | | | | | |
| EBITDA | | | (180 | ) | | | (218 | ) | | | (699 | ) | | | (578 | ) |
| Margin EBITDA | | | -16.4 | % | | | -69.9 | % | | | -20.0 | % | | | -185.3 | % |
*These amounts are included for illustrative purposes only. Unaudited.
Table 22 – Balance Sheet
| A | | B | | | C | |
| COP Billion | | Dec 16 | | | Dec 15 | |
| Current assets | | | 2,006 | | | | 1,284 | |
| Non current assets | | | 23,295 | | | | 25,398 | |
| Total Assets | | | 25,301 | | | | 26,682 | |
| Current liabilities | | | 2,975 | | | | 1,940 | |
| Non current liabilities | | | 14,211 | | | | 15,562 | |
| Total Liabilities | | | 17,186 | | | | 17,502 | |
| Equity | | | 8,115 | | | | 9,180 | |
| Total Liabilities and Equity | | | 25,301 | | | | 26,682 | |
Transport
Table 23 – Income Statement1
| A | | B | | | C | | | D | | | E | |
| COP Billion | | 4Q 2016* | | | 4Q 2015* | | | 2016 | | | 2015 | |
| Local sales | | | 977 | | | | 1,050 | | | | 4,031 | | | | 3,847 | |
| Export sales | | | 0 | | | | 0 | | | | 0 | | | | 0 | |
| Total Sales | | | 977 | | | | 1,050 | | | | 4,031 | | | | 3,847 | |
| Variable costs | | | 60 | | | | 40 | | | | 195 | | | | 143 | |
| Fixed costs | | | 409 | | | | 693 | | | | 1,757 | | | | 2,087 | |
| Cost of Sales | | | 469 | | | | 733 | | | | 1,952 | | | | 2,230 | |
| Gross Profits | | | 508 | | | | 317 | | | | 2,079 | | | | 1,617 | |
| Operating Expenses | | | 65 | | | | 140 | | | | 294 | | | | 350 | |
| Operating Income | | | 443 | | | | 177 | | | | 1,785 | | | | 1,267 | |
| Financial income (loss) | | | 17 | | | | 154 | | | | (44 | ) | | | 570 | |
| Share of profit of companies | | | 403 | | | | 650 | | | | 1,806 | | | | 2,008 | |
| Income before Income Tax | | | 863 | | | | 981 | | | | 3,547 | | | | 3,845 | |
| Income tax | | | (146 | ) | | | (130 | ) | | | (760 | ) | | | (734 | ) |
| Net Income | | | 717 | | | | 851 | | | | 2,787 | | | | 3,111 | |
| | | | | | | | | | | | | | | | | |
| EBITDA | | | 514 | | | | 364 | | | | 2,290 | | | | 1,872 | |
| EBITDA Margin | | | 52.6 | % | | | 34.7 | % | | | 56.8 | % | | | 48.7 | % |
*These amounts are included for illustrative purposes only. Unaudited.
1For purposes of comparison with the 2016 figures, the net profit shown for the 2015 periods includes the equity method, the application of which took effect in December 2015 pursuant to Decree 2496 dated Dec. 23/2015.
Table 24 – Balance Sheet
| A | | B | | | C | |
| COP Billion | | Dec 16 | | | Dec 15 | |
| Current assets | | | 1,671 | | | | 1,628 | |
| Non current assets | | | 11,966 | | | | 12,289 | |
| Total Assets | | | 13,637 | | | | 13,917 | |
| Current liabilities | | | 1,627 | | | | 884 | |
| Non current liabilities | | | 684 | | | | 887 | |
| Total Liabilities | | | 2,311 | | | | 1,771 | |
| Equity | | | 11,326 | | | | 12,146 | |
| Total Liabilities and Equity | | | 13,637 | | | | 13,917 | |
Biofuels
Table 25 – Volume Sales
| A | | B | | | C | | | D | | | E | |
| Sales volume (mboed) | | 4Q 2016 | | | 4Q 2015 | | | 2016 | | | 2015 | |
| Biodiesel | | | 2.1 | | | | 2.4 | | | | 2.2 | | | | 2.4 | |
| Glycerin | | | 0.2 | | | | 0.2 | | | | 0.2 | | | | 0.2 | |
| Total | | | 2.3 | | | | 2.6 | | | | 2.4 | | | | 2.6 | |
Table 26 – Income Statement
| A | | B | | | C | | | D | | | E | |
| COP Billion | | 4Q 2016* | | | 4Q 2015* | | | 2016 | | | 2015 | |
| Local sales | | | 118 | | | | 102 | | | | 372 | | | | 380 | |
| Export sales | | | 0 | | | | 0 | | | | 0 | | | | 0 | |
| Total Sales | | | 118 | | | | 102 | | | | 372 | | | | 380 | |
| Variable costs | | | 106 | | | | 89 | | | | 326 | | | | 330 | |
| Fixed costs | | | 0 | | | | 0 | | | | 0 | | | | 0 | |
| Cost of Sales | | | 106 | | | | 89 | | | | 326 | | | | 330 | |
| Gross Profits | | | 12 | | | | 13 | | | | 46 | | | | 51 | |
| Operating Expenses | | | 6 | | | | 3 | | | | 17 | | | | 12 | |
| Operating Income | | | 6 | | | | 10 | | | | 29 | | | | 38 | |
| Financial income (loss) | | | (0 | ) | | | (3 | ) | | | (2 | ) | | | (5 | ) |
| Share of profit of companies | | | 0 | | | | 0 | | | | 0 | | | | 0 | |
| Income before Income Tax | | | 6 | | | | 7 | | | | 28 | | | | 33 | |
| Income tax | | | (2 | ) | | | (2 | ) | | | (4 | ) | | | (6 | ) |
| Net Income | | | 4 | | | | 5 | | | | 24 | | | | 27 | |
| | | | | | | | | | | | | | | | | |
| EBITDA | | | 8 | | | | 12 | | | | 27 | | | | 30 | |
| EBITDA Margin | | | 6.8 | % | | | 11.5 | % | | | 7.3 | % | | | 7.9 | % |
*These amounts are included for illustrative purposes only. Unaudited.
Table 27 – Balance Sheet
| A | | B | | | C | |
| COP Billion | | Dec 16 | | | Dec 15 | |
| Current assets | | | 61 | | | | 65 | |
| Non current assets | | | 66 | | | | 68 | |
| Total Assets | | | 127 | | | | 133 | |
| Current liabilities | | | 54 | | | | 53 | |
| Non current liabilities | | | 0 | | | | 11 | |
| Total Liabilities | | | 54 | | | | 64 | |
| Equity | | | 73 | | | | 69 | |
| Total Liabilities and Equity | | | 127 | | | | 133 | |
Table 28 – Long Term Debt – Ecopetrol Group*
| A | | B | | | C | | | D | |
| Compañía | | USD | | | COP | | | Total | |
| Ecopetrol | | | 11,837 | | | | 1,180 | | | | 13,017 | |
| Reficar | | | 2,796 | | | | 0 | | | | 2,796 | |
| Bicentario | | | 0 | | | | 516 | | | | 516 | |
| ODL | | | 0 | | | | 257 | | | | 257 | |
| Bioenergy | | | 0 | | | | 158 | | | | 158 | |
| Ocensa | | | 500 | | | | 0 | | | | 500 | |
| Total | | | 15,133 | | | | 2,111 | | | | 17,244 | |
*Nominal value of debt as of December 31st, 2016, not including accrued interest.
**Figures stated in millions of dollars equivalent to the Representative Market Rate effective as of December 31st, 2016.