Exhibit 99.1
During the second quarter of 2018, we saw significant operational and financial achievements for the Business Group. We posted an EBITDA margin of 51%, the highest in the business group’s history, and had the highest production of the past seven quarters, at 721,000 barrels of petroleum equivalent per day, up 2.8% from the first quarter of 2018. We were able to take advantage of the favorable environment for crude prices and at the same time confirm our technical, operational and financial capacity and our commitment to safe and environmentally responsible practices.
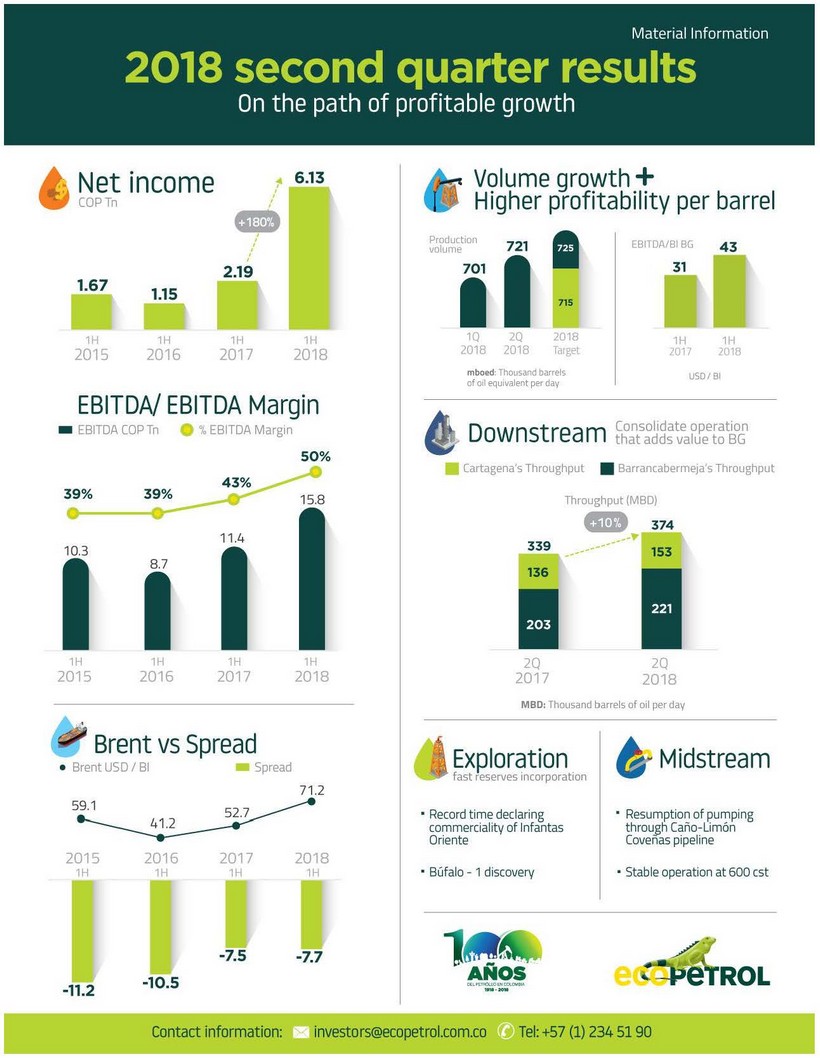
Net profit in the first half of 2018 totaled 6.1 trillion pesos, with cumulative EBITDA of 15.8 trillion pesos. This achievement was possible thanks to the optimal operation of the different business segments and the financial discipline of the Group’s companies, combined with better crude prices during the period. At the close of the quarter, we succeeded in maintaining a solid cash position of 15.8 trillion pesos, even after paying out 2 trillion pesos as dividends on 2017 earnings. Risk rating agencies acknowledge our successes and have confirmed our investment-grade credit rating. Indeed, Moody’s upgraded our baseline credit assessment from ba3 to ba1.
Our commercial strategy, announced in 2015, has succeeded in yielding tangible benefits. In the first half of 2018, we succeeded in maintaining levels close to those of the first half of 2017, even with the 35% increase in the price of Brent crude and challenging environment. For the first half of 2018, the spread on the crude sales basket was -7.7 dollars per barrel, versus -7.5 for the same period in 2017.
Average production for the quarter totaled 721,000 barrels of oil equivalent per day, some 0.6% above the same period the previous year and 2.8% over the first quarter of 2018. We succeeded in recovering from the operational issues in the first quarter, thanks to the results of the drilling campaign in fields such as La Cira, Rubiales, Caño Sur, Dina, Quifa and Castilla. The increased activity will lead us to the path of growth and ensure meeting our annual production goal at a range of 715,000 to 725,000 barrels of petroleum equivalent per day. On the other hand, the pilot recovery programs are also advancing satisfactorily; currently 21 pilots are in operation, 16 of which are still in the expansion phase.

In the exploratory campaign, we scored a success during the quarter by confirming the presence of dry gas and light crude at the Bufalo-1 well, in the Valle Medio del Magdalena basin. We have also completed drilling of the Coyote-2 and Coyote-3 appraisal wells, located in the Valle Medio del Magdalena, as well as Capachos Sur-2, located in the Piedemonte. These three wells are undergoing assessment to determine their commercial feasibility. We expect to drill at least 12 exploratory wells in 2018.
As part of our Near Field Exploration strategy, in late May the Infantas Oriente field in Barrancabermeja (Santander) was declared commercial. This allowed us to incorporate in record time the reserves associated with the Infantas Oriente-1 discovery, the assessment of which was carried out at the start of the year.
In the transport segment, I would like to note the resumption of operations on the Caño Limón - Coveñas oil pipeline in June and the stability of the transport system for heavy crudes with viscosity greater than 600 centistokes (cst - a measure of viscosity), thereby structurally reducing dilution requirements.
The reversal strategy implemented since 2017 on the Bicentenario oil pipeline allowed for reducing the impact of the attacks and illegal valves affecting the Caño Limón – Coveñas oil pipeline, preventing deferred production in its surrounding fields. In the first half of 2018, 30 reversal cycles were completed on the Bicentenario oil pipeline.
The Refining segment saw outstanding operational performance in the second quarter, achieving stable throughput of 374,000 barrels per day.
| | 2 | |
| |  | |
In the second quarter of 2018, the Cartagena refinery continued to demonstrate the consolidation and optimization of its operations with average throughput of 153,000 barrels per day and throughput composition of 79% domestic crude and 21% imported crude, thus contributing significantly to reducing the Business Group’s cost of sales. In June, it achieved a record in the use of local crudes, at 83% of its diet. The gross refining margin for the Cartagena refinery during the quarter was USD 11.1/bl, up 44% over the same period the previous year (USD 7.7/bl), thus posting 10 consecutive months with gross margins in the double digits.
Throughput and production at the Barrancabermeja refinery was up over 9% for the quarter versus the same quarter of 2017, thanks to the implementation of initiatives to segregate light and intermediate crudes, thus increasing their availability. The average refining margin for the quarter was USD 10.5/bl, affected primarily by the increase in the price of the crude basket versus Brent.
In line with the Business Group’s Efficiencies strategy, in the second quarter of the year we incorporated efficiencies representing 429 billion pesos, up 17% over the second quarter of 2017. Thus, cumulative efficiencies in the first half of 2018 totaled 892 billion pesos, for a total of 8 trillion pesos since the launching of the Transformation Program in 2015.
In addition to the above, we are particularly proud of our success in implementing operational and logistics adjustments in record time throughout the entire supply chain, in order for diesel deliveries to Medellin and its Metropolitan area to have a sulfur content of below 25 parts per million. This is in line with our commitment to the environment, thus contributing to the improvement of the city’s air quality.
We have also committed to the massive transportation system Transmilenio S.A. to supply natural gas and B2 diesel with a maximum sulfur content of 10 parts per million for the renovation of the bus fleet of phases I and II, thus enabling the entry of EURO VI technologies.
Together with the national and local institutions, Ecopetrol will continue to improve the quality of fuels for the whole country as set in the enhancement path established in the CONPES document for the improvement of air quality.
In order to achieve a significant effect, it is not only necessary to improve fuels, but it is also necessary to carry out other actions such as improving the technology and age of the vehicle fleet, as well as promoting other initiatives related to road maintenance, mobility and the reduction of emissions in fixed sources, among others.
Ecopetrol remains focused on operational excellence, value creation, a commitment to ethics and transparency, safety as a pillar of its operations and care for the environment. We are committed to profitable growth in production and reserves to deliver results that benefit the company’s sustainability and the country’s energy security.
Felipe Bayón Pardo
CEO – Ecopetrol S.A.
| | 3 | |
| | | |
Bogotá, August 14, 2018. Today, Ecopetrol S.A. (BVC: ECOPETROL; NYSE: EC) announced the Business Group’s financial results for the second quarter and the first half of 2018, prepared in accordance with International Financial Reporting Standards applicable in Colombia.
TABLE 1:
CONSOLIDATED FINANCIAL STATEMENTS
ECOPETROL BUSINESS GROUP
| A | | B | | | C | | | D | | | E | | | F | | | G | | | H | | | I | |
| COP Billion | | 2Q 2018 | | | 2Q 2017 | | | ∆ ($) | | | ∆ (%) | | | 1H 2018 | | | 1H 2017 | | | ∆ ($) | | | ∆ (%) | |
| Total Sales | | | 16,987 | | | | 13,151 | | | | 3,836 | | | | 29.2 | % | | | 31,630 | | | | 26,522 | | | | 5,108 | | | | 19.3 | % |
| Operating Profit | | | 6,384 | | | | 3,268 | | | | 3,116 | | | | 95.3 | % | | | 11,564 | | | | 6,567 | | | | 4,997 | | | | 76.1 | % |
| Net Income Consolidated | | | 3,766 | | | | 1,483 | | | | 2,283 | | | | 153.9 | % | | | 6,584 | | | | 2,556 | | | | 4,028 | | | | 157.6 | % |
| Non-Controlling Interests | | | (247 | ) | | | (178 | ) | | | (69 | ) | | | 38.8 | % | | | (450 | ) | | | (365 | ) | | | (85 | ) | | | 23.3 | % |
| Net Income Attributable to Owners of Ecopetrol | | | 3,519 | | | | 1,305 | | | | 2,214 | | | | 169.7 | % | | | 6,134 | | | | 2,191 | | | | 3,943 | | | | 180.0 | % |
| | | | | | | | | | | | | | | | | | | | | | | | | | | | | | | | | |
| EBITDA | | | 8,609 | | | | 5,632 | | | | 2,977 | | | | 52.9 | % | | | 15,759 | | | | 11,445 | | | | 4,314 | | | | 37.7 | % |
| EBITDA Margin | | | 50.7 | % | | | 42.8 | % | | | 7.9 | % | | | | | | | 49.8 | % | | | 43.2 | % | | | 6.6 | % | | | | |
The figures included in this report are unaudited. Financial information is expressed in billions of Colombian pesos (COP), US dollars (USD), thousands of barrels of oil equivalent per day (mboed) or tons, as noted where applicable. For presentation purposes, certain figures in this report have been rounded to the nearest decimal place.
| I. | Ecopetrol Business Group Financial and Operating Results |
Ecopetrol achieved its highest EBITDA margin in history, posting a 50% margin for the first half of 2018. Profit attributable to shareholders in the first half of 2018 totaled COP 6.1 trillion, with accumulated EBITDA of COP 15.8 trillion. This result is explained by: i) the recovery of production, which rose to 721 mboed in the second quarter of 2018, the highest posted in the last seven quarters; ii) the full operation of the Cartagena Refinery to supply domestic demand and replace imports, and iii) the Business Group’s financial discipline, combined with better crude prices during the period and the exchange rate trend.
Table 2: Profit and Loss Statement - Ecopetrol Business Group
| A | | B | | | C | | | D | | | E | | | F | | | G | | | H | | | I | |
| COP Billion | | 2Q 2018 | | | 2Q 2017 | | | ∆ ($) | | | ∆ (%) | | | 1H 2018 | | | 1H 2017 | | | ∆ ($) | | | ∆ (%) | |
| Local Sales | | | 8,136 | | | | 6,688 | | | | 1,448 | | | | 21.7 | % | | | 15,706 | | | | 13,419 | | | | 2,287 | | | | 17.0 | % |
| Export Sales | | | 8,851 | | | | 6,463 | | | | 2,388 | | | | 36.9 | % | | | 15,924 | | | | 13,103 | | | | 2,821 | | | | 21.5 | % |
| Total Sales | | | 16,987 | | | | 13,151 | | | | 3,836 | | | | 29.2 | % | | | 31,630 | | | | 26,522 | | | | 5,108 | | | | 19.3 | % |
| DD&A Costs | | | 1,899 | | | | 2,101 | | | | (202 | ) | | | -9.6 | % | | | 3,670 | | | | 4,123 | | | | (453 | ) | | | -11.0 | % |
| Variable Costs | | | 5,819 | | | | 5,232 | | | | 587 | | | | 11.2 | % | | | 11,019 | | | | 10,634 | | | | 385 | | | | 3.6 | % |
| Fixed Costs | | | 2,039 | | | | 1,893 | | | | 146 | | | | 7.7 | % | | | 3,915 | | | | 3,614 | | | | 301 | | | | 8.3 | % |
| Cost of Sales | | | 9,757 | | | | 9,226 | | | | 531 | | | | 5.8 | % | | | 18,604 | | | | 18,371 | | | | 233 | | | | 1.3 | % |
| Gross Profits | | | 7,230 | | | | 3,925 | | | | 3,305 | | | | 84.2 | % | | | 13,026 | | | | 8,151 | | | | 4,875 | | | | 59.8 | % |
| Operating Expenses | | | 846 | | | | 657 | | | | 189 | | | | 28.8 | % | | | 1,462 | | | | 1,584 | | | | (122 | ) | | | (7.7 | )% |
| Operating Income | | | 6,384 | | | | 3,268 | | | | 3,116 | | | | 95.3 | % | | | 11,564 | | | | 6,567 | | | | 4,997 | | | | 76.1 | % |
| Financial Income (Loss) | | | (620 | ) | | | (137 | ) | | | (483 | ) | | | 352.6 | % | | | (1,189 | ) | | | (1,156 | ) | | | (33 | ) | | | 2.9 | % |
| Share of Profit of Companies | | | 96 | | | | 24 | | | | 72 | | | | 300.0 | % | | | 182 | | | | 55 | | | | 127 | | | | 230.9 | % |
| Income Before Income Tax | | | 5,860 | | | | 3,155 | | | | 2,705 | | | | 85.7 | % | | | 10,557 | | | | 5,466 | | | | 5,091 | | | | 93.1 | % |
| Income tax | | | (2,094 | ) | | | (1,672 | ) | | | (422 | ) | | | 25.2 | % | | | (3,973 | ) | | | (2,910 | ) | | | (1,063 | ) | | | 36.5 | % |
| Net Income Consolidated | | | 3,766 | | | | 1,483 | | | | 2,283 | | | | 153.9 | % | | | 6,584 | | | | 2,556 | | | | 4,028 | | | | 157.6 | % |
| Non-Controlling Interests | | | (247 | ) | | | (178 | ) | | | (69 | ) | | | 38.8 | % | | | (450 | ) | | | (365 | ) | | | (85 | ) | | | 23.3 | % |
| Net Income (Attributable to Owners of Ecopetrol) | | | 3,519 | | | | 1,305 | | | | 2,214 | | | | 169.7 | % | | | 6,134 | | | | 2,191 | | | | 3,943 | | | | 180.0 | % |
| | | | | | | | | | | | | | | | | | | | | | | | | | | | | | | | | |
| EBITDA | | | 8,609 | | | | 5,632 | | | | 2,977 | | | | 52.9 | % | | | 15,759 | | | | 11,445 | | | | 4,314 | | | | 37.7 | % |
| EBITDA Margin | | | 50.7 | % | | | 42.8 | % | | | 7.9 | % | | | | | | | 49.8 | % | | | 43.2 | % | | | 6.6 | % | | | | |
| | 4 | |
| | | |
The 29.2% increase in sales revenue in the second quarter versus the same period of 2017 is presented as a combined result of:
| a) | An increase in the average weighted basket price of crude oil, natural gas and refined products, up USD 23/bl (+COP 4.7 trillion), largely due to better performance of the Brent crude benchmark price (USD 75/bl in Q2 2018 versus USD 51/bl in Q2 2017). |
| b) | A decrease in in the average exchange rate on revenue earned, from COP 2,936/USD (Q2 2017) to COP 2,856/USD (Q2 2018), negatively impacting total revenue (-COP 397 billion). |
| c) | A decrease in the volume of sales (-COP 491 billion). During the second half of 2018, volumes sold totaled 900 mboed. Although this volume was down by 4.7% compared with the same period of 2017, the reduction was due largely to the use of crude oil to supply the Cartagena refinery, thereby replacing imports and yielding savings for the Business Group. |
| d) | An increase in the revenue from services (+COP 25 billion). |
Table 3: Sales Volumes - Ecopetrol Business Group
| A | | B | | | C | | | D | | | E | | | F | | | G | |
| Local Sales Volume (mboed) | | 2Q 2018 | | | 2Q 2017 | | | ∆ (%) | | | 1H 2018 | | | 1H 2017 | | | ∆ (%) | |
| Crude Oil | | | 4.6 | | | | 16.0 | | | | (71.3 | )% | | | 5.9 | | | | 14.2 | | | | (58.5 | )% |
| Natural Gas | | | 77.5 | | | | 70.3 | | | | 10.2 | % | | | 74.2 | | | | 73.4 | | | | 1.1 | % |
| Gasoline | | | 107.6 | | | | 112.0 | | | | (3.9 | )% | | | 110.3 | | | | 110.6 | | | | (0.3 | )% |
| Medium Distillates | | | 149.7 | | | | 151.2 | | | | (1.0 | )% | | | 148.9 | | | | 148.8 | | | | 0.1 | % |
| LPG and Propane | | | 16.7 | | | | 17.6 | | | | (5.1 | )% | | | 16.9 | | | | 17.8 | | | | (5.1 | )% |
| Fuel Oil | | | 10.5 | | | | 8.0 | | | | 31.3 | % | | | 9.8 | | | | 8.2 | | | | 19.5 | % |
| Industrial and Petrochemical | | | 21.2 | | | | 17.6 | | | | 20.5 | % | | | 20.9 | | | | 18.5 | | | | 13.0 | % |
| Total Local Sales | | | 387.8 | | | | 392.7 | | | | (1.2 | )% | | | 386.9 | | | | 391.5 | | | | (1.2 | )% |
| | | | | | | | | | | | | | | | | | | | | | | | | |
| Export Sales Volume (mboed) | | | 2Q 2018 | | | | 2Q 2017 | | | | ∆(%) | | | | 1H 2018 | | | | 1H 2017 | | | | ∆(%) | |
| Crude Oil | | | 402.5 | | | | 442.4 | | | | (9.0 | )% | | | 384.7 | | | | 434.4 | | | | (11.4 | )% |
| Products | | | 108.3 | | | | 107.3 | | | | 0.9 | % | | | 102.7 | | | | 109.9 | | | | (6.6 | )% |
| Natural Gas | | | 1.4 | | | | 1.9 | | | | (26.3 | )% | | | 1.6 | | | | 1.7 | | | | (5.9 | )% |
| Total Export Sales | | | 512.2 | | | | 551.6 | | | | (7.1 | )% | | | 489.0 | | | | 546.0 | | | | (10.4 | )% |
| | | | | | | | | | | | | | | | | | | | | | | | | |
| Total Sales Volume (mboed) | | | 900.0 | | | | 944.3 | | | | (4.7 | )% | | | 875.9 | | | | 937.5 | | | | (6.6 | )% |
Colombian Market (43% of sales):Domestic sales declined 1.2% as compared to the second quarter of 2017 mainly due to:
| · | Lower domestic crude oil sales (11.4 mbd) as a result of crude production being diverted to the Business Group’s refineries. |
| · | Higher sales of fuel oil (2.5 mbd) primarily due to higher production at the Barrancabermeja refinery. |
| · | Lower gasoline sales (4.4 mbd) primarily due to the 8% to 10% higher quantity of ethanol in gasoline as of March 1, 2018, with the mix being done by the wholesalers. |
| · | Higher sales of natural gas (7.2 mboed) primarily due to higher demand and increased sales volume. |
International market (57% of sales):International sales declined 7.1% as compared to the second quarter of 2017 mainly due to:
| | 5 | |
| | | |
| · | Lower availability of export crude oil (39.9 mbd), primarily due to higher volumes directed to refinery throughput, maximizing crude oil realization. |
| · | An increase in diesel exports (2.5 mbd) primarily due to the availability of product associated with throughput maximization at Cartagena refinery. |
Table 4: Export Destinations - Ecopetrol Business Group
| A | | B | | | C | | | D | | | E | | | F | | | G | |
| Crude (mboed) | | 2Q 2018 | | | 2Q 2017 | | | Share (%) | | | 1H 2018 | | | 1H 2017 | | | Share (%) | |
| U.S. Gulf Coast | | | 144.8 | | | | 163.3 | | | | 36.0 | % | | | 141.8 | | | | 145.1 | | | | 36.9 | % |
| Asia | | | 101.8 | | | | 101.6 | | | | 25.3 | % | | | 108.7 | | | | 101.6 | | | | 28.3 | % |
| Central America / Caribbean | | | 101.3 | | | | 83.2 | | | | 25.2 | % | | | 83.5 | | | | 66.1 | | | | 21.7 | % |
| Europe | | | 20.8 | | | | 18.6 | | | | 5.2 | % | | | 10.5 | | | | 19.7 | | | | 2.7 | % |
| Other | | | 19.0 | | | | 14.9 | | | | 4.7 | % | | | 15.9 | | | | 17.7 | | | | 4.1 | % |
| U.S. West Coast | | | 7.4 | | | | 51.8 | | | | 1.8 | % | | | 12.4 | | | | 63.9 | | | | 3.2 | % |
| U.S. East Coast | | | 5.5 | | | | 3.9 | | | | 1.3 | % | | | 8.3 | | | | 17.7 | | | | 2.2 | % |
| South America | | | 1.9 | | | | 5.1 | | | | 0.5 | % | | | 3.6 | | | | 2.6 | | | | 0.9 | % |
| Total | | | 402.5 | | | | 442.4 | | | | 100 | % | | | 384.7 | | | | 434.4 | | | | 100 | % |
| Products (mboed) | | 2Q 2018 | | | 2Q 2017 | | | Share (%) | | | 1H 2018 | | | 1H 2017 | | | Share (%) | |
| U.S. Gulf Coast | | | 39.2 | | | | 11.7 | | | | 36.2 | % | | | 24.4 | | | | 11.2 | | | | 23.8 | % |
| Central America / Caribbean | | | 22.8 | | | | 51.6 | | | | 21.0 | % | | | 23.0 | | | | 47.4 | | | | 22.4 | % |
| Asia | | | 20.3 | | | | 13.8 | | | | 18.7 | % | | | 22.5 | | | | 17.1 | | | | 21.9 | % |
| U.S. East Coast | | | 14.9 | | | | 17.2 | | | | 13.8 | % | | | 20.8 | | | | 15.7 | | | | 20.2 | % |
| South America | | | 7.6 | | | | 8.3 | | | | 7.1 | % | | | 8.0 | | | | 12.7 | | | | 7.7 | % |
| Europe | | | 3.5 | | | | 1.6 | | | | 3.2 | % | | | 2.4 | | | | 4.2 | | | | 2.4 | % |
| U.S. West Coast | | | 0.0 | | | | 2.4 | | | | 0.0 | % | | | 1.6 | | | | 1.2 | | | | 1.6 | % |
| Other | | | 0.0 | | | | 0.7 | | | | 0.0 | % | | | 0.0 | | | | 0.4 | | | | 0.0 | % |
| Total | | | 108.3 | | | | 107.3 | | | | 100 | % | | | 102.7 | | | | 109.9 | | | | 100 | % |
Note: The information is subject to change after the close of the quarter, as some destinations might be reclassified according to final export results.
Crude oil:In the second quarter of 2018, the US Gulf Coast continued to be the main destination for crude oil exports, despite a slight loss of share given the greater availability of domestic intermediate crudes and higher discounts for competing crudes. Asia and Central America/Caribbean continued to be the second- and third-largest destinations for higher exports, given the increased shares of imports from China and the use of the Caribbean as a hub for subsequent exports to Asia.
Refined Products:The principal export destination for refined products in the second quarter of 2018 was the US Gulf Coast for sales of fuel oil, given the increased demand for imports combined with lesser availability of refined products from Venezuela. The second destination was Central America and the Caribbean, the share of which fell due to the shifting of fuel oil sales to the Gulf. Asia increased its share by 6%, explained by higher coke exports to China.
Table 5: Average Benchmark Crude Price and Basket Spread
| A | | B | | | C | | | D | | | E | | | F | | | G | |
| USD/Bl | | 2Q 2018 | | | 2Q 2017 | | | ∆ (%) | | | 1H 2018 | | | 1H 2017 | | | ∆ (%) | |
| Brent | | | 75.0 | | | | 50.8 | | | | 47.6 | % | | | 71.2 | | | | 52.7 | | | | 35.1 | % |
| Crude Oil Basket vs Brent | | | (8.2 | ) | | | (6.6 | ) | | | 24.2 | % | | | (7.7 | ) | | | (7.5 | ) | | | 2.7 | % |
| Product Oil Basket vs Brent | | | 4.3 | | | | 7.3 | | | | (41.1 | )% | | | 5.5 | | | | 7.1 | | | | (22.5 | )% |
| | 6 | |
| | | |
Table 6: Average Weighted Sale Price - Ecopetrol Business Group
| A | | B | | | C | | | D | | | | E | | | F | | | G | | | H | | | | I | |
| USD/Bl | | 2Q 2018 | | | 2Q 2017 | | | ∆ (%) | | | | Volume
(mboed)
2Q 2018 | | | 1H 2018 | | | 1H 2017 | | | ∆ (%) | | | | Volume
(mboed)
1H 2018 | |
| Crude Oil Basket | | | 66.8 | | | | 44.2 | | | | 51.1 | % | | | | 407.1 | | | | 63.5 | | | | 45.2 | | | | 40.5 | % | | | | 390.6 | |
| Refined Products Basket | | | 79.3 | | | | 58.1 | | | | 36.5 | % | | | | 414.0 | | | | 76.7 | | | | 59.8 | | | | 28.3 | % | | | | 409.5 | |
| Natural Gas Basket | | | 23.6 | | | | 22.8 | | | | 3.5 | % | | | | 78.9 | | | | 22.9 | | | | 23.1 | | | | (0.9 | )% | | | | 75.8 | |
| | | | | | | | | | | | | | | | | 900.0 | | | | | | | | | | | | | | | | | 875.9 | |
Crude oil:In the second quarter, the spread on the crude oil basket versus Brent fell by USD 1.6/bl as compared to the second quarter of 2017 (2Q 2018: USD 8.2/bl vis-á-vis 2T 2017: USD 6.6/bl). The drop was primarily due to market factors such as greater availability of heavy and intermediate crudes on the market and the weakening of competing crudes, such as Maya and Canadian crudes. To mitigate the impact of those factors, we have strengthened our commercial strategy, diversifying destinations, stabilizing the quality of our crudes and seeking end clients in markets with greater strategic value, such as the US and Asia. For Castilla crude, this commercial effort contributed a margin of USD 1.33/bl.
Refined Products:In the second quarter, the spread of the refined products basket versus Brent weakened by USD 3/bl as compared to the second quarter of 2017 (2Q 2018: USD 4.3/bl vis-á-vis 2T 2017: USD 7.3/bl). Refined product prices followed international prices, as a result of the following: i) weakness in the price of fuel oil due to lower demand for electricity generation and from bunkers in Asia, ii) high gasoline inventories in the US, ARA (Amsterdam, Rotterdam and Antwerp) and the rest of Europe, higher inventory as compared to last year and in the upper range for the past five years, partially offset by iii) higher diesel demand in the US by the manufacturing industry while inventory was low in the US, Europe and Singapore. Reficar’s strategy of delivering refined products in the local market has allowed us to place 1.9 million additional barrels of diesel and gasolines on the domestic market, generating USD 4.4 million in additional revenue.
Natural Gas:A 3.5% increase in the price per barrel equivalent in the second quarter of 2018 as compared to the second quarter of 2017, primarily due to price adjustments via indexing authorized by the Colombian Energy and Gas Regulation Commission (CREG).
Depreciation and amortization:The 9.6% decrease in in the second quarter of 2018 as compared to the second quarter of 2017 is primarily due to:
| a) | Effect of the greater incorporation of reserves in 2017 versus 2016, resulting in a decrease in the depreciation rate. |
| b) | Optimization of the variables used for calculating depreciation in the Ecopetrol America fields. |
| c) | Lower production in the Dalmatian and Gunflint fields primarily due to maintenance. |
Partially offset by higher depreciation of:
| d) | The K2 field because of Ecopetrol America’s increased stake since December 2017. |
| e) | Bioenergy, given the start of its operations. |
Variable costs:The 11.2% increase in the second quarter of 2018 as compared to the second quarter of 2017 is primarily due to:
| | 7 | |
| | | |
| a) | Higher costs of purchases of crude oil, gas and refined products (+COP 1.11 trillion) primarily due to the net effect of: |
| · | Higher average price of domestic purchases and refined product imports (+COP 1.93 trillion). |
| · | A decline in purchased volumes (-COP 678 billion, -44 mboed) primarily due to: i) lower crude imports (-COP 516 billion, -38 mbd) for throughput at the Cartagena refinery given the use of domestic crudes, ii) lower fuel imports, especially of diesel and gasolines (-COP 389 billion, -23 mboed) primarily due to substitution for products produced at the Cartagena refinery, offset by iii) higher purchases of crude from third parties (+COP 173 billion, +16 mbd) as part of the agreement with Oxy for the reversals of the Bicentenario oil pipeline, and iv) greater purchases of other products (+COP 54 billion, +1 mboed). |
| · | A decrease in the average exchange rate on purchases (-COP 146 billion), from COP 2,917/USD (Q2 2017) to COP 2,842/USD (Q2 2018). |
The use of local crudes and the delivery of fuels to the local market by the Cartagena refinery has yielded an EBITDA of COP 400 billion for the Business Group due to the following:
| · | Maximization of the throughput of own crude rather than imported crude, achieving cost optimization for raw materials and a higher product margin. |
| · | A higher proportion of demand for fuels supplied by refinery production, yielding a higher margin compared to supplies using imported products. |
| · | Our higher throughput, thanks to the stabilization of refinery operations. |
| b) | Change in inventory and other (-COP 518 billion) primarily due to: i) the appreciation of crudes and products on our consolidated balance sheet as a result of higher purchase prices; ii) greater inventory due to throughput maximization at the Cartagena refinery, partially offset by iii) higher consumption costs and energy rates at the Castilla, Chichimene and Cira Infantas fields, among others. |
Table 7: Local Purchases and Imports - Ecopetrol Business Group
| A | | B | | | C | | | D | | | E | | | F | | | G | |
| Local Purchases (mboed) | | 2Q 2018 | | | 2Q 2017 | | | ∆ (%) | | | 1H 2018 | | | 1H 2017 | | | ∆ (%) | |
| Crude Oil | | | 167.7 | | | | 160.0 | | | | 4.8 | % | | | 163.3 | | | | 158.0 | | | | 3.4 | % |
| Natural Gas | | | 9.9 | | | | 4.1 | | | | 141.5 | % | | | 5.8 | | | | 3.0 | | | | 93.3 | % |
| Refined Products | | | 3.1 | | | | 3.3 | | | | (6.1 | )% | | | 3.3 | | | | 3.4 | | | | (2.9 | )% |
| Diluent | | | 0.5 | | | | 0.2 | | | | 150.0 | % | | | 0.4 | | | | 1.5 | | | | (73.3 | )% |
| Total | | | 181.2 | | | | 167.6 | | | | 8.1 | % | | | 172.8 | | | | 165.9 | | | | 4.2 | % |
| | | | | | | | | | | | | | | | | | | | | | | | | |
| Imports (mboed) | | | 2Q 2018 | | | | 2Q 2017 | | | | ∆(%) | | | | 1H 2018 | | | | 1H 2017 | | | | ∆(%) | |
| Crude Oil | | | 36.9 | | | | 75.1 | | | | (50.9 | )% | | | 41.2 | | | | 82.7 | | | | (50.2 | )% |
| Refined Products | | | 43.0 | | | | 61.6 | | | | (30.2 | )% | | | 46.1 | | | | 70.6 | | | | (34.7 | )% |
| Diluent | | | 52.2 | | | | 52.8 | | | | (1.1 | )% | | | 50.1 | | | | 54.7 | | | | (8.4 | )% |
| Total | | | 132.1 | | | | 189.5 | | | | (30.3 | )% | | | 137.4 | | | | 208.0 | | | | (33.9 | )% |
Fixed costs:The 7.7% increase in the second quarter of 2018 as compared to the second quarter of 2017 is primarily due to:
| | 8 | |
| | | |
| a) | Higher labor cost (+COP 74 billion) primarily due to the wage increase that took effect last year, additional headcount and variable compensation in line with the half-year results. |
| b) | Higher costs related to operational activity (+COP 72 billion) primarily due to i) subsoil maintenance work at Orinoquia and Rubiales, and ii) consumption of materials at Ocensa and Cenit due to the commissioning of the P135 project and the Apiay-Monterrey line. |
Operating expensesfor the second quarter of 2018 increase by 28.8% as compared to the second quarter of 2017 primarily to: i) higher investment in seismic activity at Hocol, Ecopetrol Brasil and México, ii) lower quarterly revenue primarily due to the profit on the sale of minor assets corresponding to the Fields Round, as reported in the second quarter of 2017, iii) expenses used to deal with the emergency at the Lisama 158 well, which was fully addressed at the end of the quarter, partially offset by iv) savings in the negotiation of contracts and capitalization of corporate projects.
| 4. | Financial (non-operational) results and other results |
The change infinancial resultsin the second quarter of 2018 as compared to the second quarter of 2018 is the net result of:
| a) | Lower revenue from exchange rate spreads (down -COP 385 billion), reflecting our decreased exposure to exchange rate fluctuations because of the optimization of our net position in US dollars. |
| b) | Change in net financial interest as a result of the net effect between i) savings on financial costs (+COP 64 billion) primarily due to our pre-payments of international loans over the past year, with a nominal total amount of USD 2,750 million, and the positive effect of the lower average COP/USD exchange rate, partially offset by ii) non recurring financial revenue (-COP 184 billion) recorded in the second quarter of 2017 as a result of the change in the estimated amortized cost of variable rate loans. |
| c) | Other changes (+COP 22 billion) primarily due to the effect of the mark-to-market of our investment portfolio. |
Theeffective income tax ratefor the second quarter of 2018 was 35.7% vis-a-vis the 53% rate saw in the second quarter of 2017. The decrease was primarily due to: i) improved results at the Cartagena Refinery and Ecopetrol America Inc., which are taxed at nominal rates of 15% and 0%, respectively, ii) a 300 basis points nominal tax rate reduction lower, and iii) elimination of the wealth tax, which was an expense not deductible from income.
Table 8: Statement of Financial Position - Ecopetrol Business Group
| A | | B | | | C | | | D | | | E | |
| COP Billion | | June 30, 2018 | | | March 31, 2018 | | | ∆ ($) | | | ∆ (%) | |
| Current Assets | | | 27,249 | | | | 25,214 | | | | 2,035 | | | | 8.1 | % |
| Non Current Assets | | | 94,334 | | | | 93,356 | | | | 978 | | | | 1.0 | % |
| Total Assets | | | 121,583 | | | | 118,570 | | | | 3,013 | | | | 2.5 | % |
| Current Liabilities | | | 18,857 | | | | 20,525 | | | | (1,668 | ) | | | (8.1 | )% |
| Non-Current Liabilities | | | 50,488 | | | | 50,214 | | | | 274 | | | | 0.5 | % |
| Total Liabilities | | | 69,345 | | | | 70,739 | | | | (1,394 | ) | | | (2.0 | )% |
| Equity | | | 52,238 | | | | 47,831 | | | | 4,407 | | | | 9.2 | % |
| Total Liabilities and Equity | | | 121,583 | | | | 118,570 | | | | 3,013 | | | | 2.5 | % |
| | 9 | |
| | | |
The 2.5% increase inassetsas of June 30, 2018 as compared to March 31, 2018 was largely due to the net effect of:
| a) | An increase inproperty, plant and equipment, natural resources and intangible assets(+COP 1.9 trillion) primarily due to: i) higher CAPEX for the quarter, largely in the Upstream segment; ii) greater conversion adjustment among subsidiaries that use the dollar as functional currency, primarily due to the peso’s devaluation against the dollar, iii) adjustment in the costs of abandonment of oil fields, offset by iv) depreciation and amortization for the quarter. |
| b) | An increase intrade accounts and other accounts receivable(+COP 1.3 trillion), primarily due to higher accounts receivable by the Fuel Price Stabilization Fund and the trade portfolio as a result of the increase in international oil prices. |
| c) | A decrease inother financial assets and cash equivalents(-COP 0.84 trillion), primarily from the combined effect of: i) the outflow of funds for the payment of dividends, financial obligations and CAPEX, offset by ii) higher cash surpluses from operations. |
| d) | Other changes totaling COP 0.6 trillion. |
Table 9: Cash Position1- Ecopetrol Business Group
| A | | B | | | C | | | D | | | E | |
| COP Billion | | 2Q 2018 | | | 2Q 2017 | | | 1H 2018 | | | 1H 2017 | |
| Initial Cash and cash equivalents | | | 7,866 | | | | 8,165 | | | | 7,946 | | | | 8,410 | |
| (+) Cash generated from operations | | | 4,641 | | | | 1,495 | | | | 9,314 | | | | 5,951 | |
| (-) CAPEX | | | (1,757 | ) | | | (1,732 | ) | | | (2,952 | ) | | | (2,415 | ) |
| (+/-) Movement of portfolio investments | | | (343 | ) | | | 5,836 | | | | (2,891 | ) | | | 2,894 | |
| (+/-) Other investment activities | | | 160 | | | | 498 | | | | 305 | | | | 633 | |
| (-) Proceeds (repayment of) from borrowings and interests | | | (2,061 | ) | | | (7,210 | ) | | | (2,729 | ) | | | (8,015 | ) |
| (-) Dividends paid | | | (2,210 | ) | | | (1,023 | ) | | | (2,455 | ) | | | (1,137 | ) |
| (+/-) Exchange difference in cash | | | 41 | | | | 217 | | | | (201 | ) | | | (75 | ) |
| Final Cash and cash equivalents | | | 6,337 | | | | 6,246 | | | | 6,337 | | | | 6,246 | |
| Portfolio investments > 3 months | | | 9,463 | | | | 4,215 | | | | 9,463 | | | | 4,215 | |
| Total cash | | | 15,800 | | | | 10,461 | | | | 15,800 | | | | 10,461 | |
At the close of the second quarter, the cash composition was 58% in dollars and 42% in Colombian pesos.
| 6. | Liabilities and Net Equity |
The 2.0% decline in total liabilities as of June 30, 2018 as compared to the March 31, 2018 was due to:
| a) | A decrease inaccounts payable(-COP 1.4 trillion) from the net effect of: i) payment of dividends declared by Ecopetrol’s General Shareholders’ Meeting on 2017 earnings, and ii) higher accounts payable |
| 1 | Cash corresponds to available funds used as cash and cash equivalents, and investments in financial instruments, regardless of maturity. |
| | 10 | |
| | | |
to suppliers as a result of the effect of higher prices on purchases of crude oil and refined products and greater operational activity during the quarter.
| b) | A decrease (-COP 0.9 trillion) intaxes payableassociated with payment of the income tax during the quarter, partially offset by the application of the income tax expense for the period. |
| c) | An increase inloans and financing(+COP 0.4 trillion), largely due to the net effect of i) the exchange rate valuation of our foreign currency debt resulting from the peso’s devaluation against the dollar at the quarterly close and ii) the full pre-payment of the bond we issued in the international market in 2013 with maturity in 2019 totaling USD $350 million and regular payment of principal and interests. As of June 30, 2018, the Business Group’s debt totaled COP 41.3 trillion, 86% of which is in foreign currency and 14% in domestic currency. |
Additionally, last August 6, Ecopetrol S.A. prepaid the entire syndicated loan acquired in 2013 from local banks, which had been scheduled to be amortized up to 2025, for a total of COP 1.43 trillion.
| d) | Other changes in liabilities (+COP 0.5 trillion). |
The 9.2% increase innet equityoccurred as the combined effect of: i) higher earnings during the quarter, ii) earnings from the conversion of assets and liabilities of the subsidiaries that use a functional currency other than the Colombian peso, partially offset by iii) a decrease in the foreign exchange spread on debt used as an instrument to hedge cash flow and net investment.
| 7. | Results by Business Segment |
Table 10: Cumulative Profit and Loss Statement - By segment
| A | | B | | | C | | | D | | | E | | | F | | | G | | | H | | | I | | | J | | | K | |
| | | Upstream | | | Downstream | | | Midstream | | | Eliminations | | | Ecopetrol Consolidated | |
| COP Billion | | 1H 2018 | | | 1H 2017 | | | 1H 2018 | | | 1H 2017 | | | 1H 2018 | | | 1H 2017 | | | 1H 2018 | | | 1H 2017 | | | 1H 2018 | | | 1H 2017 | |
| Local Sales | | | 9,962 | | | | 6,476 | | | | 13,490 | | | | 10,650 | | | | 5,611 | | | | 5,042 | | | | (13,357 | ) | | | (8,749 | ) | | | 15,706 | | | | 13,419 | |
| Export Sales | | | 12,408 | | | | 10,133 | | | | 3,516 | | | | 2,970 | | | | - | | | | - | | | | - | | | | - | | | | 15,924 | | | | 13,103 | |
| Sales | | | 22,370 | | | | 16,609 | | | | 17,006 | | | | 13,620 | | | | 5,611 | | | | 5,042 | | | | (13,357 | ) | | | (8,749 | ) | | | 31,630 | | | | 26,522 | |
| DD&A Costs | | | 2,510 | | | | 3,053 | | | | 602 | | | | 523 | | | | 558 | | | | 547 | | | | - | | | | - | | | | 3,670 | | | | 4,123 | |
| Variable Costs | | | 7,525 | | | | 6,069 | | | | 14,770 | | | | 11,516 | | | | 283 | | | | 264 | | | | (11,559 | ) | | | (7,215 | ) | | | 11,019 | | | | 10,634 | |
| Fixed Costs | | | 4,121 | | | | 3,453 | | | | 904 | | | | 807 | | | | 678 | | | | 762 | | | | (1,788 | ) | | | (1,408 | ) | | | 3,915 | | | | 3,614 | |
| Cost of Sales | | | 14,156 | | | | 12,575 | | | | 16,276 | | | | 12,846 | | | | 1,519 | | | | 1,573 | | | | (13,347 | ) | | | (8,623 | ) | | | 18,604 | | | | 18,371 | |
| Gross profit | | | 8,214 | | | | 4,034 | | | | 730 | | | | 774 | | | | 4,092 | | | | 3,469 | | | | (10 | ) | | | (126 | ) | | | 13,026 | | | | 8,151 | |
| Operating Expenses | | | 762 | | | | 736 | | | | 449 | | | | 751 | | | | 261 | | | | 224 | | | | (10 | ) | | | (127 | ) | | | 1,462 | | | | 1,584 | |
| Operating Profit (Loss) | | | 7,452 | | | | 3,298 | | | | 281 | | | | 23 | | | | 3,831 | | | | 3,245 | | | | - | | | | 1 | | | | 11,564 | | | | 6,567 | |
| Financial Income (Loss) | | | (518 | ) | | | (523 | ) | | | (355 | ) | | | (465 | ) | | | (316 | ) | | | (168 | ) | | | - | | | | - | | | | (1,189 | ) | | | (1,156 | ) |
| Share of profit of companies | | | 165 | | | | 62 | | | | 16 | | | | 11 | | | | 1 | | | | (18 | ) | | | - | | | | - | | | | 182 | | | | 55 | |
| Net Income (Loss) Before Income Tax | | | 7,099 | | | | 2,837 | | | | (58 | ) | | | (431 | ) | | | 3,516 | | | | 3,059 | | | | - | | | | 1 | | | | 10,557 | | | | 5,466 | |
| Provision for Income Tax | | | (2,558 | ) | | | (1,406 | ) | | | (92 | ) | | | (201 | ) | | | (1,323 | ) | | | (1,303 | ) | | | - | | | | - | | | | (3,973 | ) | | | (2,910 | ) |
| Net Income Consolidated | | | 4,541 | | | | 1,431 | | | | (150 | ) | | | (632 | ) | | | 2,193 | | | | 1,756 | | | | - | | | | 1 | | | | 6,584 | | | | 2,556 | |
| Non-controlling interests | | | 30 | | | | - | | | | - | | | | 1 | | | | (480 | ) | | | (366 | ) | | | - | | | | - | | | | (450 | ) | | | (365 | ) |
| Net income (Loss) attributable to owners of Ecopetrol | | | 4,571 | | | | 1,431 | | | | (150 | ) | | | (631 | ) | | | 1,713 | | | | 1,390 | | | | - | | | | 1 | | | | 6,134 | | | | 2,191 | |
| | | | | | | | | | | | | | | | | | | | | | | | | | | | | | | | | | | | | | | | | |
| EBITDA | | | 10,267 | | | | 6,699 | | | | 1,045 | | | | 849 | | | | 4,447 | | | | 3,896 | | | | - | | | | 1 | | | | 15,759 | | | | 11,445 | |
| EBITDA Margin | | | 45.9 | % | | | 40.3 | % | | | 6.1 | % | | | 6.2 | % | | | 79.3 | % | | | 77.3 | % | | | 0.0 | % | | | 0.0 | % | | | 49.8 | % | | | 43.2 | % |
| | 11 | |
| | | |
Table 11: Quarterly Profit and Loss Statement - By segment
| A | | B | | | C | | | D | | | E | | | F | | | G | | | H | | | I | | | J | | | K | |
| | | Upstream | | | Downstream | | | Midstream | | | Eliminations | | | Ecopetrol Consolidated | |
| COP Billion | | 2Q 2018 | | | 2Q 2017 | | | 2Q 2018 | | | 2Q 2017 | | | 2Q 2018 | | | 2Q 2017 | | | 2Q 2018 | | | 2Q 2017 | | | 2Q 2018 | | | 2Q 2017 | |
| Local Sales | | | 5,494 | | | | 3,390 | | | | 6,992 | | | | 5,291 | | | | 2,882 | | | | 2,545 | | | | (7,232 | ) | | | (4,538 | ) | | | 8,136 | | | | 6,688 | |
| Export Sales | | | 6,912 | | | | 5,121 | | | | 1,939 | | | | 1,342 | | | | - | | | | - | | | | - | | | | - | | | | 8,851 | | | | 6,463 | |
| Sales | | | 12,406 | | | | 8,511 | | | | 8,931 | | | | 6,633 | | | | 2,882 | | | | 2,545 | | | | (7,232 | ) | | | (4,538 | ) | | | 16,987 | | | | 13,151 | |
| DD&A Costs | | | 1,315 | | | | 1,566 | | | | 305 | | | | 259 | | | | 279 | | | | 276 | | | | - | | | | - | | | | 1,899 | | | | 2,101 | |
| Variable Costs | | | 4,127 | | | | 3,179 | | | | 7,906 | | | | 5,667 | | | | 115 | | | | 149 | | | | (6,329 | ) | | | (3,763 | ) | | | 5,819 | | | | 5,232 | |
| Fixed Costs | | | 2,102 | | | | 1,818 | | | | 466 | | | | 425 | | | | 369 | | | | 356 | | | | (898 | ) | | | (706 | ) | | | 2,039 | | | | 1,893 | |
| Cost of Sales | | | 7,544 | | | | 6,563 | | | | 8,677 | | | | 6,351 | | | | 763 | | | | 781 | | | | (7,227 | ) | | | (4,469 | ) | | | 9,757 | | | | 9,226 | |
| Gross profit | | | 4,862 | | | | 1,948 | | | | 254 | | | | 282 | | | | 2,119 | | | | 1,764 | | | | (5 | ) | | | (69 | ) | | | 7,230 | | | | 3,925 | |
| Operating Expenses | | | 413 | | | | 250 | | | | 251 | | | | 389 | | | | 187 | | | | 88 | | | | (5 | ) | | | (70 | ) | | | 846 | | | | 657 | |
| Operating Profit (Loss) | | | 4,449 | | | | 1,698 | | | | 3 | | | | (107 | ) | | | 1,932 | | | | 1,676 | | | | - | | | | 1 | | | | 6,384 | | | | 3,268 | |
| Financial Income (Loss) | | | 73 | | | | 208 | | | | (649 | ) | | | (225 | ) | | | (44 | ) | | | (120 | ) | | | - | | | | - | | | | (620 | ) | | | (137 | ) |
| Share of profit of companies | | | 71 | | | | 35 | | | | 9 | | | | 7 | | | | 16 | | | | (18 | ) | | | - | | | | - | | | | 96 | | | | 24 | |
| Net Income (Loss) Before Income Tax | | | 4,593 | | | | 1,941 | | | | (637 | ) | | | (325 | ) | | | 1,904 | | | | 1,538 | | | | - | | | | 1 | | | | 5,860 | | | | 3,155 | |
| Provision for Income Tax | | | (1,592 | ) | | | (938 | ) | | | 183 | | | | (91 | ) | | | (685 | ) | | | (643 | ) | | | - | | | | - | | | | (2,094 | ) | | | (1,672 | ) |
| Net Income Consolidated | | | 3,001 | | | | 1,003 | | | | (454 | ) | | | (416 | ) | | | 1,219 | | | | 895 | | | | - | | | | 1 | | | | 3,766 | | | | 1,483 | |
| Non-controlling interests | | | 30 | | | | - | | | | - | | | | 1 | | | | (277 | ) | | | (179 | ) | | | - | | | | - | | | | (247 | ) | | | (178 | ) |
| Net income (Loss) attributable to owners of Ecopetrol | | | 3,031 | | | | 1,003 | | | | (454 | ) | | | (415 | ) | | | 942 | | | | 716 | | | | - | | | | 1 | | | | 3,519 | | | | 1,305 | |
| | | | | | | | | | | | | | | | | | | | | | | | | | | | | | | | | | | | | | | | | |
| EBITDA | | | 5,949 | | | | 3,377 | | | | 403 | | | | 292 | | | | 2,257 | | | | 1,961 | | | | - | | | | 2 | | | | 8,609 | | | | 5,632 | |
| EBITDA Margin | | | 48.0 | % | | | 39.7 | % | | | 4.5 | % | | | 4.4 | % | | | 78.3 | % | | | 77.1 | % | | | 0.0 | % | | | 0.0 | % | | | 50.7 | % | | | 42.8 | % |
Exploration
Table 12: Exploratory wells drilled - Ecopetrol Business Group
| A | | B | | | C | | | D | | | E | | | F | |
| | | 1H 2018 | |
| Company | | Hydrocarbons presence | | | Suspended | | | Under Evaluation | | | P&A | | | Total | |
| Ecopetrol S.A | | | 2 | | | | - | | | | 3 | | | | - | | | | 5 | |
| Hocol S.A | | | - | | | | - | | | | - | | | | - | | | | - | |
| ECAS | | | - | | | | - | | | | - | | | | - | | | | - | |
| Ecopetrol America (EAI) | | | - | | | | - | | | | - | | | | - | | | | - | |
| Total | | | 2 | | | | - | | | | 3 | | | | - | | | | 5 | |
Include appraisal wells
In late May, the Infantas Oriente field at Barrancabermeja was declared commercial. The reserves associated with the Infantas Oriente-1 discovery were booked in record time, since the assessment started just at the beginning of 2018. Also, during the second quarter of 2018 the Bufalo-1 well (EC operator: 51%, CPVEN E&P Corp: 49%) demonstrated the presence of dry gas and light crude (30° to 35° API).
In the second quarter three appraisal wells were drilled (Parex operator: 50%, EC: 50%): i) Coyote-2 and Coyote-3, the former in initial testing, while the latter has been temporarily suspended pending complete testing of the Coyote-2 well; and ii) Capachos Sur-2, which has been temporarily suspended pending the assessment of possible work to be carried out there.
The 2018 exploratory campaign in the Colombian onshore continued during the second quarter of 2018. In June of 2018, drilling began on the following exploratory wells in the Llanos Orientales basin: i) Andina-1, operated by Parex in a sole-risk operation, with the option for Ecopetrol to enter at 50% interest if successful; and ii) Pulpo-1 (OXY operator: 70%, EC: 30%). We expect to drill at least 12 exploratory wells in 2018.
| | 12 | |
| | | |
In order to achieve the strategic goals of growth and sustainability, Ecopetrol is working to participate in Brazil's Round 5, while in Mexico it is assessing the areas being offered in Rounds 3.2 onshore and 3.4 Deep water by the National Hydrocarbons Commission (CNH).
ECP Brasil purchased 2D seismic information (874 Km) and 3D information (4,283 Km2) to assess the pre-salt in the Campos and Santos basins (Brazil). In turn, ECP México purchased 2D seismic information (60,075 Km) and the Gigante structural interpretation project with a view to assessing the Salina basin of México.
On May 18, 2018, Hocol finalized the registration stage of the SN15-17 seismic program (Block SN 15), acquiring 337 Km of 2D seismic.
On June 13, the Colombian National Hydrocarbons Agency (AHN) approved and published the new model contract for oil and gas exploration and exploitation in the Colombian offshore, a significant milestone that will allow Ecopetrol to advance from technical evaluation agreements (TEA) to Exploration and Production (E&P) contracts, acquire new opportunities and develop its exploratory strategy for the Colombian offshore.
Table 13: Detail of Exploratory Wells - Ecopetrol Business Group
| A | | B | | C | | D | | E | | F | | G |
| | | Quarter | | Well | | Block | | Basin | | Status | | TD |
| 1 | | First | | Bufalo-1 | | VMM-32 | | Middle Magdalena Basin | | Hydrocarbon Presence | | 1/3/2018 |
| 2 | | First | | Jaspe-6D | | Quifa | | Llanos Orientales | | Hydrocarbon Presence | | 1/30/2018 |
| 3 | | Second | | Coyote-2 | | De Mares | | Middle Magdalena Basin | | Under evaluation | | 4/2/2018 |
| 4 | | Second | | Capachos Sur-2 | | Capachos | | Llanos Orientales | | Under evaluation | | 4/18/2018 |
| 5 | | Second | | Coyote-3 | | De Mares | | Middle Magdalena Basin | | Under evaluation | | 5/6/2018 |
Production
Table 14: Gross Production - Ecopetrol Business Group
| A | | B | | | C | | | D | | | E | | | F | | | G | |
| mboed | | 2Q 2018 | | | 2Q 2017 | | | ∆ % | | | 1H 2018 | | | 1H 2017 | | | ∆ (%) | |
| Crude Oil | | | 550.8 | | | | 547.1 | | | | 0.7 | % | | | 542.0 | | | | 545.1 | | | | (0.6 | )% |
| Natural Gas | | | 112.7 | | | | 108.8 | | | | 3.6 | % | | | 110.5 | | | | 110.2 | | | | 0.3 | % |
| Total Ecopetrol S.A. | | | 663.5 | | | | 655.9 | | | | 1.2 | % | | | 652.5 | | | | 655.3 | | | | (0.4 | )% |
| | | | | | | | | | | | | | | | | | | | | | | | | |
| Crude Oil | | | 19.6 | | | | 22.2 | | | | (11.7 | )% | | | 20.2 | | | | 22.1 | | | | (8.6 | )% |
| Natural Gas | | | 7.1 | | | | 5.4 | | | | 31.5 | % | | | 7.1 | | | | 5.1 | | | | 39.2 | % |
| Total Hocol | | | 26.7 | | | | 27.6 | | | | (3.3 | )% | | | 27.3 | | | | 27.2 | | | | 0.4 | % |
| | | | | | | | | | | | | | | | | | | | | | | | | |
| Crude Oil | | | 9.3 | | | | 11.2 | | | | (17.0 | )% | | | 9.2 | | | | 11.4 | | | | (19.3 | )% |
| Natural Gas | | | 5.1 | | | | 4.6 | | | | 10.9 | % | | | 5.0 | | | | 4.5 | | | | 11.1 | % |
| Total Equion** | | | 14.4 | | | | 15.8 | | | | (8.9 | )% | | | 14.2 | | | | 15.9 | | | | (10.7 | )% |
| | | | | | | | | | | | | | | | | | | | | | | | | |
| Crude Oil | | | 3.9 | | | | 3.9 | | | | 0.0 | % | | | 3.9 | | | | 3.9 | | | | 0.0 | % |
| Natural Gas | | | 1.0 | | | | 1.1 | | | | (9.1 | )% | | | 1.0 | | | | 1.0 | | | | 0.0 | % |
| Total Savia** | | | 4.9 | | | | 5.0 | | | | (2.0 | )% | | | 4.9 | | | | 4.9 | | | | 0.0 | % |
| | | | | | | | | | | | | | | | | | | | | | | | | |
| Crude Oil | | | 9.6 | | | | 10.0 | | | | (4.0 | )% | | | 10.3 | | | | 9.3 | | | | 10.8 | % |
| Natural Gas | | | 1.8 | | | | 2.2 | | | | (18.2 | )% | | | 2.0 | | | | 2.1 | | | | (4.8 | )% |
| Total Ecopetrol America | | | 11.4 | | | | 12.2 | | | | (6.6 | )% | | | 12.3 | | | | 11.4 | | | | 7.9 | % |
| | | | | | | | | | | | | | | | | | | | | | | | | |
| Crude Oil | | | 593.2 | | | | 594.4 | | | | (0.2 | )% | | | 585.6 | | | | 591.8 | | | | (1.0 | )% |
| Natural Gas | | | 127.7 | | | | 122.1 | | | | 4.6 | % | | | 125.6 | | | | 122.9 | | | | 2.2 | % |
| Total Group's Production | | | 721 | | | | 717 | | | | 0.6 | % | | | 711 | | | | 715 | | | | (0.5 | )% |
* Gross production includes royalties and is prorated for Ecopetrol’ s stake in each company.
** Equión and Savia are incorporated through the equity method. - Note: Gas production includes white products.
| | 13 | |
| | | |
In the second quarter of 2018, the Ecopetrol Group’s average production totaled 721 mboed, a 2.8% increase versus the first quarter of 2018 and 0.6% increase compared to the second quarter of 2017. Production recovered from the events of the first quarter and was in line with the goal set for 2018 (715-725 mboed) primarily due to the results from the drilling campaign in La Cira, Rubiales, Caño Sur, Dina, Quifa and Castilla fields.
The Company maintains the measures adopted in the initial months of 2018, which include: i) additional work on wells and strengthening of activity with additional rigs for the Castilla field, ii) anticipating the plan for development of the Apiay field, scheduled for 2019, iii) anticipating and accelerating the plan for water injection into 40 acres in the Chichimene field, and iv) increasing workovers, among other activities.
In the second quarter of 2018, the Ecopetrol Group subsidiary companies contributed 57 mboed, providing 8% of total production volume, with a 3.2 mboed decrease (5.3%) compared to the same quarter of 2017. The sharpest decline was noted at Equion due to the termination of the Recetor contract, which was transferred, to Ecopetrol in May 2017, and at Ecopetrol America Inc (EAI) due to scheduled maintenance at Gunflint and K2.
Drilling activity increased in 2018. In addition to the campaigns already mentioned, activity has resumed at Arrayan, Tibú, Yarigui, Akacias, Area Sur (Putumayo) and Chichimene fields. In June 2018, we had 33 rigs exceeding the 25 rigs in place at the end of 2017. The operation of 41 simultaneous rigs is planned for the end of the year. In July, production posted an average of 726 mboed.
Recovery Factor Enhancement Projects:
The success of secondary and tertiary recovery is evidenced in the 148 mboed contribution to production in the first half of 2018, from fields where the principal production mechanism is secondary and tertiary. Added to that is a further 16 mboed from pilot wells currently in execution.
The recovery pilot have shown positive results in terms of both injection efficiency and the response from the reservoir, as well as a higher recovery factor; there are currently 21 pilots in operation, 16 of which remain in the expansion phase (out of 42 pilot projects that started at the creation of the recovery program).
We note the effectiveness of the water injection pilot projects (Castilla, Chichimene, Apiay and Suria fields), CEOR (Chichimene, Casabe, La Cira, Infantas and Yariguí fields) and steam injection (Teca field), which have succeeded in significantly increasing crude production, with a lower volume of water injection and improved water with respect to the plan. This result denotes the Company’s learning curve in the program. Additionally, we confirm the possibility of increasing the recovery factor between approximately 5% and 11% for water and polymer injection and 20% for steam injection.
We are continuing the analysis of expansion of the water injection pilot at Chichimene, Castilla, Apiay and Suria, as well as the improved water injection pilot (CEOR) in Casabe, and the continuous steam injection pilot in the Teca field.
Table 15: Recovery Pilot Projects - Ecopetrol Business Group
| A | | B | | | C | | | D | | | E | |
| Technology | | # Pilots | | | Under evaluation | | | Feasible expansion | | | Non-feasible expansion | |
| Non thermal | | | | | | | | | | | | | | | | |
| Water injection | | | 19 | | | | 9 | | | | 8 | | | | 2 | |
| Optimized water injection | | | 1 | | | | - | | | | 1 | | | | - | |
| CEOR | | | 9 | | | | 5 | | | | 4 | | | | - | |
| Gas injection | | | 7 | | | | 6 | | | | 1 | | | | - | |
| Thermal | | | | | | | | | | | | | | | | |
| Steam injection | | | 4 | | | | - | | | | 2 | | | | 2 | |
| Air injection | | | 2 | | | | 1 | | | | - | | | | 1 | |
| TOTAL | | | 42 | | | | 21 | | | | 16 | | | | 5 | |
| | 14 | |
| | | |
Lifting costs
Table 16: Lifting Cost* - Ecopetrol Business Group
| A | | B | | | C | | | D | | | E | | | F | | | G | | | H | |
| USD/Bl | | 2Q 2018 | | | 2Q 2017 | | | ∆ % | | | 1H 2018 | | | 1H 2017 | | | ∆ (%) | | | % USD | |
| Lifting cost | | | 8.47 | | | | 7.31 | | | | 15.9 | % | | | 8.28 | | | | 6.99 | | | | 18.5 | % | | | 16.0 | % |
| | | | | | | | | | | | | | | | | | | | | | | | | | | | | |
| Exchange rate | | | 2,839.5 | | | | 2,919.6 | | | | (2.7 | )% | | | 2,849.1 | | | | 2,921.0 | | | | (2.5 | )% | | | | |
* Calculated based on barrels produced, without royalties
The increase of USD 1.29/bl in lifting cost in the first half of 2018 compared to the first half of 2017 was due largely to:
Cost effect (+USD1.15/bl):
| · | Higher energy consumption (+USD 0.36/bl) primarily due to: i) increased barrels of production water, ii) higher number of wells drilled, iii) higher price for liquid fuels (diesel and fuel oil) used to generate electricity in the fields, and iv) a 10% growth in the price of energy for large consumers. |
| · | Greater cost execution on subsoil maintenance (up USD 0.30/bl), due to the increased number and complexity of interventions and well services, which has allowed for positive performance of the basic production curve (6.6 mboed higher than expected). |
| · | Higher surface maintenance costs (+USD 0.21/bl) primarily due to the increased amount of surface equipment involved, which has succeeded in maintaining operational reliability and integrity in production operations. |
| · | Greater contracted services and others (+USD 0.28/bl) in line with increased activity. |
Exchange rate effect: The effect of the decrease in the USD/COP exchange rate (+USD 0.20/bl) when the cost in Colombian pesos is re-expressed to USD.
Volume effect: lower cost due to higher production (-USD 0.06/bl).
Since the start of the Transformation Program in 2015, Ecopetrol has implemented actions aimed at improving its cost structure. For the lifting cost, these have been focused on four aspects: i) bringing the failure rate and intervention time of our principal artificial lifting systemsto world-class levels; ii) ensuring maintenance frequencies and strategies for surface facilities; iii) optimizing the processing of each barrel of fluids and iv) optimizing the cost of our energy matrix and efficiency of electrical consumption. Therefore, the impact we have experienced in the lifting cost is associated primarily with the increased operating levels.
Dilution cost
Table 17: Dilution Cost* - Ecopetrol Business Group
| A | | B | | | C | | | D | | | E | | | F | | | G | |
| USD/Bl | | 2Q 2018 | | | 2Q 2017 | | | ∆ % | | | 1H 2018 | | | 1H 2017 | | | ∆ (%) | |
| Dilution cost | | | 5.30 | | | | 3.60 | | | | 47.2 | % | | | 4.77 | | | | 3.80 | | | | 25.5 | % |
* Calculated based on barrels sold
| | 15 | |
| | | |
The higher dilution cost is the result of an increased purchase price for naphtha, in line with the recovery of the international price of WTI and Brent crude, partially offset by lower consumption due to the dilution strategy. This strategy has allowed us a reduction in the dilution factor from 15.77% in June 2017 to 14.75% in June of 2018.
If we eliminate the effect of the increase in naphtha price year-to-date, the dilution cost in the first half of 2018 would have been USD 3.17/bl, which is USD 0.63/bl less than in the first half of 2017, thanks to the success of the dilution strategies we have implemented.
Financial results for the Upstream segment
Table 18: Profit and Loss Statement - Upstream
| A | | B | | | C | | | D | | | E | | | F | | | G | | | H | | | I | |
| COP Billion | | 2Q 2018 | | | 2Q 2017 | | | ∆ ($) | | | ∆ (%) | | | 1H 2018 | | | 1H 2017 | | | ∆ ($) | | | ∆ (%) | |
| Local Sales | | | 5,494 | | | | 3,390 | | | | 2,104 | | | | 62.1 | % | | | 9,962 | | | | 6,476 | | | | 3,486 | | | | 53.8 | % |
| Export Sales | | | 6,912 | | | | 5,121 | | | | 1,791 | | | | 35.0 | % | | | 12,408 | | | | 10,133 | | | | 2,275 | | | | 22.5 | % |
| Sales | | | 12,406 | | | | 8,511 | | | | 3,895 | | | | 45.8 | % | | | 22,370 | | | | 16,609 | | | | 5,761 | | | | 34.7 | % |
| DD&A Costs | | | 1,315 | | | | 1,566 | | | | (251 | ) | | | (16.0 | )% | | | 2,510 | | | | 3,053 | | | | (543 | ) | | | (17.8 | )% |
| Variable Costs | | | 4,127 | | | | 3,179 | | | | 948 | | | | 29.8 | % | | | 7,525 | | | | 6,069 | | | | 1,456 | | | | 24.0 | % |
| Fixed Costs | | | 2,102 | | | | 1,818 | | | | 284 | | | | 15.6 | % | | | 4,121 | | | | 3,453 | | | | 668 | | | | 19.3 | % |
| Cost of Sales | | | 7,544 | | | | 6,563 | | | | 981 | | | | 14.9 | % | | | 14,156 | | | | 12,575 | | | | 1,581 | | | | 12.6 | % |
| Gross profit | | | 4,862 | | | | 1,948 | | | | 2,914 | | | | 149.6 | % | | | 8,214 | | | | 4,034 | | | | 4,180 | | | | 103.6 | % |
| Operating Expenses | | | 413 | | | | 250 | | | | 163 | | | | 65.2 | % | | | 762 | | | | 736 | | | | 26 | | | | 3.5 | % |
| Operating Profit (Loss) | | | 4,449 | | | | 1,698 | | | | 2,751 | | | | 162.0 | % | | | 7,452 | | | | 3,298 | | | | 4,154 | | | | 126.0 | % |
| Financial Income (Loss) | | | 73 | | | | 208 | | | | (135 | ) | | | (64.9 | )% | | | (518 | ) | | | (523 | ) | | | 5 | | | | (1.0 | )% |
| Share of profit of companies | | | 71 | | | | 35 | | | | 36 | | | | 102.9 | % | | | 165 | | | | 62 | | | | 103 | | | | 166.1 | % |
| Net Income (Loss) Before Income Tax | | | 4,593 | | | | 1,941 | | | | 2,652 | | | | 136.6 | % | | | 7,099 | | | | 2,837 | | | | 4,262 | | | | 150.2 | % |
| Provision for Income Tax | | | (1,592 | ) | | | (938 | ) | | | (654 | ) | | | 69.7 | % | | | (2,558 | ) | | | (1,406 | ) | | | (1,152 | ) | | | 81.9 | % |
| Net Income Consolidated | | | 3,001 | | | | 1,003 | | | | 1,998 | | | | 199.2 | % | | | 4,541 | | | | 1,431 | | | | 3,110 | | | | 217.3 | % |
| Non-controlling interests | | | 30 | | | | - | | | | 30 | | | | 0.0 | % | | | 30 | | | | - | | | | 30 | | | | 0.0 | % |
| Net income (Loss) attributable to owners of Ecopetrol | | | 3,031 | | | | 1,003 | | | | 2,028 | | | | 202.2 | % | | | 4,571 | | | | 1,431 | | | | 3,140 | | | | 219.4 | % |
| | | | | | | | | | | | | | | | | | | | | | | | | | | | | | | | | |
| EBITDA | | | 5,949 | | | | 3,377 | | | | 2,572 | | | | 76.2 | % | | | 10,267 | | | | 6,699 | | | | 3,568 | | | | 53.3 | % |
| EBITDA Margin | | | 48.0 | % | | | 39.7 | % | | | 8.3 | % | | | | | | | 45.9 | % | | | 40.3 | % | | | 5.6 | % | | | | |
The increase in the segment’s revenue in the second quarter of 2018 as compared to the second quarter of 2017 is mainly explained by the increase in the crude basket price and greater production.
The increase in the Upstream segment’s cost of sales in the second quarter of 2018 as compared to the second quarter of 2017 was due to:
| · | Higher costs of crude purchases and naphtha imports, in line with the behavior of international prices. |
| · | Higher subsoil maintenance costs due to greater well interventions primarily at Orinoquía and Rubiales fields and an increase in professional services hired to address maintenance. |
| · | Higher purchase of chemical materials due to largest production. |
| · | Higher energy costs due to the increase in rates and consumption from the commissioning of new production and injection wells. |
| · | Higher transport costs given the expanded capacity at Ocensa (Project P135) since the second half of the previous year and higher fees on the El Morro - Araguaney oil pipeline, which are indexed to Brent. |
The decrease in the segment’s depreciation and amortization expenses in the second quarter of 2018 as compared to the second quarter of 2017 was primarily due to the combined effect of: i) greater incorporation of reserves in 2017 versus 2016, ii) optimization of the depreciation methodology in the Ecopetrol America fields, partially offset by iii) greater depreciation due to the increase in Ecopetrol America’s stake in the K2.
The increase in the segment’s operating expenses in the second quarter of 2018 as compared to the second quarter of 2017 was primarily due to: i) greater seismic activity at the Hocol, ECP Brasil and ECP México affiliates, and ii) lower revenue in the second quarter of 2018 due to the profit from the sale of minor assets corresponding to the Fields Round, as reported in the second quarter of 2017.
| | 16 | |
| | | |
EBITDA for the Upstream segment showed a solid recovery in the second quarter of 2018, exceeding the figure during the second quarter of 2017 by COP 2.57 trillion, with an EBITDA margin of 48%.
The segment offinancial net result was a lower revenue during the second quarter of 2018 as compared to the second quarter of 2017, as a result of: i) savings on interest costs, largely associated with the pre-payments of international loans discussed above, offset by ii) a non recurring revenue posted in the second quarter of 2017 due to the changed estimate of the amortized cost of variable-rate loans.
The reversal strategy implemented since 2017 in the Bicentenario oil pipeline allowed the reduction of the impact of the attacks and illegal valves affecting the Caño Limón – Coveñas oil pipeline, preventing deferred production in its fields of influence. In the first half of 2018, 30 reversal cycles were carried out on the Bicentenario pipeline.
Table 19: Transported Volumes2
| A | | B | | | C | | | D | | | E | | | F | | | G | |
| mbd | | 2Q 2018 | | | 2Q 2017 | | | ∆ % | | | 1H 2018 | | | 1H 2017 | | | ∆ (%) | |
| Crude | | | 842.4 | | | | 826.2 | | | | 2.0 | % | | | 819.1 | | | | 815.8 | | | | 0.4 | % |
| Refined Products | | | 272.7 | | | | 273.4 | | | | (0.2 | %) | | | 272.6 | | | | 269.6 | | | | 1.1 | % |
| Total | | | 1,115.1 | | | | 1,099.6 | | | | 1.4 | % | | | 1,091.7 | | | | 1,085.4 | | | | 0.6 | % |
Crude volumes transported in the second quarter of 2018 increased by 2.0% as compared to second quarter of 2017, primarily due to an – extraordinary - request for the evacuation of 658 thousand barrels of Castilla Norte crude oil from Galán to Coveñas and improved reversal operations, allowing for delivery of Caño Limón crude to the Barrancabermeja refinery.
In the second quarter of 2018, the oil pipeline network continued to suffer disruptions from third parties, particularly on the Caño Limón-Coveñas system; however, contingent operation of the Bicentenario oil pipeline mitigated these disruptions, transporting an average of 46 mbd to Coveñas and the Barrancabermeja refinery. Approximately 70% of the volume of crude transported by the oil pipeline system was owned by the Ecopetrol Business Group.
The volume of transported refined products fell slightly during second quarter of 2018 as compared to the second quarter of 2017, because of scheduled maintenance activities at the Galán plant and on the Sebastopol-Medellín line. Approximately 32% of the volume of refined products transported on the poly-duct system corresponded to Ecopetrol Business Group products.
2 Transported volumes in 2Q 2017 were updated based on the update of the volumetric balance of Caño Limón –Coveñas pipeline in such period as a consequence of the contingent operation of the Bicentenario pipeline.
| | 17 | |
| | | |
Table 20: Cost per Barrel Transported - Ecopetrol Business Group
| A | | B | | | C | | | D | | | E | | | F | | | G | | | H | | I | |
| USD/Bl | | 2Q 2018 | | | 2Q 2017 | | | ∆ % | | | 1H 2018 | | | 1H 2017 | | | ∆ (%) | | | Explanation 1H 2018 | | % USD | |
| Operational Transportation Cost | | | 3.11 | | | | 3.12 | | | | (0.1 | )% | | | 3.13 | | | | 3.26 | | | | (3.9 | )% | | • Volume (-USD 0.02 /bl): Higher oil volumes transported by pipelines due to the bi-directional operation at BIC
• Cost (-USD 0.19 /bl): Lower operation & maintenance cost, lower expenses for elimination of wealth tax. | | | 5.0 | % |
| | | | | | | | | | | | | | | | | | | | | | | | | | | | | | | |
| Exchange rate | | | 2,839.5 | | | | 2,919.6 | | | | (2.7 | )% | | | 2,849.1 | | | | 2,921.0 | | | | (2.5 | )% | | • Exchange Rate (+USD 0.08 /bl ): Higher cost due to lower exchange rate (-71.9 COP/USD) | | | | |
Financial results for the Midstream segment
Table 21: Profit and Loss Statement - Transport
| A | | B | | | C | | | D | | | E | | | F | | | G | | | H | | | I | |
| COP Billion | | 2Q 2018 | | | 2Q 2017 | | | ∆ ($) | | | ∆ (%) | | | 1H 2018 | | | 1H 2017 | | | ∆ ($) | | | ∆ (%) | |
| Sales | | | 2,882 | | | | 2,545 | | | | 337 | | | | 13.2 | % | | | 5,611 | | | | 5,042 | | | | 569 | | | | 11.3 | % |
| DD&A Costs | | | 279 | | | | 276 | | | | 3 | | | | 1.1 | % | | | 558 | | | | 547 | | | | 11 | | | | 2.0 | % |
| Variable Costs | | | 115 | | | | 149 | | | | (34 | ) | | | (22.8 | )% | | | 283 | | | | 264 | | | | 19 | | | | 7.2 | % |
| Fixed Costs | | | 369 | | | | 356 | | | | 13 | | | | 3.7 | % | | | 678 | | | | 762 | | | | (84 | ) | | | (11.0 | )% |
| Cost of Sales | | | 763 | | | | 781 | | | | (18 | ) | | | (2.3 | )% | | | 1,519 | | | | 1,573 | | | | (54 | ) | | | (3.4 | )% |
| Gross profit | | | 2,119 | | | | 1,764 | | | | 355 | | | | 20.1 | % | | | 4,092 | | | | 3,469 | | | | 623 | | | | 18.0 | % |
| Operating Expenses | | | 187 | | | | 88 | | | | 99 | | | | 112.5 | % | | | 261 | | | | 224 | | | | 37 | | | | 16.5 | % |
| Operating Profit (Loss) | | | 1,932 | | | | 1,676 | | | | 256 | | | | 15.3 | % | | | 3,831 | | | | 3,245 | | | | 586 | | | | 18.1 | % |
| Financial Income (Loss) | | | (44 | ) | | | (120 | ) | | | 76 | | | | (63.3 | )% | | | (316 | ) | | | (168 | ) | | | (148 | ) | | | 88.1 | % |
| Share of profit of companies | | | 16 | | | | (18 | ) | | | 34 | | | | (188.9 | )% | | | 1 | | | | (18 | ) | | | 19 | | | | (105.6 | )% |
| Net Income (Loss) Before Income Tax | | | 1,904 | | | | 1,538 | | | | 366 | | | | 23.8 | % | | | 3,516 | | | | 3,059 | | | | 457 | | | | 14.9 | % |
| Provision for Income Tax | | | (685 | ) | | | (643 | ) | | | (42 | ) | | | 6.5 | % | | | (1,323 | ) | | | (1,303 | ) | | | (20 | ) | | | 1.5 | % |
| Net Income Consolidated | | | 1,219 | | | | 895 | | | | 324 | | | | 36.2 | % | | | 2,193 | | | | 1,756 | | | | 437 | | | | 24.9 | % |
| Non-controlling interests | | | (277 | ) | | | (179 | ) | | | (98 | ) | | | 54.7 | % | | | (480 | ) | | | (366 | ) | | | (114 | ) | | | 0 | |
| Net income attributable to owners of Ecopetrol | | | 942 | | | | 716 | | | | 226 | | | | 31.6 | % | | | 1,713 | | | | 1,390 | | | | 323 | | | | 23.2 | % |
| | | | | | | | | | | | | | | | | | | | | | | | | | | | | | | | | |
| EBITDA | | | 2,257 | | | | 1,961 | | | | 296 | | | | 15.1 | % | | | 4,447 | | | | 3,896 | | | | 551 | | | | 14.1 | % |
| EBITDA Margin | | | 78.3 | % | | | 77.1 | % | | | 1.3 | % | | | | | | | 79.3 | % | | | 77.3 | % | | | 2.0 | % | | | | |
The 13.2% increase in the midstream segment’s revenue in the second quarter of 2018 as compared to the second quarter of 2017 was primarily due to: i) the reverse transport of volumes through the Bicentenario oil pipeline which, combined with the Araguaney-Monterrey and Ocensa system, allowed for the extraction of crude while the Caño Limón Coveñas system was down, and ii) the commissioning of the San Fernando - Apiay system in January 2018. We note the increase in revenue despite the lower average exchange rate during the second quarter of 2018.
The total cost of sale during second quarter of 2018 was in line with the second quarter of 2017, representing a 2.3% decrease primarily due to the postponement of maintenance activities to the second half of the year.
The increase in the midstream segment’s net operating expenses in the second quarter of 2018 as compared to the second quarter of 2017 is primarily due to the movement of provisions for litigation costs by Ocensa, as well as the reversal of provisions at Cenit in the second quarter of 2017.
| | 18 | |
| | | |
The second quarter posted revenue from the exchange rate spread due to the Colombian peso’s devaluation against the US dollar during the quarter on the segment’s net asset position in dollars.
For the second quarter of 2018, the transport segment posted an EBITDA of COP 2.3 trillion, exceeding the results for the second quarter of 2017 by approximately COP 0.3 trillion, with an EBITDA margin of 78%. Annualized, 2018 EBITDA totaled COP 4.4 trillion, exceeding the results of the same period of 2017 by COP 0.6 trillion.
Events with the Shippers of Caño Limón Coveñas and Bicentenario pipelines
During the month of July 2018, shippers that are not part of the Business Group submitted communications to Oleoducto Bicentenario de Colombia S.A.S. where they declare to terminate in advance the Ship or Pay Transport Contracts celebrated in 2012. According to the above, those shippers have ceased to fulfill their obligations under those contracts. Oleoducto Bicentenario de Colombia has rejected the terms of the communications indicating that there is no place for an anticipated termination and has reiterated to the shippers that the Transportation Contracts are in force. Oleoducto Bicentenario de Colombia will exercise its rights under the terms of the Transportation Contracts to guarantee its compliance and claim any compensation, reparation or restitution derived from the alleged anticipated termination of said contracts.
In turn, during the month of July, Cenit Transporte y Logística de Hidrocarburos S.A.S. also received from shippers that are not part of the Business Group, notice of termination of the crude transport contracts entered into with respect to the Caño Limón - Coveñas pipeline (owned by Cenit). Cenit does not agree with the circumstances alleged by the shippers in their respective notifications of termination of oil transportation contracts, for which reason it considers that they remain in force and will evaluate the actions necessary to safeguard the rights of the company.
Cartagena Refinery
Table 22: Throughput, Utilization Factor, Production and Margin - Cartagena Refinery
| A | | B | | | C | | | D | | | E | | | F | | | G | |
| | | 2Q 2018 | | | 2Q 2017 | | | ∆ % | | | 1H 2018 | | | 1H 2017 | | | ∆ (%) | |
| Throughput * (mbod) | | | 153.0 | | | | 136.2 | | | | 12.3 | % | | | 148.7 | | | | 129.6 | | | | 14.7 | % |
| Utilization (%) | | | 91.2 | | | | 72.9 | | | | 25.1 | % | | | 87.8 | | | | 70.8 | | | | 24.0 | % |
| Production (mboed) | | | 147.1 | | | | 132.5 | | | | 11.0 | % | | | 143.7 | | | | 126.1 | | | | 14.0 | % |
| Gross Margin (USD/Bl) | | | 11.1 | | | | 7.7 | | | | 44.2 | % | | | 11.3 | | | | 7.3 | | | | 54.8 | % |
* Corresponds to volumes actually throughput, not received.
The Cartagena Refinery continued to demonstrate the consolidation and optimization of its operations. Average throughput was 153 mbd in the second quarter of 2018, exceeding the average throughput of the second quarter of 2017 (136.2 mbd). The feedstock composition was 79% of domestic crudes and 21% of imported crudes vis-à-vis 42% domestic and 58% imported crude in the second quarter of 2017, thus contributing to a reduction in the cost of sales for the Business Group. In June, the refinery achieved a record in the use of local crudes, at 83% of its crude diet.
In terms of gross refining margin, the second quarter saw an average of USD 11.1/bl, a 44% increase in the second quarter of 2018 as compared to the second quarter of 2017 (USD 7.7/bl). This result reflects the refinery’s
| | 19 | |
| | | |
stable operations, which has registered ten consecutive months (from September 2017) with a double-digit gross margin.
Barrancabermeja Refinery
Table 23: Throughput, Utilization Factor, Production and Margin - Barrancabermeja Refinery
| A | | B | | | C | | | D | | | E | | | F | | | G | |
| | | 2Q 2018 | | | 2Q 2017 | | | ∆ % | | | 1H 2018 | | | 1H 2017 | | | ∆ (%) | |
| Throughput * (mbod) | | | 221.1 | | | | 202.7 | | | | 9.1 | % | | | 218.0 | | | | 208.6 | | | | 4.5 | % |
| Utilization (%) | | | 85.8 | | | | 70.3 | | | | 22.0 | % | | | 84.7 | | | | 74.2 | | | | 14.2 | % |
| Production (mboed) | | | 224.0 | | | | 204.3 | | | | 9.6 | % | | | 220.3 | | | | 210.3 | | | | 4.8 | % |
| Gross Margin (USD/Bl) | | | 10.5 | | | | 13.1 | | | | (19.8 | )% | | | 11.2 | | | | 13.9 | | | | (19.4 | )% |
* Corresponds to volumes actually throughput, not received.
Throughput and production rose by over 9% in the second quarter of 2018 as compared to the second quarter of 2017, as a result of the implementation of initiatives to segregate light and intermediate crudes, thus increasing their availability. A 19.8% decline was reported in the refining gross margin, mainly due to: i) the increase in the spread of the crude oil basket price versus Brent, which explains -4% of the variation, together with the reduction of the products basket spread, mainly fuel oil and gasoline, which explains the remaining -15%, for a total effect of -19%, in line with international markets.
Table 24: Cash Refining Cost3 - Ecopetrol Business Group*
| A | | B | | | C | | | D | | | E | | | F | | | G | | | H | | I | |
| USD/Bl | | 2Q 2018 | | | 2Q 2017 | | | ∆ % | | | 1H 2018 | | | 1H 2017 | | | ∆ (%) | | | Explanation 1H 2018 | | % USD | |
| Refining cash cost | | | 5.09 | | | | 5.18 | | | | 1.7 | % | | | 4.86 | | | | 5.04 | | | | (3.4 | )% | | • Volume (-USD 0.38 /bl): Higher throughput and stable operation.
• Cost (+USD 0.09 /bl): Higher cost in industrial services due to higher natural gas price. | | | 10.1 | % |
| | | | | | | | | | | | | | | | | | | | | | | | | | | | | | | |
| TRM | | | 2,839.5 | | | | 2,919.6 | | | | 2.7 | % | | | 2,849.1 | | | | 2,921.0 | | | | (2.4 | )% | | • Exchange Rate (+USD 0.12 /bl ): lower cost due to lower exchange rate ( -71.9 COP/ USD). | | | | |
* Includes Barrancabermeja and Cartagena refineries
3 For the sake of comparisons the refinery cash cost of 2Q, 2017 was recalculated to include the cost of the Cartagena refinery, previously not included.
| | 20 | |
| | | |
Financial results for the Refining segment
Table 25: Profit and Loss Statement - Refining
| A | | B | | | C | | | D | | | E | | | F | | | G | | | H | | | I | |
| COP Billion | | 2Q 2018 | | | 2Q 2017 | | | ∆ ($) | | | ∆ (%) | | | 1H 2018 | | | 1H 2017 | | | ∆ ($) | | | ∆ (%) | |
| Sales | | | 8,931 | | | | 6,633 | | | | 2,298 | | | | 34.6 | % | | | 17,006 | | | | 13,620 | | | | 3,386 | | | | 24.9 | % |
| DD&A Costs | | | 305 | | | | 259 | | | | 46 | | | | 17.8 | % | | | 602 | | | | 523 | | | | 79 | | | | 15.1 | % |
| Variable Costs | | | 7,906 | | | | 5,667 | | | | 2,239 | | | | 39.5 | % | | | 14,770 | | | | 11,516 | | | | 3,254 | | | | 28.3 | % |
| Fixed Costs | | | 466 | | | | 425 | | | | 41 | | | | 9.6 | % | | | 904 | | | | 807 | | | | 97 | | | | 12.0 | % |
| Cost of Sales | | | 8,677 | | | | 6,351 | | | | 2,326 | | | | 36.6 | % | | | 16,276 | | | | 12,846 | | | | 3,430 | | | | 26.7 | % |
| Gross profit | | | 254 | | | | 282 | | | | (28 | ) | | | (9.9 | )% | | | 730 | | | | 774 | | | | (44 | ) | | | (5.7 | )% |
| Operating Expenses | | | 251 | | | | 389 | | | | (138 | ) | | | (35.5 | )% | | | 449 | | | | 751 | | | | (302 | ) | | | (40.2 | )% |
| Operating Profit (Loss) | | | 3 | | | | (107 | ) | | | 110 | | | | (102.8 | )% | | | 281 | | | | 23 | | | | 258 | | | | >500% | |
| Financial Income (Loss) | | | (649 | ) | | | (225 | ) | | | (424 | ) | | | 188.4 | % | | | (355 | ) | | | (465 | ) | | | 110 | | | | (23.7 | )% |
| Share of profit of companies | | | 9 | | | | 7 | | | | 2 | | | | 28.6 | % | | | 16 | | | | 11 | | | | 5 | | | | 45.5 | % |
| Net Income (Loss) Before Income Tax | | | (637 | ) | | | (325 | ) | | | (312 | ) | | | 96.0 | % | | | (58 | ) | | | (431 | ) | | | 373 | | | | (86.5 | )% |
| Provision for Income Tax | | | 183 | | | | (91 | ) | | | 274 | | | | (301.1 | )% | | | (92 | ) | | | (201 | ) | | | 109 | | | | (54.2 | )% |
| Net Income Consolidated | | | (454 | ) | | | (416 | ) | | | (38 | ) | | | 9.1 | % | | | (150 | ) | | | (632 | ) | | | 482 | | | | (76.3 | )% |
| Non-controlling interests | | | - | | | | 1 | | | | (1 | ) | | | (100.0 | )% | | | - | | | | 1 | | | | (1 | ) | | | (1 | ) |
| Loss attributable to owners of Ecopetrol | | | (454 | ) | | | (415 | ) | | | (39 | ) | | | 9.4 | % | | | (150 | ) | | | (631 | ) | | | 481 | | | | (76.2 | )% |
| | | | | | | | | | | | | | | | | | | | | | | | | | | | | | | | | |
| EBITDA | | | 403 | | | | 292 | | | | 111 | | | | 38.0 | % | | | 1,045 | | | | 849 | | | | 196 | | | | 23.1 | % |
| EBITDA Margin | | | 4.5 | % | | | 4.4 | % | | | 0.1 | % | | | | | | | 6.1 | % | | | 6.2 | % | | | -0.1 | % | | | | |
The 35% increase in the refining segment’s revenue for the second quarter of 2018 was compared to the second quarter of 2017 is primarily due to better prices on product sales, in line with the behavior of international prices, and better returns on valuable products (diesel and gasolines) at the Barrancabermeja and Cartagena refineries.
The 37% increase in the refining segment’s cost of sales for the second quarter of 2018 as compared to the second quarter of 2017 is primarily due to: i) better throughput of crudes at both refineries, affording higher sales volumes, ii) higher prices of the crude baskets at the two refineries, and iii) higher cost of the raw material at Esenttia.
The 36% decrease in the refining segment’s operating expenses is primarily due to expiration of the Cartagena refinery stabilization period and the decline in project closure expenses, as well as lower transport costs (docking and freight) associated with fewer crude imports.
The refineries continued their positive operating performance during this quarter, reflected in the increase of 48% in EBITDA for the segment during the second quarter of 2018 as compared to the second quarter of 2017.
Financial (non-operational) results for the second quarter of 2018 registered higher expenses as compared to the second quarter of 2017 primarily due to i) the effect of the devaluation of the Colombian peso’s quarterly closing against the US dollar and the segment’s net liability position in US dollars, and ii) higher financial spending as a result of the financial adjustment of liabilities.
The refining segment posted a net loss in the second quarter of 2018 of over 9%, as compared to the second quarter of 2017 primarily due to higher interest expenses.
Fuel Quality
Ecopetrol committed to Transmilenio S.A. to supply natural gas and B2 diesel with a maximum sulfur content of 10 parts per million (ppm) for the renovation of the bus fleets of Transmilenio Phases I and II. This quality enables the entry of Euro VI technologies.
The Company has also been able to maintain the operating and logistics adjustments in order to deliver diesel with sulfur content below 25 ppm to Medellín and its metropolitan area.
| | 21 | |
| | | |
| 8. | Results of the Efficiency Initiatives |
The Ecopetrol Group’s efficiency strategy continued in the second quarter of 2018 with a primary focus on: i) optimization of CAPEX for development (drilling and completion and facilities construction) and exploration, ii) increasing Ecopetrol’s revenue and margins, iii) efficiencies in the Business Group’s subsidiaries, and iv) strategies that aim to positively impact Ecopetrol’s S.A. income statement, including strategies for subsoil and surface maintenance, energy efficiency and electrical planning, dilution, support services and fluids processing.
In the second quarter of 2018, efficiencies were incorporated that totaled COP 429 billion, which exceeded those reported during the second quarter of 2017 by COP 63 billion (+17%). Thus, cumulative efficiencies in the first half of 2018 totaled COP 892 billion, a 73% increase as compared to the first half of 2017 (COP 516 billion), which is the result of the following:
Table 26: Principal structural savings initiatives in 1H 2018
| A | | B | | | C | |
| COP Billion | | 1H 2018 | | | 1H 2017 | |
| Lower deferred production from operations | | | 257.9 | | | | - | |
| Optimization of drilling cost and facilities construction | | | 249.3 | | | | 40.5 | |
| Higher revenues at refineries | | | 182.7 | | | | 155.0 | |
| Energy strategy - Surplus sales + Cost optimization | | | 44.5 | | | | 18.7 | |
| Heavy and extra heavy crude oil dilution and transportation | | | 25.6 | | | | 104.8 | |
| Improved commercial strategy | | | 47.2 | | | | 44.2 | |
| Optimization of operating cost | | | 24.0 | | | | 52.8 | |
| Lower O&M cost in Midstream companies | | | 29.3 | | | | 36.0 | |
| Optimization of refinery cash cost | | | 16.2 | | | | 5.5 | |
| Savings on staff areas, logistics and others | | | 14.8 | | | | 58.5 | |
| TOTAL | | | 891.5 | | | | 516.0 | |
Ecopetrol Group’s investments for the six months ended June 30, 2018 totaled USD 1,009.4 million, a 15% increase as compared to the first half of 2017. The investments have been allocated primarily to the execution of key projects in the Upstream segment, where we report a 23% increase of activity. Of such amount, 78% corresponded to Ecopetrol S.A actions and 22% to its affiliates and subsidiaries, distributed by segment as follows:
Table 27: Investments by segment - Ecopetrol Business Group
| A | | B | | | C | | | D | | | E | |
| 1H 2018 (USD Million) | | Ecopetrol S.A. | | | Affiliates and
Subsidiaries | | | Total | | | Share | |
| Production | | | 717.2 | | | | 95.6 | | | | 812.8 | | | | 80.5 | % |
| Refining, Petrochemicals and Biofuels | | | 38.8 | | | | 24.3 | | | | 63.1 | | | | 6.3 | % |
| Exploration | | | 17.5 | | | | 46.1 | | | | 63.6 | | | | 6.3 | % |
| Transportation | | | 0.7 | | | | 59.7 | | | | 60.4 | | | | 6.0 | % |
| Corporate | | | 9.5 | | | | 0.0 | | | | 9.5 | | | | 0.9 | % |
| Total | | | 783.7 | | | | 225.7 | | | | 1,009.4 | | | | 100 | % |
| | 22 | |
| | | |
Production:(80.5%) The Ecopetrol S.A. drilling campaign focused on Stages 1 and 2 of the Castilla field, with 27 wells drilled, and Modules B2 and B3 of the Rubiales field, with 54 wells drilled. Progress was also made on the La Cira Infantas field drilling plan. Drilling activities were carried out at the subsidiaries by Ecopetrol America Inc. at K2, and by Hocol at Espinal and Guarrojo fields.
It is important to note that the first semester saw the approval of the start of the execution phase of major development projects that are key to profitable growth and the accomplishment of production and reserve goals, in assets such as Akacías, Cravo Norte, Quifa, Infantas Oriente, Palagua, Rubiales, Chichimene and Yariguí, with investments of USD 330 million in 2018 and the drilling of over 100 wells.
These include the start of execution of the incremental module that allows for reactivation of the development of the Akacías field, the fifth-largest original petroleum asset in the country, in which no investment projects have been developed since 2014.
Further, as of the close of June, some USD 30 million had been invested in pilot wells and improved recovery studies to support production sustainability at strategic assets such as Castilla and Chichimene. In this latter field, the water injection expansion phase has been initiated, in line with the asset’s development plan.
Exploration:(6.3%) During the first half of 2018, our focus was the purchase of 2D seismic (60,949 km) and 3D seismic (4,283 km2) in Mexico and Brazil. Hocol also executed three hundred thirty-seven km of 2D seismic. Viability activities were advanced in the Recetor, CPO-8, VMM-6 and PUT-13 blocks, executed by Ecopetrol S.A. Completion and testing processes were also carried out in the Lorito-1 Búfalo-1 and Coyote-1 wells, as well as environmental recovery in the Caño Sur and CPO-10 blocks. We also note the investments in civil works and pre-drilling activities at the sites of wells to be drilled by Hocol: Arrecife-1, Payero-E1ST, Venganza 45H and Jicaro-1.
Refining, Petrochemicals and Biofuels:(6.3%) Major maintenance and operational continuity activities were carried out on the UOP II cracking unit at the Barrancabermeja refinery, as well as on compressor equipment, steam/gas turbines and tanks at the Cartagena refinery.
Midstream:(6.0%) Progress was made in operational continuity activities on the various oil and multipurpose pipeline systems of Cenit, as well as on the Poblanco loop integrity system. At Ocensa, pumping equipment was replaced at the El Porvenir station.
For the full year, we anticipate a level of investment in a range between USD 3 and USD 3.5 billion, an increase of 36% or 59% compared to the amount invested 2017 but lower than our initial guidance. The decrease in the level of investment is due to tree factors, mainly:
| · | Approximately 260 million dollars in efficiencies thanks to the controlled management of risks in the projects and lower costs of drilling and facilities, which are aligned with the strict capital discipline. |
| · | 240 million dollars due to the displacement of some activities to 2019, among which stand exploratory study wells, to allow a longer maturation time, and the prioritization of activities such as "Near Field" exploration that would add resources in the short term. Additionally, some maintenances were rescheduled based on the results of preventive inspections carried out this year, without affecting the integrity and reliability of the operations. |
| · | Finally, the new range of investment considers the potential impact of some environmental situations such as those that occurred in Castilla and Chichimene fields in the first quarter, and the temporary suspension of licenses ruled by the National Environmental Agency of Colombia (ANLA) for new activity in La Lizama area as a result of the environmental contingency in the Lisama 158 well. |
| | 23 | |
| | | |
| II. | Organizational Consolidation and Corporate Responsibility (Ecopetrol S.A.) |
| 1. | Organizational Consolidation |
Table 28: HSE (Health, Safety and the Environment) Performance
| A | | B | | | C | | | D | | | E | |
| HSE Indexes* | | 2Q 2018 | | | 2Q 2017 | | | 1H 2018 | | | 1H 2017 | |
| Total Incidents Recordable Frequency Index (Number of registrable cases per million labor hours) | | | 0.57 | | | | 0.74 | | | | 0.59 | | | | 0.67 | |
| Environmental incidents | | | 3 | | | | 4 | | | | 6 | | | | 8 | |
* The results of the various indicators are subject to change after the close of the quarter, because some accidents and incidents are reclassified according to the final results of the investigations.
Environmental incidents are spills of hydrocarbons greater than 1 barrel, with an environmental impact.
| 2. | Corporate Responsibility |
Social Investment
As of June 30, 2018, funds were invested for social investment projects totaling COP 17.998 billion, distributed among the following programs: i) infrastructure (COP 5.406 billion), ii) reduction in education gaps (COP 3.445 billion), iii) institutional strengthening (COP 3.027 billion), iv) conservation, restoration and sustainable use of strategic ecosystems (COP 1.862 billion), v) sustainable production projects (COP 1.752 billion), vi) culture and recreation (COP 1.5 billion) and vii) other (COP 1.006 billion).
Social Investment Plan at La Lizama Region
Ecopetrol has implemented a comprehensive social investment plan that will benefit communities in the districts of El Pedral, La Lizama, La Fortuna and Meseta San Rafael.
With the support of entities such as the Mid Magdalena Development and Peace Program, a plan is being executed for the prioritization, formulation and management of projects of community interest, and we are advancing an initiative aimed at the ecological rehabilitation of river corridors, the generation of a productive aquatic and forestry model in the lower Sogamoso River, and the conservation of basic traditional fishing species.
With the support of the Alexander Von Humboldt Biological Resources Research Institute, we are promoting a technical-scientific alliance to ensure optimal environmental quality in regions affected by the incident at the Lisama 158 well. This alliance will supplement the recovery of the affected area in terms of water and soil resources and land biodiversity, and strengthen the protection of fauna and flora.
Tax projects and Tax Reimbursement Certificate (CERT)
Pursuant to Article 238 of Law 1819 of 2016, the National Government created the Tax Projects (OxI) mechanism, by which income tax payers may pay up to 50% of the specified tax charge on their respective return, by allocating that amount to direct investment in the execution of approved and priority projects in various communities. The tax obligation, corresponding to the amount awarded by OxI, will be satisfied as Ecopetrol delivers the projects in fulfillment of the legal requirements.
The Company will apply to this mechanism and will allocate a portion of the income tax and surcharges paid in fiscal year 2017 to the execution of five road infrastructure projects and two school expansion projects awarded by the Agency for Territorial Renovation (ART), the total investment of which is COP 94.185 billion.
| | 24 | |
| | | |
Ecopetrol is the company in the country that will allocate more resources to the execution of development projects in areas most affected by the armed conflict.
On the other hand, Article 365 of Law 1819 of 2016 also created an incentive for increasing investments in hydrocarbon exploration and exploitation, known as the Tax Reimbursement Certificate (CERT).
This incentive seeks to promote investments aimed at discovering new hydrocarbon reserves, adding proven reserves or incorporating new recoverable reserves, through exploration or activities aimed at increasing the recovery factor on dry-land basin projects. Ecopetrol S.A. has identified the principal commercial fields for applying for and obtaining the maximum CERT percentage, in full compliance with the requirements imposed by the Ministry of Mines and Energy, and has benefited from the incentive.
CERT may be used to pay domestic taxes, it is freely negotiable in the secondary securities market, and it is divisible and redeemable as of the second year after it is granted.
Collective Labor Agreement
On June 28, Ecopetrol S.A. submitted the withdrawal of the current collective labor agreement with the Ministry of Labor. The agreement was signed in 2014 for a four-year (4) period and expired on June 30, 2018. The purpose of denouncing the agreement is to update the content of some of its articles to align them with the Company’s transformation and growth plans.
Ecopetrol and the union organizations must negotiate a new agreement. The process includes an initial stage of direct negotiation, to begin on August 14, 2018. After that date, by law, the parties have 20 calendar days to come to an agreement. If they have not done so after that period, the stage may be extended for up to an additional 20 days. If an agreement is not reached during this stage, the Ministry of Labor will be requested to convene a Mandatory Arbitration Tribunal to settle the collective dispute, keeping in mind that the company is responsible for providing an essential public service.
| III. | Presentations of Quarterly Results |
Ecopetrol’s senior management will host two conference calls to review the results. Please find below the timing, dial-in and links to access the conferences:
| Spanish | English |
| August 15, 2018 | August 15, 2018 |
| 8:00 a.m. Bogotá | 9:30 a.m. Bogotá |
| 9:00 a.m. NYT | 10:30 a.m. NYT |
The online broadcast will be available at the Ecopetrol website:www.ecopetrol.com.co
The presentation via webcast will be available at the following links:
http://event.onlineseminarsolutions.com/wcc/r/1806327-1/E934C8DEA7B6C6E444887579EE01B359
(Spanish)
http://event.onlineseminarsolutions.com/wcc/r/1806354-1/B163754F8BF385987B8E2BFC078C5A8F
(English)
| | 25 | |
| | | |
Please be sure your browser allows for normal operation of the online presentation. We recommend the latest versions of Internet Explorer, Google Chrome and Mozilla Firefox.
Excel figures will be available at the following link:
https://www.ecopetrol.com.co/wps/portal/web_es/ecopetrol-web/investors/financial-information/quarterly-earnings
Statements on future projections:
This press release may contain statements of future projections relating to business prospects, estimates of operating and financial results, and Ecopetrol’s growth prospects. These are projections, and therefore are based solely on management’s expectations of the company’s future and its continuous access to capital to finance the Company’s sales plan. Achieving these estimates in the future depends on changes in market conditions, government regulations, competitive pressures, the performance of the Colombian economy and industry, and other factors; therefore, they are subject to change without prior notice.
Contact Information:
Capital Markets Manager
María Catalina Escobar
Telephone: +571-234-5190 - Email:investors@ecopetrol.com.co
Media Relations (Colombia)
Jorge Mauricio Tellez
Telephone: + 571-234-4329 - Email:mauricio.tellez@ecopetrol.com.co
| | 26 | |
| | | |
| IV. | Ecopetrol Business Group Appendices |
Table 1: Gross Production per Region – Ecopetrol Business Group Net Interest
| A | | B | | | C | | | D | | | G | | | F | | | G | |
| mboed | | 2Q 2018 | | | 2Q 2017 | | | ∆ (%) | | | 1H 2018 | | | 1H 2017 | | | ∆ (%) | |
| La Cira-Infantas | | | 28.3 | | | | 20.9 | | | | 35.4 | % | | | 27.8 | | | | 21.7 | | | | 28.1 | % |
| Casabe | | | 13.7 | | | | 16.3 | | | | (16.0 | )% | | | 13.8 | | | | 16.4 | | | | (15.9 | )% |
| Yarigui | | | 13.8 | | | | 15.4 | | | | (10.4 | )% | | | 14.0 | | | | 15.6 | | | | (10.3 | )% |
| Other | | | 28.3 | | | | 30.7 | | | | (7.8 | )% | | | 28.4 | | | | 30.9 | | | | (8.1 | )% |
| Total Central Region | | | 84.1 | | | | 83.3 | | | | 1.0 | % | | | 84.0 | | | | 84.6 | | | | (0.7 | )% |
| | | | | | | | | | | | | | | | | | | | | | | | | |
| Castilla | | | 112.9 | | | | 115.4 | | | | (2.2 | )% | | | 111.0 | | | | 114.6 | | | | (3.1 | )% |
| Chichimene | | | 71.3 | | | | 72.4 | | | | (1.5 | )% | | | 67.7 | | | | 70.7 | | | | (4.2 | )% |
| Cupiagua | | | 41.8 | | | | 35.3 | | | | 18.4 | % | | | 37.5 | | | | 38.2 | | | | (1.8 | )% |
| Cusiana | | | 38.9 | | | | 36.1 | | | | 7.8 | % | | | 39.8 | | | | 35.6 | | | | 11.8 | % |
| Other | | | 16.0 | | | | 19.6 | | | | (18.4 | )% | | | 16.4 | | | | 18.5 | | | | (11.4 | )% |
| Total Orinoquía Region | | | 280.9 | | | | 278.8 | | | | 0.8 | % | | | 272.4 | | | | 277.6 | | | | (1.9 | )% |
| | | | | | | | | | | | | | | | | | | | | | | | | |
| Huila Area | | | 3.6 | | | | 3.2 | | | | 12.5 | % | | | 3.4 | | | | 3.2 | | | | 6.3 | % |
| San Francisco Area | | | 6.0 | | | | 6.3 | | | | (4.8 | )% | | | 6.1 | | | | 6.4 | | | | (4.7 | )% |
| Tello Area | | | 3.5 | | | | 4.2 | | | | (16.7 | )% | | | 3.7 | | | | 4.3 | | | | (14.0 | )% |
| Other | | | 11.8 | | | | 11.9 | | | | (0.8 | )% | | | 11.9 | | | | 12.4 | | | | (4.0 | )% |
| Total South Region | | | 24.9 | | | | 25.6 | | | | (2.7 | )% | | | 25.1 | | | | 26.3 | | | | (4.6 | )% |
| | | | | | | | | | | | | | | | | | | | | | | | | |
| Rubiales | | | 118.6 | | | | 115.0 | | | | 3.1 | % | | | 116.5 | | | | 116.8 | | | | (0.3 | )% |
| Caño Sur | | | 3.3 | | | | 1.3 | | | | 153.8 | % | | | 3.0 | | | | 1.3 | | | | 130.8 | % |
| Total East Region | | | 121.9 | | | | 116.3 | | | | 4.8 | % | | | 119.5 | | | | 118.1 | | | | 1.2 | % |
| | | | | | | | | | | | | | | | | | | | | | | | | |
| Guajira | | | 24.2 | | | | 27.5 | | | | (12.0 | )% | | | 24.5 | | | | 27.1 | | | | (9.6 | )% |
| Caño Limón | | | 24.6 | | | | 25.1 | | | | (2.0 | )% | | | 24.6 | | | | 21.5 | | | | 14.4 | % |
| Piedemonte | | | 34.1 | | | | 29.3 | | | | 16.4 | % | | | 33.9 | | | | 29.0 | | | | 16.9 | % |
| Quifa | | | 20.4 | | | | 19.1 | | | | 6.8 | % | | | 20.2 | | | | 19.2 | | | | 5.2 | % |
| Nare | | | 12.3 | | | | 13.4 | | | | (8.2 | )% | | | 12.5 | | | | 13.8 | | | | (9.4 | )% |
| Other | | | 36.1 | | | | 37.5 | | | | (3.7 | )% | | | 35.8 | | | | 38.1 | | | | (6.0 | )% |
| Total Associated Operations | | | 151.7 | | | | 151.9 | | | | (0.1 | )% | | | 151.5 | | | | 148.7 | | | | 1.9 | % |
| | | | | | | | | | | | | | | | | | | | | | | | | |
| Total Ecopetrol S.A. | | | 663.5 | | | | 655.9 | | | | 1.2 | % | | | 652.5 | | | | 655.3 | | | | (0.4 | )% |
| | | | | | | | | | | | | | | | | | | | | | | | | |
| Direct Operation | | | 513.9 | | | | 506.5 | | | | 1.5 | % | | | 503.1 | | | | 509.4 | | | | (1.2 | )% |
| Associated Operation | | | 149.6 | | | | 149.3 | | | | 0.2 | % | | | 149.4 | | | | 145.9 | | | | 2.4 | % |
| | | | | | | | | | | | | | | | | | | | | | | | | |
| Ocelote (**) | | | 11.7 | | | | 13.9 | | | | (15.8 | )% | | | 12.1 | | | | 14.1 | | | | (14.2 | )% |
| Other | | | 14.9 | | | | 13.7 | | | | 8.8 | % | | | 15.3 | | | | 13.1 | | | | 16.8 | % |
| Total Hocol | | | 26.6 | | | | 27.6 | | | | (3.6 | )% | | | 27.4 | | | | 27.2 | | | | 0.7 | % |
| | | | | | | | | | | | | | | | | | | | | | | | | |
| Piedemonte | | | 14.1 | | | | 14.9 | | | | (5.4 | )% | | | 13.9 | | | | 14.7 | | | | (5.4 | )% |
| Tauramena/Rio Chitamena | | | 0.3 | | | | 0.2 | | | | 50.0 | % | | | 0.3 | | | | 0.2 | | | | 50.0 | % |
| Other | | | 0.0 | | | | 0.7 | | | | (100.0 | )% | | | 0.0 | | | | 1.0 | | | | (100.0 | )% |
| Total Equión* | | | 14.4 | | | | 15.8 | | | | (8.9 | )% | | | 14.2 | | | | 15.9 | | | | (10.7 | )% |
| | | | | | | | | | | | | | | | | | | | | | | | | |
| Lobitos | | | 2.9 | | | | 2.3 | | | | 26.1 | % | | | 2.9 | | | | 2.3 | | | | 26.1 | % |
| Peña Negra | | | 1.3 | | | | 1.7 | | | | (23.5 | )% | | | 1.3 | | | | 1.6 | | | | (18.8 | )% |
| Other | | | 0.7 | | | | 1.0 | | | | (30.0 | )% | | | 0.7 | | | | 1.0 | | | | (30.0 | )% |
| Total Savia* | | | 4.9 | | | | 5.0 | | | | (2.0 | )% | | | 4.9 | | | | 4.9 | | | | 0.0 | % |
| | | | | | | | | | | | | | | | | | | | | | | | | |
| Dalmatian | | | 1.2 | | | | 1.4 | | | | (14.3 | )% | | | 1.1 | | | | 1.3 | | | | (15.4 | )% |
| K2 | | | 4.8 | | | | 2.5 | | | | 92.0 | % | | | 4.9 | | | | 2.4 | | | | 104.2 | % |
| Gunflint | | | 5.4 | | | | 8.3 | | | | (34.9 | )% | | | 6.3 | | | | 7.7 | | | | (18.2 | )% |
| Total Ecopetrol America Inc. | | | 11.4 | | | | 12.2 | | | | (6.6 | )% | | | 12.3 | | | | 11.4 | | | | 7.9 | % |
| | | | | | | | | | | | | | | | | | | | | | | | | |
| Total Affiliates | | | 57.3 | | | | 60.6 | | | | (5.4 | )% | | | 58.8 | | | | 59.4 | | | | (1.0 | )% |
| | | | | | | | | | | | | | | | | | | | | | | | | |
| Total Group's Production | | | 721 | | | | 717 | | | | 0.6 | % | | | 711 | | | | 715 | | | | (0.5 | )% |
* Equión and Savia do not consolidate within the Ecopetrol Business Group.
** Ocelote: Since Q1 2017, in the production of the Guarrojo contract, the Pintado and Guarrojo fields have been included along with Ocelote.
| | 27 | |
| | | |
Table 2: Gross Production – Ecopetrol Business Group (By type of Crude)
| A | | B | | | C | | | D | | | E | | | F | | | G | |
| mbod | | 2Q 2018 | | | 2Q 2017 | | | ∆ (%) | | | 1H 2018 | | | 1H 2017 | | | ∆ (%) | |
| Light | | | 66.4 | | | �� | 67.6 | | | | (1.8 | )% | | | 66.0 | | | | 67.2 | | | | (1.8 | )% |
| Medium | | | 172.4 | | | | 176.3 | | | | (2.2 | )% | | | 173.6 | | | | 174.7 | | | | (0.6 | )% |
| Heavy | | | 354.4 | | | | 350.5 | | | | 1.1 | % | | | 346.0 | | | | 349.9 | | | | (1.1 | )% |
| Total | | | 593.2 | | | | 594.4 | | | | (0.2 | )% | | | 585.6 | | | | 591.8 | | | | (1.0 | )% |
Table 3: Net Production* – Ecopetrol Business Group**
| A | | B | | | C | | | D | | | E | | | F | | | G | |
| mboed | | 2Q 2018 | | | 2Q 2017 | | | ∆ (%) | | | 1H 2018 | | | 1H 2017 | | | ∆ (%) | |
| Crude Oil | | | 509.7 | | | | 504.9 | | | | 1.0 | % | | | 502.2 | | | | 501.0 | | | | 0.2 | % |
| Natural Gas*** | | | 108.4 | | | | 104.1 | | | | 4.1 | % | | | 106.5 | | | | 104.7 | | | | 1.7 | % |
| Total | | | 618.1 | | | | 609.0 | | | | 1.5 | % | | | 608.7 | | | | 605.7 | | | | 0.5 | % |
* Net production does not include royalties and is prorated for Ecopetrol’s stake in each Company.
** Equión and Savia are incorporated through the equity method.
*** Gas production includes white products.
Table 4: Profit and Loss Statement – Ecopetrol Business Group
| A | | B | | | C | | | D | | | E | |
| COP Billion | | 2Q 2018 | | | 2Q 2017 | | | 1S 2018 | | | 1S 2017 | |
| Revenue | | | | | | | | | | | | | | | | |
| Local Sales | | | 8,136 | | | | 6,688 | | | | 15,706 | | | | 13,419 | |
| Export Sales | | | 8,851 | | | | 6,463 | | | | 15,924 | | | | 13,103 | |
| Total Revenue | | | 16,987 | | | | 13,151 | | | | 31,630 | | | | 26,522 | |
| Cost of Sales | | | | | | | | | | | | | | | | |
| Depreciation, Amortization and Depletion | | | 1,899 | | | | 2,101 | | | | 3,670 | | | | 4,123 | |
| Variable cost DD&A | | | 1,282 | | | | 1,530 | | | | 2,443 | | | | 2,982 | |
| Fixed cost depreciation | | | 617 | | | | 571 | | | | 1,227 | | | | 1,141 | |
| Variable Costs | | | 5,819 | | | | 5,232 | | | | 11,019 | | | | 10,634 | |
| Imported products | | | 2,717 | | | | 2,796 | | | | 5,389 | | | | 6,325 | |
| Purchase of Hydrocarbons | | | 2,755 | | | | 1,571 | | | | 4,911 | | | | 3,263 | |
| Hydrocarbon Transportation Services | | | 188 | | | | 199 | | | | 351 | | | | 363 | |
| Inventories and others | | | 159 | | | | 666 | | | | 368 | | | | 683 | |
| Fixed Costs | | | 2,039 | | | | 1,893 | | | | 3,915 | | | | 3,614 | |
| Contracted Services | | | 659 | | | | 609 | | | | 1,257 | | | | 1,124 | |
| Maintenance | | | 522 | | | | 504 | | | | 935 | | | | 956 | |
| Labor Costs | | | 515 | | | | 441 | | | | 1,003 | | | | 856 | |
| Other | | | 343 | | | | 339 | | | | 720 | | | | 678 | |
| Total Cost of Sales | | | 9,757 | | | | 9,226 | | | | 18,604 | | | | 18,371 | |
| Gross Income | | | 7,230 | | | | 3,925 | | | | 13,026 | | | | 8,151 | |
| Operating Expenses | | | 846 | | | | 657 | | | | 1,462 | | | | 1,584 | |
| Administration expenses | | | 729 | | | | 580 | | | | 1,274 | | | | 1,480 | |
| Exploration and Projects expenses | | | 117 | | | | 77 | | | | 188 | | | | 104 | |
| Operating Income | | | 6,384 | | | | 3,268 | | | | 11,564 | | | | 6,567 | |
| Finance result, net | | | (620 | ) | | | (137 | ) | | | (1,189 | ) | | | (1,156 | ) |
| Foreign exchange, net | | | 49 | | | | 434 | | | | 70 | | | | (15 | ) |
| Interest, net | | | (513 | ) | | | (393 | ) | | | (1,001 | ) | | | (928 | ) |
| Financial Income/Loss | | | (156 | ) | | | (178 | ) | | | (258 | ) | | | (213 | ) |
| Share of profit of companies | | | 96 | | | | 24 | | | | 182 | | | | 55 | |
| Income before income tax | | | 5,860 | | | | 3,155 | | | | 10,557 | | | | 5,466 | |
| Income Tax | | | (2,094 | ) | | | (1,672 | ) | | | (3,973 | ) | | | (2,910 | ) |
| Net Income Consolidated | | | 3,766 | | | | 1,483 | | | | 6,584 | | | | 2,556 | |
| Non-controlling interest | | | (247 | ) | | | (178 | ) | | | (450 | ) | | | (365 | ) |
| Net income attributable to Owners of Ecopetrol | | | 3,519 | | | | 1,305 | | | | 6,134 | | | | 2,191 | |
| | | | | | | | | | | | | | | | | |
| EBITDA | | | 8,609 | | | | 5,632 | | | | 15,759 | | | | 11,445 | |
| EBITDA Margin | | | 50.7 | % | | | 42.8 | % | | | 49.8 | % | | | 43.2 | % |
| | 28 | |
| | | |
Table 5: Statement of Financial Position / Balance Sheet – Ecopetrol Business Group
| A | | B | | | C | | | D | |
| COP Billion | | June 30, 2018 | | | March 31, 2018 | | | ∆ (%) | |
| Current assets | | | | | | | | | | | | |
| Cash and cash equivalents | | | 6,337 | | | | 7,866 | | | | (19.4 | )% |
| Trade and other receivables | | | 7,886 | | | | 6,596 | | | | 19.6 | % |
| Inventories | | | 5,472 | | | | 4,929 | | | | 11.0 | % |
| Current tax assets | | | 475 | | | | 556 | | | | (14.6 | )% |
| Other financial assets | | | 6,263 | | | | 4,417 | | | | 41.8 | % |
| Other assets | | | 768 | | | | 750 | | | | 2.4 | % |
| | | | 27,201 | | | | 25,114 | | | | 8.3 | % |
| Non-current assets held for sale | | | 48 | | | | 100 | | | | (52.0 | )% |
| Total current assets | | | 27,249 | | | | 25,214 | | | | 8.1 | % |
| | | | | | | | | | | | | |
| Non-current assets | | | | | | | | | | | | |
| Investments in associates and joint ventures | | | 1,438 | | | | 1,327 | | | | 8.4 | % |
| Trade and other receivables | | | 786 | | | | 747 | | | | 5.2 | % |
| Property, plant and equipment | | | 60,257 | | | | 59,140 | | | | 1.9 | % |
| Natural and environmental resources | | | 21,862 | | | | 20,997 | | | | 4.1 | % |
| Intangibles | | | 359 | | | | 361 | | | | (0.6 | )% |
| Deferred tax assets | | | 4,711 | | | | 4,825 | | | | (2.4 | )% |
| Other financial assets | | | 3,200 | | | | 4,357 | | | | (26.6 | )% |
| Other assets | | | 1,721 | | | | 1,602 | | | | 7.4 | % |
| Total non-current assets | | | 94,334 | | | | 93,356 | | | | 1.0 | % |
| | | | | | | | | | | | | |
| Total assets | | | 121,583 | | | | 118,570 | | | | 2.5 | % |
| | | | | | | | | | | | | |
| Liabilities | | | | | | | | | | | | |
| Current liabilities | | | | | | | | | | | | |
| Loans and borrowings | | | 5,677 | | | | 4,933 | | | | 15.1 | % |
| Trade and other payables | | | 8,579 | | | | 9,954 | | | | (13.8 | )% |
| Provision for employees benefits | | | 1,714 | | | | 1,869 | | | | (8.3 | )% |
| Current tax liabilities | | | 1,969 | | | | 2,823 | | | | (30.3 | )% |
| Accrued liabilities and provisions | | | 538 | | | | 562 | | | | (4.3 | )% |
| Other liabilities | | | 380 | | | | 384 | | | | (1.0 | )% |
| | | | 18,857 | | | | 20,525 | | | | (8.1 | )% |
| Liabilities related to non-current assets held for sale | | | - | | | | - | | | | 0.0 | % |
| Total current liabilities | | | 18,857 | | | | 20,525 | | | | (8.1 | )% |
| | | | | | | | | | | | | |
| Non-current liabilities | | | | | | | | | | | | |
| Loans and borrowings | | | 35,652 | | | | 36,026 | | | | (1.0 | )% |
| Trade and other payables | | | 25 | | | | 24 | | | | 4.2 | % |
| Provision for employees benefits | | | 6,655 | | | | 6,705 | | | | (0.7 | )% |
| Deferred tax liabilities | | | 761 | | | | 826 | | | | (7.9 | )% |
| Accrued liabilities and provisions | | | 6,861 | | | | 6,115 | | | | 12.2 | % |
| Other liabilities | | | 534 | | | | 518 | | | | 3.1 | % |
| Total non-current liabilities | | | 50,488 | | | | 50,214 | | | | 0.5 | % |
| | | | | | | | | | | | | |
| Total liabilities | | | 69,345 | | | | 70,739 | | | | (2.0 | )% |
| | | | | | | | | | | | | |
| Equity | | | | | | | | | | | | |
| Equity attributable to owners of the Company | | | 50,330 | | | | 46,193 | | | | 9.0 | % |
| Non-controlling interests | | | 1,908 | | | | 1,638 | | | | 16.5 | % |
| Total Equity | | | 52,238 | | | | 47,831 | | | | 9.2 | % |
| | | | | | | | | | | | | |
| Total liabilities and equity | | | 121,583 | | | | 118,570 | | | | 2.5 | % |
| | 29 | |
| | | |
Table 6: Comprehensive Income Statement – Ecopetrol Business Group
| A | | B | | | C | | | D | | | E | |
| COP Billion | | 2Q 2018 | | | 2Q 2017 | | | 1H 2018 | | | 1H 2017 | |
| Net income consolidated | | | 3,766 | | | | 1,483 | | | | 6,584 | | | | 2,556 | |
| Components of other comprehensive income, net of taxes | | | | | | | | | | | | | | | | |
| Accumulated foreign currency translation | | | 1,299 | | | | 952 | | | | (507 | ) | | | 189 | |
| Cash flow hedges for future exports | | | (213 | ) | | | (437 | ) | | | 298 | | | | 2 | |
| Hedge of a net investment in foreign operation | | | (510 | ) | | | (570 | ) | | | 185 | | | | (174 | ) |
| Measurement of defined benefit obligation | | | 77 | | | | 113 | | | | (22 | ) | | | 194 | |
| Others | | | (12 | ) | | | 23 | | | | (7 | ) | | | 21 | |
| Total other comprehensive income | | | 641 | | | | 81 | | | | (53 | ) | | | 232 | |
| Total Comprehensive income | | | 4,407 | | | | 1,564 | | | | 6,531 | | | | 2,788 | |
| Attributable to: | | | | | | | | | | | | | | | | |
| Shareholders | | | 4,137 | | | | 1,345 | | | | 6,090 | | | | 2,408 | |
| Non-controlling interests | | | 270 | | | | 219 | | | | 441 | | | | 380 | |
| Total Comprehensive income | | | 4,407 | | | | 1,564 | | | | 6,531 | | | | 2,788 | |
Table 7: Cash Flow Statement – Ecopetrol Business Group
| A | | B | | | C | | | D | | | E | |
| COP Billion | | 2Q 2018 | | | 2Q 2017 | | | 1S 2018 | | | 1S 2017 | |
| Cash flow provided by operating activities: | | | | | | | | | | | | | | | | |
| Net income attributable to Owners of Ecopetrol S.A. | | | 3,519 | | | | 1,305 | | | | 6,134 | | | | 2,191 | |
| Adjustments to reconcile net income to cash provided by operating activities: | | | | | | | | | | | | | | | | |
| Non-controlling interests | | | 247 | | | | 178 | | | | 450 | | | | 365 | |
| Income tax | | | 2,094 | | | | 1,672 | | | | 3,973 | | | | 2,910 | |
| Depreciation, depletion and amortization | | | 1,917 | | | | 2,136 | | | | 3,708 | | | | 4,199 | |
| Foreign exchange (gain) loss | | | (49 | ) | | | (434 | ) | | | (70 | ) | | | 15 | |
| Finance costs recognised in profit or loss | | | 796 | | | | 659 | | | | 1,578 | | | | 1,483 | |
| Dry wells | | | 41 | | | | 30 | | | | 48 | | | | 33 | |
| Loss (gain) on disponsal of non-current assets | | | (21 | ) | | | 48 | | | | (21 | ) | | | 33 | |
| Impairment of current and non-current assets | | | (5 | ) | | | (3 | ) | | | (131 | ) | | | 54 | |
| Fair value (gain) on financial assets valuation | | | 21 | | | | (249 | ) | | | (57 | ) | | | (102 | ) |
| Profit in acquisition of participations in joint operations | | | - | | | | - | | | | 12 | | | | - | |
| Gain on assets for sale | | | 1 | | | | (167 | ) | | | 1 | | | | (167 | ) |
| (Gain) loss on share of profit of associates and joint ventures | | | (96 | ) | | | (24 | ) | | | (182 | ) | | | (55 | ) |
| Realized foreign exchange cash flow hedges | | | 109 | | | | 119 | | | | 234 | | | | 253 | |
| Others minor items | | | | | | | | | | | | | | | | |
| Net changes in operating assets and liabilities | | | (1,060 | ) | | | (727 | ) | | | (2,473 | ) | | | (1,539 | ) |
| Income tax paid | | | (2,906 | ) | | | (3,048 | ) | | | (3,889 | ) | | | (3,722 | ) |
| Cash provided by operating activities | | | 4,641 | | | | 1,495 | | | | 9,314 | | | | 5,951 | |
| | | | | | | | | | | | | | | | | |
| Cash flows from investing activities: | | | | | | | | | | | | | | | | |
| Investment in property, plant and equipment | | | (666 | ) | | | (625 | ) | | | (1,110 | ) | | | (909 | ) |
| Investment in natural and environmental resources | | | (1,074 | ) | | | (1,100 | ) | | | (1,822 | ) | | | (1,477 | ) |
| Payments for intangibles | | | (17 | ) | | | (7 | ) | | | (20 | ) | | | (29 | ) |
| Sale of assets held for sale and equity instruments | | | - | | | | 154 | | | | - | | | | 155 | |
| (Purchases) sales of other financial assets | | | (343 | ) | | | 5,836 | | | | (2,891 | ) | | | 2,894 | |
| Interest received | | | 74 | | | | 86 | | | | 158 | | | | 192 | |
| Dividends received | | | 34 | | | | 249 | | | | 53 | | | | 249 | |
| Proceeds from sales of assets | | | 52 | | | | 9 | | | | 94 | | | | 37 | |
| Net cash (used in) provided by investing activities | | | (1,940 | ) | | | 4,602 | | | | (5,538 | ) | | | 1,112 | |
| | | | | | | | | | | | | | | | | |
| Cash flows from financing activities: | | | | | | | | | | | | | | | | |
| Proceeds (repayment of) from borrowings | | | (1,478 | ) | | | (6,492 | ) | | | (1,553 | ) | | | (6,584 | ) |
| Interest paid | | | (583 | ) | | | (718 | ) | | | (1,176 | ) | | | (1,431 | ) |
| Dividends paid | | | (2,210 | ) | | | (1,023 | ) | | | (2,455 | ) | | | (1,137 | ) |
| Net cash used in financing activities | | | (4,271 | ) | | | (8,233 | ) | | | (5,184 | ) | | | (9,152 | ) |
| | | | | | | | | | | | | | | | | |
| Exchange difference in cash and cash equivalents | | | 41 | | | | 217 | | | | (201 | ) | | | (75 | ) |
| Net (decrease) increase in cash and cash equivalents | | | (1,529 | ) | | | (1,919 | ) | | | (1,609 | ) | | | (2,164 | ) |
| Cash and cash equivalents at the beginning of the period | | | 7,866 | | | | 8,165 | | | | 7,946 | | | | 8,410 | |
| Cash and cash equivalents at the end of the period | | | 6,337 | | | | 6,246 | | | | 6,337 | | | | 6,246 | |
| | 30 | |
| | | |
Table 8: EBITDA Reconciliation – Business Group
| A | | B | | | C | | | D | | | E | |
| COP Billion | | 2Q 2018 | | | 2Q 2017 | | | 1H 2018 | | | 1H 2017 | |
| RECONCILIATION NET INCOME TO EBITDA | | | | | | | | | | | | | | | | |
| Net income attributable to Ecopetrol's owners | | | 3,519 | | | | 1,305 | | | | 6,134 | | | | 2,191 | |
| + Depreciation, depletion and amortization | | | 1,917 | | | | 2,136 | | | | 3,708 | | | | 4,199 | |
| +/- Impairment of non-current assets | | | (3 | ) | | | 5 | | | | (149 | ) | | | 9 | |
| - Gain in acquisition of participation in joint operations | | | - | | | | - | | | | 12 | | | | - | |
| +/- Finance results, net | | | 620 | | | | 137 | | | | 1,189 | | | | 1,156 | |
| + Income tax | | | 2,094 | | | | 1,672 | | | | 3,973 | | | | 2,910 | |
| + Other taxes | | | 215 | | | | 199 | | | | 442 | | | | 615 | |
| +/-Non-controlling interest | | | 247 | | | | 178 | | | | 450 | | | | 365 | |
| CONSOLIDATED EBITDA | | | 8,609 | | | | 5,632 | | | | 15,759 | | | | 11,445 | |
Table 9: EBITDA Reconciliation by Segment (1H 2018) – Business Group
| A | | B | | | C | | | D | | | E | | | F | |
| COP Billion | | E&P | | | Refining &
Petrochemicals | | | Transportation
and Logistics | | | Eliminations | | | Consolidated | |
| RECONCILIATION NET INCOME TO EBITDA | | | | | | | | | | | | | | | | | | | | |
| Net income attributable to Ecopetrol's owners | | | 4,571 | | | | (150 | ) | | | 1,713 | | | | - | | | | 6,134 | |
| + Depreciation, depletion and amortization | | | 2,519 | | | | 629 | | | | 560 | | | | - | | | | 3,708 | |
| +/- Impairment of non-current assets | | | (72 | ) | | | (77 | ) | | | - | | | | - | | | | (149 | ) |
| - Gain in acquisition of participation in joint operations | | | 12 | | | | - | | | | - | | | | - | | | | 12 | |
| +/- Finance results, net | | | 518 | | | | 355 | | | | 316 | | | | - | | | | 1,189 | |
| + Income tax | | | 2,558 | | | | 92 | | | | 1,323 | | | | - | | | | 3,973 | |
| + Other taxes | | | 191 | | | | 196 | | | | 55 | | | | - | | | | 442 | |
| +/-Non-controlling interest | | | (30 | ) | | | - | | | | 480 | | | | - | | | | 450 | |
| CONSOLIDATED EBITDA | | | 10,267 | | | | 1,045 | | | | 4,447 | | | | - | | | | 15,759 | |
Table 10: EBITDA Reconciliation by Segment (2Q 2018)
| A | | B | | | C | | | D | | | E | | | F | |
| COP Billion | | E&P | | | Refining &
Petrochemicals | | | Transportation
and Logistics | | | Eliminations | | | Consolidated | |
| RECONCILIATION NET INCOME TO EBITDA | | | | | | | | | | | | | | | | | | | | |
| Net income attributable to Ecopetrol's owners | | | 3,031 | | | | (454 | ) | | | 942 | | | | - | | | | 3,519 | |
| + Depreciation, depletion and amortization | | | 1,320 | | | | 317 | | | | 280 | | | | - | | | | 1,917 | |
| +/- Impairment of non-current assets | | | 1 | | | | (4 | ) | | | - | | | | - | | | | (3 | ) |
| - Gain in acquisition of participation in joint operations | | | - | | | | - | | | | - | | | | - | | | | - | |
| +/- Finance results, net | | | (73 | ) | | | 649 | | | | 44 | | | | - | | | | 620 | |
| + Income tax | | | 1,592 | | | | (183 | ) | | | 685 | | | | - | | | | 2,094 | |
| + Other taxes | | | 108 | | | | 78 | | | | 29 | | | | - | | | | 215 | |
| +/-Non-controlling interest | | | (30 | ) | | | - | | | | 277 | | | | - | | | | 247 | |
| CONSOLIDATED EBITDA | | | 5,949 | | | | 403 | | | | 2,257 | | | | - | | | | 8,609 | |
Table 11: Long-term debt – Ecopetrol Business Group*
| A | | B | | | C | | | D | |
| Company | | Denominated in
U.S. Dollars | | | Denominated in
Colombian Pesos | | | Total ** | |
| Ecopetrol | | | 11,454 | | | | 1,056 | | | | 12,510 | |
| Bicentenario | | | - | | | | 438 | | | | 438 | |
| ODL | | | - | | | | 183 | | | | 183 | |
| Bioenergy | | | - | | | | 152 | | | | 152 | |
| Ocensa | | | 500 | | | | - | | | | 500 | |
| Total | | | 11,954 | | | | 1,829 | | | | 13,783 | |
* Nominal value of debt as of June 30, 2018, not including accrual of interest.
** Figures expressed in millions of dollars equivalent to the Exchange Rate as of June 30, 2018.
| | 31 | |
| | | |
| V. | Appendices: Results of Ecopetrol S.A. principal Subordinates |
Following are the Income Statements and Statements of Financial Position of Ecopetrol S.A. (parent company) and the most representative subordinate companies of each segment.
Table 12: Income Statement
| A | | B | | | C | | | D | | | E | |
| COP Billion | | 2Q 2018 | | | 2Q 2017 | | | 1H 2018 | | | 1H 2017 | |
| Local Sales | | | 8,335 | | | | 5,766 | | | | 15,565 | | | | 11,384 | |
| Export Sales | | | 7,143 | | | | 5,174 | | | | 12,656 | | | | 10,256 | |
| Total Sales | | | 15,478 | | | | 10,940 | | | | 28,221 | | | | 21,640 | |
| Variable Costs | | | 8,044 | | | | 6,343 | | | | 14,699 | | | | 12,489 | |
| Fixed Costs | | | 2,587 | | | | 2,254 | | | | 5,064 | | | | 4,314 | |
| Cost of Sales | | | 10,631 | | | | 8,597 | | | | 19,763 | | | | 16,803 | |
| Gross Profits | | | 4,847 | | | | 2,343 | | | | 8,458 | | | | 4,837 | |
| Operating Expenses | | | 428 | | | | 351 | | | | 812 | | | | 926 | |
| Operating Income | | | 4,419 | | | | 1,992 | | | | 7,646 | | | | 3,911 | |
| Financial Income (Loss) | | | (577 | ) | | | 159 | | | | (920 | ) | | | (767 | ) |
| Share of profit of companies | | | 1,027 | | | | 165 | | | | 1,878 | | | | 535 | |
| Income before income tax | | | 4,869 | | | | 2,316 | | | | 8,604 | | | | 3,679 | |
| Income Tax | | | (1,350 | ) | | | (1,011 | ) | | | (2,470 | ) | | | (1,489 | ) |
| Net Income | | | 3,519 | | | | 1,305 | | | | 6,134 | | | | 2,190 | |
| | | | | | | | | | | | | | | | | |
| EBITDA | | | 5,906 | | | | 3,568 | | | | 10,392 | | | | 7,158 | |
| EBITDA Margin | | | 38.2 | % | | | 32.6 | % | | | 36.8 | % | | | 33.1 | % |
| | 32 | |
| | | |
Table 13: Statement of Financial Position – Balance Sheet
| A | | B | | | C | | | D | |
| COP Billion | | June 30, 2018 | | | March 31, 2018 | | | ∆ (%) | |
| Current assets | | | | | | | | | | | | |
| Cash and cash equivalents | | | 4,493 | | | | 4,098 | | | | 9.6 | % |
| Trade and other receivables | | | 7,580 | | | | 9,550 | | | | (20.6 | )% |
| Inventories | | | 3,779 | | | | 3,510 | | | | 7.7 | % |
| Current tax assets | | | 136 | | | | 424 | | | | (67.9 | )% |
| Financial assets held for sale | | | - | | | | - | | | | 0.0 | % |
| Other financial assets | | | 9,408 | | | | 5,869 | | | | 60.3 | % |
| Other assets | | | 659 | | | | 701 | | | | (6.0 | )% |
| | | | 26,055 | | | | 24,152 | | | | 7.9 | % |
| Non-current assets held for sale | | | 23 | | | | 23 | | | | 0.0 | % |
| Total current assets | | | 26,078 | | | | 24,175 | | | | 7.9 | % |
| | | | | | | | | | | | | |
| Non-current assets | | | | | | | | | | | | |
| Investments in associates and joint ventures | | | 41,111 | | | | 38,750 | | | | 6.1 | % |
| Trade and other receivables | | | 645 | | | | 676 | | | | (4.6 | )% |
| Property, plant and equipment | | | 19,968 | | | | 19,896 | | | | 0.4 | % |
| Natural and environmental resources | | | 17,849 | | | | 17,107 | | | | 4.3 | % |
| Intangibles | | | 225 | | | | 228 | | | | (1.3 | )% |
| Deferred tax assets | | | 2,280 | | | | 2,400 | | | | (5.0 | )% |
| Other financial assets | | | 2,677 | | | | 3,863 | | | | (30.7 | )% |
| Other non-current assets | | | 923 | | | | 808 | | | | 14.2 | % |
| Total non-current assets | | | 85,678 | | | | 83,728 | | | | 2.3 | % |
| | | | | | | | | | | | | |
| Total assets | | | 111,756 | | | | 107,903 | | | | 3.6 | % |
| | | | | | | | | | | | | |
| Liabilities | | | | | | | | | | | | |
| Current liabilities | | | | | | | | | | | | |
| Loans and borrowings | | | 4,651 | | | | 4,009 | | | | 16.0 | % |
| Trade and other payables | | | 8,194 | | | | 9,467 | | | | (13.4 | )% |
| Provision for employees benefits | | | 1,674 | | | | 1,822 | | | | (8.1 | )% |
| Current tax liabilities | | | 1,578 | | | | 1,386 | | | | 13.9 | % |
| Accrued liabilities and provisions | | | 320 | | | | 331 | | | | (3.3 | )% |
| Other liabilities | | | 255 | | | | 283 | | | | (9.9 | )% |
| Total current liabilities | | | 16,672 | | | | 17,298 | | | | (3.6 | )% |
| | | | | | | | | | | | | |
| Non-current liabilities | | | | | | | | | | | | |
| Loans and borrowings | | | 32,295 | | | | 32,611 | | | | (1.0 | )% |
| Provision for employees benefits | | | 6,655 | | | | 6,705 | | | | (0.7 | )% |
| Deferred tax liabilities | | | 145 | | | | 145 | | | | 0.0 | % |
| Accrued liabilities and provisions | | | 5,645 | | | | 4,939 | | | | 14.3 | % |
| Other long-term liabilities | | | 15 | | | | 13 | | | | 15.4 | % |
| Total non-current liabilities | | | 44,755 | | | | 44,413 | | | | 0.8 | % |
| | | | | | | | | | | | | |
| Total liabilities | | | 61,427 | | | | 61,711 | | | | (0.5 | )% |
| | | | | | | | | | | | | |
| Equity | | | | | | | | | | | | |
| Equity attributable to owners of the Company | | | 50,329 | | | | 46,192 | | | | 9.0 | % |
| Total Equity | | | 50,329 | | | | 46,192 | | | | 9.0 | % |
| | | | | | | | | | | | | |
| Total liabilities and equity | | | 111,756 | | | | 107,903 | | | | 3.6 | % |
| | 33 | |
| | | |
| 2. | Principal companies consolidating within the Ecopetrol Business Group |
Table 14: Essentia (Propilco) – sales volumes
| A | | B | | | C | | | D | | | E | | | F | | | G | |
| Sales Volume (tons) | | 2Q 2018 | | | 2Q 2017 | | | ∆ (%) | | | 1H 2018 | | | 1H 2017 | | | ∆ (%) | |
| Polypropylene | | | 113,613 | | | | 102,936 | | | | 10.4 | % | | | 218,086 | | | | 211,609 | | | | 3.1 | % |
| Masterbatch* | | | 6,651 | | | | 6,178 | | | | 7.7 | % | | | 14,300 | | | | 12,306 | | | | 16.2 | % |
| Polyethylene | | | 7,963 | | | | 8,123 | | | | (2.0 | )% | | | 14,997 | | | | 15,858 | | | | (5.4 | )% |
| Total | | | 128,227 | | | | 117,237 | | | | 9.4 | % | | | 247,383 | | | | 239,773 | | | | 3.2 | % |
*Consolidated figures for Esenttia-Comai
Table 15: Cartagena Refinery – sales volumes
| A | | B | | | C | | | D | | | E | | | F | | | G | |
| Sales Volume (mboed) | | 2Q 2018 | | | 2Q 2017 | | | ∆ (%) | | | 1H 2018 | | | 1H 2017 | | | ∆ (%) | |
| Local | | | 99.4 | | | | 88.6 | | | | 12.2 | % | | | 94.7 | | | | 72.5 | | | | 30.6 | % |
| International | | | 63.2 | | | | 61.7 | | | | 2.4 | % | | | 62.2 | | | | 67.4 | | | | (7.7 | )% |
| Total | | | 162.6 | | | | 150.3 | | | | 8.2 | % | | | 156.9 | | | | 139.9 | | | | 12.2 | % |
| | 34 | |
| | | |
Table 16: Profit and Loss Statement
| A | | B | | | C | | | D | | | E | | | F | | | G | | | H | | | I | | | J | | | K | | | L | | | M | | | N | | | O | | | P | | | Q | | | R | | | S | | | T | | | U | |
| | | HOCOL | | | AMERICA INC | | | PROPILCO | | | REFICAR | | | CENIT | |
| COP Billion | | 2Q 2018 | | | 2Q 2017 | | | 1H 2018 | | | 1H 2017 | | | 2Q 2018 | | | 2Q 2017 | | | 1H 2018 | | | 1H 2017 | | | 2Q 2018 | | | 2Q 2017 | | | 1H 2018 | | | 1H 2017 | | | 2Q 2018 | | | 2Q 2017 | | | 1H 2018 | | | 1H 2017 | | | 2Q 2018 | | | 2Q 2017 | | | 1H 2018 | | | 1H 2017 | |
| Local Sales | | | 139 | | | | 120 | | | | 272 | | | | 228 | | | | 11 | | | | 14 | | | | 23 | | | | 26 | | | | 264 | | | | 221 | | | | 494 | | | | 397 | | | | 2,151 | | | | 1,442 | | | | 3,959 | | | | 2,341 | | | | 1,112 | | | | 990 | | | | 2,190 | | | | 2,005 | |
| Export Sales | | | 182 | | | | 213 | | | | 358 | | | | 401 | | | | 160 | | | | 138 | | | | 333 | | | | 249 | | | | 295 | | | | 235 | | | | 583 | | | | 528 | | | | 1,055 | | | | 683 | | | | 1,972 | | | | 1,644 | | | | - | | | | - | | | | - | | | | - | |
| Total Sales | | | 321 | | | | 333 | | | | 630 | | | | 629 | | | | 171 | | | | 152 | | | | 356 | | | | 275 | | | | 559 | | | | 456 | | | | 1,077 | | | | 925 | | | | 3,206 | | | | 2,125 | | | | 5,931 | | | | 3,985 | | | | 1,112 | | | | 990 | | | | 2,190 | | | | 2,005 | |
| Variable Costs | | | 102 | | | | 154 | | | | 204 | | | | 275 | | | | 106 | | | | 205 | | | | 235 | | | | 367 | | | | 454 | | | | 374 | | | | 898 | | | | 743 | | | | 2,860 | | | | 1,978 | | | | 5,245 | | | | 3,571 | | | | 19 | | | | 65 | | | | 102 | | | | 115 | |
| Fixed Costs | | | 80 | | | | 73 | | | | 152 | | | | 151 | | | | 43 | | | | 48 | | | | 90 | | | | 78 | | | | 31 | | | | 28 | | | | 59 | | | | 58 | | | | 294 | | | | 284 | | | | 578 | | | | 573 | | | | 374 | | | | 339 | | | | 715 | | | | 726 | |
| Cost of Sales | | | 182 | | | | 227 | | | | 356 | | | | 426 | | | | 149 | | | | 253 | | | | 325 | | | | 445 | | | | 485 | | | | 402 | | | | 957 | | | | 801 | | | | 3,154 | | | | 2,262 | | | | 5,823 | | | | 4,144 | | | | 393 | | | | 404 | | | | 817 | | | | 841 | |
| Gross Profits | | | 139 | | | | 106 | | | | 274 | | | | 203 | | | | 22 | | | | (101 | ) | | | 31 | | | | (170 | ) | | | 74 | | | | 54 | | | | 120 | | | | 124 | | | | 52 | | | | (137 | ) | | | 108 | | | | (159 | ) | | | 719 | | | | 586 | | | | 1,373 | | | | 1,164 | |
| Operating Expenses | | | 61 | | | | 35 | | | | 106 | | | | 52 | | | | 11 | | | | 22 | | | | 39 | | | | 43 | | | | 45 | | | | 40 | | | | 90 | | | | 81 | | | | 166 | | | | 222 | | | | 72 | | | | 422 | | | | 94 | | | | 11 | | | | 74 | | | | 92 | |
| Operating Income | | | 78 | | | | 71 | | | | 168 | | | | 151 | | | | 11 | | | | (123 | ) | | | (8 | ) | | | (213 | ) | | | 29 | | | | 14 | | | | 30 | | | | 43 | | | | (114 | ) | | | (359 | ) | | | 36 | | | | (581 | ) | | | 625 | | | | 575 | | | | 1,299 | | | | 1,072 | |
| Financial Income (Loss) | | | (2 | ) | | | (2 | ) | | | (9 | ) | | | (2 | ) | | | (2 | ) | | | (4 | ) | | | (5 | ) | | | (7 | ) | | | - | | | | (4 | ) | | | 6 | | | | (3 | ) | | | (70 | ) | | | (202 | ) | | | (93 | ) | | | (324 | ) | | | 15 | | | | 24 | | | | (154 | ) | | | 8 | |
| Share of profit of companies | | | 15 | | | | 11 | | | | 30 | | | | 23 | | | | - | | | | - | | | | - | | | | - | | | | 25 | | | | 19 | | | | 56 | | | | 50 | | | | - | | | | - | | | | - | | | | - | | | | 539 | | | | 384 | | | | 967 | | | | 798 | |
| Income before income tax | | | 91 | | | | 80 | | | | 189 | | | | 172 | | | | 9 | | | | (127 | ) | | | (13 | ) | | | (220 | ) | | | 54 | | | | 29 | | | | 92 | | | | 90 | | | | (184 | ) | | | (561 | ) | | | (57 | ) | | | (905 | ) | | | 1,179 | | | | 983 | | | | 2,112 | | | | 1,878 | |
| Income Tax | | | (8 | ) | | | (27 | ) | | | (62 | ) | | | (79 | ) | | | - | | | | - | | | | - | | | | - | | | | (9 | ) | | | (5 | ) | | | (12 | ) | | | (24 | ) | | | (14 | ) | | | 24 | | | | (77 | ) | | | 33 | | | | (234 | ) | | | (257 | ) | | | (423 | ) | | | (465 | ) |
| Net Income | | | 83 | | | | 53 | | | | 127 | | | | 93 | | | | 9 | | | | (127 | ) | | | (13 | ) | | | (220 | ) | | | 45 | | | | 24 | | | | 80 | | | | 66 | | | | (198 | ) | | | (537 | ) | | | (134 | ) | | | (872 | ) | | | 945 | | | | 726 | | | | 1,689 | | | | 1,413 | |
| | | | - | | | | - | | | | - | | | | - | | | | - | | | | - | | | | - | | | | - | | | | - | | | | - | | | | - | | | | - | | | | - | | | | - | | | | - | | | | - | | | | - | | | | - | | | | - | | | | - | |
| EBITDA | | | 192 | | | | 176 | | | | 392 | | | | 363 | | | | 115 | | | | 83 | | | | 237 | | | | 157 | | | | 43 | | | | 28 | | | | 58 | | | | 72 | | | | 96 | | | | (187 | ) | | | 369 | | | | (186 | ) | | | 762 | | | | 697 | | | | 1,575 | | | | 1,360 | |
| EBITDA Margin | | | 59.8 | % | | | 52.9 | % | | | 62.2 | % | | | 57.7 | % | | | 67.3 | % | | | 54.6 | % | | | 66.6 | % | | | 57.1 | % | | | 7.7 | % | | | 6.1 | % | | | 5.4 | % | | | 7.8 | % | | | 3.0 | % | | | (8.8 | )% | | | 6.2 | % | | | (4.7 | )% | | | 68.5 | % | | | 70.4 | % | | | 71.9 | % | | | 67.8 | % |
Table 17: Statement of Financial Position – Balance Sheet
| A | | B | | | C | | | D | | | E | | | F | | | G | | | H | | | I | | | J | | | K | |
| | | HOCOL | | | AMERICA INC | | | PROPILCO | | | REFICAR | | | CENIT | |
| COP Billion | | June 30, 2018 | | | March 31, 2018 | | | Junio 30, 2018 | | | Marzo 31, 2018 | | | Junio 30, 2018 | | | Marzo 31, 2018 | | | Junio 30, 2018 | | | Marzo 31, 2018 | | | Junio 30, 2018 | | | Marzo 31, 2018 | |
| Current Assets | | | 682 | | | | 567 | | | | 350 | | | | 345 | | | | 952 | | | | 939 | | | | 2,727 | | | | 2,451 | | | | 1,043 | | | | 4,009 | |
| Non Current Assets | | | 2,068 | | | | 2,038 | | | | 2,884 | | | | 2,765 | | | | 923 | | | | 850 | | | | 23,367 | | | | 22,431 | | | | 12,669 | | | | 12,110 | |
| Total Assets | | | 2,750 | | | | 2,605 | | | | 3,234 | | | | 3,110 | | | | 1,875 | | | | 1,789 | | | | 26,094 | | | | 24,882 | | | | 13,712 | | | | 16,119 | |
| Current Liabilities | | | 623 | | | | 611 | | | | 156 | | | | 201 | | | | 375 | | | | 412 | | | | 2,310 | | | | 2,148 | | | | 418 | | | | 3,831 | |
| Non-Current Liabilities | | | 327 | | | | 322 | | | | 179 | | | | 167 | | | | 100 | | | | 90 | | | | 6,166 | | | | 5,789 | | | | 534 | | | | 533 | |
| Total Liabilities | | | 950 | | | | 933 | | | | 335 | | | | 368 | | | | 475 | | | | 502 | | | | 8,476 | | | | 7,937 | | | | 952 | | | | 4,364 | |
| Equity | | | 1,800 | | | | 1,672 | | | | 2,899 | | | | 2,742 | | | | 1,400 | | | | 1,287 | | | | 17,618 | | | | 16,945 | | | | 12,760 | | | | 11,755 | |
| Total Liabilities and Equity | | | 2,750 | | | | 2,605 | | | | 3,234 | | | | 3,110 | | | | 1,875 | | | | 1,789 | | | | 26,094 | | | | 24,882 | | | | 13,712 | | | | 16,119 | |
| | 35 | |
| | | |
