Exhibit 99.1
| In words of Felipe Bayón Pardo, CEO of Ecopetrol: | |  |
| | | |
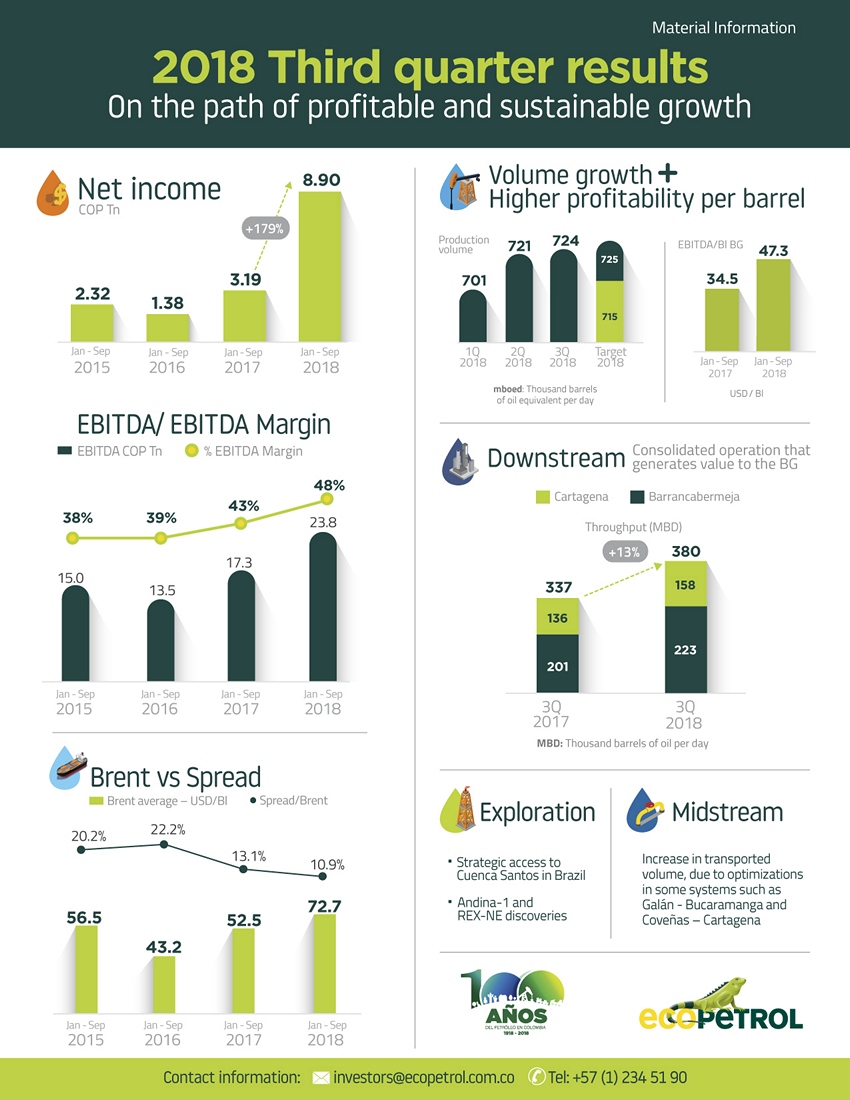
“For the first nine months of the year, Ecopetrol is reporting the best financial results of the past four years. Net income attributable to owners of Ecopetrol rose to 8.9 trillion pesos, EBITDA totaled 23.8 trillion pesos and EBITDA margin was at 48%. These solid financial results were achieved due to the good operating performance of all segments, which brought about an increase in crude oil and gas production, lower crude oil imports for the Downstream segment as well as of refined products to supply the local market. In summary, we were able to capture the profit coming from the higher international oil prices. The flexibility of the Group’s commercial strategy allowed us to take advantage from the higher demand for crude oil from refiners in Asia to create more value. In the third quarter of 2018, sales to Asia accounted for a 45% share of total crude exports, versus 25% during the same quarter in 2017. Thanks to this initiative, the discount price of the crude basket versus Brent remained at approximately 11%. In the third quarter of 2018, Ecopetrol Group’s average production totaled 724,000 barrels of oil equivalent per day, the highest in the last 10 quarters. Year-to-date average production was 716,000 barrels of oil equivalent per day. The increased production for the quarter is in line with the target set for 2018 and it was possible due to the positive results from our drilling campaign and the greater demand for natural gas in the thermal power and industrial sectors. At the end of the quarter, we had drilled 421 development wells and had 41 rigs in operation. This increase in activity is reflected in larger investments during the quarter, totaling 789 million dollars and representing 80% of what was invested in the first half of the year and more than 50% over the investment in the third quarter of 2017. In the exploration segment, Ecopetrol entered into one of the highest-potential oil basins in the world. The Pau-Brasil block, located in the central region of the Santos basin, in the Brazilian pre-salt was awarded to the joint venture between BP Energy (50% - Operator), Ecopetrol (20%) and CNOOC Petroleum (30%). This milestone is consistent with our long-term growth strategy and demonstrates Ecopetrol’s ability to develop strategic alliances with leading companies in world-class industry opportunities. | | During the third quarter, we drilled five exploratory wells, for a total of nine during the course of the year, and had an exploratory success rate of 44%. These results are in line with the goal of drilling 12 wells in 2018, and materialize our strategy of building a solid base of assets for the company’s future sustainability. In the Midstream segment, we saw increased volumes of crude oil and refined products transported, primarily due to the optimization of certain systems, such as Galán – Bucaramanga and Coveñas – Cartagena and the beginning of operation of San Fernando-Apiay-Monterrey system along with the expansion of Ocensa P135. Moreover, it is important to highlight the transportation tests carried out at a higher viscosity of 700 centistokes (cSt -- a measure of viscosity) with positive operating results, which are now under economic evaluation. During the third quarter, the oil pipeline network continued to suffer from third-party disruptions, especially on the Caño Limón- Coveñas system; nevertheless, the Bicentenario oil pipeline was able to mitigate those impacts, resulting in five reversion cycles during the quarter. Year to date, 35 reversion cycles have been carried out on the Bicentenario oil pipeline. This flexible operation has prevented deferred production from Caño Limón field. In the Downstream segment, the two refineries jointly achieved a new historic maximum of 380,000 barrels of stable throughput per day. The third quarter was the best of the year in terms of throughput and gross refining margin for each of our refineries. In line with the optimization process, the Cartagena refinery continued to generate value by achieving an average throughput of 158,000 barrels per day for the quarter, with a throughput composition of 80% domestic and 20% imported crude. This result contributed significantly to the reduction of the Group´s cost of sales. In August, a record was attained at the refinery by using 100% local crudes during nine days, getting an average throughput of 164,000 barrels per day. Gross refining margin for the quarter was 12.1 dollars per barrel which represents a 17.5% increase vis-à-vis the third quarter of 2017. |
| | | |
| 1 |
 |
Additionally, the Barrancabermeja refinery showed an 11% increase in throughput versus the third quarter of 2017. This outcome was primarily due to the stable operation of its units and the segregation of light and intermediate crudes. The average refining margin for the quarter was 13.9 dollars per barrel, largely impacted by the increase in the prices of the crude basket vs. Brent. Ecopetrol continues to work on fuel quality. In line with this commitment, we have taken advantage of the greater synergies between the Cartagena and Barrancabermeja refineries, as well as operational adjustments in the transport and logistics systems, to produce cleaner fuels. In September, diesel distributed in Colombia had an average sulfur content between 15 and 20 parts per million (ppm), below the maximum of 50 ppm of sulfur permitted by local regulation. Specifically, we delivered diesel with an average sulfur content between 12 and 14 ppm to the city of Medellin that complies with international reference markets standards as those in the United States (10 to 15 ppm sulfur content). Our reducing cost strategy through efficiency measures allowed us to account for 1.8 trillion pesos of higher efficiencies across the Groupduring the first nine months of 2018, up 26% versus those reported during the same period of 2017. We remain committed with cost efficiency and capital discipline, which are now embedded in our corporate culture. These accomplishments had enhanced the financial position of the Group. At the end of the third quarter, we increased our cash position from 15 trillion at the end of the second quarter, to 18 trillion pesos, despite the payment of the second installment of dividends to the Government for 1.6 trillion pesos and the prepayments of debt for a total amount of 637 million dollars. This financial strength is essential to support the profitable growth plans of the Group and secure long-term sustainability through crude oil price cycles | | In September, Ecopetrol completed the negotiation of a new Collective Bargaining Agreement that will apply for four and a half years and cover aspects such as education, health, food, loans and transport services, among other worker benefits. The New Collective Bargaining Agreement is aligned with the business strategy that seeks to maintain efficiency, capital discipline and collective labor in the new phase of Ecopetrol’s growth. We believe it will contribute positively to the workers wellbeing and the country’s development. Talking about our ESG initiatives, year-to-date efforts have been focused on activities such as the recycling of 63.3 million cubic meters of water used in our operations. This amount represents an additional saving of 20% compared with the same period last year, enabling us to optimize the water requirement. On another front, we have advanced towards the incorporation of non-conventional renewable energy into the matrix of energy resources, with the announcement of the construction of a solar farm that will supply part of the energy consumption of Castilla field. This is in addition to the existing renewable energy supply from biomass. Ecopetrol remains committed to generating value and caring for environment, safe operations, ethics and transparency. Maintaining positive results and growing profitably will remain our focus as we continue to operate as a sustainable company that generates value for its shareholders.” |
| 2 |
| |
Bogotá, October 31, 2018. Ecopetrol S.A. (BVC: ECOPETROL; NYSE: EC) announced today the Business Group’s financial results for the third quarter and year-to-date 2018, prepared in accordance with International Financial Reporting Standards applicable in Colombia.
TABLE 1:
CONSOLIDATED FINANCIAL RESULTS
ECOPETROL BUSINESS GROUP
| A | | B | | | C | | | D | | | E | | | F | | | G | | | H | | | I | |
| COP Billion | | 3Q 2018 | | | 3Q 2017 | | | ∆ ($) | | | ∆ (%) | | | Jan-Sep 18 | | | Jan-Sep 17 | | | ∆ ($) | | | ∆ (%) | |
| Total Sales | | | 17,876 | | | | 13,325 | | | | 4,551 | | | | 34.2 | % | | | 49,506 | | | | 39,847 | | | | 9,659 | | | | 24.2 | % |
| Operating Profit | | | 5,653 | | | | 3,323 | | | | 2,330 | | | | 70.1 | % | | | 17,217 | | | | 9,889 | | | | 7,328 | | | | 74.1 | % |
| Net Income Consolidated | | | 3,007 | | | | 1,224 | | | | 1,783 | | | | 145.7 | % | | | 9,591 | | | | 3,779 | | | | 5,812 | | | | 153.8 | % |
| Non-Controlling Interests | | | (232 | ) | | | (221 | ) | | | (11 | ) | | | 5.0 | % | | | (682 | ) | | | (585 | ) | | | (97 | ) | | | 16.6 | % |
| Net Income Attributable to Owners of Ecopetrol | | | 2,775 | | | | 1,003 | | | | 1,772 | | | | 176.7 | % | | | 8,909 | | | | 3,194 | | | | 5,715 | | | | 178.9 | % |
| | | | | | | | | | | | | | | | | | | | | | | | | | | | | | | | | |
| EBITDA | | | 7,997 | | | | 5,852 | | | | 2,145 | | | | 36.7 | % | | | 23,756 | | | | 17,296 | | | | 6,460 | | | | 37.3 | % |
| EBITDA Margin | | | 44.7 | % | | | 43.9 | % | | | 0.8 | % | | | | | | | 48.0 | % | | | 43.4 | % | | | 4.6 | % | | | | |
The figures included in this report are not audited. Financial information is expressed in billions of Colombian pesos (COP) or US dollars (USD), or thousands of barrels of oil equivalent per day (mboed) or tons, and is so indicated where applicable. For presentation purposes, certain figures in this report were rounded to the nearest decimal place. Further information on the Business Group’s financial figures may be consulted in Ecopetrol’s Consolidated Financial Statements, published on our website.
| I. | Ecopetrol Business Group Financial and Operating Results |
In the third quarter of 2018, the Ecopetrol Business Group achieved solid financial results, posting an EBITDA of some COP 8.0 trillion, COP 2.1 trillion higher than the same period in 2017. Ecopetrol’s earnings attributable to shareholders during the same period totaled COP 2.8 trillion, with an EBITDA margin of 45%. These results were achieved thanks to: i) upper levels of hydrocarbon production (724 mboed) in the third quarter of 2018, the highest of the past 10 quarters; ii) solid operational performance in refining, with the higher average throughput reported at 380,000 barrels per day and iii) efficiency in operating the reversal flow at Bicentenario oil pipeline, mitigating the impacts of the attacks on the Caño Limón-Coveñas pipeline. These realizations have enabled us to capture the benefit of higher crude prices during the period, offset in part by the recognition of the expense associated with the non-commercial exploration investment in blocks K642 and K686 in the Gulf of Mexico (León 1 and 2 wells).
| 3 |
| |
Table 2: Profit and Loss Statement – Ecopetrol Business Group
| A | | B | | | C | | | D | | | E | | | F | | | G | | | H | | | I | |
| COP Billion | | 3Q 2018 | | | 3Q 2017 | | | ∆ ($) | | | ∆ (%) | | | Jan-Sep 18 | | | Jan-Sep 17 | | | ∆ ($) | | | ∆ (%) | |
| Local Sales | | | 8,671 | | | | 6,915 | | | | 1,756 | | | | 25.4 | % | | | 24,377 | | | | 20,334 | | | | 4,043 | | | | 19.9 | % |
| Export Sales | | | 9,205 | | | | 6,410 | | | | 2,795 | | | | 43.6 | % | | | 25,129 | | | | 19,513 | | | | 5,616 | | | | 28.8 | % |
| Total Sales | | | 17,876 | | | | 13,325 | | | | 4,551 | | | | 34.2 | % | | | 49,506 | | | | 39,847 | | | | 9,659 | | | | 24.2 | % |
| DD&A Costs | | | 2,053 | | | | 2,184 | | | | (131 | ) | | | (6.0 | )% | | | 5,723 | | | | 6,307 | | | | (584 | ) | | | (9.3 | )% |
| Variable Costs | | | 6,342 | | | | 4,668 | | | | 1,674 | | | | 35.9 | % | | | 17,361 | | | | 15,302 | | | | 2,059 | | | | 13.5 | % |
| Fixed Costs | | | 2,228 | | | | 1,925 | | | | 303 | | | | 15.7 | % | | | 6,143 | | | | 5,539 | | | | 604 | | | | 10.9 | % |
| Cost of Sales | | | 10,623 | | | | 8,777 | | | | 1,846 | | | | 21.0 | % | | | 29,227 | | | | 27,148 | | | | 2,079 | | | | 7.7 | % |
| Gross Profits | | | 7,253 | | | | 4,548 | | | | 2,705 | | | | 59.5 | % | | | 20,279 | | | | 12,699 | | | | 7,580 | | | | 59.7 | % |
| Operating Expenses | | | 1,600 | | | | 1,225 | | | | 375 | | | | 30.6 | % | | | 3,062 | | | | 2,810 | | | | 252 | | | | 9.0 | % |
| Operating Income | | | 5,653 | | | | 3,323 | | | | 2,330 | | | | 70.1 | % | | | 17,217 | | | | 9,889 | | | | 7,328 | | | | 74.1 | % |
| Financial Income (Loss) | | | (521 | ) | | | (807 | ) | | | 286 | | | | (35.4 | )% | | | (1,710 | ) | | | (1,962 | ) | | | 252 | | | | (12.8 | )% |
| Share of Profit of Companies | | | 57 | | | | 4 | | | | 53 | | | | 1,325.0 | % | | | 239 | | | | 58 | | | | 181 | | | | 312.1 | % |
| Income Before Income Tax | | | 5,189 | | | | 2,520 | | | | 2,669 | | | | 105.9 | % | | | 15,746 | | | | 7,985 | | | | 7,761 | | | | 97.2 | % |
| Income tax | | | (2,182 | ) | | | (1,296 | ) | | | (886 | ) | | | 68.4 | % | | | (6,155 | ) | | | (4,206 | ) | | | (1,949 | ) | | | 46.3 | % |
| Net Income Consolidated | | | 3,007 | | | | 1,224 | | | | 1,783 | | | | 145.7 | % | | | 9,591 | | | | 3,779 | | | | 5,812 | | | | 153.8 | % |
| Non-Controlling Interests | | | (232 | ) | | | (221 | ) | | | (11 | ) | | | 5.0 | % | | | (682 | ) | | | (585 | ) | | | (97 | ) | | | 16.6 | % |
| Net Income (Attributable to Owners of Ecopetrol) | | | 2,775 | | | | 1,003 | | | | 1,772 | | | | 176.7 | % | | | 8,909 | | | | 3,194 | | | | 5,715 | | | | 178.9 | % |
| | | | | | | | | | | | | | | | | | | | | | | | | | | | | | | | | |
| EBITDA | | | 7,997 | | | | 5,852 | | | | 2,145 | | | | 36.7 | % | | | 23,756 | | | | 17,296 | | | | 6,460 | | | | 37.3 | % |
| EBITDA Margin | | | 44.7 | % | | | 43.9 | % | | | 0.8 | % | | | | | | | 48.0 | % | | | 43.4 | % | | | 4.6 | % | | | | |
The 34.2% increase in sales revenue in the third quarter versus the same period in 2017 was primarily a combined result of:
| a) | An increase in the average weighted basket price of crude oils, gas and products, up USD 18.9/bl (+COP 4.4 trillion), largely due to better performance of the Brent crude benchmark prices. |
| b) | Positive overall sales volume effect (+COP 165 billion) due to the combined effect of i) increased volumes of products sold (+33 mboed), in particular diesel and gasoline, and ii) greater volumes of natural gas sales (+4 mboed), partially offset by iii) lower volumes of crude sales (-39 mbd), primarily for the Cartagena refinery throughput, which replaced imports and thus generate savings for the Ecopetrol Business Group. |
| c) | A decrease in the revenue from services and other (COP 35 billion), due to resolution of the disagreement regarding the Ocensa P135 project tariffs, which was partially offset by higher volumes transported through the San Fernando – Apiay system and the expansion of the P135. |
| 4 |
| |
Table 3: Volume Sales - Ecopetrol Business Group
| A | | B | | | C | | | D | | | E | | | F | | | G | |
| Local Sales Volume (mboed) | | 3Q 2018 | | | 3Q 2017 | | | ∆ (%) | | | Jan-Sep 18 | | | Jan-Sep 17 | | | ∆ (%) | |
| Crude Oil | | | 16.7 | | | | 24.7 | | | | (32.4 | )% | | | 9.6 | | | | 17.7 | | | | (45.8 | )% |
| Natural Gas | | | 78.3 | | | | 73.7 | | | | 6.2 | % | | | 75.6 | | | | 73.5 | | | | 2.9 | % |
| Gasoline | | | 110.4 | | | | 107.4 | | | | 2.8 | % | | | 110.3 | | | | 109.5 | | | | 0.7 | % |
| Medium Distillates | | | 151.5 | | | | 141.3 | | | | 7.2 | % | | | 149.8 | | | | 146.3 | | | | 2.4 | % |
| LPG and Propane | | | 15.6 | | | | 15.3 | | | | 2.0 | % | | | 16.4 | | | | 17.0 | | | | (3.5 | )% |
| Fuel Oil | | | 7.4 | | | | 10.3 | | | | (28.2 | )% | | | 9.0 | | | | 8.9 | | | | 1.1 | % |
| Industrial and Petrochemical | | | 20.8 | | | | 18.5 | | | | 12.4 | % | | | 20.9 | | | | 18.5 | | | | 13.0 | % |
| Total Local Sales | | | 400.7 | | | | 391.2 | | | | 2.4 | % | | | 391.6 | | | | 391.4 | | | | 0.1 | % |
| | | | | | | | | | | | | | | | | | | | | | | | | |
| Export Sales Volume (mboed) | | 3Q 2018 | | | 3Q 2017 | | | ∆ (%) | | | Jan-Sep 18 | | | Jan-Sep 17 | | | ∆ (%) | |
| Crude Oil | | | 380.4 | | | | 410.9 | | | | (7.4 | )% | | | 383.2 | | | | 426.5 | | | | (10.2 | )% |
| Products | | | 115.9 | | | | 96.5 | | | | 20.1 | % | | | 107.2 | | | | 105.4 | | | | 1.7 | % |
| Natural Gas | | | 0.8 | | | | 1.3 | | | | (38.5 | )% | | | 1.3 | | | | 1.6 | | | | (18.8 | )% |
| Total Export Sales | | | 497.1 | | | | 508.7 | | | | (2.3 | )% | | | 491.7 | | | | 533.5 | | | | (7.8 | )% |
| | | | | | | | | | | | | | | | | | | | | | | | | |
| Total Sales Volume (mboed) | | | 897.8 | | | | 899.9 | | | | (0.2 | )% | | | 883.3 | | | | 924.9 | | | | (4.5 | )% |
Natural gas exports corresponded to sales of Ecopetrol America Inc in its local market
Market in Colombia (45% of sales):Domestic sales increased 2.4% as compared to the third quarter of 2017, primarily due to:
| · | Higher sales of medium distillates (10.2 mbd) primarily due to higher demand along the border with Venezuela and increased freight transport. |
| · | Lower sales volume of crude (-8.0 mbd) primarily due to the use of domestic crude for refinery feedstock. |
| · | Higher sales of natural gas (4.6 mboed), primarily due to: i) increased sales to the industrial and thermal power sectors and ii) development of new demand. |
| · | Lower sales of fuel oil (-2.9 mbd) primarily due to reduced navigability through the Magdalena River. |
| · | Higher industrial and petrochemical sales (2.3 mbd), primarily due to increased sales of asphalt as a result of higher production of bottoms and displacement of domestic sales to exports. |
International market (55% of sales):International sales declined 2.3% as compared to the third quarter of 2017 primarily due to:
| · | Lower availability of export crudes (30.5 mbd), primarily due to higher volumes directed to refinery throughput in order to maximize their value. |
| · | An increase in gasoline exports (10.5 mbd) and medium distillates (27.3 mbd) due to product availability when maximizing Reficar throughput. |
| · | A decline in the production of fuel oil (-19.0 mbd) primarily due to the stable operation at Reficar and the implementation of strategies aimed to decrease fuel oil production at Barrancabermeja refinery. |
| 5 |
| |
Table 4: Export Destinations - Ecopetrol Business Group
| A | | B | | | C | | | D | | | E | | | F | | | G | |
| Crude (mbod) | | 3Q 2018 | | | 3Q 2017 | | | ∆ (%) | | | Jan-Sep 18 | | | Jan-Sep 17 | | | ∆ (%) | |
| Asia | | | 171.4 | | | | 98.4 | | | | 45.1 | % | | | 142.6 | | | | 100.5 | | | | 37.2 | % |
| U.S. Gulf Coast | | | 125.3 | | | | 112.0 | | | | 32.9 | % | | | 136.2 | | | | 150.1 | | | | 35.6 | % |
| Other | | | 22.3 | | | | 15.2 | | | | 5.9 | % | | | 19.8 | | | | 16.8 | | | | 5.2 | % |
| Europe | | | 21.2 | | | | 35.8 | | | | 5.6 | % | | | 14.1 | | | | 25.1 | | | | 3.7 | % |
| U.S. West Coast | | | 13.3 | | | | 45.5 | | | | 3.5 | % | | | 28.2 | | | | 41.1 | | | | 7.4 | % |
| Central America / Caribbean | | | 11.5 | | | | 98.9 | | | | 3.0 | % | | | 30.9 | | | | 77.2 | | | | 8.1 | % |
| South America | | | 10.0 | | | | 0.0 | | | | 2.6 | % | | | 5.8 | | | | 1.7 | | | | 1.5 | % |
| U.S. East Coast | | | 5.4 | | | | 5.2 | | | | 1.4 | % | | | 5.5 | | | | 14.0 | | | | 1.4 | % |
| Total | | | 380.4 | | | | 410.9 | | | | 100.0 | % | | | 383.2 | | | | 426.5 | | | | 100 | % |
| | | | | | | | | | | | | | | | | | | | | | | | | |
| Products (mboed) | | 3Q 2018 | | | 3Q 2017 | | | ∆ (%) | | | Jan-Sep 18 | | | Jan-Sep 17 | | | ∆ (%) | |
| Central America / Caribbean | | | 36.3 | | | | 31.6 | | | | 31.3 | % | | | 27.6 | | | | 42.0 | | | | 25.7 | % |
| U.S. East Coast | | | 33.4 | | | | 8.8 | | | | 28.8 | % | | | 25.0 | | | | 12.9 | | | | 23.3 | % |
| Asia | | | 32.7 | | | | 22.8 | | | | 28.2 | % | | | 25.5 | | | | 19.7 | | | | 23.8 | % |
| South America | | | 7.9 | | | | 12.1 | | | | 6.8 | % | | | 8.4 | | | | 11.9 | | | | 7.8 | % |
| U.S. Gulf Coast | | | 5.1 | | | | 15.6 | | | | 4.4 | % | | | 18.0 | | | | 13.2 | | | | 16.8 | % |
| U.S. West Coast | | | 0.4 | | | | 5.3 | | | | 0.3 | % | | | 1.1 | | | | 2.6 | | | | 1.0 | % |
| Europe | | | 0.1 | | | | 0.3 | | | | 0.1 | % | | | 1.6 | | | | 2.9 | | | | 1.5 | % |
| Other | | | 0.0 | | | | 0.0 | | | | 0.0 | % | | | 0.0 | | | | 0.2 | | | | 0.0 | % |
| Total | | | 115.9 | | | | 96.5 | | | | 100.0 | % | | | 107.2 | | | | 105.4 | | | | 100.0 | % |
Note: The information is subject to modification after the close of the quarter, as some destinations are re-classified according to final export destination.
Crude oil:In the third quarter of 2018, the main export destination was Asia, primarily due to greater demand from independent refiners in China and contractual and commercial flexibility that allowed for the development of new customers and incremental sales to traditional customers in that region. The second largest export destination was the US Gulf Coast, despite greater availability of crude in that area and higher discounts for heavy crudes. The US West Coast saw its share declining due to the lower demand for heavy crude and loss of value generation because of higher spreads.
Refined Products:The main export market for products for the third quarter of 2018 was Central America/ Caribbean for sales of ultra-low sulfur diesel (ULSD) and fuel oil for local bunker consumption, energy generation and storage for subsequent shipment to Asia. The second largest export destination was the US East Coast, which saw its share rising due to continuous exports of Reficar naphtha for gasoline mix or reforming. The third largest export destination was Asia, primarily due to exports of fuel oil for bunker mix and coke exports.
Table 5: Average Benchmark Crude Price and Spread of the Basket
| A | | B | | | C | | | D | | | E | | | F | | | G | |
| USD/Bl | | 3Q 2018 | | | 3Q 2017 | | | ∆ (%) | | | Jan-Sep 18 | | | Jan-Sep 17 | | | ∆ (%) | |
| Brent | | | 75.8 | | | | 52.2 | | | | 45.4 | % | | | 72.7 | | | | 52.5 | | | | 38.5 | % |
| Crude Oil Basket vs Brent | | | (8.4 | ) | | | (5.9 | ) | | | (42.4 | )% | | | (7.9 | ) | | | (6.9 | ) | | | (14.5 | )% |
| Product Oil Basket vs Brent | | | 5.5 | | | | 9.6 | | | | (43.2 | )% | | | 5.6 | | | | 7.9 | | | | (29.1 | )% |
| % Crude Oil Basket vs Brent | | | (11.1 | )% | | | (11.4 | )% | | | 2.7 | % | | | (10.8 | )% | | | (13.2 | )% | | | 18.2 | % |
| % Product Oil Basket vs Brent | | | 7.2 | % | | | 18.5 | % | | | (60.9 | )% | | | 7.6 | % | | | 15.1 | % | | | (49.5 | )% |
| 6 |
| |
Table 6: Average Weighted Sales Price - Ecopetrol Business Group
| A | | B | | | C | | | D | | | E | | | F | | | G | | | H | | | I | |
| USD/Bl | | 3Q 2018 | | | 3Q 2017 | | | ∆ (%) | | | Volume
(mboed)
3Q 2018 | | | Jan-Sep 18 | | | Jan-Sep 17 | | | ∆ (%) | | | Volume
(mboed)
Jan-Sep 18 | |
| Crude Oil Basket | | | 67.4 | | | | 46.2 | | | | 45.9 | % | | | 397.1 | | | | 64.9 | | | | 45.6 | | | | 42.4 | % | | | 392.8 | |
| Refined Products Basket | | | 81.3 | | | | 61.8 | | | | 31.6 | % | | | 421.6 | | | | 78.3 | | | | 60.4 | | | | 29.5 | % | | | 413.6 | |
| Natural Gas Basket | | | 21.7 | | | | 22.9 | | | | (5.2 | )% | | | 79.1 | | | | 22.5 | | | | 23.0 | | | | (2.2 | )% | | | 76.9 | |
| | | | | | | | | | | | | | | | | | | | | | | | | | | | | | | | | |
Crude oil:In the third quarter, the spread of the crude oil basket weakened by USD 2.5/bl when compared with the third quarter of 2017. However, the price basket increased by USD 21/bl due to the Brent strength and the persistent commercial strategy towards markets with higher value. Heavy crude oil market was affected by: i) a larger supply of Canadian and Mexican crudes, ii) volatility in supplies from Venezuela, and iii) higher production of intermediate crude in USGC/Texas.
Refined Products:In the third quarter, the percentage of the refined products basket price versus Brent weakened 9.5% as compared to the same period of 2017. Gasoline prices were impacted by higher inventories compared to year 2017, the arrival of Hurricane Harvey and the decline of fuel oil price given greater market supply. These were partially offset by higher diesel prices, leveraged by lower inventories in Europe and the United States.
Natural Gas:A 5.2% decrease in the price per barrel-equivalent in the third quarter of 2018 as compared to the third quarter of 2017, primarily due to lower amount of natural gas paid an not claimed this year and lower incremental sales price to promote the non regulated and thermal power sectors demand in the inner part of the country.
Depreciation and amortization:The 6% decrease in the third quarter of 2018 as compared to the third quarter of 2017, was primarily due to the net effect of:
| a) | Greater incorporation of reserves in 2017 versus 2016, resulting in a lower depreciation rate. |
| b) | Higher level of production as a result of our drilling campaign. |
Variable costs:The 35.9% increase in the third quarter of 2018 as compared to the third quarter of 2017, was primarily due to:
| a) | Higher cost of purchases of crude, gas and products (+COP 1.1 trillion), due to the net effect of: |
| · | Higher average price of domestic purchases and imports of crudes and products (+COP 1.7 trillion). |
| 7 |
| |
| · | A decline in purchased volumes (-COP 634 billion, -43 mboed) primarily due to: i) lower crude purchases (-COP 411 billion, -30 mbod), given the substitution of light crude imports for throughput at the Cartagena refinery by our own crudes; ii) lower purchases of refined products (-COP 242 billion, -16 mboed), primarily medium distillates and gasolines due to higher production at the Barrancabermeja and Cartagena refineries to supply the domestic market, partially offset by iii) greater natural gas purchases (+COP 19 billion, +3 mboed) to ensure the supply of refineries during maintenance periods at certain gas production fields. |
| · | A lower average exchange rate on purchases (-COP 27 billion) in the third quarter of 2018 as compared to the third quarter of 2017. |
| b) | Change in inventory and other (+COP 621 billion), primarily due to inventory consumption in the third quarter of 2018 as compared to accumulation during the same period of 2017. |
Table 7: Local Purchases and Imports – Ecopetrol Business Group
| A | | B | | | C | | | D | | | E | | | F | | | G | |
| Local Purchases (mboed) | | 3Q 2018 | | | 3Q 2017 | | | ∆ (%) | | | Jan-Sep 18 | | | Jan-Sep 17 | | | ∆ (%) | |
| Crude Oil | | | 152.3 | | | | 150.0 | | | | 1.5 | % | | | 159.6 | | | | 155.3 | | | | 2.8 | % |
| Natural Gas | | | 6.0 | | | | 2.9 | | | | 106.9 | % | | | 5.9 | | | | 2.9 | | | | 103.4 | % |
| Refined Products | | | 2.8 | | | | 2.1 | | | | 33.3 | % | | | 3.1 | | | | 2.9 | | | | 6.9 | % |
| Diluent | | | 0.6 | | | | 0.3 | | | | 100.0 | % | | | 0.5 | | | | 1.1 | | | | (54.5 | )% |
| Total | | | 161.7 | | | | 155.3 | | | | 4.1 | % | | | 169.1 | | | | 162.2 | | | | 4.3 | % |
| | | | | | | | | | | | | | | | | | | | | | | | | |
| Imports (mboed) | | 3Q 2018 | | | 3Q 2017 | | | ∆ (%) | | | Jan-Sep 18 | | | Jan-Sep 17 | | | ∆ (%) | |
| Crude Oil | | | 33.2 | | | | 65.4 | | | | (49.2 | )% | | | 38.5 | | | | 76.9 | | | | (49.9 | )% |
| Refined Products | | | 41.8 | | | | 61.4 | | | | (31.9 | )% | | | 44.7 | | | | 67.5 | | | | (33.8 | )% |
| Diluent | | | 51.0 | | | | 48.5 | | | | 5.2 | % | | | 50.4 | | | | 52.6 | | | | (4.2 | )% |
| Total | | | 126.0 | | | | 175.3 | | | | (28.1 | )% | | | 133.6 | | | | 197.0 | | | | (32.2 | )% |
Crude oil:
| · | Lower crude oil imports during the third quarter of 2018 as compared to the third quarter of 2017 (-32 mbod), primarily due to the substitution of imports for throughput at the Cartagena refinery by domestic crudes. |
| · | Higher local purchases of crude oil for managing the contingency derived of the non-operation of the Caño Limón-Coveñas oil pipeline, partially offset by lower royalty purchases, which in turn was due to a decrease in the royalty percentage of the Rubiales field (3Q 18: 14.4%, versus 3Q 17: 25.6%). |
Natural Gas:Increase in purchases of gas from third parties in the third quarter of 2018 as compared to the third quarter of 2017 in order to meet the demand of our refineries during maintenance periods of certain production fields.
Refined Products:There was a decrease in our imports of medium distillates (3Q 2018: 7.6 mbd vs 3Q 2017: 17.8 mbd) and gasoline (3Q 2018: 21.7 mbd vs 3Q 2017: 32.6 mbd), primarily due to higher production at the Barrancabermeja and Cartagena refineries used to supply the domestic market.
Diluent:Higher requirements of diluent due to higher production and increased local crude oil purchases in the third quarter of 2018 as compared to the third quarter of 2017.
| 8 |
| |
Fixed costs:There was a 15.7% increase in fixed costs during the third quarter of 2018 as compared to the third quarter of 2017, largely due to:
| a) | Higher costs of contracted services, maintenance and other (+COP 261 billion) primarily as a result of greater operational activity due to: i) higher production, ii) maximization of throughput at the Cartagena refinery, and iii) commissioning of the San Fernando–Apiay system and P135 expansion. |
| b) | Higher labor costs (+COP 42 billion) primarily due to increased headcount which is aligned with the growth strategy and the salary increase over 2017. |
Operating and exploration expensesduring the third quarter of 2018 increased by 30.6% as compared to the third quarter of 2017, primarily due to the recognition in spending of exploratory activity at Ecopetrol America Inc.’s León 1 and 2 wells and Hocol’s Bonifacio, Hurón and Payero wells.
Regarding the León 1 (drilled in 2014) and 2 (drilled in 2016) exploratory wells, located in the US Gulf of Mexico, an accounting write-off of USD 252 million dollars was recognized in the exploratory expense of the third quarter, which was previously recorded as Work in Progress in the Asset. The recognition was made in this quarter, after determining based on the completion of the corresponding technical and commercial studies, that the long-term economic viability of the prospects was uncertain.
This effect was partially offset by i) a reversal of the provision we had set aside related to a dispute around the P135 project tariffs and environmental provisions as well as ii) the reconciliation with the DIAN (local tax authority) of deductible expenses in Hocol S.A.’s income tax, which had been recognized in 2017.
| D) | Financial (non-operating) income and other |
The increase infinancial incomein the third quarter of 2018 as compared to the third quarter of 2017 corresponds to the net result of:
| a) | Higher revenue due to the COP/USD exchange rate spread (COP 197 billion), given the positive impact the Colombian peso devaluation against the U.S. dollar had on our net asset position in dollars, whereas the Colombian peso appreciated against the U.S. dollar in the same quarter of 2017. |
| b) | Savings on our financial cost of debt (-COP 77 billion), primarily due to the debt prepayments we have made throughout 2018 and lower interest rate on debt indexed to the consumer price index (“CPI”)). In 2017 and 2018, we prepaid USD 3,400 million dollars of financial obligations. |
| c) | Other movements (-COP 12 billion), primarily due to the negative effect of financial returns. |
Theeffective income tax ratefor the third quarter of 2018 was 42.0%, versus the 51.4% rate applicable to the third quarter of 2017. This decline was due primarily to: i) improved results at the Cartagena refinery, which is taxed at a nominal rate of 15%, ii) a 300 basis points nominal tax rate reduction as a consequence of the 2016 tax reform, partially offset by the effect of iii) non-deductible expenses largely due to exploratory activity in Ecopetrol America Inc.’s León 1 and 2 wells.
| 9 |
| |
| 2. | Statement of Financial Position |
Table 8: Statement of Financial Position – Ecopetrol Business Group
| A | | B | | | C | | | D | | | E | |
| COP Billion | | September 30, 2018 | | | June 30, 2018 | | | ∆ ($) | | | ∆ (%) | |
| Current Assets | | | 29,288 | | | | 27,249 | | | | 2,039 | | | | 7.5 | % |
| Non Current Assets | | | 94,594 | | | | 94,334 | | | | 260 | | | | 0.3 | % |
| Total Assets | | | 123,882 | | | | 121,583 | | | | 2,299 | | | | 1.9 | % |
| | | | | | | | | | | | | | | | | |
| Current Liabilities | | | 21,943 | | | | 18,857 | | | | 3,086 | | | | 16.4 | % |
| Non-Current Liabilities | | | 46,769 | | | | 50,488 | | | | (3,719 | ) | | | (7.4 | )% |
| Total Liabilities | | | 68,712 | | | | 69,345 | | | | (633 | ) | | | (0.9 | )% |
| Equity | | | 55,170 | | | | 52,238 | | | | 2,932 | | | | 5.6 | % |
| Total Liabilities and Equity | | | 123,882 | | | | 121,583 | | | | 2,299 | | | | 1.9 | % |
The 1.9% increase in assets as of September 30, 2018 as compared to June 30, 2018 is reflective of the net effect of:
| a) | An increase inother financial assets and cash equivalents(+COP 2.3 trillion) primarily as a result of higher cash surpluses generated by our operations, partially offset by: i) payment of the latest installment of dividends to the government, ii) prepayments of certain financial obligations, and iii) higher CAPEX expenses. |
Table 9: Cash Position1 – Ecopetrol Business Group
| A | | B | | | C | | | D | | | E | |
| COP Billion | | 3Q 2018 | | | 3Q 2017 | | | Jan-Sep 18 | | | Jan-Sep 17 | |
| Initial Cash and cash equivalents | | | 6,337 | | | | 6,246 | | | | 7,946 | | | | 8,410 | |
| (+) Cash generated from operations | | | 8,554 | | | | 4,668 | | | | 17,868 | | | | 10,620 | |
| (-) CAPEX | | | (2,161 | ) | | | (1,371 | ) | | | (5,113 | ) | | | (3,786 | ) |
| (+/-) Movement of Portfolio investments | | | (1,485 | ) | | | (760 | ) | | | (4,376 | ) | | | 2,134 | |
| (+/-) Other investment activities | | | 42 | | | | 184 | | | | 347 | | | | 816 | |
| (-) Proceeds (repayment of) from borrowings and interests | | | (2,526 | ) | | | (701 | ) | | | (5,255 | ) | | | (8,716 | ) |
| (-) Dividends paid | | | (1,832 | ) | | | (168 | ) | | | (4,287 | ) | | | (1,305 | ) |
| +(-) Exchange difference in cash | | | 192 | | | | (246 | ) | | | (9 | ) | | | (321 | ) |
| Final Cash and cash equivalents | | | 7,121 | | | | 7,852 | | | | 7,121 | | | | 7,852 | |
| Portfolio investments > 3 months | | | 10,931 | | | | 4,942 | | | | 10,931 | | | | 4,942 | |
| Total cash | | | 18,052 | | | | 12,794 | | | | 18,052 | | | | 12,794 | |
As of September 30, 2018, our cash composition was 60% in U.S. dollars and 40% in Colombian pesos.
| b) | A decrease inproperty, plant and equipment, natural resources and intangibles(-COP 163 billion) primarily due to: i) depreciation and amortization during the quarter, and the accounting impact associated with the exploratory expense of the León 1 and 2 wells, partially offset by ii) an increase in CAPEX during the quarter and iii) a larger adjustment primarily due to conversion at our subsidiaries using foreign functional currencies, as a result of the Colombian peso’s devaluation against the U.S. dollar. |
1Cash corresponds to available funds in the form of cash and cash equivalents and investments in financial instruments, regardless of maturity.
| 10 |
| |
| c) | An increase intrade accounts receivable and other(+COP 210 billion), primarily due to i) an increase in the commercial portfolio given the rise in international prices, partially offset by ii) the payment received from the Fuel Prices Stabilization Fund of COP 2.3 trillion for Reficar and Ecopetrol S.A., corresponding to balances generated in 2017. |
| B) | Liabilities and Net Equity |
The 0.9% decrease in total liabilities as of September 30, 2018 as compared to June 30, 2018 was caused by:
| a) | A decrease inloans and financing(-COP 1.4 trillion), primarily due to prepayments of the following loans: i) syndicated loan with local banks in 2013, the amortization had been scheduled up to 2025, totaling COP 1.4 trillion, and ii) an international loan entered in 2013, guaranteed by the US Export-Import Bank, which amortization had been scheduled up to 2023, totaling USD 156 million. As September 30, 2018, the Ecopetrol Business Group’s debt level totaled COP 39.9 trillion, of which 90% is in foreign currency and the remaining 10% in domestic currency. |
| b) | An increase (+COP 1.0 trillion) intaxes payableassociated with earnings generated during the third quarter of 2018. |
| c) | A decrease inaccounts payable(-COP 354 billion) from the net effect of the payment of the latest installment of dividends to the Colombian government on 2017 earnings, partially offset by higher accounts payable to suppliers, which in turn was the result of: i) the effect of the price increases on purchases of crudes and refined products and ii) greater operational activity during the quarter. |
| d) | Other changes in liabilities (+COP 108 billion). |
Net Equity:The 5.6% increase in net equity is presented as the combined effect of: i) higher quarterly profits, ii) gains from the conversion of assets and liabilities of subsidiaries with functional currencies other than the Colombian peso, partially offset by iii) a decrease in the foreign exchange spread on debt used as an instrument to hedge cash flow and net investment.
| 3. | Results by Business Segment |
Table 10: Year-to-Date Profit and Loss Statement – By segment
| A | | B | | | C | | | D | | | E | | | F | | | G | | | H | | | I | | | J | | | K | |
| | | E&P | | | Dowstream | | | Midstream | | | Eliminations | | | Ecopetrol Consolidated | |
| COP Billion | | Jan-Sep 18 | | | Jan-Sep 17 | | | Jan-Sep 18 | | | Jan-Sep 17 | | | Jan-Sep 18 | | | Jan-Sep 17 | | | Jan-Sep 18 | | | Jan-Sep 17 | | | Jan-Sep 18 | | | Jan-Sep 17 | |
| Sales | | | 36,654 | | | | 25,265 | | | | 26,809 | | | | 20,461 | | | | 8,169 | | | | 7,805 | | | | (22,126 | ) | | | (13,684 | ) | | | 49,506 | | | | 39,847 | |
| DD&A Costs | | | 3,961 | | | | 4,677 | | | | 916 | | | | 818 | | | | 846 | | | | 812 | | | | - | | | | - | | | | 5,723 | | | | 6,307 | |
| Variable Costs | | | 13,248 | | | | 8,905 | | | | 23,288 | | | | 17,097 | | | | 439 | | | | 445 | | | | (19,614 | ) | | | (11,145 | ) | | | 17,361 | | | | 15,302 | |
| Fixed Costs | | | 6,163 | | | | 5,594 | | | | 1,383 | | | | 1,189 | | | | 1,096 | | | | 1,114 | | | | (2,499 | ) | | | (2,358 | ) | | | 6,143 | | | | 5,539 | |
| Cost of Sales | | | 23,372 | | | | 19,176 | | | | 25,587 | | | | 19,104 | | | | 2,381 | | | | 2,371 | | | | (22,113 | ) | | | (13,503 | ) | | | 29,227 | | | | 27,148 | |
| Gross profit | | | 13,282 | | | | 6,089 | | | | 1,222 | | | | 1,357 | | | | 5,788 | | | | 5,434 | | | | (13 | ) | | | (181 | ) | | | 20,279 | | | | 12,699 | |
| Operating Expenses | | | 2,100 | | | | 1,500 | | | | 686 | | | | 1,130 | | | | 289 | | | | 362 | | | | (13 | ) | | | (182 | ) | | | 3,062 | | | | 2,810 | |
| Operating Profit (Loss) | | | 11,182 | | | | 4,589 | | | | 536 | | | | 227 | | | | 5,499 | | | | 5,072 | | | | - | | | | 1 | | | | 17,217 | | | | 9,889 | |
| Financial Income (Loss) | | | (662 | ) | | | (977 | ) | | | (698 | ) | | | (690 | ) | | | (350 | ) | | | (293 | ) | | | - | | | | (2 | ) | | | (1,710 | ) | | | (1,962 | ) |
| Share of profit of companies | | | 216 | | | | 76 | | | | 22 | | | | 14 | | | | 1 | | | | (32 | ) | | | - | | | | - | | | | 239 | | | | 58 | |
| Income Before Income Tax | | | 10,736 | | | | 3,688 | | | | (140 | ) | | | (449 | ) | | | 5,150 | | | | 4,747 | | | | - | | | | (1 | ) | | | 15,746 | | | | 7,985 | |
| Income tax | | | (4,123 | ) | | | (1,952 | ) | | | (87 | ) | | | (296 | ) | | | (1,945 | ) | | | (1,958 | ) | | | - | | | | - | | | | (6,155 | ) | | | (4,206 | ) |
| Net Income Consolidated | | | 6,613 | | | | 1,736 | | | | (227 | ) | | | (745 | ) | | | 3,205 | | | | 2,789 | | | | - | | | | (1 | ) | | | 9,591 | | | | 3,779 | |
| Non-controlling interests | | | 45 | | | | - | | | | 1 | | | | 1 | | | | (728 | ) | | | (586 | ) | | | - | | | | - | | | | (682 | ) | | | (585 | ) |
| Net Income (Attributable to Owners of Ecopetrol) | | | 6,658 | | | | 1,736 | | | | (226 | ) | | | (744 | ) | | | 2,477 | | | | 2,203 | | | | - | | | | (1 | ) | | | 8,909 | | | | 3,194 | |
| | | | | | | | | | | | | | | | | | | | | | | | | | | | | | | | | | | | | | | | | |
| EBITDA | | | 15,602 | | | | 9,782 | | | | 1,733 | | | | 1,515 | | | | 6,421 | | | | 5,998 | | | | - | | | | 1 | | | | 23,756 | | | | 17,296 | |
| EBITDA Margin | | | 42.6 | % | | | 38.7 | % | | | 6.5 | % | | | 7.4 | % | | | 78.6 | % | | | 76.8 | % | | | 0.0 | % | | | 0.0 | % | | | 48.0 | % | | | 43.4 | % |
| 11 |
| |
Table 11: Quarterly Profit and Loss Statement – By segment
| A | | B | | | C | | | D | | | E | | | F | | | G | | | H | | | I | | | J | | | K | |
| | | E&P | | | Dowstream | | | Midstream | | | Eliminations | | | Ecopetrol Consolidated | |
| COP Billion | | 3Q 2018 | | | 3Q 2017 | | | 3Q 2018 | | | 3Q 2017 | | | 3Q 2018 | | | 3Q 2017 | | | 3Q 2018 | | | 3Q 2017 | | | 3Q 2018 | | | 3Q 2017 | |
| Sales | | | 14,285 | | | | 8,656 | | | | 9,803 | | | | 6,841 | | | | 2,558 | | | | 2,763 | | | | (8,770 | ) | | | (4,935 | ) | | | 17,876 | | | | 13,325 | |
| DD&A Costs | | | 1,451 | | | | 1,624 | | | | 314 | | | | 295 | | | | 288 | | | | 265 | | | | - | | | | - | | | | 2,053 | | | | 2,184 | |
| Variable Costs | | | 5,723 | | | | 2,836 | | | | 8,519 | | | | 5,582 | | | | 155 | | | | 180 | | | | (8,055 | ) | | | (3,930 | ) | | | 6,342 | | | | 4,668 | |
| Fixed Costs | | | 2,044 | | | | 2,141 | | | | 479 | | | | 382 | | | | 417 | | | | 352 | | | | (712 | ) | | | (950 | ) | | | 2,228 | | | | 1,925 | |
| Cost of Sales | | | 9,218 | | | | 6,601 | | | | 9,312 | | | | 6,259 | | | | 860 | | | | 797 | | | | (8,767 | ) | | | (4,880 | ) | | | 10,623 | | | | 8,777 | |
| Gross profit | | | 5,067 | | | | 2,055 | | | | 491 | | | | 582 | | | | 1,698 | | | | 1,966 | | | | (3 | ) | | | (55 | ) | | | 7,253 | | | | 4,548 | |
| Operating Expenses | | | 1,337 | | | | 764 | | | | 237 | | | | 378 | | | | 29 | | | | 138 | | | | (3 | ) | | | (55 | ) | | | 1,600 | | | | 1,225 | |
| Operating Profit (Loss) | | | 3,730 | | | | 1,291 | | | | 254 | | | | 204 | | | | 1,669 | | | | 1,828 | | | | - | | | | - | | | | 5,653 | | | | 3,323 | |
| Financial Income (Loss) | | | (145 | ) | | | (456 | ) | | | (342 | ) | | | (226 | ) | | | (34 | ) | | | (125 | ) | | | - | | | | - | | | | (521 | ) | | | (807 | ) |
| Share of profit of companies | | | 51 | | | | 15 | | | | 6 | | | | 3 | | | | - | | | | (14 | ) | | | - | | | | - | | | | 57 | | | | 4 | |
| Net Income (Loss) Before Income Tax | | | 3,636 | | | | 850 | | | | (82 | ) | | | (19 | ) | | | 1,635 | | | | 1,689 | | | | - | | | | - | | | | 5,189 | | | | 2,520 | |
| Provision for Income Tax | | | (1,565 | ) | | | (545 | ) | | | 6 | | | | (96 | ) | | | (623 | ) | | | (655 | ) | | | - | | | | - | | | | (2,182 | ) | | | (1,296 | ) |
| Net Income Consolidated | | | 2,071 | | | | 305 | | | | (76 | ) | | | (115 | ) | | | 1,012 | | | | 1,034 | | | | - | | | | - | | | | 3,007 | | | | 1,224 | |
| Non-controlling interests | | | 16 | | | | - | | | | - | | | | - | | | | (248 | ) | | | (221 | ) | | | - | | | | - | | | | (232 | ) | | | (221 | ) |
| Net income (Loss) attributable to owners of Ecopetrol | | | 2,087 | | | | 305 | | | | (76 | ) | | | (115 | ) | | | 764 | | | | 813 | | | | - | | | | - | | | | 2,775 | | | | 1,003 | |
| | | | | | | | | | | | | | | | | | | | | | | | | | | | | | | | | | | | | | | | | |
| EBITDA | | | 5,335 | | | | 3,085 | | | | 686 | | | | 664 | | | | 1,976 | | | | 2,104 | | | | - | | | | (1 | ) | | | 7,997 | | | | 5,852 | |
| EBITDA Margin | | | 37.3 | % | | | 35.6 | % | | | 7.0 | % | | | 9.7 | % | | | 77.2 | % | | | 76.1 | % | | | 0.0 | % | | | 0.0 | % | | | 44.7 | % | | | 43.9 | % |
Exploration
Consistent with the 2018 plan, five exploratory wells were drilled during the third quarter of 2018, for a total of nine year-to-date, in line with the goal of 12 exploratory wells for the year as a whole.
Ecopetrol is entering some of the highest-potential oil basins in the world. The joint venture consisting of BP Energy (50% - Operator), Ecopetrol (20%) and CNOOC Petroleum (30%) won the Pau-Brasil block located in the central region of the Santos basin, in the Brazilian pre-salt. The Pau-Brasil block has a surface area of 1,184 square kilometers in an average water depth of 2,200 meters. Through this joint venture, Ecopetrol is expanding the Ecopetrol Business Group’s portfolio of investments into what many consider one of the most attractive basins in the world. This joint venture demonstrates Ecopetrol’s capacity to develop strategic alliances with leading companies in the industry.
The presence of hydrocarbons was confirmed in the Andina-1 well, a joint venture between Parex (50%- operator and Ecopetrol (50%), in Tame, Arauca. The well met its goal on August 20, 2018 with a depth of 17,500 feet and found crude in the Guadalupe and Gacheta/Une formations. Initial tests in the Gacheta/Une formation yielded a light crude production rate of 2,489 barrels per day of 42º API and 8.8 million cubic feet of gas per day. Further tests in the Guadalupe formation indicated 2,596 barrels of oil per day of 35º API and 1.1 million cubic feet of gas per day. The Andina-2 appraisal well is currently being drilled in order to confirm the potential of this discovery.
In the third quarter, the drilling of Rex NE-02-ST well, a joint venture between OXY (70% -Operator) and Ecopetrol (30%) was completed. Production tests carried out in September 2018 confirmed the presence of high-quality light crude, of 35 degrees API. This well is located in the Cosecha block south of the Caño Limón field in Arauca, where existing infrastructure facilitates the incorporation of barrels within a short period of time. On the other hand, the Pulpo-1 well operated by OXY in association with Ecopetrol was plugged and abandoned.
As part of 2018 exploratory stage in Colombia onshore, we are continuing to work to mature projects so that we can start drilling in the fourth quarter of 2018. It is worth to highlight the advancements in the management of feasibility and environment aspects, as well as the civil works and pre-drilling activities for the Finn-1 (Cosecha block), La Cira 7000 (La Cira Infantas block) and Boranda-2 (Playón block) wells, and the following wells to be drilled by Hocol subsidiary: Ocelote 500, Ocelote 510 and Ocelote 520, all located in the Guarrojo block.
| 12 |
| |
Additionally, Ecopetrol México purchased 3D regional seismic information (11,009 Km2) for the Campeche Sur, Campeche Somero and Tabasco programs, with a view to assessing the exploratory potential of the Salina basin in Mexico and mature exploration opportunities in blocks 6 and 8.
Table 12: Detail of Exploratory Wells – Ecopetrol Business Group
| A | | B | | C | | D | | F | | G | | H | | I | | J |
| # | | Quarter | | Well | | Well Classification
(Lahee) | | Block | | Basin | | Operator/Partner | | Status | | TD |
| 1 | | First | | Bufalo-1 | | A3 | | VMM-32 | | Valle Medio del Magdalena | | ECP(51%)
CPVEN (49%) | | Hydrocarbon
Presence | | 1/3/2018 |
| 2 | | First | | Jaspe-6D | | A3 | | Quifa | | Llanos Orientales | | FRONTERA (70%)
ECP (30%) | | Hydrocarbon
Presence | | 1/30/2018 |
| 3 | | Second | | Coyote-2 | | A1 | | De Mares | | Valle Medio del Magdalena | | PAREX (50%)
ECP(50%) | | Under
Evaluation | | 4/2/2018 |
| 4 | | Second | | Capachos Sur-2 | | A1 | | Capachos | | Llanos Orientales | | PAREX (50%)
ECP(50%) | | Under
Evaluation | | 4/18/2018 |
| 5 | | Third | | Pulpo-1 | | A3 | | Rondón | | Llanos Orientales | | OXY (70%)
ECP (30%) | | Plugged and Abandoned | | 7/16/2018 |
| 6 | | Third | | Rex NE-02 ST | | A1 | | Cosecha | | Llanos Orientales | | OXY (70%)
ECP (30%) | | Hydrocarbon
Presence | | 7/28/2018 |
| 7 | | Third | | Andina-1 | | A3 | | Capachos | | Llanos Orientales | | PAREX (50%)
ECP(50%) | | Hydrocarbon
Presence | | 8/20/2018 |
| 8 | | Third | | Arrecife-1 | | A3 | | VIM 8 | | Valle Inferior del Magdalena | | HOCOL (100%) | | Under
Evaluation | | 9/20/2018 |
| 9 | | Third | | Payero E1ST-1 | | A3 | | Niscota | | Llanos - Piedemonte | | EQUION OPERATOR
HOCOL (20%)
TOTAL (50%)
REPSOL (30%) | | Plugged and Abandoned | | 9/24/2018 |
| 13 |
| |
Production
Table 13: Gross Production* - Ecopetrol Business Group
| A | | B | | | C | | | D | | | E | | | F | | | G | |
| mboed | | 3Q 2018 | | | 3Q 2017 | | | ∆ % | | | Jan-Sep 18 | | | Jan-Sep 17 | | | ∆ (%) | |
| Crude Oil | | | 551.9 | | | | 545.1 | | | | 1.2 | % | | | 545.5 | | | | 545.1 | | | | 0.1 | % |
| Natural Gas | | | 114.6 | | | | 110.5 | | | | 3.7 | % | | | 111.9 | | | | 110.3 | | | | 1.5 | % |
| Total Ecopetrol S.A. | | | 666.5 | | | | 655.6 | | | | 1.7 | % | | | 657.4 | | | | 655.4 | | | | 0.3 | % |
| | | | | | | | | | | | | | | | | | | | | | | | | |
| Crude Oil | | | 21.6 | | | | 21.9 | | | | (1.4 | %) | | | 20.7 | | | | 22.1 | | | | (6.3 | %) |
| Natural Gas | | | 7.2 | | | | 5.1 | | | | 41.2 | % | | | 7.1 | | | | 5.0 | | | | 42.0 | % |
| Total Hocol | | | 28.8 | | | | 27.0 | | | | 6.7 | % | | | 27.8 | | | | 27.1 | | | | 2.6 | % |
| | | | | | | | | | | | | | | | | | | | | | | | | |
| Crude Oil | | | 8.8 | | | | 10.0 | | | | (12.0 | %) | | | 9.1 | | | | 11 | | | | (17.3 | %) |
| Natural Gas | | | 4.9 | | | | 4.9 | | | | 0.0 | % | | | 5.0 | | | | 4.6 | | | | 8.7 | % |
| Total Equion** | | | 13.7 | | | | 14.9 | | | | (8.1 | %) | | | 14.1 | | | | 15.6 | | | | (9.6 | %) |
| | | | | | | | | | | | | | | | | | | | | | | | | |
| Crude Oil | | | 3.9 | | | | 4.5 | | | | (13.3 | %) | | | 3.9 | | | | 4.4 | | | | (11.4 | %) |
| Natural Gas | | | 1.4 | | | | 0.7 | | | | 100.0 | % | | | 1.1 | | | | 0.6 | | | | 83.3 | % |
| Total Savia** | | | 5.3 | | | | 5.2 | | | | 1.9 | % | | | 5.0 | | | | 5.0 | | | | 0.0 | % |
| | | | | | | | | | | | | | | | | | | | | | | | | |
| Crude Oil | | | 8.4 | | | | 9.7 | | | | (13.4 | %) | | | 9.7 | | | | 9.4 | | | | 3.2 | % |
| Natural Gas | | | 1.7 | | | | 2.1 | | | | (19.0 | %) | | | 1.9 | | | | 2.1 | | | | (9.5 | %) |
| Total Ecopetrol America | | | 10.1 | | | | 11.8 | | | | (14.4 | %) | | | 11.6 | | | | 11.5 | | | | 0.9 | % |
| | | | | | | | | | | | | | | | | | | | | | | | | |
| Crude Oil | | | 594.6 | | | | 591.2 | | | | 0.6 | % | | | 588.9 | | | | 592.0 | | | | (0.5 | %) |
| Natural Gas | | | 129.8 | | | | 123.3 | | | | 5.3 | % | | | 127.0 | | | | 122.6 | | | | 3.6 | % |
| Total Group's Production | | | 724 | | | | 715 | | | | 1.3 | % | | | 716 | | | | 715 | | | | 0.2 | % |
| * Gross production includes royalties and is prorated for Ecopetrol’s share in each company. |
| ** Equión and Savia are incorporated through the equity method. - Note: Gas production includes white products. |
In the third quarter of 2018, the Ecopetrol Group’s average production totaled 724 mboed (+1.3% vs 3Q 17 and + 0.4% vs 2Q 18), the highest in the past 10 quarters, achieving an average of 716 mboed year-to-date. Production was in line with the goal set for 2018, primarily due to: i) the results of the drilling campaign in the La Cira, Rubiales, Dina, Quifa and Castilla fields, and ii) increased gas production and sales, primarily due to greater demand in the industrial and thermal power sectors, supported by the commercial strategy.
In the third quarter of 2018, the Ecopetrol Business Group affiliates contributed with 58 mboed, providing 8% of consolidated total volume, reflecting a decrease of 1.0 mboed (1.7%) from the same quarter of 2017. The primary negative impact was at Ecopetrol America Inc. (EAI), primarily due to maintenance at the K2 field, and the temporary closure of the Gunflint and Dalmatian fields due to hurricanes in the Gulf of Mexico region. Nevertheless, year-to-date EAI was up 0.9% in production compared to the same period of 2017.
In September 2018, there were 41 active drilling rigs, a 64% increase compared to the number at the end of 2017 (25 rigs). At the close of the quarter, Ecopetrol Group had drilled 421 development wells.
Projects to increase Recovery Factor:
Improved recovery pilots have consolidated a stable operation that continues to support our production and reserves growth strategy. The successful application of secondary and tertiary recovery technologies contributes with 166 mboed, approximately 23% of total production, coming from fields such as La Cira Infantas, Casabe, Yariguí, Tibú, Asociación Nare, Cusiana, Cupiagua, Piedemonte and several fields located at Huila province. The 21 operating pilots are currently generating a daily production of approximately 16.6 mboed.
| 14 |
| |
It is worth it to mention thatthe water injection pilots (Castilla, Chichimene, Apiay and Suria), polymer injection pilots (Chichimene, Casabe, La Cira Infantas and Yariguí) and steam injection pilots (Teca), which have succeeded in increasing crude production, with a lower volume of injected water than originally planned.
Table 14: Recovery Pilots - Ecopetrol Business Group
| A | | B | | | C | | | D | | | E | |
| Technology | | #Pilots | | | Under evaluation | | | Feasible expansion | | | Non-feasible expansion | |
| Non thermal | | | 36 | | | | 19 | | | | 14 | | | | 3 | |
| Water injection | | | 19 | | | | 10 | | | | 8 | | | | 1 | |
| Optimized water injection | | | 1 | | | | - | | | | 1 | | | | - | |
| CEOR | | | 9 | | | | 5 | | | | 4 | | | | - | |
| Gas injection | | | 7 | | | | 4 | | | | 1 | | | | 2 | |
| Thermal | | | 6 | | | | 1 | | | | 2 | | | | 3 | |
| Steam injection | | | 4 | | | | - | | | | 2 | | | | 2 | |
| Air injection | | | 2 | | | | 1 | | | | - | | | | 1 | |
| TOTAL | | | 42 | | | | 20 | | | | 16 | | | | 6 | |
Lifting Cost
Table 15: Lifting Cost* - Ecopetrol Business Group
| A | | B | | | C | | | D | | | E | | | F | | | G | | | H | |
| USD/Bl | | 3Q 2018 | | | 3Q 2017 | | | ∆ % | | | Jan-Sep 18 | | | Jan-Sep 17 | | | ∆ (%) | | | % USD | |
| Lifting cost * | | | 8.74 | | | | 7.80 | | | | 12.1 | % | | | 8.45 | | | | 7.27 | | | | 16.2 | % | | | 16.0 | % |
| | | | | | | | | | | | | | | | | | | | | | | | | | | | | |
| TRM | | | 2,958.4 | | | | 2,976.3 | | | | -0.6 | % | | | 2,886.0 | | | | 2,939.6 | | | | -1.8 | % | | | | |
* Calculated based on barrels produced without royalties
The USD 1.18/bl increase recorded in our lifting cost in the first nine months of 2018 as compared to the same period of 2017 is largely explained by the increased operating levels, among other factors, as described below:
Activity Effect (+USD 1.13/bl):
| · | Higher energy consumption (USD +0.35/bl) primarily due to: i) an increase in water barrels used in production, ii) larger number of wells drilled, iii) higher price of liquid fuels (diesel and fuel oil) used for electricity generation in fields, and iv) higher price paid for unregulated electrical power. |
| · | Higher costs related to subsoil maintenance (USD +0.18/bl) primarily due to the increased number and complexity of interventions and services at wells, which has, however, had the positive effect of leading to better performance along basic production curve (+6.8 mboed above expectations). |
| · | Greater contracted services in line with the increase in our activity and services (+USD 0.15/bl). |
| · | Higher labor costs (+USD 0.16/bl) primarily due to increased headcount, which is aligned with the growth strategy and the salary increase over 2017. |
| · | Higher overhead costs (+USD 0.24/bl) primarily due to some changes in the allocation methodology. |
| · | Higher cost of maintenance materials and other (+USD 0.06/bl), primarily due to the larger amount of equipment involved, which has, however, succeeded in maintaining operational reliability and integrity in production operations. |
Exchange rate effect(USD +0.16/bl): The effect of the decrease in the USD/COP exchange rate (+USD 0.20/bl) when the cost in Colombian pesos is re-expressed to USD.
Volume effect(-USD 0.11/bl): Lower cost due to higher production.
| 15 |
| |
Dilution Cost
Table 16: Dilution Cost* - Ecopetrol Business Group
| A | | B | | | C | | | D | | | E | | | F | | | G | | | H | |
| USD/Bl | | | 3Q 2018 | | | | 3Q 2017 | | | | ∆% | | | | Jan-Sep 18 | | | | Jan-Sep 17 | | | | ∆(%) | | | | % USD | |
| Dilution cost | | | 4.85 | | | | 3.95 | | | | 22.8 | % | | | 4.65 | | | | 3.91 | | | | 18.9 | % | | | 100 | % |
* Calculated based on barrels sold
The increased dilution cost is primarily a result of an increased purchase price for naphtha, in line with the recovery in the international price of Brent crude, partially offset by lower volumes consumed due to the dilution strategy. The volume decrease has allowed dilution factor to go from 15.2% as of September 2017, to 14.64% as of September 2018. Without taking into account the increase in naphtha prices, the dilution cost in the third quarter 2018 would have been USD 3.32/bl, as opposed to the actual recorded cost of USD 4.65/bl.
Financial Results for the Upstream Segment
Table 17: Profit and Loss Statement – Upstream
| A | | B | | | C | | | D | | | E | | | F | | | G | | | H | | | I | |
| COP Billion | | 3Q 2018 | | | 3Q 2017 | | | ∆ ($) | | | ∆ (%) | | | Jan-Sep 18 | | | Jan-Sep 17 | | | ∆ ($) | | | ∆ (%) | |
| Sales | | | 14,285 | | | | 8,656 | | | | 5,629 | | | | 65.0 | % | | | 36,654 | | | | 25,265 | | | | 11,389 | | | | 45.1 | % |
| DD&A Costs | | | 1,451 | | | | 1,624 | | | | (173 | ) | | | (10.7 | )% | | | 3,961 | | | | 4,677 | | | | (716 | ) | | | (15.3 | )% |
| Variable Costs | | | 5,723 | | | | 2,836 | | | | 2,887 | | | | 101.8 | % | | | 13,248 | | | | 8,905 | | | | 4,343 | | | | 48.8 | % |
| Fixed Costs | | | 2,044 | | | | 2,141 | | | | (97 | ) | | | (4.5 | )% | | | 6,163 | | | | 5,594 | | | | 569 | | | | 10.2 | % |
| Cost of Sales | | | 9,218 | | | | 6,601 | | | | 2,617 | | | | 39.6 | % | | | 23,372 | | | | 19,176 | | | | 4,196 | | | | 21.9 | % |
| Gross profit | | | 5,067 | | | | 2,055 | | | | 3,012 | | | | 146.6 | % | | | 13,282 | | | | 6,089 | | | | 7,193 | | | | 118.1 | % |
| Operating Expenses | | | 1,337 | | | | 764 | | | | 573 | | | | 75.0 | % | | | 2,100 | | | | 1,500 | | | | 600 | | | | 40.0 | % |
| Operating Profit | | | 3,730 | | | | 1,291 | | | | 2,439 | | | | 188.9 | % | | | 11,182 | | | | 4,589 | | | | 6,593 | | | | 143.7 | % |
| Financial Income (Loss) | | | (145 | ) | | | (456 | ) | | | 311 | | | | (68.2 | )% | | | (662 | ) | | | (977 | ) | | | 315 | | | | (32.2 | )% |
| Share of profit of companies | | | 51 | | | | 15 | | | | 36 | | | | 240.0 | % | | | 216 | | | | 76 | | | | 140 | | | | 184.2 | % |
| Net Income Before Income Tax | | | 3,636 | | | | 850 | | | | 2,786 | | | | 327.8 | % | | | 10,736 | | | | 3,688 | | | | 7,048 | | | | 191.1 | % |
| Provision for Income Tax | | | (1,565 | ) | | | (545 | ) | | | (1,020 | ) | | | 187.2 | % | | | (4,123 | ) | | | (1,952 | ) | | | (2,171 | ) | | | 111.2 | % |
| Net Income Consolidated | | | 2,071 | | | | 305 | | | | 1,766 | | | | 579.0 | % | | | 6,613 | | | | 1,736 | | | | 4,877 | | | | 280.9 | % |
| Non-controlling interests | | | 16 | | | | - | | | | 16 | | | | 0 | % | | | 45 | | | | - | | | | 45 | | | | 0 | % |
| Net income attributable to owners of Ecopetrol | | | 2,087 | | | | 305 | | | | 1,782 | | | | 584.3 | % | | | 6,658 | | | | 1,736 | | | | 4,922 | | | | 283.5 | % |
| | | | | | | | | | | | | | | | | | | | | | | | | | | | | | | | | |
| EBITDA | | | 5,335 | | | | 3,085 | | | | 2,250 | | | | 72.9 | % | | | 15,602 | | | | 9,782 | | | | 5,820 | | | | 59.5 | % |
| EBITDA Margin | | | 37.3 | % | | | 35.6 | % | | | 1.7 | % | | | | | | | 42.6 | % | | | 38.7 | % | | | 3.9 | % | | | | |
| 16 |
| |
The increase in the segment’s revenue in third quarter 2018 increased as compared to third quarter of 2017, primarily due to: i) higher prices, in line with Brent price performance, and ii) larger production volumes, emphasizing deliveries to the Cartagena refinery to replace imported crude.
The increase in the segment’s cost of sales during the third quarter of 2018 as compared to the third quarter of 2017 was due to:
| · | Higher purchase costs for crude oil and refined products associated with the international price increases. |
| · | Greater purchased volumes of crude, naphtha, chemical materials and electrical power, in line with our production increase. |
| · | Inventory decrease in the third quarter, versus an accumulation during the same period in 2017. |
| · | Lower inter-segment oil pipeline transport costs due to fee adjustments in the P135 project. |
| · | Decrease in depreciation and amortization primarily by the greater incorporation of reserves in 2017 versus 2016. |
The increase in the segment’s operating expenses in the third quarter of 2018 as compared to the third quarter of 2017 is primarily due to recognition of the exploratory activity at Ecopetrol America Inc.’s León 1 and 2 wells, given the technical, economic and investment conditions of the project, as further explained above.
EBITDA for the exploration and production segment continued to show solid recovery during the third quarter of 2018, exceeding by COP 2.25 trillion the EBITDA figure posted during the same period of 2017, with an EBITDA margin of 37.3%.
Net financial result for the third quarter of 2018 was a lower expense versus the third quarter of 2017, primarily as a result of: i) the effect of the Colombian peso’s devaluation against the U.S. dollar had on the segment´s net asset position in U.S. dollars, ii) higher revenue from financial returns given surplus liquidity and iii) savings on financial costs due to loan prepayments.
Table 18: Volumes Transported2
| A | | B | | | C | | | D | | | E | | | F | | | G | |
| Mbod | | 3Q 2018 | | | 3Q 2017 | | | ∆ % | | | Jan-Sep 18 | | | Jan-Sep 17 | | | ∆ (%) | |
| Crude | | | 849 | | | | 826 | | | | 2.8 | % | | | 829 | | | | 819 | | | | 1.2 | % |
| Refined Products | | | 277 | | | | 263 | | | | 5.2 | % | | | 274 | | | | 267 | | | | 2.5 | % |
| Total | | | 1,126 | | | | 1,089 | | | | 3.4 | % | | | 1,103 | | | | 1,086 | | | | 1.6 | % |
Crude volumes transported during the third quarter of 2018 increased by 2.8% compared to the third quarter of 2017, primarily due to additional shipments of Castilla Norte crude as part of the plan to transport of heavy crude through the Ayacucho – Coveñas oil pipeline and an increase in volumes of crude oil transported to the Barrancabermeja refinery.
2 The information on crude transport reported here for 3Q 2017 reflects an update of the volume balance of the Caño Limón - Coveñas oil pipeline during that period due to the commissioning of the reversal of the Bicentenario oil pipeline.
| 17 |
| |
During the third quarter of 2018, the oil pipeline network continued to suffer disruptions caused by third parties, especially on the Caño Limón - Coveñas system; however, the contingent operation of the Bicentenario oil pipeline allowed these disruptions to be almost totally mitigated, a situation that resulted in five reversal cycles during the quarter. As of September 2018, 35 reversal cycles have been carried out on the Bicentenario oil pipeline. Approximately 75% of crude volumes transported by the national oil pipeline system were owned by the Ecopetrol Business Group.
The volume of refined products transported increased by 5.2% during the third quarter of 2018 as compared to the third quarter of 2017, primarily as a result of operational optimization of the Galán - Bucaramanga system, improving delivery structures and batch sizes, allowing for greater volumes transported. Additionally, the greater availability of products from the Barrancabermeja refinery contributed to maximization of the use of CENIT removal systems. Approximately 33% of the volume of refined products transported on the national poly-duct system corresponded to Ecopetrol Business Group products.
Crude oil transport test at 700 cSt
In July, Ocensa and Cenit undertook an operating crude transport test at 700 cSt. Currently, the Ecopetrol Business Group is performing financial valuations to determine the project’s economic and commercial feasibility.
Table 19: Cost per Barrel Transported - Ecopetrol Business Group
| A | | B | | | C | | | D | | | E | | | F | | | G | | | H | | | |
| USD/Bl | | 3Q 2018 | | | 3Q 2017 | | | ∆ % | | | Jan-Sep 18 | | | Jan-Sep 17 | | | ∆ (%) | | | Explanation | | % USD | |
| Operational Transportation Cost | | | 3.26 | | | | 3.06 | | | | 6.6 | % | | | 3.18 | | | | 3.19 | | | | -0.4 | % | | • Volume (-USD 0.05 /B): Higher volumes transported in oil pipelines, because reverse operation in Bicenteanrio pipeline.
• Cost (-USD 0.02 /B): Lower operation & maintenance cost, lower expenses for elimination of wealth tax. | | | 5.0 | % |
| | | | | | | | | | | | | | | | | | | | | | | | | | | | | | | |
| TRM | | | 2,958.4 | | | | 2,976.3 | | | | -0.6 | % | | | 2,886.0 | | | | 2,939.6 | | | | -1.8 | % | | • Exchange Rate (+USD 0.06 /B ): Lower level on exchange rate. | | | | |
Note: The information for 2017 has been recalculated, to take into account the change in methodology aimed at measuring the efficiency of the transport systems’ operating costs and expenses (as from 1Q 18).
| 18 |
| |
Financial Results for the Midstream Segment
Table 20: Profit and Loss Statement – Midstream
| A | | B | | | C | | | D | | | E | | | F | | | G | | | H | | | I | |
| COP Billion | | 3Q 2018 | | | 3Q 2017 | | | ∆ ($) | | | ∆ (%) | | | Jan-Sep 18 | | | Jan-Sep 17 | | | ∆ ($) | | | ∆ (%) | |
| Sales | | | 2,558 | | | | 2,763 | | | | (205 | ) | | | (7.4 | )% | | | 8,169 | | | | 7,805 | | | | 364 | | | | 4.7 | % |
| DD&A Costs | | | 288 | | | | 265 | | | | 23 | | | | 8.7 | % | | | 846 | | | | 812 | | | | 34 | | | | 4.2 | % |
| Variable Costs | | | 155 | | | | 180 | | | | (25 | ) | | | (13.9 | )% | | | 439 | | | | 445 | | | | (6 | ) | | | (1.3 | )% |
| Fixed Costs | | | 417 | | | | 352 | | | | 65 | | | | 18.5 | % | | | 1,096 | | | | 1,114 | | | | (18 | ) | | | (1.6 | )% |
| Cost of Sales | | | 860 | | | | 797 | | | | 63 | | | | 7.9 | % | | | 2,381 | | | | 2,371 | | | | 10 | | | | 0.4 | % |
| Gross profit | | | 1,698 | | | | 1,966 | | | | (268 | ) | | | (13.6 | )% | | | 5,788 | | | | 5,434 | | | | 354 | | | | 6.5 | % |
| Operating Expenses | | | 29 | | | | 138 | | | | (109 | ) | | | (79.0 | )% | | | 289 | | | | 362 | | | | (73 | ) | | | (20.2 | )% |
| Operating Profit | | | 1,669 | | | | 1,828 | | | | (159 | ) | | | (8.7 | )% | | | 5,499 | | | | 5,072 | | | | 427 | | | | 8.4 | % |
| Financial Income (Loss) | | | (34 | ) | | | (125 | ) | | | 91 | | | | (72.8 | )% | | | (350 | ) | | | (293 | ) | | | (57 | ) | | | 19.5 | % |
| Share of profit of companies | | | - | | | | (14 | ) | | | 14 | | | | (100.0 | )% | | | 1 | | | | (32 | ) | | | 33 | | | | (103.1 | )% |
| Net Income Before Income Tax | | | 1,635 | | | | 1,689 | | | | (54 | ) | | | (3.2 | )% | | | 5,150 | | | | 4,747 | | | | 403 | | | | 8.5 | % |
| Provision for Income Tax | | | (623 | ) | | | (655 | ) | | | 32 | | | | (4.9 | )% | | | (1,945 | ) | | | (1,958 | ) | | | 13 | | | | (0.7 | )% |
| Net Income Consolidated | | | 1,012 | | | | 1,034 | | | | (22 | ) | | | (2.1 | )% | | | 3,205 | | | | 2,789 | | | | 416 | | | | 14.9 | % |
| Non-controlling interests | | | (248 | ) | | | (221 | ) | | | (27 | ) | | | 12.2 | % | | | (728 | ) | | | (586 | ) | | | (142 | ) | | | 24.2 | % |
| Net income attributable to owners of Ecopetrol | | | 764 | | | | 813 | | | | (49 | ) | | | (6.0 | )% | | | 2,477 | | | | 2,203 | | | | 274 | | | | 12.4 | % |
| | | | | | | | | | | | | | | | | | | | | | | | | | | | | | | | | |
| EBITDA | | | 1,976 | | | | 2,104 | | | | (128 | ) | | | (6.1 | )% | | | 6,421 | | | | 5,998 | | | | 423 | | | | 7.1 | % |
| EBITDA Margin | | | 77.2 | % | | | 76.1 | % | | | 1.1 | % | | | | | | | 78.6 | % | | | 76.8 | % | | | 1.8 | % | | | | |
The decrease in the midstream segment’s revenue in the third quarter of 2018 as compared to the third quarter of 2017, was primarily due to: i) finalization of the fee reconciliation agreement for the P135 project at Ocensa, partially offset by ii) higher revenue due to the commissioning of the San Fernando – Apiay system in January 2018 and the P135 project in the second half of 2017.
The increase in the cost of sales in the third quarter of 2018 as compared to the third quarter of 2017 is primarily a result of: i) greater volumes transported during the reversals of the Bicentenario oil pipeline to reduce the impact of the attacks on the Caño Limón - Coveñas oil pipeline, and ii) greater consumption of materials, supplies associated with the commissioning of the San Fernando – Apiay system and the expansion of the P135 project.
The decrease in the net operating expenses in the third quarter of 2018 as compared to the third quarter of 2017 is primarily a result of: i) recovery of the provision relating to a dispute at the P135 project, and ii) higher expenses associated with emergency services and attacks by third parties on the transport system.
The Midstream segment posted a lower financial (non-operational) expense during the third quarter of 2018 as compared to the third quarter of 2017, primarily as a result of revenue from the COP/USD exchange rate spread due to the positive effect of the Colombian peso’s devaluation against the U.S. dollar had on the business unit’s net asset position in U.S. dollars.
Cartagena Refinery
Table 21: Throughput, Utilization Factor, Production and Margin – Cartagena Refinery
| A | | B | | | C | | | D | | | E | | | F | | | G | |
| | | 3Q 2018 | | | 3Q 2017 | | | ∆ % | | | Jan-Sep 18 | | | Jan-Sep 17 | | | ∆ (%) | |
| Throughput * (mbod) | | | 157.6 | | | | 136.0 | | | | 15.9 | % | | | 151.7 | | | | 131.8 | | | | 15.1 | % |
| Utilization (%) | | | 92.4 | | | | 70.6 | | | | 30.9 | % | | | 89.4 | | | | 70.9 | | | | 26.1 | % |
| Production (mboed) | | | 152.3 | | | | 133.5 | | | | 14.1 | % | | | 147.2 | | | | 128.9 | | | | 14.2 | % |
| Gross Margin (USD/Bl) | | | 12.1 | | | | 10.3 | | | | 17.5 | % | | | 11.6 | | | | 8.3 | | | | 40.3 | % |
* Corresponds to actual throughput volumes, not received volumes
| 19 |
| |
The Cartagena refinery continued to demonstrate the consolidation and optimization of its operations by processing greater throughput of crude oil and increasing its utilization factor. During the third quarter of 2018, throughput consisted of 80% domestic crude and 20% imported, compared to 49% domestic crude and 51% imported during third quarter of 2017. This change in composition contributed to a lower cost of sales for the Ecopetrol Business Group. In September 2018, the highest average throughput per month was achieved since the refinery’s commissioning, at 161 mbd, and in August 2018, a test was run with 100% domestic crude for nine days, achieving average throughput of 164 mbd. These tests are part of the optimization process of the refinery’s diet.
The significant increase in gross refining margin is the result of the stable operation of the refinery since the fourth quarter of 2017, which has mitigated the downward impact of the price differences for products (cracks) in the international market.
Barrancabermeja Refinery
Table 22: Throughput, Utilization Factor, Production and Margin –Barrancabermeja Refinery
| A | | B | | | C | | | D | | | E | | | F | | | G | |
| | | 3Q 2018 | | | 3Q 2017 | | | ∆ % | | | Jan-Sep 18 | | | Jan-Sep 17 | | | ∆ (%) | |
| Throughput * (mbod) | | | 222.7 | | | | 200.6 | | | | 11.0 | % | | | 219.6 | | | | 208.6 | | | | 5.3 | % |
| Utilization ()% | | | 85.8 | | | | 77.7 | | | | 10.4 | % | | | 86.1 | % | | | 79.6 | % | | | 8.2 | % |
| Production (mboed) | | | 226.3 | | | | 202.3 | | | | 11.9 | % | | | 222.2 | | | | 207.0 | | | | 7.3 | % |
| Gross Margin (USD/Bl) | �� | | 13.9 | | | | 14.6 | | | | (4.8 | )% | | | 12.1 | | | | 14.1 | | | | (14.2 | )% |
* Corresponds to actual throughput volumes, not received volumes
Throughput and production at the Barrancabermeja refinery increased in the third quarter of 2018 as compared to the third quarter 2017, as a result of stable operations and the implementation of initiatives to separate light and intermediate crudes, which increased their availability.
Gross refining margin at the Barrancabermeja refinery decreased in the third quarter of 2018 as compared to the third quarter of 2017, primarily due to a decrease in the price spread of products versus Brent, which was partially offset by greater production of products such as medium distillates and gasoline. However, compared to the second quarter of 2018, the margin increased, primarily as a result of a greater yield of products (medium distillates and gasoline) and lower cost of the diet.
| 20 |
| |
Table 23: Refining Cash Cost3 - Ecopetrol Business Group*
| A | | B | | | C | | | D | | | E | | | F | | | G | | | H | | | |
| USD/Bl | | 3Q 2018 | | | 3Q 2017 | | | ∆ % | | | Jan-Sep 18 | | | Jan-Sep 17 | | | ∆ (%) | | | Explanation | | % USD | |
| Refining cash cost | | | 4.80 | | | | 5.16 | | | | -7.0 | % | | | 4.82 | | | | 5.08 | | | | -5.2 | % | | • Volume (-USD 0,44 /B): Higher charges for stabilization and maximization of national crude oil in REFICAR, and availability of medium and light crude
• Cost (+USD 0,09 /B): higher cost, maintenance and industrial services for higher gas rates. | | | 9.7 | % |
| | | | | | | | | | | | | | | | | | | | | | | | | | | | | | | |
| TRM | | | 2,958.4 | | | | 2,976.3 | | | | -0.6 | % | | | 2,886.0 | | | | 2,939.6 | | | | -1.8 | % | | • Exchange Rate (+USD 0,09 /B ): Lower level on exchange rate. | | | | |
* Includes Barrancabermeja and Cartagena refineries, and Esenttia.
Financial Results for the Downstream Segment
Table 24: Profit and Loss Statement – Downstream
| A | | B | | | C | | | D | | | E | | | F | | | G | | | H | | | I | |
| COP Billion | | 3Q 2018 | | | 3Q 2017 | | | ∆ ($) | | | ∆ (%) | | | Jan-Sep 18 | | | Jan-Sep 17 | | | ∆ ($) | | | ∆ (%) | |
| Sales | | | 9,803 | | | | 6,841 | | | | 2,962 | | | | 43.3 | % | | | 26,809 | | | | 20,461 | | | | 6,348 | | | | 31.0 | % |
| DD&A Costs | | | 314 | | | | 295 | | | | 19 | | | | 6.4 | % | | | 916 | | | | 818 | | | | 98 | | | | 12.0 | % |
| Variable Costs | | | 8,519 | | | | 5,582 | | | | 2,937 | | | | 52.6 | % | | | 23,288 | | | | 17,097 | | | | 6,191 | | | | 36.2 | % |
| Fixed Costs | | | 479 | | | | 382 | | | | 97 | | | | 25.4 | % | | | 1,383 | | | | 1,189 | | | | 194 | | | | 16.3 | % |
| Cost of Sales | | | 9,312 | | | | 6,259 | | | | 3,053 | | | | 48.8 | % | | | 25,587 | | | | 19,104 | | | | 6,483 | | | | 33.9 | % |
| Gross profit | | | 491 | | | | 582 | | | | (91 | ) | | | (15.6 | )% | | | 1,222 | | | | 1,357 | | | | (135 | ) | | | (9.9 | )% |
| Operating Expenses | | | 237 | | | | 378 | | | | (141 | ) | | | (37.3 | )% | | | 686 | | | | 1,130 | | | | (444 | ) | | | (39.3 | )% |
| Operating Profit (Loss) | | | 254 | | | | 204 | | | | 50 | | | | 24.5 | % | | | 536 | | | | 227 | | | | 309 | | | | >500% | |
| Financial Income (Loss) | | | (342 | ) | | | (226 | ) | | | (116 | ) | | | 51.3 | % | | | (698 | ) | | | (690 | ) | | | (8 | ) | | | 1.2 | % |
| Share of profit of companies | | | 6 | | | | 3 | | | | 3 | | | | 100.0 | % | | | 22 | | | | 14 | | | | 8 | | | | 57.1 | % |
| Net Loss Before Income Tax | | | (82 | ) | | | (19 | ) | | | (63 | ) | | | 331.6 | % | | | (140 | ) | | | (449 | ) | | | 309 | | | | (68.8 | )% |
| Provision for Income Tax | | | 6 | | | | (96 | ) | | | 102 | | | | (106.3 | )% | | | (87 | ) | | | (296 | ) | | | 209 | | | | (70.6 | )% |
| Net Loss Consolidated | | | (76 | ) | | | (115 | ) | | | 39 | | | | (33.9 | )% | | | (227 | ) | | | (745 | ) | | | 518 | | | | (69.5 | )% |
| Non-controlling interests | | | - | | | | - | | | | - | | | | 0.0 | % | | | 1 | | | | 1 | | | | - | | | | 0.0 | % |
| Net Loss attributable to owners of Ecopetrol | | | (76 | ) | | | (115 | ) | | | 39 | | | | (33.9 | )% | | | (226 | ) | | | (744 | ) | | | 518 | | | | (69.6 | )% |
| | | | | | | | | | | | | | | | | | | | | | | | | | | | | | | | | |
| EBITDA | | | 686 | | | | 664 | | | | 22 | | | | 3.3 | % | | | 1,733 | | | | 1,515 | | | | 218 | | | | 14.4 | % |
| EBITDA Margin | | | 7.0 | % | | | 9.7 | % | | | (2.7 | )% | | | | | | | 6.5 | % | | | 7.4 | % | | | (0.9 | )% | | | | |
The increase in the Downstream segment’s revenue for the third quarter of 2018 as compared to the third quarter of 2017 is primarily due to higher sales volumes, given the increase in refinery throughput and better product sale prices, in line with the increase of international prices.
The increase in the cost of sales for third quarter of 2018 as compared to the third quarter of 2017 is primarily due to i) greater crude throughput in both refineries, ii) higher prices of the crude baskets, and iii) the higher cost of transport services.
The 37.3% decrease in the Downstream segment’s operating expenses for the third quarter of 2018 as compared to the third quarter of 2017 is primarily due to the conclusion of the stabilization period of the Cartagena refinery, and the decrease in project closure expenses, as well as the decrease in docking and freight expenses given lower imports of light crude.
3 The cash cost indicator shown in this report for 3Q 2017 differs from the one reported in the 3Q 2017 report, because for comparative purposes the refining cash cost for 3Q 2017 was recalculated to include the costs of the Cartagena refinery.
| 21 |
| |
As a result of the positive operational performance as of September 2018, the Downstream segment showed a recovery of 70% of its net loss and an increase of 14% in its EBITDA.
Financial (non-operational) results for the third quarter of 2018, increased as compared to the third quarter of 2017 was primarily due to the effect that the devaluation of Colombian pesoagainst the US dollar had on the segment’s net liability position in US dollars.
Quality of fuels
During the third quarter, greater synergies were achieved between the Cartagena and Barrancabermeja refineries and operational adjustments were made in our transport and logistics systems in order to produce cleaner fuels. In September 2018, diesel distributed in Colombia averaged between 15 and 20 parts per million (ppm) of sulfur, below the maximum of 50 ppm permitted by Colombian regulation.
Ecopetrol has also succeeded in keeping operational and logistical adjustments to deliver diesel below 25 ppm of sulfur content to the city of Medellin and its metropolitan area since March 2018. In September, diesel distributed to this city had an average sulfur content between 12 and 14 ppm that complies with standards of international reference markets as those in the United States (10 to 15 ppm sulfur content).
| 4. | Results of Efficiency Initiatives |
The Ecopetrol Group’s efficiency strategy continued in the third quarter of 2018, levered on the different segments management. As of September 30, 2018 efficiencies totaled COP 1.8 trillion, 26% higher than reported during the same 9-month period in 2017 (COP 1.4 trillion), distributed as follows:
Table 25: Principal structural savings initiatives, Jan - Sept 2018
| A | | B | | | C | |
| COP Billion | | Jan-Sep 18 | | | Jan-Sep 17 | |
| Lower deferred production | | | 253 | | | | 204 | |
| Optimization of drilling and facilities construction | | | 637 | | | | 239 | |
| Higher revenues at refineries | | | 394 | | | | 236 | |
| Energy Strategy - Surplus sales + Cost optimization | | | 92 | | | | 43 | |
| Heavy crude oil dilution | | | 63 | | | | 263 | |
| Improved commercial strategy | | | 127 | | | | 91 | |
| Operative cost optimization | | | 61 | | | | 119 | |
| Lower O&M cost in Midstream companies | | | 90 | | | | 103 | |
| Optimization of refining cash cost | | | 31 | | | | 23 | |
| Savings on staff areas, logistics and others | | | 32 | | | | 91 | |
| TOTAL | | | 1,780 | | | | 1,413 | |
As of September 30, 2018, the Ecopetrol Group investments totaled USD 1,798 million. During the third quarter of 2018 investments totaled USD 789 million, a 31% increase as compared to the second quarter of 2018 and a 51% increase as compared to the same period in 2017. Out of the USD 789 million, USD 677 were invested in the Upstream segment, a 57% increase as compared to the same period in 2017.
Investments in the third quarter represented approximately 80% of the investments in the first half of 2018. This was the result of greater levels of activity, as had been anticipated for the second half, as well as the implementation of strategies oriented toward speeding up initiatives and recovering from delays generated after the social and environmental contingency events that had occurred in the first half of the year.
| 22 |
| |
Table 26: Investments by segment - Ecopetrol Business Group
| A | | B | | | C | | | D | | | E | |
| Jan-Sep 2018 (USD Million) | | Ecopetrol S.A. | | | Affiliates and
Subsidiaries | | | Total | | | Share | |
| Production | | | 1,268.8 | | | | 132.6 | | | | 1,401.4 | | | | 77.9 | % |
| Refining, Petrochemicals and Biofuels | | | 55.4 | | | | 52.1 | | | | 107.4 | | | | 6.0 | % |
| Exploration | | | 52.3 | | | | 99.5 | | | | 151.8 | | | | 8.4 | % |
| Transportation | | | 0.9 | | | | 116.3 | | | | 117.2 | | | | 6.5 | % |
| Corporate | | | 20.4 | | | | 0.0 | | | | 20.4 | | | | 1.1 | % |
| Total | | | 1,398 | | | | 400 | | | | 1,798 | | | | 100 | % |
Production:Investment increased by 77% in the third quarter of 2018 as compared to the third quarter of 2017. The Ecopetrol S.A. drilling campaign was concentrated in the Castilla (stages 1 and 2), La Cira Infantas and Rubiales (Module B3) fields. Highlights include: i) continuation of the construction of the condensate stabilization plant at the Cupiagua field (which it is expected to maximize the value of the rich gas produced at the Piedemonte Llanero), and ii) the infill drilling campaign at Chichimene field. Drilling activities were developed by Hocol at the Espinal, Guarrojo and Bullerengue fields.
The third quarter showed the initial execution of major projects that will be the focus of the drilling activity planned for the last quarter of 2018. These include: i) Module B4 of the Rubiales field, which leverages the asset development plan, ii) the incremental module at the Akacias field (the fifth-largest original oil asset in the country, in which no investment projects have been developed since 2014), and iii) other key assets such as the Castilla, Quifa and Infantas Oriente fields. As of September 30, 2018, 421 development wells have been drilled, and over 400 capitalizable workovers have been performed.
In the third quarter of 2018, some USD 86 million have been invested in the study of important fields in the country and in the development in enhanced recovery technologies. As for the third quarter, investments also include the development of studies in fields such as Tibú, Área Sur, Caño Sur, Provincia, Llanito and Yariguí, and injection pilots in strategic assets such as Castilla and Chichimene, which support production sustainability.
Exploration:Investments totaling USD 88 million were made during the third quarter of 2018. The most significant investment was our participation in the award of the Pau-Brasil block, located in the Santos basin, consisting of a joint venture among BP Energy (50% - Operator), Ecopetrol (20%) and CNOOC Petroleum (30%). Also, Ecopetrol invested in a participation in the Andina-1 well, located in Tame, Arauca, in association with Parex Resources. It is important to mention that Hocol made investments in civil works, feasibility and drilling at the Arrecife-1, Payero-E1ST and Jicaro-1 wells.
In line with the above, investments executed during the course of 2018 have resulted in the completion of drilling of five exploratory wells (Bufalo-1, Pulpo-1, Andina-1, Payero-E1ST and Arrecife) and four appraisal wells (Coyote-2, Jaspe-6D, Capachos Sur-2 and Rex NE-02-ST1), as well as the acquisition of 61,286 km of 2D seismic and 15,292 km2 of 3D seismic in Colombia, Mexico and Brazil.
Refining, Petrochemicals and Biofuels: Major maintenance and operational continuity activities were executed in the Polyethylene, UOP II cracking and industrial services units of the Barrancabermeja refinery, as well as tank maintenance and process safety and HSE initiatives at the Cartagena Refinery. The decrease in investment compared to the third quarter of 2017 is consistent with the rescheduling of some major maintenance for the last quarter of the year, without affecting operational integrity and reliability.
| 23 |
| |
Midstream:Operational continuity activities were carried out in various oil pipeline and polyduct systems of Cenit and its subsidiaries, as well as advances in the construction of the polyduct of the Chinchiná-Pereira deviation that will supply the country’s western regions.
In line with the above, the Ecopetrol Group maintains its estimated investment for 2018 in a range between USD 3 billion and USD 3.5 billion, an increase of 36% or 59% compared to the amount invested in 2017.
| II. | Social and Corporate Responsibility (Ecopetrol S.A.) |
Table 27: HSE (Health, Safety and the Environment) Performance
| A | | B | | | C | | | D | | | E | |
| HSE Indexes* | | 3Q 2018 | | | 3Q 2017 | | | Jan-Sep 18 | | | Jan-Sep 17 | |
| Accident frequency index (accidents per million labor hours) | | | 0.51 | | | | 0.72 | | | | 0.59 | | | | 0.69 | |
| Environmental incidents | | | 3 | | | | 3 | | | | 11 | | | | 11 | |
* The results of the indicators are subject to subsequent modification at the close of the quarter, as some accidents and incidents are reclassified according to the final results of the investigations.
The results of the Ecopetrol Business Group are reported as from 2018.
Environmental incidents are defined as hydrocarbon spills greater than one barrel, with an environmental effect.
| 2. | Environment, Social Responsibility and Corporate Governance |
Social Investment:
In the third quarter of 2018, resources for socio-environmental investment totaled COP 12.258 billion, which represented an investment of COP 29.080 billion as of September 2018 (99% of which was voluntary investment). In line with the investment pillars established in the Ecopetrol S.A. Environmental Management Strategy, year-to-date investment has been distributed as follows: i) closure of socioeconomic gaps and peace (COP 18.250 billion), ii) institutional strengthening (COP 5.881 billion), and iii) diversification and strengthening of regional economies (COP 4.949 billion).
In the context of Corporate Responsibility and Sustainability, during the third quarter of 2018 efforts were focused on development of the following activities:
| · | Exercise of due diligence in Human Rights, consistent with the standard of theUnited Nations Guiding Principles on Business and Human Rights. This exercise will be carried out in the eastern regions (communities of Puerto Gaitán and Rubiales) and Orinoquía (communities of Castilla, Apiay and Chichimene), with the objective of identifying risks and impacts in the area and establishing the corresponding prevention and mitigation measures. |
| 24 |
| |
| · | Year-to-date we have focused our efforts on activities such as the recycling of 63.3 million cubic meters of water used in our operations. This amount represents an additional saving of 20% compared with the same period last year, enabling us to optimize the water requirement. |
| · | Reduction of 23,300 tons of CO2 as a result of the implementation of new initiatives, such as: i) incorporation of additional sources of non-conventional renewable energy to the energy matrix, initiating the contracting of a solar farm for the Castilla field (with capacity of between 10-15 MW, forming part of the portfolio of renewable energy initiatives), ii) electrification of the southern area, in an effort to replace 19 diesel engines with electrical engines, and iii) construction of generating centers at Área Sur and Área Orito. |
| · | Implementation of 15 plans for Reconversion to Clean Technologies in Spill Management, approved by regional environmental authorities, which have resulted in the production of 109,300 barrels of oil per day. |
| · | Revenue of COP 10,700 billion from the sale of 20,197 tons of waste generated in various operating areas. |
Ecopetrol and unions agree to new Collective Bargaining Agreement
On September 28, 2018, Ecopetrol filed a new Collective bargaining Agreement covering aspects of education, health, food, services and transport, among other worker benefits with the Ministry of Labor. The agreement, signed as an extension of the direct settlement phase, was entered into between Ecopetrol and the USO, Adeco, Sindispetrol, Utipec, Trasine, Asintrahc and Aproteco unions. The new Collective Bargaining Agreement applies for 4.5 years as of – July 1, 2018 – and includes a wage increase this year of CPI plus 1.21%, and a wage increase next year of CPI plus 1.7%.
The New Collective Bargaining Agreement is in line with the business strategy that seeks to maintain efficiency, capital discipline and collective labor in Ecopetrol’s new growth phase, and we expect it to have a positive effect on worker wellbeing and the country’s development.
| 25 |
| |
| III. | Presentations on Quarterly Results |
Ecopetrol management will provide two online presentations to review the third quarter of 2018 results:
| Spanish | English |
| November 1, 2018 | November 1, 2018 |
| 8:00 a.m. Bogotá | 9:30 a.m. Colombia |
| 9:00 a.m. New York | 10:30 a.m. New York |
The online broadcast will be available on the Ecopetrol website:www.ecopetrol.com.co
The presentation via webcast will be available at the following links:
http://event.onlineseminarsolutions.com/wcc/r/1860357-1/DC064C359529BAB504745883599DDE54
(Spanish)
http://event.onlineseminarsolutions.com/wcc/r/1860384-1/9677D33EF14DF374F0373FF46368B3AE
(English)
Please verify that your browser allows normal operation of the online presentation. We recommend the latest versions of Internet Explorer, Google Chrome and Mozilla Firefox.
Statements on future projections:
This press release may contain statements on future projections related to business prospects, estimates of operational and financial results, and Ecopetrol’s growth prospects. These are projections, and therefore are based solely on management’s expectations of the company’s future and its continuous access to capital to finance the Company’s sales plan. Achieving these estimates in the future depends on changes in market conditions, government regulations, competitive pressures, the performance of the Colombian economy and industry, and other factors; therefore, they are subject to change without prior notice.
Contact information:
Capital Markets Manager
María Catalina Escobar
Telephone: +571-234-5190
Email:investors@ecopetrol.com.co
Media Relations (Colombia)
Jorge Mauricio Tellez
Telephone: + 571-234-4329
Email:mauricio.tellez@ecopetrol.com.co
| 26 |
| |
| IV. | Ecopetrol Business Group Appendices |
Table 1: Profit and Loss Statement – Ecopetrol Business Group
| A | | B | | | C | | | D | | | E | |
| COP Billion | | 3Q 2018 | | | 3Q 2017 | | | Jan-Sep 18 | | | Jan-Sep 17 | |
| Revenue | | | | | | | | | | | | | | | | |
| Local Sales | | | 8,671 | | | | 6,915 | | | | 24,377 | | | | 20,334 | |
| Export Sales | | | 9,205 | | | | 6,410 | | | | 25,129 | | | | 19,513 | |
| Total Revenue | | | 17,876 | | | | 13,325 | | | | 49,506 | | | | 39,847 | |
| Cost of Sales | | | | | | | | | | | | | | | | |
| Depreciation, Amortization and Depletion | | | 2,053 | | | | 2,184 | | | | 5,723 | | | | 6,307 | |
| Variable cost DD&A | | | 1,416 | | | | 1,582 | | | | 3,859 | | | | 4,564 | |
| Fixed cost depreciation | | | 637 | | | | 602 | | | | 1,864 | | | | 1,743 | |
| Variable Costs | | | 6,342 | | | | 4,668 | | | | 17,361 | | | | 15,302 | |
| Imported products | | | 2,778 | | | | 2,722 | | | | 8,167 | | | | 9,047 | |
| Purchase of Hydrocarbons | | | 2,659 | | | | 1,662 | | | | 7,571 | | | | 4,926 | |
| Hydrocarbon Transportation Services | | | 212 | | | | 203 | | | | 563 | | | | 566 | |
| Inventories and others | | | 693 | | | | 81 | | | | 1,060 | | | | 763 | |
| Fixed Costs | | | 2,228 | | | | 1,925 | | | | 6,143 | | | | 5,539 | |
| Contracted Services | | | 708 | | | | 570 | | | | 1,965 | | | | 1,694 | |
| Maintenance | | | 568 | | | | 532 | | | | 1,503 | | | | 1,489 | |
| Labor Costs | | | 513 | | | | 471 | | | | 1,515 | | | | 1,327 | |
| Other | | | 439 | | | | 352 | | | | 1,160 | | | | 1,029 | |
| Total Cost of Sales | | | 10,623 | | | | 8,777 | | | | 29,227 | | | | 27,148 | |
| Gross Income | | | 7,253 | | | | 4,548 | | | | 20,279 | | | | 12,699 | |
| Operating Expenses | | | 1,600 | | | | 1,225 | | | | 3,062 | | | | 2,810 | |
| Administration expenses | | | 594 | | | | 900 | | | | 1,868 | | | | 2,380 | |
| Exploration and Projects expenses | | | 1,006 | | | | 325 | | | | 1,194 | | | | 430 | |
| Operating Income | | | 5,653 | | | | 3,323 | | | | 17,217 | | | | 9,889 | |
| Finance result, net | | | (521 | ) | | | (807 | ) | | | (1,710 | ) | | | (1,962 | ) |
| Foreign exchange, net | | | 61 | | | | (136 | ) | | | 132 | | | | (151 | ) |
| Interest, net | | | (447 | ) | | | (514 | ) | | | (1,448 | ) | | | (1,442 | ) |
| Financial Income/Loss | | | (135 | ) | | | (157 | ) | | | (394 | ) | | | (369 | ) |
| Share of profit of companies | | | 57 | | | | 4 | | | | 239 | | | | 58 | |
| Income before income tax | | | 5,189 | | | | 2,520 | | | | 15,746 | | | | 7,985 | |
| Income Tax | | | (2,182 | ) | | | (1,296 | ) | | | (6,155 | ) | | | (4,206 | ) |
| Net Income Consolidated | | | 3,007 | | | | 1,224 | | | | 9,591 | | | | 3,779 | |
| Non-controlling interest | | | (232 | ) | | | (221 | ) | | | (682 | ) | | | (585 | ) |
| Net income attributable to Owners of Ecopetrol | | | 2,775 | | | | 1,003 | | | | 8,909 | | | | 3,194 | |
| | | | | | | | | | | | | | | | | |
| EBITDA | | | 7,997 | | | | 5,852 | | | | 23,756 | | | | 17,296 | |
| EBITDA Margin | | | 44.7 | % | | | 43.9 | % | | | 48.0 | % | | | 43.4 | % |
| 27 |
| |
Table 2: Statement of Financial Position / Balance Sheet – Ecopetrol Business Group
| A | | B | | | C | | | D | |
| COP Billion | | September 30, 2018 | | | June 30, 2018 | | | ∆ (%) | |
| Current assets | | | | | | | | | | | | |
| Cash and cash equivalents | | | 7,121 | | | | 6,337 | | | | 12.4 | % |
| Trade and other receivables | | | 7,939 | | | | 7,886 | | | | 0.7 | % |
| Inventories | | | 5,413 | | | | 5,472 | | | | (1.1 | )% |
| Current tax assets | | | 369 | | | | 475 | | | | (22.3 | )% |
| Other financial assets | | | 7,563 | | | | 6,263 | | | | 20.8 | % |
| Other assets | | | 832 | | | | 768 | | | | 8.3 | % |
| | | | 29,237 | | | | 27,201 | | | | 7.5 | % |
| Non-current assets held for sale | | | 51 | | | | 48 | | | | 6.3 | % |
| Total current assets | | | 29,288 | | | | 27,249 | | | | 7.5 | % |
| | | | | | | | | | | | | |
| Non-current assets | | | | | | | | | | | | |
| Investments in associates and joint ventures | | | 1,543 | | | | 1,438 | | | | 7.3 | % |
| Trade and other receivables | | | 763 | | | | 786 | | | | (2.9 | )% |
| Property, plant and equipment | | | 60,478 | | | | 60,257 | | | | 0.4 | % |
| Natural and environmental resources | | | 21,444 | | | | 21,862 | | | | (1.9 | )% |
| Intangibles | | | 393 | | | | 359 | | | | 9.5 | % |
| Deferred tax assets | | | 4,851 | | | | 4,711 | | | | 3.0 | % |
| Other financial assets | | | 3,368 | | | | 3,200 | | | | 5.3 | % |
| Other assets | | | 1,754 | | | | 1,721 | | | | 1.9 | % |
| Total non-current assets | | | 94,594 | | | | 94,334 | | | | 0.3 | % |
| | | | | | | | | | | | | |
| Total assets | | | 123,882 | | | | 121,583 | | | | 1.9 | % |
| | | | | | | | | | | | | |
| Liabilities | | | | | | | | | | | | |
| Current liabilities | | | | | | | | | | | | |
| Loans and borrowings | | | 8,034 | | | | 5,677 | | | | 41.5 | % |
| Trade and other payables | | | 8,225 | | | | 8,579 | | | | (4.1 | )% |
| Provision for employees benefits | | | 1,834 | | | | 1,714 | | | | 7.0 | % |
| Current tax liabilities | | | 3,021 | | | | 1,969 | | | | 53.4 | % |
| Accrued liabilities and provisions | | | 384 | | | | 538 | | | | (28.6 | )% |
| Other liabilities | | | 445 | | | | 380 | | | | 17.1 | % |
| Total current liabilities | | | 21,943 | | | | 18,857 | | | | 16.4 | % |
| | | | | | | | | | | | | |
| Non-current liabilities | | | | | | | | | | | | |
| Loans and borrowings | | | 31,856 | | | | 35,652 | | | | (10.6 | )% |
| Trade and other payables | | | 26 | | | | 25 | | | | 4.0 | % |
| Provision for employees benefits | | | 6,749 | | | | 6,655 | | | | 1.4 | % |
| Deferred tax liabilities | | | 874 | | | | 761 | | | | 14.8 | % |
| Accrued liabilities and provisions | | | 6,923 | | | | 6,861 | | | | 0.9 | % |
| Other liabilities | | | 341 | | | | 534 | | | | (36.1 | )% |
| Total non-current liabilities | | | 46,769 | | | | 50,488 | | | | (7.4 | )% |
| | | | | | | | | | | | | |
| Total liabilities | | | 68,712 | | | | 69,345 | | | | (0.9 | )% |
| | | | | | | | | | | | | |
| Equity | | | | | | | | | | | | |
| Equity attributable to owners of the Company | | | 53,367 | | | | 50,330 | | | | 6.0 | % |
| Non-controlling interests | | | 1,803 | | | | 1,908 | | | | (5.5 | )% |
| Total Equity | | | 55,170 | | | | 52,238 | | | | 5.6 | % |
| | | | | | | | | | | | | |
| Total liabilities and equity | | | 123,882 | | | | 121,583 | | | | 1.9 | % |
| 28 |
| |
Table 3: Cash Flow Statement – Ecopetrol Business Group
| A | | B | | | C | | | D | | | E | |
| COP Billion | | 3Q 2018 | | | 3Q 2017 | | | Jan-Sep 18 | | | Jan-Sep 17 | |
| Cash flow provided by operating activities: | | | | | | | | | | | | | | | | |
| Net income attributable to Owners of Ecopetrol S.A. | | | 2,775 | | | | 1,003 | | | | 8,909 | | | | 3,194 | |
| Adjustments to reconcile net income to cash provided by operating activities: | | | | | | | | | | | | | | | | |
| Non-controlling interests | | | 232 | | | | 221 | | | | 682 | | | | 585 | |
| Income tax | | | 2,182 | | | | 1,296 | | | | 6,155 | | | | 4,206 | |
| Depreciation, depletion and amortization | | | 2,070 | | | | 2,230 | | | | 5,778 | | | | 6,429 | |
| Foreign exchange (gain) loss | | | (61 | ) | | | 136 | | | | (132 | ) | | | 151 | |
| Finance costs recognised in profit or loss | | | 748 | | | | 813 | | | | 2,326 | | | | 2,296 | |
| Dry wells | | | 825 | | | | 241 | | | | 873 | | | | 274 | |
| Loss (gain) on disponsal of non-current assets | | | (3 | ) | | | 17 | | | | (24 | ) | | | 50 | |
| Impairment of current and non-current assets | | | (7 | ) | | | (29 | ) | | | (138 | ) | | | 25 | |
| Fair value (gain) on financial assets valuation | | | 2 | | | | (7 | ) | | | (55 | ) | | | (109 | ) |
| Profit in acquisition of participations in joint operations | | | - | | | | - | | | | 12 | | | | - | |
| Gain on assets for sale | | | - | | | | (9 | ) | | | 1 | | | | (176 | ) |
| (Gain) loss on share of profit of associates and joint ventures | | | (57 | ) | | | (4 | ) | | | (239 | ) | | | (58 | ) |
| Realized foreign exchange cash flow hedges | | | 152 | | | | 162 | | | | 386 | | | | 415 | |
| Others minor items | | | | | | | | | | | | | | | | |
| Net changes in operating assets and liabilities | | | 316 | | | | (1,004 | ) | | | (2,154 | ) | | | (2,542 | ) |
| Income tax paid | | | (618 | ) | | | (398 | ) | | | (4,507 | ) | | | (4,120 | ) |
| Cash provided by operating activities | | | 8,554 | | | | 4,668 | | | | 17,868 | | | | 10,620 | |
| | | | | | | | | | | | | | | | | |
| Cash flows from investing activities: | | | | | | | | | | | | | | | | |
| Investment in property, plant and equipment | | | (816 | ) | | | (500 | ) | | | (1,926 | ) | | | (1,409 | ) |
| Investment in natural and environmental resources | | | (1,291 | ) | | | (739 | ) | | | (3,113 | ) | | | (2,216 | ) |
| Payments for intangibles | | | (54 | ) | | | (132 | ) | | | (74 | ) | | | (161 | ) |
| Sale of assets held for sale and equity instruments | | | - | | | | 26 | | | | - | | | | 181 | |
| (Purchases) sales of other financial assets | | | (1,485 | ) | | | (760 | ) | | | (4,376 | ) | | | 2,134 | |
| Interest received | | | 89 | | | | 105 | | | | 247 | | | | 297 | |
| Dividends received | | | 1 | | | | 20 | | | | 54 | | | | 269 | |
| Proceeds from sales of assets | | | (48 | ) | | | 33 | | | | 46 | | | | 69 | |
| Net cash used in by investing activities | | | (3,604 | ) | | | (1,947 | ) | | | (9,142 | ) | | | (836 | ) |
| | | | | | | | | | | | | | | | | |
| Cash flows from financing activities: | | | | | | | | | | | | | | | | |
| Proceeds (repayment of) from borrowings | | | (1,934 | ) | | | (77 | ) | | | (3,487 | ) | | | (6,661 | ) |
| Interest paid | | | (592 | ) | | | (624 | ) | | | (1,768 | ) | | | (2,055 | ) |
| Dividends paid | | | (1,832 | ) | | | (168 | ) | | | (4,287 | ) | | | (1,305 | ) |
| Net cash used in financing activities | | | (4,358 | ) | | | (869 | ) | | | (9,542 | ) | | | (10,021 | ) |
| | | | | | | | | | | | | | | | | |
| Exchange difference in cash and cash equivalents | | | 192 | | | | (246 | ) | | | (9 | ) | | | (321 | ) |
| Net (decrease) increase in cash and cash equivalents | | | 784 | | | | 1,606 | | | | (825 | ) | | | (558 | ) |
| Cash and cash equivalents at the beginning of the period | | | 6,337 | | | | 6,246 | | | | 7,946 | | | | 8,410 | |
| Cash and cash equivalents at the end of the period | | | 7,121 | | | | 7,852 | | | | 7,121 | | | | 7,852 | |
Table 4: EBITDA Reconciliation – Business Group
| A | | B | | | C | | | D | | | E | |
| COP Billion | | 3Q 2018 | | | 3Q 2017 | | | Jan-Sep 18 | | | Jan-Sep 17 | |
| RECONCILIATION NET INCOME TO EBITDA | | | | | | | | | | | | | | | | |
| Net income attributable to Ecopetrol's owners | | | 2,775 | | | | 1,003 | | | | 8,909 | | | | 3,194 | |
| + Depreciation, depletion and amortization | | | 2,070 | | | | 2,230 | | | | 5,778 | | | | 6,429 | |
| +/- Impairment of non-current assets | | | - | | | | 17 | | | | (149 | ) | | | 26 | |
| +/- Gain in acquisition of participation in joint operations | | | - | | | | - | | | | 12 | | | | - | |
| +/- Finance results, net | | | 521 | | | | 807 | | | | 1,710 | | | | 1,962 | |
| + Income tax | | | 2,182 | | | | 1,296 | | | | 6,155 | | | | 4,206 | |
| + Other taxes | | | 217 | | | | 278 | | | | 659 | | | | 894 | |
| +/-Non-controlling interest | | | 232 | | | | 221 | | | | 682 | | | | 585 | |
| CONSOLIDATED EBITDA | | | 7,997 | | | | 5,852 | | | | 23,756 | | | | 17,296 | |
| 29 |
| |
Table 5: EBITDA Reconciliation by Segment (3Q 2018)
| A | | B | | | C | | | D | | | E | |
| COP Billion | | E&P | | | Refining &
Petrochemicals | | | Transportation
and Logistics | | | Consolidated | |
| RECONCILIATION NET INCOME TO EBITDA | | | | | | | | | | | | | | | | |
| Net income attributable to Ecopetrol's owners | | | 2,087 | | | | (76 | ) | | | 764 | | | | 2,775 | |
| + Depreciation, depletion and amortization | | | 1,457 | | | | 324 | | | | 289 | | | | 2,070 | |
| +/- Impairment of non-current assets | | | - | | | | - | | | | - | | | | - | |
| - Gain in acquisition of participation in joint operations | | | - | | | | - | | | | - | | | | - | |
| +/- Finance results, net | | | 145 | | | | 342 | | | | 34 | | | | 521 | |
| + Income tax | | | 1,565 | | | | (6 | ) | | | 623 | | | | 2,182 | |
| + Other taxes | | | 97 | | | | 102 | | | | 18 | | | | 217 | |
| +/-Non-controlling interest | | | (16 | ) | | | - | | | | 248 | | | | 232 | |
| CONSOLIDATED EBITDA | | | 5,335 | | | | 686 | | | | 1,976 | | | | 7,997 | |
| V. | Appendices: Results of Ecopetrol S.A. |
Following are the Income Statement and Statement of Financial Position of Ecopetrol S.A. (parent company).
Table 6: Income Statement
| A | | B | | | C | | | | | | | |
| COP Billion | | 3Q 2018 | | | 3Q 2017 | | | Jan-Sep 18 | | | Jan-Sep 17 | |
| Local Sales | | | 8,940 | | | | 6,175 | | | | 24,505 | | | | 17,559 | |
| Export Sales | | | 7,153 | | | | 5,127 | | | | 19,809 | | | | 15,383 | |
| Total Sales | | | 16,093 | | | | 11,302 | | | | 44,314 | | | | 32,942 | |
| Variable Costs | | | 8,411 | | | | 6,181 | | | | 23,110 | | | | 18,671 | |
| Fixed Costs | | | 2,527 | | | | 2,599 | | | | 7,591 | | | | 6,911 | |
| Cost of Sales | | | 10,938 | | | | 8,780 | | | | 30,701 | | | | 25,582 | |
| Gross Profits | | | 5,155 | | | | 2,522 | | | | 13,613 | | | | 7,360 | |
| Operating Expenses | | | 450 | | | | 619 | | | | 1,261 | | | | 1,546 | |
| Operating Income | | | 4,705 | | | | 1,903 | | | | 12,352 | | | | 5,814 | |
| Financial Income (Loss) | | | (475 | ) | | | (618 | ) | | | (1,395 | ) | | | (1,385 | ) |
| Share of profit of companies | | | 58 | | | | 250 | | | | 1,936 | | | | 785 | |
| Income before income tax | | | 4,288 | | | | 1,535 | | | | 12,893 | | | | 5,214 | |
| Income Tax | | | (1,513 | ) | | | (532 | ) | | | (3,984 | ) | | | (2,020 | ) |
| Net Income | | | 2,775 | | | | 1,003 | | | | 8,909 | | | | 3,194 | |
| | | | | | | | | | | | | | | | | |
| EBITDA | | | 6,314 | | | | 3,600 | | | | 16,705 | | | | 10,757 | |
| EBITDA Margin | | | 39.2 | % | | | 31.9 | % | | | 37.7 | % | | | 32.7 | % |
| 30 |
| |
Table 7: Statement of Financial Position – Balance Sheet
| A | | B | | | C | | | D | |
| COP Billion | | September 30, 2018 | | | June 30, 2018 | | | ∆ (%) | |
| Current assets | | | | | | | | | | | | |
| Cash and cash equivalents | | | 4,434 | | | | 4,493 | | | | (1.3 | )% |
| Trade and other receivables | | | 7,108 | | | | 7,580 | | | | (6.2 | )% |
| Inventories | | | 3,751 | | | | 3,779 | | | | (0.7 | )% |
| Current tax assets | | | 184 | | | | 136 | | | | 35.3 | % |
| Other financial assets | | | 9,929 | | | | 9,408 | | | | 5.5 | % |
| Other assets | | | 732 | | | | 659 | | | | 11.1 | % |
| | | | 26,138 | | | | 26,055 | | | | 0.3 | % |
| Non-current assets held for sale | | | 26 | | | | 23 | | | | 13.0 | % |
| Total current assets | | | 26,164 | | | | 26,078 | | | | 0.3 | % |
| | | | | | | | | | | | | |
| Non-current assets | | | | | | | | | | | | |
| Investments in associates and joint ventures | | | 41,631 | | | | 41,111 | | | | 1.3 | % |
| Trade and other receivables | | | 624 | | | | 645 | | | | (3.3 | )% |
| Property, plant and equipment | | | 20,063 | | | | 19,968 | | | | 0.5 | % |
| Natural and environmental resources | | | 18,183 | | | | 17,849 | | | | 1.9 | % |
| Intangibles | | | 259 | | | | 225 | | | | 15.1 | % |
| Deferred tax assets | | | 2,274 | | | | 2,280 | | | | (0.3 | )% |
| Other financial assets | | | 2,855 | | | | 2,677 | | | | 6.6 | % |
| Other non-current assets | | | 976 | | | | 923 | | | | 5.7 | % |
| Total non-current assets | | | 86,865 | | | | 85,678 | | | | 1.4 | % |
| | | | | | | | | | | | | |
| Total assets | | | 113,029 | | | | 111,756 | | | | 1.1 | % |
| | | | | | | | | | | | | |
| Liabilities | | | | | | | | | | | | |
| Current liabilities | | | | | | | | | | | | |
| Loans and borrowings | | | 6,857 | | | | 4,651 | | | | 47.4 | % |
| Trade and other payables | | | 7,111 | | | | 8,194 | | | | (13.2 | )% |
| Provision for employees benefits | | | 1,786 | | | | 1,674 | | | | 6.7 | % |
| Current tax liabilities | | | 2,408 | | | | 1,578 | | | | 52.6 | % |
| Accrued liabilities and provisions | | | 298 | | | | 320 | | | | (6.9 | )% |
| Other liabilities | | | 155 | | | | 255 | | | | (39.2 | )% |
| Total current liabilities | | | 18,615 | | | | 16,672 | | | | 11.7 | % |
| | | | | | | | | | | | | |
| Non-current liabilities | | | | | | | | | | | | |
| Loans and borrowings | | | 28,553 | | | | 32,295 | | | | (11.6 | )% |
| Provision for employees benefits | | | 6,749 | | | | 6,655 | | | | 1.4 | % |
| Deferred tax liabilities | | | 145 | | | | 145 | | | | 0.0 | % |
| Accrued liabilities and provisions | | | 5,582 | | | | 5,645 | | | | (1.1 | )% |
| Other long-term liabilities | | | 18 | | | | 15 | | | | 20.0 | % |
| Total non-current liabilities | | | 41,047 | | | | 44,755 | | | | (8.3 | )% |
| | | | | | | | | | | | | |
| Total liabilities | | | 59,662 | | | | 61,427 | | | | (2.9 | )% |
| | | | | | | | | | | | | |
| Equity | | | | | | | | | | | | |
| Equity attributable to owners of the Company | | | 53,367 | | | | 50,329 | | | | 6.0 | % |
| Total Equity | | | 53,367 | | | | 50,329 | | | | 6.0 | % |
| | | | | | | | | | | | | |
| Total liabilities and equity | | | 113,029 | | | | 111,756 | | | | 1.1 | % |
| 31 |
| |
