Exhibit 99.1
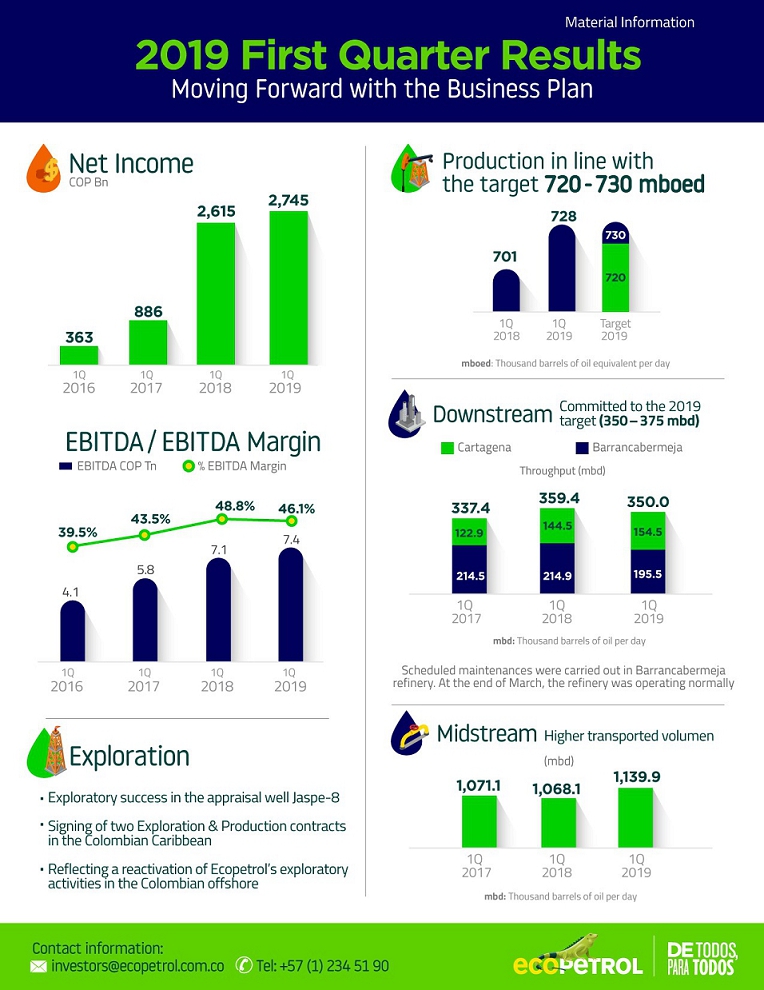

During the first quarter of 2019, the Ecopetrol Group reported a net profit of COP 2.7 trillion and an EBITDA of COP 7.4 trillion, equivalent to a 46% EBITDA margin.These results were achieved even with a lower Brent price, which went from 67.2 dollars per barrel in the first quarter of 2018 to 63.8 dollars per barrel at the end of the first quarter of 2019.
The Ecopetrol Group’s production in the first quarter totaled 728 thousand barrels of oil equivalent per day, positioning it near the upper range of the 2019 target. These results reflect the positive response of the reservoir with primary and secondary recovery; the development of gas markets and the effective execution of the investment plan. In the first quarter of 2019, 158 development wells were completed, with an average of 41 drills in operation, 13 more than those used in the first quarter of the previous year.
We highlight the operational stability achieved during the quarter, leveraged in the adequate management of the environment, allowing a continuous operation in all the regions where we operate. This contributed to the increase in production compared to the same period of 2018, which was affected by a challenging environment of public order in the department of Meta.
Sales volumes totaled 909 thousand barrels of oil equivalent per day, 7% higher than in the first quarter of 2018, driven by higher production levels and increased sales from the Cartagena refinery. This growth allowed the Ecopetrol Group to moderate the impact of the scheduled maintenance of the Barrancabermeja refinery’s Diesel Hydrotreatment plant (HDT).
Likewise, the first quarter of the year showed a favorable macroeconomic environment, where a higher exchange rate, a lower effective tax rate and greater savings in financial expenses allowed us to compensate for the lower Brent price. At the end of the quarter, the crude oil price spread registered -7.6 dollars per barrel, similar to the level of -7.3 dollars per barrel reached in the same period of 2018.
On exploration, the Ecopetrol Group confirmed its interest in the Colombian offshore by signing two new Exploration and Production agreements, for the COL-5 (100% ECP – Operator) and GUA OFF-1 (50% Repsol – Operator, 50% ECP) blocks, both in the Caribbean.
On the Colombian onshore, the Ecopetrol Group and its partners completed the drilling of three exploratory wells, of which the Jaspe-8 appraisal well confirmed the extension of the Jaspe discovery to the basalt sands of the Carbonera Formation, while the other two were declared dry.
In line with our international expansion strategy, Ecopetrol Brasil purchased 10,374 km2 of 3D seismic and 2,660 km of 2D seismic to assess the potential of blocks to be offered in Rounds 6 and 16, in the Santos and Campos basins.
“Production totaled 728 million barrels of oil equivalent per day, positioning it near the upper range of the 2019 target.”

The midstream segment continued to be a major cash generator for the Group. Crude oil volumes transported in the first quarter of 2019 increased 11% over the same period of 2018, as a result of greater production. Eight reversal cycles were executed on the Bicentenario oil pipeline, allowing us to mitigate the impact of attacks on the Caño Limón – Coveñas oil pipeline infrastructure.
The Cartagena refinery continued with its optimization process, achieving a throughput of 155 thousand barrels per day, 7% higher than in the first quarter of 2018, as a result of stable operations and the implementation of initiatives to eliminate bottlenecks in some units.
Gross margin at the Cartagena refinery was USD 11 per barrel, compared to USD 11.5 in the first quarter of 2018. The weakening of gasoline and naphtha prices, which began to become evident in the fourth quarter of 2018, continued to impact the margins, but this was offset by lower costs of raw materials, given the greater share of local crude in the refinery’s feedstock in the first quarter of 2019 (87%), as compared to the same period of 2018 (71%).
The Barrancabermeja refinery had a throughput of 196 thousand barrels per day, due to the scheduled maintenance of the Diesel Hydrotreatment unit (HDT) to replace the catalyzer and inspect equipment. This maintenance will allow the production of around 66 thousand barrels of virgin diesel, which it will deliver with a sulfur content of between 10 and 15 parts per million (ppm). This effort is in line with our commitment to deliver higher-quality diesel to the country.
The Barrancabermeja refinery’s gross margin was USD 10.5 per barrel, as compared to USD 11.8 in the first quarter of 2018, impacted by the weakening of refined products prices, in addition to the operational effect resulting from the maintenance of the period.
In terms of investments, in the first quarter of 2019 we had very positive results, with the Ecopetrol Group’s investments totaling USD 647 million, an increase of 59% as compared to the first quarter of 2018. This was an improvement in the rate of investment execution from beginning of year, compared to previous years. Investments were primarily concentrated in the upstream segment, an increase of 46% as compared to the first quarter of 2018. It is important to highlight the maturing trend of key projects during the current year, in which 74% of the funds required have already been allocated to execute the projects.
Continuing with our strategy of obtaining greater efficiencies, in the first quarter of the year we had savings of COP 487 billion, related primarily to CAPEX efficiencies in drilling costs and facilities construction.
Finally, I would like to highlight two events of great importance to the market, which occurred in the first quarter of the year: first, the update of the 2019-2021 business plan, which seeks to maximize value creation by taking advantage of our leading position as an integrated company in Colombia, subject to renewed criteria of sustainability, competitiveness and profitability; and second, the Ordinary Shareholders Meeting’s approval last March 29th of a dividend of COP 225 per share, supported by the Company’s solid financial performance, early fulfillment of its goals and robust cash position at the end of the 2018 fiscal year.
We remain committed to operations that are safe and that protect our workers and the environment; efficient and profitable, that generates value to our shareholders and shared prosperity in the regions in which we operate, all within an ethical business framework.
Felipe Bayón Pardo
CEO, Ecopetrol S.A.
Bogotá, May 6, 2019. Ecopetrol S.A. (BVC: ECOPETROL; NYSE: EC) announced today the Ecopetrol Group’s financial results for the first quarter of 2019, prepared in accordance with International Financial Reporting Standards applicable in Colombia.
During the first quarter of 2019 the Ecopetrol Group earned a net profit of COP 2.7 trillion and an EBITDA of COP 7.4 trillion, exceeding the previous year’s results, even with a lower Brent price. The upstream and midstream had better operating and financial performance compared to the first quarter of last year, while the Downstream was affected by narrower refined products spreads and the scheduled maintenance of the Diesel Hydrotreatment (HDT) Unit at the Barrancabermeja Refinery.
Table 1: Income Statement Financial Summary – Ecopetrol Group
| Billion (COP) | | 1Q 2019 | | | 1Q 2018 | | | ∆ ($) | | | ∆ (%) | |
| Total sales | | | 15,943 | | | | 14,643 | | | | 1,300 | | | | 8.9 | % |
| Depreciation and amortization | | | 1,970 | | | | 1,770 | | | | 200 | | | | 11.3 | % |
| Variable cost | | | 6,118 | | | | 5,201 | | | | 917 | | | | 17.6 | % |
| Fixed cost | | | 2,147 | | | | 1,876 | | | | 271 | | | | 14.4 | % |
| Cost of sales | | | 10,235 | | | | 8,847 | | | | 1,388 | | | | 15.7 | % |
| Gross income | | | 5,708 | | | | 5,796 | | | | (88 | ) | | | (1.5 | )% |
| Operating expenses | | | 751 | | | | 616 | | | | 135 | | | | 21.9 | % |
| Operating income | | | 4,957 | | | | 5,180 | | | | (223 | ) | | | (4.3 | )% |
| Financial income (loss) | | | (386 | ) | | | (568 | ) | | | 182 | | | | (32.0 | )% |
| Share of profit of companies | | | 161 | | | | 85 | | | | 76 | | | | 89.4 | % |
| Income before income tax | | | 4,732 | | | | 4,697 | | | | 35 | | | | 0.7 | % |
| Provision for income tax | | | (1,674 | ) | | | (1,880 | ) | | | 206 | | | | (11.0 | )% |
| Net income consolidated | | | 3,058 | | | | 2,817 | | | | 241 | | | | 8.6 | % |
| Non-controlling interest | | | (313 | ) | | | (202 | ) | | | (111 | ) | | | 55.0 | % |
| Net income attributable to owners of Ecopetrol | | | 2,745 | | | | 2,615 | | | | 130 | | | | 5.0 | % |
| | | | | | | | | | | | | | | | | |
| EBITDA | | | 7,357 | | | | 7,149 | | | | 208 | | | | 2.9 | % |
| EBITDA Margin | | | 46.1 | % | | | 48.8 | % | | | - | | | | (2.7 | )% |
The figures included in this report are not audited. The financial information is expressed in billions of Colombian pesos (COP) or US dollars (USD), or thousands of barrels of oil equivalent per day (mboed) or tons, and this is so indicated where applicable. For presentation purposes, certain figures of this report were rounded to the nearest decimal place.
Statements on future projections: This press release may contain statements on future projections related to business prospects, estimated for operating and financial results, and on Ecopetrol growth. These are projections, and therefore are based solely on management’s expectations as to the company’s future and its continuous access to capital to finance the Company’s business plan. These statements on future projections basically depend on changes in market conditions, government regulations, competitive pressure, the performance of the Colombian economy and industry, among other factors; therefore, they are subject to change without prior notice.
| I. | Financial and Operating Results Ecopetrol Group |
Increase of 8.9% in sales revenue in 1Q19 versus 1Q18, as a combined result of the following:
| a) | Decrease in the average weighted basket price of crude oils, gas and refined products -3.8 USD/bl (COP -0.9 trillion), largely due to the decline in Brent crude benchmark prices. |
| b) | A positive volume effect of sales (COP +0.9 trillion, +57.3 mboed) primarily due to: i) higher volumes of crude sold (+43.3 mbod), in line with the increase in production and consumption of inventory, ii) increased sales of refined products (+6.7 mboed), primarily due to greater throughput at the Cartagena Refinery, and iii) higher sales volumes of natural gas (+7.3 mboed), associated with new contracts as a result of the process of commercializing larger fields, incremental sales and greater production. |
| c) | Increase in the average exchange rate, positively impacting total revenue (COP +1.2 trillion) |
| d) | Greater revenue from services and other (COP +51 billion). |
Volumetric Sales: In 1Q19 volumes sold totaled 909 mboed, an increase of 6.7% as compared to 1Q18, primarily due: i) greater availability of crude oil due to increased production and purchases on the domestic market, and ii) higher diesel exports, explained primarily by lower import substitution.
Table 2: Volumetric Sales – Ecopetrol Group
| Local Sales Volume - mboed | | 1Q 2019 | | | 1Q 2018 | | | ∆ (%) | |
| Crude Oil | | | 8.8 | | | | 7.3 | | | | 20.5 | % |
| Natural Gas | | | 78.3 | | | | 71.0 | | | | 10.3 | % |
| Gasoline | | | 111.6 | | | | 113.0 | | | | (1.2 | )% |
| Medium Distillates | | | 153.4 | | | | 148.1 | | | | 3.6 | % |
| LPG and Propane | | | 14.8 | | | | 17.1 | | | | (13.5 | )% |
| Fuel Oil | | | 1.4 | | | | 9.1 | | | | (84.6 | )% |
| Industrials and Petrochemicals | | | 22.5 | | | | 20.4 | | | | 10.3 | % |
| Total Local Volumes | | | 390.8 | | | | 386.0 | | | | 1.2 | % |
| | | | | | | | | | | | | |
| Export Sales Volume - mboed | | 1Q 2019 | | | 1Q 2018 | | | ∆(%) | |
| Crude Oil | | | 408.4 | | | | 366.6 | | | | 11.4 | % |
| Products | | | 107.9 | | | | 97.2 | | | | 11.0 | % |
| Natural Gas* | | | 1.8 | | | | 1.8 | | | | 0.0 | % |
| Total Export Volumes | | | 518.1 | | | | 465.6 | | | | 11.3 | % |
| | | | | | | | | | | | | |
| Total Sales Volumes | | | 908.9 | | | | 851.6 | | | | 6.7 | % |
*Natural gas exports correspond to local sales of Ecopetrol America Inc.
Markets of Operation
Colombia (43% of sales): 1.2% increase over 1Q18, primarily due to:
| · | Higher sales of natural gas through new contracts resulting from the process of commercializing larger fields, greater commercial production of the Bullerengue field (Hocol) and higher natural gas output to thermal and industrial plants, associated with the development of new demand, the search for new customers and carbon substitution. |
| · | Higher sales of medium distillates, driven by Colombian economic growth and the increased in demand for passenger air transport. |
| · | Higher sales of industrials and petrochemicals primarily due to increased sales of asphalt, given the recovery of demand and the strategy of domestic sales for export destinations. |
| · | Lower sales of LPG and propane primarily due to the use of cleaner gasoline in production. |
| · | Lower sales of fuel oil due to the low water levels of the Magdalena River as a consequence of the dry season at the beginning of the year, which hindered evacuation of product through the River from the Barrancabermeja refinery. |
International (57% of sales): 11.3% increase over 1Q18, primarily due to:
| · | Greater availability of export crudes primarily due to increased production and higher consumption of inventory as compared to 1Q18. |
| · | Increased diesel exports from greater production at the Cartagena refinery and lower import substitution given different quality requirements at the Barrancabermeja refinery. |
| · | Higher coke exports, in line with the higher throughput and production at the Cartagena refinery-coking unit. |
Table 3: Export Destinations - Ecopetrol Group
| Crudes - mboed | | 1Q 2019 | | | 1Q 2018 | | | % Share | |
| U.S. Gulf Coast | | | 143.7 | | | | 138.9 | | | | 35.2 | % |
| Asia | | | 141.9 | | | | 115.6 | | | | 34.8 | % |
| Central America / Caribbean | | | 45.7 | | | | 23.0 | | | | 11.2 | % |
| U.S. East Coast | | | 33.4 | | | | 5.5 | | | | 8.2 | % |
| U.S. West Coast | | | 18.5 | | | | 12.7 | | | | 4.5 | % |
| Europe | | | 16.6 | | | | 65.5 | | | | 4.1 | % |
| Others | | | 5.5 | | | | 0.0 | | | | 1.3 | % |
| South America | | | 3.0 | | | | 5.4 | | | | 0.7 | % |
| Total | | | 408.3 | | | | 366.6 | | | | 100.0 | % |
| | | | | | | | | | | | | |
| Products - mboed | | 1Q 2019 | | | 1Q 2018 | | | % Share | |
| U.S. East Coast | | | 41.3 | | | | 27.2 | | | | 38.3 | % |
| Central America / Caribbean | | | 29.2 | | | | 24.2 | | | | 27.1 | % |
| Asia | | | 18.8 | | | | 23.3 | | | | 17.4 | % |
| South America | | | 10.1 | | | | 8.8 | | | | 9.4 | % |
| U.S. West Coast | | | 6.7 | | | | 3.3 | | | | 6.2 | % |
| U.S. Gulf Coast | | | 1.7 | | | | 9.0 | | | | 1.6 | % |
| Europe | | | 0.1 | | | | 1.4 | | | | 0.1 | % |
| Others | | | 0.0 | | | | 0.0 | | | | 0.0 | % |
| Total | | | 107.9 | | | | 97.2 | | | | 100.0 | % |
Note: Information subject to change after the quarter close, as some destinations are reclassified in accordance with final export results.
Exports
Crudes:
| · | Asia: Increase due to the development and incorporation of independent refiners from China and the consolidation of sales to major state companies. |
| · | Central America/Caribbean: Increase in temporary storage primarily due to higher demand from refining customers in China and some trading companies that store Latin American crude in the Caribbean for subsequent sales to Asia. |
| · | Europe: Reduction as a consequence of the supply of competing crude oils such as Maya (Mexico) and Basra Heavy (Iraq) at more heavily discounted prices. |
Refined Products:
| · | US East Coast: Increased share, primarily due to higher exports of ultra-low-sulfur diesel (ULSD). |
| · | US Gulf Coast: Lower exports of fuel oil and lower sales of naphtha by the Cartagena refinery. |
| · | Central America and Caribbean: Increased share represented by fuel oil for local bunker consumption, energy generation and, to a lesser extent, storage for subsequent shipping to Asia. |
Behavior of Prices and Price Spreads
Crudes: In 1Q19 the prices for the sale basket of crude oils decreased 6.2% as compared to 1Q18, as a result of a the greater supply of crude oil by the United States and of OPEC + countries and the seasonality of heavy crude demand during the period.
Refined Products: In 1Q19 the price for the basket of refined products versus Brent decreased 8.8% versus 1Q18, explained primarily by the weakening of gasoline prices, caused by the global over-supply of inventory due to high straight runs at refineries and the processing of light crudes with higher yields into naphthas. This was partially offset by a strengthening in the price of fuel oil, given the reduction in global supply.
Natural Gas: Increase of 9.0% in the price per barrel equivalent of natural gas versus 1Q18 due to the renewal of product contracts from the process of commercializing larger fields and incremental sales at prices higher than those in 2018.
Table 4: Average Basket Prices and Price Spreads - Ecopetrol Group
| USD/Bl | | 1Q 2019 | | | 1Q 2018 | | | ∆ (%) | |
| Brent | | | 63.8 | | | | 67.2 | | | | (5.1 | %) |
| Natural Gas Basket | | | 24.2 | | | | 22.2 | | | | 9.0 | % |
| | | | | | | | | | | | | |
| Crude Oil Basket Spread | | | (7.6 | ) | | | (7.3 | ) | | | (4.1 | %) |
| Crude Oil Basket | | | 56.2 | | | | 59.9 | | | | (6.2 | %) |
| % Crude Oil Basket vs. Brent | | | (11.9 | %) | | | (10.9 | %) | | | (9.2 | %) |
| | | | | | | | | | | | | |
| Products Basket Spread | | | 6.2 | | | | 6.8 | | | | (8.8 | %) |
| Products Basket | | | 70.0 | | | | 74.0 | | | | (5.4 | %) |
| % Products vs. Brent | | | 10.1 | % | | | 10.1 | % | | | 0.0 | % |
Depreciation and amortization: Increase of 11.3% in 1Q19 versus 1Q18, primarily due to the offsetting effect of:
| a) | Greater production levels and CAPEX associated with the results of the drilling campaign and the increased recovery factor. |
| b) | Greater incorporation of reserves in 2018 versus 2017, yielding a lower depreciation rate. |
Variable costs:Increase of 17.6% in 1Q19 as compared to 1Q18, primarily due to:
| a) | Higher cost of purchases of crude, natural gas and refined products (COP +0.9 trillion), due to the net effect of: |
| · | An increase in purchased volumes (COP +838 billion, +32.3 mboed), primarily due to: i) higher purchases of refined products (COP +1.05 trillion, +43.9 mboed), primarily through diesel imports to supply domestic demand during the scheduled maintenance of the Diesel Hydrotreatment Unit (HDT) at the Barrancabermeja refinery, ii) lower purchases of crude (imports) for throughput at the Cartagena refinery given the substitution with our own crudes (COP -215 billion, -12.1 mbd) and iii) higher purchases of national gas (+COP 4 billion, +0.5 mboed). |
| · | A decrease in the average price of domestic purchases and imports of crude oils, refined products and natural gas (COP -447 billion). |
| · | An increase in the average exchange rate on purchases (COP +512 billion). |
| b) | Other minor changes totaling (COP +15 billion). |
Table 5: Local Purchases and Imports – Ecopetrol Group
| Local Purchases - mboed | | 1Q 2019 | | | 1Q 2018 | | | ∆ (%) | |
| Crude Oil | | | 162.5 | | | | 158.8 | | | | 2.3 | % |
| Gas | | | 2.2 | | | | 1.7 | | | | 29.4 | % |
| Products | | | 3.5 | | | | 11.3 | | | | (69.0 | )% |
| Diluent | | | 0.5 | | | | 0.4 | | | | 25.0 | % |
| Total | | | 168.7 | | | | 172.2 | | | | (2.0 | )% |
| Imports – mboed | | 1Q 2019 | | | 1Q 2018 | | | ∆ (%) | |
| Crude Oil | | | 29.8 | | | | 45.6 | | | | (34.6 | )% |
| Products | | | 97.8 | | | | 49.2 | | | | 98.8 | % |
| Diluent | | | 51.0 | | | | 48.0 | | | | 6.3 | % |
| Total | | | 178.6 | | | | 142.8 | | | | 25.1 | % |
| | | | | | | | | | | | | |
| Total | | | 347.3 | | | | 315.0 | | | | 10.3 | % |
Fixed costs:Increase of 14.4% in 1Q19 versus 1Q18, primarily due to:
| · | Higher costs of maintenance and contracted services (COP +183 billion) due to an increase in operating activity primarily because of: i) higher production levels, ii) higher costs associated with incremental production, iii) well integrity activities and iv) commissioning of new wells, among others. |
| · | Higher labor costs (COP +56 billion), primarily due to the recognition of employee benefits included in our new Collective Bargaining Agreement and wage increases versus the previous year. |
Operating expenses increased 21.9% in 1Q19 over 1Q18, primarily due to i) the recognition of recovery from impairment of long-term assets in 1Q18, which was not a factor in 1Q19, and ii) lower exploratory expenses.
| d) | Financial (Non-Operational) Results |
The change in financial results in 1Q19 versus 1Q18 corresponds to the net effect of:
| a) | Savings in financial costs (COP +166 billion) associated primarily with the debt pre-payments made over the past year. In 2018 the equivalent of USD 2.5 billion in financial obligations were repaid in advance. |
| b) | Lower revenue from exchange rate difference and other (COP +16 billion), primarily due to the impact of the peso’s appreciation against the dollar that occurred in the first quarter on the average net liability position in dollars. |
Theeffective tax rate for 1Q19 was 35.4%, versus 40% in 1Q18. The decline was primarily due to the reduction of 4 percentage points in the nominal tax rate set by Financing Law approved in late 2018.
| 2. | Financial Statement Situation |
Increase of 1.5% in assets in 1Q19, primarily explained by the net effect of:
| a) | An increase inother financial assets and cash equivalents(COP +1.8 trillion) primarily from the combined effect of i) cash flow generated from operations (COP +4.8 trillion), ii) outflow of funds to CAPEX (COP -1.9 trillion), iii) use of funds to repay principal and debt service (COP -0.7 trillion), iv) payment of dividends to non-controlling shareholders of subsidiaries in the midstream segment (COP -0.3 trillion), and v) negative effect of the peso’s appreciation against the dollar (COP -0.1 trillion). At the end of the quarter the composition of the cash was 48% in dollars and 52% in pesos. |
Table 6: Cash Position – Ecopetrol Group
| Billion (COP) | | 1Q 2019 | | | 1Q 2018 | |
| Initial cash and cash equivalents | | | 6,312 | | | | 7,946 | |
| (+) Cash flow from operations | | | 4,834 | | | | 4,673 | |
| (-) CAPEX | | | (1,938 | ) | | | (1,195 | ) |
| (+/-) Investment portfolio movement | | | 698 | | | | (2,548 | ) |
| (+/-) Other investment activities | | | 153 | | | | 145 | |
| (-) Borrowings and interest payments | | | (683 | ) | | | (668 | ) |
| (-) Dividend payments | | | (333 | ) | | | (245 | ) |
| (+/-) Exchange difference (cash impact) | | | (105 | ) | | | (242 | ) |
| Final cash and cash equivalents | | | 8,938 | | | | 7,866 | |
| Investment portfolio | | | 7,365 | | | | 8,774 | |
| Total cash | | | 16,303 | | | | 16,640 | |
Note: The cash corresponds to the available resources that are classified as cash and cash equivalents and investments in financial securities, regardless of their maturity.
| b) | An increase intrade accounts receivable(COP +422 billion), primarily due to higher accounts receivable from the Fuel Prices Stabilization Fund. |
| c) | A decrease inproperty, plant and equipment, natural resources and intangibles(COP -335 billion) primarily due to the offsetting effect of: i) impact of the conversion of assets of subsidiaries with functional currencies other than the Colombian peso, as a result of the appreciation that occurred during the quarter; and ii) depreciation and amortization during the quarter, partially offset by iii) increase in CAPEX during the period. |
Increase of 12.8% (COP +8.6 trillion) in total liabilities in 1Q19, generated by:
| a) | An increase inaccounts payable(COP +9 trillion) from the recognition of dividends payable on 2018 net income decreed by Ecopetrol’s General Shareholders Meeting. |
| b) | A decrease inloans and financing(COP -335 billion), primarily due to the effect of the peso’s appreciation against the U.S. dollar and its positive impact on our dollar debt, whose exchange effect is recognized primarily in other comprehensive income, under equity, given the application of hedge accounting. As of March 31, 2019, the Ecopetrol Group’s debt totaled COP 37.7 trillion, 88% of which is originally in foreign currency and 12% in domestic currency. |
| c) | Other changes in liabilities (COP -83 billion). |
Decrease of 11.2% inequity in 1Q19, as a result of the combined effect of: i) the transfer to liabilities of dividends payable on 2018 earnings; ii) the decrease resulting from the conversion of assets and liabilities of subsidiaries operating in functional currencies other than the Colombian peso due to the peso’s appreciation against the U.S. dollar, partially offset by iii) higher earnings for the quarter, and iv) gain on the exchange rate difference applied to debt employed as a cash flow hedge instrument and net investment, given the peso’s appreciation against the dollar.
| 3. | Results by Business Segment |
EXPLORATION
During the exploratory campaign of the first quarter of 2019, Ecopetrol and its partners completed the drilling of three wells: (i) the Jaspe-8 appraisal well, confirming the extension of the Jaspe discovery to the basalt sands of the Carbonera Formation and (ii) the Cira-7000 ST and Provenza-1 exploratory wells, which were declared dry.
Continuing with the 2019 exploratory campaign, the wells: Andina Norte-1, located in the Llanos Orientales (Capachos block) and Boranda-2, located in the Valle Medio del Magdalena (Playón block), are in the process of being drilled.
After the ANH approved the new draft for Upstream (E&P) contracts in Colombia’s offshore, Ecopetrol signed two E&P contracts, COL-5 (100% ECP-Operator) and GUA OFF-1 (50% Repsol – Operator, 50% ECP). The new blocks, located in the Colombian Caribbean, have an extension of 400 thousand hectares each. The signing of these contracts is a significant milestone, reflecting a reactivation of Ecopetrol’s exploratory activities in the Colombian offshore.
Internationally, Ecopetrol Brasil purchased 10,374 km² of 3D seismic and 2,660 km of 2D seismic with a view to assessing the prospecting potential of the Santos and Campos basins for Brazil’s Rounds 6 and 16.
Table 7: Detail of Exploratory Wells – Ecopetrol Group
| # | | Quarter | | Name | | Well
Clasification
(Lahee) | | Block | | Name | | Operator/Partner | | Status | | TD Date |
| 1 | | First | | Jaspe-8 | | A1 | | Quifa | | Llanos Orientales | | FRONTERA (70%)
ECP (30%) | | Successful | | January 14 / 2019 |
| 2 | | First | | Cira 7000 ST | | A2C | | La Cira Infantas | | Valle Medio del Magdalena | | OXY (52%)
ECP (48%) | | Dry | | January 27 / 2019 |
| 3 | | First | | Provenza-1 | | A3 | | CPO-8 | | Llanos Orientales | | ECP (100%) | | Dry | | March 5 / 2019 |
PRODUCTION
In the first quarter, the Ecopetrol Group’s average production totaled 728 mboed (+3.8% versus 1Q18), primarily due to: i) the results of the drilling campaign in the fields La Cira, Rubiales, Chichimene, Quifa, Yariguí and Castilla carried out in 2018 and continuing in 2019, and ii) the positive response of the secondary and tertiary recovery, which leverages our strategy of production and reserves growth. During the first quarter of 2019 there was no effects on operations from external events, which did occur in 1Q18. In particular, we highlight the production of the Akacías field, in which Ecopetrol holds a 55% share, where a development module was initiated that afforded a tripling of production, from 5.6 mboed in 1Q18 to 17 mboed in 1Q19.
Gas production increased 6.8% primarily due to a better availability of the Cupiagua processing plant and an increased gas commercialization.
In 1Q19 the Ecopetrol Group’s subsidiaries contributed 62.8 mboed, accounting for 8.6% of consolidated total volume, reflecting an increase of 2.8 mboed (+4.5%) compared to the first quarter of 2018, leveraged primarily by the results in Ecopetrol America Inc. (EAI).
During the first quarter, we had in average 41 active drilling rigs, approximately 13 more than those in operation in 1Q18, resulting in the drilling and completion of 158 development wells.
Table 8: Gross Production* - Ecopetrol Group
| Production - mboed | | 1Q 2019 | | | 1Q 2018 | | | ∆ (%) | |
| Crude Oil | | | 551.0 | | | | 532.5 | | | | 3.5 | % |
| Natural Gas | | | 114.1 | | | | 107.9 | | | | 5.7 | % |
| Total Ecopetrol S.A. | | | 665.1 | | | | 640.4 | | | | 3.9 | % |
| Crude Oil | | | 21.1 | | | | 20.8 | | | | 1.4 | % |
| Natural Gas | | | 8.6 | | | | 7.2 | | | | 19.4 | % |
| Total Hocol | | | 29.7 | | | | 28.0 | | | | 6.1 | % |
| Crude Oil | | | 8.3 | | | | 9.0 | | | | (7.8 | )% |
| Natural Gas | | | 5.0 | | | | 4.9 | | | | 2.0 | % |
| Total Equion** | | | 13.3 | | | | 13.9 | | | | (4.3 | )% |
| Crude Oil | | | 3.6 | | | | 4.5 | | | | (20.0 | )% |
| Natural Gas | | | 1.2 | | | | 0.4 | | | | 200.0 | % |
| Total Savia** | | | 4.8 | | | | 4.9 | | | | (2.0 | )% |
| Crude Oil | | | 13.0 | | | | 11.1 | | | | 17.1 | % |
| Natural Gas | | | 2.0 | | | | 2.2 | | | | (9.1 | )% |
| Total Ecopetrol America | | | 15.0 | | | | 13.3 | | | | 12.8 | % |
| Crude Oil | | | 597.0 | | | | 577.9 | | | | 3.3 | % |
| Natural Gas | | | 130.9 | | | | 122.6 | | | | 6.8 | % |
| Total Ecopetrol Group | | | 727.9 | | | | 701.0 | | | | 3.8 | % |
* Gross production includes royalties and is prorated for Ecopetrol’s share in each company.
** Equion and Savia are included through the equity method.
Note: Natural gas production includes white products.
Recovery Program
The enhanced recovery factor program continues to assess opportunities to enhance reserves and ensure production. To date, we have 8 projects under execution, at least 10 projects that are in maturation stage and 4 pilots in the construction stage. Likewise, the 3 pilots under operation, contributed with an average incremental production of 14.7 mbod. Ecopetrol’s fields with recovery program contributed 30% of the total production.
Throughout 2019, we will continue promoting secondary recovery technologies with water injection in fields such as Castilla, Nutria, Tisquirama and Chichimene; tertiary recovery technologies by enhanced water injection at Dina K, Yariguí, Casabe and Chichimene; steam injection at Teca and Tren Nare, as well as the assessment of the air injection pilot at Chichimene.
Lifting and Dilution Cost
Lifting Cost: The increase of 0.62 USD/bl in our lifting cost in 1Q19 versus 1Q18 is primarily due to:
Cost Effect (+1.87 USD/bl):
| · | Increased energy consumption primarily due to: i) increase of approximately 16% in the unregulated energy rate, ii) increase in barrels of water production, iii) higher number of wells drilled, and iv) greater quantity of energy purchased due to a decrease in self-generation. |
| · | Increased subsoil maintenance costs primarily due to the increased number of well services. |
| · | Increased labor costs, primarily due to growth in headcount and the increased percentage of wage adjustment. |
| · | Increment in contracted association services, due to an increase in water treatment and disposal facilities, due to higher production and injection in the fields Quifa, CPO09 and Caño Limón. |
| · | Increase in labor costs in association contracts, indirect costs and environmental costs. |
Exchange rate effect(-0.85 USD/bl): Higher average exchange rate of +278.39 pesos/dollar when restating Colombian pesos to U.S dollars.
Volume effect (-0.40 USD/bl): Lower cost due to production increase.
Dilution cost:
| · | The -0.20 USD/bl decrease in the unit cost of dilution in 1Q19 as compared to 1Q18 was primarily due to the use of barrels of diluent from inventory. It is expected that, in coming months, inventory will be restored and returned to normal levels of naphtha purchases. |
Table 9: Lifting and Dilution Cost - Ecopetrol Group
| USD/Bl | | 1Q 2019 | | | 1Q 2018 | | | ∆ (%) | |
| Lifting Cost* | | | 8.7 | | | | 8.1 | | | | 7.4 | % |
| Dilution Cost** | | | 3.7 | | | | 3.9 | | | | (5.1 | )% |
* Calculated based on barrels produced without royalties
** Calculated based on barrels sold
Financial Results for the Segment
Table 10: Income Statement – Upstream
| Billion (COP) | | 1Q 2019 | | | 1Q 2018 | | | ∆ ($) | | | ∆ (%) | |
| Total revenue | | | 11,598 | | | | 9,964 | | | | 1,634 | | | | 16.4 | % |
| Depreciation, amortization and depletion | | | 1,343 | | | | 1,195 | | | | 148 | | | | 12.4 | % |
| Variable costs | | | 4,614 | | | | 3,398 | | | | 1,216 | | | | 35.8 | % |
| Fixed costs | | | 2,219 | | | | 2,018 | | | | 201 | | | | 10.0 | % |
| Total cost of sales | | | 8,176 | | | | 6,611 | | | | 1,565 | | | | 23.7 | % |
| Gross income | | | 3,422 | | | | 3,353 | | | | 69 | | | | 2.1 | % |
| Operating expenses | | | 390 | | | | 350 | | | | 40 | | | | 11.4 | % |
| Operating income | | | 3,032 | | | | 3,003 | | | | 29 | | | | 1.0 | % |
| Financial result, net | | | (17 | ) | | | (589 | ) | | | 572 | | | | (97.1 | )% |
| Share of profit of companies | | | 37 | | | | 93 | | | | (56 | ) | | | (60.2 | )% |
| Income before income tax | | | 3,052 | | | | 2,507 | | | | 545 | | | | 21.7 | % |
| Provision for income tax | | | (1,017 | ) | | | (967 | ) | | | (50 | ) | | | 5.2 | % |
| Net income consolidated | | | 2,035 | | | | 1,540 | | | | 495 | | | | 32.1 | % |
| Non-controlling interest | | | 15 | | | | 0 | | | | 15 | | | | - | |
| Net income attributable to owners of Ecopetrol | | | 2,050 | | | | 1,540 | | | | 510 | | | | 33.1 | % |
| | | | | | | | | | | | | | | | | |
| EBITDA | | | 4,564 | | | | 4,317 | | | | 247 | | | | 5.7 | % |
| EBITDA Margin | | | 39.4 | % | | | 43.3 | % | | | - | | | | (3.9 | )% |
The 1Q19 revenue increased versus 1Q18 primarily due to: i) higher production volumes as a result of the drilling campaign and a better recovery factor, highlighting the deliveries to the Cartagena refinery to replace imported crude, and ii) the positive effect of higher average exchange rate on revenues. The above offset the decrease in the average weighted basket price of crude oil.
The 1Q19 cost of sales increased versus 1Q18 as a result of i) higher purchases to the ANH associated with the higher production and the reduction of the Barrancabermeja refinery’s throughput as a result of the scheduled maintenances in the HDT unit, given the firm purchased contracts, ii) greater incremental production with an impact on the principal costs, as follows: purchases of diluent for crude, transportation costs, increased water treatment and subsoil maintenance activities, iii) higher cost of energy associated with higher rates due to the market effect, iv) increased depreciation and amortization costs associated with higher production and capitalization, as a result of our drilling campaign and v) consumption of inventories in 1Q19 compared to a capitalization presented in 1Q18.
The 1Q19 operating expenses rose versus 1Q18, primarily due to lower expenses on exploration projects and the effect of the recovery from the impairment of long-term assets noted in 1Q18.
Net financial (non-operational) results for 1Q19 versus 1Q18 reflect savings on financial interest resulting from debt prepayments made during the previous year and better results from the exchange rate exposure of dollar-denominated monetary assets and liabilities of the segment, product of the Colombian peso’s appreciation against the U.S. dollar.
Volumes
Crude Oil: In 1Q19 the volume of crude transported increased 10.6% versus 1Q18, as a result of greater production during the quarter. Approximately 72.7% of the crude volumes transported by the oil pipeline system was owned by the Ecopetrol Group.
In 1Q19, the oil pipeline network continued to experience effects caused by third parties; however, contingent operations allowed us to mitigate these impacts, resulting in eight reversal cycles on the Bicentenario Oil Pipeline. During the first quarter, there were 20 attacks to the infrastructure on the Caño Limón – Coveñas, Trasandino and San Miguel-Orito oil pipelines, 49.0% less than in 1Q18. Additionally, the number of illegal valves, for both crude oil and refined products, declined by 7.8% (214 in 1Q19 versus 232 in 1Q18).
Refined Products: In 1Q19 the transported volume of refined products decreased by 4.7% versus 1Q18, as a result of the scheduled maintenance of the HDT unit at the Barrancabermeja refinery explained in the downstream chapter. Additionally, for purposes of meeting the demand for refined products in the country’s south, Cenit made available the import of 100 mbl and 140 mbl of engine gasoline, low-sulfur diesel (B2) and diesel in two vessels at the port of Buenaventura. Approximately 35.4% of the volume of refined products transported on the polyduct system corresponded to Ecopetrol Group.
Table 11: Transported Volumes – Midstream
| mbd | | 1Q 2019 | | | 1Q 2018 | | | ∆ (%) | |
| Crude Oil | | | 880.3 | | | | 795.7 | | | | 10.6 | % |
| Products | | | 259.6 | | | | 272.4 | | | | (4.7 | )% |
| Total | | | 1,139.9 | | | | 1,068.1 | | | | 6.7 | % |
Cost per Barrel Transported
Table 12: Cost per Barrel Transported – Midstream
| USD/Bl | | 1Q 2019 | | | 1Q 2018 | | | ∆ (%) | |
| Cost per Barrel Transported | | | 2.9 | | | | 3.1 | | | | (6.5 | )% |
Financial Results for the Segment
Table 13: Income Statement – Midstream
| Billion (COP) | | 1Q 2019 | | | 1Q 2018 | | | ∆ ($) | | | ∆ (%) | |
| Total revenue | | | 3,052 | | | | 2,729 | | | | 323 | | | | 11.8 | % |
| Depreciation, amortization and depletion | | | 295 | | | | 279 | | | | 16 | | | | 5.7 | % |
| Variable costs | | | 164 | | | | 169 | | | | (5 | ) | | | (3.0 | )% |
| Fixed costs | | | 353 | | | | 310 | | | | 43 | | | | 13.9 | % |
| Total cost of sales | | | 812 | | | | 758 | | | | 54 | | | | 7.1 | % |
| Gross income | | | 2,240 | | | | 1,971 | | | | 269 | | | | 13.6 | % |
| Operating expenses | | | (7 | ) | | | 73 | | | | (80 | ) | | | (109.6 | )% |
| Operating income | | | 2,247 | | | | 1,898 | | | | 349 | | | | 18.4 | % |
| Financial result, net | | | (172 | ) | | | (272 | ) | | | 100 | | | | (36.8 | )% |
| Share of profit of companies | | | (1 | ) | | | (15 | ) | | | 14 | | | | (93.3 | )% |
| Income before income tax | | | 2,074 | | | | 1,611 | | | | 463 | | | | 28.7 | % |
| Provision for income tax | | | (683 | ) | | | (638 | ) | | | (45 | ) | | | 7.1 | % |
| Net income consolidated | | | 1,391 | | | | 973 | | | | 418 | | | | 43.0 | % |
| Non-controlling interest | | | (328 | ) | | | (202 | ) | | | (126 | ) | | | 62.4 | % |
| Net income attributable to owners of Ecopetrol | | | 1,063 | | | | 771 | | | | 292 | | | | 37.9 | % |
| | | | | | | | | | | | | | | | | |
| EBITDA | | | 2,573 | | | | 2,189 | | | | 384 | | | | 17.5 | % |
| EBITDA Margin | | | 84.3 | % | | | 80.2 | % | | | - | | | | 4.1 | % |
The 1Q19 revenue increased versus 1Q18 is primarily the result of the following: i) higher volumes transported in the Llanos region (Castilla - Chichimene - Apiay), which during the first quarter of the previous year was affected by blockages of certain communities, yielding a negative impact on production levels during that period, and ii) the positive effect on revenue resulting from a higher average exchange rate.
The 1Q19 cost of sales increased versus 1Q18 as a result of: i) consumption of materials and supplies to address the transport service, given the increase in production levels, ii) purchase of products for fill-up-line maintenance on the polyduct line, and iii) higher energy costs due to market conditions.
Operating expenses for 1Q19 decreased compared to 1Q18 as a result of the recognition of a non-recurring income due to a ruling in favor of Ocensa due to a litigation related to the fill-up-line in the transportation system.
Financial result (non-operational) in 1Q19 versus 1Q18 showed better results due to the Colombian peso’s lower appreciation against the U.S. dollar on the segment’s U.S dollar asset position.
Cartagena Refinery
In 1Q19, the Cartagena refinery achieved a crude throughput growth of 6.9% as compared to 1Q18, as a result of stable operations and the implementation of improvement initiatives that eliminated bottlenecks in some units, resulting in higher throughput, utilization factor and the generation of valuable products. During 1Q19, throughput consisted of 87% domestic crude and 13% imported crude, versus 71% domestic crude and 29% imported in 1Q18.
Gross refining margin decreased by 4.3% in 1Q19 versus 1Q18, primarily as a result of the negative impact of the international market related to the price spreads of refined products versus Brent price, particularly gasoline (-7.4 USD/Bl) and naphtha (-4.2 USD/Bl), which was partially mitigated by stable operations and a more economical feedstock favored by the higher proportion of domestic crude oil in its feedstock.
Table 14: Throughput, Utilization Factor, Production and Margin – Cartagena Refinery
| Cartagena Refinery | | 1Q 2019 | | | 1Q 2018 | | | ∆ (%) | |
| Throughput* (mbod) | | | 154.5 | | | | 144.5 | | | | 6.9 | % |
| Utilization Factor (%) | | | 88.6 | % | | | 87.9 | % | | | 0.8 | % |
| Production (mbod) | | | 148.9 | | | | 140.3 | | | | 6.1 | % |
| Gross Margin (USD/Bl) | | | 11.0 | | | | 11.5 | | | | (4.3 | )% |
*Corresponds to effective throughput volumes, not volumes received
Barrancabermeja Refinery
Throughput, production and the utilization factor decreased in 1Q19, primarily as a result of the execution of scheduled maintenance of one crude unit and the Diesel Hydrotreating Unit (HDT). The maintenance on the HDT was the first carried out since the beginning of its operations in 2010. With this maintenance it is expected to have an extended straight run, ensuring one of the key assets that will allow to deliver cleaner fuels to the country and taking advantage the entry of more restrictive regulations on sulfur content, such as IMO 2020. Additionally, the low water levels of the Magdalena River due to the dry season also impacted throughput and production by limiting the evacuation of fuel oil. Since mid-March, the refinery has returned to normal operations.
Gross refining margin decreased by 11.0% in 1Q19 versus 1Q18, as a result of the maintenances and the negative impact of the international market on price spreads for refined products, especially gasoline (-7.4 USD/Bl) versus Brent.
Table 15: Throughput, Utilization Factor, Production and Margin – Barrancabermeja Refinery
| Barrancabermeja Refinery | | 1Q 2019 | | | 1Q 2018 | | | ∆ (%) | |
| Throughput* (mbod) | | | 195.5 | | | | 214.9 | | | | (9.0 | %) |
| Utilization Factor (%) | | | 75.3 | % | | | 83.6 | % | | | (9.9 | %) |
| Production (mbod) | | | 198.3 | | | | 216.6 | | | | (8.4 | %) |
| Gross Margin (USD/Bl) | | | 10.5 | | | | 11.8 | | | | (11.0 | %) |
*Corresponds to effective throughput volumes, not volumes received
Refining Cash Cost
Cost Effect (+0.52 USD/Bl): Primarily due to higher cost of fuel gas.
Volume Effect (+0.10 USD/Bl): Higher cost due to lower crude throughput at the Barrancabermeja refinery (-19.4 mbd), partially offset by higher throughput at the Cartagena Refinery (+10.0 mbd).
Exchange Rate Effect (-0.41 US/Bl): Higher exchange rate of +278.39 pesos/dollar upon restating peso costs in dollars.
Table 16: Refining Cash Cost* – Downstream
| USD/Bl | | 1Q 2019 | | | 1Q 2018 | | | ∆ (%) | |
| Refining Cash Cost | | | 4.8 | | | | 4.6 | | | | 4.3 | % |
*Includes Barrancabermeja, Cartagena and Esenttia refineries
Financial Results for the Segment
Table 17: Income Statement - Downstream
| Billion (COP) | | 1Q 2019 | | | 1Q 2018 | | | ∆ ($) | | | ∆ (%) | |
| Total revenue | | | 8,552 | | | | 8,075 | | | | 477 | | | | 5.9 | % |
| Depreciation, amortization and depletion | | | 333 | | | | 296 | | | | 37 | | | | 12.5 | % |
| Variable costs | | | 7,692 | | | | 6,864 | | | | 828 | | | | 12.1 | % |
| Fixed costs | | | 474 | | | | 438 | | | | 36 | | | | 8.2 | % |
| Total cost of sales | | | 8,499 | | | | 7,598 | | | | 901 | | | | 11.9 | % |
| Gross income | | | 53 | | | | 477 | | | | (424 | ) | | | (88.9 | )% |
| Operating expenses | | | 293 | | | | 198 | | | | 95 | | | | 48.0 | % |
| Operating income | | | (240 | ) | | | 279 | | | | (519 | ) | | | (186.0 | )% |
| Financial result, net | | | (157 | ) | | | 293 | | | | (450 | ) | | | (153.6 | )% |
| Share of profit of companies | | | 3 | | | | 7 | | | | (4 | ) | | | (57.1 | )% |
| Income before income tax | | | (394 | ) | | | 579 | | | | (973 | ) | | | (168.0 | )% |
| Provision for income tax | | | 26 | | | | (275 | ) | | | 301 | | | | (109.5 | )% |
| Consolidated net income (loss) | | | (368 | ) | | | 304 | | | | (672 | ) | | | (221.1 | )% |
| | | | | | | | | | | | | | | | | |
| EBITDA | | | 220 | | | | 643 | | | | (423 | ) | | | (65.8 | )% |
| EBITDA Margin | | | 2.6 | % | | | 8.0 | % | | | - | | | | (5.4 | )% |
Increase in the 1Q19 revenue versus 1Q18 primarily due to: i) higher volume of diesel exports as a result of increased throughput at the Cartagena refinery and ii) the positive exchange rate effect on revenues, offset by iii) lower prices for the basket of products associated with market factors, and iv) weakening of gasoline and naphtha prices, which began to be evidenced since the fourth quarter of 2018.
Cost of sales increased in 1Q19 versus 1Q18, primarily due to: i) higher diesel imports to satisfy domestic demand during the scheduled maintenance of the Barrancabermeja refinery units, and ii) greater purchases of crude oil from the upstream segment associated with the increased throughput from the Cartagena refinery, thereby reducing the level of crude imports. This allowed for a more economical feedstock, by incorporating a higher percentage of domestic crude.
Operating expenses increased in 1Q19 versus 1Q18 due to the effect of the recovery of impairment of long-term assets posted in 1Q18, partially offset by lower expenses due to the stabilization and optimization of the Cartagena refinery.
Financial results (non-operational) for 1Q19 versus 1Q18 presented lower revenue due to the exchange rate difference as a consequence of a lower Colombian peso’s appreciation versus the U.S. dollar on the segment’s dollar liability position.
The Ecopetrol Group’s efficiency strategy allowed us to incorporate efficiencies in 1Q19 totaling COP 485.6 billion, as a result of the management of the various business lines (Upstream, Downstream, Midstream, Commercialization and the Corporate and Support Areas). This is consistent with the Efficiencies Plan’s intended savings of USD 2.0 billion for the 2019-2021 period announced in the Ecopetrol Group’s Business Plan.
Table 18: Savings Initiatives – Ecopetrol Group
| Billion (COP) | | 1Q 2019 | | | 1Q 2018 | |
| Reduction of deferred production | | | 6.6 | | | | 213.1 | |
| Optimization of drilling costs and facilities construction | | | 282.4 | | | | 108.8 | |
| Improvement in refineries revenues/margins | | | 30.7 | | | | 66.1 | |
| Energy strategy - Surplus sales - Cost optimization | | | 23.0 | | | | 24.3 | |
| Dilution and evacuation of heavy and extra heavy crude oil | | | 48.3 | | | | 17.3 | |
| Improvement of the commercial strategy | | | 50.8 | | | | 14.5 | |
| Operating optimization | | | 25.9 | | | | 13.7 | |
| Reduction of O&M midstream costs | | | 10.8 | | | | 6.0 | |
| Refining cash cost optimization | | | 0.0 | | | | 0.0 | |
| Savings on staff, logistics and other areas | | | 7.0 | | | | (1.5 | ) |
| Total | | | 485.6 | | | | 462.3 | |
As of March 31, 2019 investments totaled USD 647 million, an increase of 59% from those made in 1Q18. Approximately 81% of investments were concentrated in the upstream segment, an increase of 46% versus 1Q18, due to higher drilling activity as a result to the increase in drilling equipment in the operation. Further, given current prospects, total estimated investment for the Ecopetrol Group remains between USD 3.5 to 4 billion for 2019.
Production:
| · | Drilling: Ecopetrol S.A.’s drilling campaign was concentrated in the fields Castilla, Rubiales, Chichimene, Casabe, Yariguí, Quifa and La Cira Infantas, while in the case of the subsidiaries, drilling was led by Hocol. To date, 158 development wells have been drilled and completed, and 113 capitalizable workovers have been completed. |
| · | Strategic Studies: USD 49 million have been invested in strategic studies, with a view to reducing petro-technical uncertainty in the Provincia and Caño Sur fields. |
In particular, we would like to highlight the maturing of initiatives totaling over USD 500 million, with 200 wells to be drilled that have initiated their execution stage, leveraging the development strategy of important fields, such as La Cira Infanta (Llanito Sand Drilling C Module 1), Apiay (Northern Area of Suria Stage 4 and Stage 1 Suria Recovery) and Llanito (Llanito Dlp).
Exploration: Investment was concentrated in acquiring 2D and 3D seismics in Brazil and the drilling of three wells (one appraisal and two exploratory).
Refining, Petrochemicals and Biofuels: Execution of major maintenances, primarily at the Barrancabermeja refinery in the units mentioned in the downstream chapter.
Midstream: Ongoing operational activities, largely in geotechnical and civil projects in the various oil pipeline and polyduct systems of Cenit and its subsidiaries.
Additionally, the digital transformation program currently has four initiatives in execution phase, three of which were approved during the first quarter of 2019. The purpose of these initiatives is to ensure the optimal and timely operation of some of the company’s largest fields, through various technologies that facilitate communication and integrated monitoring.
Table 19: Investments by Segment – Ecopetrol Group
| Million (USD) | | Ecopetrol
S.A. | | | Affiliates and
Subsidiaries | | | Total | | | % Share | |
| Production | | | 464 | | | | 30 | | | | 494 | | | | 76.4 | % |
| Refining, Petrochemicals and Biofuels | | | 43 | | | | 42 | | | | 85 | | | | 13.1 | % |
| Exploration | | | 22 | | | | 7 | | | | 29 | | | | 4.5 | % |
| Transportation* | | | 0 | | | | 33 | | | | 33 | | | | 5.1 | % |
| Corporate | | | 6 | | | | 0 | | | | 6 | | | | 1.0 | % |
| Total | | | 535 | | | | 112 | | | | 647 | | | | 100.0 | % |
* Includes the total amount of investments of each of the companies of the Group (Participation Ecopetrol S.A. and non-controlling interest)
| II. | Social and Corporate Responsibility – Ecopetrol S.A. |
Relevant milestones:
| · | Release of the 10 Rules that Save Lives as part of thezero-accident challenge strategic campaign. |
Table 20: HSE (Health, Safety and Environment) Performance
| HSE Indicators* | | 1Q 2019 | | | 1Q 2018 | |
| Frequency of total recordable injuries (No. Recordable cases / Million labor hours) | | | 0.52 | | | | 0.57 | |
| Environmental incidents | | | 2 | | | | 3 | |
* The results of the indicators are subject to subsequent modification at the close of the quarter, as some accidents and incidents are reclassified according to the final results of the investigations. As of 2018, the results of the Ecopetrol Group are reported.
**Environmental incidents are defined as hydrocarbon spills greater than one barrel, with an environmental effect.
| 2. | Environment and Social Investment, Corporate Responsibility and Corporate Governance |
Environment and Social Investment:
| · | Update of the Ecopetrol S.A. Environment Strategy, with emphasis on the following strategic axes: Relationship, Environmental Management, Socio-Environmental Investment and Physical Safety. |
| · | In 1Q19, 22 cubic meters of water were reused, approximately 8% more than in 1Q18, which means that the company stopped capturing and disposing this volume, reducing the pressure on the water resource. |
| · | Funds totaling COP 10,665 million were invested, of which COP 10,021 million correspond to social investment and COP $644 million to voluntary environmental investment. The funds were largely intended for the education, sports and health, gas, infrastructure and water management sectors. |
| · | We initiated the execution of 14 socio-environmental investment projects, totaling COP 31,823 million to be executed between 2019 and 2022. |
| · | Seven projects have been developed within the framework of“Obras por Impuestos”, two for school endowments and five for road infrastructure. |
Corporate Responsibility:
Strategic Guidelines for Corporate Responsibility: Ecopetrol updated its strategic guidelines for Corporate Responsibility, orienting the exercise in which it operates as enabler of the Ecopetrol Group’s business strategy. These guidelines are developed through four pillars, (i) Corporate Integrity; (ii) Human Rights and Company; (iii) Sustainable Development Objectives; and (iv) the 2030 Agenda for Sustainable Development of the United Nations.
Integrated Sustainable Management Report: In March 28, 2019 we published the Integrated Sustainable Management Report on the Ecopetrol website, corresponding to the management of 2018. This report is the tenth that has been prepared under the Global Reporting Initiative (GRI) methodology and the second presented under the new GRI Standards. The report is equivalent to theCommunication of Progress (CoP) required by the United Nations Global Compact. This was prepared in integrated method, incorporating economic, financial, social and environmental information into a single volume.
Corporate Governance:
General Shareholders Meeting: On March 29, 2019 the Ordinary Shareholders Meeting of Ecopetrol S.A. was held, attended by 4,930 shareholders. During the meeting, the new Board of Directors was elected for the next two years, and a distribution of a COP 225 per share dividend was approved.
III. Quarterly Results Presentation
Ecopetrol’s management will hold two online presentations to review the first quarter of 2019 results:
| Spanish | English |
| May 7, 2019 | May 7, 2019 |
| 8:00 a.m. Colombia | 9:30 a.m. Colombia |
| 9:00 a.m. New York | 10:30 a.m. New York |
Internet streaming will be available on the Ecopetrol website atwww.ecopetrol.com.co
The presentation via webcast will be available at the following links:
https://event.on24.com/wcc/r/1992777/91B803BF6A6C9D4CDE758DA70D3E3E39 (Spanish)
https://event.on24.com/wcc/r/1992768/6E00F7AC5760C44EE9EDFC81CEE50208 (English)
Please verify that your browser allows normal operation of the online presentation. We recommend the latest versions of Internet Explorer, Google Chrome and Mozilla Firefox.
Contact Information:
Capital Markets Manager
María Catalina Escobar
Telephone: +571-234-5190 - Email:investors@ecopetrol.com.co
Media Relations (Colombia)
Jorge Mauricio Tellez
Telephone: +571-234-4329 - Email:mauricio.tellez@ecopetrol.com.co
Ecopetrol Group Appendices
Table 1: Income Statement – Ecopetrol Group
| Billion (COP) | | 1Q 2019 | | | 1Q 2018 | | | ∆ (%) | |
| Revenue | | | | | | | | | | | | |
| Local | | | 7,822 | | | | 7,571 | | | | 3.3 | % |
| Export | | | 8,121 | | | | 7,072 | | | | 14.8 | % |
| Total revenue | | | 15,943 | | | | 14,643 | | | | 8.9 | % |
| Cost of sales | | | | | | | | | | | | |
| Depreciation, amortization and depletion | | | 1,970 | | | | 1,770 | | | | 11.3 | % |
| Variable depreciation, amortization and depletion | | | 1,299 | | | | 1,160 | | | | 12.0 | % |
| Fixed cost depreciation | | | 671 | | | | 610 | | | | 10.0 | % |
| Variable costs | | | 6,118 | | | | 5,201 | | | | 17.6 | % |
| Imported products | | | 3,420 | | | | 2,672 | | | | 28.0 | % |
| Local purchases | | | 2,311 | | | | 2,157 | | | | 7.1 | % |
| Hydrocarbon transportation services | | | 181 | | | | 163 | | | | 11.0 | % |
| Inventories and others | | | 206 | | | | 209 | | | | (1.4 | )% |
| Fixed costs | | | 2,147 | | | | 1,876 | | | | 14.4 | % |
| Contracted services | | | 634 | | | | 598 | | | | 6.0 | % |
| Maintenance | | | 560 | | | | 413 | | | | 35.6 | % |
| Labor costs | | | 544 | | | | 488 | | | | 11.5 | % |
| Other | | | 409 | | | | 377 | | | | 8.5 | % |
| Total cost of sales | | | 10,235 | | | | 8,847 | | | | 15.7 | % |
| Gross income | | | 5,708 | | | | 5,796 | | | | (1.5 | )% |
| Operating expenses | | | 751 | | | | 616 | | | | 21.9 | % |
| Administration expenses | | | 691 | | | | 691 | | | | 0.0 | % |
| Exploration and projects expenses | | | 61 | | | | 71 | | | | (14.1 | )% |
| (Recovery) expense for impairment long-term assets | | | (1 | ) | | | (146 | ) | | | (99.3 | )% |
| Operating income | | | 4,957 | | | | 5,180 | | | | (4.3 | )% |
| Finance result, net | | | (386 | ) | | | (568 | ) | | | (32.0 | )% |
| Foreign exchange, net | | | 43 | | | | 22 | | | | 95.5 | % |
| Interest, net | | | (323 | ) | | | (489 | ) | | | (33.9 | )% |
| Financial income/loss | | | (106 | ) | | | (101 | ) | | | 5.0 | % |
| Share of profit of companies | | | 161 | | | | 85 | | | | 89.4 | % |
| Income before income tax | | | 4,732 | | | | 4,697 | | | | 0.7 | % |
| Provision for income tax | | | (1,674 | ) | | | (1,880 | ) | | | (11.0 | )% |
| Net income consolidated | | | 3,058 | | | | 2,817 | | | | 8.6 | % |
| Non-controlling interest | | | (313 | ) | | | (202 | ) | | | 55.0 | % |
| Net income attributable to owners of Ecopetrol | | | 2,745 | | | | 2,615 | | | | 5.0 | % |
| | | | | | | | | | | | | |
| EBITDA | | | 7,357 | | | | 7,149 | | | | 2.9 | % |
| EBITDA margin | | | 46.1 | % | | | 48.8 | % | | | (2.7 | )% |
Table 2: Statement of Financial Position / Balance Sheet – Ecopetrol Group
| Billion (COP) | | March 31, 2019 | | | December 31, 2018 | | | ∆ (%) | |
| Current assets | | | | | | | | | | | | |
| Cash and cash equivalents | | | 8,938 | | | | 6,312 | | | | 41.6 | % |
| Trade and other receivables | | | 8,628 | | | | 8,194 | | | | 5.3 | % |
| Inventories | | | 5,478 | | | | 5,100 | | | | 7.4 | % |
| Current tax assets | | | 672 | | | | 1,031 | | | | (34.8 | )% |
| Other financial assets | | | 4,997 | | | | 5,321 | | | | (6.1 | )% |
| Other assets | | | 1,310 | | | | 1,021 | | | | 28.3 | % |
| | | | 30,023 | | | | 26,979 | | | | 11.3 | % |
| Non-current assets held for sale | | | 28 | | | | 52 | | | | (46.2 | )% |
| Total current assets | | | 30,051 | | | | 27,031 | | | | 11.2 | % |
| | | | | | | | | | | | | |
| Non-current assets | | | | | | | | | | | | |
| Investments in associates and joint ventures | | | 1,834 | | | | 1,844 | | | | (0.5 | )% |
| Trade and other receivables | | | 744 | | | | 756 | | | | (1.6 | )% |
| Property, plant and equipment | | | 61,708 | | | | 62,770 | | | | (1.7 | )% |
| Natural and environmental resources | | | 23,316 | | | | 23,075 | | | | 1.0 | % |
| Assets by right of use | | | 477 | | | | 0 | | | | - | |
| Intangibles | | | 420 | | | | 411 | | | | 2.2 | % |
| Deferred tax assets | | | 5,452 | | | | 5,747 | | | | (5.1 | )% |
| Other financial assets | | | 2,368 | | | | 2,827 | | | | (16.2 | )% |
| Other assets | | | 1,804 | | | | 1,780 | | | | 1.3 | % |
| Total non-current assets | | | 98,123 | | | | 99,210 | | | | (1.1 | )% |
| | | | | | | | | | | | | |
| Total assets | | | 128,174 | | | | 126,241 | | | | 1.5 | % |
| | | | | | | | | | | | | |
| Current liabilities | | | | | | | | | | | | |
| Loans and borrowings | | | 4,043 | | | | 4,020 | | | | 0.6 | % |
| Trade and other payables | | | 17,936 | | | | 8,946 | | | | 100.5 | % |
| Provision for employees benefits | | | 1,870 | | | | 1,817 | | | | 2.9 | % |
| Current tax liabilities | | | 1,796 | | | | 1,751 | | | | 2.6 | % |
| Accrued liabilities and provisions | | | 784 | | | | 814 | | | | (3.7 | )% |
| Other liabilities | | | 355 | | | | 477 | | | | (25.6 | )% |
| Total current liabilities | | | 26,784 | | | | 17,825 | | | | 50.3 | % |
| | | | | | | | | | | | | |
| Non-current liabilities | | | | | | | | | | | | |
| Loans and borrowings | | | 33,685 | | | | 34,043 | | | | (1.1 | )% |
| Trade and other payables | | | 29 | | | | 31 | | | | (6.5 | )% |
| Provision for employees benefits | | | 6,699 | | | | 6,790 | | | | (1.3 | )% |
| Deferred tax liabilities | | | 790 | | | | 738 | | | | 7.0 | % |
| Accrued liabilities and provisions | | | 6,953 | | | | 6,940 | | | | 0.2 | % |
| Other liabilities | | | 567 | | | | 570 | | | | (0.5 | )% |
| Total non-current liabilities | | | 48,723 | | | | 49,112 | | | | (0.8 | )% |
| | | | | | | | | | | | | |
| Total liabilities | | | 75,507 | | | | 66,937 | | | | 12.8 | % |
| | | | | | | | | | | | | |
| Equity | | | | | | | | | | | | |
| Equity attributable to owners of the company | | | 50,681 | | | | 57,214 | | | | (11.4 | )% |
| Non-controlling interests | | | 1,986 | | | | 2,090 | | | | (5.0 | )% |
| Total equity | | | 52,667 | | | | 59,304 | | | | (11.2 | )% |
| | | | | | | | | | | | | |
| Total liabilities and equity | | | 128,174 | | | | 126,241 | | | | 1.5 | % |
Table 3: Cash Flow Statement – Ecopetrol Group
| Billion (COP) | | 1Q 2019 | | | 1Q 2018 | |
| Cash flow provided by operating activities | | | | | | | | |
| Net income attributable to owners of Ecopetrol S.A. | | | 2,745 | | | | 2,615 | |
| Adjustments to reconcile net income to cash provided by operating activities | | | | | | | | |
| Non-controlling interests | | | 313 | | | | 202 | |
| Income tax | | | 1,674 | | | | 1,880 | |
| Depreciation, depletion and amortization | | | 1,991 | | | | 1,791 | |
| Foreign exchange (gain) loss | | | (43 | ) | | | (22 | ) |
| Finance costs recognised in profit or loss | | | 641 | | | | 782 | |
| Dry wells | | | 45 | | | | 7 | |
| Loss (gain) on disponsal of non-current assets | | | 12 | | | | 0 | |
| Impairment of current and non-current assets | | | 19 | | | | (126 | ) |
| Fair value (gain) on financial assets valuation | | | (45 | ) | | | (78 | ) |
| Profit in acquisition of participations in joint operations | | | 0 | | | | 12 | |
| Gain on assets for sale | | | (1 | ) | | | 0 | |
| (Gain) loss on share of profit of associates and joint ventures | | | (161 | ) | | | (85 | ) |
| Realized foreign exchange cash flow hedges | | | 338 | | | | 125 | |
| Others minor items | | | 0 | | | | (34 | ) |
| Net changes in operating assets and liabilities | | | (1,775 | ) | | | (1,412 | ) |
| Income tax paid | | | (919 | ) | | | (984 | ) |
| Cash provided by operating activities | | | 4,834 | | | | 4,673 | |
| | | | | | | | | |
| Cash flows from investing activities | | | | | | | | |
| Investment in property, plant and equipment | | | (600 | ) | | | (444 | ) |
| Investment in natural and environmental resources | | | (1,307 | ) | | | (748 | ) |
| Payments for intangibles | | | (31 | ) | | | (3 | ) |
| (Purchases) sales of other financial assets | | | 698 | | | | (2,548 | ) |
| Interest received | | | 129 | | | | 84 | |
| Dividends received | | | 0 | | | | 19 | |
| Proceeds from sales of assets | | | 24 | | | | 42 | |
| Net cash used in investing activities | | | (1,087 | ) | | | (3,598 | ) |
| | | | | | | | | |
| Cash flows from financing activities | | | | | | | | |
| Proceeds (repayment of) from borrowings | | | (202 | ) | | | (75 | ) |
| Interest paid | | | (481 | ) | | | (593 | ) |
| Dividends paid | | | (333 | ) | | | (245 | ) |
| Net cash used in financing activities | | | (1,016 | ) | | | (913 | ) |
| | | | | | | | | |
| Exchange difference in cash and cash equivalents | | | (105 | ) | | | (242 | ) |
| Net (decrease) increase in cash and cash equivalents | | | 2,626 | | | | (80 | ) |
| Cash and cash equivalents at the beginning of the period | | | 6,312 | | | | 7,946 | |
| Cash and cash equivalents at the end of the period | | | 8,938 | | | | 7,866 | |
| | | | | | | | | |
| Non-cash transactions | | | | | | | | |
| Recognition of assets for right of use and liabilities for lease | | | 505 | | | | 0 | |
Table 4: EBITDA Reconciliation Ecopetrol Group
| Billion (COP) | | 1Q 2019 | | | 1Q 2018 | |
| Net income attributable to the owners of Ecopetrol | | | 2,745 | | | | 2,615 | |
| (+) Depreciation, amortization and depletion | | | 1,991 | | | | 1,791 | |
| (+/-) Impairment of long-term assets | | | (2 | ) | | | (146 | ) |
| (+/-) Gain in acquisition of shares in joint operations | | | - | | | | 12 | |
| (+/-) Financial result, net | | | 386 | | | | 568 | |
| (+) Income tax | | | 1,674 | | | | 1,880 | |
| (+) Taxes and others | | | 250 | | | | 227 | |
| (+/-) Non-controlling interest | | | 313 | | | | 202 | |
| Consolidated EBITDA | | | 7,357 | | | | 7,149 | |
Table 5: EBITDA Reconciliation by Segment (1Q 2019)
| Billion (COP) | | Upstream | | | Downstream | | | Midstream | | | Eliminations | | | Consolidated | |
| Net income attributable to the owners of Ecopetrol | | | 2,050 | | | | (368 | ) | | | 1,063 | | | | - | | | | 2,745 | |
| (+) Depreciation, amortization and depletion | | | 1,348 | | | | 346 | | | | 297 | | | | - | | | | 1,991 | |
| (+/-) Impairment of long-term assets | | | - | | | | (1 | ) | | | (1 | ) | | | - | | | | (2 | ) |
| (+/-) Financial result, net | | | 17 | | | | 157 | | | | 172 | | | | 40 | | | | 386 | |
| (+) Income tax | | | 1,017 | | | | (26 | ) | | | 683 | | | | - | | | | 1,674 | |
| (+) Taxes and others | | | 147 | | | | 112 | | | | 31 | | | | (40 | ) | | | 250 | |
| (+/-) Non-controlling interest | | | (15 | ) | | | - | | | | 328 | | | | - | | | | 313 | |
| Consolidated EBITDA | | | 4,564 | | | | 220 | | | | 2,573 | | | | - | | | | 7,357 | |
I. Appendices: Ecopetrol S.A Results
Following are the Income Statements and Statements of Financial Situation of Ecopetrol S.A.
Table 6: Income Statement
| Billion (COP) | | 1Q 2019 | | | 1Q 2018 | | | ∆ (%) | |
| Local | | | 7,766 | | | | 7,230 | | | | 7.4 | % |
| Exports | | | 6,386 | | | | 5,512 | | | | 15.9 | % |
| Total revenue | | | 14,152 | | | | 12,742 | | | | 11.1 | % |
| Variable costs | | | 8,194 | | | | 6,653 | | | | 23.2 | % |
| Fixed costs | | | 2,636 | | | | 2,478 | | | | 6.4 | % |
| Total cost of sales | | | 10,830 | | | | 9,131 | | | | 18.6 | % |
| Gross income | | | 3,322 | | | | 3,611 | | | | (8.0 | )% |
| Operating expenses | | | 440 | | | | 384 | | | | 14.6 | % |
| Operating income | | | 2,882 | | | | 3,227 | | | | (10.7 | )% |
| Financial income/loss | | | (316 | ) | | | (342 | ) | | | (7.6 | )% |
| Share of profit of companies | | | 1,035 | | | | 851 | | | | 21.6 | % |
| Income before income tax | | | 3,601 | | | | 3,736 | | | | (3.6 | )% |
| Provision for income tax | | | (856 | ) | | | (1,121 | ) | | | (23.6 | )% |
| Net income consolidated | | | 2,745 | | | | 2,615 | | | | 5.0 | % |
| | | | | | | | | | | | | |
| EBITDA | | | 4,414 | | | | 4,486 | | | | (1.6 | )% |
| EBITDA margin | | | 31.2 | % | | | 35.2 | % | | | | |
Table 7: Statement of Financial Position / Balance Sheet
| Billion (COP) | | March 31, 2019 | | | December 31, 2018 | | | ∆ (%) | |
| Current assets | | | | | | | | | | | | |
| Cash and cash equivalents | | | 4,687 | | | | 2,259 | | | | 107.5 | % |
| Trade and other receivables | | | 9,614 | | | | 7,642 | | | | 25.8 | % |
| Inventories | | | 3,680 | | | | 3,459 | | | | 6.4 | % |
| Current tax assets | | | 434 | | | | 827 | | | | (47.5 | )% |
| Other financial assets | | | 7,750 | | | | 6,611 | | | | 17.2 | % |
| Other assets | | | 1,142 | | | | 840 | | | | 36.0 | % |
| | | | 27,307 | | | | 21,638 | | | | 26.2 | % |
| Non-current assets held for sale | | | 24 | | | | 24 | | | | 0.0 | % |
| Total current assets | | | 27,331 | | | | 21,662 | | | | 26.2 | % |
| | | | | | | | | | | | | |
| Non-current assets | | | | | | | | | | | | |
| Investments in companies | | | 41,951 | | | | 45,142 | | | | (7.1 | )% |
| Trade and other receivables | | | 556 | | | | 576 | | | | (3.5 | )% |
| Property, plant and equipment | | | 21,031 | | | | 21,041 | | | | (0.0 | )% |
| Natural and environmental resources | | | 19,856 | | | | 19,384 | | | | 2.4 | % |
| Assets by right of use | | | 3,706 | | | | - | | | | - | |
| Intangibles | | | 258 | | | | 250 | | | | 3.2 | % |
| Deferred tax assets | | | 1,998 | | | | 2,309 | | | | (13.5 | )% |
| Other financial assets | | | 1,907 | | | | 2,402 | | | | (20.6 | )% |
| Other assets | | | 1,023 | | | | 996 | | | | 2.7 | % |
| Total non-current assets | | | 92,286 | | | | 92,100 | | | | 0.2 | % |
| | | | | | | | | | | | | |
| Total assets | | | 119,617 | | | | 113,762 | | | | 5.1 | % |
| | | | | | | | | | | | | |
| Current liabilities | | | | | | | | | | | | |
| Loans and borrowings | | | 2,721 | | | | 2,588 | | | | 5.1 | % |
| Trade and other payables | | | 17,300 | | | | 7,683 | | | | 125.2 | % |
| Provision for employees benefits | | | 1,806 | | | | 1,761 | | | | 2.6 | % |
| Current tax liabilities | | | 342 | | | | 517 | | | | (33.8 | )% |
| Accrued liabilities and provisions | | | 706 | | | | 744 | | | | (5.1 | )% |
| Other liabilities | | | 277 | | | | 282 | | | | (1.8 | )% |
| Total current liabilities | | | 23,152 | | | | 13,575 | | | | 70.5 | % |
| | | | | | | | | | | | | |
| Non-current liabilities | | | | | | | | | | | | |
| Loans and borrowings | | | 33,567 | | | | 30,706 | | | | 9.3 | % |
| Provision for employees benefits | | | 6,699 | | | | 6,790 | | | | (1.3 | )% |
| Deferred tax liabilities | | | 144 | | | | 144 | | | | 0.0 | % |
| Accrued liabilities and provisions | | | 5,350 | | | | 5,314 | | | | 0.7 | % |
| Other liabilities | | | 24 | | | | 19 | | | | 26.3 | % |
| Total non-current liabilities | | | 45,784 | | | | 42,973 | | | | 6.5 | % |
| | | | | | | | | | | | | |
| Total liabilities | | | 68,936 | | | | 56,548 | | | | 21.9 | % |
| | | | | | | | | | | | | |
| Equity | | | | | | | | | | | | |
| Equity attributable to owners of the company | | | 50,681 | | | | 57,214 | | | | (11.4 | )% |
| Total equity | | | 50,681 | | | | 57,214 | | | | (11.4 | )% |
| | | | | | | | | | | | | |
| Total liabilities and equity | | | 119,617 | | | | 113,762 | | | | 5.1 | % |