Exhibit 99.1
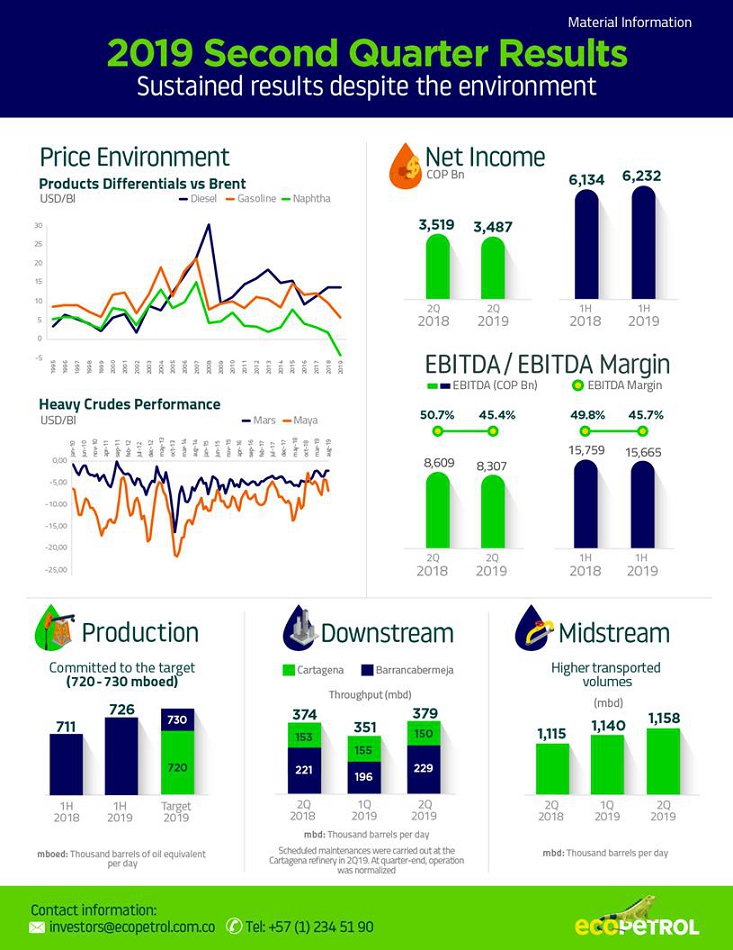

In the first half of 2019 the Ecopetrol Group reported a net profit of COP 6.2 trillion and an EBITDA of COP 15.7 trillion, equivalent to an EBITDA margin of 45.7%.
These results demonstrate the financial and operational strength of the company, which faced a challenging market environment during the second quarter, given the decline in international prices for Brent, naphtha and gasoline, as well as operating restrictions throughout the first half of the year, due to the scheduled maintenances in some fields and at the refineries, in order to achieve the highest standards of integrity in our operations.
On the positive side, we note the spread in the crude basket of -6.4 USD/bl in the first half of the year, supported by the strengthening of heavy crudes in the region and the commercial strategy of seeking higher-value markets, which helped offset the performance of international refined product prices. The 12% devaluation in the exchange rate compared to the first half of 2018 also favored our results.
The Ecopetrol group’s first-half production totaled 726,000 barrels of oil-equivalent per day, increasing 2% compared to the same period the previous year, in line with the 2019 target. The positive results of the drilling campaign in fields such as Akacias and Rubiales, and the solid performance of the recovery program, which contributed 30% of production in the semester, partially mitigated the impact of the scheduled maintenances at the Oripaya, Cusiana and Cupiagua fields.
Sales volumes totaled 913,000 barrels-equivalent per day, increasing 4.2% compared with the first half of 2018, primarily driven by higher crude exports, and refined products from the Cartagena refinery.
On the exploratory front, the Ecopetrol Group continued to expand its presence throughout Colombia, with the award of five blocks by the National Hydrocarbons Agency during the 2019 Permanent Area Allocation Process (PPAA). Further, three of the 10 exploratory wells that were drilled demonstrated the presence of hydrocarbons.
“We entered the most prolific basin in the world in terms of non-conventional reservoirs”

In July, the process of setting new crude transport tariffs was completed, which will allow a moderate increase in the midstream segment’s revenues, ensuring its financial stability for the next four years and the generation of cash for the group. Operationally, we highlight that production barrels that had been being transported by tanker, are now being transported by pipeline, as a result of the segment’s commercial management.
In the downstream segment, during the second quarter we carried out a scheduled maintenance at the hydrocracking unit of the Cartagena refinery, which together with the one completed at the Barrancabermeja refinery in the first quarter, will ensure operational stability, the quality of the diesel produced and will prepare us to take advantage of future benefits of the MARPOL (International Convention for the Prevention of Pollution from Ships) regulation. Throughput for the quarter totaled 379,000 barrels of oil per day, in line with the business plan target.
This segment’s financial results continued to be impacted by the unfavorable pricing environment for international refined products, primarily naphtha and gasoline, combined with the appreciation in heavy crudes, which comprise our refineries’ feedstock.
Regarding the investment plan, the Ecopetrol Group executed USD 1,392 million in the first half of 2019, increasing 38% versus the first half of 2018, of which 81% was allocated in the upstream segment, consistent with the Ecopetrol Group’s growth strategy.
Continuing with the efficiency strategies, we launched the new 2019 – 2023 phase, with a target of COP 8.0 trillion, involving initiatives which seek efficiencies mainly through the optimization of capex and operating costs as well as the increase of revenues and margins. During the first half of the year, COP 958 billion in efficiencies were incorporated, concentrated largely in optimizing investments in drilling and facilities construction. This is in addition to the COP 10.2 trillion of accumulated savings between 2015 and 2018.
On the environmental front, Ecopetrol S.A. was the first company in Colombia’s Oil and Gas sector to verify its reduction in greenhouse gas emissions from operating processes. The firm Ruby Canyon Engineering verified the reduction of over one million tons of CO2-equivalent between 2013 and 2017. In environmental terms, this would be equivalent to reforesting 100,000 hectares of forest.
Social and environmental investments in the first half of 2019 totaled COP 28,339 million, confirming our commitment to the environment and communities.
Additionally, in the first half of 2019 we prepared the logistics system to ensure the delivery of the ultra-low-sulfur diesel and natural gas required by the new buses of the Bogotá Mass Transportation System (Transmilenio), which began operating in June. We thus contributed to the technological renovation of this important transportation system’s fleet.
Finally, in our international expansion front, I would like to highlight two very important events. The first one is the approval by the Brazilian Ministry of Mines and Energy of Ecopetrol’s 10% stake in the Saturno block, located in the central region of the Santos Basin in the Brazilian Pre-salt; and second, our entry into the Midland in the Permian basin, the area with the fastest growth and highest yield in the United States, to participate in exploiting non-conventional reservoirs. This is transformational news for Ecopetrol and the country.
All this became possible through our strategic alliance with a first-tier operator as Occidental. This will facilitate an increase in our reserves and production, as well as consolidate our knowledge in the exploitation of non-conventional reservoirs. This is a critical step forward along the path of sustainability and profitable growth that we have been laying out for over two years, with a view to generating more value added for our shareholders.
We remain committed to profitable growth in production and reserves, with sustainable results, safe operation and operational excellence, generating integrated value in harmony with the environment and our communities.
Felipe Bayón Pardo
CEO, Ecopetrol S.A.
Bogotá, August 12, 2019. Ecopetrol S.A. (BVC: ECOPETROL; NYSE: EC) announced today the Ecopetrol Group’s second quarter of 2019 financial results, prepared in accordance with International Financial Reporting Standards applicable in Colombia.
In the first half of 2019, the Ecopetrol Group earned a net profit of COP 6.2 trillion and an EBITDA of COP 15.7 trillion, in line with the results obtained in the first half of 2018, even in the middle of a less favorable price environment for crude oil and refined products, and scheduled maintenance at the Barrancabermeja and Cartagena refineries. The record spreads between the export crude basket and Brent, the increase in production in line with the target, higher transported volumes, and savings on financial expenses continue leveraging the company’s value creation for shareholders.
Table 1: Income Statement Financial Summary – Ecopetrol Group
| Billion (COP) | | 2Q 2019 | | | 2Q 2018 | | | ∆ ($) | | | ∆ (%) | | | 6M 2019 | | | 6M 2018 | | | ∆ ($) | | | ∆ (%) | |
| Total sales | | | 18,309 | | | | 16,987 | | | | 1,322 | | | | 7.8 | % | | | 34,251 | | | | 31,630 | | | | 2,621 | | | | 8.3 | % |
| Depreciation and amortization | | | 2,052 | | | | 1,899 | | | | 153 | | | | 8.1 | % | | | 4,023 | | | | 3,670 | | | | 353 | | | | 9.6 | % |
| Variable cost | | | 6,777 | | | | 5,818 | | | | 959 | | | | 16.5 | % | | | 12,893 | | | | 11,019 | | | | 1,874 | | | | 17.0 | % |
| Fixed cost | | | 2,385 | | | | 2,040 | | | | 345 | | | | 16.9 | % | | | 4,531 | | | | 3,915 | | | | 616 | | | | 15.7 | % |
| Cost of sales | | | 11,214 | | | | 9,757 | | | | 1,457 | | | | 14.9 | % | | | 21,447 | | | | 18,604 | | | | 2,843 | | | | 15.3 | % |
| Gross income | | | 7,095 | | | | 7,230 | | | | (135 | ) | | | (1.9 | )% | | | 12,804 | | | | 13,026 | | | | (222 | ) | | | (1.7 | )% |
| Operating expenses | | | 1,137 | | | | 846 | | | | 291 | | | | 34.4 | % | | | 1,890 | | | | 1,462 | | | | 428 | | | | 29.3 | % |
| Operating income | | | 5,958 | | | | 6,384 | | | | (426 | ) | | | (6.7 | )% | | | 10,914 | | | | 11,564 | | | | (650 | ) | | | (5.6 | )% |
| Financial income (loss) | | | (391 | ) | | | (620 | ) | | | 229 | | | | (36.9 | )% | | | (776 | ) | | | (1,189 | ) | | | 413 | | | | (34.7 | )% |
| Share of profit of companies | | | 72 | | | | 96 | | | | (24 | ) | | | (25.0 | )% | | | 233 | | | | 182 | | | | 51 | | | | 28.0 | % |
| Income before income tax | | | 5,639 | | | | 5,860 | | | | (221 | ) | | | (3.8 | )% | | | 10,371 | | | | 10,557 | | | | (186 | ) | | | (1.8 | )% |
| Income tax | | | (1,872 | ) | | | (2,093 | ) | | | 221 | | | | (10.6 | )% | | | (3,546 | ) | | | (3,973 | ) | | | 427 | | | | (10.7 | )% |
| Net income consolidated | | | 3,767 | | | | 3,767 | | | | 0 | | | | 0.0 | % | | | 6,825 | | | | 6,584 | | | | 241 | | | | 3.7 | % |
| Non-controlling interest | | | (280 | ) | | | (248 | ) | | | (32 | ) | | | 12.9 | % | | | (593 | ) | | | (450 | ) | | | (143 | ) | | | 31.8 | % |
| Net income attributable to owners of Ecopetrol | | | 3,487 | | | | 3,519 | | | | (32 | ) | | | (0.9 | )% | | | 6,232 | | | | 6,134 | | | | 98 | | | | 1.6 | % |
| | | | | | | | | | | | | | | | | | | | | | | | | | | | | | | | | |
| EBITDA | | | 8,307 | | | | 8,609 | | | | (302 | ) | | | (3.5 | )% | | | 15,665 | | | | 15,759 | | | | (94 | ) | | | (0.6 | )% |
| EBITDA Margin | | | 45.4 | % | | | 50.7 | % | | | - | | | | (5.3 | )% | | | 45.7 | % | | | 49.8 | % | | | - | | | | (4.1 | )% |
The figures included in this report are not audited. The financial information is expressed in billions of Colombian pesos (COP) or US dollars (USD), or thousands of barrels of oil equivalent per day (mboed) or tons, and this is so indicated where applicable. For presentation purposes, certain figures of this report were rounded to the nearest decimal place.
Statements on future projections: This press release may contain statements on future projections related to business prospects, estimated for operating and financial results, and on Ecopetrol growth. These are projections, and therefore are based solely on management’s expectations as to the company’s future and its continuous access to capital to finance the company’s business plan. These statements on future projections basically depend on changes in market conditions, government regulations, competitive pressure, the performance of the Colombian economy and industry, among other factors; therefore, they are subject to change without prior notice.
I. Macroeconomic and Market Context
After the positive economic growth posted in 2017 (3.8%) and 2018 (3.6%), global activity has slowed considerably, as a result, among others, of: i) the low economic growth in China and the increased trade tensions with the United States, ii) the lower consumer confidence and reduced manufacturing in the Euro zone, and iii) the deceleration of industrial production worldwide. This weak growth has resulted in low demand for hydrocarbons and larger product inventories. For example, inventories of gasoline, medium distillates, jet fuel and fuel oil in OECD1 countries have been increasing along 2019, reaching levels 5% higher than those posted in 2018 and 1.4% above the average levels between 2014 and 2018.
Moreover, refineries globally have been affected by a weakening crack spread for some products due to the economic slowdown and rising prices for their intermediate and heavy crude diets, due to i) the agreement between OPEC and Russia, ii) sanctions on Iran, and iii) a sharp reduction in production in Venezuela. In this environment, Maya heavy crude on the US Gulf Coast (USGC) has strengthened against Brent over the past year, from a spread of -11.1 USD/bl to -5.7 USD/bl between the first half of 2018 and the first half of 2019, while the crack spread for regular USGC gasoline versus Brent has fallen by 3.8 USD/bl, and that of USGC heavy naphtha has fallen by 5.7 USD/bl during that same period. This situation has generated a drop in refining margins worldwide, which have posted six-year lows in some months of the first half of 2019.
Likewise, the strengthening of the dollar continued due to the resistance of the US economy to the weakening of world growth and greater risk aversion due to the escalation of the trade war between the United States and China. Although the market has cut 2019 growth forecasts for several economies throughout the year, there has been no significant change in US growth expectations, which have remained at rates close to 2.5%.
At the local level, the Colombian economy registered 2.8% growth in the first quarter of 2019, lower than expected by the market (3.0%). The Colombian Central Bank expects greater dynamism in the remainder of 2019 and forecasts a 3.0% full-year growth. Among the indexes of economic activity that show better performance and support the prospects for economic recovery are industrial production, retail sales, energy demand, oil production and a lower fall in coal production. Between January and April 2019, oil production in the country was 891,931 barrels per day average, which meant an annual variation of 4.7% compared to the first four months of 2018, when there was a production of 851,241 barrels per day average.
II. Ecopetrol Group Financial and Operating Results
Increase of 7.8% in sales revenue in 2Q19 versus 2Q18, as a combined result of:
| a) | A decrease in the average weighted basket price of crude oils, gas and refined products -3.9 USD/bl (COP -1.1 trillion), largely due to the decline in Brent crude benchmark prices, partially offset by improved crude spreads, which in turn were due primarily to restrictions on Venezuelan shipments and the Group’s commercial strategy. |
| b) | Positive volume effect of sales (COP +0.5 trillion, +17.2 mboed). |
| c) | Higher average exchange rate, positively impacting total revenue (COP +1.8 trillion) |
| d) | Higher revenue from transport and other services (COP +83 billion). |
1 Organization for Economic Cooperation and Development
Volume sales: 2Q19 volumes sold totaled 917.2 mboed, an increase of 1.9% as compared to 2Q18, primarily due to: i) higher diesel exports associated with increased available volumes from the Cartagena refinery given the lower destination to the local market, ii) higher domestic sales of liquid fuels due to greater demand, and iii) greater requests from border regions.
Table 2: Volumetric Sales – Ecopetrol Group
| Local Sales Volume - mboed | | 2Q 2019 | | | 2Q 2018 | | | ∆ (%) | | | 6M 2019 | | | 6M 2018 | | | ∆ (%) | |
| Crude Oil | | | 5.3 | | | | 4.6 | | | | 15.2 | % | | | 7.1 | | | | 5.9 | | | | 20.3 | % |
| Natural Gas | | | 75.0 | | | | 77.5 | | | | (3.2 | )% | | | 76.6 | | | | 74.2 | | | | 3.2 | % |
| Gasoline | | | 116.6 | | | | 107.6 | | | | 8.4 | % | | | 114.1 | | | | 110.3 | | | | 3.4 | % |
| Medium Distillates | | | 153.8 | | | | 149.7 | | | | 2.7 | % | | | 153.6 | | | | 148.9 | | | | 3.2 | % |
| LPG and Propane | | | 15.1 | | | | 16.7 | | | | (9.6 | )% | | | 15.0 | | | | 16.9 | | | | (11.2 | )% |
| Fuel Oil | | | 3.8 | | | | 10.5 | | | | (63.8 | )% | | | 2.6 | | | | 9.8 | | | | (73.5 | )% |
| Industrials and Petrochemicals | | | 21.9 | | | | 21.2 | | | | 3.3 | % | | | 22.2 | | | | 20.9 | | | | 6.2 | % |
| Total Local Volumes | | | 391.5 | | | | 387.8 | �� | | | 1.0 | % | | | 391.2 | | | | 386.9 | | | | 1.1 | % |
| Export Sales Volume - mboed | | 2Q 2019 | | | 2Q 2018 | | | ∆ (%) | | | 6M 2019 | | | 6M 2018 | | | ∆ (%) | |
| Crude Oil | | | 395.8 | | | | 402.5 | | | | (1.7 | )% | | | 402.1 | | | | 384.7 | | | | 4.5 | % |
| Products | | | 128.7 | | | | 108.3 | | | | 18.8 | % | | | 118.3 | | | | 102.7 | | | | 15.2 | % |
| Natural Gas* | | | 1.2 | | | | 1.4 | | | | (14.3 | )% | | | 1.5 | | | | 1.6 | | | | (6.3 | )% |
| Total Export Volumes | | | 525.7 | | | | 512.2 | | | | 2.6 | % | | | 521.9 | | | | 489.0 | | | | 6.7 | % |
| | | | | | | | | | | | | | | | | | | | | | | | | |
| Total Sales Volumes | | | 917.2 | | | | 900.0 | | | | 1.9 | % | | | 913.1 | | | | 875.9 | | | | 4.2 | % |
*Natural gas exports correspond to local sales of Ecopetrol America Inc.
Markets of Operation
Colombia (43% of sales): 1.0% increase over 2Q18, primarily due to:
| · | An increase in gasoline sales to the border region due to higher quotas set by the Ministry of Mines and Energy, given the reduced supply of Venezuelan gasoline. |
| · | Increased sales of medium distillates in the border region, higher sales to the mining sector and increased demand for air transport. |
| · | A decrease in fuel oil sales primarily due to the termination of the domestic sales agreement as of March. |
| · | Lower natural gas sales due to decreased availability as a result of the scheduled maintenances at Oripaya, Cusiana and Cupiagua, as well as the controlled shutdown of the Gibraltar plant in June 2019, partially offset by new contracts resulting from the commercialization process of larger fields and increased production at Hocol. |
International (57% of sales): 2.6% increase over 2Q18, primarily due to:
| · | Higher diesel exports given the lower sales to the local market, which was supplied with imported product. |
| · | Lower sales of crude primarily due to higher throughput at refineries in Colombia and shifting of certain sales volumes to 3Q19 by the rescheduling of deliveries. |
Table 3: Export Destinations - Ecopetrol Group
| Crudes - mboed | | 2Q 2019 | | | 2Q 2018 | | | % Share | | | 6M 2019 | | | 6M 2018 | | | % Share | |
| U.S. Gulf Coast | | | 181.4 | | | | 144.8 | | | | 45.8 | % | | | 162.4 | | | | 141.8 | | | | 40.4 | % |
| Asia | | | 151.3 | | | | 101.8 | | | | 38.2 | % | | | 146.6 | | | | 108.7 | | | | 36.5 | % |
| Europe | | | 32.9 | | | | 20.8 | | | | 8.3 | % | | | 24.7 | | | | 10.5 | | | | 6.1 | % |
| Central America / Caribbean | | | 18.8 | | | | 101.3 | | | | 4.8 | % | | | 32.3 | | | | 83.5 | | | | 8.0 | % |
| U.S. West Coast | | | 10.3 | | | | 7.4 | | | | 2.6 | % | | | 14.5 | | | | 12.4 | | | | 3.6 | % |
| South America | | | 0.8 | | | | 1.9 | | | | 0.2 | % | | | 1.9 | | | | 3.6 | | | | 0.5 | % |
| Others | | | 0.2 | | | | 19.0 | | | | 0.1 | % | | | 2.9 | | | | 15.9 | | | | 0.7 | % |
| U.S. East Coast | | | 0.0 | | | | 5.5 | | | | 0.0 | % | | | 16.8 | | | | 8.3 | | | | 4.2 | % |
| Total | | | 395.8 | | | | 402.5 | | | | 100.0 | % | | | 402.1 | | | | 384.7 | | | | 100.0 | % |
| Products - mboed | | 2Q 2019 | | | 2Q 2018 | | | % Share | | | 6M 2019 | | | 6M 2018 | | | % Share | |
| U.S. East Coast | | | 43.0 | | | | 14.9 | | | | 33.4 | % | | | 42.7 | | | | 20.8 | | | | 36.1 | % |
| Central America / Caribbean | | | 42.0 | | | | 22.8 | | | | 32.7 | % | | | 35.8 | | | | 23.0 | | | | 30.3 | % |
| Asia | | | 20.9 | | | | 20.3 | | | | 16.2 | % | | | 19.9 | | | | 22.5 | | | | 16.8 | % |
| U.S. Gulf Coast | | | 13.9 | | | | 39.2 | | | | 10.8 | % | | | 7.3 | | | | 24.4 | | | | 6.2 | % |
| South America | | | 5.5 | | | | 7.6 | | | | 4.3 | % | | | 7.3 | | | | 8.0 | | | | 6.2 | % |
| Europe | | | 3.4 | | | | 3.5 | | | | 2.6 | % | | | 2.0 | | | | 2.4 | | | | 1.7 | % |
| U.S. West Coast | | | 0.0 | | | | 0.0 | | | | 0.0 | % | | | 3.3 | | | | 1.6 | | | | 2.8 | % |
| Total | | | 128.7 | | | | 108.3 | | | | 100.0 | % | | | 118.3 | | | | 102.7 | | | | 100.0 | % |
Note: Information subject to change after the quarter close, as some destinations are reclassified in accordance with final export results.
Exports
Crudes:
| · | US Gulf Coast: Better valuation of heavy crudes due to the drop in supply from Mexico and Venezuela. |
| · | Asia: Increased share as a result of sanctions on Iranian crude that generated a greater opportunity for the entry of other heavy crudes. |
| · | Central America and the Caribbean: Less incentive for temporary storage of Latin American crude in the Caribbean for subsequent sale in Asia. |
| · | Europe: Increased share as a result of the strengthening in the price of crude competitors, due to sanctions on Iranian crude, which generated a greater enter opportunity to the Castilla blend crude. |
Refined Products:
| · | US East Coast: Increased share, largely due to greater exports of ultra-low-sulfur diesel (ULSD). |
| · | Central America and the Caribbean: Higher sales of fuel oil to Asia for better valuation versus the Gulf Coast and greater exports of ultra-low-sulfur diesel (ULSD) due to higher product availability. |
| · | US Gulf Coast: Lower exports of naphtha due to scheduled maintenance at the Cartagena Refinery, and of fuel oil at the Barrancabermeja refinery, due to detour to more valuable flows. |
Prices and Spreads Performance
Crudes: In 2Q19 the price of the sales basket of crude oils decreased 4.8% as compared to 2Q18 as a result of a decline in the Brent price, explained by the increase in supply mainly in the United States, which increased inventories more than expected. This was partially offset by a stronger basket spread, which reached its historical maximum of -4.9 USD/bl, due to the use of market conditions generated by a lower supply in the US Gulf as a result of restrictions on shipments of Venezuelan crude and higher demand from refineries in Mexico.
Refined Products: In 2Q19 the price of the basket of refined products versus Brent declined 7.7% compared to 2Q18, due to a weakness in gasoline prices, occasioned by the global oversupply of inventory due to high refinery output and the processing of light crudes with higher yields into naphtha’s. This was offset by a stronger price for fuel oil, given the reduction in global supply.
Natural Gas: Increase of 1.3% in the price per barrel equivalent versus 2Q18, due to the renewal of contracts from the commercialization process of larger fields and incremental sales at prices higher than those in 2018.
Table 4: Average Basket Prices and Price Spreads - Ecopetrol Group
| USD/Bl | | 2Q 2019 | | | 2Q 2018 | | | ∆ (%) | | | 6M 2019 | | | 6M 2018 | | | ∆ (%) | |
| Brent | | | 68.5 | | | | 75.0 | | | | (8.7 | )% | | | 66.2 | | | | 71.2 | | | | (7.0 | )% |
| Natural Gas Basket | | | 23.9 | | | | 23.6 | | | | 1.3 | % | | | 24.0 | | | | 22.9 | | | | 4.8 | % |
| | | | | | | | | | | | | | | | | | | | | | | | | |
| Crude Oil Basket Spread | | | (4.9 | ) | | | (8.2 | ) | | | 40.2 | % | | | (6.4 | ) | | | (7.7 | ) | | | 16.9 | % |
| Crude Oil Basket | | | 63.6 | | | | 66.8 | | | | (4.8 | )% | | | 59.8 | | | | 63.5 | | | | (5.8 | )% |
| % Spread Crude Oil Basket vs. Brent | | | (7.7 | )% | | | (10.9 | )% | | | 29.4 | % | | | (10.7 | )% | | | (12.1 | )% | | | 11.6 | % |
| | | | | | | | | | | | | | | | | | | | | | | | | |
| Products Basket Spread | | | 4.7 | | | | 4.3 | | | | 9.3 | % | | | 5.5 | | | | 5.5 | | | | 0.0 | % |
| Products Basket | | | 73.2 | | | | 79.3 | | | | (7.7 | )% | | | 71.7 | | | | 76.7 | | | | (6.5 | )% |
| % Spread Products Basket vs. Brent | | | 6.5 | % | | | 5.7 | % | | | 14.0 | % | | | 7.7 | % | | | 7.2 | % | | | 6.9 | % |
Depreciation and amortization: Increase of 8.1% in 2Q19 versus 2Q18, primarily due to the offsetting effect of:
| a) | Higher production and CAPEX levels, associated with the results of the drilling campaign and the improved recovery factor of the assets. |
| b) | Higher average exchange rate, impacting the depreciation cost of subsidiaries operating with the dollar as functional currency, given the devaluation against that currency. |
| c) | The above was offset by the greater incorporation of reserves in 2018 versus 2017, yielding a lower depreciation rate. |
Variable costs:Increase of 16.5% in 2Q19 versus 2Q18, primarily due to:
| a) | Higher purchase costs of crude, natural gas and refined products (COP +0.9 trillion), due to the net effect of: |
| · | Higher purchased volume (COP +716 billion, +23.4 mboed), primarily diesel to supply the local market. |
| · | Lower average price of domestic purchases and imports of crude oil, refined products and natural gas (COP -571 billion). |
| · | Higher average exchange rate on purchases (COP +799 billion). |
| b) | Other minor changes (COP +15 billion). |
Table 5: Local Purchases and Imports – Ecopetrol Group
| Local Purchases - mboed | | 2Q 2019 | | | 2Q 2018 | | | ∆ (%) | | | 6M 2019 | | | 6M 2018 | | | ∆ (%) | |
| Crude Oil | | | 162.8 | | | | 167.7 | | | | (2.9 | )% | | | 162.7 | | | | 163.3 | | | | -0.4 | % |
| Gas | | | 1.6 | | | | 9.9 | | | | (83.8 | )% | | | 1.9 | | | | 5.8 | | | | -67.2 | % |
| Products | | | 2.8 | | | | 3.1 | | | | (9.7 | )% | | | 3.1 | | | | 3.3 | | | | -6.1 | % |
| Diluent | | | 0.4 | | | | 0.5 | | | | (20.0 | )% | | | 0.4 | | | | 0.4 | | | | 0.0 | % |
| Total | | | 167.6 | | | | 181.2 | | | | (7.5 | )% | | | 168.1 | | | | 172.8 | | | | -2.7 | % |
| Imports - mboed | | 2Q 2019 | | | 2Q 2018 | | | ∆ (%) | | | 6M 2019 | | | 6M 2018 | | | ∆ (%) | |
| Crude Oil | | | 40.4 | | | | 36.9 | | | | 9.5 | % | | | 35.1 | | | | 41.2 | | | | -14.8 | % |
| Products | | | 73.5 | | | | 43.0 | | | | 70.9 | % | | | 85.6 | | | | 46.1 | | | | 85.7 | % |
| Diluent | | | 55.2 | | | | 52.2 | | | | 5.7 | % | | | 53.1 | | | | 50.1 | | | | 6.0 | % |
| Total | | | 169.1 | | | | 132.1 | | | | 28.0 | % | | | 173.8 | | | | 137.4 | | | | 26.5 | % |
| | | | | | | | | | | | | | | | | | | | | | | | | |
| Total | | | 336.7 | | | | 313.3 | | | | 7.5 | % | | | 341.9 | | | | 310.2 | | | | 10.2 | % |
Fixed costs:Increase of 16.9% in 2Q19 versus 2Q18, primarily due to:
| a) | Higher costs of maintenance and contracted services (COP +260 billion) due to the increased operational activity as a result of i) greater production levels, ii) higher costs associated with secondary recovery by water injection, iii) commissioning of new wells and workovers, and iv) larger share of fields, among others. |
| b) | Higher labor costs (COP +61 billion), primarily due to the recognition of employee benefits included in our new Collective Bargaining Agreement and higher headcount. |
| c) | Other minor changes (COP +24 billion). |
| c) | Operating and Exploratory Expenses |
Operating and exploratory expenses increased 34.4% in 2Q19 versus 2Q18, primarily due to:
| a) | Write off of the exploratory activity of the Tibirita-1, Tibirita-1A and Avila projects in Caño Sur, which were recognized as ongoing project in the balance sheet. The recognition of the expense of these projects is adopted after updating the economic viability given the completion of the technical and commercial studies, and the non-extension by the competent authority in the extension of the exploratory stage. |
| b) | High labor expenses due to the recognition of employee benefits agreed in our new Collective Bargaining Agreement and higher headcount. |
| c) | Higher taxes, primarily 4x1,000 tax on financial transactions associated with higher dividend payments. |
| d) | Higher costs in repairing damage caused by third parties to the transport system and illegal valves. |
| d) | Financial (Non-Operating) Results |
The change in financial results in 2Q19 versus 2Q18 corresponds to the net effect of:
| a) | Savings in financial costs (COP +155 billion) primarily associated with the debt prepayments in 2018. |
| b) | Higher revenue from the valuation of the securities portfolio, increased in yields and other minor factors (COP +74 billion). |
Theeffective tax rate for 2Q19 was 33.2%, versus 35.7% in 2Q18. The decline was primarily due to the reduction of four percentage points in the nominal tax rate set by the Financing Law approved in late 2018, offset by lower results in the Cartagena refinery, which taxes under presumptive income.
| 2. | Financial Statement Position |
Decline of 2.4% in assets in 2Q19 compared to 1Q19, primarily explained by the net effect of:
| a) | A reduction inother financial assets and cash equivalents(COP -3.6 trillion), primarily from the combined effect of: i) cash flow generated from operations (COP +6.0 trillion), ii) outflow of funds for CAPEX (COP -2.2 trillion), iii) payment of dividends to the Government and minority shareholders (COP -6.6 trillion), iv) payment of principal and debt service (COP -1.1 trillion) and v) positive effect of the devaluation of the Colombian peso against the dollar (COP +0.1 trillion). At the end of the quarter our cash composition was comprised of 57% U.S. dollars and 43% Colombian pesos. |
Table 6: Cash Position – Ecopetrol Group
| Billion (COP) | | 2Q 2019 | | | 2Q 2018 | | | 6M 2019 | | | 6M 2018 | |
| Initial cash and cash equivalents | | | 8,935 | | | | 7,866 | | | | 6,312 | | | | 7,946 | |
| (+) Cash flow from operations | | | 6,017 | | | | 4,641 | | | | 10,837 | | | | 9,314 | |
| (-) CAPEX | | | (2,217 | ) | | | (1,757 | ) | | | (4,141 | ) | | | (2,952 | ) |
| (+/-) Investment portfolio movement | | | 286 | | | | (343 | ) | | | 984 | | | | (2,891 | ) |
| (+) Other investment activities | | | 158 | | | | 160 | | | | 310 | | | | 305 | |
| (-) Borrowings and interest payments | | | (1,127 | ) | | | (2,061 | ) | | | (1,811 | ) | | | (2,729 | ) |
| (-) Dividend payments | | | (6,642 | ) | | | (2,210 | ) | | | (6,975 | ) | | | (2,455 | ) |
| (+/-) Exchange difference (cash impact) | | | 114 | | | | 41 | | | | 8 | | | | (201 | ) |
| Final cash and cash equivalents | | | 5,524 | | | | 6,337 | | | | 5,524 | | | | 6,337 | |
| Investment portfolio | | | 7,152 | | | | 9,463 | | | | 7,152 | | | | 9,463 | |
| Total cash | | | 12,676 | | | | 15,800 | | | | 12,676 | | | | 15,800 | |
Note: The cash corresponds to the available resources that are classified as cash and cash equivalents and investments in financial securities, regardless of their maturity.
| b) | A decrease intrade receivables(COP -374 billion), due to: i) the payment received from the Fuel Prices Stabilization Fund totaling COP -1.8 trillion and the quarterly accrual of COP +914 billion, and ii) the increase in accounts receivable of COP +548 billion, associated with higher sales and prices versus 1Q19. |
| c) | An increase inproperty, plant and equipment, natural resources and intangibles(COP +445 billion), due to: i) higher CAPEX for the period, ii) the effect of the conversion of subsidiaries assets with functional currencies other than the Colombian peso, resulting from the devaluation that occurred during the quarter, partially offset by iii) higher depreciation and amortization. |
| d) | An increase in inventory (COP +376 billion), associated with higher prices of crudes and refined products, compared to 1Q19. |
| e) | Other changes in assets (COP +123 billion). |
Decline of 9.7% of total liabilities in 2Q19 versus 1Q19, due to:
| a) | Loweraccounts payable(COP -6.1 trillion) as a result of the net effect of: i) payment of the first and second installments of dividends to the Government and the 100% of dividends owed to minority shareholders, as decreed by Ecopetrol’s General Shareholders Meeting, out of 2018 earnings, and ii) increased accounts payable to suppliers. |
| b) | A reduction intaxes payable(COP -670 billion) associated with income tax payments, primarily from midstream segment subsidiaries, partially offset by the quarterly provision for income tax. |
| c) | Lowerprovisions for employee benefits(COP -338 billion) due to payments for pension allowances and social services. |
| d) | A reduction inloans and financing (COP -261 billion) primarily due to periodic payments of principal and interest, offset by the effect of the peso’s devaluation against the U.S. dollar and its impact on dollar debt, whose exchange effect is recognized in other comprehensive income, under equity, given the application of hedge accounting. As of June 30, 2019, the Ecopetrol Group’s debt totaled COP 37.5 trillion, 89% of which is originated in foreign currency and 11% in domestic currency. |
| e) | Other minor changes in liabilities (COP -63 billion). |
Increase of 8.1% inequity in 2Q19 compared to 1Q19, as a result of the combined effect of: i) our quarterly earnings, ii) the increase resulting from the conversion of assets and liabilities of subsidiaries operating in functional currencies other than the Colombian peso, due to the peso’s devaluation against the U.S. dollar, and iii) income from exchange rate difference applied to debt employed as a cash flow hedge instrument and net investment, given the peso’s devaluation against the dollar.
| 3. | Results by Business Segment |
EXPLORATION
In the second quarter Ecopetrol and its partners completed the drilling of six exploratory wells, for a total of ten thus far this year.
During the quarter, the presence of hydrocarbons was confirmed in the Andina Norte-1 well, where crude was found in the Guadalupe and Une formations. Initial testing in the Guadalupe formation indicated a production rate of 2,785 bod of 40º API light crude and 4.3 million cubic feet per day of natural gas. On the other hand, the Une formation yielded an average production rate of 621 bod of 37º API crude oil and 1.5 million cubic feet of natural gas per day. Likewise, drilling of the Boranda-2 ST well was also completed (independent reservoir from the one found in the Boranda-1 well), where initial production testing confirmed the presence of medium crude in the Emerald formation of Eocene basal sands, at an initial rate of 960 bod of 23º API oil.
The Ecopetrol Group also obtained five of the 11 exploratory blocks awarded in Colombia by the Colombian National Hydrocarbons Agency (ANH) during the 2019 Permanent Area Assignment Process (PPAA). Of those five, one corresponds to Ecopetrol S.A. (Gua-Off 10 offshore block) and the other four to its subsidiary Hocol (Blocks COR-9, LLA 86, LLA-87 AND LLA-104).
Internationally, Ecopetrol America Inc. (31.5%), in joint venture with the companies Fieldwood Energy (58.94% - Operator) and Talos Energy (9.56%), were awarded the MC 904 block in the US Gulf of Mexico during the process of the GOM - Lease Sale 252 round. Likewise, Ecopetrol Brasil purchased an additional 341 km² of 3D seismic to assess the prospects of Pau Brasil and 1,600 km² of high-resolution 3D seismic to assess participation in the Transfer of Rights Surplus Auction in the second half of the year. Additionally, Ecopetrol Hidrocarburos México acquired a license for 88,015 km² of 3D seismic from the Campeche program.
On July 17th, Brazil’s Ministry of Mines and Energy approved Ecopetrol’s 10% stake in the Saturno block, located in the Santos basin. As a result, in the new composition, Ecopetrol retains a 10% share, while Shell, as Operator, holds 45% and Chevron the other 45%. With this approval, the process of formalization and closing of the “Production Sharing Contract” contract with which Ecopetrol will join the consortium has begun.
Table 7: Detail of Exploratory Wells – Ecopetrol Group
| # | | Quarter | | Name | | Initial Well
Classification
(Lahee) | | Block | | Name | | Operator/Partner | | Status | | TD Date |
| 1 | | First | | Jaspe-8 | | A1 | | Quifa | | Llanos Orientales | | FRONTERA (70%)
ECP (30%) | | Successful | | Enero 14 / 2019 |
| 2 | | First | | Cira 7000 ST | | A2C | | La Cira Infantas | | Valle Medio del Magdalena | | OXY (52%)
ECP (48%) | | Dry | | Enero 27 / 2019 |
| 3 | | First | | Provenza-1 | | A3 | | CPO-8 | | Llanos Orientales | | ECP (100%) | | Dry | | Marzo 5 / 2019 |
| 4 | | First | | Mamey West-1 | | A2C | | Samán | | Valle Inferior del Magdalena | | Hocol (100%) | | Dry | | Marzo 5/ 2019 |
| 5 | | Second | | Andina Norte-1 | | A3 | | Capachos | | Llanos Orientales | | Parex (50%)
ECP (50%) | | Successful | | Mayo 3 / 2019 |
| 6 | | Second | | Pastora Sur-1 | | A3 | | Chipiron | | Llanos Orientales | | Oxy (70%)
ECP (30%) | | Dry | | Mayo 19 / 2019 |
| 7 | | Second | | Boranda-2 ST | | A1 | | Playón | | Llanos Orientales | | Parex (50%)
ECP (50%) | | Successful | | Mayo 21 / 2019 |
| 8 | | Second | | Cosecha CW-01 | | A3 | | Cosecha | | Llanos Orientales | | Oxy (70%)
ECP (30%) | | Dry | | Mayo 26 / 2019 |
| 9 | | Second | | Cosecha CW-01-ST-1 | | A3 | | Cosecha | | Llanos Orientales | | Oxy (70%)
ECP (30%) | | Under Evaluation | | Junio 09 / 2019 |
| 10 | | Second | | Habanero-1 | | A3 | | Fortuna | | Valle Medio del Magdalena | | Parex (80%)
ECP (20%) | | Under Evaluation | | Junio 11 / 2019 |
PRODUCTION
In 2Q19 the Ecopetrol Group’s average production totaled 723 mboed (+0.3% over 2Q18), explained by i) the improved performance of the drilling campaigns in the Akacias, Rubiales, Chichimene, Yarigui-Cantagallo, Quifa and Castilla fields, which started in 2018 and have continued in 2019, ii) the positive response of the secondary and tertiary recovery, and iii) higher sales of natural gas at Hocol. Although production decreased 0.7% compared to 1Q19 due to the scheduled maintenances at the Cusiana and Cupiagua natural gas fields, it is still in line with the target of 720-730 mboed set for 2019. Eliminating the effect of scheduled maintenances, the production of the quarter would have been 730 mboed. For the first six months of the year, production was 726 mboed.
During 2Q19 the production at the Akacias field, where Ecopetrol holds a 55% stake, remained outstanding, reaching a record of 20 mboed, up 3 mboed over 1Q19 and up 14 mboed versus 2Q18.
In 2Q19 Ecopetrol Group upstream subsidiaries contributed approximately 60 mboed, accounting for 8.3% of the consolidated total volume, reflecting an increase of 2.8 mboed (+4.9%) compared to 2Q18, leveraged primarily by the transfer of fields between Ecopetrol and Hocol and the results at Ecopetrol America Inc. (EAI).
During 2Q19, we had an average of 37 rigs in operation, 6 more than those in operation in 2Q18, resulting in the drilling and completion of 147 development wells. In the first half of 2019, 311 development wells were drilled, 17.4% more than in 1H18.
Table 8: Gross Production* - Ecopetrol Group
| Production - mboed | | 2Q 2019 | | | 2Q 2018 | | | ∆ (%) | | | 6M 2019 | | | 6M 2018 | | | ∆ (%) | |
| Crude Oil | | | 551.4 | | | | 550.8 | | | | 0.1 | % | | | 551.2 | | | | 542.0 | | | | 1.7 | % |
| Natural Gas | | | 111.4 | | | | 112.7 | | | | (1.2 | )% | | | 112.9 | | | | 110.5 | | | | 2.2 | % |
| Total Ecopetrol S.A. | | | 662.8 | | | | 663.5 | | | | (0.1 | )% | | | 664.1 | | | | 652.5 | | | | 1.8 | % |
| Crude Oil | | | 20.7 | | | | 19.6 | | | | 5.6 | % | | | 20.9 | | | | 20.2 | | | | 3.5 | % |
| Natural Gas | | | 8.7 | | | | 7.1 | | | | 22.5 | % | | | 8.6 | | | | 7.1 | | | | 21.1 | % |
| Total Hocol | | | 29.4 | | | | 26.7 | | | | 10.1 | % | | | 29.5 | | | | 27.3 | | | | 8.1 | % |
| Crude Oil | | | 8.0 | | | | 9.3 | | | | (14.0 | )% | | | 8.1 | | | | 9.2 | | | | -12.0 | % |
| Natural Gas | | | 5.0 | | | | 5.1 | | | | (2.0 | )% | | | 5.0 | | | | 5.0 | | | | 0.0 | % |
| Total Equion** | | | 13.0 | | | | 14.4 | | | | (9.7 | )% | | | 13.1 | | | | 14.2 | | | | -7.7 | % |
| Crude Oil | | | 3.6 | | | | 3.9 | | | | (7.7 | )% | | | 3.6 | | | | 3.9 | | | | -7.7 | % |
| Natural Gas | | | 1.2 | | | | 1.0 | | | | 20.0 | % | | | 1.2 | | | | 1.0 | | | | 20.0 | % |
| Total Savia** | | | 4.8 | | | | 4.9 | | | | (2.0 | )% | | | 4.8 | | | | 4.9 | | | | -2.0 | % |
| Crude Oil | | | 11.2 | | | | 9.6 | | | | 16.7 | % | | | 12.1 | | | | 10.3 | | | | 17.5 | % |
| Natural Gas | | | 1.8 | | | | 1.8 | | | | 0.0 | % | | | 1.9 | | | | 2.0 | | | | -5.0 | % |
| Total Ecopetrol America | | | 13.0 | | | | 11.4 | | | | 14.0 | % | | | 14.0 | | | | 12.3 | | | | 13.8 | % |
| Crude Oil | | | 594.9 | | | | 593.2 | | | | 0.3 | % | | | 595.9 | | | | 585.6 | | | | 1.8 | % |
| Natural Gas | | | 128.1 | | | | 127.7 | | | | 0.3 | % | | | 129.6 | | | | 125.6 | | | | 3.2 | % |
| Total Ecopetrol Group | | | 723.0 | | | | 720.9 | | | | 0.3 | % | | | 725.5 | | | | 711.2 | | | | 2.0 | % |
* Gross production includes royalties and is prorated for Ecopetrol’s share in each company.
** Equion and Savia are included in the Financial Statements through the equity method.
Note: Natural gas production includes NGL´s.
Recovery Program
The enhanced recovery factor program remains in line with the 2019 plan and the company continues to assess opportunities to increase reserves and secure production. To date, eight projects are under way, nine in the maturity stage and 16 pilots, four of them in operation, which yield an average incremental production of 15 mboed. As of June 2019, Ecopetrol fields with recovery programs contributed around 30% of the Group’s total daily production.
We are also continuing to promote secondary recovery technologies with water injection in fields such as Castilla, Nutria, Tisquirama and Chichimene; tertiary recovery technologies using enhanced water injection at Dina K, Yariguí, Casabe and Chichimene; steam injection at Teca and Tren Nare; and we are assessing the air injection pilot at Chichimene.
Lifting and Dilution Cost
Lifting Cost:
Cost Effect (+2.01 USD/bl):
| · | Increased subsoil maintenance due to the greater number of interventions, additional workover works (+2%) and higher well services rates (+27%). |
| · | Higher energy costs due to: i) greater energy consumption as a result of increased water production, served through the increase of self-generated energy capacities and ii) higher purchase price of non-regulated energy given the higher price on the spot market. |
| · | Higher cost for payment of economic rights (X-Factor) to the ANH for increased production at the CPO09 field. |
| · | Higher surface maintenance costs due to increased comprehensive maintenance activity and operational reliability, as well as higher contract rates. |
Exchange Rate Effect(-1.29 USD/bl): Higher average exchange rate of +401.5 pesos/dollar when re-stating Colombian pesos into U.S. dollars.
Volume Effect(-0.05 USD/bl): Lower cost due to the production increase.
Dilution Cost:
Decrease of 0.26 USD/bl in 2Q19 compared to 2Q18, explained by the higher value paid in pesos due to the higher average exchange rate of +401.5 pesos/dollar, despite the reduction of 8.98 USD/bl in the price of naphtha. Greater purchase of naphtha due to higher production of heavy crude oil and the change in naphtha’s quality.
Table 9: Lifting and Dilution Cost - Ecopetrol Group
| USD/Bl | | 2Q 2019 | | | 2Q 2018 | | | ∆ (%) | | | 6M 2019 | | | 6M 2018 | | | ∆ (%) | | | % USD | |
| Lifting Cost* | | | 9.14 | | | | 8.47 | | | | 7.9 | % | | | 8.93 | | | | 8.28 | | | | 7.9 | % | | | 16.8 | % |
| Dilution Cost** | | | 5.04 | | | | 5.30 | | | | (4.9 | )% | | | 4.49 | | | | 4.77 | | | | (5.9 | )% | | | 100.0 | % |
* Calculated based on barrels produced without royalties
** Calculated based on barrels sold
Financial Results for the Segment
The 2Q19 revenues rose versus 2Q18 primarily due to: i) higher average exchange rate, ii) greater production volumes as a result of the 2018 drilling campaign and the positive effect of the recovery factor on production, and iii) higher spreads on crude versus Brent. The above offset the lower prices of the weighted average crude basket.
Cost of sales in 2Q19 rose versus 2Q18 as a result of: i) increased purchases of crude given the increased allocation of our own crudes for throughput to our refineries and the effect of a higher average exchange rate on purchases, ii) increased diluent purchases associated with the higher production of heavy crudes, change in diluent quality and exchange rate effect, iii) higher subsoil maintenance costs at Apiay and Chichimene, stimulation works at Piedemonte and well services at Llanos Norte and Quifa-Cajua, iv) increased fluid volumes and economic rights paid at the CPO09 field, v) higher depreciation and amortization related to greater capitalizations as a result of the drilling campaigns at Rubiales, Castilla and Akacias (CPO09), and vi) higher transport costs associated with the increase in the average exchange rate, and the rise in transported volumes associated with higher production.
The 2Q19 operating expenses rose versus 2Q18 primarily due to the write off of the exploratory activity of the Tibirita-1, Tibirita-1A and Avila-1 projects in Caño Sur that were recognized as ongoing project on the balance sheet.
Net financial (non-operational) results for 2Q19 versus 2Q18 reflected savings on financial interest resulting from the debt prepayments made the previous year and a reduction in the exchange rate exposure as a result of a lower devaluation of the Colombian peso compared to the U.S. dollar.
The aforementioned factors resulted in a decrease of net income and EBITDA in 2Q19 compared to 2Q18. Although incremental production generates profitable barrels, in some cases they generate a lower EBITDA margin due to the quality conditions of the crude and improved recovery processes that imply additional activities to carry out the extraction.
Table 10: Income Statement – Upstream
| Billion (COP) | | 2Q 2019 | | | 2Q 2018 | | | ∆ ($) | | | ∆ (%) | | | 6M 2019 | | | 6M 2018 | | | ∆ ($) | | | ∆ (%) | |
| Total revenue | | | 13,532 | | | | 12,406 | | | | 1,126 | | | | 9.1 | % | | | 25,129 | | | | 22,370 | | | | 2,759 | | | | 12.3 | % |
| Depreciation, amortization and depletion | | | 1,422 | | | | 1,315 | | | | 107 | | | | 8.1 | % | | | 2,764 | | | | 2,510 | | | | 254 | | | | 10.1 | % |
| Variable costs | | | 5,097 | | | | 4,127 | | | | 970 | | | | 23.5 | % | | | 9,711 | | | | 7,525 | | | | 2,186 | | | | 29.0 | % |
| Fixed costs | | | 2,471 | | | | 2,102 | | | | 369 | | | | 17.6 | % | | | 4,689 | | | | 4,121 | | | | 568 | | | | 13.8 | % |
| Total cost of sales | | | 8,990 | | | | 7,544 | | | | 1,446 | | | | 19.2 | % | | | 17,164 | | | | 14,156 | | | | 3,008 | | | | 21.2 | % |
| Gross income | | | 4,542 | | | | 4,862 | | | | (320 | ) | | | (6.6 | )% | | | 7,965 | | | | 8,214 | | | | (249 | ) | | | (3.0 | )% |
| Operating expenses | | | 665 | | | | 413 | | | | 252 | | | | 61.0 | % | | | 1,056 | | | | 762 | | | | 294 | | | | 38.6 | % |
| Operating income | | | 3,877 | | | | 4,449 | | | | (572 | ) | | | (12.9 | )% | | | 6,909 | | | | 7,452 | | | | (543 | ) | | | (7.3 | )% |
| Financial result, net | | | 182 | | | | 73 | | | | 109 | | | | 149.3 | % | | | 165 | | | | (518 | ) | | | 683 | | | | (131.9 | )% |
| Share of profit of companies | | | 67 | | | | 71 | | | | (4 | ) | | | (5.6 | )% | | | 104 | | | | 165 | | | | (61 | ) | | | (37.0 | )% |
| Income before income tax | | | 4,126 | | | | 4,593 | | | | (467 | ) | | | (10.2 | )% | | | 7,178 | | | | 7,099 | | | | 79 | | | | 1.1 | % |
| Provision for income tax | | | (1,335 | ) | | | (1,591 | ) | | | 256 | | | | (16.1 | )% | | | (2,352 | ) | | | (2,558 | ) | | | 206 | | | | (8.1 | )% |
| Net income consolidated | | | 2,791 | | | | 3,002 | | | | (211 | ) | | | (7.0 | )% | | | 4,826 | | | | 4,541 | | | | 285 | | | | 6.3 | % |
| Non-controlling interest | | | 15 | | | | 29 | | | | (14 | ) | | | (48.3 | )% | | | 30 | | | | 30 | | | | 0 | | | | 0.0 | % |
| Net income attributable to owners of Ecopetrol | | | 2,806 | | | | 3,031 | | | | (225 | ) | | | (7.4 | )% | | | 4,856 | | | | 4,571 | | | | 285 | | | | 6.2 | % |
| | | | | | | | | | | | | | | | | | | | | | | | | | | | | | | | | |
| EBITDA | | | 5,486 | | | | 5,949 | | | | (463 | ) | | | (7.8 | )% | | | 9,969 | | | | 10,267 | | | | (298 | ) | | | (2.9 | )% |
| EBITDA Margin | | | 40.5 | % | | | 48.0 | % | | | - | | | | (7.5 | )% | | | 40.0 | % | | | 50.0 | % | | | - | | | | (10.0 | )% |
Volumes
Crude: In 2Q19 transported volumes of crude increased 4.3% versus 2Q18 as a result of i) the commercial measures taken at truck unload facilities to reduce kilometers transported by tanker truck and increase transport by pipeline, ii) the greater production of Castilla Norte crude at the Barrancabermeja refinery, and iii) the entry of crude from the Acordionero field at Ayacucho. We highlight that in June, Ocensa achieved an historic daily pumping record of 743 mbd and a monthly record of 695 mbd. Approximately 75.2% of crude volumes transported by the oil pipeline system were owned by the Ecopetrol Group.
In 2Q19, the oil pipeline network continued to experience attacks by third parties. However, contingent operations allowed us to mitigate these impacts, resulting in 12 reversal cycles by the Bicentenario Oil Pipeline. During the quarter, there were 16 attacks to the infrastructure, 48% fewer than in 2Q18. Further, the number of illegal valves, for both crude oil and refined products, increased by 18.8% (285 in 2Q19 versus 240 in 2Q18).
Refined Products: In 2Q19 the transported volumes of refined products rose 2.5% versus 2Q18, as a result of i) inventory replacement and resupply process after the maintenance of the HDT unit at the Barrancabermeja refinery in 1Q19, and ii) increased delivery of fuels to the border region. Approximately 34.2% of refined products transported by the system corresponded to the Ecopetrol Group’s products.
Table 11: Transported Volumes – Midstream
| mbd | | 2Q 2019 | | | 2Q 2018 | | | ∆ (%) | | | 6M 2019 | | | 6M 2018 | | | ∆ (%) | |
| Crude Oil | | | 878.6 | | | | 842.4 | | | | 4.3 | % | | | 879.4 | | | | 819.1 | | | | 7.4 | % |
| Products | | | 279.4 | | | | 272.7 | | | | 2.5 | % | | | 269.6 | | | | 272.6 | | | | -1.1 | % |
| Total | | | 1,158.0 | | | | 1,115.2 | | | | 3.8 | % | | | 1,149.0 | | | | 1,091.7 | | | | 5.2 | % |
Tariffs Update
In late 2Q19, the Ministry of Mines and Energy issued resolutions setting new transport rates for oil pipelines, which will enter into effect starting in July 2019, up to June 30, 2023. As a result of the negotiation process and/or application of the existing tariff methodology, from July 2019 there will be an average increase in CENIT and Ocensa tariffs of 10% and a decrease in the other companies of the segment.
Cost per Barrel Transported
Volume Effect(-0.11 USD/bl): Lower cost per barrel for additional transported volumes, given the higher production.
Cost Effect(+0.52 USD/bl): Higher costs and expenses due to attacks by third parties and higher depreciation associated with the updated useful life of the infrastructure.
Exchange Rate Effect (-0.44 USD/bl): Higher average exchange rate of +401.5 pesos/dollar when re-stating Colombian pesos into U.S. dollars.
Volume Effect(-0.11 USD/bl): Lower cost per barrel for additional transported volumes, given the higher production.
Table 12: Cost per Barrel Transported – Midstream
| USD/Bl | | 2Q 2019 | | | 2Q 2018 | | | ∆ (%) | | | 6M 2019 | | | 6M 2018 | | | ∆ (%) | | | % USD | |
| Cost per Transported Barrel | | | 3.08 | | | | 3.11 | | | | (1.0 | )% | | | 3.00 | | | | 3.13 | | | | (4.2 | )% | | | 0.0 | % |
Financial Results of the Segment
The 2Q19 revenue increased versus 2Q18 primarily due to: i) higher volumes transported of both crudes and refined products, as explained above, and ii) higher average exchange rate versus the comparison period.
Cost of sales in 2Q19 rose compared to 2Q18 as a result of: i) greater consumption of materials and supplies to cover the transport service, in line with the increase in transported volumes, ii) higher energy costs consistent with the increase in energy tariffs, and iii) greater depreciation and amortization generated largely from the change in useful lives of some systems, as a result of the update performed in late 2018.
Net financial (non-operational) results for 2Q19 versus 2Q18 showed a negative effect caused primarily by a greater exchange rate difference resulting from lower net income from the cash balance in dollars.
Table 13: Income Statement – Midstream
| Billion (COP) | | 2Q 2019 | | | 2Q 2018 | | | ∆ ($) | | | ∆ (%) | | | 6M 2019 | | | 6M 2018 | | | ∆ ($) | | | ∆ (%) | |
| Total revenue | | | 3,212 | | | | 2,882 | | | | 330 | | | | 11.5 | % | | | 6,264 | | | | 5,611 | | | | 653 | | | | 11.6 | % |
| Depreciation, amortization and depletion | | | 309 | | | | 279 | | | | 30 | | | | 10.8 | % | | | 604 | | | | 558 | | | | 46 | | | | 8.2 | % |
| Variable costs | | | 178 | | | | 114 | | | | 64 | | | | 56.1 | % | | | 341 | | | | 283 | | | | 58 | | | | 20.5 | % |
| Fixed costs | | | 381 | | | | 370 | | | | 11 | | | | 3.0 | % | | | 735 | | | | 678 | | | | 57 | | | | 8.4 | % |
| Total cost of sales | | | 868 | | | | 763 | | | | 105 | | | | 13.8 | % | | | 1,680 | | | | 1,519 | | | | 161 | | | | 10.6 | % |
| Gross income | | | 2,344 | | | | 2,119 | | | | 225 | | | | 10.6 | % | | | 4,584 | | | | 4,092 | | | | 492 | | | | 12.0 | % |
| Operating expenses | | | 187 | | | | 187 | | | | 0 | | | | 0.0 | % | | | 181 | | | | 261 | | | | (80 | ) | | | (30.7 | )% |
| Operating income | | | 2,157 | | | | 1,932 | | | | 225 | | | | 11.6 | % | | | 4,403 | | | | 3,831 | | | | 572 | | | | 14.9 | % |
| Financial result, net | | | (182 | ) | | | (44 | ) | | | (138 | ) | | | 313.6 | % | | | (353 | ) | | | (316 | ) | | | (37 | ) | | | 11.7 | % |
| Share of profit of companies | | | 1 | | | | 16 | | | | (15 | ) | | | (93.8 | )% | | | 0 | | | | 1 | | | | (1 | ) | | | (100.0 | )% |
| Income before income tax | | | 1,976 | | | | 1,904 | | | | 72 | | | | 3.8 | % | | | 4,050 | | | | 3,516 | | | | 534 | | | | 15.2 | % |
| Provision for income tax | | | (668 | ) | | | (685 | ) | | | 17 | | | | (2.5 | )% | | | (1,351 | ) | | | (1,323 | ) | | | (28 | ) | | | 2.1 | % |
| Net income consolidated | | | 1,308 | | | | 1,219 | | | | 89 | | | | 7.3 | % | | | 2,699 | | | | 2,193 | | | | 506 | | | | 23.1 | % |
| Non-controlling interest | | | (295 | ) | | | (277 | ) | | | (18 | ) | | | 6.5 | % | | | (623 | ) | | | (480 | ) | | | (143 | ) | | | 29.8 | % |
| Net income attributable to owners of Ecopetrol | | | 1,013 | | | | 942 | | | | 71 | | | | 7.5 | % | | | 2,076 | | | | 1,713 | | | | 363 | | | | 21.2 | % |
| | | | | | | | | | | | | | | | | | | | | | | | | | | | | | | | | |
| EBITDA | | | 2,501 | | | | 2,257 | | | | 244 | | | | 10.8 | % | | | 5,073 | | | | 4,447 | | | | 626 | | | | 14.1 | % |
| EBITDA Margin | | | 77.9 | % | | | 78.3 | % | | | - | | | | (0.4 | )% | | | 80.0 | % | | | 80.0 | % | | | - | | | | 0.0 | % |
Cartagena Refinery
In 2Q19 we successfully completed, with the expected quality and integrity standards, the first scheduled maintenance of the hydrocracking unit to replace the catalyzer. This maintenance is expected to ensure the plant’s new four-year operating cycle. Also, works were carried out related to the maintenance of the sulfur and hydrogen units, gas generating turbines and mechanical cleaning of ovens of the Delayed Coking Unit. These tasks affected the crude throughput and the refinery’s utilization factor, which fell by 2.2% and 10.4% respectively versus 2Q18.
During 2Q19, throughput consisted of 82% domestic crude and 18% imported crude, versus 79% domestic crude and 21% imported in 2Q18.
Gross refining margin decreased by 40.5% in 2Q19 compared to 2Q18, primarily affected by the international market environment for naphtha prices, whose margins declined considerably (-6.8 USD/bl, -425%) versus 2Q18 and the strengthening of crudes in its feedstock (+2.6 USD/bl).
Table 14: Throughput, Utilization Factor, Production and Margin – Cartagena Refinery
| Cartagena Refinery | | 2Q 2019 | | | 2Q 2018 | | | ∆ (%) | | | 6M 2019 | | | 6M 2018 | | | ∆ (%) | |
| Throughput* (mbod) | | | 149.6 | | | | 153.0 | | | | (2.2 | )% | | | 152.0 | | | | 148.7 | | | | 2.2 | % |
| Utilization Factor (%) | | | 81.7 | % | | | 91.2 | % | | | (10.4 | )% | | | 85.1 | % | | | 87.8 | % | | | (3.1 | )% |
| Production (mbod) | | | 143.8 | | | | 147.1 | | | | (2.2 | )% | | | 146.3 | | | | 143.7 | | | | 1.8 | % |
| Gross Margin (USD/Bl) | | | 6.6 | | | | 11.1 | | | | (40.5 | )% | | | 8.8 | | | | 11.3 | | | | (22.1 | )% |
*Corresponds to effective throughput volumes, not volumes received
Barrancabermeja Refinery
In 2Q19 the refinery recovered the throughput levels of 1Q19 (+33.3 mbod), favored by a steady operational performance, achieved after the completion of the scheduled maintenance performed the previous quarter. Throughput increased 7.7 mbod in 2Q19 versus 2Q18, as a result of the greater availability of light crudes.
During June, we completed a scheduled maintenance to one of the cracking units, involving restoration of the unit’s reliability and intervention to the reactor. Despite this maintenance, the utilization factor during the quarter remained at 85.5%.
The refinery’s operational stability allowed it to maintain gross refining margin at levels similar to those of 2Q18, despite the rising prices of the crude oils in the refinery’s feedstock (+0.8 USD/bl), in line with the behavior on the international market.
Table 15: Throughput, Utilization Factor, Production and Margin – Barrancabermeja Refinery
| Barrancabermeja Refinery | | 2Q 2019 | | | 2Q 2018 | | | ∆ (%) | | | 6M 2019 | | | 6M 2018 | | | ∆ (%) | |
| Throughput* (mbod) | | | 228.8 | | | | 221.1 | | | | 3.5 | % | | | 212.2 | | | | 218.0 | | | | (2.7 | )% |
| Utilization Factor (%) | | | 85.5 | % | | | 85.8 | % | | | (0.3 | )% | | | 80.4 | % | | | 84.7 | % | | | (5.1 | )% |
| Production (mbod) | | | 231.7 | | | | 224.0 | | | | 3.4 | % | | | 213.7 | | | | 220.3 | | | | (3.0 | )% |
| Gross Margin (USD/Bl) | | | 10.3 | | | | 10.5 | | | | (1.9 | )% | | | 10.4 | | | | 11.2 | | | | (7.1 | )% |
*Corresponds to effective throughput volumes, not volumes received
Refining Cash Cost
Cost Effect (+0.26 USD/bl): Higher cost of energy due to the transport logistics of the natural gas used in self-generation, due to the declining of the Guajira field and higher operating level of the processing plants at the Barrancabermeja refinery.
Volume Effect (-0.06 USD/bl): Lower cost given the higher throughput at the Barrancabermeja refinery (+7.7 mbod), despite the lower throughput at the Cartagena Refinery (-3.4 mbod).
Exchange Rate Effect (-0.65 USD/bl): Exchange rate up by +401.5 pesos/dollar when re-stating peso costs in dollars.
Table 16: Refining Cash Cost* – Downstream
| USD/Bl | | 2Q 2019 | | | 2Q 2018 | | | ∆ (%) | | | 6M 2019 | | | 6M 2018 | | | ∆ (%) | | | % USD | |
| Refining Cash Cost | | | 4.64 | | | | 5.09 | | | | (8.8 | )% | | | 4.74 | | | | 4.86 | | | | (2.5 | )% | | | 10.2 | % |
*Includes Barrancabermeja, Cartagena refineries and Esenttia
Financial Results for the Segment
In 2Q19 revenue increased versus 2Q18, primarily due to: i) greater volumes of diesel exports, given the better economic performance of these volumes in the international market, ii) the positive exchange rate effect, combined with the effect of iii) lower prices for the refined products basket and the weakening of the international spreads for naphthas and gasolines.
Cost of sales rose in 2Q19 versus 2Q18, largely due to: i) increased diesel imports for sale on the domestic market and for blending at the Barrancabermeja refinery in order comply with quality specifications, ii) higher crude purchases associated with increased throughput at the Barrancabermeja refinery, and iii) the negative effect of the stronger spreads on heavy crudes versus Brent.
Operating expenses increased in 2Q19 compared to 2Q18, primarily due to the effect of: i) greater tax burden on financial transactions due to higher cash disbursements during the quarter, and ii) plant depreciation charges during their maintenance period at the Cartagena Refinery.
Net financial (non-operational) results for 2Q19 versus 2Q18 showed lower spending due to the exchange rate difference associated with a lower devaluation of the Colombian peso versus the U.S. dollar on the segment’s liability position in dollars.
Table 17: Income Statement – Downstream
| Billion (COP) | | 2Q 2019 | | | 2Q 2018 | | | ∆ ($) | | | ∆ (%) | | | 6M 2019 | | | 6M 2018 | | | ∆ ($) | | | ∆ (%) | |
| Total revenue | | | 10,225 | | | | 8,931 | | | | 1,294 | | | | 14.5 | % | | | 18,777 | | | | 17,006 | | | | 1,771 | | | | 10.4 | % |
| Depreciation, amortization and depletion | | | 321 | | | | 305 | | | | 16 | | | | 5.2 | % | | | 655 | | | | 602 | | | | 53 | | | | 8.8 | % |
| Variable costs | | | 9,204 | | | | 7,906 | | | | 1,298 | | | | 16.4 | % | | | 16,895 | | | | 14,770 | | | | 2,125 | | | | 14.4 | % |
| Fixed costs | | | 485 | | | | 466 | | | | 19 | | | | 4.1 | % | | | 959 | | | | 904 | | | | 55 | | | | 6.1 | % |
| Total cost of sales | | | 10,010 | | | | 8,677 | | | | 1,333 | | | | 15.4 | % | | | 18,509 | | | | 16,276 | | | | 2,233 | | | | 13.7 | % |
| Gross income | | | 215 | | | | 254 | | | | (39 | ) | | | (15.4 | )% | | | 268 | | | | 730 | | | | (462 | ) | | | (63.3 | )% |
| Operating expenses | | | 290 | | | | 251 | | | | 39 | | | | 15.5 | % | | | 583 | | | | 449 | | | | 134 | | | | 29.8 | % |
| Operating income (loss) | | | (75 | ) | | | 3 | | | | (78 | ) | | | (2,600.0 | )% | | | (315 | ) | | | 281 | | | | (596 | ) | | | (212.1 | )% |
| Financial result, net | | | (391 | ) | | | (649 | ) | | | 258 | | | | (39.8 | )% | | | (548 | ) | | | (355 | ) | | | (193 | ) | | | 54.4 | % |
| Share of profit of companies | | | 4 | | | | 9 | | | | (5 | ) | | | (55.6 | )% | | | 7 | | | | 16 | | | | (9 | ) | | | (56.3 | )% |
| Loss before income tax | | | (462 | ) | | | (637 | ) | | | 175 | | | | (27.5 | )% | | | (856 | ) | | | (58 | ) | | | (798 | ) | | | 1,375.9 | % |
| Provision for income tax | | | 131 | | | | 183 | | | | (52 | ) | | | (28.4 | )% | | | 157 | | | | (92 | ) | | | 249 | | | | (270.7 | )% |
| Consolidated net loss | | | (331 | ) | | | (454 | ) | | | 123 | | | | (27.1 | )% | | | (699 | ) | | | (150 | ) | | | (549 | ) | | | 366.0 | % |
| | | | | | | | | | | | | | | | | | | | | | | | | | | | | | | | | |
| EBITDA | | | 363 | | | | 403 | | | | (40 | ) | | | (9.9 | )% | | | 583 | | | | 1,045 | | | | (462 | ) | | | (44.2 | )% |
| EBITDA Margin | | | 3.6 | % | | | 4.5 | % | | | - | | | | (0.9 | )% | | | 0.0 | % | | | 10.0 | % | | | - | | | | (10.0 | )% |
During the 2Q19 we launched the new phase of the efficiencies and savings program for 2019 – 2023. The strategy has set a target of COP 8.0 trillion in efficiencies, divided among COP 2.1 trillion for 2019 and COP 5.9 trillion for the years 2020 - 2023. This new target is based on 50 strategies, consolidated into 29 levers, which seek efficiencies through the optimization of capex and operating costs and strategies to increase revenues and margins. Currently, all the Ecopetrol Group’s areas and companies are in the phase of identifying initiatives, as well as actions aimed at covering the target set for 2019. At the end of 1H19, year-to-date efficiencies totaled COP 0.96 trillion.
Table 18: Savings Initiatives – Ecopetrol Group
| Billion (COP) | | 2Q 2019 | | | 2Q 2018 | | | 6M 2019 | | | 6M 2018 | |
| Optimization of drilling costs and facilities construction | | | 253.5 | | | | 140.5 | | | | 535.9 | | | | 249.3 | |
| Improvement of the commercial strategy | | | 86.6 | | | | 32.7 | | | | 137.4 | | | | 47.2 | |
| Improvement in refineries revenues/margins | | | 56.7 | | | | 116.6 | | | | 87.4 | | | | 182.7 | |
| Reduction of O&M Midstream costs | | | 42.9 | | | | 23.3 | | | | 53.7 | | | | 29.3 | |
| Energy strategy - Surplus sales - Cost optimization | | | 23.6 | | | | 20.2 | | | | 46.6 | | | | 44.5 | |
| Savings on staff, logistics and other areas | | | 20.8 | | | | 16.3 | | | | 27.8 | | | | 14.8 | |
| Reduction of deferred production | | | 6.1 | | | | 44.8 | | | | 12.7 | | | | 257.9 | |
| Operating optimization | | | 9.8 | | | | 10.3 | | | | 35.7 | | | | 24.0 | |
| Refining cash cost optimization | | | 0.0 | | | | 16.2 | | | | 0.0 | | | | 16.2 | |
| Dilution and evacuation of heavy and extra heavy crude oil | | | (27.6 | ) | | | 8.3 | | | | 20.7 | | | | 25.6 | |
| Total | | | 472.4 | | | | 429.2 | | | | 957.9 | | | | 891.5 | |
In the first half of the year, the Ecopetrol Group invested a total of USD 1,392 million, which represents an increase of 38% over the same period of 2018.
Investments made in the first half of the year remain 81% concentrated on the Upstream segment, in line with the Ecopetrol Group’s strategic growth priorities. This segment also posted a 29% increase in investment versus 1H18, based largely on the increase in drilling activity and completion (average of 10 additional rigs versus 1H18). Given current prospects, the Ecopetrol Group’s estimated organic investment remains at USD 3.5 to 4 billion for 2019.
Production: The Ecopetrol S.A. drilling campaign was focused on the Castilla, Rubiales, Casabe, La Cira Infantas and Suria fields. At the subsidiaries, investment was led by Ecopetrol America Inc. and Hocol. To date, 311 development wells have been drilled, with 208 capitalizable workovers completed. In addition, USD 100 million have been invested in strategic studies, concentrated on seeking to reduce petro-technical uncertainty in current development areas as Provincia and Tibú.
Exploration: Investments were concentrated on the drilling of ten wells and the acquisition of 2D and 3D seismic for 173,219 km in Brazil and Mexico.
Downstream: Execution of major maintenances at the Barrancabermeja plants (distillation unit, diesel hydrotreatment, rotors and tanks) and at Cartagena refinery (hydrocracking unit, turbines and tanks).
Midstream: Operational continuity activities (major maintenances, mechanical repairs and geotechnical activities) on the various oil pipeline and polyduct systems of CENIT and its subsidiaries.
Table 19: Investments by Segment – Ecopetrol Group
| Million (USD) | | Ecopetrol S.A. | | | Affiliates and
Subsidiaries | | | Total | | | % Share | |
| Production | | | 976 | | | | 74 | | | | 1,050 | | | | 75.4 | % |
| Downstream | | | 76 | | | | 79 | | | | 155 | | | | 11.1 | % |
| Exploration | | | 46 | | | | 38 | | | | 84 | | | | 6.0 | % |
| Midstream* | | | 0 | | | | 88 | | | | 88 | | | | 6.3 | % |
| Corporate | | | 16 | | | | 0 | | | | 16 | | | | 1.2 | % |
| Total | | | 1,114 | | | | 279 | | | | 1,392 | | | | 100.0 | % |
* Includes the total amount of investments of each of the companies of the Ecopetrol Group (Participation Ecopetrol S.A. and non-controlling interest)
III. Social and Corporate Responsibility – Ecopetrol S.A.
Table 20: HSE (Health, Safety and Environment) Performance
| HSE Indicators* | | 2Q 2019 | | | 2Q 2018 | | | 6M 2019 | | | 6M 2018 | |
| Frequency of total registrable injuries (No. Recordable cases / Million man hours) | | | 0.58 | | | | 0.65 | | | | 0.56 | | | | 0.61 | |
| Environmental incidents** | | | 2 | | | | 4 | | | | 4 | | | | 7 | |
* The results of the indicators are subject to subsequent modification at the close of the quarter, as some accidents and incidents are reclassified according to the final results of the investigations.
** Environmental incidents are defined as hydrocarbon spills greater than one barrel, with an environmental effect.
| 2. | Environment and Social Investment, Corporate Responsibility and Corporate Governance |
Environment:
| · | In 2Q19 Ecopetrol S.A. obtained the verification of the reduction in greenhouse gas emissions totaling 1,068,394 tons of CO2-equivalent, by Ruby Canyon Engineering, an international auditing firm specialized in emissions reduction, accredited by the Mexican Accreditation Entity (EMA) and the American National Standards Institute (ANSI). Ecopetrol thus becomes Colombia’s first company in the sector to verify a reduction in CO2 emissions in operating processes. |
| · | In 2Q19, Ecopetrol reused 22 million cubic meters of water, which means that the company stopped capturing and disposing this volume, reducing the pressure on the water resource. In the 1H19, more than 44 million cubic meters of water have been reused, which means an increase of 4% compared 1H18. |
Social Investment:
| · | In 2Q19, COP 17.7 billion were allocated in socio-environmental investment projects. In the first half, year-to-date investments totaled COP 28.3 billion, COP 24 billion of which corresponded to Social Investment (Voluntary Investment of COP 23.3 billion, Community Benefit Programs (PBC) of COP 0.1 billion and Mandatory Investment of COP 0.6 billion), and COP 4.3 billion to Voluntary Environmental Investment. |
| · | Additionally, with the taxes of the fiscal year 2018, the Territory Renewal Agency assigned nine projects to Ecopetrol S.A. for COP 84.9 billion, equivalent to a 33.9% participation of the total quota allocated. 15 projects were approved to the Ecopetrol Group (Ecopetrol S.A. + CENIT) for COP 121.2 billion, equivalent to a 48.4% stake. |
Corporate Governance:
| · | At its session of June 14, 2019 the Ecopetrol Board of Directors approved the creation of the Technology and Innovation Committee, aimed to supporting the technological innovation and digital transformation processes underway in the company. The Committee will consist of the following members of the Board of Directors: Luis Guillermo Echeverri, Orlando Ayala, Sergio Restrepo, Germán Quintero, Carlos Gustavo Cano and Santiago Perdomo. |
IV. Quarterly Results Presentation
Ecopetrol’s management will hold two online presentations to review the second quarter of 2019 results:
| Spanish | English |
| August 13, 2019 | August 13, 2019 |
| 8:00 a.m. Colombia | 9:30 a.m. Colombia |
| 9:00 a.m. New York | 10:30 a.m. New York |
Internet streaming will be available on the Ecopetrol website atwww.ecopetrol.com.co
The presentation via webcast will be available at the following links:
https://event.on24.com/wcc/r/2041716/4593B6901DFBEC6EC1482960B30ABABB(Spanish)
https://event.on24.com/wcc/r/2041720/36A544CDA66868A53378070E599F732C(English)
Please verify that your browser allows normal operation of the online presentation. We recommend the latest versions of Internet Explorer, Google Chrome and Mozilla Firefox.
Contact Information:
Capital Markets Manager
María Catalina Escobar
Telephone: +571-234-5190 - Email:investors@ecopetrol.com.co
Media Relations (Colombia)
Jorge Mauricio Tellez
Telephone: +571-234-4329 - Email:mauricio.tellez@ecopetrol.com.co
Ecopetrol Group Appendices
Table 1: Income Statement – Ecopetrol Group
| Billion (COP) | | 2Q 2019 | | | 2Q 2018 | | | ∆ (%) | | | 6M 2019 | | | 6M 2018 | | | ∆ (%) | |
| Revenue | | | | | | | | | | | | | | | | | | | | | | | | |
| Local | | | 8,676 | | | | 8,134 | | | | 6.7 | % | | | 16,497 | | | | 15,705 | | | | 5.0 | % |
| Export | | | 9,633 | | | | 8,853 | | | | 8.8 | % | | | 17,754 | | | | 15,925 | | | | 11.5 | % |
| Total revenue | | | 18,309 | | | | 16,987 | | | | 7.8 | % | | | 34,251 | | | | 31,630 | | | | 8.3 | % |
| Cost of sales | �� | | | | | | | | | | | | | | | | | | | | | | | |
| Depreciation, amortization and depletion | | | 2,052 | | | | 1,899 | | | | 8.1 | % | | | 4,023 | | | | 3,670 | | | | 9.6 | % |
| Variable depreciation, amortization and depletion | | | 1,377 | | | | 1,282 | | | | 7.4 | % | | | 2,677 | | | | 2,443 | | | | 9.6 | % |
| Fixed cost depreciation | | | 675 | | | | 617 | | | | 9.4 | % | | | 1,346 | | | | 1,227 | | | | 9.7 | % |
| Variable costs | | | 6,777 | | | | 5,818 | | | | 16.5 | % | | | 12,893 | | | | 11,019 | | | | 17.0 | % |
| Imported products | | | 3,597 | | | | 2,717 | | | | 32.4 | % | | | 7,018 | | | | 5,389 | | | | 30.2 | % |
| Local purchases | | | 2,819 | | | | 2,755 | | | | 2.3 | % | | | 5,130 | | | | 4,911 | | | | 4.5 | % |
| Hydrocarbon transportation services | | | 208 | | | | 188 | | | | 10.6 | % | | | 390 | | | | 351 | | | | 11.1 | % |
| Inventories and others | | | 153 | | | | 158 | | | | (3.2 | )% | | | 355 | | | | 368 | | | | (3.5 | )% |
| Fixed costs | | | 2,385 | | | | 2,040 | | | | 16.9 | % | | | 4,531 | | | | 3,915 | | | | 15.7 | % |
| Contracted services | | | 785 | | | | 661 | | | | 18.8 | % | | | 1,420 | | | | 1,259 | | | | 12.8 | % |
| Maintenance | | | 658 | | | | 522 | | | | 26.1 | % | | | 1,218 | | | | 935 | | | | 30.3 | % |
| Labor costs | | | 576 | | | | 515 | | | | 11.8 | % | | | 1,120 | | | | 1,003 | | | | 11.7 | % |
| Other | | | 366 | | | | 342 | | | | 7.0 | % | | | 773 | | | | 718 | | | | 7.7 | % |
| Total cost of sales | | | 11,214 | | | | 9,757 | | | | 14.9 | % | | | 21,447 | | | | 18,604 | | | | 15.3 | % |
| Gross income | | | 7,095 | | | | 7,230 | | | | (1.9 | )% | | | 12,804 | | | | 13,026 | | | | (1.7 | )% |
| Operating expenses | | | 1,137 | | | | 846 | | | | 34.4 | % | | | 1,890 | | | | 1,462 | | | | 29.3 | % |
| Administration expenses | | | 890 | | | | 732 | | | | 21.6 | % | | | 1,582 | | | | 1,277 | | | | 23.9 | % |
| Exploration and projects expenses | | | 248 | | | | 117 | | | | 112.0 | % | | | 309 | | | | 188 | | | | 64.4 | % |
| (Recovery) expense for impairment long-term assets | | | (1 | ) | | | (3 | ) | | | (66.7 | )% | | | (1 | ) | | | (3 | ) | | | (66.7 | )% |
| Operating income | | | 5,958 | | | | 6,384 | | | | (6.7 | )% | | | 10,914 | | | | 11,564 | | | | (5.6 | )% |
| Finance result, net | | | (391 | ) | | | (620 | ) | | | (36.9 | )% | | | (776 | ) | | | (1,189 | ) | | | (34.7 | )% |
| Foreign exchange, net | | | 43 | | | | 48 | | | | (10.4 | )% | | | 86 | | | | 70 | | | | 22.9 | % |
| Interest, net | | | (358 | ) | | | (513 | ) | | | (30.2 | )% | | | (682 | ) | | | (1,001 | ) | | | (31.9 | )% |
| Financial income/loss | | | (76 | ) | | | (155 | ) | | | (51.0 | )% | | | (180 | ) | | | (258 | ) | | | (30.2 | )% |
| Share of profit of companies | | | 72 | | | | 96 | | | | (25.0 | )% | | | 233 | | | | 182 | | | | 28.0 | % |
| Income before income tax | | | 5,639 | | | | 5,860 | | | | (3.8 | )% | | | 10,371 | | | | 10,557 | | | | (1.8 | )% |
| Income tax | | | (1,872 | ) | | | (2,093 | ) | | | (10.6 | )% | | | (3,546 | ) | | | (3,973 | ) | | | (10.7 | )% |
| Net income consolidated | | | 3,767 | | | | 3,767 | | | | 0.0 | % | | | 6,825 | | | | 6,584 | | | | 3.7 | % |
| Non-controlling interest | | | (280 | ) | | | (248 | ) | | | 12.9 | % | | | (593 | ) | | | (450 | ) | | | 31.8 | % |
| Net income attributable to owners of Ecopetrol | | | 3,487 | | | | 3,519 | | | | (0.9 | )% | | | 6,232 | | | | 6,134 | | | | 1.6 | % |
| | | | | | | | | | | | | | | | | | | | | | | | | |
| EBITDA | | | 8,307 | | | | 8,609 | | | | (3.5 | )% | | | 15,665 | | | | 15,759 | | | | (0.6 | )% |
| EBITDA margin | | | 45.4 | % | | | 50.7 | % | | | (10.5 | )% | | | 45.7 | % | | | 49.8 | % | | | (8.2 | )% |
Table 2: Statement of Financial Position / Balance Sheet – Ecopetrol Group
| Billion (COP) | | June 30, 2019 | | | March 31, 2019 | | | ∆ (%) | |
| Current assets | | | | | | | | | | | | |
| Cash and cash equivalents | | | 5,524 | | | | 8,938 | | | | (38.2 | )% |
| Trade and other receivables | | | 8,221 | | | | 8,628 | | | | (4.7 | )% |
| Inventories | | | 5,854 | | | | 5,478 | | | | 6.9 | % |
| Current tax assets | | | 787 | | | | 672 | | | | 17.1 | % |
| Other financial assets | | | 3,358 | | | | 4,997 | | | | (32.8 | )% |
| Other assets | | | 1,256 | | | | 1,310 | | | | (4.1 | )% |
| | | | 25,000 | | | | 30,023 | | | | (16.7 | )% |
| Non-current assets held for sale | | | 30 | | | | 28 | | | | 7.1 | % |
| Total current assets | | | 25,030 | | | | 30,051 | | | | (16.7 | )% |
| | | | | | | | | | | | | |
| Non-current assets | | | | | | | | | | | | |
| Investments in associates and joint ventures | | | 1,885 | | | | 1,834 | | | | 2.8 | % |
| Trade and other receivables | | | 777 | | | | 744 | | | | 4.4 | % |
| Property, plant and equipment | | | 61,814 | | | | 61,708 | | | | 0.2 | % |
| Natural and environmental resources | | | 23,660 | | | | 23,316 | | | | 1.5 | % |
| Assets by right of use | | | 497 | | | | 477 | | | | 4.2 | % |
| Intangibles | | | 395 | | | | 420 | | | | (6.0 | )% |
| Deferred tax assets | | | 5,373 | | | | 5,452 | | | | (1.4 | )% |
| Other financial assets | | | 3,794 | | | | 2,368 | | | | 60.2 | % |
| Other assets | | | 1,893 | | | | 1,804 | | | | 4.9 | % |
| Total non-current assets | | | 100,088 | | | | 98,123 | | | | 2.0 | % |
| | | | | | | | | | | | | |
| Total assets | | | 125,118 | | | | 128,174 | | | | (2.4 | )% |
| | | | | | | | | | | | | |
| Current liabilities | | | | | | | | | | | | |
| Loans and borrowings | | | 4,088 | | | | 4,043 | | | | 1.1 | % |
| Trade and other payables | | | 11,825 | | | | 17,936 | | | | (34.1 | )% |
| Provision for employees benefits | | | 1,718 | | | | 1,870 | | | | (8.1 | )% |
| Current tax liabilities | | | 1,126 | | | | 1,796 | | | | (37.3 | )% |
| Accrued liabilities and provisions | | | 673 | | | | 784 | | | | (14.2 | )% |
| Other liabilities | | | 463 | | | | 355 | | | | 30.4 | % |
| Total current liabilities | | | 19,893 | | | | 26,784 | | | | (25.7 | )% |
| | | | | | | | | | | | | |
| Non-current liabilities | | | | | | | | | | | | |
| Loans and borrowings | | | 33,379 | | | | 33,685 | | | | (0.9 | )% |
| Trade and other payables | | | 25 | | | | 29 | | | | (13.8 | )% |
| Provision for employees benefits | | | 6,513 | | | | 6,699 | | | | (2.8 | )% |
| Deferred tax liabilities | | | 783 | | | | 790 | | | | (0.9 | )% |
| Accrued liabilities and provisions | | | 7,025 | | | | 6,953 | | | | 1.0 | % |
| Other liabilities | | | 566 | | | | 567 | | | | (0.2 | )% |
| Total non-current liabilities | | | 48,291 | | | | 48,723 | | | | (0.9 | )% |
| | | | | | | | | | | | | |
| Total liabilities | | | 68,184 | | | | 75,507 | | | | (9.7 | )% |
| | | | | | | | | | | | | |
| Equity | | | | | | | | | | | | |
| Equity attributable to owners of the company | | | 54,739 | | | | 50,681 | | | | 8.0 | % |
| Non-controlling interests | | | 2,195 | | | | 1,986 | | | | 10.5 | % |
| Total equity | | | 56,934 | | | | 52,667 | | | | 8.1 | % |
| | | | | | | | | | | | | |
| Total liabilities and equity | | | 125,118 | | | | 128,174 | | | | (2.4 | )% |
Table 3: Cash Flow Statement – Ecopetrol Group
| Billion (COP) | | 2Q 2019 | | | 2Q 2018 | | | 6M 2019 | | | 6M 2018 | |
| Cash flow provided by operating activities | | | | | | | | | | | | | | | | |
| Net income attributable to owners of Ecopetrol S.A. | | | 3,487 | | | | 3,519 | | | | 6,232 | | | | 6,134 | |
| Adjustments to reconcile net income to cash provided by operating activities | | | | | | | | | | | | | | | | |
| Non-controlling interests | | | 280 | | | | 248 | | | | 593 | | | | 450 | |
| Income tax | | | 1,872 | | | | 2,093 | | | | 3,546 | | | | 3,973 | |
| Depreciation, depletion and amortization | | | 2,094 | | | | 1,917 | | | | 4,084 | | | | 3,708 | |
| Foreign exchange (gain) loss | | | (43 | ) | | | (48 | ) | | | (86 | ) | | | (70 | ) |
| Finance costs recognized in profit or loss | | | 669 | | | | 796 | | | | 1,310 | | | | 1,578 | |
| Dry wells | | | 109 | | | | 41 | | | | 154 | | | | 48 | |
| Loss (gain) on disposal of non-current assets | | | 30 | | | | (21 | ) | | | 42 | | | | (21 | ) |
| Impairment of current and non-current assets | | | 15 | | | | (5 | ) | | | 34 | | | | (131 | ) |
| Fair value (gain) on financial assets valuation | | | (43 | ) | | | 21 | | | | (88 | ) | | | (57 | ) |
| Profit in acquisition of participations in joint operations | | | 0 | | | | 0 | | | | 0 | | | | 12 | |
| Gain on assets for sale | | | 0 | | | | 1 | | | | 0 | | | | 1 | |
| (Gain) loss on share of profit of associates and joint ventures | | | (72 | ) | | | (96 | ) | | | (233 | ) | | | (182 | ) |
| Realized foreign exchange cash flow hedges | | | 346 | | | | 109 | | | | 684 | | | | 234 | |
| Others minor items | | | 2 | | | | 33 | | | | 1 | | | | (1 | ) |
| Net changes in operating assets and liabilities | | | 117 | | | | (1,061 | ) | | | (1,658 | ) | | | (2,473 | ) |
| Income tax paid | | | (2,860 | ) | | | (2,906 | ) | | | (3,778 | ) | | | (3,889 | ) |
| Cash provided by operating activities | | | 6,003 | | | | 4,641 | | | | 10,837 | | | | 9,314 | |
| | | | | | | | | | | | | | | | | |
| Cash flows from investing activities | | | | | | | | | | | | | | | | |
| Investment in property, plant and equipment | | | (728 | ) | | | (666 | ) | | | (1,328 | ) | | | (1,110 | ) |
| Investment in natural and environmental resources | | | (1,473 | ) | | | (1,074 | ) | | | (2,780 | ) | | | (1,822 | ) |
| Payments for intangibles | | | (2 | ) | | | (17 | ) | | | (33 | ) | | | (20 | ) |
| (Purchases) sales of other financial assets | | | 286 | | | | (343 | ) | | | 984 | | | | (2,891 | ) |
| Interest received | | | 121 | | | | 74 | | | | 250 | | | | 158 | |
| Dividends received | | | 34 | | | | 34 | | | | 34 | | | | 53 | |
| Proceeds from sales of assets | | | 2 | | | | 52 | | | | 26 | | | | 94 | |
| Net cash used in investing activities | | | (1,760 | ) | | | (1,940 | ) | | | (2,847 | ) | | | (5,538 | ) |
| | | | | | | | | | | | | | | | | |
| Cash flows from financing activities | | | | | | | | | | | | | | | | |
| Proceeds (repayment of) from borrowings | | | (604 | ) | | | (1,478 | ) | | | (807 | ) | | | (1,553 | ) |
| Interest paid | | | (523 | ) | | | (583 | ) | | | (1,004 | ) | | | (1,176 | ) |
| Dividends paid | | | (6,643 | ) | | | (2,210 | ) | | | (6,975 | ) | | | (2,455 | ) |
| Net cash used in financing activities | | | (7,770 | ) | | | (4,271 | ) | | | (8,786 | ) | | | (5,184 | ) |
| | | | | | | | | | | | | | | | | |
| Exchange difference in cash and cash equivalents | | | 113 | | | | 41 | | | | 8 | | | | (201 | ) |
| Net (decrease) increase in cash and cash equivalents | | | (3,414 | ) | | | (1,529 | ) | | | (788 | ) | | | (1,609 | ) |
| Cash and cash equivalents at the beginning of the period | | | 8,938 | | | | 7,866 | | | | 6,312 | | | | 7,946 | |
| Cash and cash equivalents at the end of the period | | | 5,524 | | | | 6,337 | | | | 5,524 | | | | 6,337 | |
| | | | | | | | | | | | | | | | | |
| Non-cash transactions | | | | | | | | | | | | | | | | |
| Recognition of assets for right of use and liabilities for lease | | | 564 | | | | 0 | | | | 564 | | | | 0 | |
Table 4: EBITDA Reconciliation Ecopetrol Group
| Billion (COP) | | 2Q 2019 | | | 2Q 2018 | | | 6M 2019 | | | 6M 2018 | |
| Net income attributable to the owners of Ecopetrol | | | 3,487 | | | | 3,519 | | | | 6,232 | | | | 6,134 | |
| (+) Depreciation, amortization and depletion | | | 2,094 | | | | 1,917 | | | | 4,084 | | | | 3,708 | |
| (+/-) Impairment of long-term assets | | | (1 | ) | | | (3 | ) | | | (2 | ) | | | (149 | ) |
| (+/-) Gain in acquisition of shares in joint operations | | | 0 | | | | 0 | | | | 0 | | | | 12 | |
| (+/-) Financial result, net | | | 391 | | | | 620 | | | | 776 | | | | 1,189 | |
| (+) Income tax | | | 1,872 | | | | 2,093 | | | | 3,546 | | | | 3,973 | |
| (+) Taxes and others | | | 184 | | | | 215 | | | | 436 | | | | 442 | |
| (+/-) Non-controlling interest | | | 280 | | | | 248 | | | | 593 | | | | 450 | |
| Consolidated EBITDA | | | 8,307 | | | | 8,609 | | | | 15,665 | | | | 15,759 | |
Table 5: EBITDA Reconciliation by Segment (2Q 2019)
| Billion (COP) | | Upstream | | | Downstream | | | Midstream | | | Eliminations | | | Consolidated | |
| Net income attributable to the owners of Ecopetrol | | | 2,806 | | | | (331 | ) | | | 1,013 | | | | (1 | ) | | | 3,487 | |
| (+) Depreciation, amortization and depletion | | | 1,431 | | | | 345 | | | | 318 | | | | 0 | | | | 2,094 | |
| (+/-) Impairment of long-term assets | | | 0 | | | | (1 | ) | | | 0 | | | | 0 | | | | (1 | ) |
| (+/-) Financial result, net | | | (182 | ) | | | 391 | | | | 182 | | | | 0 | | | | 391 | |
| (+) Income tax | | | 1,335 | | | | (131 | ) | | | 668 | | | | 0 | | | | 1,872 | |
| (+) Other taxes | | | 111 | | | | 90 | | | | 25 | | | | (42 | ) | | | 184 | |
| (+/-) Non-controlling interest | | | (15 | ) | | | 0 | | | | 295 | | | | 0 | | | | 280 | |
| Consolidated EBITDA | | | 5,486 | | | | 363 | | | | 2,501 | | | | (43 | ) | | | 8,307 | |
Ecopetrol S.A Appendices
Following are the Income Statements and Statements of Financial Position of Ecopetrol S.A.
Table 6: Income Statement
| Billion (COP) | | 2Q 2019 | | | 2Q 2018 | | | ∆ (%) | | | 6M 2019 | | | 6M 2018 | | | ∆ (%) | |
| Local | | | 8,488 | | | | 8,335 | | | | 1.8 | % | | | 16,254 | | | | 15,565 | | | | 4.4 | % |
| Exports | | | 7,473 | | | | 7,143 | | | | 4.6 | % | | | 13,859 | | | | 12,656 | | | | 9.5 | % |
| Total revenue | | | 15,961 | | | | 15,478 | | | | 3.1 | % | | | 30,113 | | | | 28,221 | | | | 6.7 | % |
| Variable costs | | | 8,479 | | | | 8,045 | | | | 5.4 | % | | | 16,673 | | | | 14,699 | | | | 13.4 | % |
| Fixed costs | | | 2,968 | | | | 2,586 | | | | 14.8 | % | | | 5,604 | | | | 5,064 | | | | 10.7 | % |
| Total cost of sales | | | 11,447 | | | | 10,631 | | | | 7.7 | % | | | 22,277 | | | | 19,763 | | | | 12.7 | % |
| Gross income | | | 4,514 | | | | 4,847 | | | | (6.9 | )% | | | 7,836 | | | | 8,458 | | | | (7.4 | )% |
| Operating expenses | | | 684 | | | | 428 | | | | 59.8 | % | | | 1,124 | | | | 812 | | | | 38.4 | % |
| Operating income | | | 3,830 | | | | 4,419 | | | | (13.3 | )% | | | 6,712 | | | | 7,646 | | | | (12.2 | )% |
| Financial income/loss | | | (405 | ) | | | (578 | ) | | | (29.9 | )% | | | (722 | ) | | | (920 | ) | | | (21.5 | )% |
| Share of profit of companies | | | 1,169 | | | | 1,028 | | | | 13.7 | % | | | 2,204 | | | | 1,878 | | | | 17.4 | % |
| Income before income tax | | | 4,594 | | | | 4,869 | | | | (5.6 | )% | | | 8,194 | | | | 8,604 | | | | (4.8 | )% |
| Income tax | | | (1,107 | ) | | | (1,350 | ) | | | (18.0 | )% | | | (1,962 | ) | | | (2,470 | ) | | | (20.6 | )% |
| Net income consolidated | | | 3,487 | | | | 3,519 | | | | (0.9 | )% | | | 6,232 | | | | 6,134 | | | | 1.6 | % |
| | | | | | | | | | | | | | | | | | | | | | | | | |
| EBITDA | | | 5,400 | | | | 5,906 | | | | (8.6 | )% | | | 9,726 | | | | 10,392 | | | | (6.4 | )% |
| EBITDA margin | | | 33.8 | % | | | 38.2 | % | | | (11.5 | )% | | | 32.3 | % | | | 36.8 | % | | | (12.2 | )% |
Table 7: Statement of Financial Position / Balance Sheet
| Billion (COP) | | June 30, 2019 | | | March 31, 2019 | | | ∆ (%) | |
| Current assets | | | | | | | | | | | | |
| Cash and cash equivalents | | | 2,001 | | | | 4,098 | | | | (51.2 | )% |
| Trade and other receivables | | | 8,531 | | | | 9,550 | | | | (10.7 | )% |
| Inventories | | | 3,968 | | | | 3,510 | | | | 13.0 | % |
| Current tax assets | | | 318 | | | | 424 | | | | (25.0 | )% |
| Other financial assets | | | 5,715 | | | | 5,869 | | | | (2.6 | )% |
| Other assets | | | 1,081 | | | | 701 | | | | 54.2 | % |
| | | | 21,614 | | | | 24,152 | | | | (10.5 | )% |
| Non-current assets held for sale | | | 24 | | | | 23 | | | | 4.3 | % |
| Total current assets | | | 21,638 | | | | 24,175 | | | | (10.5 | )% |
| | | | | | | | | | | | | |
| Non-current assets | | | | | | | | | | | | |
| Investments in associates and joint ventures | | | 43,473 | | | | 38,750 | | | | 12.2 | % |
| Trade and other receivables | | | 632 | | | | 676 | | | | (6.5 | )% |
| Property, plant and equipment | | | 21,089 | | | | 19,896 | | | | 6.0 | % |
| Natural and environmental resources | | | 20,228 | | | | 17,107 | | | | 18.2 | % |
| Assets by right of use | | | 3,640 | | | | 0 | | | | - | |
| Intangibles | | | 236 | | | | 228 | | | | 3.5 | % |
| Deferred tax assets | | | 1,888 | | | | 2,400 | | | | (21.3 | )% |
| Other financial assets | | | 3,292 | | | | 3,863 | | | | (14.8 | )% |
| Other assets | | | 1,075 | | | | 808 | | | | 33.0 | % |
| Total non-current assets | | | 95,553 | | | | 83,728 | | | | 14.1 | % |
| | | | | | | | | | | | | |
| Total assets | | | 117,191 | | | | 107,903 | | | | 8.6 | % |
| | | | | | | | | | | | | |
| Current liabilities | | | | | | | | | | | | |
| Loans and borrowings | | | 2,738 | | | | 4,009 | | | | (31.7 | )% |
| Trade and other payables | | | 10,933 | | | | 9,467 | | | | 15.5 | % |
| Provision for employees benefits | | | 1,673 | | | | 1,822 | | | | (8.2 | )% |
| Current tax liabilities | | | 711 | | | | 1,386 | | | | (48.7 | )% |
| Accrued liabilities and provisions | | | 595 | | | | 331 | | | | 79.8 | % |
| Other liabilities | | | 391 | | | | 283 | | | | 38.2 | % |
| Total current liabilities | | | 17,041 | | | | 17,298 | | | | (1.5 | )% |
| | | | | | | | | | | | | |
| Non-current liabilities | | | | | | | | | | | | |
| Loans and borrowings | | | 33,334 | | | | 32,611 | | | | 2.2 | % |
| Provision for employees benefits | | | 6,513 | | | | 6,705 | | | | (2.9 | )% |
| Deferred tax liabilities | | | 144 | | | | 145 | | | | (0.7 | )% |
| Accrued liabilities and provisions | | | 5,396 | | | | 4,939 | | | | 9.3 | % |
| Other liabilities | | | 24 | | | | 13 | | | | 84.6 | % |
| Total non-current liabilities | | | 45,411 | | | | 44,413 | | | | 2.2 | % |
| | | | | | | | | | | | | |
| Total liabilities | | | 62,452 | | | | 61,711 | | | | 1.2 | % |
| | | | | | | | | | | | | |
| Equity | | | | | | | | | | | | |
| Equity attributable to owners of the company | | | 54,739 | | | | 46,192 | | | | 18.5 | % |
| Total equity | | | 54,739 | | | | 46,192 | | | | 18.5 | % |
| | | | | | | | | | | | | |
| Total liabilities and equity | | | 117,191 | | | | 107,903 | | | | 8.6 | % |