
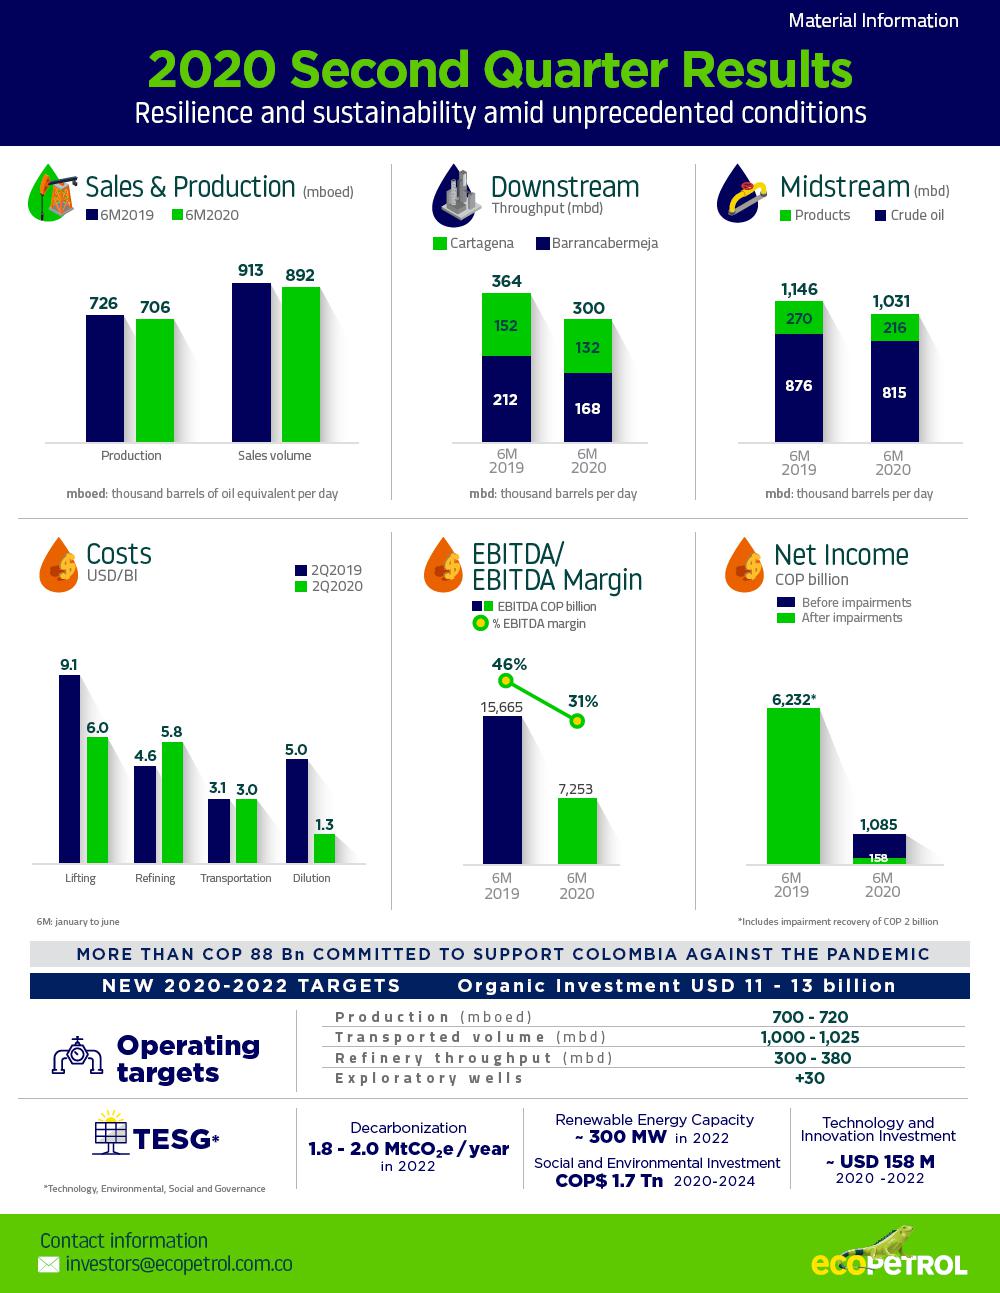
 In line with the guidance announced at the end of the first quarter, results for the second quarter reflect the impact of the unprecedented situation caused by the global spread of COVID-19. April reported the worst performance of crude prices since the beginning of the crisis. The inventory build-up and the contraction in demand as a result of the lockdown measures implemented worldwide led to a 38% decline in the Brent, compared to 2019 year-end; even with negative levels for WTI, and below USD 20 for Brent during some days. Likewise, during the second quarter, sales of our main products reported a decrease of 46%, mainly in jet fuel (-89%), gasoline (-46%) and diesel (-35%). This new reality required a rapid financial and operational adjustment that we executed decisively, while reinforcing our three strategic pillars: strict capital discipline, cash protection and cost efficiency, as well as reserve growth and profitable production. Thanks to this intervention, along with the gradual improvement in market conditions reported since mid-May, our operating and financial results, although impacted, were positive. As a result, the Ecopetrol Group reached a net income of COP 158 billion and an EBITDA of COP 7.3 trillion by the end of the first half of the year.
In response to the COVID-19 health emergency, we adapted our operations prioritizing the care and safety of our employees and contractors, through strict biosafety protocols and prevention measures, both in our operation areas and for those working remotely.
As part of Ecopetrol Group's commitment to the country, we continue allocating social investment resources to confront the pandemic, for a cumulative total of COP 88 billion to date, which includes: humanitarian aid, biosafety elements supply, aid for vulnerable families, provision of medical equipment to strengthen the healthcare system, in addition to our participation in the “Comparto mi Energía” program to support the payment of electricity services for low income families, the “Ayudar Nos Hace Bien” campaign which benefits the most vulnerable families, as well as initiatives in technology and innovation for medical equipment.
| We continued to structure the economic reactivation program, which aims to support territorial entities in the implementation of short-term projects to help promote local productive employment. As part of this initiative and to alleviate the financial crisis of our small and medium suppliers, Ecopetrol implemented advance payments or “early payments” without discount for nearly COP 60 billion per month, which has allowed them to preserve their economic activities, leverage their cash flow, safeguard employment and mitigate the negative impact from the COVID-19 pandemic.
In order to address the health emergency caused by the pandemic, the COVID-19 Crisis Committee continues its operations, deploying the protocols and guidelines for the prevention, control and mitigation of the pandemic’s effects on our employees, and to ensure the continuity of our operations during this health emergency.
Likewise, our Oil Price Committee has deployed the financial contingency plan through which we have managed the economic impact of the international oil price drop and changes in demand.
In response to the aforementioned, we were able to promptly reassess the 2020-2022 Business Plan, which responds to the crisis and protects the business sustainability going forward. The new Plan includes: i) an organic investment of USD 11 - 13 billion, of which between USD 3.0 - 3.4 billion will be invested in 2020, similar to the investment levels that of 2019, and higher than the announced in May; ii) sustainable levels of profitable production in a range between 700 – 720 mboed, maintaining the focus on exploration, where more than 30 wells are expected to be drilled; enhance recovery in higher value opportunities; Comprehensive Research Pilot Projects development for unconventional reservoirs in Colombia (PPII for its Spanish acronym); and continuity of highest potential international investments; iii) stable transported volumes in a range between 1,100 – 1,025 mbd, iv) increasing consolidated throughput in a range between 300 - 380 mbd by 2022, focusing on developing initiatives to increase the refining margin and iv) a continued focus on reducing operating cost and expenses without affecting the reliability and safety of our operations, which will allow us to achieve cumulative savings of up to COP 6.5 trillion by 2022. |
| 2 |
The Technology, Environmental, Social and Governance (TESG) front remains a priority. Therefore, we maintain our decarbonization target of 1.8 - 2.0 MtCO2e/year in 2022, renewable energy generation capacity of ~300 MW by 2022, and social and environmental investment of COP 1.7 trillion between 2020 and 2024. Likewise, in an effort to accelerate digital transformation, we will invest around USD 158 million in innovation and technology. The commitment to the continuous strengthening of our corporate governance has been reflected in a greater periodicity of the Board of Directors meetings, which has followed up on all the strategic aspects to confront the current exceptional environmental conditions.
Regarding the results for the first half of the year, we highlight the strength of our commercial strategy which has allowed us to maintain the combined refineries operation above their minimum levels and ensure the necessary revenues to make operations in our fields viable.
In the exploration campaign, during the first half of the year, the Group and its partners completed the drilling of seven wells, five in Colombia and two in Brazil. Ecopetrol and Shell continue to move forward with the COL-5, Purple Angel and Fuerte Sur projects, highlighting the start in the second half of the year of the environmental monitoring activities in the area where the appraisal well will be drilled, which is expected to occur in 2021.
In the first half of 2020 Ecopetrol Group's average production closed at 706 mboed, 19 mboed less than first semester of 2019, mainly explained by the current situation, as well as by public order events and blockages in the Rubiales and Suroriente fields. These impacts were partly offset by higher sales of white products from the LPG Plant in Cupiagua, and the operations reversal in the Pauto and Floreña fields.
| The gas business made a significant contribution to the country's energy safety, whose hydric reserves reached critical levels during May and June. Transitional regulation allowed gas to replace hydro generation, compensating for the impact on the Group's demand as a result of the health emergency.
Regarding Non-conventionals, the Ministry of Mines and Energy published the technical regulation on July 7th, and we expect that the environmental, civil and contractual regulation will be published released in the coming months, completing the regulatory framework for the development of the Comprehensive Research Pilot Projects (PPII). The activity planned in the Mid-Magdalena Valley remains within the new 2020–2022 Plan, with an investment of around USD 127 million, and we recently announced a preliminary agreement with ExxonMobil to jointly work on these pilots.
We highlight the reactivation of operations of our activity with Oxy in the Permian during the second half of 2020. Activities will mainly focus on the drilling of 22 new wells, additional to the 22 already producing, and that will be completed and begin production in the first quarter of 2021. We estimate an average net production for the Ecopetrol Group of ~5.5 mboed in 2020, higher than the 4 - 5 mboed announced in the first quarter of the year. In addition to the economic rationale, this reactivation allows us to continue with the knowledge transfer and confirms the competitiveness of the position and the alignment with our strategic partner.
In the midstream segment, transported volume decreased 10% as compared to the first half of 2019, impacted by lower domestic production, as well as lower consumption of crude by our refineries. Given the exceptional situation and, with the aim of mitigating permanent impacts on volumes, a temporary relief program was activated that resulted in total financing of USD 8.7 million and commercial tariffs discounts between 5.5% and 10%s, for April and May. Also, volume requirements were relaxed for some ship-or-pay contracts. No reversal cycles have been carried out this year, thanks to reduced maintenance times for the repair of the Caño Limón oil pipeline.
|
| 3 |
The downstream segment performance was negatively impacted by the drop in demand associated to the lockdowns, as well as in the prices for major refined products worldwide. However, given the gradual recovery in demand, refineries have increased their throughput, reaching a combined throughput of 300 mbd and an integrated refined gross margin of 8.1 USD/Bl, compared to 364 mbd and 9.7 USD/Bl for the first half of 2019.
On June 25, 2020, the Superintendence of Companies decreed the termination of the reorganization process of Bioenergy, a subsidiary of the Ecopetrol Group, and the opening of a judicial liquidation process within the framework of the corporate insolvency law 1116 of 2006. The liquidation process will be carried out under the rules that govern this kind of processes, under the direction of the Superintendence of Companies.
Continuing with our commitment towards the energy transition and the preservation of the environment, during the first semester we achieved a reduction of 687,769 tons of CO2 equivalent, verified by Ruby Canyon Engineering firm, which will be registered in order to obtain an equivalent number of Certified Emission Reductions. Likewise, in line with the announcement made in the first quarter, the competitive bidding process for the procurement of the San Fernando Solar Park received six bids for its construction. This is the Group's second mega solar farm, which will have a capacity of 50 MW and will be located in the municipality of Castilla La Nueva in Meta, and whose contract is expected to be signed in August. Additionally, we continue to make progress in the maturation of other projects for nearly 100 MW of solar generation that are expected to be awarded during the second half of 2020. | Ecopetrol remains committed to generating sustainable value for society. Today more than ever, the safety and care of our employees and contractors, the reliability of our operations and the financial discipline that leverages results are at the core of our business. With our actions, we continue to promote the implementation of better environmental, as well as the social and economic development of the regions where we operate.
Felipe Bayón Pardo CEO Ecopetrol S.A. |
Bogotá, August 4, 2020. Ecopetrol S.A. (BVC: ECOPETROL; NYSE: EC) announced today Ecopetrol Group’s financial results for the second quarter and the first half of 2020, prepared in accordance with the International Financial Reporting Standards applicable in Colombia.
| 4 |
During the first half of 2020, Ecopetrol recorded a consolidated net income of COP 158 billion and a consolidated EBITDA of COP 7.3 trillion, results that reflect the unprecedent environment for the oil and gas industry. The Company strongly executed a rapid financial adjustment, prioritizing profitable production, cash flow protection and cost efficiency.
| Table 1: Financial Summary Income Statement - Ecopetrol Group | ||||||||||
| Billion (COP) | 2Q 2020 | 2Q 2019 | ∆ ($) | ∆ (%) | 6M 2020 | 6M 2019 | ∆ ($) | ∆ (%) | ||
| Total sales | 8,442 | 18,309 | (9,867) | (53.9%) | 23,514 | 34,251 | (10,737) | (31.3%) | ||
| Depreciation and amortization | 2,236 | 2,052 | 184 | 9.0% | 4,388 | 4,023 | 365 | 9.1% | ||
| Variable cost | 3,570 | 6,777 | (3,207) | (47.3%) | 10,266 | 12,893 | (2,627) | (20.4%) | ||
| Fixed cost | 1,810 | 2,385 | (575) | (24.1%) | 4,249 | 4,531 | (282) | (6.2%) | ||
| Cost of sales | 7,616 | 11,214 | (3,598) | (32.1%) | 18,903 | 21,447 | (2,544) | (11.9%) | ||
| Gross income | 826 | 7,095 | (6,269) | (88.4%) | 4,611 | 12,804 | (8,193) | (64.0%) | ||
| Operating and exploratory expenses | 2 | 1,138 | (1,136) | (99.8%) | 1,081 | 1,892 | (811) | (42.9%) | ||
| Operating income | 824 | 5,957 | (5,133) | (86.2%) | 3,530 | 10,912 | (7,382) | (67.7%) | ||
| Financial income (loss), net | (599) | (391) | (208) | 53.2% | (1,265) | (776) | (489) | 63.0% | ||
| Share of profit of companies | 77 | 72 | 5 | 6.9% | 77 | 233 | (156) | (67.0%) | ||
| Income before income tax | 302 | 5,638 | (5,336) | (94.6%) | 2,342 | 10,369 | (8,027) | (77.4%) | ||
| Income tax | (3) | (1,872) | 1,869 | (99.8%) | (633) | (3,546) | 2,913 | (82.1%) | ||
| Net income consolidated | 299 | 3,766 | (3,467) | (92.1%) | 1,709 | 6,823 | (5,114) | (75.0%) | ||
| Non-controlling interest | (277) | (280) | 3 | (1.1%) | (624) | (593) | (31) | 5.2% | ||
| Net income attributable to owners of Ecopetrol before impairment | 22 | 3,486 | (3,464) | (99.4%) | 1,085 | 6,230 | (5,145) | (82.6%) | ||
| (Expense) recovery for impairment long-term assets | 4 | 1 | 3 | 300.0% | (1,204) | 2 | (1,206) | (60,300.0%) | ||
| Deferred tax of impairment | (1) | 0 | (1) | - | 277 | 0 | 277 | - | ||
| Net income attributable to owners of Ecopetrol | 25 | 3,487 | (3,462) | (99.3%) | 158 | 6,232 | (6,074) | (97.5%) | ||
| EBITDA | 1,996 | 8,307 | (6,311) | (76.0%) | 7,253 | 15,665 | (8,412) | (53.7%) | ||
| EBITDA Margin | 23.6% | 45.4% | - | (21.8%) | 30.8% | 45.7% | - | (14.9%) | ||
* Ebitda adjusted to exclude the effect of the Voluntary Retirement Plan amounts to COP 2,168 billion in 2Q20 and COP 7,425 billion in 6M20.
-------------------------------
The figures included in this report are not audited. The financial information is expressed in billions of Colombian pesos (COP), or US dollars (USD), or thousands of barrels of oil equivalent per day (mboed) or tons, as noted. For presentation purposes, certain figures in this report were rounded to the nearest decimal place.
Forward-looking statements: This release may contain forward-looking statements related to business prospects, estimates on operating and financial results, and Ecopetrol's growth. These are projections and, as such, are based solely on management's expectations regarding the future of the Company and its continued access to capital in order to finance the Company's business plan. These forward-looking statements basically depend on changes in market conditions, government regulations, competitive pressures, the performance of the Colombian economy and industry, among other factors; therefore, they are subject to change without notice.
| 5 |
I. Financial and Operating Results
Sales revenue
The decrease of 53.9% in sales revenues from 2Q20 versus 2Q19 as a combined result of:
| · | Lower weighted average sales price of crude oil, gas and products by -38.6 USD/Bl (COP -9.2 trillion), mainly due to the decrease in realized prices versus Brent reference. |
| · | Lower sales volume (COP -1.7 trillion, -59.4 mboed), mainly due to: i) lower throughputs and purchases due to a contraction in product demand, which was partially offset by ii) an increase in the availability of crude oil for export and iii) higher domestic gas sales due to the entry into operation of the LPG plant in Cupiagua and Hocol’s acquisition of Chevron´s stake in the Guajira fields. |
| · | Lower revenues from transport and other services (COP -0.3 trillion). |
| · | Increase in the average COP/USD exchange rate, positively impacting revenues (COP +1.4 trillion). |
| Table 2: Sales Volumes - Ecopetrol Group | ||||||||
| Local Sales Volume - mboed | 2Q 2020 | 2Q 2019 | ∆ (%) | 6M 2020 | 6M 2019 | ∆ (%) | ||
| Medium Distillates | 87.1 | 153.8 | (43.4%) | 117.2 | 153.6 | (23.7%) | ||
| Gasoline | 62.4 | 116.6 | (46.5%) | 88.5 | 114.1 | (22.4%) | ||
| Natural Gas | 80.8 | 75.0 | 7.7% | 81.9 | 76.6 | 6.9% | ||
| Industrials and Petrochemicals | 15.2 | 21.9 | (30.6%) | 20.1 | 22.2 | (9.5%) | ||
| LPG and Propane | 17.2 | 15.1 | 13.9% | 17.8 | 15.0 | 18.7% | ||
| Crude Oil | 7.6 | 5.3 | 43.4% | 6.6 | 7.1 | (7.0%) | ||
| Fuel Oil | 1.5 | 3.8 | (60.5%) | 1.8 | 2.6 | (30.8%) | ||
| Total Local Volumes | 271.8 | 391.5 | (30.6%) | 333.9 | 391.2 | (14.6%) | ||
| Export Sales Volume - mboed | 2Q 2020 | 2Q2019 | ∆ (%) | 6M 2020 | 6M 2019 | ∆ (%) | ||
| Crude Oil | 475.0 | 395.8 | 20.0% | 449.8 | 402.1 | 11.9% | ||
| Products | 109.9 | 128.7 | (14.6%) | 107.2 | 118.3 | (9.4%) | ||
| Natural Gas* | 1.1 | 1.2 | (8.3%) | 1.3 | 1.5 | (13.3%) | ||
| Total Export Volumes | 586.0 | 525.7 | 11.5% | 558.3 | 521.9 | 7.0% | ||
| Total Sales Volumes | 857.8 | 917.2 | (6.5%) | 892.2 | 913.1 | (2.3%) | ||
*Natural gas export sales correspond to local sales by Ecopetrol America LLC
Domestic sales (32%): The 30.6%, or 119.7 mboed decrease in domestic sales in 2Q20 as compared to 2Q19 was primarily the result of:
| · | A drop in fuel demand due to the mandatory preventive isolation, which resulted in a decrease in sales of medium distillates equivalent to 66.6 mboed, and in gasoline, equivalent to 54.2 mboed. |
| · | Higher gas sales due to Hocol's acquisition of Chevron's interest in the Guajira Association. Likewise, the strategy of sales to thermal power plants through the implementation of interruptible contracts has allowed the Company to offset the impact on demand because of the COVID-19 health emergency. |
| · | An increase of LPG supply due to the entry into operation of the Cupiagua plant as of September 2019. |
| · | Lower sales of industrial and petrochemical products, especially asphalt, given the reduction in demand for these products. |
International sales (68%): The 11.5%, or 60.3 mboed increase in international sales in 2Q20 as compared to 2Q19 was primarily the result of:
| · | Greater availability of crude oil for export, supported by the sales and marketing strategy, in response to reduced refinery throughputs, due to a decrease in the demand for fuels and refined products. |
| · | A decrease in the exports of products as a result of lower refinery throughputs. |
| 6 |
Sales Price
| Table 3: Average Prices - Ecopetrol Group | ||||||||
| USD/Bl | 2Q 2020 | 2Q 2019 | ∆ (%) | 6M 2020 | 6M 2019 | ∆ (%) | ||
| Brent | 33.4 | 68.5 | (51.2%) | 42.1 | 66.2 | (36.4%) | ||
| Natural Gas Basket | 24.0 | 23.9 | 0.4% | 23.5 | 24.0 | (2.1%) | ||
| Crude Oil Basket | 20.4 | 63.6 | (67.9%) | 29.8 | 59.8 | (50.2%) | ||
| Products Basket | 36.5 | 73.2 | (50.1%) | 49.9 | 71.7 | (30.4%) | ||
Crude oils: The sales and marketing strategy concentrated on anticipating crude oil sales with a focus on strategic clients with long-term supply framework contracts, which ensured the inclusion of barrels within the base feedstock of their refining systems. During this period, the first sale to independent refiners with delivery at place (DAP) in China took place (traditionally deliveries have been made free on board (FOB) in Colombia), strengthening our presence in that market and increasing our margins.
During 2Q20 crude oil storage was a key element for the continuity and assurance of our operation across the supply chain, given the lower throughput of our refineries through the pandemic. The storage capacity availability helped us to avoid sales under unfavorable terms for Ecopetrol.
Refined Products: In the second quarter of 2020, the refined product basket versus Brent weakened due to the global market situation in view of the contraction in demand, mainly for gasoline and jet fuel.
Natural Gas: The price of gas sales remained stable in the second quarter of 2020 because most of the volumes produced are associated with long-term contracts with an agreed upon fixed price in dollars, which is not tied to the behavior of the price of crude.
Gas continues to be a strategic pillar for the Ecopetrol Group. During May and June, it was key in guaranteeing energy security in Colombia through the sale of natural gas for thermal power generation proving to be a flexible business option during a crisis situation.
The Ecopetrol Group developed several mechanisms to boost demand and mitigate the impact of the economic situation on the price of gas for end users. These include i) accepting force majeure statements from our clients for 98 GBTUD, in response to lower demand; ii) offering options to clients in order to moderate the impact of the increase in the COP/USD exchange rate for the period between April and June, which represented a benefit of COP 8.3 billion for end user; iii) offering financing to companies within regulated market serving users from 1 to 4 social stratification levels ); iv) securing contracts at Hocol to make the extensive test of the Arrecife field viable, with starting date on August 1; and v) financing facilities through grace periods and refinancing of payment of overdue invoices from industrial and commercial users, which represented a benefit of COP 23 billion, through Invercolsa companies.
Cost of Sales
Depreciation and Amortization: Depreciation and amortization increased by 9.0% in 2Q20 compared to 2Q19, primarily as a result of: i) a higher level of capital investment associated with enhanced recovery campaigns and new drilling; and ii) the exchange rate effect on the depreciation cost of Group subsidiaries with the U.S. dollar as their functional currency, given the devaluation of the peso against the US dollar. The foregoing was partially offset by a lower depreciation rate due to an increase in the incorporation of reserves in 2019 as compared to 2018.
| 7 |
Variable Costs: Variable costs decreased by 47.3% in 2Q20 as compared to 2Q19, primarily due to the combined effect of:
| · | Lower cost in crude oil, gas and products purchases (COP -4.5 trillion), primarily due to: i) a decrease in the average price of domestic purchases and imports (COP -2.9 trillion); ii) a decrease in volumes purchased (COP -2.0 trillion, -95.2 mboed); and, iii) an increase in the average COP/USD exchange rate of purchases (COP +0.4 trillion). |
| · | Partial recovery (COP -0.3 trillion) of the provision, on crude oil and products inventory valuations, set up in March 2020 at Ecopetrol and Reficar as a result of market conditions and in accordance with International Financial Reporting Standards (IFRS), which establish that inventory amounts must be recognized at a value not less than its sale price, thus guaranteeing an estimate of possible losses. |
| · | Consumption of inventories in compliance with sales commitments, primarily as a result of lower production levels and reduced purchase volumes (COP +1.6 trillion). |
Fixed Costs: 24.1% decrease in 2Q20 as compared to 2Q19, primarily due to lower maintenance, contracted and professional services and other operational activity costs, which in turn was primarily the result of the implementation of strategies for the optimization of costs and the decrease in activity due to lower production, throughputs and transported volumes.
Operating Expenses (Net of Other Income)
Operating Expenses (Net of Other Income) for 2Q20 decreased by 99.8% as compared to 2Q19, mostly due to:
| · | Hocol’s acquisition of 43% of Chevron’s interest in the Guajira Association contract, which generated a market valuation for both the acquired and the pre-existing share in Ecopetrol S.A. (57%). The comparison between this valuation with amounts paid and carrying amounts, resulted in a USD 350 million revenue. This transaction is recognized under the IFRS regulatory framework, considering that a business combination by stages is occurring. |
| · | Lower exploration expenses mainly due to the accounting recognition in 2Q19 of the unsuccessful exploration activity of the Tibirita-1, Tibirita-1A and Avila projects in Caño Sur. |
The above was partially offset by:
| · | The recognition of the voluntary retirement plan of 122 employees during June. |
| · | Expenses associated with the temporary shut-down of Barrancabermeja’s refinery units, given the current health emergency and the decrease in product demand. |
| · | Financial assistance to the Country in response to the COVID-19 health emergency, represented in humanitarian aid, strengthening of the health system and personal protection elements for medical use, among others. |
| · | Custom operation expenses associated with a new crude oil sale delivery at place (DAP) in China. |
Financial Income (Non-Operating)
Increase of 53.2% in 2Q20 as compared to 2Q19, primarily due to the net effect of:
| · | Interest on new debt disbursed in April (COP -122 billion). |
| · | Increase in interest expenses on foreign currency debt due to the devaluation of the COP against the USD (COP -67 billion). |
| · | Results from the foreign exchange rate hedges of the Group´s companies (COP -19 billion). |
| 8 |
The Effective Tax Rate for 2Q20 was 1.3% versus 33.2% for 2Q19. This change was primarily due to the decrease in income before taxes and the combination of tax rates between the different Ecopetrol Group companies. For the accumulated results, the effective tax rate is equivalent to 31.3%.
Non-Recurring Events
Non-recurring events in 2Q20 impacted the financial results by COP 1.0 trillion, mainly the recognition of revenue from business combinations associated with both the acquired share of Hocol and the pre-existing share of Ecopetrol S.A. in the Guajira association contract, impacting the Upstream figures, partially compensated by the recognition of costs related to the voluntary retirement plan and the support to the country during the pandemic.
For the first half of the year, in addition to the effects of 2Q20, we recognized impairments of the long term assets in 1Q19, for a total impact in the semester of COP 78 billion.
Table 4: Non-Recurring Events
| Billion (COP) | 2Q 2020 | 2Q 2019 | ∆ ($) | ∆ (%) | 6M 2020 | 6M 2019 | ∆ ($) | ∆ (%) | ||
| Net income attributable to the owners of Ecopetrol | 25 | 3,487 | (3,462) | (99.3%) | 158 | 6,232 | (6,074) | (97.5%) | ||
| +/- Impairment of long-term assets | (4) | (1) | (3) | 300.0% | 1,204 | (2) | 1,206 | 60,300% | ||
| - Profit from business combinations | (1,439) | - | (1,439) | - | (1,439) | - | (1,439) | - | ||
| + Voluntary retirement plan | 172 | - | 172 | - | 172 | - | 172 | - | ||
| + Support to country for COVID19 | 74 | - | 74 | - | 74 | - | 74 | - | ||
| +/- Income tax and deferred income tax (non-recurring items) | 189 | - | 189 | - | (89) | - | (89) | - | ||
| (Loss) Net Income excluding non recurring items | (983) | 3,486 | (4,469) | (128.2%) | 80 | 6,230 | (6,150) | (98.7%) | ||
*Amount committed and recorded as of June 30.
Cash Flow and Debt
| Table 5: Cash Position - Ecopetrol Group | ||||||
| Billion (COP) | 2Q 2020 | 2Q 2019 | 6M 2020 | 6M 2019 | ||
| Initial cash and cash equivalents | 8,797 | 8,938 | 7,076 | 6,312 | ||
| (+/-) Cash flow from operations | (2,248) | 6,003 | 325 | 10,837 | ||
| (-) CAPEX | (2,392) | (2,203) | (5,845) | (4,141) | ||
| (+/-) Investment portfolio movement | (3,065) | 286 | (572) | 984 | ||
| (+) Other investment activities | 165 | 157 | 261 | 310 | ||
| (+/-) Borrowings and interest payments | 10,502 | (1,127) | 9,902 | (1,811) | ||
| (-) Dividend payments | (1,911) | (6,643) | (2,337) | (6,975) | ||
| (+/-) Exchange difference (cash impact) | (600) | 113 | 438 | 8 | ||
| Final cash and cash equivalents | 9,248 | 5,524 | 9,248 | 5,524 | ||
| Investment portfolio | 5,793 | 7,152 | 5,793 | 7,152 | ||
| Total cash | 15,041 | 12,676 | 15,041 | 12,676 | ||
Note: Cash represents funds available in cash or cash equivalents, as well as investments in financial securities, regardless of their maturity.
Cash Flow: By the end of 2Q20, Ecopetrol Group's final cash amounted to COP 15.0 trillion (29% COP and 71% USD). During this period, the main source of cash resulted from financing (COP 11.8 trillion). The main uses of cash were i) outflows for Capex investments in the amount of COP 2.4 trillion; ii) the payment of interest and periodic debt amortization in the amount of COP 1.3 trillion; and, iii) the payment of dividends to the Nation and non-controlling shareholders in the amount of COP 1.9 trillion.
| 9 |
Debt: As of June 30, the debt balance amounted to COP 53.7 trillion, equivalent to USD 14.3 billion; the following debt activities were carried out during 2Q20:
| · | Disbursement of a contingent line of credit in the amount of USD 665 million contracted with Scotiabank (USD 430 million) and Mizuho Bank (USD 235 million). |
| · | Treasury loans disbursed in Colombian pesos and US dollars in the amount of COP 775 billion and USD 100 million, respectively. |
| · | Issuance of international bonds in the amount of USD 2.0 billion. |
On July 14, Ocensa issued debt securities in the international capital markets in the amount of USD 500 million. The use of proceeds is specifically intended to repay Ocensa’s current global bond that is due on May 2021.
The gross debt to EBITDA ratio closed at 2.4 times as of June 30.
Efficiencies
The efficiencies obtained in 2Q20 amount to COP 615.4 billion, which represents an increase of 30% over the efficiencies reported for the same period in 2019. Three strategies explain the increase in efficiencies:
| · | Commercial, focused on protecting sale prices of products and crude oil. |
| · | Dilution, aimed at achieving i) the maximum use of the diluents produced in our refineries, and ii) improvements in field dilution operations. |
| · | The digital agenda, with initiatives aimed at: i) increase margins in the refineries, ii) early detection of well failures, which allowed a reduction in deferred production and, iii) implementation of solutions for geologists' teams, which optimize the use of licenses and ensure the continuity of exploration projects. |
Energy cost:
| · | Due to our commercial efforts focused on the incorporation of bilateral contracts and the optimization of self-generation, during the first half of the year the average cost for the portfolio of non-regulated energy purchases was 29% lower than the average energy market price. For the rest of the year, the price of non-regulated energy is expected to remain stable for the Ecopetrol Group. In terms of self-generation, the Company continues to implement initiatives aimed at increasing its cost efficiency and the use of its own available assets. |
Investments
Cumulative investments for the first half of 2020 remained close to the levels reported for the same period of 2019, mainly as a result of CAPEX execution of 1Q20, reaching USD 1,318 million. Of these resources, 77% was allocated to growth opportunities focusing on increasing production and reserves. The upstream segment accounted for 83% of total investments. 64% was allocated in Colombia and the remaining 36% to United States and Brazil.
In terms of production, Ecopetrol S.A.'s drilling campaign was concentrated in the Castilla, Rubiales, Llanito, Apiay and Yariguí-Cantagallo fields. By the end of the second quarter, more than 130 capitalizable workovers were carried out. Regarding the subsidiaries, the highest levels of investment were allocated to Rodeo Midland Basin and Hocol. In exploration, seven wells were drilled during the semester. In Downstream and Midstream, investments focused on maintaining the efficiency, reliability and integrity of the operations of the refineries and the different oil pipelines and the multi-purpose pipelines.
| 10 |
| Table 6: Investments by Segment - Ecopetrol Group | |||||
| Million (USD) | Ecopetrol S.A. | Affiliates and Subsidiaries | Total | % Share | |
| Production | 527 | 188 | 715 | 54.2% | |
| Downstream | 63 | 54 | 117 | 8.9% | |
| Exploration | 44 | 334 | 378 | 28.7% | |
| Midstream* | (0) | 78 | 78 | 5.9% | |
| Corporate | 30 | 0 | 30 | 2.3% | |
| Total | 664 | 654 | 1,318 | 100.0% | |
* Includes 100% of investments of each of the Group´s companies (Ecopetrol´s share and non-controlling interest)
II. New 2020 - 2022 Business Plan
In light of the unprecedented challenges generated in the global economy and particularly in the oil and gas sector, due to the Covid-19 pandemic and the price war between Russia and Saudi Arabia at the beginning of 2020, the Ecopetrol Group (EG) has revised its business plan for the 2020 - 2022 period. The plan seeks to establish a new action framework that, supported by the EG’s strategic pillars (reserve and production growth, capital discipline, cash flow protection and cost efficiency), will ensure the financial sustainability of the Company, respond to uncertain market conditions in the short term and maintain the value promise in the medium and long term.
The updated plan contemplates organic investments of between USD 11 - 13 billion for the next 3 years, mainly concentrated in Colombia, ensuring the allocation of capital to i) opportunities for incorporating more competitive resources and reserves in the new price environment, ii) profitable advances in energy transition (gas, decarbonization, short cycle hydrocarbons and incorporation of renewable energies), iii) investments in reliability required for a responsible and sustainable operation and, (iv) technological and social investments deemed as strategic for the future of the EG.
Investment in growth opportunities (75%) is aimed at continuing the profitable development of existing assets and accelerating the transition to gas. Investment in operational continuity (25%) will enable assets value preservation and will provide reliability and integrity within our operation.
The most relevant operational targets of the 2020 - 2022 Plan include i) production levels of approximately 700 mboed for 2020, increasing to approximately 720 mboed by 2022; ii) integrated refining system throughput of 300 to 320 mbd for 2020, up to approximately 380 mbd by 2022; iii) stable transported volumes of between 1,000 and 1,025 mbd, iv) emission reductions between 1.8 - 2.0 MtCO2e/year by 2022, and v) renewables generation capacity of approximately 300 MW by 2022.
The 2020 - 2022 Plan focuses on cost optimization by seeking efficiencies in all processes, which will be reflected in an expected total unit cost ranging between 22 - 23[1] USD/Bl between 2020 and 2022.
The Company expects to generate a cumulative operating cash flow ranging between USD 11 - 12 billion between 2020 - 2022 and maintain a cash breakeven of between 30 - 40[2] USD/Bl, leveraged on a solid EBITDA generation and investment efficiency. The plan includes net additional financing of USD 4.5 billion during the period, of which a net amount of USD 2.7 billion[3] were already deployed in 2020.
[1] Calculated at a fixed average annual Brent price of USD 38 per barrel.
[2] Corresponds to the Brent price necessary to end a period with a minimum cash balance as defined by the Company, given an initial cash balance, and the operating, financing and investment inflows and outflows through the period.
[3] Includes new debt for an amount of USD 3.1 billion minus debt service of USD 400 million.
| 11 |
The plan is based on an average annual Brent price of USD 38, USD 45 and USD 50 per barrel and an average exchange rate of COP 3,743, COP 3,600 and COP 3,500 per dollar for 2020, 2021 and 2022, respectively.
Upstream
Between USD 9 - 10 billion will be allocated to the upstream segment, prioritizing the development of EG's position in strategic assets in Colombia (78%) such as Piedemonte, Rubiales, and the Mid-Magdalena Valley fields, and internationally (22%), in core areas such as Brazil and the Permian Basin in the United States. The development of enhanced recovery activities will also continue.
In terms of exploration, the plan seeks to drill more than 30 exploratory wells located within high materiality basins, mostly in Colombia.
As for unconventional reservoirs, we will continue maturing initiatives associated with the Comprehensive Research Pilot Projects for Unconventional Reservoirs (PPII for its acronym in Spanish) in the Mid-Magdalena Valley Basin in Colombia and increasing development activities in the Permian Basin in Texas, in the United States.
Investments between USD 780 - 870 million remain allocated towards natural gas development, one of the strategic pillars of the Ecopetrol Group, which foresees the assessment and development of the offshore gas discoveries made in the Colombian Caribbean with investments of USD 180 million, the development of the Piedemonte area and other onshore gas sources, mainly in the Mid-Magdalena Valley and the Sinú-San Jacinto basin.
We continue defining targets for the replacement of reserves and will be subject to the evolution of both the plan execution and market conditions. Currently the plan foresees the achievement of a reserve replacement ratio greater than 100% after 2022.
Midstream
The new 2020-2022 plan contemplates investments between USD 780 - 830 million for this segment, focused on guaranteeing infrastructure integrity and reliability as well as increasing the flexibility and logistical efficiency in the transport of heavy crude, supported by cost efficiencies and synergies in the transport system. This segment is expected to represent between 40% and 60% of the Group’s EBITDA during the period.
Downstream
Between USD 1.2 - 1.3 billion is expected to be allocated to investments in the downstream segment, focused make the most of current infrastructure and its optimization. Critical projects will be prioritized in order to maintain the security and operational integrity of the business units, as well as projects that generate value for the segment. Investments to ensure legal compliance and major maintenances will be executed, given the life cycle of some units at the Cartagena and Barrancabermeja refineries, as well as the execution of the Interconnection Project of the Crude Oil Plants of the Cartagena refinery (IPCC), which is expected to enter into operation in 2022.
To move forward with the production of cleaner fuels for the country, investments in the 2020 - 2022 period are expected to consolidate the internal quality of diesel between 10 and 15 ppm of sulphur and for gasoline to 50 ppm of sulphur nationwide by 2021. Likewise, a project to guarantee that both fuels achieve levels of less than 10 ppm in the medium term will be considered; quality already registered in diesel, including the one received by mass transport systems such as Transmilenio.
| 12 |
TESG [4]
Investments in innovation and technology are expected to total approximately USD 158 million. Efforts will focus on achieving enhanced recovery projects viability and non-conventional reservoirs in an effective, environmentally and socially sustainable manner, among others; increasing flexibility and logistical efficiency for the disposal of heavy crudes; improve energy efficiency; and strategic studies on water management and decarbonization. In addition, digital agenda projects seeking to maximize production, improve commercial and refining margin, and incorporate digital tools to financial management, among others, will be completed.
In line with the Company’s goals of reducing 20% of CO2e emissions and to zero routine flaring to 2030, an investment of more than USD 400 million is planned between 2020 and 2024 in projects to reduce flaring, energy efficiency improvement and renewable energy sources implementation, that will enable to achieve the target of reducing emissions by 1.8 - 2.0 MtCO2e/year by 2022. Furthermore, in order to have a comprehensive water management under operational efficiency parameters, an investment of USD 130 million is planned for water treatment on production activities and from the Barrancabermeja refinery.
The plan includes an allocation of resources for social and environmental investments of approximately COP 1.7 trillion by 2024, aimed at closing social gaps and promoting development and wellbeing of the communities where we operate, through provisions for strategic infrastructure, public services, education, sports and healthcare, rural development and entrepreneurship, business development and environmental investment projects.
The 2020 - 2022 plan is based on Ecopetrol's commitment to its cultural principles, including HSE, Ethics, Excellence, Leadership, Innovation and Collaboration. We remain committed with an operation that is safe, environmentally sustainable and respectful of the communities, conditions that will generate shared prosperity and constructive dialogue with all stakeholders.
III. Results by Business Segment
| 1. | UPSTREAM |
Exploration
During the second quarter of 2020, Ecopetrol and its partners completed the drilling of four wells: i) the Gato do Mato-4 well, located in Brazil, which was declared successful, ii) the Lorito A-1 appraisal well, located in the Llanos Orientales region, which was temporarily suspended and for which the completion of production tests remains pending, iii) Obiwan-1, in the Sinú-San Jacinto basin, which was declared dry and is in the plugging and abandonment process, and iv) Saturno-1 in Brazil, which results are under evaluation in order to define next steps.
During this period, initial testing of the Merecumbé-1 well, located in the Atlantic Department of Colombia and drilled by Hocol in 2019 was also carried out, reporting production of gas from the Chengue Formation. On July 16, 2020, Hocol announced the successful discovery of natural gas at this well.
[4] Technology, Environment, Social and Governance
| 13 |
By the end of the quarter, operations at the Liria YW-12 and Antillas-1 wells continued to be temporarily suspended as a result of the COVID-19 health emergency. Operations at the Nafta-1 well, operated by Ecopetrol, were being resumed under strict biosafety protocols.
Cumulative production of the exploration assets for 2Q20 reached 791.2 mboe (4,347 boed), reflecting an increase of 110% compared to the same period in 2019 (375.7 mboe equivalent to 2,076 boed). This production is a result of the extensive testing of the Boranda, Andina, Esox and Bullerengue discoveries, drilled in 2019.
Continuing with domestic seismic activities, as of the end of the first half of the year Ecopetrol purchased 1,217.2 Km of 2D seismic as follows: i) 580 Km of 2D seismic in the Llanos 122 block, 277 Km in the Llanos 121 block, 90.4 Km in the Niscota block and 19.8 Km in the Odisea – Recetor blocks with the purpose of assessing the prospectivity of the Piedemonte Llanero, and ii) 250 Km seismic in the Upper Magdalena Valley, to continue the development opportunities in this area. Internationally, the subsidiary Ecopetrol America, purchased 629 Km2 of 3D seismic, in order to reassess the structure of the discovery made with the Esox-1 well in the Gulf of Mexico and to define the location of the structure's appraisal well.
It is important to highlight that the Petrotécnica Digital project continues to allow all professionals to access specialized applications and technical data remotely, thus maintaining continuity in the identification and maturity of exploratory opportunities for the incorporation of resources within the domestic and international portfolio.
Ecopetrol – Shell Agreement
Ecopetrol and Shell continue to move forward with the COL-5, Purple Angel and Fuerte Sur projects. The completion of the Joint Operating Agreement (JOA) negotiations is expected to occur this year, as scheduled. The assignment of the 50% interest to Shell is under approval by the National Hydrocarbons Agency (ANH) of Colombia.
Plans for the execution of the appraisal well in 2021 continue as scheduled. During 2020, environmental monitoring activities on site will be initiated, in order to start the preparation of the corresponding Environmental Management Plan.
Gato do Mato
On June 12th, the Ministry of Mines and Energy of Brazil signed the addendums to contracts BM-S-54 and Sul de Gato do Mato, materializing Ecopetrol's entry into the Gato do Mato discovery, with a 30% interest. Shell Brasil Petróleo Ltda. is the operator, with a 50% interest and the remaining 20% is owned by Total E&P do Brasil Ltda.
Production
During 2Q20, Ecopetrol Group’s average production reached 677.5 mboed, at the upper end of the range announced during 1Q20 (660-680 mboed). For the first half of the year, the Ecopetrol Group’s consolidated production reached 706 mboed.
2Q20 production fell by 58 mboed compared to the first quarter of this year, and by 45 mboed compared to the same period of last year, primarily due to the interventions associated with the COVID-19 health emergency, low oil prices, the contraction in demand and impacts due to public order issues in the Rubiales and Suroriente fields, as well as the lower production of other Ecopetrol Group companies, amounting to -4 mboed. These impacts were partially offset by increased sales of white products from the LPG plant in Cupiagua and the reversal of the Pauto and Floreña fields, which was completed during 1Q20.
In June, 10 mboed were enabled as a result of the prices recovery. Also, with the support received from the National Government we started the recovery of some deferred production due to public order issued in Rubiales, which is expected to increase its performance in 3Q20.
| 14 |
During 2Q20, 38 development wells were drilled and completed as compared to 147 wells drilled in 2Q19. As of June 2020, 148 wells were drilled and completed.
With regards to the enhanced recovery program, pilots and expansion projects have continued, even though execution times were affected by the pandemic. The most relevant expansion projects include: i) water injection in the La Cira, Yariguí, Chichimene and Castilla fields; and ii) air injection pilot in Chichimene.
Regarding Unconventional Reservoirs, the Ministry of Mines and Energy published the technical regulation on June 30th. The environmental, civil and contractual regulations are expected to be released in the upcoming months, which will complete the regulatory framework required to advance into the execution of the Comprehensive Research Pilot Projects (PPIIs).
Ecopetrol and ExxonMobil Exploration Colombia Limited are moving forward with a preliminary agreement to develop the PPIIs in the Mid Magdalena Valley. The agreement is subject to the final regulatory framework and to the fulfillment of conditions required for the alliance. Ecopetrol would act as operator of the pilot projects.
The new Operational Vice-Presidency for the East-Andean Region was created as part of the operational and structural strategies aimed at optimizing costs; it unified the former Vice-Presidencies for the South and East regions. The new Vice-presidency will be responsible for the operation of 37 fields located in the Huila, Tolima and Putumayo departments as well as for Rubiales and Caño Sur fields, all of them which are expected to contribute with 19% of the Business Group’s production for 2020.
Permian Basin
Following the contractual clauses regarding low price protection, Ecopetrol and Oxy designed a program to reduce activity in order to preserve capital, which contemplated the following actions: i) stop drilling activities at a safe point and release the drilling platforms; ii) stop completion activities when the current campaign is over; and iii) defer facilities and infrastructure projects. This plan was implemented in May 2020.
After a detailed review of the development plan under the new price perspectives and optimizations, the Joint Venture (JV) partners decided to restart operations in the second half of 2020. This mainly consists of a drilling campaign of 22 new wells, which are expected to be completed and entered into production in 1Q21.
By the end of 2020, the expectations are that 22 wells will be in production, 22 wells will be drilled, with an estimated average net production of ~5.5 mboed for the Ecopetrol Group (before royalties).
Additionally, knowledge transfer activities have been assured; consequently, as of July 30th,2020, 15 Ecopetrol employees were incorporated as secondees to the JV operations
| Table 7: Gross Production - Ecopetrol Group | ||||||||
| Production - mboed | 2Q 2020 | 2Q 2019 | ∆ (%) | 6M 2020 | 6M 2019 | ∆ (%) | ||
| Crude Oil | 507.2 | 551.4 | (8.0%) | 530.7 | 551.2 | (3.7%) | ||
| Natural Gas | 114.6 | 111.4 | 2.9% | 118.6 | 112.9 | 5.0% | ||
| Total Ecopetrol S.A. | 621.8 | 662.8 | (6.2%) | 649.3 | 664.1 | (2.2%) | ||
| Crude Oil | 20.2 | 20.7 | (2.4%) | 21.0 | 20.9 | 0.5% | ||
| Natural Gas | 14.6 | 8.7 | 67.8% | 11.7 | 8.6 | 36.0% | ||
| Total Hocol | 34.8 | 29.4 | 18.4% | 32.7 | 29.5 | 10.8% | ||
| Crude Oil | 0.0 | 8.0 | (100.0%) | 2.3 | 8.1 | (71.6%) | ||
| Natural Gas | 0.0 | 5.0 | (100.0%) | 1.7 | 5.0 | (66.0%) | ||
| Total Equion* | 0.0 | 13.0 | (100.0%) | 4.0 | 13.1 | ##### | ||
| Crude Oil | 3.2 | 3.6 | (11.1%) | 3.2 | 3.6 | (11.1%) | ||
| Natural Gas | 0.8 | 1.2 | (33.3%) | 0.8 | 1.2 | (33.3%) | ||
| Total Savia* | 4.0 | 4.8 | (16.7%) | 4.0 | 4.8 | (16.7%) | ||
| Crude Oil | 10.4 | 11.2 | (7.1%) | 11.2 | 12.1 | (7.4%) | ||
| Natural Gas | 1.7 | 1.8 | (5.6%) | 1.8 | 1.9 | (5.3%) | ||
| Total Ecopetrol America | 12.1 | 13.0 | (6.9%) | 13.0 | 14.0 | (7.1%) | ||
| Crude Oil | 4.0 | - | - | 2.6 | - | - | ||
| Natural Gas | 0.8 | - | - | 0.5 | - | - | ||
| Total Rodeo Midland Basin | 4.8 | 0.0 | - | 3.1 | - | - | ||
| Crude Oil | 545.0 | 594.9 | (8.4%) | 570.9 | 595.9 | (4.2%) | ||
| Natural Gas | 132.5 | 128.1 | 3.4% | 135.2 | 129.6 | 4.3% | ||
| Total Ecopetrol Group | 677.5 | 723.0 | (6.3%) | 706.1 | 725.5 | (2.7%) | ||
*Equión and Savia are included in the Financial Statements using the equity method. Equion’s Production goes up to February 28, 2020, which corresponds to the end date of the Piedemonte partnership agreement. As of March 1, 2020, Ecopetrol incorporates 100% of the production from the Pauto Sur and Floreña fields.
Note: Gross production includes royalties and is prorated according to Ecopetrol's share in each company. Natural gas production includes NGL´s.
| 15 |
Lifting Cost
| Table 8: Lifting and Dilution Cost - Ecopetrol Group | ||||||||||
| USD/Bl | 2Q 2020 | 2Q 2019 | ∆ (%) | 6M 2020 | 6M 2019 | ∆ (%) | % USD | |||
| Lifting Cost* | 6.02 | 9.14 | (34.1%) | 7.12 | 8.93 | (20.3%) | 18.6% | |||
| Dilution Cost** | 1.34 | 5.04 | (73.4%) | 2.48 | 4.49 | (44.8%) | 100.0% | |||
* Calculated based on barrels produced, exempt of royalties.
** Calculated based on barrels sold.
For 2Q20, lifting cost was 6.02 USD/bl, 3.12 USD/bl less than the same period for 2019, which is mainly explained by:
Cost effect (-2.19 USD/bl):
| · | Displacement of low risk activities in the surface maintenance line. |
| · | Decrease in activity, mainly in subsoil maintenance, due to the rescheduling of well service interventions as a result of the restrictions imposed from the COVID-19 pandemic. |
| · | Decrease in contracted and support services execution due to greater efficiencies identified in the operation and renegotiation of some contracts. |
Volume effect (+0.20 USD/bl): as a result of a decrease in production.
Exchange rate effect (-1.12 USD/bl): higher exchange rate of +605 pesos/dollar when restating COP costs to USD dollars.
Dilution Cost
The unit dilution cost decreased USD 3.7 per barrel between 2Q19 and 2Q20 primarily due to:
| · | Decrease in diluent purchases of 23.1 mbd, which in turn was primarily due to the decrease in heavy crude oil production and the use of naphtha produced at the Barrancabermeja refinery. |
| · | Lower purchase price for naphtha, in line with the drop in oil prices and a lower sale price, captured through sales and marketing management. |
| 16 |
Financial Results for the Segment
| Table 9: Income Statement - Upstream | ||||||||||
| Billion (COP) | 2Q 2020 | 2Q 2019 | ∆ ($) | ∆ (%) | 6M 2020 | 6M 2019 | ∆ ($) | ∆ (%) | ||
| Total revenue | 6,022 | 13,532 | (7,510) | (55.5%) | 16,506 | 25,129 | (8,623) | (34.3%) | ||
| Depreciation, amortization and depletion | 1,541 | 1,422 | 119 | 8.4% | 3,043 | 2,764 | 279 | 10.1% | ||
| Variable costs | 3,427 | 5,097 | (1,670) | (32.8%) | 8,476 | 9,711 | (1,235) | (12.7%) | ||
| Fixed costs | 2,171 | 2,471 | (300) | (12.1%) | 4,556 | 4,689 | (133) | (2.8%) | ||
| Total cost of sales | 7,139 | 8,990 | (1,851) | (20.6%) | 16,075 | 17,164 | (1,089) | (6.3%) | ||
| Gross (loss) income | (1,117) | 4,542 | (5,659) | (124.6%) | 431 | 7,965 | (7,534) | (94.6%) | ||
| Operating and exploratory expenses | (526) | 665 | (1,191) | (179.1%) | 104 | 1,056 | (952) | (90.2%) | ||
| Operating income | (591) | 3,877 | (4,468) | (115.2%) | 327 | 6,909 | (6,582) | (95.3%) | ||
| Financial result, net | (371) | 182 | (553) | (303.8%) | (521) | 165 | (686) | (415.8%) | ||
| Share of profit of companies | 38 | 67 | (29) | (43.3%) | (14) | 104 | (118) | (113.5%) | ||
| Income before income tax | (924) | 4,126 | (5,050) | (122.4%) | (208) | 7,178 | (7,386) | (102.9%) | ||
| Provision for income tax | 302 | (1,335) | 1,637 | (122.6%) | 103 | (2,352) | 2,455 | (104.4%) | ||
| Consolidated net income | (622) | 2,791 | (3,413) | (122.3%) | (105) | 4,826 | (4,931) | (102.2%) | ||
| Non-controlling interest | 20 | 15 | 5 | 33.3% | 41 | 30 | 11 | 36.7% | ||
| Net income attributable to owners of Ecopetrol before impairment | (602) | 2,806 | (3,408) | (121.5%) | (64) | 4,856 | (4,920) | (101.3%) | ||
| (Expense) income from impairment of long-term assets | - | - | - | - | (518) | - | (518) | - | ||
| Deferred tax on impairment | - | - | - | - | 151 | - | 151 | - | ||
| Net income attributable to owners of Ecopetrol | (602) | 2,806 | (3,408) | (121.5%) | (431) | 4,856 | (5,287) | (108.9%) | ||
| EBITDA* | (278) | 5,486 | (5,764) | (105.1%) | 2,206 | 9,969 | (7,763) | (77.9%) | ||
| EBITDA Margin | (4.6%) | 40.5% | - | (45.1%) | 13.4% | 39.7% | - | (26.3%) | ||
*
*Ebitda adjusted to exclude the effect of the Voluntary Retirement Plan would be COP $146 billion in 2Q20 and COP 2,338 billion in 6M20.
Revenues in 2Q20 decreased as compared to 2Q19, primarily as a result of the health emergency, reflected mainly in the decline of the crude oil price basket and lower sales volumes associated with the decrease in demand. This impact was partially offset by a higher devaluation of the peso against the dollar.
Cost of sales for 2Q20 decreased versus 2Q19, as a result of:
| · | Reduction in costs mainly due to the optimization plan adopted by the Company and a decrease in E&P activities, mainly due to: i) less subsoil activity; ii) fewer contracted services; and, iii) decrease in materials and supplies. |
| · | Lower purchase cost due to the drop in oil prices and a decrease in the volume of diluent, partially offset by i) a higher volume of crude oil from third parties (new commercial agreements), and ii) the effect of a higher average exchange rate. Additionally, crude oil inventories were consumed. |
| · | The aforementioned was partially offset by an increase in transport costs mainly due to: i) higher exchange rate, ii) updated pipeline tariffs, which in turn was partially offset by a) non-execution of reversal cycles in the Bicentenario Pipeline given the increase in operational days of the Caño Limón Pipeline and b) lower volumes transported. |
Operating expenses (net of revenues) for 2Q20 decreased as compared to 2Q19, mainly due to the recognition of revenues associated with Hocol's business combination. This was partially offset by the recognition of the voluntary retirement plan and the contributions provided to support the communities in response to the COVID-19 health emergency.
Exploration expenditures in 2Q20 decreased as compared to 2Q19, mainly due to a decrease in dry wells recognition and displacement in the drilling of wells in the Mid Magdalena Valley basin, as well as in the Colombian Piedemonte.
Net financial result (non-operating) for 2Q20 decreased as compared to 2Q19, mainly due to: i) the recognition of interest expense associated with the acquisition of new debt, ii) the effect of the exchange rate on the financial interest of US-dollar denominated debt, due to the devaluation of the peso against the dollar, iii) lower portfolio yields and, iv) the valuation effect associated to the segment’s net passive position in USD.
| 17 |
| 2. | MIDSTREAM |
| Table 10: Transported Volumes - Ecopetrol Group | ||||||||
| mbd | 2Q 2020 | 2Q 2019 | ∆ (%) | 6M 2020 | 6M 2019[5] | ∆ (%) | ||
| Crude Oil | 756.4 | 875.0 | (13.6%) | 814.6 | 875.9 | (7.0%) | ||
| Products | 170.1 | 280.6 | (39.4%) | 216.7 | 269.6 | (19.6%) | ||
| Total | 926.5 | 1,155.6 | (19.8%) | 1,031.3 | 1,145.5 | (10.0%) | ||
Crude oil: Crude oil volumes transported during 2Q20 decreased by 13.6% versus the same period of 2019, mainly as a result of lower domestic production.
Decreased maintenance times for repairs in the Caño Limón - Coveñas Oil Pipeline allowed a higher number of operational days in this line and no need to perform reversal cycles in the Bicentenario Oil Pipeline during 2020. As a result, during 2Q20, volumes transported through the Ayacucho- Coveñas 16" and 24" pipelines increased by 19% (equivalent to 21.08 mbd) as compared to the same period of 2019. Approximately 81.2% of the crude oil volume transported during the quarter was owned by the Ecopetrol Group.
In 2Q20, the oil pipeline network continued to suffer disruptions caused by third parties. During the quarter, Ecopetrol’s infrastructure suffered 13 attacks, 7% less than in 2Q19 and 28% less than in 1Q20. However, the installation of illicit valves in the crude oil transport systems increased by 13.6%, and decreased by 30.4% in the refined products systems, for a total of 309 illicit valves intercepted during the second quarter of 2020
Commercial initiatives: due to current market conditions, midstream segment companies offered relief alternatives to clients through:
| · | Financing of up to 50% of the invoice for a term of up to six months. It is important to note that the financing does not affect the segment's income. The Ecopetrol Group, which represents over 80% of the total volume transported, did not participate on this arrangement. |
| · | Cenit, Ocensa, Oleoducto de los Llanos (ODL) and Oleoducto de Colombia (ODC) offered conditioned discounts based on the exchange rate, Brent price and volumes transported. The implementation of this mechanism resulted in discounts between 5.5% and 10% in Cenit, ODL and ODC during 2Q20. This relieves gave discounts at Cenit and ODC during April and May, and during April in ODL. Ecopetrol S.A. benefited from these discounts. |
| · | In specific cases, and in order to provide necessary relief to transporters with current ship-or-pay contracts, volume requirements were modified, which are expected to be offset with additional volumes in the coming months. Nonetheless, the measure did not have a financial impact on 2Q20, given that transporters paid their ship-or-pay contract fees in full. |
Refined Products: in 2Q20, transport of refined products decreased by 39.4% compared to 2Q19, primarily attributed to the effect of the mandatory lockdown and mobility restrictions measures in response to the COVID-19 pandemic. The most affected corridor during this lockdown period has been Galán - Sebastopol, since it supplies the country's major consumption centers. Nevertheless, during June the Galán-Bucaramanga corridor showed a recovery in transported volumes, given that the border area’s usual demand has been met with a higher share of local fuel. Approximately 38.1% of the volume of refined products transported through the multipurpose system belonged to Ecopetrol Group.
[5] 2019 volumes adjusted to reflect changes in the volumetric quality compensation, associated to the closing of volumetric balances.
| 18 |
Cost per Barrel Transported
| Table 11: Cost per Transported Barrel - Ecopetrol Group | ||||||||||
| USD/Bl | 2Q 2020 | 2Q 2019 | ∆ (%) | 6M 2020 | 6M 2019 | ∆ (%) | % USD | |||
| Cost per Transported Barrel | 3.04 | 3.08 | (1.3%) | 2.97 | 3.00 | (1.0%) | 6.5% | |||
Decrease of -0.03 USD/Bl in 2Q20 versus 2Q19 is mainly explained by:
Cost effect (-0.19 USD/bl): the result of optimizations, delay of low risk maintenance activities and lower variable costs due to lower transported volumes.
Volume effect (+0.64 USD/bl): resulting from lower transported volume: i) refined: -110.5 mbd due to decreased fuel demand as a result of the lockdown measures associated with the COVID -19 crisis, and ii ) crudes: -118.6 mbd due to lower production in line with market conditions.
Exchange rate effect (-0.48 USD/bl): higher exchange rate of +605 pesos/dollar when re-stating pesos denominated costs into dollars.
Financial Results for the Segment
| Table 12: Income Statement - Midstream | ||||||||||
| Billion (COP) | 2Q 2020 | 2Q 2019 | ∆ ($) | ∆ (%) | 6M 2020 | 6M 2019 | ∆ ($) | ∆ (%) | ||
| Total revenue | 2,962 | 3,212 | (250) | (7.8%) | 6,147 | 6,264 | (117) | (1.9%) | ||
| Depreciation, amortization and depletion | 319 | 309 | 10 | 3.2% | 636 | 604 | 32 | 5.3% | ||
| Variable costs | 122 | 178 | (56) | (31.5%) | 297 | 342 | (45) | (13.2%) | ||
| Fixed costs | 351 | 381 | (30) | (7.9%) | 751 | 734 | 17 | 2.3% | ||
| Total cost of sales | 792 | 868 | (76) | (8.8%) | 1,684 | 1,680 | 4 | 0.2% | ||
| Gross income | 2,170 | 2,344 | (174) | (7.4%) | 4,463 | 4,584 | (121) | (2.6%) | ||
| Operating expenses | 188 | 187 | 1 | 0.5% | 359 | 182 | 177 | 97.3% | ||
| Operating income | 1,982 | 2,157 | (175) | (8.1%) | 4,104 | 4,402 | (298) | (6.8%) | ||
| Financial result, net | (160) | (182) | 22 | (12.1%) | 438 | (353) | 791 | (224.1%) | ||
| Share of profit of companies | (3) | 1 | (4) | (400.0%) | (2) | - | (2) | - | ||
| Income before income tax | 1,819 | 1,976 | (157) | (7.9%) | 4,540 | 4,049 | 491 | 12.1% | ||
| Provision for income tax | (578) | (668) | 90 | (13.5%) | (1,394) | (1,351) | (43) | 3.2% | ||
| Consolidated net income | 1,241 | 1,308 | (67) | (5.1%) | 3,146 | 2,698 | 448 | 16.6% | ||
| Non-controlling interest | (270) | (295) | 25 | (8.5%) | (601) | (623) | 22 | (3.5%) | ||
| Net income attributable to owners of Ecopetrol before impairment | 971 | 1,013 | (42) | (4.1%) | 2,545 | 2,075 | 470 | 22.7% | ||
| (Expense) income from impairment of long-term assets | 3 | - | 3 | - | 3 | 1 | 2 | 200.0% | ||
| Deferred tax of impairment | (1) | - | (1) | - | (1) | - | (1) | - | ||
| Net income attributable to owners of Ecopetrol | 973 | 1,013 | (40) | (3.9%) | 2,547 | 2,076 | 471 | 22.7% | ||
| EBITDA* | 2,327 | 2,501 | (174) | (7.0%) | 4,817 | 5,073 | (256) | (5.0%) | ||
| EBITDA Margin | 78.6% | 77.9% | - | 0.7% | 78.4% | 81.0% | - | (2.6%) | ||
| * Ebitda adjusted to exclude the effect of the Voluntary Retirement Plan would have been to COP $2.336 billion in 2Q20 and COP 4.826 billion in 6M20. | ||||||||||
Revenues for 2Q20 decreased in comparison to 2Q19, mainly due to: i) lower transported volumes of crude and refined products, ii) the non-recognition of disputed ship-or-pay agreements in compliance with IFRS 15; partially offset by a higher average exchange rate versus 2Q19.
| 19 |
Cost of sales for 2Q20 decreased in comparison to 2Q19, primarily as a result of: i) lower variable costs due to a decrease in transported volumes and, ii) the optimization strategy implemented as a response of the new price scenario. Operating expenses were stable when compared to 2Q19.
The (non-operating) financial result of 2Q20 decreased as compared to 2Q19, primarily as a result of the exchange rate effect on the segment’s net active US dollars position and the settlement of foreign exchange hedges.
| 3. | DOWNSTREAM |
The performance of the downstream segment was adversely affected by the unfavorable environment market generated by the Covid-19 crisis, which depressed demand for refined products, as well as the prices in the international markets. During 2Q20, the refineries reached a consolidated throughput of 254.6 mbd and a combined gross margin of 6.2 USD/bl, compared to 378.4 mbd and 8.9 USD/bl in 2Q19. Nonetheless, the gradual recovery seen in demand has allowed the refineries increase their throughput levels since May. In June, the consolidated throughput reached 289.4 mbd, exhibiting a 28% growth versus the results of April, where throughput reached 225.6 mbd, the lowest year to date.
Cartagena Refinery
After the successful completion of corrective maintenance in the Hydrogen Unit in May, Cartagena refinery exhibited operational stability across all of its units. Operations were adjusted in response to the domestic and international demand conditions, performing a slow and positive recovery in throughput, utilization factor and the gross refining margin during 2Q20. The refinery’s throughput at the end of June was 126.3 mbd.
| Table 13: Throughput, Utilization Factor, Production and Refining Margin | ||||||||
| Cartagena Refinery | 2Q 2020 | 2Q 2019 | ∆ (%) | 6M 2020 | 6M 2019 | ∆ (%) | ||
| Throughput* (mbod) | 116.8 | 149.6 | (21.9%) | 131.6 | 152.0 | (13.4%) | ||
| Utilization Factor (%) | 65.1% | 81.7% | (20.3%) | 66.9% | 85.1% | (21.4%) | ||
| Production (mbod) | 110.8 | 143.8 | (22.9%) | 124.4 | 146.3 | (15.0%) | ||
| Gross Margin (USD/Bl) | 5.4 | 6.6 | (18.2%) | 7.3 | 8.8 | (17.0%) | ||
* Corresponds to volumes effectively loaded, not those received.
Barrancabermeja Refinery
During 2Q20, Barrancabermeja refinery’s operating performance was stable; its operations were adjusted according to domestic demand as a result of the measures adopted by the Covid-19 crisis. Since May, a gradual recovery of the throughput, the utilization factor, and the production was observed. The refinery throughput at the end of June was 163.1 mbd, a 42% recovery compared to the minimum observed in April. The low demand for the quarter, as well as the strong weakening in fuel prices, deteriorated the gross refining margin in the period.
| Table 14: Throughput, Utilization Factor, Production and Refining Margin | ||||||||
| Barrancabermeja Refinery | 2Q 2020 | 2Q 2019 | ∆ (%) | 6M 2020 | 6M 2019 | ∆ (%) | ||
| Throughput* (mbod) | 137.7 | 228.8 | (39.8%) | 168.4 | 212.2 | (20.6%) | ||
| Utilization Factor (%) | 49.3% | 85.5% | (42.3%) | 61.9% | 80.4% | (23.0%) | ||
| Production (mbod) | 140.3 | 231.7 | (39.4%) | 171.2 | 213.7 | (19.9%) | ||
| Gross Margin (USD/Bl) | 6.8 | 10.3 | (34.0%) | 8.6 | 10.4 | (17.3%) | ||
* Corresponds to volumes actually loaded, not those received.
Esenttia
Throughout the year, Esenttia has exhibited reliability in its operations, reaching an increase of 2% in production in 2020 versus the same period of 2019. Despite challenging market conditions due to Covid-19, Esenttia improved its commercial positioning in the United States and Central America markets. Additionally, Esenttia led initiatives to assist in the fight against the pandemic, in alliance with Ecopetrol Group companies and Colombian plastics manufacturing companies, ensuring the delivery of protective and treatment supplies such as valves, masks and other protection elements.
| 20 |
Refining Cash Cost
| Table 15: Refining Cash Cost* - Ecopetrol Group | ||||||||||
| USD/Bl | 2Q 2020 | 2Q 2019 | ∆ (%) | 6M 2020 | 6M 2019 | ∆ (%) | % USD | |||
| Refining Cash Cost | 5.82 | 4.64 | 25.4% | 5.05 | 4.74 | 6.5% | 15.0% | |||
* Includes Barrancabermeja, Cartagena and Esenttia refineries
The refining cash flow cost increased by 1.2 USD/Bl barrel in 2Q20 versus that of 2Q19, primarily as a result of:
Volume effect (+2 .2 USD/bl): increased unit cost due to smaller throughputs of crude in the Barrancabermeja refinery (-91 mbd) and the Cartagena refinery (-33 mbd) resulting from operational adjustments responding to the reduced demand due to COVID-19.
Exchange rate effect (-1.0 USD/bl): higher exchange rate of +605 pesos/dollar when re-stating pesos denominated costs into dollars.
Financial Results for the Segment
| Table 16: Income Statement - Downstream | ||||||||||
| Billion (COP) | 2Q 2020 | 2Q 2019 | ∆ ($) | ∆ (%) | 6M 2020 | 6M 2019 | ∆ ($) | ∆ (%) | ||
| Total revenue | 4,106 | 10,225 | (6,119) | (59.8%) | 12,394 | 18,777 | (6,383) | (34.0%) | ||
| Depreciation, amortization and depletion | 376 | 321 | 55 | 17.1% | 709 | 655 | 54 | 8.2% | ||
| Variable costs | 3,503 | 9,204 | (5,701) | (61.9%) | 10,820 | 16,895 | (6,075) | (36.0%) | ||
| Fixed costs | 397 | 485 | (88) | (18.1%) | 979 | 959 | 20 | 2.1% | ||
| Total cost of sales | 4,276 | 10,010 | (5,734) | (57.3%) | 12,508 | 18,509 | (6,001) | (32.4%) | ||
| Gross income | (170) | 215 | (385) | (179.1%) | (114) | 268 | (382) | (142.5%) | ||
| Operating expenses | 397 | 291 | 106 | 36.4% | 787 | 584 | 203 | 34.8% | ||
| Operating income (loss) | (567) | (76) | (491) | 646.1% | (901) | (316) | (585) | 185.1% | ||
| Financial result, net | (68) | (391) | 323 | (82.6%) | (1,182) | (548) | (634) | 115.7% | ||
| Share of profit of companies | 42 | 4 | 38 | 950.0% | 93 | 7 | 86 | 1,228.6% | ||
| Loss before income tax | (593) | (463) | (130) | 28.1% | (1,990) | (857) | (1,133) | 132.2% | ||
| Provision for income tax | 273 | 131 | 142 | 108.4% | 658 | 157 | 501 | 319.1% | ||
| Consolidated net income | (320) | (332) | 12 | (3.6%) | (1,332) | (700) | (632) | 90.3% | ||
| Non-controlling interest | (27) | 0 | (27) | - | (64) | 0 | (64) | - | ||
| Net income attributable to owners of Ecopetrol before impairment | (347) | (332) | (15) | 4.5% | (1,396) | (700) | (696) | 99.4% | ||
| (Expense) income from impairment of long-term assets | 1 | 1 | 0 | 0.0% | (689) | 1 | (690) | (69,000.0%) | ||
| Deferred tax of impairment | 0 | 0 | 0 | - | 127 | 0 | 127 | - | ||
| Net loss attributable to owners of Ecopetrol | (346) | (331) | (15) | 4.5% | (1,958) | (699) | (1,259) | 180.1% | ||
| EBITDA* | (53) | 363 | (416) | (114.6%) | 230 | 583 | (353) | (60.5%) | ||
| EBITDA Margin | -1.3% | 3.6% | - | (4.9%) | 1.9% | 3.1% | - | (1.2%) | ||
*
*Ebitda adjusted to exclude the effect of the Voluntary Retirement Plan amounts to COP 21 billion in 2Q20 and COP 262 billion in 6M20.
Revenues in 2Q20 decreased in comparison to 2Q19 mainly because of the lower volumes sold and lower prices in line with market conditions. This effect was partially offset by a positive impact from the average exchange rate, the income generated by Invercolsa and Esenttia’s results. The latter stands out given its positive operating performance and ability to benefit from a favorable environment in the petrochemical sector.
| 21 |
Cost of sales decreased in 2Q20 as compared to 2Q19, primarily attributable to: i) lower feedstock price; ii) lower throughput due to reduced demand; and iii) lower volume and price of imported products, mainly diesel and gasolines. Additionally, there were two negative effects on the costs of sales: i) higher average exchange rate; and ii) A consumption of inventories combined with its valuation effect.
Operating expenses increased in 2Q20 as compared to 2Q19, mainly due to: i) expenditures in the period associated with temporary units shutdowns as a result of the COVID-19 health emergency and the decline in product demand;, ii) recognition of the voluntary retirement plan; and iii ) the consolidation of Invercolsa.
The (non-operating) financial results for 2Q20 as compared to 2Q19 were positive due to the effect of the revaluation of the peso against the US dollar at closing rates on the segment’s net passive position, which offsets the impact of interest on US-denominated debt.
IV. Environment, Social Investment and Corporate Governance
COVID-19 Health Emergency
In order to address the challenges generated by the COVID-19 crisis, the Board of Directors, in addition to its ordinary sessions, has been conducting extraordinary weekly meetings. Seventeen of these meetings have been held to follow up on the current emergency plans, on topics related to the health emergency resulting from the pandemic and financial contingencies, including monitoring of prices and global macroeconomy.
These extraordinary sessions have allowed the Board to remain suitably informed regarding the consequences of the health emergency on the Company to guide the Company’s administration appropriately and with the timeliness required by the current situation.
As of March 13, the COVID-19 Crisis Committee began meeting, which has provided suitable protocols and guidelines that have been deployed for the prevention, control and mitigation of the effects of the pandemic on employees and has been assuring the continuity of the company's operations during the health emergency.
Among the actions taken to confront the challenges caused by the pandemic, the following stand out:
| · | Drafting and implementation of a company-wide COVID-19 Biosecurity Plan, in compliance with the provisions set forth in Resolutions 0666, 0748 and 0797 of 2020 issued by the Ministry of Health and Social Protection. This document provides guidelines, actions and recommendations to identify and reduce the transmission of the virus, reduce its effects on employees, as well as minimize the operational repercussions that could come about as a result of the coronavirus pandemic. |
| · | Active tracing and identification of positive COVID-19 cases within Ecopetrol's operations, with 11,218 Polymerase Chain Reaction (PCR) tests carried out as of July 15, 2020. |
| · | Start of operations of the molecular biology laboratory at the Barrancabermeja Polyclinic in order to carry out COVID-19 diagnostic tests in the Mid Magdalena region. |
| · | Remote mental health and ergonomics assistance provided for Ecopetrol Group employees. |
| · | Management of epidemiological alerts in the different geographical areas where the Company operates. |
Ecopetrol has maintained an ongoing relationship and dialogue with formal institutions and the communities where it operates, in order to provide timely and transparent information in a manner regarding prevention and containment measures taken by the Company regarding COVID-19, as well as its contributions to confront the current economic and social emergency.
“Apoyo País” Program to confront the pandemic
To date, Ecopetrol has approved nearly COP 88 billion for the development of projects to support the actions to deal with the COVID-19 emergency, which include: i) humanitarian aid, delivery of personal protective equipment and cleaning supplies to territorial entities, ii) aid to vulnerable populations (relief for the payment of energy bills, voluntary donations), iii) strengthening the healthcare system (medical equipment, PCR tests), iv) strategic alliances with other companies for the production of medical protective clothing, medical equipment, glycerinated alcohol, v) technological support to the national government with a COVID-19 procurement platform and the vi) Development of the report and tracing app denominated CoronApp. Additionally, the ratification of agreements with scientific institutions for the development of innovations on medical equipment to combat the pandemic are currently underway.
| 22 |
Social and Environmental Investment
In the second quarter of 2020, Ecopetrol allocated resources for investment in social and environmental projects and initiatives included in the Sustainable Development Portfolio valued at COP 39,388 million pesos. Cumulative investments during the first half of 2020 amounted to COP 56,277 million in projects targeting increased access to public services, education, sports and healthcare, strengthening of institutional and community institutions, public and community infrastructure, fostering inclusive rural development and entrepreneurship and business growth. The above represents a 98.6% increase versus the same period of 2019 (COP 28,339 million pesos).
In May, the Ecopetrol Group was assigned 13 new projects to be implemented through the tax project initiative for COP 107,227 million pesos corresponding to the 2019 tax year, in roadway infrastructure, drinkable water and public education. The Ecopetrol Group is the largest participant in this mechanism with 48% of the total assigned quota.
Communities
Within the agenda of constructing relationships of trust with ethnic groups, the activities carried out with the U´wa indigenous community located in the Sarare region are worth to be mentioned. Opportunities for dialogue and exchange of knowledge were held, wherein the benefits provided by the industry were studied in depth and the Energy Transition Program and the Castilla Solar Park Project were presented. The National Hydrocarbons Agency and the Ethnic Team of the National Planning Department also participated in these spaces.
Water
Ecopetrol reused 21.9 million cubic meters of water (1.52 million barrels per day), which means that the Company did not capture and discharge this volume, thus reducing the pressure on water resources. This amount shows a slight decrease of less than 1% compared to the 2Q of the previous year. These results were achieved through the implementation of good practices in the reuse and recycling of water in the Barrancabermeja and Cartagena refineries, as well as in the production fields. In the first half of the year, over 47.6 million cubic meters were reused, equivalent to 65% of the total water required to operate (reused water/total water required).
Additionally, in 2Q20, 789 thousand cubic meters of treated production water (54,500 barrels per day) were reused in agricultural and livestock activities in the Área de Sostenibilidad Agroenergética (ASA) near the Castilla Field. This represents an increase of approximately 493% compared to 2Q19.
Decarbonization
In 2Q20, Ecopetrol Group achieved a verified reduction of 509,670 tons of CO2 equivalent by Ruby Canyon Engineering, the international auditing firm specializing in the validation and verification of emission reductions, which accounts for an accumulated reduction of 687,769 tons of CO2 in the first semester of 2020. The verified reductions correspond to the second accreditation period of the projects "Despacho técnico económico en la GRB -456,892 tCO2e" (Technical and economic dispatching of the Barrancabermeja refinery) and “Suministro de energía eléctrica in situ a través de la generación con gas asociado para el campo Casabe Peñas Blancas - 15,353 tCO2e” (on-site electricity supply through associated gas generation in the abovementioned field). And in Bioenergy, “Cogeneración de electricidad a partir de biomasas -37,425 tCO2e” (electricity cogeneration from biomass).
| 23 |
Renewable Energy
In line with its target to incorporate 300 MW of renewable energy by 2022, Ecopetrol received six bids for the construction of the second solar park - San Fernando 50 MW, in the municipality of Castilla La Nueva in Meta, through a PPA (Power Purchase Agreement). The final contract is expected to be signed by August, with its entry into service expected in 2Q21. Additionally, progress continues on other projects for an additional 100 MW by solar generation, expected to be awarded during the second half of 2020.
Additionally, the Castilla Solar Park (21 MW) generated approximately 2.1 GWh through renewable energy production operations in the Orinoquía area.
In terms of wind generation, prospects have been identified for 80 MW by 2022 in the Atlantic Coast and Huila. In the second half of 2020, the necessary wind measurements will begin in order to evaluate the generation potential on the Atlantic Coast, adjacent to the operations of the Cartagena refinery.
Corporate Responsibility
This year, Ecopetrol participated in the Private Socially Responsible Investment Index[6], placing among the top 10 most recognized companies for their social investment, and among the top 25 that carry out the most private social investment in the country.
In observance of the United Nations Guiding Principles on Business and Human Rights, Ecopetrol completed the assessment of human rights risks for 10 municipalities of the Mid Magdalena region where it operates, and shared the results with the operational areas in order to define a risk prevention and mitigation plan.
Corporate governance
Corporate governance efforts have been concentrated towards strengthening the practices that enable the Company´s virtual operation. Such measures include the electronic signatures in minutes and documents, the use of secure platforms and the adequate administration of confidential information.
V. Quarterly Results Presentation
Ecopetrol’s management will hold two online presentations to review the second quarter of 2020 results and the update of the Business Plan 2020-2022:
Spanish English
August 5th, 2020 August 5th, 2020
8:00 a.m. Colombia 10:00 a.m. Colombia
9:00 a.m. Nueva York 11:00 a.m. New York
The Q&A will be done in writing through the webcast at the following links:
https://onlinexperiences.com/scripts/Server.nxp?LASCmd=AI:4;F:QS!10100&ShowUUID=3B48F7D0-2CCC-4D59-901E-790CD279DD8A&LangLocaleID=1034 (Spanish)
6 This index is developed by Jaime Arteaga y Asociados, Semana Sostenible and the United States Agency for International Development in Colombia (USAID). It takes into account variables such as alignment, management, synapse, targeting and recognition, which explain corporate private social investment and corporate social responsibility activities.
| 24 |
https://onlinexperiences.com/scripts/Server.nxp?LASCmd=AI:4;F:QS!10100&ShowUUID=BF09E60F-C83D-4833-B28C-3B5E12042917 (English)
At the end of the presentation there will be a question and answer session, which must be accessed through the telephone lines on this link.
Please verify that your browser allows normal operation of the online presentation. We recommend the latest versions of Internet Explorer, Google Chrome and Mozilla Firefox.
The press release, the presentation, the webcast and the repetition of the call will be available on the Ecopetrol website: www.ecopetrol.com.co.
-----------------------------
Contact Information:
Juan Pablo Crane De Narváez
Head of Capital Markets
Telephone: +571-234-5190 - Email: investors@ecopetrol.com.co
Jorge Mauricio Tellez
Media Relations (Colombia)
Telephone: +571-234-4329 - Email: mauricio.tellez@ecopetrol.com.co
| 25 |
Ecopetrol Group Appendices
Table 1: Income Statement – Ecopetrol Group
| Billion (COP) | 2Q 2020 | 2Q 2019 | ∆ (%) | 6M 2020 | 6M 2019 | ∆ (%) | ||
| Revenue | ||||||||
| Local | 4,010 | 8,676 | (53.8%) | 11,901 | 16,497 | (27.9%) | ||
| Exports | 4,432 | 9,633 | (54.0%) | 11,613 | 17,754 | (34.6%) | ||
| Total revenue | 8,442 | 18,309 | (53.9%) | 23,514 | 34,251 | (31.3%) | ||
| Cost of sales | ||||||||
| Depreciation, amortization and depletion | 2,236 | 2,052 | 9.0% | 4,388 | 4,023 | 9.1% | ||
| Variable depreciation, amortization and depletion | 1,491 | 1,377 | 8.3% | 2,946 | 2,677 | 10.0% | ||
| Fixed cost depreciation | 745 | 675 | 10.4% | 1,442 | 1,346 | 7.1% | ||
| Variable costs | 3,570 | 6,777 | (47.3%) | 10,266 | 12,893 | (20.4%) | ||
| Imported products | 913 | 3,597 | (74.6%) | 4,128 | 7,018 | (41.2%) | ||
| Local purchases | 967 | 2,819 | (65.7%) | 3,295 | 5,130 | (35.8%) | ||
| Hydrocarbon transportation services | 226 | 208 | 8.7% | 436 | 390 | 11.8% | ||
| Inventories and others | 1,464 | 153 | 856.9% | 2,407 | 355 | 578.0% | ||
| Fixed costs | 1,810 | 2,385 | (24.1%) | 4,249 | 4,531 | (6.2%) | ||
| Contracted services | 586 | 785 | (25.4%) | 1,370 | 1,420 | (3.5%) | ||
| Maintenance | 414 | 658 | (37.1%) | 1,006 | 1,218 | (17.4%) | ||
| Labor costs | 581 | 576 | 0.9% | 1,181 | 1,120 | 5.4% | ||
| Other | 229 | 366 | (37.4%) | 692 | 773 | (10.5%) | ||
| Total cost of sales | 7,616 | 11,214 | (32.1%) | 18,903 | 21,447 | (11.9%) | ||
| Gross income | 826 | 7,095 | (88.4%) | 4,611 | 12,804 | (64.0%) | ||
| Operating expenses | 2 | 1,138 | (99.8%) | 1,081 | 1,892 | (42.9%) | ||
| Administration expenses (net of other revenue) | (138) | 890 | (115.5%) | 903 | 1,583 | (43.0%) | ||
| Exploration and projects expenses | 140 | 248 | (43.5%) | 178 | 309 | (42.4%) | ||
| Operating income | 824 | 5,957 | (86.2%) | 3,530 | 10,912 | (67.7%) | ||
| Finance result, net | (599) | (391) | 53.2% | (1,265) | (776) | 63.0% | ||
| Foreign exchange, net | 46 | 43 | 7.0% | 33 | 86 | (61.6%) | ||
| Interest, net | (562) | (358) | 57.0% | (959) | (682) | 40.6% | ||
| Financial income/loss | (83) | (76) | 9.2% | (339) | (180) | 88.3% | ||
| Share of profit of companies | 77 | 72 | 6.9% | 77 | 233 | (67.0%) | ||
| Income before income tax | 302 | 5,638 | (94.6%) | 2,342 | 10,369 | (77.4%) | ||
| Income tax | (3) | (1,872) | (99.8%) | (633) | (3,546) | (82.1%) | ||
| Net income consolidated | 299 | 3,766 | (92.1%) | 1,709 | 6,823 | (75.0%) | ||
| Non-controlling interest | (277) | (280) | (1.1%) | (624) | (593) | 5.2% | ||
| Net income attributable to owners of Ecopetrol before impairment | 22 | 3,486 | (99.4%) | 1,085 | 6,230 | (82.6%) | ||
| (Expense) recovery for impairment long-term assets | 4 | 1 | 300.0% | (1,204) | 2 | (60,300.0%) | ||
| Deferred tax of impairment | (1) | 0 | - | 277 | 0 | - | ||
| Net income attributable to owners of Ecopetrol | 25 | 3,487 | (99.3%) | 158 | 6,232 | (97.5%) | ||
| EBITDA | 1,996 | 8,307 | (76.0%) | 7,253 | 15,665 | (53.7%) | ||
| EBITDA margin | 23.6% | 45.4% | (21.8%) | 30.8% | 45.7% | (14.9%) |
| 26 |
Table 2: Statement of Financial Situation / Balance Sheet – Ecopetrol Group
| Billion (COP) | June 30, 2020 | March 31, 2020 | ∆ (%) | |
| Current assets | ||||
| Cash and cash equivalents | 9,248 | 8,797 | 5.1% | |
| Trade and other receivables | 4,817 | 4,447 | 8.3% | |
| Inventories | 5,035 | 5,812 | (13.4%) | |
| Current tax assets | 3,094 | 1,664 | 85.9% | |
| Other financial assets | 3,886 | 807 | 381.5% | |
| Other assets | 1,849 | 2,134 | (13.4%) | |
| 27,929 | 23,661 | 18.0% | ||
| Non-current assets held for sale | 5 | 22 | (77.3%) | |
| Total current assets | 27,934 | 23,683 | 17.9% | |
| Non-current assets | ||||
| Investments in associates and joint ventures | 3,357 | 3,509 | (4.3%) | |
| Trade and other receivables | 691 | 682 | 1.3% | |
| Property, plant and equipment | 68,385 | 70,244 | (2.6%) | |
| Natural and environmental resources | 31,173 | 31,608 | (1.4%) | |
| Assets by right of use | 349 | 450 | (22.4%) | |
| Intangibles | 569 | 609 | (6.6%) | |
| Deferred tax assets | 10,770 | 11,556 | (6.8%) | |
| Other financial assets | 1,998 | 2,127 | (6.1%) | |
| Other assets | 1,924 | 2,066 | (6.9%) | |
| Total non-current assets | 119,216 | 122,851 | (3.0%) | |
| Total assets | 147,150 | 146,534 | 0.4% | |
| Current liabilities | ||||
| Loans and borrowings | 9,508 | 6,127 | 55.2% | |
| Trade and other payables | 12,980 | 16,783 | (22.7%) | |
| Provision for employees benefits | 1,867 | 2,000 | (6.7%) | |
| Current tax liabilities | 565 | 2,362 | (76.1%) | |
| Accrued liabilities and provisions | 762 | 745 | 2.3% | |
| Other liabilities | 937 | 894 | 4.8% | |
| Total current liabilities | 26,619 | 28,911 | (7.9%) | |
| Non-current liabilities | ||||
| Loans and borrowings | 44,162 | 40,328 | 9.5% | |
| Trade and other payables | 23 | 27 | (14.8%) | |
| Provision for employees benefits | 9,983 | 10,194 | (2.1%) | |
| Deferred tax liabilities | 643 | 580 | 10.9% | |
| Non-current taxes | 142 | 71 | 100.0% | |
| Accrued liabilities and provisions | 9,267 | 9,326 | (0.6%) | |
| Other liabilities | 674 | 717 | (6.0%) | |
| Total non-current liabilities | 64,894 | 61,243 | 6.0% | |
| Total liabilities | 91,513 | 90,154 | 1.5% | |
| Equity | ||||
| Equity attributable to owners of the company | 51,651 | 52,575 | (1.8%) | |
| Non-controlling interests | 3,986 | 3,805 | 4.8% | |
| Total equity | 55,637 | 56,380 | (1.3%) | |
| Total liabilities and equity | 147,150 | 146,534 | 0.4% |
| 27 |
Table 3: Free Cash Flow Statement – Ecopetrol Group
| Billion (COP) | 2Q 2020 | 2Q 2019 | 6M 2020 | 6M 2019 | ||
| Cash flow provided by operating activities | ||||||
| Net income attributable to owners of Ecopetrol S.A. | 25 | 3,487 | 158 | 6,232 | ||
| Adjustments to reconcile net income to cash provided by operating activities | ||||||
| Non-controlling interests | 277 | 279 | 624 | 593 | ||
| Income tax | 4 | 1,873 | 356 | 3,546 | ||
| Depreciation, depletion and amortization | 2,289 | 2,094 | 4,519 | 4,084 | ||
| Foreign exchange (gain) loss | (46) | (43) | (33) | (86) | ||
| Finance costs recognized in profit or loss | 873 | 669 | 1,572 | 1,310 | ||
| Dry wells | 86 | 109 | 100 | 154 | ||
| Loss (gain) on disposal of non-current assets | 9 | 30 | 4 | 42 | ||
| Impairment of current and non-current assets | 3 | 15 | 1,212 | 34 | ||
| Fair value (gain) on financial assets valuation | (89) | (43) | (42) | (88) | ||
| Gain on financial derivatives | (88) | 0 | (88) | 0 | ||
| Profit in acquisition of participations in joint operations | (1,439) | 0 | (1,439) | 0 | ||
| Gain on assets for sale | (1) | 0 | (1) | 0 | ||
| (Gain) loss on share of profit of associates and joint ventures | (77) | (72) | (77) | (233) | ||
| Exchange difference on export hedges and ineffectiveness | 98 | 346 | 225 | 684 | ||
| Others minor items | (4) | 2 | 9 | 1 | ||
| Net changes in operating assets and liabilities | (1,369) | 117 | (2,790) | (1,658) | ||
| Income tax paid | (2,799) | (2,860) | (3,984) | (3,778) | ||
| Cash provided by operating activities | (2,248) | 6,003 | 325 | 10,837 | ||
| Cash flows from investing activities | ||||||
| Investment in property, plant and equipment | (1,160) | (728) | (1,983) | (1,328) | ||
| Investment in natural and environmental resources | (1,223) | (1,473) | (3,842) | (2,780) | ||
| Payments for intangibles | (9) | (2) | (20) | (33) | ||
| Sale of assets held for sale and equity instruments | 1 | 0 | 0 | 0 | ||
| (Purchases) sales of other financial assets | (3,065) | 286 | (572) | 984 | ||
| Interest received | 91 | 121 | 180 | 250 | ||
| Dividends received | 72 | 34 | 72 | 34 | ||
| Proceeds from sales of assets | 1 | 2 | 9 | 26 | ||
| Net cash used in investing activities | (5,292) | (1,760) | (6,156) | (2,847) | ||
| Cash flows from financing activities | ||||||
| Proceeds (repayment of) from borrowings | 11,184 | (478) | 11,128 | (698) | ||
| Interest paid | (591) | (494) | (1,055) | (969) | ||
| Lease Payments | (91) | (155) | (171) | (144) | ||
| Dividends paid | (1,911) | (6,643) | (2,337) | (6,975) | ||
| Net cash used in financing activities | 8,591 | (7,770) | 7,565 | (8,786) | ||
| Exchange difference in cash and cash equivalents | (600) | 113 | 438 | 8 | ||
| Net (decrease) increase in cash and cash equivalents | 451 | (3,414) | 2,172 | (788) | ||
| Cash and cash equivalents at the beginning of the period | 8,797 | 8,938 | 7,076 | 6,312 | ||
| Cash and cash equivalents at the end of the period | 9,248 | 5,524 | 9,248 | 5,524 | ||
| Non-cash transactions | ||||||
| Recognition of assets for right of use and liabilities for lease | 21 | 564 | 36 | 566 | ||
| Trade finance transactions | 303 | 0 | 469 | 0 | ||
| 28 |
Table 4: EBITDA Reconciliation – Ecopetrol Group
| Billion (COP) | 2Q 2020 | 2Q 2019 | 6M 2020 | 6M 2019 | ||
| Net income attributable to the owners of Ecopetrol | 25 | 3,487 | 158 | 6,232 | ||
| (+) Depreciation, amortization and depletion | 2,289 | 2,094 | 4,519 | 4,084 | ||
| (+/-) Impairment of long-term assets | (4) | (1) | 1,204 | (2) | ||
| (+/-) Gain in business combinations | (1,439) | 0 | (1,439) | 0 | ||
| (+/-) Financial result, net | 599 | 391 | 1,265 | 776 | ||
| (+) Income tax | 4 | 1,872 | 356 | 3,546 | ||
| (+) Taxes and others | 245 | 184 | 566 | 436 | ||
| (+/-) Non-controlling interest | 277 | 280 | 624 | 593 | ||
| Consolidated EBITDA* | 1,996 | 8,307 | 7,253 | 15,665 |
* Ebitda adjusted to exclude the effect of the Voluntary Retirement Plan expense amounts to COP 2,168 billion in 2Q20 and COP 7,425 billion in 6M20.
Table 5: EBITDA Reconciliation by Segment (2Q 2020)
| Billion (COP) | Upstream | Downstream | Midstream | Eliminations | Consolidated | |
| Net income attributable to the owners of Ecopetrol | (602) | (346) | 973 | 0 | 25 | |
| (+) Depreciation, amortization and depletion | 1,548 | 415 | 326 | 0 | 2,289 | |
| (+/-) Impairment of long-term assets | 0 | (1) | (3) | 0 | (4) | |
| (+/-) Gain in business combinations | (1,373) | (66) | 0 | 0 | (1,439) | |
| (+/-) Financial result, net | 371 | 68 | 160 | 0 | 599 | |
| (+) Income tax | (302) | (273) | 579 | 0 | 4 | |
| (+) Other taxes | 100 | 123 | 22 | 0 | 245 | |
| (+/-) Non-controlling interest | (20) | 27 | 270 | 0 | 277 | |
| Consolidated EBITDA | (278) | (53) | 2,327 | 0 | 1,996 |
Appendices, Ecopetrol S.A.
Following are the Income Statement and Statement of Financial Position of Ecopetrol S.A.
Table 6: Income Statement
| Billion (COP) | 2Q 2020 | 2Q 2019 | ∆ (%) | 6M 2020 | 6M 2019 | ∆ (%) | ||
| Local | 3,761 | 8,488 | (55.7%) | 11,153 | 16,254 | (31.4%) | ||
| Exports | 3,410 | 7,473 | (54.4%) | 9,034 | 13,859 | (34.8%) | ||
| Total revenue | 7,171 | 15,961 | (55.1%) | 20,187 | 30,113 | (33.0%) | ||
| Variable costs | 5,652 | 8,479 | (33.3%) | 14,225 | 16,673 | (14.7%) | ||
| Fixed costs | 2,628 | 2,968 | (11.5%) | 5,655 | 5,604 | 0.9% | ||
| Total cost of sales | 8,280 | 11,447 | (27.7%) | 19,880 | 22,277 | (10.8%) | ||
| Gross income | (1,109) | 4,514 | (124.6%) | 307 | 7,836 | (96.1%) | ||
| Operating expenses | (408) | 684 | (159.6%) | 189 | 1,124 | (83.2%) | ||
| Operating income | (701) | 3,830 | (118.3%) | 118 | 6,712 | (98.2%) | ||
| Financial income/loss | (288) | (405) | (28.9%) | (2,235) | (721) | 210.0% | ||
| Share of profit of companies | 706 | 1,169 | (39.6%) | 1,971 | 2,203 | (10.5%) | ||
| Income before income tax | (283) | 4,594 | (106.2%) | (146) | 8,194 | (101.8%) | ||
| Income tax | 308 | (1,107) | (127.8%) | 637 | (1,962) | (132.5%) | ||
| Net income attributable to owners of Ecopetrol | 25 | 3,487 | (99.3%) | 491 | 6,232 | (92.1%) | ||
| Impairment | 0 | 0 | - | (468) | 0 | - | ||
| Deferred tax of impairment | 0 | 0 | - | 135 | 0 | - | ||
| Net income attributable to owners of Ecopetrol | 25 | 3,487 | (99.3%) | 158 | 6,232 | (97.5%) | ||
| EBITDA | (340) | 5,400 | (106.3%) | 2,097 | 9,726 | (78.4%) | ||
| EBITDA margin | (4.7%) | 33.80% | (38.5%) | 10.40% | 32.30% | (21.9%) |
| 29 |
Table 7: Statement of Financial Position / Balance Sheet
| Billion (COP) | June 30, 2020 | March 31, 2020 | ∆ (%) | |
| Current assets | ||||
| Cash and cash equivalents | 5,787 | 3,501 | 65.3% | |
| Trade and other receivables | 4,817 | 4,828 | (0.2%) | |
| Inventories | 3,261 | 3,878 | (15.9%) | |
| Current tax assets | 2,364 | 1,260 | 87.6% | |
| Other financial assets | 6,474 | 3,263 | 98.4% | |
| Other assets | 1,274 | 1,095 | 16.3% | |
| 23,977 | 17,825 | 34.5% | ||
| Non-current assets held for sale | 5 | 19 | (73.7%) | |
| Total current assets | 23,982 | 17,844 | 34.4% | |
| Non-current assets | ||||
| Investments in associates and joint ventures | 56,770 | 59,033 | (3.8%) | |
| Trade and other receivables | 507 | 526 | (3.6%) | |
| Property, plant and equipment | 22,546 | 21,381 | 5.4% | |
| Natural and environmental resources | 21,769 | 22,088 | (1.4%) | |
| Assets by right of use | 3,337 | 3,408 | (2.1%) | |
| Intangibles | 204 | 218 | (6.4%) | |
| Deferred tax assets | 5,135 | 6,026 | (14.8%) | |
| Other financial assets | 1,540 | 1,606 | (4.1%) | |
| Other assets | 1,099 | 1,008 | 9.0% | |
| Total non-current assets | 112,907 | 115,294 | (2.1%) | |
| Total assets | 136,889 | 133,138 | 2.8% | |
| Current liabilities | ||||
| Loans and borrowings | 5,821 | 4,097 | 42.1% | |
| Trade and other payables | 11,756 | 14,840 | (20.8%) | |
| Provision for employees benefits | 1,810 | 1,905 | (5.0%) | |
| Current tax liabilities | 372 | 501 | (25.7%) | |
| Accrued liabilities and provisions | 653 | 637 | 2.5% | |
| Other liabilities | 914 | 601 | 52.1% | |
| Total current liabilities | 21,326 | 22,581 | (5.6%) | |
| Non-current liabilities | ||||
| Loans and borrowings | 46,365 | 40,343 | 14.9% | |
| Provision for employees benefits | 9,983 | 10,194 | (2.1%) | |
| Deferred tax liabilities | 141 | 141 | 0.0% | |
| Non-current tax liabilities | 103 | 34 | 202.9% | |
| Accrued liabilities and provisions | 7,263 | 7,209 | 0.7% | |
| Other liabilities | 57 | 61 | (6.6%) | |
| Total non-current liabilities | 63,912 | 57,982 | 10.2% | |
| Total liabilities | 85,238 | 80,563 | 5.8% | |
| Equity | ||||
| Equity attributable to owners of the company | 51,651 | 52,575 | (1.8%) | |
| Total equity | 51,651 | 52,575 | (1.8%) | |
| Total liabilities and equity | 136,889 | 133,138 | 2.8% |
| 30 |
Table 8: Export Destinations – Ecopetrol Group
| Crudes - mboed | 2Q 2020 | 2Q 2019 | % Share | 6M 2020 | 6M 2019 | % Share | ||
| U.S. Gulf Coast | 202.5 | 181.4 | 42.0% | 201.3 | 162.4 | 44.4% | ||
| Asia | 228.3 | 151.3 | 47.3% | 209.5 | 146.6 | 46.2% | ||
| Central America / Caribbean | 23.2 | 18.8 | 4.8% | 19.4 | 32.3 | 4.3% | ||
| Others | 0.3 | 0.2 | 0.1% | 4.5 | 2.9 | 1.0% | ||
| Europe | 11.2 | 32.9 | 2.3% | 9.2 | 24.7 | 2.0% | ||
| U.S. West Coast | 0.0 | 10.3 | 0.0% | 1.2 | 14.5 | 0.3% | ||
| South America | 0.0 | 0.8 | 0.0% | 0.0 | 1.9 | 0.0% | ||
| U.S. East Coast | 16.7 | 0.0 | 3.5% | 8.4 | 16.8 | 1.8% | ||
| Total | 482.2 | 395.8 | 100.0% | 453.4 | 402.1 | 100.0% | ||
| Products - mboed | 2Q 2020 | 2Q 2019 | % Share | 6M 2020 | 6M 2019 | % Share | ||
| Central America / Caribbean | 50.8 | 42.0 | 46.2% | 44.5 | 35.8 | 41.5% | ||
| U.S. Gulf Coast | 4.1 | 13.9 | 3.7% | 15.4 | 7.3 | 14.4% | ||
| Asia | 12.0 | 20.9 | 10.9% | 12.5 | 19.9 | 11.7% | ||
| South America | 8.0 | 5.5 | 7.3% | 10.5 | 7.3 | 9.7% | ||
| U.S. East Coast | 34.9 | 43.0 | 31.8% | 21.0 | 42.7 | 19.5% | ||
| Europe | 0.1 | 3.4 | 0.1% | 1.9 | 2.0 | 1.7% | ||
| U.S. West Coast | 0.0 | 0.0 | 0.0% | 1.6 | 3.3 | 1.5% | ||
| Others | 0.0 | 0.0 | 0.0% | 0.0 | 0.0 | 0.0% | ||
| Total | 109.9 | 128.7 | 100.0% | 107.2 | 118.3 | 22.8% |
This information is subject to change at the end of the quarter, as some of the destinations may be reclassified according to final export results.
Table 9: Domestic Purchases and Imports – Ecopetrol Group
| Local Purchases - mboed | 2Q 2020 | 2Q 2019 | ∆ (%) | 6M 2020 | 6M 2019 | ∆ (%) | ||
| Crude Oil | 164.2 | 162.8 | 0.9% | 173.4 | 162.7 | 6.6% | ||
| Gas | 1.6 | 1.6 | 0.0% | 3.7 | 1.9 | 94.7% | ||
| Products | 1.8 | 2.8 | (35.7%) | 2.7 | 3.1 | (12.9%) | ||
| Diluent | 0.2 | 0.4 | (50.0%) | 0.3 | 0.4 | (25.0%) | ||
| Total | 167.8 | 167.6 | 0.1% | 180.1 | 168.1 | 7.1% | ||
| Imports - mboed | 2Q 2020 | 2Q 2019 | ∆ (%) | 6M 2020 | 6M 2019 | ∆ (%) | ||
| Crude Oil | 8.2 | 40.4 | (79.7%) | 17.8 | 35.1 | (49.3%) | ||
| Products | 39.7 | 73.5 | (46.0%) | 68.3 | 85.6 | (20.2%) | ||
| Diluent | 25.8 | 55.2 | (53.3%) | 37.7 | 53.1 | (29.0%) | ||
| Total | 73.7 | 169.1 | (56.4%) | 123.8 | 173.8 | (28.8%) | ||
| Total | 241.5 | 336.7 | (28.3%) | 303.9 | 341.9 | (11.1%) |
| 31 |
Table 10: Detail of Exploratory Wells – Ecopetrol Group
| # | Quarter | Name | Initial Well Classification (Lahee) | Block | Basin | Operator/Partner | Status | TD Date |
| 1 | 1 | Olini Oeste-1 | A3 | Tolima | Valle Superior del Magdalena | Hocol (100%) | Dry | 3/01/2020 |
| 2 | 1 | Aguas Blancas 24 | A1 | Aguas Blancas | Valle Medio del Magdalena | PAREX 60% (Operator) ECP 40% | Temporarily suspended | 19/01/2020 |
| 3 | 1 | Lorito Este -1 | A3 | CPO-09 | Llanos Orientales | ECP 55% (Operator) Repsol 45% | Temporarily suspended | 31/01/2020 |
| 4 | 2 | Gato do Mato-4 | A1 | BM-S-54 / Sul de Gato do Mato | Santos | Shell 50% (Operator) Total 20% ECP 30% | Successful | 30/03/2020 |
| 5 | 2 | Lorito A1 | A1 | CPO-09 | Llanos Orientales | ECP 55% (Operator) Repsol 45% | Temporarily suspended | 10/06/2020 |
| 6 | 2 | Obiwan-1 | A3 | YDSN-1 | Sinú- San Jacinto | Hocol (100%) | Dry | 25/06/2020 |
| 7 | 2 | Saturno-1 | A3 | Saturno PSC | Santos | Shell 45% (Operator) Chevron 45% ECP 10% | Under evaluation | 30/05/2020 |
Table 11: Efficiency Initiatives - Ecopetrol Group
| Billion (COP) | 2Q 2020 | 2Q 2019 | 6M 2020 | 6M 2019 | ||
| Optimization of drilling costs and facilities construction | 36.8 | 253.5 | 261.3 | 535.9 | ||
| Improvement of the commercial strategy | 271.6 | 86.6 | 301.9 | 137.4 | ||
| Improvement in refineries revenues/margins | 40.0 | 56.7 | 69.4 | 87.4 | ||
| Reduction of O&M Midstream costs | 34.3 | 42.9 | 54.0 | 53.7 | ||
| Energy strategy - Surplus sales - Cost optimization | 20.4 | 23.6 | 35.7 | 46.6 | ||
| Savings on staff, logistics and other areas | 12.3 | 20.8 | 21.6 | 27.8 | ||
| Reduction of deferred production | 6.2 | 6.1 | 10.9 | 12.7 | ||
| Operating optimization | 34.1 | 9.8 | 64.8 | 35.7 | ||
| Refining cash cost optimization | 0.0 | 0.0 | 0.0 | 0.0 | ||
| Dilution and evacuation of heavy and extra heavy crude oil | 132.9 | (27.6) | 132.9 | 20.7 | ||
| Digital transformation | 26.8 | 0.0 | 29.6 | 0.0 | ||
| Total | 615.4 | 472.4 | 982.1 | 957.9 |
Table 12: HSE Performance (Health, Safety and Environmental Performance)
| HSE Indicators* | 2Q 2020 | 2Q 2019 | 6M 2020 | 6M 2019 | ||
| Frequency of total registrable injuries (No. Recordable cases / Million man hours) | 0.47 | 0.58 | 0.47 | 0.56 | ||
| Environmental incidents** | 0 | 2 | 2 | 4 |
* The results of the indicators are subject to subsequent change at the end of the quarter, as some accidents and incidents are reclassified according to the final results of the investigations. ** Environmental incidents are hydrocarbons spills in excess of 1 barrel, with environmental impact.
| 32 |