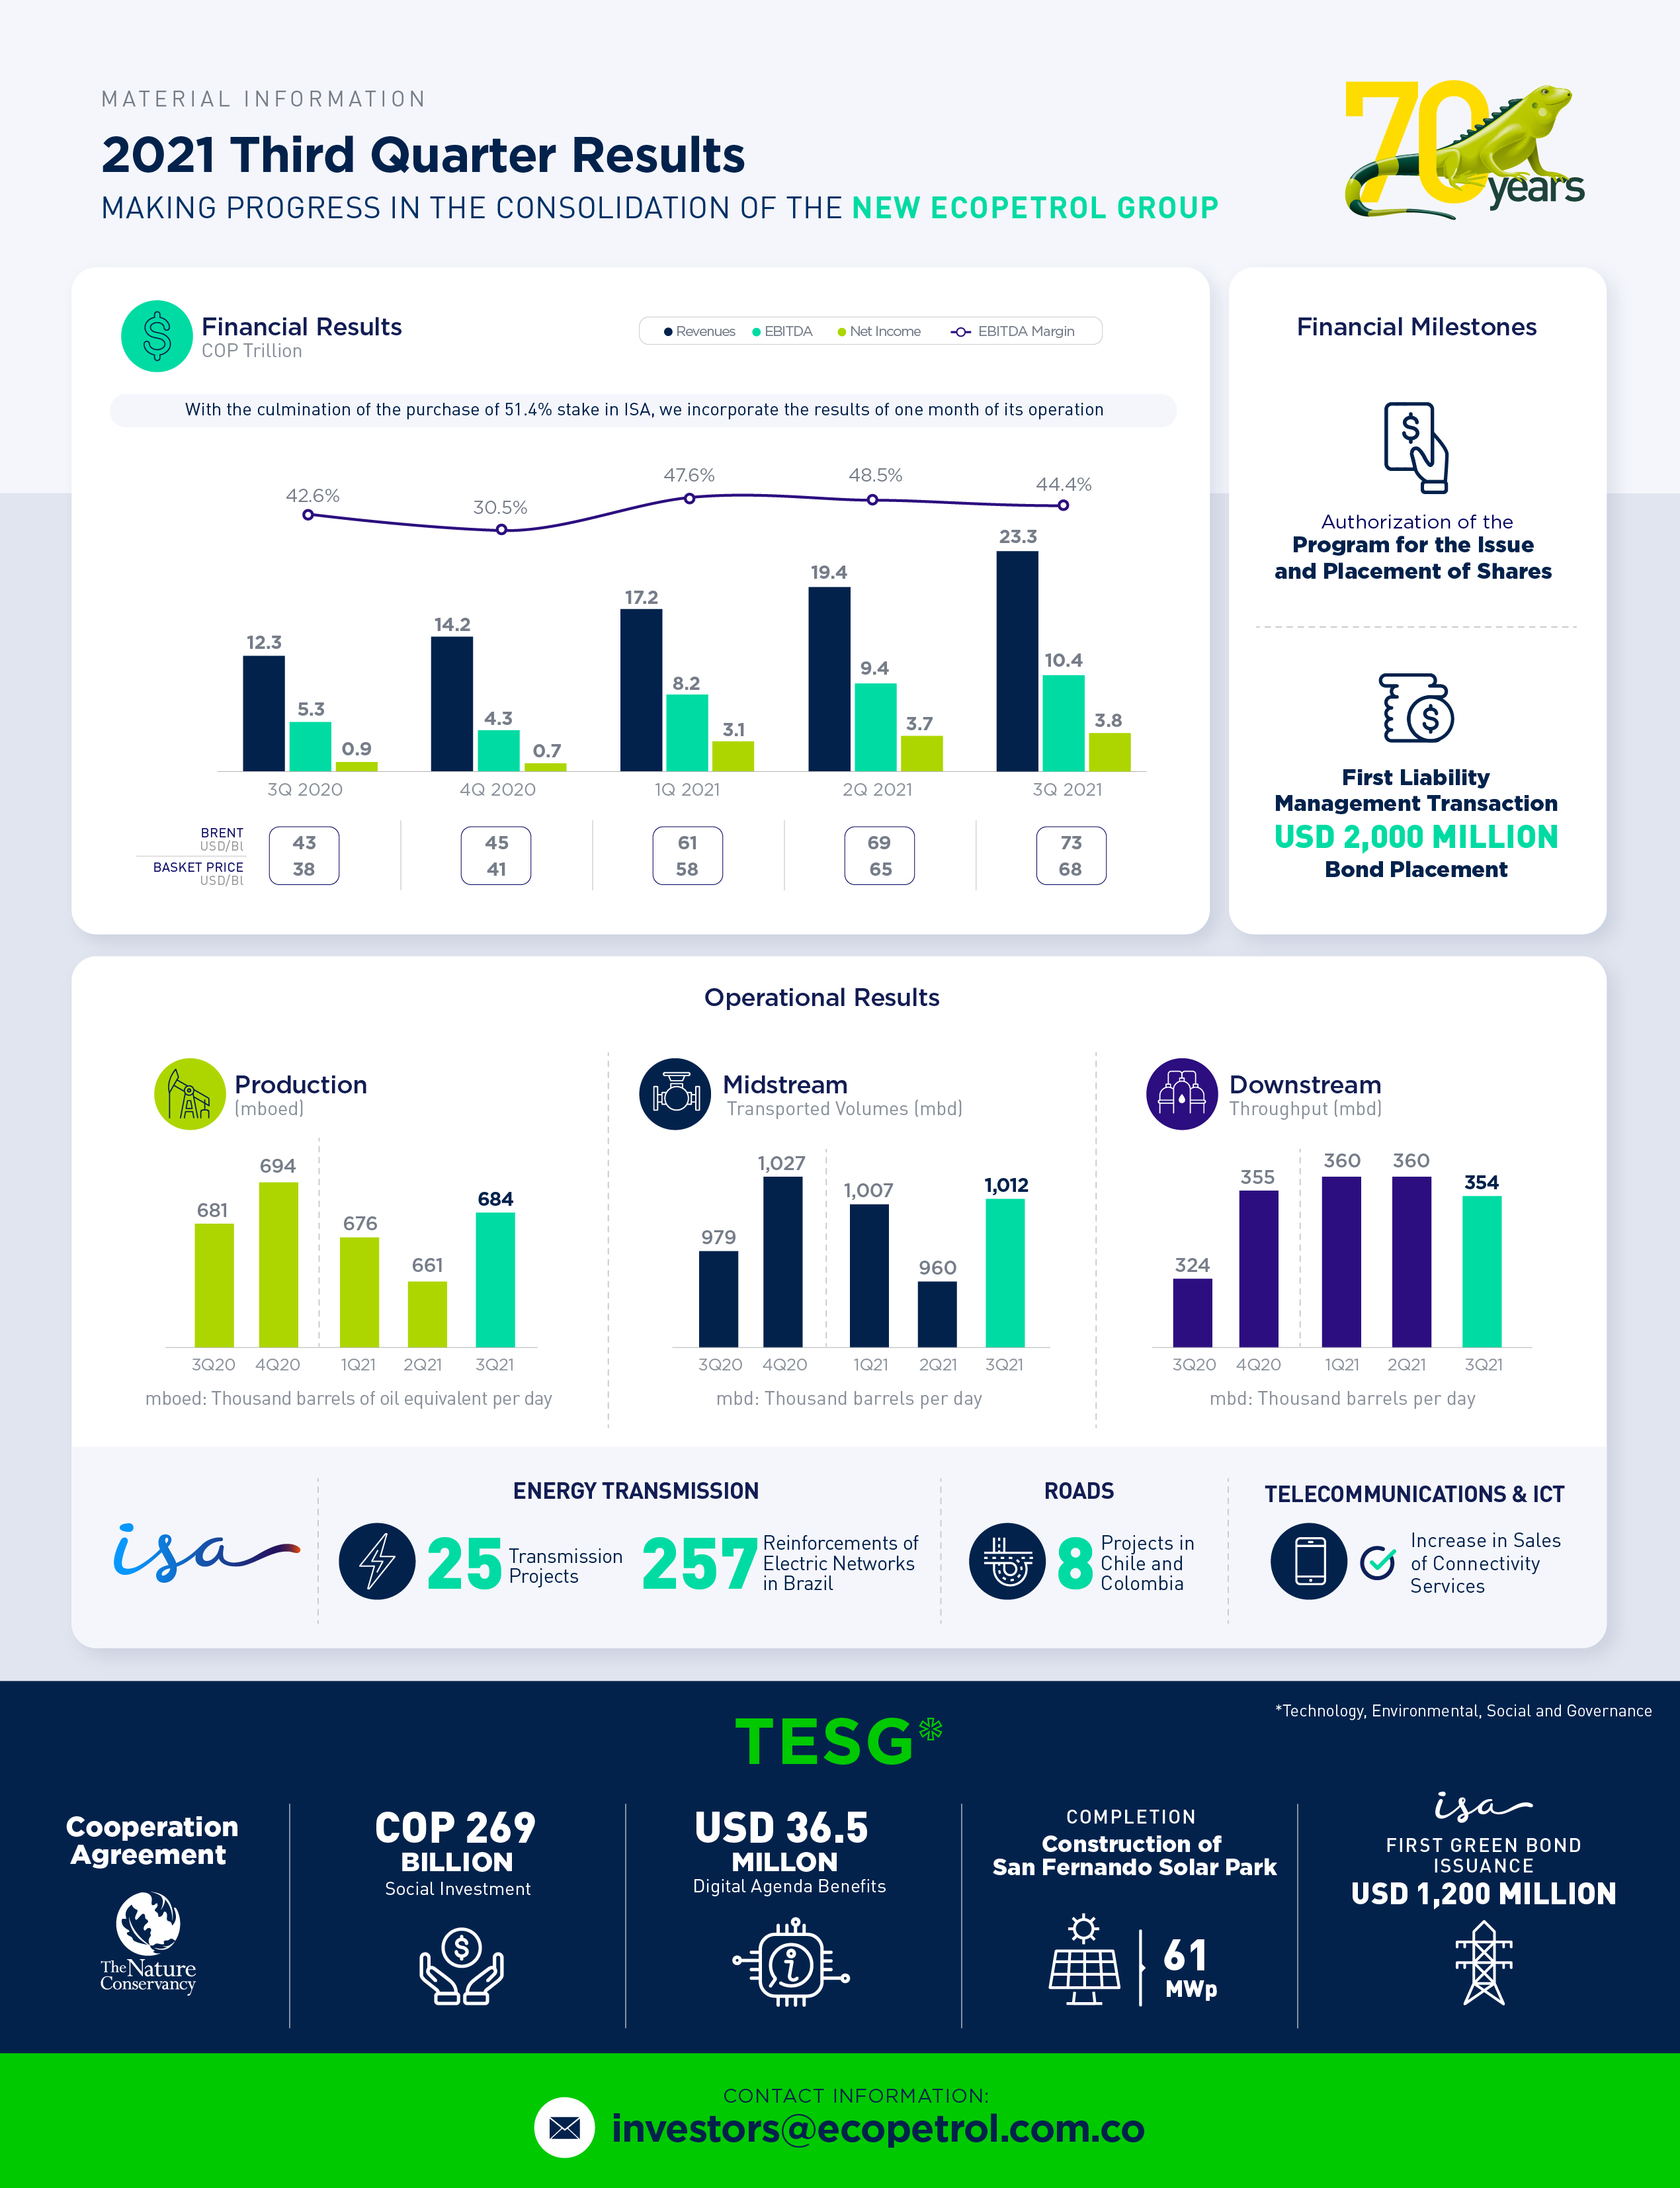
 The results for the third quarter of 2021 confirm Ecopetrol's technical, operational, and financial capacity to seize the favorable price environment. They also evidence the benefits of the structural adjustments that we have implemented in response to recent challenges. With the culmination of the purchase of a controlling 51.4% stake in Interconexión Eléctrica (“ISA”), the quarterly figures include the consolidated results of this subsidiary for one month, which represents a transformational milestone that allows us to present the results of the new Ecopetrol Group for the first time. The results for the third quarter of 2021 confirm Ecopetrol's technical, operational, and financial capacity to seize the favorable price environment. They also evidence the benefits of the structural adjustments that we have implemented in response to recent challenges. With the culmination of the purchase of a controlling 51.4% stake in Interconexión Eléctrica (“ISA”), the quarterly figures include the consolidated results of this subsidiary for one month, which represents a transformational milestone that allows us to present the results of the new Ecopetrol Group for the first time.
During this quarter, we continued delivering record results, with a consolidated revenue of COP 23.3 trillion, a net income of COP 3.8 trillion and an EBITDA of COP 10.4 trillion (EBITDA margin of 44%). In the first nine months of the year, our consolidated revenue amounted to COP 60.0 trillion, a net income of COP 10.6 trillion (6.3 times the net income generated throughout 2020), and an EBITDA of COP 28.0 trillion (EBITDA margin of 47%). On the commercial front, we highlight the improvement in the realization price of our crude oil basket, which went from 38.4 USD/Bl in the third quarter of 2020 to 68.0 USD/Bl in the third quarter of 2021, demonstrating the good results of the strategy for diversification of destinations and close relation with our customers, in addition to the operational flexibility of the company by consolidating the delivery at place (DAP) mechanism. Additionally, we highlight the signing of diesel and motor gasoline supply contracts with wholesale distributors, a milestone that represents a referent for the industry and marks the beginning of a new commercial stage that consolidates the liquid fuels distribution chain in the country. In exploration, the Liria YW12 well stands out, which proved the presence of hydrocarbons in a new structure near a production field, being a milestone that continues to drive our exploration activity in the Piedemonte Llanero. Ecopetrol and its partners completed 10 wells during the first nine months of the year, exceeding the target of 9 wells for 2021. The accumulated production of the exploratory assets accounted for more than 1.2 million boe at the end of the third quarter of 2021 (4,517 boed on average), with 67% of the production corresponding to oil and 33% to gas. Additionally, in August the Flamencos-1 and Boranda discoveries, located in the Middle Magdalena Valley, were declared commercial, which are part of the "Near Field Exploration" strategy in areas close to existing infrastructure that seeks the incorporation of production and reserves in a short period of time. In the | | international field, and in line with the growth and geographic diversification strategy of the Ecopetrol Group, our subsidiary, Ecopetrol Óleo e Gás do Brasil, acquired a 30% stake in the block S-M-1709, located in the Santos basin in Brazil during the “Rodada 17” bidding session organized by the National Petroleum Agency (ANP for its Portuguese acronym). The acquisition of this block, which will be operated by Shell, is focused on the basins with the highest potential in the continent. The average production of the Ecopetrol Group continues its recovery path, after experiencing a significant impact during the first half of the year associated with operating restrictions in the Castilla field and the public order situation in Colombia. During the third quarter, production reached 683.6 mboed, accounting for a growth of 3.5% when compared to the second quarter. Some of the relevant milestones of the quarter are: i) full production stabilization in the Castilla field, ii) normalization of production, previously affected by roadblocks due to public order disturbances in the second quarter of the year, and iii) the contribution from the new Flamencos-1 and Boranda commercial discoveries. Given the average production level for the quarter and the projections for the fourth quarter of the year, we estimate the 2021 yearly production to be around 680 mboed. Natural gas and LPG production experienced an increase of 3.5% in the third quarter of 2021 compared to the same period of the previous year, as a result of higher sales volumes from Ecopetrol, Hocol, and Permian, primarily associated with a recovery in demand. During the third quarter, the contribution of gas and LPG to the Group’s total production was 20.6%, with a combined EBITDA margin of 60.0%. At Permian, operations continue to advance according to plan, employing 4 drill rigs and 2 completion crews. We drilled 22 wells in this quarter, for a total of 69 so far this year. In addition, 16 new wells started production, for a total of 91 wells in production (22 in 2020 and 69 in 2021). It is worth highlighting that the level of production of the operation already exceeds 50.0 mboed, generating 24.4 mboed before royalties for Ecopetrol in the third quarter (equivalent to net 18.9 mboed after royalties). In terms of the Comprehensive Research Pilot Projects in Unconventional Reservoirs (PPII) Kalé and Platero, we continue advancing with the work schedules according to plan. On October 29, we submitted PPII-Kalé’s Environmental Impact Assessment (EIA) to the National Authority for Environmental Licensing (ANLA for its Spanish acronym), and on July 8, we conducted the first territorial dialogue and environmental monitoring as requirements for filing PPII-Platero’s EIA. To date, 450 dialogue and educational meetings have taken place within the influence area. |
In the midstream segment, during the quarter we transported 1,012.2 mbd, which represented a recovery of 52.3 mbd compared to the immediately previous quarter. The volume transported during the first nine months of the year was 993.3 mbd, a decrease of 2.0% compared to the same period of 2020, as a result of a lower production of crude oil in the country, mainly in the Llanos area. In terms of renewable energy self-generation in the segment, in September we started operating six new solar plants at the stations of Baranoa, Miraflores, Mansilla, Tocancipá, Yumbo, and Pereira, in order to reduce approximately 513 tons of CO2 per year, also in line with our decarbonization targets by 2050. Similarly, we finished the construction of the San Fernando Solar Park last October 22, 2021, which will provide 61 MWp of available capacity and it is considered the largest renewable energy self-generation facility in the country. Regarding transportation disputes, the agreement announced by Frontera, CENIT and Bicentenario on November 17, 2020, was approved by the Administrative Tribunal of Cundinamarca by means of an order that was notified on November 5 of 2021. It is important to mention that the agreement has a favorable opinion from the Attorney General’s Office (Procuraduría General de la Nación), received on March 24, 2021, also, it puts an end to all disputes between the parties regarding to the transportation contracts for the Bicentenario Pipeline and the Caño Limón - Coveñas Pipeline, as well as other contracts for storage and port services. With this agreement, all existing arbitration proceedings arising from these disputes are concluded. The downstream segment continued with the positive trend observed throughout 2021, with a consolidated throughput of 358.0 mbd and an integrated gross margin of 9.5 USD/Bl as of September 2021. This segment closed the third quarter with a throughput of 353.8 mbd and an integrated gross margin of 9.0 USD/Bl, respectively. These results are largely attributable to: i) the improvement of the refined products basket, in line with the generalized increase in demand due to the reactivation of the productive sector, ii) selling of inventories due to a favorable price environment and the positive operating performance at the Barrancabermeja refinery, iii) the adoption of commercial strategies at Esenttia to mitigate the weakening of the Polypropylene Margin, iv) the stability of Invercolsa as a result of higher natural gas sales and installations, and v) the segment's cash cost stability. The aforementioned, despite the operational events originated at the Cartagena refinery during the quarter, which have already been solved. | | In the new electric power transmission and toll roads segment (which arose out of our acquisition of ISA) only consolidates one month of results into the quarter, we highlight the following: i) in the electric power business, the entry into operation of three projects (in Chile, Brazil, and Colombia), as well as the granting of the Environmental license for the UPME07-2017 Sabanalarga-Bolívar 500 kV project in Colombia, and ii) in the road concessions business, the construction of eight projects continued in Colombia and Chile, which will add 246 km to the existing road network. It is important to note that a Transition Management Office (TMO) was established, which has made possible the transition process from ISA to the consolidation and reporting of the Ecopetrol Group. The main efforts in the last 12 weeks since the acquisition have been focused on ensuring compliance with the legal and regulatory requirements associated with accounting consolidation, reporting, and financial planning processes, as well as matters related to compliance and corporate governance. The next steps will be aimed at prioritizing opportunities and synergies to accelerate the capture of joint value. In TESG, we continued to make progress in each pillar of the strategy throughout the year. In the environmental front, particularly in renewable energy projects, Ecopetrol was included as a relevant participant in the Colombian Hydrogen roadmap launched by the Ministry of Mines and Energy on September 30. Moreover, we highlight the contract entered with South Pole on August 6, 2021, who will be our structuring partner for the Nature-Based Solutions projects, and the Cooperation Agreement signed with The Nature Conservancy, which seeks to leverage the implementation of the Ecopetrol Group’s decarbonization plan. As of September 2021, we had fulfilled 79% of the goal established for 2021 within the framework of the “Sembrar Nos Une” national initiative with 3,149,716 trees planted. In the social dimension, during the first nine months of the year, the Company allocated social investment resources for a total of COP 269 billion in strategic and mandatory investments. Similarly, by means of the “Obras por Impuestos” (Works in lieu of Taxes) mechanism, we completed 25 projects by the end of the third quarter, with a total value of COP 201 billion, mainly focused on the improvement of roads and endowments to student residences. Additionally, Ecopetrol's Diversity and Inclusion Program was granted the Equipares-Icontec Silver Seal, highlighting the communications efforts carried out within the framework of this program due to its coherence, assertiveness, connection, and impact as a fundamental pillar for the strategy. |
In corporate governance, the TMO team appointed within the Company has been presenting on a regular basis the developments around the successful incorporation of ISA into the Ecopetrol Group to the Board of Directors, in line with our commitment to advance in a transition that ensures the continuity of the strategy and the robustness of Ecopetrol and ISA’s governance principles. Identifying and aligning the best practices of both companies will ensure the implementation of a corporate governance structure that stands out for its experience and transparency. Last October 22 of 2021, ISA's extraordinary General Shareholders' Meeting took place, in which new Directors were appointed and Ecopetrol exercised its right to nominate candidates in virtue of the controlling position it currently holds on ISA. In digital transformation, we have captured benefits in the digital agenda for a total of USD 36.5 million by the end of the third quarter of 2021, with advancements in the digital agenda, digital factories, intelligence, and innovation projects. | | As part of other relevant milestones during the quarter, we highlight the authorization of the Program for the Issue and Placement of Shares (PEC for its Spanish acronym) granted by the Financial Superintendence of Colombia, which enables Ecopetrol, for an extendable period of five years, to make one or more simultaneous share offerings in the local and international markets. The foregoing gives us greater flexibility in the management of our capital structure, as part of our energy transition progress and efforts. Likewise, we would like to point out the execution of our first external liability management transaction for USD 2,000 million, to partially refinance the credit disbursed to leverage the acquisition of ISA, thereby optimizing the maturity debt profile of the Ecopetrol Group. As the year is coming to an end, we remain committed with the generation of sustainable value for society and our shareholders, while moving towards the consolidation of the New Ecopetrol Group and its integrated strategy, keeping our focus on the traditional business, and advancing in the energy transition pillars. Felipe Bayón CEO Ecopetrol |
Bogotá, November 9, 2021. Ecopetrol S.A. (BVC: ECOPETROL; NYSE: EC) announced the financial results of the Ecopetrol Group for the third quarter of 2021, prepared in accordance with the International Financial Reporting Standards applicable in Colombia.
In 3Q21 the Ecopetrol Group generated a net income of COP 3.8 trillion, 4.5 times higher than the results obtained in the same quarter of 2020, while EBITDA amounted to a record-high of COP 10.4 trillion. The results for the quarter reflected a recovery path in production, the increased national demand for fuels, and the higher volumes transported once the public order disturbances registered in 2Q21 were overcome. The following events stand out during this quarter: i) the lifting of water disposal restrictions in Castilla, ii) new wells in operation in Permian, iii) the declaration of success of the Liria YW12 exploratory well, iv) the acquisition and start of consolidation of ISA into the Ecopetrol Group, and v) a favorable Brent-COP environment. The foregoing allowed us to mitigate some operating events in the downstream segment, higher exploration expenses, impacts of the rainy season, and the relocation of crude sales under the DAP modality for 4Q21.
Table 1: Financial Summary Income Statement - Ecopetrol Group
| Billion (COP) | | 3Q 2021 | 3Q 2020 | ∆ ($) | ∆ (%) | | 9M 2021 | 9M 2020 | ∆ ($) | ∆ (%) |
| Total sales | | 23,333 | 12,323 | 11,010 | 89.3% | | 59,983 | 35,836 | 24,147 | 67.4% |
| Depreciation and amortization | | 2,629 | 2,296 | 333 | 14.5% | | 7,195 | 6,685 | 510 | 7.6% |
| Variable cost | | 8,994 | 4,038 | 4,956 | 122.7% | | 21,992 | 14,304 | 7,688 | 53.7% |
| Fixed cost | | 2,883 | 2,010 | 873 | 43.4% | | 7,262 | 6,256 | 1,006 | 16.1% |
| Cost of sales | | 14,506 | 8,344 | 6,162 | 73.8% | | 36,449 | 27,245 | 9,204 | 33.8% |
| Gross income | | 8,827 | 3,979 | 4,848 | 121.8% | | 23,534 | 8,591 | 14,943 | 173.9% |
| Operating and exploratory expenses | | 1,723 | 1,301 | 422 | 32.4% | | 4,364 | 2,383 | 1,981 | 83.1% |
| Operating income | | 7,104 | 2,678 | 4,426 | 165.3% | | 19,170 | 6,208 | 12,962 | 208.8% |
| Financial income (loss), net | | (697) | (956) | 259 | (27.1%) | | (2,180) | (2,221) | 41 | (1.8%) |
| Share of profit of companies | | 111 | 15 | 96 | 640.0% | | 226 | 92 | 134 | 145.7% |
| Income before income tax | | 6,518 | 1,737 | 4,781 | 275.2% | | 17,216 | 4,079 | 13,137 | 322.1% |
| Income tax | | (2,194) | (576) | (1,618) | 280.9% | | (5,499) | (1,209) | (4,290) | 354.8% |
| Net income consolidated | | 4,324 | 1,161 | 3,163 | 272.4% | | 11,717 | 2,870 | 8,847 | 308.3% |
| Non-controlling interest | | (516) | (289) | (227) | 78.5% | | (1,102) | (913) | (189) | 20.7% |
| Net income attributable to owners of Ecopetrol before impairment | | 3,808 | 872 | 2,936 | 336.7% | | 10,615 | 1,957 | 8,658 | 442.4% |
| (Expense) recovery for impairment long-term assets | | (2) | (21) | 19 | (90.5%) | | 2 | (1,225) | 1,227 | (100.2%) |
| Deferred tax of impairment | | 1 | 4 | (3) | (75.0%) | | 0 | 281 | (281) | (100.0%) |
| Net income attributable to owners of Ecopetrol | | 3,807 | 855 | 2,952 | 345.3% | | 10,617 | 1,013 | 9,604 | 948.1% |
| | | | | | | | | | | |
| EBITDA | | 10,371 | 5,254 | 5,117 | 97.4% | | 27,986 | 12,506 | 15,480 | 123.8% |
| EBITDA Margin | | 44.4% | 42.6% | - | 1.8% | | 46.7% | 34.9% | - | 11.8% |
The figures included in this report were extracted from the Company’s unaudited financial statements. The financial information is expressed in billions of Colombian pesos (COP), or US dollars (USD), or thousands of barrels of oil equivalent per day (mboed) or tons, as noted. For presentation purposes, certain figures in this report were rounded to the nearest decimal place.
Forward-looking statements: This release contains statements that may be considered forward-looking statements within the meaning of Section 27A of the U.S. Securities Act of 1933 and Section 21E of the U.S. Securities Exchange Act of 1934. All forward-looking statements, whether made in this release or in future filings or press releases or orally, address matters that involve risks and uncertainties, including in respect of Ecopetrol’s prospects for growth and its ongoing access to capital to fund Ecopetrol’s business plan, among others. Consequently, changes in the following factors, among others, could cause actual results to differ materially from those included in the forward-looking statements: market prices of oil & gas, our exploration and production activities, market conditions, applicable regulations, the exchange rate, Ecopetrol’s competitiveness, our ability to successfully integrate our recently acquired subsidiary, Interconexión Eléctrica S.A. (“ISA”), and the performance of Colombia’s economy and industry, to mention a few. We do not intend, and do not assume any obligation to update these forward-looking statements.
I. Financial and Operating Results
Sales Revenue
89.3% increase, or COP +11.0 trillion, in 3Q21 versus 3Q20, as a result of:
| a) | Higher weighted average sale price of crude oil, gas, and related products of +29.8 USD/Bl (COP +8.9 trillion), primarily due to the strengthening of the reference price. |
| b) | Higher service revenues (COP +1.0 trillion), given the consolidation of ISA's September results. |
| c) | Increase in sales volume (COP +0.6 trillion, +40.1 mboed), primarily due to higher sales of refined products and gas, given the recovery in national demand once the public order disturbances in 2Q21 were overcome. This was partially offset by a reduction in crude exports, given the higher shipments in transit at the end of September with completion expected in 4Q21. |
| d) | Positive exchange rate effect in revenue, primarily due to a higher average COP/USD exchange rate (COP +0.5 trillion). |
Table 2: Sales Volumes - Ecopetrol Group
| Local Sales Volume - mboed | | 3Q 2021 | 3Q 2020 | ∆ (%) | | 9M 2021 | 9M 2020 | ∆ (%) |
| Medium Distillates | | 153.1 | 112.1 | 36.6% | | 139.3 | 115.5 | 20.6% |
| Gasoline | | 139.4 | 99.4 | 40.2% | | 128.5 | 92.2 | 39.4% |
| Natural Gas | | 92.4 | 85.2 | 8.5% | | 90.2 | 83.1 | 8.5% |
| Industrials and Petrochemicals | | 21.6 | 23.8 | (9.2%) | | 22.2 | 21.2 | 4.7% |
| LPG and Propane | | 19.0 | 17.8 | 6.7% | | 18.9 | 17.8 | 6.2% |
| Crude Oil | | 2.3 | 6.3 | (63.5%) | | 2.4 | 6.5 | (63.1%) |
| Fuel Oil | | 0.2 | 0.6 | (66.7%) | | 0.4 | 1.4 | (71.4%) |
| Total Local Volumes | | 428.0 | 345.2 | 24.0% | | 401.9 | 337.7 | 19.0% |
| | | | | | | | | |
| Export Sales Volume - mboed | | 3Q 2021 | 3Q 2020 | ∆ (%) | | 9M 2021 | 9M 2020 | ∆ (%) |
| Crude Oil | | 340.5 | 373.7 | (8.9%) | | 347.3 | 424.2 | (18.1%) |
| Products | | 98.8 | 109.7 | (9.9%) | | 100.9 | 108.1 | (6.7%) |
| Natural Gas* | | 3.1 | 1.7 | 82.4% | | 3.0 | 1.4 | 114.3% |
| Total Export Volumes | | 442.4 | 485.1 | (8.8%) | | 451.2 | 533.7 | (15.5%) |
| | | | | | | | | |
| Total Sales Volumes | | 870.4 | 830.3 | 4.8% | | 853.1 | 871.4 | (2.1%) |
* Natural gas exports correspond to local sales by Ecopetrol America LLC and Ecopetrol Permian LLC.
Total volume sold in 3Q21 amounted to 870.4 mboed, 4.8% higher compared to 3Q20, as a result of higher local sales and despite the reduction in export volumes.
Sales in Colombia, which accounted for 49% of the total, showed an increase of 24.0% (82.8 mboed) in 3Q21 compared to 3Q20, mainly due to:
- The strengthening of the demand for fuels, both in gasoline (+40.0 mboed) and diesel (+21.5 mboed) sales, was primarily driven by the economic recovery after the COVID-19 peaks were overcome in the country. For its part, the mid-year vacation period, the lifting of restrictions on several international routes, and the greater offer of airline routes and flights drove the recovery in jet fuel sales (+19.5 mboed), although they remain at lower levels compared to 2019.
- Higher gas sales (+7.2 mboed), mainly explained by Ecopetrol and Hocol’s higher production (+4.8 mboed), leveraged on the recovery in demand.
International sales, which accounted for 51% of the total, showed a decrease of 8.8% (42.7 mboed) in 3Q21 versus 3Q20, mainly due to:
- Lower crude oil exports (-33.2 mbod) explained mainly by: i) higher throughput in refineries (-32.6 mbod), which reduces the availability of crude oil for exports, and ii) relocation of DAP shipments, which will be delivered during October and November 2021 (-69.5 mbod). This was partially offset by a higher production (+14.0 mbod) and higher purchases (+48.9 mbod), as a result of the national crude oil purchase strategy.
- Lower product exports, as a consequence of the operational challenges at the Cartagena refinery (as described in section “3. Downstream”), which caused a decrease in diesel exports (-19.8 mbod), partially offset by an increase in diesel exports (+10.6 mbod).
Table 3: Average Realization Prices - Ecopetrol Group
| USD/Bl | | 3Q 2021 | 3Q 2020 | ∆ (%) | | 9M 2021 | 9M 2020 | ∆ (%) |
| Brent | | 73.2 | 43.3 | 69.1% | | 68.0 | 42.5 | 60.0% |
| Natural Gas Basket | | 24.3 | 25.0 | (2.8%) | | 24.5 | 24.0 | 2.1% |
| Crude Oil Basket | | 68.0 | 38.4 | 77.1% | | 63.6 | 32.3 | 96.9% |
| Products Basket | | 81.8 | 45.8 | 78.6% | | 75.9 | 48.5 | 56.5% |
Crudes: Crude oil basket prices were strengthened by 29.6 USD/Bl in 3Q21 compared to 3Q20, going from 38.4 USD/Bl in 3Q20 to 68.0 USD/Bl in 3Q21. There is an increase in the DAP sales volume to various destinations such as South Korea, India, Brunei, Sweden, and the Gulf Coast of the United States, going from 17.0% in 3Q20 to 37.5% in 3Q21, thereby attaining higher price benefits than with FOB (Free on Board) shipments.
Refined Products: The refined products sales basket was strengthened by 36.0 USD/Bl in 3Q21 compared to 3Q20, going from 45.8 USD/Bl in 3Q20 to 81.8 USD/Bl in 3Q21, primarily due to the recovery of international indicators in line with the reactivation of demand, which resulted in higher fuel sales volumes.
Natural Gas: Gas sales prices decreased 2.8% in 3Q21 compared to 3Q20, going from 25.0 USD/Bl in 3Q20 to 24.3 USD/Bl in 3Q21, mainly due to the lower share in 2021 of the Cupiagua source in the volumetric sales basket.
Hedging Program: During 3Q21, Ecopetrol executed tactical price hedges for a total of 8.7 million barrels, mainly in crude oil exports.
It is highlighted the signing of contracts for a one-year supply of diesel and regular motor gasoline with Primax Colombia S.A. and Organización Terpel S.A., for an estimated amount of USD 3,159 million. On the other hand, the Apiay filler began operations in October, which is expected to allow gasoline and diesel to be supplied at this location in the multipurpose pipelines system, thereby expected to strengthen supply in the region and should lead to a decrease in costs, as well as the transit on the road of tank cars.
Cost of Sales
Cost of sales increased 73.8%, or COP +6.2 trillion, in 3Q21 versus 3Q20, mainly derived from:
Depreciation and Amortization: 14.5% increase, or COP +0.3 trillion, in 3Q21 versus 3Q20, as a consequence of: i) lower incorporation of reserves in 2020 compared to 2019, ii) higher level of CAPEX, iii) increase in Permian’s production, and iv) exchange rate effect from the COP’s depreciation against the USD on the Ecopetrol Group’s subsidiaries with USD as their functional currency, given the devaluation of the COP against the USD.
Variable Costs:
122.7% increase, or COP +5.0 trillion, in 3Q21 compared to 3Q20, as a net result between:
- Increased purchases of crude oil, gas, and refined products (COP +6.2 trillion), primarily due to: i) higher weighted average price of national purchases and imports (COP +4.1 trillion), ii) higher volumes purchased (COP +1.8 trillion, +104.9 mboed), given that the economic reactivation led to an increase in demand for fuels and new crude oil commercialization contracts, and iii) increase in the average COP/USD exchange rate for purchases (COP +0.3 trillion).
- Inventory fluctuation (COP -1.3 trillion), primarily due to: i) increase in the level of crude barrels in transit due to higher DAP sales versus FOB in the previous year, and ii) inventory accumulation of crude oil and in-process products, associated with some operational events in the downstream segment.
- Other minor variations in the amount of COP +0.1 trillion.
Fixed Costs: Fixed costs increased by 43.4%, or COP +0.9 trillion, in 3Q21 compared to 3Q20, primarily, due to: i) more contracted services, maintenance activities, operation supplies, and other operational activity costs (COP +0.4 trillion), associated with the normalization of the pace of activities during the year and the execution of some activities that had been time-shifted due to public order impacts in some fields in 2Q21, ii) consolidation of ISA's September results (COP +0.3 trillion), and iii) higher taxes and others (COP +0.2 trillion), mainly due to the increase of VAT which was not deductible in line with purchases.
Operating Expenses, net of other income (before impairment of long-term assets)
32.4% increase, or COP +0.4 trillion, in 3Q21 versus 3Q20, as a net result, primarily of:
- Higher exploration expenses (COP +0.2 trillion) primarily due to: i) recognition in the exploration activity results of Lorito Este-1, Boranda Centro-1, and Chimuelo-1 in Ecopetrol, Silverback 2 in Ecopetrol America, and Ceará in Brazil, and ii) increased exploratory activity associated with seismic, geology, and geophysics studies, and data processing.
- Higher expenses related to commissions, fees, and others (COP +0.2 trillion), mainly due to: i) transaction costs associated with the acquisition of ISA, ii) project management support at Ecopetrol, and iii) updating of environmental provisions.
- Consolidation of ISA's September results, after its acquisition (COP +0.1 trillion).
- Lower labor expenses, mainly associated with the recognition of the voluntary retirement plan of 26 people in 3Q21 versus 117 people in 3Q20 (COP -0.1 trillion).
Financial Result (Non-Operating)
27.1% decrease, or COP -259 billion, in financial expenses in 3Q21 compared to 3Q20, as a net result of:
- Income from exchange rate difference of COP +378 billion, mainly due to the effect of: i) a gain of USD 3,762 million on the exchange rate valuation of the new debt acquired to purchase the stake in ISA in 3Q21 (COP +233 billion), and ii) a lower COP devaluation against the USD in 3Q21 compared to 3Q20 (COP +145 billion).
- Incorporation of ISA's net financial results for the month of September, including interest, exchange rate difference, financial returns, and others, in the amount of COP -129 billion.
- Other minor effects amounting to COP +10 billion.
The Effective Tax Rate for 3Q21 stood at 33.7%, similar to the 33.2% in 3Q20. In September, the Ecopetrol Group recognized the effect of the tax reform under net deferred tax, in the amount of COP -36 billion. An increase in the nominal tax rate is expected in 2022, which will go from 30% to 35%.
Cash Flow and Debt
Table 4: Cash Position - Ecopetrol Group
| Billion (COP) | | 3Q 2021 | 3Q 2020 | | 9M 2021 | 9M 2020 |
| Initial cash and cash equivalents | | 5,022 | 9,248 | | 5,082 | 7,076 |
| (+) Cash flow from operations | | 5,280 | 3,526 | | 11,527 | 3,851 |
| (-) CAPEX | | (3,564) | (2,064) | | (8,753) | (7,908) |
| (+/-) Investment portfolio movement | | (552) | 1,802 | | 1,155 | 1,231 |
| (-) Acquisition of subsidiaries, net of cash acquired | | (9,316) | 0 | | (9,316) | 0 |
| (+) Other investment activities | | 56 | 92 | | 216 | 351 |
| (+/-) Acquisition, borrowings and interest payments of debt | | 13,485 | (1,877) | | 11,441 | 8,025 |
| (-) Dividend payments | | (274) | (2,910) | | (1,424) | (5,247) |
| (+/-) Exchange difference (cash impact) | | (50) | 12 | | 159 | 450 |
| Final cash and cash equivalents | | 10,087 | 7,829 | | 10,087 | 7,829 |
| Investment portfolio | | 3,047 | 4,143 | | 3,047 | 4,143 |
| Total cash | | 13,134 | 11,972 | | 13,134 | 11,972 |
Note: Cash corresponds to available resources denominated as cash and cash equivalents plus investments in financial securities, regardless of their maturity.
Cash Flow:
The Ecopetrol Group closed 3Q21 with a cash balance of COP 13.1 trillion (36% COP and 64% USD). During this quarter the main liquidity flows were: i) flows from operating activity (COP 5.2 trillion), ii) financing resources for COP 14.2 trillion for the acquisition of the controlling stake in ISA, and iii) debt service for COP 0.8 trillion. The Operating Cash Flow supported the CAPEX for COP 3.6 trillion. The effect of ISA's consolidation contributed COP 6.0 trillion to the cash balance.
By the end of September, the working capital reflects an increase, mainly due to: i) increased accounts receivable from the Fuel Price Stabilization Fund - FEPC by its Spanish acronym (as of September the account receivable amounted to COP 7.2 trillion), associated with a higher market price for gasoline and diesel against regulated prices in Colombia, and ii) inventories due to in-transit vessels under the DAP modality, higher level of in-process products, and higher valuation derived from higher market prices. This was partially offset by a higher number of accounts payable to vendors, which in turn was primarily due to higher operational activity during the quarter.
Debt:
At the end of 3Q21, the Ecopetrol Group registered a debt balance of COP 91.8 trillion, equivalent to USD 24,098 million, which is equivalent to an increase of USD 10,743 million compared to 2Q21. The foregoing, mainly as a result of: i) the effect of consolidating ISA's debt, equivalent to USD 6,100 million, ii) the contracted debt with international banks to finance the acquisition of ISA for USD 3,672 million, and iii) others for USD 971 million, mainly due to the effect of the devaluation that impacts the debt in dollars.
In the recent months the following debt operations are highlighted:
| · | Contracting of a contingent credit line in the amount of USD 1,200 million in July. This line will be available for disbursements for 2 years, as of the signing thereof in July. No disbursements have been made to date. |
| · | Issuance of SEC-registered bonds by Ecopetrol as follows: USD 1,250 million to 10 years at a coupon rate of 4.625% and USD 750 million to 30 years at a coupon rate of 5.875%, representing our first external public debt management transaction, given that the net proceeds of this issuance were used to partially refinance the USD 3,672 million we had disbursed in connection with our acquisition of ISA. Therefore, this did not generate any change in the company's indebtedness. The issuance book reached a value of more than USD 7,600 million, equivalent to 3.8 times the issued amount. |
| · | Green Financing: Issue of the first green bond on July 26 by the energy company ISA INTERCHILE, in the amount of USD 1,200 million for a term of 35 years and a coupon rate of 4.5%. The use of the proceeds will be to refinance the debt commitments acquired during the construction phase of the Cardones - Polpaico Transmission Line, a key infrastructure to decarbonize the matrix and contribute to climate change mitigation. |
The following updates were made to Ecopetrol's rating during the quarter: i) on July 6, Fitch Ratings revised Ecopetrol S.A.'s rating from BBB- to BB+, with a stable outlook, in line with the adjustment made to the Republic of Colombia, and maintained the stand-alone rating at bbb, ii) on August 18 S&P Global Ratings maintained Ecopetrol S.A.'s rating at BB+ and the stand-alone rating at bbb-, with a stable outlook, highlighting the strategic importance of the Company for the country and the benefits of being an integrated business, the Company's solid financial position, and the progress made in its energy transition, and iii) on September 1, Moody's Investor Services maintained Ecopetrol's credit rating at Baa3 and adjusted its outlook from Stable to Negative, the latter explained by the temporary surge in leverage indicators and the potential refinancing risk associated with the credit facility entered into with international banks maturing in 2023. It is worth mentioning that all three rating agencies keep the stand-alone rating of Ecopetrol in Investment Grade.
Equity
On October 13, the Financial Superintendence of Colombia authorized the public offering of common shares in Colombia, under a Program for the Issue and Placement of shares (“PEC”) in accordance with Law 1118 of 2006 and the Regulations approved by its Board of Directors on August 27, 2021. This program constitutes a structural financing option for the Company's energy transition strategy while providing flexibility in the management of its capital structure.
Some of the main characteristics of the Program include: i) the total authorized amount available for issuance is 4,364,288,831 ordinary shares ii) the Nation led by the Ministry of Finance and Public Credit would keep a stake of no less than 80% of Ecopetrol’s common equity interest, iii) Ecopetrol could make one or more simultaneous issuances of Common Stock in the local and international markets until the total authorized amount is reached, and iv) the offering may be addressed to the general public, that is, all individuals or legal entities. Ecopetrol has a renewable five-year term to launch the first simultaneous offering under this Program.
This authorization does not generate any commitment or obligation to launch an equity offering and the eventual issuance of one or more equity offering(s) under the Program will be subject, among other considerations, to the existence of favorable market conditions.
Financial Effect of ISA Consolidation
On August 20, 2021, Ecopetrol acquired 569,472,561 shares of ISA, equivalent to 51.4% of its outstanding shares. The transaction was closed with Ecopetrol’s payment of the agreed price of COP 14.2 trillion or COP 25,000 per share to the Ministry of Finance and Public Credit. The payment was made in USD, for an equivalent amount of 3,672 million dollars, financed through foreign debt and use of cash on hand.
With the culmination of the transaction, ISA and its subsidiaries began to be consolidated into financial figures of the Ecopetrol Group, in a new reporting segment. The effect on the Income Statement and Statement of Financial Position is presented below:
Income Statement
The effect of the consolidation of ISA includes one month of operation (September 2021), after the change in control. The main effects are the following[1]:
- Contribution to net income in the amount of COP 8 billion: This corresponds to the EBITDA mentioned below, discounting the line items that are not included in the EBITDA calculation: i) depreciation in the amount of COP 86 billion, ii) financial results in the amount of COP 167 billion, iii) taxes in the amount of COP 312 billion (includes the recognition of the non-recurrent expense on deferred tax due to the tax reform in the amount of COP 146 billion in expenses), and iv) the non-controlling stake in the results of the subsidiaries where ISA does not have a 100% stake, and Ecopetrol’s non-controlling stake over ISA (48.6%), in the amount of COP 164 billion.
[1] For reconciliation of figures see Table 5 - Results by Business Segment - Ecopetrol Group, in the Supplementary Tables to the Report, available on Ecopetrol's website.
- Contribution to EBITDA in the amount of COP 737 billion: This corresponds to the consolidation of 100% of the EBITDA generated by ISA since its acquisition, calculated with Ecopetrol’s methodology[2] for its three business lines: energy transmission, toll roads, and telecommunications.
- In addition to the results that come directly from ISA's operation, this segment assumes COP 105 billion in net income during the quarter, due to a gain from the exchange rate difference on the debt acquired by Ecopetrol to finance the acquisition of this subsidiary, partially offset by: i) the financial interests associated with the acquired debt, ii) the consultancy fees and costs incurred by Ecopetrol for the acquisition, and iii) the income tax associated with the items previously mentioned.
Statement of Financial Position
Additionally, as of September 30, 2021, the following effects due to the consolidation of ISA and its subsidiaries were included in the Consolidated Statement of Financial Position:
- Assets: Each of the components of ISA's assets were consolidated, equivalent to COP 62.5 trillion[3], as well as the difference between the fair value and the book value of ISA's net assets for COP 19.6 trillion[4] (initially recognized mostly as goodwill), in compliance with IFRS standards[5], given that this transaction is considered a business combination under such accounting standards.[6]
- Liabilities: 100% of ISA's liabilities, in the amount of COP 41.1 trillion, were incorporated[7].
- Equity: Consolidation of ISA's non-controlling interest in subsidiaries, and Ecopetrol's non-controlling interest in ISA, both valued at their fair value of COP 27.3 trillion, in accordance with IFRS standards. Similarly, the concepts of conversion adjustments and other concepts of the Other Comprehensive Income are also incorporated.
- Additionally, the segment assumes the international commercial credit of USD 3,672 million acquired by Ecopetrol for the acquisition of ISA.
Efficiencies
The accumulated efficiencies incorporated by the Ecopetrol Group during the first nine months of the year amount to COP 1.8 trillion, mainly due to:
| 1. | OPEX and revenue efficiencies through actions focused on strengthening the EBITDA margin, in the amount of COP 1.4 trillion, as a result of: |
· Actions related to revenues and margin strategies, especially deployed in the commercial area and refineries, whose contribution for the period was COP 531.0 billion.
· Identified and under implementation strategies in the production segment, focused on the optimization and improvement of the lifting cost, contributing COP 394.5 billion.
[2] Ecopetrol's EBITDA calculation methodology comprehends, unlike ISA's methodology, the inclusion within this indicator of the equity method in associated companies and joint ventures, and taxes other than income tax.
[3] Some of the most representative consolidated items include: i) assets from road concessions amounting to COP 31.8 trillion, ii) property, plant, and equipment amounting to COP 14 trillion, and iii) cash amounting to COP 6 trillion.
[4] Initially recognized as goodwill in the Statement of Financial Position, but it will be assigned to each of ISA’s assets and liabilities at the end of December.
[5] International Financial Reporting Standards - IFRS.
[6] In accordance with IFRS 3 - Business Combinations, all the assets of an acquired company must be valued at fair value on the acquisition date.
[7] Some of the most representative items are: i) ISA’s debt amounting to COP 26.8 trillion, and ii) current and deferred taxes amounting to COP 9.3 trillion.
· Optimization of refining cash costs, as part of the implementation of the zero-based budget methodology at the end of 2020, with efficiencies amounting to COP 249.1 billion.
· Strategies deployed by the corporate departments, together with the actions of the digital agenda, for COP 86.1 billion.
· The deployment of the new operating model at CENIT, whose contribution during the period amounted to COP 61.3 billion.
· The continuation of the heavy and extra-heavy crude oil dilution and evacuation strategy, which contributed COP 43.6 billion.
| 2. | CAPEX efficiencies in the amount of COP 0.4 trillion, as a result of: |
· Continuous improvement in the drilling and completion of wells, where: i) the cost of the drilling per foot increased by 26 USD/ft (202 USD/ft in 3Q21 vs 228 USD/ft in 3Q20), ii) the cost of completion decreased 55 KUSD/well8 (466 KUSD/Well in 3Q20 compared to 411 KUSD/well in 3Q21), and iii) the efficiency strategy was strengthened in the optimization of facility construction and major maintenance projects, workovers, and equipment replacement strategies.
Investments
Table 5: Investments by Segment – Ecopetrol Group
| Million (USD) | | Ecopetrol S.A. | Affiliates and Subsidiaries | Total 9M 2021 | % Share |
| Production | | 930 | 615 | 1,545 | 69.8% |
| Downstream | | 127 | 144 | 271 | 12.2% |
| Exploration | | 66 | 84 | 150 | 6.8% |
| Midstream* | | 0 | 196 | 196 | 8.9% |
| Corporate** | | 51 | 0 | 51 | 2.3% |
| Total excluding ISA | | 1,174 | 1,039 | 2,213 | 100.0% |
| | | | | | |
| ISA | | 0 | 946 | 946 | - |
| Total con ISA | | 1,174 | 1,985 | 3,159 | - |
* Includes the total amount of investments of each of the Ecopetrol Group companies (Ecopetrol S.A.’s share and non-controlling interest)
** Includes investment in energy transition projects
As of September 2021, the Ecopetrol Group has executed organic investments amounting to USD 2,213 million (excluding the investments made by ISA), which represents an increase of 21.6% compared to 3Q20, achieving one of the highest figures in the last five years. Out of the of total investments 72% were made in Colombia and 28% in the United States, Brazil, and Mexico. The focus has been increasing production and reserves, allocating 77% of investments to production and exploration, while the remaining 23% was allocated to the midstream, downstream, and corporate segments.
In ISA, the accumulated investment as of September 2021 closed at USD 946 million, USD 23 million more than what was registered as of September 2020. During the first nine months of the year, progress has been made in the construction of energy transmission projects in the countries where ISA is present, and toll roads in Chile and Colombia. For the full year, an investment of around USD 1,200 million is expected.
The destination of the main investments made in Ecopetrol's traditional oil and gas business is detailed below:
Exploration: 10 wells have been drilled as of September 2021, and progress is being made in the maturation of the Group's exploratory program, which is mostly concentrated in Colombia.
Production: Ecopetrol S.A.’s development and production activities were concentrated in the Rubiales, Chichimene, Castilla, Llanito, Casabe, and Caño Sur fields. In the case of subsidiaries, investments were focused on Ecopetrol Permian and Hocol. Accumulated by the end of 3Q21, 286 development wells have been drilled and completed and 303 capitalizable workovers have been executed.
[8] KUSD/well: Thousands of Dollars per Completed Well.
Midstream: The investment was focused on operational continuity activities that allow the integrity and reliability of the different oil and multipurpose pipelines systems of CENIT and its subsidiaries.
Downstream: The segment maintains its commitment to guarantee the efficiency, reliability, and integrity of operations at the Barrancabermeja and Cartagena refineries, concentrating 79% of its investments in these areas. It should be noted that around 30% of the total execution of its investments corresponds to two projects that are expected to contribute to the growth of the segment and to the improvement of the environmental quality in its area of influence: i) the Interconnection of the Cartagena Crude Oil Plants (IPCC for its Spanish acronym), which to date records 74% physical progress and an executed CAPEX of around USD 100 million, and ii) the Wastewater Treatment Plant at the Barrancabermeja refinery.
TESG: Investments in the decarbonization and efficient water management of operations represented about 6% of the period execution, and we expect to continue advancing in the maturation and execution of related projects.
The Ecopetrol Group continues to target an execution of organic investments for USD 3,500 million in 2021 (excluding ISA), prioritizing the generation of sustainable value and clean and safe operations. This level of investment would represent an increase of 30.9% compared to the level executed in 2020, and it would be one of the highest records in the last five years.
II. Results by Business Segment
Exploration
Ecopetrol and its partners drilled two exploratory wells in 3Q21: i) the Basari-1 Well, 100% operated by Hocol, which is currently in the evaluation stage, and ii) the Silverback 2 well, operated by Chevron (35%), Shell (30%), Progress (15%), Murphy (10%), and Ecopetrol America (10%), which was declared dry, and it was plugged and abandoned. In this way, 10 exploratory wells have been drilled so far in 2021 and 14 wells are expected to be drilled by the end of the year.
The Liria YW12 well, drilled to a depth of 19,750 feet, proved the presence of hydrocarbons with good initial test results. The Colombian National Hydrocarbons Agency (ANH for its Spanish acronym) approved the reclassification of the well as discoverer of a new field.
Continuing with the 2021 exploratory campaign, the Carnaval-1 well was being drilled at the end of the quarter, operated by Lewis Energy with a 50% stake and Hocol with the remaining 50%.
Accumulated production in initial and extensive tests and post-commercial exploratory wells reached 1,233,205 boe by the end of 3Q21 (4,517 boed on average), with 67% of production corresponding to oil and 33% to gas.
In line with the incorporation of reserves, commercial viability was declared in two discoveries located in the Department of Santander: Flamencos (Ecopetrol owns 100% of the stake) and Boranda, with Ecopetrol and its partner Parex (operator) owning a 50% stake, respectively.
- Flamencos-1, discovered in 2019, has produced around 23,000 barrels of 30°API oil in extensive testing thus far in 2021. To date, two delimiter wells have been drilled and are still being evaluated to determine the extent of the field: Flamencos-2 has produced around 24,461 barrels of 30°API oil in extensive testing, and Flamencos-3, which is expected to start production with initial testing in October 2021.
- Boranda, initially discovered in 2017, and sector 2 in 2019, has produced about 156 thousand barrels of 22-24°API oil in extensive testing with the Boranda-1, Boranda-2st, Boranda Sur-2 and Boranda-3 wells. Additionally, drilling activities are being conducted to finalize the delimitation of the field and incorporate additional resources associated with the Lisama Formation. Given the successful results, the Global Development License for the field was requested, which was granted by the National Authority for Environmental Licensing (ANLA) in September 2021.
On the other hand, planning continues for the Uchuva well in the Tayrona block (operated by Petrobras), in order to investigate a new play of turbidite sands of Miocene age in waters at a depth of 837 meters. If successful, an exploratory region would be opened offshore in La Guajira, which would present a portfolio of interesting opportunities.
In terms of the gas exploratory strategy at the Hocol subsidiary, the Arrecife-1ST and Arrecife-3 wells are currently producing in the extensive testing phase. Additionally, the Bullerengue-3 well, in association with Lewis Energy, is producing at the CPF (Central Production Facilities) of Bullerengue. Similarly, Hocol is currently working in the pre-drilling phase of i) three wells, located in the VIM-8 block, near the Arrecife discovery, which will allow us to leverage the gas strategy in the Lower Magdalena Valley, and ii) an exploratory well in the Guajira basin.
The following aspects stand out in relation to seismic activity: i) Hocol continues recording 2D seismic information in the block SN18 (26% progress), and ii) Ecopetrol Brazil acquired 53,972 km2 of seismic area, of which 870 km2 correspond to the "Nebula" seismic program in the Saturno Block and 53,102 km² to the “Picanha” regional seismic program.
In the international field, during the “Rodada 17” bidding session organized by the National Petroleum Agency (ANP) on October 7, Ecopetrol S.A., through its subsidiary, Ecopetrol Óleo e Gás do Brasil, acquired a 30% stake in block S-M-1709, located in the Santos basin in Brazil. The acquisition of this block, which will be operated by Shell (70% stake), is aligned with the growth strategy of the Ecopetrol Group, with a focus on the highest potential basins in the continent.
In relation to the discovery of Gato Do Mato, operated by Shell (50%), Total Energies (20%), and Ecopetrol Óleo e Gás do Brasil (30%), the commercial viability study continues by incorporating relevant technical information, as well as defining the concept of the development plan to update the technical and commercial case of the project.
Production
Table 6: Gross Production – Ecopetrol Group
| Production - mboed | | 3Q 2021 | 3Q 2020 | ∆ (%) | | 9M 2021 | 9M 2020 | ∆ (%) |
| Crude Oil | | 490.9 | 500.1 | (1.8%) | | 483.5 | 520.5 | (7.1%) |
| Natural Gas | | 122.6 | 119.9 | 2.3% | | 123.6 | 119.0 | 3.9% |
| Total Ecopetrol S.A. | | 613.5 | 620.1 | (1.1%) | | 607.1 | 639.5 | (5.1%) |
| Crude Oil | | 17.7 | 18.9 | (6.3%) | | 18.7 | 20.3 | (7.9%) |
| Natural Gas | | 18.7 | 18.0 | 3.9% | | 18.9 | 13.8 | 37.0% |
| Total Hocol | | 36.4 | 36.9 | (1.4%) | | 37.6 | 34.1 | 10.3% |
| Crude Oil | | 0.0 | 0.0 | - | | 0.0 | 1.5 | (100.0%) |
| Natural Gas | | 0.0 | 0.0 | - | | 0.0 | 1.2 | (100.0%) |
| Total Equion* | | 0.0 | 0.0 | - | | 0.0 | 2.7 | (100.0%) |
| Crude Oil | | 0.0 | 3.0 | (100.0%) | | 0.2 | 3.1 | (93.5%) |
| Natural Gas | | 0.0 | 0.9 | (100.0%) | | 0.0 | 0.9 | (100.0%) |
| Total Savia | | 0.0 | 3.9 | (100.0%) | | 0.2 | 4.0 | (95.0%) |
| Crude Oil | | 8.3 | 9.9 | (16.2%) | | 9.8 | 10.7 | (8.4%) |
| Natural Gas | | 1.1 | 1.8 | (38.9%) | | 1.5 | 1.8 | (16.7%) |
| Total Ecopetrol America | | 9.4 | 11.7 | (19.7%) | | 11.3 | 12.5 | (9.6%) |
| Crude Oil | | 17.0 | 6.1 | 178.7% | | 12.5 | 3.7 | 237.8% |
| Natural Gas | | 7.4 | 2.3 | 221.7% | | 4.9 | 1.2 | 308.3% |
| Total Ecopetrol Permian | | 24.4 | 8.4 | 190.5% | | 17.4 | 4.9 | 255.1% |
| Crude Oil | | 533.8 | 538.0 | (0.8%) | | 524.7 | 559.8 | (6.3%) |
| Natural Gas | | 149.8 | 143.0 | 4.8% | | 148.9 | 137.9 | 8.0% |
| Total Ecopetrol Group | | 683.6 | 680.9 | 0.4% | | 673.6 | 697.7 | (3.5%) |
*Equión’s production goes up to February 29, 2020, which corresponds to the end date of the Piedemonte partnership agreement. As of March 1, 2020, Ecopetrol incorporates
100% of the production from the Pauto and Floreña fields.
Note: Gross production includes royalties and is prorated according to Ecopetrol's share in each company. Natural gas production includes NGL’s.
In 3Q21, the Ecopetrol Group produced 683.6 mboed, 22.7 mboed more than 2Q21. Ecopetrol S.A. contributed 613.5 mboed and the subsidiaries 70.1 mboed. The production of gas and LPG reached 140.7 mboed, with a contribution of 20.6% to the total Group’s production, while the total white products production reached 9.1 mboed with a contribution of 1.3%. The fields with recovery technologies contributed 31%. Compared to 3Q20, production increased 2.7 mboed, mainly due to Permian’s improved performance.
Some relevant issues that are worth highlighting include the stabilization of production in the Castilla field in the third quarter (+11.7 mboed), the recovery of production affected by the roadblocks associated with the public order situation in Colombia (+23.8 mboed), and the anticipation of wells in Permian. In the gas segment, the Santiago de las Atalayas (SDLA) Exploitation and Exploration Agreement was signed with the Colombian National Hydrocarbons Agency (ANH), which allowed pre-drilling activities in two new wells to start drilling before January 2022.
Similarly, some of the events that impacted production compared to 2Q21 include: i) -2.7 mboed (after royalties) due to the hurricane season in the Gulf of Mexico; ii) -4.9 mboed due to damages to the Promioriente Pipeline due to a landslide, which transports gas from the Gibraltar field, iii) -2.8 mboed due to the increase in power outages and flooding of the Caricare field, primarily due to the strong rainy season in the country, and v) -3.1 mboed corresponding to scheduled maintenance in Cupiagua.
In terms of drilling, 107 development wells were drilled and completed in 3Q21, for an accumulated to September of 286 and an average occupancy of 18 drilling rigs for the Ecopetrol Group. 21 drilling rigs were occupied in 3Q21.
Given the average production level for 3Q21 and the projection for 4Q21, the production for the year is estimated at around 680 mboed. For 4Q21 an increase in activity is expected, due to the following activities: i) drilling of 110 - 130 development wells, ii) the re-start of the Promioriente Gas Pipeline, which is expected to reactivate the Gibraltar field, iii) the reception of the Nare asset fields after the end of the partnership agreement, and iv) the recovery of production of the fields affected by the rainy and the hurricane seasons.
Recovery Program
In 3Q21, it is highlighted the approval for the development of the improved water injection pilot in the Palagua field and the extension of the environmental authorization for the continuation of the air injection pilot in Chichimene for an additional year. The other pilots continue in operation and evaluation.
Comprehensive Research Pilot Projects (PPII for its Spanish Acronym)
During 3Q21 and regarding the development of the Environmental Impact Study (EIA) for the PPII Kalé, the forums associated with the Participation Guidelines were completed. The objective was to perform impact workshops, management measures and ecosystem services, as well as the socialization of the results of the EIA, following the provisions of the Terms of Reference issued by the Environmental Authority. On October 29, 2021, the EIA of PPII Kalé was filed before the National Authority for Environmental Licensing – ANLA.
Regarding the PPII Platero, during 3Q21, a progress of 25% was made in the EIA, and the monitoring of the season with less rainfall was performed. For 4Q21, the collection of primary information is projected for the season with the highest rainfall, as well as the creation of forums associated with Participation Guidelines, which objective is to inform about the description of the project and to develop impact workshops, management measures and ecosystem services with the communities and stakeholders in the area of influence.
Permian
The drilling of 22 wells was completed in 3Q21, for a total of 69 new wells drilled as of September. Similarly, 16 new wells started production, for total of 91 wells in production (22 in 2020 and 69 in 2021). Production reached 24.4 mboed before royalties during this period, and 18.9 mboed net Ecopetrol after royalties.
The partnership continues to achieve operational efficiencies and set operational records, such as:
- Start of drilling wells with 15,000-ft lateral. The partnership drilled six of these wells, with average drilling times of 11 days (Spud to Rig Release[9]).
- New record pumping time of 22.7 hours in a single day.
- Average drilling time per well of 12.3 days vs. 14 days in 2020.
- Increased water recycling capacity from 50,000 to 65,000 barrels/day and storage capacity from 2.0 million to 3.2 million barrels of water. In addition, more than 2.5 million barrels of recycled water have been used during completion operations.
- Adaptation of the drilling rigs and completion squads for the dual fuel system, to reduce diesel consumption by up to 20%.
Lifting and Dilution Cost
Table 7: Lifting and Dilution Cost - Ecopetrol Group
| USD/Bl | | 3Q 2021 | 3Q 2020 | ∆ (%) | | 9M 2021 | 9M 2020 | ∆ (%) | | % USD |
| Lifting Cost* | | 8.45 | 7.22 | 17.0% | | 8.01 | 7.14 | 12.2% | | 20.7% |
| Dilution Cost** | | 4.26 | 2.63 | 62.0% | | 4.04 | 2.53 | 59.7% | | 100.0% |
* Calculated based on barrels produced, excluding royalties.
** Calculated based on barrels sold.
Lifting Cost
The accumulated lifting cost as of September 2021 was 8.01 USD/Bl and increased 0.87 USD/Bl compared to September 2020, mainly due to:
Cost Effect (+0.60 USD/Bl): Increase primarily due to: i) a rise in the number of well interventions and works, oriented to strengthen process safety matters, ii) greater execution of services in subsoil works, surface and HSE, iii) greater materials for processes, energy, and support areas related to the reactivation of activities, and iv) implementation of enhanced recovery in mature fields.
Volume Effect (+0.26 USD/Bl): Lower production compared to the same period of the previous year.
Exchange Rate Effect (+0.01 USD/Bl): Lower exchange rate by -6.93 COP/USD when re-expressing costs from COP into USD.
The lifting cost for 3Q21 was 8.45 USD/Bl, with an increase of 1.23 USD/Bl compared to the same period in 2020.
Dilution Cost
The accumulated dilution cost as of September 2021 was 4.04 USD/Bl, with an increase of 1.51 USD/Bl compared to the accumulated as of September 2020, mainly due to: i) higher naphtha purchase price of 27.5 USD/Bl given the increase in the Brent price and the recovery of market conditions, ii) lower exchange rate when re-expressing costs from COP into USD, and iii) lower purchase volume of barrels of naphtha (6.5 mbd), due to the lower production of heavy crude oils and efficiencies in dilution costs.
In 2021 year-to-date, the following efficiency initiatives in dilution costs have been implemented: i) incorporation of LPG from the Cusiana, Cupiagua, and Apiay plants to replace imported diluent, ii) increase of the dilution viscosity and transport of heavy-acid crude oil from Middle Magdalena from 300 to 600 cSt for evacuation through ODC, and iii) use of chemicals to increase viscosity in different transport systems.
The dilution cost for 3Q21 was 4.26 USD/Bl, with an increase of 1.63 USD/Bl compared to the same period in 2020.
[9] Time between the start of drilling (spud) and the completion of drilling of the well at the time of releasing the drilling equipment (Rig Release).
Financial Results for the Segment
Table 8: Income Statement - Upstream
| Billion (COP) | | 3Q 2021 | 3Q 2020 | ∆ ($) | ∆ (%) | | 9M 2021 | 9M 2020 | ∆ ($) | ∆ (%) |
| Total revenue | | 15,729 | 9,684 | 6,045 | 62.4% | | 43,509 | 26,190 | 17,319 | 66.1% |
| Depreciation, amortization and depletion | | 1,869 | 1,565 | 304 | 19.4% | | 5,165 | 4,608 | 557 | 12.1% |
| Variable costs | | 5,855 | 4,102 | 1,753 | 42.7% | | 16,409 | 12,580 | 3,829 | 30.4% |
| Fixed costs | | 2,495 | 2,193 | 302 | 13.8% | | 6,861 | 6,747 | 114 | 1.7% |
| Total cost of sales | | 10,219 | 7,860 | 2,359 | 30.0% | | 28,435 | 23,935 | 4,500 | 18.8% |
| Gross income | | 5,510 | 1,824 | 3,686 | 202.1% | | 15,074 | 2,255 | 12,819 | 568.5% |
| Operating and exploratory expenses | | 1,049 | 848 | 201 | 23.7% | | 2,695 | 951 | 1,744 | 183.4% |
| Operating income | | 4,461 | 976 | 3,485 | 357.1% | | 12,379 | 1,304 | 11,075 | 849.3% |
| Financial result, net | | (507) | (565) | 58 | (10.3%) | | (1,493) | (1,087) | (406) | 37.4% |
| Share of profit of companies | | (1) | (24) | 23 | (95.8%) | | 13 | (38) | 51 | (134.2%) |
| Income before income tax | | 3,953 | 387 | 3,566 | 921.4% | | 10,899 | 179 | 10,720 | 5,988.8% |
| Provision for income tax | | (1,197) | (168) | (1,029) | 612.5% | | (3,352) | (65) | (3,287) | 5,056.9% |
| Consolidated net income | | 2,756 | 219 | 2,537 | 1,158.4% | | 7,547 | 114 | 7,433 | 6,520.2% |
| Non-controlling interest | | 22 | 20 | 2 | 10.0% | | 64 | 61 | 3 | 4.9% |
| Net income attributable to owners of Ecopetrol before impairment | | 2,778 | 239 | 2,539 | 1,062.3% | | 7,611 | 175 | 7,436 | 4,249.1% |
| (Expense) income from impairment of long-term assets | | 0 | 0 | 0 | - | | 0 | (518) | 518 | (100.0%) |
| Deferred tax on impairment | | 0 | 0 | 0 | - | | 0 | 151 | (151) | (100.0%) |
| Net income attributable to owners of Ecopetrol | | 2,778 | 239 | 2,539 | 1,062.3% | | 7,611 | (192) | 7,803 | (4,064.1%) |
| | | | | | | | | | | |
| EBITDA | | 6,477 | 2,642 | 3,835 | 145.2% | | 17,986 | 4,849 | 13,137 | 270.9% |
| EBITDA Margin | | 41.2% | 27.3% | - | 13.9% | | 41.3% | 18.5% | - | 22.8% |
Revenues for 3Q21 increased compared to 3Q20, mainly due to the increase in realization prices, partially offset by reduced crude oil exports, given the higher number of shipments in transit at the end of September, that are expected to be completed in 4Q21.
Cost of sales for 3Q21 increased compared to 3Q20 due to:
| · | Higher purchase costs due to the increase of crude oil prices, offset by lower purchase volumes of purchases to the ANH and diluent, which in turn was mainly attributed to lower production. |
| · | Greater cost execution due to: i) higher activities of contracted association services due to increased consumption of regulated energy in Cravo Norte, associated with the project to modify the self-generation source to reduce the carbon footprint ii) higher number of well interventions, maintenance, and integrity works, partly associated with the relocation of activities after the public order situation, iii) increase in process materials and support areas associated with the reactivation of operational activities, and iv) higher number of Ecopetrol services contracted due to greater execution of specialized services in operation, integrity, and HSE. |
| · | Increased levels of crude oil inventory, associated with shipments in transit to India and the United States. |
| · | Higher transportation costs due to: i) higher exchange rate, ii) annual update in oil pipeline tariffs, and iii) costs associated with the execution of reversal cycles in August and September in the Bicentenario Pipeline given the shorter operating days of the Caño Limón - Coveñas pipeline. |
Operating expenses (net of income) for 3Q21 increased compared to 3Q20, mainly due to: i) updates to environmental provisions, ii) recognition in the result of assets (Silverback 2 in Ecopetrol America, Ceará in Brazil, Chimuelo-1, and Boranda Centro-1 and Lorito Este-1 in Ecopetrol) and seismic acquisition in Brazil.
Net financial expense (non-operating) for 3Q21 decreased compared to 3Q20, mainly due to lower interest expenses associated with the prepayment of debt in September 2020.
Table 9: Volumes Transported - Ecopetrol Group
| mbd | | 3Q 2021 | 3Q 2020 | ∆ (%) | | 9M 2021 | 9M 2020 | ∆ (%) |
| Crude Oil | | 723.7 | 754.2 | (4.0%) | | 720.2 | 794.3 | (9.3%) |
| Products | | 288.5 | 225.2 | 28.1% | | 273.0 | 219.6 | 24.3% |
| Total | | 1,012.2 | 979.4 | 3.3% | | 993.3 | 1,013.9 | (2.0%) |
Note: Reported volumes subject to adjustments in volumetric quality compensation (CVC), associated to official volumetric balances.
The total volume transported in 3Q21 increased by 32.8 mbd compared to 3Q20, due to the increase of 63.3 mbd in the transport of refined products, as a result of the recovery of local demand. Similarly, 3Q21 volume increased by 52.3 mbd compared to 2Q21, with growth both in crude oil and refined products.
Crudes: In 3Q21 volumes transported decreased 4.0% compared to 3Q20 because of lower production, mainly in the Llanos region. It is worth mentioning the increased evacuation in the corridors that connect with the Barrancabermeja Refinery (Vasconia - Galán and Ayacucho - Galán; +36.4 mbd versus 3Q20 evacuation), which resulted in a decrease of 70.5 mbd in evacuation to Coveñas compared to 3Q20. Approximately 84.0% of the crude oil volume transported is owned by the Ecopetrol Group.
In 3Q21, 11 reversal cycles of the Bicentenario Pipeline were carried out, with an evacuated volume of 2.7 million barrels. The foregoing, to ensure the evacuation of the Caño Limón field after the damages caused on the pipeline due to a landslide in La China village in the Municipality of Toledo, Department of Norte de Santander. After carrying out the repair work, the pipeline started operating again on October 13, 2021.
During 3Q21 there were 12 attacks on oil pipelines caused by third parties, decreasing 50% as compared to 3Q20. The installation of illegal valves decreased 17.3%.
Refined Products: In 3Q21, the volumes of refined products transported increased by 28.1% compared to 3Q20, mainly due to the recovery of economic activity. Approximately 29.7% of the volume transported through multipurpose pipelines corresponded to Ecopetrol products.
During the quarter, the installation of illegal valves increased 30.0% compared to 3Q20.
Six New Solar Plants in CENIT’s Stations: In September 2021, six new solar plants began to operate in the stations of Baranoa, Miraflores, Mansilla, Tocancipá, Yumbo, and Pereira, which main objective is to reduce CO2 emissions, in line with the goals announced under the framework of the Ecopetrol Group and the country’s decarbonization plan. It is expected to reduce around 513 tons of CO2 annually, which is equivalent to the absorption of this compound by more than 84,830 trees. The project’s life cycle is 20 years, during which these six plants will generate 17.3 million kilowatts, what resembles the energy consumption of 15,000 Colombian households in a year.
Disputes in Transport Contracts:
The Administrative Tribunal of Cundinamarca approved the agreement signed by Frontera, CENIT and Bicentenario to resolve existing disputes regarding crude transportation in Colombia. This approval was notified on November 5 of 2021 and is still pending execution to produce full legal effects. It is important to mention that the agreement has a favorable opinion from the Attorney General’s Office (Procuraduría General de la Nación), received on March 24, 2021.
As a result of the conciliation, Frontera: i) recognizes in favor of CENIT and Bicentenario the obligations pending under their agreements as of December 31, 2019, ii) will transfer to CENIT its 43.03% stake in Bicentenario, and iii) transfers to Bicentenario the dividends payments pending by Bicentenario and the resources in a trust fund that support one of the disputes, transfers advance payments from prior years, and delivers to Bicentenario the fill-up of the line that it has in this pipeline. Likewise, as part of the agreement, Frontera will recognize to Bicentenario a portion of Bicentenario's syndicated debt in the amount of COP 438 billion.
Additionally, CENIT and Bicentenario subscribed new ship or pay contracts with Frontera, which will allow them to generate additional revenues for the payment of obligations included in the conciliation, for a value up to USD 92 million. This amount is subject to adjustment according to the value of the fill-up of the line as of the closing date. According to current projections of the Brent price is estimated that the total amount of these contracts will be approximately USD 60 million. Likewise, ODL subscribed a new ship or pay contract with Frontera, which will allow ODL to generate revenues up to USD 55.5 million.
The financial impacts of the transaction correspond to the recovery of the total amount of the debt portfolio as of December 31, 2019, for a value of COP 729 billion. The one-time impact on EBITDA will be approximately COP 700 billion, which will be reflected in the 4Q21 figures. Additionally, financial revenues for approximately COP 41 billion will be received, due to the effect of interest in arrears and returns of trust funds.
Cost per Barrel Transported
Table 10: Cost per Barrel Transported - Ecopetrol Group
| USD/Bl | | 3Q 2021 | 3Q 2020 | ∆ (%) | | 9M 2021 | 9M 2020 | ∆ (%) | | % USD |
| Cost per Transported Barrel | | 2.77 | 3.12 | (11.2%) | | 2.86 | 3.02 | (5.3%) | | 15.1% |
The accumulated cost per barrel transported as of September 2021 was 2.86 USD/Bl and decreased 0.16 USD/Bl compared to September 2020, mainly due to:
Cost Effect (-0.24 USD/Bl): Decrease in variable cost due to a reduction in the consumption of materials, supplies and energy, due to the lower volumes transported. Additionally, a lower depreciation was generated due to the change at the end of 2020 of the useful lives of Los Llanos and Bicentenario pipelines.
Volume Effect (+0.07 USD/Bl): Higher cost per barrel due to lower transported volume derived from lower production, partially offset by a higher volume of products due to the recovery of the demand for gasoline and diesel in the country.
Exchange Rate Effect (+0.01 USD/Bl): Lower exchange rate by -6.93 COP/USD when re-expressing costs from COP into USD.
The cost per barrel transported for 3Q21 was 2.77 USD/Bl, with a decrease of 0.35 USD/Bl compared to the same period in 2020.
Financial Results for the Segment
Table 11: Income Statement – Midstream
| Billion (COP) | | 3Q 2021 | 3Q 2020 | ∆ ($) | ∆ (%) | | 9M 2021 | 9M 2020 | ∆ ($) | ∆ (%) |
| Total revenue | | 3,158 | 2,986 | 172 | 5.8% | | 8,785 | 9,133 | (348) | (3.8%) |
| Depreciation, amortization and depletion | | 292 | 336 | (44) | (13.1%) | | 868 | 972 | (104) | (10.7%) |
| Variable costs | | 138 | 129 | 9 | 7.0% | | 373 | 425 | (52) | (12.2%) |
| Fixed costs | | 375 | 371 | 4 | 1.1% | | 1,081 | 1,123 | (42) | (3.7%) |
| Total cost of sales | | 805 | 836 | (31) | (3.7%) | | 2,322 | 2,520 | (198) | (7.9%) |
| Gross income | | 2,353 | 2,150 | 203 | 9.4% | | 6,463 | 6,613 | (150) | (2.3%) |
| Operating expenses | | 199 | 201 | (2) | (1.0%) | | 540 | 561 | (21) | (3.7%) |
| Operating income | | 2,154 | 1,949 | 205 | 10.5% | | 5,923 | 6,052 | (129) | (2.1%) |
| Financial result, net | | 38 | (57) | 95 | (166.7%) | | 149 | 382 | (233) | (61.0%) |
| Share of profit of companies | | 0 | 0 | 0 | - | | 0 | (2) | 2 | (100.0%) |
| Income before income tax | | 2,192 | 1,892 | 300 | 15.9% | | 6,072 | 6,432 | (360) | (5.6%) |
| Provision for income tax | | (737) | (608) | (129) | 21.2% | | (1,915) | (2,002) | 87 | (4.3%) |
| Consolidated net income | | 1,455 | 1,284 | 171 | 13.3% | | 4,157 | 4,430 | (273) | (6.2%) |
| Non-controlling interest | | (323) | (271) | (52) | 19.2% | | (865) | (872) | 7 | (0.8%) |
| Net income attributable to owners of Ecopetrol before impairment | | 1,132 | 1,013 | 119 | 11.7% | | 3,292 | 3,558 | (266) | (7.5%) |
| (Expense) income from impairment of long-term assets | | (3) | 0 | (3) | - | | (2) | 3 | (5) | (166.7%) |
| Deferred tax of impairment | | 1 | 0 | 1 | - | | 1 | (1) | 2 | (200.0%) |
| Net income attributable to owners of Ecopetrol | | 1,130 | 1,013 | 117 | 11.5% | | 3,291 | 3,560 | (269) | (7.6%) |
| | | | | | | | | | | |
| EBITDA | | 2,496 | 2,316 | 180 | 7.8% | | 6,955 | 7,134 | (179) | (2.5%) |
| EBITDA Margin | | 79.0% | 77.6% | - | 1.4% | | 79.2% | 78.1% | - | 1.1% |
Revenues for 3Q21 increased as compared to 3Q20, mainly due to: i) 11 reversal cycles of Oleoducto Bicentenario, with an evacuated volume of 2.7 million barrels, ii) an increase in transported volumes of refined products as a result of the recovery in demand throughout 2021, iii) annual tariff updates, and iv) higher average COP/USD exchange rate. Those positive effects we partially offset by the elimination of the Continuity Plan Margin value, which was part of the price structure of refined products until April 2021.
Cost of sales for 3Q21 decreased versus 3Q20, mainly as a result of a lower depreciation, primarily due to the extension of useful lives in Los Llanos and Bicentenario pipelines. This decrease was partially offset by an increase in the variable costs of materials, mainly associated with higher volumes transported and the reversal cycles registered in 3Q21.
Operating expenses (net of income) for 3Q21 remain at a similar level to those in 3Q20.
Net financial result (non-operating) for 3Q21 increased compared to 3Q20, mainly due to: i) higher income for exchange rate difference, and ii) higher costs associated with the Ocensa bond refinancing transaction in 3Q20.
In 3Q21, the refineries reached a consolidated throughput of 353.8 mbd and an integrated gross margin of 9.0 USD/Bl, compared to a consolidated throughput of 323.9 mbd and an integrated gross margin of 7.4 USD/Bl in 3Q20, continuing with the positive trend observed since 1Q21. The aforementioned is the result of: i) the improvement of the refined products basket, in line with the general increase in demand due to the productive sector reactivation, ii) throughput volumes at pre-pandemic levels, inventory valuation due to a favorable price environment, and a better operational performance at the Barrancabermeja refinery, iii) the implementation of commercial strategies in Esenttia to reduce the weakening of the Polypropylene Margin, iv) Invercolsa stability as a result of higher sales of natural gas and installations, and v) the stability of the segment's cash cost.
The above was achieved despite operational challenges related to: i) the execution of scheduled maintenances at the Barrancabermeja refinery and Esenttia, ii) corrective maintenances at the Cartagena refinery, iii) a market with challenging international prices to the Cartagena refinery and Essentia, and iv) restrictions that affected the Caño Limón - Coveñas pipeline. These events had an impact of -11 mbd on the segment’s throughput levels.
Cartagena Refinery
Table 12: Throughput, Utilization Factor, Production and Refining Margin
- Cartagena Refinery
| Cartagena Refinery | | 3Q 2021 | 3Q 2020 | ∆ (%) | | 9M 2021 | 9M 2020 | ∆ (%) |
| Throughput* (mbd) | | 139.4 | 144.7 | (3.7%) | | 142.3 | 136.0 | 4.6% |
| Utilization Factor (%) | | 75.4% | 85.2% | (11.5%) | | 77.8% | 73.0% | 6.5% |
| Production (mbd) | | 131.8 | 140.3 | (6.1%) | | 136.2 | 129.7 | 5.0% |
| Gross Margin (USD/Bl) | | 5.4 | 5.5 | (1.8%) | | 6.8 | 6.7 | 1.5% |
*Corresponds to effective throughput volumes, not volumes received
During 3Q21, throughput and gross refining margin results were affected by two operational events in August: i) the corrective maintenance of the catalytic cracking unit and ii) the general shutdown of the units due to an electrical failure. It is important to note that both events have already been resolved as of the date of this report, thanks to the resource concentration to repair and start-up of the affected units, as well as the analysis of the event causes performed, to guarantee operational reliability.
The refining gross margin was also impacted by a more expensive feedstock caused by the strengthening in the price of crude oil and the greater discount on export diesel (RVO10 effect), from 7.0 USD/Bl in 2Q21 to 5.4 USD/Bl in 3Q21. September crude throughput is highlighted, which registered levels of 145.8 mbd, gradually returning to pre-pandemic levels.
Barrancabermeja Refinery
Table 13: Throughput, Utilization Factor, Production and Refining Margin
- Barrancabermeja Refinery
| Barrancabermeja Refinery | | 3Q 2021 | 3Q 2020 | ∆ (%) | | 9M 2021 | 9M 2020 | ∆ (%) |
| Throughput* (mbd) | | 214.4 | 179.2 | 19.6% | | 215.7 | 172.0 | 25.4% |
| Utilization Factor (%) | | 76.6% | 62.4% | 22.8% | | 78.6% | 62.1% | 26.6% |
| Production (mbd) | | 217.3 | 182.0 | 19.4% | | 219.4 | 175.1 | 25.3% |
| Gross Margin (USD/Bl) | | 11.4 | 9.0 | 26.7% | | 11.3 | 8.8 | 28.4% |
*Corresponds to effective throughput volumes, not volumes received
During 3Q21, the refinery exhibited a stable operational performance, adjusted to the domestic demand environment, which was reflected in the throughput and margins recovery in 3Q21 versus 3Q20. Thus, compared to 2Q21, the refinery throughput level and the gross refining margin in two digits were maintained (216.0 mbd and 11.2 USD/Bl, respectively). These results were achieved despite the lower oil availability due to restrictions at Caño Limón - Coveñas pipeline, and the scheduled major maintenances in the Petroquimica train and the alkylation unit.
[10] Renewable Volume Obligation: Requirement to have a Mandatory Renewable Volume, which is a percentage of the fuel manufactured and sold to the United States public, within the Renewable Fuel Standard program (RFS). If any refiner and / or trader of vehicular fuels in the United States does not comply with the requirements of the RFS program, they must assume a cost per gallon RIN (Renewable Identification Numbers).
Esenttia
Table 14: Sales and Margin – Esenttia
Esenttia | | 3Q 2021 | 3Q 2020 | ∆ (%) | | 9M 2021 | 9M 2020 | ∆ (%) |
| Total Sales (KTon) | | 128.1 | 147.2 | (13.0%) | | 405.4 | 396.1 | 2.3% |
| Total Margin (USD/Ton) | | 170.8 | 227.8 | (25.0%) | | 237.1 | 230.8 | 2.7% |
During 3Q21 Polypropylene (PP) raw material prices increased, which was almost entirely offset by commercial strategies implemented by Essentia (assurance of national and international raw material sources, early sales of PP in high-value regions, among others), achieving stable results for the quarter. This, despite the challenging price environment and the low availability of RGP[11] in the domestic market (offset by imports). Regarding PGP[12], market conditions favored the results for the Splitter unit[13]. Highlights include:
| · | Average PGP-PGR spread of 46.5 cpp[14], being the quarter with the highest level in 2021, primarily due to the increased availability of PGR compared to low PGP inventories. |
| · | PP margin of 179 USD/Ton and EBITDA of COP 103 billion during 3Q21. |
| · | The higher sales volume in 2021, primarily due to a market environment with higher product demand. |
| · | The highest margin of 2021, primarily due to favorable market conditions. The substantial increase in PP prices during 3Q21 positively boosted margin results, offsetting the impact of increased propylene cost. |
Invercolsa
In 3Q21, there was sustained growth in Invercolsa's financial results compared to previous quarters in 2021 and 2020, mainly due to: i) an increase in profit per m3 and the volume of natural gas, ii) an increase in revenue from installations, and iii) higher volumes in natural gas transportation.
Refining Cash Cost
Table 15: Refining Cash Cost*
| USD/Bl | | 3Q 2021 | 3Q 2020 | ∆ (%) | | 9M 2021 | 9M 2020 | ∆ (%) | | % USD |
| Refining Cash Cost | | 4.20 | 4.94 | (15.0%) | | 4.32 | 5.01 | (13.8%) | | 13.3% |
*Includes Barrancabermeja and Cartagena refineries, and Esenttia
The accumulated refining cash cost as of September 2021 was 4.32 USD/Bl and decreased 0.69 USD/Bl compared to September 2020, mainly due to:
Cost and Volume Effect (-0.70 USD/Bl): Higher crude throughput at Barrancabermeja refinery (+43.7 mbd) and at Cartagena refinery (+6.3 mbd), due to a demand increase.
Exchange Rate Effect (+0.01 USD/Bl): Lower exchange rate by -6.93 COP/USD when re-expressing costs from COP into USD.
The refining cash cost for 3Q21 was 4.20 USD/Bl, with a decrease of 0.74 USD/Bl compared to the same period in 2020.
[11] RGP: Refinery Grade Propylene
[12] PGP: Polymer Grade Propylene
[13] The Splitter Unit produces Polymer Grade Propylene (PGP) from Refinery Grade Propylene (RGP). When the spread PGP - RGP is high, the margin of this unit is favored, and vice versa.
[14] cpp: cents per pound
Financial Results for the Segment
Table 16: Income Statement – Downstream
| Billion (COP) | | 3Q 2021 | 3Q 2020 | ∆ ($) | ∆ (%) | | 9M 2021 | 9M 2020 | ∆ ($) | ∆ (%) |
| Total revenue | | 13,893 | 6,139 | 7,754 | 126.3% | | 35,038 | 18,533 | 16,505 | 89.1% |
| Depreciation, amortization and depletion | | 399 | 395 | 4 | 1.0% | | 1,093 | 1,104 | (11) | (1.0%) |
| Variable costs | | 12,505 | 5,182 | 7,323 | 141.3% | | 30,786 | 16,000 | 14,786 | 92.4% |
| Fixed costs | | 602 | 425 | 177 | 41.6% | | 1,616 | 1,405 | 211 | 15.0% |
| Total cost of sales | | 13,506 | 6,002 | 7,504 | 125.0% | | 33,495 | 18,509 | 14,986 | 81.0% |
| Gross income | | 387 | 137 | 250 | 182.5% | | 1,543 | 24 | 1,519 | 6,329.2% |
| Operating expenses | | 425 | 383 | 42 | 11.0% | | 1,217 | 1,171 | 46 | 3.9% |
| Operating income (loss) | | (38) | (246) | 208 | (84.6%) | | 326 | (1,147) | 1,473 | (128.4%) |
| Financial result, net | | (270) | (336) | 66 | (19.6%) | | (864) | (1,517) | 653 | (43.0%) |
| Share of profit of companies | | 62 | 40 | 22 | 55.0% | | 164 | 132 | 32 | 24.2% |
| Loss before income tax | | (246) | (542) | 296 | (54.6%) | | (374) | (2,532) | 2,158 | (85.2%) |
| Provision for income tax | | 84 | 201 | (117) | (58.2%) | | 113 | 858 | (745) | (86.8%) |
| Consolidated net income | | (162) | (341) | 179 | (52.5%) | | (261) | (1,674) | 1,413 | (84.4%) |
| Non-controlling interest | | (50) | (38) | (12) | 31.6% | | (137) | (102) | (35) | 34.3% |
| Net income attributable to owners of Ecopetrol before impairment | | (212) | (379) | 167 | (44.1%) | | (398) | (1,776) | 1,378 | (77.6%) |
| (Expense) income from impairment of long-term assets | | 1 | (21) | 22 | (104.8%) | | 4 | (710) | 714 | (100.6%) |
| Deferred tax of impairment | | 0 | 4 | (4) | (100.0%) | | (1) | 131 | (132) | (100.8%) |
| Net income attributable to owners of Ecopetrol | | (211) | (396) | 185 | (46.7%) | | (395) | (2,355) | 1,960 | (83.2%) |
| | | | | | | | | | | |
| EBITDA | | 722 | 297 | 425 | 143.1% | | 2,354 | 524 | 1,830 | 349.2% |
| EBITDA Margin | | 5.2% | 4.8% | - | 0.4% | | 6.7% | 2.8% | - | 3.9% |
Revenues for 3Q21 increased compared to 3Q20, primarily due to: i) the recovery in product spreads associated with market factors, mainly in gasoline, middle distillates, and petrochemicals, despite the more significant discount in export diesel (RVO effect), and ii) growth in the national demand for fuels. It is highlighted that, given that, even though in 3Q21 Esenttia showed a weakening of polypropylene margins, its commercial strategy enabled good results in sales. In addition, Invercolsa reached an increase in its revenues, due to higher levels of natural gas and installations commercialization, which has been constant throughout 2021.
Cost of sales for 3Q21 increased compared to 3Q20, mainly due to: i) a higher throughout at Barrancabermeja refinery, ii) higher prices of the refineries' crude feedstock and product imports, iii) a higher volume of imported products, mainly diesel and gasoline, resulting from public order situations in the Caño Limón - Coveñas pipeline and operational events at the Cartagena refinery mentioned above. This increase was partially offset by the accumulation of crude oil and products inventories in process due to the technical shutdowns of the FCC (Cracking Unit) and HDT (Diesel Hydrotreater) at the Cartagena refinery.
Operating expenses (net of income) increased in 3Q21 compared to 3Q20, explained by: i) the effect of technical shutdowns at the Cartagena refinery and ii) higher commercialization expenses due to increased sales.
Net financial result (non-operating) for 3Q21 versus 3Q20 exhibited a lower expense, as a consequence of lower revaluation in the closing rate presented on the segment’s net liability position.
| 4. | ENERGY TRANSMISSION AND TOLL ROADS |
On November 4, 2021, ISA announced its financial and operating results for the third quarter of 2021 to the market, which can be consulted on the Company’s website www.isa.co/en/investors/. Some relevant operational events are highlighted below:
Energy Transmission
| · | During 3Q21, three projects started operations: i) the Nueva Pan de Azúcar - Polpaico Reactive Compensation in ISA INTERCHILE (Chile), ii) IE ITAIPURA in ISA CTEEP (Brazil), and iii) Triple-A Connection in Transelca (Colombia). Additionally, 31 reinforcements were energized to the existing ISA CTEEP network. In total, these projects will bring annual revenues of USD 22 million. |
| · | The environmental license for the UPME07 - 2017 Sabanalarga - Bolívar 500 kV project in Colombia was granted. This project will provide annual revenues of USD 4.9 million, and its implementation is expected in 4Q22. |
| · | The investment for the quarter amounted USD 236 million. Also, 25 Power Transmission projects and 257 reinforcements in Brazil are being executed, which will contribute a total annual revenue of USD 382 million once they come into operation. |
Toll Roads
- The investment for the quarter amounted USD 31 million compared to USD 40 million in 3Q20.
- Progress was made in the construction of 8 projects: Normative Safety Works in Chile's four operating concessions, Section III and Par Vial Works in Ruta del Maipo, Rutas del Loa Concession, and UF6 Tranch of Ruta Costera in Colombia. These last two projects will add 246 km to the existing road network.
ISA's contribution to the Ecopetrol Group's 3Q21 results is described in the section “Financial Effect of ISA Consolidation”.
III. Environment, Social, Corporate Governance and Technology (TESG)
The TESG strategy was presented and approved by the Board of Directors in June 2021, and it is one of the four pillars of the long-term corporate strategy that will be approved by the Board of Directors in December of this year.
The definition of the TESG implementation model has progressed during the year, with important steps in the increasingly detailed construction of CAPEX, OPEX, and business performance to 2024.
The team has been designing guidelines that provide more clarity on how the exercise should be carried out from the point of view of the business planners. In addition, it continues to specify the indicators and metrics that measure the TESG strategy, aligned with the highest standards under which Ecopetrol reports and global best practices.
Renewable Energies
The San Fernando Solar Park construction was finished on October 22, 2021, which provides an installed capacity of 61 megawatts (MW) connected to the CENIT system. A maximum of 751 people were employed on the worksite, of which 285 were women (38%).
The design of the renewable hydrogen strategy continues, and it is expected to be completed in 4Q21. The topics to highlight during 3Q21 are: i) launch of the market study “Low Emission Hydrogen Experience”, which aims to identify potential allies to collectively join efforts with industry players, ii) development of business cases of prioritized lines according to viability and strategic alignment, and iii) the inclusion of Ecopetrol as one of the main actors in the Hydrogen roadmap of Colombia launched by the Ministry of Mines and Energy on September 30, affirming our intention to support the development of this clean energy source in the country.
Integrated Water Management
During 3Q21, 27.5 million cubic meters of water (1.9 million barrels per day) were reused, which means that the company stopped capturing and disposing this volume to water sources, reducing pressure on water resources. This volume represents an increase of 19% with respect to 3Q20 and is equivalent to 73% of the total water required to operate (72% accumulated in 2021). These results have been achieved mainly due to the implementation of water reuse and recirculation better practices implemented in the Barrancabermeja and Cartagena refineries, as well as in the production fields.
Similarly, 91.4 thousand cubic meters of treated production water from the Castilla Field (6.25 thousand barrels per day) were reused in agricultural and livestock activities in the Agroenergy Sustainability Area (ASA) in the Municipality of Acacias in the Department of Meta. This represents a decrease of 88% with respect to 3Q20, due to the transition in the delivery of the previous operator (Agrosavia) to Ecopetrol. Currently, the system is operating normally, reaching an average of more than 60 thousand barrels for reuse per day, which will be reflected in the 4Q21 results.
Regarding the preventive disposing measure of the Acacías Station on the Guayuriba River, Ecopetrol S.A. performed physicochemical and hydrobiological monitoring of the discharge and the stretch of the Guayuriba River on July 15. Regulatory compliance is included in the monitoring results report, and the preventive measures definitive lifting was requested, which was filed before Cormacarena on September 27, 2021.
Climate Change
In 3Q21, Ecopetrol received the verification of a third party of the Greenhouse Gas Inventory (GHG) for the period 2017- 2020, from the Ruby Canyon Environmental, Inc. firm, an organization endorsed by the International Accreditation Forum (IAF). The results concluded that the GHG emissions statement is a fair representation for reported years.
As part of the decarbonization strategy, through the implementation of Nature-Based Solutions, a contract was signed with South Pole on August 6, 2021, who will play the role of structuring ally in Ecopetrol projects.
The Cooperation Agreement was signed with The Nature Conservancy, seeking to leverage the implementation of the Ecopetrol Group's decarbonization plan. The agreement's objective is “to join efforts to develop a carbon monitoring protocol for restoration projects and strengthen the enabling conditions for its implementation. This, by using as a basis the planting of 250,000 trees in the departments of Meta and Caquetá, in order to promote nature-based solutions as effective strategies for climate change mitigation and biodiversity conservation in the territories where Ecopetrol operates”.
Biodiversity
Regarding the national initiative “Sembrar Nos Une”, the Ecopetrol Group has contributed with 3,149,716 trees, equivalent to a 79% of the target established for 2021 (4,000,000 trees).
Air Quality
As of the end of September, Ecopetrol distributed diesel of 15 parts per million (ppm) on average for the entire country and gasoline of 77 ppm on average of sulfur content, under levels determined by the Ministry of Mines and Environment of 20 ppm maximum for diesel and 100 ppm for gasoline.
Additionally, in compliance with the provisions by the Ministry, an adjustment is being prepared to start the delivery of gasoline from the refineries with a maximum of 50 ppm of sulfur content throughout the national territory.
Social and Environmental Investment
The Ecopetrol Group allocated resources for social investment and relationships in projects and initiatives of the Sustainable Development Portfolio within the framework of the Ecopetrol Environment Strategy for a value of COP 268.6[13] billion accumulated as of 3Q21. This value includes strategic and mandatory investments.
On the other hand, the Ecopetrol Group has allocated COP 402.6 billion from the ”Works in lieu of Taxes” initiative (Obras por Impuestos) between the years 2017 and 2020, with 43 projects in 14 departments of the country. As of 3Q21, 25 projects have been completed for a value of COP 201.0 billion, highlighting the following projects: i) improvement of San Pedro – Arizona road, which benefits 1,904 citizens of Puerto Caicedo, and ii) endowments to student residences at eight educational centers in Arauca, Arauquita, Fortul, Saravena, and Tame, benefiting 2,411 students.
So far this year, 4,976 new social GAS and LPG connections have been made. With this, between 2019 - 2021, GAS and LPG have been brought to 9,535 families.
“Apoyo País” Initiative to Support COVID-19 Pandemic
Regarding the “Apoyo País” 2020 program in support of the COVID-19 pandemic, the Ecopetrol Group has contributed COP 6,701 million as of 3Q21 have been executed. Furthermore, in September, a new agreement was signed to strengthen Bogotá's public health network for a value of COP 1,633 million.
On the other hand, regarding the “Apoyo País” 2021 program, focused on the economic reactivation, COP 9,682 million have been executed as of 3Q21, in Sustainable Development Portfolio projects. Since the beginning of the pandemic, the Ecopetrol Group has contributed aids in the amount of approximately COP 85 billion.
Communities and Environment
In 3Q21, Ecopetrol S.A. participated, along with entities of the National and Territorial Government, in the reinstatement of the table for consultation and dialogue with the U'WA people in Saravena Arauca, led by the Vice-Minister for Participation and Equal Rights of the Ministry of the Interior. The aforementioned, constituted an instance of trust building through which relationships are strengthened. As a result, different initiatives that promote respect are conceived to enhance and guarantee the sustainable development of this indigenous community.
Within the framework of the Human Rights (HR) and Business strategy, within the HR training program, through the virtual course on HR and Business, more than 7,200 workers have been trained to date.
Training has also been performed on specialized matters, in conjunction with international organizations such as the Office of the United Nations (UN) High Commissioner for Human Rights in Colombia, the UN Working Group on Business and Human Rights, the International Labor Organization (ILO), the Organization for Economic Cooperation and Development (OECD), and institutions such as the Ministry of Labor, the Colombian Institute for Family Welfare (ICBF for its Spanish acronym) and the Comprehensive Action against Antipersonnel Mines (AICMA for its Spanish acronym). The management team, the Ecopetrol Group’s employees and suppliers have participated in these training sessions.
Corporate Responsibility
In 3Q21, Ecopetrol participated once again in the CDP Climate Change and CDP Water Security questionnaires completion. The results of these reports and the Dow Jones Sustainability Index are expected to be received during 4Q21.
[15] The investment as of 3Q21 is divided into i) Strategic investment, COP 238,959 million; and ii) Mandatory Investment, COP 29,605 million. Ecopetrol S.A. - Social and Relationship Investment accumulated: COP 220,262 million. Accumulated Environmental Investment: COP 21,675 million; Subsidiaries’ accumulated Socio-Environmental Investment: COP 26,627 million.
Ecopetrol was included in the benchmark exercise of the Oil & Gas sector carried out by the World Benchmarking Alliance (WBA) published in July, where the Company was ranked 23 out of 100 companies evaluated and in the top 5 of state companies.
Corporate Governance
Ecopetrol hired two specialized and market-leading firms, one specialist in corporate governance issues and another headhunter firm, to support the nomination process of the board of directors that correspond as the majority shareholder of ISA, and to support the transition process and assumption of the control position based on good corporate governance practices. Additionally, these firms are working on the referencing of good practices in similar processes of change of share control in large corporations publicly listed, to consider and include them as the transition plan advances.
Finally, during this quarter, the Board of Directors of Ecopetrol continued to analyze the implementation of the succession policy for the Ecopetrol Group’s CEO through the review of the succession program and talent map of the Company.
Technology
At the end of 3Q21, progress has been made in digital reinvention through a strategic portfolio that captures value and prints innovation in each intervened process. This has allowed capturing benefits of USD 36.5 million in the digital agenda. Among the most relevant milestones of the quarter, the following stand out:
- Digital Agenda: i) the Petrotécnica Database project, avoided quantitative interpretation work and seismic investment costs, and the implementation of a digital place that allowed the disincorporation of infrastructure, ii) the Gross Refining Margin project achieved the update of the advanced control for generating valuable refined products at the Barrancabermeja refinery, and iii) the STORM project increased the efficiency in the logistics and international marketing of crude, refined, and energy processes.
- In Digital Factories, around 55 thousand Man Hours avoided were achieved. As of 3Q21, 151 new digital solutions were delivered in operation and/or are in stabilization.
- In Intelligence, 69 new boards were delivered to centralize data, and 45 new robots for a total of 142 currently in operation.
- In Innovation, Ecopetrol earned the recognition of Sustainable Development Good Practices, led by the United Nations Global Pact with the 100X100 Innovation Program in the Sustainable Development Goal 8. The aforementioned, seeks to promote sustained, inclusive, and sustainable economic growth, full and productive employment, and decent work for all.
- In Cybersecurity and Cyberdefense, the integrated digital identity at the Group level was activated, and the design of the Quantitative Risk-Based Approach model was finalized as a basis for prioritizing initiatives and practical actions in reducing cyber risk. Additionally, reinforcement actions in Monitoring and Cyberdefense were maintained, carrying out highly specialized Ethical Hacking exercises and attention to Cyber incidents. For the return of the staff to the offices, the AR building was adapted, and applications that support the safe return were enabled: Biometric registration, “Ecopass” for the generation of a digital passport with the report of symptoms associated with COVID-19 and Hotelling for booking work spaces.
V. Results Presentation
Ecopetrol’s senior management will host two conference calls to review the third quarter of 2021 results.
Spanish | English |
November 10, 2021 | November 10, 2021 |
08:00 a.m. Colombian Time | 10:00 a.m. Colombian Time |
08:00 a.m. New York Time | 10:00 a.m. New York Time |
To access the webcast, the following links will be available:
Spanish: | https://onlinexperiences.com/scripts/Server.nxp?LASCmd=AI:4;F:QS!10100&ShowUUID=9B8C8DF0-EC40-4C53-894F-3D7EE66B4C52&LangLocaleID=1034 |
English: | https://onlinexperiences.com/scripts/Server.nxp?LASCmd=AI:4;F:QS!10100&ShowUUID=CC15AF1B-FE7B-411A-A470-11832EB436D5&LangLocaleID=1033 |
There will be a Q&A session at the end of the presentation. To ask a question, you will have to access through the telephone lines specified in the following link: https://www.conferenceplus.com/AlternateNumbers/alternatenumbers.aspx?100875&t=P&o=UiLsnYSRgwZSRU
Please check that your browser allows for the normal operation of the online presentation. We recommend the latest versions of Internet Explorer, Google Chrome and Mozilla Firefox.
The report on the results, the presentation, the webcast and a replay of the conference will be available on Ecopetrol's website: www.ecopetrol.com.co.
Contact Information:
Head of Capital Markets
Tatiana Uribe Benninghoff
Email: investors@ecopetrol.com.co
Media Engagement (Colombia)
Jorge Mauricio Téllez
Email: mauricio.tellez@ecopetrol.com.co
Ecopetrol Group Appendices
Table 1: Income Statement - Ecopetrol Group
| Billion (COP) | | 3Q 2021 | 3Q 2020 | ∆ (%) | | 9M 2021 | 9M 2020 | ∆ (%) |
| Revenue | | | | | | | | |
| Local | | 12,084 | 5,795 | 108.5% | | 30,035 | 17,696 | 69.7% |
| Export | | 11,249 | 6,528 | 72.3% | | 29,948 | 18,140 | 65.1% |
| Total revenue | | 23,333 | 12,323 | 89.3% | | 59,983 | 35,836 | 67.4% |
| Cost of sales | | | | | | | | |
| Depreciation, amortization and depletion | | 2,629 | 2,296 | 14.5% | | 7,195 | 6,685 | 7.6% |
| Variable depreciation, amortization and depletion | | 1,787 | 1,513 | 18.1% | | 4,957 | 4,460 | 11.1% |
| Fixed cost depreciation | | 842 | 783 | 7.5% | | 2,238 | 2,225 | 0.6% |
| Variable costs | | 8,994 | 4,038 | 122.7% | | 21,992 | 14,304 | 53.7% |
| Imported products | | 5,039 | 1,361 | 270.2% | | 11,265 | 5,489 | 105.2% |
| Local purchases | | 4,618 | 2,136 | 116.2% | | 11,350 | 5,431 | 109.0% |
| Hydrocarbon transportation services | | 216 | 213 | 1.4% | | 665 | 649 | 2.5% |
| Inventories and others | | (879) | 328 | (368.0%) | | (1,288) | 2,735 | (147.1%) |
| Fixed costs | | 2,883 | 2,010 | 43.4% | | 7,262 | 6,256 | 16.1% |
| Contracted services | | 1,028 | 627 | 64.0% | | 2,395 | 1,997 | 19.9% |
| Maintenance | | 663 | 531 | 24.9% | | 1,738 | 1,538 | 13.0% |
| Labor costs | | 656 | 557 | 17.8% | | 1,801 | 1,739 | 3.6% |
| Other | | 536 | 295 | 81.7% | | 1,328 | 982 | 35.2% |
| Total cost of sales | | 14,506 | 8,344 | 73.8% | | 36,449 | 27,245 | 33.8% |
| Gross income | | 8,827 | 3,979 | 121.8% | | 23,534 | 8,591 | 173.9% |
| Operating expenses | | 1,723 | 1,301 | 32.4% | | 4,364 | 2,383 | 83.1% |
| Administration expenses | | 1,422 | 1,202 | 18.3% | | 3,828 | 2,106 | 81.8% |
| Exploration and projects expenses | | 301 | 99 | 204.0% | | 536 | 277 | 93.5% |
| Operating income | | 7,104 | 2,678 | 165.3% | | 19,170 | 6,208 | 208.8% |
| Finance result, net | | (697) | (956) | (27.1%) | | (2,180) | (2,221) | (1.8%) |
| Foreign exchange, net | | 248 | (131) | (289.3%) | | 352 | (98) | (459.2%) |
| Interest, net | | (639) | (570) | 12.1% | | (1,737) | (1,529) | 13.6% |
| Financial income/loss | | (306) | (255) | 20.0% | | (795) | (594) | 33.8% |
| Share of profit of companies | | 111 | 15 | 640.0% | | 226 | 92 | 145.7% |
| Income before income tax | | 6,518 | 1,737 | 275.2% | | 17,216 | 4,079 | 322.1% |
| Income tax | | (2,194) | (576) | 280.9% | | (5,499) | (1,209) | 354.8% |
| Net income consolidated | | 4,324 | 1,161 | 272.4% | | 11,717 | 2,870 | 308.3% |
| Non-controlling interest | | (516) | (289) | 78.5% | | (1,102) | (913) | 20.7% |
| Net income attributable to owners of Ecopetrol before impairment | | 3,808 | 872 | 336.7% | | 10,615 | 1,957 | 442.4% |
| (Expense) recovery for impairment long-term assets | | (2) | (21) | (90.5%) | | 2 | (1,225) | (100.2%) |
| Deferred tax of impairment | | 1 | 4 | (75.0%) | | 0 | 281 | (100.0%) |
| Net income attributable to owners of Ecopetrol | | 3,807 | 855 | 345.3% | | 10,617 | 1,013 | 948.1% |
| | | | | | | | | |
| | | | | | | | | |
| EBITDA | | 10,371 | 5,254 | 97.4% | | 27,986 | 12,506 | 123.8% |
| EBITDA margin | | 44.4% | 42.6% | 1.8% | | 46.7% | 34.9% | 11.8% |
Table 2: Statement of Financial Position - Ecopetrol Group
| Billion (COP) | | September 30, 2021 | June 30, 2021 | ∆ (%) |
| Current assets | | | | |
| Cash and cash equivalents | | 10,087 | 5,022 | 100.9% |
| Trade and other receivables | | 16,849 | 9,540 | 76.6% |
| Inventories | | 9,078 | 7,177 | 26.5% |
| Current tax assets | | 6,598 | 5,565 | 18.6% |
| Other financial assets | | 1,835 | 206 | 790.8% |
| Other assets | | 2,494 | 1,707 | 46.1% |
| | | 46,941 | 29,217 | 60.7% |
| Non-current assets held for sale | | 75 | 53 | 41.5% |
| Total current assets | | 47,016 | 29,270 | 60.6% |
| | | | | |
| Non-current assets | | | | |
| Investments in associates and joint ventures | | 8,133 | 3,312 | 145.6% |
| Trade and other receivables | | 23,562 | 738 | 3,092.7% |
| Property, plant and equipment | | 83,087 | 69,380 | 19.8% |
| Natural and environmental resources | | 33,414 | 33,236 | 0.5% |
| Assets by right of use | | 339 | 353 | (4.0%) |
| Intangibles | | 10,377 | 588 | 1,664.8% |
| Deferred tax assets | | 12,988 | 10,699 | 21.4% |
| Other financial assets | | 1,232 | 1,192 | 3.4% |
| Other assets | | 21,086 | 2,486 | 748.2% |
| Total non-current assets | | 194,218 | 121,984 | 59.2% |
| | | | | |
| Total assets | | 241,234 | 151,254 | 59.5% |
| | | | | |
| Current liabilities | | | | |
| Loans and borrowings | | 8,654 | 5,323 | 62.6% |
| Trade and other payables | | 12,670 | 9,760 | 29.8% |
| Provision for employees benefits | | 2,179 | 1,926 | 13.1% |
| Current tax liabilities | | 1,641 | 701 | 134.1% |
| Accrued liabilities and provisions | | 1,316 | 1,019 | 29.1% |
| Other liabilities | | 1,387 | 568 | 144.2% |
| Liabilites related to non-current assets held for sell | | 34 | 33 | 3.0% |
| Total current liabilities | | 27,881 | 19,330 | 44.2% |
| | | | | |
| Non-current liabilities | | | | |
| Loans and borrowings | | 83,225 | 44,737 | 86.0% |
| Trade and other payables | | 258 | 16 | 1,512.5% |
| Provision for employees benefits | | 12,102 | 11,011 | 9.9% |
| Non-current taxes | | 10,015 | 1,318 | 659.9% |
| Accrued liabilities and provisions | | 12,044 | 11,635 | 3.5% |
| Other liabilities | | 1,921 | 612 | 213.9% |
| Total non-current liabilities | | 119,565 | 69,329 | 72.5% |
| | | | | |
| Total liabilities | | 147,446 | 88,659 | 66.3% |
| | | | | |
| Equity | | | | |
| Equity attributable to owners of the company | | 62,995 | 58,841 | 7.1% |
| Non-controlling interests | | 30,793 | 3,754 | 720.3% |
| Total equity | | 93,788 | 62,595 | 49.8% |
| | | | | |
| Total liabilities and equity | | 241,234 | 151,254 | 59.5% |
Table 3: Cash Flow Statement - Ecopetrol Group
| Billion (COP) | | 3Q 2021 | 3Q 2020 | | 9M 2021 | 9M 2020 |
| Cash flow provided by operating activities | | | | | | |
| Net income attributable to owners of Ecopetrol S.A. | | 3,807 | 855 | | 10,617 | 1,013 |
| Adjustments to reconcile net income to cash provided by operating activities | | | | | | |
| Non-controlling interests | | 516 | 289 | | 1,102 | 913 |
| Income tax | | 2,193 | 572 | | 5,499 | 928 |
| Depreciation, depletion and amortization | | 2,687 | 2,299 | | 7,384 | 6,818 |
| Foreign exchange (gain) loss | | (248) | 131 | | 10 | 98 |
| Gain on other comprenhensive Income realized | | 0 | 0 | | (362) | 0 |
| Finance costs recognized in profit or loss | | 936 | 867 | | 2,566 | 2,439 |
| Dry wells | | 180 | 64 | | 350 | 164 |
| Loss (gain) on disposal of non-current assets | | 34 | 14 | | 54 | 18 |
| Impairment of current and non-current assets | | 2 | (1) | | 17 | 1,211 |
| Fair value (gain) on financial assets valuation | | 19 | 3 | | 38 | (40) |
| Gain on financial derivatives | | (10) | 51 | | 0 | (36) |
| Profit on bussiness combinations | | 0 | 2 | | 0 | (1,437) |
| Gain on assets for sale | | (3) | (1) | | (7) | (2) |
| (Gain) loss on share of profit of associates and joint ventures | | (111) | (15) | | (226) | (92) |
| Exchange difference on export hedges and ineffectiveness | | 105 | 87 | | 255 | 312 |
| Others minor items | | (4) | 5 | | 10 | 13 |
| Net changes in operating assets and liabilities | | (3,851) | (1,150) | | (11,338) | (3,939) |
| Income tax paid | | (972) | (546) | | (4,442) | (4,530) |
| Cash provided by operating activities | | 5,280 | 3,526 | | 11,527 | 3,851 |
| | | | | | | |
| Cash flows from investing activities | | | | | | |
| Investment in joint ventures | | (16) | 0 | | (16) | 0 |
| Acquisition of subsidiaries, net of cash acquired | | (9,316) | 0 | | (9,316) | 0 |
| Investment in property, plant and equipment | | (1,725) | (1,337) | | (3,983) | (3,319) |
| Investment in natural and environmental resources | | (1,695) | (707) | | (4,562) | (4,549) |
| Payments for intangibles | | (144) | (20) | | (208) | (40) |
| Sale of assets held for sale and equity instruments | | 3 | 0 | | 0 | 0 |
| (Purchases) sales of other financial assets | | (552) | 1,802 | | 1,155 | 1,231 |
| Interest received | | 63 | 78 | | 130 | 257 |
| Dividends received | | 13 | 9 | | 95 | 81 |
| Proceeds from sales of assets | | (7) | 5 | | 7 | 13 |
| Net cash used in investing activities | | (13,376) | (170) | | (16,698) | (6,326) |
| | | | | | | |
| Cash flows from financing activities | | | | | | |
| Proceeds (repayment of) from borrowings | | 14,171 | (1,259) | | 13,492 | 9,869 |
| Interest paid | | (606) | (543) | | (1,820) | (1,598) |
| Lease Payments | | (80) | (75) | | (231) | (246) |
| Dividends paid | | (274) | (2,910) | | (1,424) | (5,247) |
| Net cash used in financing activities | | 13,211 | (4,787) | | 10,017 | 2,778 |
| | | | | | | |
| Exchange difference in cash and cash equivalents | | (50) | 12 | | 159 | 450 |
| Net (decrease) increase in cash and cash equivalents | | 5,065 | (1,419) | | 5,005 | 753 |
| Cash and cash equivalents at the beginning of the period | | 5,022 | 9,248 | | 5,082 | 7,076 |
| Cash and cash equivalents at the end of the period | | 10,087 | 7,829 | | 10,087 | 7,829 |
Table 4: EBITDA Reconciliation - Ecopetrol Group
| Billion (COP) | | 3Q 2021 | 3Q 2020 | | 9M 2021 | 9M 2020 |
| Net income attributable to the owners of Ecopetrol | | 3,807 | 855 | | 10,617 | 1,013 |
| (+) Depreciation, amortization and depletion | | 2,687 | 2,299 | | 7,384 | 6,818 |
| (+/-) Impairment of long-term assets | | 2 | 21 | | (2) | 1,225 |
| (+/-) Gain in business combinations | | 0 | 2 | | 0 | (1,437) |
| (+/-) Financial result, net | | 697 | 956 | | 2,180 | 2,221 |
| (+) Income tax | | 2,193 | 572 | | 5,499 | 928 |
| (+) Taxes and others | | 469 | 260 | | 1,206 | 825 |
| (+/-) Non-controlling interest | | 516 | 289 | | 1,102 | 913 |
| Consolidated EBITDA | | 10,371 | 5,254 | | 27,986 | 12,506 |
Table 5: Reconciliation of EBITDA by Segment (3Q21)
| Billion (COP) | | Upstream | Downstream | Midstream | Energy | Eliminations | Consolidated |
| Net income attributable to the owners of Ecopetrol | | 2,778 | (211) | 1,130 | 114 | (4) | 3,807 |
| (+) Depreciation, amortization and depletion | | 1,877 | 421 | 303 | 86 | 0 | 2,687 |
| (+/-) Impairment of long-term assets | | 0 | (1) | 3 | 0 | 0 | 2 |
| (+/-) Gain in business combinations | | 0 | 0 | 0 | 0 | 0 | 0 |
| (+/-) Financial result, net | | 507 | 270 | (38) | (48) | 6 | 697 |
| (+) Income tax | | 1,197 | (84) | 736 | 345 | (1) | 2,193 |
| (+) Other taxes | | 140 | 277 | 39 | 13 | 0 | 469 |
| (+/-) Non-controlling interest | | (22) | 50 | 323 | 164 | 1 | 516 |
| Consolidated EBITDA | | 6,477 | 722 | 2,496 | 674 | 2 | 10,371 |
Ecopetrol S.A. Appendices
Following are the Income Statements and Statements of Financial Situation of Ecopetrol S.A.
Table 6: Income Statement
| Billion (COP) | | 3Q 2021 | 3Q 2020 | ∆ (%) | | 9M 2021 | 9M 2020 | ∆ (%) |
| Local | | 11,781 | 5,992 | 96.6% | | 29,551 | 17,144 | 72.4% |
| Exports | | 8,173 | 4,987 | 63.9% | | 22,784 | 14,022 | 62.5% |
| Total revenue | | 19,954 | 10,979 | 81.7% | | 52,335 | 31,166 | 67.9% |
| Variable costs | | 11,584 | 6,716 | 72.5% | | 29,136 | 20,941 | 39.1% |
| Fixed costs | | 3,067 | 2,728 | 12.4% | | 8,465 | 8,383 | 1.0% |
| Total cost of sales | | 14,651 | 9,444 | 55.1% | | 37,601 | 29,324 | 28.2% |
| Gross income | | 5,303 | 1,535 | 245.5% | | 14,734 | 1,842 | 699.9% |
| Operating expenses | | 988 | 831 | 18.9% | | 2,505 | 1,020 | 145.6% |
| Operating income | | 4,315 | 704 | 512.9% | | 12,229 | 822 | 1,387.7% |
| Financial income/loss | | (679) | (1,085) | (37.4%) | | (2,596) | (3,320) | (21.8%) |
| Share of profit of companies | | 1,271 | 1,107 | 14.8% | | 3,941 | 3,078 | 28.0% |
| Income before income tax | | 4,907 | 726 | 575.9% | | 13,574 | 580 | 2,240.3% |
| Income tax | | (1,100) | 129 | (952.7%) | | (2,957) | 766 | (486.3%) |
| Net income attributable to owners of Ecopetrol | | 3,807 | 855 | 345.3% | | 10,617 | 1,346 | 689.1% |
| Impairment | | 0 | 0 | - | | 0 | (468) | (100.0%) |
| Deferred tax of impairment | | 0 | 0 | - | | 0 | 135 | (100.0%) |
| Net income attributable to owners of Ecopetrol | | 3,807 | 855 | 345.3% | | 10,617 | 1,013 | 948.1% |
| | | | | | | | | |
| EBITDA | | 6,363 | 2,343 | 171.6% | | 17,887 | 4,440 | 302.9% |
| EBITDA margin | | 31.9% | 21.30% | 10.6% | | 34.20% | 14.20% | 20.0% |
Table 7: Statement of Financial Position / Balance Sheet
| Billion (COP) | | September 30, 2021 | June 30, 2021 | ∆ (%) |
| Current assets | | | | |
| Cash and cash equivalents | | 1,661 | 2,195 | (24.3%) |
| Trade and other receivables | | 13,786 | 10,630 | 29.7% |
| Inventories | | 5,800 | 4,582 | 26.6% |
| Current tax assets | | 5,439 | 4,480 | 21.4% |
| Other financial assets | | 2,601 | 2,439 | 6.6% |
| Other assets | | 1,351 | 1,296 | 4.2% |
| | | 30,638 | 25,622 | 19.6% |
| Non-current assets held for sale | | 47 | 35 | 34.3% |
| Total current assets | | 30,685 | 25,657 | 19.6% |
| | | | | |
| Non-current assets | | | | |
| Investments in associates and joint ventures | | 73,028 | 57,128 | 27.8% |
| Trade and other receivables | | 546 | 549 | (0.5%) |
| Property, plant and equipment | | 23,886 | 23,498 | 1.7% |
| Natural and environmental resources | | 22,333 | 22,578 | (1.1%) |
| Assets by right of use | | 3,028 | 3,091 | (2.0%) |
| Intangibles | | 239 | 212 | 12.7% |
| Deferred tax assets | | 5,089 | 5,188 | (1.9%) |
| Other financial assets | | 648 | 690 | (6.1%) |
| Other assets | | 1,197 | 1,214 | (1.4%) |
| Total non-current assets | | 129,994 | 114,148 | 13.9% |
| | | | | |
| Total assets | | 160,679 | 139,805 | 14.9% |
| | | | | |
| Current liabilities | | | | |
| Loans and borrowings | | 3,762 | 3,544 | 6.2% |
| Trade and other payables | | 8,815 | 7,859 | 12.2% |
| Provision for employees benefits | | 1,938 | 1,846 | 5.0% |
| Current tax liabilities | | 409 | 339 | 20.6% |
| Accrued liabilities and provisions | | 805 | 906 | (11.1%) |
| Other liabilities | | 1,073 | 571 | 87.9% |
| Total current liabilities | | 16,802 | 15,065 | 11.5% |
| | | | | |
| Non-current liabilities | | | | |
| Loans and borrowings | | 59,789 | 45,146 | 32.4% |
| Provision for employees benefits | | 11,225 | 10,973 | 2.3% |
| Non-current tax liabilities | | 356 | 356 | 0.0% |
| Accrued liabilities and provisions | | 9,460 | 9,372 | 0.9% |
| Other liabilities | | 52 | 52 | 0.0% |
| Total non-current liabilities | | 80,882 | 65,899 | 22.7% |
| | | | | |
| Total liabilities | | 97,684 | 80,964 | 20.7% |
| | | | | |
| Equity | | | | |
| Equity attributable to owners of the company | | 62,995 | 58,841 | 7.1% |
| Total equity | | 62,995 | 58,841 | 7.1% |
| | | | | |
| Total liabilities and equity | | 160,679 | 139,805 | 14.9% |
Table 8: Export Destinations - Ecopetrol Group
| Crudes - mboed | | 3Q 2021 | 3Q 2020 | % Share | | 9M 2021 | 9M 2020 | % Share |
| U.S. Gulf Coast | | 118.2 | 166.3 | 34.7% | | 121.8 | 187.4 | 35.1% |
| Asia | | 198.5 | 161.3 | 58.3% | | 197.9 | 193.1 | 57.0% |
| Central America / Caribbean | | 0.0 | 15.5 | 0.0% | | 6.7 | 18.1 | 1.9% |
| Others | | 8.2 | 0.3 | 2.4% | | 3.3 | 3.1 | 1.0% |
| Europe | | 6.8 | 14.1 | 2.0% | | 11.3 | 10.8 | 3.3% |
| U.S. West Coast | | 7.4 | 16.2 | 2.2% | | 5.3 | 6.2 | 1.5% |
| South America | | 1.4 | 0.0 | 0.4% | | 0.9 | 0.0 | 0.3% |
| U.S. East Coast | | 0.0 | 0.0 | 0.0% | | 0.0 | 5.5 | 0.0% |
| Total | | 340.5 | 373.7 | 100.0% | | 347.3 | 424.2 | 100.0% |
| | | | | | | | | |
| Products - mboed | | 3Q 2021 | 3Q 2020 | % Share | | 9M 2021 | 9M 2020 | % Share |
| Central America / Caribbean | | 43.8 | 41.5 | 44.3% | | 38.5 | 43.5 | 38.1% |
| U.S. Gulf Coast | | 15.4 | 26.3 | 15.6% | | 15.5 | 19.1 | 15.4% |
| Asia | | 15.1 | 11.7 | 15.3% | | 14.4 | 12.2 | 14.3% |
| South America | | 10.8 | 16.9 | 10.9% | | 10.5 | 12.6 | 10.4% |
| U.S. East Coast | | 10.0 | 6.7 | 10.1% | | 17.3 | 16.2 | 17.2% |
| Europe | | 3.3 | 6.6 | 3.3% | | 3.8 | 3.4 | 3.7% |
| U.S. West Coast | | 0.0 | 0.0 | 0.0% | | 0.0 | 1.1 | 0.0% |
| Others | | 0.4 | 0.0 | 0.4% | | 0.9 | 0.0 | 0.9% |
| Total | | 98.8 | 109.7 | 100.0% | | 100.9 | 108.1 | 100.0% |
Note: The information is subject to change after the end of the quarter, as some destinations are reclassified according to the final result of exports.
Table 9: Local Purchases and Imports - Ecopetrol Group
| Local Purchases - mboed | | 3Q 2021 | 3Q 2020 | ∆ (%) | | 9M 2021 | 9M 2020 | ∆ (%) |
| Crude Oil | | 199.5 | 179.1 | 11.4% | | 185.0 | 175.3 | 5.5% |
| Gas | | 3.2 | 1.9 | 68.4% | | 2.3 | 3.1 | (25.8%) |
| Products | | 2.9 | 2.4 | 20.8% | | 2.8 | 2.6 | 7.7% |
| Diluent | | 0.0 | 0.3 | (100.0%) | | 0.0 | 0.3 | (100.0%) |
| Total | | 205.6 | 183.7 | 11.9% | | 190.1 | 181.3 | 4.9% |
| | | | | | | | | |
| Imports - mboed | | 3Q 2021 | 3Q 2020 | ∆ (%) | | 9M 2021 | 9M 2020 | ∆ (%) |
| Crude Oil | | 29.5 | 0.9 | 3,177.8% | | 25.8 | 12.1 | 113.2% |
| Products | | 107.8 | 43.7 | 146.7% | | 82.6 | 60.1 | 37.4% |
| Diluent | | 24.2 | 33.9 | (28.6%) | | 26.0 | 36.4 | (28.6%) |
| Total | | 161.5 | 78.5 | 105.7% | | 134.4 | 108.6 | 23.8% |
| | | | | | | | | |
| Total | | 367.1 | 262.2 | 40.0% | | 324.5 | 289.9 | 11.9% |
Table 10: Exploratory Wells Detail - Ecopetrol Group
| # | Quarter | Name | Initial Well Classification (Lahee) | Block | Name | Operator/Partner | Status | TD Date |
| 1 | First | Boranda Sur-1 | A1 | Boranda* | Middle Magdalena Valley | Parex 50% (Operator) ECP 50% | Dry** | January 11/2021 |
| 2 | First | Moyote-1 | A3 | R02-L01-A6 CS | Sureste | Petronas 50% (Operator) ECP MEXICO 50% | Dry | January 27/2021 |
| 3 | First | EST-SN-8 | Stratigraphic | SN-8 | Sinú �� San Jacinto | Hocol (100%) | Plugged and Abandoned | February 27/2021 |
| 4 | First | Boranda Sur-2 | A1 | Boranda* | Middle Magdalena Valley | Parex 50% (Operator) ECP 50% | Successful | February 11/2021 |
| 5 | First | Liria YW 12 | A2C | Recetor | Piedemonte Llanero | ECP 100% | Successful | March 7/2021 |
| 6 | Second | Boranda Centro-1 | A1 | Boranda | Middle Magdalena Valley | Parex 50% (Operator) ECP 50% | Dry | April 04/2021 |
| 7 | Second | Chimuelo-1 | A2C | Tisquirama | Middle Magdalena Valley | ECP 100% | Dry | May 19/2021 |
| 8 | Second | Flamencos-3 | A1 | VMM | Middle Magdalena Valley | ECP 100% | Under Evaluation | June 16/2021 |
| 9 | Third | Basari-1 | A3 | RC-7 | Sinú - San Jacinto | HOCOL (100%) | Under Evaluation | July 17/2021 |
| 10 | Third | Silverback 2 | A3 | Mississippi Canyon 35 | US GOM | Chevron 35%, Shell 30%, Progress 15%, Murphy 10%, EAL 10% | Dry | August 25/2021 |
* Modified as compared to the one reported in 1Q21, clarifying that the location of the well corresponds to the Boranda Block, formerly known as the Playón Block.
** Write-off recognized in the 2020 Financial Statements
Table 11: HSE Performance (Health, Safety and Environment)
| HSE Indicators* | | 3Q 2021 | 3Q 2020 | | 9M 2021 | 9M 2020 |
| Frequency of total registrable injuries (No. Recordable cases / Million man hours) | | 0.40 | 0.41 | | 0.53 | 0.45 |
| Environmental incidents** | | 1 | 3 | | 5 | 4 |
* The results of the indicators are subject to change after the end of the quarter since some of the accidents and incidents are reclassified according to the final result of the investigations. ** Environmental incidents are those hydrocarbon spills greater than 1 barrel, with environmental impact.