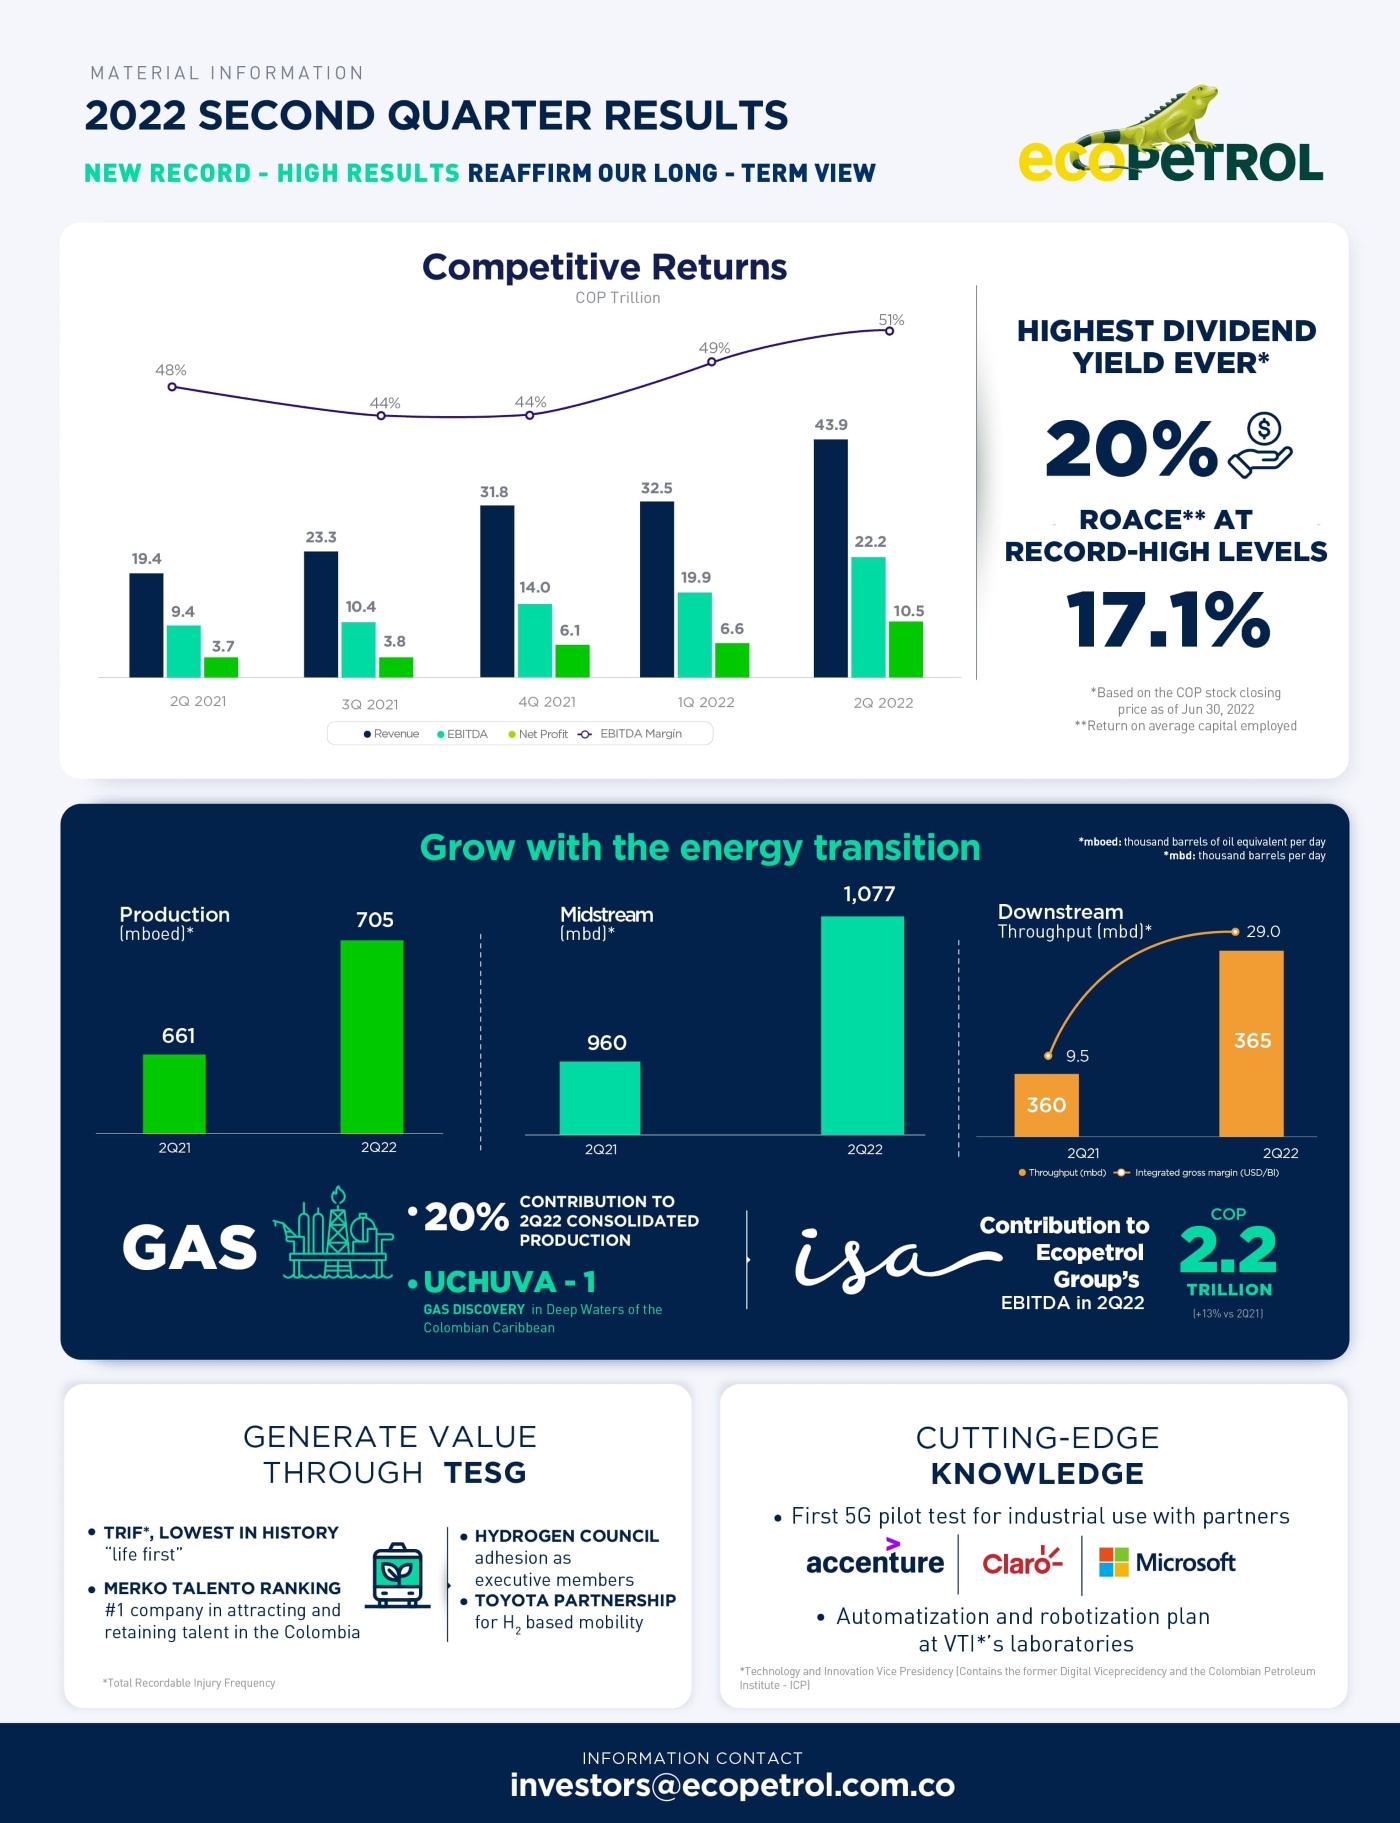
 The Ecopetrol Group's figures for the period ending June 2022 mark a new historical milestone for the Company, having achieved the best quarterly and half-yearly financial results in our history. During these first six months, the Company achieved a net income of COP 17.0 trillion, which exceeds the result for the full year of 2021. These results are a reflection of: i) the effort and commitment of more than 18,000 direct employees and all the Ecopetrol Group’s contractors to our growth, diversification, and financial profitability targets, and our 2040 “Energy that Transforms” strategy, ii) the strength, stability, and reliability of our business segments, iii) a solid commercial strategy allowing the seizing of benefits even in adverse market conditions, iv) the capture of efficiencies by more than COP 1 trillion, allowing us to mitigate certain inflationary pressures seen across all industries on a global scale; and, v) the Company’s strict capital discipline. Regarding our Competitive Returns pillar, this quarter we recorded consolidated revenues of COP 43.9 trillion, a net income of COP 10.5 trillion, an EBITDA of COP 22.2 trillion, and an EBITDA margin of 51%, the highest in the Company's history. For the six-month period ended June 2022, our consolidated revenues amounted to COP 76.4 trillion, a net income of COP 17.0 trillion, an EBITDA of COP 38.1 trillion, and an EBITDA margin of 50%. As of June 30, 2022, the Gross Debt/EBITDA leverage ratio was 1.6x and the return on average capital employed (ROACE) was 17.1% for the same period. Thanks to the Company's financial strength, in early July, S&P Ratings maintained its long-term international rating at BB+ with a stable outlook. The Company's operational, commercial and financial results reflect the effects of international crude oil prices (average Brent of 112 USD/Bl for 2Q22) and the exchange rate effect (average TRM[1] of 3,915 COP/USD for 2Q22), which allowed us to attain a better realization price of our crude basket (+39.8 USD/Bl in 2Q22 vs. 2Q21), an increase in the volume of local product sales (+24.8% in 2Q22 vs. 2Q21) and an increase in exports (+14.9% in 2Q22 vs. 2Q21) driven, among other initiatives, by the recent entry into operation of Ecopetrol Trading Asia. We highlight the consolidation of our domestic crude oil purchasing strategy, which has allowed us to diversify sources of supply for refinery feedstocks and improve refining margins. In addition, we implemented a series of initiatives to anticipate and counteract inflationary pressures and limitations in the global supply chains. | | In line with the Group’s target to protect its liquidity position and its focus on guaranteeing the annual investment plan, during the quarter we reached an agreement with the Ministry of Finance and Public Credit (MHCP for its Spanish acronym) for the payment and compensation of the COP 14.1 trillion account receivable due to us from the Fuel Price Stabilization Fund, (FEPC for its Spanish acronym), as of 1Q22. The accrued FEPC subsidy for 2Q22 due to us amounts to COP 10.6 trillion, which, by virtue of the provisions of the Government’s Medium-Term Fiscal Framework, are expected to be partially paid from fiscal surpluses during the current fiscal year or with resources approved by Congress as part of the 2023 Budget for such purpose. There are several operational milestones I would like to highlight regarding our Grow with the Energy Transition strategic pillar: On the exploration front, some of the most noteworthy activities are the concurrent activity of 2 drill-rigs in the Piedemonte and 2 in offshore areas, the recently announced confirmation of the presence of natural gas in deep waters in the Colombian Caribbean with the exploratory well Uchuva-1, the agreement reached with Oxy for joint exploration in deep waters in the northeast of the country and the acquisition of onshore seismic in Colombia stands out. Finally, it is worth noting that 60% of the hydrocarbon volumes identified in the exploratory portfolio correspond to gas, which illustrates the alignment between hydrocarbon exploration and the energy transition targets proposed by both Ecopetrol and the Nation. In production, we recorded an average of 704.6 mboed during 2Q22, an increase of 43.7 mboed as compared to 2Q21, falling on the high end of our 2022 production target. Gas, our transition fuel, continues to hold a prominent role in the Ecopetrol Group’s activities. During 2Q22, the contribution of gas to overall production was 20%. In our efforts to more effectively capitalize gas opportunities, and ensure their alignment with the 2040 Strategy, the Gas Vice Presidency was renamed the Low Emission Solutions Vice Presidency, to consolidate the gas, biogas, LPG, energy, renewables, hydrogen and CCUS (Carbon Capture, Use and Storage) areas under one vice presidency. In addition to the above, the positive operating and financial results from our operations in the Permian basin reached historical records, surpassing the results achieved in 2021. |
[1] Representative Market Exchange Rate (TRM for its Spanish acronym).
Cumulative production as of June, 2022 was 26.8 mboed (net for Ecopetrol before royalties), almost doubling the contribution of 1H21. On the other hand, we continued working to reduce our emissions intensity through our zero routine flaring initiative and the substitution of ~36% of the volume of diesel used in our completion activities with compressed natural gas (CNG). Based on the good results to date, I am pleased to announce that Occidental Petroleum Corp. (“Oxy”) and Ecopetrol have agreed to optimize activity in the Midland area and expand the partnership to cover about 21,000 acres in the Delaware area, thereby strengthening Ecopetrol's presence in the Permian. This agreement allows us to access a greater share of production (75%) while deferring carry obligations to 2025. The activity in Delaware will start in 4Q22 and its contribution to production and reserves will be reflected in the targets set for 2023. Regarding unconventional reservoirs in Colombia, during 2Q22 the environment and community relationship plan continued, which consisted of different meetings and conversations held at the local and regional levels, as part of Ecopetrol's efforts to facilitate and make viable the Kalé and Platero Comprehensive Research Pilot Projects (PPIIs for their Spanish acronyms). The midstream segment reported its best result of the last two years. Total volumes transported increased to 1,077 mbd, or by 11.8% as compared to 2Q21 results. These figures are attributed to an increase in production and additional third-party barrels captured, as well as an increase in transported refined products. The downstream segment registered record operating and financial results in the quarter, with a total throughput of 365.1 mbd and an integrated gross margin of 29 USD/Bl (vs. 360.4 mbd and 9.5 USD/Bl in 2Q21 respectively). This was the result of a high operational availability of the units, an active inventory optimization, a strategic scheduled shutdowns plan that allowed us to capture the good margins observed in the market, and a successful commercial strategy for products and petrochemicals, where volumetric maximization and the incorporation of additional products to the portfolio were key factors. During the first half of the year, 75% of the planned shutdowns for 2022 were executed. Additionally, we achieved the mechanical completion of the Interconnection of the Cartagena Crude Oil Plants (IPCC for its Spanish acronym) at the Cartagena refinery, whose commissioning and start-up is in progress and is expected to stabilize its operation during 3Q22. With this project we expect to capitalize on the benefits of a higher refining capacity reaching values of 420 - 430 mbd. | | ISA reported strong quarterly financial results, with a 14.5% growth in revenues and a 10.1% growth in EBITDA, as compared to the same period in 2021. ISA’s subsidiary CTEEP was awarded the bid for one of the largest energy transmission projects in Brazil in recent history, further consolidating its leadership in this market. During this semester, ISA's contribution to the Ecopetrol Group following its consolidation added COP 0.6 trillion to net income (net of non-controlling interest) and COP 4.2 trillion to EBITDA. In our Generate Value Through TESG pillar, we can highlight the following milestones for 2Q22: On the environmental front we continue moving forward with the maturation and implementation of an ambitious renewable energy plan, supported by solar, wind and geothermal projects in locations where the Ecopetrol Group already operates. To this end, the company has moved forward with the development and construction of two additional Solar Ecoparks, which would increase installed capacity by 49 MW, and subsequently contribute to the 400 MW target set for 2023. At the end of 1H22, the Ecopetrol Group has achieved the incorporation of 119 MW of renewable energy in its supply matrix, which represents 9% of the Group's installed capacity (MW). During 2Q22, a reduction of 4,281 tons of CO2e and operational cost-savings of COP 2,610 million were achieved supported by the Castilla, San Fernando and Cenit solar Ecoparks in 2Q22. Additionally, we announced our commitment to having more than 200 sustainable vehicles to be used by our employees. These vehicles will reduce CO2e emissions by more than 500 tons per year, or the equivalent of planting more than 16,000 trees. Along these lines, our target for 2025 seeks that more than half of our employees to use sustainable means of transport. During the quarter we also announced our adhesion to the Hydrogen Council as executive members furthering our effort to promote the domestic use of hydrogen as an energy resource while announcing the group of partner companies to develop our hydrogen roadmap. In this line, we also signed a three-year agreement with Toyota to conduct mobility tests using green hydrogen, which will initiate in 4Q22. On the social front, we allocated resources for projects and initiatives of the sustainable development portfolio for a total of COP 154 billion accumulated as of 1H22. |
The results obtained in the 2022 Merco Talent ranking are also notable as Ecopetrol was recognized as the company with the highest capacity to attract and retain talent in the country. The presence of Ecopetrol S.A. in first place, Reficar in sixth place, and Cenit in eighth place in the specialized oil and hydrocarbon sector ranking, as well as the presence of ISA in second place in the specialized energy sector ranking, stand out. In terms of health and safety, the Company reported historical results, with a TRIF indicator of 0.30 accidents per million hours worked in 2Q22 and 0.26 accumulated at the end of 1H22, the latter with a 57% improvement over the same period of the previous year. We also highlight an intense semester in scheduled plant shutdowns for maintenance in the refineries with no recordable injuries, evidencing the Company's commitment to safety and good practices. On the corporate governance front, an extraordinary General Shareholders' Meeting was held on June 17, where a modification to the maximum term for the payment of dividends to the Nation was approved, extending the term until October 2022, as well as the distribution of an extraordinary dividend of COP 168 per share. The above, in response to a request from the MHCP within the framework of the agreement for the payment of the outstanding account receivable balance due to us from the FEPC. This dividend was paid to our more than 250,000 minority shareholders on June 30, 2022. | | Finally, on the Cutting-Edge Knowledge pillar, science, technology, and innovation (STI) play a crucial role in the implementation of the 2040 Strategy, for which the Science, Technology and Innovation Vice Presidency (VTI for its Spanish acronym) was created, which contains the Digital Vice Presidency (VDI for its Spanish acronym) and the Colombian Petroleum Institute (ICP for its Spanish acronym) and coordinates the teams responsible for the STI agenda across all segments of the Ecopetrol Group's value chain. On the Science, Technology, and Innovation front, we conducted the first 5G pilot test for industrial application in partnership with Accenture, Claro, and Microsoft. This test was conducted as part of maintenance operations at the Barrancabermeja refinery, with the use of secure devices for real-time remote assistance, which enabled a three-day reduction in maintenance, and the optimization of activities worth more than USD 1 million. Additionally, an automation plan for the VTI’s laboratories and pilot plants was undertaken with the participation of 13 domestic and international companies. All the Ecopetrol Group’s employees will continue working towards generating value for all our stakeholders, taking advantage of the opportunities that align with the pillars of our 2040 Strategy, which focuses on a responsible energy transition through organized and decisive progress in our decarbonization plan within the framework of our country’s energy security and that of the regions where we operate as a Group. Felipe Bayón CEO Ecopetrol S.A. |
Bogotá, August 3, 2022. Ecopetrol S.A. (BVC: ECOPETROL; NYSE: EC) announced today the Ecopetrol Group’s financial results for the second quarter and the first half of 2022, prepared under International Financial Reporting Standards as applicable in Colombia.
The Ecopetrol Group reported solid financial results for the first half of 2022, with a net income of COP 17.0 trillion that exceeded the figure for 2021, and an EBITDA of COP 38.1 trillion. This performance was supported by: i) a favorable Brent environment and a highly effective commercial strategy to capture products’ spreads, ii) a boost in production and transported volumes by oil and multi-purpose pipelines, iii) a higher sales volume, iv) historic refining margins, and v) efforts to cover the deficit of the FEPC as of 1Q22. All of the above allowed the Group to partially offset inflationary pressures and the increase in the nominal tax rate in Colombia from 31% to 35%.
Table 1: Financial Summary Income Statement – Ecopetrol Group
| Billion (COP) | | 2Q 2022 | 2Q 2021 | ∆ ($) | ∆ (%) | | 6M 2022 | 6M 2021 | ∆ ($) | ∆ (%) |
| Total sales | | 43,885 | 19,444 | 24,441 | 125.7% | | 76,358 | 36,650 | 39,708 | 108.3% |
| Depreciation and amortization | | 2,725 | 2,328 | 397 | 17.1% | | 5,305 | 4,566 | 739 | 16.2% |
| Variable cost | | 16,343 | 6,761 | 9,582 | 141.7% | | 28,408 | 12,999 | 15,409 | 118.5% |
| Fixed cost | | 4,010 | 2,342 | 1,668 | 71.2% | | 7,303 | 4,378 | 2,925 | 66.8% |
| Cost of sales | | 23,078 | 11,431 | 11,647 | 101.9% | | 41,016 | 21,943 | 19,073 | 86.9% |
| Gross income | | 20,807 | 8,013 | 12,794 | 159.7% | | 35,342 | 14,707 | 20,635 | 140.3% |
| Operating and exploratory expenses | | 2,199 | 1,457 | 742 | 50.9% | | 4,205 | 2,637 | 1,568 | 59.5% |
| Operating income | | 18,608 | 6,556 | 12,052 | 183.8% | | 31,137 | 12,070 | 19,067 | 158.0% |
| Financial income (loss), net | | (1,991) | (831) | (1,160) | 139.6% | | (3,514) | (1,484) | (2,030) | 136.8% |
| Share of profit of companies | | 237 | 62 | 175 | 282.3% | | 439 | 115 | 324 | 281.7% |
| Income before income tax | | 16,854 | 5,787 | 11,067 | 191.2% | | 28,062 | 10,701 | 17,361 | 162.2% |
| Income tax | | (5,309) | (1,768) | (3,541) | 200.3% | | (9,193) | (3,304) | (5,889) | 178.2% |
| Net income consolidated | | 11,545 | 4,019 | 7,526 | 187.3% | | 18,869 | 7,397 | 11,472 | 155.1% |
| Non-controlling interest | | (1,075) | (295) | (780) | 264.4% | | (1,826) | (587) | (1,239) | 211.1% |
| Net income attributable to owners of Ecopetrol | | 10,470 | 3,724 | 6,746 | 181.1% | | 17,043 | 6,810 | 10,233 | 150.3% |
| | | | | | | | | | | |
| EBITDA | | 22,211 | 9,428 | 12,783 | 135.6% | | 38,106 | 17,615 | 20,491 | 116.3% |
| EBITDA Margin | | 50.6% | 48.5% | - | 2.1% | | 49.9% | 48.1% | - | 1.8% |
Financial information included in this report has not been audited and is expressed in billion or trillions of Colombian pesos (COP) or US dollars (USD), or thousands of barrels of oil equivalent per day (mboed) or tons, as noted. For presentation purposes, certain figures in this report were rounded to the nearest decimal place.
Forward-looking statements: This release contains statements that may be considered forward-looking statements within the meaning of Section 27A of the U.S. Securities Act of 1933 and Section 21E of the U.S. Securities Exchange Act of 1934. All forward-looking statements, whether made in this release or in future filings or press releases or orally, address matters that involve risks and uncertainties, including in respect of Ecopetrol’s prospects for growth and its ongoing access to capital to fund Ecopetrol’s business plan, among others. Consequently, changes in the following factors, among others, could cause actual results to differ materially from those included in the forward-looking statements: market prices of oil & gas, our exploration and production activities, market conditions, applicable regulations, the exchange rate, Ecopetrol’s competitiveness, our ability to successfully integrate our recently acquired subsidiary, ISA, and the performance of Colombia’s economy and industry, to mention a few. We do not intend, and do not assume any obligation to update these forward-looking statements.
| I. | Financial and Operating Results |
Sales Revenue
Revenues in 1H22 increased by 108.3% or COP +39.7 trillion versus 1H21, for a total of COP 76.4 trillion, primarily as a result of:
| a) | An increase of +38.8 USD/Bl (COP +24.4 trillion) in the weighted average sales price of crude oil, gas and products, primarily due to higher international reference prices and stronger price spreads in the Brent for gasoline, middle distillates and jet fuel, which reported record levels. |
| b) | An increase in service revenues (COP +6.1 trillion), mainly due to the consolidation of ISA's financial results. |
| c) | An increase in sales volume (COP +4.6 trillion, +108.4 mboed), primarily due to growth in domestic demand for fuel and gas products, and an increase in production. The above was partially offset by lower exports of middle distillates, due to scheduled maintenance at the refineries. |
| d) | Positive impact on revenues (COP +4.6 trillion), due to a higher average COP/USD exchange rate. |
Revenues increased 125.7%, or COP +24.4 trillion, in 2Q22 versus 2Q21, for a total of COP 43.9 trillion, primarily as a result of:
| a) | An increase of +44.7 USD/Bl (COP +14.7 trillion) in the weighted average sales price of crude oil, gas and products, primarily due to the factors mentioned above. |
| b) | An increase in sales volume (COP +3.8 trillion, +160.9 mboed), mainly due to a stronger demand for fuels and higher production of crude oil and gas. |
| c) | Revenues from ISA of COP +3.4 trillion. |
| d) | An increase of COP +2.5 trillion, due to a higher average COP/USD exchange rate. |
Table 2: Sales Volume – Ecopetrol Group
| Local Sales Volume - mboed | | 2Q 2022 | 2Q 2021 | ∆ (%) | | 6M 2022 | 6M 2021 | ∆ (%) |
| Medium Distillates | | 175.8 | 127.0 | 38.4% | | 170.2 | 132.4 | 28.5% |
| Gasoline | | 150.5 | 121.6 | 23.8% | | 150.2 | 123.0 | 22.1% |
| Natural Gas | | 98.3 | 85.9 | 14.4% | | 97.5 | 89.1 | 9.4% |
| Industrials and Petrochemicals | | 23.8 | 20.0 | 19.0% | | 23.3 | 22.3 | 4.5% |
| LPG and Propane | | 17.7 | 18.4 | (3.8%) | | 18.2 | 18.9 | (3.7%) |
| Crude Oil | | 2.4 | 2.3 | 4.3% | | 2.2 | 2.4 | (8.3%) |
| Fuel Oil | | 0.1 | 0.3 | (66.7%) | | 0.0 | 0.5 | (100.0%) |
| Total Local Volumes | | 468.6 | 375.5 | 24.8% | | 461.6 | 388.6 | 18.8% |
| | | | | | | | | |
| Export Sales Volume - mboed | | 2Q 2022 | 2Q 2021 | ∆ (%) | | 6M 2022 | 6M 2021 | ∆ (%) |
| Crude Oil | | 414.4 | 343.1 | 20.8% | | 405.5 | 350.7 | 15.6% |
| Products | | 103.5 | 108.6 | (4.7%) | | 81.0 | 101.9 | (20.5%) |
| Natural Gas* | | 4.9 | 3.3 | 48.5% | | 4.5 | 3.0 | 50.0% |
| Total Export Volumes | | 522.8 | 455.0 | 14.9% | | 491.0 | 455.6 | 7.8% |
| | | | | | | | | |
| Total Sales Volumes | | 991.4 | 830.5 | 19.4% | | 952.6 | 844.2 | 12.8% |
* Natural gas exports correspond to local sales of Ecopetrol América LLC and Ecopetrol Permian LLC.
Total volume sold during the quarter amounted to 991.4 mboed, registering an increase of 19.4% as compared to the volume sold in the same quarter of the previous year, primarily as a result of both an increase in local sales volume, mainly in gasoline and middle distillates, and an increase in export sales.
Sales in Colombia, which account for 47% of the total, increased by 24.8% or 93.1 mboed as compared to 2Q21, mainly due to:
| · | Increase in the sale of diesel (+33.7 mbod), gasoline (+28.9 mbod), jet fuel (+15.1 mbod), mainly explained by the strengthening of domestic fuel demand as a result of higher economic activity and the decrease in COVID-19- related restrictions. |
| · | Increase in the sale of natural gas (+12.4 mboed) driven mainly by strong growth in domestic demand. |
International sales, which account for 53% del total, increased by 14.9% or 67.8 mboed as compared to 2Q21, mainly due to the effect of:
| · | An increase in crude oil exports (+71.3 mbod), primarily due to higher production and lower refinery throughputs. |
| · | A decrease in exports (-5.1 mboed) due to lower volume of diesel exports given the higher demand for local sales and lower supply from refineries. |
| · | Ecopetrol Trading Asia (ECPTA) commercialization of 99.2 mboed during 2Q22, which started operations in April 2022, and a higher contribution from Permian (+5.3 mboed). The sum of the above helped offset lower Ecopetrol deliveries reported in transit and lower activity in Ecopetrol America (1.4 mboed). |
Table 3: Average Realization Prices – Ecopetrol Group
| USD/Bl | | 2Q 2022 | 2Q 2021 | ∆ (%) | | 6M 2022 | 6M 2021 | ∆ (%) |
| Brent | | 112.0 | 69.1 | 62.1% | | 104.9 | 65.2 | 60.9% |
| Natural Gas Basket | | 27.5 | 24.8 | 10.9% | | 27.3 | 24.6 | 11.0% |
| Crude Oil Basket | | 105.2 | 65.3 | 61.1% | | 97.0 | 61.5 | 57.7% |
| Products Basket | | 135.3 | 77.4 | 74.8% | | 122.8 | 72.6 | 69.1% |
Crudes: In 2Q22 vs. 2Q21 the crude oil basket prices increased 39.9 USD/Bl, from 65.3 USD/Bl to 105.2 USD/Bl, primarily as a result of the increase in the average Brent price and supported by a market diversification strategy in terms of clients and destinations that mitigated the effect of a more competitive market primarily due to the increased presence of Russian and Iranian crudes which traded at significant discounts. In April, the commercial subsidiary in Singapore, Ecopetrol Trading Asia, started operations, through which sales negotiations in Asia were conducted for 9.0 million barrels.
Refined Products: In 2Q22 vs. 2Q21 the product sales basket increased by 57.9 USD/Bl, from 77.4 USD/Bl to 135.3 USD/Bl, primarily as a result of the recovery of international indicators, higher global demand for gasoline and diesel and the low level of international inventories.
Natural Gas: In 2Q22 vs. 2Q21 the gas sales price increased 2.7 USD/Bl, primarily due to the indexation to US PPI (Producer Price Index) of contracts as of December 2021, and the performance of US international sales gas market indicators.
Hedging Program: During 2Q22, Ecopetrol executed six tactical price risk hedges, for 7.10 million barrels, composed of tactical hedges on: i) exports for 4.70 million barrels of crude oil, ii) imports for 1.25 million barrels of crude oil, and iii) 1.18 million barrels of maritime transportation associated with crude oil exports. Tactical hedging is part of the Asset Backed Trading (ABT) commercial strategy, which seeks to maximize the value of products through the optimal use of assets and proactive price risk management.
Cost of Sales
Cost of sales increased by 86.9% or COP +19.0 trillion in 1H22 as compared to 1H21, and by 101.9% or COP +11.6 trillion in 2Q22 versus 2Q21. The following are the most relevant facts of the cost components:
Variable Costs:
In 1H22 variable costs increased by 118.5% or COP +15.4 trillion as compared to the same period in 2021, primarily due to the combined net effect of:
- Increased purchases of crude oil, gas and products (COP +16.0 trillion) , primarily due to: i) an increase in the weighted average price of domestic purchases and imports +43.8 USD/Bl (COP +10.5 trillion); ii) higher volume purchased (COP +3.4 trillion, +72.8 mboed), mainly due to higher imported fuel requirements to meet domestic market needs due to the reactivation of economic activity and scheduled refineries maintenance; and iii) an increase in the average exchange rate on purchases (COP +2.1 trillion).
- Increases in other variable costs (COP +0.7 trillion), resulting from increased operating activities, increases in tariffs, and the negative impact on costs in US dollar terms due to an increase in the average COP/USD exchange rate.
- Inventory fluctuations (COP -1.3 trillion), primarily due to increase in the price of crude oil and products purchased due to the recovery of international reference prices.
In 2Q22, variable costs reported an increase of 141.7% or COP +9.5 trillion compared to 2Q21, mainly due to: i) an increase in purchases of crude oil, gas and products (COP +9.1 trillion), primarily as a result of a higher weighted average purchase price of +50.4 USD/Bl, a higher volume purchased of +82.9 mboed and an increase in the average COP/USD exchange rate, which had a negative effect on our costs in US dollar terms; and ii) an increase in other variable costs (COP +0.4 trillion), in both cases due to the abovementioned factors of the semester.
Fixed Costs: In 1H22, fixed costs increased by 66.8% or COP +2.9 trillion as compared to the same period in 2021 and, in 2Q22, by 71.2% or COP +1.7 trillion as compared to 2Q21, primarily due to: i) the consolidation of ISA's fixed costs; ii) increases in operating activity costs mainly due to the increased execution of activities related to the reactivation of economic activity, an increase in contract tariffs, and the negative effect of the higher average exchange rate; and iii) higher labor costs, mainly associated with salary increases compared to last year, among others.
Depreciation and Amortization: In the first six months of 2022, depreciation and amortization increased by 16.2% or COP +0.7 trillion as compared to the same period in 2021 and, in 2Q22 by 17.1% or COP +0.4 trillion as compared to 2Q21, primarily as a result of: i) the consolidation of ISA's results; ii) increased levels of capital investments; iii) increased production in the Permian basin and Ecopetrol and; iv) the negative effect of the higher average exchange rate in the depreciation of the Group's subsidiaries that use the US dollar as their functional currency, given the devaluation of the peso against the dollar. This increase was partially offset by an increase in the incorporation of reserves in 2021 compared to 2020, which results in a lower depreciation rate.
Operating Expenses, net of other income
In 1H22, operating expenses, net of other income increased 59.5% or COP +1.6 trillion as compared to the same period in 2021 and, in 2Q22 increased 50.9% or COP +0.7 trillion as compared to 2Q21, due primarily to:
| · | An increase in operating expenses associated with the incorporation of ISA's results. |
| · | An increase in exploration expenses, mainly due to a greater recognition of unsuccessful well exploration activities. |
| · | Asset write-off associated with the exit of the Rydberg project in Ecopetrol America following the technical and economic feasibility analysis in 1Q22. |
| · | An increase in customs expenses, mainly due to the increase in the number of sales under the DAP (Delivery at Place) modality in 2Q22 as compared to 2Q21. |
| · | An increase in expenses associated with agreements and social investment projects. |
Financial Result (Non- Operating)
Non-operating financial expense increased by 136.8% or COP +2.0 trillion in the first six months of 2022 as compared to the same period in 2021 and, in 2Q22 increased 139.6% or COP +1.2 trillion as compared to 2Q21, primarily as a result of:
| · | Incorporation of ISA's net financial result, which includes interest, foreign exchange difference, financial results and others. |
| · | An increase in the financial cost of debt, mainly due to new debt acquired in 2H21 to finance the purchase of ISA. |
| · | An increase in the exchange difference expense, given the higher net liability position in US dollars of the Ecopetrol Group and the devaluation of the COP against the US dollar. |
The Effective Tax Rate for in the first six months of 2022 was 32.8% as compared to 30.9% for the same period in 2021, while the effective tax rate for 2Q22 was 31.5% as compared to 30.5% in 2Q21. The variation in both periods is primarily a result of an increase in the nominal tax rate, which was partially offset by improved results in subsidiaries with special taxation regimes, as is the case of the Cartagena Refinery and companies in the United States.
Cash Flow and Debt
Table 4: Cash Position – Ecopetrol Group
| Billion (COP) | | 2Q 2022 | 2Q 2021 | | 6M 2022 | 6M 2021 |
| Initial cash and cash equivalents | | 13,999 | 6,688 | | 14,550 | 5,082 |
| (+) Cash flow from operations | | 6,154 | 3,314 | | 9,940 | 6,247 |
| (-) CAPEX | | (4,586) | (2,751) | | (7,941) | (5,188) |
| (+/-) Investment portfolio movement | | 771 | (6) | | 1,170 | 1,706 |
| (+) Other investment activities | | 352 | 128 | | 530 | 161 |
| (+/-) Acquisition, borrowings and interest payments of debt | | (1,701) | (1,434) | | (2,975) | (2,044) |
| (-) Dividend payments | | (5,692) | (982) | | (5,965) | (1,151) |
| (+/-) Exchange difference (cash impact) | | 814 | 65 | | 802 | 209 |
| (-) Other financing activities | | (7) | 0 | | (7) | 0 |
| Final cash and cash equivalents | | 10,104 | 5,022 | | 10,104 | 5,022 |
| Investment portfolio | | 1,887 | 1,386 | | 1,887 | 1,386 |
| Total cash | | 11,991 | 6,408 | | 11,991 | 6,408 |
Cash Flow:
At the end of 2Q22, the Ecopetrol Group closed with a cash balance of approximately COP 12 trillion (34% COP and 66% USD). During 2Q22, the main source of liquidity was cash from the Group's operating activities for an amount of COP 6.2 trillion, primarily due to revenues from operations across all business segments and the agreement reached with the Government to settle the accounts receivable balance due to the Company from the Fuel Price Stabilization Fund as of 1Q22. This was partially mitigated by the accumulation of the FEPC accounts receivable during 2Q22 due to the spread that continues to exist between international and local gasoline and diesel prices.
The main cash outflows for 2Q22 were allocated to CAPEX for COP -4.6 trillion[2] and dividend payments for COP -5.7 trillion. Regarding dividends, the following payments, which implied cash outflows, were made:
- 100% of the dividends to minority shareholders for COP 1.3 trillion based on 2021 results and payment of the occasional reserve distribution for COP 0.8 trillion.
- First and second installments to the Government for an aggregate amount of COP 3.2 trillion based on 2021 results.
- Payment of dividends from subsidiaries to non-controlling shareholders for COP 0.4 trillion.
[2] The time span difference between the CAPEX resources commitments and the actual cash outflow for their payment is approximately 2 months.
Additionally, taking into account CONPES documents 4074 and 4093 of 2022 and Resolution 1596 of June 23, 2022, an agreement was reached for the compensation without cash transfer of the outstanding account receivable balance due to Ecopetrol from the FEPC, through dividends payable to the Nation for COP 6.8 trillion (COP 0.7 trillion from 2021 net income and COP 6.1 trillion from the authorized distribution of the occasional reserve).
Debt:
At the closing of 2Q22, the balance of debt on the balance sheet is COP 98.8 trillion, equivalent to USD 23,788 million, +COP 7.1 trillion (or +USD 1,717 million) compared to the end of 1Q22. This increase is mostly due to the effect of the devaluation of the peso against the dollar presented in 2Q22 on the debt in USD (the closing TRM of 2Q22 was 4,151 COP/USD and the closing TRM of 1Q22 was 3,756 COP/USD). During the quarter, we disbursed a short-term loan with international banks for USD 160 million to serve debt maturities, with the objective of limiting exposure to high market rates.
As a result of the strengthening of the Ecopetrol Group's EBITDA, the Gross Debt/EBITDA ratio in 2Q22 closed at 1.6 times vs 1.8 times at the end of 1Q22 and 2Q21.
Equity
The total equity balance of the Ecopetrol Group at the closing of 2Q22 amounted to COP 94.7 trillion. Shareholders' equity at the end of 2Q22 was COP 70.6 trillion, an increase of COP 4.1 trillion compared to 1Q22, as a result of the net effect between the profits generated in 2Q22 and the distribution of a portion of the occasional reserve as a dividend, as authorized by the extraordinary Shareholders' Meeting held in June 2022. For more information on occasional reserve distribution, see the Corporate Governance section of this Report.
Efficiencies
The purpose of the 2022 efficiency strategy is to provide the Ecopetrol Group with tools to improve operations, investments and commercial strategies that will allow us to mitigate the effects of the international market environment and the Ukraine-Russia conflict on the cost structure of our operations and investments, as well as on the complexity of the commercial strategy.
Thus, by the end of the first six months of 2022, the Ecopetrol Group had recognized accumulated efficiencies in the amount to COP 1.03 trillion, mainly as a result of the initiatives summarized below:
1. Actions focused on mitigating impacts that may affect the Ecopetrol Group's EBITDA margin, which have resulted in efficiencies amounting to COP 915.8 billion, primarily in:
- Margin and revenue improvement strategies implemented by the Company’s commercial area, refining and petrochemical operations concentrated in the Barrancabermeja and Cartagena refineries, and in Esenttia, as well as revenues from energy surplus sales, among other actions, whose cumulative efficiencies as of the first half of 2022 have amounted to COP 515.1 billion.
- Strategies identified and implemented by the production segment, focused on optimizing lifting costs, which have contributed COP 183.5 billion as of 1H22.
- Dilution and evacuation strategy for heavy and extra-heavy crudes, as a result of the optimization of the crude dilution factor, which decreased from 13.5% to 12.5%, as a result of the beginning of the LPG dilution strategy, which has represented efficiencies for COP 180.3 billion.
- Operational improvement strategies implemented in the Midstream companies, whose efficiencies as of this period amount to COP 26.1 billion.
- Initiatives deployed by the corporate and support areas, which have contributed COP 25.9 billion.
2. CAPEX Efficiencies for COP 118.7 billion.
The strategies implemented in our investments, which have focused on improving the operational and technical performance of our investment projects, mainly due to:
- Continuous improvement in drilling and completion of wells, which has contributed with efficiencies totaling COP 54 billion. In this regard, the cost per drilled foot has decreased by USD 16 per drilled foot (USD 233/ft in 1H22 vs USD 249/ft in 1H21), while the completion cost experienced a decline of KUSD 8 per well, falling from KUSD 402/well in 1H21 to KUSD 394/well in 1H22.
- Strategies to leverage the use of material inventories from other projects, which has protected the group's cash flow by COP 18 billion.
- Strategies implemented by our Midstream companies focused on the optimization of pipeline maintenance projects, which have contributed COP 17 billion.
- Lean construction strategies, improved design and other facility construction strategies, which have contributed COP 30 billion.
Investments
Table 5: Investments by Segment – Ecopetrol Group
| Million (USD) | | Ecopetrol S.A. | Affiliates and Subsidiaries | Total 6M 2022 | % Share |
| Production | | 891 | 438 | 1,329 | 73.3% |
| Downstream | | 70 | 117 | 187 | 10.3% |
| Exploration | | 108 | 40 | 148 | 8.2% |
| Midstream* | | 0 | 106 | 106 | 5.8% |
| Corporate** | | 43 | 0 | 43 | 2.4% |
| Total excluding ISA | | 1,112 | 701 | 1,813 | 100.0% |
| | | | | | |
| Energy Transmission | | 0 | 365 | 365 | 87.9% |
| Toll Roads | | 0 | 39 | 39 | 9.4% |
| Telecommunications | | 0 | 11 | 11 | 2.7% |
| Total ISA | | 0 | 416 | 416 | 100.0% |
| | | | | | |
| Total | | 1,112 | 1,117 | 2,229 | - |
*Includes the total amount of investments of each of the subsidiaries and affiliates of the Ecopetrol Group (both controlling and non-controlling interest).
** Includes investment in energy transition projects.
As of 2Q22 end, the Ecopetrol Group's organic investments amounted to USD 2,229 million: CAPEX of the oil and gas business amounted to USD 1,813 million, and the investments ofy ISA amounted to USD 416 million. For 2022, investments are expected to range between USD 4,800 and 5,800 million, in line with the Company’s investment plan.
Of total investments in the oil and gas business, 77% were allocated in Colombia, while the remaining 23% were assigned mainly to the United States and Brazil. In the case of ISA, Brazil and Colombia accounted for 40% and 24% of total investments, respectively, and the remaining 36% corresponded to investments mainly in Chile and Peru. In sum, total investments made by the Ecopetrol Group in Colombia amounted to USD 1,493 million (67% of the total), with the remaining USD 736 million being primarily concentrated in Brazil and the United States.
Investments focusing on the expansion of the gas chain represented 10% of the investments made during 1H22. These investments were impacted by delays in environmental licensing and environmental issues mostly. The following investments are highlighted:
| · | The investments in: Assets of the piedmont (Floreña, Cusiana and Cupiagua-Recetor) with activities of drilling of development wells and investments of operational continuity. |
| · | Exploratory activities with the drilling of the Gorgon-2, Uchuva-1 (Tayrona block) and Cupiagua XD-45 wells. |
| · | Activities in Permian with the drilling of 50 development wells. |
At 2Q22 end, Ecopetrol’s investments were mainly allocated as detailed below:
Upstream: This segment accounted for 66% of the Ecopetrol Group's organic investments, with resources amounting to USD 1,478 million, mainly allocated to the drilling and completion of 268 development wells and 249 workovers, activities that were primarily concentrated in the Rubiales, Caño Sur, Castilla, Chichimene and Casabe fields. In addition, five exploratory wells were drilled, all of them in Colombia.
Midstream: The investment was mainly focused on operational continuity activities to maintain the integrity and reliability of the various oil and multipurpose pipeline systems owned by Cenit and its subsidiaries.
Downstream: Activities focused on operational continuity and the execution of major maintenance at the Barrancabermeja and Cartagena refineries, with the aim of maintaining the efficiency, reliability and integrity of the operation, as well as the development of mechanical completion activities for the Cartagena Crude Oil Plant Interconnection Project (IPCC for its Spanish acronym).
TESG: During the 2Q22 investments of USD 88 million were made in projects associated with TESG issues. These include investments for the management, treatment and use of water, mainly in operations related to assets in the Llanos Orientales, Piedemonte and Valle Superior del Magdalena basins. Progress continues to be made in i) the maturation and execution of decarbonization and energy efficiency projects aimed at reducing CO2 emissions, iii) investments in renewable energy projects such as La Cira, Quifa y Moriche solar Ecoparks, and iii) gas use, and the reduction of flaring and routine venting. Likewise, investments were made in studies and projects for hydrogen production at the Barrancabermeja and Cartagena refineries.
ISA:
- Transmission: During 2Q22 investments totaling USD 190.2 million were executed. In Colombia, progress was made mainly in the Sabanalarga, Cerromatoso, Copey Cuestecitas and Sogamoso-La Loma UPMES[3]. In Peru, in the Coya-Yana and Chincha-Nazca projects in CTM. In Brazil, progress was made in the reinforcement and improvement plan, the installation of a battery bank and investments in IEMG, Evrecy, IEItaunas and IEBiguacu. Finally, in Chile, investment focused on the expansion of some substations. For the first half of 2022, total investments amounted to USD 365.1 million.
- Toll Roads: During 2Q22, investments totaling USD 21.2 million were allocated to regulatory safety works in the four concessions in operation in Chile, in Tramo III and road works in Ruta del Maipo. These projects will involve ~52 km of improvements to existing roads, as well as safety and service works along all routes. Additionally, progress was made in the construction of Rutas del Loa. For the first half of 2022, total investments amounted to USD 39.2 million.
- Telecommunications: During 2Q22 investments amounting to USD 5.2 million were allocated, mainly corresponding to connectivity projects that support the dynamics of the business and allow ISA to maintain the product available for the attainment of revenues from services rendered, such as the scalability of the transport network and investments required to enable customer services. For the first half of 2022, total investments amounted to USD 11.3 million.
II. Results by Business Segment
Exploration
During the second quarter Ecopetrol and its partners completed the drilling of four exploratory wells: i) Chinchorro-1G operated 100% by Hocol (declared dry), ii) Boranda Norte-1 operated by Parex (declared dry), iii) Tejón-1 operated by Ecopetrol (under evaluation) and iv) Morito-1 operated by Ecopetrol (under evaluation). At the end of the first half of the year, a total of nine wells have been drilled in which Ecopetrol participated with direct operation or with partners.
[3] Mining and Energy Planning Unit for its Spanish acronym
Continuing with the exploration campaign, at the close of the quarter the following wells were being drilled: Cupiagua XD 45 located in the Piedemonte, the Gorgón-2 and Uchuva-1 wells in the offshore Colombian Caribbean and Starman-1 in the Gulf of Mexico in the United States.
It should be noted that during the month of July the Gorgon-2 and Uchuva-1 wells located offshore the Colombian Caribbean finished drilling. The Gorgón-2 well, operated by Shell and in which Ecopetrol has a 50% participation, is under evaluation. The Uchuva-1 well found natural gas in deep waters in Colombia, 32 km from the coast and 76 km from the city of Santa Marta, with a water column of approximately 864 meters. This well is operated by Petrobras where Ecopetrol has a 55.6% participation.
This activity is aligned with the strategic pillar of maximizing the value of its portfolio, with a focus on exploration of deepwater and ultra-deepwater assets, increasing the prospects for exploration development and future production in the Colombian Caribbean.
Cumulative production from exploratory assets at the end of the first half of the year reached 489.5 mboe (2,720 boed), which comes from the extensive testing of the Liria YW12, Ibamaca-1, Arrecife-1 ST, Arrecife-3, Flamencos-2, Lorito-1 and El Niño-2 wells; 40% of the production corresponds to oil and 60% to gas.
In May, Ecopetrol and Anadarko Colombia Company, a subsidiary of Oxy, signed a joint exploration agreement in Blocks COL 1, COL 2, COL 6 and COL 7, located in deep waters in the northeast of the Colombian Caribbean, in order to undertake the search for hydrocarbons in an area with attractive potential. Ecopetrol will hold 40% of the exploration and production rights and Anadarko the remaining 60% as operator of the blocks. The agreement has already been made official before the National Hydrocarbons Agency (ANH for its Spanish acronym).
In 2022 we have reactivated the onshore seismic acquisition in Colombia with the Flamencos 3D and SSJN1 2D programs in which it is estimated to start the recording phase in the second half of the year. The first, Flamencos 3D, is located in the Middle Magdalena Valley; and the second, SSJN1, is located in the Northern Caribbean and operated by the subsidiary Hocol. The plan is to record around 700 km equivalent of seismic information with both programs.
The company has at its disposal about 265 exploratory opportunities, including 17 discoveries in process of evaluation and/or delimitation and 116 prospects that in a period of two to four years would be tested with exploratory wells to determine potential accumulations.
These opportunities are concentrated in approximately 6 million hectares of exploratory area, distributed in basins of high strategic interest in Colombia, Brazil and the United States (Gulf of Mexico); 90% of the aforementioned area are located in Colombia, while the remaining 10% acts as a risk diversification hub with strategic partners in other countries. The resources associated with the exploratory portfolio are estimated at around 13 billion barrels of hydrocarbons (potential), most of which (around 60%) correspond to gas, in line with the company's energy transition strategy aimed at increasing the participation of low-emission hydrocarbons.
Production
Table 6: Gross Production – Ecopetrol Group
| Production - mboed | | 2Q 2022 | 2Q 2021 | ∆ (%) | | 6M 2022 | 6M 2021 | ∆ (%) |
| Crude Oil | | 494.8 | 473.3 | 4.5% | | 491.3 | 479.7 | 2.4% |
| Natural Gas | | 135.3 | 117.7 | 15.0% | | 133.9 | 124.0 | 8.0% |
| Total Ecopetrol S.A. | | 630.2 | 591.0 | 6.6% | | 625.2 | 603.7 | 3.6% |
| Crude Oil | | 16.9 | 18.1 | (6.6%) | | 16.5 | 19.2 | (14.1%) |
| Natural Gas | | 20.4 | 18.8 | 8.5% | | 20.2 | 19.0 | 6.3% |
| Total Hocol | | 37.3 | 36.9 | 1.1% | | 36.7 | 38.2 | (3.9%) |
| Crude Oil | | 0.0 | 0.0 | - | | 0.0 | 0.3 | (100.0%) |
| Natural Gas | | 0.0 | 0.0 | - | | 0.0 | 0.1 | (100.0%) |
| Total Savia | | 0.0 | 0.0 | - | | 0.0 | 0.4 | (100.0%) |
| Crude Oil | | 8.8 | 10.1 | (12.9%) | | 8.5 | 10.5 | (19.0%) |
| Natural Gas | | 1.3 | 1.8 | (27.8%) | | 1.2 | 1.8 | (33.3%) |
| Total Ecopetrol America | | 10.1 | 11.9 | (15.1%) | | 9.7 | 12.3 | (21.1%) |
| Crude Oil | | 16.6 | 16.4 | 1.2% | | 16.9 | 10.3 | 64.1% |
| Natural Gas | | 10.4 | 4.8 | 116.7% | | 9.9 | 3.5 | 182.9% |
| Total Ecopetrol Permian | | 27.0 | 21.2 | 27.4% | | 26.8 | 13.8 | 94.2% |
| Crude Oil | | 537.1 | 517.8 | 3.7% | | 533.1 | 520.1 | 2.5% |
| Natural Gas | | 167.5 | 143.1 | 17.1% | | 165.3 | 148.3 | 11.5% |
| Total Ecopetrol Group | | 704.6 | 660.9 | 6.6% | | 698.4 | 668.4 | 4.5% |
Notes: Gross production includes royalties and is prorated by the interest Ecopetrol holds in each Company. Natural gas production includes gas and white products
During 2Q22, Ecopetrol Group's production was 704.6 mboed, within the upper range of the target set in the 2022 plan, recording an increase of 43.7 mboed compared to 2Q21, of which Ecopetrol S.A. contributed 630.2 mboed and the subsidiaries 74.4 mboed. In 2Q22, the contribution of natural gas was 167.5 mboed distributed in gas with a participation of 20.1% (141.3 mboed, +15.7% vs 2Q21) and that of white products with a production accounting to 3.7% (26.2 mboed, +24.8% vs 2Q21).
In 2Q22, production increased by 12.5 mboed, as compared to 1Q22 mainly due to: i) reestablishment of normal operations in the Yariguí, Capachos, La Cira, Caño Limón and CPI Suroriente fields after the blockades that occurred during the first months of the year; ii) better performance of the Rubiales, Chichimene, Akacias, Quifa, and Nare fields; iii) recovery of gas sales after maintenance activities conducted in Cupiagua in 1Q22, (iv) higher gas sales from Guajira and; v) contributions to production from exploratory wells such as Ibamaca and Arrecife, operated by Hocol.
In 1H22, production increased by 30 mboed, as compared to 1H21, mainly due to the reestablishment of public order and the lifting of the operating restriction in Castilla related to water management.
The plan to improve the time to market in the Caño Sur facilities was implemented in April, allowing for the early and staggered entry of the first train of fluid treatment facilities (EP1), which is expected to increase production by 7 - 10 mboed by December 2022.
By the end of 2Q22, the Ecopetrol Group had drilled and completed 268 development wells, 89 more than in the same period of the previous year, with an average occupancy rate of 26 rigs, in line with the 2022 business plan.
The recovery program continues with the development of secondary and tertiary recovery technologies, which contributed 39% of the Ecopetrol Group’s total daily production in the 1H22, (as compared to 36% in 1H21). It is highlighted the start of the enhanced recovery project through water injection implemented in the Akacias field.
Comprehensive Research Pilot Projects in Unconventional Reservoirs (PPII)
During 2Q22, the environment and community relationship plan to make the Kale and Platero IIPPs viable was completed. Gatherings, meetings and discussions were held with different key local and regional stakeholders, in an effort to improve the perception of the Unconventional Reservoirs.
Within the framework of the Kale PPII licensing process, in April the First Court of Barrancabermeja ordered to stop to the pilots, stating that a prior consultation process with the Corporación Afrocolombiana de Puerto Wilches - Afrowilches had to be initiated. Ecopetrol challenged the decision, which resulted in a favorable ruling by the Santander Court, which found that prior consultation was not required, thus allowing the Company to continue with the pilots. As a result, the National Prior Consultation Authority Directorate cancelled the consultation process for the Kale PPII on June 2, 2022.
Regarding the PPII Platero, a meeting was held at the beginning of April to gather additional information and address the requirements. Furthermore, through Order 01357 of March 10, 2022, the ANLA, at the request of the Minister of Environment and Sustainable Development, ordered that an Environmental Public Hearing take place, in the development of the administrative process of evaluation of the Environmental License. The date of the hearing is still pending.
Permian
During 2Q22, the Ecopetrol-Oxy Joint Venture in the Permian basin, located in Texas, achieved outstanding results. Aspects worth highlighting include the drilling of 27 new wells (50 wells in 1H22), the completion of 26 wells (47 in 1H22) and 14 wells which were put into production, for a total of 45 new wells in the first six months of 2022. By the end of June, the joint venture has a total of 149 wells in production, which represents an average production of 26.8 mboed (net for Ecopetrol before royalties) for the semester compared to a production of 13.8 mboed for the 1H21, or an increase of 95%. In terms of quarterly results, production in 2Q22 reached 27.0 mboed as compared to 21.5 mboed in 2Q21, which represents an increase of 25.6%.
The most significant achievements for this period include:
- 14 new production wells were enabled.
- In terms of emissions reduction, the Rodeo association continues to apply the zero routine flaring initiative and to install systems for the assessment of fugitive emissions. In addition, up to 36% of the volume of diesel used in the completion activities was replaced by compressed natural gas (CNG).
- In terms of water management, we were able to recycle approximately 5 mbls of water during the 1H22 (43% more than the volume recycled during the same period in 2021).
The forecast for full year 2022 includes the drilling of 97 wells, the completion of around 95 wells and an increase in production for Ecopetrol between 4 - 6 mboed (Corresponding to a greater Ecopetrol working interest at the JV Rodeo of 26%, increasing from 49% to 75% after the JV amendment in line with the JDA subscription with OXY to access into the Delaware area), for an expected total average production in 2022 of 38 - 40 mboed (net to Ecopetrol before royalties).
Expansion into the Permian
On June 17, 2022, Ecopetrol Permian LLC (a subsidiary of Ecopetrol) signed a Joint Development Agreement (JDA) with certain Oxy subsidiaries to carry out drilling and production programs in the Delaware sub-basin of the Permian within an area of approximately 21,000 acres during the 2022-2027 period. The agreement allows Ecopetrol to expand its presence in the Permian with an interest stake over 49% of the rights in the drilling and production programs in this area.
Ecopetrol is not required to make an initial upfront payment and will cover a percentage of Oxy's development investment (up to 75%) as it is performed (otherwise known as a carry arrangement). The carry percentage that Ecopetrol will cover will be linked to the price of a barrel of oil (WTI) and will be established as the drilling activity is realized. Activity in the Delaware sub-basin is expected to start in 4Q22 and add production from 1Q23 onward. Targets will be reported when the production guide for 2023 is determined.
Additionally, the Rodeo JV agreement with Oxy was amended to provide Ecopetrol access to a greater production stake (75%) as well as to defer to 2025 its current carry obligations. This modification to the original agreement is retroactively effective as of January 1, 2022 and is expected to have a favorable impact on the expected production target by year-end 2022.
Lifting and Dilution Cost
Table 7: Cost of Lifting and Dilution - Ecopetrol Group[4]
| USD/Bl | | 2Q 2022 | 2Q 2021 | ∆ (%) | | 6M 2022 | 6M 2021 | ∆ (%) | | % USD |
| Lifting Cost* | | 9.83 | 8.03 | 22.4% | | 9.28 | 7.78 | 19.3% | | 23.2% |
| Dilution Cost** | | 6.78 | 4.39 | 54.4% | | 6.53 | 3.94 | 65.7% | | 100.0% |
* Calculated based on barrels produced without royalties. ** Calculated based on barrels sold
The Lifting Cost values for 1Q21, 2Q21 and 3Q21 were modified to eliminate an item that was incorrectly included.
[4] The lifting costs calculations for 1Q21, 2Q21 and 3Q21 were modified to eliminate an item incorrectly included. In this way, the lifting cost for 1Q21 changes from 7.51 to 7.52 USD/Bl, for 2Q21 from 8.02 to 8.03 USD/Bl, and for 3Q21 from 8.45 to 8.46 USD/Bl. Additionally, the lifting cost for first half of 2021 is changed from 7.77 to 7.78 USD/Bl, while that for the 9M21 changes from 8.01 to 8.02 USD/Bl.
Lifting Cost
In 2Q22, the lifting cost increased by 1.8 USD/Bl, as compared to 2Q21, and for 1H22 reached 9.28 USD/Bl, a 1.51 USD/Bl increase as compared to the same period in 2021. This latter outcome is mainly explained by:
Cost Effect (+2.64 USD/Bl): Increase in costs mainly due to:
- Increase in electricity rates resulting from: i) increase in the rates of both energy and its transport due to increases in PPI and inflation; ii) higher purchase requirements from the National Interconnection System (SIN for its Spanish acronym) due to an increase in production volumes.
- Increase in service contracts mainly for well interventions and maintenance, as well as an overall increase in activities, consistent with the plan to increase production.
Exchange rate effect (-0.75 USD/Bl): Increase in the average COP/USD exchange rate of COP 292 per USD.
Volume Effect (-0.39 USD/Bl): Increase in production due to the aforementioned explanations.
Dilution Cost
In 2Q22, the dilution cost increased by 2.4 USD/Bl, compared to 2Q21, and in the 1H22 it stood at 6.53 USD/Bl, a 2.59 USD/Bl increase as compared to the same period in 2021. The latter is mainly explained by:
- Increase of 42.1 USD/Bl in the price of naphtha associated with the increase in fuel prices and the recovery of market conditions.
- The positive impact of foreign exchange rate due to the devaluation of the COP against the USD by 292 COP/USD.
- Lower volume of naphtha barrels purchased (2.1 mbls) due to efficiencies mainly associated with the start-up of co-dilution projects in Cusiana and Apiay fields.
Financial Results for the Segment
Table 8: Income Statement – Upstream
| Billion (COP) | | 2Q 2022 | 2Q 2021 | ∆ ($) | ∆ (%) | | 6M 2022 | 6M 2021 | ∆ ($) | ∆ (%) |
| Total revenue | | 25,292 | 14,564 | 10,728 | 73.7% | | 44,230 | 27,781 | 16,449 | 59.2% |
| Depreciation, amortization and depletion | | 1,712 | 1,679 | 33 | 2.0% | | 3,311 | 3,295 | 16 | 0.5% |
| Variable costs | | 7,412 | 5,324 | 2,088 | 39.2% | | 12,963 | 10,551 | 2,412 | 22.9% |
| Fixed costs | | 2,950 | 2,294 | 656 | 28.6% | | 5,518 | 4,370 | 1,148 | 26.3% |
| Total cost of sales | | 12,074 | 9,297 | 2,777 | 29.9% | | 21,792 | 18,216 | 3,576 | 19.6% |
| Gross income | | 13,218 | 5,267 | 7,951 | 151.0% | | 22,438 | 9,565 | 12,873 | 134.6% |
| Operating and exploratory expenses | | 1,340 | 944 | 396 | 41.9% | | 2,494 | 1,647 | 847 | 51.4% |
| Operating income | | 11,878 | 4,323 | 7,555 | 174.8% | | 19,944 | 7,918 | 12,026 | 151.9% |
| Financial result, net | | (532) | (493) | (39) | 7.9% | | (939) | (985) | 46 | (4.7%) |
| Share of profit of companies | | 1 | 7 | (6) | (85.7%) | | 0 | 13 | (13) | (100.0%) |
| Income before income tax | | 11,347 | 3,837 | 7,510 | 195.7% | | 19,005 | 6,946 | 12,059 | 173.6% |
| Provision for income tax | | (3,994) | (1,178) | (2,816) | 239.0% | | (6,662) | (2,155) | (4,507) | 209.1% |
| Consolidated net income | | 7,353 | 2,659 | 4,694 | 176.5% | | 12,343 | 4,791 | 7,552 | 157.6% |
| Non-controlling interest | | 21 | 21 | 0 | 0.0% | | 42 | 42 | 0 | 0.0% |
| Net income attributable to owners of Ecopetrol | | 7,374 | 2,680 | 4,694 | 175.1% | | 12,385 | 4,833 | 7,552 | 156.3% |
| | | | | | | | | | | |
| EBITDA | | 13,852 | 6,168 | 7,684 | 124.6% | | 23,714 | 11,510 | 12,204 | 106.0% |
| EBITDA Margin | | 54.8% | 42.4% | - | 12.4% | | 53.6% | 41.4% | - | 12.2% |
Revenues for 2Q22 and 1H22 increased compared to 2Q21 and 1H21 respectively, mainly supported by i) higher Brent crude oil prices and COP/USD exchange rate ii) higher crude export, given the higher production. Offset by lower deliveries to refineries due to scheduled maintenances.
Cost of sales for 2Q22 and 1H22 increased compared to the same respective periods in 2021, due to:
- Higher cost in purchases, which in turn was primarily due to higher crude oil prices and the negative effect of the devaluation of the COP against the USD, which increase was partially offset by lower volumes of purchases of diluent and from third parties.
- Higher cost execution due to: i) an increase in regulated energy consumption at the Cravo Norte field, associated with the development of a project to reduce such field’s carbon footprint by modifying the energy source used for self-generation, ii) an increase in the number of well interventions, maintenance and integrity works associated with greater activity in 2Q22, as compared to the same period in 2021 when production activity was lower due to public order incidents throughout the country, iii) an increase in process materials and support areas associated with the reactivation of operational activity consistent with the reactivation of economic activity.
- Increase in crude oil inventory levels due to higher market prices and higher cargoes in transit.
- Higher transportation costs due to i) a higher COP/USD exchange rate, ii) an annual update of tariffs for oil and multi-purpose pipelines, and iii) higher transportation volumes of Teca-Nare gas, which was partially offset by savings in tariffs following the acquisition of the El Morro-Araguaney pipeline.
Operating expenses (net of other income) for 2Q22 and 1H22 increased compared to the same respective periods in 2021, mainly due to:
- Derecognition of the investments made in the Rydberg asset in Ecopetrol America in 1Q22.
- Increases in crude oil theft in the OTA and Caño Limón oil pipelines.
- Increases in customs expenses, mainly due to an increase in the number of sales made under the DAP (Delivery at Place) modality.
- Increases in exploratory expenses, due to an increase in the recognition of exploratory activity of unsuccessful wells.
Net financial results (non-operating) for 1H22 decreased compared to the same period of the previous year, mainly due to: i) the effect of the exchange difference given the active position of the segment ii) higher yields of the investment portfolio, However, compared to 2Q21 there was an increase due to higher exchange difference expense given the increase in the COP/USD exchange rate.
Table 9: Volumes Transported – Ecopetrol Group
| mbd | | 2Q 2022 | 2Q 2021 | ∆ (%) | | 6M 2022 | 6M 2021 | ∆ (%) |
| Crude Oil | | 779.1 | 704.0 | 10.7% | | 768.3 | 718.5 | 6.9% |
| Products | | 298.3 | 255.9 | 16.6% | | 290.9 | 265.1 | 9.7% |
| Total | | 1,077.4 | 959.9 | 12.2% | | 1,059.2 | 983.6 | 7.7% |
Note: The reported volumes are subject to adjustments from volumetric quality compensation (CVC) changes associated with official of volumetric balances.
Total volume transported in 2Q22 increased by 117 mbd or 12.2% as compared to 2Q21, explained by higher production and additional captured barrels from third parties outside the pipeline network, as well as an increase in the transport of refined products as a result of the recovery in economic activity. For the 1H22, total volume transported increased 7.7% to 1,059.2 mbd, as compared to the same period in 2021 and in line with the Company’s business plan.
Crude Oil: In 2Q22, transported volumes increased by 10.7% compared to 2Q21 primarily due to higher domestic production, as well as the receipt of crude oil from the Asociación Nare in the Vasconia - GRB System, and additional captured barrels from third parties outside the pipeline network. Approximately 84.5% of the crude volume transported is owned by the Ecopetrol Group.
In 2Q22, one reversal cycle of the Bicentennial Pipeline was carried out, with an evacuated volume of 292 thousand barrels, in orderto ensure the evacuation of the Caño Limón field after damage to the pipeline caused by third parties.
During this quarter, there were 9 incidents to the pipelines caused by third parties, a 50% increase as compared to 2Q21. Furthermore, illicit valve installations increased by 10.3%.
Refined Products: In 2Q22, volumes of refined products transported increased by 16.6% as compared to 2Q21, mainly due to recovery in economic activity in 2Q22 and the effect of the public order situation and the health emergency associated with the third peak of the pandemic during 2Q21. Approximately 26.8% of the volume transported by the pipelines corresponds to Ecopetrol products. During the quarter, illicit valve installations decreased by 37.0% compared to 2Q21.
Tumaco Maritime Terminal reaches historical record in the export of South Blend crude: From June 10 -12 of this year, the Tumaco Maritime Terminal handled the largest amount of South Blend crude shipped in the country to date by sea. The tanker docked in Colombian Pacific waters to load 601 thousand barrels of South Blend crude, bound for the west coast of the United States. This marks a historical milestone for the terminal given the vessel size and volume of crude oil loaded.
Other Significant Developments:
- Offshore maintenance window of 144 hours was carried out at the Pozos Colorados maritime terminal last May that included the performance of various maintenance activities to ensure high availability of the tanker service systems in the city of Santa Marta.
- Satisfactory completion of the construction of the Guamuez River crossing entailing 674 meters of special steel aerial pipe to replace the old course of the San Miguel Orito Pipeline, guaranteeing the transport of crude in the south of the country.
- Publication of the draft resolution of the tariff methodology for the payment of transport by pipelines: At the end of May 2022, the CREG published for comments the draft resolution of the tariff methodology for the payment of transport by pipelines, which is offered for comments until the end of August. Cenit is currently analyzing the regulatory proposal in order to provide comments and analyze possible impacts.
Cost per Barrel Transported
Table 10: Cost per Barrel Transported – Ecopetrol Group
| USD/Bl | | 2Q 2022 | 2Q 2021 | ∆ (%) | | 6M 2022 | 6M 2021 | ∆ (%) | | % USD |
| Cost per Transported Barrel | | 2.76 | 2.84 | (2.8%) | | 2.76 | 2.91 | (5.2%) | | 17.5% |
In 2Q22, the cost of a barrel transported remained relatively stable as compared to 2Q21 and, for the 1H22, stood at 2.76 USD/BI, a decrease of 0.15 USD/Bl (-5.2%) as compared to the same period in 2021. The latter is mainly explained by net effect of:
Cost effect (+0.28 USD/Bl): Increase in the variable cost mainly due to an increase in (i) materials and energy consumption primarily as a result of greater transported volumes along with rate increases due to from market conditions and (ii) depreciation due to the change carried out at the end of 1Q22 in the depreciation method used by the Bicentenario pipeline.
Volume effect (-0.21 USD/Bl): Lower cost per barrel primarily due to higher transported volumes of crude and products, resulting from additional production and capture of crude from outside the system, as well as the recovery in the national demand for gasoline and diesel.
Exchange rate effect (-0.22 USD/Bl): Increase in the average COP/USD exchange rate of COP 292.6 per USD.
Financial Results for the Segment
Table 11: Income Statement – Midstream
| Billion (COP) | | 2Q 2022 | 2Q 2021 | ∆ ($) | ∆ (%) | | 6M 2022 | 6M 2021 | ∆ ($) | ∆ (%) |
| Total revenue | | 3,145 | 2,819 | 326 | 11.6% | | 6,208 | 5,627 | 581 | 10.3% |
| Depreciation, amortization and depletion | | 343 | 291 | 52 | 17.9% | | 670 | 577 | 93 | 16.1% |
| Variable costs | | 167 | 103 | 64 | 62.1% | | 322 | 236 | 86 | 36.4% |
| Fixed costs | | 370 | 344 | 26 | 7.6% | | 714 | 704 | 10 | 1.4% |
| Total cost of sales | | 880 | 738 | 142 | 19.2% | | 1,706 | 1,517 | 189 | 12.5% |
| Gross income | | 2,265 | 2,081 | 184 | 8.8% | | 4,502 | 4,110 | 392 | 9.5% |
| Operating expenses | | 191 | 157 | 34 | 21.7% | | 390 | 340 | 50 | 14.7% |
| Operating income | | 2,074 | 1,924 | 150 | 7.8% | | 4,112 | 3,770 | 342 | 9.1% |
| Financial result, net | | (11) | (29) | 18 | (62.1%) | | (208) | 110 | (318) | (289.1%) |
| Share of profit of companies | | (1) | 0 | (1) | - | | (1) | 0 | (1) | - |
| Income before income tax | | 2,062 | 1,895 | 167 | 8.8% | | 3,903 | 3,880 | 23 | 0.6% |
| Provision for income tax | | (724) | (585) | (139) | 23.8% | | (1,379) | (1,177) | (202) | 17.2% |
| Consolidated net income | | 1,338 | 1,310 | 28 | 2.1% | | 2,524 | 2,703 | (179) | (6.6%) |
| Non-controlling interest | | (252) | (270) | 18 | (6.7%) | | (492) | (541) | 49 | (9.1%) |
| Net income attributable to owners of Ecopetrol | | 1,086 | 1,040 | 46 | 4.4% | | 2,032 | 2,162 | (130) | (6.0%) |
| | | | | | | | | | | |
| EBITDA | | 2,433 | 2,272 | 161 | 7.1% | | 4,852 | 4,459 | 393 | 8.8% |
| EBITDA Margin | | 77.4% | 80.6% | - | (3.2%) | | 78.2% | 79.2% | - | (1.0%) |
Revenues for 2Q22 and 1H22 increased compared to the same respective periods in 2021, mainly due to the combined effect of: i) higher volumes transported of crude oil as a result of an increase in domestic production, and an increase in volumes of transported third party crude oil, ii) an increase in volumes transported of refined products due to the recovery of domestic demand, iii) higher average COP/USDexchange rate, and iv) annual update of tariffs. These effects were partially offset by the reduction in revenues from the elimination of the Continuity Plan Margin that was part of the polyduct transportation tariffs until April 2021.
Cost of sales in 2Q22 and 1H22 increased compared to same respective periods in 2021, mainly due to the effect of: i) higher depreciation primarily as a result of the implementation of change in the depreciation method of the Bicentenario Pipeline since 1Q22, ii) an increase in the variable costs of materials and electric, mainly associated to higher volumes transported and increases in tariffs due to market conditions, and iii) higher operation and maintenance activities.
Operating expenses (net of revenues) for 2Q22 and 1H22 increased compared to the same respective periods in 2021, mainly due to increases in social investment activities and insurance policy expenses, as well as higher emergency care expenses. The latter as a result of an increase in damages caused by third parties to infrastructure.
The net financial result (non-operating) for 1H22 decreased as compared to 1HQ21, primarily due to a decrease in our net position in USD and the financial expense effect of the exchange rate on it.
In 2Q22, the refineries reached a combined throughput during the quarter of 365.1 mbd and an integrated gross margin of 29 USD/Bl, a historical quarterly record, versus a combined throughput of 360.4 mbd and an integrated gross margin of 9.5 USD/Bl in 2Q21. Cumulatively, in the first six months of 2022, throughput reached 345.1 mbd with an integrated gross margin of 21.9 USD/Bl, against a throughput of 360.3 mbd and an integrated gross margin of 9.8 USD/Bl reached on the first half of 2021.
The Downstream segment continued its cycle of scheduled plant shutdowns for maintenance at both refineries to ensure the operational availability and reliability of the assets, along with a very good HSE performance (no recordable injuries during these shutdowns).
These results were leveraged by operational and commercial strategies, with the following effects: i) major maintenance scheduled in both refineries, completing in this way 75% of the 2022 plant shutdown plan characterized by a remarkable mechanical availability performance of the units, ii) adjustments to the shutdown execution strategy in order to capture the benefits from the market environment and operational stability within the refineries and petrochemical units versus 1Q22, and, iii) integrated logistics chain planning was made, which allowed meeting demand for the products required by the market during the scheduled plants shutdown activities.
Additionally, other benefits were captured primarily due to: i) strengthening of the products basket against the Brent; ii) active inventory optimization and management as the storage of intermediate or crude products to maintain the system throughput during the shutdowns of some units and efficient commercial strategy to capture business opportunities; iii) use of favorable product sales margins (PP[5] - PGP[6]) and the Splitter unit’s raw material spread (PGP - RGP[7]), as well as high levels of RGP deliveries from refineries to Esenttia. Despite inflationary pressures, the segment has maintained costs under control.
As of 2021, the refineries have complied with the requirements of Resolution 40103/2021 regulating sulfur content to below 50 ppm of the gasoline produced (enforceable as of January 2022). However, due to the increase in the demand for gasoline, the Ministry of Mines and Energy issued an amendment of said determination until June 2022. The refineries adopted this modification in the first half of the year, yet by the end of June, the products were once again within the limits indicated by the regulations, always in compliance with legal requirements.
Cartagena Refinery
Table 12: Throughput, Utilization Factor, Production and Refining Margin
– Cartagena Refinery
| Cartagena Refinery | | 2Q 2022 | 2Q 2021 | ∆ (%) | | 6M 2022 | 6M 2021 | ∆ (%) |
| Throughput* (mbd) | | 141.7 | 144.4 | (1.9%) | | 137.8 | 143.8 | (4.2%) |
| Utilization Factor (%) | | 75.8% | 83.2% | (8.9%) | | 63.9% | 79.0% | (19.0%) |
| Production (mbd) | | 141.4 | 137.8 | 2.6% | | 135.1 | 138.5 | (2.5%) |
| Gross Margin (USD/Bl) | | 31.6 | 7.0 | 351.4% | | 25.3 | 7.5 | 237.3% |
* Corresponds to effective throughput volumes, not volumes received
The Cartagena refinery registered historical quarterly and semi-annual financial results and its highest quarterly gross margin recorded (31.6 USD/Bl). These achievements are mainly attributable to: i) better price spreads against the Brent in fuels as compared to 2Q21; and, ii) better gasoline production performance (+6.0% compared to 2Q21) primarily due to maximization of throughput in the Cracking and Alkylation units using inventories. The foregoing offset the lower throughput, which was affected by the execution of the scheduled shutdown of the Hydrogen and Coker units, both of which have been completed. A high level of operational availability of the Refinery during the period (96.9%) is noteworthy, which allowed capturing the wider spreads already mentioned.
The mechanical completion of the IPCC was achieved, currently progressing towards assurance and start-up activities. As a result, during the second half of 2022 a gradual increase in throughput is expected.
Barrancabermeja Refinery
Table 13: Throughput, Utilization Factor, Production and Refining Margin
– Barrancabermeja Refinery
| Barrancabermeja Refinery | | 2Q 2022 | 2Q 2021 | ∆ (%) | | 6M 2022 | 6M 2021 | ∆ (%) |
| Throughput* (mbd) | | 223.5 | 216.0 | 3.5% | | 207.3 | 216.4 | (4.2%) |
| Utilization Factor (%) | | 81.5% | 82.2% | (0.9%) | | 69.3% | 83.6% | (17.1%) |
| Production (mbd) | | 226.9 | 220.1 | 3.1% | | 210.5 | 220.5 | (4.5%) |
| Gross Margin (USD/Bl) | | 27.3 | 11.2 | 143.8% | | 19.7 | 11.3 | 74.3% |
* Corresponds to effective throughput volumes, not volumes received
[5] PP: Polypropylene
[6] PGP: Polymer-grade polypropylene
[7] RGP: Refinery-grade polypropylene
In 2Q22, the Barrancabermeja refinery also registered a historical quarterly gross margin record, mainly resulting from: i) better price spreads against the Brent for fuel production, and ii) throughput maximization using national and stored crudes, along with a product inventory reduction. During the period, the high level of operational availability of the refinery stands out (95.9%), as well as the faster execution than expected and successful completion of the scheduled shutdown of the Prime D unit, ending the quarter with a very positive trend in crude throughput levels and greater operational stability allowing to the refinery to capture the advantageous margins in the current environment.
Esenttia
Table 14: Sales and Margin – Esenttia
| Esenttia | | 2Q 2022 | 2Q 2021 | ∆ (%) | | 6M 2022 | 6M 2021 | ∆ (%) |
| Total Sales (KTon) | | 133.2 | 137.7 | (3.3%) | | 268.1 | 277.3 | (3.3%) |
| Total Margin (USD/Ton) | | 331.3 | 413.1 | (19.8%) | | 298.6 | 267.7 | 11.5% |
To date, total sales for the first six months of 2022 and the second quarter of the year show a 3.3% decrease compared to 2021 results for both of the periods, primarily due to market factors such as: i) greater price competition resulting from the entry of Asian products into the region; ii) high product supply in South American countries; and iii) prevailing logistics difficulties in the region.
The total 2Q22 margin decreased by 19.8% as compared to 2Q21, given the strong increase in polypropylene prices during 2Q21. However, for the first six months of 2022 as compared to the same period in 2021, the margin is +11.5% higher primarily due to: i) a commercial strategy to increase sales in high-value areas, ii) assurance of raw material at a lower cost, iii) an increase in refinery grade propylene deliveries by refineries, and iv) improved polypropylene margins in 1Q22 vs. 1Q21.
During the first six months of 2022, Esenttia has been executing strategic which the following stand out: i) capacity growth: expansion of Plant 2 and the construction of the PGP Sphere and ii) leveraging the Group's sustainability: ReCircular Project, which seeks to develop infrastructure for the transformation of recycled material as a circular economy solution in the production of recycled polypropylene and polyethylene.
Invercolsa
Table 15: Natural Gas Volume and Installations - Invercolsa
| Invercolsa | | 2Q 2022 | 2Q2021 | ∆ (%) | | 6M 2022 | 6M 2021 | ∆ (%) |
| Volume of Natural Gas (Mill. M3) | | 64.8 | 62.9 | 3.0% | | 128.9 | 125.4 | 2.8% |
| Installations (thousand) | | 18.3 | 14.6 | 25.3 | | 34.1 | 27.6 | 23.6% |
The volume of natural gas sold increased by 3.0% in 2Q22 as compared to 2Q21, and by 2.8% in first six months of 2022 compared to the same period in 2021, attributable to: i) progress in campaigns to encourage consumption in the commercial segments and in VNG[8], ii) connection of new residential units, and, iii) installation strategies for users to increase residential volumes.
Installations increased by 25.3% in 2Q22 compared to 2Q21, and 23.6% in first six months of 2022 as compared to the same period in 2021, in each case primarily due to the implementation of strategies to encourage installation sales, particularly: i) greater digital reach and media diversification; ii) changes in contract structure to increase construction capacity, and iii) partnership agreements in construction projects.
Refining Cash Cost
[8] VNG: Vehicular natural gas
Table 16: Refining Cash Cost*
| USD/Bl | | 2Q 2022 | 2Q 2021 | ∆ (%) | | 6M 2022 | 6M 2021 | ∆ (%) | | % USD |
| Refining Cash Cost | | 4.66 | 4.50 | 3.6% | | 4.58 | 4.38 | 4.6% | | 16.6% |
* Includes refineries in Barrancabermeja, Cartagena and Esenttia
The refining cash cost increased by 0.16 USD/Bl in 2Q22 as compared to 2Q21, and for the first six months of 2022 increased by 0.20 USD/Bl compared to the same period in 2021. The latter result is explained by:
Cost & Volume Effect (+0.57 USD/Bl): Mainly due to lower crude throughputs at the Barrancabermeja Refinery (-9 mbd) and Cartagena Refinery (-6 mbd), due to scheduled plant maintenance shutdowns in both refineries.
Foreign exchange rate effect (-0.37 USD/Bl): Increase in the average COP/USD exchange rate of COP 292.18 per USD.
Financial Results for the Segment
Table 17: Income Statement – Downstream
| Billion (COP) | | 2Q 2022 | 2Q 2021 | ∆ ($) | ∆ (%) | | 6M 2022 | 6M 2021 | ∆ ($) | ∆ (%) |
| Total revenue | | 24,422 | 11,465 | 12,957 | 113.0% | | 41,541 | 21,146 | 20,395 | 96.4% |
| Depreciation, amortization and depletion | | 413 | 358 | 55 | 15.4% | | 819 | 694 | 125 | 18.0% |
| Variable costs | | 19,989 | 9,800 | 10,189 | 104.0% | | 34,754 | 18,281 | 16,473 | 90.1% |
| Fixed costs | | 532 | 581 | (49) | (8.4%) | | 1,007 | 1,015 | (8) | (0.8%) |
| Total cost of sales | | 20,934 | 10,739 | 10,195 | 94.9% | | 36,580 | 19,990 | 16,590 | 83.0% |
| Gross income | | 3,488 | 726 | 2,762 | 380.4% | | 4,961 | 1,156 | 3,805 | 329.2% |
| Operating expenses | | 529 | 425 | 104 | 24.5% | | 1,014 | 789 | 225 | 28.5% |
| Operating income (loss) | | 2,959 | 301 | 2,658 | 883.1% | | 3,947 | 367 | 3,580 | 975.5% |
| Financial result, net | | (559) | (303) | (256) | 84.5% | | (725) | (594) | (131) | 22.1% |
| Share of profit of companies | | 60 | 55 | 5 | 9.1% | | 114 | 102 | 12 | 11.8% |
| Loss before income tax | | 2,460 | 53 | 2,407 | 4,541.5% | | 3,336 | (125) | 3,461 | (2,768.8%) |
| Provision for income tax | | (602) | (5) | (597) | 11,940.0% | | (949) | 28 | (977) | (3,489.3%) |
| Consolidated net income | | 1,858 | 48 | 1,810 | 3,770.8% | | 2,387 | (97) | 2,484 | (2,560.8%) |
| Non-controlling interest | | (52) | (45) | (7) | 15.6% | | (93) | (87) | (6) | 6.9% |
| Net income attributable to owners of Ecopetrol | | 1,806 | 3 | 1,803 | 60,100.0% | | 2,294 | (184) | 2,478 | (1,346.7%) |
| | | | | | | | | | | |
| EBITDA | | 3,685 | 979 | 2,706 | 276.4% | | 5,327 | 1,632 | 3,695 | 226.4% |
| EBITDA Margin | | 15.1% | 8.5% | - | 6.6% | | 12.8% | 7.7% | - | 5.1% |
Revenues for 1H22 and 2Q22 increased compared to the same respective periods in 2021, primarily due to better product price spreads, mainly in middle distillates, gasoline and petrochemicals, mainly due to the improved market price environment and the continued growth in demand for domestic fuels. In particular, Invercolsa’s revenues increased mainly due to the increased commercialization and transportation of gas; and Esenttia good results stand out with good margins in polypropylene, which increased due to higher throughputs of propylene from the refineries.
Cost of sales increased in 2Q22 and 1H22 compared to the same respective periods in 2021, mainly due to: i) higher prices in the refineries' crude feedstock, ii) a higher volume of product imports, mainly diesel and gasoline, as a consequence of the increase in demand and maintenance of the refineries. This increase was partially offset by the increase in the stock of inventories, mainly of products.
EBITDA results for 2Q22 and 1H22 for the refining segment set a new historical record again, as a result of the improved market price differentials for the refining business, the operational stability of the Barrancabermeja Refinery and the Cartagena Refinery, and the solid performance of Esenttia and Invercolsa.
Operating expenses (net of revenues) for 2Q22 and 1H22 increased compared to the same respective periods in 2021, mainly due by higher expenses incurred to commercialize products, which in turn is due to higher product sales.
The financial result (non-operating) of 2Q22 and 1H22 presented a higher expense as compared to the same respective periods in 2021, as a result of the exchange rate effect given the devaluation of the Colombian peso against the US dollar as the segment maintains a net liability position in US dollars.
| 4. | ENERGY TRANSMISSION AND TOLL ROADS |
On August 1, 2022, ISA reported its 2Q22 financial and operating results to the market, which can be accessed on the Company's website.
Some relevant operating and financial details thereof are highlighted below:
Energy Transmission
At the end of June, ISA won one of the largest projects auctioned in Brazil in recent years through ISA CTEEP, which is expected to begin operations between 2026 and 2027. ANEEL (Brazilian Electricity Regulatory Agency) estimated the investment in the two awarded projects to total USD 780 million and comprise 1,139 km of transmission lines with a Permitted Annual Income (RAP for its Portuguese acronym) of USD 60 million. The first of the lots is located in the states of Minas Gerais and Espírito Santo and consists of the execution of 1,139 km of transmission lines, two new substations and six extensions, with an estimated investment of USD 730 million. This project will transport renewable energies, contributing to the decarbonization of the country's energy matrix. The second lot has an estimated investment of USD 50 million according to ANEEL and consists of the construction of a new patio in the Agua Azul substation, located in the state of São Paulo.
Currently, 33 projects located in the countries where ISA has a presence are in the construction stage and are expected to generate annual revenues of USD 352 million once they become operational. In addition, 249 infrastructure reinforcements and improvements are under construction in Brazil which will increase annual revenues by approximately USD 110 million.
Toll Roads
Construction continues on Rutas del Loa, whose length is 136 km, with progress now reaching 28.7% and start-up expected in 2024. Additionally, progress continues as planned in additional works executed in the Ruta del Maipo, Ruta del Bosque, Ruta de los Ríos and Ruta de la Araucanía concessions.
Telecommunications
During 2Q22, efforts were focused on connectivity projects that support business dynamics and encourage product availability in order to attain further revenues from services provided. Investments were made to increase the capacity of the transport network and enable services for customers.
Financial Results
In relation to the results of the segment, the following is highlighted:
| · | ISA's net income was COP +0.7 trillion in 2Q22, a 14.4% increase compared to 2Q21, mainly due to the positive effect of inflation on operating income in ISA’s operations in Brazil (IPCA[9]) and Colombia (IPP[10]) and a lower tax expense due to the incorporation of Brazilian capital gains in the effective tax rate. The increase in net income was partially offset by higher financial expenses due to the effect of higher inflation indexation, mainly in Chile and Brazil. ISA’s contribution to net income attributable to Ecopetrol as shareholder in 2Q22 was COP +0.3 trillion and COP +0.6 trillion for 1H22. |
[9] Índice Nacional de Preços ao Consumidor Amplo (National Consumer Price Index for its Portuguese Acronym)
[10] Producer Price Index
| · | EBITDA contribution to the Ecopetrol Group amounted to COP 2.2 trillion in 2Q22 and COP 4.2 trillion in 1H22, with a significant share thereof, 85.5% and 85.0%, respectively, attributable to the power transmission business. |
| · | EBITDA for the quarter was supported mainly by the positive effect of inflation on operating revenues in ISA’s operations in Brazil (IPCA) and Colombia, the entry into operation of power transmission projects since 2Q21 and the increase in concessions construction activity in Brazil. |
| · | As of June 30, 2022, ISA’s consolidated financial debt was COP 28.9 trillion, a 3.4% increase as compared to December 30, 2021. This increase was mainly due negative impact of the increase in the COP/USD given the devaluation of the Colombian peso against the US dollar the CLP and the Chilean Unidad de Fomento (UF) on the translation of COP 1.1 trillion in financial indebtedness. Net financial expenses in 2Q22 were COP 0.7 trillion, 58.1% higher (+COP 0.26 trillion) compared to the same period in 2021. This increase in net financial expenses is due to a higher interest expense (COP 0.23 trillion) due to the increase in indebtedness to finance the growth of ISA and its subsidiaries; and higher exchange difference expense (COP 0.03 trillion) mainly due to inflationary pressures in Chile, which have translated into a higher UF, the variable to which the debt in the road concessions in that country is indexed, and for resources held in USD in Chile for future investments in energy projects. |
| · | In addition to the results directly from the operation of ISA, this segment assumes the financial interest associated with the debt acquired by Ecopetrol to finance the purchase of this subsidiary, net of income tax, which for 1H22 amounted to COP -0.2 trillion. |
III. Technology, Environment, Social and Governance (TESG)
Renewable Energy
During 2Q22, the construction and development continued in the Brisas Solar Ecoparks (26 MW) and CENIT (23 MW). Moreover, we continued with the progress and implementation of various solar, wind and geothermal projects in different parts of the country where the Ecopetrol Group has operations, including the Solar Ecoparks projects of La Cira (56 MW) and Rubiales (87 MW), which will contribute to the goal of 400MW by 2023. Likewise, progress continues in the construction of the Solar Ecopark in Providencia (1.8MW peak), which will allow the population of the island to have this source of renewable energy supply to support its reconstruction after Hurricane Iota in 2020.
By the close of 2Q22, the Ecopetrol Group incorporated 119 MW of renewable energy to its supply matrix, out of which 30 MW corresponds to auction (contracted capacity), reflecting an increase of 98 MW compared to 1H21.
Energy Efficiency
During the 2018-2021 period, energy performance improvement initiatives were carried out through the implementation of best operational and maintenance practices that made it possible to reduce operational variability, as well as the establishment of control criteria that ensure the energy efficiency of the processes.
The program began in 2018 with the diagnosis of information, measurement and characterization of the energy consumption for the main processes, under the assumption of unchanged critical variables. During 1H22, a demand equivalent to 4.5 MW of electrical energy was optimized, equivalent to COP 13.6 billion in savings and 7.7 thousand tons of CO2e avoided.
On June 9, 2022, Ecopetrol received the Andesco Award for energy efficiency (8th version), in recognition of its commitment to the rational use of energy, with the initiative "Operational Control of energy performance in Upstream, Midstream processes (CENIT) and Downstream of the Ecopetrol Group”, which was the winner in the category of industry, commerce and services.
Hydrogen
The Hydrogen Strategic Plan is a real and ambitious commitment by Ecopetrol within the framework of its low carbon emissions business portfolio. A target has been set to produce 1 million tons of low-carbon hydrogen (H2) by 2040, destined for export and national consumption. Estimates show that the current H2production from the refineries (10% blue + 90% gray), as well as other developments, can provide the aspired one million tons, distributed as follows: 40% green H2, 30% blue and 30% white. The combined investments projected within the framework of the strategy could reach USD 2,500 million.
In March of this year, the production of green H2began in Colombia through a 50 KW pilot electrolyzer powered by solar energy at the Cartagena refinery, producing 20 kg H2/day with an estimated investment around of USD 1 million. During the first six months of 2022, (i) maturation phase 1 was completed for the construction of two low-carbon H2plants in the refineries with capacities of up to 9 kton/year or higher each, with estimated investments of approximately USD 200 million between 2022 and 2024; and, (ii) the beginning of the maturation process to assess the feasibility of developing a bottom gasification project to produce blue H2at the Barrancabermeja refinery with a capacity between 150 and 180 kton /year.
In parallel, work on two sustainable mobility pilots has continued: (i) the first in the city of Bogotá, where infrastructure will be set up to recharge a bus with a hydrogen fuel cell to operate within the city’s integrated public transport system; and, (ii) the second in the city of Cartagena within the Innovation and Technology Center, where different mobility applications will be developed. For these two pilots, two hydrogen generators or stations for the generation and recharging of hydrogen for vehicles were acquired.
Finally, in May 2022, Ecopetrol accomplished alliances with six international companies to develop its strategic hydrogen plan: the French companies Total Eren and EDF, the German company Siemens, the Spanish company H2B2, and the companies Empati from the United Kingdom and Mitsui from Japan, aiming to strengthen the development of the hydrogen plan by (i) creating value to achieve cost competitiveness in hydrogen production, ensuring timely access to technology and low-cost renewable energy sources; (ii) structuring financing and investment opportunities for portfolio projects; (iii) developing demand by identifying early stage markets and off-takers.
Integrated Water Management
During 2Q22, Ecopetrol reused 32.2 million cubic meters of water (2.2 million barrels per day), which represents the company is no longer capturing or discharging this water volume, thus reducing pressure on water resources. This is a 14% increase as compared to 2Q21 and is equal to 77% of the total water required to operate in the quarter. These results have been achieved through to the implementation of best practices[11] in water reuse and recirculation in the Barrancabermeja and Cartagena refineries, as well as in the production fields.
During the quarter, 9.5 million cubic meters of fresh water (0.66 million barrels per day) were captured, a 7% reduction compared to the volume captured in 2Q21, mainly due to decreases in injection volumes in production fields. This volume represents 23% of the total water Ecopetrol required to operate during this period.
The 0.93 million cubic meters of treated production water from Campo Castilla (64 thousand barrels per day on average) were reused in agricultural and livestock activities in the Agroenergy Sustainability Area (ASA) in the municipality of Acacias (department of Meta), which represents an 70% increase as compared to 2Q2022.
Climate Change - Decarbonization
Ecopetrol’s emission reduction goal for 2022 is 262,761 tCO2e. As of the first six months of 2022, a reduction of 135,744 tCO2e has been achieved. During 2Q22, the international firm Ruby Canyon Environmental certified the reduction of 96,111 tCO2 through the Project “Energy efficiency through operational control in the Cartagena Refinery”.
[11] Implementation of best practices like:
Reuse/recirculation of water in refineries, mainly in condensate recovery, and fire-fighting systems.
Reuse in drilling activities of domestic and industrial wastewater that, after passing through a tertiary treatment process (inverse osmosis and demineralization), is used in the production of drilling mud, washing of equipment, cooling water for pumps and industrial uses.
Reuse of production waters mainly in reinjection to maintain the pressure of the reservoirs or increase the production of hydrocarbons.
Production water is also reused to prepare drilling mud, well maintenance activities, firefighting systems, cooling of equipment, power generation in Termosuria, among others.
The guidelines for the implementation of the Zero Routine Flaring Initiative by 2030 for the report on the reduction of routine flaring and the required actions as well as the “Guidelines for the implementation of the LDAR Program” (Leak Detection and Repair for its Spanish acronym) have been determined. The requirements established in the aforementioned guidelines are aligned with the obligations of Resolution 40066 issued by the Ministry of Mines and Energy of Colombia on February 11, 2022, titled “Technical requirements for the detection and repair of leaks, the use, flaring and venting of natural gas during hydrocarbon exploration and exploitation activities.”
Biodiversity
Within the framework of the national reforestation initiative “Sembrar Nos Une”, as of 2Q22, the Ecopetrol Group has contributed with 4,761,708 trees, fulfilling 79.36% of its 6,000,000 trees target as established in the business plan for 2022.
Within the framework of The Vida Silvestre (PVS) Project, an initiative for the conservation of biodiversity in alliance with the Wildlife Conservation Society and Fondo Acción, the book "Bitacoras del PVS" (PVS logbook) was launched and can be accessed by all stakeholders at PVS Book.
In 2021, an agreement was entered into with the Government of Meta and Cormacarena in order to conserve plant cover in strategic ecosystem areas in the middle and upper basin of the Guayuriba River and the Metica River (Guamal - Humadea) through the implementation of a payment arrangement for environmental services (PSAs for its Spanish acronym) over a 44-month period. The agreement has been active for seven months, during which community communication and socialization activities have been carried out, with results that include social mapping and identification of properties and access routes. Currently, progress is being made in the characterization, prioritization and selection of properties phase aimed at quantifying the variables that typify the area and each property to establish the capacity, possibilities and limitations of their natural resources and the socioeconomic conditions of the owners, possessors and/or occupants and their families.
Social and Environmental Investment
In 2Q22, the Ecopetrol Group allocated resources for social investment and engagement in projects and initiatives of the Sustainable Development Portfolio within the framework of the Environment Strategy for the amount of COP 74 billion, reaching a total of COP 147 billion[12] as of the 1H22, which include investments of a strategic and mandatory nature.
During 2Q22, the transfer of the following strategic social investment projects is most noteworthy: i) tertiary roads and village roads that connect the villages of Caño Las Cruces, X10, Yondó Nuevo, Caño Negro, Laguna del Miedo, Remolinos and Kilómetro 5 of the municipality of Yondó, Antioquia, benefiting 1,200 inhabitants; ii) improvements to 29.4 km of rural roads in the municipality of Rionegro, Santander; iii) improvements to 2.4 km of tertiary roads between the village of Brisas de Bolívar and Puerto Nuevo in Cantagallo, Bolívar, as part of the Roads for Development program; iv) improvement of the Calgary community hall and the Luis Carlos López and San Lucas schools and the auxiliary teacher services center (CASD for its Spanish acronym) Manuela Beltrán in Cartagena; v) construction of an enclosure for the Membrillal Park in Cartagena; vi) three entrepreneurship centers in Acacías, Guamal and Castilla la Nueva as spaces to encourage ideas, creativity and innovation in entrepreneurs and businessmen within the framework of the Ecopetrol Emprende Orinoquía program; vii) twelve traveling libraries delivered to the cultural corporation of Villavicencio jointly with the regional center for the promotion of books in Latin America and the Caribbean (CERLALC for its Spanish acronym) and the Mayor's Office of Villavicencio; viii) Completion of the Agroemprende Cacao Putumayo Program, an alliance with the Canadian organization for international development (SOCODEVI for its Spanish acronym), which benefited 350 farming families from San Miguel, Orito and Valle del Guamuez in Putumayo, through technical, organizational and sales/marketing support to strengthen the cocoa production chain.
[12] The investment by the second half of 2022 can be divided into: i) Strategic Investments for COP 141,516 million; and, ii) Mandatory investments for COP 5,898 million. As part of the strategic value, the execution in 2022 of the projects for the Obras por Impuestos (“Works in Lieu of Taxes”) equaling COP 20,701 million by Ecopetrol S.A. Ecopetrol S.A.: Cumulative social investment and engagement: COP 130,462 million. Affiliates cumulative socio-environmental investment : COP 16,952 million.
The following mandatory investment projects stand out, executed not only to meet legal requirements but also as an opportunity to contribute towards the improvement of the socioeconomic and environmental conditions of the areas, including the following currently in execution: i) livestock production process for income generation in Alto Unuma, Pto. Gaitan, Meta, ii) strengthening of the Joropo culture in Casanare, iii) comprehensive risk management social plan (PGSI for its Spanish acronym) in Casanare), iv) compliance with environmental obligations in Pto. Gaitan, Meta, v) crafting of the strategic life plan of the Sikuani reserve in Pto. Gaitan, Meta.
During 2Q22, the Ecopetrol Group presented to the Government proposals to finance 20 new projects worth COP 182,126 million. In line with regulations, in August 2022 the Agency for Territorial Renewal will issue resolutions regarding the assignment of the projects that may be financed according to the available CONFIS quota.
By the first half of the year, Ecopetrol allocated environmental investment resources worth COP 6,927 million, of which COP 2,996 million are mandatory investments and COP 3,931 million are voluntary investments. The construction of four descriptive guidelines for eco-reserves is worth highlighting, looking to establish their biodiversity and consolidation plans, as well as contributing towards fulfilling the Ecopetrol Group’s goal of establishing 50 eco-reserves by 2030. Investment in the services for control and surveillance of conserved and/or reforested areas is also noteworthy, as well as ecological restoration activities in the Caño Rubiales micro-basin.
Planning and Environmental Authorizations
During 2Q22, Ecopetrol S.A. obtained 11 environmental authorizations and presented 50 before national and regional environmental authorities for the development of its projects and operations.
Among the environmental authorizations obtained, the following stand out:
- Extension of the time frame for the air injection pilot in the Chichimene field
- Strategic conditioning within the central production facilities of the Cupiagua field
- Approval of the implementation of phyto-evaporators in Dina field
Within the company's strategies for self-generation of solar energy and biomass, the start of the environmental assessment for the construction of a self-generation center for solar energy (82 MW) and biomass (23 MW) to supply power to the Cartagena Refinery stands out.
Communities and Environment
Different scenarios for territorial dialogue were arranged with communities, authorities, unions and associations of Mid-Magdalena, Casanare, Huila and Meta on issues related to contracting labor, local goods and services, transportation and social investment, which were guaranteed through the backing and support of national institutions.
There was progress made in the exercise to characterize the fishing communities on the coastline between the municipalities of Riohacha and Manaure in order to acquire information on fishing practices, given the intent to carry out exploratory activities in offshore areas.
Meetings were held throughout the island of Providencia to inform the community of advances in the planning of the “Providencia Solar Ecopark” project. Alternatives are being sought from the Ministry of Mines and Energy so that the park’s benefits are reflected in the costs of the service.
The process of strengthening relations between Ecopetrol and the Alto Unuma Meta reservation in Puerto Gaitán continued, which has been called “From good neighbors to friends”, in order to advance in: i) the implementation of trust-building projects; ii) discuss tripartite support arrangements (reservation, Government and company) given the initiatives that are part of the Life Plan of the reserve; as well as, iii) to carry out joint and preventive analysis of surrounding situations to mitigate risks of conflicts.
With the presence of some Ecopetrol Directors, a visit was made to the Corregimiento Campo Duro to learn about the ecotourism experience of the beneficiaries of the Innovate project – Sueño de Canoeros (dreams of canoers) that the communities have been developing, with a meeting held with the residents to present concerns and expectations.
Corporate Responsibility
The Integrated Sustainable Management Report was published in its English and Spanish versions, which, includes, among others, indicators following standards in the Global Reporting Initiative (GRI), and consistent with the reporting guidelines of the Sustainability Accounting Standards Board (SASB), Task Force on Climate-related Financial Disclosures (TCFD), the Stakeholders Capitalism Metrics (SCM) from the World Economic Forum, and the Global Compact and the Sustainable Development Goals (SDG) of the United Nations.
Additionally, for the third consecutive year, Ecopetrol completed the information required by the Dow Jones Sustainability Index (DJSI), a division of S&P Global, with the participation of multiple areas of the Company. The updated results of this S&P evaluation are expected in November of this year.
Human Rights
In 2Q22, the review of Ecopetrol's human rights strategy was carried out with the aim of updating the guidelines for respect and due diligence, in accordance with best standards. This exercise will culminate in the implementation of a more robust strategy that continues to ensure operations respectful of human rights, as well as to prevent legal, reputational, and operational risks related to human rights.
Awareness workshops on discrimination, harassment, violence, and human rights were held. The first was held in the Eastern Management (Rubiales). These spaces offer tools to ensure healthy and respectful environments concerning human rights.
Human rights trends related to the supply chain have been analyzed, seeking to strengthen Ecopetrol's due diligence on this matter. To encourage and facilitate the alignment with the Company's suppliers and their effective management of the risks associated therewith, approximately 200 contract administrators were trained.
Bi-monthly meetings are held with Ecopetrol Group companies, both individually and through the Corporate Responsibility taskforce, to ensure Group companies are aligned with the human rights directives, and that the Human Rights Guidelines and the Human Rights Risk Management Cycle Guidelines are implemented.
Corporate Governance and Corporate Bodies
An extraordinary meeting of the General Shareholders’ Meeting was held on June 17, 2022, wherein the proposal to modify the allocation of a part of the occasional reserve with the resulting distribution of an extraordinary dividend of COP 168 Colombian pesos per share, for a total dividend of COP 448 Colombian pesos per share for this 2022 - the highest in the Company's history - was submitted for consideration by the shareholders and subsequent approval thereof, among other agenda items.
The total value of the occasional reserve the meeting approved is equivalent to about COP 6.9 trillion, of which COP 795 billion corresponded to the minority shareholders and COP 6.1 trillion to the Nation. This amount, in turn, under Paragraph 2 of Article 90 of Law 2159 of 2021, was determined in said extraordinary meeting that it would be used to partly offset the obligations the Fuel Price Stabilization Fund (FEPC for its Spanish acronym) has with Ecopetrol. The foregoing, taking into account that in 2Q22, the National Government, through the Ministry of Finance and Public Credit, defined with Ecopetrol a payment structure to cover the COP 14.1 trillion in accounts receivable balance due to Ecopetrol from the FEPC as of March 2022. The actions determined to resolve said balance were: (i) contributions from the Government for nearly COP 8 trillion, with COP 7.3 trillion allocated in cash and COP 675.4 billion in dividends already decreed on Ecopetrol's 2021 results to which the Government was entitled, as approved at the ordinary General Shareholders' Meeting on March 30, 2022; and, (ii) the proposal to release part of the occasional reserve that was constituted in the General Shareholders' Meeting of March 2022 and that would be distributed as an extraordinary dividend to the shareholders.
Consequently, as determined in the extraordinary meeting, the dividend payment to minority shareholders was carried out on June 30, 2022, and the aforementioned compensation was made within the same period.
Additionally, in May, a training seminar was held for the Directors of the Boards of Directors of the Ecopetrol Group, which is held annually by the Corporate Governance Management to strengthen understanding regarding the duties, responsibilities and functions of the Directors, given the importance of their role in achieving the objectives of the Group.
Science, Technology and Innovation
During 2Q22, advances were achieved in the implementation of the science, technology and innovation portfolio, ensuring benefits valued at USD 63.43 million, owing to the results obtained by business technologies and digital solutions implemented in Ecopetrol and Cenit, mainly resulting from:
In digital transformation, benefits of USD 44.3 million were captured, which is a 116% increase versus 2Q21 (USD 20.5 million, through:
| · | Implementing of the second wave of the Digital Agenda. During 2Q22, the operational deployment of eight digital solutions was carried out, which have contributed to the financial consolidation of the Ecopetrol Group, energy savings in the Barrancabermeja Refinery, automation of all activities of the personnel hiring process, management of the Inspection and Logistics processes, and the work execution progress monitoring from mobile devices. |
| · | In Field D, productivity benefits and avoided costs are highlighted thanks to efficiencies from the use of analytical models, statistical tools, and storage and management of digital information. Worth highlighting in 2Q22 is the deployment, through advanced analytics, of a suite of forecast models for the Projects Vice Presidency, which contributes through predictive analytics to the mitigation of risks from non-compliance of activities, capital discipline and the release of man hours of project control professionals. |
| · | In addition, USD 1.14 million in benefits were generated in Cenit corresponding to an increase in barrels transported from a decrease in pumping effects resulting from the implementation of digital solutions that integrate the management of appointments, planning, programming and load balance of hydrocarbon transports. |
Regarding innovation, worth highlighting in 2Q22 is the progress made on the deployment of the Caribbean Innovation and Technology Center (30%); advancements were realized in preparing the infrastructure, conceptual engineering of the mobility park and design of the Technopark in order to launch of the first phase of the Center in 3Q22. This Center will be the third center of Ecopetrol's nationwide innovation network, highlighting hydrogen and providing an experimentation environment and digital layer through the metaverse.
Concerning technological development and support, there have been certified benefits of USD 17.96 million through incremental production from the use of nanotechnologies, improvements in oil mobility and water control in the Castilla field and the application of pulse or cycle injection technology in four injection wells in the Corocora field in Chichimene.
Regarding intellectual property, in 2Q22 the Superintendence of Industry and Commerce granted three new patents to Ecopetrol, which represent a scientific and technological advance in the monitoring of production water management and the traditional hydrocarbon business.
V. Results Presentation
Ecopetrol management will host two virtual conference calls to review the results for the second quarter of 2022:
Spanish August 4, 2022 08:00 a.m. Colombia 09:00 a.m. New York | | English August 4, 2022 10:00 a.m. Colombia 11:00 a.m. New York |
To access it, please used the following links:
Spanish: https://onlinexperiences.com/Launch/QReg/ShowUUID=E8DA00BD-D6AE-4E05-86C9-04474345F0BB&LangLocaleID=1034
English: https://onlinexperiences.com/Launch/QReg/ShowUUID=BFCC73C2-3E0E-42AB-93CD-6AFF7E83DDC4&LangLocaleID=1033
Please check if your browser allows the normal operation of the online presentation. We recommend using the latest versions of Internet Explorer, Google Chrome and Mozilla Firefox.
The results report, presentation, webcast and replay of the webcasts will be available on the Ecopetrol website: www.ecopetrol.com.co
Any URLs referenced in this report are intended to be an inactive textual reference only. The information on any such websites, which might be accessible through a hyperlink resulting from a URL in this report, is not and shall not be deemed to be incorporated into this report.
Contact information:
Head of Capital Markets
Tatiana Uribe Benninghoff
Telephone: +57 601-234-5190 - Email: investors@ecopetrol.com.co
Media Engagement (Colombia)
Jorge Mauricio Tellez
Telephone: +57 601-234-4329 - Email: mauricio.tellez@ecopetrol.com.co
Ecopetrol Group Appendices
Table 1: Income Statement - Ecopetrol Group
| Billion (COP) | | 2Q 2022 | 2Q 2021 | ∆ (%) | | 6M 2022 | 6M 2021 | ∆ (%) |
| Revenue | | | | | | | | |
| Local | | 22,185 | 9,336 | 137.6% | | 38,798 | 17,951 | 116.1% |
| Export | | 21,700 | 10,108 | 114.7% | | 37,560 | 18,699 | 100.9% |
| Total revenue | | 43,885 | 19,444 | 125.7% | | 76,358 | 36,650 | 108.3% |
| Cost of sales | | | | | | | | |
| Depreciation, amortization and depletion | | 2,725 | 2,328 | 17.1% | | 5,305 | 4,566 | 16.2% |
| Variable depreciation, amortization and depletion | | 1,622 | 1,600 | 1.4% | | 3,129 | 3,170 | (1.3%) |
| Fixed cost depreciation | | 1,103 | 728 | 51.5% | | 2,176 | 1,396 | 55.9% |
| Variable costs | | 16,343 | 6,761 | 141.7% | | 28,408 | 12,999 | 118.5% |
| Imported products | | 8,643 | 3,030 | 185.2% | | 16,328 | 6,227 | 162.2% |
| Local purchases | | 7,096 | 3,590 | 97.7% | | 12,627 | 6,732 | 87.6% |
| Hydrocarbon transportation services | | 314 | 220 | 42.7% | | 568 | 449 | 26.5% |
| Inventories and others | | 290 | (79) | (467.1%) | | (1,115) | (409) | 172.6% |
| Fixed costs | | 4,010 | 2,342 | 71.2% | | 7,303 | 4,378 | 66.8% |
| Contracted services | | 1,073 | 734 | 46.2% | | 1,986 | 1,367 | 45.3% |
| Construction services | | 635 | 0 | - | | 1,054 | 0 | - |
| Maintenance | | 953 | 572 | 66.6% | | 1,660 | 1,075 | 54.4% |
| Labor costs | | 835 | 587 | 42.2% | | 1,618 | 1,145 | 41.3% |
| Other | | 514 | 449 | 14.5% | | 985 | 791 | 24.5% |
| Total cost of sales | | 23,078 | 11,431 | 101.9% | | 41,016 | 21,943 | 86.9% |
| Gross income | | 20,807 | 8,013 | 159.7% | | 35,342 | 14,707 | 140.3% |
| Operating expenses | | 2,199 | 1,457 | 50.9% | | 4,205 | 2,637 | 59.5% |
| Administration expenses | | 1,752 | 1,391 | 26.0% | | 3,661 | 2,405 | 52.2% |
| Exploration and projects expenses | | 445 | 67 | 564.2% | | 538 | 235 | 128.9% |
| (Recovery) expense for impairment long-term assets | | 2 | (1) | (300.0%) | | 6 | (3) | (300.0%) |
| Operating income | | 18,608 | 6,556 | 183.8% | | 31,137 | 12,070 | 158.0% |
| Finance result, net | | (1,991) | (831) | 139.6% | | (3,514) | (1,484) | 136.8% |
| Foreign exchange, net | | (186) | (17) | 994.1% | | (139) | 104 | (233.7%) |
| Interest, net | | (1,155) | (563) | 105.2% | | (2,095) | (1,098) | 90.8% |
| Financial income/loss | | (650) | (251) | 159.0% | | (1,280) | (490) | 161.2% |
| Share of profit of companies | | 237 | 62 | 282.3% | | 439 | 115 | 281.7% |
| Income before income tax | | 16,854 | 5,787 | 191.2% | | 28,062 | 10,701 | 162.2% |
| Income tax | | (5,309) | (1,768) | 200.3% | | (9,193) | (3,304) | 178.2% |
| Net income consolidated | | 11,545 | 4,019 | 187.3% | | 18,869 | 7,397 | 155.1% |
| Non-controlling interest | | (1,075) | (295) | 264.4% | | (1,826) | (587) | 211.1% |
| Net income attributable to owners of Ecopetrol | | 10,470 | 3,724 | 181.1% | | 17,043 | 6,810 | 150.3% |
| | | | | | | | | |
| | | | | | | | | |
| EBITDA | | 22,211 | 9,428 | 135.6% | | 38,106 | 17,615 | 116.3% |
| EBITDA margin | | 50.6% | 48.5% | 2.1% | | 49.9% | 48.1% | 1.8% |
Table 2: Statement of Financial Position - Ecopetrol Group
| Billion (COP) | | June 30, 2022 | March 31, 2022 | ∆ (%) |
| Current assets | | | | |
| Cash and cash equivalents | | 10,104 | 13,999 | (27.8%) |
| Trade and other receivables | | 29,114 | 25,227 | 15.4% |
| Inventories | | 12,177 | 10,972 | 11.0% |
| Current tax assets | | 6,056 | 4,840 | 25.1% |
| Other financial assets | | 1,146 | 1,649 | (30.5%) |
| Other assets | | 2,365 | 2,387 | (0.9%) |
| | | 60,962 | 59,074 | 3.2% |
| Non-current assets held for sale | | 48 | 75 | (36.0%) |
| Total current assets | | 61,010 | 59,149 | 3.1% |
| | | | | |
| Non-current assets | | | | |
| Investments in associates and joint ventures | | 9,103 | 8,669 | 5.0% |
| Trade and other receivables | | 26,282 | 26,416 | (0.5%) |
| Property, plant and equipment | | 92,035 | 87,774 | 4.9% |
| Natural and environmental resources | | 38,022 | 36,049 | 5.5% |
| Assets by right of use | | 561 | 496 | 13.1% |
| Intangibles | | 15,975 | 14,831 | 7.7% |
| Deferred tax assets | | 13,307 | 10,876 | 22.4% |
| Other financial assets | | 827 | 1,018 | (18.8%) |
| Goodwill and Other assets | | 5,755 | 5,552 | 3.7% |
| Total non-current assets | | 201,867 | 191,681 | 5.3% |
| | | | | |
| Total assets | | 262,877 | 250,830 | 4.8% |
| | | | | |
| Current liabilities | | | | |
| Loans and borrowings | | 9,763 | 8,739 | 11.7% |
| Trade and other payables | | 22,129 | 26,480 | (16.4%) |
| Provision for employees benefits | | 2,032 | 2,219 | (8.4%) |
| Current tax liabilities | | 4,692 | 2,559 | 83.4% |
| Accrued liabilities and provisions | | 1,147 | 1,464 | (21.7%) |
| Other liabilities | | 1,962 | 1,288 | 52.3% |
| Liabilites related to non-current assets held for sell | | 27 | 25 | 8.0% |
| Total current liabilities | | 41,752 | 42,774 | (2.4%) |
| | | | | |
| Non-current liabilities | | | | |
| Loans and borrowings | | 88,983 | 82,879 | 7.4% |
| Trade and other payables | | 80 | 88 | (9.1%) |
| Provision for employees benefits | | 10,643 | 9,797 | 8.6% |
| Non-current taxes | | 11,958 | 11,744 | 1.8% |
| Accrued liabilities and provisions | | 12,874 | 12,624 | 2.0% |
| Other liabilities | | 1,910 | 1,780 | 7.3% |
| Total non-current liabilities | | 126,448 | 118,912 | 6.3% |
| | | | | |
| Total liabilities | | 168,200 | 161,686 | 4.0% |
| | | | | |
| Equity | | | | |
| Equity attributable to owners of the company | | 70,608 | 66,455 | 6.2% |
| Non-controlling interests | | 24,069 | 22,689 | 6.1% |
| Total equity | | 94,677 | 89,144 | 6.2% |
| | | | | |
| Total liabilities and equity | | 262,877 | 250,830 | 4.8% |
Table 3: Cash Flow Statement - Ecopetrol Group
| Billion (COP) | | 2Q 2022 | 2Q 2021 | | 6M 2022 | 6M 2021 |
| Cash flow provided by operating activities | | | | | | |
| Net income attributable to owners of Ecopetrol S.A. | | 10,470 | 3,724 | | 17,043 | 6,810 |
| Adjustments to reconcile net income to cash provided by operating activities | | | | | | |
| Non-controlling interests | | 1,075 | 295 | | 1,826 | 587 |
| Income tax | | 5,309 | 1,768 | | 9,193 | 3,304 |
| Depreciation, depletion and amortization | | 2,856 | 2,396 | | 5,565 | 4,698 |
| Foreign exchange (gain) loss | | 186 | 17 | | 139 | 258 |
| Gain on other comprenhensive Income realized | | 0 | 0 | | 0 | (362) |
| Finance costs recognized in profit or loss | | 1,973 | 838 | | 3,523 | 1,630 |
| Dry wells | | 377 | 38 | | 438 | 170 |
| Loss (gain) on disposal of non-current assets | | 11 | 25 | | 306 | 17 |
| Impairment of current and non-current assets | | 15 | 2 | | 41 | 15 |
| Fair value (gain) on financial assets valuation | | (61) | (3) | | (103) | 19 |
| Gain on financial derivatives | | (11) | 10 | | (11) | 10 |
| Gain on assets for sale | | 12 | 1 | | 10 | 0 |
| (Gain) loss on share of profit of associates and joint ventures | | (237) | (62) | | (439) | (115) |
| Exchange difference on export hedges and ineffectiveness | | 157 | 83 | | 292 | 150 |
| Others minor items | | 27 | 7 | | 4 | 14 |
| Net changes in operating assets and liabilities | | (12,649) | (3,524) | | (22,833) | (7,487) |
| Income tax paid | | (3,356) | (2,301) | | (5,054) | (3,471) |
| Cash provided by operating activities | | 6,154 | 3,314 | | 9,940 | 6,247 |
| | | | | | | |
| Cash flows from investing activities | | | | | | |
| Investment in joint ventures | | (33) | 0 | | (65) | 0 |
| Investment in property, plant and equipment | | (1,867) | (1,408) | | (3,094) | (2,258) |
| Investment in natural and environmental resources | | (2,532) | (1,298) | | (4,490) | (2,867) |
| Payments for intangibles | | (187) | (45) | | (357) | (63) |
| Sale of assets held for sale and equity instruments | | 0 | 2 | | 0 | 0 |
| (Purchases) sales of other financial assets | | 771 | (6) | | 1,170 | 1,706 |
| Interest received | | 177 | 44 | | 336 | 68 |
| Dividends received | | 179 | 82 | | 179 | 82 |
| Proceeds from sales of assets | | 29 | 0 | | 80 | 11 |
| Net cash used in investing activities | | (3,463) | (2,629) | | (6,241) | (3,321) |
| | | | | | | |
| Cash flows from financing activities | | | | | | |
| Proceeds (repayment of) from borrowings | | (54) | (619) | | (331) | (681) |
| Interest paid | | (1,532) | (735) | | (2,439) | (1,213) |
| Lease Payments | | (115) | (80) | | (205) | (150) |
| Return of capital | | (7) | 0 | | (7) | 0 |
| Dividends paid | | (5,692) | (982) | | (5,965) | (1,151) |
| Net cash used in financing activities | | (7,400) | (2,416) | | (8,947) | (3,195) |
| | | | | | | |
| Exchange difference in cash and cash equivalents | | 814 | 65 | | 802 | 209 |
| Net (decrease) increase in cash and cash equivalents | | (3,895) | (1,666) | | (4,446) | (60) |
| Cash and cash equivalents at the beginning of the period | | 13,999 | 6,688 | | 14,550 | 5,082 |
| Cash and cash equivalents at the end of the period | | 10,104 | 5,022 | | 10,104 | 5,022 |
Table 4: EBITDA Reconciliation - Ecopetrol Group
| Billion (COP) | | 2Q 2022 | 2Q 2021 | | 6M 2022 | 6M 2021 |
| Net income attributable to the owners of Ecopetrol | | 10,470 | 3,724 | | 17,043 | 6,810 |
| (+) Depreciation, amortization and depletion | | 2,856 | 2,396 | | 5,565 | 4,698 |
| (+/-) Impairment of long-term assets | | 2 | (1) | | 6 | (3) |
| (+/-) Financial result, net | | 1,991 | 831 | | 3,514 | 1,484 |
| (+) Income tax | | 5,309 | 1,768 | | 9,193 | 3,304 |
| (+) Taxes and others | | 508 | 415 | | 959 | 735 |
| (+/-) Non-controlling interest | | 1,075 | 295 | | 1,826 | 587 |
| Consolidated EBITDA | | 22,211 | 9,428 | | 38,106 | 17,615 |
Table 5: Reconciliation of EBITDA by Segment (1Q22)
| Billion (COP) | | Upstream | Downstream | Midstream | Energy Transmission and Toll Roads | Eliminations | Consolidated |
| Net income attributable to the owners of Ecopetrol | | 7,374 | 1,806 | 1,086 | 204 | 0 | 10,470 |
| (+) Depreciation, amortization and depletion | | 1,721 | 457 | 351 | 327 | 0 | 2,856 |
| (+/-) Impairment of long-term assets | | 0 | 2 | 0 | 0 | 0 | 2 |
| (+/-) Financial result, net | | 532 | 559 | 11 | 871 | 18 | 1,991 |
| (+) Income tax | | 3,994 | 602 | 724 | (10) | (1) | 5,309 |
| (+) Other taxes | | 252 | 207 | 9 | 40 | 0 | 508 |
| (+/-) Non-controlling interest | | (21) | 52 | 252 | 792 | 0 | 1,075 |
| Consolidated EBITDA | | 13,852 | 3,685 | 2,433 | 2,224 | 17 | 22,211 |
Appendices, Ecopetrol S.A.
Following are the Income Statement and Statement of Financial Position of Ecopetrol S.A.
Table 6: Income Statement
| Billion (COP) | | 2Q 2022 | 2Q 2021 | ∆ (%) | | 6M 2022 | 6M 2021 | ∆ (%) |
| Local | | 20,599 | 9,405 | 119.0% | | 35,804 | 17,770 | 101.5% |
| Exports | | 16,471 | 7,740 | 112.8% | | 28,558 | 14,610 | 95.5% |
| Total revenue | | 37,070 | 17,145 | 116.2% | | 64,362 | 32,380 | 98.8% |
| Variable costs | | 19,510 | 9,039 | 115.8% | | 34,777 | 17,553 | 98.1% |
| Fixed costs | | 3,345 | 2,856 | 17.1% | | 6,387 | 5,396 | 18.4% |
| Total cost of sales | | 22,855 | 11,895 | 92.1% | | 41,164 | 22,949 | 79.4% |
| Gross income | | 14,215 | 5,250 | 170.8% | | 23,198 | 9,431 | 146.0% |
| Operating expenses | | 1,022 | 934 | 9.4% | | 1,816 | 1,517 | 19.7% |
| Operating income | | 13,193 | 4,316 | 205.7% | | 21,382 | 7,914 | 170.2% |
| Financial income/loss | | (1,251) | (887) | 41.0% | | (1,919) | (1,917) | 0.1% |
| Share of profit of companies | | 2,703 | 1,366 | 97.9% | | 4,395 | 2,670 | 64.6% |
| Income before income tax | | 14,645 | 4,795 | 205.4% | | 23,858 | 8,667 | 175.3% |
| Income tax | | (4,175) | (1,071) | 289.8% | | (6,815) | (1,857) | 267.0% |
| Net income attributable to owners of Ecopetrol | | 10,470 | 3,724 | 181.1% | | 17,043 | 6,810 | 150.3% |
| | | | | | | | | |
| EBITDA | | 15,031 | 6,155 | 144.2% | | 24,896 | 11,524 | 116.0% |
| EBITDA margin | | 40.5% | 35.90% | 4.6% | | 38.70% | 35.60% | 3.1% |
Table 7: Statement of Financial Position / Balance Sheet
| Billion (COP) | | June 30, 2022 | March 31, 2022 | ∆ (%) |
| Current assets | | | | |
| Cash and cash equivalents | | 2,987 | 5,157 | (42.1%) |
| Trade and other receivables | | 26,385 | 24,301 | 8.6% |
| Inventories | | 8,100 | 7,695 | 5.3% |
| Current tax assets | | 4,651 | 4,000 | 16.3% |
| Other financial assets | | 2,973 | 2,716 | 9.5% |
| Other assets | | 1,447 | 1,540 | (6.0%) |
| | | 46,543 | 45,409 | 2.5% |
| Non-current assets held for sale | | 26 | 40 | (35.0%) |
| Total current assets | | 46,569 | 45,449 | 2.5% |
| | | | | |
| Non-current assets | | | | |
| Investments in associates and joint ventures | | 78,346 | 71,497 | 9.6% |
| Trade and other receivables | | 517 | 546 | (5.3%) |
| Property, plant and equipment | | 25,409 | 24,832 | 2.3% |
| Natural and environmental resources | | 24,571 | 23,978 | 2.5% |
| Assets by right of use | | 3,001 | 3,037 | (1.2%) |
| Intangibles | | 313 | 300 | 4.3% |
| Deferred tax assets | | 7,110 | 4,860 | 46.3% |
| Other financial assets | | 308 | 535 | (42.4%) |
| Goodwill and other assets | | 1,070 | 1,043 | 2.6% |
| Total non-current assets | | 140,645 | 130,628 | 7.7% |
| | | | | |
| Total assets | | 187,214 | 176,077 | 6.3% |
| | | | | |
| Current liabilities | | | | |
| Loans and borrowings | | 5,714 | 4,316 | 32.4% |
| Trade and other payables | | 19,863 | 23,028 | (13.7%) |
| Provision for employees benefits | | 1,810 | 1,977 | (8.4%) |
| Current tax liabilities | | 3,556 | 846 | 320.3% |
| Accrued liabilities and provisions | | 778 | 1,108 | (29.8%) |
| Other liabilities | | 1,539 | 944 | 63.0% |
| Total current liabilities | | 33,260 | 32,219 | 3.2% |
| | | | | |
| Non-current liabilities | | | | |
| Loans and borrowings | | 62,812 | 58,106 | 8.1% |
| Provision for employees benefits | | 9,771 | 8,941 | 9.3% |
| Non-current tax liabilities | | 287 | 270 | 6.3% |
| Accrued liabilities and provisions | | 10,328 | 10,034 | 2.9% |
| Other liabilities | | 148 | 52 | 184.6% |
| Total non-current liabilities | | 83,346 | 77,403 | 7.7% |
| | | | | |
| Total liabilities | | 116,606 | 109,622 | 6.4% |
| | | | | |
| Equity | | | | |
| Equity attributable to owners of the company | | 70,608 | 66,455 | 6.2% |
| Total equity | | 70,608 | 66,455 | 6.2% |
| | | | | |
| Total liabilities and equity | | 187,214 | 176,077 | 6.3% |
Table 8: Export Destinations - Ecopetrol Group
| Crudes - mboed | | 2Q 2022 | 2Q 2021 | % Share | | 6M 2022 | 6M 2021 | % Share |
| U.S. Gulf Coast | | 163.2 | 123.8 | 39.4% | | 166.5 | 123.6 | 41.7% |
| Asia | | 179.3 | 181.7 | 43.3% | | 184.2 | 197.5 | 46.1% |
| Central America / Caribbean | | 37.3 | 10.8 | 9.0% | | 23.3 | 10.2 | 5.8% |
| Others | | 7.7 | 1.4 | 1.9% | | 11.8 | 0.9 | 3.0% |
| Europe | | 21.5 | 20.6 | 5.2% | | 11.8 | 13.6 | 3.0% |
| U.S. West Coast | | 5.4 | 4.8 | 1.3% | | 2.0 | 4.3 | 0.5% |
| South America | | 0.0 | 0.0 | 0.0% | | 0.0 | 0.6 | 0.0% |
| U.S. East Coast | | 0.0 | 0.0 | 0.0% | | 0.0 | 0.0 | 0.0% |
| Total | | 414.4 | 343.1 | 100.0% | | 399.6 | 350.7 | 100.0% |
| | | | | | | | | |
| Products - mboed | | 2Q 2022 | 2Q 2021 | % Share | | 6M 2022 | 6M 2021 | % Share |
| Central America / Caribbean | | 63.8 | 45.0 | 61.7% | | 45.9 | 35.7 | 56.8% |
| U.S. Gulf Coast | | 13.2 | 13.1 | 12.7% | | 16.5 | 15.6 | 20.4% |
| Asia | | 11.7 | 17.3 | 11.3% | | 8.9 | 14.1 | 11.0% |
| South America | | 5.9 | 12.5 | 5.7% | | 6.3 | 10.4 | 7.8% |
| U.S. East Coast | | 5.6 | 19.0 | 5.4% | | 0.0 | 21.0 | 0.0% |
| Europe | | 5.6 | 0.0 | 5.4% | | 2.8 | 4.0 | 3.5% |
| U.S. West Coast | | 0.0 | 0.0 | 0.0% | | 0.0 | 0.0 | 0.0% |
| Others | | (2.3) | 1.7 | -2.2% | | 0.5 | 1.1 | 0.6% |
| Total | | 103.4 | 108.6 | 100.0% | | 80.9 | 101.9 | 100.0% |
Note: The information is subject to change after the end of the quarter, as some destinations are reclassified according to the final result of exports.
Table 9: Local Purchases and Imports - Ecopetrol Group
| Local Purchases - mboed | | 2Q 2022 | 2Q 2021 | ∆ (%) | | 6M 2022 | 6M 2021 | ∆ (%) |
| Crude Oil | | 187.5 | 175.5 | 6.8% | | 182.4 | 177.7 | 2.6% |
| Gas | | 3.3 | 2.0 | 65.0% | | 2.5 | 1.8 | 38.9% |
| Products | | 3.1 | 2.6 | 19.2% | | 3.1 | 2.7 | 14.8% |
| Diluent | | 0.0 | 0.0 | - | | 0.0 | 0.0 | - |
| Total | | 193.9 | 180.1 | 7.7% | | 188.0 | 182.2 | 3.2% |
| | | | | | | | | |
| Imports - mboed | | 2Q 2022 | 2Q 2021 | ∆ (%) | | 6M 2022 | 6M 2021 | ∆ (%) |
| Crude Oil | | 41.4 | 23.7 | 74.7% | | 34.9 | 24.0 | 45.4% |
| Products | | 102.2 | 58.9 | 73.5% | | 117.3 | 69.6 | 68.5% |
| Diluent | | 35.8 | 27.6 | 29.7% | | 35.4 | 27.0 | 31.1% |
| Total | | 179.4 | 110.2 | 62.8% | | 187.6 | 120.6 | 55.6% |
| | | | | | | | | |
| Total | | 373.3 | 290.3 | 28.6% | | 375.6 | 302.8 | 24.0% |
Table 10: Exploratory Wells Detail - Ecopetrol Group
| # | Quarter | Name | Initial Well Classification (Lahee) | Block | Name | Operator/Partner | Status | TD Date |
| 1 | First | Bololó-1 | A3 | VIM-8 | Lower Magdalena Valley | Hocol 100% (Operator) | Dry | January 3/2022 |
| 2 | First | El Niño-2 | A1 | Boqueron | Magdalena Middle Valley | Perenco 30% (Operator), ECP 50%, CNOOC 20% | Suucessful | January 13/2022 |
| 3 | First | EST-SN-15 | Stratigraphic | SN-15 | Sinú - San Jacinto | Hocol 100% (Operator) | Plugged and Abandoned | January 17/2022 |
| 4 | First | Pilonera-1 | A3 | SSJN1 | Sinú - San Jacinto | Hocol 50 % Lewis Energy 50% (Operator) | Plugged and Abandoned | January 20/2022 |
| 5 | First | Boranda Sur-3 | A1 | Boranda | Magdalena Middle Valley | Parex 50% (Operator) ECP 50% | Under evaluation | February 23/2022 |
| 6 | First | Cayena-2 | A1 | Fortuna | Magdalena Middle Valley | Parex 80% (Operator) ECP 20% Partner sole risk basis | Under evaluation | January 12/2022 |
| 7 | First | Caño Caranal DT-1 | A3 | Cosecha | Colombian Eastern Plains | Sierracol 50% (Operator) ECP 50 % Partner sole risk basis | Dry | March 14/2022 |
| 8 | Second | Chinchorro-1G | A3 | GUA-2 | Lower Guajira | Hocol 100% | Dry | April 16/2022 |
| 9 | Second | Boranda Norte-1 | A1 | Boranda | Magdalena Middle Valley | Parex 50% (Operator) ECP 50% | Dry | May 15/2022 |
| 10 | Second | Tejon-1 | A2B | CPO-9 | Colombian Eastern Plains | ECP 55% (Operator) Repsol 45% | Under evaluation | May 22/2022 |
| 11 | Second | Morito-1 | A3 | Middle Magdalena Explotaition Agreement | Magdalena Middle Valley | ECP 100% | Under evaluation | June 30/2022 |
| 12 | Second | Fidalga-1 | A2C | Fortuna | Magdalena Middle Valley | Parex 80% (Operator) ECP 20% Partner sole-risk basis | Under evaluation | April 02/2022 |
| 13 | Second | Fidalga-1 ST1 | A2C | Fortuna | Magdalena Middle Valley | Parex 80% (Operator) ECP 20% Partner sole-risk basis | Under evaluation | May 02/2022 |
| 14 | Second | Caño Caranal DT-1 ST1 | A3 | Cosecha | Colombian Eastern Plains | Sierracol 50% (Operator) ECP 50 % Partner sole-risk basis | Dry | April 25/2022 |
| 15 | Second | Fidalga-1 ST2 | A2C | Fortuna | Magdalena Middle Valley | Parex 80% (Operator) ECP 20% Partner sole-risk basis | Under evaluation | June 23/2022 |
| 16 | Second | Boranda Norte-1 ST1 | A1 | Boranda | Magdalena Middle Valley | Parex 50% (Operator) ECP 50% Partner sole-risk basis | Dry | June 21/ 2022 |
* In 2022 the activity operated on a partner risk-only basis is included.
Table 11: HSE Performance (Health, Safety and Environment)
| HSE Indicators* | | 2Q 2022 | 2Q 2021 | | 6M 2022 | 6M 2021 |
| Frequency of total registrable injuries (No. Recordable cases / Million man hours) | | 0.30 | 0.50 | | 0.26 | 0.60 |
| Environmental incidents** | | 2 | 2 | | 5 | 4 |
* The results of the indicators are subject to change after the end of the quarter due to the fact that some of the accidents and incidents are reclassified according to the final result of the investigations. ** Environmental incidents are those hydrocarbon spills greater than 1 barrel, with environmental impact.
