UNITED STATES
SECURITIES AND EXCHANGE COMMISSION
Washington, D.C. 20549
FORM 10-K
(Mark One)
| x | ANNUAL REPORT PURSUANT TO SECTION 13 OR 15(d) OF THE SECURITIES EXCHANGE ACT OF 1934 |
For the fiscal year ended September 30, 2008
| ¨ | TRANSITION REPORT PURSUANT TO SECTION 13 OR 15(d) OF THE SECURITIES EXCHANGE ACT OF 1934 |
For the transition period from to
Commission File Number 333-153896
AXCAN INTERMEDIATE HOLDINGS INC.
(Exact name of registrant as specified in its charter)
Delaware
(State or other jurisdiction of incorporation or organization)
74-3249870
(IRS Employer Identification Number)
22 Inverness Center Parkway
Suite 310
Birmingham, AL 35242
(Address of Principal Executive Offices) (Zip Code)
Registrant’s telephone number, including area code: (205) 991-8085
Securities registered pursuant to Section 12(b) of the Act: NONE
Securities registered pursuant to Section 12(g) of the Act: NONE
Indicate by check mark if the registrant is a well-known seasoned issuer, as defined in Rule 405 of the Securities Act. Yes ¨ No x
Indicate by check mark if the registrant is not required to file reports pursuant to Section 13 or Section 15(d) of the Exchange Act. Yes x No ¨
Indicate by check mark whether the registrant (1) has filed all reports required to be filed by Section 13 or 15(d) of the Securities Exchange Act of 1934 during the preceding 12 months (or for such shorter period that the registrant was required to file such reports), and (2) has been subject to such filing requirements for the past 90 days.
Yes ¨ No x*
Indicate by check mark if disclosure of delinquent filers pursuant to Item 405 of Regulation S-K is not contained herein, and will not be contained, to the best of registrant’s knowledge, in definitive proxy or information statements incorporated by reference in Part III of this Form 10-K or any amendment to this Form 10-K. x
Indicate by check mark whether the registrant is a large accelerated filer, an accelerated filer, a non-accelerated filer, or a smaller reporting company. See definitions of “large accelerated filer”, “accelerated filer” and “small reporting company” in Rule 12b-2 of the Exchange Act.
Large accelerated filer ¨ Accelerated filer ¨
Non-accelerated filer x Smaller reporting company ¨
Indicate by check mark whether the registrant is a shell company (as defined in Rule 12b-2 of the Exchange Act). Yes ¨ No x
As of March 31, 2008, the last business day of the registrant’s most recently completed second fiscal quarter, there was no established public trading market for any of the common stock of the registrant and therefore, an aggregate market value of common stock of the registrant based on sales or bid and asked prices is not determinable. As of December 18, 2008, there were 100 shares of common stock of the registrant outstanding, all of which were owned by Axcan MidCo Inc.
Documents incorporated by reference: None.
| * | The registrant has not been subject to such filing requirements for the past 90 days. |
TABLE OF CONTENTS
- 2 -
Forward-Looking Statements
This Annual Report on Form 10-K contains forward-looking statements within the meaning of the U.S. federal securities laws. Statements other than statements of historical facts including, without limitation, statements regarding our future financial position, business strategy, budgets, projected costs and plans, future industry growth and objectives of management for future operations, are forward-looking statements. In addition, forward-looking statements generally can be identified by the use of forward-looking terminology such as “may,” “will,” “expect,” “intend,” “estimate,” “project,” “forecast,” “anticipate,” “believe” or “continue” or the negative thereof or variations thereon or similar terminology.
Although we believe that the expectations reflected in these forward-looking statements are reasonable, we can give no assurance that such expectations will prove to have been correct. Certain of the important factors that could cause actual results to differ materially from our expectations, or “cautionary statements,” include, but are not limited to, those discussed in “Item 1A. Risk Factors”, “Item 7. Management’s Discussion and Analysis of Financial Condition and Results of Operations”, as well as elsewhere in this Annual Report on Form 10-K.
We caution you not to place undue reliance on any forward-looking statements and we do not undertake any obligation to publicly release any revisions to these forward-looking statements to reflect events or circumstances after the date of this Annual Report on Form 10-K or to reflect the occurrence of unanticipated events. All subsequent written and oral forward-looking statements attributable to us, or persons acting on our behalf, are expressly qualified in their entirety by the cautionary statements.
- 3 -
PART I
Overview
Axcan Intermediate Holdings Inc. was incorporated in Delaware in 2007 and, together with its subsidiaries, is a leading specialty pharmaceutical company concentrating in the field of gastroenterology with operations in the U.S., Canada and the EU. Unless the context requires otherwise, references in this Annual Report on Form 10-K to “we”, “our”, “us”, “the Company” and “Axcan” means Axcan Intermediate Holdings Inc. and all of its subsidiaries. We market and sell pharmaceutical products used in the treatment of a variety of gastrointestinal diseases and disorders. Our main product lines include ULTRASE, PANZYTRAT and VIOKASE, which are pancreatic enzyme products for the treatment of exocrine pancreatic insufficiency; URSO / URSO 250, URSO FORTE / URSO DS, and DELURSAN, which are ursodiol products for the treatment of certain cholestatic liver diseases; SALOFALK and CANASA, which are mesalamine-based products for the treatment of certain inflammatory bowel diseases; CARAFATE and SULCRATE, sucralfate products for the treatment of gastric and duodenal ulcers; and PYLERA, a product for the eradication ofHelicobacter pylori in patients with duodenal ulcer disease. We also have a number of projects in all phases of clinical development, as further described below in the section “Products in Development.”
In addition to our marketing activities, we carry out research and development activities on products at various stages of development. These activities are carried out primarily with respect to products we currently market in connection with lifecycle management initiatives, as well as product candidates which are acquired or licensed from third parties. By combining our marketing capabilities with our research and development experience, we distinguish ourselves from other specialty pharmaceutical companies that focus solely on distribution of products and we offer licensors the prospect of rapidly expanding the potential market for their products on a multinational basis. As a result, we are presented with opportunities to acquire or in-license products that have been advanced to the later stages of development by other companies. Our focus on products in late-stage development enables us to reduce risks and expenses typically associated with new drug development.
Our reports filed or furnished pursuant to Section 13 or 15(d) of the Securities Exchange Act of 1934, as amended, or the Exchange Act, are available free of charge in, or may be accessed through, the “Investor Relations” section of the Company’s website at www.axcan.com as soon as reasonably practicable after the Company files or furnishes such material with or to the Securities and Exchange Commission, or the SEC. In addition, copies of these reports will be made available free of charge, upon written request to Isabelle Adjahi, Senior Director, Investor Relations and Communications, Axcan Pharma, 597 Laurier Blvd., Mont-Saint-Hilaire, Quebec J3H 6C4, Canada. Axcan Intermediate Holdings Inc. is located at 22 Inverness Center Parkway, Suite 310, Birmingham, AL 35242.
The information on the Company’s website is not included as part of, nor incorporated by reference into, this Annual Report on Form 10-K.
Transactions
The February 2008 Transactions
On November 29, 2007, Axcan Intermediate Holdings Inc., then known as Atom Intermediate Holdings Inc., entered into an Arrangement Agreement with Axcan Pharma Inc., or Axcan Pharma, pursuant to which we agreed to, through an indirect wholly-owned subsidiary, acquire all of the outstanding common stock of Axcan Pharma and enter into other various transactions in accordance with the Plan of Arrangement. We refer to such transactions collectively in this report as the Arrangement.
At a special meeting of Axcan Pharma’s shareholders on January 25, 2008, the holders of more than 99% of the outstanding common shares voted on a special resolution to approve the Arrangement. On January 28, 2008, the Superior Court of Quebec issued a final order approving the Arrangement.
- 4 -
On February 25, 2008, the Arrangement was completed and as a result,
| | • | | each share of Axcan Pharma common stock outstanding was deemed transferred to Axcan Intermediate Holdings Inc. and holders of such common stock received $23.35 per share of Axcan Pharma common stock, or the offer price, in compensation from us, without interest and less any required withholding taxes; |
| | • | | all granted and outstanding options to purchase common stock of Axcan Pharma under Axcan Pharma’s stock plans, other than those options held by Axcan Holdings Inc. or its affiliates, were deemed vested and transferred to Axcan Pharma and cancelled in exchange for an amount in cash equal to the excess, if any, of the offer price over the applicable exercise price for the option for each share of common stock subject to such option, less any required withholding taxes; and |
| | • | | all vested and unvested deferred stock units, or DSUs, and restricted stock units, or RSU, issued under Axcan Pharma’s stock option plans, were deemed vested and then cancelled and terminated. Each holder of a DSU or RSU received the offer price, less any required withholding taxes, for each DSU and RSU formerly held. |
The Arrangement was financed through the proceeds from the initial offering of $228.0 million aggregate principal amount of our 9.25% secured notes due 2015, or the secured notes, the initial borrowings under a credit facility composed of term loans and a revolving credit facility, collectively the new senior secured credit facilities, borrowings under a senior unsecured bridge facility maturing on February 25, 2009, or the senior unsecured bridge facility, equity investments funded by direct and indirect equity investments from the Sponsor Funds, or certain investment funds associated with or designated by TPG Capital, or the Sponsor, certain investors who co-invested with the Sponsor Funds, including investment funds affiliated with certain of the initial purchasers of the outstanding notes, or the Co-Investors, and the cash on hand of Axcan Pharma and its subsidiaries. The closing of the offering of the secured notes, the new senior secured credit facilities and the senior unsecured bridge facility occurred substantially concurrently with the closing of the Arrangement on February 25, 2008. We refer to the Arrangement, the closing of the transactions relating to the Arrangement, and our payment of any fees and expenses related to the Arrangement and such transactions collectively in this report as the February 2008 Transactions.
Subsequent to the February 2008 Transactions, we became an indirect wholly-owned subsidiary of Axcan Holdings Inc., or Holdings, an entity controlled by the Sponsor Funds and the Co-Investors, and Axcan Pharma became our indirect wholly-owned subsidiary.
The Refinancing
On May 6, 2008, we completed our offering of $235.0 million aggregate principal amount of our 12.75% senior unsecured notes due 2016, or the senior notes. The net proceeds from this offering, along with our cash on hand, were used to repay in full our senior unsecured bridge facility. We refer to this offering of our senior notes, along with the related use of proceeds, as the Refinancing and, collectively, with the February 2008 Transactions, as the Transactions.
Financial Information
When financial information for the fiscal year ended September 30, 2008 is presented, including product revenue, this information is presented as the mathematical combination of the relevant financial information of the Predecessor (from October 1, 2007 to February 25, 2008) and the Successor (from February 26, 2008 to September 30, 2008) for such period. The financial information presented for the Predecessor is the financial information for Axcan Pharma Inc. and its consolidated subsidiaries and the financial information presented for the Successor is the financial information for Axcan Intermediate Holdings Inc. and its consolidated subsidiaries.
Industry Overview
The pharmaceutical industry is large and growing, enjoying one of the highest growth rates across all healthcare sectors, and, as of the end of the 2007 calendar year, has averaged 11.8% compound annual growth in terms of prescription spending since 1980. According to the Centers for Medicare and Medicaid Services, U.S. prescription drug spending has grown every year since 1980, including during recessionary periods. This growth has been driven by the introduction of new products, increasing utilization, population growth, aging population and price increases, none of which we believe are sensitive to economic cycles. This market dynamic creates opportunities for specialty pharmaceutical companies like us to successfully target attractive niches in therapeutic categories such as gastrointestinal diseases and disorders.
According to IMS, the U.S. market for gastrointestinal drugs was approximately $21 billion in 2006, of which approximately $15 billion was represented by proton pump inhibitors and H2 blockers for the treatment of symptoms associated with GERD. Our current marketed products do not address this segment of the market.
- 5 -
The remaining approximately $6 billion of the U.S. gastrointestinal pharmaceutical market consists of sales of products that are used to treat non-GERD gastrointestinal indications. The markets in the U.S. for products that are prescribed primarily by specialists to treat the diseases and disorders treated by our core product lines, including inflammatory bowel disease, cholestatic liver diseases, pancreatic insufficiency, gastric and duodenal ulcers and other related gastrointestinal disorders, are estimated to be approximately $682 million in the aggregate in fiscal year 2007. We believe that the stable historical growth rates of the markets in which we participate are primarily a function of the chronic nature of many of the disorders treated by our products.
Competitive Strengths
We believe we have a number of competitive strengths that will enable us to further enhance our position in the gastroenterology market.
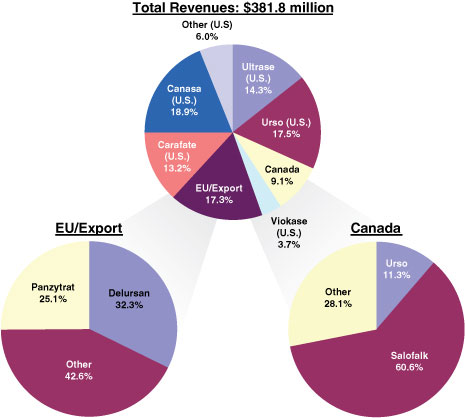
Diversified Portfolio of Branded Products.We currently market branded products in seven product categories that treat a broad range of gastrointestinal diseases and disorders. During fiscal year 2008, four product lines contributed 87.8% or more of our revenues, but no single product line accounted for more than 25.0% of our revenues. Our portfolio of products is also geographically diverse, with approximately 26.5% of our revenues being generated from sales outside the United States in fiscal year 2008. The following charts summarize our revenues in fiscal year 2008 by product line and by geography:
Leading Competitive Positions in Attractive Gastroenterology Markets.We have a strong track record of leveraging a product line’s unique market position to drive performance. CANASA and URSO are currently the only branded, actively-promoted products in their respective markets (in the U.S., with respect to CANASA and URSO 250 / URSO FORTE, and in Canada, with respect to URSO / URSO DS). CARAFATE is the only branded suspension-form sucralfate product in its market in the U.S. All these product lines enjoy leading market positions in terms of sales in their respective markets: CARAFATE is used to treat gastric and duodenal ulcers and accounted for 41.8% of the U.S. market for sucralfate products in terms of sales in fiscal year 2008; CANASA is used to treat ulcerative proctitis and colitis and accounted for 64.0% of the U.S. market for rectally-administered mesalamine products in terms of sales in fiscal year 2008; and URSO is the only ursodiol product indicated for the treatment of Primary Biliary Cirrhosis, or PBC, in the U.S. and accounted for 37.6% of the U.S. market for ursodiol products in terms of sales in fiscal year 2008. In addition, VIOKASE is the only branded non-enteric coated prescription pancreatic enzyme product in its market. VIOKASE is used to treat pancreatic insufficiency and, together with ULTRASE, accounted for 20.0% of the U.S. market for total prescriptions of pancreatic enzyme products in fiscal year 2008. We believe that our products are often the first line of treatment prescribed by physicians for these diseases and disorders. Many of the gastrointestinal diseases and disorders that our products are used to treat are chronic, and as a result, we believe that physicians tend to be reluctant to change a patient’s treatment program once the patient has been treated with and becomes accustomed to a particular product. As a result, we believe that our products experience a high degree of patient loyalty allowing us to maintain leading competitive positions in the markets in which we participate.
- 6 -
Non-Patent Barriers to Entry.Despite not having long-term patent protection, we believe that our core product lines benefit from a variety of regulatory, clinical, sourcing and manufacturing barriers to entry, including, depending upon the product line and the product, the requirement to obtain certain regulatory approvals by a specified date, the requirement to conduct clinical trials, the ability to source certain high-grade active pharmaceutical ingredients and the know-how required to manufacture certain dosage forms. We believe that these barriers to entry may create impediments for generic competitors to introduce and market generic versions of certain of our products, including products from our ULTRASE, VIOKASE, CANASA and CARAFATE product lines. See “Item 1A. Risk Factors—Risks Related to Our Business.”
Focused Sales Force with Market-Leading Performance.By focusing on establishing strong relationships with high-volume prescribing gastroenterologists, hepatologists and cystic fibrosis centers, we are able to effectively penetrate the gastroenterology market. As of September 30, 2008, our sales force is comprised of 151 sales representatives, with 82 located in the United States, 58 in the EU (including a contracted sales force in Germany that devotes its efforts exclusively to selling our products) and 11 in Canada.
Consistently Strong Historical Organic Growth and High Free Cash Flow Generation.Our business is characterized by strong free cash flows due to our robust operating history and minimal capital intensity. Over the last five fiscal years, we have increased revenue and adjusted EBITDA at compound annual growth rates of 16.3% and 22.7%, respectively. In addition, our capital expenditure requirements have historically been minimal, averaging 2.4% of revenues over the last six fiscal years, providing for strong free cash flow conversion. Over the last six fiscal years, we have generated cumulative free cash flow of approximately $385 million. We believe, but cannot guarantee, that our strong free cash flow will enable us to adequately service debt and will provide us with financial flexibility to invest in our business. For information regarding the risks we and our business face, please see “Item 1A. Risk Factors.”
Proven Track Record in Acquiring Products and Building Market Share.Our business development effort is focused on expanding our product portfolio by capitalizing on our core knowledge of gastrointestinal markets. Our experienced business development team uses a rigorous and disciplined approach to identify and acquire products that can be grown by our sales force using the strong relationships we have with gastroenterology practitioners. We have a strong record of acquiring and developing products and growing their market share, as evidenced by our leading position in a number of the markets in which we participate.
In addition to URSO, CANASA, CARAFATE, ULTRASE, SALOFALK and VIOKASE, after successfully completing Phase III trials for PYLERA and obtaining FDA approval in 2006, we launched PYLERA in the United States in May 2007. During the rolling quarter ended September 30, 2008, PYLERA had already successfully captured 15.8% of the U.S. market in terms of total prescriptions written by gastroenterologists for the eradication ofHelicobacter pylori, a bacterium recognized as being the main cause of gastric and duodenal ulcers.
Experienced and Dedicated Management Team.We have a highly experienced management team at both the corporate and operational levels. Our team is led by Frank Verwiel, M.D., our President and Chief Executive Officer, formerly with Merck & Co., Inc. and a 20-year veteran of the healthcare industry, who joined Axcan Pharma Inc. as President and Chief Executive Officer in July 2005. David Mims, formerly with Scandipharm, Inc., is our Executive Vice President and Chief Operating Officer, having joined Axcan Pharma Inc. in such capacity in February 2000, as a result of the acquisition of Scandipharm, Inc. Mr. Mims brings 20 years of experience in the healthcare industry to Axcan. Steve Gannon, our Senior Vice President, Finance and Chief Financial Officer, joined Axcan Pharma Inc. in such capacity in April 2006, having previously served as Chief Financial Officer of CryoCath Technologies Inc. and held various senior financial roles at AstraZeneca and Mallinckrodt. Dr. Alexandre LeBeaut rejoined us as Senior Vice President and Chief Scientific Officer in September 2008 after previously holding such position with Axcan Pharma Inc. from May 2006 to February 2007 and holding various executive positions in the pharmaceutical industry, most recently as Vice President, Medical Units, U.S. Medical Affairs of Sanofi-Aventis Pharmaceuticals. Nicholas Franco joined Axcan Pharma Inc. as Senior Vice President, International Commercial Operations in July 2007, having formerly held various management positions at Novartis Pharma AG. Darcy Toms joined Axcan Pharma Inc. as Vice President, Business Development in January 2007, having formerly held positions at Biovail and Aventis. Richard Tarte, formerly a partner with the law firm of Coudert Brothers, joined Axcan Pharma Inc. as Vice President, Corporate Development & General Counsel in 2001 and brings 8 years of experience in the healthcare sector to Axcan. Overall, the foregoing members of our senior management team have an average tenure of 15 years in the healthcare industry.
- 7 -
Business Strategy
We intend to enhance our position as the leading specialty pharmaceutical company concentrating in the field of gastroenterology by pursuing the following strategic initiatives:
Focus on Gastroenterology Market. While large pharmaceutical companies are primarily focusing on developing “blockbuster” drugs, we concentrate our efforts on branded products in niche gastroenterology markets that we can effectively target with our sales force, which, as of September 30, 2008, consists of a total of 151 sales representatives based in the U.S., U.K., Canada, France and Germany. We currently market a range of established specialty pharmaceutical products intended for the treatment of symptoms associated with gastrointestinal diseases and disorders. We plan to continue to grow our revenues by building on our solid base business and introducing new products to the gastroenterology market. Given the niche nature of our markets and the focused audience, consisting of gastroenterologists, hepatologists and cystic fibrosis centers, our sales representatives are able to concentrate their sales and marketing efforts to effectively target the primary prescription writers of these products.
Grow Sales of Existing Products.We seek to drive growth in sales of our products by continuing to focus on high-volume prescribing physicians in the gastroenterology market and by leveraging the market position and unique nature of our product lines. We utilize extensive analysis of prescription data relating to our products and the products of our competitors to identify physicians who are high-volume prescribers of drugs that treat the diseases and disorders that our products address, and we then call on these high-volume prescribing physicians frequently to build strong professional relationships. We also seek to leverage the unique nature of our product lines to drive performance. Products from our CANASA and URSO product lines (URSO 250 / URSO FORTE) are currently the only branded, actively-promoted products in their respective markets. CARAFATE is the only branded suspension-form sucralfate product in its market in the U.S. ULTRASE, in addition to being promoted by our sales force, also is supported by physicians and caregiver programs which we believe helps to differentiate ULTRASE from competing products and to position ULTRASE as the drug of choice for many patients. In addition, VIOKASE is the only branded non-enteric coated prescription pancreatic enzyme product in its market. As a result, we believe our products are often the first line of treatment prescribed by physicians. We seek to leverage this position and what we believe is the high degree of patient loyalty to our products in order to maintain leading competitive positions in the markets in which we participate.
Take Advantage of Recent Regulatory Developments to Increase Market Share.Due to concerns about substantial variation among pancreatic enzyme products on the market, in April 2004, the FDA formally notified manufacturers of pancreatic enzyme products, including ULTRASE and VIOKASE that their products had to be approved by the FDA in order to remain on the market in the U.S. Under current requirements, manufacturers are required to file an IND for their pancreatic enzyme products by April 2008, to file an NDA by April 2009 and to obtain FDA approval by April 2010. We believe that the manufacturers of many of the generic, or unbranded, products that are currently on the market will not complete the required clinical trials by the deadline imposed by the FDA. As generic products currently on the U.S. market accounted for approximately 52% of prescription volume in 2007, this could result in a significant growth opportunity for branded products that are approved by the FDA. We have submitted our NDA for ULTRASE MT, the mini-tablet formulation of ULTRASE and have submitted our IND for VIOKASE. On July 1, 2008, we received an approvable letter from the FDA regarding our NDA for ULTRASE MT, citing certain chemistry, manufacturing and control data work concerns and we are currently preparing a response to the FDA’s comments in collaboration with our manufacturing partners and expect that required regulatory filings will be made in time to comply with the FDA’s guidelines.
Based on publicly available information, we believe that at least three other manufacturers of pancreatic enzyme products, Eurand N.V., or Eurand, Solvay Pharmaceuticals, Inc., or Solvay, and Digestive Care, Inc., have submitted or have begun to submit NDAs for their products. In August 2007, Solvay reported that it had received an approvable letter from the FDA citing certain chemistry, manufacturing and control data work and clinical concerns regarding CREON®, its pancreatic enzyme product and has not reported further regarding its NDA. In September 2008, Eurand announced that it had responded to an approvable letter from the FDA for its pancreatic enzyme product ZENTASE®, which cited certain chemistry, manufacturing and control data work concerns and that the only missing item was a response filing by its raw material supplier to the FDA’s questions relating to the Drug Master File, or DMF. In addition, Digestive Care, Inc. has recently announced that it has completed the submission of its NDA for its pancreatic enzyme product PANCRECARB®, which was granted a “Fast Track” designation by the FDA, which allows certain new drugs and biological products to proceed more rapidly through the regulatory review process.
- 8 -
Selectively Acquire or In-License Complementary Products.We intend to continue to seek to acquire or in-license new products that complement the strategic focus of our existing portfolio of product lines. Due to our core knowledge of gastrointestinal markets, our multinational sales and marketing capabilities, our reputation and our top-tier sales force, we believe that we are a preferred partner for companies looking to sell or out-license their products. Our experienced business development team uses a rigorous and disciplined approach to ensure that the product lines we acquire fit strategically within our portfolio. In recent years, we have successfully grown a number of product lines that we acquired or developed to become leaders in their markets, including URSO, CANASA, CARAFATE, ULTRASE, SALOFALK and VIOKASE.
Pursue Growth Opportunities Through Developing Pipeline.We will maintain our commitment to research and development in order to develop the next generation of products to address unmet needs in the gastroenterology market. Our internal development efforts focus primarily on extending proprietary protection of our products through product line extensions, rather than undertaking the costly, high-risk new drug discovery usually associated with large pharmaceutical and biotechnology companies. Our experienced product development team, which includes both our quality assurance and scientific affairs teams, consists of 102 scientists and technicians, approximately 39 of whom have a Doctor of Medicine (M.D.), Doctor of Philosophy (Ph.D.) or Doctor of Pharmacy (Pharm.D.) degree, has proven expertise in the development of line extensions and formulations and in the commercialization of our development efforts. After successfully completing Phase III trials for PYLERA, we obtained FDA approval in 2006 and, in May 2007, launched PYLERA in the United States. We believe that PYLERA constitutes a therapy that is less expensive and of shorter duration than its competitors. During the rolling quarter ended September 30, 2008, PYLERA had already successfully captured 15.8% of the U.S. market in terms of total prescriptions written by gastroenterologists for the eradication ofHelicobacter pylori, a bacterium recognized as being the main cause of gastric and duodenal ulcers, and we believe that we are well-positioned to continue to capture market share from PYLERA’s competitors. We also expect to launch PYLERA in the EU in 2010, subject to successful completion of clinical trials and regulatory approval, and have a number of additional products in our pipeline, including, among others, CANASA MAX-002, a smaller-form product for our CANASA product line to be used for the treatment of ulcerative proctitis; Cx401, an innovative biological product in development for the treatment of perianal fistula; and AGI-010, a controlled-release proton pump inhibitor to be used for the treatment of symptoms associated with GERD, and, in particular, to be used for the control of night-time gastric acidity, known as nocturnal acid breakthrough. Nocturnal acid breakthrough remains a significant unmet medical need, and is estimated to occur in more than 50% of GERD patients on a proton pump inhibitor therapy.
Expand Internationally.Our current infrastructure in the U.S., Canada and the EU will form the basis of our efforts to expand internationally by increasing our sales and marketing footprint worldwide. We intend to continue to increase the geographic presence of our products, and to that end, for example, we expect to launch PYLERA in the EU in 2010, subject to successful completion of clinical trials and regulatory approval. We also plan to maintain and expand our network of third-party distributors that sell our products in countries where we do not have a sales force presence.
Products
Our focus is in the field of gastroenterology. Our current portfolio of commercial products includes a number of gastrointestinal products for the treatment of a range of gastrointestinal diseases and disorders such as inflammatory bowel disease, cholestatic liver diseases, pancreatic insufficiency, gastric and duodenal ulcers, and other related gastrointestinal disorders.
While our business focus is to sell products in the U.S., Canada and the EU, several of our products have been commercialized internationally through licensing and distribution agreements with marketing partners with expertise in their local markets.
We also have various products in development in the U.S., Canada and the EU. A discussion on these projects and on the regulatory process follows under the headings “Products in Development” and “Government Regulation.”
The majority of the products that we market do not benefit from any patent protection. We believe, however, that certain of our products benefit from other barriers to the entry of competitors or generics. Our products nevertheless remain subject to competition and generic product entries into their respective markets, which, especially in the case of generics, which are typically sold at a significant discount to reference drug prices, could significantly and negatively affect our revenues. As of September 30, 2008, our main product lines are CANASA, URSO 250 / URSO FORTE, ULTRASE, CARAFATE and PYLERA in the United States, SALOFALK and URSO in Canada and DELURSAN, PANZYTRAT and LACTEOL in the EU. In fiscal year
- 9 -
2008, the patent covering URSO 250 / URSO FORTE’s use in the treatment of PBC has expired in the United States (November 19, 2007) and the market exclusivity obtained on CANASA pursuant to the clinical investigation exclusivity provisions of the Hatch-Waxman Act, covering a change in the formulation of this drug from a 500 mg formulation to a 1,000 mg suppository formulation, has expired (November 5, 2007).
Our main marketed product lines, their sales, prescriptions, patent/regulatory protection and certain other barriers to entry are discussed below.
Pancreatic Enzyme Products
ULTRASE
We market as ULTRASE, certain pancreatic enzyme microsphere (ULTRASE MS) and mini-tablet (ULTRASE MT) products, designed to help patients with exocrine pancreatic insufficiency (including pancreatic insufficiency associated with cystic fibrosis) to better digest food. ULTRASE is marketed in the United States, Canada and a few export markets but this product line is actively promoted by us solely in the United States.
We reported net sales of $59.2 million, $47.9 million and $39.1 million for ULTRASE in fiscal years 2008, 2007, and 2006, respectively. ULTRASE competes with a number of pancreatic enzyme products including PANCREASE® (Ortho-McNeil Pharmaceutical, Inc.), CREON® (Solvay Pharmaceuticals, Inc.) and PANCRECARB® (Digestive Care, Inc.), as well as with various other unbranded products. ULTRASE, together with VIOKASE, has had the second leading market share for branded products in the U.S. for the last five years, both in terms of the number of prescriptions written for pancreatic enzyme products and sales of pancreatic enzyme products. IMS estimates that in 2007, 14% of the prescriptions written for pancreatic enzyme products in the U.S. were written for ULTRASE and VIOKASE.
ULTRASE is licensed exclusively from Eurand under an exclusive license and supply agreement. This agreement, which was entered into in 2000, initially was for a period of ten years with automatic renewals for subsequent periods of two years. This agreement was amended in 2007 and extended to 2015. We have paid Eurand licensing fees totalling $3.5 million, and we agreed to pay to Eurand royalties of 6% on annual net sales.
In April 2004, the FDA formally notified manufacturers of pancreatic insufficiency products that these drugs, which include ULTRASE, must receive regulatory approval under an NDA before April 2008 in order to remain on the market. The FDA recently extended this deadline to April 2010. We completed the submission of our NDA for ULTRASE MT. On July 1, 2008, we received an approvable letter from the FDA regarding our NDA for ULTRASE MT, citing certain chemistry, manufacturing and control data work concerns and we are currently preparing a response to the FDA’s comments in collaboration with our manufacturing partners and expect that required regulatory filings will be made in time to comply with the FDA’s guidelines.
ULTRASE does not currently benefit from patent protection. We believe that, upon approval of its NDA, ULTRASE will be entitled to receive New Drug Product Exclusivity pursuant to the Drug Price Competition and Patent Term Restoration Act, or the Hatch-Waxman Act, which would provide it limited protection from new competition in the marketplace. This exclusivity is expected to prohibit the FDA from approving ANDAs for products containing the same active moiety, for a period of five years. Further, in its guidelines (“Guidance for Industry—Exocrine Pancreatic Insufficiency Drug Products—Submitting NDAs”; April 2006), the FDA has stated that because of their complexity, pancreatic enzyme extract products are not likely to be appropriate for ANDA filings.
Based on publicly available information, we believe that at least three other manufacturers of pancreatic enzyme products, Eurand N.V., or Eurand, Solvay Pharmaceuticals, Inc., or Solvay, and Digestive Care, Inc., have submitted or have begun to submit NDAs for their products. In August 2007, Solvay reported that it had received an approvable letter from the FDA citing certain chemistry, manufacturing and control data work and clinical concerns regarding CREON®, its pancreatic enzyme product, and has not reported further regarding its NDA. In September 2008, Eurand announced that it had responded to an approvable letter from the FDA for its pancreatic enzyme product ZENTASE®, which cited certain chemistry, manufacturing and control data work concerns and that the only missing item was a response filing by its raw material supplier to the FDA’s questions relating to the Drug Master File, or DMF. In addition, Digestive Care, Inc. has recently announced that it has completed the submission of its its NDA for its pancreatic enzyme product PANCRECARB®, which was granted a “Fast Track” designation by the FDA, which allows certain new drugs and biological products to proceed more rapidly through the regulatory review process.
- 10 -
VIOKASE
We market as VIOKASE non-enteric coated pancreatic replacement enzymes for the treatment of exocrine pancreatic insufficiency. VIOKASE, although not actively promoted, is sold in the United States and Canada.
We reported net sales of $15.1 million, $11.2 million and $7.6 million for VIOKASE in fiscal years 2008, 2007 and 2006, respectively.
In April 2004, the FDA formally notified manufacturers of pancreatic insufficiency products that these drugs, which include VIOKASE, must receive regulatory approval under an NDA, before April 2008, in order to remain on the market. The FDA recently extended this deadline to April 2010. We have filed an IND and are currently advancing the completion of our NDA for VIOKASE and expect to comply with the FDA’s timeline for pancreatic enzyme product approval.
VIOKASE does not currently benefit from patent protection. We believe that it will be entitled to receive New Product Exclusivity pursuant to the Hatch-Waxman Act upon approval of our NDA. This exclusivity is expected to prohibit the FDA from approving ANDAs for products containing the same active moiety, for a period of five years. Further, in its guidelines, (“Guidance for Industry—Exocrine Pancreatic Insufficiency Drug Products—Submitting NDAs” - April 2006), the FDA stated that because of their complexity, pancreatic enzyme extract products are not likely to be appropriate for ANDA filings.
We believe that VIOKASE is currently the only branded non-enteric coated pancreatic enzyme product commercially available in the United States, though it competes with a number of generic, or unbranded products.
PANZYTRAT
PANZYTRAT consists of enteric coated microtablets for use in the treatment of exocrine pancreatic insufficiency and pancreatic enzyme deficiency. PANZYTRAT is marketed in several countries, mainly Germany and the Netherlands as well as a few export markets. We reported net sales of $16.6 million, $14.8 million and $12.1 million for PANZYTRAT in fiscal years 2008, 2007 and 2006, respectively. The main competitor for PANZYTRAT in Germany and the Netherlands is CREON® (Solvay).
PANZYTRAT does not benefit from any patent protection, nor any other form of regulatory exclusivity in the main countries in which it is marketed, namely Germany and the Netherlands.
Ursodiol
URSO 250 and URSO FORTE (United States)
In the United States, we have been marketing URSO 250, a 250-milligram ursodiol tablet for the treatment of Primary Biliary Cirrhosis, or PBC, a chronic liver disease, since May 1998. URSO FORTE, a 500-milligram ursodiol tablet, was launched in November 2004.
We reported net sales of $67.0 million, $68.1 million and $49.3 million for URSO 250/ URSO FORTE in the United States in fiscal years 2008, 2007 and 2006, respectively.
In the United States, there is currently no therapy specifically approved to be marketed for the treatment of PBC other than URSO 250 / URSO FORTE. However, other ursodiol products, approved and prescribed for gallstone dissolution as associated with active weight loss, are sometimes used for the treatment of various other liver diseases, including PBC. These products include ACTIGALL™, a product provided by Watson Pharmaceuticals, Inc. and generic versions of ACTIGALL™. According to IMS, the market share of our URSO product lines, including URSO 250 / URSO FORTE and URSO / URSO DS, in terms of the number of prescriptions written for ursodiol products in the U.S. increased from 25% in 2003 to 30% in 2007. In 2007, sales of our URSO products accounted for 67% of the sales of ursodiol products in the U.S.
In addition, on November 19, 2007, the FDA Orange Book listed patent covering the use of URSO 250 / URSO FORTE, expired. URSO 250 / URSO FORTE do not benefit from any other patent protection or other form of regulatory exclusivity in the United States. As a result, if a generic ursodiol tablet were to be launched, it could have a significant negative impact on sales of URSO 250 / URSO FORTE in the United States.
We believe that certain product lifecycle managemen initiatives we have or may take to modify and improve the product, coupled with URSO’s recognized brand name, its specific approval for the treatment of PBC and its targeted marketing approach aimed at hepatology specialists provide a competitive advantage to URSO 250 and URSO FORTE in the United States and could allow us to maintain sales of URSO in the face of
- 11 -
generic competition. There is no assurance, however, that any of these measures will produce advantages over generic competition with respect to URSO and generic sales could have a significant negative impact on our sales of URSO. See “Item 1A. Risk Factors—Risks Related to Our Business.”
URSO and URSO DS (Canada)
In Canada, we market URSO (250 mg) and URSO DS (500 mg) for the treatment of cholestatic liver diseases, which include PBC and Primary Sclerosing Cholangitis, or PSC. URSO / URSO DS were covered by a patent relating to the use ursodiol for the treatment of PBC in Canada, which was to expire in 2010. However, in 2006, the generic product manufacturer, Pharmascience Inc., successfully challenged the validity of this patent under the Notice of Compliance Regulation procedures of Health Canada. In May 2006, generic versions of URSO and URSO DS received approval for sale in Canada and were launched in fiscal year 2007. The launch of these generic products has had a negative impact on sales of URSO / URSO DS in the second half of fiscal year 2007 and fiscal 2008.
URSO / URSO DS does not benefit from any other patent protection or other form of regulatory exclusivity in Canada.
We reported net sales of $3.9 million, $9.0 million and $11.4 million in net sales for URSO/URSO DS in Canada for fiscal years 2008, 2007 and 2006, respectively.
DELURSAN
DELURSAN is an ursodiol preparation marketed in France and indicated for the treatment of cholestatic liver diseases, including PBC, PSC and liver disorders related to cystic fibrosis.
DELURSAN does not have any patent protection or any regulatory exclusivity in France. As a result, if a generic ursodiol preparation were to be launched, it could have a significant negative impact on sales of DELURSAN in France. We reported net sales of $21.3 million, $16.7 million and $13.9 million for DELURSAN in fiscal years 2008, 2007, and 2006, respectively. In France, DELURSAN currently competes mainly with URSOLVAN® (Sanofi-Aventis S.A.).
Mesalamine
CANASA
CANASA is a mesalamine suppository, which is sold by us in the United States and which is indicated for the treatment of distal ulcerative proctitis, an inflammatory bowel disease. We believe that CANASA currently is the only commercially available mesalamine suppository in the United States.
We reported net sales of $72.1 million, $65.1 million and $53.1 million for CANASA in fiscal years 2008, 2007 and 2006, respectively.
CANASA competes with topical corticosteroid enemas and suppositories, as well as mesalamine enemas. In the United States, CANASA primarily competes with ROWASA® enemas provided by Alaven Pharmaceutical LLC and with various generic mesalamine enemas. According to IMS, CANASA’s market share in terms of the number of prescriptions written for rectally-administered mesalamine products in the U.S. has increased from 51% in 2003 to 63% in 2007. In 2007, sales of CANASA accounted for 61% of sales of rectally-administered mesalamine products in the U.S.
CANASA does not have any patent protection in the United States. On November 5, 2007, the previously granted clinical investigation exclusivity pursuant to the Hatch-Waxman Act, covering a change in the formulation of this drug from a 500 mg formulation to a 1,000 mg suppository formulation, expired. As a result, if a generic mesalamine suppository were to be launched, it could have a significant negative impact on sales of CANASA in the United States.
However, in June 2007, the FDA published a draft guidance on the requirements it expects manufacturers seeking approval of a mesalamine suppository to meet in order to obtain approval to launch such a product. The draft guidance specifies in part that a request of approval must be supported by placebo and reference-drug controlled clinical studies with clinical endpoints demonstrating safety and effectiveness in patients with ulcerative proctitis. We believe the FDA has issued this guidance based upon its assessment that CANASA activity is due to, among other reasons, local rather than systemic effects in the patient’s body and, as such, pharmacokinetic studies seeking to establish comparability based on amounts of the drug in the patient’s blood levels are not adequate to demonstrate the therapeutic equivalence of another product seeking approval. This belief was supported by a presentation delivered in September 2008 by Barbara M. Davit, Ph.D., J.D., acting director, Division of Bioequivalence 2, Office of Generic Drugs at CDER, FDA at the annual Regulatory Affairs Professional Society conference during which the FDA’s position on bioequivalence standards for certain locally-acting gastrointestinal drugs was presented. In the case of mesalamine suppositories, the FDA’s position that studies with clinical endpoints are required to demonstrate therapeutic equivalence was confirmed during Dr. Davit’s presentation.
On July 27, 2007, we filed a Citizen’s Petition requiring manufacturers seeking an ANDA approval for a generic version of CANASA to conduct clinical trials in patients and adult healthy volunteers in order to demonstrate therapeutic equivalence, to which the FDA has not yet provided a substantive response. Based on the FDA guidance discussed below, we believe this request to be consistent with the standards the FDA has previously applied to other comparable topically acting or non-systemically absorbed drugs, but cannot provide assurances that our request will be granted.
- 12 -
We believe that generic competitors may be unwilling to undertake the expense required for these types of clinical trials. In addition, we believe that it may be difficult for generic competitors to meet the requirements of this FDA draft guidance. However, we cannot provide assurances that any potential generic competitor will not be able to meet such requirements.
SALOFALK
SALOFALK is a mesalamine-based product line (tablets, suspensions and suppositories) sold by us in Canada for the treatment of certain inflammatory bowel diseases, such as ulcerative colitis, ulcerative proctitis and Crohn’s Disease. In Canada, SALOFALK does not have any patent protection, or any regulatory exclusivity.
We reported net sales of $21.2 million, $19.3 million and $16.5 million for SALOFALK in fiscal years 2008, 2007 and 2006, respectively.
In Canada, SALOFALK competes with several products containing mesalamine in controlled-release tablets or capsules, including ASACOL™, a product provided by The Proctor & Gamble Company, and DIPENTUM™, a product provided by UCB Pharma, Inc.
Sucralfate
CARAFATE / SULCRATE
Our CARAFATE / SULCRATE product lines are indicated for the treatment of gastric and duodenal ulcers. CARAFATE is sold in the United States as oral tablets and an oral suspension and SULCRATE as oral suspensions in Canada, where it is not actively promoted. Both product lines compete primarily against generic sucralfate tablets.
We reported net sales $52.5 million, $52.2 million and $43.1 million for CARAFATE / SULCRATE in fiscal years 2008, 2007 and 2006, respectively. CARAFATE / SULCRATE do not have any patent protection or any regulatory exclusivity in their respective markets. Patent protection for CARAFATE lapsed in fiscal year 2001. We are not aware of any generic versions of CARAFATE / SULCRATE oral suspension that are commercially available in the United States or Canada. If a generic version of these drugs were to be launched, it could have a significant negative impact on sales of CARAFATE / SULCRATE oral suspension in the United States and Canada. According to IMS, in 2007, CARAFATE accounted for 34% of the prescriptions written for sucralfate in the U.S. and 70% of sales of sucralfate in the U.S.
We believe, but cannot provide assurances, that due to the mode of action of CARAFATE oral suspension, the FDA will require manufacturers seeking an ANDA approval for a generic version of CARAFATE oral suspension to conduct clinical trials in patients and adult healthy volunteers in order to demonstrate therapeutic equivalence. Such requirement would likely make it more difficult for a competing generic product to be introduced in the United States. This belief was supported by a presentation in September 2008 delivered by Barbara M. Davit, Ph.D., J.D., acting director, Division of Bioequivalence 2, Office of Generic Drugs at CDER, FDA at the annual Regulatory Affairs Professional Society conference during which the FDA’s position on bioequivalence standards for certain locally-acting drugs was presented. During this presentation, the FDA confirmed its position that, due in part to the low levels of systemic absorption of sucralfate and the lack of appropriate in vitro or PD tests, studies with clinical endpoints are required to demonstrate therapeutic equivalence for sucralfate tablets. We believe, but cannot provide assurances, that the FDA apply the same requirement to demonstrate therapeutic equivalence to our CARAFATE oral suspension product.
Helicobacter PyloriEradication
PYLERA
Since May 7, 2007, we have been marketing as PYLERA a 3-in-1 capsule therapy for the eradication ofHelicobacter pylori, a bacterium recognized as being the main cause of gastric and duodenal ulcers. PYLERA is protected by patent claims covering triple and quadruple therapies forHelicobacter pylori eradication. These claims cover the treatment of duodenal ulcer disease (and in some countries reflux esophagitis and gastric ulcer) through the eradication ofHelicobacter pylori using a bismuth compound together with two or more antibiotics.
- 13 -
The expiry dates of these patents vary depending on the jurisdiction. In the United States, they expire in March 2010. The double capsule formulation of this product and its use in multiple therapies is also covered by patent in a number of countries. The U.S. patent expires in December 2018.
However, because the active pharmaceutical ingredients of PYLERA include antibiotics that were approved by the FDA prior to 1997, the U.S. patents covering PYLERA’s triple and quadruple therapies forHelicobacter pylori eradication and capsule formulation are not permitted to be listed in the FDA’s Orange Book and are not eligible to benefit from the automatic stay provisions or the market exclusivity provisions of the Hatch-Waxman Act.
Since its launch in May 2007, sales of PYLERA in the United States have amounted to $1.8 million for fiscal year 2007 and $6.6 million for fiscal year ended 2008.
Other blister pack products that compete with PYLERA include HELIDAC®, a product provided by Prometheus Laboratories Inc., and PREVPAC®, a product provided by TAP Pharmaceutical Products Inc.
Other Products
LACTEOL
LACTEOL is a product containing a specific proprietary strain ofLactobacillus Acidophilusin a lyophilized powder form. It is available in a number of dosage forms, including capsules, and is primarily indicated for the treatment of diarrhoea. LACTEOL, which is mainly sold in France and in over 40 export markets, does not have any patent protection or any regulatory exclusivity. However, the product is derived from a proprietary strain of bacterium for which the ultimate parent organism is protected by a number of security safeguards, such that access by third parties seeking to reproduce it for competitive or other purposes is limited and controlled.
We reported net sales of $19.0 million, $16.3 million and $18.1 million for LACTEOL in fiscal years 2008, 2007 and 2006, including $11.1 million, $9.9 million, and $9.1 million outside of France.
Sales in France significantly decreased in fiscal years 2007 and 2006 since, as part of new measures designed to reduce healthcare cost associated with the reimbursement of prescription drugs, the French government decided to stop the reimbursement of approximately 200 drugs, including LACTEOL. However, in the first three quarters of fiscal year 2008, we have seen an increase in our sales of LACTEOL from the fiscal 2007 bottom level. We believe our over-the-counter marketing strategy has been the primary reason for this sales trend.
LACTEOL competes with a number of generic products in most markets. As LACTEOL has been marketed for several decades, we believe the brand name LACTEOL constitutes a definite marketing advantage wherever the product is sold.
PHOTOFRIN / PHOTOBARR
We market (directly or through distributors) PHOTOFRIN / PHOTOBARR in the U.S., Canada, the EU and other selected markets. PHOTOFRIN / PHOTOBARR has received regulatory approvals in a number of countries, including for the treatment of high-grade dysplasia associated with Barrett’s Esophagus, obstructing esophageal cancer and non small cell lung cancer, as well as certain types of gastric cancers and cervical dysplasia. PHOTOFRIN / PHOTOBARR is a photo-sensitizer approved for use in photodynamic therapy, an innovative medical therapy based on the use of light-activated drugs. PHOTOFRIN / PHOTOBARR is covered by a number of patents claiming compositions (including product by process claims), methods of use in approved indications, methods of manufacture, as well as patents for certain devices used in connection with treatment with these products. In the United States, PHOTOFRIN / PHOTOBARR’s main market, patent expiries for this product range from June 2009 to May 2016.
We reported net sales of $6.5 million, $5.9 million and $5.5 million for PHOTOFRIN/PHOTOBARR in fiscal years 2008, 2007 and 2006, respectively.
To our knowledge, there are currently no other photo-sensitizers approved as drugs in Canada, the United States and the EU for the treatment of high-grade dysplasia associated with Barrett’s Esophagus, obstructing esophageal cancer and lung cancer, gastric cancer or cervical dysplasia.
- 14 -
Products in Development
Our Scientific Affairs team leverages its expertise in the field of gastroenterology to develop product line enhancements and modifications to existing products and complete the clinical development of new product candidates, consistent with our research and development growth strategy. For new product candidates, we mainly consider the development of late-stage (Phase II and beyond) novel molecules and innovative product candidates that, in our view, provide an acceptable risk/return profile.
We also seek to enhance and extend exclusivity through the staged introduction of product enhancements. These may include improvements in the frequency of administration of drug products, improvements in the convenience of administration, reduction in dose, reduction in side effects (improved tolerability), or improved therapeutic effect/benefit.
Our staff of research scientists has expertise in all aspects of the drug-development process, from pre-formulation studies and formulation development, to scale-up and manufacturing. In fiscal year 2007, our development efforts resulted in the approval of PYLERA in the United States, for the eradication of theHelicobacter pylori bacterium.
As part of our business strategy, we enter into licensing agreements with companies that are developing compounds and innovative products in the field of gastroenterology. These compounds and products are typically in-licensed with some combination of upfront payments, development milestone payments and/or royalty payments. In some cases, we have an option to acquire an ownership position in the company with which we have entered into such an agreement.
We currently have development efforts ongoing for eight products that we believe may, upon regulatory approval, provide clinically meaningful benefits to patients.
Our pipeline products are in various stages of development. Despite the reduced risk profile of our pipeline programs (relative to new chemical entities), they do carry development risk, and as such, we do not anticipate the commercialization of all of these products. In addition, we routinely review and prioritize our pipeline as new product candidates are added, which can result in the discontinuation or delay in other ongoing development programs which offer, in our estimation, a less attractive risk/return profile. This is normal practice in the pharmaceutical industry.
Given that the successful development of any pipeline program is dependent on a number of variables, it is difficult to accurately predict timelines for regulatory approval and accordingly clinical development expenses. In fiscal year 2008 our research and development expenses were approximately $28.1 million or 7.4% of our total revenues ($28.6 million or 8.2% of revenue in fiscal year 2007 and $39.8 million or 13.6% of revenue in fiscal year 2006).
We from time to time, review our portfolio of products under development to set priorities for the various development programs underway and to ensure that internal and budgeted resources are allocated accordingly. As a result of these reviews, the contents of certain development programs and related timelines may be modified or certain programs terminated.
The following is a description of our active and disclosed pipeline projects. The intellectual property around these projects is discussed below in “Patents and Trademarks.”
Pancreatic Enzyme Products
ULTRASE and VIOKASE
In April 2004, the FDA formally notified manufacturers of pancreatic enzyme products that these drugs, which include ULTRASE and VIOKASE, must receive NDA approval before April 2008, in order to remain on the market. This deadline was recently extended to April 2010. The FDA has also published final guidelines aimed at assisting manufacturers of pancreatic enzyme drug products in preparing and submitting these NDAs. We completed all the clinical trial and the chemistry, manufacturing and control data work required for the submission of our NDA for ULTRASE MT in the fourth quarter of fiscal year 2007, which filing was accepted by the FDA in the first quarter of fiscal year 2008. On July 1, 2008, we received an approvable letter from the FDA regarding our NDA for ULTRASE MT, citing certain chemistry, manufacturing and control data work concerns and we are currently preparing a response to the FDA’s comments in collaboration with our manufacturing partners and expect that required regulatory filings will be made in time to comply with the FDA’s guidelines. We have submitted our IND for VIOKASE and, assuming successful completion of the currently ongoing clinical trial, we expect to submit our NDA for VIOKASE in time to comply with the FDA’s required timeline for pancreatic enzyme product approval.
- 15 -
While we can provide no assurances, we believe that some of the manufacturers of prescription pancreatic enzyme products that are currently on the market in the United States may not be able to satisfy the FDA’s requirements for NDAs for these products, which could create a significant growth opportunity for us if we receive NDA approval for ULTRASE and VIOKASE before April 2010. See “Item 1A. Risk Factors—Risks Related to Our Business.”
NMK 150
We are developing NMK 150, a new high protease pancrelipase preparation developed for the relief of pain in small duct chronic pancreatitis, which represents an unmet medical need. A dose-ranging, animal study assessing the toxicity of NMK 150, which paid special attention to duodenal irritation, confirmed the safety profile of this compound. A Phase I, ascending, multiple-dose clinical study was also completed and confirmed the safety and tolerability of this compound alone and in combination with a proton pump inhibitor. We are currently reviewing the relevance of this product in our current pipeline.
Ursodiol
SUDCA (Ursodiol Disulfate)
We are currently studying the use of SUDCA, a new ursodiol derivative, in the prevention of the recurrence of colorectal adenomateous polyps, considered to be a pre-cancerous stage of colorectal cancer.
We had previously completed a Phase II study of the effectiveness of URSO 250 in preventing the recurrence of colorectal adenomateous polyps in the United States and Canada, for which 792 patients were randomized. The final analysis confirmed a trend in the sub-group of patients suffering from early stage colorectal cancer at baseline. However, in the overall study population, no statistically significant difference between the two groups was observed in terms of mean number of recurring polyps and average polyp size.
Preliminary results of studies conducted with SUDCA showed that ursodiol disulfate reduces the number of aberrant crypts in a rat model of colon cancer.
In addition to these animal studies, a single, ascending-dose Phase I clinical study was completed in early 2006, and a multiple, ascending-dose Phase I study was completed in September 2006, to evaluate the safety, tolerability and preliminary pharmacokinetics of SUDCA. Both studies confirmed the safety and tolerability of this compound. We are currently reviewing the relevance of this product in our current pipeline.
Mesalamine
CANASA MAX-002
We have initiated the CANASA MAX-002 program, a Phase III clinical trial to evaluate the efficacy and safety of a novel, high-concentration, 1-gram mesalamine suppository for the treatment of ulcerative proctitis.
Ulcerative proctitis is a subgroup of ulcerative colitis, one of the most common inflammatory bowel diseases. For approximately 30% of patients with ulcerative colitis, the illness begins as ulcerative proctitis where bowel inflammation is limited to the rectum. Currently, it is estimated that there are 1 million cases of inflammatory bowel disease in the U.S.
In June 2007, the FDA issued draft guidance on the type of clinical program required for the approval of mesalamine suppositories. Based on this draft guidance, we temporarily suspended the recruitment of this trial and expect to resume it in fiscal year 2009, upon completion of ongoing discussions with the FDA.
Helicobacter Pylori Eradication
PYLERA
Our Phase III clinical program with PYLERA in the EU to obtain approval to market this therapy for the eradication ofHelicobacter pyloriis well underway. This Phase III clinical trial in the EU is expected to be conducted on approximately 400 patients and is intended to compare our PYLERA regimen given in combination with omeprazole, to the widely used OAC triple therapy (20 mg of omeprazole, 1 g of amoxicillin and 500 mg of clarithromycin, all given twice a day). The trial is expected to be completed in the second half of calendar 2009. PYLERA was successfully launched in the United States in fiscal year 2007. Under the terms of FDA approval, we were required to conduct a post-marketing pediatric study of PYLERA in children. However, the FDA has recently granted us a waiver for this requirement.
- 16 -
Others
AGI-010
We and AGI Therapeutics, plc, or AGI. are co-developing AGI-010, a delayed/controlled release formulation of the proton pump inhibitor drug omeprazole, which is being developed for the treatment of symptoms associated with GERD, and, in particular, is to be used for the control of night-time gastric acidity, known as nocturnal acid breakthrough. Nocturnal acid breakthrough remains a significant unmet medical need, and is estimated to occur in more than 50% of GERD patients on a proton pump inhibitor therapy.
Development of the final formulation for this compound is ongoing and once completed, will allow both companies to make a decision on the most appropriate development and filing strategy for this product.
See “Patents and Trademarks—AGI-010” below for more information regarding certain milestone payments we may have to make related to the development of AGI-010.
Cx401
On September 30, 2007, we entered into an exclusive license and development agreement with Cellerix of Spain, for the North American (United States, Canada and Mexico) rights to Cx401, an innovative biological product in development for the treatment of perianal fistulas.
A Phase II trial conducted in 50 patients in the EU demonstrated the efficacy and safety of Cx401. This randomized, open-label, parallel assignment study evaluated the safety and efficacy of Cx401 in the treatment of perianal fistulas in Crohn’s and non-Crohn’s Disease patients. The primary endpoint for this study was photographically assessed complete closure and healing, and showed a 71% response rate in the acute phase, both in Crohn’s and non-Crohn’s Disease patients. Results of this study were presented atDigestive Disease Week in May 2007 (Garci-Olmo D. et al., “Expanded Adipose-Derived Stem Cells (Cx401) for the Treatment of Complex Perianal Fistula. A Phase II Clinical Trial” (Digestive Disease Week 2007; Abstract: 492)) and are pending publication.
We will be responsible for the costs to develop and commercialize this product in North America. We expect to initiate a Phase IIb study in North America in the first half of fiscal year 2010. Depending on the outcome of further discussions with the FDA, filing could occur as early as 2012.
See “Patents and Trademarks—Cx401” below for more information regarding certain royalty payments we may have to make related to the development of Cx401.
Sales and Marketing
In the United States, we sell our products to most major wholesale drug companies and distributors, which in turn distribute our products to chain and independent pharmacies, hospitals and mail order organizations. As of September 30, 2008, we had 82 sales representatives, 9 regional sales managers managed by 2 zone directors and 5 national account managers in our managed care group, all located in the United States, who call on high-volume prescribing gastroenterology physicians, cystic fibrosis centres, hepatologists and transplant centres, potential and current PHOTOFRIN centres as well as third-party payors, clinical pharmacists and formularies administrators. Since the launch of PYLERA, in May 2007, sales representatives also visit general practitioners known to be high-volume prescribers ofHelicobacter pylori eradication therapies.
In Canada, we sell our products to hospitals and wholesale drug companies, which in turn distribute our products to pharmacies. Our major products are included in most provincial drug benefit formularies and are actively promoted by our 11 sales representatives, under the supervision of the regional sales manager, to gastroenterologists and internal medicine specialists with a particular interest in gastrointestinal diseases, as well as to colorectal surgeons.
In France, we sell our products to distributors, which in turn distribute them to wholesale drug companies, which in turn distribute them to pharmacies. As of September 30, 2008, we had 42 sales representatives who, under the supervision of 5 regional sales directors, regularly visit high-volume prescribing physicians to promote our other prescription products. In addition, in Germany, we have an exclusive contracted sales force that includes 15 sales representatives under the supervision of 1 regional sales director and in the United Kingdom, we have 1 sales representative.
This international sales structure is complemented by our sponsorship of high-level international medical meetings on topics related to our products and research activities. These events are recognized by leading institutions, and continuing medical education credits are awarded to attendees. As a consequence, we believe that we are recognized not only as a supplier of quality products, but also as an important link in the continuous medical education process.
- 17 -
Customers
While the ultimate end-users of our products are the individual patients to whom our products are prescribed by physicians, our direct customers include a number of large pharmaceutical wholesale distributors and large pharmacy chains. The pharmaceutical wholesale distributors that comprise a significant portion of our customer base sell our products primarily to retail pharmacies, which ultimately dispense our products to the end consumers.
Increasingly, in North America, third-party payors, such as private insurance companies and drug plan benefit managers, aim to rationalize the use of pharmaceutical products and medical treatments, in order to ensure that prescribed products are necessary for the patients’ disorders. Moreover, large drug store chains now account for an increasing portion of the retail sales of prescription medicines. The pharmacists and store managers of such retail outlets are under pressure to reduce the number of items in inventory in order to reduce costs.
We use a “pull-through” marketing approach that is typical of pharmaceutical companies. Under this approach, our sales representatives actively promote our products by demonstrating the features and benefits of our products to physicians and, in particular, gastroenterologists who may write their patients prescriptions for our products. The patients, in turn, take the prescriptions to pharmacies to be filled. The pharmacies then place orders with the wholesalers, to whom we sell our products.
The following table sets forth the percentage of total net sales for each of the last three fiscal years for each of our wholesale customers that accounted for ten percent or more of our total net sales in any of the last three fiscal years.
| | | | | | | | | |
| | | For the fiscal years ended
September 30, | |
| | | 2008 | | | 2007 | | | 2006 | |
Customer A | | 39.0 | % | | 41.2 | % | | 39.0 | % |
Customer B | | 26.6 | % | | 25.0 | % | | 24.4 | % |
Customer C | | 10.3 | % | | 11.1 | % | | 11.4 | % |
| | | | | | | | | |
Total | | 75.9 | % | | 77.3 | % | | 74.8 | % |
| | | | | | | | | |
Competition
Our business is highly competitive. Competition within the gastroenterology industry is primarily based upon product effectiveness, side effects and convenience, although price competition is an important factor as healthcare providers continue to be concerned with costs.
Our products face competition from both branded and generic products, sold by other pharmaceutical companies. Many of these competitors have greater financial resources and marketing capabilities than we do. Our competitors in the United States and abroad are numerous and include major pharmaceutical companies, and some of the manufacturers of our products. We believe that our focus on gastroenterology, combined with our strategy of funding and controlling all or most aspects of our business, will provide the cost savings, efficiencies in product development and acceleration of regulatory filings necessary for us to compete effectively with such companies. Our competitors, however, may succeed in developing products that are as, or more, clinically-or cost-effective than any that are being developed or licensed by us, or that would render our products obsolete or uncompetitive. In addition, certain of our competitors have greater experience than we do in clinical testing and human clinical trials of pharmaceutical products and in obtaining FDA and other regulatory approvals.
Competition for each of our key product lines is discussed in greater detail above in the “Products” section.
Manufacture and Supply
While we manufacture LACTEOL and SALOFALK at our French and Canadian facilities, respectively, we outsource all aspects of the manufacturing of our other products and product candidates. We maintain internal quality control, regulatory affairs and product planning resources to oversee the activities of these third party manufacturers. With the exception of LACTEOL, we currently rely, and expect to continue to rely, on third parties for supply of the active pharmaceutical ingredients in all of our products and product candidates and, with respect to our products other than LACTEOL and SALOFALK, for the manufacture of the finished forms of these drugs and packaging. These third parties act under contracts that expire at various times beginning in 2009 and generally provide for price increases based on inflation. We have no plans to establish
- 18 -
any additional manufacturing facilities for our products or product candidates. If any of our current manufacturers should become unavailable to us for any reason, we believe that there are a number of potential replacements, although we might incur delays in identifying and qualifying such replacements.
For all of our marketed products other than LACTEOL and SALOFALK, we have entered into agreements with third parties to manufacture the finished dosage form of the product. Depending on the particular arrangement, either we or the third party manufacturer source the active pharmaceutical ingredient. For most of the raw materials and active pharmaceutical ingredients in our products and product candidates, we rely on a sole source to supply our requirements. While we believe that there are alternative sources of supply for the active pharmaceutical ingredients and raw materials required for the manufacture of our products, if any of our current suppliers were unable to meet our needs, we may not be able to have these alternative suppliers qualified in a timely manner, and we may not be able to obtain the required materials on favorable terms. For some of our marketed products, the finished dosage manufacturer also packages the product, and for others, we use a separate third party packager.
Our agreements with our suppliers and manufacturers include customary supply terms, including product specifications, batch size requirements, price, payment terms, requirements forecasting, delivery mechanics and quality assurance. Under most of these agreements, we are obligated to purchase all or a specified percentage of our requirements for the product or active pharmaceutical ingredient supplied under the agreement. These agreements also generally permit the manufacturer or supplier to pass on to us increases in costs of production or materials.
With the exception of the manufacturers of ULTRASE, MODULON, PHOTOFRIN and PYLERA, and the manufacturer and supplier of CANASA, our manufacturers and suppliers are not restricted from supplying product to third parties. Eurand, our supplier for ULTRASE, has agreed to certain restrictions on its ability to supply any third party in the United States, Canada and certain Central and South American countries with certain pancreatic enzyme products. Eurand is permitted to commercialize its own pancreatic enzyme product line, for which it is currently seeking FDA regulatory approval in the United States, and which may be in competition with ULTRASE.
Our supplier of mesalamine and the manufacturer of CANASA have each agreed not to supply mesalamine or a mesalamine product to a third party in the United States or Canada.
Our agreements for the manufacture of our core products expire on various dates beginning in 2009 and continuing through 2015. We believe, but cannot assure, that we will be able to renew these agreements on satisfactory terms as they expire or find suitable alternative suppliers and manufacturers. If we are unable to renew these agreements on favorable terms or find suitable alternatives, however, our business could be adversely affected.
Manufacturers and suppliers of our products and product candidates are subject to the FDA’s current Good Manufacturing Practices, or cGMP, requirements and other rules and regulations prescribed by regulatory authorities outside the United States, including in Canada and the EU. We depend on our third-party suppliers and manufacturers for continued compliance with cGMP requirements and other applicable standards.
Patents and Trademarks
We believe that trademark protection is an important part of establishing product and brand recognition. We own a number of registered trademarks and trademark applications, including trademarks for all of our key product lines, and have acquired the rights to trademarks for several of our smaller product lines by license. We maintain trademark registrations in a number of jurisdictions where we sell our products. In the United States, trademark registrations remain in force for ten years and may be renewed every ten years after issuance, provided the mark is still being used in commerce.
A patent is a statutory private right that grants to the patentee exclusive rights to exclude others from using the patented invention during the term of the patent. A patent is territorial and may be sought in many jurisdictions. In the United States, as in most other countries, the term of patent protection is 20 years from the date the patent application was filed. An invention may be patentable if it meets the criteria of being “new,” “useful” and “non-obvious.” Depending upon whether a particular drug is patentable and the relative cost associated with obtaining patents for the invention, an inventor will either apply for a patent in order to protect the invention or maintain the confidentiality of the information to rely on the common law protection afforded to trade secrets.
- 19 -
A company may also enter into licensing agreements with third-party licensors in order to obtain the right to make, use and sell certain products, thereby gaining access to know-how, secret formulas and patented technology. The value of a license is generally enhanced by the existence of one or more patents. A license gives the licensee access to developed and, in many cases, tested technology and provides the licensee faster and often less expensive entry into the market. Licensing also establishes relationships, which may provide access to additional products or technology or may lead to joint ventures or alliances affording the licensor and the licensee an opportunity to evaluate each other’s products and technology. This is also true, to a lesser extent, for distribution relationships.
Pursuant to license agreements with third parties, we have acquired rights to manufacture, use or market certain of our existing products, as well as many of our development products and technologies. Such agreements typically contain provisions requiring us to use commercially reasonable efforts or otherwise exercise diligence in pursuing market development for such products in order to maintain the rights granted under the agreements, and may be cancelled upon our failure to perform our payment or other obligations.
We further rely and expect to continue to rely upon unpatented proprietary know-how and technological innovation in the development and manufacture of many of our principal products. Our policy is to require all our employees, consultants and advisors to enter into confidentiality agreements with us.
We have entered into several types of collaborative agreements with licensors, licensees and other third parties and will continue to do so. The following agreements have been entered into in connection with products marketed by us or under development.
ULTRASE
We are the owner of the trademark ULTRASE and we market certain pancreatic enzyme based microspheres and mini-tablets under the ULTRASE brand in North and Latin America, under an exclusive development, license and supply agreement with Eurand. This agreement was entered into in 2000, and was initially for a period of ten years with automatic renewals for subsequent periods of two years. This agreement was recently amended in 2007, including to provide for an extension of its term to 2015. We have paid Eurand licensing fees totalling $3.5 million, and we agreed to pay to Eurand royalties of 6% on our annual net sales of ULTRASE.
Ursodiol
URSO
We developed URSO for the Canadian market in collaboration with Falk Pharma GmbH, or Falk, and acquired the rights to manufacture, use and market URSO in the United States on March 23, 1993 through the acquisition of the shares of Axcan Pharma U.S. Inc. (now Axcan Pharma (U&V) Inc.) that we did not already own. In April 1999, we entered into two agreements with Sanofi-Synthélabo S.A. of France (now, Sanofi-Aventis) that secured our right to manufacture, use and market URSO for the treatment of PBC in Canada and the United States. For the United States, we licensed the rights to the treatment of PBC under a patent, which expired on November 19, 2007. For Canada, we acquired full ownership of the patent relating to the use of ursodiol for the treatment of PBC, which expires in 2010. However, in May 2006, the Canadian PBC patent was held to be invalid for the purposes of opposing the issuance of a Notice of Compliance for a generic version of URSO, under proceedings pursuant to the Canadian Patented Medicines (Notice of Compliance) Regulations.
SUDCA (Ursodiol Disulfate)
In September 2000, we entered into a licensing agreement with the Children’s Hospital Research Foundation, an operating division of Children’s Hospital Medical Centre of Cincinnati, Ohio, for a series of patented sulfated derivatives of ursodeoxycholic acid compounds, also known as SUDCA or ursodiol disulfate. According to the terms of this agreement, we have exclusive worldwide rights to commercially exploit formulations of SUDCA under the licensed patents and know-how developed by Children’s Hospital Research Foundation. We have paid approximately $600,000 in upfront fees. We could pay up to an additional $5.5 million in milestone payments if we successfully develop a product from the technology covered by this license and meet specified development and commercial milestones. We are also obligated to pay royalties on net sales of any product developed from the technology covered by this license.
- 20 -
PHOTOFRIN
In May 2000, we purchased from QLT Inc., or QLT, the trademark PHOTOFRIN for the United States, Canada and all other countries where it has been registered as a trademark or used in marketing. We also purchased, licensed or sublicensed from QLT, as the case may be, the worldwide rights in and to other assets and intellectual property related to PHOTOFRIN. As part of the transaction, we also acquired a European subsidiary of QLT, which holds the European regulatory approvals for PHOTOFRIN. The last of the patents, which form part of the licensed and acquired assets, expires in 2016. As part of the acquisition, we agreed to assume QLT’s obligation to pay royalties of up to 5% on net sales of PHOTOFRIN to Health Research Inc., or Health Research, pursuant to arrangements under which we are a sub-licensee of the technology that QLT licensed from Health Research. Pursuant to the terms of the transaction between us and QLT, we have paid to QLT milestone cash payments of CAN $20.0 million (representing the maximum potential aggregate amount of milestone cash payments under the terms of the transaction).
PANZYTRAT
In December 2002, we acquired from an affiliate of Abbott Laboratories, or Abbott, certain assets related to the distribution, marketing and sale of a line of pancreatic enzyme products used to enhance the digestion of fats. This pancreatic enzyme product line is commonly marketed under the trademark PANZYTRAT. Certain patents related to the product were assigned to us directly from Abbott, the last of which expired in 2006. The know-how and trade secrets associated with these products and their manufacture are the object of a perpetual unrestricted license from Abbott. The PANZYTRAT and related trademark portfolio, was assigned directly from Abbott to our French subsidiary, Axcan Pharma S.A. This portfolio contains trademarks associated with the product line for a number of countries throughout the world.
PYLERA
In January 2000, we entered into a worldwide (excluding Australia and New Zealand) licensing agreement (which was amended in November 2000 and August 2001) with Exomed Australia PTY Limited, Gastro Services PTY Limited, Ostapat PTY Limited, and Capability Services PTY Ltd. This agreement, as amended, provides us with exclusive rights in a number of countries, including Canada and the United States, to a series of patents covering triple and quadruple therapies for Helicobacter pylori eradication. These patents cover the treatment of duodenal ulcer disease (and in some countries reflux esophagitis and gastric ulcer) through the eradication ofHelicobacter pylori using a bismuth compound together with two or more antibiotics. We paid approximately $1.64 million cash for the license and will pay a 5.5% royalty based on sales. The expiry dates of these patents vary depending on the jurisdiction and expire in March 2010 in the United States.
In May 1999, we acquired the rights to a double capsule delivery technology to be used for PYLERA from Gephar S.A., or Gephar, in an asset swap transaction, whereby we sold to Gephar our interest in Axcan Ltd., a manufacturer and distributor of the PROTECTAID™ contraceptive sponge. This patent expires in December 2018 in the United States.
LACTEOL and LACTEOL FORT
In April 2002, we acquired all of the shares of Laboratoire du Lactéol du Docteur Boucard (now Axcan Pharma S.A.) which is the owner of all of the intellectual property rights to the bacterial strain (lactobacillus) composition marketed by Le Laboratoire du Lactéol under different trademarks, including the trademark LACTEOL.
AGI-010
On September 25, 2006, we entered into a license and co-development agreement with AGI. Pursuant to this agreement, we and AGI will co-develop AGI-010 to be used for the treatment of symptoms associated with GERD, and, in particular, to be used for the control of night-time gastric acidity, known as nocturnal acid breakthrough. Nocturnal acid breakthrough remains a significant unmet medical need, and is estimated to occur in more than 50% of GERD patients on a proton pump inhibitor therapy. Under the agreement, we have licensed exclusive rights to patent applications and know-how related to AGI-010 and will retain rights to any improvements to the product for North America and, if extended by us, to other territories. However, we cannot provide assurances that such patent will be granted. We and AGI have further agreed to share certain development expenses, and we paid a $1.5 million upfront fee (which was charged to expense in fiscal year 2006) and may be required to make specified milestone payments that could total up to $17.5 million at various stages of development, up to and including regulatory approvals. We have also agreed to pay royalties of up to 7.5% on net sales.
- 21 -
Cx401
Under the terms of the agreement signed with Cellerix on September 30, 2007, relating to Cx401, an innovative biological product in development for the treatment of perianal fistulas, we made a $10.0 million upfront payment to Cellerix (which was charged to expense in the fourth quarter of fiscal year 2007), and will make regulatory milestone payments that could total up to $30.0 million. In addition, patent applications were submitted, which, if granted, could provide protection until 2025. However, we cannot provide assurances that such patents will be granted.
In addition, under the terms of the agreement with Cellerix, we will pay scaled royalties of up to 18% based on the net sales of Cx401. We have also agreed to make an equity investment of up to $5.0 million in Cellerix, should Cellerix complete its initial public offering by September 30, 2010. We are responsible for the costs of development of the product for our licensed markets.
Government Regulation
The research and development, manufacture, and marketing of pharmaceutical products are subject to regulation by U.S., Canadian and foreign governmental authorities and agencies. Such national agencies and other federal, state, provincial and local entities regulate the testing, manufacturing, safety and promotion of our products. The regulations applicable to our products may be subject to change as regulators acquire additional experience in the specific area.
United States Regulations
New Drug Application
We are required by the FDA to comply with NDA procedures for our branded products prior to commencement of marketing, with the exception of the pancreatic enzyme products which require an NDA approval before April 2010. New drug compounds and new formulations for existing drug compounds which cannot be filed as ANDAs are subject to NDA procedures. These procedures include: (1) preclinical laboratory and animal toxicology tests; (2) submission of an IND and its required acceptance by FDA before any human clinical trials can commence; (3) adequate and well-controlled replicate human clinical trials to establish the safety and efficacy of a drug for its intended indication; (4) the submission of an NDA to the FDA; and (5) FDA approval of an NDA prior to any commercial sale or shipment of the product, including pre-approval and post-approval inspections of its manufacturing and testing facilities.
In seeking approval for a drug through an NDA, applicants are required to list with the FDA each patent with claims that cover the applicant’s product or an approved use of the product. Upon approval of a drug, each of the patents listed in the application for the drug is, where eligible, then published in the FDA’s Approved Drug Products with Therapeutic Equivalence Evaluations, commonly known as the Orange Book.
Abbreviated New Drug Application
When a drug is listed in the Orange Book and when a potential competitor seeks to develop a generic version of such a product, an ANDA may be filed in lieu of filing an NDA. An ANDA provides for marketing of a drug product that has the same active pharmaceutical ingredients in the same strengths and dosage form as the listed drug and has been shown through bioequivalence testing to be therapeutically equivalent to the listed drug. Under the ANDA procedure, the FDA waives the requirement to submit complete reports of preclinical and clinical studies of safety and efficacy, and instead, requires the submission of bioequivalency data, that is, demonstration that the generic drug produces the same blood levels of drug in the body as its brand-name counterpart, although the FDA may agree to other means of establishing bioequivalence.
The ANDA applicant is required to certify to the FDA concerning each patent listed for the approved product in the FDA’s Orange Book. Specifically, the applicant must certify that: (1) the required patent information has not been filed; (2) the listed patent has expired; (3) the listed patent has not expired, but will expire on a particular date and approval is sought after patent expiration; or (4) the listed patent is invalid or unenforceable or will not be infringed by the manufacture, use or sale of the new product. A certification that the new product will not infringe the already approved product’s listed patents or that such patents are invalid or unenforceable is called a Paragraph IV certification.
If the ANDA applicant has made a Paragraph IV certification, it must also send notice to the NDA and patent holders once the ANDA has been accepted for filing by the FDA. The NDA and patent holders may then initiate a patent infringement lawsuit against the ANDA applicant. The filing of a patent infringement lawsuit within 45 days of the receipt of a Paragraph IV notice automatically prevents the FDA from approving the ANDA until the earlier of 30 months from the receipt of notice by the patent holder, expiration of the patent or a decision or settlement in the infringement case finding the patent to be invalid, unenforceable or not infringed.
- 22 -
The Hatch-Waxman Act explicitly encourages generic challenges to listed patents by providing for a 180 day period of generic product exclusivity to the first generic applicant to file an ANDA with a Paragraph IV certification. Thus, many if not most successful new drug products are subject to generic applications and patent challenges prior to the expiration of all listed patents.
However, because the active pharmaceutical ingredients of PYLERA include antibiotics that were approved by the FDA prior to 1997, the U.S. patents covering PYLERA’s triple and quadruple therapies forHelicobacter pylori eradication and capsule formulation are not permitted to be listed in the FDA’s Orange Book and are not eligible to benefit from the automatic stay provisions or the market exclusivity provisions of the Hatch-Waxman Act.
505(b)(2) Application Process
Most drug products obtain FDA marketing approval pursuant to an NDA or an ANDA. A third alternative is a special type of NDA, commonly referred to as a Section 505(b)(2) NDA, which enables the applicant to rely, in part, on the FDA’s findings of safety and efficacy of an approved product, or published literature, in support of its application. Section 505(b)(2) NDAs often provide an alternate path to FDA approval for new or improved formulations or new uses of previously approved products. A 505(b)(2) application allows the applicant to file an application where at least some of the information required for approval comes from studies not conducted by or for the applicant and for which the applicant has not obtained a right of reference. The applicant may rely upon the FDA’s findings with respect to particular preclinical studies or clinical trials conducted for an approved product, although the FDA may also require companies to perform additional studies or measurements to support the change from the approved product.
Relative to normal regulatory requirements for a 505(b)(1) NDA, regulation may permit a 505(b)(2) applicant to forego costly and time-consuming drug development studies by relying on the FDA’s finding of safety and efficacy for a previously approved drug product. Under some circumstances, the extent of this reliance approaches that permitted under the generic drug approval provisions. This approach is intended to encourage innovation in drug development without requiring duplicative studies to demonstrate what is already known about a drug, while protecting the patent and exclusivity rights for the approved drug. Notwithstanding the approval of many products by the FDA pursuant to Section 505(b)(2), over the last few years, some pharmaceutical companies and others have objected to the FDA’s interpretation of Section 505(b)(2).
Data Exclusivity
Under the Hatch-Waxman Act, newly-approved drugs and indications may benefit from a statutory period of non-patent data exclusivity. The Hatch-Waxman Act provides five-year data exclusivity to the first applicant to gain approval of an NDA for a new chemical entity, or NCE, meaning that the FDA has not previously approved any other drug containing the same active pharmaceutical ingredient. Although protection under the Hatch-Waxman Act will not prevent the submission or approval of another “full” NDA, such an NDA applicant would be required to conduct its own preclinical and adequate and well-controlled clinical trials to demonstrate safety and effectiveness.
The Hatch-Waxman Act also provides three years of data exclusivity for the approval of new and supplemental NDAs, including Section 505(b)(2) applications, for, among other things, new indications, dosage forms, routes of administration, or strengths of an existing drug, or for a new use, if new clinical investigations that were conducted or sponsored by the applicant are determined by the FDA to be essential to the approval of the application. This exclusivity, which is sometimes referred to as clinical investigation exclusivity, would not prevent the approval of another application if the applicant has conducted its own adequate and well controlled clinical trials demonstrating safety and efficacy, nor would it prevent approval of a generic product that did not incorporate the exclusivity protected changes of the approved drug product.
Canadian Regulations
The requirements for selling pharmaceutical drugs in Canada are substantially similar to those of the U.S. described above, with the exception of the 505(b)(2) route, which is not available in Canada. Canadian regulations also include provisions relating to marketing and data exclusivity.
European Economic Area
A medicinal product may only be placed on the market in the European Economic Area, or EEA, composed of the 27 European Union member states, plus Norway, Iceland and Lichtenstein, when a marketing authorization has been issued by the competent authority of a member state. There are essentially three community procedures created under prevailing European pharmaceutical legislation that, if successfully completed, allow an applicant to place a medicinal product on the market in the EEA.
- 23 -
Centralized Procedure
Centralized procedure exists when a marketing authorization is granted by the European Commission, acting in its capacity as the European Licensing Authority on the advice of The European Medicines Agency. That authorization is valid throughout the entire community and directly or indirectly (Norway, Iceland and Liechtenstein) allows the applicant to place the product on the market in all member states of the EEA. The European Medicines Agency is the administrative body responsible for coordinating the existing scientific resources available in the member states for evaluation, supervision and pharmacovigilance of medicinal products.
Mutual Recognition and Decentralized Procedures
The competent authorities of the member states are responsible for granting marketing authorizations for medicinal products that are placed on their markets. If the applicant for a marketing authorization intends to market the same medicinal product in more than one member state, the applicant may seek an authorization progressively in the community under the mutual recognition or decentralized procedure.
Mutual Recognition
Mutual recognition is used if the medicinal product has already been authorized in one member state. In this case, the holder of this marketing authorization requests the member state where the authorization has been granted to act as reference member state by preparing an updated assessment report that is then used to facilitate mutual recognition of the existing authorization in the other member states in which approval is sought (the so-called concerned member state(s)). The reference member state must prepare an updated assessment report which, together with the approved Summary of Product Characteristics, or SmPC (which sets out the conditions of use of the product), and a labeling and package leaflet are sent to the concerned member states for their consideration. The concerned member states are required to make an approval decision on the assessment report, the SmPC and the labeling and package leaflet within 90 days of receipt of these documents.
The Decentralized Procedure
This procedure is used in cases where the medicinal product has not received a marketing authorization in the EU at the time of application. The applicant sends its application simultaneously to all concerned member states and requests a member state of its choice to act as reference member state to prepare an assessment report that is then used to facilitate agreement with the concerned member states and the grant of a national marketing authorization in all of these member states. In this procedure, the reference member state must prepare, for consideration by the concerned member states, the draft assessment report, a draft SmPC and a draft of the labeling and package leaflet within 120 days after receipt of a valid application. As in the case of mutual recognition, the concerned member states are required to make an approval decision on these documents within 90 days of their receipt.
International Regulations
Sales of our products outside the United States, Canada and the EU are subject to local regulatory requirements governing the testing, registration and marketing of pharmaceuticals, which vary widely from country to country.
In addition to the regulatory approval process and regulations relating to the manufacture of drugs, pharmaceutical companies are subject to regulations under provincial, state and federal laws, including requirements regarding occupational safety, laboratory practices, environmental protection and hazardous substance control, and may be subject to other present and future local, provincial, state, federal and foreign regulations, including possible future regulations of the pharmaceutical industry. We believe that we are in compliance in all material respects with such regulations as are currently in effect.
Employees
As of September 30, 2008, we employed 514 persons. Of these employees, 171 were located in the United States, 198 were located in Canada and 145 were located in the EU. In Canada, we are a party to a collective bargaining agreement, which was recently renewed and expires March 24, 2011. As of September 30, 2008, this agreement covers 62 employees, all of whom are non-management employees. In France, our employees are subject to the Convention Collective Nationale de l’Industrie Pharmaceutique, a collective bargaining agreement which applies to the entire pharmaceutical industry. We believe that relations with both our unionized and non-unionized employees are good.
- 24 -
Risks Related to Our Business Our operations and financial results are subject to various risks and uncertainities, including those described below, that could adversely affect our financial position, cash flows or overall trends in results of operation.
We currently depend on four categories of products for a large portion of our revenues; any material decline in the sales of any of them would have an adverse impact on our business.
Any factor that adversely affects the sale or price of our key products could significantly decrease our sales and profits. Pancreatic enzyme products (ULTRASE, VIOKASE and PANZYTRAT), ursodiol products (URSO 250 / URSO DS / URSO FORTE and DELURSAN), mesalamine products (CANASA and SALOFALK) and sucralfate products (CARAFATE and SULCRATE) accounted for 21.2%, 26.9%, 24.2% and 15.0%, respectively, of our total revenues for year ended 2007 and for 23.8%, 24.2 %, 24.4% and 13.8 %, respectively, of our total revenues for fiscal year 2008. We believe that sales of these products will continue to constitute a significant portion of our total revenues until we launch additional products. Any significant setback with respect to any one of these products, including shipping, manufacturing, product safety, marketing, government licenses and approvals, intellectual property rights problems, or generic or other forms of competition, could have a material adverse effect on our financial position, cash flows or overall trends in results of operations.
We no longer have patent protection for our URSO product lines in the United States and Canada. This is likely to result in competition from generic products and could lead to a significant reduction in our sales of this drug.
On November 19, 2007, our U.S. patent covering URSO 250 / URSO FORTE’s use in the treatment of PBC expired. In addition, the validity of our Canadian patent for the similar use of URSO and URSO DS in Canada was successfully challenged in 2006 by Pharmascience Inc., a generic product manufacturer, under the Notice of Compliance Regulation procedures of Health Canada. Therefore, these products no longer benefit from any effective patent protection or other form of regulatory protection or exclusivity in the United States or Canada.
As a result, competition from generic products that treat the same conditions may increase. Sales of generic products in Canada have already had a negative sales impact on our Canadian sales of URSO / URSO DS; this trend is expected to continue going forward. The loss of intellectual property protection in the United States and generic competition for our URSO 250 / URSO FORTE product line, which made up approximately 24.2% of our total revenues in fiscal year 2008, could have a material adverse effect on our results of operations and financial condition.
We have or may undertake certain product lifecycle management initiatives to modify or improve URSO, which we believe, may help maintain sales of URSO in the face of generic competition. See “Item 1. Business—Business Strategy” and “Business—Products.” There is no assurance, however, that any of these improvements will allow us to maintain sales of URSO at historic levels, and generic sales could have a significant negative impact on our sales of URSO.
We no longer have clinical investigation exclusivity in the United States for our CANASA product line. This could result in competition from generic products leading to a significant reduction in sales of this product line.
Although our CANASA product line does not have any patent protection in the United States, we previously had clinical investigation exclusivity from the FDA covering a change in the formulation of this drug from a 500 mg formulation to a 1,000 mg formulation. This clinical investigation exclusivity effectively precluded the FDA from approving a competitor’s abbreviated new drug application, or ANDA, for a 1,000 mg mesalamine product for a period of three years. However, pursuant to the Drug Price Competition and Patent Term Restoration Act, or the Hatch-Waxman Act, this exclusivity expired in November 2007.
The lack of patent protection and the loss of exclusivity for this product in the United States could give rise to competition from generic products or therapeutically substitutable products. A significant reduction in the sales for this product, which made up 18.7% of our revenues in fiscal year 2007 and 18.8% of our revenues for fiscal year 2008, could have a material adverse effect on our results of operations and financial condition.
- 25 -
In February 2006, the FDA published draft guidance indicating that placebo-controlled trials with clinical endpoints will be required for approval of generic mesalamine suppository products. We believe that these requirements will likely increase the costs of obtaining FDA approval and may make it more difficult, lengthy and costly for potential competitors to obtain the FDA approval required to sell a competing mesalamine suppository in the United States. However, there is no assurance that the FDA will require companies seeking approval of a mesalamine suppository product to comply with this draft guidance, and we cannot provide assurances that a potential competitor will not be able to meet such requirements. If a generic or therapeutically substitutable mesalamine suppository is approved by the FDA, it could significantly and negatively impact our sales of CANASA in the future.
Some of our key products face competition from generic or unbranded products.
Some of our key products, including products from our ULTRASE, URSO and CANASA product lines, currently face competition from generic or unbranded products (such as ACTIGALL™ and its generics in the case of URSO, other branded and unbranded pancreatic enzyme products, or PEPs, in the case of ULTRASE and other rectal dosage forms of mesalamine in the case of CANASA). Third-party payors and pharmacists can substitute generic or unbranded products for our products even if physicians prescribe our products by name. Particularly in the United States, government agencies and third-party payors often put pressure on patients to purchase generic products instead of brand-name products as a way to reduce healthcare costs.
Products which are no longer protected by a marketing exclusivity or a patent are subject to generic competition. Generic competition against any of our products would lower prices and unit sales and could therefore have a material adverse effect on our results of operations and financial condition.
Our revenues from ULTRASE and VIOKASE are subject to significant regulatory risk.
In April 2004, the FDA formally notified manufacturers of PEPs that these drugs had to be approved by the FDA in order to remain on the market. Under current requirements, manufacturers are required to file INDs for their PEPs by April 2008, to file NDAs by April 2009 and to obtain FDA approval by April 2010. The FDA decided to require these approvals for all pancreatic extract drug products after reviewing data that showed substantial variation among currently marketed PEPs.
ULTRASE, our enteric coated pancreatic enzyme formulation, accounted for approximately 15.5%, or $59.2 million, of our revenues in fiscal year 2008. We filed an NDA for the mini-tablet formulation of ULTRASE, ULTRASE MT, in September 2007 and such filing was accepted for review by the FDA during the first quarter of fiscal year 2008. On July 1, 2008, we received an approvable letter from the FDA regarding our NDA for ULTRASE MT, citing certain chemistry, manufacturing and control data work concerns and we are currently preparing a response to the FDA’s comments in collaboration with our manufacturing partners and expect that required regulatory filings will be made in time to comply with the FDA’s guidelines. However, there is no guarantee that we will succeed in obtaining approval for such product from the FDA prior to April 2010 or at all. We have filed an IND for VIOKASE and are working towards obtaining FDA approval by April 2010, but we cannot assure you that our NDA will be accepted for review or approved by the FDA. If we are unable to obtain FDA approval to market ULTRASE or VIOKASE prior to April 2010, we would no longer be able to sell ULTRASE or VIOKASE in the United States, which would impair our results of operations and liquidity.
Despite the FDA’s announcement of its intention to remove from the market those PEPs for which an IND has not been filed by April 2008, for which an NDA has not been filed by April 2009, and which have not been approved by April 2010, its position is non-binding. As a result, the FDA may not pursue regulatory action against companies that fail to meet these deadlines.
If we are successful in obtaining FDA approval for ULTRASE and VIOKASE and the FDA does not enforce its stated position, the level of competition that our ULTRASE and VIOKASE product lines currently face in the market may not decline and could increase in the future.
The concentration of our product sales to only a few wholesale distributors increases the risk that we will not be able to effectively distribute our products if we need to replace any of these distributors, which would cause our sales to decline.
The majority of our sales are to a small number of pharmaceutical wholesale distributors, which in turn sell our products primarily to retail pharmacies, which ultimately dispense our products to the end consumers. In fiscal year 2008, sales to our main customer, Customer A, accounted for 39.0% of our total revenue, sales to Customer B accounted for 26.6% of our total revenue, and sales to Customer C accounted for 10.3% of our total revenue.
- 26 -
If any of these distributors cease doing business with us or materially reduce the amount of product they purchase from us and we cannot conclude agreements with replacement wholesale distributors on commercially reasonable terms, we might not be able to effectively distribute our products through retail pharmacies. The possibility of this occurring is exacerbated by the recent significant consolidation in the wholesale drug distribution industry, including through mergers and acquisitions among wholesale distributors and the growth of large retail drugstore chains. As a result, a small number of large wholesale distributors control a significant share of the market.
Wholesaler buying patterns may change, and this could have a detrimental effect on our future revenue and financial condition.
Wholesalers, on which we largely depend for revenue generation, have historically practiced inventory price arbitrage. For example, in the past prior to any routine increase in prices for drugs by manufacturers, many of our wholesalers have purchased excess inventory at lower prices and resold the inventory after the price increase, thereby profiting. This inventory price arbitrage was predominantly how wholesalers were previously compensated for the distribution services they provided and had a dramatic effect on wholesaler buying patterns as wholesalers invested in inventories in anticipation of generating higher gross margins from price increases from manufacturers.
Recently, pharmaceutical manufacturers have not been able to increase drug prices as frequently as they used to, and the percentage of any such increases has been lower. The reduction in the size and frequency of price increases has contributed to wholesalers turning to fee-for-service arrangements under which their fees are expressed as a percentage of the wholesaler’s purchases from the manufacturer or as an amount per unit. As a result, wholesalers’ buying patterns have shifted from large pre-price-increase purchases to more periodic purchasing based on volume activity. Typically, wholesalers that have entered into these fee-for-service arrangements carry lower levels of inventory. This change in wholesalers’ business model has and may in the future negatively impact our revenues.
In 2006, we entered into a distribution services agreement, or a DSA, with one of our pharmaceutical wholesale distributors, which replaced a previous 2004 DSA. We anticipate that we will also enter into DSAs with our two other primary pharmaceutical wholesale distributors. Once these DSAs are put in place, these pharmaceutical wholesale distributors could reduce their inventory levels. Our DSA provides that the customer with which we have it will gradually reduce the levels of inventory of our products that it carries over a four-year period ending in 2009. There is no assurance that any DSA we enter with our other pharmaceutical wholesale distributors will include a provision for the gradual reduction of inventory levels. A reduction in inventory levels by a pharmaceutical wholesale distributor would result in a reduction in our sales to such wholesale distributor for the period during which the reduction occurs, and would have a negative effect on our results of operations for the period, particularly if such reduction is not effected gradually.
We deduct these DSA fees, which totaled approximately $3.6 million and $2.1 million for fiscal year 2007 and fiscal year 2008, respectively, from our total revenues. In the quarter ended September 30, 2006, we chose to adopt the classification of these fees as a deduction from sales. Previously, these fees were included in selling and administrative expenses. If we enter into DSAs with additional wholesalers, we will likely have to pay DSA fees to these wholesalers, which will further reduce our revenue in future periods.
Generally, changes in wholesaler buying patterns may occur in the future, and these changes could result in a reduction in our revenues and could have a detrimental effect on our overall financial condition or results of operations.
Our quarterly results may fluctuate.
Our quarterly operating results have fluctuated in the past and may continue to fluctuate in the future. Factors, many of which are not within our control, that could cause quarterly operating results to decline include, for example, the size and timing of product orders, which can be affected by customer budgeting and buying patterns, or the size and timing of expenses associated with our development and marketing programs. As a result, if customer buying patterns cause revenue shifts from one fiscal quarter to another, or if the development and marketing of our products causes our expenses to change from one fiscal quarter to another, our net quarterly income may not fluctuate.
- 27 -
Our business depends on key scientific, sales and managerial personnel for continued success.
Much of our success to date has resulted from the skills of certain of our officers, scientific personnel and sales force. If these individuals were no longer employed by us, we might not be able to attract or retain employees with similar skills or carry out our business plan.
We use third parties to manufacture and perform analytical testing for almost all of our products and product candidates. This may increase the risk that we will not have sufficient quantities of our products or product candidates or such quantities at an acceptable cost, which could adversely affect sales of our products and could result in the clinical development and commercialization of our product candidates being delayed, prevented or impaired.
We currently rely, and expect to continue to rely, on third parties for (i) the supply and testing of the active pharmaceutical ingredients in our products and product candidates, and (ii) the manufacture and testing of the finished forms of these drugs and their packaging. The current manufacturers of our products and product candidates are, and any future third party manufacturers that we enter into agreements with will likely be, our sole suppliers of our product candidates for a significant period of time. These manufacturers are commonly referred to as single source suppliers. The agreements with our suppliers expire at various times between 2009 and 2015. If we are unable to renew these agreements on favorable terms or find suitable alternatives, our business could be adversely affected. Some of our contracts prohibit us from using alternative manufacturers or suppliers for the products supplied under these contracts, which prevents us from diversifying manufacturing and supply sources. In addition, we currently purchase clinical supplies for many of our product candidates from third party manufacturers on a purchase order basis under short-term supply agreements. If any of these manufacturers should become unavailable to us for any reason, we may be unable to conclude agreements with replacements on favorable terms, if at all, and may be delayed in identifying and qualifying such replacements. In any event, identifying and qualifying a new third party manufacturer could involve significant costs associated with the transfer of the active pharmaceutical ingredient or finished product manufacturing process. A change in manufacturers or testers requires formal approval by the FDA before the new manufacturer may produce commercial supplies of our products. This approval process typically takes a minimum of 12 to 18 months and during that time we may face a shortage of supply of our products.
Reliance on third party manufacturers entails risks to which we would not be subject if we manufactured or tested products or product candidates ourselves, including:
| | • | | reliance on the third party for regulatory compliance, including the procurement and maintenance of necessary regulatory approvals, and quality assurance; |
| | • | | the possible breach of the manufacturing agreement by the third party because of factors beyond our control; and |
| | • | | the possible termination or non-renewal of the agreement by the third party, based on its own business priorities, at a time that is costly or inconvenient for us. |
Our products and product candidates may compete with other products and product candidates for access to manufacturing facilities. There are a limited number of manufacturers that operate under current good manufacturing practice regulations and that are both capable of manufacturing for us and willing to do so. If the third parties that we engage to manufacture and/or test a product for commercial sale or for our clinical trials should cease to continue to do so for any reason, we likely would experience delays in obtaining sufficient quantities of our products for us to meet commercial demand or in advancing our clinical trials while we identify and qualify replacement suppliers. If for any reason we are not able to obtain adequate supplies of our product candidates or the drug substances used to manufacture them, it will be more difficult for us to develop our product candidates and compete effectively.
Our current and anticipated future dependence upon others for the manufacture of our products and product candidates may adversely affect our profit margins and our ability to develop product candidates and commercialize any additional products that receive regulatory approval on a timely and competitive basis.
We rely on our third party manufacturers for compliance with applicable regulatory requirements. This may increase the risk of sanctions being imposed on us or on a manufacturer of our products or product candidates, which could result in our inability to obtain sufficient quantities of these products or product candidates.
Our manufacturers may not be able to comply with current good manufacturing practice regulations or other regulatory requirements or similar regulatory requirements outside the United States. Our manufacturers are subject to unannounced inspections by the FDA, state regulators and similar regulators outside the United States. Our failure, or the failure of our third party manufacturers, to comply with applicable regulations, including, in the case of ULTRASE and VIOKASE, the FDA’s guidelines for pancreatic enzyme product manufacturers, could result in sanctions being imposed on us, including:
- 28 -
| | • | | failure of regulatory authorities to grant marketing approval of our product candidates; |
| | • | | delays, suspension or withdrawal of approvals; |
| | • | | suspension of manufacturing operations; |
| | • | | seizures or recalls of products or product candidates; |
| | • | | operating restrictions; and |
Any of these sanctions could significantly and adversely affect supplies of our products and product candidates and may adversely affect our profit margins and our ability to develop product candidates and commercialize any additional products that receive regulatory approval on a timely and competitive basis.
We rely on third parties to conduct, supervise and monitor our clinical trials, and those third parties may perform in an unsatisfactory manner, such as by failing to meet established deadlines for the completion of such trials.
We rely on third parties such as contract research organizations, medical institutions and clinical investigators to enroll qualified patients and conduct, supervise and monitor our clinical trials. Our reliance on these third parties for clinical development activities reduces our control over these activities. Our reliance on these third parties, however, does not relieve us of our regulatory responsibilities, including ensuring that our clinical trials are conducted in accordance with good clinical practice regulations, and the investigational plan and protocols contained in the relevant regulatory application, such as the IND. In addition, such third parties may not complete activities on schedule, or may not conduct our preclinical studies or clinical trials in accordance with regulatory requirements or our trial design. If these third parties do not successfully carry out their contractual duties or meet expected deadlines, our efforts to obtain regulatory approvals for, and to commercialize, our product candidates may be delayed or prevented.
We may not be able to acquire or successfully integrate new products or businesses.
Our products are maturing and therefore a significant component of our strategy is growth through acquisitions of products or businesses. However, we cannot be certain that we will be able to identify appropriate acquisition candidates. Even if an acquisition candidate is identified, there can be no assurance we will be able to successfully negotiate the terms of any such acquisition on favorable terms or at all, finance such acquisition or integrate such acquired product or business into our existing business. We face significant competition from other pharmaceutical companies for acquisition candidates, which makes it more difficult to find attractive transaction opportunities for products or companies on acceptable terms. Furthermore, the negotiation of potential acquisitions and the integration of such acquired products or businesses could divert management’s time and resources and require significant financial resources to consummate. Failure to acquire new products may diminish our rate of growth and adversely affect our competitive position.
Acquisitions that we may undertake will involve a number of inherent risks, any of which could cause us not to realize the anticipated benefits.
One of our key strategies will be acquisitions of additional products and/or businesses. Acquisition transactions involve various inherent risks, such as assessing the value, strengths, weaknesses, contingent and other liabilities and potential profitability of the acquisition; the potential loss of key personnel of an acquired business; the ability to achieve identified operating and financial synergies anticipated to result from an acquisition and unanticipated changes in business, industry or general economic conditions that affect the assumptions underlying the acquisition. Any one or more of these factors could cause us not to realize the anticipated benefits from the acquisition of businesses or products.
- 29 -
If our products fail in clinical studies or if we fail, or encounter difficulties, in obtaining regulatory approval for our new products or new indications of existing products, we will have expended significant resources for no return.
If our products are not successful in clinical trials or if we do not obtain such regulatory approvals, we will have expended significant resources for no return. For example, in fiscal year 2005, our clinical trials of itopride hydrochloride, or ITAX, a proposed treatment for functional dyspepsia, were not successful and we terminated the program in 2006. Our ongoing clinical studies might be delayed or halted or additional studies might be required, for various reasons, including if:
| | • | | our products are shown not to be effective; |
| | • | | we do not comply with requirements concerning the investigational NDAs, BLAs or New Drug Submissions, or NDSs, for the protection of the rights and welfare of human subjects; |
| | • | | patients experience unacceptable side effects or die during clinical trials; |
| | • | | patients do not enroll in the studies at the rate we expect; |
| | • | | a drug is modified during testing; or |
| | • | | product supplies are delayed or are not sufficient to treat the patients participating in the studies. |
If we cannot obtain regulatory approvals for the products we are developing or may seek to develop in the future, our rate of sales growth and competitive position will suffer. This risk is most acute for products that are currently in the development of the final formulation, such as AGI-010, our controlled release omeprazole product; Cx401, our biological product for the treatment of perianal fistulas; or ULTRASE and VIOKASE, our pancreatic enzyme products, for which we need to comply with FDA’s requirement in order to remain on the market.
Approval might entail ongoing requirements for post-marketing studies. Even if regulatory approval is obtained, labeling and promotional activities are subject to continual scrutiny by the regulatory agencies, in particular the FDA, and, in some circumstances, the Federal Trade Commission. FDA enforcement policy prohibits the marketing of approved products for unapproved, or off-label, uses. These regulations and the FDA’s interpretation of them might impair our ability to effectively market our products.
We, our third-party manufacturers and certain of our suppliers are also required to comply with the applicable FDA current Good Manufacturing Practices regulations, which include requirements relating to quality control and quality assurance, as well as the corresponding maintenance of records and documentation. Furthermore, manufacturing facilities must be approved by regulatory authorities before they can be used to manufacture our products and certain raw materials used therein, and they are subject to additional inspections. If we or any of our manufacturers or suppliers fails to comply with any of the FDA’s or other relevant foreign counterparts continuing regulations, we could be subject to sanctions, including:
| | • | | delays, warning letters and fines; |
| | • | | product recalls or seizures and injunctions on sales; |
| | • | | refusal to review pending applications; |
| | • | | total or partial suspension of production; |
| | • | | withdrawals of previously approved marketing applications; and |
| | • | | civil penalties and criminal prosecutions. |
In addition, identification of side effects after a drug is on the market or the occurrence of manufacturing problems could cause subsequent withdrawal of the product from the market, reformulation of the drug, additional testing or changes in labeling of the product.
Our approved products and pipeline products remain subject to ongoing regulatory requirements. If we fail to comply with these requirements, we could lose these approvals, and the sales of any such approved commercial products could be suspended.
After receipt of initial regulatory approval, each product remains subject to extensive regulatory requirements, including requirements relating to manufacturing, labeling, packaging, adverse event reporting, storage, advertising, promotion, distribution and recordkeeping. Furthermore, even if we receive regulatory approval to market a particular product, such product will remain subject to the same extensive regulatory requirements. Even if regulatory approval of a product is granted, the approval may be subject to limitations on the uses for which the product may be marketed or the conditions of approval, or contain requirements for costly post-marketing testing and surveillance to monitor the safety or efficacy of the product, which could reduce our revenues, increase our expenses and render the approved product not commercially viable. In addition, as clinical experience with a drug expands after approval because it is typically used by a greater number and more diverse group of patients after approval than during clinical trials, side effects and other problems may be observed after approval that were not seen or anticipated during pre-approval clinical trials or other studies.
- 30 -
Our business could suffer as a result of adverse drug reactions to the products we market.
Unexpected adverse drug reactions by patients to any of our products could negatively impact utilization or market availability of our product.
Absence of long-term safety data may also limit the approved uses of our products, if any. If we fail to comply with the regulatory requirements of the FDA and other applicable regulatory authorities, or if previously unknown problems with any approved commercial products, manufacturers or manufacturing processes are discovered, we could be subject to administrative or judicially imposed sanctions or other setbacks, including:
| | • | | restrictions on the products, manufacturers or manufacturing processes; |
| | • | | warning letters and untitled letters; |
| | • | | civil penalties and criminal prosecutions and penalties; |
| | • | | product seizures or detentions; |
| | • | | import or export bans or restrictions; |
| | • | | voluntary or mandatory product recalls and related publicity requirements; |
| | • | | suspension or withdrawal of regulatory approvals; |
| | • | | total or partial suspension of production; and |
| | • | | refusal to approve pending applications for marketing approval of new products or of supplements to approved applications. |
We may find it difficult to achieve market acceptance of products in our product pipeline.
The commercial success of any of our product candidates for which we obtain marketing approval from the FDA, Health Canada’s Therapeutic Products Directorate, or TPD, or other regulatory authorities will depend upon the acceptance of these products by the medical community, including physicians, patients and healthcare payors. The degree of market acceptance of any of our approved products will depend on a number of factors, including:
| | • | | demonstration of clinical safety and efficacy compared to other products; |
| | • | | the relative convenience and ease of administration; |
| | • | | the prevalence and severity of any adverse side effects; |
| | • | | limitations or warnings contained in a product’s FDA or TPD approved labeling; |
| | • | | availability of alternative treatments for the indications we target; |
| | • | | pricing and cost effectiveness compared to competing products, particularly generic products; |
| | • | | the effectiveness of our or any future collaborators’ sales and marketing strategies; |
| | • | | the effectiveness of our manufacturing and distribution plans; |
| | • | | our ability to obtain sufficient third-party coverage or reimbursement; and |
| | • | | the willingness of patients to pay out-of-pocket in the absence of third-party coverage. |
If any of our product candidates are approved but do not achieve an adequate level of acceptance by physicians, healthcare payors and patients, we may not generate sufficient revenue from these products for such products to become or remain profitable. In addition, our efforts to educate the medical community and third-party payors on the benefits of our product candidates may require significant resources and may never be successful.
The publication of negative results of studies or clinical trials may adversely impact our sales revenue.
From time to time, studies or clinical trials on various aspects of pharmaceutical products are conducted by academics or others, including government agencies. The results of these studies or trials, when published, may have a dramatic effect on the market for the pharmaceutical product that is the subject of the study. The publication of negative results of studies or clinical trials related to our products or the therapeutic areas in which our products compete could adversely affect our sales, the prescription trends for our products and the reputation of our products. In the event of the publication of negative results of studies or clinical trials related to our products or the therapeutic areas in which our products compete, our business, financial condition, results of operation and cash flows could be materially adversely affected.
- 31 -
There is no assurance that we will continue to be successful in our licensing and marketing operations.
Certain of our products are sold and marketed by third parties. Such third-party arrangements may not be successfully negotiated in the future. Any such arrangements may not be available on commercially reasonable terms. Even if acceptable and timely marketing arrangements are available, the products we develop may not be accepted in the marketplace, and even if such products are initially accepted, sales may thereafter decline. Additionally, our clients or marketing partners may make important marketing and other commercialization decisions with respect to products we develop that are not within our control. As a result, many of the variables that may affect our revenues, cash flows and net income are not exclusively within our control.
The success of our strategic investments, partnerships or development alliances (like our co-development of AGI-010 and Cx401) depends upon the performance of the companies in which we invest, or with which we partner or co-develop products.
Economic, governmental, industry and internal company factors outside our control affect each of the companies in which we may invest or with which we may partner or co-develop products, like AGI Therapeutics Research Ltd. and Cellerix S.L. Some of the material risks relating to such companies include:
| | • | | the ability of these companies to successfully develop, manufacture and obtain necessary governmental approvals for the products which serve as the basis for our investments in, or relationship with, such companies; |
| | • | | the ability of competitors of these companies to develop similar or more effective products, making the drugs developed by these companies difficult or impossible to market; |
| | • | | the ability of these companies to adequately secure patents for their products and protect their proprietary information; |
| | • | | the ability of these companies to enter the marketplace without infringing upon competitors’ patents; |
| | • | | the ability of these companies to finance their operations; |
| | • | | the ability of these companies to remain technologically competitive; and |
| | • | | the dependence of these companies upon key scientific and managerial personnel. |
We may have limited or no control over the resources that any such company may devote to develop the products for which we collaborate with them. Any such company may not perform as expected. These companies may breach or terminate their agreements with us or otherwise fail to conduct product discovery and development activities successfully, or in a timely manner. If any of these events occurs, it could have a material adverse effect on our business and our financial results.
The pharmaceutical industry is highly competitive and is subject to rapid and significant change, which could render our products obsolete or uncompetitive.
Our products face competition from other pharmaceutical and generic companies. We compete with companies in the U.S., Canada and internationally, including major pharmaceutical and generic companies. Many of our competitors have greater financial resources and selling and marketing capabilities, have greater experience in clinical testing and human clinical trials of pharmaceutical products, and have greater experience in obtaining approvals from the FDA, the TPD, or other applicable regulatory approvals. Our competitors may succeed in developing products that are more effective or less expensive to use than any that we may develop or license. These developments could render our products obsolete or uncompetitive, which would have a material adverse effect on our business and financial results.
Pricing pressures from, and other measures taken by, third-party payors, including managed care organizations, government sponsored health systems and regulations relating to Medicare and Medicaid, healthcare reform, pharmaceutical reimbursements and pricing in general could decrease our revenues.
Our ability to successfully commercialize our products and product candidates—even if FDA or TPD approval is obtained—depends, in part, on whether appropriate reimbursement levels for the cost of the products and related treatments are obtained from government authorities and private health insurers and other organizations, such as Health Maintenance Organizations, or HMOs, Managed-Care Organizations, or MCOs, and provincial formularies.
Third-party payors increasingly challenge the pricing of pharmaceutical products. In addition, the trend toward managed health-care in the U.S., the growth of organizations such as HMOs and MCOs, and legislative proposals to reform health-care and government insurance programs, could significantly influence the purchase of pharmaceutical products, resulting in lower prices and a reduction in product demand. One way in which managed care organizations and government sponsored health systems seek to control their costs is by developing formularies to encourage plan beneficiaries to utilize preferred products for which the plans have
- 32 -
negotiated favorable terms. Exclusion of a product from a formulary, or placement of a product on a disfavored formulary tier, can lead to sharply reduced usage in the patient population covered by the applicable managed care organization or government sponsored health system. If our products are not included within an adequate number of formularies or if adequate reimbursement levels are not provided, or if reimbursement policies increasingly favor generic products, our market share and business could be negatively affected.
Recent reforms in Medicare added an out-patient prescription drug reimbursement beginning 2006 for all Medicare beneficiaries. The U.S. federal government and private plans contracting with the government to deliver the benefit, through their purchasing power under these programs, are demanding discounts from pharmaceutical companies that may implicitly create price controls on prescription drugs. These reforms may decrease our future revenues from product lines such as CARAFATE, URSO, ULTRASE, CANASA and PYLERA that are covered by the Medicare drug benefit. Further, a number of other legislative and regulatory proposals aimed at changing the healthcare system have been proposed. While we cannot predict whether any such proposals will be adopted or the effect such proposals may have on our business, the existence of such proposals, as well as the adoption of any proposal, may increase industry-wide pricing pressures, thereby adversely affecting our results or operations and cash flows.
Uncertainty also exists regarding the reimbursement status of certain newly-approved pharmaceutical products and reimbursement may not be available for some of our products. Any reimbursements granted may not be maintained or limits on reimbursements available from third-party payors may reduce the demand for, or negatively affect the price of, these products. If our products do not qualify for reimbursement, if reimbursement levels diminish, or if reimbursement is denied, our sales and profitability would be adversely affected.
Our relationships with customers and payors are subject to applicable fraud and abuse and other healthcare laws and regulations, which could expose us to criminal sanctions, civil penalties, contractual damages, reputational harm, and diminished profits and future earnings.
Healthcare providers, physicians and others play a primary role in the recommendation and prescription of our products. Our arrangements with third party payors and customers may expose us to broadly applicable fraud and abuse and other healthcare laws and regulations that may constrain the business or financial arrangements and relationships through which we market, sell and distribute our products. Applicable U.S. federal and state healthcare laws and regulations, include, but are not limited to, the following:
| | • | | The federal healthcare anti-kickback statute prohibits, among other things, persons from knowingly and willfully soliciting, offering, receiving or providing remuneration, directly or indirectly, in cash or in kind, to induce or reward either the referral of an individual for, or the purchase, order or recommendation of, any good or service, for which payment may be made under federal healthcare programs such as Medicare and Medicaid. |
| | • | | The federal False Claims Act imposes criminal and civil penalties, against individuals or entities for knowingly presenting, or causing to be presented, to the federal government, claims for payment that are false or fraudulent or making a false statement to avoid, decrease, or conceal an obligation to pay money to the federal government. |
| | • | | The federal false statements statute prohibits knowingly and willfully falsifying, concealing or covering up a material fact or making any materially false statement in connection with the delivery of or payment for healthcare benefits, items or services. |
| | • | | Analogous state laws and regulations, such as state anti-kickback and false claims laws, may apply to sales or marketing arrangements and claims involving healthcare items or services reimbursed by non-governmental third party payors, including private insurers, and some state laws require pharmaceutical companies to comply with the pharmaceutical industry’s voluntary compliance guidelines and the relevant compliance guidance promulgated by the federal government. |
| | • | | There are similar laws in countries outside the United States. |
Efforts to ensure that our business arrangements with third parties comply with applicable healthcare laws and regulations could be costly. It is possible that governmental authorities will conclude that our business practices may not comply with current or future statutes, regulations or case law involving applicable fraud and abuse or other healthcare laws and regulations. If our past or present operations, including activities conducted by our sales team or agents, are found to be in violation of any of these laws or any other governmental regulations that may apply to us, we may be subject to significant civil, criminal and administrative penalties, damages, fines, exclusion from third party payor programs, such as Medicare and Medicaid, and the curtailment or restructuring of our operations. If any of the physicians or other providers or entities with whom we do business are found to be not in compliance with applicable laws, they may be subject to criminal, civil or administrative sanctions, including exclusions from government funded healthcare programs.
- 33 -
Many aspects of these laws have not been definitively interpreted by the regulatory authorities or the courts, and their provisions are open to a variety of subjective interpretations, which increases the risk of potential violations. In addition, these laws and their interpretations are subject to change. Any action against us for violation of these laws, even if we successfully defend against it, could cause us to incur significant legal expenses, divert our management’s attention from the operation of our business and damage our reputation.
Recently enacted legislation may make it more difficult and costly for us to obtain regulatory approval of our product candidates and to produce, market and distribute our existing products.
On September 27, 2007, President Bush signed the Food and Drug Administration Amendments Act of 2007, or FDAAA, into law. The FDAAA grants a variety of new powers to the FDA, many of which are aimed at improving drug safety and assuring the safety of drug products after approval. Under the FDAAA, companies that violate the new law are subject to substantial civil monetary penalties. While we expect the FDAAA to have a substantial effect on the pharmaceutical industry, the extent of that effect is not yet known. As the FDA issues regulations, guidance and interpretations relating to the new legislation, the impact on the industry, as well as our business, will become clearer. The new requirements and other changes that the FDAAA imposes may make it more difficult, and likely more costly, to obtain approval of new pharmaceutical products and to produce, market and distribute existing products.
Changes in laws and regulations could affect our results of operations, financial position or cash flows.
Our future operating results, financial position or cash flows could be adversely affected by changes in laws and regulations such as (i) changes in the FDA or TPD (or their foreign equivalents) approval processes that may cause delays in, or prevent the approval of, new products, (ii) new laws, regulations and judicial decisions affecting product development, marketing, promotion or the healthcare field generally, (iii) new laws or judicial decisions affecting intellectual property rights and (iv) changes in the application of tax principles, including tax rates, new tax laws, or revised interpretations of existing tax laws and precedents, which result in shift of taxable earnings between tax jurisdictions.
We may be subject to investigations or other inquiries concerning our compliance with reporting obligations under federal healthcare program pharmaceutical pricing requirements.
Under federal healthcare programs, some state governments and private payors investigate and have filed civil actions against numerous pharmaceutical companies alleging that the reporting of prices for pharmaceutical products has resulted in false and overstated Average Wholesale Price, or AWP, which in turn may be alleged to have improperly inflated the reimbursements paid by Medicare, private insurers, state Medicaid programs, medical plans and others to healthcare providers who prescribed and administered those products or pharmacies that dispensed those products. These same payors may allege that companies do not properly report their “best prices” to the state under the Medicaid program. Suppliers of outpatient pharmaceuticals to the Medicaid program are also subject to price rebate agreements. Failure to comply with these price rebate agreements may lead to federal or state investigations, criminal or civil liability, exclusion from federal healthcare programs, contractual damages, and otherwise harm our reputation, business and prospects.
Future litigation and the outcome of current litigation may harm our business.
In general, and subject to the terms of each specific agreement, we have agreed to indemnify our licensors, distributors and certain of our contract manufacturers for product liability claims and there is a risk that we will be subject to product liability claims and claims for indemnification under these agreements. A substantial portion of our revenues are derived and will continue to be derived from activities in the United States, where pharmaceutical companies are exposed to a higher risk of litigation than in other jurisdictions.
Currently, we maintain claims-based product liability insurance coverage in respect of all our products marketed in the United States. We cannot be certain that existing or future insurance coverage available to us will be adequate to satisfy any or all future product liability claims and defense costs in the United States.
Exposure relating to product liability claims may harm our business.
We face an inherent business risk of exposure to product liability and other claims in the event that the use of our products results, or is alleged to have resulted, in adverse effects. While we have taken, and will continue to take, what we believe are appropriate precautions, there can be no assurance that we will avoid significant product liability claims. Although we currently carry product liability insurance that we believe is appropriate for the risks that we face, there can be no assurance that we have sufficient coverage, or can in the future obtain sufficient coverage at a reasonable cost. An inability to obtain product liability insurance at an acceptable cost or to otherwise protect against potential product liability claims could prevent or inhibit the
- 34 -
growth of our business or the number of products we can successfully market. Our obligation to pay indemnities, the withdrawal of a product following complaints, or a product-liability claim could have a material adverse effect on our business, results of operations, cash flows and financial condition. For details regarding certain litigation matters in which we are currently involved, see “Item 3. Legal Proceedings”.
Our business is subject to limitations imposed by government regulations.
Governmental agencies in the countries in which we conduct business regulate pharmaceutical products intended for human use. These regulations normally require extensive clinical trials and other testing in addition to governmental review and final approval before products can be marketed. Governmental authorities in such countries also regulate the research and development, manufacture, distribution, promotion, testing and safety of products, and therefore, the cost of complying with governmental regulations can be substantial.
Requirements for approval can vary widely from country to country. A product must normally be approved by regulatory authorities in each country in which we intend to market it, prior to the commencement of marketing in such country. There can be long delays in obtaining required clearances from regulatory authorities in many countries after applications are filed. Therefore, there can be no assurance that we will obtain regulatory approvals in such countries or that we will not incur significant costs in obtaining or maintaining such regulatory approvals. Moreover, the regulations applicable to our existing and future products may change.
Government regulations require the detailed inspection and control of research and laboratory procedures, clinical studies, manufacturing procedures and marketing and distribution methods, all of which significantly increase the level of difficulty and the costs involved in obtaining and maintaining the regulatory approval for marketing new and existing products. Moreover, regulatory measures adopted by governments provide for the possible withdrawal of products from the market and in certain cases, suspension or revocation of the required approvals for their production and sale.
Failure to obtain necessary regulatory approvals; the restriction, suspension or revocation of existing approvals; or any other failure to comply with regulatory requirements would restrict or impair our ability to market our products and carry on our business.
We rely on the intellectual property of others, and we may not be able to protect our own intellectual property.
Our continued success will depend, in part, on our ability to obtain, protect and maintain intellectual property rights and licensing arrangements for our products. Some of the proprietary rights in some of our products are held by third parties, which require us to obtain licenses for the use of such products. Despite these licenses, there can be no guarantees that the rights or patents used by us will not be challenged by third parties. Furthermore, an adverse outcome could lead to an infringement or other legal actions being brought against us directly. We have filed and/or licensed patent applications related to certain of our products, but such applications may fail to be granted, or, even if granted, may be challenged or invalidated or may fail to provide us with any competitive advantages.
To protect our own intellectual property, we have historically relied on patents and trade secrets, know-how and other proprietary information, as well as requiring our employees and other vendors and suppliers to sign confidentiality agreements which prohibit them from taking our proprietary information and technology or from using or disclosing proprietary information to third parties except in specified circumstances. However, confidentiality agreements may be breached despite all precautions taken, and we may not have adequate remedies for any breach. Third parties may gain access to our proprietary information or may independently develop substantially equivalent proprietary information. Our inability to protect and maintain intellectual property rights in our products may impair our competitive position and adversely affect our growth.
Litigation or third party claims of intellectual property infringement could require substantial time and money to resolve. Unfavorable outcomes to these proceedings could limit our intellectual property rights and our activities.
Third party patents (now or in the future) may cover the materials or methods of treatment related to our products and third parties may make allegations of infringement, regardless of merit. We cannot provide any assurances that our products or activities, or those of our licensors, will not infringe patents or other intellectual property owned by third parties. We have been (and from time to time we may be) notified that third parties consider their patents or other intellectual property relevant to our products.
- 35 -
In addition, we may from time to time have access to confidential or proprietary information of third parties that could bring a claim against us asserting that we have misappropriated their technology (which, although not patented, may be protected by trade secrets) and that we have improperly incorporated that technology into our products. Some of our employees may have been employed by other pharmaceutical or biotechnology companies that may allege violations of their trade secrets by these individuals, irrespective of the steps that we may take to prevent such allegations.
If a lawsuit is commenced with respect to any alleged intellectual property infringement by us, the uncertainties inherent in such litigation make the outcome difficult to predict, and the costs that we may incur as a result may have an adverse effect on our profitability. Such litigation would involve significant expense and would be a substantial diversion of the efforts of our scientific and our management teams. During the course of any intellectual property litigation, there may be public announcements regarding claims and defenses, and regarding the results of hearings, motions and other interim proceedings or developments in the litigation. If securities analysts or investors perceive these announcements as negative, the market price of the secured notes or any other securities that we may issue from time to time may decline.
Any such lawsuit that culminates in an adverse determination may result in the award of monetary damages to the intellectual property holder and payment by us of any such damages, and/or an injunction prohibiting all of our business activities that infringe the intellectual property, or may require us to obtain licenses from third parties on terms that may not be commercially acceptable to us, which would in each case adversely affect our profitability and our business. If so, we may attempt to redesign our processes, products or technologies so that they do not infringe, but that might not be possible. If we cannot obtain a necessary or desirable license, can obtain such a license only on terms that we consider to be unattractive or unacceptable, or cannot redesign our products or processes to avoid potential patent or other intellectual property infringement, then we or our collaborators may be restricted or prevented from developing and commercializing our products and our business will be harmed.
We might be impacted by unfavorable decisions in proceedings related to future tax assessments.
We operate in a number of jurisdictions and are from time to time subject to audits and reviews by taxation authorities in the relevant jurisdictions with respect to income, consumption, payroll and other taxes and remittances, for current as well as past periods. Accordingly, we may become subject to future tax assessments by relevant authorities. Any amount we might be required to pay in connection with a future tax assessment may have a material adverse effect on our financial position, cash flows or overall results of operations. There is a possibility of a material adverse effect on the results of operations of the period in which the matter is ultimately resolved, if it is resolved unfavorably, or in the period in which an unfavorable outcome becomes probable and reasonably estimable.
We are exposed to risks relating to foreign currencies.
We operate internationally, but a majority of our revenue and expense activities and capital expenditures are denominated in U.S. dollars. The other currencies in which we engage in significant transactions are Canadian dollars and Euros. We face foreign currency exposure on the translation of our operations in Canada and the EU from their local currencies to the U.S. dollar. Currently, we do not utilize forward contracts to hedge against foreign currency risk on an ongoing basis. A significant change in foreign currency exchange rates may have a material effect on our consolidated results of operations, including our revenue, financial position or cash flows.
Rising insurance costs could adversely impact our business.
The cost of insurance—including insurance for directors and officers, workers’ compensation, property, product-liability and general liability insurance—rose significantly in prior years and may continue to increase in future years. In response, we may increase deductibles and/or decrease certain coverages to mitigate these costs. These increases, and our increased risk due to increased deductibles and reduced coverages, could have an adverse impact on our results of operations, financial condition and cash flows.
Our operations could be disrupted if our information systems fail or if we are unsuccessful in implementing necessary upgrades.
Our business depends on the efficient and uninterrupted operation of our computer and communications systems and networks, hardware and software systems and our other information technology. If our systems were to fail or we are unable to successfully expand the capacity of these systems, or we are unable to integrate new technologies into our existing systems, our operations and financial results could suffer.
- 36 -
Risks Related to Our Indebtedness
Our substantial level of indebtedness could materially adversely affect our ability to generate sufficient cash to fulfill our obligations under our existing indebtedness, our ability to react to changes in our business and our ability to incur additional indebtedness to fund future needs.
We have a substantial amount of indebtedness. As of September 30, 2008, our total indebtedness was $622.2 million and we had an additional $115.0 million of borrowing capacity available under our new senior secured revolving credit facility. The following chart shows our level of indebtedness as of September 30, 2008.
| | | |
| ($ in millions) | | |
Debt: | | | |
Senior secured term loan facility(1) | | $ | 164.4 |
Senior secured revolving credit facility | | | 0 |
Secured Notes(2) | | | 225.4 |
Senior Notes(3) | | | 232.4 |
Obligations under capital leases(4) | | | 0 |
| | | |
Total | | $ | 622.2 |
| | | |
(1) | Represents the net proceeds received on our $175.0 million senior secured term loan facility after original issue discount. |
(2) | Represents the net proceeds received on $228.0 million aggregate principal amount of secured notes after original issue discount. |
(3) | Represents the net proceeds received on $235.0 million aggregate principal amount of senior notes after original issue discount. On February 25, 2008, we entered into a $235.0 million senior unsecured bridge facility with a 1-year maturity. The proceeds of the senior notes were used to repay in full the senior unsecured bridge facility and related fees and expenses. |
(4) | Represents the existing capital leases with remaining maturities through 2010. |
In addition, we have significant other commitments, including for milestone and royalty payments. See Note 20 in “Notes to Consolidated Financial Statements”. On a pro forma basis after giving effect to the Transactions, our cash interest expense, net for fiscal year 2008 would have been $76.0 million. As of September 30, 2008, we had outstanding approximately $164.4 million in aggregate principal amount of indebtedness under our new senior secured credit facilities that would bear interest at a floating rate. Although we may enter into interest rate swap agreements, and did enter into an interest rate swap on February 28, 2008 related to $115.0 million under our new senior secured revolving credit facility, we are exposed to interest rate increases on the floating portion of our new senior secured credit facility that is not covered by an interest rate swap. Absent any such interest rate swap agreements, a change of 1/8% in floating rates would affect our annual interest expense on the senior secured borrowings by approximately $0.2 million. See “Item 7A. Quantitative and Qualitative Disclosures about Market Risk—Interest Rate Risk”.
Our substantial level of indebtedness increases the possibility that we may be unable to generate cash sufficient to pay, when due, the principal of, interest on or other amounts due in respect of our indebtedness. Our substantial indebtedness, combined with our other financial obligations and contractual commitments, could have important consequences for our noteholders. For example, it could:
| | • | | make it more difficult for us to satisfy our obligations with respect to our indebtedness, including the notes, and any failure to comply with the obligations under any of our debt instruments, including restrictive covenants, could result in an event of default under the indentures governing the notes and the agreements governing such other indebtedness; |
| | • | | require us to dedicate a substantial portion of our cash flow from operations to payments on our indebtedness, thereby reducing funds available for working capital, capital expenditures, acquisitions, selling and marketing efforts, research and development and other purposes; |
| | • | | increase our vulnerability to adverse economic and industry conditions, which could place us at a competitive disadvantage compared to our competitors that have relatively less indebtedness; |
| | • | | limit our flexibility in planning for, or reacting to, changes in our business and the industries in which we operate; |
| | • | | limit our ability to borrow additional funds, or to dispose of assets to raise funds, if needed, for working capital, capital expenditures, acquisitions, research and development and other corporate purposes; and |
| | • | | prevent us from raising the funds necessary to repurchase all notes tendered to us upon the occurrence of certain changes of control, which would constitute a default under the indentures governing the notes. |
- 37 -
We, including our subsidiaries, have the ability to incur substantially more indebtedness, including senior secured indebtedness.
Subject to the restrictions in our new senior secured credit facilities and the indentures governing the notes, we, including our subsidiaries, may incur significant additional indebtedness. As of September 30, 2008:
| | • | | we had $389.8 million of senior secured debt, including borrowings under our new senior secured credit facilities, and the secured notes; |
| | • | | we had $232.4 million of senior unsecured indebtedness under the senior notes; |
| | • | | we had approximately $115.0 million available for borrowing under our new senior secured revolving credit facilities, which, if borrowed, would be senior secured indebtedness; and |
| | • | | provided our compliance with certain covenants under the terms of our new senior secured credit facilities, we had the option to increase the senior secured term loan facility by up to $75 million without satisfying any additional financial tests under the indentures governing the notes, which, if borrowed, would be senior secured indebtedness. |
Although the terms of our new senior secured credit facilities and the indentures governing the notes contain restrictions on the incurrence of additional indebtedness, these restrictions are subject to a number of important exceptions, and indebtedness incurred in compliance with these restrictions could be substantial. If we and our restricted subsidiaries incur significant additional indebtedness, the related risks that we face could increase.
Restrictions imposed by the indentures governing the notes, our new senior secured credit facilities and our other outstanding indebtedness may limit our ability to operate our business and to finance our future operations or capital needs or to engage in other business activities.
The terms of our new senior secured credit facilities and the indentures governing the notes restrict us and our subsidiaries from engaging in specified types of transactions. These covenants restrict our ability and the ability of our restricted subsidiaries, among other things, to:
| | • | | incur or guarantee additional indebtedness; |
| | • | | pay dividends on our capital stock or redeem, repurchase or retire our capital stock or indebtedness; |
| | • | | make investments, loans, advances and acquisitions; |
| | • | | create restrictions on the payment of dividends or other amounts to us from our restricted subsidiaries; |
| | • | | engage in transactions with our affiliates; |
| | • | | sell assets, including capital stock of our subsidiaries; |
| | • | | consolidate or merge; and |
In addition, the agreements governing our new senior secured credit facilities require us to comply with certain financial ratio maintenance covenants. Our ability to comply with these ratios can be affected by events beyond our control, and we may not be able to satisfy them. A breach of any of these covenants would be an event of default. In the event of a default under any of our new senior secured credit facilities, the lenders could elect to declare all amounts outstanding under the agreements governing our new senior secured credit facilities to be immediately due and payable or terminate their commitments to lend additional money. If the indebtedness under our new senior secured credit facilities accelerates, the indebtedness under the notes would also accelerate and our assets may not be sufficient to repay such indebtedness in full. In particular, holders of senior notes will be paid only if we have assets remaining after we pay amounts due on our secured indebtedness, including our new senior secured credit facilities and the secured notes. We have pledged a significant portion of our assets as collateral under our new senior secured credit facilities and the secured notes.
We may not be able to generate sufficient cash to service all of our indebtedness and may be forced to take other actions to satisfy our obligations under our indebtedness, which may not be successful.
Our ability to make scheduled payments on or to refinance our debt obligations depends on our financial condition and operating performance, which is subject to prevailing economic and competitive conditions and to certain financial, business and other factors beyond our control. We may not be able to maintain a level of cash flows from operating activities sufficient to permit us to pay the principal, premium, if any, and interest on our indebtedness, including the notes.
- 38 -
If our cash flows and capital resources are insufficient to fund our debt service obligations, we may be forced to reduce or delay investments and capital expenditures, or to sell assets, seek additional capital or restructure or refinance our indebtedness, including the notes. Our ability to restructure or refinance our debt will depend on the condition of the capital markets and our financial condition at such time. Any refinancing of our debt could be at higher interest rates and may require us to comply with more onerous covenants, which could further restrict our business operations. The terms of existing or future debt instruments and the indentures governing the notes may restrict us from adopting some of these alternatives. In addition, any failure to make payments of interest and principal on our outstanding indebtedness on a timely basis would likely result in a reduction of our credit rating, which could harm our ability to incur additional indebtedness. In the absence of such operating results and resources, we could face substantial liquidity problems and might be required to dispose of material assets or operations to meet our debt service and other obligations. Our new senior secured credit facilities and the indentures governing the notes restrict our ability to dispose of assets and use the proceeds from the disposition. We may not be able to consummate those dispositions or to obtain the proceeds that we could realize from them and these proceeds may not be adequate to meet any debt service obligations then due. These alternative measures may not be successful and may not permit us to meet our debt service obligations.
Our noteholders’ right to receive payments on the senior notes is effectively junior to the right of lenders who have a security interest in our assets to the extent of the value of those assets.
Our obligations under the senior notes and our guarantors’ obligations under their guarantees of the senior notes are unsecured, but our obligations under our new senior secured credit facilities and the secured notes and each guarantor’s obligations under its guarantee of our new senior secured credit facilities and secured notes are secured by a security interest in substantially all of our domestic tangible and intangible assets, including the stock of substantially all of our wholly-owned U.S. subsidiaries and all or a portion of the stock of certain of our non-U.S. subsidiaries. If we are declared bankrupt or insolvent, or if we default under our new senior secured credit facilities or the secured notes, the lenders could declare all of the funds borrowed thereunder, together with accrued interest, immediately due and payable. If we were unable to repay such indebtedness, the lenders could foreclose on the pledged assets to the exclusion of holders of the senior notes, even if an event of default exists under the indenture governing the senior notes at such time. Furthermore, if the lenders foreclose and sell the pledged equity interests in any guarantor under the senior notes, then that guarantor will be released from its guarantee of the senior notes automatically and immediately upon such sale. In any such event, because the senior notes will not be secured by any of our assets or the equity interests in the guarantors, it is possible that there would be no assets remaining from which our noteholders’ claims could be satisfied or, if any assets remained, they might be insufficient to satisfy our noteholders’ claims in full.
As of September 30, 2008, we had:
| | • | | $389.8 million of senior secured debt, including borrowings under our new senior secured credit facilities, and the secured notes; |
| | • | | an additional $115.0 million of borrowing capacity under our new senior secured revolving credit facility, which, if borrowed, would be senior secured indebtedness; and |
| | • | | provided our compliance with certain covenants under the terms of our new senior secured credit facilities, the option to increase our new senior secured term loan facility by up to $75 million, which, if borrowed, would be senior secured indebtedness. |
Subject to the limits set forth in the indentures governing the notes, we may also incur additional secured debt.
Our ability to repay our debt is affected by the cash flow generated by our subsidiaries.
Our subsidiaries own substantially all of our assets and conduct substantially all of our operations. Accordingly, repayment of our indebtedness is dependent on the generation of cash flow by our subsidiaries and their ability to make such cash available to us, by dividend, debt repayment or otherwise. Unless they are guarantors of the notes, our subsidiaries will not have any obligation to pay amounts due on the notes or to make funds available for that purpose. Our subsidiaries may not be able to, or may not be permitted to, make distributions to enable us to make payments in respect of our indebtedness, including the notes. Each subsidiary is a distinct legal entity and, under certain circumstances, legal and contractual restrictions may limit our ability to obtain cash from our subsidiaries. While the indentures governing the notes limit the ability of our subsidiaries to incur consensual restrictions on their ability to pay dividends or make other intercompany payments to us, these limitations are subject to certain qualifications and exceptions. In the event that we do not receive distributions from our subsidiaries, we may be unable to make required principal and interest payments on our indebtedness, including the notes.
- 39 -
Claims of noteholders will be structurally subordinated to claims of creditors of certain of our subsidiaries that will not guarantee the notes.
The notes will not be guaranteed by certain of our subsidiaries, including all of our significant non-U.S. subsidiaries (other than Axcan Pharma Inc.). Accordingly, claims of holders of the notes will be structurally subordinated to the claims of creditors of these non-guarantor subsidiaries, including trade creditors. All obligations of our non-guarantor subsidiaries will have to be satisfied before any of the assets of such subsidiaries would be available for distribution, upon a liquidation or otherwise, to us or a guarantor of the notes.
For fiscal year 2008, our non-guarantor subsidiaries accounted for approximately $83.5 million, or 21.9% of our consolidated revenue. As of September 30, 2008, our non-guarantor subsidiaries accounted for approximately $178.6 million, or 18.9% of our consolidated total assets and $21.9 million, or 2.8% of our consolidated total liabilities. All amounts are presented after giving effect to intercompany eliminations. The indentures governing the notes permit these subsidiaries to incur certain additional debt and does not limit, or will not limit, their ability to incur other liabilities that are not considered indebtedness under the indentures.
The lenders under our new senior secured credit facilities have the discretion to release any guarantors under these facilities in a variety of circumstances, which will cause those guarantors to be released from their guarantees of the notes.
While any obligations under our new senior secured credit facilities remain outstanding, any guarantee of the notes may be released without action by, or consent of, any holder of the notes or the trustee under the indentures governing the notes, at the discretion of lenders under our new senior secured credit facilities, if the related guarantor is no longer a guarantor of obligations under our new senior secured credit facilities or any other indebtedness. The lenders under our new senior secured credit facilities have the discretion to release the guarantees under our new senior secured credit facilities in a variety of circumstances. Any of our subsidiaries that is released as a guarantor of our senior secured credit facilities will automatically be released as a guarantor of the notes. Our noteholders will not have a claim as a creditor against any subsidiary that is no longer a guarantor of the notes, and the indebtedness and other liabilities, including trade payables, whether secured or unsecured, of those subsidiaries will effectively be senior to claims of noteholders.
If we default on our obligations to pay our other indebtedness, we may not be able to make payments on the notes.
Any default under the agreements governing our indebtedness, including a default under our new senior secured credit facilities, that is not waived by the required lenders, and the remedies sought by the holders of such indebtedness, could prevent us from paying principal, premium, if any, and interest on the notes and substantially decrease the market value of the notes. If we are unable to generate sufficient cash flow and are otherwise unable to obtain funds necessary to meet required payments of principal, premium, if any, and interest on our indebtedness, or if we otherwise fail to comply with the various covenants, including financial and operating covenants in the instruments governing our indebtedness (including covenants in our new senior secured credit facilities and the indentures governing the notes), we could be in default under the terms of the agreements governing such indebtedness, including our new senior secured credit facilities and the indentures governing the notes. In the event of such default:
| | • | | the holders of such indebtedness could elect to declare all the funds borrowed thereunder to be due and payable, together with accrued and unpaid interest; |
| | • | | the lenders under our new senior secured credit facilities could elect to terminate their commitments thereunder, cease making further loans and institute foreclosure proceedings against our assets; and |
| | • | | we could be forced into bankruptcy or liquidation. |
If our operating performance declines, we may in the future need to obtain waivers from the required lenders under our new senior secured credit facilities to avoid being in default. If we breach our covenants under our new senior secured credit facilities and seek a waiver, we may not be able to obtain a waiver from the required lenders. If this occurs, we would be in default under our new senior secured credit facilities, the lenders could exercise their rights, as described above, and we could be forced into bankruptcy or liquidation.
We may not be able to repurchase the notes upon a change of control.
Upon the occurrence of specific kinds of change of control events, we will be required to offer to repurchase all outstanding notes at 101% of their principal amount plus accrued and unpaid interest, if any. The source of funds for any such purchase of the notes will be our available cash or cash generated from our operations or the operations of our subsidiaries or other sources, including borrowings, sales of assets or sales of
- 40 -
equity. We may not be able to repurchase the notes upon a change of control because we may not have sufficient financial resources to purchase all of the notes that are tendered upon a change of control. Further, the terms of our new senior secured credit facilities provide that a change of control is an event of default thereunder that permits lenders to accelerate the maturity of borrowings thereunder and require us to offer to repay loans thereunder upon a change of control. Any of our future debt agreements may contain similar provisions. Accordingly, we may not be able to satisfy our obligations to purchase the notes unless we are able to refinance or obtain waivers under our new senior secured credit facilities. Our failure to repurchase the notes upon a change of control would cause a default under the indentures governing the notes and a cross-default under our new senior secured credit facilities.
Insolvency and fraudulent transfer laws and other limitations may preclude the recovery of payment under the notes and the guarantees.
Federal bankruptcy and state fraudulent transfer and conveyance statutes may apply to the issuance of the notes and the incurrence of any guarantees. In addition, insolvency, fraudulent transfer and conveyance statutes in Canada, the Netherlands and Luxembourg may apply to the incurrence of the guarantees by our subsidiaries organized in these countries. Although laws differ among these jurisdictions, in general, under applicable fraudulent transfer or conveyance laws, the notes or guarantees could be voided as a fraudulent transfer or conveyance if (1) we or any of the guarantors, as applicable, issued the notes or incurred the guarantees with the intent of hindering, delaying or defrauding creditors; (2) in the case of a guarantee incurred by any of our foreign subsidiaries, such subsidiary issued the guarantee in a situation where a prudent businessman as a shareholder of such subsidiary would have contributed equity to such subsidiary; or (3) we or any of the guarantors, as applicable, received less than reasonably equivalent value or fair consideration in return for either issuing the notes or incurring the guarantees and, in the case of (3) only, one of the following is also true:
| | • | | we or any of the guarantors, as applicable, were insolvent or rendered insolvent by reason of the issuance of the notes or the incurrence of the guarantees or subsequently become insolvent for other reasons; |
| | • | | the issuance of the notes or the incurrence of the guarantees left us or any of the guarantors, as applicable, with an unreasonably small amount of capital to carry on the business; |
| | • | | we or any of the guarantors intended to, or believed that we or such guarantor would, incur debts beyond our or such guarantor’s ability to pay such debts as they mature; or |
| | • | | we or any of the guarantors was a defendant in an action for money damages, or had a judgment for money damages docketed against us or such guarantor if, in either case, after final judgment, the judgment is unsatisfied. |
A court could find that we or a guarantor did not receive reasonably equivalent value or fair consideration for the notes or such guarantee if we or such guarantor did not substantially benefit directly or indirectly from the issuance of the notes or the applicable guarantee. As a general matter, value is given for a transfer or an obligation if, in exchange for the transfer or obligation, property is transferred or an antecedent debt is secured or satisfied. A debtor will generally not be considered to have received value in connection with a debt offering if the debtor uses the proceeds of that offering to make a dividend payment or otherwise retire or redeem equity securities issued by the debtor. In addition, because the debt was incurred for our benefit, and only indirectly for the benefit of the guarantors, a court could conclude that the guarantors did not receive fair value.
Different jurisdictions evaluate insolvency on various criteria. Generally, however, an entity would be considered insolvent if, at the time it incurred indebtedness:
| | • | | the sum of its debts, including contingent liabilities, was greater than the fair saleable value of all its assets; |
| | • | | the present fair saleable value of its assets was less than the amount that would be required to pay its probable liability on its existing debts, including contingent liabilities, as they become absolute and mature; or |
| | • | | it could not pay its debts as they become due. |
We cannot be certain as to the standards a court would use to determine whether or not we or the guarantors were solvent at the relevant time or, regardless of the standard that a court uses, that the issuance of the senior notes and the incurrence of the guarantees would not be held to constitute fraudulent transfers or conveyances on other grounds. If a court were to find that the issuance of the notes or the incurrence of the guarantee was a fraudulent transfer or conveyance, the court could void the payment obligations under the notes or such guarantee or further subordinate the notes or such guarantee to presently existing and future indebtedness of ours or of the related guarantor, or require the holders of the notes to repay any amounts received with respect to such guarantee. In the event of a finding that a fraudulent transfer or conveyance occurred, our noteholders may not receive any repayment on the notes.
- 41 -
Although each guarantee entered into by a guarantor will contain a provision intended to limit that guarantor’s liability to the maximum amount that it could incur without causing the incurrence of obligations under its guarantee to be a fraudulent transfer, this provision may not be effective to protect those guarantees from being voided under fraudulent transfer or conveyance laws, or may reduce that guarantor’s obligation to an amount that effectively makes its guarantee worthless.
In addition, enforcement of any of the guarantees against any guarantor will be subject to certain other defenses available to guarantors generally. These laws and defenses include those that relate to voidable preference, financial assistance, corporate purpose or benefit, preservation of share capital, thin capitalization and regulations or defenses affecting the rights of creditors generally. If one or more of these laws and defenses are applicable, a guarantor may have no liability or decreased liability under its guarantee.
Enforcing our noteholders’ rights under the guarantees entered into by certain of our foreign subsidiaries across multiple jurisdictions may be difficult.
We are a U.S. company incorporated in the State of Delaware. The notes are guaranteed by all of our significant U.S. subsidiaries and certain of our foreign subsidiaries in Canada, the Netherlands and Luxembourg. In the event of bankruptcy, insolvency or a similar event, proceedings could be initiated in any of these jurisdictions and in the jurisdiction of organization of any future guarantor of the notes. Our noteholders’ rights under the notes and the guarantees will thus be subject to the laws of several jurisdictions, and they may not be able to effectively enforce our noteholders’ rights in multiple bankruptcy, insolvency and other similar proceedings. Moreover, such multi-jurisdictional proceedings are typically complex and costly for creditors and often result in substantial uncertainty and delay in the enforcement of creditors’ rights.
We are indirectly owned and controlled by the Sponsor, and the Sponsor’s interests as equity holders may conflict with the interests of our noteholders.
The Sponsor owns approximately 70% of our indirect parent’s equity and, accordingly, has the ability to control our policies and operations. The Sponsor does not have any liability for any obligations under the notes, and the interests of the Sponsor may not in all cases be aligned with our noteholders’ interests. For example, if we encounter financial difficulties or are unable to pay our debts as they mature, the interests of our equity holders might conflict with our noteholders’ interests. In addition, our equity holders may have an interest in pursuing acquisitions, divestitures, financings or other transactions that, in their judgment, could enhance their equity investments, even though such transactions might involve risks to our noteholders. Furthermore, the Sponsor may in the future own businesses that directly or indirectly compete with us. The Sponsor also may pursue acquisition opportunities that may be complementary to our business, and as a result, those acquisition opportunities may not be available to us. For information concerning our arrangements with the Sponsor, see “Item 13. Certain Relationships and Related Transactions, and Director Independence.”
Our noteholders’ ability to transfer the notes may be limited by the absence of an active trading market, and there is no assurance that any active trading market will develop for the notes.
There is no established public market for the notes. We expect the notes to be eligible for trading by “qualified institutional buyers,” as defined in Rule 144A under the Securities Act, in The PORTALSM Market.
The initial purchasers have advised us that they intend to make a market in the notes as permitted by applicable laws and regulations; however, the initial purchasers are not obligated to make a market in any of the notes, and they may discontinue their market-making activities at any time without notice. Therefore, an active market for any of the notes may not develop or, if developed, it may not continue. The liquidity of any market for the notes will depend upon the number of holders of the notes, our performance, the market for similar securities, the interest of securities dealers in making a market in the notes and other factors. A liquid trading market may not develop for the notes or any series of notes. If a market develops, the notes could trade at prices that may be lower than their initial offering price. If an active market does not develop or is not maintained, the price and liquidity of the notes may be adversely affected. Historically, the market for non-investment grade debt has been subject to disruptions that have caused substantial volatility in the prices of securities similar to the notes. The market, if any, for any of the notes may not be free from similar disruptions, and any such disruptions may adversely affect the prices at which our noteholders may sell their notes.
- 42 -
Holders of secured notes may not be able to fully realize the value of their liens.
The security for the benefit of holders of secured notes may be released without such holders’ consent.
The liens for the benefit of the holders of secured notes may be released without vote or consent of such holders, as summarized below:
| | • | | The security documents generally provide for an automatic release of all liens on any asset that is disposed of in compliance with the provisions of the new senior secured credit facilities. |
| | • | | Any lien can be released if approved by the requisite number of lenders under our new senior secured credit facilities. |
| | • | | The collateral agent and the issuer may amend the provisions of the security documents with the consent of the requisite number of lenders under our new senior secured credit facilities and without consent of the holders of secured notes. |
| | • | | The lenders under our new senior secured credit facilities will have the sole ability to control remedies (including upon sale or liquidation of the collateral after acceleration of the secured notes or the debt under the new senior secured credit facilities) with respect to the collateral. |
| | • | | So long as we have the new senior secured credit facilities or another senior secured credit facility, the secured notes will automatically cease to be secured by those liens if those liens no longer secure our senior secured credit facilities for other reasons. |
As a result, we cannot assure holders of secured notes that the secured notes will continue to be secured by a substantial portion of our assets. Holders of secured notes will have no recourse if the lenders under our senior secured credit facilities approve the release of any or all of the collateral, even if that action adversely affects any rating of the secured notes.
In addition, securities of our subsidiaries will be excluded from the liens to the extent liens thereon would trigger reporting obligations under Rule 3-16 of Regulation S-X, which requires financial statements from any company whose securities are collateral if its book value or market value would exceed 20% of the principal amount of the notes secured thereby. However, the liens on such securities will continue to secure obligations under our new senior secured credit facilities.
The collateral may not be valuable enough to satisfy all the obligations secured by the collateral.
We secured our obligations under the secured notes by the pledge of certain of our assets. This pledge is also for the benefit of the lenders under the new senior secured credit facilities.
The value of the pledged assets in the event of a liquidation will depend upon market and economic conditions, the availability of buyers and similar factors. No independent appraisals of any of the pledged property have been prepared by or on behalf of us in connection with this exchange offer. As of September 30, 2008, before taking into consideration the effect of intercompany eliminations, the pledged assets had a book value of approximately $2,348.4 million, approximately $587.4 million of which would have consisted of intangible assets, including goodwill. Accordingly, we cannot assure holders of secured notes that the proceeds of any sale of the pledged assets following an acceleration to maturity with respect to the secured notes would be sufficient to satisfy, or would not be substantially less than, amounts due on the secured notes and the other debt secured thereby.
If the proceeds of any sale of the pledged assets were not sufficient to repay all amounts due on the secured notes, the holders of secured notes (to the extent their secured notes were not repaid from the proceeds of the sale of the pledged assets) would have only an unsecured claim against our remaining assets. By their nature, some or all of the pledged assets may be illiquid and may have no readily ascertainable market value. Likewise, we cannot assure holders of secured notes that the pledged assets will be saleable or, if saleable, that there will not be substantial delays in their liquidation. To the extent that liens, rights and easements granted to third parties encumber assets located on property owned by us or constitute subordinate liens on the pledged assets, those third parties may have or may exercise rights and remedies with respect to the property subject to such encumbrances (including rights to require marshalling of assets) that could adversely affect the value of the pledged assets located at that site and the ability of the collateral agent to realize or foreclose on the pledged assets at that site.
In addition, the indenture governing the secured notes permits us, subject to compliance with certain financial tests, to issue additional secured debt, including debt secured equally and ratably by the same assets pledged for the benefit of the holders of secured notes. This would reduce amounts payable to holders of secured notes from the proceeds of any sale of the collateral.
- 43 -
Bankruptcy laws may limit the ability of holders of secured notes to realize value from the collateral.
The right of the collateral agent to repossess and dispose of the pledged assets upon the occurrence of an event of default under the indenture is likely to be significantly impaired by applicable bankruptcy law if a bankruptcy case were to be commenced by or against us before the collateral agent repossessed and disposed of the pledged assets. For example, under Title 11 of the United States Code, or the United States Bankruptcy Code, pursuant to the automatic stay imposed upon the bankruptcy filing, a secured creditor is prohibited from repossessing its security from a debtor in a bankruptcy case, or from disposing of security repossessed from such debtor, or taking other actions to levy against a debtor, without bankruptcy court approval. Moreover, the United States Bankruptcy Code permits the debtor to continue to retain and to use collateral even though the debtor is in default under the applicable debt instruments, provided that the secured creditor is given “adequate protection.” The meaning of the term “adequate protection” may vary according to circumstances (and is within the discretion of the bankruptcy court), but it is intended in general to protect the value of the secured creditor’s interest in the collateral and may include cash payments or the granting of additional security, if and at such times as the court in its discretion determines, for any diminution in the value of the collateral as a result of the automatic stay of repossession or disposition or any use of the collateral by the debtor during the pendency of the bankruptcy case. Generally, adequate protection payments, in the form of interest or otherwise, are not required to be paid by a debtor to a secured creditor unless the bankruptcy court determines that the value of the secured creditor’s interest in the collateral is declining during the pendency of the bankruptcy case. Due to the imposition of the automatic stay, the lack of a precise definition of the term “adequate protection” and the broad discretionary powers of a bankruptcy court, it is impossible to predict (1) how long payments under the secured notes could be delayed following commencement of a bankruptcy case, (2) whether or when the collateral agent could repossess or dispose of the pledged assets or (3) whether or to what extent holders of the secured notes would be compensated for any delay in payment or loss of value of the pledged assets through the requirement of “adequate protection.” Similar and other provisions of Canadian, Dutch and Luxembourg bankruptcy laws may preclude holders of secured notes to realize value from the collateral granted by foreign subsidiaries in Canada, the Netherlands and Luxembourg.
The collateral is subject to casualty risks and no mortgage title insurance has been obtained.
We are obligated under the new senior secured credit facilities to at all times cause all the pledged assets to be properly insured and kept insured against loss or damage by fire or other hazards to the extent that such properties are usually insured by corporations operating properties of a similar nature in the same or similar localities. There are, however, some losses, including losses resulting from terrorist acts, that may be either uninsurable or not economically insurable, in whole or in part. As a result, we cannot assure holders of secured notes that the insurance proceeds will compensate us fully for our losses. If there is a total or partial loss of any of the pledged assets, we cannot assure holders of secured notes that the proceeds received by us in respect thereof will be sufficient to satisfy all the secured obligations, including the secured notes.
In the event of a total or partial loss to any of the mortgaged facilities, certain items of equipment and inventory may not be easily replaced. Accordingly, even though there may be insurance coverage, the extended period needed to manufacture replacement units or inventory could cause significant delays.
Additionally, we are not required under the new senior secured credit facilities and the security documents to purchase any title insurance insuring the collateral agent’s lien on the respective mortgaged properties if the costs of creating or perfecting liens would be considered excessive in view of the benefits obtained therefrom by the lenders under the new senior secured credit facilities. If a loss occurs arising from a title defect with respect to any mortgaged property, we cannot assure holders of secured notes that we could replace such property with collateral of equal value.
Rights of holders of secured notes in the collateral may be adversely affected by the failure to perfect security interests in collateral.
Applicable law requires that a security interest in certain tangible and intangible assets can only be properly perfected and its priority retained through certain actions undertaken by the secured party. The liens in the collateral securing the secured notes may not be perfected with respect to the claims of the secured notes if the collateral agent is not able to take the actions necessary to perfect any of these liens on or prior to the date of the indenture governing the secured notes. There can be no assurance that the lenders under the new senior secured credit facilities will have taken all actions necessary to create properly perfected security interests, which may result in the loss of the priority of the security interest in favor of the holders of the secured notes to which they would otherwise have been entitled. In addition, applicable law requires that certain property and rights acquired after the grant of a general security interest, such as real property, equipment subject to a certificate of title and certain proceeds, can only be perfected at the time such property and rights are acquired and identified. We and the guarantors have limited obligations to perfect the security interest of the holders of secured notes in specified collateral. There can be no assurance that the trustee or the collateral agent for the
- 44 -
secured notes will monitor, or that we will inform such trustee or collateral agent of, the future acquisition of property and rights that constitute collateral, and that the necessary action will be taken to properly perfect the security interest in such after-acquired collateral. Neither the trustee nor the collateral agent for the secured notes has an obligation to monitor the acquisition of additional property or rights that constitute collateral or the perfection of any security interest. Such failure may result in the loss of the security interest in the collateral or the priority of the security interest in favor of the secured notes against third parties.
Any future pledge of collateral in favor of the holders of secured notes might be voidable in bankruptcy.
Any future pledge of collateral in favor of the holders of secured notes, including pursuant to security documents delivered after the date of the indenture governing the secured notes, might be voidable by the pledgor (as debtor in possession) or by its trustee in bankruptcy if certain events or circumstances exist or occur, including, under the United States Bankruptcy Code, if the pledgor is insolvent at the time of the pledge, the pledge permits the holders of secured notes to receive a greater recovery than if the pledge had not been given and a bankruptcy proceeding in respect of the pledgor is commenced with 90 days following the pledge, or, in certain circumstances, a longer period. Similar and other provisions of Canadian, Dutch and Luxembourg bankruptcy laws may make any future pledge of collateral granted by foreign subsidiaries in Canada, the Netherlands and Luxembourg voidable.
| ITEM 1B. | UNRESOLVED STAFF COMMENTS |
Not applicable.
We own and lease space for manufacturing, warehousing, research, development, sales, marketing, and administrative purposes. All these facilities are inspected on a regular basis by regulatory authorities, and our own internal auditing team ensures compliance on an ongoing basis with such standards.
We own 107,000 square feet of office space, manufacturing facilities and warehousing in Mont-Saint-Hilaire, Quebec (Canada), the location of our corporate headquarters. The building houses administrative, marketing and pharmaceutical manufacturing operations as well as our research and development activities. We further own property next to our corporate headquarters, which could be used to expand. The building and real estate owned by us is subject to security granted in favor of our lenders, pursuant to the credit facilities described under “Management’s Discussion and Analysis of Financial Condition and Results of Operations—Liquidity and Capital Resources.”
We own 606,837 square feet of office space, manufacturing facilities and land in Houdan, France.
We lease approximately 18,233 square feet of office space in Birmingham, Alabama (United States) under a lease expiring in December 2013.
We lease approximately 3,650 square feet of office space in Bridgewater, New Jersey (United States), under a lease expiring in August 2009.
We believe that we have sufficient facilities to conduct our operations during fiscal year 2009 and that our facilities are in satisfactory condition and are suitable for their intended use, although investments to improve and expand our manufacturing and other related facilities are contemplated, as our business requires.
One of our subsidiaries, Axcan Scandipharm (now Axcan Pharma US, Inc.), has been a party to several legal proceedings related to the product line it markets under the trademark ULTRASE. These lawsuits were filed and claims were asserted against Axcan Scandipharm and certain other companies, including the product’s manufacturer, stemming from allegations that, among other things, Axcan Scandipharm’s enzyme products caused colonic strictures. In November 2006, in O’Mahony v. Axcan Scandipharm, Inc., et al., a complaint alleging a claim for damages related to these products was received in the Supreme Court of the State of New York. This complaint is in the early discovery stage such that we are not currently able to fully assess its merit. Of the 12 other previous lawsuits, the last of which was filed in 2001, Axcan Scandipharm was dismissed from one, non-suited in another and settled ten. At this time, it is difficult to predict the number of potential cases and because of the young age of the patients involved, Axcan Scandipharm’s product liability exposure for this issue in the United States will remain for a number of years. Axcan Scandipharm’s insurance carriers have defended the lawsuits to date and we expect them to continue to defend Axcan Scandipharm (to the extent of its product liability insurance) should other lawsuits be filed in the future.
- 45 -
In December 2003 and May 2004, Pharmascience Inc., or PMS served us two notices of allegation in accordance with Section 5 of the Patented Medicines (Notice of Compliance) Regulations in Canada, or the Regulations. The first notice of allegation indicated that PMS was seeking a regulatory approval to market a generic version of URSO 250 in the Canadian market, or the PMS Product, for use in gallstone dissolution, an indication for which URSO 250 was formerly approved for and marketed in Canada. The second notice of allegation dealt with the validity of our Canadian PBC use patent. We opposed both these notices of allegation by seeking prohibition orders. In September 2005, with respect to the first notice of allegation, the Federal Court of Canada held that, for purposes of the Regulations, the PMS Product did not infringe the patent that we own for the use of URSO in the treatment of PBC. In May 2006, the second application seeking a prohibition order was dismissed as our Canadian PBC use patent was held to be invalid for purposes of the Regulations. PMS has since filed a claim against us pursuant to section 8 of the Regulations seeking recovery of alleged damages sustained by reason of the delay to commercialize its product sustained as a result of our opposition.
We are involved in other routine litigation matters that we believe not to be material and we do not anticipate that the outcome of any pending litigation, if determined adversely, would have a material adverse effect on our financial condition, results of operations or cash flows.
| ITEM 4. | SUBMISSION OF MATTERS TO A VOTE OF SECURITY HOLDERS |
Not applicable.
PART II
| ITEM 5. | MARKET FOR REGISTRANT’S COMMON EQUITY, RELATED STOCKHOLDER MATTERS AND ISSUER PURCHASES OF EQUITY SECURITIES |
Market and other information
We are a privately-owned company with no established public trading market for our common stock.
Holders
As of December 18, 2008, there was one holder of our common stock, Axcan MidCo Inc., one holder of Axcan MidCo Inc.’s common stock, Axcan Holdings Inc. and 59 holders of Axcan Holdings Inc.’s common stock. See Item 12, “Security Ownership of Certain Beneficial Owners and Management and Related Stockholder Matters” for additional information about the ownership of Axcan Holdings Inc.’s common stock.
Dividends
We are currently restricted in our ability to pay dividends under various covenants of our debt agreements, including our new senior secured credit facilities and the indentures governing our notes. We do not expect for the foreseeable future to pay dividends on our common stock. Any future determination to pay dividends will depend upon, among other factors, our results of operations, financial condition, capital requirements, any contractual restrictions and any other considerations our Board of Directors deems relevant.
| ITEM 6. | SELECTED FINANCIAL DATA |
As part of the February 2008 Transactions, we, through an indirect wholly-owned subsidiary, purchased all of the outstanding common stock of Axcan Pharma Inc. on February 25, 2008. Prior to the February 2008 Transactions, Axcan Intermediate Holdings Inc. had no independent operations or assets. Accordingly, our financial information in the table below for the fiscal year ended September 30, 2008 is presented separately for the period prior to the completion of the February 2008 Transactions (from October 1, 2007 through February 25, 2008, the “Predecessor” or “Predecessor Period”) and the period after the completion of the February 2008 Transactions (from February 26, 2008 through September 30, 2008, the “Successor” or “Successor Period”), which relate to the accounting periods preceding and succeeding the completion of the February 2008 Transactions. The financial information presented for the Predecessor is the financial information for Axcan Pharma Inc. and its consolidated subsidiaries and the financial information presented for the Successor is the financial information for Axcan Intermediate Holdings Inc. and its consolidated subsidiaries. The summary financial information as of September 30, 2008 and for the Successor Period are not comparable to the summary financial information as of and for the fiscal year ended September 30, 2007 because of the new basis of accounting resulting from the February 2008 Transactions. Our results of operations for the Predecessor Period and the Successor Period should not be considered representative of our future results of operations.
- 46 -
| | | | | | | | | | | | | | | | | | | | | | | | | | |
| | | Successor | | | | | Predecessor | |
| | | February 26,
2008
through
September 30,
2008 | | | | | October 1,
2007
through
February 25,
2008 | | | Fiscal Years Ended September 30, | |
| | | | | | 2007 | | | 2006 | | | 2005 | | | 2004 | |
| | | | | | | | ($ in thousands) | |
Statement of Operations Data: | | | | | | | | | | | | | | | | | | | | | | | | | | |
Revenue | | $ | 223,179 | | | | | $ | 158,579 | | | $ | 348,947 | | | $ | 292,317 | | | $ | 251,343 | | | $ | 243,634 | |
Cost of goods sold(1) | | | 77,227 | | | | | | 38,739 | | | | 83,683 | | | | 72,772 | | | | 71,534 | | | | 54,247 | |
Selling and administrative expenses(1)(2) | | | 88,345 | | | | | | 76,198 | | | | 101,273 | | | | 93,338 | | | | 85,997 | | | | 76,365 | |
Research and development expenses(1)(3) | | | 17,768 | | | | | | 10,256 | | | | 28,655 | | | | 39,789 | | | | 31,855 | | | | 19,866 | |
Depreciation and amortization | | | 35,579 | | | | | | 9,595 | | | | 22,494 | | | | 22,823 | | | | 21,532 | | | | 16,359 | |
Acquired in-process research | | | 272,400 | | | | | | — | | | | 10,000 | | | | — | | | | — | | | | — | |
Takeover bid expenses | | | — | | | | | | — | | | | — | | | | — | | | | — | | | | — | |
Partial write-down of intangible assets | | | — | | | | | | — | | | | — | | | | 5,800 | | | | — | | | | — | |
| | | | | | | | | | | | | | | | | | | | | | | | | | |
Operating Income (loss) | | | (268,140 | ) | | | | | 23,791 | | | | 102,842 | | | | 57,795 | | | | 40,425 | | | | 76,797 | |
Financial expenses | | | 41,513 | | | | | | 262 | | | | 4,825 | | | | 6,988 | | | | 7,140 | | | | 6,885 | |
Other interest income | | | (808 | ) | | | | | (5,440 | ) | | | (11,367 | ) | | | (5,468 | ) | | | (1,340 | ) | | | (756 | ) |
Loss (gain) on foreign currency | | | (1,841 | ) | | | | | (198 | ) | | | 2,352 | | | | (1,110 | ) | | | (213 | ) | | | (313 | ) |
| | | | | | | | | | | | | | | | | | | | | | | | | | |
Income (loss) before income taxes | | | (307,004 | ) | | | | | 29,167 | | | | 107,032 | | | | 57,385 | | | | 34,838 | | | | 70,981 | |
Income taxes | | | (17,740 | ) | | | | | 12,042 | | | | 35,567 | | | | 18,266 | | | | 8,413 | | | | 22,253 | |
| | | | | | | | | | | | | | | | | | | | | | | | | | |
Net income (loss) | | $ | (289,264 | ) | | | | $ | 17,125 | | | $ | 71,465 | | | $ | 39,119 | | | $ | 26,425 | | | $ | 48,728 | |
| | | | | | | | | | | | | | | | | | | | | | | | | | |
Balance Sheet Data (at period end): | | | | | | | | | | | | | | | | | | | | | | | | | | |
Cash and cash equivalents | | $ | 56,105 | | | | | $ | 348,791 | | | $ | 179,672 | | | $ | 55,830 | | | $ | 79,969 | | | $ | 21,979 | |
Short-term investments, available for sale | | | — | | | | | | — | | | | 129,958 | | | | 117,151 | | | | 17,619 | | | | 15,922 | |
Total current assets | | | 176,980 | | | | | | 471,170 | | | | 402,127 | | | | 262,378 | | | | 190,357 | | | | 139,032 | |
Total assets | | | 944,812 | | | | | | 902,384 | | | | 832,611 | | | | 695,817 | | | | 641,407 | | | | 609,644 | |
Total short-term borrowings | | | 10,938 | | | | | | 373 | | | | 527 | | | | 681 | | | | 1,497 | | | | 1,778 | |
Total debt | | | 622,184 | | | | | | 441 | | | | 649 | | | | 126,246 | | | | 127,829 | | | | 129,694 | |
Total current liabilities | | | 99,300 | | | | | | 166,456 | | | | 104,737 | | | | 64,617 | | | | 58,336 | | | | 51,362 | |
Total liabilities | | | 779,142 | | | | | | 206,903 | | | | 142,414 | | | | 228,393 | | | | 223,803 | | | | 217,568 | |
Total shareholders’ equity(4) | | | 165,670 | | | | | | 695,401 | | | | 690,197 | | | | 467,424 | | | | 417,604 | | | | 392,076 | |
Statement of Cash Flows Data: | | | | | | | | | | | | | | | | | | | | | | | | | | |
Net cash from (used in): | | | | | | | | | | | | | | | | | | | | | | | | | | |
Operating activities | | $ | (47,512 | ) | | | | $ | 73,245 | | | $ | 136,102 | | | $ | 84,334 | | | $ | 67,745 | | | $ | 23,360 | |
Investing activities | | | (961,556 | ) | | | | | 126,630 | | | | (19,415 | ) | | | (108,139 | ) | | | (8,078 | ) | | | (42,701 | ) |
Financing activities | | | 1,066,053 | | | | | | (31,243 | ) | | | 6,553 | | | | (616 | ) | | | (1,375 | ) | | | 3,270 | |
Other Financial Data: | | | | | | | | | | | | | | | | | | | | | | | | | | |
EBITDA(5) | | | (230,720 | ) | | | | | 33,584 | | | | 122,984 | | | | 81,728 | | | | 62,170 | | | | 93,469 | |
Adjusted EBITDA(5) | | | 84,539 | | | | | | 70,119 | | | | 141,407 | | | | 92,582 | | | | 62,170 | | | | 93,469 | |
(1) | Exclusive of depreciation and amortization. |
(2) | Amounts shown for the fiscal year ended September 30, 2007, five-month period ended February 25, 2008 and seven-month period ended September 30, 2008 include approximately $800,000, $26,500,000 and $11,800,000 of expenses related to the February 2008 Transactions, respectively. |
(3) | Amount shown for the fiscal year ended September 30, 2006 includes an up-front licensing fee equal to $1,500,000 paid in connection with a co-development agreement with AGI Therapeutics Ltd. Such amount is counted as acquired in-process research for purposes of calculating Adjusted EBITDA. |
(4) | A portion of our common stock was issued to our parent company, Axcan MidCo Inc., in the February 2008 Transactions in exchange for a note receivable amounting to $133,154,405. Pursuant to U.S. GAAP, we report the principal amount as a separate balance offset against shareholders’ equity. Furthermore, we do not recognize interest income related to this note receivable due from Axcan MidCo Inc. in our income statement. |
(5) | EBITDA and Adjusted EBITDA are both non-U.S. GAAP financial measures and are presented in this report because our management considers them important supplemental measures of our performance and believes that they are frequently used by interested parties in the evaluation of companies in the industry. EBITDA, as we use it, is defined as net income before financial expenses, interest income, income taxes and depreciation and amortization. We believe that the presentation of EBITDA enhances an investor’s understanding of our financial performance. We believe that EBITDA is a useful financial metric to assess our operating performance from period to period by excluding certain items that we believe are not representative of our core business. The term EBITDA is not defined under U.S. GAAP, and EBITDA is |
- 47 -
| | not a measure of net income, operating income or any other performance measure derived in accordance with U.S. GAAP, and is subject to important limitations. Adjusted EBITDA, as we use it, is EBITDA adjusted to exclude certain non-cash charges, unusual or non-recurring items and other adjustments set forth below. Adjusted EBITDA is calculated in the same manner as “EBITDA” and “Consolidated EBITDA” as those terms are defined under our new senior secured credit facilities and the indentures governing the notes further described in “Liquidity and Capital Resources—Long-term debt and New Senior Secured Credit Facilities” in “Management’s Discussion and Analysis of Financial Condition and Results of Operations”. We believe that the inclusion of supplementary adjustments applied to EBITDA in presenting Adjusted EBITDA are appropriate to provide additional information to investors about certain material non-cash items and unusual or non-recurring items that we do not expect to continue in the future and to provide additional information with respect to our ability to meet our future debt service and to comply with various covenants in such indentures and credit facility. Adjusted EBITDA is not a measure of net income, operating income or any other performance measure derived in accordance with U.S. GAAP, and is subject to important limitations. EBITDA and Adjusted EBITDA have limitations as an analytical tool, and they should not be considered in isolation, or as substitutes for analysis of our results as reported under U.S. GAAP. Some of these limitations are: |
| | • | | EBITDA and Adjusted EBITDA do not reflect all cash expenditures, future requirements for capital expenditures, or contractual commitments; |
| | • | | EBITDA and Adjusted EBITDA do not reflect changes in, or cash requirements for, working capital needs; |
| | • | | EBITDA and Adjusted EBITDA do not reflect the significant interest expense, or the cash requirements necessary to service interest or principal payments, on our debt; |
| | • | | Although depreciation and amortization are non-cash charges, the assets being depreciated and amortized will often have to be replaced in the future, and EBITDA and Adjusted EBITDA do not reflect any cash requirements for such replacements; |
| | • | | Adjusted EBITDA reflects additional adjustments as provided in the indentures governing our notes and new senior secured credit facilities; and |
| | • | | Other companies in our industry may calculate EBITDA and Adjusted EBITDA differently than we do, limiting its usefulness as a comparative measure. |
Because of these limitations, EBITDA and Adjusted EBITDA should not be considered as measures of discretionary cash available to us to invest in our business. Our management compensates for these limitations by relying primarily on the U.S. GAAP results and using EBITDA and Adjusted EBITDA as supplemental information. A reconciliation of net income, the most directly comparable U.S. GAAP measure, to EBITDA and from EBITDA to Adjusted EBITDA for the periods indicated is as follows:
| | | | | | | | | | | | | | | | | | | | | | | | | | |
| | | Successor | | | | | Predecessor | |
| | | February 26
through
September 30,
2008 | | | | | October 1,
2007 through
February 25,
2008 | | | Fiscal Years Ended September 30, | |
| | | | | | 2007 | | | 2006 | | | 2005 | | | 2004 | |
| | | | | | | | ($ in thousands) | |
Net income to EBITDA: | | | | | | | | | | | | | | | | | | | | | | | | | | |
Net income (loss) | | $ | (289,264 | ) | | | | $ | 17,125 | | | $ | 71,465 | | | $ | 39,119 | | | $ | 26,425 | | | $ | 48,728 | |
Financial expenses | | | 41,513 | | | | | | 262 | | | | 4,825 | | | | 6,988 | | | | 7,140 | | | | 6,885 | |
Interest income | | | (808 | ) | | | | | (5,440 | ) | | | (11,367 | ) | | | (5,468 | ) | | | (1,340 | ) | | | (756 | ) |
Income taxes | | | (17,740 | ) | | | | | 12,042 | | | | 35,567 | | | | 18,266 | | | | 8,413 | | | | 22,253 | |
Depreciation and amortization | | | 35,579 | | | | | | 9,595 | | | | 22,494 | | | | 22,823 | | | | 21,532 | | | | 16,359 | |
| | | | | | | | | | | | | | | | | | | | | | | | | | |
EBITDA | | $ | (230,720 | ) | | | | $ | 33,584 | | | $ | 122,984 | | | $ | 81,728 | | | $ | 62,170 | | | $ | 93,469 | |
| | | | | | | | | | | | | | | | | | | | | | | | | | |
EBITDA to Adjusted EBITDA: | | | | | | | | | | | | | | | | | | | | | | | | | | |
EBITDA | | $ | (230,720 | ) | | | | $ | 33,584 | | | $ | 122,984 | | | $ | 81,728 | | | $ | 62,170 | | | $ | 93,469 | |
Transaction, integration and refinancing costs(a) | | | 12,702 | | | | | | 26,489 | | | | — | | | | — | | | | — | | | | — | |
Stock-based compensation expense(b) | | | 7,443 | | | | | | 10,046 | | | | 4,548 | | | | 3,554 | | | | — | | | | — | |
Acquired in-process research(c) | | | 272,400 | | | | | | — | | | | 10,000 | | | | 1,500 | | | | — | | | | — | |
Inventories stepped-up value expensed(d) | | | 22,714 | | | | | | — | | | | — | | | | — | | | | — | | | | — | |
Loss of disposal and write-down of assets(e) | | | — | | | | | | — | | | | 3,875 | | | | — | | | | — | | | | — | |
Partial write-down of intangible assets(f) | | | — | | | | | | — | | | | — | | | | 5,800 | | | | — | | | | — | |
| | | | | | | | | | | | | | | | | | | | | | | | | | |
Adjusted EBITDA | | $ | 84,539 | | | | | $ | 70,119 | | | $ | 141,407 | | | $ | 92,582 | | | $ | 62,170 | | | $ | 93,469 | |
| | | | | | | | | | | | | | | | | | | | | | | | | | |
(a) | Represents investment banking and other professional fees associated with the Transactions, including integration costs. |
(b) | Represents non-cash stock-based employee compensation expense under the provisions of SFAS No. 123(R), “Share-based Payments” for fiscal year 2006 and thereafter. |
(c) | For the period from February 26 through September 30, 2008, represents the acquired in-process research, arising from the February 2008 Transactions, expensed in the period of acquisition. The amount shown for the fiscal year ended September 30, 2006 represents an up-front licensing fee paid in connection with a co-development agreement with AGI Therapeutics Ltd. and is accounted for as a research and development expense in our financial statements. The amount shown for the fiscal year ended September 30, 2007 represents an up-front payment made in connection with an exclusive license and development agreement with Cellerix SL. |
(d) | Represents inventories stepped-up value, arising from the February 2008 Transactions, expensed as acquired inventory is sold. |
(e) | Represents loss on disposal and write-down of assets. |
(f) | Represents a partial write-down on French product lines including TAGAMET and TRANSULOSE, as the carrying value of the intangible assets associated with those products exceeded their estimated fair value. |
- 48 -
| ITEM 7. | MANAGEMENT’S DISCUSSION AND ANALYSIS OF FINANCIAL CONDITION AND RESULTS OF OPERATIONS. |
You should read the following discussion of our results of operations and financial condition with “Item 6. Selected Financial Data” and the historical audited consolidated financial statements and related notes included elsewhere in this Annual Report. The results of operations for the year ended September 30, 2008 includes the results of operations for the period prior to the completion of the February 2008 Transactions (October 1, 2007 to February 25, 2008, the Predecessor or Predecessor Period) and the results of operations for the period following the completion of the February 2008 Transactions (February 26, 2008 to September 30, 2008, the Successor or Successor Period) on a combined basis. As discussed in further detail below, although this combined basis does not comply with U.S. GAAP, we believe it provides a more meaningful method of comparison. This discussion contains forward-looking statements and involves numerous risks and uncertainties, including, but not limited to, those described above in “Item 1A. Risk Factors” and “Forward-Looking Statements”. Actual results may differ materially from those contained in any forward-looking statements.
Unless the context otherwise requires, in this “Management’s Discussion and Analysis of Financial Condition and Results of Operations,” the terms “Axcan,” “company,” “we,” “us” and “our” refer (i) for periods prior to the consummation of the February 2008 Transactions, to Axcan Pharma Inc. and its consolidated subsidiaries and (ii) for periods following the consummation of the February 2008 Transactions, to Axcan Intermediate Holdings Inc. and its consolidated subsidiaries.
Overview
Our Business
We are a leading specialty pharmaceutical company concentrating in the field of gastroenterology, with operations mainly in the U.S., Canada and the EU. We market and sell pharmaceutical products used in the treatment of a variety of gastrointestinal diseases and disorders. Our main product lines include ULTRASE, PANZYTRAT and VIOKASE, which are pancreatic enzyme products for the treatment of exocrine pancreatic insufficiency; URSO / URSO 250, URSO FORTE / URSO DS, and DELURSAN, which are ursodiol products for the treatment of certain cholestatic liver diseases; SALOFALK and CANASA, which are mesalamine-based products for the treatment of certain inflammatory bowel diseases; CARAFATE and SULCRATE, which are sucralfate products for the treatment of gastric and duodenal ulcers; and PYLERA, a product for the eradication ofHelicobacter pylori in patients with duodenal ulcer disease. We also have a number of pharmaceutical and clinical projects in various phases of development.
We intend to enhance our position as the leading specialty pharmaceutical company concentrating in the field of gastroenterology by pursuing the following strategic initiatives: 1) growing sales of existing products; 2) launching new products; 3) selectively acquiring or in-licensing complementary products; 4) pursuing growth opportunities through development pipeline; and 5) expanding internationally.
Business Environment
Our revenue in the U.S. and Canada has historically been and continues to be principally derived from sales of pharmaceutical products to large pharmaceutical wholesalers and large pharmacy chains. We utilize a “pull-through” marketing approach that is typical for pharmaceutical companies. Our sales representatives demonstrate the features and benefits of our products to gastroenterologists, who may write their patients prescriptions for our products. The patients, in turn, take the prescriptions to pharmacies to be filled. The pharmacies then place orders with the wholesalers or, in the case of large pharmacy chains, their distribution centres, to which we sell our products. Our revenue in the EU and other markets has historically been and continues to be principally derived from sales of pharmaceutical products to institutional buyers and pharmacies through a network of distributors. The level of patient and physician acceptance of our products, as well as the availability of similar therapies, which may be less effective but also less expensive than some of our products, impact our revenues by driving the level and timing of prescriptions for our products. Our operating revenues are also affected by other factors, including our ability to convince healthcare practitioners to use our products for approved indications and wholesaler buying patterns.
Our expenses are comprised primarily of selling and administrative expenses (including marketing expenses), cost of goods sold (including royalty payments to those companies from which we license some of our commercialized products), research and development expenses, financial expenses as well as depreciation and amortization.
Historically, wholesalers’ business models in the United States were dependent on drug price inflation. Their profitability and gross margins were directly tied to the speculative purchasing of pharmaceutical products at pre-increase prices, and the selling of their product inventory to their customers at the increased price. This inventory price arbitrage accounted for a predominant portion of wholesalers’ compensation for their distribution services and had a dramatic effect on wholesaler buying patterns, as they invested in inventories in anticipation of generating higher gross margins from manufacturer price increases. Since fiscal year 2005, pharmaceutical manufacturers have not been increasing drug prices as frequently, and the percentage increases have been lower. For these and other reasons, some wholesalers have changed their business model to a fee-for-service arrangement, whereby manufacturers pay wholesalers a fee for inventory management and other services. These fees typically are a percentage of the wholesaler’s purchases from the manufacturer or a fixed charge per item or per unit. The fee-for-service approach results in wholesalers’ compensation being more
- 49 -
stable, and volume-based as opposed to price-increase based. As a result of the move to a fee-for-service business model, many wholesalers are no longer investing in inventory ahead of anticipated price increases and are reducing their inventories from their historical levels. Under the new model, the consequence of manufacturers using wholesalers is that they now realize the benefit of price increases more rapidly in return for paying wholesalers for the services they provide, on a fee-for-service basis. This change in wholesalers’ business models has affected our revenue since fiscal year 2005, and the resulting distribution services agreement, or DSA, fees are deducted from gross sales. Currently, only one such DSA is in place.
The Transactions
The February 2008 Transactions
On November 29, 2007, we entered into an Arrangement Agreement with Axcan Pharma, pursuant to which we agreed to, through an indirect wholly-owned subsidiary, acquire all of the common stock of Axcan Pharma and enter into various other transactions in accordance with the Plan of Arrangement.
At a special meeting of Axcan Pharma’s shareholders on January 25, 2008, the holders of more than 99% of Axcan Pharma’s outstanding common stock voted on a special resolution to approve the Arrangement. On January 28, 2008, the Superior Court of Quebec issued a final order approving the Arrangement. The Arrangement closed on February 25, 2008 and at such time, each outstanding share of Axcan Pharma common stock was transferred to us in exchange for a payment of $23.35 per share, or the offer price, without interest and less any required withholding taxes. In addition, all granted and outstanding options to purchase common stock of Axcan Pharma, other than those options held by us or any of our affiliates, were vested, transferred by the holder of such option to Axcan Pharma and cancelled in exchange for an amount in cash equal to the excess, if any, of the offer price over the applicable option exercise price for each share of common stock subject to such option, less any required withholding taxes and all vested and unvested deferred stock units, or DSUs, and restricted stock units, or RSU, issued under any and all of Axcan Pharma’s existing stock option plans were, without any further action by the holders thereof, vested, cancelled and terminated. The holders of such DSUs and RSU received the offer price, less any required withholding taxes, for each DSU and RSU formerly held.
The Arrangement was financed through the proceeds from the initial offering of the secured notes, initial borrowings under our new senior secured credit facilities and our senior unsecured bridge facility, equity investments funded by the Sponsor Funds, the Co-Investors and Axcan Pharma’s cash on hand. The closing of the offering of the secured notes, the new senior secured credit facilities and the senior unsecured bridge facility occurred substantially concurrently with the closing of the Arrangement on February 25, 2008.
Subsequent to the February 2008 Transactions, we are an indirect wholly-owned subsidiary of Axcan Holdings Inc., or Holdings, and Axcan Pharma is our indirect wholly-owned subsidiary.
The Refinancing
On May 6, 2008, we completed an offering of $235.0 million of our senior notes. The net proceeds from this offering, along with our cash on hand, were used to repay in full our senior unsecured bridge facility.
In connection with the Transactions, we incurred significant indebtedness. See “—Liquidity and Capital Resources”. In addition, we accounted for the acquisition as a purchase combination and, accordingly, the purchase price was allocated to the assets acquired and liabilities assumed based on their estimated fair values at the acquisition date.
As at September 30, 2008, we finalized our allocation of purchase price. As a result of the finalization of the purchase price allocation, we recorded an adjustment of $1.1 million to other current assets, $4.9 million to property, plant and equipment, $7.1 million to goodwill, $1.5 million to deferred income taxes assets and $1.7 million to deferred income taxes liabilities.
- 50 -
The final purchase price allocation is as follows (in millions of U.S. dollars):
| | | | |
Cash | | $ | 348.8 | |
Inventories | | | 54.1 | |
Other current assets | | | 91.9 | |
Property, plant and equipment | | | 36.9 | |
Intangible assets | | | 581.7 | |
Acquired in-process research | | | 272.4 | |
Goodwill | | | 169.6 | |
Deferred debt issue expenses | | | 0.9 | |
Deferred income taxes assets | | | 7.2 | |
Current liabilities | | | (174.5 | ) |
Long-term debt | | | (0.1 | ) |
Deferred income taxes liabilities | | | (81.6 | ) |
| | | | |
Total | | $ | 1,307.3 | |
| | | | |
Presentation of Financial Information for Fiscal Year Ended September 30, 2008
In this “Management’s Discussion and Analysis of Financial Condition and Results of Operations,” when financial information for the fiscal year period ended September 30, 2008 is presented, including the results of operations, this information is presented as the mathematical combination of the relevant financial information of the Predecessor (from October 1, 2007 to February 25, 2008) and the Successor (from February 26, 2008 to September 30, 2008) for such period. This mathematical combination is presented because we believe it assists in a reader’s analysis of our fiscal year 2008 results as compared to our fiscal year 2007 results in comparable time periods. However, this approach is not consistent with U.S. GAAP and may yield results that are not strictly comparable on a period-to-period basis primarily due to the impact of purchase accounting entries recorded as a result of the February 2008 Transactions and the lack of substantial debt outstanding of the Predecessor as compared to the Successor. In addition, the “combined” financial information has not been prepared as pro forma information and does not reflect all of the adjustments that would be required if the results for the period were reflected on a pro forma basis. Furthermore, this financial information may not reflect the actual financial results we would have achieved absent the February 2008 Transactions and may not be predictive of future financial results.
Financial Overview for Fiscal Years Ended September 30, 2008, 2007 and 2006
This discussion and analysis is based on our audited annual consolidated financial statements and the related notes thereto reported under U.S. GAAP. For a description of our products, see the section entitled “Business—Products.”
For the year ended September 30, 2008, revenue was $381.8 million ($348.9 million in fiscal year 2007 and $292.3 million in fiscal year 2006), operating loss was $244.3 million ($102.8 million of operating income in fiscal year 2007 and $57.8 million of operating income in fiscal year 2006) and net loss was $272.2 million ($71.5 million of net income in fiscal year 2007 and $39.1 million of net income in fiscal year 2006). For the year ended September 30, 2008, our net income was largely affected by charges related to the Transactions, including for acquired in-process research amounting to $272.4 million, discussed in greater detail below. Revenue from sales of our products in the United States was $280.4 million (73.4% of total revenue) for the year ended September 30, 2008, compared to $254.7 million (73.0% of total revenue) for fiscal year 2007 and $201.8 million (69.0% of total revenue) for fiscal year 2006. In Canada, revenue was $34.9 million (9.1% of total revenue) for the year ended September 30, 2008, compared to $38.0 million (10.9% of total revenue) for fiscal year 2007 and $38.0 million (13.0% of total revenue) for fiscal year 2006. In the European Union, revenue was $66.0 million (17.3% of total revenue) for the year ended September 30, 2008, compared to $55.9 million (16.0% of total revenue) for fiscal year 2007 and $52.1 million (17.8% of total revenue) for fiscal year 2006.
- 51 -
Financial Highlights for Fiscal Years Ended September 30, 2008, 2007 and 2006
| | | | |
| | | As at
September 30,
2008 | | As at
September 30,
2007 |
| | | Successor | | Predecessor |
| (in millions of U.S. dollars) | | $ | | $ |
Total assets | | 944.8 | | 832.6 |
Long-term debt | | 622.2 | | 0.6 |
Shareholders’ equity | | 165.7 | | 690.2 |
| | | | | | | | | | | | | | |
| | | For the
seven-month
period ended
September 30,
2008 | | | | | For the
five-month
period ended
February 25,
2008 | | For the
fiscal year ended
September 30,
2008 | | | For the
fiscal year ended
September 30,
2007 | | For the
fiscal year ended
September 30,
2006 |
| | | Successor | | | | | Predecessor | | Non U.S. GAAP
Combined
Predecessor/
Successor | | | Predecessor | | Predecessor |
| (in millions of U.S. dollars) | | $ | | | | | $ | | $ | | | $ | | $ |
Revenue | | 223.2 | | | | | 158.6 | | 381.8 | | | 348.9 | | 292.3 |
EBITDA(1) | | (230.7 | ) | | | | 33.6 | | (197.1 | ) | | 122.9 | | 81.7 |
Adjusted EBITDA(1) | | 84.5 | | | | | 70.1 | | 154.6 | | | 141.4 | | 92.6 |
Net income (net loss) | | (289.3 | ) | | | | 17.1 | | (272.2 | ) | | 71.5 | | 39.1 |
| | | | | | | | | | | | | | |
(1) | A reconciliation of net income to EBITDA (a non-U.S. GAAP measure) and from EBITDA to Adjusted EBITDA (a non-U.S. GAAP measure) for the fiscal years ended September 30, 2008, 2007 and 2006 is as follows: |
| | | | | | | | | | | | | | | | | |
| | | For the
seven-month
period ended
September 30,
2008 | | | | | For the
five-month
period ended
February 25,
2008 | | | For the
fiscal year ended
September 30,
2008 | | | For the
fiscal year ended
September 30,
2007 | | | For the
fiscal year ended
September 30,
2006 | |
| | | Successor
| | | | | Predecessor | | | Non U.S. GAAP
Combined
Predecessor/
Successor | | | Predecessor | | | Predecessor | |
| (in millions of U.S. dollars) | | $ | | | | | $ | | | $ | | | $ | | | $ | |
Net income (net loss) | | (289.3 | ) | | | | 17.1 | | | (272.2 | ) | | 71.5 | | | 39.1 | |
Financial expenses | | 41.5 | | | | | 0.3 | | | 41.8 | | | 4.8 | | | 7.0 | |
Interest income | | (0.8 | ) | | | | (5.4 | ) | | (6.2 | ) | | (11.4 | ) | | (5.5 | ) |
Income taxes expense (benefit) | | (17.7 | ) | | | | 12.0 | | | (5.7 | ) | | 35.5 | | | 18.3 | |
Depreciation and amortization | | 35.6 | | | | | 9.6 | | | 45.2 | | | 22.5 | | | 22.8 | |
| | | | | | | | | | | | | | | | | |
EBITDA(g) | | (230.7 | ) | | | | 33.6 | | | (197.1 | ) | | 122.9 | | | 81.7 | |
Transaction, integration and refinancing costs(a) | | 12.7 | | | | | 26.5 | | | 39.2 | | | — | | | — | |
Stock-based compensation expense(b) | | 7.4 | | | | | 10.0 | | | 17.4 | | | 4.6 | | | 3.6 | |
Acquired in-process research(c) | | 272.4 | | | | | — | | | 272.4 | | | 10.0 | | | 1.5 | |
Inventories stepped-up value expensed(d) | | 22.7 | | | | | — | | | 22.7 | | | — | | | — | |
Loss of disposal and write-down of assets(e) | | — | | | | | — | | | — | | | 3.9 | | | — | |
Partial write-down of intangible assets(f) | | — | | | | | — | | | — | | | — | | | 5.8 | |
| | | | | | | | | | | | | | | | | |
Adjusted EBITDA(g) | | 84.5 | | | | | 70.1 | | | 154.6 | | | 141.4 | | | 92.6 | |
| | | | | | | | | | | | | | | | | |
(a) | Includes transaction, integration and refinancing costs and other professional fees associated with the Transactions. |
(b) | Represents stock-based employee compensation expense under the provisions of Statement of Financial Accounting Standards, or SFAS, No.123(R), “Share-based Payments”. |
(c) | Represents the acquired in-process research, arising from the February 2008 Transactions, expensed in the period of acquisition. |
(d) | Represents inventories stepped-up value, arising from the February 2008 Transactions, expensed as acquired inventory is sold. |
(e) | Represents loss on disposal and write-down on assets. |
(f) | Represents a partial write-down on French product lines including TAGAMET and TRANSULOSE, as the carrying value of the intangible assets associated with those products exceeded their estimated fair value. |
(g) | EBITDA and Adjusted EBITDA are both non-U.S. GAAP financial measures and are presented in this report because our management considers them important supplemental measures of our performance and believes that they are frequently used by interested parties in the evaluation of companies in the industry. EBITDA, as we use it, is net income before financial expenses, interest income, income taxes and depreciation and amortization. We believe that the presentation of EBITDA enhances an investor’s understanding of our financial performance. We believe that EBITDA is a useful financial metric to assess our operating performance from period to period by excluding |
- 52 -
| | certain items that we believe are not representative of our core business. The term EBITDA is not defined under U.S. GAAP, and EBITDA is not a measure of net income, operating income or any other performance measure derived in accordance with U.S. GAAP, and is subject to important limitations. Adjusted EBITDA, as we use it, is EBITDA adjusted to exclude certain non-cash charges, unusual or non-recurring items and other adjustments set forth below. Adjusted EBITDA is calculated in the same manner as “EBITDA” and “Consolidated EBITDA” as those terms are defined under the indentures governing the notes and credit facility further described in the section “—Liquidity and Capital Resources—Long-term Debt and New Senior Secured Credit Facilities”. We believe that the inclusion of supplementary adjustments applied to EBITDA in presenting Adjusted EBITDA are appropriate to provide additional information to investors about certain material non-cash items and unusual or non-recurring items that we do not expect to continue in the future and to provide additional information with respect to our ability to meet our future debt service and to comply with various covenants in such indentures and credit facility. Adjusted EBITDA is not a measure of net income, operating income or any other performance measure derived in accordance with U.S. GAAP, and is subject to important limitations. EBITDA and Adjusted EBITDA have limitations as an analytical tool, and they should not be considered in isolation, or as substitutes for analysis of our results as reported under U.S. GAAP. Some of these limitations are: |
| | • | | EBITDA and Adjusted EBITDA do not reflect all cash expenditures, future requirements for capital expenditures, or contractual commitments; |
| | • | | EBITDA and Adjusted EBITDA do not reflect changes in, or cash requirements for, working capital needs; |
| | • | | EBITDA and Adjusted EBITDA do not reflect the significant interest expense, or the cash requirements necessary to service interest or principal payments, on our debt; |
| | • | | Although depreciation and amortization are non-cash charges, the assets being depreciated and amortized will often have to be replaced in the future, and EBITDA and Adjusted EBITDA do not reflect any cash requirements for such replacements; |
| | • | | Adjusted EBITDA reflects additional adjustments as provided in the indentures governing our notes and new senior secured credit facilities; and |
| | • | | Other companies in our industry may calculate EBITDA and Adjusted EBITDA differently than we do, limiting its usefulness as a comparative measure. |
Because of these limitations, EBITDA and Adjusted EBITDA should not be considered as measures of discretionary cash available to us to invest in our business. Our management compensates for these limitations by relying primarily on the U.S. GAAP results and using EBITDA and Adjusted EBITDA as supplemental information.
The following table sets forth, for the years indicated, the percentage of revenue represented by items in our consolidated statements of operations:
| | | | | | | | | |
| | | For the fiscal years ended
September 30, | |
| | | 2008 | | | 2007 | | | 2006 | |
| | | % | | | % | | | % | |
Revenue | | 100.0 | | | 100.0 | | | 100.0 | |
Cost of goods sold | | 30.4 | | | 24.0 | | | 24.9 | |
Selling and administrative expenses | | 43.1 | | | 29.0 | | | 31.9 | |
Research and development expenses | | 7.4 | | | 8.2 | | | 13.6 | |
Acquired in-process research | | 71.3 | | | 2.9 | | | — | |
Depreciation and amortization | | 11.8 | | | 6.4 | | | 7.8 | |
Partial write-down of intangible assets | | — | | | — | | | 2.0 | |
| | | | | | | | | |
| | 164.0 | | | 70.5 | | | 80.2 | |
| | | | | | | | | |
Operating income (loss) | | (64.0 | ) | | 29.5 | | | 19.8 | |
Financial expenses | | 10.9 | | | 1.4 | | | 2.4 | |
Interest income | | (1.6 | ) | | (3.3 | ) | | (1.9 | ) |
Loss (gain) on foreign currency | | (0.5 | ) | | 0.7 | | | (0.4 | ) |
| | | | | | | | | |
| | 8.8 | | | (1.2 | ) | | 0.1 | |
| | | | | | | | | |
Income (loss) before income taxes | | (72.8 | ) | | 30.7 | | | 19.7 | |
Income taxes expense (benefit) | | (1.5 | ) | | 10.2 | | | 6.3 | |
| | | | | | | | | |
Net income (net loss) | | (71.3 | ) | | 20.5 | | | 13.4 | |
| | | | | | | | | |
- 53 -
Fiscal Year ended September 30, 2008 compared to Fiscal Year ended September 30, 2007
Overview of Results of Operations
| | | | | | | | | | | | | | | | | | | | |
| | | For the
seven-month
period ended
September 30,
2008 | | | | | For the
five-month
period ended
February 25,
2008 | | | For the
fiscal year ended
September 30,
2008 | | | For the
fiscal year ended
September 30,
2007 | | | Change | |
| | | Successor | | | | | Predecessor | | | Non U.S. GAAP
Combined
Predecessor/
Successor | | | Predecessor | | | | | | | |
| (in millions of U.S. dollars) | | $ | | | | | $ | | | $ | | | $ | | | $ | | | % | |
Revenue | | 223.2 | | | | | 158.6 | | | 381.8 | | | 348.9 | | | 32.9 | | | 9.4 | |
Cost of goods sold(a) | | 77.2 | | | | | 38.7 | | | 115.9 | | | 83.7 | | | 32.2 | | | 38.5 | |
Selling and administrative expenses(a) | | 88.3 | | | | | 76.2 | | | 164.5 | | | 101.3 | | | 63.2 | | | 62.4 | |
Research and development expenses(a) | | 17.8 | | | | | 10.3 | | | 28.1 | | | 28.6 | | | (0.5 | ) | | (1.7 | ) |
Acquired in-process research | | 272.4 | | | | | — | | | 272.4 | | | 10.0 | | | 262.4 | | | 2,624.0 | |
Depreciation and amortization | | 35.6 | | | | | 9.6 | | | 45.2 | | | 22.5 | | | 22.7 | | | 100.9 | |
| | | | | | | | | | | | | | | | | | | | |
| | 491.3 | | | | | 134.8 | | | 626.1 | | | 246.1 | | | 380.0 | | | 154.4 | |
| | | | | | | | | | | | | | | | | | | | |
Operating income (loss) | | (268.1 | ) | | | | 23.8 | | | (244.3 | ) | | 102.8 | | | (347.1 | ) | | (337.6 | ) |
Financial expenses | | 41.5 | | | | | 0.3 | | | 41.8 | | | 4.8 | | | 37.0 | | | 770.8 | |
Interest income | | (0.8 | ) | | | | (5.4 | ) | | (6.2 | ) | | (11.4 | ) | | 5.2 | | | 45.6 | |
Loss (gain) on foreign currency | | (1.8 | ) | | | | (0.2 | ) | | (2.0 | ) | | 2.4 | | | (4.4 | ) | | (183.3 | ) |
| | | | | | | | | | | | | | | | | | | | |
| | 38.9 | | | | | (5.3 | ) | | 33.6 | | | (4.2 | ) | | 37.8 | | | 900.0 | |
| | | | | | | | | | | | | | | | | | | | |
Income (loss) before income taxes | | (307.0 | ) | | | | 29.1 | | | (277.9 | ) | | 107.0 | | | (384.9 | ) | | (359.7 | ) |
Income taxes expense (benefit) | | (17.7 | ) | | | | 12.0 | | | (5.7 | ) | | 35.5 | | | (41.2 | ) | | (116.1 | ) |
| | | | | | | | | | | | | | | | | | | | |
Net income (net loss) | | (289.3 | ) | | | | 17.1 | | | (272.2 | ) | | 71.5 | | | (343.7 | ) | | (480.7 | ) |
| | | | | | | | | | | | | | | | | | | | |
(a) | Exclusive of depreciation and amortization |
Revenue
For the year ended September 30, 2008, revenue was $381.8 million compared to $348.9 million for fiscal year 2007, an increase of 9.4%.
This increase in revenue primarily resulted from higher sales in the United States, which amounted to $280.4 million for the year ended September 30, 2008, compared to $254.7 million for fiscal year 2007, an increase of 10.1%. The end-customer prescription demand resulted in positive growth for most of our products sold in the United States, which was reflected in sales to our major wholesalers. Strong sales of CANASA and ULTRASE, as well as the sales of PYLERA, launched in May 2007, account for the increase compared to fiscal year 2007.
Sales in the European Union increased 18.1%, from $55.9 million in fiscal year 2007 to $66.0 million for the year ended September 30, 2008, due to strong sales of DELURSAN and LACTEOL in France as well as the effect of currency conversion, which accounted for 13.2% of the increase in fiscal year 2008 sales. For the year ended September 30, 2008, we reported sales of $19.0 million ($16.3 million in fiscal year 2007), for LACTEOL, including $11.1 million ($9.9 million in fiscal year 2007), outside of France.
Sales in Canada decreased 8.2% from $38.0 million for the year ended September 30, 2007, to $34.9 million for the year ended September 30, 2008. Lower sales of URSO for the first six months of the fiscal year, following the launch of generic URSO products in the second half of fiscal year 2007, which were partially offset by the favorable effect of currency conversion, which we estimate at 11%, explain the decrease for the year ended September 30, 2008.
- 54 -
Revenue is stated net of deductions for product returns, chargebacks, contract rebates, DSA fees, discounts and other allowances. The following table summarizes our gross-to-net revenue adjustments for each significant category:
| | | | | | | | | | |
| | | For the fiscal years ended
September 30, | |
| | | 2008 | | 2007 | | Change | |
| (in millions of U.S. dollars) | | $ | | $ | | $ | | | % | |
Gross revenue | | 447.1 | | 409.7 | | 37.4 | | | 9.1 | |
| | | | | | | | | | |
Gross-to-net revenue adjustments | | | | | | | | | | |
Product returns | | 9.2 | | 13.1 | | (3.9 | ) | | (29.8 | ) |
Chargebacks | | 20.6 | | 14.2 | | 6.4 | | | 45.1 | |
Contract rebates | | 25.3 | | 22.7 | | 2.6 | | | 11.5 | |
DSA fees | | 2.1 | | 3.6 | | (1.5 | ) | | (41.7 | ) |
Discounts and other allowances | | 8.1 | | 7.2 | | 0.9 | | | 12.5 | |
| | | | | | | | | | |
Total gross-to-net revenue adjustments | | 65.3 | | 60.8 | | 4.5 | | | 7.4 | |
| | | | | | | | | | |
Net revenue | | 381.8 | | 348.9 | | 32.9 | | | 9.4 | |
| | | | | | | | | | |
Product returns, chargebacks, contract rebates, DSA fees, discounts and other allowances totalled $65.3 million (14.6% of gross revenue) for the year ended September 30, 2008, and $60.8 million (14.8% of gross revenue) for the year ended September 30, 2007.
The decrease in total deductions as a percentage of gross revenue for the year ended September 30, 2008, was primarily due to a decrease in product returns, which is in line with the decline in wholesaler inventory levels which occurred during the first half of fiscal year 2007 and the decline in DSA fees due to product price increases and their related credits and other changes in related assumptions.
Product sales
Sales growth is the result of a combination of volume and price increases. Price increases on our products were in-line with price increases of other competitive products within the respective product categories.
Key sales figures for the fiscal year 2008 are as follows:
| | • | | Sales of pancreatic enzyme products (ULTRASE, PANZYTRAT and VIOKASE) amounted to $90.9 million, an increase of 22.8% over fiscal year 2007 sales of pancreatic enzymes. |
| | • | | Sales of ursodiol products (URSO/URSO 250, URSO FORTE/URSO DS and DELURSAN) decreased 1.5% from fiscal year 2007 to $92.3 million. This decrease occurred in spite of a $4.6 million increase in the EU which was offset by a decrease in Canada due to the launch of a generic version of ursodiol. |
| | • | | Sales of mesalamine products (CANASA and SALOFALK) amounted to $93.3 million, a 10.4% increase from the prior fiscal year. |
| | • | | Sales of sucralfate products (CARAFATE and SULCRATE) amounted to $52.5 million, an increase of 0.6% over the prior fiscal year. |
| | • | | Sales of other products amounted to $52.8 million, an 18.7% increase over the prior year. This increase is mainly the result of the launch of PYLERA in May 2007 and of various price increases over the course of fiscal year 2008. |
Cost of goods sold
Cost of goods sold consists principally of the costs of raw materials, royalties and manufacturing costs. We outsource most of our manufacturing requirements. For the year ended September 30, 2008, cost of goods sold increased $32.2 million (38.5%) to $115.9 million from $83.7 million for fiscal year 2007. As a percentage of revenue, cost of goods sold for the year ended September 30, 2008, increased as compared to fiscal year 2007 from 24.0% to 30.4%. As part of the purchase price allocation for the Transactions, the book value of inventory acquired was stepped up to fair value by $22.7 million as of February 25, 2008. The stepped-up value was recorded as charge to cost of goods sold as acquired inventory was sold, until acquired inventory was sold off.
- 55 -
The total amount of $22.7 million was expensed during the year ended September 30, 2008. Without this additional charge, cost of goods sold as a percentage of revenue would have been 24.4% for the year ended September 30, 2008, compared to 24.0% for fiscal year 2007, which would represent an increase of 1.7%. This increase is mainly due to the increase in cost of raw materials used in the manufacturing of several of our products.
Selling and administrative expenses
Selling and administrative expenses consist principally of salaries and other costs associated with our sales force and our marketing activities. For the year ended September 30, 2008, selling and administrative expenses increased $63.2 million (62.4%) to $164.5 million from $101.3 million for fiscal year 2007. The increase in selling and administrative expenses for the year ended September 30, 2008, is largely attributable to the portion of transaction, integration and refinancing costs and other professional fees charged to operations, amounting to $42.2 million, and the selling and administrative portion of stock-based compensation expenses incurred in relation to the Transactions, amounting to $10.8 million, as well as higher expenses linked to increased sales performance.
Research and development expenses
Research and development expenses consist principally of fees paid to outside parties that we use to conduct clinical studies and to submit governmental approval applications on our behalf, as well as the salaries and benefits paid to our personnel involved in research and development projects. For the year ended September 30, 2008, research and development expenses decreased $0.5 million (1.7%) to $28.1 million, from $28.6 million for fiscal year 2007. The decrease for the year ended September 30, 2008 is mainly due to the termination of the development of ITAX in fiscal year 2007 and lower expenses for clinical studies related to our pancreatic enzyme products, compared to the previous fiscal year which was partly offset by the increase caused by the research and development portion of stock-based compensation expense incurred in relation to the Transactions, amounting to $0.9 million.
Acquired in-process research
The acquired in-process research of $272.4 million for the year ended September 30, 2008 relates to the intangible assets acquired in the Transactions. The acquired in-process research represents the estimated fair value of acquired in-process research and development projects that had not yet reached technological feasibility and had no alternative future use. Accordingly, this amount was immediately expensed upon the acquisition date. The value assigned to purchased in-process technology is mainly attributable to the following projects: CANASA MAX-002, pancreatic enzymes, PYLERA in the European Union, AGI-010 and Cx401.
The acquired in-process research of $10.0 million for fiscal year 2007, relates to an up-front license fee payable upon signing of the exclusive license agreement for North America with Cellerix to develop, manufacture and market Cx401, an innovative biological product in development for the treatment of perianal fistulas. As this product had not reached technological feasibility, the license fee was considered to be acquired in-process research and was expensed in fiscal year 2007, the period of acquisition.
Depreciation and amortization
Depreciation and amortization consists principally of the amortization of intangible assets with a finite life. Intangible assets include trademarks, trademark licenses and manufacturing rights. For the year ended September 30, 2008, depreciation and amortization increased $22.7 million (100.9%) to $45.2 million from $22.5 million for fiscal year 2007. This increase is due to the amortization of the stepped-up value of the intangible assets which were classified as intangible assets with a finite life, following the February 2008 Transactions, and the amortization of the intangible assets associated with PYLERA, which was launched in May 2007.
Financial expenses
Financial expenses consist principally of interest and fees paid in connection with funds borrowed for acquisitions. For the year ended September 30, 2008, financial expenses increased $37.0 million to $41.8 million from $4.8 million for fiscal year 2007. This increase is mainly due to the increases of $33.8 million in interest on long-term debt and $2.7 million in amortization of deferred debt issue expenses on the long-term debt incurred to fund the Transactions. Financial expenses for the prior fiscal year were mainly related to our $125.0 million 4.25% convertible subordinated notes due April 15, 2008, or the Convertible notes, which were converted into common shares of Axcan Pharma in September 2007.
- 56 -
Interest income
For the year ended September 30, 2008, total interest income decreased $5.2 million (45.6%) to $6.2 million from $11.4 million for fiscal year 2007. This decrease is mainly due to the reduction in short-term investments resulting from the use of cash on hand for the Transactions.
Income taxes
For the year ended September 30, 2008, income tax benefit amounted to $5.7 million compared to an expense of $35.5 million for fiscal year 2007. The effective tax rate was 2.1% for the year ended September 30, 2008, compared to 33.2% for the year ended September 30, 2007. The effective tax rate for the year ended September 30, 2008, is affected by a number of elements, the most important being the non-deductible nature of the acquired in-process research expense amounting to $272.4 million resulting from the Transactions. If the effect of the non-deductible acquired in-process research was removed, the effective tax rate on the adjusted loss before income tax of $5.5 million, for the year ended September 30, 2008, would be 103.6%, mostly because that at such a low level of net loss, the difference in foreign tax rates has an important impact on the effective tax rate.
Net income
Net loss was $272.2 million for the year ended September 30, 2008, compared to $71.5 million of net income for fiscal year 2007. The change in net income for the year ended September 30, 2008, resulted mainly from an increase in operating expenses of $380.0 million, primarily expenses related to the Transactions, including the acquired in-process research expense of $272.4 million, an increase in financial expenses of $37.0 million and a decrease in interest income of $5.2 million, which were partly offset by an increase in revenue of $32.9 million and a decrease in income taxes of $41.2 million.
Balance sheets as at September 30, 2008 and September 30, 2007
The following table summarizes balance sheet information as at September 30, 2008, compared to September 30, 2007:
| | | | | | | | | | |
| | | September 30,
2008 | | September 30,
2007 | | Change | |
| (in millions of u.s. Dollars) | | $ | | $ | | $ | | | % | |
Cash, cash equivalents and short-term investments | | 56.1 | | 309.6 | | (253.5 | ) | | (81.9 | ) |
Current assets | | 177.0 | | 402.1 | | (225.1 | ) | | (56.0 | ) |
Total assets | | 944.8 | | 832.6 | | 112.2 | | | 13.5 | |
Current liabilities | | 99.3 | | 104.7 | | (5.4 | ) | | (5.2 | ) |
Long-term debt | | 611.2 | | 0.1 | | 611.1 | | | — | |
Total liabilities | | 779.1 | | 142.4 | | 636.7 | | | 447.1 | |
Shareholders’ equity | | 165.7 | | 690.2 | | (524.5 | ) | | (76.0 | ) |
Working capital | | 77.7 | | 297.4 | | (219.7 | ) | | (73.9 | ) |
Our cash, cash equivalents and short-term investments decreased by $253.5 million (81.9%) to $56.1 million as at September 30, 2008, from $309.6 million at September 30, 2007. As at September 30, 2008, working capital was $77.7 million, compared to $297.4 million at September 30, 2007, a decrease of $219.7 million (73.9%). These decreases were mainly due to the cash used to fund the Transactions.
Total assets increased $112.2 million (13.5%) to $944.8 million as at September 30, 2008, from $832.6 million as at September 30, 2007. This increase was mainly due to the allocation of the purchase price from the Transactions. Long-term debt increased $611.1 million due to the new financing of the Transactions. Shareholders’ equity decreased $524.5 million (76.0%) to $165.7 million as at September 30, 2008, from $690.2 million as at September 30, 2007.
- 57 -
Fiscal year ended September 30, 2007 compared to fiscal year ended September 30, 2006
Overview of results of operations
| | | | | | | | | | | | |
| | | For the Fiscal Years Ended
September 30, | |
| | | 2007 | | | 2006 | | | Change | |
| | | (In millions of U.S. dollars) | |
| | | $ | | | % | |
Revenue | | 348.9 | | | 292.3 | | | 56.6 | | | 19.4 | |
Cost of goods sold(a) | | 83.7 | | | 72.8 | | | 10.9 | | | 15.0 | |
Selling and administrative expenses(a) | | 101.3 | | | 93.3 | | | 8.0 | | | 8.6 | |
Research and development expenses(a) | | 28.6 | | | 39.8 | | | (11.2 | ) | | (28.1 | ) |
Acquired in—process research | | 10.0 | | | — | | | 10.0 | | | — | |
Depreciation and amortization | | 22.5 | | | 22.8 | | | (0.3 | ) | | (1.3 | ) |
Partial write-down of intangible assets | | — | | | 5.8 | | | (5.8 | ) | | (100.0 | ) |
| | | | | | | | | | | | |
| | 246.1 | | | 234.5 | | | 11.6 | | | 4.9 | |
| | | | | | | | | | | | |
Operating income | | 102.8 | | | 57.8 | | | 45.0 | | | 77.9 | |
| | | | | | | | | | | | |
Financial expenses | | 4.8 | | | 7.0 | | | (2.2 | ) | | (31.4 | ) |
Interest income | | (11.4 | ) | | (5.5 | ) | | (5.9 | ) | | (107.3 | ) |
Loss (gain) on foreign currency | | 2.4 | | | (1.1 | ) | | 3.5 | | | 318.2 | |
| | | | | | | | | | | | |
| | (4.2 | ) | | 0.4 | | | (4.6 | ) | | — | |
| | | | | | | | | | | | |
Income before income taxes | | 107.0 | | | 57.4 | | | 49.6 | | | 86.4 | |
Income taxes | | 35.5 | | | 18.3 | | | 17.2 | | | 94.0 | |
| | | | | | | | | | | | |
Net income | | 71.5 | | | 39.1 | | | 32.4 | | | 82.9 | |
| | | | | | | | | | | | |
(a) | Exclusive of depreciation and amortization |
Revenue
For the year ended September 30, 2007, revenue was $348.9 million compared to $292.3 million for the preceding fiscal year, an increase of 19.4%.
This increase in revenue primarily resulted from higher sales in the United States, which amounted to $254.7 million for the year ended September 30, 2007 compared to $201.8 million for the preceding fiscal year, an increase of 26.2%. The end-customer prescription demand resulted in positive growth for most of our products sold in the United States, which was reflected in sales to our major wholesalers. Although sales have increased by 19.4%, major wholesalers in the United States slightly decreased their average inventory levels in fiscal year 2007. Based on our best estimate derived from information obtained from a number of our wholesalers in the United States, we believe that changes in wholesaler inventory levels did not have a material impact on revenues for the year ended September 30, 2007. We estimate that at the end of our fourth quarter overall wholesaler inventory levels of key products sold in the United States were at the higher end of the four- to six-week range. For URSO and CANASA, we saw an increase in the prescription size that contributed to higher dollar sales in fiscal year 2007 compared to fiscal year 2006. Furthermore, as we transitioned to new eligibility rules in our patient assistance programs, we began to realize revenues from certain prescriptions that were provided free of charge or at a reduced cost in prior periods.
Sales in Canada were stable at approximately $38.0 million for the year ended September 30, 2007 and for the year ended September 30, 2006. The strong performance of the SALOFALK product line was offset primarily by lower sales of URSO following the launch in Canada of generic products in the second half of fiscal year 2007.
Sales in the EU also increased 7.3%, from $52.1 million to $55.9 million for the year ended September 30, 2007, mainly due to a strong sales performance of PANZYTRAT in Germany and DELURSAN in France. This overall increase in sales in the EU was achieved despite the delisting in March 2006 by the French government of a number of pharmaceutical products from government formularies, including LACTEOL, and the re-pricing of other pharmaceuticals, including TAGAMET. For the year ended September 30, 2007, we reported sales of $16.3 million ($18.1 million in fiscal year 2006), for LACTEOL, including $9.9 million ($9.1 million in fiscal year 2006), outside of France. The reduction in LACTEOL sales in France was partially offset by the addition of over-the-counter, or OTC, sales of LACTEOL since the end of
- 58 -
fiscal year 2006 and higher sales outside of France, thus reducing the anticipated decline. We believe, but cannot provide assurances, that the sales impact caused by the delisting from French government formularies on March 1, 2006, has stabilized.
Revenue is stated net of deductions for product returns, chargebacks, contract rebates, DSA fees, discounts and other allowances. The following table summarizes our gross-to-net revenue adjustments for each significant category:
| | | | | | | | | | |
| | | For the Fiscal Years Ended
September 30, | |
| | | 2007 | | 2006 | | Change | |
| | | (In millions of U.S. dollars) | | | | |
| | | $ | | | % | |
Gross revenue | | 409.7 | | 350.9 | | 58.8 | | | 16.8 | |
Gross-to-net revenue adjustments | | | | | | | | | | |
Product returns | | 13.1 | | 16.8 | | (3.7 | ) | | (22.0 | ) |
Chargebacks | | 14.2 | | 14.5 | | (0.3 | ) | | (2.1 | ) |
Contract rebates | | 22.7 | | 20.9 | | 1.8 | | | 8.6 | |
DSA fees | | 3.6 | | 2.6 | | 1.0 | | | 38.5 | |
Discounts and other allowances | | 7.2 | | 3.8 | | 3.4 | | | 89.5 | |
| | | | | | | | | | |
Total gross-to-net revenue adjustments | | 60.8 | | 58.6 | | 2.2 | | | 3.8 | |
| | | | | | | | | | |
Net revenue | | 348.9 | | 292.3 | | 56.6 | | | 19.4 | |
| | | | | | | | | | |
Product returns, chargebacks, contract rebates, DSA fees, discounts and other allowances totalled $60.8 million (14.8% of gross revenue) for the year ended September 30, 2007, and $58.6 million (16.7% of gross revenue) for the year ended September 30, 2006.
The decrease in total deductions as a percentage of gross revenue for the year ended September 30, 2007, was primarily due to a decrease in product returns, which is in line with the decline in wholesaler inventory levels which occurred during the first half of fiscal year 2007. As stated earlier, DSA fees are included in “Gross-to-net revenue adjustments” since the quarter ended September 30, 2006; prior to July 1, 2006, such fees were included in selling and administrative expenses.
Product sales
Key sales figures for fiscal year 2007 are as follows:
| | • | | Sales of pancreatic enzyme products (ULTRASE, PANZYTRAT and VIOKASE) amounted to $74.0 million, an increase of 25.9% over fiscal year 2006 sales of pancreatic enzyme products. |
| | • | | Sales of ursodiol products (URSO / URSO 250, URSO FORTE / URSO DS and DELURSAN) increased 24.3% to $93.7 million. |
| | • | | Sales of mesalamine products (CANASA and SALOFALK) amounted to $84.5 million, a 21.4% increase from the prior fiscal year. |
| | • | | Sales of sucralfate products (CARAFATE and SULCRATE) amounted to $52.2 million, an increase of 18.9% over the previous fiscal year. |
| | • | | Sales of other products amounted to $44.5 million, a 0.2% decrease over the prior fiscal year. |
Cost of goods sold
For the year ended September 30, 2007, cost of goods sold increased $10.9 million (15.0%) to $83.7 million from $72.8 million for the preceding fiscal year. As a percentage of revenue, cost of goods sold for the year ended September 30, 2007, decreased as compared to the corresponding period of the preceding fiscal year from 24.9% to 24.0%. This decrease in the cost of goods sold as a percentage of revenue occurred as we continued to benefit from improvements to our information systems, allowing for better monitoring of our inventories as well as lower manufacturing and purchasing costs. A reduction in certain project related expenses incurred for technical services and commercial product process improvements also contributed to the decrease.
Selling and administrative expenses
For the year ended September 30, 2007, selling and administrative expenses increased $8.0 million (8.6%) to $101.3 million from $93.3 million for the preceding fiscal year. The increase in selling and administrative expenses was largely attributable to higher expenses linked to increased sales performance in our base business as well as the launch of PYLERA in May 2007 in the United States. Launch costs include certain marketing materials as well as the hiring of additional seven sales representatives in the second quarter of fiscal year 2007 to support launch activities.
- 59 -
Research and development expenses
For the year ended September 30, 2007, research and development expenses decreased $11.2 million (28.1%) to $28.6 million, from $39.8 million for the preceding fiscal year. Most of the decrease was due to the termination during the last fiscal year of the development of ITAX for the treatment of Functional Dyspepsia. This decrease was partially offset by the costs specifically related to the NDAs for ULTRASE and VIOKASE. In April 2004, the FDA had formally notified manufacturers of pancreatic insufficiency products that these drugs, which include ULTRASE and VIOKASE, must receive approval before April 2008, in order to remain on the market. This deadline was recently extended to April 2010. During fiscal year 2007, we completed the submission of our NDA for ULTRASE and were in the process of preparing our NDA for VIOKASE.
Acquired in-process research
The acquired in-process research of $10.0 million for the year ended September 30, 2007, relates to an up-front license fee payable upon signing of the exclusive license agreement for North America with Cellerix to develop, manufacture and market Cx401, an innovative biological product candidate in development for the treatment of perianal fistulas. As this product had not reached technological feasibility, the license fee was considered to be acquired in-process research and was expensed in the fourth quarter of the year ended September 30, 2007, the period of acquisition.
Depreciation and amortization
For the year ended September 30, 2007, depreciation and amortization decreased $0.3 million (1.3%) to $22.5 million from $22.8 million for the preceding fiscal year, as some assets reached the end of their depreciation period.
Partial write-down of intangible assets
In the second quarter of fiscal year 2006 and as a result of budgetary initiatives implemented by the French government, which resulted in the delisting of a number of pharmaceutical products from government formularies and the re-pricing of other pharmaceutical products, we reviewed the appropriate carrying value and useful life of our French subsidiary’s intangible assets. During the three-month period ended March 31, 2006, a partial write-down of $5.8 million was recognized on French product lines including TAGAMET and TRANSULOSE, as the carrying value of the intangible assets associated with these product lines, totalling $18.7 million prior to the write-down, exceeded their estimated fair value since management expected a negative effect on TAGAMET and TRANSULOSE future sales as a result of the budgetary initiatives implemented by the French government.
Financial expenses
For the year ended September 30, 2007, financial expenses decreased $2.2 million to $4.8 million from $7.0 million for the preceding fiscal year. This decrease was mainly due to the reduction in interest on long-term debt and the increase in amortization of deferred debt issue expenses, which were written off in the third quarter, following the conversion of the Convertible Notes.
Interest income
For the year ended September 30, 2007, interest income increased $5.9 million (107.3%) to $11.4 million from $5.5 million for the preceding fiscal year. This increase was related to the increase in cash, cash equivalents and short-term investments and an increase in the interest rates applicable to such investments.
Income taxes
For the year ended September 30, 2007, income taxes amounted to $35.5 million compared to $18.3 million for the preceding fiscal year. The effective tax rates were 33.2% for the year ended September 30, 2007, compared to 31.8% for the year ended September 30, 2006. The increase in the effective tax rate was mainly due to a charge of $5.5 million to account for capital gains taxes on currency exchange gains made upon conversion of the Convertible Notes during the third quarter of fiscal year 2007. This charge was partly offset by capital losses tax savings of $3.6 million on currency exchange losses made during the third and fourth quarters on cash held in foreign currency.
We have been audited by Canada Revenue Agency, mainly on transfer pricing issues, for fiscal years 2002 to 2004. As a result of this audit, which was completed in the second quarter of fiscal year 2007, we received new assessments from Canada Revenue Agency, which allowed management to confirm that the current estimate of our tax provision is reasonable.
- 60 -
Net income
Net income was $71.5 million for the year ended September 30, 2007, compared to $39.1 million for the preceding year. The change in net income for the year ended September 30, 2007, resulted mainly from an increase in revenue of $56.6 million, an increase in interest income of $5.9 million and a decrease in financial expenses of $2.2 million, which were partly offset by an increase in operating expenses of $11.6 million and an increase in income taxes of $17.2 million. The operating expenses for the year ended September 30, 2006, included a $5.8 million expense of partial write-down of intangible assets.
Balance sheets as of September 30, 2007 and September 30, 2006
The following table summarizes balance sheet information as at September 30, 2007, compared to September 30, 2006:
| | | | | | | | | | |
| | | As at September 30, | | | | | | |
| | | 2007 | | 2006 | | Change | |
| | | (In millions of U.S. dollars) $ | | | % | |
Cash, cash equivalents and short-term investments | | 309.6 | | 173.0 | | 136.6 | | | 79.0 | |
Current assets | | 402.1 | | 262.4 | | 139.7 | | | 53.2 | |
Total assets | | 832.6 | | 695.8 | | 136.8 | | | 19.7 | |
Current liabilities | | 104.7 | | 64.6 | | 40.1 | | | 62.1 | |
Long-term debt | | 0.1 | | 125.6 | | (125.5 | ) | | (99.9 | ) |
Total liabilities | | 142.4 | | 228.4 | | (86.0 | ) | | (37.7 | ) |
Shareholders’ equity | | 690.2 | | 467.4 | | 222.8 | | | 47.7 | |
Working capital | | 297.4 | | 197.8 | | 99.6 | | | 50.4 | |
Our cash, cash equivalents and short-term investments increased by $136.6 million (79.0%) to $309.6 million as at September 30, 2007, from $173.0 million at September 30, 2006. As at September 30, 2007, we did not hold any asset-backed commercial paper. As at September 30, 2007, working capital was $297.4 million, compared to $197.8 million at September 30, 2006, an increase of $99.6 million (50.4%). Total assets increased $136.8 million (19.7%) to $832.6 million as at September 30, 2007, from $695.8 million as at September 30, 2006. These increases were mainly due to the cash flows from operating activities of $136.1 million for the year ended September 30, 2007.
Shareholders’ equity increased $222.8 million (47.7%) to $690.2 million as at September 30, 2007, from $467.4 million as at September 30, 2006. The increase in shareholders’ equity was mainly due to the conversion of the Convertible Notes, amounting to $125.0 million, into capital stock and the net income of the year ended September 30, 2007, of $71.5 million. Long-term debt decreased $125.5 million (99.9%) to $0.1 million as at September 30, 2007, from $125.6 million as at September 30, 2006. This decrease was mainly due to the conversion of the Convertible Notes, amounting to $125.0 million, into capital stock.
Selected Quarterly Financial Data
The following tables present selected quarterly financial data for the fiscal years ending September 30, 2008 and 2007 and should be read in conjunction with our historical audited consolidated financial statements and related notes contained elsewhere in this Annual Report. Our operating results for any quarter are not necessarily indicative of results for any future quarter or for a full fiscal year.
Financial information for the fiscal quarter ended March 31, 2008 is presented as the mathematical combination of the relevant financial information of the Predecessor (from January 1, 2008 to February 25, 2008) and the Successor (from February 26, 2008 to March 31, 2008) for such period. This mathematical combination is presented because we believe it assists in a reader’s analysis of our results in the second quarter of fiscal year 2008 as compared to our results in the second quarter of fiscal year 2007. However, this approach is not consistent with U.S. GAAP and may yield results that are not strictly comparable on a period-to-period basis primarily due to the impact of purchase accounting entries recorded as a result of the February 2008 Transactions and the lack of substantial debt outstanding of the Predecessor as compared to the Successor. In addition, the “combined” financial information has not been prepared as pro forma information and does not reflect all of the adjustments that would be required if the results for the period were reflected on a pro forma basis. Furthermore, this financial information may not reflect the actual financial results we would have achieved absent the February 2008 Transactions and may not be predictive of future financial results.
- 61 -
| | | | | | | | | | | | |
| | | For the quarter ended | |
| | | September 30,
2008 | | | June 30,
2008 | | | March 31,
2008 | | | December 31,
2007 | |
| | | Successor | | | Successor | | | Non
U.S. GAAP
Combined
Predecessor/
Successor | | | Predecessor | |
| (in millions of U.S. dollars) | | $ | | | $ | | | $ | | | $ | |
Revenue | | 96.5 | | | 96.5 | | | 95.9 | | | 92.9 | |
Cost of goods sold(a) | | 23.9 | | | 38.1 | | | 31.5 | | | 22.4 | |
Selling and administrative expenses(a) | | 34.6 | | | 38.0 | | | 59.3 | | | 32.6 | |
Research and development expenses(a) | | 9.0 | | | 6.3 | | | 7.3 | | | 5.5 | |
Acquired in-process research | | — | | | — | | | 272.4 | | | — | |
Depreciation and amortization | | 14.0 | | | 16.5 | | | 8.8 | | | 5.9 | |
| | | | | | | | | | | | |
| | 81.5 | | | 98.9 | | | 379.3 | | | 66.4 | |
| | | | | | | | | | | | |
Operating income (loss) | | 15.0 | | | (2.4 | ) | | (283.4 | ) | | 26.5 | |
Financial expenses | | 17.4 | | | 16.9 | | | 7.3 | | | 0.2 | |
Interest income | | (0.4 | ) | | (0.3 | ) | | (1.9 | ) | | (3.6 | ) |
Loss (gain) on foreign currency | | (1.3 | ) | | (0.1 | ) | | (0.6 | ) | | — | |
| | | | | | | | | | | | |
| | 15.7 | | | 16.5 | | | 4.8 | | | (3.4 | ) |
| | | | | | | | | | | | |
Income (loss) before income taxes | | (0.7 | ) | | (18.9 | ) | | (288.2 | ) | | 29.9 | |
Income taxes expense (benefit) | | (3.9 | ) | | (10.3 | ) | | 0.9 | | | 7.6 | |
| | | | | | | | | | | | |
Net income (net loss) | | 3.2 | | | (8.6 | ) | | (289.1 | ) | | 22.3 | |
| | | | | | | | | | | | |
EBITDA(b) | | 30.4 | | | 14.1 | | | (274.0 | ) | | 32.4 | |
Adjusted EBITDA(b) | | 35.3 | | | 38.3 | | | 44.8 | | | 36.2 | |
| |
| | | For the quarter ended | |
| | | September 30,
2007 | | | June 30,
2007 | | | March 31,
2007 | | | December 31,
2006 | |
| | | Predecessor | | | Predecessor | | | Predecessor | | | Predecessor | |
| (in millions of U.S. dollars) | | $ | | | $ | | | $ | | | $ | |
Revenue | | 92.5 | | | 92.3 | | | 85.3 | | | 78.8 | |
Cost of goods sold(a) | | 22.6 | | | 20.5 | | | 21.4 | | | 19.2 | |
Selling and administrative expenses(a) | | 27.7 | | | 26.5 | | | 24.9 | | | 22.2 | |
Research and development expenses(a) | | 7.2 | | | 7.6 | | | 7.6 | | | 6.2 | |
Acquired in-process research | | 10.0 | | | — | | | — | | | — | |
Depreciation and amortization | | 5.9 | | | 5.7 | | | 5.5 | | | 5.4 | |
| | | | | | | | | | | | |
| | 73.4 | | | 60.3 | | | 59.4 | | | 53.0 | |
| | | | | | | | | | | | |
Operating income (loss) | | 19.1 | | | 32.0 | | | 25.9 | | | 25.8 | |
Financial expenses | | 0.1 | | | 1.2 | | | 1.7 | | | 1.8 | |
Interest income | | (3.9 | ) | | (2.9 | ) | | (2.5 | ) | | (2.1 | ) |
Loss (gain) on foreign currency | | 1.3 | | | 0.8 | | | 0.4 | | | (0.1 | ) |
| | | | | | | | | | | | |
| | (2.5 | ) | | (0.9 | ) | | (0.4 | ) | | (0.4 | ) |
| | | | | | | | | | | | |
Income (loss) before income taxes | | 21.6 | | | 32.9 | | | 26.3 | | | 26.2 | |
Income taxes expense (benefit) | | 4.8 | | | 13.5 | | | 8.5 | | | 8.7 | |
| | | | | | | | | | | | |
Net income (net loss) | | 16.8 | | | 19.4 | | | 17.8 | | | 17.5 | |
| | | | | | | | | | | | |
EBITDA(b) | | 23.7 | | | 36.9 | | | 31.0 | | | 31.3 | |
Adjusted EBITDA(b) | | 34.8 | | | 37.9 | | | 32.3 | | | 36.4 | |
| | | | | | | | | | | | |
(a) | Exclusive of depreciation and amortization |
- 62 -
(b) | A reconciliation of net income to EBITDA (a non-U.S. GAAP measure) and from EBITDA to Adjusted EBITDA (a non-U.S. GAAP measure) for each of the quarters ended in fiscal 2008 and fiscal 2007 is as follows: |
| | | | | | | | | | | | |
| | | For the quarter ended | |
| | | September 30,
2008 | | | June 30,
2008 | | | March 31,
2008 | | | December 31,
2007 | |
| | | Successor | | | Successor | | | Non
U.S. GAAP
Combined
Predecessor/
Successor | | | Predecessor | |
| (in millions of U.S. dollars) | | $ | | | $ | | | $ | | | $ | |
Net income (net loss) | | 3.2 | | | (8.6 | ) | | (289.1 | ) | | 22.3 | |
Financial expenses | | 17.4 | | | 16.9 | | | 7.3 | | | 0.2 | |
Interest income | | (0.4 | ) | | (0.3 | ) | | (1.9 | ) | | (3.6 | ) |
Income taxes expense (benefit) | | (3.8 | ) | | (10.4 | ) | | 0.9 | | | 7.6 | |
Depreciation and amortization | | 14.0 | | | 16.5 | | | 8.8 | | | 5.9 | |
| | | | | | | | | | | | |
EBITDA(g) | | 30.4 | | | 14.1 | | | (274.0 | ) | | 32.4 | |
Transaction, integration and refinancing costs(a) | | 3.1 | | | 3.5 | | | 29.8 | | | 2.8 | |
Stock-based compensation expense(b) | | 1.8 | | | 5.6 | | | 9.0 | | | 1.0 | |
Acquired in-process research(c) | | — | | | — | | | 272.4 | | | — | |
Inventories stepped-up value expensed(d) | | — | | | 15.1 | | | 7.6 | | | — | |
Loss of disposal and write-down of assets(e) | | — | | | — | | | — | | | — | |
Partial write-down of intangible assets(f) | | — | | | — | | | — | | | — | |
| | | | | | | | | | | | |
Adjusted EBITDA(g) | | 35.3 | | | 38.3 | | | 44.8 | | | 36.2 | |
| | | | | | | | | | | | |
| |
| | | For the quarter ended | |
| | | September 30,
2007 | | | June 30,
2007 | | | March 31,
2007 | | | December 31,
2006 | |
| | | Predecessor | | | Predecessor | | | Predecessor | | | Predecessor | |
| (in millions of U.S. dollars) | | $ | | | $ | | | $ | | | $ | |
Net income (net loss) | | 16.8 | | | 19.4 | | | 17.8 | | | 17.5 | |
Financial expenses | | 0.1 | | | 1.2 | | | 1.7 | | | 1.8 | |
Interest income | | (3.9 | ) | | (2.9 | ) | | (2.5 | ) | | (2.1 | ) |
Income taxes expense (benefit) | | 4.8 | | | 13.5 | | | 8.5 | | | 8.7 | |
Depreciation and amortization | | 5.9 | | | 5.7 | | | 5.5 | | | 5.4 | |
| | | | | | | | | | | | |
EBITDA(g) | | 23.7 | | | 36.9 | | | 31.0 | | | 31.3 | |
Transaction, integration and refinancing costs(a) | | — | | | — | | | — | | | — | |
Stock-based compensation expense(b) | | 1.1 | | | 1.0 | | | 1.3 | | | 1.2 | |
Acquired in-process research(c) | | 10.0 | | | — | | | — | | | — | |
Inventories stepped-up value expensed(d) | | — | | | — | | | — | | | — | |
Loss of disposal and write-down of assets(e) | | — | | | — | | | — | | | 3.9 | |
Partial write-down of intangible assets(f) | | — | | | — | | | — | | | — | |
| | | | | | | | | | | | |
Adjusted EBITDA(g) | | 34.8 | | | 37.9 | | | 32.3 | | | 36.4 | |
| | | | | | | | | | | | |
(a) | Includes transaction, integration and refinancing costs and other professional fees associated with the Transactions. |
(b) | Represents stock-based employee compensation expense under the provisions of Statement of Financial Accounting Standards, or SFAS, No.123(R), “Share-based Payments”. |
(c) | Represents the acquired in-process research, arising from the February 2008 Transactions, expensed in the period of acquisition. |
(d) | Represents inventories stepped-up value, arising from the February 2008 Transactions, expensed as acquired inventory is sold. |
(e) | Represents loss on disposal and write-down on assets. |
(f) | Represents a partial write-down on French product lines including TAGAMET and TRANSULOSE, as the carrying value of the intangible assets associated with those products exceeded their estimated fair value. |
(g) | EBITDA and Adjusted EBITDA are both non-U.S. GAAP financial measures and are presented in this report because our management considers them important supplemental measures of our performance and believes that they are frequently used by interested parties in the evaluation of companies in the industry. EBITDA, as we use it, is net income before financial expenses, interest income, income taxes and depreciation and amortization. We believe that the presentation of EBITDA enhances an investor’s understanding of our financial performance. We believe that EBITDA is a useful financial metric to assess our operating performance from period to period by excluding certain items that we believe are not representative of our core business. The term EBITDA is not defined under U.S. GAAP, and EBITDA is not a measure of net income, operating income or any other performance measure derived in accordance with U.S. GAAP, and is subject to important limitations. Adjusted EBITDA, as we use it, is EBITDA adjusted to exclude certain non-cash charges, unusual or non-recurring items and other adjustments set forth below. Adjusted EBITDA is calculated in the same manner as “EBITDA” and “Consolidated EBITDA” as those terms are defined under the indentures governing the notes and credit facility further described in the section “—Liquidity and Capital Resources—Long-term Debt and New Senior Secured Credit Facilities”. We believe that the inclusion of supplementary adjustments applied to EBITDA in presenting Adjusted EBITDA are appropriate to provide additional information to investors about certain material non-cash items and unusual or non-recurring items that we do not expect to continue in the future and to provide additional information with respect to our ability to meet our future debt service and to comply with various covenants in such indentures and credit facility. Adjusted EBITDA is not a measure of net income, operating income or any other performance measure derived in accordance with U.S. GAAP, and is subject to important limitations. EBITDA and Adjusted EBITDA have limitations as an analytical tool, and they should not be considered in isolation, or as substitutes for analysis of our results as reported under U.S. GAAP. Some of these limitations are: |
| | • | | EBITDA and Adjusted EBITDA do not reflect all cash expenditures, future requirements for capital expenditures, or contractual commitments; |
- 63 -
| | • | | EBITDA and Adjusted EBITDA do not reflect changes in, or cash requirements for, working capital needs; |
| | • | | EBITDA and Adjusted EBITDA do not reflect the significant interest expense, or the cash requirements necessary to service interest or principal payments, on our debt; |
| | • | | Although depreciation and amortization are non-cash charges, the assets being depreciated and amortized will often have to be replaced in the future, and EBITDA and Adjusted EBITDA do not reflect any cash requirements for such replacements; |
| | • | | Adjusted EBITDA reflects additional adjustments as provided in the indentures governing our notes and new senior secured credit facilities; and |
| | • | | Other companies in our industry may calculate EBITDA and Adjusted EBITDA differently than we do, limiting its usefulness as a comparative measure. |
Because of these limitations, EBITDA and Adjusted EBITDA should not be considered as measures of discretionary cash available to us to invest in our business. Our management compensates for these limitations by relying primarily on the U.S. GAAP results and using EBITDA and Adjusted EBITDA as supplemental information.
Liquidity and Capital Resources
Cash Requirements
Our research and development expenses totaled $28.1 million, $28.6 million, and $39.8 million for fiscal years 2008, 2007 and 2006, respectively. We regularly review product and other acquisition opportunities and may therefore require additional debt or equity financing. We cannot be certain that such additional financing, if required, will be available on acceptable terms, or at all.
Contractual Obligations and Other Commitments
The following table summarizes our significant contractual obligations as at September 30, 2008, and the effect such obligations are expected to have on our liquidity and cash flows in future years. This table excludes amounts already recorded on the balance sheet as current liabilities at September 30, 2008, and certain other purchase obligations as discussed below:
| | | | | | | | | | |
| | | For the fiscal year ending
September 30, |
| | | 2009 | | 2010 | | 2011 | | 2012 | | 2013 and
thereafter |
| (in millions of U.S. dollars) | | $ | | $ | | $ | | $ | | $ |
Long-term debt | | 10.9 | | 13.1 | | 15.3 | | 19.7 | | 574.6 |
Operating leases | | 1.6 | | 0.6 | | 0.2 | | 0.1 | | — |
Other commitments | | 11.7 | | 0.8 | | 0.5 | | 0.1 | | — |
| | | | | | | | | | |
| | 24.2 | | 14.5 | | 16.0 | | 19.9 | | 574.6 |
| | | | | | | | | | |
Purchase orders for raw materials, finished goods and other goods and services are not included in the above table. Management is not able to determine the aggregate amount of such purchase orders that represent contractual obligations, as purchase orders may represent authorizations to purchase rather than binding agreements. For the purpose of this table, contractual obligations for purchase of goods or services are defined as agreements that are enforceable and legally binding on us and that specify all significant terms, including: fixed or minimum quantities to be purchased; fixed, minimum or variable price provisions; and the approximate timing of the transaction. Our purchase orders are based on current needs and are fulfilled by our vendors within relatively short timetables. We do not have significant agreements for the purchase of raw materials or finished goods specifying minimum quantities or set prices that exceed our short-term expected requirements. We also enter into contracts for outsourced services; however, the obligations under these contracts are not significant and the contracts generally contain clauses allowing for cancellation without significant penalty. As milestone payments are primarily contingent on receiving regulatory approval for products under development, they do not have defined maturities and therefore are not included in the above table.
The expected timing of payment of the obligations discussed above is estimated based on current information. The timing of payments and actual amounts paid may differ depending on the timing of receipt of goods or services, or, for some obligations, changes to agreed-upon amounts.
Long-term debt and New Senior Secured Credit Facilities
On February 25, 2008, we obtained various types of financing in connection with the Arrangement. We issued $228.0 million aggregate principal amount of the secured notes. The secured notes were priced at $0.98737 with a yield to March 1, 2015, of 10% and require us to use commercially reasonable efforts to cause an exchange offer registration statement to be declared effective under the Securities Act. We are currently undertaking efforts to register the secured notes and the senior notes with the SEC. On November 14, 2008, the SEC declared our registration statement to be effective. The secured notes rank pari passu with the new senior secured credit facilities.
- 64 -
We may redeem some or all of the secured notes prior to March 1, 2011 at a redemption price equal to 100% of the principal amount of the secured notes redeemed plus a “make-whole” premium and accrued and unpaid interest. On or after March 1, 2011, we may redeem some or all of the secured notes at the redemption prices (expressed as percentages of principal amount of the secured notes to be redeemed) set forth below:
| | | |
Year | | | |
2011 | | 106.938 | % |
2012 | | 104.625 | % |
2013 | | 102.313 | % |
2014 and thereafter | | 100.000 | % |
Prior to March 1, 2011, we may also redeem up to 35% of the aggregate principal amount of the senior notes using the proceeds of one or more equity offerings at a redemption price equal to 109.250% of the aggregate principal amount of the senior notes plus accrued and unpaid interest. If there is a change of control as specified in the indenture governing the senior notes, we may offer to repurchase the senior notes at a price in cash equal to 101% of the aggregate principal amount thereof, plus accrued and unpaid interest.
We also obtained a credit facility for a total amount of $290.0 million composed of term loans totaling $175.0 million and of a revolving credit facility of $115.0 million, collectively referred to as the new senior secured credit facilities. The new senior secured credit facilities bear interest at a variable rate composed of either the Federal Funds Rate or the three-month British Banker Association LIBOR rate, at our option, plus the applicable rate based on our consolidated total leverage ratio and certain of our subsidiaries for the preceding twelve months. The new senior secured credit facilities mature on February 25, 2014, with payments on the term loans beginning in fiscal year 2008. As at September 30, 2008, $175.0 million of term loans had been issued and no amounts had been drawn against the revolving credit facility. The term loans were priced at $0.96 with a yield to February 25, 2014, of 8.75% before the effect of the interest rate swap. On February 28, 2008, we entered into interest swap agreements whereby the variable portion of the interest rate, which is based on the three-month British Banker Association LIBOR, was hedged at a fixed interest rate of 2.71% on a notional amount of $115.0 million. The new senior secured credit facilities require us to meet certain financial covenants, which were met as at September 30, 2008. The credit agreement governing our new senior secured credit facilities requires us to prepay outstanding term loans contingent upon the occurrence of their events, subject to certain exceptions, with: (1) 100% of the net cash proceeds of any incurrence of debt other than debt permitted under our new senior secured credit facilities, (2) commencing with the fiscal year ended September 30, 2009, 50% (which percentage will be reduced to 25% if our senior secured leverage ratio is less than a specified ratio) of our annual excess cash flow (as defined in the credit agreement governing our new senior secured credit facilities), and (3) 100% of the net cash proceeds of all non-ordinary course asset sales or other dispositions of property (including casualty events) by us or by our subsidiaries, subject to reinvestments rights and certain other exceptions.
On February 25, 2008, as part of the Arrangement financing, we also obtained $235.0 million in financing under our senior unsecured bridge facility maturing on February 25, 2009. On May 6, 2008, our senior unsecured bridge facility was refinanced on a long-term basis, by repaying the bridge facility with the proceeds from our sale of $235.0 million aggregate principal amount of the senior notes. The senior notes were priced at $0.9884 with a yield to March 1, 2016 of 13.16%. The unsecured notes are subordinate to the new senior secured credit facilities and secured notes.
We may redeem some or all of the senior notes prior to March 1, 2012 at a redemption price equal to 100% of the principal amount of the senior notes redeemed plus a “make-whole” premium and accrued and unpaid interest. On or after March 1, 2012, we may redeem some or all of the senior notes at the redemption prices (expressed as percentages of principal amount of the senior notes to be redeemed) set forth below:
| | | |
Year | | | |
2012 | | 106.375 | % |
2013 | | 103.188 | % |
2014 and thereafter | | 100.000 | % |
- 65 -
Prior to March 1, 2011, we may also redeem up to 35% of the aggregate principal amount of the senior notes using the proceeds of one or more equity offerings at a redemption price equal to 112.750% of the aggregate principal amount of the senior notes plus accrued and unpaid interest. If there is a change of control as specified in the indenture governing the senior notes, we must offer to repurchase the senior notes at a price in cash equal to 101% of the aggregate principal amount thereof, plus accrued and unpaid interest.
Certain of our subsidiaries have been designated as guarantors with respect to the new senior secured credit facilities, the secured notes and the senior notes. Our obligations under, and each of the guarantors’ obligations under its guarantee of, the new senior secured credit facilities and the notes are secured by a first priority security interest in our assets and such guarantor subsidiaries, respectively.
We may from time to time seek to retire or purchase our outstanding debt through cash purchases in open market purchases, privately negotiated transactions or otherwise. Such repurchases or exchanges, if any, will depend on prevailing market conditions, our liquidity requirements, contractual restrictions and other factors. The amounts involved may be material.
Operating leases
We have various long-term operating lease agreements for office space, automotive equipment and other equipment. The latest expiry date for these agreements is in 2013.
Other commitments
Other operating commitments consist primarily of amounts relating to administrative services, clinical studies and other research and development services.
Related Party Transactions
During the seven-month period ended September 30, 2008, we made a cash advance to our parent company Axcan MidCo Inc. amounting to $133.2 million and have interest income amounting to $4.7 million and related interest receivable amounting to $3.0 million. These transactions have been recorded as equity transactions in reduction of our shareholders’ equity, net of taxes amounting to $2.5 million in the case of the interest income.
During the seven-month period ended September 30, 2008, we paid management fees to our indirect parent Axcan Holdings Inc. amounting to $13.0 million. These management fees were accounted for as debt issue expenses for $4.8 million, transaction costs for $6.1 million and other fees of $2.1 million was expensed and included in selling and administrative expenses.
Off-Balance Sheet Arrangements
We do not have any transactions, arrangements and other relationships with unconsolidated entities that are likely to affect our operating results, our liquidity or capital resources. We have no special purpose or limited purpose entities that provide off-balance sheet financing, liquidity or market or credit risk support, and does not engage in leasing, hedging, research and development services, or other relationships that expose us to liability that is not reflected on the face of the consolidated financial statements.
Cash Flows
Our cash flows from operating, investing and financing activities for the fiscal years ended September 30, 2008, 2007 and 2006, as reflected in the consolidated statements of cash flows, are summarized in the following table:
| | | | | | | | | |
| | | For the years ended
September 30, | |
| | | 2008 | | | 2007 | | | 2006 | |
| (in millions of U.S. dollars) | | $ | | | $ | | | $ | |
Cash provided by operating activities | | 25.7 | | | 136.1 | | | 84.3 | |
Cash used by investing activities | | (834.9 | ) | | (19.4 | ) | | (108.1 | ) |
Cash provided by financing activities | | 1,034.8 | | | 6.6 | | | (0.6 | ) |
- 66 -
Fiscal Year 2008 Compared to Fiscal Year 2007
Cash flows from operating activities decreased $110.4 million from $136.1 million of cash provided for the fiscal year 2007, to $25.7 million for fiscal year 2008. The cash provided by operating activities decreased mainly because of a decrease of $48.6 million in net income, without taking into account the acquired in-process research amounting to $272.4 million and the inventories stepped-up value expensed amounting to $22.7 million for the year ended September 30, 2008, and a net use of cash from the changes in working capital items of $36.6 million compared to positive changes of $42.2 million for the year ended September 30, 2007. The $36.6 million change in working capital for the year ended September 30, 2008 is largely explained by an increase of inventory as well as refunds received on tax instalment payments as a result of the Transactions. Cash flows used by investing activities for the year ended September 30, 2008, were $834.9 million, mainly due to the net cash used to fund the Transactions of $958.5 million less the cash from disposal of short-term investments of $130.0 million. Cash flows provided by financing activities for the year ended September 30, 2008 were $1,034.8 million, mainly due to the issuance of common shares for cash consideration of $475.2 million and the proceeds from the issuance of long-term debt of $634.1 million to fund the Transactions, less debt issuance expenses of $37.2 million and the costs due to the cancellation of stock-based compensation plans as a result of the Transactions of $30.4 million.
Fiscal Year 2007 Compared to Fiscal Year 2006
Cash flows provided by operating activities increased $51.8 million from $84.3 million for the year ended September 30, 2006, to $136.1 million for the year ended September 30, 2007, mainly due to the increase in net income, a decrease in inventories and increases in current liabilities. Cash flows used by investing activities for the year ended September 30, 2007, were $19.4 million, mainly due to the net acquisition of short-term investments of $12.8 million, plus the net cash used for the acquisition, net of the disposal, of property, plant and equipment for $6.6 million. Cash flows used by investing activities for the year ended September 30, 2006, were $108.1 million, mainly due to the net acquisition of short-term investments of $99.5 million, and the cash used for the acquisition of property, plant and equipment for $4.0 million and intangible assets for $4.6 million. Cash flows provided by financing activities were $6.6 million for the year ended September 30, 2007, mainly due to the issue of common shares for cash consideration of $7.3 million as a result of the exercise of stock options during the year.
Critical Accounting Policies
Our consolidated financial statements are prepared in accordance with U.S. GAAP, applied on a consistent basis. Some of our critical accounting policies require the use of judgment in their application or require estimates of inherently uncertain matters. Therefore, a change in the facts and circumstances of an underlying transaction could significantly change the application of our accounting policies to that transaction, which could have an effect on our financial statements. The policies that management believes are critical and require the use of complex judgment in their application are discussed below.
Use of Estimates
The preparation of financial statements in accordance with generally accepted accounting principles requires management to make estimates and assumptions that affect the recorded amounts of assets and liabilities and the disclosure of contingent assets and liabilities as at the date of the financial statements and also affect the recognized amounts of revenues and expenses during the year. Significant estimates and assumptions made by management include the allocation of the purchase price of acquired assets and businesses, allowances for accounts receivable and inventories, reserves for product returns, rebates, chargebacks and DSA fees, the classification of intangible assets between finite life and indefinite life, the useful lives of long-lived assets, the expected cash flows used in evaluating long-lived assets, goodwill and investments for impairment, stock based compensation costs, pending legal settlements and the establishment of provisions for income taxes including the realizability of deferred tax assets. The estimates are made using the historical information and various other relevant factors available to management. We review all significant estimates affecting the financial statements on a recurring basis and records the effect of any adjustments when necessary. Actual results could differ from those estimates based upon future events, which could include, among other risks, changes in regulations governing the manner in which we sell our products, changes in the health care environment, foreign exchange and managed care consumption patterns.
- 67 -
Revenue Recognition
Revenue is recognized when the product is shipped to our customers, provided we have not retained any significant risks of ownership or future obligations with respect to the product shipped. Provisions for sales discounts and estimates for chargebacks, managed care and Medicaid rebates, product returns and DSA fees are established as a reduction of product sales revenues at the time such revenues are recognized. These revenue reductions are established by us at the time of sale, based on historical experience adjusted to reflect known changes in the factors that impact such reserves. In certain circumstances, product returns are allowed under our policy and provisions are maintained accordingly. These revenue reductions are generally reflected as an addition to accrued liabilities. Amounts received from customers as prepayments for products to be shipped in the future are reported as deferred revenue.
The following table summarizes the activity in the accounts related to revenue reductions:
| | | | | | | | | | | | | | | | | | |
| | | Product
returns | | | Contract
rebates | | | Charge-
backs | | | DSA
fees | | | Discounts
and other | | | Total | |
| (in millions of U.S. dollars) | | $ | | | $ | | | $ | | | $ | | | $ | | | $ | |
Balance as at September 30, 2007 | | 12.5 | | | 9.4 | | | 5.9 | | | 1.6 | | | 0.4 | | | 29.8 | |
Provisions | | 9.2 | | | 25.3 | | | 20.6 | | | 2.1 | | | 8.1 | | | 65.3 | |
Settlements | | (5.9 | ) | | (25.9 | ) | | (19.9 | ) | | (2.1 | ) | | (7.9 | ) | | (61.7 | ) |
| | | | | | | | | | | | | | | | | | |
Balance as at September 30, 2008 | | 15.8 | | | 8.8 | | | 6.6 | | | 1.6 | | | 0.6 | | | 33.4 | |
| | | | | | | | | | | | | | | | | | |
We do not provide any form of price protection to our wholesale customers and permits product returns only if the product is returned in the 12 months following its expiration date. Credit for returns is issued to the original purchaser at current wholesale acquisition cost less 10%. Accrued liabilities include reserves of $15.8 million and $12.5 million as at September 30, 2008, and September 30, 2007, respectively, for estimated product returns.
In the United States, we establish and maintain reserves for amounts payable to managed care organizations and state Medicaid programs for the reimbursement of portions of the retail price of prescriptions filled that are covered by these programs. We establish and maintain reserves for amounts payable to wholesale distributors for the difference between their regular sale price and the contract price for the products sold to our contract customers. The amounts are recognized as revenue reductions at the time of sale based on our best estimate of the product’s utilization by these managed care and state Medicaid patients and sales to its contract customers, using historical experience adjusted to reflect known changes in the factors that impact such reserves. Accrued liabilities include reserves of $8.8 million and $6.6 million as at September 30, 2008, and $9.4 million and $5.9 million as at September 30, 2007, respectively, for estimated contract rebates and chargebacks.
If the levels of chargebacks, fees pursuant to DSAs, managed care and Medicaid rebates, product returns and discounts fluctuate significantly and/or if our estimates do not adequately reserve for these reductions of net product revenues, our reported revenue could be negatively affected.
Intangible Assets and Goodwill
Intangible assets with a finite life are amortized over their estimated useful lives according to the straight-line method over periods varying from 5 to 20 years. The straight-line method of amortization is used because it reflects, in the opinion of management, the pattern in which the intangible assets with a finite life are used. In determining the useful life of intangible assets, we consider many factors including the intention of management to support the asset on a long-term basis by maintaining the level of expenditure necessary to support the asset, the use of the asset, the existence and expiration date of a patent, the existence of a generic version of, or competitor to, the product and any legal or regulatory provisions that could limit the use of the asset.
As a result of purchases of product rights and other identifiable intangible assets, we carried $367.2 million as net intangible assets on our consolidated balance sheet as at September 30, 2007. Also as a result of these purchases, we carried $27.5 million of Goodwill on our consolidated balance sheet as at September 30, 2007. Upon the Arrangement, the purchase price was allocated to the assets acquired and liabilities assumed based on their estimated fair values at the acquisition date. As a result, these values were increased and we carry $528.4 million as net intangible assets and $165.0 million of Goodwill on our consolidated balance sheet as at September 30, 2008. The estimated annual amortization expense for intangible assets with a finite life, which have a remaining weighted average amortization period of approximately 12 years, for the next five fiscal years, is approximately $52.7 million for the first four and $40.4 million for the fifth.
- 68 -
The following table summarizes the changes to the carrying value of the intangible assets and Goodwill from February 26, 2008 to September 30, 2008:
| | | | | | |
| | | Intangible
assets | | | Goodwill | |
| | | $ | | | $ | |
Opening balance | | 581.7 | | | 169.6 | |
Acquisitions (net of dispositions) | | — | | | — | |
Depreciation and amortization | | (31.8 | ) | | — | |
Cumulative translation adjustment | | (21.5 | ) | | (4.6 | ) |
Balance as at September 30, 2008 | | 528.4 | | | 165.0 | |
Research and Development Expenses
Research and development expenses are charged to operations in the period they are incurred. Acquired in-process research and development having no alternative future use is expensed at the time of acquisition. The cost of intangibles that are purchased from others for a particular research and development project that have no alternative future use are expensed at the time of acquisition.
Income taxes
Income taxes are calculated using the liability method. Under this method, deferred income tax assets and liabilities are recognized to account for the estimated taxes that will result from the recovery or settlement of assets and liabilities recorded at their financial statement carrying amounts. Deferred income tax assets and liabilities are measured based on enacted tax rates and laws at the date of the financial statements for the years in which the temporary differences are expected to reverse. A valuation allowance is provided for the portion of deferred tax assets that is more likely than not to remain unrealized. Adjustments to the deferred income tax asset and liability balances are recognized in net income as they occur.
We conduct business in various countries throughout the world and is subject to tax in numerous jurisdictions. As a result of our business activities, we file a significant number of tax returns that are subject to examination by various federal, state, and local tax authorities. Tax examinations are often complex as tax authorities may disagree with the treatment of items reported by us and this may require several years to resolve.
Changes in Accounting Standards
In May 2008, the Financial Accounting Standards Board (“FASB”) issued FASB Statement (“SFAS”) No. 162, “The Hierarchy of Generally Accepted Accounting Principles.” SFAS No. 162 identifies the sources of accounting principles and the framework for selecting the principles used in the preparation of financial statements of nongovernmental entities that are presented in conformity with generally accepted accounting principles. SFAS No. 162 will become effective 60 days following the Securities and Exchange Commission’s approval of the Public Company Accounting Oversight Board amendments to AU Section 411, “The Meaning of Present Fairly in Conformity With Generally Accepted Accounting Principles.” We do not expect that the adoption of SFAS No. 162 will have a material impact on our consolidated financial statements.
In April 2008, the FASB issued FASB Staff Position (“FSP”) FAS No.142-3, “Determination of the Useful Life of Intangible Assets.” This FSP amends the factors that should be considered in developing renewal or extension assumptions used to determine the useful life of a recognized intangible asset under SFAS No. 142, “Goodwill and Other Intangible Assets.” The intent of this FSP is to improve the consistency between the useful life of a recognized intangible asset under Statement No. 142 and the period of expected cash flows used to measure the fair value of the asset under SFAS No. 141 (Revised 2007), “Business Combinations,” and other U.S. generally accepted accounting principles. This FSP is effective for financial statements issued for fiscal years beginning after December 15, 2008, and interim periods within those fiscal years. Early adoption is prohibited. We are currently evaluating the impact of the adoption of the provisions of this FSP on our consolidated financial statements.
In March 2008, the FASB issued SFAS No. 161, “Disclosures about Derivative Instruments and Hedging Activities, as an amendment to SFAS No. 133, Accounting for Derivative Instruments and Hedging Activities”. SFAS No. 161 requires that objectives for using derivative instruments be disclosed in terms of underlying risk and accounting designation. SFAS 161 requires enhanced disclosures about (a) how and why derivative instruments are used, (b) how derivative instruments and related hedged items are accounted for and (c) how derivative instruments and related hedged items affect an entity’s financial position, financial performance and cash flows. The fair value of derivative instruments and their gains and losses will need to be presented in tabular format in order to present a more complete picture of the effects of using derivative instruments.
- 69 -
SFAS No. 161 is effective for financial statements issued for fiscal years and interim periods beginning after November 15, 2008. We are currently evaluating the impact of the adoption of the provisions of SFAS No. 161 on our consolidated financial statements.
In February 2008, the FASB issued SFAS No. 157-2, “Effective Date of FASB Statement No. 157” (“FSP 157-2”). This FSP delays the effective date of SFAS No. 157 for non-financial assets and non-financial liabilities, except for items that are recognized or disclosed at fair value in the financial statements on a recurring basis (at least annually). SFAS No. 157 will therefore be applicable to non-financial assets and liabilities for our fiscal year commencing October 1, 2009. We are currently evaluating the impact of the adoption of the provisions of SFAS No. 157 and FAS 157-2 on our consolidated financial statements.
In December 2007, the FASB issued SFAS No. 141 (R), “Business Combinations”, which replaces SFAS No. 141, “Business Combinations”. SFAS No. 141(R) expands the definition of a business combination and requires the acquisition method of accounting to be used for all business combinations and an acquirer to be identified for each business combination. SFAS No. 141(R) also requires that all assets, liabilities, contingent considerations, and contingencies of an acquired business be recorded at fair value at the acquisition date. In addition, SFAS No. 141(R) establishes requirement in the recognition of acquisition costs, restructuring costs and changes in accounting for deferred tax asset valuation allowances and acquired income tax uncertainties. SFAS No. 141(R) is to be applied prospectively to business combinations for which the acquisition date is on or after the beginning of the first annual reporting period beginning on or after December 15, 2008. Earlier adoption is prohibited. We will apply the provisions of SFAS No. 141(R) for future acquisitions.
In December 2007, the FASB issued SFAS No. 160, “Non-controlling Interests in Consolidated Financial Statements—an amendment of ARB No. 51”. SFAS No. 160 establishes new accounting and reporting standards for the non-controlling interest in a subsidiary and for the deconsolidation of a subsidiary. Specifically, SFAS No. 160 requires the recognition of a non-controlling interest (minority interest) as equity in the consolidated financial statements and separate from the parent’s equity. The amount of net income attributable to the non-controlling interest will be included in consolidated net income on the face of the income statement. SFAS No.160 clarifies that changes in a parent’s ownership interest in a subsidiary that do not result in deconsolidation are equity transactions if the parent retains its controlling financial interest. In addition, SFAS No. 160 requires that a parent recognize a gain or loss in net income when a subsidiary is deconsolidated. Such gain or loss will be measured using the fair value of the non controlling equity investment on the deconsolidation date. SFAS No. 160 also includes expanded disclosure requirements regarding the interests of the parent and its non-controlling interest. SFAS No. 160 is effective for fiscal years, and interim periods within those fiscal years, beginning on or after December 15, 2008. Earlier adoption is prohibited. The adoption of this standard is not expected to have a material effect on our consolidated financial statements, because we solely have wholly-owned subsidiaries.
In December 2007, the FASB ratified Emerging Issues Task Force (“EITF”) Issue No. 07-01, “Accounting for Collaborative Arrangements”. EITF No. 07-01 defines collaborative arrangements and establishes reporting requirements for transactions between participants in a collaborative arrangement and between participants in the arrangement and third parties. EITF No. 07-01 also establishes the appropriate income statement presentation and classification for joint operating activities and payments between participants, as well as the sufficiency of the disclosures related to these arrangements. EITF No. 07-01 is effective for fiscal years, and interim periods within those fiscal years, beginning after December 15, 2008. We are currently evaluating the impact of the adoption of the provisions of EITF No. 07-1 on our consolidated financial statements.
In June 2007, the EITF reached a consensus on Issue No. 07-3, “Accounting for Non-refundable Advance Payments for Goods or Services Received for Use in Future Research and Development Activities.” As a result of this consensus, non-refundable advance payments for goods or services that will be used or rendered for future research and development activities should be deferred and capitalized. Such amounts should be recognized as an expense as the related goods are delivered or the services are performed, or when the goods or services are no longer expected to be provided. This Issue is effective for financial statements issued for fiscal years beginning after December 15, 2007, and earlier application is not permitted. This consensus is to be applied prospectively for new contracts entered into on or after the effective date. The adoption of this consensus is not expected to have a material impact on our consolidated financial statements.
In February 2007, the Financial FASB issued SFAS No. 159, “The Fair Value Option for Financial Assets and Financial Liabilities”, which permits an entity to measure certain financial assets and financial liabilities at fair value. The objective of SFAS No. 159 is to improve financial reporting by allowing entities to mitigate volatility in reported earnings caused by the measurement of related assets and liabilities using different attributes, without having to apply complex hedge accounting provisions. Under SFAS No. 159, entities that elect the fair value option at the effective date (by instrument) will report unrealized gains and losses in
- 70 -
earnings at each subsequent reporting date. The fair value option election is irrevocable, unless a new election date occurs. SFAS No. 159 establishes presentation and disclosure requirements to help financial statement users understand the effect of the entity’s election on its earnings, but does not eliminate disclosure requirements of other accounting standards. Assets and liabilities that are measured at fair value must be displayed on the face of the balance sheet. This statement is effective for fiscal years beginning after November 15, 2007. We are currently evaluating the impact of the adoption of the provisions of SFAS No. 159 on our consolidated financial statements.
In September 2006, the Securities and Exchange Commission (“SEC”) issued Staff Accounting Bulletin (“SAB”) No. 108, “Considering the Effects of Prior Year Misstatements when Quantifying the Misstatements in Current Year Financial Statements” that expresses the Staff’s views regarding the process of quantifying financial statement misstatements. This bulletin is effective for any interim period of the first fiscal year ending after November 15, 2006. SAB No. 108 requires that companies utilize a “dual approach” to assess the quantitative effects of financial statement misstatements. The dual approach includes both an income statement focus and balance sheet focus assessment. SAB No. 108 permits companies to record the cumulative effect of initially applying the dual approach in the first year ending after November 15, 2006 by recording any necessary correcting adjustments to the carrying values of assets and liabilities as of the beginning of that year with the offsetting adjustment recorded to the opening balance of retained earnings. The adoption of this bulletin did not have a material effect on our consolidated financial statements.
In September 2006, the FASB issued SFAS No. 157, “Fair Value Measurements”, which defines fair value, establishes a framework for measuring fair value, and expands disclosures about fair value measurements. SFAS No. 157 replaces the different definitions of fair value in the accounting literature with a single definition. It defines fair value as the price that would be received to sell an asset or paid to transfer a liability in an orderly transaction between market participants at the measurement date. SFAS No. 157 is effective for fair-value measurements already required or permitted by other standards for financial statements issued for fiscal years beginning after November 15, 2008 and interim periods within those fiscal years. We are currently evaluating the impact of the adoption of the provisions of SFAS No. 157 on our consolidated financial statements.
In July 2006, the FASB issued FASB Interpretation (“FIN”) No. 48, “Accounting for Uncertainty in Income Taxes, an Interpretation of FASB Statement No. 109”. FIN No. 48 prescribes a recognition threshold and measurement attribute for the financial statements recognition and measurement of a tax position taken or expected to be taken in a tax return. FIN No. 48 is effective for fiscal years beginning after December 15, 2006 and is effective for us in the first quarter of the year beginning October 1, 2007. The Interpretation also provides guidance on de-recognition, measurement, classification, interest and penalties, accounting in interim periods, disclosure and transition. Differences between tax positions taken in a tax return and amounts recognized in the financial Statements are recorded as adjustments to income taxes payable or receivable, or adjustments to deferred taxes, or both. FIN No. 48 also requires expanded disclosure at the end of each annual reporting period including a tabular reconciliation of unrecognized tax benefits. In accordance with FIN No. 48, we report the difference between the net amount of assets and liabilities recognized in the balance sheet prior to and after the application of FIN No. 48 as a cumulative effect adjustment to the opening balance of retained earnings. In May 2007, the FASB issued FSP FIN 48-1, “Definition of Settlement in FASB Interpretation No. 48”, which is effective upon the initial adoption of FIN No. 48. FSP FIN 48-1 provides guidance on how to determine whether a tax position is effectively settled for the purpose of recognizing previously unrecognized tax benefits. The impact of the adoption of FIN No. 48 and FSP FIN 48-1 is described in note 8 to the consolidated financial statements.
During the June 2006 meeting of the EITF, a consensus was reached on EITF Issue No. 06-3, “How Taxes Collected from Customers and Remitted to Governmental Authorities should be presented in the Income Statement (That Is, Gross versus Net Presentation).” The EITF reached a consensus that this Issue applies to any tax assessed by a governmental authority that is both imposed on and concurrent with a specific revenue producing transaction between a seller and customer. Accordingly, taxes such as sales, use, value added, and some excise taxes may be within the scope of this Issue. The EITF reached a consensus that the income statement presentation (gross or net) of such taxes is an accounting policy decision that should be disclosed. In addition, a company should disclose in interim and annual financial statements the amount of such taxes reported on a gross basis, if significant. This Issue became effective for interim and annual reporting periods beginning after December 15, 2006. We elect to present on a net basis taxes collected from customers and remitted to governmental authorities; that is, they are excluded from revenues. The adoption of this consensus did not have an effect on our consolidated financial statements presentation.
- 71 -
In November 2005, the FASB issued FSP No. 115-1 and No. 124-1, “The Meaning of Other-Than-Temporary Impairment and Its Application to Certain Investments” (“FSP No. 115-1”), which provides guidance on determining when investments in certain debt and equity securities are considered impaired, whether that impairment is other-than-temporary, and on measuring such impairment loss. FSP No. 115-1 also includes accounting considerations subsequent to the recognition of other-than-temporary impairment and requires certain disclosures about unrealized losses that have not been recognized as other-than-temporary impairments. FSP No. 115-1 is required to be applied to reporting periods beginning after December 15, 2005 and was required to be adopted by us in the second quarter of 2006. We adopted FSP No. 115-1 beginning on January 1, 2006, and the adoption of FSP No. 115-1 did not have a material impact on our consolidated financial statements.
| ITEM 7A. | QUANTITATIVE AND QUALITATIVE DISCLOSURES ABOUT MARKET RISK |
Quantitative and Qualitative Disclosure about Market Risk
We are exposed to financial market risks, including changes in foreign currency exchange rates and interest rates. We do not use derivative financial instruments for speculative or trading purposes. We do not use off-balance sheet financing or similar special purpose entities. Inflation has not had a significant impact on our results of operations.
Foreign Currency Risk
We operate internationally; however, a substantial portion of revenue and expense activities as well as capital expenditures are transacted in U.S. dollars. Our results of operations are also affected by fluctuations of currencies other than the U.S. dollar, in particular Euros and Canadian dollars. Our exposure to exchange rate fluctuations in these currencies is reduced because, in general, our revenues denominated in currencies other than the U.S. dollar are partially offset by a corresponding amount of costs denominated in the same currency. However, significant long-term fluctuations in relative currency values could have an adverse effect on future profitability.
Interest Rate Risk
The primary objective of our investment policy is the protection of capital. Accordingly, investments are made in high-grade government and corporate securities with varying maturities, but typically, less than 180 days. Therefore, we do not have a material exposure to interest rate risk on our investments, and a 100 basis-point adverse change in interest rates would not have a material effect on our consolidated results of operations, financial position or cash flows. We are exposed to interest rate risk on borrowings under the new senior secured credit facilities and the senior unsecured bridge facility, entered into as part of the February 2008 Transactions. The new senior secured credit facilities and the senior unsecured bridge facility bear interest based on British Banker Association LIBOR. On May 6, 2008, we refinanced the senior unsecured bridge facility by repaying the existing loan using the proceeds of the senior notes. Based on projected advances under the new senior secured credit facilities and considering the interest swap agreements in place discussed below, a 100 basis-point increase or decrease in interest rates would result in a $0.6 million change in our interest rate expense per year.
On February 28, 2008, we entered into two pay-fixed, receive-floating interest rate swap agreements, effectively converting $115.0 million of variable-rate debt under the $175.0 million secured senior credit facilities to fixed-rate debt. The swaps were effective as of March 3, 2008 and are accounted for in accordance with SFAS No. 133, as amended. Derivative financial instruments are measured at fair value and are recognized as assets or liabilities on the balance sheet, with changes in the fair value of the derivatives recognized in either net income (loss) or other comprehensive income (loss), depending on the timing and designated purpose of the derivative. When we pay interest on the portion of the debt designated as hedged, the gain or loss on the swap designated as hedging the interest payment will be reclassified from accumulated other comprehensive income to interest expense. These derivative instruments are designated as cash flow hedges with the related gains or losses recorded in other comprehensive income, with an offsetting amount included in other long-term liabilities. At September 30, 2008, the notional amount of interest rate swaps entered into by us was $115.0 million. The fair value of the interest rate swap at September 30, 2008 was an asset of $0.5 million. As at September 30, 2008, the balance of deferred net losses on derivatives included in accumulated other comprehensive income was $0.5 million (less income taxes of $0.2 million). We expect that $0.3 million will be reclassified into earnings over the next 12 months as a result of transactions that are expected to occur over that period. These interest swap agreements were entered into in February 2008 and expire in February 2009 and 2010.
- 72 -
| ITEM 8. | FINANCIAL STATEMENTS AND SUPPLEMENTARY DATA |
AXCAN INTERMEDIATE HOLDINGS INC. (Successor)
and
AXCAN PHARMA INC. (Predecessor)
INDEX TO FINANCIAL STATEMENTS
| | |
Index | | |
Consolidated Financial Statements | | |
| |
Reports of Independent Registered Public Accounting Firm | | 74 |
| |
Consolidated Balance Sheets as of September 30, 2008 (Successor) and 2007 (Predecessor) | | 76 |
| |
Consolidated Statements of Operations for the period February 26, 2008 to September 30, 2008 (Successor), October 1, 2007 to February 25, 2008 (Predecessor), and years ended September 30, 2006 and 2007 (Predecessor) | | 77 |
| |
Consolidated Statements of Shareholders’ Equity and Comprehensive Income for the period February 26, 2008 to September 30, 2008 (Successor), October 1, 2007 to February 25, 2008 (Predecessor), and years ended September 30, 2006 and 2007 (Predecessor) | | 78 |
| |
Consolidated Statements of Cash Flows for the period February 26, 2008 to September 30, 2008 (Successor), October 1, 2007 to February 25, 2008 (Predecessor), and years ended September 30, 2006 and 2007 (Predecessor) | | 79 |
| |
Notes to Consolidated Financial Statements | | 80 |
- 73 -
REPORT OF INDEPENDENT REGISTERED PUBLIC ACCOUNTING FIRM
To the Board of Directors and Shareholder of Axcan Intermediate Holdings Inc.
We have audited the consolidated balance sheet of Axcan Intermediate Holdings Inc. and subsidiaries as of September 30, 2008 and the consolidated statements of operations, shareholders’ equity and comprehensive income and cash flows for the period from February 26, 2008 to September 30, 2008. These financial statements are the responsibility of the Company’s management. Our responsibility is to express an opinion on these financial statements based on our audit.
We conducted our audit in accordance with the standards of the Public Company Accounting Oversight Board (United States). Those standards require that we plan and perform an audit to obtain reasonable assurance whether the financial statements are free of material misstatement. The Company is not required to have, nor were we engaged to perform an audit of its internal control over financial reporting. Our audit included consideration of internal control over financial reporting as a basis for designing audit procedures that are appropriate in the circumstances, but not for the purpose of expressing an opinion on the effectiveness of the Company’s internal control over financial reporting. Accordingly, we express no such opinion. An audit also includes examining, on a test basis, evidence supporting the amounts and disclosures in the financial statements, assessing the accounting principles used and significant estimates made by management, as well as evaluating the overall financial statement presentation. We believe that our audit provides a reasonable basis for our opinion.
In our opinion, the consolidated financial statements referred to above present fairly, in all material respects, the financial position of Axcan Intermediate Holdings Inc. and subsidiaries as of September 30, 2008 and the results of their operations and their cash flows for the period from February 26, 2008 to September 30, 2008 in conformity with accounting principles generally accepted in the United States of America.
|
/S/ Raymond Chabot Grant Thornton LLP |
| Chartered Accountants |
Montreal, Quebec, Canada
December 9, 2008
- 74 -
REPORT OF INDEPENDENT REGISTERED PUBLIC ACCOUNTING FIRM
To the Board of Directors and Shareholder of Axcan Pharma Inc.
We have audited the consolidated balance sheet of Axcan Pharma Inc. and subsidiaries as of September 30, 2007 and the consolidated statements of operations, shareholders’ equity and comprehensive income and cash flows for the period from October 1, 2007 to February 25, 2008 and for each of the years in the two-year period ended September 30, 2007. These financial statements are the responsibility of the Company’s management. Our responsibility is to express an opinion on these financial statements based on our audits.
We conducted our audits in accordance with the standards of the Public Company Accounting Oversight Board (United States). Those standards require that we plan and perform an audit to obtain reasonable assurance whether the financial statements are free of material misstatement. An audit includes examining, on a test basis, evidence supporting the amounts and disclosures in the financial statements. An audit also includes assessing the accounting principles used and significant estimates made by management, as well as evaluating the overall financial statement presentation. We believe that our audits provide a reasonable basis for our opinion.
In our opinion, the consolidated financial statements referred to above present fairly, in all material respects, the financial position of Axcan Pharma Inc. and subsidiaries as of September 30, 2007 and the results of their operations and their cash flows for the period from October 1, 2007 to February 25, 2008 and for each of the years in the two-year period ended September 30, 2007 in conformity with accounting principles generally accepted in the United States of America.
We also have audited, in accordance with the standards of the Public Company Accounting Oversight Board (United States), the effectiveness of Axcan Pharma Inc. and subsidiaries’ internal control over financial reporting as of September 30, 2007, based on criteria established in Internal Control-Integrated Framework issued by the Committee of Sponsorship Organisations of the Treadway Commission (COSO), and our report dated November 29, 2007 expressed an unqualified opinion of the effectiveness of the Company’s internal control over financial reporting.
|
| /S/ Raymond Chabot Grant Thornton LLP |
| Chartered Accountants |
Montreal, Quebec, Canada
December 9, 2008
- 75 -
AXCAN INTERMEDIATE HOLDINGS INC.
Consolidated Balance Sheets
(in thousands of U.S. dollars, except share related data)
| | | | | | | |
| | | Successor | | | | | Predecessor |
| | | September 30,
2008 | | | | | September 30,
2007 |
| | | $ | | | | | $ |
Assets | | | | | | | |
Current assets | | | | | | | |
Cash and cash equivalents | | 56,105 | | | | | 179,672 |
Short-term investments, available for sale (Note 5) | | — | | | | | 129,958 |
Accounts receivable, net (Note 6) | | 42,513 | | | | | 36,674 |
Accounts receivable from the parent company (Note 19) | | 987 | | | | | — |
Income taxes receivable | | 17,743 | | | | | 10,092 |
Inventories (Note 7) | | 37,671 | | | | | 26,706 |
Prepaid expenses and deposits | | 3,347 | | | | | 3,070 |
Deferred income taxes (Note 8) | | 18,614 | | | | | 15,955 |
| | | | | | | |
Total current assets | | 176,980 | | | | | 402,127 |
Property, plant and equipment, net (Note 9) | | 34,675 | | | | | 31,197 |
Intangible assets, net (Note 10) | | 528,376 | | | | | 367,217 |
Goodwill | | 165,014 | | | | | 27,467 |
Other long-term assets | | 449 | | | | | — |
Deferred debt issue expenses, net of accumulated amortization of $4,201 | | 30,378 | | | | | — |
Deferred income taxes (Note 8) | | 8,940 | | | | | 4,603 |
| | | | | | | |
Total assets | | 944,812 | | | | | 832,611 |
| | | | | | | |
Liabilities | | | | | | | |
Current liabilities | | | | | | | |
Accounts payable and accrued liabilities (Note 12) | | 78,667 | | | | | 83,196 |
Income taxes payable (Note 8) | | 7,653 | | | | | 18,938 |
Instalments on long-term debt | | 10,938 | | | | | 527 |
Deferred income taxes (Note 8) | | 2,042 | | | | | 2,076 |
| | | | | | | |
Total current liabilities | | 99,300 | | | | | 104,737 |
Long-term debt (Note 13) | | 611,246 | | | | | 122 |
Other long-term liabilities | | 1,242 | | | | | — |
Deferred income taxes (Note 8) | | 67,354 | | | | | 37,555 |
| | | | | | | |
Total liabilities | | 779,142 | | | | | 142,414 |
| | | | | | | |
Commitments and contingencies (Note 20) | | | | | | | |
Shareholders’ Equity | | | | | | | |
Capital Stock (Note 14) | | | | | | | |
Predecessor | | | | | | | |
Preferred shares, without par value; unlimited shares authorized; no shares issued | | — | | | | | — |
Series A preferred shares, without par value, shares authorized: 14,175,000; no shares issued | | — | | | | | — |
Series B preferred shares, without par value, shares authorized: 12,000,000; no shares issued | | — | | | | | — |
Common shares, without par value; unlimited shares authorized: 55,359,652 issued and outstanding as at September 30, 2007 | | — | | | | | 395,888 |
Successor | | | | | | | |
Common shares, par value $0.001; 100 shares authorized: 100 issued and outstanding as at September 30, 2008 | | 1 | | | | | — |
Retained earnings (deficit) | | (289,264 | ) | | | | 249,371 |
9.05% Note receivable from the parent company (Note 19) | | (133,154 | ) | | | | — |
Additional paid-in capital | | 617,255 | | | | | 9,089 |
Accumulated other comprehensive income | | (29,168 | ) | | | | 35,849 |
| | | | | | | |
Total shareholders’ equity | | 165,670 | | | | | 690,197 |
| | | | | | | |
Total liabilities and shareholders’ equity | | 944,812 | | | | | 832,611 |
| | | | | | | |
The accompanying notes are an integral part of the consolidated financial statements.
| | | | |
On behalf of the Board, Director | | | | Director |
- 76 -
AXCAN INTERMEDIATE HOLDINGS INC.
Consolidated Operations
(in thousands of U.S. dollars)
| | | | | | | | | | | | | | |
| | | Successor | | | | | Predecessor | |
| | | For the
seven-month
period ended
September 30,
2008 | | | | | For the
five-month
period ended
February 25,
2008 | | | For the
twelve-month
period ended
September 30,
2007 | | | For the
twelve-month
period ended
September 30,
2006 | |
| | | $ | | | | | $ | | | $ | | | $ | |
Revenue | | 223,179 | | | | | 158,579 | | | 348,947 | | | 292,317 | |
| | | | | | | | | | | | | | |
Cost of goods sold(a) (Note 4) | | 77,227 | | | | | 38,739 | | | 83,683 | | | 72,772 | |
Selling and administrative expenses(a) | | 88,345 | | | | | 76,198 | | | 101,273 | | | 93,338 | |
Research and development expenses(a) | | 17,768 | | | | | 10,256 | | | 28,655 | | | 39,789 | |
Depreciation and amortization | �� | 35,579 | | | | | 9,595 | | | 22,494 | | | 22,823 | |
Acquired in-process research (Note 4) | | 272,400 | | | | | — | | | 10,000 | | | — | |
Partial write-down of intangible assets | | — | | | | | — | | | — | | | 5,800 | |
| | | | | | | | | | | | | | |
Total operating expenses | | 491,319 | | | | | 134,788 | | | 246,105 | | | 234,522 | |
| | | | | | | | | | | | | | |
Operating income (loss) | | (268,140 | ) | | | | 23,791 | | | 102,842 | | | 57,795 | |
| | | | | | | | | | | | | | |
Financial expenses | | 41,513 | | | | | 262 | | | 4,825 | | | 6,988 | |
Interest income | | (808 | ) | | | | (5,440 | ) | | (11,367 | ) | | (5,468 | ) |
Loss (gain) on foreign currency | | (1,841 | ) | | | | (198 | ) | | 2,352 | | | (1,110 | ) |
| | | | | | | | | | | | | | |
Total other (income) expense | | 38,864 | | | | | (5,376 | ) | | (4,190 | ) | | 410 | |
| | | | | | | | | | | | | | |
Income (loss) before income taxes | | (307,004 | ) | | | | 29,167 | | | 107,032 | | | 57,385 | |
Income taxes expense (benefit) (Note 8) | | (17,740 | ) | | | | 12,042 | | | 35,567 | | | 18,266 | |
| | | | | | | | | | | | | | |
Net income (loss) | | (289,264 | ) | | | | 17,125 | | | 71,465 | | | 39,119 | |
| | | | | | | | | | | | | | |
(a) | Excluding depreciation and amortization |
The accompanying notes are an integral part of the consolidated financial statements.
Note 15 presents additional information on consolidated operations.
- 77 -
AXCAN INTERMEDIATE HOLDINGS INC.
Consolidated Shareholders’ Equity and Comprehensive Income
(in thousands of U.S. dollars, except share related data)
| | | | | | | | | | | | | |
| | | Successor | | | | | Predecessor |
| | | For the
seven-month
period ended
September 30,
2008 | | | | | For the
five-month
period ended
February 25,
2008 | | | For the
twelve-month
period ended
September 30,
2007 | | | For the
twelve-month
period ended
September 30,
2006 |
Common shares (number) | | | | | | | | | | | | | |
Balance, beginning of period | | — | | | | | 55,359,652 | | | 45,800,581 | | | 45,682,175 |
Shares issued for cash | | 100 | | | | | — | | | — | | | — |
Shares issued on conversion of subordinated notes | | — | | | | | — | | | 8,924,080 | | | — |
Shares issued pursuant to the stock incentive plans for cash | | — | | | | | 17,299 | | | 634,991 | | | 118,406 |
| | | | | | | | | | | | | |
Balance, end of period | | 100 | | | | | 55,376,951 | | | 55,359,652 | | | 45,800,581 |
| | | | | | | | | | | | | |
| | | | | |
| | | $ | | | | | $ | | | $ | | | $ |
Common shares | | | | | | | | | | | | | |
Balance, beginning of period | | — | | | | | 395,888 | | | 262,786 | | | 261,714 |
Shares issued for cash | | 1 | | | | | — | | | — | | | — |
Shares issued on conversion of subordinated notes | | — | | | | | — | | | 125,000 | | | — |
Stock-based compensation on exercised options | | — | | | | | 41 | | | 845 | | | — |
Shares issued pursuant to the stock incentive plans for cash | | — | | | | | 224 | | | 7,257 | | | 1,072 |
| | | | | | | | | | | | | |
Balance, end of period | | 1 | | | | | 396,153 | | | 395,888 | | | 262,786 |
| | | | | | | | | | | | | |
Retained earnings (deficit) | | | | | | | | | | | | | |
Balance, beginning of period | | — | | | | | 249,371 | | | 177,906 | | | 138,787 |
Stock-based compensation cancellation | | — | | | | | (8,821 | ) | | — | | | — |
Net income (loss) | | (289,264 | ) | | | | 17,125 | | | 71,465 | | | 39,119 |
| | | | | | | | | | | | | |
Balance, end of period | | (289,264 | ) | | | | 257,675 | | | 249,371 | | | 177,906 |
| | | | | | | | | | | | | |
Additional paid-in capital | | | | | | | | | | | | | |
Balance, beginning of period | | — | | | | | 9,089 | | | 4,967 | | | 1,329 |
Shares issued for cash | | 608,154 | | | | | — | | | — | | | — |
Stock-based compensation expense | | 7,443 | | | | | 7,474 | | | 4,548 | | | 3,554 |
Stock-based compensation on exercised options | | — | | | | | (41 | ) | | (845 | ) | | — |
Stock-based compensation cancellation | | — | | | | | (16,395 | ) | | — | | | — |
Income tax deductions on stock options exercise | | — | | | | | (127 | ) | | 419 | | | 84 |
Interest receivable from the parent company | | (3,028 | ) | | | | — | | | — | | | — |
Interest income from the parent company, net of taxes of $2,524 | | 4,686 | | | | | — | | | — | | | — |
| | | | | | | | | | | | | |
Balance, end of period | | 617,255 | | | | | — | | | 9,089 | | | 4,967 |
| | | | | | | | | | | | | |
9.05% Note receivable from the parent company | | | | | | | | | | | | | |
Balance, beginning of period | | — | | | | | — | | | — | | | — |
Issue of note | | (133,154 | ) | | | | — | | | — | | | — |
| | | | | | | | | | | | | |
Balance, end of period | | (133,154 | ) | | | | — | | | — | | | — |
| | | | | | | | | | | | | |
Accumulated other comprehensive income | | | | | | | | | | | | | |
Balance, beginning of period | | — | | | | | 35,849 | | | 21,765 | | | 15,774 |
Hedging contracts adjustments, net of taxes of $159 | | 295 | | | | | — | | | — | | | — |
Foreign currency translation adjustments | | (29,463 | ) | | | | 5,724 | | | 14,084 | | | 5,991 |
| | | | | | | | | | | | | |
Balance, end of period | | (29,168 | ) | | | | 41,573 | | | 35,849 | | | 21,765 |
| | | | | | | | | | | | | |
Total shareholders’ equity | | 165,670 | | | | | 695,401 | | | 690,197 | | | 467,424 |
| | | | | | | | | | | | | |
Comprehensive income (loss) | | | | | | | | | | | | | |
Other comprehensive income (loss) | | (29,168 | ) | | | | 5,724 | | | 14,084 | | | 5,991 |
Net income (loss) | | (289,264 | ) | | | | 17,125 | | | 71,465 | | | 39,119 |
| | | | | | | | | | | | | |
Total comprehensive income (loss) | | (318,432 | ) | | | | 22,849 | | | 85,549 | | | 45,110 |
| | | | | | | | | | | | | |
The accompanying notes are an integral part of the consolidated financial statements.
- 78 -
AXCAN INTERMEDIATE HOLDINGS INC.
Consolidated Cash Flows
(in thousands of U.S. dollars)
| | | | | | | | | | | | | | |
| | | Successor | | | | | Predecessor | |
| | | For the
seven-month
period ended
September 30,
2008 | | | | | For the
five-month
period ended
February 25,
2008 | | | For the
twelve-month
period ended
September 30,
2007 | | | For the
twelve-month
period ended
September 30,
2006 | |
| | | $ | | | | | $ | | | $ | | | $ | |
Operating activities | | | | | | | | | | | | | | |
Net income (loss) | | (289,264 | ) | | | | 17,125 | | | 71,465 | | | 39,119 | |
Non-cash items | | | | | | | | | | | | | | |
Non-cash financial expenses | | 5,352 | | | | | — | | | 1,475 | | | 1,117 | |
Inventories stepped-up value expensed | | 22,714 | | | | | — | | | — | | | — | |
Depreciation and amortization | | 35,579 | | | | | 9,595 | | | 22,494 | | | 22,823 | |
Acquired in-process research | | 272,400 | | | | | — | | | — | | | — | |
Partial write-down of intangible assets | | — | | | | | — | | | — | | | 5,800 | |
Stock-based compensation expense | | 7,443 | | | | | 7,474 | | | 4,548 | | | 3,554 | |
Loss on disposal and write-down of assets | | — | | | | | — | | | 3,875 | | | 1,064 | |
Foreign currency fluctuations | | (3,302 | ) | | | | (67 | ) | | 1,763 | | | (739 | ) |
Hedge ineffectiveness | | 5 | | | | | — | | | — | | | — | |
Deferred income taxes | | (23,119 | ) | | | | 432 | | | (11,696 | ) | | 516 | |
Changes in working capital items (Note 16 a) | | (75,320 | ) | | | | 38,686 | | | 42,178 | | | 11,080 | |
| | | | | | | | | | | | | | |
Cash flows from operating activities | | (47,512 | ) | | | | 73,245 | | | 136,102 | | | 84,334 | |
| | | | | | | | | | | | | | |
Investing activities | | | | | | | | | | | | | | |
Net cash used for the Acquisition (Note 4) | | (958,463 | ) | | | | — | | | — | | | — | |
Acquisition of short-term investments | | — | | | | | — | | | (148,929 | ) | | (117,151 | ) |
Disposal of short-term investments | | — | | | | | 129,958 | | | 136,122 | | | 17,619 | |
Acquisition of property, plant and equipment | | (3,061 | ) | | | | (3,314 | ) | | (6,789 | ) | | (4,038 | ) |
Disposal of property, plant and equipment | | — | | | | | — | | | 219 | | | — | |
Acquisition of intangible assets | | (32 | ) | | | | (14 | ) | | (38 | ) | | (4,569 | ) |
| | | | | | | | | | | | | | |
Cash flows from investing activities | | (961,556 | ) | | | | 126,630 | | | (19,415 | ) | | (108,139 | ) |
| | | | | | | | | | | | | | |
Financing activities | | | | | | | | | | | | | | |
Issuance of long-term debt | | 634,120 | | | | | — | | | — | | | 634 | |
Repayment of long-term debt | | (10,890 | ) | | | | (221 | ) | | (704 | ) | | (2,322 | ) |
Deferred debt issue expenses | | (36,360 | ) | | | | (889 | ) | | — | | | — | |
Advance from the parent company | | 4,182 | | | | | — | | | — | | | — | |
Stock-based compensation plans cancellation | | — | | | | | (30,357 | ) | | — | | | — | |
Issue of shares, net of issuance of 9.05% note receivable from the parent company | | 475,001 | | | | | 224 | | | 7,257 | | | 1,072 | |
| | | | | | | | | | | | | | |
Cash flows from financing activities | | 1,066,053 | | | | | (31,243 | ) | | 6,553 | | | (616 | ) |
| | | | | | | | | | | | | | |
Foreign exchange gain (loss) on cash held in foreign currencies | | (880 | ) | | | | 487 | | | 602 | | | 282 | |
| | | | | | | | | | | | | | |
Net increase (decrease) in cash and cash equivalents | | 56,105 | | | | | 169,119 | | | 123,842 | | | (24,139 | ) |
Cash and cash equivalents, beginning of period | | — | | | | | 179,672 | | | 55,830 | | | 79,969 | |
| | | | | | | | | | | | | | |
Cash and cash equivalents, end of period | | 56,105 | | | | | 348,791 | | | 179,672 | | | 55,830 | |
| | | | | | | | | | | | | | |
The accompanying notes are an integral part of the consolidated financial statements.
- 79 -
AXCAN INTERMEDIATE HOLDINGS INC.
Notes to Consolidated Financial Statements
(amounts in the tables are stated in thousands of U.S. dollars, except share related data)
| 1. | Governing Statutes, Description of Business and Basis of Presentation |
Axcan Intermediate Holdings Inc., a Corporation incorporated on November 28, 2007, under the General Corporation Law of the State of Delaware and its subsidiaries (together the “Company” or the “Successor”), commenced active operations with the purchase, through a wholly-owned indirect subsidiary, of all of the outstanding common shares of Axcan Pharma Inc. a company incorporated under the Canada Business Corporation Act (the “Predecessor”). The Company is involved in the research, development, production and distribution of pharmaceutical products mainly in the field of gastroenterology. Prior to the February 2008 transaction, Axcan Intermediate Holdings Inc. had no independent operations or assets. Accordingly, the financial information is presented separately from the period prior to the completion of the February 2008 transaction and the period after the completion of the February 2008 transaction, which relate to the accounting periods preceding and succeeding the completion of the February 2008 transaction. The financial information presented for the Predecessor is the financial information for Axcan Pharma Inc. and its consolidated subsidiaries and the financial information presented for the Successor is the financial information for Axcan Intermediate Holdings Inc. and its consolidated subsidiaries. The financial information as of September 30, 2008 and for the Successor period are not comparable to the financial information of the Predecessor because of the new basis of accounting resulting from the February 2008 transaction. The results of operations for the Predecessor periods and the Successor period should not be considered representative of the Company’s future results of operations. The period referred to as the seven-month period ended September 30, 2008, includes operations from February 26, 2008 to September 30, 2008.
These consolidated financial statements are prepared in conformity with accounting principles generally accepted in United States of America and are presented in U.S. dollars, the reporting currency.
| 2. | Summary of Significant Accounting Policies |
Use of estimates
The preparation of financial statements in accordance with generally accepted accounting principles requires management to make estimates and assumptions that affect the recorded amounts of assets and liabilities and the disclosure of contingent assets and liabilities as at the date of the financial statements and also affect the recognized amounts of revenues and expenses during the year. Significant estimates and assumptions made by management include allowances for accounts receivable and inventories, reserves for product returns, rebates, chargebacks and distribution service agreement fees, the classification of intangible assets between finite life and indefinite life, the useful lives of long-lived assets, the expected cash flows used in evaluating long-lived assets, goodwill and investments for impairment, stock-based compensation costs, pending legal settlements, the establishment of provisions for income taxes including the realizability of deferred tax assets and the allocation of the purchase price of acquired assets and businesses. The estimates are made using the historical information and various other relevant factors available to management. The Company reviews all significant estimates affecting the financial statements on a recurring basis and records the effect of any adjustments when necessary. Actual results could differ from those estimates based upon future events, which could include, among other risks, changes in regulations governing the manner in which the Company sells its products, changes in the health care environment, foreign exchange and managed care consumption patterns.
Principles of consolidation
These financial statements include the accounts of Axcan Intermediate Holdings Inc. and its wholly-owned subsidiaries, the most significant being Axcan Pharma Inc., Axcan Pharma U.S. Inc. (formerly Axcan Scandipharm Inc.) and Axcan Pharma S.A. Significant intercompany balances and transactions have been eliminated on consolidation.
- 80 -
| 2. | Summary of Significant Accounting Policies (continued) |
Revenue recognition
Revenue is recognized when the product is shipped to the Company’s customers, provided the Company has not retained any significant risks of ownership or future obligations with respect to the product shipped. Provisions for sales discounts and estimates for chargebacks, managed care and Medicaid rebates, products returns and distribution service agreement fees are established as a reduction of product sales revenues at the time such revenues are recognized. These revenue reductions are established by the Company at the time of sale, based on historical experience adjusted to reflect known changes in the factors that impact such reserves. In certain circumstances, returns of products are allowed under the Company’s policy and provisions are maintained accordingly. These revenue reductions are generally reflected as an addition to accrued liabilities. Amounts received from customers as prepayments for products to be shipped in the future are reported as deferred revenue.
Cash and cash equivalents
The Company includes in Cash and cash equivalents cash and all highly liquid short-term investments with initial maturities of three months or less at the time of purchase. Cash equivalents are recorded at fair value.
Short-term investments
The Company classifies its short-term investments as available-for-sale. These investments are recorded at their fair value, and unrealized gains or losses, net of tax, are reported in Accumulated other comprehensive income in Shareholders’ Equity. As at September 30, 2008, 2007 and 2006 and February 25, 2008, there were no material unrealized gains or losses. The Company monitors its investments for other than temporary declines in fair value and charges impairment losses to income when other than a temporary decline in estimated value occurs.
Accounts receivable
The majority of the Company’s accounts receivable are due from companies in the pharmaceutical industry. Credit is extended based on an evaluation of a customer’s financial condition and, generally, collateral is not required. Accounts receivable are generally due within 30 to 60 days and are stated at amounts due from customers net of an allowance for doubtful accounts. Accounts outstanding longer than the contractual payment terms are considered past due. The Company determines its allowance by considering a number of factors, including the length of time trade accounts receivable are past due, the Company’s previous loss history, the customer’s current ability to pay its obligation to the Company, and the condition of the general economy and the industry as a whole. The Company writes off accounts receivable when they become uncollectible, and payments subsequently received on such receivables are credited to bad debt expense.
Inventory valuation
Inventories of raw materials and packaging material are valued at the lower of cost and replacement cost. Inventories of work in progress and finished goods are valued at the lower of cost and net realizable value. Cost is determined by the first-in, first-out method. Cost for work in progress and finished goods include raw materials, direct labour, subcontracts and an allocation for overhead. Allowances are maintained for slow-moving inventories based on the remaining shelf life of products and estimated time required to sell such inventories. Obsolete inventory and rejected products are written off to cost of goods sold.
Research and development
Research and development expenses are charged to operations in the year they are incurred. Acquired in-process research and development having no alternative future use is expensed at the time of acquisition. The cost of intangibles that are purchased from others for a particular research and development project that have no alternative future use are expensed at the time of acquisition.
- 81 -
| 2. | Summary of Significant Accounting Policies (continued) |
Depreciation and amortization
Property, plant and equipment and intangible assets with a finite life are reported at cost, less accumulated depreciation and amortization are depreciated or amortized over their estimated useful lives according to the straight-line method over the following periods:
| | |
| Buildings | | 10 to 25 years |
| Furniture and equipment | | 5 to 10 years |
| Computer equipment | | 2 to 5 years |
| Automotive equipment | | 4 to 5 years |
| Leasehold and building improvements | | 5 to 10 years |
| Trademarks, trademark licenses and manufacturing rights | | 5 to 20 years |
Depreciation or amortization commences when an asset is substantially completed and becomes available for productive commercial use.
Impairment of long lived-assets
The value of goodwill and intangible assets with an indefinite life are subject to an annual impairment test and the intangible assets with a finite life and property, plant and equipment are subject to an impairment test whenever events or changes in circumstances indicate that the carrying amounts of these assets may not be recoverable. The Company compares the carrying value of the unamortized portion of property, plant and equipment and intangible assets with a finite life to the future benefits of the Company’s activities or expected sales of pharmaceutical products. For goodwill and intangible assets with indefinite life, the test is based on the comparison of the fair value of the asset with its carrying amount. Should there be a permanent impairment in value, a write-down will be recognized for the current year to reflect the assets at fair value.
Income taxes
Income taxes are calculated using the liability method. Under this method, deferred income tax assets and liabilities are recognized to account for the estimated taxes that will result from the recovery or settlement of assets and liabilities recorded at their financial statement carrying amounts. Deferred income tax assets and liabilities are measured based on enacted tax rates and laws at the date of the financial statements for the years in which the temporary differences are expected to reverse. A valuation allowance is provided for the portion of deferred tax assets that is more likely than not to remain unrealized. Adjustments to the deferred income tax asset and liability balances are recognized in net income as they occur.
The Company conducts business in various countries throughout the world and is subject to tax in numerous jurisdictions. As a result of its business activities, the Company files a significant number of tax returns that are subject to examination by various federal, state, and local tax authorities. Tax examinations are often complex as tax authorities may disagree with the treatment of items reported by the Company and this may require several years to resolve.
Selling and administrative expenses
Selling and administrative expenses include shipping and handling expenses, other than distribution service agreement fees, and advertising expenses. Distribution service agreement fees are deducted from revenue. Advertising costs are expensed as incurred.
- 82 -
| 2. | Summary of Significant Accounting Policies (continued) |
Foreign currency translation
The current rate method of translation of foreign currencies is followed for subsidiaries considered financially and operationally self-sustaining. Therefore, all gains and losses arising from the translation of the financial statements of subsidiaries are deferred in a cumulative foreign currency translation adjustments account reported as a component of Accumulated other comprehensive income in Shareholders’ Equity.
For the operations in the United States of America and in Canada for the Predecessor, monetary assets and liabilities in currency other than U.S. dollars are translated into U.S. dollars, the functional currency of the Company, at the exchange rates in effect at the balance sheet date whereas other assets and liabilities are translated at exchange rates in effect at transaction dates. Revenue and operating expenses in foreign currency are translated at the average rates in effect during the year, except for depreciation and amortization, translated at historical rates. Gains and losses are included in net income for the year.
Deferred debt issue expenses
The Company paid approximately $31,400,000 in financing costs in connection with the issuance of Senior Secured Notes, a credit facility (“Credit Facility”) and a Senior Unsecured Interim Loan on February 25, 2008. These expenditures have been deferred and are included in Deferred debt issue expenses on the consolidated balance sheets. These financing costs are being expensed over the terms of the respective debt using the effective interest method.
The Company paid an additional $3,200,000 in financing costs in connection with the repayment of the Bridge Financing and the issuance of Senior Unsecured Notes on May 6, 2008. These expenditures have also been deferred and are included in Deferred debt issue expenses on the consolidated balance sheets. These deferred debt issue expenses, along with the remaining unamortized deferred debt issue expenses related to the Senior Unsecured Interim Loan are being expensed over the terms of the Senior Unsecured Notes using the effective interest method.
Derivative instruments
Statement of Financial Accounting Standards (“SFAS”) No. 133, “Accounting for Derivative Instruments and Hedging Activities”, as amended, requires that all derivatives be recorded on the consolidated balance sheets at fair value. The Company’s objective of holding derivatives is to minimize the risks of interest rate fluctuation by using the most effective methods to eliminate or reduce the impact of this exposure. The Company has designated its two interest rate swaps as cash flow hedges on $115,000,000 of the Company’s $175,000,000 variable rate term loan under the Credit Facility with Bank of America N.A. Interest expense on the Credit Facility is adjusted to include the payment made or received under the interest rate swap agreements.
For such cash flow hedges, the effective portions of the changes in the fair value of the derivatives are recorded in Other comprehensive income and are recognized in the income statement when the hedged item affects earnings; cash flows are classified consistent with the underlying hedged item.
On an ongoing basis, the Company assesses whether each derivative continues to be highly effective in offsetting changes in the cash flows of hedged items. Hedge ineffectiveness, if any, is immediately recognized in earnings.
| 3. | Recently Issued Accounting Standards |
In May 2008, the Financial Accounting Standards Board (“FASB”) issued SFAS No. 162, “The Hierarchy of Generally Accepted Accounting Principles.” SFAS No. 162 identifies the sources of accounting principles and the framework for selecting the principles used in the preparation of financial statements of nongovernmental entities that are presented in conformity with generally accepted accounting principles. SFAS No. 162 will become effective 60 days following the Securities and Exchange Commission’s (“SEC’s”) approval of the Public Company Accounting Oversight Board amendments to AU Section 411, “The Meaning of Present Fairly in Conformity With Generally Accepted Accounting Principles. The Company does not expect that the adoption of SFAS No. 162 will have a material impact on its consolidated financial statements.
- 83 -
| 3. | Recently Issued Accounting Standards (continued) |
In April 2008, the FASB issued FASB Staff Position (“FSP”) FAS No.142-3, “Determination of the Useful Life of Intangible Assets.” This FSP amends the factors that should be considered in developing renewal or extension assumptions used to determine the useful life of a recognized intangible asset under SFAS No. 142, “Goodwill and Other Intangible Assets.” The intent of this FSP is to improve the consistency between the useful life of a recognized intangible asset under Statement No. 142 and the period of expected cash flows used to measure the fair value of the asset under SFAS No. 141 (Revised 2007),“Business Combinations,” and other U.S. GAAP. This FSP is effective for financial statements issued for fiscal years beginning after December 15, 2008, and interim periods within those fiscal years. Early adoption is prohibited. The Company is currently evaluating the impact of the adoption of the provisions of this FSP on its consolidated financial statements.
In March 2008, the FASB issued SFAS No. 161,“Disclosures about Derivative Instruments and Hedging Activities, as an amendment to SFAS No. 133, Accounting for Derivative Instruments and Hedging Activities”. SFAS No. 161 requires that objectives for using derivative instruments be disclosed in terms of underlying risk and accounting designation. SFAS No. 161 requires enhanced disclosures about (a) how and why derivative instruments are used, (b) how derivative instruments and related hedged items are accounted for and (c) how derivative instruments and related hedged items affect an entity’s financial position, financial performance and cash flows. The fair value of derivative instruments and their gains and losses will need to be presented in tabular format in order to present a more complete picture of the effects of using derivative instruments. SFAS No. 161 is effective for financial statements issued for fiscal years and interim periods beginning after November 15, 2008. The Company is currently evaluating the impact of the adoption of the provisions of SFAS No. 161 on its consolidated financial statements.
In February 2008, the FASB issued SFAS No. 157-2,“Effective Date of FASB Statement No. 157” (“FSP 157-2”). This FSP delays the effective date of SFAS No. 157 for non-financial assets and non-financial liabilities, except for items that are recognized or disclosed at fair value in the financial statements on a recurring basis (at least annually). SFAS No. 157 will therefore be applicable to non-financial assets and liabilities for the Company’s fiscal year commencing October 1, 2009. The Company is currently evaluating the impact of the adoption of the provisions of SFAS No. 157 and FAS 157-2 on its consolidated financial statements.
In December 2007, the FASB issued SFAS No. 141 (R), “Business Combinations”, which replaces SFAS No. 141, “Business Combinations”. SFAS No. 141(R) expands the definition of a business combination and requires the acquisition method of accounting to be used for all business combinations and an acquirer to be identified for each business combination. SFAS No. 141(R) also requires that all assets, liabilities, contingent considerations, and contingencies of an acquired business be recorded at fair value at the acquisition date. In addition, SFAS No. 141(R) establishes requirements in the recognition of acquisition costs, restructuring costs and changes in accounting for deferred tax asset valuation allowances and acquired income tax uncertainties. SFAS No. 141(R) is to be applied prospectively to business combinations for which the acquisition date is on or after the beginning of the first annual reporting period beginning on or after December 15, 2008. Earlier adoption is prohibited. The Company will apply the principles set forth in SFAS No. 141(R) for future acquisitions.
In December 2007, the FASB ratified Emerging Issues Task Force (“EITF”) Issue No. 07-01, “Accounting for Collaborative Arrangements”. EITF No. 07-01 defines collaborative arrangements and establishes reporting requirements for transactions between participants in a collaborative arrangement and between participants in the arrangement and third parties. EITF No. 07-01 also establishes the appropriate income statement presentation and classification for joint operating activities and payments between participants, as well as the sufficiency of the disclosures related to these arrangements. EITF No. 07-01 is effective for fiscal years, and interim periods within those fiscal years, beginning after December 15, 2008. The Company is currently evaluating the impact of the adoption of the provisions of EITF No. 07-1 on its consolidated financial statements.
- 84 -
| 3. | Recently Issued Accounting Standards (continued) |
In December 2007, the FASB issued SFAS No. 160, “Non-controlling Interests in Consolidated Financial Statements – an amendment of ARB No. 51”. SFAS No. 160 establishes new accounting and reporting standards for the non-controlling interest in a subsidiary and for the deconsolidation of a subsidiary. Specifically, SFAS No. 160 requires the recognition of a non-controlling interest (minority interest) as equity in the consolidated financial statements and separate from the parent’s equity. The amount of net income attributable to the non-controlling interest will be included in consolidated net income on the face of the income statement. SFAS No.160 clarifies that changes in a parent’s ownership interest in a subsidiary that do not result in deconsolidation are equity transactions if the parent retains its controlling financial interest. In addition, SFAS No. 160 requires that a parent recognize a gain or loss in net income when a subsidiary is deconsolidated. Such gain or loss will be measured using the fair value of the non-controlling equity investment on the deconsolidation date. SFAS No. 160 also includes expanded disclosure requirements regarding the interests of the parent and its non-controlling interest. SFAS No. 160 is effective for fiscal years, and interim periods within those fiscal years, beginning on or after December 15, 2008. Earlier adoption is prohibited. The adoption of this standard is not expected to have a material impact on the Company’s consolidated financial statements, because the Company has wholly-owned subsidiaries.
In June 2007, the EITF reached a consensus on Issue No. 07-3,“Accounting for Non-refundable Advance Payments for Goods or Services Received for Use in Future Research and Development Activities.”As a result of this consensus, non-refundable advance payments for goods or services that will be used or rendered for future research and development activities should be deferred and capitalized. Such amounts should be recognized as an expense as the related goods are delivered or the services are performed, or when the goods or services are no longer expected to be provided. This Issue is effective for financial statements issued for fiscal years beginning after December 15, 2007, and earlier application is not permitted. This consensus is to be applied prospectively for new contracts entered into on or after the effective date. The adoption of this consensus is not expected to have a material impact on the Company’s consolidated financial statements.
In February 2007, the FASB issued SFAS No. 159,“The Fair Value Option for Financial Assets and Financial Liabilities”, which permits an entity to measure certain financial assets and financial liabilities at fair value. The objective of SFAS No. 159 is to improve financial reporting by allowing entities to mitigate volatility in reported earnings caused by the measurement of related assets and liabilities using different attributes, without having to apply complex hedge accounting provisions. Under SFAS No. 159, entities that elect the fair value option at the effective date (by instrument) will report unrealized gains and losses in earnings at each subsequent reporting date. The fair value option election is irrevocable, unless a new election date occurs. SFAS No. 159 establishes presentation and disclosure requirements to help financial statement users understand the effect of the entity’s election on its earnings, but does not eliminate disclosure requirements of other accounting standards. Assets and liabilities that are measured at fair value must be displayed on the face of the balance sheet. This statement is effective for fiscal years beginning after November 15, 2007. The Company is currently evaluating the impact of the adoption of the provisions of SFAS No. 159 on its consolidated financial statements.
In September 2006, the SEC issued Staff Accounting Bulletin (“SAB”) No. 108, “Considering the Effects of Prior Year Misstatements when Quantifying the Misstatements in Current Year Financial Statements” that expresses the Staff’s views regarding the process of quantifying financial statement misstatements. This bulletin is effective for any interim period of the first fiscal year ending after November 15, 2006. SAB No. 108 requires that companies utilize a “dual approach” to assess the quantitative effects of financial statement misstatements. The dual approach includes both an income statement focus and balance sheet focus assessment. SAB No. 108 permits companies to record the cumulative effect of initially applying the dual approach in the first year ending after November 15, 2006 by recording any necessary correcting adjustments to the carrying values of assets and liabilities as of the beginning of that year with the offsetting adjustment recorded to the opening balance of retained earnings. The adoption of this bulletin did not have a material effect on the Company’s consolidated financial statements.
- 85 -
| 3. | Recently Issued Accounting Standards (continued) |
In September 2006, the FASB issued SFAS No. 157,“Fair Value Measurements”, which defines fair value, establishes a framework for measuring fair value, and expands disclosures about fair value measurements. SFAS No. 157 replaces the different definitions of fair value in the accounting literature with a single definition. It defines fair value as the price that would be received to sell an asset or paid to transfer a liability in an orderly transaction between market participants at the measurement date. SFAS No. 157 is effective for fair-value measurements already required or permitted by other standards for financial statements issued for fiscal years beginning after November 15, 2008 and interim periods within those fiscal years. The Company is currently evaluating the impact of the adoption of the provisions of SFAS No. 157 on its consolidated financial statements.
In July 2006, the FASB issued FASB Interpretation (“FIN”) No. 48, “Accounting for Uncertainty in Income Taxes, an Interpretation of FASB Statement No. 109”. FIN No. 48 prescribes a recognition threshold and measurement attribute for the financial statements recognition and measurement of a tax position taken or expected to be taken in a tax return. FIN No. 48 is effective for fiscal years beginning after December 15, 2006 and is effective for the Predecessor in the first quarter of the year beginning October 1, 2007. The Interpretation also provides guidance on de-recognition, measurement, classification, interest and penalties, accounting in interim periods, disclosure and transition. Differences between tax positions taken in a tax return and amounts recognized in the financial statements are recorded as adjustments to income taxes payable or receivable, or adjustments to deferred taxes, or both. FIN No. 48 also requires expanded disclosure at the end of each annual reporting period including a tabular reconciliation of unrecognized tax benefits. In accordance with FIN No. 48, the Company reports the difference between the net amount of assets and liabilities recognized in the balance sheet prior to and after the application of FIN No. 48 as a cumulative effect adjustment to the opening balance of retained earnings. In May 2007, the FASB issued FSP FIN 48-1,“Definition of Settlement in FASB Interpretation No. 48”, which is effective upon the initial adoption of FIN No. 48. FSP FIN 48-1 provides guidance on how to determine whether a tax position is effectively settled for the purpose of recognizing previously unrecognized tax benefits. The impact of the adoption of FIN No. 48 and FSP FIN 48-1 is described in note 8.
During the June 2006 meeting of the EITF, a consensus was reached on EITF Issue No. 06-3,“How Taxes Collected from Customers and Remitted to Governmental Authorities should be presented in the Income Statement (That Is, Gross versus Net Presentation).”The EITF reached a consensus that this Issue applies to any tax assessed by a governmental authority that is both imposed on and concurrent with a specific revenue producing transaction between a seller and customer. Accordingly, taxes such as sales, use, value added, and some excise taxes may be within the scope of this Issue. The EITF reached a consensus that the income statement presentation (gross or net) of such taxes is an accounting policy decision that should be disclosed. In addition, a company should disclose in interim and annual financial statements the amount of such taxes reported on a gross basis, if significant. This Issue became effective for interim and annual reporting periods beginning after December 15, 2006. The Predecessor elected to present on a net basis taxes collected from customers and remitted to governmental authorities; that is, they are excluded from revenues. The adoption of this consensus did not have an effect on the Predecessor’s consolidated financial statements presentation.
In November 2005, the FASB issued FSP No. 115-1 and No. 124-1, “The Meaning of Other-Than-Temporary Impairment and Its Application to Certain Investments”,which provides guidance on determining when investments in certain debt and equity securities are considered impaired, whether that impairment is other-than-temporary, and on measuring such impairment loss. FSP No. 115-1 also includes accounting considerations subsequent to the recognition of other-than-temporary impairment and requires certain disclosures about unrealized losses that have not been recognized as other-than-temporary impairments. FSP No. 115-1 is required to be applied to reporting periods beginning after December 15, 2005 and was required to be adopted by the Predecessor in the second quarter of 2006. The Predecessor adopted FSP No. 115-1 beginning on January 1, 2006, and the adoption of FSP No. 115-1 did not have a material impact on the Predecessor’s consolidated financial statements.
- 86 -
On February 25, 2008, the Company, pursuant to a Plan of Arrangement dated November 29, 2007, and through a wholly-owned indirect subsidiary, completed the acquisition of all common shares of Axcan Pharma Inc. at a price of $23.35 per share and entered into various related transactions (the “Acquisition”). The cash consideration of $1,293,000,000 plus the capitalized portion of acquisition costs of approximately $14,100,000 were funded by cash equity contributions from affiliates of TPG Capital L.P. (the “Sponsor”) and certain co-investors of $475,000,000, the proceeds from long-term debt of $634,100,000 and $198,200,000 in cash on hand from Axcan Pharma Inc. The business acquired is a specialty pharmaceutical company concentrating in the field of gastroenterology, with operations in North America and the European Union.
The Company accounted for this acquisition as a purchase combination and, accordingly, the cost was allocated to the assets acquired and liabilities assumed based on their estimated fair values at the acquisition date. As at September 30, 2008, the Company finalized its allocation of the purchase price. As a result of finalization of the purchase price allocation, the Company recorded adjustments in the fourth quarter to the preliminary purchase price allocation of $1,087,000 for other current assets, $4,939,000 for property, plant and equipment, $7,073,000 for goodwill, $1,487,000 for deferred income taxes assets and $1,734,000 for deferred income taxes liabilities. None of the goodwill recorded as a result of the Acquisition is expected to be tax deductible. As at September 30, 2008, the final purchase price allocation is as follows:
| | | |
| | | $ | |
Cash | | 348,791 | |
Inventories(a) | | 54,055 | |
Other current assets | | 91,951 | |
Property, plant and equipment | | 36,912 | |
Intangible assets | | 581,653 | |
Acquired in-process research(b) | | 272,400 | |
Goodwill | | 169,625 | |
Deferred debt issue expenses | | 889 | |
Deferred income taxes assets | | 7,246 | |
Current liabilities | | (174,554 | ) |
Long-term debt | | (68 | ) |
Deferred income taxes liabilities | | (81,646 | ) |
| | | |
Total | | 1,307,254 | |
| | | |
(a) | As part of the purchase price allocation for the acquisition, the carrying value of inventory acquired was stepped-up to fair value by $22,714,000 as of February 25, 2008. The stepped-up value is recorded as a charge to Cost of goods sold as acquired inventory is sold. |
(b) | Represents the estimated fair value of acquired in-process R&D projects that had not yet reached technological feasibility and had no alternative future use. Accordingly, this amount was immediately expensed upon the acquisition date. The value assigned to purchased in-process technology is mainly attributable to the following projects: CANASA MAX 002, pancreatic enzymes, PYLERA in the European Union, AGI-010 and Cx401. |
- 87 -
| 4. | Acquisition (continued) |
The pro-forma results of operations for the Company, assuming that the transaction occurred on October 1, 2006 and October 1, 2007, and excluding any pro-forma charges for acquired in-process research, inventory stepped-up value adjustments, transaction and integration costs are as follows:
| | | | | |
| | | For the
twelve-month
period ended
September 30,
2008 | | For the
twelve-month
period ended
September 30,
2007 | |
| | | (unaudited) | | (unaudited) | |
| | | $ | | $ | |
Revenue | | 381,758 | | 348,947 | |
Income (loss) before income taxes(a) | | 259 | | (22,408 | ) |
| | | | | |
Net income (loss)(a) | | 3,964 | | (12,671 | ) |
| | | | | |
(a) | The pro-forma financial information above has not been adjusted for the acquired in-process research of $272,400,000 and inventory stepped-up value adjustments of $22,714,000, which form part of the purchase price allocation, and transaction and integration costs of $37,569,000 because they are non-recurring in nature. |
The pro-forma information is presented for informational purposes only and is not necessarily indicative of the results of operations that actually would have been achieved had the acquisition been consummated as of that time, nor is it intended to be a projection of future results.
Product acquisitions
During the fourth quarter of fiscal 2007, the Predecessor entered into an exclusive license and development agreement with Cellerix SL (“Cellerix”) of Spain, for the North American (United States, Canada and Mexico) rights to Cx401, a biological product in development for the treatment of perianal fistulas. Cx401 uses non-embryonic stem-cells to treat perianal fistulas in Crohn’s and non-Crohn’s Disease patients. Under the terms of the agreement, as at September 30, 2007, the Predecessor recorded a $10,000,000 upfront payment payable to Cellerix, and will make regulatory milestone payments that could total up to $30,000,000. As this product had not reached technological feasibility, the upfront payment was considered to be acquired in-process research and was expensed in the fourth quarter of the year ended September 30, 2007, the period of acquisition.
As at September 30, 2007, short-term investments included short-term notes and municipal bonds. Six short-term notes represented approximately 87% of the Predecessor’s total short-term investments. Interest rates on short-term investments varied from 5.00% to 5.35%.
| | | | | | |
| | | Successor | | | | Predecessor |
| | | September 30,
2008 | | | | September 30,
2007 |
| | | $ | | | | $ |
Trade accounts, net of allowance for doubtful accounts of $122,426 ($222,457 in 2007) (a) | | 41,475 | | | | 34,486 |
Taxes receivable | | 745 | | | | 1,816 |
Other | | 293 | | | | 372 |
| | | | | | |
| | 42,513 | | | | 36,674 |
| | | | | | |
The Company believes that there is no unusual exposure associated with the collection of these accounts receivable.
(a) | As at September 30, 2008, the accounts receivable include amounts receivable from three major customers which represent approximately 53% (47% in 2007) of the Company’s total accounts receivable (Note 17). |
- 88 -
| | | | | | |
| | | Successor | | | | Predecessor |
| | | September 30,
2008 | | | | September 30,
2007 |
| | | $ | | | | $ |
Raw material and packaging material | | 8,177 | | | | 9,451 |
Work in progress | | 1,867 | | | | 1,998 |
Finished goods | | 27,627 | | | | 15,257 |
| | | | | | |
| | 37,671 | | | | 26,706 |
| | | | | | |
The deferred income tax assets and liabilities result from differences between the tax value and book value of the following items:
| | | | | | | | |
| | | Successor | | | | | Predecessor | |
| | | September 30,
2008 | | | | | September 30,
2007 | |
| | | $ | | | | | $ | |
Assets | | | | | | | | |
Inventories | | 9,971 | | | | | 6,102 | |
Accounts payable and accrued liabilities | | 8,598 | | | | | 7,995 | |
Unused capital losses | | — | | | | | 1,811 | |
Property, plant and equipment | | — | | | | | 962 | |
Intangible assets | | 7,409 | | | | | 3,354 | |
Research and development tax credits | | 739 | | | | | — | |
Deferred debt issue expenses | | 2,304 | | | | | — | |
Unused losses | | 6,059 | | | | | 287 | |
Stock-based compensation | | 1,043 | | | | | — | |
Other | | 423 | | | | | 47 | |
Liabilities | | | | | | | | |
Accounts receivable | | (445 | ) | | | | (651 | ) |
Prepaid expenses and deposits | | (886 | ) | | | | (465 | ) |
Property, plant and equipment | | (1,282 | ) | | | | (1,346 | ) |
Intangible assets | | (71,327 | ) | | | | (29,931 | ) |
Goodwill | | — | | | | | (720 | ) |
Investments | | — | | | | | (4,298 | ) |
Sub Part F income | | (3,660 | ) | | | | — | |
Other | | (788 | ) | | | | (2,220 | ) |
| | | | | | | | |
Net deferred income tax liabilities | | (41,842 | ) | | | | (19,073 | ) |
| | | | | | | | |
As at September 30, 2008, the Company had tax benefit carryovers of $6,059,000 relating to operating losses and $739,000 relating to tax credits. These tax benefits expire in 2028.
- 89 -
| 8. | Income Taxes (continued) |
The amounts recognized in the consolidated balance sheet consist of:
| | | | | | | | |
| | | Successor | | | | | Predecessor | |
| | | September 30,
2008 | | | | | September 30,
2007 | |
| | | $ | | | | | $ | |
Deferred income tax assets – Current | | 18,614 | | | | | 15,955 | |
Deferred income tax assets – Non-current | | 8,940 | | | | | 4,603 | |
Deferred income tax liabilities – Current | | (2,042 | ) | | | | (2,076 | ) |
Deferred income tax liabilities – Non-current | | (67,354 | ) | | | | (37,555 | ) |
| | | | | | | | |
| | (41,842 | ) | | | | (19,073 | ) |
| | | | | | | | |
Pursuant to SFAS 109, “Accounting for Income Taxes”, current and non-current deferred income tax assets and liabilities within the same jurisdiction are generally offset for presentation in the Consolidated Balance sheet.
Income taxes included in the statement of operations are as follows:
| | | | | | | | | | | | | | |
| | | Successor | | | | | Predecessor | |
| | | For the
seven-month
period ended
September 30,
2008 | | | | | For the
five-month
period ended
February 25,
2008 | | | For the
twelve-month
period ended
September 30,
2007 | | | For the
twelve-month
period ended
September 30,
2006 | |
| | | $ | | | | | $ | | | $ | | | $ | |
Current | | 7,627 | | | | | 11,888 | | | 47,263 | | | 17,750 | |
| | | | | | | | | | | | | | |
Deferred | | | | | | | | | | | | | | |
Creation and reversal of temporary differences | | (25,367 | ) | | | | 154 | | | (11,696 | ) | | 580 | |
Change in promulgated rates | | — | | | | | — | | | — | | | (64 | ) |
| | | | | | | | | | | | | | |
| | (25,367 | ) | | | | 154 | | | (11,696 | ) | | 516 | |
| | | | | | | | | | | | | | |
| | (17,740 | ) | | | | 12,042 | | | 35,567 | | | 18,266 | |
| | | | | | | | | | | | | | |
Domestic | | | | | | | | | | | | | | |
Current | | 4,057 | | | | | (4,264 | ) | | 16,073 | | | (68 | ) |
Deferred | | (10,461 | ) | | | | 1,977 | | | (8,394 | ) | | 1,120 | |
| | | | | | | | | | | | | | |
| | (6,404 | ) | | | | (2,287 | ) | | 7,679 | | | 1,052 | |
| | | | | | | | | | | | | | |
Foreign | | | | | | | | | | | | | | |
Current | | 3,570 | | | | | 16,152 | | | 31,190 | | | 17,818 | |
Deferred | | (14,906 | ) | | | | (1,823 | ) | | (3,302 | ) | | (604 | ) |
| | | | | | | | | | | | | | |
| | (11,336 | ) | | | | 14,329 | | | 27,888 | | | 17,214 | |
| | | | | | | | | | | | | | |
| | (17,740 | ) | | | | 12,042 | | | 35,567 | | | 18,266 | |
| | | | | | | | | | | | | | |
- 90 -
| 8. | Income Taxes (continued) |
The Company’s effective income tax rate differs from the statutory federal income tax rate in the United States of America of 35% for the Successor and the combined statutory federal and provincial income tax rate in Canada for the Predecessor (31.83% for the five months ended February 25, 2008, 32.02% for the twelve-month period ended September 30, 2007 and 31.77% for the twelve-month period ended September 30, 2006). This difference arises from the following:
| | | | | | | | | | | | | | | | | | | | | | | | | | |
| | | Successor | | | | | Predecessor | |
| | | For the
seven-month
period ended
September 30,
2008 | | | | | For the
five-month
period ended
February 25,
2008 | | | For the
twelve-month
period ended
September 30,
2007 | | | For the
twelve-month
period ended
September 30,
2006 | |
| | | % | | | $ | | | | | % | | | $ | | | % | | | $ | | | % | | | $ | |
Combined statutory rate applied to pre-tax income | | 35.00 | | | (107,451 | ) | | | | 31.83 | | | 9,284 | | | 32.02 | | | 34,272 | | | 31.77 | | | 18,231 | |
Increase (decrease) in taxes resulting from: | | | | | | | | | | | | | | | | | | | | | | | | | | |
Change in promulgated rates | | — | | | — | | | | | 0.15 | | | 42 | | | — | | | — | | | (0.11 | ) | | (64 | ) |
Difference with foreign tax rates | | 1.82 | | | (5,586 | ) | | | | (5.63 | ) | | (1,643 | ) | | (2.38 | ) | | (2,548 | ) | | 1.46 | | | 837 | |
Non-deductible items | | (31.81 | ) | | 97,647 | | | | | 15.91 | | | 4,641 | | | 4.79 | | | 5,131 | | | 5.11 | | | 2,935 | |
Non-taxable items | | — | | | — | | | | | (0.06 | ) | | (17 | ) | | (0.14 | ) | | (149 | ) | | (2.78 | ) | | (1,596 | ) |
Investment tax credits | | 0.29 | | | (885 | ) | | | | (2.72 | ) | | (793 | ) | | (2.01 | ) | | (2,154 | ) | | (4.44 | ) | | (2,547 | ) |
State taxes | | 1.29 | | | (3,974 | ) | | | | — | | | — | | | — | | | — | | | — | | | — | |
Other | | (0.81 | ) | | 2,509 | | | | | 1.81 | | | 528 | | | 0.95 | | | 1,015 | | | 0.82 | | | 470 | |
| | | | | | | | | | | | | | | | | | | | | | | | | | |
| | 5.78 | | | (17,740 | ) | | | | 41.29 | | | 12,042 | | | 33.23 | | | 35,567 | | | 31.83 | | | 18,266 | |
| | | | | | | | | | | | | | | | | | | | | | | | | | |
As at September 30, 2008, no provision has been made for income taxes on the undistributed earnings of the Company’s foreign subsidiaries that the Company intends to indefinitely reinvest.
Effective October 1, 2007, the Predecessor adopted the provisions of FASB Interpretation (“FIN”) No. 48. “Accounting for Uncertainty in income taxes, an interpretation of FASB Statement No.109”. Fin No. 48 prescribes a recognition threshold and a measurement attribute for the financial statement recognition and measurement of tax positions taken or expected to be taken in a tax return. For those benefits to be recognized, a tax position must be more-likely-than-not to be sustained upon examination by taxing authorities. The adoption of the provisions of FIN No. 48 did not have a material impact on the Company’s consolidated financial position and results of operations, and a cumulative effect adjustment to the opening balance of retained earnings was not necessary. As at October 1, 2007, the Predecessor had unrecognized tax benefits of $1,245,000 which would be treated as a reduction of Goodwill if subsequently recognized. As at September 30, 2008, the Company had unrecognized tax benefits of $10,446,000 of which $9,666,000 would be treated as a reduction of Goodwill and $780,000 would favorably impact the Company’s effective tax rate if subsequently recognized. The following table presents a summary of the changes to unrecognized tax benefits:
| | | | | | | |
| | | Successor | | | | Predecessor | |
| | | For the
seven-month
period ended
September 30,
2008 | | | | For the
five-month
period ended
February 25,
2008 | |
| | | $ | | | | $ | |
Balance, beginning of period | | 2,015 | | | | 1,245 | |
Additions based on tax positions related to the current year | | 249 | | | | 904 | |
Additions for tax positions of prior years | | 8,182 | | | | 15 | |
Reductions for tax positions of prior years | | — | | | | (149 | ) |
| | | | | | | |
Balance, end of period | | 10,446 | | | | 2,015 | |
| | | | | | | |
- 91 -
| 8. | Income Taxes (continued) |
The Predecessor has historically recognized interest relating to income tax matters as a component of financial expenses and penalties related to income tax matters as a component of income tax expense. As at October 1, 2007, the Predecessor had accrued $43,587 for interest relating to income tax matters. As at September 30, 2008, the Successor had accrued $427,732 for interest relating to income tax matters. There were no amounts recorded for penalties as at October 1, 2007 and September 30, 2008.
The Company and its subsidiaries file tax returns in the U.S. federal jurisdiction and various states, local and foreign jurisdictions including Canada and France. In many cases, the Company’s uncertain tax positions are related to tax years that remain subject to examination by relevant tax authorities. The Company is subject to federal and state income tax examination by U.S. tax authorities for fiscal years 2004 through 2008. The Company is subject to Canadian and provincial income tax examination for fiscal years 2003 through 2008. There are numerous other income jurisdictions for which tax returns are not yet settled, none of which is individually significant.
The Company and its U.S. subsidiaries will file as members of a U.S. consolidated tax return, of which Axcan Holdings Inc. is the parent. Under a proposed tax allocation agreement, which will be executed for the fiscal year ended September 30, 2008, and will be finalized in conjunction with the filing of tax return. Axcan Holdings Inc. plans to allocate income tax expenses or credits based upon the pro-rata contribution of taxable income or losses, which generally results in reporting income taxes as though the Company filed a separate tax return.
| 9. | Property, Plant and Equipment |
| | | | | | |
| | | Successor |
| | | September 30, 2008 |
| | | Cost | | Accumulated
depreciation | | Net |
| | | $ | | $ | | $ |
Land | | 2,257 | | — | | 2,257 |
Buildings | | 21,066 | | 1,213 | | 19,853 |
Furniture and equipment | | 5,471 | | 936 | | 4,535 |
Automotive equipment | | 9 | | 9 | | — |
Computer equipment | | 9,739 | | 1,716 | | 8,023 |
Leasehold and building improvements | | 9 | | 2 | | 7 |
| | | | | | |
| | 38,551 | | 3,876 | | 34,675 |
| | | | | | |
| | | | | | |
| | | Predecessor |
| | | September 30, 2007 |
| | | Cost | | Accumulated
depreciation | | Net |
| | | $ | | $ | | $ |
Land | | 1,877 | | — | | 1,877 |
Buildings | | 23,796 | | 6,267 | | 17,529 |
Furniture and equipment | | 14,331 | | 10,983 | | 3,348 |
Automotive equipment | | 65 | | 61 | | 4 |
Computer equipment | | 19,277 | | 10,848 | | 8,429 |
Leasehold and building improvements | | 199 | | 189 | | 10 |
| | | | | | |
| | 59,545 | | 28,348 | | 31,197 |
| | | | | | |
Acquisitions of property, plant and equipment amount to $3,134,395 for the seven-month period ended September 30, 2008 ($2,963,225 for the five-month period ended February 25, 2008, $7,855,240 for the twelve-month period ended September 30, 2007 and $3,476,308 for the twelve-month period ended September 30, 2006).
The cost and accumulated depreciation of equipment under capital leases amount to $1,598,036 and $497,183 respectively ($6,751,459 and $4,588,246 in 2007).
- 92 -
| | | | | | |
| | | Successor |
| | | September 30, 2008 |
| | | Cost | | Accumulated
amortization | | Net |
| | | $ | | $ | | $ |
Trademarks, trademark licenses and manufacturing rights with a: | | | | | | |
Finite life | | 559,146 | | 30,770 | | 528,376 |
Indefinite life | | — | | — | | — |
| | | | | | |
| | 559,146 | | 30,770 | | 528,376 |
| | | | | | |
| | | | | | |
| | | Predecessor |
| | | September 30, 2007 |
| | | Cost | | Accumulated
amortization | | Net |
| | | $ | | $ | | $ |
Trademarks, trademark licenses and manufacturing rights with a: | | | | | | |
Finite life | | 353,619 | | 77,923 | | 275,696 |
Indefinite life | | 103,896 | | 12,375 | | 91,521 |
| | | | | | |
| | 457,515 | | 90,298 | | 367,217 |
| | | | | | |
Acquisitions of intangible assets amount to $27,708 for the seven-month period ended September 30, 2008, ($14,291 for the five-month period ended February 25, 2008, $37,736 for the twelve-month period ended September 30, 2007 and $4,569,407 for the twelve-month period ended September 30, 2006). As at September 30, 2008, the current intangible assets with a finite life have a weighted average remaining amortization period of approximately 12 years (17 years as at September 30, 2007).
Further to budgetary initiatives implemented by the French government during the year ended September 30, 2006, which resulted in the delisting of a number of pharmaceutical products from government formularies and re-pricing of other pharmaceutical products, the Company reviewed the appropriate carrying value and useful life of its French subsidiary’s intangible assets. The cost of the product LACTEOL was consequently transferred from intangible assets with an indefinite life to intangible assets with a finite life. The net cost of LACTEOL as of October 1, 2005, which amounted to $11,347,600, is therefore amortized over a 15-year period. During the year ended September 30, 2006, a partial write-down of $5,800,000 was recognized on a French line of products including TAGAMET and TRANSULOSE, as the carrying value of the intangible assets associated with these products exceeded their estimated fair value.
The annual amortization expenses, without taking into account any future acquisitions expected for the years 2009 through 2013, are as follows:
| | |
| | | $ |
2009 | | 52,748 |
2010 | | 52,748 |
2011 | | 52,748 |
2012 | | 52,748 |
2013 | | 40,408 |
- 93 -
| 11. | Authorized Line of Credit |
At September 30, 2008, the Successor has a credit facility (“Credit Facility”) for a total of $290,000,000 composed of term loans totalling $175,000,000 and of a revolving credit facility of $115,000,000. Term loans under the Credit Facility bear interest at a variable rate composed of either the Federal funds rate or the three-month British Banker Association LIBOR rate, at the option of the Company, plus the applicable rate based on the consolidated total leverage ratio of the Company and certain of its subsidiaries for the preceding twelve months. The Credit Facility matures on February 25, 2014, with payments on term loans beginning in fiscal 2008. As at September 30, 2008, there was no amount outstanding under the revolving credit facility. The Company is required to pay a commitment fee to the lenders under the Credit Facility in respect of the unutilized commitments thereunder at an initial rate equal to 0.50% per annum, subject to reduction based on the achievement of certain specified ratios. The Company also will pay customary letter of credit and agency fees.
At September 30, 2007, the Predecessor had a credit agreement relative to a $125,000,000 financing facility maturing on April 30, 2012. Under certain conditions, the amount of the credit could be increased up to an additional $100,000,000 and the maturity date extended.
The Predecessor had a credit facility which was secured by a first priority security interest on all present and future acquired assets of the Predecessor and its material subsidiaries, and provided for the maintenance of certain financial ratios. Among the restrictions imposed by the credit facility was a covenant limiting cash dividends, shares repurchases (other than redeemable shares issuable in connection with a permitted acquisition) and similar distributions to shareholders to 50% of the Predecessor’s net income for the preceding fiscal year.
The interest rate varied, depending on the Predecessor’s leverage, between 5 basis points and 75 basis points over the Canadian prime rate or U.S. base rate and between 90 basis points and 175 basis points over the LIBOR rate or bankers’ acceptances. The line of credit also provided for a stand-by fee of between 20 and 32.5 basis points. The credit facility might have been drawn in U.S. dollars, in Canadian dollars or in Euro equivalents. As at September 30, 2007, there was no amount outstanding under the line of credit.
| 12. | Accounts Payable and Accrued Liabilities |
| | | | | | |
| | | Successor | | | | Predecessor |
| | | September 30,
2008 | | | | September 30,
2007 |
| | | $ | | | | $ |
Accounts payable | | 13,112 | | | | 13,596 |
Contract rebates, product returns and accrued chargebacks | | 33,144 | | | | 29,986 |
Accrued interest on long-term debt | | 4,272 | | | | — |
Accrued royalty fees | | 6,293 | | | | 4,284 |
Accrued salaries | | 5,570 | | | | 4,759 |
Accrued bonuses | | 7,950 | | | | 7,485 |
Accrued research and development expenses | | 1,567 | | | | 15,785 |
Other accrued liabilities | | 6,759 | | | | 7,301 |
| | | | | | |
| | 78,667 | | | | 83,196 |
| | | | | | |
- 94 -
| | | | | | |
| | | Successor | | | | Predecessor |
| | | September 30,
2008 | | | | September 30,
2007 |
| | | $ | | | | $ |
Senior notes secured by substantially all of the present and future assets of the Company, bearing interest at 9.25% and maturing in March 2015 | | 225,360 | | | | — |
Term loans of $175,000,000, bearing interest at the three-month British Banker Association LIBOR (3.76% as at September 30, 2008), plus the applicable rate based on the consolidated total leverage ratio of the Company and certain of its subsidiaries for the preceding twelve months, secured by substantially all of the present and future assets of the Company, subject to interest swap agreements on a $115,000,000 portion of the loans, whereby the variable portion of the interest rate is hedged at a fixed interest rate of 2.71%, payable in quarterly instalments, maturing in February 2014 | | 164,400 | | | | — |
Senior unsecured notes, bearing interest at 12.75% and maturing in March 2016 | | 232,424 | | | | — |
Obligations under capital leases, interest rates varying between 3.81% and 6.20% | | — | | | | 649 |
| | | | | | |
| | 622,184 | | | | 649 |
Instalments due within one year | | 10,938 | | | | 527 |
| | | | | | |
| | 611,246 | | | | 122 |
| | | | | | |
On February 25, 2008, the Company obtained various types of financing in connection with the acquisition of the common shares of Axcan Pharma Inc. The Company issued $228,000,000 aggregate principal amount of its 9.25% Senior Secured Notes (the “Senior Secured Notes”) due March 1, 2015. The Senior Secured Notes were priced at $0.98737 with a yield to March 1, 2015, of 10% and require the Company to use commercially reasonable efforts to cause an exchange offer registration statement to be declared effective under the Securities Act. On November 14, 2008, the SEC declared our registration statement to be effective. The Senior Secured Notes rank pari passu with the Credit Facility.
The Company may redeem some or all of the Senior Secured Notes prior to March 1, 2011 at a redemption price equal to 100% of the principal amount of the Senior Secured Notes redeemed plus a “make-whole” premium and accrued and unpaid interest. On or after March 1, 2011, the Company may redeem some or all of the Senior Secured Notes at the redemption prices (expressed as percentages of principal amount of the Senior Secured Notes to be redeemed) set forth below:
| | |
| | | Senior Secured
Notes |
| | | % |
2011 | | 106.938 |
2012 | | 104.625 |
2013 | | 102.313 |
2014 and thereafter | | 100.000 |
Prior to March 1, 2011, the Company may also redeem up to 35% of the aggregate principal amount of the Senior Secured Notes using the proceeds of one or more equity offerings at a redemption price equal to 109.250% of the aggregate principal amount of the Senior Secured Notes plus accrued and unpaid interest. If there is a change of control as specified in the indenture governing the Senior Secured Notes, the Company must offer to repurchase the Senior Secured Notes at a price in cash equal to 101% of the aggregate principal amount thereof, plus accrued and unpaid interest.
- 95 -
| 13. | Long-term Debt (continued) |
The Company also obtained the Credit Facility for a total amount of $290,000,000 composed of term loans totalling $175,000,000 and a revolving credit facility of $115,000,000. Term loans under the Credit Facility bear interest at a variable rate composed of either the Federal Funds Rate or the three-month British Banker Association LIBOR rate, at the option of the Company, plus the applicable rate based on the consolidated total leverage ratio of the Company and certain of its subsidiaries for the preceding twelve months. The Credit Facility matures on February 25, 2014, with payments on the term loans beginning in fiscal 2008. As at September 30, 2008, $175,000,000 of term loans had been issued and no amounts had been drawn against the revolving credit facility. The term loans were priced at $0.96 with a yield to February 25, 2014, of 8.75% before the effect of the interest rate swap. On February 25, 2008, the Company entered into interest swap agreements whereby the variable portion of the interest rate, which is based on the three-month British Banker Association LIBOR, was hedged at a fixed interest rate of 2.71% on a notional amount of $115,000,000. The Credit Facility requires the Company to meet certain financial covenants, which were met as at September 30, 2008. The credit agreement governing the Credit Facility requires the Company to prepay outstanding term loans contingent upon the occurrence of their events, subject to certain exceptions, with: (1) 100% of the net cash proceeds of any incurrence of debt other than debt permitted under the Credit Facility, (2) commencing with the fiscal year ended September 30, 2009, 50% (which percentage will be reduced to 25% if the senior secured leverage ratio is less than a specified ratio) of the annual excess cash flow (as defined in the credit agreement governing the Credit Facility), and (3) 100% of the net cash proceeds of all non-ordinary course asset sales or other dispositions of property (including casualty events) by the Company or by its subsidiaries, subject to reinvestments rights and certain other exceptions.
On February 25, 2008, as part of the Acquisition financing, the Company also obtained $235,000,000 in financing under a senior unsecured bridge facility (the “Bridge Financing”) maturing on February 25, 2009. On May 6, 2008, the Bridge Financing was refinanced on a long-term basis, by repaying the bridge facility with the proceeds from the sale by the Company of $235,000,000 aggregate principal amount of its 12.75% Senior Unsecured Notes due March 1, 2016 (the “Unsecured Notes”). The Unsecured Notes were priced at $0.9884 with a yield to March 1, 2016 of 13.16%. The unsecured notes are subordinate to the Credit Facility and senior notes.
The Company may redeem some or all of the Senior Unsecured Notes prior to March 1, 2012 at a redemption price equal to 100% of the principal amount of the Senior Unsecured Notes redeemed plus a “make-whole” premium and accrued and unpaid interest. On or after March 1, 2012, the Company may redeem some or all of the Senior Unsecured Notes at the redemption prices (expressed as percentages of principal amount of the Senior Unsecured Notes to be redeemed) set forth below:
| | |
| | | Senior Unsecured
Notes |
| | | % |
2012 | | 106.375 |
2013 | | 103.188 |
2014 and thereafter | | 100.000 |
Prior to March 1, 2011, the Company may also redeem up to 35% of the aggregate principal amount of the Senior Unsecured Notes using the proceeds of one or more equity offerings at a redemption price equal to 112.750% of the aggregate principal amount of the Senior Unsecured Notes plus accrued and unpaid interest. If there is a change of control as specified in the indenture governing the Senior Unsecured Notes, the Company must offer to repurchase the Senior Unsecured Notes at a price in cash equal to 101% of the aggregate principal amount thereof, plus accrued and unpaid interest.
During the year ended September 30, 2007, the Predecessor called for redemption all of its $125,000,000 4.25% convertible subordinated notes (“Notes”) and the holders of all of the Notes exercised their right to convert their Notes, in lieu of redemption, by June 28, 2007. The Predecessor completed the conversion of the notes by issuing an aggregate of 8,924,080 common shares and paying $613 in lieu of fractional shares. Long-term debt was consequently reduced by $125,000,000 and capital stock increased by the same amount.
- 96 -
| 13. | Long-term Debt (continued) |
Payments required in each of the next five twelve-month periods to meet the retirement provisions of the long-term debt are as follows:
| | |
| | | $ |
2009 | | 10,938 |
2010 | | 13,125 |
2011 | | 15,313 |
2012 | | 19,687 |
2013 | | 61,250 |
Thereafter | | 513,326 |
| | |
| | 633,639 |
Unamortized original issuance discount | | 11,455 |
| | |
| | 622,184 |
| | |
Preferred shares
Predecessor
The Predecessor had an unlimited number of authorized preferred shares without par value, issuable in series, rights, privileges and restrictions determined at the creation date.
Two series of preferred shares had been created as follows:
Series A, shares authorized: 14,175,000 non-voting, annual preferential cumulative dividend of 5%, redeemable on or prior to June 8, 2001 at CAN$1.00 per share payable at the option of the Predecessor in cash or by the issuance of common shares or in any combination of cash and common shares.
Series B, shares authorized: 12,000,000 non-voting, redeemable on the fifth anniversary of their issuance at CAN$1.00 per share payable in cash or by the issuance of common shares at the option of the Predecessor, convertible into common shares at the holder’s option on the basis of one common share for each 15 Series B preferred shares.
Stock incentive plans
Predecessor
In 2006, the Predecessor adopted a new stock incentive plan (the “2006 plan”) in replacement of its previous stock option plan and pursuant to which the Predecessor did, among other instruments, grant options, restricted share units (“RSU”) and deferred share units (“DSUs”) to eligible employees and directors of the Predecessor. The 2006 plan provided that a maximum of 2,300,000 common shares were issuable pursuant to awards made under the 2006 plan, of which a maximum of 800,000 shares were available in the form of RSU and DSUs. The per share purchase price could not be less than the market price of the common stock on the last trading day prior to the date of grant, and the options expired no later than seven years from that date. Options could be exercised over a period established at the date of grant except for the annual options granted to outside directors which were exercisable one year after the date of grant.
Under the Predecessor’s previous stock option plan established in 1995 (the “1995 plan”), a maximum of 4,500,000 common shares were issuable pursuant to the exercise of options. Options were granted at the market price of one common share on the last trading day prior to the granting date. Options granted under the 1995 plan were exercisable at a rate of 20% per year and expired ten years after the granting date except for the annual options granted to outside directors, which vested one year after the granting date. At February 22, 2006, Axcan Pharma no longer issued options under the 1995 plan.
- 97 -
| 14. | Capital Stock (continued) |
Stock incentive plans (continued)
Predecessor (continued)
Generally, any RSU granted under the 2006 plan vested three years after grant and any options granted under the 2006 plan vested in equal annual increments over a three-year period, except for new hire grants which vested ratably over five years. Upon consummation of the Acquisition, all outstanding options under the 1995 and 2006 plans at the time of the closing of February 25, 2008, were immediately vested, transferred by the holder of such option to Axcan Pharma Inc. and cancelled in exchange for an amount in cash equal to the excess, if any, of the offer price of $23.35 over the applicable option exercise price for each share of common stock subject to such option, less any required withholding taxes. In addition, each RSU held by the Predecessor’s named executive officers at the time of the closing of the Acquisition was vested and terminated in exchange for the offer price of $23.35, less any required withholding taxes.
The following table presents a summary of the changes to the number of stock options outstanding:
| | | | | | | | | | | | | | | |
| | | For the five-month period
ended February 25, 2008 | | For the twelve-month period
ended September 30, 2007 | | For the twelve-month period
ended September 30, 2006 |
| | | Number of
options | | | Weighted
average
exercise
price | | Number of
options | | | Weighted
average
exercise
price | | Number of
options | | | Weighted
average
exercise
price |
| | | | | | $ | | | | | $ | | | | | $ |
Balance, beginning of period | | 2,684,835 | | | 13.61 | | 3,057,084 | | | 13.01 | | 2,986,748 | | | 12.87 |
Granted | | — | | | — | | 599,800 | | | 15.30 | | 416,714 | | | 13.81 |
Exercised | | (17,299 | ) | | 12.72 | | (634,991 | ) | | 11.43 | | (118,406 | ) | | 9.07 |
Expired | | (4,000 | ) | | 11.99 | | (74,660 | ) | | 17.06 | | (35,650 | ) | | 14.14 |
Forfeited | | (47,710 | ) | | 14.62 | | (262,398 | ) | | 14.75 | | (192,322 | ) | | 14.89 |
Settled upon consummation of the Acquisition | | (2,615,826 | ) | | 13.85 | | — | | | — | | — | | | — |
| | | | | | | | | | | | | | | |
Balance, end of period | | — | | | — | | 2,684,835 | | | 13.61 | | 3,057,084 | | | 13.01 |
| | | | | | | | | | | | | | | |
Options exercisable at the end of the period | | — | | | — | | 1,445,871 | | | 12.45 | | 1,790,020 | | | 11.93 |
| | | | | | | | | | | | | | | |
The following table presents a summary of the changes to the number of non-vested stock options in the Predecessor five month-period ended February 25, 2008:
| | | | | |
| | | Number of
options | | | Weighted
average
grant date
fair value |
| | | | | | $ |
Balance, beginning of period | | 1,238,064 | | | 6.26 |
Granted | | — | | | — |
Vested(1) | | (1,190,354 | ) | | 6.25 |
Forfeited | | (47,710 | ) | | 6.44 |
| | | | | |
Balance, end of period | | — | | | — |
| | | | | |
(1) | Upon consummation of the Acquisition, all non-vested stock options became vested, as a result, the Predecessor recorded $2,572,085 in share-based compensation expense for the five-month period ended February 25, 2008, $8,821,215 in reduction of retained earnings and $16,394,611 in reduction of additional paid-in capital. |
Excluding the expenses recorded upon the consummation of the Acquisition, the Predecessor recorded $7,473,061 of share-based compensation expense relative to stock options for the five-month period ended February 25, 2008, ($4,548,293 for the twelve-month period ended September 30, 2007 and $3,554,924 for the twelve-month period ended September 30, 2006) in accordance with SFAS No. 123 (R). The amount of expense has been reduced to take into account the forfeitures.
The weighted average fair value of granted stock options was $5.89 and $6.41 for the twelve-month periods ended September 30, 2007 and 2006.
- 98 -
| 14. | Capital Stock (continued) |
Stock incentive plans (continued)
Predecessor (continued)
The fair value of each option award granted during the Predecessor periods was estimated on the date of grant using the Black-Scholes valuation model and the assumptions noted in the following table. The expected life of options was based on observed historical exercise patterns. Groups of employees that have similar historical exercise patterns were considered separately for valuation purposes. The expected volatility was based solely on historical volatility. The risk free interest rate was based on the implied yield on a U.S. or Canadian Treasury zero-coupon issue with a remaining term equal to the expected term of the option. The dividend yield reflects that the Predecessor had not paid any cash dividends since inception and did not intend to pay any cash dividends in the foreseeable future.
| | | | | | | | |
| | | For the
five-month
period ended
February 25,
2008 | | For the
twelve-month
period ended
September 30,
2007 | | | For the
twelve-month
period ended
September 30,
2006 | |
Expected term of options (years) | | — | | 4.5 | | | 5.8 | |
Expected stock price volatility | | — | | 38 | % | | 42 | % |
Risk-free interest rate | | — | | 4.36 | % | | 4.28 | % |
Expected dividend | | — | | — | | | — | |
The total number of RSU granted in 2007 was 190,875 (40,950 in 2006) with a fair value of $14.61 ($12.99 in 2006) each. As at the Acquisition date, there were 199,050 outstanding RSU (201,025 as at September 30, 2007).
Since 2006, directors received an annual grant of DSUs having a value of $15,000 and each of the eligible persons may have elected to receive a portion of their annual compensation in the form of DSUs. DSUs were credited with dividend equivalents when dividends were paid on the Predecessor’s common shares. Directors may not have received any distribution in respect of the DSUs until they withdrew from the Board and members of management until cessation of employment. The amount of compensation was converted into DSUs based on the market price of the common stock on the last trading day prior to the date of grant. At the Acquisition date, the Predecessor’s directors held 16,211 DSUs (9,961 as at September 30, 2007).
Successor
Management equity incentive plan
In April 2008, the Company’s parent company adopted a Management Equity Incentive Plan (the “MEIP plan”), pursuant to which the parent company will grant options to selected employees and directors of the Company. The MEIP Plan provides that a maximum of 3,833,307 shares of common stock of the parent company are issuable pursuant to the exercise of options. The per share purchase price cannot be less than the fair value of the share of common stock of the parent company at the grant date and the option expires no later than ten years from the date of grant. Vesting of these stock options is split into 3 categories: 1) Time-Based Options: 50% of option grants generally vest ratably over 5 years and with a fixed exercise price equal to the fair value of common stock of the parent company on grant date, 2) Premium Options: 25% of stock option grants with an exercise price initially equal to the fair value of common stock on grant date that will increase by 10% each year, and generally vesting ratably over 5 years, and 3) Performance-Based Options: 25% of stock option grants with a fixed exercise price equal to the fair value of common stock on grant date which vest upon the occurrence of a liquidity event (as defined under the terms of the MEIP plan) based on the achievement of return targets calculated based on the return received by majority shareholders from the liquidity event. While the time-based options and the premium options will be expensed over the requisite service period, the performance-based options will not be expensed until the occurrence of the liquidity event.
- 99 -
| 14. | Capital Stock (continued) |
Stock incentive plans (continued)
Successor (continued)
The following table presents the changes to the number of stock options outstanding under the MEIP in the Successor seven-month period ended September 30, 2008:
| | | | | |
| | | Number of
options | | | Weighted
average
exercise
price |
| | | | | | $ |
Balance, beginning of period | | — | | | — |
Granted | | 3,723,000 | | | 10.00 |
Exercised | | — | | | — |
Expired | | — | | | — |
Forfeited | | (75,000 | ) | | 10.00 |
| | | | | |
Balance, end of period | | 3,648,000 | | | 10.00 |
| | | | | |
As at September 30, 2008, all of the 3,648,000 outstanding options under the MEIP plan are non-vested and the Time-based and Premiums Options have a weighted average remaining contractual life of 9.54 years and a weighted average grant date fair value of $10.00.
The weighted average fair value of stock options granted under the MEIP was $3.43 for the seven-month period ended September 30, 2008.
The fair value of each option award is estimated on the date of grant using the Black-Scholes valuation model for the service-based options and the Monte Carlo simulation model for the performance-based options. The expected life of options is based on the weighted contractual life based on the probability of change in control/liquidity event. The expected volatility is based on historical volatility of Axcan Pharma Inc. and peer companies. The risk free interest rate is based on the average rate of return on U.S. and Canadian Government Strips with a remaining term equal to the expected term of the option. The dividend yield reflects that the Company has not paid any cash dividends since inception and does not intend to pay any cash dividends in the foreseeable future.
The fair value estimates are based on the following weighted average assumptions for options granted during the successor’s seven-month period ended September 30, 2008:
| | | |
Expected term of options (years) | | 4.15 | |
Expected stock price volatility | | 46 | % |
Risk-free interest rate | | 2.8 | % |
Expected dividend | | — | |
Special equity grant
In April 2008, the parent company approved the restricted stock unit grant agreement and the penny option grant agreement (collectively “Equity Grant Agreements”) pursuant to which a onetime grant of equity based award of either restricted stock units (“RSU”) or options to purchase shares of common stock of the parent company for a penny (“Penny Options”) was made to certain employees of the Company. A maximum of 1,343,348 shares of common stock of the parent company are issuable with respect to the special grants. As a result of the option to allow the recipients elect to have an amount withheld that is in excess of the required minimum withholding under the current tax law, the special grants will be accounted for as a liability awards. As a liability award, the fair value on which expense is based is remeasured each period based on the current stock price and final expense is based on the fair value of the shares on the date the award is settled. The RSU and Penny Options expire no later than four years and ten years from the date of grant. One third of the granted RSU and Penny Options vested immediately on date of grant and the remainder shall vest in equal portions on August 25, 2009 and 2010.
- 100 -
| 14. | Capital Stock (continued) |
Stock incentive plans (continued)
Successor (continued)
The carrying value of an RSU or Penny Option is always equal to the fair market value of one common share of the parent company. The RSU and Penny Options entitle the holders to receive common shares of the parent company at the end of a vesting period. The total number of RSU and Penny Options granted were 1,343,348 with an initial fair value of $10 each, equal to the share price at the date of grant. As at September 30, 2008, there were 1,309,909 outstanding RSU and Penny Options of which 436,636 were vested.
The Company recorded $7,443,668 of share-based compensation expense relative to the MEIP and the Special Equity Grant for the seven-month period ended September 30, 2008, in accordance with SFAS 123 (R). The amount of expense has been reduced to take into account estimated forfeitures. As at September 30, 2008, there were $14,241,664 of total unrecognized compensation costs related to MEIP and the Special Equity Grant based on the grant date fair value. These costs are expected to be recognized over a weighted average period of 3.44 years. At September 30, 2008, there was $2,476,412 of compensation expense related to the performance based options that will be recognized upon the occurrence of a liquidity event.
| 15. | Financial Information Included in the Consolidated Operations |
| | | | | | | | | | |
| | | Successor | | | | Predecessor |
| | | For the
seven-month
period ended
September 30,
2008 | | | | For the
five-month
period ended
February 25,
2008 | | For the
twelve-month
period ended
September 30,
2007 | | For the
twelve-month
period ended
September 30,
2006 |
| | | $ | | | | $ | | $ | | $ |
Interest on long-term debt (including amortization of original issuance discount of $1,150) | | 36,636 | | | | 14 | | 2,870 | | 5,416 |
Bank charges | | 207 | | | | 76 | | 182 | | 154 |
Financing fees | | 469 | | | | 172 | | 298 | | 301 |
Amortization of deferred debt issue expenses | | 4,201 | | | | — | | 1,475 | | 1,117 |
| | | | | | | | | | |
| | 41,513 | | | | 262 | | 4,825 | | 6,988 |
| | | | | | | | | | |
| | | | | |
b) Other information | | | | | | | | | | |
| | | Successor | | | | Predecessor |
| | | For the
seven-month
period ended
September 30,
2008 | | | | For the
five-month
period ended
February 25,
2008 | | For the
twelve-month
period ended
September 30,
2007 | | For the
twelve-month
period ended
September 30,
2006 |
| | | $ | | | | $ | | $ | | $ |
Rental expenses | | 1,831 | | | | 1,052 | | 2,336 | | 1,989 |
Shipping and handling expenses | | 3,748 | | | | 2,263 | | 5,911 | | 5,097 |
Advertizing expenses | | 8,803 | | | | 4,628 | | 13,557 | | 11,488 |
Depreciation of property, plant and equipment | | 3,824 | | | | 2,526 | | 5,356 | | 5,901 |
Amortization of intangible assets | | 31,755 | | | | 7,069 | | 17,138 | | 16,922 |
Stock-based compensation expense | | 7,443 | | | | 10,046 | | 4,548 | | 3,554 |
Transaction and integration costs | | 11,780 | | | | 26,489 | | — | | — |
- 101 -
| 16. | Financial Information Included in the Consolidated Cash Flows |
| a) | Changes in working capital items |
| | | | | | | | | | | | | | |
| | | Successor | | | | | Predecessor | |
| | | For the
seven-month
period ended
September 30,
2008 | | | | | For the
five-month
period ended
February 25,
2008 | | | For the
twelve-month
period ended
September 30,
2007 | | | For the
twelve-month
period ended
September 30,
2006 | |
| | | $ | | | | | $ | | | $ | | | $ | |
Accounts receivable, net | | 6,343 | | | | | (12,340 | ) | | (4,047 | ) | | 7,338 | |
Accounts receivable from parent company | | (987 | ) | | | | — | | | — | | | — | |
Income taxes receivable | | 3,097 | | | | | (5,929 | ) | | (492 | ) | | (260 | ) |
Inventories | | (6,818 | ) | | | | (3,803 | ) | | 11,658 | | | (402 | ) |
Prepaid expenses and deposits | | (149 | ) | | | | (49 | ) | | 770 | | | (1,812 | ) |
Accounts payable and accrued liabilities | | (71,205 | ) | | | | 67,865 | | | 17,712 | | | 7,263 | |
Income taxes payable | | (5,601 | ) | | | | (7,058 | ) | | 16,577 | | | (1,047 | ) |
| | | | | | | | | | | | | | |
| | (75,320 | ) | | | | 38,686 | | | 42,178 | | | 11,080 | |
| | | | | | | | | | | | | | |
|
b) Cash flows relating to interest and income taxes of operating activities | |
| | | |
| | | Successor | | | | | Predecessor | |
| | | For the
seven-month
period ended
September 30,
2008 | | | | | For the
five-month
period ended
February 25,
2008 | | | For the
twelve-month
period ended
September 30,
2007 | | | For the
twelve-month
period ended
September 30,
2006 | |
| | | $ | | | | | $ | | | $ | | | $ | |
Interest received | | 918 | | | | | 4,507 | | | 7,036 | | | 4,562 | |
Interest paid | | 31,599 | | | | | 11 | | | 5,627 | | | 5,416 | |
Income taxes paid | | 8,954 | | | | | 24,080 | | | 29,404 | | | 19,568 | |
- 102 -
The Company considers that it operates in a single field of activity, the pharmaceutical industry.
No customer represents more than 10% of the Company’s revenue except for three major customers for which the sales represented 77.1% of revenue for the seven-month period ended September 30, 2008 (74.2% for the five-month period ended February 25, 2008, 77.3% for the twelve-month period ended September 30, 2007 and 74.8% for the twelve-month period ended September 30, 2006) and are detailed as follows:
| | | | | | | | | | |
| | | Successor | | | | Predecessor |
| | | For the
seven-month
period ended
September 30,
2008 | | | | For the
five-month
period ended
February 25,
2008 | | For the
twelve-month
period ended
September 30,
2007 | | For the
twelve-month
period ended
September 30,
2006 |
| | | % | | | | % | | % | | % |
Customer A | | 43.7 | | | | 32.4 | | 41.2 | | 39.0 |
Customer B | | 24.3 | | | | 29.8 | | 25.0 | | 24.4 |
Customer C | | 9.1 | | | | 12.0 | | 11.1 | | 11.4 |
| | | | | | | | | | |
| | 77.1 | | | | 74.2 | | 77.3 | | 74.8 |
| | | | | | | | | | |
Purchases from two suppliers represent approximately 38% of the cost of goods sold for the seven-month period ended September 30, 2008 (two for 40% for the five-month period ended February 25, 2008, one for 19% for the twelve-month period ended September 30, 2007 and two for 42% for the twelve-month period ended September 30, 2006). The Company purchases its inventory from third party manufacturers, many of whom are the sole source of products for the Company. The failure of such manufacturers to provide an uninterrupted supply of products could adversely impact the Company’s ability to sell such products. The Company operates in the following geographic areas: |
| | | Successor | | | | Predecessor |
| | | For the
seven-month
period ended
September 30,
2008 | | | | For the
five-month
period ended
February 25,
2008 | | For the
twelve-month
period ended
September 30,
2007 | | For the
twelve-month
period ended
September 30,
2006 |
| | | $ | | | | $ | | $ | | $ |
Revenue | | | | | | | | | | |
United States | | | | | | | | | | |
Domestic sales | | 162,908 | | | | 112,146 | | 250,774 | | 195,954 |
Foreign sales | | 3,076 | | | | 2,221 | | 3,958 | | 5,801 |
Canada | | | | | | | | | | |
Domestic sales | | 19,614 | | | | 15,302 | | 37,950 | | 37,956 |
Foreign sales | | — | | | | — | | — | | — |
European Union | | | | | | | | | | |
Domestic sales | | 33,082 | | | | 24,608 | | 45,859 | | 43,374 |
Foreign sales | | 4,258 | | | | 4,093 | | 10,011 | | 8,702 |
Other | | 241 | | | | 209 | | 395 | | 530 |
| | | | | | | | | | |
| | 223,179 | | | | 158,579 | | 348,947 | | 292,317 |
| | | | | | | | | | |
- 103 -
| 17. | Segmented Information (continued) |
Revenue is attributed to geographic areas based on the country of origin of the sales.
| | | | | | |
| | | Successor | | | | Predecessor |
| | | September 30,
2008 | | | | September 30,
2007 |
| | | $ | | | | $ |
Property, plant, equipment and intangible assets | | | | | | |
Canada | | 352,974 | | | | 32,037 |
United States | | 106,526 | | | | 105,922 |
European Union | | 86,751 | | | | 230,937 |
Other | | 16,800 | | | | 29,518 |
| | | | | | |
| | 563,051 | | | | 398,414 |
| | | | | | |
| | | | | | |
| | | Successor | | | | Predecessor |
| | | September 30,
2008 | | | | September 30,
2007 |
| | | $ | | | | $ |
Goodwill | | | | | | |
Canada | | 61,548 | | | | 1,011 |
United States | | 91,400 | | | | 18,460 |
European Union | | 12,066 | | | | 7,996 |
| | | | | | |
| | 165,014 | | | | 27,467 |
| | | | | | |
Interest rate risk
Effective March 3, 2008, the Company entered into two pay-fixed, receive-floating interest rate swap agreements, effectively converting $115,000,000 of variable-rate debt under its secured senior credit facilities to fixed-rate debt. The swaps are accounted for in accordance with SFAS No. 133, as amended.
Derivative financial instruments are measured at fair value and are recognized as assets or liabilities on the balance sheet, with changes in the fair value of the derivatives recognized in either net income (loss) or other comprehensive income (loss), depending on the timing and designated purpose of the derivative. When the Company pays interest on the portion of the debt designated as hedged, the gain or loss on the swap designated as hedging the interest payment will be reclassified from Accumulated other comprehensive income to Interest expense.
Through the first two quarters of 2008, the Company’s two interest rate swaps were designated as effective hedges of cash flows as defined by FAS 133. For the quarter ended September 30, 2008, due to the increased volatility in short-term interest rates, and a realignment of our LIBOR rate election on our debt capital repayment schedule, hedge accounting was discontinued as the hedge relationship ceased to satisfy the conditions of hedge accounting under FAS 133. The Company recognized approximately a net gain-loss of $120,000 (reported as financial expenses in the statement of operations), which represented the total ineffectiveness of all cash flow hedges. This amount includes amortization of deferred gains and losses from other comprehensive income on these hedge relationships. The Company believes that these interest rate swaps are good economic hedges of interest rate fluctuation so they will continue to hold these derivatives to managed economic cash flows exposure. The two interest rate swaps were subsequently re-designated after September 30, 2008 for hedge accounting under FAS 133 using an improved method prospectively for assessing effectiveness and are expected to be highly effective. Management expects to amortize the remaining balance in Accumulated other comprehensive income over the remaining lives of the hedges.
- 104 -
| 18. | Financial Instruments (continued) |
Currency risk
The Company is exposed to financial risk arising from fluctuations in foreign exchange rates and the degree of volatility of the rates. The Company does not use derivative instruments to reduce its exposure to foreign currency risk. As of September 30, 2008, the financial assets totalling $98,871,814 ($344,489,729 as of September 30, 2007, for the Predecessor) include cash and cash equivalents and accounts receivable for CAN$686,704 and 16,720,635 Euros respectively (CAN$983,118 and 14,183,381 Euros as of September 30, 2007, for the Predecessor). As of September 30, 2008, the financial liabilities totalling $700,851,028 ($83,844,415 as of September 30, 2007, for the Predecessor) include accounts payable and accrued liabilities and long-term debt of CAN$13,418,871 and 8,199,430 Euros respectively (CAN$15,130,739 and 9,978,971 Euros as of September 30, 2007, for the Predecessor).
Credit risk
As at September 30, 2008, the Company had $24,919,855 of cash with one financial institution.
Fair value of the financial instruments on the balance sheet
The estimated fair value of the financial instruments is as follows:
| | | | | | | | | | |
| | | Successor | | | | Predecessor |
| | | September 30, 2008 | | | | September 30, 2007 |
| | | Fair
value | | Carrying
amount | | | | Fair
value | | Carrying
amount |
| | | $ | | $ | | | | $ | | $ |
Assets | | | | | | | | |
Cash and cash equivalents | | 56,105 | | 56,105 | | | | 179,672 | | 179,672 |
Short-term investments | | — | | — | | | | 129,958 | | 129,958 |
Accounts receivable from the parent company | | 987 | | 987 | | | | — | | — |
Accounts receivable, net | | 41,780 | | 41,780 | | | | 34,859 | | 34,859 |
Liabilities | | | | | | | | |
Accounts payable and accrued liabilities | | 78,667 | | 78,667 | | | | 83,196 | | 83,196 |
Long-term debt | | 614,862 | | 622,184 | | | | 649 | | 649 |
The following methods and assumptions were used to calculate the estimated fair value of the financial instruments on the balance sheet.
| a) | Financial instruments valued at carrying amount |
The estimated fair value of certain financial instruments shown on the consolidated balance sheet is equivalent to their carrying amount because they are realizable in the short-term or because their carrying amount approximates the fair value. These financial instruments include cash and cash equivalents, short-term investments, accounts receivable, accounts payable and accrued liabilities.
The fair value of the long-term debt has been established by discounting the future cash flows at interest rates corresponding to those the Company would have obtained at the period end date for loans with similar maturity dates and terms.
- 105 -
| 19. | Related Party Transactions |
During the seven-month period ended September 30, 2008, the Company made a cash advance to its parent company amounting to $133,154,405 and has earned interest income amounting to $4,686,844 net of taxes amounting to $2,523,685 and related interest receivable from the parent company amounting to $3,029,081 which have been recorded in the shareholders’ equity section of the consolidated balance sheet. The Company also recorded an account receivable from the parent company amounting $984,760.
During the seven-month period ended September 30, 2008, the Company paid management fees to a controlling shareholding company amounting to $12,975,424. These management fees were accounted for as debt issue expenses for $4,785,000, transaction costs for $6,127,710 and other fees of $2,062,714 were expensed and included in selling and administrative expenses.
For the five-month period ended February 25, 2008, the Predecessor incurred professional fees with entities, in which directors of the company were partner or shareholder totalling $125,648 ($294,280 for the twelve-month period ended September 30, 2007 and $414,147 for the twelve-month period ended September 30, 2006). These transactions were concluded in the normal course of operations, at the amount agreed to by related parties.
| 20. | Commitments and Contingencies |
The Predecessor has entered into non-cancellable operating leases and service agreements with fixed minimum payment obligations expiring on different dates for the rental of office space, automotive equipment and other equipment and for administrative, research and development and other services.
Minimum future payments under these commitments for the next years are as follows:
| | |
| | | $ |
2009 | | 2,846 |
2010 | | 1,447 |
2011 | | 692 |
2012 | | 126 |
2013 | | 7 |
| | |
| | 5,118 |
| | |
In May 2000, the Predecessor entered into agreements with QLT Photo Therapeutics Inc. (“QLT”) relating to the purchase of PHOTOFRIN, which provided for milestone payments to be made by the Predecessor to QLT that could reach a maximum of CAN$20,000,000 upon receipt of certain regulatory approvals for specific or additional indications of PHOTOFRIN or other conditions. To date, the maximum of CAN$20,000,000 ($15,440,767) has been paid in cash and recorded in intangible assets with a finite life.
In October 2000, the Predecessor entered into a licensing agreement with the Children’s Hospital Research Foundation for a series of sulfated derivatives of ursodeoxychologic acid compounds (“SUDCA”). The Predecessor and the Company have, as at September 30, 2008 paid $1,439,562 in cash. The Predecessor also agreed to pay milestones for a maximum amount of $200,000 when a SUDCA product receives regulatory approval and a bonus when certain conditions are met; finally, the Predecessor agreed to pay royalties based on net sales.
- 106 -
| 20. | Commitments and Contingencies (continued) |
| | b) | Licensing agreements (continued) |
In February 2005, the Predecessor signed a license agreement with Lisapharma S.p.A., an Italian company, to submit for approval and commercialize, in North America, products in gel sachet and tablet dosage forms that contain sucralfate as the main active ingredient. Under the agreement, the Predecessor agreed to pay license fees of up to $2,000,000 over a maximum period of four years (as at September 30, 2008 an amount of $1,000,000 had been recorded as expense) and make milestone payments totalling up to $3,000,000 upon regulatory approvals. The Predecessor also agreed to pay royalties of 6% of net sales of products enjoying patent protection and 3% of sale. During fiscal 2007, the Predecessor decided to cease the development of this product and terminated its agreement with Lisapharma S.p.A.
In September 2006, the Predecessor entered into a license and co-development agreement with AGI Therapeutics Research Ltd. (“AGI”). Pursuant to this agreement, AGI and the Predecessor will co-develop a controlled release omeprazole product, AGI-010, for the treatment of gastro-oesophageal reflux disease. Under the agreement, the Predecessor and AGI have agreed to share certain development expenses and the Predecessor paid a $1,500,000 upfront fee, accounted for as milestone payments that could total up to $17,500,000 at various stages of development up to and including regulatory approvals. Finally, the Predecessor agreed to pay royalties varying between 4% and 7.5% of net sales.
In September 2007, the Predecessor entered into an exclusive license and development agreement with Cellerix SL (“Cellerix”) of Spain, for the North American (United States, Canada and Mexico) rights to Cx401, a biological product in development for the treatment of perianal fistulas. Cx401 uses non-embryonic stem-cells to treat perianal fistulas in Crohn’s and non-Crohn’s diseased patients. Under the terms of the agreement, the Predecessor paid a $10,000,000 upfront payment and agreed to pay regulatory milestone payments that could total up to another $30,000,000. The Predecessor has also agreed to make an equity investment of up to $5,000,000 in Cellerix, should Cellerix complete its initial public offering by September 30, 2010. Finally, the Predecessor agreed to pay royalties varying between 10% and 18% of net sales.
The Company pays royalties on the sales of certain of its marketed products to unrelated third parties under license and similar agreements, at rates ranging between 1% and 6%.
During the seven-month period ended September 30, 2008, the Company charged to cost of goods sold a total of $2,302,146 ($1,936,139 for the five-month period ended February 25, 2008, $4,107,635 for the twelve-month period ended September 30, 2007 and $3,768,515 for the twelve-month period ended September 30, 2006) in royalties in connection with the sales of its URSO, ULTRASE, PHOTOFRIN, ADEKs and PYLERA products.
The Company and its subsidiaries are involved in litigation matters arising in the ordinary course and conduct of its business. Although resolution of such matters cannot be predicted with certainty, management does not consider the Company’s exposure to litigation to be material to these consolidated financial statements. As at September 30, 2005, the Predecessor had accrued $2,900,000 to cover any future settlements in connection with an indemnification claim and product liability lawsuits initiated against its subsidiary. Axcan Scandipharm (now known as Axcan Pharma US Inc.), relating to the product line it markets under the name ULTRASE. During the year ended September 30, 2006, following a series of favourable decisions in the indemnification claim, the Predecessor revaluated its exposure and this accrual was reversed, thus reducing the selling and administrative expenses by the same amount. In November 2006, a new complaint alleging a claim for damages related to these products was received in the Supreme Court of the State of New York. This complaint is in the early discovery stage such that we are not currently able to fully assess its merit.
A subsidiary of the Company has a defined contribution plan (the “Plan”) for its U.S. employees. Participation is available to substantially all U.S. employees. Employees may contribute up to 15% of their gross pay or up to limits set by the U.S. Internal Revenue Service. The Company may make matching contributions of a discretionary percentage. During the seven-month period ended September 30, 2008, the Board of Directors approved, and the Company charged to operations, contributions to the Plan totalling $233,305 ($218,810 for the five-month period ended February 25, 2008, $454,015 for the twelve-month period ended September 30, 2007 and $385,018 for the twelve-month period ended September 30, 2006).
- 107 -
| 21. | Condensed Consolidating Financial Information |
As of September 30, 2008, the Company had outstanding $228,000,000 aggregate principal amount of 9.25% Notes due in 2015. These Notes are fully and unconditionally guaranteed, jointly and severally by certain of the Company’s wholly-owned subsidiaries.
The following supplemental tables present condensed consolidating balance sheets for the Company and its subsidiary guarantors and non-guarantors as at September 30, 2008 (Successor) and September 30, 2007 (Predecessor), the condensed consolidating statements of operations for the seven-month period ended September 30, 2008 (Successor), five-month period ended February 25, 2008 (Predecessor), twelve-month periods ended September 30, 2007 and 2006 (Predecessor), and the condensed consolidating statement of cash flows for the seven-month period ended September 30, 2008 (Successor), five-month period ended February 25, 2008 (Predecessor) and twelve-month periods ended September 30, 2007 and 2006 (Predecessor).
Condensed Consolidating Balance Sheet as of September 30, 2008 (Successor)
| | | | | | | | | | | | | | | |
| | | Axcan
Intermediate
Holdings Inc. | | | Subsidiary
guarantors | | | Subsidiary
non-guarantors | | | Eliminations | | | Consolidated | |
| | | $ | | | $ | | | $ | | | $ | | | $ | |
Assets | | | | | | | | | | | | | | | |
Current assets | | | | | | | | | | | | | | | |
Cash and cash equivalents | | 21 | | | 26,181 | | | 29,903 | | | — | | | 56,105 | |
Accounts receivable, net | | — | | | 29,613 | | | 12,900 | | | — | | | 42,513 | |
Accounts receivable from the parent company | | 5,803 | | | 29,712 | | | 30,305 | | | (64,833 | ) | | 987 | |
Income taxes receivable | | — | | | 15,841 | | | 1,902 | | | — | | | 17,743 | |
Inventories | | — | | | 30,376 | | | 7,433 | | | (138 | ) | | 37,671 | |
Prepaid expenses and deposits | | — | | | 2,679 | | | 668 | | | — | | | 3,347 | |
Deferred income taxes | | — | | | 18,258 | | | 336 | | | 20 | | | 18,614 | |
| | | | | | | | | | | | | | | |
Total current assets | | 5,824 | | | 152,660 | | | 83,447 | | | (64,951 | ) | | 176,980 | |
Intercompany advances | | 898,816 | | | 32,878 | | | 671,702 | | | (1,603,396 | ) | | — | |
Property, plant and equipment, net | | — | | | 25,097 | | | 9,578 | | | — | | | 34,675 | |
Intangible assets, net | | — | | | 434,403 | | | 93,973 | | | — | | | 528,376 | |
Investment in subsidiaries | | (247,787 | ) | | 863,676 | | | — | | | (615,889 | ) | | — | |
Goodwill | | — | | | 152,948 | | | 12,066 | | | — | | | 165,014 | |
Other long-term assets | | 192 | | | 257 | | | — | | | — | | | 449 | |
Deferred debt issue expenses, net | | 26,714 | | | 3,664 | | | — | | | — | | | 30,378 | |
Deferred income taxes | | 21,716 | | | (22,652 | ) | | 9,876 | | | — | | | 8,940 | |
| | | | | | | | | | | | | | | |
Total assets | | 705,475 | | | 1,642,931 | | | 880,642 | | | (2,284,236 | ) | | 944,812 | |
| | | | | | | | | | | | | | | |
Liabilities | | | | | | | | | | | | | | | |
Current liabilities | | | | | | | | | | | | | | | |
Accounts payable and accrued liabilities | | 7,188 | | | 118,273 | | | 18,828 | | | (65,622 | ) | | 78,667 | |
Income taxes payable | | 318 | | | 6,345 | | | 990 | | | — | | | 7,653 | |
Instalments on long-term debt | | 4,609 | | | 6,329 | | | — | | | — | | | 10,938 | |
Deferred income taxes | | — | | | 1,611 | | | 431 | | | — | | | 2,042 | |
| | | | | | | | | | | | | | | |
Total current liabilities | | 12,115 | | | 132,558 | | | 20,249 | | | (65,622 | ) | | 99,300 | |
Long-term debt | | 522,384 | | | 88,862 | | | — | | | — | | | 611,246 | |
Other long-term liabilities | | — | | | 1,242 | | | — | | | — | | | 1,242 | |
Intercompany advances | | — | | | 1,590,988 | | | 12,408 | | | (1,603,396 | ) | | — | |
Deferred income taxes | | 5,306 | | | 60,389 | | | 1,659 | | | — | | | 67,354 | |
| | | | | | | | | | | | | | | |
Total liabilities | | 539,805 | | | 1,874,039 | | | 34,316 | | | (1,669,018 | ) | | 779,142 | |
| | | | | | | | | | | | | | | |
Shareholders’ Equity | | | | | | | | | | | | | | | |
Capital stock | | | | | | | | | | | | | | | |
Common shares | | 1 | | | 98,459 | | | 875,682 | | | (974,141 | ) | | 1 | |
Retained earnings (deficit) | | (289,264 | ) | | (248,703 | ) | | 2,533 | | | 246,170 | | | (289,264 | ) |
9.05% Note receivable from the parent company | | (133,154 | ) | | — | | | — | | | — | | | (133,154 | ) |
Additional paid-in capital | | 617,255 | | | 1,975 | | | 297 | | | (2,272 | ) | | 617,255 | |
Accumulated other comprehensive income | | (29,168 | ) | | (82,839 | ) | | (32,186 | ) | | 115,025 | | | (29,168 | ) |
| | | | | | | | | | | | | | | |
Total shareholders’ equity | | 165,670 | | | (231,108 | ) | | 846,326 | | | (615,218 | ) | | 165,670 | |
| | | | | | | | | | | | | | | |
Total liabilities and shareholders’ equity | | 705,475 | | | 1,642,931 | | | 880,642 | | | (2,284,236 | ) | | 944,812 | |
| | | | | | | | | | | | | | | |
- 108 -
| 21. | Condensed Consolidating Financial Information (continued) |
Condensed Consolidating Balance Sheet as of September 30, 2007 (Predecessor)
| | | | | | | | | | | |
| | | Axcan
Intermediate
Holdings Inc. | | Subsidiary
guarantors | | Subsidiary
non-guarantors | | Eliminations | | | Consolidated |
| | | $ | | $ | | $ | | $ | | | $ |
Assets | | | | | | | | | | | |
Current assets | | | | | | | | | | | |
Cash and cash equivalents | | — | | 150,856 | | 28,816 | | — | | | 179,672 |
Short-term investments, available for sale | | — | | 129,958 | | — | | — | | | 129,958 |
Accounts receivable, net | | — | | 32,798 | | 15,068 | | (11,192 | ) | | 36,674 |
Short-term portion of Intercompany advances | | — | | — | | 4,500 | | (4,500 | ) | | — |
Income taxes receivable | | — | | 7,554 | | 2,647 | | (109 | ) | | 10,092 |
Inventories | | — | | 18,216 | | 8,797 | | (307 | ) | | 26,706 |
Prepaid expenses and deposits | | — | | 2,263 | | 807 | | — | | | 3,070 |
Deferred income taxes | | — | | 15,588 | | 290 | | 77 | | | 15,955 |
| | | | | | | | | | | |
Total current assets | | — | | 357,233 | | 60,925 | | (16,031 | ) | | 402,127 |
Property, plant and equipment, net | | — | | 19,861 | | 11,336 | | — | | | 31,197 |
Intangible assets | | — | | 118,097 | | 249,120 | | — | | | 367,217 |
Investments in subsidiaries | | — | | 378,969 | | — | | (378,969 | ) | | — |
Intercompany advances | | — | | 2,599 | | 82,664 | | (85,263 | ) | | — |
Goodwill | | — | | 19,471 | | 7,996 | | — | | | 27,467 |
Deferred income taxes | | — | | 5,273 | | 8,090 | | (8,760 | ) | | 4,603 |
| | | | | | | | | | | |
Total assets | | — | | 901,503 | | 420,131 | | (489,023 | ) | | 832,611 |
| | | | | | | | | | | |
Liabilities | | | | | | | | | | | |
Current liabilities | | | | | | | | | | | |
Accounts payable and accrued liabilities | | — | | 71,945 | | 22,443 | | (11,192 | ) | | 83,196 |
Income taxes payable | | — | | 17,758 | | 1,180 | | — | | | 18,938 |
Instalments on long-term debt | | — | | 245 | | 282 | | — | | | 527 |
Short-term portion of Intercompany advances | | — | | 4,500 | | — | | (4,500 | ) | | — |
Deferred income taxes | | — | | 1,425 | | 651 | | — | | | 2,076 |
| | | | | | | | | | | |
Total current liabilities | | — | | 95,873 | | 24,556 | | (15,692 | ) | | 104,737 |
Long-term debt | | — | | 61 | | 61 | | — | | | 122 |
Intercompany advances | | — | | 82,664 | | 2,599 | | (85,263 | ) | | — |
Deferred income taxes | | — | | 32,708 | | 13,607 | | (8,760 | ) | | 37,555 |
| | | | | | | | | | | |
Total liabilities | | — | | 211,306 | | 40,823 | | (109,715 | ) | | 142,414 |
| | | | | | | | | | | |
Shareholders’ Equity | | | | | | | | | | | |
Capital stock | | — | | 395,888 | | 290,861 | | (290,861 | ) | | 395,888 |
Retained earnings | | — | | 249,371 | | 47,157 | | (47,157 | ) | | 249,371 |
Additional paid-in capital | | — | | 9,089 | | — | | — | | | 9,089 |
Accumulated other comprehensive income | | — | | 35,849 | | 41,290 | | (41,290 | ) | | 35,849 |
| | | | | | | | | | | |
Total shareholders’ equity | | — | | 690,197 | | 379,308 | | (379,308 | ) | | 690,197 |
| | | | | | | | | | | |
Total liabilities and shareholders’ equity | | — | | 901,503 | | 420,131 | | (489,023 | ) | | 832,611 |
| | | | | | | | | | | |
- 109 -
| 21. | Condensed Consolidating Financial Information (continued) |
Condensed Consolidating Operations for the seven-month period ended September 30, 2008 (Successor)
| | | | | | | | | | | | | | | |
| | | Axcan
Intermediate
Holdings Inc. | | | Subsidiary
guarantors | | | Subsidiary
non-guarantors | | | Eliminations | | | Consolidated | |
| | | $ | | | $ | | | $ | | | $ | | | $ | |
Revenue | | — | | | 185,600 | | | 45,310 | | | (7,731 | ) | | 223,179 | |
| | | | | | | | | | | | | | | |
Cost of goods sold | | — | | | 66,857 | | | 18,359 | | | (7,989 | ) | | 77,227 | |
Selling and administrative expenses | | 9,396 | | | 59,353 | | | 19,565 | | | 31 | | | 88,345 | |
Research and development expenses | | — | | | 15,520 | | | 2,279 | | | (31 | ) | | 17,768 | |
Depreciation and amortization | | — | | | 31,876 | | | 3,703 | | | — | | | 35,579 | |
Acquired in-process research | | — | | | 272,400 | | | — | | | — | | | 272,400 | |
| | | | | | | | | | | | | | | |
| | 9,396 | | | 446,006 | | | 43,906 | | | (7,989 | ) | | 491,319 | |
| | | | | | | | | | | | | | | |
Operating income (loss) | | (9,396 | ) | | (260,406 | ) | | 1,404 | | | 258 | | | (268,140 | ) |
| | | | | | | | | | | | | | | |
Financial expenses | | 36,723 | | | 41,521 | | | 87 | | | (36,818 | ) | | 41,513 | |
Other interest income | | (41,459 | ) | | 42,775 | | | (38,942 | ) | | 36,818 | | | (808 | ) |
Loss (gain) on foreign currency | | 52,151 | | | (87,691 | ) | | 41,692 | | | (7,993 | ) | | (1,841 | ) |
| | | | | | | | | | | | | | | |
| | 47,415 | | | (3,395 | ) | | 2,837 | | | (7,993 | ) | | 38,864 | |
| | | | | | | | | | | | | | | |
Loss before income taxes | | (56,811 | ) | | (257,011 | ) | | (1,433 | ) | | 8,251 | | | (307,004 | ) |
Income taxes | | (16,250 | ) | | 2,473 | | | (3,966 | ) | | 3 | | | (17,740 | ) |
Equity in earnings (loss) of subsidiaries | | (248,703 | ) | | 10,781 | | | — | | | 237,922 | | | — | |
| | | | | | | | | | | | | | | |
Net income (loss) | | (289,264 | ) | | (248,703 | ) | | 2,533 | | | 246,170 | | | (289,264 | ) |
| | | | | | | | | | | | | | | |
Condensed Consolidating Operations for the five-month period ended February 25, 2008 (Predecessor)
| | | | | | | | | | | | | | |
| | | Axcan
Intermediate
Holdings Inc. | | Subsidiary
guarantors | | | Subsidiary
non-guarantors | | | Eliminations | | | Consolidated | |
| | | $ | | $ | | | $ | | | $ | | | $ | |
Revenue | | — | | 129,669 | | | 38,142 | | | (9,232 | ) | | 158,579 | |
| | | | | | | | | | | | | | |
Cost of goods sold | | — | | 37,346 | | | 10,869 | | | (9,476 | ) | | 38,739 | |
Selling and administrative expenses | | — | | 65,595 | | | 10,581 | | | 22 | | | 76,198 | |
Research and development expenses | | — | | 7,826 | | | 2,452 | | | (22 | ) | | 10,256 | |
Depreciation and amortization | | — | | 2,952 | | | 6,643 | | | — | | | 9,595 | |
| | | | | | | | | | | | | | |
| | — | | 113,719 | | | 30,545 | | | (9,476 | ) | | 134,788 | |
| | | | | | | | | | | | | | |
Operating income | | — | | 15,950 | | | 7,597 | | | 244 | | | 23,791 | |
| | | | | | | | | | | | | | |
Financial expenses | | — | | 3,238 | | | 41 | | | (3,017 | ) | | 262 | |
Interest income | | — | | (5,096 | ) | | (3,361 | ) | | 3,017 | | | (5,440 | ) |
Loss (gain) on foreign currency | | — | | 8,267 | | | 76 | | | (8,541 | ) | | (198 | ) |
| | | | | | | | | | | | | | |
| | — | | 6,409 | | | (3,244 | ) | | (8,541 | ) | | (5,376 | ) |
| | | | | | | | | | | | | | |
Income before income taxes | | — | | 9,541 | | | 10,841 | | | 8,785 | | | 29,167 | |
Income taxes | | — | | 11,682 | | | 297 | | | 63 | | | 12,042 | |
Equity in earnings of subsidiaries | | — | | 19,266 | | | — | | | (19,266 | ) | | — | |
| | | | | | | | | | | | | | |
Net income | | — | | 17,125 | | | 10,544 | | | (10,544 | ) | | 17,125 | |
| | | | | | | | | | | | | | |
- 110 -
| 21. | Condensed Consolidating Financial Information (continued) |
Condensed Consolidating Operations for the twelve-month period ended September 30, 2007 (Predecessor)
| | | | | | | | | | | | | | |
| | | Axcan
Intermediate
Holdings Inc. | | Subsidiary
guarantors | | | Subsidiary
non-guarantors | | | Eliminations | | | Consolidated | |
| | | $ | | $ | | | $ | | | $ | | | $ | |
Revenue | | — | | 292,683 | | | 78,324 | | | (22,060 | ) | | 348,947 | |
| | | | | | | | | | | | | | |
Cost of goods sold | | — | | 85,971 | | | 19,755 | | | (22,043 | ) | | 83,683 | |
Selling and administrative expenses | | — | | 77,607 | | | 23,666 | | | — | | | 101,273 | |
Research and development expenses | | — | | 19,299 | | | 9,356 | | | — | | | 28,655 | |
Depreciation and amortization | | — | | 6,724 | | | 15,770 | | | — | | | 22,494 | |
Acquired in-process research | | — | | 10,000 | | | — | | | — | | | 10,000 | |
| | | | | | | | | | | | | | |
| | — | | 199,601 | | | 68,547 | | | (22,043 | ) | | 246,105 | |
| | | | | | | | | | | | | | |
Operating income | | — | | 93,082 | | | 9,777 | | | (17 | ) | | 102,842 | |
| | | | | | | | | | | | | | |
Financial expenses | | — | | 12,547 | | | 124 | | | (7,846 | ) | | 4,825 | |
Interest income | | — | | (10,820 | ) | | (8,393 | ) | | 7,846 | | | (11,367 | ) |
Loss on foreign currency | | — | | 2,204 | | | 148 | | | — | | | 2,352 | |
| | | | | | | | | | | | | | |
| | — | | 3,931 | | | (8,121 | ) | | — | | | (4,190 | ) |
| | | | | | | | | | | | | | |
Income before income taxes | | — | | 89,151 | | | 17,898 | | | (17 | ) | | 107,032 | |
Income taxes | | — | | 34,964 | | | 501 | | | 102 | | | 35,567 | |
Equity in earnings of subsidiaries | | — | | 17,278 | | | — | | | (17,278 | ) | | — | |
| | | | | | | | | | | | | | |
Net income | | — | | 71,465 | | | 17,397 | | | (17,397 | ) | | 71,465 | |
| | | | | | | | | | | | | | |
Condensed Consolidating Operations for the twelve-month period ended September 30, 2006 (Predecessor)
| | | | | | | | | | | | | | |
| | | Axcan
Intermediate
Holdings Inc. | | Subsidiary
guarantors | | | Subsidiary
non-guarantors | | | Eliminations | | | Consolidated | |
| | | $ | | $ | | | $ | | | $ | | | $ | |
Revenue | | — | | 239,712 | | | 71,717 | | | (19,112 | ) | | 292,317 | |
| | | | | | | | | | | | | | |
Cost of goods sold | | — | | 74,103 | | | 18,993 | | | (20,324 | ) | | 72,772 | |
Selling and administrative expenses | | — | | 68,794 | | | 24,932 | | | (388 | ) | | 93,338 | |
Research and development expenses | | — | | 17,569 | | | 22,202 | | | 18 | | | 39,789 | |
Depreciation and amortization | | — | | 7,414 | | | 15,409 | | | — | | | 22,823 | |
Partial write-down of intangible assets | | — | | — | | | 5,800 | | | — | | | 5,800 | |
| | | | | | | | | | | | | | |
| | — | | 167,880 | | | 87,336 | | | (20,694 | ) | | 234,522 | |
| | | | | | | | | | | | | | |
Operating income (loss) | | — | | 71,832 | | | (15,619 | ) | | 1,582 | | | 57,795 | |
| | | | | | | | | | | | | | |
Financial expenses | | — | | 15,077 | | | 160 | | | (8,249 | ) | | 6,988 | |
Interest income | | — | | (5,015 | ) | | (8,677 | ) | | 8,224 | | | (5,468 | ) |
Loss (gain) on foreign currency | | — | | (1,124 | ) | | 14 | | | — | | | (1,110 | ) |
| | | | | | | | | | | | | | |
| | — | | 8,938 | | | (8,503 | ) | | (25 | ) | | 410 | |
| | | | | | | | | | | | | | |
Income (loss) before income taxes | | — | | 62,894 | | | (7,116 | ) | | 1,607 | | | 57,385 | |
Income taxes expense (benefit) | | — | | 21,686 | | | (3,610 | ) | | 190 | | | 18,266 | |
Equity in loss of subsidiaries | | — | | (2,089 | ) | | — | | | 2,089 | | | — | |
| | | | | | | | | | | | | | |
Net income (loss) | | — | | 39,119 | | | (3,506 | ) | | 3,506 | | | 39,119 | |
| | | | | | | | | | | | | | |
- 111 -
| 21. | Condensed Consolidating Financial Information (continued) |
Condensed Consolidating Cash Flows for the seven-month period ended September 30, 2008 (Successor)
| | | | | | | | | | | | | | | |
| | | Axcan
Intermediate
Holdings Inc. | | | Subsidiary
guarantors | | | Subsidiary
non-guarantors | | | Eliminations | | | Consolidated | |
| | | $ | | | $ | | | $ | | | $ | | | $ | |
Operating activities | | | | | | | | | | | | | | | |
Cash flows from operating activities | | (53,068 | ) | | (21,846 | ) | | 27,402 | | | — | | | (47,512 | ) |
| | | | | | | | | | | | | | | |
Investing activities | | | | | | | | | | | | | | | |
Net cash used for the acquisition | | — | | | (958,463 | ) | | — | | | — | | | (958,463 | ) |
Acquisition of property, plant and equipment | | — | | | (2,029 | ) | | (1,032 | ) | | — | | | (3,061 | ) |
Acquisition of intangible assets | | — | | | — | | | (32 | ) | | — | | | (32 | ) |
Intercompany advances | | (898,816 | ) | | (32,878 | ) | | (671,702 | ) | | 1,603,396 | | | — | |
Investments on subsidiaries | | (21,020 | ) | | (663,674 | ) | | — | | | 684,694 | | | — | |
| | | | | | | | | | | | | | | |
Cash flows from investing activities | | (919,836 | ) | | (1,657,044 | ) | | (672,766 | ) | | 2,288,090 | | | (961,556 | ) |
| | | | | | | | | | | | | | | |
Financing activities | | | | | | | | | | | | | | | |
Issuance of long-term debt | | 538,120 | | | 96,000 | | | — | | | — | | | 634,120 | |
Repayment of long-term debt | | (10,457 | ) | | (164 | ) | | (269 | ) | | — | | | (10,890 | ) |
Deferred debt issue expenses | | (33,921 | ) | | (2,439 | ) | | — | | | — | | | (36,360 | ) |
Intercompany advances | | — | | | 1,590,988 | | | 12,408 | | | (1,603,396 | ) | | — | |
Advances from the parent company | | 4,182 | | | — | | | — | | | — | | | 4,182 | |
Issue of shares | | 475,001 | | | 21,020 | | | 663,674 | | | (684,694 | ) | | 475,001 | |
| | | | | | | | | | | | | | | |
Cash flows from the financing activities | | 972,925 | | | 1,705,405 | | | 675,813 | | | (2,288,090 | ) | | 1,066,053 | |
| | | | | | | | | | | | | | | |
Foreign exchange gain on cash held in foreign currencies | | — | | | (334 | ) | | (546 | ) | | — | | | (880 | ) |
| | | | | | | | | | | | | | | |
Net increase in cash and cash equivalents | | 21 | | | 26,181 | | | 29,903 | | | — | | | 56,105 | |
| | | | | | | | | | | | | | | |
Cash and cash equivalents, end of period | | 21 | | | 26,181 | | | 29,903 | | | — | | | 56,105 | |
| | | | | | | | | | | | | | | |
Condensed Consolidating Cash Flows for the five-month period ended February 25, 2008 (Predecessor)
| | | | | | | | | | | | | | |
| | | Axcan
Intermediate
Holdings Inc. | | Subsidiary
guarantors | | | Subsidiary
non-guarantors | | | Eliminations | | | Consolidated | |
| | | $ | | $ | | | $ | | | $ | | | $ | |
Operating activities | | | | | | | | | | | | | | |
Cash flows from operating activities | | — | | 77,714 | | | (4,469 | ) | | — | | | 73,245 | |
| | | | | | | | | | | | | | |
Investing activities | | | | | | | | | | | | | | |
Disposal of short-term investments | | — | | 129,958 | | | — | | | — | | | 129,958 | |
Repayment of intercompany advances | | — | | 4,500 | | | — | | | (4,500 | ) | | — | |
Acquisition of property, plant and equipment | | — | | (3,063 | ) | | (251 | ) | | — | | | (3,314 | ) |
Acquisition of intangible assets | | — | | — | | | (14 | ) | | — | | | (14 | ) |
| | | | | | | | | | | | | | |
Cash flows from investing activities | | — | | 131,395 | | | (265 | ) | | (4,500 | ) | | 126,630 | |
| | | | | | | | | | | | | | |
Financing activities | | | | | | | | | | | | | | |
Repayment of long-term debt | | — | | (101 | ) | | (120 | ) | | — | | | (221 | ) |
Repayment of intercompany advances | | — | | — | | | (4,500 | ) | | 4,500 | | | — | |
Deferred debt issue expenses | | — | | (889 | ) | | — | | | — | | | (889 | ) |
Stock-based compensation plans | | — | | (29,219 | ) | | (1,138 | ) | | — | | | (30,357 | ) |
Issue of shares | | — | | 224 | | | — | | | — | | | 224 | |
| | | | | | | | | | | | | | |
Cash flows on financing activities | | — | | (29,985 | ) | | (5,758 | ) | | 4,500 | | | (31,243 | ) |
| | | | | | | | | | | | | | |
Foreign exchange gain on cash held in foreign currencies | | — | | 64 | | | 423 | | | — | | | 487 | |
| | | | | | | | | | | | | | |
Net increase (decrease) in cash and cash equivalents | | — | | 179,188 | | | (10,069 | ) | | — | | | 169,119 | |
Cash and cash equivalents, beginning of period | | — | | 150,856 | | | 28,816 | | | — | | | 179,672 | |
| | | | | | | | | | | | | | |
Cash and cash equivalents, end of period | | — | | 330,044 | | | 18,747 | | | — | | | 348,791 | |
| | | | | | | | | | | | | | |
- 112 -
| 21. | Condensed Consolidating Financial Information (continued) |
Condensed Consolidating Cash Flows for the twelve-month period ended September 30, 2007 (Predecessor)
| | | | | | | | | | | | | | |
| | | Axcan
Intermediate
Holdings Inc. | | Subsidiary
guarantors | | | Subsidiary
non-guarantors | | | Eliminations | | | Consolidated | |
| | | $ | | $ | | | $ | | | $ | | | $ | |
Operating activities | | | | | | | | | | | | | | |
Cash flows from operating activities | | — | | 115,415 | | | 20,687 | | | — | | | 136,102 | |
| | | | | | | | | | | | | | |
Investing activities | | | | | | | | | | | | | | |
Acquisition of short-term investments | | — | | (148,929 | ) | | — | | | — | | | (148,929 | ) |
Disposal of short-term investments | | — | | 136,122 | | | — | | | — | | | 136,122 | |
Repayment of intercompany advances | | — | | — | | | 4,500 | | | (4,500 | ) | | — | |
Investments in subsidiaries | | — | | (16,100 | ) | | — | | | 16,100 | | | — | |
Disposal of investments in subsidiaries | | — | | 28,250 | | | — | | | (28,250 | ) | | — | |
Acquisition of property, plant and equipment | | — | | (6,279 | ) | | (510 | ) | | — | | | (6,789 | ) |
Disposal of property, plant and equipment | | — | | 219 | | | — | | | — | | | 219 | |
Acquisition of intangible assets | | — | | — | | | (38 | ) | | — | | | (38 | ) |
| | | | | | | | | | | | | | |
Cash flows from investing activities | | — | | (6,717 | ) | | 3,952 | | | (16,650 | ) | | (19,415 | ) |
| | | | | | | | | | | | | | |
Financing activities | | | | | | | | | | | | | | |
Repayment of long-term debt | | — | | (209 | ) | | (495 | ) | | — | | | (704 | ) |
Repayment of intercompany advances | | — | | (4,500 | ) | | — | | | 4,500 | | | — | |
Issue of shares | | — | | 7,257 | | | 16,100 | | | (16,100 | ) | | 7,257 | |
Redemption of capital stock | | — | | — | | | (28,250 | ) | | 28,250 | | | — | |
| | | | | | | | | | | | | | |
Cash flows on financing activities | | — | | 2,548 | | | (12,645 | ) | | 16,650 | | | 6,553 | |
| | | | | | | | | | | | | | |
Foreign exchange gain on cash held in foreign currencies | | — | | 159 | | | 443 | | | — | | | 602 | |
| | | | | | | | | | | | | | |
Net increase in cash and cash equivalents | | — | | 111,405 | | | 12,437 | | | — | | | 123,842 | |
Cash and cash equivalents, beginning of period | | — | | 39,451 | | | 16,379 | | | — | | | 55,830 | |
| | | | | | | | | | | | | | |
Cash and cash equivalents, end of period | | — | | 150,856 | | | 28,816 | | | — | | | 179,672 | |
| | | | | | | | | | | | | | |
Condensed Consolidating Cash Flows for the twelve-month period ended September 30, 2006 (Predecessor)
| | | | | | | | | | | | | | |
| | | Axcan
Intermediate
Holdings Inc. | | Subsidiary
guarantors | | | Subsidiary
non-guarantors | | | Eliminations | | | Consolidated | |
| | | $ | | $ | | | $ | | | $ | | | $ | |
Operating activities | | | | | | | | | | | | | | |
Cash flows from operating activities | | — | | 54,241 | | | 30,093 | | | — | | | 84,334 | |
| | | | | | | | | | | | | | |
Investing activities | | | | | | | | | | | | | | |
Acquisition of short-term investments | | — | | (117,151 | ) | | — | | | — | | | (117,151 | ) |
Disposal of short-term investments | | — | | 17,619 | | | — | | | — | | | 17,619 | |
Repayment of intercompany advances | | — | | — | | | 4,500 | | | (4,500 | ) | | — | |
Disposal of investments in subsidiaries | | — | | 32,150 | | | — | | | (32,150 | ) | | — | |
Acquisition of property, plant and equipment | | — | | (2,950 | ) | | (1,088 | ) | | — | | | (4,038 | ) |
Acquisition of intangible assets | | — | | — | | | (4,569 | ) | | — | | | (4,569 | ) |
| | | | | | | | | | | | | | |
Cash flows from investing activities | | — | | (70,332 | ) | | (1,157 | ) | | (36,650 | ) | | (108,139 | ) |
| | | | | | | | | | | | | | |
Financing activities | | | | | | | | | | | | | — | |
Issuance of long-term debt | | — | | 634 | | | — | | | — | | | 634 | |
Repayment of long-term debt | | — | | (187 | ) | | (2,135 | ) | | — | | | (2,322 | ) |
Repayment of intercompany advances | | — | | (4,500 | ) | | — | | | 4,500 | | | — | |
Issue of shares | | — | | 1,072 | | | — | | | — | | | 1,072 | |
Redemption of capital stock | | — | | — | | | (32,150 | ) | | 32,150 | | | — | |
| | | | | | | | | | | | | | |
Cash flows from financing activities | | — | | (2,981 | ) | | (34,285 | ) | | 36,650 | | | (616 | ) |
| | | | | | | | | | | | | | |
Foreign exchange gain on cash held in foreign currencies | | — | | 138 | | | 144 | | | — | | | 282 | |
| | | | | | | | | | | | | | |
Net decrease in cash and cash equivalents | | — | | (18,934 | ) | | (5,205 | ) | | — | | | (24,139 | ) |
Cash and cash equivalents, beginning of period | | — | | 58,324 | | | 21,645 | | | — | | | 79,969 | |
| | | | | | | | | | | | | | |
Cash and cash equivalents, end of period | | — | | 39,390 | | | 16,440 | | | — | | | 55,830 | |
| | | | | | | | | | | | | | |
- 113 -
| ITEM 9. | CHANGES IN AND DISAGREEMENTS WITH ACCOUNTANTS ON ACCOUNTING AND FINANCIAL DISCLOSURE |
Not applicable.
ITEM 9A(T). CONTROLS AND PROCEDURES
(a) Evaluation of disclosure controls and procedures.
We conducted an evaluation under the supervision and with the participation of our management, including our principal executive officer and principal financial officer, of the effectiveness of the design and operation of our disclosure controls and procedures (as defined in Rules 13a-15(e) and 15d-15(e) under the Securities Exchange Act of 1934, as amended, or the Exchange Act), as of September 30, 2008, the end of the period covered by this Annual Report on Form 10-K. Based upon this evaluation, our principal executive officer and principal financial officer concluded that our disclosure controls and procedures are effective to ensure that material information required to be disclosed by us in reports that we file or submit under the Exchange Act is recorded, processed, summarized and reported within the time periods specified in Securities and Exchange Commission rules and forms and is accumulated and communicated to our management, including our principal executive officer and principal financial officer, as appropriate to allow timely decisions regarding required disclosure.
(b) Changes in internal control over financial reporting.
There have been no changes in internal control over financial reporting that occurred during our most recent fiscal quarter that has materially affected, or is reasonably likely to materially affect, our internal control over financial reporting.
(c) Management’s report on internal control over financial reporting.
This Annual Report does not include a report of management’s assessment regarding internal control over financial reporting or an attestation report of the Company’s registered public accounting firm due to a transition period established by rules of the Securities and Exchange Commission for newly public companies.
| ITEM 9B. | OTHER INFORMATION |
Not applicable.
- 114 -
PART III
| ITEM 10. | DIRECTORS, EXECUTIVE OFFICERS AND CORPORATE GOVERNANCE |
Directors and Executive Officers
Below is a list of the names, ages and positions, and a brief account of the business experience, of (1) the individuals who serve as our executive officers and as members of our Board of Directors, or the Board, and (2) the individuals who serve as the executive officers and members of the Board of Directors of our indirect parent Holdings. We include director and management information for both us and Holdings, an entity controlled by the Sponsor and the Co-Investors, since our executive officers also serve as officers in the same capacity for Holdings and certain decisions relating to our business are made by the Board of Directors of Holdings, or the Holdings Board, in their capacity as our indirect parent. See “Item 11. Executive Compensation” for further discussion on the relationship between our management and the management of Holdings.
In addition, certain of the individuals listed below as our officers and directors also serve as the officers and directors of Axcan MidCo Inc., or MidCo, our direct parent and all of our officers serve in the same capacity as officers for our indirect subsidiary Axcan Pharma Inc.
| | | | |
Name | | Age | | Position |
| Frank Verwiel, M.D. | | 46 | | President and Chief Executive Officer; Director, Axcan Intermediate Holdings Inc. and Axcan Holdings Inc. |
| | |
| David W. Mims | | 46 | | Executive Vice President and Chief Operating Officer; Director, Axcan Intermediate Holdings Inc. |
| | |
| Steve Gannon | | 47 | | Senior Vice President, Finance, Chief Financial Officer and Treasurer; Director, Axcan Intermediate Holdings Inc. |
| | |
| Dr. Alexandre LeBeaut | | 51 | | Senior Vice President and Chief Scientific Officer |
| | |
| Nicholas Franco | | 46 | | Senior Vice President, International Commercial Operations |
| | |
| Richard Tarte | | 45 | | Vice President, Corporate Development, General Counsel and Secretary |
| | |
| Darcy Toms | | 45 | | Vice President, Business Development |
| | |
| Martha Donze | | 55 | | Vice President, Administration and Assistant Secretary; Director, Axcan Intermediate Holdings Inc. |
| | |
| Dr. Norbert Claveille | | 57 | | General Manager, Axcan Pharma S.A. |
| | |
| Fred Cohen | | 52 | | Director, Axcan Holdings Inc. |
| | |
| Geoff Lieberthal | | 34 | | Director, Axcan Holdings Inc. |
| | |
| Heather Preston | | 42 | | Director, Axcan Holdings Inc. |
| | |
| Todd Sisitsky | | 37 | | Director, Axcan Holdings Inc. |
Frank Verwiel, M.D.has been a director on our Board and a director of our parent corporations Axcan MidCo Inc. and Axcan Holdings Inc. since February 2008. Dr. Verwiel joined Axcan Pharma Inc. as President and Chief Executive Officer in July 2005 and joined the Board of Directors of Axcan Pharma Inc. in August 2005. Dr. Verwiel most recently held the position of Vice President, Hypertension, Worldwide Human Health Marketing with Merck & Co., Inc. while concurrently serving as a member of Merck’s worldwide hypertension business strategy team. He joined Merck in 1996 and was appointed managing director of MSD in the Netherlands in 1997. Prior to joining Merck, from 1988 to 1996, Dr. Verwiel worked with Les Laboratories Servier in the EU in various executive positions. Dr. Verwiel holds a Medical Degree from the Erasmus University in Rotterdam, the Netherlands and a Masters in Business Administration, or MBA, from INSEAD in Fontainebleau, France.
- 115 -
David W. Mims has been a director on the Board and a director of our parent corporation Axcan MidCo Inc. since February 2008. Mr. Mims has also served as President of our parent corporations Axcan MidCo Inc. and Axcan Holdings Inc. since February 2008. Mr. Mims joined Axcan Pharma Inc. as Executive Vice President and Chief Operating Officer in February 2000 shortly after Axcan Pharma Inc.’s acquisition of Scandipharm, Inc. He served as senior accountant at a major accounting firm before joining Russ Pharmaceuticals, Inc. in 1987 as Accounting Services Manager. In 1991, Mr. Mims helped found Scandipharm, Inc. and served as Vice President, Chief Operating Officer, and Chief Financial Officer. He resigned from Scandipharm, Inc. in March 1998 to join Cebert Pharmaceuticals, Inc. as Executive Vice President and Chief Operating Officer. He was previously a Director of the University of Alabama, Birmingham Research Foundation from 2000 to 2005 and is a member of the American Institute of Certified Public Accountants and the Alabama Society of Certified Public Accountants.
Steve Gannonhas been our Senior Vice President, Finance, Chief Financial Officer and Treasurer and a director on the Board since February 2008. Mr. Gannon has also served as director of our parent corporation Axcan MidCo Inc. and Senior Vice President, Finance, Chief Financial Officer and Treasurer of our parent corporations Axcan MidCo Inc. and Axcan Holdings Inc. since February 2008. Mr. Gannon joined Axcan Pharma Inc. as Senior Vice President and Chief Financial Officer in February 2006. He has extensive financial experience in corporate growth initiatives such as acquisitions, corporate alliances, and partnerships within the biotechnology and pharmaceutical sector. Mr. Gannon has held a number of senior financial roles in AstraZeneca and most recently, served as Chief Financial Officer of CryoCath Technologies Inc. Mr. Gannon received his Bachelor of Commerce from the University of Concordia and his chartered accountant’s designation (CA) in 1985.
Dr. Alexandre LeBeaut has been our Senior Vice President and Chief Scientific Officer since September 2008. Dr. LeBeaut previously held the title of Senior Vice President and Chief Scientific Officer of Axcan Pharma from May 2006 to February 2007. Most recently, Dr. LeBeaut was Vice President, Medical Units, U.S. Medical Affairs of Sanofi-Aventis Pharmaceuticals. Dr. LeBeaut has held a number of senior positions with pharmaceutical companies in the U.S., France and Italy, including the Schering Plough Research Institute (Kenilworlth, NJ), where he was a project leader for development programs focusing on Cardiovascular and Metabolism, Gastroenterology, Clinical Immunology and Infectious Diseases. Dr. LeBeaut is a member of the American Gastroenterological Association, the American College of Gastroenterology, the American Society of Microbiology, the American Society of Critical Care Medicine, the American Academy of Pharmaceutical Physicians and the Association of Clinical Research Professionals. Dr. LeBeaut received his medical degree with honors from the University of Paris VII, France in 1984 and is a pediatrician by training.
Nicholas Franco was appointed as Senior Vice President, International Commercial Operations of Axcan Pharma Inc. in July 2007. Prior to joining us, Mr. Franco was Head of Market Access Region Europe for Novartis Pharma AG in Basel, Switzerland, a company where he has held various management positions since 1991. Previous positions of Mr. Franco include President of Novartis Ophthalmics, Global Head, Business Development and Licensing, Global Head of the Neuroscience Business Franchise, and Global Brand Director for gastrointestinal products. During his tenure with Novartis, Mr. Franco has successfully led cross-functional teams and business units that directly controlled local markets, as well as large business franchises and business units in international settings. He also established Novartis’ Global Alliance Management function and led the Primary Care Global Negotiations team in completing over a dozen in-licensing deals for development compounds. Mr. Franco graduated from McGill University (Canada) where he earned a Bachelor of Science in Biochemistry and a Masters in Business Administration, or MBA, Strategic Planning and Marketing.
Richard Tartehas been our Vice President, Corporate Development, General Counsel and Secretary since February 2008. Mr. Tarte has also served as Vice President, Corporate Development, General Counsel and Secretary of our parent corporations Axcan MidCo Inc. and Axcan Holdings Inc. since February 2008. Mr. Tarte joined Axcan Pharma Inc. as Vice President, Corporate Development and General Counsel in 2001. Previously, Mr. Tarte served as in-house counsel at the Société générale de financement du Quebec, a diversified investment fund. He was also a partner with Coudert Frères, an international law firm where he practiced business law for 10 years. Mr. Tarte was admitted to the Quebec Bar in 1988. He holds a MBA from l’Institut Européen d’Administration des Affaires (INSEAD) in Fontainebleau, France and a Bachelor of Law degree from the University of Montreal (1986).
Darcy Toms has been our Vice President of Business Development since February 2008 and joined Axcan Pharma in that capacity in January 2007. He has more than 20 years of experience in the United States and Canada. Prior to joining Axcan Pharma, he was Senior Director of Business Development with Biovail Pharmaceuticals, Inc. Before joining Biovail, he was Director of Business Development and Director of Alliances and Product Evaluation with Aventis Inc. Mr. Toms holds a Bachelor of Science in Civil Engineering (Distinction) from the University of Manitoba, and an MBA from McGill University, Montreal, Quebec. He is a Certified General Accountant (CGA), Certified Management Consultant (CMC) and Engineer (ENG).
- 116 -
Martha Donze has been our Vice President—Administration and Assistant Secretary and a director on the Board since February 2008. Ms. Donze has also served as director of our parent corporation Axcan MidCo Inc. and Vice President—Administration and Assistant Secretary of our parent corporations Axcan MidCo Inc. and Axcan Holdings Inc. since February 2008. Ms. Donze joined Axcan Pharma Inc. as Vice President, Corporate Administration in October 1999. Ms. Donze joined Scandipharm in 1993 as manager, human resources and corporate communications and was later promoted to director, human resources and corporate communications. She has more than 30 years of professional experience in the fields of human resources and communications having also worked with Alabama Power Company, Avondale Mills, and Employers Insurance. Ms. Donze is a member of the U.S. Society of Human Resource Management and the Society of Human Resource Global Forum, an international human resources organization. She is a 1975 graduate of The University of Alabama and holds a bachelor’s degree.
Dr. Norbert Claveilleis the General Manager of Axcan Pharma S.A. Dr. Claveille joined Axcan Pharma Inc. in 2001 after 25 years in the pharmaceutical industry with companies including Beaufour-Ipsen, where he was president of the French division, Servier Laboratories and Bottu-Human Pharm. He began his career in 1973 as a general practitioner physician. Dr. Claveille holds a Doctorate of Medicine degree and is an Honors graduate of the Faculté de Médecine Necker-Enfants Malades in Paris, France. He is also a graduate of the National Institute of Marketing of the Paris Business School.
Fred Cohen, M.D., D. Phil.has been a director on the Holdings Board since February 2008. Prior to joining TPG Ventures in 2001, Dr. Cohen was a Professor of Medicine, Cellular and Molecular Pharmacology, Biochemistry and Biophysics and Pharmaceutical Chemistry at the University of California, San Francisco. In this context, he was Chief of the Division of Endocrinology and Metabolism and directed an active research program in the areas of prion biology, structure based drug design, bioinformatics and heteropolymer chemistry. Dr. Cohen is a Fellow of the American College of Physicians and the American College of Medical Informatics, a member of the American Society for Clinical Investigation and the Association of American Physicians, and the recipient of several awards and honors including the Burroughs-Wellcome New Initiatives in Malaria Award, the LVMH Science Pour L’Art Prize (shared with Stanley Prusiner), a Searle Scholars Award and Young Investigator Awards from the Endocrine Society and the Western Society for Clinical Investigation. Dr. Cohen holds a Bachelor of Arts degree, magna cum laude, from Yale University, a D. Phil. from Oxford University as a Rhodes Scholar and a Doctor of Medicine degree from Stanford Medical School. He was an American Cancer Society postdoctoral fellow in internal medicine and endocrinology at the University of California, San Francisco. During the past twenty years, Dr. Cohen has played advisory and board roles for the venture capital, biotechnology and pharmaceutical industries with Kleiner Perkins Caufield and Byers, Chiron Corporation, Incyte Corporation, Synteni, Syrrx Inc., Genomic Health, Inc., Arris Pharmaceuticals Corporation, Immunex Corporation, DoubleTwist, Procept and Eli Lilly and Company. He currently serves on the boards of Anaborex, GenomicHealth, Kémia, FivePrime, Expression Diagnostics (XDx), CardioDx, Matrix Laboratories, Nodality, ProteoGenix, and Quintiles Transnational Corp. Dr. Cohen was elected to the Institute of Medicine of the National Academics in 2004 and to the American Academy of Arts and Sciences in 2008.
Geoff Lieberthal has been a director on the Holdings Board since February 2008. Mr. Lieberthal is a Vice President at TPG Capital, L.P. Prior to joining TPG in 2007, Mr. Lieberthal worked in the North America Private Equity group at Bain Capital, LLC from 2004 to 2007 and for Bain & Company from 1997 to 2004. Mr. Lieberthal earned an MBA from the Stanford Graduate School of Business and a Bachelor of Arts degree from Dartmouth College, where he graduated cum laude.
Heather Preston, M.D. has been a director on the Holdings Board since February 2008. Prior to joining TPG Biotech in May 2005, Dr. Preston spent two years at JP Morgan Partners where she focused on medical device and biotechnology venture capital investing. Prior to JP Morgan Partners, Dr. Preston was an entrepreneur-in-residence with New Enterprise Associates. Dr. Preston has an undergraduate degree in biochemistry from the University of London and a medical degree from the University of Oxford. After leaving Oxford, she completed a post-doctoral fellowship in molecular biology at the Dana Farber Cancer Institute, Harvard University. She completed her training in Internal Medicine at the Massachusetts General Hospital and then she sub-specialized in Gastroenterology and Hepatology at the University of California, San Francisco. During her academic career, she was the recipient of a Fulbright Scholarship, a Fulbright Cancer Research Scholarship, a Harlech Scholarship and a Science and Engineering Research Council Post-doctoral Fellowship Award. After leaving academic medicine, Dr. Preston spent five years at McKinsey & Co. in New York, where she was a leader of their pharmaceutical and medical products consulting practice. She advised large pharmaceutical companies and biotechnology companies on critical strategic issues such as research and development portfolio prioritization, mergers & acquisitions opportunities, new technology acquisitions, new product launches and product growth strategies. Dr. Preston co-founded and is the Chief Executive Officer of Virobay Inc., a biotechnology company that is seeking to develop new therapies for the treatment of Hepatitis C Virus (HCV). She serves on the boards of Alder Biotheraputics, Virobay Inc. and VLST Inc. and is an observer on the boards of Aerie Pharmaceuticals, FoldRx, Albireo Inc. and Macrogenics.
- 117 -
Todd Sisitsky is a partner of TPG Capital, L.P. where he leads the firm’s investment activities in the healthcare services and pharmaceutical / medical device sectors. He played leadership roles in connection with TPG’s investments in Axcan Pharma, Biomet, Fenwal Transfusion Therapies, IASIS Healthcare, and Surgical Care Affiliates (carved out from HealthSouth Corporation). Prior to joining TPG in 2003, Mr. Sisitsky worked at Forstmann Little & Company and Oak Hill Capital Partners. He received an M.B.A. from the Stanford Graduate School of Business where he was an Arjay Miller Scholar, and earned his undergraduate degree from Dartmouth College, where he graduated summacum laude.
Corporate Governance
Our Board consists of four members and the Holdings Board consists of five members. There are no representatives of the Sponsor on our Board, which consists solely of members of our executive management team. The Holdings Board consists of representatives of the Sponsor and our CEO. While decisions regarding the Company’s business and affairs are taken by our Board, the Holdings Board exercises certain strategic and oversight functions. As discussed in more detail below, matters relating to named executive officers compensation are considered and approved by a committee of the Holdings Board comprised of Todd Sisitsky, Fred Cohen and Frank Verwiel (“Compensation Committee”) . A committee of the Holdings Board comprised of Geoff Lieberthal, Heather Preston and Frank Verwiel, also exercises oversight on financial statement approval, auditor nomination and disclosure (“Audit Committee”) .Because of these requirements, together with the Sponsor’s ownership of a majority of our outstanding common shares through Holdings, we nor Holdings currently have a policy or procedure with respect to shareholder nominees to our respective Boards of Directors. Though not formally considered by our Board given that our securities are not registered or traded on any national securities exchange, based upon the listing standards of the NASDAQ Global Market, the national securities exchange upon which Axcan Pharma’s common stock was listed prior to the February 2008 Transactions, we do not currently believe that any of our directors would be considered independent because of their relationships with us as executive officers. In addition, when using the same independence standards, none of the directors on the Holdings Board would be considered independent due to Dr. Verwiel’s position as President and Chief Executive Officer of Holdings and us and the respective relationships of Drs. Cohen and Preston and Messrs. Lieberthal and Sisitsky with the Sponsor, the owner of a majority of the outstanding common equity of Holdings. See Item 13, “Certain Relationships and Related Transactions, and Director Independence.”
Section 16(a) Compliance
There is no established public trading market for our common stock. We are a wholly-owned subsidiary of Axcan MidCo Inc. which holds all of our outstanding common stock and is wholly-owned subsidiary of Axcan Holdings Inc., a privately-held company.
Audit Committee
Our entire Board of Directors performs the duties of an Audit Committee for us and we do not have a separate audit committee. Our Board selects our independent auditors and reviews the independence of such auditors, approves the scope of the annual audit activities of the independent auditors, approves the audit fee payable to the independent auditors and reviews such audit results with the independent auditors. Due to our status as a privately- held company and the absence of a public trading market for our common stock, we have not designated any member of the Board as an “audit committee financial expert”. A committee of the Holdings Board comprised of Geoff Lieberthal, Heather Preston and Frank Verwiel also exercises oversight on financial statement approval, auditor nomination and disclosure (“Audit Committee”).
Compensation Committee
A committee of the Holdings Board comprised of Todd Sisitsky, Fred Cohen and Frank Verwiel also considers and approves matters related to compensation of our named executive officers (“Compensation Committee”). The Holdings Compensation Committee is responsible for reviewing and approving goals and objectives related to our executive officers’ compensation, evaluating the chief executive officer’s performance against these goals and objectives and approving his compensation, approving total compensation for the other named executive officers, establishing total compensation for the directors and overseeing our incentive plans. Though not formally considered by the Holdings Board given that neither our securities nor the securities of Holdings are registered or traded on any national securities exchange, based upon the listing standards of the NASDAQ Global Market, the national securities exchange upon which Axcan Pharma’s common stock was listed prior to the February 2008 Transactions, we do not currently believe that any of the members of the
- 118 -
Holdings Compensation Committee would be considered independent because of their relationships with the Sponsor, who own a majority of our outstanding common shares through Holdings. See Item 13, “Certain Relationships and Related Transactions, and Director Independence.”
Compensation Committee Interlocks and Insider Participation
Dr. Verwiel is our Chief Executive Officer. Messrs. Sisitsky and Cohen are affiliated with the Sponsor, which holds the majority of the outstanding common stock of Holdings and is a party to the management services agreement with us. The management services agreement is described in greater detail in Item 13, “Certain Relationships and Related Transactions, and Director Independence.” During fiscal year 2008, we had no compensation committee “interlocks”— meaning that it was not the case that an executive officer of ours served as a director or member of the compensation committee of another entity and an executive officer of the other entity served as a director or member of the Holdings Compensation Committee.
Code of Ethics
We have a Business Ethics and Conduct Code that applies to, among others, our principal executive officer, principal financial officer, principal accounting officer, and persons performing similar functions. A copy of our Business Ethics and Conduct Code is available on our website.
| ITEM 11. | EXECUTIVE COMPENSATION |
Introduction
Prior to the consummation of the February 2008 Transactions, we had no independent operations or compensation arrangements of any type with our directors and officers.
As a result of the February 2008 Transactions:
| | (1) | we, through an indirect, wholly-owned subsidiary, acquired all the outstanding common stock of Axcan Pharma Inc., or Axcan Pharma, who, previous to that time, had been a public company with its common stock traded on the NASDAQ Global Market and the Toronto Stock Exchange, or TSX; |
| | (2) | all of the directors of Axcan Pharma, except Dr. Frank Verwiel, resigned from the Board of Axcan Pharma and any committees thereof; |
| | (3) | certain of the executive officers of Axcan Pharma entered into employment agreements with our indirect parent Axcan Holdings Inc., or Holdings, Axcan Pharma, and Axcan Pharma US Inc., our indirect subsidiary, in which the executive officer agreed to serve as an officer for these entities and certain of their subsidiaries, which include Axcan Intermediate Holdings Inc. Specifically, all of our named executive officers and directors were officers of Axcan Pharma in fiscal year 2008 prior to the February 2008 Transactions; and |
| | (4) | all of our named executive officers serve in the same capacity for us as they do for our indirect parent company Holdings. |
Axcan Intermediate Holdings Inc. was formed in connection with the February 2008 Transactions and succeeded to all the business, properties, assets, and liabilities of Axcan Pharma. Therefore, we believe that a discussion of the compensation program of Axcan Pharma in fiscal year 2008 prior to the February 2008 Transactions as it related to the compensation of its named executive officers and its Board of Directors in addition to a description of our executive compensation programs after the consummation of the February 2008 Transactions would most accurately reflect the compensation arrangements between us and our executive officers and directors in fiscal year 2008.
In this section, unless otherwise noted, for purposes of presenting in U.S. dollars the cash compensation paid to named executive officers and directors in non-U.S. currency, we have used the following exchange rates: 1.0065 Canadian dollars to 1 U.S. dollar and 0.6649 Euros to 1 U.S. dollar. These rates are the average of the monthly average exchange rates for each respective currency conversion during fiscal year 2008 as reported by The Bank of Canada. Unless otherwise specified, the source of all exchange rates mentioned in this section is The Bank of Canada.
- 119 -
Compensation Discussion and Analysis for Axcan Pharma in Fiscal Year 2008 Prior to the February 2008 Transactions
Overview
This section includes information regarding, among other things, the overall objectives of Axcan Pharma’s compensation programs and each element of compensation that Axcan Pharma provided, in each case with respect to the fiscal year 2008 prior to the February 2008 Transactions. The goal of this section is to provide a summary of Axcan Pharma’s executive compensation practices and the decisions that Axcan Pharma made during this period concerning the compensation package payable to Axcan Pharma’s executive officers, including the five executives listed in the summary compensation table below. Each of the executives listed in the summary compensation table is referred to herein as a “named executive officer.” This section should be read in conjunction with the section entitled “Compensation Discussion and Analysis for Axcan Intermediate Holdings in Fiscal Year 2008 After the February 2008 Transactions” and the detailed tables and narrative descriptions under “Executive Compensation Tables” below.
Prior to the February 2008 Transactions, it was generally the responsibility of the Compensation Committee of Axcan Pharma, or the Axcan Pharma Compensation Committee, to review and recommend to the Board of Directors of Axcan Pharma, or the Axcan Pharma Board, for its approval at the beginning of each fiscal year (1) the corporate goals and objectives that were relevant to the compensation of Axcan Pharma’s executive officers for the upcoming fiscal year and (2) the level and form of compensation to be offered to Axcan Pharma’s President and Chief Executive Officer and other named executive officers. After the conclusion of each fiscal year, the Axcan Pharma Compensation Committee evaluated the performance of its executive officers against these preset goals and objectives along with the effectiveness of the respective officer’s leadership and made recommendations to the Axcan Pharma Board with respect to the incentive compensation that should be paid to the most senior executive officers, including the named executive officers.
During fiscal year 2007, the Axcan Pharma Compensation Committee recommended the approval of an executive compensation program, or the Program, on November 28, 2006, and on November 29, 2006, the Axcan Pharma Board approved the Program, which included a revised salary structure and an adjustment of the annual cash incentive bonus and long-term incentive award levels for certain of Axcan Pharma’s executive officers. The Program continued to be in place during fiscal year 2008.
Executive Compensation Philosophy and Objectives
During fiscal year 2008 prior to the February 2008 Transactions, Axcan Pharma’s executive compensation philosophy was to provide and maintain a total compensation program that was internally equitable in relation to the value of each job and externally competitive in relation to the total compensation levels and practices at other companies with similar revenue levels in the pharmaceutical industry and geographic areas, and that also recognized the company’s performance. The Program was designed to attract and retain talented individuals and motivate them to focus on activities that contributed to Axcan Pharma’s long-term success. The Program was developed and administered in a manner to reward superior operating performance while maximizing shareholder value and rewards were linked to the accomplishment of specific business goals and outstanding individual performance.
The Axcan Pharma Board and Axcan Pharma Compensation Committee, when making compensation decisions in fiscal year 2008 prior to the February 2008 Transactions, followed these four principles:
| | • | | Performance-based: Executive compensation levels were intended to reflect both company and individual results based on specific quantitative and qualitative objectives established at the start of each fiscal year in keeping with Axcan Pharma’s short-term, mid-term and long-term strategic objectives. |
| | • | | Aligned with shareholder interests:Axcan Pharma sought to align the interests of the named executive officers with those of its investors by evaluating executive performance on the basis of key financial measurements which were believed to be closely correlated to long-term shareholder value. Key elements of compensation that were meant to align the interests of the named executive officers with shareholders included: |
| | • | | Axcan Pharma’s Annual Incentive Compensation Plan, which offered performance-based cash incentives and used net sales and operating income as measures of corporate performance; and |
| | • | | The Axcan Pharma 2006 Stock Incentive Plan, which offered long-term equity incentives, consisting of a mix of both stock option and restricted stock unit awards, to senior executives with the intention of encouraging them to increase shareholder value. |
- 120 -
| | • | | Market competitive: Axcan Pharma’s compensation for executives was designed to be competitive with compensation of executives of comparable peer companies and to consider company and business unit results relative to the results of peers. See “—Compensation Methodology—Benchmarking Practices” below. |
| | • | | Individual considerations:Axcan Pharma’s compensation levels were also designed to reflect individual factors such as scope of responsibility, experience and performance against individual objectives. |
Compensation Methodology
The Program consisted of the following three basic components: (1) a Base Salary that was internally equitable and externally competitive; (2) Annual Performance-Based Cash Incentives linked to Axcan Pharma’s performance and the performance of its individual executive officers; and (3) Long-Term Equity Incentives comprised of equity-based compensation such as stock options or share units. Each compensation component had a different function, but all elements were intended to work in concert to maximize corporate and individual performance by establishing specific, aggressive operational and financial goals and by providing financial incentives to employees based on their level of achievement of these goals.
Benchmarking Practices
Each component of the Program was aligned with competitive market practices and levels. The compensation of Axcan Pharma’s executives was compared to the compensation of executives from competitor organizations of comparable revenue and market capitalization size and other pharmaceutical companies that Axcan Pharma competed with for talent. The fact that Axcan Pharma’s named executive officers typically had North American or global responsibilities was a factor when determining competitive salaries and therefore, certain positions were also benchmarked in whole or in part against both Canadian and U.S. competitor pharmaceutical companies based on individual circumstances such as the scope of an executive’s position, relevant skills or experience. The Axcan Pharma Compensation Committee also took into consideration Axcan Pharma’s financial performance as well as the individual performance of the executive. Consideration was given, but not limited to, leadership abilities as well as retention risk.
In fiscal year 2008, the Axcan Pharma Compensation Committee worked with Mercer Human Resource Consulting, an independent compensation consultant, to evaluate and provide recommendations on the overall competitive positioning of Axcan Pharma’s compensation plans for executives. As part of this process, the Axcan Pharma Compensation Committee reviewed proxy compensation data for all Canadian-based pharmaceutical and biotechnology companies whose shares are listed on stock exchanges in both Canada and the United States (as Axcan Pharma’s shares were during fiscal year 2008 prior to the February 2008 Transactions), as well as for a group of eleven U.S.-based specialty pharmaceutical companies that were similar in size to Axcan Pharma (based on annual revenues and market capitalization). A list of the companies used for proxy compensation benchmarking purposes is shown in the following table.
| | | | |
Canadian Proxy Group | | U.S. Proxy Group |
| MDS Inc. | | Alpharma Inc. | | Ligand Pharmaceuticals |
| Biovail Corporation | | Par Pharmaceuticals | | Enzon Pharmaceuticals |
| Aeterna Zentaris | | Medicis Pharmaceuticals | | Salix Pharmaceuticals |
| QLT Inc. | | KV Pharmaceuticals | | Medicines Co. |
| Angiotech Pharmaceuticals | | MGI Pharma | | |
| Draxis Health Inc. | | First Horizon Pharmaceuticals | | |
| Aspreva Pharmaceuticals | | Connetics Corp. | | |
In addition, the Axcan Pharma Compensation Committee considered market data from six different compensation surveys. While external information and advice were used in the development of Axcan Pharma’s executive compensation plans, together, the Axcan Pharma Compensation Committee and the Axcan Pharma Board retained full responsibility for all decisions related to these plans as well as their implementation.
Compensation Elements
During fiscal year 2008, the principal elements of compensation for the named executive officers of Axcan Pharma were (1) Base Salary; (2) Annual Performance-Based Cash Incentives; (3) Long-Term Equity Incentives; and (4) Other Benefits and Perquisites.
- 121 -
Base Salary
Base salaries for the named executive officers in fiscal year 2008 were established with consideration to the criteria discussed above in “Executive Compensation Philosophy and Objectives” and “Compensation Methodology”, including the executive’s role, responsibilities, and capabilities, as well as the market pay levels for the position, and were benchmarked against competitor group practices. As set forth in the table below, for fiscal year 2008, base salary adjustments for the named executive officers ranged from 0% to 12% based on the executive’s individual performance and position within the relevant salary range.
| | | |
Executive Officer | | Percentage of
Base Salary
Adjustment
in Fiscal Year 2008 | |
Frank Verwiel, M.D. | | 12 | % |
President and Chief Executive Officer | | | |
David Mims | | 8 | % |
Executive Vice President and Chief Operating Officer | | | |
Steve Gannon | | 11 | % |
Senior Vice President, Finance and Chief Financial Officer | | | |
Nicholas Franco | | 0 | % |
Senior Vice President, International Commercial Operations | | | |
Richard Tarte | | 4 | % |
Vice President, Corporate Development and General Counsel | | | |
Due to his recent date of hire, Mr. Franco was ineligible for a base salary adjustment in fiscal year 2008. Payment of base salaries were made in the currency of the named executive officer’s country of residence. The base salaries for the named executive officers in fiscal year 2008 are set forth below in “Executive Compensation Tables—Summary Compensation Table”.
Performance-Based Cash Incentives
Prior to the February 2008 Transactions in fiscal year 2008, the named executive officers participated in Axcan Pharma’s Annual Incentive Compensation Plan, or the Incentive Plan, a program designed to maximize corporate and individual performance by establishing specific, ambitious operational and financial goals at the beginning of the fiscal year and providing financial incentives to employees based on the level of achievement of these goals. Cash incentives granted to the named executive officers under the Incentive Plan required the approval of both the Axcan Pharma Compensation Committee and Axcan Pharma Board and were based upon an assessment ofcorporateand individual performance, respectively described as:
| | • | | Corporate performance, a measure of corporate net sales and operating income goals; and |
| | • | | Individual performance, determined by means of an evaluation under Axcan Pharma’s formal performance management program and general discharge of duties. |
The weighting of corporate performance measures and individual performance measures varied for each named executive officer as described in more detail below.
The annual incentive targets were reviewed and established as part of Axcan Pharma’s annual benchmarking of executive compensation. For fiscal year 2008, the Axcan Pharma Compensation Committee and Axcan Pharma Board decided to maintain the same annual performance-based cash incentive targets for its named executive officers as in fiscal year 2007, determining that this would deliver total cash compensation levels that were aligned with the market. Under the terms of the Incentive Plan, incentive compensation awards were not intended to be paid to any named executive officers, including the President and Chief Executive Officer, if minimum performance objectives were not met. Incentive targets were established to provide median total cash compensation when Axcan Pharma’s performance objectives were achieved, the potential for above median total cash compensation when Axcan Pharma’s performance objectives were exceeded and the risk of below median total cash compensation when Axcan Pharma did not achieve its annual performance objectives.
- 122 -
The following table sets forth the annual cash incentive targets determined by Axcan Pharma for each named executive officer for fiscal year 2008 as well as the weighting of corporate performance measures and individual performance measures for each named executive officer under the Incentive Plan. The actual percentage of base salary which serves as the basis for non-equity incentive award calculations may be more or less than the annual incentive target shown in the table below, depending on the individual performance evaluation. Furthermore, corporate and individual weightings may vary slightly depending on the specific responsibilities and span of control of the respective named executive officer.
| | | | | | | | | |
Name and Principal Position | | Annual Incentive
Target
(as % of Base
Salary) | | | Corporate
Performance
Weighting | | | Individual
Performance
Weighting | |
Frank Verwiel, M.D. | | 60 | % | | 100 | % | | 0 | % |
President and Chief Executive Officer | | | | | | | | | |
David Mims | | 45 | % | | 90 | % | | 10 | % |
Executive Vice President and Chief Operating Officer | | | | | | | | | |
Steve Gannon | | 45 | % | | 85 | % | | 15 | % |
Senior Vice President, Finance and Chief Financial Officer | | | | | | | | | |
Nicholas Franco | | 40 | % | | 85 | % | | 15 | % |
Senior Vice President, International Commercial Operations | | | | | | | | | |
Richard Tarte | | 35 | % | | 80 | % | | 20 | % |
Vice President, Corporate Development and General Counsel | | | | | | | | | |
The following tables generally illustrate the potential payouts under the Incentive Plan for the corporate and the individual performance measures, which are calculated separately. The corporate performance target table below does not illustrate the full incremental range of potential target annual incentive payouts. Upon Axcan Pharma’s achievement of 80% of its corporate performance targets, 50% of the target annual incentive payout would be earned and for approximately every 5% of the corporate performance target achieved above the 80% level, the annual incentive payout earned would increase by 12.5%. For example, if Axcan Pharma achieved between 105.0% to 109.9999% of its corporate performance targets, 112.5% of the target annual incentive payout would be earned. If either corporate performance or individual performance did not meet a certain threshold, then, generally, no incentive award would be granted to the named executive officer. Regardless of corporate and/or individual performance, no non-equity incentive awards were guaranteed and all such awards were subject to the discretion of the Axcan Pharma Board.
| | | | | | | | |
Percentage of Corporate
Performance Targets Achieved | | Percentage of Target Annual
Incentive Payout Earned
(Corporate) | | | | Individual Performance
Evaluation Received | | Percentage of Target Annual
Incentive Payout Earned
(Individual) |
140% of target or more | | 200% of target | | | | Excellent | | 110% to 115% of target |
100% of target | | 100% of target | | | | Exceeds Expectations | | 105% to 110% of target |
| | | | | | Fully Effective | | 95% to 105% of target |
Less than 80% of target | | 0% of target | | | | Needs Improvement | | 50% to 95% of target |
| | | | | | Below Expectations | | 0% of target |
Each fiscal year, with the exception of Axcan Pharma’s President and Chief Executive Officer, each named executive officer’s individual performance was measured in part by the evaluation of his direct supervisor, who gave his recommended evaluation of the named executive officer to the Axcan Pharma Compensation Committee for its review and consideration. The Axcan Pharma Compensation Committee ultimately made a recommendation to the Axcan Pharma Board for the individual performance evaluation of such named executive officer. The individual performance of Axcan Pharma’s President and Chief Executive Officer, Dr. Frank Verwiel, was to be evaluated by the Axcan Pharma Compensation Committee and the Axcan Pharma Board.
- 123 -
Long-Term Equity Incentives
Generally, annual grants of long-term equity incentive awards were made by Axcan Pharma to its named executive officers on a discretionary basis. Each fiscal year, the Axcan Pharma Compensation Committee and Axcan Pharma Board reviewed the long-term equity incentive award levels as part of Axcan Pharma’s annual benchmarking of executive compensation. The Axcan Pharma Compensation Committee, after considering each named executive officer’s individual performance measured against Axcan Pharma’s set financial and other corporate objectives for the fiscal year, recommended certain long-term equity incentive awards for each named executive officer to the Axcan Pharma Board for approval.
In fiscal year 2007, the potential for long-term equity incentive awards earned by named executive officers was increased over previous years in order to improve the competitive positioning of Axcan Pharma’s overall executive compensation program, and to more closely align executive interests with those of shareholders. Long- term incentive awards were granted pursuant to the Axcan Pharma Inc. 2006 Stock Incentive Plan, or the 2006 Plan (as discussed further below), and generally, 50% of the value of the awards consisted of options to purchase Axcan Pharma common stock and the other 50% of the value was comprised of restricted stock units, or RSU, each RSU being equal, for the purposes of the long-term equity incentive awards, to 2.25 options.
As with the other components of the Program, target long-term equity incentive awards were established to provide median total direct compensation when Axcan Pharma’s performance objectives were achieved, the potential for above median total direct compensation when Axcan Pharma’s performance objectives were exceeded and the risk of below median total direct compensation when Axcan Pharma did not achieve its annual performance objectives.
The following table generally summarizes the annual long-term incentive target award levels for each of the named executive officers for fiscal year 2008, prior to the February 2008 Transactions. These levels did not change from fiscal year 2007. The percentage representing the annual long-term incentive target award is a percentage of the midpoint of the salary range for each named executive officer’s position.
| | | |
Name and Principal Position | | Annual Long-Term Incentive Target
Award as % of Salary Range
Midpoint | |
Frank Verwiel, M.D. | | 200 | % |
President and Chief Executive Officer | | | |
David Mims | | 175 | % |
Executive Vice President and Chief Operating Officer | | | |
Steve Gannon | | 175 | % |
Senior Vice President, Finance and Chief Financial Officer | | | |
Nicholas Franco | | 150 | % |
Senior Vice President, International Commercial Operations | | | |
Richard Tarte | | 125 | % |
Vice President, Corporate Development and General Counsel | | | |
Because Axcan Pharma was engaged in discussions regarding possible strategic alternatives for its business at the end of fiscal year 2007 and an agreement to enter into the February 2008 Transactions was entered into during November 2007, no annual long-term incentive awards were granted to Axcan Pharma’s named executive officers for fiscal year 2007 performance. For a discussion of long-term equity incentive awards granted in fiscal year 2008, see “Compensation Discussion and Analysis for Axcan Intermediate Holdings in Fiscal Year 2008 After the February 2008 Transactions—Compensation Elements—Long-Term Equity Incentives”.
Equity Compensation Plans
Prior to the consummation of the February 2008 Transactions in fiscal year 2008 there was one plan, the 2006 Plan, under which options to purchase Axcan Pharma common stock and RSU were available for grant. Axcan Pharma had one other stock option plan, the 1995 Axcan Pharma Inc. Stock Option Plan as Amended and Restated on January 9, 2002, or the 2002 Plan, under which there were options outstanding to purchase Axcan Pharma common stock. As of February 22, 2006, Axcan Pharma no longer issued options under the 2002 Plan. The number of common shares covered by any stock option, the exercise price, expiry date and vesting period of such stock option and any other matter pertaining thereto were determined by the Axcan Pharma Board or the Axcan Pharma Compensation Committee at the time of its grant.
- 124 -
Under the 2006 Plan, there were three categories of equity grants for employees: (1) Annual Grants which were intended to strengthen the connection between pay and performance and provide a market competitive compensation program; (2) Special Grants which were intended to reward exceptional performance; and (3) New Hire Grants for new employees of Axcan Pharma at the vice president level or higher. As noted above, Annual Grants under the 2006 Plan generally included both stock options and RSU. New Hire Grants were solely in the form of stock options. Other forms of awards were also considered under the 2006 Plan in order to provide tax-effective incentives under local laws and regulations in a manner that was cost effective for Axcan Pharma, but none of these types of awards were granted to executive officers under the 2006 Plan.
Generally, any RSU granted under the 2006 Plan vested three years after grant and any options granted under the 2006 Plan vested in equal annual increments over a three-year period, except for New Hire Grants which vested ratably over five years. Any options previously granted by Axcan Pharma under the 2002 Plan vested in equal annual increments over a five-year period. Any options granted under the 2002 Plan and the 2006 Plan were non-assignable and generally had an exercise price equal to the market value of the common shares on the date immediately preceding the grant of such stock option. Under both of these plans, no single person could be granted options covering more than 5% of Axcan Pharma’s issued and outstanding common shares. The exercise period for options granted was limited to a maximum of ten years under the 2002 Plan and seven years under the 2006 Plan. The 2002 Plan and the 2006 Plan both provide that no more than 10% of the outstanding common shares of Axcan Pharma may be reserved for issuance pursuant to awards granted to “insiders” (as such term is defined in the Securities Act (Quebec)) of Axcan Pharma, including the directors and officers of it and its subsidiaries, on the date of reservation of such shares, or issued to such insiders within a one-year period.
As described above in “The Transactions” and below in “Compensation Discussion and Analysis for Axcan Intermediate Holdings in Fiscal Year 2008 After the February 2008 Transactions—Payments Received by Named Executive Officers in Connection with the February 2008 Transactions” of this Annual Report on Form 10-K, all options held under the 2002 and 2006 Plans by Axcan Pharma’s named executive officers employed by Axcan Pharma at the time of the closing of the February 2008 Transactions were vested, transferred by the holder of such option to Axcan Pharma and cancelled in exchange for an amount in cash equal to the excess, if any, of the offer price of $23.35 over the applicable option exercise price for each share of common stock subject to such option, less any required withholding taxes. In addition, each RSU held by Axcan Pharma’s named executive officers at the time of the closing of the February 2008 Transactions was vested and terminated in exchange for the offer price of $23.35, less any required withholding taxes.
Other Benefits and Perquisites
Benefits
Axcan Pharma’s benefit programs in fiscal year 2008 were targeted to be competitive with other pharmaceutical companies. They included competitive health, welfare and retirement plans. The benefit programs provided to the named executive officers were generally the same benefits provided to the employee population at large. Although the types of benefits offered to Axcan Pharma’s named executive officers were similar, the cost paid by Axcan Pharma to secure such benefits varied depending on the country of residence of the named executive officer. In fiscal year 2008, Axcan Pharma did not have a pension plan or exceptional retirement benefits for any employee group including the named executive officers with the exception of the President and Chief Executive Officer who was provided a competitive supplemental executive retirement plan, as described below under “Retirement Plans”, according to the terms of his employment agreement.
Perquisites
As disclosed in the “All Other Compensation” column in the “Summary Compensation Table” below in “Executive Compensation Tables”, Axcan Pharma provided its named executive officers with additional compensation in the form of perquisites. This compensation was targeted to be competitive with other pharmaceutical companies and included a car allowance or a company-provided vehicle.
Retirement Plans
In fiscal year 2008, Axcan Pharma maintained defined contribution registered retirement plans in the form of a 401K Plan for all of its U.S. employees and a registered retirement savings plan, or RRSP/DPSP, for all of its employees in Canada, including the named executive officers residing in each location. Axcan Pharma did not maintain a supplemental retirement plan, pension plan or any other retirement benefits for any executive or employee groups other than Dr. Verwiel.
- 125 -
As part of Dr. Verwiel’s employment agreement with Axcan Pharma prior to the February 2008 Transactions, Axcan Pharma agreed to implement a Supplemental Executive Retirement Plan, or SERP, on his behalf. In fiscal year 2008, Axcan Pharma provided Dr. Verwiel with a cash payment equal to $635,454, representing 26.9% of his base salary plus his annual bonus paid under the Incentive Plan for the fiscal years 2005, 2006 and 2007. Axcan Pharma also committed to provide Dr. Verwiel, during each fiscal year of his employment with Axcan Pharma, a cash payment equivalent to 26.9% of his base salary for the respective fiscal year payable in quarterly installments and a cash payment equivalent to 26.9% of his annual bonus payment under the Incentive Plan for such fiscal year. The contribution level was intended to provide Dr. Verwiel with an after-tax retirement fund at retirement age that is equivalent in value to a Defined Benefit (DB) pension plan with a 2% accrual rate per year of service. However, unlike a DB pension plan, Dr. Verwiel was responsible for managing the investment of his retirement fund and Axcan Pharma did not accrue an ongoing balance sheet liability for the fund.
Employee Stock Purchase Plan
During fiscal year 2008 prior to the February 2008 Transactions, Axcan Pharma maintained an Employee Stock Purchase Plan, or ESPP, for all of its Canadian employees, including Dr. Verwiel, Mr. Gannon and Mr. Tarte. Under the ESPP, employees were able to contribute up to 5% of their base salary towards the purchase of shares of Axcan Pharma common stock. If an employee made such contribution, Axcan Pharma agreed to also participate in the ESPP by matching 50% of the employee’s contribution to the ESPP. Shares purchased by the employee vested immediately. Shares purchased with the funds contributed by Axcan Pharma were allocated to the employee’s contribution account and were vested at the end of each calendar year if, at such time, the shares purchased by the employee under the ESPP remained in his subscription account and the shares purchased with Axcan Pharma’s contribution had been in the contribution account for a twelve-month period following their date of purchase. Axcan Pharma also maintained an Employee Stock Purchase Plan for its U.S. employees, but none of the named executive officers participated in such plan.
Compensation Discussion and Analysis for Axcan Intermediate Holdings in Fiscal Year 2008 After the February 2008 Transactions
Overview
Since, after the consummation of the February 2008 Transactions, our named executive officers are also the executive officers of our indirect parent Holdings, compensation and related matters related to our named executive officers are reviewed by the Compensation Committee of Holdings, or the Holdings Compensation Committee, which then makes recommendations regarding executive compensation to the Board of Directors of Holdings, or the Holdings Board. Please see “Item 10. Directors, Executive Officers and Corporate Governance” for further details regarding the composition of the Holdings Board. As described below in “Employment Agreements and Potential Payments upon Certain Terminations”, following the February 2008 Transactions, Holdings entered into new employment agreements with certain of our named executive officers under which our named executive officers agreed to serve in certain capacities for us, Holdings and certain subsidiaries of Holdings.
Executive Compensation Philosophy and Objectives
With respect to fiscal year 2008, after the consummation of the February 2008 Transactions, our executive compensation philosophy was substantially similar to that of Axcan Pharma prior to the February 2008 Transactions. The Holdings Board and Holdings Compensation Committee followed the same four principles when making compensation decisions as set forth above in “Compensation Discussion and Analysis for Axcan Pharma in Fiscal Year 2008 Prior to the February 2008 Transactions—Executive Compensation Philosophy and Objectives”, ensuring the compensation was performance-based, aligned with investors’ interests, competitive with the market, and considerate of the individual’s achievement of certain objectives. Perhaps the most significant development in our compensation philosophy following the consummation of the February 2008 Transactions has been a greater emphasis on correlating compensation to long-term equity growth. As discussed in greater detail below, the Holdings Compensation Committee has provided equity investment opportunities tied to financial objectives and all of our named executive officers have chosen to subscribe for additional shares of Holdings.
Compensation Methodology
In fiscal year 2008 following the February 2008 Transactions, our executive compensation program consisted of the same three basic components as Axcan Pharma’s Program: (1) a Base Salary that was internally equitable and externally competitive; (2) Annual Performance-Based Cash Incentives linked to our performance and the performance of our individual executive officers; and (3) Long-Term Equity Incentives comprised of equity-based compensation.
- 126 -
Neither the Holdings Compensation Committee nor the Holdings Board engaged in formal benchmarking practices with a third-party consultant during fiscal year 2008. However, we believe that each component of our executive compensation in fiscal year 2008 was aligned with competitive market practices and levels for executives from competitor organizations of comparable revenue and market capitalization size and other pharmaceutical companies that we compete with for talent.
Compensation Elements
The principal elements of compensation for our named executive officers during fiscal year 2008 were (1) Base Salary; (2) Annual Performance-Based Cash Incentives; (3) Long-Term Equity Incentives; and (4) Other Benefits and Perquisites.
Base Salary
The fiscal year 2008 base salaries of our named executive officers after the February 2008 Transactions did not change from their previous levels prior to the February 2008 Transactions. We expect that decisions on fiscal year 2009 base salary adjustments for our named executive officers will be made by the Holdings Board in the first quarter of fiscal year 2009. The base salaries for the named executive officers in fiscal year 2008, including the amounts paid before and after the February 2008 Transactions, are set forth below in “Executive Compensation Tables—Summary Compensation Table”.
Performance-Based Cash Incentives
Following the February 2008 Transactions, our named executive officers continued to be eligible for annual performance-based cash incentive awards under the Incentive Plan, which, with the exception of an amendment to change the evaluation of corporate performance to a measurement of corporate net sales and EBITDA goals rather than corporate net sales and operating income goals, was identical to its description in “Compensation Discussion and Analysis for Axcan Pharma in Fiscal Year 2008 Prior to the February 2008 Transactions—Compensation Elements—Performance-Based Cash Incentives”. In the first quarter of fiscal year 2009, upon the recommendation of the Holdings Compensation Committee, the Holdings Board granted the following performance-based cash incentive awards to our named executive officers under the Incentive Plan for fiscal year 2008 performance:
| | | |
Name and Principal Position | | Performance-Based
Cash Incentive Awards
for Fiscal Year 2008 |
Frank Verwiel, M.D. | | $ | 580,500 |
President and Chief Executive Officer | | | |
David Mims | | | 262,123 |
Executive Vice President and Chief Operating Officer | | | |
Steve Gannon | | | 182,276 |
Senior Vice President, Finance and Chief Financial Officer | | | |
Nicholas Franco | | | 177,851 |
Senior Vice President, International Commercial Operations | | | |
Richard Tarte | | | 109,020 |
Vice President, Corporate Development and General Counsel | | | |
Long-Term Equity Incentives
We do not anticipate that annual grants of long-term equity incentive awards will be made to our named executive officers. Currently, there is one plan under which our named executive officers receive long-term equity incentive awards, the Axcan Holdings Inc. Management Equity Incentive Plan, or the Management Equity Incentive Plan, which provides for the grant of options to purchase Holdings common stock, or Holdings Options, to our own and our affiliates’ key employees, directors, service providers and consultants. The Management Equity Incentive Plan was approved on April 15, 2008 and is discussed in more detail below. Under the Management Equity Incentive Plan, our named executive officers received one-time equity incentive awards in fiscal year 2008.
- 127 -
The Axcan Holdings Inc. Management Equity Incentive Plan
Generally, for any grant made under the Management Equity Incentive Plan, 50% of the Holdings Options granted vest based on continued employment (time-based options), 25% vest based on continued employment and have an exercise price that increases annually (premium options), and 25% vest based on continued employment and upon the occurrence of a liquidity event and the achievement of specified performance targets (performance-based options). Subject to the participant’s continued employment with us, the time-based and premium options vest ratably on each of the first through fifth anniversaries of the date of grant and the performance-based options have the potential to vest, following the occurrence of a Liquidity Event (as defined in the Management Equity Incentive Plan), upon the realization of certain profits by the Sponsor Funds and/or their affiliates as a result of such event(s), calculated by comparing the value of the cash or certain securities obtained in exchange for the equity of Holdings held by the Sponsor Funds and/or their affiliates to the Sponsor Funds’ initial investment in the February 2008 Transactions. For our employees who are residents of France, the Management Equity Incentive Plan has been amended to include a French sub-plan. The French sub-plan amends certain guidelines set forth in the Management Equity Incentive Plan in order to allow our French employees to benefit from, as it relates to the Holdings Options, the favorable tax and social regime under French law.
Upon termination of a participant’s employment, the Management Equity Incentive Plan provides that, subject to the terms of any participant’s employment agreement, any unvested portion of a participant’s Holdings Options will be forfeited, and that the vested portion of his or her Holdings Options will expire on the earlier of (1) the date the participant’s employment is terminated for cause, (2) 90 days after the date the participant’s employment is terminated by us for any reason other than cause, death or disability, (3) one year after the date the participant’s employment is terminated by reason of death or disability, except for those employees subject to the French sub-plan for whom Holdings Options will expire 6 months after the participant’s death, or (4) the tenth anniversary of the grant date of the Holdings Option. However, if a participant’s employment is terminated by us without Cause (as defined in the Management Equity Incentive Plan) or by the participant for Good Reason (as defined in the Management Equity Incentive Plan) during the two-year period following a Change in Control (as defined in the Management Equity Incentive Plan), all time-based and premium options will immediately vest and become exercisable as of the date of such termination.
Under the Management Equity Incentive Plan, 3,833,307 shares of Holdings common stock were reserved for issuance. The Holdings Board or a committee appointed by the Holdings Board is responsible for administering the Management Equity Incentive Plan and authorizing the grant of Holdings Options pursuant thereto, and may amend the Management Equity Incentive Plan (and any Holdings Options) at any time with certain restrictions. As of September 30, 2008 there were 3,648,000 Holdings Options outstanding under the Management Equity Incentive Plan. All of the outstanding Holdings Options have been granted to our employees and, specifically, 1,790,000 were granted to our named executive officers in fiscal year 2008 and remain outstanding (640,000 Holdings Options to Dr. Verwiel, 410,000 Holdings Options to Mr. Mims, 335,000 Holdings Options to Mr. Gannon, 230,000 Holdings Options to Mr. Franco and 175,000 Holdings Options to Mr. Tarte).
Prior to receiving shares of Holdings common stock (whether pursuant to the exercise of Holdings Options or otherwise), participants must execute a Management Stockholders’ Agreement, which provides that the shares are subject to certain transfer restrictions, put and call rights, and tag-along and drag-along rights.
Other Benefits and Perquisites
The elements of the benefits and perquisites offered to our named executive officers following the February 2008 Transactions are substantially similar to those offered by Axcan Pharma to the named executive officers in fiscal year 2008 prior to the February 2008 Transactions. However, we did not have an Employee Share Purchase Plan and did not institute a SERP for Dr. Verwiel in fiscal year 2008 following the February 2008 Transactions.
- 128 -
Payments Received by Named Executive Officers in Connection with the February 2008 Transactions
At the time of the February 2008 Transactions, each of our named executive officers held, in some combination, (1) shares of Axcan Pharma common stock, (2) granted and outstanding options to purchase common stock of Axcan Pharma and/or (3) vested or unvested restricted stock units, or RSU. Upon closing of the February 2008 Transactions, our named executive officers received the same consideration for their equity holdings in Axcan Pharma as other such holders. Specifically:
(1) each outstanding share of Axcan Pharma common stock was deemed transferred to Axcan Intermediate Holdings Inc. in exchange for a payment of $23.35 per share, or the offer price, without interest and less any required withholding taxes;
(2) all granted and outstanding options to purchase common stock of Axcan Pharma under Axcan Pharma’s stock plans were deemed vested and transferred to Axcan Pharma and cancelled in exchange for an amount in cash equal to the excess, if any, of the offer price over the applicable option exercise price for each share of common stock subject to such option, less any required withholding taxes; and
(3) all vested and unvested RSU, issued under Axcan Pharma’s stock option plans were deemed vested and then cancelled and terminated. Each holder of a RSU received the offer price, less any required withholding taxes, for each RSU formerly held.
Additional Compensation Granted in Connection with the February 2008 Transactions
Change-of-Control Payments
Pursuant to the respective employment agreements of Dr. Verwiel and Mr. Mims with Axcan Pharma in effect as of the consummation of the February 2008 Transactions, upon a Change of Control (as defined in the employment agreements), of Axcan Pharma Inc. both Dr. Verwiel and Mr. Mims were entitled to a payment equal to two times his annual base salary plus the average of the bonuses he had received during the past two full fiscal years, or the change-of-control payment. The February 2008 Transactions constituted a Change of Control under the employment agreements of both Dr. Verwiel and Mr. Mims. On March 5, 2008, Mr. Mims entered into a general release of claims with Axcan Pharma Inc. in consideration of the change-of-control payment of $1,233,839. On May 16, 2008, Dr. Verwiel entered into a general release of claims with Axcan Pharma in consideration for a change-of-control payment of $2,674,351.
Additional Equity Grants Following the February 2008 Transactions
Dr. Verwiel and Mr. Mims, in consideration of their continued employment with us, received a one-time nonrecurring equity grant on April 15, 2008 in the form of restricted stock units. Dr. Verwiel and Mr. Mims received, respectively, 77,834 and 108,578 RSU. Such RSU are, upon vesting and settlement, convertible into shares of Holdings common stock. For Dr. Verwiel, all of the granted RSU vested immediately upon grant and, for Mr. Mims, approximately one-third of the RSU vested immediately upon grant and, subject to Mr. Mims’ continued employment with us, the remainder of the RSU are scheduled to vest in two equal installments on August 25, 2009 and August 25, 2010, respectively. Additionally, pursuant to Dr. Verwiel’s employment agreement, we agreed to grant Dr. Verwiel 155,666 RSU on August 25, 2009, one-half of which shall vest immediately upon grant and one-half of which shall vest on August 25, 2010. Vested RSU shall be settled into shares of Holdings common stock, with certain exceptions, on the earlier of: (1) four years from the date of grant, or April 15, 2012; (2) the termination of the officer’s employment; (3) a Liquidity Event (as defined in the Management Equity Incentive Plan); and (4) a Change in Control (as defined in the Management Equity Incentive Plan).
Mr. Gannon and Mr. Tarte, in consideration of their continued employment with us, received a one-time equity grant on April 15, 2008 in the form of penny options, or options to purchase shares of common stock of Holdings for $0.01. Mr. Gannon and Mr. Tarte received, respectively, 96,436 and 54,873 penny options pursuant to the terms of a Penny Option Grant Agreement which each officer entered into with Holdings on April 15, 2008. Approximately one-third of these penny options vested on April 15, 2008 and, subject to each officer’s continued respective employment with us, the remainder of the penny options are scheduled to vest in two equal installments on August 25, 2009 and August 25, 2010, respectively.
- 129 -
Compensation Committee Report
The following report of the Holdings Compensation Committee is included in accordance with the rules and regulations of the Securities and Exchange Commission. It is not incorporated by reference into any of our registration statements under the Securities Act of 1933, as amended.
Compensation Committee Report
The Holdings Compensation Committee has reviewed and discussed the Compensation Discussion and Analysis, or CD&A, with management. Based upon the review and discussions, the Holdings Compensation Committee recommended to the Board of Directors of Axcan Intermediate Holdings Inc., and such board approved, that the CD&A be included in the Form 10-K for the year ended September 30, 2008.
Respectfully submitted on December 18, 2008 by the members of the Compensation Committee of the Board of Directors of Axcan Holdings Inc.:
Todd Sisitsky
Fred Cohen
Frank Verwiel
Executive Compensation Tables
In fiscal year 2008, certain of our named executive officers were compensated in non-U.S. currency, depending on the officer’s country of residence. Generally, Dr. Verwiel, Mr. Gannon and Mr. Tarte were compensated in Canadian dollars and Mr. Franco was compensated in Euros. Unless otherwise indicated, in the executive compensation tables presented below, all cash compensation paid to the named executive officers has been converted into U.S. dollars using an exchange rate equal to the average of the monthly average exchange rates for each respective currency conversion during fiscal year 2008 as calculated by the Bank of Canada. For conversions of Canadian dollars to U.S. dollars, this rate was equal to 1.0065 and for conversions of Euros to U.S. dollars, this rate was equal to 0.6649. As designated by footnotes, figures related to equity compensation in the tables below may have been converted using a different exchange rate in order to accurately reflect values related to such equity compensation at a particular time, such as the date of grant.
Summary Compensation Table
The information set forth below in this section reflects the compensation awarded to, earned by, or paid to our named executive officers in fiscal year 2008 for their services rendered in all capacities to us and our subsidiaries, including compensation paid by Axcan Pharma to our named executive officers prior to the February 2008 Transactions.
| | | | | | | | | | | | | | | | | | | | | | | |
Name and Principal Position | | Year | | Salary
($)(1) | | Bonus
($)(2) | | Restricted Stock
Awards
($)(3) | | Option
Awards
($)(4) | | Non-Equity
Incentive Plan
Compensation
($)(5) | | All other
Compensation
($)(6) | | Total
Compensation
($) |
Frank Verwiel, M.D. | | 2008 | | $ | 645,000 | | $ | 750,000 | | $ | 1,216,618 | | $ | 154,505 | | $ | 580,500 | | $ | 6,150,326 | | $ | 9,496,949 |
President and Chief Executive Officer | | | | | | | | | | | | | | | | | | | | | | | |
David Mims | | 2008 | | | 387,426 | | | 75,000 | | | 565,730 | | | 98,980 | | | 262,123 | | | 4,084,610 | | | 5,473,869 |
Executive Vice President and Chief Operating Officer | | | | | | | | | | | | | | | | | | | | | | | |
Steve Gannon | | 2008 | | | 336,364 | | | 60,000 | | | 502,466 | | | 80,874 | | | 182,276 | | | 766,140 | | | 1,928,120 |
Senior Vice President, Finance and Chief Financial Officer | | | | | | | | | | | | | | | | | | | | | | | |
Nicholas Franco | | 2008 | | | 368,476 | | | 40,000 | | | — | | | 55,525 | | | 177,851 | | | 406,210 | | | 1,048,062 |
Senior Vice President, International Commercial Operations | | | | | | | | | | | | | | | | | | | | | | | |
Richard Tarte | | 2008 | | | 260,387 | | | 25,000 | | | 285,908 | | | 42,247 | | | 109,020 | | | 1,195,938 | | | 1,918,500 |
Vice President, Corporate Development and General Counsel | | | | | | | | | | | | | | | | | | | | | | | |
(1) | Dr. Verwiel’s base salary is USD$645,000 per year but he is currently compensated in Canadian dollars. An adjustment will be made at the end of calendar year 2008 so that, after taking into account currency conversions, Dr. Verwiel will have been paid USD$645,000 in base salary by us for his services in fiscal year 2008. |
(2) | Amounts set forth in the Bonus column represent a special one-time incentive bonus paid to our named executive officers that related to their performance in fiscal year 2008. |
(3) | Amounts set forth in the Restricted Stock Awards column represent the aggregate amount recognized for financial statement reporting purposes with respect to the named executive officers for the fiscal year ended September 30, 2008 calculated in accordance with SFAS 123(R), disregarding the estimate of forfeitures related to service-based vesting conditions. For a discussion of the assumptions used in SFAS 123R for fiscal year 2008, see Note 14 to our audited consolidated financial statements for the fiscal year ended September 30, 2008 contained in this |
- 130 -
| | report. The respective values set forth in this column for Mr. Gannon and Mr. Tarte include the amount recognized for financial statement reporting purposes for the fiscal year 2008 due to our grant of penny options to Mr. Gannon and Mr. Tarte as detailed above in “Compensation Discussion and Analysis for Axcan Intermediate Holdings in Fiscal Year 2008 After the February 2008 Transactions—Additional Compensation Granted in Connection with the February 2008 Transactions—Additional Equity Grants Following the February 2008 Transactions.” |
(4) | Amounts set forth in the Option Awards column represent the aggregate amount recognized for financial statement reporting purposes with respect to the named executive officers for the fiscal year ended September 30, 2008 calculated in accordance with SFAS 123(R), disregarding the estimate of forfeitures related to service-based conditions. The fair value of the stock was calculated using a Black-Scholes option-pricing model. For a discussion of the assumptions used by us for fiscal year 2008, see Note 14 to Axcan Pharma’s audited consolidated financial statements for the fiscal year ended September 30, 2008 contained in this report. |
(5) | The values in this column represent, in U.S. dollars, incentive awards under the Incentive Plan earned by the named executive officers in fiscal year 2008, but paid in fiscal year 2009. Since the incentive awards granted to Mr. Gannon and Mr. Tarte were paid in Canadian dollars and the incentive award granted to Mr. Franco was paid in Euros, the values for such awards have been converted to U.S. dollars using an exchange rate of 1.2372 Canadian dollars to one U.S. dollar and 0.7877 Euros to one U.S. dollar, respectively. |
(6) | All other compensation includes the compensation set forth in the table below: |
| | | | | | | | | | | | | | | | | | |
Name & Principal Position | | Car Allowance
and/or Company-
Paid Car ($) | | Company
Contributions
to Defined
Contribution
Plans ($)(a) | | Insurance
Premiums
($)(b) | | Payments Related
to February 2008
Transactions (c) | | Other (d) | | Total ($) |
Frank Verwiel, M.D. | | $ | 17,884 | | $ | 15,330 | | $ | 10,907 | | $ | 5,242,041 | | $ | 864,164 | | $ | 6,150,326 |
President and Chief Executive Officer | | | | | | | | | | | | | | | | | | |
David Mims | | | 9,775 | | | 9,554 | | | 15,239 | | | 4,050,042 | | | — | | | 4,084,610 |
Executive Vice President and Chief Operating Officer | | | | | | | | | | | | | | | | | | |
Steve Gannon | | | 10,134 | | | 16,360 | | | 2,353 | | | 737,294 | | | — | | | 766,140 |
Senior Vice President, Finance and Chief Financial Officer | | | | | | | | | | | | | | | | | | |
Nicholas Franco | | | 33,251 | | | — | | | 166,405 | | | 151,440 | | | 55,115 | | | 406,211 |
Senior Vice President, International Commercial Operations | | | | | | | | | | | | | | | | | | |
Richard Tarte | | | 10,134 | | | 13,085 | | | 5,683 | | | 1,167,036 | | | — | | | 1,195,938 |
Vice President, Corporate Development and General Counsel | | | | | | | | | | | | | | | | | | |
(a) | Company contributions to defined contribution plans includes contributions to 401K and RRSP/DPSP matching funds, as well as to the ESPP during fiscal year 2008. |
(b) | This column includes payments for life and disability insurance, as well as medical and dental benefits. In addition, $4,655 in additional life insurance and long-term disability premiums were paid on behalf of Dr. Verwiel and $160,146 was paid to maintain an unemployment insurance policy for Mr. Franco since, in France, Mr. Franco’s country of residency, corporate officers who become unemployed are generally not eligible for unemployment benefits. |
(c) | The compensation paid to the named executive officers related to the February 2008 Transactions includes the compensation set forth below. |
- 131 -
| | | | | | | | | | | | | | | |
Name & Principal Position | | Compensation
for Axcan
Pharma
Options and
RSU Held(i) | | Change of
Control
Payments(ii) | | ESPP-Related
Compensation(iii) | | Equalization
Payments(iv) | | Total |
Frank Verwiel, M.D. | | $ | 2,356,705 | | $ | 2,674,351 | | $ | 66,685 | | $ | 144,300 | | $ | 5,242,041 |
President and Chief Executive Officer | | | | | | | | | | | | | | | |
David Mims | | | 2,816,203 | | | 1,233,839 | | | — | | | — | | | 4,050,042 |
Executive Vice President and Chief Operating Officer | | | | | | | | | | | | | | | |
Steve Gannon | | | 659,702 | | | — | | | 47,208 | | | 30,384 | | | 737,294 |
Senior Vice President, Finance and Chief Financial Officer | | | | | | | | | | | | | | | |
Nicholas Franco | | | 151,440 | | | — | | | — | | | — | | | 151,440 |
Senior Vice President, International Commercial Operations | | | | | | | | | | | | | | | |
Richard Tarte | | | 1,077,634 | | | — | | | 50,048 | | | 39,354 | | | 1,167,036 |
Vice President, Corporate Development and General Counsel | | | | | | | | | | | | | | | |
| (i) | As described above in “Compensation Discussion and Analysis for Axcan Intermediate Holdings in Fiscal Year 2008 After the February 2008 Transactions—Payments Received by Named Executive Officers in Connection with the February 2008 Transactions”, in connection with the February 2008 Transactions, our named executive officers received certain payments for all granted and outstanding options to purchase common stock of Axcan Pharma and/or all restricted stock units issued under any and all of Axcan Pharma’s existing equity plans which each respective officer held at the time of the consummation of the February 2008 Transactions. |
| (ii) | Dr. Verwiel and Mr. Mims were entitled, under their respective employment agreements, to a lump sum payment in the event that Axcan Pharma underwent a Change of Control (as defined in the agreements). The February 2008 Transactions were deemed to be a change of control under these agreements. |
| (iii) | As part of the ESPP, upon the February 2008 Transactions, the unvested portion of the shares of Axcan Pharma common stock purchased by either Axcan Pharma’s contributions to the ESPP on behalf of Dr. Verwiel, Mr. Gannon and Mr. Tarte or each individual officer’s respective contribution to the ESPP immediately vested and were transferred to us in exchange for the offer price as described above in “Compensation Discussion and Analysis for Axcan Intermediate Holdings in Fiscal Year 2008 After the February 2008 Transactions—Payments Received by Named Executive Officers in Connection with the February 2008 Transactions”. This column reflects the value received by the named executive officers upon such acceleration. |
(iv) | An equalization payment was made by Axcan Pharma in fiscal year 2008 in connection with the February 2008 Transactions to certain non-U.S. employees, including Dr. Verwiel, Mr. Gannon, and Mr. Tarte, to compensate such employees for the difference between non-U.S. option exercise prices and lower U.S. option exercise prices. The equalization payment was calculated by taking the difference between the non-U.S. employee option exercise price (converted from Canadian dollars to U.S. dollars using the applicable exchange rate on February 22, 2008, the last business day before the February 2008 Transactions, of 1.0156 Canadian dollars to one U.S. dollar) and the U.S. employee option exercise price at the time of the February 2008 Transactions (such difference being $1.75 for Dr. Verwiel, Mr. Gannon and Mr. Tarte), and multiplying that amount by the number of shares of Axcan Pharma which underlied such outstanding options held by the employee. Before equalization payments were made to our named executive officers, such payments were converted from U.S. dollars to Canadian dollars using an exchange rate of 1.0020 Canadian dollars to one U.S. dollar, the exchange rate at noon on February 25, 2008. Equalization payments were only given for stock option grants under the 2006 Plan. All grants issued under the 2002 Plan had an exercise price in U.S. currency and, therefore, an equalization payment was not needed. |
(d) | Consists of a cash payment of $635,454 made to Dr. Verwiel by Axcan Pharma in fiscal year 2008 in connection with his SERP as discussed above in “Compensation Discussion and Analysis for Axcan Pharma in Fiscal Year 2008 Prior to the February 2008 Transactions—Compensation Elements—Other Benefits and Perquisites”, a cash payment of $217,688 made to Dr. Verwiel by us pursuant to the terms of his employment agreement as a “match payment”, or a payment equal to one-half of the amount of Dr. Verwiel’s non-equity incentive award for fiscal year 2008 (this payment in fiscal year 2008 was pro-rated over a nine-month period) and $11,022 paid for the preparation of Dr. Verwiel’s annual tax returns. Mr. Franco received $36,998 in housing expenses and $18,117 in relocation expenses in fiscal year 2008. |
- 132 -
Grants of Plan-Based Awards
During fiscal year 2008, we granted equity awards to our named executive officers in the form of stock options under the Management Equity Incentive Plan and RSU and “penny options” pursuant to individual equity grant agreements. Information with respect to each of these awards on a grant-by-grant basis is set forth in the table below. All grants of equity awards in fiscal year 2008 were one-time nonrecurring awards given following the February 2008 Transactions. All plan-based awards were awarded at the discretion of the Holdings Board. For additional discussion of the Management Equity Incentive Plan, refer to “Compensation Discussion and Analysis for Axcan Intermediate Holdings in Fiscal Year 2008 After the February 2008 Transactions—Compensation Elements—Long-Term Equity Incentives”.
| | | | | | | | | | | | | | | | | | | | | | | | | | | |
Name and Principal Position | | Grant
Date | | Estimated Future Payouts
Under Non-Equity Incentive
Plan Awards (1) | | Estimated
Future
Payouts
Under
Equity
Incentive
Plan (2) | | All Other
Stock
Awards:
Number of
Shares of
Stock or
Units (3) | | All Other
Option
Awards:
Number of
Securities
Underlying
Options (4) | | Exercise or
Base Price
of Option
Awards | | | Closing
Market
Price on
Date
of Grant
(7) | | Grant
Date Fair
Value of
Stock and
Option
Awards
(8) |
| | | Threshold | | Target | | Maximum | | | | | | |
Frank Verwiel, M.D. | | — | | $ | 177,375 | | $ | 387,000 | | $ | 774,000 | | | | | | | | | | | | | | | | |
President and Chief Executive Officer | | 4/15/2008 | | | | | | | | | | | 160,000 | | | | | | $ | 10.00 | | | $ | 10.00 | | $ | 513,600 |
| | 4/15/2008 | | | | | | | | | | | | | 77,834 | | | | | | | | | | | | 778,340 |
| | 4/15/2008 | | | | | | | | | | | | | | | 320,000 | | | 10.00 | | | | 10.00 | | | 1,241,600 |
| | 4/15/2008 | | | | | | | | | | | | | | | 160,000 | | | 10.00 | (5) | | | 10.00 | | | 436,800 |
David Mims | | — | | | 71,746 | | | 161,428 | | | 206,269 | | | | | | | | | | | | | | | | |
Executive Vice President and Chief Operating Officer | | 4/15/2008 | | | | | | | | | | | 102,500 | | | | | | | 10.00 | | | | 10.00 | | | 329,025 |
| | 4/15/2008 | | | | | | | | | | | | | 108,578 | | | | | | | | | | | | 1,085,780 |
| | 4/15/2008 | | | | | | | | | | | | | | | 205,000 | | | 10.00 | | | | 10.00 | | | 795,400 |
| | 4/15/2008 | | | | | | | | | | | | | | | 102,500 | | | 10.00 | (5) | | | 10.00 | | | 279,825 |
Steve Gannon | | — | | | 53,030 | | | 121,212 | | | 156,818 | | | | | | | | | | | | | | | | |
Senior Vice President, Finance and Chief Financial Officer | | 4/15/2008 | | | | | | | | | | | 83,750 | | | | | | | 10.00 | | | | 10.00 | | | 268,838 |
| | 4/15/2008 | | | | | | | | | | | | | | | 96,436 | | | 0.01 | (6) | | | 10.00 | | | 964,360 |
| | 4/15/2008 | | | | | | | | | | | | | | | 167,500 | | | 10.00 | | | | 10.00 | | | 649,900 |
| | 4/15/2008 | | | | | | | | | | | | | | | 83,750 | | | 10.00 | (5) | | | 10.00 | | | 228,638 |
Nicholas Franco | | — | | | 64,483 | | | 147,390 | | | 190,686 | | | | | | | | | | | | | | | | |
Senior Vice President, International Commercial Operations | | 4/15/2008 | | | | | | | | | | | 57,500 | | | | | | | 10.00 | | | | 10.00 | | | 184,575 |
| | 4/15/2008 | | | | | | | | | | | | | | | 115,000 | | | 10.00 | | | | 10.00 | | | 446,200 |
| | 4/15/2008 | | | | | | | | | | | | | | | 57,500 | | | 10.00 | (5) | | | 10.00 | | | 156,975 |
Richard Tarte | | — | | | 37,556 | | | 87,361 | | | 115,172 | | | | | | | | | | | | | | | | |
Vice President, Corporate Development and General Counsel | | 4/15/2008 | | | | | | | | | | | 43,750 | | | | | | | 10.00 | | | | 10.00 | | | 140,438 |
| | 4/15/2008 | | | | | | | | | | | | | | | 54,873 | | | 0.01 | (6) | | | 10.00 | | | 548,730 |
| | 4/15/2008 | | | | | | | | | | | | | | | 87,500 | | | 10.00 | | | | 10.00 | | | 339,500 |
| | 4/15/2008 | | | | | | | | | | | | | | | 43,750 | | | 10.00 | (5) | | | 10.00 | | | 119,438 |
| (1) | This column shows the potential non-equity incentive awards that are possible under the Incentive Plan, as amended following the February 2008 Transactions, at the threshold, target and maximum levels of performance in fiscal year 2008. As discussed above in “Compensation Discussion and Analysis for Axcan Pharma in Fiscal Year 2008 Prior to the February 2008 Transactions—Compensation Elements— Performance-Based Cash Incentives” and “Compensation Discussion and Analysis for Axcan Intermediate Holdings in Fiscal Year 2008 After the February 2008 Transactions —Compensation Elements—Performance-Based Cash Incentives”, no incentive payments were to be paid under the Incentive Plan if both threshold fiscal and individual performance goals were not met. The threshold payments are based on the achievement of both the minimum corporate and individual performance necessary to yield a non-equity incentive award under the Incentive Plan. The target payments are based on achieving the 100% target level of performance for both corporate financial measures and individual performance measures. The maximum payments are based on the maximum incentive payments available to our named executive officers under the Incentive Plan as discussed above in “Compensation Discussion and Analysis for Axcan Pharma in Fiscal Year 2008 Prior to the February 2008 Transactions—Compensation Elements—Performance-Based Cash Incentives”. The actual non-equity incentive awards are reflected in the Summary Compensation Table. |
| (2) | This column represents the number of performance-based options granted to our named executive officers under the Management Equity Incentive Plan in fiscal year 2008 as part of an one-time nonrecurring grant. Under the terms of the Management Equity Incentive Plan, the amount of performance-based options that will vest is dependent upon the occurrence of a Liquidity Event (as defined in the Management Equity Incentive Plan) and the realization of certain profits by the Sponsor Funds and/or their affiliates as a result of such event(s), calculated by comparing the value of the cash or certain securities obtained in exchange for the equity of Holdings held by the Sponsor Funds and/or their affiliates to the Sponsor Funds’ initial investment in the February 2008 Transactions. Depending on these factors, all, none, or one-half of the performance-based options held by our named executive officers may vest upon the occurrence of the Liquidity Event (as defined in the Management Equity Incentive Plan), subject to the officer’s continued employment with us on the date of such event. |
| (3) | On April 15, 2008, Dr. Verwiel and Mr. Mims were awarded a one-time nonrecurring grant of RSU, in consideration of the respective officer’s continued employment with us. |
- 133 -
| (4) | On April 15, 2008, the Holdings Board granted all of our named executive officers certain one-time nonrecurring awards of Holdings Options. Specifically, Dr. Verwiel received 640,000 Holdings Options, Mr. Mims received 410,000 Holdings Options, Mr. Gannon received 335,000 Holdings Options, Mr. Franco received 230,000 Holdings Options and Mr. Tarte received 175,000 Holdings Options. Fifty percent of these were time-based options which, subject to the officer’s continued employment, vest in annual equal installments over a five-year period, 25% of these were premium options, which, subject to the officer’s continued employment, also vest in annual equal installments over a five-year period and 25% of these were performance-based options, which are discussed in footnote 2 to this table and represented in the “Estimated Future Payouts Under Equity Incentive Plan” column to this table. This column represents the time-based and premium options granted to the named executive officers in fiscal year 2008. |
| (5) | For the premium options granted under the Management Equity Incentive Plan to Dr. Verwiel, Mr. Mims, Mr. Gannon and Mr. Tarte, the exercise price of these options increases at a 10.00% compound rate on each anniversary of the date of grant of such options until, with certain exceptions, the earlier of: (a) the exercise of such option; (b) the fifth anniversary of the grant date of such option; (c) a Liquidity Event (as defined in the Management Equity Incentive Plan) or (d) the occurrence of a Change in Control (as defined in the Management Equity Incentive Plan) of Axcan Holdings Inc. For Mr. Franco, any premium options granted to him under the Management Equity Incentive Plan will be subject to the terms of the French sub-plan, under which the premium options will not be subject to an increasing exercise price over time. Rather, any vested premium options held by Mr. Franco will be exercisable in a percentage equal to (i) the percentage of the premium options exercisable under the terms of the Management Equity Incentive Plan multiplied by (ii) the difference between the fair market value of one share of Holdings common stock on the exercise date and the exercise price of the premium option to be exercised if it had accreted in price under the terms of the Management Equity Incentive Plan divided by (iii) the difference between the fair market value of the share and the exercise price of $10.00. |
| (6) | On April 15, 2008, Mr. Gannon and Mr. Tarte, both of whom reside and work in Canada, were awarded a one-time nonrecurring grant of “penny options”, or options to purchase common stock of Holdings for $0.01, in consideration of the respective officer’s continued employment with us. Mr. Gannon and Mr. Tarte received these penny options in lieu of RSU because the Holdings Compensation Committee and Holdings Board believed it to be one of the more tax-efficient methods of equity compensation available for grant to our Canadian employees. |
| (7) | Since, on the date of grant, no public market existed for shares of Holdings common stock, the price in this column reflects the Holdings Board’s determination that $10.00 was the fair market value of one share of Holdings common stock on April 15, 2008. |
| (8) | For each named executive officer listed in the Grants of Plan-Based Awards table above, the value reflects the full grant-date fair value calculated under SFAS 123(R) solely for awards granted during the 2008 fiscal year. The fair value of the stock option awards for financial reporting purposes likely will vary from the actual amount ultimately realized by the named executive officer based on a number of factors. These factors include our actual operating performance, common share price fluctuations, differences from the valuation assumptions used and the timing of exercise or applicable vesting. |
Outstanding Equity Awards at Fiscal Year-End
The following table shows the outstanding equity awards as of the end of fiscal year 2008 for each of our named executive officers:
| | | | | | | | | | | | | | | | | | | | |
| | | Option Awards | | Stock Awards |
Name and Principal Position | | Number of
Securities
Underlying
Unexercised
Options (#)
Exercisable | | | Number of
Securities
Underlying
Unexercised
Options (#)
Unexercisable | | | Equity
Incentive
Plan
Awards:
Number of
Securities
Underlying
Unexercised
Unearned
Options | | | Option
Exercise
Price ($) | | | Option
Expiration
Date | | Number of
Shares or Units
of Stock that
Have Not
Vested (#)(6) | | Market Value of
Shares or Units of
Stock that Have
Not Vested(7) |
Frank Verwiel, M.D. | | — | | | 320,000 | (1) | | — | | | $ | 10.00 | | | 4/15/2018 | | — | | $ | — |
President and ChiefExecutive Officer | | — | | | 160,000 | (2) | | — | | | | 10.00 | | | 4/15/2018 | | — | | | — |
| | — | | | — | | | 160,000 | (4) | | | 10.00 | (5) | | 4/15/2018 | | — | | | — |
David Mims | | — | | | 205,000 | (1) | | — | | | | 10.00 | | | 4/15/2018 | | 72,386 | | | 796,246 |
Executive Vice President and Chief Operating Officer | | — | | | 102,500 | (2) | | — | | | | 10.00 | | | 4/15/2018 | | — | | | — |
| | — | | | — | | | 102,500 | (4) | | | 10.00 | (5) | | 4/15/2018 | | — | | | — |
Steve Gannon | | — | | | 167,500 | (1) | | — | | | | 10.00 | | | 4/15/2018 | | — | | | — |
Senior Vice President, Finance and Chief Financial Officer | | — | | | 83,750 | (2) | | — | | | | 10.00 | | | 4/15/2018 | | — | | | — |
| | 32,145 | (3) | | 64,291 | (3) | | — | | | | 0.01 | | | 4/15/2018 | | — | | | — |
| | — | | | — | | | 83,750 | (4) | | | 10.00 | (5) | | 4/15/2008 | | — | | | — |
Nicholas Franco | | — | | | 115,000 | (1) | | — | | | | 10.00 | | | 4/15/2018 | | — | | | — |
Senior Vice President, International Commercial Operations | | — | | | 57,500 | (2) | | — | | | | 10.00 | | | 4/15/2018 | | — | | | — |
| | — | | | — | | | 57,500 | (4) | | | 10.00 | (5) | | 4/15/2018 | | — | | | — |
Richard Tarte | | — | | | 87,500 | (1) | | — | | | | 10.00 | | | 4/15/2018 | | — | | | — |
Vice President, CorporateDevelopment and General Counsel | | — | | | 43,750 | (2) | | — | | | | 10.00 | | | 4/15/2018 | | — | | | — |
| | 18,291 | (3) | | 36,582 | (3) | | — | | | | 0.01 | | | 4/15/2018 | | — | | | — |
| | — | | | — | | | 43,750 | (4) | | | 10.00 | (5) | | 4/15/2018 | | — | | | — |
| (1) | These values reflect the number of time-based options granted to our named executive officers under the Management Equity Incentive Plan. Time-based options vest ratably on each of the first through fifth anniversaries of the date of grant, subject to the officer’s continued employment with us through each anniversary. These options will fully vest on April 15, 2013. |
- 134 -
| (2) | These values reflect the number of premium options granted to our named executive officers under the Management Equity Incentive Plan. Premium options vest ratably on each of the first through fifth anniversaries of the date of grant, subject to the officer’s continued employment with us through each anniversary. These options will fully vest on April 15, 2013. |
| (3) | These values represent the number of “penny options”, or options to purchase common stock of Holdings for $0.01, granted to Mr. Gannon and Mr. Tarte, both of whom reside and work in Canada, pursuant to individual penny option grant agreements. Approximately one-third of the penny options immediately vested upon grant on April 15, 2008 and subject to each officer’s respective continued employment with us, the remainder of the penny options were scheduled to vest in two approximately equal installments on August 25, 2009 and August 25, 2010. |
| (4) | These values represent the number of performance-based options granted to our named executive officers under the Management Equity Incentive Plan. Under the terms of the Management Equity Incentive Plan, the amount of performance-based options that will vest is dependent upon the occurrence of a Liquidity Event (as defined in the Management Equity Incentive Plan) and the realization of certain profits by the Sponsor Funds and/or their affiliates as a result of such event(s), calculated by comparing the value of the cash or certain securities obtained in exchange for the equity of Holdings held by the Sponsor Funds and/or their affiliates to the Sponsor Funds’ initial investment in the February 2008 Transactions. Depending on these factors, all, none, or one-half of the performance-based options held by our named executive officers may vest upon the occurrence of the Liquidity Event (as defined in the Management Equity Incentive Plan), subject to the officer’s continued employment with us on the date of the liquidity event. |
| (5) | For the premium options granted under the Management Equity Incentive Plan to Dr. Verwiel, Mr. Mims, Mr. Gannon and Mr. Tarte, the exercise price of these options increases at a 10.00% compound rate on each anniversary of the date of grant of such options until, with certain exceptions, the earlier of: (a) the exercise of such option; (b) the fifth anniversary of the grant date of such option; (c) a Liquidity Event (as defined in the Management Equity Incentive Plan) or (d) the occurrence of a Change in Control (as defined in the Management Equity Incentive Plan) of Axcan Holdings Inc. For Mr. Franco, any premium options granted to him under the Management Equity Incentive Plan will be subject to the terms of the French sub-plan, under which the premium options will not be subject to an increasing exercise price over time. Rather, any vested premium options held by Mr. Franco will be exercisable in a percentage equal to (i) the percentage of the premium options exercisable under the terms of the Management Equity Incentive Plan multiplied by (ii) the difference between the fair market value of one share of Holdings common stock on the exercise date and the exercise price of the premium option to be exercised if it had accreted in price under the terms of the Management Equity Incentive Plan divided by (iii) the difference between the fair market value of the share and the exercise price of $10.00. |
| (6) | These values represent the restricted stock units held by Mr. Mims that had not yet vested as of September 30, 2008. One-half of these RSU are scheduled to vest on August 25, 2009 and the remaining half are scheduled to vest on August 25, 2010. Vested RSU shall be settled, with certain exceptions, on the earlier of: (1) four years from the date of grant, or April 15, 2012; (2) the termination of the officer’s employment; (3) a Liquidity Event (as defined in the Management Equity Incentive Plan); and (4) a Change in Control (as defined in the Management Equity Incentive Plan). |
| (7) | Since there was no public market for shares of Holdings common stock at the end of fiscal year 2008, we determined the “market value” of the unvested RSU by multiplying the number of such RSU by $11.00, the value of one share of Holdings common stock on September 30, 2008 as determined by the Holdings Board. |
Options Exercised and Stock Vested
The table below sets forth information on stock vested and value realized on vesting during fiscal year 2008. There were no options exercised by our named executive officers in fiscal year 2008.
| | | | | |
| | | Stock Awards |
Name & Principal Position | | Number of
Shares Acquired
on Vesting
(#)(1) | | Value Realized
on Vesting
($)(2) |
Frank Verwiel, M.D. | | 77,834 | | $ | 778,340 |
President and Chief Executive Officer | | | | | |
David Mims | | 36,192 | | | 361,920 |
Executive Vice President and Chief Operating Officer | | | | | |
Steve Gannon | | — | | | — |
Senior Vice President, Finance and Chief Financial Officer | | | | | |
Nicholas Franco | | — | | | — |
Senior Vice President, International Commercial Operations | | | | | |
Richard Tarte | | — | | | — |
Vice President, Corporate Development and General Counsel | | | | | |
| (1) | The values in this column reflect the number of RSU granted to Dr. Verwiel and Mr. Mims on April 15, 2008 that vested immediately upon grant. These vested RSU will not be settled in Holdings common stock until the earlier of: (1) four years from the date of grant, or April 15, 2012; (2) the termination of the officer’s employment; (3) a Liquidity Event (as defined in the Management Equity Incentive Plan); and (4) a Change in Control (as defined in the Management Equity Incentive Plan). |
| (2) | Represents the number of RSU vested multiplied by $10.00, the fair market value of one share of Holdings common stock on the vesting date, as determined by the Holdings Board. |
- 135 -
Employment Agreements and Potential Payments upon Certain Terminations
The following are descriptions of our employment agreements with our named executive officers in effect as of the end of fiscal year 2008. After the February 2008 Transactions, Axcan Pharma and certain of its affiliates, including Axcan Holdings Inc., entered into an amended and restated employment agreement with Dr. Verwiel and new employment agreements with Mr. Mims and Mr. Gannon. In addition, Axcan Pharma and certain of its affiliates, including Holdings, entered into a new employment agreement with Dr. Alexander LeBeaut, who joined us as Senior Vice President and Chief Scientific Officer in September 2008.
Since all of our named executive officers are also officers in the same capacity for Axcan Pharma, unless otherwise specified in their respective employment agreements, our named executive officers’ rights to compensation and/or benefits upon a change of control of Axcan Pharma are set forth in the Axcan Pharma Severance Plan, or the Severance Plan. The Severance Plan sets forth the compensation and benefits available to certain employees of Axcan Pharma Inc., including its executive officers, upon termination of such employee upon a change of control of Axcan Pharma. Under the Severance Plan, if an employee of Axcan Pharma served at the level of a vice-president or higher and either (1) is terminated or resigns within 90 days after having his or her job responsibilities or base compensation materially reduced following a change of control and such situation is not cured by Axcan Pharma within 30 days of notice (which must be given within 90 days of the event) or (2) is terminated on or within 24 months after a change of control of Axcan Pharma and a comparable position is not offered to the officer by the acquiring or surviving company, then, depending on the level of the employee, such employee would receive between 9 and 24 months’ of base salary, bonus and benefits.
Employment Agreement with Dr. Frank Verwiel
On May 16, 2008, we entered into an amended and restated employment agreement with Dr. Verwiel to continue his service as President and Chief Executive Officer of Axcan Pharma, and to serve as President and Chief Executive Officer of Holdings and an officer of certain other subsidiaries of Holdings, including Axcan Intermediate Holdings Inc. The agreement has an initial five-year term beginning on February 25, 2008 that provides for automatic twelve-month extensions, beginning on February 25, 2013, unless either we or Dr. Verwiel give 60 days’ prior notice of termination.
Dr. Verwiel will receive a base salary at a rate no less than USD$645,000 per year, which shall be adjusted at our discretion. Although no annual bonus is guaranteed to Dr. Verwiel, Dr. Verwiel will have the opportunity to earn an annual cash bonus of 60% of his base salary for on-target performance, or Target Annual Bonus, with the possibility of achieving 120% for high achievement. In addition, if in any year Dr. Verwiel receives an annual cash bonus as described above, he will also be entitled to receive a “match payment” equal to one-half (1/2) the annual bonus payable with respect to such year.
In addition, Dr. Verwiel received a one-time nonrecurring grant of 640,000 options to purchase shares of Holdings under the Management Equity Incentive Plan. These Holdings Options will vest in accordance with our Management Equity Incentive Plan (described above) and have an initial exercise price of $10.00 per share.
We agreed to grant Dr. Verwiel a total of 233,500 restricted stock units. 77,834 of these RSU were granted as fully vested on April 15, 2008 and we intend to grant an additional 155,666 RSU to Dr. Verwiel on August 25, 2009, half of which will vest immediately upon grant and half of which will vest on August 25, 2010. Vested RSU will be settled into Holdings common stock, with certain exceptions, upon the earlier of: (1) four years from the date of grant, April 15, 2012; (2) the termination of the officer’s employment; (3) a Liquidity Event (as defined in the Management Equity Incentive Plan); and (4) a Change in Control (as defined in the Management Equity Incentive Plan).
In addition, Dr. Verwiel agreed to, and did, purchase 75,000 shares of Holdings common stock for an aggregate investment of $750,000 pursuant to a subscription agreement and a Management Stockholders’ Agreement. For more details on these agreements, see “Item 13. Certain Relationships and Related Transactions, and Director Independence” in this Annual Report on Form 10-K.
The agreement further provides that Dr. Verwiel could be entitled to certain severance benefits following termination of employment. If we terminate him without Cause (as defined in the agreement), or if Dr. Verwiel terminates his employment for Good Reason (as defined in the agreement), all outstanding Holdings Options granted to Dr. Verwiel by us pursuant to the Management Equity Incentive Plan will expire pursuant to the terms of that plan as described above in “—The Axcan Holdings Inc. Management Equity Incentive Plan” except that, with certain exceptions, any performance-based Holdings Options that have not vested as of the date of termination shall remain outstanding for a 12-month period following termination and if a liquidity event (as defined under the Management Equity Incentive Plan) occurs within such period, all, none or one-half of the unvested performance-based options will become vested and exercisable in accordance with the Management Equity Incentive Plan. In addition, Dr. Verwiel would be entitled to the following:
| | • | | An amount equal to Dr. Verwiel’s accrued but unused vacation and base salary through the date of termination, or collectively, the accrued benefits. |
- 136 -
| | • | | An amount equal to (a) two times his base salary in effect at the date of termination, plus (b) two times the amount of his Target Annual Bonus, which is 60% of Dr. Verwiel’s base salary. This amount will be paid in equal, ratable installments in accordance with our regular payroll policies over the course of 24 months. |
| | • | | Medical benefits which are substantially similar to the benefits provided to our executive officers for 24 months after the date of termination. However, if Dr. Verwiel becomes re-employed with another employer and is eligible to receive comparable benefits, we shall cease to provide continued medical benefits. |
If Dr. Verwiel is terminated without Cause or terminates his employment for Good Reason within twelve (12) months following a Change of Control (as defined in the agreement), Dr. Verwiel shall be entitled to the benefits described above except that he shall receive two times his base salary and Target Annual Bonus immediately, rather than over a 24-month period.
If Dr. Verwiel is terminated due to Dr. Verwiel’s death, Disability (as defined in the agreement), or is terminated with Cause or without Good Reason, we will pay Dr. Verwiel the accrued benefits when due.
Employment Agreement with David Mims
On June 3, 2008, we entered into an employment agreement with Mr. Mims to continue his service as Executive Vice President and Chief Operating Officer of Axcan Pharma, and to serve as Executive Vice President and Chief Operating Officer of Holdings as well as an officer of certain other subsidiaries of Holdings, including Axcan Intermediate Holdings Inc. The agreement has an initial five-year term beginning on February 25, 2008 that provides for automatic twelve-month extensions, beginning on February 25, 2013, unless either we or Mr. Mims give 60 days’ prior notice of termination.
Mr. Mims will receive a base salary at a rate no less than $387,426 per year, which shall be adjusted at our discretion. Although no annual bonus is guaranteed to Mr. Mims, Mr. Mims will have the opportunity to earn an annual cash bonus of 45% of his base salary for on-target performance, or Target Annual Bonus, with the possibility of achieving 90% for high achievement.
In addition, Mr. Mims received a one-time nonrecurring grant of 410,000 options to purchase shares of Holdings under the Management Equity Incentive Plan. These Holdings Options will vest in accordance with our Management Equity Incentive Plan (as described above) and have an initial exercise price of $10.00 per share.
We also agreed to grant Mr. Mims a total of 108,578 restricted stock units. One-third of these RSU vested immediately upon grant and the remaining RSU will vest in two approximately equal installments on August 25, 2009 and August 25, 2010. Vested RSU will be settled into Holdings common stock, with certain exceptions, upon the earlier of: (1) four years from the date of grant, April 15, 2012; (2) the termination of the officer’s employment; (3) a Liquidity Event (as defined in the Management Equity Incentive Plan); and (4) a Change in Control (as defined in the Management Equity Incentive Plan).
In addition, Mr. Mims agreed to, and did, purchase 50,000 shares of Holdings common stock for an aggregate investment of $500,000 pursuant to a subscription agreement and a Management Stockholders’ Agreement. For more details on these agreements, see “Item 13. Certain Relationships and Related Transactions, and Director Independence” in this Annual Report on Form 10-K.
The agreement further provides that Mr. Mims could be entitled to certain severance benefits following termination of employment. If we terminate him without Cause (as defined in the agreement), or if Mr. Mims terminates his employment for Good Reason (as defined in the agreement), all outstanding options granted to Mr. Mims by us pursuant to the Management Equity Incentive Plan will expire pursuant to the terms of that plan as described above in “—The Axcan Holdings Inc. Management Equity Incentive Plan” except that, with certain exceptions, any performance-based Holdings Options that have not vested as of the date of termination shall remain outstanding for a 12-month period following termination and if a liquidity event (as defined under the Management Equity Incentive Plan) occurs within such period, all, none or one-half of the unvested performance-based options will become vested and exercisable in accordance with the Management Equity Incentive Plan. In addition, Mr. Mims would be entitled to the following:
| | • | | An amount equal to Mr. Mims’ accrued but unused vacation and base salary through the date of termination, or collectively, the accrued benefits. |
| | • | | An amount equal to (a) two times his base salary in effect at the date of termination, plus (b) two times the amount of his Target Annual Bonus, which is 45% of Mr. Mims’ base salary. This amount will be paid in equal, ratable installments in accordance with our regular payroll policies over the course of 24 months. |
- 137 -
| | • | | Medical benefits which are substantially similar to the benefits provided to our executive officers for 24 months after the date of termination. However, if Mr. Mims becomes re-employed with another employer and is eligible to receive comparable benefits, we shall cease to provide continued medical benefits. |
If Mr. Mims is terminated without Cause or terminates his employment for Good Reason within twelve (12) months following a Change of Control (as defined in the agreement), Mr. Mims shall be entitled to the benefits described above except that he shall receive two times his base salary and Target Annual Bonus immediately, rather than over a 24-month period.
If Mr. Mims is terminated due to Mr. Mims’ death, Disability (as defined in the agreement), or is terminated with Cause or without Good Reason we will pay Mr. Mims the accrued benefits when due.
Employment Agreement with Steve Gannon
On July 3, 2008, we entered into an employment agreement with Mr. Gannon to continue his service to us as Senior Vice President, Finance and Chief Financial Officer of Axcan Pharma, and to serve as Senior Vice President and Chief Financial Officer of Holdings as well as an officer of certain other subsidiaries of Holdings, including as Senior Vice President, Finance and Chief Financial Officer of Axcan Intermediate Holdings Inc. The agreement has an initial five-year term beginning on February 25, 2008 that provides for automatic twelve-month extensions, beginning on February 25, 2013, unless either we or Mr. Gannon give 60 days’ prior notice of termination.
Mr. Gannon will receive a base salary at a rate no less than CDN $338,550 (USD $336,364 after the application of the fiscal year 2008 Canadian Dollar - U.S. Dollar exchange rate) per year, which shall be adjusted at our discretion. Although no annual bonus is guaranteed to Mr. Gannon, Mr. Gannon will also have the opportunity to earn an annual cash bonus of 45% of his base salary for on-target performance with the possibility of achieving 90% for high achievement.
In addition, Mr. Gannon received a one-time nonrecurring grant of 335,000 options to purchase shares of Holdings under the Management Equity Incentive Plan. These Holdings Options will vest in accordance with our Management Equity Incentive Plan (as described above) and have an initial exercise price of $10.00 per share.
We also agreed to, and did, grant Mr. Gannon a total of 96,436 “penny options”, which are options to purchase a share of Holdings common stock for $0.01. Subject to Mr. Gannon’s continued employment with us, these penny options were scheduled to vest in three approximately equal installments on April 15, 2008, August 25, 2009 and August 25, 2010.
In addition, Mr. Gannon agreed to purchase 20,640 shares of Holdings common stock for an aggregate investment of $206,400 pursuant to a subscription agreement and a Management Stockholders’ Agreement. For more details on these agreements, see “Item 13. Certain Relationships and Related Transactions, and Director Independence” in this Annual Report on Form 10-K.
The agreement further provides that Mr. Gannon could be entitled to certain severance benefits following termination of employment. If we terminate him without Cause (as defined in the agreement), or if Mr. Gannon terminates his employment for Good Reason (as defined in the agreement), all outstanding options granted to Mr. Gannon by us pursuant to the Management Equity Incentive Plan will expire pursuant to the terms of that plan as described above in “—The Axcan Holdings Inc. Management Equity Incentive Plan” except that, with certain exceptions, any performance-based Holdings Options that have not vested as of the date of termination shall remain outstanding for a 12-month period following termination and if a liquidity event (as defined under the Management Equity Incentive Plan) occurs within such period, all, none or one-half of the unvested performance-based options will become vested and exercisable in accordance with the Management Equity Incentive Plan. In addition, Mr. Gannon would be entitled to the following:
| | • | | An amount equal to Mr. Gannon’s accrued but unused vacation and base salary through the date of termination, or collectively, the accrued benefits. |
| | • | | An amount equal to one-and-a-half times his base salary in effect at the date of termination. This amount will be paid in equal, ratable installments in accordance with our regular payroll policies over the course of 18 months. |
| | • | | Medical benefits which are substantially similar to the benefits provided to our executive officers for 18 months after the date of termination. However, if Mr. Gannon becomes re-employed with another employer and is eligible to receive comparable benefits, we shall cease to provide continued medical benefits. |
- 138 -
If Mr. Gannon is terminated without Cause or terminates his employment for Good Reason within twelve (12) months following a Change of Control (as defined in the agreement), Mr. Gannon shall be entitled to the benefits described above except that he shall receive one-and-a-half times his base salary immediately, rather than over a 18-month period.
If Mr. Gannon is terminated due to Mr. Gannon’s death, Disability (as defined in the agreement), or is terminated with Cause or without Good Reason, we will pay Mr. Gannon the accrued benefits when due.
Employment Agreement with Dr. Alexandre LeBeaut
On September 15, 2008, we entered into an employment agreement with Dr. LeBeaut, under which he agreed to serve as Senior Vice President and Chief Scientific Officer of us, Holdings and Axcan Pharma US Inc. The agreement has an initial five-year term beginning on September 29, 2008 that provides for automatic twelve-month extensions, beginning on September 29, 2013, unless either we or Dr. LeBeaut give 60 days’ prior notice of termination.
Dr. LeBeaut will receive a base salary at a rate no less than $382,000 per year, which shall be adjusted at our discretion. Dr. LeBeaut will also have the opportunity to earn an annual cash bonus of 45% of his base salary for on-target performance.
In addition, Dr. LeBeaut received a one-time nonrecurring grant of 230,000 options to purchase shares of Holdings under the Management Equity Incentive Plan. These Holdings Options will vest in accordance with our Management Equity Incentive Plan (as described above) and have an exercise price equal to the Fair Market Value (as defined in the Management Equity Incentive Plan) of the shares at the time of grant, as determined by the Board.
We also agreed to grant Dr. LeBeaut, as soon as practicable after September 29, 2008, a $50,000 signing bonus, a $35,000 tax assistance payment and a $42,000 special signing bonus. In addition, Dr. LeBeaut agreed to purchase Holdings common stock for an aggregate investment of no less than $25,000, as soon as practicable after September 29, 2008, pursuant to a subscription agreement and Management Stockholders’ Agreement. For more details on these agreements, see “Item 13. Certain Relationships and Related Transactions, and Director Independence” in this Annual Report on Form 10-K.
The agreement further provides that Dr. LeBeaut could be entitled to certain severance benefits following termination of employment. If we terminate him without Cause (as defined in the agreement), or if Dr. LeBeaut terminates his employment for Good Reason (as defined in the agreement), all outstanding options granted to Dr. LeBeaut by us pursuant to the Management Equity Incentive Plan would expire pursuant to the terms of that plan and Dr. LeBeaut would be entitled to the following:
| | • | | An amount equal to Dr. LeBeaut’s accrued but unused vacation and base salary through the date of termination, or collectively, the accrued benefits. |
| | • | | An amount equal to one-and-a-half times his base salary in effect at the date of termination. This amount will be paid in equal, ratable installments in accordance with our regular payroll policies over the course of 18 months. |
| | • | | Medical benefits which are substantially similar to the benefits provided to our executive officers for 18 months after the date of termination. However, if Dr. LeBeaut becomes re-employed with another employer and is eligible to receive comparable benefits, we shall cease to provide continued medical benefits. |
If Dr. LeBeaut is terminated without Cause or terminates his employment for Good Reason within twelve (12) months following a Change of Control (as defined in the agreement), Dr. LeBeaut shall be entitled to the benefits described above except that he shall receive one-and-a-half times his base salary immediately, rather than over a 18-month period.
If Dr. LeBeaut is terminated due to Dr. LeBeaut’s death, Disability (as defined in the agreement), or is terminated with Cause or without Good Reason, we will pay Dr. LeBeaut the accrued benefits when due.
Employment Agreement with Nicholas Franco
The employment agreement between Axcan Pharma and Mr. Franco was effective as of October 5, 2007, and has an indefinite term. Mr. Franco’s employment agreement provides for gross annual compensation of 245,000 Euros (or USD $368,476 after the application of the fiscal year 2008 Euro - U.S. Dollar exchange rate),
- 139 -
which shall be adjusted at our discretion at the end of each fiscal year. Mr. Franco is eligible to participate in any executive incentive program approved by the Axcan Pharma Board, and his target annual incentive for fiscal year 2008 is 40% of his base salary, prorated based on time of service.
The employment agreement provides Mr. Franco could be entitled to certain severance benefits following termination of employment. If Mr. Franco is terminated at any time, he is entitled to a incentive bonus based on the target of what he would have earned for the full year, prorated for the time he served during that particular fiscal year. In the event that Mr. Franco is terminated due to or following a Change of Control (as defined in the agreement), he is entitled to receive an amount equal to the gross base compensation he received during the twelve months prior to the termination.
Potential Payments upon Certain Terminations or a Change in Control
This table shows the potential compensation that we would have had to pay to our named executive officers upon various termination of service scenarios. The table excludes certain amounts payable pursuant to plans that are available generally to all salaried employees and any payment of accrued base salary and vacation through the date of termination. For example, unless otherwise indicated, this table does not reflect amounts that may be payable upon a named executive officer’s termination under the Severance Plan, pursuant to which the February 2008 Transactions were deemed a “change of control”. The amounts shown assume that termination of employment was effective September 30, 2008. The amounts shown are only estimates of the amounts that would be payable to the named executive officers upon termination of employment and do not reflect tax positions we may have taken or the accounting treatment of such payments. Actual amounts to be paid can only be determined at the time of separation. Although the calculations are intended to provide reasonable estimates of the potential benefits, they are based on numerous assumptions and do not represent the actual amount, if any, an executive would receive if an eligible termination event were to occur.
The following table provides information regarding the potential value of our severance arrangements for our named executive officers under the following termination of service scenarios: (1) upon termination by us with cause or by the executive officer without good reason, including a retirement; (2) upon termination by us without cause or by the executive officer for good reason; (3) upon termination of the executive due to his death or disability or (4) our change-in-control.
Severance Arrangements
Assuming Termination of Service at the end of Fiscal Year 2008
| | | | | | | | | | | | | |
Name & Principal Position | | Benefit Type | | Termination with
Cause or without
Good Reason
($) | | Termination without
Cause or for Good
Reason(1)
($) | | Termination due to
Death or Disability
($) | | Change in
Control(2)
($) | |
Frank Verwiel, M.D. President and Chief Executive Officer | | Severance Payment | | — | | $ | 2,064,000 | | — | | $ | 2,064,000 | |
| | Bonus | | — | | | — | | — | | | — | |
| | Benefits | | — | | $ | 8,576 | | — | | $ | 8,576 | |
| | Value of Equity
Award Acceleration(3),(5) | | — | | $ | 1,712,326 | | — | | $ | 1,712,326 | |
| | | | | | | | | | | | | |
| | Total | | — | | $ | 3,784,902 | | — | | $ | 3,784,902 | |
David Mims Executive Vice President and Chief Operating Officer | | Severance Payment | | — | | $ | 1,097,708 | | — | | $ | 1,097,708 | |
| | Bonus | | — | | | — | | — | | | — | |
| | Benefits | | — | | $ | 26,856 | | — | �� | $ | 26,856 | |
| | Value of Equity
Award Acceleration(3),(5) | | — | | $ | 796,246 | | — | | $ | 796,246 | |
| | | | | | | | | | | | | |
| | Total | | — | | $ | 1,920,810 | | — | | $ | 1,920,810 | |
Steve Gannon Senior Vice President, Finance and Chief Financial Officer | | Severance Payment | | — | | $ | 504,545 | | — | | $ | 504,545 | |
| | Bonus | | — | | | — | | — | | | — | |
| | Benefits | | — | | $ | 2,407 | | — | | $ | 2,407 | |
| | Value of Equity
Award Acceleration(4),(5) | | — | | $ | 706,558 | | — | | $ | 706,558 | |
| | | | | | | | | | | | | |
| | Total | | — | | $ | 1,213,510 | | — | | $ | 1,213,510 | |
Nicholas Franco Senior Vice President, International Commercial Operations | | Severance Payment(6) | | — | | | — | | — | | $ | 396,821 | |
| | Bonus(6) | | — | | | — | | — | | $ | 73,695 | (7) |
| | Benefits(6) | | — | | | — | | — | | $ | 2,498 | |
| | Value of Equity
Award Acceleration(5) | | — | | | — | | — | | | — | |
| | | | | | | | | | | | | |
| | Total | | — | | | — | | — | | $ | 473,014 | |
Richard Tarte Vice President, Corporate Development and General Counsel | | Severance Payment(8) | | — | | | — | | — | | $ | 317,973 | |
| | Bonus(8) | | — | | | — | | — | | $ | 108,044 | (9) |
| | Benefits(8) | | — | | | — | | — | | $ | 5,237 | |
| | Value of Equity
Award Acceleration(4),(5) | | — | | $ | 402,036 | | — | | $ | 402,036 | |
| | | | | | | | | | | | | |
| | Total | | — | | $ | 402,036 | | — | | $ | 833,290 | |
| (1) | The severance payments set forth in this column would have been paid to Dr. Verwiel and Mr. Mims, respectively, in equal installments over a period of 24 months in accordance with our standard payroll procedures and any benefits would be provided over a period of 24 months. For Mr. Gannon, the severance payments set forth in this column would have been paid to him in equal installments over a period of 18 months in accordance with our standard payroll procedures and any benefits would be provided over a period of 18 months. |
- 140 -
| (2) | The severance payments set forth in this column would have been paid immediately upon termination to Dr. Verwiel, Mr. Mims and Mr. Gannon. For Mr. Franco and Mr. Tarte, the severance payments set forth in this column would have been paid in one lump sum no later than the March 15th following the year of termination. The determination of the form in which benefits would be paid to Mr. Franco and Mr. Tarte would have been at our discretion. |
| (3) | This amount represents the value of the RSU held by Dr. Verwiel and Mr. Mims, respectively, that would vest and settle upon Dr. Verwiel’s or Mr. Mims’ termination by us without cause, termination by the executive officer for good reason or termination by us due to a change-in-control at the end of fiscal year 2008. Upon such termination, Dr. Verwiel would have been granted 155,666 RSU pursuant to the terms of his employment agreement and such RSU would have vested and settled into shares of Holdings common stock immediately upon grant. For Mr. Mims, pursuant to his employment agreement, 72,386 RSU would have vested and settled into shares of Holdings common stock upon such termination. As of September 30, 2008, one share of Holdings common stock had a value of $11.00 according to the Holdings Board. |
| (4) | This amount represents the value of the penny options held by Mr. Gannon and Mr. Tarte, respectively, that would vest upon Mr. Gannon’s or Mr. Tarte’s termination by us without cause, termination by the executive officer for good reason or termination by us due to a change-in-control at the end of fiscal year 2008. Upon such termination, 64,291 penny options held by Mr. Gannon would have vested and 36,582 penny options held by Mr. Tarte would have vested. Each penny option held by Mr. Gannon and Mr. Tarte had an exercise price of $0.01. As of September 30, 2008, one share of Holdings common stock had a value of $11.00 according to the Holdings Board. |
| (5) | Upon any event of termination, the named executive officers were entitled to receive the same treatment of their Holdings Options under the Management Equity Incentive Plan as any other employee with the exception of the performance-based Holdings Options held by Dr. Verwiel, Mr. Mims and Mr. Gannon. In the event one of these named executive officers were terminated without cause or for good reason, any performance-based options that had not vested as of the date of termination would remain outstanding for a 12-month period following termination and if a liquidity event (as defined under the Management Equity Incentive Plan) were to occur within such period, all unvested performance-based shares would become vested and exercisable in accordance with the Management Equity Incentive Plan. Otherwise, upon any event of termination of a named executive officer, any unvested Holdings Options would be forfeited unless such termination was without Cause (as defined in the Management Equity Incentive Plan) or by the participant for Good Reason (as defined in the Management Equity Incentive Plan) and occurred during the two-year period following a Change of Control (as defined in the Management Equity Incentive Plan), in which case all unvested time-based and premium Holdings Options would immediately vest and become exercisable as of the date of such termination. |
| (6) | The Severance Plan sets forth the severance payments Mr. Franco would have been able to receive upon his termination in connection with a change-in-control at the end of fiscal year 2008. |
| (7) | Mr. Franco was eligible to receive, upon his termination in connection with a change of control under the Severance Plan, the average of his annual cash incentive award in fiscal year 2007 and fiscal year 2008. Mr. Franco was not employed by us or our subsidiaries, including Axcan Pharma, in fiscal year 2007 and therefore received no annual cash incentive award for the fiscal 2007 performance year. Since the Holdings Board has not yet approved any annual cash incentive award for the fiscal 2008 performance year, we have assumed that Mr. Franco would receive his on-target bonus under the Incentive Plan, which would amount to $147,390. |
| (8) | The Severance Plan sets forth the severance payments Mr. Tarte would have been able to receive upon his termination in connection with a change-in-control at the end of fiscal year 2008. |
| (9) | Mr. Tarte was eligible to receive, upon his termination in connection with a change of control under the Severance Plan, the average of his annual cash incentive award in fiscal year 2007 and fiscal year 2008. Mr. Tarte received $128,726 for the fiscal 2007 performance year and, since the Holdings Board has not yet approved any annual cash incentive award for the fiscal 2008 performance year, we have assumed that Mr. Tarte would receive his on-target bonus under the Incentive Plan, which would amount to $87,361. |
Director Compensation
This section will set forth details regarding compensation paid to the Axcan Pharma Board prior to the February 2008 Transactions and our director compensation policy following the February 2008 Transactions. During fiscal year 2008 prior to the February 2008 Transactions, only the outside, or non-employee, directors of Axcan Pharma received compensation for their duties as corporate directors and their attendance at the Axcan Pharma Board and Committee meetings. Those directors are listed below in the “Director Compensation Table” and are referred to as Outside Directors.
Outside Directors’ Compensation Program
The Outside Directors’ compensation was set by the Axcan Pharma Board and benchmarked against remuneration paid to directors of other specialty pharmaceutical companies of similar size. During fiscal year 2008, the compensation was comprised solely of cash compensation. Outside Directors were paid an annual retainer along with an amount for each Board meeting or Committee meeting attended.
- 141 -
The general fees payable to the Outside Directors are set forth below:
| | | |
Description | | Fee |
Annual retainer for an Outside Director paid in cash | | $ | 15,000 |
Annual retainer for an Outside Director paid in Deferred Share Units | | $ | 15,000 |
Annual retainer for an Outside Director paid in stock options, cash, or Deferred Share Units | | $ | 25,000 |
Annual retainer for the Chairman of the Audit Committee | | $ | 10,000 |
Annual retainer for the Committee Chairman (other than of the Audit Committee) | | $ | 5,000 |
Board or Committee Meeting in person | | $ | 1,500 |
Board or Committee Meeting via telephone | | $ | 750 |
Initial option grant (expected value based on the Black Scholes option value on the date of grant) | | $ | 50,000 |
Equity Grants to Outside Directors
Outside Directors were eligible to receive an annual grant of stock options with an expected value of $25,000 based on the Black Scholes value of the options on the date of grant. Outside Directors were not eligible to receive option grants if, at the time of the proposed grant, the total number of Axcan Pharma options granted and outstanding to all Outside Directors exceeded 1% of Axcan Pharma’s common shares outstanding. In years where the annual grant of options could not be given to Outside Directors, the Outside Director would have the choice to either take the equivalent value in cash, in deferred stock units, or DSUs, or in a combination of cash and DSUs. Any options granted to an Outside Director in this annual grant were eligible for termination in any given year if such Outside Director failed, in the fair opinion of the Axcan Pharma Board, to reasonably fulfill his or her duties as director; in such a case, all options granted to him or her in the form of the annual grant would terminate immediately as if never granted.
All DSU grants to the Outside Directors were subject to the 2006 Plan, as amended from time to time. In the case of the initial option grant to Outside Directors, the options were to vest in equal annual increments over 5 years from the date of grant (and will become fully vested upon the death of the Outside Director) and in the case of the annual option grant to Outside Directors, the option was to vest in full at the end of each year upon the re-election or expiration of the term of the Director. All options held by Outside Directors would expire if not exercised within a period of ten years from the date of grant. The exercise price per share of the shares underlying the option grants to Outside Directors was set at the closing price for the common shares of Axcan Pharma on the close of trading on the day immediately prior to such grant.
In fiscal year 2008, no equity grants were awarded to Outside Directors due to the February 2008 Transactions. Upon the consummation of the February 2008 Transactions, all Outside Directors of Axcan Pharma resigned.
Director Compensation Table
The table below details compensation information for Outside Directors in fiscal year 2008:
| | | | | | | | | |
Name of Director | | Fees Earned or
Paid in Cash | | All Other
Compensation(1) | | Total |
Dr. E. Rolland Dickson | | $ | 13,750 | | $ | 198,739 | | $ | 212,489 |
Jacques Gauthier | | | 18,250 | | | 763,213 | | | 781,463 |
Louis Lacasse | | | 20,500 | | | 330,448 | | | 350,948 |
Colin Mallet | | | 18,250 | | | 734,359 | | | 752,609 |
François Painchaud | | | 11,500 | | | 507,896 | | | 519,396 |
Mary Ritchie | | | 10,750 | | | 73,457 | | | 84,207 |
Dr. Claude Sauriol | | | 16,750 | | | 744,529 | | | 761,279 |
Michael Tarnow | | | 21,750 | | | 873,849 | | | 895,599 |
| (1) | Reflects compensation paid as consideration for options to purchase Axcan Pharma common stock and Axcan Pharma DSUs held by Axcan Pharma’s directors at the time of the February 2008 Transactions, as described below in “Payments Received by Directors in Connection with the February 2008 Transactions.” In addition, Mary Ritchie was granted an initial cash award of $50,000 in 2006 in lieu of an initial grant of stock options. Such award was to be paid in five equal annual installments. At the time of the February 2008 Transactions, $30,000 of this award was still due to Ms. Ritchie and such amount was paid to her at the time of the February 2008 Transactions. |
Director Compensation in Fiscal Year 2008 After February 2008 Transactions
Certain members of our Board also serve on the Board of Directors of certain of our parents and subsidiaries. For example, the director composition of our Board is identical to the composition of the board of our parent company MidCo. The current membership of our Board is not compensated for their services as directors by us or any of our parents or subsidiaries. Members of the Board of Directors of Holdings, which, as the board of our indirect parent, makes certain compensation and business decisions that relate to our employees, are also not compensated for their services as directors by us, Holdings, or any of our parents or subsidiaries.
- 142 -
Payments Received by Directors in Connection with the February 2008 Transactions
Members of the Axcan Pharma Board who, at the time of the February 2008 Transactions, held (1) shares of Axcan Pharma common stock; (2) granted and outstanding options to purchase common stock of Axcan Pharma; (3) vested or unvested DSUs received the same consideration for their equity holdings in connection with the February 2008 Transactions as other such holders. Specifically:
(1) each outstanding share of Axcan Pharma common stock was deemed transferred to Axcan Intermediate Holdings Inc. in exchange for a payment of $23.35 per share, or the offer price, without interest and less any required withholding taxes;
(2) all granted and outstanding options to purchase common stock of Axcan Pharma under Axcan Pharma’s stock plans were deemed vested and transferred to Axcan Pharma and cancelled in exchange for an amount in cash equal to the excess, if any, of the offer price over the applicable option exercise price for each share of common stock subject to such option, less any required withholding taxes; and
(3) all vested and unvested DSUs issued under any and all of Axcan Pharma’s stock option plans were deemed vested and then cancelled and terminated. Each holder of a DSU received the offer price, less any required withholding taxes, for each DSU formerly held.
| ITEM 12. | SECURITY OWNERSHIP OF CERTAIN BENEFICIAL OWNERS AND MANAGEMENT AND RELATED STOCKHOLDER MATTERS |
Beneficial Ownership
Axcan MidCo Inc., or MidCo, directly owns all our issued and outstanding stock. All of MidCo’s issued and outstanding stock is directly owned by Axcan Holdings Inc., or Holdings. All equity interests in Holdings are owned, directly or indirectly, by the Sponsor Funds, the Co-Investors and certain of our employees, including certain of our named executive officers and directors.
The following table sets forth information with respect to the ownership as of September 30, 2008 for (a) each person known by us to own beneficially more than a 5% equity interest in Holdings, (b) each member of our board of directors, (c) each member of Holdings’ board of directors, (d) each of our named executive officers (who are also the named executive officers of Holdings), and (e) all of our and Holdings’ executive officers and directors as a group. We have 100 shares of common stock outstanding, all of which are owned indirectly by Holdings. Share amounts indicated below reflect beneficial ownership, through Holdings, by such entities or individuals of these 100 shares of Axcan Intermediate Holdings Inc.
The amounts and percentages of shares beneficially owned are reported on the basis of SEC regulations governing the determination of beneficial ownership of securities. Under SEC rules, a person is deemed to be a “beneficial owner” of a security if that person has or shares voting power or investment power, which includes the power to dispose of or to direct the disposition of such security. A person is also deemed to be a beneficial owner of any securities of which that person has a right to acquire beneficial ownership within 60 days. Securities that can be so acquired are deemed to be outstanding for purposes of computing such person’s ownership percentage, but not for purposes of computing any other person’s percentage. Under these rules, more than one person may be deemed to be a beneficial owner of the same securities and a person may be deemed to be a beneficial owner of securities as to which such person has no economic interest.
- 143 -
Except as otherwise indicated in the footnotes below, each of the beneficial owners has, to our knowledge, sole voting and investment power with respect to the indicated shares. Unless otherwise noted, the address of each beneficial owner is c/o Axcan Intermediate Holdings Inc., 22 Inverness Center Parkway, Suite 310, Birmingham, AL 35242.
| | | | | |
Name and Address of Beneficial Owner | | Beneficial Ownership
of Common Shares | | Percentage
Owned | |
TPG Capital(1) | | 69.91 | | 69.91 | % |
Banc of America Capital Investors V, L.P.(2) | | 8.35 | | 8.35 | % |
Société Génerale de Financement du Quebec(3) | | 6.26 | | 6.26 | % |
HSBC(4) | | 5.22 | | 5.22 | % |
OMERS Capital Partners Inc.(5) | | 5.22 | | 5.22 | % |
Alberta Investment Management Corp.(6) | | 4.17 | | 4.17 | % |
Frank Verwiel, M.D. | | * | | * | |
David Mims | | * | | * | |
Steve Gannon | | * | | * | |
Nicholas Franco | | * | | * | |
Richard Tarte | | * | | * | |
Darcy Toms | | * | | * | |
Martha Donze | | * | | * | |
Dr. Norbert Claveille | | * | | * | |
Dr. Fred Cohen(7) | | 69.91 | | 69.91 | % |
Geoff Lieberthal(7) | | 69.91 | | 69.91 | % |
Dr. Heather Preston(7) | | 69.91 | | 69.91 | % |
Todd Sisitsky(7) | | 69.91 | | 69.91 | % |
All executive officers and directors as a group (12 persons) | | 0.39 | | 0.39 | % |
| * | Represents less than one percent or one share, as applicable. |
(1) | Axcan Intermediate Holdings Inc. shares shown as benefically owned by TPG Capital reflect an aggregate of the following record ownership: (i) 30,854,198.80 shares of Holdings held by TPG Partners V, L.P., (ii) 80,715.00 shares of Holdings held by TPG FOF V-A, L.P., (iii) 65,086.20 shares of Holdings held by TPG FOF V-B, L.P. and (iv) 2,500,000.00 shares of Holdings held by TPG Biotechnology Partners II, LP. The address of TPG Capital is 301 Commerce Street, Suite 3300, Fort Worth, TX 76102. |
(2) | Axcan Intermediate Holdings Inc. shares shown as beneficially owned by Banc of America Capital Investors V, L.P. reflect the following record ownership: 4,000,000 shares of Holdings held by Banc of America Capital Investors V, L.P. The address of Banc of America Capital Investors V, L.P. is 100 North Tryon Street, 25th floor, Attention: Scott R. Poole, Charlotte, NC 28255. |
(3) | Axcan Intermediate Holdings Inc. shares shown as beneficially owned by Société Génerale de Financement du Quebec reflect the following record ownership: 3,000,000 shares of Holdings held by SGF Bio-Pharma Capital Inc. The address of Société Génerale de Financement du Quebec is 600 de la Gauchetiere West, Suite 1500, Montreal, Quebec H3B 4L8 Canada. |
(4) | Axcan Intermediate Holdings Inc. shares shown as benefically owned by HSBC reflect an aggregate of the following record ownership:(i) 2,100,000 shares held by HSBC Equity Partners USA, L.P. and (ii) 400,000 shares held by HSBC Private Equity Partners II USA, LP. The address of HSBC is 452 Fifth Avenue, 14th floor, Attention: Andrew Trigg, New York, NY 10018. |
(5) | Axcan Intermediate Holdings Inc. shares shown as benefically owned by OMERS Capital Partners Inc. reflect the following record ownership: 2,500,000 shares of Holdings held by OCP API Holdings, Inc. The address of OMERS Capital Partners Inc. is Royal Bank Plaza, South Tower, Suite 2010, 200 Bay Street, Toronto, Ontario M5J 2J2. |
(6) | Axcan Intermediate Holdings Inc. shares shown as benefically owned by Alberta Investment Management Corp. reflect an aggregate of the following record ownership: (i) 1,140,000 shares of Holdings held by GP08GV (General) Ltd. and (ii) 860,000 shares of Holdings held by GP08PX (General) Ltd. The address of Alberta Investment Management Corp. is 9515-107 Street, 340 Terrace Building, Edmonton, Alberta T5K 2C3, Canada. |
(7) | Includes all shares held by TPG Partners V, L.P., TPG FOF V-A, L.P., TPG FOF V-B, L.P., and TPG Biotechnology Partners II, LP. Each of Fred Cohen, Geoff Lieberthal, Heather Preston and Todd Sisitsky may be deemed to be a beneficial owner of these interests due to his or her status as an employee of TPG Capital, and each such person disclaims beneficial ownership of any such interests in which he or she does not have a pecuniary interest. The address of each of Dr. Cohen, Mr. Lieberthal, Dr. Preston and Mr. Sisitsky is c/o TPG Capital, 301 Commerce Street, Suite 3300, Fort Worth, TX 76102. |
- 144 -
Securities Authorized for Issuance Under Equity Compensation Plans
The following table provides information about the shares of Holdings Common Stock that may be issued upon the exercise of options and rights (including restricted stock units) under all of our existing equity compensation plans as of September 30, 2008, including the Management Equity Incentive Plan and certain individual arrangements between us and our employees. The table below does not include shares of Holdings Common Stock which may be issued to certain of our employees as incentive awards correlated to our performance under the Axcan Holdings Inc. Employee Long Term Incentive Plan since we cannot predict the value, if any, of such awards or whether any of our employees will elect to receive shares of Holdings Common Stock in lieu of cash awards under such plan. All of our shares are owned by MidCo and we do do not have any equity compensation plans under which shares of our common stock are granted.
| | | | | | | | | |
| | | Number of securities to
be issued upon exercise
of outstanding options,
warrants and rights | | | Weighted-average
exercise price of
outstanding
options, warrants and
rights | | | Number of securities
remaining available for
future issuance
under equity
compensation
plans (excluding securities
reflected in first column) |
Plan Category | | | | | | | | | |
Equity compensation plans approved by security holders | | — | | | | — | | | — |
Equity compensation plans not approved by security holders(1) | | 4,957,909 | (2) | | $ | 10.00 | (3) | | 185,307 |
Total | | 4,957,909 | | | $ | 10.00 | | | 185,307 |
| (1) | Since our indirect parent Holdings is owned primarily by the Sponsor and the majority of the Holdings Board is comprised of persons affiliated with the Sponsor, the Holdings Board, and not the Holdings stockholders, have approved all decisions related to equity-based compensation, including the approval of the Management Equity Incentive Plan and individual compensation arrangements with our executive officers. |
| (2) | This amount includes 3,648,000 shares of Holdings Common Stock issuable under the Management Equity Incentive Plan, 832,011 shares of Holdings Common Stock issuable upon the settlement of Restricted Stock Unit awards granted to certain of our employees and 477,898 shares of Holdings Common Stock issuable upon the exercise of penny options, or options to purchase Holdings Common Stock for $0.01, granted to certain of our employees. |
| (3) | The weighted-average exercise price reflects the $10.00 exercise price of all options to purchase Holdings Common Stock issued under the Management Equity Incentive Plan and does not reflect the exercise price of the RSU awards or penny option awards, which have exercise prices of $0 and $0.01, respectively. |
| ITEM 13. | CERTAIN RELATIONSHIPS AND RELATED TRANSACTIONS, AND DIRECTOR INDEPENDENCE |
Review, Approval or Ratification of Transactions with Related Persons
We have not adopted any formal policies or procedures for the review, approval or ratification of certain related-party transactions that may be required to be reported under the SEC disclosure rules. Such transactions, if and when they are proposed or have occurred, have traditionally been (and will continue to be) reviewed by our Board of Directors (other than the board members involved, if any) on a case-by-case basis.
Stockholders Agreement
We have entered into a stockholders agreement with Holdings and the stockholders of Holdings, including investment funds associated with our Sponsor and certain members of our management. Future stockholders may also be required to become parties to the agreement. The stockholders agreement contains agreements among the parties with respect to the election of our directors and the directors of Holdings, restrictions on the issuance of shares (including certain participation rights), restrictions on the transfer of shares (including tag-along rights, drag-along rights and a right of first offer) and other special corporate governance provisions (including the right of our Sponsor and its affiliates to approve various corporate actions).
Registration Rights Agreement
We have entered into a registration rights agreement with Holdings and the stockholders of Holdings, including investment funds associated with our Sponsor and certain members of our management. The registration rights agreement contains customary demand and piggyback registration rights. The agreement also requires Holdings and us to indemnify each holder of registrable securities and certain of their affiliates from liability arising from any violation of the securities laws by Holdings or us or any material misstatements or omissions made by Holdings or us in connection with a public offering.
- 145 -
Management Agreement
We have entered into a management agreement with Holdings and our Sponsor pursuant to which our Sponsor will provide management and other advisory services to us. In consideration for ongoing management and other advisory services, the management agreement requires us to pay our Sponsor an annual management fee of $750,000 and to reimburse our Sponsor for out-of-pocket expenses incurred in connection with its services. The management agreement also provides that our Sponsor will receive transaction fees in connection with certain subsequent financings and acquisition transactions. The management agreement includes customary indemnification provisions in favor of our Sponsor and its affiliates.
Director Independence
We are a privately held corporation. As discussed in Item 10 above, no current director of our Board is deemed to be “independent” under our previously adopted independence standards. See “Item 10. Directors, Executive Officers and Corporate Governance.”
| ITEM 14. | PRINCIPAL ACCOUNTING FEES AND SERVICES |
For the periods indicated, Raymond Chabot Grant Thornton LLP, and its affiliates, the Company’s independent registered public accounting firm and principal accountant, billed the fees set forth below.
| | | | | | | | | |
| | | Initial seven-
month period
ended
September 30,
2008
(successor) | | Five-month
period ended
February 25,
2008
(predecessor) | | Year ended
September 30,
2007
(predecessor) |
Audit Fees (1) | | $ | 81,565 | | $ | 44,169 | | | 798,582 |
Audit-Related Fees (2) | | | 60,666 | | | 369,990 | | | 8,516 |
Tax Fees (3) | | | 141,027 | | | 71,844 | | | 504,736 |
All Other Fees | | | — | | | — | | | — |
| | | | | | | | | |
Total Fees | | $ | 283,258 | | $ | 486,003 | | $ | 1,311,834 |
| | | | | | | | | |
| (1) | Audit Fees billed for the periods indicated represented fees for the following services: audit of the Company’s (or the predecessor company’s) annual financial statements and Internal Control Over Financial Reporting, reviews of the Company’s (or the predecessor company’s) quarterly financial statements and other services normally provided in connection with statutory and regulatory filings. |
| (2) | Audit-Related Fees billed for the periods indicated represented fees for the following services: issue of consent and comfort letters and other services provided in conjunction with financing transactions. |
| (3) | Tax Fees billed for the periods indicated represented fees for the following services: compliance, transfer pricing studies and other tax consultation. |
We do not have an audit committee and as such, our Board performs the duties of an audit committee, including the review and pre-approval of fees paid to and services performed by Raymond Chabot Grant Thornton LLP.
- 146 -
PART IV
| ITEM 15. | EXHIBITS AND FINANCIAL STATEMENT SCHEDULES |
The financial statements are filed as part of this Annual Report on Form 10-K under Item 8 – “Financial Statements and Supplementary Data.”
| (b) | Financial Statement Schedules |
Financial statement schedules have been omitted because they are either not required, not applicable, or the information is presented in the consolidated financial statements and the notes thereto in Item 8 above.
Refer to the Index to Exhibits immediately following the signature page of this report, which is incorporated herein by reference.
- 147 -
SIGNATURES
Pursuant to the requirements of the Securities Exchange Act of 1934, the registrant has duly caused this report to be signed on its behalf by the undersigned, thereunto duly authorized in the City of Mont-Saint-Hilaire, Province of Quebec, Canada, on December 22, 2008.
| | |
| AXCAN INTERMEDIATE HOLDINGS INC. |
| |
| By: | | /s/ Steve Gannon |
| Name: | | Steve Gannon |
| Title: | | Senior Vice President, Finance, Chief Financial Officer and Treasurer |
Pursuant to the requirements of Section 13 or Section 15(d) of the Securities Exchange Act of 1934, this report has been signed by the following persons in the capacities and on the date indicated below.
| | | | |
Signature | | Title | | Date |
| | |
/s/ Frank A.G.M. Verwiel Frank A.G.M. Verwiel, M.D. | | President, Chief Executive Officer
and Director (Principal Executive Officer) | | December 22, 2008 |
| | |
/s/ Steve Gannon Steve Gannon | | Senior Vice President, Finance,
Chief Financial Officer, Treasurer
and Director (Principal Financial
and Accounting Officer) | | December 22, 2008 |
| | |
/s/ David Mims David Mims | | Executive Vice President, Chief
Operating Officer and Director | | December 22, 2008 |
| | |
/s/ Martha Donze Martha Donze | | Vice President, Administration,
Assistant Secretary and Director | | December 22, 2008 |
- 148 -
EXHIBIT INDEX
| | |
Exhibit No. | | Exhibit |
| |
| 2.1 | | Arrangement Agreement, dated as of November 29, 2007, between Atom Intermediate Holdings Inc. and Axcan Pharma Inc. (Exhibit 2.1 to Axcan Intermediate Holdings Inc. Form S-4 filed October 7, 2007). |
| |
| 3.1 | | Certificate of Incorporation of Axcan Intermediate Holdings Inc. (f/k/a Atom Intermediate Holdings Inc.), as amended (Exhibit 3.1 to Axcan Intermediate Holdings Inc. Form S-4 filed October 7, 2007). |
| |
| 3.2 | | By-laws of Axcan Intermediate Holdings Inc. (Exhibit 3.2 to Axcan Intermediate Holdings Inc. Form S-4 filed October 7, 2007). |
| |
| 4.1 | | Senior Secured Notes Indenture, dated as of February 25, 2008, among Axcan Intermediate Holdings Inc., the Guarantors listed therein and The Bank of New York, as Trustee, relating to the 9.25% Senior Secured Notes due 2015 (Exhibit 4.1 to Axcan Intermediate Holdings Inc. Form S-4 filed October 7, 2007). |
| |
| 4.2 | | Senior Notes Indenture, dated as of May 6, 2008, among Axcan Intermediate Holdings Inc., the Guarantors listed therein and The Bank of New York, as Trustee, relating to the 12.75% Senior Notes due 2016 (Exhibit 4.2 to Axcan Intermediate Holdings Inc. Form S-4 filed October 7, 2007). |
| |
| 4.3 | | Form of 9.25% Senior Secured Notes due 2015 (included in the Senior Secured Notes Indenture filed as Exhibit 4.1 to Axcan Intermediate Holdings Inc. Form S-4 filed October 7, 2007). |
| |
| 4.4 | | Form of 12.75% Senior Notes due 2016 (included in the Senior Notes Indenture filed as Exhibit 4.2 to Axcan Intermediate Holdings Inc. Form S-4 filed October 7, 2007). |
| |
| 4.5 | | Registration Rights Agreement, dated as of February 25, 2008, by and among Axcan Intermediate Holdings Inc., the Guarantors named therein and Banc of America Securities LLC, HSBC Securities (USA) Inc., RBC Capital Markets Corporation (Exhibit 4.5 to Axcan Intermediate Holdings Inc. Form S-4 filed October 7, 2007). |
| |
| 4.6 | | Registration Rights Agreement, dated as of May 6, 2008, by and among Axcan Intermediate Holdings Inc., the Guarantors named therein and Banc of America Securities LLC, HSBC Securities (USA) Inc., RBC Capital Markets Corporation (Exhibit 4.6 to Axcan Intermediate Holdings Inc. Form S-4 filed October 7, 2007). |
| |
| 4.7 | | Pledge and Security Agreement, dated as of February 25, 2008, among Axcan Intermediate Holdings Inc., as the Parent Borrower, Axcan US Partnership 1 LP, as the Co-Borrower, Axcan MidCo Inc., as Holdings, certain other Subsidiaries of Axcan Intermediate Holdings Inc. from time to time party thereto and Bank of America, N.A., as Administrative Agent for the Secured Parties (as defined therein) (Exhibit 4.7 to Axcan Intermediate Holdings Inc. Form S-4 filed October 7, 2007). |
| |
| 4.8 | | Trademark Security Agreement, dated of February 25, 2008, between Axcan Pharma US, Inc. and Bank of America, N.A. (Exhibit 4.8 to Axcan Intermediate Holdings Inc. Form S-4 filed October 7, 2007). |
| |
| 4.9 | | Trademark Security Agreement, dated as of February 25, 2008, between Axcan Pharma Inc. and Bank of America, N.A. (Exhibit 4.9 to Axcan Intermediate Holdings Inc. Form S-4 filed October 7, 2007). |
| |
| 4.10 | | Patent Security Agreement, dated as of February 25, 2008, between Axcan Pharma Inc. and Bank of America, N.A. (Exhibit 4.10 to Axcan Intermediate Holdings Inc. Form S-4 filed October 7, 2007). |
| |
| 4.11 | | Trademark Security Agreement, dated as of February 25, 2008, between Axcan Pharma (U&V) Inc. and Bank of America, N.A. (Exhibit 4.11 to Axcan Intermediate Holdings Inc. Form S-4 filed October 7, 2007). |
| |
| 4.12 | | Parallel Debt Agreement, dated as of February 25, 2008, among Axcan LuxCo 1 S.àr.l. and Axcan LuxCo 2 S.àr.l and The Bank of New York, relating to the Senior Secured Notes Indenture (Exhibit 4.12 to Axcan Intermediate Holdings Inc. Form S-4 filed October 7, 2007). |
| |
| 4.13 | | Parallel Debt Agreement, dated as of May 6, 2008, among Axcan LuxCo 2 S.àr.l. and Axcan LuxCo 2 S.àr.l and The Bank of New York, relating to the Senior Notes Indenture (Exhibit 4.13 to Axcan Intermediate Holdings Inc. Form S-4 filed October 7, 2007). |
| |
| 4.14 | | Pledge Agreement, dated as of February 25, 2008, among Axcan Intermediate Holdings Inc., as Pledgor, Bank of America, N.A., as Administrative Agent and Collateral Agent, and Axcan LuxCo 1 S.àr.l., as Company (Exhibit 4.14 to Axcan Intermediate Holdings Inc. Form S-4 filed October 7, 2007). |
| |
| 4.15 | | Pledge Agreement, dated as of February 25, 2008, among Axcan Intermediate Holdings Inc., as Pledgor, Bank of America, N.A., as Administrative Agent and Collateral Agent, and Axcan LuxCo 2 S.àr.l., as Company (Exhibit 4.15 to Axcan Intermediate Holdings Inc. Form S-4 filed October 7, 2007). |
- 149 -
| | |
Exhibit No. | | Exhibit |
| |
| 4.16 | | Deed of Pledge of Membership Rights, dated February 25, 2008, among Axcan Intermediate Holdings Inc. and Axcan US LLC, as Pledgors, and Bank of America, N.A., as Pledgee, and Axcan Coöperatieve U.A., as Coop (Exhibit 4.16 to Axcan Intermediate Holdings Inc. Form S-4 filed October 7, 2007). |
| |
| 4.17 | | Pledge and Security Agreement, dated as of February 25, 2008, among certain subsidiaries of Axcan Intermediate Holdings Inc. identified therein, as Grantors, and Bank of America, N.A., as Administrative Agent (Exhibit 4.17 to Axcan Intermediate Holdings Inc. Form S-4 filed October 7, 2007). |
| |
| 4.18 | | Pledge Agreement, dated as of February 25, 2008, among Axcan LuxCo 2 S.àr.l., as Pledgor, Bank of America, N.A., as Administrative and Collateral Agent, and Axcan Nova Scotia 1 ULC, as Company (Exhibit 4.18 to Axcan Intermediate Holdings Inc. Form S-4 filed October 7, 2007). |
| |
| 4.19 | | Deed of Hypothec in favor of Bank of America, N.A., dated as of February 25, 2008 (Exhibit 4.19 to Axcan Intermediate Holdings Inc. Form S-4 filed October 7, 2007). |
| |
| 4.20 | | Debenture, dated as of February 25, 2008 (Exhibit 4.20 to Axcan Intermediate Holdings Inc. Form S-4 filed October 7, 2007). |
| |
| 4.21 | | Pledge of Debentures, dated as of February 25, 2008, between Axcan Pharma Inc. and the Secured Parties (as defined therein) (Exhibit 4.21 to Axcan Intermediate Holdings Inc. Form S-4 filed October 7, 2007). |
| |
| 10.1 | | Management Services Agreement, dated as of February 21, 2008, by and among Axcan Holdings Inc., Axcan Intermediate Holdings Inc. and TPG Capital, L.P. (Exhibit 10.1 to Axcan Intermediate Holdings Inc. Form S-4 filed October 7, 2007). |
| |
| 10.2 | | Joinder to Management Services Agreement, dated as of February 25, 2008, by and among TPG Capital, L.P., Axcan Pharma Inc. and Axcan US Partnership 1 LP (Exhibit 10.2 to Axcan Intermediate Holdings Inc. Form S-4 filed October 7, 2007). |
| |
| 10.3 | | Lease Agreement, dated August 28, 1991, as amended on January 20, 1992, July 10, 1992, September 8, 1993, December 16, 1993, October 16, 1996, March 21, 1997, August 27, 1999, October 27, 2003, December 9, 2004, and December 7, 2005, between Teachers Insurance and Annuity Association of America (a successor in title to Metropolitan Life Insurance Company) and Axcan Scandipharm Inc. (Exhibit 10.3 to Axcan Intermediate Holdings Inc. Form S-4 filed October 7, 2007). |
| |
| 10.4 | | Sublease, dated July 23, 2007, between Norris, McLaughlin & Marcus, P.A. and Axcan Pharma US, Inc. (f/k/a Axcan Scandipharm Inc.) (Exhibit 10.4 to Axcan Intermediate Holdings Inc. Form S-4 filed October 7, 2007). |
| |
| 10.5+ | | Exclusive Development/License/Supply Agreement, dated May 16, 2000, between Eurand S.p.A. (f/k/a Eurand International S.p.A.) and Axcan Pharma US, Inc. (f/k/a Axcan Scandipharm Inc.), as amended by Amendment No. 1, dated March 23, 2007 (Exhibit 10.5 to Axcan Intermediate Holdings Inc. Form S-4 filed October 7, 2007). |
| |
| 10.6+ | | Finished Product Supply Agreement, dated October 8, 2003, by and between Sanofi-Aventis U.S. LLC (successor in interest of Aventis Pharmaceuticals Inc.) and Axcan Pharma Inc., as amended by Amendment No. 1, dated August 2, 2008 (Exhibit 10.6 to Axcan Intermediate Holdings Inc. Form S-4 filed October 7, 2007). |
| |
| 10.7+ | | Manufacturing Services Agreement, dated October 1, 2003, between Patheon Inc. and Axcan Pharma Inc. (Exhibit 10.7 to Axcan Intermediate Holdings Inc. Form S-4 filed October 7, 2007). |
| |
| 10.8+ | | Supply Agreement, dated May 7, 2004, between Paddock Laboratories, Inc. and Axcan Pharma Inc. (Exhibit 10.8 to Axcan Intermediate Holdings Inc. Form S-4 filed October 7, 2007). |
| |
| 10.9 | | Credit Agreement, dated as of February 25, 2008, among Axcan Intermediate Holdings Inc., as Parent Borrower, Axcan US Partnership 1 LP, as Co-Borrower, Axcan MidCo Inc., as Holdings, Bank of America, N.A., as Administrative Agent, Swing Line Lender and L/C Issuer, and the other lenders from time to time party thereto (Exhibit 10.9 to Axcan Intermediate Holdings Inc. Form S-4 filed October 7, 2007). |
| |
| 10.10 | | Guaranty, dated as of February 25, 2008, among Axcan MidCo Inc., Axcan Intermediate Holdings Inc., Axcan US Partnership 1 LP, certain other Subsidiaries of Axcan Intermediate Holdings Inc. from time to time party thereto and Bank of America, N.A., as Administrative Agent (Exhibit 10.10 to Axcan Intermediate Holdings Inc. Form S-4 filed October 7, 2007). |
| |
| 10.11 | | Amendment and Restatement of Employment Agreement between Axcan Pharma Inc., Axcan Pharma US, Inc., Axcan Holdings Inc. and Dr. Frank A.G.M. Verwiel, dated May 16, 2008 (Exhibit 10.11 to Axcan Intermediate Holdings Inc. Form S-4 filed October 7, 2007). |
| |
| 10.12 | | Employment Agreement between Axcan Pharma Inc., Axcan Pharma US, Inc., Axcan Holdings Inc. and David Mims, dated June 3, 2008 (Exhibit 10.12 to Axcan Intermediate Holdings Inc. Form S-4 filed October 7, 2007). |
- 150 -
| | |
Exhibit No. | | Exhibit |
| |
| 10.13 | | Employment Agreement between Axcan Pharma Inc., Axcan Pharma US, Inc., Axcan Holdings Inc. and Steve Gannon, dated July 3, 2008 (Exhibit 10.13 to Axcan Intermediate Holdings Inc. Form S-4 filed October 7, 2007). |
| |
| 10.14 | | Employment Agreement between Axcan Pharma Inc., Axcan Pharma US, Inc., Axcan Holdings Inc. and Alexandre P. LeBeaut, dated September 15, 2008 (Exhibit 10.14 to Axcan Intermediate Holdings Inc. Form S-4 filed October 7, 2007). |
| |
| 10.15 | | Employment Agreement between Axcan Pharma Inc. and Nicholas Franco, dated October 5, 2007 (Exhibit 10.15 to Axcan Intermediate Holdings Inc. Form S-4/A filed November 7, 2007). |
| |
| 10.16 | | Axcan Pharma Inc. Severance Pay Plan (Exhibit 10.16 to Axcan Intermediate Holdings Inc. Form S-4/A filed November 12, 2007). |
| |
| 10.17 | | Axcan Holdings Inc. Management Equity Incentive Plan (Exhibit 10.17 to Axcan Intermediate Holdings Inc. Form S-4/A filed November 12, 2007). |
| |
| 10.18 | | Axcan Pharma Inc. Incentive Compensation Plan for Executives (Exhibit 10.18 to Axcan Intermediate Holdings Inc. Form S-4/A filed November 12, 2007). |
| |
| 10.19 | | Form of Axcan Holdings Inc. Management Stockholders’ Agreement (Exhibit 10.19 to Axcan Intermediate Holdings Inc. Form S-4 filed October 7, 2007). |
| |
| 10.20 | | Form of Restricted Stock Unit Grant Agreement between Axcan Holdings Inc. and U.S. Grantee (Exhibit 10.20 to Axcan Intermediate Holdings Inc. Form S-4 filed October 7, 2007). |
| |
| 10.21 | | Form of Restricted Stock Unit Grant Agreement between Axcan Holdings Inc. and French Grantee (Exhibit 10.21 to Axcan Intermediate Holdings Inc. Form S-4 filed October 7, 2007). |
| |
| 10.22 | | Form of Penny Option Grant Agreement between Axcan Holdings Inc. and Optionee (Exhibit 10.22 to Axcan Intermediate Holdings Inc. Form S-4 filed October 7, 2007). |
| |
| 10.23* | | Axcan Holdings Inc. Employee Long Term Incentive Plan. |
| |
| 12.1* | | Computation of Ratio of Earnings to Fixed Charges. |
| |
| 21.1* | | Subsidiaries of Axcan Intermediate Holdings Inc. |
| |
| 31.1* | | Certification of Chief Executive Officer Pursuant to Section 302 of the Sarbanes-Oxley Act of 2002. |
| |
| 31.2* | | Certification of Chief Financial Officer Pursuant to Section 302 of the Sarbanes-Oxley Act of 2002. |
| |
| 32.1* | | Certification of Chief Executive Officer Pursuant to 18 U.S.C. Section 1350, as Adopted Pursuant to Section 906 of the Sarbanes-Oxley Act of 2002. |
| |
| 32.2* | | Certification of Chief Financial Officer Pursuant to 18 U.S.C. Section 1350, as Adopted Pursuant to Section 906 of the Sarbanes-Oxley Act of 2002. |
| * | Exhibits marked with an asterisk (*) are filed herewith. |
| + | This Exhibit was filed separately with the Commission pursuant to an application for confidential treatment. The confidential portions of the Exhibit have been omitted and have been marked by the following symbol: [ ** ]. |
- 151 -