As filed with the Securities and Exchange Commission on October 14, 2008
Registration No. 333-
UNITED STATES
SECURITIES AND EXCHANGE COMMISSION
Washington, D.C. 20549
FORM S-1
REGISTRATION STATEMENT
UNDER
THE SECURITIES ACT OF 1933
PHOSPHATE HOLDINGS, INC.
(Exact name of registrant as specified in its charter)
| | | | |
| Delaware | | 2870 | | 20-2055395 |
(State or other jurisdiction of incorporation or organization) | | (Primary Standard Industrial Classification Code Number) | | (I.R.S. Employer Identification Number) |
100 Webster Circle, Suite 4
Madison, MS 39110
(601) 898-9004
(Address, including zip code and telephone number, including
area code, of registrant’s principal executive offices)
Robert E. Jones
Chief Executive Officer
Phosphate Holdings, Inc.
100 Webster Circle, Suite 4
Madison, MS 39110
(601) 898-9004
(Name, address, including zip code and telephone number, including area code, of agent for service)
Copies to:
| | | | |
Alan J. Bogdanow Christine A. Hathaway Vinson & Elkins L.L.P. 2001 Ross Avenue, Suite 3700 Dallas, TX 75201 (214) 220-7700 | | Don B. Cannada Joseph E. Dudek M. Elizabeth Saxton Butler, Snow, O’Mara, Stevens & Cannada, PLLC 6075 Poplar Avenue, Suite 500 Memphis, TN 38119 (901) 680-7200 | | Andrew D. Soussloff Sullivan & Cromwell LLP 125 Broad Street New York, NY 10004 (212) 558-4000 |
Approximate date of commencement of proposed sale to the public:
As soon as practicable after this registration statement becomes effective.
If any of the securities being registered on this Form are to be offered on a delayed or continuous basis pursuant to Rule 415 under the Securities Act of 1933, check the following box. ¨
If this Form is filed to register additional securities for an offering pursuant to Rule 462(b) under the Securities Act, check the following box and list the Securities Act registration statement number of the earlier effective registration statement for the same offering. ¨
If this Form is a post-effective amendment filed pursuant to Rule 462(c) under the Securities Act, check the following box and list the Securities Act registration statement number of the earlier effective registration statement for the same offering. ¨
If this Form is a post-effective amendment filed pursuant to Rule 462(d) under the Securities Act, check the following box and list the Securities Act registration statement number of the earlier effective registration statement for the same offering. ¨
Indicate by check mark whether the registrant is a large accelerated filer, an accelerated filer, a non-accelerated filer, or a smaller reporting company. See the definitions of “large accelerated filer,” “accelerated filer” and “smaller reporting company” in Rule 12b-2 of the Exchange Act.
| | |
| Large accelerated filer ¨ | | Accelerated filer ¨ |
Non-accelerated filer x (Do not check if a smaller reporting company) | | Smaller reporting company ¨ |
CALCULATION OF REGISTRATION FEE
| | | | |
| |
Title of Each Class of Securities to be Registered | | Proposed Maximum
Aggregate Offering
Price(1)(2) | | Amount of
Registration Fee |
Common stock, par value $0.01 per share | | $200,000,000.00 | | $7,860.00 |
| |
| |
| (1) | Includes the offering price of shares of common stock that the underwriters have the option to purchase. |
| (2) | Estimated pursuant to Rule 457(o). |
The registrant hereby amends this Registration Statement on such date or dates as may be necessary to delay its effective date until the registrant shall file a further amendment which specifically states that this Registration Statement shall thereafter become effective in accordance with Section 8(a) of the Securities Act of 1933, or until this Registration Statement shall become effective on such date as the Commission, acting pursuant to said Section 8(a), may determine.
The information in this preliminary prospectus is not complete and may be changed. These securities may not be sold until the registration statement filed with the Securities and Exchange Commission is effective. This preliminary prospectus is not an offer to sell nor does it seek an offer to buy these securities in any jurisdiction where the offer or sale is not permitted.
Subject to Completion, Dated October 14, 2008
Shares
Phosphate Holdings, Inc.
Common Stock
We are offering shares of our common stock. We anticipate that the offering price per share will be between $ and $ .
Currently, shares of our common stock are traded in the OTC markets under the symbol “PHOS.” As of October 10, 2008, the closing bid price of our common stock as reported by the OTC Bulletin Board was $18.00 per share. We plan to apply for approval for listing of our common stock on the under the symbol “ .”
See “Risk Factors” beginning on page 12 to read about factors you should consider before buying shares of our common stock.
Neither the Securities and Exchange Commission nor any other regulatory body has approved or disapproved of these securities or passed upon the accuracy or adequacy of this prospectus. Any representation to the contrary is a criminal offense.
| | | | | | |
| | | Per Share | | Total |
Initial public offering price | | $ | | | $ | |
Underwriting discount | | $ | | | $ | |
Proceeds, before expenses, to Phosphate Holdings, Inc. | | $ | | | $ | |
To the extent that the underwriters sell more than shares of our common stock, the underwriters have the option to purchase up to an additional shares of our common stock at the initial public offering price less the underwriting discount.
The underwriters expect to deliver the shares against payment in New York, New York on , 2008.
Goldman, Sachs & Co. | Merrill Lynch & Co. |
Prospectus dated , 2008.
TABLE OF CONTENTS
Prospectus
Through and including , 2008 (the 25th day after the date of this prospectus), all dealers effecting transactions in these securities, whether or not participating in this offering, may be required to deliver a prospectus. This is in addition to a dealer’s obligation to deliver a prospectus when acting as an underwriter and with respect to an unsold allotment or subscription.
No dealer, salesperson or other person is authorized to give any information or to represent anything not contained in this prospectus. You must not rely on any unauthorized information or representations. This prospectus is an offer to sell only the shares offered hereby, but only under circumstances and in jurisdictions where it is lawful to do so. The information contained in this prospectus is current only as of its date.
PROSPECTUS SUMMARY
The following summary highlights information appearing elsewhere in this prospectus. This summary does not contain all of the information you should consider before investing in our common stock. You should read this entire prospectus carefully, especially the matters discussed under “Risk Factors” and “Management’s Discussion and Analysis of Financial Condition and Results of Operations” and our consolidated financial statements and the related notes thereto appearing elsewhere in this prospectus, before deciding to invest in our common stock.
References in this prospectus to “PHI,” “Phosphate Holdings,” “our,” “we” or “us” are to Phosphate Holdings, Inc. and its wholly owned subsidiary, Mississippi Phosphates Corporation, or MPC, unless the context otherwise requires. References to “tons” in this prospectus refer to short tons unless otherwise indicated. One short ton equals 2,000 pounds, one long ton equals 2,240 pounds and one metric ton equals 1,000 kilograms or approximately 2,200 pounds. References to “FOB, NOLA” mean free on board, New Orleans, Louisiana, and refer to domestic prices, and “FOB, U.S. GULF” mean free on board, U.S. gulf coast, and refer to export prices. References to “C&F, Tampa” mean cost and freight, Tampa, Florida.
Phosphate Holdings, Inc.
Overview
We are a major U.S. producer and marketer of diammonium phosphate, or DAP, the most widely used phosphate fertilizer. DAP serves an important role in global agriculture by providing two of the three primary nutrients essential for plant development and growth. In its chemical composition, DAP is composed of 46% phosphate and 18% nitrogen. Phosphate is essential for the photosynthesis process, seed germination, efficient water utilization by plants and protection of plants against diseases. Thus, phosphate fertilizers play an important role in improving crop quality, increasing crop yields and mitigating the effects of environmental stresses on plants.
In 2007, we sold 620,569 tons of DAP at an average price of $353.80 per ton, up from the 579,772 tons we sold in 2006 at an average price of $225.21 per ton. For the six months ended June 30, 2008, we sold 266,343 tons of DAP at an average price of $871.06 per ton. For the year ended December 31, 2007 and the six months ended June 30, 2008, we generated total net sales of $222.4 million and $238.5 million, EBITDA of $85.7 million and $71.9 million, and net income of $48.9 million and $42.0 million, respectively.
Our production facilities are strategically located on a deep water channel in Pascagoula, Mississippi with direct access to the Gulf of Mexico. Our manufacturing facilities consist of two sulfuric acid plants, a phosphoric acid plant and a DAP granulation plant. Our DAP granulation plant has a maximum annual DAP production capacity of approximately 870,000 tons. Our existing sulfuric acid plants currently produce sulfuric acid sufficient for annual DAP production of approximately 750,000 tons. When it is economical to do so, we can purchase additional quantities of sulfuric acid on the open market, allowing us to manufacture DAP at our full capacity. However, due to current high sulfuric acid prices, we do not expect to purchase supplemental sulfuric acid to increase our DAP production in 2008.
Historically, we have sold our DAP primarily into the U.S. domestic market where we have typically obtained better prices relative to export markets. During 2006 and 2007, we made 71% and 65%, respectively, of our DAP sales into the domestic market. In late 2007 and early 2008, however, prices in the export market exceeded those in the domestic market due to a significant increase in
1
international demand for phosphate fertilizers. As a result, we strategically directed our sales into the export market, and in the first half of 2008, we sold the substantial majority of our DAP into the export market. Latin America is the principal destination for our export sales. Our internal sales staff manages our domestic sales while Transammonia, Inc., or Transammonia, a major global trading company, markets our export volumes.
Industry Overview
Fertilizer Fundamentals. Fertilizers are crucial for the agricultural process because they replace the nutrients that crops remove from the soil, thereby sustaining the yield and quality of crops. Phosphate, nitrogen and potassium (potash) are the three primary nutrients essential to crop development. Each of these three key nutrients serves a different vital function in plant formation, and a proper balance of the three nutrients is necessary to maximize crop viability.
Global demand for food, which is a function of population growth and changes in dietary habits, is the primary driver of global fertilizer demand. Developed countries use fertilizers more intensively than developing countries, but sustained economic growth in the developing world is changing the patterns of fertilizer usage. Improvements in the standard of living in developing countries have produced a shift in dietary preferences towards more meat consumption. Producing meat from livestock requires large amounts of grain and, in turn, the fertilizer necessary to grow it. According to the International Fertilizer Industry Association, or the IFA, world fertilizer usage increased by 10% between 2005 and 2007, and world fertilizer demand is estimated to grow by approximately 15% from 2007 to 2012.
DAP Market Conditions and Outlook. Phosphate, the primary component of DAP, is essential for the photosynthesis process, which drives the production, transportation and accumulation of sugars in plants. Phosphate also aids seed germination, promotes efficient water utilization and protects plants against diseases. Thus, phosphate fertilizers play an important role in improving crop quality, increasing crop yields and mitigating the effects of environmental stresses on plants.
Over the last decade, DAP prices were relatively stable due to excess world capacity and static pricing for the key raw materials required to produce DAP, principally phosphate rock and sulfur. Since late 2006, global phosphate consumption has increased significantly, driven by growing demand for agricultural commodities for use as food and fuel. This surge in demand has dramatically altered the supply and demand balance for phosphate fertilizers. In the United States, producers’ inventory of DAP during 2007 fell significantly below five-year average levels. As a result of this supply and demand imbalance, DAP prices escalated rapidly in 2007. During 2007, DAP prices, FOB, NOLA, rose from $231 per ton on January 1, 2007 to $550 per ton on December 31, 2007.
As DAP production increased during 2007 to meet increased demand, raw material capacities tightened and shortages of sulfur and phosphate rock developed late in the year. Consequently, prices for both raw materials rose sharply, exerting further upward pressure on finished product prices. Between January 1, 2008 and July 1, 2008, posted prices, C&F, Tampa, for sulfur rose from $112 per ton to $625 per ton and reported ranges of merchant phosphate rock prices have increased from $68 to $75 per metric ton to $150 to $400 per metric ton. During that same period, DAP prices increased rapidly, with published prices for DAP, FOB, NOLA, increasing from $550 per ton to $1,070 per ton and prices for DAP, FOB, U.S. GULF, increasing from $544 per ton to $1,070 per ton.
Since the completion of the 2008 domestic planting season, we have experienced a customary decline in demand for DAP. Additionally, there has been a delay in the typical fall season DAP shipments to markets in the United States, Europe and Latin America. As a result, demand for DAP
2
has been sharply reduced, and DAP prices have declined to $834 per ton, FOB, NOLA, and $920 per ton, FOB, U.S. GULF, at October 13, 2008. This price decline has been partially offset by net reductions in the cost of raw materials. We expect that an increase in demand in late October and November, coupled with a reduction in available supply due to recent storms and announced production curtailments, will partially alleviate the current weakness in the DAP market.
The following table shows domestic and export DAP prices over the last 15 years:
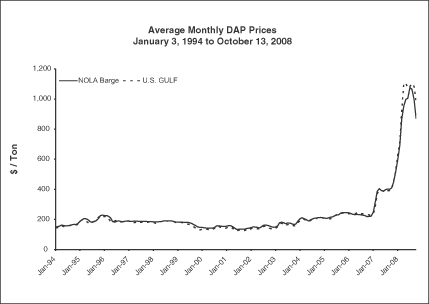
Source: Green Markets
Looking forward, the following factors are expected to continue to support strong demand for agricultural commodities and fertilizers:
| | Ÿ | | growing population and improving diets; |
| | Ÿ | | declining grain stocks despite record crops; |
| | Ÿ | | current biofuel initiatives; and |
The IFA estimates that global DAP consumption will increase at an average annual growth rate of 3.5% from 2008 to 2012. Given the favorable industry dynamics, a large number of projects to increase phosphate fertilizer production capacity are under active consideration. However, due to the long lead-time typically required to complete these projects, significant additional phosphate fertilizer production capacity is not expected to be available before 2011. As a result, the supply and demand balance for phosphate fertilizers is expected to remain tight until at least that time.
Competitive Strengths
We believe the following competitive strengths have contributed to our recent success, differentiate us from our competitors and will drive our future growth:
Long-Term Strategic Supplier Relationship. We have a strong, long-term relationship with OCP S.A., or OCP, a corporation owned by the Kingdom of Morocco. A significant portion of the
3
world’s known phosphate rock reserves are located in Morocco, and OCP is the world’s leading exporter of phosphate rock, accounting for approximately 45% of world trade in phosphate rock. We are one of OCP’s largest buyers of phosphate rock, and we have purchased all of our phosphate rock requirements from OCP since 1991.
We believe the phosphate rock that OCP supplies to us is of a higher grade than the average phosphate rock mined in the United States. The higher grade lowers our conversion cost because we can more efficiently convert this phosphate rock into phosphoric acid. The higher grade also helps us meet the nitrogen content specification of our DAP without the need to add solid nitrogen products, such as urea, as supplements.
We believe that we have a strategic and mutually beneficial working relationship with OCP. During the 18 years that we have purchased phosphate rock from OCP, we have never experienced an interruption in our supply of phosphate rock caused by OCP. When Hurricane Katrina severely damaged our facilities in 2005, OCP’s prompt assurances that our supply of phosphate rock would be available when we were ready to resume operations facilitated our recovery from that disaster.
The price we pay OCP for phosphate rock is currently re-set each quarter. OCP has advised us that it is presently engaged in a comprehensive review of its existing customer contracts and contract terms, which it intends to update and standardize. OCP has stated that its objective is to execute new multi-year contracts with all of its global customers, rather than to extend current agreements. In connection with this objective, OCP has notified us that, rather than extend the term of our current contract, it plans to enter into a new agreement with us prior to the expiration of our current agreement on December 31, 2008. Accordingly, in June 2008, OCP provided us with written notice that it will not extend our current four-year agreement beyond December 31, 2008. OCP has advised us that it wishes to continue our long-standing relationship, and we currently anticipate entering into a new contract with OCP in advance of the expiration of our existing contract on December 31, 2008.
Strategically Located Facilities. Our production facilities are strategically located on a deep water channel with direct access to the Gulf of Mexico. We believe that our location provides the following important benefits:
Marketing Flexibility. We believe that our location provides us with maximum flexibility to direct our sales into markets that will yield the best price for our product. We are able to load our finished product either onto deep water vessels for shipment into the export market or onto barges for delivery along the Mississippi River and its tributaries for domestic consumption. Our export volumes are loaded directly onto ocean vessels from our Pascagoula plant without the extra expense that inland producers must incur for inland transport and terminal operations. Our Pascagoula location also permits us to directly access much of the U.S. corn belt by barge rather than higher cost rail transport. We also have rail and truck shipping capabilities, which maximize our delivery options.
Raw Material Access. Our deep water location also allows us to receive raw materials at a lower cost than our competitors with inland facilities. We can receive ammonia and sulfur directly at our dock while our competitors not located on a deep water channel must first move these materials through a deep water terminal and then transport them by rail or pipeline to their inland locations. Our Pascagoula plant is close to the major sulfur production regions in Texas and Louisiana. We believe this proximity lowers our sulfur delivery costs compared to our inland competitors. We also obtain a considerable portion of our molten sulfur requirement directly via pipeline from a large-scale oil refinery situated contiguous to our facility, which further strengthens our sulfur access advantage.
4
Established Valuable Infrastructure. Our Pascagoula plant has significant, well-maintained facilities and infrastructure in place. Based on current costs for similar assets, we estimate the replacement cost of our Pascagoula plant at approximately $900 million. In addition to the extensive capital investment, the construction of a similar facility in the United States could involve a complex, time-consuming and costly governmental and regulatory permitting process. We estimate that project development and execution would require approximately four years.
Our existing asset base provides a platform for cost-effective incremental expansion. We are currently unable to use a material portion of our phosphoric acid and DAP granulation capacity due to our limited sulfuric acid production capacity. We intend to use substantially all of the net proceeds from this offering to construct a new sulfuric acid plant, which will allow us to increase our sulfuric acid production and thereby utilize our full phosphoric acid and DAP production capacity. We believe this possibility is an attractive investment opportunity that will allow us to maximize our DAP production without the need to add additional phosphoric acid or granulation capacity.
We believe that our Pascagoula plant is well positioned to become an important terminal for fertilizer and related products and chemicals. Since 2005, we have provided ammonia terminaling services to Transammonia. Our Pascagoula plant has ample space for us to construct additional terminal facilities to handle more products and to provide terminaling services to additional third parties. We have commenced projects to add terminaling capabilities for sulfuric acid and liquid nitrogen fertilizer, which we expect to complete in 2009. Other projects to expand our terminaling business are under evaluation.
Environmental regulations require gypsum, a by-product of DAP production, to be stored in on-site permitted disposal facilities. Our active gypsum disposal facility is fully-permitted and has sufficient capacity to meet our operating requirements for approximately 18 additional years assuming we produce at our maximum annual DAP production rate of approximately 870,000 tons. The fully-permitted status and long remaining life of our active gypsum stack is a valuable resource that provides ongoing stability to our DAP operations. We believe that this stability provides us with a significant advantage over other companies whose gypsum disposal facilities have remaining lives that are significantly less than the remaining life of our active gypsum stack. Developing new gypsum disposal facilities has become increasingly difficult due to extensive capital investment requirements and a costly regulatory permitting process.
Key Strategic Alliances. In addition to our strategic relationship with OCP, we believe that our operating results benefit substantially from our broad-ranging alliances with two other strategic partners, Transammonia and International Commodities Export Corporation, or ICEC.
Transammonia, a major global trading company, supplies our ammonia requirements, priced competitively on a cost-plus basis, subject to an index-based maximum price. In addition, all of our DAP export sales and a significant portion of our domestic DAP sales are to Transammonia. Pursuant to our sales agreement with Transammonia, sales are made at a price composed of a market related “base price” plus an additional price related to the profitability of Transammonia’s ultimate sale. This framework allows us to achieve potentially higher profit margins on our sales. Under the Transammonia agreement, we maintain maximum flexibility and can react quickly to take advantage of changing price differentials in the domestic and export markets. In contrast, the agreement with our previous sole export customer, Phosphate Chemicals Export Association, Inc., or PhosChem, did not provide us this level of flexibility. Transammonia is also the exclusive user of our ammonia terminal, for which we receive ammonia throughput fees. Ammonia throughput fees consist of a base fee plus an additional fee related to the margins Transammonia achieves on sales through our terminal.
5
ICEC, the largest global marketer of sulfur, is our major supplier of sulfur. Pursuant to our sulfur supply contract with ICEC, ICEC supplies us with 7,000 to 12,000 long tons of sulfur per month. From time to time, at our request, ICEC sources additional sulfur and sulfuric acid to us. ICEC also purchases a significant portion of our DAP for resale into the U.S. domestic market.
Significant Management Experience. We benefit from the experience and long-standing industry relationships of our senior management team. On average, our senior management team has over 25 years of experience in the fertilizer industry. Our current senior leadership has successfully steered our business through the financial and operational challenges MPC faced during the bankruptcy of MPC and its former parent, Mississippi Chemical Corporation, or MCC, and, subsequently, Hurricane Katrina. We believe that our senior management team has the knowledge and experience to capitalize on business growth opportunities that will further enhance our reputation as well as our earnings and cash flow.
Business Strategy
Our objective is to increase long-term stockholder value. Key elements of our business strategy to accomplish our objective include:
Expand our manufacturing capacity to facilitate growth in revenues and cash flow. We plan to use substantially all of the net proceeds of this offering to build a new sulfuric acid plant and related cogeneration facility at our Pascagoula plant. Currently, our DAP production capacity is limited by our sulfuric acid production capacity, and the price of sulfuric acid in the open market makes the purchase of supplemental sulfuric acid economically unattractive. The new sulfuric acid plant will expand our sulfuric acid production capacity and will allow us to utilize our full DAP production capacity without relying on purchases of supplemental sulfuric acid. In addition, the new sulfuric acid plant will allow us to sell up to 95,000 tons of excess sulfuric acid per year into the merchant acid market. The new planned cogeneration operations will reduce our operating costs and provide additional revenue opportunities through the sale of excess electricity. We expect that the new sulfuric acid plant and related cogeneration unit will enable us to lower our DAP production cost per ton and increase our cash flow due to full utilization of our DAP production capacity, improved plant efficiency and reduced electricity costs.
Capture opportunities for higher margins by strategically targeting our sales to more profitable markets. We constantly monitor domestic and export DAP market conditions. Unlike other domestic DAP producers, we can react quickly to take advantage of favorable regional conditions and strategically target our sales into higher yielding markets. Historically, we have delivered most of our DAP for sale into the U.S. domestic market. However, in late 2007, when pricing in the export market became more advantageous, we swiftly increased the amount of our DAP sold into the export markets. Pursuant to our sales agreement with Transammonia, we maintain maximum flexibility and can react quickly to take advantage of changing price differentials between domestic and export markets. Sales are made at a price composed of a market related “base price” plus an additional price related to the profitability of Transammonia’s ultimate sale. This framework allows us to achieve potentially higher profit margins on our export sales.
Diversify and grow our revenue stream primarily through investment in additional projects that capitalize on our strategic location and existing facilities. We continuously evaluate strategic investment opportunities, such as expanding our terminaling services, that will enable us to diversify our revenue stream beyond DAP sales. Currently, we offer ammonia terminaling services to Transammonia, our exclusive supplier of ammonia. In 2007, we expanded our terminal to
6
accommodate Transammonia’s increased requirements, and Transammonia increased its minimum throughput commitments under our terminaling contract. We have commenced projects that will expand our terminaling capacity to handle liquid nitrogen fertilizers and sulfuric acid. We are also evaluating a project that will increase our capacity to handle dry bulk goods. In addition, we are exploring other capital projects such as uranium recovery from phosphoric acid and solid sulfur prilling. We believe that these potential capital projects, which capitalize on our location in a heavily industrialized area on a deep water channel with access to the Gulf of Mexico, and our existing infrastructure can help us diversify and grow our revenue stream.
Maintain our financial strength to respond to changes in product prices and raw material costs and to withstand downturns in our industry. Recent increases in the price of raw materials, including phosphate rock, sulfur and ammonia, have highlighted the importance of being able to respond quickly to changes in market prices for DAP and raw materials. The degree of liquidity required to operate our business and respond to market conditions has increased significantly. During 2007, we dramatically improved our liquidity through the repayment of the $4.9 million outstanding balance under our revolving credit facility and by increasing cash on hand to $43.6 million at December 31, 2007. Our enhanced liquidity affords us the flexibility to capitalize on changing market conditions. During 2007, our financial strength permitted us to strategically accumulate DAP inventory in anticipation of the higher DAP sales prices that materialized in late 2007, to capture arbitrage opportunities created by price differentials between domestic and export markets and to build significant raw material inventories in advance of sharp raw material price increases. At June 30, 2008, our cash on hand had declined to $31.3 million principally due to our March 2008 special dividend payment and the buildup of raw material inventories. We intend to maintain a strong balance sheet and ample capital reserves to protect against any future downturn in the industry.
Continue to evaluate opportunities to expand our business. We are constantly analyzing opportunities to expand our core business through investments and acquisitions. We also will consider expanding into new businesses that are compatible with our core competencies and synergistic with our current operations.
Maintain our commitment to operate our facilities in an environmentally responsible and safe manner. We are firmly committed to protecting the environment in which we operate and take pride in the significant progress we have made in this area. Since our emergence from bankruptcy in December 2004, the number of reported environmental permit exceedances at our Pascagoula plant declined by more than 75%, compared to the three year period prior to our emergence from bankruptcy. We continually review our processes and practices to identify methods to reduce the environmental impact of our operations.
Our commitment to maintaining a strong safety record has resulted in significant improvements in our safety programs since our emergence from bankruptcy in December 2004. Our success in our safety efforts is reflected in our workers’ compensation insurance premium rates, which we believe are approximately one-third lower than the industry average.
Corporate History and Principal Executive Offices
We were incorporated in December 2004 as a Delaware corporation to act as a holding company for MPC, a subsidiary of MCC and owner of the phosphate fertilizer business of MCC, which was spun off as part of MCC’s emergence from bankruptcy under Chapter 11 of the U.S. Bankruptcy Code, or the Bankruptcy Code. Our principal executive offices are located at 100 Webster Circle, Suite 4, Madison, Mississippi 39110, and our telephone number is (601) 898-9004.
7
The Offering
Common stock offered by us | shares. |
Common stock to be outstanding after this offering | shares. |
Option to purchase additional shares | The underwriters have a 30-day option to purchase up to additional shares of our common stock at the initial public offering price less underwriting discounts and commissions. |
Use of proceeds | We estimate that the net proceeds to us from this offering will be approximately $ million (based on the midpoint of the price range set forth on the cover page of this prospectus). |
| | We intend to use substantially all of the net proceeds of this offering to fund the engineering, design and construction of a new sulfuric acid plant to replace our existing sulfuric acid plants, which will allow us to utilize our full DAP production capacity. We intend to use the balance of the net proceeds for general corporate purposes or for other capital projects. See “Use of Proceeds.” |
Dividend policy | We do not currently intend to pay a regular dividend on our common stock. |
Exchange listing | We plan to apply for approval for listing on the , or , under the symbol “ .” |
Risk factors | See “Risk Factors” beginning on page 12 and other information appearing elsewhere in this prospectus for a discussion of factors you should carefully consider before deciding whether to invest in our common stock. |
The number of shares of our common stock to be outstanding after this offering is based on 7,654,290 shares outstanding as of October 10, 2008. Unless otherwise indicated, this number and all information presented in this prospectus:
| | Ÿ | | assumes no exercise of the underwriters’ option to purchase up to additional shares of our common stock from us; |
| | Ÿ | | excludes 757,018 shares of our common stock issuable upon the exercise of outstanding stock options, with an exercise price of $2.36 per share; |
| | Ÿ | | excludes 46,703 shares of our common stock reserved for issuance under outstanding stock appreciation right, or SAR, awards; and |
| | Ÿ | | excludes shares of our common stock reserved for future issuance under our equity incentive plans. |
8
Summary Historical Consolidated Financial and Operating Information
The following tables show summary historical consolidated financial and operating data of Phosphate Holdings and its wholly owned subsidiary, MPC. We derived the summary historical consolidated financial data for each of the years ended December 31, 2007, 2006 and 2005 and as of December 31, 2007 and 2006 from our audited consolidated financial statements and the related notes thereto appearing elsewhere in this prospectus. We derived the summary consolidated statement of operations data for the six months ended June 30, 2008 and 2007 and the summary consolidated balance sheet data as of June 30, 2008 from our unaudited consolidated interim financial statements and the related notes thereto appearing elsewhere in this prospectus, which, in the opinion of our management, have been prepared on the same basis as the audited consolidated financial statements and reflect all adjustments, consisting only of normal recurring adjustments, necessary for the fair presentation of our operating results and financial position for those periods and as of those dates. The summary unaudited financial data for the six months ended June 30, 2008 are not necessarily indicative of our results for the year ending December 31, 2008, and our historical results are not necessarily indicative of our results for any future period. The per share data in the table below have been retroactively adjusted to give effect to a 7,654.29-to-1 stock split in June 2007. The information provided below should be read in conjunction with “Management’s Discussion and Analysis of Financial Condition and Results of Operations” and our consolidated financial statements and the related notes thereto and other financial information appearing elsewhere in this prospectus.
| | | | | | | | | | | | | | | | | |
| | | Six Months
Ended June 30, | | Years Ended
December 31, | |
| | | 2008(1) | | 2007(1) | | 2007(1) | | 2006(1) | | | 2005(1) | |
| | | (In thousands, except per share and per ton data) | |
Statement of Operations Data: | | | | | | | | | | | | | | | | | |
DAP sales | | $ | 232,001 | | $ | 109,208 | | $ | 219,569 | | $ | 130,579 | | | $ | 100,151 | |
Other | | | 6,453 | | | 689 | | | 2,805 | | | 985 | | | | 513 | |
| | | | | | | | | | | | | | | | | |
Total net sales | | | 238,454 | | | 109,897 | | | 222,374 | | | 131,564 | | | | 100,664 | |
Cost of sales | | | 164,461 | | | 88,141 | | | 169,952 | | | 128,684 | | | | 90,117 | |
| | | | | | | | | | | | | | | | | |
Gross profit | | | 73,993 | | | 21,756 | | | 52,422 | | | 2,880 | | | | 10,547 | |
Selling, general and administrative expenses | | | 6,529 | | | 5,436 | | | 12,301 | | | 4,472 | | | | 2,879 | |
Impairment of assets | | | 1,572 | | | — | | | — | | | — | | | | — | |
| | | | | | | | | | | | | | | | | |
Operating income (loss) | | | 65,892 | | | 16,320 | | | 40,121 | | | (1,592 | ) | | | 7,668 | |
Other income (expenses): | | | | | | | | | | | | | | | | | |
Interest, net | | | 293 | | | 67 | | | 301 | | | (735 | ) | | | (73 | ) |
Hurricane-related gain | | | — | | | 37,830 | | | 37,830 | | | — | | | | — | |
Other, net | | | 213 | | | 232 | | | 176 | | | 533 | | | | (246 | ) |
| | | | | | | | | | | | | | | | | |
Income (loss) before income taxes | | | 66,398 | | | 54,449 | | | 78,428 | | | (1,794 | ) | | | 7,349 | |
Income tax expense | | | 24,407 | | | 20,793 | | | 29,539 | | | — | | | | 2,465 | |
| | | | | | | | | | | | | | | | | |
Net income (loss) | | $ | 41,991 | | $ | 33,656 | | $ | 48,889 | | $ | (1,794 | ) | | $ | 4,884 | |
| | | | | | | | | | | | | | | | | |
Earnings (loss) per share, basic | | $ | 5.49 | | $ | 4.40 | | $ | 6.39 | | $ | (0.24 | ) | | $ | 0.68 | |
| | | | | | | | | | | | | | | | | |
Earnings (loss) per share, diluted | | $ | 5.19 | | $ | 4.40 | | $ | 6.04 | | $ | (0.24 | ) | | $ | 0.66 | |
| | | | | | | | | | | | | | | | | |
Cash dividends per share | | $ | 1.50 | | $ | — | | $ | — | | $ | — | | | $ | 0.68 | |
| | | | | | | | | | | | | | | | | |
Other Financial Data: | | | | | | | | | | | | | | | | | |
EBITDA(2) | | $ | 71,866 | | $ | 57,513 | | $ | 85,676 | | $ | 2,931 | | | $ | 8,945 | |
| | | | | | | | | | | | | | | | | |
9
| | | | | | | | | | | | | | | |
| | | Six Months
Ended June 30, | | Years Ended
December 31, |
| | | 2008(1) | | 2007(1) | | 2007(1) | | 2006(1) | | 2005(1) |
| | | (In thousands, except per share and per ton data) |
Selected Operating Data: | | | | | | | | | | | | | | | |
Tons of DAP produced | | | 258.1 | | | 341.4 | | | 631.1 | | | 597.8 | | | 485.6 |
Tons of DAP sold | | | 266.3 | | | 346.9 | | | 620.6 | | | 579.8 | | | 478.7 |
Average sales price per ton of DAP sold | | $ | 871.06 | | $ | 314.83 | | $ | 353.80 | | $ | 225.21 | | $ | 209.21 |
Average cost of sales per ton of DAP sold | | $ | 617.58 | | $ | 254.08 | | $ | 273.85 | | $ | 221.95 | | $ | 188.25 |
| | | | | | | | | | | | |
| | | June 30,
2008(1) | | December 31, |
| | | | 2007(1) | | 2006(1) | | 2005(1) |
| | | (In thousands) |
Balance Sheet Data: | | | | | | | | | | | | |
Current assets | | $ | 144,751 | | $ | 79,418 | | $ | 24,463 | | $ | 24,585 |
Property, plant and equipment, net | | | 47,286 | | | 41,417 | | | 35,219 | | | 13,658 |
Total assets | | | 195,684 | | | 124,303 | | | 63,478 | | | 40,688 |
Total current liabilities | | | 62,504 | | | 23,124 | | | 12,922 | | | 17,994 |
Total long-term debt | | | — | | | — | | | 4,875 | | | — |
Asset retirement obligations | | | 5,333 | | | 5,086 | | | 4,627 | | | 4,209 |
Stockholders’ equity | | | 115,740 | | | 85,230 | | | 17,570 | | | 18,485 |
| (1) | For substantial intervals during the period from December 31, 2005 to June 30, 2008, as a result of several factors, including Hurricane Katrina and significant equipment failures, our production facilities in Pascagoula were not operating or were operating significantly below expected capacity. For a discussion of these factors, see “—Hurricane Katrina” and “—Equipment Failures” under “Management’s Discussion and Analysis of Financial Condition and Results of Operations.” Our financial and operating data in the tables above and below reflect the effects of such unplanned shutdowns and reduced production rates. |
| (2) | We define EBITDA as net income before interest; income taxes; depreciation, amortization and accretion; and asset impairment charges. EBITDA is used as a supplemental financial measure by our management and by external users of our financial statements to assess: |
| | Ÿ | | the financial performance of our assets without regard to financing methods, capital structure or historical cost basis; |
| | Ÿ | | our operating performance and return on capital as compared to other companies in the fertilizer business, without regard to financing or capital structure; and |
| | Ÿ | | the viability of acquisitions and capital expenditure projects and the overall rates of return on alternative investment opportunities. |
We use EBITDA as a primary operating performance measure and an important indicator of our ability to provide cash flows to meet future debt service, if any, capital expenditures and working capital requirements and to fund future growth.
The U.S. Generally Accepted Accounting Principles, or GAAP, measure most directly comparable to EBITDA is net income. Our non-GAAP financial measure of EBITDA should not be considered as an alternative to GAAP net income. You should not consider EBITDA in isolation or as a substitute for analysis of our results as reported under GAAP. Because EBITDA excludes some, but not all, items that affect income from continuing operations and is defined differently by different companies in our industry, our definition of EBITDA may not be comparable to similarly titled measures of other companies.
10
We compensate for the limitations of EBITDA as an analytical tool by reviewing the comparable GAAP measures, understanding the differences between the measures and incorporating this information into our decision-making processes.
The following table shows the reconciliation of net income (loss) to EBITDA for the periods indicated:
| | | | | | | | | | | | | | | | | | | |
| | | Six Months
Ended June 30, | | | Years Ended
December 31, |
| | | 2008 | | | 2007 | | | 2007 | | | 2006 | | | 2005 |
| | | (In thousands) |
Net income (loss) | | $ | 41,991 | | | $ | 33,656 | (a) | | $ | 48,889 | (a) | | $ | (1,794 | ) | | $ | 4,884 |
Interest, net | | | (293 | ) | | | (67 | ) | | | (301 | ) | | | 735 | | | | 73 |
Income tax provision | | | 24,407 | | | | 20,793 | | | | 29,539 | | | | — | | | | 2,465 |
Depreciation, amortization and accretion | | | 4,189 | | | | 3,131 | | | | 7,549 | | | | 3,990 | | | | 1,523 |
Asset impairment charge(b) | | | 1,572 | | | | — | | | | — | | | | — | | | | — |
| | | | | | | | | | | | | | | | | | | |
EBITDA | | $ | 71,866 | | | $ | 57,513 | | | $ | 85,676 | | | $ | 2,931 | | | $ | 8,945 |
| | | | | | | | | | | | | | | | | | | |
| (a) | This amount includes $37,830 of Hurricane Katrina insurance related pre-tax gains. |
| (b) | During the six months ended June 30, 2008, we recorded an asset impairment charge of $1,572 related to the failure of certain internal components of the waste heat boiler in our No. 2 sulfuric acid plant. See Notes 1(d) and 13(f) to our unaudited consolidated interim financial statements appearing elsewhere in this prospectus. |
11
RISK FACTORS
Investing in our common stock involves a high degree of risk. You should carefully consider the following risk factors together with all of the other information included in this prospectus in evaluating an investment in our common stock. If any of the following risks were actually to occur, our business, financial condition or operating results could be materially and adversely affected. In that case, the trading price of our common stock could decline and you could lose all or part of your investment.
Risks Related to Our Business
Our operating results are highly dependent upon, and fluctuate based on, the business and economic conditions and policies affecting fertilizer demand and prices as well as the agriculture industry in general. These factors are outside of our control and may significantly affect our profitability.
Fertilizers, including DAP, are global commodities and can be subject to intense price competition from domestic and foreign sources, often resulting in volatile changes in pricing from one growing season to the next and sometimes within one growing season. Historically, the majority of our sales have been made into the U.S. domestic market. As a result, our operating results are highly dependent upon conditions in the U.S. agricultural industry. A variety of factors beyond our control can materially affect domestic fertilizer demand and pricing. These factors include, but are not limited to, future prices for crops, U.S. planted acreage, government agricultural policies, government energy policies, particularly as they relate to the use of ethanol, fertilizer application rates and product selection, projected grain stocks, crop failures, weather, field conditions, changing or unpredictable crop choices by farmers, changes in agricultural production methods and seed technologies and general economic conditions. U.S. governmental policies may directly or indirectly influence the number of acres planted, the level of grain inventories, the mix of crops planted or crop prices.
The substantial majority of our sales in the first half of 2008 were made into the export market. Therefore, our operating results may also be significantly influenced by international market conditions. The export market for fertilizers is influenced by such factors as foreign agricultural policies, particularly in countries with high fertilizer consumption rates such as India, China, Pakistan and Brazil; the relative value of the U.S. dollar and its impact upon the cost of importing or exporting fertilizers; the existence of, or changes in, import or foreign currency exchange barriers in certain foreign markets; changes in the hard currency demands of certain countries and other regulatory policies of foreign governments; as well as the laws and policies of the United States affecting foreign trade and investment.
Adverse changes in one or more of these factors could have a materially adverse effect on our profitability, operating results and financial condition.
Our operating results are subject to price and demand volatility resulting from periodic imbalances of supply and demand, which may cause our operating results to fluctuate.
The market for fertilizer products tends to be cyclical as periods of high demand, increasing profits and high capacity utilization generally lead to investments in new plants and increased production. This growth increases the supply of fertilizer until the market is over-supplied, leading to declining fertilizer prices and declining capacity utilization until the cycle repeats. This cyclicality can result in supply and demand imbalances, which exert both positive and negative pressure on prices and profit margins. If market participants significantly increase their production capacities, demand may be insufficient to support prices at current levels, which could adversely affect our business, financial condition and operating results. As a result, our future DAP prices may be significantly lower than those currently prevailing.
12
High fertilizer prices may result in a decrease in phosphate fertilizer demand.
Fertilizer demand may decrease when the expected increase in crop yields and resulting economic returns attributable to fertilizer application do not offset the user’s fertilizer cost. When financial factors constrain fertilizer application rates, the ultimate user will usually reduce phosphate and potash fertilizer usage because these nutrients remain in the soil longer than nitrogen, which must be replenished each year. As a result, a decrease in phosphate fertilizer demand caused by high fertilizer prices could adversely affect our operating results and cash flows.
Phosphate rock production is highly concentrated, and we are dependent upon one source to supply us with phosphate rock, the primary raw material in DAP.
Phosphate rock is the primary raw material used in the production of DAP, and its production is highly concentrated. Although more than 30 countries produce phosphate rock, the four largest producers (China, the United States, Morocco and Russia) account for nearly 75% of world production. Since 1991, we have purchased all of our phosphate rock from OCP, a corporation owned by the Kingdom of Morocco. Obtaining alternate sources of supply for phosphate rock on reasonable terms would be very difficult.
Historically, the purchase price of our phosphate rock has been determined annually based on negotiations with OCP. For 2008, however, our phosphate rock price was set for the first six months of the year and then re-set for each of the third quarter and the fourth quarter of the year. The price adjustments for the first six months and the third quarter of 2008 each involved substantial increases in our phosphate rock price. However, the purchase price of our phosphate rock for the fourth quarter of 2008 was recently set at a level below our third quarter phosphate rock price. OCP has advised us that it is presently engaged in a comprehensive review of its existing customer contracts and contract terms, which it intends to update and standardize. OCP has stated that its objective is to execute new multi-year contracts with all of its global customers, rather than to extend current agreements. In connection with this objective, OCP has notified us that, rather than extend the term of our current contract, it plans to enter into a new agreement with us prior to the expiration of our current agreement on December 31, 2008. Accordingly, in June 2008, OCP provided us with written notice that it will not extend our current four-year agreement beyond December 31, 2008. Although no assurances can be given, based on our long-standing positive relationship with OCP, we expect to reach a new multi-year agreement with OCP in advance of the expiration of our existing contract on December 31, 2008.
Additional increases in the price we pay for phosphate rock could adversely affect our operating results by significantly increasing our production costs, and we may not be able to pass through phosphate rock price increases to our customers. If we are unable to reach a new agreement with OCP, or if a new agreement provides pricing that is unfavorable to us, our operating results would be adversely affected, and we ultimately could be forced to halt the production of DAP, which would have a material adverse effect on our business.
Our operating results could be adversely affected by increases in other raw material prices, which may be subject to volatile pricing or an interruption of supply.
In addition to phosphate rock, we use other raw materials in the production of DAP, including ammonia, sulfur and sulfuric acid. Most of these raw materials are supplied to us by either a single supplier or a small number of suppliers. Increases in the prices we pay for these raw materials could adversely affect our operating results by significantly increasing our production costs. In recent years, markets for our primary raw materials have been very volatile. The prices of sulfur and ammonia have substantially increased in recent periods. We may not be able to pass through raw material price increases to our customers. Interruptions in the availability of raw materials caused by accidents, labor disputes, transportation delays or other events could also have an adverse effect on our business.
13
An unplanned shutdown of our production facility could have an adverse effect on our operating results.
Our production facility has a recent history of significant shutdowns. In August 2005, our production facility in Pascagoula was severely damaged by Hurricane Katrina and did not resume operations until February 2006. Our No. 2 sulfuric acid plant, which has a nameplate capacity of 1,500 tons of sulfuric acid per day, was idled for four months in the third and fourth quarters of 2007 and the first quarter of 2008 due to the failure of a waste heat boiler in July 2007 and the subsequent inability of the retained contractor to repair the boiler. On February 20, 2008, the same sulfuric acid plant was shut down due to the failure of an original fabrication weld and did not resume operation until March 15, 2008. In addition, the maximum production rate of both of our sulfuric acid plants was negatively impacted by leaking heat exchangers beginning in the second quarter of 2007 and continuing into 2008. We installed a new heat exchanger in our No. 2 sulfuric acid plant during the January/February 2008 repairs and in our No. 3 sulfuric acid plant during the scheduled May 2008 turnaround. Since May 2008, both of our sulfuric acid plants have routinely achieved production rates in excess of nameplate capacity.
Our operations are also subject to hazards associated with the manufacturing, handling, storage, transportation and disposal of chemical materials and products, including pipeline leaks and ruptures, explosions, fires, inclement weather and natural disasters, terrorist attacks, mechanical failures, unscheduled downtime, transportation interruptions, remediation complications, chemical spills, discharges or releases of toxic or hazardous substances, storage tank leaks or other risks. Any unplanned shutdown at our facility for an extended period as a result of any of these risks could significantly affect our ability to meet the demand requirements of our customers, thereby resulting in lost sales and profitability in the short term or eventual loss of customers in the long term. Because we have a single production facility, any one of the events described above could significantly disrupt our production and distribution of DAP, and any sustained disruption could have a material adverse effect on our business, financial condition and operating results.
We plan to use substantially all of the net proceeds from this offering for the construction of a new sulfuric acid plant, which will enable us to utilize our full DAP production capacity. There is no guarantee that the new sulfuric acid plant will be constructed for its current estimated cost, that the construction will be completed on time or that the new plant will operate efficiently or at its nameplate capacity. Any construction delays or cost overruns could impact our future profitability.
We currently intend to use substantially all of the net proceeds from this offering for the design and construction of a new sulfuric acid plant with a nameplate capacity of 3,600 tons of sulfuric acid per day, an increase of 600 tons per day over the nameplate capacity of our current sulfuric acid plants. The construction of a sulfuric acid plant involves complicated engineering, project management involving numerous contractors and subcontractors and complex governmental and regulatory permitting processes. Unforeseen circumstances frequently arise during the permitting and construction of such complex facilities, and such events may not be budgeted for or factored into the construction timeline. There is no guarantee that we will be able to complete this planned project or, if completed, that we will be able to complete the project on our anticipated schedule or for its current estimated cost of construction. Construction of a new sulfuric acid plant could divert management’s attention from other projects, and the construction itself will impact the day-to-day operations at our Pascagoula plant, which could adversely affect our operating results and cash flows.
14
We have identified a material weakness in our internal control over financial reporting. If we fail to remedy this material weakness or otherwise achieve and maintain effective internal control over financial reporting, we may not be able to accurately report our operating results or prevent fraud and, as a result, our business could be harmed and current and potential stockholders could lose confidence in us, which could cause our stock price to fall.
Prior to this offering, we were not subject to the reporting requirements of the Securities Exchange Act of 1934, as amended, or the Exchange Act, and had limited accounting personnel and other resources with which to address our internal controls and procedures. As a public reporting company, we will be required, among other obligations, to maintain effective internal control over financial reporting suitable to prepare our publicly reported financial statements in a timely and accurate manner. In connection with this offering and in preparation for the re-audit of our financial statements for 2006 and 2007, we determined that a material weakness exists in our internal control over financial reporting. A material weakness is defined as a control deficiency, or combination of control deficiencies, that adversely affects an entity’s ability to initiate, authorize, record, process or report financial data reliably in accordance with GAAP such that there is more than a remote likelihood that a material misstatement of the entity’s financial statements will not be prevented or detected by the entity’s internal control over financial reporting. The material weakness we have identified relates to our lack of expertise to properly apply GAAP for non-routine and complex accounting issues. The material weakness resulted in a number of audit adjustments to our consolidated financial statements. This material weakness could result in a material misstatement of our financial statements or prevent us from identifying fraud. Moreover, we cannot assure you that we have identified all of our material weaknesses or that we will not have additional material weaknesses in the future. A material weakness may subject us to additional regulatory scrutiny or cause delays in filing our financial statements and periodic reports with the U.S. Securities and Exchange Commission, or the SEC, which might result in SEC penalties or a loss of public confidence in the reliability of our financial statements. This in turn could affect our ability to access the capital markets and cause the value of our stock to fall.
We hired a chief financial officer with extensive financial reporting experience and knowledge of GAAP in the second quarter of 2008. As his appointment alone will not be sufficient to overcome the material weakness, we intend to implement a number of additional measures, including: (i) hiring additional accounting personnel with experience in GAAP and SEC reporting requirements and (ii) engaging the use of a third party accounting service provider to further support and supplement our internal staff in accounting and related areas. There can be no assurance, however, that these steps will be implemented in a timely manner or that they will be sufficient to remediate our material weakness.
Upon completion of this offering, we will become subject to the Sarbanes-Oxley Act of 2002, or the Sarbanes-Oxley Act. Under Section 404 of the Sarbanes-Oxley Act and related SEC rules, we will be obligated, beginning with our Annual Report on Form 10-K for our fiscal year ending December 31, 2009, to assess the effectiveness of our internal control over financial reporting. Our independent registered public accounting firm will also be required to report on the effectiveness of our internal control over financial reporting. We have not yet begun our efforts to comply with these requirements, and it is possible that such efforts could result in the identification of additional material weaknesses or other reportable conditions.
A substantial majority of our total net sales are made to a few large customers.
During the first half of 2008, approximately 73% of our total net sales were made into international markets in order to capture higher prices. All of those sales were made to Transammonia, our sole export wholesaler. In 2007, we made 76% of our total net sales to three large customers. In 2006, we made 77% of our total net sales to four large customers. There can be no assurance that we will be able to maintain these customer relationships or that these customers will continue to purchase similar
15
quantities in the future. If we were to lose one or more of these customers, or if one or more of these customers were to change their demand, delays in replacing such customers, or a failure to meet such customers’ new demands, could have an adverse effect on our operating results.
As a DAP-only, single location producer, we are less diversified than our principal domestic competitors, and a decrease in the demand for DAP or increase in DAP supply could have a material adverse effect on our operating results.
We are dedicated exclusively to the production and marketing of DAP, while most of our domestic competitors are diversified, primarily into the nitrogen and potash-based fertilizer businesses and other chemical and industrial businesses. As a result of our DAP focus, we would likely be impacted more adversely by factors affecting our industry than we would if our business was more diversified. Decreases in the demand for or large increases in the supply of DAP could materially impact our operating results more than the operating results of our diversified competitors.
Some of our competitors have greater resources than we do, which may place us at a competitive disadvantage and adversely affect our sales and profitability. These competitors include domestic integrated producers and state-owned and government-subsidized entities in other countries.
We compete with a number of producers in the United States and globally, including state-owned and government-subsidized entities. Most of our primary domestic competitors have substantially greater operating and capital resources than we do. In addition, our primary domestic competitors have their own phosphate rock mines, which may allow them to have significantly lower production costs during periods of high phosphate rock prices, and some of our foreign competitors may have access to lower cost or government-subsidized raw materials, in each case placing us at a competitive disadvantage. Furthermore, some of our government-owned competitors may be willing to accept lower prices and profit on their products in order to support domestic employment or other political or social goals. To the extent that other fertilizer producers have competitive advantages or are willing to accept lower profit levels, the price of our products, our sales volumes and our profits may be adversely affected.
Loss of our key senior management personnel could adversely affect our business.
We believe that our continued success depends, in significant part, upon the collective abilities and continued service of our senior management personnel. On average, our senior managementteam has over 25 years of experience in the fertilizer industry. The loss of services of one or more of our key senior management personnel could adversely affect our future operating results.
Our inability to attract and retain skilled employees may result in significant increases in the cost of labor or a disruption in our operations.
As of June 30, 2008, we had 265 employees. Competition for skilled employees in the Pascagoula area, where our sole operating facility is located, is intense, and, as a result, we operate in a very competitive wage market. In addition, turnover of skilled employees has increased since Hurricane Katrina. Although we believe that our relations with our employees are good, we cannot give assurances that we will be successful in attracting and retaining needed skilled personnel in the future. Our business could be disrupted and our operating results could be adversely affected if we are unable to attract and retain skilled employees or if personnel costs increase substantially.
16
Our production facility is subject to extensive state and federal environmental, health and safety statutes and regulations, and our potential environmental liabilities may have an adverse effect on our business, financial condition or operating results.
Our operations involve the use, handling, processing, storage, transportation and disposal of hazardous materials, and we could incur substantial additional costs to comply with environmental, health and safety law requirements. We also could incur substantial costs for liabilities arising from past unknown releases of, or exposure to, hazardous substances. Under the Comprehensive Environmental Response, Compensation, and Liability Act of 1980, or CERCLA, we could be held jointly and severally responsible for the removal or remediation of any hazardous substance contamination at our current facility, at neighboring properties to which such contamination may have migrated and at third-party waste disposal sites to which we have sent waste. We could also be held liable for natural resource damages. In addition, we are subject to liabilities for past operations at our current facilities and in some cases to liabilities for past operations by us and our predecessor companies and their subsidiaries. Liabilities under these and other environmental health and safety laws involve inherent uncertainties. Violations of environmental, health and safety laws are subject to civil, and, in some cases, criminal sanctions. As a result of liabilities under and violations of environmental, health and safety laws and related uncertainties, we may incur unexpected interruptions to operations, fines, penalties or other reductions in income, third-party claims for property damage or personal injury or remedial or other costs that would negatively impact our financial condition and operating results. Finally, we may discover currently unknown environmental problems or conditions. The discovery of currently unknown environmental problems may subject us to material capital expenditures or liabilities in the future.
Continued government and public emphasis on environmental issues can be expected to result in increased future investments for environmental controls at ongoing operations, which will be charged against income from future operations. Permit renewals and compliance with present and future environmental laws and regulations applicable to our operations may require substantial capital expenditures and may have a material adverse effect on our business, financial condition and operating results.
Our active gypsum disposal facility requires us to make quarterly contributions to a trust to fund the closure and post-closure care of the disposal facility. If we are unable to meet our current funding obligation, or any increased funding obligation, in violation of our permit, our business, financial condition and operating results would be adversely affected.
A by-product of DAP production is gypsum, a chemical with little commercial use or value, and we generate approximately 2.4 tons of gypsum per ton of DAP produced. The U.S. Environmental Protection Agency, or the EPA, requires us to dispose of our gypsum by storing it on the grounds of our production facility in Pascagoula. To dispose of our gypsum, we have two “stacks,” or gypsum disposal facilities. The older stack is no longer in use and is closed, although we remain obligated to maintain it in accordance with applicable environmental regulations. The Mississippi Department of Environmental Quality, or the MDEQ, regulates the newer, active gypsum stack as solid waste. The remaining capacity of the active stack is expected to support our operations for approximately 18 additional years assuming we produce at our maximum annual DAP production rate of approximately 870,000 tons. The MDEQ permit to operate the active stack is conditioned upon the requirement that we provide financial assurance for payment of the closure and post-closure care of the active stack, estimated to cost approximately $37.6 million in future, undiscounted dollars. We are fulfilling this obligation through a sinking fund arrangement whereby we make quarterly contributions of $0.2 million into an interest-bearing trust fund for closure and post-closure related costs to be incurred when the capacity of such stack is depleted. These payments will continue until funds in the trust, including earnings from trust assets, are sufficient to cover the estimated costs of closure at the
17
completion of the disposal site’s useful life and the post-closure costs for water treatment and leachate for 20 years after the closure. We must periodically review the adequacy of this fund and report any adjustments to the quarterly contributions (positive or negative) through an annual reporting requirement of the MDEQ permit. At June 30, 2008, the fair value of the trust assets available to fund this obligation was $3.5 million. Although we cannot give any assurances, we currently do not expect any increase in this funding requirement. If we are unable to meet this funding requirement, we may lose our permit to operate the active stack. The loss of this permit or the imposition of additional environmental requirements with respect to either stack could adversely affect our business, financial condition and operating results.
Our operating results could be adversely affected by disruption to our transportation or terminaling facilities for raw materials or by increased freight prices.
In the event of a disruption of existing transportation or terminaling facilities for raw materials, alternative transportation and terminaling facilities might not have sufficient capacity to fully serve our facilities. Freight is also an important factor in the total delivered cost of raw materials. Increases in the prices we pay for freight could adversely affect our operating results by significantly increasing production costs. We may not be able to pass through freight price increases to our customers. Freight also increases the delivered cost of our product to our customers, which tends to exert downward pressure on our prices.
Inadequate transportation and distribution infrastructure and capacity could limit our growth, and a shortage of bulk ships, barges and railcars and increased transit time could result in customer dissatisfaction, loss of sales and higher transportation costs.
Inadequate transportation and distribution infrastructure and capacity could limit our growth. We rely heavily upon barge and ocean freightliners and, to a much lesser degree, trucks, railcars and warehouse and port storage facilities to obtain raw materials and to deliver our product to our customers. Finding affordable and dependable transportation is important to our ability to obtain raw materials and to supply DAP to our customers. Higher costs for transportation services or an interruption or slowdown could result from labor disputes, derailments, adverse weather or other environmental events, short-term swings in demand for phosphate products and raw materials and changes to rail, barge or ocean freight systems. These disruptions and changes could interrupt or limit available transport services, which in turn could negatively affect our production or our ability to deliver our product to our customers. Any resulting customer dissatisfaction or loss of sales could negatively impact our financial performance.
Strong demand for grain and other bulk products can affect the availability of transportation and may lead to higher freight rates. The shipping industry currently has a shortage of ships, and the substantial time needed to build new ships prevents rapid market response. Delays and missed shipments resulting from transportation shortages, including ocean freightliners, barges, trucks and railcars for carrying product, and increased transit time may impact our ability to deliver our products on a timely basis, which could result in customer dissatisfaction and loss of sales and could negatively affect our financial performance.
Any future indebtedness could adversely affect our financial condition and impair our ability to operate our business.
At the time of this offering, we have no outstanding borrowings under our credit facility or other material indebtedness. Our credit facility allows us to borrow up to $30.0 million. Any indebtedness we incur in the future could have important consequences, including the following:
| | Ÿ | | it may limit our ability to borrow money to fund our working capital, capital expenditures and debt service requirements; |
18
| | Ÿ | | it may limit our flexibility in planning for, or reacting to, changes in our business; |
| | Ÿ | | it may make us more highly leveraged than some of our competitors, which may place us at a competitive disadvantage; |
| | Ÿ | | it may make us more vulnerable to a downturn in our business or the economy; |
| | Ÿ | | it may require us to dedicate a substantial portion of our cash flow from operations to the repayment of our indebtedness, thereby reducing the availability of our cash flow for other purposes; and |
| | Ÿ | | it may materially and adversely affect our business and financial condition if we are unable to service our indebtedness or obtain additional financing, as needed. |
In addition, our current credit facility contains financial and other restrictive covenants that may limit our ability to engage in activities that may be in our long-term best interests. Our failure to comply with those covenants could result in an event of default which, if not cured or waived, could result in the acceleration of all of our debt. See “Management’s Discussion and Analysis of Financial Condition and Results of Operations—Liquidity and Capital Resources.”
Risks Related to This Offering
Our common stock price may be volatile, and you may lose all or part of your investment.
Securities markets worldwide experience significant price and volume fluctuations in response to general economic and market conditions and their effect on various industries. This market volatility could cause the price of our common stock to decline significantly without regard to our operating performance, and you may not be able to resell your shares at or above the price at which you purchased them. Any fluctuations could be based on various factors in addition to those otherwise described in this prospectus, including:
| | Ÿ | | our operating performance and the performance of our competitors; |
| | Ÿ | | the public’s reaction to our press releases, our other public announcements and our filings with the SEC; |
| | Ÿ | | changes in earnings estimates or recommendations by research analysts who follow us or other companies in our industry; |
| | Ÿ | | variations in general economic, market and political conditions; |
| | Ÿ | | the number of shares publicly traded; |
| | Ÿ | | actions of our current stockholders, including sales of our common stock by our directors and executive officers; |
| | Ÿ | | the arrival or departure of key personnel; and |
| | Ÿ | | other developments affecting us, our industry or our competitors. |
In addition, the stock market has recently experienced significant price and volume fluctuations. These fluctuations may be unrelated to the operating performance of particular companies. These broad market fluctuations may cause declines in the market price of our common stock. The price of our common stock could fluctuate based upon factors that have little or nothing to do with us or our performance, and those fluctuations could materially reduce our common stock price.
19
If securities or industry analysts do not publish research or reports about us, our industry or our market, or if they adversely change their recommendations regarding our common stock, then our stock price and trading volume could decline.
The trading market for our common stock is influenced by the research and reports that industry or securities analysts publish about us, our industry and our market. If no analyst elects to cover us and publish research or reports about us, the market for our common stock could be severely limited and our stock price could be adversely affected. In addition, if one or more analysts ceases coverage of us or fails to regularly publish reports on us, we could lose visibility in the financial markets, which in turn could cause our stock price or trading volume to decline. If one or more analysts who elects to cover us adversely changes their recommendation regarding our common stock, our stock price could decline.
Future sales of our common stock or the perception that such sales may occur could depress our stock price.
Sales of a substantial number of shares of our common stock, either by us or by our stockholders, or the perception that such sales may occur, could depress the market price of our common stock and may impede our ability to raise additional capital in the future. Because we are currently not a reporting company under the Exchange Act, holders of our common stock are not required to file reports with the SEC disclosing their beneficial ownership of our common stock. As a result, there may be holders of our common stock who are unknown to us and who may control a substantial number of shares of our common stock and effect transactions that could depress the market price of our common stock.
Under our first amended and restated certificate of incorporation, or our certificate of incorporation, we are authorized to issue up to 30,000,000 shares of common stock, of which approximately shares will be outstanding after this offering ( shares if the underwriters exercise their option to purchase additional shares in full). We cannot predict the size of future issuances or sales of our common stock or the effect, if any, that future sales or issuances of shares of our common stock would have on the market price of our common stock. All of the shares of our common stock that will be outstanding following this offering will continue to be freely tradable without restrictions, unless such shares are held by our affiliates or are subject to the lock-up agreements described below.
In addition, immediately following the effectiveness of the registration statement of which this prospectus is a part, we intend to file one or more registration statements under the Securities Act of 1933, as amended, or the Securities Act, to register the shares of our common stock underlying outstanding stock options or equity compensation grants or reserved for issuance under our equity incentive plans. These registration statements will become effective upon filing, and shares covered by these registration statements will be eligible for sale in the public market immediately after the effective dates of these registration statements, subject to the lock-up agreements described below.
Our directors and executive officers have agreed to enter into lock-up agreements pursuant to which they have agreed not to sell shares of our common stock in the public market for a period of 180 days following the completion of this offering. Upon expiration of the lock-up period, shares subject to such lock-up agreements will become freely tradable without limitation, unless held by our affiliates. The representatives of the underwriters may waive lock-up provisions in their sole discretion. See “Shares Eligible for Future Sale.”
20
We may issue additional shares of our common stock without your approval, which would dilute your existing ownership interests.
Our certificate of incorporation allows us to issue additional shares of our common stock at any time without the approval of our stockholders. Following this offering, we will have shares of our common stock available for issuance. The issuance by us of additional shares of our common stock will have the following effects:
| | • | | our then current stockholders’ proportionate ownership interest in us will decrease; |
| | • | | the relative voting strength of each previously outstanding common share may be diminished; and |
| | • | | the market price of our common stock may decline. |
The market for our common stock is and may remain relatively illiquid.
Our common stock, which is currently traded in the OTC markets, has limited liquidity. We currently intend to list our common stock on . However, there is no guarantee that we will be able to list our common stock on a national exchange. has stringent listing requirements, and there is no guarantee that we will be able to meet or maintain such listing requirements. If we do list our common stock on , we cannot predict the extent to which investor interest will lead to the development of an active trading market for our common stock on , or how liquid that market may become. If an active trading market does not develop, you may have difficulty selling any shares of our common stock that you buy.
We will incur increased costs as a result of being a reporting company under the Exchange Act.
As a reporting company under the Exchange Act, we will incur significant legal, accounting and other expenses that we would not incur if we were not a reporting company. The Sarbanes-Oxley Act, as well as related rules implemented by the SEC, have required changes in corporate governance practices of publicly-traded and reporting companies. We expect these new rules and regulations to substantially increase our legal and financial compliance costs and to make some activities more time-consuming and costly. For example, as a result of becoming a publicly-traded company, we will be required to adopt policies regarding internal controls and disclosure controls and procedures, including the preparation of reports on internal control over financial reporting. In addition, we will incur additional costs associated with our reporting requirements. We also expect these new rules and regulations to make it more expensive for us to obtain director and officer liability insurance, and we may be required to accept reduced policy limits and coverage or incur substantially higher costs to obtain the same or similar coverage. As a result, it may be more difficult for us to attract and retain qualified persons to serve on our board of directors or as executive officers. We estimate that we will incur approximately $1.5 million of incremental costs per year associated with being a reporting company; however, it is possible that our actual incremental costs of being a reporting company will be higher than we currently estimate.
We will not be fully subject to the requirements of Section 404 of the Sarbanes-Oxley Act until the end of 2009.
Under Section 404 of the Sarbanes-Oxley Act, we will be obligated, beginning with our Annual Report on Form 10-K for our fiscal year ended December 31, 2009, to assess the effectiveness of our internal control over financial reporting. Our independent registered public accounting firm will also be required to report on the effectiveness of our internal control over financial reporting. As a result, we expect to incur substantial additional expenses and diversion of our management’s time. We cannot be certain as to the timing of completion of our evaluation, testing and remediation actions or their effect
21
on our operations. If we are unable to implement the requirements of Section 404 of the Sarbanes-Oxley Act in a timely manner or with adequate compliance, we may not be able to accurately report our operating results or prevent fraud and might be subject to sanctions or investigation by regulatory authorities, such as the SEC. Any such action could harm our business or investors’ confidence in us and could cause our stock price to fall.
You will experience immediate and substantial dilution in net tangible book value per share of our common stock.
The initial public offering price of our common stock will be substantially higher than the net tangible book value per share of our outstanding common stock. If you purchase shares of our common stock, you will incur immediate and substantial dilution in net tangible book value in the amount of $ per share based on an assumed offering price of $ per share, which is the midpoint of the price range set forth on the cover page of this prospectus.
We have a limited financial history upon which you may evaluate our financial performance.
MPC emerged from bankruptcy on December 21, 2004 as the wholly owned subsidiary of PHI. See “Business—Our History.” As a result, we have been operating under our current corporate structure for only three fiscal years. Because of our limited financial history, we believe that period-to-period comparisons of our operating results may not be meaningful in the short-term and may not be fully indicative of our future performance.
Provisions in our charter documents and Delaware law may delay or prevent an acquisition of us by a third party.
We are a Delaware corporation and the anti-takeover provisions of Delaware law impose various barriers to the ability of a third party to acquire control of us, even if a change of control would be beneficial to our existing stockholders. In addition, our certificate of incorporation and our amended and restated bylaws, or bylaws, contain several provisions that may make it more difficult for a third party to acquire control of us without the approval of our board of directors. These provisions may make it more difficult or expensive for a third party to acquire a majority of our outstanding common stock. These provisions, as well as the provisions of our 2007 Stockholders’ Rights Plan, as discussed under “Description of Capital Stock—Common Stock—Rights Plan,” may also delay, prevent or deter a merger, acquisition, tender offer, proxy contest or other transaction that might otherwise result in our stockholders receiving a premium over the market price for their investment in our common stock.
22
FORWARD-LOOKING STATEMENTS
Some of the statements under “Prospectus Summary,” “Risk Factors,” “Management’s Discussion and Analysis of Financial Condition and Results of Operations,” “Industry Overview,” “Business” and elsewhere in this prospectus constitute forward-looking statements. In some cases, you can identify these statements by forward-looking words such as “anticipate,” “believe,” “could,” “estimate,” “expect,” “intend,” “may,” “plan,” “potential,” “should,” “might,” “continue,” “will” and “would” or similar words. You should read statements that contain these words carefully because they discuss our future expectations, contain projections of our future operating results or of our financial position or state other forward-looking information. Although we believe that the expectations reflected in the forward-looking statements are reasonable, we cannot guarantee future results, levels of activity, performance or achievements. You should not place undue reliance on these forward-looking statements, which apply only as of the date of this prospectus. These forward-looking statements involve known and unknown risks, uncertainties and other factors that may cause our actual results, levels of activity, performance or achievements to be materially different from any future results, levels of activity, performance or achievements expressed or implied by such forward-looking statements. These risks and uncertainties include, but are not limited to the following:
| | Ÿ | | changes in matters that affect the global supply and demand of phosphate fertilizer products, phosphate rock, ammonia, sulfur and sulfuric acid; |
| | Ÿ | | a variety of conditions in the agricultural industry such as grain prices, planted acreage, actual grain stocks, U.S. government policies, weather and changes in agricultural production methods; |
| | Ÿ | | changes in capital markets; |
| | Ÿ | | possible unscheduled plant outages and other operating difficulties; |
| | Ÿ | | price competition and capacity expansions and reductions from both domestic and international competitors; |
| | Ÿ | | foreign government agricultural policies (in particular, the policies of the governments of India and China); |
| | Ÿ | | the relative unpredictability of international and local economic conditions; |
| | Ÿ | | the relative value of the U.S. dollar; |
| | Ÿ | | regulations regarding the environment and the sale and transportation of fertilizer products; |
| | Ÿ | | the impact of future storms and natural disasters; and |
| | Ÿ | | other risks described under “Risk Factors.” |
This list of factors that may affect our future performance and the accuracy of forward-looking statements is illustrative but not exhaustive. Accordingly, all forward-looking statements should be evaluated with an understanding of their inherent uncertainty. Before you invest in our common stock, you should be aware that the occurrence of the events described in “Risk Factors” and elsewhere in this prospectus could have a material adverse effect on our business, financial position and operating results.
23
USE OF PROCEEDS
We estimate that we will receive net cash proceeds from this offering of approximately $ million, after deducting estimated underwriting discounts and commissions and estimated offering expenses payable by us. For purposes of estimating our net proceeds, we have assumed that the initial public offering price of the shares of our common stock will be $ , which is the midpoint of the price range set forth on the cover page of this prospectus, and no exercise of the underwriters’ option to purchase additional shares of our common stock will occur.
We expect to use substantially all of the net proceeds from this offering to fund the engineering, design and construction of a new sulfuric acid production plant, which we will build at our existing facility in Pascagoula, Mississippi. We currently estimate that the total construction cost of the new sulfuric acid plant will be between $ and $ . We anticipate that it will take approximately three years to permit and construct the new sulfuric acid plant.
Our two existing sulfuric acid plants were originally constructed in the 1970’s. Constructing a new replacement plant will allow us to increase our sulfuric acid production and thereby utilize our full DAP production capacity of approximately 870,000 tons without relying on purchases of supplemental sulfuric acid on the open market. This increase represents a 16% increase over our current annual DAP production rate of approximately 750,000 tons using internally generated sulfuric acid only. We also anticipate that we will have the ability to sell up to 95,000 tons of excess sulfuric acid per year into the merchant acid market.
Additionally, we expect that the new sulfuric acid plant will have cogeneration capabilities that will allow us to produce approximately 30 megawatts of electricity. Our current internal demand for electricity is approximately 10-12 megawatts, and we may sell any excess electricity generated via the local distribution grid. Other anticipated direct benefits of the new sulfuric acid plant include reduced maintenance costs and increased onstream factor.
The remainder of the net proceeds from this offering will be used for general corporate purposes, including the support of significantly higher working capital requirements due to the recent sharp increases in raw material and finished product prices, and the expansion of our terminaling operations. Any remaining net proceeds may also be used to fund other potential capital projects under evaluation, including the expansion of our dock facilities, solid sulfur prilling operations and uranium recovery from phosphoric acid. The net proceeds will be invested in government securities and other short-term, investment-grade, interest-bearing instruments until we use them in our business.
The above discussion represents our best estimate of the allocation of the net proceeds of this offering based on our current plans. Actual expenditures may vary substantially from these estimates, and we may find it necessary or advisable to reallocate the net proceeds within the above-described categories or to use portions for other purposes.
A $1.00 increase (decrease) in the assumed offering price per share would increase (decrease) net proceeds to us from this offering by approximately $ , after deducting underwriting discounts and commissions and estimated offering expenses payable by us. Assuming that the underwriters exercise their option to purchase additional shares in full, a $1.00 increase (decrease) in the assumed offering price would increase (decrease) net proceeds to us from the exercise of the option to purchase additional shares by approximately $ million, after deducting underwriting discounts and commissions and estimated offering expenses payable by us.
24
MARKET PRICE AND DIVIDENDS
Market Information
Since July 5, 2007, our common stock has traded on the OTC markets under the symbol “PHOS.” The price ranges presented below represent the highest and lowest quoted bid prices during the third and fourth quarters for 2007 and each quarter of 2008 as reported by the OTC Bulletin Board. The quotes represent prices between dealers and do not reflect markups, markdowns or commissions and therefore may not necessarily represent actual transactions.
| | | | | | | | |
Year | | Period | | Common
Stock Price |
| | | | | High | | Low |
2007 | | 3rd Quarter | | $ | 40.00 | | $ | 27.00 |
| | 4th Quarter | | $ | 43.00 | | $ | 35.50 |
| | | |
2008 | | 1st Quarter | | $ | 42.00 | | $ | 20.00 |
| | 2nd Quarter | | $ | 48.00 | | $ | 24.50 |
| | 3rd Quarter | | $ | 41.00 | | $ | 21.00 |
| | 4th Quarter to October 10 | | $ | 30.00 | | $ | 16.00 |
As reported by the OTC Bulletin Board, on October 10, 2008, the closing bid price of our common stock was $18.00 per share.
Dividends
On January 29, 2008, our board of directors declared a special dividend of $1.50 per share of our common stock. This dividend was paid on March 7, 2008 to stockholders of record on February 25, 2008.
Prior to June 27, 2007, all of our common stock was held by a trust pursuant to a plan of reorganization under the Bankruptcy Code. See “Business—Our History.” On May 26, 2005, when our capital stock was held in the trust structure, our board of directors declared a special dividend of $3.40 per trust unit, or an aggregate dividend payment to all unit holders of $5.0 million.
We do not currently intend to pay a regular dividend on our common stock. The timing and amount of any future dividends will be determined in light of our operating results, financial condition, liquidity needs, restrictions under any agreements, including our credit facility, or under applicable law and other factors that our board of directors deems relevant.
25
CAPITALIZATION
The following table sets forth our cash and cash equivalents and our unaudited capitalization as of June 30, 2008:
| | Ÿ | | on an actual basis; and |
| | Ÿ | | on an as adjusted basis to give effect to the sale of shares of our common stock in this offering at an assumed initial public offering price of $ per share, after deducting estimated underwriting discounts and commissions and estimated offering expenses payable by us, as if such transactions occurred on June 30, 2008. |
This table should be read in conjunction with “Use of Proceeds,” “Selected Historical Consolidated Financial and Operating Information,” “Management’s Discussion and Analysis of Financial Condition and Results of Operations” and our consolidated financial statements and the related notes thereto appearing elsewhere in this prospectus.
| | | | | | |
| | | As of June 30, 2008 |
| | | Actual | | As adjusted |
| | | (Unaudited) (In thousands) |
Cash and cash equivalents | | $ | 31,287 | | $ | |
| | | | | | |
Long-term debt | | $ | — | | $ | — |
| | |
Stockholders’ equity: | | | | | | |
Common stock, $0.01 par value: 30,000,000 shares authorized, 7,654,290 shares issued and outstanding, actual; 30,000,000 shares authorized, shares issued and outstanding, as adjusted | | | 77 | | | |
Additional paid-in-capital | | | 33,880 | | | |
Retained earnings | | | 81,783 | | | 81,783 |
| | | | | | |
Total stockholders’ equity | | | 115,740 | | | |
| | | | | | |
Total capitalization | | $ | 115,740 | | $ | |
| | | | | | |
A $1.00 increase (decrease) in the assumed offering price of $ per share would increase (decrease) cash and cash equivalents, additional paid-in capital, total stockholders’ equity and total capitalization by $ million, assuming that the number of shares of our common stock offered by us, as set forth on the cover page of this prospectus, remains the same, and after deducting estimated underwriting discounts and commissions and estimated offering expenses payable by us.
26
DILUTION
If you purchase our common stock in this offering, you will suffer an immediate and substantial dilution in net tangible book value per share. Dilution is the amount by which the offering price paid by purchasers of our common stock exceeds the net tangible book value per share of our common stock after this offering. Net tangible book value represents the amount of our total tangible assets reduced by our total liabilities. Tangible assets equal our total assets less intangible assets. Net tangible book value per share represents our net tangible book value divided by the number of shares of our common stock outstanding. The number of shares of our common stock outstanding after this offering will be (excluding shares that will be sold to the underwriters if they exercise their option to purchase additional shares in full). As of June 30, 2008, our net tangible book value was $115.7 million and our net tangible book value per share was $15.12.
After giving effect to the sale of shares of our common stock in this offering at an initial public offering price of $ per share, which is the midpoint of the price range set forth on the cover page of this prospectus, our adjusted net tangible book value as of June 30, 2008 would have been $ , or $ per share. This represents an immediate increase in net tangible book value of $ per share to our existing stockholders and an immediate dilution of $ per share to new investors purchasing shares in this offering. The following table illustrates this per share dilution:
| | | | | | |
Assumed offering price per share | | | | | $ | |
Net tangible book value per share as of June 30, 2008 | | $ | 15.12 | | | |
Increase in net tangible book value per share attributable to new investors | | $ | | | | |
Adjusted net tangible book value per share after this offering | | | | | $ | |
Pro forma dilution per share to new investors | | | | | $ | |
| | | | | | |
A $1.00 increase (decrease) in the assumed offering price per share would result in no change to our net tangible book value per share after this offering and would increase (reduce) dilution per share to new investors by approximately $ , after deducting the estimated underwriting discounts and commissions and estimated offering expenses payable by us. Assuming that the underwriters exercise their option to purchase additional shares in full, a $1.00 increase (decrease) in the assumed offering price would increase (decrease) net proceeds to us from the exercise of the option to purchase additional shares by approximately $ , after deducting the estimated underwriting discounts and commissions and estimated offering expenses payable by us.
27
The following table illustrates, on the as adjusted basis described above as of June 30, 2008, the total number of shares of our common stock held, total consideration paid and average price per share paid by existing stockholders and by new investors for our common stock, assuming the sale of shares of our common stock in this offering at an initial public offering price of $ per share, which is the midpoint of the price range set forth on the cover page of this prospectus:
| | | | | | | | | | | | |
| | | Assuming No Exercise of Underwriters’ Option |
| | | Shares Held | | Total Consideration | | Average Price
Per Share |
| | | Number | | Percent | | Amount | | Percent | |
Existing stockholders | | | | % | | $ | | | % | | $ | |
New investors | | | | % | | $ | | | % | | $ | |
Total | | | | 100% | | $ | | | 100% | | $ | |
| | | | | | | | | | | | |
| | | Assuming Full Exercise of Underwriters’ Option |
| | | Shares Held | | Total Consideration | | Average Price
Per Share |
| | | Number | | Percent | | Amount | | Percent | |
Existing stockholders | | | | % | | $ | | | % | | $ | |
New investors | | | | % | | $ | | | % | | $ | |
Total | | | | 100% | | $ | | | 100% | | $ | |
28
SELECTED HISTORICAL CONSOLIDATED FINANCIAL AND OPERATING INFORMATION
The following tables show selected historical consolidated financial and operating data of Phosphate Holdings and its wholly owned subsidiary, MPC. We derived the selected historical consolidated financial data for each of the years ended December 31, 2007, 2006 and 2005 and as of December 31, 2007 and 2006 from our audited consolidated financial statements and the related notes thereto appearing elsewhere in this prospectus. We derived the selected consolidated statement of operations data for the six months ended June 30, 2008 and 2007 and for the period from December 21, 2004 (the date we emerged from bankruptcy) through December 31, 2004 and the selected consolidated balance sheet data as of June 30, 2008 and December 31, 2004 from our unaudited consolidated interim financial statements, which, in the opinion of our management, have been prepared on the same basis as the audited consolidated financial statements and reflect all adjustments, consisting only of normal recurring adjustments, necessary for the fair presentation of our operating results and financial position for those periods and as of those dates, as applicable. The unaudited consolidated interim financial statements for the six months ended June 30, 2008 and 2007 and the related notes thereto appear elsewhere in this prospectus. The selected unaudited financial data for the six months ended June 30, 2008 are not necessarily indicative of our results for the year ending December 31, 2008, and our historical results are not necessarily indicative of our results for any future period. The per share data in the table below have been retroactively adjusted to give effect to a 7,654.29-to-1 stock split in June 2007. The information provided below should be read in conjunction with “Management’s Discussion and Analysis of Financial Condition and Results of Operations” and our consolidated financial statements and the related notes thereto and other financial information appearing elsewhere in this prospectus.
| | | | | | | | | | | | | | | | | | | | | |
| | | Six Months Ended
June 30, | | Years Ended
December 31, | | | Period from
December 21,
2004 through
December 31,
2004(1) | |
| | | 2008(2) | | 2007(2) | | 2007(2) | | 2006(2) | | | 2005(2) | | |
| | | (In thousands, except per share and per ton data) | |
Statement of Operations Data: | | | | | | | | | | | | | | | | | | | | | |
DAP sales | | $ | 232,001 | | $ | 109,208 | | $ | 219,569 | | $ | 130,579 | | | $ | 100,151 | | | $ | 10,781 | |
Other | | | 6,453 | | | 689 | | | 2,805 | | | 985 | | | | 513 | | | | — | |
| | | | | | | | | | | | | | | | | | | | | |
Total net sales | | | 238,454 | | | 109,897 | | | 222,374 | | | 131,564 | | | | 100,664 | | | | 10,781 | |
Cost of sales | | | 164,461 | | | 88,141 | | | 169,952 | | | 128,684 | | | | 90,117 | | | | 10,584 | |
| | | | | | | | | | | | | | | | | | | | | |
Gross profit | | | 73,993 | | | 21,756 | | | 52,422 | | | 2,880 | | | | 10,547 | | | | 197 | |
Selling, general and administrative expenses | | | 6,529 | | | 5,436 | | | 12,301 | | | 4,472 | | | | 2,879 | | | | 73 | |
Impairment of assets | | | 1,572 | | | — | | | — | | | — | | | | — | | | | — | |
| | | | | | | | | | | | | | | | | | | | | |
Operating income (loss) | | | 65,892 | | | 16,320 | | | 40,121 | | | (1,592 | ) | | | 7,668 | | | | 124 | |
Other income (expenses): | | | | | | | | | | | | | | | | | | | | | |
Interest, net | | | 293 | | | 67 | | | 301 | | | (735 | ) | | | (73 | ) | | | (13 | ) |
Hurricane-related gain | | | — | | | 37,830 | | | 37,830 | | | — | | | | — | | | | — | |
Other, net | | | 213 | | | 232 | | | 176 | | | 533 | | | | (246 | ) | | | 57 | |
| | | | | | | | | | | | | | | | | | | | | |
Income (loss) before income taxes | | | 66,398 | | | 54,449 | | | 78,428 | | | (1,794 | ) | | | 7,349 | | | | 168 | |
Income tax expense | | | 24,407 | | | 20,793 | | | 29,539 | | | — | | | | 2,465 | | | | 64 | |
| | | | | | | | | | | | | | | | | | | | | |
Net income (loss) | | $ | 41,991 | | $ | 33,656 | | $ | 48,889 | | $ | (1,794 | ) | | $ | 4,884 | | | $ | 104 | |
| | | | | | | | | | | | | | | | | | | | | |
Earnings (loss) per share, basic | | $ | 5.49 | | $ | 4.40 | | $ | 6.39 | | $ | (0.24 | ) | | $ | 0.68 | | | $ | 0.02 | |
| | | | | | | | | | | | | | | | | | | | | |
Earnings (loss) per share, diluted | | $ | 5.19 | | $ | 4.40 | | $ | 6.04 | | $ | (0.24 | ) | | $ | 0.66 | | | $ | 0.02 | |
| | | | | | | | | | | | | | | | | | | | | |
Cash dividends per share | | $ | 1.50 | | $ | — | | $ | — | | $ | — | | | $ | 0.68 | | | $ | — | |
| | | | | | | | | | | | | | | | | | | | | |
29
| | | | | | | | | | | | | | | | | | |
| | | Six Months Ended
June 30, | | Years Ended
December 31, | | Period from
December 21,
2004 through
December 31,
2004(1) |
| | | 2008(2) | | 2007(2) | | 2007(2) | | 2006(2) | | 2005(2) | |
| | | (In thousands, except per share and per ton data) |
Other Financial Data: | | | | | | | | | | | | | | | | | | |
EBITDA(3) | | $ | 71,866 | | $ | 57,513 | | $ | 85,676 | | $ | 2,931 | | $ | 8,945 | | $ | 181 |
| | | | | | | | | | | | | | | | | | |
Selected Operating Data: | | | | | | | | | | | | | | | | | | |
Tons of DAP produced | | | 258.1 | | | 341.4 | | | 631.1 | | | 597.8 | | | 485.6 | | | 22.2 |
Tons of DAP sold | | | 266.3 | | | 346.9 | | | 620.6 | | | 579.8 | | | 478.7 | | | 52.1 |
Average sales price per ton of DAP sold | | $ | 871.06 | | $ | 314.83 | | $ | 353.80 | | $ | 225.21 | | $ | 209.21 | | $ | 206.93 |
Average cost of sales per ton of DAP sold | | $ | 617.58 | | $ | 254.08 | | $ | 273.85 | | $ | 221.95 | | $ | 188.25 | | $ | 203.15 |
| | | | | | | | | | | | | | | |
| | | June 30,
2008(2) | | December 31, | | December 31,
2004(1) |
| | | | 2007(2) | | 2006(2) | | 2005(2) | |
| | | (In thousands, except per share data) |
Balance Sheet Data: | | | | | | | | | | | | | | | |
Current assets | | $ | 144,751 | | $ | 79,418 | | $ | 24,463 | | $ | 24,585 | | $ | 39,977 |
Property, plant and equipment, net | | | 47,286 | | | 41,417 | | | 35,219 | | | 13,658 | | | 53 |
Total assets | | | 195,684 | | | 124,303 | | | 63,478 | | | 40,688 | | | 40,890 |
Total current liabilities | | | 62,504 | | | 23,124 | | | 12,922 | | | 17,994 | | | 18,591 |
Total long-term debt | | | — | | | — | | | 4,875 | | | — | | | 3,511 |
Asset retirement obligations | | | 5,333 | | | 5,086 | | | 4,627 | | | 4,209 | | | 3,829 |
Stockholders’ equity | | | 115,740 | | | 85,230 | | | 17,570 | | | 18,485 | | | 14,960 |
The above financial and operating data does not include information for periods prior to December 21, 2004, when PHI’s predecessor and now wholly owned subsidiary, MPC, emerged from bankruptcy. MPC’s then parent company, MCC, and MPC filed for bankruptcy on May 15, 2003. MPC, as predecessor, had a June 30 fiscal year and was subject to the financial reporting guidelines of Statement of Position 90-7,Financial Reporting by Entities in Reorganization under the Bankruptcy Code, or SOP 90-7. This basis of financial reporting is not comparable to the basis of financial reporting required for us. Set forth below is certain financial and operating data for the last two full fiscal years of the predecessor company, which is based on MPC’s consolidated financial statements for the periods indicated, which are not included in this prospectus.
| | | | | | | | |
| | | Fiscal Years Ended
June 30, | |
| | | 2004 | | | 2003 | |
| | | (In thousands, except
per ton data) | |
DAP sales | | $ | 111,847 | | | $ | 102,261 | |
Other | | | 4,505 | | | | 494 | |
| | | | | | | | |
Total net sales | | | 116,352 | | | | 102,755 | |
Cost of sales | | | 118,877 | | | | 110,092 | |
| | | | | | | | |
Gross loss | | $ | (2,525 | ) | | $ | (7,337 | ) |
| | | | | | | | |
Tons of DAP produced | | | 636 | | | | 697 | |
Tons of DAP sold | | | 637 | | | | 700 | |
Average sales price per ton of DAP sold | | $ | 175.58 | | | $ | 146.09 | |
| | | | | | | | |
Average cost of sales per ton of DAP sold | | $ | 186.62 | | | $ | 154.62 | |
| | | | | | | | |
30
| (1) | The results presented in the accompanying table for the period from December 21, 2004 through December 31, 2004 reflect our net income before extraordinary items rather than net income because net income before extraordinary items is more comparable to the amounts reported for the other periods presented. Upon MPC’s emergence from bankruptcy on December 21, 2004, the enterprise fair value of PHI was determined to be $10,600, which was allocated to the net assets in accordance with SOP 90-7. As a result of this allocation, the accounting basis for all long-lived assets was reduced to zero and an extraordinary gain of $4,191, or $0.61 per basic and diluted share, was recognized in the period from December 21, 2004 through December 31, 2004. Our net income, including the extraordinary gain, for the period from December 21, 2004 through December 31, 2004 was $4,295, or $0.63 per basic and diluted share. |
| (2) | For substantial intervals during the period from December 31, 2005 to June 30, 2008, as a result of several factors, including Hurricane Katrina and significant equipment failures, our production facilities in Pascagoula were not operating or were operating significantly below expected capacity. For a discussion of these factors, see “—Hurricane Katrina” and “—Plant Shutdowns” under “Management’s Discussion and Analysis of Financial Condition and Results of Operations.” Our financial and operating data in the tables above and below reflect the effects of such unplanned shutdowns and reduced production rates. |
| (3) | We define EBITDA as net income before interest; income taxes; depreciation, amortization and accretion; and asset impairment charges. EBITDA is used as a supplemental financial measure by our management and by external users of our financial statements to assess: |
| | Ÿ | | the financial performance of our assets without regard to financing methods, capital structure or historical cost basis; |
| | Ÿ | | our operating performance and return on capital as compared to other companies in the fertilizer business, without regard to financing or capital structure; and |
| | Ÿ | | the viability of acquisitions and capital expenditure projects and the overall rates of return on alternative investment opportunities. |
We use EBITDA as a primary operating performance measure and an important indicator of our ability to provide cash flows to meet future debt service, if any, capital expenditures and working capital requirements and to fund future growth.
The GAAP measure most directly comparable to EBITDA is net income. Our non-GAAP financial measure of EBITDA should not be considered as an alternative to GAAP net income. You should not consider EBITDA in isolation or as a substitute for analysis of our results as reported under GAAP. Because EBITDA excludes some, but not all, items that affect income from continuing operations and is defined differently by different companies in our industry, our definition of EBITDA may not be comparable to similarly titled measures of other companies.
We compensate for the limitations of EBITDA as any analytical tool by reviewing the comparable GAAP measures, understanding the differences between the measures and incorporating this information into our decision-making processes.
31
The following table shows the reconciliation of net income (loss) to EBITDA for the periods indicated:
| | | | | | | | | | | | | | | | | | | | | | |
| | | Six Months Ended
June 30, | | | Years Ended
December 31, | | Period from
December 21,
2004 through
December 31,
2004 |
| | | 2008 | | | 2007 | | | 2007 | | | 2006 | | | 2005 | |
| | | (In thousands) |
Net income (loss) | | $ | 41,991 | | | $ | 33,656 | (a) | | $ | 48,889 | (a) | | $ | (1,794 | ) | | $ | 4,884 | | $ | 104 |
Interest, net | | | (293 | ) | | | (67 | ) | | | (301 | ) | | | 735 | | | | 73 | | | 13 |
Income tax provision | | | 24,407 | | | | 20,793 | | | | 29,539 | | | | — | | | | 2,465 | | | 64 |
Depreciation, amortization and accretion | | | 4,189 | | | | 3,131 | | | | 7,549 | | | | 3,990 | | | | 1,523 | | | — |
Asset impairment charge(b) | | | 1,572 | | | | — | | | | — | | | | — | | | | — | | | — |
| | | | | | | | | | | | | | | | | | | | | | |
EBITDA | | $ | 71,866 | | | $ | 57,513 | | | $ | 85,676 | | | $ | 2,931 | | | $ | 8,945 | | $ | 181 |
| | | | | | | | | | | | | | | | | | | | | | |
| (a) | This amount includes $37,830 of Hurricane Katrina insurance related pre-tax gains. |
| (b) | During the six months ended June 30, 2008, we recorded an asset impairment charge of $1,572 related to the failure of certain internal components of the waste heat boiler in our No. 2 sulfuric acid plant. See Notes 1(d) and 13(f) to our unaudited consolidated interim financial statements appearing elsewhere in this prospectus. |
32
MANAGEMENT’S DISCUSSION AND ANALYSIS OF
FINANCIAL CONDITION AND RESULTS OF OPERATIONS
You should read the following discussion and analysis together with our consolidated financial statements and the related notes thereto and the other financial information appearing elsewhere in this prospectus. This discussion contains forward-looking statements that are subject to risks, uncertainties and assumptions, including those discussed under “Risk Factors.” Our actual results may differ materially from those expressed in or implied by these forward-looking statements. See “Forward-Looking Statements.”
Overview
Our Company
We are a major U.S. producer and marketer of DAP, the most widely used phosphate fertilizer. Our production facilities are strategically located on a deep water channel in Pascagoula, Mississippi, with direct access to the Gulf of Mexico. Our manufacturing facilities consist of two sulfuric acid plants, a phosphoric acid plant and a DAP granulation plant. Our DAP granulation plant has a maximum annual DAP production capacity of approximately 870,000 tons. Our existing sulfuric acid plants currently produce sulfuric acid sufficient for annual DAP production of approximately 750,000 tons. When it is economical to do so, we can purchase additional quantities of sulfuric acid on the open market, allowing us to manufacture DAP at our full capacity. However, due to current high sulfuric acid prices, we do not expect to purchase supplemental sulfuric acid to increase our DAP production in 2008.
Our facility is capable of receiving raw materials and delivering finished products by ocean vessel, barge, rail and truck. Our Pascagoula plant has storage facilities for 70,000 tons of finished product and raw material storage capacities of 175,000 tons of phosphate rock, 8,000 long tons of molten sulfur, 18,000 tons of sulfuric acid and 24,000 tons of ammonia. Our Pascagoula plant has ample space to construct additional terminal facilities to handle more products and to provide terminaling services to additional third parties.
Our History
PHI was formed in December 2004 in connection with the bankruptcy of MCC. MCC experienced substantial losses over a five-year period beginning in MCC’s 1999 fiscal year. These losses resulted primarily from adverse conditions in MCC’s nitrogen fertilizer business that were caused by an over-supply in world markets resulting from new capacity built in the late 1990’s, the unprecedented increase in the price and price volatility of natural gas that began in 2001 and MCC’s leveraged capital structure. Unlike nitrogen fertilizer products, the production cost of DAP is not significantly impacted by the price of natural gas and, as a result, MCC’s phosphate fertilizer business was not as severely impacted by the factors impacting its nitrogen fertilizer business.
As a result of MCC’s deteriorating financial condition and an impending default on its credit facility, MCC and several of its subsidiaries, including MPC, filed for reorganization under Chapter 11 of the Bankruptcy Code on May 15, 2003. Pursuant to the bankruptcy reorganization plan, all of the common stock of MPC was issued to a trust for the benefit of certain creditors of MCC and MPC. Immediately after MPC’s emergence from bankruptcy on December 21, 2004, the trust transferred all of the common stock of MPC to PHI in exchange for PHI’s common stock. On June 20, 2007, the trust unit holders voted to dissolve the trust, which resulted in the distribution of the PHI shares held by the trust to the trust unit holders. Upon the dissolution and winding up of the trust in June 2007, each holder of trust units received five shares of PHI common stock per trust unit.
33
Our Products
Our primary product is DAP. To produce DAP, we combine phosphate rock and sulfuric acid to form phosphoric acid, which is then mixed with ammonia to produce DAP, a dry granular product. In its chemical composition, DAP is composed of 46% phosphate and 18% nitrogen. In 2007, we sold 620,569 tons of DAP at an average price of $353.80 per ton. For the six months ended June 30, 2008, we sold 266,343 tons of DAP at an average price of $871.06 per ton.
Plants cannot survive without phosphate and must have a steady supply of this nutrient to complete healthy growth and produce a bountiful harvest. Phosphate is essential for the photosynthesis process, seed germination, efficient water utilization by plants and protection of plants against diseases. Thus, phosphate fertilizers play an important role in improving crop quality, increasing crop yields and mitigating the effects of environmental stresses on plants. There are no known nutrient substitutes for phosphate.
Phosphate fertilizers are produced almost exclusively from phosphate rock. World deposits of phosphate rock are generally of sedimentary origin and were laid down under the ocean in earlier geologic times and later raised above sea level. North African reserves of phosphate rock, concentrated in Morocco, Tunisia and Algeria, make up the majority of the world’s phosphate rock reserves.
Key Industry Factors
We operate in a highly competitive, global industry. DAP is a globally traded commodity and, as a result, we compete on the basis of delivered price, timely service and product quality. Moreover, our operating results are influenced by a broad range of factors, including those outlined below.
Fertilizer Demand
According to the IFA, world fertilizer usage increased by 10% between 2005 and 2007. Global demand for food is the primary driver of global fertilizer demand and is a function of population growth, planted acreage, crop yields, grain inventories, application rates, global economic conditions, weather patterns and farm sector income. Sustained income growth in the developing world also affects demand for food; as incomes grow, diets become more diverse, nutritious and protein-rich, primarily through increased meat consumption. Producing meat from livestock and poultry requires large amounts of grain for feed. We expect these key variables to continue to have a significant impact on the demand for food, and a subsequent impact on the demand for fertilizer, for the foreseeable future.
Energy prices and consumption also affect fertilizer demand. Growing demand for energy has encouraged the development of biofuels, which currently rely upon agricultural and livestock products as raw materials. As demand and prices for these agricultural and livestock products increase, the use of fertilizer increases as farmers seek to maximize their crop yields. Fertilizer demand is also affected by other geopolitical factors like temporary disruptions in fertilizer trade related to government intervention and changes in the buying patterns of key consuming countries.
Global Phosphate Pricing
High prices for corn, wheat and soybeans, coupled with low grain stocks despite strong crop yields, have supported strong demand for phosphates. The supply of phosphates has been constrained due to the limited capacity and availability of the key raw materials, which are phosphate rock, sulfur and ammonia. According to the IFA, phosphate fertilizer consumption in 2007 increased 4.5% over 2006 levels. This increase in demand, coupled with relatively static supply, has caused
34
global phosphate prices to rise dramatically since the beginning of 2007. Between January 1, 2007 and July 1, 2008, DAP prices increased rapidly, with published domestic prices for DAP, FOB, NOLA, increasing from $231 per ton to $1,070 per ton and prices for DAP, FOB, U.S. GULF, increasing from $229 per ton to $1,070 per ton. Since the completion of the 2008 domestic planting season, we have experienced a customary decline in demand for DAP. Additionally, there has been a delay in the typical fall season DAP shipments to markets in the United States, Europe and Latin America. As a result, demand for DAP has been sharply reduced, and DAP prices have declined to $834 per ton, FOB, NOLA, and $920 per ton, FOB, U.S. GULF, at October 13, 2008. This price decline has been partially offset by net reductions in the cost of raw materials. We expect that an increase in demand in late October and November, coupled with a reduction in available supply due to recent storms and announced production curtailments, will partially alleviate the current weakness in the DAP market.
Political Factors and Government Policies
Government policies and regulations play an important role in the pricing and supply of phosphate fertilizers. China has established itself as a key player in world phosphate markets, increasing its export of processed phosphates from almost zero at the beginning of the decade to approximately 2.5 million tons in 2007. The Chinese government, however, has become increasingly concerned about ensuring adequate phosphate supply for its home market, as major Chinese producers have concentrated on more lucrative export markets. After ineffective attempts to reverse this trend with a 20% export tax in the second half of 2007, the Chinese government imposed a 35% export tax on January 1, 2008. This rate was again increased to 135% in April 2008 to further disincentivize phosphate exports until the end of the Chinese domestic agricultural season. We believe China exported approximately 1.0 million tons in early 2008, which included products that were sold before the Chinese government increased export taxes. However, China’s export tax and the May earthquake have essentially removed nearly 1.5 million tons of processed phosphate from international trade for 2008.
The U.S. government provides various subsidy programs that can impact domestic demand for fertilizers. Direct subsidies to farmers and special subsidies or mandates for further processed products, such as ethanol, can influence the type and quantity of crops planted and, therefore, impact the quantity of fertilizer consumption.
India, like the United States, has a significant farm subsidy program; however, subsidies are made to fertilizer producers or importers rather than directly to farmers. Such subsidies are intended to support lower prices for farmers. India’s subsidy program can have a significant influence on the amount of local production versus imports of fertilizer and the types of fertilizer available to farmers.
Foreign Currency Fluctuations
Our DAP sales and raw material purchases are denominated in U.S. dollars, which minimizes our direct foreign currency exchange risk. However, fluctuations in the value of the U.S. dollar can impact overall supply and demand balance and pricing for DAP and raw materials, which can affect our competitiveness against non-U.S. DAP producers. Because the vast majority of global commodity trades are transacted in U.S. dollars, a weak U.S. dollar tends to exert upward pressure on U.S. dollar-denominated commodity prices while a strong U.S. dollar tends to have the opposite effect. As a U.S. DAP producer, our DAP is more affordable to foreign buyers when the U.S. dollar is weak relative to such foreign buyers’ currencies, which positively impacts DAP demand and pricing for us. A weak U.S. dollar also provides us with a competitive advantage over DAP producers in other countries whose local currencies are strong relative to the U.S. dollar. Conversely, when the U.S. dollar strengthens relative to the currencies of foreign buyers, our DAP becomes more expensive and DAP demand and pricing can be negatively impacted.
35
Raw materials that we purchase from foreign suppliers are more affordable to us when the U.S. dollar is strong relative to such foreign suppliers’ currencies, which positively impacts raw materials supply and pricing for us. A strong U.S. dollar also provides us with a competitive advantage over non-U.S. DAP producers who buy raw materials from foreign suppliers and whose local currencies are weak relative to the U.S. dollar. Conversely, when the U.S. dollar weakens relative to the currencies of our foreign suppliers, raw materials that we purchase from such suppliers become more expensive and the supply and pricing of these raw materials can be negatively impacted.
Factors Affecting Our Results
Total Net Sales
Our total net sales are principally derived from the sales of DAP and are determined by the quantities of fertilizer we sell and the selling price we realize. We quote prices to customers both on a delivered basis and on the basis of customer pick up at our plant, as many of our customers arrange their own freight. When we do arrange and pay for freight, our quotes and billings are based upon expected freight costs to the point of delivery. Our total net sales include the freight that we bill.
The volumes we sell are determined by our production capabilities and by the demand for our products. Recently, our volumes have been significantly less than our production capacity because of production disruptions caused by unplanned shutdowns of our plant and the impact of Hurricane Katrina on the Mississippi Gulf Coast.
A combination of regional and global supply and demand factors impact our selling practices. Ocean, land and barge shipping rates also impact both the volumes we sell and the price we realize for our products. From January 2007 to June 30, 2008, we have seen an unprecedented increase in DAP pricing. This increase is principally demand driven. Given the long lead time necessary to bring new DAP production online, we do not expect that additional product supply sufficient to counteract demand increases will emerge until at least 2011.
Total net sales include storage and handling fees we receive from Transammonia, currently the exclusive user of our 24,000 ton ammonia terminal, and income from our DAP trading activities. In October 2007, we entered into an agreement with a third party whereby we and the third party jointly identify opportunities to purchase DAP in the U.S. domestic market for resale. When an opportunity is identified, the third party purchases and ultimately resells the DAP. Gains or losses that result from these trading transactions are shared equally between us and the third party. Generally, income from terminaling and DAP trading activities has not been a significant component of our operating results. Our total net sales also include the proceeds from any sales of sulfuric acid we may make from time to time, although such sales are generally small and infrequent.
Cost of Sales
Our cost of sales reflects our costs to produce DAP, which are heavily dependent upon the price of raw materials, principally phosphate rock, sulfur and ammonia. Our phosphate rock costs have increased in the third quarter of 2008, as new deliveries of phosphate rock at a higher contract price for the third quarter of 2008 increased the average cost of our phosphate rock inventory. Our phosphate rock price for the fourth quarter of 2008 will be determined based on negotiations with OCP.
The following table illustrates the approximate amount of raw material inputs we would need if we produced at our current annual DAP production rate of approximately 750,000 tons and at our
36
maximum annual DAP production capacity of approximately 870,000 tons following the construction of a new sulfuric acid plant:
| | | | | | |
| | | 750,000 tons | | 870,000 tons | | Conversion Factor
(tons per DAP
short ton) |
Phosphate rock | | 1,230,000 short | | 1,426,800 short | | 1.64 |
Sulfur | | 292,500 long | | 339,300 long | | 0.39 |
Ammonia | | 170,250 short | | 197,490 short | | 0.227 |
With limited exceptions, our conversion costs, an additional component of our cost of sales, do not change proportionately with production volumes, as a significant portion of our costs are fixed. Our conversion costs include direct labor and benefits, maintenance materials, contract labor, electricity, natural gas, operating supplies, chemicals, insurance, taxes (other than income), depreciation and amortization and plant overhead expenses. We have recently seen these costs increase due to inflationary factors and higher energy costs.
A component of our cost of sales is the amortization of plant turnaround costs. We schedule periodic plant maintenance turnarounds for our sulfuric acid plants, phosphoric acid plant and DAP granulation plant. These maintenance turnaround costs are capitalized as a prepaid expense and amortized to cost of sales over the respective periods between the turnarounds.
Also included in cost of sales are the accretion associated with our gypsum disposal closure and post-closure costs, as described under “—Liquidity and Capital Resources—Gypsum Disposal Costs,” and warehousing and handling costs incurred for storing our finished product at our plant and loading oceangoing vessels, barges, railcars and trucks. These latter costs are principally impacted by prevailing labor rates.
We make references elsewhere in this prospectus to production costs, which include the same components as cost of sales mentioned above.
Selling, General and Administrative Expenses
Our selling, general and administrative expenses consist primarily of personnel and related costs; legal, accounting and other professional fees; sales and public relations expenses; environmental compliance; and costs related to our information and technology systems.
We anticipate an increase in selling, general and administrative expenses after this offering. These expenses will include additional legal and corporate governance expenses, share-based compensation for management, accounting staff costs, exchange listing fees, transfer agent and stockholder-related fees and increased premiums for director and officer liability insurance coverage.
Other Income (Expense)
Other income (expense) includes interest and financing expenses, insurance proceeds in excess of property losses, investment income, unrealized gains (losses) on investments, unrealized gain (loss) on our trust funds and other costs that do not relate directly to our core operations.
Income Tax Expense
We recognize income taxes based on the actual amount of taxes currently payable or receivable as well as deferred tax assets and liabilities attributable to temporary differences between the financial statement carrying amounts of existing assets and liabilities and the respective tax basis of such
37
existing assets and liabilities. We had no significant unrecognized tax benefits at the adoption of FASB Interpretation No. 48,Providing for Uncertainty in Income Taxes—an Interpretation of FASB Statement No. 109, or FIN 48, at December 31, 2007. As of December 31, 2007, we had net operating loss carryforwards of $6.8 million, which are subject to an annual limit of approximately $0.45 million per year through 2022 due to provisions of the Internal Revenue Code of 1986, as amended, or the Code, that apply to the change in our ownership on December 21, 2004.
Results of Operations
The following table sets forth selected information derived from our consolidated statements of operations for the six months ended June 30, 2008 and 2007 and for the years ended December 31, 2007, 2006 and 2005.
| | | | | | | | | | | | | | | | | | | | | | | |
| | | Six Months Ended
June 30, | | Years Ended
December 31, | | | % Change
between
Six Months
2008 and
2007 | | % Change
between
2007 and
2006 | | % Change
between
2006 and
2005 |
| | | 2008 | | 2007 | | 2007 | | 2006 | | | 2005 | | | | |
| | | (Dollars in thousands, except per share data) |
DAP sales | | $ | 232,001 | | $ | 109,208 | | $ | 219,569 | | $ | 130,579 | | | $ | 100,151 | | | 112% | | 68% | | 30% |
Other | | | 6,453 | | | 689 | | | 2,805 | | | 985 | | | | 513 | | | 837% | | 185% | | 92% |
| | | | | | | | | | | | | | | | | | | | | | | |
Total net sales | | | 238,454 | | | 109,897 | | | 222,374 | | | 131,564 | | | | 100,664 | | | 117% | | 69% | | 31% |
Cost of sales | | | 164,461 | | | 88,141 | | | 169,952 | | | 128,684 | | | | 90,117 | | | 87% | | 32% | | 43% |
Selling, general and administrative expenses | | | 6,529 | | | 5,436 | | | 12,301 | | | 4,472 | | | | 2,879 | | | 20% | | 175% | | 55% |
Impairment of assets | | | 1,572 | | | — | | | — | | | — | | | | — | | | N/A | | N/A | | N/A |
Interest, net | | | 293 | | | 67 | | | 301 | | | (735 | ) | | | (73 | ) | | 337% | | N/A | | 907% |
Hurricane-related gain | | | — | | | 37,830 | | | 37,830 | | | — | | | | — | | | N/A | | N/A | | N/A |
Other, net | | | 213 | | | 232 | | | 176 | | | 533 | | | | (246 | ) | | (8)% | | (67)% | | N/A |
Income tax expense | | | 24,407 | | | 20,793 | | | 29,539 | | | — | | | | 2,465 | | | 17% | | N/A | | N/A |
| | | | | | | | | | | | | | | | | | | | | | | |
Net income (loss) | | $ | 41,991 | | $ | 33,656 | | $ | 48,889 | | $ | (1,794 | ) | | $ | 4,884 | | | 25% | | N/A | | N/A |
| | | | | | | | | | | | | | | | | | | | | | | |
Earnings (loss) per share, basic | | $ | 5.49 | | $ | 4.40 | | $ | 6.39 | | $ | (0.24 | ) | | $ | 0.68 | | | 25% | | N/A | | N/A |
| | | | | | | | | | | | | | | | | | | | | | | |
Earnings (loss) per share, diluted | | $ | 5.19 | | $ | 4.40 | | $ | 6.04 | | $ | (0.24 | ) | | $ | 0.66 | | | 18% | | N/A | | N/A |
| | | | | | | | | | | | | | | | | | | | | | | |
EBITDA(1) | | $ | 71,866 | | $ | 57,513 | | $ | 85,676 | | $ | 2,931 | | | $ | 8,945 | | | 25% | | 2,823% | | (67)% |
| | | | | | | | | | | | | | | | | | | | | | | |
| (1) | See note 2 to “Selected Historical Consolidated Financial and Operating Information” for a discussion of EBITDA and a reconciliation of net income (loss) to EBITDA for the periods presented. |
Hurricane Katrina
On August 29, 2005, Hurricane Katrina hit shore on the Mississippi Gulf Coast. The high winds and storm surge from Katrina severely damaged our Pascagoula plant and effectively idled our plant through mid-February of 2006. The issues we faced included:
| | Ÿ | | assisting our employees and their families through their personal losses; |
| | Ÿ | | cleaning the massive amounts of debris and wreckage from the storm; |
| | Ÿ | | securing contractors with the skill set and the labor resources necessary to repair or to rebuild our damaged facilities; |
| | Ÿ | | preparing casualty loss claims and securing the related insurance proceeds; and |
| | Ÿ | | managing difficult liquidity issues. |
38
In 2005, our plant was operational from January 1, 2005 through August 28, 2005. Our plant resumed production on February 11, 2006, but it experienced intermittent outages due to storm-related issues.
The discussion and analysis of all periods presented in this prospectus should be read in the context of the discussion of Hurricane Katrina above and its impact on the comparability of the reported periods.
Equipment Failures
Our No. 2 sulfuric acid plant, with a nameplate capacity of 1,500 tons per day of sulfuric acid, was idled for four months in the third and fourth quarters of 2007 and the first quarter of 2008 due to the failure of a waste heat boiler in July 2007 and the subsequent inability of the retained contractor to repair the boiler. On February 20, 2008, the same sulfuric acid plant was shut down due to the failure of an original fabrication weld and did not resume operations until March 15, 2008. In addition, the maximum production rate of both of our sulfuric acid plants was negatively impacted by leaking heat exchangers beginning in the second quarter of 2007 and continuing into 2008. We installed a new heat exchanger in our No. 2 sulfuric acid plant during the January/February 2008 turnaround and in our No. 3 sulfuric acid plant during the scheduled May 2008 turnaround. Since installation of the new heat exchangers, both of our sulfuric acid plants have regularly achieved production levels above nameplate capacity of 1,500 tons per day. These unplanned shutdowns and reduced production rates negatively affected our financial and operating results during these periods.
The discussion and analysis of all periods presented in this prospectus should be read in the context of the discussion of the equipment failures above and their impact on the comparability of the reported periods.
Six Months Ended June 30, 2008 Compared to Six Months Ended June 30, 2007
Operating Results. Net income and EBITDA for the six months ended June 30, 2008 were $42.0 million and $71.9 million, respectively, on total net sales of $238.5 million, as compared to the six months ended June 30, 2007, in which net income and EBITDA were $33.7 million and $57.3 million, respectively, on total net sales of $109.9 million. Gross profit for the six month period ended June 30, 2008 was $74.0 million, or 31% of total net sales, as compared to the six months ended June 30, 2007, in which gross profit was $21.8 million, or 20% of total net sales.
Total Net Sales. The following table presents DAP sales for the subject periods.
| | | | | | | | | | | | |
| | | Six Months Ended
June 30, | | Change | | | % Change |
| | | 2008 | | 2007 | | |
Net sales of DAP(in millions) | | $ | 232.0 | | $ | 109.2 | | $ | 122.8 | | | 112% |
Sales volume of DAP(thousands of tons) | | | 266.3 | | | 346.9 | | | (80.6 | ) | | (23)% |
Average net sales price per ton of DAP sold | | $ | 871.06 | | $ | 314.83 | | $ | 556.23 | | | 177% |
Net sales of DAP increased 112% during the six months ended June 30, 2008 to $232.0 million from $109.2 million during the six months ended June 30, 2007. This increase resulted from a 177% increase in average DAP sales prices, partially offset by a 23% decrease in DAP sales volumes. The price effect (current-period average sales price, less prior-period average sales price, multiplied by current-period sales tons) and volume effect (current-period sales tons, less prior-period sales tons, multiplied by prior-period average sales price) were $148.1 million and $(25.4) million, respectively. During the six months ended June 30, 2008, we sold 266,343 tons of DAP at an average price of $871.06 per ton, as compared to the six months ended June 30, 2007, in which we sold 346,882 tons of DAP at an average price of $314.83 per ton.
39
During the six months ended June 30, 2008, other sales included $1.1 million in ammonia terminaling fees, $2.4 million in net DAP trading profit and $3.0 million in sulfuric acid sales. We generated $0.6 million in ammonia terminaling fees, $0.1 million in sulfuric acid sales and no DAP trading profit in the six months ended June 30, 2007.
Cost of Sales. The following table presents our cost of sales for DAP for the subject periods.
| | | | | | | | | | | |
| | | Six Months Ended
June 30, | | Change | | % Change |
| | | 2008 | | 2007 | | |
Cost of sales(in millions) | | $ | 164.5 | | $ | 88.1 | | $ | 76.4 | | 87% |
Gross profit margin | | | 31% | | | 20% | | | 11% | | — |
Production of DAP(thousands of tons) | | | 258.1 | | | 341.4 | | | (83.3) | | (24)% |
Average cost of sales per ton of DAP sold | | $ | 617.58 | | $ | 254.08 | | $ | 363.50 | | 143% |
Cost of sales increased 87% during the six months ended June 30, 2008 to $164.5 million from $88.1 million during the six months ended June 30, 2007. This increase resulted from higher raw material costs per ton, partially offset by lower sales volumes. The price effect (current-period average cost per ton sold, less prior-period average cost per ton sold, multiplied by current-period tons sold) and volume effect (current-period sales tons, less prior-period sales tons, multiplied by prior-period average costs per ton) were $96.8 million and $(20.5) million, respectively. As a percentage of total net sales, gross profit increased to 31% during the six months ended June 30, 2008, from 20% during the six months ended June 30, 2007. We realized a gross profit of $74.0 million during the six months ended June 30, 2008, as compared to a gross profit of $21.8 million during the six months ended June 30, 2007.
During the six months ended June 30, 2008, we had higher per-ton production costs as compared to the six months ended June 30, 2007, primarily resulting from higher raw materials costs and lower production during the six months ended June 30, 2008. The cost of phosphate rock, sulfur and ammonia consumed in the production of DAP increased 210%, 605% and 54%, respectively, during the six months ended June 30, 2008, as compared to the six months ended June 30, 2007.
Production of DAP during the six months ended June 30, 2008 was 258,071 tons, a 24% decrease from the 341,374 tons produced for the six months ended June 30, 2007. This decrease was attributable to equipment failures that caused our production facility in Pascagoula to not operate or operate significantly below expected capacity. See “—Results of Operations—Equipment Failures.”
Selling, General and Administrative. Selling, general and administrative expenses increased during the six months ended June 30, 2008 to $6.5 million from $5.4 million during the six months ended June 30, 2007, primarily due to increases in payroll and benefit costs and professional fees.
Impairment of Assets. During the six months ended June 30, 2008, we recorded an impairment charge of $0.7 million for property, plant and equipment and $0.8 million for maintenance turnaround costs associated with the failure of the internal components, specifically the boiler tubes and tube sheets, of the waste heat boiler in our No. 2 sulfuric acid plant. We did not record any asset impairment charges during the six months ended June 30, 2007.
Interest, Net. During the six months ended June 30, 2008, we recorded net interest income of $0.3 million as compared to net interest income of $0.1 million for the six months ended June 30, 2007. We earned interest on our cash balances and had higher average cash balances during the six months ended June 30, 2008. During the six months ended June 30, 2007, we incurred interest expense of $0.3 million related to our line of credit and other short-term financing arrangements.
40
Hurricane-Related Gain. On August 29, 2005, Hurricane Katrina made landfall and severely damaged certain of our assets and disrupted our operations. Effective as of March 30, 2007, we agreed to a $55.2 million global settlement with our insurer of our claims related to Hurricane Katrina. Our consolidated statement of operations for the six months ended June 30, 2007 includes the gain of $37.8 million from insurance recoveries.
Other, Net. Other, net was $0.2 million during the six months ended June 30, 2008 and $0.2 million during the six months ended June 30, 2007. These amounts are principally attributable to unrealized gains on our trust funds.
Income Tax Expense. Income tax expense was $24.4 million during the six months ended June 30, 2008, resulting in an effective tax rate of 36.8%. We had income tax expense for the six months ended June 30, 2007 of $20.8 million, resulting in an effective tax rate of 38.2%.
Earnings Per Share. Basic earnings per share was $5.49 for the six months ended June 30, 2008 and $4.40 for the six months ended June 30, 2007. Diluted earnings per share was $5.19 for the six months ended June 30, 2008 and $4.40 for the six months ended June 30, 2007. Basic and diluted weighted average shares outstanding were 7,654,290 and 8,091,986, respectively, for the six months ended June 30, 2008. Basic and diluted weighted average shares outstanding were each 7,654,290 for the six months ended June 30, 2007.
Year Ended December 31, 2007 Compared to Year Ended December 31, 2006
Operating Results. Net income and EBITDA for 2007 were $48.9 million and $85.7 million, respectively, on total net sales of $222.4 million, as compared to 2006, in which net loss and EBITDA were $(1.8) million and $2.9 million, respectively, on total net sales of $131.6 million. Gross profit for 2007 was $52.4 million, or 24% of total net sales, as compared to 2006, in which gross profit was $2.9 million, or 2% of total net sales. Our 2007 results include gains on insurance recoveries of $37.8 million.
Total Net Sales. The following table presents DAP sales for the subject periods.
| | | | | | | | | | | |
| | | Years Ended
December 31, | | Change | | % Change |
| | | 2007 | | 2006 | | |
Net sales of DAP(in millions) | | $ | 219.6 | | $ | 130.6 | | $ | 89.0 | | 68% |
Sales volume of DAP(thousands of tons) | | | 620.6 | | | 579.8 | | | 40.8 | | 7% |
Average net sales price per ton of DAP sold | | $ | 353.80 | | $ | 225.21 | | $ | 128.59 | | 57% |
Net sales of DAP increased 68% during 2007 to $219.6 million from $130.6 million in 2006. This increase resulted from a 57% increase in average sales prices and a 7% increase in sales volumes. The price effect (current-period average sales price, less prior-period average sales price, multiplied by current-period sales tons) and volume effect (current-period sales tons, less prior-period sales tons, multiplied by prior-period average sales price) were $79.8 million and $9.2 million, respectively. During 2007, we sold 620,569 tons of DAP at an average price of $353.80 per ton as compared to 2006, in which we sold 579,772 tons of DAP at an average price of $225.21 per ton.
During 2007, other sales included $2.0 million in ammonia terminaling fees, $0.5 million in net DAP trading profit and $0.3 million in sulfuric acid sales. During 2006, other sales included $1.0 million in ammonia terminaling fees. In 2006, we had no sulfuric acid sales and did not engage in DAP trading.
41
Cost of Sales. The following table presents our cost of sales for DAP for the subject periods.
| | | | | | | | | | | |
| | | Years Ended
December 31, | | Change | | % Change |
| | | 2007 | | 2006 | | |
Cost of sales(in millions) | | $ | 170.0 | | $ | 128.7 | | $ | 41.3 | | 32% |
Gross profit margin | | | 24% | | | 2% | | | 22% | | — |
Production of DAP(thousands of tons) | | | 631.1 | | | 597.8 | | | 33.3 | | 6% |
Average cost of sales per ton of DAP sold | | $ | 273.85 | | $ | 221.95 | | $ | 51.90 | | 23% |
Cost of sales increased 32% during 2007 to $170.0 million from $128.7 million in 2006. This increase resulted from higher raw material costs per ton and higher sales volumes. The price effect (current-period average cost per ton, less prior-period average cost of sales per ton, multiplied by current-period tons sold) and volume effect (current-period sales tons, less prior-period sales tons, multiplied by prior-period average cost of sales per ton) were $32.2 million and $9.1 million, respectively. As a percentage of total net sales, gross profit margin increased to 24% in 2007, from 2% in 2006. We realized a gross profit of $52.4 million in 2007, compared to a gross profit of $2.9 million in 2006.
During 2007, we had higher per-ton production costs as compared to 2006, primarily resulting from higher raw material costs. The cost of phosphate rock, sulfur and ammonia consumed in the production of DAP increased 16%, 21% and 8%, respectively, during 2007, as compared to 2006.
We produced 631,058 tons of DAP during 2007, which was 6% more than the 597,755 tons of DAP we produced in 2006. A scheduled maintenance turnaround during late April and early May and significantly lower sulfuric acid production during the third quarter, when our No. 2 sulfuric acid plant was idled for most days of the quarter as described under “—Results of Operations—Equipment Failures,” negatively impacted 2007 production.
Production of DAP during 2006 was negatively impacted by:
| | Ÿ | | limited production during the first quarter of 2006 as we resumed operations in mid-February after being down for five and one-half months due to Hurricane Katrina; |
| | Ÿ | | continued storm-related damage problems, particularly in our sulfuric acid plants; |
| | Ÿ | | reduced production due to a maintenance turnaround taken during August 2006 to further address known storm damage-related items; and |
| | Ÿ | | curtailed production late in the fourth quarter as a result of a delayed phosphate rock shipment that experienced mechanical problems en route to our facilities in Pascagoula, Mississippi. |
Selling, General and Administrative Expenses. Selling, general and administrative expenses increased during 2007 to $12.3 million from $4.5 million during 2006, primarily due to increased compensation expense and costs related to a comprehensive settlement of certain environmental issues. Approximately $7.0 million of compensation expense in 2007 related to cash bonuses payable to two of our officers pursuant to their employment agreements that were entered into in connection with MPC’s emergence from bankruptcy. The bonuses were based on our net cash flow (earnings before bonuses, interest, taxes, depreciation and amortization, less capital expenditures of a normal and customary nature and net cash payments for interest and federal, state and local income taxes) for the period December 21, 2004 through December 31, 2007. Effective January 1, 2008, the two officers entered into new employment agreements. Under the new agreements, cash bonuses are based on a return on equity formula, as defined in their employment agreements. See “Management—Executive Compensation.”
42
On January 31, 2008, we entered into a settlement agreement with the MDEQ related to unresolved alleged water permit violations. The terms of the settlement agreement provide for a cash payment of $0.95 million in connection with certain alleged water permit violations and a cash payment of $1.0 million in connection with a dike failure at our gypsum disposal facility that impacted contiguous water bodies. In April 2008, our pollution liability insurance carrier reimbursed the $1.0 million payment related to the dike failure. We recorded the $0.95 million payment as a component of selling, general and administrative expenses in 2007.
Interest, Net. We had net interest income of $0.3 million during 2007 and net interest expense of $0.7 million during 2006. This change was primarily the result of reduced borrowings during 2007. As a result of receiving the final insurance settlement of $14.3 million in April 2007 and increased operating cash flow, we reduced our line-of-credit balance to zero during April.
Hurricane-Related Gain. On March 30, 2007, we agreed to a $55.2 million global settlement with the insurer of our claims related to the damage caused by Hurricane Katrina. Our consolidated statement of operations for the year ended December 31, 2007 includes the gain of $37.8 million from insurance recoveries. No such gain existed in 2006.
Other, Net. Other, net decreased during 2007 to $0.2 million from $0.5 million during 2006. In 2006, we received $0.3 million in insurance recoveries unrelated to Hurricane Katrina.
Income Tax Expense. Income tax expense was $29.5 million in 2007, resulting in an effective tax rate of 37.7%. The effective rate differs from the federal statutory rate of 35% due to state income taxes offset by the effect of the reversal of valuation allowances totaling $0.8 million for the realization of post-bankruptcy net deferred tax assets in the current year. During 2007, we also reversed the remaining valuation allowance of $16.4 million established on the net deferred tax assets that existed upon our emergence from bankruptcy. We determined that it is more likely than not that the net operating loss carryforwards will be realized in future years based upon an evaluation of the reversal of existing taxable temporary differences as well as projected future income resulting from the recent increases in DAP prices. Pursuant to SOP 90-7, this reduction in the valuation allowance was reflected as an increase in additional paid-in capital. As of December 31, 2007, we had net operating loss carryforwards totaling approximately $6.8 million, which are subject to an annual limit of approximately $0.45 million per year through 2022 due to provisions of the Code that apply to the change in our ownership on December 21, 2004. We had no income tax expense for 2006 due to losses from operations, and we did not record any tax benefits in connection with these losses because we did not deem it more likely than not that the benefits would be realized at that time. Accordingly, we recorded a valuation allowance of $0.8 million on those losses as of December 31, 2006.
Earnings (Loss) Per Share. Basic earnings (loss) per share was $6.39 in 2007 and $(0.24) in 2006. Diluted earnings (loss) per share was $6.04 in 2007 and $(0.24) in 2006. Basic and diluted weighted average shares outstanding were 7,654,290 and 8,088,729, respectively, for the year ended December 31, 2007. Basic and diluted weighted average shares outstanding were each 7,369,323 for the year ended December 31, 2006. Common stock equivalents have been excluded from the computation of diluted weighted average shares outstanding for the year ended December 31, 2006 because their inclusion would be anti-dilutive.
Year Ended December 31, 2006 Compared to Year Ended December 31, 2005
Operating Results. Net loss and EBITDA for 2006 were $(1.8) million and $2.9 million, respectively, on total net sales of $131.6 million, as compared to 2005, in which net income and EBITDA were $4.9 million and $8.9 million, respectively, on total net sales of $100.7 million. Gross profit for 2006 was $2.9 million, or 2% of total net sales, as compared to 2005, in which gross profit was $10.5 million, or 10% of total net sales.
43
Total Net Sales. The following table presents DAP sales for the subject years.
| | | | | | | | | | | |
| | | Years Ended
December 31, | | | | |
| | | 2006 | | 2005 | | Change | | % Change |
Net sales of DAP(in millions) | | $ | 130.6 | | $ | 100.2 | | $ | 30.4 | | 30% |
Sales volume of DAP(thousands of tons) | | | 579.8 | | | 478.7 | | | 101.1 | | 21% |
Average sale price per ton of DAP sold | | $ | 225.21 | | $ | 209.21 | | $ | 16.00 | | 8% |
Net sales of DAP increased 30% in 2006 to $130.6 million from $100.2 million in 2005. This increase resulted from an 8% increase in average sale price per ton and a 21% increase in sales volume. The price effect (current-period average sales price, less prior-period average sales price, multiplied by current-period sales tons) and volume effect (current-period sales tons, less prior-period sales tons, multiplied by prior-period average sales price) were $9.3 million and $21.1 million, respectively, for 2006. In 2006, we sold 579,772 tons of DAP at an average price of $225.21 per ton, as compared to 2005, in which we sold 478,685 tons of DAP at an average price of $209.21 per ton.
During 2006 and 2005, other sales included $1.0 million and $0.5 million, respectively, of ammonia terminaling fees.
Cost of Sales. The following table presents our cost of sales for DAP for the subject years.
| | | | | | | | | | | |
| | | Years Ended
December 31, | | | | |
| | | 2006 | | 2005 | | Change | | % Change |
Cost of sales(in millions) | | $ | 128.7 | | $ | 90.1 | | $ | 38.6 | | 43% |
Gross profit margin | | | 2% | | | 10% | | | (8)% | | — |
Production of DAP(thousands of tons) | | | 597.8 | | | 485.6 | | | 112.2 | | 23% |
Average cost of sales per ton of DAP sold | | $ | 221.95 | | $ | 188.25 | | $ | 33.70 | | 18% |
Cost of sales increased 43% in 2006 to $128.7 million from $90.1 million in 2005. This increase primarily resulted from higher cost of sales per ton and higher sales volumes. The price effect (current-period average cost per ton, less prior-period average cost per ton, multiplied by current-period tons sold) and volume effect (current-period sales tons, less prior-period sales tons, multiplied by prior-period average costs per ton) were $19.5 million and $19.0 million, respectively, for 2006. As a percentage of total net sales, gross profit decreased to 2% in 2006, from 10% in 2005. We realized a gross profit of $2.9 million in 2006, compared to a gross profit of $10.5 million in 2005.
During 2006, we had higher per-ton production costs as compared to 2005, primarily attributable to higher raw material costs. The cost of phosphate rock, sulfur and ammonia consumed in the production of DAP increased 18%, 7% and 14%, respectively, during the year ended December 31, 2006, as compared to the year ended December 31, 2005. Also in 2006, we had higher conversion costs attributable to operational difficulties in recovering from Hurricane Katrina.
During 2006, we produced 597,755 tons of DAP, as compared to 485,617 tons of DAP produced in 2005, which represents a 23% increase.
Production of DAP during 2006 was negatively impacted by:
| | Ÿ | | limited production during the first quarter of 2006 as we resumed operations in mid-February after being shut down for five and one-half months due to Hurricane Katrina; |
44
| | Ÿ | | continued storm-related damage problems, particularly in our sulfuric acid plants; |
| | Ÿ | | reduced production due to a maintenance turnaround taken during August 2006 to further address known storm-related damage; and |
| | Ÿ | | curtailed production late in the fourth quarter as a result of a delayed phosphate rock shipment that experienced mechanical problems en route to our facilities in Pascagoula, Mississippi. |
Production of DAP during 2005 was negatively impacted by the damage inflicted by Hurricane Katrina, which idled our plant from August 29 through the balance of the year.
Selling, General and Administrative Expenses. Selling, general and administrative expenses increased in 2006 to $4.5 million from $2.9 million in 2005, due primarily to costs incurred during the recovery from Hurricane Katrina that were not reimbursable under our insurance policies.
Interest, Net. Net interest expense increased in 2006 to $0.7 million from $0.1 million in 2005. This increase in net interest expense was primarily the result of amounts borrowed to fund working capital as we restarted operations after Hurricane Katrina.
Other, Net. In 2006, other, net increased to $0.5 million from an expense of $(0.2) million in 2005. This increase was largely attributable to $0.3 million of insurance recoveries unrelated to Hurricane Katrina.
Income Tax Expense. During 2006, we had no income tax expense due to operating losses. We did not record any income tax benefit related to those losses because we did not deem it more likely than not that the benefit would be realized at that time. Accordingly, we recorded a valuation allowance of $0.8 million as of December 31, 2006. In 2005, we had income tax expense of $2.5 million, resulting in an effective tax rate of 33.5%. Our effective tax rate was favorably impacted by tax credits related to our Hurricane Katrina recovery. In 2005, we also reversed $2.5 million of the valuation allowance established on the net deferred tax assets that existed upon our emergence from bankruptcy. Pursuant to SOP 90-7, this reduction in the valuation allowance was reflected as an increase in additional paid-in capital.
Earnings (Loss) Per Share. Basic earnings (loss) per share was $(0.24) and $0.68 in 2006 and 2005, respectively. Diluted earnings (loss) per share was $(0.24) and $0.66 in 2006 and 2005, respectively. Basic and diluted weighted average shares outstanding were each 7,369,323 for the year ended December 31, 2006. Common stock equivalents have been excluded from the computation of diluted weighted average shares outstanding for the year ended December 31, 2006 because their inclusion would be anti-dilutive. Basic and diluted weighted average shares outstanding were 7,145,663 and 7,373,179, respectively, for the year ended December 31, 2005.
Liquidity and Capital Resources
We have funded our operations primarily through funds generated by our operations and through borrowings under our existing credit facility. We believe that the net proceeds retained by us from this offering, cash flow from operations and available borrowings under our existing credit facility described below will be sufficient to fund our operations, our capital spending program and debt service requirements for at least the next two years. If we do not achieve forecasted results from operations, additional financing in the form of debt or equity may be required for us to offset any cash flow deficiencies. As described below, our existing credit facility covenants are calculated using cash flow and fixed charges, and therefore, materially adverse operating results could restrict the availability of our credit.
45
The following table sets forth, as of the dates indicated, certain liquidity measures (in millions):
| | | | | | | | | |
| | | June 30, 2008 | | December 31, 2007 | | December 31, 2006 |
Cash and cash equivalents | | $ | 31.3 | | $ | 43.6 | | $ | 0.6 |
Working capital | | | 82.2 | | | 56.3 | | | 11.5 |
Revolving line of credit availability | | | 27.0(1) | | | 13.9 | | | 9.7 |
| (1) | See “—Existing Credit Facility” for a discussion of the increase in the line of credit availability. |
Operating Activities
Six Months Ended June 30, 2008 Compared to Six Months Ended June 30, 2007. Total cash provided by operating activities was $7.7 million for the six months ended June 30, 2008 compared to $19.7 million for the six months ended June 30, 2007. The $12.0 million change in cash provided by operating activities is due primarily to a significant increase in our investment in inventories and higher accounts receivables, partially offset by greater operating income and higher current taxes payable. Operating income increased to $65.9 million during the six months ended June 30, 2008, as compared to operating income of $16.3 million during the six months ended June 30, 2007. The increase in operating income for the six months ended June 30, 2008, as compared to the six months ended June 30, 2007, resulted from a significant increase in the average sales price of our DAP, partially offset by fewer tons of DAP sold. Operating cash flows for the six months ended June 30, 2007 was favorably impacted by the collection of the last of the Hurricane Katrina-related insurance settlements of $14.3 million, of which $5.9 million was attributable to operating activities. Accounts receivable increased by $29.4 million during the six months ended June 30, 2008, as compared to $8.2 million during the six months ended June 30, 2007, primarily as a result of higher sales prices. Inventories increased by $46.0 million during the six months ended June 30, 2008, as compared to $3.4 million during the six months ended June 30, 2007, due primarily to an increase in raw material costs and greater quantities of phosphate rock on hand.
Year Ended December 31, 2007 Compared to Year Ended December 31, 2006. Total cash provided by operating activities was $48.7 million for 2007 compared to cash used in operations of $1.2 million for 2006. The $49.9 million increase in cash provided by operating activities is primarily due to an increase in operating income, deferred income taxes and accrued expenses, partially offset by an increase in inventories and accounts receivable resulting from significantly higher sales levels. Operating income increased to $40.1 million in 2007 compared to an operating loss of $1.6 million in 2006. The increases in operating income for 2007 as compared to 2006 resulted from an increase in sales volumes and DAP pricing. Additionally, 2006 operations were disrupted due to the impact of Hurricane Katrina recovery as our plant did not begin producing DAP until February 11, 2006 and had several periods of unplanned outages related to the Katrina aftermath during the year. Collections from Hurricane Katrina-related insurance settlements provided $14.3 million in 2007, of which $5.9 million was attributable to operating activities, as compared to $33.3 million in 2006, of which $13.7 million was attributable to operating activities. Trade accounts receivable increased $6.2 million in 2007 relative to an increase of $5.2 million in 2006 as a result of increased revenues. In 2007, inventories increased $4.5 million due primarily to an increase in raw material costs, while in 2006 inventories increased $2.3 million due to an increase in raw material cost but at a lower rate than in 2007.
Year Ended December 31, 2006 Compared to Year Ended December 31, 2005. Total cash used in operating activities was $1.2 million in 2006 and $1.6 million in 2005. The $0.4 million improvement in cash used in operating activities in 2006 relative to 2005 was due primarily to factors resulting from Hurricane Katrina, such as the timing of collection of insurance settlements and restoring operations. In 2006, we had an operating loss of $1.6 million, which was principally attributable to very low margins realized on the sale of our product and the production problems encountered from the aftermath of Hurricane Katrina. In 2005, we had operating income of $7.7 million despite the
46
disruption caused by Hurricane Katrina. Changes in trade accounts receivables and inventories decreased cash flows from operations in 2006 by $7.6 million and increased cash flows from operations in 2005 by $6.7 million. These changes were due primarily to the increased working capital needed to resume our business in the aftermath of Hurricane Katrina and the impact of lost production while our plant was idled.
Investing Activities
Six Months Ended June 30, 2008 Compared to Six Months Ended June 30, 2007. Total cash used in investing activities was $9.5 million for the six months ended June 30, 2008, as compared to $2.5 million of cash provided by investing activities for the six months ended June 30, 2007. Cash invested in property, plant and equipment increased to $9.1 million in the first six months of 2008 from $5.6 million in the first six months of 2007. The capital expenditures incurred in the first six months of 2008 included $2.5 million for the fabrication and installation of the “B” heat exchangers in our No. 2 and No. 3 sulfuric acid plants. We also spent $1.1 million for the improvement of our converter vessel and $1.0 million to rebuild the waste heat boiler in our No. 2 sulfuric acid plant. In the first half of 2007, we spent approximately $0.6 million to expand our ammonia terminal and approximately $2.8 million to build a storm levee. During the six months ended June 30, 2007, we collected the final Hurricane Katrina-related insurance proceeds of $14.3 million, of which $8.4 million was attributable to investing activities. In addition, we contributed $0.4 million in both six month periods to provide future funding of our gypsum stack closure obligation.
Year Ended December 31, 2007 Compared to Year Ended December 31, 2006. Total cash used in investing activities was $2.8 million for 2007, as compared to cash used of $5.3 million for 2006. Cash invested in property, plant and equipment was $10.4 million in 2007, as compared to $24.1 million in 2006. In 2007, we expended $3.5 million for a storm levee, $0.8 million to expand our ammonia terminal and approximately $3.6 million for improvements to our sulfuric acid plants. During 2007, we collected the final Hurricane Katrina-related insurance proceeds of $14.3 million, of which $8.4 million was attributable to investing activities. In 2006, we expended $22.0 million in capital to restore our facilities from the damage caused by Hurricane Katrina and $0.3 million to expand our dock. During 2006, we collected advances on our Hurricane Katrina insurance claim of $33.3 million, of which $19.6 million was attributable to investing activities. In addition, we contributed $0.8 million in both years to provide future funding of our gypsum stack closure obligation.
Year Ended December 31, 2006 Compared to Year Ended December 31, 2005. Total cash used in investing activities was $5.3 million in 2006 and $9.8 million in 2005. In 2006 and 2005, we expended approximately $22.0 million and $10.8 million, respectively, in capital to restore our facilities from the damage caused by Hurricane Katrina. In 2006, we collected advances on our Hurricane Katrina insurance claim of $33.3 million, of which $19.6 million was attributable to investing activities. Also, in 2006, we spent $0.3 million to expand our dock. In 2005, we collected advances of $7.6 million related to our Hurricane Katrina insurance claim, of which $4.4 million was attributable to investing activities. Also, in 2005, we spent approximately $0.3 million on an ammonia railcar and barge loading system and $2.6 million on various other capital projects. In addition, we contributed $0.8 million and $0.6 million in 2006 and 2005, respectively, to provide future funding of our gypsum stack closure obligations.
Financing Activities
Six Months Ended June 30, 2008 Compared to Six Months Ended June 30, 2007. Total cash used in financing activities was $10.5 million for the six months ended June 30, 2008, as compared to $4.4 million for the six months ended June 30, 2007. In the first six months of 2008, we had net borrowings related to the financing of our property and casualty insurance premiums of
47
$1.0 million and paid $11.5 million in a special dividend to our stockholders. In the first six months of 2007, we repaid $4.9 million pursuant to the revolving portion of our credit facility and had net borrowings of $0.5 million to finance our property and casualty insurance premiums.
Year Ended December 31, 2007 Compared to Year Ended December 31, 2006. Total cash used in financing activities was $3.0 million for 2007, as compared to cash provided from financing activities of $6.4 million for 2006. In 2007, we repaid $4.9 million of borrowings under the revolving portion of our credit facility and repaid $0.3 million of net amounts borrowed to finance our property and casualty insurance premiums. These uses of financing activities were partially offset by a $2.2 million excess tax benefit recognized from the exercise of stock options. In 2006, we borrowed $4.9 million pursuant to the revolving portion of our credit facility and borrowed $0.7 million to finance our property and casualty insurance premiums. We also collected cash proceeds of $0.8 million from the exercise of stock options.
Year Ended December 31, 2006 Compared to Year Ended December 31, 2005. Total cash provided by financing activities was $6.4 million in 2006, as compared to cash used in financing activities of $6.5 million in 2005. In 2006, we borrowed $4.9 million pursuant to the revolving portion of our credit facility and borrowed $0.7 million to finance our property and casualty insurance premiums. We also collected cash proceeds of $0.8 million from the exercise of stock options. During 2005, we repaid $2.3 million of the financing of our property and casualty insurance premiums.We also collected $1.2 million from the exercise of stock options, paid a $5.0 million dividend to the trust unit holders and paid $0.4 million in deferred loan costs.
Existing Credit Facility
At December 31, 2007 and 2006, we had a $15.0 million and $17.5 million, respectively, revolving line of credit facility with PNC Bank, National Association, or PNC, which permits borrowings based on a specified percentage of accounts receivable and inventories. The credit facility was entered into in March 2005 and has been subsequently extended to mature in March 2011. The credit facility is secured by our receivables, inventories, equipment and other personal property. As of June 30, 2008 and December 31, 2007, there were no borrowings outstanding under the line of credit. In May 2008, the revolving credit facility was increased to $27.0 million.
In 2007, we also added a $3.0 million term loan to our credit facility that is available to finance the construction of a storm protection levee for our Pascagoula plant. This levee was constructed in 2007 and was funded through cash from operations. As of June 30, 2008 and December 31, 2007, there were no borrowings outstanding under the term loan, which remains available through December 31, 2008.
Outstanding balances under our credit facility bear interest at a margin above a floating rate, which, at our option, is one of (i) the Alternate Base Rate or (ii) the Eurodollar Rate, both as defined in our credit agreement. We have paid $0.5 million in upfront financing costs associated with this credit facility. As of December 31, 2007, we had unamortized deferred financing costs of $0.1 million.
The credit facility contains certain covenants, including restrictions on: (i) indebtedness; (ii) the incurrence of liens; (iii) investments and acquisitions; (iv) mergers and the sale of assets; (v) guarantees; (vi) dividends; (vii) capital expenditures; (viii) transactions with affiliates; and (ix) leasing activities. The credit facility also contains a requirement to maintain an adjusted net worth (adjusted to eliminate the effect of Hurricane Katrina additions) of $18.0 million and a ratio of adjusted earnings before income taxes, depreciation and amortization to fixed charges of 1.2 to 1.0.
The credit facility also contains events of default, including upon the failure to pay principal and interest in a timely manner, the breach of certain covenants or representations and warranties, the
48
occurrence of a change in control, and noncompliance with local, state and federal laws. We were in compliance with all covenants with respect to the credit facility at June 30, 2008 and December 31, 2007.
Capital Expenditures
2007 Capital Expenditures
Ammonia Terminal. In June 2007, we completed an expansion of our ammonia terminal, which increased ammonia railcar load out capacity from four to ten railcars per day. The total cost of this project was approximately $0.8 million. The expansion has enabled Transammonia, the exclusive user of our ammonia terminal, to secure new business of 50,000 to 60,000 tons of ammonia per year from a specific customer. Our ammonia terminal investment is supported by minimum throughput obligations assumed by Transammonia. Ammonia terminal revenues were $2.0 million in 2007, compared to $1.0 million in 2006. We expect continued revenue growth from these ammonia terminaling activities.
Ammonia Transfer Line—South Dock. We have two deep water loading areas that we refer to as the north and south docks. Prior to our construction of an ammonia transfer line at the south dock, ammonia could only be loaded or unloaded at the north dock. This project has allowed ammonia vessels to be loaded and unloaded at either the north or south dock, which has greatly enhanced our ability to conduct our ammonia terminaling business and provided greater dock utilization. This project was completed in mid-2007 at a cost of $0.6 million and was a prerequisite to our ammonia terminal expansion described above.
Storm Levee. In July 2007, we completed the construction of a levee around our Pascagoula plant to protect it from hurricane-related storm surge. The vast majority of the damage inflicted by Hurricane Katrina was caused by wind-driven water. The completed levee is three feet higher than the storm surge produced by Hurricane Katrina in the Pascagoula area. The total project cost was approximately $3.5 million. As a result of this improvement, we realized a property insurance premium reduction of approximately $1.0 million and a decrease in the named windstorm deductible from $15.0 million to $9.5 million, and we expect further insurance cost benefits from this project at future renewals.
2008 Capital Expenditures
Sulfuric Acid Exchangers. In 2008, we completed the replacement of two heat exchangers, one in each of our two sulfuric acid plants, at a cost of approximately $2.5 million. A heat exchanger is a common unit in all chemical manufacturing operations that allows for the efficient use of energy. Our existing “B” heat exchangers had, over time, developed internal leaks that allowed sulfur dioxide gas to mix internally with sulfur trioxide gas. This problem required us to operate our two sulfuric acid plants at reduced rates in order to maintain compliance with their environmental operating permits. The replacement exchangers were installed in our No. 2 sulfuric acid plant when it was shutdown in the first quarter of 2008 and in our No. 3 sulfuric acid plant during its scheduled turnaround in May 2008. Since the installations, we have achieved production rates above nameplate capacity in both plants.
Miscellaneous Projects. During the six months ended June 30, 2008, we incurred capital costs of $0.8 million for the replacement of our Pascagoula office buildings that were destroyed by Hurricane Katrina, $1.1 million for the improvement of the converter vessel and $1.0 million for the rebuilding of a waste heat boiler in our No. 2 sulfuric acid plant, and we incurred additional capital costs for the completion of various capital maintenance projects.
Our capital expenditures for 2008 are estimated to be approximately $16.8 million to be funded from operations. Through June 30, 2008, we incurred $9.1 million of capital expenditures on the projects described above. A majority, approximately $4.0 million, of the projected spending during the
49
remainder of 2008 will be directed toward the expansion of our terminaling activities. The balance of the projected spending during 2008 will include $0.7 million to complete the construction of our Pascagoula office buildings, $0.6 million to begin the fabrication of a new universal spare absorption tower for the existing sulfuric acid plants and additional amounts to complete additional capital maintenance projects. The universal spare absorption tower is estimated to ultimately cost $4.4 million and can be utilized in our existing sulfuric acid plants or as a component in the construction of a new sulfuric acid plant.
Our 2008 capital spending exceeds our historical spending levels and has been directed primarily at our sulfuric acid plants. This spending has resulted in an improvement in the on-stream factor as well as an increase in the instantaneous production rates of our sulfuric acid plants. We expect that these operating improvements will allow us to increase our DAP production.
Gypsum Disposal Costs
The MDEQ permit required to operate the active stack of our gypsum disposal facility obligates us to provide financial assurance for payment of the closure and post-closure care of the active stack, which is estimated to cost approximately $37.6 million in future, undiscounted dollars. We are fulfilling this obligation by making quarterly contributions of $0.2 million into a trust fund managed by a third party for closure and post-closure related costs to be incurred when the capacity of the active stack is depleted. These payments will continue until funds in the trust, combined with projected earnings from trust assets, are considered sufficient to cover the estimated costs of closure at the completion of the disposal site’s useful life and the post-closure costs for water treatment. At June 30, 2008, the fair value of the trust assets available to fund this obligation was $3.5 million.
Qualitative and Quantitative Disclosures about Market Risk
Commodity prices, changes in interest rates and foreign currency exchange rates may impact our operating results.
Commodity Prices
DAP, our principal product, is a commodity but is not traded on any commodity exchange or other trading platform with sufficient liquidity to permit the effective hedging of DAP price risk. In general, buyers and sellers are unwilling to enter into long-term fixed price contracts for DAP, and as a result, we are not able to undertake direct hedging of the prices for future DAP production. As we do not have long-term sales contracts with our customers, prices for our DAP will vary with each transaction and individual bid received. Additionally, the DAP we produce is marketed for sale almost exclusively into the agricultural market as a fertilizer. Decreases in agricultural demand for DAP could reduce our sales, and prices for DAP will vary based upon the demand from this market.
Our total net sales and ultimate profitability are determined principally by the price of DAP and the price of raw materials (phosphate rock, sulfur and ammonia) used in the production of DAP. Our phosphate rock supply is dependent upon one supplier. See “Risk Factors—Risks Related to Our Business—Phosphate rock production is highly concentrated, and we are dependent upon one source to supply us with phosphate rock, the primary raw material in DAP.” Since the beginning of 2008, rising demand for sulfur has caused prices to increase dramatically. However, current market indicators suggest a supply and demand balance that could lower sulfur prices. Our cost of sales is also subject to market movements in other commodities such as ammonia and, occasionally, sulfuric acid.
Interest Rate Fluctuations
As of December 31, 2007, our outstanding short-term borrowings were $2.2 million, representing amounts used to finance property and liability insurance premiums. These borrowings bear a fixed interest rate of 5.75% and mature throughout the policy periods in 2008. Based on the principal
50
outstanding under these arrangements as of December 31, 2007, a 1% change in the interest rate would increase our annual interest expense by $22,000.
Foreign Currency Exchange Rates
Our sales of DAP and purchases of raw materials are denominated in U.S. dollars, which minimizes our direct foreign currency exchange risk.
Indirectly, we have foreign exchange risk based upon the movement in the U.S. dollar relative to certain other currencies. For the six months ended June 30, 2008, $174.0 million, or 75% of our DAP sales, was attributable to product sold for resale into the export market. If the U.S. currency were to strengthen against currencies of other DAP importing countries, we could face lower sales in the export market, which may adversely affect our operating results.
Contractual Obligations
As of December 31, 2007, we had contractual obligations totaling $40.1 million, as indicated below. The following table summarizes our contractual payment obligations and commitments as of December 31, 2007 (in thousands):
| | | | | | | | | | | | | | |
| | | Total | | Less than 1
Year | | 1-3
Years | | 3-5
Years | | More than 5
Years |
Long-term debt obligations | | $ | 2,185 | | $ | 2,185 | | | — | | — | | | — |
Capital lease obligations | | | — | | | — | | | — | | — | | | — |
Operating lease obligations | | | 307 | | | 185 | | $ | 122 | | — | | | — |
Purchase obligations | | | — | | | — | | | — | | — | | | — |
Other long-term liabilities(1) | | | 37,636 | | | — | | | — | | — | | $ | 37,636 |
| | | | | | | | | | | | | | |
Total | | $ | 40,128 | | $ | 2,370 | | $ | 122 | | — | | $ | 37,636 |
| | | | | | | | | | | | | | |
| (1) | We are obligated for physical closure costs and post-closure treatment of leachate related to our active gypsum disposal site. We estimate that our existing disposal site has a remaining life of approximately 18 years assuming we produce at our maximum annual DAP production rate of approximately 870,000 tons. Due to the long-term life remaining on this disposal site, we have disclosed this information as a more than five years obligation. The obligation shown is in future, undiscounted dollars. We have entered into a financial assurance mechanism with the MDEQ, as described under “—Liquidity and Capital Resources—Gypsum Disposal Costs.” |
Off-Balance Sheet Arrangements
On October 1, 2007, we entered into an agreement with a third party under the terms of which we and the third party jointly identify opportunities to purchase DAP in the U.S. domestic market for resale. When opportunities are identified, the third party purchases and ultimately resells the DAP. Gains or losses that result from these trading transactions are shared equally between us and the third party. During the six months ended June 30, 2008, we recorded income related to this agreement of $2.4 million. As of June 30, 2008, we had no open DAP positions. The agreement limits the aggregate notional value of open DAP trade positions to $20.0 million at any point in time. Either party can force the other party to liquidate a position in an orderly fashion. We are not obligated to accept or make delivery of DAP pursuant to the trading positions that this third party executed. See Note 1(i) to our unaudited consolidated interim financial statements for the six months ended June 30, 2008 appearing elsewhere in this prospectus.
51
Application of Critical Accounting Policies
Our consolidated financial statements are prepared in conformity with GAAP. In preparing our consolidated financial statements, we are required to make various judgments, estimates and assumptions that could have a significant impact on the results reported in our consolidated financial statements. We base these estimates on historical experience and other assumptions that management believes to be reasonable under the circumstances. Actual results could differ from such estimates and assumptions, and changes in these estimates and assumptions could have a material effect on our consolidated financial statements.
Our significant accounting policies can be found in Note 1 to our audited consolidated financial statements appearing elsewhere in this prospectus. We believe the following accounting policies may include a higher degree of judgment and complexity in their application and are most critical to aid in fully understanding and evaluating our reported financial condition and operating results.
Revenue Recognition. Revenue is recognized when the earnings process is complete. We view the earnings process as complete when risk of ownership and title passes to the customer. Title passes to the customer at shipping point, which is FOB vessel, barge, rail or truck at Pascagoula. Base prices for our product are set at the time of, or prior to, shipment, pursuant to sales contracts based on current published prices or upon negotiated short-term prices with our customers.
Shipping and handling costs are included as a component of cost of sales.
Inventory Valuation. Inventories are valued at the lower of cost (moving average) or market value. We review our inventory balances at least quarterly to determine if the carrying amount of inventories exceeds their net realizable value. This review process incorporates industry and market trends, current operational plans for the inventory and historical price activity for the inventory. If the carrying amount of our inventory were to exceed its estimated net realizable value, we would adjust our carrying values accordingly. Upon inventory liquidation, if the actual sales price ultimately realized were less than our initial estimate of net realizable value, additional losses would be recorded in the period of liquidation.
Recoverability of Long-Lived Assets. We evaluate our long-lived assets for impairment in accordance with SFAS No. 144,Accounting for the Impairment or Disposal of Long-Lived Assets, when events or changes in circumstances indicate that we may not recover the related carrying amount. Assets subject to this evaluation are our property, plant and equipment and related turnaround costs. Impairment is considered to exist if the total estimated future cash flow on an undiscounted basis is less than the carrying amount of the related assets. An impairment loss is measured and recorded based on the discounted estimated future cash flows.
The measurement of recoverability of these assets is dependent upon the accuracy of the assumptions used in making estimates on a number of factors including, but not necessarily limited to, sales volumes, sales prices, costs of raw materials, tax rates and capital spending. Certain of these operating assumptions are particularly sensitive because of the cyclical nature of the phosphate fertilizer industry.
Changes in significant assumptions underlying future cash flow estimates or fair values of assets may have a material effect on our financial position and operating results.
We had one triggering event in January 2008 that required an evaluation of the recoverability of certain long-lived assets. Our No. 2 sulfuric acid plant had a failure of certain internal components, specifically, the boiler tubes and tube sheets. Accordingly, we recorded an impairment charge of $1.6 million, which represents the net book value of the boiler components and the related unamortized turnaround costs. We have not identified any other triggering events in the current year.
52
Currently, we have no long-lived intangible assets for evaluation.
Useful Lives of Depreciable Assets. Property, plant and equipment is stated at historical cost and depreciation is computed using the straight-line method over the lives of the assets. The lives used in computing depreciation expense are based on estimates of the period that the assets will be of economic benefit to us. Estimated lives are based on historical experience, manufacturers’ estimates, engineering or appraisal estimates and future business plans. We review the depreciable lives assigned to our property, plant and equipment on a periodic basis, and change our estimates, if necessary, to reflect the results of these reviews.
Asset Retirement Obligation. We, together with our third-party consultants, develop estimates for the costs of retiring our active gypsum disposal facility pursuant to the guidance set forth in SFAS No. 143,Accounting for Asset Retirement Obligations, and FIN No. 47,Accounting for Conditioned Asset Retirement Obligations. The costs are inflated based on an inflation factor and discounted based on a credit adjusted risk free rate. For operating facilities, fluctuations in the estimated costs, inflation and interest rates can have an impact on the amounts recorded on our consolidated balance sheet. For closed facilities, fluctuations in the estimated costs, inflation and interest rates can have an impact on our consolidated statement of operations. A further discussion of our asset retirement obligations can be found in Note 8 to our audited consolidated financial statements appearing elsewhere in this prospectus.
Share-Based Compensation. Effective January 1, 2006, we adopted the provisions of, and account for stock-based compensation in accordance with, SFAS No. 123(R),Share-Based Payment, or SFAS 123(R). As such, stock-based compensation expense is measured at the grant date based on the fair value of the award using an option-pricing model and is recognized as an expense over the vesting period. Determining the fair value of the stock-based awards at the grant date requires judgment. Key assumptions used in an option-pricing model include estimating the expected term of stock options, the expected volatility of our stock, the risk-free interest rate and expected dividends. In addition, estimates of the number of stock-based awards that are expected to be forfeited are also required as a component of measuring stock-based compensation expense. Prior to the adoption of SFAS 123(R), we accounted for stock-based compensation in accordance with APB Opinion No. 25,Accounting for Stock Issued to Employees, and related interpretations.
In the second quarter of 2008, we approved a SAR plan for our board of directors. We have issued 21,703 SARs pursuant to this plan as of June 30, 2008. Also, we granted one of our newly hired officers 25,000 SARs upon commencement of employment. The SARs will be accounted for as liability awards, and we recorded $38,000 of share-based compensation expense related to these awards in the second quarter of 2008.
Deferred Income Taxes. We estimate the actual amount of taxes currently payable or receivable as well as deferred tax assets and liabilities attributable to temporary differences between the financial statement carrying amounts of existing assets and liabilities and their respective tax bases. We measure deferred income tax assets and liabilities using enacted tax rates expected to apply to taxable income in the years in which these temporary differences are expected to be recovered or settled. The effect on deferred tax assets and liabilities of a change in tax rates is recognized in income in the period that includes the enactment date.
A valuation allowance is provided for those deferred tax assets for which it is more likely than not that the related tax benefits will not be realized, which generally includes significant estimates and assumptions that result from a complex series of judgments about future events. The judgments include evaluating objective evidence, both positive and negative, in determining the need for a valuation allowance. In determining whether a valuation allowance is required, we apply the principles
53
enumerated in SFAS No. 109,Accounting for Income Taxes. If during an accounting period we determine that we will not realize all or a portion of our deferred tax assets, we will increase our valuation allowances with a charge to income tax expense. Conversely, if we determine that we will ultimately be able to realize all or a portion of the related tax benefits, we will reduce valuation allowances with a reduction to income tax expense or, if the valuation allowance reduction was attributable to deferred tax assets that existed at our emergence from bankruptcy, we would recognize additional paid-in capital. For example, during 2007, we reversed the valuation allowances on our deferred tax assets of $17.2 million based upon the determination that it is more likely than not the net operating loss carryforwards would be utilized in future years. Of this reduction in the valuation allowance, $16.4 million was applicable to the valuation allowance established at our emergence from bankruptcy and, accordingly, was recorded as an addition to paid-in capital pursuant to SOP 90-7. The balance of the valuation allowance was established on deferred tax assets recorded after MPC’s emergence from bankruptcy and, accordingly, this amount of $(0.8) million was recorded as a reduction in income tax expense.
As of December 31, 2007, we had net operating loss carryforwards of $6.8 million, which are subject to an annual limit of approximately $0.45 million per year through 2022 due to provisions of the Code that apply to the change in our ownership on December 21, 2004.
Environmental Remediation. Environmental remediation liabilities are recognized when the related costs are considered probable and can be reasonably estimated consistent with the requirements of SFAS No. 5,Accounting for Contingencies. Estimates of these costs are based upon currently available facts, existing technology, site-specific costs and currently enacted laws and regulations. In reporting environmental liabilities, no offset is made for potential recoveries. All liabilities are monitored and adjusted as new facts or changes in law or technology occur. In accordance with GAAP, environmental expenditures are capitalized when such costs provide future economic benefits. We had no environmental remediation liabilities recorded as of June 30, 2008. However, as disclosed in Note 17 to our audited consolidated financial statements and Note 13 to our unaudited consolidated interim financial statements, both appearing elsewhere in this prospectus, we are subject to several pending environmental matters for which we are currently unable to predict the outcome. The final resolution of these matters could have a material impact on our financial position or operating results.
Recent Accounting Pronouncements
FIN 48, Accounting for Uncertainty in Income Taxes
In June 2006, the Financial Accounting Standards Board, or FASB, issued FIN No. 48,Accounting for Uncertainty in Income Taxes, an interpretation of FASB Interpretation No. 109, or FIN 48, which provides that a company may recognize the effect of income tax positions only if those positions are more likely than not to be sustained. Recognized income tax positions are measured at the largest amount that is greater than 50% likely to be realized. Changes in recognition or measurement are reflected in the period in which the change in judgment occurs. The provisions of FIN 48 are effective for us as of January 1, 2007. The adoption of FIN 48 did not have a material effect on our financial position or operating results.
SFAS No. 157, Fair Value Measurements
In September 2006, the FASB issued SFAS No. 157,Fair Value Measurements, or SFAS 157. SFAS 157 defines fair value, establishes a framework for measuring fair value and expands disclosure requirements regarding fair value measurement. Where applicable, this statement simplifies and codifies fair value related guidance previously issued within GAAP. SFAS 157 is effective for us as of January 1, 2008 as it relates to financial assets and liabilities. FSP FAS 157-2 deferred the adoption of
54
this pronouncement on nonfinancial assets and liabilities. The adoption of SFAS 157 did not have a significant impact upon our consolidated financial statements.
SFAS No. 159, The Fair Value Option for Financial Assets and Financial Liabilities
In February 2007, the FASB issued SFAS No. 159,The Fair Value Option for Financial Assets and Financial Liabilities, or SFAS 159, which permits entities to choose to measure certain financial assets and liabilities at fair value. SFAS 159 is effective for years beginning after November 15, 2007. We adopted SFAS 159, effective January 1, 2008, but we have not elected the fair value option for any assets or liabilities under SFAS 159.
SFAS No. 141 (Revised 2007), Business Combinations and SFAS No. 160, Noncontrolling Interests in Consolidated Financial Statements
In December 2007, the FASB issued SFAS No. 141 (Revised 2007),Business Combinations, or SFAS 141R, and SFAS No. 160,Noncontrolling Interests in Consolidated Financial Statements, an Amendment of ARB No. 51, or SFAS 160. SFAS 141R and SFAS 160 significantly change the accounting for and reporting of business combination transactions and noncontrolling (minority) interests. Under SFAS 141R, an acquiring entity will be required to recognize all the assets and liabilities assumed in a transaction at the acquisition date fair value. In addition, SFAS 141R includes a substantial number of additional disclosure requirements. SFAS 160 changes the accounting and reporting for minority interests, which will be recharacterized as noncontrolling interests and classified as a component of equity. We will be required to apply the provisions of SFAS 141R and SFAS 160 prospectively effective January 1, 2009.
SFAS No. 161, Disclosure about Derivative Instruments and Hedging Activities, an Amendment of FASB Statement No. 133
In March 2008, the FASB issued SFAS No. 161,Disclosure about Derivative Instruments and Hedging Activities, an Amendment of FASB Statement No. 133, or SFAS 161. SFAS 161 changes the disclosure requirements for derivative instruments and hedging activities. We will be required to provide enhanced disclosures about (i) how and why we use derivative instruments, (ii) how these derivative and related hedged items are accounted for pursuant to SFAS No. 133 and related interpretations and (iii) how these items will affect our financial position, financial performance and cash flows. We must adopt this statement in 2009. We do not anticipate any significant impact on our financial position or operating results in applying this statement.
CHANGES IN AND DISAGREEMENTS WITH ACCOUNTANTS ON
ACCOUNTING AND FINANCIAL DISCLOSURE
HORNE LLP, Certified Public Accountants, was our independent auditor from December 21, 2004 through June 5, 2008. HORNE LLP’s reports on our consolidated financial statements have not contained any adverse opinion, disclaimer of opinion or any qualification or modification regarding uncertainty, audit scope or accounting principles. The audit committee of our board of directors approved the decision to change auditors and dismiss HORNE LLP. There were no disagreements with HORNE LLP on any matter of accounting principles or practices, financial statement disclosure or auditing scope procedure, which, if not resolved to HORNE LLP’s satisfaction, would have caused it to make reference to the subject matter of the disagreement(s) in connection with its report. A copy of this disclosure has been provided to HORNE LLP, and we have received a response that HORNE LLP agrees with this disclosure. Our consolidated financial statements for the year ended December 31, 2005 appearing elsewhere in this prospectus, have been audited by HORNE LLP. KPMG LLP, independent registered public accounting firm, has served as our independent registered public accounting firm since June 6, 2008. Our consolidated financial statements as of December 31, 2007 and 2006 and for each of the years ended December 31, 2007 and 2006 appearing elsewhere in this prospectus have been audited by KPMG LLP.
55
INDUSTRY OVERVIEW
We obtained the information about the fertilizer industry in this prospectus from several independent outside sources, including: the International Fertilizer Industry Association, or the IFA, a not-for-profit organization representing the global fertilizer industry; and Green Markets Fertilizer Market Intelligence Weekly, or Green Markets, a fertilizer industry news publication.
Overview of Fertilizers
Fertilizers play a fundamental role in global agriculture by replacing the nutrients that crops remove from the soil, thereby sustaining the yield and quality of crops. Phosphate, nitrogen and potassium (potash) are the three primary nutrients essential to crop development.
Each of these three key nutrients serves a different vital function in plant formation, and a proper balance of the three nutrients is necessary to maximize a fertilizer’s effectiveness. Phosphate is essential for the photosynthesis process, which drives the production, transportation and accumulation of sugars in the plant. Phosphate also aids seed germination, promotes efficient water utilization and protects plants against diseases. Nitrogen plays a critical role in protein formation, helps make plants green and plays a major role in boosting crop yields. Potash helps regulate plants’ physiological functions, improves plant durability and helps provide crops with protection from extreme temperatures, disease and parasites.
According to the IFA, global consumption of these three principal crop nutrients in the 2006/2007 fertilizer year (the 12 months ended June 30, 2007) was approximately 181.0 million nutrient tons, and of this total, phosphate (P2O5) represented 24% or 43.0 million tons. These nutrients are primarily used as fertilizer for commercial agriculture. In the United States, growers of the major commodity crops are the largest consumers of fertilizer. Other uses for crop nutrients include livestock feed and industrial applications such as the production of resins, plastics, synthetic fibers, drilling fluids, explosives and detergents. According to the IFA, world fertilizer usage increased by 10% between 2005 and 2007, and world fertilizer demand is estimated to grow by approximately 15% from 2007 to 2012.
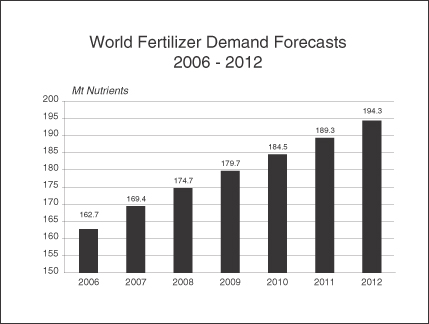
Source: IFA
56
Phosphate Fertilizers
Phosphate fertilizers, the second-most widely used fertilizer products globally, are critical to plant photosynthesis, reproduction and increased crop yields. The phosphate fertilizer market consists of three sectors—agricultural usage, industrial applications and feed products, with agricultural usage accounting for a significant portion of the total phosphate fertilizer market. The principal raw materials used in the production of ammonium phosphate fertilizers are phosphate rock, sulfur and ammonia. Typically, sulfur is used to make sulfuric acid, which is combined with phosphate rock to produce phosphoric acid that is reacted with ammonia to produce principal phosphate fertilizer products—diammonium phosphate, or DAP, and monoammonium phosphate, or MAP. DAP has phosphate and nitrogen content of 46% and 18%, respectively, whereas the primary grade of MAP has phosphate and nitrogen content of 52% and 11%, respectively. DAP is the preferred and most commonly used phosphate fertilizer due to its high nutrient content and excellent handling qualities.
Phosphate fertilizers are produced almost entirely from phosphate rock. World deposits of phosphate rock are generally of sedimentary origin and were laid down under the ocean in earlier geologic times and later raised above sea level. North African reserves of phosphate rock, concentrated in Tunisia, Algeria and Morocco, make up a majority of the world’s phosphate rock reserves.
Demand Fundamentals
The process of growing and harvesting crops extracts a substantial portion of essential nutrients from the soil, which should be replenished in appropriate ratios. As a result, DAP demand depends primarily on the overall demand for fertilizers, which is a function of total planted acreage, crop mix, soil characteristics, fertilizer application rates, crop yields and farm income. These factors are impacted by current and projected grain stocks and prices, agricultural policies, improvements in agronomic efficiency and weather. Increasing demand from developing countries in Latin America and Asia has also driven recent growth in the global demand for DAP.
The use of DAP and MAP has been increasing as a percentage of agricultural usage of phosphate fertilizers. From the 1985/86 through 2005/06 fertilizer years, the combined consumption of DAP and MAP grew at an average rate of 3.5% per year. The IFA estimates that global DAP consumption will grow at a compound annual average growth rate of 3.5% from 2008 to 2012.
Supply Fundamentals
The supply of DAP is primarily influenced by the availability of phosphate rock, the key raw material used in the production of DAP. Phosphate rock production is highly concentrated. China, the United States, Morocco and Russia are the four largest producers of phosphate rock and account for nearly 75% of world production. According to the IFA, global production of phosphate rock increased by 4.6% in 2007 to 176.1 million metric tons, up from 168.3 million metric tons in 2006. Despite significant global resources, over the near term, we anticipate that phosphate rock supplies will remain tight due to the lead time required to expand the production capacity in order to meet growing demand.
While farmers in many countries use DAP, China, the United States, Morocco and Russia produce the vast majority of the world’s supply, making many of the world’s countries dependent upon imports to satisfy their DAP requirements. The increasing demand for fertilizer products and constrained supply of raw materials have led some countries to restrict DAP exports in order to ensure adequate supply to meet domestic demand. In 2007, China accounted for approximately 16.5% of world DAP exports. However, in April 2008, the Chinese government imposed a 135% tax on DAP exports. We expect China’s level of DAP exports to drop considerably throughout the remainder of 2008, which will reduce the worldwide supply of DAP and put further upward pressure on DAP prices.
In 2006 and 2007, global DAP capacity was relatively flat; however, the recent strength in agricultural and fertilizer fundamentals has encouraged the development of new DAP production
57
capacity in China and several developing countries. The new capacity being built in China, however, is expected to be used primarily for domestic production. As a result, and due to the long lead time necessary to bring DAP production online, we do not expect that additional product supply sufficient to counteract demand increases will emerge until at least 2011.
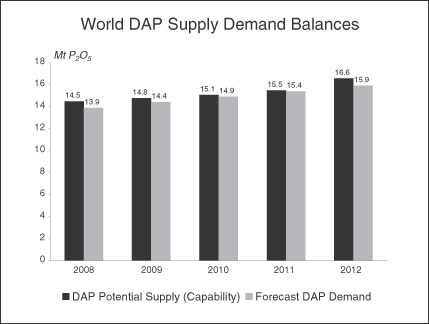
Source: IFA
Price Fundamentals
The following chart shows the increase in average monthly DAP prices from January 3, 1994 to October 13, 2008.
Source: Green Markets
58
Prior to 2006, DAP pricing remained relatively flat, primarily due to excess DAP supply in the world markets. The average domestic DAP prices for 2003, 2004 and 2005 were $172 per ton, $205 per ton and $227 per ton, respectively. In 2006, DAP demand grew sufficiently to absorb this excess supply, and prices began to increase. Since that time, consistent growth in global demand, coupled with limited increases in global supply, has led to a significant increase in DAP prices. DAP prices, FOB, NOLA, increased approximately 195% during the first half of 2008 to $1,070 per ton at June 30, 2008, up from $550 per ton on January 1, 2008. DAP prices, FOB, US Gulf, have behaved similarly rising from $544 per ton on January 1, 2008 to $1,070 per ton at June 30, 2008. Since the completion of the 2008 domestic planting season, we have experienced a customary decline in demand for DAP. Additionally, there has been a delay in the typical fall season DAP shipments to markets in the United States, Europe and Latin America. As a result, demand for DAP has been sharply reduced, and DAP prices have declined to $834 per ton, FOB, NOLA, and $920 per ton, FOB, U.S. GULF, at October 13, 2008. This price decline has been partially offset by net reductions in the cost of raw materials. We expect that an increase in demand in late October and November, coupled with a reduction in available supply due to recent storms and announced production curtailments, will partially alleviate the current weakness in the DAP market.
59
BUSINESS
Our Company
We are a major U.S. producer and marketer of DAP, the most common form of phosphate fertilizer.
Our production facilities are strategically located on a deep water channel in Pascagoula, Mississippi, with direct access to the Gulf of Mexico. Our manufacturing facilities consist of two sulfuric acid plants, a phosphoric acid plant and a DAP granulation plant. Our DAP granulation plant has a maximum annual DAP production capacity of approximately 870,000 tons. Our existing sulfuric acid plants currently produce sulfuric acid sufficient for annual DAP production of approximately 750,000 tons. When it is economical to do so, we can purchase additional quantities of sulfuric acid on the open market, allowing us to manufacture DAP at our full capacity. However, due to current high sulfuric acid prices, we do not expect to purchase supplemental sulfuric acid to increase our DAP production in 2008.
Our History
PHI was formed in December 2004 in connection with the bankruptcy of MCC. MCC experienced substantial losses over a five-year period beginning in MCC’s 1999 fiscal year. These losses resulted primarily from a decrease in sales prices for MCC’s nitrogen fertilizer products, the unprecedented increase in the price and price volatility of natural gas that began in 2001 and MCC’s leveraged capital structure. Unlike nitrogen fertilizer products, the production cost of DAP is not significantly impacted by the price of natural gas, and as a result, MCC’s phosphate fertilizer business was not as severely impacted by the factors impacting its nitrogen fertilizer business.
As a result of MCC’s deteriorating financial condition and an impending default on its credit facility, MCC and several of its subsidiaries, including MPC, filed for reorganization under Chapter 11 of the Bankruptcy Code on May 15, 2003. Pursuant to the bankruptcy reorganization plan, all of the common stock of MPC was issued to a trust for the benefit of certain creditors of MCC and MPC. Immediately after MPC’s emergence from bankruptcy on December 21, 2004, the trust transferred all of the common stock of MPC to PHI in exchange for PHI’s common stock. On June 20, 2007, the trust unit holders voted to dissolve the trust, which resulted in the distribution of the PHI shares held by the trust to the trust unit holders. Upon the dissolution and winding up of the trust in June 2007, each holder of trust units received five shares of PHI common stock per trust unit.
Our Products
Our primary product is DAP. To produce DAP, we combine phosphate rock and sulfuric acid to form phosphoric acid, which is then mixed with ammonia to produce DAP, a dry granular product. In its chemical composition, DAP is composed of 46% phosphate and 18% nitrogen. Of the ammoniated phosphate produced in the United States, 98% is sold as fertilizer. In 2007, we sold 620,569 tons of DAP at an average price of $353.80 per ton. For the six months ended June 30, 2008, we sold 266,343 tons of DAP at an average price of $871.06 per ton.
Plants need a steady supply of phosphate to complete a healthy growth cycle and produce a bountiful harvest. Phosphate plays a key role in the photosynthesis process, which drives the production, transportation and accumulation of sugars in plants. Phosphate is also involved in seed germination, helps plants use water efficiently and protects plants against diseases. Thus, phosphate fertilizers play an important role in improving crop quality, increasing crop yields and mitigating the effects of environmental stresses on plants.
60
Our Competitive Strengths
We believe the following competitive strengths, in addition to our strategic relationships with Transammonia and ICEC, as described under “—Our Key Strategic Alliances,” have contributed to our recent success, differentiate us from our competitors and will drive our future growth:
Long-Term Strategic Supplier Relationship. We have a strong, long-term relationship with OCP, a corporation owned by the Kingdom of Morocco. A significant portion of the world’s known phosphate rock reserves are located in Morocco, and OCP is the world’s leading exporter of phosphate rock, accounting for approximately 45% of world trade in phosphate rock. We are one of OCP’s largest buyers of phosphate rock, and we have purchased all of our phosphate rock requirements from OCP since 1991.
We believe the phosphate rock that OCP supplies to us is of a higher grade than the average phosphate rock mined in the United States. The higher grade lowers our conversion cost because we can more efficiently convert this phosphate rock into phosphoric acid. The higher grade also helps us meet the nitrogen content specification of our DAP without the need to add solid nitrogen products, such as urea, as supplements.
We believe that we have a strategic and mutually beneficial working relationship with OCP. During the 18 years that we have purchased phosphate rock from OCP, we have never experienced an interruption in our supply of phosphate rock caused by OCP. When Hurricane Katrina severely damaged our facilities in 2005, OCP’s prompt assurances that our supply of phosphate rock would be available when we were ready to resume operations facilitated our recovery from that disaster.
The price we pay OCP for phosphate rock is currently re-set each quarter. OCP has advised us that it is presently engaged in a comprehensive review of its existing customer contracts and contract terms, which it intends to update and standardize. OCP has stated that its objective is to execute new multi-year contracts with all of its global customers, rather than to extend current agreements. In connection with this objective, OCP has notified us that, rather than extend the term of our current contract, it plans to enter into a new agreement with us prior to the expiration of our current agreement on December 31, 2008. Accordingly, in June 2008, OCP provided us with written notice that it will not extend our current four-year agreement beyond December 31, 2008. OCP has advised us that it wishes to continue our long-standing relationship, and we currently anticipate entering into a new contract with OCP in advance of the expiration of our existing contract on December 31, 2008.
Strategically Located Facilities. Our production facilities are strategically located on a deep water channel with direct access to the Gulf of Mexico. We believe that our location provides the following important benefits:
Marketing Flexibility. We believe that our location provides us with maximum flexibility to direct our sales into markets that will yield the best price for our product. We are able to load our finished product either onto deep water vessels for shipment into the export market or onto barges for delivery along the Mississippi River and its tributaries for domestic consumption. Our export volumes are loaded directly onto ocean vessels from our Pascagoula plant without the extra expense that inland producers must incur for inland transport and terminal operations. Our Pascagoula location also permits us to directly access much of the U.S. corn belt by barge rather than higher cost rail transport. We also have rail and truck shipping capabilities, which maximize our delivery options.
Raw Material Access. Our deep water location also allows us to receive raw materials at a lower cost than our competitors with inland facilities. We can receive ammonia and sulfur directly at our dock while our competitors not located on a deep water channel must first move these materials through a
61
deep water terminal and then transport them by rail or pipeline to their inland locations. Our Pascagoula plant is close to the major sulfur production regions in Texas and Louisiana. We believe this proximity lowers our sulfur delivery costs compared to our inland competitors. We also obtain a considerable portion of our molten sulfur requirement directly via pipeline from a large-scale oil refinery situated contiguous to our facility, which further strengthens our sulfur access advantage.
Established Valuable Infrastructure. Our Pascagoula plant has significant, well-maintained facilities and infrastructure in place. Based on current costs for similar assets, we estimate the replacement cost of our Pascagoula plant at approximately $900 million. In addition to the extensive capital investment, the construction of a similar facility in the United States could involve a complex, time-consuming and costly governmental and regulatory permitting process. We estimate that project development and execution would require approximately four years.
Our existing asset base provides a platform for cost-effective incremental expansion. We are currently unable to use a material portion of our phosphoric acid and DAP granulation capacity due to our limited sulfuric acid production capacity. We intend to use substantially all of the net proceeds from this offering to construct a new sulfuric acid plant, which will allow us to increase our sulfuric acid production and thereby utilize our full phosphoric acid and DAP production capacity. We believe this possibility is an attractive investment opportunity that will allow us to maximize our DAP production without the need to add additional phosphoric acid or granulation capacity.
We believe that our Pascagoula plant is well positioned to become an important terminal for fertilizer and related products and chemicals. Since 2005, we have provided ammonia terminaling services to Transammonia. Our Pascagoula plant has ample space for us to construct additional terminal facilities to handle more products and to provide terminaling services to additional third parties. We have commenced projects to add terminaling capabilities for sulfuric acid and liquid nitrogen fertilizer, which we expect to complete in 2009. Other projects to expand our terminaling business are under evaluation.
Environmental regulations require gypsum, a by-product of DAP production, to be stored in on-site permitted disposal facilities. We generate approximately 2.4 tons of gypsum per ton of DAP produced. Our active gypsum disposal facility is fully-permitted and has sufficient capacity to meet our operating requirements for approximately 18 additional years assuming we produce at our maximum annual DAP production rate of approximately 870,000 tons. The fully-permitted status and long remaining life of our active gypsum stack is a valuable resource that provides ongoing stability to our DAP operations. We believe that this stability provides us with a significant advantage over other companies whose gypsum disposal facilities have remaining lives that are significantly less than the remaining life of our active gypsum stack. Developing new gypsum disposal facilities has become increasingly difficult due to extensive capital investment requirements and a costly regulatory permitting process.
Significant Management Experience. We benefit from the experience and long-standing industry relationships of our senior management team. On average, our senior management team has over 25 years of experience in the fertilizer industry. Our current senior leadership has successfully steered our business through the financial and operational challenges MPC faced during the bankruptcy of MPC and its former parent, MCC, and, subsequently, Hurricane Katrina. We believe that our senior management team has the knowledge and experience to capitalize on business growth opportunities that will further enhance our reputation as well as our earnings and cash flow.
62
Our Strategy
Our objective is to increase long-term stockholder value. Key elements of our business strategy to accomplish our objective include:
Expand our manufacturing capacity to facilitate growth in revenues and cash flow. We plan to use substantially all of the net proceeds of this offering to build a new sulfuric acid plant and related cogeneration facility at our Pascagoula plant. Currently, our DAP production capacity is limited by our sulfuric acid production capacity, and the price of sulfuric acid in the open market makes the purchase of supplemental sulfuric acid economically unattractive. The new sulfuric acid plant will expand our sulfuric acid production capacity and will allow us to utilize our full DAP production capacity without relying on purchases of supplemental sulfuric acid. In addition, the new sulfuric acid plant will allow us to sell up to 95,000 tons of excess sulfuric acid per year into the merchant acid market. The new planned cogeneration operations will reduce our operating costs and provide additional revenue opportunities through the sale of excess electricity. We expect that the new sulfuric acid plant and related cogeneration unit will enable us to lower our DAP production cost per ton and increase our cash flow due to full utilization of our DAP production capacity, improved plant efficiency and reduced electricity costs.
Capture opportunities for higher margins by strategically targeting our sales to more profitable markets. We constantly monitor domestic and export DAP market conditions. Unlike other domestic DAP producers, we can react quickly to take advantage of favorable regional conditions and strategically target our sales into higher yielding markets. Historically, we have delivered most of our DAP for sale into the U.S. domestic market. However, in late 2007, when pricing in the export market became more advantageous, we swiftly increased the amount of our DAP sold into the export markets. Pursuant to our sales agreement with Transammonia, we maintain maximum flexibility and can react quickly to take advantage of changing price differentials between domestic and export markets. Sales are made at a price composed of a market related “base price” plus an additional price related to the profitability of Transammonia’s ultimate sale. This framework allows us to achieve potentially higher profit margins on our export sales.
Diversify and grow our revenue stream primarily through investment in additional projects that capitalize on our strategic location and existing facilities. We continuously evaluate strategic investment opportunities, such as expanding our terminaling services, that will enable us to diversify our revenue stream beyond DAP sales. Currently, we offer ammonia terminaling services to Transammonia, our exclusive supplier of ammonia. In 2007, we expanded our terminal to accommodate Transammonia’s increased requirements, and Transammonia increased its minimum throughput commitments under our terminaling contract. We have commenced projects that will expand our terminaling capacity to handle liquid nitrogen fertilizers and sulfuric acid. We are also evaluating a project that will increase our capacity to handle dry bulk goods. In addition, we are exploring other capital projects such as uranium recovery from phosphoric acid and solid sulfur prilling. We believe that these potential capital projects, which capitalize on our location in a heavily industrialized area on a deep water channel with access to the Gulf of Mexico, and our existing infrastructure can help us diversify and grow our revenue stream.
Maintain our financial strength to respond to changes in product prices and raw material costs and to withstand downturns in our industry. Recent increases in the price of raw materials, including phosphate rock, sulfur and ammonia, have highlighted the importance of being able to respond quickly to changes in market prices for DAP and raw materials. The degree of liquidity required to operate our business and respond to market conditions has increased significantly. During 2007, we dramatically improved our liquidity through the repayment of the $4.9 million outstanding balance under our revolving credit facility and by increasing cash on hand to $43.6 million at December 31, 2007. Our enhanced liquidity affords us the flexibility to capitalize on changing market
63
conditions. During 2007, our financial strength permitted us to strategically accumulate DAP inventory in anticipation of the higher DAP sales prices that materialized in late 2007, to capture arbitrage opportunities created by price differentials between domestic and export markets and to build significant raw material inventories in advance of sharp raw material price increases. At June 30, 2008, our cash on hand had declined to $31.3 million principally due to our March 2008 special dividend payment and the buildup of raw material inventories. We intend to maintain a strong balance sheet and ample capital reserves to protect against any future downturn in the industry.
Continue to evaluate opportunities to expand our business. We are constantly analyzing opportunities to expand our core business through investments and acquisitions. We also will consider expanding into new businesses that are compatible with our core competencies and synergistic with our current operations.
Maintain our commitment to operate our facilities in an environmentally responsible and safe manner. We are firmly committed to protecting the environment in which we operate and take pride in the significant progress we have made in this area. Since our emergence from bankruptcy in December 2004, the number of reported environmental permit exceedances at our Pascagoula plant declined by more than 75%, compared to the three year period prior to our emergence from bankruptcy. We continually review our processes and practices to identify methods to reduce the environmental impact of our operations.
Our commitment to maintaining a strong safety record has resulted in significant improvements in our safety programs since our emergence from bankruptcy in December 2004. Our success in our safety efforts is reflected in our workers’ compensation insurance premium rates, which we believe are approximately one-third lower than the industry average.
Our Key Strategic Alliances
Since our inception, we have strived to develop and maintain broad-ranging strategic alliances with some of our key suppliers and customers. We believe that our operating results benefit substantially from these relationships.
Transammonia, Inc.
Transammonia is an international merchandising and trading company that markets, trades, distributes and transports fertilizer materials, liquefied petroleum gas, petrochemicals, methanol, crude oil and oil products. Transammonia is our exclusive marketer of DAP into the export market and a significant domestic customer. Our DAP sales contract with Transammonia requires Transammonia to purchase a certain volume of DAP for both the export and domestic market per contract year. Transammonia takes title to the DAP at the loading point at an agreed to base price. When Transammonia remarkets the DAP, either domestically or internationally, we share in the subsequent profit, less Transammonia’s direct costs and deemed commissions, if any. We do not share in losses that Transammonia realizes in the remarketing of the DAP. However, Transammonia may recapture any lost commissions on DAP remarketed at a loss on profits from future DAP purchased from us. Our DAP sales contract with Transammonia automatically renews on January 1 each year, unless either party notifies the other party in writing of its intention to not renew the contract at least six months prior to expiration of the then current term. Because neither party gave such notice by July 1, 2008, our DAP sales contract with Transammonia will now run through at least December 31, 2009.
Transammonia is also our supplier of ammonia, which we use in the production of DAP. Transammonia fulfills all of our ammonia requirements upon receipt of quantities needed and delivery dates. The purchase price of ammonia is based upon Transammonia’s delivered direct costs, plus a fee within a defined range. The total price of ammonia cannot exceed a certain margin over the quoted
64
C&F, Tampa price, based upon prices reported in recognized fertilizer trade publications. Our ammonia supply contract with Transammonia automatically renews for successive periods of two years upon the contract’s initial termination date on December 31, 2009, unless either party notifies the other party in writing of its intention to not renew the contract at least six months prior to expiration of the then current term. As of the date of this prospectus, neither party has given such notice.
Transammonia is the exclusive user of our ammonia terminal. We provide ammonia terminaling services to Transammonia for a base fee per ton, plus a percentage share of the profit, as determined annually based on the profits, if any, Transammonia realizes on the sale of ammonia. Transammonia is also required to achieve certain minimum throughputs. Our terminal contract with Transammonia automatically renews for successive periods of two years upon the contract’s initial termination date on December 31, 2009, unless either party notifies the other party of its intention to not renew the contract at least six months prior to expiration of the then current term. As of the date of this prospectus, neither party has given such notice.
In limited instances, we have also used Transammonia to supply both sulfur and sulfuric acid.
International Commodities Export Corporation
ICEC is an international marketer of fertilizer and fertilizer raw materials. ICEC is also the largest global marketer of sulfur, a key raw material used to manufacture DAP. Contractually, ICEC has agreed to provide between 7,000 and 12,000 long tons of sulfur to us per month at negotiated and agreed prices. ICEC has also agreed to undertake, on our behalf, efforts to source sulfur in excess of the contracted terms. This supply contract renews annually on January 1, unless either party gives written notice to the contrary at least 90 days prior to the expiration date. As of July 1, 2008, neither party had given such notice. Because neither party has given such notice, the contract will now run through at least December 31, 2009.
We also supply DAP to ICEC through barges, and, to a lesser extent, railcars, at sales prices agreed to by us and ICEC. Our DAP sales contract with ICEC renews annually on August 1, unless either party gives written notice to the contrary no later than 90 days prior to expiration. Because neither party has given such notice, the contract will now run through at least July 31, 2009.
ICEC also, from time to time, sources sulfuric acid for our DAP production process.
Our Production Process
Key Raw Materials
Phosphate Rock. Phosphate rock is the primary raw material used to manufacture DAP. Based on our annual DAP production capacity of approximately 870,000 tons, our Pascagoula plant would require 1,426,800 tons of phosphate rock per year. It takes approximately 1.64 tons of phosphate rock to produce one ton of DAP.
Ammonia. Ammonia is an essential component in the production of DAP. Based on our annual DAP production capacity of approximately 870,000 tons, our Pascagoula plant would require 197,490 tons of ammonia per year. It takes approximately 0.227 tons of ammonia to produce a ton of DAP.
Sulfur. Sulfur is used to manufacture sulfuric acid. Based on our annual DAP production capacity of approximately 870,000 tons, our Pascagoula plant would require 339,300 long tons of sulfur per year. It takes approximately 0.39 long tons of sulfur to produce one ton of DAP.
65
Sulfuric Acid. Sulfuric acid is a required component in the production of DAP. We produce approximately 1.0 million tons of sulfuric acid per year at our two sulfuric acid plants at our Pascagoula plant. In the past, we have purchased sulfuric acid on the open market in order supplement our in-house capacity and to increase DAP production. Sulfuric acid is not currently available for purchase at prices we deem economical, however, and we expect this condition to persist for the balance of 2008.
Production of DAP
The following diagram outlines the DAP production process.
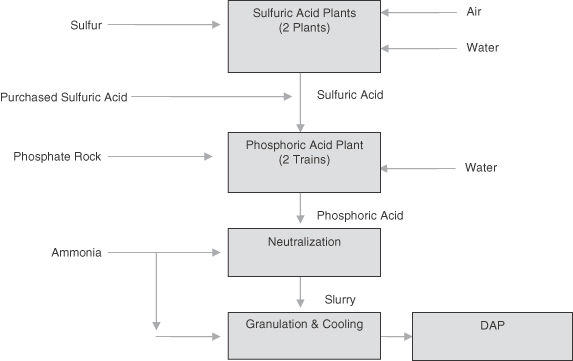
The production of DAP begins with molten sulfur, which is burned in dry air to produce sulfur dioxide gas. This gas is then cooled and forms into sulfur trioxide gas by combining with excess oxygen in the dry air. This gas passes through an absorption tower where it is contacted with sulfuric acid and water, combining with the water to form additional sulfuric acid.
The sulfuric acid is then combined with phosphate rock to produce phosphoric acid and gypsum, a solid waste by-product. The gypsum is washed and dried through a series of steps and then mixed with water and pumped to the gypsum disposal area. The phosphoric acid produced is filtered out and concentrated in evaporators by boiling off some of the water in the phosphoric acid.
Finally, DAP is produced by reacting phosphoric acid with anhydrous ammonia, which is then dried and granulated.
66
Our Marketing and Distribution
During the first half of 2008, 75% of our DAP sales were to Transammonia, our sole export wholesaler. In 2007, 76% of our DAP sales came from sales to three key customers, Transammonia, ICEC and Oakley Fertilizer, Inc., while 78% of our DAP sales in 2006 came from four customers, Phosphate Chemical Export Association, Inc., ICEC, Transammonia and Oakley Fertilizer, Inc. Transammonia remarkets the substantial majority of the DAP it purchases from us into the export market. Transammonia marketed all of our export sales in 2007 and in the first half of 2008. PhosChem marketed our export sales in 2006. Our internal sales staff manages our domestic sales.
Historically, we have sold our DAP primarily into the U.S. domestic market where we have typically obtained better prices relative to export markets. In late 2007 and early 2008, however, prices in the export market exceeded those in the domestic market due to a significant increase in international demand for fertilizers. As a result, we strategically directed our sales into the export market, and in the first half of 2008, we sold the majority of our product into the export market. The table below shows the portion of our total DAP sales delivered to the domestic and export markets during the six months ended June 30, 2008 and 2007 and the years ended December 31, 2007, 2006 and 2005:
| | | | | | | | | | | | | | | |
| | | Percentage of DAP Sales | |
| | | Six Months Ended
June 30, | | | Years Ended
December 31, | |
| | | 2008 | | | 2007 | | | 2007 | | | 2006 | | | 2005 | |
Domestic | | 25 | % | | 79 | % | | 65 | % | | 71 | % | | 87 | % |
Export | | 75 | % | | 21 | % | | 35 | % | | 29 | % | | 13 | % |
| | | | | | | | | | | | | | | |
Total | | 100 | % | | 100 | % | | 100 | % | | 100 | % | | 100 | % |
| | | | | | | | | | | | | | | |
Our Competition
DAP is a global commodity, and consumers base their purchasing decisions principally on the delivered price of the product. Other competitive factors include product quality and customer service. Our competitors include a number of producers in the United States and throughout the world, including state-owned and government-subsidized entities. Most of our competitors are engaged in non-phosphate lines of business, in addition to their phosphate fertilizer operations. Most of our primary domestic competitors have substantially greater operating and capital resources than we do. In addition, our primary domestic competitors have their own phosphate rock mines, which may allow them to have significantly lower production costs during periods of high phosphate rock prices, and some of our foreign competitors may have access to lower cost or government-subsidized raw materials. Furthermore, some of our government-owned competitors may be willing to accept lower prices and profit on their products in order to support domestic employment or other political or social goals.
Our Employees
As of June 30, 2008, we had 265 employees. Our employees are not covered by any collective bargaining agreements. We believe that our employee relations are good.
67
Our Properties
Corporate Headquarters
Our corporate headquarters are located in Madison, Mississippi, where we lease approximately 7,000 square feet of office space for a term extending through February 2009, subject to a two year renewal option.
Production and Storage Facilities
Our production facilities are strategically located on a deep water channel in Pascagoula, Mississippi, with direct access to the Gulf of Mexico. Our manufacturing facilities consist of two sulfuric acid plants, which are our No. 2 and No. 3 sulfuric acid plants, a phosphoric acid plant and a DAP granulation plant. Our DAP granulation plant has a maximum annual DAP production capacity of approximately 870,000 tons. Our existing sulfuric acid plants currently produce sulfuric acid sufficient for annual DAP production of approximately 750,000 tons. When it is economical to do so, we can purchase additional quantities of sulfuric acid on the open market, allowing us to manufacture DAP at our full capacity. However, due to current high sulfuric acid prices, we do not expect to purchase supplemental sulfuric acid to increase our DAP production in 2008.
In July 2007, we completed the construction of a levee around our Pascagoula plant to protect it from hurricane-related storm surge. The vast majority of the damage inflicted by Hurricane Katrina was caused by wind-driven water. The completed levee is three feet higher than the storm surge that Hurricane Katrina produced in the Pascagoula area. The total project cost was approximately $3.5 million. As a result of this improvement, we realized a property insurance premium reduction of approximately $1.0 million in 2007 and a decrease in the named windstorm deductible from $15.0 million to $9.5 million in 2007. We expect further insurance cost benefits from this project at future renewals.
Terminal Facilities
Since 2005, we have provided ammonia terminaling services to Transammonia at our Pascagoula plant. During June 2007, we completed an expansion of our ammonia terminal, which increased ammonia load out capacity from four to ten railcars per day. The expansion has enabled Transammonia, the exclusive user of our terminal, to secure new business of 50,000 to 60,000 tons of ammonia per year from a specific customer. Our Pascagoula plant has ample space to construct additional terminal facilities to handle more products and to provide terminaling services to additional third parties. We have commenced projects to add terminaling capabilities for sulfuric acid and liquid nitrogen fertilizer, which we expect to complete in 2009. Other projects to expand our terminaling business are under evaluation.
Gypsum Disposal Facility
The EPA requires us to store our gypsum, a by-product of DAP production with little commercial use or market, on the grounds of our production facility in Pascagoula. We have two “stacks,” or gypsum disposal facilities to store our gypsum. The older stack is no longer in use and is closed, although we remain obligated to maintain it in accordance with applicable environmental regulations. The MDEQ regulates the newer, active gypsum stack, which has a fully-permitted remaining capacity to support our operations for approximately 18 additional years assuming we produce at our maximum annual DAP production capacity of approximately 870,000 tons. We generate approximately 2.4 tons of gypsum per ton of DAP produced. We are currently depositing gypsum into Phase I of our active stack and expect to open Phase II in approximately three to four years at a cost of approximately $3.0 to $4.0 million. The fully-permitted status and long life of our active stack provides stability to our DAP operations on a going-forward basis. We believe that this stability provides us with a significant advantage over other companies whose gypsum disposal facilities have remaining lives that are significantly less than the remaining life of our active stack. Developing new gypsum disposal facilities has become increasingly difficult due to the extensive capital investment required and the costly regulatory permitting process.
68
Legal Proceedings
Mississippi Phosphates Corporation v. Furnace and Tube Service, Inc. and Analytic Stress Relieving, Inc.
In July 2007, the waste heat boiler in our No. 2 sulfuric acid plant suffered a major failure, which required extensive repairs. Furnace and Tube Services, Inc., of Gonzales, Louisiana, or F&T, the repair contractor, was to complete the repair work on or before August 2, 2007. However, F&T’s failure to repair the waste heat boiler extended the shutdown until October 4, 2007, when the sulfuric acid plant was placed back in service. The sulfuric acid plant was shut down for five days in November 2007 to repair leaks in the waste heat boiler. The waste heat boiler failed again on January 17, 2008. At that time, we determined that F&T could not successfully repair the boiler. As a result, we engaged a new contractor to replace the internals of the waste heat boiler. On October 12, 2007, we filed suit against F&T in the United States District Court for the Southern District of Mississippi. Subsequently, we amended our complaint to add Analytic Stress Relieving, Inc., or ASR, to the lawsuit. Our amended complaint principally alleges that the negligence and breach of contract of F&T and ASR, its subcontractor, directly caused lost production in the sulfuric acid plant and caused us to incur substantial damages, which are estimated to be $20.0 to $25.0 million. F&T has counterclaimed against us for moneys allegedly owed by us of approximately $0.9 million for work performed on the waste heat boiler. We intend to vigorously pursue the recovery of all damages caused by F&T and ASR.
Phosphate Industries Investigation
In 2003, the EPA announced a nationwide review of all mineral processing facilities. As a result, the EPA selected the mineral processing industry as a National Enforcement and Compliance Priority for fiscal years 2005 and 2006. One focus of this initiative was to examine the scope of applicability of the Bevill Amendment to Subtitle C of the Resource Conservation Recovery Act, or RCRA, which exempts waste generated during phosphate mining beneficiation and processing activities from regulation as a hazardous substance under RCRA. As a part of the EPA initiative, between 2005 and 2007, the EPA inspected all phosphate producers in the United States. In January and March 2005, the EPA conducted site visits of our Pascagoula plant. In September 2005, the EPA issued a Notice of Violation, or NOV, to us alleging that the reuse of low pH process water as DAP scrubber water and other uses within our facility is not protected by the Bevill Amendment and therefore violates RCRA. We believe that we have meritorious defenses against the allegations in the NOV, including prior written guidance and interpretations from the EPA inconsistent with its assertions in the NOV. The EPA has issued similar NOVs to other U.S. phosphate producers.
We intend to cooperate with the EPA and to work toward a negotiated resolution of this matter. If we do not achieve a resolution, we intend to aggressively defend the issues raised in the NOV. We have entered into a joint defense agreement with certain other phosphate producers with respect to this EPA initiative. We are presently unable to predict the future costs or impact of this EPA initiative.
On June 8, 2007, we entered into a 3013 Consent Order with the EPA, which requires us to prepare a plan for groundwater and surface water sampling around our Pascagoula plant. The 3013 Consent Order is part of the phosphate industry investigation, pursuant to which the EPA is requiring all the phosphate producing facilities to conduct groundwater and surface water sampling. We already have been conducting a majority of the sampling requested by the EPA under the 3013 Consent Order pursuant to our current MDEQ permits, and we intend to conduct the additional sampling required by the 3013 Consent Order once our sampling plan is approved. To date, none of the current groundwater and surface sampling has indicated that there has been any offsite impact from our operations. We will continue to place the highest priority on our environmental responsibilities, but we cannot predict whether additional sampling will produce a similar result.
69
Environmental Settlements
On January 31, 2008, we entered into a comprehensive settlement agreement with the MDEQ. The settlement resolved all of our outstanding alleged water permit violations except for potential issues associated with an on-going phosphate industry-wide investigation, as described in “—Legal Proceedings—Phosphate Industries Investigation.”
The settlement resolved numerous alleged violations under the Clean Water Act and our facility’s NPDES (water discharge) permit. As a by-product of phosphoric acid production, our Pascagoula plant produces gypsum. We store gypsum and untreated process water at our facility in stacks surrounded by a dike system. The vast majority of our alleged violations occurred during 2002 through 2004 and were due to the emergency discharge of partially treated water. During this period, we were forced to discharge water when heavy rainfall events created an emergency situation and threatened the release of significant volumes of untreated water.
To resolve these issues, we agreed to a payment of $0.95 million. Of this $0.95 million, we paid $0.55 million directly to the MDEQ and the remaining $0.4 million to Jackson County, Mississippi, to fund sewage connections for lower income dwellings.
This settlement also resolved all state law claims arising out of the April 14, 2005 release of untreated wastewater from our Pascagoula plant. Due to unusually heavy rainfalls in late March and early April 2005, a small portion of the dike system was severely weakened and collapsed on April 14, 2005. This breach resulted in the uncontrolled release of low pH untreated process water which flowed into, and adversely affected, aquatic life and vegetation in Bangs Lake and Bayou Casote, water bodies contiguous to our plant site.
Under the settlement agreement, we agreed to the payment of $1.0 million to the Mississippi Department of Marine Resources, or DMR, in connection with the restoration of impacted areas. We are also obligated to provide additional protection against any potential future release of untreated water from the gypsum disposal facility. The cost of these additional measures is currently estimated to be less than $1.0 million. We have recovered the $1.0 million payment to the DMR and certain other costs associated with this matter from our environmental liability insurance carrier, and we may recover additional costs we may incur to implement this settlement subject to a policy limit of $2.0 million.
We believe that our settlement with the MDEQ was concluded on terms favorable to us and that we will benefit materially from the elimination of the costs and risks relating to these matters.
Notice of Potential Violation
On May 8, 2008, the EPA issued a Notice of Potential Violation, or NOPV, to us, alleging potential violations under the National Emission Standards for Hazardous Air Pollutants for Phosphoric Acid Manufacturing Plants and National Emission Standards for Hazardous Air Pollutants for Phosphate Fertilizer Production Plants.
According to the EPA’s compliance guidelines for related field activities, a NOPV does not constitute a compliance order, a penalty assessment or any other administrative or judicial enforcement action. Although the EPA routinely monitors the compliance of regulated entities and issues NOVs for documented violations of applicable environmental regulations, the NOPV that we received merely alleges potential violations of regulations that may ultimately be deemed inapplicable to us and, possibly, the entire phosphate industry.
70
The EPA based our NOPV on the premise that we are a “major source,” claiming that our emission or potential emission of a single hazardous air pollutant, hydrogen fluoride, exceeds ten tons per year. The EPA concedes that it has relied exclusively on its own calculations to support its contention that all known phosphate fertilizer and phosphoric acid plants are major sources of hydrogen fluoride. Our records indicate a maximum potential emission of 9.7 tons of hydrogen fluoride per year and actual emissions that have never exceeded more than three tons per year. We intend to cooperate with the EPA and to work toward a negotiated resolution of this matter. If no resolution is achieved, we intend to aggressively defend the issues raised in the NOPV. We are presently unable to predict the future costs or impact of this EPA initiative.
Environmental Matters
We are subject to numerous environmental, health and safety laws and regulations. These laws include the Clean Air Act, Clean Water Act, CERCLA, and various other federal, state, and local laws and regulations. Violations can result in substantial penalties, court orders to install pollution-control equipment, civil and criminal sanctions, permit revocations and facility shutdowns. In addition, environmental, health and safety laws and regulations may impose joint and several liability, without regard to fault, and for cleanup costs on potentially responsible parties who have released, disposed of or arranged for release or disposal of hazardous substances in the environment.
We hold numerous environmental, solid waste and other permits or approvals authorizing operations at our facility. Our operations are subject to permits for, among other things, solid waste disposal, wastewater, air and maintenance dredging. A decision by a government agency to deny or delay issuing a new or renewed permit or approval, or to revoke or substantially modify an existing permit or approval, could limit our ability to continue operations at our facility or increase our capital and operating costs. The renewal of our wastewater discharge permit is expected to require modifications to our discharge system that are estimated to cost approximately $0.5 million if approved by regulatory authorities. Any expansion of our operations is also predicated upon securing the necessary environmental or other permits or approvals.
We are fully-permitted by the MDEQ to operate our gypsum disposal facility. This MDEQ permit is conditioned on the requirement that we provide financial assurance for payment of the closure and post-closure care of the active stack, estimated to cost approximately $37.6 million in future, undiscounted dollars. We are fulfilling this obligation through a sinking fund arrangement whereby we make quarterly contributions of $0.2 million into an interest-bearing trust fund for closure and post-closure related costs to be incurred when the capacity of the active stack is depleted. At June 30, 2008, the fair value of the trust assets available to fund this obligation was $3.5 million. We must periodically review the adequacy of this fund and report any adjustments to the quarterly contributions (positive or negative) through an annual reporting requirement of the MDEQ permit. Although our older stack is no longer in use and is closed, we remain obligated to maintain it in accordance with applicable environmental regulations.
Insurance
We maintain insurance policies covering general liability, property and business interruption, workers’ compensation, pollution legal liability, maritime liability, marine cargo loss, foreign casualty, automobile liability, directors and officers’ liability and various ancillary and customary policies.
On August 29, 2005, Hurricane Katrina made landfall and severely damaged certain of our assets and disrupted our operations. Effective as of March 30, 2007, we agreed to a $55.2 million global settlement with our insurance carrier. Prior to the settlement, the insurer had already made partial
71
payments of $40.9 million. We included the final Katrina-related recoveries of $14.3 million in our consolidated statement of cash flows for the six months ended June 30, 2007 and recorded a gain on insurance recoveries of $37.8 million in our consolidated statement of operations for the six months ended June 30, 2007.
We currently have a pending insurance claim related to the failure of the dike surrounding one of our gypsum stacks in April 2005. See “—Legal Proceedings—Environmental Settlements.” We have made a claim with our pollution legal liability insurance carrier and have been reimbursed approximately $1.4 million against our $2.0 million limit.
We also have made an insurance claim against our insurance carrier for the failure of the waste heat boiler in our No. 2 sulfuric acid plant in the summer of 2007 as described under “Management’s Discussion and Analysis of Financial Position and Results of Operations—Results of Operations—Equipment Failures.” On October 12, 2007, we filed a lawsuit in the U.S. District Court for the Southern District of Mississippi against the initial repair contractor involved in the repair of the waste heat boiler.
All of our existing insurance policies have been renewed for 2008, and we added a $50.0 million catastrophic excess policy. The catastrophic excess policy resulted in a named windstorm coverage limit of $100.0 million per event, and the named windstorm deductible structure was also favorably changed, which resulted in a substantial reduction to the waiting period (deductible) for our business interruption coverage. Underwriters for these policies remained the same, except for our pollution legal liability policy, which was moved to a new underwriter that offered us more favorable terms. Premiums decreased for our casualty insurance lines, remained relatively unchanged for our property policy and increased for our other policies.
72
MANAGEMENT
Directors and Executive Officers
The table below shows information about our directors and executive officers as of October 10, 2008:
| | | | |
Name | | Age | | Position |
Robert E. Jones | | 61 | | Chief Executive Officer; Director |
C.E. “Ed” McCraw | | 60 | | Chief Operating Officer and Secretary |
Timothy R. Cantrell | | 51 | | Chief Financial Officer and Treasurer |
Stephen F. Wehmann | | 55 | | Vice President of Sales and Marketing (MPC only) |
James G. Perkins | | 58 | | Vice President and General Manager (MPC only) |
Coleman L. Bailey | | 57 | | Director |
Ronald M. Bringewatt | | 45 | | Director |
Rex M. Deloach | | 71 | | Director |
Deborah H. Midanek | | 53 | | Director |
Greg J. Seketa | | 44 | | Director |
Robert E. Joneshas served as President of PHI from 2004 to April 2008, as a director of PHI since April 2005 and Chief Executive Officer of PHI since April 2008. Mr. Jones has served as Chief Executive Officer of MPC since 2004 and a director since 2004. Prior to these roles, Mr. Jones served as Senior Vice President of Corporate Development of MCC from 1997 until 2004 and was an officer of MCC when MCC filed for reorganization under Chapter 11 of the Bankruptcy Code in May 2003. Mr. Jones has 34 years of experience in the chemical and fertilizer industry. Mr. Jones holds a B.A. and a J.D. from the University of Mississippi.
C.E. “Ed” McCrawhas served as Secretary of PHI since 2004 and Chief Operating Officer of PHI since April 2008. Mr. McCraw has served as Chief Operating Officer and Secretary of MPC since 2004. Prior to these roles, Mr. McCraw served as Senior Vice President of Operations of MCC from 1994 until 2004 and was an officer of MCC when MCC filed for reorganization under Chapter 11 of the Bankruptcy Code in May 2003. Mr. McCraw holds a B.S. in engineering from Mississippi State University.
Timothy R. Cantrellhas served as Chief Financial Officer and Treasurer of PHI and MPC since May 2008. Prior to joining PHI and MPC, Mr. Cantrell served as Chief Financial Officer for Mr. Richard F. Scruggs, an individual, and provided financial and management oversight to Mr. Scruggs’ various financial interests from May 2005 through May 2008. Prior to serving as Chief Financial Officer for Mr. Scruggs, Mr. Cantrell practiced in public accounting as an audit partner with KPMG LLP from May 2002 through May 2005. Prior to KPMG, Mr. Cantrell was an audit partner at Arthur Andersen from 1990 to 2002. Mr. Cantrell holds a B.S. in accounting from the University of Mississippi and is a Certified Public Accountant.
Stephen F. Wehmannhas served as Vice President of Sales and Marketing of MPC since 2004. Prior to serving in this role, Mr. Wehmann served in various engineering, procurement and management roles at MCC from 1981 to 2004, including as Director of Corporate Procurement and Director of Corporate Engineering. Mr. Wehmann holds a B.S. in civil engineering from Purdue University and an M.B.A. from Mississippi College.
James G. Perkinshas served as Vice President and General Manager of MPC since May 2002. Prior to serving in this role, Mr. Perkins served in various management and technical positions at MPC and MCC from 1975 to 2002, including Project Manager, Chief Process Engineer, Director of Planning
73
and Development and General Manager. Mr. Perkins was an officer of MPC when MCC filed for reorganization under Chapter 11 of the Bankruptcy Code in May 2003. Mr. Perkins was in the leadership position of General Manager at MPC during the restoration, repair and restart activities subsequent to Hurricane Georges, and again as Vice President and General Manager subsequent to Hurricane Katrina. Mr. Perkins holds a B.S. in chemical engineering from the University of Mississippi and an M.B.A. from Mississippi College. Additionally, Mr. Perkins is a licensed Professional Engineer in the states of Mississippi and Alabama.
Coleman L. Baileyhas served as a director of PHI since 2004 and currently serves as the chairman of the PHI board of directors. Mr. Bailey is currently, and prior to joining our board of directors has been, engaged in farming activities. Mr. Bailey served as chairman of the board of directors of MCC when MCC filed for reorganization under Chapter 11 of the Bankruptcy Code in May of 2003. Mr. Bailey is also a member of the board of directors of Terra Nitrogen Company, L.P., a partnership that produces and distributes fertilizer products. Mr. Bailey holds a B.S. in agriculture from Mississippi State University.
Ronald M. Bringewatthas served as a director of PHI since 2008. Mr. Bringewatt has served as a Portfolio Manager and Partner in Armory Advisors, LLC, an investment advisory firm, since July 2006. Prior to joining Armory Advisors, Mr. Bringewatt served as a Managing Director for The Seaport Group LLC, a brokerage firm, from September 2003 until June 2006. Prior to joining Seaport, Mr. Bringewatt was a Managing Director for Times Square Capital Management LLC, an equity investment management firm, from October 2001 until June 2003. Mr. Bringewatt holds a B.B.A in finance from the University of Missouri, Kansas City. Mr. Bringewatt is also a Chartered Financial Analyst.
Rex M. Deloachhas served as a director of PHI since 2007. Since 2002, Mr. Deloach has served as President and Chief Executive Officer of Financial Insights, Inc., a financial consulting firm. Mr. Deloach has also served as Vice President of Oxford Land & Timber Company, which invests in land and timber, since 1994. From 1980 to 1997, Mr. Deloach was a partner with the accounting firm Arthur Andersen LLP. Mr. Deloach is a member of the Board of Trustees of three affiliated registered mutual funds: Longleaf Partners Fund, Longleaf International Fund and Longleaf Small Cap Fund, all managed by Southeastern Asset Management, Inc., Memphis, Tennessee. Mr. Deloach holds a B.B.A. in accounting from the University of Memphis.
Deborah H. Midanek has served as a director of PHI since 2004. Ms. Midanek served as Chief Restructuring Advisor of MCC from 2003 through 2004 during its bankruptcy reorganization. From 2004 until present, Ms. Midanek has served as President of Solon Group, Inc., a firm that focuses on turnarounds, restructurings and financings of distressed and early stage companies. Ms. Midanek served as a director, President and Chief Operating Officer of Glass & Associates, Inc., an international management consulting and financial advisory firm, from 2000 until late 2004, and as non executive Chairman of American Homestar, Inc., a factory built housing company with operations in manufacturing and sales, from 2001 to 2004. Prior to 2000, Ms. Midanek served as president, chief executive officer, chairman and/or director of a number of companies. Ms. Midanek holds an A.B. from Bryn Mawr College and an M.B.A. from the Wharton School of the University of Pennsylvania.
Greg J. Seketahas served as a director of PHI since 2004. Mr. Seketa served as chairman of the Official Unsecured Creditors Committee during the bankruptcy reorganization of MCC. Since 2001 until present, Mr. Seketa has served as Vice President of 40|86 Advisers, Inc., a fixed income investment advisory firm with $25.0 billion under management. Mr. Seketa holds a B.A. in political science and American history from DePauw University and a J.D. from Indiana University School of Law.
Our board of directors consists of six members, five of whom our board of directors has determined are independent as that term is defined under rules. Our independent directors
74
are Mr. Bailey, Mr. Bringewatt, Mr. Deloach, Ms. Midanek and Mr. Seketa. No family relationship exists between any director or executive officer, with the exception of Mr. Bailey and Ms. Midanek, who are married.
Board Committees
Our board of directors has a standing audit committee, compensation committee, corporate governance committee and enterprise risk management committee.
Audit Committee. We have an audit committee, which is composed of independent directors, Mr. Bailey, Mr. Bringewatt, Mr. Deloach, Ms. Midanek and Mr. Seketa. Our board of directors has determined that Mr. Deloach is an audit committee financial expert as that term is defined in pertinent SEC rules and Listing Standards. Mr. Deloach also serves as chairman of our audit committee. Our audit committee:
| | Ÿ | | maintains the reliability and integrity of our accounting policies, financial reporting practices and financial statements; |
| | Ÿ | | ensures our independent registered public accounting firm’s qualifications and independence; |
| | Ÿ | | selects our independent registered public accounting firm; and |
| | Ÿ | | ensures our compliance with laws and regulations and the requirements of any stock exchange or quotation system on which our securities may be listed. |
Compensation Committee. Our compensation committee is composed of independent directors, Mr. Bailey, Mr. Bringewatt, Mr. Deloach, Ms. Midanek and Mr. Seketa. Mr. Seketa serves as chairman of our compensation committee. Our compensation committee:
| | Ÿ | | establishes our general compensation philosophy and oversees the development and implementation of the executive compensation programs; |
| | Ÿ | | reviews and approves the compensation of our officers above the level of Vice President; |
| | Ÿ | | evaluates the performance of our Chief Executive Officer and sets the compensation for our Chief Executive Officer based on his or her performance and our objectives; |
| | Ÿ | | reviews and recommends to our board of directors the compensation that should be paid to our directors; |
| | Ÿ | | reviews and administers our incentive and performance-based compensation plans, equity-based plans, retirement plans, deferred compensation plans and welfare benefit plans; and |
| | Ÿ | | reviews our policies with respect to post-service arrangements and perquisites provided to our officers. |
Corporate Governance Committee. Our corporate governance committee is composed of independent directors Mr. Bailey, Mr. Bringewatt, Mr. Deloach, Ms. Midanek and Mr. Seketa. Ms. Midanek serves as chairman of our corporate governance committee. Our corporate governance committee:
| | Ÿ | | identifies individuals qualified to become members of our board of directors; |
| | Ÿ | | recommends to our board of directors any director nominees; |
| | Ÿ | | ensures that our audit committee, our compensation committee and our corporate governance committee are each comprised of qualified and experienced independent directors; and |
| | Ÿ | | develops and recommends corporate governance policies and procedures applicable to us. |
75
Enterprise Risk Management Committee. On April 29, 2008, our board of directors established an enterprise risk management committee. All members of our board of directors are members of our enterprise risk management committee. Our enterprise risk management committee assists our board of directors by providing oversight to management relating to the identification and evaluation of major strategic, operational, regulatory, informational and external risks inherent in our business and the control processes with respect to these risks. Mr. Bringewatt serves as chairman of our enterprise risk management committee.
We do not have a written policy that requires members of our board of directors to attend our annual meeting of stockholders, but they are encouraged to do so. All of our directors were in attendance at our 2008 annual meeting of stockholders.
Executive Compensation
The following discussion and analysis of the compensation arrangements of our named executive officers should be read together with the tables and related disclosures set forth below. The following discussion contains forward-looking statements that are based on our current plans, considerations, expectations and determinations regarding future executive compensation programs. Actual compensation programs that we adopt may differ materially from the programs described below.
Compensation Discussion and Analysis
Overview. The primary responsibility of our compensation committee is to aid our board of directors in discharging its duties by recommending to the full board of directors the compensation of our Chief Executive Officer and other executive and senior officers, including the officers identified in the Summary Compensation Table and other tables on the following pages of this prospectus, as well as the compensation paid to members of our board of directors. Our compensation committee’s goal is to maintain executive compensation that is fair, reasonable and consistent both with our size and the compensation practices of the chemical industry in general. The objective is to attract, develop and retain high caliber executive officers who are capable of optimizing our performance for the benefit of our stockholders.
Our compensation committee relies upon the advice of our retained compensation consultants in determining the executive officers’ compensation. Additionally, management provides information and analysis, including compensation surveys and comparisons to comparable companies, to our compensation committee that our compensation committee uses in determining our executive officers’ compensation.
Our compensation committee’s considerations consist of, but are not limited to, analysis of our financial performance, including return on assets, return on equity, and management of assets, liabilities, capital and risk. In determining total compensation, our compensation committee also considers performance of the individual executive officer in areas such as: the scope of responsibility of the executive officer; leadership within PHI, the community, and the industry; achievement of work goals; and whether we, under the executive officer’s leadership, have been a good corporate citizen while enhancing stockholder value. All of these factors are considered in the context of the complexity and the difficulty of managing business risks in the prevailing economic conditions and regulatory environment. The analysis is conducted with respect to each of our executive officers, including our Chief Executive Officer.
With respect to director compensation, our compensation committee’s considerations include, but are not limited to, a comparison of compensation paid to directors of similar organizations, as well as the business risks and substantial time commitments of the members of our board of directors. Our compensation committee also uses third-party compensation surveys in determining comparable director compensation.
76
Salaries and Bonuses
Mr. Jones and Mr. McCraw’s salaries and bonuses for 2007 were each set per the terms of employment agreements that each executed with us in December 2004 concurrent with our formation. Under these agreements, Mr. Jones and Mr. McCraw were each eligible to receive a bonus based on our financial performance. This bonus was based upon an objective calculation using a formula measuring cash flow set forth in their respective written employment agreements. The employment agreements between us and Mr. Jones and Mr. McCraw both expired on December 31, 2007.
Mr. Wehmann’s and Mr. Perkins’s salaries and bonuses for 2007 were determined based upon our performance during 2006 and the individual performance of each officer. Individual performance was measured using criteria such as level of job responsibility, achievement of work goals and management skills.
Effective January 1, 2008, Messrs. Jones, McCraw, Wehmann and Perkins each executed a new employment agreement with us. Under the terms of the new employment agreements, Mr. Jones and Mr. McCraw will each receive a salary of $325,000. Mr. Wehmann will receive a salary of $225,000, and Mr. Perkins will receive a salary of $190,000, and in addition, each of the named executive officers will be eligible to receive cash bonuses paid out of a management bonus pool and/or a performance bonus pool. Pursuant to our bonus plan, management bonus payments are based upon our return on stockholders’ equity. Specifically, these bonuses will be paid out of a management bonus pool covering all current senior management and consisting generally of 10% of the excess, if any, of our net income over an amount equal to 10% of our stockholders’ equity at the beginning of the applicable fiscal year. Mr. Jones will recommend to our board of directors annually the allocation of the management bonus pool among senior management.
Pursuant to the new employment agreement, Mr. Jones will also be eligible to receive an annual performance bonus that will be payable upon us meeting certain annual, typically non-financial, performance objectives. Our board of directors will annually determine the amount of any performance bonus, and such amount will be paid into a performance bonus pool. Mr. Jones will have the sole discretion to allocate any of the performance bonus pool among our senior management.
For our other named executive officers, our compensation committee’s recommendation concerning salaries for 2007 was based upon our performance during 2006 and the individual performance of each officer. Individual performance was measured using criteria such as level of job responsibility, achievement of work goals and management skills.
77
Summary Compensation Table
The following table presents certain summary information concerning compensation paid to or earned by our Chief Executive Officer and each of our three other most highly compensated executive officers, determined as of the year ended December 31, 2007, whose total annual salary and bonus exceeded $100,000 during such year. Together, they are referred to in this prospectus as the named executive officers. Timothy R. Cantrell became our Chief Financial Officer in May 2008 and was therefore not a named executive officer as of the year ended December 31, 2007.
| | | | | | | | | | | | | | | | | | | |
Name and Principal Position | | Year | | Salary
($) | | Bonus
($) | | | Stock
Awards
($) | | Option
Awards
($) | | Non-Equity
Incentive
Plan
Compen-
sation | | Change in
Pension
Value and
Nonqualified
Deferred
Compen-
sation
Earnings | | All Other
Compen-
sation
($) | | Total
($) |
Robert E. Jones, Chief Executive Officer | | 2007 | | 312,500 | | 3,366,371 | (1) | | — | | — | | — | | — | | — | | 3,678,871 |
| | | | | | | | | |
C.E. “Ed” McCraw, Chief Operating Officer and Secretary | | 2007 | | 312,500 | | 3,366,371 | (1) | | — | | — | | — | | — | | — | | 3,678,871 |
| | | | | | | | | |
Stephen F. Wehmann, Vice President of Sales and Marketing | | 2007 | | 175,000 | | 105,000 | | | — | | — | | — | | — | | — | | 280,000 |
| | | | | | | | | |
James G. Perkins, Vice President and General Manager | | 2007 | | 175,000 | | 105,000 | | | — | | — | | — | | — | | — | | 280,000 |
| (1) | Mr. Jones’s and Mr. McCraw’s employment agreements were entered into in December 2004 in connection with our formation and provided that each individual would be eligible to receive an annual bonus in 2007 based upon our financial performance. We determined the actual amounts of the 2007 bonuses in accordance with a formula tied to cash flow described in the employment agreements. These employment agreements expired on December 31, 2007. Mr. Jones and Mr. McCraw entered into new employment agreements effective January 1, 2008 that discontinue the prior bonus system and instead provide for management bonuses based upon our return on stockholders’ equity. Mr. Jones’s employment agreement additionally provides for a potential performance bonus based upon an achievement of certain annual non-financial performance objectives. |
Outstanding Equity Awards at December 31, 2007
The following table sets forth information with respect to all stock options and unvested restricted stock awards that the named executive officers held at December 31, 2007.
| | | | | | | | | | | | | | | | | | |
| | | Option Awards | | Stock Awards |
Name | | Number of
Securities
Underlying
Unexercised
Options—
Exercisable
(#) | | | Number of
Securities
Underlying
Unexercised
Options—
Unexercisable
(#) | | Option
Exercise
Price ($) | | Option
Expiration
Date | | Number of
Shares or
Units of
Stock
That
Have Not
Vested (#) | | Market
Value of
Shares or
Units of
Stock
That
Have Not
Vested
($) | | Equity
Incentive
Plan
Awards:
Number of
Unearned
Shares,
Units or
Other
Rights
That
Have Not
Vested (#) | | Equity
Incentive
Plan
Awards:
Market or
Payout
Value of
Unearned
Shares,
Units or
Other
Rights
That
Have Not
Vested
($) |
Robert E. Jones | | 378,509 | (1) | | — | | $ | 2.36 | | 12/21/09 | | — | | — | | — | | — |
C.E. “Ed” McCraw | | 378,509 | (2) | | — | | $ | 2.36 | | 12/21/09 | | — | | — | | — | | — |
Stephen F. Wehmann | | — | | | — | | | — | | — | | — | | — | | — | | — |
James G. Perkins | | — | | | — | | | — | | — | | — | | — | | — | | — |
| (1) | Vested in 2007 pursuant to an employment agreement entered into in December 2004 concurrent with the formation of PHI. |
| (2) | Vested in 2007 pursuant to an employment agreement entered into in December 2004 concurrent with the formation of PHI. |
78
Option Exercises and Stock Vested
None of our executive officers exercised any options in 2007.
Payments upon Termination
Messrs. Jones & McCraw. Effective January 1, 2008, Mr. Jones and Mr. McCraw each entered into an employment agreement with us that is set to expire on December 31, 2008, but each agreement automatically renews for one-year periods unless either party provides the other party written notice of non-renewal at least 60 days prior to the expiration of the term. Pursuant to their employment agreements with us, Mr. Jones and Mr. McCraw would each receive a severance package upon certain termination from employment events. Termination from employment events that would trigger severance payments include:
| | Ÿ | | termination of employment by us for any reason other than cause; |
| | Ÿ | | termination of employment as a result of the executive’s disability; or |
| | Ÿ | | termination of employment by the executive for “good reason.” |
This severance package would include a lump sum payment consisting of:
| | Ÿ | | base compensation owed for the remaining portion of the terminated executive’s employment term in which the termination occurs; plus |
| | Ÿ | | the terminated executive’s proportionate share of any awarded but unpaid management bonus and/or performance bonus for the prior calendar year; plus |
| | Ÿ | | an annualized management bonus for the year of termination. |
The lump sum must be paid by the fifteenth day of the third calendar month following the date of termination. The terminated executive would also receive general employee benefits through the end of his employment term, plus an additional 12 months of general employee benefits.
Termination by an executive for “good reason” includes:
| | Ÿ | | a material change in his responsibilities and duties by our board of directors; |
| | Ÿ | | our failure to pay him a material portion of his base compensation or any other compensation owed; |
| | Ÿ | | our material breach of any material term of his employment agreement; |
| | Ÿ | | a material reduction of base compensation or employee benefits that is not part of a general, board of directors approved, reduction applicable to all key employees or exceeds 25% of his base compensation; or |
| | Ÿ | | the change of his principal place of employment to a location more than 50 miles from Jackson, Mississippi. |
Under the terms of these employment agreements, Mr. Jones and Mr. McCraw each agree that during the term of his employment and for a period of one year after termination for any reason, he will not directly or indirectly compete with us. Additionally, Mr. Jones and Mr. McCraw each agree that during the term of his employment and for a period of two years after termination for any reason, he will not improperly use or disclose confidential information belonging to us.
79
Mr. Cantrell. On May 5, 2008, Mr. Cantrell entered into an employment agreement with us that is set to expire on May 5, 2010, but the agreement automatically renews for one-year periods unless either party provides the other party written notice of non-renewal at least 60 days prior to the expiration of the term. Pursuant to his employment agreement with us, Mr. Cantrell would receive a severance package upon certain termination from employment events. Termination from employment events that would trigger a severance payment include:
| | Ÿ | | termination of employment by us for any reason other than cause; |
| | Ÿ | | termination of employment as a result of his disability; or |
| | Ÿ | | termination of employment by him for “good reason.” |
This severance package would include a lump sum payment consisting of:
| | Ÿ | | base compensation owed for the remaining portion of Mr. Cantrell’s employment term in which the termination occurs; plus |
| | Ÿ | | awarded but unpaid bonus for the prior calendar year; plus |
| | Ÿ | | unpaid phantom stock and SARs payable pursuant to the terms of his employment agreement. |
The lump sum must be paid no later than 30 days following the date of termination. He would also receive employee benefits through the end of his employment term, plus additional 12 months of general employee benefits.
Termination by Mr. Cantrell for “good reason” includes:
| | Ÿ | | a material change in his responsibilities and duties by our board of directors; |
| | Ÿ | | our failure to pay him a material portion of his base compensation or any other compensation owed; |
| | Ÿ | | our breach of any material term of his employment agreement, which has a material adverse effect on him; |
| | Ÿ | | a material reduction of base compensation or employee benefits that is not part of a general, board of directors approved, reduction applicable to all employees; or |
| | Ÿ | | the change of his principal place of employment to a location more than 50 miles from Jackson, Mississippi. |
Under the terms of his employment agreement, Mr. Cantrell agrees that during the term of his employment and for a period of two years after termination for any reason, he will not improperly use or disclose confidential information belonging to us.
On September 22, 2008, Mr. Cantrell entered into a change in control agreement with us that becomes effective upon the occurrence of a “change in control.” The agreement defines a “change in control” as the occurrence of any of the following:
| | Ÿ | | a sale of assets representing 50% or more of the net book value and of the fair market value of our consolidated assets (in a single transaction or in a series of related transactions); |
| | Ÿ | | in general, a merger or consolidation involving us in which our stockholders immediately prior to the merger or consolidation beneficially own securities representing less than 50% of the combined voting power of the entity surviving the merger or consolidation; |
80
| | Ÿ | | the acquisition by any person, entity or group of beneficial ownership of securities representing more than 30% of the combined voting power of our outstanding securities; |
| | Ÿ | | individuals who are members of our board of directors immediately prior to the change in control cease to constitute at least 50% of our board of directors; or |
| | Ÿ | | any transaction or series of transactions that would have substantially the same effect as the above described change of control events. |
The change in control agreement provides that all of Mr. Cantrell’s unvested options, restricted stock, SARs and other awards shall immediately vest upon a change in control. In addition, the change in control agreement provides that Mr. Cantrell would receive a severance package if, during the 24 month period following a change in control, his employment with us and our subsidiary is terminated by us for any reason other than his death, disability or for cause or by Mr. Cantrell in the event of a “constructive discharge.”
Mr. Cantrell’s severance package under his change in control agreement would include the following:
| | Ÿ | | a lump sum payment, to be paid within five days following the date of termination, consisting of: |
| | Ÿ | | Mr. Cantrell’s accrued but unpaid salary; plus |
| | Ÿ | | an amount equal to 2.99 times Mr. Cantrell’s then annual base salary; |
| | Ÿ | | continued coverage for Mr. Cantrell and his covered dependents under our benefit plans for a period not to exceed 13 months following the date of termination; and |
| | Ÿ | | in certain circumstances, a gross-up payment to reimburse Mr. Cantrell for excise taxes imposed on his severance payments and benefits. |
The change in control agreement provides that the amounts payable to Mr. Cantrell under such agreement shall be reduced by severance payments and benefits provided under Mr. Cantrell’s employment agreement and any other severance, change in control or similar plans or agreements with us.
Termination by Mr. Cantrell for a “constructive discharge” includes:
| | Ÿ | | a material failure by us to comply with the change in control agreement, which is not cured by us within 30 days after notice of such failure; |
| | Ÿ | | our requiring Mr. Cantrell to be based at any office or location more than 50 miles from the location where he was based on the day prior to the change in control; |
| | Ÿ | | a reduction of more than 25% in Mr. Cantrell’s base salary or maximum annual bonus opportunity or his long-term incentive compensation; or |
| | Ÿ | | a more than de minimis reduction in the long term disability and life insurance coverage provided to Mr. Cantrell. |
We are not obligated to pay any amounts or provide any benefits under the change in control agreement until Mr. Cantrell executes a release of all claims against us and our subsidiary relating to his employment and termination.
Messrs. Wehmann & Perkins. On January 1, 2008, Mr. Wehmann and Mr. Perkins each entered into an employment agreement with us that is set to expire on December 31, 2008, but each agreement automatically renews for one-year periods unless either party provides the other party
81
written notice of non-renewal at least 60 days prior to the expiration of the term. Pursuant to their employment agreements with us, Mr. Wehmann and Mr. Perkins would each receive a severance package upon certain termination from employment events. Termination from employment events that would trigger a severance payment include:
| | Ÿ | | termination of employment by us for any reason other than cause; |
| | Ÿ | | termination of employment as a result of his disability; or |
| | Ÿ | | termination of employment by executive for “good reason.” |
This severance package would include a lump sum payment consisting of:
| | Ÿ | | base compensation owed for the remaining portion of the terminated executive’s employment term in which the termination occurs; plus |
| | Ÿ | | the terminated executive’s proportionate share of any awarded but unpaid management bonus for the prior calendar year; plus |
| | Ÿ | | an annualized management bonus for the year of termination. |
The lump sum must be paid to Mr. Wehmann no later than 30 days following the date of termination and to Mr. Perkins no later than the fifteenth day of the third calendar month following the date of termination. Each would also receive employee benefits through the end of his employment term.
Termination by an executive for “good reason” includes:
| | Ÿ | | a material change in his responsibilities and duties by our board of directors; |
| | Ÿ | | our failure to pay Mr. Wehmann his base compensation, or in the case of Mr. Perkins a material portion of his base compensation, or any other compensation owed; |
| | Ÿ | | our breach of any material term of his employment agreement, which has a material adverse effect on him; |
| | Ÿ | | a material reduction of base compensation or employee benefits that is not part of a general, board of directors approved, reduction applicable to all employees; or |
| | Ÿ | | the change of his principal place of employment to a location more than 50 miles from his permanent abode. |
Under the terms of Mr. Wehmann’s and Mr. Perkins’s employment agreements, each of Mr. Wehmann and Mr. Perkins agrees that during the term of his employment and for a period of two years after termination for any reason, he will not improperly use or disclose confidential information belonging to us.
On September 22, 2008, Mr. Wehmann and Mr. Perkins each entered into a change in control agreement with us that becomes effective upon the occurrence of a “change in control.” The agreement defines a “change in control” as the occurrence of any of the following:
| | Ÿ | | a sale of assets representing 50% or more of the net book value and of the fair market value of our consolidated assets (in a single transaction or in a series of related transactions); |
| | Ÿ | | in general, a merger or consolidation involving us in which our stockholders immediately prior to the merger or consolidation beneficially own securities representing less than 50% of the combined voting power of the entity surviving the merger or consolidation; |
82
| | Ÿ | | the acquisition by any person, entity or group of beneficial ownership of securities representing more than 30% of the combined voting power of our outstanding securities; |
| | Ÿ | | individuals who are members of our board of directors immediately prior to the change in control cease to constitute at least 50% of our board of directors; or |
| | Ÿ | | any transaction or series of transactions that would have substantially the same effect as the above described change of control events. |
The change in control agreements provide that all of Mr. Wehmann’s and Mr. Perkins’ unvested options, restricted stock, SARs and other awards shall immediately vest upon a change in control. In addition, the change in control agreements provide that Mr. Wehmann and Mr. Perkins would each receive a severance package if, during the 24 month period following a change in control, his employment with us and our subsidiary is terminated by us for any reason other than his death, disability or for cause or by Mr. Wehmann or Mr. Perkins, as applicable, in the event of a “constructive discharge.”
Mr. Wehmann’s and Mr. Perkins’ severance package under their change in control agreements would include the following:
| | Ÿ | | a lump sum payment, to be paid within five days following the date of termination, consisting of: |
| | Ÿ | | the terminated executive’s accrued but unpaid salary; plus |
| | Ÿ | | an amount equal to 2.99 times Mr. Wehmann’s or 1.99 times Mr. Perkins’, as applicable, then annual base salary; |
| | Ÿ | | continued coverage for the terminated executive and his covered dependents under our benefit plans for a period not to exceed 13 months following the date of termination; and |
| | Ÿ | | in certain circumstances, a gross-up payment to reimburse the terminated executive for excise taxes imposed on his severance payments and benefits. |
The change in control agreements provide that the amounts payable to Mr. Wehmann and Mr. Perkins under such agreements shall be reduced by severance payments and benefits provided under such executive’s employment agreement and any other severance, change in control or similar plans or agreements with us.
Termination by Mr. Wehmann or Mr. Perkins for a “constructive discharge” includes:
| | Ÿ | | a material failure by us to comply with the change in control agreement, which is not cured by us within 30 days after notice of such failure; |
| | Ÿ | | our requiring Mr. Wehmann or Mr. Perkins, as applicable, to be based at any office or location more than 50 miles from the location where he was based on the day prior to the change in control; |
| | Ÿ | | a reduction of more than 25% in Mr. Wehmann’s or Mr. Perkins’, as applicable, base salary or maximum annual bonus opportunity or his long-term incentive compensation; or |
| | Ÿ | | a more than de minimis reduction in the long term disability and life insurance coverage provided to Mr. Wehmann and Mr. Perkins. |
We are not obligated to pay any amounts or provide any benefits under the change in control agreement until Mr. Wehmann or Mr. Perkins, as applicable, executes a release of all claims against us and our subsidiary relating to his employment and termination.
83
Director Compensation
During 2007, Mr. Jones, who is an employee of PHI and MPC, did not receive any compensation for serving on the board of directors of PHI or MPC or on any board committee. Prior to July 2007, all non-employee directors were entitled to receive an annual retainer of $24,000, except for Mr. Bailey who was entitled to receive $32,000 for serving as chair of our board of directors. After July 1, 2007, all non-employee directors were entitled to receive an annual retainer of $48,000, except for Mr. Bailey who was entitled to receive $64,000 for serving as chair of our board of directors.
Additionally, prior to July 1, 2007, with the exception of Mr. Bailey, each non-employee director received $1,000 per board meeting attended in person, $500 per board meeting attended telephonically and $500 per committee meeting attended, unless such committee meeting was held in connection with a meeting of our full board of directors. After July 1, 2007, with the exception of Mr. Bailey, each non-employee director received $2,000 per board meeting attended, either in person or telephonically, and $1,000 per committee meeting attended, unless such committee meeting was held in connection with a full meeting of our board of directors.
The compensation committee, having reviewed comparable programs that employ cash and equity components, recommended that our board of directors implement a change in the amounts and types of director compensation. Pursuant to this recommendation, our board of directors adopted these changes at its meeting on April 29, 2008. Effective April 29, 2008, each non-employee director will receive an annual cash retainer of $50,000, except for Mr. Bailey, who will receive $65,000 for serving as chair of our board of directors; however, neither board members nor the chair will receive additional compensation for attending board meetings, either telephonically or in-person, or for attending committee meetings. On August 7, 2008, our board of directors approved a one-time $20,000 cash payment to Mr. Deloach in recognition of his work as chair of our audit committee. Additionally, pursuant to the 2008 Stock Option and Stock Appreciation Rights for Non-Employee-Directors, or 2008 Directors Plan, adopted by the board of directors at its April 29, 2008 meeting, each non-employee director will be granted SARs. The SARs have the following features:
| | Ÿ | | a grant date value equal to such director’s cash compensation for the ensuing year; |
| | Ÿ | | an exercise price equivalent to the then current trading price of our common stock; and |
| | Ÿ | | a three-year vesting period. |
Upon the filing of a registration statement on Form S-8 or other applicable registration statement covering shares of our common stock reserved under our 2008 Directors Plan, the SARs will automatically be converted into options to purchase shares of our common stock.
84
Director Compensation Table for 2007
The following table sets forth certain information regarding the compensation earned by or awarded to each director, who is not also a named executive officer, who served on our board of directors in 2007. Directors who are our employees are not compensated for their service as directors. See “Executive Compensation—Summary Compensation Table.”
| | | | | | | | | | | | | | | | |
Name | | Fees
Earned
or Paid
in Cash
($) | | Stock
Awards
($) | | Option
Award(s)
($) | | Non-Equity
Incentive Plan
Compensation
($) | | Change in
Pension
Value and
Nonqualified
Deferred
Compensation
Earnings | | All Other
Compensation | | Total ($) |
Coleman L. Bailey | | $ | 48,000 | | — | | — | | — | | — | | — | | $ | 48,000 |
Rex M. Deloach | | $ | 59,500 | | — | | — | | — | | — | | — | | $ | 59,500 |
Deborah H. Midanek | | $ | 59,500 | | — | | — | | — | | — | | — | | $ | 59,500 |
Greg J. Seketa | | $ | 59,500 | | — | | — | | — | | — | | — | | $ | 59,500 |
Compensation Committee Interlocks and Insider Participation
During our last fiscal year, our compensation committee was composed of independent directors Mr. Bailey, Ms. Midanek, Mr. Seketa and Mr. Deloach. Mr. Deloach joined the committee on January 30, 2007. None of our executive officers or former executive officers served on our compensation committee during our last fiscal year. None of our executive officers serves, or in our last fiscal year has served, as a member of the board of directors or compensation committee of any entity that has one or more executive officers serving on our compensation committee. None of our executive officers serves, or in our last fiscal year has served, as a member of the compensation committee of any entity that has one or more executive officers serving on our board of directors.
Approval of Related Party Transactions
Since January 1, 2005, there have been no transactions between us and any related party and there are no currently proposed transactions between us and any related party. We do not currently have any formal written policies or procedures for the review, approval or ratification of any related party transaction. However, during 2008, we intend to adopt a related party transaction policy to be administered by our audit committee. Under the proposed policy, a related party transaction is any transaction between us or a consolidated subsidiary and any related party where the aggregate amount involved will or may be expected to exceed $120,000 and any related party will have a direct or indirect material interest. A related party is:
| | Ÿ | | any executive officer, director or nominee for election as director of PHI or MPC; |
| | Ÿ | | any person who is the beneficial owner of more than 5% of our voting securities; |
| | Ÿ | | an immediate family member of any of the foregoing; or |
| | Ÿ | | any firm, corporation or other entity in which any of the foregoing persons is employed or is a partner or other principal or has a substantial ownership interest or control of such entity. |
Pursuant to our proposed policy, our audit committee must approve or ratify a related party transaction in accordance with the terms of the policy.
85
PRINCIPAL STOCKHOLDERS
As of October 10, 2008, there were 7,654,290 shares of our common stock issued and outstanding. The following table shows, as of that date, the number of shares of our common stock beneficially owned by:
| | Ÿ | | each of our named executive officers; |
| | Ÿ | | all of our directors and executive officers as a group; and |
| | Ÿ | | each person or group of affiliated persons, known by us to beneficially own more than 5% of our outstanding shares of common stock. |
The number of shares beneficially owned by each stockholder is determined under rules promulgated by the SEC and generally includes voting or investment power over the shares. The information does not necessarily indicate beneficial ownership for any other purpose. Under SEC rules, for purposes of the calculations in the table below, the number of shares of common stock deemed outstanding includes shares issuable upon exercise of options held by the respective person or group which may be exercised within 60 days after October 10, 2008. For purposes of calculating each person’s or group’s percentage ownership, shares of common stock issuable pursuant to stock options exercisable within 60 days after October 10, 2008 are included as outstanding and beneficially owned for that person or group, but are not treated as outstanding for the purpose of computing the percentage ownership of any other person or group. Except as otherwise set forth in the footnotes to the table below, and subject to applicable community property laws, to our knowledge, each person has sole voting and investment power over the shares shown as beneficially owned.
| | | | | |
Beneficial Owner(1)(2) | | Amount and Nature
of Beneficial Ownership
of Common Stock | | | Percent of
Outstanding Shares
of Common Stock |
Robert E. Jones | | 379,484 | (3) | | 4.72% |
C.E. “Ed” McCraw | | 379,484 | (3) | | 4.72% |
Timothy R. Cantrell | | — | | | * |
Stephen F. Wehmann | | — | | | * |
James G. Perkins | | — | | | * |
Coleman L. Bailey | | — | (4) | | * |
Ronald M. Bringewatt | | 234,120 | (5) | | 3.06% |
Rex M. Deloach | | 2,000 | | | * |
Deborah H. Midanek | | 1,000 | (6) | | * |
Greg J. Seketa | | 650 | (7) | | * |
All directors and executive officers as a group (10 persons) | | 996,738 | | | 11.85% |
| (1) | Unless otherwise specified, the address of each named beneficial owner is c/o Phosphate Holdings, Inc., 100 Webster Circle, Suite 4, Madison, Mississippi 29110. |
| (2) | We are not a reporting company under the Exchange Act, and holders of our common stock are not required to file reports with the SEC disclosing their beneficial ownership of our common stock. Based on information available to us, we do not have knowledge of any record owner of more than 5% of our outstanding common stock under SEC rules. |
| (3) | Includes 975 shares of our common stock and currently exercisable stock options to purchase 378,509 shares of common stock. |
| (4) | Excludes 1,000 shares of our common stock beneficially owned by Mr. Bailey’s spouse, Deborah H. Midanek, of which he disclaims beneficial ownership. |
| (5) | Consists of shares of our common stock held in two accounts that are managed by Armory Advisors, LLC, an investment advisory firm. Armory Advisors, LLC possesses voting and investment power over the shares that are owned by the two accounts and may be deemed to be the beneficial owner of the |
86
| | shares held in the accounts. Mr. Bringewatt is a member of Armory Advisors, LLC and as such has shared voting and investment power over the shares. Mr. Bringewatt disclaims beneficial ownership of such shares except to the extent of his pecuniary interest therein. |
| (6) | Consists of 1,000 shares of our common stock held in a revocable trust over which Ms. Midanek, as trustee, has sole voting and investment power. |
| (7) | Includes 405 shares of our common stock over which Mr. Seketa has sole voting and investment power and 245 shares of our common stock held by Mr. Seketa’s spouse over which he has shared voting and investment power. |
87
DESCRIPTION OF CAPITAL STOCK
The following description of material terms of our capital stock and certain provisions of our certificate of incorporation and bylaws, each of which will be in effect on the completion of this offering, are summaries and are qualified by reference to our certificate of incorporation and bylaws, copies of which have been filed as exhibits to the registration statement, of which this prospectus forms a part.
Common Stock
We are authorized to issue up to 30,000,000 shares of common stock, $0.01 par value per share. On October 10, 2008, there were 7,654,290 issued and outstanding shares of our common stock held of record by 171 persons, as determined from our transfer agent’s stockholder list. Such list does not include beneficial owners of securities whose shares are held in “street” name by a brokerage firm or other institution. Each holder of our common stock is entitled to one vote for each share held on all matters submitted to a vote of the stockholders. The holders of our common stock do not have cumulative voting rights in the election of directors. Accordingly, the holders of a majority of the outstanding shares of our common stock entitled to vote in any election of directors may elect all of the directors standing for election. The holders of our common stock are entitled to receive ratably such dividends as may be declared by our board of directors out of funds legally available therefor. In the event of a liquidation, dissolution or winding-up of our affairs, holders of our common stock are entitled to share ratably in all assets and funds remaining after payment of debts and liabilities, if any. Holders of our common stock are not entitled to preemptive rights and have no subscription, redemption or conversion privileges. All outstanding shares of our common stock are validly issued, fully paid and non-assessable.
Options
We currently have outstanding options to purchase 757,018 shares of our common stock and an additional shares of our common stock are reserved for issuance under our equity incentive plans. On April 29, 2008, our board of directors adopted the 2008 Directors Plan. Effective as of April 29, 2008, each of our non-employee directors other than Mr. Bailey received grants of SARs related to 4,095 shares of stock with a grant price of $32.50. Mr. Bailey, in consideration of serving as chair of our board of directors, received SARs related to 5,323 shares of stock with a grant price of $32.50. Upon the filing of a registration statement on Form S-8 or other applicable registration statement covering shares of our common stock reserved under our 2008 Directors Plan, the SARs will automatically be converted into options to purchase the same number of shares of our common stock at the grant price.
On May 5, 2008, we granted 25,000 SARs to Mr. Cantrell. Mr. Cantrell’s SARs vest on the second anniversary of the grant date and are to be settled with a cash payment equal to the intrinsic value of the SAR as of the exercise date. In the event that our shares become registered with the SEC, Mr. Cantrell’s SARs will immediately convert to stock options on the same terms as Mr. Cantrell’s SARs, except that there will no longer be a cash settlement feature.
Rights Plan
On December 5, 2007, our board of directors adopted a stockholders’ rights plan designed to help protect our long-term value for our stockholders and to enable all of our stockholders to realize the full and fair value of their investment in the event of any proposed takeover of us.
Under the plan, our board of directors declared a dividend of one common stock purchase right for each share of our common stock outstanding payable on December 17, 2007 to stockholders of
88
record at the close of business on such date. Under the plan, the rights will initially trade together with our common stock and will not be exercisable. The rights generally will become exercisable to acquire our common stock (or, in certain circumstances, shares of an acquirer) at a discounted price if a person or group becomes an “acquiring person” through the acquisition of 20% or more of our outstanding common stock or the announcement of a tender or exchange offer that would result in ownership of 20% or more of our common stock on terms not approved by our board of directors. If a person or group already owned 20% or more of our outstanding common stock on the date the rights plan was adopted, the rights will become exercisable if that person or group acquires any additional shares of our outstanding common stock after the date of the adoption of the plan. Rights held by an acquiring person will become void and will not be exercisable to purchase shares at the bargain purchase price.
The board of directors, at its option, may redeem the rights for $0.01 per right for a limited time after a person becomes an acquiring person. The plan also permits our board of directors to issue to holders of its common stock other than an acquiring person one share of common stock in exchange for each right which is then exercisable. The rights will expire on December 31, 2009, unless earlier redeemed, exchanged or amended.
Anti-Takeover Effects of Certain Provisions of our Certificate of Incorporation, our Bylaws and Delaware Law
Our certificate of incorporation and bylaws include a number of provisions that may have the effect of encouraging persons considering unsolicited tender offers or other unilateral takeover proposals to negotiate with our board of directors rather than to pursue non-negotiated takeover attempts. These provisions include the items described below.
Board Vacancies. Our bylaws provide that any vacancy on our board of directors, however occurring, including a vacancy resulting from an increase in the size of our board of directors, may only be filled by the affirmative vote of a majority of our remaining directors then in office even if less than a quorum.
Meetings of Stockholders. Our bylaws provide that our Chief Executive Officer or Secretary may call a special meeting of the stockholders at the request of a majority of the members of our board of directors then in office or our stockholders owning at least 50% of our shares issued and outstanding. Our bylaws limit the business that may be conducted at either an annual meeting or a special meeting of stockholders to those matters properly brought before the meeting.
Advance Notice Requirements for Stockholder Proposals and Director Nominations. Our bylaws establish advance notice procedures with regard to stockholder proposals relating to the nomination of candidates for election as directors or new business to be brought before meetings of our stockholders. These procedures provide that notice of stockholder proposals must be timely given in writing to our Secretary prior to the meeting at which the action is to be taken. To be timely, a stockholder’s notice must be delivered to or mailed and received at our principal executive offices not less than 90 calendar days before the one year anniversary of the date on which we first mailed the proxy statement to stockholders in connection with the previous year’s annual meeting; provided, however, that in the event that no annual meeting was held in the previous year or the date of the annual meeting has been changed by more than 30 days from the date of the prior year’s meeting, notice by the stockholder to be timely must be so received not later than the close of business on the later of 90 calendar days in advance of such annual meeting and 10 calendar days following the date on which public announcement of the date of the meeting is first made. The notice must contain certain information specified in our bylaws.
89
Amendment to Certificate of Incorporation and Bylaws. As required by the Delaware General Corporation Law, or the DGCL, any amendment of our certificate of incorporation must first be approved by a majority of our board of directors and, if required by law or our certificate of incorporation, be approved by the holders of a majority of the outstanding shares entitled to vote on the amendment, and the holders of a majority of the outstanding shares of each class entitled to vote thereon as a class. Our bylaws may be amended by the affirmative vote of a majority of the directors then in office, subject to any limitations in our bylaws, and may also be amended by the affirmative vote of the holders of a majority of the outstanding shares entitled to vote on the amendment.
Delaware Anti-Takeover Statute. Upon completion of this offering, we will become subject to Section 203 of the DGCL. Section 203 is an anti-takeover law. In general, Section 203 prohibits a publicly held Delaware corporation from engaging in a business combination with an interested stockholder for a period of three years following the date that the person became an interested stockholder, unless the business combination or the transaction in which the person became an interested stockholder is approved in a prescribed manner. Generally, a business combination includes a merger, asset or stock sale, or another transaction resulting in a financial benefit to the interested stockholder. Generally, an interested stockholder is a person who, together with affiliates and associates, owns 15% or more of the corporation’s voting stock. The existence of this provision may have an anti-takeover effect with respect to transactions that are not approved in advance by our board of directors, including discouraging attempts that might result in a premium over the market price for the shares of common stock held by stockholders.
Authorized but Unissued Shares
The authorized but unissued shares of our common stock are available for future issuance without stockholder approval except as may be required by applicable rules. These additional shares may be used for a variety of corporate purposes, including future public offerings to raise additional capital, corporate acquisitions and employee benefit plans.
Transfer Agent and Registrar
The transfer agent and registrar for our common stock is Computershare Trust Company, New York, New York.
90
SHARES ELIGIBLE FOR FUTURE SALE
Upon completion of this offering, shares of our common stock will be outstanding, excluding shares that may be sold to the underwriters if they exercise their option to purchase additional shares.
Of the shares of our common stock to be outstanding upon completion of this offering, the shares of our common stock offered pursuant to this offering will be freely tradable without restriction or further registration under federal securities laws, except to the extent shares of our common stock are purchased in this offering by our affiliates, as that term is defined in Rule 144 under the Securities Act. All of our shares outstanding prior to this offering, except those shares owned by our affiliates or subject to the lock-up agreements described below, will continue to be freely tradable without restriction under federal securities laws.
We and all of our executive officers and directors have agreed with the underwriters not to offer, sell, dispose of or hedge any shares of our common stock or securities convertible into or exchangeable for shares of our common stock, subject to specified limited exceptions and extensions described elsewhere in this prospectus, during the period continuing through the date that is 180 days (subject to extension) after the date of this prospectus, except with the prior written consent of Goldman, Sachs & Co. and Merrill Lynch & Co., on behalf of the underwriters. Goldman, Sachs & Co. and Merrill Lynch & Co., in their sole discretion on behalf of the underwriters, may release any of the securities subject to these lock-up agreements at any time without notice. The lock-up period may be extended in the circumstances described under “Underwriting.”
Immediately following the effectiveness of the registration statement of which this prospectus is a part, we intend to file one or more registration statements under the Securities Act to register the shares of our common stock underlying outstanding stock options or equity compensation grants or reserved for issuance under our equity incentive plans. These registration statements will become effective upon filing, and shares covered by these registration statements will be eligible for sale in the public market immediately after the effective dates of these registration statements, subject to the lock-up agreements described in the preceding paragraph.
In general, Rule 144 under the Securities Act permits securities acquired by an affiliate of the issuer to be sold into the market in an amount that does not exceed, during any three-month period, the greater of: (i) 1% of the total number of the securities outstanding or (ii) the average weekly reported trading volume of the common stock for the four calendar weeks prior to the sale. Sales under Rule 144 by our affiliates are also subject to specific manner of sale provisions, holding period requirements, notice requirements and the availability of current public information about us.
91
CERTAIN U.S. FEDERAL TAX CONSIDERATIONS FOR NON-U.S. HOLDERS
The following is a general discussion of certain U.S. federal income and estate tax consequences of the ownership and disposition of our common stock by a non-U.S. holder. For purposes of this discussion, the term “non-U.S. holder” means a beneficial owner of our common stock that is not, for U.S. federal income tax purposes:
| | Ÿ | | an individual who is a citizen or resident of the United States; |
| | Ÿ | | a corporation, including any entity treated as a corporation for U.S. federal income tax purposes, created or organized in or under the laws of the United States, any state thereof or the District of Columbia; |
| | Ÿ | | an estate whose income is subject to U.S. federal income taxation regardless of its source; or |
| | Ÿ | | a trust, if a U.S. court is able to exercise primary supervision over the administration of the trust and one or more U.S. persons have authority to control all substantial decisions of the trust, or if it has a valid election in effect under applicable U.S. Treasury Regulations to be treated as a U.S. person. |
An individual may be treated as a resident of the United States in any calendar year for U.S. federal income tax purposes, instead of a nonresident, by, among other ways, being present in the United States for at least 31 days in that calendar year and for an aggregate of at least 183 days during a three-year period ending in that calendar year. For purposes of the 183-day calculation, the U.S. Internal Revenue Service counts all of the days present in that calendar year, one-third of the days present in the immediately preceding year and one-sixth of the days present in the second preceding year. Residents receive the same U.S. federal income tax treatment as U.S. citizens.
This discussion does not consider:
| | Ÿ | | U.S. state or local or non-U.S. tax consequences; |
| | Ÿ | | all aspects of U.S. federal income and estate taxes or specific facts and circumstances that may be relevant to a particular non-U.S. holder’s tax position, including the fact that, in the case of a non-U.S. holder that is an entity treated as a partnership for U.S. federal income tax purposes, the U.S. tax consequences of holding and disposing of our common stock may be affected by certain determinations made at the partner level; |
| | Ÿ | | the tax consequences for the stockholders, partners or beneficiaries of a non-U.S. holder; |
| | Ÿ | | special tax rules that may apply to particular non-U.S. holders, such as financial institutions, insurance companies, tax-exempt organizations, U.S. expatriates, broker-dealers and traders in securities; or |
| | Ÿ | | special tax rules that may apply to a non-U.S. holder that holds our common stock as part of a “straddle,” “hedge,” “conversion transaction,” “synthetic security” or other integrated investment. |
The following discussion is based on provisions of the Code, existing and proposed U.S. Treasury Regulations and administrative and judicial interpretations, all as of the date of this prospectus, and all of which are subject to change, retroactively or prospectively. The following summary assumes that a non-U.S. holder holds our common stock as a capital asset, generally, property held for investment.
If you are considering the purchase of our common stock, we urge you to consult your own tax advisors regarding the U.S. federal, state, local and non-U.S. income and other tax consequences of acquiring, holding and disposing of shares of our common stock.
92
Distributions on Common Stock
Cash distributions on our common stock generally will constitute dividends for U.S. federal income tax purposes to the extent that we pay them from our current or accumulated earnings and profits, as determined under U.S. federal income tax principles. If any such distribution exceeds our current and accumulated earnings and profits, the U.S. Internal Revenue Service will treat the excess as a non-taxable return of capital to the extent of your tax basis in our common stock and thereafter as capital gain from the sale or exchange of such common stock. Dividends that we pay to non-U.S. holders of our common stock that are not effectively connected with the non-U.S. holder’s conduct of a U.S. trade or business will be subject to U.S. federal withholding tax at a 30% rate or such lower rate as an applicable income tax treaty may specify.
The U.S. Internal Revenue Service will require a non-U.S. holder that wishes to claim the benefit of an applicable income tax treaty to comply with certain certification requirements, which one can generally meet by providing a properly executed Internal Revenue Service Form W-8BEN. However,
| | Ÿ | | in the case of common stock held by a foreign partnership, the certification requirement will generally be applied to the partners of the partnership and the partnership will be required to provide certain information; |
| | Ÿ | | in the case of common stock held by a foreign trust, the certification requirement will generally be applied to the trust or the beneficial owners of the trust depending on whether the trust is a “foreign complex trust,” “foreign simple trust” or “foreign grantor trust” as defined in the U.S. Treasury Regulations; and |
| | Ÿ | | look-through rules will apply for tiered partnerships, foreign simple trusts and foreign grantor trusts. |
We urge a non-U.S. holder that is a foreign partnership or a foreign trust to consult its own tax advisor regarding its status under the U.S. Treasury Regulations and the certification requirements applicable to it. A non-U.S. holder that is eligible for a reduced rate of U.S. federal withholding tax under an income tax treaty may obtain a refund or credit of any excess amounts withheld by filing an appropriate claim for refund with the U.S. Internal Revenue Service.
The U.S. Internal Revenue Service taxes dividends that are effectively connected with a non-U.S. holder’s conduct of a trade or business in the United States and, if an income tax treaty applies, are attributable to the non-U.S. holder’s maintained permanent establishment in the United States, on a net income basis at the regular graduated rates and in the manner applicable to U.S. persons, as defined in the Code. In that case, we will not have to withhold U.S. federal withholding tax if the non-U.S. holder complies with applicable certification and disclosure requirements. In general, one can meet such certification requirements by providing us with a properly executed IRS Form W-8 ECI. In addition, the U.S. Internal Revenue Service may impose a “branch profits tax” at a 30% rate, or a lower rate under an applicable income tax treaty, on dividends received by a foreign corporation that are effectively connected with its conduct of a trade or business in the United States.
Gain on Disposition of Common Stock
A non-U.S. holder generally will not be subject to U.S. federal income tax on gain recognized on a disposition of our common stock unless:
| | Ÿ | | the gain is effectively connected with the non-U.S. holder’s conduct of a trade or business in the United States and, if an income tax treaty applies, is attributable to a permanent establishment maintained by the non-U.S. holder in the United States; |
| | Ÿ | | the non-U.S. holder is an individual who is present in the United States for 183 days or more in the taxable year of the disposition and meets other requirements; or |
93
| | Ÿ | | we are or have been a “U.S. real property holding corporation” for U.S. federal income tax purposes at any time during the shorter of the five-year period ending on the date of disposition or the period that the non-U.S. holder held our common stock. |
A non-corporate non-U.S. holder described in the first bullet point above will be subject to tax on the net gain realized from the sale under regular graduated U.S. federal income tax rates in the same manner as if it were a U.S. person. If a non-U.S. holder that is a foreign corporation is described in the first bullet point above, it will be subject to tax on its net gain in the same manner as if it were a U.S. person and may also be subject to the branch profits tax at a rate of 30% of its effectively connected earnings and profits or at such lower rate as may be specified by an applicable income tax treaty. An individual non-U.S. holder described in the second bullet point above will be subject to a flat 30% tax on the gain derived from the sale or other disposition, which may be offset by U.S. source capital losses, even though the individual is not considered a resident of the United States.
Generally, a corporation is a U.S. real property holding corporation, or USRPHC, if the fair market value of its U.S. real property interests equals or exceeds 50% of the sum of the fair market value of its worldwide real property interests and its other assets used or held for use in a trade or business. We believe that we may be a USRPHC for U.S. federal income tax purposes. So long as our common stock is regularly traded on an established securities market, which for these purposes includes any OTC market such as trading through an interdealer quotation system, but may not include trading through the Pink Sheets, only a non-U.S. holder who holds or held at any time during the shorter of the five year period preceding the date of disposition or the holder’s holding period more than 5% of our common stock will generally be subject to U.S. federal income tax on the disposition of our common stock. If we are a USRPHC and a non-U.S. holder actually or constructively owned more than 5% of our common stock at any time during the applicable period or our common stock were not considered to be “regularly traded on an established securities market,” then any gain recognized by a non-U.S. holder on the sale or other disposition of our common stock would be treated as effectively connected with a U.S. trade or business and would be subject to U.S. federal income tax at regular graduated U.S. federal income tax rates and in much the same manner as applicable to U.S. persons. In such a case, the non-U.S. holder could also be subject to certain withholding taxes imposed on the gross proceeds realized with respect to the sale or other disposition of our common stock.
U.S. Federal Estate Tax
Common stock owned or treated as owned by an individual who is a non-U.S. holder for U.S. federal estate tax purposes at the time of death will generally be included in the individual’s gross estate for U.S. federal estate tax purposes, unless an applicable estate tax or other treaty provides otherwise, and therefore may be subject to U.S. federal estate tax.
Information Reporting and Backup Withholding Tax
We must report annually to the Internal Revenue Service and to you the amount of dividends paid to you and any tax withheld with respect to those dividends, regardless of whether withholding is required. We may also have to make copies of the information returns available to the tax authorities in the country in which you reside under the provisions of an applicable income tax treaty. U.S. backup withholding tax is imposed at a current rate of 28% on certain payments to persons that fail to furnish the information required under the U.S. information reporting requirements. If you are a non-U.S. holder, you will be exempt from this backup withholding tax if you properly provide a Form W-8BEN certifying that you are not a U.S. person or otherwise meet documentary evidence requirements for establishing that you are not a U.S. person or you otherwise establish an exemption.
94
The gross proceeds from the disposition of our common stock may be subject to information reporting and backup withholding. If you sell your common stock outside the U.S. through a non-U.S. office of a non-U.S. broker and the purchaser pays you sales proceeds outside the United States, then the U.S. backup withholding and information reporting requirements generally will not apply to that payment. However, U.S. information reporting, but not backup withholding, will generally apply to a payment of sales proceeds, even if that payment is made outside the United States, if you sell your common stock through a non-U.S. office of a broker that:
| | Ÿ | | is a foreign person that derives 50% or more of its gross income in specific periods from the conduct of a trade or business in the United States; |
| | Ÿ | | is a “controlled foreign corporation” for U.S. tax purposes; or |
| | Ÿ | | is a foreign partnership, if at any time during its tax year: |
| | Ÿ | | one or more of its partners are U.S. persons who in the aggregate hold more than 50% of the income or capital interests in the partnership; or |
| | Ÿ | | the foreign partnership is engaged in a U.S. trade or business, |
unless the broker has documentary evidence in its files that you are a non-U.S. person and certain other conditions are met, or you otherwise establish an exemption.
If you receive payments of the proceeds of a sale of our common stock to or through a U.S. office of a broker, the payment is subject to both U.S. backup withholding and information reporting unless you properly provide a Form W-8BEN certifying that you are a non-U.S. person or you otherwise establish an exemption.
Backup withholding is not an additional tax. You generally may obtain a refund of any amounts withheld under the backup withholding rules that exceed your U.S. federal income tax liability by timely filing a properly completed claim for refund with the U.S. Internal Revenue Service.
THE FOREGOING DISCUSSION IS FOR GENERAL INFORMATION ONLY AND SHOULD NOT BE VIEWED AS TAX ADVICE. INVESTORS CONSIDERING THE PURCHASE OF OUR COMMON STOCK ARE URGED TO CONSULT THEIR OWN TAX ADVISORS REGARDING THE APPLICATION OF THE U.S. FEDERAL INCOME AND ESTATE TAX LAWS TO THEIR PARTICULAR SITUATIONS AND THE APPLICABILITY AND EFFECT OF STATE, LOCAL OR FOREIGN TAX LAWS AND TAX TREATIES.
95
UNDERWRITING
We and the underwriters named below have entered into an underwriting agreement with respect to the shares being offered. Subject to certain conditions, each underwriter has severally agreed to purchase the number of shares indicated in the following table. Goldman, Sachs & Co. and Merrill Lynch, Pierce, Fenner & Smith Incorporated are the representatives of the underwriters.
| | |
Underwriters | | Number of
Shares |
Goldman, Sachs & Co. | | |
Merrill Lynch, Pierce, Fenner & Smith
Incorporated | | |
| | |
Total | | |
| | |
The underwriters are committed to take and pay for all of the shares being offered, if any are taken, other than the shares covered by the option described below unless and until this option is exercised.
If the underwriters sell more shares than the total number set forth in the table above, the underwriters have an option to buy up to an additional shares from us. They may exercise that option for 30 days. If any shares are purchased pursuant to this option, the underwriters will severally purchase shares in approximately the same proportion as set forth in the table above.
The following table shows the per share and total underwriting discounts and commissions to be paid to the underwriters by us. Such amounts are shown assuming both no exercise and full exercise of the underwriters’ option to purchase additional shares.
| | | | | | |
| | | No Exercise | | Full Exercise |
Per Share | | $ | | | $ | |
Total | | $ | | | $ | |
Shares sold by the underwriters to the public will initially be offered at the offering price set forth on the cover of this prospectus. Any shares sold by the underwriters to securities dealers may be sold at a discount of up to $ per share from the offering price. If all the shares are not sold at the offering price, the representatives may change the offering price and the other selling terms. The offering of the shares by the underwriters is subject to receipt and acceptance and subject to the underwriters’ right to reject any order in whole or in part.
We and our directors and executive officers have agreed with the underwriters, subject to certain exceptions, not to dispose of or hedge any of our common stock or securities convertible into or exchangeable for shares of common stock during the period from the date of this prospectus continuing through the date 180 days after the date of this prospectus, except with the prior written consent of the representatives. This agreement does not apply to any existing employee benefit plans. See “Shares Eligible for Future Sale” for a discussion of certain transfer restrictions.
The 180-day restricted period described in the preceding paragraph will be automatically extended if: (1) during the last 17 days of the 180-day restricted period, we issue an earnings release or announce material news or a material event; or (2) prior to the expiration of the 180-day restricted period, we announce that we will release earnings results during the 15-day period following the last day of the 180-day period, in which case the restrictions described in the preceding paragraph will continue to apply until the expiration of the 18-day period beginning on the issuance of the earnings release of the announcement of the material news or material event.
The offering price has been negotiated among us and the representatives. Among the factors to be considered in determining the offering price of the shares, in addition to prevailing market
96
conditions, will be our historical performance, estimates of our business potential and earnings prospects, an assessment of our management and the consideration of the above factors in relation to market valuation of companies in related businesses.
We plan to apply to list our common stock on under the symbol “ .” In order to meet one of the requirements for listing the common stock on , the underwriters have undertaken to sell lots of or more shares to a minimum of beneficial holders.
In connection with the offering, the underwriters may purchase and sell shares of common stock in the open market. These transactions may include short sales, stabilizing transactions and purchases to cover positions created by short sales. Short sales involve the sale by the underwriters of a greater number of shares than they are required to purchase in the offering. “Covered” short sales are sales made in an amount not greater than the underwriters’ option to purchase additional shares from us in the offering. The underwriters may close out any covered short position by either exercising their option to purchase additional shares or purchasing shares in the open market. In determining the source of shares to close out the covered short position, the underwriters will consider, among other things, the price of shares available for purchase in the open market as compared to the price at which they may purchase additional shares pursuant to the option granted to them. “Naked” short sales are any sales in excess of such option. The underwriters must close out any naked short position by purchasing shares in the open market. A naked short position is more likely to be created if the underwriters are concerned that there may be downward pressure on the price of our common stock in the open market after pricing that could adversely affect investors who purchase in the offering. Stabilizing transactions consist of various bids for or purchases of our common stock made by the underwriters in the open market prior to the completion of the offering.
The underwriters may also impose a penalty bid. This occurs when a particular underwriter repays to the underwriters a portion of the underwriting discount received by it because the representatives have repurchased shares sold by or for the account of such underwriter in stabilizing or short covering transactions.
Purchases to cover a short position and stabilizing transactions, as well as other purchases by the underwriters for their own accounts, may have the effect of preventing or retarding a decline in the market price of our stock, and together with the imposition of the penalty bid, may stabilize, maintain or otherwise affect the market price of the common stock. As a result, the price of our common stock may be higher than the price that otherwise might exist in the open market. If these activities are commenced, they may be discontinued at any time. These transactions may be effected on , in the over-the-counter market or otherwise.
In relation to each Member State of the European Economic Area that has implemented the Prospectus Directive (each, a Relevant Member State), each underwriter has represented and agreed that with effect from and including the date on which the Prospectus Directive is implemented in that Relevant Member State (the Relevant Implementation Date) it has not made and will not make an offer of shares to the public in that Relevant Member State prior to the publication of a prospectus in relation to the shares which has been approved by the competent authority in that Relevant Member State or, where appropriate, approved in another Relevant Member State and notified to the competent authority in that Relevant Member State, all in accordance with the Prospectus Directive, except that it may, with effect from and including the Relevant Implementation Date, make an offer of shares to the public in that Relevant Member State at any time:
(a) to legal entities which are authorized or regulated to operate in the financial markets or, if not so authorized or regulated, whose corporate purpose is solely to invest in securities;
97
(b) to any legal entity which has two or more of (1) an average of at least 250 employees during the last financial year; (2) a total balance sheet of more than€43,000,000 and (3) an annual net turnover of more than€50,000,000, as shown in its last annual or consolidated accounts;
(c) to fewer than 100 natural or legal persons (other than qualified investors as defined in the Prospectus Directive) subject to obtaining the prior consent of the representatives for any such offer; or
(d) in any other circumstances which do not require the publication by the company of a prospectus pursuant to Article 3 of the Prospectus Directive.
For the purposes of this provision, the expression an “offer of shares to the public” in relation to any shares in any Relevant Member State means the communication in any form and by any means of sufficient information on the terms of the offer and the shares to be offered so as to enable an investor to decide to purchase or subscribe the shares, as the same may be varied in that Relevant Member State by any measure implementing the Prospectus Directive in that Relevant Member State and the expression Prospectus Directive means Directive 2003/71/EC and includes any relevant implementing measure in each Relevant Member State.
Each underwriter has represented and agreed that:
(a) it has only communicated or caused to be communicated and will only communicate or cause to be communicated an invitation or inducement to engage in investment activity (within the meaning of Section 21 of the Financial Services and Markets Act 2000, or the FSMA) received by it in connection with the issue or sale of the shares in circumstances in which Section 21(1) of the FSMA does not apply to us; and
(b) it has complied and will comply with all applicable provisions of the FSMA with respect to anything done by it in relation to the shares in, from or otherwise involving the United Kingdom.
The shares may not be offered or sold by means of any document other than (i) in circumstances which do not constitute an offer to the public within the meaning of the Companies Ordinance (Cap.32, Laws of Hong Kong), or (ii) to “professional investors” within the meaning of the Securities and Futures Ordinance (Cap.571, Laws of Hong Kong) and any rules made thereunder, or (iii) in other circumstances which do not result in the document being a “prospectus” within the meaning of the Companies Ordinance (Cap.32, Laws of Hong Kong), and no advertisement, invitation or document relating to the shares may be issued or may be in the possession of any person for the purpose of issue (in each case whether in Hong Kong or elsewhere), which is directed at, or the contents of which are likely to be accessed or read by, the public in Hong Kong (except if permitted to do so under the laws of Hong Kong) other than with respect to shares which are or are intended to be disposed of only to persons outside Hong Kong or only to “professional investors” within the meaning of the Securities and Futures Ordinance (Cap. 571, Laws of Hong Kong) and any rules made thereunder.
This prospectus has not been registered as a prospectus with the Monetary Authority of Singapore. Accordingly, this prospectus and any other document or material in connection with the offer or sale, or invitation for subscription or purchase, of the shares may not be circulated or distributed, nor may the be offered or sold, or be made the subject of an invitation for subscription or purchase, whether directly or indirectly, to persons in Singapore other than (i) to an institutional investor under Section 274 of the Securities and Futures Act, Chapter 289 of Singapore, or the SFA, (ii) to a relevant person, or any person pursuant to Section 275(1A), and in accordance with the conditions, specified in Section 275 of the SFA or (iii) otherwise pursuant to, and in accordance with the conditions of, any other applicable provision of the SFA.
Where the shares are subscribed or purchased under Section 275 by a relevant person which is: (a) a corporation (which is not an accredited investor) the sole business of which is to hold investments
98
and the entire share capital of which is owned by one or more individuals, each of whom is an accredited investor; or (b) a trust (where the trustee is not an accredited investor) whose sole purpose is to hold investments and each beneficiary is an accredited investor, shares, debentures and units of shares and debentures of that corporation or the beneficiaries’ rights and interest in that trust shall not be transferable for six months after that corporation or that trust has acquired the shares under Section 275 except: (1) to an institutional investor under Section 274 of the SFA or to a relevant person, or any person pursuant to Section 275(1A), and in accordance with the conditions, specified in Section 275 of the SFA; (2) where no consideration is given for the transfer; or (3) by operation of law.
The securities have not been and will not be registered under the Financial Instruments and Exchange Law of Japan, and each underwriter has agreed that it will not offer or sell any securities, directly or indirectly, in Japan or to, or for the benefit of, any resident of Japan (which term as used herein means any person resident in Japan, including any corporation or other entity organized under the laws of Japan), or to others for re-offering or resale, directly or indirectly, in Japan or to a resident of Japan, except pursuant to an exemption from the registration requirements of, and otherwise in compliance with, the Financial Instruments and Exchange Law and any other applicable laws, regulations and ministerial guidelines of Japan.
The underwriters do not expect sales to discretionary accounts to exceed 5% of the total number of shares offered.
We estimate that the total expenses of the offering, excluding underwriting discounts and commissions, will be approximately $ .
We have agreed to indemnify the several underwriters against certain liabilities, including liabilities under the Securities Act.
Certain of the underwriters and their respective affiliates have, from time to time, performed, and may in the future perform, various financial advisory and investment banking services for us, for which they received or will receive customary fees and expenses.
99
VALIDITY OF THE COMMON STOCK
The validity of the common stock offered by this prospectus will be passed upon for us by Vinson & Elkins L.L.P., Dallas, Texas and for the underwriters by Sullivan & Cromwell LLP, New York, New York.
EXPERTS
Our consolidated financial statements as of December 31, 2007 and 2006, and for each of the years in the two-year period ended December 31, 2007, have been included herein and in the registration statement in reliance upon the report of KPMG LLP, independent registered public accounting firm, appearing elsewhere in this prospectus, and upon the authority of said firm as experts in accounting and auditing. The audit report covering these consolidated financial statements refers to a change in the accounting for income tax uncertainties effective January 1, 2007 and refers to a change in the accounting for share-based compensation effective January 1, 2006.
Our consolidated financial statements for the year ended December 31, 2005, have been included herein and in the registration statement in reliance upon the report of HORNE LLP, independent registered public accounting firm, appearing elsewhere in this prospectus, and upon the authority of said firm as experts in accounting and auditing.
WHERE YOU CAN FIND MORE INFORMATION
We have filed with the SEC a registration statement on Form S-1 under the Securities Act with respect to the shares of common stock to be sold in the offering. As permitted by the rules and regulations of the SEC, this prospectus does not contain all of the information contained in the registration statement and the exhibits filed as part of the registration statement. For further information about us and our common stock, we refer you to the registration statement and the exhibits that have been filed with the registration statement. Statements in this prospectus concerning the contents of any contract or any other document are not necessarily complete. If a contract or document has been filed as an exhibit to the registration statement, we refer you to that exhibit. Each statement in this prospectus relating to a contract or document filed as an exhibit to the registration statement is qualified by the filed exhibit. A copy of the registration statement and the exhibits that were filed with the registration statement may be inspected without charge at the public reference room maintained by the SEC at 100 F Street, N.E., Washington, D.C. 20549, and copies of all or any part of the registration statement may be obtained from the SEC upon payment of the prescribed fee. Information on the operation of the public reference room may be obtained by calling the SEC at 1-800-SEC-0330. The SEC maintains a website that contains reports, proxy and information statements, and other information regarding registrants that file electronically with the SEC. The address of the website is http://www.sec.gov.
We maintain an Internet website at http://www.missphosphates.com (which is not intended to be an active hyperlink in this prospectus). The information contained on, connected to or that can be accessed via our website is not part of this prospectus.
Upon completion of the offering, we will become subject to the reporting and information requirements of the Exchange Act and, as a result, will file periodic and current reports, proxy statements and other information with the SEC. We expect to make our periodic reports and other information filed with or furnished to the SEC, available, free of charge, through our website as soon as reasonably practicable after those reports and other information are filed with or furnished to the SEC. Additionally, these periodic reports, proxy statements and other information will be available for inspection and copying at the regional offices, public reference room and website of the SEC referred to above.
100
INDEX TO CONSOLIDATED FINANCIAL STATEMENTS
Phosphate Holdings, Inc. and Subsidiary
| | |
| | | Page |
Report of KPMG LLP, Independent Registered Public Accounting Firm, on the consolidated balance sheets as of December 31, 2007 and 2006 and the related consolidated statements of operations, stockholders’ equity, and cash flows for each of the years in the two-year period ended December 31, 2007 | | F-2 |
Report of HORNE LLP, Independent Registered Public Accounting Firm, on the consolidated statements of operations, stockholders’ equity and cash flows for the year ended December 31, 2005 | | F-3 |
Consolidated Balance Sheets as of December 31, 2007 and 2006 | | F-4 |
Consolidated Statements of Operations for the years ended December 31, 2007, 2006 and 2005 | | F-5 |
Consolidated Statements of Stockholders’ Equity for the years ended December 31, 2007, 2006 and 2005 | | F-6 |
Consolidated Statements of Cash Flows for the years ended December 31, 2007, 2006 and 2005 | | F-7 |
Notes to Consolidated Financial Statements | | F-8 |
Unaudited Consolidated Balance Sheets as of June 30, 2008 and December 31, 2007 | | F-29 |
Unaudited Consolidated Statements of Operations for the six months ended June 30, 2008 and 2007 | | F-30 |
Unaudited Consolidated Statements of Cash Flows for the six months ended June 30, 2008 and 2007 | | F-31 |
Notes to Unaudited Consolidated Interim Financial Statements | | F-32 |
F-1
REPORT OF INDEPENDENT REGISTERED PUBLIC ACCOUNTING FIRM
The Board of Directors
Phosphate Holdings, Inc.:
We have audited the accompanying consolidated balance sheets of Phosphate Holdings, Inc. and Subsidiary (the Company) as of December 31, 2007 and 2006, and the related consolidated statements of operations, stockholders’ equity, and cash flows for each of the years in the two-year period ended December 31, 2007. These consolidated financial statements are the responsibility of the Company’s management. Our responsibility is to express an opinion on these consolidated financial statements based on our audits.
We conducted our audits in accordance with the standards of the Public Company Accounting Oversight Board (United States). Those standards require that we plan and perform the audit to obtain reasonable assurance about whether the financial statements are free of material misstatement. An audit also includes examining, on a test basis, evidence supporting the amounts and disclosures in the financial statements. An audit also includes assessing the accounting principles used and significant estimates made by management, as well as evaluating the overall financial statement presentation. We believe that our audits provide a reasonable basis for our opinion.
In our opinion, the consolidated financial statements referred to above present fairly, in all material respects, the financial position of Phosphate Holdings, Inc. and Subsidiary as of December 31, 2007 and 2006, and the results of their operations and their cash flows for each of the years in the two-year period ended December 31, 2007, in conformity with U.S. generally accepted accounting principles.
As discussed in Note 1 to the consolidated financial statements, effective January 1, 2007, the Company adopted FASB Interpretation No. 48,Accounting for Uncertainty in Income Taxes—an Interpretation of FASB Statement No. 109.
As discussed in Note 1 to the consolidated financial statements, effective January 1, 2006, the Company adopted the fair value method of accounting for share-based compensation as required by Statement of Financial Accounting Standards No. 123(R),Share-Based Payment.
/s/ KPMG LLP
Jackson, Mississippi
October 10, 2008
F-2
REPORT OF INDEPENDENT REGISTERED PUBLIC ACCOUNTING FIRM
To the Board of Directors
Phosphate Holdings, Inc.
We have audited the accompanying consolidated statements of operations, stockholders’ equity and cash flows of Phosphate Holdings, Inc. and Subsidiary (the “Company”) for the year ended December 31, 2005. These financial statements are the responsibility of the Company’s management. Our responsibility is to express an opinion on these financial statements based on our audit.
We conducted our audit in accordance with the standards of the Public Company Accounting Oversight Board (United States). Those standards require that we plan and perform the audit to obtain reasonable assurance about whether the financial statements are free of material misstatement. An audit includes examining, on a test basis, evidence supporting the amounts and disclosures in the financial statements. An audit also includes assessing the accounting principles used and significant estimates made by management, as well as evaluating the overall financial statement presentation. We believe that our audit provides a reasonable basis for our opinion.
In our opinion, the consolidated financial statements referred to above present fairly, in all material respects, the results of operations of Phosphate Holdings, Inc. and Subsidiary and their cash flows for the year ended December 31, 2005, in conformity with U.S. generally accepted accounting principles.
HORNE LLP
/s/ HORNE LLP
Jackson, Mississippi
August 25, 2008
F-3
PHOSPHATE HOLDINGS, INC. AND SUBSIDIARY
Consolidated Balance Sheets
(In thousands, except share data)
| | | | | |
| | | December 31, |
| | | 2007 | | 2006 |
| Assets | | | | | |
Current assets: | | | | | |
Cash and cash equivalents | | $ | 43,576 | | 647 |
Trade accounts receivable | | | 10,041 | | 5,479 |
Other receivables | | | 1,682 | | 59 |
Inventories | | | 18,103 | | 13,606 |
Prepaid expenses and other | | | 4,957 | | 4,672 |
Deferred income taxes | | | 1,059 | | — |
| | | | | |
Total current assets | | | 79,418 | | 24,463 |
| | |
Restricted investments held in trust, at fair value | | | 3,348 | | 2,615 |
Property, plant and equipment, net | | | 41,417 | | 35,219 |
Deferred income taxes | | | — | | 1,036 |
Other | | | 120 | | 145 |
| | | | | |
Total assets | | $ | 124,303 | | 63,478 |
| | | | | |
| Liabilities and Stockholders’ Equity | | | | | |
Current liabilities: | | | | | |
Accounts payable | | $ | 2,236 | | 1,539 |
Accrued expenses | | | 18,703 | | 7,876 |
Short-term financing obligations | | | 2,185 | | 2,471 |
Deferred income taxes | | | — | | 1,036 |
| | | | | |
Total current liabilities | | | 23,124 | | 12,922 |
| | |
Advances from insurance companies, net | | | — | | 23,484 |
Revolving credit agreement | | | — | | 4,875 |
Asset retirement obligations | | | 5,086 | | 4,627 |
Deferred income taxes | | | 10,863 | | — |
| | | | | |
Total liabilities | | | 39,073 | | 45,908 |
| | | | | |
Stockholders’ equity: | | | | | |
Common stock ($0.01 par; 11,000,000 shares authorized at December 31, 2007, 8,411,308 shares authorized at December 31, 2006, 7,654,290 shares issued and outstanding at December 31, 2007 and 2006) | | | 77 | | 77 |
Additional paid-in capital | | | 33,880 | | 15,109 |
Retained earnings | | | 51,273 | | 2,384 |
| | | | | |
Total stockholders’ equity | | | 85,230 | | 17,570 |
| | | | | |
Commitments and contingencies (notes 15 and 17) | | | | | |
Total liabilities and stockholders’ equity | | $ | 124,303 | | 63,478 |
| | | | | |
See accompanying notes to consolidated financial statements.
F-4
PHOSPHATE HOLDINGS, INC. AND SUBSIDIARY
Consolidated Statements of Operations
(In thousands, except per share data)
| | | | | | | | | |
| | | Years ended December 31, | |
| | | 2007 | | 2006 | | | 2005 | |
Net sales: | | | | | | | | | |
DAP | | $ | 219,569 | | 130,579 | | | 100,151 | |
Other | | | 2,805 | | 985 | | | 513 | |
| | | | | | | | | |
Total net sales | | | 222,374 | | 131,564 | | | 100,664 | |
| | | |
Cost of sales | | | 169,952 | | 128,684 | | | 90,117 | |
| | | | | | | | | |
Gross profit | | | 52,422 | | 2,880 | | | 10,547 | |
| | | |
Selling, general and administrative expenses | | | 12,301 | | 4,472 | | | 2,879 | |
| | | | | | | | | |
Operating income (loss) | | | 40,121 | | (1,592 | ) | | 7,668 | |
| | | |
Other income (expense): | | | | | | | | | |
Interest, net | | | 301 | | (735 | ) | | (73 | ) |
Hurricane related gain | | | 37,830 | | — | | | — | |
Other, net | | | 176 | | 533 | | | (246 | ) |
| | | | | | | | | |
Total other income (expense) | | | 38,307 | | (202 | ) | | (319 | ) |
| | | | | | | | | |
Income (loss) before income taxes | | | 78,428 | | (1,794 | ) | | 7,349 | |
| | | |
Income tax expense | | | 29,539 | | — | | | 2,465 | |
| | | | | | | | | |
Net income (loss) | | $ | 48,889 | | (1,794 | ) | | 4,884 | |
| | | | | | | | | |
Earnings (loss) per share—basic | | $ | 6.39 | | (0.24 | ) | | 0.68 | |
Earnings (loss) per share—diluted | | | 6.04 | | (0.24 | ) | | 0.66 | |
| | | |
Weighted average common shares outstanding—basic | | | 7,654 | | 7,369 | | | 7,146 | |
Weighted average common shares outstanding—diluted | | | 8,089 | | 7,369 | | | 7,373 | |
See accompanying notes to consolidated financial statements.
F-5
PHOSPHATE HOLDINGS, INC. AND SUBSIDIARY
Consolidated Statements of Stockholders’ Equity
Years ended December 31, 2007, 2006, and 2005
(In thousands, except share data)
| | | | | | | | | | | | | |
| | | Common Stock | | Additional
Paid-in
Capital | | Retained
Earnings | | | Total | |
| | | Shares | | Par Value | | | |
Balance, December 31, 2004 | | 6,812,330 | | $ | 68 | | 10,597 | | 4,294 | | | 14,959 | |
Net income | | — | | | — | | — | | 4,884 | | | 4,884 | |
Capital contributions from exercise of stock options | | 500,000 | | | 5 | | 1,172 | | — | | | 1,177 | |
Recognition of pre-bankruptcy deferred tax assets | | — | | | — | | 2,465 | | — | | | 2,465 | |
Cash dividends ($0.68 per share) | | — | | | — | | — | | (5,000 | ) | | (5,000 | ) |
| | | | | | | | | | | | | |
Balance, December 31, 2005 | | 7,312,330 | | | 73 | | 14,234 | | 4,178 | | | 18,485 | |
Net loss | | — | | | — | | — | | (1,794 | ) | | (1,794 | ) |
Share-based compensation expense | | — | | | — | | 74 | | — | | | 74 | |
Capital contributions from exercise of stock options | | 341,960 | | | 4 | | 801 | | — | | | 805 | |
| | | | | | | | | | | | | |
Balance, December 31, 2006 | | 7,654,290 | | | 77 | | 15,109 | | 2,384 | | | 17,570 | |
Net income | | — | | | — | | — | | 48,889 | | | 48,889 | |
Share-based compensation expense | | — | | | — | | 223 | | — | | | 223 | |
Recognition of pre-bankruptcy deferred tax assets | | — | | | — | | 16,398 | | — | | | 16,398 | |
Excess income tax benefit of employee stock option exercises | | — | | | — | | 2,150 | | — | | | 2,150 | |
| | | | | | | | | | | | | |
Balance, December 31, 2007 | | 7,654,290 | | $ | 77 | | 33,880 | | 51,273 | | | 85,230 | |
| | | | | | | | | | | | | |
See accompanying notes to consolidated financial statements.
F-6
PHOSPHATE HOLDINGS, INC. AND SUBSIDIARY
Consolidated Statements of Cash Flows
(In thousands)
| | | | | | | | | | |
| | | Years ended December 31, | |
| | | 2007 | | | 2006 | | | 2005 | |
Cash flows from operating activities: | | | | | | | | | | |
Net income (loss) | | $ | 48,889 | | | (1,794 | ) | | 4,884 | |
Adjustments to reconcile net income (loss) to net cash provided by (used in) operating activities: | | | | | | | | | | |
Depreciation of property, plant and equipment | | | 4,199 | | | 2,561 | | | 58 | |
Amortization of prepaid maintenance turnaround costs | | | 2,891 | | | 1,011 | | | 1,085 | |
Accretion of asset retirement obligation | | | 459 | | | 418 | | | 380 | |
Deferred loan cost amortization | | | 52 | | | 106 | | | 119 | |
Deferred income taxes | | | 26,202 | | | — | | | 2,465 | |
Hurricane related gain | | | (37,830 | ) | | — | | | — | |
Proceeds from insurance reimbursements—property, plant and equipment related | | | (8,437 | ) | | (19,581 | ) | | (4,446 | ) |
Share-based compensation | | | 223 | | | 74 | | | — | |
Other | | | 40 | | | (262 | ) | | (70 | ) |
Changes in operating assets and liabilities: | | | | | | | | | | |
Trade and other accounts receivable | | | (6,185 | ) | | (5,241 | ) | | 1,298 | |
Inventories | | | (4,497 | ) | | (2,323 | ) | | 5,365 | |
Prepaid expenses and other | | | (3,176 | ) | | (1,758 | ) | | (1,985 | ) |
Accounts payable and accrued expenses | | | 11,524 | | | (6,215 | ) | | (2,475 | ) |
Advances from insurance carrier, net | | | 14,346 | | | 31,809 | | | (8,326 | ) |
| | | | | | | | | | |
Net cash provided by (used in) operating activities | | | 48,700 | | | (1,195 | ) | | (1,648 | ) |
| | | | | | | | | | |
Cash flows from investing activities: | | | | | | | | | | |
Purchases of restricted investments held in trust | | | (800 | ) | | (800 | ) | | (600 | ) |
Purchases of property, plant and equipment | | | (10,397 | ) | | (24,099 | ) | | (13,663 | ) |
Proceeds from insurance reimbursements—property, plant and equipment related | | | 8,437 | | | 19,581 | | | 4,446 | |
| | | | | | | | | | |
Net cash used in investing activities | | | (2,760 | ) | | (5,318 | ) | | (9,817 | ) |
| | | | | | | | | | |
Cash flows from financing activities: | | | | | | | | | | |
Net (payments) borrowings on revolving credit agreement | | | (4,875 | ) | | 4,875 | | | — | |
Payments of short-term financing obligations | | | (3,883 | ) | | (3,356 | ) | | (3,042 | ) |
Proceeds from short-term financing obligations | | | 3,597 | | | 4,080 | | | 746 | |
Excess income tax benefit of stock options exercised | | | 2,150 | | | — | | | — | |
Capital contributions from exercise of stock options | | | — | | | 805 | | | 1,177 | |
Payment of deferred loan costs | | | — | | | — | | | (357 | ) |
Cash dividends | | | — | | | — | | | (5,000 | ) |
| | | | | | | | | | |
Net cash (used in) provided by financing activities | | | (3,011 | ) | | 6,404 | | | (6,476 | ) |
| | | | | | | | | | |
Net increase (decrease) in cash and cash equivalents | | | 42,929 | | | (109 | ) | | (17,941 | ) |
Cash and cash equivalents at beginning of year | | | 647 | | | 756 | | | 18,697 | |
| | | | | | | | | | |
Cash and cash equivalents at end of year | | $ | 43,576 | | | 647 | | | 756 | |
| | | | | | | | | | |
Supplemental disclosure of cash flow information: | | | | | | | | | | |
Cash payments for interest | | $ | 374 | | | 860 | | | 105 | |
Cash payments (refunds) of income taxes | | | 1,094 | | | (1,275 | ) | | 1,275 | |
See accompanying notes to consolidated financial statements.
F-7
PHOSPHATE HOLDINGS, INC. AND SUBSIDIARY
Notes to Consolidated Financial Statements
December 31, 2007, 2006, and 2005
(Dollars in thousands unless otherwise indicated)
| (1) | Nature of Business and Significant Accounting Policies |
Phosphate Holdings, Inc. (PHI) and its subsidiary, Mississippi Phosphates Corporation (MPC or the Subsidiary), produces diammonium phosphate (DAP) fertilizer at its production facility in Pascagoula, Mississippi. PHI and MPC are referred to collectively as “the Company.” The Company is organized and managed internally based on one reportable segment, phosphates, which includes the production and sales of DAP.
PHI was incorporated on December 17, 2004, under the laws of the state of Delaware in order to acquire the stock of MPC in conjunction with the bankruptcy reorganization of Mississippi Chemical Corporation (MCC). MPC was incorporated on October 29, 1990, under the laws of the state of Delaware. Pursuant to the bankruptcy reorganization plan, all of the common stock of MPC was issued to the MPC Statutory Trust (Trust) for the benefit of certain creditors of MCC and MPC. Immediately after MPC’s emergence from bankruptcy on December 21, 2004 (the Emergence Date), the Trust transferred all of the common stock of MPC to PHI in exchange for PHI’s common stock. Through June 20, 2007, all of the common stock of PHI was owned by the Trust. The beneficial ownership of the Trust was represented by Trust Units, which were freely tradable. On June 20, 2007, at a Special Meeting of the Trust Unit Holders, dissolution of the Trust was approved. As a result of the dissolution of the Trust, the Unit Holders received their proportionate interest in the assets of the Trust consisting of 7,654,290 shares of PHI common stock. PHI currently owns all of the outstanding common stock of MPC.
On the Emergence Date, the enterprise fair value of PHI was determined to be $10,600, which is comprised of $4,900, representing the equity valuation presented in the court approved plan of reorganization, plus $5,700 of capital contributed by MCC upon consummation of the plan of reorganization. This value was allocated to the net assets in accordance with the provisions of Statement of Position 90-7,Financial Reporting by Entities in Reorganization under the Bankruptcy Code(SOP 90-7). As a result of this allocation, and based upon the Emergence Date enterprise fair value of $10,600, the accounting basis for all long-lived assets, including land, land improvements, buildings, machinery and furniture and fixtures, was reduced to zero and an extraordinary gain in the amount of $4,191 was recognized.
| | (c) | Principles of Consolidation |
The consolidated financial statements include the accounts of PHI and its wholly owned subsidiary, MPC. All significant intercompany balances and transactions have been eliminated in consolidation.
The preparation of financial statements in conformity with U.S. generally accepted accounting principles requires management to make estimates and assumptions that affect the reported amounts of assets and liabilities and disclosure of contingent assets and liabilities at the date of the financial statements and the reported amounts of revenue and expenses during the reporting period. Actual results could differ from those estimates.
F-8
PHOSPHATE HOLDINGS, INC. AND SUBSIDIARY
Notes to Consolidated Financial Statements—(Continued)
December 31, 2007, 2006, and 2005
(Dollars in thousands unless otherwise indicated)
| | (e) | Cash and Cash Equivalents |
Cash equivalents include investments with maturities of three months or less when purchased. The balances reported as of December 31, 2007 and 2006 include $43,187 and $20, respectively, representing investments in a money-market mutual fund.
Inventories are valued at the lower of cost or market on a moving average cost basis. Finished goods include material costs, labor costs, and manufacturing overhead.
The Company maintains replacement parts at its production facility in order to minimize reduction in production in the event of part failures. Replacement parts which are considered expendable are included in inventories and are charged to cost of sales as they are placed in service. Replacement parts which are repairable are reported as a component of property, plant and equipment and are depreciated over their estimated useful lives.
| | (h) | Allowances for Doubtful Accounts |
The Company is subject to credit risk in connection with the collection of its accounts receivable and, accordingly, makes estimates related to the ultimate collection of accounts receivable. Specifically, the Company analyzes accounts receivable, bad debt experience, customer concentrations, customer credit-worthiness and current economic trends, when evaluating the adequacy of the allowance for doubtful accounts. The Company’s business is primarily with a small number of customers and the collection history with these customers has been favorable. All accounts receivable balances outstanding as of December 31, 2007 and 2006 were collected subsequent to year-end. Accordingly, the Company has determined that no allowance for doubtful accounts is necessary at December 31, 2007 and 2006. Additionally, the Company experienced no write-offs or related recoveries of accounts receivable for the years ended December 31, 2007, 2006, or 2005.
| | (i) | Restricted Investments Held in Trust |
In conjunction with producing DAP, the Company is required to maintain a phosphogypsum disposal facility for waste byproducts. The Company has developed a financial assurance mechanism with the Mississippi Department of Environmental Quality (MDEQ) in order to ensure that there will be adequate funds available to cover the estimated costs related to the closure of the Company’s disposal facilities when they reach capacity levels. Quarterly, payments in the amount of $200 are made into a restricted trust fund managed by a third-party trustee. The investments held within this trust fund represent debt and equity securities, which are classified as trading securities in accordance with Statement of Financial Accounting Standards (SFAS) No. 115,Accounting for Certain Investments in Debt and Equity Securities,as such securities are actively managed in order to maximize the portfolio’s investment returns. The Company recognizes realized and unrealized gains or losses on these securities in the period incurred. The Company’s investments are comprised of exchange traded securities and investment funds, which are recorded at fair value based upon daily quoted closing prices.
F-9
PHOSPHATE HOLDINGS, INC. AND SUBSIDIARY
Notes to Consolidated Financial Statements—(Continued)
December 31, 2007, 2006, and 2005
(Dollars in thousands unless otherwise indicated)
| | (j) | Property, Plant, and Equipment |
Property, plant, and equipment are stated at cost, less accumulated depreciation. Expenditures for major improvements are capitalized; expenditures for normal maintenance and repairs are charged to expense as incurred. Depreciation expense is computed using the straight-line method over the estimated useful lives of the assets as follows:
| | |
Buildings | | 31 to 40 years |
Land improvements | | 20 to 31 years |
Machinery and equipment | | 2 to 10 years |
Replacement parts | | 10 years |
| | (k) | Impairment of Long-Lived Assets |
In accordance with SFAS No. 144,Accounting for the Impairment or Disposal of Long-Lived Assets, long-lived assets, such as property, plant, and equipment, are reviewed for impairment whenever events or changes in circumstances indicate that the carrying amount of an asset may not be recoverable. If circumstances require that a long-lived asset be tested for possible impairment, the Company first compares undiscounted cash flows expected to be generated by an asset to the carrying value of the asset. If the carrying value of the long-lived asset is not recoverable on an undiscounted cash flow basis. An impairment is recognized to the extent that the carrying value of the asset exceeds its fair value. Fair value is determined through various valuation techniques including discounted cash flow models, quoted market values and third-party independent appraisals, as considered necessary.
Income taxes are accounted for under the asset and liability method. Deferred tax assets and liabilities are recognized for the future tax consequences attributable to differences between the financial statement carrying amounts of existing assets and liabilities and their respective tax bases and operating loss and tax credit carryforwards. Deferred tax assets and liabilities are measured using enacted tax rates expected to apply to taxable income in the years in which those temporary differences are expected to be recovered or settled. The effect on deferred tax assets and liabilities of a change in tax rates is recognized in income in the period that includes the enactment date. Beginning with the adoption of Financial Accounting Standards Board (FASB) Interpretation No. 48,Accounting for Uncertainty in Income Taxes (FIN 48) as of January 1, 2007, the Company recognizes the effect of income tax positions only if those positions are more likely than not of being sustained. Recognized income tax positions are measured at the largest amount that is greater than 50% likely of being realized. Changes in recognition or measurement are reflected in the period in which the change in judgment occurs. Prior to the adoption of FIN 48, the Company recognized the effect of income tax positions only if such positions were probable of being sustained. Upon adoption, the Company recorded no liability for unrecognized tax benefits as it believes all of the Company’s tax positions are highly certain of being recognized for income tax purposes. Therefore, the adoption of FIN 48 had no impact on the Company’s consolidated financial position or its results of operations.
F-10
PHOSPHATE HOLDINGS, INC. AND SUBSIDIARY
Notes to Consolidated Financial Statements—(Continued)
December 31, 2007, 2006, and 2005
(Dollars in thousands unless otherwise indicated)
Environmental expenditures that relate to existing conditions caused by past operations, and that do not contribute to current or future revenue generation, are expensed. Environmental costs are capitalized if the costs extend the life of the property, increase its capacity or mitigate or prevent contamination from future operations.
| | (n) | Asset Retirement Obligations |
The Company is required to maintain a disposal facility for its by-product phosphogypsum. Under an agreement with the MDEQ, the Company is obligated to incur future costs associated with closure and related remediation of the disposal facilities. The Company develops estimates for the cost to close its disposal facility as well as the related environmental remediation requirements pursuant to the guidance set forth in SFAS No. 143,Accounting for Asset Retirement Obligations. The costs are adjusted for inflation and discounted based on a credit adjusted risk free rate. Over time, the liability is accreted to its present value. The accretion expense is included as a component of cost of sales in the accompanying consolidated statements of operations.
Revenue is recognized when the earnings process is completed. The Company considers the earnings process to be complete when the risk of ownership and title passes to the customer, collection of the related receivable is probable, evidence of an arrangement exists and the sales price is fixed or determinable. Base prices for the Company’s product are set pursuant to sales contracts based on current published prices or upon negotiated short-term prices with the customer. Shipping and handling costs incurred by the Company are included in cost of sales.
| | (p) | DAP Trading Activities |
The Company has entered into an agreement with a third party whereby the third party and the Company jointly identify opportunities to purchase and resell DAP in the domestic market. When an opportunity is identified, the third party purchases and ultimately resells the DAP. Under the terms of the agreement, the Company and the third party each share 50 percent of the gain or loss on the completed transaction. The Company is obligated to remit to the trading partner the Company’s share of any losses incurred in conjunction with this activity but is not obligated to accept or make delivery of DAP pursuant to any of these trading positions. The Company marks open trading positions to market at each reporting period end based on its profit and loss sharing percentage. The income or loss related to this activity is reported as other sales revenue.
| | (q) | Maintenance Turnaround Costs |
The Pascagoula facility schedules periodic maintenance turnarounds for the various plants within the facility. The associated costs of these turnarounds are capitalized and then amortized as part of cost of sales over the expected benefit period.
F-11
PHOSPHATE HOLDINGS, INC. AND SUBSIDIARY
Notes to Consolidated Financial Statements—(Continued)
December 31, 2007, 2006, and 2005
(Dollars in thousands unless otherwise indicated)
| | (r) | Share-Based Compensation |
Effective January 1, 2006, the Company adopted SFAS No. 123 (revised 2004),Share-Based Payment (SFAS 123R), which requires the measurement and recognition of compensation expense for all share-based payment awards to be made based on estimated grant date fair values. SFAS 123R supersedes the Company’s previous accounting under Accounting Principles Board Opinion No. 25,Accounting for Stock Issued to Employees (APB 25), which was in effect for years prior to 2006. The Company adopted SFAS 123R using the modified prospective transition method, which requires the application of the accounting standard for all awards, including those granted prior to the adoption date, beginning as of January 1, 2006. Accordingly, the consolidated financial statements for the year ended December 31, 2005 have not been adjusted to reflect the provisions of SFAS 123R.
The following table illustrates the effect on net income and net income per share if the Company had accounted for share-based compensation using the fair value method in the year ended December 31, 2005:
| | | | |
Net income as reported | | $ | 4,884 | |
Deduct: Share-based compensation expense determined using the fair value based method, net of related tax effects | | | (46 | ) |
| | | | |
Pro forma net income | | $ | 4,838 | |
| | | | |
Earnings per share: | | | | |
Basic—as reported | | $ | 0.68 | |
| | | | |
Basic—pro forma | | $ | 0.68 | |
| | | | |
Diluted—as reported | | $ | 0.66 | |
| | | | |
Diluted—pro forma | | $ | 0.66 | |
| | | | |
Under the fair value recognition provisions of SFAS 123R, share-based compensation cost is measured at the grant date based on the fair value of the award and is recognized as expense on a straight-line basis over the requisite service period, which is the vesting period. The fair value of share-based payment awards on the date of grant is determined using an option-pricing model which is affected by assumptions regarding a number of complex and subjective variables, which include the expected life of the award, the expected stock price volatility over the expected life of the awards, expected dividend yield, and the risk-free interest rate.
| | (s) | Fair Value of Financial Instruments |
Due to their short-term nature, the Company’s cash and cash equivalents, accounts receivable, accounts payable and short-term financing obligations are carried at cost, which approximates fair value. The revolving credit facility’s recorded value approximates its fair value as it bears interest at a floating rate. The Company’s restricted investments are recorded at fair value based upon quoted closing market prices.
F-12
PHOSPHATE HOLDINGS, INC. AND SUBSIDIARY
Notes to Consolidated Financial Statements—(Continued)
December 31, 2007, 2006, and 2005
(Dollars in thousands unless otherwise indicated)
| | (t) | Recent Accounting Pronouncements |
In September 2006, the FASB issued SFAS No. 157,Fair Value Measurements(SFAS 157). SFAS 157 defines fair value, establishes a framework for measuring fair value and expands disclosure about the use of fair value measurements. As amended, SFAS 157 is effective for financial assets and liabilities in fiscal years beginning after November 15, 2007, and for non-financial assets and liabilities in fiscal years beginning after November 15, 2008. The Company will adopt SFAS 157 for financial assets and liabilities in the first quarter of fiscal 2008. The adoption of SFAS 157 for financial assets and liabilities is not expected to have a material impact to the Company’s consolidated financial statements. The Company is currently evaluating the impact the application of SFAS 157 will have on the consolidated financial statements as it relates to non-financial assets and liabilities.
In February 2007, the FASB issued SFAS No. 159,The Fair Value Option for Financial Assets and Financial Liabilities(SFAS 159). SFAS 159 permits entities to choose to measure many financial instruments and certain other items at fair value. SFAS 159 is effective for fiscal years beginning after November 15, 2007. The Company does not anticipate that the impact of adopting SFAS 159 will have a material impact on the financial position of the Company.
In December 2007, the FASB issued SFAS No. 141 (Revised 2007),Business Combinations (SFAS 141R) and SFAS No. 160,Noncontrolling Interests in Consolidated Financial Statements, an Amendment of ARB No. 51 (SFAS 160). SFAS 141R and SFAS 160 significantly change the accounting for and reporting of business combination transactions and noncontrolling (minority) interests. Under SFAS 141R, an acquiring entity will be required to recognize all the assets and liabilities assumed in a transaction at the acquisition date fair value. In addition, SFAS 141R includes a substantial number of additional disclosure requirements. SFAS 160 changes the accounting and reporting for minority interests, which will be recharacterized as noncontrolling interests and classified as a component of equity. The Company will be required to apply the provisions of SFAS 141R and SFAS 160 prospectively effective January 1, 2009.
In March 2008, the FASB issued SFAS 161,Disclosure about Derivative Instruments and Hedging Activities, an Amendment of FASB Statement No. 133 (SFAS 161). SFAS 161 changes the disclosure requirements for derivative instruments and hedging activities. The Company will be required to provide enhanced disclosures about (a) how and why the Company uses derivative instruments, (b) how these derivative and related hedged items are accounted for pursuant to SFAS 133 and related interpretations and (c) how these items will affect the Company’s financial position, financial performance and cash flows. The Company must adopt SFAS 161 effective January 1, 2009. The Company does not anticipate any significant impact on their financial position or operating results in applying this statement.
F-13
PHOSPHATE HOLDINGS, INC. AND SUBSIDIARY
Notes to Consolidated Financial Statements—(Continued)
December 31, 2007, 2006, and 2005
(Dollars in thousands unless otherwise indicated)
Inventories consisted of the following:
| | | | | |
| | | December 31, |
| | | 2007 | | 2006 |
Raw materials | | $ | 5,104 | | 4,634 |
Finished goods | | | 7,740 | | 4,139 |
Replacement parts | | | 5,259 | | 4,833 |
| | | | | |
| | $ | 18,103 | | 13,606 |
| | | | | |
Phosphate rock is a primary raw material in the manufacture of DAP. Effective January 1, 2005, the Company entered into a contract with OCP S.A. (OCP) in Morocco to import its full requirement of phosphate rock through December 31, 2008. The purchase price of rock was fixed for the period January 1, 2005 through June 30, 2006. The purchase prices for the periods July 1, 2006 through December 31, 2006, January 1, 2007 through December 31, 2007, and January 1, 2008 through September 30, 2008 were each established based on negotiation between the parties. The purchase price of phosphate rock for the fourth quarter of 2008 will also be based upon negotiations between the parties. On June 6, 2008, OCP notified the Company that, rather than extend the current contract, it desired to enter into a new agreement prior to December 31, 2008. Management is currently negotiating a new contract and believes a new long-term supply arrangement with OCP will be achieved before December 31, 2008, although there can be no assurances that such agreement will be reached. As of the date of this report, no contract is in place with OCP to purchase phosphate rock subsequent to December 31, 2008.
| (3) | Prepaid Expenses and Other |
Prepaid expenses and other consisted of the following:
| | | | | |
| | | December 31, |
| | | 2007 | | 2006 |
Prepaid insurance | | $ | 2,465 | | 2,946 |
Prepaid maintenance turnaround costs | | | 1,469 | | 866 |
Deposits | | | 384 | | 632 |
Prepaid income taxes | | | 113 | | — |
Other | | | 526 | | 228 |
| | | | | |
| | $ | 4,957 | | 4,672 |
| | | | | |
Amortization expense related to maintenance turnaround costs was $2,891, $1,011, and $308 for the years ended December 31, 2007, 2006, and 2005, respectively. These expenses are included as a component of cost of sales. In addition, maintenance turnaround costs of $777 were written off in 2005 as a result of damage sustained from Hurricane Katrina.
F-14
PHOSPHATE HOLDINGS, INC. AND SUBSIDIARY
Notes to Consolidated Financial Statements—(Continued)
December 31, 2007, 2006, and 2005
(Dollars in thousands unless otherwise indicated)
| (4) | Property, Plant and Equipment, Net |
Property, plant and equipment consisted of the following:
| | | | | |
| | | December 31, |
| | | 2007 | | 2006 |
Buildings | | $ | 2,044 | | 2,044 |
Land improvements | | | 3,757 | | 287 |
Machinery and equipment | | | 38,004 | | 33,272 |
Replacement parts | | | 1,690 | | 1,194 |
Construction in progress | | | 2,697 | | 1,019 |
| | | | | |
| | | 48,192 | | 37,816 |
Less accumulated depreciation | | | 6,775 | | 2,597 |
| | | | | |
Property, plant and equipment, net | | $ | 41,417 | | 35,219 |
| | | | | |
Depreciation expense totaled $4,199, $2,561, and $58 for the years ended December 31, 2007, 2006, and 2005, respectively.
Accounts payable and accrued expenses consisted of the following:
| | | | | |
| | | December 31, |
| | | 2007 | | 2006 |
Accrued compensation | | $ | 7,597 | | 1,596 |
Accrued raw material purchases | | | 5,182 | | 3,697 |
Accrued environmental settlements | | | 1,950 | | — |
Accrued freight | | | 652 | | 129 |
Accrued property taxes | | | 538 | | 521 |
Accrued utilities | | | 522 | | 889 |
Accrued self-insurance claims | | | 294 | | 356 |
Other | | | 1,968 | | 688 |
| | | | | |
| | $ | 18,703 | | 7,876 |
| | | | | |
Approximately $6,983 of the accrued compensation at December 31, 2007, relates to cash bonuses payable to two officers of the Company pursuant to their employment agreements, which were entered into effective as of the Emergence Date. The bonuses are based on the Company’s net cash flow (earnings before bonuses, interest, taxes, depreciation and amortization less capital expenditures of a normal and customary nature and net cash payments for interest, federal, state and local taxes) for the period from the Emergence Date through December 31, 2007. Effective January 1, 2008, the two officers entered into new employment agreements. Under the new agreements, bonuses are calculated based on return on equity, as defined in the agreements and are shared with additional members of management with the approval of the Company’s Board of Directors.
F-15
PHOSPHATE HOLDINGS, INC. AND SUBSIDIARY
Notes to Consolidated Financial Statements—(Continued)
December 31, 2007, 2006, and 2005
(Dollars in thousands unless otherwise indicated)
| (6) | Short-term Financing Obligation |
The Company has financed its property and liability insurance premiums for policy periods ranging from December 2007 through December 2008. The premiums are financed at an interest rate of 5.75%. The notes are payable in monthly installments and mature at dates ranging from June 2008 through December 2008.
As of December 31, 2007 and 2006, the Company had a revolving credit agreement with PNC Bank, National Association (PNC), which provides for revolving advances based on specified percentages of accounts receivable and inventories. The maximum revolving advance amount under this agreement was $15,000 and $17,500 at December 31, 2007 and 2006, respectively. In 2006, borrowings bore interest at a variable rate which was the greater of PNC’s base rate plus 1.00% or the Federal Funds Open Rate plus 1.50%. This rate was 9.25% at December 31, 2006. On March 23, 2007, the Company executed an amendment to its revolving credit agreement with PNC which changed interest charges to the Company’s option of the Alternate Base Rate plus 0.50% or the Eurodollar Rate (both as defined in the credit agreement) plus 3.00%. The Company was charged an annual commitment fee of 0.50% on the unused portion of the revolving advances throughout 2007 and 2006. The Company had $13,921 available to borrow under the borrowing base limitations of the revolving credit agreement at December 31, 2007. The Company had no borrowings outstanding under this revolving credit agreement at December 31, 2007, and had $4,875 of borrowings outstanding at December 31, 2006. The revolving credit agreement expires on March 31, 2011. As of December 31, 2007, the Company also had a $3,000 term loan available for its use under this agreement which is available to be drawn through December 31, 2008 to fund the construction cost of its storm protection levee which was completed in 2007. The Company had no borrowings outstanding under the term loan as of December 31, 2007.
The borrowings are collateralized by receivables, inventories, equipment, and other personal property. Financial covenants of the revolving credit agreement require the Company to maintain specified levels of tangible net worth and fixed charge coverage ratios and to limit capital expenditures. For fiscal years 2007 and 2008 only, the capital expenditure covenant excludes Katrina-related expenditures.
On May 5, 2008, the Company executed an amendment to its revolving credit agreement with PNC, which increases the maximum borrowing amount to $27,000. The amendment also changes the Company’s annual commitment fee to 0.40% on the unused portion of the revolving credit agreement.
| (8) | Asset Retirement Obligations |
In conjunction with producing DAP, the Company is required to maintain a phosphogypsum disposal facility for its waste byproducts. The Company’s East disposal facility became fully operational during 2003. Prior to 2003, the Company maintained a West disposal facility for its waste byproducts. The closure of the West facility was completed in 2005. There is no asset retirement obligation recorded for the West facility as the closure is complete and the related water leachate is being used by the Company in production. The Company has a legal obligation to incur future costs associated with the closure of the East disposal facility. Accordingly, the Company has recorded the estimated fair
F-16
PHOSPHATE HOLDINGS, INC. AND SUBSIDIARY
Notes to Consolidated Financial Statements—(Continued)
December 31, 2007, 2006, and 2005
(Dollars in thousands unless otherwise indicated)
value of the asset retirement obligations in accordance with SFAS No. 143. The liability for the East disposal facility costs include closure, post-closure monitoring and related water treatment. The actual amounts to be spent will depend on factors such as the timing of activities, refinements in scope, technological developments, cost inflation, changes in regulations, as well as the Company’s business plans. It is possible that these factors could change and that such changes could have a significant impact on the estimates included in the accompanying consolidated financial statements. Closure expenditures for the East disposal facility are currently estimated to occur in the 2025 to 2033 timeframe.
The balance of the Company’s asset retirement obligations and changes thereto are summarized below. Accretion expense is reported in cost of sales in the accompanying consolidated statements of operations.
| | | |
Obligations at December 31, 2004 | | $ | 3,829 |
Accretion expense | | | 380 |
| | | |
Obligations at December 31, 2005 | | | 4,209 |
Accretion expense | | | 418 |
| | | |
Obligations at December 31, 2006 | | | 4,627 |
Accretion expense | | | 459 |
| | | |
Obligations at December 31, 2007 | | $ | 5,086 |
| | | |
As described in Note 1, the Company has developed a financial assurance mechanism with the MDEQ to ensure funds will be available to satisfy the Company’s asset retirement obligations. Quarterly payments in the amount of $200 are made into a trust fund managed by a third-party trustee and will be used to fund closure, post-closure monitoring and remediation of the East disposal facility.
Prior to June 20, 2007, all of the common stock of PHI was owned by the Trust. The beneficial ownership of the Trust was represented by Trust Units, which were freely tradable. At a special meeting of the stockholders of PHI on June 19, 2007, the Trust voted to amend the Certificate of Incorporation of PHI to increase the authorized shares of PHI to 11,000,000 shares of common stock, $0.01 par value, and to effectuate a 7,654.29 to 1 split of all issued and outstanding shares of PHI. On June 20, 2007, at a Special Meeting of the Trust Unit Holders, dissolution of the Trust was approved. As a result of the dissolution of the Trust, the Unit Holders received their proportionate interest in the assets of the Trust consisting of 7,654,290 shares of PHI common stock. All share information included in the accompanying consolidated financial statements and related notes, including reported earnings per share, have been adjusted to reflect the Company’s capital structure as of December 31, 2007.
On December 5, 2007, the Board of Directors of the Company adopted a stockholders’ rights plan. Under the plan, the Company declared a dividend of one common stock purchase right for each share of the Company’s common stock outstanding payable on December 17, 2007, to stockholders of record at the close of business on such date. Under the plan, the rights will initially trade together with the Company’s common stock and will not be exercisable. The rights generally will become exercisable
F-17
PHOSPHATE HOLDINGS, INC. AND SUBSIDIARY
Notes to Consolidated Financial Statements—(Continued)
December 31, 2007, 2006, and 2005
(Dollars in thousands unless otherwise indicated)
to acquire the Company’s common stock (or, in certain circumstances, shares of an acquirer) at a discounted price if a person or group becomes an “acquiring person” through the acquisition of 20% or more of the Company’s outstanding common stock or the announcement of a tender or exchange offer that would result in ownership of 20% or more of the Company’s common stock on terms not approved by the Company. If a person or group already owned 20% or more of the Company’s outstanding common stock on the date the rights plan was adopted, the rights will become exercisable if that person or group acquires any additional shares of the Company’s outstanding common stock after the date of the adoption of the plan. Rights held by an “acquiring person” will become void and will not be exercisable to purchase shares at the bargain purchase price. The Company, at its option, may redeem the rights for $0.01 per right for a limited time after a person becomes an “acquiring person.” The plan also permits the Company to issue to holders of its common stock, other than an “acquiring person,” one share of common stock in exchange for each right, which is then exercisable. The rights will expire on December 31, 2009, unless earlier redeemed, exchanged, or amended.
SFAS No. 128,Earnings Per Share(SFAS 128), requires the presentation of basic and diluted earnings per share. Basic earnings per share is calculated based on the weighted-average shares of common stock outstanding during the period. Diluted earnings per share is calculated to include any dilutive effect of common stock equivalents. The Company’s common stock equivalents consist of stock options. The dilutive effect of the stock options is calculated using the treasury stock method in accordance with the provisions of SFAS 128.
The weighted-average number of common shares outstanding for the purpose of computing basic and diluted earnings per share is as follows (in thousands):
| | | | | | |
| | | Years ended December 31, |
| | | 2007 | | 2006 | | 2005 |
Weighted-average number of common shares outstanding—basic | | 7,654 | | 7,369 | | 7,146 |
Common stock equivalents | | 435 | | — | | 227 |
| | | | | | |
Weighted-average number of common shares outstanding—diluted | | 8,089 | | 7,369 | | 7,373 |
| | | | | | |
Pursuant to the provisions of SFAS 128, common stock equivalents totaling 130 have been excluded from the computation of diluted net loss per share for the year ended December 31, 2006 because their inclusion would have reduced the reported net loss per share.
F-18
PHOSPHATE HOLDINGS, INC. AND SUBSIDIARY
Notes to Consolidated Financial Statements—(Continued)
December 31, 2007, 2006, and 2005
(Dollars in thousands unless otherwise indicated)
| (11) | Concentration of Business |
Effective January 1, 2007, all of the Company’s sales of DAP into international markets are made through a single wholesale broker, while all domestic sales of DAP are made through the Company’s internal sales staff. Approximately 35%, 29%, and 13% of the Company’s DAP sales were made into international markets in 2007, 2006, and 2005, respectively.
Customers which account for over 10% of total net sales are shown below:
| | | | | | | | | | | | | | | | | | |
| | | 2007 | | | 2006 | | | 2005 | |
| | | Sales
amount | | Percent of
total | | | Sales
amount | | Percent of
total | | | Sales
amount | | Percent of
total | |
Customer A | | $ | 112,733 | | 51 | % | | $ | 21,904 | | 17 | % | | $ | — | | — | |
Customer B | | | 29,628 | | 13 | % | | | 24,286 | | 18 | % | | | 22,225 | | 22 | % |
Customer C | | | 26,910 | | 12 | % | | | 17,944 | | 14 | % | | | 18,352 | | 18 | % |
Customer D | | | — | | — | | | | 37,746 | | 29 | % | | | 13,263 | | 13 | % |
Customer E | | | — | | — | | | | — | | — | | | | 12,022 | | 12 | % |
Customer F | | | — | | — | | | | — | | — | | | | 11,679 | | 12 | % |
Customers which account for over 10% of trade accounts receivable are shown below:
| | | | | | | | | | | | |
| | | 2007 | | | 2006 | |
| | | Outstanding
receivables | | Percent of
total | | | Outstanding
receivables | | Percent of
total | |
Customer A | | $ | 2,231 | | 22 | % | | $ | — | | — | |
Customer B | | | 2,270 | | 23 | % | | | 3,181 | | 58 | % |
Customer C | | | — | | — | | | | 675 | | 12 | % |
Customer G | | | 1,479 | | 15 | % | | | 713 | | 13 | % |
Customer H | | | 1,577 | | 16 | % | | | — | | — | |
Interest, net, consisted of the following for the years ended December 31:
| | | | | | | | | | |
| | | 2007 | | | 2006 | | | 2005 | |
Interest expense | | $ | (421 | ) | | (1,004 | ) | | (173 | ) |
Interest income | | | 722 | | | 269 | | | 100 | |
| | | | | | | | | | |
Net interest income (expense) | | $ | 301 | | | (735 | ) | | (73 | ) |
| | | | | | | | | | |
F-19
PHOSPHATE HOLDINGS, INC. AND SUBSIDIARY
Notes to Consolidated Financial Statements—(Continued)
December 31, 2007, 2006, and 2005
(Dollars in thousands unless otherwise indicated)
Income tax expense consisted of the following for the years ended December 31:
| | | | | | | |
| | | 2007 | | 2006 | | 2005 |
Current: | | | | | | | |
Federal | | $ | 2,619 | | — | | — |
State | | | 718 | | — | | — |
Deferred: | | | | | | | |
Federal | | | 23,239 | | — | | 2,097 |
State | | | 2,963 | | — | | 368 |
| | | | | | | |
Total income tax expense | | $ | 29,539 | | — | | 2,465 |
| | | | | | | |
The differences between income tax expense at the federal statutory rate of 35% and reported income tax expense were as follows for the years ended December 31:
| | | | | | | | | | | | | | | | | | | | | |
| | | 2007 | | | 2006 | | | 2005 | |
| | | Amount | | | Percent of
pre-tax
income | | | Amount | | | Percent of
pre-tax
income | | | Amount | | | Percent of
pre-tax
income | |
Expected income tax expense (benefit) | | $ | 27,450 | | | 35.0 | % | | $ | (628 | ) | | 35.0 | % | | $ | 2,572 | | | 35.0 | % |
State income taxes, net | | | 2,459 | | | 3.1 | % | | | (67 | ) | | 3.7 | % | | | 239 | | | 3.3 | % |
Increase (decrease) in valuation allowance | | | (773 | ) | | (1.0 | )% | | | 773 | | | (43.1 | )% | | | — | | | — | |
Other, net | | | 403 | | | 0.6 | % | | | (78 | ) | | 4.4 | % | | | (346 | ) | | (4.8 | )% |
| | | | | | | | | | | | | | | | | | | | | |
Total income tax expense | | $ | 29,539 | | | 37.7 | % | | $ | — | | | — | % | | $ | 2,465 | | | 33.5 | % |
| | | | | | | | | | | | | | | | | | | | | |
F-20
PHOSPHATE HOLDINGS, INC. AND SUBSIDIARY
Notes to Consolidated Financial Statements—(Continued)
December 31, 2007, 2006, and 2005
(Dollars in thousands unless otherwise indicated)
Deferred income tax assets and liabilities consisted of the following at December 31:
| | | | | |
| | | 2007 | | 2006 |
Deferred tax liabilities: | | | | | |
Property, plant and equipment | | $ | 3,376 | | — |
Gain on involuntary conversion | | | 12,828 | | — |
Prepaid and other assets | | | 1,001 | | 1,185 |
| | | | | |
Total deferred tax liabilities | | | 17,205 | | 1,185 |
| | |
Deferred tax assets: | | | | | |
Net operating loss carryforwards | | | 2,635 | | 14,453 |
Property, plant and equipment | | | — | | 220 |
Tax credit carryforwards | | | 1,456 | | 631 |
Asset retirement obligation | | | 1,946 | | 1,770 |
Accrued expenses and other liabilities | | | 246 | | 275 |
Other | | | 1,118 | | 1,007 |
| | | | | |
Total deferred tax assets | | | 7,401 | | 18,356 |
Less valuation allowance | | | — | | 17,171 |
| | | | | |
Total deferred tax assets, net of valuation allowance | | | 7,401 | | 1,185 |
| | | | | |
Net deferred tax liabilities | | $ | 9,804 | | — |
| | | | | |
As of December 31, the net deferred tax liabilities are presented in the accompanying consolidated balance sheets as follows:
| | | | | | | |
| | | 2007 | | | 2006 | |
Current deferred income tax assets | | $ | 1,059 | | | — | |
Long-term deferred income tax assets | | | — | | | 1,036 | |
Current deferred income tax liabilities | | | — | | | (1,036 | ) |
Long-term deferred income tax liabilities | | | (10,863 | ) | | — | |
| | | | | | | |
| | $ | (9,804 | ) | | — | |
| | | | | | | |
A valuation allowance was provided on the associated deferred tax assets as of December 31, 2006, due to the uncertainty of realization of the tax benefits associated with the Company’s net deferred tax assets. During 2007, management reduced the valuation allowance associated with these net deferred tax assets by $17,171, based upon the determination that it is more likely than not that the net operating loss carryforwards will be realized in future years based upon an evaluation of the reversal of existing taxable temporary differences as well as projected future income resulting from the recent significant increase in the price of DAP. Of the total reduction in the valuation allowance in 2007, $16,398 was applicable to the valuation allowance established as of the Emergence Date and, accordingly, was recorded as an addition to additional paid-in capital in accordance with SOP 90-7. As of December 31, 2007, the Company had net operating loss carryforwards totaling approximately $6,789 which are subject to annual utilization limitations pursuant to Internal Revenue Code section 382 of approximately $453 through 2022.
F-21
PHOSPHATE HOLDINGS, INC. AND SUBSIDIARY
Notes to Consolidated Financial Statements—(Continued)
December 31, 2007, 2006, and 2005
(Dollars in thousands unless otherwise indicated)
The valuation allowance provided against recorded deferred tax assets was $0, $17,171, and $16,398 as of December 31, 2007, 2006, and 2005, respectively. An increase in the valuation allowance was recorded during 2006 to reserve for the additional deferred tax assets related to the net operating loss incurred in 2006. The reduction in the valuation allowance during 2007 was primarily the result of an increase in deferred tax liabilities resulting from the recognition of the hurricane related gain, the utilization of net operating loss carryforwards in the current year, and the reversal of the balance of the valuation reserve as a result of management’s conclusion that it was more likely than not that they would be realized. This conclusion was based upon an assessment of the scheduled reversals of timing differences as well as projected future income levels.
The Company had no significant unrecognized tax benefits at the date of adoption of FIN 48 or at December 31, 2007. If interest or penalties were to be incurred related to uncertain tax positions, such amounts would be recognized in income tax expense. Tax periods for all years after 2004 remain open for examination by the federal and state taxing jurisdictions to which the Company is subject. The Company does not anticipate any significant changes in unrecognized tax benefits during the next twelve months.
The Company has a contributory thrift plan that covers substantially all regular full-time employees who have elected to participate in the plan. The Company matches a certain percentage of each employee’s contributions to the plan up to a maximum percentage of the employee’s base compensation. The Company’s expense related to this plan totaled approximately $283, $237, and $196 in 2007, 2006, and 2005, respectively.
The Company has commitments under operating leases for equipment and office space. The following is a schedule of the future minimum rental payments required as of December 31, 2007, under operating leases having noncancelable lease terms in excess of one year as of the respective lease’s inception:
| | | |
| | | Amount |
Years ending December 31: | | | |
2008 | | $ | 185 |
2009 | | | 92 |
2010 | | | 30 |
| | | |
| | $ | 307 |
| | | |
Rental expense for all operating leases was $367, $362, and $156 for the years ended December 31, 2007, 2006, and 2005, respectively.
F-22
PHOSPHATE HOLDINGS, INC. AND SUBSIDIARY
Notes to Consolidated Financial Statements—(Continued)
December 31, 2007, 2006, and 2005
(Dollars in thousands unless otherwise indicated)
| | (b) | Open DAP Trading Positions |
As discussed in Note 1 to the consolidated financial statements, the Company engages in DAP trading activities pursuant to which the Company is exposed to market price risk. The Company’s exposure and opportunity related to open trading positions is limited based on a negotiated profit and loss sharing percentage with a third party who is responsible for executing and settling the trading positions, including taking physical delivery of DAP, when necessary. The Company is not obligated to accept or make delivery of DAP pursuant to the trading positions executed by its trading partner. As of December 31, 2007, the Company and its trading partner had open long positions in DAP totaling 4,689 tons which had a market value of approximately $2,579. The Company’s share of the mark-to-market gain related to these open trading positions totaled $99.
Net trading gains, which include the mark-to-market adjustments discussed above for the open positions as of year end, totaled $451 for the year ended December 31, 2007. The Company did not engage in DAP trading activity during 2006 or 2005.
| (16) | Share-based Compensation |
On the Emergence Date, the Company granted options covering a total of 841,960 shares to two executive employees. Of this total, 459,251 of the options were subject to time based vesting during the twelve months subsequent to the Emergence Date (the Tranche 1 Options) and 382,709 of the options were subject to a performance condition which was satisfied on January 1, 2005 (the Tranche 2 Options). Tranche 1 and Tranche 2 options covering 500,000 shares were exercised in 2005 and the remaining 341,960 of these options were exercised in 2006. The strike price on the Tranche 1 Option grant was greater than the market value of the Company’s stock as of the grant. Additionally, the strike price of the Tranche 2 Option grant was greater than the market value of the Company’s stock as of the date the performance condition was satisfied. Accordingly, pursuant to the provisions of APB 25, no compensation expense has been recorded related to the Tranche 1 and Tranche 2 Options.
In addition to the options discussed above, as of the Emergence Date, the Company also granted options covering a total of 757,018 shares (the Tranche 3 and Tranche 4 Options) to the same two executive employees discussed above. These options include performance conditions related to the achievement of certain investor rate of return targets and the achievement of certain stock liquidity objectives, as specified in the respective agreements. As discussed in Note 1, these options were accounted for pursuant to the provisions of APB 25 prior to the adoption of SFAS 123R on January 1, 2006. Under APB 25, options which contain performance conditions are accounted for as variable awards until the measurement date is determined, which occurs when the performance condition or conditions are satisfied. As a variable award, compensation expense is recognized as of the end of each reporting period prior to the measurement date based on 1) the intrinsic value of the option, and 2) management’s assessment of the probability of satisfying the performance condition. Based on an evaluation of the stock option performance conditions, management determined that the options were not probable of exercise, and as such, recorded no compensation expense related to these options for the year ended December 31, 2005. Beginning on January 1, 2006, pursuant to the adoption of SFAS 123R, the Company has recorded compensation expense for the Tranche 3 and Tranche 4 options based on their grant date fair value. As of July 31, 2007, the performance conditions were satisfied and the options became fully vested, which resulted in the remaining unrecognized compensation expense measured pursuant to SFAS 123R being charged to earnings at that time.
F-23
PHOSPHATE HOLDINGS, INC. AND SUBSIDIARY
Notes to Consolidated Financial Statements—(Continued)
December 31, 2007, 2006, and 2005
(Dollars in thousands unless otherwise indicated)
Recorded share-based compensation expense related to the Company’s stock options totaled $223, $74, and $0 for the years ended December 31, 2007, 2006, and 2005, respectively. Tax benefits related to the share-based compensation expense has been recorded using a blended federal and state income tax rate of 38.25%.
A summary of the Company’s stock option activity during the year ended December 31, 2007 is as follows:
| | | | | | | | | | |
| | | Options | | Weighted-
average
exercise
price | | Weighted-
average
remaining
contractual
life | | Aggregated
intrinsic
value |
Outstanding as of December 31, 2006 | | 757,018 | | $ | 2.36 | | 3 | | $ | 4,421 |
Granted | | — | | | | | | | | |
Exercised | | — | | | | | | | | |
Forfeited | | — | | | | | | | | |
| | | | | | | | | | |
Outstanding as of December 31, 2007 | | 757,018 | | | 2.36 | | 2 | | | 29,251 |
| | | | | | | | | | |
Exercisable as of December 31, 2007 | | 757,018 | | | 2.36 | | 2 | | | 29,251 |
The intrinsic value of options exercised during 2007, 2006, and 2005 was $0, $2,339, and $4,770, respectively.
| | (b) | Stock Appreciation Rights (SARs) |
On April 29, 2008, the Company granted 21,703 Stock Appreciation Rights (SAR) to the Directors of the Company (the Director SARs). The Director SARs are to be settled with a cash payment equal to the intrinsic value of the SAR as of the exercise date. One-third of the Director SARs vest on each of the first three anniversary dates following the grant date. The Director SARs expire on the fifth anniversary of the grant date.
On May 5, 2008, the Company granted 25,000 SARs to a key employee (the Employee SARs). The Employee SARs vest on the second anniversary of the grant date and are to be settled with a cash payment equal to the intrinsic value of the SAR as of the exercise date. In the event that the Company’s shares become registered with the Securities Exchange Commission, the Employee SARs shall immediately convert to stock options on the same terms as the Employee SARs except that there will no longer be a cash settlement feature.
Both the Director SARs and the Employee SARs will be accounted for as liability awards with compensation cost measured as of the end of each reporting period based on the then current fair value of the SAR.
On May 5, 2008, the Company issued a phantom stock award valued at $100 as of the grant date to a key employee. As of the grant date the award equated to 2,723 shares of the Company’s stock. On each of the first two anniversary dates of the grant, the employee is to receive a cash payment equal to the then fair value of 50% of the 2,723 shares. This award will be accounted for as a liability award with compensation cost measured as of the end of each reporting period based on the market value of the Company’s stock.
F-24
PHOSPHATE HOLDINGS, INC. AND SUBSIDIARY
Notes to Consolidated Financial Statements—(Continued)
December 31, 2007, 2006, and 2005
(Dollars in thousands unless otherwise indicated)
| | (a) | Phosphate Industry Investigation |
In 2003, the U.S. Environmental Projection Agency (EPA) announced a nationwide review of all mineral processing facilities. As a result, the EPA selected the mineral processing industry as a national enforcement and compliance priority for fiscal years 2005 and 2006. One focus of this initiative is to examine the scope of applicability of the Bevill Amendment to Subtitle C of the Resource Conservation Recovery Act (RCRA), which exempts waste generated during phosphate mining beneficiation and processing activities from regulation under RCRA. As a part of the EPA initiative, between 2005 and 2007, the EPA visited all phosphate producers in the United States. In January and March 2005, the EPA conducted site visits at the Company’s facility in Pascagoula, Mississippi. In September 2005, the EPA issued a Notice of Violation (NOV) to the Company alleging that the reuse of low pH process water as DAP scrubber water and other use within the facility is not protected by the Bevill Amendment and therefore violates RCRA. The Company believes that it has meritorious defenses against the allegations of the NOV, including prior written guidance and interpretations from the EPA inconsistent with its assertions in the NOV. The EPA has issued similar NOVs to other U.S. phosphate producers.
On June 8, 2007, the Company and the EPA entered into a consent order, which requires the Company to prepare a plan for groundwater and surface water sampling around the facility. The consent order is part of the phosphate industry initiative, pursuant to which the EPA is requiring all the phosphate producing facilities to conduct groundwater and surface water sampling. The Company currently conducts a majority of the sampling requested by the EPA under current MDEQ permits. To date, there is no indication from current groundwater and surface sampling that there has been any offsite impact from the Company’s operations. Because the Company is currently conducting a majority of the sampling, the cost for complying with the consent order is not material.
On July 28, 2008, the United States Department of Justice (DOJ) notified all U.S. phosphate producers of concerns regarding compliance with certain public and regulatory notice requirements related to hydrogen fluoride emissions which may have exceeded the daily reportable quantity thresholds. The EPA and DOJ intend to meet with each facility to discuss these concerns; however, the DOJ has stated that this may take some time to complete.
The Company intends to cooperate with the EPA and to work toward a negotiated resolution of these matters. If no resolution is achieved, the Company intends to aggressively defend the issues. The Company has entered into a joint defense agreement with certain other phosphate producers with respect to this EPA initiative. The Company is presently unable to predict the future costs or impact of this EPA initiative.
| | (b) | Notice of Potential Violation |
On May 8, 2008, the EPA issued a Notice of Potential Violation (NOPV) advising that the EPA believes the Company’s hydrogen fluoride emissions may exceed certain phosphate industry air emission standards. The NOPV is based on the premise that the Company’s hydrogen fluoride emissions exceed 10 tons per year. However, according to the Company’s records, the maximum potential hydrogen fluoride emissions are 9.7 tons per year and actual emissions have never exceeded more than three tons per year. The EPA has not provided the basis for the NOPV. The Company
F-25
PHOSPHATE HOLDINGS, INC. AND SUBSIDIARY
Notes to Consolidated Financial Statements—(Continued)
December 31, 2007, 2006, and 2005
(Dollars in thousands unless otherwise indicated)
intends to cooperate with the EPA and work toward a negotiated resolution of this matter. If a satisfactory resolution is not achieved, the Company intends to aggressively defend the issues raised in the NOPV. The Company is presently unable to predict the impact of resolving this matter.
| | (c) | National Pollutant Discharge Elimination System (NPDES) Permit Violations from 2000-2004 |
Operations from 2000 through 2004 resulted in numerous violations of the Company’s NPDES (wastewater) permits. Most of these violations are attributable to the contemporaneous operation of two phosphogypsum disposal facilities. After closure of the West disposal facility, the frequency and degree of permit violations materially declined.
By Agreed Order dated January 31, 2008 (the Agreed Order), the Company has agreed with the MDEQ to resolve all NPDES permit violations from January 1, 2000 to January 31, 2008.
The terms of the settlement call for a monetary penalty in the amount of $950, of which $550 will be paid directly to the MDEQ. The remaining $400 will be paid to the Jackson County Utility Authority (the Authority) to establish a trust fund to assist the Authority with the costs associated with connecting low-to-moderate income residents in Jackson County to the regional sewer system. The Company has recorded this penalty of $950 as a component of selling, general and administrative expenses in its 2007 consolidated statement of operations.
| | (d) | TMDL and NPDES Permit Renewal |
On April 16, 2007, the EPA issued a final Total Maximum Daily Load (TMDL) for Bayou Casotte, a body of water adjacent to the Company’s plant, which established a new concentration limit on free un-ionized ammonia for discharge into Bayou Casotte. As a result of the TMDL, the Company’s NPDES permit will contain new ammonia concentration limits on the Company’s wastewater discharge entering Bayou Casotte. The new permit will place limits on ammonia, which the Company cannot meet under its current operating conditions. To satisfy the permit limits, the Company has proposed the relocation of its NPDES discharge location to a point further out into the mouth of Bayou Casotte, where there is greater area for mixing of the ammonia upon final discharge. The Company has commissioned a study which demonstrated that the relocation of the Company’s outfall would meet the EPA water quality standards and satisfy the final TMDL requirement. The relocation of the outfall will cost approximately $500. Although no assurance can be given, the Company believes that its proposal to relocate its outfall will be accepted and that it will be given adequate time to implement its proposal.
On December 22, 2006, the Company submitted its renewal application for its wastewater discharge permits (NPDES permit) to the MDEQ. The permit expired in June 2007, but the facility will continue to operate under the state’s permit shield until the MDEQ issues a new NPDES permit.
As a byproduct of phosphoric acid production, phosphogypsum is produced at the Pascagoula plant. Phosphogypsum and untreated process water are stored at the plant in “stacks” surrounded by a dike system. Due to unusually heavy rainfalls in late March and early April 2005, a small portion of the
F-26
PHOSPHATE HOLDINGS, INC. AND SUBSIDIARY
Notes to Consolidated Financial Statements—(Continued)
December 31, 2007, 2006, and 2005
(Dollars in thousands unless otherwise indicated)
dike system was severely weakened and collapsed on April 14, 2005. This breach resulted in the uncontrolled release of untreated low pH process water which flowed into, and adversely affected aquatic life and vegetation in Bangs Lake, a shallow lake contiguous to the plant site. The Company believes that Bangs Lake has substantially recovered from the impact of this incident.
Pursuant to the previously mentioned Agreed Order dated January 31, 2008, the Company has agreed with the MDEQ to resolve this issue. Under the Agreed Order, the Company will pay $1,000 (which will be fully reimbursed by the Company’s pollution liability insurance provider) for the restoration of environmental damage caused to Bangs Lake and the Grand Bay National Estuarine Research Reserve as a result of the April 2005 dike failure. In addition, the Agreed Order requires the Company to prepare a revised plan to provide greater protection against the release of untreated wastewater from the phosphogypsum storage system. The Company is required to submit the plan within ninety days from execution of the Agreed Order and, upon approval of the plan by the MDEQ, to implement the plan within one year.
The Company estimates that the cost for implementation of the release prevention plan will be less than $1,000. The Agreed Order resolves all issues with the MDEQ regarding the April 14, 2005 dike failure.
In July 2007, the internals (boiler tubes and tube sheets) of the boiler in one of the Company’s two sulfuric acid plants suffered a major failure. The Company hired a contractor to assemble and install the replacement components of the boiler. The installation and replacement of the components required a number of repairs and unexpected downtime at the sulfuric acid plant. In the fourth quarter of 2007, the Company filed a lawsuit against the contractor and one of its subcontractors asserting negligence in replacing and repairing the boiler components and breach of contract which led to lost profits and unexpected downtime suffered by the Company. The Company is seeking in excess of $20,000 in damages from the contractor and subcontractor. The contractor has counterclaimed against the Company for $872 for moneys allegedly owed by the Company for work performed. The litigation is in the discovery phase.
Additionally, the Company, in the ordinary course of its business, is the subject of or party to, various pending or threatened legal actions. The Company believes that any ultimate liability arising from these actions will not have a material impact on the financial position or operating results of the Company.
F-27
PHOSPHATE HOLDINGS, INC. AND SUBSIDIARY
Notes to Consolidated Financial Statements—(Continued)
December 31, 2007, 2006, and 2005
(Dollars in thousands unless otherwise indicated)
On August 29, 2005, Hurricane Katrina made landfall and damaged certain of the Company’s assets and disrupted the Company’s operations. Effective as of March 30, 2007, the Company and its insurers agreed to a $55,200 global settlement of the Company’s claims related to the storm. The following is a schedule showing the Company’s hurricane related expenses, insurance proceeds, and related net gain:
| | | | | | | | | | |
| | | Years ended December 31, | |
| | | 2007 | | | 2006 | | | 2005 | |
Beginning balance—advances (receivable) from insurance companies, net | | $ | 23,484 | | | (8,326 | ) | | — | |
Hurricane-related expenses | | | — | | | (1,483 | ) | | (15,887 | ) |
Insurance proceeds | | | 14,346 | | | 33,293 | | | 7,561 | |
Recognition of hurricane related gain | | | (37,830 | ) | | — | | | — | |
| | | | | | | | | | |
Ending balance—advances (receivable) from insurance companies, net | | $ | — | | | 23,484 | | | (8,326 | ) |
| | | | | | | | | | |
The net advances (receivable) from insurance companies have not been classified as current liabilities as they are not expected to result in the expenditure of cash.
For consolidated statement of cash flow purposes, the Company estimated the components of the insurance proceeds attributable to operating activities and investing activities based on the nature of the insurance claims filed, the related insurance policy deductibles, and the factors influencing the negotiation of the final insurance settlement.
On January 29, 2008, the Company’s Board of Directors declared a special dividend of $1.50 per share. The dividend was paid on March 7, 2008, to stockholders of record on February 25, 2008.
During the first quarter of 2008, two events occurred that caused one of the Company’s two sulfuric acid plants to shut down for a significant portion of the first quarter.
As described more fully in note 17(f), the Company hired a contractor to assemble and install replacement internal components of the boiler. The boiler in question failed on January 17, 2008. The boiler repairs were completed and the plant resumed production on February 19, 2008. During the quarter ended March 31, 2008, the Company recorded an impairment charge of approximately $700 for property, plant and equipment and approximately $800 for maintenance turnaround costs associated with the January 17, 2008 boiler failure.
On February 20, 2008, a converter in the plant suffered a failure related to a weld. The failure analysis conducted by the Company and its third-party consultants indicated that the failed weld, which dates back to the original construction of the plant in the mid-1970s, was defective. The weld rupture caused only minimal damage to the internals of the converter, and no apparent damage to other areas of the plant. A repair plan was developed and the Company completed the repairs and resumed production during March 2008.
F-28
PHOSPHATE HOLDINGS, INC. AND SUBSIDIARY
Consolidated Balance Sheets
(In thousands, except share data)
(Unaudited)
| | | | | |
| | | June 30,
2008 | | December 31,
2007 |
| Assets | | | | | |
Current assets: | | | | | |
Cash and cash equivalents | | $ | 31,287 | | 43,576 |
Trade accounts receivable | | | 41,118 | | 10,041 |
Other receivables | | | 51 | | 1,682 |
Inventories | | | 64,083 | | 18,103 |
Prepaid expenses and other | | | 8,212 | | 4,957 |
Deferred income taxes | | | — | | 1,059 |
| | | | | |
Total current assets | | | 144,751 | | 79,418 |
Restricted investments held in trust, at fair value | | | 3,488 | | 3,348 |
Property, plant and equipment, net | | | 47,286 | | 41,417 |
Other | | | 159 | | 120 |
| | | | | |
Total assets | | $ | 195,684 | | 124,303 |
| | | | | |
| Liabilities and Stockholders’ Equity | | | | | |
Current liabilities: | | | | | |
Accounts payable | | $ | 5,748 | | 2,236 |
Accrued expenses | | | 42,789 | | 18,703 |
Income taxes payable | | | 10,627 | | — |
Short-term financing obligations | | | 3,194 | | 2,185 |
Deferred income taxes | | | 146 | | — |
| | | | | |
Total current liabilities | | | 62,504 | | 23,124 |
Asset retirement obligations | | | 5,333 | | 5,086 |
Deferred income taxes | | | 12,107 | | 10,863 |
| | | | | |
Total liabilities | | | 79,944 | | 39,073 |
| | | | | |
Stockholders’ equity: | | | | | |
Common stock ($0.01 par; 30,000,000 shares authorized at June 30, 2008, 11,000,000 shares authorized at December 31, 2007, 7,654,290 shares issued and outstanding at June 30, 2008 and December 31, 2007) | | | 77 | | 77 |
Additional paid-in capital | | | 33,880 | | 33,880 |
Retained earnings | | | 81,783 | | 51,273 |
| | | | | |
Total stockholders’ equity | | | 115,740 | | 85,230 |
| | | | | |
Contingencies (note 13) | | | | | |
Total liabilities and stockholders’ equity | | $ | 195,684 | | 124,303 |
| | | | | |
See accompanying notes to consolidated financial statements.
F-29
PHOSPHATE HOLDINGS, INC. AND SUBSIDIARY
Consolidated Statements of Operations
(In thousands, except per share data)
(Unaudited)
| | | | | |
| | | Six months ended
June 30, |
| | | 2008 | | 2007 |
Net sales: | | | | | |
DAP | | $ | 232,001 | | 109,208 |
Other | | | 6,453 | | 689 |
| | | | | |
Total net sales | | | 238,454 | | 109,897 |
Cost of sales | | | 164,461 | | 88,141 |
| | | | | |
Gross profit | | | 73,993 | | 21,756 |
Selling, general and administrative expenses | | | 6,529 | | 5,436 |
Impairment of assets | | | 1,572 | | — |
| | | | | |
Operating income | | | 65,892 | | 16,320 |
Other income: | | | | | |
Interest, net | | | 293 | | 67 |
Hurricane related gain | | | — | | 37,830 |
Other, net | | | 213 | | 232 |
| | | | | |
Total other income | | | 506 | | 38,129 |
| | | | | |
Income before income taxes | | | 66,398 | | 54,449 |
Income tax expense | | | 24,407 | | 20,793 |
| | | | | |
Net income | | $ | 41,991 | | 33,656 |
| | | | | |
Earnings per share—basic | | $ | 5.49 | | 4.40 |
Earnings per share—diluted | | | 5.19 | | 4.40 |
| | |
Weighted average common shares outstanding—basic | | | 7,654 | | 7,654 |
Weighted average common shares outstanding—diluted | | | 8,092 | | 7,654 |
See accompanying notes to consolidated financial statements.
F-30
PHOSPHATE HOLDINGS, INC. AND SUBSIDIARY
Consolidated Statements of Cash Flows
(In thousands)
(Unaudited)
| | | | | | | |
| | | Six months ended
June 30, | |
| | | 2008 | | | 2007 | |
Cash flows from operating activities: | | | | | | | |
Net income | | $ | 41,991 | | | 33,656 | |
Adjustments to reconcile net income to net cash provided by operating activities: | | | | | | | |
Depreciation of property, plant and equipment | | | 2,520 | | | 1,941 | |
Amortization of prepaid maintenance turnaround costs | | | 1,422 | | | 966 | |
Accretion of asset retirement obligation | | | 247 | | | 224 | |
Deferred loan cost amortization | | | 20 | | | 35 | |
Deferred income taxes | | | 2,449 | | | 18,783 | |
Hurricane related gain | | | — | | | (37,830 | ) |
Proceeds from insurance reimbursements—property, plant and equipment related | | | — | | | (8,437 | ) |
Share-based compensation | | | 38 | | | 37 | |
Impairment charges | | | 1,572 | | | — | |
Other | | | 200 | | | (259 | ) |
Changes in operating assets and liabilities: | | | | | | | |
Trade and other accounts receivable | | | (29,446 | ) | | (8,216 | ) |
Inventories | | | (45,980 | ) | | (3,413 | ) |
Prepaid expenses and other | | | (5,512 | ) | | (1,729 | ) |
Accounts payable and accrued expenses | | | 27,562 | | | 8,779 | |
Income taxes payable | | | 10,627 | | | 824 | |
Advances from insurance carrier, net | | | — | | | 14,346 | |
| | | | | | | |
Net cash provided by operating activities | | | 7,710 | | | 19,707 | |
| | | | | | | |
Cash flows from investing activities: | | | | | | | |
Purchases of restricted investments held in trust | | | (400 | ) | | (400 | ) |
Purchases of property, plant and equipment | | | (9,127 | ) | | (5,579 | ) |
Proceeds from insurance reimbursements—property, plant and equipment related | | | — | | | 8,437 | |
| | | | | | | |
Net cash provided by (used in) investing activities | | | (9,527 | ) | | 2,458 | |
| | | | | | | |
Cash flows from financing activities: | | | | | | | |
Net payments on revolving credit agreement | | | — | | | (4,875 | ) |
Payments of short-term financing obligations | | | (1,735 | ) | | (2,103 | ) |
Proceeds from short-term financing obligations | | | 2,744 | | | 2,620 | |
Cash dividends | | | (11,481 | ) | | — | |
| | | | | | | |
Net cash used in financing activities | | | (10,472 | ) | | (4,358 | ) |
| | | | | | | |
Net increase (decrease) in cash and cash equivalents | | | (12,289 | ) | | 17,807 | |
Cash and cash equivalents at beginning of period | | | 43,576 | | | 647 | |
| | | | | | | |
Cash and cash equivalents at end of period | | $ | 31,287 | | | 18,454 | |
| | | | | | | |
See accompanying notes to consolidated financial statements.
F-31
PHOSPHATE HOLDINGS, INC. AND SUBSIDIARY
Notes to Consolidated Financial Statements
June 30, 2008 and 2007
(Dollars in thousands unless otherwise indicated)
(Unaudited)
| (1) | Nature of Business and Significant Accounting Policies |
Phosphate Holdings, Inc. (PHI) and its subsidiary, Mississippi Phosphates Corporation (MPC or the Subsidiary), produces diammonium phosphate (DAP) fertilizer at its production facility in Pascagoula, Mississippi. PHI and MPC are referred to collectively as “the Company.” The Company is organized and managed internally based on one reportable segment, phosphates, which includes the production and sales of DAP.
The unaudited consolidated interim financial statements of PHI have been prepared in accordance with U.S. generally accepted accounting principles for interim financial information and pursuant to the rules and regulations of the Securities and Exchange Commission. Certain information and footnote disclosures normally included in financial statements prepared in accordance with U.S. generally accepted accounting principles have been condensed or omitted pursuant to these rules and regulations. Accordingly, these unaudited consolidated interim financial statements should be read in conjunction with our consolidated financial statements and related notes for the years ended December 31, 2007, 2006, and 2005.
In the opinion of management, these unaudited consolidated interim financial statements reflect all adjustments necessary for a fair presentation of our interim financial results. All such adjustments are of a normal and recurring nature. The results of operations for any interim period are not indicative of results for the full fiscal year.
The consolidated financial statements include the accounts of PHI and its wholly owned subsidiary, MPC. All significant intercompany balances and transactions have been eliminated in consolidation.
The preparation of financial statements in conformity with U.S. generally accepted accounting principles requires management to make estimates and assumptions that affect the reported amounts of assets and liabilities and disclosure of contingent assets and liabilities at the date of the financial statements and the reported amounts of revenue and expenses during the reporting period. Actual results could differ from those estimates.
| | (d) | Impairment of Long-Lived Assets |
In accordance with Statement of Financial Accounting Standards (SFAS) No. 144,Accounting for the Impairment or Disposal of Long-Lived Assets, long-lived assets, such as property, plant, and equipment, are reviewed for impairment whenever events or changes in circumstances indicate that the carrying amount of an asset may not be recoverable. If circumstances require that a long-lived asset be tested for possible impairment, the Company first compares undiscounted cash flows expected to be generated by an asset to the carrying value of the asset. If the carrying value of the long-lived asset is not recoverable on an undiscounted cash flow basis. An impairment is recognized to the extent that the carrying value of the asset exceeds its fair value. Fair value is determined through various valuation techniques including discounted cash flow models, quoted market values and third-party independent appraisals, as considered necessary.
F-32
PHOSPHATE HOLDINGS, INC. AND SUBSIDIARY
Notes to Consolidated Financial Statements—(Continued)
June 30, 2008 and 2007
(Dollars in thousands unless otherwise indicated)
(Unaudited)
During the first quarter of 2008, two events occurred that caused one of the Company’s two sulfuric acid plants to shut down for a significant portion of the first quarter.
As described more fully in note 13(f), the Company hired a contractor to assemble and install replacement internal components of the boiler. The boiler in question failed on January 17, 2008. The boiler repairs were completed and the plant resumed production on February 19, 2008. During the quarter ended March 31, 2008, the Company recorded an impairment charge of approximately $737 for property, plant and equipment and approximately $835 for maintenance turnaround costs associated with the January 17, 2008 boiler failure.
On February 20, 2008, a converter in the plant suffered a failure related to a weld. The failure analysis conducted by the Company and its third-party consultants indicated that the failed weld, which dates back to the original construction of the plant in the mid-1970s, was defective. The weld rupture caused only minimal damage to the internals of the converter, and no apparent damage to other areas of the plant. A repair plan was developed and the Company completed the repairs and resumed production during March 2008.
Income taxes are accounted for under the asset and liability method. Deferred tax assets and liabilities are recognized for the future tax consequences attributable to differences between the financial statement carrying amounts of existing assets and liabilities and their respective tax bases and operating loss and tax credit carryforwards. Deferred tax assets and liabilities are measured using enacted tax rates expected to apply to taxable income in the years in which those temporary differences are expected to be recovered or settled. The effect on deferred tax assets and liabilities of a change in tax rates is recognized in income in the period that includes the enactment date. Beginning with the adoption of Financial Accounting Standards Board (FASB) Interpretation No. 48,Accounting for Uncertainty in Income Taxes (FIN 48) as of January 1, 2007, the Company recognizes the effect of income tax positions only if those positions are more likely than not of being sustained. Recognized income tax positions are measured at the largest amount that is greater than 50% likely of being realized. Changes in recognition or measurement are reflected in the period in which the change in judgment occurs. Prior to the adoption of FIN 48, the Company recognized the effect of income tax positions only if such positions were probable of being sustained. Upon adoption, the Company recorded no liability for unrecognized tax benefits as it believes all of the Company’s tax positions are highly certain of being recognized for income tax purposes. The Company had no significant unrecognized tax benefits at the date of adoption of FIN 48 or at June 30, 2008. The Company does not anticipate any significant changes in unrecognized tax benefits during the next twelve months.
Environmental expenditures that relate to existing conditions caused by past operations, and that do not contribute to current or future revenue generation, are expensed. Environmental costs are capitalized if the costs extend the life of the property, increase its capacity or mitigate or prevent contamination from future operations.
F-33
PHOSPHATE HOLDINGS, INC. AND SUBSIDIARY
Notes to Consolidated Financial Statements—(Continued)
June 30, 2008 and 2007
(Dollars in thousands unless otherwise indicated)
(Unaudited)
| | (g) | Asset Retirement Obligations |
The Company is required to maintain a disposal facility for its byproduct phosphogypsum. Under an agreement with the Mississippi Department of Environmental Quality (MDEQ), the Company is obligated to incur future costs associated with closure and related remediation of the disposal facilities. The Company develops estimates for the cost to close its disposal facility as well as the related environmental remediation requirements pursuant to the guidance set forth in SFAS No. 143,Accounting for Asset Retirement Obligations. The costs are adjusted for inflation and discounted based on a credit adjusted risk free rate. Over time, the liability is accreted to its present value. The accretion expense is included as a component of cost of sales in the accompanying consolidated statements of operations.
Revenue is recognized when the earnings process is completed. The Company considers the earnings process to be complete when the risk of ownership and title passes to the customer, collection of the related receivable is probable, evidence of an arrangement exists and the sales price is fixed or determinable. Base prices for the Company’s product are set pursuant to sales contracts based on current published prices or upon negotiated short-term prices with the customer. Shipping and handling costs incurred by the Company are included in cost of sales.
| | (i) | DAP Trading Activities |
The Company has entered into an agreement with a third party whereby the third party and the Company jointly identify opportunities to purchase and resell DAP in the domestic market. When an opportunity is identified, the third party purchases and ultimately resells the DAP. Under the terms of the agreement, the Company and the third party each share 50 percent of the gain or loss on the completed transaction. The Company is obligated to remit to the trading partner the Company’s share of any losses incurred in conjunction with this activity but is not obligated to accept or make delivery of DAP pursuant to any of these trading positions. The Company marks open trading positions to market at each reporting period end based on its profit and loss sharing percentage. The income or loss related to this activity is reported as other sales revenue.
The Company’s exposure and opportunity related to open trading positions is limited based on a negotiated profit and loss sharing percentage with a third party who is responsible for executing and settling the trading positions, including taking physical delivery of DAP, when necessary.
Net trading gains totaled $2,379 and $0 for the six month periods ended June 30, 2008 and 2007, respectively.
| | (j) | Share-Based Compensation |
The Company applies the provisions of SFAS No. 123 (revised 2004),Share-Based Payment (SFAS 123R), which requires the measurement and recognition of compensation expense for all share-based payment awards to be made based on estimated grant date fair values. Under the fair value recognition provisions of SFAS 123R, share-based compensation cost is measured at the grant date based on the fair value of the award and is recognized as expense on a straight-line basis over
F-34
PHOSPHATE HOLDINGS, INC. AND SUBSIDIARY
Notes to Consolidated Financial Statements—(Continued)
June 30, 2008 and 2007
(Dollars in thousands unless otherwise indicated)
(Unaudited)
the requisite service period, which is the vesting period. The fair value of share-based payment awards on the date of grant is determined using an option-pricing model which is affected by assumptions regarding a number of complex and subjective variables, which include the expected life of the award, the expected stock price volatility over the expected life of the awards, expected dividend yield, and the risk-free interest rate.
| (2) | Fair Value Measurements |
Effective January 1, 2008, the Company adopted SFAS No. 157,Fair Value Measurements (SFAS 157) and FASB Staff Position (FSP) No. 157-2 which deferred the adoption of portions of SFAS 157. SFAS 157 establishes a single authoritative definition of fair value, sets out a framework for measuring fair value, and provides a disclosure framework for assets and liabilities measured at fair value. FSP No. 157-2 defers for one year the effective date of SFAS 157 for nonfinancial assets and liabilities measured at fair value on a nonrecurring basis. The purpose of this deferral is to allow the FASB and constituents additional time to consider the effect of various implementation issues that have arisen, or may arise, from the application of SFAS 157. The assets and liabilities included in the consolidated balance sheet for which the adoption of SFAS 157 has been deferred include the Company’s long-lived assets and asset retirement obligations.
Due to their short-term nature, the Company’s cash and cash equivalents, accounts receivable, accounts payable and short-term financing obligations are carried at cost, which approximates fair value. The revolving credit facility’s recorded value approximates its fair value as it bears interest at a floating rate. The Company’s restricted investments are recorded at fair value based upon quoted closing market prices.
Effective January 1, 2008, the Company also adopted SFAS No. 159,The Fair Value Option for Financial Assets and Financial Liabilities (SFAS 159). SFAS 159 permits entities to choose to measure many financial instruments and certain other items at fair value. SFAS 159 is effective for fiscal years beginning after November 15, 2007. The Company has not elected the fair value option for any assets or liabilities under SFAS No. 159.
Inventories consisted of the following:
| | | | | |
| | | June 30,
2008 | | December 31,
2007 |
Raw materials | | $ | 44,012 | | 5,104 |
Finished goods | | | 14,631 | | 7,740 |
Replacement parts | | | 5,440 | | 5,259 |
| | | | | |
| | $ | 64,083 | | 18,103 |
| | | | | |
Phosphate rock is a primary raw material in the manufacture of DAP. Effective January 1, 2005, the Company entered into a contract with OCP S.A. (OCP) in Morocco to import its full requirement of phosphate rock through December 31, 2008. The purchase prices of rock for the periods January 1, 2007 through December 31, 2007, January 1, 2008 through June 30, 2008, and July 1, 2008 through
F-35
PHOSPHATE HOLDINGS, INC. AND SUBSIDIARY
Notes to Consolidated Financial Statements—(Continued)
June 30, 2008 and 2007
(Dollars in thousands unless otherwise indicated)
(Unaudited)
September 30, 2008 were each established based on negotiation between the parties. The purchase price of phosphate rock for the fourth quarter of 2008 will also be based upon negotiations between the parties. On June 6, 2008, OCP notified the Company that, rather than extend the current contract, it desired to enter into a new agreement prior to December 31, 2008. Management is currently negotiating a new contract and believes a new long-term supply arrangement with OCP will be achieved before December 31, 2008, although there can be no assurances that such agreement will be reached. As of the date of this report, no contract is in place with OCP to purchase phosphate rock subsequent to December 31, 2008.
| (4) | Property, Plant and Equipment, Net |
Property, plant and equipment consisted of the following:
| | | | | |
| | | June 30,
2008 | | December 31,
2007 |
Buildings | | $ | 2,044 | | 2,044 |
Land improvements | | | 3,991 | | 3,757 |
Machinery and equipment | | | 44,020 | | 38,004 |
Replacement parts | | | 1,943 | | 1,690 |
Construction in progress | | | 4,585 | | 2,697 |
| | | | | |
| | | 56,583 | | 48,192 |
Less accumulated depreciation | | | 9,297 | | 6,775 |
| | | | | |
Property, plant and equipment, net | | $ | 47,286 | | 41,417 |
| | | | | |
| (5) | Short-term Financing Obligation |
The Company has financed its property and liability insurance premiums for policy periods ranging from December 2007 through June 2009. The premiums are financed at an interest rates ranging from 4.53% to 5.75%. The notes are payable in monthly installments and mature at dates ranging from November 2008 through May 2009.
As of June 30, 2008, the Company had a revolving credit agreement with PNC Bank, National Association (PNC), which provides for revolving advances based on specified percentages of accounts receivable and inventories. The maximum revolving advance amount under this agreement was $27,000 at June 30, 2008. Borrowings bear interest at a variable rate which is the Company’s option of the Alternate Base Rate plus 0.50% or the Eurodollar Rate (both as defined in the credit agreement) plus 3.00%. The Company is also obligated to pay an annual commitment fee of 0.40% on the unused portion of the revolving credit agreement. The Company had $27,000 available to borrow under the borrowing base limitations of the revolving credit agreement at June 30, 2008. The Company had no borrowings outstanding under this revolving credit agreement at June 30, 2008. The revolving credit agreement expires on March 31, 2011.
F-36
PHOSPHATE HOLDINGS, INC. AND SUBSIDIARY
Notes to Consolidated Financial Statements—(Continued)
June 30, 2008 and 2007
(Dollars in thousands unless otherwise indicated)
(Unaudited)
As of June 30, 2008, the Company also had a $3,000 term loan available for its use under this agreement which is available to be drawn through December 31, 2008 to fund the construction cost of its storm protection levee which was completed in 2007. The Company had no borrowings outstanding under the term loan as of June 30, 2008.
The borrowings are collateralized by receivables, inventories, equipment, and other personal property. Financial covenants of the revolving credit agreement require the Company to maintain specified levels of tangible net worth and fixed charge coverage ratios and to limit capital expenditures. For fiscal years 2007 and 2008 only, the capital expenditure covenant excludes Katrina-related expenditures.
| (7) | Asset Retirement Obligations |
In conjunction with producing DAP, the Company is required to maintain a phosphogypsum disposal facility for its waste byproducts. The Company’s East disposal facility became fully operational during 2003. Prior to 2003, the Company maintained a West disposal facility for its waste byproducts. The closure of the West facility was completed in 2005. There is no asset retirement obligation recorded for the West facility as the closure is complete and the related water leachate is being used by the Company in production. The Company has a legal obligation to incur future costs associated with the closure of the East disposal facility. Accordingly, the Company has recorded the estimated fair value of the asset retirement obligations in accordance with SFAS No. 143. The liability for the East disposal facility costs include closure, post-closure monitoring and related water treatment. The actual amounts to be spent will depend on factors such as the timing of activities, refinements in scope, technological developments, cost inflation, changes in regulations, as well as the Company’s business plans. It is possible that these factors could change and that such changes could have a significant impact on the estimates included in the accompanying consolidated financial statements. Closure expenditures for the East disposal facility are currently estimated to begin in the 2025 to 2033 timeframe.
The balance of the Company’s asset retirement obligations and changes thereto are summarized below. Accretion expense is reported in cost of sales in the accompanying consolidated statements of operations.
| | | | | |
| | | Six months ended
June 30, |
| | | 2008 | | 2007 |
Asset retirement obligations—beginning of period | | $ | 5,086 | | 4,627 |
Changes in estimated obligations | | | — | | — |
Accretion expense | | | 247 | | 224 |
| | | | | |
Total asset retirement obligations—end of period | | $ | 5,333 | | 4,851 |
| | | | | |
The Company has developed a financial assurance mechanism with the MDEQ to ensure funds will be available to satisfy the Company’s asset retirement obligations. Quarterly payments in the amount of $200 are made into a trust fund managed by a third-party trustee and will be used to fund closure, post-closure monitoring and remediation of the East disposal facility.
F-37
PHOSPHATE HOLDINGS, INC. AND SUBSIDIARY
Notes to Consolidated Financial Statements—(Continued)
June 30, 2008 and 2007
(Dollars in thousands unless otherwise indicated)
(Unaudited)
Prior to June 20, 2007, all of the common stock of PHI was owned by the Trust. The beneficial ownership of the Trust was represented by Trust Units, which were freely tradable. At a special meeting of the stockholders of PHI on June 19, 2007, the Trust voted to amend the Certificate of Incorporation of PHI to increase the authorized shares of PHI to 11,000,000 shares of common stock, $0.01 par value, and to effectuate a 7,654.29 to 1 split of all issued and outstanding shares of PHI. On June 20, 2007, at a Special Meeting of the Trust Unit Holders, dissolution of the Trust was approved. As a result of the dissolution of the Trust, the Unit Holders received their proportionate interest in the assets of the Trust consisting of 7,654,290 shares of PHI common stock. All share information included in the accompanying consolidated financial statements and related notes, including reported earnings per share, have been adjusted to reflect the Company’s capital structure.
On January 29, 2008, the Company’s Board of Directors declared a special dividend of $1.50 per share. The dividend was paid on March 7, 2008, to stockholders of record on February 25, 2008.
On April 29, 2008, PHI amended its Certificate of Incorporation to increase the authorized shares of PHI to 30,000,000 shares of common stock, $0.01 par value.
SFAS No. 128,Earnings Per Share(SFAS 128), requires the presentation of basic and diluted earnings per share. Basic earnings per share is calculated based on the weighted-average shares of common stock outstanding during the period. Diluted earnings per share is calculated to include any dilutive effect of common stock equivalents. The Company’s common stock equivalents consist of stock options. The dilutive effect of the stock options is calculated using the treasury stock method in accordance with the provisions of SFAS 128.
The weighted-average number of common shares outstanding for the purpose of computing basic and diluted earnings per share is as follows (in thousands):
| | | | |
| | | Six months ended
June 30, |
| | | 2008 | | 2007 |
Weighted-average number of common shares outstanding—basic | | 7,654 | | 7,654 |
Common stock equivalents | | 438 | | — |
| | | | |
Weighted-average number of common shares outstanding—diluted | | 8,092 | | 7,654 |
| | | | |
| (10) | Concentration of Business |
Effective January 1, 2007, all of the Company’s sales of DAP into international markets are made through a single wholesale broker, while all domestic sales of DAP are made through the Company’s internal sales staff. Approximately 75% and 21% of DAP sales were made into international markets during the six months ended June 30, 2008 and 2007, respectively.
F-38
PHOSPHATE HOLDINGS, INC. AND SUBSIDIARY
Notes to Consolidated Financial Statements—(Continued)
June 30, 2008 and 2007
(Dollars in thousands unless otherwise indicated)
(Unaudited)
Interest, net, consisted of the following for the periods noted:
| | | | | | | |
| | | Six months ended
June 30, | |
| | | 2008 | | | 2007 | |
Interest expense | | $ | (110 | ) | | (295 | ) |
Interest income | | | 403 | | | 362 | |
| | | | | | | |
Net interest income | | $ | 293 | | | 67 | |
| | | | | | | |
| (12) | Share-based Compensation |
On the Emergence Date, the Company granted options covering a total of 841,960 shares to two executive employees. Of this total, 459,251 of the options were subject to time based vesting during the twelve months subsequent to the Emergence Date (the Tranche 1 Options) and 382,709 of the options were subject to a performance condition which was satisfied on January 1, 2005 (the Tranche 2 Options). Tranche 1 and Tranche 2 options covering 500,000 shares were exercised in 2005 and the remaining 341,960 of these options were exercised in 2006. The strike price on the Tranche 1 Option grant was greater than the market value of the Company’s stock as of the grant. Additionally, the strike price of the Tranche 2 Option grant was greater than the market value of the Company’s stock as of the date the performance condition was satisfied. Accordingly, pursuant to the provisions of Accounting Principles Board Opinion No. 25 (APB 25),Accounting for Stock Issued to Employees,no compensation expense has been recorded related to the Tranche 1 and Tranche 2 Options.
In addition to the options discussed above, as of the Emergence Date, the Company also granted options covering a total of 757,018 shares (the Tranche 3 and Tranche 4 Options) to the same two executive employees discussed above. These options include performance conditions related to the achievement of certain investor rate of return targets and the achievement of certain stock liquidity objectives, as specified in the respective agreements. These options were accounted for pursuant to the provisions of APB 25 prior to the adoption of SFAS 123R on January 1, 2006. Under APB 25, options which contain performance conditions are accounted for as variable awards until the measurement date is determined, which occurs when the performance condition or conditions are satisfied. As a variable award, compensation expense is recognized as of the end of each reporting period prior to the measurement date based on 1) the intrinsic value of the option, and 2) management’s assessment of the probability of satisfying the performance condition. Based on an evaluation of the stock option performance conditions, management determined that the options were not probable of exercise, and as such, recorded no compensation expense related to these options for the year ended December 31, 2005. Beginning on January 1, 2006, pursuant to the adoption of SFAS 123R, the Company has recorded compensation expense for the Tranche 3 and Tranche 4 options based on their grant date fair value. As of July 31, 2007, the performance conditions were satisfied and the options became fully vested, which resulted in the remaining unrecognized compensation expense measured pursuant to SFAS 123R being charged to earnings at that time.
F-39
PHOSPHATE HOLDINGS, INC. AND SUBSIDIARY
Notes to Consolidated Financial Statements—(Continued)
June 30, 2008 and 2007
(Dollars in thousands unless otherwise indicated)
(Unaudited)
Recorded share-based compensation expense related to the Company’s stock options totaled $37 for the six month period ended June 30, 2007. Tax benefits related to the share-based compensation expense has been recorded using a blended federal and state income tax rate of 38.25%.
A summary of the Company’s stock option activity during the period ended June 30, 2008 is as follows:
| | | | | | | | | | |
| | | Options | | Weighted-
average
exercise
price | | Weighted-
average
remaining
contractual
life | | Aggregated
intrinsic
value |
Outstanding as of December 31, 2007 | | 757,018 | | $ | 2.36 | | 2 | | $ | 29,251 |
Granted | | — | | | | | | | | |
Exercised | | — | | | | | | | | |
Forfeited | | — | | | | | | | | |
| | | | | | | | | | |
Outstanding as of June 30, 2008 | | 757,018 | | | 2.36 | | 1.5 | | | 27,737 |
| | | | | | | | | | |
Exerciseable as of June 30, 2008 | | 757,018 | | | 2.36 | | 1.5 | | | 27,737 |
| | (b) | Stock Appreciation Rights (SARs) |
On April 29, 2008, the Company granted 21,703 Stock Appreciation Rights (SAR) to the Directors of the Company (the Director SARs). The Director SARs are to be settled with a cash payment equal to the intrinsic value of the SAR as of the exercise date. One-third of the Director SARs vest on each of the first three anniversary dates following the grant date. The Director SARs expire on the fifth anniversary of the grant date.
On May 5, 2008, the Company granted 25,000 SARs to a key employee (the Employee SARs). The Employee SARs vest on the second anniversary of the grant date and are to be settled with a cash payment equal to the intrinsic value of the SAR as of the exercise date. In the event that the Company’s shares become registered with the Securities Exchange Commission, the Employee SARs shall immediately convert to stock options on the same terms as the Employee SARs except that there will no longer be a cash settlement feature.
Both the Director SARs and the Employee SARs are accounted for as liability awards with compensation cost measured as of the end of each reporting period based on the then current fair value of the SAR. Compensation cost recognized in the accompanying financial statements related to the Director and Employee SARs totaled $38 for the six-months ended June 30, 2008.
On May 5, 2008, the Company issued a phantom stock award valued at $100 as of the grant date to a key employee. As of the grant date the award equated to 2,723 shares of the Company’s stock. On each of the first two anniversary dates of the grant, the employee is to receive a cash payment equal to the then fair value of 50% of the 2,723 shares. This award is accounted for as a liability award with compensation cost measured as of the end of each reporting period based on the market value of
F-40
PHOSPHATE HOLDINGS, INC. AND SUBSIDIARY
Notes to Consolidated Financial Statements—(Continued)
June 30, 2008 and 2007
(Dollars in thousands unless otherwise indicated)
(Unaudited)
the Company’s stock. Compensation costs recognized in the accompanying consolidated financial statements related to the phantom stock award were not material for the six-months ended June 30, 2008.
| | (a) | Phosphate Industry Investigation |
In 2003, the U.S. Environmental Projection Agency (EPA) announced a nationwide review of all mineral processing facilities. As a result, the EPA selected the mineral processing industry as a national enforcement and compliance priority for fiscal years 2005 and 2006. One focus of this initiative is to examine the scope of applicability of the Bevill Amendment to Subtitle C of the Resource Conservation Recovery Act (RCRA), which exempts waste generated during phosphate mining beneficiation and processing activities from regulation under RCRA. As a part of the EPA initiative, between 2005 and 2007, the EPA visited all phosphate producers in the United States. In January and March 2005, the EPA conducted site visits at the Company’s facility in Pascagoula, Mississippi. In September 2005, the EPA issued a Notice of Violation (NOV) to the Company alleging that the reuse of low pH process water as DAP scrubber water and other use within the facility is not protected by the Bevill Amendment and therefore violates RCRA. The Company believes that it has meritorious defenses against the allegations of the NOV, including prior written guidance and interpretations from the EPA inconsistent with its assertions in the NOV. The EPA has issued similar NOVs to other U.S. phosphate producers.
On June 8, 2007, the Company and the EPA entered into a consent order, which requires the Company to prepare a plan for groundwater and surface water sampling around the facility. The consent order is part of the phosphate industry initiative, pursuant to which the EPA is requiring all the phosphate producing facilities to conduct groundwater and surface water sampling. The Company currently conducts a majority of the sampling requested by the EPA under current MDEQ permits. To date, there is no indication from current groundwater and surface sampling that there has been any offsite impact from the Company’s operations. Because the Company is currently conducting a majority of the sampling, the cost for complying with the consent order is not material.
On July 28, 2008, the United States Department of Justice (DOJ) notified all U.S. phosphate producers of concerns regarding compliance with certain public and regulatory notice requirements related to hydrogen fluoride emissions which may have exceeded the daily reportable quantity thresholds. The EPA and DOJ intend to meet with each facility to discuss these concerns; however, the DOJ has stated that this may take some time to complete.
The Company intends to cooperate with the EPA and to work toward a negotiated resolution of these matters. If no resolution is achieved, the Company intends to aggressively defend the issues. The Company has entered into a joint defense agreement with certain other phosphate producers with respect to this EPA initiative. The Company is presently unable to predict the future costs or impact of this EPA initiative.
F-41
PHOSPHATE HOLDINGS, INC. AND SUBSIDIARY
Notes to Consolidated Financial Statements—(Continued)
June 30, 2008 and 2007
(Dollars in thousands unless otherwise indicated)
(Unaudited)
| | (b) | Notice of Potential Violation |
On May 8, 2008, the EPA issued a Notice of Potential Violation (NOPV) advising that the EPA believes the Company’s hydrogen fluoride emissions may exceed certain phosphate industry air emission standards. The NOPV is based on the premise that the Company’s hydrogen fluoride emissions exceed 10 tons per year. However, according to the Company’s records, the maximum potential hydrogen fluoride emissions are 9.7 tons per year and actual emissions have never exceeded more than three tons per year. The EPA has not provided the basis for the NOPV. The Company intends to cooperate with the EPA and work toward a negotiated resolution of this matter. If a satisfactory resolution is not achieved, the Company intends to aggressively defend the issues raised in the NOPV. The Company is presently unable to predict the impact of resolving this matter.
| | (c) | National Pollutant Discharge Elimination System (NPDES) Permit Violations from 2000-2004 |
Operations from 2000 through 2004 resulted in numerous violations of the Company’s NPDES (wastewater) permits. Most of these violations are attributable to the contemporaneous operation of two phosphogypsum disposal facilities. After closure of the West disposal facility, the frequency and degree of permit violations materially declined.
By Agreed Order dated January 31, 2008 (the Agreed Order), the Company agreed with the MDEQ to resolve all NPDES permit violations from January 1, 2000 to January 31, 2008.
The terms of the settlement called for a monetary penalty in the amount of $950, of which $550 was paid directly to the MDEQ. The remaining $400 was paid to the Jackson County Utility Authority (the Authority) to establish a trust fund to assist the Authority with the costs associated with connecting low-to-moderate income residents in Jackson County to the regional sewer system. The Company recorded this penalty of $950 as a component of selling, general and administrative expenses in its 2007 consolidated statement of operations.
| | (d) | TMDL and NPDES Permit Renewal |
On April 16, 2007, the EPA issued a final Total Maximum Daily Load (TMDL) for Bayou Casotte, a body of water adjacent to the Company’s plant, which established a new concentration limit on free un-ionized ammonia for discharge into Bayou Casotte. As a result of the TMDL, the Company’s NPDES permit will contain new ammonia concentration limits on the Company’s wastewater discharge entering Bayou Casotte. The new permit will place limits on ammonia, which the Company cannot meet under its current operating conditions. To satisfy the permit limits, the Company has proposed the relocation of its NPDES discharge location to a point further out into the mouth of Bayou Casotte, where there is greater area for mixing of the ammonia upon final discharge. The Company has commissioned a study which demonstrated that the relocation of the Company’s outfall would meet the EPA water quality standards and satisfy the final TMDL requirement. The relocation of the outfall will cost approximately $500. Although no assurance can be given, the Company believes that its proposal to relocate its outfall will be accepted and that it will be given adequate time to implement its proposal.
On December 22, 2006, the Company submitted its renewal application for its wastewater discharge permits (NPDES permit) to the MDEQ. The permit expired in June 2007, but the facility will continue to operate under the state’s permit shield until the MDEQ issues a new NPDES permit.
F-42
PHOSPHATE HOLDINGS, INC. AND SUBSIDIARY
Notes to Consolidated Financial Statements—(Continued)
June 30, 2008 and 2007
(Dollars in thousands unless otherwise indicated)
(Unaudited)
As a by product of phosphoric acid production, phosphogypsum is produced at the Pascagoula plant. Phosphogypsum and untreated process water are stored at the plant in “stacks” surrounded by a dike system. Due to unusually heavy rainfalls in late March and early April 2005, a small portion of the dike system was severely weakened and collapsed on April 14, 2005. This breach resulted in the uncontrolled release of untreated low pH process water which flowed into, and adversely affected aquatic life and vegetation in Bangs Lake and Bayou Casotte, a shallow lake contiguous to the plant site. The Company believes both bodies of water have substantially recovered from the impact of this incident.
Pursuant to the previously mentioned Agreed Order dated January 31, 2008, the Company agreed with the MDEQ to resolve this issue. Under the Agreed Order, the Company paid $1,000 (which was fully reimbursed by the Company’s pollution liability insurance provider) for the restoration of environmental damage caused to Bangs Lake and the Grand Bay National Estuarine Research Reserve as a result of the April 2005 dike failure. In addition, the Agreed Order required the Company to prepare a revised plan to provide greater protection against the release of untreated wastewater from the phosphogypsum storage system. In accordance with the Agreed Order, the Company submitted the plan and, upon approval by the MDEQ, is required to implement the plan within one year.
The Company estimates that the cost for implementation of the release prevention plan will be less than $1,000. The Agreed Order resolves all issues with the MDEQ regarding the April 14, 2005 dike failure.
In July 2007, the internals (boiler tubes and tube sheets) of the boiler in one of the Company’s two sulfuric acid plants reached the end of their useful lives. The Company hired a contractor to assemble and install the replacement components of the boiler. The installation and replacement of the components required a number of repairs and unexpected downtime at the sulfuric acid plant. In the fourth quarter of 2007, the Company filed a lawsuit against the contractor and one of its subcontractors asserting negligence in replacing and repairing the boiler components and breach of contract which led to lost profits and unexpected downtime suffered by the Company. The Company is seeking in excess of $20,000 in damages from the contractor and subcontractor. The contractor has counterclaimed against the Company for $872 for moneys allegedly owed by the Company for work performed. The litigation is in the discovery phase.
Additionally, the Company, in the ordinary course of its business, is the subject of or party to, various pending or threatened legal actions. The Company believes that any ultimate liability arising from these actions will not have a material impact on the financial position or operating results of the Company.
F-43
PHOSPHATE HOLDINGS, INC. AND SUBSIDIARY
Notes to Consolidated Financial Statements—(Continued)
June 30, 2008 and 2007
(Dollars in thousands unless otherwise indicated)
(Unaudited)
On August 29, 2005, Hurricane Katrina made landfall and damaged certain of the Company’s assets and disrupted the Company’s operations. Effective as of March 30, 2007, the Company and its insurers agreed to a $55,200 global settlement of the Company’s claims related to the storm. The following is a schedule showing the Company’s hurricane related expenses, insurance proceeds, and related net gain:
| | | | |
| | | Six months ended
June 30, 2007 | |
Beginning balance—advances from insurance companies, net | | $ | 23,484 | |
Hurricane-related expenses | | | — | |
Insurance proceeds | | | 14,346 | |
Recognition of hurricane related gain | | | (37,830 | ) |
| | | | |
Ending balance—advances from insurance companies, net | | $ | — | |
| | | | |
For consolidated statement of cash flow purposes, the Company estimated the components of the insurance proceeds attributable to operating activities and investing activities based on the nature of the insurance claims filed, the related insurance policy deductibles, and the factors influencing the negotiation of the final insurance settlement.
F-44
Shares
Phosphate Holdings, Inc.
Common Stock
PROSPECTUS
Goldman, Sachs & Co.
Merrill Lynch & Co.
Through and including , 2008 (the 25th day after the date of this prospectus), all dealers effecting transactions in these securities, whether or not participating in this offering, may be required to deliver a prospectus. This is in addition to a dealer’s obligation to deliver a prospectus when acting as an underwriter and with respect to an unsold allotment or subscription.
PART II
Information Not Required in Prospectus
| Item 13. | Other Expenses of Issuance and Distribution |
The following table sets forth the various fees and expenses, other than the underwriting discounts and commissions, payable by Phosphate Holdings, Inc. (the “Registrant” or “PHI”) in connection with the sale of the shares of common stock being registered hereby. All amounts shown are estimates except for the U.S. Securities and Exchange Commission (the “SEC”) registration fee and the Financial Industry Regulatory Authority (the “FINRA”) filing fee.
| | | |
| | | Amount |
SEC registration fee | | $ | 7,860.00 |
FINRA filing fee | | | 20,500.00 |
listing fee | | | * |
Blue sky qualification fees and expenses | | | * |
Accounting fees and expenses | | | * |
Legal fees and expenses | | | * |
Printing and engraving expenses | | | * |
Transfer agent and registrar fees | | | * |
Financial advisory fee and miscellaneous expenses | | | * |
| | | |
Total | | $ | * |
| | | |
| * | To be completed by amendment. |
| Item 14. | Indemnification of Directors and Officers |
The Registrant’s first amended and restated certificate of incorporation provides that it will, to the fullest extent legally permissible under Delaware law, indemnify all persons that it has the power to indemnify and hold harmless under Delaware law from and against all liabilities and expenses which are imposed upon or reasonably incurred by such person in connection with any action, suit or proceeding in which he or she may be involved or with which he or she may be threatened, or other matters covered by Delaware law, both as to action in his or her official capacity and as to action in another capacity while holding such office, and will continue as to a person who has ceased to be a director or officer of the Registrant.
No director will be personally liable to the Registrant or its stockholders for monetary damages for breach of fiduciary duty as a director, except for liability: (i) for any breach of the director’s duty of loyalty to the Registrant or its stockholders; (ii) for acts or omissions not in good faith or which involve intentional misconduct or a knowing violation of law; (iii) for certain unlawful dividend payments or stock redemptions or repurchases; or (iv) for any transaction from which the director derived an improper personal benefit. The effect of these provisions is to eliminate the Registrant’s rights and those of its stockholders (through stockholders’ derivative suits on behalf of the Registrant) to recover monetary damages against a director for breach of fiduciary duty as a director (including breaches resulting from grossly negligent behavior), except in the situations described above.
As permitted by Section 102(b)(7) of the Delaware General Corporation Law (the “DGCL”), Article 8 of the Registrant’s first amended and restated certificate of incorporation contains a limitation of liability provision under which the personal liability of all of the Registrant’s directors is eliminated to the fullest extent allowed under Delaware law.
Article 8, Section 8.8 of the Registrant’s amended and restated bylaws provides that it will indemnify its officers and directors according to the terms of Section 145 of the DGCL. Section 145
II-1
thereof permits indemnification of an officer or director upon a determination that such officer or director has met the applicable standard of conduct. Under Section 145, an officer or director is required to have acted in good faith and in a manner he or she reasonably believed to be in or not opposed to the best interests of the Registrant and, with respect to any criminal action or proceeding, without reasonable cause to believe his or her conduct was unlawful. Section 145 does not authorize indemnification, in actions brought by or in the right of a corporation, against judgments, fines or amounts paid in settlement, nor does it provide for indemnification of expenses incurred in the defense or settlement of claims as to which a director or officer is adjudged to be liable to the Registrant, unless specifically authorized by the Delaware Court of Chancery or the court in which such action is brought.
The above discussion of the provisions of Sections 102(b)(7) and 145 of the DGCL, Article 8 of the Registrant’s first amended and restated certificate of incorporation and Article 8, Section 8.8 of the Registrant’s amended and restated bylaws is not intended to be exhaustive and is respectively qualified in its entirety by the applicable provisions of the DGCL, Article 8 of the Registrant’s first amended and restated certificate of incorporation and Article 8, Section 8.8 of the Registrant’s amended and restated bylaws.
The Registrant has entered into indemnification agreements with each of its directors and executive officers. These agreements require the Registrant to indemnify the director or executive officer to the fullest extent permitted by Delaware law. This provision means, among other things, that the Registrant must indemnify the director or executive officer against expenses (including attorneys’ fees), judgments, fines, penalties and amounts paid in settlement that are incurred in any action, suit or proceeding by reason of the fact that the person is or was one of the Registrant’s directors, officers, employees, agents or fiduciaries or is or was serving at the Registrant’s request as a director, officer, employee or agent of another corporation or other entity if the indemnitee meets the standard of conduct provided in Delaware law. Also, as permitted under Delaware law, the indemnification agreements require the Registrant to advance expenses in defending such an action provided that the director or executive officer undertakes to repay the amounts if the person ultimately is determined not to be entitled to indemnification from the Registrant. The indemnification agreements also set forth procedures that will apply in the event of a claim for indemnification thereunder.
The Registrant has a director and officer and fiduciary liability policy that has a $10.0 million primary limit as well as a $5.0 million excess limit. The deductible for this policy is $50,000.
| Item 15. | Recent Sales of Unregistered Securities |
On December 21, 2004, PHI granted each of Mr. Jones and Mr. McCraw, both executive officers of PHI, options to purchase 799,489 shares of PHI common stock. On April 20, 2005, Mr. Jones and Mr. McCraw each exercised their options to purchase 250,000 shares of PHI common stock, and on November 6, 2006, Mr. Jones and Mr. McCraw each exercised their options to purchase 170,980 shares of PHI common stock. The aggregate exercise price paid by each of Mr. Jones and Mr. McCraw was $590,000 for the April 20, 2005 exercise and $403,512.80 for the November 6, 2006 exercise. Both the granting of the options and the issuance of the PHI common stock were exempt from registration under Rule 701 and/or Section 4(2) of the Securities Act of 1933, as amended (the “Securities Act”).
| Item 16. | Exhibits and Financial Statement Schedules |
(a) Exhibits
The exhibits to this registration statement are listed on the exhibit index, which appears elsewhere herein and is incorporated by reference.
(b) Financial Statement Schedules
II-2
All schedules have been omitted because they are not required, are not applicable or the information is included in the selected consolidated financial data or notes contained in this registration statement.
(a) Insofar as indemnification for liabilities arising under the Securities Act may be permitted to directors, officers and controlling persons of the Registrant pursuant to the foregoing provisions, or otherwise, the Registrant has been advised that in the opinion of the SEC such indemnification is against public policy as expressed in the Securities Act and is, therefore, unenforceable. In the event that a claim for indemnification against such liabilities (other than the payment by the Registrant of expenses incurred or paid by a director, officer or controlling person of the Registrant in the successful defense of any action, suit or proceeding) is asserted by such director, officer or controlling person in connection with the securities being registered, the Registrant will, unless in the opinion of its counsel the matter has been settled by controlling precedent, submit to a court of appropriate jurisdiction the question whether such indemnification by it is against public policy as expressed in the Securities Act and will be governed by the final adjudication of such issue.
(b) The Registrant hereby undertakes that:
(1) For purposes of determining any liability under the Securities Act, the information omitted from the form of prospectus filed as part of this registration statement in reliance upon Rule 430A and contained in a form of prospectus filed by the registrant pursuant to Rule 424(b)(1) or (4) or 497(h) under the Securities Act shall be deemed to be part of this registration statement as of the time it was declared effective.
(2) For the purpose of determining any liability under the Securities Act, each post-effective amendment that contains a form of prospectus shall be deemed to be a new registration statement relating to the securities offered therein, and the offering of such securities at that time shall be deemed to be the initial bona fide offering thereof.
(c) The Registrant hereby undertakes to provide to the underwriter at the closing specified in the underwriting agreement certificates in such denominations and registered in such names as required by the underwriter to permit prompt delivery to each purchaser.
II-3
SIGNATURES
Pursuant to the requirements of the Securities Act, the registrant has duly caused this registration statement to be signed on its behalf by the undersigned, thereunto duly authorized, in the City of Madison, Mississippi, on October 14, 2008.
| | |
| PHOSPHATE HOLDINGS, INC. |
| |
| By: | | /s/ ROBERT E. JONES |
| Name: | | Robert E. Jones |
| Title: | | Chief Executive Officer and Director |
KNOW ALL PERSONS BY THESE PRESENTS, that each individual whose signature appears below constitutes and appoints Robert E. Jones and Timothy R. Cantrell, and each of them, his true and lawful attorneys in fact and agents with full power of substitution, for him and in his name, place and stead, in any and all capacities, to sign any and all amendments (including post effective amendments) to this registration statement, and to sign any registration statement for the same offering covered by this registration statement that is to be effective on filing pursuant to Securities Act Rule 462(b), as amended, and all post-effective amendments thereto, and to file the same, with all exhibits thereto and all documents in connection therewith, with the SEC, granting unto such attorneys-in-fact and agents, and each of them, full power and authority to do and perform each and every act and thing requisite and necessary to be done in and about the premises, as fully to all intents and purposes as he might or could do in person, hereby ratifying and confirming all that such attorneys-in-fact and agents or any of them, or his or their substitute or substitutes, may lawfully do or cause to be done by virtue hereof.
Pursuant to the requirements of the Securities Act, this registration statement has been signed by the following persons in the capacities and on the date indicated.
| | | | |
Name | | Title | | Date |
| | |
/s/ ROBERT E. JONES Robert E. Jones | | Chief Executive Officer and Director (Principal Executive Officer) | | October 14, 2008 |
| | |
/s/ TIMOTHY R. CANTRELL Timothy R. Cantrell | | Chief Financial Officer (Principal Financial Officer and Principal Accounting Officer) | | October 14, 2008 |
| | |
/s/ COLEMAN L. BAILEY Coleman L. Bailey | | Director | | October 14, 2008 |
| | |
/s/ RONALD M. BRINGEWATT Ronald M. Bringewatt | | Director | | October 14, 2008 |
| | |
/s/ REX M. DELOACH Rex M. Deloach | | Director | | October 14, 2008 |
| | |
/s/ DEBORAH H. MIDANEK Deborah H. Midanek | | Director | | October 14, 2008 |
| | |
/s/ GREG J. SEKETA Greg J. Seketa | | Director | | October 14, 2008 |
II-4
| | |
EXHIBIT
NUMBER | | DESCRIPTION |
| |
| 1.1* | | Form of Underwriting Agreement |
| |
| 3.1 | | First Amended and Restated Certificate of Incorporation of Phosphate Holdings, Inc. |
| |
| 3.2 | | Amended and Restated Bylaws of Phosphate Holdings, Inc. |
| |
| 4.1* | | Specimen stock certificate of Phosphate Holdings, Inc. |
| |
| 4.2 | | Rights Agreement between Phosphate Holdings, Inc. and Computershare Trust Company, N.A. dated December 5, 2007 |
| |
| 5.1* | | Opinion of Vinson & Elkins L.L.P. regarding the validity of the common stock |
| |
| 10.1† | | Agreement between Office Chérifien des Phosphates and Mississippi Phosphates Corporation dated January 1, 2005 |
| |
| 10.2 | | Amendment No. 1 to the Agreement between Office Chérifien des Phosphates and Mississippi Phosphates Corporation dated January 1, 2005 |
| |
| 10.3† | | Amendment No. 2 to the Agreement between Office Chérifien des Phosphates and Mississippi Phosphates Corporation dated January 1, 2006 |
| |
| 10.4† | | DAP Sales Contract between Mississippi Phosphates Corporation and Transammonia, Inc. dated December 5, 2006 |
| |
| 10.5† | | Anhydrous Ammonia Sales Contract between Mississippi Phosphates Corporation and Transammonia, Inc. effective January 1, 2007 |
| |
| 10.6† | | ICEC Purchase Contract No. P50899 between Mississippi Phosphates Corporation and International Commodities Export Corporation dated August 1, 2006 |
| |
| 10.7† | | Phosphate Charter-Party agreement between Mississippi Phosphates Corporation and T. Klaveness Shipping AS, Oslo dated June 24, 1999 |
| |
| 10.8† | | Addendum No. 1 to the Phosphate Charter-Party agreement between Mississippi Phosphates Corporation and Klaveness Chartering AS, Oslo dated February 23, 2005 |
| |
| 10.9 | | Addendum No. 2 to the Phosphate Charter-Party agreement between Mississippi Phosphates Corporation and A/S Klaveness Chartering dated October 17, 2007 |
| |
| 10.10 | | Employment Agreement between Phosphate Holdings, Inc., Mississippi Phosphates Corporation and Robert E. Jones dated January 1, 2008 |
| |
| 10.11 | | Employment Agreement between Phosphate Holdings, Inc., Mississippi Phosphates Corporation and C.E. McCraw dated January 1, 2008 |
| |
| 10.12 | | Employment Agreement between Phosphate Holdings, Inc., Mississippi Phosphates Corporation and Timothy R. Cantrell effective May 5, 2008 |
| |
| 10.13 | | Employment Agreement between Phosphate Holdings, Inc. and Stephen F. Wehmann dated January 1, 2008 |
| |
| 10.14 | | Employment Agreement between Mississippi Phosphates Corporation and James G. Perkins dated January 1, 2008 |
| |
| 10.15 | | Change in Control Agreement between Phosphate Holdings, Inc. and Timothy R. Cantrell executed September 22, 2008 |
| |
| 10.16 | | Change in Control Agreement between Phosphate Holdings, Inc. and Stephen F. Wehmann executed September 22, 2008 |
| |
| 10.17 | | Change in Control Agreement between Phosphate Holdings, Inc. and James G. Perkins executed September 22, 2008 |
II-5
| | |
EXHIBIT
NUMBER | | DESCRIPTION |
| |
| 10.18 | | Phosphate Holdings, Inc. 2008 Stock Option and Stock Appreciation Right Plan for Non-Employee Directors |
| |
| 10.19 | | Form of Phosphate Holdings, Inc. Stock Appreciation Right Award Agreement |
| |
| 10.20 | | Form of Phosphate Holdings, Inc. Indemnification Agreement |
| |
| 10.21 | | Revolving Credit and Security Agreement between Phosphate Holdings, Inc., Mississippi Phosphates Corporation, Lenders Parties Thereto and PNC Bank, National Association dated March 24, 2005 |
| |
| 10.22 | | First Amendment to Revolving Credit and Security Agreement between Phosphate Holdings, Inc., Mississippi Phosphates Corporation, Lenders Parties Thereto and PNC Bank, National Association dated February 27, 2006 |
| |
| 10.23 | | Second Amendment to Revolving Credit and Security Agreement between Phosphate Holdings, Inc., Mississippi Phosphates Corporation, Lenders Parties Thereto and PNC Bank, National Association dated August 23, 2006 |
| |
| 10.24 | | Third Amendment to Revolving Credit and Security Agreement between Phosphate Holdings, Inc., Mississippi Phosphates Corporation, Lenders Parties Thereto and PNC Bank, National Association dated March 23, 2007 |
| |
| 10.25 | | Fourth Amendment to Revolving Credit and Security Agreement between Phosphate Holdings, Inc., Mississippi Phosphates Corporation, Lenders Parties Thereto and PNC Bank, National Association dated December 20, 2007 |
| |
| 10.26 | | Fifth Amendment to Revolving Credit and Security Agreement between Phosphate Holdings, Inc., Mississippi Phosphates Corporation, Lenders Parties Thereto and PNC Bank, National Association dated May 5, 2008 |
| |
| 10.27 | | Second Amended, Restated and Substituted Revolving Credit Note by Phosphate Holdings, Inc. and Mississippi Phosphates Corporation in favor of PNC Bank, National Association dated May 5, 2008 |
| |
| 10.28 | | Term Note by Phosphate Holdings, Inc. and Mississippi Phosphates Corporation in favor of PNC Bank, National Association dated March 23, 2007 |
| |
| 10.29† | | Phosphate Charter-Party agreement between Mississippi Phosphates Corporation and Baumarine AS, Oslo dated July 30, 2007 |
| |
| 16.1 | | Letter from HORNE LLP |
| |
| 21.1 | | Subsidiaries of Phosphate Holdings, Inc. |
| |
| 23.1 | | Consent of KPMG LLP |
| |
| 23.2 | | Consent of HORNE LLP |
| |
| 23.3* | | Consent of Vinson & Elkins L.L.P. (included in the opinion to be filed as Exhibit 5.1) |
| |
| 24.1 | | Power of attorney (included on signature page) |
| * | To be filed by amendment. |
| † | Certain portions of this exhibit have been omitted and filed separately with the Securities and Exchange Commission under a confidential treatment request pursuant to Rule 406 of the Securities Act of 1933, as amended, and Rule 24b-2 of the Securities Exchange Act of 1934, as amended. |
II-6