Exhibit 99.3.2
Territorial Bancorp Inc.
Conversion
Valuation
Appraisal
February 27, 2009
Exhibit 99.3.2
Table of Contents
Territorial Bancorp Inc.
Honolulu, Hawaii
TABLE OF CONTENTS | I | |
INTRODUCTION | 1 | |
1. OVERVIEW AND FINANCIAL ANALYSIS | 3 | |
GENERAL OVERVIEW | 3 | |
HISTORYAND OVERVIEW | 4 | |
STRATEGIC DIRECTION | 5 | |
BALANCE SHEET TRENDS | 6 | |
LOAN PORTFOLIO | 8 | |
INVESTMENTS | 11 | |
INVESTMENTSAND MORTGAGE-BACKED SECURITIES | 12 | |
ASSET QUALITY | 13 | |
FUNDING COMPOSITION | 16 | |
ASSET/LIABILITY MANAGEMENT | 18 | |
NET WORTHAND CAPITAL | 19 | |
PROFITABILITY TRENDS | 20 | |
LEGAL PROCEEDINGS | 24 | |
SUBSIDIARIES | 24 | |
2. MARKET AREA ANALYSIS | 26 | |
3. COMPARISONS WITH PUBLICLY TRADED THRIFTS | 28 | |
INTRODUCTION | 28 | |
SELECTION CRITERIA | 28 | |
OVERVIEWOFTHE COMPARABLES | 30 | |
4. MARKET VALUE DETERMINATION | 33 | |
MARKET VALUE ADJUSTMENTS | 33 | |
FINANCIAL CONDITION | 34 | |
BALANCE SHEET GROWTH | 38 | |
EARNINGS QUALITY, PREDICTABILITYAND GROWTH | 39 | |
MARKETAREA | 44 | |
CASH DIVIDENDS | 45 | |
LIQUIDITYOFTHE ISSUE | 46 | |
RECENT REGULATORY MATTERS | 47 | |
5. OTHER FACTORS | 48 | |
MANAGEMENT | 48 | |
SUBSCRIPTION INTEREST | 49 | |
OTHERTHAN TEMPORARY IMPAIRMENT CHARGE | 51 | |
VALUATION ADJUSTMENTS | 52 | |
6. VALUATION | 53 | |
DISCUSSIONOF WEIGHT GIVENTO VALUATION MULTIPLES | 53 | |
FULL OFFERING VALUEIN RELATIONTO COMPARABLES | 55 | |
VALUATION CONCLUSION | 57 | |
List of Figures
Territorial Bancorp Inc.
Honolulu, Hawaii
FIGURE 1 - CURRENT FACILITIES LIST | 3 | |
FIGURE 2 - ASSET AND RETAINED EARNINGS CHART | 6 | |
FIGURE 3 - KEY BALANCE SHEET DATA | 7 | |
FIGURE 4 - KEY RATIOS | 7 | |
FIGURE 5 - NET LOANS RECEIVABLE CHART | 8 | |
FIGURE 6 - LOAN MIX AS OF DECEMBER 31, 2008 | 9 | |
FIGURE 7 - LOAN MIX AT DECEMBER 31, 2008 | 10 | |
FIGURE 8 - SECURITIES CHART | 11 | |
FIGURE 9 - INVESTMENT MIX | 12 | |
FIGURE 10 - ASSET QUALITY CHART | 13 | |
FIGURE 11 - NONPERFORMING LOANS | 14 | |
FIGURE 12 - ALLOWANCE FOR POSSIBLE LOAN AND LEASE LOSSES CHART | 15 | |
FIGURE 13 - DEPOSIT AND BORROWING TREND CHART | 16 | |
FIGURE 14 - DEPOSIT MIX | 17 | |
FIGURE 15 - INTEREST RATE RISK | 18 | |
FIGURE 16 - CAPITAL ANALYSIS | 19 | |
FIGURE 17 - NET INCOME CHART | 20 | |
FIGURE 18 - AVERAGE YIELDS AND COSTS | 21 | |
FIGURE 19 - SPREAD AND MARGIN CHART | 22 | |
FIGURE 20 - INCOME STATEMENT TRENDS | 23 | |
FIGURE 21 - DEPOSIT AND DEMOGRAPHIC DATA FOR HONOLULU | 26 | |
FIGURE 22 - DEPOSIT AND DEMOGRAPHIC DATA FOR HAWAII | 26 | |
FIGURE 23 - DEPOSIT AND DEMOGRAPHIC DATA FOR MAUI | 27 | |
FIGURE 24 - DEPOSIT AND DEMOGRAPHIC DATA FOR KAUAI | 27 | |
FIGURE 25 - COMPARABLE GROUP | 29 | |
FIGURE 26 - KEY FINANCIAL INDICATORS | 32 | |
FIGURE 27 - KEY BALANCE SHEET DATA | 34 | |
FIGURE 28 - CAPITAL DATA | 35 | |
FIGURE 29 - ASSET QUALITY TABLE | 36 | |
FIGURE 30 - BALANCE SHEET GROWTH DATA | 38 | |
FIGURE 31 - NET INCOME CHART | 40 | |
FIGURE 32 - PROFITABILITY DATA | 41 | |
FIGURE 33 - INCOME STATEMENT DATA | 42 | |
FIGURE 34 - MARKET AREA DATA | 44 | |
FIGURE 35 - DIVIDEND DATA | 45 | |
FIGURE 36 - MARKET CAPITALIZATION DATA | 46 | |
FIGURE 37 - CONVERSIONS (SINCE 1/1/07) PRO FORMA DATA | 49 | |
FIGURE 38 -CONVERSIONS PRICE APPRECIATION | 50 | |
FIGURE 39 - VALUE RANGE - FULL OFFERING | 55 | |
FIGURE 40 - FULL CONVERSION OFFERING PRICING MULTIPLES | 56 | |
FIGURE 41 - COMPARABLE FULL CONVERSION PRICING MULTIPLES TO THE BANK’S PRO FORMA MIDPOINT | 56 | |
FIGURE 42 - COMPARABLE FULL CONVERSION PRICING MULTIPLES TO THE BANK’S PRO FORMA SUPER MAXIMUM | 56 | |
FIGURE 43 - COMPARABLE FULL CONVERSION PRICING MULTIPLES TO THE BANK’S PRO FORMA MINIMUM | 56 |
List of Exhibits
Territorial Bancorp Inc.
Honolulu, Hawaii
Exhibit | ||
| 1. | Profile of FinPro, Inc. and the Author of the Appraisal | |
| 2. | Consolidated Balance Sheets | |
| 3. | Consolidated Statements of Income | |
| 4. | Consolidated Statements of Equity and Comprehensive Income | |
| 5. | Consolidated Statements of Cash Flows | |
| 6. | Income Reconciliation of TFR to Consolidated Statements | |
| 7. | Comparable Group Selection Screens | |
| 8. | Selected Financial Data | |
| 9. | Industry Pricing Multiples | |
| 10. | Standard Conversions 2007 to 2009 Year-to-Date | |
| 11. | Appraisal Full Offering No Foundation Pro Forma December 31, 2008 – 12 Months | |
| 12. | Fiscal Year Full Offering No Foundation Pro Forma December 31, 2008 – 12 Months | |
| Conversion Valuation Appraisal Report | Page: 1 |
Introduction
Territorial Bancorp Inc., a Maryland corporation, is offering shares of common stock for sale in connection with the conversion of Territorial Mutual Holding Company from the mutual to the stock form of organization. Upon completion of the conversion and the offering, all of the common stock of Territorial Bancorp Inc. will be owned by public stockholders. This report represents FinPro, Inc.’s (“FinPro”) independent appraisal of the estimated pro forma market value of the common stock (the “Common Stock”) of Territorial Bancorp Inc. (hereafter referred to on a consolidated basis as the “Bank”).
In compiling the pro formas, FinPro relied upon the assumptions provided by the Bank and its agents. The pro forma assumptions are as follows:
| • | 100% of the total shares will be sold to the depositors and public, |
| • | the stock will be issued at $10.00 per share, |
| • | the conversion expenses will be $2.9 million at the midpoint, |
| • | there will be an ESOP equal to 8% of the shares issued funded internally, amortized over 20 years straight-line, |
| • | there will be an MRP equal to 4% of the shares issued, amortized over 5 years straight-line, |
| • | there will be a Stock Option Plan equal to 10% of the shares issued, expensed at $3.04 per option over 5 years straight-line, |
| • | the tax rate is assumed at 39.00%, |
| • | the Bank will pay down $14.0 million in trust preferred securities at the minimum of the range, $20.0 million at the midpoint and $24.0 million at the maximum and super maximum, and |
| • | the net proceeds will be invested at the three-year treasury rate of 1.00%, pre-tax. |
It is our understanding that the Bank will offer its stock in a subscription and community offering to Eligible Account Holders, to the Employee Plans and to Supplemental Eligible Account Holders of the Bank. This appraisal has been prepared in accordance with Regulation 563b.7 and the “Guidelines for Appraisal Reports for the Valuation of Savings and Loan Associations Converting from Mutual to Stock Form of Organization” of the Office of Thrift Supervision (“OTS”) which have been adopted in practice by the Federal Deposit Insurance Corporation (“FDIC”), including the most recent revisions as of October 21, 1994, and applicable regulatory interpretations thereof.
In the course of preparing our report, we reviewed the Bank’s audited financials for the years ended December 31, 2008 and December 31, 2007. We also reviewed the registration statement on Form S-1 as filed with the Securities and Exchange Commission (“SEC”). We have conducted due diligence analysis of the Bank and held due diligence related discussions with the Bank’s Management and Board, Keefe Bruyette and Woods, Inc. (the Bank’s underwriter), and Luse Gorman Pomerenk and Schick, P.C. (the Bank’s special counsel). The valuation parameters set
| Conversion Valuation Appraisal Report | Page: 2 |
forth in the appraisal were predicated on these discussions but all conclusions related to the valuation were reached and made independent of such discussions.
Where appropriate, we considered information based upon other publicly available sources, which we believe to be reliable; however, we cannot guarantee the accuracy or completeness of such information. We visited the Bank’s primary market area and reviewed the market area’s economic condition. We also reviewed the competitive environment in which the Bank operates and its relative strengths and weaknesses. We compared the Bank’s performance with selected publicly traded thrift institutions. We reviewed conditions in the securities markets in general and in the market for savings institutions in particular. Our analysis included a review of the estimated effects of the Conversion of the Bank on the operations and expected financial performance as they related to the Bank’s estimated pro forma value.
In preparing our valuation, we relied upon and assumed the accuracy and completeness of financial and other information provided to us by the Bank and its independent accountants. We did not independently verify the financial statements and other information provided by the Bank and its independent accountants, nor did we independently value any of the Bank’s assets or liabilities. This estimated valuation considers the Bank only as a going concern and should not be considered as an indication of its liquidation value.
Our valuation is not intended, and must not be construed, to be a recommendation of any kind as the advisability of purchasing shares of Common Stock in the stock issuance. Moreover, because such valuation is necessarily based upon estimates and projections of a number of matters, all of which are subject to change from time to time, no assurance can be given that persons who purchase shares of Common Stock in the stock issuance will thereafter be able to sell such shares at prices related to the foregoing valuation of the pro forma market value thereof. FinPro is not a seller of securities within the meaning of any federal or state securities laws. Any report prepared by FinPro shall not be used as an offer or solicitation with respect to the purchase or sale of any securities.
The estimated valuation herein will be updated as appropriate. These updates will consider, among other factors, any developments or changes in the Bank’s financial condition, operating performance, management policies and procedures and current conditions in the securities market for thrift institution common stock. Should any such developments or changes, in our opinion, be material to the estimated pro forma market value of the Bank, appropriate adjustments to the estimated pro forma market value will be made. The reasons for any such adjustments will be explained at that time.
| Conversion Valuation Appraisal Report | Page: 3 |
1. Overview and Financial Analysis
GENERAL OVERVIEW
As of December 31, 2008, the Bank had $1.2 billion in total assets, $923.9 million in deposits, $633.2 million in net loans and $99.4 million in equity. The following table sets forth information with respect to the Bank’s full-service banking offices, including the expiration date of leases with respect to leased facilities.
FIGURE 1 – CURRENT FACILITIES LIST
ALA MOANA CENTER 1450 Ala Moana Blvd. Honolulu, Oahu 96814 1/31/2010 | KAILUA 19 Oneawa Street Kailua, Oahu 96734 | KAPOLEI Ace Center at Kapolei 480 Kamokila Blvd. Kapolei, Oahu 96707 7/31/2014 | NUUANU Nuuanu Shopping Center 1613 Nuuanu Avenue Honolulu, Oahu 96817 7/22/2016 | |||
DOWNTOWN 1000 Bishop Street Honolulu, Oahu 96813 12/31/2015 | KAIMUKI 1108 12th Avenue Honolulu, Oahu 96816 12/31/2018 | KAUAI Kukui Grove Shopping Center 4393 Kukui Grove Street Lihue, Kauai 96766 2/28/2013 | PEARL CITY Pearl City Shopping Center 850 Kamehameha Highway Pearl City, Oahu 96782 9/22/2009 | |||
HAWAII KAI Hawaii Kai Shopping Center 377 Keahole Street Honolulu, Oahu 96825 9/30/2013 | KALIHI-KAPALAMA 1199 Dillingham Boulevard Honolulu, Oahu 96817 8/31/2012 | KONA Crossroads Shopping Center 75-1027 Henry Street Kailua-Kona, Hawaii 96740 8/31/2015 | PEARLRIDGE 98-084 Kamehameha Highway Aiea, Oahu 96701 6/30/2012 | |||
HILO Waiakea Center 315 Makaala Street Hilo, Hawaii 96720 12/31/2018 | KAMEHAMEHA SHOPPING CENTER 1620 North School St. Honolulu, Oahu 96817 9/30/2015 | LAHAINA Old Lahaina Center 170 Papalaua Street Lahaina, Maui 96761 3/31/2013 | SALT LAKE Salt Lake Shopping Center 848 Ala Lilikoi Street Honolulu, Oahu 96818 1/31/2011 | |||
KAHALA 4819 Kilauea Avenue Honolulu, Oahu 96816 3/16/2015 | KANEOHE 46-005 Kawa Street Kaneohe, Oahu 96744 12/31/2014 | McCULLY 1111 McCully Street Honolulu, Oahu 96826 5/31/2013 | WAIPAHU Waipahu Town Center 94-050 Farrington Highway Waipahu, Oahu 96797 12/31/2014 | |||
KAHULUI Kaahumanu Center 275 W. Kaahumanu Ave. Kahului, Maui 96732 12/31/2009 | KAPAHULU Kilohana Square 1016 Kapahulu Avenue Honolulu, Oahu 96816 11/14/2013 | MILILANI Town Center of Mililani 95-1249 Meheula Parkway Mililani, Oahu 96789 10/11/2014 | WAIPIO Laniakea Plaza 94-1221 Ka Uka Blvd. Waipahu, Oahu 96797 9/30/2016 | |||
Source: Offering Prospectus
| Conversion Valuation Appraisal Report | Page: 4 |
HISTORYAND OVERVIEW
TERRITORIAL SAVINGS BANK
Territorial Savings Bank is a federally chartered savings bank headquartered in Honolulu, Hawaii. Territorial Savings Bank was organized in 1921, and reorganized into the mutual holding company structure in 2002. Territorial Savings Bank is currently the wholly owned subsidiary of Territorial Savings Group, Inc., a federal corporation, which is the wholly owned subsidiary of Territorial Mutual Holding Company, a federal mutual holding company. The Bank provides financial services to individuals, families and businesses through its 24 banking offices located throughout the State of Hawaii.
Territorial Savings Bank’s business consists primarily of accepting deposits from the general public and investing those deposits, together with funds generated from operations and borrowings, in one- to four-family residential mortgage loans and investment securities. To a much lesser extent, the Bank also originates home equity loans and lines of credit, construction, commercial and other non-residential real estate loans, consumer loans, multi-family mortgage loans and other loans. Territorial Savings Bank offers a variety of deposit accounts, including passbook and statement savings accounts, certificates of deposit, money market accounts, commercial and regular checking accounts and Super NOW accounts. Through a subsidiary, Territorial Financial Services, Inc., the Bank engages in insurance agency activities. The Bank also offers various non-deposit investments to its customers, including annuities and mutual funds, through a third-party broker-dealer.
Territorial Savings Bank’s executive offices are located at 1132 Bishop Street, Suite 2200, Honolulu, Hawaii 96813.
TERRITORIAL BANCORP INC.
Territorial Bancorp Inc. is a newly formed Maryland corporation that will own all of the outstanding shares of common stock of Territorial Savings Bank upon completion of the mutual-to-stock conversion and the offering. Territorial Bancorp Inc. has not engaged in any business to date.
| Conversion Valuation Appraisal Report | Page: 5 |
STRATEGIC DIRECTION
The Bank’s business strategy is to grow and improve profitability by:
| • | remaining a community-oriented financial institution; |
| • | increasing loan production while maintaining high asset quality; |
| • | emphasizing lower cost core deposits to maintain low funding costs; and |
| • | expanding its branch network. |
| Conversion Valuation Appraisal Report | Page: 6 |
BALANCE SHEET TRENDS
The Bank’s balance sheet increased by $88.9 million between December 31, 2004 and December 31, 2006. Assets declined $137.8 million between December 31, 2006 and December 31, 2007, but increased $62.4 million between December 31, 2007 and December 31, 2008
Equity was $99.4 million as of December 31, 2008 and the equity to assets ratio was 8.12% at December 31, 2008.
FIGURE 2 - ASSETAND RETAINED EARNINGS CHART
[object omitted]
Source: Offering Prospectus
| Conversion Valuation Appraisal Report | Page: 7 |
The following tables set forth certain information concerning the financial position of the Bank at the dates indicated.
FIGURE 3 - KEY BALANCE SHEET DATA
[object omitted]
Source: Offering Prospectus
FIGURE 4 - KEY RATIOS
[object omitted]
Source: Offering Prospectus
| Conversion Valuation Appraisal Report | Page: 8 |
LOAN PORTFOLIO
The Bank’s loan portfolio has increased by $153.1 million from December 31, 2004 to December 31, 2008, with $78.4 million of the growth coming between December 31, 2007 and December 31, 2008. As a percent of assets, the loan portfolio has increased from 39.65% to 51.71% between December 31, 2004 and December 31, 2008, respectively.
FIGURE 5 - NET LOANS RECEIVABLE CHART
[object omitted]
Source: Offering Prospectus
| Conversion Valuation Appraisal Report | Page: 9 |
The Bank’s lending operations are primarily focused on 1-4 family residential loans. Since December 31, 2004, the loan portfolio composition has shifted slightly toward home equity loans and lines as well as construction, commercial and other loans.
FIGURE 6 - LOAN MIXASOF DECEMBER 31, 2008
[object omitted]
Source: Offering Prospectus
| Conversion Valuation Appraisal Report | Page: 10 |
The loan portfolio is highly focused, with over 90% concentrated in 1-4 family residential loans.
FIGURE 7 - LOAN MIXAT DECEMBER 31, 2008
[object omitted]
Source: Offering Prospectus
| Conversion Valuation Appraisal Report | Page: 11 |
INVESTMENTS
The investment portfolio decreased $116.7 million between December 31, 2004 and December 31, 2008. The cash flow from the portfolio has been used to fund loan growth and compensate for lower deposits during that time frame.
FIGURE 8 - SECURITIES CHART
[object omitted]
Source: Offering Prospectus
| Conversion Valuation Appraisal Report | Page: 12 |
INVESTMENTSAND MORTGAGE-BACKED SECURITIES
The following table provides the Bank’s investment portfolio. As of December 31, 2008, the entire portfolio is classified as held to maturity. The portfolio is predominately agency sponsored MBS. During the quarter ended December 31, 2008, the Bank took a $2.5 million impairment charge on its portfolio of trust preferred securities pools.
FIGURE 9 - INVESTMENT MIX
[object omitted]
Source: Offering Prospectus
| Conversion Valuation Appraisal Report | Page: 13 |
ASSET QUALITY
The Bank’s conservative underwriting culture has resulted in a low level of nonperforming loans and nonperforming assets.
FIGURE 10 - ASSET QUALITY CHART
[object omitted]
Source: Offering Prospectus
| Conversion Valuation Appraisal Report | Page: 14 |
At December 31, 2008, the Bank’s nonperforming loans to total loan ratio was 0.02% and the nonperforming assets to total assets ratio was 0.02%.
FIGURE 11 - NONPERFORMING LOANS
[object omitted]
Source: Offering Prospectus
| Conversion Valuation Appraisal Report | Page: 15 |
Due to the historically low level of charge-offs and nonperforming assets, the Bank’s reserve to loan ratio is 0.14% as of December 31, 2008.
FIGURE 12 - ALLOWANCEFOR POSSIBLE LOANAND LEASE LOSSES CHART
[object omitted]
Source: Offering Prospectus
| Conversion Valuation Appraisal Report | Page: 16 |
FUNDING COMPOSITION
The Bank experienced deposit runoff of $132.5 million between December 31, 2004 and December 31, 2007. Deposits increased $31.6 million between December 31, 2007 and December 31, 2008. Borrowings have trended upward between December 31, 2004 and December 31, 2008.
FIGURE 13 - DEPOSITAND BORROWING TREND CHART
[object omitted]
Source: Offering Prospectus
| Conversion Valuation Appraisal Report | Page: 17 |
The following chart illustrates the Bank’s deposit mix as of December 31, 2008. The two largest components of the deposit mix are certificates of deposit and savings accounts.
FIGURE 14 - DEPOSIT MIX
[object omitted]
Source: Offering Prospectus
| Conversion Valuation Appraisal Report | Page: 18 |
ASSET/LIABILITY MANAGEMENT
The following chart provides the net portfolio value sensitivity in various interest rate shock scenarios provided by the OTS as of December 31, 2008. The Bank’s interest rate risk position is considered to be “Minimum Risk” according to TB-13a relative to “Significant Risk” as of September 30, 2008. The primary change relates to a substantial increase in assumed prepayment speeds on loans and mortgage backed securities.
FIGURE 15 - INTEREST RATE RISK
[object omitted]
Source: Offering Prospectus
| Conversion Valuation Appraisal Report | Page: 19 |
NET WORTHAND CAPITAL
At December 31, 2008 the Bank had capital in excess of the minimum requirements for all capital ratios. Approximately, $24.0 million of the Bank’s capital is currently funded by trust preferred debt at the holding company.
FIGURE 16 - CAPITAL ANALYSIS
[object omitted]
Source: Offering Prospectus
| Conversion Valuation Appraisal Report | Page: 20 |
PROFITABILITY TRENDS
Net income trended downward between the twelve months ended December 31, 2004 and the twelve months ended December 31, 2007. The decline of $8.2 million over this time period was primarily attributable to lower net interest income resulting from higher noninterest expense, lower noninterest income and margin compression.
For the twelve months ended December 31, 2008 compared to twelve months ended December 31, 2007, net income increased $1.4 million or 24.8%. The increase was primarily attributable to an increase in net interest income of $7.4 million, resulting primarily from lower interest expense. This was partially offset by a $3.0 million increase in noninterest expense a $1.2 increase in provision for income tax expense and a $1.7 million decrease in noninterest income.
FIGURE 17 - NET INCOME CHART
[object omitted]
Source: Offering Prospectus
| Conversion Valuation Appraisal Report | Page: 21 |
The net interest spread and margin increased between the twelve months ended December 31, 2007 and the twelve months ended December 31, 2008. The increase was primarily attributable to a lower cost of interest bearing liabilities, which was complemented by a modestly higher yield on earning assets.
FIGURE 18 - AVERAGE YIELDSAND COSTS
[object omitted]
Source: Offering Prospectus
| Conversion Valuation Appraisal Report | Page: 22 |
Spread and margin trended downward between December 31, 2004 and December 31, 2007, due in large part to a rising cost of funds.
The net interest spread and margin both increased between the twelve months ended December 31, 2008 due primarily to a lower cost of funds.
FIGURE 19 - SPREADAND MARGIN CHART
[object omitted]
Source: Offering Prospectus
| Conversion Valuation Appraisal Report | Page: 23 |
Net income trended downward between the twelve months ended December 31, 2004 and the twelve months ended December 31, 2007. The decline of $8.2 million over this time period was primarily attributable to lower net interest income resulting from higher noninterest expense, lower noninterest income and margin compression.
For the twelve months ended December 31, 2008 compared to twelve months ended December 31, 2007, net income increased $1.4 million or 24.8%. The increase was primarily attributable to an increase in net interest income of $7.4 million, resulting primarily from lower interest expense. This was partially offset by a $3.0 million increase in noninterest expense a $1.2 increase in provision for income tax expense and a $1.7 million decrease in noninterest income.
FIGURE 20 - INCOME STATEMENT TRENDS
[object omitted]
Source: Offering Prospectus
| Conversion Valuation Appraisal Report | Page: 24 |
LEGAL PROCEEDINGS
Territorial Mutual Holding Company, Territorial Savings Group, Inc., Territorial Savings Bank and Territorial Realty, Inc. (the Bank’s real estate investment trust subsidiary) have filed appeals with the Tax Appeal Court of the State of Hawaii seeking refunds of approximately $4.5 million in taxes paid to the State of Hawaii from 2004 through 2007. The refunds represent 70% of the amount of dividends paid to Territorial Savings Bank by Territorial Realty, Inc. from 2004 to 2007. The claim for the refunds is based on a 70% dividends-received deduction under Hawaii statutes, these refunds have been denied by the State of Hawaii Department of Taxation. A hearing has been set for March 2010. At this time, management is unable to predict an outcome, favorable or unfavorable, with respect to these actions.
Other than as disclosed in the preceding paragraph, at December 31, 2008, the Bank was not involved in any legal proceedings the outcome of which it believes would be material to its financial condition or results of operations.
SUBSIDIARIES
In addition to owning all of the outstanding capital stock of Territorial Savings Bank, Territorial Savings Group, Inc. owns all of the common stock of three statutory trusts formed under the laws of the State of Connecticut: Territorial Savings Statutory Trust I, Territorial Savings Statutory Trust II and Territorial Savings Statutory Trust III. The three statutory trusts were formed to issue a total of $24.0 million of trust preferred securities. At December 31, 2008, Territorial Savings Group, Inc.’s investment in the statutory trusts totaled $743,000, and these entities had assets of $24.8 million at that date.
Territorial Savings Bank owns 100% of the common stock of Territorial Holdings, Inc., a Hawaii corporation, which in turn owns 100% of the voting common stock of Territorial Realty, Inc. Territorial Realty, Inc. is a Hawaii real estate investment trust that holds mortgage loans and mortgage-backed securities. These entities enable Territorial Savings Bank to segregate certain assets for management purposes, and promote Territorial Savings Bank’s ability to raise regulatory capital in the future through the sale of preferred stock or other capital-enhancing securities by these entities. At December 31, 2008, Territorial Savings Bank’s investment in Territorial Holdings, Inc. was $480.5 million, and Territorial Holdings, Inc. had assets of $480.6 million at that date. At December 31, 2008, Territorial Holdings, Inc.’s investment in Territorial Realty, Inc. was $480.5 million, and Territorial Realty, Inc. had $480.4 million in assets at that date.
Territorial Savings Bank owns 100% of the common stock of Territorial Financial Services, Inc., a Hawaii corporation that engages primarily in insurance activities. At December 31, 2008, Territorial Savings Bank’s investment in Territorial Financial Services, Inc. was $12,000, and
| Conversion Valuation Appraisal Report | Page: 25 |
Territorial Financial Services, Inc. had assets of $53,000 at that date. Territorial Savings Bank also owns 100% of the common stock of Territorial Real Estate Co., Inc., an inactive Hawaii corporation that is authorized to manage and dispose of troubled real estate.
| Conversion Valuation Appraisal Report | Page: 26 |
2. Market Area Analysis
The following tables provide deposit and demographic data for the Bank’s market area.
FIGURE 21 - DEPOSITAND DEMOGRAPHIC DATAFOR HONOLULU
[object omitted]
Source: SNL Securities and ESRI
FIGURE 22 - DEPOSITAND DEMOGRAPHIC DATAFOR HAWAII
[object omitted]
Source: SNL Securities and ESRI
| Conversion Valuation Appraisal Report | Page: 27 |
FIGURE 23 - DEPOSITAND DEMOGRAPHIC DATAFOR MAUI
[object omitted]
Source: SNL Securities and ESRI
FIGURE 24 - - DEPOSITAND DEMOGRAPHIC DATAFOR KAUAI
[object omitted]
Source: SNL Securities and ESRI
| Conversion Valuation Appraisal Report | Page: 28 |
3. Comparisons with Publicly Traded Thrifts
INTRODUCTION
This section presents an analysis of the Bank’s operations against a selected group (“Comparable Group”) of publicly traded thrifts. The Comparable Group was selected based upon similarity of characteristics to the Bank. The Comparable Group multiples provide the basis for the valuation of the Bank.
Factors that influence the Bank’s value such as balance sheet structure and size, profitability, income and expense trends, capital levels, credit risk, and recent operating results can be measured against the Comparable Group. The Comparable Group’s current market pricing, coupled with the appropriate aggregate adjustment for differences between the Bank and the Comparable Group, will then be utilized as the basis for the pro forma valuation of the Bank’s to-be-issued common stock.
SELECTION CRITERIA
The goal of the selection criteria process is to find those institutions with characteristics that most closely match those of the Bank. In an ideal world, all of the Comparable Group would contain the exact characteristics of the Bank. However, none of the Comparables selected will be exact clones of the Bank.
As of the date of this appraisal, there are a total of 194 fully converted thrifts nationally. There are 115 traded on the NYSE, NASDAQ or AMEX. FinPro limited the Comparable Group to institutions whose common stock is listed on a major exchange, since these companies tend to trade regularly. FinPro believes that thrifts that trade over-the-counter or as pink sheets are inappropriate for the Comparable Group, due to irregular trading activity and wide bid/ask spreads, which may skew the trading value and make trading multiples less reliable as an indicator of value.
Two announced merger targets were eliminated from the group leaving 113 remaining.
| Conversion Valuation Appraisal Report | Page: 29 |
FinPro excluded institutions that have recently converted, as the earnings of newly converted institutions do not reflect a full year’s benefit from the reinvestment of proceeds, and thus the price/earnings multiples and return on equity measures for these institutions tend to be skewed upward and downward, respectively. As such, the 5 institutions that converted after December 31, 2007 were eliminated.
Institutions with significant asset quality problems are inappropriate comparables relative to an institution with strong asset quality. FinPro eliminated 21 institutions with NPA/assets greater than 3%, leaving 87 remaining.
Of the remaining 87, FinPro then eliminated 24 of the institutions with assets less than $600 million as these entities have less financial and managerial resources.
Of the remaining 63, FinPro then eliminated 17 of the institutions with assets greater than $3.0 billion as these entities have greater financial and managerial resources and a broader branch network.
In order to eliminate struggling institutions, FinPro eliminated 11 institutions which were not profitable on an aggregate net income basis for the trailing twelve months, leaving 35.
Ideally, all of the Comparables would be located in Hawaii or on the West Coast. However, due to the limited universe and critical financial characteristics that is not possible. FinPro was forced to expand the geographic screen to include the Western, Southwestern and Midwestern Regions. As such, FinPro eliminated 22 institutions located in the New England, Mid Atlantic and Southeastern Regions.
FinPro then eliminated two institutions due to the lack of sufficient public financial data, leaving 11 institutions.
This results in a total of 11 Comparables. FinPro reviewed the recent performance and news releases of these 11 companies. FinPro determined that BofI Holding, Inc. was not appropriate due to its internet strategy. The remaining 10 were acceptable Comparables.
FIGURE 25 - COMPARABLE GROUP
[object omitted]
| Conversion Valuation Appraisal Report | Page: 30 |
OVERVIEWOFTHE COMPARABLES
The members of the Comparable Group were reviewed against the Bank to ensure comparability based upon the following criteria:
| 1. | Asset size |
| 2. | Profitability |
| 3. | Capital Level |
| 4. | Balance Sheet Mix |
| 5. | Operating Strategy |
| 6. | Date of conversion |
1. Asset SizeIdeally, the Comparable Group should have a similar asset size to the Bank. The Comparable Group ranged in size from $671.6 million to $2.3 billion in total assets with a median of $1.3 billion. The Bank’s asset size was $1.2 billion as of December 31, 2008. On a pro forma basis, the Bank’s assets are projected to be $1.3 billion at the midpoint of the estimated value range.
2. ProfitabilityThe Comparable Group had a median core ROAA of 0.57% and a median ROAE of 6.86% for the last twelve months. The Bank had a core ROAA of 0.72% and a core ROAE of 9.38% for the twelve months ended December 31, 2008. On a pro forma basis, the Bank’s ROAA and ROAE are 0.70% and 5.42%, respectively.
3. Capital LevelThe Comparable Group had a median tangible equity to tangible assets ratio of 8.59% with a high of 28.89% and a low of 4.51%. At December 31, 2008, the Bank had a tangible equity to tangible assets ratio of 8.10%. On a pro forma basis, at the midpoint, the Bank would have a tangible equity to tangible assets ratio of 12.84%.
4. Balance Sheet MixAt December 31, 2008, the Bank had a net loan to asset ratio of 51.71%. The median loan to asset ratio for the Comparables was 79.39%, ranging from a low of 52.50% to a high of 85.22%. On the liability side, the Bank’s deposit to asset ratio was 75.46% at December 31, 2008 while the Comparable median was 72.29%, ranging from 52.55% to 82.83%. The Bank’s borrowing to asset ratio of 14.31% is below the Comparable median of 17.01%.
5. Operating StrategyAn institution’s operating characteristics are important because they determine future performance. Operational strategy also affects expected rates of return and investors’ general perception of the quality, risk and attractiveness of a given company. Specific
| Conversion Valuation Appraisal Report | Page: 31 |
operating characteristics include profitability, balance sheet growth, asset quality, capitalization and non-financial factors such as management strategies and lines of business.
6. Date of ConversionRecent conversions, those completed on or after December 31, 2007, were excluded since the earnings of a newly converted institution do not reflect the reinvestment of conversion proceeds. Additionally, new issues tend to trade at a discount to the market averages.
| Conversion Valuation Appraisal Report | Page: 32 |
The following table represents key financial indicators for the Bank and the Comparable Group.
FIGURE 26 - KEY FINANCIAL INDICATORS
[object omitted]
Source: The Bank’s Offering Circular, FinPro calculations and SNL Securities
| Conversion Valuation Appraisal Report | Page: 33 |
4. Market Value Determination
MARKET VALUE ADJUSTMENTS
The estimated pro forma market value of the Bank, along with certain adjustments to its value relative to market values for the Comparable Group are delineated in this section. The adjustments are made from potential investors’ viewpoint and are adjustments necessary when comparing the Bank to the Comparable Group. The adjustment factors are subjectively assessed using the appraiser’s knowledge and expertise and an aggregate adjustment is determined. Potential investors include depositors holding subscription rights and unrelated parties who may purchase stock in the community offering and who are assumed to be aware of all relevant and necessary facts as they pertain to the value of the Bank relative to other publicly traded thrift institutions and relative to alternative investment opportunities.
There are numerous criteria on which the market value adjustments are based. The major criteria utilized for purposes of this report include:
Adjustments Relative to the Comparable Group:
| • | Financial Condition |
| • | Balance Sheet Growth |
| • | Earnings Quality, Predictability and Growth |
| • | Market Area |
| • | Cash Dividends |
| • | Liquidity of the Issue |
| • | Recent Regulatory Matters |
Adjustments for Other Factors:
| • | Management |
| • | Subscription Interest |
| • | Other than Temporary Impairment Charge |
To ascertain the market value of the Bank, the median trading multiple values for the Comparable Group are utilized as the starting point. The adjustment, up or down, to the Comparable Group median multiple values is made based on the comparison of the Bank to the Comparable Group.
| Conversion Valuation Appraisal Report | Page: 34 |
FINANCIAL CONDITION
The balance sheet strength of an institution is an important market value determinant, as the investment community considers such factors as cash liquidity, capitalization, asset composition, funding mix, intangible levels and interest rate risk in assessing the attractiveness of investing in the common stock of a thrift. The following figures summarize the key financial elements of the Bank measured against the Comparable Group.
FIGURE 27 - KEY BALANCE SHEET DATA
[object omitted]
Sources: SNL and Offering Circular Data, FinPro Computations
Asset Size - The Bank, at $1.2 billion, is below the Comparable Group median of $1.3 billion. At the pro forma midpoint of the offering range, the Bank is expected to have assets of $1.3 million.
Asset Composition - The Bank’s loans to assets ratio of 51.71% is below the Comparable Group median of 79.39%. The Bank has a higher level of securities as a percentage of assets.
Funding Mix - The Bank funds itself through deposits, 75.46% of assets and borrowings, 14.31% of assets. The Comparable Group has a deposits to assets ratio of 72.29% and a borrowing to asset ratio of 17.01%.
Cash Liquidity - The cash liquidity of the Bank and the Comparable Group appear to be sufficient to meet funding requirements and regulatory guidelines.
Interest Rate Risk - The Bank’s interest rate risk position is illustrated on page 18. The Bank’s interest rate risk position is considered to be “Minimum Risk”. The pro forma increase in capital is expected to reduce the institution’s interest rate risk. No similar data is available for the Comparable Group.
| Conversion Valuation Appraisal Report | Page: 35 |
FIGURE 28 - CAPITAL DATA
[object omitted]
Sources: SNL and Offering Circular Data, FinPro Computations
Capitalization - The Comparable Group’s median tangible equity to tangible assets ratio of 8.59% is above the Bank’s ratio of 8.10%. The Bank’s pro forma equity to assets ratio is projected to be 12.84% at the midpoint of the valuation range.
| Conversion Valuation Appraisal Report | Page: 36 |
The asset quality of an institution is an important determinant of market value. The investment community considers levels of nonperforming loans, Real Estate Owned (“REO”) and levels of Allowance for Loan and Lease Losses (“ALLL”) in assessing the attractiveness of investing in the common stock of an institution.
FIGURE 29 - ASSET QUALITY TABLE
[object omitted]
Sources: SNL and Offering Circular Data, FinPro Computations
The Bank has a nominal level of NPLs and NPAs. The Comparable Group NPAs to assets ratio is 1.95%. The Bank’s reserve level, 0.14% to total loans, is substantially below the Comparable median of 1.31% of loans. The Bank’s level of reserves to NPLs is not meaningful because of the low level of NPLs.
| Conversion Valuation Appraisal Report | Page: 37 |
Positive | Neutral | Negative | ||
Higher Pro forma Capital | Similar Capital | Lower Loans to Assets | ||
Lower Borrowings to Assets | Lower ALLL to Loans | |||
Higher Deposits to Assets | ||||
Nominal NPLs or NPAs | ||||
The Bank’s asset mix is weaker than the Comparable Group’s mix. The Bank has a higher level of deposits and lower level of borrowings as a percentage of assets relative to the Comparable Group. The Bank has slightly lower capital levels, but at the midpoint of the range will have higher tangible capital levels after the conversion. The Bank has a lower level of NPLs and NPAs, but has a lower level of reserves as a percentage of loans relative to the Comparable levels. Taken collectively, an upward adjustment is warranted for financial condition.
| Conversion Valuation Appraisal Report | Page: 38 |
BALANCE SHEET GROWTH
The Bank’s assets, loans and deposits have all increased. However, relative to the Comparable Group median, the Bank’s asset and deposit growth rates are lower, while loan growth is higher. The additional capital raised as part of the offering will provide the Bank with the opportunity to grow its balance sheet at a time when the industry is lacking capital.
FIGURE 30 - BALANCE SHEET GROWTH DATA
[object omitted]
Sources: SNL and Offering Circular Data, FinPro Computations
Positive | Neutral | Negative | ||
Higher Loan Growth | Lower Asset Growth | |||
Additional Capital | Lower Deposit Growth | |||
A slight upward adjustment is warranted.
| Conversion Valuation Appraisal Report | Page: 39 |
EARNINGS QUALITY, PREDICTABILITYAND GROWTH
The earnings quality, predictability and growth are critical components in the establishment of market values for thrifts. Thrift earnings are primarily a function of:
| • | net interest income |
| • | loan loss provision |
| • | non-interest income |
| • | non-interest expense |
The quality and predictability of earnings is dependent on both internal and external factors. Some internal factors include the mix of the balance sheet, the interest rate sensitivity of the balance sheet, the asset quality, and the infrastructure in place to deliver the assets and liabilities to the public. External factors include the competitive market for both assets and liabilities, the global interest rate scenario, local economic factors and regulatory issues.
Investors are focusing on earnings sustainability as interest rate volatility has caused a wide variation in income levels. With the intense competition for both assets and deposits, banks cannot easily replace lost spread and margin with balance sheet growth.
Each of these factors can influence the earnings of an institution, and each of these factors is volatile. Investors prefer stability and consistency. As such, solid, consistent earnings are preferred to high but risky earnings. Investors also prefer earnings to be diversified and not entirely dependent on interest income.
| Conversion Valuation Appraisal Report | Page: 40 |
Net income trended downward between the twelve months ended December 31, 2004 and the twelve months ended December 31, 2007. The decline of $8.2 million over this time period was primarily attributable to lower net interest income resulting from higher noninterest expense, lower noninterest income and margin compression.
For the twelve months ended December 31, 2008 compared to twelve months ended December 31, 2007, net income increased $1.4 million or 24.8%. The increase was primarily attributable to an increase in net interest income of $7.4 million, resulting primarily from lower interest expense. This was partially offset by a $3.0 million increase in noninterest expense a $1.2 increase in provision for income tax expense and a $1.7 million decrease in noninterest income.
FIGURE 31 - NET INCOME CHART
[object omitted]
Source: Offering Prospectus
| Conversion Valuation Appraisal Report | Page: 41 |
The Bank’s core ROAA and core ROAE are above the Comparable Group medians. The Bank’s higher capitalization following the offering is expected to reduce return on equity for the near term. On a pro forma basis, the Bank’s core ROAA and core ROAE are 0.70% and 5.42%, respectively.
FIGURE 32 - PROFITABILITY DATA
[object omitted]
Sources: SNL and Offering Circular Data, FinPro Computations
| Conversion Valuation Appraisal Report | Page: 42 |
FIGURE 33 - INCOME STATEMENT DATA
[object omitted]
Sources: SNL and Offering Circular Data, FinPro Computations
Note: The cost of funds and the net interest spread medians are less reliable due to the lack of four data points.
The Bank has a 29 basis point disadvantage in net margin relative to the Comparable Group. This disadvantage is compounded by a 100 basis point disadvantage in noninterest income. However, noninterest expense as a percentage of average assets is 87 basis points lower than the Comparable Group median.
The Bank’s efficiency ratio of 70.79% is below the Comparable median of 69.67%.
On a forward looking basis, after the conversion the Bank’s operating expenses are expected to rise as a result of the stock benefit plans and additional costs of being a public company. At the same time, the Bank will have additional capital to deploy and leverage.
| Conversion Valuation Appraisal Report | Page: 43 |
Positive | Neutral | Negative | ||
Higher ROAA | Lower Net Interest Margin | |||
Higher ROAE | Lower Noninterest Income | |||
Lower Noninterest Expense | Lower Pro Forma ROAE | |||
The Bank’s profitability is above the Comparables on an ROAA and ROAE basis. The Bank’s earnings composition is weaker than the Comparable Group as the Bank has a lower margin and lower noninterest income. However, the Bank has a lower level of noninterest expense. The Bank’s historical earnings have been trending downward. Taken collectively, a moderate upward adjustment is warranted for this factor.
| Conversion Valuation Appraisal Report | Page: 44 |
MARKETAREA
The market area that an institution serves has a significant impact on value, as future success is interrelated with the economic, demographic and competitive aspects of the market. The location of an institution will have an impact on the trading value of an institution, as many analysts compare the pricing of institutions relative to a state or regional multiples in investor presentations.
The following figure compares the demographic and competitive data for the counties serviced by the Bank, to the county data of the Comparable Group members.
FIGURE 34 - MARKET AREA DATA
[object omitted]
Sources: SNL Securities
The two largest components of Hawaii’s economy are tourism and the federal government, including the military. However, the State of Hawaii has been striving to diversify the state’s economy by attracting more high-technology businesses to the state. The Hawaii Department of Business, Economic Development and Tourism expects total visitor arrivals to decline 5.9% in 2009, down from a 1.9% decline projected in the previous (November 2008) forecast. Some of the largest individual private employers in the state include a staffing companies, financial services companies, the University of Hawaii System of higher education and research and health services companies.
Positive | Neutral | Negative | ||
Higher Median Income | Historical Population Growth | Lower Income Growth | ||
Lower Unemployment | Proj. Population Growth | Tourism Reliance | ||
| Population Per Branch | ||||
The Bank’s market area has experienced population growth that is modestly slower than the median for the Comparable Group and population growth is projected to continue into the future. Household income levels are higher in the Bank’s markets, but are projected to grow at a rate that is slower than the Comparables. The Bank’s market area has a similar ratio of population to branches than the Comparable Group, indicating a similar competition. The unemployment rate in the Bank’s market area is lower. However, the Hawaiian economy is heavily dependent on the tourist industry which has slowed based upon economic weakness. Based upon these factors, no adjustment is warranted for market area.
| Conversion Valuation Appraisal Report | Page: 45 |
CASH DIVIDENDS
The industry has typically not disclosed dividend policies concurrent with conversion. Recently, a number of financial institutions have cut dividend rates in an effort to conserve capital.
FIGURE 35 - DIVIDEND DATA
[object omitted]
Sources: SNL and Offering Circular Data, FinPro Computations
All of the Comparable institutions had declared cash dividends. The median dividend payout ratio for the Comparable Group was 99.48%, ranging from a high of 468.75% to a low of 17.27%. The Bank, on a pro forma basis at the mid point of the value range will have a tangible equity to tangible assets ratio of 12.84%. The Bank will have adequate capital and profits to pay cash dividends.
As such, no adjustment is warranted for this factor.
| Conversion Valuation Appraisal Report | Page: 46 |
LIQUIDITYOFTHE ISSUE
The Comparable Group is by definition composed only of companies that trade in the public markets with all of the Comparables trading on NASDAQ or AMEX. Typically, the number of shares outstanding and the market capitalization provides an indication of how much liquidity there will be in a given stock. The actual liquidity can be measured by volume traded over a given period of time.
FIGURE 36 - MARKET CAPITALIZATION DATA
[object omitted]
Sources: SNL and Offering Circular Data, FinPro Computations
The market capitalization values of the Comparable Group range from a low of $21.5 million to a high of $128.1 million with a median market capitalization of $41.9 million. The Bank expects to have $76.0 million of market capital at the midpoint on a pro forma basis. It is expected that the Bank will trade on NASDAQ along with all but one of the Comparables.
No adjustment for this factor appears warranted as both the Bank and the Comparables are expected to be liquidly traded.
| Conversion Valuation Appraisal Report | Page: 47 |
RECENT REGULATORY MATTERS
Regulatory matters influence the market for thrift conversions. It is expected that industry regulation will increase as a result of the current crisis. Both the Bank and the Comparable Group are expected to operate in substantially the same regulatory environment.
Taken collectively, no adjustment for this factor is warranted as both the Bank and the Comparables will operate in the same ownership structure and will be supervised in the same regulatory environment.
| Conversion Valuation Appraisal Report | Page: 48 |
5. Other Factors
MANAGEMENT
The current team has considerable banking experience and has held similar positions in other financial institutions. The Bank’s organizational chart is reasonable for an institution of its size and complexity. Financial performance and asset quality are strong.
The Board is active and oversees and advises on all key strategic and policy decisions.
As such, no adjustment appears to be warranted for this factor.
| Conversion Valuation Appraisal Report | Page: 49 |
SUBSCRIPTION INTEREST
The pro forma price to tangible book multiple of conversions declined from 2007 to 2009 YTD. It is also important to note that a number of institutions cancelled or postponed conversions over the past six months.
FIGURE 37 - CONVERSIONS (SINCE 1/1/07) PRO FORMA DATA
[object omitted]
Source: SNL Securities
| Conversion Valuation Appraisal Report | Page: 50 |
There was no first day “pop” for 2009 year-to-date and half of the 2008 transactions traded down on their first day. Three of the four 2008 standard conversions are trading below their IPO price.
FIGURE 38 - CONVERSIONS PRICE APPRECIATION
[object omitted]
Source: SNL Securities
A strong downward adjustment is warranted given weakness in the market.
| Conversion Valuation Appraisal Report | Page: 51 |
OTHERTHAN TEMPORARY IMPAIRMENT CHARGE
During the quarter ended December 31, 2008, the Bank posted a $2.5 million pre-tax charge related to its holdings of pools of trust preferred securities. As of the date of this appraisal, the Bank has received notification that a second one of the pools of trust preferred securities will be deferring interest. Based upon discussions with KPMG, the Bank’s auditor, the Bank will take another impairment charge during the quarter ended March 31, 2009. Management estimates that the charge will approximate $2.5 million, pre-tax.
Based upon the knowledge of this factor, FinPro believes that a moderate downward adjustment is warranted.
| Conversion Valuation Appraisal Report | Page: 52 |
VALUATION ADJUSTMENTS
Relative to the Comparables the following adjustments need to be made to the Bank’s pro forma market value.
Valuation Factor | Valuation Adjustment | |
| Financial Condition | Upward | |
| Balance Sheet Growth | Slight Upward | |
| Earnings Quality, Predictability and Growth | Moderate Upward | |
| Market Area | No Adjustment | |
| Dividends | No Adjustment | |
| Liquidity of the Issue | No Adjustment | |
| Recent Regulatory Matters | No Adjustment | |
Additionally, the following adjustment should be made to the Bank’s market value.
Valuation Factor | Valuation Adjustment | |
| Management | No Adjustment | |
| Subscription Interest | Strong Downward | |
| Other than Temporary Impairment Charge | Moderate Downward | |
| Conversion Valuation Appraisal Report | Page: 53 |
6. Valuation
In applying the accepted valuation methodology promulgated by the regulators, i.e., the pro forma market value approach, three key pricing multiples were considered. The four multiples include:
Price to core earnings (“P/E”)
Price to book value (“P/B”) / Price to tangible book value (“P/TB”)
Price to assets (“P/A”)
All of the approaches were calculated on a pro forma basis including the effects of the conversion proceeds. All of the assumptions utilized are presented in Exhibits 11 through 12.
DISCUSSIONOF WEIGHT GIVENTO VALUATION MULTIPLES
To ascertain the pro forma estimated market value of the Bank, the market multiples for the Comparable Group were utilized. As a secondary check, all publicly traded thrifts and the recent and historical conversions were assessed. The multiples for the Comparable Group, all publicly traded thrifts are shown in Exhibit 9.
Price to Earnings - According to the Appraisal Guidelines: “When both the converting institution and the comparable companies are recording “normal” earnings. A P/E approach may be the simplest and most direct method of valuation. When earnings are low or negative, however, this approach may not be appropriate and the greater consideration should be given to the P/BV approach.” In this particular case, the Bank’s earnings are normal. As such, this approach was given consideration in this appraisal.
In the pro forma figures for the Bank, FinPro incorporated the impact of SFAS 123, which requires the expensing of stock options. In preparing the fully converted pro forma figures for the Comparable Group, FinPro also incorporated the impact of SFAS 123.
As the Bank has stated its intention to pay down some or all of its outstanding trust preferred securities at various points in the value range, FinPro has eliminated the interest expense on the trust preferred securities based upon the expense incurred over the twelve month period ended December 31, 2008.
| Conversion Valuation Appraisal Report | Page: 54 |
Price to Book/Price to Tangible Book - According to the Appraisal Guidelines: “The P/BV approach works best when the converting institution and the Comparables have a normal amount of book value. The P/BV approach could seriously understate the value of an institution that has almost no book value but has an outstanding future earnings potential. For converting institutions with high net worth, the appraiser may have difficulty in arriving at a pro forma market value because of pressure placed on the P/E multiple as higher P/BV levels are required to reflect a similar P/BV ratio as the peer group average. The P/BV approach also suffers from the use of historical cost accounting data.”
Since thrift earnings in general have had a high degree of volatility, the P/B is utilized frequently as the benchmark for market value. A better approach is the P/TB approach. In general, investors tend to price financial institutions on a tangible book basis, because it incorporates the P/B approach adjusted for intangibles. Initially following conversion, FinPro believes that thrifts often trade on a price to tangible book basis.
Price to Assets - According to the Appraisal Guidelines: “This approach remedies the problems of a small base that can occur with the P/BV approach, but the approach has many of the other limitations of the latter approach (the P/BV approach).” FinPro places little weight on this valuation approach due to the lack of consideration of asset and funding mixes and the resulting earnings impact.
| Conversion Valuation Appraisal Report | Page: 55 |
FULL OFFERING VALUEIN RELATIONTO COMPARABLES
Based upon the adjustments defined in the previous section, the Bank is pricing at the midpoint as a standard conversion is estimated to be $76,000,000. Based upon a range below and above the midpoint value, the respective values are $64,600,000 at the minimum and $87,400,000 at the maximum respectively. At the super maximum of the range, the offering value would be $100,510,000.
At the various levels of the estimated value range, the full offering would result in the following offering data:
FIGURE 39 - VALUE RANGE - FULL OFFERING
[object omitted]
Source: FinPro Inc. Pro forma Model
| Conversion Valuation Appraisal Report | Page: 56 |
FIGURE 40 - FULL CONVERSION OFFERING PRICING MULTIPLES
[object omitted]
Source: FinPro Calculations
FIGURE 41 - COMPARABLE FULL CONVERSION PRICING MULTIPLESTOTHE BANK’S PRO FORMA MIDPOINT
[object omitted]
Source: SNL data, FinPro Calculations
As Figure 41 demonstrates, at the midpoint of the estimated valuation range the Bank is priced at a premium of 22.12% on a fully converted core earnings basis. On a price to fully converted tangible book basis, the Bank is priced at a 14.23% discount to the Comparable Group.
FIGURE 42 - COMPARABLE FULL CONVERSION PRICING MULTIPLESTOTHE BANK’S PRO FORMA SUPER MAXIMUM
[object omitted]
Source: SNL data, FinPro Calculations
As Figure 42 demonstrates, at the super maximum of the estimated valuation range the Bank is priced at a premium of 62.88% on a core earnings basis. On a price to tangible book basis, the Bank is priced at a 0.29% premium to the Comparable Group.
FIGURE 43 - COMPARABLE FULL CONVERSION PRICING MULTIPLESTOTHE BANK’S PRO FORMA MINIMUM
[object omitted]
Source: SNL data, FinPro Calculations
As Figure 43 demonstrates, at the minimum of the estimated valuation range the Bank is priced at a premium of 5.15% on a core earnings basis. On a price to tangible book basis, the Bank is priced at a 22.41% discount to the Comparable Group.
| Conversion Valuation Appraisal Report | Page: 57 |
VALUATION CONCLUSION
We believe that the discount on a tangible book basis at the midpoint is appropriate relative to the Comparable Group.
It is, therefore, FinPro’s opinion that as of February 27, 2009, the estimated pro forma market value of the Bank in a full offering was $76,000,000 at the midpoint of a range with a minimum of $64,600,000 to a maximum of $87,400,000 at 15% below and 15% above the midpoint of the range respectively. Assuming an adjusted maximum value of 15% above the maximum value, the adjusted maximum value or super maximum value in a full offering is $100,510,000.
The document represents an initial valuation for the Bank. Due to the duration of time that passes between the time this document is compiled and the time the offering closes, numerous factors could lead FinPro to update or revise the appraised value of the Bank. Some factors that could lead FinPro to adjust the appraised value include: (1) changes in the Bank’s operations and financial condition; (2) changes in the market valuation or financial condition of the Comparable Group; (3) changes in the broader market; and (4) changes in the market for thrift conversions. Should there be material changes to any of these factors, FinPro will prepare an appraisal update to appropriately adjust the value of the Bank. At the time of closing, FinPro will prepare a final appraisal to determine if the valuation range is still appropriate and determine the exact valuation amount appropriate for the Bank.
|

Exhibit 1.
Profile of FinPro and the Author
20 Church Street •
Liberty Corner, NJ 07938 •
P: (908) 604-9336 •
F: (908) 604-5951 •
finpro@finpronj.com •
www.finpronj.com
|
About the Firm . . .
FinPro, Inc. was established in 1987 as a full service financial advisory and management consulting firm specializing in providing advisory services to the financial institutions industry. FinPro is not a transaction oriented firm. This approach uniquely positions FinPro as an objective third party willing to explore all strategic alternatives rather than focus solely on transaction oriented strategies. FinPro believes that a client deserves to be presented with all alternatives. Careful consideration is given to the associated benefits and drawbacks of each alternative so decisions can be made on the merits of these alternatives.
FinPro principals are frequent speakers and presenters at financial institution trade association functions. FinPro teaches:
– strategic planning and mergers and acquisitions at the Stonier School of Banking;
– strategic planning to examiners from the Federal Deposit Insurance Corporation, Office of Thrift Supervision and several State Banking Departments;
– various capital market and finance courses at the Graduate School of Bank Investments and Financial Management at the University of South Carolina; and
– an online mergers and acquisitions course for the American Bankers Association.
FinPro maintains a library of databases encompassing bank and thrift capital markets data, census data, branch deposit data, national peer data, market research data along with many other related topics. As such, FinPro can provide quick, current and precise analytical assessments based on timely data. In addition, FinPro’s geographic mapping capabilities give it a unique capability to thematically illustrate multiple issues and to provide targeted marketing opportunities to its clients.
HEADQUARTERS
FinPro, Inc.
20 Church Street
P.O. Box 323
Liberty Corner, NJ 07938
Phone: (908) 604-9336
Fax: (908) 604-5951
NEW ENGLAND REGIONAL OFFICE
FinPro, Inc.
831 Beacon Street Newton Centre, MA 02459
Phone: (617) 852-5290
Fax: (617) 795-2416
NEW YORK REGIONAL OFFICE
FinPro, Inc.
P.O. Box 780
East Aurora, NY 14052
Phone: (716) 652-5177
Fax: (716) 652-5177
1
|
About the Author . . .
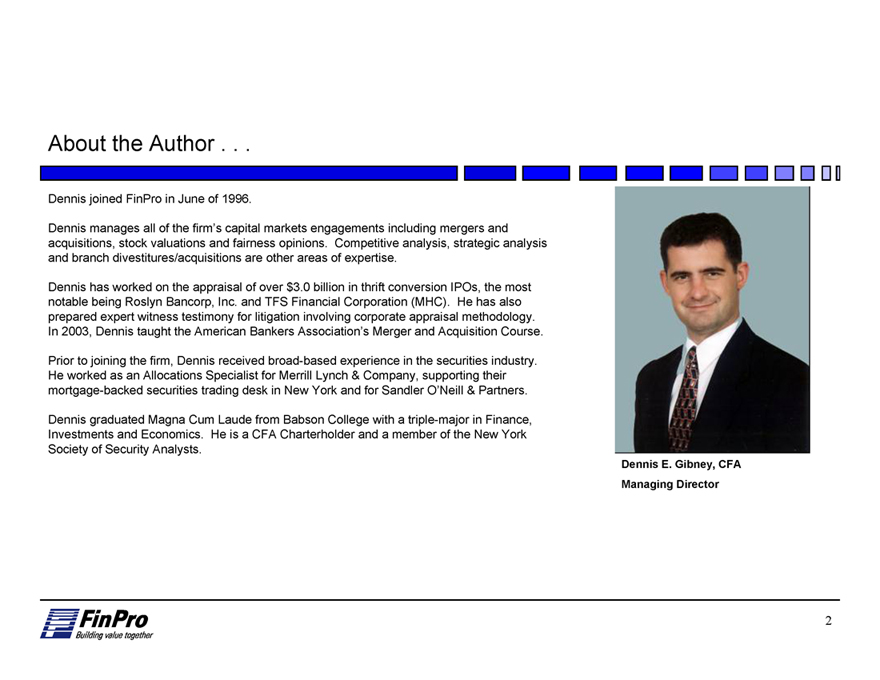
Dennis joined FinPro in June of 1996.
Dennis manages all of the firm’s capital markets engagements including mergers and acquisitions, stock valuations and fairness opinions. Competitive analysis, strategic analysis and branch divestitures/acquisitions are other areas of expertise.
Dennis has worked on the appraisal of over $3.0 billion in thrift conversion IPOs, the most notable being Roslyn Bancorp, Inc. and TFS Financial Corporation (MHC). He has also prepared expert witness testimony for litigation involving corporate appraisal methodology. In 2003, Dennis taught the American Bankers Association’s Merger and Acquisition Course.
Prior to joining the firm, Dennis received broad-based experience in the securities industry. He worked as an Allocations Specialist for Merrill Lynch & Company, supporting their mortgage-backed securities trading desk in New York and for Sandler O’Neill & Partners.
Dennis graduated Magna Cum Laude from Babson College with a triple-major in Finance, Investments and Economics. He is a CFA Charterholder and a member of the New York Society of Security Analysts.
Dennis E. Gibney, CFA
Managing Director
2