UNITED STATES
SECURITIES AND EXCHANGE COMMISSION
Washington, D.C. 20549
FORM N-CSR
CERTIFIED SHAREHOLDER REPORT OF REGISTERED
MANAGEMENT INVESTMENT COMPANIES
Investment Company Act file number: 811-22241
Partners Group PRIVATE EQUITY (MASTER FUND), LLC
(Exact name of registrant as specified in charter)
c/o Partners Group (USA) Inc.
1114 Avenue of the Americas, 37th Floor
New York, NY 10036
(Address of principal executive offices) (zip code)
Robert M. Collins
1114 Avenue of the Americas, 37th Floor
New York, NY 10036
(Name and address of agent for service)
Copy to:
Joshua B. Deringer, Esq.
Faegre Drinker Biddle & Reath LLP
One Logan Square, Ste. 2000
Philadelphia, PA 19103-6996
(215) 988-2700
Registrant’s telephone number, including area code: (212) 908-2600
Date of fiscal year end: March 31
Date of reporting period: September 30, 2024
Item 1. Reports to Shareholders.
(a) The Reports to Shareholders are attached herewith.
PARTNERS GROUP PRIVATE EQUITY (MASTER FUND), LLC
(a Delaware Limited Liability Company)
Semi-Annual Report
For the Six Months Ended September 30, 2024
See the inside front cover for important information about access to your Fund’s annual and semiannual shareholder reports. | 
|
Important information about access to shareholder reports
Beginning on January 1, 2021, as permitted by regulations adopted by the Securities and Exchange Commission, paper copies of the Fund’s annual and semiannual shareholder reports like this one will no longer be sent by mail, unless you specifically request paper copies of the reports. Instead, the reports will be made available on the Fund’s website, and each time a report is posted you will be notified by mail and provided with a website address to access the report.
If you have already elected to receive shareholder reports electronically, you will not be affected by this change and you need not take any action. You may elect to receive shareholder reports and other communications from the Fund electronically at any time by contacting your financial intermediary (such as a broker-dealer or bank) or, if you invest directly with the Fund, by calling 1-888-977-9790.
You may elect to receive all future reports in paper free of charge. If you invest through a financial intermediary, you can contact your financial intermediary to request that you continue receiving paper copies of your shareholder reports. If you invest directly with the Fund, you can call 1-888-977-9790 to let the Fund know you wish to continue receiving paper copies of your shareholder reports. Your election to receive paper reports will apply to all Partners Group funds held in your account if you invest through a financial intermediary or all Partners Group funds held with the fund complex if you invest directly with the Fund.
Partners Group Private Equity (Master Fund), LLC
(a Delaware Limited Liability Company)
Table of Contents
For the Six Months Ended September 30, 2024 (Unaudited)
| | |
Consolidated Schedule of Investments | 1-31 |
Consolidated Statement of Assets and Liabilities | 32-33 |
Consolidated Statement of Operations | 34 |
Consolidated Statements of Changes in Net Assets | 35 |
Consolidated Statement of Cash Flows | 36-37 |
Consolidated Financial Highlights | 38-39 |
Notes to Consolidated Financial Statements | 40-55 |
Other Information | 56 |
Partners Group Private Equity (Master Fund), LLC
(a Delaware Limited Liability Company)
Consolidated Schedule of Investments –
September 30, 2024 (Unaudited)
INVESTMENT PORTFOLIO AS A PERCENTAGE OF TOTAL NET ASSETS
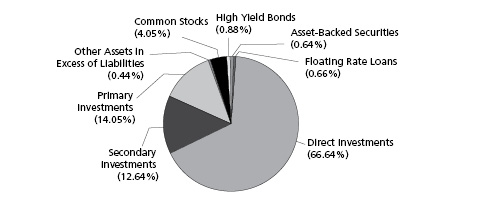
Public Investments (6.23%)
Common Stocks (4.05%) North America (2.36%) | Industry | | Acquisition
Date | | | Shares | | | Fair
Value | |
American Tower Corp. | Communication | | | 05/29/20 | | | | 111,913 | | | $ | 26,014,177 | |
American Water Works Co., Inc. | Utilities | | | 02/16/16 | | | | 163,750 | | | | 23,945,162 | |
Apollo Global Management, LLC | Diversified Financial Services | | | 09/05/23 | | | | 141,223 | | | | 17,638,753 | |
Ares Capital Corp. | Diversified Financial Services | | | 02/16/16 | | | | 368,598 | | | | 7,711,070 | |
Ares Management Corp. | Diversified Financial Services | | | 06/28/19 | | | | 48,492 | | | | 7,553,114 | |
Atmos Energy Corp. | Utilities | | | 02/16/16 | | | | 112,179 | | | | 15,567,080 | |
Blackstone Group, Inc. | Diversified Financial Services | | | 07/12/19 | | | | 65,912 | | | | 10,090,468 | |
Brookfield Corp. | Diversified Financial Services | | | 12/12/22 | | | | 74,599 | | | | 3,964,937 | |
Canadian National Railway Co. | Transportation | | | 05/14/19 | | | | 149,718 | | | | 17,398,334 | |
CMS Energy Corp. | Utilities | | | 11/01/19 | | | | 250,811 | | | | 17,712,273 | |
Crown Castle International Corp. | Communication | | | 02/16/16 | | | | 113,776 | | | | 13,497,247 | |
CSX Corp. | Transportation | | | 11/28/23 | | | | 438,568 | | | | 15,139,367 | |
Equinix Inc. | Diversified Financial Services | | | 07/31/20 | | | | 19,969 | | | | 17,725,882 | |
Golub Capital BDC Inc. | Diversified Financial Services | | | 02/24/22 | | | | 510,196 | | | | 7,709,061 | |
HarbourVest Global Private Equity | Diversified Financial Services | | | 12/21/18 | | | | 366,113 | | | | 11,931,677 | |
KKR & Co., Inc. | Diversified Financial Services | | | 02/16/16 | | | | 106,501 | | | | 13,905,836 | |
Old Dominion Freight Line, Inc. | Transportation | | | 09/25/24 | | | | 45,315 | | | | 9,004,544 | |
Onex Corp. f | Diversified Financial Services | | | 02/16/16 | | | | 138,810 | | | | 9,681,529 | |
Republic Services Inc. | Commercial & Professional Services | | | 08/28/17 | | | | 163,669 | | | | 32,868,009 | |
SBA Communications Corp. | Real Estate | | | 09/05/23 | | | | 54,795 | | | | 13,182,581 | |
Sempra Energy | Utilities | | | 06/28/23 | | | | 105,671 | | | | 8,833,039 | |
TC Energy Corp. | Utilities | | | 11/01/19 | | | | 442,257 | | | | 20,950,224 | |
The Williams Companies, Inc. | Utilities | | | 03/20/23 | | | | 307,168 | | | | 14,019,147 | |
TPG Inc. | Financials | | | 09/25/24 | | | | 64,152 | | | | 3,692,589 | |
Union Pacific Corp. | Transportation | | | 06/29/16 | | | | 98,247 | | | | 24,203,148 | |
Waste Management Inc. | Utilities | | | 07/02/20 | | | | 17,423 | | | | 3,614,053 | |
Total North America (2.36%) | | | | | | | | | | | | 367,553,301 | |
| | | | | | | | | | | | | | |
Western Europe (1.69%) |
3i Group Plc | Diversified Financial Services | | | 10/01/20 | | | | 347,415 | | | | 15,399,268 | |
Aena SA | Transportation | | | 12/21/18 | | | | 119,925 | | | | 26,437,438 | |
Cellnex Telecom SA | Communication | | | 05/15/19 | | | | 875,899 | | | | 35,558,208 | |
CVC Capital Partners Plc | Financials | | | 04/26/24 | | | | 455,414 | | | | 10,197,174 | |
Elia System Operator SA/NV | Utilities | | | 11/03/22 | | | | 75,746 | | | | 8,666,148 | |
EQT AB | Diversified Financial Services | | | 04/06/20 | | | | 105,206 | | | | 3,593,347 | |
Eurazeo SA f | Financials | | | 12/12/16 | | | | 116,350 | | | | 9,571,421 | |
Ferrovial SA | Industrials | | | 04/15/24 | | | | 308,625 | | | | 13,276,553 | |
HBM Healthcare Investments AG | Diversified Financial Services | | | 04/07/20 | | | | 23,916 | | | | 5,370,432 | |
HgCapital Trust PLC f | Diversified Financial Services | | | 02/12/16 | | | | 2,286,602 | | | | 15,640,146 | |
Infrastrutture Wireless Italiane S.p.A. f | Communication | | | 09/26/24 | | | | 731,111 | | | | 9,009,380 | |
Intermediate Capital Group PLC | Diversified Financial Services | | | 12/12/16 | | | | 463,876 | | | | 13,848,640 | |
1
Partners Group Private Equity (Master Fund), LLC
(a Delaware Limited Liability Company)
Consolidated Schedule of Investments –
September 30, 2024 (Unaudited) (continued)
Public Investments (continued)
Common Stocks (continued) North America (continued) | Industry | | Acquisition
Date | | | Shares | | | Fair
Value | |
Investment AB Kinnevik | Diversified Financial Services | | | 06/10/24 | | | | 745,641 | | | $ | 6,063,370 | |
Investor AB | Diversified Financial Services | | | 08/28/17 | | | | 311,306 | | | | 9,589,764 | |
National Grid PLC | Utilities | | | 02/12/16 | | | | 1,592,939 | | | | 22,004,749 | |
NB Private Equity Partners Ltd. | Diversified Financial Services | | | 11/06/19 | | | | 228,777 | | | | 4,927,628 | |
Pantheon International Participations Plc | Diversified Financial Services | | | 11/04/19 | | | | 1,190,169 | | | | 5,267,477 | |
Terna Rete Elettrica Nazionale SpA | Utilities | | | 01/05/18 | | | | 2,452,570 | | | | 22,135,925 | |
Vinci SA | Transportation | | | 02/12/16 | | | | 234,491 | | | | 27,456,438 | |
Total Western Europe (1.69%) | | | | | | | | | | | | 264,013,506 | |
| | | | | | | | | | | | | | |
Total Common Stocks (Cost $548,963,841)(4.05%) | | | | | | | | | | | $ | 631,566,807 | |
High Yield Bonds (0.88%) | Interest | | Acquisition
Date | | | Maturity
Date | | Investment
Type | | Principal | | | Fair
Value** | |
North America (0.18%) |
Acrisure LLC / Acrisure Finance, Inc. ***, + | 7.50% | | | 06/05/24 | | | | 11/06/30 | | Senior | | $ | 3,000,000 | | | $ | 3,154,030 | |
Clarios Global LP / Clarios US Finance Co. ***, + | 4.375% | | | 06/21/24 | | | | 05/15/26 | | Senior | | € | 1,575,000 | | | | 1,784,249 | |
Pactiv Evergreen Group ***, + | 4.00% | | | 06/20/24 | | | | 10/15/27 | | Senior | | $ | 7,941,333 | | | | 7,853,347 | |
Radiology Partners, Inc. + | 8.50% | | | 04/22/24 | | | | 01/31/29 | | Senior | | | 7,582,395 | | | | 7,628,297 | |
UPCB Finance VII Ltd. ***, + | 3.625% | | | 06/24/24 | | | | 06/15/29 | | Senior | | € | 7,325,287 | | | | 8,125,371 | |
Total North America (0.18%) | | | | | | | | | | | | | | | | | 28,545,294 | |
| | | | | | | | | | | | | | | | | | | |
Western Europe (0.70%) |
AccorInvest Group S.A. ***, +, f | 6.375% | | | 09/18/24 | | | | 10/15/29 | | Senior | | | 738,000 | | | | 853,568 | |
Cedacri Mergeco SPA ***, + | 4.625% + E## | | | 05/31/24 | | | | 05/15/28 | | Senior | | | 2,040,499 | | | | 2,309,259 | |
Deuce Finco Plc + | 5.50% | | | 06/24/24 | | | | 06/15/27 | | Senior | | £ | 5,873,770 | | | | 6,702,031 | |
Deuce Finco Plc ***, + | 5.50% | | | 05/01/24 | | | | 06/15/27 | | Senior | | | 7,494,453 | | | | 8,042,438 | |
Howden UK Refinance PLC / Howden UK Refinance 2 PLC / Howden US Refinance LLC ***, + | 7.25% | | | 05/08/24 | | | | 02/15/31 | | Senior | | $ | 5,000,000 | | | | 5,237,313 | |
IMA Industria Macchine ***, + | 3.75% | | | 06/20/24 | | | | 01/15/28 | | Senior | | € | 6,000,000 | | | | 6,579,622 | |
INEOS Finance Plc ***, + | 7.50% | | | 01/31/24 | | | | 04/15/29 | | Senior | | $ | 1,800,000 | | | | 1,970,211 | |
Ineos Quattro Finance 2 ***, + | 2.50% | | | 06/19/24 | | | | 01/15/26 | | Senior | | € | 9,000,000 | | | | 10,058,353 | |
Miller Homes Group Finco Plc + | 7.00% | | | 02/26/24 | | | | 05/15/29 | | Senior | | £ | 3,570,097 | | | | 4,703,348 | |
Nobian Finance B.V. ***, + | 3.625% | | | 06/19/24 | | | | 07/15/26 | | Senior | | € | 10,000,000 | | | | 11,140,606 | |
ONE Hotels GmbH ***, + | 7.75% | | | 05/02/24 | | | | 04/02/31 | | Senior | | | 2,000,000 | | | | 2,424,078 | |
Rossini S.à.r.l. ***, + | 6.75% | | | 07/11/24 | | | | 12/31/29 | | Senior | | | 906,000 | | | | 1,065,412 | |
Rossini S.à.r.l. ***, + | 3.875% + E## | | | 07/11/24 | | | | 12/31/29 | | Senior | | | 2,840,000 | | | | 3,201,648 | |
Sherwood Financing PLC ***, + | 6.00% | | | 05/08/24 | | | | 11/15/26 | | Senior | | £ | 3,883,333 | | | | 5,177,622 | |
Summer BC Holdco A S.à.r.l. + | 9.25% | | | 05/08/24 | | | | 10/31/27 | | Senior | | € | 2,695,170 | | | | 3,480,160 | |
Summer BC Holdco B S.à.r.l. + | 5.75% | | | 06/21/24 | | | | 10/31/26 | | Senior | | | 6,000,000 | | | | 6,865,230 | |
TeamSystem SpA ***, + | 3.50% | | | 06/20/24 | | | | 02/15/28 | | Senior | | | 5,959,726 | | | | 6,587,304 | |
TeamSystem SpA ***, + | 3.50% + E## | | | 07/17/24 | | | | 07/31/31 | | Senior | | | 3,830,000 | | | | 4,298,820 | |
Verisure Holding AB ***, + | 3.25% | | | 06/20/24 | | | | 02/15/27 | | Senior | | | 10,000,000 | | | | 11,017,493 | |
Wp/ap Telecom Holdings III B.V. ***, + | 5.50% | | | 05/29/24 | | | | 01/15/30 | | Senior | | | 5,874,875 | | | | 6,642,949 | |
Total Western Europe (0.70%) | | | | | | | | | | | | | | | | 108,357,465 | |
| | | | | | | | | | | | | | | | | | | |
Total High Yield Bonds (Cost $127,615,976)(0.88%) | | | | | | $ | 136,902,759 | |
| | | | | | | | | | | | | | | | | | | |
| |
The accompanying notes are an integral part of these Consolidated Financial Statements.
2
Partners Group Private Equity (Master Fund), LLC
(a Delaware Limited Liability Company)
Consolidated Schedule of Investments –
September 30, 2024 (Unaudited) (continued)
Asset-Backed Securities (0.64%) | Interest | | Acquisition
Date | | | Maturity
Date | | Investment
Type | | Principal | | | Fair
Value** | |
North America (0.44%) |
AGL CLO 9 Ltd. ***, + | 6.50% + SFvv | | | 04/11/24 | | | | 04/20/37 | | Series 2020-9A, Class ER | | $ | 3,500,000 | | | $ | 3,602,603 | |
AIMCO CLO 21 Ltd. ***, + | 6.00% + SFvv | | | 04/09/24 | | | | 04/18/37 | | Series 2024-21A, Class E | | | 3,000,000 | | | | 3,156,477 | |
AIMCO CLO Series 2015-A ***, + | 6.35% + SFvv | | | 08/21/24 | | | | 10/17/34 | | Series 2015-AA, Class ER3 | | | 1,967,607 | | | | 2,057,112 | |
Ballyrock CLO 20 Ltd. ***, +, f | 6.20% + SFvv | | | 09/18/24 | | | | 10/15/36 | | Series 2022-20A, Class DR2 | | | 3,000,000 | | | | 3,000,000 | |
Benefit Street Partners CLO XIX Ltd. ***, + | 5.75% + SFvv | | | 05/10/24 | | | | 01/15/33 | | Series 2019-19A, Class ER | | | 3,000,000 | | | | 3,080,815 | |
Benefit Street Partners CLO XXXIV Ltd. ***, + | 6.70% + SFvv | | | 03/22/24 | | | | 07/25/37 | | Series 2024-34A, Class E | | | 1,000,000 | | | | 1,077,495 | |
Benefit Street Partners CLO XXXIV Ltd. ***, + | 0.00% | | | 03/22/24 | | | | 07/25/37 | | Series 2024-34A, Class SUB | | | 2,500,000 | | | | 2,327,250 | |
CIFC Funding 2019-VI Ltd. ***, + | 6.25% + SFvv | | | 05/22/24 | | | | 07/16/37 | | Series 2019-6A, Class ER | | | 1,200,000 | | | | 1,255,096 | |
CIFC Funding 2021-I Ltd. ***, + | 6.00% + SFvv | | | 06/03/24 | | | | 07/25/37 | | Series 2021-1A, Class ER | | | 2,500,000 | | | | 2,590,445 | |
CIFC Funding 2021-VI Ltd. ***, + | 6.51% + SFvv | | | 09/22/21 | | | | 10/15/34 | | Series 2021-6A, Class E | | | 1,500,000 | | | | 1,550,519 | |
CIFC Funding 2022-IV Ltd. ***, + | 7.00% + SFvv | | | 04/20/22 | | | | 07/16/35 | | Series 2022-4A, Class E | | | 1,250,000 | | | | 1,288,413 | |
CIFC Funding 2024-II Ltd. ***, + | 0.00% | | | 04/01/24 | | | | 04/22/37 | | Series 2024-2A, Class SUBB | | | 3,000,000 | | | | 3,018,600 | |
CIFC Funding Ltd. ***, + | 7.27% + SFvv | | | 04/05/22 | | | | 04/21/35 | | Series 2022-3A, Class E | | | 1,000,000 | | | | 1,031,781 | |
Elmwood CLO 26 Ltd. ***, + | 6.45% + SFvv | | | 02/15/24 | | | | 04/18/37 | | Series 2024-1A, Class E | | | 2,500,000 | | | | 2,704,017 | |
Elmwood CLO 28 Ltd. ***, + | 6.00% + SFvv | | | 04/19/24 | | | | 04/17/37 | | Series 2024-4A, Class E | | | 1,400,000 | | | | 1,481,836 | |
Elmwood CLO VII Ltd. ***, +, f | 5.90% + SFvv | | | 09/26/24 | | | | 10/17/37 | | Series 2020-4A, Class ERR | | | 2,750,000 | | | | 2,750,000 | |
Elmwood CLO X Ltd. ***, + | 5.85% + SFvv | | | 04/05/24 | | | | 07/20/37 | | Series 2021-3A, Class ER | | | 4,500,000 | | | | 4,612,964 | |
Madison Park Funding LX Ltd. + | 5.50% + SFvv | | | 11/28/22 | | | | 10/25/35 | | Series 2022-60A, Class D | | | 1,000,000 | | | | 1,026,660 | |
Madison Park Funding LX Ltd. + | 8.95% + SFvv | | | 11/28/22 | | | | 10/25/35 | | Series 2022-60A, Class E | | | 1,250,000 | | | | 1,299,481 | |
Magnetite CLO Ltd. ***, + | 6.46% + SFvv | | | 10/01/21 | | | | 10/25/34 | | Series 2021-30A, Class E | | | 1,625,000 | | | | 1,671,152 | |
Magnetite XXIV Ltd. ***, + | 6.40% + SFvv | | | 02/04/22 | | | | 04/15/35 | | Series 2019-24A, Class ER | | | 4,000,000 | | | | 4,128,023 | |
Magnetite XXVI Ltd. ***, + | 6.21% + SFvv | | | 08/02/21 | | | | 07/25/34 | | Series 2020-26A, Class ER | | | 1,000,000 | | | | 1,027,144 | |
Neuberger Berman CLO XXI Ltd. ***, + | 3.56% + SFvv | | | 04/02/21 | | | | 04/20/34 | | Series 2016-21A, Class DR2 | | | 500,000 | | | | 511,558 | |
Neuberger Berman CLO XXI Ltd. ***, + | 6.72% + SFvv | | | 04/02/21 | | | | 04/20/34 | | Series 2016-21A, Class ER2 | | | 1,000,000 | | | | 1,026,313 | |
Neuberger Berman Loan Advisers CLO 45 Ltd. ***, + | 6.51% + SFvv | | | 10/07/21 | | | | 10/14/35 | | Series 2021-45A, Class E | | | 1,000,000 | | | | 1,029,216 | |
Ocean Trails CLO IX ***, + | 7.71% + SFvv | | | 09/22/21 | | | | 10/15/34 | | Series 2020-9A, Class ER | | | 2,647,264 | | | | 2,634,072 | |
OHA Credit Funding 19 Ltd. ***, + | 5.60% + SFvv | | | 05/31/24 | | | | 07/20/37 | | Series 2024-19A, Class E | | | 950,000 | | | | 977,879 | |
OHA Credit Partners XI Ltd. ***, + | 5.75% + SFvv | | | 05/06/24 | | | | 04/20/37 | | Series 2015-11A, Class ER2 | | | 2,000,000 | | | | 2,059,048 | |
Palmer Square CLO 2024-2 Ltd. ***, + | 5.70% + SFvv | | | 05/30/24 | | | | 07/20/37 | | Series 2024-2A, Class E | | | 4,000,000 | | | | 4,075,971 | |
Peebles Park CLO Ltd. ***, + | 6.45% + SFvv | | | 02/12/24 | | | | 04/21/37 | | Series 2024-1A, Class E | | | 1,000,000 | | | | 1,088,021 | |
Southwick Park CLO LLC ***, + | 6.51% + SFvv | | | 11/16/21 | | | | 07/20/32 | | Series 2019-4A, Class ER | | | 800,000 | | | | 817,740 | |
Symphony CLO XXV Ltd. ***, + | 6.76% + SFvv | | | 03/12/21 | | | | 04/19/34 | | Series 2021-25A, Class E | | | 752,616 | | | | 774,003 | |
Symphony CLO XXXIII Ltd. ***, + | 7.10% + SFvv | | | 04/27/22 | | | | 04/24/35 | | Series 2022-33A, Class E | | | 1,250,000 | | | | 1,286,351 | |
Tallman Park CLO Ltd. ***, + | 6.61% + SFvv | | | 04/09/21 | | | | 04/20/34 | | Series 2021-1A, Class E | | | 500,000 | | | | 513,531 | |
Wellman Park CLO Ltd. ***, + | 6.30% + SFvv | | | 07/25/24 | | | | 07/15/37 | | Series 2021-1A, Class ER | | | 2,000,000 | | | | 2,044,421 | |
Total North America (0.44%) | | | | | | | | | | | | | | | | | 68,576,007 | |
| | | | | | | | | | | | | | | | | | | |
Western Europe (0.20%) |
Aurium CLO V Designated Activity Co. ***, + | 6.16% + E## | | | 03/08/21 | | | | 04/17/34 | | Series 5A, Class ER | | € | 1,500,000 | | | | 1,729,272 | |
Aurium CLO VII DAC ***, + | 5.86% + E## | | | 02/04/22 | | | | 05/15/34 | | Series 7A, Class E | | | 1,521,243 | | | | 1,729,745 | |
Avoca CLO XXVI DAC ***, + | 9.12% + E## | | | 02/23/22 | | | | 04/15/35 | | Series 26A, Class F | | | 1,200,000 | | | | 1,372,227 | |
Avoca CLO XXVI DAC ***, + | 6.51% + E## | | | 02/23/22 | | | | 04/15/35 | | Series 26A, Class E | | | 750,000 | | | | 873,849 | |
Blackrock European CLO VIII DAC ***, + | 3.30% + E## | | | 02/03/22 | | | | 01/20/36 | | Series 8A, Class DR | | | 1,000,000 | | | | 1,130,960 | |
The accompanying notes are an integral part of these Consolidated Financial Statements.
3
Partners Group Private Equity (Master Fund), LLC
(a Delaware Limited Liability Company)
Consolidated Schedule of Investments –
September 30, 2024 (Unaudited) (continued)
Public Investments (continued)
Asset-Backed Securities (continued) Western Europe (continued) | Interest | | Acquisition
Date | | | Maturity
Date | | Investment
Type | | Principal | | | Fair
Value** | |
Blackrock European CLO VIII DAC ***, + | 6.26% + E## | | | 02/03/22 | | | | 01/20/36 | | Series 8A, Class ER | | $ | 2,500,000 | | | $ | 2,818,522 | |
Boyce Park CLO Ltd. ***, + | 6.25% + SFvv | | | 01/28/22 | | | | 04/21/35 | | Series 2022-1A, Class E | | | 2,625,000 | | | | 2,712,503 | |
Brookhaven Park CLO Ltd. ***, + | 6.50% + SFvv | | | 03/15/24 | | | | 04/19/37 | | Series 2024-1A, Class E | | | 1,000,000 | | | | 1,094,791 | |
Carlyle Euro CLO 2021-1 DAC ***, + | 6.12% + E## | | | 05/01/21 | | | | 04/15/34 | | Series 2021-1A, Class D | | € | 333,000 | | | | 375,080 | |
Carlyle Global Market Strategies 2015-1 Ltd. ***, + | 0.00% | | | 01/20/22 | | | | 01/16/33 | | Series 2015-1A, Class SUB | | € | 3,000,000 | | | | 1,002,907 | |
Carlyle Global Market Strategies 2015-1 Ltd. ***, + | 5.50% + E## | | | 01/20/22 | | | | 01/16/33 | | Series 2015-1A, Class DR | | | 1,502,063 | | | | 1,679,238 | |
Carysfort Park CLO ***, + | 6.14% + E## | | | 03/12/21 | | | | 07/28/34 | | Series 2021-1A, Class D | | | 500,000 | | | | 572,914 | |
CVC Cordatus Loan Fund + | 6.16% + E## | | | 11/07/22 | | | | 01/15/37 | | Series 26A, Class D1 | | | 1,100,000 | | | | 1,266,639 | |
CVC Cordatus Loan Fund + | 7.73% + E## | | | 11/07/22 | | | | 01/15/37 | | Series 26A, Class D2 | | | 400,000 | | | | 464,078 | |
Octagon 58 Ltd. ***, + | 7.20% + SFvv | | | 04/21/22 | | | | 07/15/37 | | Series 2022-1A, Class E | | $ | 2,140,000 | | | | 2,208,486 | |
Otranto Park CLO ***, + | 7.05% + E## | | | 03/04/22 | | | | 05/15/35 | | Series 1A, Class E | | € | 1,172,000 | | | | 1,329,535 | |
Otranto Park CLO ***, + | 4.15% + E## | | | 03/04/22 | | | | 05/15/35 | | Series 1A, Class D | | | 750,000 | | | | 846,502 | |
Palmer Square European Loan Funding 2021-1 DAC ***, + | 5.95% + E## | | | 08/02/21 | | | | 04/15/31 | | Series 2021-1A, Class E | | | 714,000 | | | | 821,485 | |
Palmer Square European Loan Funding 2021-2 DAC ***, + | 8.05% + E## | | | 10/15/21 | | | | 07/15/31 | | Series 2021-2A, Class F | | | 375,000 | | | | 421,192 | |
Palmer Square European Loan Funding 2021-2 DAC ***, + | 5.90% + E## | | | 10/15/21 | | | | 07/15/31 | | Series 2021-2A, Class E | | | 625,000 | | | | 713,237 | |
Palmer Square European Loan Funding 2022-1 DAC ***, + | 5.90% + E## | | | 02/03/22 | | | | 10/15/31 | | Series 2022-1A, Class E | | | 667,000 | | | | 757,936 | |
Palmer Square European Loan Funding 2022-1 DAC ***, + | 8.05% + E## | | | 02/03/22 | | | | 10/15/31 | | Series 2022-1A, Class F | | | 500,000 | | | | 562,059 | |
Palmer Square European Loan Funding 2022-1 DAC ***, + | 7.37% + E## | | | 03/17/22 | | | | 10/15/31 | | Series 2022-2A, Class E | | | 1,500,000 | | | | 1,713,878 | |
Palmer Square European Loan Funding 2024-1 DAC ***, + | 6.75% + E## | | | 02/22/24 | | | | 08/15/33 | | Series 2024-1A, Class E | | | 1,230,000 | | | | 1,393,343 | |
Storm King Park CLO Ltd. ***, + | 6.15% + SFvv | | | 09/17/24 | | | | 10/15/37 | | Series 2022-1A, Class ER | | $ | 1,500,000 | | | | 1,500,000 | |
Total Western Europe (0.20%) | | | 31,090,378 | |
| | | | | | | | | | | | | | | | | | | |
Total Asset-Backed Securities (Cost $97,252,710)(0.64%) | | $ | 99,666,385 | |
| | | | | | | | | | | | | | | | | | | |
Floating Rate Loans (0.66%) | Interest | | Acquisition
Date | | | Maturity
Date | | Investment
Type | | Principal | | | Fair
Value** | |
North America (0.45%) |
AAL Delaware Holdco, Inc. + | 3.50% + SFv | | | 09/30/24 | | | | 07/30/31 | | Senior | | $ | 800,000 | | | $ | 804,632 | |
Alliant Holdings Intermediate LLC +, f | 3.00% + SFv | | | 09/12/24 | | | | 09/19/31 | | Senior | | | 5,000,000 | | | | 4,977,650 | |
Alpha Generation LLC +, f | 2.75% + SFv | | | 09/19/24 | | | | 09/30/31 | | Senior | | | 1,200,000 | | | | 1,201,716 | |
Amentum Government Services Holdings LLC +, f | 2.25% + SFv | | | 07/30/24 | | | | 09/29/31 | | Senior | | | 1,000,000 | | | | 998,130 | |
CHG Healthcare Services, Inc. + | 3.50% + SFv | | | 09/30/24 | | | | 09/29/28 | | Senior | | | 1,795,477 | | | | 1,800,343 | |
CPPIB Capital, Inc. + | 3.25% + SFvv | | | 09/30/24 | | | | 08/20/31 | | Senior | | | 1,400,000 | | | | 1,402,338 | |
Delta 2 (LUX) S.à.r.l. +, f | 2.00% + SFvv | | | 09/10/24 | | | | 09/10/31 | | Senior | | | 1,033,333 | | | | 1,035,162 | |
Delta 2 (LUX) S.à.r.l. +, f | 2.00% + SFvv | | | 09/10/24 | | | | 09/10/31 | | Senior | | | 2,066,667 | | | | 2,070,325 | |
Dragon Buyer, Inc. +, f | 3.25% + SFvv | | | 09/24/24 | | | | 09/30/31 | | Senior | | | 5,800,000 | | | | 5,779,700 | |
Dynamo Newco II GmbH +, f | 4.00% + SFvvv | | | 09/25/24 | | | | 09/26/31 | | Senior | | | 4,650,000 | | | | 4,667,437 | |
Froneri International Ltd. +, f | 2.00% + SFvv | | | 09/17/24 | | | | 09/17/31 | | Senior | | | 4,000,000 | | | | 3,990,280 | |
Hobbs & Associates LLC + | 3.25% + SFv | | | 09/30/24 | | | | 07/23/31 | | Senior | | | 5,000,000 | | | | 4,995,572 | |
Hobbs & Associates LLC +, e, f | 3.25% + SFvv | | | 07/16/24 | | | | 07/23/31 | | Senior | | | 500,000 | | | | — | |
Madison Safety & Flow LLC +, f | 3.25% + SFv | | | 09/19/24 | | | | 09/19/31 | | Senior | | | 2,000,000 | | | | 2,001,880 | |
The accompanying notes are an integral part of these Consolidated Financial Statements.
4
Partners Group Private Equity (Master Fund), LLC
(a Delaware Limited Liability Company)
Consolidated Schedule of Investments –
September 30, 2024 (Unaudited) (continued)
Public Investments (continued)
Floating Rate Loans (continued) North America (continued) | Interest | | Acquisition
Date | | | Maturity
Date | | Investment
Type | | Principal | | | Fair
Value** | |
NSM Top Holdings Corp. +, f | 5.25% + SFvv | | | 08/05/24 | | | | 05/14/29 | | Senior | | $ | 1,900,000 | | | $ | 1,907,182 | |
Nuvei Technologies Corp. +, f | 3.00% + SFvv | | | 07/19/24 | | | | 07/18/31 | | Senior | | | 3,750,000 | | | | 3,713,288 | |
Nvent Electric Public Ltd. Co. +, f | 3.50% + SFvv | | | 09/12/24 | | | | 09/12/31 | | Senior | | | 1,850,000 | | | | 1,850,389 | |
Paint Intermediate III LLC +, f | 3.00% + SFvv | | | 09/11/24 | | | | 09/11/31 | | Senior | | | 1,300,000 | | | | 1,299,597 | |
Plano HoldCo, Inc. +, f | 3.50% + SFvv | | | 08/02/24 | | | | 08/15/31 | | Senior | | | 4,800,000 | | | | 4,812,000 | |
Procera Networks, Inc. +, f | 9.00% + SFvv | | | 09/26/24 | | | | 09/29/25 | | Senior | | | 219,512 | | | | 219,512 | |
Ryan Specialty Group LLC +, f | 2.25% + SFv | | | 09/10/24 | | | | 09/15/31 | | Senior | | | 1,000,000 | | | | 1,001,250 | |
Sandvine Corp. +, f | 2.00% | | | 09/26/24 | | | | 06/21/27 | | Senior | | | 109,756 | | | | 109,756 | |
Thevelia (US) LLC + | 3.25% + SFvv | | | 09/30/24 | | | | 06/18/29 | | Senior | | | 2,194,472 | | | | 2,200,792 | |
Thunder Generation Funding LLC +, f | 3.00% + SFvv | | | 09/27/24 | | | | 09/27/31 | | Senior | | | 6,000,000 | | | | 6,000,000 | |
TransDigm, Inc. + | 2.50% + SFvv | | | 09/25/24 | | | | 01/19/32 | | Senior | | | 4,700,000 | | | | 4,686,793 | |
USALCO LLC +, f | 4.00% + SFvv | | | 09/17/24 | | | | 09/17/31 | | Senior | | | 154,121 | | | | 154,941 | |
USALCO LLC +, f | 4.00% + SFv | | | 09/17/24 | | | | 09/17/31 | | Senior | | | 1,495,879 | | | | 1,503,837 | |
Varsity Brands, Inc. +, f | 3.75% + SFvv | | | 07/26/24 | | | | 08/26/31 | | Senior | | | 3,800,000 | | | | 3,779,024 | |
Total North America (0.45%) | | | | | | | | | | | | | | | | | 68,963,526 | |
| | | | | | | | | | | | | | | | | | | |
Western Europe (0.21%) |
AccorInvest Group SA +, f | 5.00% + E### | | | 09/20/24 | | | | 06/10/27 | | Senior | | € | 4,000,000 | | | | 4,481,548 | |
Care Bidco SAS +, f | 3.50% + E## | | | 05/13/24 | | | | 11/06/28 | | Senior | | | 2,100,000 | | | | 2,316,199 | |
Elsan SAS + | 3.35% + E## | | | 09/26/24 | | | | 06/16/28 | | Senior | | | 5,000,000 | | | | 5,550,478 | |
Lorca Holdco Ltd. + | 3.70% + E## | | | 09/24/24 | | | | 09/17/27 | | Senior | | | 2,709,458 | | | | 3,035,974 | |
LSF10 XL Bidco S.C.A. +, f | 4.175% + E## | | | 05/07/24 | | | | 04/12/28 | | Senior | | | 5,000,000 | | | | 5,104,556 | |
Quimper AB +, f | 2.925% + E## | | | 05/17/24 | | | | 02/16/26 | | Senior | | | 7,000,000 | | | | 7,800,126 | |
Summer (BC) Holdco B S.à.r.l. +, f | 4.50% + E## | | | 05/07/24 | | | | 01/31/29 | | Senior | | | 570,642 | | | | 640,302 | |
Summer (BC) Holdco B S.à.r.l. +, f | 4.50% + E## | | | 05/07/24 | | | | 01/31/29 | | Senior | | | 3,737,050 | | | | 4,193,242 | |
Total Western Europe (0.21%) | | | | | | | 33,122,425 | |
| | | | | | | | | | | | | | | | | | | |
Total Floating Rate Loans (Cost $101,177,107)(0.66%) | | | | | | $ | 102,085,951 | |
| | | | | | | | | | | | | | | | | | | |
Total Public Investments (Cost $875,009,634)(6.23%) | | | | | | $ | 970,221,902 | |
Private Equity Investments (93.33%)
Direct Investments * (66.64%) Direct Equity (55.21%) | Investment Type | | Acquisition
Date | | | Shares | | | Fair
Value** | |
Asia - Pacific (3.16%) |
AAVAS Financiers Limited +, a, e | Common equity | | | 03/28/18 | | | | 2,623,753 | | | $ | 39,082,573 | |
Argan Mauritius Limited +, a, e | Common equity | | | 05/09/16 | | | | 106,215 | | | | 15,144,315 | |
KKR Pebble Co-Invest L.P. +, a, c, e | Limited partnership interest | | | 05/13/21 | | | | — | | | | 37,182,707 | |
Partners Terra Pte. Ltd. +, a, b, e | Common equity | | | 05/14/21 | | | | 7,357,185 | | | | 10,328,598 | |
PG Esmeralda Pte. Ltd. +, a, b, e | Common equity | | | 03/03/21 | | | | 5,433,284 | | | | 3,854,192 | |
PG Esmeralda Pte. Ltd. +, a, b | Preferred equity | | | 03/03/21 | | | | 14,754 | | | | 1,904,405 | |
PG Esmeralda Pte. Ltd. +, a, b, e | Preferred equity | | | 03/03/21 | | | | 7,406,251 | | | | 55,695,429 | |
PG Loa Pte. Ltd. +, a | Common equity | | | 04/25/22 | | | | 118,793 | | | | 1,455,095 | |
PG Loa Pte. Ltd. +, a | Preferred equity | | | 04/25/22 | | | | 2,257,072 | | | | 27,646,804 | |
Sunsure Energy Private Limited +, a, b, c, e | Member interest | | | 12/27/22 | | | | — | | | | 11,912,656 | |
Sunsure Energy Private Limited +, a, b, e | Common equity | | | 12/27/22 | | | | 481,884 | | | | 5,493,748 | |
Sunsure Energy Private Limited +, a, b, e | Preferred equity | | | 12/27/22 | | | | 1,927,535 | | | | 3,371,095 | |
TPG Upswing Co-Invest, L.P. +, a, c | Limited partnership interest | | | 01/10/19 | | | | — | | | | 14,252,826 | |
Zenith Longitude Limited +, a, b, e | Common equity | | | 08/13/21 | | | | 26,838,037 | | | | 265,445,394 | |
Total Asia - Pacific (3.16%) | | | | | | | | | | | | 492,769,837 | |
| | | | | | | | | | | | | | |
The accompanying notes are an integral part of these Consolidated Financial Statements.
5
Partners Group Private Equity (Master Fund), LLC
(a Delaware Limited Liability Company)
Consolidated Schedule of Investments –
September 30, 2024 (Unaudited) (continued)
Private Equity Investments (continued)
Direct Investments * (continued) Direct Equity (continued) | Investment Type | | Acquisition
Date | | | Shares | | | Fair
Value** | |
North America (25.64%) |
Alliant Holdings, L.P. +, a, c | Limited partnership interest | | | 12/01/21 | | | | — | | | $ | 46,296,834 | |
AmSurg HoldCo, LLC +, a | Common equity | | | 11/03/23 | | | | 896,098 | | | | 33,599,164 | |
AP VIII Prime Security Services Holdings, L.P. +, a, c, e | Limited partnership interest | | | 05/02/16 | | | | — | | | | 7,752,998 | |
Astorg VII Co-Invest ERT +, a, c | Limited partnership interest | | | 04/28/21 | | | | — | | | | 86,827,833 | |
BCPE Hercules Holdings, L.P. +, a, c | Limited partnership interest | | | 07/30/18 | | | | — | | | $ | 2,511,678 | |
BI Gen Holdings, Inc. +, a | Common equity | | | 01/01/21 | | | | 14,561 | | | | 280,322 | |
CapitalSpring Finance Company, LLC +, a, b | Common equity | | | 03/01/17 | | | | 3,020,546 | | | | 2,251,984 | |
Carestream Dental Technology, Inc. +, a | Common equity | | | 08/30/24 | | | | 4,205,000 | | | | 2,366,338 | |
CB Poly Holdings, LLC +, a, e | Preferred equity | | | 08/16/16 | | | | 171,270 | | | | 36,927,446 | |
CB Titan MidCo Holdings, Inc. +, a | Common equity | | | 01/01/21 | | | | 56,634 | | | | 1 | |
CD&R Mercury Co-Investor, L.P. +, a, c, e | Limited partnership interest | | | 10/14/20 | | | | — | | | | 339,647,780 | |
Checkers Topco, LLC +, a | Common equity | | | 06/16/23 | | | | 9,517 | | | | 82,911 | |
Clarience Technologies, LLC +, a | Common equity | | | 03/05/24 | | | | 3,429 | | | | 9,497,544 | |
Confluent Health Holdings LP +, a, b | Common equity | | | 05/30/19 | | | | 30,362 | | | | 71,605,003 | |
ConvergeOne Holdings, Inc. +, a | Common equity | | | 06/06/24 | | | | 2,154,218 | | | | 2,235,622 | |
Cowboy Topco, Inc. +, a | Common equity | | | 05/18/22 | | | | 1,348,750 | | | | 1,767,886 | |
Cure Holdings, LLC +, a | Common equity | | | 05/13/21 | | | | 238,834 | | | | 2,102,961 | |
Cure Holdings, LLC +, a, e | Common equity | | | 05/13/21 | | | | 2,723 | | | | 21,700 | |
Dermatology Holdings, L.P. +, a, b, c, e | Limited partnership interest | | | 04/01/22 | | | | — | | | | 154,776,158 | |
DIF VI Co-Invest Project 2C C.V. +, a, c, e | Limited partnership interest | | | 03/15/22 | | | | — | | | | 64,032,797 | |
ECP Parent, LLC +, a, b, e | Preferred equity | | | 12/21/23 | | | | 4,250,000 | | | | 9,610,040 | |
ECP Parent, LLC +, a, b | Common equity | | | 11/15/21 | | | | 105,520,023 | | | | 88,228,196 | |
ECP Parent, LLC +, a, b, e | Common equity | | | 11/15/21 | | | | — | | | | 4,870,336 | |
EdgeCore Holdings, L.P. +, a, b, c, e | Limited partnership interest | | | 08/22/24 | | | | — | | | | 137,727,841 | |
Encore Holdings LP +, a, b, c, e | Limited partnership interest | | | 07/01/22 | | | | — | | | | 118,475,306 | |
EnfraGen LLC +, a, b, e | Common equity | | | 09/17/19 | | | | 37,786 | | | | 95,854,104 | |
EQT Infrastructure IV Co-Investment (B) SCSp +, a, c | Limited partnership interest | | | 03/09/20 | | | | — | | | | 125,230,370 | |
EQT IX Co-Investment (F) SCSp +, a, c, e | Limited partnership interest | | | 11/15/21 | | | | — | | | | 146,295,986 | |
EQT VIII Co-Investment (C) SCSp +, a, c, e | Limited partnership interest | | | 01/25/19 | | | | — | | | | 62,315,084 | |
EQT X Co-Investment (A) SCSp +, a, c, e | Limited partnership interest | | | 07/02/24 | | | | — | | | | 20,475,870 | |
FH EP Parent L.P. +, a, c, e | Limited partnership interest | | | 03/12/24 | | | | — | | | | 13,096,400 | |
FRP Investors II, L.P. +, a, c, e | Limited partnership interest | | | 09/16/22 | | | | — | | | | 67,914,588 | |
Gateway Fleets Holdings, LP +, a, c, e | Limited partnership interest | | | 09/30/24 | | | | — | | | | 1,816,000 | |
Halo Parent Newco, LLC +, a | Preferred equity | | | 02/22/22 | | | | 1,109 | | | | 20,836,028 | |
Icebox Holdco I Inc. +, a, b, c | Member interest | | | 03/01/22 | | | | — | | | | 63,201,866 | |
Icebox Parent L.P. +, a, b, c | Limited partnership interest | | | 12/22/21 | | | | — | | | | 244,709,933 | |
Idera Parent L.P. +, a, b, c, e | Limited partnership interest | | | 03/02/21 | | | | — | | | | 230,645,223 | |
KDOR Merger Sub Inc. +, a | Common equity | | | 05/11/18 | | | | 481 | | | | 1 | |
KENE Holdings, L.P. +, a, c | Limited partnership interest | | | 08/08/19 | | | | — | | | | 451,477 | |
KKR Cavalry Co-Invest Blocker Parent L.P. +, a, c | Limited partnership interest | | | 03/24/22 | | | | — | | | | 79,982,505 | |
KKR Enterprise Co-Invest AIV A L.P. +, a, c | Limited partnership interest | | | 07/31/20 | | | | — | | | | 123,851 | |
KKR Enterprise Co-Invest L.P. +, a, e | Common equity | | | 10/09/18 | | | | 9,684 | | | | — | |
KPOCH Holdings, L.P. +, a, b, c | Limited partnership interest | | | 11/10/22 | | | | — | | | | 164,063,063 | |
KPSKY Holdings L.P. +, a, b, c | Limited partnership interest | | | 10/19/21 | | | | — | | | | 48,279,749 | |
KSLB Holdings, LLC +, a | Common equity | | | 07/30/18 | | | | 252,000 | | | | 1 | |
LTF Holdings, Inc. +, a | Common equity | | | 01/06/20 | | | | 3,464,630 | | | | 63,757,747 | |
LTF Holdings, Inc. +, a, e | Common equity | | | 01/06/20 | | | | — | | | | 7,317,337 | |
Matterhorn Topco, L.P. +, a, c | Limited partnership interest | | | 04/04/23 | | | | — | | | | 15,898,788 | |
MHS Acquisition Holdings, LLC +, a, b | Common equity | | | 03/10/17 | | | | 356 | | | | 395,145 | |
MHS Acquisition Holdings, LLC +, a, b | Preferred equity | | | 03/10/17 | | | | 35,285 | | | | 214,630 | |
MHS Blocker Purchaser L.P. +, a, b, c | Limited partnership interest | | | 03/10/17 | | | | — | | | | 47,147,358 | |
Milestone Investment Holdings, LLC +, a, e | Common equity | | | 09/23/21 | | | | 22,293,150 | | | | 35,387,555 | |
NC Ocala Co-Invest Alpha, L.P. +, a, c | Limited partnership interest | | | 11/24/21 | | | | — | | | | 82,611,554 | |
OMNIA Coinvest L.P. +, a, c, e | Limited partnership interest | | | 10/23/20 | | | | — | | | | 26,781,658 | |
The accompanying notes are an integral part of these Consolidated Financial Statements.
6
Partners Group Private Equity (Master Fund), LLC
(a Delaware Limited Liability Company)
Consolidated Schedule of Investments –
September 30, 2024 (Unaudited) (continued)
Private Equity Investments (continued)
Direct Investments * (continued) Direct Equity (continued) | Investment Type | | Acquisition
Date | | | Shares | | | Fair
Value** | |
North America (continued) |
Onex Fox, L.P. +, a, c, e | Limited partnership interest | | | 04/25/19 | | | | — | | | $ | 87,574,700 | |
Orion Opportunity L.P. +, a, c, e | Limited partnership interest | | | 09/01/21 | | | | — | | | | 50,733,290 | |
PG BRPC Investment, LLC +, a, b | Common equity | | | 08/01/19 | | | | 32,079 | | | | 82,829,617 | |
PG Delta HoldCo, LLC +, a, b, e | Common equity | | | 06/24/21 | | | | 40,952 | | | $ | 96,939,643 | |
Raptor Holding Parent, L.P. +, a | Common equity | | | 04/01/22 | | | | 11,209 | | | | 1,206,135 | |
Real Hero Topco, L.P. +, a, c | Limited partnership interest | | | 04/01/21 | | | | — | | | | 19,128,062 | |
Safari Co-Investment L.P. +, a, c | Limited partnership interest | | | 03/14/18 | | | | — | | | | 3,118,248 | |
Safari Co-Investment L.P. +, a, c, e | Limited partnership interest | | | 03/14/18 | | | | — | | | | 9,240,013 | |
SC Landco Parent, LLC +, a | Common equity | | | 11/21/13 | | | | 2,672 | | | | 484,731 | |
SC Landco Parent, LLC +, a | Preferred equity | | | 04/21/17 | | | | — | | | | 1 | |
Shermco Intermediate Holdings, Inc. +, a, e | Common equity | | | 06/05/18 | | | | 11,525 | | | | 2,469,905 | |
SIH RP HoldCo L.P. +, a, e | Common equity | | | 09/10/19 | | | | 5,995,126 | | | | 58,377,941 | |
SIH RP HoldCo L.P. +, a | Common equity | | | 09/10/19 | | | | — | | | | 11,079,392 | |
SLP West Holdings Co-Invest Feeder II, L.P. +, a, c | Limited partnership interest | | | 08/18/17 | | | | — | | | | 34,443,837 | |
SnackTime PG Holdings, Inc. +, a, b, e | Common equity | | | 05/23/18 | | | | 12 | | | | — | |
SnackTime PG Holdings, Inc. +, a, b, c, e | Member interest | | | 05/23/18 | | | | — | | | | 3,694,852 | |
Specialty Pharma Holdings LP +, a, b, c | Limited partnership interest | | | 04/01/21 | | | | — | | | | 142,327,558 | |
Starfish Intermediate, Inc. +, a | Preferred equity | | | 06/06/22 | | | | 7,136,374 | | | | 223,774,676 | |
Stonepeak Tiger (Co-Invest) Holdings (I-B) L.P. +, a, c, e | Limited partnership interest | | | 08/17/21 | | | | — | | | | 33,313,191 | |
SureWerx Topco, L.P. +, a, b, c, e | Limited partnership interest | | | 04/30/24 | | | | — | | | | 387,081 | |
SureWerx Topco, L.P. +, a, b, c | Limited partnership interest | | | 12/28/22 | | | | — | | | | 69,863,226 | |
T-VIII Mercury Co-Invest L.P. +, a, c, e | Limited partnership interest | | | 07/29/21 | | | | — | | | | 8,346,030 | |
Thermostat Purchaser, L.P. +, a, b, c | Limited partnership interest | | | 08/31/21 | | | | — | | | | 103,681,060 | |
TKC Topco LLC +, a | Common equity | | | 10/14/16 | | | | 4,632,829 | | | | 346,332 | |
VEEF II Co-Invest 2-A, L.P. +, a, c | Limited partnership interest | | | 03/15/22 | | | | — | | | | 6,382,636 | |
Velocity Holdings US LP +, a, c, e | Limited partnership interest | | | 08/31/22 | | | | — | | | | 28,894,275 | |
WHCG Purchaser, L.P. +, a, b, c | Limited partnership interest | | | 06/22/21 | | | | — | | | | 13,461,168 | |
WHCG Purchaser, L.P. +, a, b, e | Preferred equity | | | 08/02/24 | | | | 10,934,833 | | | | 11,111,584 | |
WHCG Purchaser, L.P. +, a, b | Preferred equity | | | 08/02/24 | | | | 3,088,000 | | | | 3,137,914 | |
Woof Parent L.P. +, a | Common equity | | | 12/21/20 | | | | 1,441 | | | | 1 | |
Total North America (25.64%) | | | | | | | | | | | | 3,994,647,649 | |
| | | | | | | | | | | | | | |
Rest of World (1.66%) |
Carlyle Retail Turkey Partners, L.P. +, a, c | Limited partnership interest | | | 07/11/13 | | | | — | | | | 8,454,413 | |
PG Investment Company 53 S.à.r.l. +, a | Preferred equity | | | 03/04/24 | | | | 6,084,438 | | | | 7,293,838 | |
PG Investment Company 53 S.à.r.l. +, a | Common equity | | | 03/04/24 | | | | 711,862 | | | | 3,503,816 | |
Velvet LP SCS +, a, c | Limited partnership interest | | | 03/04/24 | | | | — | | | | 197,964 | |
Zabka Polska SA +, a | Preferred equity | | | 09/25/19 | | | | — | | | | 103,190 | |
Zabka Polska SA +, a | Common equity | | | 09/25/19 | | | | 2,551,723 | | | | 234,503,541 | |
Zabka Polska SA +, a, e | Preferred equity | | | 09/25/19 | | | | 120,777,003 | | | | 3,805,455 | |
Total Rest of World (1.66%) | | | | | | | | | | | | 257,862,217 | |
| | | | | | | | | | | | | | |
South America (0.04%) |
Centauro Co-Investment Fund, L.P. +, a, c | Limited partnership interest | | | 11/28/13 | | | | — | | | | 5,473,138 | |
Total South America (0.04%) | | | | | | | | | | | | 5,473,138 | |
| | | | | | | | | | | | | | |
Western Europe (24.71%) |
Akur8 SAS +, a, e | Common equity | | | 08/28/24 | | | | 6,271,791 | | | | 7,759,249 | |
Akur8 SAS +, a, e | Preferred equity | | | 08/28/24 | | | | 8,741,790 | | | | 10,129,079 | |
Ark EquityCo SAS +, a, c, e | Limited partnership interest | | | 02/21/22 | | | | — | | | | 16,904,219 | |
Aston Lux Acquisitions S.à.r.l. +, a, c | Limited partnership interest | | | 11/28/19 | | | | — | | | | 4,075,591 | |
Aston Lux Acquisitions S.à.r.l. +, a | Common equity | | | 01/11/21 | | | | 218,625 | | | | 277,411 | |
Astorg VIII Co-Invest Open Health +, a, c | Limited partnership interest | | | 08/04/22 | | | | — | | | | 25,873,071 | |
Astorg VIII Co-Invest Open Health +, a, c, e | Limited partnership interest | | | 07/14/23 | | | | — | | | | 434,000 | |
The accompanying notes are an integral part of these Consolidated Financial Statements.
7
Partners Group Private Equity (Master Fund), LLC
(a Delaware Limited Liability Company)
Consolidated Schedule of Investments –
September 30, 2024 (Unaudited) (continued)
Private Equity Investments (continued)
Direct Investments * (continued) Direct Equity (continued) | Investment Type | | Acquisition
Date | | | Shares | | | Fair
Value** | |
Western Europe (continued) |
Audiotonix Co-Invest SCSp +, a, c, e | Limited partnership interest | | | 07/23/24 | | | | — | | | $ | 14,411,036 | |
Blackstone Cornerstone Co-Invest (CYM) L.P. +, a, c, e | Limited partnership interest | | | 04/16/24 | | | | — | | | | 23,374,574 | |
Bock Capital JVCo Nature S.à.r.l. +, a, b | Common equity | | | 07/01/21 | | | | 12,590,000,000 | | | | 227,034,516 | |
Capri Acquisitions Topco Limited +, a, e | Preferred equity | | | 11/01/17 | | | | 13,288 | | | | — | |
Capri Acquisitions Topco Limited +, a | Common equity | | | 11/01/17 | | | | 8,345,985 | | | | 59,256,509 | |
CD&R Market Co-Investor, L.P. +, a, c, e | Limited partnership interest | | | 11/10/21 | | | | — | | | | 65,923,326 | |
Ciddan S.à.r.l. +, a, e | Preferred equity | | | 09/15/17 | | | | — | | | | 26,247,646 | |
Ciddan S.à.r.l. +, a, e | Common equity | | | 09/15/17 | | | | 12,263,240 | | | | 61,027,501 | |
Ciddan S.à.r.l. +, a | Preferred equity | | | 09/15/17 | | | | 23,249,522 | | | | 2,574,075 | |
Climeworks AG +, a | Common equity | | | 04/25/22 | | | | 18,455 | | | | 556,237 | |
Climeworks AG +, a, e | Preferred equity | | | 04/25/22 | | | | 2,288,663 | | | | 68,980,738 | |
EQT Future Co-Investment (C) SCSp +, a, c | Limited partnership interest | | | 02/15/23 | | | | — | | | | 90,606,020 | |
EQT Jaguar Co-Investment SCSp +, a, c | Limited partnership interest | | | 04/18/24 | | | | — | | | | 718,495 | |
EQT Jaguar Co-Investment SCSp +, a, c, e | Limited partnership interest | | | 11/30/18 | | | | — | | | | 64,626,296 | |
EQT VIII Co-Investment (D) SCSp +, a, c, e, g | Limited partnership interest | | | 10/01/19 | | | | — | | | | 212,298,924 | |
EQT VIII Co-Investment (D) SCSp +, a, c, g | Limited partnership interest | | | 10/01/19 | | | | — | | | | 10,264,360 | |
Fides S.p.A +, a | Common equity | | | 12/15/16 | | | | 78,505 | | | | 297,712 | |
Five Arrows Royal FAPI IV Co Invest SCSp +, a, c, e | Limited partnership interest | | | 07/05/24 | | | | — | | | | 4,643,624 | |
Global Blue Group Holding AG +, a | Common equity | | | 09/11/20 | | | | 97,250 | | | | 526,608 | |
Global Blue Holding L.P. +, a, c | Limited partnership interest | | | 07/31/12 | | | | — | | | | 8,691,646 | |
Green DC LuxCo S.à.r.l. +, a, b, c, e | Member interest | | | 01/20/22 | | | | — | | | | 40,796,638 | |
Green DC LuxCo S.à.r.l. +, a, b, e | Common equity | | | 03/31/24 | | | | 19,465,958 | | | | 20,315,024 | |
Green DC LuxCo S.à.r.l. +, a, b, c, e | Member interest | | | 03/31/24 | | | | — | | | | 6,574,743 | |
Green DC LuxCo S.à.r.l. +, a, b | Common equity | | | 01/20/22 | | | | 19,595,288 | | | | 125,017,010 | |
KKR Pegasus Co-Invest L.P. +, a, c | Limited partnership interest | | | 07/07/22 | | | | — | | | | 17,089,051 | |
KKR Sprint Co-Invest L.P. +, a, c | Limited partnership interest | | | 09/29/22 | | | | — | | | | 2,482,237 | |
KKR Traviata Co-invest L.P. +, a, c | Limited partnership interest | | | 12/18/19 | | | | — | | | | 153,543,065 | |
Luxembourg Investment Company 261 S.à.r.l. +, a | Common equity | | | 07/31/18 | | | | 1,484 | | | | 62,816,451 | |
Luxembourg Investment Company 261 S.à.r.l. +, a, c | Member interest | | | 07/31/18 | | | | — | | | | 68,223,399 | |
Luxembourg Investment Company 285 S.à.r.l. +, a, b | Preferred equity | | | 08/22/19 | | | | 7,865,820 | | | | 6,734,799 | |
Luxembourg Investment Company 285 S.à.r.l. +, a, b, c | Member interest | | | 08/22/19 | | | | — | | | | 23,238,459 | |
Luxembourg Investment Company 285 S.à.r.l. +, a, b | Common equity | | | 08/22/19 | | | | 6,999,953 | | | | — | |
Luxembourg Investment Company 293 S.à.r.l. +, a, b, e | Common equity | | | 06/26/19 | | | | 9,789,622 | | | | 39,892,237 | |
Luxembourg Investment Company 293 S.à.r.l. +, a, b, c, e | Member interest | | | 06/26/19 | | | | — | | | | 12,237,366 | |
Luxembourg Investment Company 314 S.à.r.l. +, a, b | Common equity | | | 08/22/19 | | | | 192,000 | | | | 1 | |
Luxembourg Investment Company 404 S.à.r.l. +, a, b, e | Common equity | | | 02/14/23 | | | | 145,800 | | | | 10,156,347 | |
Luxembourg Investment Company 404 S.à.r.l. +, a, b, e | Preferred equity | | | 02/14/23 | | | | — | | | | 16,115,420 | |
Luxembourg Investment Company 414 S.à.r.l. +, a, b, c, e | Member interest | | | 07/02/21 | | | | — | | | | 43,082,017 | |
Luxembourg Investment Company 414 S.à.r.l. +, a, b, e | Common equity | | | 07/02/21 | | | | 12,316,087 | | | | 70,546,299 | |
Luxembourg Investment Company 430 S.à.r.l. +, a, b, e | Common equity | | | 05/10/21 | | | | 52,594,635 | | | | 63,193,837 | |
Luxembourg Investment Company 430 S.à.r.l. +, a, b, c, e | Member interest | | | 05/10/21 | | | | — | | | | 16,673,332 | |
Magnesium Co-Invest SCSp +, a, c, e | Limited partnership interest | | | 05/19/22 | | | | — | | | | 109,392,548 | |
Mauritius (Luxemburg) Investments S.à.r.l. +, a | Common equity | | | 10/19/21 | | | | 11,698 | | | | 1 | |
Nerve Co-Invest SCSp +, a, c, e | Limited partnership interest | | | 01/27/21 | | | | — | | | | 61,911,357 | |
Nerve Co-Invest SCSp +, a, c | Limited partnership interest | | | 01/27/21 | | | | — | | | | 8,391,204 | |
Oakley Capital V Co-Investment (A) SCSp +, a, c, e | Limited partnership interest | | | 12/12/22 | | | | — | | | | 75,894,626 | |
Orbiter Investments S.à.r.l. +, a, b, e | Common equity | | | 12/17/21 | | | | 4,898,329 | | | | 186,904,705 | |
Orbiter Investments S.à.r.l. +, a, b | Common equity | | | 12/17/21 | | | | 3,670,528 | | | | 94,089,171 | |
OT Luxco 3 & Cy S.C.A. +, a | Warrants | | | 12/01/17 | | | | 844,553 | | | | 1,214,863 | |
Partners Group Satellite HoldCo S.à.r.l. +, a, b, e | Common equity | | | 03/22/23 | | | | 7,017,978 | | | | — | |
Partners Group Satellite HoldCo S.à.r.l. +, a, b, e | Preferred equity | | | 03/22/23 | | | | 7,975,901 | | | | 49,593,566 | |
Partners Group Satellite Warehouse S.C.S. +, a, b, c | Member interest | | | 03/22/23 | | | | — | | | | 1,130,046 | |
PG Investment Company 1 S.à.r.l. +, a, b, c | Member interest | | | 10/28/21 | | | | — | | | | 66,448,504 | |
PG Investment Company 1 S.à.r.l. +, a, b, e | Common equity | | | 10/28/21 | | | | 12,822,040 | | | | 36,086,845 | |
The accompanying notes are an integral part of these Consolidated Financial Statements.
8
Partners Group Private Equity (Master Fund), LLC
(a Delaware Limited Liability Company)
Consolidated Schedule of Investments –
September 30, 2024 (Unaudited) (continued)
Private Equity Investments (continued)
Direct Investments * (continued) Direct Equity (continued) | Investment Type | | Acquisition
Date | | | Shares | | | Fair
Value** | |
Western Europe (continued) |
PG Investment Company 18 S.à.r.l. +, a, b, e | Preferred equity | | | 07/07/22 | | | | 113,856,528 | | | $ | 163,864,044 | |
PG Investment Company 18 S.à.r.l. +, a, b, e | Common equity | | | 07/07/22 | | | | 12,650,106 | | | | 30,097,994 | |
PG Investment Company 24 S.à.r.l. +, a, b, e | Common equity | | | 07/13/22 | | | | 889,862 | | | | 21,298,308 | |
PG Investment Company 24 S.à.r.l. +, a, b, e | Preferred equity | | | 07/13/22 | | | | 101,367,616 | | | | 139,870,672 | |
PG Investment Company 60 S.à r.l. +, a, b, e | Common equity | | | 01/31/24 | | | | 109,610 | | | | 122,365 | |
PG Investment Company 60 S.à r.l. +, a, b, e | Preferred equity | | | 01/31/24 | | | | 269,765 | | | | 5,893,377 | |
PG Investment Company 67 S.à.r.l. +, a, b, e | Preferred equity | | | 07/16/24 | | | | 4,251,649 | | | | 4,747,537 | |
PG Investment Company 67 S.à.r.l. +, a, b, e | Common equity | | | 07/16/24 | | | | 473,795 | | | | 528,435 | |
PG Investment Company 69 S.à.r.l. +, a, b | Preferred equity | | | 07/16/24 | | | | 301,734 | | | | 336,187 | |
PG Investment Company 69 S.à.r.l. +, a, b | Common equity | | | 07/16/24 | | | | 533,864 | | | | 595,085 | |
PG Investment Company 71 S.à.r.l. +, a, b, e | Common equity | | | 09/26/24 | | | | 5,428,472 | | | | 6,059,268 | |
PG Investment Company 76 S.à.r.l. +, a, b, e | Common equity | | | 09/03/24 | | | | 360,670 | | | | 402,580 | |
PG Investment Company 76 S.à.r.l. +, a, b, e | Preferred equity | | | 09/03/24 | | | | 43,748,069 | | | | 48,831,651 | |
PG Lion Management Warehouse S.C.S +, a, b, c | Limited partnership interest | | | 08/22/19 | | | | — | | | | 175,288 | |
PG Polaris TopCo S.à r.l. +, a, e | Common equity | | | 03/27/24 | | | | 1,941,043 | | | | 2 | |
PG Polaris TopCo S.à r.l. +, a | Preferred equity | | | 03/27/24 | | | | 36,879,822 | | | | 38,938,671 | |
PG Polaris Warehouse SCSp +, a, c, d | Limited partnership interest | | | 03/27/24 | | | | — | | | | 609,512 | |
PG TLP S.à.r.l. +, a, b, c, e | Member interest | | | 04/14/21 | | | | — | | | | 50,752,937 | |
PG TLP S.à.r.l. +, a, b, e | Common equity | | | 04/14/21 | | | | 6,473,126 | | | | 82,154,251 | |
PG Wave Limited +, a, b, e | Common equity | | | 02/03/22 | | | | 53,215,581 | | | | 97,561,066 | |
Pharmathen GP S.à.r.l. +, a, b | Common equity | | | 01/20/22 | | | | 110,300 | | | | 1 | |
Pharmathen Topco S.à.r.l. +, a, b | Preferred equity | | | 01/20/22 | | | | 98,858,068 | | | | 142,588,840 | |
Pharmathen Topco S.à.r.l. +, a, b | Common equity | | | 01/20/22 | | | | 79,910 | | | | 17,375,459 | |
Polyusus Lux XVI S.à.r.l. +, a, b, e | Common equity | | | 05/23/18 | | | | 44,442,345 | | | | — | |
Polyusus Lux XVI S.à.r.l. +, a, b, e | Preferred equity | | | 07/05/24 | | | | 247,436,084 | | | | 3,098,650 | |
Polyusus Lux XVI S.à.r.l. +, a, b, c | Member interest | | | 10/03/22 | | | | — | | | | 1 | |
Polyusus Lux XVI S.à.r.l. +, a, b, c, e | Member interest | | | 10/01/22 | | | | — | | | | 1 | |
Polyusus Lux XXIII S.à.r.l. +, a, e | Preferred equity | | | 04/11/22 | | | | 1,155,552 | | | | 56,089 | |
Polyusus Lux XXIII S.à.r.l. +, a | Preferred equity | | | 08/19/21 | | | | 11,772,986 | | | | 215,204 | |
Polyusus Lux XXIII S.à.r.l. +, a | Common equity | | | 08/19/21 | | | | 3,936,244 | | | | 55,651 | |
Polyusus Lux XXIII S.à.r.l. +, a, e | Preferred equity | | | 08/19/21 | | | | 1,341,978 | | | | 771,993 | |
Polyusus Lux XXIII S.à.r.l. +, a, e | Common equity | | | 08/19/21 | | | | 447,324 | | | | 199,634 | |
Refresco 2 Co-Invest SCSp +, a, c | Limited partnership interest | | | 07/12/22 | | | | — | | | | 50,032,489 | |
Rivage Luxco S.à.r.l. +, a | Common equity | | | 02/22/22 | | | | 450,000 | | | | 65,510,145 | |
Rivage Luxco S.à.r.l. +, a, e | Common equity | | | 06/28/23 | | | | 450,000 | | | | 416,883 | |
Root JVCo S.à.r.l. +, a, b, c | Member interest | | | 09/29/20 | | | | — | | | | 42,792,786 | |
Root JVCo S.à.r.l. +, a, b | Common equity | | | 02/07/23 | | | | 2,362,997 | | | | 20,713,101 | |
Root JVCo S.à.r.l. +, a, b | Preferred equity | | | 02/07/23 | | | | 8,686,753 | | | | 57,214,683 | |
S.TOUS, S.L +, a | Common equity | | | 10/06/15 | | | | 622 | | | | 20,704,208 | |
Strider Investment 2 +, a, e | Preferred equity | | | 04/01/23 | | | | 278,539 | | | | 985,495 | |
Strider Investment 3 +, a, e | Preferred equity | | | 04/01/23 | | | | 24,476 | | | | 27,320 | |
Strider Topco S.a.s. +, a, c | Member interest | | | 04/01/23 | | | | — | | | | 3,975,034 | |
Strider Topco S.a.s. +, a, e | Common equity | | | 04/01/23 | | | | 8,138,656 | | | | 28,734,593 | |
Strider Topco S.a.s. +, a, e | Preferred equity | | | 04/01/23 | | | | 52,067,087 | | | | 68,234,838 | |
Surfaces SLP (SCSp) +, a, b, c | Limited partnership interest | | | 10/01/20 | | | | — | | | | 25,224,600 | |
Vanquish Bidco +, a, c | Member interest | | | 05/25/23 | | | | — | | | | 4,044,189 | |
Vanquish Topco +, a | Common equity | | | 05/25/23 | | | | 379,731 | | | | 1 | |
Vanquish Topco +, a | Preferred equity | | | 05/25/23 | | | | 34,851,987 | | | | 47,439,378 | |
Veonet Co-Invest SCSp (Lux) +, a, c, e | Limited partnership interest | | | 03/09/22 | | | | — | | | | 42,851,053 | |
Zephyr Syndication L.P. +, a, c, e | Limited partnership interest | | | 08/08/24 | | | | — | | | | 13,051,834 | |
Zoncolan Topco S.à.r.l. +, a, e | Preferred equity | | | 08/01/24 | | | | 2,850,750 | | | | 3,219,129 | |
Total Western Europe (24.71%) | | | | | | | | | | | | 3,849,670,143 | |
| | | | | | | | | | | | | | |
Total Direct Equity (55.21%) | | | | | | | | | | | $ | 8,600,422,984 | |
The accompanying notes are an integral part of these Consolidated Financial Statements.
9
Partners Group Private Equity (Master Fund), LLC
(a Delaware Limited Liability Company)
Consolidated Schedule of Investments –
September 30, 2024 (Unaudited) (continued)
Private Equity Investments (continued)
Direct Investments * (continued) Direct Debt (11.43%) | Interest | | Acquisition
Date | | | Maturity
Date | | Investment
Type | | Principal | | | Fair
Value** | |
Asia - Pacific (0.43%) | | | | | | | | | �� | | | | | | | | | |
FFML Holdco Limited +, a | Cash 6.25% + BBSY (0.75% Floor)†† | | | 11/30/22 | | | | 11/30/28 | | Senior | | $ | 11,773,569 | | | $ | 12,056,442 | |
Fugue Finance B.V. +, a | Cash 4.50% + SF (0.50% Floor)vv | | | 03/10/23 | | | | 01/31/28 | | Senior | | | 5,447,437 | | | | 5,487,339 | |
Fugue Finance B.V. +, a | Cash 3.75% + SFvv | | | 03/06/24 | | | | 02/26/31 | | Senior | | | 7,980,000 | | | | 8,036,858 | |
Fugue Finco Pty Ltd +, a, e | Cash 5.75% + BBSY†† | | | 04/10/24 | | | | 04/10/30 | | Senior | | | 966,531 | | | | 977,272 | |
Fugue Finco Pty Ltd. +, a | Cash 5.75% + BBSY†† | | | 04/10/24 | | | | 05/30/30 | | Senior | | | 3,621,280 | | | | 3,794,306 | |
Fugue NZ Bidco Limited +, a | Cash 5.75% + BBSY†† | | | 04/10/24 | | | | 05/30/30 | | Senior | | | 2,370,912 | | | | 2,476,136 | |
Global Academic Group Limited +, a | Cash 6.00% + BBSY (0.50% Floor)†† | | | 07/26/22 | | | | 07/26/27 | | Senior | | | 12,728,400 | | | | 12,803,930 | |
Global Academic Group Limited +, a | Cash 6.00% + BBSY (0.50% Floor)†† | | | 07/29/22 | | | | 07/29/27 | | Senior | | | 4,651,970 | | | | 4,571,715 | |
Greencross Limited +, a | Cash 5.75% + BBSY (0.75% Floor)†† | | | 09/30/24 | | | | 03/23/28 | | Senior | | | 10,237,251 | | | | 10,236,259 | |
ICON Cancer Care +, a | Cash 7.25% + BBSY (0.50% Floor)† | | | 04/12/22 | | | | 03/29/30 | | Second Lien | | | 5,183,849 | | | | 4,249,286 | |
Snacking Investments BidCo Pty Limited +, a | Cash 4.00% + SF (1.00% Floor)v | | | 01/15/20 | | | | 12/18/26 | | Senior | | | 1,241,500 | | | | 1,248,484 | |
Voyage Australia Pty Ltd +, a | Cash 3.50% + SF (0.50% Floor)vv | | | 07/23/21 | | | | 06/18/28 | | Senior | | | 1,649,000 | | | | 1,650,649 | |
Total Asia - Pacific (0.43%) | | | | | | | | | | | | | | | | | 67,588,676 | |
| | | | | | | | | | | | | | | | | | | |
North America (6.61%) |
Acrisure, LLC +, a | Cash 3.50% + SFvv | | | 03/27/20 | | | | 02/15/27 | | Senior | | | 6,736,184 | | | | 6,729,178 | |
Acrisure, LLC +, a | Cash 4.25% + SF (0.50% Floor)vv | | | 12/08/21 | | | | 02/15/27 | | Senior | | | 5,962,556 | | | | 5,914,110 | |
Acrisure, LLC +, a, f | Cash 3.25% + SFvv | | | 05/29/24 | | | | 11/06/30 | | Senior | | | 5,000,000 | | | | 4,960,950 | |
Acrisure, LLC +, a | Cash 4.50% + SFvv | | | 11/10/23 | | | | 10/18/30 | | Senior | | | 995,006 | | | | 986,922 | |
ADMI Corp. +, a | Cash 3.75% + SF (0.50% Floor)vv | | | 07/14/21 | | | | 12/23/27 | | Senior | | | 1,358,000 | | | | 1,332,049 | |
ADMI Corp. +, a | Cash 5.75% + SFv | | | 09/17/24 | | | | 12/23/27 | | Senior | | | 1,488,750 | | | | 1,492,933 | |
Aimbridge Acquisition Co., Inc. +, a | Cash 3.75% + SFv | | | 04/26/23 | | | | 02/02/26 | | Senior | | | 4,441,619 | | | | 4,343,081 | |
Air Medical Group Holdings, Inc. +, a | Cash 4.25% + SF (1.00% Floor)vv | | | 02/25/21 | | | | 10/02/25 | | Senior | | | 8,029,972 | | | | 7,995,483 | |
AIT Buyer, LLC +, a | Cash 7.50% + SF (0.75% Floor)v | | | 04/06/21 | | | | 03/30/29 | | Second Lien | | | 6,860,000 | | | | 6,846,094 | |
AlixPartners, LLP +, a | Cash 2.50% + SF (0.50% Floor)v | | | 06/12/24 | | | | 02/04/28 | | Senior | | | 4,974,222 | | | | 4,984,817 | |
Alliant Holdings Intermediate, LLC +, a | Cash 3.50% + SF (0.50% Floor)v | | | 12/08/21 | | | | 11/05/27 | | Senior | | | 1,275,210 | | | | 1,273,272 | |
Allied Universal Holdco LLC +, a | Cash 3.75% + SFv | | | 06/12/24 | | | | 05/12/28 | | Senior | | | 3,979,487 | | | | 3,944,846 | |
American Airlines, Inc. +, a | Cash 2.50% + SFvv | | | 09/06/24 | | | | 06/04/29 | | Senior | | | 5,000,000 | | | | 4,968,750 | |
Amneal Pharmaceuticals, Inc. +, a | Cash 5.50% + SFv | | | 06/03/22 | | | | 05/04/25 | | Senior | | | 8,251,863 | | | | 8,365,326 | |
Amynta Agency Borrower, Inc. +, a | Cash 3.75% + SFv | | | 06/06/24 | | | | 02/28/28 | | Senior | | | 1,396,500 | | | | 1,398,469 | |
Apex Tool Group +, a | Cash 5.25% + SF (0.50% Floor)v | | | 02/22/22 | | | | 02/08/29 | | Senior | | | 3,210,778 | | | | 2,220,253 | |
AppLovin Corp. +, a | Cash 2.50% + SFv | | | 03/24/21 | | | | 08/15/25 | | Senior | | | 3,452,269 | | | | 3,454,427 | |
AppLovin Corp. +, a | Cash 2.50% + SF (0.50% Floor)v | | | 12/08/21 | | | | 08/16/30 | | Senior | | | 1,368,623 | | | | 1,370,450 | |
Apro, LLC +, a | Cash 3.75% + SFvv | | | 06/26/24 | | | | 07/09/31 | | Senior | | | 3,300,000 | | | | 3,315,477 | |
Aptean, Inc. +, a, e | Cash 5.25% + SF (0.75% Floor)v | | | 01/30/24 | | | | 01/30/31 | | Senior | | | 382,975 | | | | 378,476 | |
Aptean, Inc. +, a | Cash 5.25% + SF (0.75% Floor)v | | | 01/30/24 | | | | 01/30/31 | | Senior | | | 7,047,349 | | | | 7,073,777 | |
AQA Acquisition Holding, Inc. +, a | Cash 4.25% + SF (0.50% Floor)vv | | | 03/18/21 | | | | 03/03/28 | | Senior | | | 1,064,250 | | | | 1,067,911 | |
athenahealth Group, Inc. +, a | Cash 3.25% + SF (0.50% Floor)vv | | | 02/23/22 | | | | 02/15/29 | | Senior | | | 12,589,266 | | | | 12,526,319 | |
Azalea TopCo, Inc. +, a | Cash 3.50% + SFv | | | 05/08/24 | | | | 04/24/31 | | Senior | | | 1,900,000 | | | | 1,898,138 | |
Banff Merger Sub Inc. +, a | Cash 4.25% + SFvv | | | 01/31/22 | | | | 10/02/25 | | Senior | | | 4,361,843 | | | | 4,358,026 | |
Barracuda Networks, Inc. +, a | Cash 7.00% + SF (0.50% Floor)vvv | | | 05/17/22 | | | | 08/15/30 | | Second Lien | | | 2,000,000 | | | | 1,805,000 | |
Bausch & Lomb Inc. +, a | Cash 3.25% + SF (0.50% Floor)vvvv | | | 05/18/22 | | | | 05/10/27 | | Senior | | | 11,185,038 | | | | 11,158,641 | |
The accompanying notes are an integral part of these Consolidated Financial Statements.
10
Partners Group Private Equity (Master Fund), LLC
(a Delaware Limited Liability Company)
Consolidated Schedule of Investments –
September 30, 2024 (Unaudited) (continued)
Private Equity Investments (continued)
Direct Investments * (continued) Direct Debt (continued) | Interest | | Acquisition
Date | | | Maturity
Date | | Investment
Type | | Principal | | | Fair
Value** | |
North America (continued) | | | | | | | | | | | | | | | | | | |
Bausch + Lomb Corp. +, a | Cash 4.00% + SFv | | | 09/14/23 | | | | 09/14/28 | | Senior | | $ | 1,980,000 | | | $ | 1,981,247 | |
BCPE Empire Holdings, Inc. +, a | Cash 4.00% + SF (0.50% Floor)v | | | 06/07/23 | | | | 12/11/28 | | Senior | | | 2,267,157 | | | | 2,270,422 | |
Bella Holding Company, LLC +, a, f | Cash 3.75% + SF (0.75% Floor)v | | | 05/13/21 | | | | 04/01/28 | | Senior | | | 5,481,744 | | | | 7,286,980 | |
BEP Intermediate Holdco, LLC +, a | Cash 3.75% + SFvv | | | 05/01/24 | | | | 04/11/31 | | Senior | | | 997,500 | | | | 1,002,488 | |
Berlin Packaging, LLC +, a | Cash 3.75% + SFvv | | | 06/13/24 | | | | 06/07/31 | | Senior | | | 3,990,000 | | | | 3,991,257 | |
BI Gen Holdings, Inc. +, a | Cash 5.00% + SFvv | | | 10/04/18 | | | | 09/05/25 | | Senior | | | 5,485,268 | | | | 5,518,618 | |
Blackhawk Network Holdings, Inc. +, a | Cash 5.00% + SF (1.00% Floor)v | | | 03/18/24 | | | | 02/27/29 | | Senior | | | 6,184,500 | | | | 6,221,854 | |
BlueConic Holding, Inc. +, a | Cash 6.50% + SF (0.75% Floor)vv | | | 01/27/22 | | | | 01/27/28 | | Senior | | | 18,912,000 | | | | 18,856,462 | |
BlueConic Holding, Inc. +, a | Cash 6.50% + SF (0.75% Floor)vv | | | 06/13/23 | | | | 01/27/28 | | Senior | | | 7,092,000 | | | | 7,071,173 | |
Brand Industrial Services, Inc. +, a | Cash 4.50% + SF (0.50% Floor)vv | | | 04/19/24 | | | | 08/01/30 | | Senior | | | 1,393,000 | | | | 4,280,054 | |
Brown Group Holding, LLC +, a | Cash 3.00% + SF (0.50% Floor)vv | | | 06/09/22 | | | | 07/02/29 | | Senior | | | 2,176,768 | | | | 2,174,047 | |
Brown Group Holding, LLC +, a | Cash 2.75% + SFvv | | | 05/23/24 | | | | 06/07/28 | | Senior | | | 2,991,753 | | | | 2,988,641 | |
Burger Bossco Intermediate, Inc. +, a | Cash 9.00% + SF (1.00% Floor)vv | | | 01/01/21 | | | | 06/16/28 | | Senior | | | 59,808 | | | | 59,330 | |
Cablevision Lightpath LLC +, a | Cash 3.25% + SFv | | | 05/29/24 | | | | 11/30/27 | | Senior | | | 7,979,275 | | | | 7,975,524 | |
Calpine Corporation +, a, e | Cash 2.00% + SFv | | | 06/14/24 | | | | 01/31/31 | | Senior | | | 9,950,000 | | | | 9,927,364 | |
Campaign Monitor (UK) Limited +, a | Cash 8.90% + SF (1.00% Floor)vv; PIK 14.795% | | | 01/01/21 | | | | 11/06/25 | | Second Lien | | | 207,851 | | | | 179,555 | |
Campaign Monitor (UK) Limited +, a | Cash 8.90% + SF (1.00% Floor)vv | | | 01/01/21 | | | | 11/06/25 | | Second Lien | | | 1,662,807 | | | | 1,436,442 | |
CapitalSpring Finance Company, LLC +, a, b | PIK 5.00% | | | 03/01/17 | | | | 02/10/25 | | Mezzanine | | | 4,019,127 | | | | 3,720,486 | |
CapitalSpring Finance Company, LLC +, a, b | Cash 8.00% | | | 03/01/17 | | | | 02/10/25 | | Mezzanine | | | 726,932 | | | | 696,548 | |
Carestream Dental Technology, Inc. +, a | Cash 6.25% + SFv | | | 08/30/24 | | | | 08/30/30 | | Senior | | | 3,513,857 | | | | 3,566,565 | |
CD&R Hydra Buyer, Inc. +, a | Cash 4.00% + SFv | | | 03/15/24 | | | | 03/25/31 | | Senior | | | 1,791,000 | | | | 1,781,490 | |
Cedar Fair, L.P. +, a | Cash 2.00% + SFvv | | | 05/23/24 | | | | 05/01/31 | | Senior | | | 2,992,500 | | | | 2,991,752 | |
Cengage Learning, Inc. +, a | Cash 4.25% + SF (1.00% Floor)vv | | | 03/28/24 | | | | 03/18/31 | | Senior | | | 2,487,500 | | | | 2,495,684 | |
Central Parent LLC +, a, f | Cash 3.25% + SFvv | | | 05/28/24 | | | | 07/06/29 | | Senior | | | 1,000,000 | | | | 2,972,515 | |
Central Parent, Inc. +, a | Cash 4.50% + SF (0.50% Floor)vv | | | 07/12/22 | | | | 07/06/29 | | Senior | | | 992,500 | | | | 983,404 | |
Chariot Buyer LLC +, a | Cash 3.75% + SF (0.50% Floor)v | | | 02/08/24 | | | | 11/03/28 | | Senior | | | 995,000 | | | | 993,846 | |
Charlotte Buyer Inc +, a | Cash 5.25% + SF (0.50% Floor)vv | | | 08/16/22 | | | | 02/11/28 | | Senior | | | 4,066,864 | | | | 4,098,769 | |
Charter NEX US, Inc. +, a | Cash 3.50% + SF (0.75% Floor)v | | | 05/31/19 | | | | 12/01/27 | | Senior | | | 1,412,578 | | | | 1,414,273 | |
Checkers Drive-in Restaurants, Inc. +, a | Cash 7.00% + SFvv | | | 06/16/23 | | | | 06/16/27 | | Senior | | | 7,340 | | | | 7,313 | |
Cheniere Energy Partners +, a | Cash 3.50% + SF (0.50% Floor)vvvv | | | 06/09/21 | | | | 06/04/28 | | Senior | | | 7,898,431 | | | | 7,899,497 | |
Citadel Securities LP +, a | Cash 2.25% + SFv | | | 05/22/24 | | | | 07/29/30 | | Senior | | | 5,969,627 | | | | 5,972,671 | |
Clarios Global LP +, a | Cash 3.00% + E# | | | 05/16/24 | | | | 04/30/26 | | Senior | | | 7,622,168 | | | | 7,828,604 | |
Clydesdale Acquisition Holdings, Inc. +, a | Cash 3.675% + SF (0.50% Floor)vv | | | 04/19/22 | | | | 04/13/29 | | Senior | | | 5,309,787 | | | | 5,289,450 | |
CNT Holdings I Corp. +, a | Cash 3.50% + SF (0.75% Floor)vv | | | 02/15/24 | | | | 11/08/27 | | Senior | | | 1,691,500 | | | | 1,697,361 | |
CommScope, Inc. +, a | Cash 3.25% + SFv | | | 04/26/19 | | | | 04/06/26 | | Senior | | | 2,949,512 | | | | 2,864,094 | |
ConnectWise, LLC +, a | Cash 3.50% + SF (0.76% Floor)vv | | | 10/06/21 | | | | 09/29/28 | | Senior | | | 1,653,250 | | | | 3,655,077 | |
Conservice Midco, LLC +, a | Cash 4.00% + SFvv | | | 05/18/20 | | | | 05/13/27 | | Senior | | | 1,632,435 | | | | 1,638,589 | |
Convergint Tech LLC +, a | Cash 6.75% + SF (0.76% Floor)v | | | 04/12/21 | | | | 03/30/29 | | Second Lien | | | 1,400,000 | | | | 1,320,816 | |
Cornerstone Building Brands, Inc. +, a | Cash 3.25% + SFv | | | 06/24/24 | | | | 04/12/28 | | Senior | | | 2,984,536 | | | | 2,927,755 | |
Cornerstone Building Brands, Inc. +, a | Cash 4.50% + SFv | | | 05/17/24 | | | | 05/15/31 | | Senior | | | 1,700,000 | | | | 1,683,536 | |
Cornerstone OnDemand, Inc. +, a | Cash 3.75% + SF (0.50% Floor)v | | | 10/22/21 | | | | 10/16/28 | | Senior | | | 1,170,000 | | | | 1,102,140 | |
The accompanying notes are an integral part of these Consolidated Financial Statements.
11
Partners Group Private Equity (Master Fund), LLC
(a Delaware Limited Liability Company)
Consolidated Schedule of Investments –
September 30, 2024 (Unaudited) (continued)
Private Equity Investments (continued)
Direct Investments * (continued) Direct Debt (continued) | Interest | | Acquisition
Date | | | Maturity
Date | | Investment
Type | | Principal | | | Fair
Value** | |
North America (continued) | | | | | | | | | | | | | | | | | | |
Cornerstone OnDemand, Inc. +, a | Cash 6.00% + SF (1.00% Floor)v | | | 09/07/23 | | | | 10/16/28 | | Senior | | $ | 2,962,500 | | | $ | 2,952,758 | |
CPI Holdco B, LLC +, a | Cash 2.00% + SFv | | | 05/23/24 | | | | 05/17/31 | | Senior | | | 1,000,000 | | | | 995,940 | |
Critical Start, Inc. +, a, e | Cash 6.25% + SF (0.75% Floor)vv | | | 03/27/23 | | | | 05/17/28 | | Senior | | | 10,007,313 | | | | 8,364,088 | |
Critical Start, Inc. +, a | Cash 3.125% + SF (0.75% Floor)vv + PIK 3.125% | | | 03/27/23 | | | | 05/17/28 | | Senior | | | 4,720,775 | | | | 4,618,181 | |
Crown Subsea Communications Holding, Inc. +, a | Cash 4.75% + SF (0.75% Floor)vv | | | 02/07/24 | | | | 01/30/31 | | Senior | | | 7,381,500 | | | | 7,435,939 | |
CSC Holdings, LLC +, a | Cash 2.50% + SFv | | | 08/11/21 | | | | 04/15/27 | | Senior | | | 2,004,310 | | | | 1,843,965 | |
CSC Holdings, LLC +, a | Cash 4.50% + SFv | | | 12/07/18 | | | | 01/15/26 | | Senior | | | 950,456 | | | | 926,523 | |
Datix Bidco Limited +, a | Cash 5.50% + S>>> | | | 04/25/24 | | | | 04/30/31 | | Senior | | | 901,982 | | | | 952,890 | |
DCert Buyer, Inc. +, a | Cash 4.00% + SFv | | | 10/24/19 | | | | 10/16/26 | | Senior | | | 1,918,618 | | | | 1,865,856 | |
Deerfield Dakota Holding, LLC +, a | Cash 3.75% + SF (1.00% Floor)vv | | | 06/01/20 | | | | 04/09/27 | | Senior | | | 957,500 | | | | 939,489 | |
Delta TopCo, Inc. +, a | Cash 3.50% + SFvv | | | 05/13/24 | | | | 12/24/29 | | Senior | | | 2,892,750 | | | | 2,892,548 | |
Dentive Capital, LLC +, a, e | Cash 6.75% + SF (0.75% Floor)vv | | | 12/23/22 | | | | 12/22/28 | | Senior | | | 4,395,107 | | | | 4,534,772 | |
Dentive Capital, LLC +, a | Cash 6.75% + SF (0.75% Floor)vv | | | 12/23/22 | | | | 12/22/28 | | Senior | | | 9,973,539 | | | | 9,789,510 | |
Dentive, LLC +, a, e | Cash 6.75% + SFvv | | | 05/03/24 | | | | 12/23/28 | | Senior | | | 3,371,890 | | | | 3,309,672 | |
Dexko Global, Inc. +, a | Cash 3.75% + SF (0.50% Floor)vv | | | 10/07/21 | | | | 10/04/28 | | Senior | | | 1,560,000 | | | | 1,510,135 | |
DG Investment Intermediate Holdings 2, Inc. +, a | Cash 3.75% + SF (0.76% Floor)v | | | 04/23/21 | | | | 03/31/28 | | Senior | | | 9,216,661 | | | | 9,202,836 | |
Dieter’s Metal Fabricating Limited +, a | Cash 5.25% + SF (1.00% Floor)vv | | | 12/19/23 | | | | 12/19/29 | | Senior | | | 439,407 | | | | 433,851 | |
Diligent Corporation +, a | Cash 5.00% + SFvv + PIK 3.00% | | | 05/02/24 | | | | 08/02/30 | | Senior | | | 3,575,690 | | | | 3,566,751 | |
Diligent Corporation +, a, e | Cash 5.00% + SFvv | | | 04/30/24 | | | | 08/04/30 | | Senior | | | 20,857,887 | | | | 20,841,176 | |
Discovery Energy Holding Corporation +, a | Cash 4.75% + SFvv | | | 05/14/24 | | | | 01/30/31 | | Senior | | | 4,788,000 | | | | 4,838,872 | |
Eagle Broadband Investments, LLC +, a | Cash 3.00% + SF (0.75% Floor)vv | | | 04/24/24 | | | | 11/12/27 | | Senior | | | 4,974,160 | | | | 4,969,808 | |
ECI Macola/Max Holding, LLC +, a | Cash 3.75% + SF (0.75% Floor)vv | | | 09/13/21 | | | | 11/09/27 | | Senior | | | 1,644,750 | | | | 1,651,814 | |
Eisner Advisory Group LLC +, a | Cash 4.00% + SF (0.50% Floor)v | | | 03/01/24 | | | | 02/28/31 | | Senior | | | 2,580,533 | | | | 2,592,996 | |
Element Materials Technology +, a, e | Cash 4.25% + SF (0.50% Floor)vv | | | 08/17/22 | | | | 06/22/29 | | Senior | | | 1,873,302 | | | | 1,880,336 | |
Element Materials Technology +, a, e | Cash 4.25% + SFvv | | | 08/17/22 | | | | 06/22/29 | | Senior | | | 4,058,820 | | | | 4,074,061 | |
Endurance International Group Holdings, Inc. +, a | Cash 3.50% + SF (0.75% Floor)vv | | | 04/28/21 | | | | 02/10/28 | | Senior | | | 2,978,410 | | | | 2,640,941 | |
Engineered Machinery Holdings, Inc. +, a | Cash 3.75% + SF (0.75% Floor)vv | | | 08/16/21 | | | | 05/21/28 | | Senior | | | 1,556,000 | | | | 1,562,372 | |
Epiq Systems +, a | Cash 4.75% + SF (0.75% Floor)v | | | 06/02/22 | | | | 04/26/29 | | Senior | | | 6,904,772 | | | | 6,940,538 | |
Evergreen Services Group, LLC +, a | Cash 6.25% + SF (0.75% Floor)vv | | | 06/15/22 | | | | 06/15/29 | | Senior | | | 13,983,162 | | | | 13,983,162 | |
Evergreen Services Group, LLC +, a, e | Cash 5.75% + SFvv | | | 02/26/24 | | | | 06/15/29 | | Senior | | | 294,686 | | | | 292,591 | |
Explorer Holdings, Inc. +, a | Cash 8.00% + SF (0.50% Floor)v | | | 02/04/20 | | | | 02/04/28 | | Second Lien | | | 19,491,899 | | | | 18,322,384 | |
Fiesta Purchaser, Inc. +, a | Cash 4.00% + SFv | | | 02/15/24 | | | | 02/12/31 | | Senior | | | 6,284,250 | | | | 6,295,687 | |
Filtration Group Corp. +, a | Cash 3.50% + SF (0.50% Floor)v | | | 11/01/21 | | | | 10/21/28 | | Senior | | | 2,037,000 | | | | 2,039,821 | |
First Student Bidco Inc. +, a | Cash 3.00% + SF (0.98% Floor)vv | | | 08/11/21 | | | | 08/21/28 | | Senior | | | 1,019,087 | | | | 1,021,563 | |
First Student Bidco, Inc. +, a | Cash 4.00% + SF (0.50% Floor)vv | | | 08/05/22 | | | | 07/21/28 | | Senior | | | 2,017,964 | | | | 2,023,150 | |
Flynn Restaurant Group LP +, a | Cash 4.25% + SF (0.50% Floor)vv | | | 12/10/21 | | | | 11/22/28 | | Senior | | | 3,325,554 | | | | 3,338,773 | |
Foundation Building Materials, Inc. +, a | Cash 4.00% + SFv | | | 03/06/24 | | | | 01/29/31 | | Senior | | | 3,850,638 | | | | 3,757,010 | |
Genesys Cloud Services Holdings I, LLC +, a | Cash 3.75% + SF (0.75% Floor)v | | | 03/15/24 | | | | 12/01/27 | | Senior | | | 4,875,500 | | | | 4,885,275 | |
GHX Ultimate Parent Corp. +, a | Cash 4.00% + SF (0.50% Floor)vv | | | 01/01/21 | | | | 06/30/27 | | Senior | | | 2,676,071 | | | | 2,691,124 | |
The accompanying notes are an integral part of these Consolidated Financial Statements.
12
Partners Group Private Equity (Master Fund), LLC
(a Delaware Limited Liability Company)
Consolidated Schedule of Investments –
September 30, 2024 (Unaudited) (continued)
Private Equity Investments (continued)
Direct Investments * (continued) Direct Debt (continued) | Interest | | Acquisition
Date | | | Maturity
Date | | Investment
Type | | Principal | | | Fair
Value** | |
North America (continued) | | | | | | | | | | | | | | | | | | |
Global Medical Response, Inc. +, a, f | Cash 4.75% + SFvv | | | 04/18/24 | | | | 10/31/28 | | Senior | | $ | 2,787,709 | | | $ | 2,776,168 | |
Global Medical Response, Inc. +, a | Cash 4.25% + SF (1.00% Floor)vv | | | 03/27/24 | | | | 03/14/25 | | Senior | | | 3,023,149 | | | | 3,010,164 | |
GoTo Group, Inc. +, a | Cash 4.75% + SFv | | | 02/05/24 | | | | 04/30/28 | | Senior | | | 4,101,888 | | | | 2,425,425 | |
Grant Thornton Advisors LLC +, a | Cash 3.25% + SFvv | | | 06/05/24 | | | | 06/02/31 | | Senior | | | 3,900,000 | | | | 3,909,497 | |
Great American Outdoors Group, LLC +, a | Cash 3.75% + SF (0.75% Floor)vv | | | 05/14/21 | | | | 03/06/28 | | Senior | | | 1,732,905 | | | | 1,734,889 | |
GTCR W Merger Sub, LLC +, a | Cash 3.00% + SFvv | | | 02/06/24 | | | | 01/31/31 | | Senior | | | 1,800,000 | | | | 1,803,375 | |
Gurobi Optimization, LLC +, a, e, f | Cash 4.75% + SFvv | | | 09/10/24 | | | | 09/10/31 | | Senior | | | 720,308 | | | | (7,145 | ) |
Gurobi Optimization, LLC +, a, e | Cash 4.75% + SFvv | | | 09/10/24 | | | | 09/10/31 | | Senior | | | 8,643,692 | | | | 8,557,255 | |
Heartland Dental Holdings, Inc. +, a | Cash 5.00% + SF (0.75% Floor)vv | | | 05/15/18 | | | | 04/28/28 | | Senior | | | 8,439,233 | | | | 8,372,079 | |
Heartland Home Services, Inc. +, a | Cash 6.75% + SF (1.00% Floor)vv | | | 11/08/22 | | | | 12/15/26 | | Senior | | | 11,820,000 | | | | 11,515,547 | |
Help/Systems Holdings, Inc. +, a | Cash 6.75% + SF (0.75% Floor)v | | | 11/05/21 | | | | 11/19/27 | | Second Lien | | | 3,600,000 | | | | 3,105,000 | |
Help/Systems Holdings, Inc. +, a | Cash 4.00% + SF (1.00% Floor)v | | | 05/25/21 | | | | 11/19/26 | | Senior | | | 4,051,515 | | | | 3,874,261 | |
High Bar Brands Operating LLC +, a, e | Cash 5.25% + SF (1.00% Floor)v | | | 12/19/23 | | | | 12/19/29 | | Senior | | | 371,891 | | | | 367,189 | |
High Bar Brands Operating, LLC +, a, e | Cash 5.25% + SF (1.00% Floor)vv | | | 12/19/23 | | | | 12/19/29 | | Senior | | | 2,548,560 | | | | 2,074,758 | |
Howden Group Holdings Ltd. +, a | Cash 4.00% + SF (0.50% Floor)vv | | | 02/14/24 | | | | 04/18/30 | | Senior | | | 1,385,930 | | | | 1,388,182 | |
Hub International Ltd. +, a | Cash 3.25% + SF (0.75% Floor)vv | | | 06/08/23 | | | | 06/20/30 | | Senior | | | 1,091,771 | | | | 1,091,279 | |
Husky Injection Molding Systems Ltd. +, a | Cash 9.00% | | | 02/01/24 | | | | 02/01/29 | | Senior | | | 200,000 | | | | 210,680 | |
Husky Injection Molding Systems Ltd. +, a | Cash 5.00% + SFvvv | | | 02/01/24 | | | | 02/01/29 | | Senior | | | 7,223,208 | | | | 9,688,107 | |
Idera, Inc. +, a, b | Cash 3.50% + SF (0.75% Floor)vv | | | 12/17/18 | | | | 03/02/28 | | Senior | | | 1,229,194 | | | | 1,206,725 | |
Indy US Bidco, LLC +, a | Cash 3.75% + SFvv | | | 03/29/21 | | | | 03/06/28 | | Senior | | | 965,150 | | | | 956,020 | |
Ineos Quattro Holdings UK Limited +, a | Cash 4.25% + SF (0.50% Floor)v | | | 03/07/24 | | | | 01/29/26 | | Senior | | | 3,283,500 | | | | 3,289,673 | |
Ineos US Finance, LLC +, a | Cash 3.25% + SFvv | | | 06/05/24 | | | | 02/18/30 | | Senior | | | 4,000,000 | | | | 4,002,860 | |
INNIO Group Holdings GmbH +, a | Cash 4.25% + SFvv | | | 02/08/24 | | | | 11/02/28 | | Senior | | | 2,499,076 | | | | 2,512,621 | |
INNIO Group Holdings GmbH +, a | Cash 3.25% + E## | | | 11/30/18 | | | | 11/02/28 | | Senior | | | 1,103,751 | | | | 1,081,489 | |
Iris Holdings Inc. +, a | Cash 4.75% + SF (0.50% Floor)vv | | | 06/15/22 | | | | 06/28/28 | | Senior | | | 1,812,018 | | | | 1,714,622 | |
KCIBT Intermediate II, Inc. +, a | Cash 1.00% + SF (1.00% Floor)vv | | | 12/23/20 | | | | 06/30/27 | | Senior | | | 262,981 | | | | 122,944 | |
KDC/ONE Development Corporation, Inc. +, a | Cash 4.50% + SFv | | | 06/11/24 | | | | 08/15/28 | | Senior | | | 2,200,000 | | | | 2,204,477 | |
Kene Acquisition, Inc. +, a, e | Cash 5.50% + SF (1.00% Floor)vv | | | 02/13/24 | | | | 02/07/31 | | Senior | | | 3,634,823 | | | | 3,576,627 | |
Kingpin Intermediate Holdings LLC +, a | Cash 3.50% + SFvv | | | 10/05/18 | | | | 02/08/28 | | Senior | | | 8,241,262 | | | | 8,237,801 | |
Knowlton Development Corp. Inc. +, a | Cash 4.50% + SFv | | | 06/24/22 | | | | 12/22/25 | | Senior | | | 1,476,919 | | | | 1,479,924 | |
KSLB Holdings, LLC +, a | Cash 8.75% + SF (1.00% Floor)vv | | | 01/01/21 | | | | 07/30/26 | | Second Lien | | | 3,212,308 | | | | 2,443,924 | |
Lakeshore Learning Materials, LLC +, a | Cash 3.50% + SFv | | | 06/06/24 | | | | 09/29/28 | | Senior | | | 1,989,770 | | | | 1,994,336 | |
LBM Acquisition, LLC +, a | Cash 3.75% + SFv | | | 08/02/24 | | | | 06/06/31 | | Senior | | | 9,803,658 | | | | 9,626,996 | |
Magenta Buyer LLC +, a | Cash 5.00% + SF (0.75% Floor)vv | | | 08/02/21 | | | | 07/27/28 | | Senior | | | 1,662,701 | | | | 1,579,566 | |
Mamba Purchaser, Inc. +, a | Cash 3.25% + SF (0.50% Floor)vv | | | 06/07/24 | | | | 10/16/28 | | Senior | | | 2,786,000 | | | | 2,786,348 | |
Maverick Bidco, Inc. +, a | Cash 6.75% + SF (0.75% Floor)vv | | | 05/26/21 | | | | 05/18/29 | | Second Lien | | | 6,603,000 | | | | 6,470,940 | |
Mavis Tire Express Services Topco, Corp. +, a | Cash 3.75% + SF (0.75% Floor)v | | | 04/17/24 | | | | 05/04/28 | | Senior | | | 1,492,500 | | | | 1,493,433 | |
Max US BidCo, Inc. +, a | Cash 5.00% + SF (0.50% Floor)vv | | | 10/11/23 | | | | 10/03/30 | | Senior | | | 4,987,500 | | | | 4,739,571 | |
McAfee Corp. +, a | Cash 3.50% + E# | | | 06/07/24 | | | | 03/01/29 | | Senior | | | 10,632,998 | | | | 10,977,497 | |
McAfee Inc. +, a | Cash 3.75% + SF (0.50% Floor)vv | | | 03/09/22 | | | | 03/01/29 | | Senior | | | 3,154,500 | | | | 3,146,835 | |
The accompanying notes are an integral part of these Consolidated Financial Statements.
13
Partners Group Private Equity (Master Fund), LLC
(a Delaware Limited Liability Company)
Consolidated Schedule of Investments –
September 30, 2024 (Unaudited) (continued)
Private Equity Investments (continued)
Direct Investments * (continued) Direct Debt (continued) | Interest | | Acquisition
Date | | | Maturity
Date | | Investment
Type | | Principal | | | Fair
Value** | |
North America (continued) | | | | | | | | | | | | | | | | | | |
Medline Borrower, L.P. +, a | Cash 2.75% + SF (0.50% Floor)v | | | 11/03/21 | | | | 10/23/28 | | Senior | | $ | 977,020 | | | $ | 978,808 | |
Medline Borrower, L.P. +, a | Cash 2.25% + SF (0.50% Floor)v | | | 06/05/24 | | | | 10/23/28 | | Senior | | | 3,400,000 | | | | 3,399,694 | |
Mitchell International, Inc. +, a | Cash 3.25% + SFv | | | 06/21/24 | | | | 06/06/31 | | Senior | | | 8,479,734 | | | | 8,365,639 | |
MJH Healthcare Holdings, LLC +, a | Cash 3.50% + SF (0.50% Floor)vv | | | 04/08/22 | | | | 01/28/29 | | Senior | | | 1,657,596 | | | | 1,658,118 | |
Motion Acquisition Limited +, a | Cash 3.50% + SFvv | | | 01/24/24 | | | | 11/12/29 | | Senior | | | 4,975,031 | | | | 4,796,552 | |
Naked Juice LLC +, a | Cash 3.25% + SF (0.50% Floor)vv | | | 05/23/24 | | | | 01/24/29 | | Senior | | | 1,989,822 | | | | 1,633,514 | |
National Mentor Holdings, Inc. +, a | Cash 3.75% + SF (0.75% Floor)vv | | | 04/26/21 | | | | 03/02/28 | | Senior | | | — | | | | 1,928,400 | |
National Spine & Pain Centers, LLC +, a | Cash 8.50% + SFvv | | | 04/01/23 | | | | 02/13/26 | | Senior | | | 536,542 | | | | 1,128 | |
Navicure, Inc. +, a | Cash 4.00% + SFvv | | | 11/19/19 | | | | 10/22/26 | | Senior | | | 2,545,505 | | | | 2,550,291 | |
Nelipak Holding Company +, a | Cash 5.50% + SF (1.00% Floor)vv | | | 04/04/24 | | | | 03/26/31 | | Senior | | | 2,765,752 | | | | 2,719,557 | |
Nelipak Holding Company +, a, e | Cash 5.50% + SF (1.00% Floor)vv | | | 04/04/24 | | | | 03/26/31 | | Senior | | | — | | | | 437,225 | |
NEP Group, Inc. +, a | Cash 4.00% + SF (0.50% Floor)vv | | | 12/06/21 | | | | 08/19/26 | | Senior | | | 1,898,181 | | | | 1,824,627 | |
NEP Group, Inc. +, a | Cash 3.25% + SFvv + PIK 1.50% | | | 02/10/22 | | | | 08/19/26 | | Senior | | | 1,068,566 | | | | 1,027,827 | |
NorthStar Group Services, Inc. +, a | Cash 4.75% + SFvv | | | 06/05/24 | | | | 05/08/30 | | Senior | | | 2,892,750 | | | | 2,908,573 | |
NSM Top Holdings Corp. +, a | Cash 5.25% + SFvv | | | 11/26/19 | | | | 11/16/26 | | Senior | | | 1,432,500 | | | | 1,437,915 | |
NSPC Intermediate II, LLC +, a | Cash 8.50% + SFvv | | | 03/01/24 | | | | 03/01/25 | | Senior | | | 20,494 | | | | 20,961 | |
NSPC Intermediate II, LLC +, a | Cash 8.00% + SF (1.00% Floor)vv | | | 05/08/23 | | | | 02/13/26 | | Senior | | | 75,749 | | | | 9,446 | |
nThrive Health Inc. +, a | Cash 4.00% + SF (0.50% Floor)vv | | | 05/24/22 | | | | 12/18/28 | | Senior | | | 1,950,000 | | | | 1,362,153 | |
Oceankey (U.S.) II Corp. +, a | Cash 3.50% + SF (0.05% Floor)vv | | | 01/06/22 | | | | 12/15/28 | | Senior | | | 1,852,500 | | | | 1,854,427 | |
Odyssey Logistics & Technology Corp. +, a | Cash 4.50% + SF (0.50% Floor)v | | | 08/10/23 | | | | 10/12/27 | | Senior | | | 2,498,958 | | | | 2,482,952 | |
Olympus Water US Holding Corp. +, a | Cash 5.00% + SF (1.50% Floor)vv | | | 05/24/23 | | | | 11/09/28 | | Senior | | | 1,377,120 | | | | 1,378,676 | |
OneDigital Borrower, LLC +, a | Cash 4.25% + SF (0.50% Floor)vv | | | 12/11/20 | | | | 11/16/27 | | Senior | | | — | | | | — | |
OneDigital Borrower, LLC +, a | Cash 3.25% + SF (0.50% Floor)vv | | | 06/13/24 | | | | 06/13/31 | | Senior | | | 5,286,750 | | | | 5,251,514 | |
Oscar AcquisitionCo, LLC +, a | Cash 4.50% + SF (0.50% Floor)vv | | | 02/08/24 | | | | 04/29/29 | | Senior | | | 7,454,373 | | | | 7,375,170 | |
Ovation Parent, Inc. +, a | Cash 3.50% + SFvv | | | 04/24/24 | | | | 03/27/31 | | Senior | | | 1,300,000 | | | | 1,305,961 | |
Pactiv Evergreen Inc. +, a | Cash 2.50% + SFv | | | 06/12/24 | | | | 09/24/28 | | Senior | | | 1,596,000 | | | | 1,597,412 | |
PAI Holdco, Inc. +, a | Cash 3.75% + SF (1.00% Floor)vv | | | 11/09/20 | | | | 10/22/27 | | Senior | | | 1,157,999 | | | | 1,067,217 | |
Pascal Midco 2, LLC +, a | Cash 5.75% + SF (0.75% Floor)vv | | | 07/01/22 | | | | 07/21/27 | | Senior | | | 13,535,092 | | | | 13,505,023 | |
PDI TA Holdings, Inc. +, a, e | Cash 5.50% + SF (0.75% Floor)vv | | | 02/01/24 | | | | 02/03/31 | | Senior | | | 7,245,107 | | | | 7,155,727 | |
Pediatric Associates Holding Company, LLC +, a | Cash 3.25% + SFvv | | | 08/05/24 | | | | 12/29/28 | | Senior | | | 3,979,592 | | | | 3,879,823 | |
Peraton Corp. +, a | Cash 3.75% + SF (0.75% Floor)v | | | 04/12/21 | | | | 02/01/28 | | Senior | | | 891,330 | | | | 859,020 | |
PetSmart LLC +, a | Cash 3.75% + SF (0.75% Floor)v | | | 05/22/24 | | | | 02/11/28 | | Senior | | | 5,984,576 | | | | 5,942,355 | |
Pre-Paid Legal Services, Inc. +, a | Cash 3.75% + SF (0.50% Floor)v | | | 01/18/22 | | | | 12/14/29 | | Senior | | | 10,729,836 | | | | 10,734,557 | |
Premier Care Dental Management, LLC +, a, e | Cash 5.25% + SFv | | | 05/31/24 | | | | 08/05/28 | | Senior | | | 2,714,836 | | | | 1,451,137 | |
Pretium PKG Holdings, Inc. +, a | Cash 6.75% + SF (0.50% Floor)vv | | | 10/05/21 | | | | 10/01/29 | | Second Lien | | | 1,800,000 | | | | 740,250 | |
Primary Products Finance, LLC +, a | Cash 3.50% + SF (0.50% Floor)vv | | | 06/06/24 | | | | 04/01/29 | | Senior | | | 2,586,967 | | | | 2,592,025 | |
ProAmpac PG Borrower, LLC +, a | Cash 4.50% + SF (0.75% Floor)vv | | | 09/26/23 | | | | 09/15/28 | | Senior | | | 1,992,757 | | | | 1,998,237 | |
Procera Networks, Inc. +, a | Cash 4.50% + SFv | | | 11/20/18 | | | | 10/31/25 | | Senior | | | 1,128,717 | | | | 208,530 | |
Project Alpha Intermediate Holding, Inc. +, a | Cash 4.75% + SF (0.50% Floor)vv | | | 10/31/23 | | | | 10/28/30 | | Senior | | | 4,484,000 | | | | 4,499,021 | |
Project Alpha Intermediate Holding, Inc. +, a | Cash 3.75% + SFvv | | | 05/16/24 | | | | 10/28/30 | | Senior | | | 1,884,000 | | | | 1,890,311 | |
Project Boost Purchaser, LLC +, a | Cash 3.50% + SFvv | | | 07/29/24 | | | | 07/16/31 | | Senior | | | 1,036,150 | | | | 1,036,766 | |
Project Leopard Holdings, Inc. +, a | Cash 5.25% + SF (0.50% Floor)vv | | | 06/15/22 | | | | 07/20/29 | | Senior | | | 2,947,500 | | | | 2,656,744 | |
The accompanying notes are an integral part of these Consolidated Financial Statements.
14
Partners Group Private Equity (Master Fund), LLC
(a Delaware Limited Liability Company)
Consolidated Schedule of Investments –
September 30, 2024 (Unaudited) (continued)
Private Equity Investments (continued)
Direct Investments * (continued) Direct Debt (continued) | Interest | | Acquisition
Date | | | Maturity
Date | | Investment
Type | | Principal | | | Fair
Value** | |
North America (continued) | | | | | | | | | | | | | | | | | | |
Project Ruby Ultimate Parent Corp. +, a | Cash 3.50% + SFv | | | 02/23/24 | | | | 03/10/28 | | Senior | | $ | 3,084,500 | | | $ | 3,087,970 | |
Prometric Holdings PIK, Inc. +, a | Cash 7.50% + SF (1.00% Floor)vv; PIK 9.25% | | | 10/06/23 | | | | 07/31/28 | | Mezzanine | | | 7,993,115 | | | | 7,955,032 | |
Prometric Holdings, Inc. +, a | Cash 3.00% + SF (1.00% Floor)v | | | 10/26/23 | | | | 01/31/28 | | Senior | | | 5,850,272 | | | | 5,894,149 | |
PT Intermediate Holdings III, LLC +, a | Cash 3.25% + SFvv + PIK 1.75% | | | 04/09/24 | | | | 04/09/30 | | Senior | | | 27,081,306 | | | | 27,081,306 | |
PT Intermediate Holdings III, LLC +, a, e | Cash 6.75% + SFvv + PIK 1.75% | | | 04/09/24 | | | | 04/09/30 | | Senior | | | 565,957 | | | | 565,957 | |
Radiology Partners, Inc. +, a | Cash 4.00% + SFvv | | | 01/01/21 | | | | 01/31/29 | | Senior | | | 2,144,772 | | | | 2,105,898 | |
Radwell Parent, LLC +, a, e | Cash 5.50% + SF (0.75% Floor)vv | | | 12/01/22 | | | | 04/01/29 | | Senior | | | 1,120,924 | | | | 222,730 | |
Radwell Parent, LLC +, a | Cash 6.525% + SF (0.75% Floor)vv | | | 04/06/22 | | | | 04/01/29 | | Senior | | | 13,898,809 | | | | 13,968,303 | |
Radwell Parent, LLC +, a | Cash 6.75% + SF (0.75% Floor)vv | | | 12/01/22 | | | | 04/01/29 | | Senior | | | 5,896,458 | | | | 5,925,940 | |
Rand Parent, LLC +, a, e | Cash 3.75% + SFvv | | | 08/09/24 | | | | 03/17/30 | | Senior | | | 2,586,951 | | | | 5,596,133 | |
Raptor Parent, LLC +, a, e | Cash 6.525% + SF (0.75% Floor)vv | | | 04/06/22 | | | | 04/01/29 | | Senior | | | 1,534,749 | | | | 1,542,423 | |
Recess Holdings, Inc. +, a | Cash 4.50% + SF (1.00% Floor)vv | | | 03/01/24 | | | | 02/20/30 | | Senior | | | 6,368,000 | | | | 8,901,976 | |
Recorded Books Inc. +, a | Cash 4.00% + SFv | | | 06/17/22 | | | | 08/29/25 | | Senior | | | — | | | | — | |
Red Planet Borrower, LLC +, a, f | Cash 3.75% + SF (0.50% Floor)v | | | 10/04/21 | | | | 10/02/28 | | Senior | | | 6,096,981 | | | | 6,678,239 | |
Redstone Holdco 2 L.P. +, a | Cash 4.75% + SF (0.75% Floor)vv | | | 05/10/21 | | | | 04/27/28 | | Senior | | | 1,083,705 | | | | 834,962 | |
Redstone Holdco 2 L.P. +, a | Cash 7.75% + SF (0.75% Floor)vv | | | 05/03/21 | | | | 04/16/29 | | Second Lien | | | 2,500,000 | | | | 1,871,250 | |
Rent-A-Center, Inc. +, a | Cash 4.00% + SF (0.75% Floor)vv | | | 03/02/21 | | | | 02/17/28 | | Senior | | | 917,363 | | | | 916,890 | |
Restaurant Technologies, Inc. +, a | Cash 4.25% + SF (0.50% Floor)vv | | | 04/06/22 | | | | 04/02/29 | | Senior | | | 3,412,500 | | | | 3,244,537 | |
Riverside Assessments, LLC +, a, e | Cash 5.25% + SFvv | | | 03/19/24 | | | | 03/19/31 | | Senior | | | 391,832 | | | | 31,674 | |
Riverside Assessments, LLC +, a | Cash 5.25% + SFvv | | | 03/19/24 | | | | 03/19/31 | | Senior | | | 2,703,393 | | | | 2,647,368 | |
RL Datix Holdings (USA), Inc. +, a | Cash 5.50% + SFvvv | | | 04/25/24 | | | | 04/30/31 | | Senior | | | 2,399,040 | | | | 2,361,838 | |
Rocket Software, Inc. +, a | Cash 4.25% + SFv | | | 12/05/18 | | | | 11/28/28 | | Senior | | | 5,742,477 | | | | 5,752,900 | |
Rough Country, LLC +, a | Cash 3.50% + SF (0.75% Floor)v | | | 08/03/21 | | | | 07/26/28 | | Senior | | | 1,842,840 | | | | 1,846,987 | |
Ryan, LLC +, a, e | Cash 4.50% + SF (0.50% Floor)v | | | 11/20/23 | | | | 11/14/30 | | Senior | | | 1,937,881 | | | | 5,781,944 | |
Sabre GLBL Inc. +, a | Cash 3.50% + SF (0.50% Floor)v | | | 08/09/21 | | | | 12/17/27 | | Senior | | | 1,118,754 | | | | 1,048,362 | |
Sabre GLBL Inc. +, a | Cash 3.50% + SF (0.50% Floor)vv | | | 08/09/21 | | | | 12/17/27 | | Senior | | | 712,020 | | | | 667,220 | |
SCIH Salt Holdings, Inc. +, a | Cash 4.00% + SF (0.75% Floor)vv | | | 04/17/20 | | | | 03/16/27 | | Senior | | | 785,967 | | | | 786,726 | |
Sedgwick Claims Management Services, Inc. +, a | Cash 3.75% + SFvv | | | 08/09/24 | | | | 02/24/28 | | Senior | | | 1,750,000 | | | | 1,748,740 | |
Senneca Holdings, Inc. +, a | PIK 11.00% | | | 01/01/21 | | | | 05/11/26 | | Second Lien | | | 1,276,647 | | | | 3 | |
Senneca Holdings, Inc. +, a | PIK 10.00% | | | 01/01/21 | | | | 11/11/25 | | 1.5 Lien | | | 1,439,444 | | | | 1 | |
Skopima Consilio Parent LLC +, a | Cash 4.00% + SF (0.76% Floor)vvvv | | | 05/18/21 | | | | 04/30/28 | | Senior | | | 4,546,130 | | | | 4,544,720 | |
Skopima Consilio Parent LLC +, a | Cash 4.50% + SF (0.50% Floor)v | | | 10/11/23 | | | | 05/12/28 | | Senior | | | 8,237,750 | | | | 8,257,068 | |
Sound Inpatient Physicians, Inc. +, a | Cash 5.50% + SF (1.00% Floor)vv | | | 06/04/24 | | | | 06/28/28 | | Senior | | | 578,791 | | | | 592,175 | |
Sound Inpatient Physicians, Inc. +, a | Cash 3.50% + SFv | | | 07/01/24 | | | | 06/28/28 | | Senior | | | 1,150,936 | | | | 1,035,842 | |
Sovos Compliance, LLC +, a | Cash 4.50% + SF (0.50% Floor)v | | | 08/16/21 | | | | 08/11/28 | | Senior | | | 4,639,168 | | | | 4,643,134 | |
Spring Education Group, Inc. +, a | Cash 4.50% + SFvv | | | 09/29/23 | | | | 10/04/30 | | Senior | | | 4,472,253 | | | | 4,510,268 | |
SS&C Technologies, Inc. +, a | Cash 2.00% + SFv | | | 05/14/24 | | | | 04/29/31 | | Senior | | | 3,750,953 | | | | 3,754,629 | |
SSH Group Holdings, Inc. +, a | Cash 4.25% + SFvv | | | 06/05/19 | | | | 07/30/25 | | Senior | | | 938,137 | | | | 946,111 | |
SSH Group Holdings, Inc. +, a | Cash 4.25% + SFvvvv | | | 06/05/19 | | | | 07/30/25 | | Senior | | | 2,334,363 | | | | 2,354,205 | |
Star US Bidco, LLC +, a | Cash 4.25% + SF (1.00% Floor)v | | | 04/24/20 | | | | 03/17/27 | | Senior | | | 1,834,852 | | | | 1,846,898 | |
Surgery Center Holdings, Inc. +, a | Cash 3.50% + SFv | | | 01/02/24 | | | | 12/19/30 | | Senior | | | 892,604 | | | | 894,130 | |
Tacala Investment Corp. +, a | Cash 4.00% + SF (0.75% Floor)v | | | 02/08/24 | | | | 01/31/31 | | Senior | | | 2,388,000 | | | | 2,395,594 | |
Tank Holding Corp. +, a, e | Cash 5.75% + SF (0.75% Floor)vv | | | 03/31/22 | | | | 03/26/26 | | Senior | | | 21,061,215 | | | | 21,292,174 | |
Telenet Financing USD LLC +, a | Cash 2.00% + SFv | | | 04/27/20 | | | | 04/30/28 | | Senior | | | 5,400,000 | | | | 5,216,076 | |
The accompanying notes are an integral part of these Consolidated Financial Statements.
15
Partners Group Private Equity (Master Fund), LLC
(a Delaware Limited Liability Company)
Consolidated Schedule of Investments –
September 30, 2024 (Unaudited) (continued)
Private Equity Investments (continued)
Direct Investments * (continued) Direct Debt (continued) | Interest | | Acquisition
Date | | | Maturity
Date | | Investment
Type | | Principal | | | Fair
Value** | |
North America (continued) | | | | | | | | | | | | | | | | | | |
Thevelia (US), LLC +, a | Cash 3.75% + SFvv | | | 03/29/23 | | | | 06/18/29 | | Senior | | $ | 6,819,139 | | | $ | 6,837,039 | |
Tivity Health Inc +, a | Cash 6.00% + SF (0.75% Floor)v | | | 06/28/22 | | | | 06/28/29 | | Senior | | | 15,338,665 | | | | 15,142,401 | |
Tivity Health, Inc. +, a | Cash 5.00% + SFv | | | 07/15/24 | | | | 06/28/29 | | Senior | | | 5,203,958 | | | | 5,137,371 | |
TLP Acquisition Holdings, LLC +, a | Cash 8.00% + SF (1.00% Floor)v | | | 02/26/19 | | | | 02/25/25 | | Mezzanine | | | 21,681,108 | | | | 21,559,040 | |
Tory Burch LLC +, a | Cash 3.50% + SF (0.50% Floor)v | | | 04/30/21 | | | | 04/16/28 | | Senior | | | 967,500 | | | | 969,769 | |
Trident TPI Holdings, Inc. +, a | Cash 4.00% + SF (0.50% Floor)v | | | 09/22/21 | | | | 09/15/28 | | Senior | | | 1,654,519 | | | | 1,659,052 | |
Trilon Group, LLC +, a, e | Cash 6.25% + SF (0.75% Floor)vv | | | 06/02/22 | | | | 05/27/29 | | Senior | | | 10,303,847 | | | | 10,332,748 | |
Triton Water Holdings, Inc. +, a | Cash 3.25% + SF (0.50% Floor)vv | | | 04/19/21 | | | | 03/31/28 | | Senior | | | 1,354,504 | | | | 1,353,692 | |
Truist Insurance Holdings, LLC +, a | Cash 3.25% + SFvv | | | 05/10/24 | | | | 05/06/31 | | Senior | | | 1,900,000 | | | | 1,901,425 | |
UKG Inc. +, a | Cash 3.50% + SF (0.75% Floor)vv | | | 07/13/20 | | | | 05/04/26 | | Senior | | | 3,949,121 | | | | 3,953,742 | |
Upstream Newco, Inc. +, a | Cash 4.25% + SFv | | | 08/04/21 | | | | 11/20/26 | | Senior | | | 6,157,606 | | | | 5,360,965 | |
Utz Quality Foods, LLC +, a | Cash 3.00% + SFvv | | | 01/29/21 | | | | 01/20/28 | | Senior | | | 2,932,943 | | | | 2,941,654 | |
Verde Purchaser, LLC +, a | Cash 4.125% | | | 05/02/24 | | | | 11/15/28 | | Senior | | | 5,000,000 | | | | 4,917,869 | |
Verde Purchaser, LLC +, a | Cash 4.50% + SFvv | | | 05/10/24 | | | | 11/30/30 | | Senior | | | 6,683,250 | | | | 6,636,601 | |
Virtusa Corp. +, a | Cash 3.75% + SF (0.75% Floor)vv | | | 02/28/22 | | | | 02/11/28 | | Senior | | | 3,040,720 | | | | 3,043,001 | |
Vision Solutions, Inc. +, a | Cash 4.00% + SF (0.75% Floor)vv | | | 05/06/21 | | | | 04/24/28 | | Senior | | | 3,783,000 | | | | 3,691,130 | |
Vision Solutions, Inc. +, a | Cash 7.25% + SF (0.75% Floor)vv | | | 09/07/21 | | | | 04/23/29 | | Second Lien | | | 2,300,000 | | | | 2,166,313 | |
Vortex Opco, LLC +, a | Cash 4.25% + SFv | | | 09/03/24 | | | | 12/17/28 | | Senior | | | 614,428 | | | | 447,764 | |
VS Buyer, LLC +, a | Cash 3.25% + SFvv | | | 04/10/20 | | | | 02/28/27 | | Senior | | | 3,810,450 | | | | 3,819,976 | |
Waystar Technologies, Inc. +, a | Cash 2.75% + SFv | | | 06/24/24 | | | | 10/22/29 | | Senior | | | 451,922 | | | | 452,772 | |
Weld North Education LLC +, a | Cash 3.50% + SF (0.75% Floor)vv | | | 01/06/21 | | | | 12/21/27 | | Senior | | | 8,212,021 | | | | 8,219,741 | |
Whatabrands LLC +, a | Cash 2.75% + SFv | | | 06/10/24 | | | | 08/03/28 | | Senior | | | 2,985,000 | | | | 2,984,269 | |
White Cap Supply Holdings, LLC +, a | Cash 3.25% + SFv | | | 06/06/24 | | | | 10/19/29 | | Senior | | | 2,900,000 | | | | 4,571,907 | |
Windsor Holdings III, LLC +, a | Cash 4.50% + SFv | | | 08/07/23 | | | | 08/01/30 | | Senior | | | 2,278,064 | | | | 2,291,699 | |
Woof Holdings, Inc. +, a | Cash 7.25% + SF (0.75% Floor)vv | | | 01/08/21 | | | | 12/22/28 | | Second Lien | | | 7,200,000 | | | | 3,484,800 | |
Woof Holdings, Inc. +, a | Cash 3.75% + SF (0.75% Floor)vv | | | 09/26/23 | | | | 12/21/27 | | Senior | | | 2,964,168 | | | | 2,003,274 | |
WWEX UNI TopCo Holdings, LLC +, a | Cash 4.25% + SF (0.75% Floor)vv | | | 08/03/21 | | | | 07/26/28 | | Senior | | | 2,625,750 | | | | 2,641,478 | |
YI Group Midco, LLC +, a, e | Cash 5.75% + SF (1.00% Floor)v | | | 12/01/23 | | | | 12/01/29 | | Senior | | | 6,114,738 | | | | 5,853,547 | |
Zacapa S.à.r.l. +, a | Cash 4.25% + SF (0.50% Floor)vv | | | 07/31/18 | | | | 03/22/29 | | Senior | | | 7,657,439 | | | | 7,679,569 | |
Total North America (6.61%) | | | | | | | | | | | | | | | | | 1,029,236,338 | |
| | | | | | | | | | | | | | | | | | | |
Rest of World (0.03%) |
AI Sirona (Luxembourg) Acquisition S.à.r.l. +, a | Cash 5.00% + E# | | | 05/17/24 | | | | 09/30/28 | | Senior | | | 5,437,714 | | | | 5,619,376 | |
Total Rest of World (0.03%) | | | | | | | | | | | | | | | | | 5,619,376 | |
| | | | | | | | | | | | | | | | | | | |
Western Europe (4.36%) |
Acuris Finance US, Inc. +, a | Cash 4.00% + SF (0.50% Floor)vv | | | 03/11/21 | | | | 02/16/28 | | Senior | | | 420,430 | | | | 419,030 | |
AD Education +, a | PIK 8.50% | | | 06/21/22 | | | | 03/30/29 | | Mezzanine | | | 14,770,114 | | | | 15,940,425 | |
AEA International Holdings (Luxembourg) S.à.r.l. +, a | Cash 3.75% + SF (0.50% Floor)vv | | | 09/15/21 | | | | 09/07/28 | | Senior | | | 2,237,123 | | | | 2,239,920 | |
AI PLEX AcquiCo GmbH +, a | Cash 5.00% + SFv | | | 08/23/19 | | | | 07/31/26 | | Senior | | | 4,760,193 | | | | 4,498,382 | |
Albion Financing 3 S.à.r.l +, a | Cash 5.51% + SF (0.50% Floor)vv | | | 01/14/22 | | | | 08/17/26 | | Senior | | | 3,927,656 | | | | 3,957,114 | |
Alcumus +, a, e | Cash 5.75% + S>> | | | 03/09/22 | | | | 03/09/29 | | Senior | | | 1,984,236 | | | | 1,892,069 | |
Altice France S.A. +, a | Cash 5.50% + SFvv | | | 01/27/21 | | | | 08/14/26 | | Senior | | | 3,795,309 | | | | 3,100,293 | |
Amer Sports Company +, a | Cash 3.25% + SFvv | | | 02/26/24 | | | | 02/17/31 | | Senior | | | 1,995,250 | | | | 2,002,732 | |
Anticimex Global AB +, a | Cash 3.40% + SFvv | | | 06/18/24 | | | | 11/16/28 | | Senior | | | 2,686,500 | | | | 2,691,537 | |
Artemis Acquisitions (UK) Limited +, a | Cash 3.75% + E## | | | 06/25/24 | | | | 06/26/31 | | Senior | | | 4,000,000 | | | | 4,474,851 | |
Asgard Investments B.V. +, a | Cash 5.50% + E## | | | 03/15/22 | | | | 03/15/29 | | Senior | | | 13,721,320 | | | | 13,924,642 | |
Aston Finco S.à.r.l. +, a | Cash 4.25% + SFv | | | 11/14/19 | | | | 10/09/26 | | Senior | | | 2,674,000 | | | | 2,548,656 | |
The accompanying notes are an integral part of these Consolidated Financial Statements.
16
Partners Group Private Equity (Master Fund), LLC
(a Delaware Limited Liability Company)
Consolidated Schedule of Investments –
September 30, 2024 (Unaudited) (continued)
Private Equity Investments (continued)
Direct Investments * (continued) Direct Debt (continued) | Interest | | Acquisition
Date | | | Maturity
Date | | Investment
Type | | Principal | | | Fair
Value** | |
Western Europe (continued) | | | | | | | | | | | | | | | | | | |
Aston Finco S.à.r.l. +, a | Cash 8.25% + S> | | | 10/25/19 | | | | 10/09/27 | | Second Lien | | $ | 36,733,592 | | | $ | 34,273,397 | |
Athena Bidco +, a | Cash 4.00% + E### | | | 03/06/24 | | | | 04/14/31 | | Senior | | | 3,691,558 | | | | 3,824,136 | |
Athena BidCo GmbH +, a | Cash 2.75% + E### | | | 05/22/24 | | | | 03/31/27 | | Senior | | | 5,414,368 | | | | 5,586,839 | |
Auris Luxembourg III S.à.r.l. +, a, e | Cash 3.75% + SFvvv | | | 04/04/19 | | | | 02/27/26 | | Senior | | | 5,287,146 | | | | 5,295,421 | |
Auris Luxembourg III S.à.r.l. +, a | Cash 4.50% + E### | | | 06/12/24 | | | | 02/27/26 | | Senior | | | 4,339,194 | | | | 4,476,592 | |
Babar Bidco +, a | Cash 4.00% + E### | | | 12/04/20 | | | | 11/17/27 | | Senior | | | 1,214,051 | | | | 1,108,879 | |
Barentz International B.V. +, a | Cash 4.00% + SFvv | | | 03/01/24 | | | | 03/30/31 | | Senior | | | 2,194,500 | | | | 2,206,394 | |
Biscuit Holding S.A.S +, a | Cash 4.00% + E### | | | 06/03/24 | | | | 02/12/27 | | Senior | | | 4,325,208 | | | | 4,170,106 | |
BME Group Holding B.V. +, a | Cash 4.75% + E## | | | 03/22/24 | | | | 10/30/26 | | Senior | | | 5,401,976 | | | | 5,216,009 | |
Breeze Buyer B.V. +, a | Cash 6.00% + E## | | | 01/10/24 | | | | 01/10/31 | | Senior | | | 19,233,629 | | | | 19,507,199 | |
Breeze Buyer B.V. +, a | Cash 5.75% + E## | | | 01/10/24 | | | | 01/10/31 | | Senior | | | 1,301,506 | | | | 1,334,263 | |
CAB +, a | Cash 3.50% + E## | | | 06/12/24 | | | | 02/09/28 | | Senior | | | 10,759,524 | | | | 10,651,798 | |
Casper Bidco SAS +, a | Cash 3.88% + E# | | | 03/01/24 | | | | 03/21/31 | | Senior | | | 6,305,908 | | | | 6,614,400 | |
CD&R Firefly Bidco Limited +, a | Cash 6.00% + S>> | | | 08/31/18 | | | | 06/23/25 | | Senior | | | 7,113,072 | | | | 7,387,878 | |
CD&R Firefly Bidco Limited +, a, f | Cash 5.75% + S>> | | | 03/16/24 | | | | 06/21/28 | | Senior | | | 1,907,075 | | | | 8,725,026 | |
CEP V Investment 22 S.à.r.l. (Lux) +, a | PIK 8.25% + SFv | | | 02/28/22 | | | | 08/31/30 | | Mezzanine | | | 7,520,983 | | | | 7,488,845 | |
CEP V Investment 22 S.à.r.l. (Lux) +, a | PIK 8.25% + E### | | | 02/28/22 | | | | 08/31/30 | | Mezzanine | | | 1,060,313 | | | | 1,060,381 | |
Chrysaor Bidco S.à.r.l. +, a, f | Cash 3.50% + SFvv | | | 05/15/24 | | | | 05/14/31 | | Senior | | | 192,814 | | | | 193,827 | |
Chrysaor Bidco S.à.r.l. +, a | Cash 3.50% + SFvv | | | 05/15/24 | | | | 07/17/31 | | Senior | | | 2,607,186 | | | | 2,620,873 | |
Cidron Kuma 2 S.à.r.l. +, a | Cash 13.00% + E (0.50% Floor)#### | | | 01/01/21 | | | | 02/28/26 | | Second Lien | | | 1,209,477 | | | | 1,025,981 | |
Cimpress plc +, a | Cash 3.00% + SFv | | | 05/17/24 | | | | 05/17/28 | | Senior | | | 6,368,000 | | | | 6,383,920 | |
Constellation Automotive Group Limited +, a | Cash 4.75% + S>>> | | | 09/03/21 | | | | 07/28/28 | | Senior | | | 1,387,192 | | | | 1,243,770 | |
Constellation Automotive Limited +, a | Cash 7.50% + S>>> | | | 10/18/21 | | | | 07/30/29 | | Second Lien | | | 1,372,084 | | | | 955,575 | |
Constellation BidCo GmbH +, a | Cash 5.25% + E## | | | 10/26/22 | | | | 06/27/29 | | Senior | | | 26,760,488 | | | | 29,568,318 | |
Constellation HoldCo GmbH +, a, e | Cash 5.15% + E## | | | 08/08/24 | | | | 08/08/31 | | Senior | | | 1,110,043 | | | | 1,108,812 | |
CTEC III GmbH +, a | Cash 3.50% + E## | | | 03/29/18 | | | | 03/07/25 | | Senior | | | 14,737,672 | | | | 14,599,006 | |
DataCo AcquiCo GmbH +, a | Cash 6.00% + E### | | | 01/26/24 | | | | 01/31/31 | | Senior | | | 9,473,132 | | | | 9,532,823 | |
Dorna Sports, S.L. +, a | Cash 3.25% + E### | | | 06/25/24 | | | | 03/30/29 | | Senior | | | 5,374,619 | | | | 5,595,824 | |
Dragon Bidco Limited +, a | Cash 5.75% + S>> | | | 03/09/22 | | | | 03/09/29 | | Senior | | | 8,941,459 | | | | 9,114,424 | |
Eagle Bidco Limited +, a | Cash 3.75% + E# | | | 09/07/23 | | | | 03/20/28 | | Senior | | | 7,386,454 | | | | 7,709,414 | |
Envirotainer +, a, e | Cash 5.75% + E## | | | 07/29/22 | | | | 07/27/29 | | Senior | | | 8,191,195 | | | | 8,910,143 | |
Envirotainer +, a | Cash 5.75% + SF (0.75% Floor)vv | | | 07/29/22 | | | | 07/27/29 | | Senior | | | 4,089,559 | | | | 4,063,030 | |
Europa University Education Group +, a | Cash 3.75% + E### | | | 06/13/24 | | | | 06/13/31 | | Senior | | | 3,300,000 | | | | 3,706,891 | |
Financiere Astek +, a, e | Cash 6.50% + E## | | | 04/25/24 | | | | 04/25/31 | | Senior | | | 1,749,645 | | | | 1,812,017 | |
Financiere Astek +, a | Cash 6.50% + E## | | | 04/25/24 | | | | 04/25/31 | | Senior | | | 6,333,943 | | | | 6,629,544 | |
Financière Mendel +, a | Cash 3.25% + SFvv | | | 12/06/23 | | | | 11/12/30 | | Senior | | | 2,388,000 | | | | 2,395,964 | |
Froneri International Limited +, a, e | Cash 2.25% + SFv | | | 07/05/24 | | | | 01/29/27 | | Senior | | | 3,979,221 | | | | 3,972,834 | |
Fusilli AcquiCo S.à.r.l. +, a | Cash 5.25% + E### | | | 01/27/22 | | | | 04/12/26 | | Senior | | | 6,845,735 | | | | 7,016,145 | |
Grupo Iberica de Congelados, SA +, a | Cash 7.12% + E# | | | 06/28/19 | | | | 11/28/24 | | Senior | | | 459,370 | | | | 408,770 | |
Grupo Iberica de Congelados, SA +, a | Cash 7.75% + E## | | | 06/28/19 | | | | 11/28/24 | | Senior | | | 513,326 | | | | 456,783 | |
Gulfstream Bidco AS +, a | Cash 5.00% + SFvv | | | 01/19/24 | | | | 01/19/31 | | Senior | | | 3,676,000 | | | | 3,585,742 | |
HNVR Holdco Limited +, a | Cash 5.25% + E### | | | 01/25/22 | | | | 09/12/27 | | Senior | | | 3,321,745 | | | | 3,365,548 | |
HNVR Holdco Limited +, a | Cash 4.25% + E### | | | 03/22/24 | | | | 09/12/27 | | Senior | | | 6,567,909 | | | | 6,843,281 | |
Holding Socotec SAS +, a | Cash 4.00% + SF (0.75% Floor)vv | | | 09/10/21 | | | | 06/30/28 | | Senior | | | 1,455,000 | | | | 1,455,909 | |
The accompanying notes are an integral part of these Consolidated Financial Statements.
17
Partners Group Private Equity (Master Fund), LLC
(a Delaware Limited Liability Company)
Consolidated Schedule of Investments –
September 30, 2024 (Unaudited) (continued)
Private Equity Investments (continued)
Direct Investments * (continued) Direct Debt (continued) | Interest | | Acquisition
Date | | | Maturity
Date | | Investment
Type | | Principal | | | Fair
Value** | |
Western Europe (continued) | | | | | | | | | | | | | | | | | | |
HomeVi SAS +, a | Cash 3.25% + E## | | | 05/10/24 | | | | 10/31/26 | | Senior | | $ | 5,715,208 | | | $ | 10,754,155 | |
Hunter Douglas NV +, a | Cash 3.50% + SF (0.50% Floor)vv | | | 03/07/22 | | | | 02/26/29 | | Senior | | | 8,719,377 | | | | 8,670,330 | |
Hunter Holdco 3 Limited +, a | Cash 4.25% + SF (0.50% Floor)vv | | | 08/26/21 | | | | 08/19/28 | | Senior | | | 10,285,188 | | | | 10,246,618 | |
IGT Holding IV AB +, a | Cash 5.31% + SF (0.50% Floor)vv | | | 07/21/21 | | | | 03/31/28 | | Senior | | | 1,833,500 | | | | 1,833,500 | |
Inception Finco S.à r.l. +, a | Cash 4.50% + SFvv | | | 03/15/24 | | | | 04/18/31 | | Senior | | | 1,097,250 | | | | 1,106,165 | |
Ineos Quattro Holdings UK Limited +, a | Cash 3.75% + SFv | | | 03/17/23 | | | | 03/01/30 | | Senior | | | 1,975,000 | | | | 1,979,938 | |
Infinity Bidco 1 Limited +, a | Cash 3.40% + E# | | | 07/03/24 | | | | 07/06/28 | | Senior | | | 3,241,938 | | | | 3,328,998 | |
International Park Holdings B.V. +, a | Cash 5.00% + E### | | | 11/16/21 | | | | 12/14/26 | | Senior | | | 2,967,557 | | | | 2,929,672 | |
ION Trading Finance Limited +, a | Cash 4.75% + SF (1.00% Floor)vv | | | 05/25/21 | | | | 04/01/28 | | Senior | | | 1,626,341 | | | | 1,628,992 | |
Kouti B.V. +, a | Cash 3.175% + E## | | | 05/20/24 | | | | 08/31/28 | | Senior | | | 12,074,093 | | | | 12,417,679 | |
Lernen Bidco Ltd. +, a | Cash 4.25% + E### | | | 06/16/23 | | | | 04/24/29 | | Senior | | | 6,523,196 | | | | 6,719,275 | |
Loire UK Midco 3 Limited +, a | Cash 3.50% + SF (0.75% Floor)vv | | | 07/09/21 | | | | 04/21/27 | | Senior | | | 1,251,730 | | | | 1,245,471 | |
Loire UK Midco 3 Limited +, a | Cash 3.00% + SFv | | | 06/08/20 | | | | 04/21/27 | | Senior | | | 1,341,675 | | | | 1,333,712 | |
Lorca Holdco Limited +, a | Cash 3.50% + E### | | | 07/02/24 | | | | 03/25/31 | | Senior | | | 11,600,226 | | | | 14,980,913 | |
Lorca Holdco Limited +, a | Cash 3.50% + SFvvv | | | 07/23/24 | | | | 03/25/31 | | Senior | | | 4,378,000 | | | | 4,393,498 | |
Mar Bidco S.à.r.l. +, a | Cash 4.25% + SFvv | | | 07/30/21 | | | | 07/06/28 | | Senior | | | 2,910,000 | | | | 2,822,700 | |
Matador Bidco S.à.r.l. +, a | Cash 4.25% + SFv | | | 08/01/24 | | | | 07/16/29 | | Senior | | | 8,523,676 | | | | 8,555,640 | |
Nobel Bidco B.V. +, a | Cash 3.50% + E### | | | 06/12/24 | | | | 09/01/28 | | Senior | | | 5,423,992 | | | | 5,510,212 | |
Nomad Foods Limited +, a | Cash 3.75% + SF (0.50% Floor)vv | | | 12/09/22 | | | | 11/12/29 | | Senior | | | 1,173,110 | | | | 1,174,700 | |
Nouryon Finance B.V. +, a | Cash 3.50% + E# | | | 06/20/24 | | | | 04/03/28 | | Senior | | | 2,251,627 | | | | 2,349,660 | |
Nouryon Finance B.V. +, a | Cash 4.00% + SFvv | | | 03/03/23 | | | | 04/03/28 | | Senior | | | 2,376,045 | | | | 2,384,456 | |
One Hotels GmbH +, a | Cash 4.50% + E## | | | 06/12/24 | | | | 04/02/31 | | Senior | | | 6,725,751 | | | | 6,948,857 | |
OT Luxco 3 & Cy S.C.A. +, a | Cash 8.75% + E (1.00% Floor)###; PIK 9.00% | | | 05/31/17 | | | | 05/31/27 | | Mezzanine | | | 32,102,236 | | | | 34,161,503 | |
PEARLS (Netherlands) Bidco B.V. +, a | Cash 4.00% + SFvvv | | | 03/30/22 | | | | 03/01/29 | | Senior | | | 2,460,088 | | | | 2,467,013 | |
PEARLS (Netherlands) Bidco B.V. +, a | Cash 4.00% + E## | | | 06/06/24 | | | | 02/26/29 | | Senior | | | 7,614,628 | | | | 7,837,826 | |
Pegasus BidCo B.V. +, a | Cash 3.75% + SF (0.50% Floor)vv | | | 08/08/22 | | | | 07/12/29 | | Senior | | | 6,984,933 | | | | 7,004,596 | |
Piolin II S.à.r.l. +, a | Cash 4.50% + E## | | | 06/11/24 | | | | 09/16/29 | | Senior | | | 10,240,413 | | | | 10,643,946 | |
Planet US Buyer LLC +, a | Cash 3.50% + SFvv | | | 02/20/24 | | | | 02/07/31 | | Senior | | | 2,892,750 | | | | 2,901,428 | |
Platin2025 Acquisition S.à.r.l. +, a | Cash 3.90% + E## | | | 05/28/24 | | | | 12/29/28 | | Senior | | | 6,524,382 | | | | 6,681,436 | |
Rainbow Jvco Ltd. +, a | Cash 7.25% + E##; PIK 7.25% | | | 02/24/22 | | | | 02/24/30 | | Mezzanine | | | 9,405,746 | | | | 9,335,671 | |
Rainbow UK Holdco Limited +, a | Cash 3.75% + E### | | | 05/31/24 | | | | 02/26/29 | | Senior | | | 11,935,918 | | | | 12,279,258 | |
RC Acquisition II B.V. +, a | Cash 6.25% + E## | | | 12/19/23 | | | | 12/18/30 | | Senior | | | 9,234,378 | | | | 9,391,118 | |
Rohm Holding GmbH +, a | Cash 4.50% + E### + PIK 0.25% | | | 06/28/24 | | | | 01/31/29 | | Senior | | | 6,433,497 | | | | 6,306,286 | |
Sapphire Bidco B.V. +, a | Cash 3.00% + E## | | | 05/25/18 | | | | 05/05/25 | | Senior | | | 2,271,578 | | | | 2,245,239 | |
Seren Bidco AB +, a | Cash 7.25% + SR ¤¤ | | | 11/16/21 | | | | 11/16/29 | | Second Lien | | | 16,653,255 | | | | 14,200,028 | |
Sevetys Invest +, a, e | Cash 6.25% + E## | | | 12/16/22 | | | | 08/03/29 | | Senior | | | 15,740,503 | | | | 16,040,379 | |
Sigma Holdco B.V. +, a | Cash 4.75% + SFvvv | | | 09/20/23 | | | | 01/02/28 | | Senior | | | 5,890,753 | | | | 5,876,556 | |
Sigma Holdco B.V. +, a | Cash 4.25% + SFvvv | | | 08/26/24 | | | | 01/03/28 | | Senior | | | 2,992,474 | | | | 2,985,262 | |
Skywalker BidCo GmbH +, a | Cash 6.00% + E### | | | 12/20/23 | | | | 12/20/30 | | Senior | | | 6,537,633 | | | | 6,633,283 | |
Skywalker BidCo GmbH +, a, e | Cash 6.00% + E### | | | 12/20/23 | | | | 12/20/30 | | Senior | | | 724,157 | | | | 743,453 | |
Speedster BidCo GmbH +, a | Cash 2.50% + E### | | | 06/17/24 | | | | 03/31/27 | | Senior | | | 10,722,920 | | | | 11,180,263 | |
Sport Group Holding GMBH +, a | Cash 4.25% + E## | | | 06/07/24 | | | | 06/06/31 | | Senior | | | 2,600,000 | | | | 2,916,634 | |
Starfruit Finco B.V. +, a | Cash 3.50% + SFvv | | | 11/14/18 | | | | 10/01/25 | | Senior | | | 2,722,548 | | | | 2,731,491 | |
Summer (BC) Bidco B LLC +, a | Cash 5.00% + SF (0.75% Floor)vv | | | 09/08/21 | | | | 12/04/26 | | Senior | | | 970,169 | | | | 973,807 | |
team.blue Finco S.à.r.l. +, a | Cash 3.20% + E# | | | 06/25/21 | | | | 03/27/28 | | Senior | | | 11,959,050 | | | | 11,900,716 | |
TK Elevator Midco GmbH +, a | Cash 3.50% + SF (0.5% Floor)vvv | | | 03/11/24 | | | | 04/30/30 | | Senior | | | 3,374,564 | | | | 3,384,586 | |
TMF Sapphire Bidco B.V. +, a | Cash 5.00% + SFvv | | | 07/25/23 | | | | 05/03/28 | | Senior | | | 1,389,518 | | | | 1,397,618 | |
Touchdown Acquirer Inc. +, a, e | Cash 3.25% + SFvv | | | 03/11/24 | | | | 02/07/31 | | Senior | | | 3,855,689 | | | | 3,856,286 | |
UPC Financing Partnership +, a | Cash 2.925% + SFv | | | 07/08/24 | | | | 01/31/29 | | Senior | | | 5,000,000 | | | | 4,981,950 | |
The accompanying notes are an integral part of these Consolidated Financial Statements.
18
Partners Group Private Equity (Master Fund), LLC
(a Delaware Limited Liability Company)
Consolidated Schedule of Investments –
September 30, 2024 (Unaudited) (continued)
Private Equity Investments (continued)
Direct Investments * (continued) Direct Debt (continued) | Interest | | Acquisition
Date | | | Maturity
Date | | Investment
Type | | Principal | | | Fair
Value** | |
Western Europe (continued) | | | | | | | | | | | | | | | | | | |
Vertical Midco GmbH +, a | Cash 3.50% + SFvv | | | 09/09/20 | | | | 07/30/27 | | Senior | | $ | 3,842,677 | | | $ | 3,854,090 | |
Virgin Media Bristol LLC +, a | Cash 3.25% + SFv | | | 06/25/24 | | | | 01/31/29 | | Senior | | | 10,000,000 | | | | 9,565,050 | |
Virgin Media Bristol, LLC +, a | Cash 2.50% + SFv | | | 02/07/18 | | | | 01/31/28 | | Senior | | | 5,486,250 | | | | 5,267,405 | |
ZF Invest +, a | Cash 3.475% + E### | | | 06/04/24 | | | | 07/12/28 | | Senior | | | 5,222,419 | | | | 5,322,057 | |
Ziggo Financing Partnership +, a | Cash 2.50% + SFv | | | 02/27/20 | | | | 04/30/28 | | Senior | | | 10,000,000 | | | | 9,773,450 | |
Total Western Europe (4.36%) | | | 679,047,207 | |
| | | | | | | | | | | | | | | | | | | |
Total Direct Debt (11.43%) | | $ | 1,781,491,597 | |
| | | | | | | | | | | | | | | | | | | |
Total Direct Investments (66.64%) | | $ | 10,381,914,581 | |
Private Equity Investments (continued)
Secondary Investments *, c (12.64%) | | Acquisition
Date | | | Fair
Value | |
Asia - Pacific (0.96%) |
Affinity Asia Pacific Fund IV (No.2) L.P. +, a, e | | | 09/30/24 | | | $ | 5,942,112 | |
Archer Capital Fund 5 +, a, e | | | 09/30/24 | | | | 242,977 | |
Crescent Capital Partners IV, LP +, a, e | | | 09/30/24 | | | | 236,399 | |
CVC Capital Partners Asia Pacific III, L.P. +, a, e | | | 01/11/13 | | | | 209,701 | |
KV Asia Capital Fund I L.P. +, a, e | | | 09/30/24 | | | | 2,192,317 | |
MBK Partners Colonel Fund, L.P. +, a, e | | | 09/20/21 | | | | 86,329,292 | |
The Baring Asia Private Equity Fund VII, L.P. +, a, e | | | 03/31/24 | | | | 4,884,137 | |
TPG Asia VII (B), L.P. +, a, e | | | 12/07/18 | | | | 16,596,156 | |
TRG Growth Partnership (Offshore) II, L.P. +, a, e | | | 08/02/10 | | | | 24,141 | |
TRG Growth Partnership II, L.P. +, a, e | | | 07/08/10 | | | | 63,447 | |
Yunfeng Capital Fund III, L.P. +, a, e | | | 05/18/21 | | | | 29,357,823 | |
Yunfeng Capital Fund IV, L.P. +, a, e | | | 05/31/21 | | | | 3,697,748 | |
Total Asia - Pacific (0.96%) | | | | | | | 149,776,250 | |
| | | | | | | | | |
North America (8.57%) |
Abingworth Bioventures V, L.P. +, a, e | | | 06/30/12 | | | | 3,503 | |
ACP Investment Fund, L.P. +, a, e | | | 09/30/24 | | | | 269,213 | |
Apollo Investment Fund VII, L.P. +, a, e | | | 07/01/10 | | | | 2 | |
Ares PE Extended Value Fund, L.P. +, a, e | | | 11/14/19 | | | | 36,347,621 | |
ASP SEC Exchange Fund II LP +, a, e | | | 09/30/24 | | | | 8,533,169 | |
Avenue Golden Continuation Fund PV, L.P. +, a, e | | | 04/26/22 | | | | 112,451,881 | |
Bain Capital Fund X, L.P. +, a, e | | | 06/30/11 | | | | 4,520,491 | |
Bain Capital Venture Fund 2009, L.P. +, a, e | | | 09/30/24 | | | | 266,733 | |
Bain Capital Venture Fund 2012, L.P. +, a | | | 09/30/24 | | | | 1,906,167 | |
Berkshire Fund VIII, L.P. +, a, e | | | 09/03/21 | | | | 15,583,566 | |
Berkshire Fund VIII, L.P. +, a, e | | | 09/30/24 | | | | 797,889 | |
Berkshire Fund X-A, L.P. +, a, e | | | 09/03/21 | | | | 16,052,502 | |
Bertram Growth Capital II-A, L.P. +, a, e | | | 09/30/15 | | | | 11,403 | |
Carlyle Partners VII, L.P. +, a, e | | | 02/15/23 | | | | 31,600,409 | |
Carlyle Partners VIII, L.P. +, a, e | | | 03/10/23 | | | | 4,577,250 | |
Centerbridge Seaport Acquisition Fund, L.P. +, a, e | | | 05/12/22 | | | | 129,560 | |
Clayton, Dubilier & Rice Fund VIII, L.P. +, a, e | | | 03/29/12 | | | | 33,400 | |
Cortec Group Fund V, L.P. +, a, e | | | 09/30/24 | | | | 106 | |
DST Opportunities Access Offshore L.P. +, a, e | | | 09/30/20 | | | | 6,003,725 | |
ECP Terra-Gen Growth Fund, L.P. +, a, e | | | 03/23/21 | | | | 4,130,907 | |
EETF Sidecar, L.P. +, a, e | | | 04/30/21 | | | | 5,452,025 | |
EnCap Energy Co-Investment Fund I-C, L.P. +, a, e | | | 04/30/21 | | | | 1,063,646 | |
EnCap Energy Transition Fund I, L.P. +, a, e | | | 04/30/21 | | | | 2,518,693 | |
Energy Capital Partners Credit Solutions II, L.P. +, a, e | | | 02/03/21 | | | | 3,064,887 | |
The accompanying notes are an integral part of these Consolidated Financial Statements.
19
Partners Group Private Equity (Master Fund), LLC
(a Delaware Limited Liability Company)
Consolidated Schedule of Investments –
September 30, 2024 (Unaudited) (continued)
Private Equity Investments (continued)
Secondary Investments *, c (continued) | | Acquisition
Date | | | Fair
Value | |
North America (continued) |
Energy Capital Partners III, L.P. +, a, e | | | 02/01/21 | | | $ | 6,328,257 | |
Fengate Everest Continuation Fund L.P. +, a, d, e | | | 06/17/24 | | | | 18,301,124 | |
Frazier Healthcare VI, L.P. +, a | | | 06/30/12 | | | | 134,136 | |
FS Equity Partners V, L.P. +, a, e | | | 08/07/12 | | | | 13,261 | |
GA Continuity Fund I L.P. (Bermuda) +, a, e | | | 06/30/21 | | | | 86,496,197 | |
General Atlantic Investment Partners 2021, L.P. +, a, e | | | 07/02/21 | | | | 7,776,312 | |
General Atlantic Investment Partners 2023, L.P. +, a, e | | | 12/01/22 | | | | 1,681,182 | |
Genstar Capital Partners IX, L.P. +, a, e | | | 03/31/24 | | | | 2,596,074 | |
Genstar Capital Partners V, L.P. +, a, e | | | 09/30/15 | | | | 1,547 | |
Genstar IX Opportunities Fund I +, a, e | | | 03/31/24 | | | | 1,259,782 | |
Green Equity Investors Side CF, L.P. +, a, e | | | 04/16/21 | | | | 47,525,259 | |
Gridiron Energy Feeder I, L.P. +, a, e | | | 05/15/17 | | | | 31,599,235 | |
Gryphon Partners 3.5, L.P. +, a, e | | | 05/21/13 | | | | 110,939 | |
Gryphon Partners IV L.P. +, a, e | | | 02/08/16 | | | | 15,061,081 | |
H.I.G. Bayside Debt & LBO Fund II, L.P. +, a, e | | | 12/30/10 | | | | 123,379 | |
Icon Partners IV, L.P. +, a, e | | | 05/26/21 | | | | 31,827,014 | |
Icon Partners V, L.P. +, a, e | | | 12/27/21 | | | | 95,382,096 | |
Index Ventures Life VI (Jersey), L.P. +, a, e | | | 09/30/24 | | | | 383,971 | |
Insight Venture Partners Continuation Fund, L.P. +, a, e | | | 09/09/19 | | | | 59,078,972 | |
KKR Associates Indigo Equity Partners, L.P. +, a | | | 06/09/22 | | | | 122,073,864 | |
KSL Capital Partners CV I, L.P. +, a, e | | | 05/23/22 | | | | 54,939,424 | |
Lee Equity Partners II, L.P. +, a, e | | | 06/30/17 | | | | 6,716,584 | |
Lee Equity Partners Realization Fund, L.P. +, a | | | 06/30/17 | | | | 6,029,409 | |
LEP Captive Co-Invest II, L.P. +, a | | | 07/01/22 | | | | 18,350,630 | |
Madison Dearborn Capital Partners V, L.P. +, a, e | | | 03/31/11 | | | | 1,919 | |
Madison Dearborn Capital Partners VIII, L.P. +, a, e | | | 03/15/21 | | | | 9,212,681 | |
Mainsail Partners III, L.P. +, a, e | | | 09/30/24 | | | | 368,022 | |
Marlin Equity III, L.P. +, a, e | | | 09/30/24 | | | | 33,754 | |
Monomoy Capital Partners II, L.P. +, a, e | | | 09/30/15 | | | | 125,330 | |
New Enterprise Associates 17, L.P. +, a, e | | | 09/30/20 | | | | 6,664,017 | |
NGP Natural Resources X, L.P. +, a, e | | | 09/30/24 | | | | 297,062 | |
Northgate Growth Fund, L.P. +, a | | | 12/20/19 | | | | 8,089,356 | |
NVP VIII PG, L.P. +, a, e | | | 05/31/19 | | | | 84,426,614 | |
Oak Investment Partners XII, L.P. +, a | | | 06/28/12 | | | | 1,683 | |
Providence Equity Partners IV, L.P. +, a, e | | | 06/30/11 | | | | 976 | |
Providence Equity Partners V, L.P. +, a, e | | | 06/30/11 | | | | 7,072 | |
Providence Equity Partners VI-A, L.P. +, a, e | | | 06/30/11 | | | | 96,086 | |
Providence Equity Partners VII-A, L.P. +, a, e | | | 06/30/13 | | | | 1,174,843 | |
PT2, L.P. +, a, e | | | 12/21/21 | | | | 12,875,394 | |
Redpoint Omega II, L.P. +, a | | | 09/30/24 | | | | 2,681,172 | |
Redpoint Ventures IV, L.P. +, a | | | 09/30/24 | | | | 596,448 | |
Revelstoke EPIC Fund I, L.P. +, a, e | | | 11/20/19 | | | | 71,815,269 | |
RoundTable Healthcare Partners III, L.P. +, a, e | | | 09/30/24 | | | | 924,059 | |
Samson Partners, L.P. +, a, e | | | 12/21/20 | | | | 50,467,810 | |
Sigma Partners 6, L.P. +, a | | | 09/30/24 | | | | 565,941 | |
Sigma Partners 7, L.P. +, a | | | 09/30/24 | | | | 220,673 | |
Sigma Partners 8, L.P. +, a | | | 09/30/24 | | | | 498,375 | |
Silver Lake Partners III, L.P. +, a, e | | | 03/31/13 | | | | 968,388 | |
Silver Lake Partners V, L.P. +, a, e | | | 09/30/20 | | | | 10,145,803 | |
Silver Lake Partners VI, L.P. +, a, e | | | 09/30/22 | | | | 43,668,918 | |
SL SPV-1, L.P. +, a | | | 12/01/17 | | | | 3,695,269 | |
SL SPV-2, L.P. +, a | | | 06/30/10 | | | | 7,105,822 | |
STG IV, L.P. +, a, e | | | 09/30/24 | | | | 374,457 | |
Sun Capital Partners V, L.P. +, a, e | | | 09/30/13 | | | | 1,463,460 | |
TA Atlantic & Pacific VI, L.P. +, a, e | | | 09/30/15 | | | | 47,814 | |
The accompanying notes are an integral part of these Consolidated Financial Statements.
20
Partners Group Private Equity (Master Fund), LLC
(a Delaware Limited Liability Company)
Consolidated Schedule of Investments –
September 30, 2024 (Unaudited) (continued)
Private Equity Investments (continued)
Secondary Investments *, c (continued) | | Acquisition
Date | | | Fair
Value | |
North America (continued) |
TA Atlantic and Pacific VII-A L.P. +, a, e | | | 09/30/24 | | | $ | 3,221,205 | |
TA Subordinated Debt Fund III, L.P. +, a, e | | | 09/30/24 | | | | 13,743 | |
TA XI, L.P. +, a, e | | | 09/30/15 | | | | 782,347 | |
TCV VII (A), L.P. +, a, e | | | 09/30/13 | | | | 282,542 | |
TorQuest Partners Fund (U.S.) II, L.P. +, a, e | | | 09/30/15 | | | | 209,065 | |
TPG Healthcare Partners, L.P. +, a, e | | | 04/01/24 | | | | 3,247,547 | |
TPG Partners V, L.P. +, a, e | | | 07/11/11 | | | | 5,054 | |
TPG Partners VI, L.P. +, a, e | | | 12/31/12 | | | | 325,932 | |
TPG Partners VIII, L.P. +, a, e | | | 04/01/24 | | | | 8,457,520 | |
Trident VIII, L.P. +, a, e | | | 09/30/22 | | | | 31,529,831 | |
TSCP CV II, L.P. +, a, e | | | 09/09/24 | | | | — | |
TSCP CV II, L.P. +, a | | | 09/09/24 | | | | 4,016,292 | |
Vistria Fund III, L.P. +, a, e | | | 07/29/19 | | | | 15,974,816 | |
Vistria Fund IV, L.P. +, a, e | | | 10/01/22 | | | | 42,534,331 | |
Vistria Fund V, L.P. +, a, e | | | 03/31/23 | | | | 2,557,739 | |
Warburg Pincus Private Equity X, L.P. +, a | | | 09/28/12 | | | | 231,301 | |
Welsh, Carson, Anderson & Stowe XI, L.P. +, a | | | 09/30/24 | | | | 9,940 | |
Welsh, Carson, Anderson & Stowe XII, L.P. +, a, e | | | 12/31/18 | | | | 29,061,110 | |
Welsh, Carson, Anderson & Stowe XIII, L.P. +, a, e | | | 12/20/18 | | | | 5,314,841 | |
Total North America (8.57%) | | | | | | | 1,335,498,120 | |
| | | | | | | | | |
Rest of World (0.05%) |
Pitango Venture Capital Fund VI L.P. +, a, e | | | 09/30/24 | | | | 6,542,978 | |
Victoria South American Partners II, L.P. +, a, e | | | 09/30/24 | | | | 629,329 | |
Total Rest of World (0.05%) | | | | | | | 7,172,307 | |
| | | | | | | | | |
Western Europe (3.06%) |
3i Eurofund Vb, L.P. +, a | | | 09/30/09 | | | | 17,955 | |
3i Growth Capital B, L.P. +, a, e | | | 10/01/14 | | | | 64,998 | |
Abingworth Bioventures III, L.P. +, a, e | | | 09/30/15 | | | | 3,668 | |
Abingworth Bioventures V Co-Investment Growth Equity Fund, L.P. +, a, e | | | 06/30/12 | | | | 394 | |
Advent International GPE VI, L.P. +, a | | | 09/30/10 | | | | 278,011 | |
Alchemy Special Opportunities Fund II L.P. +, a, e | | | 09/30/24 | | | | 436,442 | |
Aparca8 Capital Estacionamientos, S.C.R., S.A. +, a, d, e | | | 12/15/23 | | | | 14,330,350 | |
Apax Europe VI - A, L.P. +, a, e | | | 07/01/11 | | | | 34,398 | |
Apax Europe VII - B, L.P. +, a, e | | | 04/30/11 | | | | 7,323 | |
Astorg IQ-EQ Fund SCSp +, a, e | | | 01/13/22 | | | | 27,726,586 | |
Astorg V FCPR +, a, e | | | 09/30/24 | | | | 9,138 | |
BC European Capital IX, L.P. +, a, e | | | 09/30/14 | | | | 2,001,109 | |
Carlyle Europe Partners II, L.P. +, a, e | | | 12/28/12 | | | | 12,253 | |
Carlyle Europe Partners III, L.P. +, a, e | | | 12/28/12 | | | | 273,768 | |
CCP IX L.P. No.2 +, a | | | 09/30/14 | | | | 42,012 | |
CD&R Value Building Partners I, L.P. +, a | | | 12/17/21 | | | | 64,955,297 | |
Charterhouse Capital Partners IX +, a, e | | | 09/30/24 | | | | 22,107 | |
CVC Capital Partners Pachelbel (A) SCSp +, a, e | | | 07/08/24 | | | | 1,359,055 | |
CVC Capital Partners VII L.P. +, a, e | | | 03/31/24 | | | | 12,747,550 | |
CVC Capital Partners VIII, L.P. +, a, e | | | 03/31/24 | | | | 11,096,024 | |
Daiwa ICP European Infrastructure 1, L.P. +, a, e | | | 12/22/22 | | | | 70,226,746 | |
DBAG Fund VI (Guernsey) L.P. +, a, e | | | 09/30/24 | | | | 257,984 | |
EPIC I-b Fund SLP +, a, e | | | 11/30/20 | | | | 27,602,242 | |
ESP Golden Bear Europe Fund +, a, e | | | 12/31/16 | | | | 404,467 | |
F2i III +, a, e | | | 07/01/24 | | | | 7,606,351 | |
Galileo III FCPR +, a, e | | | 09/30/15 | | | | 30,843 | |
Graphite Capital Partners VII, L.P. +, a, e | | | 09/30/15 | | | | 242,727 | |
HitecVision Asset Solutions, L.P. +, a, e | | | 09/30/24 | | | | 14,808 | |
The accompanying notes are an integral part of these Consolidated Financial Statements.
21
Partners Group Private Equity (Master Fund), LLC
(a Delaware Limited Liability Company)
Consolidated Schedule of Investments –
September 30, 2024 (Unaudited) (continued)
Private Equity Investments (continued)
Secondary Investments *, c (continued) | | Acquisition
Date | | | Fair
Value | |
Western Europe (continued) |
HitecVision SpringPoint L.P. +, a, e | | | 09/30/24 | | | $ | 2,252 | |
HitecVision V, L.P. +, a, e | | | 09/30/24 | | | | 9,435 | |
HitecVision VI, L.P. +, a, e | | | 09/30/24 | | | | 1,410,118 | |
Index Ventures Growth II (Jersey), L.P. +, a | | | 09/30/24 | | | | 1,368,886 | |
Index Ventures VI (Jersey), L.P. +, a, e | | | 09/30/24 | | | | 10,618,198 | |
Industrial Opportunity Partners II, L.P. +, a, e | | | 09/30/24 | | | | 154,684 | |
Investindustrial V L.P. +, a | | | 09/30/24 | | | | 1,504,486 | |
Italian Private Equity Fund IV, L.P. +, a, e | | | 01/29/16 | | | | 4,171 | |
KKR European Fund III, L.P. +, a, e | | | 11/01/10 | | | | 78,264 | |
Montagu+ SCSp +, a, e | | | 12/06/21 | | | | 65,921,315 | |
Permira Europe II, L.P. +, a | | | 11/29/13 | | | | 4,726 | |
Permira Europe III, L.P. +, a | | | 09/30/13 | | | | 7,411 | |
Permira VII L.P. +, a, e | | | 09/29/22 | | | | 42,118,262 | |
Phoenix Equity Partners 2010 LP +, a | | | 09/30/24 | | | | 4,761 | |
Prime Ventures IV C.V. +, a, e | | | 09/30/24 | | | | 1,779,369 | |
Rivean Special Opportunity Fund I Coöperatief U.A. +, a, e | | | 11/29/22 | | | | 45,788,848 | |
Riverside Europe Fund IV, L.P. +, a, e | | | 09/30/14 | | | | 90,979 | |
Sixth Cinven Fund (No.2) Limited Partnership +, a, e | | | 03/31/24 | | | | 3,539,835 | |
STG Alternative Investments S.C.A. SICAV-RAIF +, a, e | | | 09/17/21 | | | | 36,670,086 | |
The Seventh Cinven Fund, L.P. +, a, e | | | 03/31/24 | | | | 8,642,959 | |
Trilantic Capital Partners V (Europe) S.C.A., SICAR +, a, e | | | 11/20/20 | | | | 7,027,318 | |
Trilantic Europe VI SCSp +, a, e | | | 12/10/20 | | | | 4,832,493 | |
Turkish Private Equity Fund III L.P. +, a, e | | | 09/30/24 | | | | 3,998,809 | |
Total Western Europe (3.06%) | | | | | | | 477,382,271 | |
| | | | | | | | | |
Total Secondary Investments (12.64%) | | | | | | $ | 1,969,828,948 | |
| | | | | | | | | |
Primary Investments *, c (14.05%) | | | | | | | | |
Asia - Pacific (0.87%) | | | | | | | | |
Bain Capital Asia V, L.P. +, a, e | | | 09/01/23 | | | | 192,954 | |
Baring Asia Private Equity Fund V, L.P. +, a, e | | | 12/01/10 | | | | 285,617 | |
BGH Capital Fund I +, a, e | | | 03/01/18 | | | | 19,767,830 | |
BGH Capital VCLP II +, a, e | | | 02/01/22 | | | | 550,761 | |
CPEChina Fund III, L.P. +, a, e | | | 03/28/18 | | | | 31,455,880 | |
Hony Capital Fund VIII, L.P. +, a, e | | | 10/30/15 | | | | 8,581,250 | |
Hony Capital Partners V, L.P. +, a, e | | | 12/15/11 | | | | 2,663,269 | |
J-STAR No.4-C, L.P. +, a, e | | | 08/02/19 | | | | 14,278,172 | |
J-STAR No.5-B, L.P. +, a, e | | | 02/28/22 | | | | 2,150,678 | |
Kedaara Capital Growth Fund IV +, a, e | | | 04/03/24 | | | | 34,279 | |
Kedaara Capital III Limited +, a, e | | | 06/17/21 | | | | 7,204,403 | |
KKR Asian Fund IV SCSp +, a, e | | | 05/29/20 | | | | 4,104,648 | |
Primavera Capital Fund III L.P. +, a, e | | | 05/09/18 | | | | 10,959,376 | |
Primavera Capital Fund IV, L.P. +, a, e | | | 05/20/21 | | | | 5,410,360 | |
Southern Capital Fund IV L.P. +, a, e | | | 01/26/18 | | | | 3,461,853 | |
The Baring Asia Private Equity Fund VII, L.P. +, a, e | | | 07/10/18 | | | | 8,796,426 | |
TPG ASIA VIII (B), L.P. +, a, e | | | 07/01/22 | | | | 5,867,995 | |
Trustbridge Partners VI, L.P. +, a, e | | | 04/12/18 | | | | 9,816,849 | |
Total Asia - Pacific (0.87%) | | | | | | | 135,582,600 | |
| | | | | | | | | |
North America (8.36%) |
Advent Global Technology, L.P. +, a, e | | | 06/25/19 | | | | 2,924,841 | |
AEA Investors Fund VII L.P. +, a, e | | | 02/08/19 | | | | 4,145,361 | |
American Industrial Partners Capital Fund VII, L.P. +, a, e | | | 03/29/19 | | | | 23,307,228 | |
American Industrial Partners Capital Fund VIII, L.P. +, a, e | | | 07/10/23 | | | | 292,840 | |
Apollo Investment Fund IX, L.P +, a, e | | | 06/01/17 | | | | 32,800,845 | |
The accompanying notes are an integral part of these Consolidated Financial Statements.
22
Partners Group Private Equity (Master Fund), LLC
(a Delaware Limited Liability Company)
Consolidated Schedule of Investments –
September 30, 2024 (Unaudited) (continued)
Private Equity Investments (continued)
Primary Investments *, c (continued) | | Acquisition
Date | | | Fair
Value | |
North America (continued) |
Apollo Investment Fund VIII, L.P. +, a, e | | | 06/28/13 | | | $ | 2,804,206 | |
Ares Corporate Opportunities Fund IV, L.P. +, a, e | | | 04/19/12 | | | | 1,785,221 | |
Ares Corporate Opportunities Fund V, L.P. +, a, e | | | 12/28/15 | | | | 9,645,211 | |
Ares Corporate Opportunities Fund VI, L.P. +, a, e | | | 06/02/20 | | | | 2,843,038 | |
Avista Capital Partners II, L.P. +, a, e | | | 01/01/14 | | | | 1 | |
Bain Capital Fund XII, L.P. +, a, e | | | 06/30/17 | | | | 17,930,124 | |
Bain Capital Fund XIII, L.P. +, a, e | | | 08/07/20 | | | | 16,900,140 | |
Barings Transportation Fund, L.P. +, a, e | | | 09/23/21 | | | | 13,770,133 | |
Berkshire Fund IX, L.P. +, a, e | | | 03/18/16 | | | | 13,623,170 | |
Berkshire Fund XI-TE, L.P. +, a, e | | | 12/18/23 | | | | — | |
Caltius Partners V-A, L.P. +, a, e | | | 12/02/14 | | | | 5,681,867 | |
Carlyle Partners VII, L.P. +, a, e | | | 11/29/17 | | | | 62,121,368 | |
Carlyle Partners VIII, L.P. +, a, e | | | 09/10/21 | | | | 5,415,379 | |
Centerbridge Seaport Acquisition Fund, L.P. +, a | | | 04/27/22 | | | | 1,017,047 | |
Clayton, Dubilier & Rice Fund IX, L.P. +, a, e | | | 07/31/13 | | | | 5,926,486 | |
Clayton, Dubilier & Rice Fund X, L.P. +, a, e | | | 12/13/16 | | | | 21,937,202 | |
Clayton, Dubilier & Rice Fund XI, L.P. +, a, e | | | 05/15/20 | | | | 18,879,176 | |
Clayton, Dubilier & Rice Fund XII, L.P. +, a, e | | | 09/02/22 | | | | 5,086,014 | |
Clearlake Capital Partners V, L.P. +, a, e | | | 12/15/17 | | | | 31,445,446 | |
Clearlake Capital Partners VI, L.P. +, a, e | | | 12/10/19 | | | | 22,496,404 | |
Clearlake Capital Partners VII, L.P. +, a, e | | | 09/23/21 | | | | 9,948,073 | |
Clearlake Capital Partners VIII, L.P. +, a, e | | | 04/05/24 | | | | — | |
Crescent Mezzanine Partners VI, L.P. +, a, e | | | 03/30/12 | | | | 426,827 | |
Cressey & Company Fund VII-A L.P. +, a, e | | | 06/30/22 | | | | 823,154 | |
ECP V, LP +, a, e | | | 08/19/22 | | | | 2,656,107 | |
Frazier Healthcare Growth Buyout Fund X, L.P. +, a, e | | | 03/10/21 | | | | 10,473,735 | |
Frazier Healthcare Growth Buyout Fund XI, L.P. +, a, e | | | 09/20/24 | | | | — | |
Genstar AMBA CV, L.P. +, a | | | 04/01/23 | | | | 562,061 | |
Genstar Capital Partners IX, L.P. +, a, e | | | 02/21/19 | | | | 22,813,729 | |
Genstar Capital Partners VI, L.P. +, a, e | | | 09/01/12 | | | | 373,466 | |
Genstar Capital Partners VII, L.P. +, a, e | | | 06/26/15 | | | | 5,838,312 | |
Genstar Capital Partners VIII, L.P. +, a, e | | | 03/23/17 | | | | 33,972,360 | |
Genstar Capital Partners X, L.P. +, a, e | | | 04/01/21 | | | | 10,704,345 | |
Genstar Capital Partners XI, L.P. +, a, e | | | 04/26/23 | | | | 183,783 | |
Genstar X Opportunities Fund, L.P. +, a, e | | | 08/13/21 | | | | 2,666,576 | |
Genstar XI Opportunities Fund, L.P. +, a, e | | | 04/26/23 | | | | 585,688 | |
GI Data Infrastructure Fund II LP +, a, d, e | | | 01/27/23 | | | | 1,016,902 | |
GoldPoint Mezzanine Partners IV, L.P. +, a, e | | | 12/30/15 | | | | 6,548,247 | |
Green Equity Investors IX, L.P. +, a, e | | | 03/01/22 | | | | 5,861,939 | |
Green Equity Investors Side VIII, L.P. +, a, e | | | 10/18/19 | | | | 35,552,190 | |
Gryphon Heritage Partners, L.P. +, a, e | | | 12/17/20 | | | | 6,040,920 | |
Gryphon Partners V, L.P. +, a, e | | | 02/23/18 | | | | 8,701,054 | |
Gryphon Partners VI, L.P. +, a, e | | | 12/17/20 | | | | 8,651,303 | |
Harvest Partners IX, L.P. +, a, e | | | 09/24/21 | | | | 4,455,666 | |
Harvest Partners VII, L.P. +, a, e | | | 12/14/15 | | | | 10,057,856 | |
Harvest Partners VIII, L.P. +, a, e | | | 12/19/18 | | | | 20,982,680 | |
Hellman & Friedman Capital Partners VII, L.P. +, a, e | | | 06/30/14 | | | | 189,206 | |
Hellman & Friedman Capital Partners X, L.P. +, a, e | | | 05/10/21 | | | | 12,523,912 | |
Hellman & Friedman Capital Partners XI, LP +, a, e | | | 03/31/23 | | | | — | |
HGGC Fund IV, L.P. +, a, e | | | 04/08/22 | | | | 2,032,984 | |
Icon Partners IV, L.P. +, a, e | | | 09/01/21 | | | | 5,427,623 | |
Icon Partners V, L.P. +, a, e | | | 12/27/21 | | | | 9,375,656 | |
Insight Partners XII (Co-Investors), L.P. +, a, e | | | 05/14/21 | | | | 2,035,595 | |
Insight Partners XIII, L.P. +, a, e | | | 12/23/22 | | | | 277,726 | |
Insight Venture Partners X, L.P. +, a, e | | | 07/06/18 | | | | 14,769,963 | |
The accompanying notes are an integral part of these Consolidated Financial Statements.
23
Partners Group Private Equity (Master Fund), LLC
(a Delaware Limited Liability Company)
Consolidated Schedule of Investments –
September 30, 2024 (Unaudited) (continued)
Private Equity Investments (continued)
Primary Investments *, c (continued) | | Acquisition
Date | | | Fair
Value | |
North America (continued) |
Insight Venture Partners XI, L.P. +, a, e | | | 12/17/19 | | | $ | 7,503,164 | |
Insight Ventures Partners XII, L.P. +, a, e | | | 05/14/21 | | | | 5,930,442 | |
Jade Equity Investors II, L.P. +, a, e | | | 03/01/22 | | | | 11,430 | |
K6 Private Investors, L.P. +, a, e | | | 06/28/24 | | | | — | |
Khosla Ventures VIII, L.P. +, a, e | | | 01/06/23 | | | | 772,809 | |
KKR Americas Fund XII L.P. +, a, e | | | 01/31/18 | | | | 30,681,882 | |
KKR Associates Indigo Equity Partners, L.P. +, a | | | 10/01/22 | | | | 1,760,025 | |
KKR North America Fund XI, L.P. +, a, e | | | 02/01/12 | | | | 3,668,795 | |
KKR North America Fund XIII, SCSP +, a, e | | | 04/06/21 | | | | 7,747,589 | |
Kleiner Perkins Caufield & Byers XIX LLC +, a, e | | | 03/05/20 | | | | 11,136,906 | |
Kleiner Perkins Select Fund III, LLC +, a, e | | | 06/28/24 | | | | — | |
Kleiner Perkins XXI, LLC +, a, e | | | 06/28/24 | | | | — | |
Kohlberg TE Investors IX, L.P. +, a, e | | | 12/20/19 | | | | 26,576,421 | |
Kohlberg TE Investors VIII, L.P. +, a, e | | | 08/04/16 | | | | 26,345,639 | |
Kohlberg TE Investors X, L.P. +, a, e | | | 10/06/23 | | | | 10,566 | |
Lee Equity Partners IV, L.P. +, a, e | | | 06/28/24 | | | | 3,080,998 | |
Leeds Equity Partners VI, L.P. +, a, e | | | 11/25/16 | | | | 17,345,076 | |
Lerer Hippeau Select Fund III, L.P. +, a, e | | | 12/20/19 | | | | 6,513,080 | |
Lerer Hippeau VII, L.P. +, a, e | | | 12/20/19 | | | | 3,246,318 | |
Lux Total Opportunities, L.P. +, a, e | | | 05/28/21 | | | | 2,948,233 | |
Lux Ventures VII, L.P. +, a, e | | | 05/28/21 | | | | 1,054,547 | |
Lux Ventures VIII, L.P. +, a, e | | | 04/03/23 | | | | 1,125,464 | |
Madison Dearborn Capital Partners VIII, L.P. +, a, e | | | 03/20/20 | | | | 8,732,401 | |
Mayfield Select III, L.P. +, a, e | | | 05/01/23 | | | | — | |
Mayfield XVII, L.P. +, a, e | | | 05/01/23 | | | | 37,500 | |
Nautic Partners IX-A, L.P. +, a, e | | | 03/12/19 | | | | 7,585,836 | |
Nautic Partners VII-A, L.P. +, a, e | | | 06/27/14 | | | | 2,508,277 | |
Nautic Partners X-A, L.P. +, a, e | | | 07/19/21 | | | | 9,261,325 | |
Nautic Partners XI-A, L.P. +, a, e | | | 06/21/24 | | | | — | |
NEA 18 Venture Growth Equity, L.P. +, a, e | | | 12/22/21 | | | | 1,717,084 | |
New Enterprise Associates 14, L.P. +, a, e | | | 05/04/12 | | | | 7,370,219 | |
New Enterprise Associates 17, L.P. +, a, e | | | 06/06/19 | | | | 9,026,337 | |
New Enterprise Associates 18, L.P. +, a, e | | | 12/22/21 | | | | 1,772,740 | |
New Mountain Capital V, L.P. +, a, e | | | 06/29/17 | | | | 28,662,427 | |
New Mountain Partners VI, L.P. +, a, e | | | 10/16/20 | | | | 24,545,663 | |
New Mountain Partners VII, L.P. +, a, e | | | 04/06/23 | | | | 130,013 | |
NexPhase Capital Fund III-A, L.P. +, a, e | | | 09/01/16 | | | | 15,617,024 | |
NexPhase Capital Fund V, L.P. +, a, e | | | 08/04/23 | | | | 80,841 | |
Oak Hill Capital Partners IV, L.P. +, a, e | | | 04/28/17 | | | | 7,249,160 | |
Oak Hill Capital Partners V, L.P. +, a, e | | | 12/21/18 | | | | 35,611,813 | |
Oak Hill Capital Partners VI, L.P. +, a, e | | | 02/25/22 | | | | 3,502,995 | |
Pamlico Capital V, L.P. +, a, e | | | 02/03/20 | | | | 4,204,428 | |
PennantPark Credit Opportunities Fund II, L.P. +, a, e | | | 08/03/12 | | | | 1,045,072 | |
Revelstoke Capital Partners Fund III, L.P +, a, e | | | 02/23/22 | | | | 4,598,256 | |
Silver Lake Partners IV, L.P. +, a, e | | | 07/30/12 | | | | 15,199,355 | |
Silver Lake Partners V, L.P. +, a, e | | | 03/31/17 | | | | 46,646,064 | |
Silver Lake Partners VI, L.P. +, a, e | | | 06/04/20 | | | | 7,487,686 | |
Silver Lake Partners VII, L.P. +, a, e | | | 05/26/22 | | | | 3,360,180 | |
Spark Capital Growth Fund IV, L.P. +, a, e | | | 10/14/21 | | | | 5,331,242 | |
Spark Capital Growth Fund V, L.P. +, a, e | | | 02/29/24 | | | | — | |
Spark Capital VII, L.P. +, a, e | | | 10/14/21 | | | | 2,303,278 | |
Spark Capital VIII, L.P. +, a, e | | | 02/29/24 | | | | 80,000 | |
Sumeru Equity Partners Fund, L.P. +, a, e | | | 04/27/15 | | | | 3,568,887 | |
Summit Partners Growth Equity Fund XI, L.P. +, a, e | | | 10/01/21 | | | | 1,833,585 | |
TA Select Opportunities Fund II-B, L.P. +, a, e | | | 05/27/21 | | | | 2,281,822 | |
The accompanying notes are an integral part of these Consolidated Financial Statements.
24
Partners Group Private Equity (Master Fund), LLC
(a Delaware Limited Liability Company)
Consolidated Schedule of Investments –
September 30, 2024 (Unaudited) (continued)
Private Equity Investments (continued)
Primary Investments *, c (continued) | | Acquisition
Date | | | Fair
Value | |
North America (continued) |
TA XIII-B, L.P. +, a, e | | | 05/02/19 | | | $ | 19,269,549 | |
TA XIV-B, L.P. +, a, e | | | 05/27/21 | | | | 10,561,708 | |
TCV X, L.P. +, a, e | | | 08/31/18 | | | | 14,497,140 | |
TCV XI (A), L.P. +, a, e | | | 10/02/20 | | | | 7,972,567 | |
The Veritas Capital Fund IX, L.P. +, a, e | | | 07/01/24 | | | | — | |
Thompson Street Capital Partners IV, L.P. +, a, e | | | 12/10/15 | | | | 5,460,813 | |
Thompson Street Capital Partners V, L.P. +, a, e | | | 05/04/18 | | | | 8,871,442 | |
Thompson Street Capital Partners VI, L.P. +, a, e | | | 06/11/21 | | | | 10,631,337 | |
TPG Partners IX, L.P. +, a, e | | | 12/23/22 | | | | 849,908 | |
TPG Partners VII, L.P. +, a, e | | | 03/01/16 | | | | 6,104,074 | |
TPG Partners VIII, L.P. +, a, e | | | 01/31/19 | | | | 12,266,814 | |
Trident IX, L.P. +, a, e | | | 11/19/21 | | | | 13,696,016 | |
Trident VII, L.P. +, a, e | | | 09/22/16 | | | | 38,127,296 | |
Trident VIII, L.P. +, a, e | | | 04/05/19 | | | | 25,470,921 | |
Trident X, L.P. +, a, e | | | 05/23/24 | | | | — | |
Vista Equity Partners Fund VII, L.P. +, a, e | | | 08/31/18 | | | | 20,690,350 | |
Vista Equity Partners Fund VIII, L.P. +, a, e | | | 04/28/22 | | | | 9,532,247 | |
Vistria Fund II, L.P. +, a, e | | | 12/19/17 | | | | 12,439,156 | |
Vistria Fund III, L.P. +, a, e | | | 06/19/19 | | | | 15,974,816 | |
Vistria Fund IV, L.P. +, a, e | | | 03/31/21 | | | | 15,271,444 | |
Vistria Fund V, L.P. +, a, e | | | 10/31/23 | | | | 449,977 | |
Warburg Pincus Global Growth 14, L.P. +, a, e | | | 01/31/22 | | | | 4,978,543 | |
Warburg Pincus Global Growth, L.P. +, a, e | | | 11/20/18 | | | | 11,976,466 | |
Welsh, Carson, Anderson & Stowe XII, L.P. +, a | | | 12/19/14 | | | | 7,432,231 | |
Welsh, Carson, Anderson & Stowe XIII, L.P. +, a, e | | | 12/20/18 | | | | 19,133,427 | |
Welsh, Carson, Anderson & Stowe XIV, L.P. +, a, e | | | 01/19/22 | | | | 1,553,317 | |
West Street Offshore Infrastructure Partners IV +, a, e | | | 11/02/22 | | | | 6,153,477 | |
Windjammer Senior Equity Fund IV, L.P. +, a, e | | | 02/06/13 | | | | 4,450,422 | |
Total North America (8.36%) | | | | | | | 1,301,934,738 | |
| | | | | | | | | |
Rest of World (0.70%) |
Advent Latin American Private Equity Fund VI-H L.P. +, a, e | | | 10/17/14 | | | | 7,869,976 | |
Altra Private Equity Fund II, L.P. +, a | | | 12/07/12 | | | | 358,388 | |
Patria - Brazilian Private Equity Fund IV, L.P. +, a, e | | | 06/30/11 | | | | 4,255,102 | |
Polish Enterprise Fund VIII, L.P. +, a, e | | | 09/15/17 | | | | 96,495,134 | |
Total Rest of World (0.70%) | | | | | | | 108,978,600 | |
| | | | | | | | | |
Western Europe (4.12%) |
Adagia Capital Europe S.L.P. +, a, d, e | | | 06/01/21 | | | | 6,359,684 | |
Advent International GPE IX-C, L.P. +, a, e | | | 05/31/19 | | | | 28,521,965 | |
Advent International GPE VII-B, L.P. +, a, e | | | 07/01/12 | | | | 1,333,073 | |
Advent International GPE VIII-C, L.P +, a, e | | | 03/22/16 | | | | 8,549,822 | |
Advent International GPE X (USD) +, a, e | | | 05/31/22 | | | | 9,575,936 | |
Apax X USD L.P. +, a, e | | | 07/16/19 | | | | 21,815,827 | |
APAX XI USD L.P. +, a, e | | | 06/30/22 | | | | 3,240,115 | |
Astorg Mid-Cap +, a, e | | | 02/22/21 | | | | 3,525,496 | |
Astorg VI, FCPI +, a, e | | | 06/30/16 | | | | 3,506,804 | |
Astorg VIII S.à.r.l. +, a, e | | | 12/17/21 | | | | 8,113,759 | |
Axcel VI K/S +, a, e | | | 02/21/20 | | | | 25,643,144 | |
Axcel VII K/S +, a, e | | | 05/17/23 | | | | 289,441 | |
Bain Capital Europe Fund IV, L.P. +, a, e | | | 09/01/14 | | | | 3,559,552 | |
Bain Capital Europe Fund VI, SCSp +, a, e | | | 06/30/22 | | | | 783,316 | |
BC Partners XI, L.P. +, a, e | | | 12/18/20 | | | | 25,218,572 | |
Bregal Unternehmerkapital IV-A SCSP +, a, e | | | 05/23/24 | | | | — | |
Capvis Equity V L.P. +, a, e | | | 01/17/18 | | | | 25,285,953 | |
The accompanying notes are an integral part of these Consolidated Financial Statements.
25
Partners Group Private Equity (Master Fund), LLC
(a Delaware Limited Liability Company)
Consolidated Schedule of Investments –
September 30, 2024 (Unaudited) (continued)
Private Equity Investments (continued)
Primary Investments *, c (continued) | | Acquisition
Date | | | Fair
Value | |
Western Europe (continued) |
Carlyle Europe Partners IV, L.P. +, a, e | | | 08/27/13 | | | $ | 566,832 | |
Carlyle Europe Partners V, L.P. +, a, e | | | 04/23/18 | | | | 7,850,888 | |
CD&R Value Building Partners I, L.P. +, a | | | 12/17/21 | | | | 8,079,510 | |
Charterhouse Capital Partners XI +, a, e | | | 11/26/21 | | | | 4,680,935 | |
CVC Capital Partners IX L.P. +, a, e | | | 05/12/23 | | | | — | |
CVC Capital Partners VI (A) L.P. +, a, e | | | 07/05/13 | | | | 6,972,273 | |
CVC Capital Partners VIII, L.P. +, a, e | | | 06/19/20 | | | | 2,013,919 | |
DPE Deutschland IV +, a, e | | | 08/24/20 | | | | 3,961,895 | |
EQT IX, L.P. (USD) +, a, e | | | 05/15/20 | | | | 22,161,867 | |
EQT Mid-Market (No.1) Feeder L.P. +, a, e | | | 07/01/16 | | | | 11,502,232 | |
EQT X, L.P. (USD) +, a, e | | | 04/28/22 | | | | 4,210,372 | |
Exponent Private Equity Partners V, L.P. +, a, e | | | 09/14/23 | | | | 1,116,366 | |
Gilde Buy-Out Fund VI C.V. +, a, e | | | 06/28/19 | | | | 32,430,329 | |
Graphite Capital Partners IX L.P. +, a, e | | | 04/11/18 | | | | 14,509,212 | |
Hg Genesis 10 L.P. +, a, e | | | 04/14/22 | | | | 3,417,106 | |
Hg Mercury 4 L.P. +, a, e | | | 01/12/23 | | | | 818,446 | |
Hg Saturn 3 L.P. +, a, e | | | 02/25/22 | | | | 13,921,612 | |
Hg Saturn I L.P. +, a, e | | | 06/28/18 | | | | 15,153,407 | |
HgCapital 8 L.P. +, a, e | | | 12/19/16 | | | | 24,570,669 | |
HgCapital Mercury 2 +, a, e | | | 02/15/17 | | | | 15,850,188 | |
Index Ventures Growth III (Jersey) L.P. +, a | | | 03/18/15 | | | | 18,233,615 | |
KKR European Fund V (EUR) SCSp +, a, e | | | 11/05/18 | | | | 33,930,780 | |
KKR European Fund VI (USD) +, a, e | | | 11/01/21 | | | | 3,455,962 | |
Livingbridge 7 L.P. +, a, e | | | 09/04/20 | | | | 14,032,437 | |
MCH Iberian Capital Fund V FCR +, a, e | | | 12/10/21 | | | | 16,642,803 | |
Nordic Capital Evo GP, SCSp +, a, e | | | 06/30/21 | | | | 5,815,842 | |
Nordic Capital IX, L.P. +, a, e | | | 07/18/17 | | | | 38,617,011 | |
Nordic Capital X, L.P. +, a, e | | | 09/30/20 | | | | 25,283,676 | |
Nordic Capital XI, L.P. +, a, e | | | 05/01/22 | | | | 9,181,971 | |
Oakley Capital Fund V, SCSp +, a, e | | | 04/28/22 | | | | 4,141,505 | |
PAI Europe VI-1, L.P. +, a, e | | | 03/12/15 | | | | 4,234,695 | |
PAI Partners VIII-1 SCSp +, a, e | | | 12/17/21 | | | | 10,154,231 | |
Permira VII L.P. +, a, e | | | 06/21/19 | | | | 30,631,731 | |
Permira VIII SCSp +, a, e | | | 02/10/22 | | | | 11,527,836 | |
ProA Capital Iberian Buyout Fund IV, F.C.R. +, a, e | | | 05/31/23 | | | | 1,964,912 | |
Rivean Capital Fund VII Cooperatief U.A. +, a, e | | | 05/24/23 | | | | 2,729,920 | |
Sixth Cinven Fund (No.3) L.P. +, a, e | | | 05/01/16 | | | | 5,494,825 | |
The Eighth Cinven Fund, L.P. +, a, e | | | 07/05/22 | | | | 860,651 | |
The Paragon Partners Fund IV GmbH & Co. KG +, a, e | | | 04/29/22 | | | | 18,364 | |
The Seventh Cinven Fund, L.P. +, a, e | | | 04/16/19 | | | | 35,615,043 | |
Vitruvian Investment Partnership V +, a, e | | | 10/07/22 | | | | 465,204 | |
Total Western Europe (4.12%) | | | | | | | 642,143,531 | |
| | | | | | | | | |
Total Primary Investments (14.05%) | | | | | | $ | 2,188,639,469 | |
| | | | | | | | | |
Total Private Equity Investments (Cost $10,359,867,097)(93.33%) | | | | | | $ | 14,540,382,998 | |
| | | | | | | | | |
Total Investments (Cost $11,234,876,731)(99.56%) | | | | | | | 15,510,604,900 | |
| | | | | | | | | |
Other Assets in Excess of Liabilities (0.44%) | | | | | | | 67,822,795 | |
| | | | | | | | | |
Net Assets (100.00%) | | | | | | $ | 15,578,427,695 | |
* | Direct Investments are private investments directly into the equity or debt of selected operating companies, often together with the management of the company. Primary Investments are investments in newly established private equity partnerships |
The accompanying notes are an integral part of these Consolidated Financial Statements.
26
Partners Group Private Equity (Master Fund), LLC
(a Delaware Limited Liability Company)
Consolidated Schedule of Investments –
September 30, 2024 (Unaudited) (continued)
where underlying portfolio companies are not known as of the time of investment. Secondary Investments are portfolios of assets on the secondary market.
** | The Fair Value of any Direct Investment may not necessarily reflect the current or expected future performance of such Direct Investment or the Fair Value of the Fund’s interest in such Direct Investment. Furthermore, the Fair Value of any Direct Investment has not been calculated, reviewed, verified or in any way approved by such Direct Investment or its general partner, manager or sponsor (including any of its affiliates). Please see below for further details regarding the valuation policy of the Fund. |
*** | Security exempt from registration under Rule 144A of the Securities Act of 1933, as amended (the “Securities Act”). These securities may be sold in certain transactions in reliance on an exemption from registration (normally to “qualified institutional buyers” in accordance with Rule 144(a)(1) under the Securities Act). At September 30, 2024, the aggregate value of these securities is $203,133,220 or 1.30% of the Fund’s net assets. |
# | As of September 30, 2024, 1 month EURIBOR was 3.35%. |
## | As of September 30, 2024, 3 month EURIBOR was 3.28%. |
### | As of September 30, 2024, 6 month EURIBOR was 3.11%. |
#### | As of September 30, 2024, 12 month EURIBOR was 2.75%. |
+ | The fair value of the investment was determined using significant unobservable inputs. |
† | As of September 30, 2024, 1 month Bank Bill Swap Rate was 4.30%. |
†† | As of September 30, 2024, 3 month Bank Bill Swap Rate was 4.43%. |
> | As of September 30, 2024, 1 month Sterling Overnight Interbank Average Rate was 4.95%. |
>> | As of September 30, 2024, 3 month Sterling Overnight Interbank Average Rate was 5.04%. |
>>> | As of September 30, 2024, 6 month Sterling Overnight Interbank Average Rate was 5.12%. |
¤¤ | As of September 30, 2024, 3 month Stockholm Interbank Offered Rate was 3.08%. |
v | As of September 30, 2024, 1 month Secured Overnight Financing Rate was 4.84%. |
vv | As of September 30, 2024, 3 month Secured Overnight Financing Rate was 4.59%. |
vvv | As of September 30, 2024, 6 month Secured Overnight Financing Rate was 4.26%. |
vvvv | As of September 30, 2024, 12 month Secured Overnight Financing Rate was 3.78%. |
a | Private equity investments are generally issued in private placement transactions and as such are generally restricted as to resale. Each investment may have been purchased on various dates and for different amounts. The date of the first purchase is reflected under Acquisition Date as shown in the Schedule of Investments. Total fair value of restricted investments as of September 30, 2024 was $14,540,382,998, or 93.33% of net assets. As of September 30, 2024, the aggregate cost of each investment restricted to resale was $11,186,881, $10,621,500, $27,816,585, $8,092,052, $5,433,284, $1,475,400, $62,095,071, $1,212,540, $23,038,255, $11,912,656, $1,705,085, $3,371,095, $18,518,292, $126,985,067, $24,784,703, $27,959,148, $9,524,381, $44,578,381, $869,932, $150,000, $4,168,272, $4,205,000, $17,127,003, $56,634, $122,578,028, $94,154, $8,436,000, $33,244,066, $2,154,218, $1,348,750, $3,602,070, $27,230, $120,019,757, $41,227,776, $8,508,422, $100,002,943, $7,120,999, $92,461,330, $64,101,828, $41,233,336, $94,861,790, $103,097,510, $56,985,983, $20,475,870, $10,422,000, $47,761,620, $1,816,000, $15,617,280, $62,631,543, $122,197,759, $151,702,453, $250,000, $1, $56,024,281, $716,331, $9,683,863, $187,500,000, $61,566,000, $252,000, $70,593,765, $4,907,333, $11,341,677, $317,827, $172,633, $37,921,966, $22,737,472, $60,534,545, $15,306,665, $45,225,381, $40,498,701, $32,126,730, $44,310,850, $1,120,924, $13,722,831, $2,361,000, $6,996,130, $3, $1, $1,201,845, $39,475,202, $7,491,892, $28,417,946, $55,011,041, $14,874,473, $90,509,738, $178,485,000, $32,334,585, $301,146, $54,353,000, $5,013,868, $71,817,900, $4,632,829, $3,620,372, $22,340,802, $68,399,200, $10,934,833, $3,088,000, $1,441,200, $7,070,769, $6,609,817, $773,331, $143,839, $101,309, $69,246,328, $17,408,823, $6,014,065, $6,979,844, $9,728,692, $12,018,364, $3,796,283, $264,490, $21,849,512, $402,797, $13,873,440, $22,216,875, $149,423,941, $17,247, $83,976,881, $78,514,453, $25,494,638, $14,672,982, $2,323,442, $465,142, $60,730,492, $47,337,703, $711,598, $32,709,803, $65,522,973, $7,105,232, $745,309, $4,660,720, $1,045,423, $1, $37,402,098, $19,465,958, $6,508,042, $52,429,641, $11,664,382, $42,821,436, $92,759,254, $21,615,986, $48,949,162, $17,052,864, $17,052,864, $3,377,868, $18,476,616, $10,370,882, $7,793, $1,667,819, $14,746,472, $40,092,414, $9,770,324, $64,619,159, $15,139,432, $78,775,560, $13,620, $41,647,590, $5,073,504, $51,489,677, $95,734,502, $93,661,837, $0, $4,759,308, $48,680,396, $1,453,837, $97,483,897, $6,616,483, $115,820,054, $128,682, $1,135,700, $102,497,783, $119,065, $5,814,436, $4,648,315, $517,991, $328,227, $580,738, $6,069,028, $398,214, $48,302,049, $1,063,586, $1,941,291, $36,879,819, $748,547, $5,337,259, $88,079,152, $73,161,629, $1,773, $112,190,937, $88,912, $6,275,980, $26,882,335, $333,654, $849,596, $40,573, $694,245, $231,415, $77,113, $25,704, $33,400,016, $51,009,932, $312,165, $36,261,531, $2,858,842, $42,469,064, $12,156,155, $302,803, $26,591, $3,389,622, $8,834,459, $56,519,570, $34,731,898, $3,381,170, $936,729, $42,986,878, $26,331,605, $12,374,422, $3,155,502, $11,494,473, $5,467,400, $7,961,340, $966,531, $3,512,641, $2,299,785, $12,609,291, $4,607,996, $9,983,037, $4,608,754, $1,236,984, $1,639,145, $6,742,627, $6,031,767, $5,012,500, $986,014, $1,354,222, $1,532,398, $4,341,882, $8,016,225, $6,858,539, $5,004,093, $1,277,549, |
The accompanying notes are an integral part of these Consolidated Financial Statements.
27
Partners Group Private Equity (Master Fund), LLC
(a Delaware Limited Liability Company)
Consolidated Schedule of Investments –
September 30, 2024 (Unaudited) (continued)
$3,987,661, $5,006,162, $8,168,520, $1,396,500, $3,000,687, $3,447,413, $1,366,411, $3,291,922, $375,179, $6,981,727, $1,058,505, $12,528,681, $1,881,851, $4,307,497, $1,950,841, $11,146,894, $1,963,499, $2,228,507, $7,278,856, $992,749, $3,998,514, $5,426,754, $6,071,617, $18,675,725, $6,928,120, $4,351,750, $2,153,364, $3,004,204, $59,928, $7,718,421, $10,038,756, $207,851, $1,655,502, $4,090,243, $731,728, $3,426,010, $1,782,509, $2,985,328, $2,463,952, $2,980,140, $970,666, $988,391, $3,981,476, $1,412,578, $7,350, $7,952,923, $6,016,789, $7,636,438, $5,294,874, $1,684,472, $2,837,519, $3,643,092, $1,597,255, $1,395,271, $2,971,719, $1,691,937, $1,166,307, $2,888,365, $997,623, $8,591,206, $4,652,233, $7,312,688, $1,997,941, $949,513, $883,942, $1,917,410, $953,551, $2,885,933, $4,557,639, $9,776,265, $3,279,146, $1,554,893, $9,246,003, $431,488, $3,550,600, $20,695,386, $4,650,172, $4,951,364, $1,642,459, $2,556,391, $1,857,244, $4,024,073, $2,966,058, $1,551,376, $6,857,277, $13,819,981, $292,185, $19,303,934, $6,225,615, $2,033,758, $1,016,051, $1,971,634, $3,304,039, $3,835,740, $4,864,902, $2,666,060, $2,700,593, $2,939,193, $4,038,398, $3,900,000, $1,728,045, $1,791,629, $-7,145, $8,557,945, $8,461,117, $11,658,483, $3,600,000, $4,051,515, $368,233, $2,063,419, $1,376,362, $1,082,293, $200,000, $9,424,786, $1,226,121, $962,540, $3,223,085, $3,992,099, $2,487,996, $1,090,975, $1,710,982, $263,217, $2,200,000, $3,557,574, $8,237,830, $1,463,511, $3,183,008, $1,987,438, $9,703,240, $1,652,423, $2,772,737, $6,580,810, $1,492,952, $4,762,871, $10,655,673, $3,145,670, $973,940, $3,400,000, $8,438,616, $1,656,784, $4,986,054, $1,938,004, $1,927,500, $536,542, $2,544,380, $2,726,347, $438,418, $1,897,366, $1,062,349, $2,878,877, $1,427,366, $20,494, $74,016, $1,886,228, $1,840,344, $2,460,835, $1,320,913, $35,937, $5,261,141, $7,519,438, $1,296,905, $1,596,484, $1,153,677, $13,380,282, $7,174,274, $3,945,508, $888,883, $5,991,452, $10,759,493, $1,462,416, $1,787,340, $2,576,929, $1,976,092, $1,126,864, $4,402,908, $1,884,000, $1,033,622, $2,789,804, $3,075,716, $7,654,463, $5,712,325, $27,018,535, $565,277, $2,137,124, $224,118, $13,748,552, $5,759,799, $5,616,611, $1,534,749, $8,767,458, $375, $6,699,679, $1,296,558, $2,470,018, $914,871, $3,352,122, $31,737, $2,652,307, $2,353,023, $5,686,996, $1,840,028, $5,770,719, $1,117,248, $711,061, $782,759, $1,745,712, $1,268,165, $1,429,089, $4,522,488, $8,103,020, $546,540, $1,148,250, $4,625,451, $4,422,697, $3,750,953, $944,799, $2,331,007, $1,827,057, $884,436, $2,382,451, $21,323,987, $5,284,478, $6,754,051, $15,165,878, $5,203,958, $21,584,459, $962,023, $1,652,790, $10,212,960, $1,350,716, $1,895,460, $3,945,632, $6,021,475, $2,929,126, $4,680,666, $6,696,282, $3,026,016, $3,772,176, $2,293,831, $575,562, $3,806,003, $452,432, $8,220,898, $2,994,256, $4,584,556, $2,245,163, $7,109,302, $2,516,022, $2,609,738, $5,988,601, $7,677,524, $5,451,921, $419,855, $15,145,153, $2,223,505, $4,591,916, $3,912,134, $1,947,155, $3,725,511, $1,985,928, $2,686,500, $4,287,002, $13,496,067, $2,664,940, $36,213,064, $3,691,558, $5,419,001, $5,261,749, $4,354,888, $1,184,092, $2,184,033, $4,078,986, $5,223,537, $18,789,615, $1,285,237, $10,635,731, $6,246,001, $7,082,117, $8,276,496, $7,463,800, $1,045,877, $192,814, $2,607,186, $1,191,623, $6,368,000, $1,378,167, $1,362,116, $26,258,549, $1,099,231, $14,566,494, $9,262,375, $5,400,768, $8,792,874, $7,004,920, $8,039,979, $4,011,601, $3,554,594, $1,718,123, $6,159,759, $2,366,257, $4,012,257, $6,594,686, $451,829, $504,651, $3,590,799, $3,188,129, $6,567,909, $1,450,870, $9,849,895, $8,750,063, $10,215,837, $1,830,849, $1,091,999, $1,958,719, $3,238,128, $2,962,281, $1,624,060, $12,008,192, $6,413,528, $1,248,672, $1,341,675, $14,342,767, $4,367,358, $2,901,520, $8,472,421, $5,381,368, $1,135,902, $2,251,627, $2,358,313, $6,658,493, $33,801,119, $2,448,131, $7,642,924, $6,958,620, $10,142,961, $2,886,027, $6,525,034, $9,149,336, $11,946,945, $9,001,496, $6,159,366, $2,330,990, $16,453,820, $15,416,618, $5,771,515, $3,055,169, $6,382,178, $714,905, $10,691,917, $2,790,390, $2,714,442, $966,788, $11,895,594, $3,366,562, $1,367,517, $3,841,081, $5,036,210, $3,806,936, $9,948,791, $5,497,446, $5,064,392, $10,014,410, $3,077,958, $143,239, $214,056, $1,120,617, $1,147,357, $47,185,254, $4,424,286, $9,198,450, $1, $1, $31,837,313, $4,130,251, $1, $80,584, $60,994, $24,017,734, $4,857,256, $56,671,110, $800,155, $159,041, $1,419,228, $1, $111,513, $14,672,750, $1, $22,600,285, $3,577,296, $16,717, $2, $1, $1, $2,569,506, $81,784, $81,485, $768,435, $2,651,110, $1, $17,966,832, $1, $217,743, $65,354,974, $7,489,509, $1,729,254, $2,252,172, $1, $1,157,061, $20,855,892, $20,054,310, $1, $298,439, $1, $32,242,262, $74,601,748, $345,231, $19,018,947, $122,897,152, $43,450,331, $413,420, $1, $13,932,792, $3, $7,057,049, $346,868, $24,892, $13,021, $5,534,488, $202,770, $6,880,500, $42,608,694, $1,008,832, $8, $411,708, $34,314, $1, $9,327,441, $1,710,353, $532,193, $44,302,327, $415,281, $31,364,096, $380,328, $211,205, $371,302, $4, $6,568,478, $40,759,294, $2,858,751, $7,881, $264,102, $15,822,902, $1, $1,741,518, $1, $191,558, $1, $894,581, $2,762,165, $1,072,196, $3, $7,343,956, $24,792,378, $0, $4,016,292, $12,677,067, $37,039,712, $3,009,338, $1, $35,201, $1, $2,805,622, $4,805,109, $527,636, $3, $1, $1, $827,095, $2,178, $302,746, $13,681,704, $2, $332,524, $12,749,518, $14,942, $1, $20,229, $1,590,137, $2,025,967, $49,245,268, $16,749, $1,318,995, $10,827,452, $10,448,443, $43,501,855, $288,501, $8,865,086, $1, $5,694,122, $1, $1, $1, $0, $106,221, $1,453,010, $1,538,344, $13,357,265, $80,907, $1,157,013, $1, $1,047, $37,856,608, $83,196, $356,908, $34,762,236, $1, $919,119, $22,713,138, $162,378, $2,489,461, $17,212,805, $7,296,688, $5,688,697, $3,610,850, $1,968,049, $176,605, $1, $15,287,740, $796,363, $18,429,286, $7,792,402, $5,112,086, $3,930,447, $2,047,254, $34,279, $6,247,574, $3,067,538, $8,323,834, $6,774,552, $3,948,926, $2,517,343, $5,308,270, $7,678,916, $2,297,285, $3,859,334, $13,188,453, $306,818, $15,851,646, $1, $1, $6,147,550, $1,973,144, $94,819, $1,067,975, $15,272,697, $6,983,099, $4,659,307, $0, $1,068,047, $44,504,680, $5,735,294, $988,701, $40,903, $1, $17,200,229, $4,620,574, $1,054,805, $14,325,635, $8,868,058, $0, $1, $1,100,000, $2,276,813, $8,964,000, $0, $372,353, $4,352,559, $1, $1, $136,945, $10,224,685, $152,456, $2,380,631, $551,144, $994,640, $1,885,272, $4,880,756, $26,103,466, $1,518,594, $3,739,658, $7,379,750, $5,006,124, $900,652, $11,381,776, $1, $10,557,975, $0, $998,087, $5,496,717, $7,330,785, $1,625,762, $350,000, $1,495,257, $4,833,557, $6,247,377, $23,772, $0, $770,000, $6,939,657, $1,778,908, $1,913, $7,109,687, $7,402,500, $0, $0, $17,624,966, $5,359,552, $0, $3,080,998, $485,366, $4,359,398, $3,600,000, $2,925,000, $800,000, $980,000, $6,670,701, $0, $37,500, $2,441,753, $372,505, $7,555,708, $0, $1,989,000, $1, $7,709,876, $1,364,596, $156,159, $19,095,115, $130,013, $1, $123,040, $1, $22,765,771, $3,264,978, $4,250,851, $1, $4,534,908, $1, $18,878,137, $6,179,213, $3,045,583, $5,173,125, $0, $2,477,125, $80,000, $1, $1,650,003, $2,275,625, $6,487,500, $10,637,500, $4,641,867, $7,934,923, $0, $1, $1,367,402, $11,238,746,
The accompanying notes are an integral part of these Consolidated Financial Statements.
28
Partners Group Private Equity (Master Fund), LLC
(a Delaware Limited Liability Company)
Consolidated Schedule of Investments –
September 30, 2024 (Unaudited) (continued)
$802,429, $185,637, $7,740,678, $11,748,844, $5,128,715, $15,897,040, $0, $17,296,876, $8,153,868, $412,603, $12,677,067, $13,122,909, $215,071, $4,490,850, $7,184,796, $1, $10,100,239, $1,763,704, $6,060,974, $12,908, $662,130, $2,479,661, $4,737,450, $37,266,285, $5,476,103, $16,932,147, $1, $1, $8,614,257, $16,805,955, $3,157,348, $3,779,405, $1, $6,575,510, $15,252,799, $275,724, $1, $862,695, $20,165,341, $0, $15,810,801, $1, $6,209,870, $6,120,943, $3,972,881, $0, $1, $1,750,309, $3,255,634, $19,357,561, $1, $4,664,457, $1,074,466, $25,515,128, $11,089,609, $2,812,500, $891,944, $12,474,444, $1,725,934, $1, $1, $1, $24,244,055, $6,358,896, $12,618,586, $11,583,206, $4,779,770, $16,026,671, $17,926,273, $9,348,662, $3,734,699, $1, $10,129,098, $24,337,479, $10,549,200, $2,022,185, $2,805,967, $1, $1,167,391, $100,726, $28,117,156 and $806,014, respectively, totaling $10,359,867,097.
b | Represents an affiliated issuer. |
c | Investment does not issue shares. |
e | Investment has been committed to but has not been fully funded by the Fund. |
f | Security or a portion thereof is unsettled at September 30, 2024. |
g | Investment is subject to contractual sales restrictions resulting from an entity specific lock-up arrangement. The contractual sale restriction is set to expire on September 2024. |
A summary of outstanding financial instruments at September 30, 2024 is as follows:
Forward Foreign Currency Contracts | | | | | | | | | | | | | | | | |
Settlement Date | Counterparty | | Currency
Purchased | | | Currency
Sold | | | Value | | | Unrealized
Appreciation
(Depreciation) | |
October 2, 2024 | BNY Mellon | | $ | 60,071,837 | | | € | 55,700,000 | | | $ | 61,639,977 | | | $ | (1,568,140 | ) |
October 2, 2024 | Bank of America | | $ | 60,072,974 | | | € | 55,700,000 | | | $ | 61,639,977 | | | $ | (1,567,003 | ) |
October 2, 2024 | Nomura International PLC | | € | 25,700,000 | | | $ | 28,457,610 | | | $ | 28,440,708 | | | $ | (16,902 | ) |
October 2, 2024 | Nomura International PLC | | € | 30,000,000 | | | $ | 33,213,000 | | | $ | 33,199,270 | | | $ | (13,730 | ) |
October 2, 2024 | Nomura International PLC | | € | 55,700,000 | | | $ | 61,609,770 | | | $ | 61,639,977 | | | $ | 30,207 | |
October 9, 2024 | BNY Mellon | | $ | 60,125,532 | | | € | 55,700,000 | | | $ | 61,601,248 | | | $ | (1,475,716 | ) |
October 9, 2024 | BNY Mellon | | $ | 60,133,163 | | | € | 55,700,000 | | | $ | 61,601,248 | | | $ | (1,468,085 | ) |
October 9, 2024 | Nomura International PLC | | € | 50,700,000 | | | $ | 56,071,665 | | | $ | 56,071,513 | | | $ | (152 | ) |
October 9, 2024 | Nomura International PLC | | € | 55,700,000 | | | $ | 61,598,630 | | | $ | 61,601,248 | | | $ | 2,618 | |
October 9, 2024 | Nomura International PLC | | € | 5,000,000 | | | $ | 5,534,000 | | | $ | 5,529,735 | | | $ | (4,265 | ) |
October 16, 2024 | Bank of America | | $ | 60,104,906 | | | € | 55,700,000 | | | $ | 61,623,078 | | | $ | (1,518,172 | ) |
October 16, 2024 | Bank of America | | $ | 60,104,906 | | | € | 55,700,000 | | | $ | 61,623,078 | | | $ | (1,518,172 | ) |
October 16, 2024 | Nomura International PLC | | € | 55,700,000 | | | $ | 61,593,060 | | | $ | 61,623,078 | | | $ | 30,018 | |
October 16, 2024 | Nomura International PLC | | € | 35,000,000 | | | $ | 38,741,500 | | | $ | 38,721,862 | | | $ | (19,638 | ) |
October 16, 2024 | Nomura International PLC | | € | 20,700,000 | | | $ | 22,914,900 | | | $ | 22,901,216 | | | $ | (13,684 | ) |
October 23, 2024 | Barclays | | $ | 60,173,958 | | | € | 55,700,000 | | | $ | 61,697,929 | | | $ | (1,523,971 | ) |
October 23, 2024 | Barclays | | $ | 60,173,958 | | | € | 55,700,000 | | | $ | 61,697,929 | | | $ | (1,523,971 | ) |
October 23, 2024 | Nomura International PLC | | € | 10,000,000 | | | $ | 11,061,000 | | | $ | 11,076,827 | | | $ | 15,827 | |
October 23, 2024 | Nomura International PLC | | € | 15,700,000 | | | $ | 17,390,890 | | | $ | 17,390,619 | | | $ | (271 | ) |
October 23, 2024 | Nomura International PLC | | € | 40,000,000 | | | $ | 44,304,000 | | | $ | 44,307,310 | | | $ | 3,310 | |
October 23, 2024 | Nomura International PLC | | € | 45,700,000 | | | $ | 50,644,740 | | | $ | 50,621,101 | | | $ | (23,639 | ) |
The accompanying notes are an integral part of these Consolidated Financial Statements.
29
Partners Group Private Equity (Master Fund), LLC
(a Delaware Limited Liability Company)
Consolidated Schedule of Investments –
September 30, 2024 (Unaudited) (continued)
Forward Foreign Currency Contracts | | | | | | | | | | | | | | | | |
Settlement Date | Counterparty | | Currency
Purchased | | | Currency
Sold | | | Value | | | Unrealized
Appreciation
(Depreciation) | |
October 29, 2024 | Bank of America | | $ | 60,142,704 | | | € | 55,700,000 | | | $ | 61,869,858 | | | $ | (1,727,154 | ) |
October 29, 2024 | Bank of America | | $ | 60,142,704 | | | € | 55,700,000 | | | $ | 61,869,858 | | | $ | (1,727,154 | ) |
October 29, 2024 | Bank of America | | € | 40,700,000 | | | $ | 45,467,716 | | | $ | 45,208,317 | | | $ | (259,399 | ) |
October 29, 2024 | Nomura International PLC | | € | 55,700,000 | | | $ | 61,654,330 | | | $ | 61,869,859 | | | $ | 215,529 | |
October 29, 2024 | Nomura International PLC | | € | 15,000,000 | | | $ | 16,624,500 | | | $ | 16,661,542 | | | $ | 37,042 | |
November 5, 2024 | BNY Mellon | | $ | 12,693,767 | | | | zl50,000,000 | | | $ | 13,024,532 | | | $ | (330,765 | ) |
November 5, 2024 | BNY Mellon | | $ | 76,769,980 | | | € | 70,000,000 | | | $ | 78,237,049 | | | $ | (1,467,069 | ) |
November 5, 2024 | Bank of America | | $ | 10,736,439 | | | | zl42,280,000 | | | $ | 11,013,544 | | | $ | (277,105 | ) |
November 5, 2024 | Barclays | | $ | 83,752,504 | | | € | 76,360,000 | | | $ | 85,345,444 | | | $ | (1,592,940 | ) |
November 6, 2024 | BNY Mellon | | $ | 12,693,738 | | | | zl50,000,000 | | | $ | 13,024,104 | | | $ | (330,366 | ) |
November 6, 2024 | Bank of America | | $ | 80,248,003 | | | € | 73,180,000 | | | $ | 81,794,108 | | | $ | (1,546,105 | ) |
November 6, 2024 | Bank of America | | $ | 80,248,003 | | | € | 73,180,000 | | | $ | 81,794,108 | | | $ | (1,546,105 | ) |
November 6, 2024 | Bank of America | | $ | 12,695,598 | | | | zl50,000,000 | | | $ | 13,024,104 | | | $ | (328,506 | ) |
November 13, 2024 | Bank of America | | $ | 81,567,514 | | | € | 74,360,000 | | | $ | 83,133,745 | | | $ | (1,566,231 | ) |
November 13, 2024 | Bank of America | | $ | 12,689,534 | | | | zl50,000,000 | | | $ | 13,021,107 | | | $ | (331,573 | ) |
November 13, 2024 | Bank of America | | $ | 12,693,464 | | | | zl50,000,000 | | | $ | 13,021,107 | | | $ | (327,643 | ) |
November 13, 2024 | Barclays | | $ | 79,005,557 | | | € | 72,000,000 | | | $ | 80,495,288 | | | $ | (1,489,731 | ) |
November 20, 2024 | Bank of America | | $ | 12,689,032 | | | | zl50,000,000 | | | $ | 13,018,127 | | | $ | (329,095 | ) |
November 20, 2024 | Bank of America | | $ | 12,690,381 | | | | zl50,000,000 | | | $ | 13,018,127 | | | $ | (327,746 | ) |
November 20, 2024 | Barclays | | $ | 59,292,243 | | | € | 54,000,000 | | | $ | 60,386,586 | | | $ | (1,094,343 | ) |
November 20, 2024 | Barclays | | $ | 59,283,576 | | | € | 54,000,000 | | | $ | 60,386,586 | | | $ | (1,103,010 | ) |
November 20, 2024 | Barclays | | $ | 42,105,186 | | | € | 38,360,000 | | | $ | 42,896,841 | | | $ | (791,655 | ) |
November 27, 2024 | Bank of America | | $ | 63,189,933 | | | € | 57,540,000 | | | $ | 64,361,213 | | | $ | (1,171,280 | ) |
November 27, 2024 | Barclays | | $ | 97,508,328 | | | € | 88,820,000 | | | $ | 99,349,373 | | | $ | (1,841,045 | ) |
December 3, 2024 | BNY Mellon | | $ | 65,372,792 | | | | zl254,800,000 | | | $ | 66,317,186 | | | $ | (944,394 | ) |
December 3, 2024 | Bank of America | | $ | 74,333,259 | | | | zl289,600,000 | | | $ | 75,374,635 | | | $ | (1,041,376 | ) |
December 3, 2024 | Bank of America | | $ | 65,417,756 | | | | zl254,800,000 | | | $ | 66,317,186 | | | $ | (899,430 | ) |
December 3, 2024 | Bank of America | | $ | 66,205,170 | | | € | 60,000,000 | | | $ | 67,130,809 | | | $ | (925,639 | ) |
December 3, 2024 | Barclays | | $ | 81,245,371 | | | £ | 63,250,000 | | | $ | 84,788,224 | | | $ | (3,542,853 | ) |
December 3, 2024 | Barclays | | $ | 60,299,432 | | | € | 54,500,000 | | | $ | 60,977,152 | | | $ | (677,720 | ) |
December 4, 2024 | Barclays | | $ | 86,605,652 | | | | Fr.74,500,000 | | | $ | 88,921,132 | | | $ | (2,315,480 | ) |
December 4, 2024 | Barclays | | $ | 60,305,024 | | | € | 54,500,000 | | | $ | 60,980,345 | | | $ | (675,321 | ) |
December 4, 2024 | Barclays | | $ | 66,383,130 | | | € | 60,000,000 | | | $ | 67,134,325 | | | $ | (751,195 | ) |
December 10, 2024 | BNY Mellon | | $ | 86,652,089 | | | | Fr.74,500,000 | | | $ | 88,977,838 | | | $ | (2,325,749 | ) |
December 10, 2024 | BNY Mellon | | $ | 99,607,770 | | | € | 90,000,000 | | | $ | 100,724,850 | | | $ | (1,117,080 | ) |
December 10, 2024 | Barclays | | $ | 81,228,971 | | | £ | 63,250,000 | | | $ | 84,781,357 | | | $ | (3,552,386 | ) |
December 10, 2024 | Barclays | | $ | 98,810,479 | | | € | 89,500,000 | | | $ | 100,165,267 | | | $ | (1,354,788 | ) |
December 11, 2024 | BNY Mellon | | $ | 82,597,806 | | | | Fr.71,000,000 | | | $ | 84,806,769 | | | $ | (2,208,963 | ) |
December 11, 2024 | BNY Mellon | | $ | 4,071,296 | | | | Fr.3,500,000 | | | $ | 4,180,615 | | | $ | (109,319 | ) |
December 11, 2024 | Bank of America | | $ | 99,371,844 | | | € | 90,000,000 | | | $ | 100,727,997 | | | $ | (1,356,153 | ) |
December 11, 2024 | Barclays | | $ | 81,237,016 | | | £ | 63,250,000 | | | $ | 84,780,465 | | | $ | (3,543,449 | ) |
December 11, 2024 | Barclays | | $ | 98,862,783 | | | € | 89,500,000 | | | $ | 100,168,397 | | | $ | (1,305,614 | ) |
December 18, 2024 | Bank of America | | $ | 8,150,446 | | | | Fr.7,000,000 | | | $ | 8,367,643 | | | $ | (217,197 | ) |
December 18, 2024 | Bank of America | | $ | 99,443,304 | | | € | 90,000,000 | | | $ | 100,757,655 | | | $ | (1,314,351 | ) |
December 18, 2024 | Barclays | | $ | 81,248,180 | | | £ | 63,250,000 | | | $ | 84,773,945 | | | $ | (3,525,765 | ) |
December 18, 2024 | Barclays | | $ | 99,093,344 | | | € | 89,500,000 | | | $ | 100,197,890 | | | $ | (1,104,546 | ) |
December 18, 2024 | Barclays | | $ | 78,762,392 | | | | Fr.67,500,000 | | | $ | 80,687,983 | | | $ | (1,925,591 | ) |
January 7, 2025 | Bank of America | | $ | 45,584,594 | | | € | 40,700,000 | | | $ | 45,606,784 | | | $ | (22,190 | ) |
June 11, 2025 | Nomura International PLC | | $ | 33,490,800 | | | € | 30,000,000 | | | $ | 33,792,142 | | | $ | (301,342 | ) |
The accompanying notes are an integral part of these Consolidated Financial Statements.
30
Partners Group Private Equity (Master Fund), LLC
(a Delaware Limited Liability Company)
Consolidated Schedule of Investments –
September 30, 2024 (Unaudited) (continued)
Forward Foreign Currency Contracts | | | | | | | | | | | | | | | | |
Settlement Date | Counterparty | | Currency
Purchased | | | Currency
Sold | | | Value | | | Unrealized
Appreciation
(Depreciation) | |
June 11, 2025 | Nomura International PLC | | $ | 62,126,109 | | | € | 55,700,000 | | | $ | 62,740,743 | | | $ | (614,634 | ) |
September 10, 2025 | Nomura International PLC | | $ | 28,771,150 | | | € | 25,700,000 | | | $ | 29,041,835 | | | $ | (270,685 | ) |
September 10, 2025 | Nomura International PLC | | $ | 62,231,215 | | | € | 55,700,000 | | | $ | 62,942,810 | | | $ | (711,595 | ) |
September 10, 2025 | Nomura International PLC | | $ | 5,592,900 | | | € | 5,000,000 | | | $ | 5,650,162 | | | $ | (57,262 | ) |
December 10, 2025 | Nomura International PLC | | $ | 56,813,913 | | | € | 50,700,000 | | | $ | 57,508,779 | | | $ | (694,866 | ) |
December 10, 2025 | Nomura International PLC | | $ | 39,238,850 | | | € | 35,000,000 | | | $ | 39,700,340 | | | $ | (461,490 | ) |
March 11, 2026 | Nomura International PLC | | $ | 62,576,165 | | | € | 55,700,000 | | | $ | 63,399,295 | | | $ | (823,130 | ) |
March 11, 2026 | Nomura International PLC | | $ | 23,268,870 | | | € | 20,700,000 | | | $ | 23,561,318 | | | $ | (292,448 | ) |
March 11, 2026 | Nomura International PLC | | $ | 11,228,500 | | | € | 10,000,000 | | | $ | 11,382,279 | | | $ | (153,779 | ) |
June 10, 2026 | Nomura International PLC | | $ | 45,076,000 | | | € | 40,000,000 | | | $ | 45,664,352 | | | $ | (588,352 | ) |
June 10, 2026 | Nomura International PLC | | $ | 51,526,978 | | | € | 45,700,000 | | | $ | 52,171,522 | | | $ | (644,544 | ) |
September 9, 2026 | Nomura International PLC | | $ | 62,872,767 | | | € | 55,700,000 | | | $ | 63,759,357 | | | $ | (886,590 | ) |
September 9, 2026 | Nomura International PLC | | $ | 17,735,505 | | | € | 15,700,000 | | | $ | 17,971,668 | | | $ | (236,163 | ) |
September 9, 2026 | Nomura International PLC | | $ | 16,950,450 | | | € | 15,000,000 | | | $ | 17,170,384 | | | $ | (219,934 | ) |
| | | | | | | | | | | | | | | | $ | (77,140,343 | ) |
Legend:
£ - British Pound
€ - Euro
BBSY - Bank Bill Swap Rate
E - EURIBOR
Fr. - Swiss Franc
I - Indian Rupee
PIK - Payment-in-kind
S - Sterling Overnight Interbank Average Rate
SF - Secured Overnight Financing Rate
SR - Stockholm Interbank Offered Rate
zl - Polish Zloty
The accompanying notes are an integral part of these Consolidated Financial Statements.
31
Partners Group Private Equity (Master Fund), LLC
(a Delaware Limited Liability Company)
Consolidated Statement of Assets and Liabilities –
September 30, 2024 (Unaudited)
Assets | | | | |
Unaffiliated Private Equity Investments, at fair value (cost $7,049,210,373) | | $ | 10,049,104,035 | |
Affiliated Private Equity Investments, at fair value (cost of $3,310,656,724) | | | 4,491,278,963 | |
Common stocks, at fair value (cost $548,963,841) | | | 631,566,807 | |
High Yield Bonds, at fair value (cost $127,615,976) | | | 136,902,759 | |
Asset-Backed Securities, at fair value (cost $97,252,710) | | | 99,666,385 | |
Floating Rate Loans, at fair value (cost $101,177,107) | | | 102,085,951 | |
Cash and cash equivalents | | | 542,192,148 | |
Deposit for investments | | | 9,402,800 | |
Investment sales receivable | | | 63,493,802 | |
Unaffiliated dividends and interest receivable | | | 36,493,533 | |
Affiliated interest receivable | | | 204,744 | |
Due from broker | | | 138,000,000 | |
Unrealized appreciation on forward foreign currency contracts | | | 334,551 | |
Other receivable | | | 17,671,520 | |
Receivable for fund units sold | | | 244,584 | |
Prepaid assets | | | 367,902 | |
Total Assets | | $ | 16,319,010,484 | |
| | | | | |
Liabilities | | | | |
Cash overdraft | | | 9,452,774 | |
Investment purchases payable | | | 214,796,306 | |
Distribution, servicing and transfer agency fees payable | | | 17,221,358 | |
Unrealized depreciation on forward foreign currency contracts | | | 77,474,894 | |
Repurchase amounts payable for tender offers | | | 315,678,232 | |
Incentive fee payable | | | 34,259,346 | |
Management fees payable | | | 21,544,679 | |
Dividends payable | | | 47,403 | |
Professional fees payable | | | 1,304,634 | |
Line of credit fees payable | | | 6,147,533 | |
Interest expense payable | | | 3,096,533 | |
Accounting and administration fees payable | | | 8,870,109 | |
Custodian fees payable | | | 346,380 | |
Deferred tax liability, net | | | 30,143,013 | |
Other payable | | | 199,595 | |
Total Liabilities | | $ | 740,582,789 | |
| | | | | |
Commitments and contingencies (See note 11) | | | | |
| | | | | |
Net Assets | | $ | 15,578,427,695 | |
| | | | | |
Net Assets consists of: | | | | |
Paid-in capital | | $ | 12,285,195,309 | |
Distributable earnings (accumulated loss) | | | 3,293,232,386 | |
Total Net Assets | | $ | 15,578,427,695 | |
The accompanying notes are an integral part of these Consolidated Financial Statements.
32
Partners Group Private Equity (Master Fund), LLC
(a Delaware Limited Liability Company)
Consolidated Statement of Assets and Liabilities –
September 30, 2024 (Unaudited) (continued)
| | | | | |
Class A Units | | | | |
Net assets | | $ | 8,455,457,210 | |
Units outstanding | | | 4,107,343,591 | |
Net asset value per unit | | $ | 2.06 | |
Class I Units | | | | |
Net assets | | $ | 7,122,970,485 | |
Units outstanding | | | 3,310,295,883 | |
Net asset value per unit | | $ | 2.15 | |
The accompanying notes are an integral part of these Consolidated Financial Statements.
33
Partners Group Private Equity (Master Fund), LLC
(a Delaware Limited Liability Company)
Consolidated Statement of Operations –
For the Six Months Ended September 30, 2024 (Unaudited)
Investment Income | | | | |
Dividends from unaffiliated investments (net of $343,789 withholding tax) | | $ | 8,192,984 | |
Dividends from affiliated investments | | | 5,149,350 | |
Interest from unaffiliated investments | | | 109,857,321 | |
Interest from affiliated investments | | | 1,627,818 | |
Transaction fee income from unaffiliated issuers | | | 2,087,886 | |
Transaction fee income from affiliated issuers | | | 4,191,618 | |
Other fee income | | | 5,461,307 | |
Total Investment Income | | | 136,568,284 | |
| | | | | |
Operating Expenses | | | | |
Management fees | | | 122,614,341 | |
Incentive fees | | | 51,026,837 | |
Line of credit fees | | | 6,777,100 | |
Accounting and administration fees | | | 5,629,494 | |
Professional fees | | | 1,649,465 | |
Board of Managers’ fees | | | 240,000 | |
Custodian fees | | | 232,456 | |
Insurance expense | | | 195,240 | |
Distribution and servicing fees | | | | |
Class A Units | | | 28,920,054 | |
Transfer agency fees | | | | |
Class A Units | | | 635,339 | |
Class I Units | | | 424,847 | |
Other expenses | | | 302,250 | |
Total Expenses | | | 218,647,423 | |
| | | | | |
Net Investment Loss | | | (82,079,139 | ) |
| | | | | |
Net Realized Gain (Loss) and Change in Unrealized Appreciation (Depreciation) on Investments, Forward Foreign Currency Contracts and Foreign Currency | | | | |
Net realized gain from unaffiliated investments | | | 116,328,399 | |
Net realized gain from affiliated investments | | | 69,808,707 | |
Net realized gain on foreign currency transactions | | | 1,773,911 | |
Net realized gain on forward foreign currency contracts | | | 2,439,027 | |
Net realized gain distributions from primary and secondary investments | | | 96,218,629 | |
Net change in accumulated unrealized appreciation (depreciation) on: | | | | |
Unaffiliated investments | | | 142,268,926 | |
Affiliated investments | | | 190,587,666 | |
Foreign currency translation | | | (1,350,926 | ) |
Forward foreign currency contracts | | | (106,371,069 | ) |
Deferred income tax expense on unrealized appreciation | | | (261,198 | ) |
| | | | | |
Net Realized Gain (Loss) and Change in Unrealized Appreciation (Depreciation) on Investments, Forward Foreign Currency Contracts and Foreign Currency | | | 511,442,072 | |
| | | | | |
Net Increase (Decrease) in Net Assets From Operations | | $ | 429,362,933 | |
The accompanying notes are an integral part of these Consolidated Financial Statements.
34
Partners Group Private Equity (Master Fund), LLC
(a Delaware Limited Liability Company)
Consolidated Statements of Changes in Net Assets –
| | | For the Six
Months Ended
September 30,
2024
(Unaudited) | | | For the
Year Ended
March 31, 2024 | |
Increase (decrease) in Net Assets resulting from operations: | | | | | | | | |
Net investment loss | | $ | (82,079,139 | ) | | $ | (153,954,880 | ) |
Net realized gain (loss) on investments, foreign currency transactions and forward foreign currency contracts | | | 286,568,673 | | | | 193,797,042 | |
Net change in unrealized appreciation (depreciation) on investments, foreign currency translation and forward foreign currency contracts | | | 224,873,399 | | | | 796,526,277 | |
Net increase in Net Assets resulting from operations | | $ | 429,362,933 | | | $ | 836,368,439 | |
| | | | | | | | | |
Distributions to Members from: | | | | | | | | |
Distributable earnings | | | — | | | | (400,009,858 | ) |
Total distributions to Members | | $ | — | | | $ | (400,009,858 | ) |
| | | | | | | | | |
Capital transactions (See note 5): | | | | | | | | |
Issuance of common Units | | | | | | | | |
Class A Units | | $ | 543,380,623 | | | $ | 867,184,668 | |
Class I Units | | | 444,291,857 | | | | 728,148,848 | |
Reinvestment of common Units | | | | | | | | |
Class A Units | | | — | | | | 207,209,706 | |
Class I Units | | | — | | | | 152,280,709 | |
Redemption of common Units | | | | | | | | |
Class A Units | | | (286,366,885 | ) | | | (438,997,302 | ) |
Class I Units | | | (357,348,946 | ) | | | (554,919,154 | ) |
Exchanges of common Units | | | | | | | | |
Class A Units | | | (27,832,111 | ) | | | (62,024,192 | ) |
Class I Units | | | 27,832,111 | | | | 62,024,192 | |
Total increase in Net Assets resulting from capital transactions | | $ | 343,956,649 | | | $ | 960,907,475 | |
| | | | | | | | | |
Total increase in Net Assets | | $ | 773,319,582 | | | $ | 1,397,266,056 | |
| | | | | | | | | |
Net Assets at beginning of period | | $ | 14,805,108,113 | | | $ | 13,407,842,057 | |
Net Assets at end of period | | $ | 15,578,427,695 | | | $ | 14,805,108,113 | |
The accompanying notes are an integral part of these Consolidated Financial Statements.
35
Partners Group Private Equity (Master Fund), LLC
(a Delaware Limited Liability Company)
Consolidated Statement of Cash Flows –
For the Six Months Ended September 30, 2024 (Unaudited)
CASH FLOWS FROM OPERATING ACTIVITIES | | | | |
Net Increase in Net Assets from Operations | | $ | 429,362,933 | |
Adjustments to reconcile Net Increase (Decrease) in Net Assets from Operations to net cash provided by (used in) operating activities: | | | | |
Net change in accumulated unrealized (appreciation) depreciation on investments | | | (332,856,592 | ) |
Net change in unrealized (appreciation) depreciation on forward foreign currency contracts | | | 106,371,069 | |
Net realized gain from investments and foreign currency transactions | | | (284,139,789 | ) |
Purchases of investments | | | (1,928,178,334 | ) |
Proceeds from sales of investments | | | 1,079,281,904 | |
Net (purchases) sales and amortization of short-term investments | | | 74,236,426 | |
Net realized gain distributions from primary and secondary investments | | | 96,218,629 | |
Amortization of premium and accretion of discount | | | (2,716,365 | ) |
Increase in investment sales receivable | | | (42,683,686 | ) |
Increase in deposit of investments | | | (8,746,214 | ) |
Increase in dividends and interest receivable | | | (19,453,974 | ) |
Increase in due from broker | | | (138,000,000 | ) |
Increase in other receivable | | | (13,638,034 | ) |
Increase in prepaid assets | | | (283,969 | ) |
Increase in cash overdraft | | | 9,452,774 | |
Increase in dividends payable | | | 42,416 | |
Decrease in due to broker | | | (26,320,000 | ) |
Increase in incentive fees payable | | | 17,196,953 | |
Decrease in management fees payable | | | (16,819,788 | ) |
Decrease in distribution, servicing and transfer agency fees payable | | | (315,781 | ) |
Decrease in professional fees payable | | | (1,231,397 | ) |
Increase in line of credit fees payable | | | 3,407,066 | |
Increase in interest expense payable | | | 3,084,922 | |
Increase in accounting and administrative fees payable | | | 3,791,552 | |
Increase in custodian fees payable | | | 32,277 | |
Increase in deferred tax liability, net | | | 261,198 | |
Increase in other payable | | | 151,958 | |
Net Cash (Used in) Operating Activities | | | (992,491,846 | ) |
| | | | | |
The accompanying notes are an integral part of these Consolidated Financial Statements.
36
Partners Group Private Equity (Master Fund), LLC
(a Delaware Limited Liability Company)
Consolidated Statement of Cash Flows –
For the Six Months Ended September 30, 2024 (Unaudited) (continued)
CASH FLOWS FROM FINANCING ACTIVITIES | | | | |
Proceeds from issuance of Units | | $ | 987,427,896 | |
Payments for Units redeemed | | | (635,074,763 | ) |
Net Cash Provided by Financing Activities | | | 352,353,133 | |
| | | | | |
Net change in cash and cash equivalents | | | (640,138,713 | ) |
| | | | | |
Effect of exchange rate changes on cash | | | 1,773,911 | |
| | | | | |
Cash and cash equivalents at beginning of period(1) | | | 1,180,556,950 | |
Cash and cash equivalents at end of period | | $ | 542,192,148 | |
(1) | Balance includes cash and cash equivalents and cash denominated in foreign currencies of $1,163,033,562 and $17,523,388, respectively. |
The accompanying notes are an integral part of these Consolidated Financial Statements.
37
Partners Group Private Equity (Master Fund), LLC
(a Delaware Limited Liability Company)
Consolidated Financial Highlights –
| | | Class A | |
| | | Six Months
Ended
September 30,
2024
(Unaudited)* | | | Year Ended
March 31,
2024* | | | Year Ended
March 31,
2023* | | | Year Ended
March 31,
2022* | | | Year Ended
March 31,
2021* | | | Year Ended
March 31,
2020* | |
Per Unit Operating Performance:(1) | | | | | | | | | | | | | | | | | | | | | | | | |
Net asset value, beginning of period | | $ | 2.01 | | | $ | 1.95 | | | $ | 1.98 | | | $ | 1.78 | | | $ | 1.33 | | | $ | 1.43 | |
Income from investment operations: | | | | | | | | | | | | | | | | | | | | | | | | |
Net investment loss(2) | | | (0.01 | ) | | | (0.03 | ) | | | (0.03 | ) | | | (0.06 | ) | | | (0.05 | ) | | | (0.02 | ) |
Net realized and unrealized gains (losses) on investments(2) | | | 0.06 | | | | 0.15 | | | | 0.06 | | | | 0.38 | | | | 0.53 | | | | (0.04 | ) |
Net increase (decrease) in net assets resulting from operations | | | 0.05 | | | | 0.12 | | | | 0.03 | | | | 0.32 | | | | 0.48 | | | | (0.06 | ) |
Distributions from: | | | | | | | | | | | | | | | | | | | | | | | | |
Net realized gains | | | — | | | | (0.06 | ) | | | (0.06 | ) | | | (0.12 | ) | | | (0.03 | ) | | | (0.04 | ) |
Total distributions | | | — | | | | (0.06 | ) | | | (0.06 | ) | | | (0.12 | ) | | | (0.03 | ) | | | (0.04 | ) |
Net asset value, end of period | | $ | 2.06 | | | $ | 2.01 | | | $ | 1.95 | | | $ | 1.98 | | | $ | 1.78 | | | $ | 1.33 | |
| | | | | | | | | | | | | | | | | | | | | | | | | |
Total Return(3)(4) | | | 2.62 | % | | | 5.68 | % | | | 1.96 | % | | | 18.12 | % | | | 36.48 | % | | | (4.69 | )% |
| | | | | | | | | | | | | | | | | | | | | | | | | |
Ratios and supplemental data: | | | | | | | | | | | | | | | | | | | | | | | | |
Net assets, end of period in thousands (000’s) | | $ | 8,455,457 | | | $ | 8,007,550 | | | $ | 7,228,144 | | | $ | 6,367,381 | | | $ | 4,098,863 | | | $ | 2,705,680 | |
Net investment income (loss) to average net assets before Incentive Fee | | | (0.73 | )%(5) | | | (0.71 | )% | | | (1.28 | )% | | | (1.29 | )% | | | (1.00 | )% | | | (0.52 | )% |
Ratio of gross expenses to average net assets, excluding Incentive Fee(6)(7) | | | 2.52 | %(5) | | | 2.58 | % | | | 2.67 | % | | | 2.72 | % | | | 2.77 | % | | | 2.87 | % |
Ratio of Incentive Fee to average net assets | | | 0.33 | %(4) | | | 0.70 | % | | | 0.33 | % | | | 1.88 | % | | | 2.10 | % | | | 1.15 | % |
Ratio of gross expenses and Incentive Fee to average net assets(6)(7) | | | 2.85 | %(5)(8) | | | 3.28 | % | | | 3.00 | % | | | 4.60 | % | | | 4.87 | % | | | 4.02 | % |
Ratio of expense waivers to average net assets | | | — | %(5) | | | — | % | | | — | % | | | — | % | | | — | % | | | — | % |
Ratio of net expenses and Incentive Fee to average net assets(7) | | | 2.85 | %(5)(8) | | | 3.28 | % | | | 3.00 | % | | | 4.60 | % | | | 4.87 | % | | | 4.02 | % |
Ratio of net expenses to average net assets, excluding Incentive Fee(7) | | | 2.52 | %(5) | | | 2.58 | % | | | 2.67 | % | | | 2.72 | % | | | 2.77 | % | | | 2.87 | % |
| | | | | | | | | | | | | | | | | | | | | | | | | |
Portfolio Turnover(4) | | | 7.36 | % | | | 6.71 | % | | | 10.26 | % | | | 20.77 | % | | | 19.36 | % | | | 13.35 | % |
* | Updated to reflect the effect of a 1-for-4 unit split on July 2, 2024. |
(1) | Selected data for a Net Asset Value per Unit outstanding throughout the period. |
(2) | Calculated using average units outstanding. |
(3) | Total return based on net asset value calculated as the change in Net Asset Value per Unit during the respective periods, assuming distributions, if any, are reinvested on the effects of the performance of the Fund during the period. |
(6) | Represents the ratio of expenses to average net assets absent fee waivers and/or expense waivers by/to the Adviser. |
(7) | Ratio does not include expenses of Primary and Secondary Investments. |
(8) | The Incentive Fee and/or organizational expenses are not annualized. |
The accompanying notes are an integral part of these Consolidated Financial Statements.
38
Partners Group Private Equity (Master Fund), LLC
(a Delaware Limited Liability Company)
Consolidated Financial Highlights –
| | | Class I | |
| | | Six Months
Ended
September 30,
2024
(Unaudited)* | | | Year Ended
March 31,
2024* | | | Year Ended
March 31,
2023* | | | Year Ended
March 31,
2022* | | | Year Ended
March 31,
2021* | | | Year Ended
March 31,
2020* | |
Per Unit Operating Performance:(1) | | | | | | | | | | | | | | | | | | | | | | | | |
Net asset value, beginning of period | | $ | 2.09 | | | $ | 2.02 | | | $ | 2.03 | | | $ | 1.80 | | | $ | 1.34 | | | $ | 1.44 | |
Income from investment operations: | | | | | | | | | | | | | | | | | | | | | | | | |
Net investment income (loss)(2) | | | (0.01 | ) | | | (0.01 | ) | | | (0.02 | ) | | | (0.05 | ) | | | (0.04 | ) | | | (0.02 | ) |
Net realized and unrealized gain (loss) on investments(2) | | | 0.07 | | | | 0.14 | | | | 0.07 | | | | 0.40 | | | | 0.53 | | | | (0.04 | ) |
Net increase (decrease) in net assets from operations | | | 0.06 | | | | 0.13 | | | | 0.05 | | | | 0.35 | | | | 0.49 | | | | (0.06 | ) |
Distributions from: | | | | | | | | | | | | | | | | | | | | | | | | |
Net investment income (loss) | | | — | | | | — | | | | — | | | | — | | | | — | | | | (0.00 | )(3) |
Net realized gains (losses) | | | — | | | | (0.06 | ) | | | (0.06 | ) | | | (0.12 | ) | | | (0.03 | ) | | | (0.04 | ) |
Total distributions | | | — | | | | (0.06 | ) | | | (0.06 | ) | | | (0.12 | ) | | | (0.03 | ) | | | (0.04 | ) |
Net asset value, end of period | | $ | 2.15 | | | $ | 2.09 | | | $ | 2.02 | | | $ | 2.03 | | | $ | 1.80 | | | $ | 1.34 | |
| | | | | | | | | | | | | | | | | | | | | | | | | |
Total Return after Incentive Fee(4)(5) | | | 2.97 | % | | | 6.42 | % | | | 2.68 | % | | | 18.95 | % | | | 37.44 | % | | | (4.00 | )% |
| | | | | | | | | | | | | | | | | | | | | | | | | |
Ratio and Supplemental Data: | | | | | | | | | | | | | | | | | | | | | | | | |
Net assets, end of period in thousands (000’s) | | $ | 7,122,970 | | | $ | 6,797,558 | | | $ | 6,179,698 | | | $ | 5,703,697 | | | $ | 3,688,456 | | | $ | 2,312,841 | |
Net investment income (loss) to average net assets before Incentive Fee(6)(7) | | | (0.03 | )%(8) | | | (0.01 | )% | | | (0.57 | )% | | | (0.56 | )% | | | (0.29 | )% | | | 0.20 | % |
Ratio of gross expenses to average net assets, excluding Incentive Fee(6)(7) | | | 1.82 | %(8) | | | 1.88 | % | | | 1.96 | % | | | 2.00 | % | | | 2.05 | % | | | 2.13 | % |
Ratio of Incentive Fee to average net assets | | | 0.34 | %(5) | | | 0.70 | % | | | 0.33 | % | | | 1.89 | % | | | 2.12 | % | | | 1.14 | % |
Ratio of gross expenses and Incentive Fee to average net assets(6)(7) | | | 2.16 | %(8)(9) | | | 2.58 | % | | | 2.29 | % | | | 3.89 | % | | | 4.17 | % | | | 3.27 | % |
Ratio of expense waivers to average net assets | | | — | %(8) | | | — | % | | | — | % | | | — | % | | | — | % | | | — | % |
Ratio of net expenses and Incentive Fee to average net assets(7) | | | 2.16 | %(8)(9) | | | 2.58 | % | | | 2.29 | % | | | 3.89 | % | | | 4.17 | % | | | 3.27 | % |
Ratio of net expenses to average net assets, excluding Incentive Fee(7) | | | 1.82 | %(8) | | | 1.88 | % | | | 1.96 | % | | | 2.00 | % | | | 2.05 | % | | | 2.13 | % |
| | | | | | | | | | | | | | | | | | | | | | | | | |
Portfolio Turnover | | | 7.36 | %(5) | | | 6.71 | % | | | 10.26 | % | | | 20.77 | % | | | 19.36 | % | | | 13.35 | % |
* | Updated to reflect the effect of a 1-for-4 unit split on July 2, 2024. |
(1) | Selected data for a Net Asset Value per Unit outstanding throughout the period. |
(2) | Calculated using average units outstanding. |
(3) | Rounds to less than $0.005. |
(4) | Total return based on net asset value calculated as the change in Net Asset Value per Unit during the respective periods, assuming distributions, if any, are reinvested on the effects of the performance of the Fund during the period. |
(6) | Represents the ratio of expenses to average net assets absent fee waivers and/or expense reimbursement by/to the Adviser. |
(7) | Ratio does not include expenses of Primary and Secondary Investments. |
(9) | The Incentive Fee and/or organizational expenses are not annualized. |
The accompanying notes are an integral part of these Consolidated Financial Statements.
39
Partners Group Private Equity (Master Fund), LLC
(a Delaware Limited Liability Company)
Notes to Consolidated Financial Statements – September 30, 2024 (Unaudited)
1. Organization
Partners Group Private Equity (Master Fund), LLC (the “Fund”) is a Delaware limited liability company that was organized on August 4, 2008 and commenced operations on July 1, 2009. The Fund is registered under the Investment Company Act of 1940, as amended (the “Investment Company Act”), as a non-diversified, closed-end management investment company. The Fund has filed an application to register units of limited liability company interests in the Fund (“Units”) under the Securities Act of 1933 as amended (the “1933 Act”). The Fund is managed by Partners Group (USA) Inc. (the “Adviser”), an investment adviser registered under the Investment Advisers Act of 1940, as amended (the “Investment Advisers Act”) pursuant to a second amended and restated investment management agreement between the Fund and the Adviser (the “Investment Management Agreement”). The Board of Managers of the Fund (collectively, the “Board” and each member thereof a “Manager”) has oversight responsibility for the management and supervision of the business operations of the Fund. As permitted by applicable law, the Board may delegate any of its rights, powers and authority to, among others, the officers of the Fund, a committee of the Board, or the Adviser, as it did in causing the Fund to enter into the Investment Management Agreement. The Fund’s investment objective is to seek long-term capital appreciation by investing in a diversified portfolio of private equity and debt investments including infrastructure. The Fund makes investments directly and through its wholly owned subsidiaries, Partners Group Private Equity (Subholding), LLC (the “Onshore Subsidiary”), Partners Group Private Equity (Luxembourg) S.à r.l (the “Offshore Subsidiary”), and Partners Group Revolver Pooling PGPE, LLC (the “Revolver Subsidiary”).
Units are offered only to investors that represent that they are “accredited investors” within the meaning of Rule 501 under the Securities Act of 1933, as amended, and “qualified clients” within the meaning of Rule 205-3 under the Investment Advisers Act. Purchasers of Units become members of the Fund (“Members”).
The Fund has elected to be treated for U.S. federal income tax purposes, and intends to qualify annually, as a regulated investment company (“RIC”) under Subchapter M of the Internal Revenue Code of 1986, as amended (the “Code”).
The Fund currently offers two classes of Units designated as “Class A Units” and “Class I Units”. In the future the Fund may offer additional classes of Units. The Class A Units and the Class I Units have, and each additional class of Units issued by the Fund, if any, will have different characteristics, particularly regarding the sales charges that purchasers of Units of the additional class bear, and the distribution and service fees, if any, and other class specific expenses, if any, that are charged to holders of Units of the additional class. The Fund has received an exemptive order from the SEC with respect to the Fund’s multi-class structure.
Although Units of each class represent pro rata interests in the Fund, each class votes separately on class-specific matters. Realized and unrealized gains and losses and net investment income and losses, other than class-specific expenses, are allocated daily to each class of Units based on the relative net assets of each class to the total net assets of the Fund.
2. Significant Accounting Policies
The Fund is an investment company and applies the guidance set forth in Accounting Standards Codification (“ASC”) 946, Financial Services—Investment Companies. The following is a summary of significant accounting and reporting policies used in preparing the consolidated financial statements.
a. Basis of Accounting
The Fund’s accounting and reporting policies conform with U.S. generally accepted accounting principles (“U.S. GAAP”).
b. Valuation of Investments
Investments held by the Fund include short-term investments, direct equity and debt investments in operating companies (“Direct Investments”) and primary and secondary investments in private equity funds (“Primary Investments” and “Secondary Investments”, respectively, and together, “Private Equity Fund Investments”; Direct Investments and Private Equity Fund Investments, collectively, “Private Equity Investments”).
The Fund is required to report its investments, including those for which current market values are not readily available, at fair value.
40
Partners Group Private Equity (Master Fund), LLC
(a Delaware Limited Liability Company)
Notes to Consolidated Financial Statements – September 30, 2024 (Unaudited) (continued)
2. Significant Accounting Policies (continued)
The Fund values its investments in accordance with ASC 820, Fair Value Measurements (“ASC 820”), which defines fair value as the amount that would be received to sell an asset or paid to transfer a liability in an orderly transaction between market participants at the applicable measurement date, and Rule 2a-5 under the Investment Company Act (“Rule 2a-5”). Pursuant to Rule 2a-5, the Board designated the Adviser as “valuation designee” to perform fair value determinations and approved amended Valuation Procedures.
Fair value is based on observable market prices or parameters or derived from such prices or parameters when such quotations are readily available. In accordance with Rule 2a-5, a market quotation is “readily available” only when it is a quoted price (unadjusted) in active markets for identical instruments that a fund can access at the measurement date, provided that such a quotation is not considered to be readily available if it is not reliable.
The Adviser, as “valuation designee” under Rule 2a-5, determines the fair value of the Fund’s Private Equity Investments in conformity with U.S. GAAP, Rule 2a-5, and the Fund’s Valuation Procedures. As permitted by the Valuation Procedures, the Adviser values the Fund’s Private Equity Investments in consultation with persons who are employees of the Adviser’s parent company or one of its subsidiaries. The Valuation Procedures require evaluation of all relevant factors reasonably available to the Adviser and its affiliates at the time the Fund’s Private Equity Investments are valued.
Direct Investments
In assessing the fair value of the Fund’s non-traded Direct Investments in accordance with the Valuation Procedures, the Adviser uses a variety of methods such as earnings multiples, discounted cash flow and market data from third party pricing services. The Adviser makes valuation assumptions based on market conditions existing at the end of each reporting period. Quoted market prices or dealer quotes for certain similar instruments are used for debt investments where appropriate. Other techniques, such as option pricing models and estimated discounted value of future cash flows, are used to determine fair value for the remaining financial instruments. Because of the inherent uncertainty of estimates, fair value determinations based on estimates may differ from the values that would have been used had a ready market for the securities existed, and the differences could be material.
Private Equity Fund Investments
The fair values of Private Equity Fund Investments determined by the Adviser in accordance with the Valuation Procedures are estimates. These estimates are net of management and performance incentive fees or allocations payable pursuant to the respective organizational documents of the Private Equity Fund Investments. Ordinarily, the fair value of a Private Equity Fund Investment is based on the net asset value of that Private Equity Fund Investment reported by its investment manager. If the Adviser determines that the most recent net asset value reported by the investment manager of a Private Equity Fund Investment does not represent fair value or if the manager of a Private Equity Fund Investment fails to report a net asset value to the Fund, a fair value determination is made by the Adviser in accordance with the Valuation Procedures. In making that determination, the Adviser will consider whether it is appropriate, considering all relevant factors, to value such Private Equity Fund Investment at the net asset value last reported by its investment manager, or whether to adjust such value by a premium or discount. Because of the inherent uncertainty of estimates, fair value determinations based on estimates may differ from the values that would have been used had a ready market for the securities existed, and the differences could be material.
For each of the Fund’s Private Equity Fund Investments (for the purposes of this paragraph, an “Investee”), the Fund has no right to cause the Investee or any third party to purchase the Fund’s investment in the Investee, at the end of the term of such investment, or any other time. Accordingly, in a typical Private Equity Fund Investment, the Fund expects to realize the value remaining in its investment at the end of the investment’s term through distributions resulting from the liquidation of the remaining assets of the Investee.
Daily Traded Investments
The fair values of financial instruments traded in active markets are based on quoted market prices at the end of the reporting period. The quoted market price used is the price within the bid-ask spread that is considered most representative of fair value at the end of the reporting period. The fair values of actively traded financial instruments with lock-up restrictions may be discounted.
41
Partners Group Private Equity (Master Fund), LLC
(a Delaware Limited Liability Company)
Notes to Consolidated Financial Statements – September 30, 2024 (Unaudited) (continued)
2. Significant Accounting Policies (continued)
The fair values of asset-backed securities are determined by price quotations from unaffiliated market makers, financial institutions that regularly trade similar investments or independent valuation agents using industry standard valuation models.
The Valuation Procedures are implemented by the Adviser and State Street Bank and Trust Company, as the Fund’s administrator (the “Administrator”). Both the Adviser and the Administrator are subject to the oversight of, and report to, the Board. The Adviser and the Administrator monitor and review the methodologies of the various third-party pricing services that are employed by the Fund.
The Adviser and certain of its affiliates act as investment advisers to clients other than the Fund. However, the valuation attributed to a Private Equity Investment held by the Fund and to the same Private Equity Investment held by another client, one of the Adviser’s affiliates, or by a client of one of its affiliates might differ due to differences in accounting, regulatory or other factors applicable to the Fund, to such other client or the Adviser’s affiliate.
c. Cash and Cash Equivalents
In the normal course of its business the Fund holds cash, including foreign currencies, in short-term interest-bearing deposit accounts, and short-term U.S. Treasury Bills (“T-Bills”) to provide liquidity pending investment in Private Equity Investments. T-Bills are valued at amortized cost which is close to or a proxy for fair value. At times, the amounts held in these accounts may exceed applicable federally insured limits. The Fund has not experienced any losses in these accounts and does not believe that it is exposed to significant credit risk in these accounts.
d. Foreign Currency Translation
The books and records of the Fund are maintained in U.S. Dollars. Generally, valuations of assets and liabilities denominated in currencies other than the U.S. Dollar are translated into U.S. Dollar equivalents using valuation date exchange rates, while purchases, realized gains and losses, income and expenses are translated at transaction date exchange rates. As of September 30, 2024, the Fund’s investments denominated in foreign currencies were as follows:
Currency | | Number of
investments | |
Australian Dollars | | | 9 | |
Brazilian Reals | | | 1 | |
Canadian Dollars | | | 7 | |
Euros | | | 315 | |
Indian Rupees | | | 2 | |
Japanese Yen | | | 2 | |
New Zealand Dollars | | | 3 | |
Norwegian Kroner | | | 2 | |
Philippine Pesos | | | 1 | |
Pounds Sterling | | | 42 | |
Swedish Kronor | | | 4 | |
Swiss Francs | | | 7 | |
The Fund does not separately state the portion of the results of operations due to fluctuations in foreign exchange rates. They are included with other changes in fair values of the investments during the period.
e. Forward Foreign Currency Exchange Contracts
The Fund may enter forward foreign currency exchange contracts to manage foreign exchange rate risk. These contracts for the purchase or sale of a specific foreign currency at a fixed price on a future date may be entered into as a hedge against either specific transactions or portfolio positions. The objective of the Fund’s foreign currency hedging transactions is to reduce the risk that the U.S. Dollar value of the Fund’s foreign currency denominated investments will decline due to
42
Partners Group Private Equity (Master Fund), LLC
(a Delaware Limited Liability Company)
Notes to Consolidated Financial Statements – September 30, 2024 (Unaudited) (continued)
2. Significant Accounting Policies (continued)
changes in foreign currency exchange rates. All forward foreign currency exchange contracts are “marked-to-market” daily at the applicable translation rates resulting in unrealized gains or losses. Realized gains or losses are recorded at the time the forward foreign currency exchange contract is offset by entering a closing transaction or by the delivery or receipt of the currency. The risk that counterparties may be unable to meet the terms of their contracts and the risk of unanticipated movements in the value of a foreign currency relative to the U.S. Dollar are inherent in forward foreign exchange contracts.
During the six months ended September 30, 2024, the Fund entered 219 long/short forward foreign currency exchange contracts. As disclosed in the Consolidated Statement of Assets and Liabilities, the Fund had $334,551 in unrealized appreciation and $(77,474,894) in unrealized depreciation on forward foreign currency exchange contracts. As disclosed in the Consolidated Statement of Operations, the Fund had $2,439,027 in net realized gains (losses) and $(106,371,069) change in net unrealized appreciation (depreciation) on forward foreign currency contracts.
f. Investment Income
The Fund records a distribution of cash or in-kind securities on a Private Equity Investment at fair value based on the information contained in the notice provided to the Fund when the distribution is received. Thus, the Fund recognizes in the Consolidated Statement of Operations its share of realized gains (or losses) and the Fund’s share of net investment income (or loss) based upon information received about distributions on Private Equity Investments. Unrealized appreciation (depreciation) on investments presented in the Consolidated Statement of Operations includes the Fund’s share of unrealized gains and losses, realized undistributed gains/losses, and undistributed net investment income (or loss) on Private Equity Investments for the relevant period.
The Fund classifies various types of non-interest income earned from Direct Investments as either other income or transaction income. Other income includes transfer fees, amendment fees, and unfunded fees. Transaction income includes break-up fees, directors’ fees, financial advisory fees, topping fees, investment banking fees, monitoring fees, organizational fees, and syndication fees.
g. Interest and Dividend Income
Dividend income is recorded on the ex-dividend date, except for certain dividends received from foreign securities and Direct Equity Investments for which the ex-dividend date has passed, in which case the dividend is recorded as soon as a Fund is informed that the ex-dividend date has occurred. Interest income, adjusted for the accretion of discounts and amortization of premiums, is recorded on an accrual basis from the settlement date, except for securities with a forward starting effective date, where interest income is recorded on the accrual basis from the effective date.
h. Fund Expenses
The Fund bears all expenses incurred in its conduct of the business of the Fund on an accrual basis, including, but not limited to, the following: all costs and expenses related to portfolio transactions and positions for the Fund’s account; legal fees; accounting, auditing, and tax preparation fees; custodial fees; fees for lines of credit; fees for data and software providers; costs of insurance; registration expenses; fees of each Manager who is not an “interested person” of the Fund, as defined in the Investment Company Act (each, individually an “Independent Manager” and collectively, the “Independent Managers”); and expenses of meetings of the Board, including reimbursement of the Independent Managers for their expenses in attending meetings.
i. Costs Relating to Purchases of Secondary Investments
Costs relating to purchases of Secondary Investments include the amortization of deferred payments on Secondary Investments. Such amortization expense is recognized on a monthly basis until the due date of a deferred payment.
j. Income Taxes
The Fund recognizes tax positions in its consolidated financial statements only when it is more likely than not that the relevant taxing authority will, upon examination, sustain the position based on its merits. A position that meets this standard is measured at the maximum benefit that will more likely than not be realized upon settlement. The Fund classifies any interest expense related to income taxes in income tax expense, and any income tax penalties under expenses in the Consolidated Statements of Operations.
43
Partners Group Private Equity (Master Fund), LLC
(a Delaware Limited Liability Company)
Notes to Consolidated Financial Statements – September 30, 2024 (Unaudited) (continued)
2. Significant Accounting Policies (continued)
The Fund’s tax positions have been reviewed based on applicable statutes of limitation for tax assessments, which may vary by jurisdiction. Based on this review, the Fund has concluded that no additional provision for income tax is required in the Fund’s consolidated financial statements. The Fund is subject to potential examination by certain taxing authorities in various jurisdictions. The Fund’s tax positions are subject to ongoing interpretation of laws and regulations by taxing authorities.
As noted above, the Fund has elected to be treated for U.S. federal income tax purposes, and intends to qualify annually, as a RIC under Subchapter M of the Code. If the Fund were to fail to meet the requirements of Subchapter M to qualify as a RIC, and if the Fund were ineligible to or otherwise were not to cure such failure, the Fund would be subject to tax on its taxable income, whether or not distributed to Members, at corporate rates, and all distributions of earnings and profits would be taxable to Members as ordinary income. In addition, the Fund could be required to recognize unrealized gains, pay substantial taxes and interest, and make substantial distributions until it requalifies as a RIC that is accorded special tax treatment under Subchapter M. In order to comply with the requirements of Subchapter M, the Fund must distribute substantially all of its taxable income and gains to holders of Fund Units and meet certain diversification and income requirements with respect to its investments. The Onshore Subsidiary is treated as an association taxable as a corporation for U.S. federal income tax purposes. The Offshore Subsidiary is treated as an entity separate from the Fund, and thus is disregarded, for U.S. federal income tax purposes. The Revolver Subsidiary is treated as an association taxable as a corporation for U.S. federal income tax purposes. In preparing its consolidated financial statements, the Onshore Subsidiary is required to recognize its estimate of income taxes for Federal and State purposes as a deferred tax asset or liability. Deferred income taxes reflect the net tax effects of temporary differences between the carrying amounts of assets and liabilities for financial reporting purposes and the corresponding amounts used for income tax purposes. If the Onshore Subsidiary has a deferred tax asset, consideration is given to whether a valuation allowance is required. The Offshore Subsidiary is not subject to U.S. federal and state income taxes.
The Fund files tax returns as prescribed by the tax laws of the jurisdictions in which it operates. In the normal course of business, the Fund is subject to examination by U.S. federal, state, local and foreign jurisdictions, where applicable. As of September 30, 2024, the tax years from 2019 forward remain subject to examination by the major tax jurisdictions in which the Fund is subject to examination.
During the six months ended September 30, 2024 the Fund reclassified $82,472,127 from undistributed net investment income, $(135,081,938) of accumulated net realized gain (loss) on investments and forward foreign currency contracts, $0 of accumulated net unrealized appreciation on investments and forward foreign currency contracts, and $0 of foreign currency translation, to paid-in capital.
k. Use of Estimates
The preparation of financial statements in conformity with U.S. GAAP requires the Fund to make estimates and assumptions that affect the reported amounts of assets and liabilities and the disclosure of contingent assets and liabilities as of the date of the financial statements, as well as the reported increases and decreases in capital from operations during the reporting period. Actual results may differ from those estimates.
l. Consolidated Financial Statements
The Consolidated Schedule of Investments, Consolidated Statement of Assets and Liabilities, Consolidated Statement of Operations, Consolidated Statements of Changes in Net Assets, Consolidated Statement of Cash Flows and Consolidated Financial Highlights of the Fund include the accounts of the Subsidiaries. All significant intercompany accounts and transactions have been eliminated in consolidation.
m. Disclosures about Offsetting Assets and Liabilities
The Fund is subject to requirements to disclose information about offsetting assets and liabilities and similar arrangements to enable users of its financial statements to understand the effect of those arrangements on its financial position.
44
Partners Group Private Equity (Master Fund), LLC
(a Delaware Limited Liability Company)
Notes to Consolidated Financial Statements – September 30, 2024 (Unaudited) (continued)
2. Significant Accounting Policies (continued)
For financial reporting purposes, the Fund does not offset derivative assets and liabilities that are subject to Master Netting Agreements (“MNA”) or similar arrangements in the Consolidated Statement of Assets and Liabilities. The table below presents the amounts of the Fund’s derivative assets and liabilities as of September 30, 2024: gross, net of amounts available for offset under a MNA, and net of the related collateral received and/or pledged, if any, by the Fund:
Counterparty | | Derivative Assets
Subject to a MNA
with Counterparty | | | Financial
Instruments
Available for Offset | | | Collateral
Received1 | | | Net Amount2 | |
Nomura International PLC | | $ | 334,551 | | | $ | 334,551 | | | $ | — | | | $ | — | |
Counterparty | | Derivative Liabilities
Subject to a MNA
with Counterparty | | | Financial
Instruments
Available for Offset | | | Collateral
Pledged1 | | | Net Amount3 | |
Bank of America | | $ | 21,844,779 | | | $ | — | | | $ | 21,844,779 | | | $ | — | |
Barclays | | | 35,235,374 | | | | — | | | | 35,235,374 | | | | — | |
BNY Mellon | | | 13,345,646 | | | | — | | | | 13,345,646 | | | | — | |
Nomura International PLC | | | 7,049,095 | | | | 334,551 | | | | — | | | | 6,714,544 | |
1 | In some instances, the actual collateral received and/or pledged may be more than the amount shown here due to overcollateralization. |
2 | Net amount represents the net amount receivable from the counterparty in the event of default. |
3 | Net amount represents the net amount due from the Fund to the counterparty in the event of default. |
n. New Accounting Pronouncements
The Fund considers the applicability and impact of all accounting standard updates (“ASU”) issued by the Financial Accounting Standards Board. The Fund has assessed currently issued ASUs and has determined that they are not applicable or expected to have minimal impact on its consolidated financial statements.
3. Fair Value Measurements
In conformity with U.S. GAAP, investments are classified in their entirety based on the lowest level of input that is significant to the fair value measurement. Estimated fair values may differ from the values that would have been used if a ready market existed or if the investments were liquidated at the valuation date. A three-level hierarchy is used to distinguish between (1) inputs that reflect the assumptions market participants would use in pricing an asset or liability developed based on market data obtained from sources independent of the reporting entity (observable inputs) and (2) inputs that reflect the reporting entity’s own assumptions about the assumptions market participants would use in pricing an asset or liability developed based on the best information available in the circumstances (unobservable inputs). This distinction determines the classification of fair value measurements for disclosure purposes.
The various types of inputs used in determining the value of the Fund’s investments are summarized below for each of the three levels:
Valuation of Investments
● | Level 1 – Pricing inputs are quoted prices available in active markets for identical investments as of the measurement date. The type of investments included in Level 1 include marketable securities that are primarily traded on a securities exchange. The fair value is determined to be the last sale price on the determination date, or, if no sales occurred on that date, the mean of the closing bid and ask prices the date. In accordance with authoritative guidance, the Fund does not apply a blockage discount to the quoted price for these investments, even in situations where the Fund holds a large position in an investment and a sale could reasonably impact the quoted price. |
45
Partners Group Private Equity (Master Fund), LLC
(a Delaware Limited Liability Company)
Notes to Consolidated Financial Statements – September 30, 2024 (Unaudited) (continued)
3. Fair Value Measurements (continued)
● | Level 2 – Pricing inputs are observable inputs other than quoted prices for identical assets in active markets (i.e., not Level 1 inputs). Fair value is determined using models or other valuation methodologies through direct or indirect corroboration with observable market data. Investments that are generally included in this category include corporate notes, convertible notes, warrants and restricted public equity securities. The fair value of legally restricted equity securities may be discounted depending on the likely impact of the restrictions on liquidity and the Adviser’s estimates. |
● | Level 3 – Pricing inputs are unobservable for the investment and include situations where there is little, if any, market activity for the investment. The inputs into the determination of fair value require significant management judgment and/or estimation. Investments that are included in this category are private equity and debt investments, as well as convertible notes and warrants that are not actively traded. The fair value for investments using Level 3 pricing inputs is based on the Adviser’s estimates that consider a combination of various factors and performance measurements. These factors and measurements include the timing of the transaction; the market in which the investment operates; comparable market transactions; operational performance and projections of the investments; various performance multiples as applied to earnings before interest, taxes, depreciation, and amortization or a similar measure of earnings for the latest reporting period or a forward period; brokers’ quotes; and discounted cash flow analysis. |
Due to the inherent uncertainty of estimates, fair value determinations based on estimates may materially differ from the values that would have been used had a ready market for the securities existed. The following is a summary of the Fund’s investments classified in the fair value hierarchy as of September 30, 2024:
Investments | | Level 1 | | | Level 2 | | | Level 3 | | | Total | |
Common Stocks | | $ | 631,566,807 | | | $ | — | | | $ | — | | | $ | 631,566,807 | |
High Yield Bonds | | | — | | | | 136,902,759 | | | | — | | | | 136,902,759 | |
Asset-Backed Securities | | | — | | | | — | | | | 99,666,385 | | | | 99,666,385 | |
Floating Rate Loans | | | — | | | | — | | | | 102,085,951 | | | | 102,085,951 | |
Direct Investments: | | | | | | | | | | | | | | | | |
Direct Equity | | | — | | | | 71,601,692 | | | | 8,528,821,292 | | | | 8,600,422,984 | |
Direct Debt | | | — | | | | 5,128,549 | | | | 1,776,363,048 | | | | 1,781,491,597 | |
Total Direct Investments* | | $ | — | | | $ | 76,730,241 | | | $ | 10,305,184,340 | | | $ | 10,381,914,581 | |
Secondary Investments* | | | — | | | | — | | | | 1,969,828,948 | | | | 1,969,828,948 | |
Primary Investments* | | | — | | | | — | | | | 2,188,639,469 | | | | 2,188,639,469 | |
Total Investments | | $ | 631,566,807 | | | $ | 213,633,000 | | | $ | 14,665,405,093 | | | $ | 15,510,604,900 | |
Other Financial Instruments | | Level 1 | | | Level 2 | | | Level 3 | | | Total | |
Assets | | | | | | | | | | | | | | | | |
Foreign Currency Exchange Contracts** | | $ | — | | | $ | 334,551 | | | $ | — | | | $ | 334,551 | |
Total Assets | | $ | — | | | $ | 334,551 | | | $ | — | | | $ | 334,551 | |
Liabilities | | | | | | | | | | | | | | | | |
Foreign Currency Exchange Contracts** | | $ | — | | | $ | (77,474,894 | ) | | $ | — | | | $ | (77,474,894 | ) |
Total Liabilities | | $ | — | | | $ | (77,474,894 | ) | | $ | — | | | $ | (77,474,894 | ) |
Total Investments net of Foreign Currency Exchange Contracts | | $ | 631,566,807 | | | $ | 136,492,657 | | | $ | 14,665,405,093 | | | $ | 15,433,464,557 | |
* | Private Equity Investments are described in Note 2.b. |
** | Forward Foreign Currency Exchange Contracts are described in Note 2.e. |
46
Partners Group Private Equity (Master Fund), LLC
(a Delaware Limited Liability Company)
Notes to Consolidated Financial Statements – September 30, 2024 (Unaudited) (continued)
3. Fair Value Measurements (continued)
The following is a reconciliation of the amount of the account balances on April 1, 2024 and September 30, 2024 of those investments in which significant unobservable inputs (Level 3) were used in determining value:
| | Balance
as of
April 1,
2024 | | | Realized
Gain/(Loss) | | | Net Change
in Unrealized
Appreciation/
(Depreciation) | | | Gross
Purchases | | | Gross
Sales | | | Net
Amortization
of Discount/
(Premium) | | | Net
Transfers
In or Out
of Level 3 | | | Balance
as of
September
30, 2024 | |
Asset-Backed Securities | | $ | 61,753,834 | | | $ | 478,984 | | | $ | 1,988,643 | | | $ | 40,067,500 | | | $ | (4,656,520 | ) | | $ | 33,944 | | | $ | — | | | $ | 99,666,385 | |
Floating Rate Loans | | | — | | | | — | | | | 908,844 | | | | 101,187,580 | | | | (10,050 | ) | | | (423 | ) | | | — | | | | 102,085,951 | |
Direct Investments: | | | | | | | | | | | | | | | | | | | | | | | | | | | | | | | | |
Direct Equity Investments | | $ | 8,531,221,626 | | | $ | 232,143,036 | | | $ | 106,928,489 | | | $ | 265,098,369 | | | $ | (644,522,133 | ) | | $ | — | | | $ | 37,951,905 | | | $ | 8,528,821,292 | |
Direct Debt Investments | | | 1,251,252,987 | | | | (29,772,425 | ) | | | 50,221,243 | | | | 705,329,339 | | | | (202,961,966 | ) | | | 2,293,870 | | | | — | | | | 1,776,363,048 | |
Total Direct Investments* | | $ | 9,782,474,613 | | | $ | 202,370,611 | | | $ | 157,149,732 | | | $ | 970,427,708 | | | $ | (847,484,099 | ) | | $ | 2,293,870 | | | $ | 37,951,905 | | | $ | 10,305,184,340 | |
Secondary Investments* | | | 1,827,755,657 | | | | 124,983 | | | | 43,103,971 | | | | 148,663,090 | | | | (49,818,753 | ) | | | — | | | | — | | | | 1,969,828,948 | |
Primary Investments* | | | 2,123,078,112 | | | | (991,466 | ) | | | 35,970,470 | | | | 109,779,884 | | | | (79,197,531 | ) | | | — | | | | — | | | | 2,188,639,469 | |
Total | | $ | 13,795,062,216 | | | $ | 201,983,112 | | | $ | 239,121,660 | | | $ | 1,370,125,762 | | | $ | (981,166,953 | ) | | $ | 2,327,391 | | | $ | 37,951,905 | | | $ | 14,665,405,093 | |
* | For the purposes of the tables above: (i) “Direct Investments” are private investments directly in the equity or debt of selected operating companies, often together with the management of the investee operating company; (ii) “Primary Investments” are investments in newly established private equity partnerships where underlying portfolio companies are generally not known as of the time of investment; (iii) and “Secondary Investments” are single or portfolios of assets acquired on the secondary market. However, in the private equity market sector the term “secondary investments” is generally understood to mean Private Equity Fund Investments acquired in the secondary market (See Note 2.b). Notwithstanding the foregoing, if the Fund reasonably determines that the strict application of the above definitions would not reflect the economic substance of any investment, the Fund may re-classify such investment as it deems appropriate. |
Changes in inputs or methods used for valuing investments may result in transfers in or out of levels within the fair value hierarchy. The inputs or methods used for valuing investments may not necessarily be an indication of the risk associated with investing in those investments. Transfers between levels of the fair value hierarchy are reported at the beginning of the reporting period in which they occur.
The amount of the net change in unrealized appreciation (depreciation) for the six months ended September 30, 2024 relating to investments in Level 3 assets still held at September 30, 2024 is $406,653,683, which is included as a component of net change in accumulated unrealized depreciation on investments on the Consolidated Statement of Operations.
47
Partners Group Private Equity (Master Fund), LLC
(a Delaware Limited Liability Company)
Notes to Consolidated Financial Statements – September 30, 2024 (Unaudited) (continued)
3. Fair Value Measurements (continued)
The following is a summary of quantitative information about significant unobservable valuation inputs approved by the Adviser for Level 3 Fair Value Measurements for investments held as of September 30, 2024:
Type of Security | | Fair Value at
September 30,
2024
(000’s)* | | Valuation Technique(s) | Unobservable Input | Range
(weighted average) |
Asset-Backed Securities | | $ | 7,250 | | Recent financing/transaction | Recent transaction price | n/a |
| | | | 92,416 | | Reported fair value | Reported fair value | n/a |
Floating Rate Loans | | $ | 102,086 | | Broker quotes | Indicative quotes for an inactive market | n/a |
Direct Investments: | | | | | | | |
Direct Equity | | $ | 587,163 | | Discounted cash flow | Discount factor | 9.13% – 19.20% (12.63%) |
| | | | 6,975,816 | | Market comparable companies | Enterprise value to EBITDA multiple | 5.25x – 33.00x (16.92x) |
| | | | 87,575 | | Market comparable companies | Price to book ratio | 1.80x – 1.80x (1.80x) |
| | | | 172,634 | | Exit price | Recent transaction price | n/a |
| | | | 220,112 | | Recent financing/transaction | Recent transaction price | n/a |
| | | | 341,216 | | Reported fair value | Reported fair value | n/a |
| | | | 144,305 | | Market comparable companies | Enterprise value to sales multiple | 2.00x – 15.80x (7.27x) |
Direct Debt | | $ | 1,239,826 | | Broker quotes | Indicative quotes for an inactive market | n/a |
| | | | 485,450 | | Discounted cash flow | Discount factor | 8.00% – 27.00% (10.67%) |
| | | | 2,698 | | Market comparable companies | Enterprise value to EBITDA multiple | 7.00x – 13.80x (7.57x) |
| | | | 4,343 | | Exit price | Recent transaction price | n/a |
| | | | 35,682 | | Recent financing/transaction | Recent transaction price | n/a |
| | | | 8,364 | | Market comparable companies | Enterprise value to sales multiple | 13.90x – 13.90x (13.90x) |
Primary and Secondary Investments | | $ | 4,158,468 | | Adjusted reported net asset value | Reported net asset value | n/a |
* | Level 3 fair value includes accrued interest. |
Level 3 Direct Equity Investments valued using an unobservable input are directly affected by a change in that input. For Level 3 Direct Debt Investments, the Fund estimates fair value utilizing earnings and multiples analysis or an analysis of discounted cash flows that considers the credit risk and interest rate risk of the particular investment. For Direct Investments, significant increases or decreases in these inputs in isolation would result in a significantly lower or higher fair value measurements.
The amounts from Partners Group investment vehicles pertain to non-investment related assets (liabilities) and/or any difference in fair value classification of its underlying investments. In certain cases, this may also include underlying investments that are measured under Level 1 or Level 2 but presented under Level 3 in fair value measurement note since the investments are held under external partnership investments.
48
Partners Group Private Equity (Master Fund), LLC
(a Delaware Limited Liability Company)
Notes to Consolidated Financial Statements – September 30, 2024 (Unaudited) (continued)
4. Revolving Credit Agreement
The Fund has a secured, committed multicurrency revolving line of credit (“LOC”) facility with Lloyds Bank Corporate Markets plc (successor of Lloyds Bank plc), NatWest Markets plc (successor of The Royal Bank of Scotland plc), Barclays Bank plc, UBS AG, and Bank of America, N.A. in the aggregate maximum principal amount of $1,111,000,000. The Fund anticipates that this LOC facility will be used primarily for working capital requirements and for financing investments and funding associated costs and expenses. The Fund will incur additional interest and other expenses for the use of this and other future line of credit facilities. Borrowings under this facility had been charged a rate of interest per annum that was the aggregate of the applicable margin of 3.25% which was until June 30, 2023, London Interbank Offered Rate (LIBOR), after June 30, 2023, Secured Overnight Financing Rate (SOFR), or, in relation to any loan in Euros, the Euro Interbank Offered Rate (EURIBOR), and a commitment fee of 1.20% per annum on the daily unused portion. For the six months ended September 30, 2024, the Fund did not have any borrowings and did not incur any interest expense under the LOC facility. In addition to the commitment fee under the LOC facility the Fund agrees to pay arrangement fees based on the rate agreed to with the various lenders, agency fees of $25,000 per annum, monitoring fees of $25,000 per annum and trustee fees of $15,000 per annum. The term of the LOC facility runs until January 31, 2025.
5. Unit Transactions/Subscription and Repurchase of Units
In general, Units are offered for purchase as of the first day of each calendar month. However, Units may be offered more or less frequently as determined by the Board in its sole discretion.
Pursuant to the conditions of an exemptive order issued by the SEC, and in compliance with Rule 12b-1 under the Investment Company Act, the Fund has adopted a Distribution and Service Plan for the Class A Units (the “Distribution Plan”). The Distribution Plan allows the Fund to pay distribution fees for the promotion and distribution of its Class A Units and the provision of personal services to holders of Class A Units. Under the Distribution Plan, the Fund may pay as compensation an amount up to 0.70% on an annualized basis of the value of the Fund’s net asset attributable to Class A Units (the “Distribution Fee”). Payment of the Distribution Fee is governed by the Distribution Plan. The Distribution Fee is paid out of the Fund’s assets and decreases the net profits or increases the net losses of the Fund solely with respect to Class A Units. For the six months ended September 30, 2024, the Fund accrued distribution fees of $28,920,054, which were attributable to Class A Units. Class I Units are not subject to the Distribution Plan or the Distribution Fee and do not bear any expenses associated therewith. In addition, under the Distribution Plan, subscriptions for Class A Units may be subject to a placement fee (the “Placement Fee”) of up to 3.50% of the subscription amount. No Placement Fee may be charged without the consent of the placement agent.
The Board may, from time to time and in its sole discretion, cause the Fund to repurchase Units from Members pursuant to written tenders by Members at such times and on such terms and conditions as established by the Board. In determining whether the Fund should offer to repurchase Units, the Board considers the recommendation of the Adviser, as well as a variety of other operational, business, and economic factors. The Adviser anticipates recommending to the Board that, under normal circumstances, the Fund conduct quarterly repurchase offers for Units having an aggregate value of no more than 5% of the Fund’s net assets each January 1st, April 1st, July 1st, and October 1st. The Fund is entitled to charge a 2.00% early repurchase fee for any repurchase of Units from a Member at any time prior to the day immediately preceding the first anniversary of the Member’s purchase of such Units.
Transactions in Units were as follows:
| | | For the Six Months Ended
September 30, 2024* | | | For the Year Ended
March 31, 2024* | |
| | | Units | | | Dollar Amounts | | | Units | | | Dollar Amounts | |
Class A Units | | | | | | | | | | | | | | | | |
Sales | | | 207,731,597 | | | $ | 543,380,623 | | | | 435,055,860 | | | $ | 867,184,668 | |
Reinvestments | | | — | | | | — | | | | 104,139,872 | | | | 207,209,706 | |
Repurchases | | | (87,423,248 | ) | | | (286,366,885 | ) | | | (218,882,176 | ) | | | (438,997,302 | ) |
Class exchanges | | | (4,500,426 | ) | | | (27,832,111 | ) | | | (30,924,852 | ) | | | (62,024,192 | ) |
Net increase (decrease) | | | 115,807,923 | | | $ | 229,181,627 | | | | 289,388,704 | | | $ | 573,372,880 | |
49
Partners Group Private Equity (Master Fund), LLC
(a Delaware Limited Liability Company)
Notes to Consolidated Financial Statements – September 30, 2024 (Unaudited) (continued)
5. Unit Transactions/Subscription and Repurchase of Units (continued)
| | | For the Six Months Ended
September 30, 2024* | | | For the Year Ended
March 31, 2024* | |
| | | Units | | | Dollar Amounts | | | Units | | | Dollar Amounts | |
Class I Units | | | | | | | | | | | | | | | | |
Sales | | | 154,827,932 | | | $ | 444,291,857 | | | | 352,539,664 | | | $ | 728,148,848 | |
Reinvestments | | | — | | | | — | | | | 73,606,452 | | | | 152,280,709 | |
Repurchases | | | (101,941,173 | ) | | | (357,348,946 | ) | | | (266,162,372 | ) | | | (554,919,154 | ) |
Class exchanges | | | 4,315,492 | | | | 27,832,111 | | | | 29,826,636 | | | | 62,024,192 | |
Net increase (decrease) | | | 57,202,251 | | | $ | 114,775,022 | | | | 189,810,380 | | | $ | 387,534,595 | |
* | Updated to reflect the effect of a 1-for-4 unit split on July 2, 2024. |
6. Management Fees, Incentive Fee and Fees and Expenses of Managers
Under the terms of the Investment Management Agreement the Adviser is responsible for providing day-to-day investment management and certain other services to the Fund, subject to the ultimate supervision of and to any policies established by the Board. Accordingly, the Adviser is responsible for developing, implementing and supervising the Fund’s investment program. As consideration for its investment management services under the Investment Management Agreement, the Fund pays the Adviser a monthly management fee equal to 1/12th of 1.50% (1.50% on an annualized basis) of the greater of (i) the Fund’s net asset value and (ii) the Fund’s net asset value less cash and cash equivalents plus the total of all commitments made by the Fund that have not yet been drawn for investment. However, the Investment Management Agreement provides that in no event will the management fee exceed 1.75% as a percentage of the Fund’s net asset value. For the six months ended September 30, 2024, the Fund incurred $122,614,341 in management fees payable to the Adviser.
In addition to the monthly management fee, at the end of each calendar quarter (and at certain other times), the Adviser will be entitled to receive an Incentive Fee equal to 10% of the excess, if any, of (i) the net profits of the Fund for the relevant period over (ii) the then balance, if any, of the New Loss Recovery Account (as defined below). For the purposes of calculating the Incentive Fee, the term “net profits” means the amount by which the net asset value of the Fund on the last day of the relevant period exceeds the net asset value of the Fund as of the beginning of the same period, including any net change in unrealized appreciation or depreciation of investments, realized gains or losses, investment income, expenses, while excluding contributions and withdrawals from the calculation of the Incentive Fee. The Fund maintains a memorandum account (the “New Loss Recovery Account”), which had an initial balance of zero and will be (i) increased upon the close of each calendar quarter of the Fund by the amount of the net losses of the Fund for the quarter, and (ii) decreased (but not below zero) upon the close of each calendar quarter by the amount of the net profits of the Fund for the quarter. Members will benefit from the New Loss Recovery Account in proportion to their holdings of Units. For the six months ended September 30, 2024, the Fund incurred $51,026,837 in Incentive Fees due to the Adviser.
The Adviser has entered into an expense limitation agreement (the “Expense Limitation Agreement”) with the Fund, whereby the Adviser has agreed to waive fees that it would otherwise be paid, and/or to assume expenses of the Fund (a “Waiver”), if required to ensure the Total Annual Expenses (excluding taxes, interest, brokerage commissions, certain transaction related expenses arising out of investments made by the Fund, extraordinary expenses, the Incentive Fee, and any acquired fund fees and expenses) do not exceed 3.00% on an annualized basis with respect to Class A Units and 2.30% on an annualized basis with respect to Class I Units (the “Expense Limit”). For a period not to exceed three years from the date on which a Waiver is made, the Adviser may recoup amounts waived or assumed, provided it is able to affect such recoupment without causing the Fund’s expense ratio (after recoupment) to exceed the lesser of (a) the expense limit in effect at the time of the waiver, and (b) the expense limit in effect at the time of the recoupment. The Expense Limitation Agreement may be terminated by the Adviser or the Fund upon thirty days’ written notice to the other party. From six months ended September 30, 2024, the Adviser did not waive any fees and the Fund did not pay any recoupment of existing waivers pursuant to the Expense Limitation Agreement.
50
Partners Group Private Equity (Master Fund), LLC
(a Delaware Limited Liability Company)
Notes to Consolidated Financial Statements – September 30, 2024 (Unaudited) (continued)
6. Management Fees, Incentive Fee and Fees and Expenses of Managers (continued)
Each Independent Manager is paid an annual fee. Effective January 1, 2023, the Fund increased the annual fee from $140,000 to $150,000. The Fund pays an additional fee of $10,000 to the Chairman of the Board, the Chairman of the Audit Committee, and effective January 1, 2024, the Chairman of the Nominating Committee. The Fund also reimburses the expenses of the Independent Managers incurred in connection with their services as Independent Managers. The Independent Managers do not receive any pension or retirement benefits from the Fund.
7. Affiliated Investments
Under Section 2(a)(3) of the Investment Company Act, a portfolio company is considered “affiliated” with the Fund if the Fund owns five percent or more of such portfolio company’s outstanding voting securities. The Fund held at least five percent of the outstanding voting securities of the following portfolio companies as of September 30, 2024:
| | Shares/
Principal as of
September 30,
2024 | | | Fair Value
as of
March 31,
2024 | | | Gross
Additions(1) | | | Gross
Reductions(2) | | | Realized
Gains/
Losses | | | Change in
Unrealized
Gains
(Losses) | | | Fair Value
as of
September 30,
2024 | | | Affiliated
Income/
Accretion of
Discount | |
Non-Controlled Affiliates | | | | | | | | | | | | | | | | | | | | | | | | | | | | | | | | |
Bock Capital JVCo Nature S.à.r.l. | | | 12,590,000,000 | | | $ | 184,424,230 | | | $ | — | | | $ | — | | | $ | — | | | $ | 42,610,286 | | | $ | 227,034,516 | | | $ | — | |
Camelia Investment 1 Limited(3)(4) | | | — | | | | 161,208,496 | | | | — | | | | (161,259,391 | ) | | | 72,124,832 | | | | (72,073,937 | ) | | | — | | | | — | |
CapitalSpring Finance Company, LLC | | | 7,766,605 | | | | 8,205,962 | | | | 131,812 | | | | (1,556,316 | ) | | | — | | | | (112,440 | ) | | | 6,669,018 | | | | 161,928 | |
Confluent Health Holdings LP | | | 30,362 | | | | 75,177,581 | | | | 216,482 | | | | (203,671 | ) | | | — | | | | (3,585,389 | ) | | | 71,605,003 | | | | — | |
Dermatology Holdings, L.P.(4) | | | — | | | | 144,036,748 | | | | 41,324 | | | | — | | | | — | | | | 10,698,086 | | | | 154,776,158 | | | | — | |
Ecom Express Private Limited(5) | | | 63,417 | | | | 9,410,364 | | | | — | | | | — | | | | — | | | | 154,661 | | | | 9,565,025 | | | | — | |
ECP Parent, LLC | | | 109,770,023 | | | | 102,237,386 | | | | — | | | | — | | | | — | | | | 471,186 | | | | 102,708,572 | | | | 17,171 | |
EdgeCore Holdings, L.P.(4) | | | — | | | | 103,722,191 | | | | 16,742,527 | | | | — | | | | — | | | | 17,263,123 | | | | 137,727,841 | | | | — | |
Encore Holdings LP(4) | | | — | | | | 103,191,531 | | | | 3,460,000 | | | | — | | | | — | | | | 11,823,775 | | | | 118,475,306 | | | | — | |
EnfraGen LLC | | | 37,786 | | | | 90,545,380 | | | | — | | | | (944,650 | ) | | | — | | | | 6,253,374 | | | | 95,854,104 | | | | 850,185 | |
Green DC LuxCo Sarl | | | 39,061,246 | | | | 154,904,427 | | | | 25,974,000 | | | | — | | | | — | | | | 11,824,988 | | | | 192,703,415 | | | | — | |
Icebox Holdco I Inc(4) | | | — | | | | 62,800,836 | | | | — | | | | — | | | | — | | | | 401,030 | | | | 63,201,866 | | | | — | |
Icebox Parent LP(4) | | | — | | | | 218,133,631 | | | | — | | | | — | | | | — | | | | 26,576,302 | | | | 244,709,933 | | | | — | |
Idera, Inc. | | | 1,229,194 | | | | 1,229,521 | | | | (2,934 | ) | | | (3,081 | ) | | | 8 | | | | (16,789 | ) | | | 1,206,725 | | | | 53,175 | |
Idera Parent L.P.(4) | | | — | | | | 270,973,196 | | | | — | | | | — | | | | — | | | | (40,327,973 | ) | | | 230,645,223 | | | | — | |
KPOCH Holdings, L.P.(4) | | | — | | | | 170,690,437 | | | | — | | | | — | | | | — | | | | (6,627,374 | ) | | | 164,063,063 | | | | 1,164,854 | |
KPSKY Holdings L.P.(4) | | | — | | | | 76,653,056 | | | | — | | | | — | | | | — | | | | (28,373,307 | ) | | | 48,279,749 | | | | — | |
Luxembourg Investment Company 285 S.à.r.l.(6) | | | 14,865,773 | | | | 28,178,939 | | | | — | | | | — | | | | — | | | | 1,794,319 | | | | 29,973,258 | | | | — | |
Luxembourg Investment Company 293 S.à.r.l. | | | 9,789,622 | | | | 50,762,648 | | | | — | | | | — | | | | — | | | | 1,366,955 | | | | 52,129,603 | | | | — | |
51
Partners Group Private Equity (Master Fund), LLC
(a Delaware Limited Liability Company)
Notes to Consolidated Financial Statements – September 30, 2024 (Unaudited) (continued)
7. Affiliated Investments (continued)
| | Shares/
Principal as of
September 30,
2024 | | | Fair Value
as of
March 31,
2024 | | | Gross
Additions(1) | | | Gross
Reductions(2) | | | Realized
Gains/
Losses | | | Change in
Unrealized
Gains
(Losses) | | | Fair Value
as of
September 30,
2024 | | | Affiliated
Income/
Accretion of
Discount | |
Luxembourg Investment Company 314 S.à.r.l.(6) | | | 192,000 | | | $ | 1 | | | $ | — | | | $ | — | | | $ | — | | | $ | — | | | $ | 1 | | | $ | — | |
Luxembourg Investment Company 404 S.à r.l. | | | 145,800 | | | | 24,435,176 | | | | — | | | | (16,590 | ) | | | (133 | ) | | | 1,853,314 | | | | 26,271,767 | | | | — | |
Luxembourg Investment Company 414 S.à r.l. | | | 12,316,087 | | | | 101,514,227 | | | | — | | | | — | | | | — | | | | 12,114,089 | | | | 113,628,316 | | | | — | |
Luxembourg Investment Company 430 S.à r.l. | | | 52,594,635 | | | | 76,366,764 | | | | — | | | | — | | | | — | | | | 3,500,405 | | | | 79,867,169 | | | | — | |
MHS Acquisition Holdings, LLC | | | 35,641 | | | | 985,319 | | | | — | | | | — | | | | — | | | | (375,544 | ) | | | 609,775 | | | | — | |
MHS Blocker Purchaser L.P.(4) | | | — | | | | 76,184,208 | | | | — | | | | | (1) | | | — | | | | (29,036,849 | ) | | | 47,147,358 | | | | — | |
Orbiter Investments S.à.r.l. | | | 8,568,857 | | | | 273,466,108 | | | | — | | | | — | | | | — | | | | 7,527,768 | | | | 280,993,876 | | | | — | |
Partners Group Satellite HoldCo S.à.r.l. | | | 14,993,879 | | | | 53,842,689 | | | | — | | | | — | | | | — | | | | (4,249,123 | ) | | | 49,593,566 | | | | — | |
Partners Group Satellite Warehouse S.C.S.(4) | | | — | | | | 1,174,555 | | | | — | | | | — | | | | — | | | | (44,509 | ) | | | 1,130,046 | | | | — | |
Partners Terra Pte. Ltd. | | | 7,357,185 | | | | 9,130,863 | | | | 622,964 | | | | — | | | | — | | | | 574,771 | | | | 10,328,598 | | | | — | |
PG BRPC Investment, LLC | | | 32,079 | | | | 84,594,435 | | | | — | | | | — | | | | — | | | | (1,764,818 | ) | | | 82,829,617 | | | | — | |
PG Delta Holdco, LLC | | | 40,952 | | | | 87,245,404 | | | | — | | | | — | | | | — | | | | 9,694,239 | | | | 96,939,643 | | | | — | |
PG Esmeralda Pte. Ltd. | | | 12,790,872 | | | | 42,748,489 | | | | 6,853,838 | | | | — | | | | — | | | | 2,286,674 | | | | 51,889,001 | | | | — | |
PG Investment Company 1 S.à r.l. | | | 12,822,040 | | | | 96,885,494 | | | | — | | | | — | | | | — | | | | 5,649,855 | | | | 102,535,349 | | | | — | |
PG Investment Company 18 S.à.r.l. | | | 126,506,634 | | | | 170,136,983 | | | | — | | | | — | | | | — | | | | 23,825,055 | | | | 193,962,038 | | | | — | |
PG Investment Company 24 S.à.r.l. | | | 102,257,478 | | | | 152,072,826 | | | | — | | | | — | | | | — | | | | 9,096,154 | | | | 161,168,980 | | | | — | |
PG Investment Company 60 S.à.r.l. | | | 379,375 | | | | 1,928,633 | | | | 3,994,425 | | | | — | | | | — | | | | 92,684 | | | | 6,015,742 | | | | — | |
PG Investment Company 67 S.à.r.l. | | | 4,725,444 | | | | — | | | | 5,166,306 | | | | — | | | | — | | | | 109,666 | | | | 5,275,972 | | | | — | |
PG Investment Company 69 S.à.r.l. | | | 835,598 | | | | — | | | | 908,965 | | | | — | | | | — | | | | 22,307 | | | | 931,272 | | | | — | |
PG Investment Company 71 S.à.r.l. | | | 5,428,472 | | | | — | | | | 6,069,028 | | | | — | | | | — | | | | (9,760 | ) | | | 6,059,268 | | | | — | |
PG Investment Company 76 S.à.r.l. | | | 44,108,739 | | | | — | | | | 48,700,263 | | | | — | | | | — | | | | 533,968 | | | | 49,234,231 | | | | — | |
52
Partners Group Private Equity (Master Fund), LLC
(a Delaware Limited Liability Company)
Notes to Consolidated Financial Statements – September 30, 2024 (Unaudited) (continued)
7. Affiliated Investments (continued)
| | Shares/
Principal as of
September 30,
2024 | | | Fair Value
as of
March 31,
2024 | | | Gross
Additions(1) | | | Gross
Reductions(2) | | | Realized
Gains/
Losses | | | Change in
Unrealized
Gains
(Losses) | | | Fair Value
as of
September 30,
2024 | | | Affiliated
Income/
Accretion of
Discount | |
PG Lion Management Warehouse S.C.S(4)(6) | | | — | | | $ | 232,873 | | | $ | — | | | $ | — | | | $ | — | | | $ | (57,585 | ) | | $ | 175,288 | | | $ | — | |
PG TLP S.à r.l. | | | 6,473,126 | | | | 114,276,166 | | | | — | | | | — | | | | — | | | | 18,631,022 | | | | 132,907,188 | | | | — | |
PG Wave Limited | | | 53,215,581 | | | | 86,899,848 | | | | — | | | | — | | | | — | | | | 10,661,218 | | | | 97,561,066 | | | | — | |
Pharmathen GP S.à r.l. | | | 110,300 | | | | 1 | | | | — | | | | — | | | | — | | | | — | | | | 1 | | | | — | |
Pharmathen Topco S.à r.l. | | | 98,937,978 | | | | 160,504,707 | | | | — | | | | — | | | | — | | | | (540,408 | ) | | | 159,964,299 | | | | — | |
Polyusus Lux XVI S.à.r.l. | | | 291,878,429 | | | | 2 | | | | 3,004,977 | | | | — | | | | — | | | | 93,673 | | | | 3,098,652 | | | | — | |
Root JVCo S.à r.l. | | | 11,049,750 | | | | 111,951,014 | | | | — | | | | — | | | | — | | | | 8,769,556 | | | | 120,720,570 | | | | — | |
SnackTime PG Holdings, Inc. | | | 12 | | | | 10,573,061 | | | | 4,029 | | | | — | | | | — | | | | (6,882,238 | ) | | | 3,694,852 | | | | — | |
Specialty Pharma Holdings LP(4) | | | — | | | | 145,782,767 | | | | — | | | | — | | | | — | | | | (3,455,209 | ) | | | 142,327,558 | | | | — | |
Sunsure Energy Private Limited | | | 2,409,419 | | | | 12,075,632 | | | | 7,217,800 | | | | — | | | | — | | | | 1,484,067 | | | | 20,777,499 | | | | — | |
SureWerx Topco, L.P.(4) | | | — | | | | 59,814,352 | | | | 3,367,000 | | | | — | | | | — | | | | 7,068,955 | | | | 70,250,307 | | | | — | |
Surfaces SLP (SCSp)(4) | | | — | | | | 29,161,781 | | | | — | | | | — | | | | — | | | | (3,937,181 | ) | | | 25,224,600 | | | | — | |
Thermostat Purchaser, L.P.(4) | | | — | | | | 90,401,213 | | | | — | | | | — | | | | — | | | | 13,279,847 | | | | 103,681,060 | | | | — | |
WHCG Purchaser, Inc.(3) | | | — | | | | 3,407,722 | | | | 169,919 | | | | (3,577,641 | ) | | | — | | | | — | | | | — | | | | 230,690 | |
WHCG Purchaser, Inc.(3)(4) | | | — | | | | 2,377,506 | | | | — | | | | — | | | | (2,316,000 | ) | | | (61,506 | ) | | | — | | | | — | |
WHCG Purchaser, L.P. | | | 14,022,833 | | | | 12,901,389 | | | | 14,022,833 | | | | — | | | | — | | | | 786,444 | | | | 27,710,666 | | | | — | |
Zenith Longitude Limited | | | 26,838,037 | | | | 262,470,388 | | | | — | | | | — | | | | — | | | | 2,975,006 | | | | 265,445,394 | | | | 4,299,165 | |
Total Non-Controlled Affiliates | | | | | | $ | 4,372,029,156 | | | $ | 146,665,558 | | | $ | (167,561,341 | ) | | $ | 69,808,707 | | | $ | 70,336,883 | | | $ | 4,491,278,963 | | | $ | 6,777,168 | |
(1) | Gross additions may include increases in the cost basis of investments resulting from new portfolio investments, the accretion of discounts and the exchange of one or more existing securities for one or more new securities. |
(2) | Gross reductions may include decreases in the cost basis of investments resulting from principal collections related to investment repayments or sales and the exchange of one or more existing securities for one or more new securities. |
(3) | Investment was exited during the period ended September 30, 2024. |
(4) | Investment does not issue shares. |
(5) | This investment is associated with PG Esmeralda Pte. Ltd. |
(6) | Luxembourg Investment Company 285 S.à.r.l, Luxembourg Investment Company 314 S.à.r.l and PG Lion Management Warehouse S.C.S. are related to the same investment. |
8. Accounting and Administration Agreement
The Administrator serves as administrator and accounting agent to the Fund and provides certain accounting, record keeping and investor related services pursuant to an Accounting and Administration Agreement between the Fund and the Administrator. For its services the Administrator receives a monthly fee that is based upon the average net assets of the Fund, fees on portfolio transactions, as well as reasonable out of pocket expenses. For the six months ended September 30, 2024, the Fund incurred $5,629,494 in administration and accounting fees due to the Administrator.
53
Partners Group Private Equity (Master Fund), LLC
(a Delaware Limited Liability Company)
Notes to Consolidated Financial Statements – September 30, 2024 (Unaudited) (continued)
9. Investment Transactions
Total purchases of investments for the six months ended September 30, 2024 amounted to $1,995,828,154. Total distribution proceeds from sale, redemption, or other disposition of investments for the six months ended September 30, 2024 amounted to $1,079,281,904. The cost of investments for U.S. federal income tax purposes is adjusted for items of taxable income allocated to the Fund from such investments. The Fund relies upon actual and estimated tax information provided by the managers of the Private Equity Fund Investments as to the amounts of taxable income allocated to the Fund as of September 30, 2024.
10. Indemnification
In the normal course of business, the Fund may enter contracts that provide general indemnification. The Fund’s maximum exposure under these agreements is dependent on future claims that may be made against the Fund under such agreements, and therefore cannot be established; however, based on management’s experience, the risk of loss from such claims is considered remote.
11. Commitments
As of September 30, 2024, the Fund had funded $15,695,031,383 or 89.5% of the $17,544,639,742 of its total commitments to Private Equity Investments. With respect to its (i) Direct Investments it had funded $11,519,006,613 of $12,101,251,594 in total commitments, (ii) Secondary Investments it had funded $2,233,001,810 of $2,528,137,499 in total commitments, and (iii) Primary Investments it had funded $1,943,022,960 of $2,915,250,649 in total commitments, in each case, as of September 30, 2024.
12. Risk Factors
An investment in the Fund involves significant risks, including industry risk, liquidity risk, interest rate risk and economic conditions risk. These risks should be carefully considered prior to investing and should only be considered by investors financially able to maintain their investment and who can afford a loss of a substantial part or all of such investment. The Fund invests substantially all its available capital in Private Equity Investments. Typically, these investments are in restricted securities that are not traded in public markets and are subject to substantial holding periods, so that the Fund may not be able to resell some of its holdings for extended periods, which may be several years. The Fund may have a concentration of investments in a particular industry or sector. The performance of investments in the sector may have a significant impact on the performance of the Fund. The Fund’s Private Equity Investments are illiquid, typically subject to various restrictions on resale, and there is no assurance that the Fund will be able to realize the value of such investments in a timely manner. Private Equity Fund Investments are generally closed-end private equity partnerships with no right to withdraw prior to the termination of the partnership. The frequency of withdrawals is dictated by the governing documents of the Private Equity Fund Investments. Except where a market exists for the securities in which the Fund is directly or indirectly invested, the valuations of the Fund’s investments are estimated. Due to the inherent uncertainty in estimated valuations, those valuations may differ from the valuations that would have been used had a ready market for the securities existed, and the differences could be material.
Investments in Units provide limited liquidity. It is currently intended that holders of Fund Units will be able to redeem Units only through quarterly offers by the Fund to purchase, from holders of Fund Units, a limited number of Units. Those offers are at the discretion of the Board on the recommendation of the Adviser. Therefore, an investment in the Fund is suitable only for investors who can bear the risks associated with the limited liquidity of Units and should be viewed as a long-term investment. No guarantee or representation is made that the Fund’s investment objective will be met.
The impairment or failure of one or more banks with whom the Fund, an underlying fund or their portfolio companies transacts may inhibit the Fund, an underlying fund or their portfolio companies’ ability to access depository accounts. In such cases, the Fund or an underlying fund or portfolio company may be forced to delay or forgo investments or other business opportunities or initiatives, resulting in lower Fund performance. In the event of such a failure of a banking institution where the Fund, an underlying fund or portfolio company holds depository accounts, access to such accounts could be restricted and U.S. Federal Deposit Insurance Corporation (“FDIC”) protection may not be available for balances in excess of amounts insured by the FDIC. In such instances, the Fund, an underlying fund or their portfolio companies may not recover such excess, uninsured amounts.
54
Partners Group Private Equity (Master Fund), LLC
(a Delaware Limited Liability Company)
Notes to Consolidated Financial Statements – September 30, 2024 (Unaudited) (continued)
12. Risk Factors (continued)
The failure of certain financial institutions, namely banks, may increase the possibility of a sustained deterioration of financial market liquidity, or illiquidity at clearing, cash management and/or custodial financial institutions. The failure of a bank (or banks) with which the Fund, an underlying fund or their portfolio companies have a commercial relationship could adversely affect, among other things, the Fund, underlying fund or one of their portfolio company’s ability to pursue key strategic initiatives, including by affecting the Fund, an underlying fund or portfolio company’s ability to borrow from financial institutions on favorable terms.
Additionally, if the sponsor of an underlying fund, or a portfolio company, has a commercial relationship with a bank that has failed or is otherwise distressed, the underlying fund and/or its portfolio companies may experience issues receiving financial support from the sponsor to support its operations or consummate transactions, to the detriment of their business, financial condition and/or results of operations.
13. Tax Information
As of September 30, 2024, for U.S. federal income tax purposes, the Fund’s aggregate unrealized appreciation and depreciation on its investments based on cost were as follows:
| | | Investments | | | Forward Foreign
Currency Contracts | |
Tax Cost | | $ | 11,234,876,731 | | | $ | 3,931,312,709 | |
Gross unrealized appreciation | | | 4,775,272,518 | | | | 334,551 | |
Gross unrealized depreciation | | | (499,544,349 | ) | | | (77,474,894 | ) |
Net unrealized investment appreciation | | $ | 4,275,728,169 | | | $ | (77,140,343 | ) |
The tax cost of the Fund’s investments as of September 30, 2024, approximates their amortized cost.
14. Stock Split
Effective as of the close of business on the date listed in the subsequent table, the Fund’s units underwent a stock split. There was no impact to the aggregate market value of units outstanding. The historical per unit data presented within the Financial Highlights has been retroactively adjusted to reflect the stock split. The stock split ratios, net effect on the NAV per unit, and the number of units outstanding as of the date indicated were as follows:
| | | Date | | | Share Split
Ratio | | | Shares Prior
to Stock Split | | | Shares After
Stock Split | | | Increase
(Decrease)
in Net Asset
Value per
Share | | | Increase
(Decrease)
in Net Shares
Outstanding | |
Class A | | | July 2, 2024 | | | | 1 for 4 | | | | 1,025,821,220 | | | | 4,103,284,878 | | | | Decrease | | | | Increase | |
Class I | | | July 2, 2024 | | | | 1 for 4 | | | | 834,063,251 | | | | 3,336,253,004 | | | | Decrease | | | | Increase | |
15. Subsequent Events
Management has evaluated the impact of all subsequent events on the Fund and determined that there were no subsequent events that require disclosure in the consolidated financial statements.
55
Partners Group Private Equity (Master Fund), LLC
(a Delaware Limited Liability Company)
Other Information (Unaudited)
Proxy Voting
The Fund is required to file Form N-PX, with its complete proxy voting record for the twelve months ended June 30, no later than August 31. The Fund’s Form N-PX filing is available: (i) without charge, upon request, by calling 1-877-748-7209 or (ii) by visiting the SEC’s website at www.sec.gov.
Availability of Quarterly Portfolio Schedules
The Fund files its complete schedule of portfolio holdings with the SEC for the first and third quarters of each fiscal year as an exhibit to its reports on Form N-PORT. The Fund’s Forms N-PORT are available on the SEC’s website at www.sec.gov.
56
(b) Not applicable.
Item 2. Code of Ethics.
Not applicable.
Item 3. Audit Committee Financial Expert.
Not applicable.
Item 4. Principal Accountant Fees and Services.
Not applicable.
Item 5. Audit Committees of Listed Registrants.
Not applicable.
Item 6. Investments.
(a) Schedules of Investments are included as part of the reports to shareholders filed under Item 1(a) of this Form N-CSR.
(b) Not applicable.
Item 7. Financial Statements and Financial Highlights for Open-End Management Investment Companies
(a) Not applicable.
(b) Not applicable.
Item 8. Changes in and Disagreements with Accountants for Open-End Management Investment Companies
Not applicable.
Item 9. Proxy Disclosures for Open-End Management Investment Companies
Not applicable.
Item 10. Remuneration Paid to Directors, Officers, and Others of Open-End Management Investment Companies
Not applicable.
Item 11. Statement Regarding Basis for Approval of Investment Advisory Contract
Not applicable.
Item 12. Disclosure of Proxy Voting Policies and Procedures for Closed-End Management Investment Companies
Not applicable.
Item 13. Portfolio Managers of Closed-End Management Investment Companies
Not applicable.
Item 14. Purchases of Equity Securities by Closed-End Management Investment Company and Affiliated Purchasers
Not applicable.
Item 15. Submission of Matters to a Vote of Security Holders
There have been no material changes to the procedures by which the shareholders may recommend nominees to the registrant's board of managers, where those changes were implemented after the registrant last provided disclosure in response to the requirements of Item 407(c)(2)(iv) of Regulation S-K (17 CFR 229.407), or this Item.
Item 16. Controls and Procedures
(a). The registrant's principal executive and principal financial officers, or persons performing similar functions, have concluded that the registrant's disclosure controls and procedures (as defined in Rule 30a-3(c) under the Investment Company Act of 1940, as amended (the "1940 Act") (17 CFR 270.30a-3(c))) are effective, as of a date within 90 days of the filing date of the report that includes the disclosure required by this paragraph, based on their evaluation of these controls and procedures required by Rule 30a-3(b) under the 1940 Act (17 CFR 270.30a-3(b)) and Rules 13a-15(b) or 15d-15(b) under the Securities Exchange Act of 1934, as amended (17 CFR 240.13a-15(b) or 240.15d-15(b)).
(b). There was no change in the registrant's internal control over financial reporting (as defined in Rule 30a-3(d) under the 1940 Act (17 CFR 270.30a-3(d)) that occurred during the period covered by this report that has materially affected, or is reasonably likely to materially affect, the registrant's internal control over financial reporting.
Item 17. Disclosure of Securities Lending Activities for Closed-End Management Investment Companies
(a) Not applicable.
(b) Not applicable.
Item 18. Recovery of Erroneously Awarded Compensation
Not applicable.
Item 19. Exhibits
(a)(1) Not applicable.
(a)(2) Not applicable.
(a)(3) Certifications pursuant to Rule 30a-2(a) under the 1940 Act and Section 302 of the Sarbanes-Oxley Act of 2002 are attached hereto.
(a)(4) Not applicable.
(a)(5) Not applicable.
(b) The certifications required by Rule 30a-2(b) under the 1940 Act (17 CFR 270.30a-2(b)) and Section 906 of the Sarbanes-Oxley Act of 2002 are attached hereto.
SIGNATURES
Pursuant to the requirements of the Securities Exchange Act of 1934, as amended, and the Investment Company Act of 1940, as amended, the registrant has duly caused this report to be signed on its behalf by the undersigned, thereunto duly authorized.
Partners Group Private Equity (Master Fund), LLC
| By (Signature and Title): | /s/ Robert M. Collins | |
| | Robert M. Collins, President & | |
| | Chief Executive Officer | |
| | (Principal Executive Officer) | |
| | | |
| Date: | December 6, 2024 | |
Pursuant to the requirements of the Securities Exchange Act of 1934, as amended, and the Investment Company Act of 1940, as amended, this report has been signed below by the following persons on behalf of the registrant and in the capacities and on the dates indicated.
| By (Signature and Title): | /s/ Robert M. Collins | |
| | Robert M. Collins, President & | |
| | Chief Executive Officer | |
| | (Principal Executive Officer) | |
| | | |
| Date: | December 6, 2024 | |
| | | |
| By (Signature and Title): | /s/ Brian Igoe | |
| | Brian Igoe, Chief Financial Officer | |
| | (Principal Financial Officer) | |
| | | |
| Date: | December 6, 2024 | |