UNITED STATES
SECURITIES AND EXCHANGE COMMISSION
Washington, D.C. 20549
FORM N-CSR
CERTIFIED SHAREHOLDER REPORT OF REGISTERED
MANAGEMENT INVESTMENT COMPANIES
Investment Company Act File Number: 811-22243
| T. Rowe Price Global Multi-Sector Bond Fund, Inc. |
|
| (Exact name of registrant as specified in charter) |
| |
| 100 East Pratt Street, Baltimore, MD 21202 |
|
| (Address of principal executive offices) |
| |
| David Oestreicher |
| 100 East Pratt Street, Baltimore, MD 21202 |
|
| (Name and address of agent for service) |
Registrant’s telephone number, including area code: (410) 345-2000
Date of fiscal year end: May 31
Date of reporting period: November 30, 2017
Item 1. Report to Shareholders
| Global Multi-Sector Bond Fund | November 30, 2017 |
The views and opinions in this report were current as of November 30, 2017. They are not guarantees of performance or investment results and should not be taken as investment advice. Investment decisions reflect a variety of factors, and the managers reserve the right to change their views about individual stocks, sectors, and the markets at any time. As a result, the views expressed should not be relied upon as a forecast of the fund’s future investment intent. The report is certified under the Sarbanes-Oxley Act, which requires mutual funds and other public companies to affirm that, to the best of their knowledge, the information in their financial reports is fairly and accurately stated in all material respects.
REPORTS ON THE WEB
Sign up for our Email Program, and you can begin to receive updated fund reports and prospectuses online rather than through the mail. Log in to your account at troweprice.com for more information.
Manager’s Letter
Fellow Shareholders
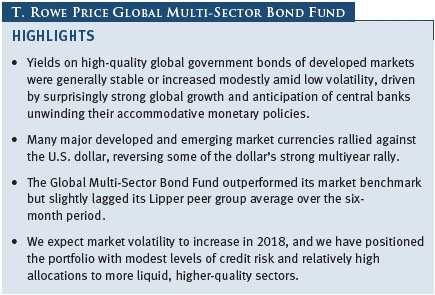
Yields on global developed market government debt were generally stable or increased modestly while trading in a relatively narrow range. Global economic growth was surprisingly strong, with all major global regions experiencing growth in the second half of 2017, which helped push yields higher as investors anticipated that central banks would remove their accommodative monetary policies. European and U.S. high yield bonds rallied, supported by anticipation of expansionary U.S. fiscal policy—tax reform in particular—as well as higher oil prices. Investment-grade corporate bonds also produced solid returns as investors continued to seek out higher-yielding securities.
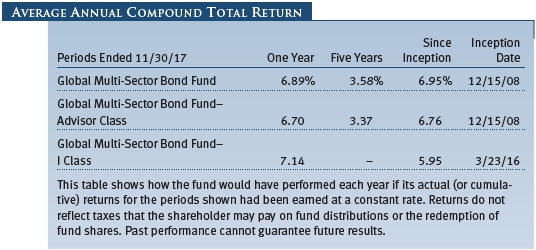
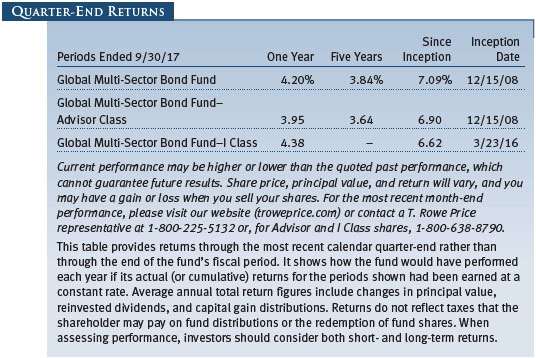
PERFORMANCE COMPARISON
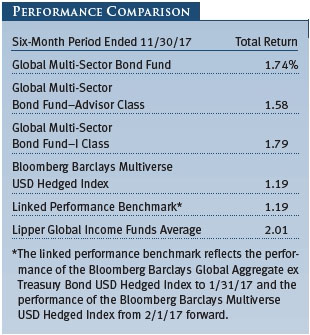
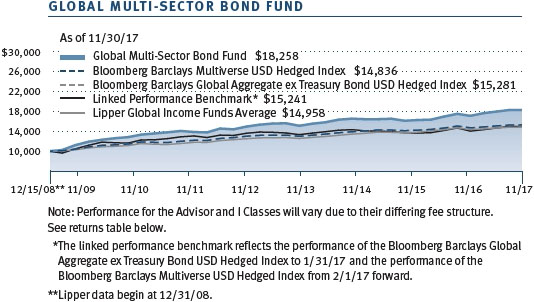
The Global Multi-Sector Bond Fund returned 1.74% for the six months ended November 30, 2017, outperforming the Bloomberg Barclays Multiverse USD Hedged Index, which returned 1.19%. (Results for Advisor and I Class shares may vary, reflecting their different fee structures.) Duration positioning, sector allocation, and security selection decisions all contributed to the fund’s relative performance.
The fund slightly underperformed the Lipper Global Income Funds Average but ranks favorably in the Lipper universe over longer-term periods. Based on cumulative total return, the Global Multi-Sector Bond Fund ranked 99 of 206, 15 of 190, 12 of 174, and 20 of 100 funds in the Lipper global income funds group for the one-, three-, and five-year and since-inception periods ended November 30, 2017, respectively. (The Lipper since-inception ranking was calculated from 12/31/08 through 11/30/17. Past performance cannot guarantee future results.) As shown in the Growth of $10,000 chart on page 16, the fund’s longer-term performance compares favorably with both the benchmark and its peers since its inception in December 2008.
The fund is a highly diversified fixed income portfolio that invests in a broad range of securities: domestic and foreign, developed and emerging markets, higher-risk and higher-quality, government-issued, corporate, and securitized bonds. The fund represents a more aggressive diversified bond portfolio than many other T. Rowe Price offerings due to its substantial allocation flexibility across sectors and foreign bonds and our willingness to deviate significantly from the benchmark when we perceive attractive opportunities. However, the portfolio is designed to typically be less volatile than bond funds concentrated in a single higher-risk sector, such as high yield.
MARKET ENVIRONMENT
All major global regions experienced growth in the second half of 2017, although the economic health of some individual countries lagged. U.S. gross domestic product (GDP) increased at annualized rates of 3.1% and 3.2% in the second and third quarters, respectively, rebounding from a weak first quarter. The U.S. labor market has been healthy, with the national unemployment rate reaching a 17-year low of 4.1% in October and November. Inflation data showed some signs of normalizing after very weak pricing pressures earlier in 2017. Citing the strengthening labor market and expectations that inflation would move higher over the medium term, the Fed raised short-term interest rates once in June during the six-month reporting period and then again shortly after the end of the period in December, lifting the federal funds target rate to a range of 1.25% to 1.50%. Additionally, in October, the Fed began the important process of slowly unwinding its $4.5 trillion balance sheet, a legacy of its massive purchases of Treasury bonds and mortgage-backed securities (MBS) in the aftermath of the 2008 financial crisis, by slowing reinvestment of payments from its holdings.
Eurozone growth was surprisingly strong as the region’s GDP expanded at 2.4% and 2.6% year-over-year rates in the second and third quarters, respectively. This led many market participants to anticipate that the European Central Bank (ECB) would begin to remove its accommodative monetary policy sooner than originally expected. In October, ECB President Mario Draghi announced that the central bank would continue to buy bonds at least through September 2018 while cutting the size of its monthly purchases in half beginning in January 2018. Japanese growth remained sluggish and inflation persistently low, leading the Bank of Japan (BoJ) to maintain its government bond purchase policy that targets a 0% yield on the 10-year Japanese government bond. While UK growth remained positive and the pound sterling gained versus the U.S. dollar in the reporting period, the decline in the value of sterling since the Brexit vote triggered an increase in inflation. In November, the Bank of England (BoE) raised its benchmark lending rate by 25 basis points to 0.50% in an effort to support the pound and subdue inflation. The rate hike was the first from the BoE since 2007.
Growth in emerging markets as a whole continued to outpace developed markets, although there was more dispersion in the economic health of individual emerging countries as a result of idiosyncratic themes. The price of Brent crude, the global oil benchmark, climbed to nearly $64 per barrel after starting the period just below $50, supporting the economies of Latin American countries such as Brazil and Mexico that depend on commodity exports. Brazil’s economy showed signs of recovering from its deepest recession in 100 years, despite continued uncertainty around fiscal issues. Conversely, Mexican growth faltered amid damage from major earthquakes and ongoing concerns about a potential U.S. move toward protectionist trade policies. Asian emerging markets remained closely linked with China, where GDP grew by 6.8% in the third quarter, above the government’s stated goal of around 6.5%. China held its Communist Party National Congress, which occurs every five years, in October to choose government leaders. The Congress further solidified Chinese President Xi Jinping’s political power and resulted in pledges to improve the quality and sustainability of economic growth. Geopolitical concerns centered on North Korea weighed on sentiment toward emerging Asian countries. In emerging European countries, signs of accelerating inflation appeared in Hungary, Romania, and Russia. South Africa remained mired in political turbulence as President Jacob Zuma survived a legislative attempt to oust him.
The monetary policies of emerging market central banks diverged in response to their varying economic growth trajectories and economic linkages. The Central Bank of Brazil extended its series of interest rate cuts as softer inflation gave the central bank room to stimulate the economy. Shortly after the end of the reporting period, the central bank lowered its benchmark short-term rate to a record low of 7%. On the other hand, Romania’s central bank took a first step toward tightening monetary policy by narrowing the range around its targeted benchmark interest rate, citing accelerating inflation pressures, a theme likely to be repeated across other Central and Eastern European countries.
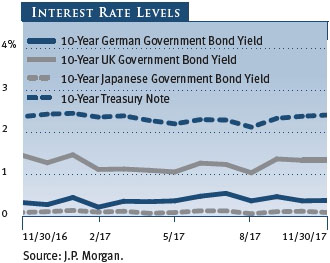
Volatility in interest rates was low, with global developed market government debt trading in a relatively narrow range during the six-month period. U.S. Treasury yields generally increased, although yields on shorter-maturity Treasuries rose more than intermediate- and longer-term yields amid expectations that the Fed would continue to gradually increase the federal funds rate, resulting in a flatter yield curve. U.S. Treasuries offered a meaningful yield premium over high-quality government bonds from other developed markets, creating demand that likely helped contain their yield increase. During the six-month period, the yield on the 10-year U.S. Treasury note generally stayed between 2.10% and 2.40%, a tight 30-basis-point range. In the same period of 2016, the yield varied from about 1.40% to 2.50%, a much larger 110-basis-point range.
Volatility in high-quality eurozone sovereign debt was similarly low, although stronger-than-expected growth in Europe pushed yields modestly higher. The 10-year German note’s yield largely traded between 0.35% and 0.60% in the reporting period, with the 25-basis-point range contrasting with the 60-basis-point range in the same period of 2016, when the note generally yielded -0.20% to 0.40%. The BoJ’s yield curve control policy, which started in late 2016, kept the yield on the 10-year Japanese government bond near the central bank’s 0% target.
There was modestly higher volatility in emerging market local government debt, given the differing monetary policies and political situations across individual countries. The yield on Russia’s 10-year government note finished the period little changed from where it started but was volatile intra-period as investors worked through the implications of higher commodities prices and geopolitical risk for the country’s economy. Mexico’s 10-year local government bond rallied until concerns around North American Free Trade Agreement (NAFTA) negotiations and the possibility of renewed tightening due to inflationary pressures pushed yields higher to end the period near where they started. The yield on South Africa’s 10-year government note increased sharply near the end of the reporting period when S&P lowered its credit rating for local currency South African debt into the noninvestment-grade category.
Many major currencies of both developed and emerging markets rallied against the U.S. dollar, particularly early in the period, reversing some of the dollar’s multiyear run of strength. The euro gained about 6% versus the greenback while the British pound sterling recovered some of its post-Brexit losses by rallying nearly 5%. However, the Japanese yen lost slightly more than 1% against the dollar, possibly because the BoJ is likely to lag other central banks in removing its extraordinary accommodative monetary policies, keeping rates low relative to the higher rates in the U.S. In emerging markets, the Polish zloty gained over 5.5% versus the U.S. dollar and the Malaysian ringgit climbed more than 4.5%. However, the Brazilian real lost a modest 1% as the country’s central bank cut rates, making its currency relatively less attractive.
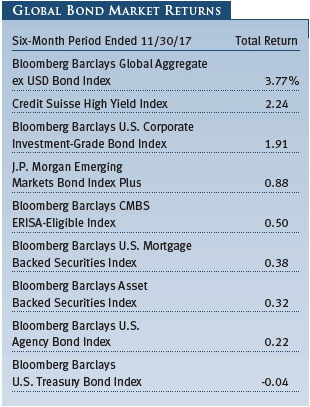
U.S. high yield bonds rallied through most of the reporting period, although some negative earnings releases, uncertainty around tax reform, and the cessation of a potential large merger in the telecom sector caused a rare sell-off in early November. Going forward, we expect more of this type of sensitivity to negative events, as the rally has been extended and we appear to be increasingly late in the growth cycle. Despite the uncertainty, as anticipation of expansionary U.S. fiscal policy became more likely and oil prices increased, the high yield market quickly recovered, as bonds from commodity-related industries account for a significant proportion of the U.S. high yield bond market. Credit spreads on U.S. high yield reached their narrowest levels in 10 years late in 2017. European noninvestment-grade bonds outperformed their U.S. counterparts as spreads compressed so much that the yield of the sector, as measured by the J.P. Morgan European Currency High Yield Index, reached 3.00% at the end of October, compared with an average yield since 1999 of 8.78%. Investment-grade corporate bonds modestly lagged the high yield market as a result of their lower yields and longer durations as increases in government yields had a negative effect on return. Asset-backed securities and MBS posted gains, though modest, despite the increase in Treasury yields. Ongoing demand for yield also supported emerging market bonds, where locally denominated debt benefited from the U.S. dollar’s weakness against some key emerging market currencies.
PERFORMANCE AND INVESTMENT REVIEW
Interest rate positioning, sector allocation, and security selection all contributed to the fund’s relative performance. The fund benefited from an underweight to developed market global sovereign debt and shorter-than-benchmark duration as rates increased marginally due to surprisingly strong global growth. Security selection in global sovereigns from peripheral eurozone countries such as Slovenia and Cyprus also added value. In addition, security selection in emerging markets, including positions in oil-related quasi-sovereign bonds, benefited relative returns.
Partially offsetting the positive factors, the fund’s broad currency positioning weighed on relative returns. A long position in the Turkish lira was particularly impactful as rising geopolitical risks in Turkey weighed on the currency. A short position in the pound sterling also weighed on performance as Brexit did not impact the currency as expected and the BoE hiked rates. These were offset somewhat by added value from a short position in the Australian dollar, tactical moves in the Mexican peso, and a long position in the Serbian dinar, which benefited as the country’s government continues to make progress on structural reforms.
Throughout the reporting period, the fund had a sizable allocation to global sovereign bonds, which tend to be more liquid and higher quality than more credit-intensive bonds. The level of risk exposure in the portfolio was at or near previous lows with modest exposure to credit sectors relative to the fund’s history and with hedges against risk in U.S. high yield, European credit, and some currencies via the derivatives market. The fund’s overall duration was generally about one year shorter than the benchmark. On a regional basis, the portfolio’s relative duration was short versus the benchmark in the eurozone, the UK, and Japan. Although we ended the period with longer-than-benchmark duration in U.S. Treasuries, we shifted U.S. duration tactically and utilized both long- and short-duration positioning as interest rates shifted and we saw opportunities. Duration in several emerging markets, including Mexico, Malaysia, and Brazil, was generally long relative to the benchmark.
In addition to the previously mentioned currencies, we were also long the Brazilian real and short the Russian ruble early in the reporting period but eliminated those active positions during the period. Later in the period, we initiated a long position in the South African rand, as valuations were attractive and prospects for a market-friendly election outcome seemed probable. We also maintained a longstanding short position in the South Korean won as a hedge against an escalation in tensions on the Korean Peninsula or an abrupt slowdown in the Chinese economy.

We made very few tactical changes in sector allocation during the six-month period amid low volatility and stretched valuations. The fund’s low risk exposure and conservative positioning continued to emphasize liquidity as we position for volatility in credit-sensitive sectors that we believe is increasingly likely.
When determining portfolio allocation targets among the various fixed income sectors, we actively consider both current and potential future liquidity. U.S. Treasuries and the sovereign debt of other developed markets, such as Germany and the UK, are typically very liquid. However, liquidity tends to decrease in sectors with increasing amounts of credit risk. Emerging market corporate bonds is an example of a sector that can be difficult to buy or sell efficiently in a “flight to quality” environment.

The fund maintains material holdings in various types of derivatives, primarily for hedging risk or gaining exposure to certain sectors or currencies. We also periodically use currency derivatives to hedge foreign currency exposure, reducing risk versus the benchmark, which consists entirely of bonds denominated in, or hedged to, U.S. dollars. The ability to hedge is an integral part of our risk management on nondollar bonds. During some time periods, the currency hedging component has a positive effect on absolute performance. However, the fund’s exposure to currency derivatives detracted slightly from absolute performance during the six-month period as the dollar generally underperformed the foreign currencies we were hedging.
OUTLOOK
While we are concerned about lingering market risks, we expect the global expansion that took hold in the second half of 2017 to continue into early next year, led by healthy growth in the U.S., the eurozone, and China. Inflation is likely to trend upward from its current relatively low levels, although the direction of oil prices and food prices in emerging markets will likely prompt upswings or downturns in inflation. If stronger-than-expected inflation prompts the Fed to accelerate its interest rate hikes, we would be concerned about outflows from emerging markets. However, faster Fed policy normalization triggered by stronger-than-expected growth, rather than inflation, would likely be a good sign for emerging markets.
A variety of risk factors leads us to believe that volatility and market risks will increase as we navigate through 2018, following 2017’s remarkably low volatility across fixed income sectors. Markets have thus far shrugged off risks, including North Korean nuclear tests and expected actions by many developed market central banks to unwind their ultra-accommodative monetary policies, but we think that is unlikely to persist through next year. As a result, we favor meaningful allocations to liquid sectors such as high-quality developed market sovereign debt and agency MBS to facilitate tactical portfolio shifts as the market environment evolves. While holding liquidity entails a cost, that cost is currently low given a generally positive investment environment. Although the timing and magnitude of risk events are difficult to predict, history shows that the value of liquidity can increase dramatically around heightened volatility.
With relative value opportunities across credit sectors appearing limited, we expect the majority of near-term tactical opportunities to come from interest rates and currencies. We are confident that T. Rowe Price’s team of sector-specific credit analysts can help us continue to find value within credit sectors while our economists and sovereign debt analysts provide insights on individual countries that drive our interest rate and currency allocations. In this uncertain environment, we believe that our strengths in identifying return opportunities and risks, actively adjusting our portfolio allocations, and performing fundamental credit analysis will allow us to continue to generate solid long-term performance for our shareholders.
Thank you for investing with T. Rowe Price.
Respectfully submitted,

Steven C. Huber
Chairman of the fund’s Investment Advisory Committee
December 21, 2017
The committee chairman has day-to-day responsibility for managing the portfolio and works with committee members in developing and executing the fund’s investment program.

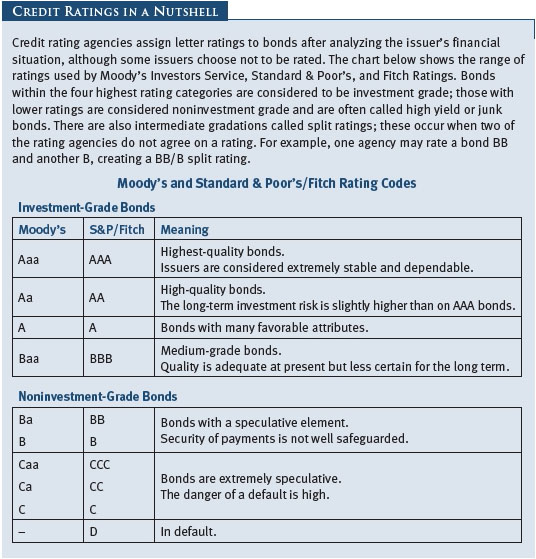
RISKS OF BOND INVESTING
Bonds are subject to interest rate risk, the decline in bond prices that usually accompanies a rise in interest rates, and credit risk, the chance that any fund holding could have its credit rating downgraded or that a bond issuer will default (fail to make timely payments of interest or principal), potentially reducing the fund’s income level and share price. MBS are subject to prepayment risk, particularly if falling rates lead to heavy refinancing activity, and extension risk, which is an increase in interest rates that causes a fund’s average maturity to lengthen unexpectedly due to a drop in mortgage prepayments. This could increase the fund’s sensitivity to rising interest rates and its potential for price declines.
Investing in the securities of non-U.S. issuers involves special risks not typically associated with investing in U.S. issuers. Foreign securities tend to be more volatile and less liquid than investments in U.S. securities and may lose value because of adverse local, political, social, or economic developments overseas, or due to changes in the exchange rates between foreign currencies and the U.S. dollar. In addition, foreign investments are subject to settlement practices and regulatory and financial reporting standards that differ from those of the U.S. These risks are heightened for the fund’s investments in emerging markets, which are more susceptible to governmental interference, less efficient trading markets, and the imposition of local taxes or restrictions on gaining access to sales proceeds for foreign investors.
GLOSSARY
Basis point: One one-hundredth of one percentage point, or 0.01%.
Bloomberg Barclays Asset-Backed Securities Index: Tracks the performance of securities backed by assets including credit card, home equity, and auto loans.
Bloomberg Barclays CMBS ERISA-Eligible Index: An unmanaged index that tracks the performance of commercial mortgage-backed securities.
Bloomberg Barclays Global Aggregate ex Treasury Bond USD Hedged Index: Tracks the global investment-grade fixed rate debt markets, excluding U.S. Treasury securities, and is hedged to the dollar.
Bloomberg Barclays Global Aggregate ex USD Bond Index: Tracks the performance of government, corporate, agency, and mortgage-related bonds in Europe, the Asia-Pacific region, and Canada.
Bloomberg Barclays Multiverse USD Hedged Index: Tracks the performance of the global fixed income market, including both investment-grade and high yield bonds.
Bloomberg Barclays U.S. Agency Bond Index: Tracks the performance of securities issued by U.S. agencies such as Fannie Mae (FNMA), Freddie Mac (FHLMC), and the Federal Home Loan Bank.
Bloomberg Barclays U.S. Corporate Investment-Grade Bond Index: A measure of corporate and noncorporate fixed income securities that are primarily rated investment grade (Baa by Moody’s Investors Service and BBB by Standard & Poor’s).
Bloomberg Barclays U.S. Mortgage Backed Securities Index: An index that tracks the performance of the mortgage backed pass-through securities of Ginnie Mae (GNMA), Fannie Mae (FNMA), and Freddie Mac (FHLMC).
Bloomberg Barclays U.S. Treasury Bond Index: An unmanaged index of publicly traded obligations of the U.S. Treasury.
Credit spreads: The additional yield that investors demand to hold a bond with credit risk compared with a Treasury security with a comparable maturity date.
Credit Suisse High Yield Index: An index that tracks the performance of domestic noninvestment-grade corporate bonds.
Duration: A measure of a bond fund’s sensitivity to changes in interest rates. For example, a fund with a four-year duration would fall about 4% in response to a one-percentage-point rise in interest rates, and vice versa.
Federal funds rate: The interest rate charged on overnight loans of reserves by one financial institution to another in the U.S. The Federal Reserve sets a target federal funds rate to affect the level and direction of market rates.
Gross domestic product: The total market value of all goods and services produced in a country in a given year.
J.P. Morgan Emerging Markets Bond Index Plus: Tracks the total return of U.S. dollar and external currency debt instruments traded in emerging markets.
J.P. Morgan European Currency High Yield Index: Tracks the total return of noninvestment-grade corporate bonds denominated in European currencies.
Lipper averages: The averages of available mutual fund performance returns for specified time periods in categories defined by Lipper Inc.
SEC yield (30-day): A method of calculating a fund’s yield that assumes all portfolio securities are held until maturity. Yield will vary and is not guaranteed.
Weighted average maturity: A measure of a fund’s interest rate sensitivity. In general, the longer the average maturity, the greater the fund’s sensitivity to interest rate changes. The weighted average maturity may take into account the interest rate readjustment dates for certain securities. Money funds must maintain a weighted average maturity of less than 60 days.
Yield curve: A graphic depiction of the relationship between yields and maturity dates for a set of similar securities. A security with a longer maturity usually has a higher yield. If a short-term security offers a higher yield, then the curve is said to be “inverted.” If short- and long-term bonds are offering equivalent yields, then the curve is said to be “flat.”
Note: Bloomberg Index Services Ltd. Copyright 2017, Bloomberg Index Services Ltd. Used with permission.
Performance and Expenses
This chart shows the value of a hypothetical $10,000 investment in the fund over the past 10 fiscal year periods or since inception (for funds lacking 10-year records). The result is compared with benchmarks, which may include a broad-based market index and a peer group average or index. Market indexes do not include expenses, which are deducted from fund returns as well as mutual fund averages and indexes.
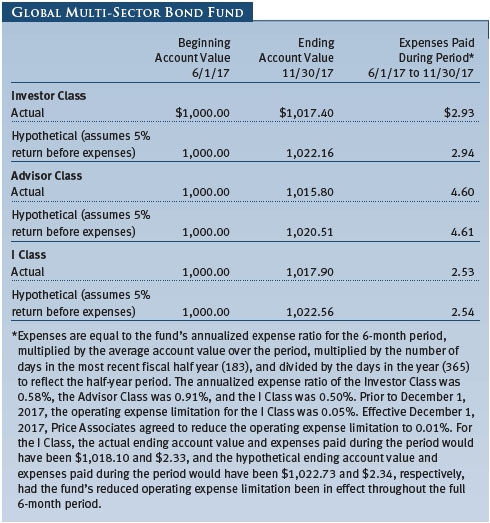
As a mutual fund shareholder, you may incur two types of costs: (1) transaction costs, such as redemption fees or sales loads, and (2) ongoing costs, including management fees, distribution and service (12b-1) fees, and other fund expenses. The following example is intended to help you understand your ongoing costs (in dollars) of investing in the fund and to compare these costs with the ongoing costs of investing in other mutual funds. The example is based on an investment of $1,000 invested at the beginning of the most recent six-month period and held for the entire period.
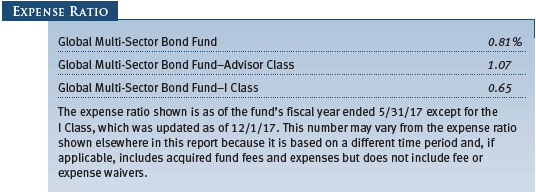
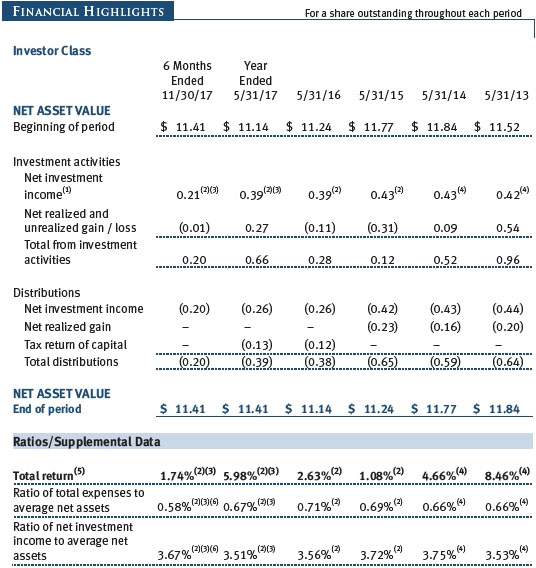
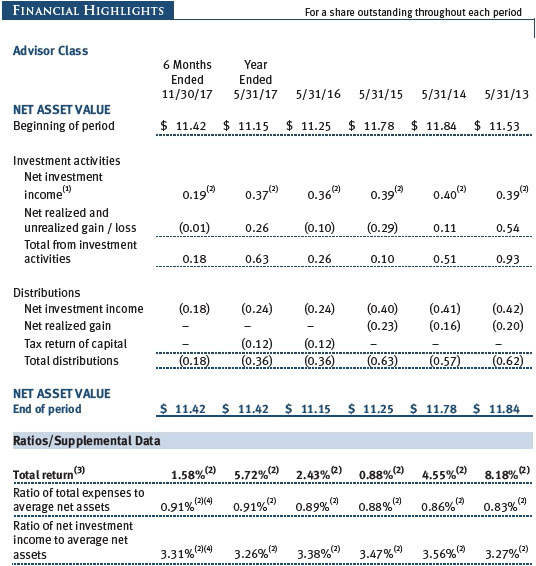
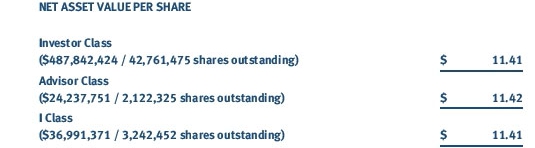
Please note that the fund has three share classes: The original share class (Investor Class) charges no distribution and service (12b-1) fee, the Advisor Class shares are offered only through unaffiliated brokers and other financial intermediaries and charge a 0.25% 12b-1 fee, and I Class shares are available to institutionally oriented clients and impose no 12b-1 or administrative fee payment. Each share class is presented separately in the table.
Actual Expenses
The first line of the following table (Actual) provides information about actual account values and expenses based on the fund’s actual returns. You may use the information on this line, together with your account balance, to estimate the expenses that you paid over the period. Simply divide your account value by $1,000 (for example, an $8,600 account value divided by $1,000 = 8.6), then multiply the result by the number on the first line under the heading “Expenses Paid During Period” to estimate the expenses you paid on your account during this period.
Hypothetical Example for Comparison Purposes
The information on the second line of the table (Hypothetical) is based on hypothetical account values and expenses derived from the fund’s actual expense ratio and an assumed 5% per year rate of return before expenses (not the fund’s actual return). You may compare the ongoing costs of investing in the fund with other funds by contrasting this 5% hypothetical example and the 5% hypothetical examples that appear in the shareholder reports of the other funds. The hypothetical account values and expenses may not be used to estimate the actual ending account balance or expenses you paid for the period.
Note: T. Rowe Price charges an annual account service fee of $20, generally for accounts with less than $10,000. The fee is waived for any investor whose T. Rowe Price mutual fund accounts total $50,000 or more; accounts electing to receive electronic delivery of account statements, transaction confirmations, prospectuses, and shareholder reports; or accounts of an investor who is a T. Rowe Price Personal Services or Enhanced Personal Services client (enrollment in these programs generally requires T. Rowe Price assets of at least $250,000). This fee is not included in the accompanying table. If you are subject to the fee, keep it in mind when you are estimating the ongoing expenses of investing in the fund and when comparing the expenses of this fund with other funds.
You should also be aware that the expenses shown in the table highlight only your ongoing costs and do not reflect any transaction costs, such as redemption fees or sales loads. Therefore, the second line of the table is useful in comparing ongoing costs only and will not help you determine the relative total costs of owning different funds. To the extent a fund charges transaction costs, however, the total cost of owning that fund is higher.
Unaudited
The accompanying notes are an integral part of these financial statements.
Unaudited

The accompanying notes are an integral part of these financial statements.
Unaudited

The accompanying notes are an integral part of these financial statements.
Unaudited


The accompanying notes are an integral part of these financial statements.
Unaudited

The accompanying notes are an integral part of these financial statements.
Unaudited

The accompanying notes are an integral part of these financial statements.
Unaudited


The accompanying notes are an integral part of these financial statements.
Unaudited
| Notes to Financial Statements |
T. Rowe Price Global Multi-Sector Bond Fund, Inc. (the fund) is registered under the Investment Company Act of 1940 (the 1940 Act) as a diversified, open-end management investment company. The fund seeks to provide high income and some capital appreciation. The fund has three classes of shares: the Global Multi-Sector Bond Fund (Investor Class), the Global Multi-Sector Bond Fund–Advisor Class (Advisor Class), and the Global Multi-Sector Bond Fund–I Class (I Class). Advisor Class shares are sold only through unaffiliated brokers and other unaffiliated financial intermediaries. I Class shares generally are available only to investors meeting a $1,000,000 minimum investment or certain other criteria. The Advisor Class operates under a Board-approved Rule 12b-1 plan pursuant to which the class compensates financial intermediaries for distribution, shareholder servicing, and/or certain administrative services; the Investor and I Classes do not pay Rule 12b-1 fees. Each class has exclusive voting rights on matters related solely to that class; separate voting rights on matters that relate to all classes; and, in all other respects, the same rights and obligations as the other classes.
NOTE 1 - SIGNIFICANT ACCOUNTING POLICIES
Basis of Preparation The fund is an investment company and follows accounting and reporting guidance in the Financial Accounting Standards Board (FASB) Accounting Standards Codification Topic 946 (ASC 946). The accompanying financial statements were prepared in accordance with accounting principles generally accepted in the United States of America (GAAP), including, but not limited to, ASC 946. GAAP requires the use of estimates made by management. Management believes that estimates and valuations are appropriate; however, actual results may differ from those estimates, and the valuations reflected in the accompanying financial statements may differ from the value ultimately realized upon sale or maturity.
Investment Transactions, Investment Income, and Distributions Investment transactions are accounted for on the trade date basis. Income and expenses are recorded on the accrual basis. Realized gains and losses are reported on the identified cost basis. Premiums and discounts on debt securities are amortized for financial reporting purposes. Paydown gains and losses are recorded as an adjustment to interest income. Inflation adjustments to the principal amount of inflation-indexed bonds are reflected as interest income. Dividends received from mutual fund investments are reflected as dividend income; capital gain distributions are reflected as realized gain/loss. Dividend income and capital gain distributions are recorded on the ex-dividend date. Income tax-related interest and penalties, if incurred, are recorded as income tax expense. Income distributions are declared by each class daily and paid monthly. Distributions to shareholders are recorded on the ex-dividend date. A capital gain distribution may also be declared and paid by the fund annually.
Currency Translation Assets, including investments, and liabilities denominated in foreign currencies are translated into U.S. dollar values each day at the prevailing exchange rate, using the mean of the bid and asked prices of such currencies against U.S. dollars as quoted by a major bank. Purchases and sales of securities, income, and expenses are translated into U.S. dollars at the prevailing exchange rate on the respective date of such transaction. The portion of the results of operations attributable to changes in foreign exchange rates on investments is not bifurcated from the portion attributable to changes in market prices. The effect of changes in foreign currency exchange rates on realized and unrealized security gains and losses is reflected as a component of security gains and losses.
Class Accounting Shareholder servicing, prospectus, and shareholder report expenses incurred by each class are charged directly to the class to which they relate. Expenses common to all classes and investment income are allocated to the classes based upon the relative daily net assets of each class’s settled shares; realized and unrealized gains and losses are allocated based upon the relative daily net assets of each class’s outstanding shares. To the extent any expenses are waived or reimbursed in accordance with an expense limitation (see Note 6), the waiver or reimbursement is charged to the applicable class or allocated across the classes in the same manner as the related expense. The Advisor Class pays Rule 12b-1 fees, in an amount not exceeding 0.25% of the class’s average daily net assets.
New Accounting Guidance In March 2017, the FASB issued amended guidance to shorten the amortization period for certain callable debt securities, held at a premium. The guidance is effective for fiscal years and interim periods beginning after December 15, 2018. Adoption will have no effect on the fund’s net assets or results of operations.
On August 1, 2017, the fund implemented amendments to Regulation S-X, issued by the Securities and Exchange Commission, which require standardized, enhanced disclosures, particularly related to derivatives, in investment company financial statements. Adoption had no effect on the fund’s net assets or results of operations.
Indemnification In the normal course of business, the fund may provide indemnification in connection with its officers and directors, service providers, and/or private company investments. The fund’s maximum exposure under these arrangements is unknown; however, the risk of material loss is currently considered to be remote.
NOTE 2 - VALUATION
The fund’s financial instruments are valued and each class’s net asset value (NAV) per share is computed at the close of the New York Stock Exchange (NYSE), normally 4 p.m. ET, each day the NYSE is open for business. However, the NAV per share may be calculated at a time other than the normal close of the NYSE if trading on the NYSE is restricted, if the NYSE closes earlier, or as may be permitted by the SEC.
Fair Value The fund’s financial instruments are reported at fair value, which GAAP defines as the price that would be received to sell an asset or paid to transfer a liability in an orderly transaction between market participants at the measurement date. The T. Rowe Price Valuation Committee (the Valuation Committee) is an internal committee that has been delegated certain responsibilities by the fund’s Board of Directors (the Board) to ensure that financial instruments are appropriately priced at fair value in accordance with GAAP and the 1940 Act. Subject to oversight by the Board, the Valuation Committee develops and oversees pricing-related policies and procedures and approves all fair value determinations. Specifically, the Valuation Committee establishes procedures to value securities; determines pricing techniques, sources, and persons eligible to effect fair value pricing actions; oversees the selection, services, and performance of pricing vendors; oversees valuation-related business continuity practices; and provides guidance on internal controls and valuation-related matters. The Valuation Committee reports to the Board and has representation from legal, portfolio management and trading, operations, risk management, and the fund’s treasurer.
Various valuation techniques and inputs are used to determine the fair value of financial instruments. GAAP establishes the following fair value hierarchy that categorizes the inputs used to measure fair value:
Level 1 – quoted prices (unadjusted) in active markets for identical financial instruments that the fund can access at the reporting date
Level 2 – inputs other than Level 1 quoted prices that are observable, either directly or indirectly (including, but not limited to, quoted prices for similar financial instruments in active markets, quoted prices for identical or similar financial instruments in inactive markets, interest rates and yield curves, implied volatilities, and credit spreads)
Level 3 – unobservable inputs
Observable inputs are developed using market data, such as publicly available information about actual events or transactions, and reflect the assumptions that market participants would use to price the financial instrument. Unobservable inputs are those for which market data are not available and are developed using the best information available about the assumptions that market participants would use to price the financial instrument. GAAP requires valuation techniques to maximize the use of relevant observable inputs and minimize the use of unobservable inputs. When multiple inputs are used to derive fair value, the financial instrument is assigned to the level within the fair value hierarchy based on the lowest-level input that is significant to the fair value of the financial instrument. Input levels are not necessarily an indication of the risk or liquidity associated with financial instruments at that level but rather the degree of judgment used in determining those values.
Valuation Techniques Debt securities generally are traded in the over-the-counter (OTC) market. Securities with remaining maturities of one year or more at the time of acquisition are valued at prices furnished by dealers who make markets in such securities or by an independent pricing service, which considers the yield or price of bonds of comparable quality, coupon, maturity, and type, as well as prices quoted by dealers who make markets in such securities. Securities with remaining maturities of less than one year at the time of acquisition generally use amortized cost in local currency to approximate fair value. However, if amortized cost is deemed not to reflect fair value or the fund holds a significant amount of such securities with remaining maturities of more than 60 days, the securities are valued at prices furnished by dealers who make markets in such securities or by an independent pricing service. Generally, debt securities are categorized in Level 2 of the fair value hierarchy; however, to the extent the valuations include significant unobservable inputs, the securities would be categorized in Level 3.
Investments in mutual funds are valued at the mutual fund’s closing NAV per share on the day of valuation and are categorized in Level 1 of the fair value hierarchy. Financial futures contracts are valued at closing settlement prices and are categorized in Level 1 of the fair value hierarchy. Forward currency exchange contracts are valued using the prevailing forward exchange rate and are categorized in Level 2 of the fair value hierarchy. Swaps are valued at prices furnished by an independent pricing service or independent swap dealers and generally are categorized in Level 2 of the fair value hierarchy; however, if unobservable inputs are significant to the valuation, the swap would be categorized in Level 3. Assets and liabilities other than financial instruments, including short-term receivables and payables, are carried at cost, or estimated realizable value, if less, which approximates fair value.
Thinly traded financial instruments and those for which the above valuation procedures are inappropriate or are deemed not to reflect fair value are stated at fair value as determined in good faith by the Valuation Committee. The objective of any fair value pricing determination is to arrive at a price that could reasonably be expected from a current sale. Financial instruments fair valued by the Valuation Committee are primarily private placements, restricted securities, warrants, rights, and other securities that are not publicly traded.
Subject to oversight by the Board, the Valuation Committee regularly makes good faith judgments to establish and adjust the fair valuations of certain securities as events occur and circumstances warrant. For instance, in determining the fair value of troubled or thinly traded debt instruments, the Valuation Committee considers a variety of factors, which may include, but are not limited to, the issuer’s business prospects, its financial standing and performance, recent investment transactions in the issuer, strategic events affecting the company, market liquidity for the issuer, and general economic conditions and events. In consultation with the investment and pricing teams, the Valuation Committee will determine an appropriate valuation technique based on available information, which may include both observable and unobservable inputs. The Valuation Committee typically will afford greatest weight to actual prices in arm’s length transactions, to the extent they represent orderly transactions between market participants, transaction information can be reliably obtained, and prices are deemed representative of fair value. However, the Valuation Committee may also consider other valuation methods such as a discount or premium from market value of a similar, freely traded security of the same issuer; discounted cash flows; yield to maturity; or some combination. Fair value determinations are reviewed on a regular basis and updated as information becomes available, including actual purchase and sale transactions of the issue. Because any fair value determination involves a significant amount of judgment, there is a degree of subjectivity inherent in such pricing decisions, and fair value prices determined by the Valuation Committee could differ from those of other market participants. Depending on the relative significance of unobservable inputs, including the valuation technique(s) used, fair valued securities may be categorized in Level 2 or 3 of the fair value hierarchy.
Valuation Inputs The following table summarizes the fund’s financial instruments, based on the inputs used to determine their fair values on November 30, 2017:

There were no material transfers between Levels 1 and 2 during the six months ended November 30, 2017.
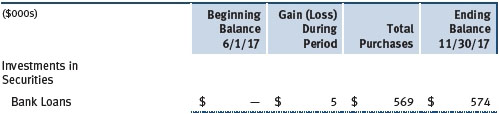
Following is a reconciliation of the fund’s Level 3 holdings for the six months ended November 30, 2017. Gain (loss) reflects both realized and change in unrealized gain/loss on Level 3 holdings during the period, if any, and is included on the accompanying Statement of Operations. The change in unrealized gain/loss on Level 3 instruments held at November 30, 2017, totaled $5,000 for the six months ended November 30, 2017.
NOTE 3 - DERIVATIVE INSTRUMENTS
During the six months ended November 30, 2017, the fund invested in derivative instruments. As defined by GAAP, a derivative is a financial instrument whose value is derived from an underlying security price, foreign exchange rate, interest rate, index of prices or rates, or other variable; it requires little or no initial investment and permits or requires net settlement. The fund invests in derivatives only if the expected risks and rewards are consistent with its investment objectives, policies, and overall risk profile, as described in its prospectus and Statement of Additional Information. The fund may use derivatives for a variety of purposes, such as seeking to hedge against declines in principal value, increase yield, invest in an asset with greater efficiency and at a lower cost than is possible through direct investment, or to adjust portfolio duration and credit exposure. The risks associated with the use of derivatives are different from, and potentially much greater than, the risks associated with investing directly in the instruments on which the derivatives are based. The fund at all times maintains sufficient cash reserves, liquid assets, or other SEC-permitted asset types to cover its settlement obligations under open derivative contracts.
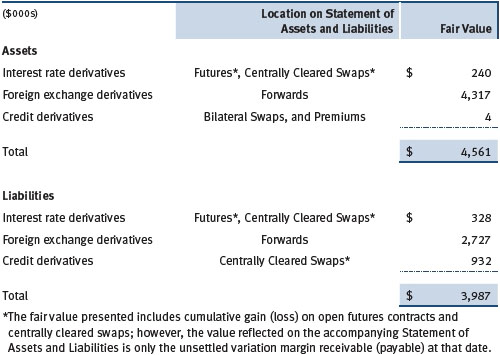
The fund values its derivatives at fair value and recognizes changes in fair value currently in its results of operations. Accordingly, the fund does not follow hedge accounting, even for derivatives employed as economic hedges. Generally, the fund accounts for its derivatives on a gross basis. It does not offset the fair value of derivative liabilities against the fair value of derivative assets on its financial statements, nor does it offset the fair value of derivative instruments against the right to reclaim or obligation to return collateral. The following table summarizes the fair value of the fund’s derivative instruments held as of November 30, 2017, and the related location on the accompanying Statement of Assets and Liabilities, presented by primary underlying risk exposure:
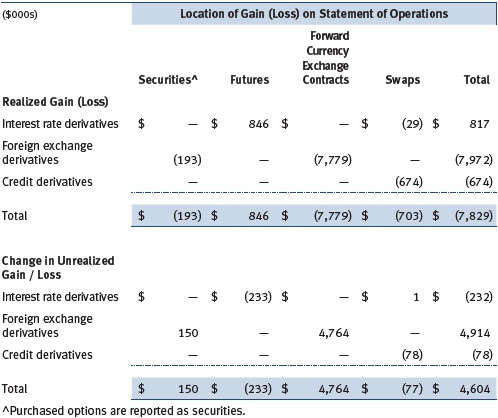
Additionally, the amount of gains and losses on derivative instruments recognized in fund earnings during the six months ended November 30, 2017, and the related location on the accompanying Statement of Operations is summarized in the following table by primary underlying risk exposure:
Counterparty Risk and Collateral The fund invests in derivatives in various markets, which expose it to differing levels of counterparty risk. Counterparty risk on exchange-traded and centrally cleared derivative contracts, such as futures, exchange-traded options, and centrally cleared swaps, is minimal because the clearinghouse provides protection against counterparty defaults. For futures and centrally cleared swaps, the fund is required to deposit collateral in an amount specified by the clearinghouse and the clearing firm (margin requirement), and the margin requirement must be maintained over the life of the contract. Each clearinghouse and clearing firm, in its sole discretion, may adjust the margin requirements applicable to the fund.
Derivatives, such as bilateral swaps, forward currency exchange contracts, and OTC options, that are transacted and settle directly with a counterparty (bilateral derivatives) expose the fund to greater counterparty risk. To mitigate this risk, the fund has entered into master netting arrangements (MNAs) with certain counterparties that permit net settlement under specified conditions and, for certain counterparties, also require the exchange of collateral to cover mark-to-market exposure. MNAs may be in the form of International Swaps and Derivatives Association master agreements (ISDAs) or foreign exchange letter agreements (FX letters).
MNAs provide the ability to offset amounts the fund owes a counterparty against amounts the counterparty owes the fund (net settlement). Both ISDAs and FX letters generally allow termination of transactions and net settlement upon the occurrence of contractually specified events, such as failure to pay or bankruptcy. In addition, ISDAs specify other events, the occurrence of which would allow one of the parties to terminate. For example, a downgrade in credit rating of a counterparty would allow the fund to terminate, while a decline in the fund’s net assets of more than a specified percentage would allow the counterparty to terminate. Upon termination, all transactions with that counterparty would be liquidated and a net termination amount settled. ISDAs include collateral agreements whereas FX letters do not. Collateral requirements are determined daily based on the net aggregate unrealized gain or loss on all bilateral derivatives with a counterparty, subject to minimum transfer amounts that typically range from $100,000 to $250,000. Any additional collateral required due to changes in security values is typically transferred the same business day.
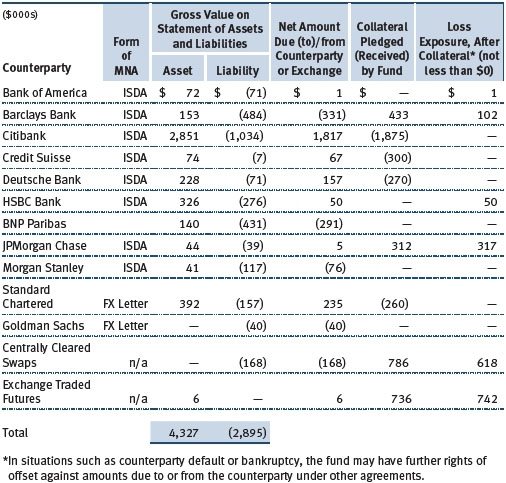
The following table summarizes the fund’s derivatives at the reporting date by loss exposure to each counterparty or clearinghouse after consideration of collateral, if any. Exchange-traded and centrally cleared derivatives that settle variation margin daily are presented at the variation margin receivable or payable on the reporting date, and exchange-traded options are presented at value.
Collateral may be in the form of cash or debt securities issued by the U.S. government or related agencies. Cash posted by the fund are reflected as cash deposits in the accompanying financial statements and generally are restricted from withdrawal by the fund; securities posted by the fund are so noted in the accompanying Portfolio of Investments; both remain in the fund’s assets. Collateral pledged by counterparties is not included in the fund’s assets because the fund does not obtain effective control over those assets. For bilateral derivatives, collateral posted by the fund is held in a segregated account by the fund’s custodian.
While typically not sold similar to equity or fixed income securities, exchange-traded or centrally cleared derivatives may be closed out only on the exchange or clearinghouse where the contracts were traded, and OTC and bilateral derivatives may be unwound with counterparties or transactions assigned to other counterparties to allow the fund to exit the transaction. This ability is subject to the liquidity of underlying positions.
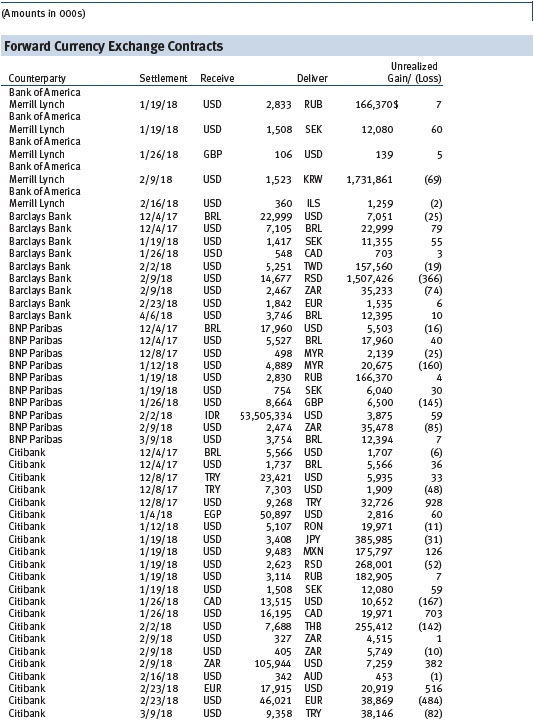
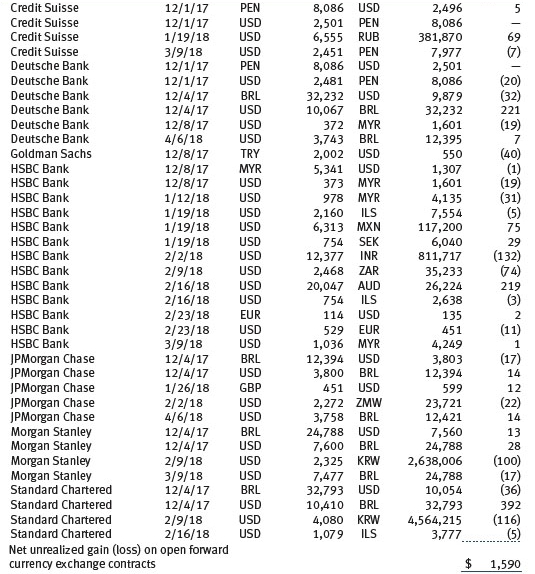
Forward Currency Exchange Contracts The fund is subject to foreign currency exchange rate risk in the normal course of pursuing its investment objectives. It uses forward currency exchange contracts (forwards) primarily to protect its non-U.S. dollar-denominated securities from adverse currency movements. A forward involves an obligation to purchase or sell a fixed amount of a specific currency on a future date at a price set at the time of the contract. Although certain forwards may be settled by exchanging only the net gain or loss on the contract, most forwards are settled with the exchange of the underlying currencies in accordance with the specified terms. Forwards are valued at the unrealized gain or loss on the contract, which reflects the net amount the fund either is entitled to receive or obligated to deliver, as measured by the difference between the forward exchange rates at the date of entry into the contract and the forward rates at the reporting date. Appreciated forwards are reflected as assets and depreciated forwards are reflected as liabilities on the accompanying Statement of Assets and Liabilities. Risks related to the use of forwards include the possible failure of counterparties to meet the terms of the agreements; that anticipated currency movements will not occur, thereby reducing the fund’s total return; and the potential for losses in excess of the fund’s initial investment. During the six months ended November 30, 2017, the volume of the fund’s activity in forwards, based on underlying notional amounts, was generally between 38% and 45% of net assets.
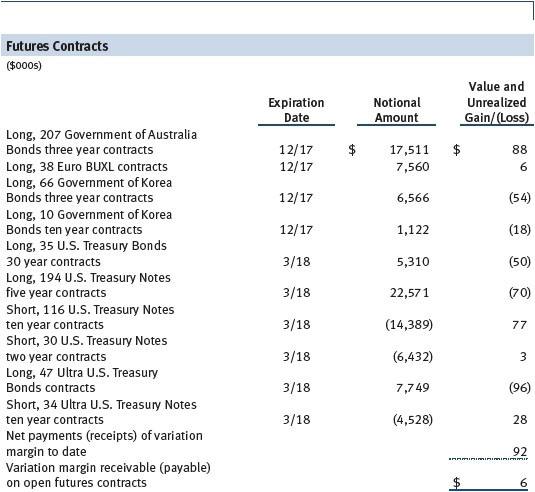
Futures Contracts The fund is subject to interest rate risk in the normal course of pursuing its investment objectives and uses futures contracts to help manage such risk. The fund may enter into futures contracts to manage exposure to interest rate and yield curve movements, security prices, foreign currencies, credit quality, and mortgage prepayments; as an efficient means of adjusting exposure to all or part of a target market; to enhance income; as a cash management tool; or to adjust portfolio duration and credit exposure. A futures contract provides for the future sale by one party and purchase by another of a specified amount of a specific underlying financial instrument at an agreed-upon price, date, time, and place. The fund currently invests only in exchange-traded futures, which generally are standardized as to maturity date, underlying financial instrument, and other contract terms. Payments are made or received by the fund each day to settle daily fluctuations in the value of the contract (variation margin), which reflect changes in the value of the underlying financial instrument. Variation margin is recorded as unrealized gain or loss until the contract is closed. The value of a futures contract included in net assets is the amount of unsettled variation margin; net variation margin receivable is reflected as an asset and net variation margin payable is reflected as a liability on the accompanying Statement of Assets and Liabilities. Risks related to the use of futures contracts include possible illiquidity of the futures markets, contract prices that can be highly volatile and imperfectly correlated to movements in hedged security values and/or interest rates, and potential losses in excess of the fund’s initial investment. During the six months ended November 30, 2017, the volume of the fund’s activity in futures, based on underlying notional amounts, was generally between 10% and 17% of net assets.
Options The fund is subject to foreign currency exchange rate risk in the normal course of pursuing its investment objectives and uses options to help manage such risk. The fund may use options to manage exposure to security prices, interest rates, foreign currencies, and credit quality; as an efficient means of adjusting exposure to all or a part of a target market; to enhance income; as a cash management tool; or to adjust credit exposure. Options are included in net assets at fair value, purchased options are included in Investments in Securities, and written options are separately reflected as a liability on the accompanying Statement of Assets and Liabilities. Premiums on unexercised, expired options are recorded as realized gains or losses; premiums on exercised options are recorded as an adjustment to the proceeds from the sale or cost of the purchase. The difference between the premium and the amount received or paid in a closing transaction is also treated as realized gain or loss. In return for a premium paid, currency options give the holder the right, but not the obligation, to buy and sell currency at a specified exchange rate. Risks related to the use of options include possible illiquidity of the options markets; trading restrictions imposed by an exchange or counterparty; movements in the underlying asset values and currency values and, for written options, potential losses in excess of the fund’s initial investment. During the six months ended November 30, 2017, the volume of the fund’s activity in options, based on underlying notional amounts, was generally between 0% and 4% of net assets.
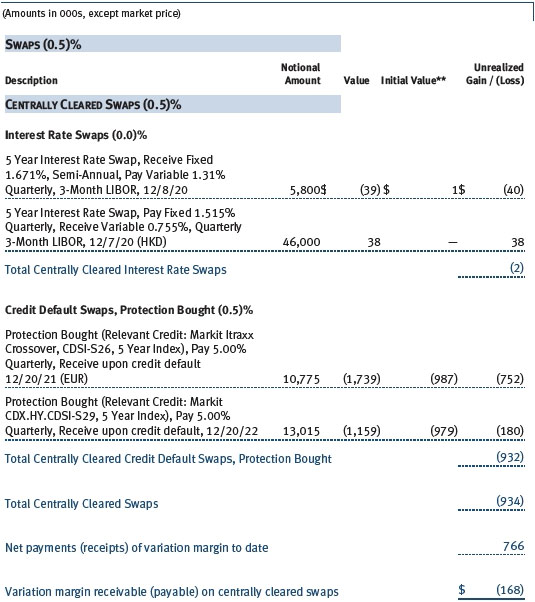
Swaps The fund is subject to interest rate risk and credit risk in the normal course of pursuing its investment objectives and uses swap contracts to help manage such risks. The fund may use swaps in an effort to manage exposure to changes in interest rates, inflation rates, and credit quality; to adjust overall exposure to certain markets; to enhance total return or protect the value of portfolio securities; to serve as a cash management tool; or to adjust portfolio duration and credit exposure. Swap agreements can be settled either directly with the counterparty (bilateral swap) or through a central clearinghouse (centrally cleared swap). Fluctuations in the fair value of a contract are reflected in unrealized gain or loss and are reclassified to realized gain or loss upon contract termination or cash settlement. Net periodic receipts or payments required by a contract increase or decrease, respectively, the value of the contract until the contractual payment date, at which time such amounts are reclassified from unrealized to realized gain or loss. For bilateral swaps, cash payments are made or received by the fund on a periodic basis in accordance with contract terms; unrealized gain on contracts and premiums paid are reflected as assets and unrealized loss on contracts and premiums received are reflected as liabilities on the accompanying Statement of Assets and Liabilities. For bilateral swaps, premiums paid or received are amortized over the life of the swap and are recognized as realized gain or loss in the Statement of Operations. For centrally cleared swaps, payments are made or received by the fund each day to settle the daily fluctuation in the value of the contract (variation margin). Accordingly, the value of a centrally cleared swap included in net assets is the unsettled variation margin; net variation margin receivable is reflected as an asset and net variation margin payable is reflected as a liability on the accompanying Statement of Assets and Liabilities.
Interest rate swaps are agreements to exchange cash flows based on the difference between specified interest rates applied to a notional principal amount for a specified period of time. Risks related to the use of interest rate swaps include the potential for unanticipated movements in interest or currency rates, the possible failure of a counterparty to perform in accordance with the terms of the swap agreements, potential government regulation that could adversely affect the fund’s swap investments, and potential losses in excess of the fund’s initial investment.
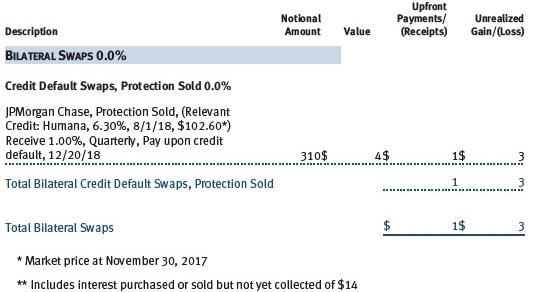
Credit default swaps are agreements where one party (the protection buyer) agrees to make periodic payments to another party (the protection seller) in exchange for protection against specified credit events, such as certain defaults and bankruptcies related to an underlying credit instrument, or issuer or index of such instruments. Upon occurrence of a specified credit event, the protection seller is required to pay the buyer the difference between the notional amount of the swap and the value of the underlying credit, either in the form of a net cash settlement or by paying the gross notional amount and accepting delivery of the relevant underlying credit. For credit default swaps where the underlying credit is an index, a specified credit event may affect all or individual underlying securities included in the index and will be settled based upon the relative weighting of the affected underlying security(ies) within the index. Generally, the payment risk for the seller of protection is inversely related to the current market price or credit rating of the underlying credit or the market value of the contract relative to the notional amount, which are indicators of the markets’ valuation of credit quality. As of November 30, 2017, the notional amount of protection sold by the fund totaled $310,000 (0.1% of net assets), which reflects the maximum potential amount the fund could be required to pay under such contracts. Risks related to the use of credit default swaps include the possible inability of the fund to accurately assess the current and future creditworthiness of underlying issuers, the possible failure of a counterparty to perform in accordance with the terms of the swap agreements, potential government regulation that could adversely affect the fund’s swap investments, and potential losses in excess of the fund’s initial investment.
During the six months ended November 30, 2017, the volume of the fund’s activity in swaps, based on underlying notional amounts, was generally between 6% and 8% of net assets.
NOTE 4 - OTHER INVESTMENT TRANSACTIONS
Consistent with its investment objective, the fund engages in the following practices to manage exposure to certain risks and/or to enhance performance. The investment objective, policies, program, and risk factors of the fund are described more fully in the fund’s prospectus and Statement of Additional Information.
Emerging and Frontier Markets The fund may invest, either directly or through investments in T. Rowe Price institutional funds, in securities of companies located in, issued by governments of, or denominated in or linked to the currencies of emerging and frontier market countries; at period-end, approximately 32% of the fund’s net assets were invested in emerging markets and 7% in frontier markets. Emerging markets, and to a greater extent frontier markets, generally have economic structures that are less diverse and mature, and political systems that are less stable, than developed countries. These markets may be subject to greater political, economic, and social uncertainty and differing regulatory environments that may potentially impact the fund’s ability to buy or sell certain securities or repatriate proceeds to U.S. dollars. Such securities are often subject to greater price volatility, less liquidity, and higher rates of inflation than U.S. securities. Investing in frontier markets is significantly riskier than investing in other countries, including emerging markets.
Noninvestment-Grade Debt At November 30, 2017, approximately 39% of the fund’s net assets were invested, either directly or through its investment in T. Rowe Price institutional funds, in noninvestment-grade debt, including “high yield” or “junk” bonds or leveraged loans. The noninvestment-grade debt market may experience sudden and sharp price swings due to a variety of factors, including changes in economic forecasts, stock market activity, large sustained sales by major investors, a high-profile default, or a change in market sentiment. These events may decrease the ability of issuers to make principal and interest payments and adversely affect the liquidity or value, or both, of such securities. Investments in noninvestment-grade holdings may be considered speculative.
Restricted Securities The fund may invest in securities that are subject to legal or contractual restrictions on resale. Prompt sale of such securities at an acceptable price may be difficult and may involve substantial delays and additional costs.
Collateralized Loan Obligations The fund may invest in collateralized loan obligations (CLOs) which are entities backed by a diversified pool of syndicated bank loans. The cash flows of the CLO can be split into multiple segments, called “tranches” or “classes”, which will vary in risk profile and yield. The riskiest segments, which are the subordinate or “equity” tranches, bear the greatest risk of loss from defaults in the underlying assets of the CLO and serve to protect the other, more senior, tranches. Senior tranches will typically have higher credit ratings and lower yields than the securities underlying the CLO. Despite the protection from the more junior tranches, senior tranches can experience substantial losses.
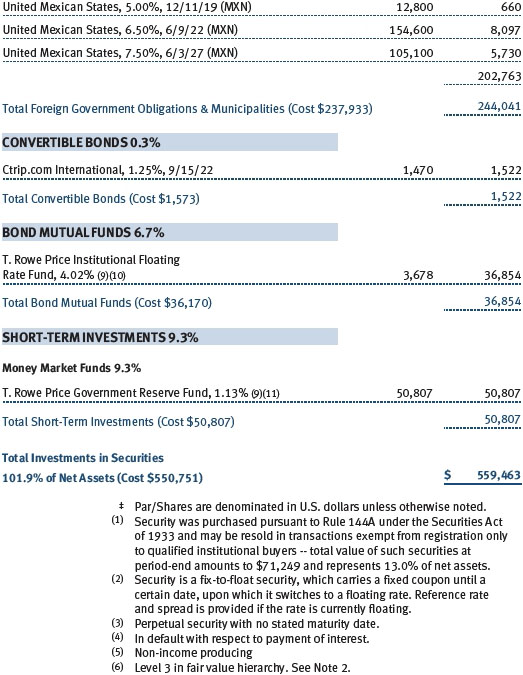
TBA Purchase and Sale Commitments The fund may enter into to-be-announced (TBA) purchase or sale commitments (collectively, TBA transactions), pursuant to which it agrees to purchase or sell, respectively, mortgage-backed securities for a fixed unit price, with payment and delivery at a scheduled future date beyond the customary settlement period for such securities. With TBA transactions, the particular securities to be received or delivered by the fund are not identified at the trade date; however, the securities must meet specified terms, including issuer, rate, and mortgage term, and be within industry-accepted “good delivery” standards. The fund may enter into TBA transactions with the intention of taking possession of or relinquishing the underlying securities, may elect to extend the settlement by “rolling” the transaction, and/or may use TBA transactions to gain or reduce interim exposure to underlying securities. Until settlement, the fund maintains liquid assets sufficient to settle its commitment to purchase a TBA or, in the case of a sale commitment, the fund maintains an entitlement to the security to be sold.
To mitigate counterparty risk, the fund has entered into agreements with TBA counterparties that provide for collateral and the right to offset amounts due to or from those counterparties under specified conditions. Subject to minimum transfer amounts, collateral requirements are determined and transfers made based on the net aggregate unrealized gain or loss on all TBA commitments with a particular counterparty. At any time, the fund’s risk of loss from a particular counterparty related to its TBA commitments is the aggregate unrealized gain on appreciated TBAs in excess of unrealized loss on depreciated TBAs and collateral received, if any, from such counterparty. As of November 30, 2017, no collateral was pledged by the fund or counterparties for TBAs.
Bank Loans The fund may invest in bank loans, which represent an interest in amounts owed by a borrower to a syndicate of lenders. Bank loans are generally noninvestment grade and often involve borrowers whose financial condition is highly leveraged. Bank loans may be in the form of either assignments or participations. A loan assignment transfers all legal, beneficial, and economic rights to the buyer, and transfer typically requires consent of both the borrower and agent. In contrast, a loan participation generally entitles the buyer to receive the cash flows from principal, interest, and any fee payments on a portion of a loan; however, the seller continues to hold legal title to that portion of the loan. As a result, the buyer of a loan participation generally has no direct recourse against the borrower and is exposed to credit risk of both the borrower and seller of the participation. Bank loans often have extended settlement periods, generally may be repaid at any time at the option of the borrower, and may require additional principal to be funded at the borrowers’ discretion at a later date (e.g., unfunded commitments and revolving debt instruments). Until settlement, the fund maintains liquid assets sufficient to settle its unfunded loan commitments. The fund reflects both the funded portion of a bank loan as well as its unfunded commitment in the Portfolio of Investments. However, if a credit agreement provides no initial funding of a tranche, and funding of the full commitment at a future date(s) is at the borrower’s discretion and considered uncertain, a loan is reflected in the Portfolio of Investments only if, and only to the extent that, the fund has actually settled a funding commitment.
Mortgage-Backed Securities The fund may invest in mortgage-backed securities (MBS or pass-through certificates) that represent an interest in a pool of specific underlying mortgage loans and entitle the fund to the periodic payments of principal and interest from those mortgages. MBS may be issued by government agencies or corporations, or private issuers. Most MBS issued by government agencies are guaranteed; however, the degree of protection differs based on the issuer. The fund also may invest in stripped MBS, created when a traditional MBS is split into an interest-only (IO) and a principal-only (PO) strip. MBS, including IOs and POs, are sensitive to changes in economic conditions that affect the rate of prepayments and defaults on the underlying mortgages; accordingly, the value, income, and related cash flows from MBS may be more volatile than other debt instruments. IOs also risk loss of invested principal from faster-than-anticipated prepayments.
Other Purchases and sales of portfolio securities other than short-term and U.S. government securities aggregated $209,154,000 and $125,896,000, respectively, for the six months ended November 30, 2017. Purchases and sales of U.S. government securities aggregated $207,599,000 and $175,981,000, respectively, for the six months ended November 30, 2017.
NOTE 5 - FEDERAL INCOME TAXES
No provision for federal income taxes is required since the fund intends to continue to qualify as a regulated investment company under Subchapter M of the Internal Revenue Code and distribute to shareholders all of its taxable income and gains. Distributions determined in accordance with federal income tax regulations may differ in amount or character from net investment income and realized gains for financial reporting purposes. Financial reporting records are adjusted for permanent book/tax differences to reflect tax character but are not adjusted for temporary differences. The amount and character of tax-basis distributions and composition of net assets are finalized at fiscal year-end; accordingly, tax-basis balances have not been determined as of the date of this report.
At November 30, 2017, the cost of investments for federal income tax purposes was $548,982,000. Net unrealized gain aggregated $9,072,000 at period-end, of which $21,007,000 related to appreciated investments and $11,935,000 related to depreciated investments.
NOTE 6 - RELATED PARTY TRANSACTIONS
The fund is managed by T. Rowe Price Associates, Inc. (Price Associates), a wholly owned subsidiary of T. Rowe Price Group, Inc. (Price Group). The investment management agreement between the fund and Price Associates provides for an annual investment management fee, which is computed daily and paid monthly. The fee consists of an individual fund fee, equal to 0.20% of the fund’s average daily net assets, and a group fee. The group fee rate is calculated based on the combined net assets of certain mutual funds sponsored by Price Associates (the group) applied to a graduated fee schedule, with rates ranging from 0.48% for the first $1 billion of assets to 0.265% for assets in excess of $650 billion. The fund’s group fee is determined by applying the group fee rate to the fund’s average daily net assets. At November 30, 2017, the effective annual group fee rate was 0.29%.
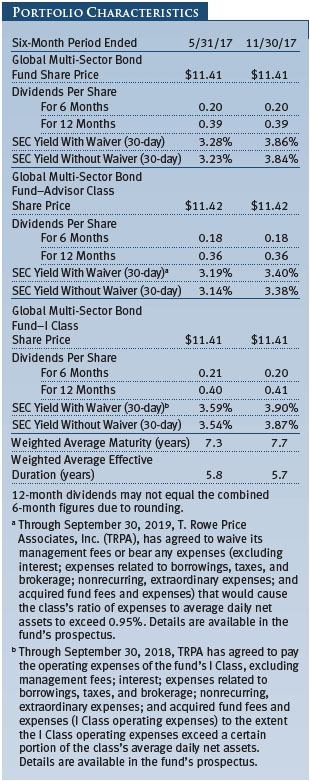
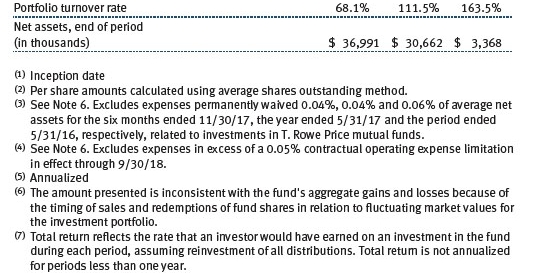
The Advisor Class is subject to a contractual expense limitation through September 30, 2019. During the limitation period, Price Associates is required to waive its management fee or pay any expenses (excluding interest, expenses related to borrowings, taxes, brokerage, and other non-recurring expenses permitted by the investment management agreement) that would otherwise cause the class’s ratio of annualized total expenses to average net assets (expense ratio) to exceed its expense limitation of 0.95%. The class is required to repay Price Associates for expenses previously waived/paid to the extent the class’s net assets grow or expenses decline sufficiently to allow repayment without causing the class’s expense ratio (after the repayment is taken into account) to exceed both: (1) the expense limitation in place at the time such amounts were waived; and (2) the class’s current expense limitation. However, no repayment will be made more than three years after the date of a payment or waiver.
The I Class is also subject to an operating expense limitation (I Class limit) pursuant to which Price Associates is contractually required to pay all operating expenses of the I Class, excluding management fees, interest, expenses related to borrowings, taxes, brokerage, and other non-recurring expenses permitted by the investment management agreement, to the extent such operating expenses, on an annualized basis, exceed 0.05% of average net assets. This agreement will continue until September 30, 2018, and may be renewed, revised, or revoked only with approval of the fund’s Board. The I Class is required to repay Price Associates for expenses previously paid to the extent the class’s net assets grow or expenses decline sufficiently to allow repayment without causing the class’s operating expenses (after the repayment is taken into account) to exceed both: (1) the expense limitation in place at the time such amounts were paid; and (2) the class’s current expense limitation. However, no repayment will be made more than three years after the date of a payment or waiver.
Pursuant to these agreements, $78,000 of expenses were waived/paid by Price Associates during the six months ended November 30, 2017. Including this amount, expenses previously waived/paid by Price Associates in the amount of $309,000 remain subject to repayment by the fund at November 30, 2017.
In addition, the fund has entered into service agreements with Price Associates and two wholly owned subsidiaries of Price Associates (collectively, Price). Price Associates provides certain accounting and administrative services to the fund. T. Rowe Price Services, Inc. provides shareholder and administrative services in its capacity as the fund’s transfer and dividend-disbursing agent. T. Rowe Price Retirement Plan Services, Inc. provides subaccounting and recordkeeping services for certain retirement accounts invested in the Investor Class and I Class. For the six months ended November 30, 2017, expenses incurred pursuant to these service agreements were $44,000 for Price Associates; $119,000 for T. Rowe Price Services, Inc.; and $6,000 for T. Rowe Price Retirement Plan Services, Inc. The total amount payable at period-end pursuant to these service agreements is reflected as Due to Affiliates in the accompanying financial statements.
The fund may invest in certain open-end management investment companies managed by Price Associates and considered affiliates of the fund: the T. Rowe Price Government Reserve Fund or the T. Rowe Price Treasury Reserve Fund, organized as money market funds, or the T. Rowe Price Short-Term Fund, a short-term bond fund (collectively, the Price Reserve Funds). The Price Reserve Funds are offered as short-term investment options to mutual funds, trusts, and other accounts managed by Price Associates or its affiliates and are not available for direct purchase by members of the public. The Price Reserve Funds pay no investment management fees.
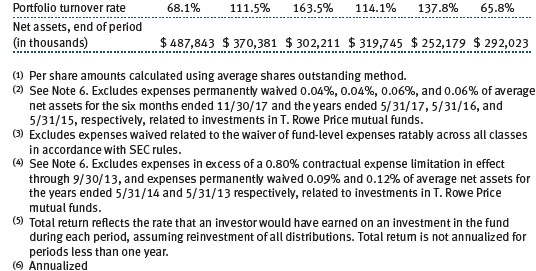
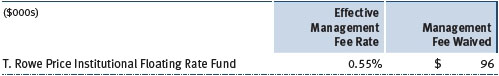
The fund may also invest in certain other T. Rowe Price funds (Price Funds) as a means of gaining efficient and cost-effective exposure to certain markets. The fund does not invest for the purpose of exercising management or control; however, investments by the fund may represent a significant portion of an underlying Price Fund’s net assets. Each underlying Price Fund is an open-end management investment company managed by Price Associates and is considered an affiliate of the fund. To ensure that the fund does not incur duplicate management fees (paid by the underlying Price Fund(s) and the fund), Price Associates has agreed to permanently waive a portion of its management fee charged to the fund in an amount sufficient to fully offset that portion of management fees paid by each underlying Price Fund related to the fund’s investment therein. Annual management fee rates and amounts waived related to investments in the underlying Price Fund(s) for the six months ended November 30, 2017, are as follows:
The fund may participate in securities purchase and sale transactions with other funds or accounts advised by Price Associates (cross trades), in accordance with procedures adopted by the fund’s Board and Securities and Exchange Commission rules, which require, among other things, that such purchase and sale cross trades be effected at the independent current market price of the security. During the six months ended November 30, 2017, the fund had no purchases or sales cross trades with other funds or accounts advised by Price Associates.
NOTE 7 - SUBSEQUENT EVENT
Effective December 1, 2017, the fund’s I Class operating expense limitation was reduced from 0.05% to 0.01% of average net assets. This agreement will continue until September 30, 2018, and may be renewed, revised, or revoked only with approval of the fund’s Board.
| Information on Proxy Voting Policies, Procedures, and Records |
A description of the policies and procedures used by T. Rowe Price funds and portfolios to determine how to vote proxies relating to portfolio securities is available in each fund’s Statement of Additional Information. You may request this document by calling 1-800-225-5132 or by accessing the SEC’s website, sec.gov.
The description of our proxy voting policies and procedures is also available on our corporate website. To access it, please visit the following Web page:
https://www3.troweprice.com/usis/corporate/en/utility/policies.html
Scroll down to the section near the bottom of the page that says, “Proxy Voting Policies.” Click on the Proxy Voting Policies link in the shaded box.
Each fund’s most recent annual proxy voting record is available on our website and through the SEC’s website. To access it through T. Rowe Price, visit the website location shown above, and scroll down to the section near the bottom of the page that says, “Proxy Voting Records.” Click on the Proxy Voting Records link in the shaded box.
| How to Obtain Quarterly Portfolio Holdings |
The fund files a complete schedule of portfolio holdings with the Securities and Exchange Commission for the first and third quarters of each fiscal year on Form N-Q. The fund’s Form N-Q is available electronically on the SEC’s website (sec.gov); hard copies may be reviewed and copied at the SEC’s Public Reference Room, 100 F St. N.E., Washington, DC 20549. For more information on the Public Reference Room, call 1-800-SEC-0330.
Item 2. Code of Ethics.
A code of ethics, as defined in Item 2 of Form N-CSR, applicable to its principal executive officer, principal financial officer, principal accounting officer or controller, or persons performing similar functions is filed as an exhibit to the registrant’s annual Form N-CSR. No substantive amendments were approved or waivers were granted to this code of ethics during the registrant’s most recent fiscal half-year.
Item 3. Audit Committee Financial Expert.
Disclosure required in registrant’s annual Form N-CSR.
Item 4. Principal Accountant Fees and Services.
Disclosure required in registrant’s annual Form N-CSR.
Item 5. Audit Committee of Listed Registrants.
Not applicable.
Item 6. Investments.
(a) Not applicable. The complete schedule of investments is included in Item 1 of this Form N-CSR.
(b) Not applicable.
Item 7. Disclosure of Proxy Voting Policies and Procedures for Closed-End Management Investment Companies.
Not applicable.
Item 8. Portfolio Managers of Closed-End Management Investment Companies.
Not applicable.
Item 9. Purchases of Equity Securities by Closed-End Management Investment Company and Affiliated Purchasers.
Not applicable.
Item 10. Submission of Matters to a Vote of Security Holders.
Not applicable.
Item 11. Controls and Procedures.
(a) The registrant’s principal executive officer and principal financial officer have evaluated the registrant’s disclosure controls and procedures within 90 days of this filing and have concluded that the registrant’s disclosure controls and procedures were effective, as of that date, in ensuring that information required to be disclosed by the registrant in this Form N-CSR was recorded, processed, summarized, and reported timely.
(b) The registrant’s principal executive officer and principal financial officer are aware of no change in the registrant’s internal control over financial reporting that occurred during the registrant’s second fiscal quarter covered by this report that has materially affected, or is reasonably likely to materially affect, the registrant’s internal control over financial reporting.
Item 12. Exhibits.
(a)(1) The registrant’s code of ethics pursuant to Item 2 of Form N-CSR is filed with the registrant’s annual Form N-CSR.
(2) Separate certifications by the registrant's principal executive officer and principal financial officer, pursuant to Section 302 of the Sarbanes-Oxley Act of 2002 and required by Rule 30a-2(a) under the Investment Company Act of 1940, are attached.
(3) Written solicitation to repurchase securities issued by closed-end companies: not applicable.
(b) A certification by the registrant's principal executive officer and principal financial officer, pursuant to Section 906 of the Sarbanes-Oxley Act of 2002 and required by Rule 30a-2(b) under the Investment Company Act of 1940, is attached.
SIGNATURES
Pursuant to the requirements of the Securities Exchange Act of 1934 and the Investment Company Act of 1940, the registrant has duly caused this report to be signed on its behalf by the undersigned, thereunto duly authorized.
T. Rowe Price Global Multi-Sector Bond Fund, Inc.
| By | | /s/ Edward C. Bernard |
| | | Edward C. Bernard |
| | | Principal Executive Officer |
| |
| Date | | January 19, 2018 | | | | |
Pursuant to the requirements of the Securities Exchange Act of 1934 and the Investment Company Act of 1940, this report has been signed below by the following persons on behalf of the registrant and in the capacities and on the dates indicated.
| By | | /s/ Edward C. Bernard |
| | | Edward C. Bernard |
| | | Principal Executive Officer |
| |
| Date | | January 19, 2018 | | | | |
| |
| |
| By | | /s/ Catherine D. Mathews |
| | | Catherine D. Mathews |
| | | Principal Financial Officer |
| |
| Date | | January 19, 2018 | | | | |