DRAFT FAIRNESS OPINION OF FINANCIAL ADVISOR DATED SEPTEMBER 5, 2008
FAIRNESS OPINION
FIRST FREEDOM BANK
LEBANON, TENNESSEE
September 2008
FAIRNESS OPINION
FIRST FREEDOM BANK
FIRST FREEDOM BANK
TABLE OF CONTENTS
| Tab | Page | |||
1APPRAISAL LETTER | 1 | |||
| 3 | ||||
3ECONOMIC PROFILE | ||||
| 5 | ||||
| 8 | ||||
| 10 | ||||
| 13 | ||||
| 16 | ||||
| 26 | ||||
| 29 | ||||
8FIRM QUALIFICATIONS | ||||
| 30 | ||||
| Resumes | 31 | |||
| 34 | ||||
| 35 | ||||
| Professional Bank Services, | The 1000 Building | |||
| Incorporated | 6200 Dutchman’s Lane, Suite 305 | |||
| Louisville, Kentucky 40205 | ||||
| Louisville, Nashville, | ||||
| Orlando | 502 451-6633 | |||
| 502 451-6755 (FAX) | ||||
| Consultants to the | 800-523-4778 | |||
| Financial Industry | www.probank.com | |||
| pbs@probank.com |
 | ProfessionalBankServices |
September 5, 2008
Board of Directors
First Freedom Bank
1620 West Main Street
Lebanon, Tennessee 37087
First Freedom Bank
1620 West Main Street
Lebanon, Tennessee 37087
To The Directorate:
You have requested our opinion as investment bankers as to the fairness, from a financial perspective, to the common shareholders of First Freedom Bank, Lebanon, Tennessee (the “Bank”) relative to a proposed amendment to the charter of the Bank whereby certain of the common shares will be reclassified. This fair value appraisal is based on a review of the financial condition and history of the Bank, regulatory and audit reports, and other such summary information available and deemed appropriate. The date of this appraisal is August 25, 2008.
Professional Bank Services, Inc. (“PBS”) has performed stock appraisals for many financial institutions in the United States. Our knowledge of the financial industry evolves from an experienced staff and a history as consultants and financial advisors to the banking industry. The firm’s wholly owned subsidiary, Investment Bank Services, Inc., is a registered Broker/Dealer with the Securities and Exchange Commission.
For purposes of this appraisal, we have reviewed and analyzed the historical performance of the Bank, including: (i) June 30, 2008 Consolidated Reports of Condition and Income filed with the Federal Deposit Insurance Corporation by the Bank; (ii) June 30, 2008 Uniform Bank Performance Reports for the Bank; (iii) Form 10-Q filed by the Bank for the quarterly period ended Mach 31, 2008, and (iv) the Proxy Statement filed by the Bank.
- 1 -
Board of Directors
First Freedom Bank
September 5, 2008
First Freedom Bank
September 5, 2008
Financial projections have been prepared and analyzed as well as other financial studies, analyses and investigations as deemed relevant for the purposes of this appraisal. In review of the aforementioned information, we have taken into account our assessment of general market and financial conditions, our experience in other transactions, and our knowledge of the banking industry generally.
We have not compiled or audited the financial statements of the Bank, nor have we independently verified any of the information reviewed; we have relied upon such information as being complete and accurate in all material respects. We have not made an independent evaluation of the assets of the Bank.
PBS, its officers, and its staff have no present business interest in the Bank. No benefits will accrue to PBS as a result of this review, other than the professional fees previously agreed to by the Bank. PBS is independent of all parties to the Bank within the meaning of proposed regulation 29 CFR 2510.3-18(b) issued by the Department of Labor, as well as Section 401(a)(28)(c) of the Internal Revenue Code of 1986, as amended. Fees paid to PBS for the preparation of this review are neither dependent nor contingent upon any transaction or upon the results of the review.
Based on the foregoing and all other factors deemed relevant, it is our opinion as investment bankers, that, as of the date hereof, the consideration proposed to be received by the shareholders of the Bank is fair and equitable from a financial perspective.
Very truly yours,

PROFESSIONAL BANK SERVICES, INC.
- 2 -
BACKGROUND
First Freedom Bank, Lebanon, Tennessee, (the “Bank”) was established in 2006 and is a state chartered commercial bank. The proposed reclassification transaction is being considered to reduce expenses associated with SEC reporting. These expenses include legal expenses, accounting expenses, shareholder communication expenses, and software and data processing expenses. The Bank would also avoid the costs associated with the implementation of Sarbanes-Oxley reporting requirements and the hiring of additional staff that would be required for reporting and securities law compliance. Overall, the Bank estimates annual cost savings of $201,000 through the contemplated going private transaction.
The proposed reclassification transaction calls for common shares held by holders of between 900 and 2,499 shares of common stock to be reclassified into Class A common stock, common shares held by holders of between 225 and 899 shares of common stock to be reclassified into shares of Class B common stock and common shares held by holders of 224 or less shares of common stock to be reclassified into shares of Series A Preferred Stock on the basis of one share of Class A common stock, Class B common stock, or Series A preferred stock for each share of common stock held by such shareholders.
The Bank also proposes to reclassify the common stock warrants held by holders of between 900 and 2,499 shares of common stock into Class A common stock warrants, common stock warrants held by holders of between 225 and 899 shares of common stock to be reclassified into shares of Class B common stock warrants and common stock warrants held by holders of 224 or less shares of common stock to be reclassified into shares of Series A Preferred Stock warrants. Holders of 2,500 or more shares of common stock will continue to hold the same number of shares of common stock and common stock warrants that were held prior to the reclassification transaction.
Class B common shares and Series A Preferred will have no voting rights except as required by law (and Series A Preferred will have voting rights in connection with the issuance of any stock having rights superior to the Series A preferred). Class A common shares will have no voting rights except to vote on any merger or similar transaction and as otherwise required by law. Class A common shares are entitled to a
- 3 -
dividend premium of 3% above that paid on any common shares. Class B common shares are entitled to a 5% premium and Series A Preferred shares will receive a 10% dividend premium. In addition, Series A Preferred shares are convertible to common stock upon a change in control.
- 4 -
NATIONAL ECONOMY
According to preliminary estimates released by the Bureau of Economic Analysis, the U.S. economy experienced a slight acceleration in growth during the first quarter of 2008 compared to the fourth quarter of 2007. First quarter 2008 real Gross Domestic Product (“GDP”) increased at a 0.90% annual rate compared to fourth quarter 2007 real GDP annualized growth rate of 0.60%.
Acceleration in inventory investment compared to fourth quarter numbers contributed to the increased rate of growth in real GDP during the first quarter. The minimal acceleration in first quarter growth was partially offset by deceleration in personal consumption expenditures. The increase in real GDP during the first quarter reflects contributions from personal consumption expenditures for services, exports, federal government spending, and private inventory investment. Imports, which are subtracted from GDP, decreased in the first quarter of 2008. The growth in GDP during the first quarter was hindered by negative contributions from residential fixed investment and personal consumption expenditures for durable goods.
During the first quarter equipment and software decreased 0.90% compared to a fourth quarter increase of 3.10%. Personal consumption expenditures increased 1.00% for the first quarter of 2008 compared to the fourth quarter increase of 2.30%. Nonresidential fixed investment decreased 0.20% for the first quarter of 2008, compared to a fourth quarter increase of 6.00%. Residential investment decreased 25.50% in the first quarter of 2008 compared to a 25.20% decrease in the fourth quarter of 2007. Exports of goods and services increased 2.80% in the first quarter of 2008 compared to an increase of 6.50% during the fourth quarter of 2007. Imports of goods and services decreased 2.60% for the first quarter of 2008 compared to a decrease of 1.40% during the fourth quarter. Federal government consumption expenditures and gross investment increased 4.40% for the first quarter of 2008 compared to a 0.50% increase for the fourth quarter of 2007. State and local government consumption expenditures increased 0.60% during the first quarter 2008 compared to a 2.80% increase during the fourth quarter 2007. Private inventories added to the change in the first quarter 2008 GDP 0.21% after subtracting 1.79% from the change in the fourth quarter 2007 GDP.
- 5 -
Beginning at the June 30, 2004 FOMC meeting, the FOMC has increased the Federal Funds rate seventeen times for a total of 425 basis points since reaching a low in June 2003. Significant appreciation in the housing market in years past is now under an intense correction. This combined with troubles in the sub-prime lending market have caused concern in the markets of a slow down in economic growth. At the December 11, 2007 meeting the FOMC reduced the targeted Fed Funds by 25 basis points to 4.25% compared to a high of 6.50% at year-end 2000. The FOMC in an unscheduled meeting reduced the targeted Fed Funds rate by 75 basis points to 3.50% on January 22, 2008. On January 30, 2008 and March 18, 2008 the FOMC reduced the Fed Funds rate by 50 basis points and 75 basis points, respectively.
The 10-year Treasury rate, which strongly correlates to macro interest rates and bank profitability, fell from 5.12% at year end 2000 to below 4% during 2003 and the first half of 2004. At December 31, 2006 and December 31, 2007 the 10-year Treasury was 4.71% and 4.03% and has now decreased to 3.79% at August 25, 2008.
On August 25, 2008 the S&P 500 Index closed at 1,266.84 compared to 1,468.36 at December 31, 2007, 1,418.30 at December 31, 2006, 1,248.29 at December 31, 2005, 1,211.92 at December 31, 2004, 1,111.92 at December 31, 2003, 879.82 at December 31, 2002, 1,148.08 at December 31, 2001, 1,320.28 at December 31, 2000 and 330.22 at December 31, 1990.
The recent credit crunch and continued turmoil in the Middle East has cast a shadow over consumer and business sentiment. The equity markets, while rebounding significantly from 2002 year-end index values, remain characterized by a significant degree of uncertainty and volatility. On August 25, 2008 the NASDAQ Index closed at 2,365.59 which is a decrease of 10.81% from the December 31, 2007 closing value of 2,652.28 and a 2.06% decrease from the December 31, 2006 closing value of 2,415.29. On August 25, 2008, the SNL Securities Bank Index closed at 363.05 representing a decrease of 26.34% from the December 31, 2007 closing value of 492.85 and a decrease of 44.88% from the December 31, 2006 closing value of 658.64.
- 6 -
CURRENT ECONOMIC OUTLOOK
Real Gross Domestic Product and Related Measures: Percent Change From Preceding Period
[Quarters seasonally adjusted at annual rates]
[Quarters seasonally adjusted at annual rates]
| 2005 | 2006 | 2007\r\ | 2007 : Q1 | 2007 : Q2 | 2007 : Q3 | 2007 : Q4\r\ | 2008 : Q1\r\ | |||||||||||||||||||||||||
| Gross domestic product (GDP) | 3.1 | 2.9 | 2.2 | 0.6 | 3.8 | 4.9 | 0.6 | 0.9 | ||||||||||||||||||||||||
| Personal consumption expenditures | 3.2 | 3.1 | 2.9 | 3.7 | 1.4 | 2.8 | 2.3 | 1.0 | ||||||||||||||||||||||||
| Durable goods | 4.9 | 3.8 | 4.7 | 8.8 | 1.7 | 4.5 | 2.0 | -6.2 | ||||||||||||||||||||||||
| Nondurable goods | 3.6 | 3.6 | 2.4 | 3.0 | -0.5 | 2.2 | 1.2 | -0.3 | ||||||||||||||||||||||||
| Services | 2.7 | 2.7 | 2.8 | 3.1 | 2.3 | 2.8 | 2.8 | 3.0 | ||||||||||||||||||||||||
| Gross private domestic investment | 5.6 | 2.7 | -4.9 | -8.2 | 4.6 | 5.0 | -14.6 | -6.5 | ||||||||||||||||||||||||
| Fixed investment | 6.9 | 2.4 | -2.9 | -4.4 | 3.2 | -0.7 | -4.0 | -7.8 | ||||||||||||||||||||||||
| Nonresidential | 7.1 | 6.6 | 4.7 | 2.1 | 11.0 | 9.3 | 6.0 | -0.2 | ||||||||||||||||||||||||
| Structures | 0.5 | 8.4 | 12.9 | 6.4 | 26.2 | 16.4 | 12.4 | 1.1 | ||||||||||||||||||||||||
| Equipment and software | 9.6 | 5.9 | 1.3 | 0.3 | 4.7 | 6.2 | 3.1 | -0.9 | ||||||||||||||||||||||||
| Residential | 6.6 | -4.6 | -17.0 | -16.3 | -11.8 | -20.5 | -25.2 | -25.5 | ||||||||||||||||||||||||
| Change in private inventories | — | — | — | — | — | — | — | — | ||||||||||||||||||||||||
| Net exports of goods and services | — | — | — | — | — | — | — | — | ||||||||||||||||||||||||
| Exports | 6.9 | 8.4 | 8.1 | 1.1 | 7.5 | 19.1 | 6.5 | 2.8 | ||||||||||||||||||||||||
| Goods | 7.5 | 9.9 | 7.9 | 0.9 | 6.6 | 26.2 | 3.9 | 1.5 | ||||||||||||||||||||||||
| Services | 5.4 | 4.8 | 8.5 | 1.6 | 9.6 | 4.0 | 13.2 | 5.8 | ||||||||||||||||||||||||
| Imports | 5.9 | 5.9 | 1.9 | 3.9 | -2.7 | 4.4 | -1.4 | -2.6 | ||||||||||||||||||||||||
| Goods | 6.6 | 6.0 | 1.6 | 4.2 | -2.9 | 4.8 | -2.6 | -3.6 | ||||||||||||||||||||||||
| Services | 2.3 | 5.2 | 3.5 | 2.3 | -1.7 | 1.7 | 5.5 | 2.8 | ||||||||||||||||||||||||
| Government consumption expenditures and gross investment | 0.7 | 1.8 | 2.0 | -0.5 | 4.1 | 3.8 | 2.0 | 2.0 | ||||||||||||||||||||||||
| Federal | 1.5 | 2.2 | 1.7 | -6.3 | 6.0 | 7.1 | 0.5 | 4.4 | ||||||||||||||||||||||||
| National defense | 1.5 | 1.9 | 2.8 | -10.8 | 8.5 | 10.1 | -0.5 | 5.6 | ||||||||||||||||||||||||
| Nondefense | 1.3 | 2.8 | -0.4 | 3.8 | 0.9 | 1.1 | 2.8 | 1.8 | ||||||||||||||||||||||||
| State and local | 0.3 | 1.6 | 2.2 | 3.0 | 3.0 | 1.9 | 2.8 | 0.6 | ||||||||||||||||||||||||
| Addenda: | ||||||||||||||||||||||||||||||||
| Final sales of domestic product | 3.3 | 2.8 | 2.5 | 1.3 | 3.6 | 4.0 | 2.4 | 0.7 | ||||||||||||||||||||||||
| Gross domestic purchases | 3.1 | 2.8 | 1.5 | 1.1 | 2.4 | 3.3 | -0.4 | 0.1 | ||||||||||||||||||||||||
| Final sales to domestic purchasers | 3.3 | 2.7 | 1.8 | 1.7 | 2.1 | 2.5 | 1.3 | -0.1 | ||||||||||||||||||||||||
| Gross national product (GNP) | 3.0 | 2.8 | 2.4 | 0.7 | 4.0 | 5.8 | 1.9 | 1.1 | ||||||||||||||||||||||||
| Disposable personal income | 1.7 | 3.1 | 3.1 | 5.4 | -0.8 | 4.0 | 0.9 | 1.8 | ||||||||||||||||||||||||
| Current -dollar measures: | ||||||||||||||||||||||||||||||||
| GDP | 6.4 | 6.1 | 4.9 | 4.9 | 6.6 | 6.0 | 3.0 | 3.5 | ||||||||||||||||||||||||
| Final sales of domestic product. | 6.6 | 6.1 | 5.3 | 5.5 | 6.3 | 5.1 | 4.9 | 3.4 | ||||||||||||||||||||||||
| Gross domestic purchases | 6.9 | 6.1 | 4.2 | 4.9 | 6.2 | 5.1 | 3.3 | 3.5 | ||||||||||||||||||||||||
| Final sales to domestic purchasers | 7.1 | 6.1 | 4.6 | 5.5 | 6.0 | 4.3 | 5.0 | 3.4 | ||||||||||||||||||||||||
| GNP | 6.3 | 6.0 | 5.2 | 4.9 | 6.8 | 6.9 | 4.3 | 3.7 | ||||||||||||||||||||||||
| Disposable personal income | 4.7 | 5.9 | 5.7 | 9.1 | 3.4 | 5.9 | 4.9 | 5.3 | ||||||||||||||||||||||||
r Revised. Revisions include changes to series affected by the incorporation of revised wage and salary estimates for the fourth quarter of 2007.
- 7 -
CURRENT STATE OF THE INDUSTRY (March 31, 2008)
Industry profitability decreased during the first quarter of 2008 with FDIC-insured institutions reporting total net income of $19.3 billion. The first quarter earnings were $16.3 billion less than the first quarter 2007. The industry’s first quarter earnings were primarily impacted by higher provisions for loan losses. The industry’s average return on assets (“ROA”) for the first quarter was 0.59%, which was down from 1.20% for the first quarter 2007. The industry’s first quarter ROA of 0.59% is the second lowest quarterly rate since the fourth quarter of 1991. However, the decline in the industry’s earnings was primarily concentrated in a few larger institutions. The ROA for institutions under $1.0 billion totaled 1.02% during the first quarter of 2008 compared to 0.13% for institutions over $1.0 billion over the same period. Overall, 50% of all institutions reported lower 2008 first quarter earnings as compared to the first quarter of 2007.
The industry’s net interest margin was 3.33% for the first quarter 2008 compared to the fourth quarter 2007 net interest margin of 3.32%. During the first quarter the industry reported $4.8 billion less in trading income and a $1.7 billion loss in sale of loans. First quarter non-interest expenses were $3.2 billion higher than a year earlier while non-interest income was $1.7 billion less than a year earlier.
Noncurrent loans for the industry were 1.71% at March 31, 2008 after increasing $26.0 billion during the first quarter. This is the highest level the noncurrent rate has reached since the first quarter of 1994. Construction and development loans that were noncurrent increased by $9.5 billion during the first quarter. Noncurrent residential mortgage loans increased by $9.3 billion during the quarter. Provisions were $37.1 billion for the first quarter 2008. Net charge-offs during the first quarter 2008 totaled $19.6 billion.
Assets increased by $335.4 billion during the first quarter of 2008. Total loans only increased $61.4 billion (0.80%) during the first quarter. Commercial and industrial loans increased $45.5 billion (3.2%). Real estate construction loans increased $2.7 billion (0.4%) and residential mortgage loans decreased $26.5 billion (1.20%). Assets in trading accounts increased by $135.2 billion (15.40%).
- 8 -
During the first quarter 2008, the total number of insured financial institutions declined from 8,534 to 8,494. For the period there were 38 newly chartered institutions, while mergers and acquisitions absorbed 77 charters. Two institutions failed during the first quarter. As of March 31, 2008 there are a total of 90 institutions on the FDIC’s “Problem List” with total assets of $26.3 billion, compared to 76 institutions and $22.2 billion in assets at December 31, 2008. (Source: The FDIC Quarterly Banking Profile, First Quarter 2008).
- 9 -
BANKING MARKET PROFILE
Demographic and Economic Review
First Freedom Bank, Lebanon, Tennessee (the “Bank”) provides financial products and services to its primary market of Wilson County from its main office and one branch office. The following data is a review of the demographics and economics of the market area in which the Bank operates.
The table below lists the population of Wilson County, Tennessee and the State of Tennessee as a whole.
POPULATION TRENDS
| % Change | Estimate | % Change | ||||||||||||||||||
| 2000 | 2007 | 2000-2007 | 2012 | 2007-2012 | ||||||||||||||||
| Wilson County | 88,809 | 106,391 | 19.80 | % | 120,711 | 13.46 | % | |||||||||||||
| State of Tennessee | 5,689,283 | 6,185,390 | 8.72 | % | 6,560,843 | 6.07 | % | |||||||||||||
Source: SNL Securities, L.P. ESRI
The 2007 population base of Wilson County at 106,391 exhibited an increase of 19.80% since the year 2000. Population estimates for the year 2012 for Wilson County indicate a continued increase in population. In comparison, the population in the State of Tennessee has grown 8.72% since 2000 and is expected to grow approximately 6.07% through 2012.
2007 POPULATION DISTRIBUTION
| Total 2007 | ||||||||||||||||||||
| 0-14 | 15-34 | 35-54 | 55+ | Population | ||||||||||||||||
| Wilson County | 20.00 | % | 24.00 | % | 33.00 | % | 23.00 | % | 106,391 | |||||||||||
| State of Tennessee | 19.00 | % | 27.00 | % | 29.00 | % | 24.00 | % | 6,185,390 | |||||||||||
The 2007 age distribution of the Bank’s market reflects a mature population base concentrated in the 35-54 age group. The age distribution in the State of Tennessee as a whole is also concentrated in the 35-54 age group.
- 10 -
INCOME TRENDS
| % Change | Estimate | % Change | ||||||||||||||||||
| 2000 | 2007 | 2000-2007 | 2012 | 2007-2012 | ||||||||||||||||
Wilson County | ||||||||||||||||||||
| Median HH Income | $ | 50,138 | $ | 61,919 | 23.50 | % | $ | 72,421 | 16.96 | % | ||||||||||
| Per Capita Income | $ | 22,739 | $ | 28,217 | 24.09 | % | $ | 33,554 | 18.91 | % | ||||||||||
State of Tennessee | ||||||||||||||||||||
| Median HH Income | $ | 36,361 | $ | 46,151 | 26.92 | % | $ | 54,180 | 17.40 | % | ||||||||||
| Per Capita Income | $ | 19,393 | $ | 24,928 | 28.54 | % | $ | 30,239 | 21.31 | % | ||||||||||
The median household and per-capita income levels of Wilson County are well above those of the State of Tennessee as a whole. The median household and per-capita income levels of Wilson County are expected to grow at a lower rate than those of the State of Tennessee.
The tables below present household growth trends and the 2007 income distribution levels for Wilson County and the State of Tennessee.
HOUSEHOLD TRENDS
| % Change | Estimate | % Change | ||||||||||||||||||
| 2000 | 2007 | 2000-2007 | 2012 | 2007-2012 | ||||||||||||||||
| Wilson County | 32,798 | 40,120 | 22.32 | % | 45,948 | 14.53 | % | |||||||||||||
| State of Tennessee | 2,232,905 | 2,466,845 | 10.48 | % | 2,632,633 | 6.72 | % | |||||||||||||
The number of households in Wilson County grew 22.32% from 2000 through 2007 and is expected to increase 14.53% through 2012. The housing trend for the State of Tennessee indicates growth of 10.48% since 2000. The number of households in the State of Tennessee is expected to increase 6.72% through 2012.
- 11 -
2007 HOUSEHOLD INCOME DISTRIBUTION
| 2007 | Median HH | |||||||||||||||||||
| $0-$24K | $25K-$49K | $50K+ | Households | Income | ||||||||||||||||
| Wilson County | 16.00 | % | 22.00 | % | 62.00 | % | 40,120 | $ | 61,919 | |||||||||||
| State of Tennessee | 26.00 | % | 27.00 | % | 46.00 | % | 2,466,845 | $ | 46,151 | |||||||||||
The 2007 household income data reveals that the largest percentage of the households in the Wilson County earn $50,000 and above. This compares to 46% of the households earning $50,000 and above for the State of Tennessee. The projected 2012 income distribution data reflects an increasing level of affluence within the banking market reviewed.
2012 HOUSEHOLD INCOME DISTRIBUTION
| 2012 | Median HH | |||||||||||||||||||
| $0-$24K | $25K-$49K | $50K+ | Households | Income | ||||||||||||||||
| Wilson County | 13.00 | % | 19.00 | % | 69.00 | % | 45,948 | $ | 72,421 | |||||||||||
| State of Tennessee | 22.00 | % | 24.00 | % | 54.00 | % | 2,632,633 | $ | 54,180 | |||||||||||
- 12 -
COMPETITIVE MARKET OVERVIEW
The Bank operates from its main office and one branch office in Wilson County, Tennessee. Wilson County’s total deposit base, as of June 30, 2007, equals $1.652 billion and has exhibited a two-year compound growth rate of 12.91%. At June 30, 2007 the Wilson County marketplace is serviced by 10 financial institutions with a total of 39 retail office facilities. As of June 30, 2007, the Bank maintains a total deposit base of $93.4 million representing a 5.65% market share.
The following charts present a detailed summary of the Bank’s deposit growth and marketshare position within its market area as of June 30, 2007.
- 13 -
WILSON COUNTY, TENNESSEE DEPOSIT MARKET SHARE ANALYSIS
| Two Yr. | 6/07 | Deposits | Deposits | Deposits | ||||||||||||||||||||||||||
| Branch | Comp. | Pct of List | 6/07 | 6/06 | 6/05 | |||||||||||||||||||||||||
| Holding Company | Institution | Type | Address | City | Growth | (%) | ($000) | ($000) | ($000) | |||||||||||||||||||||
| Wilson Bank Holding Company | Wilson Bank & Trust | Bank | 1444 W Baddour Pkwy | Lebanon | 12.67 | % | 1.99 | 32,908 | 30,354 | 25,925 | ||||||||||||||||||||
| Wilson Bank Holding Company | Wilson Bank & Trust | Bank | 1130 Castle Heights Ave N | Lebanon | 8.39 | % | 1.27 | 20,969 | 19,957 | 17,850 | ||||||||||||||||||||
| Wilson Bank Holding Company | Wilson Bank & Trust | Bank | 623 W Main St | Lebanon | 4.31 | % | 20.39 | 336,744 | 328,909 | 309,468 | ||||||||||||||||||||
| Wilson Bank Holding Company | Wilson Bank & Trust | Bank | 1476 N Mt Juliet Rd | Mount Juliet | 17.05 | % | 7.15 | 118,010 | 96,663 | 86,128 | ||||||||||||||||||||
| Wilson Bank Holding Company | Wilson Bank & Trust | Bank | 11835 Lebanon Rd | Mount Juliet | 79.13 | % | 0.77 | 12,671 | 8,197 | 3,949 | ||||||||||||||||||||
| Wilson Bank Holding Company | Wilson Bank & Trust | Bank | 101 Public Sq | Watertown | 11.51 | % | 2.07 | 34,236 | 31,269 | 27,534 | ||||||||||||||||||||
| Wilson Bank Holding Company | Wilson Bank & Trust | Bank | 440 Hwy 109 N | Lebanon | 24.93 | % | 1.18 | 19,570 | 14,132 | 12,539 | ||||||||||||||||||||
| Wilson Bank Holding Company | Wilson Bank & Trust | Bank | 8875 Stewarts Ferry Pike | Mount Juliet | 11.26 | % | 2.62 | 43,347 | 39,679 | 35,015 | ||||||||||||||||||||
| Wilson Bank Holding Company | Wilson Bank & Trust | Bank | 200 Tennessee Blvd | Lebanon | 10.31 | % | 2.09 | 34,437 | 31,273 | 28,303 | ||||||||||||||||||||
| Wilson Bank Holding Company | Wilson Bank & Trust | Bank | 615 S Cumberland | Lebanon | 15.35 | % | 0.69 | 11.374 | 9,774 | 8,548 | ||||||||||||||||||||
| 9.38 | % | 40.22 | 664,266 | 610,207 | 555,259 | |||||||||||||||||||||||||
| Pinnacle Financial Partners | Pinnacle National Bank | Bank | 411 S Cumberland St | Lebanon | NA | 6.80 | 112,369 | 83,657 | NA | |||||||||||||||||||||
| Pinnacle Financial Partners | Pinnacle National Bank | Bank | 1412 W Baddour Pkwy | Lebanon | -46.83 | % | 1.57 | 25,999 | 22,127 | 91,972 | ||||||||||||||||||||
| Pinnacle Financial Partners | Pinnacle National Bank | Bank | 551 N Mt Juliet Rd | Mount Juliet | 17.90 | % | 6.20 | 102,445 | 86,233 | 73,700 | ||||||||||||||||||||
| Pinnacle Financial Partners | Pinnacle National Bank | Bank | 401 Castle Heights Ave N | Lebanon | -10.99 | % | 1.85 | 30,616 | 33,359 | 38,646 | ||||||||||||||||||||
| Pinnacle Financial Partners | Pinnacle National Bank | Bank | 11400 Lebanon Rd | Mount Juliet | 47.46 | % | 0.67 | 11,059 | 7,967 | 5,086 | ||||||||||||||||||||
| 16.15 | % | 17.09 | 282,488 | 233,343 | 209,404 | |||||||||||||||||||||||||
| SunTrust Banks Inc. | SunTrust Bank | Bank | 225 W Main St | Lebanon | -12.89 | % | 1.79 | 29,603 | 36,873 | 39,014 | ||||||||||||||||||||
| SunTrust Banks Inc. | SunTrust Bank | Bank | 15375 Lebanon Rd | Old Hickory | -11.87 | % | 1.40 | 23,100 | 25,250 | 23,991 | ||||||||||||||||||||
| SunTrust Banks Inc. | SunTrust Bank | Bank | 240 W Main St | Lebanon | -14.12 | % | 3.13 | 51,739 | 65,679 | 70,145 | ||||||||||||||||||||
| SunTrust Banks Inc. | SunTrust Bank | Bank | 11190 Cainsville Rd | Lebanon | 6.95 | % | 0.73 | 12,128 | 11,852 | 10,602 | ||||||||||||||||||||
| SunTrust Banks Inc. | SunTrust Bank | Bank | 11359 Lebanon Rd | Mount Juliet | 5.09 | % | 2.34 | 38,719 | 38,738 | 35,060 | ||||||||||||||||||||
| SunTrust Banks Inc. | SunTrust Bank | Bank | 1691 N Mount Juliet Rd | Mount Juliet | 5.61 | % | 1.96 | 32.402 | 37,805 | 29.053 | ||||||||||||||||||||
| -4.98 | % | 11.35 | 187,691 | 216,197 | 207,865 | |||||||||||||||||||||||||
| First Horizon National Corp. | First Tennessee Bk NA | Bank | 1283 N Mt Juliet Rd | Mount Juliet | 7.72 | % | 1.31 | 21,567 | 22,393 | 18,587 | ||||||||||||||||||||
| First Horizon National Corp. | First Tennessee Bk NA | Bank | 249 W Main St | Lebanon | 0.09 | % | 2.58 | 42,574 | 44,345 | 42,501 | ||||||||||||||||||||
| First Horizon National Corp. | First Tennessee Bk NA | Bank | 1615 W Main St | Lebanon | 29.04 | % | 4.88 | 80,620 | 61,968 | 48,419 | ||||||||||||||||||||
| First Horizon National Corp. | First Tennessee Bk NA | Bank | 105 E Main St | Watertown | NA | NA | NA | NA | 3.399 | |||||||||||||||||||||
| 13.23 | % | 8.77 | 144,761 | 128,706 | 112,906 | |||||||||||||||||||||||||
| Regions Financial Corp. | Regions Bank | Bank | 1477 N Mount Juliet Rd | Mount Juliet | -3.69 | % | 1.84 | 30,390 | 30,743 | 32,764 | ||||||||||||||||||||
| Regions Financial Corp. | Regions Bank | Bank | 1395 N Mount Juliet Rd | Mount Juliet | 16.87 | % | 1.09 | 18,010 | 15,370 | 13,185 | ||||||||||||||||||||
- 14 -
WILSON COUNTY, TENNESSEE DEPOSIT MARKET SHARE ANALYSIS
| Two Yr. | 6/07 | Deposits | Deposits | Deposits | ||||||||||||||||||||||||||
| Branch | Comp. | Pct of List | 6/07 | 6/06 | 6/05 | |||||||||||||||||||||||||
| Holding Company | Institution | Type | Address | City | Growth | (%) | ($000) | ($000) | ($000) | |||||||||||||||||||||
| Regions Financial Corp. | Regions Bank | Bank | 1436 W Main St | Lebanon | 8.94 | % | 1.32 | 21,776 | 18,982 | 18,347 | ||||||||||||||||||||
| Regions Financial Corp. | Regions Bank | Bank | 715 W Main St | Lebanon | 4.41 | % | 1.32 | 21,872 | 22,759 | 20,063 | ||||||||||||||||||||
| Regions Financial Corp. | Regions Bank | Bank | 4116 N Mount Juliet Rd | Mount Juliet | 596.76 | % | 0.66 | 10.826 | 6,409 | 223 | ||||||||||||||||||||
| 10.28 | % | 6.23 | 102,874 | 94,263 | 84,582 | |||||||||||||||||||||||||
First Freedom Bank | First Freedom Bank | Bank | 1620 W Main St | Lebanon | NA | 5.65 | 93,379 | 14,459 | NA | |||||||||||||||||||||
First Freedom Bank | First Freedom Bank | Bank | 12888 Lebanon Rd | Mount Juliet | NA | NA | NA | NA | NA | |||||||||||||||||||||
| NA | 5.65 | 93,379 | 14,459 | 0 | ||||||||||||||||||||||||||
| CedarStone Bank | CedarStone Bank | Bank | 1499NMount Juliet Rd | Mount Juliet | 29.90 | % | 1.16 | 19,094 | 17,210 | 11,315 | ||||||||||||||||||||
| CedarStone Bank | CedarStone Bank | Bank | 900 W Main St | Lebanon | 45.02 | % | 3.07 | 50,653 | 40,014 | 24,086 | ||||||||||||||||||||
| 40.36 | % | 4.23 | 69,747 | 57,224 | 35,401 | |||||||||||||||||||||||||
| Bank of America Corp. | Bank of America NA | Bank | 120 W Main St | Lebanon | 0.28 | % | 1.66 | 27,426 | 27,773 | 27,271 | ||||||||||||||||||||
| Bank of America Corp. | Bank of America NA | Bank | 1416-AWMainSt | Lebanon | 8.91 | % | 1.00 | 16,547 | 16,321 | 13,950 | ||||||||||||||||||||
| 3.28 | % | 2.66 | 43,973 | 44,094 | 41,221 | |||||||||||||||||||||||||
| Citizens Bncp Investment Inc. | Liberty State Bank | Bank | 1035 W Main St | Lebanon | 34.41 | % | 1.78 | 29,366 | 18,273 | 16,256 | ||||||||||||||||||||
| Citizens Bncp Investment Inc. | Liberty State Bank | Bank | 214 N Cumberland | Lebanon | -21.90 | % | 0.46 | 7,523 | 13,886 | 12,335 | ||||||||||||||||||||
| 13.59 | % | 2.24 | 36,889 | 32,159 | 28,591 | |||||||||||||||||||||||||
| F&M Financial Corporation | F&M Bank | Bank | 4151 N Mount Juliet Rd | Mount Juliet | NA | 0.27 | 4,523 | 1,210 | NA | |||||||||||||||||||||
| F&M Financial Corporation | F&M Bank | Bank | 225 W Main St | Lebanon | 3.58 | % | 1.27 | 20.959 | 20,161 | 19,535 | ||||||||||||||||||||
| 14.21 | % | 1.54 | 25,482 | 21,371 | 19,535 | |||||||||||||||||||||||||
| Old Hickory Credit Union | Old Hickory C U | CU | 104 Hartman Dr | Lebanon | NA | NA | NA | 643 | 746 | |||||||||||||||||||||
Aggregate: | 12.91 | % | 100.00 | 1,651,550 | 1,452,666 | 1,295,510 | ||||||||||||||||||||||||
- 15 -
FINANCIAL HISTORY AND CONDITION
The following analysis presents a synopsis of the financial highlights and operating performance of the Bank for the last six quarters ending June 30, 2008.
Financial Highlights
First Freedom Bank
(Dollars in Thousands)
First Freedom Bank
(Dollars in Thousands)
| 03/07 Q | 06/07 Q | 09/07 Q | 12/07 Q | 03/08 Q | 06/08 Q | |||||||||||||||||||
Balance Sheet Highlights | ||||||||||||||||||||||||
| Total Assets | 95,327 | 111,182 | 128,868 | 141,669 | 151,433 | 170,496 | ||||||||||||||||||
| Asset Growth Rate (%) | 116.13 | 66.53 | 63.63 | 39.73 | 27.57 | 50.35 | ||||||||||||||||||
| Total Loans & Leases (Incl HFS) | 50,275 | 61,484 | 79,463 | 96,880 | 105,878 | 130,419 | ||||||||||||||||||
| Loan Growth Rate (%) | 223.93 | 89.18 | 116.97 | 87.67 | 37.15 | 92.71 | ||||||||||||||||||
| Total Loans & Leases/Assets (%) | 52.74 | 55.30 | 61.66 | 68.38 | 69.92 | 76.49 | ||||||||||||||||||
| Total Deposits (Incl Dom & For) | 76,585 | 93,379 | 110,266 | 122,662 | 132,304 | 152,698 | ||||||||||||||||||
| Deposit Growth Rate (%) | 155.21 | 87.71 | 72.34 | 44.97 | 31.44 | 61.66 | ||||||||||||||||||
| Loans/ Deposits (%) | 65.65 | 65.84 | 72.06 | 78.98 | 80.03 | 85.41 | ||||||||||||||||||
| Memo:Full-time Employees | 20 | 22 | 24 | 25 | 31 | 34 | ||||||||||||||||||
Performance Measures | ||||||||||||||||||||||||
| Net Income | (245 | ) | (153 | ) | (20 | ) | 80 | 89 | (599 | ) | ||||||||||||||
| ROAA (%) | (1.20 | ) | (0.59 | ) | (0.07 | ) | 0.24 | 0.24 | (1.51 | ) | ||||||||||||||
| ROAE (%) | (5.43 | ) | (3.49 | ) | (0.46 | ) | 1.76 | 1.92 | (13.38 | ) | ||||||||||||||
| Interest Income/Avg Assets (%) | 6.47 | 6.60 | 6.77 | 7.16 | 6.17 | 5.75 | ||||||||||||||||||
| Interest Expense/ Avg Assets (%) | 3.65 | 4.00 | 4.17 | 4.19 | 4.03 | 3.43 | ||||||||||||||||||
| Net Interest Income/Avg Assets (%) | 2.82 | 2.60 | 2.61 | 2.97 | 2.14 | 2.33 | ||||||||||||||||||
| Noninterest Income/Avg Assets (%) | 0.26 | 0.34 | 0.46 | 0.32 | 0.32 | 0.36 | ||||||||||||||||||
| Noninterest Expense/Avg Assets (%) | 2.96 | 2.88 | 2.17 | 2.25 | 2.22 | 2.53 | ||||||||||||||||||
| Net Interest Margin (%) | 2.97 | 2.71 | 2.70 | 3.10 | 2.22 | 2.42 | ||||||||||||||||||
| Yield/ Cost Spread (%) | 1.91 | 1.69 | 1.84 | 2.48 | 1.60 | 2.00 | ||||||||||||||||||
| Efficiency Ratio (FTE) (%) | 96.18 | 98.03 | 70.76 | 68.48 | 89.98 | 94.47 | ||||||||||||||||||
Capitalization | ||||||||||||||||||||||||
| Total Equity Capital | 17,942 | 17,135 | 17,927 | 18,421 | 18,640 | 17,179 | ||||||||||||||||||
| Tier 1 Capital | 17,833 | 17,758 | 17,805 | 17,946 | 18,074 | 17,570 | ||||||||||||||||||
| Equity/ Assets (%) | 18.82 | 15.41 | 13.91 | 13.00 | 12.31 | 10.08 | ||||||||||||||||||
| Tang Equity/ Tang Assets (%) | 18.82 | 15.41 | 13.91 | 13.00 | 12.31 | 10.08 | ||||||||||||||||||
| Risk Based Capital Ratio (%) | 28.61 | 23.53 | 19.51 | 16.82 | 15.75 | 13.20 | ||||||||||||||||||
| Tier 1 Risk-based Ratio (%) | 27.46 | 22.38 | 18.29 | 15.61 | 14.67 | 11.95 | ||||||||||||||||||
| Leverage Ratio (%) | 21.84 | 17.19 | 14.94 | 13.59 | 12.41 | 11.05 | ||||||||||||||||||
| Common Dividnds Declrd/ Net Inc (%) | 0.00 | 0.00 | 0.00 | 0.00 | 0.00 | 0.00 | ||||||||||||||||||
- 16 -
Financial Highlights
First Freedom Bank
(Dollars in Thousands)
First Freedom Bank
(Dollars in Thousands)
| 03/07 Q | 06/07 Q | 09/07 Q | 12/07 Q | 03/08 Q | 06/08 Q | |||||||||||||||||||
Loan Composition(%) | ||||||||||||||||||||||||
| Constr & Dev Loans/ Loans | 27.94 | 27.59 | 26.85 | 25.76 | 27.85 | 22.15 | ||||||||||||||||||
| Tot 1-4 Fam Loans/ Loans | 28.20 | 27.14 | 23.01 | 22.60 | 22.13 | 21.84 | ||||||||||||||||||
| Multifamily Loans/ Loans | 0.28 | 0.23 | 0.17 | 0.14 | 0.13 | 0.47 | ||||||||||||||||||
| Farm Loans/ Loans | 0.18 | 4.65 | 4.49 | 3.28 | 0.35 | 0.24 | ||||||||||||||||||
| CommRE(Nfarm/NRes)/ Loans | 19.94 | 17.25 | 19.70 | 18.90 | 23.82 | 24.31 | ||||||||||||||||||
| Foreign RE Lns/ Loans | 0.00 | 0.00 | 0.00 | 0.00 | 0.00 | 0.00 | ||||||||||||||||||
| Real Estate Loans/ Loans | 76.54 | 76.85 | 74.23 | 70.69 | 74.29 | 69.01 | ||||||||||||||||||
| Total C&I Loans/ Loans | 19.53 | 19.21 | 21.74 | 25.27 | 22.18 | 24.26 | ||||||||||||||||||
| Total Cons Lns/ Loans | 3.99 | 4.16 | 3.87 | 4.06 | 3.59 | 6.73 | ||||||||||||||||||
| Agricultural Prod/ Loans | 0.20 | 0.02 | 0.02 | 0.01 | 0.01 | 0.07 | ||||||||||||||||||
| Other Loans/ Loans | 0.00 | 0.00 | 0.37 | 0.03 | 0.00 | 0.00 | ||||||||||||||||||
| Total Leases/ Loans | 0.00 | 0.00 | 0.00 | 0.00 | 0.00 | 0.00 | ||||||||||||||||||
| LESS: Unearn Inc/ Loans | 0.26 | 0.25 | 0.23 | 0.06 | 0.06 | 0.06 | ||||||||||||||||||
Deposit Composition(%) | ||||||||||||||||||||||||
| Nonint-Bear Dep/ Deposits | 7.78 | 5.74 | 6.25 | 4.21 | 4.31 | 4.86 | ||||||||||||||||||
| Transaction Accounts/ Deposits | 15.70 | 12.86 | 13.14 | 10.92 | 10.86 | 11.05 | ||||||||||||||||||
| MMDAs+Savings/ Deposits | 9.02 | 6.75 | 6.72 | 7.81 | 8.36 | 9.62 | ||||||||||||||||||
| Retail Time Dep/ Deposits | 24.57 | 28.75 | 30.86 | 30.56 | 31.87 | 31.73 | ||||||||||||||||||
| Jumbo Time Deposits/ Deposits | 50.71 | 51.64 | 49.28 | 50.72 | 48.92 | 47.60 | ||||||||||||||||||
Asset Quality(%) | ||||||||||||||||||||||||
| Total Noncurrent Lns/ Loans | 0.00 | 0.00 | 0.00 | 0.00 | 0.07 | 1.42 | ||||||||||||||||||
| N PLs/ Loans | 0.00 | 0.00 | 0.00 | 0.00 | 0.07 | 1.70 | ||||||||||||||||||
| NPAs/ Assets | 0.00 | 0.00 | 0.00 | 0.00 | 0.05 | 1.30 | ||||||||||||||||||
| NPAs/(Loans+OREO) | 0.00 | 0.00 | 0.00 | 0.00 | 0.07 | 1.70 | ||||||||||||||||||
| NPAs + 90 Days PD/ Assets | 0.00 | 0.00 | 0.00 | 0.00 | 0.05 | 1.30 | ||||||||||||||||||
| Loan Loss Reserves/ Gross Loans | 1.50 | 1.48 | 1.50 | 1.50 | 1.50 | 1.49 | ||||||||||||||||||
| Reserves/ NPAs | NA | NA | NA | NA | 2,062.34 | 87.67 | ||||||||||||||||||
| Net LCOs/Avg Loans | 0.00 | 0.11 | 0.01 | 0.01 | 0.02 | 1.04 | ||||||||||||||||||
| Loan Loss Prov/ NCOs | NA | 1,120.00 | 14,350.00 | 13,100.00 | 3,525.00 | 220.81 | ||||||||||||||||||
Liquidity(%) | ||||||||||||||||||||||||
| Liquidity Ratio | 26.65 | 23.75 | 16.84 | 11.33 | 7.88 | 3.05 | ||||||||||||||||||
| Earning Assets/ IBL | 128.96 | 121.33 | 119.80 | 116.08 | 113.46 | 112.15 | ||||||||||||||||||
| Sees (FV)/ Sees (Amt Cost) | 100.41 | 98.02 | 100.34 | 101.35 | 101.64 | 98.82 | ||||||||||||||||||
| Pledged Sees/ Securities | 79.87 | 78.53 | 76.85 | 76.60 | 87.93 | 91.43 | ||||||||||||||||||
| Brokered Deposits/ Deposits | 0.00 | 0.00 | 0.00 | 0.00 | 0.00 | 0.00 | ||||||||||||||||||
| Jumbo Time Deposits/ Deposits | 50.71 | 51.64 | 49.28 | 50.72 | 48.92 | 47.60 | ||||||||||||||||||
Yields/Cost(%) | ||||||||||||||||||||||||
| Yield on Loans | 8.36 | 8.08 | 8.10 | 8.47 | 6.94 | 6.34 | ||||||||||||||||||
| Yield on Debt and Equity Securities | 5.41 | 5.41 | 5.51 | 5.51 | 5.37 | 5.29 | ||||||||||||||||||
| Yield on Earning Assets | 6.82 | 6.89 | 7.02 | 7.48 | 6.40 | 6.00 | ||||||||||||||||||
| Cost of Int Bearing Dep | 4.92 | 5.20 | 5.18 | 5.01 | 4.80 | 4.01 | ||||||||||||||||||
| Cost of Borrowings (Non Deps) | 1.55 | 2.02 | 2.57 | 1.72 | 2.63 | 0.00 | ||||||||||||||||||
| Cost of Interest Bearing Liab | 4.91 | 5.19 | 5.17 | 5.00 | 4.80 | 4.00 | ||||||||||||||||||
| Cost of Funds | 4.51 | 4.85 | 4.86 | 4.74 | 4.59 | 3.82 | ||||||||||||||||||
| Yield/ Cost Spread | 1.91 | 1.69 | 1.84 | 2.48 | 1.60 | 2.00 | ||||||||||||||||||
- 17 -
The following pages graphically depict the Bank’s financial performance versus that of its peer group. The information was taken from the Bank’s June 30, 2008 Uniform Bank Performance Report.
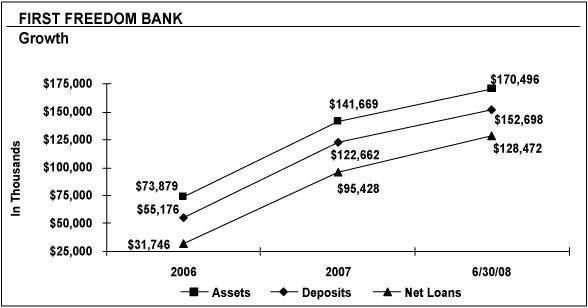
| SCONTFIRST FREEDOM BANK Growth $175000 T $170’496 $141669* $150’000 $152698 $125000 —J 1-*128 472 $122662 $128472 $100000 — SS ¦= *e nnn $73879 $95428 |
| h- $75000 — WT s |
| c $55176 y $50000 $25000 | $31746 2006 2007 6/30/08 ¦ Assets —?—Deposits —A— Net Loans |
A review of the historic data presented reveals significant growth since year-end 2006. Overall, total assets have increased $96.6 million for a compound growth rate of 74.63% since year-end 2006.
As indicated above, total deposits of $152.7 million at June 30, 2008 have increased $97.5 million since year-end 2006, resulting in a compound growth rate of 97.12%. The growth within the Bank’s deposit base since 2006 has primarily been concentrated in time deposits. Time deposits less than $100,000 have increased approximately $34.6 million since year-end 2006 and time deposits $100,000 and over have increased $46.6 million since year-end 2006.
Since year-end 2006 net loans have increased $96.7 million representing a compound growth rate of 153.95%. The loan growth achieved since 2006 has been concentrated within the Bank’s real estate related loan portfolio. Since year-end 2006, the Bank’s real estate loan portfolio has increased approximately $65.6 million.
- 18 -
The Bank has historically maintained an adequate capital base in excess of regulatory minimum guidelines. As of June 30, 2008, the Bank maintains a total tier one capital base of $17.6 million representing a tier one leveraged capital position of 11.05%.
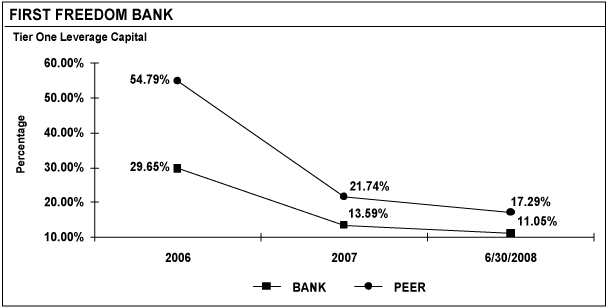
| FIRST FREEDOM BANK — Tier One Leverage Capital6000% -r 5479%• 5000% — v f 4000% — >v I 3000%-2965%bv “N 2174% 2000% — -v —17-29% - -— — - -«,13-59%*1105% —— —1000% -I 1 I =* 1 2006 2007 6/30/2008 |
| BANK PEER |
- 19 -
For the six months ending June 30, 2008, the Bank has reported a net loss of $510,000 which equates to a return on average assets (“ROAA”) and equity (“ROAE”) of -0.67% and -5.64%, respectively. The Bank’s lower level of net losses compared to peer can primarily be attributed to the Bank’s below peer non-interest expense.
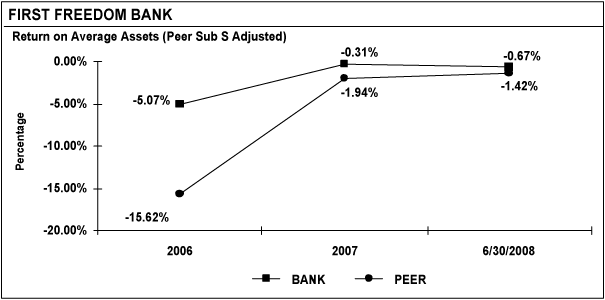
| FIRST FREEDOM BANKReturn on Average Assets (Peer Sub S Adjusted) - -031% n 67% 000% j ————¦S*A940/ T42%-500%- ¦507/o ¦—¦/ at r «j /S -1000% —/-1500% —4S-1562% - -2000% -J 1 1 1 2006 2007 6/30/2008 |
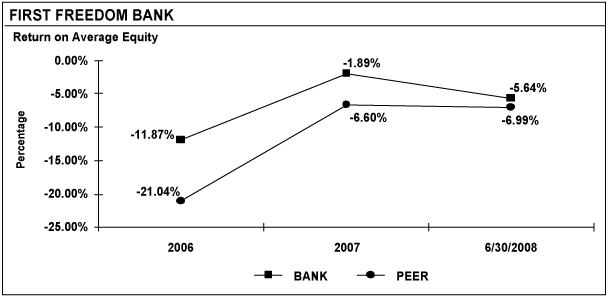
| -m-BANK -•- PEER FIRST FREEDOM BANKReturn on Average Equity 000% j -189% - -500% — 564% I ,,,,,no/ -660% J99o/0 |
| I -1000%- -11879-s’ I -1500% --2000% —2104°// - -2500% -I 1 1 1 2006 2007 6/30/2008 _«___BANK -•- PEER |
- 20 -
As reflected below, the Bank has experienced a below peer net margin over the period reviewed. This trend has resulted primarily due to the Bank’s higher than peer level of interest bearing funds and higher cost of funds. For the six months ending June 30, 2008 the Bank’s interest income to average assets is 5.95% compared to peer of 5.99%. However, the Bank’s interest expense is 3.71% of average assets which is 98 basis points above the peer level of 2.73%. The Bank’s cost of total interest bearing funds totaled 4.42% for the two quarters ending June 30, 2008 compared to 3.73% for peer. Additionally, the Bank’s average interest bearing funds to average assets equals 83.94% compared to peer of 73.28% as of June 30, 2008.
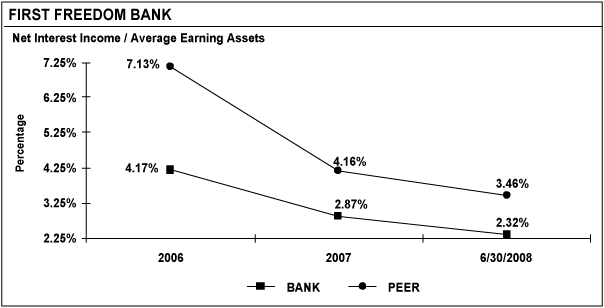
| FIRST FREEDOM BANK — Net Interest Income / Average Earning Assets725% -r713%• 625% — S | 525% — \ I 425%-417% XiOTt* “ ¦ ___346% 325% — 287% "¦ 232% 225% H 1 I =¦ 1 2006 2007 6/30/2008 _¦___BANK -•- PEER |
- 21 -
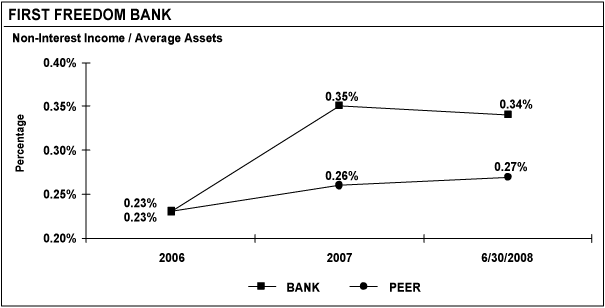
The Bank’s total non-interest income to average assets has remained above peer over the period reviewed. During the first six months of 2008 the Bank’s non-interest income to average assets equals 0.34% compared to peer at 0.27%.
| FIRST FREEDOM BANK |
| Non-Interest Income / Average Assets |
| 040% j |
| 035% ,,, 035% —M-034% |
| <£ 030% —y^ S ^no*,,, 027%S^026% _• 25% “ 023%_y/* ‘ 023% ¦* 020%\1 1 1 2006 2007 6/30/2008 |
| -m-BANK -*- PEER |
- 22 -
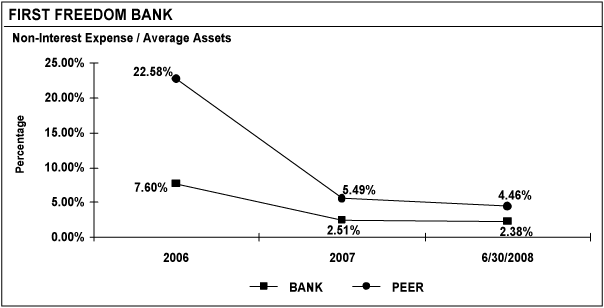
The Bank’s non-interest expense to average assets has significantly declined from 2006 through 2008 and has remained below peer. Over the first six months of 2008 the Bank’s non-interest expense to average assets decreased 13 basis points to 2.38% compared to 4.46% for peer.
| FIRST FREEDOM BANK Non-Interest Expense / Average Assets 25.00% — 22.58% 20.00% - | 15.00% - q 10.00% 5.00% 7.60% ¦—___XsJ.49% 4.46% ——• |
| n nn% — 2.51% 2.38% {2006 } 2007 6/30/2008 — BANK -•— PEER |
The Bank’s overhead components through June 30, 2008 are shown in the following table:
Percent of Average Assets
| Bank | Peer | |||||||
| Personnel Expense | 1.29 | % | 2.49 | % | ||||
| Occupancy Expense | 0.22 | % | 0.63 | % | ||||
| Other Expense | 0.86 | % | 1.30 | % | ||||
| Total | 2.38 | % | 4.46 | % | ||||
- 23 -
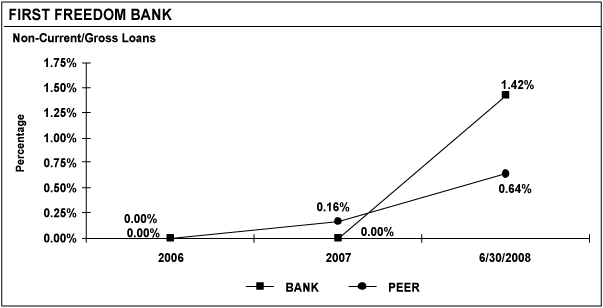
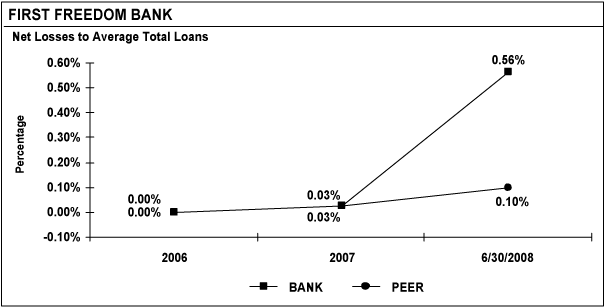
The Bank’s had no non-current loans during 2006 and 2007. Over the first six months of 2008 the Bank’s non-current loans and net losses significantly increased. As of June 30, 2008 the Bank’s non-current loans to gross loans equals 1.42% compared to peer of 0.64%. The Bank’s net losses through June 30, 2008 equal 0.56% of average total loans compared to 0.10% for peer.
| FIRST FREEDOM BANK Non-Current/Gross Loans 175% -r 150% — 1-42%&125% —yr| 100% —/| 075% —/050% —/064% o25%— ooo%_Jr 000% Jo-oo%¦- -T-“o-oo%—, ,2006 2007 6/30/2008 |
| -¦- BANK -•- PEER FIRST FREEDOM BANK |
| Net Losses to Average Total Loans 060% T 056% 050% —yf |
| %040% —/CDS| 030% —/» 020% —/010% — n n,o/X—• 000% 003%/___Q% |
| 000% —000% ¦— q03% - -010% -I 1 1 1 2006 2007 6/30/2008 _»___BANK -•- PEER |
- 24 -
| FIRST FREEDOM BANKAllowance for Loan and Lease Loss to Total Loans 180% j• 1-60% “ 1 SO”/ f 150% 9%a 140% — 131% £ 127%r100% -I 1 1 1 2006 2007 6/30/2008 - -¦- BANK -•- PEER |
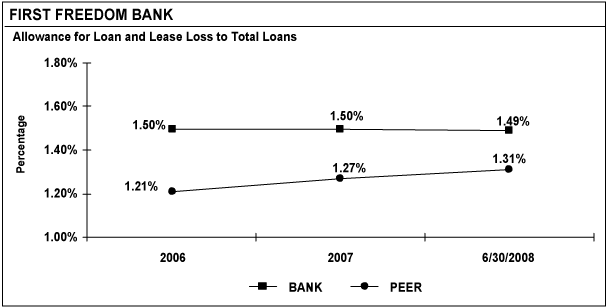
As of June 30, 2008 the Bank maintains an allowance for loan losses of $1,948,000 which represent 1.49% of total loans compared to 1.31% for peer.
- 25 -
METHODOLOGY
The following section is an analysis of the value of the Bank’s common shares based on the status quo compared to the value of the proposed reclassified shares of the Bank.
- 26 -
EARNINGS METHOD
The Earnings Method is based on the premise that common stock value is equivalent to that price at which its future dividends and residual earnings will produce a particular yield.
Discount Rate Analysis
The yield or discount rate utilized in this appraisal is 12.4% based on analysis of available market information and consideration of risk factors including those specific to the Bank.
The Capital Asset Pricing Model can be defined as the covariance of any particular company’s risk relative to the markets overall risk. A company’s beta is a measure of the covariance or correlation of a particular company’s stock return over time relative to the overall stock market. A beta of one implies the stock will move exactly in line with the overall market. All things being equal, the lower the beta the lower the risk associated with a particular stock and therefore the lower the required return or discount rate. The formula is as follows:
Required Rate of Return (“K”) = Risk free rate (“Krf”) + (B (Market Index Required Rate of Return (“Kfm”) - - Risk free rate of Return)) + Small Company Stock Premium
The risk free rate utilized in this analysis is the Five Year Constant Maturity Treasury Bond yield of 3.14% as of August 22, 2008. According to the SNL DataSource, as of August 25, 2008, the average Beta for all 343 publicly traded banks stocks which did not report net losses over the last twelve months equals 0.81 relative to the S&P 500. The long term inflation adjusted historical risk premium of stocks over US Treasuries has averaged approximately 7.0% since 1871. While there has been significant debate in the investment community over the last decade or more since Eugene Fama and Kenneth French published their hallmark findings on the small company size premium and value versus growth stock premium, in the Journal of Finance in 1992, trying to disentangle the observed premiums, data measuring equity returns from 1941 to 1990 confirms that these premiums do exist and typically range from 3.0% to 5.50%.
- 27 -
Utilizing the inputs above, the following analysis demonstrates the calculation of the discount rate utilized in this appraisal.
K = 3.14% + 0.81 (7.00%) + 3.55%
K = 12.4%
Two earnings methods are established:
| 1. | Short-term value based on 5 years projections and cash flows; | ||
| 2. | Long-term value based on 20 year projections and cash flows. |
The June 30, 2008 ending equity and assets are used as the basis for the projections. An asset growth rate of 10.00% was used for the short-term and 7.00% for the long-term. ROA was increased from 0.00% in Year 1 to 1.15% in Year 16 and beyond. Dividends are projected to equal 40.0% of net income beginning in Year 6 and beyond. The earnings at the end of the fifth year, for the short-term, and the end of the twentieth year, for the long-term, are given a terminal value equal to 23.78 times ending net income. The terminal value represents the median price to last-twelve-month earnings ratio paid of bank merger and acquisitions in Tennessee since June 30, 2001.
The same parameters are used in the pro forma analysis. However, the pro forma model has been adjusted to account for the dividend premiums paid on the new classes of stock and include cost savings of $201,000 in Year 1 that increase by 3% a year throughout the analysis.
- 28 -
CONCLUSION
The following table summarizes the results of the analysis.
PRESENT VALUE WITH TERMINAL VALUE EQUAL TO 23.78X
| Pro Forma | Preferred | Pro Forma | ||||||||||||||||||||||
| Status Quo | Common | Class A | Class B | A | Combined | |||||||||||||||||||
| Short-term ($000) | $ | 21,838 | $ | 17,497 | $ | 4,958 | $ | 1,790 | $ | 591 | $ | 24,836 | ||||||||||||
| Per Share | $ | 10.73 | $ | 12.20 | $ | 12.20 | $ | 12.20 | $ | 12.20 | ||||||||||||||
| Long-term ($000) | $ | 25,892 | $ | 19,042 | $ | 5,433 | $ | 1,971 | $ | 658 | $ | 27,103 | ||||||||||||
| Per Share | $ | 12.72 | $ | 13.28 | $ | 13.37 | $ | 13.43 | $ | 13.59 | ||||||||||||||
As can be seen in the summary above, our analysis indicates that the contemplated share reclassification will result in a higher institution value and higher per share value for each class of stock compared to the status quo.
Based on this as well as all other factors considered and deemed relevant, it is our opinion as investment bankers that the proposed consideration to be received by the Bank’s shareholders, under the proposed share reclassification, is fair from a financial perspective.
- 29 -
PROFESSIONAL BANK SERVICES, INC.
INVESTMENT BANKING ENGAGEMENTS
INVESTMENT BANKING ENGAGEMENTS
Professional Bank Services, Inc. (“PBS”), a consulting firm for financial institutions with offices in Orlando, FL, Louisville, KY and Nashville, TN was established in 1978. Since its inception, the firm has assisted over 1,000 institutions in various capacities. One area of specialization is the firm’s appraisal services. The company is continually engaged to provide assistance with corporate expansion, holding company formation, and to perform fairness opinions and stock appraisals. PBS’ wholly owned subsidiary, Investment Bank Services, Inc., is a registered Broker Dealer with the Securities and Exchange Commission (“S.E.C.”).
The firm’s stock appraisals have been recognized by various courts and regulatory agencies in settling dissenting shareholder suits. In addition to appraisal valuations, the firm also specializes in valuations that facilitate the merger or acquisition process. The firm has valued institutions with assets totaling over $5.0 billion and fair market values over $600 million.
PBS utilizes proven industry accepted methods in providing common stock appraisals. The appraisal and support documents are prepared in a fashion that is easily understood and are often accompanied by professional presentation. The appraisals have been used for reverse common stock splits, consummation of interim bank mergers and valuing stock for Employee Stock Ownership Plans, as well as other traditional purposes.
- 30 -
CHRISTOPHER L. HARGROVE
Chairman & CEO
Professional Bank Services, Inc.
Chairman & CEO
Professional Bank Services, Inc.
Mr. Hargrove has an in-depth understanding of the acquisition process. As a senior analyst for a major mid-south bank holding company, Mr. Hargrove assisted in the successful acquisition of several commercial banks with assets totaling over $2.0 billion. Mr. Hargrove is also experienced in analyzing financial data concerning common stock and other securities. His expertise includes:
Acquisition Strategy | Designing and implementing plans for continual growth through acquisition to ensure the client remains competitive in an industry of transition. | |
Capital Analysis | Determining the optimal use of a bank’s capital resources in order to accurately plan for growth and profitability. | |
Common Stock Appraisal | Determining through market and fundamental analyses the value of common stock for the purpose of preparing fairness opinions and special actions called for by management. |
PROFESSIONAL EXPERIENCE
| Professional Bank Services, Inc. | 2004 - Present | |
| Louisville, Kentucky | Chairman and CEO | |
| Professional Bank Services, Inc. | 1996 - 2004 | |
| Louisville, Kentucky | President and Senior Consultant | |
| Professional Bank Services, Inc. | 1989 - 1996 | |
| Louisville, Kentucky | Vice President and Senior Consultant | |
| Professional Bank Services, Inc. | 1985 - 1989 | |
| Nashville, Tennessee | Senior Consultant | |
| Investment Bank Services, Inc. | 1987 - Present | |
| Louisville, Kentucky | President | |
| Investment Bank Services, Inc. | 1986 - 1987 | |
| Louisville, Kentucky | Vice President | |
| First American Corporation | 1982 - 1985 | |
| Nashville, Tennessee | Senior Financial Analyst |
EDUCATIONAL EXPERIENCE
| Middle Tennessee State University | B.B.A. Finance 1980 | |
| Murfreesboro, Tennessee | M.A. Finance 1982 | |
| National Association of Securities Dealers | Registered Representative 1987 | |
| Washington, D.C. | ||
| National Association of Securities Dealers | Registered Principal 1988 | |
| Washington, D.C. |
- 31 -
JIM HUGUENARD
Managing Director
Professional Bank Services, Inc.
Managing Director
Professional Bank Services, Inc.
Mr. Huguenard has a strong background in mergers and acquisitions and business transactions in general, and in the banking industry in particular. Mr. Huguenard has participated in financial institution acquisitions with aggregate deal values in excess of $1 billion and non-financial institution deals with even greater aggregate deal values.
PROFESSIONAL EXPERIENCE
| Professional Bank Services, Inc. | July 2007 - Present | |
| Louisville, Kentucky | Managing Director | |
| E.ON U.S. LLC | July 2001 - June 2007 | |
| Louisville, Kentucky | Senior Corporate Attorney, Transactions | |
| Frost Brown Todd LLC | July 2000 - July 2001 | |
| Louisville, Kentucky | Partner | |
| Strategia Corporation | August 1997 - July 2000 | |
| Louisville, Kentucky | President, COO, General Counsel | |
| Frost Brown Todd LLC | August 1983 - August 1997 | |
| Louisville, Kentucky | Partner |
EDUCATIONAL BACKGROUND
| University of Michigan Law School | J.D. | |
| Ann Arbor, Michigan | 1983 | |
| Purdue University | B.S. Computer Science | |
| West Lafayette, Indiana | 1975 |
- 32 -
SUSAN S. RAPIER
Senior Consultant
Professional Bank Services, Inc.
Senior Consultant
Professional Bank Services, Inc.
Ms. Rapier has a strong finance and accounting background that allows her to bring a broad-based analytical and financial approach to assignments. She has assisted clients in evaluating candidates for acquisitions and mergers and has provided database analysis on costs and profitability. Her expertise includes:
Fairness Opinions | Evaluating proposed mergers and acquisitions for acquired institutions to ensure fair and equitable treatment to shareholders. | |
Common Stock Appraisals | Appraising majority and minority interests in the ownership of banks and holding companies, thereby improving management’s knowledge of the value of the institution. | |
Financial Analysis | Analyses and recommendations to financial institutions regarding profitability, expansion, capital and long-range strategic planning. |
PROFESSIONAL EXPERIENCE
| Professional Bank Services, Inc. Louisville, Kentucky | October 1990 - Present Senior Consultant | |
| Investment Bank Services,Inc. Louisville, Kentucky | May 1992- Present Director/Secretary |
EDUCATIONAL EXPERIENCE
| University of Kentucky Lexington, Kentucky | B.S. Accounting 1990 | |
| National Association of Securities Dealers Washington, D.C. | Registered Representative 1991 | |
| National Association of Securities Dealers Washington, D.C. | State Agent Exam 1991 | |
| National Association of Securities Dealers Washington, D.C. | Registered Principal 1992 |
- 33 -
CODE OF PROFESSIONAL CONDUCT
Professional Bank Services, Inc. (“PBS”), is a consulting firm whose mission is the provision of quality business advice, and superior service to the financial industry. Our services reflect the firm’s extensive experience in the financial industry, its keen awareness of a financial institution’s special position of trust, and acknowledge of financial and regulatory issues.
The firm and its employees are committed to the highest standards of professional conduct.
Conflicts of Interest
The firm shall not represent a client if its ability to consider, recommend or carry out a course of action on behalf of the client could be adversely affected by its responsibilities to another client, a third party, its own interests or those of its principals. Neither the firm nor its employees shall acquire an equity interest in or become indebted to any organization where such relationship creates a conflict of interest. The firm shall use its best efforts to avoid even the appearance of a conflict of interest.
The firm shall not represent a client if its ability to consider, recommend or carry out a course of action on behalf of the client could be adversely affected by its responsibilities to another client, a third party, its own interests or those of its principals. Neither the firm nor its employees shall acquire an equity interest in or become indebted to any organization where such relationship creates a conflict of interest. The firm shall use its best efforts to avoid even the appearance of a conflict of interest.
The Client
When engaged by a financial institution, the firm’s sole duty of loyalty shall be to the welfare and the best interests of the institution, as distinct from the sometimes inconsistent interests of employees, management, directors or shareholders.
When engaged by a financial institution, the firm’s sole duty of loyalty shall be to the welfare and the best interests of the institution, as distinct from the sometimes inconsistent interests of employees, management, directors or shareholders.
When engaged by an individual or other party, the firm’s duty of loyalty shall be to that individual or other party. PBS is often engaged to carry out difficult and challenging assignments in situations where conflict with third parties is inevitable. Such engagements will be conducted efficiently, fairly and in the best interest of the client, with a view towards constructive management of conflict.
Duty of Competence
The firm shall provide competent services to its clients and decline to render advice in matters for which it is not qualified. The firm shall not provide legal advice and when appropriate shall request that the client seek the services of other qualified professionals.
The firm shall provide competent services to its clients and decline to render advice in matters for which it is not qualified. The firm shall not provide legal advice and when appropriate shall request that the client seek the services of other qualified professionals.
The firm’s consultants shall continue to develop their skill and knowledge through ongoing programs of continuing education and professional development. The firm’s consultants shall not violate or in any way participate in the violation of any law, regulation or technical standard applicable to financial institutions, their directors, officers or shareholders.
Engagement Letters and Fees
Each engagement of the firm shall be described in an engagement letter which specifies the services which the firm shall perform and which has been approved by the client or the client’s board of directors or authorized officer. The firm’s fees shall, except in unusual circumstances and when otherwise agreed, be based on the firm’s usual and customary rates. Fees for services take into account (a) the nature of the particular services to be performed, (b) the novelty and difficulty of the matter, (c) the skill, standing and experience of the consultants performing the work, and (d) the urgency of the matter.
Each engagement of the firm shall be described in an engagement letter which specifies the services which the firm shall perform and which has been approved by the client or the client’s board of directors or authorized officer. The firm’s fees shall, except in unusual circumstances and when otherwise agreed, be based on the firm’s usual and customary rates. Fees for services take into account (a) the nature of the particular services to be performed, (b) the novelty and difficulty of the matter, (c) the skill, standing and experience of the consultants performing the work, and (d) the urgency of the matter.
Nature of Advice
The firm shall always keep clients reasonably informed about all matters relevant to its professional services. In matters requiring action by a client, the firm shall explain all aspects of a matter and alternate courses of action as reasonably necessary to permit the client to make informed decisions.
The firm shall always keep clients reasonably informed about all matters relevant to its professional services. In matters requiring action by a client, the firm shall explain all aspects of a matter and alternate courses of action as reasonably necessary to permit the client to make informed decisions.
Integrity of Communications
The firm shall never disclose any confidential or other information about a client to any other party except with the consent of the client and in the course of providing its services. When dealing with third parties, the firm shall always identify its clients except when clearly inappropriate to do so.
The firm shall never disclose any confidential or other information about a client to any other party except with the consent of the client and in the course of providing its services. When dealing with third parties, the firm shall always identify its clients except when clearly inappropriate to do so.
Code of Professional Conduct
This Code of Professional Conduct shall be prominently displayed in the firm’s informational material and included as part of engagement letters.
This Code of Professional Conduct shall be prominently displayed in the firm’s informational material and included as part of engagement letters.
PROFESSIONALBANKSERVICES
- 34 -
EXHIBITS
| BEGINNING EQUITY | 17,179 | (06/30/08 | ) | |||||
| BEGIN AVE ASSETS | $ | 170.496 | (06/30/08 | ) | ||||
| SHORT TERM GROWTH RATE | 10.00 | % | ||||||
| LONG TERM GROWTH RATE | 7.00 | % | ||||||
| DISCOUNT RATE | 12.40 | % | ||||||
| DIVIDEND SHORT TERM | 0.00 | % | ||||||
| DIVIDEND LONG TERM (Beginning in Year 6) | 40.00 | % | ||||||
| MULTIPLE OF EARNINGS | 23.78 | X | ||||||
| COMMON SHARES | 2,035.133 | 9/4/2008 |
FIRST FREEDOM
STATUS QUO
SHORT-TERM EARNINGS VALUATION
STATUS QUO
SHORT-TERM EARNINGS VALUATION
| NET | PRESENT | EQUITY/ | ||||||||||||||||||||||||||||||||||||||
| PD | YEAR | EQUITY | INCOME | ASSETS | DIVS. | PVIF | VALUE | ROE | ROA | ASSETS | ||||||||||||||||||||||||||||||
| 1.0 | 1 | 17,179 | — | 187,546 | — | 0.89 | — | 0.00 | % | 0.00 | % | 9.16 | % | |||||||||||||||||||||||||||
| 2.0 | 2 | 17,488 | 309 | 206,300 | — | 0.79 | — | 1.77 | % | 0.15 | % | 8.48 | % | |||||||||||||||||||||||||||
| 3.0 | 3 | 18,169 | 681 | 226,930 | — | 0.70 | — | 3.75 | % | 0.30 | % | 8.01 | % | |||||||||||||||||||||||||||
| 4.0 | 4 | 19,293 | 1,123 | 249,623 | — | 0.63 | — | 5.82 | % | 0.45 | % | 7.73 | % | |||||||||||||||||||||||||||
| 5.0 | 5 | 20,940 | 1,648 | 274,586 | — | 0.56 | — | 7.87 | % | 0.60 | % | 7.63 | % | |||||||||||||||||||||||||||
| TERMINAL VALUE | 39,178 | 55.74 | % | 21,838 | ||||||||||||||||||||||||||||||||||||
| PRESENT VALUE WITH TERMINAL VALUE EQUAL TO 23.78 ENDING EARNINGS | $ | 21,838 | ||||||||||||||||||||||||||||||||||||||
| PER COMMON SHARE | $ | 10.73 | ||||||||||||||||||||||||||||||||||||||
| MULTIPLE OF BOOK VALUE | 1.27 | |||||||||||||||||||||||||||||||||||||||
STATUS QUO
LONG-TERM EARNINGS VALUATION
LONG-TERM EARNINGS VALUATION
| NET | PRESENT | EQUITY/ | ||||||||||||||||||||||||||||||||||||||
| PD | YEAR | EQUITY | INCOME | ASSETS | DIVS. | PVIF | VALUE | ROE | ROA | ASSETS | ||||||||||||||||||||||||||||||
| 1.0 | 1 | $ | 17,179 | $ | 0 | $ | 187,546 | $ | 0 | 88.97 | % | $ | 0 | 0.00 | % | 0.00 | % | 9.16 | % | |||||||||||||||||||||
| 2.0 | 2 | 17,488 | 309 | 206,300 | 0 | 79.15 | % | 0 | 1.77 | % | 0.15 | % | 8.48 | % | ||||||||||||||||||||||||||
| 3.0 | 3 | 18,169 | 681 | 226,930 | 0 | 70.42 | % | 0 | 3.75 | % | 0.30 | % | 8.01 | % | ||||||||||||||||||||||||||
| 4.0 | 4 | 19,293 | 1,123 | 249,623 | 0 | 62.65 | % | 0 | 5.82 | % | 0.45 | % | 7.73 | % | ||||||||||||||||||||||||||
| 5.0 | 5 | 20,940 | 1,648 | 274,586 | 0 | 55.74 | % | 0 | 7.87 | % | 0.60 | % | 7.63 | % | ||||||||||||||||||||||||||
| 6.0 | 6 | 22,086 | 1,910 | 293,806 | 764 | 49.59 | % | 379 | 8.65 | % | 0.65 | % | 7.52 | % | ||||||||||||||||||||||||||
| 7.0 | 7 | 23,406 | 2,201 | 314,373 | 880 | 44.12 | % | 388 | 9.40 | % | 0.70 | % | 7.45 | % | ||||||||||||||||||||||||||
| 8.0 | 8 | 24,920 | 2,523 | 336,379 | 1,009 | 39.25 | % | 396 | 10.12 | % | 0.75 | % | 7.41 | % | ||||||||||||||||||||||||||
| 9.0 | 9 | 26,648 | 2,879 | 359,926 | 1,152 | 34.92 | % | 402 | 10.81 | % | 0.80 | % | 7.40 | % | ||||||||||||||||||||||||||
| 10.0 | 10 | 28,612 | 3,274 | 385,120 | 1,309 | 31.07 | % | 407 | 11.44 | % | 0.85 | % | 7.43 | % | ||||||||||||||||||||||||||
| 11.0 | 11 | 30,837 | 3,709 | 412,079 | 1,483 | 27.64 | % | 410 | 12.03 | % | 0.90 | % | 7.48 | % | ||||||||||||||||||||||||||
| 12.0 | 12 | 33,350 | 4,189 | 440,924 | 1,676 | 24.59 | % | 412 | 12.56 | % | 0.95 | % | 7.56 | % | ||||||||||||||||||||||||||
| 13.0 | 13 | 36,181 | 4,718 | 471,789 | 1,887 | 21.88 | % | 413 | 13.04 | % | 1.00 | % | 7.67 | % | ||||||||||||||||||||||||||
| 14.0 | 14 | 39,361 | 5,301 | 504,814 | 2,120 | 19.47 | % | 413 | 13.47 | % | 1.05 | % | 7.80 | % | ||||||||||||||||||||||||||
| 15.0 | 15 | 42,926 | 5,942 | 540,151 | 2,377 | 17.32 | % | 412 | 13.84 | % | 1.10 | % | 7.95 | % | ||||||||||||||||||||||||||
| 16.0 | 16 | 46,914 | 6,647 | 577,962 | 2,659 | 15.41 | % | 410 | 14.17 | % | 1.15 | % | 8.12 | % | ||||||||||||||||||||||||||
| 17.0 | 17 | 51,181 | 7,112 | 618,419 | 2,845 | 13.71 | % | 390 | 13.90 | % | 1.15 | % | 8.28 | % | ||||||||||||||||||||||||||
| 18.0 | 18 | 55,747 | 7,610 | 661 ,709 | 3,044 | 12.20 | % | 371 | 13.65 | % | 1.15 | % | 8.42 | % | ||||||||||||||||||||||||||
| 19.0 | 19 | 60,633 | 8,142 | 708,028 | 3,257 | 10.85 | % | 353 | 13.43 | % | 1.15 | % | 8.56 | % | ||||||||||||||||||||||||||
| 20.0 | 20 | 65,860 | 8,712 | 757,590 | 3,485 | 9.65 | % | 336 | 13.23 | % | 1.15 | % | 8.69 | % | ||||||||||||||||||||||||||
| TERMINAL VALUE | 207,178 | 9.65 | % | 19,999 | ||||||||||||||||||||||||||||||||||||
| PRESENT VALUE WITH TERMINAL VALUE EQUAL TO 23.78 ENDING EARNINGS | $ | 25,892 | ||||||||||||||||||||||||||||||||||||||
| PER COMMON SHARE | $ | 12.72 | ||||||||||||||||||||||||||||||||||||||
| MULTIPLE OF BOOK VALUE | 1.51 | |||||||||||||||||||||||||||||||||||||||
- 35 -
| Common | A | B | Preferred | |||||||||||||||||
| SHARES | 2035.133 | 1 ,433.764 | 406.269 | 146.692 | 48.408 | |||||||||||||||
| BEGINNING EQUITY | (06/30/08 | ) | 17,179 | |||||||||||||||||
| BEGIN AVE ASSETS | (06/30/08 | ) | 170.496 | |||||||||||||||||
| SHORT TERM GROWTH RATE | 10.00 | % | ||||||||||||||||||
| LONG TERM GROWTH RATE | 7.00 | % | ||||||||||||||||||
| DISCOUNT RATE | 12.40 | % | ||||||||||||||||||
| DIVIDEND SHORT TERM | 0.00 | % | ||||||||||||||||||
| DIVIDEND LONG TERM (Beginning in Year 6) | 39.52 | % | ||||||||||||||||||
| MULTIPLE OF EARNINGS | 23.78 | X | ||||||||||||||||||
| 70.45 | % | 19.96 | % | 7.21 | % | 2.38 | % | |||||||||||||
FIRST FREEDOM
PRO FORMA
SHORT-TERM EARNINGS VALUATION
PRO FORMA
SHORT-TERM EARNINGS VALUATION
| Class | Class | |||||||||||||||||||||||||||||||||||||||||||||||||||||||||||||||||||
| NET | Common | Class A | Class B | Pref. | Common | A | B | Pref. | Combined | EQUITY/ | ||||||||||||||||||||||||||||||||||||||||||||||||||||||||||
| PD | YEAR | EQUITY | INCOME | ASSETS | DIVS. | DIVS. | DIVS. | DIVS. | PVIF | PV | PV | PV | PV | Classes | ROE | ROA | ASSETS | |||||||||||||||||||||||||||||||||||||||||||||||||||
| 1.0 | 1 | 17,380 | 201 | 187,546 | — | — | — | — | 0.89 | — | — | — | — | — | 1.16 | % | 0.11 | % | 9.27 | % | ||||||||||||||||||||||||||||||||||||||||||||||||
| 2.0 | 2 | 17,896 | 516 | 206,300 | — | — | — | — | 0.79 | — | — | — | — | — | 2.89 | % | 0.25 | % | 8.67 | % | ||||||||||||||||||||||||||||||||||||||||||||||||
| 3.0 | 3 | 18,791 | 894 | 226,930 | — | — | — | — | 0.70 | — | — | — | — | — | 4.76 | % | 0.39 | % | 8.28 | % | ||||||||||||||||||||||||||||||||||||||||||||||||
| 4.0 | 4 | 20,133 | 1,343 | 249,623 | — | — | — | — | 0.63 | — | — | — | — | — | 6.67 | % | 0.54 | % | 8.07 | % | ||||||||||||||||||||||||||||||||||||||||||||||||
| 5.0 | 5 | 22,007 | 1,874 | 274,586 | — | — | — | — | 0.56 | — | — | — | — | — | 8.51 | % | 0.68 | % | 8.01 | % | ||||||||||||||||||||||||||||||||||||||||||||||||
| TERMINAL VALUE | 44,558 | 55.74 | % | 17.497 | 4.958 | 1.790 | 591 | 24.836 | ||||||||||||||||||||||||||||||||||||||||||||||||||||||||||||
| PRESENT VALUE WITH TERMINAL VALUE EQUAL TO 23.78 ENDING EARNINGS | $ | 17.497 | $ | 4.958 | $ | 1.790 | $ | 591 | $ | 24.836 | ||||||||||||||||||||||||||||||||||||||||||||||||||||||||||
| PRO FORMA | $ | 12.20 | $ | 12.20 | $ | 12.20 | $ | 12.20 | $ | 12.20 | ||||||||||||||||||||||||||||||||||||||||||||||||||||||||||
- 36 -
| Common | A | B | Preferred | |||||||||||||||||
| SHARES | 2035.133 | 1 ,433.764 | 406.269 | 146.692 | 48.408 | |||||||||||||||
| BEGINNING EQUITY | (06/30/08 | ) | 17,179 | |||||||||||||||||
| BEGIN AVE ASSETS | (06/30/08 | ) | 170.496 | |||||||||||||||||
| SHORT TERM GROWTH RATE | 10.00 | % | ||||||||||||||||||
| LONG TERM GROWTH RATE | 7.00 | % | ||||||||||||||||||
| DISCOUNT RATE | 12.40 | % | ||||||||||||||||||
| DIVIDEND SHORT TERM | 0.00 | % | ||||||||||||||||||
| DIVIDEND LONG TERM (Beginning in Year 6) | 39.52 | % | ||||||||||||||||||
| MULTIPLE OF EARNINGS | 23.78 | X | ||||||||||||||||||
| 70.45 | % | 19.96 | % | 7.21 | % | 2.38 | % | |||||||||||||
FIRST FREEDOM
PRO FORMA
LONG-TERM EARNINGS VALUATION
PRO FORMA
LONG-TERM EARNINGS VALUATION
| �� | Class | Class | ||||||||||||||||||||||||||||||||||||||||||||||||||||||||||||||||||
| NET | Common | Class A | Class B | Pref. | Common | A | B | Pref. | Combined | EQUITY/ | ||||||||||||||||||||||||||||||||||||||||||||||||||||||||||
| PD | YEAR | EQUITY | INCOME | ASSETS | DIVS. | DIVS. | DIVS. | DIVS. | PVIF | PV | PV | PV | PV | Classes | ROE | ROA | ASSETS | |||||||||||||||||||||||||||||||||||||||||||||||||||
| 1.0 | 1 | $ | 17,380 | $ | 201 | $ | 187,546 | — | — | — | — | 88.97 | % | — | — | — | — | — | 1.16 | % | 0.11 | % | 9.27 | % | ||||||||||||||||||||||||||||||||||||||||||||
| 2.0 | 2 | 17,896 | 516 | 206,300 | — | — | — | — | 79.15 | % | — | — | — | — | — | 2.89 | % | 0.25 | % | 8.67 | % | |||||||||||||||||||||||||||||||||||||||||||||||
| 3.0 | 3 | 18,791 | 894 | 226,930 | — | — | — | — | 70.42 | % | — | — | — | — | — | 4.76 | % | 0.39 | % | 8.28 | % | |||||||||||||||||||||||||||||||||||||||||||||||
| 4.0 | 4 | 20,133 | 1,343 | 249,623 | — | — | — | — | 62.65 | % | — | — | — | — | — | 6.67 | % | 0.54 | % | 8.07 | % | |||||||||||||||||||||||||||||||||||||||||||||||
| 5.0 | 5 | 22,007 | 1,874 | 274,586 | — | — | — | — | 55.74 | % | — | — | — | — | — | 8.51 | % | 0.68 | % | 8.01 | % | |||||||||||||||||||||||||||||||||||||||||||||||
| 6.0 | 6 | 23,293 | 2,143 | 293,806 | 597 | 174 | 64 | 22 | 49.59 | % | 296 | 86 | 32 | 11 | 425 | 9.20 | % | 0.73 | % | 7.93 | % | |||||||||||||||||||||||||||||||||||||||||||||||
| 7.0 | 7 | 24,757 | 2,441 | 314,373 | 680 | 198 | 73 | 25 | 44.12 | % | 300 | 88 | 32 | 11 | 431 | 9.86 | % | 0.78 | % | 7.88 | % | |||||||||||||||||||||||||||||||||||||||||||||||
| 8.0 | 8 | 26,420 | 2,770 | 336,379 | 771 | 225 | 83 | 29 | 39.25 | % | 303 | 88 | 33 | 11 | 435 | 10.48 | % | 0.82 | % | 7.85 | % | |||||||||||||||||||||||||||||||||||||||||||||||
| 9.0 | 9 | 28,300 | 3,134 | 359,926 | 873 | 255 | 94 | 32 | 34.92 | % | 305 | 89 | 33 | 11 | 438 | 11.07 | % | 0.87 | % | 7.86 | % | |||||||||||||||||||||||||||||||||||||||||||||||
| 10.0 | 10 | 30,422 | 3,536 | 385,120 | 984 | 287 | 106 | 37 | 31.07 | % | 306 | 89 | 33 | 11 | 439 | 11.62 | % | 0.92 | % | 7.90 | % | |||||||||||||||||||||||||||||||||||||||||||||||
| 11.0 | 11 | 32,809 | 3,979 | 412,079 | 1,108 | 323 | 119 | 41 | 27.64 | % | 306 | 89 | 33 | 11 | 440 | 12.13 | % | 0.97 | % | 7.96 | % | |||||||||||||||||||||||||||||||||||||||||||||||
| 12.0 | 12 | 35,490 | 4,467 | 440,924 | 1,244 | 363 | 134 | 46 | 24.59 | % | 306 | 89 | 33 | 11 | 439 | 12.59 | % | 1.01 | % | 8.05 | % | |||||||||||||||||||||||||||||||||||||||||||||||
| 13.0 | 13 | 38,493 | 5,004 | 471,789 | 1,393 | 407 | 150 | �� | 52 | 21.88 | % | 305 | 89 | 33 | 11 | 438 | 13.00 | % | 1.06 | % | 8.16 | % | ||||||||||||||||||||||||||||||||||||||||||||||
| 14.0 | 14 | 41,851 | 5,596 | 504,814 | 1,558 | 455 | 167 | 58 | 19.47 | % | 303 | 89 | 33 | 11 | 436 | 13.37 | % | 1.11 | % | 8.29 | % | |||||||||||||||||||||||||||||||||||||||||||||||
| 15.0 | 15 | 45,598 | 6,246 | 540,151 | 1,739 | 508 | 187 | 65 | 17.32 | % | 301 | 88 | 32 | 11 | 433 | 13.70 | % | 1.16 | % | 8.44 | % | |||||||||||||||||||||||||||||||||||||||||||||||
| 16.0 | 16 | 49,775 | 6,960 | 577,962 | 1,938 | 566 | 208 | 72 | 15.41 | % | 299 | 87 | 32 | 11 | 429 | 13.98 | % | 1.20 | % | 8.61 | % | |||||||||||||||||||||||||||||||||||||||||||||||
| 17.0 | 17 | 54,236 | 7,434 | 618,419 | 2,070 | 604 | 222 | 77 | 13.71 | % | 284 | 83 | 30 | 11 | 408 | 13.71 | % | 1.20 | % | 8.77 | % | |||||||||||||||||||||||||||||||||||||||||||||||
| 18.0 | 18 | 59,001 | 7,942 | 661,709 | 2,211 | 645 | 238 | 82 | 12.20 | % | 270 | 79 | 29 | 10 | 387 | 13.46 | % | 1.20 | % | 8.92 | % | |||||||||||||||||||||||||||||||||||||||||||||||
| 19.0 | 19 | 64,092 | 8,485 | 708,028 | 2,362 | 689 | 254 | 88 | 10.85 | % | 256 | 75 | 28 | 10 | 368 | 13.24 | % | 1.20 | % | 9.05 | % | |||||||||||||||||||||||||||||||||||||||||||||||
| 20.0 | 20 | 69,532 | 9,065 | 757,590 | 2,524 | 737 | 271 | 94 | 9.65 | % | 244 | 71 | 26 | 9 | 350 | 13.04 | % | 1.20 | % | 9.18 | % | |||||||||||||||||||||||||||||||||||||||||||||||
| TERMINAL VALUE | 215,560 | 9.65 | % | 14,660 | 4,154 | 1.500 | 495 | 20,809 | ||||||||||||||||||||||||||||||||||||||||||||||||||||||||||||
| PRESENT VALUE WITH TERMINAL VALUE OF TO 23.78 ENDING EARNINGS | $ | 19,042 | $ | 5,433 | $ | 1,971 | $ | 658 | $ | 27,103 | ||||||||||||||||||||||||||||||||||||||||||||||||||||||||||
| PRO FORMA | $ | 13.28 | $ | 13.37 | $ | 13.43 | $ | 13.59 | $ | 13.32 | ||||||||||||||||||||||||||||||||||||||||||||||||||||||||||
- 37 -