Corporate Presentation
April 2013
This Information Memorandum ("Memorandum") describes and summarizes the business matters related to EFLO Energy, Inc. ("EFLO" or the "Company"). This Memorandum has been prepared solely for informational purposes and should be read in conjunction with the Company’s 10-K for a full disclosure of risks related to the Company.
This Memorandum contains statements which constitute forward looking statements. These statements appear in a number of places in this Memorandum. Recipients are cautioned that any such forward looking statements are not guarantees of future performance and involve risks and uncertainties, and that actual results may differ materially from those in the forward looking statements as a result of various factors.
EFLO Energy, Inc. | March 2013 | Page i |
Definitions and abbreviations
Bcf/d | Billions of cubic feet per day |
Bcm | Billions of cubic meters |
CAD | Canadian Dollars |
EFLO | EFL Overseas, Inc. |
KGP | Kotaneelee Gas Project |
LNG | Liquefied Natural Gas |
NGL | Natural gas liquids |
MMcf/d | Millions of cubic feet per day |
MMcfe | Millions of cubic feet equivalent |
Mboe | Thousand barrels of oil equivalent |
ORGIP | Original Raw Gas in Place |
Tcf | Trillions of cubic feet |
USD | U.S. Dollars |
WCSB | Western Canadian Sedimentary Basin |
EFLO Energy, Inc. | March 2013 | Page ii |
Table of Contents
1 | Executive Summary | 1 | |
1.1. | Company Overview | 1 | |
1.2. | Senior Executive Management Team | 2 | |
2 | The Natural Gas Industry in Western Canada | 3 | |
2.1. | The Canadian Natural Gas Sector | 3 | |
2.2. | Natural Gas In Western Canada | 4 | |
2.3. | Monetization Options for Western Canadian Gas | 9 | |
2.4. | Recent Development in Western Canada | 12 | |
3 | Company and Asset Overview | 14 | |
3.1. | Overview | 14 | |
3.2. | Kotaneelee Gas Project (Yukon Territory, Canada) | 14 | |
3.3. | KGP Gas Reserves and Resources | 16 | |
3.4. | KGP Existing Infrastructure | 20 | |
3.5. | Near Term Development Plan | 21 | |
3.6. | Long-Term Monetization and Marketing Strategy | 21 | |
4 | Capital Requirements | 23 | |
5 | Senior Executive and Management Team | 24 | |
5.1. | Ownership Structure and Overview | 24 | |
5.2. | Major Shareholders | 24 | |
5.3. | Board of Directors | 25 | |
5.4. | Management Team | 25 | |
6 | Risk Factors | 28 |
EFLO Energy, Inc. | March 2013 | Page iii |
Table of Tables | |
Table 1: Estimated Kotanelee Gas Resource | 1 |
Table 2: Comparison of Shale Plays in Western Canada | 5 |
Table 3: Summary of Proposed LNG Facilities in Canada | 12 |
Table 4: Summary of Reserves | 19 |
Table 5: Estimated Kotanelee Gas Resource | 20 |
Table 6: Capital Requirements | 23 |
Table 7: Capital Structure | 24 |
Table 8: EFLO Major Shareholders | 24 |
Table 9: EFLO Board of Directors | 25 |
Table of Figures | |
Figure 1: West Canadian Sedimentary Basin | 1 |
Figure 2: Major North American Gas Basins | 3 |
Figure 3: Comparison of Shale Basins | 6 |
Figure 4: Stratigraphic Section of Devonian-Mississippian in NE B.C. & SE Yukon | 8 |
Figure 5: Map of Gas Fields in the Yukon Liard Basin | 9 |
Figure 6: Major Canada-U.S. Export-Import Gas Pipelines | 10 |
Figure 7: Possible Export Routes for LNG from Kitimat | 11 |
Figure 8: Total Kotaneelee Lease Holdings in Yukon Liard Basin | 16 |
Figure 9: Kotaneelee Seismic Structure | 17 |
Figure 10: Seismic Line Indicating the Nahanni Formation on the East and West Flanks of Kotaneelee | 18 |
Figure 11: Resources Classification Framework | 19 |
Figure 12: Pre-existing Facilities On-site | 20 |
Figure 13: Major North American Gas Pipelines | 21 |
Figure 14: Proposed and Existing Supply Pipelines for Kitimat | 22 |
EFLO Energy, Inc. | March 2013 | Page iv |
1. | Executive Summary |
1.1. | Company Overview |
EFL Energy, Inc. (“EFLO” or “the Company”) is a Houston, TX based development stage company engaged in the acquisition, exploration and development of oil and gas properties in Canada and the United States. EFLO is publicly-listed (OTCQB: EFLO) and incorporated in the State of Nevada. EFLO’s largest single shareholder (with 23.4% interest) is Holloman Corporation, a Houston-based, employee owned upstream/midstream construction contractor. Other significant shareholders include Pacific LNG Operations Ltd., a Singapore-based oil and gas company (with 20.6%), and EFLO’s officers and directors, (who as a group own 14.4% of the Company).
EFLO’s primary exploration and development acreage (30,542 gross acres) is located in the resource-rich Liard Basin in Southeastern Yukon, Canada (Figure 1). EFLO currently owns 53.65% working interest in the Kotaneelee Gas Project (also “KGP”) and is seeking to increase its working interest to 68% and continue its exploration and development program. Apache Corporation (“Apache”) currently owns the remaining working interest of 32%. Kotaneelee has significant conventional and shale gas potential and is supported by an environment of growing investment in gas processing and export in Western Canada. | Figure 1: West Canadian Sedimentary Basin |
EFLO’s resource interests include up to 7.0 Tcf of Original Raw Gas in Place (“ORGIP”) of unconventional gas and up to 0.9 Tcf of ORGIP of conventional gas (see Table 1).
Table 1: Estimated Kotanelee Gas Resource
Original Raw Gas in Place (“ORGIP”) | Recoverable Raw Gas in Place (assuming 100% WI) | EFLO Share of ORGIP (53.65% WI) | |
Shale Gas* | 7.23 to 12.96 Tcf | 3.3 to 5.2 Tcf (Prospective) | 3.9 to 7.0 Tcf |
Conventional Gas** | 0.530 to 1.630 Tcf | 0.182 to 0.563 Tcf (Prospective) | 0.284 to 0.874 Tcf |
*AJM Deloitte Resource Report
** Company estimates
KGP includes a fully developed infrastructure including, among others:
● | Gas plant with a capacity of 70 MMcf/d; |
● | Gas gathering system; |
● | 24” sales line to the Fort Nelson gas processing plant. |
This fully developed infrastructure connects EFLO to Ft. Nelson, the site of a 1.0 Bcf/d processing plant. The plant itself is connected to the North American gas grid.
EFLO Energy, Inc. | March 2013 | Page 1 |
1.2. | Senior Executive Management Team |
The executive management team of the Company consists of a number of seasoned industry veterans in the oil and gas business. Selected biographies of key officers are contained is Section 5. Highlights are provided below:
Henry Aldorf Chairman & Director | ● President of Pacific LNG Operations Ltd. and Liquid Niugini Gas Ltd. ● Past President of Marathon International and Vice-President Global Upstream Business Development of Marathon Oil. |
James Hutton President & Director | ● President and CEO of Hutton Capital Corporation. ● Director of several Canadian resource sector companies. ● Executed in excess of USD 1.4 billion in flow-through share resource financings for the Canadian energy and mining sectors. |
Keith Macdonald Chief Executive Officer & Director | ● President of Bamako Investment Management and Founder, President, CFO, Director of New Cache Petroleums. ● Director of: Drakkar Energy Ltd., Holloman Energy, Surge Energy, Mountainview Energy, WCSB Oil & Gas Royalty Income Funds , Bellatrix Exploration, Rocky Mountain Dealerships. ● Past Director of Cirrus Energy, Profound Energy, Breaker Energy, Cordy Oilfield. ● Past Chairman and Director of the Small Explorers and Producers of Canada. |
H. Wayne Hamal Chief Operating Officer | ● Former General Manager of Exploration and Production for InterOil Corporation. ● JV Manager, Equatorial Guinea, Marathon Oil Corporation. |
Bob Wesolek, Chief Financial Officer & Director | ● CFO of Holloman Energy Corp. ● Former President and CEO of The Navigates Corp., CFO of Sharp Technology Inc. , and COO of Kent Marsh Ltd. |
Eric Prim Director | ● President of Pilot Energy Solutions Inc. ● Senior VP of Holloman Corp. |
James Ebeling Director | ● Current CFO of Holloman Corporation. ● Former Vice President of SUEZ Energy North America, Inc., Senior Vice President of Hawkins Oil and Gas, Transworld Oil Company, Anchor Coupling, and The Charter Company. |
EFLO Energy, Inc. | March 2013 | Page 2 |
2. | The Natural Gas Industry in Western Canada |
2.1. | The Canadian Natural Gas Sector |
Despite holding a relatively small share of the world's proven natural gas reserves, Canada ranks third in dry natural gas production after the United States and Russia, followed by Iran and Qatar. It is the fourth-largest exporter of natural gas, behind Russia, Norway, and Qatar. Though Canada has plans to export liquefied natural gas (LNG), all of Canada's current natural gas exports are sent to U.S. markets via pipeline. The proportion of Canada's natural gas production that is devoted to meeting domestic requirements has risen in recent years, as net exports to the United States have fallen.
According to the 2012 BP Statistical Review, Canada’s proved gas reserves amount to 70.0 Tcf as of the end of 2011, an 11% increase over 2010. After a decade of stagnant and even declining reserves, the introduction of new technologies promoted the addition of proved reserves that were deemed economically feasible.
Most of Canada’s gas reserves are conventional, as drilling for unconventional gas has begun only recently; however an initial assessment by EIA estimated there is 388 Tcf of technically recoverable shale gas reserves.1
Figure 2: Major North American Gas Basins2
2.1.1. | Producing Regions |
Most of Canada’s natural gas is extracted conventionally from a formation called the Western Canadian Sedimentary Basin (“WCSB”). The WCSB stretches across the western provinces of British Columbia (“BC”), Alberta, Saskatchewan, and Yukon. Other areas with significant concentrations of natural gas reserves include offshore fields near the eastern shore of Canada, principally around Newfoundland, Nova Scotia, and the Arctic region (Figure 2).
The WCSB contains some of the most abundant amounts of oil and gas in the world, though the basin is widely spread. Most of Canada’s conventional gas comes from associated onshore oilfields in the WCSB.
__________________________
1 EIA. April 2011. World Shale Gas Resources: An Initial Assessment of 14 Regions Outside the United States. http://www.eia.gov/analysis/studies/worldshalegas/
2 Imperial Oil. 2012. http://www.imperialoil.ca/Canada-English/operations_ngas_ataglance.aspx
EFLO Energy, Inc. | March 2013 | Page 3 |
Vast deposits of unconventional natural gas reside in the WCSB in the form of coal bed methane (CBM), shale gas, and tight gas, though they have not been as extensively developed as similar formations in the United States.
2.2. | Natural Gas In Western Canada |
2.2.1. | Overview |
Most of Canada’s natural gas is extracted conventionally from the WCSB. Alberta produced nearly two-thirds of Canada’s gas in 2011, while British Columbia was responsible for most of the remaining third. BC has seen its share of production rise as exploration and production of unconventional shale gas in the northeast accelerated during the last half decade.
Five large sedimentary basins in Western Canada with thick, organic-rich shales account for over 90% of Canada’s total unconventional natural gas reserves. The five sedimentary basins are the Horn River and Liard in northern British Columbia and Yukon, Cordova Embayment in British Columbia and the Northwest Territories, the Deep Basin/Montney in central Alberta and British Columbia, and the Colorado Group in central and southern Alberta.3
While there are no definitive projections for the amount of shale gas reserves in Western Canada, the EIA’s initial assessment estimated there is 388 Tcf of technically recoverable gas resources. A 2009 study by the Canadian National Energy Board tallied over 1,000 Tcf of estimated gas in place.
According to the National Energy Board and BC Ministry of Energy and Mines, published estimated reserves for Montney range between 80-700 Tcf.4 Estimates for Horn River include a medium-case ORGIP of 448 Tcf, with 78 Tcf of medium-case marketable gas resource.5 (“Marketable resource” comes one step after defining “recoverable” resource and is a more restrictive standard.)
Horn River and Montney have received the bulk of initial investment and activity for shale and therefore are the only areas producing material quantities of gas. Montney and Horn River are currently producing 1.5 Bcf/d and 0.5 Bcf/d respectively. While less developed, early tests in Liard show a highly promising shale reservoir, one that is held by relatively fewer owners in comparison with Horn River and Montney.
See Table 2 for a summarized comparison between the different shale plays identified.
__________________________
3 Energy Information Agency (EIA). 2012. Canada country profile. http://www.eia.gov/countries/cab.cfm?fips=CA
4 National Energy Board, 2009. A primer for understanding Canadian shale gas. Energy Briefing Note, p. 19
5 British Columbia Ministry of Energy and Mines and National Energy Board, 2011. Ultimate potential for unconventional natural gas in northeastern British Columbia’s Horn River Basin. Oil and Gas Reports 2011-1.
EFLO Energy, Inc. | March 2013 | Page 4 |
Table 2: Comparison of Shale Plays in Western Canada6
Estimated Gas in Place (Tcf) | Estimated Marketable (Tcf) | Production (Bcf/d) | |
Horn River | 448 | 78 | 0.5 |
Montney | 80 to 700 | 16-1407 | 1.5 |
Liard8 | >210 | >48 | - |
Cordova Embayment | 200 | - | - |
Colorado | >100 | - | - |
Utica | >120 | - | - |
Horton Bluff | >130 | - | - |
2.2.2. | Liard Basin |
The Liard Basin, one of Western Canada’s sedimentary basins, extends across the border between northeast British Columbia and the southeastern-most corner of the Yukon, and is located west of the Horn River Basin, between the Rocky Mountains to the south and the Mackenzie and Franklin Mountains to the north.
Geologic work in BC and the Northwest Territories portions have helped inform the potential for shale gas on the Yukon side. The shale sequences seen in the Liard in southeast Yukon, and more specifically underlying Kotaneelee, are geologically continuous across the Liard and Horn River Basins in northeast British Columbia. A 2012 study performed by the Yukon Geological Survey concluded that the Yukon Liard Basin has good prospects for shales, and should be given the highest priority for future geo-scientific work.9
Apache announced in June 2012 that their tests in Liard suggest 48 Tcf of marketable gas lie within Apache’s property. For comparison, the entire Horn River basin is estimated to hold 78 Tcf of marketable natural gas. Apache’s test wells in Liard suggest a reservoir that ranks among the world’s most prolific gas shales.10 Apache drilled two vertical wells and one horizontal well that encountered continuous gas filled porosity in the shales, with net pay thickness of 400 to 1,000 feet. Apache is estimating ORGIP of 290 to 502 Bcf per section.
__________________________
6 National Energy Board. 2009. Energy Briefing Note: A Primer for Understanding Canadian Shale Gas.
7 Not a published study estimate. Assuming a 20% recoverable rate, per National Energy Board.
8 Using reported figures for Apache’s large working interest as baseline.
9 Hayes, B.J.R. and Archibald, H.B., 2012. Scoping study of unconventional oil and gas potential, Yukon. Yukon Geological Survey, Miscellaneous Report 7, p. 86.
10 Hart Energy. 2012. Key Players: Apache. Canada Playbook. p. 16
EFLO Energy, Inc. | March 2013 | Page 5 |
Figure 3: Comparison of Shale Basins11
Geology of Liard Basin
The Liard Basin is also a sub-basin of the Western Canadian Sedimentary Basin system, covering a large part of extreme northeast B.C., the extreme southeast corner of the Yukon, and southeast N.W.T. under the Southern Mackenzie Plain. The area includes the physiographic Liard Plateau and portions of the southern Mackenzie and Franklin Mountains.
The Liard Plateau lies on the northwestern side of the Liard Basin. Structurally, this is a northern continuation of the fold and thrust belt of the Rocky Mountain Foothills in Alberta and B.C. Stratigraphically, it is contiguous with the Liard Basin and the Horn River Basin (see Figure 3).
The Liard Plateau extends from the South Nahanni River to the north, approximately 80 miles north of Kotaneelee, to the Liard River in northeastern B.C., approximately 50 miles to the south of Kotaneelee. The plateau is bounded to the west by the Liard Plains and the Hyland Plateau in the interior Yukon and B.C., at a longitude of 126oW, approximately 80 miles to the west. The Disturbed Belt, overlying the Kotaneelee gas field, is the eastern rim of the Liard Plateau.
The stratigraphy of the Liard Plateau can be divided into four main sequences, listed from oldest to youngest:
1. Early to Middle Devonian Carbonates
These rocks outcrop in the Mackenzie Mountains to the north of the Liard Plateau. They are the principal reservoir rocks in the subsurface under the Liard Plateau.
__________________________
11 Source: Nexen 2012 Investor Update Presentation, July 2012.
EFLO Energy, Inc. | March 2013 | Page 6 |
2. Middle Devonian to Lower Mississippian Shales
These organic rich shale form the source rocks for the generation of hydrocarbons in the Liard Plateau (and Mackenzie Mountains), and also to the southeast in the Liard Basin and Horn River Basin. Erosion of anticlines can expose these rocks at the surface.
3. Lower Mississippian to Permian shales, sandstones, cherts and minor limestones
Prominent as ridge forming sandstones; surficial mapping of these rocks outline the prominent shallow anticlines. The sandstones, cherts and limestones can form secondary hydrocarbon targets, especially in the interior plans and less so in the Liard Plateau.
4. Middle Triassic to Lower Cretaceous sandstones and shales
These rocks occur in the cores of eroded anticlines. Like the prior sequences, surficial mapping of these rocks identifies the edges of the prominent shallow anticlines.
The proved producing, probable and potential hydrocarbon-bearing target formations at the Kotaneelee gas field in south-eastern Yukon Territories comprise formations of Middle Devonian to Upper Mississippian age (Figure 4). These are:
● | Middle Devonian Manetoe dolomite facies in the Nahanni, Arnica and Headless Formations; this is the principal conventional gas target. |
● | Middle Devonian “Lower Black Mudstone” (informal designation of Horn River Formation mudstones and shales), the lower principal unconventional gas target. |
● | Upper Devonian “Middle Shale”, a newly identified mudstone unit in the Fort Simpson Formation; the middle unconventional gas target. |
● | Upper Devonian to Basal Mississippian “Upper Black Shale” (informal designation of Exshaw Formation shales), the uppermost principal unconventional gas target. |
● | Middle Mississippian Prophet Formation (Flett formation), the lower secondary gas target. |
● | Upper Mississippian basal sand member of the Mattson Formation, the upper secondary gas target.* |
The Arnica and Nahanni sections in the Kotaneelle wells are approximately 1300 feet and 700 feet in thickness, respectively. The shales observed in our wells are comparable in thickness to the Apache wells to the south. The total thickness of all three shales are approximately 1500 feet at Kotaneelee. The Flett formation is also present in all the Kotaneelee wells and ranges in thickness from 790 feet to 2200 feet across the field. This formation has also tested positive for hydrocarbons12.
__________________________
12 Apex Energy Consultants Inc., 2010. Geology, Geophysics, Reservoir Performance and Engineering of the Kotaneelee Gas Field, Yukon Territory, p. 28.
EFLO Energy, Inc. | March 2013 | Page 7 |
Figure 4: Stratigraphic Section of Devonian-Mississippian in NE B.C. & SE Yukon13
The Liard Basin in the Yukon area contains portions of three fields that are all on trend: Beaver River Field, Kotaneelee Field and Pointed Mountain Field. The Kotaneelee field is currently the only producing field in Yukon ( See Figure 5).
__________________________
13 From Ross and Bustin 2008
EFLO Energy, Inc. | March 2013 | Page 8 |
Figure 5: Map of Gas Fields in the Yukon Liard Basin
2.3. | Monetization Options for Western Canadian Gas |
2.3.1. | Marketing Natural Gas in North America Using the Integrated Gas Network |
The lower 48 U.S. states and Western Canada form an integrated gas network that effectively makes it a single gas market. Gas producers in Western Canada have the strategic option to transport gas for sale from Fort Nelson in British Columbia into various markets to take advantage of price arbitrage opportunities. The potential regional gas markets include:
● | Intra-Alberta |
● | Eastern Canada and Northeast USA |
● | Midwest USA |
● | Pacific Northwest & California |
● | British Columbia interior & Pacific Northwest |
A map of the pipelines connecting Fort Nelson to these various markets can be seen in Figure 6.
EFLO Energy, Inc. | March 2013 | Page 9 |
Figure 6: Major Canada-U.S. Export-Import Gas Pipelines14
Canada exports over half of its natural gas production to the United States via an intricate and integrated network of gas pipelines. At near-peak levels in 2007, trade was 3.8 Tcf between Canada and the U.S. In 2011, the U.S. imported 3.1 Tcf, or 8.5 Bcf/d.
TransCanada operates the largest network of natural gas pipelines in North America, including thirteen major pipeline systems and approximately 37,000 miles of gas pipelines in operation. Within Canada, TransCanada Pipeline operates a 25,600-mile network that includes the 10.6-Bcf/d Alberta System and the 7.2-Bcf/d Canadian Mainline.
Spectra Energy operates a 3,540-mile, 2.2-Bcf/d pipeline system connecting western Canadian gas supply regions with markets in the U.S. and Canada. Spectra Energy also operates the Maritimes and Northeast Pipeline linking eastern Canadian supplies with consumers in the eastern United States.
Finally, the Alliance Pipeline, a 2,311-mile pipeline system, is a significant source of natural gas for the U.S. Midwest region that delivers 4.6 Bcf/d to both Canadian and U.S. markets.
After six years of regulatory review, the NEB approved the MacKenzie Valley Pipeline, part of the MacKenzie Gas Project, in 2011. Imperial Oil will construct and operate the pipeline; other partners are ConocoPhillips, Shell, ExxonMobil, and the Aboriginal Pipeline Group. The 1.2-Bcf/d pipeline will travel 745 miles from Canada's Beaufort Sea to Alberta, where it will join existing pipeline networks.
However, the outlook for the pipeline is uncertain, as more permits are required, it is competing with the Alaska Gas Pipeline, and natural gas prices and import needs are projected to remain low due to shale gas and other developments.
__________________________
14 Office of the Federal Coordinator, Alaska Natural Gas Transportation Projects. May 2011. Accessed 23 January 2013. http://www.arcticgas.gov/sites/default/files/documents/map-gas-pipeline-distribution-lower-48.pdf
EFLO Energy, Inc. | March 2013 | Page 10 |
2.3.2. | Sale of LNG to Asia |
Situated on the west coast of Canada, British Columbia offers an advantageous location for shipping LNG to Asian power markets where higher priced, oil-indexed contracts offer opportunities for price arbitrage. From Kitimat, the site of two approved LNG facilities, LNG exporters can access the most important Asian LNG markets: Japan, South Korea, and China/Taiwan (Figure 7). Travel time for an LNG vessel from Kitimat to Tokyo requires 10 days, compared to 16 days from Qatar to Tokyo.
Figure 7: Possible Export Routes for LNG from Kitimat15
Six different natural gas liquefaction facilities have been proposed to export LNG from British Columbia in Western Canada to markets in Asia (see Table 3). Four proposed projects would be located in Kitimat and another two would be a short distance north in Prince Rupert (for an illustration of the pipeline connectivity between KGP and Kitimat, see Figure 14). A new pipeline, the Pacific Trail Gas pipe, has been proposed by Chevron and Apache to transport shale gas from the Liard Basin with the intent to export it as liquid natural gas (“LNG”) to East Asian markets.
__________________________
15 Image source: Kitimat LNG. http://www.kitimatlngfacility.com/Markets/marketing.aspx
EFLO Energy, Inc. | March 2013 | Page 11 |
Table 3: Summary of Proposed LNG Facilities in Canada
Project Name | Companies | Location | Capacity mtpa | Capacity Bcf/d | Planned onstream | Status |
Kitimat LNG | Chevron-Apache | Kitimat | 10.0 | 1.3 | 2017 | Approved |
BC LNG | LNG Partners/ Haisla Nation | Kitimat | 1.8 | 0.2 | 2015 | Approved |
LNG Canada | Shell/ Kogas/ Mitsubishi/ CNPC | Kitimat | 13.1 | 1.7 | 2018 | Approved |
Pacific Northwest LNG | Petronas/ Progress Energy | Prince Rupert | 12.3 | 1.6 | 2018 | Proposed |
Prince Rupert | BG Group | Prince Rupert | 32.3 | 4.2 | - | Proposed |
Kitimat Floating LNG | Teekay/BAML | Kitimat | 0.6 | 0.1 | - | Proposed |
Total | 70.1 | 9.1 |
The Kitimat LNG project received an injection of capital and management expertise with Chevron’s acquisition of 50% interest in the plant and pipeline. Chevron will be the operator for the LNG facility and planned Pacific Trail Gas pipeline. The deal was completed in December 2012 and was estimated to be worth USD USD1.3 billion.1
Kitimat has access to the preexisting Pacific Northwest Gas pipeline network, but its 0.1 Bcf/d capacity is insufficient to meet the required amount proposed by all the new terminals.
2.4. | Recent Development in Western Canada |
The natural gas sector in Western Canada, especially with respect to British Columbia and Yukon, has experienced a number of significant developments over the last 15 months. Selected developments are highlighted below.
February 2013: LNG Canada, led by Royal Dutch Shell, becomes the third LNG project to receive approval from the Canadian government to export LNG from Kitimat, British Columbia.
December 2012: Chevron announces acquisition of 50% operating interest from Encana/EOG in the proposed Kitimat LNG plant and Pacific Trail Pipeline and a 50% interest in approximately 644,000 acres in the Horn River and Liard Basin.
December 2012: China’s National Offshore Oil Corporation (“CNOOC”) receives approval from Canadian government and completes acquisition of oil producer Nexen in Canada. The deal was valued at USD 15.1 billion.2 Nexen’s assets include shale gas fields in northeast BC., including the Liard Basin.
__________________________
16 Bloomberg. 2012. Chevron Buys Encana, EOG Stake in Kitimat LNG Terminal http://www.bloomberg.com/news/2012-12-24/chevron-buys-encana-eog-stakes-in-kitimat-lng-terminal-1-.html
17 Interfax Energy. 2012. CNOOC, Petronas clinch long-awaited approvals for Canadian buyouts. http://interfaxenergy.com/natural-gas-news-analysis/north-america/cnooc-petronas-clinch-long-awaited-approvals-for-canadian-buyouts/
EFLO Energy, Inc. | March 2013 | Page 12 |
December 2012: Malaysia’s Petronas receives approval from Canadian government to fully acquire unconventional gas developer Progress Energy, 49 days after being initially blocked. The deal was valued at USD 5.24 billion.3 Petronas is proceeding with plans for an LNG export terminal in Prince Rupert.
December 2012: EnCana agrees to sell a minority share (49.9%) in approximately 180,000 hectares of Duvernay shales to China National Petroleum Company.4 The deal was valued at US$ 2.18 billion.
August 2012: Nexen announces the completion of acquisition of 40% participating interest in Horn River and Laird Basins by INPEX of Japan.
June 2012: Apache makes Liard Basin announcement “THE BEST SHALE GAS RESERVOIR IN NORTH AMERICA,” stating 210 Tcf net gas in place, 48 Tcf net sales gas and 21 MMcf/d IP on third test well
February 2012: PetroChina acquires 20% stake in Royal Dutch Shell’s gas assets in BC. Deal value is USD 1.3 billion.
December 2011: Sinopec fully acquires Daylight Energy, their gas and oil-sand reserves, and associated pipelines for USD 2.78 billion.5
December 2011: Lone Pine Resources announces it re-entered and recompleted an existing vertical wellbore with two uphole shale formations at Pointed Mountain in Liard Basin. The company reported 61,000 net acres and made application for an additional 21 years.
__________________________
18 Interfax Energy. 2012. CNOOC, Petronas clinch long-awaited approvals for Canadian buyouts. http://interfaxenergy.com/natural-gas-news-analysis/north-america/cnooc-petronas-clinch-long-awaited-approvals-for-canadian-buyouts/
19 University of Alberta-China Institute. 2012. http://www.china.ualberta.ca/en/Energy%20Research.aspx
20 University of Alberta-China Institute. 2012. http://www.china.ualberta.ca/en/Energy%20Research.aspx
EFLO Energy, Inc. | March 2013 | Page 13 |
3. | Company and Asset Overview |
3.1. | Overview |
EFLO is a Houston, TX-based development stage company engaged in the acquisition, exploration and development of oil and gas properties in Canada and the United States. EFLO is publicly-listed (OTCQB: EFLO) and incorporated in the State of Nevada.
3.2. | Kotaneelee Gas Project (Yukon Territory, Canada) |
EFLO’s primary exploration and development acreage is located in the resource-rich Liard Basin in southeastern Yukon, Canada. EFLO currently owns 53.65% working interest in the Kotaneelee Gas Project (“KGP”) and is seeking to increase its working interest to 68% and continue its exploration and development program. Apache Corporation (“Apache”) currently owns the remaining working interest of 32%. KGP has significant conventional and shale gas potential and is supported by an environment of growing investment in gas processing and export in Western Canada.
3.2.1. | KGP Acquisition |
On July 18, 2012, EFLO completed the acquisition of of Devon Canada’s (“Devon”) entire right and interest (generally a working interest of 22.989%, with a working interest of 69.337% in one gas well) in the KGP.
As consideration for Devon’s working interest in the KGP (the “Devon Assets”), EFLO paid approximately USD 23,298,000. The consideration was comprised of USD 290,000 in cash, 7,250,000 shares of EFLO’s restricted common stock valued at USD 15,950,000, and the absorption of USD 7,058,000 in asset retirement obligations.
On October 17, 2012, EFLO completed the acquisition of Nahanni Energy’s entire right and interest in KGP (generally a working interest of 30.664%) in the KGP (the “Nahanni Assets”).
As consideration for the Nahanni Assets, EFLO paid Nahanni approximately $13,761,000. The consideration was comprised of approximately $133,000 in cash, 1,614,767 shares of one of EFLO’s subsidiaries, which are exchangeable for 1,614,767 shares of EFLO’s restricted common stock valued at approximately $4,191,000, and the absorption of approximately $9,437,000 in asset retirement obligations. Both the cash paid and stock issued for the Nahanni Assets are subject to certain holdbacks for asset related liabilities or breach of representations and warranties.
EFLO allocated the consideration paid for the Nahanni Assets and Devon assets based upon its preliminary assessment of their fair value at the dates of purchase, as follows:
EFLO Energy, Inc. | March 2013 | Page 14 |
Fair Value of Assets Acquired | ||||||||||||
Nahanni Assets | Devon Assets | Total | ||||||||||
Asset Description | ||||||||||||
Proven Properties | ||||||||||||
Reserves and resources | $ | 4,895,588 | $ | 7,037,002 | $ | 11,932,590 | ||||||
Plant and equipment | 8,594,362 | 6,484,001 | 15,078,363 | |||||||||
Gathering systems | 2,383,405 | 1,788,001 | 4,171,406 | |||||||||
Vehicles | – | 4,527 | 4,527 | |||||||||
Leasehold costs | 254,828 | 388,246 | 643,074 | |||||||||
16,128,183 | 15,701,777 | 31,829,960 | ||||||||||
Unproven Leasehold Costs | 9,398,371 | 6,401,753 | 15,800,124 | |||||||||
25,526,554 | 22,103,530 | 47,630,084 | ||||||||||
Goodwill | – | 1,194,365 | 1,194,365 | |||||||||
Total Assets Acquired - KGP | $ | 25,526,554 | $ | 23,297,895 | $ | 48,824,449 |
EFLO intends to carry out further acquisition of working interest in KGP in the near future, specifically seeking to increase its working interest to 68%.
3.2.2. | History of KGP |
Kotaneelee’s exploration, development and production history dates back to the 1970s. Starting in 1977 the first three wells B-38, E-37 and I-48 wells were drilled. In 1982 the gas facility with 70 MMCF/D Capacity was built. In 1991 new production began with I-48 (40 MMcf/d) and B-38 (70-75 MMcf/d) wells. In 2004 a new drilling and production program was initiated with a new L-38 well (44 MMcf/d).
Cumulative production to date has reached 234 Bcf. The number of wells drilled and the associated well logs, tests, sampling and other technical studies based on this drilling is very significant in understanding the existing resource potential and in turn helps to de-risk the future development.
3.2.3. | Acreage and Lease Overview |
KGP covers 30,542 gross acres across 47 sections. As of November 29, 2012, EFLO had 806 acres of gross and net developed acreage and 29,736 of undeveloped gross acreage (15,894 net undeveloped acres). All leases are held until 2020.
Kotaneelee is located within the lease-holdings delimited in Figure 8 below.6 These leases represent a 100% working interest in the property.
__________________________
21Yukon Government. 2013. Yukon Land Status Map with Oil and Gas Interests. http://www.emr.gov.yk.ca/oilandgas/pdf/Yukon_Land_Status_and_Oil_and_Gas_Interests.pdf Accessed January 22, 2013.
EFLO Energy, Inc. | March 2013 | Page 15 |
Figure 8: Total Kotaneelee Lease Holdings in Yukon Liard Basin
3.3. | KGP Gas Reserves and Resources |
3.3.1. | Kotaneelee Gas Field |
The Kotaneelee Field consists of series of conventional carbonate gas reservoirs along with three unconventional shale targets. Of the conventional reservoirs, the Nahanni formation is the existing producing interval and has cumulative production of 234 Bcf from the Eastern flank of the thrust sheet. Material balance calculations and volumetrics indicate significant additional recoverable reserves from this reservoir. In addition, there are two other tested carbonate reservoirs (the deeper Arnica formation and the shallower Flett Formation) that are seen in each of the three wellbores drilled into the eastern flank.
The Western thrust sheet has yet to be drilled and is delineated on seismic. All three carbonate reservoirs are anticipated to be present indicating significant potential resources. Figure 9 depicts both the East and West flanks of the structure and Figure 10 is an east-west running seismic line through the heart of the field indicating two existing wellbores and a potential future well location to test the western flank.
EFLO Energy, Inc. | March 2013 | Page 16 |
Figure 9: Kotaneelee Seismic Structure
EFLO Energy, Inc. | March 2013 | Page 17 |
Figure 10: Seismic Line Indicating the Nahanni Formation on the East and West Flanks of Kotaneelee
The three most important unconventional gas exploration targets above the Nahanni Formation are informally called the “Lower Black Mudstone”, the “Middle Shale” of the Fort Simpson Formation, and the “Upper Black Shale”. Lithologically, all three “shale” units are mudstones, being richer in silica than shales and more amenable to fracturing and stimulation. Both units and the Lower Black Mudstone in particular, are important shale-gas exploration targets in the Liard Basin in northeast B.C., currently being exploited by Apache and Chevron. EFLO will be the first exploration program targeting the gas shales in the Liard Plateau in the Yukon.
3.3.2 | Framework |
Figure 11 below highlights the classification framework for oil and gas resources according to section 5 of the Canada Oil and Gas Evaluation Handbook (“COGE Handbook”).
EFLO Energy, Inc. | March 2013 | Page 18 |
Figure 11: Resources Classification Framework22
3.3.3. | KGP Reserves |
Table 4 below summarizes the combined reserve estimates provided by AJM Deloitte. These are presented on a net basis (reserves attributable to EFLO’s 53.65% working interest). AJM Deloitte is an independent petroleum engineering firm that has been providing petroleum consulting services worldwide for over 20 years.
Reserves are presented using common industry terminology (Proven-Probable-Possible) in accordance with definitions, standards and procedures contained in the Canadian Oil and Gas Evaluation Handbook ("COGE Handbook") and National Instrument 51-101 Standards of Disclosure for Oil and Gas Activities ("NI 51-101").
Table 4: Summary of Reserves23
Gas (MMcf) | Oil & NGLs (Mbbl) | Combined (Mboe) | |
Proved Developed Producing | 3,213 | 0 | 536 |
Proved Undeveloped | 7,656 | 0 | 1,276 |
TOTAL PROVED (1P) | 10,869 | 0 | 1,812 |
Probable | 10,108 | 0 | 1,685 |
Total Proved + Probable (2P) | 20,977 | 0 | 3,496 |
Possible | 9,279 | 0 | 1,547 |
Total Proved + Probable + Possible (3P) | 30,256 | 0 | 5,043 |
The Company emphasizes that its reported reserves are estimates which, by their nature, are subject to revision. The estimates are made using available geological and reservoir data, as well as production performance data.
__________________________
22 Canada Oil and Gas Evaluation Handbook, section 5.
23 For informative purposes only. Reserve information is not compliant with SEC reporting rules.
EFLO Energy, Inc. | March 2013 | Page 19 |
3.3.4. | KGP Gas Resources |
Table 5 below summarizes EFLO’s gas resources. These estimates include “contingent” resources pending the need for further facility design, preparation of firm development plans and regulatory applications (including associated reservoir studies and delineation drilling) and corporate approvals to proceed with development, and “prospective” resources. Prospective resources are those quantities of gas, as of a given date, to be potentially recoverable from undiscovered accumulations by application of future development.
Table 5: Estimated Kotanelee Gas Resource
Original Raw Gas in Place (“ORGIP”) | Recoverable Raw Gas in Place (assuming 100% WI) | EFLO Share of ORGIP (53.65% WI) | |
Shale Gas* | 7.23 to 12.96 Tcf | 3.3 to 5.2 Tcf (Prospective) | 3.9 to 7.0 Tcf |
Conventional Gas** | 0.530 to 1.630 Tcf | 0.182 to 0.563 Tcf (Prospective) | 0.284 to 0.874 Tcf |
*AJM Deloitte Resource Report
** Company estimates
3.4. | KGP Existing Infrastructure |
Along with their leases, EFLO acquired access and ownership over a preexisting gas plant and facilities (Figure 12). These include:
■ | Gas dehydration plant (capacity: 70 MMcf/d) |
■ | Outlet gas compression: 1200 psig – added in 2005 |
■ | Water disposal: 6,000 bopd |
■ | Gas gathering system |
■ | Sales line: 24” sales line to Fort Nelson processing plant |
■ | Flarestack, pipeline, storage tanks, local airstrip, barge dock, grading equipment, trucks, an on-site camp |
The sales pipeline from Kotaneelee connects the gas field to another higher capacity processing plant located in Fort Nelson, British Columbia. Owned by Spectra Energy, it has a 1.0 Bcf/d processing capacity. Construction for the expansion of the plant (total 1.7 Bcf/d) is underway.2 The infrastructure ensures full access to the North American gas grid.
Figure 12: Pre-existing Facilities On-site
__________________________
24 Spectra Energy. Fort Nelson North Processing. http://www.spectraenergy.com/Operations/New-Projects/Fort-Nelson-North-Processing/
EFLO Energy, Inc. | March 2013 | Page 20 |
3.5 | Near Term Development Plan |
The Company intends to carry out a development and appraisal plan which includes several components.
● | Recompletion of the B-38 up-hole to the Flett formation (USD 2.0 million gross), |
● | Deepening of the I-48 well to the Arnica formation(USD 6.0 million gross), |
● | Drilling of a well on the eastern flank to evaluate the three shale members and then subsequently completing in the Arnica, Nahanni or Flett formation (USD 18.0 million gross) |
● | Drilling of a well on the western flank to evaluate the three shale members and then subsequently completing in the Nahanni formation (USD 20.0 million gross) |
● | acquisition of additional working interests |
This program is intended to increase reserves and generate a minimum production rate of 20 MMcf/d, which would allow the Company to generate positive cash flows.
3.6 | Long-Term Monetization and Marketing Strategy |
EFLO will have immediate access to the North American gas grid thanks to its existing infrastructure which is connected to the gas processing plant at Fort Nelson, BC (see Figure 13 below)
Figure 13: Major North American Gas Pipelines25
While the Company believes it can generate positive cash flow even in the current price environment, given its status as a low cost producer, more lucrative monetization strategies will be pursued in the medium to long term. These include sales to the Asian LNG market through one of the proposed LNG terminals, including four proposed at Kitimat (see connectivity between KGP and Kitimat on Figure 14 below).
__________________________
25mage source: http://www.theodora.com/pipelines/north_america_pipelines_map.jpg
EFLO Energy, Inc. | March 2013 | Page 21 |
Figure 14: Proposed and Existing Supply Pipelines for Kitimat1
Other long-term monetization potential may include the sale of gas to mining concerns in the Yukon. While home to less than 35 thousand people, Yukon is a territory rich with mineral resources, including significant gold, silver, copper, and diamond deposits. The world’s second largest underdeveloped iron ore deposit is located in Yukon. All these mining operations are currently burning very expensive diesel to power their operations. Premium-priced natural gas liquids could be sold as diesel substitutes to this market. This monetization strategy would require additional investment in pipeline to transport NGLs, the timing of which would rely on the permitting process.
__________________________
26mage source: Zeus LNG Intelligence
EFLO Energy, Inc. | March 2013 | Page 22 |
4. | Capital Requirements |
4.1. | Capital Requirements |
Table 6: Capital Requirements
Activities | USD million | |||
Acquisition of additional working interests | 5.0 | |||
Recompletion, deepening, or drilling, including evaluation of the shale reservoirs | 28.0 | |||
Acquisition of additional undeveloped acreage / seismic work | 5.0 | |||
General working capital | 2.0 | |||
Total | 40.0 |
Acquisition of additional working interest
Approximately USD 5 to acquire additional working interest in KGP. The additional working interest is expected to have a base net asset value of USD 7-11 million, and include estimated ORGIP of 0.85-1.52 Tcf shale resources and 0.062-0.191 Tcf conventional gas resources.
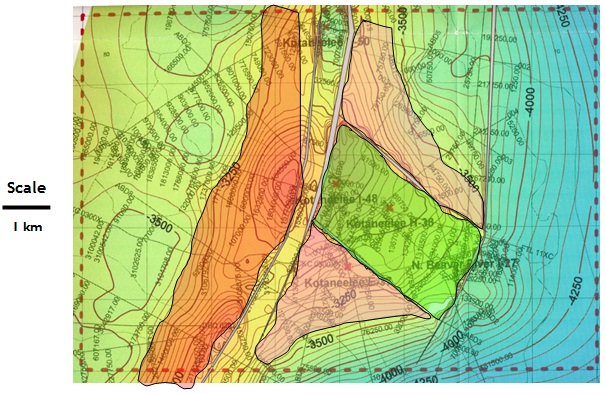
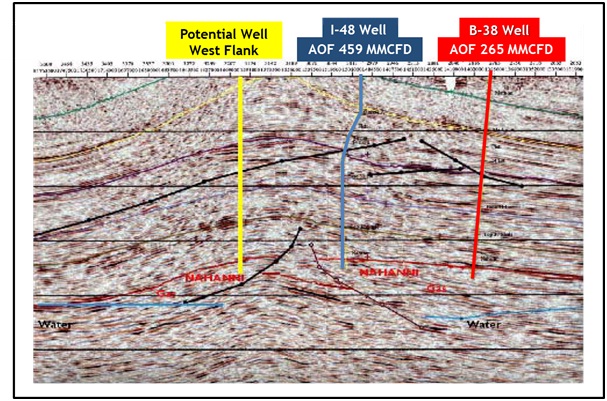
Successful Nahanni production (south-east flank)
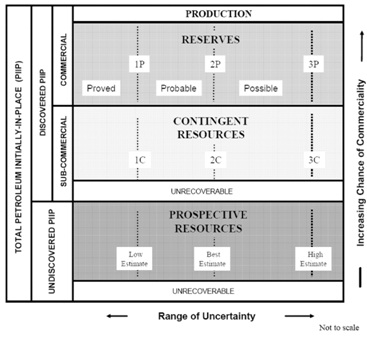
The successful drilling into the Nahanni layer on the south-east flank would shift current contingent resources into proven (1P), probable (2P) and possible (3P) reserves.
Successful Nahanni/Arnica production (western flank)
The successful drilling to the Arnica formation would add reserves (1P-3P) and resources.
Shale evaluation
The new drilling on the eastern and western flanks will allow for significant shale evaluation and analysis, and will be critical to the development process.
Successful Arnica well (south-east flank)
This is expected to shift a portion of the current probable (2P) and possible (3P) reserves into the proven (1P) reserves category. Further, based on the offset logs and seismic work that will be performed, it is expected that additional probable and possible reserves will be booked.
Successful Flett production
This is expected to shift a portion of the current probable (2P) and possible (3P) reserves into the proven (1P) reserves category, and potentially to result in the recognition of additional probable and possible reserves.
Acquisition of additional lands
The acquisition of an additional 30,000 acres by the Company could potentially add gas resources of 7-13 Tcf of shale ORGIP (double the current resources).
EFLO Energy, Inc. | March 2013 | Page 23 |
5. | Senior Executive and Management Team |
5.1. | Ownership Structure and Overview |
EFLO is listed on the Over-The-Counter-Quotation-Board (OTCQB) exchange under the ticker EFLO. Details of the Company’s capital structure are highlighted below in Table 7 as of February 6, 2013.
Table 7: Capital Structure
Name | Position |
Shares Issued and Outstanding | 19,422,020 |
Warrants and Options | 3,748,101 |
Fully Diluted Shares | 23,170,171 |
Insider Ownership | 62% |
Market Capitalization | USD 41 million |
Average Price Performance (60 days) | USD 2.11 |
Table 8 below highlights a list of major shareholders:
Table 8: EFLO Major Shareholders
Name | Shares | Warrants | % |
Holloman Corporation | 4,530,870 | 10,870 | 23.37% |
Pacific LNG Operations Limited | 4,000,000 | - | 20.60% |
VP Bank (Switzerland) Ltd. | 1,027,500 | - | 5.29% |
Directors and Officers (as a group) | 2,199,103 | 700,000 | 14.41% |
5.2. | Major Shareholders |
5.2.1. | Holloman Corporation |
Holloman Corporation is a Houston-based employee owned upstream/midstream construction contractor with design/build capabilities. Holloman offers construction services and turnkey installations of gathering systems, gas processing/treating, compression, pumping stations, metering facilities and natural gas storage.
Since 1960, when the company was founded by Sam Holloman as Holloman Construction, the company has completed 5000 projects for over 300 customers. Holloman is active in Marcellus, Bakken, Barnett, Haynesville and Eagle Ford Unconventional Gas projects for both pipeline and gas plant facilities.
5.2.2. | Pacific LNG Operations Ltd. |
Pacific LNG Operations Ltd. is a Singapore-based oil and gas company. It is a substantial indirect interest holder in the Elk and Antelope gas discoveries in Papua New Guinea, and 47.5% LNG partner in Liquid Niugini Gas Limited with InterOil Corporation (NYSE-IOC). Liquid Niugini Gas is proposing the construction of a 3.8 mmtpa LNG project in Papua New Guinea. Pacific LNG also has a working interest in the significant gas and condensate discoveries in the Elk and Antilope fields.
EFLO Energy, Inc. | March 2013 | Page 24 |
5.2.3 | VP BANK (SWITZERLAND) LTD. |
A member of a private banking group based in Zurich, Switzerland. It is owned by the Verwaltungs- und Privat-Bank, Vaduz, one of the three largest banks in Liechtenstein
5.3. | Board of Directors |
The Board of Directors for the Company is comprised of six members, listed in Table 9 below.
Table 9: EFLO Board of Directors
Name | Position | Date of Appointment |
Henry Aldorf | Chairman of the Board of Directors | June 18, 2012 |
Keith Macdonald | Chief Executive Officer and Secretary | March 10, 2011 |
Robert Wesolek | Chief Financial and Accounting Officer | June 16, 2011 |
James Hutton | President and Director | June 18, 2012 |
Eric Prim | Director | March 17, 2011 |
James Ebeling | Director | June 22, 2011 |
5.4. | Management Team |
The executive management team of the Company consists of a number of seasoned industry veterans in the oil and gas business. Selected biographies of key employees are provided below:
5.4.1. | Henry Aldorf, MsC, MBA (Chairman & Director) |
Mr. Aldorf has 37 years’ experience in the petroleum and chemicals industry. Since February 2010, Mr. Aldorf has served as President of Pacific LNG Operations Ltd. and Liquid Niugini Gas Limited. From August 2001 to January 2010, Mr. Aldorf held a variety of senior executive positions with Marathon Oil including; President of Marathon International and Vice-President of Global Upstream of Marathon Oil (2008-2010), Senior Vice President International Business Development – Marathon Oil International (2006-2008), Senior Vice-President West Africa, Middle East and Asia Business Development (2005-2006), and Senior Vice-President West Africa Business Development (2004-2005). In the latter position Mr. Aldorf was responsible for Marathon's EG LNG project in Equatorial Guinea and was the first Managing Director of EG LNG Co. Before joining Marathon in 2001, Mr. Aldorf worked for Unocal in a variety of positions of increasing responsibility, in both the chemical and business development organization of that company. His international experience includes Europe, United States, Canada, Russian Federation, Brazil, the Asia Pacific Region, Japan, Korea and China. He graduated from the University of Leiden in the Netherlands, with a Bachelor of Science degree in Chemistry and Biochemistry. He also gained a Master of Science degree in Chemical Engineering from Technical University in Delft in the Netherlands, and holds a master of Business Administration from the INSEAD graduate business school, Fountainebleau, France.
5.4.2. | Keith Macdonald, CA (Chief Executive Officer & Director) |
Keith Macdonald has been President of Bamako Investment Management Ltd., a private holding and financial advisory company since 1994. He is currently Chairman and director of Drakkar Energy Ltd., a private in situ oil sands company. In addition, Mr. Macdonald currently serves on the board of Bellatrix Exploration Ltd. (TSX), Rocky Mountain Dealerships Inc. (TSX), Madalena Ventures Inc. (TSVX), Surge Energy Inc. (TSX), Mountainview Energy Ltd. (TSVX), Holloman Energy Corporation (OTCQB), WCSB Oil & Gas Royalty Income Funds and Orange Directional Services Inc.. Most recently, he was a director of Profound Energy Inc. (TSX), Cordy Oilfield Services Inc.(TSVX), Stratabound Minerals Inc.(TSVX) and Breaker Energy Ltd (TSX) , and prior thereto a director of several public and private oil and gas companies. Mr. Macdonald was founder, President and Director of New Cache Petroleums from 1987 until its amalgamation in 1994 and thereafter Chief Financial Officer and Director until its sale in 1999. He is a past Chairman and director of the Small Explorers and Producers of Canada.
EFLO Energy, Inc. | March 2013 | Page 25 |
5.4.3. | James Hutton (President & Director) |
James Hutton has spent his career in the financial services industry and for the past 25 years has specialized in structured finance and resource company finance. He has served as President and Chief Executive Officer of Hutton Capital Corporation, a company engaged in investment banking since September 1996. In April 1998, Mr. Hutton also founded, and was President and Chief Executive Officer of the Canada Dominion Resources Group of companies, one of the largest flow-through share funds in Canada. The Canada Dominion Resources Group focused their investments on mining and energy issuers actively exploring for resources in Canada. The Canada Dominion Resources Group was acquired from Mr. Hutton by the Dundee/Dynamic Mutual fund organization in December of 2006. In addition, Mr. Hutton was the President and Chief Operating Officer of the CMP Resource Group from 2003 to 2005. He also serves as director of Tasman Metals Ltd. (AMEX/TSXV-TSM), SantaCruz Silver Mining Inc. (TXSV-SCZ), Batero Gold Corp. (TSXV-BAT) and Caymus Resources Inc. (TSXV-CJX).
5.4.4. | Robert Wesolek (Chief Financial Officer & Director) |
Robert Wesolek has been the Chief Financial Officer of Holloman Energy Corporation since August 4, 2009, and has acted as an executive consultant providing financial, regulatory and system design services to emerging corporations since 2006. Prior to 2006, Mr. Wesolek served as Chief Financial Officer and director of House of Brussels Chocolates Inc. (2004-2006), President and Chief Executive Officer of The Navigates Corporation (1998-2004), Chief Financial Officer of Sharp Technology Inc. (1998-2001), President of the Desktop Software Division of Citadel Security Software (1996-1998), and Chief Operating Officer of Kent Marsh Ltd., Inc. (1988-1996). During the period from 1980 to 1988, Mr. Wesolek was a Senior Practice Manager in the Audit Division of Arthur Andersen LLP.
5.4.5. | H. Wayne Hamal (Chief Operating Officer) |
H. Wayne Hamal has over 25 years of oil and gas industry experience with both major and independent oil companies. He was General Manager of Exploration and Production (2008-2011), and Senior Engineering and Drilling Manager (2005-2008), for InterOil Corporation (NYSE-IOC) operating in Papua New Guinea. In that role, he was instrumental in the development of the drilling program for InterOil and was integral to the discovery and appraisal of the Elk/Antelope gas condensate fields. From 2002 to 2005, Mr. Hamal worked for Marathon Oil Company (NYSE-MRO) as Joint Venture Manager, Equatorial Guinea, West Africa, where he worked directly with production operations and major projects primarily involved with the development of the Alba gas condensate field and associated LPG, methanol and LNG plants. Before joining Marathon, Mr. Hamal worked for CMS Oil and Gas (1987-2001) where he held a variety of engineering positions, both domestic and international, including Production Manager Equatorial Guinea, West Africa. Mr. Hamal holds a Bachelor of Science degree in Petroleum Engineering from the Colorado School of Mines.
5.4.6. | Eric Prim, B.Sc, MBA (Director) |
Eric Prim is the President of Pilot Energy Solutions, and has been Vice President of its affiliate, Holloman Corporation since 1997. He has served as a director of Holloman Energy Corporation since 2007 and also became that company’s Chief Operating Officer in 2009. Prior to his association with Holloman, Mr. Prim held senior technical management positions with Hunt Energy (1982-1987) and Rexene Corporation (1987-1997). Mr. Prim holds a B.S. in Chemical Engineering from The University of Texas (1982) and an M.B.A. from Amber University (1987). Mr. Prim is a registered Professional Engineer in Texas and holds eight issued or pending U.S. Patents, all pertaining to energy technology.
EFLO Energy, Inc. | March 2013 | Page 26 |
5.4.7. | James Ebeling (Director) |
James Ebeling is the Chief Financial Officer of Holloman Corporation. During the period from 2001 to 2007, Mr. Ebeling was Vice President of SUEZ Energy North America, Inc. In that capacity, he provided project management and development services on a variety of multi-billion dollar energy related projects. Prior to 2001, Mr. Ebeling served as Vice President of Hawkins Oil and Gas (1996-2001), Vice President of Transworld Oil Company (1989-1996), Vice President of Anchor Coupling (1984-1989), and Vice President of the Charter Company (1981-1984).
EFLO Energy, Inc. | March 2013 | Page 27 |
6. | Risk Factors |
A description of major risks factors and considerations is contained below. For a more extensive description of these risks the reader should consult the Company’s most recent 10-K.
These factors could have a material adverse effect on the Company’s businesses, operations and financial condition that, in turn, could have a material adverse effect on the Company’s ability to produce and deliver hydrocarbons, and generate positive cash flow. The risks and uncertainties described below are not the only ones the Company faces. Additional risks and uncertainties not presently known or that are currently deemed immaterial may also harm the business.
The Company’s proved natural gas reserve estimates may prove to be incorrect and may be subject to revision.
There are numerous uncertainties inherent in estimating crude oil and natural gas reserves and their estimated values. The reserves the Company reports in its filings with the SEC are estimates and such estimates may prove to be inaccurate because of these uncertainties. Reservoir engineering is a subjective and inexact process of estimating underground accumulations of crude oil and natural gas that cannot be measured in an exact manner. Substantial expenditures are required to establish proven and probable resource reserves. Whether a resource will be commercially viable depends on a number of factors outside our control, which include, without limitation, the particular attributes of the resource formation, and proximity to infrastructure; prices, which fluctuate widely; and government regulations, including, without limitation, regulations relating to prices, taxes, development, production, stimulation and fracking, royalties, land tenure, land use, importing and exporting of resources and environmental protection. For these reasons, estimates of the economically recoverable quantities of crude oil and natural gas attributable to any particular group of properties, classifications of such reserves based on risk of recovery, and estimates of the future net cash flows prepared by different engineers or by the same engineers but at different times may vary substantially. Accordingly, reserve estimates may be subject to downward or upward adjustment. Actual production, revenue and expenditures with respect to our reserves will likely vary from estimates, and such variances may be material.
The volatility of natural gas and condensate prices may adversely affect the Company’s ability to generate positive cash flows and be profitable.
The Company’s ability to generate positive cash flows is highly dependent on the price of, and demand for natural gas. Even relatively modest changes in natural gas prices may significantly change cash flows generated by the Company. Historically, the markets for natural gas and condensates have been volatile and are likely to continue to be volatile in the future. Prices for natural gas may fluctuate widely in response to relatively minor changes in the supply of, and demand for natural gas and condensates and a variety of additional factors that are beyond the Company’s control, such as:
● | economic and political developments in oil and gas producing regions; |
● | global and regional supply and demand, and expectations regarding future supply and demand, for petroleum products; |
● | weather conditions; |
● | speculation in the commodity futures market; |
● | technological advances affecting energy consumption; |
● | prices and availability of alternative fuels; |
● | global economic and political conditions; and |
● | prices and availability of new technologies. |
EFLO Energy, Inc. | March 2013 | Page 28 |
The Company cannot predict future natural gas and condensate price movements.
Changes to regulations with respect to the gas market may materially impact the business.
The exploration, production and sale of oil and gas are extensively regulated by governmental authorities. Applicable legislation is under constant review for amendment or expansion. These efforts frequently result in an increase in the regulatory burden on companies in the oil and gas industry and consequently an increase in the cost of doing business and decrease in profitability. Numerous governmental departments and agencies are authorized to, and have, issued rules and regulations imposing additional burdens on the oil and gas industry that often are costly to comply with and carry substantial penalties for non-compliance. Production operations are affected by changing tax and other laws relating to the petroleum industry, constantly changing administrative regulations and possible delays, interruptions or termination by government authorities.
Oil and gas mineral rights may be held by individuals, corporations or governments having jurisdiction over the area in which such mineral rights are located. As a general rule, parties holding such mineral rights grant licenses or leases to third parties to facilitate the exploration and development of these mineral rights. The terms of the leases and licenses are generally established to require timely development. Notwithstanding the ownership of mineral rights, the government of the jurisdiction in which mineral rights are located generally retains authority over the drilling and operation of oil and gas wells.
Current, as well as future, environmental laws and regulation may have a material effect on the business.
The Company’s operations are also subject to a variety of constantly changing laws and regulations governing the discharge of materials into the environment or otherwise relating to environmental protection. Failure to comply with environmental laws and regulations can result in the imposition of substantial fines and penalties as well as potential orders suspending or terminating the Company’s rights to operate. Some environmental laws to which the Company is subject provide for strict liability for pollution damage, rendering a company liable for environmental damage without regard to negligence or fault on the part of such company.
In addition, the Company may be subject to claims alleging personal injury or property damage as a result of alleged exposure to hazardous substances, such as oil and gas related products or for other reasons. Some environmental protection laws and regulations may expose the Company to liability arising out of the conduct of operations or conditions caused by others, or for acts which were in compliance with all applicable laws at the time the acts were performed. Changes in environmental laws and regulations, or claims for damages to persons, property, natural resources or the environment, could result in substantial costs and liabilities to the Company. These laws and regulations may substantially increase the cost of exploring, developing, producing or processing oil and gas and may prevent or delay the commencement or continuation of a given project and thus generally could have a material adverse effect upon the Company’s capital expenditures, earnings, or competitive position. The Company believes that it is in substantial compliance with current applicable environmental laws and regulations. Nevertheless, changes in existing environmental laws and regulations or in the interpretations thereof could have a significant impact on the Company and the oil and gas industry in general.
EFLO Energy, Inc. | March 2013 | Page 29 |
The Company’s drilling activities may not be commercially successful, which would adversely affect the financial condition of its business.
Oil and gas exploration is not an exact science, and involves a high degree of risk. The primary exploration risk lies in the drilling of dry holes or drilling and completing wells which, though productive, do not produce gas and/or oil in sufficient amounts to return the amounts expended and produce a profit.
Hazards, such as unusual or unexpected formation pressures, downhole fires, blowouts, loss of circulation of drilling fluids and other conditions are involved in drilling and completing oil and gas wells and, if such hazards are encountered, completion of any well may be substantially delayed or prevented. In addition, adverse weather conditions can hinder or delay operations, as can shortages of equipment and materials or unavailability of drilling, completion, and/or work-over rigs. Even though a well is completed and is found to be productive, water and/or other substances may be encountered in the well, which may impair or prevent production or marketing of oil or gas from the well. Exploratory drilling involves substantially greater economic risks than development drilling because the percentage of wells completed as producing wells is usually less than in development drilling. Exploratory drilling itself can be of varying degrees of risk and can generally be divided into higher risk attempts to discover a reservoir in a completely unproven area or relatively lower risk efforts in areas not too distant from existing reservoirs. While exploration adjacent to or near existing reservoirs may be more likely to result in the discovery of oil and gas than in completely unproven areas, exploratory efforts are nevertheless high risk activities.
Although the completion of oil and gas wells is, to a certain extent, less risky than drilling for oil and gas, the process of completing an oil or gas well is nevertheless associated with considerable risk. In addition, even if a well is completed as a producer, the well for a variety of reasons may not produce sufficient oil or gas in order to repay the Company’s investment in the well.
The Company’s business involves many operating risks that can cause substantial losses; insurance may not protect it against all these risks.
The Originator’s business may experience hazards and risks inherent in drilling for, producing and transporting natural gas and condensates. These hazards and risks may result in loss of hydrocarbons, environmental pollution, personal injury claims and other damage to the Properties from third parties and include:
● | fires; |
● | explosions; |
● | encountering formations with abnormal pressures; |
● | encountering unusual or unexpected geological formations; |
● | blowouts; |
● | cratering; |
● | unexpected operational events; |
● | equipment malfunctions; |
● | pipeline ruptures; |
● | spills; |
● | compliance with environmental and governmental regulations; and |
● | title problems. |
The business is insured against some, but not all, of the hazards associated with the business. The occurrence of an event that is not covered or not fully covered by insurance could have a material adverse effect on the Company’s ability to generate positive cash flows and be profitable.
EFLO Energy, Inc. | March 2013 | Page 30 |
Intense competition in the industry may affect the Company’s future financial condition.
The oil and gas industry is highly competitive. Numerous independent oil and gas companies, oil and gas syndicates and major oil and gas companies actively seek out and bid for oil and gas properties as well as for the services of third party providers, such as drilling companies, upon which the Company relies. From time to time, seismic vendors, drilling contractors, rigs and supplies may be in short supply. Their availability may be controlled by other larger explorers in the area. Native title holders or certain of the Company’s competitors may control pipeline capacity, roads, bridges and other infrastructure it requires to access or fully exploit its properties. The Company’s reliance upon their resources may create a competitive disadvantage for the Company. A substantial number of competitors have longer operating histories and substantially greater financial and personnel resources than the Company does, and have demonstrated the ability to operate through industry cycles. Some of the Company’s competitors not only explore for, produce and market petroleum and natural gas, but also carry out refining operations and market the resultant products on a worldwide basis which may provide them with additional sources of capital.
Larger and better capitalized competitors may be in a position to outbid the Company for particular prospect rights. These competitors may also be better able to withstand sustained periods of unsuccessful drilling. Larger competitors may be able to absorb the burden of any changes in laws and regulations more easily than the Company can, which would adversely affect the Company’s competitive position. Petroleum and natural gas producers also compete with other suppliers of energy and fuel to industrial, commercial and individual customers. Competitive conditions may be substantially affected by various forms of energy legislation and/or regulation considered from time to time by the governments and/or their agencies and other factors which are out of the Company’s control including, international political conditions, terrorism, overall levels of supply and demand for oil and gas, and the markets for synthetic fuels and alternative energy sources.
The Company is dependent on certain pipelines and transportation systems. Any damage or other material changes to those systems may materially affect the Company’s business.
The Company is dependent on certain pipelines as well as the links between pipeline networks for the transportation and gathering of hydrocarbons. These transportation services are provided by unaffiliated third parties, which the Company does not control.
The contracts governing the transportation of production output are of limited duration and may be terminated with limited notice. If these business relationships are terminated or materially altered, the Company may not be able to maintain satisfactory hydrocarbon transportation arrangements, which will hinder the Company’s ability to bring its hydrocarbons to market, and may materially adversely affect the results of its business.
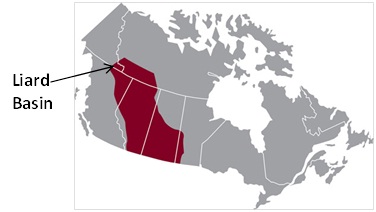
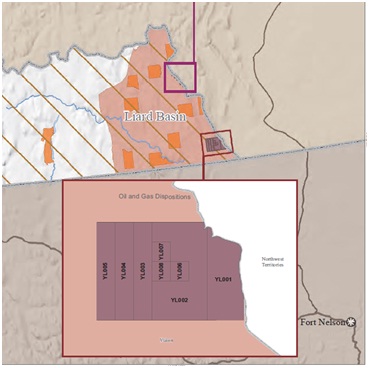
The Company’s business is located in the Liard Basin, Yukon and this concentration of activity makes its business vulnerable to the risks associated with that region, including the effects of severe weather.
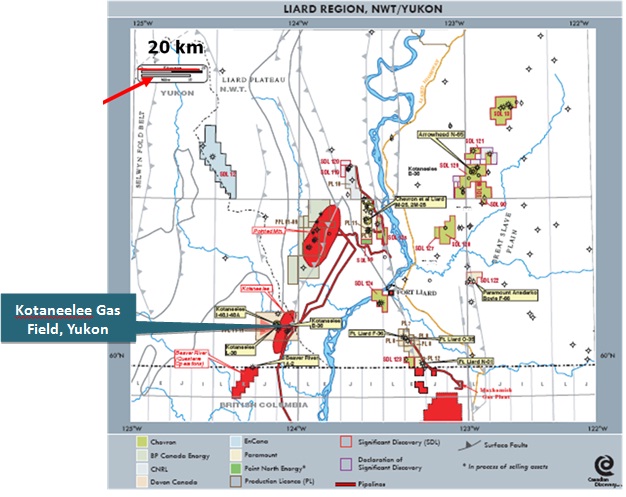
Moreover, the Company is substantially dependent on production from the KGP and this dependence on a single asset makes the Originator vulnerable to any problems related to that asset.
The Company will for the foreseeable future derive all of its revenue from the production of hydrocarbons from a single project. As such, its results of operations are directly related to, and significantly impacted by, material changes in the economic production, or lack thereof, from that particular project.
EFL Information Memorandum 3-27-13
EFLO Energy, Inc. | March 2013 | Page 31 |