Annual Meeting of Shareholders
June 20, 2024
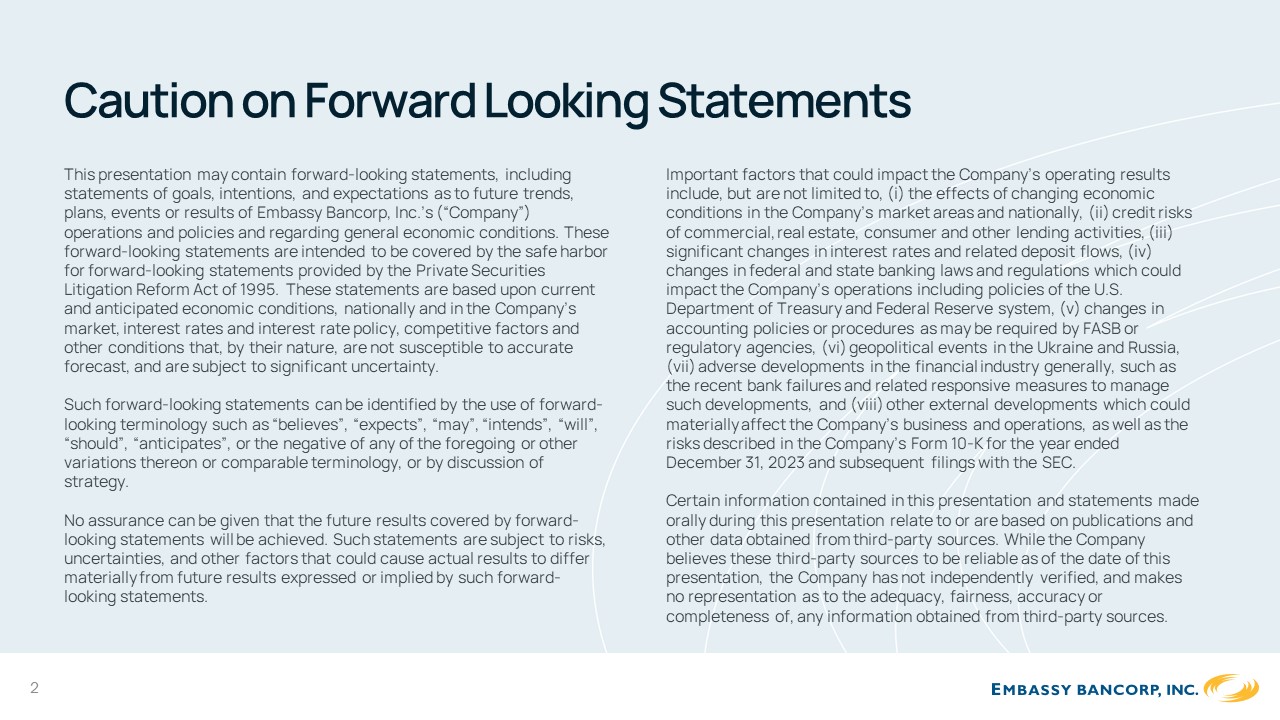
Caution on Forward Looking Statements
This presentation may contain forward-looking statements, including statements of goals, intentions, and expectations as to future trends, plans, events or results of Embassy Bancorp, Inc.’s (“Company”)
operations and policies and regarding general economic conditions. These forward-looking statements are intended to be covered by the safe harbor for forward-looking statements provided by the Private Securities Litigation Reform Act of 1995. These statements are based upon current and anticipated economic conditions, nationally and in the Company’s market, interest rates and interest rate policy, competitive factors and other conditions that, by their nature, are not susceptible to accurate forecast, and are subject to significant uncertainty.
Such forward-looking statements can be identified by the use of forward- looking terminology such as “believes”, “expects”, “may”, “intends”, “will”, “should”, “anticipates”, or the negative of any of the foregoing or other variations thereon or comparable terminology, or by discussion of strategy.
No assurance can be given that the future results covered by forward- looking statements will be achieved. Such statements are subject to risks, uncertainties, and other factors that could cause actual results to differ materially from future results expressed or implied by such forward- looking statements.
Important factors that could impact the Company’s operating results include, but are not limited to, (i) the effects of changing economic conditions in the Company’s market areas and nationally, (ii) credit risks of commercial, real estate, consumer and other lending activities, (iii) significant changes in interest rates and related deposit flows, (iv) changes in federal and state banking laws and regulations which could impact the Company’s operations including policies of the U.S. Department of Treasury and Federal Reserve system, (v) changes in accounting policies or procedures as may be required by FASB or regulatory agencies, (vi) geopolitical events in the Ukraine and Russia,
(vii) adverse developments in the financial industry generally, such as the recent bank failures and related responsive measures to manage such developments, and (viii) other external developments which could materially affect the Company’s business and operations, as well as the risks described in the Company’s Form 10-K for the year ended December 31, 2023 and subsequent filings with the SEC.
Certain information contained in this presentation and statements made orally during this presentation relate to or are based on publications and other data obtained from third-party sources. While the Company believes these third-party sources to be reliable as of the date of this presentation, the Company has not independently verified, and makes no representation as to the adequacy, fairness, accuracy or completeness of, any information obtained from third-party sources.
2

Board
of Directors
Frank "Chip" Banko IIIGeoffrey F. BoyerJohn G. EnglessonBernard M. Lesavoy
David M. Lobach, Jr.
Chairman
3
John C. PittmanPatti Gates SmithJohn T. Yurconic

Leadership Team
David M. Lobach, Jr.Judith A. HunsickerDiane M. CunninghamLynne M. Neel
Mark A. CascianoMichael B. MacyJeffrey C. SkuminBrandi L. StefanovJennifer A. Tropeano
4

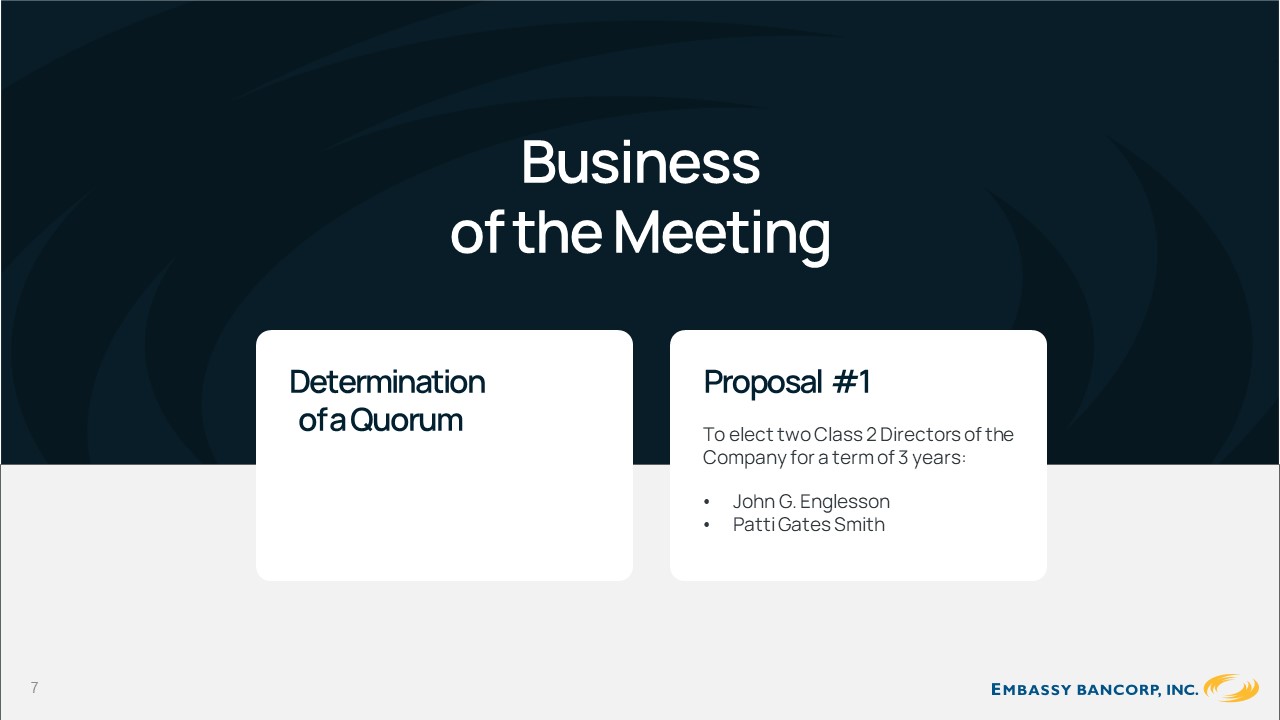
Business
of the Meeting
5

Business
of the Meeting
Determination of a Quorum
Proposal #1
To elect two Class 2 Directors of the Company for a term of 3 years:
• John G. Englesson
• Patti Gates Smith
7
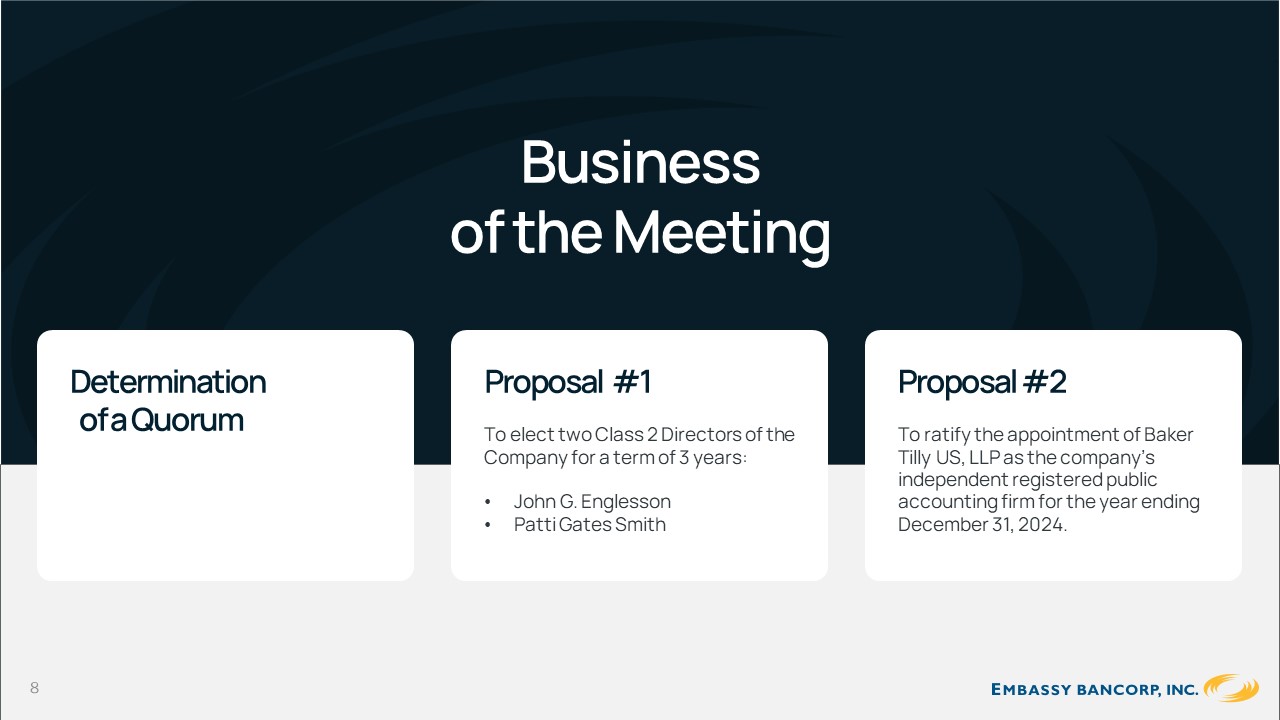
Business
of the Meeting
Determination of a Quorum
Proposal #1
To elect two Class 2 Directors of the Company for a term of 3 years:
• John G. Englesson
• Patti Gates Smith
Proposal #2
To ratify the appointment of Baker Tilly US, LLP as the company’s independent registered public accounting firm for the year ending December 31, 2024.
8

Business
of the Meeting
Final Voting in Progress
9

Business
of the Meeting
The Polls are Now Closed
10
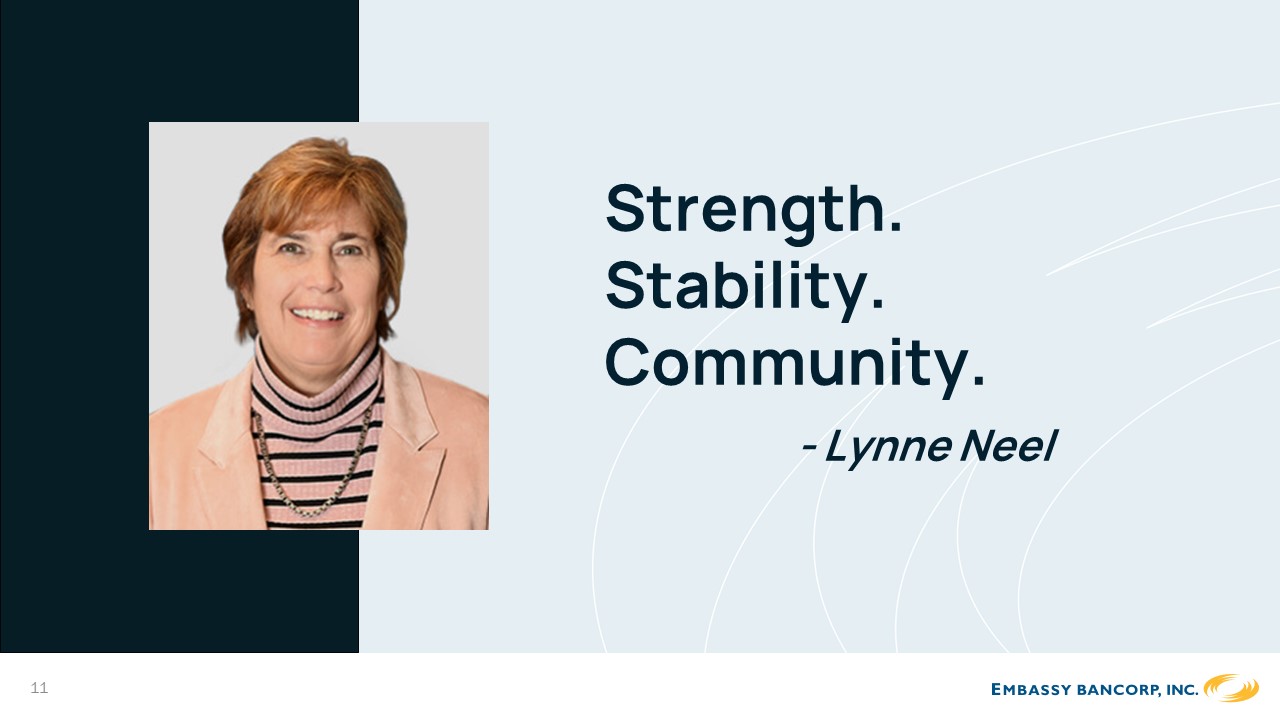
Strength. Stability.
Community.
- Lynne Neel
11
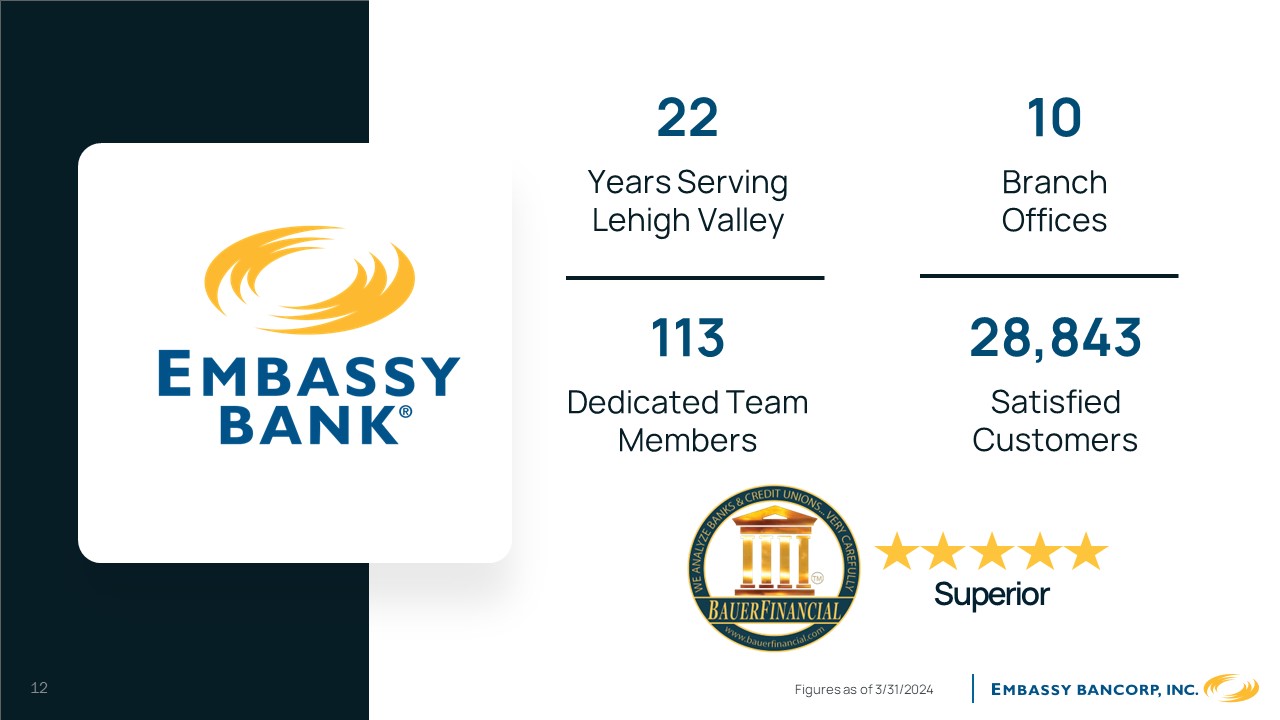
22
Years Serving Lehigh Valley
113
Dedicated Team Members
10
Branch Offices
28,843
Satisfied
Customers
Superior
12Figures as of 3/31/2024
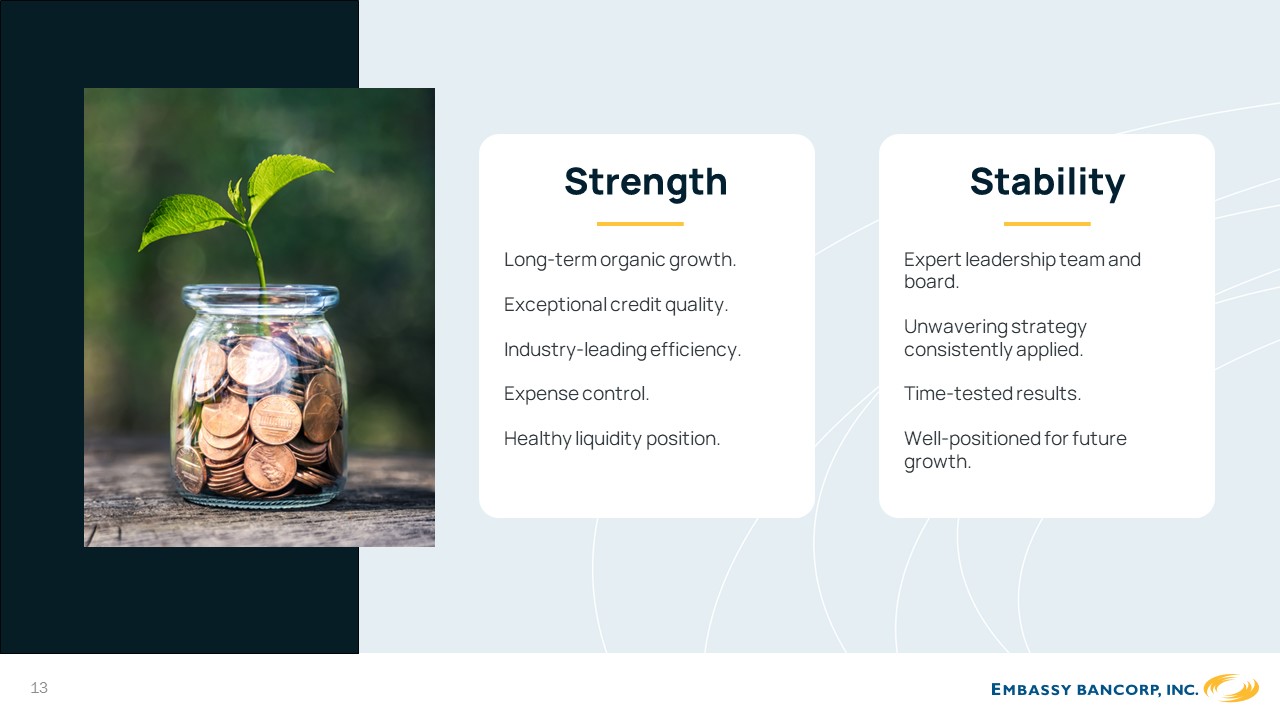
Strength
Long-term organic growth. Exceptional credit quality. Industry-leading efficiency. Expense control.
Healthy liquidity position.
Stability
Expert leadership team and board.
Unwavering strategy consistently applied.
Time-tested results.
Well-positioned for future growth.
13
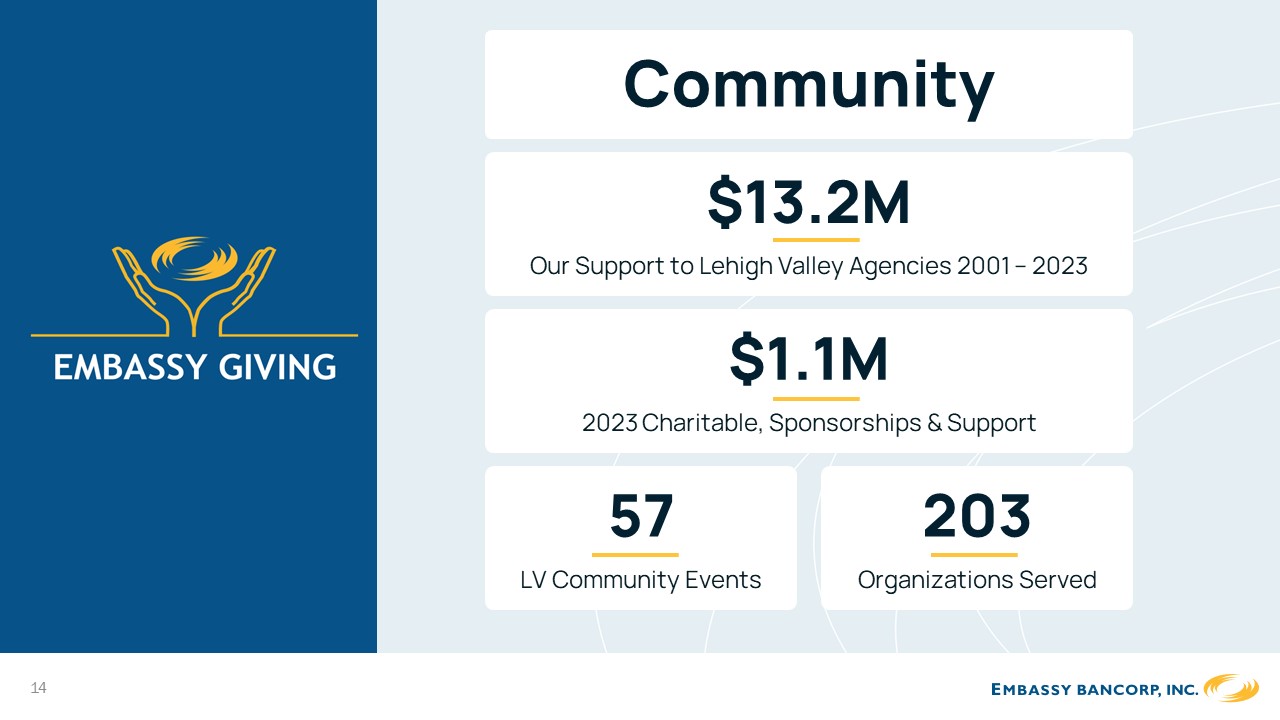
Community
$13.2M
Our Support to Lehigh Valley Agencies 2001 – 2023
$1.1M
2023 Charitable, Sponsorships & Support
57
LV Community Events
203
Organizations Served
14
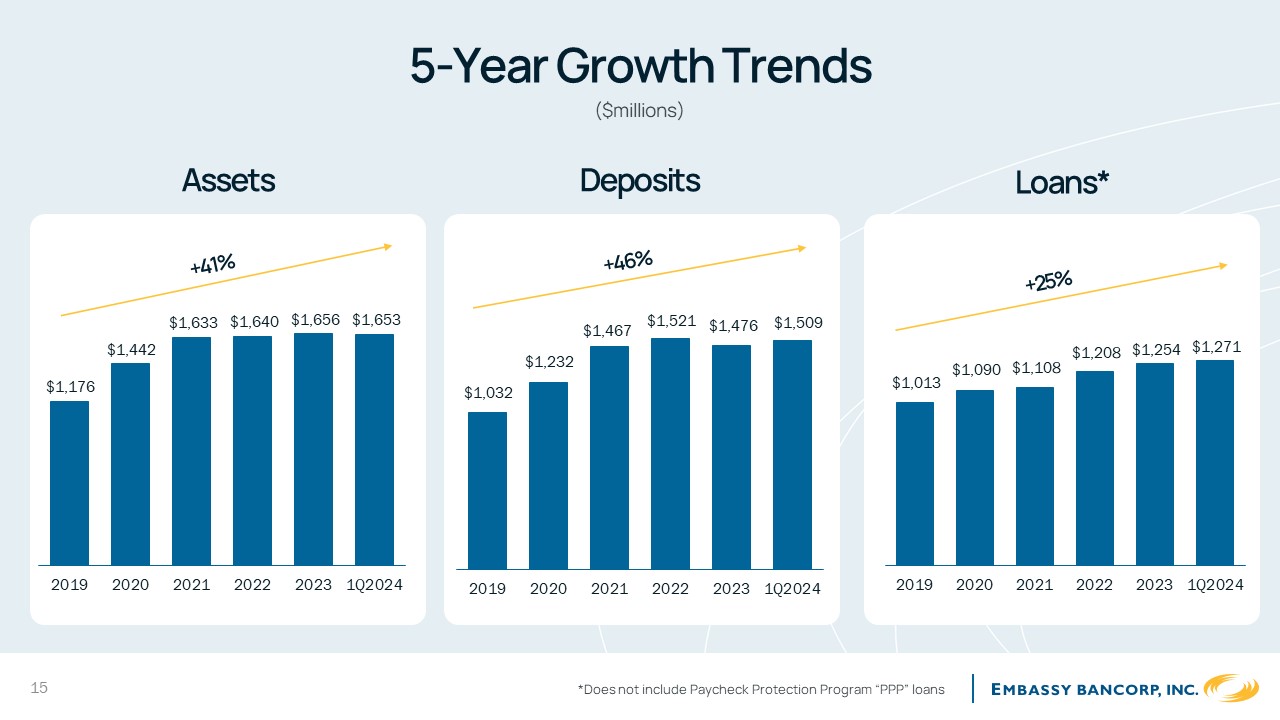
5-Year Growth Trends
($millions)
AssetsDepositsLoans*
$1,176
$1,442
$1,633 $1,640 $1,656 $1,653
$1,032
$1,232
$1,467$1,521 $1,476$1,509
$1,013
$1,090 $1,108
$1,208 $1,254 $1,271
201920202021202220231Q2024
201920202021202220231Q2024
20192020202120222023 1Q2024
15*Does not include Paycheck Protection Program “PPP” loans
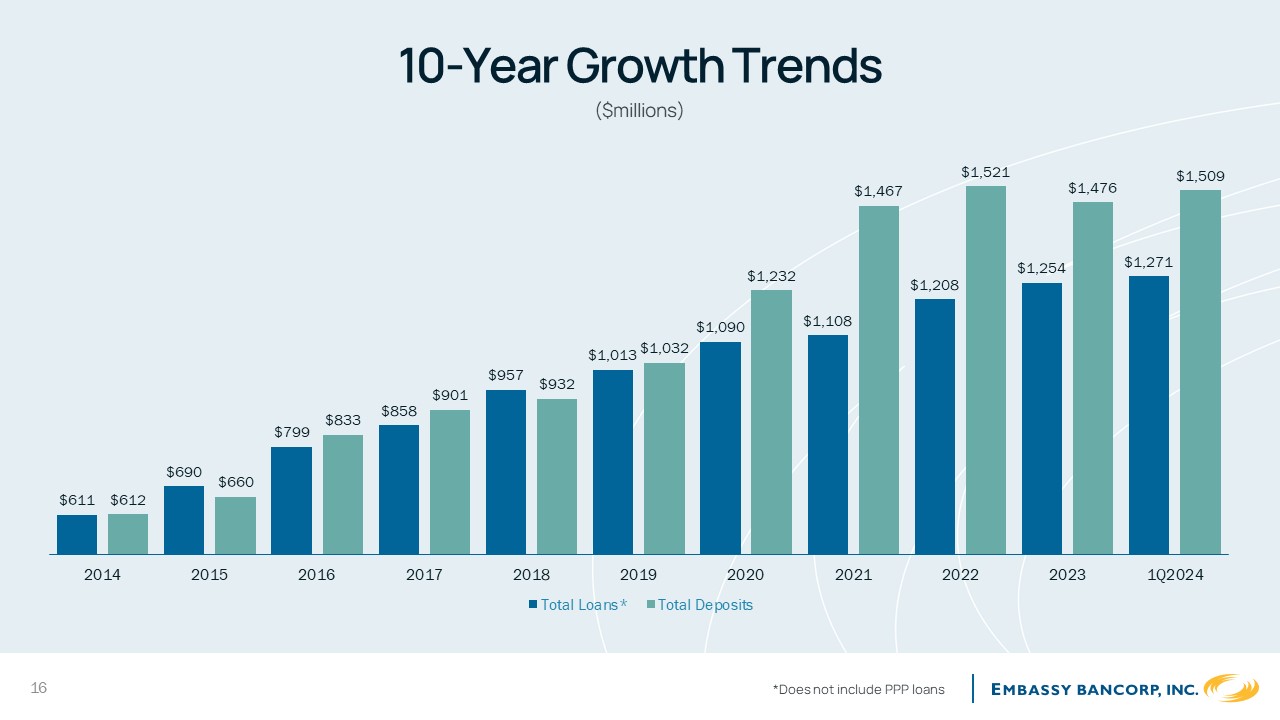
10-Year Growth Trends
($millions)
$1,521$1,509
$1,467$1,476
$611
$612$690$660$799$833$858$901$957$932$1,013 $1,032
$1,090
$1,232
$1,108
$1,254
$1,208
$1,271
20142015201620172018201920202021202220231Q2024
Total Loans*Total Deposits
16*Does not include PPP loans
Deposits Cost of Funds Market Share
- Diane Cunningham
17
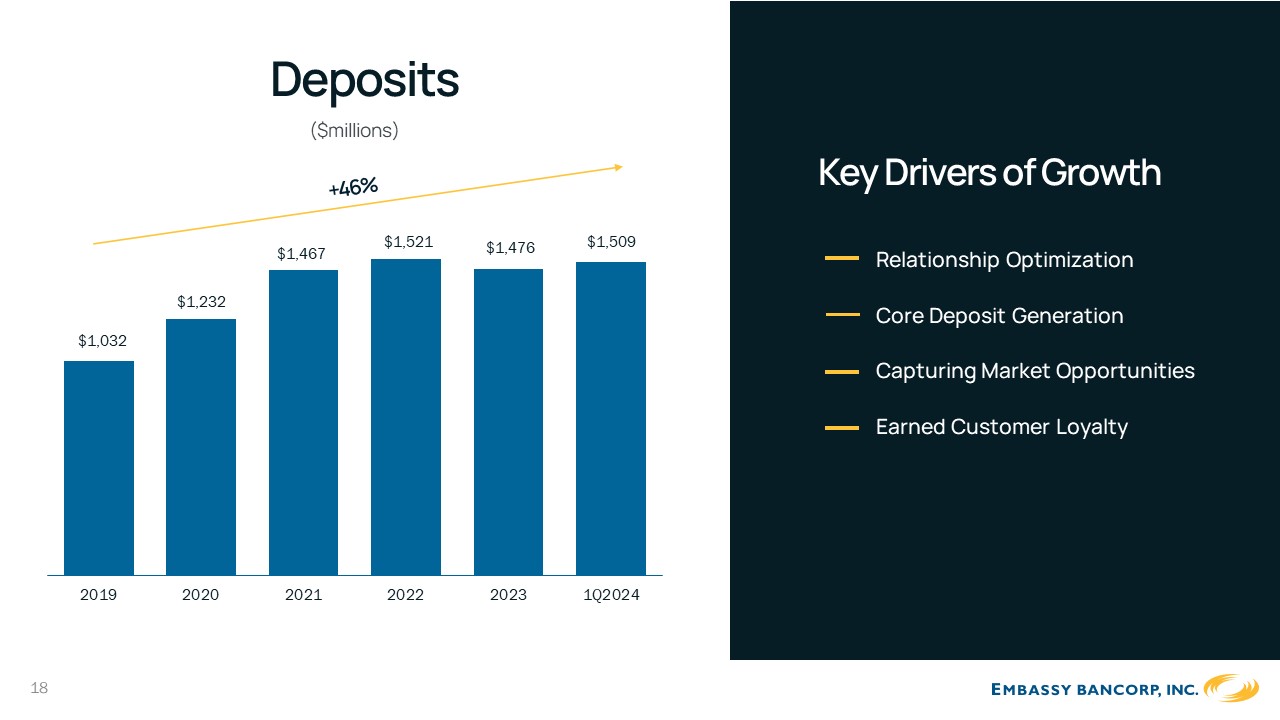
Deposits
($millions)
201920202021202220231Q2024
18
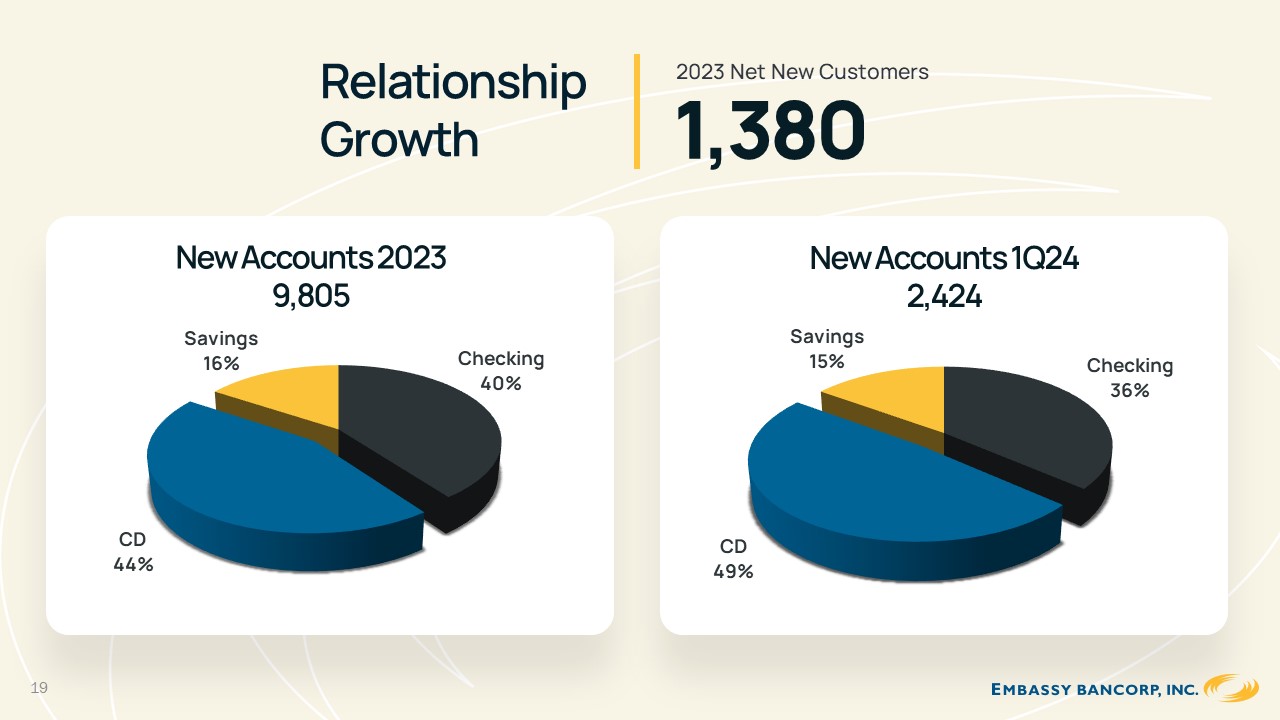
Relationship Growth
2023 Net New Customers
1,380
New Accounts 2023 9,805
Savings 16%
Checking 40%
New Accounts 1Q24 2,424
Savings
15%
Checking 36%
CD 44%
CD 49%
19
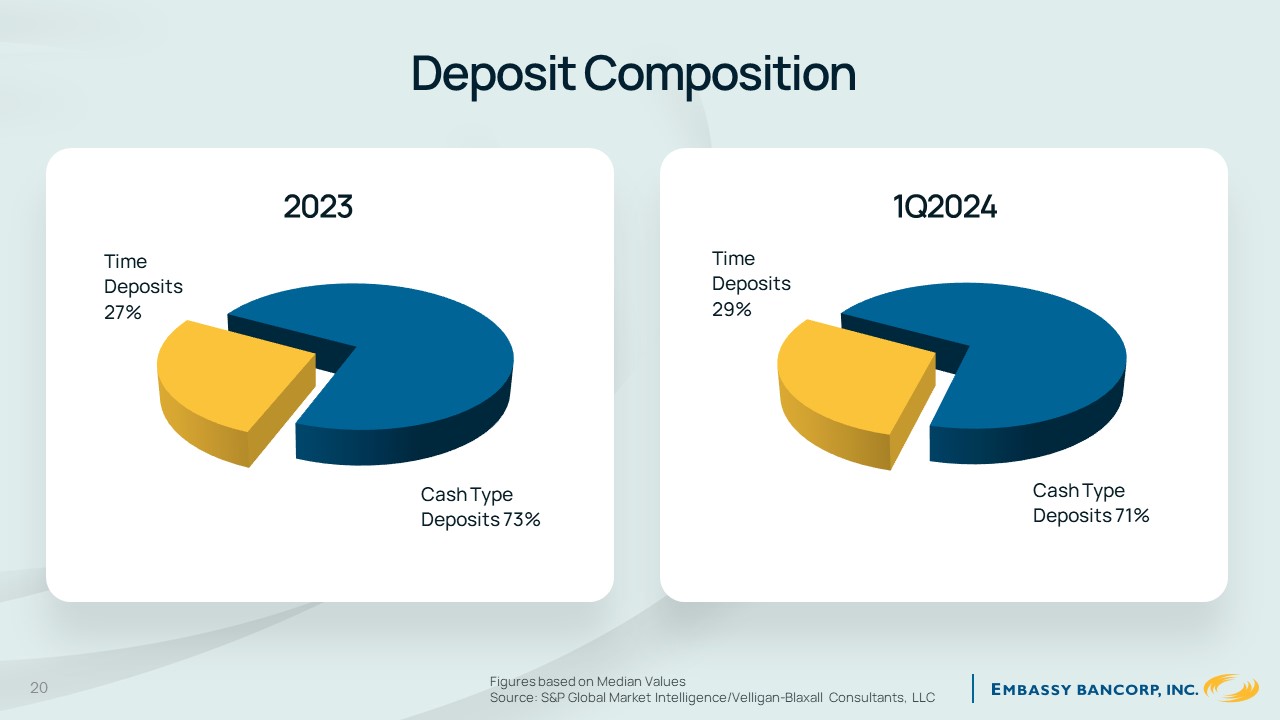
Deposit Composition
Time Deposits 27%
20231Q2024
Time Deposits 29%
Cash Type Deposits 73%
Cash Type Deposits 71%
20
Figures based on Median Values
Source: S&P Global Market Intelligence/Velligan-Blaxall Consultants, LLC
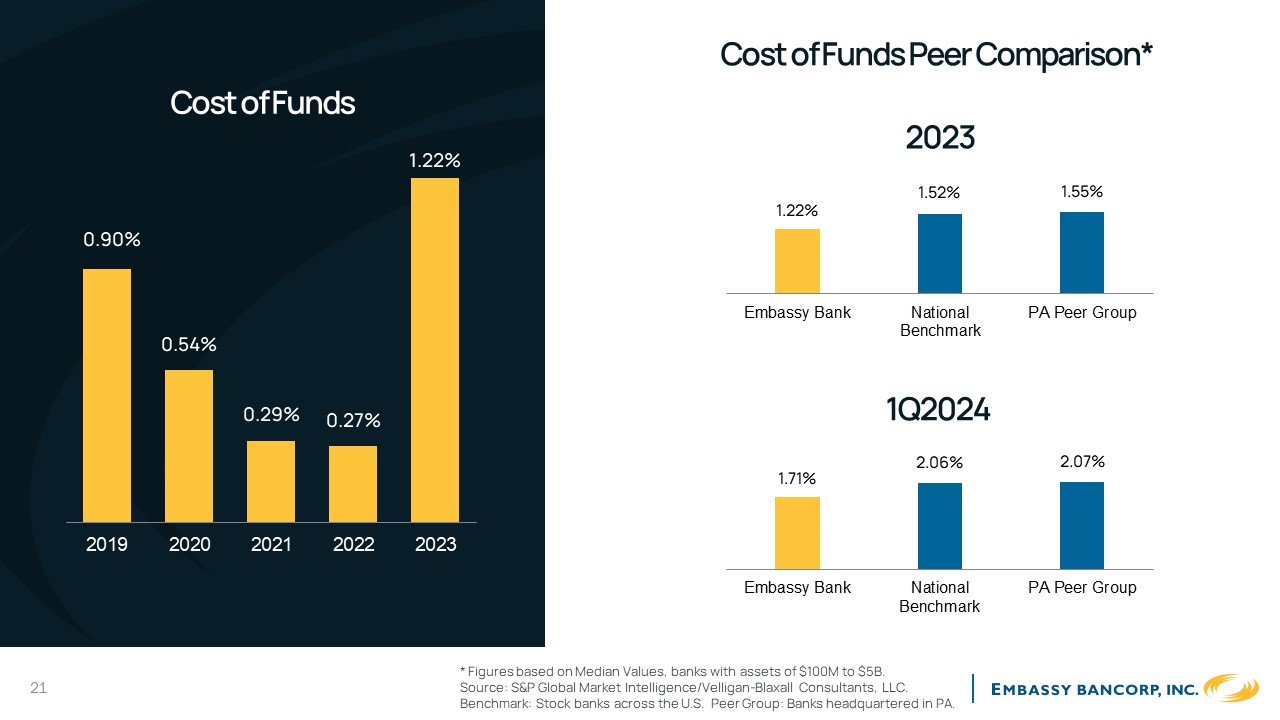
Cost of Funds Peer Comparison*
2023
1.52%1.55%
Embassy BankNational Benchmark
1Q2024
PA Peer Group
2.06%2.07%
Embassy BankNational Benchmark
PA Peer Group
* Figures based on Median Values, banks with assets of $100M to $5B.
21Source: S&P Global Market Intelligence/Velligan-Blaxall Consultants, LLC. Benchmark: Stock banks across the U.S. Peer Group: Banks headquartered in PA.
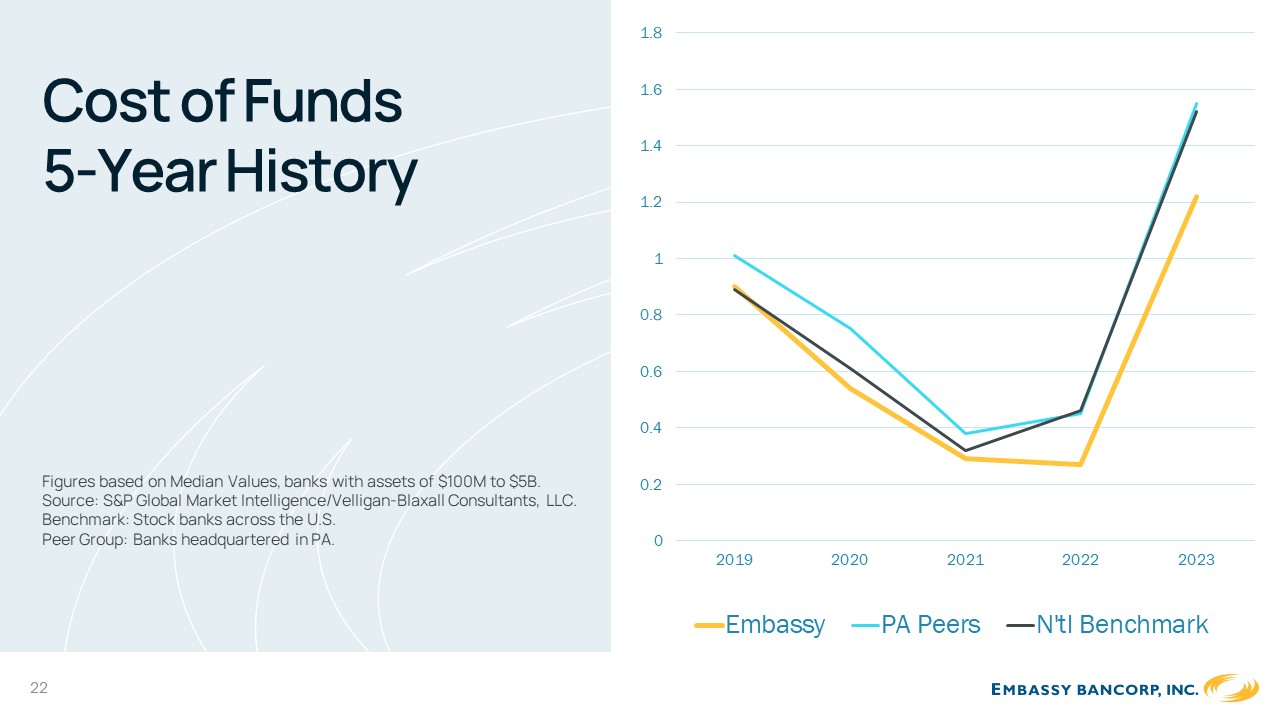
Cost of Funds 5-Year History
1.8
1.6
1.4
1.2
1
0.8
0.6
0.4
Figures based on Median Values, banks with assets of $100M to $5B. Source: S&P Global Market Intelligence/Velligan-Blaxall Consultants, LLC. Benchmark: Stock banks across the U.S.
0.2
Peer Group: Banks headquartered in PA.0
20192020202120222023
EmbassyPA PeersN'tl Benchmark
22
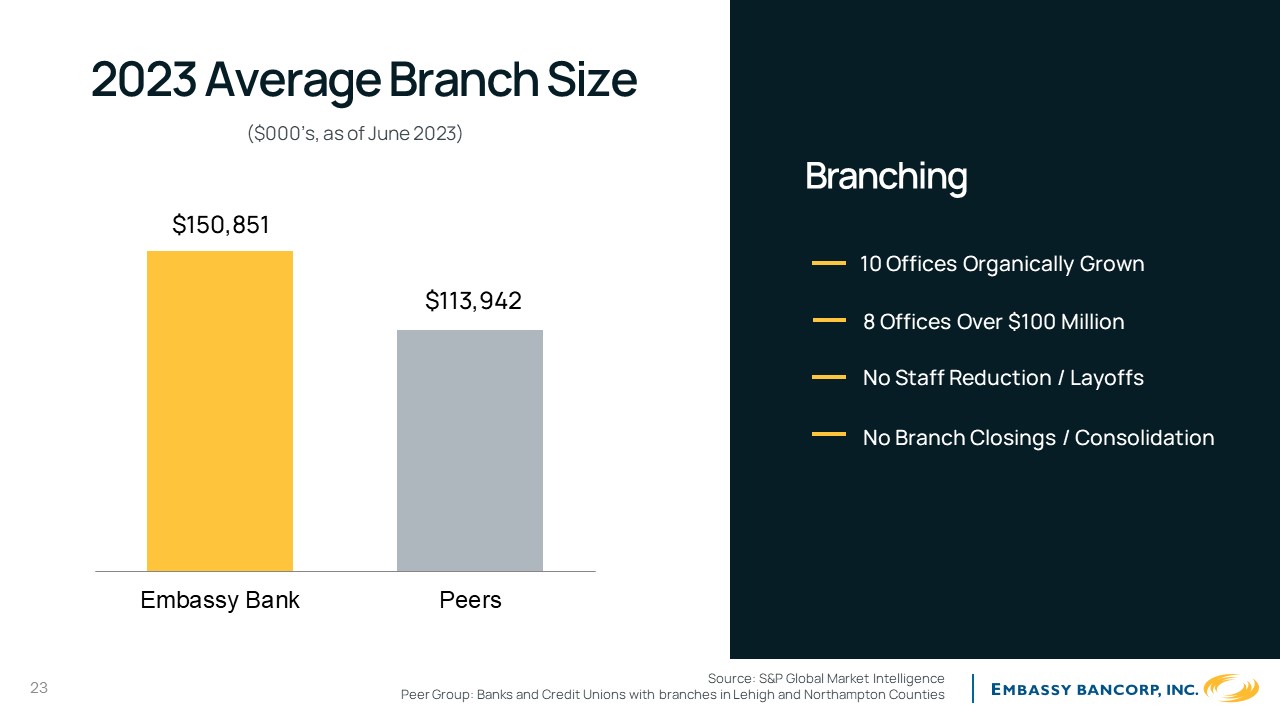
2023 Average Branch Size
($000’s, as of June 2023)
$150,851
Embassy BankPeers
Source: S&P Global Market Intelligence Peer Group: Banks and Credit Unions with branches in Lehigh and Northampton Counties
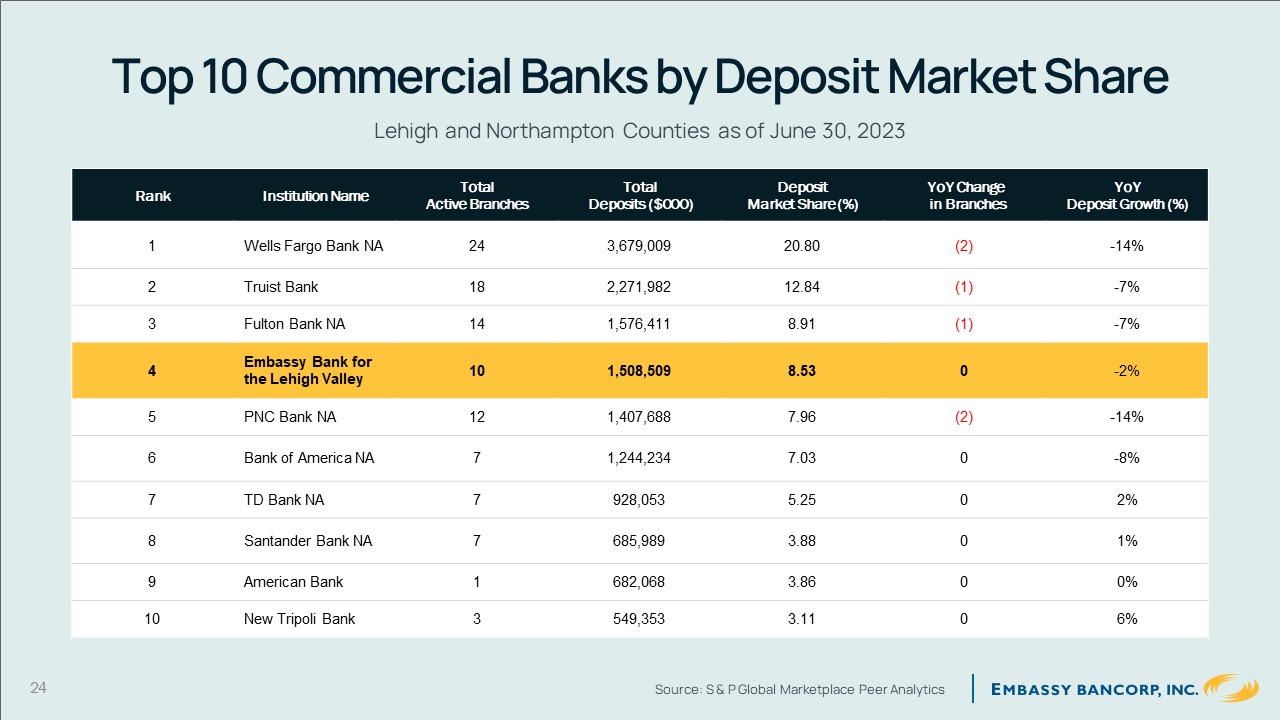
Top 10 Commercial Banks by Deposit Market Share
Lehigh and Northampton Counties as of June 30, 2023
RankInstitution NameTotalActive BranchesTotalDeposits ($000)DepositMarket Share (%)YoY Changein BranchesYoYDeposit Growth (%)1Wells Fargo Bank NA243,679,00920.80(2)-14%2Truist Bank182,271,982
12.84(1)-7%3Fulton Bank NA141,576,4118.91(1)-7%4Embassy Bank for the Lehigh Valley101,508,509
8.530-2%5PNC Bank NA121,407,6887.96(2)-14%6Bank of America NA71,244,2347.030-8%7TD Bank NA
7928,0535.2502%8Santander Bank NA7685,9893.8801%9American Bank1682,0683.8600%10New Tripoli Bank3549,3533.1106%
24Source: S & P Global Marketplace Peer Analytics
Lending Asset Quality Liquidity
- Judy Hunsicker
25
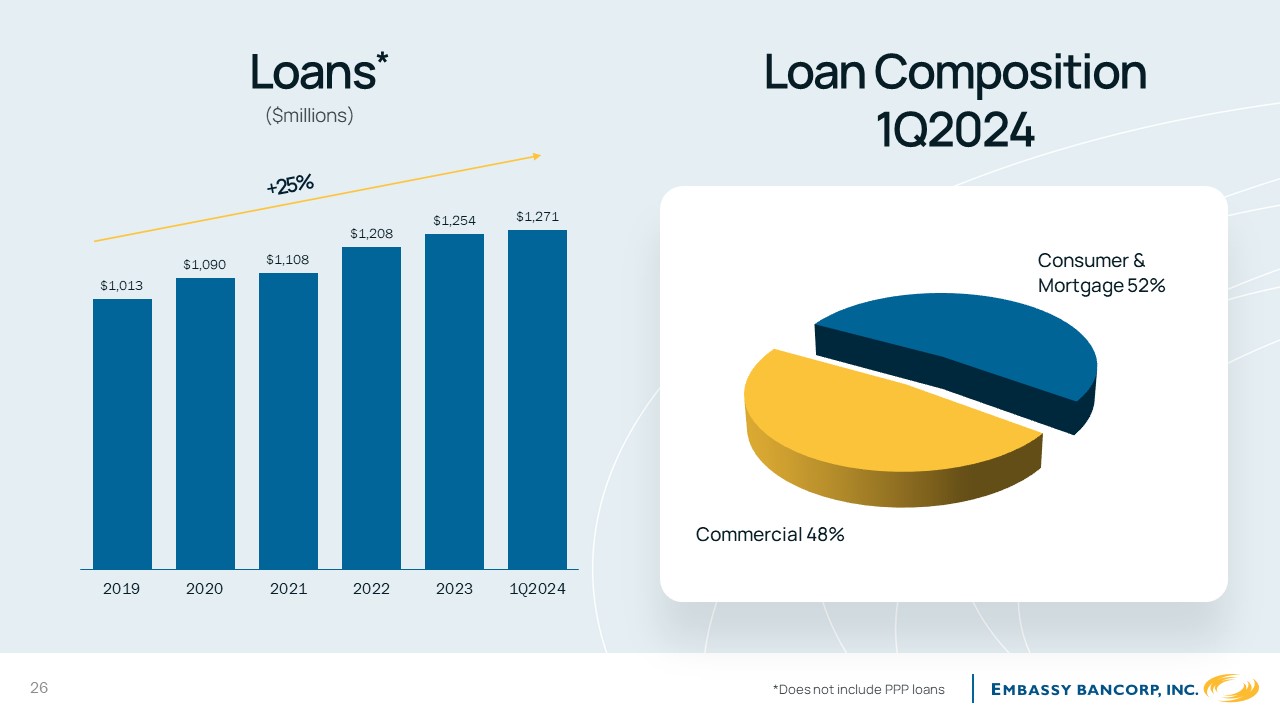
Loans*
($millions)
Loan Composition 1Q2024
$1,013
$1,090$1,108
Consumer &
Mortgage 52%
Commercial 48%
201920202021202220231Q2024
26*Does not include PPP loans
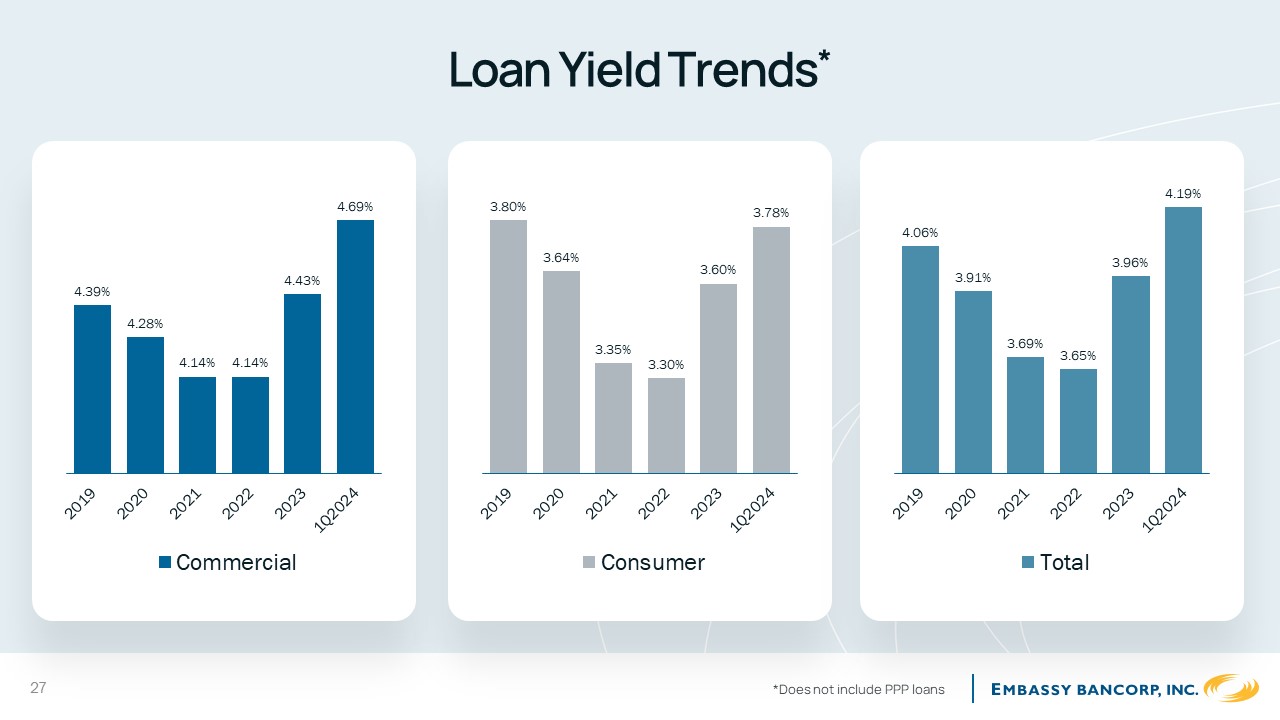
Loan Yield Trends*4.39%4.43%4.69%3.80%3.64%3.60%3.78%4.06%3.91%3.96%4.19%4.28%4.14%4.14%
3.35%3.30%3.69%3.65%CommercialConsumerTotal
27*Does not include PPP loans
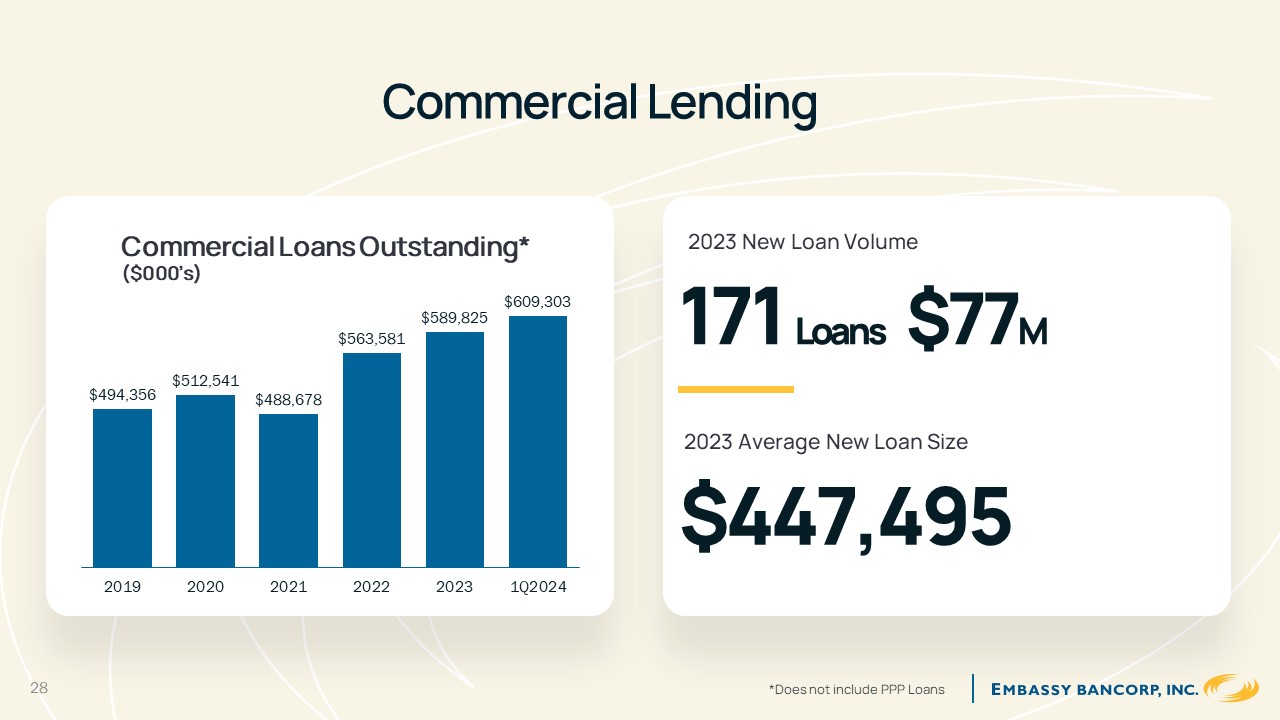
Commercial Lending
Commercial Loans Outstanding*
2023 New Loan Volume
($000’s)
$512,541
$494,356$488,678
$589,825
$563,581
$609,303
171
Loans
$77M
201920202021202220231Q2024
2023 Average New Loan Size
$447,495
28*Does not include PPP Loans
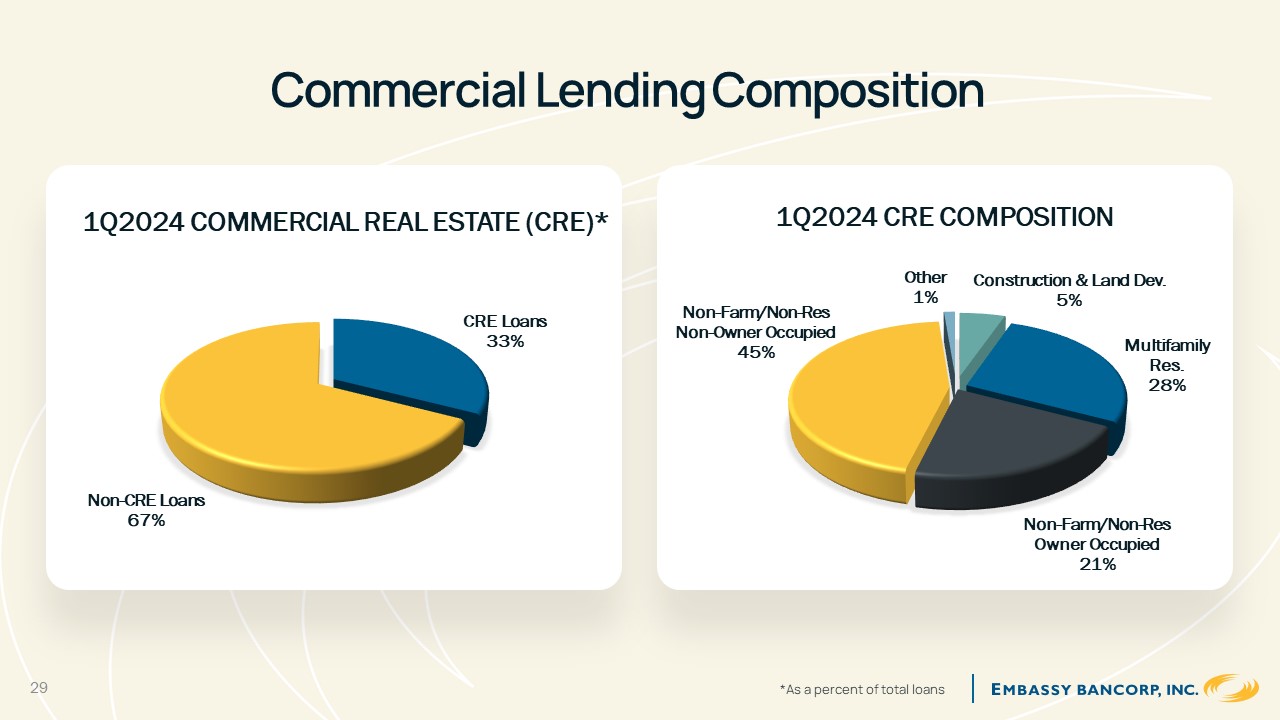
Commercial Lending Composition
1Q2024 COMMERCIAL REAL ESTATE (CRE)*
1Q2024 CRE COMPOSITION
Non-CRE Loans 67%
CRE Loans 33%
Non-Farm/Non-Res Non-Owner Occupied 45%
Other 1%
Construction & Land Dev.
5%
Multifamily Res.
28%
Non-Farm/Non-Res Owner Occupied 21%
29*As a percent of total loans
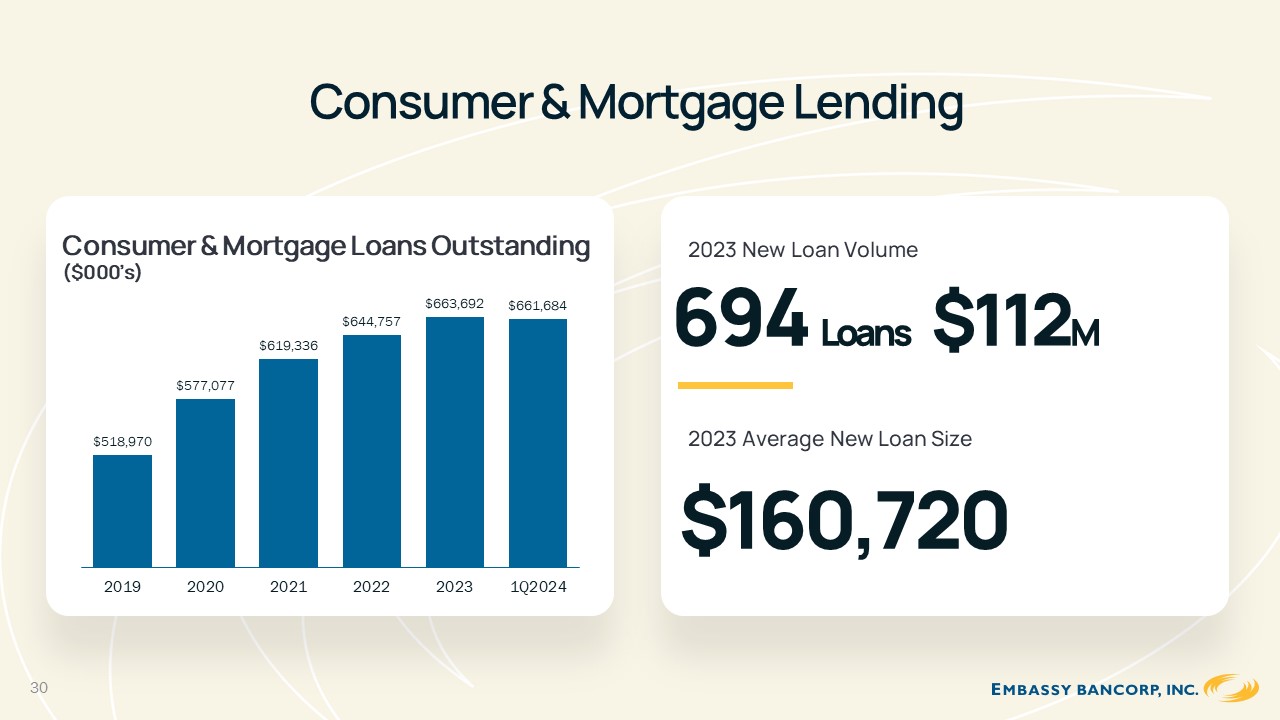
Consumer & Mortgage Lending
Consumer & Mortgage Loans Outstanding
($000’s)
2023 New Loan Volume
$663,692$661,684
$644,757
$619,336
694 Loans
$112M
$577,077
$518,970
201920202021202220231Q2024
2023 Average New Loan Size
$160,720
30
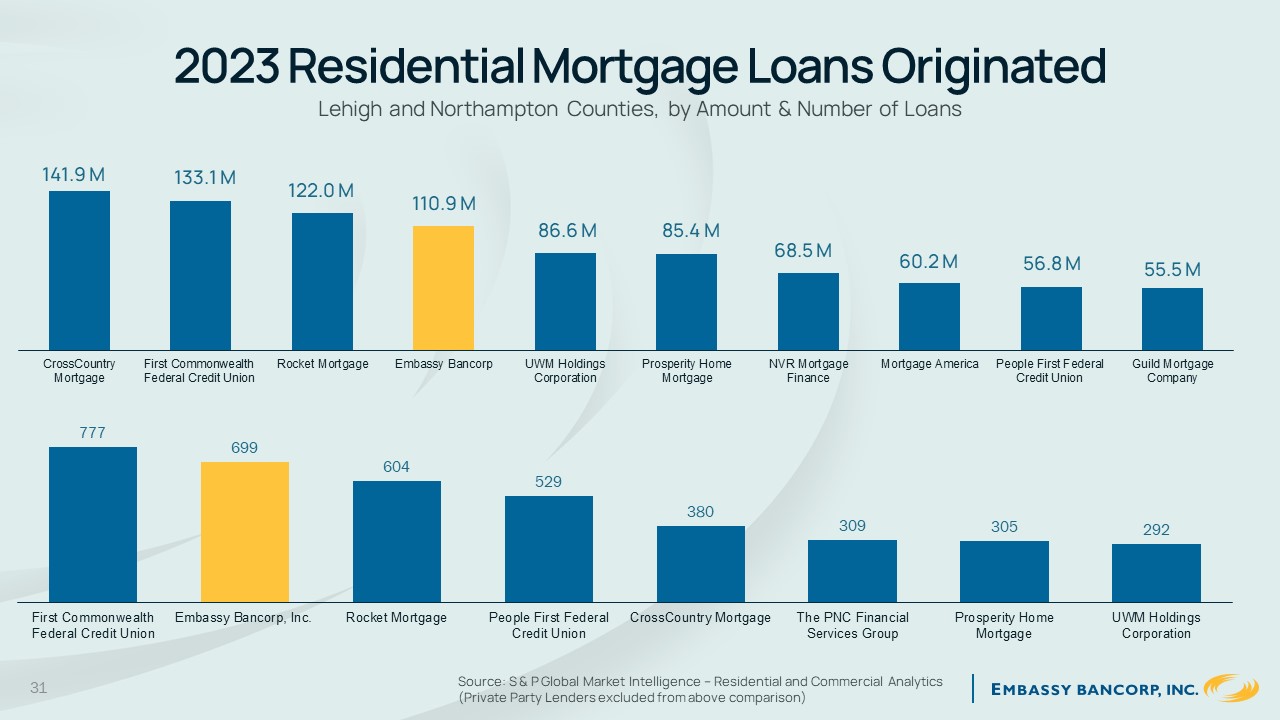
2023 Residential Mortgage Loans Originated
Lehigh and Northampton Counties, by Amount & Number of Loans
141.9 M133.1 M122.0 M110.9 M86.6 M85.4 M68.5 M60.2 M56.8 M55.5 M
CrossCountry
First Commonwealth
Rocket Mortgage
Embassy Bancorp
UWM Holdings
Prosperity Home
NVR Mortgage
Mortgage America
People First Federal
Guild Mortgage
Mortgage
Federal Credit Union
Corporation
Mortgage
FinanceCredit Union
Company777699604529380309305292
First CommonwealthEmbassy Bancorp, Inc.Rocket MortgagePeople First FederalCrossCountry MortgageThe PNC FinancialProsperity HomeUWM HoldingsFederal Credit UnionCredit UnionServices Group
Mortgage
Corporation
31Source: S & P Global Market Intelligence – Residential and Commercial Analytics
(Private Party Lenders excluded from above comparison)

Asset Quality
Non-Performing Assets to Total Assets
20231Q2024
0.41%
0.37%
0.24%
0.25%
0.13%
0.12%
Embassy BankNational BenchmarkPA Peer GroupEmbassy BankNational BenchmarkPA Peer Group
Figures based on Median Values, banks with assets of $100M to $5B.
32Source: S&P Global Market Intelligence/Velligan-Blaxall Consultants, LLC. Benchmark: Stock banks across the U.S. Peer Group: Banks headquartered in PA.
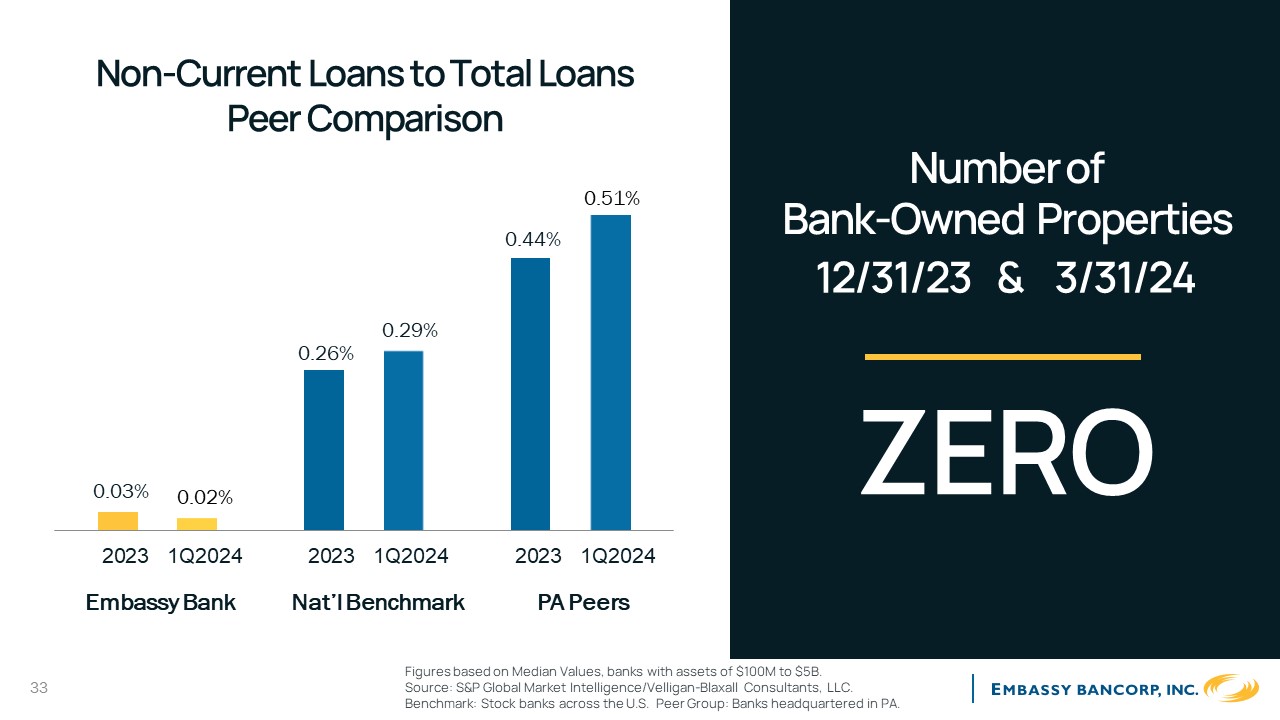
Non-Current Loans to Total Loans Peer Comparison
0.51%
20231Q202420231Q202420231Q2024
Number of
Bank-Owned Properties
12/31/23 & 3/31/24
ZERO
Embassy BankNat’l BenchmarkPA Peers
Figures based on Median Values, banks with assets of $100M to $5B.
33Source: S&P Global Market Intelligence/Velligan-Blaxall Consultants, LLC. Benchmark: Stock banks across the U.S. Peer Group: Banks headquartered in PA.
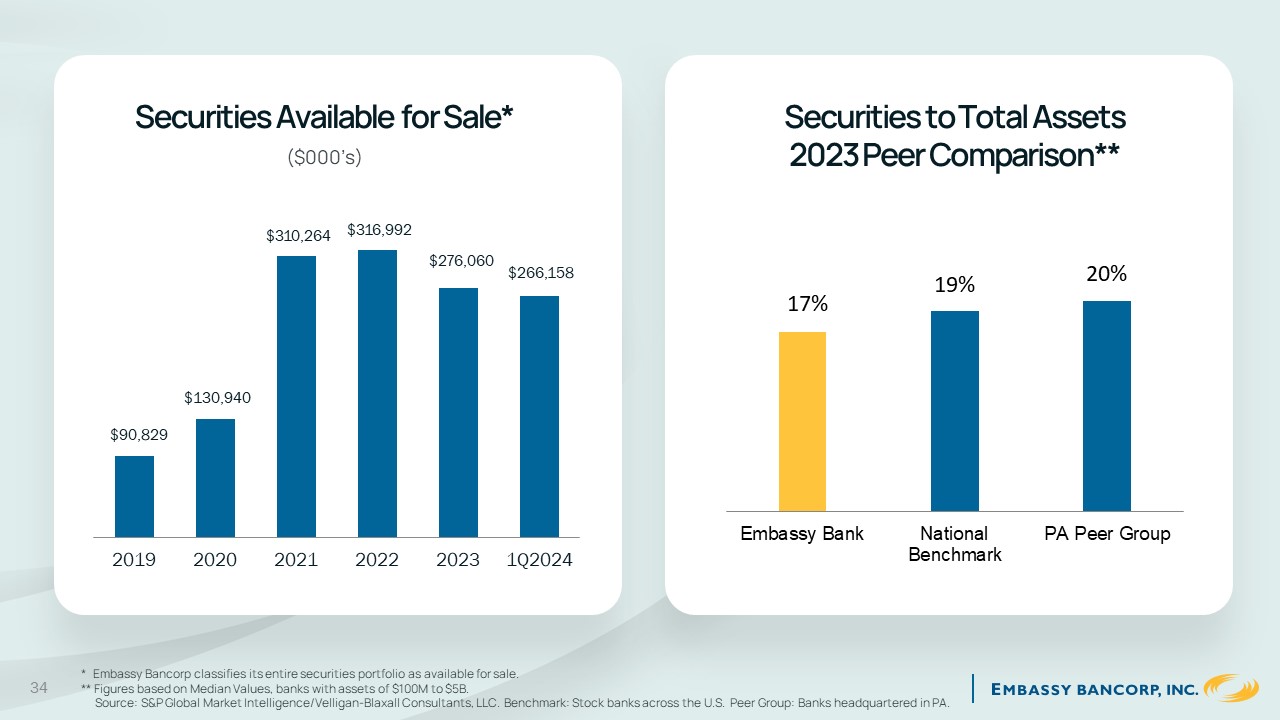
Securities Available for Sale*Securities to Total Assets
($000’s)
2023 Peer Comparison**
$310,264 $316,992
$276,060 $266,158
17%19%20%$130,940$90,829
201920202021202220231Q2024
Embassy BankNational Benchmark
PA Peer Group
* Embassy Bancorp classifies its entire securities portfolio as available for sale.
34** Figures based on Median Values, banks with assets of $100M to $5B.
Source: S&P Global Market Intelligence/Velligan-Blaxall Consultants, LLC. Benchmark: Stock banks across the U.S. Peer Group: Banks headquartered in PA.
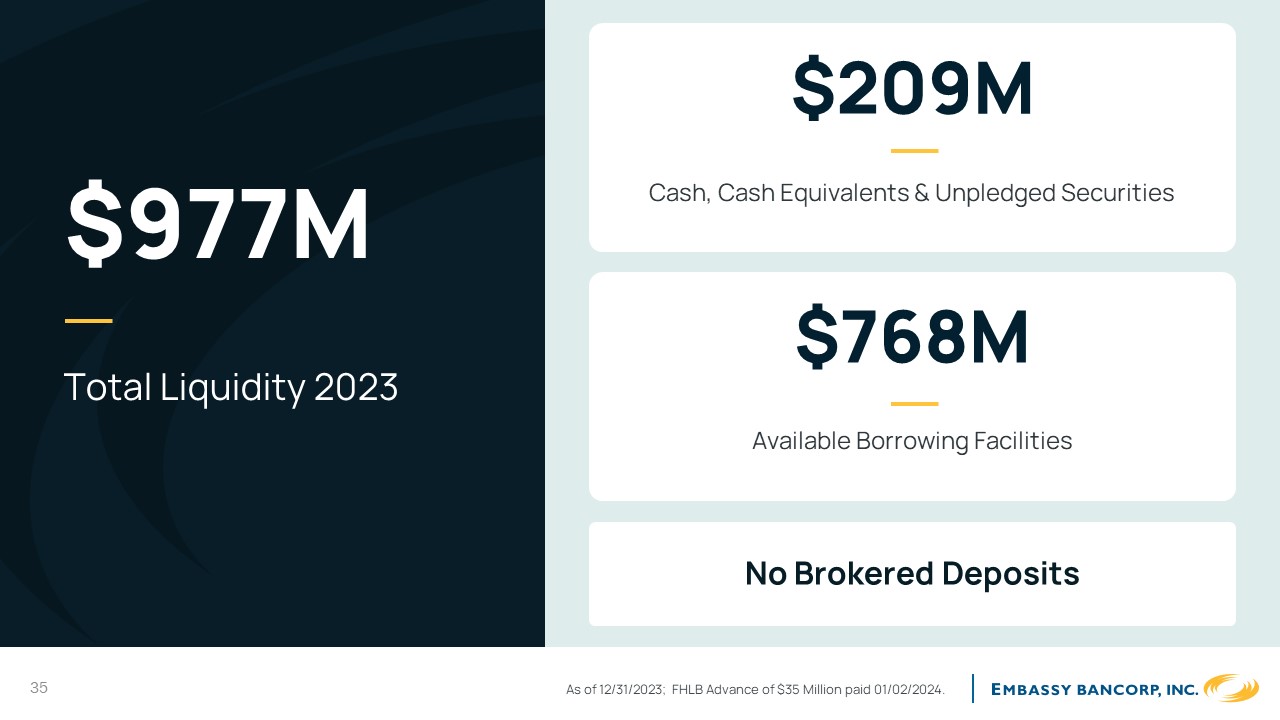
$977M total liquidity 2023 $209M Cash, Cash Equivalents & Unpledged securities $768M available borrowing facilities No brokered deposits as of 12/31/2023 FHLB Advance of $35 million paid on 01/02/2023 Embassy Bancorp, Inc.
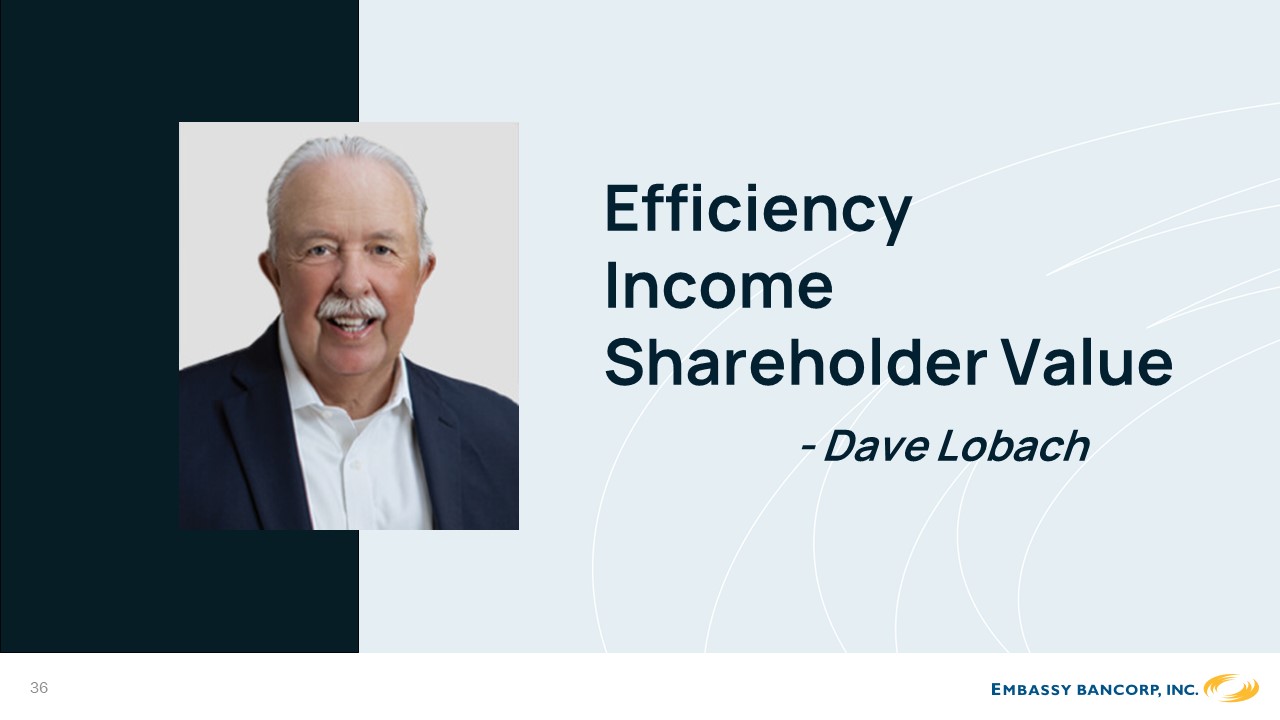
Efficiency Income
Shareholder Value
- Dave Lobach
36
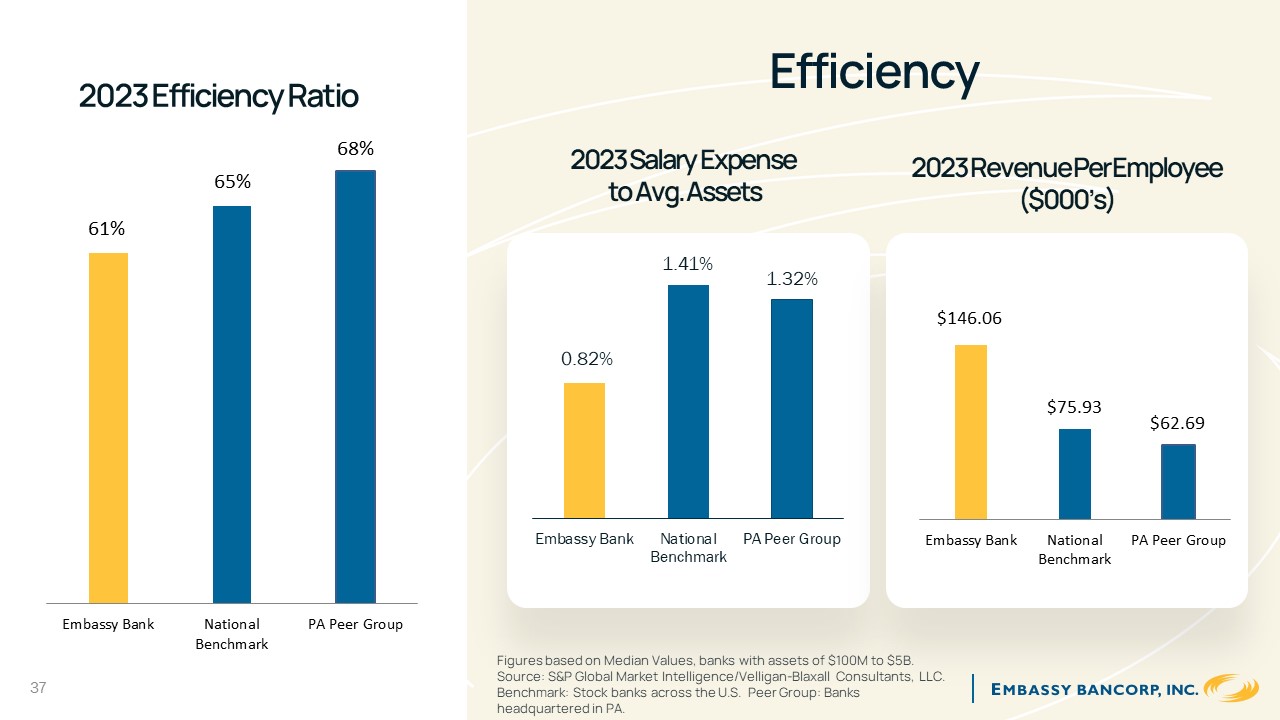
2023 Efficiency Ratio
Efficiency
61%65%68%2023SalaryExpensetoAvg.Assets1.41%2023RevenuePerEmployee($000’s)1.32%0.82%$146.06
$75.93$62.69Embassy BankNationalBenchmarkPA Peer GroupEmbassy BankNationalBenchmark
PA Peer GroupEmbassy BankNational Benchmark
37
PA Peer Group
Figures based on Median Values, banks with assets of $100M to $5B. Source: S&P Global Market Intelligence/Velligan-Blaxall Consultants, LLC. Benchmark: Stock banks across the U.S. Peer Group: Banks headquartered in PA.
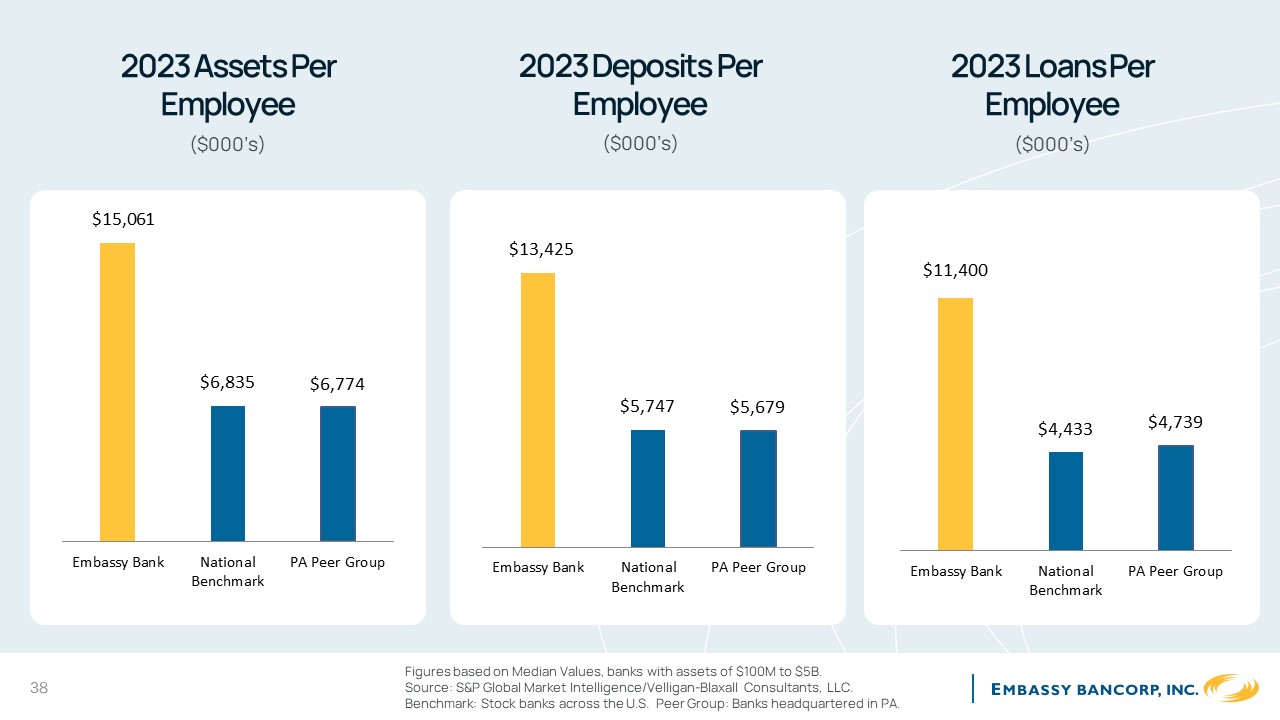
2023 Assets Per Employee
($000’s)
2023 Deposits Per Employee
($000’s)
2023 Loans Per Employee
($000’s)
$15,061$13,425$11,400$6,835$6,774$5,747$5,679$4,433$4,739
Embassy BankNationalBenchmarkPA Peer GroupEmbassy BankNationalBenchmarkPA Peer Group
Embassy BankNationalBenchmarkPA Peer Group
Figures based on Median Values, banks with assets of $100M to $5B.
38Source: S&P Global Market Intelligence/Velligan-Blaxall Consultants, LLC. Benchmark: Stock banks across the U.S. Peer Group: Banks headquartered in PA.
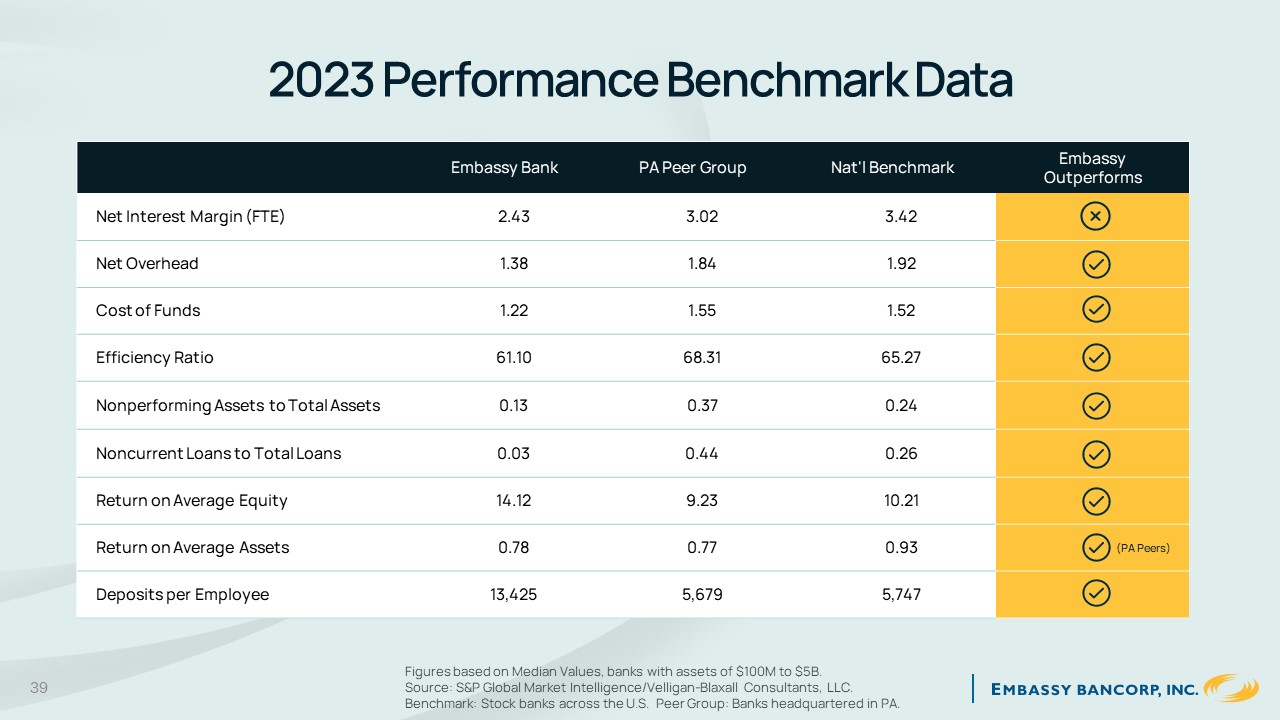
2023 Performance Benchmark Data
Embassy Bank
PA Peer Group
Nat'l Benchmark
Embassy Outperforms
Net Interest Margin (FTE)
2.43
3.02
3.42
Net Overhead
1.38
1.84
1.92
Cost of Funds
1.22
1.55
1.52
Efficiency Ratio
61.10
68.31
65.27
Nonperforming Assets to Total Assets
0.13
0.37
0.24
Noncurrent Loans to Total Loans
0.03
0.44
0.26
Return on Average Equity
14.12
9.23
10.21
Return on Average Assets
0.78
0.77
0.93
(PA Peers)
Deposits per Employee
13,425
5,679
5,747
Figures based on Median Values, banks with assets of $100M to $5B.
39Source: S&P Global Market Intelligence/Velligan-Blaxall Consultants, LLC. Benchmark: Stock banks across the U.S. Peer Group: Banks headquartered in PA.
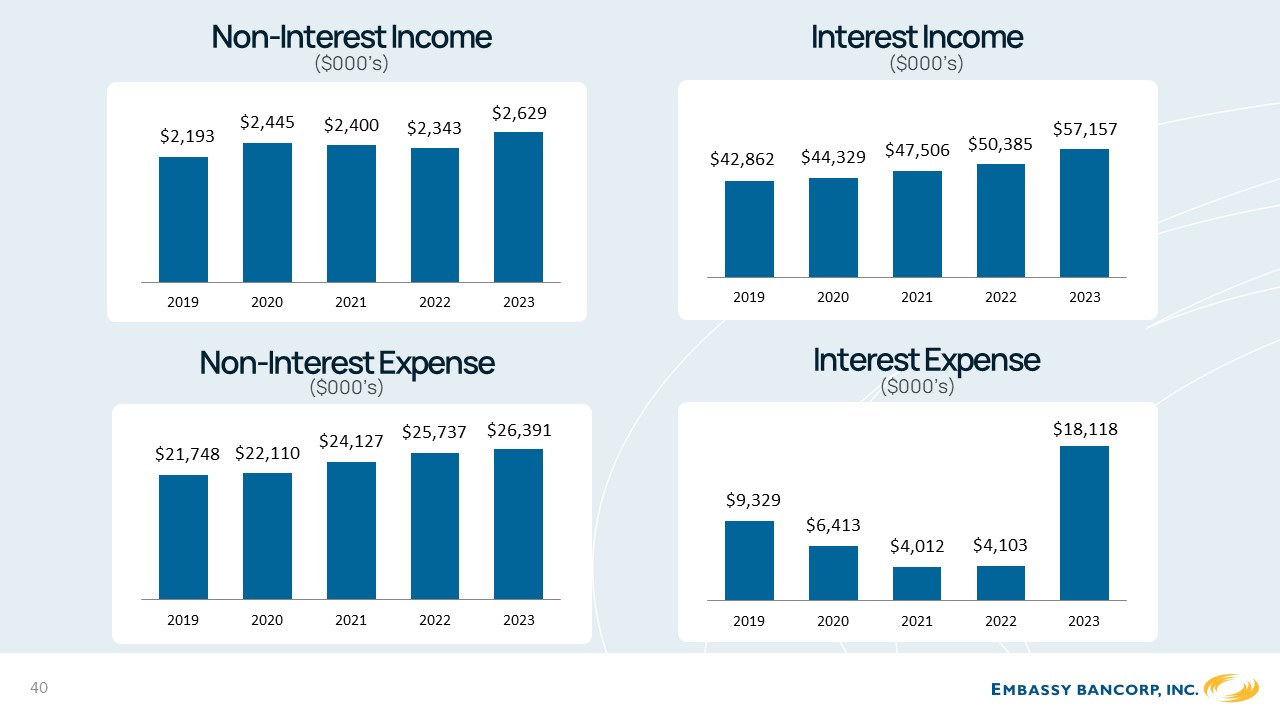
Non-Interest Income
($000’s)
$2,445$2,400$2,629
$2,193
Interest Income
($000’s)
$42,862$44,329$47,506$50,385
$57,157
20192020202120222023
Non-Interest Expense
($000’s)
$24,127$25,737$26,391
$21,748$22,110
20192020202120222023
Interest Expense
($000’s)
$18,118
$9,329
$6,413
$4,012$4,103
20192020202120222023
20192020202120222023
40
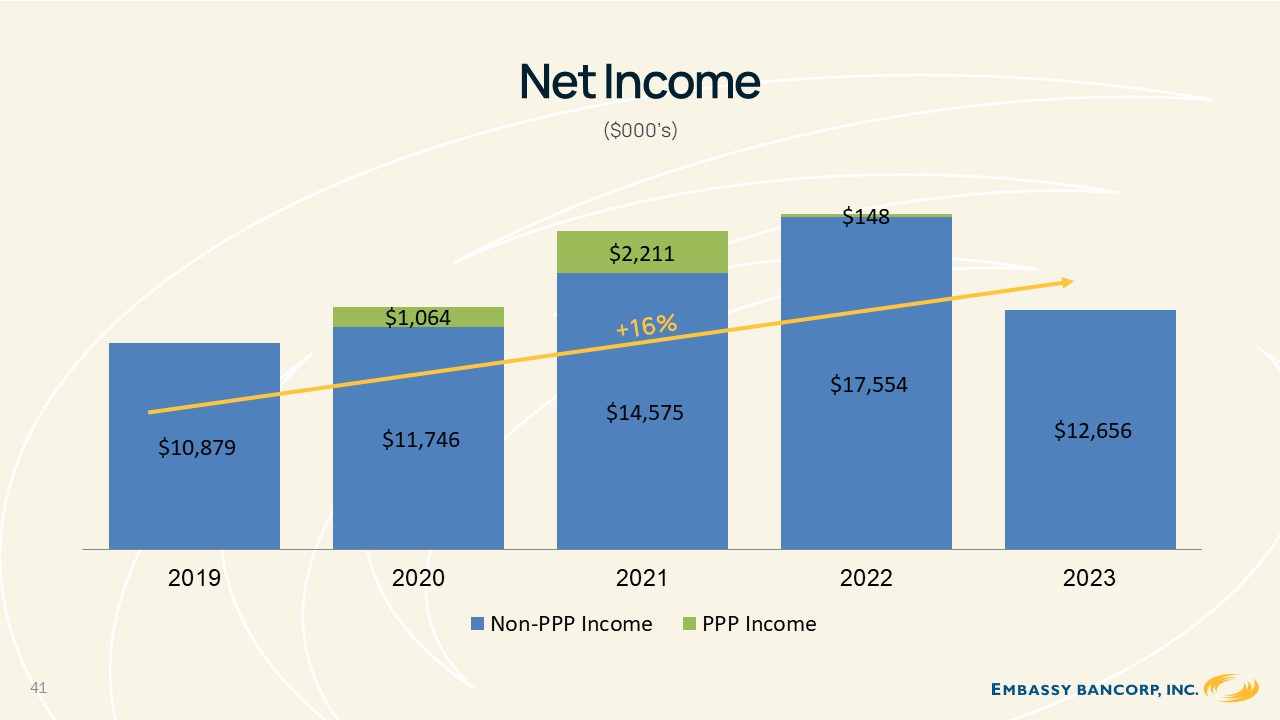
Net Income
($000’s)
20192020202120222023
Non-PPP Income PPP Income
41
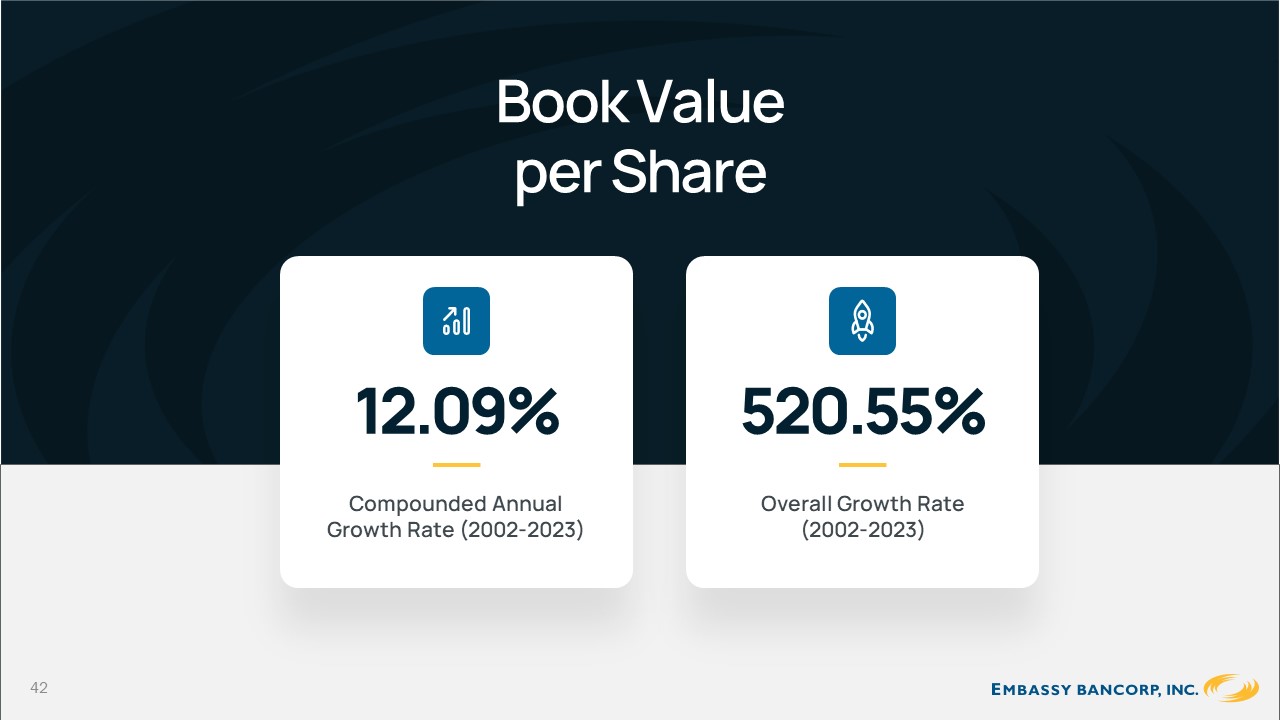
Book Value per Share
12.09%
Compounded Annual Growth Rate (2002-2023)
520.55%
Overall Growth Rate (2002-2023)
42
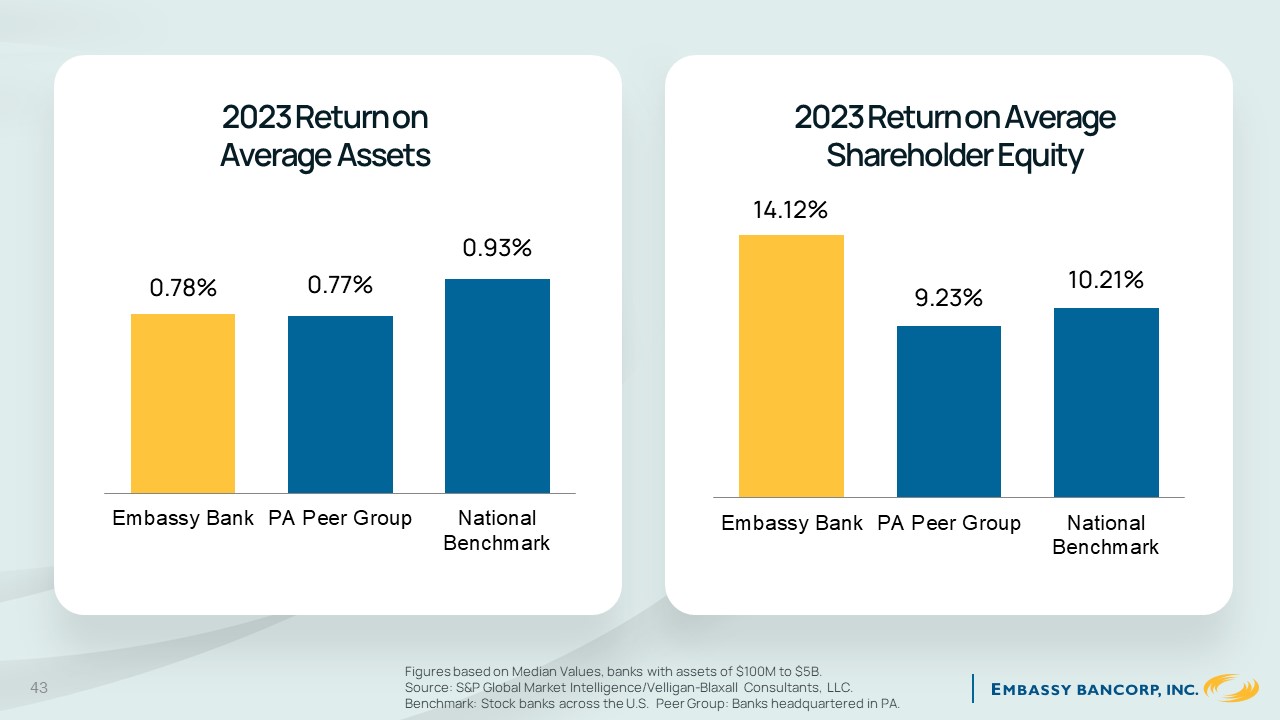
2023 Return on Average Assets
0.78%0.77%
0.93%
2023 Return on Average Shareholder Equity
14.12%
9.23%10.21%
Embassy Bank PA Peer GroupNational
Benchmark
Embassy Bank PA Peer GroupNational
Benchmark
Figures based on Median Values, banks with assets of $100M to $5B.
43Source: S&P Global Market Intelligence/Velligan-Blaxall Consultants, LLC. Benchmark: Stock banks across the U.S. Peer Group: Banks headquartered in PA.
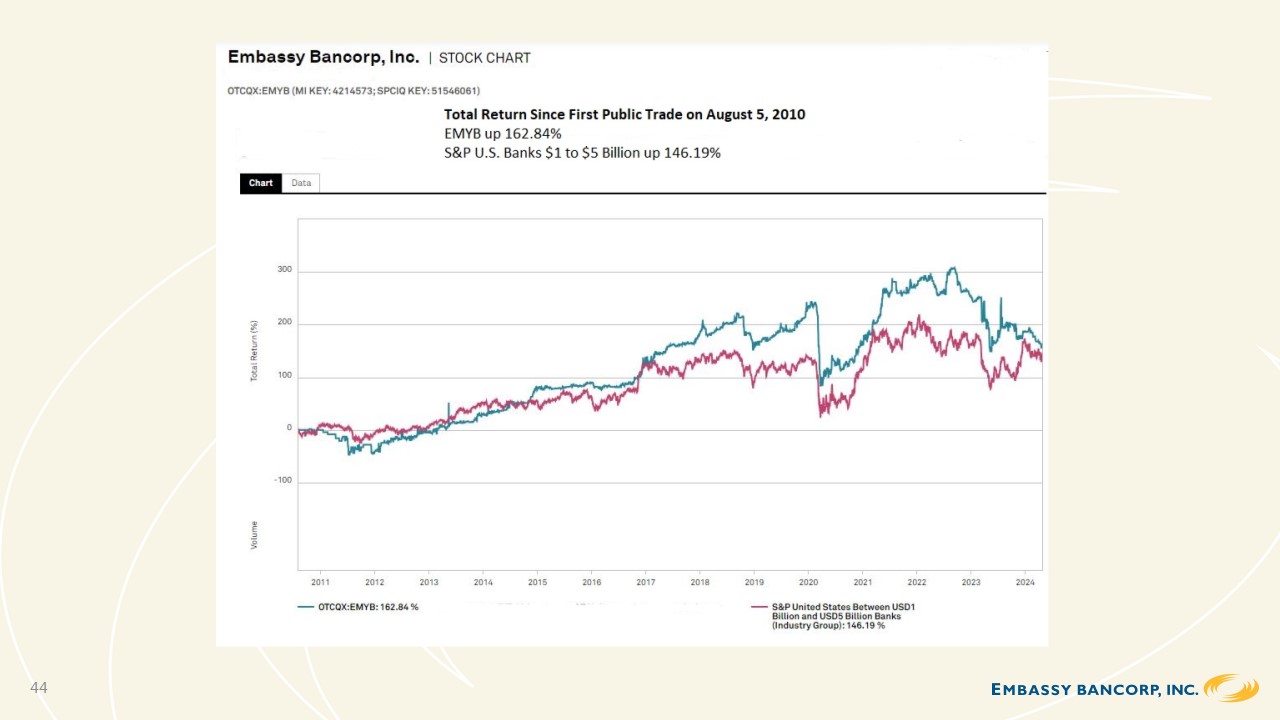
Total Return since first public trade on August 5, 2010 OTCQX EMYB 162.84% S&P U.S. Banks $1 to $5 billion up 146.19% 44
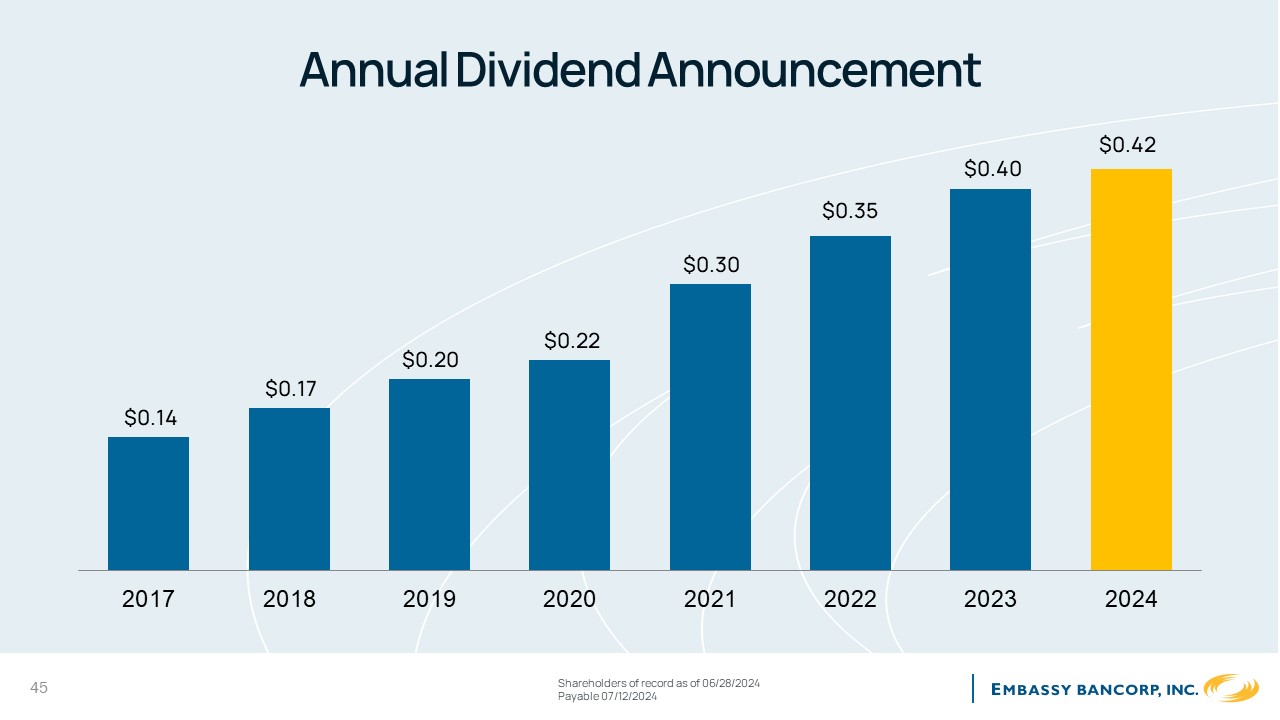
$0.14 45
Annual Dividend Announcement
$0.40
$0.35
$0.30
$0.20$0.22
$0.17
$0.42
20172018201920202021202220232024
Shareholders of record as of 06/28/2024
Payable 07/12/2024
Closing Items
Questions & Answers
Results of Voting
Conclusion of
Meeting
46
Thank You From Our
Board of Directors
47