UNITED STATES
SECURITIES AND EXCHANGE COMMISSION
Washington, D.C. 20549
FORMN-CSR
CERTIFIED SHAREHOLDER REPORT OF REGISTERED MANAGEMENT
INVESTMENT COMPANIES
Investment Company Act file number:811-22250
PIMCO ETF Trust
(Exact name of registrant as specified in charter)
650 Newport Center Drive, Newport Beach, CA 92660
(Address of principal executive office)
Trent W. Walker
Treasurer (Principal Financial & Accounting Officer)
PIMCO ETF Trust
650 Newport Center Drive
Newport Beach, CA 92660
(Name and address of agent for service)
Copies to:
Brendan C. Fox
Dechert LLP
1900 K Street, N.W.
Washington, D.C. 20006
Registrant’s telephone number, including area code: (888)877-4626
Date of fiscal year end: June 30
Date of reporting period: December 31, 2018
Form N-CSR is to be used by management investment companies to file reports with the Commission not later than 10 days after the transmission to stockholders of any report that is required to be transmitted to stockholders under Rule 30e-1 under the Investment Company Act of 1940 (17 CFR 270.30e-1). The Commission may use the information provided on Form N-CSR in its regulatory, disclosure review, inspection, and policymaking roles.
A registrant is required to disclose the information specified by Form N-CSR, and the Commission will make this information public. A registrant is not required to respond to the collection of information contained in Form N-CSR unless the Form displays a currently valid Office of Management and Budget (“OMB”) control number. Please direct comments concerning the accuracy of the information collection burden estimate and any suggestions for reducing the burden to Secretary, Securities and Exchange Commission, 450 Fifth Street, NW, Washington, DC 20549-0609. The OMB has reviewed this collection of information under the clearance requirements of 44 U.S.C. § 3507.
| Item 1. | Reports to Shareholders. |
The following is a copy of the report transmitted to shareholders pursuant to Rule 30e-1 under the Investment Company Act of 1940, as amended (the “Act”) (17 CFR 270.30e-1).

PIMCO ETF TRUST
Semiannual Report
December 31, 2018
Index Exchange-Traded Funds
PIMCO 1-3 Year U.S. Treasury Index Exchange-Traded Fund | TUZ | NYSE Arca
PIMCO 25+ Year Zero Coupon U.S. Treasury Index Exchange-Traded Fund | ZROZ | NYSE Arca
PIMCO 1-5 Year U.S. TIPS Index Exchange-Traded Fund | STPZ | NYSE Arca
PIMCO 15+ Year U.S. TIPS Index Exchange-Traded Fund | LTPZ | NYSE Arca
PIMCO Broad U.S. TIPS Index Exchange-Traded Fund | TIPZ | NYSE Arca
PIMCO 0-5 Year High Yield Corporate Bond Index Exchange-Traded Fund | HYS | NYSE Arca
PIMCO Investment Grade Corporate Bond Index Exchange-Traded Fund | CORP | NYSE Arca
Actively-Managed Exchange-Traded Funds
PIMCO Active Bond Exchange-Traded Fund | BOND | NYSE Arca
PIMCO Enhanced Low Duration Active Exchange-Traded Fund | LDUR | NYSE Arca
PIMCO Enhanced Short Maturity Active Exchange-Traded Fund | MINT | NYSE Arca
PIMCO Intermediate Municipal Bond Active Exchange-Traded Fund | MUNI | NYSE Arca
PIMCO Short Term Municipal Bond Active Exchange-Traded Fund | SMMU | NYSE Arca
Beginning on January 1, 2021, as permitted by regulations adopted by the Securities and Exchange Commission, you may not be receiving paper copies of the Fund’s shareholder reports from the financial intermediary, such as a broker-dealer or bank, which offers the Fund unless you specifically request paper copies from the financial intermediary. Instead, the shareholder reports will be made available on a website, and the financial intermediary will notify you by mail each time a report is posted and provide you with a website link to access the report. Instructions for requesting paper copies will be provided by your financial intermediary.
If you already elected to receive shareholder reports electronically, you will not be affected by this change and you need not take any action. You may elect to receive shareholder reports and other communications from the financial intermediary electronically by following the instructions provided by the financial intermediary.
You may elect to receive all future reports in paper free of charge from the financial intermediary. You should contact the financial intermediary if you wish to continue receiving paper copies of your shareholder reports. Your election to receive reports in paper will apply to all funds held in your account at the financial intermediary.
Table of Contents
This material is authorized for use only when preceded or accompanied by the current PIMCO ETF Trust prospectus.
Chairman’s Letter
Dear Shareholder,
Following this letter is the PIMCO ETF Trust Semiannual Report, which covers the six-month reporting period ended December 31, 2018. On the subsequent pages you will find specific details regarding investment results and discussion of the factors that most affected performance during the reporting period.
For the six-month reporting period ended December 31, 2018
The U.S. economy continued to expand during the reporting period. Looking back, U.S. gross domestic product (“GDP”) grew at an annual pace of 4.2% during the second quarter of 2018, the strongest since the third quarter of 2014. GDP then expanded at an annual pace of 3.4% during the third quarter of the year. Finally, the Commerce Department’s initial reading for fourth-quarter 2018 GDP has been delayed due to the partial government shutdown.
The Federal Reserve (the “Fed”) continued to normalize monetary policy during the reporting period. After raising rates in March and June, the Fed again moved rates higher at its September and December 2018 meetings. The Fed’s December rate hike pushed the federal funds rate to a range between 2.25% and 2.50%. In addition, the Fed continued to reduce its balance sheet during the reporting period.
Economic activity outside the U.S. initially accelerated during the reporting period, but moderated as it progressed. Against this backdrop, the European Central Bank (the “ECB”) and the Bank of Japan largely maintained their highly accommodative monetary policies, while other central banks took a more hawkish stance. The Bank of England raised rates at its meeting in August 2018 and the Bank of Canada raised rates twice during the reporting period. Meanwhile, the ECB ended its quantitative easing program in December 2018, but indicated that it does not expect to raise interest rates “at least through the summer of 2019.”
The U.S. Treasury yield curve flattened during the reporting period as longer-term rates fell more than short-term rates. The yield on the benchmark 10-year U.S. Treasury note was 2.69% at the end of the reporting period, down from 2.85% on June 30, 2018. U.S. Treasuries, as measured by the Bloomberg Barclays U.S. Treasury Index, returned 1.96% over the six months ended December 31, 2018. Meanwhile, the Bloomberg Barclays U.S. Aggregate Bond Index, a widely used index of U.S. investment grade bonds, returned 1.65% over the period. Riskier fixed income asset classes, including high yield corporate bonds and emerging market debt, generated weaker results versus the broad U.S. market. The ICE BofAML U.S. High Yield Index returned -2.34% over the reporting period, whereas emerging market external debt, as represented by the JPMorgan Emerging Markets Bond Index (EMBI) Global, returned 0.65% over the reporting period. Emerging market local bonds, as represented by the JPMorgan Government Bond Index-Emerging Markets Global Diversified Index (Unhedged), returned 0.25% over the period.
Global equities produced poor results during the reporting period. U.S. equities moved sharply higher over the first half of the period. We believe this rally was driven by a number of factors, including corporate profits that often exceeded expectations. However, U.S. equities fell sharply during the fourth quarter of 2018. We believe this was triggered by a number of factors, including signs of moderating global growth, concerns over future Fed rate hikes, the ongoing trade dispute between the U.S. and China and the partial U.S. government shutdown. All told, U.S. equities, as represented by the S&P 500 Index, returned -6.85% during the reporting period. Elsewhere, emerging market equities, as measured by the MSCI Emerging Markets Index, returned -8.49% during the reporting period, whereas global equities, as represented by the MSCI World Index, returned -9.10%. Elsewhere, Japanese equities, as represented by the Nikkei 225 Index (in JPY), returned -9.45% during the reporting period and European equities, as represented by the MSCI Europe Index (in EUR), returned -10.14%.
Commodity prices fluctuated and generally declined during the reporting period. When the reporting period began, West Texas crude oil was approximately $70 a barrel, but by the end it was roughly $45 a barrel. This was driven in part by increased supply and declining global demand. Elsewhere, gold prices rose, whereas copper prices declined during the reporting period.
Finally, during the reporting period the foreign exchange markets experienced periods of volatility, due in part to signs of decoupling economic growth and central bank policies, along with a number of geopolitical events. The U.S. dollar produced mixed results against other major currencies during the reporting period. For example, the U.S. dollar appreciated 1.92% and 3.53% versus the euro and the British pound, respectively, whereas the U.S. dollar depreciated 0.97% versus the yen during the reporting period.
Thank you for the assets you have placed with us. We deeply value your trust, and we will continue to work diligently to meet your broad investment needs. For any questions regarding the PIMCO ETF Trust, please contact your financial adviser, or call one of our shareholder associates at (888) 400-4ETF. We also invite you to visit our website at pimcoetfs.com to learn more about PIMCO ETFs.
| | |
 | | Sincerely, 
Brent R. Harris Chairman of the Board
PIMCO ETF Trust |
Past performance is no guarantee of future results. Unless otherwise noted, index returns reflect the reinvestment of income distributions and capital gains, if any, but do not reflect fees, brokerage commissions or other expenses of investing. It is not possible to invest directly in an unmanaged index.
| | | | | | |
| | SEMIANNUAL REPORT | | DECEMBER 31, 2018 | | 3 |
Important Information About the Funds
PIMCO ETF Trust (the “Trust”) is an open-end management investment company that includes the PIMCO 1-3 Year U.S. Treasury Index Exchange-Traded Fund, PIMCO 25+ Year Zero Coupon U.S. Treasury Index Exchange-Traded Fund, PIMCO1-5 Year U.S. TIPS Index Exchange-Traded Fund, PIMCO 15+ Year U.S. TIPS Index Exchange-Traded Fund, PIMCO Broad U.S. TIPS Index Exchange-Traded Fund, PIMCO 0-5 Year High Yield Corporate Bond Index Exchange-Traded Fund, and PIMCO Investment Grade Corporate Bond Index Exchange-Traded Fund, which are exchange-traded funds (“ETFs”) that seek to provide total return that closely corresponds, before fees and expenses, to the total return of a specified index (collectively, the “Index Funds”). Each Index Fund employs a representative sampling strategy in seeking to achieve its investment objective. In using this strategy, PIMCO seeks to invest in a combination of instruments such that the portfolio effectively provides exposure to the underlying index. An Index Fund may not track its underlying index with the same degree of accuracy as a fund that replicates the composition and weighting of the underlying index. The PIMCO Active Bond Exchange-Traded Fund, PIMCO Enhanced Low Duration Active Exchange-Traded Fund, PIMCO Enhanced Short Maturity Active Exchange-Traded Fund, PIMCO Intermediate Municipal Bond Active Exchange-Traded Fund and PIMCO Short Term Municipal Bond Active Exchange-Traded Fund, unlike the Index Funds, are actively managed ETFs that do not seek to track the performance of a specified index (collectively, the “Active Funds” and together with the Index Funds, a “Fund” or the “Funds”). Shares of the Funds will be listed and traded at market prices on NYSE Arca, Inc. (“NYSE Arca”) and other secondary markets. The market price for each Fund’s shares may be different from the Fund’s net asset value (“NAV”). Each Fund issues and redeems shares at its NAV only in blocks of a specified number of shares (“Creation Units”). Only certain large institutional investors may purchase or redeem Creation Units directly with the Funds at NAV (“Authorized Participants”). These transactions are in exchange for certain securities similar to a Fund’s portfolio and/or cash. Except when aggregated in Creation Units, shares of a Fund are not redeemable securities. Shareholders who are not Authorized Participants may not redeem shares from the Funds at NAV.
We believe that bond funds have an important role to play in a well-diversified investment portfolio. It is important to note, however, that in an environment where interest rates may trend upward, rising rates would negatively impact the performance of most bond funds, and fixed income securities and other instruments held by the Funds are likely to decrease in value. A wide variety of factors can cause interest rates to rise (e.g., central bank monetary policies, inflation rates, general economic conditions, etc.). In addition, changes in interest rates can be sudden and unpredictable, and there is no guarantee that management will anticipate such movement accurately. The Funds may lose money as a result of movements in interest rates.
As of the date of this report, interest rates in the U.S. and many parts of the world, including certain European countries, are at or near historically low levels. Thus, the Funds currently face a heightened level of interest rate risk, especially since the Fed has ended its quantitative easing program and has begun, and may continue, to raise interest rates. To the extent the Fed continues to raise interest rates, there is a risk that rates across the financial system may rise. Further, while bond markets have steadily grown over the past three decades, dealer inventories of corporate bonds are near historic lows in relation to market size. As a result, there has been a significant reduction in the ability of dealers to “make markets.”
Bond funds and individual bonds with a longer duration (a measure used to determine the sensitivity of a security’s price to changes in interest rates) tend to be more sensitive to changes in interest rates, usually making them more volatile than securities or funds with shorter durations. All of the factors mentioned above, individually or collectively, could lead to increased volatility and/or lower liquidity in the fixed income markets or negatively impact a Fund’s performance or cause a Fund to incur losses. As a result, there could be increased sales of shares which could further reduce the market price for a Fund’s shares.
The Funds may be subject to various risks as described in each Fund’s prospectus and in the Principal Risks in the Notes to Financial Statements.
The geographical classification of foreign (non-U.S.) securities in this report are classified by the country of incorporation of a holding. In certain instances, a security’s country of incorporation may be different from its country of economic exposure.
The United States presidential administration’s enforcement of tariffs on goods from other countries, with a focus on China, has contributed to international trade tensions and may impact portfolio securities.
The United Kingdom’s decision to leave the European Union may impact Fund returns. This decision may cause substantial volatility in foreign exchange markets, lead to weakness in the exchange rate of the British pound, result in a sustained period of market uncertainty, and destabilize some or all of the other European Union member countries and/or the Eurozone.
On each individual Fund Summary page in this Shareholder Report, the Average Annual Total Return table and Cumulative Returns chart measure performance assuming that any dividend and capital gain distributions were reinvested. Returns do not reflect the deduction of taxes that a shareholder would pay on: (i) Fund distributions; or (ii) the sale of Fund shares. Each Fund’s performance is measured against the performance of at least one broad-based securities market index
(“benchmark index”). A Fund’s past performance, before and after
taxes, is not necessarily an indication of how the Fund will perform in the future. There is no assurance that any Fund, including any Fund that has experienced high or unusual performance for one or more periods, will experience similar levels of performance in the future. High performance is defined as a significant increase in either 1) a Fund’s
total return in excess of that of the Fund’s benchmark between reporting periods or 2) a Fund’s total return in excess of the Fund’s historical returns between reporting periods. Unusual performance is defined as a significant change in a Fund’s performance as compared to one or more previous reporting periods.
The following table discloses the inception dates of each Fund along with each Fund’s diversification status as of period end:
| | | | | | | | | | | | |
| Fund Name | | | | | Fund
Inception | | | Diversification
Status | |
PIMCO 1-3 Year U.S. Treasury Index Exchange-Traded Fund | | | | | | | 06/01/09 | | | | Diversified | |
PIMCO 25+ Year Zero Coupon U.S. Treasury Index Exchange-Traded Fund | | | | | | | 10/30/09 | | | | Diversified | |
PIMCO 1-5 Year U.S. TIPS Index Exchange-Traded Fund | | | | | | | 08/20/09 | | | | Diversified | |
PIMCO 15+ Year U.S. TIPS Index Exchange-Traded Fund | | | | | | | 09/03/09 | | | | Diversified | |
PIMCO Broad U.S. TIPS Index Exchange-Traded Fund | | | | | | | 09/03/09 | | | | Diversified | |
PIMCO 0-5 Year High Yield Corporate Bond Index Exchange-Traded Fund | | | | | | | 06/16/11 | | | | Diversified | |
PIMCO Investment Grade Corporate Bond Index Exchange-Traded Fund | | | | | | | 09/20/10 | | | | Diversified | |
PIMCO Active Bond Exchange-Traded Fund | | | | | | | 02/29/12 | | | | Diversified | |
PIMCO Enhanced Low Duration Active Exchange-Traded Fund | | | | | | | 01/22/14 | | | | Diversified | |
PIMCO Enhanced Short Maturity Active Exchange-Traded Fund | | | | | | | 11/16/09 | | | | Diversified | |
PIMCO Intermediate Municipal Bond Active Exchange-Traded Fund | | | | | | | 11/30/09 | | | | Diversified | |
PIMCO Short Term Municipal Bond Active Exchange-Traded Fund | | | | | | | 02/01/10 | | | | Diversified | |
An investment in a Fund is not a bank deposit and is not guaranteed or insured by the Federal Deposit Insurance Corporation (“FDIC”) or any other government agency. It is possible to lose money on investments in the Funds.
The Trustees are responsible generally for overseeing the management of the Trust. The Trustees authorize the Trust to enter into service agreements with the Adviser, the Distributor, the Administrator and other service providers in order to provide, and in some cases authorize service providers to procure through other parties, necessary or desirable services on behalf of the Trust and the Funds. Shareholders are not parties to or third-party beneficiaries of such service agreements. Neither a Fund’s prospectus nor a Fund’s summary prospectus, the Trust’s Statement of Additional Information (“SAI”), any contracts filed as exhibits to the Trust’s registration statement, nor any other communications, disclosure documents or regulatory filings (including this report) from or on behalf of the Trust or a Fund creates a contract between or among any shareholder of a Fund, on the one hand, and the Trust, a Fund, a service provider to the Trust or a Fund, and/or the Trustees or officers of the Trust, on the other hand. The Trustees (or the Trust and its officers, service providers or other delegates acting under authority of the Trustees) may amend the most recent prospectus or use a new prospectus, summary prospectus or SAI with respect to a Fund or the Trust, and/or amend, file and/or issue any other communications, disclosure documents or regulatory filings, and may amend or enter into any contracts to which the Trust or a Fund is a party, and interpret the investment objective(s), policies, restrictions
and contractual provisions applicable to any Fund, without shareholder input or approval, except in circumstances in which shareholder approval is specifically required by law (such as changes to fundamental investment policies) or where a shareholder approval requirement is specifically disclosed in the Trust’s then-current prospectus or SAI.
The Index Funds may make available a complete schedule of portfolio holdings and the percentages they represent of the Index Fund’s net assets. On each business day, before commencement of trading on NYSE Arca, each Active Fund will disclose on www.pimcoetfs.com the identities and quantities of the Active Fund’s portfolio holdings that will form the basis for the Active Fund’s calculation of NAV at the end of the business day. The frequency at which the daily market prices were at a discount or premium to each Fund’s NAV is disclosed on www.pimcoetfs.com. Please see “Disclosure of Portfolio Holdings” in the SAI for information about the availability of the complete schedule of each Fund’s holdings. Fund fact sheets provide additional information regarding a Fund and may be requested by calling (888) 400-4ETF and are available on the Fund’s website at www.pimcoetfs.com.
PIMCO has adopted written proxy voting policies and procedures (“Proxy Policy”) as required by Rule206(4)-6 under the Investment Advisers Act of 1940, as amended. The Proxy Policy has been adopted by the Trust as the policies and procedures that PIMCO will use when voting proxies on behalf of the Funds. A description of the policies and
| | | | | | |
| | SEMIANNUAL REPORT | | DECEMBER 31, 2018 | | 5 |
Important Information About the Funds(Cont.)
procedures that PIMCO uses to vote proxies relating to portfolio securities of each Fund, and information about how each Fund voted proxies relating to portfolio securities held during the most recent twelve-month period ended June 30, are available without charge, upon request, by calling the Trust at(888) 400-4ETF, on the Funds’ website at www.pimcoetfs.com, and on the Securities and Exchange Commission’s (“SEC”) website at www.sec.gov.
The Trust files a complete schedule of each Fund’s holdings with the SEC for the first and third quarters of each fiscal year on FormN-Q. A copy of the Funds’ FormN-Q is available on the SEC’s website at www.sec.gov. A copy of the Funds’ Form N-Q is also available without charge, upon request, by calling the Trust at (888) 400-4ETF and on the Funds’ website at www.pimcoetfs.com.
The SEC adopted a rule that, beginning in 2021, generally will allow the Funds to fulfill their obligation to deliver shareholder reports to investors by providing access to such reports online free of charge and by mailing a notice that the report is electronically available. Pursuant to the rule, investors may still elect to receive a complete shareholder report in the mail. Instructions for electing to receive paper copies of a Fund’s shareholder reports going forward may be found on the front cover of this report.
The SEC adopted amendments to certain disclosure requirements relating to open-end investment companies’ liquidity risk management programs. Effective December 1, 2019, large fund complexes will be required to include in their shareholder reports a discussion of their liquidity risk management programs’ operations over the past year.
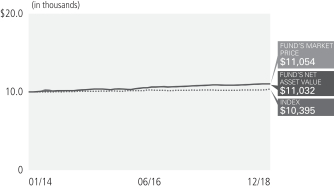
PIMCO 1-3 Year U.S. Treasury Index Exchange-Traded Fund
Cumulative Returns Through December 31, 2018
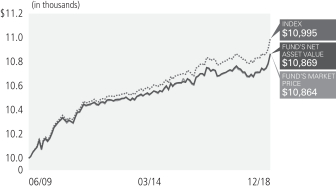
$10,000 invested at the end of the month when the Fund commenced operations.
Allocation Breakdown
as of 12/31/2018†§
| | | | |
U.S. Treasury Obligations | | | 99.5% | |
| |
Short-Term Instruments | | | 0.5% | |
| | † | % of Investments, at value. |
| | § | Allocation Breakdown and % of investments exclude securities sold short and financial derivative instruments, if any. |
| | | | | | | | | | | | | | | | | | |
|
| Average Annual Total Return for the period ended December 31, 2018 | |
| | | | | |
| | | | | 6 Months* | | | 1 Year | | | 5 Year | | | Fund Inception
(06/01/2009) | |
 | | PIMCO1-3 Year U.S. Treasury IndexExchange-Traded Fund (Based on Net Asset Value) | | | 1.41% | | | | 1.42% | | | | 0.66% | | | | 0.87% | |
 | | PIMCO1-3 Year U.S. Treasury IndexExchange-Traded Fund (At Market Price)(1) | | | 1.46% | | | | 1.47% | | | | 0.65% | | | | 0.87% | |
 | | ICE BofAML1-3 Year U.S. Treasury Index± | | | 1.49% | | | | 1.58% | | | | 0.81% | | | | 0.99% | |
All Fund returns are net of fees and expenses.
* Cumulative return.
Market Returns do not include brokerage commissions that may be payable on secondary market transactions. If brokerage commissions were included, market returns would be lower. Market and NAV returns assume that dividends and capital gain distributions have been reinvested in the Fund at market price and NAV, respectively.
| (1) | The market price is determined using the midpoint between the highest bid and the lowest offer on the listing exchange, as of the time that the Fund’s NAV is calculated. |
± The ICE BofAML1-3 Year US Treasury Index is an unmanaged index comprised of U.S. Treasury securities, other than inflation-protection securities and STRIPS, with at least $1 billion in outstanding face value and a remaining term to final maturity of at least one year and less than three years.
It is not possible to invest directly in an unmanaged index.
Performance quoted represents past performance. Past performance is not a guarantee or a reliable indicator of future results. Current performance may be lower or higher than performance shown. Investment return and the principal value of an investment will fluctuate. Shares may be worth more or less than original cost when redeemed by authorized participants. Returns shown do not reflect the deduction of taxes that a shareholder would pay on Fund distributions or on the redemption of Fund shares. Differences in the Fund’s performance versus the index and related attribution information with respect to particular categories of securities or individual positions may be attributable, in part, to differences in the pricing methodologies used by the Fund and the index. Performance data current to the most recentmonth-end is available at www.pimcoetfs.com orvia (888) 400-4ETF.
The Fund’s total annual operating expense ratio in effect as of period end was 0.16%. Details regarding any changes to the Fund’s operating expenses, subsequent to period end, can be found in the Fund’s current prospectus, as supplemented.
Investment Objective and Strategy Overview
PIMCO 1-3 Year U.S. Treasury Index Exchange-Traded Fund seeks to provide total return that closely corresponds, before fees and expenses, to the total return of the ICE BofAML 1-3 Year US Treasury Index (the “Underlying Index”), by investing under normal circumstances at least 80% of its total assets (exclusive of collateral held from securities lending) in the component securities (“Component Securities”) of the Underlying Index. The Fund may invest the remainder of its assets in Fixed Income Instruments that are not Component Securities, but which PIMCO believes will help the Fund track its Underlying Index, as well as in cash and investment grade, liquid short-term instruments, forwards or derivatives, such as options, futures contracts or swap agreements, and shares of affiliated bond funds. “Fixed Income Instruments” include bonds, debt securities and other similar instruments issued by various U.S. and non-U.S. public- or private-sector entities. Fund strategies may change from time to time. Please refer to the Fund’s current prospectus for more information regarding the Fund’s strategy.
Fund Insights at NAV
The following affected performance during the reporting period:
| » | | Yields in the two- to three-year segment of the U.S. Treasury yield curve fell, positively impacting the price return of both the Fund and the Underlying Index. Income return also contributed to positive performance for both the Fund and the Underlying Index. |
| | | | | | |
| | SEMIANNUAL REPORT | | DECEMBER 31, 2018 | | 7 |
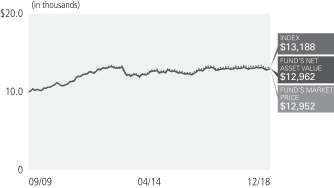
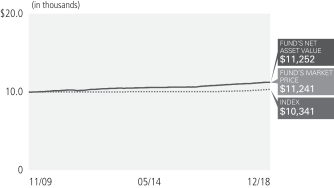
PIMCO 25+ Year Zero Coupon U.S. Treasury Index Exchange-Traded Fund
Cumulative Returns Through December 31, 2018
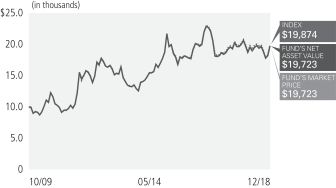
$10,000 invested at the end of the month when the Fund commenced operations.
Allocation Breakdown as of 12/31/2018†§
| | | | |
U.S. Treasury Obligations | | | 100.0% | |
| | † | % of Investments, at value. |
| | § | Allocation Breakdown and % of investments exclude securities sold short and financial derivative instruments, if any. |
| | | | | | | | | | | | | | | | | | |
|
| Average Annual Total Return for the period ended December 31, 2018 | |
| | | | | |
| | | | | 6 Months* | | | 1 Year | | | 5 Year | | | Fund Inception
(10/30/2009) | |
| | PIMCO 25+ Year Zero Coupon U.S. Treasury Index Exchange-Traded Fund (Based on Net Asset Value) | | | (0.45)% | | | | (4.29)% | | | | 9.47% | | | | 7.69% | |
| | PIMCO 25+ Year Zero Coupon U.S. Treasury Index Exchange-Traded Fund (At Market Price)(1) | | | (0.25)% | | | | (4.40)% | | | | 9.31% | | | | 7.69% | |
| | ICE BofAML Long U.S. Treasury Principal STRIPS Index± | | | (0.87)% | | | | (4.40)% | | | | 9.52% | | | | 7.77% | |
All Fund returns are net of fees and expenses.
* Cumulative return.
Market Returns do not include brokerage commissions that may be payable on secondary market transactions. If brokerage commissions were included, market returns would be lower. Market and NAV returns assume that dividends and capital gain distributions have been reinvested in the Fund at market price and NAV, respectively.
| (1) | The market price is determined using the midpoint between the highest bid and the lowest offer on the listing exchange, as of the time that the Fund’s NAV is calculated. |
± The ICE BofAML Long US Treasury Principal STRIPS Index is an unmanaged index comprised of long maturity Separate Trading of Registered Interest and Principal of Securities (“STRIPS”) representing the final principal payment of U.S. Treasury bonds.
It is not possible to invest directly in an unmanaged index.
Performance quoted represents past performance. Past performance is not a guarantee or a reliable indicator of future results. Current performance may be lower or higher than performance shown. Investment return and the principal value of an investment will fluctuate. Shares may be worth more or less than original cost when redeemed by authorized participants. Returns shown do not reflect the deduction of taxes that a shareholder would pay on Fund distributions or on the redemption of Fund shares. Differences in the Fund’s performance versus the index and related attribution information with respect to particular categories of securities or individual positions may be attributable, in part, to differences in the pricing methodologies used by the Fund and the index. Performance data current to the most recentmonth-end is available at www.pimcoetfs.com orvia (888) 400-4ETF.
The Fund’s total annual operating expense ratio in effect as of period end was 0.15%. Details regarding any changes to the Fund’s operating expenses, subsequent to period end, can be found in the Fund’s current prospectus, as supplemented.
Investment Objective and Strategy Overview
PIMCO 25+ Year Zero Coupon U.S. Treasury Index Exchange-Traded Fund seeks to provide total return that closely corresponds, before fees and expenses, to the total return of the ICE BofAML Long US Treasury Principal STRIPS Index (the “Underlying Index”), by investing under normal circumstances at least 80% of its total assets (exclusive of collateral held from securities lending) in the component securities (“Component Securities”) of the Underlying Index. The Fund may invest the remainder of its assets in Fixed Income Instruments that are not Component Securities, but which PIMCO believes will help the Fund track its Underlying Index, as well as in cash and investment grade, liquid short-term instruments, forwards or derivatives, such as options, futures contracts or swap agreements, and shares of affiliated bond funds. “Fixed Income Instruments” include bonds, debt securities and other similar instruments issued by various U.S. and non-U.S. public- or private-sector entities. Fund strategies may change from time to time. Please refer to the Fund’s current prospectus for more information regarding the Fund’s strategy.
Fund Insights at NAV
The following affected performance during the reporting period:
| » | | Yields in the 25+ year segment of the U.S. Treasury STRIPS (zero-coupon) curve rose, negatively impacting the return of both the Fund and the Underlying Index. |
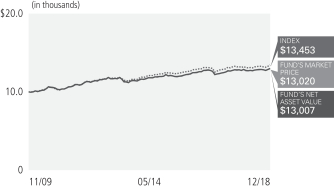
PIMCO 1-5 Year U.S. TIPS Index Exchange-Traded Fund
Cumulative Returns Through December 31, 2018
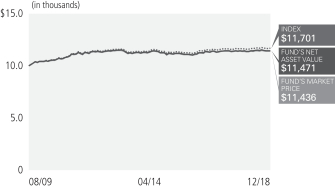
$10,000 invested at the end of the month when the Fund commenced operations.
Allocation Breakdown as of 12/31/2018†§
| | | | |
U.S. Treasury Obligations | | | 99.8% | |
| |
Short-Term Instruments | | | 0.2% | |
| | † | % of Investments, at value. |
| | § | Allocation Breakdown and % of investments exclude securities sold short and financial derivative instruments, if any. |
| | | | | | | | | | | | | | | | | | |
|
| Average Annual Total Return for the period ended December 31, 2018 | |
| | | | | |
| | | | | 6 Months* | | | 1 Year | | | 5 Year | | | Fund Inception
(08/20/2009) | |
| | PIMCO1-5 Year U.S. TIPS Index Exchange-Traded Fund (Based on Net Asset Value) | | | (0.30)% | | | | 0.19% | | | | 0.40% | | | | 1.45% | |
| | PIMCO1-5 Year U.S. TIPS Index Exchange-Traded Fund (At Market Price)(1) | | | (0.28)% | | | | 0.22% | | | | 0.39% | | | | 1.45% | |
| | ICE BofAML1-5 Year U.S. Inflation-Linked Treasury Index± | | | (0.21)% | | | | 0.40% | | | | 0.62% | | | | 1.68% | |
All Fund returns are net of fees and expenses.
* Cumulative return.
Market Returns do not include brokerage commissions that may be payable on secondary market transactions. If brokerage commissions were included, market returns would be lower. Market and NAV returns assume that dividends and capital gain distributions have been reinvested in the Fund at market price and NAV, respectively.
| (1) | The market price is determined using the midpoint between the highest bid and the lowest offer on the listing exchange, as of the time that the Fund’s NAV is calculated. |
± The ICE BofAML 1-5 Year US Inflation-Linked Treasury Index is an unmanaged index comprised of TIPS (Treasury Inflation Protected Securities) with a maturity of at least 1 year and less than 5 years.
It is not possible to invest directly in an unmanaged index.
Performance quoted represents past performance. Past performance is not a guarantee or a reliable indicator of future results. Current performance may be lower or higher than performance shown. Investment return and the principal value of an investment will fluctuate. Shares may be worth more or less than original cost when redeemed by authorized participants. Returns shown do not reflect the deduction of taxes that a shareholder would pay on Fund distributions or on the redemption of Fund shares. Differences in the Fund’s performance versus the index and related attribution information with respect to particular categories of securities or individual positions may be attributable, in part, to differences in the pricing methodologies used by the Fund and the index. Performance data current to the most recentmonth-end is available at www.pimcoetfs.com orvia (888) 400-4ETF.
The Fund’s total annual operating expense ratio in effect as of period end was 0.20%. Details regarding any changes to the Fund’s operating expenses, subsequent to period end, can be found in the Fund’s current prospectus, as supplemented.
Investment Objective and Strategy Overview
PIMCO 1-5 Year U.S. TIPS Index Exchange-Traded Fund seeks to provide total return that closely corresponds, before fees and expenses, to the total return of the ICE BofAML 1-5 Year US Inflation-Linked Treasury Index (the “Underlying Index”), by investing under normal circumstances at least 80% of its total assets (exclusive of collateral held from securities lending) in the component securities (“Component Securities”) of the Underlying Index. The Fund may invest the remainder of its assets in Fixed Income Instruments that are not Component Securities, but which PIMCO believes will help the Fund track its Underlying Index, as well as in cash and investment grade, liquid short-term instruments, forwards or derivatives, such as options, futures contracts or swap agreements, and shares of affiliated bond funds. “Fixed Income Instruments” include bonds, debt securities and other similar instruments issued by various U.S. and non-U.S. public- or private-sector entities. Fund strategies may change from time to time. Please refer to the Fund’s current prospectus for more information regarding the Fund’s strategy.
Fund Insights at NAV
The following affected performance during the reporting period:
| » | | Real yields, or the rates of return in excess of expected future inflation, rose across the one- to five-year segment of the U.S. Treasury Inflation-Protected Securities (“TIPS”) yield curve, detracted from the performance of both the Fund and the Underlying Index. |
| » | | A positive inflation accrual, or change in the Consumer Price Index (“CPI”), applied to the principal of the underlying TIPS, contributed to the performance of both the Fund and the Underlying Index. The net result, inclusive of coupon payments, was negative absolute performance for both the Fund and the Underlying Index. |
| | | | | | |
| | SEMIANNUAL REPORT | | DECEMBER 31, 2018 | | 9 |
PIMCO 15+ Year U.S. TIPS Index Exchange-Traded Fund
Cumulative Returns Through December 31, 2018
��
$10,000 invested at the end of the month when the Fund commenced operations.
Allocation Breakdown as of 12/31/2018†§
| | | | |
U.S. Treasury Obligations | | | 99.9% | |
| |
Short-Term Instruments | | | 0.1% | |
| | † | % of Investments, at value. |
| | § | Allocation Breakdown and % of investments exclude securities sold short and financial derivative instruments, if any. |
| | | | | | | | | | | | | | | | | | |
|
| Average Annual Total Return for the period ended December 31, 2018 | |
| | | | | |
| | | | | 6 Months* | | | 1 Year | | | 5 Year | | | Fund Inception
(09/03/2009) | |
| | PIMCO 15+ Year U.S. TIPS Index Exchange-Traded Fund (Based on Net Asset Value) | | | (5.94)% | | | | (7.40)% | | | | 3.86% | | | | 4.66% | |
| | PIMCO 15+ Year U.S. TIPS Index Exchange-Traded Fund (At Market Price)(1) | | | (6.12)% | | | | (7.35)% | | | | 3.82% | | | | 4.65% | |
| | ICE BofAML 15+ Year U.S. Inflation-Linked Treasury Index± | | | (5.99)% | | | | (7.21)% | | | | 4.02% | | | | 4.86% | |
All Fund returns are net of fees and expenses.
* Cumulative return.
Market Returns do not include brokerage commissions that may be payable on secondary market transactions. If brokerage commissions were included, market returns would be lower. Market and NAV returns assume that dividends and capital gain distributions have been reinvested in the Fund at market price and NAV, respectively.
| (1) | The market price is determined using the midpoint between the highest bid and the lowest offer on the listing exchange, as of the time that the Fund’s NAV is calculated. |
± The ICE BofAML 15+ Year US Inflation-Linked Treasury Index is an unmanaged index comprised of TIPS (Treasury Inflation Protected Securities) with a maturity of at least 15 years.
It is not possible to invest directly in an unmanaged index.
Performance quoted represents past performance. Past performance is not a guarantee or a reliable indicator of future results. Current performance may be lower or higher than performance shown. Investment return and the principal value of an investment will fluctuate. Shares may be worth more or less than original cost when redeemed by authorized participants. Returns shown do not reflect the deduction of taxes that a shareholder would pay on Fund distributions or on the redemption of Fund shares. Differences in the Fund’s performance versus the index and related attribution information with respect to particular categories of securities or individual positions may be attributable, in part, to differences in the pricing methodologies used by the Fund and the index. Performance data current to the most recent month-end is available at www.pimcoetfs.com or via (888) 400-4ETF.
The Fund’s total annual operating expense ratio in effect as of period end was 0.20%. Details regarding any changes to the Fund’s operating expenses, subsequent to period end, can be found in the Fund’s current prospectus, as supplemented.
Investment Objective and Strategy Overview
PIMCO 15+ Year U.S. TIPS Index Exchange-Traded Fund seeks to provide total return that closely corresponds, before fees and expenses, to the total return of the ICE BofAML 15+ Year US Inflation-Linked Treasury Index (the “Underlying Index”), by investing under normal circumstances at least 80% of its total assets (exclusive of collateral held from securities lending) in the component securities (“Component Securities”) of the Underlying Index. The Fund may invest the remainder of its assets in Fixed Income Instruments that are not Component Securities, but which PIMCO believes will help the Fund track its Underlying Index, as well as in cash and investment grade, liquid short-term instruments, forwards or derivatives, such as options, futures contracts or swap agreements, and shares of affiliated bond funds. “Fixed Income Instruments” include bonds, debt securities and other similar instruments issued by various U.S. and non-U.S. public- or private-sector entities. Fund strategies may change from time to time. Please refer to the Fund’s current prospectus for more information regarding the Fund’s strategy.
Fund Insights at NAV
The following affected performance during the reporting period:
| » | | Real yields, or the rates of return in excess of expected future inflation, rose across the 15+ year segment of the U.S. Treasury Inflation-Protected Securities (“TIPS”) yield curve, detracted from the performance of both the Fund and the Underlying Index. |
| » | | A positive inflation accrual, or change in the Consumer Price Index (“CPI”), applied to the principal of the underlying TIPS, contributed to the performance of both the Fund and the Underlying Index. The net result, inclusive of coupon payments, was negative absolute performance for both the Fund and the Underlying Index. |
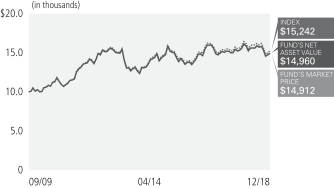
PIMCO Broad U.S. TIPS Index Exchange-Traded Fund
Cumulative Returns Through December 31, 2018
$10,000 invested at the end of the month when the Fund commenced operations.
Allocation Breakdown as of 12/31/2018†§
| | | | |
U.S. Treasury Obligations | | | 100.0% | |
| | † | % of Investments, at value. |
| | § | Allocation Breakdown and % of investments exclude securities sold short and financial derivative instruments, if any. |
| | | | | | | | | | | | | | | | | | |
|
| Average Annual Total Return for the period ended December 31, 2018 | |
| | | | | |
| | | | | 6 Months* | | | 1 Year | | | 5 Year | | | Fund Inception
(09/03/2009) | |
| | PIMCO Broad U.S. TIPS Index Exchange-Traded Fund
(Based on Net Asset Value) | | | (1.49)% | | | | (1.73)% | | | | 1.68% | | | | 2.98% | |
| | PIMCO Broad U.S. TIPS Index Exchange-Traded Fund
(At Market Price)(1) | | | (1.39)% | | | | (1.59)% | | | | 1.71% | | | | 2.99% | |
| | ICE BofAML U.S. Inflation-Linked Treasury Index± | | | (1.43)% | | | | (1.50)% | | | | 1.85% | | | | 3.16% | |
All Fund returns are net of fees and expenses.
* Cumulative return.
Market Returns do not include brokerage commissions that may be payable on secondary market transactions. If brokerage commissions were included, market returns would be lower. Market and NAV returns assume that dividends and capital gain distributions have been reinvested in the Fund at market price and NAV, respectively.
| (1) | The market price is determined using the midpoint between the highest bid and the lowest offer on the listing exchange, as of the time that the Fund’s NAV is calculated. |
± The ICE BofAML US Inflation-Linked Treasury Index is an unmanaged index comprised of TIPS (Treasury Inflation Protected Securities).
It is not possible to invest directly in an unmanaged index.
Performance quoted represents past performance. Past performance is not a guarantee or a reliable indicator of future results. Current performance may be lower or higher than performance shown. Investment return and the principal value of an investment will fluctuate. Shares may be worth more or less than original cost when redeemed by authorized participants. Returns shown do not reflect the deduction of taxes that a shareholder would pay on Fund distributions or on the redemption of Fund shares. Differences in the Fund’s performance versus the index and related attribution information with respect to particular categories of securities or individual positions may be attributable, in part, to differences in the pricing methodologies used by the Fund and the index. Performance data current to the most recentmonth-end is available at www.pimcoetfs.com orvia (888) 400-4ETF.
The Fund’s total annual operating expense ratio in effect as of period end was 0.21%. Details regarding any changes to the Fund’s operating expenses, subsequent to period end, can be found in the Fund’s current prospectus, as supplemented.
Investment Objective and Strategy Overview
PIMCO Broad U.S. TIPS Index Exchange-Traded Fund seeks to provide total return that closely corresponds, before fees and expenses, to the total return of the ICE BofAML US Inflation-Linked Treasury Index (the “Underlying Index”), by investing under normal circumstances at least 80% of its total assets (exclusive of collateral held from securities lending) in the component securities (“Component Securities”) of the Underlying Index. The Fund may invest the remainder of its assets in Fixed Income Instruments that are not Component Securities, but which PIMCO believes will help the Fund track its Underlying Index, as well as in cash and investment grade, liquid short-term instruments, forwards or derivatives, such as options, futures contracts or swap agreements, and shares of affiliated bond funds. PIMCO uses an indexing approach in managing the Fund’s investments. “Fixed Income Instruments” include bonds, debt securities and other similar instruments issued by various U.S. and non-U.S. public- or private-sector entities. Fund strategies may change from time to time. Please refer to the Fund’s current prospectus for more information regarding the Fund’s strategy.
Fund Insights at NAV
The following affected performance during the reporting period:
| » | | Real yields, or the rates of return in excess of expected future inflation, rose across the U.S. Treasury Inflation-Protected Securities (“TIPS”) yield curve, detracted from the performance of both the Fund and the Underlying Index. |
| » | | A positive inflation accrual, or change in the Consumer Price Index (“CPI”), applied to the principal of the underlying TIPS, contributed to the performance of both the Fund and the Underlying Index. The net result, inclusive of coupon payments, was negative absolute performance for both the Fund and the Underlying Index. |
| | | | | | |
| | SEMIANNUAL REPORT | | DECEMBER 31, 2018 | | 11 |
PIMCO 0-5 Year High Yield Corporate Bond Index Exchange-Traded Fund
Cumulative Returns Through December 31, 2018
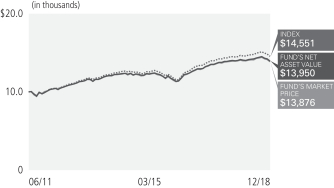
$10,000 invested at the end of the month when the Fund commenced operations.
Allocation Breakdown as of 12/31/2018†§
| | | | |
Corporate Bonds & Notes | | | 91.0% | |
| |
Short-Term Instruments | | | 9.0% | |
| | † | % of Investments, at value. |
| | § | Allocation Breakdown and % of investments exclude securities sold short and financial derivative instruments, if any. |
| | | | | | | | | | | | | | | | | | |
|
| Average Annual Total Return for the period ended December 31, 2018 | |
| | | | | |
| | | | | 6 Months* | | | 1 Year | | | 5 Year | | | Fund Inception
(06/16/2011) | |
| | PIMCO0-5 Year High Yield Corporate Bond Index Exchange-Traded Fund (Based on Net Asset Value) | | | (1.87)% | | | | (0.54)% | | | | 2.92% | | | | 4.58% | |
| | PIMCO0-5 Year High Yield Corporate Bond Index Exchange-Traded Fund (At Market Price)(1) | | | (1.67)% | | | | (0.74)% | | | | 2.83% | | | | 4.53% | |
| | ICE BofAML0-5 Year US High Yield Constrained Index± | | | (1.76)% | | | | 0.10% | | | | 3.52% | | | | 5.14% | |
All Fund returns are net of fees and expenses.
* Cumulative return.
Market Returns do not include brokerage commissions that may be payable on secondary market transactions. If brokerage commissions were included, market returns would be lower. Market and NAV returns assume that dividends and capital gain distributions have been reinvested in the Fund at market price and NAV, respectively.
| (1) | The market price is determined using the midpoint between the highest bid and the lowest offer on the listing exchange, as of the time that the Fund’s NAV is calculated. |
± The ICE BofAML 0-5 Year US High Yield Constrained Index tracks the performance of short-term U.S. dollar denominated below investment grade corporate debt issued in the U.S. domestic market with less than five years remaining term to final maturity, a fixed coupon schedule and a minimum amount outstanding of $100 million, issued publicly. Allocations to an individual issuer will not exceed 2%.
It is not possible to invest directly in an unmanaged index.
Performance quoted represents past performance. Past performance is not a guarantee or a reliable indicator of future results. Current performance may be lower or higher than performance shown. Investment return and the principal value of an investment will fluctuate. Shares may be worth more or less than original cost when redeemed by authorized participants. Returns shown do not reflect the deduction of taxes that a shareholder would pay on Fund distributions or on the redemption of Fund shares. Differences in the Fund’s performance versus the index and related attribution information with respect to particular categories of securities or individual positions may be attributable, in part, to differences in the pricing methodologies used by the Fund and the index. Performance data current to the most recentmonth-end is available at www.pimcoetfs.com orvia (888) 400-4ETF.
The Fund’s total annual operating expense ratio in effect as of period end was 0.56%. Details regarding any changes to the Fund’s operating expenses, subsequent to period end, can be found in the Fund’s current prospectus, as supplemented.
Investment Objective and Strategy Overview
PIMCO 0-5 Year High Yield Corporate Bond Index Exchange-Traded Fund seeks to provide total return that closely corresponds, before fees and expenses, to the total return of the ICE BofAML 0-5 Year US High Yield Constrained Index (the “Underlying Index”), by investing under normal circumstances at least 80% of its total assets (exclusive of collateral held from securities lending) in the component securities (“Component Securities”) of the Underlying Index. The Fund may invest the remainder of its assets in Fixed Income Instruments that are not Component Securities, but which PIMCO believes will help the Fund track its Underlying Index, as well as in cash and investment grade, liquid short-term instruments, forwards or derivatives, such as options, futures contracts or swap agreements, and shares of affiliated bond funds. “Fixed Income Instruments” include bonds, debt securities and other similar instruments issued by various U.S. and non-U.S. public- or private-sector entities. Fund strategies may change from time to time. Please refer to the Fund’s current prospectus for more information regarding the Fund’s strategy.
Fund Insights at NAV
The following affected performance during the reporting period:
| » | | Security selection in the automotive sector contributed to performance, as the Fund’s automotive positions outperformed the broader sector. |
| » | | Security selection in the support services sector contributed to performance, as the Fund’s support services positions outperformed the broader sector. |
| » | | Security selection in the metals and mining sectors contributed to performance, as the Fund’s metals and mining positions outperformed the broader sector. |
| » | | Security selection in the media, entertainment and publishing sector detracted from performance, as the Fund’s media, entertainment and publishing positions underperformed the broader sector. |
| » | | Security selection in the energy sector detracted from performance, as the Fund’s energy positions underperformed the broader sector. |
| » | | Security selection in the retail sector detracted from performance, as the Fund’s retail positions underperformed the broader sector. |
PIMCO Investment Grade Corporate Bond Index Exchange-Traded Fund
Cumulative Returns Through December 31, 2018
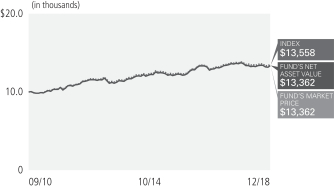
$10,000 invested at the end of the month when the Fund commenced operations.
Allocation Breakdown as of 12/31/2018†§
| | | | |
Industrials | | | 47.0% | |
| |
Banking & Finance | | | 40.1% | |
| |
Utilities | | | 11.4% | |
| |
Short-Term Instruments | | | 1.1% | |
| |
Other | | | 0.4% | |
| | † | % of Investments, at value. |
| | § | Allocation Breakdown and % of investments exclude securities sold short and financial derivative instruments, if any. |
| | | | | | | | | | | | | | | | | | |
|
| Average Annual Total Return for the period ended December 31, 2018 | |
| | | | | |
| | | | | 6 Months* | | | 1 Year | | | 5 Year | | | Fund Inception
(09/20/2010) | |
| | PIMCO Investment Grade Corporate Bond Index Exchange-Traded Fund (Based on Net Asset Value) | | | 0.76% | | | | (2.71)% | | | | 3.28% | | | | 3.73% | |
| | PIMCO Investment Grade Corporate Bond Index Exchange-Traded Fund (At Market Price)(1) | | | 0.79% | | | | (2.99)% | | | | 3.23% | | | | 3.72% | |
| | ICE BofAML US Corporate Index± | | | 0.90% | | | | (2.25)% | | | | 3.34% | | | | 3.88% | |
All Fund returns are net of fees and expenses.
* Cumulative return.
Market Returns do not include brokerage commissions that may be payable on secondary market transactions. If brokerage commissions were included, market returns would be lower. Market and NAV returns assume that dividends and capital gain distributions have been reinvested in the Fund at market price and NAV, respectively.
| (1) | The market price is determined using the midpoint between the highest bid and the lowest offer on the listing exchange, as of the time that the Fund’s NAV is calculated. |
± ICE BofAML US Corporate Index is an unmanaged index comprised of U.S. dollar denominated investment grade, fixed rate corporate debt securities publicly issued in the U.S. domestic market with at least one year remaining term to final maturity and at least $250 million outstanding.
It is not possible to invest directly in an unmanaged index.
Performance quoted represents past performance. Past performance is not a guarantee or a reliable indicator of future results. Current performance may be lower or higher than performance shown. Investment return and the principal value of an investment will fluctuate. Shares may be worth more or less than original cost when redeemed by authorized participants. Returns shown do not reflect the deduction of taxes that a shareholder would pay on Fund distributions or on the redemption of Fund shares. Differences in the Fund’s performance versus the index and related attribution information with respect to particular categories of securities or individual positions may be attributable, in part, to differences in the pricing methodologies used by the Fund and the index. Performance data current to the most recentmonth-end is available at www.pimcoetfs.com orvia (888) 400-4ETF.
The Fund’s total annual operating expense ratio in effect as of period end was 0.20%. Details regarding any changes to the Fund’s operating expenses, subsequent to period end, can be found in the Fund’s current prospectus, as supplemented.
Investment Objective and Strategy Overview
PIMCO Investment Grade Corporate Bond Index Exchange-Traded Fund seeks to provide total return that closely corresponds, before fees and expenses, to the total return of the ICE BofAML US Corporate Index (the “Underlying Index”), by investing under normal circumstances at least 80% of its total assets (exclusive of collateral held from securities lending) in the component securities (“Component Securities”) of the Underlying Index. The Fund may invest the remainder of its assets in Fixed Income Instruments that are not Component Securities, but which PIMCO believes will help the Fund track its Underlying Index, as well as in cash and investment grade, liquid short-term instruments, forwards or derivatives, such as options, futures contracts or swap agreements, and shares of affiliated bond funds. “Fixed Income Instruments” include bonds, debt securities and other similar instruments issued by various U.S. and non-U.S. public- or private-sector entities. Fund strategies may change from time to time. Please refer to the Fund’s current prospectus for more information regarding the Fund’s strategy.
Fund Insights at NAV
The following affected performance during the reporting period:
| » | | Underweight exposure to the consumer products sector contributed to performance, as the sector underperformed the benchmark. |
| » | | Overweight exposure to the healthcare sector contributed to performance, as the sector outperformed the benchmark. |
| » | | Underweight exposure to real estate investment trusts detracted from performance, as the sector outperformed the index. |
| | | | | | |
| | SEMIANNUAL REPORT | | DECEMBER 31, 2018 | | 13 |
PIMCO Active Bond Exchange-Traded Fund
Cumulative Returns Through December 31, 2018
$10,000 invested at the end of the month when the Fund commenced operations.
Allocation Breakdown as of 12/31/2018†§
| | | | |
U.S. Government Agencies | | | 45.4% | |
| |
Corporate Bonds & Notes | | | 27.1% | |
| |
Asset-Backed Securities | | | 12.9% | |
| |
U.S. Treasury Obligations | | | 7.7% | |
| |
Non-Agency Mortgage-Backed Securities | | | 3.8% | |
| |
Municipal Bonds & Notes | | | 1.8% | |
| |
Other | | | 1.3% | |
| | † | % of Investments, at value. |
| | § | Allocation Breakdown and % of investments exclude securities sold short and financial derivative instruments, if any. |
All Fund returns are net of fees and expenses.
* Cumulative return.
Market Returns do not include brokerage commissions that may be payable on secondary market transactions. If brokerage commissions were included, market returns would be lower. Market and NAV returns assume that dividends and capital gain distributions have been reinvested in the Fund at market price and NAV, respectively.
| (1) | The market price is determined using the midpoint between the highest bid and the lowest offer on the listing exchange, as of the time that the Fund’s NAV is calculated. |
± Bloomberg Barclays U.S. Aggregate Index represents securities that are SEC-registered, taxable, and dollar denominated. The index covers the U.S. investment grade fixed rate bond market, with index components for government and corporate securities, mortgage pass-through securities, and asset-backed securities. These major sectors are subdivided into more specific indices that are calculated and reported on a regular basis.
It is not possible to invest directly in an unmanaged index.
Performance quoted represents past performance. Past performance is not a guarantee or a reliable indicator of future results. Current performance may be lower or higher than performance shown. Investment return and the principal value of an investment will fluctuate. Shares may be worth more or less than original cost when redeemed by authorized participants. Returns shown do not reflect the deduction of taxes that a shareholder would pay on Fund distributions or on the redemption of Fund shares. Differences in the Fund’s performance versus the index and related attribution information with respect to particular categories of securities or individual positions may be attributable, in part, to differences in the pricing methodologies used by the Fund and the index. Performance data current to the most recent month-end is available at www.pimcoetfs.com or via (888) 400-4ETF.
The Fund’s total annual operating expense ratio in effect as of period end was 0.76%. Details regarding any changes to the Fund’s operating expenses, subsequent to period end, can be found in the Fund’s current prospectus, as supplemented.
Investment Objective and Strategy Overview
PIMCO Active Bond Exchange-Traded Fund seeks current income and long-term capital appreciation, consistent with prudent investment management, by investing under normal circumstances at least 80% of its assets in a diversified portfolio of Fixed Income Instruments of varying maturities, which may be represented by forwards or derivatives such as options, futures contracts, or swap agreements. “Fixed Income Instruments” include bonds, debt securities and other similar instruments issued by various U.S. and non-U.S. public- or private-sector entities. Fund strategies may change from time to time. Please refer to the Fund’s current prospectus for more information regarding the Fund’s strategy.
Fund Insights at NAV
The following affected performance during the reporting period:
| » | | U.S. interest rate strategies, particularly a combination of yield advantage and underweight exposure to overall duration, contributed to relative performance, as rates fell. |
| » | | Selection in specific high yield credits contributed to performance, as their spreads fell. |
| » | | Positions in non-agency mortgage-backed securities and other securitized instruments contributed to relative performance, as total returns in these securities were positive. |
| » | | Positions in agency mortgage-backed securities detracted from relative performance, as excess returns in these securities were negative. |
| » | | Long exposure to the Brazilian real, particularly in the beginning of the period, detracted from performance, as the currency depreciated relative to the U.S. dollar. |
| » | | Investment-grade corporate credit exposure, particularly financials, detracted from performance, as spreads widened. |
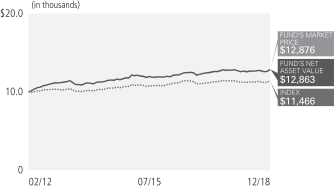
PIMCO Enhanced Low Duration Active Exchange-Traded Fund
Cumulative Returns Through December 31, 2018
$10,000 invested at the end of the month when the Fund commenced operations.
Allocation Breakdown as of 12/31/2018†§
| | | | |
U.S. Treasury Obligations | | | 42.4% | |
| |
Corporate Bonds & Notes | | | 36.6% | |
| |
U.S. Government Agencies | | | 8.6% | |
| |
Asset-Backed Securities | | | 7.1% | |
| |
Non-Agency Mortgage-Backed Securities | | | 2.5% | |
| |
Short-Term Instruments | | | 1.6% | |
| |
Other | | | 1.2% | |
| | † | % of Investments, at value. |
| | § | Allocation Breakdown and % of investments exclude securities sold short and financial derivative instruments, if any. |
| | | | | | | | | | | | | | |
|
| Average Annual Total Return for the period ended December 31, 2018 | |
| | | | |
| | | | | 6 Months* | | | 1 Year | | | Fund Inception
(01/22/2014) | |
| | PIMCO Enhanced Low Duration Active Exchange-Traded Fund (Based on Net Asset Value) | | | 0.94% | | | | 1.34% | | | | 2.07% | |
| | PIMCO Enhanced Low Duration Active Exchange-Traded Fund (At Market Price)(1) | | | 0.97% | | | | 1.44% | | | | 2.10% | |
| | ICE BofAML1-3 Year U.S. Treasury Index± | | | 1.49% | | | | 1.58% | | | | 0.82% | |
All Fund returns are net of fees and expenses.
* Cumulative return.
Market Returns do not include brokerage commissions that may be payable on secondary market transactions. If brokerage commissions were included, market returns would be lower. Market and NAV returns assume that dividends and capital gain distributions have been reinvested in the Fund at market price and NAV, respectively.
| (1) | The market price is determined using the midpoint between the highest bid and the lowest offer on the listing exchange, as of the time that the Fund’s NAV is calculated. |
± The ICE BofAML1-3 Year U.S. Treasury Index is an unmanaged index comprised of U.S. Treasury securities, other than inflation-protection securities and STRIPS, with at least $1 billion in outstanding face value and a remaining term to final maturity of at least one year and less than three years.
It is not possible to invest directly in an unmanaged index.
Performance quoted represents past performance. Past performance is not a guarantee or a reliable indicator of future results. Current performance may be lower or higher than performance shown. Investment return and the principal value of an investment will fluctuate. Shares may be worth more or less than original cost when redeemed by authorized participants. Returns shown do not reflect the deduction of taxes that a shareholder would pay on Fund distributions or on the redemption of Fund shares. Differences in the Fund’s performance versus the index and related attribution information with respect to particular categories of securities or individual positions may be attributable, in part, to differences in the pricing methodologies used by the Fund and the index. Performance data current to the most recentmonth-end is available at www.pimcoetfs.com orvia (888) 400-4ETF.
The Fund’s total annual operating expense ratio in effect as of period end was 1.09%. Details regarding any changes to the Fund’s operating expenses, subsequent to period end, can be found in the Fund’s current prospectus, as supplemented.
Investment Objective and Strategy Overview
PIMCO Enhanced Low Duration Active Exchange-Traded Fund seeks maximum total return, consistent with preservation of capital and prudent investment management, by investing under normal circumstances at least 80% of its net assets in a diversified portfolio of Fixed Income Instruments of varying maturities, which may be represented by forwards or derivatives such as options, futures contracts, or swap agreements. “Fixed Income Instruments” include bonds, debt securities and other similar instruments issued by various U.S. and non-U.S. public- or private-sector entities. Fund strategies may change from time to time. Please refer to the Fund’s current prospectus for more information regarding the Fund’s strategy.
Fund Insights at NAV
The following affected performance during the reporting period:
| » | | Holdings of investment grade corporate credit detracted from performance, as spreads widened. |
| » | | Overweight exposure to Treasury Inflation-Protected Securities detracted from performance, as the securities generally posted negative total returns. |
| » | | Underweight exposure to the 7-year portion of the U.S. Treasury curve detracted from performance because the 7-year portion of the curve fell. |
| » | | Short exposure to the euro versus the U.S. dollar contributed to performance, as the euro depreciated against the U.S. dollar. |
| » | | Short exposure to the Japanese yen versus the U.S. dollar contributed to performance, as the Japanese yen generally depreciated against the U.S. dollar. |
| | | | | | |
| | SEMIANNUAL REPORT | | DECEMBER 31, 2018 | | 15 |
PIMCO Enhanced Short Maturity Active Exchange-Traded Fund
Cumulative Returns Through December 31, 2018
$10,000 invested at the end of the month when the Fund commenced operations.
Allocation Breakdown as of 12/31/2018†§
| | | | |
Corporate Bonds & Notes | | | 66.4% | |
| |
Asset-Backed Securities | | | 12.3% | |
| |
Short-Term Instruments | | | 10.2% | |
| |
Sovereign Issues | | | 4.6% | |
| |
Non-Agency Mortgage-Backed Securities | | | 3.1% | |
| |
U.S. Government Agencies | | | 3.1% | |
| |
Municipal Bonds & Notes | | | 0.3% | |
| | † | % of Investments, at value. |
| | § | Allocation Breakdown and % of investments exclude securities sold short and financial derivative instruments, if any. |
| | | | | | | | | | | | | | | | | | |
|
| Average Annual Total Return for the period ended December 31, 2018 | |
| | | | | |
| | | | | 6 Months* | | | 1 Year | | | 5 Year | | | Fund Inception
(11/16/2009) | |
| | PIMCO Enhanced Short Maturity ActiveExchange-Traded Fund (Based on Net Asset Value) | | | 0.86% | | | | 1.72% | | | | 1.33% | | | | 1.31% | |
| | PIMCO Enhanced Short Maturity ActiveExchange-Traded Fund (At Market Price)(1) | | | 0.90% | | | | 1.73% | | | | 1.33% | | | | 1.31% | |
| | FTSE3-Month Treasury Bill Index± | | | 1.07% | | | | 1.86% | | | | 0.60% | | | | 0.37%¨ | |
All Fund returns are net of fees and expenses.
* Cumulative return.
¨ Average annual total return since 11/30/2009.
Market Returns do not include brokerage commissions that may be payable on secondary market transactions. If brokerage commissions were included, market returns would be lower. Market and NAV returns assume that dividends and capital gain distributions have been reinvested in the Fund at market price and NAV, respectively.
| (1) | The market price is determined using the midpoint between the highest bid and the lowest offer on the listing exchange, as of the time that the Fund’s NAV is calculated. |
± FTSE3-Month Treasury Bill Index is an unmanaged index representing monthly return equivalents of yield averages of the last 3 month Treasury Bill issues.
It is not possible to invest directly in an unmanaged index.
Performance quoted represents past performance. Past performance is not a guarantee or a reliable indicator of future results. Current performance may be lower or higher than performance shown. Investment return and the principal value of an investment will fluctuate. Shares may be worth more or less than original cost when redeemed by authorized participants. Returns shown do not reflect the deduction of taxes that a shareholder would pay on Fund distributions or on the redemption of Fund shares. Differences in the Fund’s performance versus the index and related attribution information with respect to particular categories of securities or individual positions may be attributable, in part, to differences in the pricing methodologies used by the Fund and the index. Performance data current to the most recentmonth-end is available at www.pimcoetfs.com orvia (888) 400-4ETF.
The Fund’s total annual operating expense ratio in effect as of period end was 0.42%. Details regarding any changes to the Fund’s operating expenses, subsequent to period end, can be found in the Fund’s current prospectus, as supplemented.
Investment Objective and Strategy Overview
PIMCO Enhanced Short Maturity Active Exchange-Traded Fund seeks maximum current income, consistent with preservation of capital and daily liquidity, by investing under normal circumstances at least 80% of its net assets in a diversified portfolio of Fixed Income Instruments of varying maturities, which may be represented by forwards. “Fixed Income Instruments” include bonds, debt securities and other similar instruments issued by various U.S. and non-U.S. public- or private-sector entities. The Fund primarily invests in U.S. dollar-denominated investment grade debt securities, rated Baa or higher by Moody’s Investors Service, Inc. (“Moody’s”), or equivalently rated by Standard & Poor’s Ratings Services (“S&P”) or Fitch, Inc. (“Fitch”), or, if unrated, determined by PIMCO to be of comparable quality. The Fund may invest, without limitation, in U.S. dollar-denominated securities and instruments of foreign issuers. Fund strategies may change from time to time. Please refer to the Fund’s current prospectus for more information regarding the Fund’s strategy.
Fund Insights at NAV
The following affected performance during the reporting period:
| » | | Holdings of investment grade corporate credit detracted from performance, as spreads widened. |
| » | | Holdings of non-agency mortgage-backed securities detracted from performance, as spreads widened. |
| » | | Underweight exposure to the 3-month portion of the U.S. Treasury curve contributed to performance, as the 3-month portion of the curve rose. |
| » | | Holdings of U.S. dollar denominated emerging market debt contributed to performance, as security selection benefited the performance. |
PIMCO Intermediate Municipal Bond Active Exchange-Traded Fund
Cumulative Returns Through December 31, 2018
$10,000 invested at the end of the month when the Fund commenced operations.
Allocation Breakdown as of 12/31/2018†§
| | | | |
Municipal Bonds & Notes | | | | |
| |
Health, Hospital & Nursing Home Revenue | | | 14.6% | |
| |
Ad Valorem Property Tax | | | 10.3% | |
| |
Electric Power & Light Revenue | | | 7.4% | |
| |
Highway Revenue Tolls | | | 7.2% | |
| |
Port, Airport & Marina Revenue | | | 5.6% | |
| |
Tobacco Settlement Funded | | | 5.5% | |
| |
Miscellaneous Revenue | | | 5.4% | |
| |
Natural Gas Revenue | | | 5.2% | |
| |
College & University Revenue | | | 4.5% | |
| |
Income Tax Revenue | | | 3.2% | |
| |
Miscellaneous Taxes | | | 2.7% | |
| |
Appropriations | | | 2.6% | |
| |
Industrial Revenue | | | 2.6% | |
| |
Fuel Sales Tax Revenue | | | 2.2% | |
| |
Lease (Appropriation) | | | 2.1% | |
| |
Water Revenue | | | 1.9% | |
| |
General Fund | | | 1.5% | |
| |
Hotel Occupancy Tax | | | 1.5% | |
| |
Transit Revenue | | | 1.3% | |
| |
Nuclear Revenue | | | 1.2% | |
| |
Lease (Renewal) | | | 1.1% | |
| |
Sewer Revenue | | | 1.1% | |
| |
Government Fund/Grant Revenue | | | 1.0% | |
| |
Other | | | 2.0% | |
| |
Short-Term Instruments | | | 6.3% | |
| | † | % of Investments, at value. |
| | § | Allocation Breakdown and % of investments exclude securities sold short and financial derivative instruments, if any. |
| | | | | | | | | | | | | | | | | | |
|
| Average Annual Total Return for the period ended December 31, 2018 | |
| | | | | |
| | | | | 6 Months* | | | 1 Year | | | 5 Year | | | Fund Inception
(11/30/2009) | |
| | PIMCO Intermediate Municipal Bond Active Exchange-Traded Fund (Based on Net Asset Value) | | | 1.36% | | | | 1.11% | | | | 2.65% | | | | 2.93% | |
| | PIMCO Intermediate Municipal Bond Active Exchange-Traded Fund (At Market Price)(1) | | | 1.49% | | | | 0.97% | | | | 2.69% | | | | 2.95% | |
| | Bloomberg Barclays1-15 Year Municipal Bond Index± | | | 1.65% | | | | 1.58% | | | | 3.00% | | | | 3.32% | |
All Fund returns are net of fees and expenses.
* Cumulative return.
Market Returns do not include brokerage commissions that may be payable on secondary market transactions. If brokerage commissions were included, market returns would be lower. Market and NAV returns assume that dividends and capital gain distributions have been reinvested in the Fund at market price and NAV, respectively.
| (1) | The market price is determined using the midpoint between the highest bid and the lowest offer on the listing exchange, as of the time that the Fund’s NAV is calculated. |
± Bloomberg Barclays1-15 Year Municipal Bond Index consists of a broad selection of investment grade general obligation and revenue bonds of maturities ranging from one year to 17 years. It is an unmanaged index representative of the tax exempt bond market.
It is not possible to invest directly in an unmanaged index.
Performance quoted represents past performance. Past performance is not a guarantee or a reliable indicator of future results. Current performance may be lower or higher than performance shown. Investment return and the principal value of an investment will fluctuate. Shares may be worth more or less than original cost when redeemed by authorized participants. Returns shown do not reflect the deduction of taxes that a shareholder would pay on Fund distributions or on the redemption of Fund shares. Differences in the Fund’s performance versus the index and related attribution information with respect to particular categories of securities or individual positions may be attributable, in part, to differences in the pricing methodologies used by the Fund and the index. Performance data current to the most recentmonth-end is available at www.pimcoetfs.com orvia (888) 400-4ETF.
The Fund’s total annual operating expense ratio in effect as of period end was 0.35%. Details regarding any changes to the Fund’s operating expenses, subsequent to period end, can be found in the Fund’s current prospectus, as supplemented.
Investment Objective and Strategy Overview
PIMCO Intermediate Municipal Bond Active Exchange-Traded Fund seeks attractive tax-exempt income, consistent with preservation of capital, by investing under normal circumstances at least 80% of its assets in a diversified portfolio of debt securities whose interest is, in the opinion of bond counsel for the issuer at the time of issuance, exempt from federal income tax (“Municipal Bonds”). The Fund does not intend to invest in Municipal Bonds whose interest is subject to the federal alternative minimum tax. The Fund may only invest in U.S. dollar-denominated investment grade debt securities, rated Baa or higher by Moody’s Investors Service, Inc. (“Moody’s”), or equivalently rated by Standard & Poor’s Ratings Services (“S&P”) or Fitch, Inc. (“Fitch”), or, if unrated, determined by PIMCO to be of comparable quality. The Fund may invest 25% or more of its total assets in Municipal Bonds that finance similar projects, such as those relating to education, health care, housing, transportation, and utilities, and 25% or more of its total assets in industrial development bonds. Fund strategies may change from time to time. Please refer to the Fund’s current prospectus for more information regarding the Fund’s strategy.
Fund Insights at NAV
The following affected performance during the reporting period:
| » | | Select exposure within the industrial revenue sector contributed to performance. |
| » | | Select exposure within the healthcare sector contributed to performance. |
| » | | Underweight exposure to pre-refunded debt contributed to performance, as the sector underperformed the general municipal market. |
| » | | Underweight exposure to the general obligation sector detracted from performance, as the sector outperformed the general municipal market. |
| » | | Underweight exposure to the water and sewer sector detracted from performance, as the sector outperformed the general municipal market. |
| » | | Select exposure within the education sector detracted from performance. |
| | | | | | |
| | SEMIANNUAL REPORT | | DECEMBER 31, 2018 | | 17 |
PIMCO Short Term Municipal Bond Active Exchange-Traded Fund
Cumulative Returns Through December 31, 2018
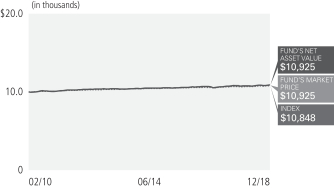
$10,000 invested at the end of the month when the Fund commenced operations.
Allocation Breakdown as of 12/31/2018†§
| | | | |
Municipal Bonds & Notes | | | | |
| |
Health, Hospital & Nursing Home Revenue | | | 16.2% | |
| |
Electric Power & Light Revenue | | | 12.1% | |
| |
Ad Valorem Property Tax | | | 9.8% | |
| |
Highway Revenue Tolls | | | 9.3% | |
| |
Natural Gas Revenue | | | 7.7% | |
| |
Industrial Revenue | | | 4.4% | |
| |
College & University Revenue | | | 4.4% | |
| |
Tobacco Settlement Funded | | | 4.2% | |
| |
Miscellaneous Revenue | | | 4.1% | |
| |
Port, Airport & Marina Revenue | | | 4.0% | |
| |
Miscellaneous Taxes | | | 2.6% | |
| |
Sewer Revenue | | | 2.3% | |
| |
Water Revenue | | | 2.3% | |
| |
Resource Recovery Revenue | | | 2.2% | |
| |
Sales Tax Revenue | | | 2.2% | |
| |
Local or Guaranteed Housing | | | 2.0% | |
| |
Fuel Sales Tax Revenue | | | 1.4% | |
| |
Other | | | 1.3% | |
| |
Short-Term Instruments | | | 7.5% | |
| | † | % of Investments, at value. |
| | § | Allocation Breakdown and % of investments exclude securities sold short and financial derivative instruments, if any. |
| | | | | | | | | | | | | | | | | | |
|
| Average Annual Total Return for the period ended December 31, 2018 | |
| | | | | |
| | | | | 6 Months* | | | 1 Year | | | 5 Year | | | Fund Inception
(02/01/2010) | |
| | PIMCO Short Term Municipal Bond Active Exchange-Traded Fund (Based on Net Asset Value) | | | 0.84% | | | | 1.38% | | | | 0.96% | | | | 1.02% | |
| | PIMCO Short Term Municipal Bond Active Exchange-Traded Fund (At Market Price)(1) | | | 1.03% | | | | 1.76% | | | | 0.98% | | | | 1.02% | |
| | Bloomberg Barclays 1 Year Municipal Bond Index± | | | 0.76% | | | | 1.74% | | | | 0.83% | | | | 0.94% | |
All Fund returns are net of fees and expenses.
* Cumulative return.
Market Returns do not include brokerage commissions that may be payable on secondary market transactions. If brokerage commissions were included, market returns would be lower. Market and NAV returns assume that dividends and capital gain distributions have been reinvested in the Fund at market price and NAV, respectively.
| (1) | The market price is determined using the midpoint between the highest bid and the lowest offer on the listing exchange, as of the time that the Fund’s NAV is calculated. |
± The Bloomberg Barclays 1-Year Municipal Bond Index is the 1 Year (1-2) component of the Municipal Bond Index. The Index is a rules-based, market-value-weighted index engineered for the long term tax-exempt bond market. To be included in the Index, bonds must be rated investment-grade (Baa3/BBB- or higher) by at least two of the following ratings agencies: Moody’s, S&P and Fitch. If only two of the three agencies rate the security, the lower rating is used to determine index eligibility. If only one of the three agencies rates a security, the rating must be investment-grade. They must have an outstanding par value of at least $7 million and be issued as part of a transaction of at least $75 million. The bonds must be fixed rate, have a dated-date after December 31, 1990, and must be at least one year from their maturity date. Remarketed issues, taxable municipal bonds, bonds with floating rates, and derivatives, are excluded from the benchmark.
It is not possible to invest directly in an unmanaged index.
Performance quoted represents past performance. Past performance is not a guarantee or a reliable indicator of future results. Current performance may be lower or higher than performance shown. Investment return and the principal value of an investment will fluctuate. Shares may be worth more or less than original cost when redeemed by authorized participants. Returns shown do not reflect the deduction of taxes that a shareholder would pay on Fund distributions or on the redemption of Fund shares. Differences in the Fund’s performance versus the index and related attribution information with respect to particular categories of securities or individual positions may be attributable, in part, to differences in the pricing methodologies used by the Fund and the index. Performance data current to the most recentmonth-end is available at www.pimcoetfs.com or via (888)400-4ETF.
The Fund’s total annual operating expense ratio in effect as of period end was 0.35%. Details regarding any changes to the Fund’s operating expenses, subsequent to period end, can be found in the Fund’s current prospectus, as supplemented.
Investment Objective and Strategy Overview
PIMCO Short Term Municipal Bond Active Exchange-Traded Fund seeks attractive tax-exempt income, consistent with preservation of capital, by investing under normal circumstances at least 80% of its assets in a diversified portfolio of debt securities whose interest is, in the opinion of bond counsel for the issuer at the time of issuance, exempt from federal income tax (“Municipal Bonds”). The Fund does not intend to invest in Municipal Bonds whose interest is subject to the federal alternative minimum tax. The Fund may only invest in U.S. dollar-denominated investment grade debt securities, rated Baa or higher by Moody’s Investors Service, Inc. (“Moody’s”), or equivalently rated by Standard & Poor’s Ratings Services (“S&P”) or Fitch, Inc. (“Fitch”), or, if unrated, determined by PIMCO to be of comparable quality. The Fund may invest 25% or more of its total assets in Municipal Bonds that finance similar projects, such as those relating to education, health care, housing, transportation, and utilities, and 25% or more of its total assets in industrial development bonds. Fund strategies may change from time to time. Please refer to the Fund’s current prospectus for more information regarding the Fund’s strategy.
Fund Insights at NAV
The following affected performance during the reporting period:
| » | | Duration positioning contributed to performance, as yields rose over the 1-4 year portion of the municipal curve, and fell over the 5-10 year portion. |
| » | | Select exposure within the revenue segment contributed to performance. |
| » | | Select exposure within the industrial revenue sector contributed to performance. |
| » | | Select exposure within the pre-refunded debt sector detracted from performance. |
| » | | Underweight exposure to the lease-backed sector detracted from performance, as the sector outperformed the general municipal market. |
| » | | Select exposure to the education sector detracted from performance. |
Expense Examples
Example
As a shareholder of a Fund, you incur two types of costs: (1) transaction costs, including brokerage commissions paid on purchases and sales of Fund shares and (2) ongoing costs, including management fees and other Fund expenses. The Example is intended to help you understand your ongoing costs (in dollars) of investing in a Fund and to compare these costs with the ongoing costs of investing in other exchange-traded funds.
The Example is based on an investment of $1,000 invested at the beginning of the period and held for the entire period indicated, which for all Funds is from July 1, 2018 to December 31, 2018 unless noted otherwise in the table and footnotes below.
Actual Expenses
The information in the table under the heading “Actual” provides information about actual account values and actual expenses. You may use this information, together with the amount you invested, to estimate the expenses that you paid over the period. Simply divide your account value by $1,000 (for example, an $8,600 account value divided by $1,000 = 8.60), then multiply the result by the number in the column titled “Expenses Paid During Period” to estimate the expenses you paid on your account during this period.
Hypothetical Example for Comparison Purposes
The information in the table under the heading “Hypothetical (5% return before expenses)” provides information about hypothetical account values and hypothetical expenses based on a Fund’s actual expense ratio and an assumed rate of return of 5% per year before expenses, which is not the Fund’s actual return. The hypothetical account values and expenses may not be used to estimate the actual ending account balance or expenses you paid for the period. You may use this information to compare the ongoing costs of investing in a Fund and other exchange-traded funds. To do so, compare this 5% hypothetical example with the 5% hypothetical examples that appear in the shareholder reports of other exchange-traded funds.
Please note that the expenses shown in the table are meant to highlight your ongoing costs only and do not reflect any transactional costs, such as brokerage commissions paid on purchases and sales of shares of the Funds. Therefore, the information under the heading “Hypothetical (5% return before expenses)” is useful in comparing ongoing costs only, and will not help you determine the relative total costs of owning different exchange-traded funds. In addition, if these transactional costs were included, your costs would have been higher.
Expense ratios may vary period to period because of various factors, such as an increase in expenses not covered by the management fee (such as expenses of the independent trustees and their counsel, extraordinary expenses and interest expense).
| | | | | | | | | | | | | | | | | | | | | | | | | | | | | | | | | | | | | | | | |
| | | | | | Actual | | | | | | Hypothetical
(5% return before expenses) | | | | | | | |
| | | | | | Beginning
Account Value
(07/01/18) | | | Ending
Account Value
(12/31/18) | | | Expenses Paid
During Period* | | | | | | Beginning
Account Value
(07/01/18) | | | Ending
Account Value
(12/31/18) | | | Expenses Paid
During Period* | | | | | | Net Annualized
Expense Ratio** | |
| PIMCO1-3 Year U.S. Treasury IndexExchange-Traded Fund | | | | | | $ | 1,000.00 | | | $ | 1,014.10 | | | $ | 0.81 | | | | | | | $ | 1,000.00 | | | $ | 1,024.40 | | | $ | 0.82 | | | | | | | | 0.16 | % |
| PIMCO 25+ Year Zero Coupon U.S. Treasury Index Exchange-Traded Fund | | | | | | | 1,000.00 | | | | 995.50 | | | | 0.75 | | | | | | | | 1,000.00 | | | | 1,024.45 | | | | 0.77 | | | | | | | | 0.15 | |
| PIMCO1-5 Year U.S. TIPS Index Exchange-Traded Fund | | | | | | | 1,000.00 | | | | 997.00 | | | | 1.01 | | | | | | | | 1,000.00 | | | | 1,024.20 | | | | 1.02 | | | | | | | | 0.20 | |
| PIMCO 15+ Year U.S. TIPS Index Exchange-Traded Fund | | | | | | | 1,000.00 | | | | 940.60 | | | | 0.98 | | | | | | | | 1,000.00 | | | | 1,024.20 | | | | 1.02 | | | | | | | | 0.20 | |
| PIMCO Broad U.S. TIPS Index Exchange-Traded Fund | | | | | | | 1,000.00 | | | | 985.10 | | | | 1.05 | | | | | | | | 1,000.00 | | | | 1,024.15 | | | | 1.07 | | | | | | | | 0.21 | |
| PIMCO0-5 Year High Yield Corporate Bond Index Exchange-Traded Fund | | | | | | | 1,000.00 | | | | 981.30 | | | | 2.80 | | | | | | | | 1,000.00 | | | | 1,022.38 | | | | 2.85 | | | | | | | | 0.56 | |
| PIMCO Investment Grade Corporate Bond Index Exchange-Traded Fund | | | | | | | 1,000.00 | | | | 1,007.60 | | | | 1.01 | | | | | | | | 1,000.00 | | | | 1,024.20 | | | | 1.02 | | | | | | | | 0.20 | |
| PIMCO Active Bond Exchange-Traded Fund | | | | | | | 1,000.00 | | | | 1,015.60 | | | | 4.17 | | | | | | | | 1,000.00 | | | | 1,021.07 | | | | 4.18 | | | | | | | | 0.82 | |
| PIMCO Enhanced Low Duration ActiveExchange-Traded Fund | | | | | | | 1,000.00 | | | | 1,009.40 | | | | 5.72 | | | | | | | | 1,000.00 | | | | 1,019.51 | | | | 5.75 | | | | | | | | 1.13 | |
| PIMCO Enhanced Short Maturity ActiveExchange-Traded Fund | | | | | | | 1,000.00 | | | | 1,008.60 | | | | 1.82 | | | | | | | | 1,000.00 | | | | 1,023.39 | | | | 1.84 | | | | | | | | 0.36 | |
| PIMCO Intermediate Municipal Bond ActiveExchange-Traded Fund | | | | | | | 1,000.00 | | | | 1,013.60 | | | | 1.78 | | | | | | | | 1,000.00 | | | | 1,023.44 | | | | 1.79 | | | | | | | | 0.35 | |
| PIMCO Short Term Municipal Bond ActiveExchange-Traded Fund | | | | | | | 1,000.00 | | | | 1,008.40 | | | | 1.77 | | | | | | | | 1,000.00 | | | | 1,023.44 | | | | 1.79 | | | | | | | | 0.35 | |
* Expenses Paid During Period are equal to the net annualized expense ratio for the Fund, multiplied by the average account value over the period, multiplied by 184/365 (to reflect theone-half year period).
** Net Annualized Expense Ratio is reflective of any applicable contractual fee waivers and/or expense reimbursements or voluntary fee waivers. Details regarding fee waivers, if any, can be found in Note 9, Fees and Expenses, in the Notes to Financial Statements.
| | | | | | |
| | SEMIANNUAL REPORT | | DECEMBER 31, 2018 | | 19 |
Financial Highlights
| | | | | | | | | | | | | | | | | | | | | | | | | | | | | | | | | | | | |
| | | | | | Investment Operations | | | | | | Less Distributions(b) | |
| | | | | | | | | | | | | |
| Selected Per Share Data for the Year or Period Ended^: | | Net Asset
Value
Beginning
of Year
or Period | | | Net
Investment
Income (Loss)(a) | | | Net
Realized/
Unrealized
Gain (Loss) | | | Total | | | | | | From Net
Investment
Income | | | From Net
Realized
Capital Gains | | | Tax Basis
Return of
Capital | | | Total | |
| | | | | | | | | |
PIMCO1-3 Year U.S. Treasury Index Exchange-Traded Fund | | | | | | | | | | | | | | | | | | | | | | | | | | | | | | | | | | | | |
| | | | | | | | | |
07/01/2018 - 12/31/2018+ | | $ | 50.01 | | | $ | 0.45 | | | $ | 0.25 | | | $ | 0.70 | | | | | | | $ | (0.56 | ) | | $ | 0.00 | | | $ | 0.00 | | | $ | (0.56 | ) |
| | | | | | | | | |
06/30/2018 | | | 50.67 | | | | 0.61 | | | | (0.65 | ) | | | (0.04 | ) | | | | | | | (0.62 | ) | | | 0.00 | | | | 0.00 | | | | (0.62 | ) |
| | | | | | | | | |
06/30/2017 | | | 51.26 | | | | 0.42 | | | | (0.55 | ) | | | (0.13 | ) | | | | | | | (0.42 | ) | | | (0.04 | ) | | | 0.00 | | | | (0.46 | ) |
| | | | | | | | | |
06/30/2016 | | | 50.99 | | | | 0.35 | | | | 0.25 | | | | 0.60 | | | | | | | | (0.31 | ) | | | (0.02 | ) | | | 0.00 | | | | (0.33 | ) |
| | | | | | | | | |
06/30/2015 | | | 50.94 | | | | 0.25 | | | | 0.11 | | | | 0.36 | | | | | | | | (0.25 | ) | | | (0.06 | ) | | | 0.00 | | | | (0.31 | ) |
| | | | | | | | | |
06/30/2014 | | | 50.78 | | | | 0.16 | | | | 0.19 | | | | 0.35 | | | | | | | | (0.16 | ) | | | (0.03 | ) | | | 0.00 | | | | (0.19 | ) |
| | | | | | | | | |
PIMCO 25+ Year Zero Coupon U.S. Treasury IndexExchange-Traded Fund | | | | | | | | | | | | | | | | | | | | | | | | | | | | | | | | | | | | |
| | | | | | | | | |
07/01/2018 - 12/31/2018+ | | $ | 115.51 | | | $ | 1.58 | | | $ | (2.15 | ) | | $ | (0.57 | ) | | | | | | $ | (2.49 | ) | | $ | 0.00 | | | $ | 0.00 | | | $ | (2.49 | ) |
| | | | | | | | | |
06/30/2018 | | | 117.38 | | | | 3.11 | | | | (1.85 | ) | | | 1.26 | | | | | | | | (3.13 | ) | | | 0.00 | | | | 0.00 | | | | (3.13 | ) |
| | | | | | | | | |
06/30/2017 | | | 135.43 | | | | 3.10 | | | | (17.80 | ) | | | (14.70 | ) | | | | | | | (3.35 | ) | | | 0.00 | | | | 0.00 | | | | (3.35 | ) |
| | | | | | | | | |
06/30/2016 | | | 105.39 | | | | 3.16 | | | | 29.17 | | | | 32.33 | | | | | | | | (2.29 | ) | | | 0.00 | | | | 0.00 | | | | (2.29 | ) |
| | | | | | | | | |
06/30/2015 | | | 99.87 | | | | 3.18 | | | | 5.62 | | | | 8.80 | | | | | | | | (3.28 | ) | | | 0.00 | | | | 0.00 | | | | (3.28 | ) |
| | | | | | | | | |
06/30/2014 | | | 94.57 | | | | 3.26 | | | | 5.46 | | | | 8.72 | | | | | | | | (3.42 | ) | | | 0.00 | | | | 0.00 | | | | (3.42 | ) |
| | | | | | | | | |
PIMCO1-5 Year U.S. TIPS Index Exchange-Traded Fund | | | | | | | | | | | | | | | | | | | | | | | | | | | | | | | | | | | | |
| | | | | | | | | |
07/01/2018 - 12/31/2018+ | | $ | 51.76 | | | $ | 0.46 | | | $ | (0.62 | ) | | $ | (0.16 | ) | | | | | | $ | (0.75 | ) | | $ | 0.00 | | | $ | 0.00 | | | $ | (0.75 | ) |
| | | | | | | | | |
06/30/2018 | | | 52.18 | | | | 1.04 | | | | (0.51 | ) | | | 0.53 | | | | | | | | (0.95 | ) | | | 0.00 | | | | 0.00 | | | | (0.95 | ) |
| | | | | | | | | |
06/30/2017 | | | 52.83 | | | | 0.87 | | | | (0.87 | ) | | | 0.00 | | | | | | | | (0.65 | ) | | | 0.00 | | | | 0.00 | | | | (0.65 | ) |
| | | | | | | | | |
06/30/2016 | | | 52.18 | | | | 0.19 | | | | 0.71 | | | | 0.90 | | | | | | | | 0.00 | | | | 0.00 | | | | (0.25 | ) | | | (0.25 | ) |
| | | | | | | | | |
06/30/2015 | | | 53.58 | | | | (0.67 | ) | | | (0.54 | ) | | | (1.21 | ) | | | | | | | (0.02 | ) | | | 0.00 | | | | (0.17 | ) | | | (0.19 | ) |
| | | | | | | | | |
06/30/2014 | | | 52.69 | | | | 0.34 | | | | 0.86 | | | | 1.20 | | | | | | | | (0.31 | ) | | | 0.00 | | | | 0.00 | | | | (0.31 | ) |
| | | | | | | | | |
PIMCO 15+ Year U.S. TIPS Index Exchange-Traded Fund | | | | | | | | | | | | | | | | | | | | | | | | | | | | | | | | | | | | |
| | | | | | | | | |
07/01/2018 - 12/31/2018+ | | $ | 67.57 | | | $ | 0.83 | | | $ | (4.81 | ) | | $ | (3.98 | ) | | | | | | $ | (1.26 | ) | | $ | 0.00 | | | $ | 0.00 | | | $ | (1.26 | ) |
| | | | | | | | | |
06/30/2018 | | | 65.64 | | | | 2.03 | | | | 1.79 | | | | 3.82 | | | | | | | | (1.89 | ) | | | 0.00 | | | | 0.00 | | | | (1.89 | ) |
| | | | | | | | | |
06/30/2017 | | | 69.55 | | | | 1.80 | | | | (3.74 | ) | | | (1.94 | ) | | | | | | | (1.97 | ) | | | 0.00 | | | | 0.00 | | | | (1.97 | ) |
| | | | | | | | | |
06/30/2016 | | | 62.95 | | | | 1.01 | | | | 6.02 | | | | 7.03 | | | | | | | | (0.43 | ) | | | 0.00 | | | | 0.00 | | | | (0.43 | ) |
| | | | | | | | | |
06/30/2015 | | | 65.02 | | | | 0.21 | | | | (1.83 | ) | | | (1.62 | ) | | | | | | | (0.45 | ) | | | 0.00 | | | | 0.00 | | | | (0.45 | ) |
| | | | | | | | | |
06/30/2014 | | | 61.05 | | | | 1.09 | | | | 4.23 | | | | 5.32 | | | | | | | | (1.35 | ) | | | 0.00 | | | | 0.00 | | | | (1.35 | ) |
| | | | | | | | | |
PIMCO Broad U.S. TIPS Index Exchange-Traded Fund | | | | | | | | | | | | | | | | | | | | | | | | | | | | | | | | | | | | |
| | | | | | | | | |
07/01/2018 - 12/31/2018+ | | $ | 57.61 | | | $ | 0.51 | | | $ | (1.36 | ) | | $ | (0.85 | ) | | | | | | $ | (0.80 | ) | | $ | 0.00 | | | $ | 0.00 | | | $ | (0.80 | ) |
| | | | | | | | | |
06/30/2018 | | | 57.61 | | | | 1.25 | | | | (0.07 | ) | | | 1.18 | | | | | | | | (1.18 | ) | | | 0.00 | | | | 0.00 | | | | (1.18 | ) |
| | | | | | | | | |
06/30/2017 | | | 59.09 | | | | 1.10 | | | | (1.61 | ) | | | (0.51 | ) | | | | | | | (0.97 | ) | | | 0.00 | | | | 0.00 | | | | (0.97 | ) |
| | | | | | | | | |
06/30/2016 | | | 56.73 | | | | 0.54 | | | | 2.13 | | | | 2.67 | | | | | | | | (0.31 | ) | | | 0.00 | | | | 0.00 | | | | (0.31 | ) |
| | | | | | | | | |
06/30/2015 | | | 58.14 | | | | 0.00 | | | | (1.17 | ) | | | (1.17 | ) | | | | | | | (0.09 | ) | | | 0.00 | | | | (0.15 | ) | | | (0.24 | ) |
| | | | | | | | | |
06/30/2014 | | | 56.40 | | | | 0.71 | | | | 1.81 | | | | 2.52 | | | | | | | | (0.78 | ) | | | 0.00 | | | | 0.00 | | | | (0.78 | ) |
| | | | | | | | | |
PIMCO0-5 Year High Yield Corporate Bond IndexExchange-Traded Fund | | | | | | | | | | | | | | | | | | | | | | | | | | | | | | | | | | | | |
| | | | | | | | | |
07/01/2018 - 12/31/2018+ | | $ | 100.07 | | | $ | 2.24 | | | $ | (4.05 | ) | | $ | (1.81 | ) | | | | | | $ | (2.82 | ) | | $ | 0.00 | | | $ | 0.00 | | | $ | (2.82 | ) |
| | | | | | | | | |
06/30/2018 | | | 101.62 | | | | 4.44 | | | | (1.28 | ) | | | 3.16 | | | | | | | | (4.71 | ) | | | 0.00 | | | | 0.00 | | | | (4.71 | ) |
| | | | | | | | | |
06/30/2017 | | | 96.65 | | | | 4.60 | | | | 5.66 | | | | 10.26 | | | | | | | | (5.29 | ) | | | 0.00 | | | | 0.00 | | | | (5.29 | ) |
| | | | | | | | | |
06/30/2016 | | | 100.37 | | | | 4.52 | | | | (3.69 | ) | | | 0.83 | | | | | | | | (4.55 | ) | | | 0.00 | | | | 0.00 | | | | (4.55 | ) |
| | | | | | | | | |
06/30/2015 | | | 106.76 | | | | 4.06 | | | | (4.96 | ) | | | (0.90 | ) | | | | | | | (4.53 | ) | | | (0.96 | ) | | | 0.00 | | | | (5.49 | ) |
| | | | | | | | | |
06/30/2014 | | | 102.54 | | | | 4.23 | | | | 4.83 | | | | 9.06 | | | | | | | | (4.59 | ) | | | (0.25 | ) | | | 0.00 | | | | (4.84 | ) |
| | | | | | | | | |
PIMCO Investment Grade Corporate Bond IndexExchange-Traded Fund | | | | | | | | | | | | | | | | | | | | | | | | | | | | | | | | | | | | |
| | | | | | | | | |
07/01/2018 - 12/31/2018+ | | $ | 100.41 | | | $ | 1.70 | | | $ | (0.95 | ) | | $ | 0.75 | | | | | | | $ | (2.05 | ) | | $ | 0.00 | | | $ | 0.00 | | | $ | (2.05 | ) |
| | | | | | | | | |
06/30/2018 | | | 104.90 | | | | 3.31 | | | | (4.43 | ) | | | (1.12 | ) | | | | | | | (3.31 | ) | | | (0.06 | ) | | | 0.00 | | | | (3.37 | ) |
| | | | | | | | | |
06/30/2017 | | | 105.72 | | | | 3.11 | | | | (0.86 | ) | | | 2.25 | | | | | | | | (3.07 | ) | | | 0.00 | | | | 0.00 | | | | (3.07 | ) |
| | | | | | | | | |
06/30/2016 | | | 100.50 | | | | 3.10 | | | | 4.91 | | | | 8.01 | | | | | | | | (2.75 | ) | | | (0.04 | ) | | | 0.00 | | | | (2.79 | ) |
| | | | | | | | | |
06/30/2015 | | | 103.21 | | | | 3.14 | | | | (2.35 | ) | | | 0.79 | | | | | | | | (3.17 | ) | | | (0.33 | ) | | | 0.00 | | | | (3.50 | ) |
| | | | | | | | | |
06/30/2014 | | | 102.11 | | | | 3.42 | | | | 4.64 | | | | 8.06 | | | | | | | | (3.28 | ) | | | (3.68 | ) | | | 0.00 | | | | (6.96 | ) |
| | | | | | | | |
| 20 | | PIMCO ETF TRUST | | | | | See Accompanying Notes | |
| | | | | | | | | | | | | | | | | | | | | | | | | | | | | | | | | | |
| | | | | | | Ratios/Supplemental Data | |
| | | | | | | | | | Ratios to Average Net Assets | | | | |
Net Asset
Value End of
Year or
Period | | | Total Return | | | Net Assets
End of Year or
Period (000s) | | | Expenses | | | Expenses
Excluding
Waivers | | | Expenses
Excluding
Interest
Expense | | | Expenses
Excluding
Interest
Expense and
Waivers | | | Net
Investment
Income (Loss) | | | Portfolio
Turnover
Rate(c) | |
| | | | | | | | |
| | | | | | | | | | | | | | | | | | | | | | | | | | | | | | | | | | |
| | | | | | | | |
| $ | 50.15 | | | | 1.41 | % | | $ | 55,262 | | | | 0.16 | %* | | | 0.16 | %* | | | 0.16 | %* | | | 0.16 | %* | | | 1.78 | %* | | | 27 | % |
| | | | | | | | |
| | 50.01 | | | | (0.09 | ) | | | 87,616 | | | | 0.16 | | | | 0.16 | | | | 0.16 | | | | 0.16 | | | | 1.21 | | | | 54 | |
| | | | | | | | |
| | 50.67 | | | | (0.26 | ) | | | 119,187 | | | | 0.15 | | | | 0.15 | | | | 0.15 | | | | 0.15 | | | | 0.82 | | | | 56 | |
| | | | | | | | |
| | 51.26 | | | | 1.19 | | | | 151,316 | | | | 0.15 | | | | 0.15 | | | | 0.15 | | | | 0.15 | | | | 0.68 | | | | 66 | |
| | | | | | | | |
| | 50.99 | | | | 0.70 | | | | 107,175 | | | | 0.14 | | | | 0.16 | | | | 0.14 | | | | 0.16 | | | | 0.49 | | | | 60 | |
| | | | | | | | |
| | 50.94 | | | | 0.68 | | | | 127,442 | | | | 0.10 | | | | 0.16 | | | | 0.10 | | | | 0.16 | | | | 0.32 | | | | 61 | |
| | | | | | | | |
|
|
| | | | | | | | | | | | | | | | | | | | | | | | | | | | | | | | |
| | | | | | | | |
| $ | 112.45 | | | | (0.45 | )% | | $ | 142,815 | | | | 0.15 | %* | | | 0.15 | %* | | | 0.15 | %* | | | 0.15 | %* | | | 2.87 | %* | | | 9 | % |
| | | | | | | | |
| | 115.51 | | | | 1.08 | | | | 164,028 | | | | 0.15 | | | | 0.15 | | | | 0.15 | | | | 0.15 | | | | 2.71 | | | | 19 | |
| | | | | | | | |
| | 117.38 | | | | (10.88 | ) | | | 166,683 | | | | 0.15 | | | | 0.15 | | | | 0.15 | | | | 0.15 | | | | 2.53 | | | | 14 | |
| | | | | | | | |
| | 135.43 | | | | 31.09 | | | | 442,851 | | | | 0.15 | | | | 0.15 | | | | 0.15 | | | | 0.15 | | | | 2.67 | | | | 23 | |
| | | | | | | | |
| | 105.39 | | | | 8.64 | | | | 96,960 | | | | 0.16 | | | | 0.16 | | | | 0.16 | | | | 0.16 | | | | 2.75 | | | | 18 | |
| | | | | | | | |
| | 99.87 | | | | 9.70 | | | | 76,902 | | | | 0.16 | | | | 0.16 | | | | 0.16 | | | | 0.16 | | | | 3.61 | | | | 18 | |
| | | | | | | | |
| | | | | | | | | | | | | | | | | | | | | | | | | | | | | | | | | | |
| | | | | | | | |
| $ | 50.85 | | | | (0.30 | )% | | $ | 794,350 | | | | 0.20 | %* | | | 0.20 | %* | | | 0.20 | %* | | | 0.20 | %* | | | 1.77 | %* | | | 14 | % |
| | | | | | | | |
| | 51.76 | | | | 1.02 | | | | 826,530 | | | | 0.20 | | | | 0.20 | | | | 0.20 | | | | 0.20 | | | | 2.01 | | | | 32 | |
| | | | | | | | |
| | 52.18 | | | | 0.00 | | | | 1,136,011 | | | | 0.20 | | | | 0.20 | | | | 0.20 | | | | 0.20 | | | | 1.64 | | | | 38 | |
| | | | | | | | |
| | 52.83 | | | | 1.74 | | | | 1,065,611 | | | | 0.20 | | | | 0.20 | | | | 0.20 | | | | 0.20 | | | | 0.36 | | | | 41 | |
| | | | | | | | |
| | 52.18 | | | | (2.27 | ) | | | 1,182,866 | | | | 0.20 | | | | 0.20 | | | | 0.20 | | | | 0.20 | | | | (1.28 | ) | | | 31 | |
| | | | | | | | |
| | 53.58 | | | | 2.28 | | | | 1,337,875 | | | | 0.20 | | | | 0.20 | | | | 0.20 | | | | 0.20 | | | | 0.63 | | | | 33 | |
| | | | | | | | |
| | | | | | | | | | | | | | | | | | | | | | | | | | | | | | | | | | |
| | | | | | | | |
| $ | 62.33 | | | | (5.94 | )% | | $ | 194,453 | | | | 0.20 | %* | | | 0.20 | %* | | | 0.20 | %* | | | 0.20 | %* | | | 2.54 | %* | | | 2 | % |
| | | | | | | | |
| | 67.57 | | | | 5.88 | | | | 254,745 | | | | 0.20 | | | | 0.20 | | | | 0.20 | | | | 0.20 | | | | 3.05 | | | | 10 | |
| | | | | | | | |
| | 65.64 | | | | (2.82 | ) | | | 148,992 | | | | 0.20 | | | | 0.20 | | | | 0.20 | | | | 0.20 | | | | 2.66 | | | | 16 | |
| | | | | | | | |
| | 69.55 | | | | 11.25 | | | | 109,197 | | | | 0.20 | | | | 0.20 | | | | 0.20 | | | | 0.20 | | | | 1.59 | | | | 12 | |
| | | | | | | | |
| | 62.95 | | | | (2.52 | ) | | | 92,539 | | | | 0.21 | | | | 0.21 | | | | 0.21 | | | | 0.21 | | | | 0.31 | | | | 14 | |
| | | | | | | | |
| | 65.02 | | | | 8.83 | | | | 69,570 | | | | 0.21 | | | | 0.21 | | | | 0.21 | | | | 0.21 | | | | 1.81 | | | | 47 | |
| | | | | | | | |
| | | | | | | | | | | | | | | | | | | | | | | | | | | | | | | | | | |
| | | | | | | | |
| $ | 55.96 | | | | (1.49 | )% | | $ | 54,837 | | | | 0.21 | %* | | | 0.21 | %* | | | 0.21 | %* | | | 0.21 | %* | | | 1.78 | %* | | | 2 | % |
| | | | | | | | |
| | 57.61 | | | | 2.07 | | | | 50,695 | | | | 0.21 | | | | 0.21 | | | | 0.21 | | | | 0.21 | | | | 2.18 | | | | 8 | |
| | | | | | | | |
| | 57.61 | | | | (0.87 | ) | | | 70,864 | | | | 0.20 | | | | 0.20 | | | | 0.20 | | | | 0.20 | | | | 1.88 | | | | 8 | |
| | | | | | | | |
| | 59.09 | | | | 4.73 | | | | 90,404 | | | | 0.20 | | | | 0.20 | | | | 0.20 | | | | 0.20 | | | | 0.96 | | | | 10 | |
| | | | | | | | |
| | 56.73 | | | | (2.02 | ) | | | 92,473 | | | | 0.21 | | | | 0.21 | | | | 0.21 | | | | 0.21 | | | | (0.01 | ) | | | 23 | |
| | | | | | | | |
| | 58.14 | | | | 4.50 | | | | 106,402 | | | | 0.21 | | | | 0.21 | | | | 0.21 | | | | 0.21 | | | | 1.26 | | | | 19 | |
| | | | | | | | |
| | | | | | | | | | | | | | | | | | | | | | | | | | | | | | | | | | |
| | | | | | | | |
| $ | 95.44 | | | | (1.87 | )% | | $ | 1,221,671 | | | | 0.56 | %* | | | 0.56 | %* | | | 0.55 | %* | | | 0.55 | %* | | | 4.46 | %* | | | 12 | % |
| | | | | | | | |
| | 100.07 | | | | 3.18 | | | | 1,666,164 | | | | 0.56 | | | | 0.56 | | | | 0.55 | | | | 0.55 | | | | 4.41 | | | | 42 | |
| | | | | | | | |
| | 101.62 | | | | 10.88 | | | | 1,824,151 | | | | 0.55 | | | | 0.55 | | | | 0.55 | | | | 0.55 | | | | 4.58 | | | | 43 | |
| | | | | | | | |
| | 96.65 | | | | 1.04 | | | | 2,044,168 | | | | 0.55 | | | | 0.55 | | | | 0.55 | | | | 0.55 | | | | 4.75 | | | | 34 | |
| | | | | | | | |
| | 100.37 | | | | (0.82 | ) | | | 2,805,241 | | | | 0.55 | | | | 0.55 | | | | 0.55 | | | | 0.55 | | | | 3.92 | | | | 28 | |
| | | | | | | | |
| | 106.76 | | | | 8.98 | | | | 5,119,202 | | | | 0.55 | | | | 0.55 | | | | 0.55 | | | | 0.55 | | | | 3.98 | | | | 28 | |
| | | | | | | | |
| | | | | | | | | | | | | | | | | | | | | | | | | | | | | | | | | | |
| | | | | | | | |
| $ | 99.11 | | | | 0.76 | % | | $ | 627,367 | | | | 0.20 | %* | | | 0.20 | %* | | | 0.20 | %* | | | 0.20 | %* | | | 3.37 | %* | | | 12 | % |
| | | | | | | | |
| | 100.41 | | | | (1.12 | ) | | | 756,084 | | | | 0.20 | | | | 0.20 | | | | 0.20 | | | | 0.20 | | | | 3.20 | | | | 10 | |
| | | | | | | | |
| | 104.90 | | | | 2.19 | | | | 737,459 | | | | 0.20 | | | | 0.20 | | | | 0.20 | | | | 0.20 | | | | 2.97 | | | | 7 | |
| | | | | | | | |
| | 105.72 | | | | 8.14 | | | | 447,211 | | | | 0.20 | | | | 0.20 | | | | 0.20 | | | | 0.20 | | | | 3.05 | | | | 13 | |
| | | | | | | | |
| | 100.50 | | | | 0.74 | | | | 244,203 | | | | 0.20 | | | | 0.20 | | | | 0.20 | | | | 0.20 | | | | 3.04 | | | | 12 | |
| | | | | | | | |
| | 103.21 | | | | 8.24 | | | | 199,196 | | | | 0.20 | | | | 0.20 | | | | 0.20 | | | | 0.20 | | | | 3.36 | | | | 17 | |
| | | | | | |
| | SEMIANNUAL REPORT | | DECEMBER 31, 2018 | | 21 |
Financial Highlights(Cont.)
| | | | | | | | | | | | | | | | | | | | | | | | | | | | | | | | | | | | |
| | | | | | Investment Operations | | | | | | Less Distributions(b) | |
| | | | | | | | | | | | | |
| Selected Per Share Data for the Year or Period Ended^: | | Net Asset
Value
Beginning
of Year
or Period | | | Net
Investment
Income (Loss)(a) | | | Net
Realized/
Unrealized
Gain (Loss) | | | Total | | | | | | From Net
Investment
Income | | | From Net
Realized
Capital Gains | | | Tax Basis
Return of
Capital | | | Total | |
| | | | | | | | | |
PIMCO Active Bond Exchange-Traded Fund | | | | | | | | | | | | | | | | | | | | | | | | | | | | | | | | | | | | |
| | | | | | | | | |
07/01/2018 - 12/31/2018+ | | $ | 103.19 | | | $ | 1.77 | | | $ | (0.18 | ) | | $ | 1.59 | | | | | | | $ | (2.13 | ) | | $ | 0.00 | | | $ | 0.00 | | | $ | (2.13 | ) |
| | | | | | | | | |
06/30/2018 | | | 106.07 | | | | 3.17 | | | | (2.73 | ) | | | 0.44 | | | | | | | | (3.06 | ) | | | 0.00 | | | | (0.26 | ) | | | (3.32 | ) |
| | | | | | | | | |
06/30/2017 | | | 107.31 | | | | 2.88 | | | | (0.80 | ) | | | 2.08 | | | | | | | | (2.48 | ) | | | 0.00 | | | | (0.84 | ) | | | (3.32 | ) |
| | | | | | | | | |
06/30/2016 | | | 106.69 | | | | 3.09 | | | | 1.31 | | | | 4.40 | | | | | | | | (3.78 | ) | | | 0.00 | | | | 0.00 | | | | (3.78 | ) |
| | | | | | | | | |
06/30/2015 | | | 108.85 | | | | 2.83 | | | | 0.42 | | | | 3.25 | | | | | | | | (5.41 | ) | | | 0.00 | | | | 0.00 | | | | (5.41 | ) |
| | | | | | | | | |
06/30/2014 | | | 105.66 | | | | 2.38 | | | | 2.94 | | | | 5.32 | | | | | | | | (1.69 | ) | | | (0.44 | ) | | | 0.00 | | | | (2.13 | ) |
| | | | | | | | | |
PIMCO Enhanced Low Duration Active Exchange-Traded Fund | | | | | | | | | | | | | | | | | | | | | | | | | | | | | | | | | | | | |
| | | | | | | | | |
07/01/2018 - 12/31/2018+ | | $ | 99.61 | | | $ | 1.45 | | | $ | (0.51 | ) | | $ | 0.94 | | | | | | | $ | (1.90 | ) | | $ | 0.00 | | | $ | 0.00 | | | $ | (1.90 | ) |
| | | | | | | | | |
06/30/2018 | | | 101.02 | | | | 2.51 | | | | (1.42 | ) | | | 1.09 | | | | | | | | (2.50 | ) | | | 0.00 | | | | 0.00 | | | | (2.50 | ) |
| | | | | | | | | |
06/30/2017 | | | 100.23 | | | | 2.17 | | | | 0.35 | | | | 2.52 | | | | | | | | (1.73 | ) | | | 0.00 | | | | 0.00 | | | | (1.73 | ) |
| | | | | | | | | |
06/30/2016 | | | 101.62 | | | | 1.97 | | | | (0.24 | ) | | | 1.73 | | | | | | | | (2.30 | ) | | | (0.82 | ) | | | 0.00 | | | | (3.12 | ) |
| | | | | | | | | |
06/30/2015 | | | 101.27 | | | | 1.32 | | | | 1.05 | | | | 2.37 | | | | | | | | (1.77 | ) | | | (0.25 | ) | | | 0.00 | | | | (2.02 | ) |
| | | | | | | | | |
01/22/2014 - 06/30/2014 | | | 100.00 | | | | 0.30 | | | | 1.22 | | | | 1.52 | | | | | | | | (0.25 | ) | | | 0.00 | | | | 0.00 | | | | (0.25 | ) |
| | | | | | | | | |
PIMCO Enhanced Short Maturity Active Exchange-Traded Fund | | | | | | | | | | | | | | | | | | | | | | | | | | | | | | | | | | | | |
| | | | | | | | | |
07/01/2018 - 12/31/2018+ | | $ | 101.58 | | | $ | 1.30 | | | $ | (0.43 | ) | | $ | 0.87 | | | | | | | $ | (1.49 | ) | | $ | 0.00 | | | $ | 0.00 | | | $ | (1.49 | ) |
| | | | | | | | | |
06/30/2018 | | | 101.74 | | | | 1.95 | | | | (0.23 | ) | | | 1.72 | | | | | | | | (1.85 | ) | | | (0.03 | ) | | | 0.00 | | | | (1.88 | ) |
| | | | | | | | | |
06/30/2017 | | | 101.14 | | | | 1.45 | | | | 0.61 | | | | 2.06 | | | | | | | | (1.46 | ) | | | 0.00 | | | | 0.00 | | | | (1.46 | ) |
| | | | | | | | | |
06/30/2016 | | | 101.15 | | | | 1.05 | | | | (0.02 | ) | | | 1.03 | | | | | | | | (1.02 | ) | | | (0.02 | ) | | | 0.00 | | | | (1.04 | ) |
| | | | | | | | | |
06/30/2015 | | | 101.45 | | | | 0.62 | | | | (0.09 | ) | | | 0.53 | | | | | | | | (0.74 | ) | | | (0.09 | ) | | | 0.00 | | | | (0.83 | ) |
| | | | | | | | | |
06/30/2014 | | | 101.26 | | | | 0.67 | | | | 0.36 | | | | 1.03 | | | | | | | | (0.69 | ) | | | (0.15 | ) | | | 0.00 | | | | (0.84 | ) |
| | | | | | | | | |
PIMCO Intermediate Municipal Bond ActiveExchange-Traded Fund | | | | | | | | | | | | | | | | | | | | | | | | | | | | | | | | | | | | |
| | | | | | | | | |
07/01/2018 - 12/31/2018+ | | $ | 52.84 | | | $ | 0.70 | | | $ | 0.02 | | | $ | 0.72 | | | | | | | $ | (0.80 | ) | | $ | 0.00 | | | $ | 0.00 | | | $ | (0.80 | ) |
| | | | | | | | | |
06/30/2018 | | | 53.48 | | | | 1.30 | | | | (0.64 | ) | | | 0.66 | | | | | | | | (1.30 | ) | | | 0.00 | | | | 0.00 | | | | (1.30 | ) |
| | | | | | | | | |
06/30/2017 | | | 55.11 | | | | 1.25 | | | | (1.64 | ) | | | (0.39 | ) | | | | | | | (1.24 | ) | | | 0.00 | | | | 0.00 | | | | (1.24 | ) |
| | | | | | | | | |
06/30/2016 | | | 52.84 | | | | 1.25 | | | | 2.15 | | | | 3.40 | | | | | | | | (1.13 | ) | | | 0.00 | | | | 0.00 | | | | (1.13 | ) |
| | | | | | | | | |
06/30/2015 | | | 53.17 | | | | 1.12 | | | | (0.34 | ) | | | 0.78 | | | | | | | | (1.11 | ) | | | 0.00 | | | | 0.00 | | | | (1.11 | ) |
| | | | | | | | | |
06/30/2014 | | | 52.06 | | | | 1.05 | | | | 1.13 | | | | 2.18 | | | | | | | | (1.07 | ) | | | 0.00 | | | | 0.00 | | | | (1.07 | ) |
| | | | | | | | | |
PIMCO Short Term Municipal Bond ActiveExchange-Traded Fund | | | | | | | | | | | | | | | | | | | | | | | | | | | | | | | | | | | | |
| | | | | | | | | |
07/01/2018 - 12/31/2018+ | | $ | 49.91 | | | $ | 0.46 | | | $ | (0.04 | ) | | $ | 0.42 | | | | | | | $ | (0.53 | ) | | $ | 0.00 | | | $ | 0.00 | | | $ | (0.53 | ) |
| | | | | | | | | |
06/30/2018 | | | 50.25 | | | | 0.77 | | | | (0.35 | ) | | | 0.42 | | | | | | | | (0.76 | ) | | | 0.00 | | | | 0.00 | | | | (0.76 | ) |
| | | | | | | | | |
06/30/2017 | | | 50.65 | | | | 0.60 | | | | (0.41 | ) | | | 0.19 | | | | | | | | (0.59 | ) | | | 0.00 | | | | 0.00 | | | | (0.59 | ) |
| | | | | | | | | |
06/30/2016 | | | 50.24 | | | | 0.48 | | | | 0.36 | | | | 0.84 | | | | | | | | (0.43 | ) | | | 0.00 | | | | 0.00 | | | | (0.43 | ) |
| | | | | | | | | |
06/30/2015 | | | 50.47 | | | | 0.38 | | | | (0.19 | ) | | | 0.19 | | | | | | | | (0.42 | ) | | | 0.00 | | | | 0.00 | | | | (0.42 | ) |
| | | | | | | | | |
06/30/2014 | | | 50.14 | | | | 0.26 | | | | 0.29 | | | | 0.55 | | | | | | | | (0.22 | ) | | | 0.00 | | | | 0.00 | | | | (0.22 | ) |
| ^ | A zero balance may reflect actual amounts rounding to less than $0.01 or 0.01%. |
| (a) | Per share amounts based on average number of shares outstanding during the year or period. |
| (b) | The tax characterization of distributions is determined in accordance with Federal income tax regulations. The actual tax characterization of distributions paid is determined at the end of the fiscal year. See Note 2, Distributions to Shareholders, in the Notes to Financial Statements for more information. |
| (c) | Portfolio turnover rate excludes securities received or delivered fromin-kind processing of creation or redemptions. |
| (d) | Effective May 8, 2017, the Fund’s Management fees was decreased by 0.09% to an annual rate of 0.46%. |
| | | | | | | | |
| 22 | | PIMCO ETF TRUST | | | | | See Accompanying Notes | |
| | | | | | | | | | | | | | | | | | | | | | | | | | | | | | | | | | |
| | | | | | | Ratios/Supplemental Data | |
| | | | | | | | | | Ratios to Average Net Assets | | | | |
Net Asset
Value End of
Year or
Period | | | Total Return | | | Net Assets
End of Year or
Period (000s) | | | Expenses | | | Expenses
Excluding
Waivers | | | Expenses
Excluding
Interest
Expense | | | Expenses
Excluding
Interest
Expense and
Waivers | | | Net
Investment
Income (Loss) | | | Portfolio
Turnover
Rate(c) | |
| | | | | | | | |
| | | | | | | | | | | | | | | | | | | | | | | | | | | | | | | | | | |
| | | | | | | | |
| $ | 102.65 | | | | 1.56 | % | | $ | 1,989,278 | | | | 0.82 | %* | | | 0.82 | %* | | | 0.55 | %* | | | 0.55 | %* | | | 3.43 | %* | | | 83 | % |
| | | | | | | | |
| | 103.19 | | | | 0.41 | | | | 2,072,132 | | | | 0.76 | | | | 0.76 | | | | 0.55 | | | | 0.55 | | | | 3.03 | | | | 142 | |
| | | | | | | | |
| | 106.07 | | | | 2.00 | | | | 2,039,657 | | | | 0.61 | | | | 0.61 | | | | 0.55 | | | | 0.55 | | | | 2.70 | | | | 569 | |
| | | | | | | | |
| | 107.31 | | | | 4.25 | | | | 2,594,821 | | | | 0.56 | | | | 0.58 | | | | 0.55 | | | | 0.57 | | | | 2.92 | | | | 475 | |
| | | | | | | | |
| | 106.69 | | | | 3.01 | | | | 2,489,072 | | | | 0.57 | | | | 0.63 | | | | 0.55 | | | | 0.61 | | | | 2.60 | | | | 180 | |
| | | | | | | | |
| | 108.85 | | | | 5.10 | | | | 3,431,844 | | | | 0.56 | | | | 0.57 | | | | 0.55 | | | | 0.56 | | | | 2.24 | | | | 577 | |
| | | | | | | | |
| | | | | | | | | | | | | | | | | | | | | | | | | | | | | | | | | | |
| | | | | | | | |
| $ | 98.65 | | | | 0.94 | % | | $ | 220,974 | | | | 1.13 | %* | | | 1.20 | %* | | | 0.40 | %* | | | 0.47 | %* | | | 2.90 | %* | | | 524 | % |
| | | | | | | | |
| | 99.61 | | | | 1.09 | | | | 157,382 | | | | 1.02 | | | | 1.09 | | | | 0.39 | | | | 0.46 | | | | 2.51 | | | | 326 | |
| | | | | | | | |
| | 101.02 | | | | 2.54 | | | | 93,947 | | | | 0.67 | (d) | | | 0.74 | (d) | | | 0.47 | (d) | | | 0.54 | (d) | | | 2.15 | | | | 651 | |
| | | | | | | | |
| | 100.23 | | | | 1.75 | | | | 58,134 | | | | 0.57 | | | | 0.64 | | | | 0.55 | | | | 0.56 | | | | 1.96 | | | | 2,288 | |
| | | | | | | | |
| | 101.62 | | | | 2.37 | | | | 175,808 | | | | 0.52 | | | | 0.57 | | | | 0.50 | | | | 0.55 | | | | 1.30 | | | | 1,591 | |
| | | | | | | | |
| | 101.27 | | | | 1.52 | | | | 139,750 | | | | 0.56 | * | | | 0.69 | * | | | 0.56 | * | | | 0.69 | * | | | 0.69 | * | | | 4,098 | |
| | | | | | | | |
| | | | | | | | | | | | | | | | | | | | | | | | | | | | | | | | | | |
| | | | | | | | |
| $ | 100.96 | | | | 0.86 | % | | $ | 12,193,710 | | | | 0.36 | %* | | | 0.36 | %* | | | 0.35 | %* | | | 0.35 | %* | | | 2.54 | %* | | | 48 | % |
| | | | | | | | |
| | 101.58 | | | | 1.70 | | | | 9,410,140 | | | | 0.42 | | | | 0.42 | | | | 0.35 | | | | 0.35 | | | | 1.92 | | | | 86 | |
| | | | | | | | |
| | 101.74 | | | | 2.05 | | | | 7,195,945 | | | | 0.35 | | | | 0.35 | | | | 0.35 | | | | 0.35 | | | | 1.43 | | | | 82 | |
| | | | | | | | |
| | 101.14 | | | | 1.03 | | | | 4,647,542 | | | | 0.36 | | | | 0.36 | | | | 0.35 | | | | 0.35 | | | | 1.04 | | | | 208 | |
| | | | | | | | |
| | 101.15 | | | | 0.53 | | | | 3,536,050 | | | | 0.36 | | | | 0.36 | | | | 0.35 | | | | 0.35 | | | | 0.61 | | | | 193 | |
| | | | | | | | |
| | 101.45 | | | | 1.02 | | | | 3,773,896 | | | | 0.35 | | | | 0.35 | | | | 0.35 | | | | 0.35 | | | | 0.66 | | | | 188 | |
| | | | | | | | |
| | | | | | | | | | | | | | | | | | | | | | | | | | | | | | | | | | |
| | | | | | | | |
| $ | 52.76 | | | | 1.36 | % | | $ | 314,425 | | | | 0.35 | %* | | | 0.35 | %* | | | 0.35 | %* | | | 0.35 | %* | | | 2.63 | %* | | | 17 | % |
| | | | | | | | |
| | 52.84 | | | | 1.25 | | | | 275,309 | | | | 0.35 | | | | 0.35 | | | | 0.35 | | | | 0.35 | | | | 2.44 | | | | 27 | |
| | | | | | | | |
| | 53.48 | | | | (0.69 | ) | | | 259,917 | | | | 0.35 | | | | 0.35 | | | | 0.35 | | | | 0.35 | | | | 2.33 | | | | 30 | |
| | | | | | | | |
| | 55.11 | | | | 6.52 | | | | 254,045 | | | | 0.35 | | | | 0.35 | | | | 0.35 | | | | 0.35 | | | | 2.32 | | | | 23 | |
| | | | | | | | |
| | 52.84 | | | | 1.45 | | | | 227,728 | | | | 0.35 | | | | 0.35 | | | | 0.35 | | | | 0.35 | | | | 2.09 | | | | 13 | |
| | | | | | | | |
| | 53.17 | | | | 4.23 | | | | 210,548 | | | | 0.35 | | | | 0.35 | | | | 0.35 | | | | 0.35 | | | | 2.01 | | | | 15 | |
| | | | | | | | |
| | | | | | | | | | | | | | | | | | | | | | | | | | | | | | | | | | |
| | | | | | | | |
| $ | 49.80 | | | | 0.84 | % | | $ | 80,173 | | | | 0.35 | %* | | | 0.35 | %* | | | 0.35 | %* | | | 0.35 | %* | | | 1.85 | %* | | | 30 | % |
| | | | | | | | |
| | 49.91 | | | | 0.83 | | | | 67,874 | | | | 0.35 | | | | 0.35 | | | | 0.35 | | | | 0.35 | | | | 1.55 | | | | 87 | |
| | | | | | | | |
| | 50.25 | | | | 0.37 | | | | 65,826 | | | | 0.35 | | | | 0.35 | | | | 0.35 | | | | 0.35 | | | | 1.20 | | | | 80 | |
| | | | | | | | |
| | 50.65 | | | | 1.67 | | | | 68,881 | | | | 0.35 | | | | 0.35 | | | | 0.35 | | | | 0.35 | | | | 0.95 | | | | 36 | |
| | | | | | | | |
| | 50.24 | | | | 0.37 | | | | 55,765 | | | | 0.35 | | | | 0.35 | | | | 0.35 | | | | 0.35 | | | | 0.76 | | | | 20 | |
| | | | | | | | |
| | 50.47 | | | | 1.10 | | | | 76,211 | | | | 0.35 | | | | 0.35 | | | | 0.35 | | | | 0.35 | | | | 0.51 | | | | 44 | |
| | | | | | |
| | SEMIANNUAL REPORT | | DECEMBER 31, 2018 | | 23 |
Statements of Assets and Liabilities
| | | | | | | | | | | | | | | | |
| (Amounts in thousands†, except per share amounts) | | PIMCO
1-3 Year U.S.
Treasury Index
Exchange-
Traded Fund | | | PIMCO
25+ Year Zero
Coupon U.S.
Treasury Index
Exchange-
Traded Fund | | | PIMCO
1-5 Year U.S.
TIPS Index
Exchange-
Traded Fund | | | PIMCO
15+ Year U.S.
TIPS Index
Exchange-
Traded Fund | |
| | | | |
Assets: | | | | | | | | | | | | | | | | |
| | | | |
Investments, at value | | | | | | | | | | | | | | | | |
Investments in securities* | | $ | 55,001 | | | $ | 142,803 | | | $ | 793,721 | | | $ | 193,637 | |
Investments in Affiliates | | | 0 | | | | 0 | | | | 0 | | | | 0 | |
Financial Derivative Instruments | | | | | | | | | | | | | | | | |
Exchange-traded or centrally cleared | | | 0 | | | | 0 | | | | 0 | | | | 0 | |
Over the counter | | | 0 | | | | 0 | | | | 0 | | | | 0 | |
Cash | | | 0 | | | | 5 | | | | 0 | | | | 0 | |
Deposits with counterparty | | | 0 | | | | 0 | | | | 0 | | | | 0 | |
Foreign currency, at value | | | 0 | | | | 0 | | | | 0 | | | | 0 | |
Receivable for investments sold | | | 2,018 | | | | 7,808 | | | | 21,637 | | | | 434 | |
Receivable for TBA investments sold | | | 0 | | | | 0 | | | | 0 | | | | 0 | |
Receivable for Fund shares sold | | | 0 | | | | 0 | | | | 0 | | | | 0 | |
Interest and/or dividends receivable | | | 333 | | | | 0 | | | | 1,462 | | | | 874 | |
Reimbursement receivable from PIMCO | | | 1 | | | | 0 | | | | 0 | | | | 0 | |
Other assets | | | 0 | | | | 0 | | | | 0 | | | | 0 | |
Total Assets | | | 57,353 | | | | 150,616 | | | | 816,820 | | | | 194,945 | |
| | | | |
Liabilities: | | | | | | | | | | | | | | | | |
| | | | |
Borrowings & Other Financing Transactions | | | | | | | | | | | | | | | | |
Payable for reverse repurchase agreements | | $ | 0 | | | $ | 0 | | | $ | 0 | | | $ | 0 | |
Payable for sale-buyback transactions | | | 0 | | | | 0 | | | | 0 | | | | 0 | |
Payable for short sales | | | 0 | | | | 0 | | | | 0 | | | | 0 | |
Financial Derivative Instruments | | | | | | | | | | | | | | | | |
Exchange-traded or centrally cleared | | | 0 | | | | 0 | | | | 0 | | | | 0 | |
Over the counter | | | 0 | | | | 0 | | | | 0 | | | | 0 | |
Payable for investments purchased | | | 1,996 | | | | 6,575 | | | | 21,069 | | | | 0 | |
Payable for TBA investments purchased | | | 0 | | | | 0 | | | | 0 | | | | 0 | |
Payable upon return of securities loaned | | | 0 | | | | 0 | | | | 0 | | | | 0 | |
Deposits from counterparty | | | 0 | | | | 0 | | | | 0 | | | | 0 | |
Payable for Fund shares redeemed | | | 0 | | | | 0 | | | | 0 | | | | 0 | |
Distributions payable | | | 88 | | | | 1,207 | | | | 1,250 | | | | 459 | |
Overdraft due to custodian | | | 0 | | | | 0 | | | | 19 | | | | 0 | |
Accrued management fees | | | 7 | | | | 19 | | | | 132 | | | | 33 | |
Other liabilities | | | 0 | | | | 0 | | | | 0 | | | | 0 | |
Total Liabilities | | | 2,091 | | | | 7,801 | | | | 22,470 | | | | 492 | |
| | | | |
Net Assets | | $ | 55,262 | | | $ | 142,815 | | | $ | 794,350 | | | $ | 194,453 | |
| | | | |
Net Assets Consist of: | | | | | | | | | | | | | | | | |
| | | | |
Paid in capital | | $ | 56,592 | | | $ | 185,362 | | | $ | 834,706 | | | $ | 223,727 | |
Distributable earnings (accumulated loss) | | | (1,330 | ) | | | (42,547 | ) | | | (40,356 | ) | | | (29,274 | ) |
| | | | |
Net Assets | | $ | 55,262 | | | $ | 142,815 | | | $ | 794,350 | | | $ | 194,453 | |
| | | | |
Shares Issued and Outstanding | | | 1,102 | | | | 1,270 | | | | 15,620 | | | | 3,120 | |
| | | | |
Net Asset Value Per Share Outstanding: | | $ | 50.15 | | | $ | 112.45 | | | $ | 50.85 | | | $ | 62.33 | |
| | | | |
Cost of investments in securities | | $ | 55,278 | | | $ | 155,750 | | | $ | 813,897 | | | $ | 206,772 | |
Cost of investments in Affiliates | | $ | 0 | | | $ | 0 | | | $ | 0 | | | $ | 0 | |
Cost of foreign currency held | | $ | 0 | | | $ | 0 | | | $ | 0 | | | $ | 0 | |
Proceeds received on short sales | | $ | 0 | | | $ | 0 | | | $ | 0 | | | $ | 0 | |
Cost or premiums of financial derivative instruments, net | | $ | 0 | | | $ | 0 | | | $ | 0 | | | $ | 0 | |
| | | | |
* Includes repurchase agreements of: | | $ | 264 | | | $ | 0 | | | $ | 1,863 | | | $ | 124 | |
^ Includes securities on loan of: | | $ | 0 | | | $ | 0 | | | $ | 0 | | | $ | 0 | |
| † | A zero balance may reflect actual amounts rounding to less than one thousand. |
| | | | | | | | |
| 24 | | PIMCO ETF TRUST | | | | | See Accompanying Notes | |
(Unaudited)
| | | | | | | | | | | | | | | | | | | | | | | | | | | | | | |
PIMCO
Broad U.S.
TIPS Index
Exchange-
Traded Fund | | | PIMCO
0-5 Year High
Yield Corporate
Bond Index
Exchange-
Traded Fund | | | PIMCO
Investment
Grade Corporate
Bond Index
Exchange-
Traded Fund | | | PIMCO
Active Bond
Exchange-
Traded Fund | | | PIMCO
Enhanced Low
Duration Active
Exchange-
Traded Fund | | | PIMCO
Enhanced Short
Maturity Active
Exchange-
Traded Fund | | | PIMCO
Intermediate
Municipal
Bond Active
Exchange-
Traded Fund | | | PIMCO
Short Term
Municipal
Bond Active
Exchange-
Traded Fund | |
| | | | | | | |
| | | | | | | | | | | | | | | | | | | | | | | | | | | | | | |
| | | | | | | |
| | | | | | | | | | | | | | | | | | | | | | | | | | | | | | | |
| $ | 54,426 | | | $ | 1,204,714 | | | $ | 620,738 | | | $ | 2,219,863 | | | $ | 381,253 | | | $ | 12,153,531 | | | $ | 314,037 | | | $ | 80,320 | |
| | 0 | | | | 32,683 | | | | 651 | | | | 0 | | | | 0 | | | | 0 | | | | 0 | | | | 0 | |
| | | | | | | | | | | | | | | | | | | | | | | | | | | | | | | |
| | 0 | | | | 253 | | | | 111 | | | | 8 | | | | 96 | | | | 0 | | | | 0 | | | | 0 | |
| | 0 | | | | 0 | | | | 0 | | | | 26 | | | | 364 | | | | 0 | | | | 0 | | | | 0 | |
| | 91 | | | | 0 | | | | 623 | | | | 1,884 | | | | 0 | | | | 1,770 | | | | 0 | | | | 385 | |
| | 0 | | | | 6,952 | | | | 1,834 | | | | 15,259 | | | | 1,465 | | | | 0 | | | | 0 | | | | 0 | |
| | 0 | | | | 0 | | | | 0 | | | | 290 | | | | 23 | | | | 0 | | | | 0 | | | | 0 | |
| | 169 | | | | 21,142 | | | | 0 | | | | 99,302 | | | | 62 | | | | 2,380 | | | | 3,391 | | | | 0 | |
| | 0 | | | | 0 | | | | 0 | | | | 77,420 | | | | 1,018 | | | | 0 | | | | 0 | | | | 0 | |
| | 0 | | | | 38,128 | | | | 0 | | | | 0 | | | | 0 | | | | 7,066 | | | | 0 | | | | 0 | |
| | 257 | | | | 18,935 | | | | 6,824 | | | | 13,011 | | | | 2,386 | | | | 62,069 | | | | 3,313 | | | | 638 | |
| | 1 | | | | 0 | | | | 1 | | | | 0 | | | | 15 | | | | 0 | | | | 1 | | | | 0 | |
| | 0 | | | | 2,146 | | | | 0 | | | | 10 | | | | 0 | | | | 0 | | | | 0 | | | | 0 | |
| | 54,944 | | | | 1,324,953 | | | | 630,782 | | | | 2,427,073 | | | | 386,682 | | | | 12,226,816 | | | | 320,742 | | | | 81,343 | |
| | | | | | | |
| | | | | | | | | | | | | | | | | | | | | | | | | | | | | | |
| | | | | | | |
| | | | | | | | | | | | | | | | | | | | | | | | | | | | | | | |
| $ | 0 | | | $ | 0 | | | $ | 0 | | | $ | 143,520 | | | $ | 106,417 | | | $ | 0 | | | $ | 0 | | | $ | 0 | |
| | 0 | | | | 0 | | | | 0 | | | | 139,810 | | | | 0 | | | | 0 | | | | 0 | | | | 0 | |
| | 0 | | | | 0 | | | | 0 | | | | 15,614 | | | | 0 | | | | 0 | | | | 0 | | | | 0 | |
| | | | | | | | | | | | | | | | | | | | | | | | | | | | | | | |
| | 0 | | | | 55 | | | | 66 | | | | 64 | | | | 362 | | | | 0 | | | | 0 | | | | 0 | |
| | 0 | | | | 2,553 | | | | 0 | | | | 684 | | | | 536 | | | | 0 | | | | 0 | | | | 0 | |
| | 0 | | | | 38,302 | | | | 622 | | | | 567 | | | | 55,904 | | | | 1,786 | | | | 2,931 | | | | 1,018 | |
| | 0 | | | | 0 | | | | 0 | | | | 129,021 | | | | 1,516 | | | | 0 | | | | 0 | | | | 0 | |
| | 0 | | | | 34,829 | | | | 651 | | | | 0 | | | | 0 | | | | 0 | | | | 0 | | | | 0 | |
| | 0 | | | | 0 | | | | 0 | | | | 1,812 | | | | 60 | | | | 0 | | | | 0 | | | | 0 | |
| | 0 | | | | 19,089 | | | | 0 | | | | 0 | | | | 0 | | | | 0 | | | | 0 | | | | 0 | |
| | 98 | | | | 4,032 | | | | 1,962 | | | | 5,814 | | | | 829 | | | | 27,747 | | | | 596 | | | | 129 | |
| | 0 | | | | 3,811 | | | | 0 | | | | 0 | | | | 0 | | | | 0 | | | | 2,709 | | | | 0 | |
| | 9 | | | | 611 | | | | 111 | | | | 889 | | | | 84 | | | | 3,491 | | | | 81 | | | | 23 | |
| | 0 | | | | 0 | | | | 3 | | | | 0 | | | | 0 | | | | 82 | | | | 0 | | | | 0 | |
| | 107 | | | | 103,282 | | | | 3,415 | | | | 437,795 | | | | 165,708 | | | | 33,106 | | | | 6,317 | | | | 1,170 | |
| | | | | | | |
| $ | 54,837 | | | $ | 1,221,671 | | | $ | 627,367 | | | $ | 1,989,278 | | | $ | 220,974 | | | $ | 12,193,710 | | | $ | 314,425 | | | $ | 80,173 | |
| | | | | | | |
| | | | | | | | | | | | | | | | | | | | | | | | | | | | | | |
| $ | 58,717 | | | $ | 1,450,732 | | | $ | 664,244 | | | $ | 2,077,797 | | | $ | 226,545 | | | $ | 12,242,841 | | | $ | 314,076 | | | $ | 80,935 | |
| | | | | | | |
| | (3,880 | ) | | | (229,061 | ) | | | (36,877 | ) | | | (88,519 | ) | | | (5,571 | ) | | | (49,131 | ) | | | 349 | | | | (762 | ) |
| | | | | | | |
| $ | 54,837 | | | $ | 1,221,671 | | | $ | 627,367 | | | $ | 1,989,278 | | | $ | 220,974 | | | $ | 12,193,710 | | | $ | 314,425 | | | $ | 80,173 | |
| | | | | | | |
| | 980 | | | | 12,800 | | | | 6,330 | | | | 19,380 | | | | 2,240 | | | | 120,780 | | | | 5,960 | | | | 1,610 | |
| | | | | | | |
| $ | 55.96 | | | $ | 95.44 | | | $ | 99.11 | | | $ | 102.65 | | | $ | 98.65 | | | $ | 100.96 | | | $ | 52.76 | | | $ | 49.80 | |
| | | | | | | |
| $ | 57,208 | | | $ | 1,276,648 | | | $ | 646,162 | | | $ | 2,239,243 | | | $ | 382,850 | | | $ | 12,190,294 | | | $ | 309,065 | | | $ | 80,136 | |
| $ | 0 | | | $ | 32,683 | | | $ | 651 | | | $ | 0 | | | $ | 0 | | | $ | 0 | | | $ | 0 | | | $ | 0 | |
| $ | 0 | | | $ | 0 | | | $ | 0 | | | $ | 297 | | | $ | 26 | | | $ | 0 | | | $ | 0 | | | $ | 0 | |
| $ | 0 | | | $ | 0 | | | $ | 0 | | | $ | 15,263 | | | $ | 0 | | | $ | 0 | | | $ | 0 | | | $ | 0 | |
| $ | 0 | | | $ | 5,424 | | | $ | 769 | | | $ | (2,990 | ) | | $ | (717 | ) | | $ | 0 | | | $ | 0 | | | $ | 0 | |
| | | | | | | |
| $ | 0 | | | $ | 74,112 | | | $ | 6,143 | | | $ | 0 | | | $ | 4,565 | | | $ | 155,444 | | | $ | 0 | | | $ | 0 | |
| $ | 0 | | | $ | 33,030 | | | $ | 637 | | | $ | 0 | | | $ | 0 | | | $ | 0 | | | $ | 0 | | | $ | 0 | |
| | | | | | |
| | SEMIANNUAL REPORT | | DECEMBER 31, 2018 | | 25 |
Statements of Operations
| | | | | | | | | | | | | | | | |
| Six Months Ended December 31, 2018 (Unaudited) | | | | | | | | | | | | |
| (Amounts in thousands†) | | PIMCO
1-3 Year U.S.
Treasury Index
Exchange-
Traded Fund | | | PIMCO
25+ Year Zero
Coupon U.S.
Treasury Index
Exchange-
Traded Fund | | | PIMCO
1-5 Year U.S.
TIPS Index
Exchange-
Traded Fund | | | PIMCO
15+ Year U.S.
TIPS Index
Exchange-
Traded Fund | |
| | | | |
Investment Income: | | | | | | | | | | | | | | | | |
| | | | |
Interest, net of foreign taxes* | | $ | 729 | | | $ | 2,390 | | | $ | 8,151 | | | $ | 3,158 | |
Dividends | | | 0 | | | | 0 | | | | 0 | | | | 0 | |
Dividends from Investments in Affiliates | | | 0 | | | | 0 | | | | 0 | | | | 0 | |
Securities lending income | | | 0 | | | | 0 | | | | 0 | | | | 0 | |
Total Income | | | 729 | | | | 2,390 | | | | 8,151 | | | | 3,158 | |
| | | | |
Expenses: | | | | | | | | | | | | | | | | |
| | | | |
Management fees | | | 57 | | | | 119 | | | | 827 | | | | 230 | |
Trustee fees | | | 1 | | | | 2 | | | | 12 | | | | 3 | |
Interest expense | | | 0 | | | | 0 | | | | 0 | | | | 0 | |
Miscellaneous expense | | | 2 | | | | 0 | | | | 0 | | | | 0 | |
Total Expenses | | | 60 | | | | 121 | | | | 839 | | | | 233 | |
Waiver and/or Reimbursement by PIMCO | | | (1 | ) | | | 0 | | | | 0 | | | | 0 | |
Net Expenses | | | 59 | | | | 121 | | | | 839 | | | | 233 | |
| | | | |
Net Investment Income (Loss) | | | 670 | | | | 2,269 | | | | 7,312 | | | | 2,925 | |
| | | | |
Net Realized Gain (Loss): | | | | | | | | | | | | | | | | |
| | | | |
Investments in securities | | | (229 | ) | | | (2,935 | ) | | | (2,737 | ) | | | (812 | ) |
In-kind redemptions | | | (310 | ) | | | (879 | ) | | | (451 | ) | | | (1,708 | ) |
Exchange-traded or centrally cleared financial derivative instruments | | | 0 | | | | 0 | | | | 0 | | | | 0 | |
Over the counter financial derivative instruments | | | 0 | | | | 0 | | | | 0 | | | | 0 | |
Short sales | | | 0 | | | | 0 | | | | 0 | | | | 0 | |
Foreign currency | | | 0 | | | | 0 | | | | 0 | | | | 0 | |
| | | | |
Net Realized Gain (Loss) | | | (539 | ) | | | (3,814 | ) | | | (3,188 | ) | | | (2,520 | ) |
| | | | |
Net Change in Unrealized Appreciation (Depreciation): | | | | | | | | | | | | | | | | |
| | | | |
Investments in securities | | | 734 | | | | 609 | | | | (6,631 | ) | | | (15,766 | ) |
Exchange-traded or centrally cleared financial derivative instruments | | | 0 | | | | 0 | | | | 0 | | | | 0 | |
Over the counter financial derivative instruments | | | 0 | | | | 0 | | | | 0 | | | | 0 | |
Short sales | | | 0 | | | | 0 | | | | 0 | | | | 0 | |
Foreign currency assets and liabilities | | | 0 | | | | 0 | | | | 0 | | | | 0 | |
| | | | |
Net Change in Unrealized Appreciation (Depreciation) | | | 734 | | | | 609 | | | | (6,631 | ) | | | (15,766 | ) |
| | | | |
Net Increase (Decrease) in Net Assets Resulting from Operations | | $ | 865 | | | $ | (936 | ) | | $ | (2,507 | ) | | $ | (15,361 | ) |
| | | | |
* Foreign tax withholdings | | $ | 0 | | | $ | 0 | | | $ | 0 | | | $ | 0 | |
| † | A zero balance may reflect actual amounts rounding to less than one thousand. |
| | | | | | | | |
| 26 | | PIMCO ETF TRUST | | | | | See Accompanying Notes | |
| | | | | | | | | | | | | | | | | | | | | | | | | | | | | | |
| | | | | | | | | | | | | | | | | | | | | | | |
PIMCO
Broad U.S.
TIPS Index
Exchange-
Traded Fund | | | PIMCO
0-5 Year High
Yield Corporate
Bond Index
Exchange-
Traded Fund | | | PIMCO
Investment
Grade Corporate
Bond Index
Exchange-
Traded Fund | | | PIMCO
Active Bond
Exchange-
Traded Fund | | | PIMCO
Enhanced Low
Duration Active
Exchange-
Traded Fund | | | PIMCO
Enhanced Short
Maturity Active
Exchange-
Traded Fund | | | PIMCO
Intermediate
Municipal
Bond Active
Exchange-
Traded Fund | | | PIMCO
Short Term
Municipal
Bond Active
Exchange-
Traded Fund | |
| | | | | | | |
| | | | | | | | | | | | | | | | | | | | | | | | | | | | | | |
| | | | | | | |
| $ | 526 | | | $ | 39,162 | | | $ | 13,777 | | | $ | 42,368 | | | $ | 3,837 | | | $ | 157,971 | | | $ | 4,164 | | | $ | 820 | |
| | 0 | | | | 0 | | | | 0 | | | | 1 | | | | 10 | | | | 0 | | | | 0 | | | | 0 | |
| | 0 | | | | 484 | | | | 3 | | | | 0 | | | | 0 | | | | 0 | | | | 0 | | | | 0 | |
| | 0 | | | | (13 | ) | | | (2 | ) | | | 0 | | | | 0 | | | | 0 | | | | 0 | | | | 0 | |
| | 526 | | | | 39,633 | | | | 13,778 | | | | 42,369 | | | | 3,847 | | | | 157,971 | | | | 4,164 | | | | 820 | |
| | | | | | | |
| | | | | | | | | | | | | | | | | | | | | | | | | | | | | | |
| | | | | | | |
| | 53 | | | | 4,340 | | | | 769 | | | | 5,470 | | | | 438 | | | | 18,989 | | | | 488 | | | | 131 | |
| | 1 | | | | 23 | | | | 11 | | | | 29 | | | | 3 | | | | 150 | | | | 4 | | | | 1 | |
| | 0 | | | | 94 | | | | 17 | | | | 2,716 | | | | 701 | | | | 660 | | | | 0 | | | | 0 | |
| | 1 | | | | 0 | | | | 0 | | | | 3 | | | | 5 | | | | 0 | | | | 0 | | | | 0 | |
| | 55 | | | | 4,457 | | | | 797 | | | | 8,218 | | | | 1,147 | | | | 19,799 | | | | 492 | | | | 132 | |
| | (1 | ) | | | 0 | | | | 0 | | | | 0 | | | | (69 | ) | | | 0 | | | | 0 | | | | 0 | |
| | 54 | | | | 4,457 | | | | 797 | | | | 8,218 | | | | 1,078 | | | | 19,799 | | | | 492 | | | | 132 | |
| | | | | | | |
| | 472 | | | | 35,176 | | | | 12,981 | | | | 34,151 | | | | 2,769 | | | | 138,172 | | | | 3,672 | | | | 688 | |
| | | | | | | |
| | | | | | | | | | | | | | | | | | | | | | | | | | | | | | |
| | | | | | | |
| | (58 | ) | | | (9,780 | ) | | | (5,511 | ) | | | (4,832 | ) | | | 148 | | | | (880 | ) | | | (68 | ) | | | (88 | ) |
| | 0 | | | | (9,709 | ) | | | (4,574 | ) | | | 0 | | | | 0 | | | | 0 | | | | 0 | | | | 0 | |
| | 0 | | | | 2,217 | | | | (9 | ) | | | (204 | ) | | | (339 | ) | | | 0 | | | | 0 | | | | 0 | |
| | 0 | | | | (1,134 | ) | | | 0 | | | | 221 | | | | 564 | | | | 0 | | | | 0 | | | | 0 | |
| | 0 | | | | 0 | | | | 0 | | | | (46 | ) | | | 56 | | | | 0 | | | | 0 | | | | 0 | |
| | 0 | | | | 0 | | | | 0 | | | | (6 | ) | | | 107 | | | | 0 | | | | 0 | | | | 0 | |
| | | | | | | |
| | (58 | ) | | | (18,406 | ) | | | (10,094 | ) | | | (4,867 | ) | | | 536 | | | | (880 | ) | | | (68 | ) | | | (88 | ) |
| | | | | | | |
| | | | | | | | | | | | | | | | | | | | | | | | | | | | | | |
| | | | | | | |
| | (1,163 | ) | | | (37,848 | ) | | | 1,193 | | | | 2,013 | | | | (183 | ) | | | (49,369 | ) | | | 90 | | | | 61 | |
| | 0 | | | | (1,803 | ) | | | 143 | | | | (92 | ) | | | (1,211 | ) | | | 0 | | | | 0 | | | | 0 | |
| | 0 | | | | (2,135 | ) | | | 0 | | | | (183 | ) | | | (232 | ) | | | 0 | | | | 0 | | | | 0 | |
| | 0 | | | | 0 | | | | 0 | | | | (351 | ) | | | (8 | ) | | | 0 | | | | 0 | | | | 0 | |
| | 0 | | | | 0 | | | | (2 | ) | | | 0 | | | | 0 | | | | 0 | | | | 0 | | | | 0 | |
| | | | | | | |
| | (1,163 | ) | | | (41,786 | ) | | | 1,334 | | | | 1,387 | | | | (1,634 | ) | | | (49,369 | ) | | | 90 | | | | 61 | |
| | | | | | | |
| $ | (749 | ) | | $ | (25,016 | ) | | $ | 4,221 | | | $ | 30,671 | | | $ | 1,671 | | | $ | 87,923 | | | $ | 3,694 | | | $ | 661 | |
| | | | | | | |
| $ | 0 | | | $ | 0 | | | $ | 2 | | | $ | 0 | | | $ | 0 | | | $ | 0 | | | $ | 0 | | | $ | 0 | |
| | | | | | |
| | SEMIANNUAL REPORT | | DECEMBER 31, 2018 | | 27 |
Statements of Changes in Net Assets
| | | | | | | | | | | | | | | | |
| | | PIMCO
1-3 Year U.S. Treasury Index
Exchange-Traded Fund | | | PIMCO
25+ Year Zero Coupon
U.S. Treasury Index
Exchange-Traded Fund | |
| | | | |
| (Amounts in thousands†) | | Six Months Ended
December 31, 2018
(Unaudited) | | | Year Ended
June 30, 2018 | | | Six Months Ended
December 31, 2018
(Unaudited) | | | Year Ended
June 30, 2018 | |
| | | | |
Increase (Decrease) in Net Assets from: | | | | | | | | | | | | | | | | |
| | | | |
Operations: | | | | | | | | | | | | | | | | |
| | | | |
Net investment income (loss) | | $ | 670 | | | $ | 1,151 | | | $ | 2,269 | | | $ | 4,584 | |
Net realized gain (loss) | | | (539 | ) | | | (670 | ) | | | (3,814 | ) | | | (4,308 | ) |
Net change in unrealized appreciation (depreciation) | | | 734 | | | | (520 | ) | | | 609 | | | | 522 | |
| | | | |
Net Increase (Decrease) in Net Assets Resulting from Operations | | | 865 | | | | (39 | ) | | | (936 | ) | | | 798 | |
| | | | |
Distributions to Shareholders: | | | | | | | | | | | | | | | | |
| | | | |
From net investment income and/or net realized capital gains* | | | (801 | ) | | | (1,134 | ) | | | (3,432 | ) | | | (4,645 | ) |
Tax basis return of capital | | | 0 | | | | 0 | | | | 0 | | | | 0 | |
| | | | |
Total Distributions(a) | | | (801 | ) | | | (1,134 | ) | | | (3,432 | ) | | | (4,645 | ) |
| | | | |
Fund Share Transactions: | | | | | | | | | | | | | | | | |
| | | | |
Receipts for shares sold | | | 0 | | | | 30,158 | | | | 5,453 | | | | 51,744 | |
Cost of shares redeemed | | | (32,418 | ) | | | (60,556 | ) | | | (22,298 | ) | | | (50,552 | ) |
Net increase (decrease) resulting from Fund share transactions | | | (32,418 | ) | | | (30,398 | ) | | | (16,845 | ) | | | 1,192 | |
| | | | |
Total Increase (Decrease) in Net Assets | | | (32,354 | ) | | | (31,571 | ) | | | (21,213 | ) | | | (2,655 | ) |
| | | | |
Net Assets: | | | | | | | | | | | | | | | | |
| | | | |
Beginning of period | | | 87,616 | | | | 119,187 | | | | 164,028 | | | | 166,683 | |
End of period | | $ | 55,262 | | | $ | 87,616 | | | $ | 142,815 | | | $ | 164,028 | |
| | | | |
Shares of Beneficial Interest: | | | | | | | | | | | | | | | | |
| | | | |
Shares sold | | | 0 | | | | 600 | | | | 50 | | | | 450 | |
Shares redeemed | | | (650 | ) | | | (1,200 | ) | | | (200 | ) | | | (450 | ) |
Net increase (decrease) in shares outstanding | | | (650 | ) | | | (600 | ) | | | (150 | ) | | | 0 | |
| † | A zero balance may reflect actual amounts rounding to less than one thousand. |
| * | See Note 2, New Accounting Pronouncements, in the Notes to Financial Statements for more information. |
| (a) | The tax characterization of distributions is determined in accordance with Federal income tax regulations. The actual tax characterization of distributions paid is determined at the end of the fiscal year. See Note 2, Distributions to Shareholders, in the Notes to Financial Statements for more information. |
| | | | | | | | |
| 28 | | PIMCO ETF TRUST | | | | | See Accompanying Notes | |
| | | | | | | | | | | | | | | | | | | | | | | | | | | | | | | | | | | | | | |
PIMCO
1-5 Year U.S. TIPS Index
Exchange-Traded Fund | | | PIMCO
15+ Year U.S. TIPS Index
Exchange-Traded Fund | | | PIMCO
Broad U.S. TIPS Index
Exchange-Traded Fund | | | PIMCO
0-5 Year High Yield
Corporate Bond Index
Exchange-Traded Fund | | | PIMCO
Investment Grade
Corporate Bond Index
Exchange-Traded Fund | |
| | | | | | | | | |
Six Months Ended
December 31, 2018
(Unaudited) | | | Year Ended
June 30, 2018 | | | Six Months Ended
December 31, 2018
(Unaudited) | | | Year Ended
June 30, 2018 | | | Six Months Ended
December 31, 2018
(Unaudited) | | | Year Ended
June 30, 2018 | | | Six Months Ended
December 31, 2018
(Unaudited) | | | Year Ended
June 30, 2018 | | | Six Months Ended
December 31, 2018
(Unaudited) | | | Year Ended
June 30, 2018 | |
| | | | | | | | | |
| | | | | | | | | | | | | | | | | | | | | | | | | | | | | | | | | | | | | | |
| | | | | | | | | |
| | | | | | | | | | | | | | | | | | | | | | | | | | | | | | | | | | | | | | |
| | | | | | | | | |
| $ | 7,312 | | | $ | 19,948 | | | $ | 2,925 | | | $ | 7,066 | | | $ | 472 | | | $ | 1,291 | | | $ | 35,176 | | | $ | 74,891 | | | $ | 12,981 | | | $ | 26,676 | |
| | (3,188 | ) | | | (4,235 | ) | | | (2,520 | ) | | | (982 | ) | | | (58 | ) | | | (239 | ) | | | (18,406 | ) | | | 20,566 | | | | (10,094 | ) | | | (513 | ) |
| | (6,631 | ) | | | (5,959 | ) | | | (15,766 | ) | | | 7,342 | | | | (1,163 | ) | | | 287 | | | | (41,786 | ) | | | (45,229 | ) | | | 1,334 | | | | (38,683 | ) |
| | | | | | | | | |
| | (2,507 | ) | | | 9,754 | | | | (15,361 | ) | | | 13,426 | | | | (749 | ) | | | 1,339 | | | | (25,016 | ) | | | 50,228 | | | | 4,221 | | | | (12,520 | ) |
| | | | | | | | | |
| | | | | | | | | | | | | | | | | | | | | | | | | | | | | | | | | | | | | | |
| | | | | | | | | |
| | (11,921 | ) | | | (17,826 | ) | | | (4,419 | ) | | | (6,527 | ) | | | (738 | ) | | | (1,240 | ) | | | (43,493 | ) | | | (80,322 | ) | | | (15,506 | ) | | | (27,152 | ) |
| | 0 | | | | 0 | | | | 0 | | | | 0 | | | | 0 | | | | 0 | | | | 0 | | | | 0 | | | | 0 | | | | 0 | |
| | | | | | | | | |
| | (11,921 | ) | | | (17,826 | ) | | | (4,419 | ) | | | (6,527 | ) | | | (738 | ) | | | (1,240 | ) | | | (43,493 | ) | | | (80,322 | ) | | | (15,506 | ) | | | (27,152 | ) |
| | | | | | | | | |
| | | | | | | | | | | | | | | | | | | | | | | | | | | | | | | | | | | | | | |
| | | | | | | | | |
| | 46,098 | | | | 41,665 | | | | 3,291 | | | | 128,633 | | | | 5,629 | | | | 20,046 | | | | 745,998 | | | | 1,314,803 | | | | 50,324 | | | | 229,491 | |
| | (63,850 | ) | | | (343,074 | ) | | | (43,803 | ) | | | (29,779 | ) | | | 0 | | | | (40,314 | ) | | | (1,121,982 | ) | | | (1,442,696 | ) | | | (167,756 | ) | | | (171,194 | ) |
| | (17,752 | ) | | | (301,409 | ) | | | (40,512 | ) | | | 98,854 | | | | 5,629 | | | | (20,268 | ) | | | (375,984 | ) | | | (127,893 | ) | | | (117,432 | ) | | | 58,297 | |
| | | | | | | | | |
| | (32,180 | ) | | | (309,481 | ) | | | (60,292 | ) | | | 105,753 | | | | 4,142 | | | | (20,169 | ) | | | (444,493 | ) | | | (157,987 | ) | | | (128,717 | ) | | | 18,625 | |
| | | | | | | | | |
| | | | | | | | | | | | | | | | | | | | | | | | | | | | | | | | | | | | | | |
| | | | | | | | | |
| | 826,530 | | | | 1,136,011 | | | | 254,745 | | | | 148,992 | | | | 50,695 | | | | 70,864 | | | | 1,666,164 | | | | 1,824,151 | | | | 756,084 | | | | 737,459 | |
| $ | 794,350 | | | $ | 826,530 | | | $ | 194,453 | | | $ | 254,745 | | | $ | 54,837 | | | $ | 50,695 | | | $ | 1,221,671 | | | $ | 1,666,164 | | | $ | 627,367 | | | $ | 756,084 | |
| | | | | | | | | |
| | | | | | | | | | | | | | | | | | | | | | | | | | | | | | | | | | | | | | |
| | | | | | | | | |
| | 900 | | | | 800 | | | | 50 | | | | 1,950 | | | | 100 | | | | 350 | | | | 7,600 | | | | 13,050 | | | | 500 | | | | 2,200 | |
| | (1,250 | ) | | | (6,600 | ) | | | (700 | ) | | | (450 | ) | | | 0 | | | | (700 | ) | | | (11,450 | ) | | | (14,350 | ) | | | (1,700 | ) | | | (1,700 | ) |
| | (350 | ) | | | (5,800 | ) | | | (650 | ) | | | 1,500 | | | | 100 | | | | (350 | ) | | | (3,850 | ) | | | (1,300 | ) | | | (1,200 | ) | | | 500 | |
| | | | | | |
| | SEMIANNUAL REPORT | | DECEMBER 31, 2018 | | 29 |
Statements of Changes in Net Assets(Cont.)
| | | | | | | | | | | | | | | | |
| | | PIMCO
Active Bond
Exchange-Traded Fund | | | PIMCO
Enhanced Low
Duration Active
Exchange-Traded Fund | |
| | | | |
| (Amounts in thousands†) | | Six Months Ended
December 31, 2018
(Unaudited) | | | Year Ended
June 30, 2018 | | | Six Months Ended
December 31, 2018
(Unaudited) | | | Year Ended
June 30, 2018 | |
| | | | |
Increase (Decrease) in Net Assets from: | | | | | | | | | | | | | | | | |
| | | | |
Operations: | | | | | | | | | | | | | | | | |
| | | | |
Net investment income (loss) | | $ | 34,151 | | | $ | 64,089 | | | $ | 2,769 | | | $ | 3,412 | |
Net realized gain (loss) | | | (4,867 | ) | | | (35,474 | ) | | | 536 | | | | (113 | ) |
Net change in unrealized appreciation (depreciation) | | | 1,387 | | | | (21,676 | ) | | | (1,634 | ) | | | (1,939 | ) |
| | | | |
Net Increase (Decrease) in Net Assets Resulting from Operations | | | 30,671 | | | | 6,939 | | | | 1,671 | | | | 1,360 | |
| | | | |
Distributions to Shareholders: | | | | | | | | | | | | | | | | |
| | | | |
From net investment income and/or net realized capital gains* | | | (41,203 | ) | | | (61,891 | ) | | | (3,708 | ) | | | (3,376 | ) |
Tax basis return of capital | | | 0 | | | | (5,271 | ) | | | 0 | | | | 0 | |
| | | | |
Total Distributions(a) | | | (41,203 | ) | | | (67,162 | ) | | | (3,708 | ) | | | (3,376 | ) |
| | | | |
Fund Share Transactions: | | | | | | | | | | | | | | | | |
| | | | |
Receipts for shares sold | | | 107,011 | | | | 201,594 | | | | 65,629 | | | | 73,439 | |
Cost of shares redeemed | | | (179,333 | ) | | | (108,896 | ) | | | 0 | | | | (7,988 | ) |
Net increase (decrease) resulting from Fund share transactions | | | (72,322 | ) | | | 92,698 | | | | 65,629 | | | | 65,451 | |
| | | | |
Total Increase (Decrease) in Net Assets | | | (82,854 | ) | | | 32,475 | | | | 63,592 | | | | 63,435 | |
| | | | |
Net Assets: | | | | | | | | | | | | | | | | |
| | | | |
Beginning of period | | | 2,072,132 | | | | 2,039,657 | | | | 157,382 | | | | 93,947 | |
End of period | | $ | 1,989,278 | | | $ | 2,072,132 | | | $ | 220,974 | | | $ | 157,382 | |
| | | | |
Shares of Beneficial Interest: | | | | | | | | | | | | | | | | |
| | | | |
Shares sold | | | 1,050 | | | | 1,900 | | | | 660 | | | | 730 | |
Shares redeemed | | | (1,750 | ) | | | (1,050 | ) | | | 0 | | | | (80 | ) |
Net increase (decrease) in shares outstanding | | | (700 | ) | | | 850 | | | | 660 | | | | 650 | |
| † | A zero balance may reflect actual amounts rounding to less than one thousand. |
| * | See Note 2, New Accounting Pronouncements, in the Notes to Financial Statements for more information. |
| (a) | The tax characterization of distributions is determined in accordance with Federal income tax regulations. The actual tax characterization of distributions paid is determined at the end of the fiscal year. See Note 2, Distributions to Shareholders, in the Notes to Financial Statements for more information. |
| | | | | | | | |
| 30 | | PIMCO ETF TRUST | | | | | See Accompanying Notes | |
| | | | | | | | | | | | | | | | | | | | | | |
PIMCO
Enhanced Short Maturity Active
Exchange-Traded Fund | | | PIMCO
Intermediate Municipal Bond Active
Exchange-Traded Fund | | | PIMCO
Short Term Municipal Bond Active
Exchange-Traded Fund | |
| | | | | |
Six Months Ended
December 31, 2018
(Unaudited) | | | Year Ended
June 30, 2018 | | | Six Months Ended
December 31, 2018
(Unaudited) | | | Year Ended
June 30, 2018 | | | Six Months Ended
December 31, 2018
(Unaudited) | | | Year Ended
June 30, 2018 | |
| | | | | |
| | | | | | | | | | | | | | | | | | | | | | |
| | | | | |
| | | | | | | | | | | | | | | | | | | | | | |
| | | | | |
| $ | 138,172 | | | $ | 155,560 | | | $ | 3,672 | | | $ | 6,579 | | | $ | 688 | | | $ | 1,031 | |
| | (880 | ) | | | (4,843 | ) | | | (68 | ) | | | (445 | ) | | | (88 | ) | | | (221 | ) |
| | (49,369 | ) | | | (13,066 | ) | | | 90 | | | | (2,970 | ) | | | 61 | | | | (268 | ) |
| | | | | |
| | 87,923 | | | | 137,651 | | | | 3,694 | | | | 3,164 | | | | 661 | | | | 542 | |
| | | | | |
| | | | | | | | | | | | | | | | | | | | | | |
| | | | | |
| | (159,698 | ) | | | (149,394 | ) | | | (4,263 | ) | | | (6,575 | ) | | | (787 | ) | | | (1,009 | ) |
| | 0 | | | | 0 | | | | 0 | | | | 0 | | | | 0 | | | | 0 | |
| | | | | |
| | (159,698 | ) | | | (149,394 | ) | | | (4,263 | ) | | | (6,575 | ) | | | (787 | ) | | | (1,009 | ) |
| | | | | |
| | | | | | | | | | | | | | | | | | | | | | |
| | | | | |
| | 4,062,381 | | | | 2,993,841 | | | | 52,778 | | | | 24,103 | | | | 12,425 | | | | 7,535 | |
| | (1,207,036 | ) | | | (767,903 | ) | | | (13,093 | ) | | | (5,300 | ) | | | 0 | | | | (5,020 | ) |
| | 2,855,345 | | | | 2,225,938 | | | | 39,685 | | | | 18,803 | | | | 12,425 | | | | 2,515 | |
| | | | | |
| | 2,783,570 | | | | 2,214,195 | | | | 39,116 | | | | 15,392 | | | | 12,299 | | | | 2,048 | |
| | | | | |
| | | | | | | | | | | | | | | | | | | | | | |
| | | | | |
| | 9,410,140 | | | | 7,195,945 | | | | 275,309 | | | | 259,917 | | | | 67,874 | | | | 65,826 | |
| $ | 12,193,710 | | | $ | 9,410,140 | | | $ | 314,425 | | | $ | 275,309 | | | $ | 80,173 | | | $ | 67,874 | |
| | | | | |
| | | | | | | | | | | | | | | | | | | | | | |
| | | | | |
| | 40,040 | | | | 29,470 | | | | 1,000 | | | | 450 | | | | 250 | | | | 150 | |
| | (11,900 | ) | | | (7,560 | ) | | | (250 | ) | | | (100 | ) | | | 0 | | | | (100 | ) |
| | 28,140 | | | | 21,910 | | | | 750 | | | | 350 | | | | 250 | | | | 50 | |
| | | | | | |
| | SEMIANNUAL REPORT | | DECEMBER 31, 2018 | | 31 |
Statement of Cash Flows
| | | | |
| Six Months Ended December 31, 2018 (Unaudited) | | | |
| (Amounts in thousands†) | | PIMCO
Enhanced Low
Duration Active
Exchange-
Traded Fund | |
| |
Cash Flows Provided by (Used for) Operating Activities: | | | | |
| |
Net increase (decrease) in net assets resulting from operations | | $ | 1,671 | |
| |
Adjustments to Reconcile Net Increase (Decrease) in Net Assets from Operations to Net Cash Provided by (Used for) Operating Activities: | | | | |
| |
Purchases of long-term securities | | | (1,487,711 | ) |
Proceeds from sales of long-term securities | | | 1,355,634 | |
(Purchases) Proceeds from sales of short-term portfolio investments, net | | | (15,993 | ) |
(Increase) decrease in deposits with counterparty | | | (957 | ) |
(Increase) decrease in receivable for investments sold | | | 23,569 | |
(Increase) decrease in interest and/or dividends receivable | | | (891 | ) |
Proceeds from (Payments on) exchange-traded or centrally cleared financial derivative instruments | | | (1,273 | ) |
Proceeds from (Payments on) over the counter financial derivative instruments | | | 580 | |
(Increase) decrease in reimbursement receivable from PIMCO | | | (5 | ) |
Increase (decrease) in payable for investments purchased | | | 54,230 | |
Increase (decrease) in deposits from counterparty | | | 60 | |
Increase (decrease) in accrued management fees | | | 25 | |
Proceeds from (Payments on) short sales transactions, net | | | (7,656 | ) |
Proceeds from (Payments on) foreign currency transactions | | | 107 | |
Net Realized (Gain) Loss | | | | |
Investments in securities | | | (148 | ) |
Exchange-traded or centrally cleared financial derivative instruments | | | 339 | |
Over the counter financial derivative instruments | | | (564 | ) |
Short sales | | | (56 | ) |
Foreign currency | | | (107 | ) |
Net Change in Unrealized (Appreciation) Depreciation | | | | |
Investments in securities | | | 183 | |
Exchange-traded or centrally cleared financial derivative instruments | | | 1,211 | |
Over the counter financial derivative instruments | | | 232 | |
Short sales | | | 8 | |
Net amortization (accretion) on investments | | | 65 | |
| |
Net Cash Provided by (Used for) Operating Activities | | | (77,447 | ) |
| |
Cash Flows Received from (Used for) Financing Activities: | | | | |
| |
Proceeds from shares sold | | | 67,621 | |
Increase (decrease) in overdraft due to custodian | | | (17,883 | ) |
Cash distributions paid | | | (2,879 | ) |
Proceeds from reverse repurchase agreements | | | 121,640 | |
Payments on reverse repurchase agreements | | | (15,223 | ) |
Proceeds from sale-buyback transactions | | | 2,593,248 | |
Payments on sale-buyback transactions | | | (2,669,072 | ) |
| |
Net Cash Received from (Used for) Financing Activities | | | 77,452 | |
| |
Net Increase (Decrease) in Cash and Foreign Currency | | | 5 | |
| |
Cash and Foreign Currency: | | | | |
| |
Beginning of period | | | 18 | |
End of period | | $ | 23 | |
| |
Supplemental Disclosure of Cash Flow Information: | | | | |
Interest expense paid during the period | | $ | 574 | |
| † | A zero balance may reflect actual amounts rounding to less than one thousand. |
A Statement of Cash Flows is presented when a Fund has a significant amount of borrowing during the period, based on the average total borrowing outstanding in relation to total assets or when substantially all of a Fund’s investments are not classified as Level 1 or 2 in the fair value hierarchy.
| | | | | | | | |
| 32 | | PIMCO ETF TRUST | | | | | See Accompanying Notes | |
Schedule of InvestmentsPIMCO1-3 Year U.S. Treasury Index Exchange-Traded Fund
December 31, 2018 (Unaudited)
(Amounts in thousands*, except number of shares, contracts and units, if any)
| | | | | | | | | | | | |
| | | | | PRINCIPAL
AMOUNT
(000S) | | | | | MARKET
VALUE
(000S) | |
| INVESTMENTS IN SECURITIES 99.5% | |
| |
| U.S. TREASURY OBLIGATIONS 99.0% | |
|
U.S. Treasury Notes | |
1.375% due 01/15/2020 | | $ | | | 2,380 | | | $ | | | 2,350 | |
1.375% due 09/15/2020 | | | | | 1,875 | | | | | | 1,840 | |
1.500% due 04/15/2020 | | | | | 2,270 | | | | | | 2,240 | |
1.500% due 06/15/2020 | | | | | 1,805 | | | | | | 1,779 | |
1.500% due 07/15/2020 | | | | | 2,215 | | | | | | 2,181 | |
1.500% due 08/15/2020 | | | | | 1,875 | | | | | | 1,844 | |
1.625% due 03/15/2020 | | | | | 2,160 | | | | | | 2,136 | |
1.625% due 10/15/2020 | | | | | 2,075 | | | | | | 2,043 | |
1.750% due 11/30/2021 | | | | | 500 | | | | | | 490 | |
1.875% due 12/15/2020 | | | | | 2,120 | | | | | | 2,095 | |
2.000% due 01/15/2021 | | | | | 2,015 | | | | | | 1,995 | |
| | | | | | | | | | | | |
| | | | | PRINCIPAL
AMOUNT
(000S) | | | | | MARKET
VALUE
(000S) | |
2.000% due 11/15/2021 | | $ | | | 2,500 | | | $ | | | 2,468 | |
2.125% due 08/15/2021 | | | | | 2,395 | | | | | | 2,373 | |
2.375% due 03/15/2021 | | | | | 1,970 | | | | | | 1,965 | |
2.375% due 04/15/2021 | | | | | 2,565 | | | | | | 2,559 | |
2.625% due 08/15/2020 | | | | | 2,160 | | | | | | 2,163 | |
2.625% due 11/15/2020 | | | | | 3,160 | | | | | | 3,166 | |
2.625% due 06/15/2021 | | | | | 2,200 | | | | | | 2,208 | |
2.625% due 07/15/2021 | | | | | 1,405 | | | | | | 1,410 | |
2.750% due 09/15/2021 | | | | | 1,785 | | | | | | 1,797 | |
2.875% due 10/15/2021 | | | | | 2,000 | | | | | | 2,021 | |
3.125% due 05/15/2021 | | | | | 3,120 | | | | | | 3,167 | |
3.500% due 05/15/2020 | | | | | 2,715 | | | | | | 2,749 | |
3.625% due 02/15/2020 | | | | | 3,410 | | | | | | 3,447 | |
3.625% due 02/15/2021 | | | | | 2,200 | | | | | | 2,251 | |
| | | | | | | | | | | | |
Total U.S. Treasury Obligations (Cost $55,014) | | | 54,737 | |
| | | | | | | | | | | | |
| | | | | | | | | | | | |
| | | | | | | | | | MARKET
VALUE
(000S) | |
| SHORT-TERM INSTRUMENTS 0.5% | |
| |
| REPURCHASE AGREEMENTS (a) 0.5% | |
| | | | | | | | $ | | | 264 | |
| | | | | | | | | | | | |
Total Short-Term Instruments
(Cost $264) | | | | | | | | | 264 | |
| | | | | | | | | | | | |
| | | | |
| | | | | | | | | | | | |
Total Investments in Securities
(Cost $55,278) | | | | | | | | | 55,001 | |
| | | | |
| | | | | | | | | | | | |
Total Investments 99.5%
(Cost $55,278) | | | | | | | | $ | | | 55,001 | |
| |
| Other Assets and Liabilities, net 0.5% | | | | | | 261 | |
| | | | | | | | | | | | |
| Net Assets 100.0% | | | | | | | | $ | | | 55,262 | |
| | | | | | | | | | | | |
NOTES TO SCHEDULE OF INVESTMENTS:
| * | A zero balance may reflect actual amounts rounding to less than one thousand. |
BORROWINGS AND OTHER FINANCING TRANSACTIONS
(a) REPURCHASE AGREEMENTS:
| | | | | | | | | | | | | | | | | | | | | | | | | | | | | | |
| Counterparty | | Lending
Rate | | | Settlement
Date | | | Maturity
Date | | | Principal
Amount | | | Collateralized By | | Collateral
(Received) | | | Repurchase
Agreements,
at Value | | | Repurchase
Agreement
Proceeds
to be
Received(1) | |
| FICC | | | 2.000 | % | | | 12/31/2018 | | | | 01/02/2019 | | | $ | 264 | | | U.S. Treasury Notes 2.875% due 07/31/2025 | | $ | (272 | ) | | $ | 264 | | | $ | 264 | |
| | | | | | | | | | | | | | | | | | | | | | | | | | | | | | |
Total Repurchase Agreements | | | | | $ | (272 | ) | | $ | 264 | | | $ | 264 | |
| | | | | | | | | | | | | | | |
BORROWINGS AND OTHER FINANCING TRANSACTIONS SUMMARY
The following is a summary by counterparty of the market value of Borrowings and Other Financing Transactions and collateral pledged/(received) as of December 31, 2018:
| | | | | | | | | | | | | | | | | | | | | | | | | | | | |
| Counterparty | | Repurchase
Agreement
Proceeds
to be
Received(1) | | | Payable for
Reverse
Repurchase
Agreements | | | Payable for
Sale-Buyback
Transactions | | | Securities
Out on Loan | | | Total
Borrowings and
Other Financing
Transactions | | | Collateral
Pledged/(Received) | | | Net Exposure(2) | |
Global/Master Repurchase Agreement | | | | | | | | | | | | | | | | | | | | | | | | | | | | |
FICC | | $ | 264 | | | $ | 0 | | | $ | 0 | | | $ | 0 | | | $ | 264 | | | $ | (272 | ) | | $ | (8 | ) |
| | | | | | | | | | | | | | | | | | | | | | | | | | | | |
Total Borrowings and Other Financing Transactions | | $ | 264 | | | $ | 0 | | | $ | 0 | | | $ | 0 | | | | | | | | | | | | | |
| | | | | | | | | | | | | | | | | | | | | | | | | | | | |
| (1) | Includes accrued interest. |
| (2) | Net Exposure represents the net receivable/(payable) that would be due from/to the counterparty in the event of default. Exposure from borrowings and other financing transactions can only be netted across transactions governed under the same master agreement with the same legal entity. See Note 8, Master Netting Arrangements, in the Notes to Financial Statements for more information regarding master netting arrangements. |
FAIR VALUE MEASUREMENTS
The following is a summary of the fair valuations according to the inputs used as of December 31, 2018 in valuing the Fund’s assets and liabilities:
| | | | | | | | | | | | | | | | |
| Category and Subcategory | | Level 1 | | | Level 2 | | | Level 3 | | | Fair
Value at
12/31/2018 | |
Investments in Securities, at Value | |
U.S. Treasury Obligations | | $ | 0 | | | $ | 54,737 | | | $ | 0 | | | $ | 54,737 | |
Short-Term Instruments | |
Repurchase Agreements | | | 0 | | | | 264 | | | | 0 | | | | 264 | |
| | | | | | | | | | | | | | | | |
| | | | |
Total Investments | | $ | 0 | | | $ | 55,001 | | | $ | 0 | | | $ | 55,001 | |
| | | | | | | | | | | | | | | | |
There were no significant transfers into or out of Level 3 during the period ended December 31, 2018.
| | | | | | |
| See Accompanying Notes | | SEMIANNUAL REPORT | | DECEMBER 31, 2018 | | 33 |
Schedule of InvestmentsPIMCO 25+ Year Zero Coupon U.S. Treasury Index Exchange-Traded Fund
December 31, 2018 (Unaudited)
(Amounts in thousands*, except number of shares, contracts and units, if any)
| | | | | | | | | | | | |
| | | | | PRINCIPAL
AMOUNT
(000S) | | | | | MARKET
VALUE
(000S) | |
| INVESTMENTS IN SECURITIES 100.0% | |
| |
| U.S. TREASURY OBLIGATIONS 100.0% | |
|
U.S. Treasury STRIPS (a) | |
0.000% due 02/15/2044 | | $ | | | 16,489 | | | $ | | | 7,692 | |
0.000% due 05/15/2044 | | | | | 16,429 | | | | | | 7,626 | |
0.000% due 08/15/2044 | | | | | 16,259 | | | | | | 7,493 | |
0.000% due 11/15/2044 | | | | | 16,560 | | | | | | 7,575 | |
0.000% due 02/15/2045 | | | | | 16,461 | | | | | | 7,460 | |
0.000% due 05/15/2045 | | | | | 16,331 | | | | | | 7,356 | |
0.000% due 08/15/2045 | | | | | 16,352 | | | | | | 7,299 | |
0.000% due 11/15/2045 | | | | | 16,533 | | | | | | 7,337 | |
0.000% due 02/15/2046 | | | | | 16,478 | | | | | | 7,229 | |
0.000% due 05/15/2046 | | | | | 16,227 | | | | | | 7,066 | |
0.000% due 08/15/2046 | | | | | 16,563 | | | | | | 7,164 | |
0.000% due 11/15/2046 | | | | | 16,226 | | | | | | 6,967 | |
0.000% due 02/15/2047 | | | | | 16,504 | | | | | | 7,051 | |
0.000% due 05/15/2047 | | | | | 16,612 | | | | | | 7,026 | |
| | | | | | | | | | | | |
| | | | | PRINCIPAL
AMOUNT
(000S) | | | | | MARKET
VALUE
(000S) | |
0.000% due 08/15/2047 | | $ | | | 16,295 | | | $ | | | 6,830 | |
0.000% due 11/15/2047 | | | | | 16,384 | | | | | | 6,809 | |
0.000% due 02/15/2048 | | | | | 16,547 | | | | | | 6,827 | |
0.000% due 05/15/2048 | | | | | 16,447 | | | | | | 6,733 | |
0.000% due 08/15/2048 | | | | | 16,400 | | | | | | 6,675 | |
0.000% due 11/15/2048 | | | | | 16,300 | | | | | | 6,588 | |
| | | | | | | | | | | | |
Total U.S. Treasury Obligations
(Cost $155,750) | | | | | | | | | | | 142,803 | |
| | | | | | | | | | | | |
| | | | |
| | | | | | | | | | | | |
Total Investments in Securities
(Cost $155,750) | | | | | | | | | | | 142,803 | |
| | | | |
| | | | | | | | | | | | |
Total Investments 100.0%
(Cost $155,750) | | | | | | | | $ | | | 142,803 | |
| |
| Other Assets and Liabilities, net 0.0% | | | | | | 12 | |
| | | | | | | | | | | | |
| Net Assets 100.0% | | | | | | | | $ | | | 142,815 | |
| | | | | | | | | | | | |
NOTES TO SCHEDULE OF INVESTMENTS:
| * | A zero balance may reflect actual amounts rounding to less than one thousand. |
BORROWINGS AND OTHER FINANCING TRANSACTIONS
FAIR VALUE MEASUREMENTS
The following is a summary of the fair valuations according to the inputs used as of December 31, 2018 in valuing the Fund’s assets and liabilities:
| | | | | | | | | | | | | | | | |
| Category and Subcategory | | Level 1 | | | Level 2 | | | Level 3 | | | Fair
Value at
12/31/2018 | |
Investments in Securities, at Value | |
U.S. Treasury Obligations | | $ | 0 | | | $ | 142,803 | | | $ | 0 | | | $ | 142,803 | |
| | | | | | | | | | | | | | | | |
There were no significant transfers into or out of Level 3 during the period ended December 31, 2018.
| | | | | | | | |
| 34 | | PIMCO ETF TRUST | | | | | See Accompanying Notes | |
Schedule of InvestmentsPIMCO1-5 Year U.S. TIPS Index Exchange-Traded Fund
December 31, 2018 (Unaudited)
(Amounts in thousands*, except number of shares, contracts and units, if any)
| | | | | | | | | | | | |
| | | | | PRINCIPAL
AMOUNT
(000S) | | | | | MARKET
VALUE
(000S) | |
| INVESTMENTS IN SECURITIES 99.9% | |
| |
| U.S. TREASURY OBLIGATIONS 99.7% | |
|
U.S. Treasury Inflation Protected Securities (a) | |
0.125% due 04/15/2020 | | $ | | | 91,591 | | | $ | | | 89,562 | |
0.125% due 04/15/2021 | | | | | 70,966 | | | | | | 69,044 | |
0.125% due 01/15/2022 | | | | | 68,469 | | | | | | 66,475 | |
0.125% due 04/15/2022 | | | | | 73,252 | | | | | | 70,890 | |
0.125% due 07/15/2022 | | | | | 67,647 | | | | | | 65,720 | |
0.125% due 01/15/2023 | | | | | 74,675 | | | | | | 72,143 | |
0.375% due 07/15/2023 | | | | | 74,768 | | | | | | 73,129 | |
0.625% due 07/15/2021 | | | | | 65,543 | | | | | | 64,839 | |
0.625% due 04/15/2023 | | | | | 69,172 | | | | | | 68,053 | |
1.125% due 01/15/2021 | | | | | 71,547 | | | | | | 71,233 | |
1.250% due 07/15/2020 | | | | | 52,187 | | | | | | 52,088 | |
1.375% due 01/15/2020 | | | | | 28,858 | | | | | | 28,682 | |
| | | | | | | | | | | | |
Total U.S. Treasury Obligations
(Cost $812,034) | | | 791,858 | |
| | | | | | | | | | | | |
| | | | | | | | | | | | |
| | | | | | | | | | MARKET
VALUE
(000S) | |
| SHORT-TERM INSTRUMENTS 0.2% | |
| |
| REPURCHASE AGREEMENTS (b) 0.2% | |
| | | | | | | | $ | | | 1,863 | |
| | | | | | | | | | | | |
Total Short-Term Instruments
(Cost $1,863) | | | | | | | | | 1,863 | |
| | | | | | | | | | | | |
| | | | |
| | | | | | | | | | | | |
Total Investments in Securities
(Cost $813,897) | | | | | | | | | 793,721 | |
| | | | |
| | | | | | | | | | | | |
Total Investments 99.9%
(Cost $813,897) | | | | | | | | $ | | | 793,721 | |
| |
| Other Assets and Liabilities, net 0.1% | | | | | | 629 | |
| | | | | | | | | | | | |
| Net Assets 100.0% | | | | | | | | $ | | | 794,350 | |
| | | | | | | | | | | | |
NOTES TO SCHEDULE OF INVESTMENTS:
| * | A zero balance may reflect actual amounts rounding to less than one thousand. |
| (a) | Principal amount of security is adjusted for inflation. |
BORROWINGS AND OTHER FINANCING TRANSACTIONS
(b) REPURCHASE AGREEMENTS:
| | | | | | | | | | | | | | | | | | | | | | | | | | | | | | |
| Counterparty | | Lending
Rate | | | Settlement
Date | | | Maturity
Date | | | Principal
Amount | | | Collateralized By | | Collateral
(Received) | | | Repurchase
Agreements,
at Value | | | Repurchase
Agreement
Proceeds
to be
Received(1) | |
| FICC | | | 2.000 | % | | | 12/31/2018 | | | | 01/02/2019 | | | $ | 1,863 | | | U.S. Treasury Notes 2.875% due 07/31/2025 | | $ | (1,903 | ) | | $ | 1,863 | | | $ | 1,863 | |
| | | | | | | | | | | | | | | | | | | | | | | | | | | | | | |
Total Repurchase Agreements | | | | | $ | (1,903 | ) | | $ | 1,863 | | | $ | 1,863 | |
| | | | | | | | | | | | | | | |
BORROWINGS AND OTHER FINANCING TRANSACTIONS SUMMARY
The following is a summary by counterparty of the market value of Borrowings and Other Financing Transactions and collateral pledged/(received) as of December 31, 2018:
| | | | | | | | | | | | | | | | | | | | | | | | | | | | |
| Counterparty | | Repurchase
Agreement
Proceeds
to be
Received(1) | | | Payable for
Reverse
Repurchase
Agreements | | | Payable for
Sale-Buyback
Transactions | | | Securities
Out on Loan | | | Total
Borrowings and
Other Financing
Transactions | | | Collateral
Pledged/(Received) | | | Net Exposure(2) | |
Global/Master Repurchase Agreement | |
FICC | | $ | 1,863 | | | $ | 0 | | | $ | 0 | | | $ | 0 | | | $ | 1,863 | | | $ | (1,903 | ) | | $ | (40 | ) |
| | | | | | | | | | | | | | | | | | | | | | | | | | | | |
Total Borrowings and Other Financing Transactions | | $ | 1,863 | | | $ | 0 | | | $ | 0 | | | $ | 0 | | | | | | | | | | | | | |
| | | | | | | | | | | | | | | | | | | | | | | | | | | | |
| (1) | Includes accrued interest. |
| (2) | Net Exposure represents the net receivable/(payable) that would be due from/to the counterparty in the event of default. Exposure from borrowings and other financing transactions can only be netted across transactions governed under the same master agreement with the same legal entity. See Note 8, Master Netting Arrangements, in the Notes to Financial Statements for more information regarding master netting arrangements. |
FAIR VALUE MEASUREMENTS
The following is a summary of the fair valuations according to the inputs used as of December 31, 2018 in valuing the Fund’s assets and liabilities:
| | | | | | | | | | | | | | | | |
| Category and Subcategory | | Level 1 | | | Level 2 | | | Level 3 | | | Fair
Value at
12/31/2018 | |
Investments in Securities, at Value | |
U.S. Treasury Obligations | | $ | 0 | | | $ | 791,858 | | | $ | 0 | | | $ | 791,858 | |
Short-Term Instruments | |
Repurchase Agreements | | | 0 | | | | 1,863 | | | | 0 | | | | 1,863 | |
| | | | | | | | | | | | | | | | |
| | | | |
Total Investments | | $ | 0 | | | $ | 793,721 | | | $ | 0 | | | $ | 793,721 | |
| | | | | | | | | | | | | | | | |
There were no significant transfers into or out of Level 3 during the period ended December 31, 2018.
| | | | | | |
| See Accompanying Notes | | SEMIANNUAL REPORT | | DECEMBER 31, 2018 | | 35 |
Schedule of InvestmentsPIMCO 15+ Year U.S. TIPS Index Exchange-Traded Fund
December 31, 2018 (Unaudited)
(Amounts in thousands*, except number of shares, contracts and units, if any)
| | | | | | | | | | | | |
| | | | | PRINCIPAL
AMOUNT
(000S) | | | | | MARKET
VALUE
(000S) | |
| INVESTMENTS IN SECURITIES 99.6% | |
| |
| U.S. TREASURY OBLIGATIONS 99.5% | |
|
U.S. Treasury Inflation Protected Securities (a) | |
0.625% due 02/15/2043 | | $ | | | 24,549 | | | $ | | | 21,575 | |
0.750% due 02/15/2042 | | | | | 23,955 | | | | | | 21,792 | |
0.750% due 02/15/2045 | | | | | 24,051 | | | | | | 21,564 | |
0.875% due 02/15/2047 | | | | | 18,918 | | | | | | 17,408 | |
1.000% due 02/15/2046 | | | | | 20,181 | | | | | | 19,180 | |
1.000% due 02/15/2048 | | | | | 17,955 | | | | | | 17,055 | |
1.375% due 02/15/2044 | | | | | 22,926 | | | | | | 23,727 | |
2.125% due 02/15/2040 | | | | | 16,468 | | | | | | 19,401 | |
2.125% due 02/15/2041 | | | | | 26,875 | | | | | | 31,811 | |
| | | | | | | | | | | | |
Total U.S. Treasury Obligations (Cost $206,648) | | | 193,513 | |
| | | | |
| | | | | | | | | | | | |
| | | | | | | | | | MARKET
VALUE
(000S) | |
| SHORT-TERM INSTRUMENTS 0.1% | |
| |
| REPURCHASE AGREEMENTS (b) 0.1% | |
| | | | | | | | $ | | | 124 | |
| | | | | | | | | | | | |
Total Short-Term Instruments
(Cost $124) | | | 124 | |
| | | | |
| | | | |
| | | | | | | | | | | | |
Total Investments in Securities
(Cost $206,772) | | | 193,637 | |
| | | | |
| | | | | | | | | | | | |
Total Investments 99.6%
(Cost $206,772) | | | $ | | | 193,637 | |
| |
| Other Assets and Liabilities, net 0.4% | | | 816 | |
| | | | |
| Net Assets 100.0% | | | $ | | | 194,453 | |
| | | | | | | |
NOTES TO SCHEDULE OF INVESTMENTS:
| * | A zero balance may reflect actual amounts rounding to less than one thousand. |
| (a) | Principal amount of security is adjusted for inflation. |
BORROWINGS AND OTHER FINANCING TRANSACTIONS
(b) REPURCHASE AGREEMENTS:
| | | | | | | | | | | | | | | | | | | | | | | | | | | | | | |
| Counterparty | | Lending
Rate | | | Settlement
Date | | | Maturity
Date | | | Principal
Amount | | | Collateralized By | | Collateral
(Received) | | | Repurchase
Agreements,
at Value | | | Repurchase
Agreement
Proceeds
to be
Received(1) | |
| FICC | | | 2.000 | % | | | 12/31/2018 | | | | 01/02/2019 | | | $ | 124 | | | U.S. Treasury Notes 2.875% due 07/31/2025 | | $ | (128 | ) | | $ | 124 | | | $ | 124 | |
| | | | | | | | | | | | | | | | | | | | | | | | | | | | | | |
Total Repurchase Agreements | | | | | $ | (128 | ) | | $ | 124 | | | $ | 124 | |
| | | | | | | | | | | | | | | |
BORROWINGS AND OTHER FINANCING TRANSACTIONS SUMMARY
The following is a summary by counterparty of the market value of Borrowings and Other Financing Transactions and collateral pledged/(received) as of December 31, 2018:
| | | | | | | | | | | | | | | | | | | | | | | | | | | | |
| Counterparty | | Repurchase
Agreement
Proceeds
to be
Received(1) | | | Payable for
Reverse
Repurchase
Agreements | | | Payable for
Sale-Buyback
Transactions | | | Securities
Out on Loan | | | Total
Borrowings and
Other Financing
Transactions | | | Collateral
Pledged/(Received) | | | Net Exposure(2) | |
Global/Master Repurchase Agreement | |
FICC | | $ | 124 | | | $ | 0 | | | $ | 0 | | | $ | 0 | | | $ | 124 | | | $ | (128 | ) | | $ | (4 | ) |
| | | | | | | | | | | | | | | | | | | | | | | | | | | | |
Total Borrowings and Other Financing Transactions | | $ | 124 | | | $ | 0 | | | $ | 0 | | | $ | 0 | | | | | | | | | | | | | |
| | | | | | | | | | | | | | | | | | | | | | | | | | | | |
| (1) | Includes accrued interest. |
| (2) | Net Exposure represents the net receivable/(payable) that would be due from/to the counterparty in the event of default. Exposure from borrowings and other financing transactions can only be netted across transactions governed under the same master agreement with the same legal entity. See Note 8, Master Netting Arrangements, in the Notes to Financial Statements for more information regarding master netting arrangements. |
FAIR VALUE MEASUREMENTS
The following is a summary of the fair valuations according to the inputs used as of December 31, 2018 in valuing the Fund’s assets and liabilities:
| | | | | | | | | | | | | | | | |
| Category and Subcategory | | Level 1 | | | Level 2 | | | Level 3 | | | Fair
Value at
12/31/2018 | |
Investments in Securities, at Value | |
U.S. Treasury Obligations | | $ | 0 | | | $ | 193,513 | | | $ | 0 | | | $ | 193,513 | |
Short-Term Instruments | |
Repurchase Agreements | | | 0 | | | | 124 | | | | 0 | | | | 124 | |
| | | | | | | | | | | | | | | | |
| | | | |
Total Investments | | $ | 0 | | | $ | 193,637 | | | $ | 0 | | | $ | 193,637 | |
| | | | | | | | | | | | | | | | |
There were no significant transfers into or out of Level 3 during the period ended December 31, 2018.
| | | | | | | | |
| 36 | | PIMCO ETF TRUST | | | | | See Accompanying Notes | |
Schedule of InvestmentsPIMCO Broad U.S. TIPS Index Exchange-Traded Fund
December 31, 2018 (Unaudited)
(Amounts in thousands*, except number of shares, contracts and units, if any)
| | | | | | | | | | | | |
| | | | | PRINCIPAL
AMOUNT
(000S) | | | | | MARKET
VALUE
(000S) | |
| INVESTMENTS IN SECURITIES 99.3% | |
| |
| U.S. TREASURY OBLIGATIONS 99.3% | |
|
U.S. Treasury Inflation Protected Securities (a) | |
0.125% due 01/15/2022 | | $ | | | 4,107 | | | $ | | | 3,988 | |
0.125% due 07/15/2022 | | | | | 3,211 | | | | | | 3,120 | |
0.125% due 01/15/2023 | | | | | 2,709 | | | | | | 2,618 | |
0.125% due 07/15/2026 | | | | | 1,374 | | | | | | 1,291 | |
0.375% due 07/15/2025 | | | | | 3,457 | | | | | | 3,335 | |
0.375% due 01/15/2027 | | | | | 1,676 | | | | | | 1,593 | |
0.500% due 01/15/2028 | | | | | 457 | | | | | | 437 | |
0.625% due 01/15/2024 | | | | | 4,986 | | | | | | 4,909 | |
0.750% due 07/15/2028 | | | | | 729 | | | | | | 714 | |
0.750% due 02/15/2042 | | | | | 2,900 | | | | | | 2,638 | |
0.875% due 02/15/2047 | | | | | 776 | | | | | | 714 | |
1.000% due 02/15/2046 | | | | | 848 | | | | | | 806 | |
1.000% due 02/15/2048 | | | | | 550 | | | | | | 522 | |
1.125% due 01/15/2021 | | | | | 5,677 | | | | | | 5,652 | |
1.375% due 01/15/2020 | | | | | 2,793 | | | | | | 2,776 | |
| | | | | | | | | | | | |
| | | | | PRINCIPAL
AMOUNT
(000S) | | | | | MARKET
VALUE
(000S) | |
1.375% due 02/15/2044 | | $ | | | 2,814 | | | $ | | | 2,912 | |
1.750% due 01/15/2028 | | | | | 3,851 | | | | | | 4,092 | |
2.000% due 01/15/2026 | | | | | 3,350 | | | | | | 3,576 | |
2.125% due 02/15/2040 | | | | | 717 | | | | | | 845 | |
2.375% due 01/15/2025 | | | | | 3,696 | | | | | | 3,998 | |
2.500% due 01/15/2029 | | | | | 2,803 | | | | | | 3,194 | |
3.375% due 04/15/2032 | | | | | 541 | | | | | | 696 | |
| | | | | | | | | | | | |
Total U.S. Treasury Obligations
(Cost $57,208) | | | 54,426 | |
| | | | |
| | | | |
| | | | | | | | | | | | |
Total Investments in Securities
(Cost $57,208) | | | 54,426 | |
| | | | |
| | | | | | | | | | | | |
Total Investments 99.3%
(Cost $57,208) | | | $ | | | 54,426 | |
| |
| Other Assets and Liabilities, net 0.7% | | | 411 | |
| | | | |
| Net Assets 100.0% | | | $ | | | 54,837 | |
| | | | | | | |
NOTES TO SCHEDULE OF INVESTMENTS:
| * | A zero balance may reflect actual amounts rounding to less than one thousand. |
| (a) | Principal amount of security is adjusted for inflation. |
FAIR VALUE MEASUREMENTS
The following is a summary of the fair valuations according to the inputs used as of December 31, 2018 in valuing the Fund’s assets and liabilities:
| | | | | | | | | | | | | | | | |
| Category and Subcategory | | Level 1 | | | Level 2 | | | Level 3 | | | Fair
Value at
12/31/2018 | |
Investments in Securities, at Value | |
U.S. Treasury Obligations | | $ | 0 | | | $ | 54,426 | | | $ | 0 | | | $ | 54,426 | |
| | | | | | | | | | | | | | | | |
There were no significant transfers into or out of Level 3 during the period ended December 31, 2018.
| | | | | | |
| See Accompanying Notes | | SEMIANNUAL REPORT | | DECEMBER 31, 2018 | | 37 |
Schedule of InvestmentsPIMCO0-5 Year High Yield Corporate Bond Index Exchange-Traded Fund
(Amounts in thousands*, except number of shares, contracts and units, if any)
| | | | | | | | | | | | |
| | | | | PRINCIPAL
AMOUNT
(000S) | | | | | MARKET
VALUE
(000S) | |
| INVESTMENTS IN SECURITIES 98.6% | |
| |
| CORPORATE BONDS & NOTES 92.2% | |
| |
| BANKING & FINANCE 11.4% | |
|
Abe Investment Holdings, Inc. | |
10.500% due 10/16/2020 | | $ | | | 1,200 | | | $ | | | 1,221 | |
|
AGFC Capital Trust | |
4.186% (US0003M + 1.750%) due 01/15/2067 ~ | | | | | 1,440 | | | | | | 648 | |
|
Aircastle Ltd. | |
5.125% due 03/15/2021 | | | | | 1,231 | | | | | | 1,252 | |
5.500% due 02/15/2022 | | | | | 2,245 | | | | | | 2,299 | |
|
Alliant Holdings Intermediate LLC | |
8.250% due 08/01/2023 | | | | | 2,512 | | | | | | 2,504 | |
|
Ally Financial, Inc. | |
3.500% due 01/27/2019 | | | | | 3,241 | | | | | | 3,241 | |
3.750% due 11/18/2019 | | | | | 4,020 | | | | | | 4,015 | |
4.125% due 03/30/2020 | | | | | 3,479 | | | | | | 3,451 | |
4.125% due 02/13/2022 | | | | | 6,066 | | | | | | 5,907 | |
4.250% due 04/15/2021 | | | | | 3,194 | | | | | | 3,147 | |
8.000% due 03/15/2020 | | | | | 1,640 | | | | | | 1,702 | |
|
Ardonagh Midco PLC | |
8.625% due 07/15/2023 | | | | | 1,618 | | | | | | 1,383 | |
|
Avolon Holdings Funding Ltd. | |
5.125% due 10/01/2023 | | | | | 1,640 | | | | | | 1,570 | |
5.500% due 01/15/2023 | | | | | 300 | | | | | | 292 | |
|
CIT Group, Inc. | |
5.000% due 08/15/2022 | | | | | 10,104 | | | | | | 9,990 | |
|
CoreCivic, Inc. | |
5.000% due 10/15/2022 | | | | | 4,596 | | | | | | 4,418 | |
|
Equinix, Inc. | |
5.375% due 01/01/2022 | | | | | 3,383 | | | | | | 3,417 | |
|
Genworth Holdings, Inc. | |
7.625% due 09/24/2021 | | | | | 3,456 | | | | | | 3,430 | |
|
GLP Capital LP | |
4.375% due 04/15/2021 | | | | | 300 | | | | | | 300 | |
4.875% due 11/01/2020 | | | | | 3,251 | | | | | | 3,287 | |
|
Icahn Enterprises LP | |
6.250% due 02/01/2022 | | | | | 2,980 | | | | | | 2,950 | |
|
International Lease Finance Corp. | |
6.250% due 05/15/2019 | | | | | 1,569 | | | | | | 1,583 | |
|
Iron Mountain, Inc. | |
4.375% due 06/01/2021 | | | | | 2,893 | | | | | | 2,864 | |
|
iStar, Inc. | |
5.000% due 07/01/2019 | | | | | 1,315 | | | | | | 1,312 | |
5.250% due 09/15/2022 | | | | | 3,216 | | | | | | 3,015 | |
6.000% due 04/01/2022 | | | | | 2,778 | | | | | | 2,695 | |
|
Jefferies Finance LLC | |
6.875% due 04/15/2022 | | | | | 1,730 | | | | | | 1,691 | |
7.375% due 04/01/2020 | | | | | 4,503 | | | | | | 4,509 | |
7.500% due 04/15/2021 | | | | | 4,977 | | | | | | 4,989 | |
|
KCA Deutag UK Finance PLC | |
9.875% due 04/01/2022 | | | | | 4,018 | | | | | | 3,315 | |
|
LoanCore Capital Markets LLC | |
6.875% due 06/01/2020 | | | | | 1,720 | | | | | | 1,721 | |
|
MGIC Investment Corp. | |
5.750% due 08/15/2023 | | | | | 3,749 | | | | | | 3,744 | |
|
Navient Corp. | |
4.875% due 06/17/2019 | | | | | 1,903 | | | | | | 1,897 | |
5.000% due 10/26/2020 | | | | | 3,057 | | | | | | 2,935 | |
5.500% due 01/25/2023 | | | | | 4,940 | | | | | | 4,341 | |
6.500% due 06/15/2022 | | | | | 2,896 | | | | | | 2,702 | |
6.625% due 07/26/2021 | | | | | 3,528 | | | | | | 3,413 | |
7.250% due 01/25/2022 | | | | | 500 | | | | | | 484 | |
8.000% due 03/25/2020 | | | | | 1,717 | | | | | | 1,749 | |
|
Radian Group, Inc. | |
5.250% due 06/15/2020 | | | | | 1,285 | | | | | | 1,298 | |
7.000% due 03/15/2021 | | | | | 1,118 | | | | | | 1,167 | |
|
Realogy Group LLC | |
4.500% due 04/15/2019 | | | | | 1,705 | | | | | | 1,703 | |
|
Royal Bank of Scotland Group PLC | |
7.648% due 09/30/2031 •(e) | | | | | 233 | | | | | | 288 | |
|
SBA Communications Corp. | |
4.000% due 10/01/2022 | | | | | 7,111 | | | | | | 6,809 | |
| | | | | | | | | | | | |
| | | | | PRINCIPAL
AMOUNT
(000S) | | | | | MARKET
VALUE
(000S) | |
|
Springleaf Finance Corp. | |
5.625% due 03/15/2023 | | $ | | | 500 | | | $ | | | 462 | |
6.125% due 05/15/2022 | | | | | 6,427 | | | | | | 6,264 | |
7.750% due 10/01/2021 | | | | | 4,427 | | | | | | 4,460 | |
8.250% due 12/15/2020 | | | | | 1,902 | | | | | | 1,973 | |
|
Starwood Property Trust, Inc. | |
5.000% due 12/15/2021 | | | | | 3,653 | | | | | | 3,598 | |
|
Stearns Holdings LLC | |
9.375% due 08/15/2020 | | | | | 1,977 | | | | | | 1,868 | |
|
VEREIT Operating Partnership LP | |
4.125% due 06/01/2021 | | | | | 100 | | | | | | 101 | |
| | | | | | | | | | | | |
| | | | | | | | | | | 139,374 | |
| | | | | | | | | | | | |
| |
| INDUSTRIALS 74.8% | |
|
24 Hour Fitness Worldwide, Inc. | |
8.000% due 06/01/2022 (g) | | | | | 5,101 | | | | | | 4,833 | |
|
Acadia Healthcare Co., Inc. | |
5.625% due 02/15/2023 | | | | | 750 | | | | | | 714 | |
|
Actuant Corp. | |
5.625% due 06/15/2022 | | | | | 1,000 | | | | | | 992 | |
|
ADT Security Corp. | |
3.500% due 07/15/2022 | | | | | 5,679 | | | | | | 5,274 | |
5.250% due 03/15/2020 | | | | | 3,672 | | | | | | 3,700 | |
6.250% due 10/15/2021 | | | | | 4,317 | | | | | | 4,398 | |
|
Aleris International, Inc. | |
10.750% due 07/15/2023 | | | | | 2,557 | | | | | | 2,619 | |
|
Algeco Global Finance PLC | |
8.000% due 02/15/2023 | | | | | 5,619 | | | | | | 5,268 | |
|
Allegheny Technologies, Inc. | |
5.950% due 01/15/2021 | | | | | 3,539 | | | | | | 3,486 | |
|
Altice Financing S.A. | |
6.625% due 02/15/2023 | | | | | 5,840 | | | | | | 5,621 | |
|
Altice Luxembourg S.A. | |
7.750% due 05/15/2022 | | | | | 8,670 | | | | | | 7,922 | |
|
American Airlines Group, Inc. | |
5.500% due 10/01/2019 | | | | | 5,485 | | | | | | 5,526 | |
|
Anixter, Inc. | |
5.125% due 10/01/2021 | | | | | 4,431 | | | | | | 4,442 | |
|
Antero Resources Corp. | |
5.125% due 12/01/2022 | | | | | 1,000 | | | | | | 944 | |
5.375% due 11/01/2021 | | | | | 4,050 | | | | | | 3,923 | |
|
APX Group, Inc. | |
8.750% due 12/01/2020 | | | | | 1,710 | | | | | | 1,633 | |
|
ArcelorMittal | |
5.125% due 06/01/2020 | | | | | 1,692 | | | | | | 1,721 | |
5.250% due 08/05/2020 | | | | | 2,584 | | | | | | 2,629 | |
5.500% due 03/01/2021 | | | | | 2,221 | | | | | | 2,285 | |
6.250% due 02/25/2022 | | | | | 2,843 | | | | | | 3,011 | |
|
Arconic, Inc. | |
5.400% due 04/15/2021 | | | | | 4,921 | | | | | | 4,987 | |
6.150% due 08/15/2020 | | | | | 5,916 | | | | | | 6,057 | |
|
ARD Finance S.A. (7.125% Cash or 7.875% PIK) | |
7.125% due 09/15/2023 (a) | | | | | 1,480 | | | | | | 1,336 | |
|
Ardagh Packaging Finance PLC | |
4.250% due 09/15/2022 | | | | | 4,401 | | | | | | 4,203 | |
4.625% due 05/15/2023 | | | | | 1,895 | | | | | | 1,800 | |
|
Ascent Resources Utica Holdings LLC | |
10.000% due 04/01/2022 | | | | | 5,106 | | | | | | 5,248 | |
|
Ashland LLC | |
4.750% due 08/15/2022 | | | | | 1,000 | | | | | | 989 | |
|
Avon International Operations, Inc. | |
7.875% due 08/15/2022 | | | | | 250 | | | | | | 248 | |
|
Avon Products, Inc. | |
6.600% due 03/15/2020 | | | | | 5,429 | | | | | | 5,429 | |
7.000% due 03/15/2023 | | | | | 5,647 | | | | | | 4,814 | |
|
B&G Foods, Inc. | |
4.625% due 06/01/2021 | | | | | 3,090 | | | | | | 3,024 | |
|
Ball Corp. | |
4.375% due 12/15/2020 | | | | | 4,223 | | | | | | 4,249 | |
|
Barminco Finance Pty. Ltd. | |
6.625% due 05/15/2022 | | | | | 4,114 | | | | | | 4,034 | |
|
Bausch Health Cos., Inc. | |
5.500% due 03/01/2023 | | | | | 5,656 | | | | | | 5,178 | |
| | | | | | | | | | | | |
| | | | | PRINCIPAL
AMOUNT
(000S) | | | | | MARKET
VALUE
(000S) | |
5.625% due 12/01/2021 | | $ | | | 3,550 | | | $ | | | 3,499 | |
5.875% due 05/15/2023 | | | | | 1,846 | | | | | | 1,714 | |
6.500% due 03/15/2022 | | | | | 600 | | | | | | 605 | |
|
Baytex Energy Corp. | |
5.125% due 06/01/2021 | | | | | 4,728 | | | | | | 4,551 | |
|
BC Unlimited Liability Co. | |
4.625% due 01/15/2022 | | | | | 6,472 | | | | | | 6,278 | |
14.000% due 02/13/2020 ^(a)(b) | | | | | 672 | | | | | | 4 | |
|
Bombardier, Inc. | |
6.125% due 01/15/2023 | | | | | 1,480 | | | | | | 1,391 | |
7.750% due 03/15/2020 | | | | | 5,125 | | | | | | 5,221 | |
8.750% due 12/01/2021 | | | | | 9,078 | | | | | | 9,384 | |
|
Bristow Group, Inc. | |
6.250% due 10/15/2022 | | | | | 4,449 | | | | | | 1,579 | |
|
Brookfield Residential Properties, Inc. | |
6.500% due 12/15/2020 | | | | | 1,710 | | | | | | 1,712 | |
|
Bruin E&P Partners LLC | |
8.875% due 08/01/2023 | | | | | 3,240 | | | | | | 2,896 | |
|
Cablevision Systems Corp. | |
5.875% due 09/15/2022 | | | | | 1,600 | | | | | | 1,576 | |
8.000% due 04/15/2020 | | | | | 3,938 | | | | | | 3,997 | |
|
California Resources Corp. | |
8.000% due 12/15/2022 (g) | | | | | 6,024 | | | | | | 4,096 | |
|
Calumet Specialty Products Partners LP | |
6.500% due 04/15/2021 | | | | | 6,116 | | | | | | 5,122 | |
|
Carrizo Oil & Gas, Inc. | |
6.250% due 04/15/2023 | | | | | 3,749 | | | | | | 3,487 | |
|
CCO Holdings LLC | |
5.250% due 03/15/2021 | | | | | 1,671 | | | | | | 1,673 | |
|
Centene Corp. | |
4.750% due 05/15/2022 | | | | | 4,664 | | | | | | 4,623 | |
5.625% due 02/15/2021 | | | | | 2,699 | | | | | | 2,712 | |
|
CF Industries, Inc. | |
7.125% due 05/01/2020 | | | | | 4,162 | | | | | | 4,297 | |
|
Chesapeake Energy Corp. | |
4.875% due 04/15/2022 | | | | | 5,551 | | | | | | 4,871 | |
5.375% due 06/15/2021 | | | | | 1,000 | | | | | | 920 | |
6.625% due 08/15/2020 | | | | | 4,532 | | | | | | 4,407 | |
|
CITGO Holding, Inc. | |
10.750% due 02/15/2020 | | | | | 3,529 | | | | | | 3,608 | |
|
Clean Harbors, Inc. | |
5.125% due 06/01/2021 | | | | | 4,230 | | | | | | 4,230 | |
|
Clear Channel Worldwide Holdings, Inc. | |
6.500% due 11/15/2022 | | | | | 1,000 | | | | | | 1,005 | |
7.625% due 03/15/2020 | | | | | 10,234 | | | | | | 10,017 | |
|
Clearwater Paper Corp. | |
4.500% due 02/01/2023 | | | | | 1,480 | | | | | | 1,339 | |
|
CNX Resources Corp. | |
5.875% due 04/15/2022 | | | | | 6,110 | | | | | | 5,881 | |
|
Cogent Communications Group, Inc. | |
5.375% due 03/01/2022 | | | | | 4,356 | | | | | | 4,345 | |
|
CommScope, Inc. | |
5.000% due 06/15/2021 | | | | | 3,687 | | | | | | 3,664 | |
|
Community Health Systems, Inc. | |
6.250% due 03/31/2023 | | | | | 6,139 | | | | | | 5,602 | |
6.875% due 02/01/2022 | | | | | 5,751 | | | | | | 2,645 | |
11.000% due 06/30/2023 Ø(g) | | | | | 5,047 | | | | | | 3,911 | |
|
Consolidated Communications, Inc. | |
6.500% due 10/01/2022 | | | | | 3,383 | | | | | | 2,994 | |
|
Continental Resources, Inc. | |
5.000% due 09/15/2022 | | | | | 800 | | | | | | 795 | |
|
CPG Merger Sub LLC | |
8.000% due 10/01/2021 | | | | | 5,146 | | | | | | 5,017 | |
|
Crown Americas LLC | |
4.500% due 01/15/2023 | | | | | 2,974 | | | | | | 2,911 | |
|
CSC Holdings LLC | |
6.750% due 11/15/2021 | | | | | 5,232 | | | | | | 5,376 | |
8.625% due 02/15/2019 | | | | | 1,325 | | | | | | 1,332 | |
|
DAE Funding LLC | |
4.000% due 08/01/2020 | | | | | 200 | | | | | | 196 | |
4.500% due 08/01/2022 | | | | | 200 | | | | | | 193 | |
|
Darling Ingredients, Inc. | |
5.375% due 01/15/2022 | | | | | 2,770 | | | | | | 2,760 | |
| | | | | | | | |
| 38 | | PIMCO ETF TRUST | | | | | See Accompanying Notes | |
December 31, 2018 (Unaudited)
| | | | | | | | | | | | |
| | | | | PRINCIPAL
AMOUNT
(000S) | | | | | MARKET
VALUE
(000S) | |
|
DCP Midstream Operating LP | |
5.350% due 03/15/2020 | | $ | | | 2,750 | | | $ | | | 2,767 | |
|
Dell International LLC | |
5.875% due 06/15/2021 | | | | | 5,502 | | | | | | 5,510 | |
|
Dell, Inc. | |
4.625% due 04/01/2021 | | | | | 3,723 | | | | | | 3,676 | |
|
Denbury Resources, Inc. | |
9.000% due 05/15/2021 | | | | | 5,179 | | | | | | 4,868 | |
|
Diamond Resorts International, Inc. | |
7.750% due 09/01/2023 | | | | | 200 | | | | | | 193 | |
|
DISH DBS Corp. | |
5.125% due 05/01/2020 | | | | | 6,599 | | | | | | 6,533 | |
5.875% due 07/15/2022 | | | | | 6,458 | | | | | | 5,966 | |
6.750% due 06/01/2021 | | | | | 5,210 | | | | | | 5,169 | |
7.875% due 09/01/2019 | | | | | 2,861 | | | | | | 2,926 | |
|
DJO Finance LLC | |
8.125% due 06/15/2021 | | | | | 3,995 | | | | | | 4,125 | |
10.750% due 04/15/2020 | | | | | 1,265 | | | | | | 1,268 | |
|
DKT Finance ApS | |
9.375% due 06/17/2023 | | | | | 1,100 | | | | | | 1,130 | |
|
DriveTime Automotive Group, Inc. | |
8.000% due 06/01/2021 | | | | | 1,710 | | | | | | 1,719 | |
|
DynCorp International, Inc. (10.375% Cash and 1.500% PIK) | |
11.875% due 11/30/2020 (a) | | | | | 926 | | | | | | 958 | |
|
Edgewell Personal Care Co. | |
4.700% due 05/19/2021 | | | | | 3,225 | | | | | | 3,189 | |
|
Eldorado Resorts, Inc. | |
7.000% due 08/01/2023 | | | | | 3,849 | | | | | | 3,964 | |
|
EMC Corp. | |
2.650% due 06/01/2020 | | | | | 3,368 | | | | | | 3,235 | |
|
Endo Dac | |
6.000% due 07/15/2023 | | | | | 3,858 | | | | | | 2,961 | |
|
Endo Finance LLC | |
5.750% due 01/15/2022 | | | | | 7,345 | | | | | | 6,151 | |
|
Energy Transfer LP | |
7.500% due 10/15/2020 | | | | | 2,650 | | | | | | 2,763 | |
|
Ferrellgas LP | |
6.750% due 01/15/2022 | | | | | 4,887 | | | | | | 4,007 | |
|
Fiat Chrysler Automobiles NV | |
4.500% due 04/15/2020 | | | | | 6,663 | | | | | | 6,696 | |
5.250% due 04/15/2023 | | | | | 3,586 | | | | | | 3,534 | |
|
FMG Resources Pty. Ltd. | |
4.750% due 05/15/2022 | | | | | 4,641 | | | | | | 4,426 | |
|
Freeport-McMoRan, Inc. | |
3.100% due 03/15/2020 | | | | | 3,466 | | | | | | 3,397 | |
3.550% due 03/01/2022 | | | | | 4,841 | | | | | | 4,593 | |
3.875% due 03/15/2023 | | | | | 3,424 | | | | | | 3,176 | |
4.000% due 11/14/2021 | | | | | 1,000 | | | | | | 976 | |
|
Fresenius Medical Care U.S. Finance, Inc. | |
5.625% due 07/31/2019 | | | | | 10 | | | | | | 10 | |
|
GameStop Corp. | |
6.750% due 03/15/2021 (g) | | | | | 1,897 | | | | | | 1,897 | |
|
Gates Global LLC | |
6.000% due 07/15/2022 | | | | | 4,568 | | | | | | 4,494 | |
|
GFL Environmental, Inc. | |
5.625% due 05/01/2022 | | | | | 4,158 | | | | | | 3,857 | |
|
Global Partners LP | |
6.250% due 07/15/2022 | | | | | 3,033 | | | | | | 2,881 | |
|
Global Ship Lease, Inc. | |
9.875% due 11/15/2022 | | | | | 1,036 | | | | | | 998 | |
|
goeasy Ltd. | |
7.875% due 11/01/2022 | | | | | 1,730 | | | | | | 1,756 | |
|
Gogo Intermediate Holdings LLC | |
12.500% due 07/01/2022 | | | | | 2,200 | | | | | | 2,361 | |
|
Griffon Corp. | |
5.250% due 03/01/2022 | | | | | 6,393 | | | | | | 5,810 | |
|
Harland Clarke Holdings Corp. | |
8.375% due 08/15/2022 | | | | | 3,917 | | | | | | 3,589 | |
|
Harvest Operations Corp. | |
2.330% due 04/14/2021 | | | | | 10 | | | | | | 10 | |
|
HCA Healthcare, Inc. | |
6.250% due 02/15/2021 | | | | | 3,303 | | | | | | 3,386 | |
| | | | | | | | | | | | |
| | | | | PRINCIPAL
AMOUNT
(000S) | | | | | MARKET
VALUE
(000S) | |
|
HCA, Inc. | |
4.250% due 10/15/2019 | | $ | | | 50 | | | $ | | | 50 | |
5.875% due 03/15/2022 | | | | | 7,271 | | | | | | 7,471 | |
6.500% due 02/15/2020 | | | | | 5,738 | | | | | | 5,896 | |
7.500% due 02/15/2022 | | | | | 2,864 | | | | | | 3,050 | |
|
Herc Rentals, Inc. | |
7.500% due 06/01/2022 | | | | | 1,380 | | | | | | 1,449 | |
|
Hertz Corp. | |
5.875% due 10/15/2020 | | | | | 4,329 | | | | | | 4,215 | |
7.625% due 06/01/2022 | | | | | 3,257 | | | | | | 3,078 | |
|
Hexion, Inc. | |
6.625% due 04/15/2020 | | | | | 5,342 | | | | | | 4,274 | |
|
Hillman Group, Inc. | |
6.375% due 07/15/2022 | | | | | 1,950 | | | | | | 1,599 | |
|
Hughes Satellite Systems Corp. | |
7.625% due 06/15/2021 | | | | | 3,364 | | | | | | 3,499 | |
|
Huntsman International LLC | |
4.875% due 11/15/2020 | | | | | 5,487 | | | | | | 5,528 | |
|
iHeartCommunications, Inc. | |
9.000% due 12/15/2019 ^(b) | | | | | 6,870 | | | | | | 4,637 | |
9.000% due 03/01/2021 ^(b) | | | | | 13,050 | | | | | | 8,809 | |
11.250% due 03/01/2021 ^(b) | | | | | 6,950 | | | | | | 4,517 | |
|
IHO Verwaltungs GmbH (4.125% Cash or 4.875% PIK) | |
4.125% due 09/15/2021 (a) | | | | | 2,565 | | | | | | 2,450 | |
|
Imperial Metals Corp. | |
7.000% due 03/15/2019 | | | | | 400 | | | | | | 270 | |
|
Infor Software Parent LLC (7.125% Cash or 7.875% PIK) | |
7.125% due 05/01/2021 (a) | | | | | 5,052 | | | | | | 4,938 | |
|
Infor U.S., Inc. | |
6.500% due 05/15/2022 | | | | | 6,574 | | | | | | 6,383 | |
|
Informatica LLC | |
7.125% due 07/15/2023 | | | | | 1,100 | | | | | | 1,077 | |
|
Inmarsat Finance PLC | |
4.875% due 05/15/2022 | | | | | 4,363 | | | | | | 4,128 | |
|
Intelsat Connect Finance S.A. | |
9.500% due 02/15/2023 | | | | | 3,051 | | | | | | 2,639 | |
|
Intelsat Jackson Holdings S.A. | |
5.500% due 08/01/2023 | | | | | 3,100 | | | | | | 2,712 | |
9.500% due 09/30/2022 | | | | | 4,915 | | | | | | 5,628 | |
|
International Game Technology PLC | |
6.250% due 02/15/2022 | | | | | 7,566 | | | | | | 7,623 | |
|
INVISTA Finance LLC | |
4.250% due 10/15/2019 | | | | | 1,750 | | | | | | 1,746 | |
|
IQVIA, Inc. | |
4.875% due 05/15/2023 | | | | | 4,586 | | | | | | 4,517 | |
|
Jack Ohio Finance LLC | |
6.750% due 11/15/2021 | | | | | 2,871 | | | | | | 2,907 | |
|
Jaguar Holding Co. | |
6.375% due 08/01/2023 | | | | | 4,760 | | | | | | 4,561 | |
|
Jaguar Land Rover Automotive PLC | |
3.500% due 03/15/2020 | | | | | 2,965 | | | | | | 2,843 | |
|
JC Penney Corp., Inc. | |
5.650% due 06/01/2020 | | | | | 24 | | | | | | 18 | |
|
Jurassic Holdings, Inc. | |
6.875% due 02/15/2021 (g) | | | | | 3,338 | | | | | | 2,837 | |
|
KB Home | |
4.750% due 05/15/2019 | | | | | 3,388 | | | | | | 3,388 | |
7.000% due 12/15/2021 | | | | | 3,714 | | | | | | 3,793 | |
7.500% due 09/15/2022 | | | | | 2,021 | | | | | | 2,087 | |
8.000% due 03/15/2020 | | | | | 1,422 | | | | | | 1,472 | |
|
KGA Escrow LLC | |
7.500% due 08/15/2023 | | | | | 1,680 | | | | | | 1,661 | |
|
Kinetic Concepts, Inc. | |
7.875% due 02/15/2021 | | | | | 1,734 | | | | | | 1,758 | |
12.500% due 11/01/2021 | | | | | 1,000 | | | | | | 1,075 | |
|
Kronos Acquisition Holdings, Inc. | |
9.000% due 08/15/2023 | | | | | 250 | | | | | | 193 | |
|
L Brands, Inc. | |
5.625% due 02/15/2022 | | | | | 4,874 | | | | | | 4,874 | |
6.625% due 04/01/2021 | | | | | 9,727 | | | | | | 10,019 | |
|
Lennar Corp. | |
4.125% due 01/15/2022 | | | | | 800 | | | | | | 771 | |
4.500% due 11/15/2019 | | | | | 2,679 | | | | | | 2,666 | |
4.750% due 04/01/2021 | | | | | 3,827 | | | | | | 3,803 | |
| | | | | | | | | | | | |
| | | | | PRINCIPAL
AMOUNT
(000S) | | | | | MARKET
VALUE
(000S) | |
4.750% due 11/15/2022 | | $ | | | 1,789 | | | $ | | | 1,742 | |
6.250% due 12/15/2021 | | | | | 1,710 | | | | | | 1,746 | |
6.625% due 05/01/2020 | | | | | 250 | | | | | | 258 | |
|
Lightstream Resources Ltd. | |
8.625% due 02/01/2020 ^«(b) | | | | | 3,575 | | | | | | 984 | |
|
LKQ Corp. | |
4.750% due 05/15/2023 | | | | | 2,403 | | | | | | 2,295 | |
|
Mallinckrodt International Finance S.A. | |
4.875% due 04/15/2020 | | | | | 3,293 | | | | | | 3,194 | |
5.750% due 08/01/2022 (g) | | | | | 4,164 | | | | | | 3,602 | |
|
Masonite International Corp. | |
5.625% due 03/15/2023 | | | | | 1,680 | | | | | | 1,636 | |
|
MEG Energy Corp. | |
6.375% due 01/30/2023 | | | | | 3,405 | | | | | | 3,230 | |
|
Men’s Wearhouse, Inc. | |
7.000% due 07/01/2022 | | | | | 449 | | | | | | 453 | |
|
MGM Resorts International | |
5.250% due 03/31/2020 | | | | | 1,730 | | | | | | 1,739 | |
6.625% due 12/15/2021 | | | | | 4,576 | | | | | | 4,702 | |
6.750% due 10/01/2020 | | | | | 3,947 | | | | | | 4,065 | |
7.750% due 03/15/2022 | | | | | 2,601 | | | | | | 2,773 | |
8.625% due 02/01/2019 | | | | | 5,259 | | | | | | 5,292 | |
|
Momentive Performance Materials, Inc. | |
3.880% due 10/24/2021 | | | | | 2,655 | | | | | | 2,824 | |
|
Murphy Oil Corp. | |
4.000% due 06/01/2022 | | | | | 1,000 | | | | | | 939 | |
4.450% due 12/01/2022 | | | | | 4,327 | | | | | | 4,085 | |
|
Murphy Oil USA, Inc. | |
6.000% due 08/15/2023 | | | | | 1,680 | | | | | | 1,695 | |
|
Murray Energy Corp. | |
11.250% due 04/15/2021 | | | | | 3,024 | | | | | | 1,901 | |
|
Nabors Industries, Inc. | |
4.625% due 09/15/2021 | | | | | 4,199 | | | | | | 3,786 | |
5.000% due 09/15/2020 | | | | | 1,869 | | | | | | 1,807 | |
|
National CineMedia LLC | |
6.000% due 04/15/2022 | | | | | 3,337 | | | | | | 3,358 | |
|
Navios Maritime Holdings, Inc. | |
7.375% due 01/15/2022 | | | | | 4,425 | | | | | | 2,832 | |
|
NCL Corp. Ltd. | |
4.750% due 12/15/2021 | | | | | 1,688 | | | | | | 1,680 | |
|
NCR Corp. | |
5.000% due 07/15/2022 | | | | | 3,647 | | | | | | 3,456 | |
5.875% due 12/15/2021 | | | | | 1,100 | | | | | | 1,077 | |
|
Neiman Marcus Group Ltd. LLC | |
8.000% due 10/15/2021 | | | | | 4,980 | | | | | | 2,079 | |
|
Netflix, Inc. | |
5.500% due 02/15/2022 | | | | | 7,383 | | | | | | 7,464 | |
|
Newfield Exploration Co. | |
5.750% due 01/30/2022 | | | | | 2,714 | | | | | | 2,748 | |
|
Nielsen Finance LLC | |
5.000% due 04/15/2022 | | | | | 7,022 | | | | | | 6,741 | |
|
Nine Energy Service, Inc. | |
8.750% due 11/01/2023 | | | | | 1,480 | | | | | | 1,413 | |
|
Nokia Oyj | |
3.375% due 06/12/2022 | | | | | 3,532 | | | | | | 3,347 | |
5.375% due 05/15/2019 | | | | | 2,039 | | | | | | 2,049 | |
|
Northwest Acquisitions ULC | |
7.125% due 11/01/2022 | | | | | 1,580 | | | | | | 1,566 | |
|
Nuance Communications, Inc. | |
5.375% due 08/15/2020 | | | | | 949 | | | | | | 948 | |
|
NuStar Logistics LP | |
4.800% due 09/01/2020 | | | | | 1,933 | | | | | | 1,904 | |
|
NXP BV | |
3.875% due 09/01/2022 | | | | | 1,040 | | | | | | 1,001 | |
4.125% due 06/15/2020 | | | | | 1,440 | | | | | | 1,437 | |
4.125% due 06/01/2021 | | | | | 1,086 | | | | | | 1,075 | |
|
Oasis Petroleum, Inc. | |
6.875% due 03/15/2022 | | | | | 2,842 | | | | | | 2,686 | |
|
Open Text Corp. | |
5.625% due 01/15/2023 | | | | | 5,249 | | | | | | 5,249 | |
|
Ortho-Clinical Diagnostics, Inc. | |
6.625% due 05/15/2022 | | | | | 9,722 | | | | | | 8,798 | |
|
Owens-Brockway Glass Container, Inc. | |
5.000% due 01/15/2022 | | | | | 2,137 | | | | | | 2,124 | |
| | | | | | |
| See Accompanying Notes | | SEMIANNUAL REPORT | | DECEMBER 31, 2018 | | 39 |
Schedule of InvestmentsPIMCO0-5 Year High Yield Corporate Bond Index Exchange-Traded Fund(Cont.)
| | | | | | | | | | | | |
| | | | | PRINCIPAL
AMOUNT
(000S) | | | | | MARKET
VALUE
(000S) | |
|
Park Aerospace Holdings Ltd. | |
3.625% due 03/15/2021 | | $ | | | 1,200 | | | $ | | | 1,158 | |
4.500% due 03/15/2023 | | | | | 3,348 | | | | | | 3,139 | |
5.250% due 08/15/2022 | | | | | 5,524 | | | | | | 5,365 | |
|
Party City Holdings, Inc. | |
6.125% due 08/15/2023 (g) | | | | | 1,431 | | | | | | 1,410 | |
|
Perstorp Holding AB | |
11.000% due 09/30/2021 | | | | | 1,000 | | | | | | 1,066 | |
|
PetSmart, Inc. | |
7.125% due 03/15/2023 | | | | | 1,480 | | | | | | 870 | |
|
Platform Specialty Products Corp. | |
6.500% due 02/01/2022 | | | | | 6,494 | | | | | | 6,518 | |
|
PolyOne Corp. | |
5.250% due 03/15/2023 | | | | | 3,950 | | | | | | 3,831 | |
|
Precision Drilling Corp. | |
6.500% due 12/15/2021 | | | | | 1,219 | | | | | | 1,140 | |
7.750% due 12/15/2023 | | | | | 250 | | | | | | 232 | |
|
Prestige Brands, Inc. | |
5.375% due 12/15/2021 | | | | | 3,090 | | | | | | 3,032 | |
|
QEP Resources, Inc. | |
5.375% due 10/01/2022 | | | | | 3,093 | | | | | | 2,826 | |
|
Radiate Holdco LLC | |
6.875% due 02/15/2023 | | | | | 1,735 | | | | | | 1,583 | |
|
Range Resources Corp. | |
5.000% due 08/15/2022 | | | | | 6,048 | | | | | | 5,436 | |
|
Resolute Energy Corp. | |
8.500% due 05/01/2020 | | | | | 1,280 | | | | | | 1,262 | |
|
Revlon Consumer Products Corp. | |
5.750% due 02/15/2021 (g) | | | | | 3,348 | | | | | | 2,536 | |
|
Reynolds Group Issuer, Inc. | |
5.125% due 07/15/2023 | | | | | 3,637 | | | | | | 3,469 | |
5.750% due 10/15/2020 | | | | | 8,894 | | | | | | 8,882 | |
|
Riverbed Technology, Inc. | |
8.875% due 03/01/2023 (g) | | | | | 1,730 | | | | | | 1,285 | |
|
Rivers Pittsburgh Borrower LP | |
6.125% due 08/15/2021 | | | | | 3,730 | | | | | | 3,627 | |
|
Rockies Express Pipeline LLC | |
5.625% due 04/15/2020 | | | | | 8,179 | | | | | | 8,220 | |
6.000% due 01/15/2019 | | | | | 2,600 | | | | | | 2,602 | |
|
Rowan Cos., Inc. | |
4.875% due 06/01/2022 | | | | | 4,108 | | | | | | 3,405 | |
7.875% due 08/01/2019 | | | | | 2,433 | | | | | | 2,415 | |
|
RR Donnelley & Sons Co. | |
7.875% due 03/15/2021 | | | | | 1,123 | | | | | | 1,129 | |
|
Sabine Pass Liquefaction LLC | |
5.625% due 02/01/2021 | | | | | 10 | | | | | | 10 | |
|
Sable Permian Resources Land LLC | |
7.125% due 11/01/2020 (g) | | | | | 3,617 | | | | | | 832 | |
13.000% due 11/30/2020 | | | | | 3,045 | | | | | | 3,197 | |
|
Sabre GLBL, Inc. | |
5.375% due 04/15/2023 | | | | | 5,775 | | | | | | 5,775 | |
|
Sanchez Energy Corp. | |
7.250% due 02/15/2023 (g) | | | | | 1,480 | | | | | | 1,214 | |
7.750% due 06/15/2021 | | | | | 5,688 | | | | | | 1,365 | |
|
Sanmina Corp. | |
4.375% due 06/01/2019 | | | | | 1,568 | | | | | | 1,568 | |
|
Scientific Games International, Inc. | |
10.000% due 12/01/2022 | | | | | 5,260 | | | | | | 5,345 | |
|
Select Medical Corp. | |
6.375% due 06/01/2021 | | | | | 2,624 | | | | | | 2,627 | |
|
SESI LLC | |
7.125% due 12/15/2021 | | | | | 1,609 | | | | | | 1,376 | |
|
Sinclair Television Group, Inc. | |
5.375% due 04/01/2021 | | | | | 1,710 | | | | | | 1,710 | |
6.125% due 10/01/2022 | | | | | 1,710 | | | | | | 1,727 | |
|
Sirius XM Radio, Inc. | |
3.875% due 08/01/2022 | | | | | 4,021 | | | | | | 3,869 | |
|
Sotera Health Topco, Inc. (8.125% Cash or 8.875% PIK) | |
8.125% due 11/01/2021 (a) | | | | | 3,730 | | | | | | 3,516 | |
|
Southwestern Energy Co. | |
4.100% due 03/15/2022 | | | | | 60 | | | | | | 55 | |
|
Spectrum Brands Holdings, Inc. | |
7.750% due 01/15/2022 | | | | | 6,939 | | | | | | 7,043 | |
| | | | | | | | | | | | |
| | | | | PRINCIPAL
AMOUNT
(000S) | | | | | MARKET
VALUE
(000S) | |
|
Standard Industries, Inc. | |
5.500% due 02/15/2023 | | $ | | | 2,783 | | | $ | | | 2,734 | |
|
Sunoco LP | |
4.875% due 01/15/2023 | | | | | 3,170 | | | | | | 3,099 | |
|
Syniverse Holdings, Inc. | |
9.125% due 01/15/2019 | | | | | 281 | | | | | | 279 | |
|
T-Mobile USA, Inc. | |
4.000% due 04/15/2022 | | | | | 3,718 | | | | | | 3,634 | |
|
Taylor Morrison Communities, Inc. | |
5.250% due 04/15/2021 | | | | | 1,660 | | | | | | 1,650 | |
|
Teekay Corp. | |
8.500% due 01/15/2020 (g) | | | | | 1,963 | | | | | | 1,882 | |
|
TEGNA, Inc. | |
5.125% due 10/15/2019 | | | | | 1,259 | | | | | | 1,260 | |
|
Teine Energy Ltd. | |
6.875% due 09/30/2022 | | | | | 3,287 | | | | | | 3,205 | |
|
Tenet Healthcare Corp. | |
4.375% due 10/01/2021 | | | | | 3,885 | | | | | | 3,778 | |
4.500% due 04/01/2021 | | | | | 2,723 | | | | | | 2,662 | |
4.750% due 06/01/2020 | | | | | 2,749 | | | | | | 2,753 | |
5.500% due 03/01/2019 | | | | | 2,211 | | | | | | 2,219 | |
6.000% due 10/01/2020 | | | | | 7,145 | | | | | | 7,261 | |
7.500% due 01/01/2022 | | | | | 600 | | | | | | 610 | |
8.125% due 04/01/2022 | | | | | 5,628 | | | | | | 5,663 | |
|
Toll Brothers Finance Corp. | |
5.875% due 02/15/2022 | | | | | 2,164 | | | | | | 2,183 | |
|
TPC Group, Inc. | |
8.750% due 12/15/2020 | | | | | 3,981 | | | | | | 3,802 | |
|
TransDigm, Inc. | |
5.500% due 10/15/2020 | | | | | 2,914 | | | | | | 2,896 | |
6.000% due 07/15/2022 | | | | | 3,074 | | | | | | 3,009 | |
|
Transocean, Inc. | |
5.800% due 10/15/2022 | | | | | 5,968 | | | | | | 5,282 | |
9.000% due 07/15/2023 | | | | | 700 | | | | | | 699 | |
|
TRI Pointe Group, Inc. | |
4.875% due 07/01/2021 | | | | | 1,300 | | | | | | 1,245 | |
|
Triumph Group, Inc. | |
4.875% due 04/01/2021 | | | | | 3,784 | | | | | | 3,415 | |
|
TRU Taj LLC | |
12.000% due 08/15/2021 ^ | | | | | 2,000 | | | | | | 980 | |
|
Unisys Corp. | |
10.750% due 04/15/2022 | | | | | 1,725 | | | | | | 1,895 | |
|
Unit Corp. | |
6.625% due 05/15/2021 | | | | | 3,141 | | | | | | 2,874 | |
|
United Continental Holdings, Inc. | |
4.250% due 10/01/2022 | | | | | 1,690 | | | | | | 1,633 | |
|
United Rentals North America, Inc. | |
4.625% due 07/15/2023 | | | | | 2,281 | | | | | | 2,247 | |
|
Univision Communications, Inc. | |
5.125% due 05/15/2023 | | | | | 500 | | | | | | 450 | |
|
VeriSign, Inc. | |
4.625% due 05/01/2023 | | | | | 3,624 | | | | | | 3,579 | |
|
Vertiv Intermediate Holding Corp. (12.000% Cash or 13.000% PIK) | |
12.000% due 02/15/2022 (a) | | | | | 1,200 | | | | | | 1,108 | |
|
Videotron Ltd. | |
5.000% due 07/15/2022 | | | | | 1,680 | | | | | | 1,678 | |
|
Virgin Australia Holdings Ltd. | |
7.875% due 10/15/2021 | | | | | 1,100 | | | | | | 1,075 | |
|
Virgin Media Secured Finance PLC | |
5.250% due 01/15/2021 | | | | | 3,699 | | | | | | 3,691 | |
|
Watco Cos. LLC | |
6.375% due 04/01/2023 | | | | | 2,043 | | | | | | 2,058 | |
|
Weatherford International Ltd. | |
4.500% due 04/15/2022 (g) | | | | | 2,875 | | | | | | 1,696 | |
7.750% due 06/15/2021 (g) | | | | | 3,172 | | | | | | 2,395 | |
|
WEX, Inc. | |
4.750% due 02/01/2023 | | | | | 2,003 | | | | | | 1,958 | |
|
Whiting Petroleum Corp. | |
5.750% due 03/15/2021 | | | | | 3,321 | | | | | | 3,172 | |
6.250% due 04/01/2023 | | | | | 1,000 | | | | | | 915 | |
|
Williams Scotsman International, Inc. | |
6.875% due 08/15/2023 | | | | | 500 | | | | | | 481 | |
| | | | | | | | | | | | |
| | | | | PRINCIPAL
AMOUNT
(000S) | | | | | MARKET
VALUE
(000S) | |
|
WPX Energy, Inc. | |
6.000% due 01/15/2022 | | $ | | | 4,196 | | | $ | | | 4,102 | |
|
WR Grace &Co-Conn | |
5.125% due 10/01/2021 | | | | | 4,357 | | | | | | 4,324 | |
|
Wyndham Destinations, Inc. | |
4.250% due 03/01/2022 | | | | | 500 | | | | | | 479 | |
|
XPO Logistics, Inc. | |
6.500% due 06/15/2022 | | | | | 5,227 | | | | | | 5,201 | |
|
Yum! Brands, Inc. | |
3.875% due 11/01/2020 | | | | | 6,309 | | | | | | 6,214 | |
|
ZF North America Capital, Inc. | |
4.000% due 04/29/2020 | | | | | 2,731 | | | | | | 2,719 | |
| | | | | | | | | | | | |
| | | | | | | | | | | 914,398 | |
| | | | | | | | | | | | |
| |
| UTILITIES 6.0% | |
|
AES Corp. | |
4.000% due 03/15/2021 | | | | | 1,571 | | | | | | 1,547 | |
|
American Midstream Partners LP | |
9.500% due 12/15/2021 | | | | | 2,356 | | | | | | 2,226 | |
|
Blue Racer Midstream LLC | |
6.125% due 11/15/2022 | | | | | 3,215 | | | | | | 3,119 | |
|
CenturyLink, Inc. | |
5.625% due 04/01/2020 | | | | | 5,068 | | | | | | 5,062 | |
5.800% due 03/15/2022 | | | | | 8,305 | | | | | | 8,035 | |
6.450% due 06/15/2021 | | | | | 5,173 | | | | | | 5,179 | |
|
Frontier Communications Corp. | |
10.500% due 09/15/2022 | | | | | 4,282 | | | | | | 2,997 | |
|
Genesis Energy LP | |
6.750% due 08/01/2022 | | | | | 5,595 | | | | | | 5,483 | |
|
Great Western Petroleum LLC | |
9.000% due 09/30/2021 | | | | | 3,641 | | | | | | 3,332 | |
|
NGPL PipeCo LLC | |
4.375% due 08/15/2022 | | | | | 4,682 | | | | | | 4,612 | |
|
SemGroup Corp. | |
5.625% due 07/15/2022 | | | | | 3,233 | | | | | | 3,063 | |
|
Sprint Capital Corp. | |
6.900% due 05/01/2019 | | | | | 1,525 | | | | | | 1,538 | |
|
Sprint Communications, Inc. | |
6.000% due 11/15/2022 | | | | | 4,395 | | | | | | 4,324 | |
7.000% due 03/01/2020 | | | | | 2,353 | | | | | | 2,418 | |
7.000% due 08/15/2020 | | | | | 4,699 | | | | | | 4,823 | |
|
Sprint Corp. | |
7.250% due 09/15/2021 | | | | | 4,753 | | | | | | 4,877 | |
7.875% due 09/15/2023 | | | | | 4,329 | | | | | | 4,453 | |
|
Talen Energy Supply LLC | |
4.600% due 12/15/2021 | | | | | 300 | | | | | | 271 | |
9.500% due 07/15/2022 | | | | | 2,589 | | | | | | 2,615 | |
|
Targa Resources Partners LP | |
4.125% due 11/15/2019 | | | | | 2,799 | | | | | | 2,782 | |
| | | | | | | | | | | | |
| | | | | | | | | | | 72,756 | |
| | | | | | | | | | | | |
Total Corporate Bonds & Notes (Cost $1,198,461) | | | | | | 1,126,528 | |
| | | | | | | | | | | | |
| |
| SHORT-TERM INSTRUMENTS 6.4% | |
| |
| REPURCHASE AGREEMENTS (h) 6.1% | |
| | | | | | | | | | | 74,112 | |
| | | | | | | | | | | | |
| |
| U.S. TREASURY BILLS 0.3% | | | | | | | | | | | | |
2.361% due 01/03/2019 - 03/14/2019 (c)(d)(k) | | | | | 4,087 | | | | | | 4,074 | |
| | | | | | | | | | | | |
Total Short-Term Instruments
(Cost $78,187) | | | | | | | | | | | 78,186 | |
| | | | | | | | | | | | |
| | | | |
| | | | | | | | | | | | |
| Total Investments in Securities (Cost $1,276,648) | | | | | | 1,204,714 | |
| | | | | | | | | | | | |
| | | | | | | | |
| 40 | | PIMCO ETF TRUST | | | | | See Accompanying Notes | |
December 31, 2018 (Unaudited)
| | | | | | | | | | | | |
| | | | | SHARES | | | | | MARKET
VALUE
(000S) | |
| INVESTMENTS IN AFFILIATES 2.7% | |
| |
| SHORT-TERM INSTRUMENTS 2.7% | |
| |
| MUTUAL FUNDS 2.7% | |
| | | | |
PIMCO Government Money Market Fund (f)(g) | | | | | 32,683,467 | | | $ | | | 32,683 | |
| | | | | | | | | | | | |
| Total Short-Term Instruments (Cost $32,683) | | | | | | 32,683 | |
| | | | | | | | | | | | |
| | | | |
| | | | | | | | | | | | |
| Total Investments in Affiliates (Cost $32,683) | | | | | | 32,683 | |
| | | | |
| | | | | | | | | | | | |
| Total Investments 101.3% (Cost $1,309,331) | | | $ | | | 1,237,397 | |
| |
Financial Derivative
Instruments (i)(j) (0.2)% (Cost or Premiums, net $5,424) | | | | | | (2,355 | ) |
| |
| Other Assets and Liabilities, net (1.1)% | | | | | | (13,371 | ) |
| | | | | | | | | | | | |
| Net Assets 100.0% | | | | | | | | $ | | | 1,221,671 | |
| | | | | | | | | | | | |
NOTES TO SCHEDULE OF INVESTMENTS:
| * | A zero balance may reflect actual amounts rounding to less than one thousand. |
| « | Security valued using significant unobservable inputs (Level 3). |
| ~ | Variable or Floating rate security. Rate shown is the rate in effect as of period end. Certain variable rate securities are not based on a published reference rate and spread, rather are determined by the issuer or agent and are based on current market conditions. Reference rate is as of reset date, which may vary by security. These securities may not indicate a reference rate and/or spread in their description. |
| • | Rate shown is the rate in effect as of period end. The rate may be based on a fixed rate, a capped rate or a floor rate and may convert to a variable or floating rate in the future. These securities do not indicate a reference rate and spread in their description. |
| Ø | Coupon represents a rate which changes periodically based on a predetermined schedule or event. Rate shown is the rate in effect as of period end. |
| (a) | Payment in-kind security. |
| (b) | Security is not accruing income as of the date of this report. |
| (c) | Coupon represents a weighted average yield to maturity. |
| (e) | Perpetual maturity; date shown, if applicable, represents next contractual call date. |
| (f) | Institutional Class Shares of each Fund. |
| (g) | Securities with an aggregate market value of $33,030 were out on loan in exchange for $34,829 of cash collateral as of December 31, 2018. See Note 5, Securities Lending, in the Notes to Financial Statements for more information regarding securities on loan and cash collateral. |
BORROWINGS AND OTHER FINANCING TRANSACTIONS
(h) REPURCHASE AGREEMENTS:
| | | | | | | | | | | | | | | | | | | | | | | | | | | | | | |
| Counterparty | | Lending
Rate | | | Settlement
Date | | | Maturity
Date | | | Principal
Amount | | | Collateralized By | | Collateral
(Received) | | | Repurchase
Agreements,
at Value | | | Repurchase
Agreement
Proceeds
to be
Received(1) | |
| BCY | | | 2.920 | % | | | 12/31/2018 | | | | 01/02/2019 | | | $ | 50,000 | | | U.S. Treasury Notes 1.875% due 01/31/2022 | | $ | (51,078 | ) | | $ | 50,000 | | | $ | 50,008 | |
| FICC | | | 2.000 | | | | 12/31/2018 | | | | 01/02/2019 | | | | 6,412 | | | U.S. Treasury Notes 2.875% due 07/31/2025 | | | (6,541 | ) | | | 6,412 | | | | 6,413 | |
| MBC | | | 3.200 | | | | 12/31/2018 | | | | 01/02/2019 | | | | 17,700 | | | U.S. Treasury Notes 2.875% due 04/30/2025 | | | (18,326 | ) | | | 17,700 | | | | 17,703 | |
| | | | | | | | | | | | | | | | | | | | | | | | | | | | | | |
Total Repurchase Agreements | | | | | $ | (75,945 | ) | | $ | 74,112 | | | $ | 74,124 | |
| | | | | | | | | | | | | | | |
| | | | | | |
| See Accompanying Notes | | SEMIANNUAL REPORT | | DECEMBER 31, 2018 | | 41 |
Schedule of InvestmentsPIMCO0-5 Year High Yield Corporate Bond Index Exchange-Traded Fund(Cont.)
BORROWINGS AND OTHER FINANCING TRANSACTIONS SUMMARY
The following is a summary by counterparty of the market value of Borrowings and Other Financing Transactions and collateral pledged/(received) as of December 31, 2018:
| | | | | | | | | | | | | | | | | | | | | | | | | | | | |
| Counterparty | | Repurchase
Agreement
Proceeds
to be
Received(1) | | | Payable for
Reverse
Repurchase
Agreements | | | Payable for
Sale-Buyback
Transactions | | | Securities
Out on Loan | | | Total
Borrowings and
Other Financing
Transactions | | | Collateral
Pledged/(Received) | | | Net Exposure(2) | |
Global/Master Repurchase Agreement | | | | | | | | | | | | | | | | | | | | | | | | | | | | |
BCY | | $ | 50,008 | | | $ | 0 | | | $ | 0 | | | $ | 0 | | | $ | 50,008 | | | $ | (51,078 | ) | | $ | (1,070 | ) |
FICC | | | 6,413 | | | | 0 | | | | 0 | | | | 0 | | | | 6,413 | | | | (6,541 | ) | | | (128 | ) |
MBC | | | 17,703 | | | | 0 | | | | 0 | | | | 0 | | | | 17,703 | | | | (18,326 | ) | | | (623 | ) |
| | | | | | | |
Master Securities Lending Agreement | | | | | | | | | | | | | | | | | | | | | | | | | | | | |
BCY | | | 0 | | | | 0 | | | | 0 | | | | 16,460 | | | | 16,460 | | | | (16,782 | ) | | | (322 | ) |
BMO | | | 0 | | | | 0 | | | | 0 | | | | 1,009 | | | | 1,009 | | | | (1,029 | ) | | | (20 | ) |
FOB | | | 0 | | | | 0 | | | | 0 | | | | 1,467 | | | | 1,467 | | | | (1,497 | ) | | | (30 | ) |
GSC | | | 0 | | | | 0 | | | | 0 | | | | 6,983 | | | | 6,983 | | | | (8,181 | ) | | | (1,198 | ) |
JPM | | | 0 | | | | 0 | | | | 0 | | | | 2,483 | | | | 2,483 | | | | (2,532 | ) | | | (49 | ) |
RDR | | | 0 | | | | 0 | | | | 0 | | | | 3,546 | | | | 3,546 | | | | (3,625 | ) | | | (79 | ) |
SAL | | | 0 | | | | 0 | | | | 0 | | | | 1,082 | | | | 1,082 | | | | (1,183 | ) | | | (101 | ) |
| | | | | | | | | | | | | | | | | | | | | | | | | | | | |
Total Borrowings and Other Financing Transactions | | $ | 74,124 | | | $ | 0 | | | $ | 0 | | | $ | 33,030 | | | | | | | | | | | | | |
| | | | | | | | | | | | | | | | | | | | | | | | | | | | |
CERTAIN TRANSFERS ACCOUNTED FOR AS SECURED BORROWINGS
Remaining Contractual Maturity of the Agreements
| | | | | | | | | | | | | | | | | | | | |
| | | Overnight and
Continuous | | | Up to 30 days | | | 31-90 days | | | Greater Than 90 days | | | Total | |
Securities Lending Transactions(3) | |
Corporate Bonds & Notes | | $ | 33,030 | | | $ | 0 | | | $ | 0 | | | $ | 0 | | | $ | 33,030 | |
| | | | | | | | | | | | | | | | | | | | |
Total Borrowings | | $ | 33,030 | | | $ | 0 | | | $ | 0 | | | $ | 0 | | | $ | 33,030 | |
| | | | | | | | | | | | | | | | | | | | |
Gross amount of recognized liabilities for reverse repurchase agreements and securities lending transactions | | | $ | 33,030 | |
| | | | | | | | | | | | | | | | | | | | |
| (1) | Includes accrued interest. |
| (2) | Net Exposure represents the net receivable/(payable) that would be due from/to the counterparty in the event of default. Exposure from borrowings and other financing transactions can only be netted across transactions governed under the same master agreement with the same legal entity. See Note 8, Master Netting Arrangements, in the Notes to Financial Statements for more information regarding master netting arrangements. |
| (3) | Includes cash collateral as described in Note 5 in the Notes to Financial Statements. |
(i) FINANCIAL DERIVATIVE INSTRUMENTS: EXCHANGE-TRADED OR CENTRALLY CLEARED
FUTURES CONTRACTS:
| | | | | | | | | | | | | | | | | | | | | | | | |
| LONG FUTURES CONTRACTS | |
| | | | | |
| Description | | Expiration
Month | | | # of
Contracts | | | Notional
Amount | | | Unrealized
Appreciation/
(Depreciation) | | | Variation Margin | |
| | Asset | | | Liability | |
U.S. Treasury 5-Year Note March Futures | | | 03/2019 | | | | 436 | | | $ | 50,004 | | | $ | 819 | | | $ | 109 | | | $ | 0 | |
| | | | | | | | | | | | | | | | | | | | | | | | |
| | | | | | | | | | | | | | | | | | | | | | | | |
| SHORT FUTURES CONTRACTS | |
| | | | | |
| Description | | Expiration
Month | | | # of
Contracts | | | Notional
Amount | | | Unrealized
Appreciation/
(Depreciation) | | | Variation Margin | |
| | Asset | | | Liability | |
U.S. Treasury 2-Year Note March Futures | | | 03/2019 | | | | 137 | | | $ | (29,087 | ) | | $ | (29 | ) | | $ | 0 | | | $ | (19 | ) |
U.S. Treasury 10-Year Note March Futures | | | 03/2019 | | | | 91 | | | | (11,103 | ) | | | (50 | ) | | | 0 | | | | (36 | ) |
| | | | | | | | | | | | | | | | | | | | | | | | |
| | | | | | | | | | | | | | $ | (79 | ) | | $ | 0 | | | $ | (55 | ) |
| | | | | | | | | | | | | | | | | | | | | | | | |
Total Futures Contracts | | | $ | 740 | | | $ | 109 | | | $ | (55 | ) |
| | | | | | | | | | | | | | | | | | | | | | | | |
| | | | | | | | |
| 42 | | PIMCO ETF TRUST | | | | | See Accompanying Notes | |
December 31, 2018 (Unaudited)
SWAP AGREEMENTS:
CREDIT DEFAULT SWAPS ON CREDIT INDICES - SELL PROTECTION(1)
| | | | | | | | | | | | | | | | | | | | | | | | | | | | | | | | | | |
| Index/Tranches | | Fixed
Receive Rate | | | Payment
Frequency | | Maturity
Date | | | Notional
Amount(2) | | | Premiums
Paid/(Received) | | | Unrealized
Appreciation/
(Depreciation) | | | Market
Value(3) | | | Variation Margin | |
| | Asset | | | Liability | |
CDX.HY-30 5-Year Index | | | 5.000 | % | | Quarterly | | | 06/20/2023 | | | $ | 65,775 | | | $ | 4,402 | | | $ | (2,263 | ) | | $ | 2,139 | | | $ | 96 | | | $ | 0 | |
CDX.HY-31 5-Year Index | | | 5.000 | | | Quarterly | | | 12/20/2023 | | | | 29,200 | | | | 1,441 | | | | (796 | ) | | | 645 | | | | 48 | | | | 0 | |
| | | | | | | | | | | | | | | | | | | | | | | | | | | | | | | | | | |
Total Swap Agreements | | | $ | 5,843 | | | $ | (3,059 | ) | | $ | 2,784 | | | $ | 144 | | | $ | 0 | |
| | | | | | | | | | | | | | | | | | | | | | | | | | | | | | | | | | |
FINANCIAL DERIVATIVE INSTRUMENTS: EXCHANGE-TRADED OR CENTRALLY CLEARED SUMMARY
The following is a summary of the market value and variation margin of Exchange-Traded or Centrally Cleared Financial Derivative Instruments as of December 31, 2018:
| | | | | | | | | | | | | | | | | | | | | | | | | | | | | | | | | | | | |
| | | Financial Derivative Assets | | | | | | Financial Derivative Liabilities | |
| | | Market Value | | | Variation Margin
Asset | | | Total | | | | | | Market Value | | | Variation Margin
Liability | | | Total | |
| | | Purchased
Options | | | Futures | | | Swap
Agreements | | | | | | Written
Options | | | Futures | | | Swap
Agreements | |
Total Exchange-Traded or Centrally Cleared | | $ | 0 | | | $ | 109 | | | $ | 144 | | | $ | 253 | | | | | | | $ | 0 | | | $ | (55) | | | $ | 0 | | | $ | (55) | |
| | | | | | | | | | | | | | | | | | | | | | | | | | | | | | | | | | | | |
Cash of $6,952 has been pledged as collateral for exchange-traded and centrally cleared financial derivative instruments as of December 31, 2018. See Note 8, Master Netting Arrangements, in the Notes to Financial Statements for more information regarding master netting arrangements.
| (1) | If the Fund is a seller of protection and a credit event occurs, as defined under the terms of that particular swap agreement, the Fund will either (i) pay to the buyer of protection an amount equal to the notional amount of the swap and take delivery of the referenced obligation or underlying securities comprising the referenced index or (ii) pay a net settlement amount in the form of cash, securities or other deliverable obligations equal to the notional amount of the swap less the recovery value of the referenced obligation or underlying securities comprising the referenced index. |
| (2) | The maximum potential amount the Fund could be required to pay as a seller of credit protection or receive as a buyer of credit protection if a credit event occurs as defined under the terms of that particular swap agreement. |
| (3) | The prices and resulting values for credit default swap agreements serve as indicators of the current status of the payment/performance risk and represent the likelihood of an expected liability (or profit) for the credit derivative should the notional amount of the swap agreement be closed/sold as of the period end. Increasing market values, in absolute terms when compared to the notional amount of the swap, represent a deterioration of the referenced indices’ credit soundness and a greater likelihood or risk of default or other credit event occurring as defined under the terms of the agreement. |
(j) FINANCIAL DERIVATIVE INSTRUMENTS: OVER THE COUNTER
SWAP AGREEMENTS:
TOTAL RETURN SWAPS ON INTEREST RATE INDICES
| | | | | | | | | | | | | | | | | | | | | | | | | | | | | | | | | | |
| Counterparty | | Pay/Receive(1) | | Underlying Reference | | # of Units | | | Financing Rate | | Payment
Frequency | | Maturity
Date | | Notional
Amount | | | Premiums
Paid/(Received) | | | Unrealized
Appreciation/
(Depreciation) | | | Swap Agreements,
at Value | |
| | Asset | | | Liability | |
BNP | | Receive | | iBoxx USD Liquid High Yield Index | | | N/A | | | 3-Month USD LIBOR | | Maturity | | 03/20/2019 | | $ | 26,000 | | | $ | (99 | ) | | $ | (542 | ) | | $ | 0 | | | $ | (641 | ) |
| | | | | | | | | | | |
BPS | | Receive | | iBoxx USD Liquid High Yield Index | | | N/A | | | 3-Month USD LIBOR | | Maturity | | 06/20/2019 | | | 6,100 | | | | (17 | ) | | | (121 | ) | | | 0 | | | | (138 | ) |
| | | | | | | | | | | |
GST | | Receive | | iBoxx USD Liquid High Yield Index | | | N/A | | | 3-Month USD LIBOR | | Maturity | | 03/20/2019 | | | 17,200 | | | | (71 | ) | | | (413 | ) | | | 0 | | | | (484 | ) |
| | Receive | | iBoxx USD Liquid High Yield Index | | | N/A | | | 3-Month USD LIBOR | | Maturity | | 06/20/2019 | | | 16,400 | | | | (77 | ) | | | (242 | ) | | | 0 | | | | (319 | ) |
| | | | | | | | | | | |
JPM | | Receive | | iBoxx USD Liquid High Yield Index | | | N/A | | | 3-Month USD LIBOR | | Maturity | | 03/20/2019 | | | 41,500 | | | | (155 | ) | | | (816 | ) | | | 0 | | | | (971 | ) |
| | | | | | | | | | | | | | | | | | | | | | | | | | | | | | | | | | |
Total Swap Agreements | | | $ | (419 | ) | | $ | (2,134 | ) | | $ | 0 | | | $ | (2,553 | ) |
| | | | | | | | | | | | | | | | | | | | | | | | | | | | | | | | | | |
| | | | | | |
| See Accompanying Notes | | SEMIANNUAL REPORT | | DECEMBER 31, 2018 | | 43 |
Schedule of InvestmentsPIMCO0-5 Year High Yield Corporate Bond Index Exchange-Traded Fund(Cont.)
FINANCIAL DERIVATIVE INSTRUMENTS: OVER THE COUNTER SUMMARY
The following is a summary by counterparty of the market value of OTC financial derivative instruments and collateral pledged as of December 31, 2018:
| | | | | | | | | | | | | | | | | | | | | | | | | | | | | | | | | | | | | | | | | | | | | | | | |
| | | Financial Derivative Assets | | | | | | Financial Derivative Liabilities | | | | | | | | | | |
| Counterparty | | Forward
Foreign
Currency
Contracts | | | Purchased
Options | | | Swap
Agreements | | | Total
Over the
Counter | | | | | | Forward
Foreign
Currency
Contracts | | | Written
Options | | | Swap
Agreements | | | Total
Over the
Counter | | | Net Market
Value of OTC
Derivatives | | | Collateral
Pledged/
(Received) | | | Net
Exposure(2) | |
BNP | | $ | 0 | | | $ | 0 | | | $ | 0 | | | $ | 0 | | | | | | | $ | 0 | | | $ | 0 | | | $ | (641 | ) | | $ | (641 | ) | | $ | (641 | ) | | $ | 0 | | | $ | (641 | ) |
BPS | | | 0 | | | | 0 | | | | 0 | | | | 0 | | | | | | | | 0 | | | | 0 | | | | (138 | ) | | | (138 | ) | | | (138 | ) | | | 1,070 | | | | 932 | |
GST | | | 0 | | | | 0 | | | | 0 | | | | 0 | | | | | | | | 0 | | | | 0 | | | | (803 | ) | | | (803 | ) | | | (803 | ) | | | 958 | | | | 155 | |
JPM | | | 0 | | | | 0 | | | | 0 | | | | 0 | | | | | | | | 0 | | | | 0 | | | | (971 | ) | | | (971 | ) | | | (971 | ) | | | 1,157 | | | | 186 | |
| | | | | | | | | | | | | | | | | | | | | | | | | | | | | | | | | | | | | | | | | | | | | | | | |
Total Over the Counter | | $ | 0 | | | $ | 0 | | | $ | 0 | | | $ | 0 | | | | | | | $ | 0 | | | $ | 0 | | | $ | (2,553 | ) | | $ | (2,553 | ) | | | | | | | | | | | | |
| | | | | | | | | | | | | | | | | | | | | | | | | | | | | | | | | | | | | | | | | | | | | | | | |
| (k) | Securities with an aggregate market value of $3,186 have been pledged as collateral for financial derivative instruments as governed by International Swaps and Derivatives Association, Inc. master agreements as of December 31, 2018. |
| (1) | Receive represents that the Fund receives payments for any positive net return on the underlying reference. The Fund makes payments for any negative net return on such underlying reference. Pay represents that the Fund receives payments for any negative net return on the underlying reference. The Fund makes payments for any positive net return on such underlying reference. |
| (2) | Net Exposure represents the net receivable/(payable) that would be due from/to the counterparty in the event of default. Exposure from OTC financial derivative instruments can only be netted across transactions governed under the same master agreement with the same legal entity. See Note 8, Master Netting Arrangements, in the Notes to Financial Statements for more information regarding master netting arrangements. |
FAIR VALUE OF FINANCIAL DERIVATIVE INSTRUMENTS
The following is a summary of the fair valuation of the Fund’s derivative instruments categorized by risk exposure. See Note 7, Principal Risks, in the Notes to Financial Statements on risks of the Fund.
Fair Values of Financial Derivative Instruments on the Statements of Assets and Liabilities as of December 31, 2018:
| | | | | | | | | | | | | | | | | | | | | | | | |
| | | Derivatives not accounted for as hedging instruments | |
| | | Commodity
Contracts | | | Credit
Contracts | | | Equity
Contracts | | | Foreign
Exchange
Contracts | | | Interest
Rate Contracts | | | Total | |
Financial Derivative Instruments - Assets | | | | | | | | | | | | | | | | | | | | | | | | |
Exchange-traded or centrally cleared | | | | | | | | | | | | | | | | | | | | | | | | |
Futures | | $ | 0 | | | $ | 0 | | | $ | 0 | | | $ | 0 | | | $ | 109 | | | $ | 109 | |
Swap Agreements | | | 0 | | | | 144 | | | | 0 | | | | 0 | | | | 0 | | | | 144 | |
| | | | | | | | | | | | | | | | | | | | | | | | |
| | $ | 0 | | | $ | 144 | | | $ | 0 | | | $ | 0 | | | $ | 109 | | | $ | 253 | |
| | | | | | | | | | | | | | | | | | | | | | | | |
| | | | | | |
Financial Derivative Instruments - Liabilities | | | | | | | | | | | | | | | | | | | | | | | | |
Exchange-traded or centrally cleared | | | | | | | | | | | | | | | | | | | | | | | | |
Futures | | $ | 0 | | | $ | 0 | | | $ | 0 | | | $ | 0 | | | $ | 55 | | | $ | 55 | |
| | | | | | | | | | | | | | | | | | | | | | | | |
Over the counter | | | | | | | | | | | | | | | | | | | | | | | | |
Swap Agreements | | $ | 0 | | | $ | 0 | | | $ | 0 | | | $ | 0 | | | $ | 2,553 | | | $ | 2,553 | |
| | | | | | | | | | | | | | | | | | | | | | | | |
| | $ | 0 | | | $ | 0 | | | $ | 0 | | | $ | 0 | | | $ | 2,608 | | | $ | 2,608 | |
| | | | | | | | | | | | | | | | | | | | | | | | |
The effect of Financial Derivative Instruments on the Statements of Operations for the period ended December 31, 2018:
| | | | | | | | | | | | | | | | | | | | | | | | |
| | | Derivatives not accounted for as hedging instruments | |
| | | Commodity
Contracts | | | Credit
Contracts | | | Equity
Contracts | | | Foreign
Exchange
Contracts | | | Interest
Rate Contracts | | | Total | |
Net Realized Gain (Loss) on Financial Derivative Instruments | | | | | | | | | | | | | |
Exchange-traded or centrally cleared | | | | | | | | | | | | | | | | | | | | | | | | |
Futures | | $ | 0 | | | $ | 0 | | | $ | 0 | | | $ | 0 | | | $ | (23 | ) | | $ | (23 | ) |
Swap Agreements | | | 0 | | | | 2,182 | | | | 0 | | | | 0 | | | | 58 | | | | 2,240 | |
| | | | | | | | | | | | | | | | | | | | | | | | |
| | $ | 0 | | | $ | 2,182 | | | $ | 0 | | | $ | 0 | | | $ | 35 | | | $ | 2,217 | |
| | | | | | | | | | | | | | | | | | | | | | | | |
Over the counter | | | | | | | | | | | | | | | | | | | | | | | | |
Swap Agreements | | $ | 0 | | | $ | 3 | | | $ | 0 | | | $ | 0 | | | $ | (1,137 | ) | | $ | (1,134 | ) |
| | | | | | | | | | | | | | | | | | | | | | | | |
| | $ | 0 | | | $ | 2,185 | | | $ | 0 | | | $ | 0 | | | $ | (1,102 | ) | | $ | 1,083 | |
| | | | | | | | | | | | | | | | | | | | | | | | |
| | | | | | | | |
| 44 | | PIMCO ETF TRUST | | | | | See Accompanying Notes | |
December 31, 2018 (Unaudited)
| | | | | | | | | | | | | | | | | | | | | | | | |
| | | Derivatives not accounted for as hedging instruments | |
| | | Commodity
Contracts | | | Credit
Contracts | | | Equity
Contracts | | | Foreign
Exchange
Contracts | | | Interest
Rate Contracts | | | Total | |
| | | |
Net Change in Unrealized Appreciation (Depreciation) on Financial Derivative Instruments | | | | | | | | | | | | | |
Exchange-traded or centrally cleared | | | | | | | | | | | | | | | | | | | | | | | | |
Futures | | $ | 0 | | | $ | 0 | | | $ | 0 | | | $ | 0 | | | $ | 712 | | | $ | 712 | |
Swap Agreements | | | 0 | | | | (2,515 | ) | | | 0 | | | | 0 | | | | 0 | | | | (2,515 | ) |
| | | | | | | | | | | | | | | | | | | | | | | | |
| | $ | 0 | | | $ | (2,515 | ) | | $ | 0 | | | $ | 0 | | | $ | 712 | | | $ | (1,803 | ) |
| | | | | | | | | | | | | | | | | | | | | | | | |
Over the counter | | | | | | | | | | | | | | | | | | | | | | | | |
Swap Agreements | | $ | 0 | | | $ | 0 | | | $ | 0 | | | $ | 0 | | | $ | (2,135 | ) | | $ | (2,135 | ) |
| | | | | | | | | | | | | | | | | | | | | | | | |
| | $ | 0 | | | $ | (2,515 | ) | | $ | 0 | | | $ | 0 | | | $ | (1,423 | ) | | $ | (3,938 | ) |
| | | | | | | | | | | | | | | | | | | | | | | | |
FAIR VALUE MEASUREMENTS
The following is a summary of the fair valuations according to the inputs used as of December 31, 2018 in valuing the Fund’s assets and liabilities:
| | | | | | | | | | | | | | | | |
| Category and Subcategory | | Level 1 | | | Level 2 | | | Level 3 | | | Fair
Value at
12/31/2018 | |
Investments in Securities, at Value | |
Corporate Bonds & Notes | | | | | | | | | | | | | | | | |
Banking & Finance | | $ | 0 | | | $ | 139,374 | | | $ | 0 | | | $ | 139,374 | |
Industrials | | | 0 | | | | 913,414 | | | | 984 | | | | 914,398 | |
Utilities | | | 0 | | | | 72,756 | | | | 0 | | | | 72,756 | |
Short-Term Instruments | | | | | | | | | | | | | | | | |
Repurchase Agreements | | | 0 | | | | 74,112 | | | | 0 | | | | 74,112 | |
U.S. Treasury Bills | | | 0 | | | | 4,074 | | | | 0 | | | | 4,074 | |
| | | | | | | | | | | | | | | | |
| | $ | 0 | | | $ | 1,203,730 | | | $ | 984 | | | $ | 1,204,714 | |
|
Investments in Affiliates, at Value | |
Short-Term Instruments | | | | | | | | | | | | | | | | |
Mutual Funds | | | 32,683 | | | | 0 | | | | 0 | | | | 32,683 | |
| | | | | | | | | | | | | | | | |
| | | | |
Total Investments | | $ | 32,683 | | | $ | 1,203,730 | | | $ | 984 | | | $ | 1,237,397 | |
| | | | | | | | | | | | | | | | |
| | | | | | | | | | | | | | | | |
| Category and Subcategory | | Level 1 | | | Level 2 | | | Level 3 | | | Fair
Value at
12/31/2018 | |
|
Financial Derivative Instruments - Assets | |
Exchange-traded or centrally cleared | | $ | 109 | | | $ | 144 | | | $ | 0 | | | $ | 253 | |
| | | | | | | | | | | | | | | | |
|
Financial Derivative Instruments - Liabilities | |
Exchange-traded or centrally cleared | | | (55 | ) | | | 0 | | | | 0 | | | | (55 | ) |
Over the counter | | | 0 | | | | (2,553 | ) | | | 0 | | | | (2,553 | ) |
| | | | | | | | | | | | | | | | |
| | $ | (55 | ) | | $ | (2,553 | ) | | $ | 0 | | | $ | (2,608 | ) |
| | | | | | | | | | | | | | | | |
| | | | |
Total Financial Derivative Instruments | | $ | 54 | | | $ | (2,409 | ) | | $ | 0 | | | $ | (2,355 | ) |
| | | | | | | | | | | | | | | | |
| | | | |
Totals | | $ | 32,737 | | | $ | 1,201,321 | | | $ | 984 | | | $ | 1,235,042 | |
| | | | | | | | | | | | | | | | |
There were no significant transfers into or out of Level 3 during the period ended December 31, 2018.
| | | | | | |
| See Accompanying Notes | | SEMIANNUAL REPORT | | DECEMBER 31, 2018 | | 45 |
Schedule of InvestmentsPIMCO Investment Grade Corporate Bond Index Exchange-Traded Fund
(Amounts in thousands*, except number of shares, contracts and units, if any)
| | | | | | | | | | | | |
| | | | | PRINCIPAL
AMOUNT
(000S) | | | | | MARKET
VALUE
(000S) | |
| INVESTMENTS IN SECURITIES 98.9% | |
| |
| CORPORATE BONDS & NOTES 97.5% | |
| |
| BANKING & FINANCE 39.7% | |
|
AerCap Ireland Capital DAC | |
4.500% due 05/15/2021 | | $ | | | 1,615 | | | $ | | | 1,621 | |
4.625% due 10/30/2020 | | | | | 3,585 | | | | | | 3,611 | |
|
Aflac, Inc. | |
3.625% due 11/15/2024 | | | | | 2,490 | | | | | | 2,490 | |
|
AIG Global Funding | |
3.277% (US0003M + 0.480%) due 07/02/2020 ~ | | | | | 1,460 | | | | | | 1,459 | |
|
American Express Co. | |
2.650% due 12/02/2022 | | | | | 300 | | | | | | 290 | |
4.050% due 12/03/2042 | | | | | 337 | | | | | | 321 | |
|
American Honda Finance Corp. | |
2.450% due 09/24/2020 | | | | | 1,723 | | | | | | 1,702 | |
|
American International Group, Inc. | |
3.750% due 07/10/2025 | | | | | 4,012 | | | | | | 3,849 | |
3.900% due 04/01/2026 | | | | | 600 | | | | | | 579 | |
|
American Tower Corp. | |
3.125% due 01/15/2027 | | | | | 2,700 | | | | | | 2,450 | |
3.375% due 10/15/2026 | | | | | 1,110 | | | | | | 1,035 | |
3.500% due 01/31/2023 | | | | | 800 | | | | | | 787 | |
3.600% due 01/15/2028 | | | | | 800 | | | | | | 749 | |
|
Athene Global Funding | |
3.000% due 07/01/2022 | | | | | 1,270 | | | | | | 1,241 | |
|
Athene Holding Ltd. | |
4.125% due 01/12/2028 | | | | | 1,840 | | | | | | 1,675 | |
|
Aviation Capital Group LLC | |
6.750% due 04/06/2021 | | | | | 100 | | | | | | 106 | |
7.125% due 10/15/2020 | | | | | 100 | | | | | | 105 | |
|
AXA Equitable Holdings, Inc. | |
4.350% due 04/20/2028 | | | | | 960 | | | | | | 909 | |
5.000% due 04/20/2048 | | | | | 800 | | | | | | 705 | |
|
B3 S.A. - Brasil Bolsa Balcao | |
5.500% due 07/16/2020 | | | | | 860 | | | | | | 878 | |
|
Banco do Brasil S.A. | |
6.000% due 01/22/2020 | | | | | 275 | | | | | | 282 | |
|
Banco Santander Mexico S.A. | |
4.125% due 11/09/2022 | | | | | 325 | | | | | | 321 | |
|
Bank of America Corp. | |
2.369% due 07/21/2021 • | | | | | 1,803 | | | | | | 1,771 | |
2.650% due 04/01/2019 | | | | | 1,085 | | | | | | 1,084 | |
3.419% due 12/20/2028 • | | | | | 2,337 | | | | | | 2,187 | |
3.500% due 04/19/2026 | | | | | 3,640 | | | | | | 3,509 | |
4.000% due 04/01/2024 | | | | | 2,026 | | | | | | 2,039 | |
4.271% due 07/23/2029 • | | | | | 1,920 | | | | | | 1,914 | |
7.750% due 05/14/2038 | | | | | 300 | | | | | | 389 | |
|
Bank of New York Mellon Corp. | |
3.000% due 02/24/2025 | | | | | 3,281 | | | | | | 3,172 | |
|
Barclays PLC | |
4.375% due 01/12/2026 | | | | | 4,090 | | | | | | 3,893 | |
|
BB&T Corp. | |
2.450% due 01/15/2020 | | | | | 3,466 | | | | | | 3,443 | |
|
Berkshire Hathaway Finance Corp. | |
5.750% due 01/15/2040 | | | | | 277 | | | | | | 331 | |
|
BNP Paribas S.A. | |
5.000% due 01/15/2021 | | | | | 4,746 | | | | | | 4,917 | |
|
Boston Properties LP | |
3.800% due 02/01/2024 | | | | | 615 | | | | | | 613 | |
|
BPCE S.A. | |
4.500% due 03/15/2025 | | | | | 440 | | | | | | 427 | |
5.150% due 07/21/2024 | | | | | 195 | | | | | | 196 | |
|
Brighthouse Financial, Inc. | |
4.700% due 06/22/2047 | | | | | 1,040 | | | | | | 778 | |
|
Capital One Financial Corp. | |
4.750% due 07/15/2021 | | | | | 3,049 | | | | | | 3,130 | |
|
Cboe Global Markets, Inc. | |
3.650% due 01/12/2027 | | | | | 300 | | | | | | 292 | |
|
Charles Schwab Corp. | |
3.000% due 03/10/2025 | | | | | 250 | | | | | | 242 | |
| | | | | | | | | | | | |
| | | | | PRINCIPAL
AMOUNT
(000S) | | | | | MARKET
VALUE
(000S) | |
|
China Cinda Finance Ltd. | |
4.250% due 04/23/2025 | | $ | | | 620 | | | $ | | | 604 | |
|
Chubb INA Holdings, Inc. | |
3.350% due 05/03/2026 | | | | | 3,043 | | | | | | 2,981 | |
4.350% due 11/03/2045 | | | | | 591 | | | | | | 611 | |
|
Citigroup, Inc. | |
2.700% due 03/30/2021 | | | | | 2,192 | | | | | | 2,159 | |
2.876% due 07/24/2023 • | | | | | 1,250 | | | | | | 1,210 | |
3.400% due 05/01/2026 | | | | | 3,054 | | | | | | 2,879 | |
3.700% due 01/12/2026 | | | | | 3,500 | | | | | | 3,372 | |
4.000% due 08/05/2024 | | | | | 2,557 | | | | | | 2,529 | |
8.125% due 07/15/2039 | | | | | 84 | | | | | | 117 | |
|
Citizens Financial Group, Inc. | |
2.375% due 07/28/2021 | | | | | 100 | | | | | | 97 | |
|
CME Group, Inc. | |
3.000% due 09/15/2022 | | | | | 2,147 | | | | | | 2,141 | |
3.000% due 03/15/2025 | | | | | 300 | | | | | | 292 | |
3.750% due 06/15/2028 | | | | | 500 | | | | | | 508 | |
4.150% due 06/15/2048 | | | | | 800 | | | | | | 814 | |
|
Commonwealth Bank of Australia | |
2.750% due 03/10/2022 | | | | | 600 | | | | | | 587 | |
|
Cooperatieve Rabobank UA | |
3.875% due 02/08/2022 | | | | | 275 | | | | | | 278 | |
5.250% due 05/24/2041 | | | | | 3,116 | | | | | | 3,443 | |
|
Credit Suisse AG | |
3.000% due 10/29/2021 | | | | | 730 | | | | | | 721 | |
|
Credit Suisse Group Funding Guernsey Ltd. | |
3.800% due 06/09/2023 | | | | | 2,952 | | | | | | 2,900 | |
4.875% due 05/15/2045 | | | | | 600 | | | | | | 596 | |
|
Crown Castle International Corp. | |
4.450% due 02/15/2026 | | | | | 2,826 | | | | | | 2,819 | |
5.250% due 01/15/2023 | | | | | 1,110 | | | | | | 1,154 | |
|
Deutsche Bank AG | |
3.406% (US0003M + 0.970%) due 07/13/2020 ~ | | | | | 1,540 | | | | | | 1,500 | |
4.100% due 01/13/2026 | | | | | 3,512 | | | | | | 3,227 | |
|
Duke Realty LP | |
3.875% due 10/15/2022 | | | | | 200 | | | | | | 202 | |
4.000% due 09/15/2028 | | | | | 800 | | | | | | 796 | |
|
EPR Properties | |
4.950% due 04/15/2028 | | | | | 1,040 | | | | | | 1,032 | |
|
Essex Portfolio LP | |
3.250% due 05/01/2023 | | | | | 2,230 | | | | | | 2,184 | |
|
Fairfax Financial Holdings Ltd. | |
4.850% due 04/17/2028 | | | | | 600 | | | | | | 578 | |
|
First Republic Bank | |
4.375% due 08/01/2046 | | | | | 200 | | | | | | 186 | |
|
Ford Motor Credit Co. LLC | |
2.375% due 03/12/2019 | | | | | 3,988 | | | | | | 3,982 | |
3.336% due 03/18/2021 | | | | | 600 | | | | | | 582 | |
5.875% due 08/02/2021 | | | | | 2,812 | | | | | | 2,886 | |
|
GE Capital International Funding Co. Unlimited Co. | |
2.342% due 11/15/2020 | | | | | 4,275 | | | | | | 4,127 | |
4.418% due 11/15/2035 | | | | | 3,177 | | | | | | 2,680 | |
|
General Motors Financial Co., Inc. | |
3.700% due 11/24/2020 | | | | | 600 | | | | | | 598 | |
5.250% due 03/01/2026 | | | | | 800 | | | | | | 784 | |
|
GLP Capital LP | |
4.375% due 04/15/2021 | | | | | 1,040 | | | | | | 1,038 | |
4.875% due 11/01/2020 | | | | | 2,670 | | | | | | 2,699 | |
5.300% due 01/15/2029 | | | | | 800 | | | | | | 785 | |
|
Goldman Sachs Group, Inc. | |
2.550% due 10/23/2019 | | | | | 4,236 | | | | | | 4,210 | |
3.487% (US0003M + 1.000%) due 07/24/2023 ~ | | | | | 1,540 | | | | | | 1,497 | |
3.500% due 01/23/2025 | | | | | 300 | | | | | | 285 | |
4.750% due 10/21/2045 | | | | | 475 | | | | | | 455 | |
6.750% due 10/01/2037 | | | | | 2,742 | | | | | | 3,105 | |
|
Guardian Life Insurance Co. of America | |
4.850% due 01/24/2077 | | | | | 200 | | | | | | 198 | |
|
Harley-Davidson Financial Services, Inc. | |
2.550% due 06/09/2022 | | | | | 1,270 | | | | | | 1,213 | |
|
Healthcare Trust of America Holdings LP | |
2.950% due 07/01/2022 | | | | | 1,140 | | | | | | 1,109 | |
| | | | | | | | | | | | |
| | | | | PRINCIPAL
AMOUNT
(000S) | | | | | MARKET
VALUE
(000S) | |
|
Hospitality Properties Trust | |
5.000% due 08/15/2022 | | $ | | | 559 | | | $ | | | 571 | |
|
HSBC Holdings PLC | |
2.650% due 01/05/2022 | | | | | 1,590 | | | | | | 1,543 | |
3.900% due 05/25/2026 | | | | | 600 | | | | | | 576 | |
4.300% due 03/08/2026 | | | | | 3,446 | | | | | | 3,404 | |
|
HSBC USA, Inc. | |
2.375% due 11/13/2019 | | | | | 4,185 | | | | | | 4,159 | |
|
Hutchison Whampoa International Ltd. | |
7.450% due 11/24/2033 | | | | | 450 | | | | | | 614 | |
|
ING Bank NV | |
2.500% due 10/01/2019 | | | | | 3,145 | | | | | | 3,131 | |
|
Intesa Sanpaolo SpA | |
4.375% due 01/12/2048 | | | | | 200 | | | | | | 151 | |
|
John Deere Capital Corp. | |
2.800% due 03/06/2023 | | | | | 2,141 | | | | | | 2,094 | |
3.900% due 07/12/2021 | | | | | 225 | | | | | | 229 | |
|
JPMorgan Chase & Co. | |
2.550% due 03/01/2021 | | | | | 3,335 | | | | | | 3,289 | |
2.950% due 10/01/2026 | | | | | 3,379 | | | | | | 3,125 | |
3.625% due 05/13/2024 | | | | | 3,608 | | | | | | 3,586 | |
4.850% due 02/01/2044 | | | | | 2,081 | | | | | | 2,127 | |
5.400% due 01/06/2042 | | | | | 250 | | | | | | 275 | |
|
KeyCorp | |
2.900% due 09/15/2020 | | | | | 2,254 | | | | | | 2,240 | |
|
Kilroy Realty LP | |
3.800% due 01/15/2023 | | | | | 575 | | | | | | 573 | |
|
Kimco Realty Corp. | |
4.450% due 09/01/2047 | | | | | 600 | | | | | | 547 | |
|
Lazard Group LLC | |
3.750% due 02/13/2025 | | | | | 2,410 | | | | | | 2,342 | |
|
Liberty Mutual Group, Inc. | |
4.850% due 08/01/2044 | | | | | 600 | | | | | | 585 | |
|
Lloyds Bank PLC | |
5.800% due 01/13/2020 | | | | | 300 | | | | | | 307 | |
|
Lloyds Banking Group PLC | |
3.750% due 01/11/2027 | | | | | 3,815 | | | | | | 3,513 | |
|
Macquarie Bank Ltd. | |
6.625% due 04/07/2021 | | | | | 49 | | | | | | 52 | |
|
Marsh & McLennan Cos., Inc. | |
3.750% due 03/14/2026 | | | | | 333 | | | | | | 330 | |
4.350% due 01/30/2047 | | | | | 150 | | | | | | 141 | |
|
MetLife, Inc. | |
5.700% due 06/15/2035 | | | | | 600 | | | | | | 677 | |
5.875% due 02/06/2041 | | | | | 85 | | | | | | 100 | |
9.250% due 04/08/2038 | | | | | 575 | | | | | | 727 | |
|
Metropolitan Life Global Funding | |
2.650% due 04/08/2022 | | | | | 1,145 | | | | | | 1,116 | |
|
Mitsubishi UFJ Financial Group, Inc. | |
2.665% due 07/25/2022 | | | | | 2,360 | | | | | | 2,295 | |
3.850% due 03/01/2026 | | | | | 1,738 | | | | | | 1,732 | |
|
Mizuho Financial Group, Inc. | |
2.273% due 09/13/2021 | | | | | 1,590 | | | | | | 1,540 | |
2.632% due 04/12/2021 | | | | | 2,865 | | | | | | 2,811 | |
|
Morgan Stanley | |
3.875% due 01/27/2026 | | | | | 3,177 | | | | | | 3,103 | |
4.350% due 09/08/2026 | | | | | 3,320 | | | | | | 3,233 | |
7.300% due 05/13/2019 | | | | | 2,907 | | | | | | 2,951 | |
|
Nasdaq, Inc. | |
3.850% due 06/30/2026 | | | | | 100 | | | | | | 96 | |
|
National Australia Bank Ltd. | |
2.800% due 01/10/2022 | | | | | 600 | | | | | | 588 | |
|
National Rural Utilities Cooperative Finance Corp. | |
4.400% due 11/01/2048 | | | | | 250 | | | | | | 261 | |
|
New York Life Global Funding | |
2.350% due 07/14/2026 | | | | | 100 | | | | | | 92 | |
|
New York Life Insurance Co. | |
6.750% due 11/15/2039 | | | | | 590 | | | | | | 776 | |
|
Nippon Life Insurance Co. | |
4.700% due 01/20/2046 • | | | | | 600 | | | | | | 584 | |
5.100% due 10/16/2044 • | | | | | 600 | | | | | | 603 | |
|
Nissan Motor Acceptance Corp. | |
2.826% (US0003M + 0.390%) due 07/13/2020 ~ | | | | | 1,540 | | | | | | 1,529 | |
| | | | | | | | |
| 46 | | PIMCO ETF TRUST | | | | | See Accompanying Notes | |
December 31, 2018 (Unaudited)
| | | | | | | | | | | | |
| | | | | PRINCIPAL
AMOUNT
(000S) | | | | | MARKET
VALUE
(000S) | |
|
Nuveen Finance LLC | |
4.125% due 11/01/2024 | | $ | | | 600 | | | $ | | | 612 | |
|
ORIX Corp. | |
2.900% due 07/18/2022 | | | | | 1,250 | | | | | | 1,222 | |
|
PNC Bank N.A. | |
3.800% due 07/25/2023 | | | | | 300 | | | | | | 301 | |
|
Principal Life Global Funding | |
3.000% due 04/18/2026 | | | | | 817 | | | | | | 785 | |
|
Progressive Corp. | |
2.450% due 01/15/2027 | | | | | 150 | | | | | | 137 | |
|
Prudential Financial, Inc. | |
3.500% due 05/15/2024 | | | | | 3,601 | | | | | | 3,625 | |
|
Raymond James Financial, Inc. | |
3.625% due 09/15/2026 | | | | | 100 | | | | | | 94 | |
|
Royal Bank of Scotland Group PLC | |
4.892% due 05/18/2029 • | | | | | 800 | | | | | | 765 | |
|
Santander Holdings USA, Inc. | |
4.500% due 07/17/2025 | | | | | 4,151 | | | | | | 4,118 | |
|
Societe Generale S.A. | |
4.250% due 04/14/2025 | | | | | 600 | | | | | | 575 | |
|
Spirit Realty LP | |
4.450% due 09/15/2026 | | | | | 1,450 | | | | | | 1,396 | |
|
Standard Chartered PLC | |
3.050% due 01/15/2021 | | | | | 870 | | | | | | 858 | |
|
State Street Corp. | |
3.540% (US0003M + 0.900%) due 08/18/2020 ~ | | | | | 740 | | | | | | 744 | |
|
Sumitomo Life Insurance Co. | |
6.500% due 09/20/2073 •(b) | | | | | 450 | | | | | | 479 | |
|
Sumitomo Mitsui Banking Corp. | |
3.200% due 07/18/2022 | | | | | 2,234 | | | | | | 2,210 | |
|
Sumitomo Mitsui Financial Group, Inc. | |
2.058% due 07/14/2021 | | | | | 600 | | | | | | 581 | |
3.205% (US0003M + 0.780%) due 07/12/2022 ~ | | | | | 1,190 | | | | | | 1,184 | |
|
Synchrony Financial | |
2.700% due 02/03/2020 | | | | | 200 | | | | | | 197 | |
|
Tanger Properties LP | |
3.750% due 12/01/2024 | | | | | 1,460 | | | | | | 1,418 | |
|
Toyota Motor Credit Corp. | |
1.900% due 04/08/2021 | | | | | 600 | | | | | | 586 | |
|
U.S. Bancorp | |
2.950% due 07/15/2022 | | | | | 3,428 | | | | | | 3,383 | |
|
UBS AG | |
3.347% due 06/08/2020 • | | | | | 1,150 | | | | | | 1,150 | |
|
UBS Group Funding Switzerland AG | |
4.125% due 09/24/2025 | | | | | 3,315 | | | | | | 3,297 | |
|
Ventas Realty LP | |
4.400% due 01/15/2029 | | | | | 400 | | | | | | 399 | |
|
Visa, Inc. | |
4.300% due 12/14/2045 | | | | | 2,346 | | | | | | 2,447 | |
|
Washington Prime Group LP | |
5.950% due 08/15/2024 | | | | | 800 | | | | | | 703 | |
|
WEA Finance LLC | |
3.750% due 09/17/2024 | | | | | 2,475 | | | | | | 2,460 | |
|
Wells Fargo & Co. | |
2.625% due 07/22/2022 | | | | | 1,600 | | | | | | 1,544 | |
3.300% due 09/09/2024 | | | | | 4,765 | | | | | | 4,613 | |
3.500% due 03/08/2022 | | | | | 1,590 | | | | | | 1,585 | |
3.900% due 05/01/2045 | | | | | 800 | | | | | | 737 | |
4.125% due 08/15/2023 | | | | | 75 | | | | | | 76 | |
4.400% due 06/14/2046 | | | | | 600 | | | | | | 556 | |
4.750% due 12/07/2046 | | | | | 400 | | | | | | 387 | |
|
Welltower, Inc. | |
4.250% due 04/15/2028 | | | | | 600 | | | | | | 595 | |
|
Westpac Banking Corp. | |
2.850% due 05/13/2026 | | | | | 600 | | | | | | 558 | |
|
Weyerhaeuser Co. | |
7.375% due 03/15/2032 | | | | | 1,424 | | | | | | 1,746 | |
|
WR Berkley Corp. | |
4.625% due 03/15/2022 | | | | | 300 | | | | | | 309 | |
| | | | | | | | | | | | |
| | | | | | | | | | | 248,992 | |
| | | | | | | | | | | | |
| | | | | | | | | | | | |
| | | | | PRINCIPAL
AMOUNT
(000S) | | | | | MARKET
VALUE
(000S) | |
| INDUSTRIALS 46.5% | |
|
21st Century Fox America, Inc. | |
4.950% due 10/15/2045 | | $ | | | 1,515 | | | $ | | | 1,670 | |
6.400% due 12/15/2035 | | | | | 100 | | | | | | 125 | |
|
Abbott Laboratories | |
2.550% due 03/15/2022 | | | | | 300 | | | | | | 293 | |
4.750% due 11/30/2036 | | | | | 1,490 | | | | | | 1,560 | |
|
AbbVie, Inc. | |
2.900% due 11/06/2022 | | | | | 4,092 | | | | | | 3,985 | |
3.200% due 05/14/2026 | | | | | 2,966 | | | | | | 2,755 | |
4.300% due 05/14/2036 | | | | | 400 | | | | | | 358 | |
4.450% due 05/14/2046 | | | | | 600 | | | | | | 528 | |
|
Activision Blizzard, Inc. | |
2.300% due 09/15/2021 | | | | | 328 | | | | | | 320 | |
3.400% due 09/15/2026 | | | | | 3,072 | | | | | | 2,892 | |
|
AEP Transmission Co. LLC | |
4.250% due 09/15/2048 | | | | | 840 | | | | | | 850 | |
|
Aetna, Inc. | |
3.875% due 08/15/2047 | | | | | 600 | | | | | | 511 | |
|
Alibaba Group Holding Ltd. | |
3.600% due 11/28/2024 | | | | | 1,415 | | | | | | 1,385 | |
|
Allergan Funding SCS | |
3.450% due 03/15/2022 | | | | | 1,040 | | | | | | 1,025 | |
|
Altria Group, Inc. | |
2.950% due 05/02/2023 | | | | | 3,238 | | | | | | 3,083 | |
|
Amazon.com, Inc. | |
3.150% due 08/22/2027 | | | | | 1,295 | | | | | | 1,252 | |
3.875% due 08/22/2037 | | | | | 2,220 | | | | | | 2,162 | |
|
Amgen, Inc. | |
3.200% due 11/02/2027 | | | | | 800 | | | | | | 753 | |
3.450% due 10/01/2020 | | | | | 1,109 | | | | | | 1,114 | |
3.625% due 05/22/2024 | | | | | 4,600 | | | | | | 4,591 | |
4.400% due 05/01/2045 | | | | | 100 | | | | | | 94 | |
|
Andeavor Logistics LP | |
5.500% due 10/15/2019 | | | | | 2,337 | | | | | | 2,357 | |
|
Anheuser-Busch Cos. LLC | |
3.650% due 02/01/2026 | | | | | 1,710 | | | | | | 1,618 | |
4.900% due 02/01/2046 | | | | | 2,002 | | | | | | 1,863 | |
|
Anheuser-Busch InBev Worldwide, Inc. | |
3.750% due 01/15/2022 | | | | | 3,863 | | | | | | 3,868 | |
|
Anthem, Inc. | |
3.500% due 08/15/2024 | | | | | 734 | | | | | | 721 | |
3.650% due 12/01/2027 | | | | | 800 | | | | | | 766 | |
4.550% due 03/01/2048 | | | | | 600 | | | | | | 578 | |
|
Apache Corp. | |
4.750% due 04/15/2043 | | | | | 428 | | | | | | 369 | |
5.100% due 09/01/2040 | | | | | 77 | | | | | | 69 | |
|
Apple, Inc. | |
2.500% due 02/09/2025 | | | | | 2,375 | | | | | | 2,246 | |
3.250% due 02/23/2026 | | | | | 4,260 | | | | | | 4,164 | |
3.450% due 05/06/2024 | | | | | 325 | | | | | | 327 | |
3.850% due 08/04/2046 | | | | | 600 | | | | | | 567 | |
|
AstraZeneca PLC | |
4.000% due 01/17/2029 | | | | | 800 | | | | | | 790 | |
|
AutoNation, Inc. | |
3.800% due 11/15/2027 | | | | | 600 | | | | | | 536 | |
|
Bacardi Ltd. | |
2.750% due 07/15/2026 | | | | | 100 | | | | | | 86 | |
|
Baidu, Inc. | |
3.625% due 07/06/2027 | | | | | 980 | | | | | | 915 | |
|
Barrick PD Australia Finance Pty. Ltd. | |
4.950% due 01/15/2020 | | | | | 100 | | | | | | 102 | |
|
BAT Capital Corp. | |
2.297% due 08/14/2020 | | | | | 1,000 | | | | | | 977 | |
2.764% due 08/15/2022 | | | | | 1,050 | | | | | | 993 | |
3.222% due 08/15/2024 | | | | | 1,200 | | | | | | 1,107 | |
4.540% due 08/15/2047 | | | | | 500 | | | | | | 400 | |
|
Baxalta, Inc. | |
5.250% due 06/23/2045 | | | | | 252 | | | | | | 257 | |
|
Bayer U.S. Finance LLC | |
4.375% due 12/15/2028 | | | | | 800 | | | | | | 766 | |
4.875% due 06/25/2048 | | | | | 400 | | | | | | 361 | |
|
Becton Dickinson and Co. | |
2.675% due 12/15/2019 | | | | | 2,987 | | | | | | 2,959 | |
| | | | | | | | | | | | |
| | | | | PRINCIPAL
AMOUNT
(000S) | | | | | MARKET
VALUE
(000S) | |
|
BHP Billiton Finance USA Ltd. | |
5.000% due 09/30/2043 | | $ | | | 622 | | | $ | | | 679 | |
|
Booking Holdings, Inc. | |
3.550% due 03/15/2028 | | | | | 1,000 | | | | | | 939 | |
|
BorgWarner, Inc. | |
3.375% due 03/15/2025 | | | | | 150 | | | | | | 147 | |
|
Broadcom Corp. | |
2.375% due 01/15/2020 | | | | | 400 | | | | | | 395 | |
3.000% due 01/15/2022 | | | | | 400 | | | | | | 385 | |
3.625% due 01/15/2024 | | | | | 400 | | | | | | 379 | |
3.875% due 01/15/2027 | | | | | 400 | | | | | | 360 | |
|
Burlington Northern Santa Fe LLC | |
5.400% due 06/01/2041 | | | | | 2,345 | | | | | | 2,662 | |
|
Cardinal Health, Inc. | |
2.616% due 06/15/2022 | | | | | 1,350 | | | | | | 1,302 | |
|
Caterpillar, Inc. | |
3.803% due 08/15/2042 | | | | | 1,488 | | | | | | 1,389 | |
|
CBS Corp. | |
2.500% due 02/15/2023 | | | | | 1,276 | | | | | | 1,203 | |
2.900% due 01/15/2027 | | | | | 150 | | | | | | 133 | |
|
Celgene Corp. | |
4.350% due 11/15/2047 | | | | | 950 | | | | | | 804 | |
|
Cenovus Energy, Inc. | |
5.400% due 06/15/2047 | | | | | 1,092 | | | | | | 947 | |
6.750% due 11/15/2039 | | | | | 218 | | | | | | 214 | |
|
Charter Communications Operating LLC | |
4.908% due 07/23/2025 | | | | | 4,665 | | | | | | 4,643 | |
5.750% due 04/01/2048 | | | | | 400 | | | | | | 376 | |
|
Chevron Corp. | |
2.100% due 05/16/2021 | | | | | 2,256 | | | | | | 2,213 | |
|
China Resources Gas Group Ltd. | |
4.500% due 04/05/2022 | | | | | 600 | | | | | | 614 | |
|
Cimarex Energy Co. | |
4.375% due 06/01/2024 | | | | | 779 | | | | | | 776 | |
|
Comcast Corp. | |
3.125% due 07/15/2022 | | | | | 3,017 | | | | | | 3,010 | |
3.150% due 03/01/2026 | | | | | 2,373 | | | | | | 2,274 | |
3.200% due 07/15/2036 | | | | | 600 | | | | | | 518 | |
3.600% due 03/01/2024 | | | | | 743 | | | | | | 745 | |
4.250% due 10/15/2030 | | | | | 800 | | | | | | 811 | |
|
Conagra Brands, Inc. | |
4.850% due 11/01/2028 | | | | | 800 | | | | | | 789 | |
5.300% due 11/01/2038 | | | | | 1,040 | | | | | | 987 | |
5.400% due 11/01/2048 | | | | | 500 | | | | | | 463 | |
|
Concho Resources, Inc. | |
4.300% due 08/15/2028 | | | | | 800 | | | | | | 785 | |
4.875% due 10/01/2047 | | | | | 1,669 | | | | | | 1,595 | |
|
Constellation Brands, Inc. | |
4.100% due 02/15/2048 | | | | | 400 | | | | | | 339 | |
|
Continental Resources, Inc. | |
4.500% due 04/15/2023 | | | | | 250 | | | | | | 246 | |
|
Corning, Inc. | |
5.750% due 08/15/2040 | | | | | 235 | | | | | | 256 | |
|
Cox Communications, Inc. | |
3.350% due 09/15/2026 | | | | | 100 | | | | | | 92 | |
|
CRH America Finance, Inc. | |
3.400% due 05/09/2027 | | | | | 300 | | | | | | 276 | |
|
CSX Corp. | |
3.800% due 11/01/2046 | | | | | 780 | | | | | | 691 | |
6.220% due 04/30/2040 | | | | | 125 | | | | | | 149 | |
|
CVS Health Corp. | |
3.125% due 03/09/2020 | | | | | 2,680 | | | | | | 2,675 | |
3.375% due 08/12/2024 | | | | | 2,700 | | | | | | 2,622 | |
5.050% due 03/25/2048 | | | | | 1,875 | | | | | | 1,833 | |
5.125% due 07/20/2045 | | | | | 569 | | | | | | 557 | |
|
D.R. Horton, Inc. | |
4.000% due 02/15/2020 | | | | | 600 | | | | | | 601 | |
|
Dell International LLC | |
5.450% due 06/15/2023 | | | | | 400 | | | | | | 407 | |
6.020% due 06/15/2026 | | | | | 1,811 | | | | | | 1,823 | |
8.100% due 07/15/2036 | | | | | 400 | | | | | | 433 | |
8.350% due 07/15/2046 | | | | | 600 | | | | | | 652 | |
|
Delta Air Lines, Inc. | |
4.375% due 04/19/2028 | | | | | 800 | | | | | | 769 | |
| | | | | | |
| See Accompanying Notes | | SEMIANNUAL REPORT | | DECEMBER 31, 2018 | | 47 |
Schedule of InvestmentsPIMCO Investment Grade Corporate Bond Index Exchange-Traded Fund(Cont.)
| | | | | | | | | | | | |
| | | | | PRINCIPAL
AMOUNT
(000S) | | | | | MARKET
VALUE
(000S) | |
|
Deutsche Telekom International Finance BV | |
3.600% due 01/19/2027 | | $ | | | 2,850 | | | $ | | | 2,694 | |
|
Dolphin Energy Ltd. LLC | |
5.500% due 12/15/2021 | | | | | 600 | | | | | | 626 | |
|
Dominion Energy Gas Holdings LLC | |
3.600% due 12/15/2024 | | | | | 1,362 | | | | | | 1,355 | |
|
Dow Chemical Co. | |
3.000% due 11/15/2022 | | | | | 1,714 | | | | | | 1,664 | |
5.250% due 11/15/2041 | | | | | 491 | | | | | | 492 | |
|
Eaton Corp. | |
2.750% due 11/02/2022 | | | | | 618 | | | | | | 602 | |
|
eBay, Inc. | |
4.000% due 07/15/2042 | | | | | 1,419 | | | | | | 1,061 | |
|
Ecopetrol S.A. | |
5.375% due 06/26/2026 | | | | | 1,525 | | | | | | 1,538 | |
|
Eli Lilly & Co. | |
2.750% due 06/01/2025 | | | | | 2,569 | | | | | | 2,478 | |
|
Empresa Nacional de Telecomunicaciones S.A. | |
4.875% due 10/30/2024 | | | | | 600 | | | | | | 585 | |
|
Enbridge, Inc. | |
2.900% due 07/15/2022 | | | | | 1,351 | | | | | | 1,308 | |
3.488% (US0003M + 0.700%) due 06/15/2020 ~ | | | | | 1,150 | | | | | | 1,146 | |
|
Encana Corp. | |
5.150% due 11/15/2041 | | | | | 30 | | | | | | 30 | |
|
Energy Transfer Operating LP | |
3.600% due 02/01/2023 | | | | | 3,648 | | | | | | 3,518 | |
4.200% due 04/15/2027 | | | | | 400 | | | | | | 374 | |
4.650% due 06/01/2021 | | | | | 100 | | | | | | 102 | |
4.750% due 01/15/2026 | | | | | 1,040 | | | | | | 1,013 | |
5.300% due 04/15/2047 | | | | | 400 | | | | | | 354 | |
|
Eni SpA | |
4.000% due 09/12/2023 | | | | | 1,040 | | | | | | 1,025 | |
4.750% due 09/12/2028 | | | | | 1,010 | | | | | | 990 | |
|
Entergy Louisiana LLC | |
4.200% due 09/01/2048 | | | | | 1,200 | | | | | | 1,189 | |
|
Enterprise Products Operating LLC | |
3.750% due 02/15/2025 | | | | | 2,635 | | | | | | 2,612 | |
3.950% due 02/15/2027 | | | | | 1,281 | | | | | | 1,278 | |
4.850% due 03/15/2044 | | | | | 640 | | | | | | 624 | |
|
Equifax, Inc. | |
2.300% due 06/01/2021 | | | | | 250 | | | | | | 243 | |
7.000% due 07/01/2037 | | | | | 780 | | | | | | 896 | |
|
ERAC USA Finance LLC | |
3.300% due 12/01/2026 | | | | | 600 | | | | | | 565 | |
4.200% due 11/01/2046 | | | | | 600 | | | | | | 538 | |
|
Exxon Mobil Corp. | |
3.176% due 03/15/2024 | | | | | 963 | | | | | | 965 | |
|
FedEx Corp. | |
4.550% due 04/01/2046 | | | | | 575 | | | | | | 525 | |
|
Fomento Economico Mexicano S.A.B. de C.V. | |
2.875% due 05/10/2023 | | | | | 1,390 | | | | | | 1,328 | |
|
Freeport-McMoRan, Inc. | |
3.550% due 03/01/2022 | | | | | 75 | | | | | | 71 | |
|
General Electric Co. | |
3.100% due 01/09/2023 | | | | | 75 | | | | | | 70 | |
5.500% due 01/08/2020 | | | | | 2,369 | | | | | | 2,397 | |
6.875% due 01/10/2039 | | | | | 316 | | | | | | 332 | |
|
General Motors Co. | |
4.875% due 10/02/2023 | | | | | 1,976 | | | | | | 1,982 | |
5.400% due 04/01/2048 | | | | | 600 | | | | | | 513 | |
|
Georgia-Pacific LLC | |
3.163% due 11/15/2021 | | | | | 2,095 | | | | | | 2,077 | |
|
GlaxoSmithKline Capital, Inc. | |
2.800% due 03/18/2023 | | | | | 175 | | | | | | 172 | |
6.375% due 05/15/2038 | | | | | 1,065 | | | | | | 1,342 | |
|
Glencore Finance Canada Ltd. | |
4.250% due 10/25/2022 | | | | | 3,157 | | | | | | 3,150 | |
|
Grupo Televisa S.A.B. | |
5.000% due 05/13/2045 | | | | | 400 | | | | | | 352 | |
6.625% due 01/15/2040 | | | | | 600 | | | | | | 647 | |
|
GTL Trade Finance, Inc. | |
5.893% due 04/29/2024 | | | | | 1,009 | | | | | | 1,054 | |
| | | | | | | | | | | | |
| | | | | PRINCIPAL
AMOUNT
(000S) | | | | | MARKET
VALUE
(000S) | |
|
Halliburton Co. | |
5.000% due 11/15/2045 | | $ | | | 2,390 | | | $ | | | 2,375 | |
|
Hess Corp. | |
5.800% due 04/01/2047 | | | | | 1,430 | | | | | | 1,290 | |
|
Home Depot, Inc. | |
3.000% due 04/01/2026 | | | | | 1,932 | | | | | | 1,870 | |
3.500% due 09/15/2056 | | | | | 100 | | | | | | 85 | |
4.250% due 04/01/2046 | | | | | 7 | | | | | | 7 | |
|
IHS Markit Ltd. | |
4.125% due 08/01/2023 | | | | | 1,040 | | | | | | 1,031 | |
4.750% due 08/01/2028 | | | | | 400 | | | | | | 391 | |
|
Intel Corp. | |
3.700% due 07/29/2025 | | | | | 2,469 | | | | | | 2,494 | |
|
International Business Machines Corp. | |
4.000% due 06/20/2042 | | | | | 92 | | | | | | 84 | |
5.600% due 11/30/2039 | | | | | 29 | | | | | | 32 | |
|
International Flavors & Fragrances, Inc. | |
4.450% due 09/26/2028 | | | | | 800 | | | | | | 814 | |
|
Kinder Morgan Energy Partners LP | |
3.950% due 09/01/2022 | | | | | 2,405 | | | | | | 2,406 | |
5.300% due 09/15/2020 | | | | | 385 | | | | | | 396 | |
|
Kinder Morgan, Inc. | |
3.050% due 12/01/2019 | | | | | 150 | | | | | | 149 | |
5.550% due 06/01/2045 | | | | | 1,706 | | | | | | 1,697 | |
|
KLA-Tencor Corp. | |
4.650% due 11/01/2024 | | | | | 1,049 | | | | | | 1,076 | |
|
Kraft Heinz Foods Co. | |
4.375% due 06/01/2046 | | | | | 3,473 | | | | | | 2,875 | |
5.200% due 07/15/2045 | | | | | 800 | | | | | | 734 | |
6.500% due 02/09/2040 | | | | | 400 | | | | | | 427 | |
|
Kroger Co. | |
6.150% due 01/15/2020 | | | | | 225 | | | | | | 231 | |
|
Lockheed Martin Corp. | |
4.090% due 09/15/2052 | | | | | 1,923 | | | | | | 1,811 | |
|
Lowe’s Cos., Inc. | |
4.650% due 04/15/2042 | | | | | 1,493 | | | | | | 1,416 | |
|
LyondellBasell Industries NV | |
4.625% due 02/26/2055 | | | | | 400 | | | | | | 339 | |
|
McDonald’s Corp. | |
4.875% due 12/09/2045 | | | | | 3,854 | | | | | | 3,911 | |
|
Medtronic, Inc. | |
3.150% due 03/15/2022 | | | | | 3,134 | | | | | | 3,127 | |
3.500% due 03/15/2025 | | | | | 2,971 | | | | | | 2,963 | |
4.625% due 03/15/2045 | | | | | 1,365 | | | | | | 1,436 | |
|
Merck & Co., Inc. | |
3.700% due 02/10/2045 | | | | | 1,713 | | | | | | 1,652 | |
|
Microsoft Corp. | |
2.700% due 02/12/2025 | | | | | 3,008 | | | | | | 2,921 | |
4.250% due 02/06/2047 | | | | | 600 | | | | | | 632 | |
4.450% due 11/03/2045 | | | | | 2,339 | | | | | | 2,490 | |
|
Moody’s Corp. | |
2.625% due 01/15/2023 | | | | | 1,230 | | | | | | 1,175 | |
4.875% due 02/15/2024 | | | | | 2,202 | | | | | | 2,319 | |
5.500% due 09/01/2020 | | | | | 250 | | | | | | 259 | |
|
MPLX LP | |
4.700% due 04/15/2048 | | | | | 400 | | | | | | 348 | |
5.200% due 03/01/2047 | | | | | 400 | | | | | | 370 | |
|
Mylan NV | |
5.250% due 06/15/2046 | | | | | 450 | | | | | | 381 | |
|
Mylan, Inc. | |
3.125% due 01/15/2023 | | | | | 100 | | | | | | 94 | |
4.550% due 04/15/2028 | | | | | 800 | | | | | | 747 | |
|
Nexen Energy ULC | |
6.400% due 05/15/2037 | | | | | 600 | | | | | | 733 | |
|
Norfolk Southern Corp. | |
4.650% due 01/15/2046 | | | | | 2,365 | | | | | | 2,423 | |
|
Northrop Grumman Corp. | |
3.850% due 04/15/2045 | | | | | 465 | | | | | | 413 | |
|
NXP BV | |
4.125% due 06/15/2020 | | | | | 1,000 | | | | | | 998 | |
|
ONEOK Partners LP | |
4.900% due 03/15/2025 | | | | | 997 | | | | | | 1,012 | |
5.000% due 09/15/2023 | | | | | 200 | | | | | | 206 | |
| | | | | | | | | | | | |
| | | | | PRINCIPAL
AMOUNT
(000S) | | | | | MARKET
VALUE
(000S) | |
|
Oracle Corp. | |
2.800% due 07/08/2021 | | $ | | | 2,829 | | | $ | | | 2,816 | |
4.125% due 05/15/2045 | | | | | 1,721 | | | | | | 1,641 | |
|
Owens Corning | |
3.400% due 08/15/2026 | | | | | 100 | | | | | | 92 | |
|
Penske Truck Leasing Co. LP | |
3.400% due 11/15/2026 | | | | | 150 | | | | | | 141 | |
|
PepsiCo, Inc. | |
2.850% due 02/24/2026 | | | | | 600 | | | | | | 574 | |
|
Pertamina Persero PT | |
4.300% due 05/20/2023 | | | | | 600 | | | | | | 592 | |
6.000% due 05/03/2042 | | | | | 600 | | | | | | 600 | |
|
Petroleos Mexicanos | |
4.250% due 01/15/2025 | | | | | 465 | | | | | | 408 | |
4.875% due 01/24/2022 | | | | | 275 | | | | | | 268 | |
6.375% due 01/23/2045 | | | | | 2,335 | | | | | | 1,888 | |
6.750% due 09/21/2047 | | | | | 1,350 | | | | | | 1,120 | |
6.875% due 08/04/2026 | | | | | 790 | | | | | | 770 | |
|
Pfizer, Inc. | |
4.400% due 05/15/2044 | | | | | 300 | | | | | | 314 | |
|
Philip Morris International, Inc. | |
2.750% due 02/25/2026 | | | | | 600 | | | | | | 555 | |
3.375% due 08/11/2025 | | | | | 325 | | | | | | 316 | |
3.600% due 11/15/2023 | | | | | 555 | | | | | | 557 | |
|
QUALCOMM, Inc. | |
3.000% due 05/20/2022 | | | | | 575 | | | | | | 566 | |
3.450% due 05/20/2025 | | | | | 193 | | | | | | 186 | |
|
Ras Laffan Liquefied Natural Gas Co. Ltd. | |
5.838% due 09/30/2027 | | | | | 600 | | | | | | 653 | |
|
Reliance Industries Ltd. | |
4.125% due 01/28/2025 | | | | | 600 | | | | | | 587 | |
|
Republic Services, Inc. | |
3.375% due 11/15/2027 | | | | | 1,190 | | | | | | 1,143 | |
5.250% due 11/15/2021 | | | | | 245 | | | | | | 260 | |
|
Reynolds American, Inc. | |
4.450% due 06/12/2025 | | | | | 3,198 | | | | | | 3,089 | |
|
Rio Tinto Finance USA Ltd. | |
3.750% due 06/15/2025 | | | | | 1,965 | | | | | | 1,972 | |
|
Roche Holdings, Inc. | |
2.625% due 05/15/2026 | | | | | 1,420 | | | | | | 1,345 | |
|
Rockwell Collins, Inc. | |
4.800% due 12/15/2043 | | | | | 1,560 | | | | | | 1,544 | |
|
Sabine Pass Liquefaction LLC | |
5.625% due 02/01/2021 | | | | | 4,422 | | | | | | 4,557 | |
|
SASOL Financing USA LLC | |
6.500% due 09/27/2028 | | | | | 1,500 | | | | | | 1,504 | |
|
Seagate HDD Cayman | |
4.750% due 06/01/2023 | | | | | 1,040 | | | | | | 973 | |
4.750% due 01/01/2025 | | | | | 1,010 | | | | | | 897 | |
|
Shire Acquisitions Investments Ireland DAC | |
1.900% due 09/23/2019 | | | | | 600 | | | | | | 592 | |
|
Sky Ltd. | |
3.750% due 09/16/2024 | | | | | 256 | | | | | | 255 | |
|
Southern Co. | |
3.503% (US0003M + 0.700%) due 09/30/2020 ~ | | | | | 1,460 | | | | | | 1,456 | |
4.400% due 07/01/2046 | | | | | 600 | | | | | | 555 | |
|
Southern Copper Corp. | |
6.750% due 04/16/2040 | | | | | 2,600 | | | | | | 2,882 | |
|
Spectra Energy Partners LP | |
3.451% (US0003M + 0.700%) due 06/05/2020 ~ | | | | | 980 | | | | | | 974 | |
|
Sprint Spectrum Co. LLC | |
3.360% due 03/20/2023 | | | | | 206 | | | | | | 204 | |
|
Stryker Corp. | |
2.625% due 03/15/2021 | | | | | 150 | | | | | | 148 | |
3.500% due 03/15/2026 | | | | | 600 | | | | | | 578 | |
4.375% due 01/15/2020 | | | | | 100 | | | | | | 102 | |
4.625% due 03/15/2046 | | | | | 730 | | | | | | 737 | |
|
Target Corp. | |
3.875% due 07/15/2020 | | | | | 200 | | | | | | 203 | |
|
Tech Data Corp. | |
3.700% due 02/15/2022 | | | | | 400 | | | | | | 393 | |
| | | | | | | | |
| 48 | | PIMCO ETF TRUST | | | | | See Accompanying Notes | |
December 31, 2018 (Unaudited)
| | | | | | | | | | | | |
| | | | | PRINCIPAL
AMOUNT
(000S) | | | | | MARKET
VALUE
(000S) | |
|
Telefonica Emisiones S.A. | |
5.462% due 02/16/2021 | | $ | | | 125 | | | $ | | | 130 | |
7.045% due 06/20/2036 | | | | | 1,465 | | | | | | 1,675 | |
|
Thermo Fisher Scientific, Inc. | |
2.950% due 09/19/2026 | | | | | 3,129 | | | | | | 2,894 | |
3.150% due 01/15/2023 | | | | | 100 | | | | | | 98 | |
|
Time Warner Cable LLC | |
5.000% due 02/01/2020 | | | | | 2,141 | | | | | | 2,171 | |
|
Toyota Industries Corp. | |
3.566% due 03/16/2028 | | | | | 1,190 | | | | | | 1,188 | |
|
TransCanada PipeLines Ltd. | |
3.800% due 10/01/2020 | | | | | 165 | | | | | | 166 | |
|
Tyson Foods, Inc. | |
4.500% due 06/15/2022 | | | | | 4,224 | | | | | | 4,317 | |
4.875% due 08/15/2034 | | | | | 1,262 | | | | | | 1,226 | |
|
Union Pacific Corp. | |
3.799% due 10/01/2051 | | | | | 1,355 | | | | | | 1,156 | |
|
United Technologies Corp. | |
3.100% due 06/01/2022 | | | | | 4,233 | | | | | | 4,148 | |
|
UnitedHealth Group, Inc. | |
4.750% due 07/15/2045 | | | | | 3,569 | | | | | | 3,790 | |
6.875% due 02/15/2038 | | | | | 315 | | | | | | 413 | |
|
Vale Overseas Ltd. | |
6.875% due 11/21/2036 | | | | | 1,927 | | | | | | 2,213 | |
|
Valero Energy Corp. | |
4.350% due 06/01/2028 | | | | | 800 | | | | | | 795 | |
|
Viacom, Inc. | |
4.250% due 09/01/2023 | | | | | 745 | | | | | | 743 | |
|
Volkswagen Group of America Finance LLC | |
4.750% due 11/13/2028 | | | | | 1,500 | | | | | | 1,456 | |
|
Walmart, Inc. | |
3.250% due 10/25/2020 | | | | | 1,400 | | | | | | 1,414 | |
3.700% due 06/26/2028 | | | | | 500 | | | | | | 508 | |
|
Walt Disney Co. | |
4.125% due 06/01/2044 | | | | | 1,636 | | | | | | 1,627 | |
|
Warner Media LLC | |
3.400% due 06/15/2022 | | | | | 450 | | | | | | 444 | |
3.550% due 06/01/2024 | | | | | 3,300 | | | | | | 3,192 | |
|
Western Gas Partners LP | |
4.650% due 07/01/2026 | | | | | 250 | | | | | | 242 | |
|
Whirlpool Corp. | |
3.700% due 03/01/2023 | | | | | 200 | | | | | | 196 | |
5.150% due 03/01/2043 | | | | | 250 | | | | | | 235 | |
|
Williams Cos., Inc. | |
5.400% due 03/04/2044 | | | | | 1,254 | | | | | | 1,201 | |
|
Woodside Finance Ltd. | |
3.700% due 09/15/2026 | | | | | 300 | | | | | | 277 | |
|
Wyeth LLC | |
5.950% due 04/01/2037 | | | | | 600 | | | | | | 724 | |
|
Yara International ASA | |
4.750% due 06/01/2028 | | | | | 800 | | | | | | 799 | |
|
Zoetis, Inc. | |
3.900% due 08/20/2028 | | | | | 800 | | | | | | 786 | |
| | | | | | | | | | | | |
| | | | | | | | | | | 291,774 | |
| | | | | | | | | | | | |
| |
| UTILITIES 11.3% | |
|
Acwa Power Management And Investments One Ltd. | |
5.950% due 12/15/2039 | | | | | 600 | | | | | | 566 | |
|
American Water Capital Corp. | |
3.850% due 03/01/2024 | | | | | 623 | | | | | | 637 | |
|
Appalachian Power Co. | |
7.000% due 04/01/2038 | | | | | 455 | | | | | | 574 | |
|
AT&T, Inc. | |
3.800% due 03/01/2024 | | | | | 600 | | | | | | 595 | |
4.100% due 02/15/2028 | | | | | 1,291 | | | | | | 1,244 | |
4.125% due 02/17/2026 | | | | | 2,840 | | | | | | 2,779 | |
4.300% due 02/15/2030 | | | | | 630 | | | | | | 597 | |
4.450% due 04/01/2024 | | | | | 800 | | | | | | 814 | |
4.800% due 06/15/2044 | | | | | 3,480 | | | | | | 3,133 | |
5.150% due 02/15/2050 | | | | | 450 | | | | | | 419 | |
5.650% due 02/15/2047 | | | | | 325 | | | | | | 326 | |
|
Atmos Energy Corp. | |
4.150% due 01/15/2043 | | | | | 580 | | | | | | 558 | |
| | | | | | | | | | | | |
| | | | | PRINCIPAL
AMOUNT
(000S) | | | | | MARKET
VALUE
(000S) | |
|
Berkshire Hathaway Energy Co. | |
6.125% due 04/01/2036 | | $ | | | 321 | | | $ | | | 384 | |
|
BG Energy Capital PLC | |
5.125% due 10/15/2041 | | | | | 115 | | | | | | 119 | |
|
Black Hills Corp. | |
3.150% due 01/15/2027 | | | | | 250 | | | | | | 235 | |
4.200% due 09/15/2046 | | | | | 100 | | | | | | 93 | |
|
BP Capital Markets America, Inc. | |
3.937% due 09/21/2028 | | | | | 600 | | | | | | 603 | |
4.234% due 11/06/2028 | | | | | 800 | | | | | | 825 | |
|
CNOOC Finance Ltd. | |
3.000% due 05/09/2023 | | | | | 2,445 | | | | | | 2,363 | |
3.875% due 05/02/2022 | | | | | 450 | | | | | | 454 | |
|
Commonwealth Edison Co. | |
4.000% due 03/01/2048 | | | | | 800 | | | | | | 775 | |
|
Consolidated Edison Co. of New York, Inc. | |
3.850% due 06/15/2046 | | | | | 640 | | | | | | 588 | |
|
Consumers Energy Co. | |
3.125% due 08/31/2024 | | | | | 1,585 | | | | | | 1,566 | |
|
Delmarva Power & Light Co. | |
3.500% due 11/15/2023 | | | | | 1,722 | | | | | | 1,732 | |
|
DTE Electric Co. | |
3.650% due 03/15/2024 | | | | | 2,080 | | | | | | 2,124 | |
|
Duke Energy Corp. | |
3.750% due 09/01/2046 | | | | | 100 | | | | | | 87 | |
3.950% due 10/15/2023 | | | | | 300 | | | | | | 303 | |
|
Duke Energy Ohio, Inc. | |
3.800% due 09/01/2023 | | | | | 3,665 | | | | | | 3,755 | |
|
E.ON International Finance BV | |
6.650% due 04/30/2038 | | | | | 1,490 | | | | | | 1,751 | |
|
Electricite de France S.A. | |
4.600% due 01/27/2020 | | | | | 325 | | | | | | 330 | |
4.875% due 01/22/2044 | | | | | 1,655 | | | | | | 1,500 | |
|
Enable Midstream Partners LP | |
4.950% due 05/15/2028 | | | | | 800 | | | | | | 759 | |
|
Enel Finance International NV | |
6.000% due 10/07/2039 | | | | | 2,435 | | | | | | 2,424 | |
|
Entergy Corp. | |
4.000% due 07/15/2022 | | | | | 1,180 | | | | | | 1,191 | |
5.125% due 09/15/2020 | | | | | 250 | | | | | | 255 | |
|
Exelon Corp. | |
3.950% due 06/15/2025 | | | | | 575 | | | | | | 569 | |
4.450% due 04/15/2046 | | | | | 600 | | | | | | 574 | |
|
Exelon Generation Co. LLC | |
5.600% due 06/15/2042 | | | | | 600 | | | | | | 590 | |
|
FirstEnergy Corp. | |
2.850% due 07/15/2022 | | | | | 1,140 | | | | | | 1,112 | |
7.375% due 11/15/2031 | | | | | 2,377 | | | | | | 3,012 | |
|
Florida Power & Light Co. | |
4.125% due 02/01/2042 | | | | | 100 | | | | | | 101 | |
|
Gazprom OAO Via Gaz Capital S.A. | |
6.510% due 03/07/2022 | | | | | 1,420 | | | | | | 1,486 | |
|
Indiana Michigan Power Co. | |
4.250% due 08/15/2048 | | | | | 800 | | | | | | 791 | |
|
Kentucky Utilities Co. | |
5.125% due 11/01/2040 | | | | | 100 | | | | | | 113 | |
|
KeySpan Gas East Corp. | |
2.742% due 08/15/2026 | | | | | 600 | | | | | | 560 | |
|
MidAmerican Energy Co. | |
3.500% due 10/15/2024 | | | | | 3,397 | | | | | | 3,456 | |
|
ONEOK, Inc. | |
4.550% due 07/15/2028 | | | | | 800 | | | | | | 794 | |
|
Pacific Gas & Electric Co. | |
3.500% due 10/01/2020 | | | | | 255 | | | | | | 244 | |
4.750% due 02/15/2044 | | | | | 2,212 | | | | | | 1,831 | |
5.800% due 03/01/2037 | | | | | 205 | | | | | | 191 | |
|
Pennsylvania Electric Co. | |
5.200% due 04/01/2020 | | | | | 70 | | | | | | 72 | |
|
Petronas Global Sukuk Ltd. | |
2.707% due 03/18/2020 | | | | | 620 | | | | | | 617 | |
|
Plains All American Pipeline LP | |
4.500% due 12/15/2026 | | | | | 600 | | | | | | 579 | |
5.150% due 06/01/2042 | | | | | 575 | | | | | | 519 | |
| | | | | | | | | | | | |
| | | | | PRINCIPAL
AMOUNT
(000S) | | | | | MARKET
VALUE
(000S) | |
|
Shell International Finance BV | |
3.875% due 11/13/2028 | | $ | | | 1,500 | | | $ | | | 1,544 | |
4.000% due 05/10/2046 | | | | | 600 | | | | | | 582 | |
4.375% due 03/25/2020 | | | | | 180 | | | | | | 183 | |
6.375% due 12/15/2038 | | | | | 405 | | | | | | 515 | |
|
Sinopec Group Overseas Development Ltd. | |
2.500% due 04/28/2020 | | | | | 1,090 | | | | | | 1,077 | |
|
Southern California Edison Co. | |
4.125% due 03/01/2048 | | | | | 1,200 | | | | | | 1,141 | |
|
Southern California Gas Co. | |
3.150% due 09/15/2024 | | | | | 2,255 | | | | | | 2,240 | |
|
Southern Power Co. | |
5.150% due 09/15/2041 | | | | | 2,395 | | | | | | 2,391 | |
|
Southwestern Public Service Co. | |
6.000% due 10/01/2036 | | | | | 1,743 | | | | | | 2,067 | |
|
Verizon Communications, Inc. | |
3.376% due 02/15/2025 | | | | | 520 | | | | | | 505 | |
4.125% due 08/15/2046 | | | | | 400 | | | | | | 355 | |
4.400% due 11/01/2034 | | | | | 2,484 | | | | | | 2,403 | |
4.522% due 09/15/2048 | | | | | 64 | | | | | | 60 | |
4.672% due 03/15/2055 | | | | | 550 | | | | | | 508 | |
4.862% due 08/21/2046 | | | | | 1,217 | | | | | | 1,202 | |
5.012% due 08/21/2054 | | | | | 702 | | | | | | 683 | |
| | | | | | | | | | | | |
| | | | | | | | | | | 71,125 | |
| | | | | | | | | | | | |
Total Corporate Bonds & Notes (Cost $637,270) | | | 611,891 | |
| | | | |
| |
| U.S. TREASURY OBLIGATIONS 0.1% | |
|
U.S. Treasury Bonds | |
3.000% due 08/15/2048 | | | | | 212 | | | | | | 211 | |
3.125% due 05/15/2048 | | | | | 591 | | | | | | 604 | |
| | | | | | | | | | | | |
Total U.S. Treasury Obligations (Cost $797) | | | 815 | |
| | | | |
| |
| SOVEREIGN ISSUES 0.3% | |
|
Korea Hydro & Nuclear Power Co. Ltd. | |
3.000% due 09/19/2022 | | | | | 550 | | | | | | 541 | |
3.125% due 07/25/2027 | | | | | 1,420 | | | | | | 1,348 | |
| | | | | | | | | | | | |
Total Sovereign Issues (Cost $1,952) | | | 1,889 | |
| | | | |
| |
| SHORT-TERM INSTRUMENTS 1.0% | |
| |
| REPURCHASE AGREEMENTS (c) 1.0% | |
| | | | | | | | | | | 6,143 | |
| | | | | | | | | | | | |
Total Short-Term Instruments
(Cost $6,143) | | | 6,143 | |
| | | | |
| | | | |
| | | | | | | | | | | | |
| Total Investments in Securities (Cost $646,162) | | | 620,738 | |
| | | | |
| |
| | | | | SHARES | | | | | | |
| INVESTMENTS IN AFFILIATES 0.1% | |
| |
| SHORT-TERM INSTRUMENTS 0.1% | |
| |
| MUTUAL FUNDS 0.1% | |
| | | | |
PIMCO Government Money Market Fund (a)(b) | | | | | 651,242 | | | | | | 651 | |
| | | | | | | | | | | | |
Total Short-Term Instruments
(Cost $651) | | | 651 | |
| | | | |
| | | | |
| | | | | | | | | | | | |
Total Investments in Affiliates
(Cost $651) | | | 651 | |
| |
| | | | |
Total Investments 99.0%
(Cost $646,813) | | | $ | | | 621,389 | |
| |
Financial Derivative
Instruments (d) 0.0% (Cost or Premiums, net $769) | | | | | | | | | | | 45 | |
| |
| Other Assets and Liabilities, net 1.0% | | | 5,933 | |
| | | | |
| Net Assets 100.0% | | | $ | | | 627,367 | |
| | | | | | | |
| | | | | | |
| See Accompanying Notes | | SEMIANNUAL REPORT | | DECEMBER 31, 2018 | | 49 |
Schedule of InvestmentsPIMCO Investment Grade Corporate Bond Index Exchange-Traded Fund(Cont.)
NOTES TO SCHEDULE OF INVESTMENTS:
| * | A zero balance may reflect actual amounts rounding to less than one thousand. |
| ~ | Variable or Floating rate security. Rate shown is the rate in effect as of period end. Certain variable rate securities are not based on a published reference rate and spread, rather are determined by the issuer or agent and are based on current market conditions. Reference rate is as of reset date, which may vary by security. These securities may not indicate a reference rate and/or spread in their description. |
| • | Rate shown is the rate in effect as of period end. The rate may be based on a fixed rate, a capped rate or a floor rate and may convert to a variable or floating rate in the future. These securities do not indicate a reference rate and spread in their description. |
| (a) | Institutional Class Shares of each Fund. |
| (b) | Securities with an aggregate market value of $637 were out on loan in exchange for $651 of cash collateral as of December 31, 2018. See Note 5, Securities Lending, in the Notes to Financial Statements for more information regarding securities on loan and cash collateral. |
BORROWINGS AND OTHER FINANCING TRANSACTIONS
(c) REPURCHASE AGREEMENTS:
| | | | | | | | | | | | | | | | | | | | | | | | | | | | | | |
| Counterparty | | Lending
Rate | | | Settlement
Date | | | Maturity
Date | | | Principal
Amount | | | Collateralized By | | Collateral
(Received) | | | Repurchase
Agreements,
at Value | | | Repurchase
Agreement
Proceeds
to be
Received(1) | |
| BSN | | | 3.100 | % | | | 12/31/2018 | | | | 01/02/2019 | | | $ | 5,400 | | | U.S. Treasury Notes 2.500% due 05/15/2024 | | $ | (5,524 | ) | | $ | 5,400 | | | $ | 5,401 | |
| FICC | | | 2.000 | | | | 12/31/2018 | | | | 01/02/2019 | | | | 743 | | | U.S. Treasury Notes 2.875% due 07/31/2025 | | | (759 | ) | | | 743 | | | | 743 | |
| | | | | | | | | | | | | | | | | | | | | | | | | | | | | | |
Total Repurchase Agreements | | | | | $ | (6,283 | ) | | $ | 6,143 | | | $ | 6,144 | |
| | | | | | | | | | | | | | | | | | | | | | | | | | | | | | |
BORROWINGS AND OTHER FINANCING TRANSACTIONS SUMMARY
The following is a summary by counterparty of the market value of Borrowings and Other Financing Transactions and collateral pledged/(received) as of December 31, 2018:
| | | | | | | | | | | | | | | | | | | | | | | | | | | | |
| Counterparty | | Repurchase
Agreement
Proceeds
to be
Received(1) | | | Payable for
Reverse
Repurchase
Agreements | | | Payable for
Sale-Buyback
Transactions | | | Securities
Out on Loan | | | Total
Borrowings and
Other Financing
Transactions | | | Collateral
Pledged/(Received) | | | Net Exposure(2) | |
Global/Master Repurchase Agreement | |
BSN | | $ | 5,401 | | | $ | 0 | | | $ | 0 | | | $ | 0 | | | $ | 5,401 | | | $ | (5,524 | ) | | $ | (123 | ) |
FICC | | | 743 | | | | 0 | | | | 0 | | | | 0 | | | | 743 | | | | (759 | ) | | | (16 | ) |
|
Master Securities Lending Agreement | |
GSC | | | 0 | | | | 0 | | | | 0 | | | | 637 | | | | 637 | | | | (651 | ) | | | (14 | ) |
| | | | | | | | | | | | | | | | | | | | | | | | | | | | |
Total Borrowings and Other Financing Transactions | | $ | 6,144 | | | $ | 0 | | | $ | 0 | | | $ | 637 | | | | | | | | | | | | | |
| | | | | | | | | | | | | | | | | | | | | | | | | | | | |
CERTAIN TRANSFERS ACCOUNTED FOR AS SECURED BORROWINGS
Remaining Contractual Maturity of the Agreements
| | | | | | | | | | | | | | | | | | | | |
| | | Overnight and
Continuous | | | Up to 30 days | | | 31-90 days | | | Greater Than 90 days | | | Total | |
Securities Lending Transactions(3) | | | | | | | | | | | | | | | | | | | | |
Corporate Bonds & Notes | | $ | 637 | | | $ | 0 | | | $ | 0 | | | $ | 0 | | | $ | 637 | |
| | | | | | | | | | | | | | | | | | | | |
Total Borrowings | | $ | 637 | | | $ | 0 | | | $ | 0 | | | $ | 0 | | | $ | 637 | |
| | | | | | | | | | | | | | | | | | | | |
Payable for securities lending transactions | | | $ | 637 | |
| | | | | | | | | | | | | | | | | | | | |
| (1) | Includes accrued interest. |
| (2) | Net Exposure represents the net receivable/(payable) that would be due from/to the counterparty in the event of default. Exposure from borrowings and other financing transactions can only be netted across transactions governed under the same master agreement with the same legal entity. See Note 8, Master Netting Arrangements, in the Notes to Financial Statements for more information regarding master netting arrangements. |
| (3) | Includes cash collateral as described in Note 5 in the Notes to Financial Statements. |
The average amount of borrowings outstanding during ended December 31, 2018 was $(412) at a weighted average interest rate of 1.098%. Average borrowings may include sale-buyback transactions and reverse repurchase agreements, if held during the period.
| | | | | | | | |
| 50 | | PIMCO ETF TRUST | | | | | See Accompanying Notes | |
December 31, 2018 (Unaudited)
(d) FINANCIAL DERIVATIVE INSTRUMENTS: EXCHANGE-TRADED OR CENTRALLY CLEARED
FUTURES CONTRACTS:
LONG FUTURES CONTRACTS
| | | | | | | | | | | | | | | | | | | | | | | | | | | | |
| | | | | |
| Description | | Expiration
Month | | | # of
Contracts | | | Notional
Amount | | | Unrealized
Appreciation/
(Depreciation) | | | Variation Margin | |
| | Asset | | | Liability | |
U.S. Treasury2-Year Note March Futures | | | 03/2019 | | | | 87 | | | | $ | | | | 18,471 | | | $ | 125 | | | $ | 12 | | | $ | 0 | |
U.S. Treasury5-Year Note March Futures | | | 03/2019 | | | | 43 | | | | | | | | 4,932 | | | | 79 | | | | 11 | | | | 0 | |
U.S. Treasury30-Year Bond March Futures | | | 03/2019 | | | | 123 | | | | | | | | 17,958 | | | | 825 | | | | 58 | | | | 0 | |
U.S. Treasury Ultra Long-Term Bond March Futures | | | 03/2019 | | | | 24 | | | | | | | | 3,856 | | | | 175 | | | | 12 | | | | (1 | ) |
| | | | | | | | | | | | | | | | | | | | | | | | | | | | |
| | | | | | | | | | | | | | | | | | $ | 1,204 | | | $ | 93 | | | $ | (1 | ) |
| | | | | | | | | | | | | | | | | | | | | | | | | | | | |
| | | | | | | | | | | | | | | | | | | | | | | | | | | | |
| SHORT FUTURES CONTRACTS | |
| | | | | |
| Description | | Expiration
Month | | | # of
Contracts | | | Notional
Amount | | | Unrealized
Appreciation/
(Depreciation) | | | Variation Margin | |
| | Asset | | | Liability | |
U.S. Treasury10-Year Note March Futures | | | 03/2019 | | | | 167 | | | | $ | | | | (20,377 | ) | | $ | (484 | ) | | $ | 0 | | | $ | (65 | ) |
| | | | | | | | | | | | | | | | | | | | | | | | | | | | |
Total Futures Contracts | | | $ | 720 | | | $ | 93 | | | $ | (66 | ) |
| | | | | | | | | | | | | | | | | | | | | | | | | | | | |
SWAP AGREEMENTS:
CREDIT DEFAULT SWAPS ON CREDIT INDICES - SELL PROTECTION(1)
| | | | | | | | | | | | | | | | | | | | | | | | | | | | | | | | | | |
| Index/Tranches | | Fixed
Receive Rate | | | Payment
Frequency | | Maturity
Date | | | Notional
Amount(2) | | | Premiums
Paid/(Received) | | | Unrealized
Appreciation/
(Depreciation) | | | Market
Value(3) | | | Variation Margin | |
| | Asset | | | Liability | |
CDX.IG-315-Year Index | | | 1.000 | % | | Quarterly | | | 12/20/2023 | | | $ | 50,100 | | | $ | 769 | | | $ | (469 | ) | | $ | 300 | | | $ | 18 | | | $ | 0 | |
| | | | | | | | | | | | | | | | | | | | | | | | | | | | | | | | | | |
Total Swap Agreements | | | $ | 769 | | | $ | (469 | ) | | $ | 300 | | | $ | 18 | | | $ | 0 | |
| | | | | | | | | | | | | | | | | | | | | | | | | | | | | | | | | | |
FINANCIAL DERIVATIVE INSTRUMENTS: EXCHANGE-TRADED OR CENTRALLY CLEARED SUMMARY
The following is a summary of the market value and variation margin of Exchange-Traded or Centrally Cleared Financial Derivative Instruments as of December 31, 2018:
| | | | | | | | | | | | | | | | | | | | | | | | | | | | | | | | | | | | |
| | | Financial Derivative Assets | | | | | | Financial Derivative Liabilities | |
| | | Market Value | | | Variation Margin
Asset | | | Total | | | | | | Market Value | | | Variation Margin
Liability | | | Total | |
| | | Purchased
Options | | | Futures | | | Swap
Agreements | | | | | | Written
Options | | | Futures | | | Swap
Agreements | |
Total Exchange-Traded or Centrally Cleared | | $ | 0 | | | $ | 93 | | | $ | 18 | | | $ | 111 | | | | | | | $ | 0 | | | $ | (66) | | | $ | 0 | | | $ | (66) | |
| | | | | | | | | | | | | | | | | | | | | | | | | | | | | | | | | | | | |
Cash of $1,834 has been pledged as collateral for exchange-traded and centrally cleared financial derivative instruments as of December 31, 2018. See Note 8, Master Netting Arrangements, in the Notes to Financial Statements for more information regarding master netting arrangements.
| (1) | If the Fund is a seller of protection and a credit event occurs, as defined under the terms of that particular swap agreement, the Fund will either (i) pay to the buyer of protection an amount equal to the notional amount of the swap and take delivery of the referenced obligation or underlying securities comprising the referenced index or (ii) pay a net settlement amount in the form of cash, securities or other deliverable obligations equal to the notional amount of the swap less the recovery value of the referenced obligation or underlying securities comprising the referenced index. |
| (2) | The maximum potential amount the Fund could be required to pay as a seller of credit protection or receive as a buyer of credit protection if a credit event occurs as defined under the terms of that particular swap agreement. |
| (3) | The prices and resulting values for credit default swap agreements serve as indicators of the current status of the payment/performance risk and represent the likelihood of an expected liability (or profit) for the credit derivative should the notional amount of the swap agreement be closed/sold as of the period end. Increasing market values, in absolute terms when compared to the notional amount of the swap, represent a deterioration of the referenced indices’ credit soundness and a greater likelihood or risk of default or other credit event occurring as defined under the terms of the agreement. |
| | | | | | |
| See Accompanying Notes | | SEMIANNUAL REPORT | | DECEMBER 31, 2018 | | 51 |
Schedule of InvestmentsPIMCO Investment Grade Corporate Bond Index Exchange-Traded Fund(Cont.)
December 31, 2018 (Unaudited)
FAIR VALUE OF FINANCIAL DERIVATIVE INSTRUMENTS
The following is a summary of the fair valuation of the Fund’s derivative instruments categorized by risk exposure. See Note 7, Principal Risks, in the Notes to Financial Statements on risks of the Fund.
Fair Values of Financial Derivative Instruments on the Statements of Assets and Liabilities as of December 31, 2018:
| | | | | | | | | | | | | | | | | | | | | | | | |
| | | Derivatives not accounted for as hedging instruments | |
| | | Commodity
Contracts | | | Credit
Contracts | | | Equity
Contracts | | | Foreign
Exchange
Contracts | | | Interest
Rate Contracts | | | Total | |
Financial Derivative Instruments - Assets | |
Exchange-traded or centrally cleared | |
Futures | | $ | 0 | | | $ | 0 | | | $ | 0 | | | $ | 0 | | | $ | 93 | | | $ | 93 | |
Swap Agreements | | | 0 | | | | 18 | | | | 0 | | | | 0 | | | | 0 | | | | 18 | |
| | | | | | | | | | | | | | | | | | | | | | | | |
| | $ | 0 | | | $ | 18 | | | $ | 0 | | | $ | 0 | | | $ | 93 | | | $ | 111 | |
| | | | | | | | | | | | | | | | | | | | | | | | |
|
Financial Derivative Instruments - Liabilities | |
Exchange-traded or centrally cleared | |
Futures | | $ | 0 | | | $ | 0 | | | $ | 0 | | | $ | 0 | | | $ | 66 | | | $ | 66 | |
| | | | | | | | | | | | | | | | | | | | | | | | |
The effect of Financial Derivative Instruments on the Statements of Operations for the period ended December 31, 2018:
| | | | | | | | | | | | | | | | | | | | | | | | |
| | | Derivatives not accounted for as hedging instruments | |
| | | Commodity
Contracts | | | Credit
Contracts | | | Equity
Contracts | | | Foreign
Exchange
Contracts | | | Interest
Rate Contracts | | | Total | |
Net Realized Gain (Loss) on Financial Derivative Instruments | |
Exchange-traded or centrally cleared | |
Futures | | $ | 0 | | | $ | 0 | | | $ | 0 | | | $ | 0 | | | $ | (188 | ) | | $ | (188 | ) |
Swap Agreements | | | 0 | | | | 169 | | | | 0 | | | | 0 | | | | 10 | | | | 179 | |
| | | | | | | | | | | | | | | | | | | | | | | | |
| | $ | 0 | | | $ | 169 | | | $ | 0 | | | $ | 0 | | | $ | (178 | ) | | $ | (9 | ) |
| | | | | | | | | | | | | | | | | | | | | | | | |
|
Net Change in Unrealized Appreciation (Depreciation) on Financial Derivative Instruments | |
Exchange-traded or centrally cleared | |
Futures | | $ | 0 | | | $ | 0 | | | $ | 0 | | | $ | 0 | | | $ | 546 | | | $ | 546 | |
Swap Agreements | | | 0 | | | | (403 | ) | | | 0 | | | | 0 | | | | 0 | | | | (403 | ) |
| | | | | | | | | | | | | | | | | | | | | | | | |
| | $ | 0 | | | $ | (403 | ) | | $ | 0 | | | $ | 0 | | | $ | 546 | | | $ | 143 | |
| | | | | | | | | | | | | | | | | | | | | | | | |
FAIR VALUE MEASUREMENTS
The following is a summary of the fair valuations according to the inputs used as of December 31, 2018 in valuing the Fund’s assets and liabilities:
| | | | | | | | | | | | | | | | |
| Category and Subcategory | | Level 1 | | | Level 2 | | | Level 3 | | | Fair
Value at
12/31/2018 | |
Investments in Securities, at Value | |
Corporate Bonds & Notes | |
Banking & Finance | | $ | 0 | | | $ | 248,992 | | | $ | 0 | | | $ | 248,992 | |
Industrials | | | 0 | | | | 291,774 | | | | 0 | | | | 291,774 | |
Utilities | | | 0 | | | | 71,125 | | | | 0 | | | | 71,125 | |
U.S. Treasury Obligations | | | 0 | | | | 815 | | | | 0 | | | | 815 | |
Sovereign Issues | | | 0 | | | | 1,889 | | | | 0 | | | | 1,889 | |
Short-Term Instruments | |
Repurchase Agreements | | | 0 | | | | 6,143 | | | | 0 | | | | 6,143 | |
| | | | | | | | | | | | | | | | |
| | $ | 0 | | | $ | 620,738 | | | $ | 0 | | | $ | 620,738 | |
| | | | | | | | | | | | | | | | |
|
Investments in Affiliates, at Value | |
Short-Term Instruments | |
Mutual Funds | | | 651 | | | | 0 | | | | 0 | | | | 651 | |
| | | | | | | | | | | | | | | | |
| | | | |
Total Investments | | $ | 651 | | | $ | 620,738 | | | $ | 0 | | | $ | 621,389 | |
| | | | | | | | | | | | | | | | |
| | | | | | | | | | | | | | | | |
| Category and Subcategory | | Level 1 | | | Level 2 | | | Level 3 | | | Fair
Value at
12/31/2018 | |
Financial Derivative Instruments - Assets | |
Exchange-traded or centrally cleared | | $ | 93 | | | $ | 18 | | | $ | 0 | | | $ | 111 | |
| | | | | | | | | | | | | | | | |
|
Financial Derivative Instruments - Liabilities | |
Exchange-traded or centrally cleared | | $ | (66 | ) | | $ | 0 | | | $ | 0 | | | $ | (66 | ) |
| | | | | | | | | | | | | | | | |
| | | | |
Total Financial Derivative Instruments | | $ | 27 | | | $ | 18 | | | $ | 0 | | | $ | 45 | |
| | | | | | | | | | | | | | | | |
| | | | |
Totals | | $ | 678 | | | $ | 620,756 | | | $ | 0 | | | $ | 621,434 | |
| | | | | | | | | | | | | | | | |
There were no significant transfers into or out of Level 3 during the period ended December 31, 2018.
| | | | | | | | |
| 52 | | PIMCO ETF TRUST | | | | | See Accompanying Notes | |
Schedule of InvestmentsPIMCO Active Bond Exchange-Traded Fund
December 31, 2018 (Unaudited)
(Amounts in thousands*, except number of shares, contracts and units, if any)
| | | | | | | | | | | | |
| | | | | PRINCIPAL
AMOUNT
(000S) | | | | | MARKET
VALUE
(000S) | |
| INVESTMENTS IN SECURITIES 111.6% | |
| |
| LOAN PARTICIPATIONS AND ASSIGNMENTS 0.6% | |
|
Castlelake Aircraft Securitization Trust | |
3.967% due 07/15/2042 | | $ | | | 4,963 | | | $ | | | 4,930 | |
|
State of Rio de Janeiro | |
6.024% (LIBOR03M + 3.250%) due 12/20/2020 «~ | | | | | 2,400 | | | | | | 2,318 | |
|
Zephyrus Capital Aviation Partners LLC | |
4.605% due 10/15/2038 | | | | | 4,095 | | | | | | 4,076 | |
| | | | | | | | | | | | |
Total Loan Participations and Assignments (Cost $11,398) | | | 11,324 | |
| | | | |
| |
| CORPORATE BONDS & NOTES 30.3% | |
| |
| BANKING & FINANCE 21.9% | |
|
AerCap Ireland Capital DAC | |
3.875% due 01/23/2028 | | | | | 2,100 | | | | | | 1,837 | |
|
American Homes 4 Rent LP | |
4.250% due 02/15/2028 | | | | | 2,900 | | | | | | 2,809 | |
|
American Tower Corp. | |
3.375% due 10/15/2026 | | | | | 3,300 | | | | | | 3,077 | |
|
Banco Santander Mexico S.A. | |
4.125% due 11/09/2022 | | | | | 4,300 | | | | | | 4,246 | |
|
Bank of America Corp. | |
3.093% due 10/01/2025 • | | | | | 4,400 | | | | | | 4,175 | |
3.419% due 12/20/2028 • | | | | | 20,118 | | | | | | 18,826 | |
3.593% due 07/21/2028 • | | | | | 9,000 | | | | | | 8,549 | |
5.875% due 03/15/2028 •(e) | | | | | 5,300 | | | | | | 4,832 | |
|
Barclays Bank PLC | |
7.625% due 11/21/2022 (f) | | | | | 16,900 | | | | | | 17,544 | |
|
BBVA Bancomer S.A. | |
6.500% due 03/10/2021 | | | | | 6,000 | | | | | | 6,240 | |
|
BGC Partners, Inc. | |
5.375% due 07/24/2023 | | | | | 5,000 | | | | | | 5,078 | |
|
Blackstone CQP Holdco LP | |
6.000% due 08/18/2021 | | | | | 7,800 | | | | | | 7,850 | |
|
BNP Paribas S.A. | |
4.400% due 08/14/2028 | | | | | 700 | | | | | | 685 | |
|
BPCE S.A. | |
5.700% due 10/22/2023 | | | | | 6,600 | | | | | | 6,846 | |
|
Brixmor Operating Partnership LP | |
3.650% due 06/15/2024 | | | | | 7,000 | | | | | | 6,806 | |
|
Charles Schwab Corp. | |
5.000% due 12/01/2027 •(e) | | | | | 5,500 | | | | | | 4,628 | |
|
CIT Group, Inc. | |
4.750% due 02/16/2024 | | | | | 4,000 | | | | | | 3,855 | |
|
Citicorp Lease Pass-Through Trust | |
8.040% due 12/15/2019 | | | | | 3,871 | | | | | | 4,043 | |
|
Citigroup, Inc. | |
3.668% due 07/24/2028 • | | | | | 5,000 | | | | | | 4,731 | |
3.887% due 01/10/2028 • | | | | | 10,000 | | | | | | 9,629 | |
5.500% due 09/13/2025 | | | | | 4,000 | | | | | | 4,205 | |
|
Cooperatieve Rabobank UA | |
3.875% due 09/26/2023 | | | | | 6,150 | | | | | | 6,175 | |
|
Credit Suisse AG | |
6.500% due 08/08/2023 (f) | | | | | 15,400 | | | | | | 16,103 | |
|
Credit Suisse Group Funding Guernsey Ltd. | |
3.750% due 03/26/2025 | | | | | 10,000 | | | | | | 9,580 | |
|
Crown Castle International Corp. | |
4.450% due 02/15/2026 | | | | | 5,200 | | | | | | 5,187 | |
|
Deutsche Bank AG | |
3.375% due 05/12/2021 | | | | | 13,100 | | | | | | 12,649 | |
4.250% due 10/14/2021 | | | | | 3,000 | | | | | | 2,935 | |
|
EPR Properties | |
4.500% due 06/01/2027 | | | | | 4,300 | | | | | | 4,154 | |
|
Farmers Insurance Exchange | |
4.747% due 11/01/2057 • | | | | | 2,000 | | | | | | 1,774 | |
|
Ford Motor Credit Co. LLC | |
5.875% due 08/02/2021 | | | | | 3,900 | | | | | | 4,002 | |
|
Goldman Sachs Group, Inc. | |
3.691% due 06/05/2028 • | | | | | 7,100 | | | | | | 6,609 | |
3.850% due 01/26/2027 | | | | | 13,000 | | | | | | 12,247 | |
| | | | | | | | | | | | |
| | | | | PRINCIPAL
AMOUNT
(000S) | | | | | MARKET
VALUE
(000S) | |
|
Goodman U.S. Finance Three LLC | |
3.700% due 03/15/2028 | | $ | | | 5,000 | | | $ | | | 4,771 | |
|
Hampton Roads PPV LLC | |
6.621% due 06/15/2053 | | | | | 35,651 | | | | | | 36,532 | |
|
Healthcare Trust of America Holdings LP | |
3.750% due 07/01/2027 | | | | | 4,600 | | | | | | 4,390 | |
|
Hospitality Properties Trust | |
3.950% due 01/15/2028 | | | | | 3,000 | | | | | | 2,710 | |
4.250% due 02/15/2021 | | | | | 2,200 | | | | | | 2,207 | |
4.375% due 02/15/2030 | | | | | 1,300 | | | | | | 1,194 | |
|
HSBC Holdings PLC | |
4.250% due 03/14/2024 | | | | | 6,000 | | | | | | 5,961 | |
4.250% due 08/18/2025 | | | | | 7,200 | | | | | | 7,001 | |
4.583% due 06/19/2029 • | | | | | 5,300 | | | | | | 5,263 | |
|
Hudson Pacific Properties LP | |
3.950% due 11/01/2027 | | | | | 900 | | | | | | 839 | |
|
JPMorgan Chase & Co. | |
3.782% due 02/01/2028 • | | | | | 19,000 | | | | | | 18,473 | |
6.100% due 10/01/2024 •(e) | | | | | 7,000 | | | | | | 6,965 | |
|
Lloyds Bank PLC | |
12.000% due 12/16/2024 •(e) | | | | | 6,600 | | | | | | 7,752 | |
|
Lloyds Banking Group PLC | |
7.500% due 09/27/2025 •(e)(f) | | | | | 5,000 | | | | | | 4,839 | |
|
Mid-America Apartments LP | |
4.000% due 11/15/2025 | | | | | 7,500 | | | | | | 7,487 | |
|
MMcapS Funding Ltd. | |
3.112% (US0003M + 0.290%) due 12/26/2039 ~ | | | | | 826 | | | | | | 771 | |
|
Morgan Stanley | |
4.000% due 07/23/2025 | | | | | 27,500 | | | | | | 27,165 | |
|
Nordea Bank Abp | |
6.125% due 09/23/2024 •(e)(f) | | | | | 550 | | | | | | 518 | |
|
Omega Healthcare Investors, Inc. | |
4.750% due 01/15/2028 (g) | | | | | 3,350 | | | | | | 3,290 | |
|
Pacific Life Insurance Co. | |
9.250% due 06/15/2039 | | | | | 5,000 | | | | | | 7,701 | |
|
Physicians Realty LP | |
4.300% due 03/15/2027 | | | | | 2,000 | | | | | | 1,946 | |
|
Preferred Term Securities Ltd. | |
3.088% (US0003M + 0.300%) due 03/22/2037 ~ | | | | | 3,080 | | | | | | 2,832 | |
|
Royal Bank of Scotland Group PLC | |
4.519% due 06/25/2024 • | | | | | 5,000 | | | | | | 4,911 | |
8.625% due 08/15/2021 •(e)(f) | | | | | 3,000 | | | | | | 3,113 | |
|
Santander UK Group Holdings PLC | |
3.373% due 01/05/2024 • | | | | | 2,900 | | | | | | 2,754 | |
3.823% due 11/03/2028 • | | | | | 5,000 | | | | | | 4,529 | |
|
Springleaf Finance Corp. | |
6.125% due 05/15/2022 | | | | | 4,500 | | | | | | 4,386 | |
8.250% due 12/15/2020 | | | | | 5,500 | | | | | | 5,706 | |
|
State Street Corp. | |
5.625% due 12/15/2023 •(e) | | | | | 5,000 | | | | | | 4,731 | |
|
UBS AG | |
7.625% due 08/17/2022 (f) | | | | | 13,950 | | | | | | 14,892 | |
|
UDR, Inc. | |
3.500% due 07/01/2027 | | | | | 2,400 | | | | | | 2,289 | |
|
Washington Prime Group LP | |
3.850% due 04/01/2020 | | | | | 1,900 | | | | | | 1,872 | |
|
Wells Fargo & Co. | |
3.584% due 05/22/2028 • | | | | | 15,000 | | | | | | 14,425 | |
| | | | | | | | | | | | |
| | | | | | | | | | | 436,121 | |
| | | | | | | | | | | | |
| |
| INDUSTRIALS 7.1% | |
|
Andeavor Logistics LP | |
4.250% due 12/01/2027 | | | | | 4,200 | | | | | | 3,974 | |
|
AP Moller - Maersk A/S | |
3.750% due 09/22/2024 | | | | | 2,500 | | | | | | 2,431 | |
|
Arrow Electronics, Inc. | |
3.250% due 09/08/2024 | | | | | 5,000 | | | | | | 4,664 | |
3.875% due 01/12/2028 | | | | | 2,500 | | | | | | 2,283 | |
|
Bacardi Ltd. | |
4.450% due 05/15/2025 | | | | | 5,000 | | | | | | 4,942 | |
| | | | | | | | | | | | |
| | | | | PRINCIPAL
AMOUNT
(000S) | | | | | MARKET
VALUE
(000S) | |
|
Campbell Soup Co. | |
3.650% due 03/15/2023 | | $ | | | 3,400 | | | $ | | | 3,319 | |
|
Charter Communications Operating LLC | |
4.908% due 07/23/2025 | | | | | 4,600 | | | | | | 4,578 | |
|
Corp. Nacional del Cobre de Chile | |
3.625% due 08/01/2027 | | | | | 4,000 | | | | | | 3,819 | |
4.500% due 09/16/2025 | | | | | 3,500 | | | | | | 3,553 | |
|
CVS Health Corp. | |
4.100% due 03/25/2025 | | | | | 10,000 | | | | | | 9,926 | |
|
Dell International LLC | |
5.450% due 06/15/2023 | | | | | 4,000 | | | | | | 4,074 | |
|
Ecopetrol S.A. | |
5.875% due 09/18/2023 | | | | | 5,000 | | | | | | 5,225 | |
|
Energy Transfer Operating LP | |
5.200% due 02/01/2022 | | | | | 2,275 | | | | | | 2,338 | |
|
Energy Transfer Partners LP | |
4.500% due 11/01/2023 | | | | | 5,000 | | | | | | 5,007 | |
5.000% due 10/01/2022 | | | | | 2,500 | | | | | | 2,553 | |
|
ERAC USA Finance LLC | |
3.800% due 11/01/2025 | | | | | 900 | | | | | | 884 | |
|
General Electric Co. | |
5.000% due 01/21/2021 •(e) | | | | | 6,000 | | | | | | 4,598 | |
|
Kinder Morgan Energy Partners LP | |
4.300% due 05/01/2024 (g) | | | | | 850 | | | | | | 851 | |
6.850% due 02/15/2020 | | | | | 1,100 | | | | | | 1,139 | |
|
Kinder Morgan, Inc. | |
5.625% due 11/15/2023 | | | | | 2,000 | | | | | | 2,118 | |
|
Kraft Heinz Foods Co. | |
3.950% due 07/15/2025 | | | | | 5,000 | | | | | | 4,848 | |
|
Magellan Health, Inc. | |
4.400% due 09/22/2024 | | | | | 5,500 | | | | | | 5,182 | |
|
Marvell Technology Group Ltd. | |
4.200% due 06/22/2023 | | | | | 3,000 | | | | | | 2,994 | |
|
New York and Presbyterian Hospital | |
4.763% due 08/01/2116 | | | | | 3,000 | | | | | | 2,975 | |
|
Norwegian Air Shuttle ASA Pass-Through Trust | |
4.875% due 11/10/2029 | | | | | 5,114 | | | | | | 5,025 | |
|
QVC, Inc. | |
4.450% due 02/15/2025 | | | | | 1,250 | | | | | | 1,154 | |
|
Sabine Pass Liquefaction LLC | |
5.625% due 03/01/2025 | | | | | 2,000 | | | | | | 2,080 | |
|
Sands China Ltd. | |
4.600% due 08/08/2023 | | | | | 6,600 | | | | | | 6,573 | |
|
Sprint Spectrum Co. LLC | |
4.738% due 09/20/2029 | | | | | 6,500 | | | | | | 6,394 | |
|
Sunoco Logistics Partners Operations LP | |
5.950% due 12/01/2025 | | | | | 2,300 | | | | | | 2,403 | |
|
Syngenta Finance NV | |
4.441% due 04/24/2023 | | | | | 5,400 | | | | | | 5,209 | |
|
Tech Data Corp. | |
4.950% due 02/15/2027 | | | | | 2,420 | | | | | | 2,276 | |
|
Teva Pharmaceutical Finance Netherlands BV | |
2.800% due 07/21/2023 | | | | | 5,500 | | | | | | 4,742 | |
|
Wabtec Corp. | |
4.700% due 09/15/2028 | | | | | 4,600 | | | | | | 4,325 | |
|
Wesleyan University | |
4.781% due 07/01/2116 | | | | | 3,248 | | | | | | 3,336 | |
|
Western Gas Partners LP | |
3.950% due 06/01/2025 | | | | | 7,547 | | | | | | 7,123 | |
|
ZF North America Capital, Inc. | |
4.500% due 04/29/2022 | | | | | 2,800 | | | | | | 2,737 | |
| | | | | | | | | | | | |
| | | | | | | | | | | 141,652 | |
| | | | | | | | | | | | |
| |
| UTILITIES 1.3% | |
|
AT&T, Inc. | |
4.300% due 02/15/2030 | | | | | 4,163 | | | | | | 3,945 | |
|
Enable Midstream Partners LP | |
3.900% due 05/15/2024 | | | | | 2,750 | | | | | | 2,641 | |
|
FirstEnergy Corp. | |
3.900% due 07/15/2027 | | | | | 6,000 | | | | | | 5,825 | |
|
IPALCO Enterprises, Inc. | |
3.700% due 09/01/2024 | | | | | 4,450 | | | | | | 4,336 | |
| | | | | | |
| See Accompanying Notes | | SEMIANNUAL REPORT | | DECEMBER 31, 2018 | | 53 |
Schedule of InvestmentsPIMCO Active Bond Exchange-Traded Fund(Cont.)
| | | | | | | | | | | | |
| | | | | PRINCIPAL
AMOUNT
(000S) | | | | | MARKET
VALUE
(000S) | |
|
Odebrecht Drilling Norbe Ltd. | |
6.350% due 12/01/2021 | | $ | | | 1,426 | | | $ | | | 1,377 | |
|
Plains All American Pipeline LP | |
3.600% due 11/01/2024 | | | | | 6,762 | | | | | | 6,443 | |
| | | | | | | | | | | | |
| | | | | | | | | | | 24,567 | |
| | | | | | | | | | | | |
Total Corporate Bonds & Notes
(Cost $612,440) | | | 602,340 | |
| | | | |
| |
| MUNICIPAL BONDS & NOTES 2.0% | |
| |
| CALIFORNIA 0.4% | |
|
California State General Obligation Bonds, (BABs), Series 2010 | |
7.600% due 11/01/2040 | | | | | 2,000 | | | | | | 2,920 | |
|
University of California Revenue Bonds, Series 2012 | |
4.858% due 05/15/2112 | | | | | 2,000 | | | | | | 2,109 | |
|
University of California Revenue Bonds, Series 2015 | |
4.767% due 05/15/2115 | | | | | 2,100 | | | | | | 2,168 | |
| | | | | | | | | | | | |
| | | | | | | | | | | 7,197 | |
| | | | | | | | | | | | |
| |
| FLORIDA 0.4% | |
|
Palm Beach County, Florida Revenue Bonds, Series 2013 | |
5.250% due 11/01/2043 | | | | | 7,520 | | | | | | 8,017 | |
| | | | | | | | | | | | |
| |
| ILLINOIS 0.4% | |
|
Illinois State General Obligation Bonds, (BABs), Series 2010 | |
7.350% due 07/01/2035 | | | | | 6,800 | | | | | | 7,548 | |
| | | | | | | | | | | | |
| |
| NEW JERSEY 0.1% | |
|
New Jersey Economic Development Authority Revenue Notes, Series 2017 | |
3.520% due 07/01/2020 | | | | | 500 | | | | | | 502 | |
3.650% due 07/01/2021 | | | | | 500 | | | | | | 503 | |
3.800% due 07/01/2022 | | | | | 1,000 | | | | | | 1,008 | |
| | | | | | | | | | | | |
| | | | | | | | | | | 2,013 | |
| | | | | | | | | | | | |
| |
| SOUTH DAKOTA 0.4% | |
|
Educational Enhancement Funding Corp., South Dakota Revenue Notes, Series 2013 | |
3.539% due 06/01/2022 | | | | | 8,000 | | | | | | 8,029 | |
| | | | | | | | | | | | |
| |
| TEXAS 0.1% | |
|
Texas Public Finance Authority Revenue Notes, Series 2014 | |
8.250% due 07/01/2024 | | | | | 2,700 | | | | | | 2,745 | |
| | | | | | | | | | | | |
| |
| WEST VIRGINIA 0.2% | |
|
Tobacco Settlement Finance Authority, West Virginia Revenue Bonds, Series 2007 | |
7.467% due 06/01/2047 | | | | | 3,605 | | | | | | 3,540 | |
| | | | | | | | | | | | |
Total Municipal Bonds & Notes
(Cost $38,095) | | | | | | 39,089 | |
| | | | | | | | | | | | |
| |
| U.S. GOVERNMENT AGENCIES 50.6% | |
|
Fannie Mae | |
0.000% due 07/25/2031 - 02/25/2040 (b)(d) | | | | | 230 | | | | | | 198 | |
0.564% due 08/25/2022 ~(a) | | | | | 15,610 | | | | | | 259 | |
2.500% due 03/25/2033 | | | | | 2 | | | | | | 2 | |
3.000% due 03/25/2033 - 04/25/2043 | | | | | 10 | | | | | | 8 | |
3.491% due 05/25/2042 • | | | | | 206 | | | | | | 192 | |
3.494% due 09/25/2042 •(a) | | | | | 69,013 | | | | | | 11,958 | |
3.500% due 04/01/2032 - 05/01/2047 | | | | | 32,368 | | | | | | 32,507 | |
3.500% due 12/01/2047 (g) | | | | | 55,739 | | | | | | 55,778 | |
3.700% due 12/01/2028 • | | | | | 230 | | | | | | 231 | |
| | | | | | | | | | | | |
| | | | | PRINCIPAL
AMOUNT
(000S) | | | | | MARKET
VALUE
(000S) | |
3.914% due 04/25/2040 •(a) | | $ | | | 88 | | | $ | | | 11 | |
4.000% due 12/01/2020 - 10/01/2048 | | | | | 167,057 | | | | | | 170,930 | |
4.110% due 01/01/2037 • | | | | | 17 | | | | | | 17 | |
4.190% due 04/01/2036 • | | | | | 18 | | | | | | 19 | |
4.498% due 09/01/2034 • | | | | | 47 | | | | | | 50 | |
4.500% due 03/01/2019 - 06/01/2051 | | | | | 30,812 | | | | | | 32,156 | |
4.585% due 10/01/2035 • | | | | | 4 | | | | | | 4 | |
4.694% due 05/25/2036 •(a) | | | | | 1,908 | | | | | | 324 | |
4.750% due 09/01/2033 | | | | | 146 | | | | | | 152 | |
4.780% due 11/01/2035 • | | | | | 11 | | | | | | 11 | |
5.000% due 02/01/2019 - 11/01/2039 | | | | | 2,534 | | | | | | 2,599 | |
5.500% due 09/01/2027 - 04/01/2039 | | | | | 1,633 | | | | | | 1,692 | |
6.000% due 05/25/2031 - 09/01/2037 | | | | | 2,616 | | | | | | 2,787 | |
6.500% due 01/01/2036 - 05/01/2038 | | | | | 129 | | | | | | 139 | |
7.000% due 10/01/2020 - 11/01/2038 | | | | | 1,060 | | | | | | 1,098 | |
7.500% due 10/01/2021 - 10/01/2037 | | | | | 347 | | | | | | 368 | |
12.915% due 01/25/2036 • | | | | | 335 | | | | | | 395 | |
21.948% due 07/25/2023 • | | | | | 10 | | | | | | 12 | |
|
Fannie Mae, TBA | |
3.500% due 02/01/2049 | | | | | 47,000 | | | | | | 46,979 | |
|
Freddie Mac | |
0.000% due 01/15/2033 - 07/15/2039 (b)(d) | | | | | 948 | | | | | | 848 | |
1.689% due 06/15/2040 ~(a) | | | | | 23,791 | | | | | | 1,185 | |
2.575% due 05/15/2041 • | | | | | 2,789 | | | | | | 2,535 | |
2.949% due 06/15/2042 • | | | | | 2,040 | | | | | | 1,824 | |
3.000% due 01/01/2043 - 04/01/2043 | | | | | 21 | | | | | | 19 | |
3.500% due 12/15/2028 (a) | | | | | 3,519 | | | | | | 263 | |
3.500% due 10/01/2041 - 11/01/2047 | | | | | 185,346 | | | | | | 185,588 | |
4.000% due 09/01/2033 - 09/01/2048 | | | | | 154,929 | | | | | | 158,146 | |
4.000% due 09/01/2047 (g) | | | | | 132,698 | | | | | | 135,371 | |
4.375% due 10/01/2036 • | | | | | 2 | | | | | | 2 | |
4.465% due 12/01/2031 • | | | | | 120 | | | | | | 126 | |
4.467% due 07/01/2036 • | | | | | 26 | | | | | | 27 | |
4.500% due 02/01/2034 - 02/01/2045 | | | | | 9,991 | | | | | | 10,424 | |
4.740% due 11/01/2023 • | | | | | 1 | | | | | | 1 | |
4.990% due 01/15/2041 • | | | | | 5,689 | | | | | | 6,006 | |
5.000% due 03/01/2033 - 07/15/2041 | | | | | 770 | | | | | | 821 | |
5.000% due 08/15/2039 (a) | | | | | 154 | | | | | | 9 | |
5.250% due 04/15/2033 | | | | | 44 | | | | | | 48 | |
5.500% due 01/01/2023 - 10/01/2037 | | | | | 2,211 | | | | | | 2,339 | |
6.000% due 02/01/2033 - 08/01/2037 | | | | | 234 | | | | | | 248 | |
6.500% due 01/01/2037 - 07/01/2037 | | | | | 30 | | | | | | 32 | |
8.500% due 12/01/2022 - 03/01/2023 | | | | | 34 | | | | | | 34 | |
9.000% due 12/01/2025 - 11/01/2030 | | | | | 18 | | | | | | 20 | |
9.500% due 01/01/2025 | | | | | 11 | | | | | | 11 | |
10.000% due 02/01/2019 - 04/01/2025 | | | | | 21 | | | | | | 21 | |
12.883% due 10/15/2023 • | | | | | 133 | | | | | | 152 | |
12.911% due 05/15/2033 • | | | | | 72 | | | | | | 95 | |
|
Freddie Mac, TBA | |
3.500% due 01/01/2049 | | | | | 6,000 | | | | | | 5,999 | |
|
Ginnie Mae | |
3.114% due 05/20/2066 • | | | | | 5,725 | | | | | | 5,800 | |
3.464% due 03/20/2066 • | | | | | 3,819 | | | | | | 3,923 | |
3.500% due 12/20/2040 - 03/20/2047 | | | | | 27,150 | | | | | | 27,330 | |
4.000% due 09/20/2040 - 06/15/2047 | | | | | 60,465 | | | | | | 62,494 | |
4.500% due 08/20/2038 - 02/20/2047 | | | | | 4,279 | | | | | | 4,415 | |
4.750% due 01/20/2035 | | | | | 39 | | | | | | 43 | |
| | | | | | | | | | | | |
| | | | | PRINCIPAL
AMOUNT
(000S) | | | | | MARKET
VALUE
(000S) | |
5.000% due 03/20/2034 - 05/20/2047 | | $ | | | 1,233 | | | $ | | | 1,275 | |
5.500% due 04/16/2034 - 11/20/2038 | | | | | 91 | | | | | | 99 | |
6.000% due 08/20/2038 - 02/20/2039 | | | | | 103 | | | | | | 107 | |
6.500% due 12/20/2038 | | | | | 28 | | | | | | 29 | |
10.000% due 12/15/2019 | | | | | 3 | | | | | | 3 | |
|
Ginnie Mae, TBA | |
3.000% due 02/01/2049 | | | | | 16,000 | | | | | | 15,736 | |
|
Tennessee Valley Authority | |
4.250% due 09/15/2065 | | | | | 10,000 | | | | | | 11,437 | |
|
Tennessee Valley Authority STRIPS | |
0.000% due 06/15/2038 (d) | | | | | 2,500 | | | | | | 1,232 | |
| | | | | | | | | | | | |
Total U.S. Government Agencies
(Cost $1,030,290) | | | | | | 1,006,993 | |
| | | | | | | | | | | | |
| |
| U.S. TREASURY OBLIGATIONS 8.5% | |
|
U.S. Treasury Bonds | |
3.375% due 11/15/2048 (g) | | | | | 35,000 | | | | | | 37,500 | |
|
U.S. Treasury Notes | |
3.000% due 10/31/2025 (g) | | | | | 88,000 | | | | | | 90,332 | |
3.125% due 11/15/2028 (g) | | | | | 40,800 | | | | | | 42,356 | |
| | | | | | | | | | | | |
Total U.S. Treasury Obligations
(Cost $162,441) | | | | | | 170,188 | |
| | | | | | | | | | | | |
| |
| NON-AGENCY MORTGAGE-BACKED SECURITIES 4.3% | |
|
American Home Mortgage Investment Trust | |
4.385% due 09/25/2045 • | | | | | 18 | | | | | | 17 | |
|
Banc of America Funding Trust | |
2.455% due 08/27/2036 ~ | | | | | 8,335 | | | | | | 7,238 | |
|
Banc of America Mortgage Trust | |
4.746% due 10/25/2034 ~ | | | | | 387 | | | | | | 388 | |
|
BCAP LLC Trust | |
2.656% due 05/25/2047 ^• | | | | | 4,249 | | | | | | 3,938 | |
|
Bear StearnsALT-A Trust | |
3.146% due 04/25/2034 • | | | | | 39 | | | | | | 39 | |
|
Civic Mortgage LLC | |
3.892% due 06/25/2022 Ø | | | | | 2,746 | | | | | | 2,742 | |
|
Countrywide Alternative Loan Trust | |
5.500% due 08/25/2035 | | | | | 714 | | | | | | 685 | |
5.500% due 12/25/2035 | | | | | 1,426 | | | | | | 1,321 | |
|
Countrywide Home Loan Mortgage Pass-Through Trust | |
3.046% due 03/25/2035 • | | | | | 147 | | | | | | 141 | |
3.879% due 03/20/2036 ~ | | | | | 1,336 | | | | | | 1,245 | |
|
Countrywide Home Loan Reperforming REMIC Trust | |
2.846% due 01/25/2036 • | | | | | 3,216 | | | | | | 3,159 | |
|
Credit Suisse First Boston Mortgage Securities Corp. | |
3.156% due 11/25/2031 • | | | | | 40 | | | | | | 36 | |
4.356% due 11/25/2034 ~ | | | | | 45 | | | | | | 46 | |
|
Credit Suisse Mortgage Capital Certificates | |
6.000% due 05/27/2036 | | | | | 7 | | | | | | 7 | |
6.000% due 07/25/2037 ^ | | | | | 1,243 | | | | | | 1,111 | |
|
Great Hall Mortgages PLC | |
2.931% due 06/18/2039 • | | | | | 3,193 | | | | | | 3,077 | |
|
GSMPS Mortgage Loan Trust | |
2.856% due 01/25/2036 • | | | | | 3,279 | | | | | | 2,912 | |
|
GSR Mortgage Loan Trust | |
4.354% due 01/25/2036 ~ | | | | | 3,105 | | | | | | 3,086 | |
4.464% due 11/25/2035 ~ | | | | | 25 | | | | | | 25 | |
4.680% due 09/25/2034 ~ | | | | | 322 | | | | | | 330 | |
|
HarborView Mortgage Loan Trust | |
3.010% due 03/19/2035 • | | | | | 2,404 | | | | | | 2,326 | |
|
HomeBanc Mortgage Trust | |
2.836% due 10/25/2035 • | | | | | 1,812 | | | | | | 1,814 | |
|
Impac Secured Assets Trust | |
2.676% due 01/25/2037 • | | | | | 2,137 | | | | | | 2,065 | |
|
JPMorgan Alternative Loan Trust | |
4.330% due 12/25/2035 ^~ | | | | | 981 | | | | | | 857 | |
|
JPMorgan Mortgage Trust | |
4.101% due 07/25/2035 ~ | | | | | 43 | | | | | | 44 | |
6.000% due 08/25/2037 ^ | | | | | 1,334 | | | | | | 1,054 | |
6.500% due 01/25/2036 ^ | | | | | 7,698 | | | | | | 6,048 | |
| | | | | | | | |
| 54 | | PIMCO ETF TRUST | | | | | See Accompanying Notes | |
December 31, 2018 (Unaudited)
| | | | | | | | | | | | |
| | | | | PRINCIPAL
AMOUNT
(000S) | | | | | MARKET
VALUE
(000S) | |
|
JPMorgan Resecuritization Trust | |
4.008% due 07/27/2037 ~ | | $ | | | 27 | | | $ | | | 27 | |
|
Lehman XS Trust | |
2.696% due 11/25/2046 • | | | | | 5,260 | | | | | | 4,927 | |
3.157% due 11/25/2035 • | | | | | 98 | | | | | | 99 | |
|
MASTR Adjustable Rate Mortgages Trust | |
2.199% due 04/25/2034 ~ | | | | | 1,516 | | | | | | 1,455 | |
4.002% due 03/25/2035 ~ | | | | | 1,940 | | | | | | 1,918 | |
|
Merrill Lynch Mortgage Investors Trust | |
3.066% due 07/25/2029 • | | | | | 599 | | | | | | 575 | |
4.068% due 05/25/2029 ~ | | | | | 25 | | | | | | 25 | |
|
Morgan Stanley Capital Trust | |
3.402% due 07/13/2029 ~ | | | | | 5,030 | | | | | | 5,032 | |
|
Morgan Stanley Mortgage Loan Trust | |
4.293% due 06/25/2036 ~ | | | | | 6,717 | | | | | | 6,873 | |
|
RBSGC Mortgage Loan Trust | |
2.886% due 12/25/2034 • | | | | | 2,264 | | | | | | 1,996 | |
|
Residential Asset Securitization Trust | |
3.056% due 08/25/2033 • | | | | | 44 | | | | | | 41 | |
5.500% due 08/25/2034 | | | | | 2,309 | | | | | | 2,351 | |
|
Sequoia Mortgage Trust | |
2.820% due 07/20/2033 • | | | | | 44 | | | | | | 42 | |
3.027% due 02/20/2035 • | | | | | 1,222 | | | | | | 1,212 | |
|
Thornburg Mortgage Securities Trust | |
2.636% due 06/25/2037 • | | | | | 428 | | | | | | 412 | |
4.270% due 10/25/2046 • | | | | | 3,570 | | | | | | 3,556 | |
|
WaMu Mortgage Pass-Through Certificates Trust | |
2.579% due 10/25/2046 • | | | | | 2,387 | | | | | | 2,285 | |
|
Wells Fargo Mortgage-Backed Securities Trust | |
4.844% due 12/28/2037 ~ | | | | | 4,608 | | | | | | 4,487 | |
5.750% due 02/25/2037 | | | | | 2,520 | | | | | | 2,362 | |
| | | | | | | | | | | | |
TotalNon-Agency Mortgage-Backed Securities (Cost $84,503) | | | | | | 85,426 | |
| | | | | | | | | | | | |
| |
| ASSET-BACKED SECURITIES 14.4% | |
|
AASET Trust | |
3.967% due 05/16/2042 | | | | | 4,320 | | | | | | 4,315 | |
|
AASET U.S. Ltd. | |
3.844% due 01/16/2038 | | | | | 4,553 | | | | | | 4,571 | |
|
Adams Mill CLO Ltd. | |
3.536% due 07/15/2026 • | | | | | 1,310 | | | | | | 1,308 | |
|
ALESCO Preferred Funding Ltd. | |
3.154% due 12/23/2036 • | | | | | 2,559 | | | | | | 2,378 | |
3.574% due 09/23/2038 • | | | | | 3,289 | | | | | | 3,090 | |
|
Allegro CLO Ltd. | |
3.740% due 01/30/2026 • | | | | | 2,728 | | | | | | 2,729 | |
|
Apidos CLO | |
3.430% due 01/19/2025 • | | | | | 3,532 | | | | | | 3,525 | |
|
Argent Securities Trust | |
2.696% due 03/25/2036 • | | | | | 5,058 | | | | | | 4,526 | |
|
Argent Securities, Inc. Asset-Backed Pass-Through Certificates | |
2.736% due 01/25/2036 • | | | | | 2,143 | | | | | | 1,987 | |
|
Asset-Backed Funding Certificates Trust | |
2.746% due 09/25/2036 • | | | | | 3,913 | | | | | | 3,598 | |
|
Asset-Backed Securities Corp. Home Equity Loan Trust | |
5.680% due 08/15/2032 • | | | | | 605 | | | | | | 586 | |
|
Avery Point CLO Ltd. | |
3.565% due 01/18/2025 • | | | | | 4,342 | | | | | | 4,338 | |
|
Bayview Koitere Fund Trust | |
3.623% due 03/28/2033 Ø | | | | | 2,049 | | | | | | 2,052 | |
|
Bayview Opportunity Master Fund Trust | |
3.352% due 11/28/2032 Ø | | | | | 1,319 | | | | | | 1,317 | |
3.672% due 03/28/2033 Ø | | | | | 429 | | | | | | 430 | |
3.721% due 02/28/2033 Ø | | | | | 2,572 | | | | | | 2,562 | |
3.844% due 04/28/2033 Ø | | | | | 2,663 | | | | | | 2,674 | |
4.090% due 05/28/2033 Ø | | | | | 3,140 | | | | | | 3,145 | |
|
Black Diamond CLO Ltd. | |
3.499% due 02/06/2026 • | | | | | 3,274 | | | | | | 3,270 | |
|
BlueMountain CLO Ltd. | |
3.945% due 07/18/2027 • | | | | | 1,700 | | | | | | 1,666 | |
|
BSPRT Issuer Ltd. | |
3.805% due 06/15/2027 • | | | | | 869 | | | | | | 870 | |
| | | | | | | | | | | | |
| | | | | PRINCIPAL
AMOUNT
(000S) | | | | | MARKET
VALUE
(000S) | |
|
Business Jet Securities LLC | |
4.335% due 02/15/2033 | | $ | | | 3,990 | | | $ | | | 4,015 | |
4.447% due 06/15/2033 | | | | | 5,425 | | | | | | 5,487 | |
|
Carrington Mortgage Loan Trust | |
2.666% due 10/25/2036 • | | | | | 4,054 | | | | | | 3,010 | |
3.556% due 05/25/2035 • | | | | | 5,100 | | | | | | 4,979 | |
|
Castlelake Aircraft Securitization Trust | |
4.125% due 06/15/2043 | | | | | 1,929 | | | | | | 1,960 | |
|
Cent CLO Ltd. | |
4.086% due 10/15/2026 • | | | | | 2,000 | | | | | | 1,962 | |
|
CIT Mortgage Loan Trust | |
3.856% due 10/25/2037 • | | | | | 3,420 | | | | | | 3,465 | |
|
Citigroup Mortgage Loan Trust | |
6.164% due 05/25/2036 Ø | | | | | 5,687 | | | | | | 3,233 | |
|
Citigroup Mortgage Loan Trust, Inc. | |
2.766% due 03/25/2037 • | | | | | 421 | | | | | | 380 | |
|
Countrywide Asset-Backed Certificates | |
2.726% due 09/25/2037 ^• | | | | | 3,870 | | | | | | 3,265 | |
3.781% due 10/25/2034 • | | | | | 361 | | | | | | 357 | |
|
EFS Volunteer LLC | |
3.386% due 07/26/2027 • | | | | | 69 | | | | | | 69 | |
|
EMC Mortgage Loan Trust | |
3.606% due 08/25/2040 • | | | | | 1,859 | | | | | | 1,805 | |
|
First Franklin Mortgage Loan Asset-Backed Certificates | |
3.331% due 05/25/2034 • | | | | | 3,407 | | | | | | 3,357 | |
|
Flagship CLO Ltd. | |
3.286% due 01/16/2026 • | | | | | 7,000 | | | | | | 6,974 | |
|
GSAA Trust | |
2.726% (US0001M + 0.220%) due 03/25/2047 ~ | | | | | 4,324 | | | | | | 2,463 | |
|
Halcyon Loan Advisors Funding Ltd. | |
3.569% due 10/22/2025 • | | | | | 7,000 | | | | | | 6,987 | |
|
Home Equity Mortgage Loan Asset-Backed Trust | |
2.746% due 11/25/2036 • | | | | | 7,515 | | | | | | 5,885 | |
|
ICG U.S. CLO Ltd. | |
3.286% due 01/16/2028 • | | | | | 7,600 | | | | | | 7,555 | |
|
JPMorgan Mortgage Acquisition Corp. | |
2.896% due 05/25/2035 • | | | | | 6,000 | | | | | | 5,946 | |
|
JPMorgan Mortgage Acquisition Trust | |
2.806% due 07/25/2036 • | | | | | 1,510 | | | | | | 1,421 | |
|
KDAC Aviation Finance Ltd. | |
4.212% due 12/15/2042 | | | | | 4,813 | | | | | | 4,821 | |
|
Lehman XS Trust | |
2.676% due 12/25/2036 • | | | | | 2,453 | | | | | | 2,349 | |
|
Long Beach Mortgage Loan Trust | |
3.406% due 06/25/2035 • | | | | | 6,225 | | | | | | 6,242 | |
|
Loomis Sayles CLO Ltd. | |
3.336% due 04/15/2028 • | | | | | 5,500 | | | | | | 5,427 | |
|
M360 Advisors LLC | |
4.395% due 07/24/2028 | | | | | 6,200 | | | | | | 6,226 | |
|
Merrill Lynch Mortgage Investors Trust | |
4.190% due 02/25/2037 ^Ø | | | | | 13,708 | | | | | | 2,776 | |
|
METAL LLC | |
4.581% due 10/15/2042 | | | | | 4,879 | | | | | | 4,924 | |
|
Mid-State Capital Corp. Trust | |
6.005% due 08/15/2037 | | | | | 33 | | | | | | 36 | |
|
Mid-State Trust | |
6.340% due 12/15/2036 | | | | | 4,918 | | | | | | 5,234 | |
|
Morgan Stanley ABS Capital, Inc. Trust | |
2.646% due 05/25/2037 • | | | | | 199 | | | | | | 176 | |
2.756% due 07/25/2036 • | | | | | 1,969 | | | | | | 1,023 | |
3.756% due 07/25/2037 • | | | | | 3,420 | | | | | | 3,179 | |
|
Morgan Stanley Mortgage Loan Trust | |
5.965% due 09/25/2046 ^Ø | | | | | 3,681 | | | | | | 2,012 | |
|
Mountain View CLO Ltd. | |
3.236% due 10/15/2026 • | | | | | 6,200 | | | | | | 6,189 | |
|
OHA Loan Funding Ltd. | |
3.827% due 01/23/2027 • | | | | | 9,050 | | | | | | 9,052 | |
|
Renaissance Home Equity Loan Trust | |
5.586% due 11/25/2036 Ø | | | | | 692 | | | | | | 377 | |
6.120% due 11/25/2036 Ø | | | | | 1,219 | | | | | | 723 | |
|
Residential Asset Mortgage Products Trust | |
4.531% due 03/25/2032 • | | | | | 1,274 | | | | | | 1,253 | |
| | | | | | | | | | | | |
| | | | | PRINCIPAL
AMOUNT
(000S) | | | | | MARKET
VALUE
(000S) | |
|
Residential Asset Securities Corp. Trust | |
4.620% due 10/25/2034 ~ | | $ | | | 78 | | | $ | | | 76 | |
|
S-Jets Ltd. | |
3.967% due 08/15/2042 | | | | | 5,922 | | | | | | 5,982 | |
|
Sapphire Aviation Finance Ltd. | |
4.250% due 03/15/2040 | | | | | 4,688 | | | | | | 4,699 | |
|
Saxon Asset Securities Trust | |
3.110% due 03/25/2035 ^• | | | | | 1,754 | | | | | | 1,713 | |
4.256% due 12/25/2037 • | | | | | 1,348 | | | | | | 1,345 | |
|
Securitized Asset-Backed Receivables LLC Trust | |
2.796% due 12/25/2035 • | | | | | 4,997 | | | | | | 4,885 | |
|
SLM Student Loan Trust | |
3.240% due 04/25/2023 • | | | | | 3,920 | | | | | | 3,887 | |
3.390% due 07/25/2023 • | | | | | 6,182 | | | | | | 6,194 | |
3.990% due 04/25/2023 • | | | | | 7,577 | | | | | | 7,685 | |
4.190% due 07/25/2023 • | | | | | 5,250 | | | | | | 5,338 | |
|
Sprite Ltd. | |
4.250% due 12/15/2037 | | | | | 6,456 | | | | | | 6,414 | |
|
Structured Asset Investment Loan Trust | |
3.211% due 03/25/2034 • | | | | | 4,861 | | | | | | 4,799 | |
|
TICP CLO Ltd. | �� |
3.309% due 04/20/2028 • | | | | | 8,700 | | | | | | 8,589 | |
|
Tralee CLO Ltd. | |
3.499% due 10/20/2027 • | | | | | 8,000 | | | | | | 7,967 | |
|
Venture CLO Ltd. | |
3.316% due 04/15/2027 • | | | | | 9,000 | | | | | | 8,906 | |
|
Vericrest Opportunity Loan Transferee LLC | |
3.125% due 09/25/2047 Ø | | | | | 5,375 | | | | | | 5,339 | |
3.250% due 06/25/2047 Ø | | | | | 4,203 | | | | | | 4,193 | |
|
WaMu Asset-Backed Certificates WaMu Trust | |
2.731% due 05/25/2037 • | | | | | 3,827 | | | | | | 3,613 | |
|
Whitehorse Ltd. | |
3.609% due 07/17/2026 • | | | | | 3,389 | | | | | | 3,384 | |
| | | | | | | | | | | | |
Total Asset-Backed Securities
(Cost $281,768) | | | | | | | | | | | 286,539 | |
| | | | | | | | | | | | |
| |
| SOVEREIGN ISSUES 0.9% | |
|
Mexico Government International Bond | |
5.750% due 10/12/2110 | | | | | 4,000 | | | | | | 3,775 | |
|
Qatar Government International Bond | |
3.875% due 04/23/2023 | | | | | 4,000 | | | | | | 4,052 | |
|
Saudi Government International Bond | |
4.000% due 04/17/2025 | | | | | 9,500 | | | | | | 9,436 | |
| | | | | | | | | | | | |
Total Sovereign Issues (Cost $17,608) | | | | | | 17,263 | |
| | | | | | | | | | | | |
| |
| SHORT-TERM INSTRUMENTS 0.0% | |
| |
| U.S. TREASURY BILLS 0.0% | |
2.353% due 01/03/2019 - 03/14/2019 (c)(d)(g)(j) | | | | | 702 | | | | | | 701 | |
| | | | | | | | | | | | |
Total Short-Term Instruments
(Cost $700) | | | | | | | | | | | 701 | |
| | | | | | | | | | | | |
| | | | |
| | | | | | | | | | | | |
Total Investments in Securities
(Cost $2,239,243) | | | | | | 2,219,863 | |
| | | | |
| | | | | | | | | | | | |
Total Investments 111.6%
(Cost $2,239,243) | | | | | | | | $ | | | 2,219,863 | |
| | | | | | | | | | | | |
Financial Derivative
Instruments (h)(i) (0.0)% (Cost or Premiums, net $(2,990)) | | | | | | (714 | ) |
| |
| Other Assets and Liabilities, net (11.6)% | | | (229,871 | ) |
| | | | | | | | | | | | |
| Net Assets 100.0% | | | | | | | | $ | | | 1,989,278 | |
| | | | | | | | | | | | |
| | | | | | |
| See Accompanying Notes | | SEMIANNUAL REPORT | | DECEMBER 31, 2018 | | 55 |
Schedule of InvestmentsPIMCO Active Bond Exchange-Traded Fund(Cont.)
NOTES TO SCHEDULE OF INVESTMENTS:
| * | A zero balance may reflect actual amounts rounding to less than one thousand. |
| « | Security valued using significant unobservable inputs (Level 3). |
| ~ | Variable or Floating rate security. Rate shown is the rate in effect as of period end. Certain variable rate securities are not based on a published reference rate and spread, rather are determined by the issuer or agent and are based on current market conditions. Reference rate is as of reset date, which may vary by security. These securities may not indicate a reference rate and/or spread in their description. |
| • | Rate shown is the rate in effect as of period end. The rate may be based on a fixed rate, a capped rate or a floor rate and may convert to a variable or floating rate in the future. These securities do not indicate a reference rate and spread in their description. |
| Ø | Coupon represents a rate which changes periodically based on a predetermined schedule or event. Rate shown is the rate in effect as of period end. |
| (a) | Interest only security. |
| (b) | Principal only security. |
| (c) | Coupon represents a weighted average yield to maturity. |
| (e) | Perpetual maturity; date shown, if applicable, represents next contractual call date. |
| (f) | Contingent convertible security. |
BORROWINGS AND OTHER FINANCING TRANSACTIONS
REVERSE REPURCHASE AGREEMENTS:
| | | | | | | | | | | | | | | | | | | | |
| Counterparty | | Borrowing
Rate(1) | | | Settlement
Date | | | Maturity
Date | | | Amount
Borrowed(1) | | | Payable for
Reverse
Repurchase
Agreements | |
BCY | | | 1.750 | % | | | 12/24/2018 | | | | TBD | (2) | | $ | (2,346 | ) | | $ | (2,347 | ) |
BOS | | | 2.750 | | | | 12/14/2018 | | | | 01/14/2019 | | | | (4,175 | ) | | | (4,181 | ) |
JPS | | | 3.050 | | | | 12/28/2018 | | | | 01/04/2019 | | | | (27,820 | ) | | | (27,832 | ) |
RCY | | | 2.500 | | | | 11/27/2018 | | | | 01/09/2019 | | | | (87,033 | ) | | | (87,251 | ) |
| | | 2.750 | | | | 12/13/2018 | | | | 01/14/2019 | | | | (21,876 | ) | | | (21,909 | ) |
| | | | | | | | | | | | | | | | | | | | |
Total Reverse Repurchase Agreements | | | | | | | $ | (143,520 | ) |
| | | | | | | | | | | | | | | | | | | | |
SALE-BUYBACK TRANSACTIONS:
| | | | | | | | | | | | | | | | | | | | |
| Counterparty | | Borrowing
Rate(1) | | | Borrowing
Date | | | Maturity
Date | | | Amount
Borrowed(1) | | | Payable for
Sale-Buyback
Transactions(3) | |
GSC | | | 2.750 | % | | | 12/18/2018 | | | | 01/02/2019 | | | $ | (69,724 | ) | | $ | (69,803 | ) |
UBS | | | 2.420 | | | | 10/17/2018 | | | | 01/17/2019 | | | | (69,646 | ) | | | (70,007 | ) |
| | | | | | | | | | | | | | | | | | | | |
Total Sale-Buyback Transactions | | | | | | | | | | | | | | | $ | (139,810 | ) |
| | | | | | | | | | | | | | | | | | | | |
SHORT SALES:
| | | | | | | | | | | | | | | | | | | | |
| Description | | Coupon | | | Maturity
Date | | | Principal
Amount | | | Proceeds | | | Payable for
Short Sales | |
U.S. Government Agencies (0.8)% | | | | | | | | | | | | | | | | | | | | |
Fannie Mae, TBA | | | 3.000% | | | | 01/01/2049 | | | $ | 16,000 | | | $ | (15,263 | ) | | $ | (15,614 | ) |
| | | | | | | | | | | | | | | | | | | | |
Total Short Sales (0.8)% | | | | | | | $ | (15,263 | ) | | $ | (15,614 | ) |
| | | | | | | | | | | | | | | | | | | | |
BORROWINGS AND OTHER FINANCING TRANSACTIONS SUMMARY
The following is a summary by counterparty of the market value of Borrowings and Other Financing Transactions and collateral pledged/(received) as of December 31, 2018:
| | | | | | | | | | | | | | | | | | | | | | | | | | | | |
| Counterparty | | Repurchase
Agreement
Proceeds
to be
Received | | | Payable for
Reverse
Repurchase
Agreements | | | Payable for
Sale-Buyback
Transactions(3) | | | Securities
Out on Loan | | | Total
Borrowings and
Other Financing
Transactions | | | Collateral
Pledged/(Received) | | | Net Exposure(4) | |
Global/Master Repurchase Agreement | |
BCY | | $ | 0 | | | $ | (2,347 | ) | | $ | 0 | | | $ | 0 | | | $ | (2,347 | ) | | $ | 2,584 | | | $ | 237 | |
BOS | | | 0 | | | | (4,181 | ) | | | 0 | | | | 0 | | | | (4,181 | ) | | | 4,381 | | | | 200 | |
JPS | | | 0 | | | | (27,832 | ) | | | 0 | | | | 0 | | | | (27,832 | ) | | | 27,857 | | | | 25 | |
RCY | | | 0 | | | | (109,160 | ) | | | 0 | | | | 0 | | | | (109,160 | ) | | | 110,212 | | | | 1,052 | |
| | | | | | | | |
| 56 | | PIMCO ETF TRUST | | | | | See Accompanying Notes | |
December 31, 2018 (Unaudited)
| | | | | | | | | | | | | | | | | | | | | | | | | | | | |
| Counterparty | | Repurchase
Agreement
Proceeds
to be
Received | | | Payable for
Reverse
Repurchase
Agreements | | | Payable for
Sale-Buyback
Transactions(3) | | | Securities
Out on Loan | | | Total
Borrowings and
Other Financing
Transactions | | | Collateral
Pledged/(Received) | | | Net Exposure(4) | |
Master Securities Forward Transaction Agreement | |
GSC | | $ | 0 | | | $ | 0 | | | $ | (69,803 | ) | | $ | 0 | | | $ | (69,803 | ) | | $ | 69,903 | | | $ | 100 | |
UBS | | | 0 | | | | 0 | | | | (70,007 | ) | | | 0 | | | | (70,007 | ) | | | 71,529 | | | | 1,522 | |
| | | | | | | | | | | | | | | | | | | | | | | | | | | | |
Total Borrowings and Other Financing Transactions | | $ | 0 | | | $ | (143,520 | ) | | $ | (139,810 | ) | | $ | 0 | | | | | | | | | | | | | |
| | | | | | | | | | | | | | | | | | | | | | | | | | | | |
CERTAIN TRANSFERS ACCOUNTED FOR AS SECURED BORROWINGS
Remaining Contractual Maturity of the Agreements
| | | | | | | | | | | | | | | | | | | | |
| | | Overnight and
Continuous | | | Up to 30 days | | | 31-90 days | | | Greater Than 90 days | | | Total | |
Reverse Repurchase Agreements | |
Corporate Bonds & Notes | | $ | 0 | | | $ | 0 | | | $ | 0 | | | $ | (2,347 | ) | | $ | (2,347 | ) |
U.S. Government Agencies | | | 0 | | | | (26,090 | ) | | | 0 | | | | 0 | | | | (26,090 | ) |
U.S. Treasury Obligations | | | 0 | | | | (115,083 | ) | | | 0 | | | | 0 | | | | (115,083 | ) |
| | | | | | | | | | | | | | | | | | | | |
Total | | $ | 0 | | | $ | (141,173 | ) | | $ | 0 | | | $ | (2,347 | ) | | $ | (143,520 | ) |
| | | | | | | | | | | | | | | | | | | | |
|
Sale-Buyback Transactions | |
U.S. Treasury Obligations | | | 0 | | | | (139,810 | ) | | | 0 | | | | 0 | | | | (139,810 | ) |
| | | | | | | | | | | | | | | | | | | | |
Total | | $ | 0 | | | $ | (139,810 | ) | | $ | 0 | | | $ | 0 | | | $ | (139,810 | ) |
| | | | | | | | | | | | | | | | | | | | |
Total Borrowings | | $ | 0 | | | $ | (280,983 | ) | | $ | 0 | | | $ | (2,347 | ) | | $ | (283,330 | ) |
| | | | | | | | | | | | | | | | | | | | |
Payable for reverse repurchase agreements and sale-buyback financing transactions | | | $ | (283,330 | ) |
| | | | | |
| (g) | Securities with an aggregate market value of $289,080 have been pledged as collateral under the terms of the above master agreements as of December 31, 2018. |
| (1) | The average amount of borrowings outstanding during the period ended December 31, 2018 was $(236,067) at a weighted average interest rate of 2.231%. Average borrowings may include sale-buyback transactions and reverse repurchase agreements, if held during the period. |
| (2) | Open maturity reverse repurchase agreement. |
| (3) | Payable for sale-buyback transactions includes $(70) of deferred price drop. |
| (4) | Net Exposure represents the net receivable/(payable) that would be due from/to the counterparty in the event of default. Exposure from borrowings and other financing transactions can only be netted across transactions governed under the same master agreement with the same legal entity. See Note 8, Master Netting Arrangements, in the Notes to Financial Statements for more information regarding master netting arrangements. |
(h) FINANCIAL DERIVATIVE INSTRUMENTS: EXCHANGE-TRADED OR CENTRALLY CLEARED
SWAP AGREEMENTS:
CREDIT DEFAULT SWAPS ON CORPORATE ISSUES - SELL PROTECTION(1)
| | | | | | | | | | | | | | | | | | | | | | | | | | | | | | | | | | | | | | |
| Reference Entity | | Fixed
Receive Rate | | | Payment
Frequency | | | Maturity
Date | | Implied
Credit Spread at
December 31, 2018(2) | | | Notional
Amount(3) | | | Premiums
Paid/(Received) | | | Unrealized
Appreciation/
(Depreciation) | | | Market
Value(4) | | | Variation Margin | |
| | Asset | | | Liability | |
Ford Motor Credit Co. LLC | | | 5.000 | % | | | Quarterly | | | 06/20/2022 | | | 1.689 | % | | $ | 10,100 | | | $ | 1,710 | | | $ | (617 | ) | | $ | 1,093 | | | $ | 0 | | | $ | (19 | ) |
General Electric Co. | | | 1.000 | | | | Quarterly | | | 06/20/2023 | | | 1.989 | | | | 15,000 | | | | 14 | | | | (601 | ) | | | (587 | ) | | | 0 | | | | 0 | |
General Motors Co. | | | 5.000 | | | | Quarterly | | | 06/20/2022 | | | 1.343 | | | | 6,000 | | | | 988 | | | | (260 | ) | | | 728 | | | | 0 | | | | (12 | ) |
Navient Corp. | | | 5.000 | | | | Quarterly | | | 06/20/2022 | | | 4.648 | | | | 6,000 | | | | 392 | | | | (317 | ) | | | 75 | | | | 0 | | | | (23 | ) |
| | | | | | | | | | | | | | | | | | | | | | | | | | | | | | | | | | | | | | |
| | | | | | | | | | | | | | | | | $ | 3,104 | | | $ | (1,795 | ) | | $ | 1,309 | | | $ | 0 | | | $ | (54 | ) |
| | | | | | | | | | | | | | | | | | | | | | | | | | | | | | | | | | | | | | |
CREDIT DEFAULT SWAPS ON CREDIT INDICES - SELL PROTECTION(1)
| | | | | | | | | | | | | | | | | | | | | | | | | | | | | | | | | | |
Index/Tranches | | Fixed
Receive Rate | | | Payment
Frequency | | Maturity
Date | | | Notional
Amount(3) | | | Premiums
Paid/(Received) | | | Unrealized
Appreciation/
(Depreciation) | | | Market
Value(4) | | | Variation Margin | |
| | Asset | | | Liability | |
CDX.EM-295-Year Index | | | 1.000 | % | | Quarterly | | | 06/20/2023 | | | $ | 1,500 | | | $ | (69 | ) | | $ | 14 | | | $ | (55 | ) | | $ | 1 | | | $ | 0 | |
CDX.EM-305-Year Index | | | 1.000 | | | Quarterly | | | 12/20/2023 | | | | 9,100 | | | | (428 | ) | | | 3 | | | | (425 | ) | | | 7 | | | | 0 | |
| | | | | | | | | | | | | | | | | | | | | | | | | | | | | | | | | | |
| | | $ | (497 | ) | | $ | 17 | | | $ | (480 | ) | | $ | 8 | | | $ | 0 | |
| | | | | | | | | | | | | | | | | | | | | | | | | | | | | | | | | | |
| | | | | | |
| See Accompanying Notes | | SEMIANNUAL REPORT | | DECEMBER 31, 2018 | | 57 |
Schedule of InvestmentsPIMCO Active Bond Exchange-Traded Fund(Cont.)
INTEREST RATE SWAPS
| | | | | | | | | | | | | | | | | | | | | | | | | | | | | | | | | | | | |
Pay/Receive
Floating Rate | | Floating Rate Index | | Fixed Rate | | | Payment
Frequency | | Maturity
Date | | | Notional
Amount | | | Premiums
Paid/
(Received) | | | Unrealized
Appreciation/
(Depreciation) | | | Market
Value | | | Variation Margin | |
| | Asset | | | Liability | |
Pay | | 3-Month USD-LIBOR | | | 1.750 | % | | Semi-Annual | | | 06/20/2020 | | | $ | 273,000 | | | $ | (5,078 | ) | | $ | 1,149 | | | $ | (3,929 | ) | | $ | 0 | | | $ | (10 | ) |
| | | | | | | | | | | | | | | | | | | | | | | | | | | | | | | | | | | | |
Total Swap Agreements | | | $ | (2,471 | ) | | $ | (629 | ) | | $ | (3,100 | ) | | $ | 8 | | | $ | (64 | ) |
| | | | | | | | | | | | | | | | | | | | | | | | | | | | | | | | | | | | |
FINANCIAL DERIVATIVE INSTRUMENTS: EXCHANGE-TRADED OR CENTRALLY CLEARED SUMMARY
The following is a summary of the market value and variation margin of Exchange-Traded or Centrally Cleared Financial Derivative Instruments as of December 31, 2018:
| | | | | | | | | | | | | | | | | | | | | | | | | | | | | | | | | | | | |
| | | Financial Derivative Assets | | | | | | Financial Derivative Liabilities | |
| | | Market Value | | | Variation Margin
Asset | | | Total | | | | | | Market Value | | | Variation Margin
Liability | | | Total | |
| | | Purchased
Options | | | Futures | | | Swap
Agreements | | | | | | Written
Options | | | Futures | | | Swap
Agreements | |
Total Exchange-Traded or Centrally Cleared | | $ | 0 | | | $ | 0 | | | $ | 8 | | | $ | 8 | | | | | | | $ | 0 | | | $ | 0 | | | $ | (64) | | | $ | (64) | |
| | | | | | | | | | | | | | | | | | | | | | | | | | | | | | | | | | | | |
Cash of $15,259 has been pledged as collateral for exchange-traded and centrally cleared financial derivative instruments as of December 31, 2018. See Note 8, Master Netting Arrangements, in the Notes to Financial Statements for more information regarding master netting arrangements.
| (1) | If the Fund is a seller of protection and a credit event occurs, as defined under the terms of that particular swap agreement, the Fund will either (i) pay to the buyer of protection an amount equal to the notional amount of the swap and take delivery of the referenced obligation or underlying securities comprising the referenced index or (ii) pay a net settlement amount in the form of cash, securities or other deliverable obligations equal to the notional amount of the swap less the recovery value of the referenced obligation or underlying securities comprising the referenced index. |
| (2) | Implied credit spreads, represented in absolute terms, utilized in determining the market value of credit default swap agreements on corporate or sovereign issues as of period end serve as indicators of the current status of the payment/performance risk and represent the likelihood or risk of default for the credit derivative. The implied credit spread of a particular referenced entity reflects the cost of buying/selling protection and may include upfront payments required to be made to enter into the agreement. Wider credit spreads represent a deterioration of the referenced entity’s credit soundness and a greater likelihood or risk of default or other credit event occurring as defined under the terms of the agreement. |
| (3) | The maximum potential amount the Fund could be required to pay as a seller of credit protection or receive as a buyer of credit protection if a credit event occurs as defined under the terms of that particular swap agreement. |
| (4) | The prices and resulting values for credit default swap agreements serve as indicators of the current status of the payment/performance risk and represent the likelihood of an expected liability (or profit) for the credit derivative should the notional amount of the swap agreement be closed/sold as of the period end. Increasing market values, in absolute terms when compared to the notional amount of the swap, represent a deterioration of the referenced indices’ credit soundness and a greater likelihood or risk of default or other credit event occurring as defined under the terms of the agreement. |
(i) FINANCIAL DERIVATIVE INSTRUMENTS: OVER THE COUNTER
FORWARD FOREIGN CURRENCY CONTRACTS:
| | | | | | | | | | | | | | | | | | | | | | | | |
Counterparty | | Settlement
Month | | | Currency to
be Delivered | | | Currency to
be Received | | | Unrealized Appreciation/
(Depreciation) | |
| | Asset | | | Liability | |
| | | | | | | |
CBK | | | 01/2019 | | | EUR | | | 354 | | | $ | | | 403 | | | $ | 0 | | | $ | (3 | ) |
| | | | | | | | | | | | | | | | | | | | | | | | |
Total Forward Foreign Currency Contracts | | | | | | | | | | | | | | | $ | 0 | | | $ | (3 | ) |
| | | | | | | | | | | | | | | | | | | | | | | | |
WRITTEN OPTIONS:
CREDIT DEFAULT SWAPTIONS ON CREDIT INDICES
| | | | | | | | | | | | | | | | | | | | | | | | | | |
| Counterparty | | Description | | Buy/Sell
Protection | | Exercise
Rate | | | Expiration
Date | | | Notional
Amount | | | Premiums
(Received) | | | Market
Value | |
BOA | | Put - OTCCDX.IG-315-Year Index | | Sell | | | 1.200 | % | | | 03/20/2019 | | | $ | | | 29,500 | | | $ | (33 | ) | | $ | (50 | ) |
CBK | | Put - OTCCDX.IG-315-Year Index | | Sell | | | 1.050 | | | | 02/20/2019 | | | | | | 28,000 | | | | (48 | ) | | | (47 | ) |
GST | | Put - OTCCDX.IG-315-Year Index | | Sell | | | 2.400 | | | | 09/18/2019 | | | | | | 4,000 | | | | (7 | ) | | | (8 | ) |
JPM | | Put - OTCCDX.IG-315-Year Index | | Sell | | | 0.950 | | | | 02/20/2019 | | | | | | 35,000 | | | | (63 | ) | | | (95 | ) |
MYC | | Put - OTCCDX.IG-315-Year Index | | Sell | | | 1.400 | | | | 04/17/2019 | | | | | | 10,000 | | | | (19 | ) | | | (16 | ) |
| | | | | | | | | | | | | | | | | | | | | | | | | | |
Total Written Options | | | $ | (170 | ) | | $ | (216 | ) |
| | | | | | | | | |
| | | | | | | | |
| 58 | | PIMCO ETF TRUST | | | | | See Accompanying Notes | |
December 31, 2018 (Unaudited)
SWAP AGREEMENTS:
CREDIT DEFAULT SWAPS ON CORPORATE AND SOVEREIGN ISSUES - SELL PROTECTION(1)
| | | | | | | | | | | | | | | | | | | | | | | | | | | | | | | | | | | | | | |
Counterparty | | Reference Entity | | Fixed
Receive Rate | | | Payment
Frequency | | | Maturity
Date | | | Implied
Credit Spread at
December 31, 2018(2) | | | Notional
Amount(3) | | | Premiums
Paid/(Received) | | | Unrealized
Appreciation/
(Depreciation) | | | Swap Agreements,
at Value(4) | |
| | Asset | | | Liability | |
| CBK | | Colombia Government International Bond | | | 1.000 | % | | | Quarterly | | | | 12/20/2022 | | | | 1.307 | % | | $ | 4,400 | | | $ | (57 | ) | | $ | 8 | | | $ | 0 | | | $ | (49 | ) |
| | Mexico Government International Bond | | | 1.000 | | | | Quarterly | | | | 12/20/2023 | | | | 1.549 | | | | 200 | | | | (1 | ) | | | (4 | ) | | | 0 | | | | (5 | ) |
| | Petroleos Mexicanos | | | 1.000 | | | | Quarterly | | | | 06/20/2022 | | | | 2.817 | | | | 5,000 | | | | (252 | ) | | | (34 | ) | | | 0 | | | | (286 | ) |
| | | | | | | | | | |
| FBF | | Mexico Government International Bond | | | 1.000 | | | | Quarterly | | | | 06/20/2022 | | | | 1.208 | | | | 1,200 | | | | (3 | ) | | | (5 | ) | | | 0 | | | | (8 | ) |
| | | | | | | | | | |
| GST | | Colombia Government International Bond | | | 1.000 | | | | Quarterly | | | | 12/20/2022 | | | | 1.307 | | | | 4,700 | | | | (48 | ) | | | (4 | ) | | | 0 | | | | (52 | ) |
| | Mexico Government International Bond | | | 1.000 | | | | Quarterly | | | | 06/20/2023 | | | | 1.434 | | | | 1,000 | | | | (9 | ) | | | (9 | ) | | | 0 | | | | (18 | ) |
| | Springleaf Finance Corp. | | | 5.000 | | | | Quarterly | | | | 06/20/2022 | | | | 3.391 | | | | 500 | | | | 43 | | | | (17 | ) | | | 26 | | | | 0 | |
| | | | | | | | | | |
| HUS | | Mexico Government International Bond | | | 1.000 | | | | Quarterly | | | | 06/20/2023 | | | | 1.434 | | | | 1,600 | | | | (12 | ) | | | (16 | ) | | | 0 | | | | (28 | ) |
| | Mexico Government International Bond | | | 1.000 | | | | Quarterly | | | | 12/20/2023 | | | | 1.549 | | | | 700 | | | | (9 | ) | | | (8 | ) | | | 0 | | | | (17 | ) |
| | | | | | | | | | |
| JPM | | Mexico Government International Bond | | | 1.000 | | | | Quarterly | | | | 12/20/2023 | | | | 1.549 | | | | 100 | | | | (1 | ) | | | (1 | ) | | | 0 | | | | (2 | ) |
| | | | | | | | | | | | | | | | | | | | | | | | | | | | | | | | | | | | | | |
Total Swap Agreements | | | $ | (349 | ) | | $ | (90 | ) | | $ | 26 | | | $ | (465 | ) |
| | | | | | | | | | | | | | | | | | | | | | | | | | | | | | | | | | | | | | |
FINANCIAL DERIVATIVE INSTRUMENTS: OVER THE COUNTER SUMMARY
The following is a summary by counterparty of the market value of OTC financial derivative instruments and collateral pledged/(received) as of December 31, 2018:
| | | | | | | | | | | | | | | | | | | | | | | | | | | | | | | | | | | | | | | | | | | | | | | | |
| | | Financial Derivative Assets | | | | | | Financial Derivative Liabilities | | | | | | | | | | |
| Counterparty | | Forward
Foreign
Currency
Contracts | | | Purchased
Options | | | Swap
Agreements | | | Total
Over the
Counter | | | | | | Forward
Foreign
Currency
Contracts | | | Written
Options | | | Swap
Agreements | | | Total
Over the
Counter | | | Net Market
Value of OTC
Derivatives | | | Collateral
Pledged/
(Received) | | | Net
Exposure(5) | |
BOA | | $ | 0 | | | $ | 0 | | | $ | 0 | | | $ | 0 | | | | | | | $ | 0 | | | $ | (50 | ) | | $ | 0 | | | $ | (50 | ) | | $ | (50 | ) | | $ | 0 | | | $ | (50 | ) |
CBK | | | 0 | | | | 0 | | | | 0 | | | | 0 | | | | | | | | (3 | ) | | | (47 | ) | | | (340 | ) | | | (390 | ) | | | (390 | ) | | | 276 | | | | (114 | ) |
DUB | | | 0 | | | | 0 | | | | 0 | | | | 0 | | | | | | | | 0 | | | | 0 | | | | 0 | | | | 0 | | | | 0 | | | | (50 | ) | | | (50 | ) |
FBF | | | 0 | | | | 0 | | | | 0 | | | | 0 | | | | | | | | 0 | | | | 0 | | | | (8 | ) | | | (8 | ) | | | (8 | ) | | | 0 | | | | (8 | ) |
GST | | | 0 | | | | 0 | | | | 26 | | | | 26 | | | | | | | | 0 | | | | (8 | ) | | | (70 | ) | | | (78 | ) | | | (52 | ) | | | 0 | | | | (52 | ) |
HUS | | | 0 | | | | 0 | | | | 0 | | | | 0 | | | | | | | | 0 | | | | 0 | | | | (45 | ) | | | (45 | ) | | | (45 | ) | | | 0 | | | | (45 | ) |
JPM | | | 0 | | | | 0 | | | | 0 | | | | 0 | | | | | | | | 0 | | | | (95 | ) | | | (2 | ) | | | (97 | ) | | | (97 | ) | | | 0 | | | | (97 | ) |
MYC | | | 0 | | | | 0 | | | | 0 | | | | 0 | | | | | | | | 0 | | | | (16 | ) | | | 0 | | | | (16 | ) | | | (16 | ) | | | 0 | | | | (16 | ) |
| | | | | | | | | | | | | | | | | | | | | | | | | | | | | | | | | | | | | | | | | | | | | | | | |
Total Over the Counter | | $ | 0 | | | $ | 0 | | | $ | 26 | | | $ | 26 | | | | | | | $ | (3 | ) | | $ | (216 | ) | | $ | (465 | ) | | $ | (684 | ) | | | | | | | | | | | | |
| | | | | | | | | | | | | | | | | | | | | | | | | | | | | | | | | | | | | | | | | | | | | | | | |
| (j) | Securities with an aggregate market value of $276 have been pledged as collateral for financial derivative instruments as governed by International Swaps and Derivatives Association, Inc. master agreements as of December 31, 2018. |
| (1) | If the Fund is a seller of protection and a credit event occurs, as defined under the terms of that particular swap agreement, the Fund will either (i) pay to the buyer of protection an amount equal to the notional amount of the swap and take delivery of the referenced obligation or underlying securities comprising the referenced index or (ii) pay a net settlement amount in the form of cash, securities or other deliverable obligations equal to the notional amount of the swap less the recovery value of the referenced obligation or underlying securities comprising the referenced index. |
| (2) | Implied credit spreads, represented in absolute terms, utilized in determining the market value of credit default swap agreements on corporate or sovereign issues as of period end serve as indicators of the current status of the payment/performance risk and represent the likelihood or risk of default for the credit derivative. The implied credit spread of a particular referenced entity reflects the cost of buying/selling protection and may include upfront payments required to be made to enter into the agreement. Wider credit spreads represent a deterioration of the referenced entity’s credit soundness and a greater likelihood or risk of default or other credit event occurring as defined under the terms of the agreement. |
| (3) | The maximum potential amount the Fund could be required to pay as a seller of credit protection or receive as a buyer of credit protection if a credit event occurs as defined under the terms of that particular swap agreement. |
| (4) | The prices and resulting values for credit default swap agreements serve as indicators of the current status of the payment/performance risk and represent the likelihood of an expected liability (or profit) for the credit derivative should the notional amount of the swap agreement be closed/sold as of the period end. Increasing market values, in absolute terms when compared to the notional amount of the swap, represent a deterioration of the referenced indices’ credit soundness and a greater likelihood or risk of default or other credit event occurring as defined under the terms of the agreement. |
| (5) | Net Exposure represents the net receivable/(payable) that would be due from/to the counterparty in the event of default. Exposure from OTC financial derivative instruments can only be netted across transactions governed under the same master agreement with the same legal entity. See Note 8, Master Netting Arrangements, in the Notes to Financial Statements for more information regarding master netting arrangements. |
| | | | | | |
| See Accompanying Notes | | SEMIANNUAL REPORT | | DECEMBER 31, 2018 | | 59 |
Schedule of InvestmentsPIMCO Active Bond Exchange-Traded Fund(Cont.)
FAIR VALUE OF FINANCIAL DERIVATIVE INSTRUMENTS
The following is a summary of the fair valuation of the Fund’s derivative instruments categorized by risk exposure. See Note 7, Principal Risks, in the Notes to Financial Statements on risks of the Fund.
Fair Values of Financial Derivative Instruments on the Statements of Assets and Liabilities as of December 31, 2018:
| | | | | | | | | | | | | | | | | | | | | | | | |
| | | Derivatives not accounted for as hedging instruments | |
| | | Commodity
Contracts | | | Credit
Contracts | | | Equity
Contracts | | | Foreign
Exchange
Contracts | | | Interest
Rate Contracts | | | Total | |
Financial Derivative Instruments - Assets | |
Exchange-traded or centrally cleared | |
Swap Agreements | | $ | 0 | | | $ | 8 | | | $ | 0 | | | $ | 0 | | | $ | 0 | | | $ | 8 | |
| | | | | | | | | | | | | | | | | | | | | | | | |
Over the counter | |
Swap Agreements | | $ | 0 | | | $ | 26 | | | $ | 0 | | | $ | 0 | | | $ | 0 | | | $ | 26 | |
| | | | | | | | | | | | | | | | | | | | | | | | |
| | $ | 0 | | | $ | 34 | | | $ | 0 | | | $ | 0 | | | $ | 0 | | | $ | 34 | |
| | | | | | | | | | | | | | | | | | | | | | | | |
|
Financial Derivative Instruments - Liabilities | |
Exchange-traded or centrally cleared | |
Swap Agreements | | $ | 0 | | | $ | 54 | | | $ | 0 | | | $ | 0 | | | $ | 10 | | | $ | 64 | |
| | | | | | | | | | | | | | | | | | | | | | | | |
Over the counter | |
Forward Foreign Currency Contracts | | $ | 0 | | | $ | 0 | | | $ | 0 | | | $ | 3 | | | $ | 0 | | | $ | 3 | |
Written Options | | | 0 | | | | 216 | | | | 0 | | | | 0 | | | | 0 | | | | 216 | |
Swap Agreements | | | 0 | | | | 465 | | | | 0 | | | | 0 | | | | 0 | | | | 465 | |
| | | | | | | | | | | | | | | | | | | | | | | | |
| | $ | 0 | | | $ | 681 | | | $ | 0 | | | $ | 3 | | | $ | 0 | | | $ | 684 | |
| | | | | | | | | | | | | | | | | | | | | | | | |
| | $ | 0 | | | $ | 735 | | | $ | 0 | | | $ | 3 | | | $ | 10 | | | $ | 748 | |
| | | | | | | | | | | | | | | | | | | | | | | | |
The effect of Financial Derivative Instruments on the Statements of Operations for the period ended December 31, 2018:
| | | | | | | | | | | | | | | | | | | | | | | | |
| | | Derivatives not accounted for as hedging instruments | |
| | | Commodity
Contracts | | | Credit
Contracts | | | Equity
Contracts | | | Foreign
Exchange
Contracts | | | Interest
Rate Contracts | | | Total | |
Net Realized Gain (Loss) on Financial Derivative Instruments | |
Exchange-traded or centrally cleared | |
Futures | | $ | 0 | | | $ | 0 | | | $ | 0 | | | $ | 0 | | | $ | (57 | ) | | $ | (57 | ) |
Swap Agreements | | | 0 | | | | 1,144 | | | | 0 | | | | 0 | | | | (1,291 | ) | | | (147 | ) |
| | | | | | | | | | | | | | | | | | | | | | | | |
| | $ | 0 | | | $ | 1,144 | | | $ | 0 | | | $ | 0 | | | $ | (1,348 | ) | | $ | (204 | ) |
| | | | | | | | | | | | | | | | | | | | | | | | |
Over the counter | |
Forward Foreign Currency Contracts | | $ | 0 | | | $ | 0 | | | $ | 0 | | | $ | (30 | ) | | $ | 0 | | | $ | (30 | ) |
Written Options | | | 0 | | | | 26 | | | | 0 | | | | 0 | | | | 97 | | | | 123 | |
Swap Agreements | | | 0 | | | | 128 | | | | 0 | | | | 0 | | | | 0 | | | | 128 | |
| | | | | | | | | | | | | | | | | | | | | | | | |
| | $ | 0 | | | $ | 154 | | | $ | 0 | | | $ | (30 | ) | | $ | 97 | | | $ | 221 | |
| | | | | | | | | | | | | | | | | | | | | | | | |
| | $ | 0 | | | $ | 1,298 | | | $ | 0 | | | $ | (30 | ) | | $ | (1,251 | ) | | $ | 17 | |
| | | | | | | | | | | | | | | | | | | | | | | | |
|
Net Change in Unrealized Appreciation (Depreciation) on Financial Derivative Instruments | |
Exchange-traded or centrally cleared | |
Swap Agreements | | $ | 0 | | | $ | (1,942 | ) | | $ | 0 | | | $ | 0 | | | $ | 1,850 | | | $ | (92 | ) |
| | | | | | | | | | | | | | | | | | | | | | | | |
Over the counter | |
Forward Foreign Currency Contracts | | $ | 0 | | | $ | 0 | | | $ | 0 | | | $ | 50 | | | $ | 0 | | | $ | 50 | |
Written Options | | | 0 | | | | (46 | ) | | | 0 | | | | 0 | | | | 36 | | | | (10 | ) |
Swap Agreements | | | 0 | | | | (223 | ) | | | 0 | | | | 0 | | | | 0 | | | | (223 | ) |
| | | | | | | | | | | | | | | | | | | | | | | | |
| | $ | 0 | | | $ | (269 | ) | | $ | 0 | | | $ | 50 | | | $ | 36 | | | $ | (183 | ) |
| | | | | | | | | | | | | | | | | | | | | | | | |
| | $ | 0 | | | $ | (2,211 | ) | | $ | 0 | | | $ | 50 | | | $ | 1,886 | | | $ | (275 | ) |
| | | | | | | | | | | | | | | | | | | | | | | | |
FAIR VALUE MEASUREMENTS
The following is a summary of the fair valuations according to the inputs used as of December 31, 2018 in valuing the Fund’s assets and liabilities:
| | | | | | | | | | | | | | | | |
| Category and Subcategory | | Level 1 | | | Level 2 | | | Level 3 | | | Fair
Value at
12/31/2018 | |
Investments in Securities, at Value | |
Loan Participations and Assignments | | $ | 0 | | | $ | 9,006 | | | $ | 2,318 | | | $ | 11,324 | |
Corporate Bonds & Notes | |
Banking & Finance | | | 0 | | | | 436,121 | | | | 0 | | | | 436,121 | |
| | | | | | | | | | | | | | | | |
| Category and Subcategory | | Level 1 | | | Level 2 | | | Level 3 | | | Fair
Value at
12/31/2018 | |
Industrials | | $ | 0 | | | $ | 141,652 | | | $ | 0 | | | $ | 141,652 | |
Utilities | | | 0 | | | | 24,567 | | | | 0 | | | | 24,567 | |
Municipal Bonds & Notes | |
California | | | 0 | | | | 7,197 | | | | 0 | | | | 7,197 | |
| | | | | | | | |
| 60 | | PIMCO ETF TRUST | | | | | See Accompanying Notes | |
December 31, 2018 (Unaudited)
| | | | | | | | | | | | | | | | |
| Category and Subcategory | | Level 1 | | | Level 2 | | | Level 3 | | | Fair
Value at
12/31/2018 | |
Florida | | $ | 0 | | | $ | 8,017 | | | $ | 0 | | | $ | 8,017 | |
Illinois | | | 0 | | | | 7,548 | | | | 0 | | | | 7,548 | |
New Jersey | | | 0 | | | | 2,013 | | | | 0 | | | | 2,013 | |
South Dakota | | | 0 | | | | 8,029 | | | | 0 | | | | 8,029 | |
Texas | | | 0 | | | | 2,745 | | | | 0 | | | | 2,745 | |
West Virginia | | | 0 | | | | 3,540 | | | | 0 | | | | 3,540 | |
U.S. Government Agencies | | | 0 | | | | 1,006,993 | | | | 0 | | | | 1,006,993 | |
U.S. Treasury Obligations | | | 0 | | | | 170,188 | | | | 0 | | | | 170,188 | |
Non-Agency Mortgage-Backed Securities | | | 0 | | | | 85,426 | | | | 0 | | | | 85,426 | |
Asset-Backed Securities | | | 0 | | | | 286,539 | | | | 0 | | | | 286,539 | |
Sovereign Issues | | | 0 | | | | 17,263 | | | | 0 | | | | 17,263 | |
Short-Term Instruments | |
U.S. Treasury Bills | | | 0 | | | | 701 | | | | 0 | | | | 701 | |
| | | | | | | | | | | | | | | | |
| | | | |
Total Investments | | $ | 0 | | | $ | 2,217,545 | | | $ | 2,318 | | | $ | 2,219,863 | |
| | | | | | | | | | | | | | | | |
|
Short Sales, at Value - Liabilities | |
U.S. Government Agencies | | $ | 0 | | | $ | (15,614 | ) | | $ | 0 | | | $ | (15,614 | ) |
| | | | | | | | | | | | | | | | |
| | | | | | | | | | | | | | | | |
| Category and Subcategory | | Level 1 | | | Level 2 | | | Level 3 | | | Fair
Value at
12/31/2018 | |
|
Financial Derivative Instruments - Assets | |
Exchange-traded or centrally cleared | | $ | 0 | | | $ | 8 | | | $ | 0 | | | $ | 8 | |
Over the counter | | | 0 | | | | 26 | | | | 0 | | | | 26 | |
| | | | | | | | | | | | | | | | |
| | $ | 0 | | | $ | 34 | | | $ | 0 | | | $ | 34 | |
| | | | | | | | | | | | | | | | |
|
Financial Derivative Instruments - Liabilities | |
Exchange-traded or centrally cleared | | | 0 | | | | (64 | ) | | | 0 | | | | (64 | ) |
Over the counter | | | 0 | | | | (684 | ) | | | 0 | | | | (684 | ) |
| | | | | | | | | | | | | | | | |
| | $ | 0 | | | $ | (748 | ) | | $ | 0 | | | $ | (748 | ) |
| | | | | | | | | | | | | | | | |
| | | | |
Total Financial Derivative Instruments | | $ | 0 | | | $ | (714 | ) | | $ | 0 | | | $ | (714 | ) |
| | | | | | | | | | | | | | | | |
| | | | |
Totals | | $ | 0 | | | $ | 2,201,217 | | | $ | 2,318 | | | $ | 2,203,535 | |
| | | | | | | | | | | | | | | | |
There were no significant transfers into or out of Level 3 during the period ended December 31, 2018.
| | | | | | |
| See Accompanying Notes | | SEMIANNUAL REPORT | | DECEMBER 31, 2018 | | 61 |
Schedule of InvestmentsPIMCO Enhanced Low Duration Active Exchange-Traded Fund
(Amounts in thousands*, except number of shares, contracts and units, if any)
| | | | | | | | | | | | |
| | | | | PRINCIPAL
AMOUNT
(000S) | | | | | MARKET
VALUE
(000S) | |
| INVESTMENTS IN SECURITIES 172.5% | |
| |
| LOAN PARTICIPATIONS AND ASSIGNMENTS 0.4% | |
|
Qatar National Bank SAQ | |
3.516% (LIBOR03M + 0.900%) due 12/22/2020 ~ | | $ | | | 1,000 | | | $ | | | 992 | |
| | | | | | | | | | | | |
Total Loan Participations and Assignments
(Cost $993) | | | 992 | |
| | | | |
| |
| CORPORATE BONDS & NOTES 63.1% | |
| |
| BANKING & FINANCE 28.3% | |
|
ADCB Finance Cayman Ltd. | |
2.625% due 03/10/2020 | | | | | 2,000 | | | | | | 1,969 | |
|
AerCap Ireland Capital DAC | |
4.625% due 10/30/2020 | | | | | 1,300 | | | | | | 1,309 | |
|
Air Lease Corp. | |
2.500% due 03/01/2021 | | | | | 600 | | | | | | 585 | |
2.750% due 01/15/2023 | | | | | 1,300 | | | | | | 1,231 | |
|
Aircastle Ltd. | |
5.500% due 02/15/2022 | | | | | 1,200 | | | | | | 1,229 | |
|
Ally Financial, Inc. | |
3.500% due 01/27/2019 | | | | | 1,300 | | | | | | 1,300 | |
3.750% due 11/18/2019 | | | | | 100 | | | | | | 100 | |
7.500% due 09/15/2020 | | | | | 200 | | | | | | 208 | |
8.000% due 03/15/2020 | | | | | 400 | | | | | | 415 | |
|
American International Group, Inc. | |
2.300% due 07/16/2019 | | | | | 1,000 | | | | | | 996 | |
|
American Tower Corp. | |
2.250% due 01/15/2022 | | | | | 600 | | | | | | 575 | |
2.800% due 06/01/2020 | | | | | 500 | | | | | | 496 | |
3.300% due 02/15/2021 | | | | | 400 | | | | | | 398 | |
3.450% due 09/15/2021 | | | | | 400 | | | | | | 400 | |
|
Assurant, Inc. | |
4.072% (US0003M + 1.250%) due 03/26/2021 ~ | | | | | 400 | | | | | | 400 | |
|
Aviation Capital Group LLC | |
2.875% due 01/20/2022 | | | | | 620 | | | | | | 600 | |
4.125% due 08/01/2025 | | | | | 400 | | | | | | 389 | |
|
Axis Bank Ltd. | |
3.250% due 05/21/2020 | | | | | 700 | | | | | | 692 | |
|
Barclays PLC | |
2.750% due 11/08/2019 | | | | | 1,500 | | | | | | 1,490 | |
|
BGC Partners, Inc. | |
5.125% due 05/27/2021 | | | | | 250 | | | | | | 252 | |
|
BOC Aviation Ltd. | |
2.375% due 09/15/2021 | | | | | 200 | | | | | | 193 | |
3.000% due 03/30/2020 | | | | | 450 | | | | | | 448 | |
3.000% due 05/23/2022 | | | | | 500 | | | | | | 487 | |
3.609% (US0003M + 1.050%) due 05/02/2021 ~ | | | | | 500 | | | | | | 502 | |
3.875% due 05/09/2019 | | | | | 400 | | | | | | 401 | |
|
Cantor Fitzgerald LP | |
6.500% due 06/17/2022 | | | | | 400 | | | | | | 424 | |
7.875% due 10/15/2019 | | | | | 1,500 | | | | | | 1,544 | |
|
Citigroup, Inc. | |
3.437% (US0003M + 0.950%) due 07/24/2023 ~ | | | | | 200 | | | | | | 195 | |
|
CNH Industrial Capital LLC | |
3.375% due 07/15/2019 | | | | | 1,800 | | | | | | 1,787 | |
|
Credit Suisse Group Funding Guernsey Ltd. | |
3.800% due 09/15/2022 | | | | | 250 | | | | | | 248 | |
4.735% (US0003M + 2.290%) due 04/16/2021 ~ | | | | | 500 | | | | | | 514 | |
|
Danske Bank A/S | |
3.836% (US0003M + 1.060%) due 09/12/2023 ~ | | | | | 1,400 | | | | | | 1,348 | |
|
Five Corners Funding Trust | |
4.419% due 11/15/2023 | | | | | 400 | | | | | | 412 | |
|
Ford Motor Credit Co. LLC | |
2.681% due 01/09/2020 (d) | | | | | 2,000 | | | | | | 1,967 | |
5.750% due 02/01/2021 | | | | | 500 | | | | | | 510 | |
|
General Motors Financial Co., Inc. | |
3.150% due 01/15/2020 | | | | | 1,000 | | | | | | 994 | |
3.500% due 07/10/2019 | | | | | 1,500 | | | | | | 1,500 | |
| | | | | | | | | | | | |
| | | | | PRINCIPAL
AMOUNT
(000S) | | | | | MARKET
VALUE
(000S) | |
|
Goldman Sachs Group, Inc. | |
3.618% (US0003M + 1.110%) due 04/26/2022 ~ | | $ | | | 1,000 | | | $ | | | 989 | |
4.036% (US0003M + 1.600%) due 07/15/2020 ~ | | | | | 1,000 | | | | | | 1,004 | |
|
Goodman HK Finance | |
4.375% due 06/19/2024 | | | | | 1,000 | | | | | | 1,005 | |
|
Hartford Financial Services Group, Inc. | |
5.500% due 03/30/2020 | | | | | 500 | | | | | | 513 | |
|
ICICI Bank Ltd. | |
3.125% due 08/12/2020 | | | | | 1,465 | | | | | | 1,447 | |
|
Industrial Bank of Korea | |
2.000% due 04/23/2020 | | | | | 1,000 | | | | | | 987 | |
|
International Lease Finance Corp. | |
8.250% due 12/15/2020 | | | | | 200 | | | | | | 215 | |
8.625% due 01/15/2022 | | | | | 500 | | | | | | 556 | |
|
JPMorgan Chase & Co. | |
5.990% (US0003M + 3.470%) due 01/30/2019 ~(b) | | | | | 1,117 | | | | | | 1,106 | |
|
Lloyds Banking Group PLC | |
3.590% (US0003M + 0.800%) due 06/21/2021 ~ | | | | | 900 | | | | | | 891 | |
|
Mitsubishi UFJ Financial Group, Inc. | |
3.368% (US0003M + 0.860%) due 07/26/2023 ~(d) | | | | | 2,000 | | | | | | 1,979 | |
|
Mitsubishi UFJ Lease & Finance Co. Ltd. | |
2.250% due 09/07/2021 | | | | | 200 | | | | | | 192 | |
3.252% (US0003M + 0.775%) due 07/23/2019 ~ | | | | | 500 | | | | | | 501 | |
|
Mizuho Financial Group, Inc. | |
3.651% (US0003M + 0.880%) due 09/11/2022 ~ | | | | | 500 | | | | | | 497 | |
3.905% (US0003M + 1.480%) due 04/12/2021 ~ | | | | | 400 | | | | | | 405 | |
3.919% (US0003M + 1.140%) due 09/13/2021 ~ | | | | | 700 | | | | | | 703 | |
|
Morgan Stanley | |
3.649% (US0003M + 1.180%) due 01/20/2022 ~ | | | | | 400 | | | | | | 399 | |
|
MUFG Bank Ltd. | |
2.300% due 03/05/2020 | | | | | 200 | | | | | | 198 | |
|
Nationwide Building Society | |
6.250% due 02/25/2020 | | | | | 150 | | | | | | 155 | |
|
Natwest Markets PLC | |
5.625% due 08/24/2020 | | | | | 500 | | | | | | 516 | |
|
Navient Corp. | |
4.875% due 06/17/2019 | | | | | 138 | | | | | | 138 | |
5.000% due 10/26/2020 | | | | | 200 | | | | | | 192 | |
5.875% due 03/25/2021 | | | | | 200 | | | | | | 192 | |
6.625% due 07/26/2021 | | | | | 200 | | | | | | 194 | |
8.000% due 03/25/2020 | | | | | 1,000 | | | | | | 1,019 | |
|
Nissan Motor Acceptance Corp. | |
2.150% due 09/28/2020 | | | | | 1,000 | | | | | | 972 | |
|
ORIX Corp. | |
2.650% due 04/13/2021 | | | | | 500 | | | | | | 488 | |
2.900% due 07/18/2022 | | | | | 500 | | | | | | 489 | |
3.200% due 01/19/2022 | | | | | 500 | | | | | | 493 | |
|
QNB Finance Ltd. | |
2.125% due 09/07/2021 | | | | | 200 | | | | | | 191 | |
4.068% (US0003M + 1.450%) due 08/11/2021 ~ | | | | | 600 | | | | | | 599 | |
|
Royal Bank of Scotland Group PLC | |
4.086% (US0003M + 1.470%) due 05/15/2023 ~ | | | | | 800 | | | | | | 777 | |
4.372% (US0003M + 1.550%) due 06/25/2024 ~ | | | | | 580 | | | | | | 555 | |
|
Santander Holdings USA, Inc. | |
2.650% due 04/17/2020 | | | | | 200 | | | | | | 197 | |
|
Santander UK Group Holdings PLC | |
2.875% due 08/05/2021 | | | | | 800 | | | | | | 773 | |
|
Santander UK PLC | |
3.400% due 06/01/2021 | | | | | 1,000 | | | | | | 995 | |
|
SBA Tower Trust | |
3.156% due 10/10/2045 | | | | | 1,500 | | | | | | 1,486 | |
| | | | | | | | | | | | |
| | | | | PRINCIPAL
AMOUNT
(000S) | | | | | MARKET
VALUE
(000S) | |
|
Sinochem Overseas Capital Co. Ltd. | |
4.500% due 11/12/2020 | | $ | | | 1,000 | | | $ | | | 1,015 | |
|
SL Green Operating Partnership LP | |
3.609% (US0003M + 0.980%) due 08/16/2021 ~ | | | | | 200 | | | | | | 199 | |
|
SMBC Aviation Capital Finance DAC | |
2.650% due 07/15/2021 | | | | | 1,510 | | | | | | 1,470 | |
3.000% due 07/15/2022 | | | | | 200 | | | | | | 194 | |
|
Springleaf Finance Corp. | |
5.250% due 12/15/2019 | | | | | 100 | | | | | | 101 | |
8.250% due 12/15/2020 | | | | | 950 | | | | | | 986 | |
|
Starwood Property Trust, Inc. | |
3.625% due 02/01/2021 | | | | | 1,000 | | | | | | 965 | |
|
State Bank of India | |
3.622% due 04/17/2019 | | | | | 500 | | | | | | 501 | |
|
Synchrony Financial | |
3.000% due 08/15/2019 (d) | | | | | 2,000 | | | | | | 1,987 | |
|
WEA Finance LLC | |
2.700% due 09/17/2019 | | | | | 1,525 | | | | | | 1,518 | |
|
Weyerhaeuser Co. | |
7.375% due 10/01/2019 | | | | | 950 | | | | | | 976 | |
| | | | | | | | | | | | |
| | | | | | | | | | | 62,428 | |
| | | | | | | | | | | | |
| |
| INDUSTRIALS 28.6% | |
|
Andeavor Logistics LP | |
5.500% due 10/15/2019 | | | | | 2,000 | | | | | | 2,017 | |
|
Aptiv PLC | |
3.150% due 11/19/2020 | | | | | 700 | | | | | | 695 | |
|
Arrow Electronics, Inc. | |
3.500% due 04/01/2022 | | | | | 900 | | | | | | 889 | |
|
BAT Capital Corp. | |
3.496% (US0003M + 0.880%) due 08/15/2022 ~ | | | | | 1,100 | | | | | | 1,079 | |
|
Bayer U.S. Finance LLC | |
2.375% due 10/08/2019 | | | | | 200 | | | | | | 198 | |
2.375% due 10/08/2019 (d) | | | | | 1,835 | | | | | | 1,821 | |
|
Boral Finance Pty. Ltd. | |
3.000% due 11/01/2022 | | | | | 400 | | | | | | 387 | |
|
Broadcom Corp. | |
2.375% due 01/15/2020 | | | | | 2,000 | | | | | | 1,975 | |
|
Central Nippon Expressway Co. Ltd. | |
2.849% due 03/03/2022 | | | | | 1,000 | | | | | | 985 | |
3.548% (US0003M + 0.810%) due 03/03/2022 • | | | | | 500 | | | | | | 500 | |
3.628% (US0003M + 0.850%) due 09/14/2021 ~ | | | | | 500 | | | | | | 502 | |
|
Charter Communications Operating LLC | |
3.579% due 07/23/2020 | | | | | 500 | | | | | | 500 | |
4.191% (US0003M + 1.650%) due 02/01/2024 ~ | | | | | 500 | | | | | | 492 | |
4.464% due 07/23/2022 | | | | | 1,000 | | | | | | 1,010 | |
|
Cigna Corp. | |
3.750% due 07/15/2023 | | | | | 1,000 | | | | | | 998 | |
|
CNPC General Capital Ltd. | |
2.750% due 05/14/2019 | | | | | 1,300 | | | | | | 1,299 | |
|
Conagra Brands, Inc. | |
4.600% due 11/01/2025 | | | | | 500 | | | | | | 503 | |
|
Continental Airlines Pass-Through Trust | |
7.250% due 05/10/2021 | | | | | 441 | | | | | | 453 | |
|
Cox Communications, Inc. | |
3.250% due 12/15/2022 | | | | | 300 | | | | | | 293 | |
|
Crown Castle Towers LLC | |
3.222% due 05/15/2042 | | | | | 800 | | | | | | 788 | |
|
CVS Health Corp. | |
3.350% due 03/09/2021 | | | | | 800 | | | | | | 798 | |
|
D.R. Horton, Inc. | |
3.750% due 03/01/2019 | | | | | 1,400 | | | | | | 1,400 | |
|
Daimler Finance North America LLC | |
2.250% due 03/02/2020 (d) | | | | | 2,500 | | | | | | 2,467 | |
|
Dell International LLC | |
3.480% due 06/01/2019 | | | | | 1,500 | | | | | | 1,496 | |
4.420% due 06/15/2021 | | | | | 400 | | | | | | 400 | |
5.450% due 06/15/2023 | | | | | 500 | | | | | | 509 | |
| | | | | | | | |
| 62 | | PIMCO ETF TRUST | | | | | See Accompanying Notes | |
December 31, 2018 (Unaudited)
| | | | | | | | | | | | |
| | | | | PRINCIPAL
AMOUNT
(000S) | | | | | MARKET
VALUE
(000S) | |
|
Delta Air Lines, Inc. | |
2.600% due 12/04/2020 | | $ | | | 800 | | | $ | | | 787 | |
3.625% due 03/15/2022 | | | | | 900 | | | | | | 881 | |
|
Deutsche Telekom International Finance BV | |
1.500% due 09/19/2019 | | | | | 1,375 | | | | | | 1,357 | |
|
DISH DBS Corp. | |
7.875% due 09/01/2019 | | | | | 1,300 | | | | | | 1,330 | |
|
Dominion Energy Gas Holdings LLC | |
3.388% (US0003M + 0.600%) due 06/15/2021 ~ | | | | | 300 | | | | | | 299 | |
|
Energy Transfer Operating LP | |
4.150% due 10/01/2020 | | | | | 500 | | | | | | 503 | |
|
Energy Transfer Partners LP | |
5.750% due 09/01/2020 | | | | | 200 | | | | | | 205 | |
|
EQT Corp. | |
8.125% due 06/01/2019 | | | | | 990 | | | | | | 1,007 | |
|
Equifax, Inc. | |
3.486% (US0003M + 0.870%) due 08/15/2021 ~ | | | | | 800 | | | | | | 791 | |
3.600% due 08/15/2021 | | | | | 1,200 | | | | | | 1,199 | |
|
Flex Ltd. | |
4.625% due 02/15/2020 | | | | | 500 | | | | | | 503 | |
|
Fresenius Medical Care U.S. Finance, Inc. | |
5.625% due 07/31/2019 | | | | | 1,400 | | | | | | 1,416 | |
|
GATX Corp. | |
3.302% (US0003M + 0.720%) due 11/05/2021 ~ | | | | | 500 | | | | | | 495 | |
|
General Electric Co. | |
2.700% due 10/09/2022 | | | | | 400 | | | | | | 371 | |
5.000% due 01/21/2021 •(b) | | | | | 1,200 | | | | | | 920 | |
6.000% due 08/07/2019 | | | | | 500 | | | | | | 505 | |
|
General Mills, Inc. | |
6.610% due 10/15/2022 | | | | | 500 | | | | | | 528 | |
|
Georgia-Pacific LLC | |
2.539% due 11/15/2019 | | | | | 400 | | | | | | 397 | |
|
Humana, Inc. | |
2.625% due 10/01/2019 | | | | | 500 | | | | | | 498 | |
|
Hyundai Capital America | |
1.750% due 09/27/2019 | | | | | 800 | | | | | | 790 | |
3.348% (US0003M + 0.940%) due 07/08/2021 ~ | | | | | 700 | | | | | | 698 | |
|
Imperial Brands Finance PLC | |
2.950% due 07/21/2020 | | | | | 1,700 | | | | | | 1,675 | |
|
Kansas City Southern | |
3.000% due 05/15/2023 | | | | | 1,100 | | | | | | 1,077 | |
|
KLA-Tencor Corp. | |
3.375% due 11/01/2019 | | | | | 100 | | | | | | 100 | |
|
Latam Airlines Pass-Through Trust | |
4.200% due 08/15/2029 | | | | | 126 | | | | | | 122 | |
|
Masco Corp. | |
7.125% due 03/15/2020 | | | | | 39 | | | | | | 41 | |
|
MGM Resorts International | |
6.750% due 10/01/2020 | | | | | 1,000 | | | | | | 1,030 | |
8.625% due 02/01/2019 | | | | | 300 | | | | | | 302 | |
|
Mylan NV | |
2.500% due 06/07/2019 | | | | | 1,000 | | | | | | 995 | |
3.150% due 06/15/2021 | | | | | 1,000 | | | | | | 980 | |
|
Pacific National Finance Pty. Ltd. | |
4.625% due 09/23/2020 | | | | | 911 | | | | | | 923 | |
6.000% due 04/07/2023 | | | | | 1,000 | | | | | | 1,065 | |
|
Penske Truck Leasing Co. LP | |
3.300% due 04/01/2021 | | | | | 700 | | | | | | 696 | |
|
Petroleos Mexicanos | |
8.000% due 05/03/2019 | | | | | 1,500 | | | | | | 1,520 | |
|
Petronas Capital Ltd. | |
5.250% due 08/12/2019 | | | | | 300 | | | | | | 304 | |
|
QVC, Inc. | |
3.125% due 04/01/2019 | | | | | 1,100 | | | | | | 1,098 | |
|
Reynolds American, Inc. | |
4.000% due 06/12/2022 | | | | | 700 | | | | | | 693 | |
|
Sabine Pass Liquefaction LLC | |
5.625% due 02/01/2021 | | | | | 500 | | | | | | 515 | |
6.250% due 03/15/2022 | | | | | 500 | | | | | | 526 | |
| | | | | | | | | | | | |
| | | | | PRINCIPAL
AMOUNT
(000S) | | | | | MARKET
VALUE
(000S) | |
|
Schaeffler Finance BV | |
4.750% due 05/15/2023 | | $ | | | 300 | | | $ | | | 289 | |
|
Shire Acquisitions Investments Ireland DAC | |
1.900% due 09/23/2019 | | | | | 1,700 | | | | | | 1,677 | |
2.875% due 09/23/2023 | | | | | 300 | | | | | | 284 | |
|
Sky Ltd. | |
2.625% due 09/16/2019 | | | | | 900 | | | | | | 893 | |
|
Southern Co. | |
3.104% (US0003M + 0.490%) due 02/14/2020 ~ | | | | | 400 | | | | | | 399 | |
|
Southwest Airlines Co. | |
2.750% due 11/06/2019 | | | | | 500 | | | | | | 498 | |
|
Syngenta Finance NV | |
3.933% due 04/23/2021 | | | | | 1,200 | | | | | | 1,184 | |
|
Takeda Pharmaceutical Co. Ltd. | |
2.450% due 01/18/2022 | | | | | 1,000 | | | | | | 964 | |
|
Teva Pharmaceutical Finance Netherlands BV | |
1.700% due 07/19/2019 | | | | | 700 | | | | | | 691 | |
|
Time Warner Cable LLC | |
5.000% due 02/01/2020 | | | | | 500 | | | | | | 507 | |
|
WestJet Airlines Ltd. | |
3.500% due 06/16/2021 | | | | | 1,050 | | | | | | 1,041 | |
|
Woodside Finance Ltd. | |
3.650% due 03/05/2025 | | | | | 100 | | | | | | 95 | |
3.700% due 09/15/2026 | | | | | 200 | | | | | | 185 | |
4.600% due 05/10/2021 | | | | | 200 | | | | | | 202 | |
|
Woolworths Group Ltd. | |
4.000% due 09/22/2020 | | | | | 300 | | | | | | 302 | |
|
ZF North America Capital, Inc. | |
4.000% due 04/29/2020 | | | | | 394 | | | | | | 392 | |
| | | | | | | | | | | | |
| | | | | | | | | | | 63,199 | |
| | | | | | | | | | | | |
| |
| UTILITIES 6.2% | |
|
AT&T, Inc. | |
3.504% (US0003M + 0.890%) due 02/15/2023 ~ | | | | | 1,100 | | | | | | 1,081 | |
3.956% (US0003M + 1.180%) due 06/12/2024 ~ | | | | | 300 | | | | | | 291 | |
|
Chugoku Electric Power Co., Inc. | |
2.701% due 03/16/2020 | | | | | 200 | | | | | | 199 | |
|
Duke Energy Corp. | |
3.114% (US0003M + 0.500%) due 05/14/2021 ~ | | | | | 600 | | | | | | 597 | |
|
Duquesne Light Holdings, Inc. | |
5.900% due 12/01/2021 | | | | | 500 | | | | | | 529 | |
6.400% due 09/15/2020 | | | | | 200 | | | | | | 209 | |
|
Enel Finance International NV | |
4.250% due 09/14/2023 | | | | | 200 | | | | | | 196 | |
|
FirstEnergy Corp. | |
2.850% due 07/15/2022 | | | | | 970 | | | | | | 946 | |
|
NextEra Energy Capital Holdings, Inc. | |
3.107% (US0003M + 0.400%) due 08/21/2020 ~ | | | | | 500 | | | | | | 499 | |
3.257% (US0003M + 0.550%) due 08/28/2021 ~ | | | | | 1,500 | | | | | | 1,482 | |
|
Pennsylvania Electric Co. | |
5.200% due 04/01/2020 | | | | | 1,000 | | | | | | 1,025 | |
|
Plains All American Pipeline LP | |
5.750% due 01/15/2020 | | | | | 1,500 | | | | | | 1,528 | |
|
Sinopec Group Overseas Development Ltd. | |
2.250% due 09/13/2020 | | | | | 500 | | | | | | 491 | |
2.500% due 04/28/2020 | | | | | 2,000 | | | | | | 1,976 | |
|
Sprint Capital Corp. | |
6.900% due 05/01/2019 | | | | | 300 | | | | | | 303 | |
|
Verizon Communications, Inc. | |
3.716% (US0003M + 1.100%) due 05/15/2025 ~ | | | | | 1,000 | | | | | | 970 | |
|
Vodafone Group PLC | |
3.426% (US0003M + 0.990%) due 01/16/2024 ~ | | | | | 1,500 | | | | | | 1,464 | |
| | | | | | | | | | | | |
| | | | | | | | | | | 13,786 | |
| | | | | | | | | | | | |
Total Corporate Bonds & Notes
(Cost $140,996) | | | 139,413 | |
| | | | |
| | | | | | | | | | | | |
| | | | | PRINCIPAL
AMOUNT
(000S) | | | | | MARKET
VALUE
(000S) | |
| MUNICIPAL BONDS & NOTES 0.3% | |
| |
| CALIFORNIA 0.1% | |
|
California Earthquake Authority Revenue Notes, Series 2014 | |
2.805% due 07/01/2019 | | $ | | | 210 | | | $ | | | 210 | |
| | | | | | | | | | | | |
| |
| KANSAS 0.2% | |
|
Kansas Development Finance Authority Revenue Notes, Series 2015 | |
2.258% due 04/15/2019 | | | | | 500 | | | | | | 499 | |
| | | | | | | | | | | | |
Total Municipal Bonds & Notes (Cost $710) | | | 709 | |
| | | | |
| |
| U.S. GOVERNMENT AGENCIES 14.9% | |
|
Fannie Mae | |
3.500% due 08/01/2047 - 10/01/2047 | | | | | 7,880 | | | | | | 7,890 | |
4.000% due 09/01/2039 - 03/01/2047 | | | | | 2,834 | | | | | | 2,908 | |
4.000% due 10/01/2048 (d) | | | | | 4,735 | | | | | | 4,833 | |
4.250% due 11/01/2035 - 01/01/2036 | | | | | 347 | | | | | | 356 | |
4.750% due 09/01/2034 - 04/01/2036 | | | | | 815 | | | | | | 852 | |
5.000% due 04/01/2019 - 09/01/2047 | | | | | 2,434 | | | | | | 2,497 | |
5.500% due 06/01/2019 - 09/01/2040 | | | | | 1,706 | | | | | | 1,783 | |
6.000% due 05/01/2029 - 01/01/2039 | | | | | 1,183 | | | | | | 1,256 | |
6.500% due 09/01/2021 - 12/01/2037 | | | | | 923 | | | | | | 1,007 | |
|
Fannie Mae, TBA | |
4.000% due 02/01/2049 | | | | | 500 | | | | | | 510 | |
|
Freddie Mac | |
2.000% due 02/01/2028 - 04/01/2028 | | | | | 12 | | | | | | 12 | |
4.500% due 12/01/2019 - 07/01/2021 | | | | | 36 | | | | | | 37 | |
5.000% due 07/01/2019 - 03/01/2033 | | | | | 41 | | | | | | 43 | |
5.500% due 11/01/2021 - 10/01/2037 | | | | | 283 | | | | | | 294 | |
6.000% due 02/01/2028 - 02/01/2033 | | | | | 50 | | | | | | 51 | |
6.500% due 07/01/2037 - 02/01/2038 | | | | | 548 | | | | | | 590 | |
7.000% due 10/01/2037 | | | | | 86 | | | | | | 88 | |
10.500% due 04/01/2019 - 12/01/2020 | | | | | 9 | | | | | | 8 | |
11.000% due 06/01/2019 - 10/01/2020 | | | | | 2 | | | | | | 1 | |
|
Ginnie Mae | |
3.000% due 11/20/2046 | | | | | 216 | | | | | | 213 | |
3.455% due 08/16/2039 • | | | | | 9 | | | | | | 10 | |
3.500% due 05/20/2042 - 09/20/2044 | | | | | 741 | | | | | | 743 | |
3.700% due 04/15/2042 | | | | | 218 | | | | | | 221 | |
3.740% due 03/20/2042 - 07/20/2042 | | | | | 363 | | | | | | 367 | |
3.750% due 04/15/2042 - 03/20/2044 | | | | | 297 | | | | | | 303 | |
4.000% due 04/20/2040 - 06/20/2043 | | | | | 2,453 | | | | | | 2,469 | |
4.500% due 08/20/2038 - 01/20/2042 | | | | | 1,584 | | | | | | 1,642 | |
5.000% due 02/20/2039 - 10/20/2047 | | | | | 277 | | | | | | 284 | |
5.500% due 03/20/2034 - 08/20/2041 | | | | | 637 | | | | | | 656 | |
6.500% due 09/20/2025 - 07/20/2039 | | | | | 147 | | | | | | 155 | |
7.000% due 09/15/2024 - 06/20/2039 | | | | | 716 | | | | | | 751 | |
| | | | | | | | | | | | |
Total U.S. Government Agencies
(Cost $33,170) | | | 32,830 | |
| | | | |
| |
| | | | | | |
| See Accompanying Notes | | SEMIANNUAL REPORT | | DECEMBER 31, 2018 | | 63 |
Schedule of InvestmentsPIMCO Enhanced Low Duration Active Exchange-Traded Fund(Cont.)
| | | | | | | | | | | | |
| | | | | PRINCIPAL
AMOUNT
(000S) | | | | | MARKET
VALUE
(000S) | |
| U.S. TREASURY OBLIGATIONS 73.1% | |
|
U.S. Treasury Inflation Protected Securities (a) | |
0.125% due 04/15/2022 | | $ | | | 6,551 | | | $ | | | 6,340 | |
0.625% due 04/15/2023 | | | | | 5,589 | | | | | | 5,499 | |
0.750% due 07/15/2028 (d) | | | | | 7,455 | | | | | | 7,303 | |
|
U.S. Treasury Notes | |
2.875% due 10/31/2020 (d) | | | | | 141,600 | | | | | | 142,484 | |
| | | | | | | | | | | | |
Total U.S. Treasury Obligations
(Cost $161,369) | | | 161,626 | |
| | | | |
| |
| NON-AGENCY MORTGAGE-BACKED SECURITIES 4.3% | |
|
Bear Stearns Adjustable Rate Mortgage Trust | |
4.337% due 02/25/2033 ~ | | | | | 2 | | | | | | 2 | |
|
BX Trust | |
3.335% due 07/15/2034 • | | | | | 626 | | | | | | 623 | |
|
Chevy Chase Funding LLC Mortgage-Backed Certificates | |
2.736% due 10/25/2035 • | | | | | 510 | | | | | | 503 | |
|
GSR Mortgage Loan Trust | |
4.494% due 09/25/2035 ~ | | | | | 26 | | | | | | 27 | |
4.869% due 08/25/2033 • | | | | | 216 | | | | | | 217 | |
|
Holmes Master Issuer PLC | |
2.856% due 10/15/2054 • | | | | | 1,600 | | | | | | 1,597 | |
|
Impac CMB Trust | |
3.146% due 03/25/2035 • | | | | | 233 | | | | | | 227 | |
|
JPMorgan Chase Commercial Mortgage Securities Trust | |
3.379% due 09/15/2050 | | | | | 300 | | | | | | 298 | |
|
MASTR Adjustable Rate Mortgages Trust | |
4.670% due 04/21/2034 ~ | | | | | 53 | | | | | | 54 | |
|
Merrill Lynch Mortgage Investors Trust | |
4.381% due 12/25/2035 ~ | | | | | 692 | | | | | | 688 | |
|
Nomura Resecuritization Trust | |
3.574% due 04/26/2037 ~ | | | | | 418 | | | | | | 423 | |
|
Sequoia Mortgage Trust | |
3.026% due 11/22/2024 • | | | | | 5 | | | | | | 5 | |
3.130% due 06/20/2033 • | | | | | 4 | | | | | | 4 | |
|
Structured Asset Mortgage Investments Trust | |
3.050% due 07/19/2034 • | | | | | 10 | | | | | | 10 | |
3.130% due 09/19/2032 • | | | | | 20 | | | | | | 20 | |
|
Thornburg Mortgage Securities Trust | |
3.718% due 04/25/2045 ~ | | | | | 148 | | | | | | 149 | |
|
VMC Finance LLC | |
3.390% due 10/15/2035 • | | | | | 2,000 | | | | | | 1,977 | |
|
WaMu Mortgage Pass-Through Certificates Trust | |
2.816% due 01/25/2045 • | | | | | 27 | | | | | | 27 | |
2.906% due 06/25/2044 • | | | | | 1,112 | | | | | | 1,107 | |
4.079% due 06/25/2033 ~ | | | | | 3 | | | | | | 3 | |
|
Wells Fargo Mortgage-Backed Securities Trust | |
4.694% due 06/25/2035 ~ | | | | | 3 | | | | | | 3 | |
|
WellsFargo-RBS Commercial Mortgage Trust | |
3.905% due 06/15/2044 • | | | | | 1,500 | | | | | | 1,521 | |
| | | | | | | | | | | | |
TotalNon-Agency Mortgage-Backed Securities (Cost $9,459) | | | 9,485 | |
| | | | |
| |
| ASSET-BACKED SECURITIES 12.3% | |
|
Ameriquest Mortgage Securities, Inc. Asset-Backed Pass-Through Certificates | |
3.266% due 09/25/2033 • | | | | | 40 | | | | | | 40 | |
| | | | | | | | | | | | |
| | | | | PRINCIPAL
AMOUNT
(000S) | | | | | MARKET
VALUE
(000S) | |
|
Apidos CLO | |
3.430% due 01/19/2025 • | | $ | | | 224 | | | $ | | | 224 | |
|
Bayview Opportunity Master Fund Trust | |
4.213% due 10/29/2033 Ø | | | | | 475 | | | | | | 476 | |
|
Bear Stearns Asset-Backed Securities Trust | |
3.306% due 10/27/2032 • | | | | | 40 | | | | | | 39 | |
|
BlueMountain CLO Ltd. | |
3.766% due 04/13/2027 • | | | | | 300 | | | | | | 301 | |
|
Cent CLO Ltd. | |
3.839% due 10/29/2025 • | | | | | 236 | | | | | | 237 | |
|
Chase Funding Trust | |
3.106% due 07/25/2033 • | | | | | 210 | | | | | | 204 | |
|
CIFC Funding Ltd. | |
3.350% due 10/25/2027 • | | | | | 300 | | | | | | 296 | |
|
Credit Suisse Mortgage Capital Trust | |
4.500% due 03/25/2021 | | | | | 136 | | | | | | 137 | |
|
Crown Point CLO Ltd. | |
3.389% due 07/17/2028 • | | | | | 700 | | | | | | 698 | |
|
Drug Royalty LP | |
5.286% due 07/15/2023 • | | | | | 57 | | | | | | 57 | |
|
Dryden Senior Loan Fund | |
3.336% due 10/15/2027 • | | | | | 300 | | | | | | 298 | |
|
First Franklin Mortgage Loan Trust | |
2.666% due 04/25/2036 • | | | | | 2,065 | | | | | | 2,006 | |
3.256% due 11/25/2034 • | | | | | 256 | | | | | | 251 | |
3.436% due 07/25/2034 • | | | | | 1,414 | | | | | | 1,413 | |
|
LCM LP | |
3.379% due 10/20/2027 • | | | | | 500 | | | | | | 498 | |
|
Navient Private Education Loan Trust | |
3.655% due 12/15/2028 • | | | | | 674 | | | | | | 680 | |
|
New Century Home Equity Loan Trust | |
3.436% due 11/25/2034 • | | | | | 601 | | | | | | 601 | |
|
NovaStar Mortgage Funding Trust | |
3.166% due 01/25/2036 • | | | | | 1,000 | | | | | | 991 | |
|
RAAC Trust | |
3.056% due 01/25/2046 • | | | | | 1,000 | | | | | | 990 | |
|
Residential Asset Mortgage Products Trust | |
3.186% due 05/25/2035 • | | | | | 500 | | | | | | 496 | |
|
Saxon Asset Securities Trust | |
3.035% due 05/25/2035 • | | | | | 195 | | | | | | 177 | |
|
Securitized Asset-Backed Receivables LLC Trust | |
3.181% due 01/25/2035 • | | | | | 382 | | | | | | 376 | |
|
SLM Student Loan Trust | |
3.240% due 04/25/2023 • | | | | | 530 | | | | | | 525 | |
3.990% due 04/25/2023 • | | | | | 569 | | | | | | 572 | |
4.190% due 07/25/2023 • | | | | | 500 | | | | | | 508 | |
|
SMB Private Education Loan Trust | |
2.980% due 07/15/2027 | | | | | 1,663 | | | | | | 1,660 | |
|
SoFi Professional Loan Program LLC | |
3.020% due 02/25/2040 | | | | | 292 | | | | | | 290 | |
|
Soundview Home Loan Trust | |
3.181% due 06/25/2035 • | | | | | 1,178 | | | | | | 1,171 | |
|
Starwood Waypoint Homes Trust | |
3.405% due 01/17/2035 • | | | | | 986 | | | | | | 981 | |
|
Structured Asset Investment Loan Trust | |
3.056% due 09/25/2034 • | | | | | 1,980 | | | | | | 1,953 | |
|
Structured Asset Securities Corp. Mortgage Loan Trust | |
2.641% due 07/25/2036 • | | | | | 1,722 | | | | | | 1,678 | |
| | | | | | | | | | | | |
| | | | | PRINCIPAL
AMOUNT
(000S) | | | | | MARKET
VALUE
(000S) | |
|
Towd Point Mortgage Trust | |
2.915% due 02/25/2057 • | | $ | | | 687 | | | $ | | | 685 | |
|
Tralee CLO Ltd. | |
3.869% due 10/20/2028 • | | | | | 1,000 | | | | | | 983 | |
|
Vericrest Opportunity Loan Transferee LLC | |
3.125% due 09/25/2047 Ø | | | | | 799 | | | | | | 794 | |
|
Wellfleet CLO Ltd. | |
3.609% due 10/20/2027 • | | | | | 1,000 | | | | | | 1,000 | |
|
WhiteHorse Ltd. | |
3.379% due 04/17/2027 • | | | | | 1,000 | | | | | | 995 | |
|
Whitehorse Ltd. | |
3.609% due 07/17/2026 • | | | | | 357 | | | | | | 356 | |
|
Zais CLO Ltd. | |
3.586% due 04/15/2028 • | | | | | 1,500 | | | | | | 1,497 | |
| | | | | | | | | | | | |
Total Asset-Backed Securities (Cost $27,099) | | | 27,134 | |
| | | | |
| |
| SOVEREIGN ISSUES 1.3% | |
|
Export-Import Bank of India | |
2.750% due 04/01/2020 | | | | | 800 | | | | | | 792 | |
|
Export-Import Bank of Korea | |
3.389% (US0003M + 0.700%) due 05/26/2019 ~ | | | | | 2,000 | | | | | | 2,011 | |
| | | | | | | | | | | | |
Total Sovereign Issues (Cost $2,793) | | | 2,803 | |
| | | | |
| |
| SHORT-TERM INSTRUMENTS 2.8% | |
| |
| CERTIFICATES OF DEPOSIT 0.6% | |
|
Itau CorpBanca | |
2.570% due 01/11/2019 | | | | | 300 | | | | | | 300 | |
|
Lloyds Bank Corporate Markets PLC | |
2.908% (US0003M + 0.500%) due 10/26/2020 ~ | | | | | 1,100 | | | | | | 1,100 | |
| | | | | | | | | | | | |
| | | | | | | | | | | 1,400 | |
| | | | | | | | | | | | |
| |
| COMMERCIAL PAPER 0.1% | |
|
CNH Industrial Capital LLC | |
3.500% due 05/09/2019 | | | | | 300 | | | | | | 296 | |
| | | | | | | | | | | | |
| |
| REPURCHASE AGREEMENTS (c) 2.1% | |
| | | | | | | | | | | 4,565 | |
| | | | | | | | | | | | |
Total Short-Term Instruments
(Cost $6,261) | | | 6,261 | |
| | | | |
| | | | |
| | | | | | | | | | | | |
Total Investments in Securities
(Cost $382,850) | | | 381,253 | |
| | | | |
| | | | | | | | | | | | |
Total Investments 172.5%
(Cost $382,850) | | | $ | | | 381,253 | |
| |
Financial Derivative
Instruments (e)(f) (0.2)% (Cost or Premiums, net $(717)) | | | | | | | | | | | (438 | ) |
| |
| Other Assets and Liabilities, net (72.3)% | | | (159,841 | ) |
| | | | |
| Net Assets 100.0% | | | $ | | | 220,974 | |
| | | | | | | |
NOTES TO SCHEDULE OF INVESTMENTS:
| * | A zero balance may reflect actual amounts rounding to less than one thousand. |
| ~ | Variable or Floating rate security. Rate shown is the rate in effect as of period end. Certain variable rate securities are not based on a published reference rate and spread, rather are determined by the issuer or agent and are based on current market conditions. Reference rate is as of reset date, which may vary by security. These securities may not indicate a reference rate and/or spread in their description. |
| • | Rate shown is the rate in effect as of period end. The rate may be based on a fixed rate, a capped rate or a floor rate and may convert to a variable or floating rate in the future. These securities do not indicate a reference rate and spread in their description. |
| Ø | Coupon represents a rate which changes periodically based on a predetermined schedule or event. Rate shown is the rate in effect as of period end. |
| (a) | Principal amount of security is adjusted for inflation. |
| (b) | Perpetual maturity; date shown, if applicable, represents next contractual call date. |
| | | | | | | | |
| 64 | | PIMCO ETF TRUST | | | | | See Accompanying Notes | |
December 31, 2018 (Unaudited)
BORROWINGS AND OTHER FINANCING TRANSACTIONS
(c) REPURCHASE AGREEMENTS:
| | | | | | | | | | | | | | | | | | | | | | | | | | | | | | |
| Counterparty | | Lending
Rate | | | Settlement
Date | | | Maturity
Date | | | Principal
Amount | | | Collateralized By | | Collateral
(Received) | | | Repurchase
Agreements,
at Value | | | Repurchase
Agreement
Proceeds
to be
Received(1) | |
| FICC | | | 2.000 | % | | | 12/31/2018 | | | | 01/02/2019 | | | $ | 4,565 | | | U.S. Treasury Notes 2.875% due 07/31/2025 | | $ | (4,659 | ) | | $ | 4,565 | | | $ | 4,565 | |
| | | | | | | | | | | | | | | | | | | | | | | | | | | | | | |
Total Repurchase Agreements | | | | | $ | (4,659 | ) | | $ | 4,565 | | | $ | 4,565 | |
| | | | | | | | | | | | | | | |
REVERSE REPURCHASE AGREEMENTS:
| | | | | | | | | | | | | | | | | | | | |
| Counterparty | | Borrowing
Rate(2) | | | Settlement
Date | | | Maturity
Date | | | Amount
Borrowed(2) | | | Payable for
Reverse
Repurchase
Agreements | |
BOS | | | 2.900 | % | | | 12/21/2018 | | | | 01/04/2019 | | | $ | (2,136 | ) | | $ | (2,138 | ) |
DEU | | | 2.800 | | | | 12/31/2018 | | | | 01/02/2019 | | | | (87,163 | ) | | | (87,177 | ) |
| | | 4.000 | | | | 12/31/2018 | | | | 01/02/2019 | | | | (7,308 | ) | | | (7,309 | ) |
RDR | | | 2.710 | | | | 12/31/2018 | | | | 01/07/2019 | | | | (9,792 | ) | | | (9,793 | ) |
| | | | | | | | | | | | | | | | | | | | |
Total Reverse Repurchase Agreements | | | | | | | | | | | | | | | $ | (106,417 | ) |
| | | | | | | | | | | | | | | | | | | | |
BORROWINGS AND OTHER FINANCING TRANSACTIONS SUMMARY
The following is a summary by counterparty of the market value of Borrowings and Other Financing Transactions and collateral pledged/(received) as of December 31, 2018:
| | | | | | | | | | | | | | | | | | | | | | | | | | | | |
| Counterparty | | Repurchase
Agreement
Proceeds
to be
Received(1) | | | Payable for
Reverse
Repurchase
Agreements | | | Payable for
Sale-Buyback
Transactions | | | Securities
Out on Loan | | | Total
Borrowings and
Other Financing
Transactions | | | Collateral
Pledged/(Received) | | | Net Exposure(3) | |
Global/Master Repurchase Agreement | |
BOS | | $ | 0 | | | $ | (2,138 | ) | | $ | 0 | | | $ | 0 | | | $ | (2,138 | ) | | $ | 2,215 | | | $ | 77 | |
DEU | | | 0 | | | | (94,486 | ) | | | 0 | | | | 0 | | | | (94,486 | ) | | | 94,141 | | | | (345 | ) |
FICC | | | 4,565 | | | | 0 | | | | 0 | | | | 0 | | | | 4,565 | | | | (4,659 | ) | | | (94 | ) |
RDR | | | 0 | | | | (9,793 | ) | | | 0 | | | | 0 | | | | (9,793 | ) | | | 10,220 | | | | 427 | |
| | | | | | | | | | | | | | | | | | | | | | | | | | | | |
Total Borrowings and Other Financing Transactions | | $ | 4,565 | | | $ | (106,417 | ) | | $ | 0 | | | $ | 0 | | | | | | | | | | | | | |
| | | | | | | | | | | | | | | | | | | | | | | | | | | | |
CERTAIN TRANSFERS ACCOUNTED FOR AS SECURED BORROWINGS
Remaining Contractual Maturity of the Agreements
| | | | | | | | | | | | | | | | | | | | |
| | | Overnight and
Continuous | | | Up to 30 days | | | 31-90 days | | | Greater Than 90 days | | | Total | |
Reverse Repurchase Agreements | | | | | | | | | | | | | | | | | | | | |
Corporate Bonds & Notes | | $ | 0 | | | $ | (9,793 | ) | | $ | 0 | | | $ | 0 | | | $ | (9,793 | ) |
U.S. Government Agencies | | | 0 | | | | (2,138 | ) | | | 0 | | | | 0 | | | | (2,138 | ) |
U.S. Treasury Obligations | | | 0 | | | | (94,486 | ) | | | 0 | | | | 0 | | | | (94,486 | ) |
| | | | | | | | | | | | | | | | | | | | |
Total Borrowings | | $ | 0 | | | $ | (106,417 | ) | | $ | 0 | | | $ | 0 | | | $ | (106,417 | ) |
| | | | | | | | | | | | | | | | | | | | |
Payable for reverse repurchase agreements | | | | | | | | | | | | | | | | | | $ | (106,417 | ) |
| | | | | | | | | | | | | | | | | | | | |
| (d) | Securities with an aggregate market value of $106,577 have been pledged as collateral under the terms of the above master agreements as of December 31, 2018. |
| (1) | Includes accrued interest. |
| (2) | The average amount of borrowings outstanding during the period ended December 31, 2018 was $(62,141) at a weighted average interest rate of 2.109%. Average borrowings may include sale-buyback transactions and reverse repurchase agreements, if held during the period. |
| (3) | Net Exposure represents the net receivable/(payable) that would be due from/to the counterparty in the event of default. Exposure from borrowings and other financing transactions can only be netted across transactions governed under the same master agreement with the same legal entity. See Note 8, Master Netting Arrangements, in the Notes to Financial Statements for more information regarding master netting arrangements. |
| | | | | | |
| See Accompanying Notes | | SEMIANNUAL REPORT | | DECEMBER 31, 2018 | | 65 |
Schedule of InvestmentsPIMCO Enhanced Low Duration Active Exchange-Traded Fund(Cont.)
(e) FINANCIAL DERIVATIVE INSTRUMENTS: EXCHANGE-TRADED OR CENTRALLY CLEARED
PURCHASED OPTIONS:
OPTIONS ON EXCHANGE-TRADED FUTURES CONTRACTS
| | | | | | | | | | | | | | | | | | | | | | | | |
| Description | | Strike
Price | | | Expiration
Date | | | # of
Contracts | | | Notional
Amount | | | Cost | | | Market
Value | |
Call - CBOT U.S. Treasury10-Year Note March 2019 Futures | | $ | 135.000 | | | | 02/22/2019 | | | | 124 | | | $ | 124 | | | $ | 1 | | | $ | 1 | |
Put - CBOT U.S. Treasury2-Year Note March 2019 Futures | | | 103.375 | | | | 02/22/2019 | | | | 730 | | | | 1,460 | | | | 6 | | | | 1 | |
Call - CBOT U.S. Treasury5-Year Note March 2019 Futures | | | 120.000 | | | | 02/22/2019 | | | | 425 | | | | 425 | | | | 4 | | | | 6 | |
| | | | | | | | | | | | | | | | | | | | | | | | |
Total Purchased Options | | | $ | 11 | | | $ | 8 | |
| | | | | | | | | | | | | |
FUTURES CONTRACTS:
LONG FUTURES CONTRACTS
| | | | | | | | | | | | | | | | | | | | | | | | |
| Description | | Expiration
Month | | | # of
Contracts | | | Notional
Amount | | | Unrealized
Appreciation/
(Depreciation) | | | Variation Margin | |
| | Asset | | | Liability | |
90-Day Eurodollar December Futures | | | 12/2019 | | | | 57 | | | $ | 13,872 | | | $ | 8 | | | $ | 1 | | | $ | 0 | |
90-Day Eurodollar March Futures | | | 03/2019 | | | | 265 | | | | 64,455 | | | | 103 | | | | 0 | | | | 0 | |
90-Day Eurodollar September Futures | | | 09/2019 | | | | 80 | | | | 19,468 | | | | 3 | | | | 3 | | | | 0 | |
U.S. Treasury2-Year Note March Futures | | | 03/2019 | | | | 561 | | | | 119,107 | | | | 815 | | | | 79 | | | | 0 | |
| | | | | | | | | | | | | | | | | | | | | | | | |
| | | | | | | | | | | | | | $ | 929 | | | $ | 83 | | | $ | 0 | |
| | | | | | | | | | | | | | | | | | | | | | | | |
SHORT FUTURES CONTRACTS
| | | | | | | | | | | | | | | | | | | | | | | | |
| Description | | Expiration
Month | | | # of
Contracts | | | Notional
Amount | | | Unrealized
Appreciation/
(Depreciation) | | | Variation Margin | |
| | Asset | | | Liability | |
90-Day Eurodollar December Futures | | | 12/2020 | | | | 57 | | | $ | (13,898 | ) | | $ | (12 | ) | | $ | 0 | | | $ | (5 | ) |
90-Day Eurodollar March Futures | | | 03/2020 | | | | 119 | | | | (28,990 | ) | | | (174 | ) | | | 0 | | | | (6 | ) |
U.S. Treasury5-Year Note March Futures | | | 03/2019 | | | | 722 | | | | (82,804 | ) | | | (1,208 | ) | | | 0 | | | | (181 | ) |
U.S. Treasury10-Year Note March Futures | | | 03/2019 | | | | 332 | | | | (40,509 | ) | | | (963 | ) | | | 0 | | | | (130 | ) |
U.S. Treasury Ultra Long-Term Bond March Futures | | | 03/2019 | | | | 21 | | | | (3,374 | ) | | | (178 | ) | | | 0 | | | | (12 | ) |
| | | | | | | | | | | | | | | | | | | | | | | | |
| | | | | | | | | | | | | | $ | (2,535 | ) | | $ | 0 | | | $ | (334 | ) |
| | | | | | | | | | | | | | | | | | | | | | | | |
Total Futures Contracts | | | $ | (1,606 | ) | | $ | 83 | | | $ | (334 | ) |
| | | | | | | | | | | | | |
SWAP AGREEMENTS:
CREDIT DEFAULT SWAPS ON CREDIT INDICES - BUY PROTECTION(1)
| | | | | | | | | | | | | | | | | | | | | | | | | | | | | | | | | | |
| Index/Tranches | | Fixed
(Pay) Rate | | | Payment
Frequency | | Maturity
Date | | | Notional
Amount(2) | | | Premiums
Paid/(Received) | | | Unrealized
Appreciation/
(Depreciation) | | | Market
Value(3) | | | Variation Margin | |
| | Asset | | | Liability | |
CDX.HY-315-Year Index | | | (5.000 | )% | | Quarterly | | | 12/20/2023 | | | $ | 14,500 | | | $ | (705 | ) | | $ | 385 | | | $ | (320 | ) | | $ | 0 | | | $ | (24 | ) |
| | | | | | | | | | | | | | | | | | | | | | | | | | | | | | | | | | |
INTEREST RATE SWAPS
| | | | | | | | | | | | | | | | | | | | | | | | | | | | | | | | | | | | |
Pay/Receive
Floating Rate | | Floating Rate Index | | Fixed Rate | | | Payment
Frequency | | Maturity
Date | | | Notional
Amount | | | Premiums
Paid/(Received) | | | Unrealized
Appreciation/
(Depreciation) | | | Market
Value | | | Variation Margin | |
| | Asset | | | Liability | |
Receive | | 3-Month USD-LIBOR | | | 3.000 | % | | Semi-Annual | | | 12/19/2028 | | | $ | 1,200 | | | $ | 20 | | | $ | (49 | ) | | $ | (29 | ) | | $ | 0 | | | $ | (4 | ) |
| | | | | | | | | | | | | | | | | | | | | | | | | | | | | | | | | | | | |
INTEREST RATE SWAPS - BASIS SWAPS
| | | | | | | | | | | | | | | | | | | | | | | | | | | | | | | | |
| Pay Floating Rate Index | | Receive Floating Rate Index | | Payment
Frequency | | Maturity
Date | | | Notional
Amount | | | Premiums
Paid/(Received) | | | Unrealized
Appreciation/
(Depreciation) | | | Market
Value | | | Variation Margin | |
| | Asset | | | Liability | |
3-Month USD-LIBOR | | 1-Month USD-LIBOR + 0.139% | | Quarterly | | | 05/10/2021 | | | $ | 23,740 | | | $ | 0 | | | $ | (2 | ) | | $ | (2 | ) | | $ | 3 | | | $ | 0 | |
3-Month USD-LIBOR | | 1-Month USD-LIBOR + 0.136% | | Quarterly | | | 05/11/2021 | | | | 11,900 | | | | 0 | | | | 0 | | | | 0 | | | | 1 | | | | 0 | |
3-Month USD-LIBOR | | 1-Month USD-LIBOR + 0.139% | | Quarterly | | | 05/14/2021 | | | | 14,760 | | | | 0 | | | | (2 | ) | | | (2 | ) | | | 1 | | | | 0 | |
| | | | | | | | | | | | | | | | | | | | | | | | | | | | | | | | |
| | | $ | 0 | | | $ | (4 | ) | | $ | (4 | ) | | $ | 5 | | | $ | 0 | |
| | | | | | | | | | | | | | | | | | | | | |
Total Swap Agreements | | | $ | (685 | ) | | $ | 332 | | | $ | (353 | ) | | $ | 5 | | | $ | (28 | ) |
| | | | | | | | | | | | | | | | | | | | | |
| | | | | | | | |
| 66 | | PIMCO ETF TRUST | | | | | See Accompanying Notes | |
December 31, 2018 (Unaudited)
FINANCIAL DERIVATIVE INSTRUMENTS: EXCHANGE-TRADED OR CENTRALLY CLEARED SUMMARY
The following is a summary of the market value and variation margin of Exchange-Traded or Centrally Cleared Financial Derivative Instruments as of December 31, 2018:
| | | | | | | | | | | | | | | | | | | | | | | | | | | | | | | | | | | | |
| | | Financial Derivative Assets | | | | | | Financial Derivative Liabilities | |
| | | Market Value | | | Variation Margin
Asset | | | Total | | | | | | Market Value | | | Variation Margin
Liability | | | Total | |
| | | Purchased
Options | | | Futures | | | Swap
Agreements | | | | | | Written
Options | | | Futures | | | Swap
Agreements | |
Total Exchange-Traded or Centrally Cleared | | $ | 8 | | | $ | 83 | | | $ | 5 | | | $ | 96 | | | | | | | $ | 0 | | | $ | (334) | | | $ | (28) | | | $ | (362) | |
| | | | | | | | | | | | | | | | | | | | | | | | | | | | | | | | | | | | |
Cash of $1,465 has been pledged as collateral for exchange-traded and centrally cleared financial derivative instruments as of December 31, 2018. See Note 8, Master Netting Arrangements, in the Notes to Financial Statements for more information regarding master netting arrangements.
| (1) | If the Fund is a buyer of protection and a credit event occurs, as defined under the terms of that particular swap agreement, the Fund will either (i) receive from the seller of protection an amount equal to the notional amount of the swap and deliver the referenced obligation or underlying securities comprising the referenced index or (ii) receive a net settlement amount in the form of cash, securities or other deliverable obligations equal to the notional amount of the swap less the recovery value of the referenced obligation or underlying securities comprising the referenced index. |
| (2) | The maximum potential amount the Fund could be required to pay as a seller of credit protection or receive as a buyer of credit protection if a credit event occurs as defined under the terms of that particular swap agreement. |
| (3) | The prices and resulting values for credit default swap agreements serve as indicators of the current status of the payment/performance risk and represent the likelihood of an expected liability (or profit) for the credit derivative should the notional amount of the swap agreement be closed/sold as of the period end. Increasing market values, in absolute terms when compared to the notional amount of the swap, represent a deterioration of the referenced indices’ credit soundness and a greater likelihood or risk of default or other credit event occurring as defined under the terms of the agreement. |
(f) FINANCIAL DERIVATIVE INSTRUMENTS: OVER THE COUNTER
FORWARD FOREIGN CURRENCY CONTRACTS:
| | | | | | | | | | | | | | | | | | | | | | | | |
| Counterparty | | Settlement
Month | | | Currency to
be Delivered | | | Currency to
be Received | | | Unrealized Appreciation/
(Depreciation) | |
| | Asset | | | Liability | |
BOA | | | 01/2019 | | | EUR | | | 5,681 | | | $ | | | 6,486 | | | $ | 0 | | | $ | (28 | ) |
| | | | | | | |
CBK | | | 01/2019 | | | | | | 2,081 | | | | | | 2,372 | | | | 0 | | | | (13 | ) |
| | | | | | | |
GLM | | | 01/2019 | | | $ | | | 1,233 | | | JPY | | | 139,000 | | | | 36 | | | | 0 | |
| | | | | | | |
IND | | | 01/2019 | | | JPY | | | 617,500 | | | $ | | | 5,447 | | | | 0 | | | | (188 | ) |
| | | | | | | |
JPM | | | 01/2019 | | | | | | 143,800 | | | | | | 1,272 | | | | 0 | | | | (41 | ) |
| | | | | | | |
RYL | | | 01/2019 | | | $ | | | 4,530 | | | JPY | | | 504,300 | | | | 72 | | | | 0 | |
| | | | | | | |
SSB | | | 01/2019 | | | | | | 1,051 | | | | | | 118,700 | | | | 32 | | | | 0 | |
| | | | | | | | | | | | | | | | | | | | | | | | |
Total Forward Foreign Currency Contracts | | | $ | 140 | | | $ | (270 | ) |
| | | | | | | | | |
PURCHASED OPTIONS:
INTEREST RATE SWAPTIONS
| | | | | | | | | | | | | | | | | | | | | | | | | | | | | | |
| Counterparty | | Description | | Floating Rate Index | | Pay/Receive
Floating Rate | | Exercise
Rate | | | Expiration
Date | | | Notional
Amount | | | Cost | | | Market
Value | |
| CBK | | Call - OTC2-Year Interest Rate Swap | | 3-Month USD-LIBOR | | Pay | | | 3.000% | | | | 02/11/2019 | | | | $ | | | | 31,000 | | | $ | 18 | | | $ | 224 | |
| | | | | | | | | | | | | | | | | | | | | | | | | | | | | | |
Total Purchased Options | | | $ | 18 | | | $ | 224 | |
| | | | | | | | | |
WRITTEN OPTIONS:
CREDIT DEFAULT SWAPTIONS ON CREDIT INDICES
| | | | | | | | | | | | | | | | | | | | | | | | | | |
| Counterparty | | Description | | Buy/Sell
Protection | | Exercise
Rate | | | Expiration
Date | | | Notional
Amount | | | Premiums
(Received) | | | Market
Value | |
BOA | | Put - OTCCDX.IG-315-Year Index | | Sell | | | 0.850 | % | | | 01/16/2019 | | | $ | | | 1,200 | | | $ | (2 | ) | | $ | (3 | ) |
| | Put - OTCCDX.IG-315-Year Index | | Sell | | | 0.900 | | | | 01/16/2019 | | | | | | 3,200 | | | | (5 | ) | | | (5 | ) |
| | Put - OTCCDX.IG-315-Year Index | | Sell | | | 0.950 | | | | 02/20/2019 | | | | | | 600 | | | | (1 | ) | | | (2 | ) |
| | Put - OTCCDX.IG-315-Year Index | | Sell | | | 1.000 | | | | 02/20/2019 | | | | | | 1,600 | | | | (3 | ) | | | (3 | ) |
| | Put - OTCCDX.IG-315-Year Index | | Sell | | | 1.200 | | | | 03/20/2019 | | | | | | 3,000 | | | | (3 | ) | | | (5 | ) |
| | | | | | | | |
BRC | | Put - OTCCDX.IG-315-Year Index | | Sell | | | 1.000 | | | | 01/16/2019 | | | | | | 1,100 | | | | (1 | ) | | | (1 | ) |
| | Put - OTCCDX.IG-315-Year Index | | Sell | | | 1.050 | | | | 02/20/2019 | | | | | | 1,200 | | | | (2 | ) | | | (2 | ) |
| | Put - OTCCDX.IG-315-Year Index | | Sell | | | 1.100 | | | | 03/20/2019 | | | | | | 600 | | | | (1 | ) | | | (1 | ) |
| | | | | | |
| See Accompanying Notes | | SEMIANNUAL REPORT | | DECEMBER 31, 2018 | | 67 |
Schedule of InvestmentsPIMCO Enhanced Low Duration Active Exchange-Traded Fund(Cont.)
| | | | | | | | | | | | | | | | | | | | | | | | | | |
| Counterparty | | Description | | Buy/Sell
Protection | | Exercise
Rate | | | Expiration
Date | | | Notional
Amount | | | Premiums
(Received) | | | Market
Value | |
CBK | | Put - OTCCDX.IG-315-Year Index | | Sell | | | 0.950 | % | | | 01/16/2019 | | | $ | | | 1,100 | | | $ | (1 | ) | | $ | (1 | ) |
| | Put - OTCCDX.IG-315-Year Index | | Sell | | | 1.000 | | | | 01/16/2019 | | | | | | 6,100 | | | | (5 | ) | | | (4 | ) |
| | Put - OTCCDX.IG-315-Year Index | | Sell | | | 0.950 | | | | 02/20/2019 | | | | | | 2,400 | | | | (5 | ) | | | (7 | ) |
| | Put - OTCCDX.IG-315-Year Index | | Sell | | | 1.100 | | | | 03/20/2019 | | | | | | 600 | | | | (1 | ) | | | (1 | ) |
| | | | | | | | |
GST | | Put - OTCCDX.IG-315-Year Index | | Sell | | | 0.900 | | | | 01/16/2019 | | | | | | 1,600 | | | | (2 | ) | | | (3 | ) |
| | Put - OTCCDX.IG-315-Year Index | | Sell | | | 2.400 | | | | 09/18/2019 | | | | | | 1,400 | | | | (2 | ) | | | (3 | ) |
| | | | | | | | |
JPM | | Put - OTCCDX.IG-315-Year Index | | Sell | | | 0.950 | | | | 02/20/2019 | | | | | | 1,000 | | | | (2 | ) | | | (3 | ) |
| | Put - OTCCDX.IG-315-Year Index | | Sell | | | 1.200 | | | | 03/20/2019 | | | | | | 800 | | | | (2 | ) | | | (1 | ) |
| | | | | | | | |
MYC | | Put - OTCCDX.IG-315-Year Index | | Sell | | | 0.900 | | | | 01/16/2019 | | | | | | 1,600 | | | | (2 | ) | | | (3 | ) |
| | | | | | | | | | | | | | | | | | | | | | | | | | |
| | | | | | | | | | | | | | | | | | $ | (40 | ) | | $ | (48 | ) |
| | | | | | | | | | | | | | | | | | | | | | | | |
INTEREST RATE SWAPTIONS
| | | | | | | | | | | | | | | | | | | | | | | | | | | | | | |
| Counterparty | | Description | | Floating Rate Index | | Pay/Receive
Floating Rate | | Exercise
Rate | | | Expiration
Date | | | Notional
Amount | | | Premiums
(Received) | | | Market
Value | |
| CBK | | Call - OTC10-Year Interest Rate Swap | | 3-Month USD-LIBOR | | Receive | | | 3.030 | % | | | 02/11/2019 | | | | $ | | | | 3,600 | | | $ | (10 | ) | | $ | (99 | ) |
| | | | | | | | | |
| GLM | | Call - OTC5-Year Interest Rate Swap | | 3-Month USD-LIBOR | | Receive | | | 2.950 | | | | 02/11/2019 | | | | | | | | 6,700 | | | | (11 | ) | | | (119 | ) |
| | | | | | | | | | | | | | | | | | | | | | | | | | | | | | |
| | | | | | | | | | | | | | | | | | | | | | $ | (21 | ) | | $ | (218 | ) |
| | | | | | | | | | | | | | | | | | | | | | | | | | | | |
Total Written Options | | | $ | (61 | ) | | $ | (266 | ) |
| | | | | | | | | |
FINANCIAL DERIVATIVE INSTRUMENTS: OVER THE COUNTER SUMMARY
The following is a summary by counterparty of the market value of OTC financial derivative instruments and collateral (received) as of December 31, 2018:
| | | | | | | | | | | | | | | | | | | | | | | | | | | | | | | | | | | | | | | | | | | | | | | | |
| | | Financial Derivative Assets | | | | | | Financial Derivative Liabilities | | | | | | | | | | |
| Counterparty | | Forward
Foreign
Currency
Contracts | | | Purchased
Options | | | Swap
Agreements | | | Total
Over the
Counter | | | | | | Forward
Foreign
Currency
Contracts | | | Written
Options | | | Swap
Agreements | | | Total
Over the
Counter | | | Net Market
Value of OTC
Derivatives | | | Collateral
(Received) | | | Net
Exposure(1) | |
BOA | | $ | 0 | | | $ | 0 | | | $ | 0 | | | $ | 0 | | | | | | | $ | (28 | ) | | $ | (18 | ) | | $ | 0 | | | $ | (46 | ) | | $ | (46 | ) | | $ | 0 | | | $ | (46 | ) |
BRC | | | 0 | | | | 0 | | | | 0 | | | | 0 | | | | | | | | 0 | | | | (4 | ) | | | 0 | | | | (4 | ) | | | (4 | ) | | | 0 | | | | (4 | ) |
CBK | | | 0 | | | | 224 | | | | 0 | | | | 224 | | | | | | | | (13 | ) | | | (112 | ) | | | 0 | | | | (125 | ) | | | 99 | | | | 0 | | | | 99 | |
GLM | | | 36 | | | | 0 | | | | 0 | | | | 36 | | | | | | | | 0 | | | | (119 | ) | | | 0 | | | | (119 | ) | | | (83 | ) | | | 0 | | | | (83 | ) |
GST | | | 0 | | | | 0 | | | | 0 | | | | 0 | | | | | | | | 0 | | | | (6 | ) | | | 0 | | | | (6 | ) | | | (6 | ) | | | 0 | | | | (6 | ) |
IND | | | 0 | | | | 0 | | | | 0 | | | | 0 | | | | | | | | (188 | ) | | | 0 | | | | 0 | | | | (188 | ) | | | (188 | ) | | | 0 | | | | (188 | ) |
JPM | | | 0 | | | | 0 | | | | 0 | | | | 0 | | | | | | | | (41 | ) | | | (4 | ) | | | 0 | | | | (45 | ) | | | (45 | ) | | | 0 | | | | (45 | ) |
MYC | | | 0 | | | | 0 | | | | 0 | | | | 0 | | | | | | | | 0 | | | | (3 | ) | | | 0 | | | | (3 | ) | | | (3 | ) | | | 0 | | | | (3 | ) |
RYL | | | 72 | | | | 0 | | | | 0 | | | | 72 | | | | | | | | 0 | | | | 0 | | | | 0 | | | | 0 | | | | 72 | | | | (60 | ) | | | 12 | |
SSB | | | 32 | | | | 0 | | | | 0 | | | | 32 | | | | | | | | 0 | | | | 0 | | | | 0 | | | | 0 | | | | 32 | | | | 0 | | | | 32 | |
| | | | | | | | | | | | | | | | | | | | | | | | | | | | | | | | | | | | | | | | | | | | | | | | |
Total Over the Counter | | $ | 140 | | | $ | 224 | | | $ | 0 | | | $ | 364 | | | | | | | $ | (270 | ) | | $ | (266 | ) | | $ | 0 | | | $ | (536 | ) | | | | | | | | | | | | |
| | | | | | | | | | | | | | | | | | | | | | | | | | | | | | | | | | | | | | | | | | | | | | | | |
| (1) | Net Exposure represents the net receivable/(payable) that would be due from/to the counterparty in the event of default. Exposure from OTC financial derivative instruments can only be netted across transactions governed under the same master agreement with the same legal entity. See Note 8, Master Netting Arrangements, in the Notes to Financial Statements for more information regarding master netting arrangements. |
FAIR VALUE OF FINANCIAL DERIVATIVE INSTRUMENTS
The following is a summary of the fair valuation of the Fund’s derivative instruments categorized by risk exposure. See Note 7, Principal Risks, in the Notes to Financial Statements on risks of the Fund.
Fair Values of Financial Derivative Instruments on the Statements of Assets and Liabilities as of December 31, 2018:
| | | | | | | | | | | | | | | | | | | | | | | | |
| | | Derivatives not accounted for as hedging instruments | |
| | | Commodity
Contracts | | | Credit
Contracts | | | Equity
Contracts | | | Foreign
Exchange
Contracts | | | Interest
Rate Contracts | | | Total | |
Financial Derivative Instruments - Assets | |
Exchange-traded or centrally cleared | |
Purchased Options | | $ | 0 | | | $ | 0 | | | $ | 0 | | | $ | 0 | | | $ | 8 | | | $ | 8 | |
Futures | | | 0 | | | | 0 | | | | 0 | | | | 0 | | | | 83 | | | | 83 | |
Swap Agreements | | | 0 | | | | 0 | | | | 0 | | | | 0 | | | | 5 | | | | 5 | |
| | | | | | | | | | | | | | | | | | | | | | | | |
| | $ | 0 | | | $ | 0 | | | $ | 0 | | | $ | 0 | | | $ | 96 | | | $ | 96 | |
| | | | | | | | | | | | | | | | | | | | | | | | |
| | | | | | | | |
| 68 | | PIMCO ETF TRUST | | | | | See Accompanying Notes | |
December 31, 2018 (Unaudited)
| | | | | | | | | | | | | | | | | | | | | | | | |
| | | Derivatives not accounted for as hedging instruments | |
| | | Commodity
Contracts | | | Credit
Contracts | | | Equity
Contracts | | | Foreign
Exchange
Contracts | | | Interest
Rate Contracts | | | Total | |
Over the counter | |
Forward Foreign Currency Contracts | | $ | 0 | | | $ | 0 | | | $ | 0 | | | $ | 140 | | | $ | 0 | | | $ | 140 | |
Purchased Options | | | 0 | | | | 0 | | | | 0 | | | | 0 | | | | 224 | | | | 224 | |
| | | | | | | | | | | | | | | | | | | | | | | | |
| | $ | 0 | | | $ | 0 | | | $ | 0 | | | $ | 140 | | | $ | 224 | | | $ | 364 | |
| | | | | | | | | | | | | | | | | | | | | | | | |
| | $ | 0 | | | $ | 0 | | | $ | 0 | | | $ | 140 | | | $ | 320 | | | $ | 460 | |
| | | | | | | | | | | | | | | | | | | | | | | | |
|
Financial Derivative Instruments - Liabilities | |
Exchange-traded or centrally cleared | |
Futures | | $ | 0 | | | $ | 0 | | | $ | 0 | | | $ | 0 | | | $ | 334 | | | $ | 334 | |
Swap Agreements | | | 0 | | | | 24 | | | | 0 | | | | 0 | | | | 4 | | | | 28 | |
| | | | | | | | | | | | | | | | | | | | | | | | |
| | $ | 0 | | | $ | 24 | | | $ | 0 | | | $ | 0 | | | $ | 338 | | | $ | 362 | |
| | | | | | | | | | | | | | | | | | | | | | | | |
Over the counter | |
Forward Foreign Currency Contracts | | $ | 0 | | | $ | 0 | | | $ | 0 | | | $ | 270 | | | $ | 0 | | | $ | 270 | |
Written Options | | | 0 | | | | 48 | | | | 0 | | | | 0 | | | | 218 | | | | 266 | |
| | | | | | | | | | | | | | | | | | | | | | | | |
| | $ | 0 | | | $ | 48 | | | $ | 0 | | | $ | 270 | | | $ | 218 | | | $ | 536 | |
| | | | | | | | | | | | | | | | | | | | | | | | |
| | $ | 0 | | | $ | 72 | | | $ | 0 | | | $ | 270 | | | $ | 556 | | | $ | 898 | |
| | | | | | | | | | | | | | | | | | | | | | | | |
The effect of Financial Derivative Instruments on the Statements of Operations for the period ended December 31, 2018:
| | | | | | | | | | | | | | | | | | | | | | | | |
| | | Derivatives not accounted for as hedging instruments | |
| | | Commodity
Contracts | | | Credit
Contracts | | | Equity
Contracts | | | Foreign
Exchange
Contracts | | | Interest
Rate Contracts | | | Total | |
Net Realized Gain (Loss) on Financial Derivative Instruments | |
Exchange-traded or centrally cleared | |
Purchased Options | | $ | 0 | | | $ | 0 | | | $ | 0 | | | $ | 0 | | | $ | (10 | ) | | $ | (10 | ) |
Futures | | | 0 | | | | 0 | | | | 0 | | | | 0 | | | | (124 | ) | | | (124 | ) |
Swap Agreements | | | 0 | | | | (224 | ) | | | 0 | | | | 0 | | | | 19 | | | | (205 | ) |
| | | | | | | | | | | | | | | | | | | | | | | | |
| | $ | 0 | | | $ | (224 | ) | | $ | 0 | | | $ | 0 | | | $ | (115 | ) | | $ | (339 | ) |
| | | | | | | | | | | | | | | | | | | | | | | | |
Over the counter | |
Forward Foreign Currency Contracts | | $ | 0 | | | $ | 0 | | | $ | 0 | | | $ | 507 | | | $ | 0 | | | $ | 507 | |
Purchased Options | | | 0 | | | | 0 | | | | 0 | | | | 0 | | | | (64 | ) | | | (64 | ) |
Written Options | | | 0 | | | | 7 | | | | 0 | | | | 0 | | | | 114 | | | | 121 | |
| | | �� | | | | | | | | | | | | | | | | | | | | | |
| | $ | 0 | | | $ | 7 | | | $ | 0 | | | $ | 507 | | | $ | 50 | | | $ | 564 | |
| | | | | | | | | | | | | | | | | | | | | | | | |
| | $ | 0 | | | $ | (217 | ) | | $ | 0 | | | $ | 507 | | | $ | (65 | ) | | $ | 225 | |
| | | | | | | | | | | | | | | | | | | | | | | | |
|
Net Change in Unrealized Appreciation (Depreciation) on Financial Derivative Instruments | |
Exchange-traded or centrally cleared | |
Purchased Options | | $ | 0 | | | $ | 0 | | | $ | 0 | | | $ | 0 | | | $ | (3 | ) | | $ | (3 | ) |
Futures | | | 0 | | | | 0 | | | | 0 | | | | 0 | | | | (1,465 | ) | | | (1,465 | ) |
Swap Agreements | | | 0 | | | | 309 | | | | 0 | | | | 0 | | | | (52 | ) | | | 257 | |
| | | | | | | | | | | | | | | | | | | | | | | | |
| | $ | 0 | | | $ | 309 | | | $ | 0 | | | $ | 0 | | | $ | (1,520 | ) | | $ | (1,211 | ) |
| | | | | | | | | | | | | | | | | | | | | | | | |
Over the counter | |
Forward Foreign Currency Contracts | | $ | 0 | | | $ | 0 | | | $ | 0 | | | $ | (224 | ) | | $ | 0 | | | $ | (224 | ) |
Purchased Options | | | 0 | | | | 0 | | | | 0 | | | | 0 | | | | 213 | | | | 213 | |
Written Options | | | 0 | | | | (10 | ) | | | 0 | | | | 0 | | | | (211 | ) | | | (221 | ) |
| | | | | | | | | | | | | | | | | | | | | | | | |
| | $ | 0 | | | $ | (10 | ) | | $ | 0 | | | $ | (224 | ) | | $ | 2 | | | $ | (232 | ) |
| | | | | | | | | | | | | | | | | | | | | | | | |
| | $ | 0 | | | $ | 299 | | | $ | 0 | | | $ | (224 | ) | | $ | (1,518 | ) | | $ | (1,443 | ) |
| | | | | | | | | | | | | | | | | | | | | | | | |
| | | | | | |
| See Accompanying Notes | | SEMIANNUAL REPORT | | DECEMBER 31, 2018 | | 69 |
Schedule of InvestmentsPIMCO Enhanced Low Duration Active Exchange-Traded Fund(Cont.)
December 31, 2018 (Unaudited)
FAIR VALUE MEASUREMENTS
The following is a summary of the fair valuations according to the inputs used as of December 31, 2018 in valuing the Fund’s assets and liabilities:
| | | | | | | | | | | | | | | | |
| Category and Subcategory | | Level 1 | | | Level 2 | | | Level 3 | | | Fair
Value at
12/31/2018 | |
Investments in Securities, at Value | |
Loan Participations and Assignments | | $ | 0 | | | $ | 992 | | | $ | 0 | | | $ | 992 | |
Corporate Bonds & Notes | |
Banking & Finance | | | 0 | | | | 62,428 | | | | 0 | | | | 62,428 | |
Industrials | | | 0 | | | | 63,199 | | | | 0 | | | | 63,199 | |
Utilities | | | 0 | | | | 13,786 | | | | 0 | | | | 13,786 | |
Municipal Bonds & Notes | |
California | | | 0 | | | | 210 | | | | 0 | | | | 210 | |
Kansas | | | 0 | | | | 499 | | | | 0 | | | | 499 | |
U.S. Government Agencies | | | 0 | | | | 32,830 | | | | 0 | | | | 32,830 | |
U.S. Treasury Obligations | | | 0 | | | | 161,626 | | | | 0 | | | | 161,626 | |
Non-Agency Mortgage-Backed Securities | | | 0 | | | | 9,485 | | | | 0 | | | | 9,485 | |
Asset-Backed Securities | | | 0 | | | | 27,134 | | | | 0 | | | | 27,134 | |
Sovereign Issues | | | 0 | | | | 2,803 | | | | 0 | | | | 2,803 | |
Short-Term Instruments | |
Certificates of Deposit | | | 0 | | | | 1,400 | | | | 0 | | | | 1,400 | |
Commercial Paper | | | 0 | | | | 296 | | | | 0 | | | | 296 | |
Repurchase Agreements | | | 0 | | | | 4,565 | | | | 0 | | | | 4,565 | |
| | | | | | | | | | | | | | | | |
| | | | |
Total Investments | | $ | 0 | | | $ | 381,253 | | | $ | 0 | | | $ | 381,253 | |
| | | | | | | | | | | | | | | | |
| | | | | | | | | | | | | | | | |
| Category and Subcategory | | Level 1 | | | Level 2 | | | Level 3 | | | Fair
Value at
12/31/2018 | |
Financial Derivative Instruments - Assets | |
Exchange-traded or centrally cleared | | $ | 84 | | | $ | 12 | | | $ | 0 | | | $ | 96 | |
Over the counter | | | 0 | | | | 364 | | | | 0 | | | | 364 | |
| | | | | | | | | | | | | | | | |
| | $ | 84 | | | $ | 376 | | | $ | 0 | | | $ | 460 | |
| | | | | | | | | | | | | | | | |
|
Financial Derivative Instruments - Liabilities | |
Exchange-traded or centrally cleared | | | (334 | ) | | | (28 | ) | | | 0 | | | | (362 | ) |
Over the counter | | | 0 | | | | (536 | ) | | | 0 | | | | (536 | ) |
| | | | | | | | | | | | | | | | |
| | $ | (334 | ) | | $ | (564 | ) | | $ | 0 | | | $ | (898 | ) |
| | | | | | | | | | | | | | | | |
| | | | |
Total Financial Derivative Instruments | | $ | (250 | ) | | $ | (188 | ) | | $ | 0 | | | $ | (438 | ) |
| | | | | | | | | | | | | | | | |
| | | | |
Totals | | $ | (250 | ) | | $ | 381,065 | | | $ | 0 | | | $ | 380,815 | |
| | | | | | | | | | | | | | | | |
There were no significant transfers into or out of Level 3 during the period ended December 31, 2018.
| | | | | | | | |
| 70 | | PIMCO ETF TRUST | | | | | See Accompanying Notes | |
Schedule of InvestmentsPIMCO Enhanced Short Maturity Active Exchange-Traded Fund
December 31, 2018 (Unaudited)
(Amounts in thousands*, except number of shares, contracts and units, if any)
| | | | | | | | | | | | |
| | | | | PRINCIPAL
AMOUNT
(000S) | | | | | MARKET
VALUE
(000S) | |
| INVESTMENTS IN SECURITIES 99.7% | |
| |
| CORPORATE BONDS & NOTES 66.2% | |
| |
| BANKING & FINANCE 37.0% | |
|
ABN AMRO Bank NV | |
1.800% due 09/20/2019 | | $ | | | 8,000 | | | $ | | | 7,928 | |
2.100% due 01/18/2019 | | | | | 1,000 | | | | | | 1,001 | |
3.261% (US0003M + 0.570%) due 08/27/2021 ~ | | | | | 20,000 | | | | | | 19,893 | |
|
ADCB Finance Cayman Ltd. | |
2.625% due 03/10/2020 | | | | | 5,000 | | | | | | 4,921 | |
2.750% due 09/16/2019 | | | | | 7,500 | | | | | | 7,455 | |
3.000% due 03/04/2019 | | | | | 29,000 | | | | | | 28,987 | |
|
AerCap Ireland Capital DAC | |
3.750% due 05/15/2019 | | | | | 64,044 | | | | | | 64,045 | |
4.250% due 07/01/2020 | | | | | 1,500 | | | | | | 1,504 | |
4.625% due 10/30/2020 | | | | | 2,300 | | | | | | 2,317 | |
|
AIA Group Ltd. | |
2.250% due 03/11/2019 | | | | | 4,880 | | | | | | 4,871 | |
3.312% (US0003M + 0.520%) due 09/20/2021 ~ | | | | | 27,000 | | | | | | 26,904 | |
|
AIG Global Funding | |
3.282% (US0003M + 0.460%) due 06/25/2021 ~ | | | | | 8,900 | | | | | | 8,835 | |
|
Air Lease Corp. | |
2.125% due 01/15/2020 | | | | | 17,935 | | | | | | 17,678 | |
3.375% due 01/15/2019 | | | | | 35,564 | | | | | | 35,561 | |
|
American Express Co. | |
3.151% (US0003M + 0.610%) due 08/01/2022 ~ | | | | | 14,200 | | | | | | 14,038 | |
|
American Express Credit Corp. | |
3.828% (US0003M + 1.050%) due 09/14/2020 ~ | | | | | 8,900 | | | | | | 8,962 | |
|
American Honda Finance Corp. | |
2.954% (US0003M + 0.340%) due 02/14/2020 ~ | | | | | 1,114 | | | | | | 1,112 | |
3.057% (US0003M + 0.290%) due 12/10/2021 ~ | | | | | 33,000 | | | | | | 32,635 | |
|
American Tower Corp. | |
2.800% due 06/01/2020 | | | | | 5,000 | | | | | | 4,963 | |
3.400% due 02/15/2019 | | | | | 13,655 | | | | | | 13,663 | |
|
Athene Global Funding | |
2.750% due 04/20/2020 | | | | | 585 | | | | | | 580 | |
3.609% (US0003M + 1.140%) due 04/20/2020 ~ | | | | | 42,225 | | | | | | 42,476 | |
4.038% (US0003M + 1.230%) due 07/01/2022 ~ | | | | | 35,659 | | | | | | 35,827 | |
|
AvalonBay Communities, Inc. | |
2.866% (US0003M + 0.430%) due 01/15/2021 ~ | | | | | 7,200 | | | | | | 7,150 | |
|
Aviation Capital Group LLC | |
3.190% (US0003M + 0.670%) due 07/30/2021 ~ | | | | | 4,250 | | | | | | 4,218 | |
3.688% (US0003M + 0.950%) due 06/01/2021 ~ | | | | | 30,700 | | | | | | 30,659 | |
|
Axis Bank Ltd. | |
3.250% due 05/21/2020 | | | | | 3,000 | | | | | | 2,965 | |
|
Bank of America Corp. | |
2.600% due 01/15/2019 | | | | | 30,000 | | | | | | 29,994 | |
3.129% (US0003M + 0.660%) due 07/21/2021 ~ | | | | | 5,700 | | | | | | 5,678 | |
3.447% (US0003M + 0.650%) due 10/01/2021 ~ | | | | | 28,000 | | | | | | 27,805 | |
3.476% (US0003M + 1.040%) due 01/15/2019 ~ | | | | | 13,783 | | | | | | 13,786 | |
|
Bank of America N.A. | |
2.957% (US0003M + 0.250%) due 08/28/2020 ~ | | | | | 9,000 | | | | | | 8,970 | |
|
Banque Federative du Credit Mutuel S.A. | |
2.750% due 01/22/2019 | | | | | 2,500 | | | | | | 2,499 | |
2.932% (US0003M + 0.350%) due 08/05/2019 ~ | | | | | 10,000 | | | | | | 9,995 | |
|
Barclays PLC | |
2.750% due 11/08/2019 | | | | | 89,930 | | | | | | 89,344 | |
4.009% (US0003M + 1.380%) due 05/16/2024 ~ | | | | | 19,000 | | | | | | 18,105 | |
| | | | | | | | | | | | |
| | | | | PRINCIPAL
AMOUNT
(000S) | | | | | MARKET
VALUE
(000S) | |
|
BNZ International Funding Ltd. | |
2.350% due 03/04/2019 | | $ | | | 22,563 | | | $ | | | 22,538 | |
2.400% due 02/21/2020 | | | | | 2,500 | | | | | | 2,476 | |
3.346% (US0003M + 0.700%) due 02/21/2020 ~ | | | | | 20,650 | | | | | | 20,689 | |
|
BOC Aviation Ltd. | |
3.000% due 03/30/2020 | | | | | 3,590 | | | | | | 3,571 | |
3.875% due 05/09/2019 | | | | | 28,495 | | | | | | 28,555 | |
|
Canadian Imperial Bank of Commerce | |
3.259% (US0003M + 0.520%) due 09/06/2019 ~ | | | | | 1,860 | | | | | | 1,862 | |
|
Caterpillar Financial Services Corp. | |
3.046% (US0003M + 0.280%) due 09/07/2021 ~ | | | | | 14,000 | | | | | | 13,910 | |
3.126% (US0003M + 0.510%) due 05/15/2023 ~ | | | | | 8,400 | | | | | | 8,245 | |
|
Chiba Bank Ltd. | |
2.550% due 10/30/2019 | | | | | 14,400 | | | | | | 14,250 | |
|
Citibank N.A. | |
3.061% (US0003M + 0.260%) due 09/18/2019 ~ | | | | | 4,500 | | | | | | 4,494 | |
|
Citigroup, Inc. | |
3.696% (US0003M + 0.930%) due 06/07/2019 ~ | | | | | 9,000 | | | | | | 9,022 | |
3.749% (US0003M + 1.190%) due 08/02/2021 ~ | | | | | 8,200 | | | | | | 8,226 | |
3.761% (US0003M + 1.023%) due 06/01/2024 ~ | | | | | 37,800 | | | | | | 37,053 | |
3.818% (US0003M + 1.310%) due 10/26/2020 ~ | | | | | 11,200 | | | | | | 11,285 | |
4.183% (US0003M + 1.380%) due 03/30/2021 ~ | | | | | 27,000 | | | | | | 27,190 | |
|
Cooperatieve Rabobank UA | |
3.244% (US0003M + 0.830%) due 01/10/2022 ~ | | | | | 45,000 | | | | | | 44,808 | |
|
Credit Suisse AG | |
2.300% due 05/28/2019 | | | | | 500 | | | | | | 499 | |
|
Credit Suisse Group AG | |
4.016% (US0003M + 1.240%) due 06/12/2024 ~ | | | | | 5,000 | | | | | | 4,928 | |
|
Credit Suisse Group Funding Guernsey Ltd. | |
4.735% (US0003M + 2.290%) due 04/16/2021 ~ | | | | | 16,900 | | | | | | 17,385 | |
|
Danske Bank A/S | |
1.650% due 09/06/2019 | | | | | 10,000 | | | | | | 9,841 | |
2.200% due 03/02/2020 | | | | | 3,900 | | | | | | 3,816 | |
3.248% (US0003M + 0.510%) due 03/02/2020 ~ | | | | | 22,100 | | | | | | 22,059 | |
3.319% (US0003M + 0.580%) due 09/06/2019 ~ | | | | | 4,850 | | | | | | 4,847 | |
|
DBS Group Holdings Ltd. | |
2.246% due 07/16/2019 | | | | | 4,328 | | | | | | 4,314 | |
2.936% (US0003M + 0.500%) due 07/16/2019 ~ | | | | | 12,900 | | | | | | 12,909 | |
3.110% (US0003M + 0.620%) due 07/25/2022 ~ | | | | | 33,530 | | | | | | 33,574 | |
3.257% (US0003M + 0.490%) due 06/08/2020 ~ | | | | | 18,384 | | | | | | 18,380 | |
|
Dexia Credit Local S.A. | |
1.875% due 03/28/2019 | | | | | 37,300 | | | | | | 37,239 | |
1.875% due 01/29/2020 | | | | | 1,700 | | | | | | 1,685 | |
2.250% due 01/30/2019 | | | | | 63,195 | | | | | | 63,164 | |
2.500% due 01/25/2021 | | | | | 10,150 | | | | | | 10,097 | |
|
DNB Bank ASA | |
3.167% (US0003M + 0.370%) due 10/02/2020 ~ | | | | | 10,000 | | | | | | 9,938 | |
3.808% (US0003M + 1.070%) due 06/02/2021 ~ | | | | | 5,000 | | | | | | 5,046 | |
|
Erste Abwicklungsanstalt | |
2.977% (US0003M + 0.210%) due 03/09/2020 ~ | | | | | 22,400 | | | | | | 22,449 | |
|
EXIM Sukuk Malaysia Bhd. | |
2.874% due 02/19/2019 | | | | | 9,400 | | | | | | 9,391 | |
|
First Abu Dhabi Bank PJSC | |
3.000% due 08/13/2019 | | | | | 5,734 | | | | | | 5,718 | |
| | | | | | | | | | | | |
| | | | | PRINCIPAL
AMOUNT
(000S) | | | | | MARKET
VALUE
(000S) | |
|
First Gulf Bank PJSC | |
3.250% due 01/14/2019 | | $ | | | 7,700 | | | $ | | | 7,703 | |
|
First Republic Bank | |
2.375% due 06/17/2019 | | | | | 1,880 | | | | | | 1,872 | |
|
FMS Wertmanagement | |
2.918% (US0003M + 0.300%) due 02/11/2019 • | | | | | 7,600 | | | | | | 7,603 | |
|
Ford Motor Credit Co. LLC | |
1.897% due 08/12/2019 | | | | | 5,745 | | | | | | 5,689 | |
2.021% due 05/03/2019 | | | | | 22,758 | | | | | | 22,668 | |
2.262% due 03/28/2019 | | | | | 2,500 | | | | | | 2,493 | |
2.375% due 03/12/2019 | | | | | 4,500 | | | | | | 4,493 | |
2.597% due 11/04/2019 | | | | | 1,500 | | | | | | 1,484 | |
2.943% due 01/08/2019 | | | | | 13,615 | | | | | | 13,615 | |
2.989% (US0003M + 0.430%) due 11/02/2020 ~ | | | | | 1,200 | | | | | | 1,167 | |
3.408% (US0003M + 1.000%) due 01/09/2020 ~ | | | | | 19,900 | | | | | | 19,699 | |
3.512% (US0003M + 0.930%) due 11/04/2019 ~ | | | | | 830 | | | | | | 827 | |
3.606% (US0003M + 0.830%) due 03/12/2019 ~ | | | | | 19,700 | | | | | | 19,686 | |
3.754% (US0003M + 0.930%) due 09/24/2020 ~ | | | | | 58,100 | | | | | | 57,074 | |
8.125% due 01/15/2020 | | | | | 8,677 | | | | | | 9,010 | |
|
General Motors Financial Co., Inc. | |
2.350% due 10/04/2019 | | | | | 9,600 | | | | | | 9,518 | |
3.150% due 01/15/2020 | | | | | 4,600 | | | | | | 4,573 | |
3.258% (US0003M + 0.850%) due 04/09/2021 ~ | | | | | 6,900 | | | | | | 6,745 | |
3.366% (US0003M + 0.930%) due 04/13/2020 ~ | | | | | 22,213 | | | | | | 22,078 | |
3.500% due 07/10/2019 | | | | | 13,042 | | | | | | 13,042 | |
3.678% (US0003M + 1.270%) due 10/04/2019 ~ | | | | | 12,867 | | | | | | 12,921 | |
3.692% (US0003M + 1.100%) due 11/06/2021 ~ | | | | | 35,000 | | | | | | 34,080 | |
3.996% (US0003M + 1.560%) due 01/15/2020 ~ | | | | | 34,832 | | | | | | 35,000 | |
4.051% (US0003M + 1.450%) due 05/09/2019 ~ | | | | | 2,194 | | | | | | 2,197 | |
|
Goldman Sachs Group, Inc. | |
2.550% due 10/23/2019 | | | | | 5,600 | | | | | | 5,566 | |
3.552% (US0003M + 0.730%) due 12/27/2020 ~ | | | | | 3,000 | | | | | | 2,988 | |
3.618% (US0003M + 1.110%) due 04/26/2022 ~ | | | | | 19,000 | | | | | | 18,795 | |
3.637% (US0003M + 1.160%) due 04/23/2020 ~ | | | | | 10,000 | | | | | | 10,036 | |
3.786% (US0003M + 1.170%) due 11/15/2021 ~ | | | | | 38,125 | | | | | | 38,052 | |
3.850% (US0003M + 1.360%) due 04/23/2021 ~ | | | | | 6,656 | | | | | | 6,708 | |
|
Harley-Davidson Financial Services, Inc. | |
2.150% due 02/26/2020 | | | | | 2,000 | | | | | | 1,969 | |
2.250% due 01/15/2019 | | | | | 850 | | | | | | 850 | |
2.400% due 09/15/2019 | | | | | 4,136 | | | | | | 4,102 | |
3.117% (US0003M + 0.350%) due 03/08/2019 ~ | | | | | 12,220 | | | | | | 12,218 | |
3.146% (US0003M + 0.500%) due 05/21/2020 ~ | | | | | 15,500 | | | | | | 15,481 | |
3.647% (US0003M + 0.940%) due 03/02/2021 ~ | | | | | 36,700 | | | | | | 36,670 | |
|
Hong Kong Sukuk Ltd. | |
2.005% due 09/18/2019 | | | | | 2,200 | | | | | | 2,187 | |
|
HSBC Holdings PLC | |
3.240% (US0003M + 0.600%) due 05/18/2021 ~ | | | | | 6,550 | | | | | | 6,455 | |
3.426% (US0003M + 0.650%) due 09/11/2021 ~ | | | | | 33,000 | | | | | | 32,576 | |
4.349% (US0003M + 1.660%) due 05/25/2021 ~ | | | | | 66,000 | | | | | | 66,699 | |
5.007% (US0003M + 2.240%) due 03/08/2021 ~ | | | | | 3,075 | | | | | | 3,151 | |
|
Hutchison Whampoa International Ltd. | |
5.750% due 09/11/2019 | | | | | 2,200 | | | | | | 2,241 | |
7.625% due 04/09/2019 | | | | | 18,164 | | | | | | 18,388 | |
| | | | | | |
| See Accompanying Notes | | SEMIANNUAL REPORT | | DECEMBER 31, 2018 | | 71 |
Schedule of InvestmentsPIMCO Enhanced Short Maturity Active Exchange-Traded Fund(Cont.)
| | | | | | | | | | | | |
| | | | | PRINCIPAL
AMOUNT
(000S) | | | | | MARKET
VALUE
(000S) | |
|
Hyundai Capital Services, Inc. | |
1.625% due 08/30/2019 | | $ | | | 17,969 | | | $ | | | 17,786 | |
|
ICICI Bank Ltd. | |
3.125% due 08/12/2020 | | | | | 500 | | | | | | 494 | |
3.500% due 03/18/2020 | | | | | 1,150 | | | | | | 1,146 | |
4.800% due 05/22/2019 | | | | | 71,888 | | | | | | 72,186 | |
|
Indian Railway Finance Corp. Ltd. | |
3.917% due 02/26/2019 | | | | | 9,204 | | | | | | 9,210 | |
|
Industrial Bank of Korea | |
2.000% due 04/23/2020 | | | | | 2,500 | | | | | | 2,468 | |
|
ING Bank NV | |
3.487% (US0003M + 0.690%) due 10/01/2019 ~ | | | | | 24,225 | | | | | | 24,272 | |
3.610% (US0003M + 0.970%) due 08/17/2020 ~ | | | | | 2,000 | | | | | | 2,013 | |
3.954% (US0003M + 1.130%) due 03/22/2019 ~ | | | | | 500 | | | | | | 501 | |
|
International Finance Facility for Immunisation Co. | |
2.801% (US0003M + 0.260%) due 11/01/2019 • | | | | | 5,575 | | | | | | 5,590 | |
|
International Lease Finance Corp. | |
5.875% due 04/01/2019 | | | | | 25,282 | | | | | | 25,387 | |
6.250% due 05/15/2019 | | | | | 31,044 | | | | | | 31,322 | |
8.250% due 12/15/2020 | | | | | 2,301 | | | | | | 2,476 | |
|
Intesa Sanpaolo SpA | |
3.875% due 01/15/2019 | | | | | 21,550 | | | | | | 21,546 | |
|
Jackson National Life Global Funding | |
2.736% (US0003M + 0.300%) due 10/15/2020 ~ | | | | | 17,400 | | | | | | 17,235 | |
2.809% (US0003M + 0.300%) due 04/27/2020 ~ | | | | | 19,400 | | | | | | 19,340 | |
3.251% (US0003M + 0.480%) due 06/11/2021 ~ | | | | | 1,700 | | | | | | 1,690 | |
3.552% (US0003M + 0.730%) due 06/27/2022 ~ | | | | | 25,750 | | | | | | 25,843 | |
|
John Deere Capital Corp. | |
2.588% (US0003M + 0.180%) due 01/07/2020 ~ | | | | | 15,000 | | | | | | 14,999 | |
|
JPMorgan Chase & Co. | |
3.411% (US0003M + 0.610%) due 06/18/2022 ~ | | | | | 47,000 | | | | | | 46,506 | |
4.218% (US0003M + 1.480%) due 03/01/2021 ~ | | | | | 12,145 | | | | | | 12,304 | |
|
JPMorgan Chase Bank N.A. | |
2.831% (US0003M + 0.290%) due 02/01/2021 ~ | | | | | 19,000 | | | | | | 18,870 | |
2.868% (US0003M + 0.250%) due 02/13/2020 ~ | | | | | 15,000 | | | | | | 14,983 | |
2.968% (US0003M + 0.230%) due 09/01/2020 ~ | | | | | 13,100 | | | | | | 13,052 | |
|
LeasePlan Corp. NV | |
2.875% due 01/22/2019 | | | | | 38,705 | | | | | | 38,691 | |
|
Lloyds Bank PLC | |
3.079% (US0003M + 0.490%) due 05/07/2021 ~ | | | | | 24,000 | | | | | | 23,766 | |
|
Macquarie Bank Ltd. | |
2.600% due 06/24/2019 | | | | | 15,500 | | | | | | 15,455 | |
2.758% (US0003M + 0.350%) due 04/04/2019 ~ | | | | | 2,145 | | | | | | 2,145 | |
3.616% (US0003M + 1.180%) due 01/15/2019 ~ | | | | | 4,500 | | | | | | 4,501 | |
3.629% (US0003M + 1.120%) due 07/29/2020 ~ | | | | | 51,650 | | | | | | 51,935 | |
|
Macquarie Group Ltd. | |
3.727% (US0003M + 1.020%) due 11/28/2023 ~ | | | | | 2,750 | | | | | | 2,697 | |
7.625% due 08/13/2019 | | | | | 4,200 | | | | | | 4,309 | |
|
Metropolitan Life Global Funding | |
3.030% (SOFRRATE + 0.570%) due 09/07/2020 ~ | | | | | 42,500 | | | | | | 42,223 | |
|
Mitsubishi Corp. Finance PLC | |
3.000% (US0003M + 0.480%) due 04/30/2019 ~ | | | | | 6,000 | | | | | | 5,999 | |
|
Mitsubishi UFJ Financial Group, Inc. | |
3.280% (US0003M + 0.790%) due 07/25/2022 ~ | | | | | 38,516 | | | | | | 38,093 | |
| | | | | | | | | | | | |
| | | | | PRINCIPAL
AMOUNT
(000S) | | | | | MARKET
VALUE
(000S) | |
3.478% (US0003M + 0.740%) due 03/02/2023 ~ | | $ | | | 16,000 | | | $ | | | 15,744 | |
3.609% (US0003M + 0.920%) due 02/22/2022 ~ | | | | | 24,249 | | | | | | 24,103 | |
3.839% (US0003M + 1.060%) due 09/13/2021 ~ | | | | | 30,912 | | | | | | 30,977 | |
|
Mitsubishi UFJ Lease & Finance Co. Ltd. | |
2.500% due 03/09/2020 | | | | | 4,800 | | | | | | 4,750 | |
3.252% (US0003M + 0.775%) due 07/23/2019 ~ | | | | | 33,422 | | | | | | 33,473 | |
3.570% (US0003M + 0.925%) due 02/20/2019 ~ | | | | | 4,150 | | | | | | 4,153 | |
|
Mizuho Bank Ltd. | |
2.450% due 04/16/2019 | | | | | 12,645 | | | | | | 12,625 | |
2.650% due 09/25/2019 | | | | | 1,564 | | | | | | 1,559 | |
|
Mizuho Financial Group, Inc. | |
3.647% (US0003M + 0.940%) due 02/28/2022 ~ | | | | | 9,000 | | | | | | 9,000 | |
3.651% (US0003M + 0.880%) due 09/11/2022 ~ | | | | | 42,600 | | | | | | 42,330 | |
3.905% (US0003M + 1.480%) due 04/12/2021 ~ | | | | | 23,600 | | | | | | 23,886 | |
3.919% (US0003M + 1.140%) due 09/13/2021 ~ | | | | | 18,255 | | | | | | 18,332 | |
|
Morgan Stanley | |
2.375% due 07/23/2019 | | | | | 36,000 | | | | | | 35,849 | |
2.500% due 01/24/2019 | | | | | 561 | | | | | | 561 | |
3.168% (US0003M + 0.550%) due 02/10/2021 ~ | | | | | 40,100 | | | | | | 39,664 | |
3.399% (US0003M + 0.930%) due 07/22/2022 ~ | | | | | 22,500 | | | | | | 22,195 | |
3.649% (US0003M + 1.140%) due 01/27/2020 ~ | | | | | 2,400 | | | | | | 2,410 | |
5.625% due 09/23/2019 | | | | | 10,632 | | | | | | 10,791 | |
7.300% due 05/13/2019 | | | | | 26,634 | | | | | | 27,041 | |
|
MUFG Bank Ltd. | |
2.350% due 09/08/2019 | | | | | 5,200 | | | | | | 5,170 | |
|
Nasdaq, Inc. | |
3.214% (US0003M + 0.390%) due 03/22/2019 ~ | | | | | 68,000 | | | | | | 67,985 | |
|
National Bank of Canada | |
3.049% (US0003M + 0.600%) due 01/17/2020 ~ | | | | | 18,000 | | | | | | 18,028 | |
|
National Rural Utilities Cooperative Finance Corp. | |
3.178% (US0003M + 0.375%) due 06/30/2021 ~ | | | | | 11,000 | | | | | | 10,919 | |
|
Nationwide Building Society | |
2.350% due 01/21/2020 | | | | | 1,000 | | | | | | 990 | |
6.250% due 02/25/2020 | | | | | 2,794 | | | | | | 2,883 | |
|
Nederlandse Waterschapsbank NV | |
2.808% (US0003M + 0.020%) due 03/15/2019 ~ | | | | | 4,000 | | | | | | 4,001 | |
2.808% (US0003M + 0.020%)
due 03/15/2019 ~ | | | | | 25,000 | | | | | | 25,006 | |
|
Nissan Motor Acceptance Corp. | |
2.000% due 03/08/2019 | | | | | 10,900 | | | | | | 10,871 | |
2.150% due 07/13/2020 | | | | | 2,085 | | | | | | 2,035 | |
2.150% due 09/28/2020 | | | | | 9,500 | | | | | | 9,232 | |
2.826% (US0003M + 0.390%) due 07/13/2020 ~ | | | | | 21,000 | | | | | | 20,844 | |
3.016% (US0003M + 0.580%) due 01/13/2020 ~ | | | | | 9,786 | | | | | | 9,767 | |
3.086% (US0003M + 0.650%) due 07/13/2022 ~ | | | | | 9,550 | | | | | | 9,274 | |
3.203% (US0003M + 0.390%) due 09/28/2020 ~ | | | | | 7,650 | | | | | | 7,567 | |
3.203% due 09/28/2020 ~ | | | | | 3,200 | | | | | | 3,165 | |
3.299% due 09/13/2019 • | | | | | 13,890 | | | | | | 13,858 | |
3.299% (US0003M + 0.520%) due 09/13/2019 • | | | | | 1,925 | | | | | | 1,921 | |
3.308% (US0003M + 0.520%) due 03/15/2021 ~ | | | | | 4,200 | | | | | | 4,137 | |
3.326% (US0003M + 0.890%) due 01/13/2022 ~ | | | | | 43,745 | | | | | | 43,003 | |
3.420% (US0003M + 0.630%) due 09/21/2021 ~ | | | | | 24,117 | | | | | | 23,651 | |
3.503% due 09/28/2022 • | | | | | 9,850 | | | | | | 9,548 | |
| | | | | | | | | | | | |
| | | | | PRINCIPAL
AMOUNT
(000S) | | | | | MARKET
VALUE
(000S) | |
|
Nomura Holdings, Inc. | |
2.750% due 03/19/2019 | | $ | | | 51,330 | | | $ | | | 51,289 | |
|
Nordea Bank Abp | |
2.375% due 04/04/2019 | | | | | 9,500 | | | | | | 9,486 | |
3.176% (US0003M + 0.470%) due 05/29/2020 ~ | | | | | 9,000 | | | | | | 8,993 | |
|
NRW Bank | |
2.661% (US0003M + 0.120%)
due 02/01/2022 ~ | | | | | 27,000 | | | | | | 27,152 | |
2.788% (US0003M + 0.170%) due 02/11/2019 ~ | | | | | 12,900 | | | | | | 12,904 | |
3.197% (US0003M + 0.430%) due 03/08/2019 ~ | | | | | 5,000 | | | | | | 5,005 | |
|
NTT Finance Corp. | |
3.333% (US0003M + 0.530%) due 06/29/2020 ~ | | | | | 84,128 | | | | | | 84,328 | |
|
Protective Life Global Funding | |
2.856% (US0003M + 0.420%) due 03/29/2019 ~ | | | | | 5,010 | | | | | | 5,011 | |
3.333% (US0003M + 0.520%) due 06/28/2021 ~ | | | | | 10,000 | | | | | | 9,925 | |
|
QNB Finance Ltd. | |
3.939% (US0003M + 1.350%)
due 02/07/2020 ~ | | | | | 3,500 | | | | | | 3,522 | |
3.968% (US0003M + 1.350%)
due 02/12/2020 ~ | | | | | 4,200 | | | | | | 4,226 | |
4.015% (US0003M + 1.570%) due 07/18/2021 ~ | | | | | 4,000 | | | | | | 4,025 | |
4.057% (US0003M + 1.350%)
due 05/31/2021 ~ | | | | | 11,675 | | | | | | 11,774 | |
|
Reliance Standard Life Global Funding | |
2.500% due 04/24/2019 | | | | | 18,772 | | | | | | 18,727 | |
2.500% due 01/15/2020 | | | | | 5,000 | | | | | | 4,952 | |
|
Royal Bank of Scotland Group PLC | |
4.086% (US0003M + 1.470%) due 05/15/2023 ~ | | | | | 46,500 | | | | | | 45,134 | |
6.400% due 10/21/2019 | | | | | 46,456 | | | | | | 47,436 | |
|
Santander UK PLC | |
2.350% due 09/10/2019 | | | | | 42,100 | | | | | | 41,786 | |
2.500% due 03/14/2019 | | | | | 68,000 | | | | | | 67,926 | |
3.276% (US0003M + 0.660%) due 11/15/2021 ~ | | | | | 21,600 | | | | | | 21,408 | |
3.358% (US0003M + 0.620%) due 06/01/2021 ~ | | | | | 10,000 | | | | | | 9,893 | |
|
Siam Commercial Bank PCL | |
3.500% due 04/07/2019 | | | | | 12,840 | | | | | | 12,854 | |
|
Skandinaviska Enskilda Banken AB | |
3.070% (US0003M + 0.430%) due 05/17/2021 ~ | | | | | 15,000 | | | | | | 14,906 | |
|
SL Green Operating Partnership LP | |
3.609% (US0003M + 0.980%) due 08/16/2021 ~ | | | | | 13,800 | | | | | | 13,721 | |
|
Standard Chartered PLC | |
2.100% due 08/19/2019 | | | | | 31,274 | | | | | | 31,025 | |
2.400% due 09/08/2019 | | | | | 26,358 | | | | | | 26,213 | |
3.770% (US0003M + 1.130%) due 08/19/2019 ~ | | | | | 40,060 | | | | | | 40,232 | |
|
State Bank of India | |
3.358% (US0003M + 0.950%) due 04/06/2020 ~ | | | | | 53,000 | | | | | | 53,067 | |
3.622% due 04/17/2019 | | | | | 14,743 | | | | | | 14,762 | |
|
SumitG Guaranteed Secured Obligation Issuer DAC | |
2.251% due 11/02/2020 | | | | | 3,500 | | | | | | 3,437 | |
|
Sumitomo Mitsui Banking Corp. | |
2.755% (US0003M + 0.310%) due 10/18/2019 ~ | | | | | 39,400 | | | | | | 39,372 | |
2.806% (US0003M + 0.370%) due 10/16/2020 ~ | | | | | 38,000 | | | | | | 37,757 | |
|
Sumitomo Mitsui Financial Group, Inc. | |
3.185% (US0003M + 0.740%) due 10/18/2022 ~ | | | | | 4,500 | | | | | | 4,462 | |
3.205% (US0003M + 0.780%) due 07/12/2022 ~ | | | | | 40,065 | | | | | | 39,852 | |
3.390% (US0003M + 0.970%) due 01/11/2022 ~ | | | | | 12,000 | | | | | | 12,005 | |
3.546% (US0003M + 1.110%) due 07/14/2021 ~ | | | | | 11,500 | | | | | | 11,590 | |
| | | | | | | | |
| 72 | | PIMCO ETF TRUST | | | | | See Accompanying Notes | |
December 31, 2018 (Unaudited)
| | | | | | | | | | | | |
| | | | | PRINCIPAL
AMOUNT
(000S) | | | | | MARKET
VALUE
(000S) | |
4.447% (US0003M + 1.680%) due 03/09/2021 ~ | | $ | | | 6,000 | | | $ | | | 6,117 | |
|
Sumitomo Mitsui Trust Bank Ltd. | |
1.950% due 09/19/2019 | | | | | 790 | | | | | | 783 | |
2.050% due 03/06/2019 | | | | | 12,000 | | | | | | 11,979 | |
2.050% due 10/18/2019 | | | | | 5,735 | | | | | | 5,686 | |
3.244% (US0003M + 0.440%) due 09/19/2019 ~ | | | | | 3,000 | | | | | | 3,002 | |
3.249% (US0003M + 0.510%) due 03/06/2019 ~ | | | | | 75,508 | | | | | | 75,530 | |
3.355% (US0003M + 0.910%) due 10/18/2019 ~ | | | | | 11,400 | | | | | | 11,448 | |
|
Suncorp-Metway Ltd. | |
2.100% due 05/03/2019 | | | | | 2,000 | | | | | | 1,993 | |
|
Svenska Handelsbanken AB | |
3.159% (US0003M + 0.470%) due 05/24/2021 ~ | | | | | 9,700 | | | | | | 9,615 | |
3.229% (US0003M + 0.490%) due 09/06/2019 ~ | | | | | 14,950 | | | | | | 14,962 | |
3.278% (US0003M + 0.490%) due 06/17/2019 ~ | | | | | 3,900 | | | | | | 3,904 | |
|
Synchrony Financial | |
2.600% due 01/15/2019 | | | | | 70,692 | | | | | | 70,669 | |
3.000% due 08/15/2019 | | | | | 61,531 | | | | | | 61,135 | |
|
Toyota Motor Credit Corp. | |
3.040% due 05/17/2022 • | | | | | 18,900 | | | | | | 18,699 | |
3.110% due 01/11/2022 • | | | | | 21,500 | | | | | | 21,472 | |
|
UBS AG | |
3.027% (US0003M + 0.320%) due 05/28/2019 ~ | | | | | 8,500 | | | | | | 8,499 | |
3.218% (US0003M + 0.480%) due 12/01/2020 ~ | | | | | 11,500 | | | | | | 11,449 | |
3.347% due 06/08/2020 • | | | | | 3,000 | | | | | | 3,000 | |
3.588% (US0003M + 0.850%) due 06/01/2020 ~ | | | | | 1,700 | | | | | | 1,708 | |
|
UBS Group Funding Switzerland AG | |
3.566% (US0003M + 0.950%) due 08/15/2023 ~ | | | | | 37,500 | | | | | | 36,732 | |
4.216% due 04/14/2021 • | | | | | 28,300 | | | | | | 28,763 | |
|
United Overseas Bank Ltd. | |
2.957% (US0003M + 0.480%) due 04/23/2021 ~ | | | | | 8,500 | | | | | | 8,481 | |
|
VEREIT Operating Partnership LP | |
3.000% due 02/06/2019 | | | | | 29,379 | | | | | | 29,362 | |
|
WEA Finance LLC | |
2.700% due 09/17/2019 | | | | | 23,841 | | | | | | 23,738 | |
|
Wells Fargo & Co. | |
4.076% (US0003M + 1.340%) due 03/04/2021 ~ | | | | | 6,800 | | | | | | 6,873 | |
|
Wells Fargo Bank N.A. | |
2.940% (SOFRRATE + 0.480%) due 03/25/2020 ~ | | | | | 10,000 | | | | | | 9,954 | |
2.977% (US0003M + 0.500%) due 07/23/2021 ~ | | | | | 24,000 | | | | | | 23,872 | |
2.987% (US0003M + 0.510%) due 10/22/2021 ~ | | | | | 41,162 | | | | | | 40,691 | |
|
Weyerhaeuser Co. | |
7.375% due 10/01/2019 | | | | | 21,000 | | | | | | 21,582 | |
| | | | | | | | | | | | |
| | | | | | | | | | | 4,509,332 | |
| | | | | | | | | | | | |
| |
| INDUSTRIALS 23.7% | |
|
Alimentation Couche-Tard, Inc. | |
3.279% (US0003M + 0.500%) due 12/13/2019 ~ | | | | | 10,090 | | | | | | 10,065 | |
|
Allergan Funding SCS | |
3.000% due 03/12/2020 | | | | | 9,737 | | | | | | 9,701 | |
4.031% (US0003M + 1.255%) due 03/12/2020 ~ | | | | | 57,841 | | | | | | 58,027 | |
|
Amgen, Inc. | |
2.935% (US0003M + 0.320%) due 05/10/2019 ~ | | | | | 3,000 | | | | | | 2,999 | |
3.065% (US0003M + 0.450%) due 05/11/2020 ~ | | | | | 900 | | | | | | 899 | |
|
Anthem, Inc. | |
2.250% due 08/15/2019 | | | | | 11,725 | | | | | | 11,664 | |
| | | | | | | | | | | | |
| | | | | PRINCIPAL
AMOUNT
(000S) | | | | | MARKET
VALUE
(000S) | |
|
AstraZeneca PLC | |
3.305% (US0003M + 0.665%) due 08/17/2023 ~ | | $ | | | 7,500 | | | $ | | | 7,314 | |
|
Baidu, Inc. | |
2.750% due 06/09/2019 | | | | | 51,482 | | | | | | 51,397 | |
|
BAT Capital Corp. | |
2.297% due 08/14/2020 | | | | | 12,700 | | | | | | 12,402 | |
3.204% due 08/14/2020 • | | | | | 81,613 | | | | | | 80,828 | |
3.496% (US0003M + 0.880%) due 08/15/2022 ~ | | | | | 36,950 | | | | | | 36,258 | |
|
BAT International Finance PLC | |
1.625% due 09/09/2019 | | | | | 12,710 | | | | | | 12,543 | |
2.750% due 06/15/2020 | | | | | 4,000 | | | | | | 3,931 | |
|
Bayer U.S. Finance LLC | |
2.125% due 07/15/2019 | | | | | 12,125 | | | | | | 12,032 | |
2.375% due 10/08/2019 | | | | | 38,735 | | | | | | 38,433 | |
3.452% (US0003M + 0.630%) due 06/25/2021 ~ | | | | | 28,197 | | | | | | 27,831 | |
|
BMW U.S. Capital LLC | |
2.788% (US0003M + 0.380%) due 04/06/2020 ~ | | | | | 4,040 | | | | | | 4,020 | |
2.835% (US0003M + 0.410%) due 04/12/2021 ~ | | | | | 5,600 | | | | | | 5,547 | |
2.984% (US0003M + 0.370%) due 08/14/2020 ~ | | | | | 38,000 | | | | | | 37,723 | |
3.048% (US0003M + 0.640%) due 04/06/2022 ~ | | | | | 12,234 | | | | | | 12,038 | |
|
BP AMI Leasing, Inc. | |
5.523% due 05/08/2019 | | | | | 2,342 | | | | | | 2,361 | |
|
Broadcom Corp. | |
2.375% due 01/15/2020 | | | | | 72,567 | | | | | | 71,671 | |
|
Cardinal Health, Inc. | |
3.558% (US0003M + 0.770%) due 06/15/2022 ~ | | | | | 9,495 | | | | | | 9,395 | |
|
Central Nippon Expressway Co. Ltd. | |
2.079% due 11/05/2019 | | | | | 24,200 | | | | | | 23,984 | |
2.170% due 08/05/2019 | | | | | 62,906 | | | | | | 62,615 | |
2.381% due 09/17/2020 | | | | | 5,500 | | | | | | 5,410 | |
3.076% (US0003M + 0.460%) due 02/15/2022 ~ | | | | | 18,800 | | | | | | 18,606 | |
3.119% (US0003M + 0.560%) due 11/02/2021 ~ | | | | | 19,850 | | | | | | 19,712 | |
3.122% (US0003M + 0.540%) due 08/04/2020 ~ | | | | | 26,000 | | | | | | 25,948 | |
3.547% (US0003M + 1.070%) due 04/23/2021 ~ | | | | | 7,570 | | | | | | 7,628 | |
3.548% (US0003M + 0.810%) due 03/03/2022 • | | | | | 69,660 | | | | | | 69,646 | |
3.599% (US0003M + 0.970%) due 02/16/2021 ~ | | | | | 1,000 | | | | | | 1,005 | |
3.628% (US0003M + 0.850%) due 09/14/2021 ~ | | | | | 21,050 | | | | | | 21,114 | |
3.707% (US0003M + 1.000%) due 05/28/2021 ~ | | | | | 29,200 | | | | | | 29,374 | |
|
Cigna Corp. | |
3.138% (US0003M + 0.350%) due 03/17/2020 ~ | | | | | 8,550 | | | | | | 8,497 | |
3.438% (US0003M + 0.650%) due 09/17/2021 ~ | | | | | 50,000 | | | | | | 49,313 | |
|
CNPC General Capital Ltd. | |
2.700% due 11/25/2019 | | | | | 3,687 | | | | | | 3,671 | |
2.750% due 05/14/2019 | | | | | 23,248 | | | | | | 23,237 | |
|
Comcast Corp. | |
3.127% (US0003M + 0.330%) due 10/01/2020 ~ | | | | | 37,690 | | | | | | 37,526 | |
5.700% due 07/01/2019 | | | | | 1,457 | | | | | | 1,474 | |
|
Conagra Brands, Inc. | |
2.908% (US0003M + 0.500%) due 10/09/2020 ~ | | | | | 4,000 | | | | | | 3,956 | |
3.219% (US0003M + 0.750%) due 10/22/2020 ~ | | | | | 3,755 | | | | | | 3,745 | |
|
Constellation Brands, Inc. | |
3.209% (US0003M + 0.700%) due 11/15/2021 ~ | | | | | 8,300 | | | | | | 8,204 | |
|
CVS Health Corp. | |
3.397% (US0003M + 0.630%) due 03/09/2020 ~ | | | | | 12,900 | | | | | | 12,879 | |
3.487% (US0003M + 0.720%) due 03/09/2021 ~ | | | | | 2,700 | | | | | | 2,679 | |
| | | | | | | | | | | | |
| | | | | PRINCIPAL
AMOUNT
(000S) | | | | | MARKET
VALUE
(000S) | |
|
D.R. Horton, Inc. | |
3.750% due 03/01/2019 | | $ | | | 4,769 | | | $ | | | 4,769 | |
|
Daimler Finance North America LLC | |
1.500% due 07/05/2019 | | | | | 12,300 | | | | | | 12,180 | |
2.200% due 05/05/2020 | | | | | 2,283 | | | | | | 2,246 | |
2.250% due 09/03/2019 | | | | | 955 | | | | | | 949 | |
2.250% due 03/02/2020 | | | | | 2,685 | | | | | | 2,649 | |
2.972% (US0003M + 0.390%) due 05/04/2020 ~ | | | | | 10,000 | | | | | | 9,946 | |
3.048% (US0003M + 0.430%) due 02/12/2021 ~ | | | | | 7,275 | | | | | | 7,201 | |
3.048% (US0003M + 0.430%) due 02/12/2021 ~ | | | | | 3,500 | | | | | | 3,464 | |
3.112% (US0003M + 0.530%) due 05/05/2020 ~ | | | | | 10,250 | | | | | | 10,216 | |
3.132% (US0003M + 0.550%) due 05/04/2021 ~ | | | | | 42,938 | | | | | | 42,570 | |
3.252% (US0003M + 0.670%) due 11/05/2021 ~ | | | | | 47,000 | | | | | | 46,718 | |
|
Dell International LLC | |
3.480% due 06/01/2019 | | | | | 139,689 | | | | | | 139,291 | |
4.420% due 06/15/2021 | | | | | 2,259 | | | | | | 2,258 | |
|
Deutsche Telekom International Finance BV | |
1.500% due 09/19/2019 | | | | | 5,500 | | | | | | 5,428 | |
3.029% (US0003M + 0.580%) due 01/17/2020 ~ | | | | | 6,075 | | | | | | 6,088 | |
3.254% (US0003M + 0.450%) due 09/19/2019 ~ | | | | | 20,830 | | | | | | 20,791 | |
6.000% due 07/08/2019 | | | | | 5,000 | | | | | | 5,069 | |
|
Diageo Capital PLC | |
2.880% (US0003M + 0.240%) due 05/18/2020 ~ | | | | | 5,000 | | | | | | 4,981 | |
|
Dignity Health | |
2.637% due 11/01/2019 | | | | | 8,000 | | | | | | 7,954 | |
|
Discovery Communications LLC | |
2.200% due 09/20/2019 | | | | | 6,089 | | | | | | 6,026 | |
2.750% due 11/15/2019 | | | | | 4,700 | | | | | | 4,653 | |
3.502% (US0003M + 0.710%) due 09/20/2019 ~ | | | | | 14,158 | | | | | | 14,148 | |
5.050% due 06/01/2020 | | | | | 2,085 | | | | | | 2,132 | |
5.625% due 08/15/2019 | | | | | 21,825 | | | | | | 22,113 | |
|
Dominion Energy Gas Holdings LLC | |
3.388% (US0003M + 0.600%) due 06/15/2021 ~ | | | | | 43,400 | | | | | | 43,294 | |
|
DXC Technology Co. | |
3.688% (US0003M + 0.950%) due 03/01/2021 ~ | | | | | 3,843 | | | | | | 3,840 | |
|
eBay, Inc. | |
3.021% (US0003M + 0.480%) due 08/01/2019 ~ | | | | | 30,583 | | | | | | 30,563 | |
|
Enbridge, Inc. | |
3.488% (US0003M + 0.700%) due 06/15/2020 ~ | | | | | 11,400 | | | | | | 11,363 | |
|
Energy Transfer Operating LP | |
9.000% due 04/15/2019 | | | | | 11,760 | | | | | | 11,959 | |
|
Enterprise Products Operating LLC | |
2.550% due 10/15/2019 | | | | | 1,350 | | | | | | 1,343 | |
6.500% due 01/31/2019 | | | | | 8,600 | | | | | | 8,619 | |
|
EQT Corp. | |
2.500% due 10/01/2020 | | | | | 2,280 | | | | | | 2,230 | |
3.567% (US0003M + 0.770%) due 10/01/2020 ~ | | | | | 7,240 | | | | | | 7,055 | |
8.125% due 06/01/2019 | | | | | 21,842 | | | | | | 22,215 | |
|
ERAC USA Finance LLC | |
2.350% due 10/15/2019 | | | | | 4,650 | | | | | | 4,619 | |
|
Florida Gas Transmission Co. LLC | |
7.900% due 05/15/2019 | | | | | 4,940 | | | | | | 5,015 | |
|
Fresenius Medical Care U.S. Finance, Inc. | |
5.625% due 07/31/2019 | | | | | 13,098 | | | | | | 13,248 | |
|
GATX Corp. | |
2.500% due 07/30/2019 | | | | | 5,000 | | | | | | 4,970 | |
3.302% (US0003M + 0.720%) due 11/05/2021 ~ | | | | | 10,400 | | | | | | 10,297 | |
|
General Electric Co. | |
2.200% due 01/09/2020 | | | | | 2,000 | | | | | | 1,971 | |
6.000% due 08/07/2019 | | | | | 39,795 | | | | | | 40,230 | |
| | | | | | |
| See Accompanying Notes | | SEMIANNUAL REPORT | | DECEMBER 31, 2018 | | 73 |
Schedule of InvestmentsPIMCO Enhanced Short Maturity Active Exchange-Traded Fund(Cont.)
| | | | | | | | | | | | |
| | | | | PRINCIPAL
AMOUNT
(000S) | | | | | MARKET
VALUE
(000S) | |
|
General Mills, Inc. | |
6.610% due 10/15/2022 | | $ | | | 10,800 | | | $ | | | 11,412 | |
|
General Motors Co. | |
3.389% (US0003M + 0.800%) due 08/07/2020 ~ | | | | | 3,000 | | | | | | 2,970 | |
|
GlaxoSmithKline Capital PLC | |
2.964% (US0003M + 0.350%) due 05/14/2021 ~ | | | | | 6,400 | | | | | | 6,358 | |
|
Harris Corp. | |
3.000% (US0003M + 0.480%) due 04/30/2020 ~ | | | | | 4,900 | | | | | | 4,887 | |
3.166% due 02/27/2019 ~ | | | | | 20,793 | | | | | | 20,790 | |
|
Hewlett Packard Enterprise Co. | |
2.100% due 10/04/2019 | | | | | 51,510 | | | | | | 50,940 | |
3.059% (US0003M + 0.720%) due 10/05/2021 ~ | | | | | 19,600 | | | | | | 19,437 | |
|
HP, Inc. | |
3.376% (US0003M + 0.940%) due 01/14/2019 ~ | | | | | 3,096 | | | | | | 3,096 | |
|
Hyundai Capital America | |
1.750% due 09/27/2019 | | | | | 10,115 | | | | | | 9,988 | |
2.000% due 07/01/2019 | | | | | 6,790 | | | | | | 6,747 | |
2.500% due 03/18/2019 | | | | | 21,014 | | | | | | 20,980 | |
2.550% due 02/06/2019 | | | | | 21,289 | | | | | | 21,277 | |
2.600% due 03/19/2020 | | | | | 4,400 | | | | | | 4,345 | |
3.601% due 09/18/2020 • | | | | | 8,400 | | | | | | 8,367 | |
3.608% (US0003M + 0.800%) due 04/03/2020 ~ | | | | | 1,200 | | | | | | 1,196 | |
3.801% (US0003M + 1.000%) due 09/18/2020 ~ | | | | | 1,085 | | | | | | 1,084 | |
|
Imperial Brands Finance PLC | |
2.950% due 07/21/2020 | | | | | 6,500 | | | | | | 6,404 | |
|
Incitec Pivot Finance LLC | |
6.000% due 12/10/2019 | | | | | 275 | | | | | | 281 | |
|
Kinder Morgan Energy Partners LP | |
2.650% due 02/01/2019 | | | | | 13,044 | | | | | | 13,037 | |
9.000% due 02/01/2019 | | | | | 3,000 | | | | | | 3,013 | |
|
Kinder Morgan, Inc. | |
3.050% due 12/01/2019 | | | | | 2,300 | | | | | | 2,287 | |
|
KLA-Tencor Corp. | |
3.375% due 11/01/2019 | | | | | 2,905 | | | | | | 2,902 | |
|
Kraft Heinz Foods Co. | |
3.021% (US0003M + 0.420%) due 08/09/2019 ~ | | | | | 39,647 | | | | | | 39,549 | |
3.188% (US0003M + 0.570%) due 02/10/2021 ~ | | | | | 14,804 | | | | | | 14,686 | |
|
Kroger Co. | |
1.500% due 09/30/2019 | | | | | 2,560 | | | | | | 2,525 | |
|
LyondellBasell Industries NV | |
5.000% due 04/15/2019 | | | | | 13,160 | | | | | | 13,175 | |
|
Marriott International, Inc. | |
3.229% (US0003M + 0.600%) due 12/01/2020 ~ | | | | | 15,000 | | | | | | 14,968 | |
|
Martin Marietta Materials, Inc. | |
3.292% (US0003M + 0.500%) due 12/20/2019 ~ | | | | | 9,665 | | | | | | 9,639 | |
3.327% (US0003M + 0.650%) due 05/22/2020 ~ | | | | | 9,526 | | | | | | 9,477 | |
|
McDonald’s Corp. | |
2.939% (US0003M + 0.430%) due 10/28/2021 ~ | | | | | 20,600 | | | | | | 20,466 | |
|
Minera y Metalurgica del Boleo SAPI de C.V. | |
2.875% due 05/07/2019 | | | | | 18,699 | | | | | | 18,681 | |
|
Molson Coors Brewing Co. | |
1.450% due 07/15/2019 | | | | | 30,576 | | | | | | 30,268 | |
1.900% due 03/15/2019 | | | | | 14,533 | | | | | | 14,492 | |
|
Mondelez International Holdings Netherlands BV | |
1.625% due 10/28/2019 | | | | | 19,750 | | | | | | 19,479 | |
3.119% (US0003M + 0.610%) due 10/28/2019 ~ | | | | | 26,890 | | | | | | 26,875 | |
|
Mylan NV | |
2.500% due 06/07/2019 | | | | | 15,861 | | | | | | 15,788 | |
|
NBCUniversal Enterprise, Inc. | |
1.974% due 04/15/2019 | | | | | 10,150 | | | | | | 10,118 | |
| | | | | | | | | | | | |
| | | | | PRINCIPAL
AMOUNT
(000S) | | | | | MARKET
VALUE
(000S) | |
|
Nexen Energy ULC | |
6.200% due 07/30/2019 | | $ | | | 6,870 | | | $ | | | 6,990 | |
|
Oil India Ltd. | |
3.875% due 04/17/2019 | | | | | 15,000 | | | | | | 15,028 | |
|
ONEOK Partners LP | |
8.625% due 03/01/2019 | | | | | 635 | | | | | | 640 | |
|
ONGC Videsh Ltd. | |
3.250% due 07/15/2019 | | | | | 7,046 | | | | | | 7,044 | |
|
Ooredoo International Finance Ltd. | |
7.875% due 06/10/2019 | | | | | 4,300 | | | | | | 4,391 | |
|
Petroleos Mexicanos | |
8.000% due 05/03/2019 | | | | | 20,740 | | | | | | 21,020 | |
|
Petronas Capital Ltd. | |
5.250% due 08/12/2019 | | | | | 35,039 | | | | | | 35,495 | |
|
Phillips 66 | |
3.186% (US0003M + 0.750%) due 04/15/2020 ~ | | | | | 8,300 | | | | | | 8,302 | |
3.289% (US0003M + 0.600%) due 02/26/2021 ~ | | | | | 5,000 | | | | | | 4,946 | |
|
QUALCOMM, Inc. | |
3.195% (US0003M + 0.550%) due 05/20/2020 ~ | | | | | 37,684 | | | | | | 37,684 | |
3.250% (US0003M + 0.730%) due 01/30/2023 ~ | | | | | 30,383 | | | | | | 30,229 | |
|
QVC, Inc. | |
3.125% due 04/01/2019 | | | | | 3,112 | | | | | | 3,105 | |
|
Reckitt Benckiser Treasury Services PLC | |
3.384% (US0003M + 0.560%) due 06/24/2022 ~ | | | | | 31,700 | | | | | | 31,162 | |
|
Reynolds American, Inc. | |
8.125% due 06/23/2019 | | | | | 10,697 | | | | | | 10,914 | |
|
Rockwell Collins, Inc. | |
1.950% due 07/15/2019 | | | | | 3,114 | | | | | | 3,092 | |
5.250% due 07/15/2019 | | | | | 8,835 | | | | | | 8,931 | |
|
Shire Acquisitions Investments Ireland DAC | |
1.900% due 09/23/2019 | | | | | 140,797 | | | | | | 138,851 | |
|
Sky Ltd. | |
2.625% due 09/16/2019 | | | | | 10,524 | | | | | | 10,447 | |
|
Sky PLC | |
2.625% due 09/16/2019 | | | | | 4,050 | | | | | | 4,020 | |
|
Southern Co. | |
3.104% (US0003M + 0.490%) due 02/14/2020 ~ | | | | | 36,150 | | | | | | 36,094 | |
3.503% (US0003M + 0.700%) due 09/30/2020 ~ | | | | | 19,900 | | | | | | 19,846 | |
|
Takeda Pharmaceutical Co. Ltd. | |
3.800% due 11/26/2020 | | | | | 7,100 | | | | | | 7,145 | |
|
Telefonica Emisiones S.A. | |
5.877% due 07/15/2019 | | | | | 26,017 | | | | | | 26,332 | |
|
Tencent Holdings Ltd. | |
3.375% due 05/02/2019 | | | | | 41,555 | | | | | | 41,603 | |
|
Textron, Inc. | |
3.168% (US0003M + 0.550%) due 11/10/2020 ~ | | | | | 4,800 | | | | | | 4,760 | |
|
Time Warner Cable LLC | |
5.000% due 02/01/2020 | | | | | 8,908 | | | | | | 9,034 | |
8.250% due 04/01/2019 | | | | | 111,895 | | | | | | 113,157 | |
8.750% due 02/14/2019 | | | | | 15,170 | | | | | | 15,255 | |
|
Tyson Foods, Inc. | |
2.650% due 08/15/2019 | | | | | 7,000 | | | | | | 6,965 | |
3.096% (US0003M + 0.450%) due 08/21/2020 ~ | | | | | 1,245 | | | | | | 1,229 | |
3.157% (US0003M + 0.450%) due 05/30/2019 ~ | | | | | 6,830 | | | | | | 6,822 | |
3.288% (US0003M + 0.550%) due 06/02/2020 ~ | | | | | 27,516 | | | | | | 27,371 | |
|
United Technologies Corp. | |
3.279% (US0003M + 0.650%) due 08/16/2021 ~ | | | | | 20,000 | | | | | | 19,932 | |
8.875% due 11/15/2019 | | | | | 1,585 | | | | | | 1,660 | |
|
Volkswagen Group of America Finance LLC | |
2.125% due 05/23/2019 | | | | | 7,020 | | | | | | 6,987 | |
2.400% due 05/22/2020 | | | | | 700 | | | | | | 689 | |
2.450% due 11/20/2019 | | | | | 6,937 | | | | | | 6,872 | |
| | | | | | | | | | | | |
| | | | | PRINCIPAL
AMOUNT
(000S) | | | | | MARKET
VALUE
(000S) | |
3.388% (US0003M + 0.770%) due 11/13/2020 ~ | | $ | | | 69,590 | | | $ | | | 69,144 | |
3.558% (US0003M + 0.940%) due 11/12/2021 ~ | | | | | 16,100 | | | | | | 15,949 | |
|
Vulcan Materials Co. | |
3.388% (US0003M + 0.600%) due 06/15/2020 ~ | | | | | 2,000 | | | | | | 1,988 | |
|
Wabtec Corp. | |
3.838% (US0003M + 1.050%) due 09/15/2021 ~ | | | | | 18,200 | | | | | | 18,140 | |
|
Xerox Corp. | |
2.750% due 03/15/2019 | | | | | 1,800 | | | | | | 1,791 | |
| | | | | | | | | | | | |
| | | | | | | | | | | 2,889,013 | |
| | | | | | | | | | | | |
| |
| UTILITIES 5.5% | |
|
AT&T, Inc. | |
3.386% (US0003M + 0.950%) due 07/15/2021 ~ | | | | | 16,700 | | | | | | 16,651 | |
3.488% (US0003M + 0.750%) due 06/01/2021 ~ | | | | | 26,300 | | | | | | 26,141 | |
3.504% (US0003M + 0.890%) due 02/15/2023 ~ | | | | | 33,485 | | | | | | 32,906 | |
|
BellSouth LLC | |
4.333% due 04/26/2021 | | | | | 32,200 | | | | | | 32,301 | |
|
British Telecommunications PLC | |
2.350% due 02/14/2019 | | | | | 14,806 | | | | | | 14,787 | |
|
Chugoku Electric Power Co., Inc. | |
2.701% due 03/16/2020 | | | | | 6,000 | | | | | | 5,956 | |
|
Commonwealth Edison Co. | |
2.150% due 01/15/2019 | | | | | 5,375 | | | | | | 5,373 | |
|
Consolidated Edison Co. of New York, Inc. | |
3.222% (US0003M + 0.400%) due 06/25/2021 ~ | | | | | 17,200 | | | | | | 17,037 | |
|
Dominion Energy, Inc. | |
3.288% (US0003M + 0.550%) due 06/01/2019 ~ | | | | | 20,548 | | | | | | 20,536 | |
5.200% due 08/15/2019 | | | | | 4,059 | | | | | | 4,104 | |
|
Duke Energy Corp. | |
5.050% due 09/15/2019 | | | | | 4,600 | | | | | | 4,643 | |
|
Emera U.S. Finance LP | |
2.150% due 06/15/2019 | | | | | 41,571 | | | | | | 41,236 | |
|
Enable Midstream Partners LP | |
2.400% due 05/15/2019 | | | | | 17,040 | | | | | | 16,945 | |
|
Entergy Texas, Inc. | |
7.125% due 02/01/2019 | | | | | 5,000 | | | | | | 5,014 | |
|
Exelon Generation Co. LLC | |
2.950% due 01/15/2020 | | | | | 2,955 | | | | | | 2,942 | |
|
Iberdrola Finance Ireland DAC | |
5.000% due 09/11/2019 | | | | | 11,407 | | | | | | 11,517 | |
|
Israel Electric Corp. Ltd. | |
7.250% due 01/15/2019 | | | | | 12,217 | | | | | | 12,228 | |
9.375% due 01/28/2020 | | | | | 5,000 | | | | | | 5,311 | |
|
Korea Midland Power Co. Ltd. | |
2.750% due 02/11/2019 | | | | | 4,765 | | | | | | 4,764 | |
|
KT Corp. | |
2.625% due 04/22/2019 | | | | | 16,014 | | | | | | 15,998 | |
|
Mississippi Power Co. | |
3.472% (US0003M + 0.650%) due 03/27/2020 ~ | | | | | 5,075 | | | | | | 5,067 | |
|
Nevada Power Co. | |
7.125% due 03/15/2019 | | | | | 1,300 | | | | | | 1,311 | |
|
NextEra Energy Capital Holdings, Inc. | |
3.053% (US0003M + 0.315%) due 09/03/2019 ~ | | | | | 18,401 | | | | | | 18,382 | |
3.107% (US0003M + 0.400%) due 08/21/2020 ~ | | | | | 30,000 | | | | | | 29,970 | |
3.342% due 09/01/2020 | | | | | 10,000 | | | | | | 10,022 | |
|
Oglethorpe Power Corp. | |
6.100% due 03/15/2019 | | | | | 6,038 | | | | | | 6,072 | |
|
Orange S.A. | |
2.750% due 02/06/2019 | | | | | 3,056 | | | | | | 3,054 | |
5.375% due 07/08/2019 | | | | | 7,744 | | | | | | 7,829 | |
| | | | | | | | |
| 74 | | PIMCO ETF TRUST | | | | | See Accompanying Notes | |
December 31, 2018 (Unaudited)
| | | | | | | | | | | | |
| | | | | PRINCIPAL
AMOUNT
(000S) | | | | | MARKET
VALUE
(000S) | |
|
PacifiCorp | |
5.500% due 01/15/2019 | | $ | | | 2,000 | | | $ | | | 2,002 | |
|
Plains All American Pipeline LP | |
5.750% due 01/15/2020 | | | | | 5,300 | | | | | | 5,400 | |
|
Progress Energy, Inc. | |
4.875% due 12/01/2019 | | | | | 7,000 | | | | | | 7,090 | |
|
Public Service Co. of Oklahoma | |
5.150% due 12/01/2019 | | | | | 6,080 | | | | | | 6,193 | |
|
Sempra Energy | |
2.686% (US0003M + 0.250%) due 07/15/2019 ~ | | | | | 13,546 | | | | | | 13,507 | |
3.238% (US0003M + 0.450%) due 03/15/2021 ~ | | | | | 7,498 | | | | | | 7,348 | |
|
Sinopec Group Overseas Development Ltd. | |
1.750% due 09/29/2019 | | | | | 28,700 | | | | | | 28,415 | |
2.125% due 05/03/2019 | | | | | 10,293 | | | | | | 10,265 | |
2.250% due 09/13/2020 | | | | | 1,950 | | | | | | 1,915 | |
2.375% due 04/12/2020 | | | | | 8,950 | | | | | | 8,852 | |
2.500% due 04/28/2020 | | | | | 27,515 | | | | | | 27,181 | |
2.750% due 04/10/2019 | | | | | 20,750 | | | | | | 20,735 | |
3.334% (US0003M + 0.920%) due 04/10/2019 ~ | | | | | 35,629 | | | | | | 35,662 | |
|
Southern Co. Gas Capital Corp. | |
5.250% due 08/15/2019 | | | | | 3,470 | | | | | | 3,503 | |
|
Southern Power Co. | |
3.342% (US0003M + 0.550%) due 12/20/2020 ~ | | | | | 31,454 | | | | | | 31,075 | |
|
State Grid Overseas Investment Ltd. | |
2.250% due 05/04/2020 | | | | | 4,062 | | | | | | 4,009 | |
2.750% due 05/07/2019 | | | | | 23,950 | | | | | | 23,927 | |
|
Verizon Communications, Inc. | |
3.716% (US0003M + 1.100%) due 05/15/2025 ~ | | | | | 24,300 | | | | | | 23,582 | |
3.788% (US0003M + 1.000%) due 03/16/2022 ~ | | | | | 33,300 | | | | | | 33,351 | |
| | | | | | | | | | | | |
| | | | | | | | | | | 672,109 | |
| | | | | | | | | | | | |
Total Corporate Bonds & Notes (Cost $8,104,482) | | | 8,070,454 | |
| | | | |
| |
| MUNICIPAL BONDS & NOTES 0.3% | |
| |
| ARKANSAS 0.0% | |
|
Arkansas Student Loan Authority Revenue Bonds, Series 2010 | |
3.589% due 11/25/2043 • | | | | | 619 | | | | | | 621 | |
| | | | | | | | | | | | |
| |
| CALIFORNIA 0.2% | |
|
California State General Obligation Bonds, Series 2017 | |
3.127% (US0001M + 0.780%) due 04/01/2047 ~ | | | | | 27,950 | | | | | | 28,108 | |
| | | | | | | | | | | | |
| |
| TEXAS 0.0% | |
|
Texas State General Obligation Notes, Series 2014 | |
2.749% (US0001M + 0.400%) due 06/01/2019 ~ | | | | | 475 | | | | | | 475 | |
| | | | | | | | | | | | |
| |
| WASHINGTON 0.1% | |
|
Washington Health Care Facilities Authority Revenue Bonds, Series 2017 | |
2.779% (0.67*US0001M + 1.100%) due 01/01/2042 ~ | | | | | 7,350 | | | | | | 7,420 | |
| | | | | | | | | | | | |
Total Municipal Bonds & Notes (Cost $36,392) | | | 36,624 | |
| | | | |
| |
| U.S. GOVERNMENT AGENCIES 3.1% | |
|
Fannie Mae | |
2.619% due 08/25/2044 • | | | | | 8,347 | | | | | | 8,325 | |
2.649% due 12/25/2044 • | | | | | 17,554 | | | | | | 17,559 | |
2.660% due 12/25/2048 • | | | | | 25,365 | | | | | | 25,317 | |
2.699% due 07/25/2044 • | | | | | 6,628 | | | | | | 6,619 | |
2.749% due 07/25/2046 • | | | | | 19,104 | | | | | | 19,079 | |
2.756% due 05/25/2037 • | | | | | 40 | | | | | | 40 | |
2.806% due 01/25/2037 - 12/25/2045 • | | | | | 5,067 | | | | | | 5,070 | |
| | | | | | | | | | | | |
| | | | | PRINCIPAL
AMOUNT
(000S) | | | | | MARKET
VALUE
(000S) | |
2.836% due 02/25/2037 • | | $ | | | 87 | | | $ | | | 86 | |
2.855% due 04/18/2028 - 09/18/2031 • | | | | | 1,173 | | | | | | 1,179 | |
2.856% due 11/25/2036 • | | | | | 124 | | | | | | 125 | |
2.906% due 06/25/2026 • | | | | | 236 | | | | | | 237 | |
2.916% due 09/25/2035 • | | | | | 550 | | | | | | 552 | |
2.926% due 03/25/2037 • | | | | | 415 | | | | | | 416 | |
2.955% due 05/18/2032 • | | | | | 204 | | | | | | 206 | |
2.956% due 02/25/2038 - 06/25/2042 • | | | | | 1,139 | | | | | | 1,143 | |
3.005% due 03/18/2032 • | | | | | 163 | | | | | | 165 | |
3.006% due 06/25/2031 • | | | | | 118 | | | | | | 119 | |
3.021% due 04/25/2023 • | | | | | 2,449 | | | | | | 2,461 | |
3.056% due 09/25/2041 • | | | | | 636 | | | | | | 643 | |
3.186% due 12/25/2037 • | | | | | 618 | | | | | | 628 | |
3.206% due 05/25/2037 • | | | | | 125 | | | | | | 126 | |
3.256% due 03/25/2037 - 02/25/2040 • | | | | | 160 | | | | | | 165 | |
3.286% due 02/25/2038 • | | | | | 1,105 | | | | | | 1,127 | |
3.356% due 07/25/2038 • | | | | | 108 | | | | | | 111 | |
3.406% due 03/25/2032 • | | | | | 35 | | | | | | 36 | |
4.264% due 01/01/2036 • | | | | | 5,073 | | | | | | 5,344 | |
4.293% due 05/01/2038 • | | | | | 675 | | | | | | 708 | |
|
FDIC Structured Sale Guaranteed Notes | |
3.020% due 11/29/2037 • | | | | | 165 | | | | | | 165 | |
|
Freddie Mac | |
2.619% due 05/15/2038 • | | | | | 6,170 | | | | | | 6,159 | |
2.629% due 05/15/2041 • | | | | | 6,510 | | | | | | 6,503 | |
2.647% due 11/25/2024 • | | | | | 7,449 | | | | | | 7,399 | |
2.649% due 03/15/2037 - 08/15/2042 • | | | | | 54,151 | | | | | | 54,124 | |
2.699% due 12/15/2042 - 11/15/2044 • | | | | | 14,359 | | | | | | 14,343 | |
2.705% due 11/15/2036 - 01/15/2040 • | | | | | 50 | | | | | | 50 | |
2.749% due 12/15/2037 • | | | | | 3,947 | | | | | | 3,953 | |
2.775% due 02/15/2037 • | | | | | 1,396 | | | | | | 1,401 | |
2.875% due 04/15/2041 • | | | | | 360 | | | | | | 360 | |
2.955% due 07/15/2039 • | | | | | 74 | | | | | | 75 | |
4.360% due 09/01/2037 • | | | | | 3,885 | | | | | | 4,091 | |
|
Ginnie Mae | |
2.514% due 06/20/2066 • | | | | | 18,157 | | | | | | 18,135 | |
2.684% due 06/20/2061 - 10/20/2066 • | | | | | 1,864 | | | | | | 1,864 | |
2.714% due 10/20/2062 • | | | | | 6,650 | | | | | | 6,652 | |
2.784% due 06/20/2067 • | | | | | 2,039 | | | | | | 2,044 | |
2.814% due 03/20/2061 - 07/20/2067 • | | | | | 10,983 | | | | | | 11,014 | |
2.864% due 04/20/2062 • | | | | | 4,606 | | | | | | 4,622 | |
2.870% due 04/20/2040 • | | | | | 11,909 | | | | | | 12,005 | |
2.914% due 05/20/2065 - 10/20/2065 • | | | | | 15,938 | | | | | | 16,018 | |
2.964% due 12/20/2064 - 10/20/2065 • | | | | | 26,294 | | | | | | 26,470 | |
3.014% due 02/20/2062 • | | | | | 6,259 | | | | | | 6,304 | |
3.064% due 12/20/2065 - 08/20/2066 • | | | | | 13,714 | | | | | | 13,871 | |
3.094% due 09/20/2066 • | | | | | 2,336 | | | | | | 2,365 | |
3.110% due 05/20/2063 • | | | | | 1,118 | | | | | | 1,121 | |
3.114% due 05/20/2066 - 07/20/2066 • | | | | | 13,851 | | | | | | 14,032 | |
3.144% due 08/20/2066 • | | | | | 1,347 | | | | | | 1,367 | |
3.234% due 07/20/2065 • | | | | | 6,396 | | | | | | 6,504 | |
3.247% due 04/20/2067 • | | | | | 2,372 | | | | | | 2,434 | |
3.314% due 01/20/2066 • | | | | | 6,419 | | | | | | 6,557 | |
3.364% due 02/20/2066 • | | | | | 16,011 | | | | | | 16,362 | |
3.527% due 06/20/2067 • | | | | | 8,075 | | | | | | 8,291 | |
6.000% due 12/15/2033 | | | | | 23 | | | | | | 26 | |
6.500% due 11/15/2033 - 09/15/2034 | | | | | 24 | | | | | | 26 | |
7.000% due 01/15/2024 - 07/15/2032 | | | | | 107 | | | | | | 107 | |
7.500% due 07/15/2024 - 06/15/2028 | | | | | 104 | | | | | | 107 | |
10.000% due 03/15/2019 - 04/15/2025 | | | | | 1 | | | | | | 0 | |
|
NCUA Guaranteed Notes | |
2.737% due 12/07/2020 • | | | | | 632 | | | | | | 634 | |
2.940% due 12/08/2020 • | | | | | 1,951 | | | | | | 1,960 | |
| | | | | | | | | | | | |
Total U.S. Government Agencies (Cost $375,906) | | | 377,101 | |
| | | | |
| | | | | | | | | | | | |
| | | | | PRINCIPAL
AMOUNT
(000S) | | | | | MARKET
VALUE
(000S) | |
| NON-AGENCY MORTGAGE-BACKED SECURITIES 3.1% | |
|
AREIT Trust | |
3.290% due 02/14/2035 • | | $ | | | 10,795 | | | $ | | | 10,703 | |
|
BAMLL Commercial Mortgage Securities Trust | |
3.707% due 12/15/2031 • | | | | | 7,897 | | | | | | 7,896 | |
|
Banc of America Mortgage Trust | |
3.928% due 03/25/2034 ~ | | | | | 129 | | | | | | 131 | |
|
Bear Stearns Adjustable Rate Mortgage Trust | |
4.157% due 08/25/2033 ~ | | | | | 1,011 | | | | | | 999 | |
|
BSPRT Issuer Ltd. | |
3.275% due 10/15/2034 • | | | | | 1,000 | | | | | | 992 | |
|
BX Commercial Mortgage Trust | |
3.205% due 11/15/2035 • | | | | | 21,867 | | | | | | 21,756 | |
|
BX Trust | |
3.375% due 07/15/2034 • | | | | | 14,420 | | | | | | 14,295 | |
|
Citigroup Commercial Mortgage Trust | |
3.305% due 07/15/2032 • | | | | | 5,000 | | | | | | 4,986 | |
3.735% due 07/15/2027 • | | | | | 4,100 | | | | | | 4,082 | |
|
Civic Mortgage LLC | |
3.892% due 06/25/2022 Ø | | | | | 1,961 | | | | | | 1,959 | |
|
Core Industrial Trust | |
3.040% due 02/10/2034 | | | | | 11,384 | | | | | | 11,352 | |
|
Credit Suisse Mortgage Capital Trust | |
3.205% due 07/15/2032 • | | | | | 13,000 | | | | | | 12,929 | |
|
Ginnie Mae | |
2.664% due 08/20/2065 | | | | | 30,000 | | | | | | 29,897 | |
|
Gosforth Funding PLC | |
3.139% due 08/25/2060 • | | | | | 18,566 | | | | | | 18,519 | |
3.274% due 12/19/2059 • | | | | | 9,385 | | | | | | 9,363 | |
|
GPMT Ltd. | |
3.379% due 11/21/2035 • | | | | | 15,000 | | | | | | 14,834 | |
|
Great Wolf Trust | |
3.455% due 09/15/2034 • | | | | | 5,000 | | | | | | 4,917 | |
|
GS Mortgage Securities Corp. Trust | |
3.155% due 07/15/2032 • | | | | | 16,300 | | | | | | 16,149 | |
|
GS Mortgage Securities Trust | |
3.648% due 01/10/2047 | | | | | 10,000 | | | | | | 10,110 | |
|
IMT Trust | |
3.155% due 06/15/2034 • | | | | | 3,000 | | | | | | 2,991 | |
|
JPMorgan Chase Commercial Mortgage Securities Corp. | |
3.255% due 06/15/2032 • | | | | | 16,000 | | | | | | 15,984 | |
|
Ladder Capital Commercial Mortgage Mortgage Trust | |
3.335% due 09/15/2034 • | | | | | 3,749 | | | | | | 3,735 | |
|
Mellon Residential Funding Corp. Mortgage Pass-Through Certificates | |
3.155% due 11/15/2031 • | | | | | 981 | | | | | | 979 | |
|
Morgan Stanley Capital Trust | |
3.305% due 11/15/2034 • | | | | | 5,000 | | | | | | 4,952 | |
|
Motel 6 Trust | |
3.375% due 08/15/2034 • | | | | | 43,826 | | | | | | 43,152 | |
|
Permanent Master Issuer PLC | |
2.816% due 07/15/2058 • | | | | | 4,500 | | | | | | 4,486 | |
|
PFP Ltd. | |
3.335% due 07/14/2035 • | | | | | 10,290 | | | | | | 10,175 | |
3.505% (LIBOR01M + 1.050%) due 01/14/2035 ~ | | | | | 232 | | | | | | 232 | |
|
RBSSP Resecuritization Trust | |
2.815% due 10/26/2036 • | | | | | 27 | | | | | | 27 | |
|
Resource Capital Corp. Ltd. | |
3.255% (LIBOR01M + 0.800%) due 07/15/2034 ~ | | | | | 4,697 | | | | | | 4,700 | |
|
Rosslyn Portfolio Trust | |
3.405% due 06/15/2033 • | | | | | 4,500 | | | | | | 4,486 | |
|
ShellpointCo-Originator Trust | |
3.500% due 08/25/2045 ~ | | | | | 9,748 | | | | | | 9,657 | |
|
Stonemont Portfolio Trust | |
3.320% due 08/20/2030 • | | | | | 12,738 | | | | | | 12,730 | |
|
UBS-Barclays Commercial Mortgage Trust | |
3.211% due 04/10/2046 • | | | | | 14,981 | | | | | | 15,163 | |
|
VMC Finance LLC | |
3.275% (LIBOR01M + 0.820%) due 03/15/2035 ~ | | | | | 3,293 | | | | | | 3,269 | |
3.390% due 10/15/2035 • | | | | | 10,000 | | | | | | 9,886 | |
| | | | | | |
| See Accompanying Notes | | SEMIANNUAL REPORT | | DECEMBER 31, 2018 | | 75 |
Schedule of InvestmentsPIMCO Enhanced Short Maturity Active Exchange-Traded Fund(Cont.)
| | | | | | | | | | | | |
| | | | | PRINCIPAL
AMOUNT
(000S) | | | | | MARKET
VALUE
(000S) | |
|
Wells Fargo Commercial Mortgage Trust | |
3.282% due 12/13/2031 • | | $ | | | 5,400 | | | $ | | | 5,381 | |
3.505% due 07/15/2046 • | | | | | 5,700 | | | | | | 5,773 | |
|
WellsFargo-RBS Commercial Mortgage Trust | |
3.905% due 06/15/2044 • | | | | | 29,300 | | | | | | 29,703 | |
| | | | | | | | | | | | |
TotalNon-Agency Mortgage-Backed Securities (Cost $385,478) | | | 383,330 | |
| | | | |
| |
| ASSET-BACKED SECURITIES 12.2% | |
|
Allegro CLO Ltd. | |
3.740% due 01/30/2026 • | | $ | | | 5,456 | | | $ | | | 5,459 | |
|
Ally Auto Receivables Trust | |
1.750% due 12/15/2021 | | | | | 425 | | | | | | 421 | |
|
Ally Master Owner Trust | |
2.775% due 07/15/2022 • | | | | | 20,000 | | | | | | 19,939 | |
|
Apex Credit CLO Ltd. | |
3.611% due 10/27/2028 • | | | | | 41,300 | | | | | | 41,125 | |
|
Atlas Senior Loan Fund Ltd. | |
3.296% due 02/17/2026 • | | | | | 5,776 | | | | | | 5,753 | |
|
B&M CLO Ltd. | |
3.166% due 04/16/2026 • | | | | | 3,485 | | | | | | 3,471 | |
|
Bank of The West Auto Trust | |
3.090% due 04/15/2021 | | | | | 26,300 | | | | | | 26,320 | |
|
Canadian Pacer Auto Receivables Trust | |
2.670% due 12/19/2019 • | | | | | 1,856 | | | | | | 1,856 | |
2.700% due 08/19/2020 | | | | | 5,411 | | | | | | 5,405 | |
3.000% due 06/21/2021 | | | | | 10,000 | | | | | | 10,007 | |
|
Carmax Auto Owner Trust | |
1.390% due 05/17/2021 | | | | | 6,660 | | | | | | 6,609 | |
|
CarMax Auto Owner Trust | |
1.400% due 08/15/2021 | | | | | 13,967 | | | | | | 13,807 | |
1.800% due 03/15/2021 | | | | | 2,074 | | | | | | 2,065 | |
2.730% due 08/16/2021 | | | | | 10,572 | | | | | | 10,550 | |
|
Chesapeake Funding LLC | |
1.880% due 06/15/2028 | | | | | 19,851 | | | | | | 19,766 | |
1.910% due 08/15/2029 | | | | | 10,632 | | | | | | 10,498 | |
1.990% due 05/15/2029 | | | | | 1,839 | | | | | | 1,820 | |
2.110% due 03/15/2028 | | | | | 3,700 | | | | | | 3,692 | |
2.825% due 08/15/2030 • | | | | | 35,000 | | | | | | 34,920 | |
|
Chrysler Capital Auto Receivables Trust | |
1.770% due 10/15/2020 | | | | | 231 | | | | | | 231 | |
|
CIFC Funding Ltd. | |
3.350% due 10/25/2027 • | | | | | 8,800 | | | | | | 8,686 | |
|
Citibank Credit Card Issuance Trust | |
3.124% due 04/22/2026 • | | | | | 6,000 | | | | | | 6,038 | |
|
Commonbond Student Loan Trust | |
3.165% due 05/25/2041 • | | | | | 1,258 | | | | | | 1,252 | |
|
Crown Point CLO Ltd. | |
3.389% due 07/17/2028 • | | | | | 21,000 | | | | | | 20,927 | |
3.975% due 10/20/2028 • | | | | | 40,000 | | | | | | 39,818 | |
|
CVP Cascade CLO Ltd. | |
3.586% due 01/16/2026 • | | | | | 12,399 | | | | | | 12,389 | |
|
Dell Equipment Finance Trust | |
3.160% due 02/22/2021 | | | | | 9,500 | | | | | | 9,509 | |
|
Denali Capital CLO LLC | |
3.558% due 10/26/2027 • | | | | | 15,180 | | | | | | 15,085 | |
|
Drug Royalty LP | |
5.286% due 07/15/2023 • | | | | | 622 | | | | | | 626 | |
|
Dryden Senior Loan Fund | |
3.336% due 10/15/2027 • | | | | | 15,200 | | | | | | 15,091 | |
|
Edsouth Indenture LLC | |
3.236% due 04/25/2039 • | | | | | 1,381 | | | | | | 1,373 | |
3.656% due 09/25/2040 • | | | | | 325 | | | | | | 327 | |
|
Emerson Park CLO Ltd. | |
3.416% due 07/15/2025 • | | | | | 1,837 | | | | | | 1,834 | |
|
Enterprise Fleet Financing LLC | |
2.550% due 08/20/2019 | | | | | 5,062 | | | | | | 5,058 | |
3.380% due 05/20/2024 | | | | | 16,800 | | | | | | 16,873 | |
|
Evergreen Credit Card Trust | |
2.715% due 10/15/2021 • | | | | | 18,000 | | | | | | 17,989 | |
2.805% due 07/15/2022 • | | | | | 25,000 | | | | | | 24,996 | |
|
Figueroa CLO Ltd. | |
3.336% due 01/15/2027 • | | | | | 15,000 | | | | | | 14,990 | |
3.642% due 06/20/2027 • | | | | | 5,000 | | | | | | 4,968 | |
| | | | | | | | | | | | |
| | | | | PRINCIPAL
AMOUNT
(000S) | | | | | MARKET
VALUE
(000S) | |
|
Flagship CLO Ltd. | |
3.286% due 01/16/2026 • | | $ | | | 2,500 | | | $ | | | 2,491 | |
|
Ford Credit Auto Lease Trust | |
1.800% due 06/15/2020 | | | | | 3,211 | | | | | | 3,202 | |
2.030% due 12/15/2020 | | | | | 510 | | | | | | 506 | |
|
Gallatin CLO Ltd. | |
3.486% (US0003M + 1.050%) due 07/15/2027 ~ | | | | | 7,600 | | | | | | 7,570 | |
|
GM Financial Automobile Leasing Trust | |
2.060% due 05/20/2020 | | | | | 8,658 | | | | | | 8,625 | |
2.890% due 09/21/2020 | | | | | 26,000 | | | | | | 25,975 | |
|
GM Financial Consumer Automobile | |
1.510% due 03/16/2020 | | | | | 59 | | | | | | 59 | |
|
GM Financial Consumer Automobile Receivables Trust | |
2.080% due 01/19/2021 | | | | | 10,943 | | | | | | 10,902 | |
|
GMF Floorplan Owner Revolving Trust | |
1.960% due 05/17/2021 | | | | | 9,155 | | | | | | 9,114 | |
2.865% due 09/15/2023 • | | | | | 28,400 | | | | | | 28,447 | |
|
Gracechurch Card Funding PLC | |
2.855% due 07/15/2022 • | | | | | 21,200 | | | | | | 21,240 | |
|
Halcyon Loan Advisors Funding Ltd. | |
3.389% due 04/20/2027 • | | | | | 5,000 | | | | | | 4,972 | |
4.116% due 08/15/2023 • | | | | | 433 | | | | | | 433 | |
|
Hyundai Auto Lease Securitization Trust | |
1.650% due 07/15/2020 | | | | | 12,410 | | | | | | 12,377 | |
1.970% due 07/15/2020 | | | | | 4,000 | | | | | | 3,979 | |
|
LCM LP | |
3.379% due 10/20/2027 • | | | | | 3,500 | | | | | | 3,485 | |
|
Master Credit Card Trust | |
2.969% due 07/21/2024 • | | | | | 12,000 | | | | | | 11,971 | |
|
Mercedes-Benz Auto Lease Trust | |
2.200% due 04/15/2020 | | | | | 5,440 | | | | | | 5,428 | |
|
Mercedes-Benz Auto Receivables Trust | |
2.350% due 08/15/2019 | | | | | 3,006 | | | | | | 3,006 | |
|
MMAF Equipment Finance LLC | |
1.930% due 10/15/2020 | | | | | 4,878 | | | | | | 4,857 | |
|
Mountain Hawk CLO Ltd. | |
3.289% due 07/20/2024 • | | | | | 4,425 | | | | | | 4,416 | |
|
Navient Private Education Refi Loan Trust | |
2.755% due 12/15/2059 • | | | | | 8,844 | | | | | | 8,847 | |
3.010% due 06/16/2042 | | | | | 24,625 | | | | | | 24,553 | |
|
Navient Student Loan Trust | |
3.106% due 07/26/2066 • | | | | | 11,500 | | | | | | 11,520 | |
3.256% due 07/26/2066 • | | | | | 3,158 | | | | | | 3,171 | |
3.306% due 07/26/2066 • | | | | | 9,829 | | | | | | 9,856 | |
3.556% due 12/27/2066 • | | | | | 22,061 | | | | | | 22,089 | |
|
Nelnet Student Loan Trust | |
2.763% due 08/23/2027 • | | | | | 14,016 | | | | | | 13,976 | |
2.944% due 12/24/2035 • | | | | | 5,260 | | | | | | 5,225 | |
3.106% due 03/25/2030 • | | | | | 4,691 | | | | | | 4,706 | |
3.306% due 09/25/2065 • | | | | | 22,596 | | | | | | 22,810 | |
3.356% due 02/25/2066 • | | | | | 14,767 | | | | | | 14,922 | |
3.477% due 11/25/2048 • | | | | | 1,763 | | | | | | 1,774 | |
|
Nissan Auto Lease Trust | |
1.640% due 09/16/2019 | | | | | 1,633 | | | | | | 1,630 | |
|
Nissan Auto Receivables Owner Trust | |
1.590% due 07/15/2022 | | | | | 3,000 | | | | | | 2,957 | |
|
Northstar Education Finance, Inc. | |
3.206% due 12/26/2031 • | | | | | 1,318 | | | | | | 1,318 | |
|
OFSI Fund Ltd. | |
3.086% due 03/20/2025 • | | | | | 8,696 | | | | | | 8,680 | |
|
OneMain Financial Issuance Trust | |
2.370% due 09/14/2032 | | | | | 13,600 | | | | | | 13,395 | |
|
OSCAR U.S. Funding Trust LLC | |
2.857% due 08/10/2021 • | | | | | 9,000 | | | | | | 9,007 | |
|
Palmer Square CLO Ltd. | |
3.466% due 08/15/2026 • | | | | | 8,576 | | | | | | 8,525 | |
|
Palmer Square Loan Funding Ltd. | |
3.036% due 04/15/2026 • | | | | | 52,201 | | | | | | 51,886 | |
3.150% due 11/15/2026 • | | | | | 11,000 | | | | | | 10,954 | |
|
Panhandle-Plains Higher Education Authority, Inc. | |
3.927% due 10/01/2035 • | | | | | 800 | | | | | | 805 | |
|
Penarth Master Issuer PLC | |
2.835% due 03/18/2022 • | | | | | 17,000 | | | | | | 16,976 | |
2.905% due 09/18/2022 • | | | | | 30,000 | | | | | | 29,936 | |
| | | | | | | | | | | | |
| | | | | PRINCIPAL
AMOUNT
(000S) | | | | | MARKET
VALUE
(000S) | |
|
PHEAA Student Loan Trust | |
3.456% due 11/25/2065 • | | $ | | | 10,234 | | | $ | | | 10,294 | |
|
Progress Residential Trust | |
3.855% due 01/17/2034 • | | | | | 4,995 | | | | | | 5,005 | |
|
SBA Tower Trust | |
2.898% due 10/15/2044 Ø | | | | | 2,000 | | | | | | 1,989 | |
|
Securitized Term Auto Receivables Trust | |
2.706% due 01/27/2020 • | | | | | 3,954 | | | | | | 3,954 | |
2.716% due 02/25/2021 • | | | | | 27,000 | | | | | | 27,003 | |
|
SLC Student Loan Trust | |
2.776% due 05/15/2023 • | | | | | 4,323 | | | | | | 4,321 | |
2.888% due 09/15/2026 • | | | | | 12,150 | | | | | | 12,131 | |
2.898% due 03/15/2027 • | | | | | 12,205 | | | | | | 12,164 | |
2.908% due 06/15/2029 • | | | | | 28,709 | | | | | | 28,561 | |
|
SLM Private Credit Student Loan Trust | |
3.338% due 12/16/2030 • | | | | | 840 | | | | | | 840 | |
|
SLM Private Education Loan Trust | |
1.850% due 06/17/2030 | | | | | 1,183 | | | | | | 1,176 | |
2.940% due 10/15/2031 | | | | | 305 | | | | | | 305 | |
3.505% due 05/17/2027 • | | | | | 641 | | | | | | 641 | |
3.555% due 06/17/2030 • | | | | | 2,151 | | | | | | 2,156 | |
4.540% due 10/17/2044 | | | | | 1,450 | | | | | | 1,460 | |
4.705% due 06/16/2042 • | | | | | 6,500 | | | | | | 6,626 | |
4.955% due 01/15/2043 • | | | | | 10,913 | | | | | | 11,064 | |
|
SLM Student Loan Trust | |
2.580% due 01/26/2026 • | | | | | 11,494 | | | | | | 11,460 | |
2.600% due 01/27/2025 • | | | | | 3,905 | | | | | | 3,890 | |
2.600% due 10/27/2025 • | | | | | 1,822 | | | | | | 1,820 | |
2.610% due 01/25/2027 • | | | | | 21,818 | | | | | | 21,720 | |
2.630% due 10/25/2028 • | | | | | 3,184 | | | | | | 3,162 | |
2.660% due 07/25/2023 • | | | | | 1,399 | | | | | | 1,399 | |
2.990% due 04/25/2024 • | | | | | 6,039 | | | | | | 6,049 | |
3.040% due 10/26/2026 • | | | | | 1,254 | | | | | | 1,254 | |
3.040% due 01/25/2028 • | | | | | 8,154 | | | | | | 8,163 | |
3.156% due 12/27/2038 • | | | | | 3,408 | | | | | | 3,407 | |
3.206% due 01/25/2029 • | | | | | 3,769 | | | | | | 3,749 | |
3.258% due 12/15/2027 • | | | | | 37,236 | | | | | | 37,274 | |
3.338% due 12/15/2025 • | | | | | 6,740 | | | | | | 6,775 | |
3.990% due 04/25/2023 • | | | | | 569 | | | | | | 572 | |
|
SMB Private Education Loan Trust | |
2.490% due 06/15/2027 | | | | | 4,166 | | | | | | 4,110 | |
2.755% due 09/15/2025 • | | | | | 12,400 | | | | | | 12,383 | |
2.805% due 03/16/2026 • | | | | | 11,836 | | | | | | 11,830 | |
2.980% due 07/15/2027 | | | | | 7,782 | | | | | | 7,770 | |
3.050% due 05/15/2026 | | | | | 1,660 | | | | | | 1,652 | |
3.355% due 09/15/2034 • | | | | | 19,000 | | | | | | 19,022 | |
3.555% due 09/15/2034 • | | | | | 9,630 | | | | | | 9,705 | |
3.655% due 07/15/2027 • | | | | | 8,814 | | | | | | 8,905 | |
|
SoFi Consumer Loan Program LLC | |
2.200% due 11/25/2026 | | | | | 2,845 | | | | | | 2,831 | |
2.500% due 05/26/2026 | | | | | 5,796 | | | | | | 5,731 | |
2.770% due 05/25/2026 | | | | | 5,327 | | | | | | 5,282 | |
|
SoFi Consumer Loan Program Trust | |
2.930% due 04/26/2027 | | | | | 2,272 | | | | | | 2,267 | |
|
SoFi Professional Loan Program LLC | |
1.750% due 07/25/2040 | | | | | 5,879 | | | | | | 5,833 | |
1.830% due 05/25/2040 | | | | | 1,903 | | | | | | 1,894 | |
2.390% due 02/25/2042 | | | | | 2,284 | | | | | | 2,264 | |
2.856% due 02/25/2042 • | | | | | 2,672 | | | | | | 2,674 | |
3.106% due 07/25/2040 • | | | | | 1,537 | | | | | | 1,541 | |
3.356% due 07/25/2039 • | | | | | 5,530 | | | | | | 5,558 | |
3.606% due 10/27/2036 • | | | | | 2,042 | | | | | | 2,070 | |
3.806% due 02/25/2040 • | | | | | 2,160 | | | | | | 2,196 | |
|
SoFi Professional Loan Program Trust | |
2.640% due 08/25/2047 | | | | | 8,609 | | | | | | 8,571 | |
3.080% due 01/25/2048 | | | | | 20,854 | | | | | | 20,812 | |
|
Staniford Street CLO Ltd. | |
3.968% due 06/15/2025 • | | | | | 6,543 | | | | | | 6,551 | |
|
Starwood Waypoint Homes Trust | |
3.405% due 01/17/2035 • | | | | | 9,856 | | | | | | 9,812 | |
|
THL Credit Wind River CLO Ltd. | |
3.886% due 01/15/2026 • | | | | | 5,200 | | | | | | 5,203 | |
|
Towd Point Mortgage Trust | |
2.915% due 02/25/2057 • | | | | | 5,151 | | | | | | 5,135 | |
|
Trillium Credit Card Trust | |
2.756% due 02/27/2023 • | | | | | 15,000 | | | | | | 14,974 | |
2.856% due 09/26/2023 • | | | | | 53,000 | | | | | | 52,973 | |
| | | | | | | | |
| 76 | | PIMCO ETF TRUST | | | | | See Accompanying Notes | |
December 31, 2018 (Unaudited)
| | | | | | | | | | | | |
| | | | | PRINCIPAL
AMOUNT
(000S) | | | | | MARKET
VALUE
(000S) | |
|
Utah State Board of Regents | |
3.256% due 09/25/2056 • | | $ | | | 13,045 | | | $ | | | 13,028 | |
3.256% due 01/25/2057 • | | | | | 8,231 | | | | | | 8,223 | |
|
Venture CLO Ltd. | |
3.650% due 10/22/2031 • | | | | | 25,000 | | | | | | 24,975 | |
|
Volkswagen Auto Loan Enhanced Trust | |
3.050% due 08/20/2021 | | | | | 4,000 | | | | | | 4,006 | |
|
Voya CLO Ltd. | |
3.210% due 07/25/2026 • | | | | | 8,241 | | | | | | 8,231 | |
|
WhiteHorse Ltd. | |
3.379% due 04/17/2027 • | | | | | 10,000 | | | | | | 9,950 | |
|
Whitehorse Ltd. | |
3.609% due 07/17/2026 • | | | | | 1,159 | | | | | | 1,158 | |
|
World Omni Auto Receivables Trust | |
1.300% due 02/15/2022 | | | | | 2,402 | | | | | | 2,374 | |
|
Zais CLO Ltd. | |
3.586% due 04/15/2028 • | | | | | 24,100 | | | | | | 24,053 | |
| | | | | | | | | | | | |
Total Asset-Backed Securities (Cost $1,491,903) | | | 1,490,047 | |
| | | | |
| |
| SOVEREIGN ISSUES 4.6% | |
|
Agence Francaise de Developpement | |
2.670% (US0003M + 0.250%) due 07/11/2019 ~ | | | | | 14,400 | | | | | | 14,417 | |
|
Caisse des Depots et Consignations | |
2.867% (US0003M + 0.100%) due 09/09/2019 ~ | | | | | 20,200 | | | | | | 20,204 | |
|
CDP Financial, Inc. | |
4.400% due 11/25/2019 | | | | | 18,000 | | | | | | 18,260 | |
|
CPPIB Capital, Inc. | |
1.250% due 09/20/2019 | | | | | 13,417 | | | | | | 13,292 | |
|
Development Bank of Japan, Inc. | |
2.749% (US0003M + 0.240%) due 01/28/2020 ~ | | | | | 32,900 | | | | | | 32,948 | |
3.047% (US0003M + 0.570%) due 04/23/2021 ~ | | | | | 6,000 | | | | | | 6,042 | |
3.136% (US0003M + 0.700%) due 04/16/2019 ~ | | | | | 2,000 | | | | | | 2,003 | |
|
Export-Import Bank of India | |
2.750% due 04/01/2020 | | | | | 1,891 | | | | | | 1,870 | |
3.646% (US0003M + 1.000%) due 08/21/2022 ~ | | | | | 31,268 | | | | | | 31,288 | |
3.875% due 10/02/2019 | | | | | 10,980 | | | | | | 11,016 | |
|
Export-Import Bank of Korea | |
3.389% (US0003M + 0.700%) due 05/26/2019 ~ | | | | | 25,000 | | | | | | 25,142 | |
|
Japan Bank for International Cooperation | |
2.125% due 02/07/2019 | | | | | 6,000 | | | | | | 5,997 | |
2.859% (US0003M + 0.390%) due 07/21/2020 ~ | | | | | 66,700 | | | | | | 66,964 | |
3.259% (US0003M + 0.570%) due 02/24/2020 ~ | | | | | 49,900 | | | | | | 50,171 | |
|
Japan Finance Organization for Municipalities | |
2.000% due 09/08/2020 | | | | | 46,586 | | | | | | 45,833 | |
2.125% due 03/06/2019 | | | | | 68,300 | | | | | | 68,229 | |
| | | | | | | | | | | | |
| | | | | PRINCIPAL
AMOUNT
(000S) | | | | | MARKET
VALUE
(000S) | |
|
Japan International Cooperation Agency | |
1.875% due 11/13/2019 | | $ | | | 19,200 | | | $ | | | 19,041 | |
|
Korea Expressway Corp. | |
3.169% (US0003M + 0.700%) due 04/20/2020 ~ | | | | | 6,700 | | | | | | 6,716 | |
3.209% (US0003M + 0.700%) due 10/28/2019 ~ | | | | | 8,000 | | | | | | 8,021 | |
|
Korea National Oil Corp. | |
2.750% due 01/23/2019 | | | | | 15,700 | | | | | | 15,697 | |
3.422% (US0003M + 0.600%) due 03/27/2020 ~ | | | | | 3,155 | | | | | | 3,158 | |
|
Province of Quebec | |
2.749% (US0003M + 0.280%) due 07/21/2019 ~ | | | | | 3,800 | | | | | | 3,805 | |
|
State of North Rhine-Westphalia | |
2.679% (US0003M + 0.500%) due 08/16/2019 ~ | | | | | 5,500 | | | | | | 5,500 | |
|
Tokyo Metropolitan Government | |
2.125% due 05/20/2019 | | | | | 53,550 | | | | | | 53,456 | |
2.125% due 05/19/2020 | | | | | 27,800 | | | | | | 27,463 | |
| | | | | | | | | | | | |
Total Sovereign Issues (Cost $556,591) | | | 556,533 | |
| | | | |
| |
| SHORT-TERM INSTRUMENTS 10.2% | |
| |
| CERTIFICATES OF DEPOSIT 0.6% | |
|
Lloyds Bank Corporate Markets PLC | |
2.908% (US0003M + 0.500%) due 10/26/2020 ~ | | | | | 53,400 | | | | | | 53,414 | |
3.324% (US0003M + 0.500%) due 09/24/2020 ~ | | | | | 22,500 | | | | | | 22,506 | |
| | | | | | | | | | | | |
| | | | | | | | | | | 75,920 | |
| | | | | | | | | | | | |
| |
| COMMERCIAL PAPER 8.0% | |
|
AT&T, Inc. | |
3.000% due 05/28/2019 | | | | | 30,000 | | | | | | 29,611 | |
|
Autonation, Inc. | |
3.250% due 01/14/2019 | | | | | 55,000 | | | | | | 54,937 | |
3.250% due 01/15/2019 | | | | | 25,000 | | | | | | 24,969 | |
3.250% due 01/22/2019 | | | | | 50,000 | | | | | | 49,908 | |
|
Boston Scientific Corp. | |
3.000% due 01/07/2019 | | | | | 14,400 | | | | | | 14,392 | |
3.050% due 01/07/2019 | | | | | 46,700 | | | | | | 46,676 | |
3.050% due 01/14/2019 | | | | | 91,000 | | | | | | 90,902 | |
|
Campbell Soup Co. | |
2.900% due 01/15/2019 | | | | | 4,400 | | | | | | 4,395 | |
3.100% due 02/11/2019 | | | | | 11,900 | | | | | | 11,860 | |
3.100% due 02/13/2019 | | | | | 2,000 | | | | | | 1,993 | |
3.200% due 02/25/2019 | | | | | 49,000 | | | | | | 48,774 | |
3.210% due 02/07/2019 | | | | | 30,000 | | | | | | 29,908 | |
|
CNH Industrial Capital LLC | |
2.870% due 01/03/2019 | | | | | 5,000 | | | | | | 4,999 | |
3.500% due 05/09/2019 | | | | | 11,500 | | | | | | 11,360 | |
|
Constellation Brands, Inc. | |
3.050% due 01/23/2019 | | | | | 23,400 | | | | | | 23,355 | |
|
Electricite De France S.A. | |
2.525% due 01/30/2019 | | | | | 20,000 | | | | | | 19,952 | |
| | | | | | | | | | | | |
| | | | | PRINCIPAL
AMOUNT
(000S) | | | | | MARKET
VALUE
(000S) | |
|
Energy Transfer Partners LP | |
3.130% due 01/02/2019 | | $ | | | 55,000 | | | $ | | | 54,991 | |
3.200% due 01/07/2019 | | | | | 50,000 | | | | | | 49,972 | |
3.650% due 03/07/2019 | | | | | 12,400 | | | | | | 12,327 | |
|
Entergy Corp. | |
2.900% due 02/06/2019 | | | | | 16,000 | | | | | | 15,952 | |
|
Ford Motor Credit Co. | |
2.935% due 01/04/2019 | | | | | 17,600 | | | | | | 17,594 | |
3.190% due 04/15/2019 | | | | | 1,105 | | | | | | 1,094 | |
|
Hitachi Capital America Corp. | |
3.090% due 01/22/2019 | | | | | 40,000 | | | | | | 39,931 | |
|
Humana, Inc. | |
3.000% due 01/15/2019 | | | | | 3,350 | | | | | | 3,346 | |
3.000% due 01/16/2019 | | | | | 9,650 | | | | | | 9,638 | |
3.100% due 01/14/2019 | | | | | 6,450 | | | | | | 6,443 | |
3.100% due 01/15/2019 | | | | | 19,750 | | | | | | 19,726 | |
|
Mondelez International, Inc. | |
3.100% due 02/26/2019 | | | | | 50,000 | | | | | | 49,761 | |
|
NiSource, Inc. | |
2.780% due 01/07/2019 | | | | | 17,000 | | | | | | 16,991 | |
3.120% due 01/29/2019 | | | | | 22,800 | | | | | | 22,747 | |
|
Reckitt Benckister Treasury | |
2.600% due 02/06/2019 | | | | | 16,500 | | | | | | 16,456 | |
|
Spectra Energy Partners LP | |
3.080% due 01/08/2019 | | | | | 34,400 | | | | | | 34,379 | |
|
Spire, Inc. | |
2.900% due 01/04/2019 | | | | | 10,500 | | | | | | 10,497 | |
|
VW CR, Inc. | |
3.050% due 07/01/2019 | | | | | 50,000 | | | | | | 49,197 | |
|
WEC Energy Group, Inc. | |
3.000% due 01/09/2019 | | | | | 75,000 | | | | | | 74,949 | |
| | | | | | | | | | | | |
| | | | | | | | | | | 973,982 | |
| | | | | | | | | | | | |
| |
| REPURCHASE AGREEMENTS (a) 1.3% | |
| | | | | | | | | | | 155,444 | |
| | | | | | | | | | | | |
| |
| SHORT-TERM NOTES 0.3% | |
|
Holmes Master Issuer PLC | |
2.805% due 07/15/2019 • | | | | | 27,600 | | | | | | 27,604 | |
|
Pepper Residential Securities Trust | |
2.955% due 03/16/2019 • | | | | | 6,500 | | | | | | 6,492 | |
| | | | | | | | | | | | |
| | | | | | | | | | | 34,096 | |
| | | | | | | | | | | | |
| Total Short-Term Instruments (Cost $1,239,542) | | | 1,239,442 | |
| | | | |
| | | | |
| | | | | | | | | | | | |
| Total Investments in Securities (Cost $12,190,294) | | | 12,153,531 | |
| | | | |
| | | | | | | | | | | | |
| Total Investments 99.7% (Cost $12,190,294) | | | $ | | | 12,153,531 | |
| |
| Other Assets and Liabilities, net 0.3% | | | 40,179 | |
| | | | |
| Net Assets 100.0% | | | $ | | | 12,193,710 | |
| | | | | | | |
NOTES TO SCHEDULE OF INVESTMENTS:
| * | A zero balance may reflect actual amounts rounding to less than one thousand. |
| ~ | Variable or Floating rate security. Rate shown is the rate in effect as of period end. Certain variable rate securities are not based on a published reference rate and spread, rather are determined by the issuer or agent and are based on current market conditions. Reference rate is as of reset date, which may vary by security. These securities may not indicate a reference rate and/or spread in their description. |
| • | Rate shown is the rate in effect as of period end. The rate may be based on a fixed rate, a capped rate or a floor rate and may convert to a variable or floating rate in the future. These securities do not indicate a reference rate and spread in their description. |
| Ø | Coupon represents a rate which changes periodically based on a predetermined schedule or event. Rate shown is the rate in effect as of period end. |
| | | | | | |
| See Accompanying Notes | | SEMIANNUAL REPORT | | DECEMBER 31, 2018 | | 77 |
Schedule of InvestmentsPIMCO Enhanced Short Maturity Active Exchange-Traded Fund(Cont.)
December 31, 2018 (Unaudited)
BORROWINGS AND OTHER FINANCING TRANSACTIONS
(a) REPURCHASE AGREEMENTS:
| | | | | | | | | | | | | | | | | | | | | | | | | | | | | | |
| Counterparty | | Lending
Rate | | | Settlement
Date | | | Maturity
Date | | | Principal
Amount | | | Collateralized By | | Collateral
(Received) | | | Repurchase
Agreements,
at Value | | | Repurchase
Agreement
Proceeds
to be
Received(1) | |
| FICC | | | 2.000 | % | | | 12/31/2018 | | | | 01/02/2019 | | | $ | 644 | | | U.S. Treasury Notes 2.875% due 07/31/2025 | | $ | (657 | ) | | $ | 644 | | | $ | 644 | |
| SAL | | | 3.150 | | | | 12/31/2018 | | | | 01/02/2019 | | | | 137,700 | | | U.S. Treasury Notes 2.625% due 12/31/2023 | | | (140,908 | ) | | | 137,700 | | | | 137,724 | |
| TDM | | | 3.500 | | | | 12/31/2018 | | | | 01/02/2019 | | | | 17,100 | | | U.S. Treasury Notes 1.875% due 12/31/2019 | | | (17,460 | ) | | | 17,100 | | | | 17,103 | |
| | | | | | | | | | | | | | | | | | | | | | | | | | | | | | |
Total Repurchase Agreements | | | | | $ | (159,025 | ) | | $ | 155,444 | | | $ | 155,471 | |
| | | | | | | | | | | | | | | |
BORROWINGS AND OTHER FINANCING TRANSACTIONS SUMMARY
The following is a summary by counterparty of the market value of Borrowings and Other Financing Transactions and collateral pledged/(received) as of December 31, 2018:
| | | | | | | | | | | | | | | | | | | | | | | | | | | | |
| Counterparty | | Repurchase
Agreement
Proceeds
to be
Received(1) | | | Payable for
Reverse
Repurchase
Agreements | | | Payable for
Sale-Buyback
Transactions | | | Securities
Out on Loan | | | Total
Borrowings and
Other Financing
Transactions | | | Collateral
Pledged/(Received) | | | Net Exposure(2) | |
Global/Master Repurchase Agreement | |
FICC | | $ | 644 | | | $ | 0 | | | $ | 0 | | | $ | 0 | | | $ | 644 | | | $ | (657 | ) | | $ | (13 | ) |
SAL | | | 137,724 | | | | 0 | | | | 0 | | | | 0 | | | | 137,724 | | | | (140,908 | ) | | | (3,184 | ) |
TDM | | | 17,103 | | | | 0 | | | | 0 | | | | 0 | | | | 17,103 | | | | (17,460 | ) | | | (357 | ) |
| | | | | | | | | | | | | | | | | | | | | | | | | | | | |
Total Borrowings and Other Financing Transactions | | $ | 155,471 | | | $ | 0 | | | $ | 0 | | | $ | 0 | | | | | | | | | | | | | |
| | | | | | | | | | | | | | | | | | | | | | | | | | | | |
| (1) | Includes accrued interest. |
| (2) | Net Exposure represents the net receivable/(payable) that would be due from/to the counterparty in the event of default. Exposure from borrowings and other financing transactions can only be netted across transactions governed under the same master agreement with the same legal entity. See Note 8, Master Netting Arrangements, in the Notes to Financial Statements for more information regarding master netting arrangements. |
The average amount of borrowings outstanding during the period ended December 31, 2018 was $(68,184) at a weighted average interest rate of 2.029%. Average borrowings may include sale-buyback transactions and reverse repurchase agreements, if held during the period.
FAIR VALUE MEASUREMENTS
The following is a summary of the fair valuations according to the inputs used as of December 31, 2018 in valuing the Fund’s assets and liabilities:
| | | | | | | | | | | | | | | | |
| Category and Subcategory | | Level 1 | | | Level 2 | | | Level 3 | | | Fair
Value at
12/31/2018 | |
Investments in Securities, at Value | |
Corporate Bonds & Notes | |
Banking & Finance | | $ | 0 | | | $ | 4,509,332 | | | $ | 0 | | | $ | 4,509,332 | |
Industrials | | | 0 | | | | 2,889,013 | | | | 0 | | | | 2,889,013 | |
Utilities | | | 0 | | | | 672,109 | | | | 0 | | | | 672,109 | |
Municipal Bonds & Notes | |
Arkansas | | | 0 | | | | 621 | | | | 0 | | | | 621 | |
California | | | 0 | | | | 28,108 | | | | 0 | | | | 28,108 | |
Texas | | | 0 | | | | 475 | | | | 0 | | | | 475 | |
Washington | | | 0 | | | | 7,420 | | | | 0 | | | | 7,420 | |
U.S. Government Agencies | | | 0 | | | | 377,101 | | | | 0 | | | | 377,101 | |
| | | | | | | | | | | | | | | | |
| Category and Subcategory | | Level 1 | | | Level 2 | | | Level 3 | | | Fair
Value at
12/31/2018 | |
Non-Agency Mortgage-Backed Securities | | $ | 0 | | | $ | 383,330 | | | $ | 0 | | | $ | 383,330 | |
Asset-Backed Securities | | | 0 | | | | 1,490,047 | | | | 0 | | | | 1,490,047 | |
Sovereign Issues | | | 0 | | | | 556,533 | | | | 0 | | | | 556,533 | |
Short-Term Instruments | |
Certificates of Deposit | | | 0 | | | | 75,920 | | | | 0 | | | | 75,920 | |
Commercial Paper | | | 0 | | | | 973,982 | | | | 0 | | | | 973,982 | |
Repurchase Agreements | | | 0 | | | | 155,444 | | | | 0 | | | | 155,444 | |
Short-Term Notes | | | 0 | | | | 34,096 | | | | 0 | | | | 34,096 | |
| | | | | | | | | | | | | | | | |
| | | | |
Total Investments | | $ | 0 | | | $ | 12,153,531 | | | $ | 0 | | | $ | 12,153,531 | |
| | | | | | | | | | | | | | | | |
There were no significant transfers into or out of Level 3 during the period ended December 31, 2018.
| | | | | | | | |
| 78 | | PIMCO ETF TRUST | | | | | See Accompanying Notes | |
Schedule of InvestmentsPIMCO Intermediate Municipal Bond Active Exchange-Traded Fund
December 31, 2018 (Unaudited)
(Amounts in thousands*, except number of shares, contracts and units, if any)
| | | | | | | | | | | | |
| | | | | PRINCIPAL
AMOUNT
(000S) | | | | | MARKET
VALUE
(000S) | |
| INVESTMENTS IN SECURITIES 99.9% | |
| |
| MUNICIPAL BONDS & NOTES 93.6% | |
| |
| ALABAMA 1.2% | |
|
Southeast Alabama Gas Supply District Revenue Bonds, Series 2018 | |
4.000% due 06/01/2049 | | $ | | | 3,500 | | | $ | | | 3,663 | |
| | | | | | | | | | | | |
| |
| ARIZONA 2.3% | |
|
Chandler Industrial Development Authority, Arizona Revenue Bonds, Series 2005 | |
2.400% due 12/01/2035 | | | | | 2,750 | | | | | | 2,774 | |
|
Maricopa County, Arizona Special Health Care District General Obligation Bonds, Series 2018 | |
5.000% due 07/01/2029 | | | | | 1,940 | | | | | | 2,305 | |
|
Phoenix Civic Improvement Corp., Arizona Revenue Bonds, Series 2017 | |
3.125% due 07/01/2034 | | | | | 425 | | | | | | 414 | |
5.000% due 07/01/2029 | | | | | 1,500 | | | | | | 1,775 | |
| | | | | | | | | | | | |
| | | | | | | | | | | 7,268 | |
| | | | | | | | | | | | |
| |
| CALIFORNIA 3.4% | |
|
Bay Area Toll Authority, California Revenue Bonds, Series 2007 | |
2.410% (MUNIPSA + 0.700%) due 04/01/2047 ~ | | | | | 1,000 | | | | | | 1,001 | |
|
California Health Facilities Financing Authority Revenue Bonds, Series 2009 | |
6.000% due 07/01/2039 | | | | | 1,000 | | | | | | 1,022 | |
|
California State General Obligation Bonds, Series 2009 | |
5.000% due 07/01/2020 | | | | | 500 | | | | | | 509 | |
|
California State General Obligation Notes, Series 2010 | |
5.000% due 11/01/2019 | | | | | 500 | | | | | | 514 | |
|
California State General Obligation Notes, Series 2013 | |
5.000% due 09/01/2021 | | | | | 3,000 | | | | | | 3,255 | |
|
Los Angeles, California Wastewater System Revenue Bonds, Series 2015 | |
5.000% due 06/01/2029 | | | | | 1,350 | | | | | | 1,575 | |
|
Sacramento Municipal Utility District, California Revenue Bonds, Series 2013 | |
5.000% due 08/15/2029 | | | | | 1,000 | | | | | | 1,133 | |
|
Southern California Public Power Authority Revenue Bonds, Series 2007 | |
5.250% due 11/01/2020 | | | | | 575 | | | | | | 604 | |
|
University of California Revenue Bonds, Series 2009 | |
5.000% due 05/15/2020 | | | | | 1,000 | | | | | | 1,013 | |
| | | | | | | | | | | | |
| | | | | | | | | | | 10,626 | |
| | | | | | | | | | | | |
| |
| COLORADO 1.5% | |
|
Board of Governors of Colorado State University System Revenue Bonds, Series 2015 | |
5.000% due 03/01/2028 | | | | | 1,580 | | | | | | 1,843 | |
|
Colorado Health Facilities Authority Revenue Bonds, Series 2018 | |
5.000% due 11/15/2048 | | | | | 2,500 | | | | | | 2,912 | |
| | | | | | | | | | | | |
| | | | | | | | | | | 4,755 | |
| | | | | | | | | | | | |
| |
| CONNECTICUT 5.6% | |
|
Bridgeport, Connecticut General Obligation Notes, Series 2017 | |
5.000% due 08/15/2023 | | | | | 1,635 | | | | | | 1,799 | |
5.000% due 08/15/2027 | | | | | 3,000 | | | | | | 3,444 | |
|
Connecticut Special Tax State Revenue Bonds, Series 2018 | |
5.000% due 01/01/2030 | | | | | 3,000 | | | | | | 3,439 | |
5.000% due 10/01/2033 | | | | | 1,000 | | | | | | 1,136 | |
|
Connecticut State General Obligation Bonds, Series 2018 | |
5.000% due 09/15/2030 | | | | | 3,640 | | | | | | 4,118 | |
|
Connecticut State Health & Educational Facilities Authority Revenue Bonds, Series 2018 | |
5.000% due 07/01/2029 | | | | | 1,200 | | | | | | 1,411 | |
| | | | | | | | | | | | |
| | | | | PRINCIPAL
AMOUNT
(000S) | | | | | MARKET
VALUE
(000S) | |
|
Metropolitan District, Connecticut General Obligation Bonds, Series 2018 | |
5.000% due 07/15/2029 | | $ | | | 1,845 | | | $ | | | 2,179 | |
| | | | | | | | | | | | |
| | | | | | | | | | | 17,526 | |
| | | | | | | | | | | | |
| |
| DISTRICT OF COLUMBIA 1.1% | |
|
District of Columbia Revenue Bonds, Series 2010 | |
5.000% due 12/01/2024 | | | | | 1,000 | | | | | | 1,043 | |
|
District of Columbia Revenue Bonds, Series 2015 | |
5.000% due 07/15/2028 | | | | | 2,000 | | | | | | 2,275 | |
| | | | | | | | | | | | |
| | | | | | | | | | | 3,318 | |
| | | | | | | | | | | | |
| |
| FLORIDA 6.3% | |
|
Broward County, Florida Airport System Revenue Bonds, Series 2012 | |
5.000% due 10/01/2023 | | | | | 1,000 | | | | | | 1,105 | |
|
Central Florida Expressway Authority Revenue Bonds, Series 2018 | |
5.000% due 07/01/2030 | | | | | 450 | | | | | | 534 | |
5.000% due 07/01/2031 | | | | | 900 | | | | | | 1,061 | |
|
Citizens Property Insurance Corp., Florida Revenue Notes, Series 2011 | |
5.000% due 06/01/2019 | | | | | 1,000 | | | | | | 1,013 | |
|
Escambia County, Florida Revenue Bonds, Series 2009 | |
1.790% due 04/01/2039 | | | | | 3,500 | | | | | | 3,500 | |
|
Florida Lottery State Revenue Notes, Series 2010 | |
5.000% due 07/01/2019 | | | | | 2,910 | | | | | | 2,957 | |
|
Florida State General Obligation Bonds, Series 2018 | |
5.000% due 06/01/2030 | | | | | 1,500 | | | | | | 1,817 | |
|
Jacksonville, Florida Revenue Notes, Series 2012 | |
5.000% due 10/01/2021 | | | | | 1,000 | | | | | | 1,076 | |
|
JEA Water & Sewer System, Florida Revenue Bonds, Series 2012 | |
5.000% due 10/01/2025 | | | | | 1,500 | | | | | | 1,602 | |
|
Lakeland, Florida Department of Electric Utilities Revenue Bonds, Series 2016 | |
5.000% due 10/01/2026 | | | | | 505 | | | | | | 594 | |
|
Palm Beach County, Florida Revenue Bonds, Series 2012 | |
5.000% due 06/01/2023 | | | | | 1,300 | | | | | | 1,431 | |
|
Palm Beach County, Florida School District Certificates of Participation Bonds, Series 2018 | |
5.000% due 08/01/2029 | | | | | 2,500 | | | | | | 3,003 | |
| | | | | | | | | | | | |
| | | | | | | | | | | 19,693 | |
| | | | | | | | | | | | |
| |
| GEORGIA 2.1% | |
|
Atlanta Department of Aviation, Georgia Revenue Bonds, Series 2012 | |
5.000% due 01/01/2025 | | | | | 500 | | | | | | 541 | |
|
Burke County, Georgia Development Authority Revenue Bonds, Series 2017 | |
3.250% due 11/01/2045 | | | | | 3,750 | | | | | | 3,740 | |
|
Cobb County, Georgia Kennestone Hospital Authority Revenue Bonds, Series 2017 | |
5.000% due 04/01/2028 | | | | | 600 | | | | | | 694 | |
|
Cobb County, Georgia Kennestone Hospital Authority Revenue Notes, Series 2017 | |
5.000% due 04/01/2027 | | | | | 400 | | | | | | 469 | |
|
LaGrange-Troup County, Georgia Hospital Authority Revenue Bonds, Series 2017 | |
5.000% due 04/01/2028 | | | | | 700 | | | | | | 810 | |
|
LaGrange-Troup County, Georgia Hospital Authority Revenue Notes, Series 2017 | |
5.000% due 04/01/2027 | | | | | 200 | | | | | | 234 | |
|
Municipal Electric Authority of Georgia Revenue Notes, Series 2011 | |
5.000% due 01/01/2020 | | | | | 250 | | | | | | 257 | |
| | | | | | | | | | | | |
| | | | | | | | | | | 6,745 | |
| | | | | | | | | | | | |
| |
| | | | | | | | | | | | |
| | | | | PRINCIPAL
AMOUNT
(000S) | | | | | MARKET
VALUE
(000S) | |
| GUAM 0.3% | |
|
Guam Government Waterworks Authority Revenue Notes, Series 2014 | |
5.000% due 07/01/2023 | | $ | | | 770 | | | $ | | | 841 | |
| | | | | | | | | | | | |
| |
| HAWAII 0.7% | |
|
Honolulu, Hawaii City & County General Obligation Bonds, Series 2015 | |
5.000% due 10/01/2030 | | | | | 2,000 | | | | | | 2,305 | |
| | | | | | | | | | | | |
| |
| ILLINOIS 8.1% | |
|
Chicago Midway International Airport, Illinois Revenue Bonds, Series 2014 | |
5.000% due 01/01/2035 | | | | | 6,500 | | | | | | 7,099 | |
|
Chicago, Illinois General Obligation Bonds, Series 2015 | |
5.250% due 01/01/2027 | | | | | 4,000 | | | | | | 4,253 | |
|
Chicago, Illinois General Obligation Notes, Series 2015 | |
5.000% due 01/01/2026 | | | | | 2,000 | | | | | | 2,110 | |
|
Illinois Development Finance Authority Revenue Bonds, Series 2001 | |
1.700% due 05/01/2031 | | | | | 2,000 | | | | | | 2,000 | |
|
Illinois State General Obligation Bonds, Series 2012 | |
4.000% due 01/01/2024 | | | | | 4,000 | | | | | | 4,041 | |
|
Illinois State Toll Highway Authority Revenue Bonds, Series 2019 | |
5.000% due 01/01/2030 (a) | | | | | 2,500 | | | | | | 2,966 | |
|
Railsplitter Tobacco Settlement Authority, Illinois Revenue Notes, Series 2010 | |
5.125% due 06/01/2019 | | | | | 500 | | | | | | 506 | |
|
Railsplitter Tobacco Settlement Authority, Illinois Revenue Notes, Series 2017 | |
5.000% due 06/01/2023 | | | | | 1,100 | | | | | | 1,213 | |
5.000% due 06/01/2025 | | | | | 1,000 | | | | | | 1,135 | |
| | | | | | | | | | | | |
| | | | | | | | | | | 25,323 | |
| | | | | | | | | | | | |
| |
| INDIANA 1.0% | |
|
Indiana Finance Authority Revenue Bonds, Series 2018 | |
5.000% due 02/01/2030 | | | | | 1,500 | | | | | | 1,810 | |
|
Rockport, Indiana Revenue Bonds, Series 2009 | |
3.050% due 06/01/2025 | | | | | 1,500 | | | | | | 1,502 | |
| | | | | | | | | | | | |
| | | | | | | | | | | 3,312 | |
| | | | | | | | | | | | |
| |
| KENTUCKY 1.2% | |
|
Kentucky Public Energy Authority Revenue Bonds, Series 2018 | |
4.000% due 01/01/2049 | | | | | 3,000 | | | | | | 3,175 | |
|
Kentucky Turnpike Authority Revenue Notes, Series 2017 | |
5.000% due 07/01/2026 | | | | | 525 | | | | | | 609 | |
| | | | | | | | | | | | |
| | | | | | | | | | | 3,784 | |
| | | | | | | | | | | | |
| |
| LOUISIANA 2.3% | |
|
Louisiana Gasoline & Fuels Tax State Revenue Notes, Series 2017 | |
5.000% due 05/01/2026 | | | | | 2,050 | | | | | | 2,418 | |
|
Louisiana Public Facilities Authority Revenue Bonds, Series 2016 | |
3.375% due 09/01/2028 | | | | | 2,000 | | | | | | 1,988 | |
|
Louisiana Public Facilities Authority Revenue Bonds, Series 2017 | |
5.000% due 05/15/2028 | | | | | 855 | | | | | | 982 | |
|
Louisiana State General Obligation Notes, Series 2014 | |
5.000% due 02/01/2019 | | | | | 1,760 | | | | | | 1,764 | |
| | | | | | | | | | | | |
| | | | | | | | | | | 7,152 | |
| | | | | | | | | | | | |
| |
| MAINE 0.4% | |
|
Maine Municipal Bond Bank Revenue Bonds, Series 2017 | |
5.000% due 11/01/2030 | | | | | 1,095 | | | | | | 1,304 | |
| | | | | | | | | | | | |
| | | | | | |
| See Accompanying Notes | | SEMIANNUAL REPORT | | DECEMBER 31, 2018 | | 79 |
Schedule of InvestmentsPIMCO Intermediate Municipal Bond Active Exchange-Traded Fund(Cont.)
| | | | | | | | | | | | |
| | | | | PRINCIPAL
AMOUNT
(000S) | | | | | MARKET
VALUE
(000S) | |
| MARYLAND 0.6% | |
|
Baltimore, Maryland Revenue Notes, Series 2011 | |
5.000% due 07/01/2021 | | $ | | | 60 | | | $ | | | 64 | |
|
Baltimore, Maryland Revenue Notes, Series 2017 | |
5.000% due 09/01/2027 | | | | | 1,750 | | | | | | 1,984 | |
| | | | | | | | | | | | |
| | | | | | | | | | | 2,048 | |
| | | | | | | | | | | | |
| |
| MASSACHUSETTS 1.6% | |
|
Massachusetts Development Finance Agency Revenue Bonds, Series 2017 | |
2.210% (MUNIPSA + 0.500%) due 07/01/2038 ~ | | | | | 2,000 | | | | | | 1,996 | |
|
Massachusetts Development Finance Agency Revenue Bonds, Series 2018 | |
5.000% due 07/01/2030 | | | | | 1,500 | | | | | | 1,713 | |
|
Massachusetts School Building Authority Revenue Notes, Series 2012 | |
5.000% due 08/15/2022 | | | | | 1,175 | | | | | | 1,304 | |
| | | | | | | | | | | | |
| | | | | | | | | | | 5,013 | |
| | | | | | | | | | | | |
| |
| MICHIGAN 0.7% | |
|
Michigan Finance Authority Revenue Bonds, Series 2015 | |
5.000% due 07/01/2030 | | | | | 1,200 | | | | | | 1,344 | |
|
Michigan Finance Authority Revenue Notes, Series 2015 | |
5.000% due 12/01/2021 | | | | | 910 | | | | | | 986 | |
| | | | | | | | | | | | |
| | | | | | | | | | | 2,330 | |
| | | | | | | | | | | | |
| |
| MINNESOTA 0.4% | |
|
Rochester, Minnesota Electric Utility Revenue Bonds, Series 2017 | |
5.000% due 12/01/2029 | | | | | 1,000 | | | | | | 1,175 | |
| | | | | | | | | | | | |
| |
| NEBRASKA 0.7% | |
|
Public Power Generation Agency, Nebraska Revenue Notes, Series 2015 | |
5.000% due 01/01/2025 | | | | | 1,905 | | | | | | 2,172 | |
| | | | | | | | | | | | |
| |
| NEVADA 0.5% | |
|
Las Vegas Valley Water District, Nevada General Obligation Bonds, Series 2015 | |
5.000% due 06/01/2034 | | | | | 1,500 | | | | | | 1,700 | |
| | | | | | | | | | | | |
| |
| NEW HAMPSHIRE 0.4% | |
|
Merrimack County, New Hampshire General Obligation Notes, Series 2012 | |
5.000% due 12/01/2022 | | | | | 1,115 | | | | | | 1,242 | |
| | | | | | | | | | | | |
| |
| NEW JERSEY 4.7% | |
|
New Jersey Economic Development Authority Revenue Bonds, Series 2012 | |
5.000% due 06/15/2023 | | | | | 1,000 | | | | | | 1,075 | |
|
New Jersey Economic Development Authority Revenue Bonds, Series 2013 | |
3.260% (MUNIPSA + 1.550%) due 09/01/2027 ~ | | | | | 3,000 | | | | | | 2,957 | |
|
New Jersey Health Care Facilities Financing Authority Revenue Bonds, Series 2011 | |
5.000% due 07/01/2023 | | | | | 1,000 | | | | | | 1,101 | |
|
New Jersey Transportation Trust Fund Authority Revenue Bonds, Series 2011 | |
5.250% due 06/15/2024 | | | | | 2,500 | | | | | | 2,649 | |
|
New Jersey Transportation Trust Fund Authority Revenue Notes, Series 2015 | |
5.000% due 06/15/2022 | | | | | 1,000 | | | | | | 1,077 | |
|
New Jersey Turnpike Authority Revenue Bonds, Series 2017 | |
5.000% due 01/01/2030 | | | | | 2,250 | | | | | | 2,623 | |
| | | | | | | | | | | | |
| | | | | PRINCIPAL
AMOUNT
(000S) | | | | | MARKET
VALUE
(000S) | |
|
Tobacco Settlement Financing Corp., New Jersey Revenue Notes, Series 2018 | |
5.000% due 06/01/2025 | | $ | | | 1,000 | | | $ | | | 1,122 | |
5.000% due 06/01/2028 | | | | | 2,000 | | | | | | 2,277 | |
| | | | | | | | | | | | |
| | | | | | | | | | | 14,881 | |
| | | | | | | | | | | | |
| |
| NEW MEXICO 0.6% | |
|
Farmington, New Mexico Revenue Bonds, Series 2010 | |
2.125% due 06/01/2040 | | | | | 1,800 | | | | | | 1,746 | |
| | | | | | | | | | | | |
| |
| NEW YORK 10.9% | |
|
Erie County, New York Industrial Development Agency Revenue Notes, Series 2012 | |
5.000% due 05/01/2022 | | | | | 1,000 | | | | | | 1,100 | |
|
Metropolitan Transportation Authority, New York Revenue Bonds, Series 2005 | |
5.000% due 11/15/2019 | | | | | 500 | | | | | | 513 | |
|
Metropolitan Transportation Authority, New York Revenue Bonds, Series 2014 | |
5.000% due 11/15/2029 | | | | | 3,000 | | | | | | 3,512 | |
|
Monroe County Industrial Development Corp., New York Revenue Bonds, Series 2017 | |
5.000% due 12/01/2027 | | | | | 1,000 | | | | | | 1,162 | |
|
Nassau County, New York General Obligation Notes, Series 2016 | |
5.000% due 04/01/2026 | | | | | 1,360 | | | | | | 1,583 | |
|
New York City Transitional Finance Authority Future Tax Secured, New York Revenue Bonds, Series 2014 | |
5.000% due 08/01/2031 | | | | | 5,000 | | | | | | 5,636 | |
|
New York City, New York Transitional Finance Authority Building Aid Revenue Bonds, Series 2018 | |
5.000% due 07/15/2031 | | | | | 1,500 | | | | | | 1,778 | |
|
New York Convention Center Development Corp. Revenue Bonds, Series 2015 | |
5.000% due 11/15/2027 | | | | | 2,000 | | | | | | 2,325 | |
|
New York State Dormitory Authority Revenue Bonds, Series 2011 | |
5.000% due 05/01/2022 | | | | | 2,000 | | | | | | 2,147 | |
|
New York State Dormitory Authority Revenue Bonds, Series 2012 | |
5.000% due 12/15/2025 | | | | | 405 | | | | | | 450 | |
|
New York State Dormitory Authority Revenue Bonds, Series 2018 | |
5.000% due 03/15/2031 | | | | | 3,000 | | | | | | 3,585 | |
5.000% due 01/15/2032 | | | | | 500 | | | | | | 587 | |
|
New York State Energy Research & Development Authority Revenue Bonds, Series 1994 | |
3.500% due 10/01/2029 | | | | | 3,000 | | | | | | 3,027 | |
|
Triborough Bridge & Tunnel Authority, New York Revenue Bonds, Series 2012 | |
5.000% due 11/15/2025 | | | | | 2,000 | | | | | | 2,219 | |
|
Triborough Bridge & Tunnel Authority, New York Revenue Bonds, Series 2013 | |
5.000% due 11/15/2027 | | | | | 2,075 | | | | | | 2,341 | |
5.000% due 11/15/2028 | | | | | 825 | | | | | | 930 | |
|
TSASC, Inc., New York Revenue Notes, Series 2017 | |
5.000% due 06/01/2026 | | | | | 1,250 | | | | | | 1,423 | |
| | | | | | | | | | | | |
| | | | | | | | | | | 34,318 | |
| | | | | | | | | | | | |
| |
| NORTH CAROLINA 2.1% | |
|
Charlotte-Mecklenburg Hospital Authority, North Carolina Revenue Bonds, Series 2018 | |
1.700% due 01/15/2048 | | | | | 3,000 | | | | | | 3,000 | |
|
Mecklenburg County, North Carolina Certificates of Participation Notes, Series 2009 | |
5.000% due 02/01/2019 | | | | | 300 | | | | | | 301 | |
|
North Carolina Medical Care Commission Revenue Bonds, Series 2012 | |
5.000% due 06/01/2023 | | | | | 1,665 | | | | | | 1,825 | |
5.000% due 10/01/2027 | | | | | 1,100 | | | | | | 1,211 | |
| | | | | | | | | | | | |
| | | | | PRINCIPAL
AMOUNT
(000S) | | | | | MARKET
VALUE
(000S) | |
|
University of North Carolina at Greensboro Revenue Bonds, Series 2014 | |
5.000% due 04/01/2026 | | $ | | | 250 | | | $ | | | 285 | |
| | | | | | | | | | | | |
| | | | | | | | | | | 6,622 | |
| | | | | | | | | | | | |
| |
| OHIO 2.6% | |
|
American Municipal Power, Inc., Ohio Revenue Notes, Series 2012 | |
5.000% due 02/15/2022 | | | | | 800 | | | | | | 871 | |
|
Butler County, Ohio Revenue Bonds, Series 2017 | |
5.000% due 11/15/2030 | | | | | 1,235 | | | | | | 1,422 | |
|
Cleveland Department of Public Utilities Division of Water, Ohio Revenue Bonds, Series 2012 | |
5.000% due 01/01/2026 | | | | | 1,000 | | | | | | 1,091 | |
|
Cuyahoga County, Ohio Certificates of Participation Bonds, Series 2014 | |
5.000% due 12/01/2025 | | | | | 3,000 | | | | | | 3,371 | |
|
University of Cincinnati, Ohio Revenue Bonds, Series 2012 | |
5.000% due 06/01/2024 | | | | | 1,250 | | | | | | 1,369 | |
| | | | | | | | | | | | |
| | | | | | | | | | | 8,124 | |
| | | | | | | | | | | | |
| |
| OREGON 0.7% | |
|
Oregon State Lottery Revenue Notes, Series 2015 | |
5.000% due 04/01/2024 | | | | | 2,040 | | | | | | 2,343 | |
| | | | | | | | | | | | |
| |
| PENNSYLVANIA 6.7% | |
|
Commonwealth Financing Authority, Pennsylvania Revenue Notes, Series 2018 | |
5.000% due 06/01/2025 | | | | | 1,500 | | | | | | 1,711 | |
|
Commonwealth of Pennsylvania General Obligation Notes, Series 2016 | |
5.000% due 01/15/2027 | | | | | 2,000 | | | | | | 2,352 | |
|
Delaware River Port Authority, Pennsylvania Revenue Notes, Series 2012 | |
5.000% due 01/01/2023 | | | | | 900 | | | | | | 988 | |
|
Luzerne County, Pennsylvania General Obligation Bonds, (AGM Insured), Series 2017 | |
5.000% due 12/15/2029 | | | | | 750 | | | | | | 853 | |
|
Montgomery County Industrial Development Authority, Pennsylvania Revenue Bonds, Series 1994 | |
2.550% due 06/01/2029 | | | | | 1,500 | | | | | | 1,496 | |
|
Pennsylvania Economic Development Financing Authority Revenue Bonds, Series 2009 | |
2.800% due 12/01/2033 | | | | | 1,000 | | | | | | 1,003 | |
|
Pennsylvania Higher Educational Facilities Authority Revenue Bonds, Series 2011 | |
5.250% due 06/15/2023 | | | | | 2,500 | | | | | | 2,688 | |
|
Pennsylvania Higher Educational Facilities Authority Revenue Bonds, Series 2015 | |
5.000% due 08/15/2029 | | | | | 340 | | | | | | 393 | |
5.000% due 08/15/2031 | | | | | 300 | | | | | | 344 | |
5.000% due 08/15/2033 | | | | | 1,000 | | | | | | 1,139 | |
|
Pennsylvania Higher Educational Facilities Authority Revenue Bonds, Series 2017 | |
5.000% due 08/15/2029 | | | | | 1,250 | | | | | | 1,487 | |
|
Pennsylvania Turnpike Commission Revenue Notes, Series 2014 | |
2.590% (MUNIPSA + 0.880%) due 12/01/2020 ~ | | | | | 4,500 | | | | | | 4,526 | |
|
Philadelphia Gas Works, Co., Pennsylvania Revenue Bonds, Series 2015 | |
5.000% due 08/01/2027 | | | | | 750 | | | | | | 854 | |
|
Philadelphia Gas Works, Colorado, Pennsylvania Revenue Bonds, Series 2015 | |
5.000% due 08/01/2026 | | | | | 1,000 | | | | | | 1,142 | |
| | | | | | | | | | | | |
| | | | | | | | | | | 20,976 | |
| | | | | | | | | | | | |
| |
| PUERTO RICO 0.4% | |
|
Puerto Rico Electric Power Authority Revenue Bonds, (AGM Insured), Series 2007 | |
2.125% (0.67*US0003M + 0.520%) due 07/01/2029 ~ | | | | | 1,280 | | | | | | 1,187 | |
| | | | | | | | | | | | |
| | | | | | | | |
| 80 | | PIMCO ETF TRUST | | | | | See Accompanying Notes | |
December 31, 2018 (Unaudited)
| | | | | | | | | | | | |
| | | | | PRINCIPAL
AMOUNT
(000S) | | | | | MARKET
VALUE
(000S) | |
| RHODE ISLAND 2.5% | |
|
Tobacco Settlement Financing Corp., Rhode Island Revenue Bonds, Series 2015 | |
5.000% due 06/01/2035 | | $ | | | 7,500 | | | $ | | | 7,894 | |
| | | | | | | | | | | | |
| |
| SOUTH DAKOTA 0.7% | |
|
South Dakota Health & Educational Facilities Authority Revenue Bonds, Series 2014 | |
5.000% due 11/01/2027 | | | | | 925 | | | | | | 1,042 | |
|
South Dakota Health & Educational Facilities Authority Revenue Bonds, Series 2015 | |
5.000% due 11/01/2028 | | | | | 900 | | | | | | 1,025 | |
| | | | | | | | | | | | |
| | | | | | | | | | | 2,067 | |
| | | | | | | | | | | | |
| |
| TENNESSEE 2.0% | |
|
Tennessee Energy Acquisition Corp. Revenue Bonds, Series 2006 | |
5.000% due 02/01/2021 | | | | | 870 | | | | | | 913 | |
5.250% due 09/01/2026 | | | | | 1,715 | | | | | | 1,950 | |
|
Tennessee Energy Acquisition Corp., Revenue Bonds, Series 2006 | |
5.000% due 02/01/2027 | | | | | 3,000 | | | | | | 3,359 | |
| | | | | | | | | | | | |
| | | | | | | | | | | 6,222 | |
| | | | | | | | | | | | |
| |
| TEXAS 10.6% | |
|
Austin Convention Enterprises, Inc., Texas Revenue Notes, Series 2017 | |
5.000% due 01/01/2026 | | | | | 750 | | | | | | 842 | |
|
Corpus Christi Independent School District, Texas General Obligation Notes, (PSF Insured), Series 2016 | |
5.000% due 08/15/2025 | | | | | 2,115 | | | | | | 2,478 | |
|
Dallas, Texas Waterworks & Sewer System Revenue Bonds, Series 2012 | |
5.000% due 10/01/2023 | | | | | 1,000 | | | | | | 1,108 | |
|
Harris County, Texas Cultural Education Facilities Finance Corp. Revenue Bonds, Series 2008 | |
1.720% due 12/01/2024 | | | | | 2,500 | | | | | | 2,500 | |
|
Harris County, Texas Cultural Education Facilities Finance Corp. Revenue Bonds, Series 2014 | |
2.290% (MUNIPSA + 0.580%) due 12/01/2042 ~ | | | | | 4,500 | | | | | | 4,503 | |
5.000% due 12/01/2025 | | | | | 500 | | | | | | 571 | |
|
Harris County, Texas Cultural Education Facilities Finance Corp. Revenue Bonds, Series 2017 | |
5.000% due 11/15/2029 | | | | | 510 | | | | | | 603 | |
|
Harris County, Texas Revenue Bonds, (AMBAC Insured), Series 2007 | |
2.423% (0.67*US0003M + 0.670%) due 08/15/2035 ~ | | | | | 1,150 | | | | | | 1,051 | |
| | | | | | | | | | | | |
| | | | | PRINCIPAL
AMOUNT
(000S) | | | | | MARKET
VALUE
(000S) | |
|
Houston, Texas Airport System Revenue Bonds, Series 2018 | |
5.000% due 07/01/2029 | | $ | | | 1,500 | | | $ | | | 1,793 | |
5.000% due 07/01/2030 | | | | | 3,250 | | | | | | 3,854 | |
|
Katy Independent School District, Texas General Obligation Bonds, (PSF Insured), Series 2018 | |
5.000% due 02/15/2029 | | | | | 1,435 | | | | | | 1,726 | |
|
New Hope Cultural Education Facilities Finance Corp., Texas Revenue Bonds, Series 2017 | |
5.000% due 01/01/2029 | | | | | 1,205 | | | | | | 1,253 | |
|
North Central Texas Health Facility Development Corp. Revenue Notes, Series 2012 | |
5.000% due 08/15/2020 | | | | | 1,000 | | | | | | 1,050 | |
|
North Texas Tollway Authority Revenue Bonds, Series 2016 | |
5.000% due 01/01/2028 | | | | | 2,875 | | | | | | 3,314 | |
|
Pflugerville Independent School District, Texas General Obligation Bonds, (PSF Insured), Series 2012 | |
5.000% due 02/15/2024 | | | | | 1,165 | | | | | | 1,270 | |
|
San Antonio Public Facilities Corp., Texas Revenue Bonds, Series 2012 | |
5.000% due 09/15/2025 | | | | | 1,000 | | | | | | 1,098 | |
|
Texas Water Development Board Revenue Bonds, Series 2018 | |
5.000% due 04/15/2030 | | | | | 250 | | | | | | 303 | |
5.000% due 10/15/2030 | | | | | 3,000 | | | | | | 3,624 | |
|
University of Texas System Revenue Bonds, Series 2010 | |
5.000% due 08/15/2022 | | | | | 500 | | | | | | 554 | |
| | | | | | | | | | | | |
| | | | | | | | | | | 33,495 | |
| | | | | | | | | | | | |
| |
| UTAH 0.8% | |
|
Murray, Utah Revenue Bonds, Series 2005 | |
1.700% due 05/15/2037 | | | | | 2,500 | | | | | | 2,500 | |
| | | | | | | | | | | | |
| |
| WASHINGTON 4.2% | |
|
Energy Northwest, Washington Revenue Bonds, Series 2018 | |
5.000% due 07/01/2031 | | | | | 3,000 | | | | | | 3,594 | |
|
Seattle, Washington Solid Waste Revenue Notes, Series 2014 | |
5.000% due 05/01/2024 | | | | | 545 | | | | | | 626 | |
|
Washington Health Care Facilities Authority Revenue Bonds, Series 2017 | |
2.760% (MUNIPSA + 1.050%) due 01/01/2042 ~ | | | | | 2,500 | | | | | | 2,545 | |
|
Washington State Convention Center Public Facilities District Revenue Bonds, Series 2018 | |
5.000% due 07/01/2030 | | | | | 750 | | | | | | 879 | |
5.000% due 07/01/2031 | | | | | 1,200 | | | | | | 1,399 | |
| | | | | | | | | | | | |
| | | | | PRINCIPAL
AMOUNT
(000S) | | | | | MARKET
VALUE
(000S) | |
|
Washington State General Obligation Notes, Series 2017 | |
5.000% due 08/01/2027 | | $ | | | 1,625 | | | $ | | | 1,963 | |
|
Washington State Revenue Bonds, Series 2012 | |
5.000% due 09/01/2023 | | | | | 2,000 | | | | | | 2,208 | |
| | | | | | | | | | | | |
| | | | | | | | | | | 13,214 | |
| | | | | | | | | | | | |
| |
| WEST VIRGINIA 1.0% | |
|
Mason County, West Virginia Revenue Bonds, Series 2003 | |
2.750% due 10/01/2022 | | | | | 2,000 | | | | | | 1,994 | |
|
West Virginia Commissioner of Highways Revenue Bonds, Series 2017 | |
5.000% due 09/01/2028 | | | | | 850 | | | | | | 1,011 | |
| | | | | | | | | | | | |
| | | | | | | | | | | 3,005 | |
| | | | | | | | | | | | |
| |
| WISCONSIN 0.7% | |
|
Wisconsin Health & Educational Facilities Authority Revenue Notes, Series 2018 | |
5.000% due 04/01/2029 | | | | | 1,925 | | | | | | 2,297 | |
| | | | | | | | | | | | |
Total Municipal Bonds & Notes (Cost $289,214) | | | 294,186 | |
| | | | |
| |
| SHORT-TERM INSTRUMENTS 6.3% | |
| |
| SHORT-TERM NOTES 6.3% | |
|
Federal Home Loan Bank | |
2.129% due 01/02/2019 (b)(c) | | | | | 16,300 | | | | | | 16,300 | |
|
Texas State Revenue Notes, Series 2018 | |
4.000% due 08/29/2019 | | | | | 3,500 | | | | | | 3,551 | |
| | | | | | | | | | | | |
| | | | | | | | | | | 19,851 | |
| | | | | | | | | | | | |
Total Short-Term Instruments
(Cost $19,851) | | | 19,851 | |
| | | | |
| | | | |
| | | | | | | | | | | | |
| Total Investments in Securities (Cost $309,065) | | | 314,037 | |
| | | | |
| | | | | | | | | | | | |
Total Investments 99.9%
(Cost $309,065) | | | $ | | | 314,037 | |
| |
| Other Assets and Liabilities, net 0.1% | | | 388 | |
| | | | |
| Net Assets 100.0% | | | $ | | | 314,425 | |
| | | | | | | |
NOTES TO SCHEDULE OF INVESTMENTS:
| * | A zero balance may reflect actual amounts rounding to less than one thousand. |
| ~ | Variable or Floating rate security. Rate shown is the rate in effect as of period end. Certain variable rate securities are not based on a published reference rate and spread, rather are determined by the issuer or agent and are based on current market conditions. Reference rate is as of reset date, which may vary by security. These securities may not indicate a reference rate and/or spread in their description. |
| (c) | Coupon represents a yield to maturity. |
| | | | | | |
| See Accompanying Notes | | SEMIANNUAL REPORT | | DECEMBER 31, 2018 | | 81 |
Schedule of InvestmentsPIMCO Intermediate Municipal Bond Active Exchange-Traded Fund(Cont.)
December 31, 2018 (Unaudited)
FAIR VALUE MEASUREMENTS
The following is a summary of the fair valuations according to the inputs used as of December 31, 2018 in valuing the Fund’s assets and liabilities:
| | | | | | | | | | | | | | | | |
| Category and Subcategory | | Level 1 | | | Level 2 | | | Level 3 | | | Fair
Value at
12/31/2018 | |
Investments in Securities, at Value | |
Municipal Bonds & Notes | |
Alabama | | $ | 0 | | | $ | 3,663 | | | $ | 0 | | | $ | 3,663 | |
Arizona | | | 0 | | | | 7,268 | | | | 0 | | | | 7,268 | |
California | | | 0 | | | | 10,626 | | | | 0 | | | | 10,626 | |
Colorado | | | 0 | | | | 4,755 | | | | 0 | | | | 4,755 | |
Connecticut | | | 0 | | | | 17,526 | | | | 0 | | | | 17,526 | |
District of Columbia | | | 0 | | | | 3,318 | | | | 0 | | | | 3,318 | |
Florida | | | 0 | | | | 19,693 | | | | 0 | | | | 19,693 | |
Georgia | | | 0 | | | | 6,745 | | | | 0 | | | | 6,745 | |
Guam | | | 0 | | | | 841 | | | | 0 | | | | 841 | |
Hawaii | | | 0 | | | | 2,305 | | | | 0 | | | | 2,305 | |
Illinois | | | 0 | | | | 25,323 | | | | 0 | | | | 25,323 | |
Indiana | | | 0 | | | | 3,312 | | | | 0 | | | | 3,312 | |
Kentucky | | | 0 | | | | 3,784 | | | | 0 | | | | 3,784 | |
Louisiana | | | 0 | | | | 7,152 | | | | 0 | | | | 7,152 | |
Maine | | | 0 | | | | 1,304 | | | | 0 | | | | 1,304 | |
Maryland | | | 0 | | | | 2,048 | | | | 0 | | | | 2,048 | |
Massachusetts | | | 0 | | | | 5,013 | | | | 0 | | | | 5,013 | |
Michigan | | | 0 | | | | 2,330 | | | | 0 | | | | 2,330 | |
Minnesota | | | 0 | | | | 1,175 | | | | 0 | | | | 1,175 | |
Nebraska | | | 0 | | | | 2,172 | | | | 0 | | | | 2,172 | |
Nevada | | | 0 | | | | 1,700 | | | | 0 | | | | 1,700 | |
| | | | | | | | | | | | | | | | |
| Category and Subcategory | | Level 1 | | | Level 2 | | | Level 3 | | | Fair
Value at
12/31/2018 | |
New Hampshire | | $ | 0 | | | $ | 1,242 | | | $ | 0 | | | $ | 1,242 | |
New Jersey | | | 0 | | | | 14,881 | | | | 0 | | | | 14,881 | |
New Mexico | | | 0 | | | | 1,746 | | | | 0 | | | | 1,746 | |
New York | | | 0 | | | | 34,318 | | | | 0 | | | | 34,318 | |
North Carolina | | | 0 | | | | 6,622 | | | | 0 | | | | 6,622 | |
Ohio | | | 0 | | | | 8,124 | | | | 0 | | | | 8,124 | |
Oregon | | | 0 | | | | 2,343 | | | | 0 | | | | 2,343 | |
Pennsylvania | | | 0 | | | | 20,976 | | | | 0 | | | | 20,976 | |
Puerto Rico | | | 0 | | | | 1,187 | | | | 0 | | | | 1,187 | |
Rhode Island | | | 0 | | | | 7,894 | | | | 0 | | | | 7,894 | |
South Dakota | | | 0 | | | | 2,067 | | | | 0 | | | | 2,067 | |
Tennessee | | | 0 | | | | 6,222 | | | | 0 | | | | 6,222 | |
Texas | | | 0 | | | | 33,495 | | | | 0 | | | | 33,495 | |
Utah | | | 0 | | | | 2,500 | | | | 0 | | | | 2,500 | |
Washington | | | 0 | | | | 13,214 | | | | 0 | | | | 13,214 | |
West Virginia | | | 0 | | | | 3,005 | | | | 0 | | | | 3,005 | |
Wisconsin | | | 0 | | | | 2,297 | | | | 0 | | | | 2,297 | |
Short-Term Instruments | |
Short-Term Notes | | | 0 | | | | 19,851 | | | | 0 | | | | 19,851 | |
| | | | | | | | | | | | | | | | |
| | | | |
Total Investments | | $ | 0 | | | $ | 314,037 | | | $ | 0 | | | $ | 314,037 | |
| | | | | | | | | | | | | | | | |
There were no significant transfers into or out of Level 3 during the period ended December 31, 2018.
| | | | | | | | |
| 82 | | PIMCO ETF TRUST | | | | | See Accompanying Notes | |
Schedule of InvestmentsPIMCO Short Term Municipal Bond Active Exchange-Traded Fund
December 31, 2018 (Unaudited)
(Amounts in thousands*, except number of shares, contracts and units, if any)
| | | | | | | | | | | | |
| | | | | PRINCIPAL
AMOUNT
(000S) | | | | | MARKET
VALUE
(000S) | |
| INVESTMENTS IN SECURITIES 100.2% | |
| |
| MUNICIPAL BONDS & NOTES 92.6% | |
| |
| ALABAMA 2.6% | |
|
Black Belt Energy Gas District, Alabama Revenue Bonds, Series 2018 | |
4.000% due 12/01/2048 | | $ | | | 1,000 | | | $ | | | 1,045 | |
|
Southeast Alabama Gas Supply District Revenue Bonds, Series 2018 | |
4.000% due 06/01/2049 | | | | | 1,000 | | | | | | 1,046 | |
| | | | | | | | | | | | |
| | | | | | | | | | | 2,091 | |
| | | | | | | | | | | | |
| |
| ARIZONA 3.0% | |
|
Chandler Industrial Development Authority, Arizona Revenue Bonds, Series 2005 | |
2.400% due 12/01/2035 | | | | | 1,000 | | | | | | 1,009 | |
|
Industrial Development Authority of the City of Phoenix, Arizona Revenue Notes, Series 2018 | |
5.000% due 07/01/2024 | | | | | 200 | | | | | | 220 | |
|
Industrial Development Authority of the County, Arizona of Yavapai Revenue Bonds, Series 2010 | |
2.100% due 04/01/2029 | | | | | 750 | | | | | | 750 | |
|
Maricopa County, Arizona Special Health Care District General Obligation Notes, Series 2018 | |
5.000% due 07/01/2024 | | | | | 350 | | | | | | 400 | |
| | | | | | | | | | | | |
| | | | | | | | | | | 2,379 | |
| | | | | | | | | | | | |
| |
| CALIFORNIA 2.2% | |
|
Bay Area Toll Authority, California Revenue Bonds, Series 2007 | |
2.410% (MUNIPSA + 0.700%) due 04/01/2047 ~ | | | | | 1,000 | | | | | | 1,001 | |
|
Southern California Public Power Authority Revenue Bonds, Series 2018 | |
1.960% (MUNIPSA + 0.250%) due 07/01/2040 ~ | | | | | 750 | | | | | | 747 | |
| | | | | | | | | | | | |
| | | | | | | | | | | 1,748 | |
| | | | | | | | | | | | |
| |
| COLORADO 2.3% | |
|
Denver, Colorado Airport System City & County Revenue Bonds, Series 2016 | |
2.504% (0.7*US0001M + 0.860%) due 11/15/2031 ~ | | | | | 855 | | | | | | 856 | |
|
E-470 Public Highway Authority, Colorado Revenue Bonds, Series 2017 | |
2.579% (0.67*US0001M + 0.900%) due 09/01/2039 ~ | | | | | 1,000 | | | | | | 1,001 | |
| | | | | | | | | | | | |
| | | | | | | | | | | 1,857 | |
| | | | | | | | | | | | |
| |
| CONNECTICUT 4.9% | |
|
Bridgeport, Connecticut General Obligation Notes, Series 2017 | |
5.000% due 11/01/2021 | | | | | 650 | | | | | | 706 | |
5.000% due 08/15/2023 | | | | | 500 | | | | | | 550 | |
|
Connecticut Special Tax State Revenue Notes, Series 2018 | |
5.000% due 10/01/2025 | | | | | 1,000 | | | | | | 1,145 | |
|
Connecticut State Health & Educational Facility Authority Revenue Bonds, Series 2015 | |
2.547% (0.68*US0001M + 0.950%) due 07/01/2049 ~ | | | | | 1,000 | | | | | | 1,003 | |
|
Metropolitan District, Connecticut General Obligation Notes, Series 2018 | |
5.000% due 07/15/2023 | | | | | 500 | | | | | | 559 | |
| | | | | | | | | | | | |
| | | | | | | | | | | 3,963 | |
| | | | | | | | | | | | |
| |
| DISTRICT OF COLUMBIA 0.7% | |
|
District of Columbia Revenue Notes, Series 2016 | |
5.000% due 04/01/2022 | | | | | 500 | | | | | | 544 | |
| | | | | | | | | | | | |
| | | | | | | | | | | | |
| | | | | PRINCIPAL
AMOUNT
(000S) | | | | | MARKET
VALUE
(000S) | |
| FLORIDA 5.0% | |
|
Central Florida Expressway Authority Revenue Notes, Series 2018 | |
5.000% due 07/01/2023 | | $ | | | 700 | | | $ | | | 790 | |
|
Florida State General Obligation Notes, Series 2015 | |
5.000% due 06/01/2022 | | | | | 750 | | | | | | 827 | |
|
Jacksonville, Florida Revenue Notes, Series 2012 | |
5.000% due 10/01/2021 | | | | | 915 | | | | | | 984 | |
|
Miami-Dade County, Florida Water & Sewer System Revenue Notes, Series 2015 | |
5.000% due 10/01/2024 | | | | | 710 | | | | | | 820 | |
|
Miami-Dade Seaport Department, Florida Revenue Notes, Series 2013 | |
5.000% due 10/01/2023 | | | | | 550 | | | | | | 610 | |
| | | | | | | | | | | | |
| | | | | | | | | | | 4,031 | |
| | | | | | | | | | | | |
| |
| GEORGIA 5.0% | |
|
Burke County, Georgia Development Authority Revenue Bonds, Series 1994 | |
2.200% due 10/01/2032 | | | | | 1,000 | | | | | | 1,000 | |
|
Burke County, Georgia Development Authority Revenue Bonds, Series 2017 | |
3.000% due 11/01/2045 | | | | | 1,000 | | | | | | 993 | |
|
Monroe County, Georgia Development Authority Revenue Bonds, Series 2002 | |
2.000% due 09/01/2037 | | | | | 1,000 | | | | | | 994 | |
|
Municipal Gas Authority of Georgia Revenue Notes, Series 2016 | |
5.000% due 10/01/2019 | | | | | 1,000 | | | | | | 1,023 | |
| | | | | | | | | | | | |
| | | | | | | | | | | 4,010 | |
| | | | | | | | | | | | |
| |
| HAWAII 1.2% | |
|
Honolulu, Hawaii City & County General Obligation Notes, Series 2017 | |
2.030% (MUNIPSA + 0.320%) due 09/01/2025 ~ | | | | | 1,000 | | | | | | 1,000 | |
| | | | | | | | | | | | |
| |
| ILLINOIS 4.9% | |
|
Chicago, Illinois General Obligation Bonds, Series 2012 | |
5.000% due 01/01/2023 | | | | | 1,000 | | | | | | 1,037 | |
|
Illinois Finance Authority Revenue Notes, Series 2015 | |
5.000% due 11/15/2020 | | | | | 540 | | | | | | 569 | |
|
Illinois State General Obligation Notes, Series 2016 | |
5.000% due 06/01/2022 | | | | | 750 | | | | | | 788 | |
|
Railsplitter Tobacco Settlement Authority, Illinois Revenue Notes, Series 2010 | |
5.250% due 06/01/2020 | | | | | 1,115 | | | | | | 1,161 | |
|
Railsplitter Tobacco Settlement Authority, Illinois Revenue Notes, Series 2017 | |
5.000% due 06/01/2023 | | | | | 350 | | | | | | 386 | |
| | | | | | | | | | | | |
| | | | | | | | | | | 3,941 | |
| | | | | | | | | | | | |
| |
| INDIANA 1.0% | |
|
Whiting, Indiana Revenue Bonds, Series 2009 | |
5.250% due 01/01/2021 | | | | | 750 | | | | | | 794 | |
| | | | | | | | | | | | |
| |
| KENTUCKY 2.0% | |
|
Kentucky Public Energy Authority Revenue Bonds, Series 2018 | |
4.000% due 01/01/2049 | | | | | 500 | | | | | | 529 | |
|
Louisville & Jefferson County, Kentucky Metropolitan Sewer District Revenue Notes, Series 2016 | |
5.000% due 05/15/2021 | | | | | 1,000 | | | | | | 1,073 | |
| | | | | | | | | | | | |
| | | | | | | | | | | 1,602 | |
| | | | | | | | | | | | |
| |
| MASSACHUSETTS 2.0% | |
|
Massachusetts Development Finance Agency Revenue Bonds, Series 2017 | |
2.210% (MUNIPSA + 0.500%) due 07/01/2038 ~ | | | | | 1,000 | | | | | | 998 | |
| | | | | | | | | | | | |
| | | | | PRINCIPAL
AMOUNT
(000S) | | | | | MARKET
VALUE
(000S) | |
|
Massachusetts Development Finance Agency Revenue Notes, Series 2018 | |
5.000% due 07/01/2021 | | $ | | | 575 | | | $ | | | 612 | |
| | | | | | | | | | | | |
| | | | | | | | | | | 1,610 | |
| | | | | | | | | | | | |
| |
| MICHIGAN 4.3% | |
|
Michigan Finance Authority Revenue Notes, Series 2010 | |
5.000% due 12/01/2020 | | | | | 780 | | | | | | 826 | |
|
Michigan State Hospital Finance Authority Revenue Bonds, Series 2010 | |
4.000% due 11/15/2047 | | | | | 1,500 | | | | | | 1,617 | |
|
University of Michigan Revenue Bonds, Series 2012 | |
1.960% (MUNIPSA + 0.270%) due 04/01/2033 ~ | | | | | 1,000 | | | | | | 998 | |
| | | | | | | | | | | | |
| | | | | | | | | | | 3,441 | |
| | | | | | | | | | | | |
| |
| MINNESOTA 1.3% | |
|
Minneapolis-St. Paul Metropolitan Airports Commission, Minnesota Revenue Notes, Series 2016 | |
4.000% due 01/01/2021 | | | | | 250 | | | | | | 261 | |
|
Northern Municipal Power Agency, Minnesota Revenue Notes, Series 2010 | |
5.000% due 01/01/2019 | | | | | 750 | | | | | | 750 | |
| | | | | | | | | | | | |
| | | | | | | | | | | 1,011 | |
| | | | | | | | | | | | |
| |
| MISSISSIPPI 1.4% | |
|
Mississippi Hospital Equipment & Facilities Authority Revenue Bonds, Series 2004 | |
2.125% due 09/01/2022 | | | | | 350 | | | | | | 350 | |
|
Warren County, Mississippi Revenue Bonds, Series 2018 | |
2.900% due 09/01/2032 | | | | | 750 | | | | | | 753 | |
| | | | | | | | | | | | |
| | | | | | | | | | | 1,103 | |
| | | | | | | | | | | | |
| |
| MONTANA 1.2% | |
|
Montana Facility Finance Authority Revenue Bonds, Series 2018 | |
2.260% (MUNIPSA + 0.550%) due 08/15/2037 ~ | | | | | 1,000 | | | | | | 995 | |
| | | | | | | | | | | | |
| |
| NEBRASKA 1.1% | |
|
Public Power Generation Agency, Nebraska Revenue Notes, Series 2015 | |
5.000% due 01/01/2021 | | | | | 840 | | | | | | 887 | |
| | | | | | | | | | | | |
| |
| NEW HAMPSHIRE 1.2% | |
|
New Hampshire Health and Education Facilities Authority Act Revenue Bonds, Series 2005 | |
1.720% due 07/01/2033 | | | | | 1,000 | | | | | | 1,000 | |
| | | | | | | | | | | | |
| |
| NEW JERSEY 3.5% | |
|
New Jersey Economic Development Authority Revenue Notes, Series 2016 | |
5.000% due 06/15/2020 | | | | | 500 | | | | | | 519 | |
|
New Jersey Turnpike Authority Revenue Notes, Series 2012 | |
5.000% due 01/01/2020 | | | | | 1,070 | | | | | | 1,103 | |
|
South Jersey Port Corp., New Jersey Revenue Notes, Series 2016 | |
5.000% due 01/01/2020 | | | | | 350 | | | | | | 358 | |
|
Tobacco Settlement Financing Corp., New Jersey Revenue Notes, Series 2018 | |
5.000% due 06/01/2022 | | | | | 750 | | | | | | 810 | |
| | | | | | | | | | | | |
| | | | | | | | | | | 2,790 | |
| | | | | | | | | | | | |
| |
| NEW YORK 7.9% | |
|
Brooklyn Arena Local Development Corp., New York Revenue Notes, Series 2016 | |
5.000% due 07/15/2020 | | | | | 500 | | | | | | 521 | |
5.000% due 07/15/2021 | | | | | 585 | | | | | | 624 | |
| | | | | | |
| See Accompanying Notes | | SEMIANNUAL REPORT | | DECEMBER 31, 2018 | | 83 |
Schedule of InvestmentsPIMCO Short Term Municipal Bond Active Exchange-Traded Fund(Cont.)
| | | | | | | | | | | | |
| | | | | PRINCIPAL
AMOUNT
(000S) | | | | | MARKET
VALUE
(000S) | |
|
Nassau County, New York General Obligation Notes, Series 2010 | |
5.000% due 10/01/2020 | | $ | | | 500 | | | $ | | | 526 | |
|
New York City, New York Housing Development Corp. Revenue Bonds, Series 2018 | |
1.500% due 11/01/2048 | | | | | 665 | | | | | | 665 | |
2.750% due 05/01/2050 | | | | | 750 | | | | | | 752 | |
|
New York State Energy Research & Development Authority Revenue Bonds, Series 2004 | |
2.625% due 04/01/2034 | | | | | 1,000 | | | | | | 996 | |
|
New York State Thruway Authority Revenue Notes, Series 2013 | |
5.000% due 05/01/2019 | | | | | 1,365 | | | | | | 1,380 | |
|
TSASC, Inc., New York Revenue Notes, Series 2017 | |
5.000% due 06/01/2021 | | | | | 500 | | | | | | 531 | |
|
Yates County, New York General Obligation Notes, (AGM Insured), Series 2010 | |
4.000% due 12/01/2019 | | | | | 295 | | | | | | 301 | |
| | | | | | | | | | | | |
| | | | | | | | | | | 6,296 | |
| | | | | | | | | | | | |
| |
| NORTH CAROLINA 2.5% | |
|
Charlotte-Mecklenburg Hospital Authority, North Carolina Revenue Bonds, (AGM Insured), Series 2007 | |
1.760% due 01/15/2044 | | | | | 1,000 | | | | | | 1,000 | |
|
University of North Carolina at Chapel Hill Revenue Bonds, Series 2012 | |
1.974% (0.67*US0001M + 0.400%) due 12/01/2041 ~ | | | | | 1,000 | | | | | | 997 | |
| | | | | | | | | | | | |
| | | | | | | | | | | 1,997 | |
| | | | | | | | | | | | |
| |
| OHIO 3.2% | |
|
American Municipal Power, Inc., Ohio Revenue Bonds, Series 2018 | |
2.250% due 02/15/2048 | | | | | 500 | | | | | | 500 | |
|
Butler County, Ohio Revenue Notes, Series 2017 | |
4.000% due 11/15/2023 | | | | | 500 | | | | | | 539 | |
|
Ohio Water Development Authority Water Pollution Control Loan Fund Revenue Bonds, Series 2016 | |
1.680% due 12/01/2036 | | | | | 1,000 | | | | | | 1,000 | |
|
University of Cincinnati, Ohio Revenue Notes, Series 2018 | |
2.019% (0.67*US0001M + 0.340%) due 06/01/2020 ~ | | | | | 500 | | | | | | 500 | |
| | | | | | | | | | | | |
| | | | | | | | | | | 2,539 | |
| | | | | | | | | | | | |
| |
| PENNSYLVANIA 9.8% | |
|
Bethlehem Area School District, Pennsylvania Revenue Bonds, Series 2017 | |
2.244% (0.7*US0001M + 0.490%) due 01/01/2030 ~ | | | | | 750 | | | | | | 749 | |
|
Commonwealth Financing Authority, Pennsylvania Revenue Notes, Series 2018 | |
5.000% due 06/01/2020 | | | | | 500 | | | | | | 520 | |
|
Luzerne County, Pennsylvania General Obligation Notes, (AGM Insured), Series 2017 | |
5.000% due 12/15/2022 | | | | | 500 | | | | | | 550 | |
|
Montgomery County Industrial Development Authority, Pennsylvania Revenue Bonds, Series 2002 | |
2.550% due 12/01/2029 | | | | | 1,000 | | | | | | 997 | |
|
Montgomery County, Pennsylvania Higher Education & Health Authority Revenue Bonds, Series 2018 | |
2.430% (MUNIPSA + 0.720%) due 09/01/2051 ~ | | | | | 500 | | | | | | 500 | |
|
Northampton County, Pennsylvania General Purpose Authority Revenue Bonds, Series 2018 | |
2.684% (0.7*US0001M + 1.040%) due 08/15/2048 ~ | | | | | 750 | | | | | | 751 | |
| | | | | | | | | | | | |
| | | | | PRINCIPAL
AMOUNT
(000S) | | | | | MARKET
VALUE
(000S) | |
|
Pennsylvania Economic Development Financing Authority Revenue Bonds, Series 2009 | |
2.800% due 12/01/2033 | | $ | | | 1,000 | | | $ | | | 1,003 | |
|
Pennsylvania Turnpike Commission Revenue Notes, Series 2018 | |
2.310% (MUNIPSA + 0.600%) due 12/01/2023 ~ | | | | | 1,000 | | | | | | 996 | |
|
Philadelphia Gas Works, Co., Pennsylvania Revenue Notes, Series 2015 | |
5.000% due 08/01/2020 | | | | | 500 | | | | | | 523 | |
|
Southeastern Pennsylvania Transportation Authority Revenue Notes, Series 2010 | |
5.000% due 03/01/2020 | | | | | 1,215 | | | | | | 1,258 | |
| | | | | | | | | | | | |
| | | | | | | | | | | 7,847 | |
| | | | | | | | | | | | |
| |
| TENNESSEE 0.8% | |
|
Greeneville Health & Educational Facilities Board, Tennessee Revenue Notes, Series 2018 | |
5.000% due 07/01/2023 | | | | | 600 | | | | | | 666 | |
| | | | | | | | | | | | |
| |
| TEXAS 7.6% | |
|
Harris County, Texas Cultural Education Facilities Finance Corp. Revenue Bonds, Series 2008 | |
1.720% due 12/01/2027 | | | | | 1,000 | | | | | | 1,000 | |
|
Houston Independent School District, Texas General Obligation Bonds, (PSF Insured), Series 2012 | |
2.400% due 06/01/2030 | | | | | 1,000 | | | | | | 1,006 | |
|
North Texas Tollway Authority Revenue Notes, Series 2014 | |
5.000% due 01/01/2022 | | | | | 720 | | | | | | 781 | |
|
North Texas Tollway Authority Revenue Notes, Series 2016 | |
5.000% due 01/01/2021 | | | | | 385 | | | | | | 408 | |
|
Northside Independent School District, Texas General Obligation Bonds, (PSF Insured), Series 2018 | |
2.750% due 08/01/2048 | | | | | 750 | | | | | | 766 | |
|
San Antonio, Texas Electric & Gas Systems Revenue Bonds, Series 2018 | |
2.750% due 02/01/2048 | | | | | 500 | | | | | | 507 | |
|
Texas Municipal Gas Acquisition & Supply Corp. Revenue Bonds, Series 2006 | |
5.250% due 12/15/2019 | | | | | 1,000 | | | | | | 1,031 | |
|
Texas Water Development Board Revenue Notes, Series 2018 | |
5.000% due 10/15/2024 | | | | | 500 | | | | | | 580 | |
| | | | | | | | | | | | |
| | | | | | | | | | | 6,079 | |
| | | | | | | | | | | | |
| |
| UTAH 0.7% | |
|
Utah County, Utah Revenue Bonds, Series 2018 | |
5.000% due 05/15/2057 | | | | | 500 | | | | | | 561 | |
| | | | | | | | | | | | |
| |
| VIRGINIA 1.2% | |
|
Louisa Industrial Development Authority, Virginia Revenue Bonds, Series 2008 | |
2.150% due 11/01/2035 | | | | | 1,000 | | | | | | 998 | |
| | | | | | | | | | | | |
| |
| WASHINGTON 6.0% | |
|
Central Puget Sound Regional Transit Authority, Washington Revenue Bonds, Series 2015 | |
2.160% (MUNIPSA + 0.450%) due 11/01/2045 ~ | | | | | 750 | | | | | | 750 | |
| | | | | | | | | | | | |
| | | | | PRINCIPAL
AMOUNT
(000S) | | | | | MARKET
VALUE
(000S) | |
|
King County, Washington Sewer Revenue Bonds, Series 2012 | |
2.600% due 01/01/2043 | | $ | | | 750 | | | $ | | | 755 | |
|
Port of Seattle, Washington Revenue Notes, Series 2015 | |
5.000% due 03/01/2023 | | | | | 1,000 | | | | | | 1,116 | |
|
Port of Tacoma, Washington General Obligation Notes, Series 2016 | |
4.000% due 12/01/2022 | | | | | 440 | | | | | | 473 | |
|
Seattle, Washington Municipal Light & Power Revenue Bonds, Series 2018 | |
2.200% (MUNIPSA + 0.490%) due 11/01/2046 ~ | | | | | 675 | | | | | | 674 | |
|
Washington Health Care Facilities Authority Revenue Bonds, Series 2017 | |
2.760% (MUNIPSA + 1.050%) due 01/01/2042 ~ | | | | | 1,000 | | | | | | 1,018 | |
| | | | | | | | | | | | |
| | | | | | | | | | | 4,786 | |
| | | | | | | | | | | | |
| |
| WEST VIRGINIA 1.2% | |
|
West Virginia Economic Development Authority Revenue Bonds, Series 2009 | |
2.625% due 12/01/2042 | | | | | 1,000 | | | | | | 993 | |
| | | | | | | | | | | | |
| |
| WISCONSIN 0.9% | |
|
Wisconsin Health & Educational Facilities Authority Revenue Notes, Series 2018 | |
5.000% due 04/01/2022 | | | | | 650 | | | | | | 713 | |
| | | | | | | | | | | | |
Total Municipal Bonds & Notes (Cost $74,087) | | | 74,272 | |
| | | | |
| |
| SHORT-TERM INSTRUMENTS 7.6% | |
| |
| COMMERCIAL PAPER 2.5% | |
|
JEA Electric System Revenue | |
2.100% due 01/03/2019 | | | | | 1,000 | | | | | | 1,000 | |
|
Private Colleges & Universities Authority | |
1.830% due 02/07/2019 | | | | | 1,000 | | | | | | 1,000 | |
| | | | | | | | | | | | |
| | | | | | | | | | | 2,000 | |
| | | | | | | | | | | | |
| |
| SHORT-TERM NOTES 5.1% | |
|
Commonwealth of Massachusetts General Obligation Notes, Series 2018 | |
4.000% due 06/20/2019 | | | | | 1,000 | | | | | | 1,010 | |
|
County of Nassau NY | |
4.000% due 12/10/2019 (a) | | | | | 1,000 | | | | | | 1,019 | |
|
County of Suffolk NY | |
5.000% due 07/24/2019 | | | | | 1,000 | | | | | | 1,015 | |
|
St Louis, Missouri Revenue Notes, Series 2018 | |
3.000% due 05/30/2019 | | | | | 1,000 | | | | | | 1,004 | |
| | | | | | | | | | | | |
| | | | | | | | | | | 4,048 | |
| | | | | | | | | | | | |
Total Short-Term Instruments
(Cost $6,049) | | | 6,048 | |
| | | | |
| | | | |
| | | | | | | | | | | | |
Total Investments in Securities
(Cost $80,136) | | | 80,320 | |
| | | | |
| | | | | | | | | | | | |
Total Investments 100.2%
(Cost $80,136) | | | $ | | | 80,320 | |
| |
| Other Assets and Liabilities, net (0.2)% | | | (147 | ) |
| | | | |
| Net Assets 100.0% | | | $ | | | 80,173 | |
| | | | | | | |
NOTES TO SCHEDULE OF INVESTMENTS:
| * | A zero balance may reflect actual amounts rounding to less than one thousand. |
| ~ | Variable or Floating rate security. Rate shown is the rate in effect as of period end. Certain variable rate securities are not based on a published reference rate and spread, rather are determined by the issuer or agent and are based on current market conditions. Reference rate is as of reset date, which may vary by security. These securities may not indicate a reference rate and/or spread in their description. |
| | | | | | | | |
| 84 | | PIMCO ETF TRUST | | | | | See Accompanying Notes | |
December 31, 2018 (Unaudited)
FAIR VALUE MEASUREMENTS
The following is a summary of the fair valuations according to the inputs used as of December 31, 2018 in valuing the Fund’s assets and liabilities:
| | | | | | | | | | | | | | | | |
| Category and Subcategory | | Level 1 | | | Level 2 | | | Level 3 | | | Fair
Value at
12/31/2018 | |
Investments in Securities, at Value | |
Municipal Bonds & Notes | |
Alabama | | $ | 0 | | | $ | 2,091 | | | $ | 0 | | | $ | 2,091 | |
Arizona | | | 0 | | | | 2,379 | | | | 0 | | | | 2,379 | |
California | | | 0 | | | | 1,748 | | | | 0 | | | | 1,748 | |
Colorado | | | 0 | | | | 1,857 | | | | 0 | | | | 1,857 | |
Connecticut | | | 0 | | | | 3,963 | | | | 0 | | | | 3,963 | |
District of Columbia | | | 0 | | | | 544 | | | | 0 | | | | 544 | |
Florida | | | 0 | | | | 4,031 | | | | 0 | | | | 4,031 | |
Georgia | | | 0 | | | | 4,010 | | | | 0 | | | | 4,010 | |
Hawaii | | | 0 | | | | 1,000 | | | | 0 | | | | 1,000 | |
Illinois | | | 0 | | | | 3,941 | | | | 0 | | | | 3,941 | |
Indiana | | | 0 | | | | 794 | | | | 0 | | | | 794 | |
Kentucky | | | 0 | | | | 1,602 | | | | 0 | | | | 1,602 | |
Massachusetts | | | 0 | | | | 1,610 | | | | 0 | | | | 1,610 | |
Michigan | | | 0 | | | | 3,441 | | | | 0 | | | | 3,441 | |
Minnesota | | | 0 | | | | 1,011 | | | | 0 | | | | 1,011 | |
Mississippi | | | 0 | | | | 1,103 | | | | 0 | | | | 1,103 | |
Montana | | | 0 | | | | 995 | | | | 0 | | | | 995 | |
Nebraska | | | 0 | | | | 887 | | | | 0 | | | | 887 | |
| | | | | | | | | | | | | | | | |
| Category and Subcategory | | Level 1 | | | Level 2 | | | Level 3 | | | Fair
Value at
12/31/2018 | |
New Hampshire | | $ | 0 | | | $ | 1,000 | | | $ | 0 | | | $ | 1,000 | |
New Jersey | | | 0 | | | | 2,790 | | | | 0 | | | | 2,790 | |
New York | | | 0 | | | | 6,296 | | | | 0 | | | | 6,296 | |
North Carolina | | | 0 | | | | 1,997 | | | | 0 | | | | 1,997 | |
Ohio | | | 0 | | | | 2,539 | | | | 0 | | | | 2,539 | |
Pennsylvania | | | 0 | | | | 7,847 | | | | 0 | | | | 7,847 | |
Tennessee | | | 0 | | | | 666 | | | | 0 | | | | 666 | |
Texas | | | 0 | | | | 6,079 | | | | 0 | | | | 6,079 | |
Utah | | | 0 | | | | 561 | | | | 0 | | | | 561 | |
Virginia | | | 0 | | | | 998 | | | | 0 | | | | 998 | |
Washington | | | 0 | | | | 4,786 | | | | 0 | | | | 4,786 | |
West Virginia | | | 0 | | | | 993 | | | | 0 | | | | 993 | |
Wisconsin | | | 0 | | | | 713 | | | | 0 | | | | 713 | |
Short-Term Instruments | |
Commercial Paper | | | 0 | | | | 2,000 | | | | 0 | | | | 2,000 | |
Short-Term Notes | | | 0 | | | | 4,048 | | | | 0 | | | | 4,048 | |
| | | | | | | | | | | | | | | | |
| | | | |
Total Investments | | $ | 0 | | | $ | 80,320 | | | $ | 0 | | | $ | 80,320 | |
| | | | | | | | | | | | | | | | |
There were no significant transfers into or out of Level 3 during the period ended December 31, 2018.
| | | | | | |
| See Accompanying Notes | | SEMIANNUAL REPORT | | DECEMBER 31, 2018 | | 85 |
Notes to Financial Statements
1. ORGANIZATION
PIMCO ETF Trust (the “Trust”) was established as a Delaware statutory trust on November 14, 2008. The Trust is registered under the Investment Company Act of 1940, as amended (the “Act”), as anopen-end management investment company. Information presented in these financial statements pertains to the funds (each a “Fund” and collectively the “Funds”) offered by the Trust. Pacific Investment Management Company LLC (“PIMCO” or “Manager”) serves as the investment adviser for the Funds.
Each Fund is an exchange-traded fund (“ETF”). ETFs are funds that trade like other publicly-traded securities and may be designed to track an index or to be actively managed. Unlike shares of a mutual fund, which can be bought from and redeemed by the issuing fund by all shareholders at a price based on net asset value (“NAV”), shares of a Fund may be directly purchased from and redeemed by a Fund at NAV solely by certain large institutional investors. Also unlike shares of a mutual fund, shares of each Fund are listed on a national securities exchange and trade in the secondary market at market prices that change throughout the day. Each Fund offers and issues shares only in aggregations of a specified number of shares (“Creation Units”).
2. SIGNIFICANT ACCOUNTING POLICIES
The following is a summary of significant accounting policies consistently followed by the Trust in the preparation of its financial statements in conformity with accounting principles generally accepted in the United States of America (“U.S. GAAP”). Each Fund is treated as an investment company under the reporting requirements of U.S. GAAP. The functional and reporting currency for the Funds is the U.S. dollar. The preparation of financial statements in accordance with U.S. GAAP requires management to make estimates and assumptions that affect the reported amounts of assets and liabilities and disclosure of contingent assets and liabilities at the date of the financial statements and the reported amounts of increases and decreases in net assets from operations during the reporting period. Actual results could differ from those estimates.
(a) Securities Transactions and Investment Income Securities transactions are recorded as of the trade date for financial reporting purposes. Securities purchased or sold on a when-issued or delayed-delivery basis may be settled beyond a standard settlement period for the security after the trade date. Realized gains (losses) from securities sold are recorded on the identified cost basis. Dividend income is recorded on theex-dividend date, except certain dividends from foreign securities where theex-dividend date may have passed, which are recorded as soon as a Fund is informed of theex-dividend date. Interest income, adjusted for the accretion of discounts and amortization of premiums, is recorded on the accrual basis from
settlement date, with the exception of securities with a forward starting effective date, where interest income is recorded on the accrual basis from effective date. For convertible securities, premiums attributable to the conversion feature are not amortized. Estimated tax liabilities on certain foreign securities are recorded on an accrual basis and are reflected as components of interest income or net change in unrealized appreciation (depreciation) on investments on the Statements of Operations, as appropriate. Tax liabilities realized as a result of such security sales are reflected as a component of net realized gain (loss) on investments on the Statements of Operations. Paydown gains (losses) on mortgage-related and other asset-backed securities, if any, are recorded as components of interest income on the Statements of Operations. Income or short-term capital gain distributions received from registered investment companies, if any, are recorded as dividend income. Long-term capital gain distributions received from registered investment companies, if any, are recorded as realized gains.
Debt obligations may be placed onnon-accrual status and related interest income may be reduced by ceasing current accruals and writing off interest receivable when the collection of all or a portion of interest has become doubtful based on consistently applied procedures. A debt obligation is removed fromnon-accrual status when the issuer resumes interest payments or when collectability of interest is probable.
(b) Foreign Currency Translation The market values of foreign securities, currency holdings and other assets and liabilities denominated in foreign currencies are translated into U.S. dollars based on the current exchange rates each business day. Purchases and sales of securities and income and expense items denominated in foreign currencies, if any, are translated into U.S. dollars at the exchange rate in effect on the transaction date. The Funds do not separately report the effects of changes in foreign exchange rates from changes in market prices on securities held. Such changes are included in net realized gain (loss) and net change in unrealized appreciation (depreciation) from investments on the Statements of Operations. The Funds may invest in foreign currency-denominated securities and may engage in foreign currency transactions either on a spot (cash) basis at the rate prevailing in the currency exchange market at the time or through a forward foreign currency contract. Realized foreign exchange gains (losses) arising from sales of spot foreign currencies, currency gains (losses) realized between the trade and settlement dates on securities transactions and the difference between the recorded amounts of dividends, interest, and foreign withholding taxes and the U.S. dollar equivalent of the amounts actually received or paid are included in net realized gain (loss) on foreign currency transactions on the Statements of Operations. Net unrealized foreign exchange gains (losses) arising from changes in foreign exchange rates on foreign denominated assets and liabilities other than investments in securities
December 31, 2018 (Unaudited)
held at the end of the reporting period are included in net change in unrealized appreciation (depreciation) on foreign currency assets and liabilities on the Statements of Operations.
(c) Distributions to Shareholders The following table shows the anticipated frequency of distributions from net investment income, if any, for each Fund.
| | | | | | | | | | | | |
| | | | | | Distribution Frequency | |
| | | |
| Fund Name | | | | | Declared | | | Distributed | |
| | | |
PIMCO1-3 Year U.S. Treasury IndexExchange-Traded Fund | | | | | | | Monthly | | | | Monthly | |
| | | |
PIMCO1-5 Year U.S. TIPS IndexExchange-Traded Fund | | | | | | | Monthly | | | | Monthly | |
| | | |
PIMCO 15+ Year U.S. TIPS IndexExchange-Traded Fund | | | | | | | Monthly | | | | Monthly | |
| | | |
PIMCO Broad U.S. TIPS Index Exchange-Traded Fund | | | | | | | Monthly | | | | Monthly | |
| | | |
PIMCO0-5 Year High Yield Corporate Bond Index Exchange-Traded Fund | | | | | | | Monthly | | | | Monthly | |
| | | |
PIMCO Investment Grade Corporate Bond Index Exchange-Traded Fund | | | | | | | Monthly | | | | Monthly | |
| | | |
PIMCO Active Bond Exchange-Traded Fund | | | | | | | Monthly | | | | Monthly | |
| | | |
PIMCO Enhanced Low Duration ActiveExchange-Traded Fund | | | | | | | Monthly | | | | Monthly | |
| | | |
PIMCO Enhanced Short Maturity ActiveExchange-Traded Fund | | | | | | | Monthly | | | | Monthly | |
| | | |
PIMCO Intermediate Municipal Bond ActiveExchange-Traded Fund | | | | | | | Monthly | | | | Monthly | |
| | | |
PIMCO Short Term Municipal Bond ActiveExchange-Traded Fund | | | | | | | Monthly | | | | Monthly | |
| | | |
PIMCO 25+ Year Zero Coupon U.S. Treasury Index Exchange-Traded Fund | | | | | | | Quarterly | | | | Quarterly | |
Net realized capital gains earned by each Fund, if any, will be distributed no less frequently than once each year. The Trust does not provide an automatic dividend and/or distributions reinvestment service.
Income distributions and capital gain distributions are determined in accordance with income tax regulations which may differ from U.S. GAAP. Differences between tax regulations and U.S. GAAP may cause timing differences between income and capital gain recognition. Further, the character of investment income and capital gains may be different for certain transactions under the two methods of accounting. As a result, income distributions and capital gain distributions declared during a fiscal period may differ significantly from the net investment income (loss) and realized gains (losses) reported on each Fund’s annual financial statements presented under U.S. GAAP.
If a Fund estimates that a portion of its distribution may be comprised of amounts from sources other than net investment income in accordance with its policies and good accounting practices, the Fund will notify shareholders of the estimated composition of such distribution through a Section 19 Notice. For these purposes, a Fund estimates the source or sources from which a distribution is paid, to the close of the period as of which it is paid, in reference to its internal accounting records and related
accounting practices. If, based on such accounting records and practices, it is estimated that a particular distribution does not include capital gains orpaid-in surplus or other capital sources, a Section 19 Notice generally would not be issued. It is important to note that differences exist between a Fund’s daily internal accounting records and practices, a Fund’s financial statements presented in accordance with U.S. GAAP, and recordkeeping practices under income tax regulations. For instance, a Fund’s internal accounting records and practices may take into account, among other factors,tax-related characteristics of certain sources of distributions that differ from treatment under U.S. GAAP. Examples of such differences may include, among others, the treatment of paydowns on mortgage-backed securities purchased at a discount and periodic payments under interest rate swap contracts. Accordingly, among other consequences, it is possible that a Fund may not issue a Section 19 Notice in situations where the Fund’s financial statements prepared later and in accordance with U.S. GAAP and/or the final tax character of those distributions might later report that the sources of those distributions included capital gains and/or a return of capital. Please visit www.pimco.com for the most recent Section 19 Notice, if applicable, for additional information regarding the estimated composition of distributions. Final determination of a distribution’s tax character will be reported on Form 1099 DIV sent to shareholders for the calendar year.
Distributions classified as a tax basis return of capital, if any, are reflected on the Statements of Changes in Net Assets and have been recorded to paid in capital on the Statements of Assets and Liabilities. In addition, other amounts have been reclassified between distributable earnings (accumulated loss) and paid in capital on the Statements of Assets and Liabilities to more appropriately conform U.S. GAAP to tax characterizations of distributions.
(d) New Accounting Pronouncements In August 2016, the Financial Accounting Standards Board (“FASB”) issued an Accounting Standards Update (“ASU”), ASU2016-15, which amends Accounting Standards Codification (“ASC”) 230 to clarify guidance on the classification of certain cash receipts and cash payments in the Statement of Cash Flows. The ASU is effective for annual periods beginning after December 15, 2017, and interim periods within those annual periods. The Funds have adopted the ASU. The implementation of the ASU did not have an impact on the Funds’ financial statements.
In November 2016, the FASB issued ASU2016-18 which amends ASC 230 to provide guidance on the classification and presentation of changes in restricted cash and restricted cash equivalents on the Statement of Cash Flows. The ASU is effective for annual periods beginning after December 15, 2017, and interim periods within those annual periods. The Funds have adopted the ASU. The implementation of the ASU did not have an impact on the Funds’ financial statements.
| | | | | | |
| | SEMIANNUAL REPORT | | DECEMBER 31, 2018 | | 87 |
Notes to Financial Statements(Cont.)
In March 2017, the FASB issued ASU2017-08 which provides guidance related to the amortization period for certain purchased callable debt securities held at a premium. The ASU is effective for annual periods beginning after December 15, 2018, and interim periods within those annual periods. The Funds have adopted the ASU. The implementation of the ASU did not have an impact on the Funds’ financial statements.
In August 2018, the FASB issued ASU2018-13 which modifies certain disclosure requirements for fair value measurements in ASC 820. The
ASU is effective for annual periods beginning after December 15, 2019, and interim periods within those annual periods. At this time, management has elected to early adopt the amendments that allow for removal of certain disclosure requirements. Management plans to adopt the amendments that require additional fair value measurement disclosures for annual periods beginning after December 15, 2019, and interim periods within those annual periods. Management is currently evaluating the impact of these changes on the financial statements.
In August 2018, the U.S. Securities and Exchange Commission (“SEC”) adopted amendments to certain rules and forms for the purpose of disclosure update and simplification. The compliance date for these amendments is 30 days after date of publication in the Federal Register, which was on October 4, 2018. Management has adopted these amendments and the changes are incorporated throughout all periods presented in the financial statements. Prior distributions for the period ended June 30, 2018, before these amendments became effective, were presented as follows (amounts in thousands†):
| | | | | | | | | | | | | | | | | | | | | | | | | | | | | | | | | | | | | | | | | | | | | | | | | | | | |
| | | | | | PIMCO
1-3 Year
U.S. Treasury
Index
Exchange-
Traded
Fund | | | PIMCO 25+
Year Zero
Coupon
U.S. Treasury
Index
Exchange-
Traded Fund | | | PIMCO
1-5 Year
U.S. TIPS
Index
Exchange-
Traded
Fund | | | PIMCO
15+ Year
U.S. TIPS
Index
Exchange-
Traded
Fund | | | PIMCO
Broad
U.S. TIPS
Index
Exchange-
Traded
Fund | | | PIMCO
0-5 Year
High Yield
Corporate
Bond Index
Exchange-
Traded
Fund | | | PIMCO
Investment
Grade
Corporate
Bond
Exchange-
Traded
Fund | | | PIMCO
Active
Exchange-
Traded
Fund | | | PIMCO
Enhanced
Low
Duration
Active
Exchange-
Traded
Fund | | | PIMCO
Enhanced
Short
Maturity
Active
Exchange-
Traded
Fund | | | PIMCO
Intermediate
Municipal
Bond Active
Exchange-
Traded
Fund | | | PIMCO
Short Term
Municipal
Bond Active
Exchange-
Traded
Fund | |
| | | | | | | | | | | | | |
Distributions to Shareholders: | | | | | | | | | | | | | | | | | | | | | | | | | | | | | | | | | | | | | | | | | | | | | | | | | | | | |
| | | | | | | | | | | | | |
From net investment income | | | | | | $ | (1,134 | ) | | $ | (4,645 | ) | | $ | (17,826 | ) | | $ | (6,527 | ) | | $ | (1,240 | ) | | $ | (80,322 | ) | | $ | (26,637 | ) | | $ | (61,891 | ) | | $ | (3,376 | ) | | $ | (147,351 | ) | | $ | (6,575 | ) | | $ | (1,009 | ) |
| | | | | | | | | | | | | |
From net realized capital gains | | | | | | | 0 | | | | 0 | | | | 0 | | | | 0 | | | | 0 | | | | 0 | | | | (515 | ) | | | 0 | | | | 0 | | | | (2,043 | ) | | | 0 | | | | 0 | |
| | | | | | | | | | | | | |
Total Distributions from Net Investment Income and/or Net Realized Capital Gains | | | | | | $ | (1,134 | ) | | $ | (4,645 | ) | | $ | (17,826 | ) | | $ | (6,527 | ) | | $ | (1,240 | ) | | $ | (80,322 | ) | | $ | (27,152 | ) | | $ | (61,891 | ) | | $ | (3,376 | ) | | $ | (149,394 | ) | | $ | (6,575 | ) | | $ | (1,009 | ) |
| † | A zero balance may reflect actual amounts rounding to less than one thousand. |
3. INVESTMENT VALUATION AND FAIR VALUE MEASUREMENTS
(a) Investment Valuation Policies The NAV of the Fund’s shares is determined by dividing the total value of the Fund’s portfolio investments and other assets, less any liabilities attributable to that Fund, by the total number of shares outstanding.
On each day that the NYSE Arca is open, Fund shares are ordinarily valued as of the close of regular trading (“NYSE Close”). Information that becomes known to the Funds or their agents after the time as of which NAV has been calculated on a particular day will not generally be used to retroactively adjust the price of a security or the NAV determined earlier that day. Each Fund reserves the right to change the time as of which its respective NAV is calculated if the Fund closes earlier, or as permitted by the SEC.
For purposes of calculating a NAV, portfolio securities and other assets for which market quotes are readily available are valued at market
value. Market value is generally determined on the basis of official closing prices or the last reported sales prices, or if no sales are reported, based on quotes obtained from established market makers or prices (including evaluated prices) supplied by the Funds’ approved pricing services, quotation reporting systems and other third-party sources (together, “Pricing Services”). The Funds will normally use pricing data for domestic equity securities received shortly after the NYSE Close and do not normally take into account trading, clearances or settlements that take place after the NYSE Close. If market value pricing is used, a foreign(non-U.S.) equity security traded on a foreign exchange or on more than one exchange is typically valued using pricing information from the exchange considered by the Manager to be the primary exchange. A foreign(non-U.S.) equity security will be valued as of the close of trading on the foreign exchange, or the NYSE Close, if the NYSE Close occurs before the end of trading on the foreign exchange. Domestic and foreign(non-U.S.) fixed income securities,non-exchange traded derivatives, and equity options are normally valued on the basis of quotes obtained from brokers and dealers or
December 31, 2018 (Unaudited)
Pricing Services using data reflecting the earlier closing of the principal markets for those securities. Prices obtained from Pricing Services may be based on, among other things, information provided by market makers or estimates of market values obtained from yield data relating to investments or securities with similar characteristics. Certain fixed income securities purchased on a delayed-delivery basis are marked to market daily until settlement at the forward settlement date. Exchange-traded options, except equity options, futures and options on futures are valued at the settlement price determined by the relevant exchange. Swap agreements are valued on the basis of bid quotes obtained from brokers and dealers or market-based prices supplied by Pricing Services. A Fund’s investments inopen-end management investment companies, other than exchange-traded funds (“ETFs”), are valued at the NAVs of such investments.Open-end management investment companies may include affiliated funds.
If a foreign(non-U.S.) equity security’s value has materially changed after the close of the security’s primary exchange or principal market but before the NYSE Close, the security may be valued at fair value based on procedures established and approved by the Board of Trustees of the Trust (the “Board”). Foreign(non-U.S.) equity securities that do not trade when the NYSE is open are also valued at fair value. With respect to foreign(non-U.S.) equity securities, a Fund may determine the fair value of investments based on information provided by Pricing Services and other third-party vendors, which may recommend fair value or adjustments with reference to other securities, indices or assets. In considering whether fair valuation is required and in determining fair values, a Fund may, among other things, consider significant events (which may be considered to include changes in the value of U.S. securities or securities indices) that occur after the close of the relevant market and before the NYSE Close. A Fund may utilize modeling tools provided by third-party vendors to determine fair values of foreign(non-U.S.) securities. For these purposes, any movement in the applicable reference index or instrument (“zero trigger”) between the earlier close of the applicable foreign market and the NYSE Close may be deemed to be a significant event, prompting the application of the pricing model (effectively resulting in daily fair valuations). Foreign exchanges may permit trading in foreign(non-U.S.) equity securities on days when the Trust is not open for business, which may result in a Fund’s portfolio investments being affected when shareholders are unable to buy or sell shares.
Senior secured floating rate loans for which an active secondary market exists to a reliable degree will be valued at the mean of the last available bid/ask prices in the market for such loans, as provided by a Pricing Service. Senior secured floating rate loans for which an active secondary market does not exist to a reliable degree will be valued at fair value, which is intended to approximate market value. In valuing a senior secured floating rate loan at fair value, the factors considered may include, but are not limited to, the following: (a) the
creditworthiness of the borrower and any intermediate participants, (b) the terms of the loan, (c) recent prices in the market for similar loans, if any, and (d) recent prices in the market for instruments of similar quality, rate, period until next interest rate reset and maturity.
Investments valued in currencies other than the U.S. dollar are converted to the U.S. dollar using exchange rates obtained from Pricing Services. As a result, the value of such investments and, in turn, the NAV of a Fund’s shares may be affected by changes in the value of currencies in relation to the U.S. dollar. The value of investments traded in markets outside the United States or denominated in currencies other than the U.S. dollar may be affected significantly on a day that the Trust is not open for business. As a result, to the extent that a Fund holds foreign(non-U.S.) investments, the value of those investments may change at times when shareholders are unable to buy or sell shares and the value of such investments will be reflected in the Fund’s next calculated NAV.
Investments for which market quotes or market based valuations are not readily available are valued at fair value as determined in good faith by the Board or persons acting at their direction. The Board has adopted methods for valuing securities and other assets in circumstances where market quotes are not readily available, and has delegated to the Manager the responsibility for applying the fair valuation methods. In the event that market quotes or market based valuations are not readily available, and the security or asset cannot be valued pursuant to a Board approved valuation method, the value of the security or asset will be determined in good faith by the Board. Market quotes are considered not readily available in circumstances where there is an absence of current or reliable market-based data (e.g., trade information, bid/ask information, indicative market quotations (“Broker Quotes”), Pricing Services’ prices), including where events occur after the close of the relevant market, but prior to the NYSE Close, that materially affect the values of a Fund’s securities or assets. In addition, market quotes are considered not readily available when, due to extraordinary circumstances, the exchanges or markets on which the securities trade do not open for trading for the entire day and no other market prices are available. The Board has delegated, to the Manager, the responsibility for monitoring significant events that may materially affect the values of a Fund’s securities or assets and for determining whether the value of the applicable securities or assets should be reevaluated in light of such significant events.
When a Fund uses fair valuation to determine the value of a portfolio security or other asset for purposes of calculating its NAV, such investments will not be priced on the basis of quotes from the primary market in which they are traded, but rather may be priced by another method that the Board or persons acting at their direction believe reflects fair value. Fair valuation may require subjective determinations about the value of a security. While the Trust’s policy is intended to
| | | | | | |
| | SEMIANNUAL REPORT | | DECEMBER 31, 2018 | | 89 |
Notes to Financial Statements(Cont.)
result in a calculation of a Fund’s NAV that fairly reflects security values as of the time of pricing, the Trust cannot ensure that fair values determined by the Board or persons acting at their direction would accurately reflect the price that a Fund could obtain for a security if it were to dispose of that security as of the time of pricing (for instance, in a forced or distressed sale). The prices used by a Fund may differ from the value that would be realized if the securities were sold. The Funds’ use of fair valuation may also help to deter “stale price arbitrage” as discussed under the “Abusive Trading Practices” section in each Fund’s prospectus.
(b) Fair Value Hierarchy U.S. GAAP describes fair value as the price that a Fund would receive to sell an asset or pay to transfer a liability in an orderly transaction between market participants at the measurement date. It establishes a fair value hierarchy that prioritizes inputs to valuation methods and requires disclosure of the fair value hierarchy, separately for each major category of assets and liabilities, that segregates fair value measurements into levels (Level 1, 2, or 3). The inputs or methodology used for valuing securities are not necessarily an indication of the risks associated with investing in those securities. Levels 1, 2, and 3 of the fair value hierarchy are defined as follows:
| ∎ | | Level 1 — Quoted prices in active markets or exchanges for identical assets and liabilities. |
| ∎ | | Level 2 — Significant other observable inputs, which may include, but are not limited to, quoted prices for similar assets or liabilities in markets that are active, quoted prices for identical or similar assets or liabilities in markets that are not active, inputs other than quoted prices that are observable for the assets or liabilities (such as interest rates, yield curves, volatilities, prepayment speeds, loss severities, credit risks and default rates) or other market corroborated inputs. |
| ∎ | | Level 3 — Significant unobservable inputs based on the best information available in the circumstances, to the extent observable inputs are not available, which may include assumptions made by the Board or persons acting at their direction that are used in determining the fair value of investments. |
In accordance with the requirements of U.S. GAAP, the amounts of transfers into and out of Level 3, if material, are disclosed in the Notes to Schedule of Investments for each respective Fund.
For fair valuations using significant unobservable inputs, U.S. GAAP requires a reconciliation of the beginning to ending balances for reported fair values that presents changes attributable to realized gain (loss), unrealized appreciation (depreciation), purchases and sales, accrued discounts (premiums), and transfers into and out of the Level 3 category during the period. The end of period value is used for the transfers between Levels of a Fund’s assets and liabilities. Additionally, U.S. GAAP requires quantitative information regarding the significant
unobservable inputs used in the determination of fair value of assets or liabilities categorized as Level 3 in the fair value hierarchy. In accordance with the requirements of U.S. GAAP, a fair value hierarchy, and if material, a Level 3 reconciliation and details of significant unobservable inputs, have been included in the Notes to Schedule of Investments for each respective Fund.
(c) Valuation Techniques and the Fair Value Hierarchy
Level 1 and Level 2 trading assets and trading liabilities, at fair value The valuation methods (or “techniques”) and significant inputs used in determining the fair values of portfolio securities or other assets and liabilities categorized as Level 1 and Level 2 of the fair value hierarchy are as follows:
Fixed income securities including corporate, convertible and municipal bonds and notes, U.S. government agencies, U.S. treasury obligations, sovereign issues, bank loans, convertible preferred securities andnon-U.S. bonds are normally valued on the basis of quotes obtained from brokers and dealers or Pricing Services that use broker-dealer quotations, reported trades or valuation estimates from their internal pricing models. The Pricing Services’ internal models use inputs that are observable such as issuer details, interest rates, yield curves, prepayment speeds, credit risks/spreads, default rates and quoted prices for similar assets. Securities that use similar valuation techniques and inputs as described above are categorized as Level 2 of the fair value hierarchy.
Fixed income securities purchased on a delayed-delivery basis or as a repurchase commitment in a sale-buyback transaction are marked to market daily until settlement at the forward settlement date and are categorized as Level 2 of the fair value hierarchy.
Mortgage-related and asset-backed securities are usually issued as separate tranches, or classes, of securities within each deal. These securities are also normally valued by Pricing Services that use broker-dealer quotations, reported trades or valuation estimates from their internal pricing models. The pricing models for these securities usually consider tranche-level attributes, current market data, estimated cash flows and market-based yield spreads for each tranche, and incorporate deal collateral performance, as available. Mortgage-related and asset-backed securities that use similar valuation techniques and inputs as described above are categorized as Level 2 of the fair value hierarchy.
Common stocks, ETFs, exchange-traded notes and financial derivative instruments, such as futures contracts, rights and warrants, or options on futures that are traded on a national securities exchange, are stated at the last reported sale or settlement price on the day of valuation. To the extent these securities are actively traded and valuation adjustments are not applied, they are categorized as Level 1 of the fair value hierarchy.
December 31, 2018 (Unaudited)
Valuation adjustments may be applied to certain securities that are solely traded on a foreign exchange to account for the market movement between the close of the foreign market and the NYSE Close. These securities are valued using Pricing Services that consider the correlation of the trading patterns of the foreign security to the intraday trading in the U.S. markets for investments. Securities using these valuation adjustments are categorized as Level 2 of the fair value hierarchy. Preferred securities and other equities traded on inactive markets or valued by reference to similar instruments are also categorized as Level 2 of the fair value hierarchy.
Equity exchange-traded options and over the counter financial derivative instruments, such as forward foreign currency contracts and options contracts derive their value from underlying asset prices, indices, reference rates, and other inputs or a combination of these factors. These contracts are normally valued on the basis of quotes obtained from a quotation reporting system, established market makers or Pricing Services (normally determined as of the NYSE Close). Depending on the product and the terms of the transaction, financial derivative instruments can be valued by Pricing Services using a series of techniques, including simulation pricing models. The pricing models use inputs that are observed from actively quoted markets such as quoted prices, issuer details, indices, bid/ask spreads, interest rates, implied volatilities, yield curves, dividends and exchange rates. Financial derivative instruments that use similar valuation techniques and inputs as described above are categorized as Level 2 of the fair value hierarchy.
Centrally cleared swaps and over the counter swaps derive their value from underlying asset prices, indices, reference rates, and other inputs or a combination of these factors. They are valued using a broker-dealer bid quotation or on market-based prices provided by Pricing Services (normally determined as of the NYSE close). Centrally cleared swaps and over the counter swaps can be valued by Pricing Services using a series of techniques, including simulation pricing models. The pricing models may use inputs that are observed from actively quoted markets such as the overnight index swap rate (“OIS”), London Interbank Offered Rate (“LIBOR”) forward rate, interest rates, yield curves and credit spreads. These securities are categorized as Level 2 of the fair value hierarchy.
Level 3 trading assets and trading liabilities, at fair value When a fair valuation method is applied by the Manager that uses significant unobservable inputs, investments will be priced by a method that the Board or persons acting at their direction believe reflects fair value and are categorized as Level 3 of the fair value hierarchy.
Short-term debt instruments (such as commercial paper) having a remaining maturity of 60 days or less may be valued at amortized cost, so long as the amortized cost value of such short-term debt instruments is approximately the same as the fair value of the instrument as determined without the use of amortized cost valuation. These securities are categorized as Level 2 or Level 3 of the fair value hierarchy depending on the source of the base price.
4. SECURITIES AND OTHER INVESTMENTS
(a) Investments in Affiliates
Each Fund eligible to participate in securities lending may invest the cash collateral received for securities out on loan in the PIMCO Government Money Market Fund under the Securities Lending Agreement. PIMCO Government Money Market Fund is considered to be affiliated with the Funds. The table below shows the Funds’ transactions in and earnings from investments in the affiliated Fund for the period ended December 31, 2018 (amounts in thousands†):
| | | | | | | | | | | | | | | | | | | | | | | | | | | | | | | | | | | | |
| Investments in PIMCO Government Money Market Fund | |
| Fund Name | | | | | Market Value
06/30/2018 | | | Purchases
at Cost | | | Proceeds
from Sales | | | Net
Realized
Gain (Loss) | | | Change in
Unrealized
Appreciation
(Depreciation) | | | Market Value
12/31/2018 | | | Dividend
Income(1) | | | Realized Net
Capital Gain
Distributions(1) | |
| | | | | | | | | |
PIMCO0-5 Year High Yield Corporate Bond IndexExchange-Traded Fund | | | | | | $ | 58,024 | | | $ | 86,955 | | | $ | (112,296 | ) | | $ | 0 | | | $ | 0 | | | $ | 32,683 | | | $ | 484 | | | $ | 0 | |
| | | | | | | | | |
PIMCO Investment Grade Corporate Bond IndexExchange-Traded Fund | | | | | | | 4,016 | | | | 1,610 | | | | (4,975 | ) | | | (0 | ) | | | 0 | | | | 651 | | | | 3 | | | | 0 | |
| † | A zero balance may reflect actual amounts rounding to less than one thousand. |
| (1) | The tax characterization of distributions is determined in accordance with Federal income tax regulations. The actual tax characterization of distributions received is determined at the end of the fiscal year of the affiliated fund. See Note 2, Distributions to Shareholders, in the Notes to Financial Statements for more information. |
(b) Investments in Securities
The Funds may utilize the investments and strategies described below to the extent permitted by each Fund’s respective investment policies.
| | | | | | |
| | SEMIANNUAL REPORT | | DECEMBER 31, 2018 | | 91 |
Notes to Financial Statements(Cont.)
Inflation-Indexed Bonds are fixed income securities whose principal value is periodically adjusted by the rate of inflation. The interest rate on these bonds is generally fixed at issuance at a rate lower than typical bonds. Over the life of an inflation-indexed bond, however, interest will be paid based on a principal value which is adjusted for inflation. Any increase or decrease in the principal amount of an inflation-indexed bond will be included as interest income on the Statements of Operations, even though investors do not receive their principal until maturity. Repayment of the original bond principal upon maturity (as adjusted for inflation) is guaranteed in the case of U.S. Treasury Inflation-Protected Securities (“TIPS”). For bonds that do not provide a similar guarantee, the adjusted principal value of the bond repaid at maturity may be less than the original principal.
Loans and Other Indebtedness, Loan Participations and Assignments are direct debt instruments which are interests in amounts owed to lenders or lending syndicates by corporate, governmental, or other borrowers. A Fund’s investments in loans may be in the form of participations in loans or assignments of all or a portion of loans from third parties or investments in or originations of loans by the Fund or Funds. A loan is often administered by a bank or other financial institution (the “agent”) that acts as agent for all holders. The agent administers the terms of the loan, as specified in the loan agreement. A Fund may invest in multiple series or tranches of a loan, which may have varying terms and carry different associated risks. When a Fund purchases assignments from agents it acquires direct rights against the borrowers of the loans. These loans may include participations in bridge loans, which are loans taken out by borrowers for a short period (typically less than one year) pending arrangement of more permanent financing through, for example, the issuance of bonds, frequently high yield bonds issued for the purpose of acquisitions.
The types of loans and related investments in which the Funds may invest include, among others, senior loans, subordinated loans (including second lien loans,B-Notes and mezzanine loans), whole loans, commercial real estate and other commercial loans and structured loans. The Funds may originate loans or acquire direct interests in loans through primary loan distributions and/or in private transactions. In the case of subordinated loans, there may be significant indebtedness ranking ahead of the borrower’s obligation to the holder of such a loan, including in the event of the borrower’s insolvency. Mezzanine loans are typically secured by a pledge of an equity interest in the mortgage borrower that owns the real estate rather than an interest in a mortgage.
Investments in loans may include unfunded loan commitments, which are contractual obligations for funding. Unfunded loan commitments may include revolving credit facilities, which may obligate a Fund to
supply additional cash to the borrower on demand. Unfunded loan commitments represent a future obligation in full, even though a percentage of the committed amount may not be utilized by the borrower. When investing in a loan participation, a Fund has the right to receive payments of principal, interest and any fees to which it is entitled only from the agent selling the loan agreement and only upon receipt of payments by the agent from the borrower. A Fund may receive a commitment fee based on the undrawn portion of the underlying line of credit portion of a loan. In certain circumstances, a Fund may receive a penalty fee upon the prepayment of a loan by a borrower. Fees earned or paid are recorded as a component of interest income or interest expense, respectively, on the Statements of Operations. Unfunded loan commitments are reflected as a liability on the Statements of Assets and Liabilities.
Mortgage-Related and Other Asset-Backed Securities directly or indirectly represent a participation in, or are secured by and payable from, loans on real property. Mortgage-related securities are created from pools of residential or commercial mortgage loans, including mortgage loans made by savings and loan institutions, mortgage bankers, commercial banks and others. These securities provide a monthly payment which consists of both interest and principal. Interest may be determined by fixed or adjustable rates. The rate of prepayments on underlying mortgages will affect the price and volatility of a mortgage-related security, and may have the effect of shortening or extending the effective duration of the security relative to what was anticipated at the time of purchase. The timely payment of principal and interest of certain mortgage-related securities is guaranteed with the full faith and credit of the U.S. Government. Pools created and guaranteed bynon-governmental issuers, including government-sponsored corporations, may be supported by various forms of insurance or guarantees, but there can be no assurance that private insurers or guarantors can meet their obligations under the insurance policies or guarantee arrangements. Many of the risks of investing in mortgage-related securities secured by commercial mortgage loans reflect the effects of local and other economic conditions on real estate markets, the ability of tenants to make lease payments, and the ability of a property to attract and retain tenants. These securities may be less liquid and may exhibit greater price volatility than other types of mortgage-related or other asset-backed securities. Other asset-backed securities are created from many types of assets, including, but not limited to, auto loans, accounts receivable, such as credit card receivables and hospital account receivables, home equity loans, student loans, boat loans, mobile home loans, recreational vehicle loans, manufactured housing loans, aircraft leases, computer leases and syndicated bank loans.
Collateralized Debt Obligations (“CDOs”) include Collateralized Bond Obligations (“CBOs”), Collateralized Loan Obligations (“CLOs”) and
December 31, 2018 (Unaudited)
other similarly structured securities. CBOs and CLOs are types of asset-backed securities. A CBO is a trust which is backed by a diversified pool of high risk, below investment grade fixed income securities. A CLO is a trust typically collateralized by a pool of loans, which may include, among others, domestic and foreign senior secured loans, senior unsecured loans, and subordinate corporate loans, including loans that may be rated below investment grade or equivalent unrated loans. The risks of an investment in a CDO depend largely on the type of the collateral securities and the class of the CDO in which a Fund invests. In addition to the normal risks associated with fixed income securities discussed elsewhere in this report and each Fund’s prospectus and statement of additional information (e.g., prepayment risk, credit risk, liquidity risk, market risk, structural risk, legal risk and interest rate risk (which may be exacerbated if the interest rate payable on a structured financing changes based on multiples of changes in interest rates or inversely to changes in interest rates)), CBOs, CLOs and other CDOs carry additional risks including, but not limited to, (i) the possibility that distributions from collateral securities will not be adequate to make interest or other payments, (ii) the quality of the collateral may decline in value or default, (iii) the risk that a Fund may invest in CBOs, CLOs, or other CDOs that are subordinate to other classes, and (iv) the complex structure of the security may not be fully understood at the time of investment and may produce disputes with the issuer or unexpected investment results.
Collateralized Mortgage Obligations (“CMOs”) are debt obligations of a legal entity that are collateralized by whole mortgage loans or private mortgage bonds and divided into classes. CMOs are structured into multiple classes, often referred to as “tranches”, with each class bearing a different stated maturity and entitled to a different schedule for payments of principal and interest, including prepayments. CMOs may be less liquid and may exhibit greater price volatility than other types of mortgage-related or asset-backed securities.
Stripped Mortgage-Backed Securities (“SMBS”) are derivative multi-class mortgage securities. SMBS are usually structured with two classes that receive different proportions of the interest and principal distributions on a pool of mortgage assets. An SMBS will have one class that will receive all of the interest (the interest-only or “IO” class), while the other class will receive the entire principal (the principal-only or “PO” class). Payments received for IOs are included in interest income on the Statements of Operations. Because no principal will be received at the maturity of an IO, adjustments are made to the cost of the security on a monthly basis until maturity. These adjustments are included in interest income on the Statements of Operations. Payments received for POs are treated as reductions to the cost and par value of the securities.
Payment In-Kind Securities (“PIKs”) may give the issuer the option at each interest payment date of making interest payments in either cash and/or additional debt securities. Those additional debt securities usually have the same terms, including maturity dates and interest rates, and associated risks as the original bonds. The daily market quotations of the original bonds may include the accrued interest (referred to as a dirty price) and require a pro rata adjustment from the unrealized appreciation (depreciation) on investments to interest receivable on the Statements of Assets and Liabilities.
Perpetual Bonds are fixed income securities with no maturity date but pay a coupon in perpetuity (with no specified ending or maturity date). Unlike typical fixed income securities, there is no obligation for perpetual bonds to repay principal. The coupon payments, however, are mandatory. While perpetual bonds have no maturity date, they may have a callable date in which the perpetuity is eliminated and the issuer may return the principal received on the specified call date. Additionally, a perpetual bond may have additional features, such as interest rate increases at periodic dates or an increase as of a predetermined point in the future.
Securities Issued by U.S. Government Agencies or Government-Sponsored Enterprises are obligations of and, in certain cases, guaranteed by, the U.S. Government, its agencies or instrumentalities. Some U.S. Government securities, such as Treasury bills, notes and bonds, and securities guaranteed by the Government National Mortgage Association (“GNMA” or “Ginnie Mae”), are supported by the full faith and credit of the U.S. Government; others, such as those of the Federal Home Loan Banks, are supported by the right of the issuer to borrow from the U.S. Department of the Treasury (the “U.S. Treasury”); and others, such as those of the Federal National Mortgage Association (“FNMA” or “Fannie Mae”), are supported by the discretionary authority of the U.S. Government to purchase the agency’s obligations. U.S. Government securities may include zero coupon securities. Zero coupon securities do not distribute interest on a current basis and tend to be subject to a greater risk than interest-paying securities.
Government-related guarantors (i.e., not backed by the full faith and credit of the U.S. Government) include FNMA and the Federal Home Loan Mortgage Corporation (“FHLMC” or “Freddie Mac”). FNMA is a government-sponsored corporation. FNMA purchases conventional (i.e., not insured or guaranteed by any government agency) residential mortgages from a list of approved seller/servicers which include state and federally chartered savings and loan associations, mutual savings banks, commercial banks and credit unions and mortgage bankers. Pass-through securities issued by FNMA are guaranteed as to timely payment of principal and interest by FNMA, but are not backed by the full faith and credit of the U.S. Government. FHLMC issues Participation
| | | | | | |
| | SEMIANNUAL REPORT | | DECEMBER 31, 2018 | | 93 |
Notes to Financial Statements(Cont.)
Certificates (“PCs”), which are pass-through securities, each representing an undivided interest in a pool of residential mortgages. FHLMC guarantees the timely payment of interest and ultimate collection of principal, but PCs are not backed by the full faith and credit of the U.S. Government.
Roll-timing strategies can be used where a Fund seeks to extend the expiration or maturity of a position, such as a TBA security on an underlying asset, by closing out the position before expiration and opening a new position with respect to substantially the same underlying asset with a later expiration date. TBA securities purchased or sold are reflected on the Statements of Assets and Liabilities as an asset or liability, respectively.
Separate Trading of Registered Interest and Principal of Securities (“STRIPS”) are U.S. Treasury fixed income securities in which the principal is separated, or stripped, from the interest and each takes the form of zero coupon securities. A STRIP is sold at a significant discount to face value and offers no interest payments; rather, investors receive payment at maturity. Zero coupon securities do not distribute interest on a current basis and tend to be subject to greater risk than interest-paying securities.
When-Issued Transactions are purchases or sales made on a when-issued basis. These transactions are made conditionally because a security, although authorized, has not yet been issued in the market. Transactions to purchase or sell securities on a when-issued basis involve a commitment by a Fund to purchase or sell these securities for a predetermined price or yield, with payment and delivery taking place beyond the customary settlement period. A Fund may sell when-issued securities before they are delivered, which may result in a realized gain (loss).
5. BORROWINGS AND OTHER FINANCING TRANSACTIONS
The Funds may enter into the borrowings and other financing transactions described below to the extent permitted by each Fund’s respective investment policies.
The following disclosures contain information on a Fund’s ability to lend or borrow cash or securities to the extent permitted under the Act, which may be viewed as borrowing or financing transactions by a Fund. The location of these instruments in each Fund’s financial statements is described below.
(a) Repurchase Agreements Under the terms of a typical repurchase agreement, a Fund purchases an underlying debt obligation (collateral) subject to an obligation of the seller to repurchase, and a Fund to resell, the obligation at an agreed-upon price and time. In an open
maturity repurchase agreement, there is nopre-determined repurchase date and the agreement can be terminated by the Fund or counterparty at any time. The underlying securities for all repurchase agreements are held by a Fund’s custodian or designated subcustodians undertri-party repurchase agreements and in certain instances will remain in custody with the counterparty. The market value of the collateral must be equal to or exceed the total amount of the repurchase obligations, including interest. Repurchase agreements, if any, including accrued interest, are included on the Statements of Assets and Liabilities. Interest earned is recorded as a component of interest income on the Statements of Operations. In periods of increased demand for collateral, a Fund may pay a fee for the receipt of collateral, which may result in interest expense to the Fund.
(b) Reverse Repurchase Agreements In a reverse repurchase agreement, a Fund delivers a security in exchange for cash to a financial institution, the counterparty, with a simultaneous agreement to repurchase the same or substantially the same security at an agreed upon price and date. In an open maturity reverse repurchase agreement, there is nopre-determined repurchase date and the agreement can be terminated by the Fund or counterparty at any time. A Fund is entitled to receive principal and interest payments, if any, made on the security delivered to the counterparty during the term of the agreement. Cash received in exchange for securities delivered plus accrued interest payments to be made by a Fund to counterparties are reflected as a liability on the Statements of Assets and Liabilities. Interest payments made by a Fund to counterparties are recorded as a component of interest expense on the Statements of Operations. In periods of increased demand for the security, a Fund may receive a fee for use of the security by the counterparty, which may result in interest income to the Fund. A Fund will segregate assets determined to be liquid by the Manager or will otherwise cover its obligations under reverse repurchase agreements.
(c) Sale-Buybacks A sale-buyback financing transaction consists of a sale of a security by a Fund to a financial institution, the counterparty, with a simultaneous agreement to repurchase the same or substantially the same security at an agreed-upon price and date. A Fund is not entitled to receive principal and interest payments, if any, made on the security sold to the counterparty during the term of the agreement. The agreed-upon proceeds for securities to be repurchased by a Fund are reflected as a liability on the Statements of Assets and Liabilities. A Fund will recognize net income represented by the price differential between the price received for the transferred security and the agreed-upon repurchase price. This is commonly referred to as the ‘price drop’. A price drop consists of (i) the foregone interest and inflationary income adjustments, if any, a Fund would have otherwise received had the security not been sold and (ii) the negotiated financing terms
December 31, 2018 (Unaudited)
between a Fund and counterparty. Foregone interest and inflationary income adjustments, if any, are recorded as components of interest income on the Statements of Operations. Interest payments based upon negotiated financing terms made by a Fund to counterparties are recorded as a component of interest expense on the Statements of Operations. In periods of increased demand for the security, a Fund may receive a fee for use of the security by the counterparty, which may result in interest income to the Fund. A Fund will segregate assets determined to be liquid by the Manager or will otherwise cover its obligations under sale-buyback transactions.
(d) Securities Lending The Funds listed below may seek to earn additional income by lending their securities to certain qualified broker-dealers and institutions on a short-term or long-term basis via a lending agent.
|
| Fund Name |
|
PIMCO1-3 Year U.S. Treasury Index Exchange-Traded Fund |
|
PIMCO 25+ Year Zero Coupon U.S. Treasury Index Exchange-Traded Fund |
|
PIMCO1-5 Year U.S. TIPS Index Exchange-Traded Fund |
|
PIMCO 15+ Year U.S. TIPS Index Exchange-Traded Fund |
|
PIMCO Broad U.S. TIPS Index Exchange-Traded Fund |
|
PIMCO0-5 Year High Yield Corporate Bond Index Exchange-Traded Fund |
|
PIMCO Investment Grade Corporate Bond Index Exchange-Traded Fund |
|
PIMCO Enhanced Low Duration Active Exchange-Traded Fund |
|
PIMCO Enhanced Short Maturity Active Exchange-Traded Fund |
Securities on loan are required to be secured by cash collateral at least equal to 102% of the domestic, or 105% of the foreign security’s market value. If the market value of the collateral at the close of trading on a business day is less than 100% of the market value of the loaned securities at the close of trading on that day, the borrower shall be required to deliver, by the close of business on the following business day, an additional amount of collateral, so that the total amount of posted collateral is equal to at least 100% of the market value of all the loaned securities as of such preceding day. The Funds will then invest the cash collateral received in the PIMCO Government Money Market Fund and record a liability for the return of the collateral during the period the securities are on loan. Each Fund is subject to a lending limit of 33.33% of total assets (including the value of collateral).
The loans are subject to termination at the option of the borrower or the Fund. Upon termination of the loan, the borrower will return to the lender securities identical to the loaned securities. Should the borrower of the securities fail to return loaned securities, the Fund has the right to repurchase the securities using the collateral in the open market.
The borrower pays fees at the Funds’ direction to the lending agent. The lending agent may retain a portion of the fees and interest earned on the cash collateral invested as compensation for its services.
Investments made with the cash collateral are disclosed on the Schedules of Investments, if applicable. The lending fees and the Funds’ portion of the interest income earned on cash collateral are included on the Statements of Operations as securities lending income, if applicable.
(e) Short Sales Short sales are transactions in which a Fund sells a security that it may not own. A Fund may make short sales of securities to (i) offset potential declines in long positions in similar securities, (ii) to increase the flexibility of the Fund, (iii) for investment return, (iv) as part of a risk arbitrage strategy, and (v) as part of its overall portfolio management strategies involving the use of derivative instruments. When a Fund engages in a short sale, it may borrow the security sold short and deliver it to the counterparty. A Fund will ordinarily have to pay a fee or premium to borrow a security and be obligated to repay the lender of the security any dividend or interest that accrues on the security during the period of the loan. Securities sold in short sale transactions and the dividend or interest payable on such securities, if any, are reflected as payable for short sales on the Statements of Assets and Liabilities. Short sales expose a Fund to the risk that it will be required to cover its short position at a time when the security or other asset has appreciated in value, thus resulting in losses to a Fund. A short sale is “against the box” if a Fund holds in its portfolio or has the right to acquire the security sold short, or securities identical to the security sold short, at no additional cost. A Fund will be subject to additional risks to the extent that it engages in short sales that are not “against the box.” A Fund’s loss on a short sale could theoretically be unlimited in cases where a Fund is unable, for whatever reason, to close out its short position.
6. FINANCIAL DERIVATIVE INSTRUMENTS
The Funds may enter into the financial derivative instruments described below to the extent permitted by each Fund’s respective investment policies.
The following disclosures contain information on how and why the Funds use financial derivative instruments, and how financial derivative instruments affect the Funds’ financial position, results of operations and cash flows. The location and fair value amounts of these instruments on the Statements of Assets and Liabilities and the net realized gain (loss) and net change in unrealized appreciation (depreciation) on the Statements of Operations, each categorized by type of financial derivative contract and related risk exposure, are included in a table in the Notes to Schedules of Investments. The financial derivative instruments outstanding as of period end and the amounts of net realized gain (loss) and net change in unrealized appreciation (depreciation) on financial derivative instruments during the period, as disclosed in the Notes to Schedules of Investments, serve as indicators of the volume of financial derivative activity for the Funds.
| | | | | | |
| | SEMIANNUAL REPORT | | DECEMBER 31, 2018 | | 95 |
Notes to Financial Statements(Cont.)
(a) Forward Foreign Currency Contracts may be engaged, in connection with settling planned purchases or sales of securities, to hedge the currency exposure associated with some or all of a Fund’s securities or as part of an investment strategy. A forward foreign currency contract is an agreement between two parties to buy and sell a currency at a set price on a future date. The market value of a forward foreign currency contract fluctuates with changes in foreign currency exchange rates. Forward foreign currency contracts are marked to market daily, and the change in value is recorded by a Fund as an unrealized gain (loss). Realized gains (losses) are equal to the difference between the value of the contract at the time it was opened and the value at the time it was closed and are recorded upon delivery or receipt of the currency. These contracts may involve market risk in excess of the unrealized gain (loss) reflected on the Statements of Assets and Liabilities. In addition, a Fund could be exposed to risk if the counterparties are unable to meet the terms of the contracts or if the value of the currency changes unfavorably to the U.S. dollar. To mitigate such risk, cash or securities may be exchanged as collateral pursuant to the terms of the underlying contracts.
(b) Futures Contracts are agreements to buy or sell a security or other asset for a set price on a future date. A Fund may use futures contracts to manage its exposure to the securities markets or to movements in interest rates and currency values. The primary risks associated with the use of futures contracts are the imperfect correlation between the change in market value of the securities held by a Fund and the prices of futures contracts and the possibility of an illiquid market. Futures contracts are valued based upon their quoted daily settlement prices. Upon entering into a futures contract, a Fund is required to deposit with its futures broker an amount of cash, U.S. Government and Agency Obligations, or select sovereign debt, in accordance with the initial margin requirements of the broker or exchange. Futures contracts are marked to market daily and based on such movements in the price of the contracts, an appropriate payable or receivable for the change in value may be posted or collected by the Fund (“Futures Variation Margin”). Gains (losses) are recognized but not considered realized until the contracts expire or close. Futures contracts involve, to varying degrees, risk of loss in excess of the Futures Variation Margin included within exchange traded or centrally cleared financial derivative instruments on the Statements of Assets and Liabilities.
(c) Options Contracts may be written or purchased to enhance returns or to hedge an existing position or future investment.A Fund may write call and put options on securities and financial derivative instruments it owns or in which it may invest. Writing put options tends to increase a Fund’s exposure to the underlying instrument. Writing call options tends to decrease a Fund’s exposure to the underlying instrument. When a Fund writes a call or put, an amount equal to the premium
received is recorded and subsequently marked to market to reflect the current value of the option written. These amounts are included on the Statements of Assets and Liabilities. Premiums received from writing options which expire are treated as realized gains. Premiums received from writing options which are exercised or closed are added to the proceeds or offset against amounts paid on the underlying futures, swap, security or currency transaction to determine the realized gain (loss). Certain options may be written with premiums to be determined on a future date. The premiums for these options are based upon implied volatility parameters at specified terms. A Fund as a writer of an option has no control over whether the underlying instrument may be sold (“call”) or purchased (“put”) and as a result bears the market risk of an unfavorable change in the price of the instrument underlying the written option. There is the risk a Fund may not be able to enter into a closing transaction because of an illiquid market.
Purchasing call options tends to increase a Fund’s exposure to the underlying instrument. Purchasing put options tends to decrease a Fund’s exposure to the underlying instrument. A Fund pays a premium which is included as an asset on the Statements of Assets and Liabilities and subsequently marked to market to reflect the current value of the option. Premiums paid for purchasing options which expire are treated as realized losses. Certain options may be purchased with premiums to be determined on a future date. The premiums for these options are based upon implied volatility parameters at specified terms. The risk associated with purchasing put and call options is limited to the premium paid. Premiums paid for purchasing options which are exercised or closed are added to the amounts paid or offset against the proceeds on the underlying investment transaction to determine the realized gain (loss) when the underlying transaction is executed.
Credit Default Swaptions may be written or purchased to hedge exposure to the credit risk of an investment without making a commitment to the underlying instrument. A credit default swaption is an option to sell or buy credit protection on a specific reference by entering into apre-defined swap agreement by some specified date in the future.
Interest Rate Swaptions may be written or purchased to enter into apre-defined swap agreement or to shorten, extend, cancel or otherwise modify an existing swap agreement, by some specified date in the future. The writer of the swaption becomes the counterparty to the swap if the buyer exercises. The interest rate swaption agreement will specify whether the buyer of the swaption will be a fixed-rate receiver or a fixed-rate payer upon exercise.
Options on Exchange-Traded Futures Contracts (“Futures Option”) may be written or purchased to hedge an existing position or future investment, for speculative purposes or to manage exposure to market
December 31, 2018 (Unaudited)
movements. A Futures Option is an option contract in which the underlying instrument is a single futures contract.
Options on Securities may be written or purchased to enhance returns or to hedge an existing position or future investment. An option on a security uses a specified security as the underlying instrument for the option contract.
(d) Swap Agreements are bilaterally negotiated agreements between a Fund and a counterparty to exchange or swap investment cash flows, assets, foreign currencies or market-linked returns at specified, future intervals. Swap agreements may be privately negotiated in the over the counter market (“OTC swaps”) or may be cleared through a third party, known as a central counterparty or derivatives clearing organization (“Centrally Cleared Swaps”). A Fund may enter into asset, credit default, cross-currency, interest rate, total return, variance and other forms of swap agreements to manage its exposure to credit, currency, interest rate, commodity, equity and inflation risk. In connection with these agreements, securities or cash may be identified as collateral or margin in accordance with the terms of the respective swap agreements to provide assets of value and recourse in the event of default or bankruptcy/insolvency.
Centrally Cleared Swaps are marked to market daily based upon valuations as determined from the underlying contract or in accordance with the requirements of the central counterparty or derivatives clearing organization. Changes in market value, if any, are reflected as a component of net change in unrealized appreciation (depreciation) on the Statements of Operations. Daily changes in valuation of centrally cleared swaps (“Swap Variation Margin”), if any, are disclosed within centrally cleared financial derivative instruments on the Statements of Assets and Liabilities. Centrally Cleared and OTC swap payments received or paid at the beginning of the measurement period are included on the Statements of Assets and Liabilities and represent premiums paid or received upon entering into the swap agreement to compensate for differences between the stated terms of the swap agreement and prevailing market conditions (credit spreads, currency exchange rates, interest rates, and other relevant factors). Upfront premiums received (paid) are initially recorded as liabilities (assets) and subsequently marked to market to reflect the current value of the swap. These upfront premiums are recorded as realized gain (loss) on the Statements of Operations upon termination or maturity of the swap. A liquidation payment received or made at the termination of the swap is recorded as realized gain (loss) on the Statements of Operations. Net periodic payments received or paid by a Fund are included as part of realized gain (loss) on the Statements of Operations.
For purposes of applying certain of a Fund’s investment policies and restrictions, swap agreements, like other derivative instruments, may be
valued by a Fund at market value, notional value or full exposure value. In the case of a credit default swap, in applying certain of a Fund’s investment policies and restrictions, the Funds will value the credit default swap at its notional value or its full exposure value (i.e., the sum of the notional amount for the contract plus the market value), but may value the credit default swap at market value for purposes of applying certain of a Fund’s other investment policies and restrictions. For example, a Fund may value credit default swaps at full exposure value for purposes of a Fund’s credit quality guidelines (if any) because such value in general better reflects a Fund’s actual economic exposure during the term of the credit default swap agreement. As a result, a Fund may, at times, have notional exposure to an asset class (before netting) that is greater or lesser than the stated limit or restriction noted in a Fund’s prospectus. In this context, both the notional amount and the market value may be positive or negative depending on whether a Fund is selling or buying protection through the credit default swap. The manner in which certain securities or other instruments are valued by a Fund for purposes of applying investment policies and restrictions may differ from the manner in which those investments are valued by other types of investors.
Entering into swap agreements involves, to varying degrees, elements of interest, credit, market and documentation risk in excess of the amounts recognized on the Statements of Assets and Liabilities. Such risks involve the possibility that there will be no liquid market for these agreements, that the counterparty to the agreements may default on its obligation to perform or disagree as to the meaning of contractual terms in the agreements and that there may be unfavorable changes in interest rates or the values of the asset upon which the swap is based.
A Fund’s maximum risk of loss from counterparty credit risk is the discounted net value of the cash flows to be received from the counterparty over the contract’s remaining life, to the extent that amount is positive. The risk may be mitigated by having a master netting arrangement between a Fund and the counterparty and by the posting of collateral to a Fund to cover a Fund’s exposure to the counterparty.
To the extent a Fund has a policy to limit the net amount owed to or to be received from a single counterparty under existing swap agreements, such limitation only applies to counterparties to OTC swaps and does not apply to centrally cleared swaps where the counterparty is a central counterparty or derivatives clearing organization.
Credit Default Swap Agreements on corporate, loan, sovereign, U.S. municipal or U.S. Treasury issues are entered into to provide a measure of protection against defaults of the issuers (i.e., to reduce risk where a Fund owns or has exposure to the referenced obligation) or to take an active long or short position with respect to the likelihood of a
| | | | | | |
| | SEMIANNUAL REPORT | | DECEMBER 31, 2018 | | 97 |
Notes to Financial Statements(Cont.)
particular issuer’s default. Credit default swap agreements involve one party making a stream of payments (referred to as the buyer of protection) to another party (the seller of protection) in exchange for the right to receive a specified return in the event that the referenced entity, obligation or index, as specified in the swap agreement, undergoes a certain credit event. As a seller of protection on credit default swap agreements, a Fund will generally receive from the buyer of protection a fixed rate of income throughout the term of the swap provided that there is no credit event. As the seller, a Fund would effectively add leverage to its portfolio because, in addition to its total net assets, a Fund would be subject to investment exposure on the notional amount of the swap.
If a Fund is a seller of protection and a credit event occurs, as defined under the terms of that particular swap agreement, a Fund will either (i) pay to the buyer of protection an amount equal to the notional amount of the swap and take delivery of the referenced obligation, other deliverable obligations or underlying securities comprising the referenced index or (ii) pay a net settlement amount in the form of cash or securities equal to the notional amount of the swap less the recovery value of the referenced obligation or underlying securities comprising the referenced index. If a Fund is a buyer of protection and a credit event occurs, as defined under the terms of that particular swap agreement, a Fund will either (i) receive from the seller of protection an amount equal to the notional amount of the swap and deliver the referenced obligation, other deliverable obligations or underlying securities comprising the referenced index or (ii) receive a net settlement amount in the form of cash or securities equal to the notional amount of the swap less the recovery value of the referenced obligation or underlying securities comprising the referenced index. Recovery values are estimated by market makers considering either industry standard recovery rates or entity specific factors and considerations until a credit event occurs. If a credit event has occurred, the recovery value is determined by a facilitated auction whereby a minimum number of allowable broker bids, together with a specified valuation method, are used to calculate the settlement value. The ability to deliver other obligations may result in acheapest-to-deliver option (the buyer of protection’s right to choose the deliverable obligation with the lowest value following a credit event).
Credit default swap agreements on credit indices involve one party making a stream of payments to another party in exchange for the right to receive a specified return in the event of a write-down, principal shortfall, interest shortfall or default of all or part of the referenced entities comprising the credit index. A credit index is a basket of credit instruments or exposures designed to be representative of some part of the credit market as a whole. These indices are made up of reference credits that are judged by a poll of dealers to be the most liquid entities
in the credit default swap market based on the sector of the index. Components of the indices may include, but are not limited to, investment grade securities, high yield securities, asset-backed securities, emerging markets, and/or various credit ratings within each sector. Credit indices are traded using credit default swaps with standardized terms including a fixed spread and standard maturity dates. An index credit default swap references all the names in the index, and if there is a default, the credit event is settled based on that name’s weight in the index. The composition of the indices changes periodically, usually every six months, and for most indices, each name has an equal weight in the index. A Fund may use credit default swaps on credit indices to hedge a portfolio of credit default swaps or bonds, which is less expensive than it would be to buy many credit default swaps to achieve a similar effect. Credit default swaps on indices are instruments for protecting investors owning bonds against default, and traders use them to speculate on changes in credit quality.
Implied credit spreads, represented in absolute terms, utilized in determining the market value of credit default swap agreements on corporate, loan, sovereign, U.S. municipal or U.S. Treasury issues as of period end, if any, are disclosed in the Notes to Schedules of Investments. They serve as an indicator of the current status of payment/performance risk and represent the likelihood or risk of default for the reference entity. The implied credit spread of a particular referenced entity reflects the cost of buying/selling protection and may include upfront payments required to be made to enter into the agreement. Wider credit spreads represent a deterioration of the referenced entity’s credit soundness and a greater likelihood or risk of default or other credit event occurring as defined under the terms of the agreement. For credit default swap agreements on asset-backed securities and credit indices, the quoted market prices and resulting values serve as the indicator of the current status of the payment/performance risk. Increasing market values, in absolute terms when compared to the notional amount of the swap, represent a deterioration of the referenced entity’s credit soundness and a greater likelihood or risk of default or other credit event occurring as defined under the terms of the agreement.
The maximum potential amount of future payments (undiscounted) that a Fund as a seller of protection could be required to make under a credit default swap agreement equals the notional amount of the agreement. Notional amounts of each individual credit default swap agreement outstanding as of period end for which a Fund is the seller of protection are disclosed in the Notes to Schedules of Investments. These potential amounts would be partially offset by any recovery values of the respective referenced obligations, upfront payments received upon entering into the agreement, or net amounts received from the settlement of buy protection credit default swap agreements entered into by a Fund for the same referenced entity or entities.
December 31, 2018 (Unaudited)
Interest Rate Swap Agreements may be entered into to help hedge against interest rate risk exposure and to maintain a Fund’s ability to generate income at prevailing market rates. The value of the fixed rate bonds that the Funds hold may decrease if interest rates rise. To help hedge against this risk and to maintain its ability to generate income at prevailing market rates, a Fund may enter into interest rate swap agreements. Interest rate swap agreements involve the exchange by a Fund with another party for their respective commitment to pay or receive interest on the notional amount of principal. Certain forms of interest rate swap agreements may include: (i) interest rate caps, under which, in return for a premium, one party agrees to make payments to the other to the extent that interest rates exceed a specified rate, or “cap”, (ii) interest rate floors, under which, in return for a premium, one party agrees to make payments to the other to the extent that interest rates fall below a specified rate, or “floor”, (iii) interest rate collars, under which a party sells a cap and purchases a floor or vice versa in an attempt to protect itself against interest rate movements exceeding given minimum or maximum levels, (iv) callable interest rate swaps, under which the buyer pays an upfront fee in consideration for the right to early terminate the swap transaction in whole, at zero cost and at a predetermined date and time prior to the maturity date, (v) spreadlocks, which allow the interest rate swap users to lock in the
forward differential (or spread) between the interest rate swap rate and a specified benchmark, or (vi) basis swaps, under which two parties can exchange variable interest rates based on different segments of money markets.
Total Return Swap Agreements are entered into to gain or mitigate exposure to the underlying reference asset. Total return swap agreements involve commitments where single or multiple cash flows are exchanged based on the price of an underlying reference asset and on a fixed or variable interest rate. Total return swap agreements may involve commitments to pay interest in exchange for a market-linked return. One counterparty pays out the total return of a specific underlying reference asset, which may include a single security, a basket of securities, or an index, and in return receives a fixed or variable rate. At the maturity date, a net cash flow is exchanged where the total return is equivalent to the return of the underlying reference asset less a financing rate, if any. As a receiver, a Fund would receive payments based on any net positive total return and would owe payments in the event of a net negative total return. As the payer, a Fund would owe payments on any net positive total return, and would receive payments in the event of a net negative total return.
7. PRINCIPAL RISKS
The principal risks of investing in a Fund, which could adversely affect its net asset value, yield and total return, are listed below.
| | | | | | | | | | | | | | | | | | | | | | | | | | | | |
| Risks | | | | | PIMCO
1-3 Year
U.S.
Treasury
Index
Exchange-
Traded Fund | | PIMCO
1-5 Year
U.S. TIPS
Index
Exchange-
Traded Fund | | PIMCO
15+ Year
U.S. TIPS
Index
Exchange-
Traded Fund | | PIMCO
Broad
U.S. TIPS
Index
Exchange-
Traded Fund | | PIMCO
0-5 Year
High Yield
Corporate
Bond Index
Exchange-
Traded Fund | | PIMCO
Investment
Grade
Corporate
Bond Index
Exchange-
Traded Fund | | PIMCO
Active
Bond
Exchange-
Traded Fund | | PIMCO
Enhanced
Low
Duration
Active
Exchange-
Traded Fund | | PIMCO
Enhanced
Short
Maturity
Active
Exchange-
Traded Fund | | PIMCO
Intermediate
Municipal
Bond Active
Exchange-
Traded Fund | | PIMCO
Short Term
Municipal
Bond Active
Exchange-
Traded Fund | | PIMCO
25+ Year
Zero Coupon
U.S. Treasury
Index
Exchange-
Traded Fund |
| | | | | | | | | | | | | |
New/Small Fund | | | | | | | | | | | | X | | | | | | | | X | | | | | | X | | |
| | | | | | | | | | | | | |
Market Trading | | | | | | X | | X | | X | | X | | X | | X | | X | | X | | X | | X | | X | | X |
| | | | | | | | | | | | | |
Interest Rate | | | | | | X | | X | | X | | X | | X | | X | | X | | X | | X | | X | | X | | X |
| | | | | | | | | | | | | |
Call | | | | | | X | | X | | X | | X | | X | | X | | X | | X | | X | | X | | X | | X |
| | | | | | | | | | | | | |
Inflation-Indexed Security | | | | | | | | X | | X | | X | | | | | | | | | | | | | | | | |
| | | | | | | | | | | | | |
Credit | | | | | | X | | X | | X | | X | | X | | X | | X | | X | | X | | X | | X | | X |
| | | | | | | | | | | | | |
High Yield | | | | | | | | | | | | | | X | | | | X | | X | | | | | | | | |
| | | | | | | | | | | | | |
Market | | | | | | X | | X | | X | | X | | X | | X | | X | | X | | X | | X | | X | | X |
| | | | | | | | | | | | | |
Municipal Bond | | | | | | | | | | | | | | | | | | | | | | | | X | | X | | |
| | | | | | | | | | | | | |
Issuer | | | | | | | | | | | | | | X | | X | | X | | X | | X | | X | | X | | |
| | | | | | | | | | | | | |
Liquidity | | | | | | X | | X | | X | | X | | X | | X | | X | | X | | X | | X | | X | | X |
| | | | | | | | | | | | | |
Derivatives | | | | | | X | | X | | X | | X | | X | | X | | X | | X | | | | X | | X | | X |
| | | | | | | | | | | | | |
Equity | | | | | | | | | | | | | | | | | | X | | | | | | | | | | |
| | | | | | | | | | | | | |
Mortgage-Related and Other Asset Backed Securities | | | | | | | | | | | | | | | | | | X | | X | | X | | | | | | |
| | | | | | | | | | | | | |
Foreign(Non-
U.S.) Investment | | | | | | | | | | | | | | X | | X | | X | | X | | X | | | | | | |
| | | | | | | | | | | | | |
Emerging Markets | | | | | | | | | | | | | | X | | X | | X | | X | | | | | | | | |
| | | | | | | | | | | | | |
Sovereign Debt | | | | | | | | | | | | | | X | | X | | | | | | | | | | | | |
| | | | | | | | | | | | | |
Currency | | | | | | | | | | | | | | | | | | X | | X | | | | | | | | |
| | | | | | | | | | | | | |
Leveraging | | | | | | X | | X | | X | | X | | X | | X | | X | | X | | X | | X | | X | | X |
| | | | | | |
| | SEMIANNUAL REPORT | | DECEMBER 31, 2018 | | 99 |
Notes to Financial Statements(Cont.)
| | | | | | | | | | | | | | | | | | | | | | | | | | | | |
| Risks | | | | | PIMCO
1-3 Year
U.S.
Treasury
Index
Exchange-
Traded Fund | | PIMCO
1-5 Year
U.S. TIPS
Index
Exchange-
Traded Fund | | PIMCO
15+ Year
U.S. TIPS
Index
Exchange-
Traded Fund | | PIMCO
Broad
U.S. TIPS
Index
Exchange-
Traded Fund | | PIMCO
0-5 Year
High Yield
Corporate
Bond Index
Exchange-
Traded Fund | | PIMCO
Investment
Grade
Corporate
Bond Index
Exchange-
Traded Fund | | PIMCO
Active
Bond
Exchange-
Traded Fund | | PIMCO
Enhanced
Low
Duration
Active
Exchange-
Traded Fund | | PIMCO
Enhanced
Short
Maturity
Active
Exchange-
Traded Fund | | PIMCO
Intermediate
Municipal
Bond Active
Exchange-
Traded Fund | | PIMCO
Short Term
Municipal
Bond Active
Exchange-
Traded Fund | | PIMCO
25+ Year
Zero Coupon
U.S. Treasury
Index
Exchange-
Traded Fund |
| | | | | | | | | | | | | |
Management and
Tracking Error | | | | | | X | | X | | X | | X | | X | | X | | | | | | | | | | | | X |
| | | | | | | | | | | | | |
Indexing | | | | | | X | | X | | X | | X | | X | | X | | | | | | | | | | | | X |
| | | | | | | | | | | | | |
Management | | | | | | | | | | | | | | | | | | X | | X | | X | | X | | X | | |
| | | | | | | | | | | | | |
California State-Specific | | | | | | | | | | | | | | | | | | | | | | | | X | | | | |
| | | | | | | | | | | | | |
New York State-Specific | | | | | | | | | | | | | | | | | | | | | | | | X | | | | |
| | | | | | | | | | | | | |
Municipal Project-Specific | | | | | | | | | | | | | | | | | | | | | | | | X | | X | | |
| | | | | | | | | | | | | |
Short Exposure | | | | | | | | | | | | | | | | | | X | | X | | | | | | | | |
| | | | | | | | | | | | | |
Convertible Securities | | | | | | | | | | | | | | | | | | X | | | | | | | | | | |
| | | | | | | | | | | | | |
Tax-Efficient Investing | | | | | | | | | | | | | | | | | | X | | X | | | | | | | | |
| | | | | | | | | | | | | |
Distribution Rate | | | | | | | | | | | | | | | | | | X | | X | | | | | | | | |
Please see “Description of Principal Risks” in a Fund’s prospectus for a more detailed description of the risks of investing in a Fund.
New/Small Fund Risk is the risk that a new or smaller Fund’s performance may not represent how a Fund is expected to or may perform in the long term. In addition, new Funds have limited operating histories for investors to evaluate and new and smaller Funds may not attract sufficient assets to achieve investment and trading efficiencies.
Market Trading Risk is the risk that an active secondary trading market for Fund shares does not continue once developed, that a Fund may not continue to meet a listing exchange’s trading or listing requirements, or that Fund shares trade at prices other than a Fund’s net asset value.
Interest Rate Risk is the risk that fixed income securities will decline in value because of an increase in interest rates; a fund with a longer average portfolio duration will be more sensitive to changes in interest rates than a fund with a shorter average portfolio duration.
Call Risk is the risk that an issuer may exercise its right to redeem a fixed income security earlier than expected (a call). Issuers may call outstanding securities prior to their maturity for a number of reasons (e.g., declining interest rates, changes in credit spreads and improvements in the issuer’s credit quality). If an issuer calls a security that a Fund has invested in, a Fund may not recoup the full amount of its initial investment and may be forced to reinvest in lower-yielding securities, securities with greater credit risks or securities with other, less favorable features.
Inflation-Indexed Security Risk is the risk that the value of an inflation-indexed security (such as TIPS) tends to decrease when real interest rates increase and increase when real interest rates decrease and interest payments on inflation-indexed securities will vary along with changes in the CPI.
Credit Risk is the risk that a Fund could lose money if the issuer or guarantor of a fixed income security, or the counterparty to a derivative contract, is unable or unwilling to meet its financial obligations.
High Yield Risk is the risk that high yield securities and unrated securities of similar credit quality (commonly known as “junk bonds”) are subject to greater levels of credit, call and liquidity risks. High yield securities are considered primarily speculative with respect to the issuer’s continuing ability to make principal and interest payments, and may be more volatile than higher-rated securities of similar maturity.
Market Risk is the risk that the value of securities owned by a Fund may go up or down, sometimes rapidly or unpredictably, due to factors affecting securities markets generally or particular industries.
Municipal Bond Risk is the risk that by investing in Municipal Bonds a Fund may be affected significantly by the economic, regulatory or political developments affecting the ability of issuers of Municipal Bonds to pay interest or repay principal.
Issuer Risk is the risk that the value of a security may decline for a reason directly related to the issuer, such as management performance, financial leverage and reduced demand for the issuer’s goods or services.
Liquidity Risk is the risk that a particular investment may be difficult to purchase or sell and that a Fund may be unable to sell illiquid securities at an advantageous time or price or achieve its desired level of exposure to a certain sector. Liquidity risk may result from the lack of an active market, reduced number and capacity of traditional market participants to make a market in fixed income securities, and may be magnified in a rising interest rate environment or other circumstances where investor redemptions from fixed income funds may be higher than normal, causing increased supply in the market due to selling activity.
December 31, 2018 (Unaudited)
Derivatives Risk is the risk of investing in derivative instruments (such as futures, swaps and structured securities), including leverage, liquidity, interest rate, market, credit and management risks, mispricing or valuation complexity. Changes in the value of the derivative may not correlate perfectly with, and may be more sensitive to market events than, the underlying asset, rate or index, and a Fund could lose more than the initial amount invested. A Fund’s use of derivatives may result in losses to a Fund, a reduction in a Fund’s returns and/or increased volatility.Over-the-counter (“OTC”) derivatives are also subject to the risk that a counterparty to the transaction will not fulfill its contractual obligations to the other party, as many of the protections afforded to centrally-cleared derivative transactions might not be available for OTC derivatives. For derivatives traded on an exchange or through a central counterparty, credit risk resides with a Fund’s clearing broker, or the clearinghouse itself, rather than with a counterparty in an OTC derivative transaction. Changes in regulation relating to a fund’s use of derivatives and related instruments could potentially limit or impact a Fund’s ability to invest in derivatives, limit a Fund’s ability to employ certain strategies that use derivatives and/or adversely affect the value of derivatives and a Fund’s performance.
Equity Risk is the risk that the value of equity or equity-related securities may decline due to general market conditions which are not specifically related to a particular company or to factors affecting a particular industry or industries. Equity or equity-related securities generally have greater price volatility than fixed income securities.
Mortgage-Related and Other Asset-Backed Securities Risk is the risk of investing in mortgage-related and other asset-backed securities, including interest rate risk, extension risk, prepayment risk, and credit risk.
Foreign(Non-U.S.) Investment Risk is the risk that investing in foreign(non-U.S.) securities may result in a Fund experiencing more rapid and extreme changes in value than a fund that invests exclusively in securities of U.S. companies, due to smaller markets, differing reporting, accounting and auditing standards, increased risk of delayed settlement of portfolio transactions or loss of certificates of portfolio securities, and the risk of unfavorable foreign government actions, including nationalization, expropriation or confiscatory taxation, currency blockage, or political changes or diplomatic developments. Foreign securities may also be less liquid and more difficult to value than securities of U.S. issuers.
Emerging Markets Risk is the risk of investing in emerging market securities, primarily increased foreign(non-U.S.) investment risk.
Sovereign Debt Risk is the risk that investments in fixed income instruments issued by sovereign entities may decline in value as a result
of default or other adverse credit event resulting from an issuer’s inability or unwillingness to make principal or interest payments in a timely fashion.
Currency Risk is the risk that foreign(non-U.S.) currencies will change in value relative to the U.S. dollar and affect a Fund’s investments in foreign(non-U.S.) currencies or in securities that trade in, and receive revenues in, or in derivatives that provide exposure to, foreign(non-U.S.) currencies.
Leveraging Risk is the risk that certain transactions of a Fund, such as reverse repurchase agreements, loans of portfolio securities, and the use of when-issued, delayed delivery or forward commitment transactions, or derivative instruments, may give rise to leverage, magnifying gains and losses and causing a Fund to be more volatile than if it had not been leveraged. This means that leverage entails a heightened risk of loss.
Management and Tracking Error Risk is the risk that the portfolio manager’s investment decisions may not produce the desired results or that a Fund’s portfolio may not closely track the Underlying Index for a number of reasons. A Fund incurs operating expenses, which are not applicable to the Underlying Index, and the costs of buying and selling securities, especially when rebalancing a Fund’s portfolio to reflect changes in the composition of the Underlying Index. Performance of a Fund and the Underlying Index may vary due to asset valuation differences and differences between a Fund’s portfolio and the Underlying Index due to legal restrictions, cost or liquidity restraints. The risk that performance of a Fund and the Underlying Index may vary may be heightened during periods of increased market volatility or other unusual market conditions. In addition, a Fund’s use of a representative sampling approach may cause a Fund to be less correlated to the return of the Underlying Index than if a Fund held all of the securities in the Underlying Index.
Indexing Risk is the risk that a Fund is negatively affected by general declines in the asset classes represented by the Underlying Index.
Management Risk is the risk that the investment techniques and risk analyses applied by PIMCO will not produce the desired results and that legislative, regulatory, or tax restrictions, policies or developments may affect the investment techniques available to PIMCO and the individual portfolio manager in connection with managing a Fund. There is no guarantee that the investment objective of a Fund will be achieved.
California State-Specific Risk is the risk that by concentrating its investments in California Municipal Bonds, a Fund may be affected significantly by economic, regulatory or political developments affecting the ability of California issuers to pay interest or repay principal.
| | | | | | |
| | SEMIANNUAL REPORT | | DECEMBER 31, 2018 | | 101 |
Notes to Financial Statements(Cont.)
New York State-Specific Risk is the risk that by concentrating its investments in New York Municipal Bonds, a Fund may be affected significantly by economic, regulatory or political developments affecting the ability of New York issuers to pay interest or repay principal.
Municipal Project-Specific Risk is the risk that a Fund may be more sensitive to adverse economic, business or political developments if it invests a substantial portion of its assets in the bonds of similar projects (such as those relating to education, health care, housing, transportation, and utilities), industrial development bonds, or in bonds from issuers in a single state.
Short Exposure Risk is the risk of entering into short sales, including the potential loss of more money than the actual cost of the investment, and the risk that the third party to the short sale will not fulfill its contractual obligations, causing a loss to a Fund.
Convertible Securities Risk is the risk thatarises when convertible securities share both fixed income and equity characteristics. Convertible securities are subject to risks to which fixed income and equity investments are subject. These risks include equity risk, interest rate risk and credit risk.
Tax-Efficient Investing Risk is the risk that investment strategies intended to manage capital gain distributions may not succeed, and that such strategies may reduce investment returns or result in investment losses.
Distribution Rate Risk is the risk that a Fund’s distribution rate may change unexpectedly as a result of numerous factors, including changes in realized and projected market returns, fluctuations in market interest rates, Fund performance and other factors.
8. MASTER NETTING ARRANGEMENTS
A Fund may be subject to various netting arrangements (“Master Agreements”) with select counterparties. Master Agreements govern the terms of certain transactions, and are intended to reduce the counterparty risk associated with relevant transactions by specifying credit protection mechanisms and providing standardization that is intended to improve legal certainty. Each type of Master Agreement governs certain types of transactions. Different types of transactions may be traded out of different legal entities or affiliates of a particular organization, resulting in the need for multiple agreements with a single counterparty. As the Master Agreements are specific to unique operations of different asset types, they allow a Fund to close out and net its total exposure to a counterparty in the event of a default with respect to all the transactions governed under a single Master Agreement with a counterparty. For financial reporting purposes the Statements of Assets and Liabilities generally present derivative assets and liabilities on a gross basis, which reflects the full risks and exposures prior to netting.
Master Agreements can also help limit counterparty risk by specifying collateral posting arrangements atpre-arranged exposure levels. Under most Master Agreements, collateral is routinely transferred if the total net exposure to certain transactions (net of existing collateral already in place) governed under the relevant Master Agreement with a counterparty in a given account exceeds a specified threshold, which typically ranges from zero to $250,000 depending on the counterparty and the type of Master Agreement. United States Treasury Bills and U.S. dollar cash are generally the preferred forms of collateral, although other securities may be used depending on the terms outlined in the applicable Master Agreement. Securities and cash pledged as collateral are reflected as assets on the Statements of Assets and Liabilities as either a component of Investments at value (securities) or Deposits with counterparty. Cash collateral received is not typically held in a segregated account and as such is reflected as a liability on the Statements of Assets and Liabilities as Deposits from counterparty. The market value of any securities received as collateral is not reflected as a component of NAV. A Fund’s overall exposure to counterparty risk can change substantially within a short period, as it is affected by each transaction subject to the relevant Master Agreement.
Master Repurchase Agreements and Global Master Repurchase Agreements (individually and collectively “Master Repo Agreements”) govern repurchase, reverse repurchase, and certain sale-buyback transactions between a Fund and select counterparties. Master Repo Agreements maintain provisions for, among other things, initiation, income payments, events of default, and maintenance of collateral. The market value of transactions under the Master Repo Agreement, collateral pledged or received, and the net exposure by counterparty as of period end are disclosed in the Notes to Schedules of Investments.
Master Securities Forward Transaction Agreements (“Master Forward Agreements”) govern certain forward settling transactions, such as TBA securities, delayed-delivery or certain sale-buyback transactions by and between a Fund and select counterparties. The Master Forward Agreements maintain provisions for, among other things, transaction initiation and confirmation, payment and transfer, events of default, termination, and maintenance of collateral. The market value of forward settling transactions, collateral pledged or received, and the net exposure by counterparty as of period end is disclosed in the Notes to Schedules of Investments.
Customer Account Agreements and related addenda govern cleared derivatives transactions such as futures, options on futures, and cleared OTC derivatives. Such transactions require posting of initial margin as determined by each relevant clearing agency which is segregated in an account at a futures commission merchant (“FCM”) registered with the Commodity Futures Trading Commission (“CFTC”). In the United States, counterparty risk may be reduced as creditors of an FCM cannot
December 31, 2018 (Unaudited)
have a claim to Fund assets in the segregated account. Portability of exposure reduces risk to the Funds. Variation margin, or changes in market value, are exchanged daily, but may not be netted between futures and cleared OTC derivatives unless the parties have agreed to a separate arrangement in respect of portfolio margining. The market value or accumulated unrealized appreciation (depreciation), initial margin posted, and any unsettled variation margin as of period end are disclosed in the Notes to Schedules of Investments.
Prime Broker Arrangements may be entered into to facilitate execution and/or clearing of listed equity option transactions or short sales of equity securities between a Fund and selected counterparties. The arrangements provide guidelines surrounding the rights, obligations, and other events, including, but not limited to, margin, execution, and settlement. These agreements maintain provisions for, among other things, payments, maintenance of collateral, events of default, and termination. Margin and other assets delivered as collateral are typically in the possession of the prime broker and would offset any obligations due to the prime broker. The market values of listed options and securities sold short and related collateral are disclosed in the Notes to Schedules of Investments.
International Swaps and Derivatives Association, Inc. Master Agreements and Credit Support Annexes (“ISDA Master Agreements”) govern bilateral OTC derivative transactions entered into by a Fund with select counterparties. ISDA Master Agreements maintain provisions for general obligations, representations, agreements, collateral posting and events of default or termination. Events of termination include conditions that may entitle counterparties to elect to terminate early and cause settlement of all outstanding transactions under the applicable ISDA Master Agreement. Any election to terminate early could be material to the financial statements. In limited circumstances, the ISDA Master Agreement may contain additional provisions that add counterparty protection beyond coverage of existing daily exposure if the counterparty has a decline in credit quality below a predefined level. These amounts, if any, may be segregated with a third-party custodian. The market value of OTC financial derivative instruments, collateral received or pledged, and net exposure by counterparty as of period end are disclosed in the Notes to Schedules of Investments.
9. FEES AND EXPENSES
(a) Management Fee PIMCO, a majority-owned subsidiary of Allianz Asset Management of America L.P. (“Allianz Asset Management”), serves as the Manager to the Trust, pursuant to an investment management agreement. Each Fund pays PIMCO fees in return for providing investment advisory, supervisory and administrative services under anall-in fee structure. Each Fund will pay monthly management
fees to PIMCO at an annual rate based on average daily net assets (the “Management Fee”), at an annual rate as noted in the table below.
| | | | | | | | |
| Fund Name | | | | | Management Fee | |
| | |
PIMCO1-3 Year U.S. Treasury Index
Exchange-Traded Fund | | | | | | | 0.15% | |
| | |
PIMCO 25+ Year Zero Coupon U.S. Treasury Index Exchange-Traded Fund | | | | | | | 0.15% | |
| | |
PIMCO1-5 Year U.S. TIPS Index
Exchange-Traded Fund | | | | | | | 0.20% | |
| | |
PIMCO 15+ Year U.S. TIPS Index
Exchange-Traded Fund | | | | | | | 0.20% | |
| | |
PIMCO Broad U.S. TIPS Index Exchange-Traded Fund | | | | | | | 0.20% | |
| | |
PIMCO0-5 Year High Yield Corporate Bond Index Exchange-Traded Fund | | | | | | | 0.55% | |
| | |
PIMCO Investment Grade Corporate Bond Index Exchange-Traded Fund | | | | | | | 0.20% | |
| | |
PIMCO Active Bond Exchange-Traded Fund | | | | | | | 0.55% | |
| | |
PIMCO Enhanced Low Duration Active
Exchange-Traded Fund(1) | | | | | | | 0.46% | |
| | |
PIMCO Enhanced Short Maturity Active
Exchange-Traded Fund | | | | | | | 0.35% | |
| | |
PIMCO Intermediate Municipal Bond Active
Exchange-Traded Fund | | | | | | | 0.35% | |
| | |
PIMCO Short Term Municipal Bond Active
Exchange-Traded Fund | | | | | | | 0.35% | |
| (1) | PIMCO has contractually agreed, through October 31, 2019, to waive its management fee by 0.07% of the average daily net assets attributable to the Fund. |
(b) Distribution and Servicing Fees PIMCO Investments LLC, a wholly-owned subsidiary of PIMCO, serves as the distributor (“Distributor”) of each Fund’s Creation Units. The Distributor does not maintain a secondary market in shares of the Funds. During the period ended December 31, 2018 each Fund was permitted to compensate the Distributor at an annual rate of up to 0.25% of a Fund’s average daily net assets (the“12b-1 Plan Fee”). However, the Board of Trustees has determined not to authorize payment of a12b-1 Plan Fee at this time. The12b-1 Plan Fee may only be imposed or increased when the Board determines that it is in the best interests of shareholders to do so. Because these fees are paid out of a Fund’s assets on an ongoing basis, to the extent that a fee is authorized, over time it will increase the cost of an investment in the Fund. The12b-1 Plan Fee may cost an investor more than other types of sales charges.
(c) Fund Expenses PIMCO provides or procures supervisory and administrative services for shareholders and also bears the costs of various third-party services required by the Funds, including audit, custodial, portfolio accounting, legal, transfer agency and printing costs. The Funds bear other expenses which are not covered under the Management Fee which may vary and affect the total level of expenses paid by shareholders, such as (i) taxes and governmental fees; (ii) brokerage fees and commissions and other portfolio transaction expenses; (iii) costs of borrowing money, including interest expense; (iv) securities lending fees and expenses; (v) fees and expenses of the Trustees who are not “interested persons” of PIMCO or the Trust, and any counsel retained exclusively for their benefit; (vi) extraordinary
| | | | | | |
| | SEMIANNUAL REPORT | | DECEMBER 31, 2018 | | 103 |
Notes to Financial Statements(Cont.)
expense, including costs of litigation and indemnification expenses; and (vii) organizational expenses. The ratio of expenses to average net assets, as disclosed on the Financial Highlights, may differ from the annual fund operating expenses as disclosed in the Prospectus.
Each Trustee, other than those affiliated with PIMCO or its affiliates, receives an annual retainer of $41,200, plus $4,250 for each Board meeting attended in person, $850 for each committee meeting attended and $750 for each Board meeting attended telephonically, plus reimbursement of related expenses. In addition, the audit committee chair receives an additional annual retainer of $8,000, the valuation oversight committee lead receives an additional annual retainer of $8,500 (to the extent there are co-leads of the valuation oversight committee, the annual retainer will be split evenly between the co-leads, so that each co-lead individually receives an additional annual retainer of $4,250) and each other committee chair receives an additional annual retainer of $5,500. The Lead Independent Trustee receives an annual retainer of $7,000.
These expenses are allocated on a pro rata basis to each Fund of the Trust according to its respective net assets. The Trust pays no compensation directly to any Trustee or any other officer who is affiliated with the Manager, all of whom receive remuneration for their services to the Trust from the Manager or its affiliates.
(d) Expense Limitation Pursuant to the Expense Limitation Agreement, PIMCO has agreed to waive a portion of the Funds’ Management Fee, or reimburse each Fund, to the extent that each Fund’s organizational expenses, pro rata share of expenses related to obtaining or maintaining a Legal Entity Identifier and pro rata share of Trustee Fees exceed 0.0049%, the “Expense Limit” (calculated as a percentage of the Fund’s average daily net assets). The Expense Limitation Agreement will automatically renew forone-year terms unless PIMCO provides written notice to the Trust at least 30 days prior to the end of the then current term.
Pursuant to a Fee Waiver Agreement, PIMCO has contractually agreed, through October 31, 2019, to waive or reduce its Management Fee for the PIMCO Active Bond Exchange-Traded Fund.
Pursuant to a Fee Waiver Agreement, PIMCO has contractually agreed, through October 31, 2019, to waive or reduce its Management Fee for the PIMCO Enhanced Low Duration Active Exchange-Traded Fund. The Fee Waiver Agreements will automatically renew forone-year terms unless PIMCO provides written notice to the Trust at least 30 days prior to the end of the then current term.
Each waiver is reflected on the Statements of Operations as a component of Waiver and/or Reimbursement by PIMCO.
Under certain conditions, PIMCO may be reimbursed for amounts waived pursuant to the Expense Limitation Agreement in future periods, not to exceedthirty-six months after the waiver. The total recoverable amounts to PIMCO at December 31, 2018, were as follows (amounts in thousands†):
| | | | | | | | | | | | | | | | | | | | |
| | | | | | Expiring within | | | | |
| Fund Name | | | | | 12 months | | | 13-24 months | | | 25-36 months | | | Total | |
| | | | | |
PIMCO1-3 Year U.S. Treasury IndexExchange-Traded Fund | | | | | | $ | 0 | | | $ | 1 | | | $ | 2 | | | $ | 3 | |
| | | | | |
PIMCO Broad U.S. TIPS Index
Exchange-Traded Fund | | | | | | | 0 | | | | 0 | | | | 1 | | | | 1 | |
| | | | | |
PIMCO Enhanced Low Duration Active
Exchange-Traded Fund | | | | | | | 46 | | | | 72 | | | | 124 | | | | 242 | |
| † | A zero balance may reflect actual amounts rounding to less than one thousand. |
10. RELATED PARTY TRANSACTIONS
The Manager and Distributor are related parties. Fees paid to these parties are disclosed in Note 9, Fees and Expenses, and the accrued related party fee amounts are disclosed on the Statements of Assets and Liabilities.
Certain Funds are permitted to purchase or sell securities from or to certain related affiliated funds under specified conditions outlined in procedures adopted by the Board. The procedures have been designed to ensure that any purchase or sale of securities by the Funds from or to another fund or portfolio that are, or could be, considered an affiliate, or an affiliate of an affiliate, by virtue of having a common investment adviser (or affiliated investment advisers), common Trustees and/or common officers complies with Rule17a-7 under the Act.
Further, as defined under the procedures, each transaction is effected at the current market price. Purchases and sales of securities pursuant to Rule17a-7 under the Act for the period ended December 31, 2018, were as follows (amounts in thousands†):
| | | | | | | | | | | | |
| Fund Name | | | | | Purchases | | | Sales | |
| | | |
PIMCO0-5 Year High Yield Corporate Bond Index Exchange-Traded Fund | | | | | | $ | 31,712 | | | $ | 3,171 | |
| | | |
PIMCO Active Bond Exchange-Traded Fund | | | | | | | 13,255 | | | | 42,147 | |
| | | |
PIMCO Enhanced Low Duration ActiveExchange-Traded Fund | | | | | | | 9,721 | | | | 2,650 | |
| | | |
PIMCO Enhanced Short Maturity ActiveExchange-Traded Fund | | | | | | | 544,100 | | | | 434,767 | |
| | | |
PIMCO Short Term Municipal Bond ActiveExchange-Traded Fund | | | | | | | 809 | | | | 0 | |
| † | A zero balance may reflect actual amounts rounding to less than one thousand. |
December 31, 2018 (Unaudited)
11. GUARANTEES AND INDEMNIFICATIONS
Under the Trust’s organizational documents, each Trustee or officer of the Trust is indemnified and each employee or other agent of the Trust (including the Trust’s investment manager) may be indemnified, to the extent permitted by the Act, against certain liabilities that may arise out of performance of their duties to the Funds. Additionally, in the normal course of business, the Funds enter into contracts that contain a variety of indemnification clauses. The Funds’ maximum exposure under these arrangements is unknown as this would involve future claims that may be made against the Funds that have not yet occurred. However, the Funds have not had prior claims or losses pursuant to these contracts.
12. PURCHASES AND SALES OF SECURITIES
The length of time a Fund has held a particular security is not generally a consideration in investment decisions. A change in the securities held
by a Fund is known as “portfolio turnover.” Each Fund may engage in frequent and active trading of portfolio securities to achieve its investment objective, particularly during periods of volatile market movements. High portfolio turnover may involve correspondingly greater transaction costs to a Fund, including brokerage commissions or dealermark-ups and other transaction costs on the sale of securities and reinvestments in other securities. Such sales may also result in realization of taxable capital gains, including short-term capital gains (which are generally taxed at ordinary income tax rates). The transaction costs and tax effects associated with portfolio turnover may adversely affect a Fund’s performance. The portfolio turnover rates are reported in the Financial Highlights.
Purchases and sales of securities (excluding short-term investments) for the period ended December 31, 2018, were as follows (amounts in thousands†):
| | | | | | | | | | | | | | | | | | | | |
| | | | | | U.S. Government/Agency | | | All Other | |
| | | | | |
| Fund Name | | | | | Purchases | | | Sales | | | Purchases | | | Sales | |
| | | | | |
PIMCO1-3 Year U.S. Treasury Index Exchange-Traded Fund | | | | | | $ | 19,817 | | | $ | 19,451 | | | $ | 0 | | | $ | 0 | |
| | | | | |
PIMCO 25+ Year Zero Coupon U.S. Treasury Index Exchange-Traded Fund | | | | | | | 14,145 | | | | 17,487 | | | | 0 | | | | 0 | |
| | | | | |
PIMCO1-5 Year U.S. TIPS Index Exchange-Traded Fund | | | | | | | 116,694 | | | | 128,239 | | | | 0 | | | | 0 | |
| | | | | |
PIMCO 15+ Year U.S. TIPS Index Exchange-Traded Fund | | | | | | | 5,124 | | | | 8,440 | | | | 0 | | | | 0 | |
| | | | | |
PIMCO Broad U.S. TIPS Index Exchange-Traded Fund | | | | | | | 1,188 | | | | 1,512 | | | | 0 | | | | 0 | |
| | | | | |
PIMCO0-5 Year High Yield Corporate Bond Index Exchange-Traded Fund | | | | | | | 0 | | | | 0 | | | | 162,654 | | | | 227,552 | |
| | | | | |
PIMCO Investment Grade Corporate Bond Index Exchange-Traded Fund | | | | | | | 6,641 | | | | 6,719 | | | | 90,328 | | | | 82,424 | |
| | | | | |
PIMCO Active Bond Exchange-Traded Fund | | | | | | | 1,678,064 | | | | 1,592,578 | | | | 236,551 | | | | 251,746 | |
| | | | | |
PIMCO Enhanced Low Duration Active Exchange-Traded Fund | | | | | | | 1,411,693 | | | | 1,321,016 | | | | 75,986 | | | | 30,286 | |
| | | | | |
PIMCO Enhanced Short Maturity Active Exchange-Traded Fund | | | | | | | 1,864,853 | | | | 3,098,959 | | | | 3,119,991 | | | | 800,661 | |
| | | | | |
PIMCO Intermediate Municipal Bond Active Exchange-Traded Fund | | | | | | | 0 | | | | 0 | | | | 67,393 | | | | 45,085 | |
| | | | | |
PIMCO Short Term Municipal Bond Active Exchange-Traded Fund | | | | | | | 0 | | | | 0 | | | | 28,865 | | | | 20,809 | |
| † | A zero balance may reflect actual amounts rounding to less than one thousand. |
13. CAPITAL SHARE TRANSACTIONS
Capital shares are issued and redeemed by a Fund only in Creation Units. Except when aggregated in Creation Units, shares of a Fund are not redeemable. Transactions in capital shares for a Fund are disclosed in detail on the Statements of Changes in Net Assets.
The consideration for the purchase of Creation Units of a Fund generally consists of a basket of cash and/or securities that the Fund specifies each business day. Authorized Participants may be charged transaction fees as set forth below. To offset transfer and other transaction costs associated with the issuance and redemption of Creation Units, Authorized Participants are subject to standard creation and redemption transaction fees payable directly to State Street Bank and Trust Company, thesub-administrator of the Funds. PIMCO may, from time to time, at its own expense, compensate purchasers of Creation Units who have purchased substantial amounts of Creation Units and other financial institutions for administrative or marketing services. Creations and redemptions for cash (when cash creations and redemptions are available or specified) may be subject to an additional variable charge up to the maximum amount shown in the table below.
| | | | | | | | | | |
Standard Creation/
Redemption
Transaction Fee* | | | Maximum
Variable Charge
for Cash Creations** | | | Maximum
Variable Charge for
Cash Redemptions** | |
| $ | 500 | | | | 3.00 | % | | | 2.00 | % |
| * | Applicable toin-kind contributions or redemptions only. |
| ** | As a percentage of the net asset value per Creation Unit purchased or redeemed, inclusive of the standard creation transaction fee (if imposed). |
| | | | | | |
| | SEMIANNUAL REPORT | | DECEMBER 31, 2018 | | 105 |
Notes to Financial Statements(Cont.)
14. INVESTMENT TRANSACTIONS
For the period ended December 31, 2018, certain Funds hadin-kind contributions andin-kind redemptions as follows (amounts in thousands†):
| | | | | | | | | | | | |
| Fund Name | | | | | Contributions | | | Redemptions | |
| | | |
PIMCO1-3 Year U.S. Treasury Index Exchange-Traded Fund | | | | | | $ | 0 | | | $ | 32,020 | |
| | | |
PIMCO 25+ Year Zero Coupon U.S. Treasury Index Exchange-Traded Fund | | | | | | | 5,454 | | | | 22,274 | |
| | | |
PIMCO1-5 Year U.S. TIPS Index Exchange-Traded Fund | | | | | | | 45,991 | | | | 63,700 | |
| | | |
PIMCO 15+ Year U.S. TIPS Index Exchange-Traded Fund | | | | | | | 3,267 | | | | 43,617 | |
| | | |
PIMCO Broad U.S. TIPS Index Exchange-Traded Fund | | | | | | | 5,592 | | | | 0 | |
| | | |
PIMCO0-5 Year High Yield Corporate Bond Index Exchange-Traded Fund | | | | | | | 732,841 | | | | 1,018,845 | |
| | | |
PIMCO Investment Grade Corporate Bond Index Exchange-Traded Fund | | | | | | | 48,321 | | | | 162,403 | |
| † | A zero balance may reflect actual amounts rounding to less than one thousand. |
Thein-kind contributions andin-kind redemptions in this table may not agree with the Fund Share Transactions on the Statements of Changes in Net Assets. The table represents the accumulation of each Fund’s daily net shareholder transactions while the Statements of Changes in Net Assets reflect gross shareholder transactions including any cash component of the transactions.
15. REGULATORY AND LITIGATION MATTERS
The Funds are not named as defendants in any material litigation or arbitration proceedings and are not aware of any material litigation or claim pending or threatened against them.
The foregoing speaks only as of the date of this report.
16. FEDERAL INCOME TAX MATTERS
Each Fund intends to qualify as a regulated investment company under Subchapter M of the Internal Revenue Code (the “Code”) and distribute all of its taxable income and net realized gains, if applicable, to shareholders. Accordingly, no provision for Federal income taxes has been made.
A Fund may be subject to local withholding taxes, including those imposed on realized capital gains. Any applicable foreign capital gains
tax is accrued daily based upon net unrealized gains, and may be payable following the sale of any applicable investments.
In accordance with U.S. GAAP, the Manager has reviewed the Funds’ tax positions for all open tax years. As of December 31, 2018, the Funds have recorded no liability for net unrecognized tax benefits relating to uncertain income tax positions they have taken or expect to take in future tax returns.
The Funds file U.S. federal, state, and local tax returns as required. The Funds’ tax returns are subject to examination by relevant tax authorities until expiration of the applicable statute of limitations, which is generally three years after the filing of the tax return but which can be extended to six years in certain circumstances. Tax returns for open years have incorporated no uncertain tax positions that require a provision for income taxes.
As of their last fiscal year ended June 30, 2018, the Funds had accumulated capital losses expiring in the following years (amounts in thousands†). The Funds will resume capital gain distributions in the future to the extent gains are realized in excess of accumulated capital losses.
| | | | | | | | |
| | | | | | Expiration of Accumulated
Capital losses | |
| | |
| | | | | | 06/30/2019 | |
| | |
PIMCO1-3 Year U.S. Treasury Index Exchange-Traded Fund | | | | | | $ | 0 | |
| | |
PIMCO 25+ Year Zero Coupon U.S. Treasury IndexExchange-Traded Fund | | | | | | | 363 | |
| | |
PIMCO1-5 Year U.S. TIPS Index Exchange-Traded Fund | | | | | | | 0 | |
| | |
PIMCO 15+ Year U.S. TIPS Index Exchange-Traded Fund | | | | | | | 0 | |
| | |
PIMCO Broad U.S. TIPS Index Exchange-Traded Fund | | | | | | | 0 | |
| | |
PIMCO0-5 Year High Yield Corporate Bond IndexExchange-Traded Fund | | | | | | | 0 | |
| | |
PIMCO Investment Grade Corporate Bond IndexExchange-Traded Fund | | | | | | | 0 | |
| | |
PIMCO Active Bond Exchange-Traded Fund | | | | | | | 0 | |
| | |
PIMCO Enhanced Low Duration Active Exchange-Traded Fund | | | | | | | 0 | |
| | |
PIMCO Enhanced Short Maturity Active Exchange-Traded Fund | | | | | | | 0 | |
| | |
PIMCO Intermediate Municipal Bond ActiveExchange-Traded Fund | | | | | | | 0 | |
| | |
PIMCO Short Term Municipal Bond Active Exchange-Traded Fund | | | | | | | 0 | |
| † | A zero balance may reflect actual amounts rounding to less than one thousand. |
December 31, 2018 (Unaudited)
Under the Regulated Investment Company Modernization Act of 2010, a Fund is permitted to carry forward any new capital losses for an unlimited period. Additionally, such capital losses that are carried forward will retain their character as either short-term or long-term capital losses rather than being considered all short-term under previous law.
As of their last fiscal year ended June 30, 2018, the Funds had the following post-effective capital losses with no expiration (amounts in thousands†):
| | | | | | | | | | | | |
| | | | | | Short-Term | | | Long-Term | |
| | | |
PIMCO1-3 Year U.S. Treasury IndexExchange-Traded Fund | | | | | | $ | 88 | | | $ | 395 | |
| | | |
PIMCO 25+ Year Zero Coupon U.S. Treasury Index Exchange- Traded Fund | | | | | | | 16,129 | | | | 9,256 | |
| | | |
PIMCO1-5 Year U.S. TIPS IndexExchange-Traded Fund | | | | | | | 5,414 | | | | 11,692 | |
| | | |
PIMCO 15+ Year U.S. TIPS IndexExchange-Traded Fund | | | | | | | 4,166 | | | | 9,367 | |
| | | |
PIMCO Broad U.S. TIPS Index Exchange-Traded Fund | | | | | | | 165 | | | | 851 | |
| | | |
PIMCO0-5 Year High Yield Corporate Bond Index Exchange- Traded Fund | | | | | | | 29,825 | | | | 95,392 | |
| | | |
PIMCO Investment Grade Corporate Bond Index Exchange-Traded Fund | | | | | | | 0 | | | | 0 | |
| | | |
PIMCO Active Bond Exchange-Traded Fund | | | | | | | 19,381 | | | | 33,901 | |
| | | |
PIMCO Enhanced Low Duration ActiveExchange-Traded Fund | | | | | | | 1,905 | | | | 571 | |
| | | |
PIMCO Enhanced Short Maturity ActiveExchange-Traded Fund | | | | | | | 0 | | | | 0 | |
| | | |
PIMCO Intermediate Municipal Bond ActiveExchange-Traded Fund | | | | | | | 4,040 | | | | 493 | |
| | | |
PIMCO Short Term Municipal Bond ActiveExchange-Traded Fund | | | | | | | 672 | | | | 149 | |
| † | A zero balance may reflect actual amounts rounding to less than one thousand. |
As of December 31, 2018, the aggregate cost and the net unrealized appreciation/(depreciation) of investments for Federal income tax purposes are as follows (amounts in thousands†):
| | | | | | | | | | | | | | | | | | | | |
| | | | | | Federal
Tax Cost | | | Unrealized
Appreciation | | | Unrealized
(Depreciation) | | | Net Unrealized
Appreciation/
(Depreciation)(1) | |
| | | | | |
PIMCO1-3 Year U.S. Treasury IndexExchange-Traded Fund | | | | | | $ | 55,288 | | | $ | 103 | | | $ | (390 | ) | | $ | (287 | ) |
| | | | | |
PIMCO 25+ Year Zero Coupon U.S. Treasury Index Exchange-Traded Fund | | | | | | | 155,750 | | | | 277 | | | | (13,224 | ) | | | (12,947 | ) |
| | | | | |
PIMCO1-5 Year U.S. TIPS IndexExchange-Traded Fund | | | | | | | 813,897 | | | | 0 | | | | (20,176 | ) | | | (20,176 | ) |
| | | | | |
PIMCO 15+ Year U.S. TIPS IndexExchange-Traded Fund | | | | | | | 206,860 | | | | 0 | | | | (13,223 | ) | | | (13,223 | ) |
| | | | | |
PIMCO Broad U.S. TIPS Index Exchange-Traded Fund | | | | | | | 57,208 | | | | 1 | | | | (2,783 | ) | | | (2,782 | ) |
| | | | | |
PIMCO0-5 Year High Yield Corporate Bond Index Exchange-Traded Fund | | | | | | | 1,314,755 | | | | 1,400 | | | | (77,787 | ) | | | (76,387 | ) |
| | | | | |
PIMCO Investment Grade Corporate Bond Index Exchange-Traded Fund | | | | | | | 647,586 | | | | 2,383 | | | | (27,560 | ) | | | (25,177 | ) |
| | | | | |
PIMCO Active Bond Exchange-Traded Fund | | | | | | | 2,221,022 | | | | 26,204 | | | | (46,735 | ) | | | (20,531 | ) |
| | | | | |
PIMCO Enhanced Low Duration ActiveExchange-Traded Fund | | | | | | | 382,133 | | | | 2,413 | | | | (5,416 | ) | | | (3,003 | ) |
| | | | | |
PIMCO Enhanced Short Maturity ActiveExchange-Traded Fund | | | | | | | 12,190,296 | | | | 7,846 | | | | (44,611 | ) | | | (36,765 | ) |
| | | | | |
PIMCO Intermediate Municipal Bond ActiveExchange-Traded Fund | | | | | | | 309,065 | | | | 5,241 | | | | (269 | ) | | | 4,972 | |
| | | | | |
PIMCO Short Term Municipal Bond ActiveExchange-Traded Fund | | | | | | | 80,136 | | | | 270 | | | | (86 | ) | | | 184 | |
| † | A zero balance may reflect actual amounts rounding to less than one thousand. |
| (1) | Primary differences, if any, between book and tax net unrealized appreciation/(depreciation) are attributable to wash sale loss deferrals for Federal income tax purposes. |
| | | | | | |
| | SEMIANNUAL REPORT | | DECEMBER 31, 2018 | | 107 |
Glossary:(abbreviations that may be used in the preceding statements)
(Unaudited)
| | | | | | | | | | |
|
Counterparty Abbreviations: |
| | | | | |
| BCY | | Barclays Capital, Inc. | | DUB | | Deutsche Bank AG | | JPS | | JP Morgan Securities, Inc. |
| | | | | |
| BMO | | BMO Capital Markets Corp. | | FBF | | Credit Suisse International | | MBC | | HSBC Bank Plc |
| | | | | |
| BNP | | BNP Capital Markets Ltd. | | FICC | | Fixed Income Clearing Corporation | | MYC | | Morgan Stanley Capital Services, Inc. |
| | | | | |
| BOA | | Bank of America N.A. | | FOB | | Credit Suisse Securities (USA) LLC | | RCY | | Royal Bank of Canada |
| | | | | |
| BOS | | Banc of America Securities LLC | | GLM | | Goldman Sachs Bank USA | | RDR | | RBC Capital Markets LLC |
| | | | | |
| BPS | | BNP Paribas S.A. | | GSC | | Goldman Sachs & Co. | | RYL | | Royal Bank of Scotland Group PLC |
| | | | | |
| BRC | | Barclays Bank PLC | | GST | | Goldman Sachs International | | SAL | | Citigroup Global Markets, Inc. |
| | | | | |
| BSN | | Bank of Nova Scotia | | HUS | | HSBC Bank USA N.A. | | SSB | | State Street Bank and Trust Co. |
| | | | | |
| CBK | | Citibank N.A. | | IND | | Crédit Agricole Corporate and Investment Bank S.A. | | TDM | | TD Securities (USA) LLC |
| | | | | |
| DEU | | Deutsche Bank Securities, Inc. | | JPM | | JP Morgan Chase Bank N.A. | | UBS | | UBS Securities LLC |
|
Currency Abbreviations: |
| | | | | |
| EUR | | Euro | | JPY | | Japanese Yen | | USD (or $) | | United States Dollar |
|
Exchange Abbreviations: |
| | | | | |
| CBOT | | Chicago Board of Trade | | OTC | | Over the Counter | | | | |
|
Index/Spread Abbreviations: |
| | | | | |
| CDX.EM | | Credit Derivatives Index - Emerging Markets | | LIBOR01M | | 1 MonthUSD-LIBOR | | US0001M | | 1 Month USD Swap Rate |
| | | | | |
| CDX.HY | | Credit Derivatives Index - High Yield | | LIBOR03M | | 3 MonthUSD-LIBOR | | US0003M | | 3 Month USD Swap Rate |
| | | | | |
| CDX.IG | | Credit Derivatives Index - Investment Grade | | SOFRRATE | | Secured Overnight Financing Rate | | | | |
|
Municipal Bond or Agency Abbreviations: |
| | | | | |
| AGM | | Assured Guaranty Municipal | | AMBAC | | American Municipal Bond Assurance Corp. | | PSF | | Public School Fund |
|
Other Abbreviations: |
| | | | | |
| ABS | | Asset-Backed Security | | DAC | | Designated Activity Company | | PIK | | Payment-in-Kind |
| | | | | |
| ALT | | Alternate Loan Trust | | FDIC | | Federal Deposit Insurance Corp. | | REMIC | | Real Estate Mortgage Investment Conduit |
| | | | | |
| BABs | | Build America Bonds | | LIBOR | | London Interbank Offered Rate | | TBA | | To-Be-Announced |
| | | | | |
| CLO | | Collateralized Loan Obligation | | NCUA | | National Credit Union Administration | | TBD | | To-Be-Determined |
Approval of Investment Advisory Contract and Other Agreements
(Unaudited)
At a meeting held on August20-21, 2018, the Board of Trustees (the “Board”) of PIMCO ETF Trust (the “Trust”), including the Trustees who are not “interested persons” of the Trust under the Investment Company Act of 1940, as amended (the “Independent Trustees”), considered and unanimously approved the renewal of the Investment Management Agreement (the “Agreement”) between the Trust, on behalf of each of the Trust’s series (the “Funds”), and Pacific Investment Management Company LLC (“PIMCO”) for an additionalone-year term through August 31, 2019. Under the Agreement, PIMCO provides investment advisory services, as well as supervisory and administrative services, to each Fund for a single management fee (“unified fee”).
The information, material factors and conclusions that formed the basis for the Board’s approval are summarized below.
1. INFORMATION RECEIVED
(a) Materials Reviewed: During the course of the past year, the Trustees received a wide variety of materials relating to the services provided by PIMCO to the Trust. At each of its quarterly meetings, the Board reviewed the Funds’ investment performance and a significant amount of information relating to Fund operations, including shareholder services, valuation and custody, the Funds’ compliance program and other information relating to the nature, extent and quality of services provided by PIMCO to the Trust and each of the Funds. In considering whether to approve the renewal of the Agreement, the Board reviewed additional information, including, but not limited to, comparative industry data with regard to investment performance, advisory and supervisory and administrative fees and expenses, financial information for PIMCO, information regarding the profitability to PIMCO of its relationship with the Funds, information about the personnel providing investment management services, other advisory services and supervisory and administrative services to the Funds, and information about the fees charged and services provided to other clients with similar investment mandates as the Funds, where applicable. In addition, the Board reviewed materials provided by counsel to the Trust and the Independent Trustees, which included, among other things, memoranda outlining legal duties of the Board in considering the renewal of the Agreement.
(b) Review Process: In connection with considering the renewal of the Agreement, the Board reviewed written materials prepared by PIMCO in response to requests from counsel to the Trust and the Independent Trustees encompassing a wide variety of topics. The Board requested and received assistance and advice regarding, among other things, applicable legal standards from counsel to the Trust and the Independent Trustees, and reviewed comparative fee and performance data prepared at the Board’s request by Broadridge Financial Solutions, Inc. (“Broadridge”), an independent provider of investment company
performance information and fee and expense data. The Board received information on matters related to the Agreement and met both as a full Board and in a separate session of the Independent Trustees, without management present, at the August20-21, 2018 meeting. The Independent Trustees also conductedin-person meetings with counsel to the Trust and the Independent Trustees, including one on July 18, 2018, to discuss the Lipper Report, as defined below, and certain aspects of the 2018 15(c) materials presented and other matters deemed relevant to their consideration of the renewal of the Agreement. In addition, the Independent Trustees requested and received supplemental information.
The approval determination was made on the basis of each Trustee’s business judgment after consideration and evaluation of all the information presented. Individual Trustees may have given different weights to certain factors and assigned various degrees of materiality to information received in connection with the approval process. In deciding to approve the renewal of the Agreement, the Board did not identify any single factor or particular information that, in isolation, was controlling. The discussion below is intended to summarize the broad factors and information that figured prominently in the Board’s consideration of the renewal of the Agreement, but is not intended to summarize all of the factors considered by the Board.
2. NATURE, EXTENT AND QUALITY OF SERVICES
(a) PIMCO, its Personnel, and Resources: The Board considered the depth and quality of PIMCO’s investment management process, including, but not limited to: the experience, capability and integrity of its senior management and other personnel; the overall financial strength and stability of its organization; and the ability of its organizational structure to address changes in the Funds’ asset levels. The Board also considered the various services in addition to portfolio management that PIMCO provides under the Agreement. The Board noted that PIMCO makes available to its investment professionals a variety of resources and systems relating to investment management, compliance, trading, performance and portfolio accounting. The Board also noted PIMCO’s commitment to enhancing and investing in its global infrastructure, technology capabilities, risk management processes and the specialized talent needed to stay at the forefront of the competitive investment management industry and to strengthen its ability to deliver services under the Agreement. The Board considered PIMCO’s policies, procedures and systems reasonably designed to assure compliance with applicable laws and regulations and its commitment to further developing and strengthening these programs, its oversight of matters that may involve conflicts of interest between the Funds’ investments and those of other accounts managed by PIMCO, and its efforts to keep the Trustees informed about matters relevant to the Funds and their shareholders. The Board also
| | | | | | |
| | SEMIANNUAL REPORT | | DECEMBER 31, 2018 | | 109 |
Approval of Investment Advisory Contract and Other Agreements(Cont.)
considered PIMCO’s continuous investment in new disciplines and talented personnel, which has enhanced PIMCO’s services to the Funds and has allowed PIMCO to introduce innovative new funds over time.
The Trustees considered that PIMCO has continued to strengthen the process it uses to actively manage counterparty risk and to assess the financial stability of counterparties with which the Funds do business, to manage collateral and to protect the Funds from an unforeseen deterioration in the creditworthiness of trading counterparties. The Trustees noted that, consistent with its fiduciary duty, PIMCO executes transactions through a competitive best execution process and uses only those counterparties that meet its stringent and monitored criteria. The Trustees considered that PIMCO’s collateral management team utilizes a counterparty risk system to analyze portfolio level exposure and collateral being exchanged with counterparties.
In addition, the Trustees considered new services and service enhancements that PIMCO has implemented since the Board renewed the Agreement in 2017, including, but not limited to: upgrading the global network and infrastructure to support trading and risk management systems; enhancing and continuing to expand capabilities within thepre-trade compliance platform; enhancing flexible client reporting capabilities to support increased differentiation within local markets; developing new application and database frameworks to support new trading strategies; expanding proprietary applications suites to enrich capabilities across Compliance, Analytics, Risk Management, Client Reporting, Attribution and Customer Relationship management; continuing investment in its enterprise risk management function, including PIMCO’s cybersecurity program and global business continuity functions; oversight by the Americas Fund Oversight Committee, which provides senior-level oversight and supervision focused on new and ongoing fund-related business opportunities; engaging a third party service provider to implement the SEC reporting modernization regime; expanding the Fund Treasurer’s Office; enhancing a proprietary application to provide portfolio managers with more timely and high quality income reporting; developing a global tax management application that will enable investment professionals to access foreign market and security tax information on a real-time basis; enhancing reporting of tax reporting for portfolio managers for income products with improved transparency on tax factors impacting income generation and dividend yield; upgrading a proprietary application to allow shareholder subscription and redemption data to pass to portfolio managers more quickly and efficiently; and continuing to expand the pricing portal and the proprietary performance reconciliation tool. In addition, the Board considered the investment in derivatives by certain active ETFs, and how PIMCO assesses and manages risk and regulatory compliance with respect to the use of derivatives by the Funds, as applicable.
Ultimately, the Board concluded that the nature, extent and quality of services provided or procured by PIMCO under the Agreement are likely to continue to benefit the Funds and their shareholders.
(b) Other Services: The Board also considered the nature, extent and quality of supervisory and administrative services provided by PIMCO to the Funds under the Agreement. The Board considered the terms of the Agreement, under which the Trust pays for the supervisory and administrative services provided pursuant to that agreement under the unified fee. In return, PIMCO provides or procures certain supervisory and administrative services and bears the costs of various third party services required by the Funds, including audit, custodial, portfolio accounting, legal, transfer agency and printing costs. The Board noted that the scope and complexity, as well as the costs, of the supervisory and administrative services provided by PIMCO under the Agreement continue to increase. The Board considered PIMCO’s provision of these services and its supervision of the Trust’s third party service providers to assure that these service providers continue to provide a high level of service relative to alternatives available in the market.
Ultimately, the Board concluded that the nature, extent and quality of the services provided or procured by PIMCO has benefited, and will likely continue to benefit, the Funds and their shareholders.
3. INVESTMENT PERFORMANCE
The Board reviewed information from PIMCO concerning the Funds’ performance, as available, over short- and long-term periods ended March 31, 2018 and other performance data, as available, over short- and long-term periods ended June 30, 2018 (the “PIMCO Report”) and from Broadridge concerning the Funds’ performance, as available, overshort- and long-term periods ended March 31, 2018 (the “Lipper Report”).
The Board considered information regarding both the short- and long-term investment performance of each Fund relative to its peer group and relevant benchmark index as provided to the Board in advance of each of its quarterly meetings throughout the year, including materials provided in advance of the August20-21, 2018 meeting. The Trustees noted that, as of June 30, 2018, the Trust had accumulated $16 billion in assets under management since its launch, and that the PIMCO Enhanced Short Maturity Exchange-Traded Fund and the PIMCO Active Bond Exchange-Traded Fund were the largest and fifth-largest actively managed exchange-traded funds, respectively. The Board also noted that, on a gross basis, approximately half of the Funds outperformed their respective benchmarks while the remaining Funds either performed in line with their respective benchmarks or slightly underperformed their respective benchmarks, and that PIMCO did not expect certain Funds, for structural reasons, to outperform their benchmarks on anafter-fee basis over longer time horizons. The Board
(Unaudited)
discussed with PIMCO the reasons for the underperformance of certain Funds. The Board also considered actions that have been taken by PIMCO throughout the year to attempt to address underperformance.
The Board ultimately concluded, within the context of all of its considerations in connection with the Agreement, that PIMCO’s performance record and process in managing the Funds indicates that its continued management is likely to benefit the Funds and their shareholders, and merits the approval of the renewal of the Agreement.
4. MANAGEMENT FEE AND TOTAL EXPENSES
The Board considered that PIMCO seeks to price new funds to scale. PIMCO reported to the Board that, in proposing fees for any Fund, it considers a number of factors, including, but not limited to, the type and complexity of the services provided, the cost of providing services, the risk assumed by PIMCO in the development of products and the provision of services and the competitive marketplace for financial products. Fees charged to or proposed for different Funds for management services may vary in light of these various factors.
The Board reviewed the management fee and total expenses of each Fund (each as a percentage of average net assets) and compared such amounts with the average and median fee and expense levels of other similar funds. With respect to the management fee, the Board reviewed data from Broadridge that compared the average and median management fees of other funds in a “Peer Group” of comparable funds, as well as the universe of other similar funds. The Board noted that the total expense ratio for many of the Funds was equal to or less than the median expenses of comparable funds in the Peer Group. The Board considered that certain of the actively-managed Funds offered by PIMCO are unique strategies with no competitors in the marketplace and that the Lipper Report compares these Funds to a mix of active and index exchange-traded funds. The Board compared each Fund’s total expenses to other funds in the Broadridge Expense Group, and found each Fund’s total expenses to be reasonable.
The Board also reviewed data comparing the Funds’ management fees to the standard and negotiated fee rates PIMCO charges to separate accounts, collective investment trusts and to other investment companies (both as adviser andsub-adviser) with similar investment strategies. The Board noted that PIMCO, for a number of Funds in the Trust, does not currently manage separate accounts with similar investment strategies. In cases where the fees for other clients were lower than those charged to the Funds, the Trustees noted that the differences in fees were attributable to various factors, including, but not limited to, differences in the number or extent of the services provided by PIMCO to the Funds, the manner in which similar portfolios may be managed, different requirements with respect to liquidity management and the implementation of other regulatory requirements, and the fact that separate accounts may have other contractual
arrangements or arrangements across PIMCO strategies that justify different levels of fees. The Board considered that, with respect to collective investment trusts, PIMCO performs fewer or less extensive services because collective investment trusts are generally exempt from SEC regulation; investors in a collective investment trust may receive shareholder services from a trustee bank, rather than PIMCO; collective investment trusts have less regulatory disclosure; and the management structure of collective investment trusts differs from that of funds. The Trustees also considered that PIMCO faces increased entrepreneurial, legal and regulatory risk in sponsoring and managing mutual funds and ETFs as compared to separate accounts, externalsub-advised funds or other investment products.
Regarding advisory fees charged by PIMCO in its capacity assub-adviser to third party/unaffiliated funds, the Trustees took into account that such fees may be lower than the fees charged by PIMCO to serve as adviser to the Funds. The Trustees also took into account that there are various reasons for any such differences in fees, including, but not limited to, the fact that PIMCO may be subject to varying levels of entrepreneurial, legal and regulatory risk and different servicing requirements when PIMCO does not serve as the sponsor of a fund and is not principally responsible for all aspects of a fund’s investment program and operations as compared to when PIMCO serves as investment adviser and sponsor.
The Board considered the Funds’ unified fee structure, under which each Fund pays for the advisory and supervisory and administrative services it requires for one set fee. In return for this unified fee, PIMCO provides or procures such services and bears the costs of various third party services required by the Funds, including audit, custodial, portfolio accounting, legal, transfer agency, and printing costs. The Board considered that the unified fee leads to Fund fees that are fixed over the contract period, rather than variable. The Board noted that, although the unified fee structure does not have breakpoints, it implicitly reflects economies of scale by fixing the absolute level of Fund fees at competitive levels over the contract period even if the Funds’ operating costs rise when assets remain flat or decrease. Other factors the Board considered in assessing the unified fee include PIMCO’s approach of pricing Funds at scale at inception and reinvesting in other important areas of the business that support the Funds. The Board concluded that each Fund’s fees were reasonable in relation to the value of the services provided, and that the unified fee represents, in effect, a cap on overall Fund fees during the contractual period, which is beneficial to the Funds and their shareholders.
Based on the information presented by PIMCO, members of the Board determined that, in the exercise of their business judgment, the management fee charged by PIMCO under the Agreement, as well as the total expenses of each Fund, are reasonable.
| | | | | | |
| | SEMIANNUAL REPORT | | DECEMBER 31, 2018 | | 111 |
Approval of Investment Advisory Contract and Other Agreements(Cont.)
(Unaudited)
5. ADVISER COSTS, LEVEL OF PROFITS AND ECONOMIES OF SCALE
The Board reviewed information regarding PIMCO’s costs of providing services to the Funds as a whole, as well as the resulting level of profits to PIMCO under both the adjusted asset profitability method and the profit and loss profitability method, which were each utilized to calculate profitability. The Board also noted that it had received information regarding the structure and manner in which PIMCO’s investment professionals were compensated, and PIMCO’s view of the relationship of such compensation to the attraction and retention of quality personnel. The Board considered PIMCO’s need to invest in global infrastructure, technology capabilities, risk management processes and qualified personnel to reinforce and offer new services and to accommodate changing regulatory requirements.
With respect to potential economies of scale, the Board noted that PIMCO shares the benefits of economies of scale with the Funds and their shareholders in a number of ways, including investing in portfolio and trade operations management, firm technology, middle and back office support, legal and compliance, and fund administration logistics; senior management supervision, governance and oversight of those services; and through fee reductions or waivers, the pricing of Funds to scale from inception and the enhancement of services provided to the Funds in return for fees paid. The Board considered that the Funds’ unified fee rates had been set competitively and/or priced to scale from inception, had been held steady during the contractual period at that scaled competitive rate for most Funds as assets grew, or as assets declined in the case of some Funds, and continued to be competitive compared with peers. The Board also considered the substantial investments PIMCO has made in order to support the operational and technological issues required to support exchange-traded funds as compared to traditional mutual funds, including enhancements related to the creation/redemption process, trade processing systems and iNAV process. The Board also considered that the unified fee is a transparent means of informing a Fund’s shareholders of the fees associated with the Fund, and that the Fund bears certain expenses that are not covered by the management fee. The Board further considered the challenges that arise when managing large funds, which can result in certain “diseconomies” of scale and noted that PIMCO has continued to reinvest in many areas of the business to support the Funds.
The Trustees considered that the unified fee has provided inherent economies of scale because a Fund maintains competitive fixed fees over the annual contract period even if the particular Fund’s assets decline and/or operating costs rise.The Trustees further considered that, in contrast, breakpoints may be a proxy for charging higher fees on lower asset levels and that when a fund’s assets decline, breakpoints may reverse, which causes expense ratios to increase.The
Trustees also considered that, unlike the Funds’ unified fee structure, funds with “pass through” fee structures may experience increased expense ratios when fixed dollar fees are charged against declining fund assets.The Trustees also considered that the unified fee protects shareholders from a rise in operating costs that may result from, among other things, PIMCO’s investments in various business enhancements and infrastructure, including those referenced above.The Trustees noted that PIMCO’s investments in these areas are extensive.
The Board concluded that the Funds’ cost structures were reasonable and that PIMCO is appropriately sharing economies of scale, if any, through the Funds’ unified fee structure, generally pricing Funds at scale at inception and reinvesting in its business to provide enhanced and expanded services to the Funds and their shareholders.
6. ANCILLARY BENEFITS
The Board considered other benefits realized by PIMCO and its affiliates as a result of PIMCO’s relationship with the Trust. Such benefits may include possible ancillary benefits to PIMCO’s institutional investment management business due to the reputation and market penetration of the Trust or third-party service providers’ relationship-level fee concessions, which decrease fees paid by PIMCO. The Board also reviewed PIMCO’s soft dollar policies and procedures, noting that while PIMCO has the authority to receive the benefit of research provided by broker-dealers executing portfolio transactions on behalf of the Funds, it has adopted a policy not to enter into contractual soft dollar arrangements.
7. CONCLUSIONS
Based on their review, including their comprehensive consideration and evaluation of each of the broad factors and information summarized above, the Independent Trustees and the Board as a whole concluded that the nature, extent and quality of the services rendered to the Funds by PIMCO supported the renewal of the Agreement. The Independent Trustees and the Board as a whole concluded that the Agreement continued to be fair and reasonable to the Funds and their shareholders, that the Funds’ shareholders received reasonable value in return for the fees paid to PIMCO by the Funds under the Agreement, and that the renewal of the Agreement was in the best interests of the Funds and their shareholders.
General Information
Investment Manager
Pacific Investment Management Company LLC
650 Newport Center Drive
Newport Beach, CA 92660
Distributor
PIMCO Investments LLC
1633 Broadway
New York, NY 10019
Custodian
State Street Bank and Trust Company
801 Pennsylvania Avenue
Kansas City, MO 64105
Transfer Agent
State Street Bank and Trust Company
1 Heritage Drive
Quincy, MA 02171
Legal Counsel
Dechert LLP
1900 K Street N.W.
Washington, D.C. 20006
Independent Registered Public Accounting Firm
PricewaterhouseCoopers LLP
1100 Walnut Street, Suite 1300
Kansas City, MO 64106
This report is submitted for the general information of the shareholders of the Funds listed on the report cover.

ETF4001SAR_123118
The information required by this Item 2 is only required in an annual report on this FormN-CSR.
| Item 3. | Audit Committee Financial Expert. |
The information required by this Item 3 is only required in an annual report on this FormN-CSR.
| Item 4. | Principal Accountant Fees and Services. |
The information required by this Item 4 is only required in an annual report on this FormN-CSR.
| Item 5. | Audit Committee of Listed Registrants. |
The information required by this Item 5 is only required in an annual report on this FormN-CSR.
| Item 6. | Schedule of Investments. |
The information required by this Item 6 is included as part of the semiannual reports to shareholders filed under Item 1 of this FormN-CSR.
| Item 7. | Disclosure of Proxy Voting Policies and Procedures for Closed-End Management Investment Companies. |
Not applicable toopen-end investment companies.
| Item 8. | Portfolio Managers of Closed-End Management Investment Companies. |
Not applicable toopen-end investment companies.
| Item 9. | Purchases of Equity Securities by Closed-End Management Investment Company and Affiliated Purchasers. |
Not applicable toopen-end investment companies.
| Item 10. | Submission of Matters to a Vote of Security Holders. |
There have been no material changes to the procedures by which shareholders may recommend nominees to the Trust’s Board of Trustees since the Trust last provided disclosure in response to this item.
| Item 11. | Controls and Procedures. |
| | (a) | The principal executive officer and principal financial & accounting officer have concluded that the Registrant’s disclosure controls and procedures (as defined in Rule30a-3(c) under the Act) provide reasonable assurances that material information relating to the Registrant is made known to them by the appropriate persons, based on their evaluation of these controls and procedures as of a date within 90 days of the filing of this report. |
| | (b) | There were no changes in the Registrant’s internal control over financial reporting (as defined in Rule30a-3(d) under the Act) that occurred during the last fiscal quarter of the period covered by this report that have materially affected, or are reasonably likely to materially affect, the Registrant’s internal control over financial reporting. |
| Item 12. | Disclosure of Securities Lending Activities forClosed-End Management Investment Companies. |
Not applicable toopen-end investment companies.
| | (a)(1) | Exhibit 99.CODE—Code of Ethics is not applicable for semiannual reports. |
| | (a)(2) | Exhibit 99.CERT—Certifications pursuant to Section 302 of the Sarbanes-Oxley Act of 2002. |
| | (a)(3) | Not applicable toopen-end investment companies. |
| | (a)(4) | There was no change in the registrant’s independent public accountant for the period covered by the report. |
| | (b) | Exhibit 99.906CERT—Certifications pursuant to Section 906 of the Sarbanes-Oxley Act of 2002. |
Signatures
Pursuant to the requirements of the Securities Exchange Act of 1934 and the Investment Company Act of 1940, the registrant has duly caused this report to be signed on its behalf by the undersigned, thereunto duly authorized.
| | |
| PIMCO ETF Trust |
| |
| By: | | /s/ Peter G. Strelow |
| | Peter G. Strelow |
| | President (Principal Executive Officer) |
|
| Date: February 28, 2019 |
Pursuant to the requirements of the Securities Exchange Act of 1934 and the Investment Company Act of 1940, this report has been signed below by the following persons on behalf of the registrant and in the capacities and on the dates indicated.
| | |
| By: | | /s/ Peter G. Strelow |
| | Peter G. Strelow |
| | President (Principal Executive Officer) |
|
| Date: February 28, 2019 |
| |
| By: | | /s/ Trent W. Walker |
| | Trent W. Walker |
| | Treasurer (Principal Financial & Accounting Officer) |
|
| Date: February 28, 2019 |