Exhibit 99.1
Results 3Q23
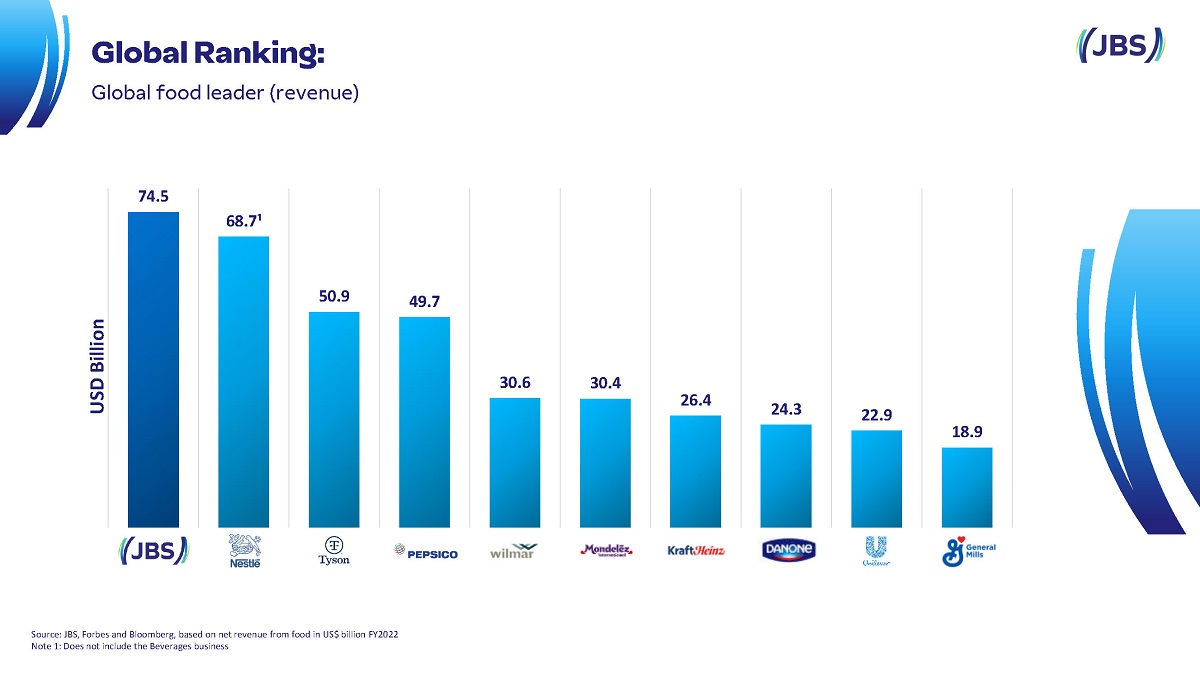
74.5 68.7¹ 50.9 49.7 30.6 30.4 26.4 24.3 22.9 18.9 USD Billion Source : JBS, Forbes and Bloomberg, based on net revenue from food in US$ billion FY2022 Note 1: Does not include the Beverages business Global Ranking: Global food leader ( revenue )
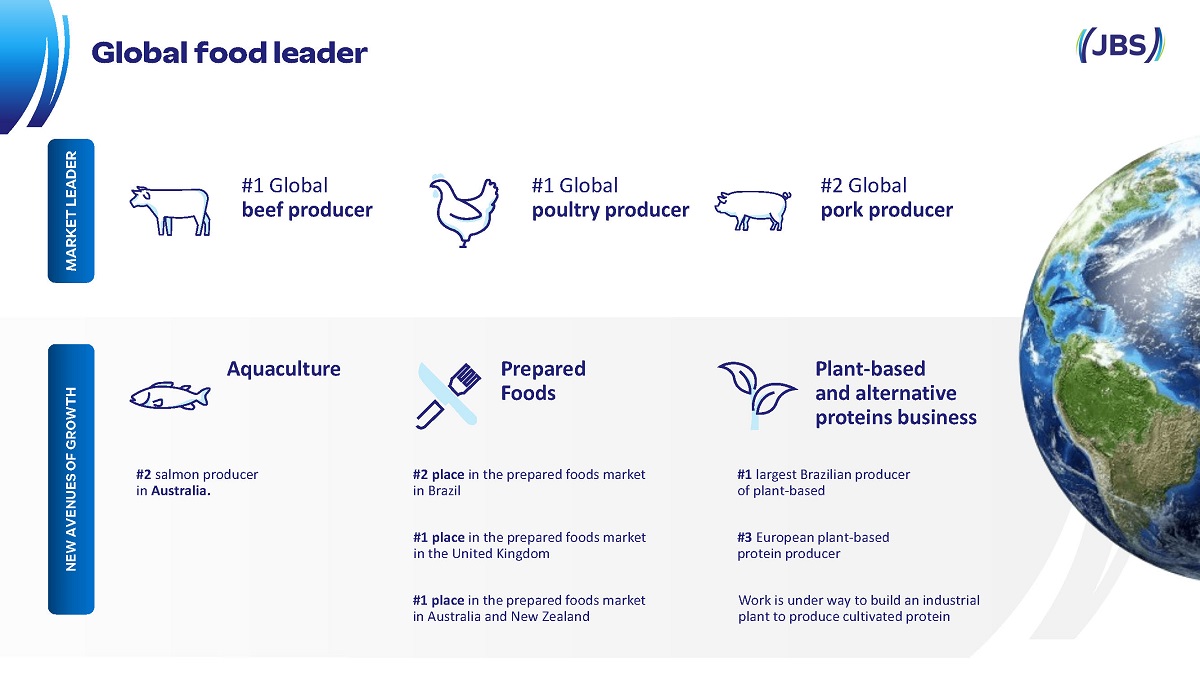
#1 Global beef producer #1 Global poultry producer #2 Global pork producer Aquaculture Plant - based and alternative proteins business #3 European plant - based protein producer #2 salmon producer in Australia. Work is under way to build an industrial plant to produce cultivated protein Prepared Foods #1 largest Brazilian producer of plant - based #2 place in the prepared foods market in Brazil #1 place in the prepared foods market in the United Kingdom #1 place in the prepared foods market in Australia and New Zealand MARKET LEADER NEW AVENUES OF GROWTH Global food leader

Fonte: JBS Income Origin United States Brazil Europe Mexico Australia Canada 51% 27% 7% 3% 8% 4% Canada USA Mexico Brazil South America 1% Europe Africa & Middle East Asia Australia & New Zealand Net revenue 3Q23 ( by destination ) 3 % 5 % 13 % 9% 14 % 3 % 3 % 49 % Cattle Pork Lamb Poultry Aquaculture Leather Plant Based Sales Offices Center for Innovation Cultivated Protein Prepared Foods Strategy Geographical diversification multiproteins
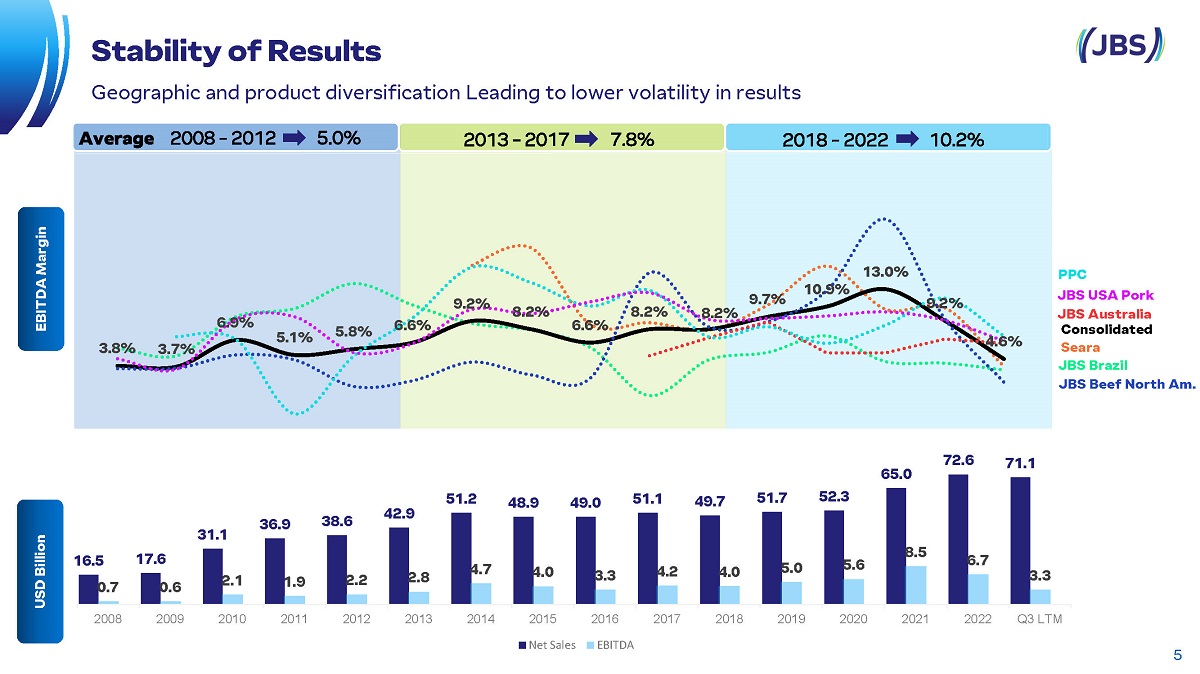
16.5 17.6 31.1 36.9 38.6 42.9 51.2 48.9 49.0 51.1 49.7 51.7 52.3 65.0 72.6 71.1 0.7 0.6 2.1 1.9 2.2 2.8 4.7 4.0 3.3 4.2 4.0 5.0 5.6 8.5 6.7 3.3 2008 2009 2010 2011 2012 2013 2014 2015 2016 2017 2018 2019 2020 2021 2022 Q3 LTM Net Sales EBITDA JBS Beef North Am. Consolidated PPC Seara JBS USA Pork JBS Brazil JBS Australia USD Billion 5 Stability of Results Geographic and product diversification Leading to lower volatility in results EBITDA Margin USD Billion 3.8% 3.7% 6.9% 5.1% 5.8% 6.6% 9.2% 8.2% 6.6% 8.2% 8.2% 9.7% 10.9% 13.0% 9.2% 4.6%ND0

R$ 350,309 billion In the amount that JBS contributes to the Brazilian economy JBS represents 2,1 % of Brazil’s GDP, says Brazilian institute FIPE Study carried out by FIPE (the Economic Research Institute Foundation), from the University São Paulo, by analyzing input - produc t modeling that maps the economy as a series of interconnected sectors. FIPE Data: 2020; Job data: 2021 and JBS data: 2023 PA AC RO MT PE BA MG RJ SP PR RS MS GO CE TO SC DF Includes economic sectors directly affected by JBS’s operations, such as suppliers of inputs. For example: livestock farmers, grain suppliers, transport companies, power utilities and every kind of input required for producing food. Includes purchases and sales among the sectors necessary for addressing the increased demand. For example: fertilizer used in the production of corn used as feed. SUPPLIERS R$ 49,9 b n SUPPLIER’S SUPPLIERS R$ 98,8 b n CONSUMPTION R$ 130,6 b n R$ 70 b n Direct and indirect purchases by consumers and team members. For example: Team members from JBS or companies involved in the production chain spend their wages in local stores. Is the total production value of the JBS operations, such as plants and offices MORE THAN 152,000 TEAM MEMBERS MORE THAN 130 PLANTS IN THE COUNTRY INVESTMENTS IN BRAZIL OF R$ 8 bn 2020 - 2023 JBS OPERATION Main brands in Brazil
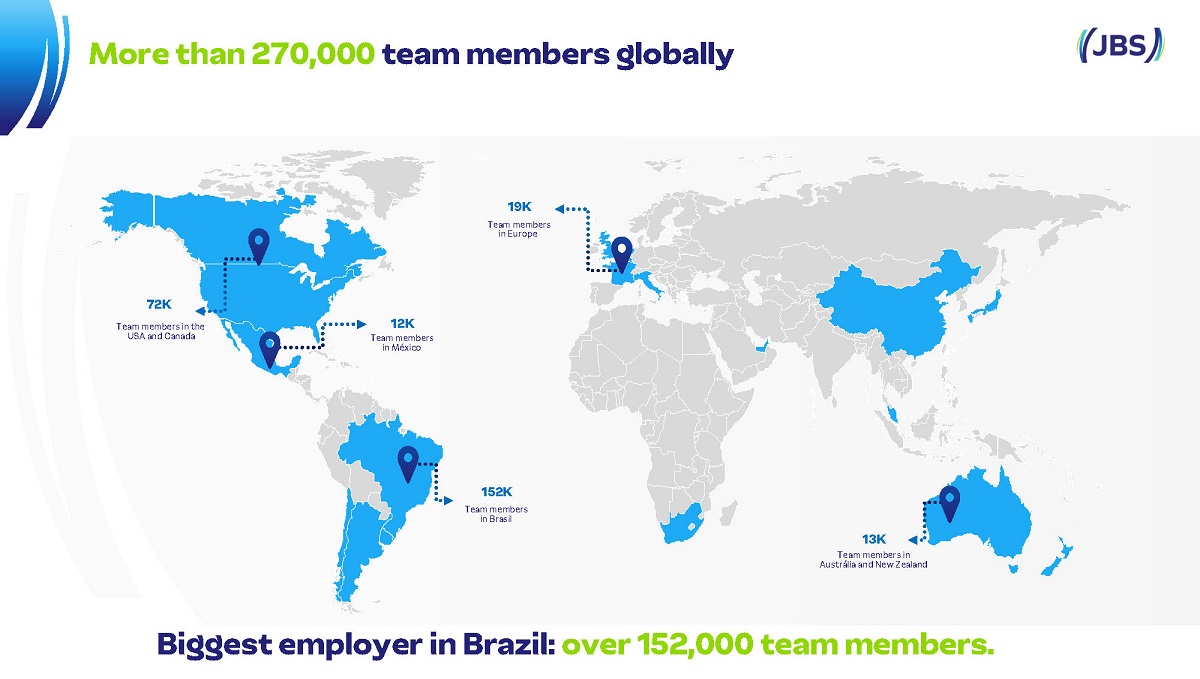
More than 270,000 team members globally Team members in Brasil 13K Team members in Austrália and New Zealand 152K 12K Team members in México 19K Team members in Europe 72K Team members in the USA and Canada Biggest employer in Brazil: over 152,000 team members.

Inauguration of 2 high added - value food factory • New range of breaded Chicken and sausages • Located in Rolândia - PR • Over R$ 1 billion in investments • 4,500 team members with the capacity to expand to 6,000 team members • It is considered the most modern JBS unit in Brazil and one of the world’s most modern • The factories have sustainability protocols like : ▪ Rainwater catchment ▪ Use of electric vehicles for on - site transit ▪ Solar energy Generation in the parking lot ▪ Reuse of celulose waste from the industrial process to be turned into fuel and / or compost ND0
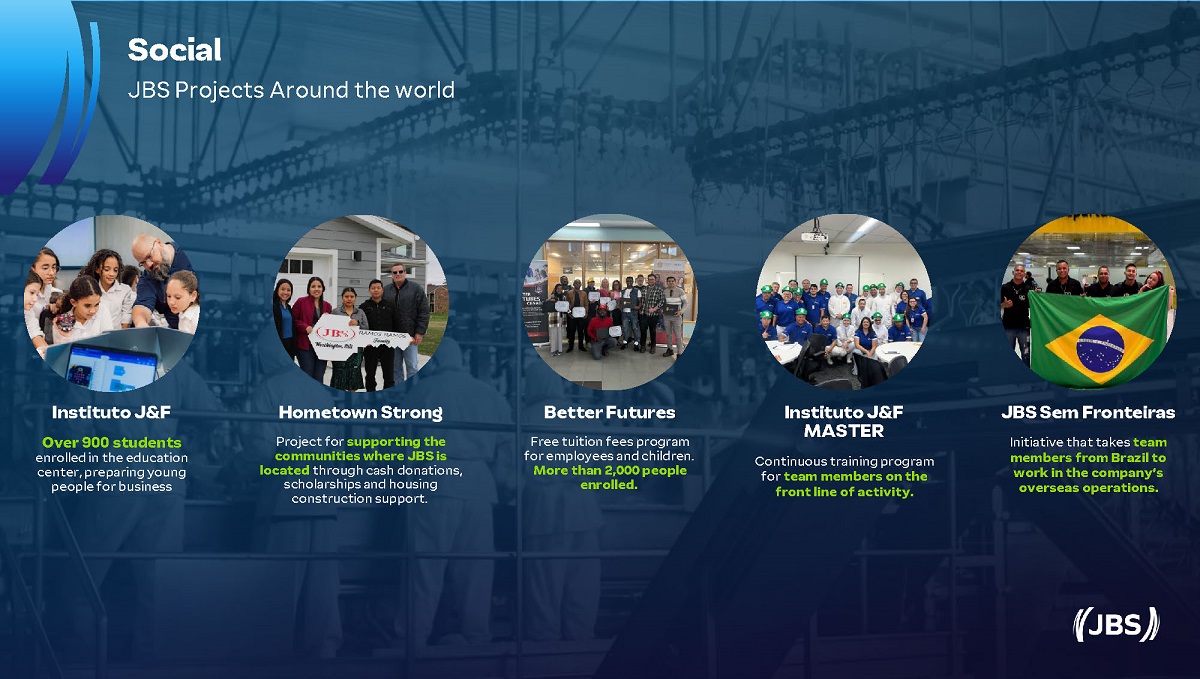
Social JBS Projects Around the world Instituto J&F Over 900 students enrolled in the education center, preparing young people for business Better Futures Free tuition fees program for employees and children. More than 2,000 people enrolled. JBS Sem Fronteiras Initiative that takes team members from Brazil to work in the company’s overseas operations. Instituto J&F MASTER Continuous training program for team members on the front line of activity. Hometown Strong Project for supporting the communities where JBS is located through cash donations, scholarships and housing construction support.
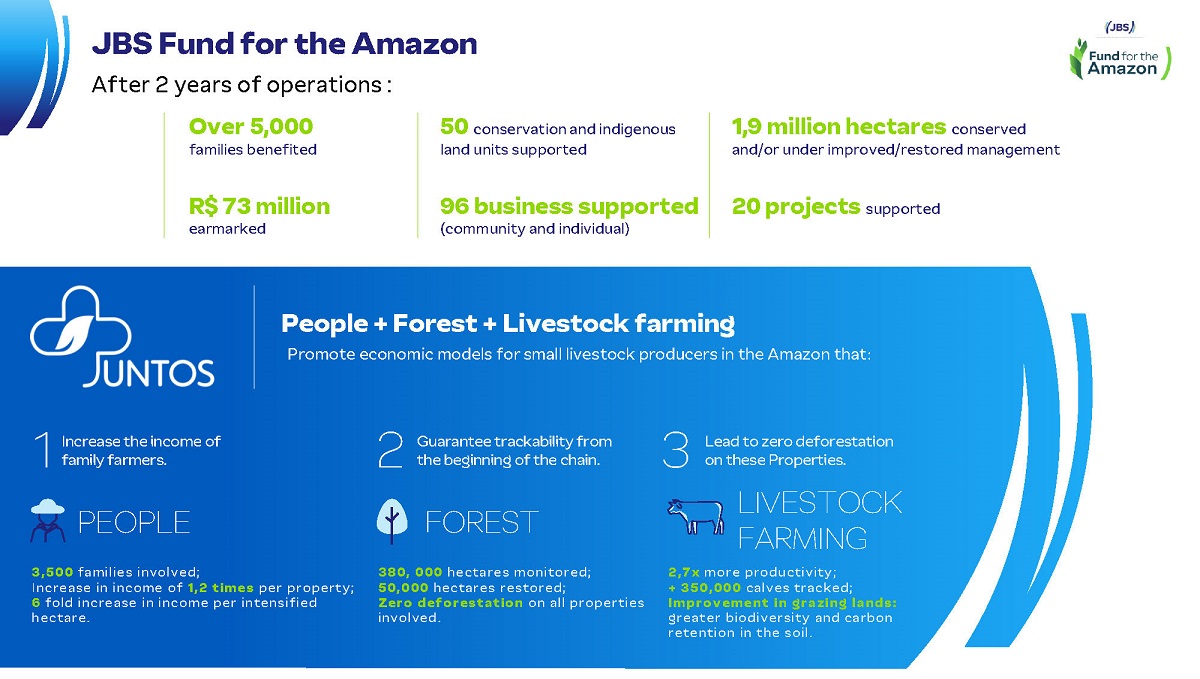
People + Forest + Livestock farming Promote economic models for small livestock producers in the Amazon that : Increase the income of family farmers . 1 Guarantee trackability from the beginning of the chain . 2 Lead to zero deforestation on these Properties. 3 PEOPLE 3,500 families involved ; Increase in income of 1,2 times per property ; 6 fold increase in income per intensified hectare. LIVESTOCK FARMING 2,7x more productivity ; + 350,000 calves tracked ; Improvement in grazing lands : greater biodiversity and carbon retention in the soil . FOREST 380, 000 hectares monitored ; 50,000 hectares restored ; Zero deforestation on all properties involved . JBS Fund for the Amazon Over 5,000 families benefited After 2 years of operations : R$ 73 million earmarked 50 conservation and indigenous land units supported 1,9 million hectares conserved and / or under improved / restored management 20 projects supported 96 business supported ( community and individual)

Financial & Operating

3Q23 – Financial and Operating Highlights • In October, the industrial complex located in the city of Rolândia (PR) was inaugurated, with a chicken breaded plant and a hot dog plant, the largest in these categories in Latin America. The new plants are the most automated at Seara , in Brazil , and amongst the most modern at JBS around the world. • In September, following its liability management, JBS issued US$2.5 billion in Senior Notes , as follows: ( i ) US$1.6 billion with a coupon of 6.75% and maturity in 2034; and (ii) US$900 million with a coupon of 7.25% and maturing in 2053. • In October, JBS issued R$1.7 billion in CRA (Agribusiness Receivables Certificates). With the resources, JBS increased its average debt term to 12 years and repaid its short - term debts.
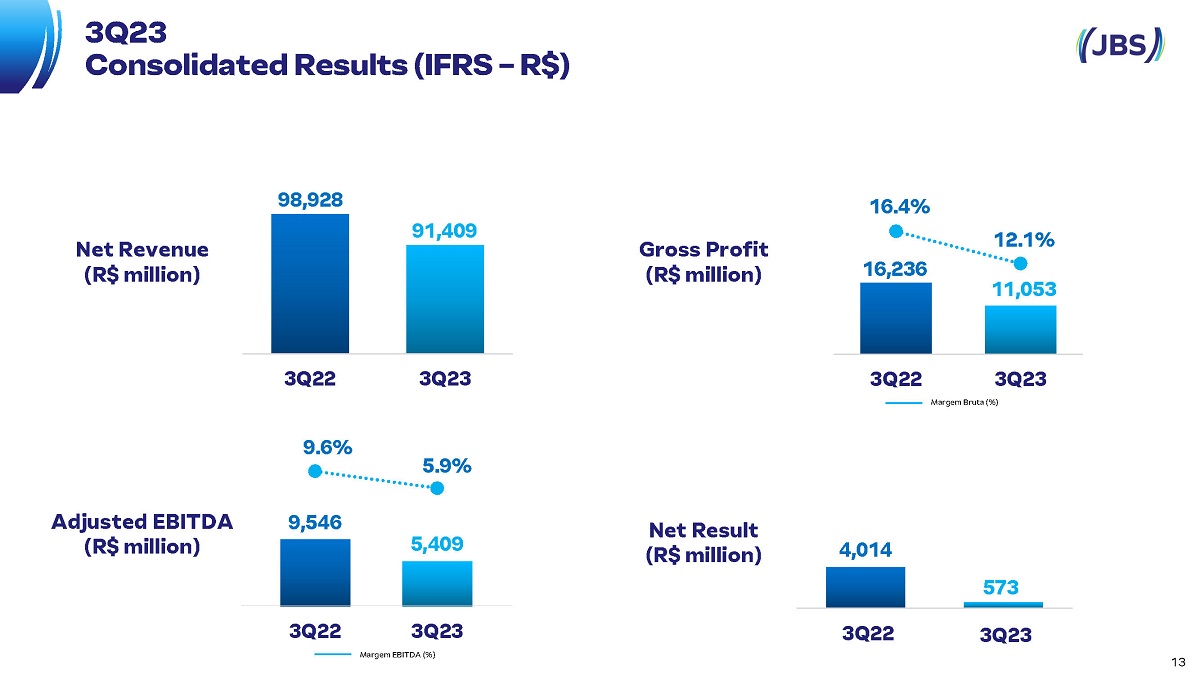
4,014 573 3Q23 13 3Q22 Gross Profit (R$ million) Net Result (R$ million) Adjusted EBITDA (R$ million) Net Revenue (R$ million) 98,928 91,409 3Q22 3Q23 9,546 5,409 9.6% 5.9% 3Q22 3Q23 Margem EBITDA (%) 16,236 11,053 16.4% 12.1% 3Q22 3Q23 Margem Bruta (%) 3Q23 Consolidated Results (IFRS – R$)
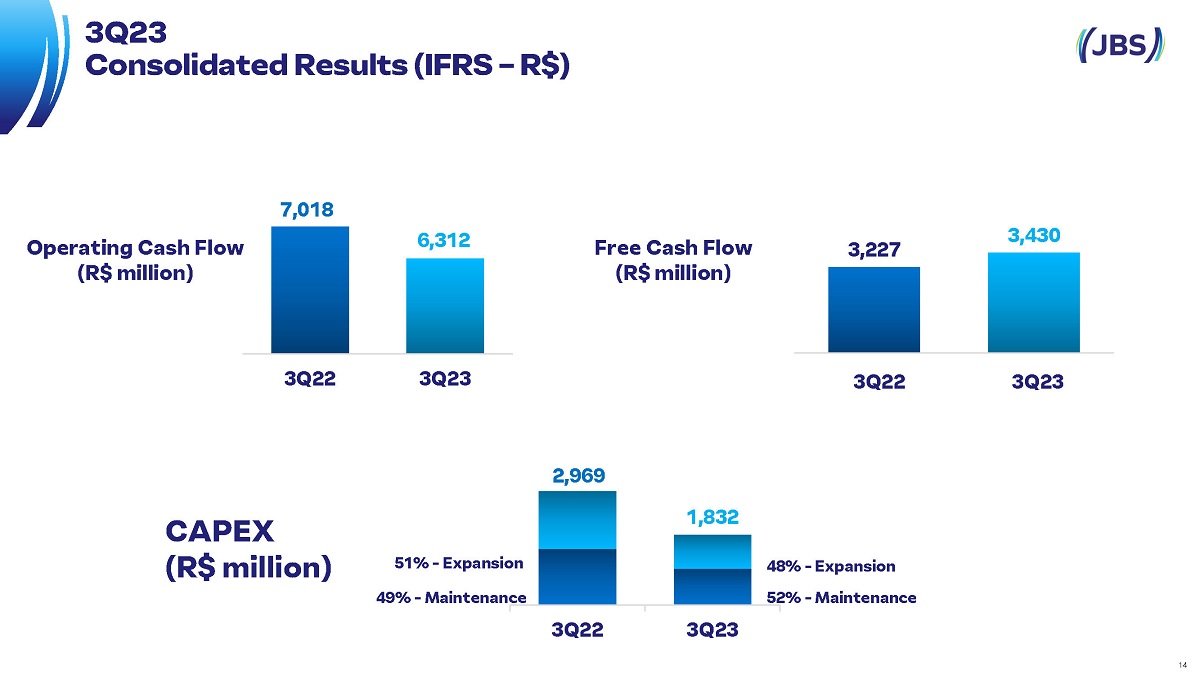
3,227 3,430 3Q23 14 3Q22 Operating Cash Flow (R$ million) Free Cash Flow (R$ million) 52% - Maintenance 48% - Expansion 49% - Maintenance 51% - Expansion 3Q23 Consolidated Results (IFRS – R$) 7,018 6,312 3Q22 3Q23 2,969 1,832 3Q22 3Q23 CAPEX (R$ million)
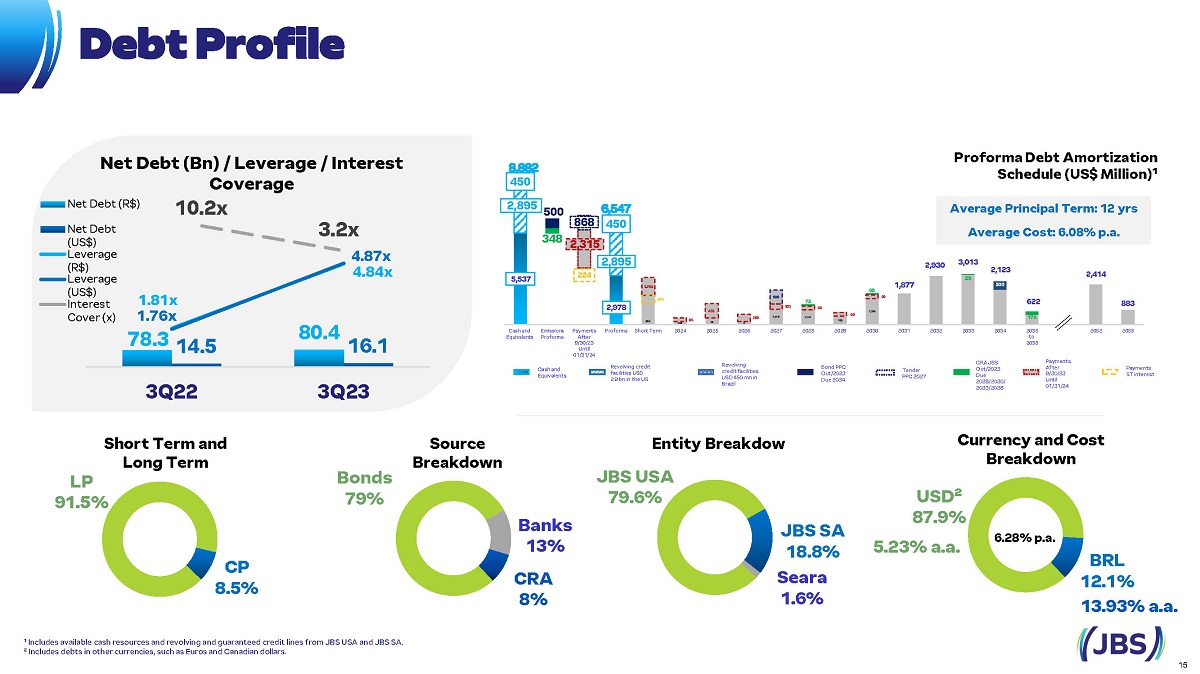
10.2x 3.2x 0 10000 78.3 80.4 14.5 16.1 1.81x 4.84x 1.76x 4.87x 3Q22 3Q23 Net Debt (R$) Net Debt (US$) Leverage (R$) Leverage (US$) Interest Cover (x) Net Debt ( Bn ) / Leverage / Interest Coverage Debt Profile Short Term and Long Term LP 91.5% CP 8.5% Source Breakdown Bonds 79% Banks 13% CRA 8% Entity Breakdow JBS USA 79.6% JBS SA 18.8% Seara 1.6% Currency and Cost Breakdown USD² 87.9% BRL 12.1% 15 ¹ Includes available cash resources and revolving and guaranteed credit lines from JBS USA and JBS SA. ² Includes debts in other currencies, such as Euros and Canadian dollars. 6.28% p.a. 5.23% a.a. 13.93% a.a. Cash and Equivalents Revolving credit facilities USD 2.9 bn in the US Revolving credit facilities USD 450 mn in Brazil CRA JBS Out/2023 Due 2028/2030/ 2033/2038 Payments After 9/30/23 Until 01/31/24 Bond PPC Out/2023 Due 2034 Tender PPC 2027 Payments ST interest Proforma Debt Amortization Schedule (US$ Million)¹ Average Principal Term : 12 yrs Average Cost : 6.08% p.a . 5,537 2,978 1,877 2,930 3,013 2,123 622 2,414 883 224 75 68 29 176 2,895 348 2,315 2,895 450 500 868 450 500 Cash and Equivalents Emissions Proforma Payments After 9/30/23 Until 01/31/24 Proforma Short Term 2024 2025 2026 2027 2028 2029 2030 2031 2032 2033 2034 2035 à 2038 2039 à 2051 2052 2053 1,285 65 453 200 1,073 868 336 143 18 6 163 50 1,101 50 703 50 1,786 224 to

1,780 566 15.1% 5.5% - 500 1,000 1,500 2,000 2,500 3Q22 3Q23 Net Revenue (R$ million) Adjusted EBITDA (R$ million and %) 3Q23 Seara Seara Products 11,768 10,208 3Q22 3Q23

3Q23 Net Revenue (R$ million) Adjusted EBITDA (R$ million and %) JBS Brasil 17 JBS Brasil Products 826 484 5.1% 3.4% 3Q22 3Q23 16,240 14,441 3Q22 3Q23
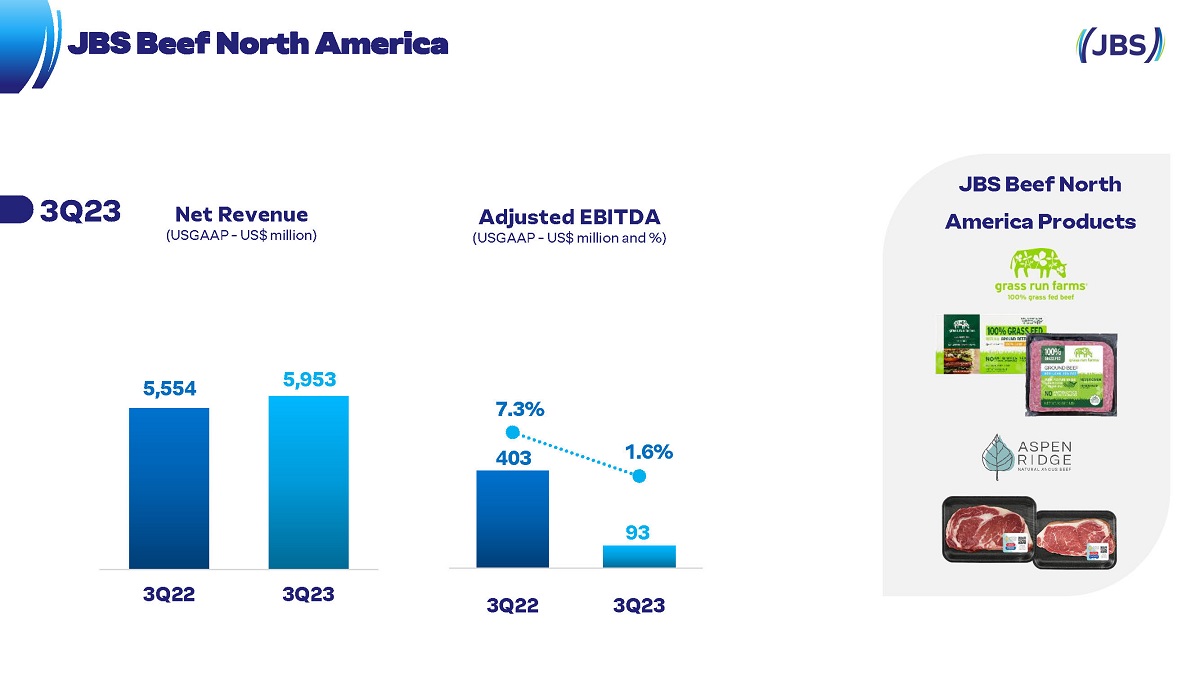
Net Revenue (USGAAP - US$ million) Adjusted EBITDA (USGAAP - US$ million and %) 5,554 5,953 3Q22 3Q23 403 93 7.3% 1.6% -12.0% -7.0% -2.0% 3.0% 8.0% 13.0% 18.0% 3Q22 3Q23 3Q23 JBS Beef North America JBS Beef North America Products
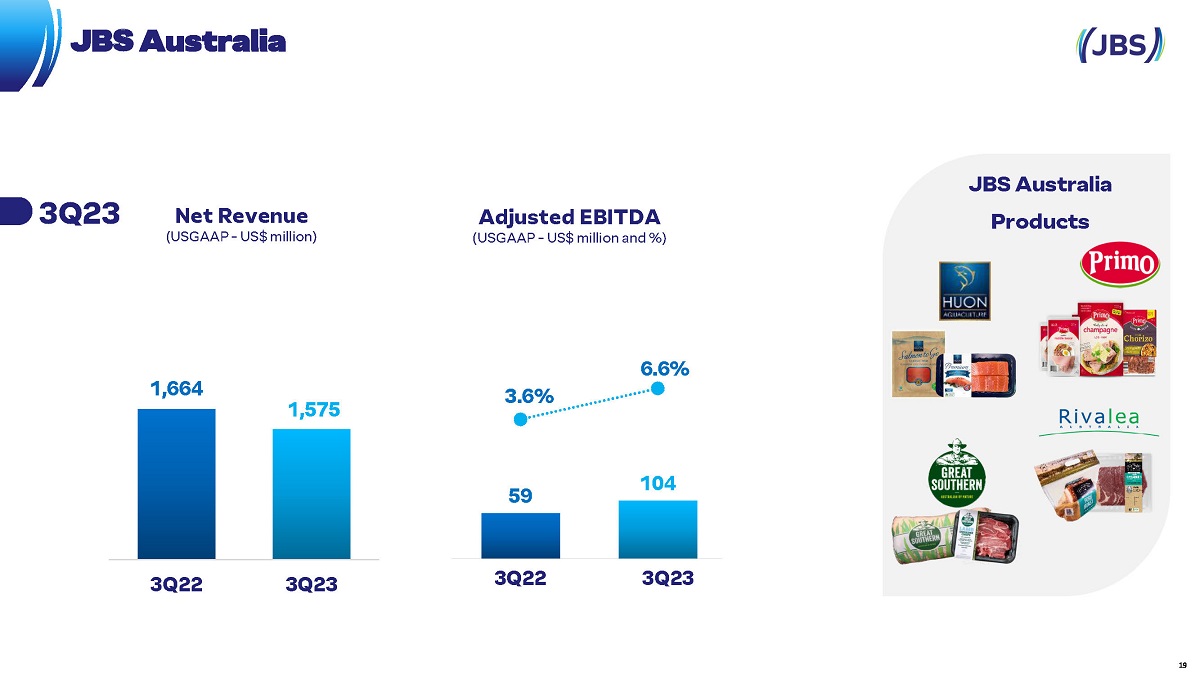
1,664 1,575 3Q22 3Q23 59 104 3.6% 6.6% 3Q22 3Q23 3Q23 Net Revenue (USGAAP - US$ million) Adjusted EBITDA (USGAAP - US$ million and %) 19 JBS Australia JBS Australia Products
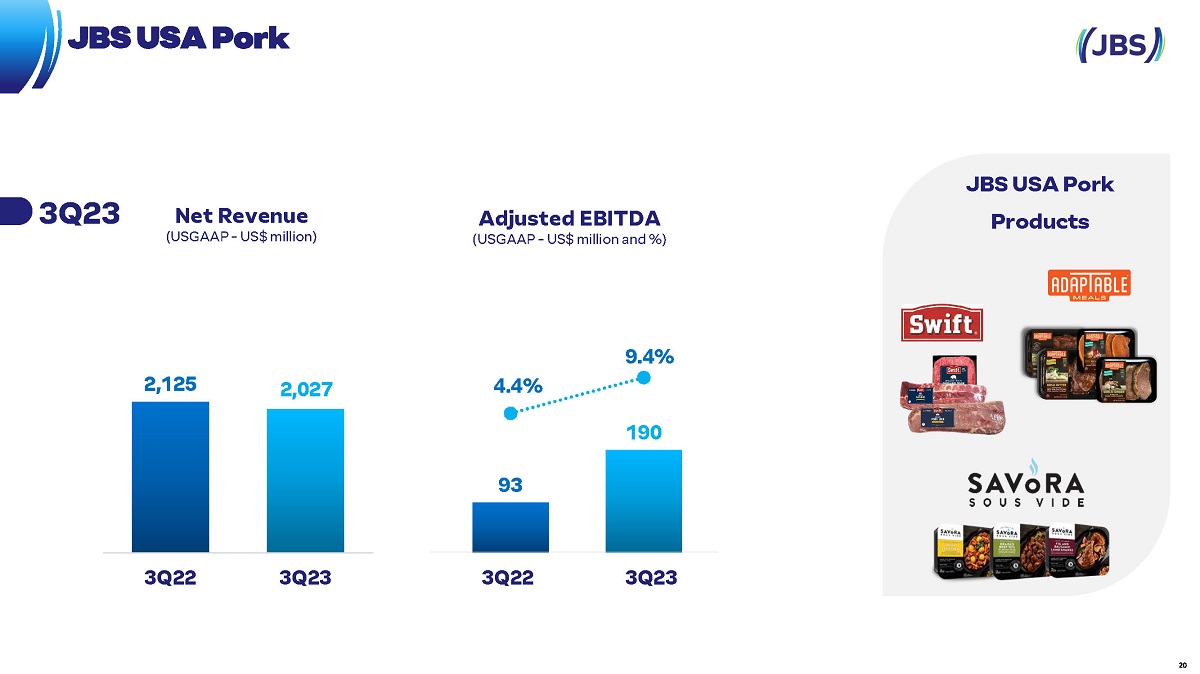
2,125 2,027 3Q22 3Q23 93 190 4.4% 9.4% -15.0% -10.0% -5.0% 0.0% 5.0% 10.0% 15.0% 0.0 50.0 100.0 150.0 200.0 250.0 300.0 350.0 400.0 3Q22 3Q23 Net Revenue (USGAAP - US$ million) Adjusted EBITDA (USGAAP - US$ million and %) 3Q23 20 JBS USA Pork JBS USA Pork Products
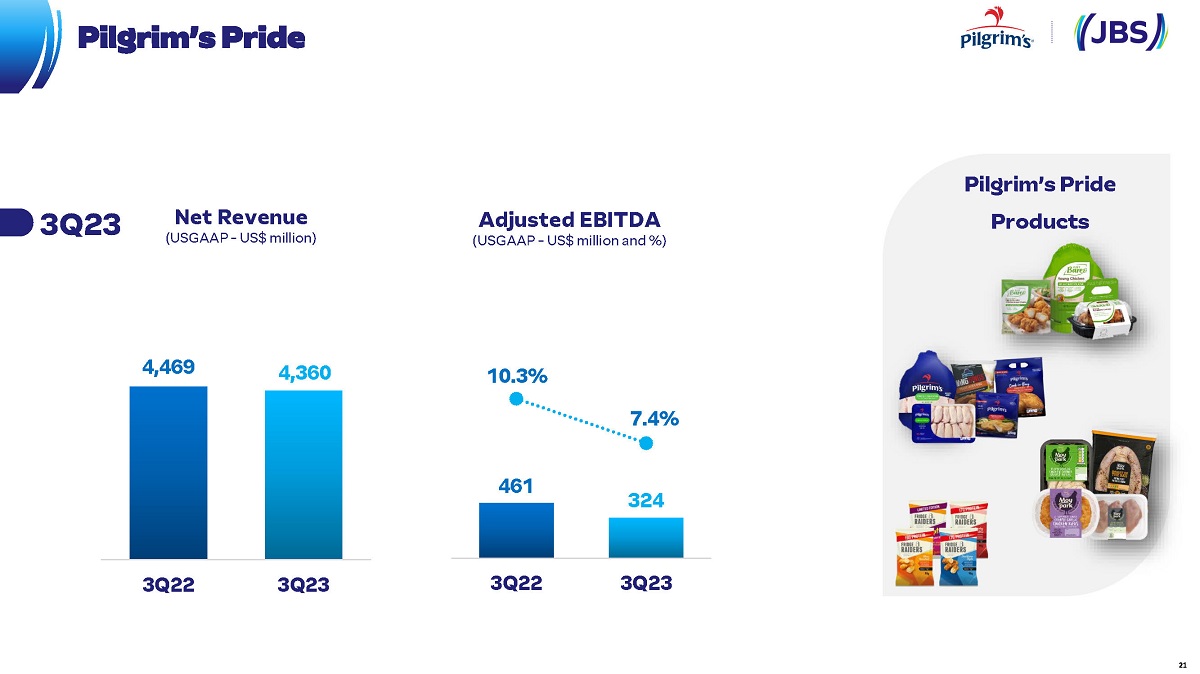
461 324 10.3% 7.4% 3Q22 3Q23 4,469 4,360 3Q22 3Q23 3Q23 Net Revenue (USGAAP - US$ million) Adjusted EBITDA (USGAAP - US$ million and %) 21 Pilgrim’s Pride Pilgrim’s Pride Products
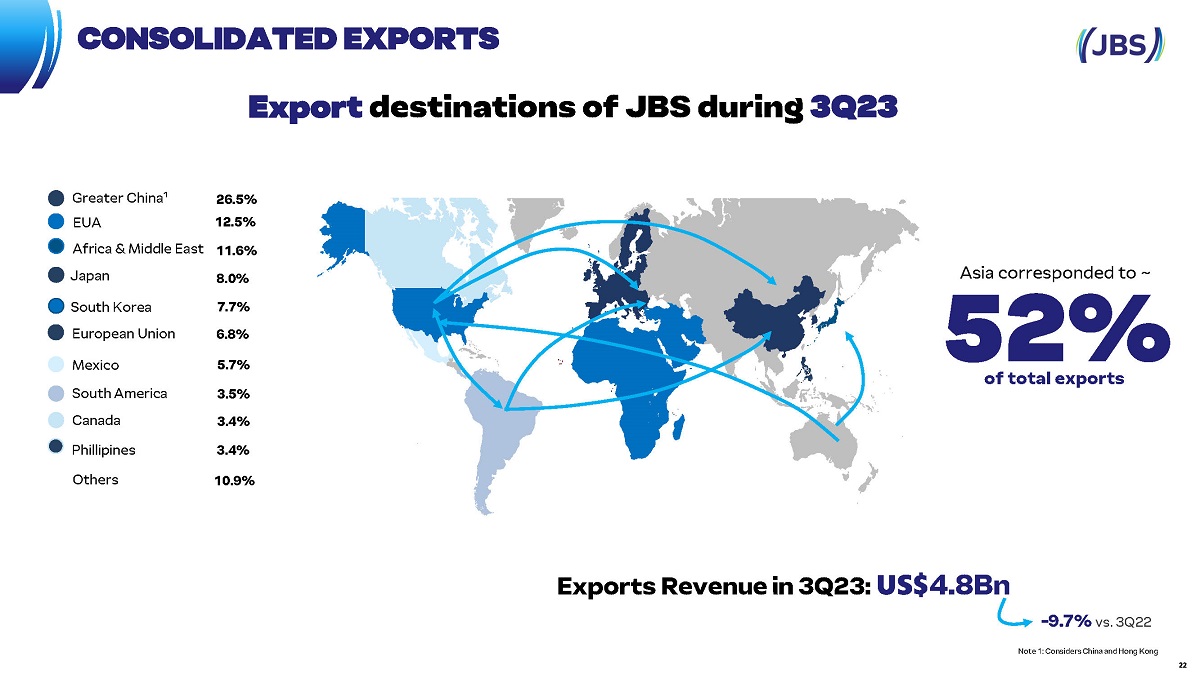
Exports Revenue in 3Q23: US$ 4.8Bn Export destinations of JBS during 3Q23 Note 1: Considers China and Hong Kong - 9.7% vs. 3Q22 Asia corresponded to ~ 52% of total exports Greater China¹ 26.5% Japan 8.0% Africa & Middle East 11.6% South Korea 7.7% European Union 12.5% EUA 6.8% Phillipines 3.5% Mexico 5.7% South America 3.4% Others 10.9% Canada 3.4% 22 CONSOLIDATED EXPORTS
Bringing more to the table .