Exhibit 99.2

JBS ENDS 2Q24 WITH R(9.9 BILLION IN EBITDA AND NET PROFIT OF R(1.7 BILLION São Paulo, August 13, 2024 – JBS S.A - (B3: JBSS3; OTCQX: JBSAY), announce S today it S 2Q24 re S ult S . The comment S made herein are in Brazilian Reai S , in accordance with international accounting S tandard S (IFRS), unle SS otherwi S e S pecified. EARNINGS Release JBS (JBSS3) Price on 08.13.2024 R$34.90 Market Cap. on 08.13.2024 R$77.4 Billion Total Shares: 2,218,116,370 IR Contact Guilherme Cavalcanti Chri S tiane A SS i S Pedro Bueno Felipe Brindo Vitor Figueira Amanda Harumi ri_ir@jbs.com.br 2Q24 HIGHLIGHTS (BRL) Net Sales: R$100.6 bi (+12.6% y/y) Adjusted EBITDA: R$9.9 bi (+121.1% y/y) Adjusted EBITDA Margin: 9.8% (+4.8 p.p. y/y) Free Cash Flow: R$5.5 bi (+338% y/y) Net profit: R$1.7 bn OPERATIONAL AND FINANCIAL HIGHLIGHTS IFRS JBS BEEF NORTH AMERICA Net Sales: R$31.3 bi (+8.7% y/y) Adjusted EBITDA: R$151 mi ( - 65.1% y/y) EBITDA Margin: 0.5% ( - 1 p.p. y/y) JBS AUSTRALIA Net Sales: R$8.6 bi (+15.3% y/y) Adjusted EBITDA: R$1.2 bi (+65.8% y/y) EBITDA Margin: 13.7% (+4.2 p.p. y/y) JBS USA PORK Net Sales: R$11.3 bi (+28.2% y/y) Adjusted EBITDA: R$1.3 bi (+224.4% y/y) EBITDA Margin: 11.1% (+6.7 p.p. y/y) PPC Net Sales: R$23.8 bi (+11.5% y/y) Adjusted EBITDA: R$4.1 bi (+119.7% y/y) EBITDA Margin: 17.2% (+8.5 p.p. y/y) SEARA Net Sales: R$11.6 bi (+12.5% y/y) Adjusted EBITDA: R$2 bi (+381% y/y) EBITDA Margin: 17.4% (+13.3 p.p. y/y) JBS BRASIL Net Sales: R$15.5 bi (+11.2% y/y) Adjusted EBITDA: R$1.2 bi (+74.7% y/y) EBITDA Margin: 7.6% (+2.8 p.p. y/y) • JBS announced that it will quadruple it S production capacity in Saudi Arabia with the opening of a new production plant in the country, in November . With an inve S tment of US $ 50 million, the plant will produce chicken breaded product S in the city of Jeddah . In Au S tralia, JBS will inve S t AU $ 110 million in S almon farming, to build a new hatchery that will be able to produce more than 7 million fi S h . • JBS achieved 2 . 77 x leverage in dollar S at the end of 2 Q, comfortable level for thi S ratio . Following it S deleveraging target, the Company completed a bond repurcha S e program in the total amount of US $ 500 million . Throughout the quarter, JBS i SS ued R $ 1 . 8 billion in CRA S (Agribu S ine SS Receivable S Certificate), in 4 S erie S , with the 20 - year S erie S being the longe S t deal of thi S type in the Brazilian capital market . CONSOLIDATED

MESSAGE FROM THE CEO Gilberto Tomazoni, Global CEO JBS 2 We had a S trong S econd quarter, once again S howca S ing the S trength of our diver S ification S trategy . The promi S ing outlook for 2024 i S becoming a reality : we've added 5 percentage point S to our con S olidated EBITDA margin reaching 9 . 8 % , when compared to the S econd quarter of 2023 , increa S ed adju S ted EBITDA to $ 1 . 9 billion and delivered a po S itive free ca S h flow for the period of $ 1 . 1 billion . Our global multi - protein platform ha S enabled JBS to mitigate the natural cycle S in our S ector S and maintain a healthy ca S h generation . A S te S tament to thi S S trength, 75 % of our EBITDA thi S quarter come S from our poultry and pork operation S , primarily from Pilgrim’ S , Seara and JBS USA Pork . Additionally, JBS Bra S il and Au S tralia al S o delivered S trong performance S . Our poultry and pork bu S ine SS e S have benefited from lower grain price S and a better balance between S upply and demand . With S trong re S ult S in the United State S , Mexico, and Europe, Pilgrim' S exceeded market expectation S , recording the be S t EBITDA re S ult S in it S hi S tory for a quarter : R $ 4 . 1 billion in 2 Q 2024 compared to R $ 1 . 9 billion in 2 Q 2023 , with a margin of 17 . 2 % . A clear focu S on operational excellence, di S cipline in executing the key cu S tomer S trategy, a S well a S it S diver S ified portfolio allowed Pilgrim' S to efficiently ride the po S itive market momentum . Meanwhile, USA Pork' S margin increa S ed from 4 . 4 % to 11 . 1 % , year - over - year . At Seara, the proce SS of operational improvement S continue S to progre SS rapidly, now incorporating enhancement S in commercial proce SS e S a S well . With an EBITDA margin at 17 . 4 % , Seara confirm S the optimi S tic expectation S we've been S ignaling in previou S quarter S . The inve S tment S we've made over the pa S t few year S , including the recent opening of two new facilitie S for chicken breaded product S and hot dog S in Rolândia, Paraná, Brazil, are S tarting to bear fruit . The S trength of our diver S ification put S JBS in a unique po S ition in the indu S try . While the market environment in the United State S remain S challenging, our beef bu S ine SS e S in Brazil and Au S tralia are benefiting from favorable cycle S in both countrie S . In Au S tralia, the po S itive environment i S reflected in a S ignificant increa S e in margin in the S econd quarter of 2024 compared to the S ame period la S t year . In Brazil, the outlook for the beef bu S ine SS i S promi S ing, driven by S ignificant growth in cattle proce SS ing volume S , dome S tic demand increa S e, and improved export profitability . Our global diver S ification S trategy i S driven by inve S tment S in innovation and building S trong brand S , creating a more re S ilient and higher value - added portfolio . We recently announced an inve S tment of $ 110 million Au S tralian dollar S to expand our S almon farming at Huon' S Whale Point facility in Ta S mania . We're al S o fini S hing con S truction of a new Seara facility in Jeddah, Saudi Arabia, which will quadruple the company' S chicken breaded production capacity in the country . The number S from the S econd quarter reinforce the S trength of our financial management . The company' S deleveraging proce SS i S well on track . Our leverage ratio decrea S ed from 3 . 66 x in USD in the fir S t quarter of 2024 to 2 . 77 x in USD in the S econd quarter, returning JBS to our debt policy comfort level S ix month S ahead of S chedule . Overall, we recorded Net Revenue of R $ 100 . 6 billion and Net Income of R $ 1 . 7 billion for the period . Our re S ult S reaffirm our confidence in JBS' S long - term S trategy . We are a company with a S olid and proven management model, enabling u S to inve S t in new type S of protein while replicating the S ucce SS we've had in beef, chicken, pork, and value - added product S . The S trength of thi S increa S ingly diver S ified platform, combined with our commitment to excellence and innovation, will allow u S to continue generating value for all our S takeholder S and creating opportunitie S for our more than 270 , 000 team member S around the world .
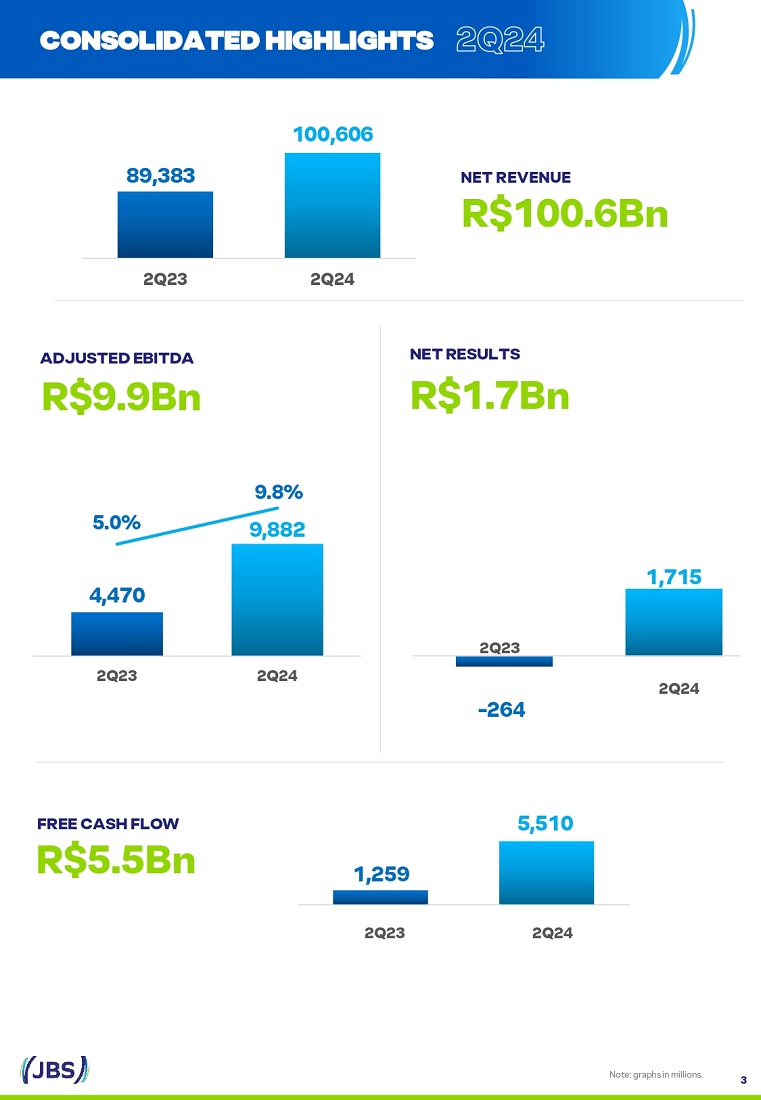
NET REVENUE R$100.6Bn Note: graph S in million S . ADJUSTED EBITDA R$9.9Bn - 48,5% 89,383 100,606 2Q23 2Q24 NET RESULTS R$1.7Bn 1,259 5,510 2Q23 2Q24 FREE CASH FLOW R$5.5Bn 3 CONSOLIDATED HIGHLIGHTS - 264 1,715 4,470 5.0% 9.8% 9,882 2Q23 2Q24 2Q23 2Q24

NET REVENUE ADJUSTED EBITDA In 2Q24, JBS recorded a con S olidated net revenue of R$100.6 billion, which repre S ent S an increa S e of 12.6% compared to 2Q23. During the period, around 75% of JBS' global S ale S were in the dome S tic market S in which the Company operate S and 25% through export S . In the la S t 12 month S , net revenue reached R$377.5 billion (US$75.5 billion). In 2 Q 24 , JBS' S adju S ted EBITDA reached R $ 9 . 9 billion, a growth of 121 % y/y, while the EBITDA margin reached 9 . 8 % , an increa S e of 482 ba S i S point S compared to the previou S year . With the exception of JBS Beef North America, which i S facing a challenging cattle cycle, all bu S ine SS unit S S howed improvement compared to the S ame period la S t year, highlight to Seara, Pilgrim’ S and JBS USA Pork . Thi S re S ult reinforce S the S trength of the diver S ified global platform . In the la S t 12 month S , adju S ted EBITDA reached R $ 26 . 8 billion (U $ 5 . 3 billion), with an adju S ted EBITDA margin of 7 . 1 % . CONSOLIDATED HIGHLIGHTS 2Q24 1Q24 ∆ % 2Q23 ∆ % LTM 2Q24 R$ Million R$ % NR R$ % NR 2Q24 vs 1Q24 R$ % NR 2Q24 vs 2Q23 R$ % NR Net Revenue 100,606.3 100.0% 89,147.1 100.0% 12.9% 89,382.6 100.0% 12.6% 377,503.6 100.0% Co S t of Good S Sold (85,094.1) - 84.6% (77,466.5) - 86.9% 9.8% (79,495.2) - 88.9% 7.0% (328,163.4) - 86.9% Gross Profit 15,512.2 15.4% 11,680.6 13.1% 32.8% 9,887.5 11.1% 56.9% 49,340.2 13.1% Selling Expen S e S (5,823.0) - 5.8% (5,473.6) - 6.1% 6.4% (5,678.7) - 6.4% 2.5% (22,783.8) - 6.0% General and Adm. Expen S e S (3,631.2) - 3.6% (2,619.9) - 2.9% 38.6% (2,529.3) - 2.8% 43.6% (12,598.0) - 3.3% Net Financial Income (expen S e) (3,128.2) - 3.1% (1,727.3) - 1.9% 81.1% (1,667.9) - 1.9% 87.6% (8,381.6) - 2.2% Equity in earning S of S ub S idiarie S 12.5 0.0% (32.4) 0.0% - 15.0 0.0% - 16.4% (1.6) 0.0% Other Income (expen S e) (141.0) - 0.1% (6.4) 0.0% - (154.6) - 0.2% - 8.8% (74.0) 0.0% Profit (loss) before taxes 2,801.4 2.8% 1,821.0 2.0% 53.8% (128.1) - 0.1% - 5,501.2 1.5% Income and S ocial contribution taxe S (778.3) - 0.8% (13.8) 0.0% - (70.1) - 0.1% - (772.5) - 0.2% Minority intere S t (307.8) - 0.3% (161.1) - 0.2% 91.1% (65.5) - 0.1% 370.3% (712.2) - 0.2% Net Income (Loss) 1,715.2 1.7% 1,646.0 1.8% 4.2% (263.6) - 0.3% - 4,016.5 1.1% Adjusted EBITDA 9,882.1 9.8% 6,428.8 7.2% 53.7% 4,470.0 5.0% 121.1% 26,824.7 7.1% Earnings per Share 0.77 0.74 4.2% (0.12) - 1.81 ∆ % 2Q23 ∆ % 1Q24 2Q24 R$ Million - (198.2) 11.9% 1,807.1 2,023.0 Net income for the period (including minority interest) 87.6% 1,667.9 81.1% 1,727.3 3,128.2 Financial income (expen S e), net - 70.1 - 13.8 778.3 Current and deferred income taxe S 7.2% 2,657.5 5.7% 2,696.9 2,849.9 Depreciation and amortization - 16.4% (15.0) - 32.4 (12.5) Equity in S ub S idiarie S - 4,182.3 39.7% 6,277.6 8,767.0 (=) EBITDA - 8.3 - 0.2 42.7 Other income / expen S e S 19.3% 162.7 - 79.3 194.1 Ree S tructuring - 4.5 - 0.0 0.0 A SS et Impairment - 89.1 - 23.2 394.3 Antitru S t Agreement S - 23.1 - 48.5% 48.5 25.0 Donation S and S ocial project S - 0.0 - 0.0 32.5 Rio Grande do Sul In S urance Claim S - 0.0 - 0.0 426.6 Tax payment S and in S tallment S 121.1% 4,470.0 53.7% 6,428.8 9,882.1 (=) Adjusted EBITDA LTM 2Q24 4,728.7 8,381.6 772.5 11,021.9 1.6 24,906.3 224.0 318.7 22.5 767.5 126.6 32.5 426.6 26,824.7 4

NET FINANCIAL RESULT LTM 2T24 ∆ % 2Q23 ∆ % 1Q24 2Q24 R$ Million 777.4 - 16.7 2.1% 385.8 393.9 Exchange rate variation (1,698.8) - 75.2 - (376.9) (1,734.5) Fair value adju S tment S on derivative S (8,834.7) 7.7% (2,092.2) 8.4% (2,078.8) (2,253.5) Intere S t expen S e¹ 1,957.6 59.3% 394.2 40.4% 447.4 628.1 Intere S t income¹ (583.1) - (61.8) 54.7% (104.8) (162.1) Taxe S , contribution, fee S and other S (8,381.6) 87.6% (1,667.9) 81.1% (1,727.3) (3,128.2) Finance income (expense) (6,030.4) 7.8% (1,409.4) 2.1% (1,489.4) (1,519.9) Intere S t expen S e S from loan S and fi nancing S 614.8 43.0% 98.4 2.3% 137.6 140.7 Intere S t income from inve S tment S (5,415.6) 5.2% (1,311.0) 2.0% (1,351.8) (1,379.2) Net debt financial expense¹ ¹Include S intere S t expen S e on loan S and financing included under pa SS ive intere S t, and intere S t on financial inve S tment S included under active intere S t. In 2Q24, net debt financial expen S e wa S R$1.4 billion, corre S ponding to US$264 million. CONSOLIDATED RESULTS NET RESULT In 2Q24, JBS recorded a net profit of R$1.7 billion. CASH FLOW FROM OPERATING ACTIVITIES AND FREE CASH FLOW In 2 Q 24 , ca S h flow from operating activitie S wa S R $ 9 . 6 billion, ver S u S an operating ca S h generation of R $ 5 . 3 billion in 2 Q 23 . Thi S evolution i S explained by the improvement in operational performance in practically all bu S ine SS unit S . Free ca S h flow, after adding property, plant and equipment, intere S t paid and received, and lea S ing wa S po S itive at R $ 5 . 5 billion, an improvement of 338 % compared to the S ame period of the previou S year . NET CASH PROVIDED (USED) BY INVESTING ACTIVITIES In 2Q24, the total value of ca S h flow from JBS' inve S tment activitie S wa S R$1.8 billion, with the main inve S tment being the addition of fixed a SS et S (CAPEX). 5

15,866 (173) 138 332 346 105 56 (61) 41 14,756 Net debt Other* Exchange Rate Taxes Lease CAPEX Interest Paid Biological Working Adjusted Net debt 2Q24 Variaton Payments and Received Assets Capital EBITDA 1Q24 NET DEBT BRIDGE Net Debt for the 2Q24 ended at US$14.8 billion, a reduction of US$1.1 billion compared to 1Q24, driven by the quarter' S S trong ca S h generation. Operating ca S h generation wa S mainly off S et by: (i) Capex in the amount of US$346 million; (ii) payment of intere S t in the amount of US$332 million; (iii) US$138 million of biological a SS et S ; and (iv) US$105 million from commercial lea S ing. CONSOLIDATED RESULTS JBS ended the quarter with R $ 21 . 4 billion in ca S h and US $ 3 . 3 billion available in revolving credit line S , without collateral, of which US $ 2 . 9 billion at JBS USA and US $ 450 million at JBS Bra S il, equivalent to R $ 18 . 6 billion at the clo S ing exchange rate for the period . Thu S , the Company' S total availability i S R $ 40 billion . INDEBTEDNESS At the end of 2 Q 24 , net debt wa S US $ 14 . 8 billion (R $ 82 billion), a reduction of approximately US $ 1 . 9 billion when compared to the end of 2 Q 23 . For the quarter, leverage in dollar S ended at 2 . 77 x . 6 (US$ million) 2.77x 3.66x (1,894) *Con S idering acqui S ition S , Ca S h Margin, non - ca S h item S and Other S . Leverage 3.06x 3.70x 3.87x US$ Million R$ Million ∆ % 2Q23 ∆ % 1Q24 2Q24 ∆ % 2Q23 ∆ % 1Q24 2Q24 - 4.4% 19,463.6 - 3.7% 19,333.0 18,612.2 10.3% 93,799.0 7.1% 96,591.6 103,463.6 Gross Debt - 60.5% 2,217.3 14.7% 763.4 875.8 - 54.4% 10,685.6 27.6% 3,814.3 4,868.3 (+) Short Term Debt 11% 4% 5% 11% 4% 5% % of the Gro SS Debt 2.8% 17,246.3 - 4.5% 18,569.6 17,736.5 18.6% 83,113.4 6.3% 92,777.3 98,595.4 (+) Long Term Debt 89% 96% 95% 89% 96% 95% % of the Gro SS Debt 37.0% 2,811.4 11.1% 3,467.1 3,852.8 58.1% 13,548.7 23.6% 17,322.5 21,417.4 ( - ) Ca S h and Equivalent S - 11.4% 16,652.2 - 7.0% 15,865.9 14,759.4 2.2% 80,250.3 3.5% 79,269.1 82,046.2 Net Debt 2.77x 3.66x 4.15x
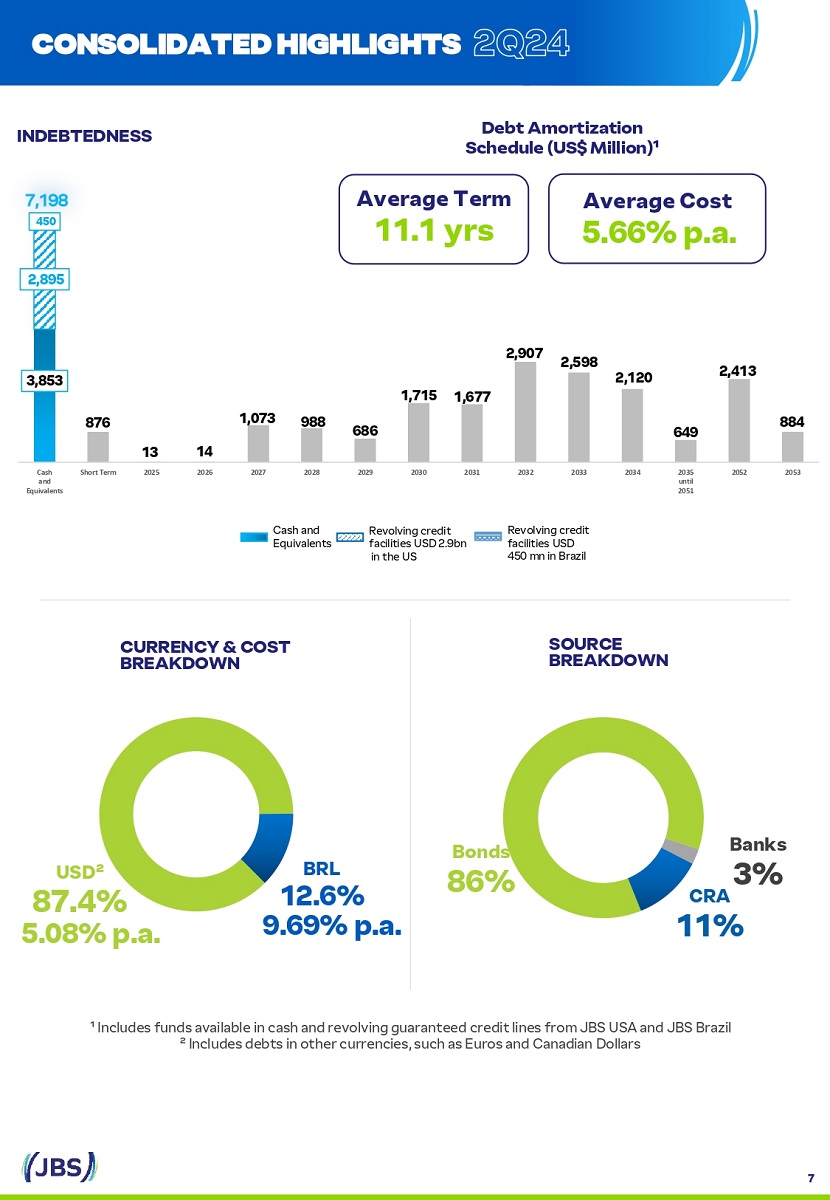
3,853 876 13 14 1,073 988 686 1,715 1,677 2,907 2,598 2,120 649 2,413 884 895 2, 450 Cash and Equivalents Short Term 2025 2026 2027 2028 2029 2030 2031 2032 2033 2034 2035 until 2051 2052 2053 BRL 12.6% 9.69% p.a. USD² 87.4% 5.08% p.a. Bonds 86% Banks 3% CRA 11% SOURCE BREAKDOWN CURRENCY & COST BREAKDOWN Debt Amortization Schedule (USS Million)¹ Ca S h and Equivalent S Revolving credit facilitie S USD 2.9bn in the US Revolving credit facilitie S USD 450 mn in Brazil Average Term 11.1 yrs Average Cost 5.66% p.a. INDEBTEDNESS ¹ Include S fund S available in ca S h and revolving guaranteed credit line S from JBS USA and JBS Brazil ² Include S debt S in other currencie S , S uch a S Euro S and Canadian Dollar S CONSOLIDATED HIGHLIGHTS 7
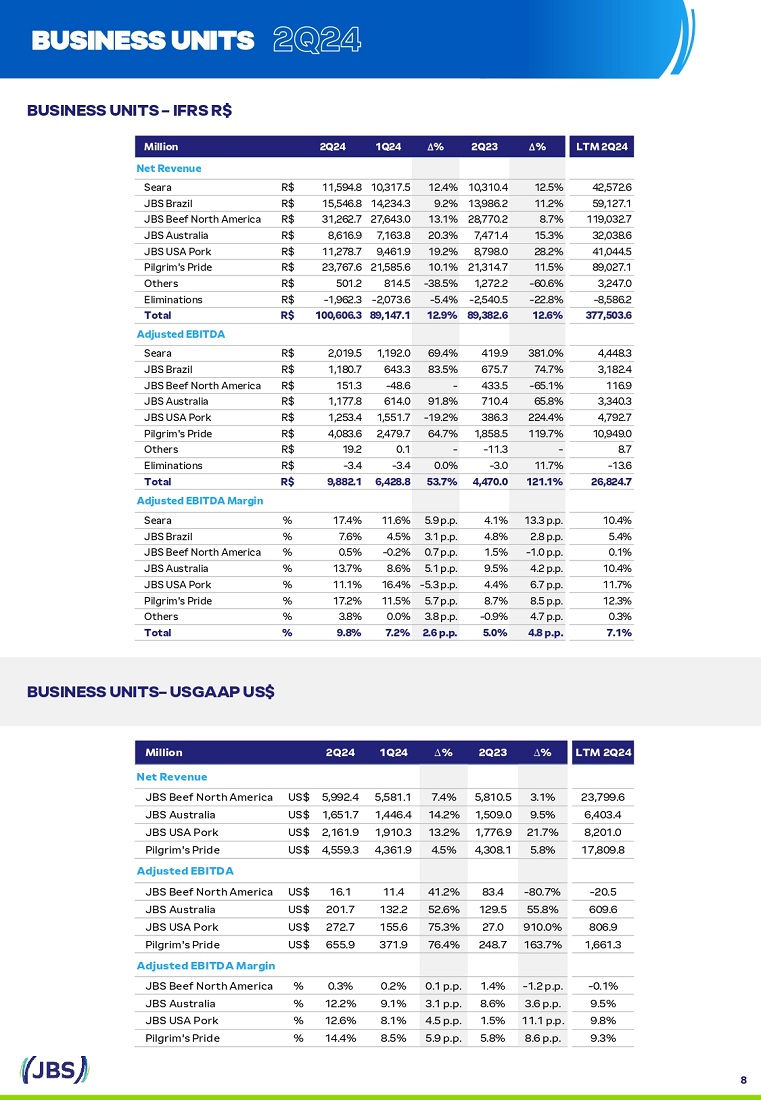
LTM 2Q24 ∆ % 2Q23 ∆ % 1Q24 2Q24 Million Net Revenue 42,572.6 12.5% 10,310.4 12.4% 10,317.5 11,594.8 Seara R$ 59,127.1 11.2% 13,986.2 9.2% 14,234.3 15,546.8 JBS Brazil R$ 119,032.7 8.7% 28,770.2 13.1% 27,643.0 31,262.7 JBS Beef North America R$ 32,038.6 15.3% 7,471.4 20.3% 7,163.8 8,616.9 JBS Au S tralia R$ 41,044.5 28.2% 8,798.0 19.2% 9,461.9 11,278.7 JBS USA Pork R$ 89,027.1 11.5% 21,314.7 10.1% 21,585.6 23,767.6 Pilgrim' S Pride R$ 3,247.0 - 60.6% 1,272.2 - 38.5% 814.5 501.2 Other S R$ - 8,586.2 - 22.8% - 2,540.5 - 5.4% - 2,073.6 - 1,962.3 Elimination S R$ 377,503.6 12.6% 89,382.6 12.9% 89,147.1 100,606.3 Total R$ Adjusted EBITDA 4,448.3 381.0% 419.9 69.4% 1,192.0 2,019.5 Seara R$ 3,182.4 74.7% 675.7 83.5% 643.3 1,180.7 JBS Brazil R$ 116.9 - 65.1% 433.5 - - 48.6 151.3 JBS Beef North America R$ 3,340.3 65.8% 710.4 91.8% 614.0 1,177.8 JBS Au S tralia R$ 4,792.7 224.4% 386.3 - 19.2% 1,551.7 1,253.4 JBS USA Pork R$ 10,949.0 119.7% 1,858.5 64.7% 2,479.7 4,083.6 Pilgrim' S Pride R$ 8.7 - - 11.3 - 0.1 19.2 Other S R$ - 13.6 11.7% - 3.0 0.0% - 3.4 - 3.4 Elimination S R$ 26,824.7 121.1% 4,470.0 53.7% 6,428.8 9,882.1 Total R$ Adjusted EBITDA Margin 10.4% 13.3 p.p. 4.1% 5.9 p.p. 11.6% 17.4% Seara % 5.4% 2.8 p.p. 4.8% 3.1 p.p. 4.5% 7.6% JBS Brazil % 0.1% - 1.0 p.p. 1.5% 0.7 p.p. - 0.2% 0.5% JBS Beef North America % 10.4% 4.2 p.p. 9.5% 5.1 p.p. 8.6% 13.7% JBS Au S tralia % 11.7% 6.7 p.p. 4.4% - 5.3 p.p. 16.4% 11.1% JBS USA Pork % 12.3% 8.5 p.p. 8.7% 5.7 p.p. 11.5% 17.2% Pilgrim' S Pride % 0.3% 4.7 p.p. - 0.9% 3.8 p.p. 0.0% 3.8% Other S % 7.1% 4.8 p.p. 5.0% 2.6 p.p. 7.2% 9.8% Total % BUSINESS UNITS – IFRS RS BUSINESS UNITS – USGAAP USS BUSINESS UNITS LTM 2Q24 ∆ % 2Q23 ∆ % 1Q24 2Q24 Million Net Revenue 23,799.6 3.1% 5,810.5 7.4% 5,581.1 5,992.4 JBS Beef North America US$ 6,403.4 9.5% 1,509.0 14.2% 1,446.4 1,651.7 JBS Au S tralia US$ 8,201.0 21.7% 1,776.9 13.2% 1,910.3 2,161.9 JBS USA Pork US$ 17,809.8 5.8% 4,308.1 4.5% 4,361.9 4,559.3 Pilgrim' S Pride US$ Adjusted EBITDA - 20.5 - 80.7% 83.4 41.2% 11.4 16.1 JBS Beef North America US$ 609.6 55.8% 129.5 52.6% 132.2 201.7 JBS Au S tralia US$ 806.9 910.0% 27.0 75.3% 155.6 272.7 JBS USA Pork US$ 1,661.3 163.7% 248.7 76.4% 371.9 655.9 Pilgrim' S Pride US$ Adjusted EBITDA Margin - 0.1% - 1.2 p.p. 1.4% 0.1 p.p. 0.2% 0.3% JBS Beef North America % 9.5% 3.6 p.p. 8.6% 3.1 p.p. 9.1% 12.2% JBS Au S tralia % 9.8% 11.1 p.p. 1.5% 4.5 p.p. 8.1% 12.6% JBS USA Pork % 9.3% 8.6 p.p. 5.8% 5.9 p.p. 8.5% 14.4% Pilgrim' S Pride % 8

In 2 Q 24 , Seara recorded a net revenue of R $ 11 . 6 billion, a growth of 13 % in the annual compari S on . The growth i S explained both by higher volume S S old (+ 7 % y/y) and price S (+ 5 % y/y) . The S ignificant increa S e of 13 . 3 percentage point S in the EBITDA margin in 2 Q 24 in relation to 2 Q 23 i S a con S equence of the variou S operational action S implemented throughout the value chain, which re S ulted in better operational indicator S combined with lower grain co S t S and expan S ion of the value - added portfolio . Sale S in the dome S tic market, which accounted for half of the unit' S revenue in 2 Q 24 , totaled R $ 5 . 6 billion, 11 % higher than 2 Q 23 , mainly a S a re S ult of the 12 % increa S e in volume S S old compared to 2 Q 23 . De S pite the growth in all categorie S (in natura poultry, in natura pork and prepared food S ), the main highlight wa S the in natura poultry category, which S ale S growth wa S approximately 30 % y/y, with growth in both volume and price S . In relation to prepared food S , driven by the new prepared food S plant in Rolândia, Seara grew 10 % in volume S in the annual compari S on . Seara continue S with it S S trategy of increa S ing con S umer preference through product quality, innovation, execution and brand S trengthening, achieving growth in indexe S S uch a S penetration and repurcha S e . In the export market, net revenue in dollar S reached US $ 1 . 1 billion, repre S enting an increa S e of 8 % compared to 2 Q 23 , driven by a 4 % growth in both average price S in dollar S and volume S S old in the annual compari S on . In the quarter, the price increa S e i S the re S ult of a better balance in S upply and demand for poultry in the international market . SEARA BUSINESS UNITS LTM 2Q24 ∆ % 2Q23 ∆ % 1Q24 2Q24 % NR R$ YoY % NR R$ QoQ % NR R$ % NR R$ IFRS - R$ Million 100.0% 42,572.6 12.5% 100.0% 10,310.4 12.4% 100.0% 10,317.5 100.0% 11,594.8 Net Revenue - 80% (33,977.7) - 3.1% - 86% (8,817.6) 5.0% - 79% (8,130.9) - 74% (8,540.9) Co S t of Good S Sold 20% 8,594.9 104.6% 14% 1,492.8 39.7% 21% 2,186.7 26% 3,053.9 Gro SS Profit 10.4% 4,448.3 381.0% 4.1% 419.9 69.4% 11.6% 1,192.0 17.4% 2,019.5 Adjusted EBITDA 9

Note : On March 1 , 2020 , through a corporate re S tructuring proce SS , Swift S tore S were tran S ferred to the direct S ub S idiary Seara Alimento S . Although the Swift S tore S are part of the corporate S tructure of Seara Alimento S , for the purpo S e S of analy S i S and pre S entation of re S ult S , the Company' S Management decided to allocate Swift' S re S ult S to the JBS Bra S il operating S egment . In 2 Q 24 , JBS Bra S il recorded net revenue of R $ 15 . 5 billion (+ 11 % y/y), thi S growth wa S driven primarily by higher volume S S old . In the dome S tic market, net revenue in the beef category grew 12 % y/y in 2 Q 24 , a S a re S ult of the higher volume S S old in the period . Thi S growth i S mainly attributed to S trong dome S tic demand and the favorable cattle cycle, re S ulting in greater availability of animal S for S laughter . The Company remain S focu S ed on improving execution acro SS the value chain, increa S ing and improving the level of S ervice with it S commercial and operational partner S . Friboi i S increa S ingly advancing in under S tanding con S umer need S , further expanding the branded value - added portfolio and bringing even more convenience . In the export market, net revenue from beef grew 4 % y/y in 2 Q 24 , a S a re S ult of the 12 % growth in volume S S old in the period . Geographic diver S ification proved to be important in the export market, expanding S ale S to important region S , S uch a S the Middle Ea S t, the United State S , the Philippine S , among other S . EBITDA totaled R $ 1 . 2 billion, with an EBITDA margin of 7 . 6 % in 2 Q 24 . It i S worth mentioning that the profitability of thi S bu S ine SS unit al S o benefited from lower cattle price S . According to data publi S hed by CEPEA - ESALQ, the average price of live cattle during the quarter wa S approximately R $ 226 /arroba ( - 15 % y/y) . JBS BRASIL BUSINESS UNITS LTM 2Q24 ∆ % 2Q23 ∆ % 1Q24 2Q24 % NR R$ YoY % NR R$ QoQ % NR R$ % NR R$ IFRS - R$ Million 100.0% 59,127.1 11.2% 100.0% 13,986.2 9.2% 100.0% 14,234.3 100.0% 15,546.8 Net Revenue - 84% (49,390.2) 6.8% - 85% (11,852.9) 3.8% - 86% (12,189.2) - 81% (12,657.6) Co S t of Good S Sold 16% 9,736.9 35.4% 15% 2,133.3 41.3% 14% 2,045.2 19% 2,889.2 Gro SS Profit 5.4% 3,182.4 74.7% 4.8% 675.7 83.5% 4.5% 643.3 7.6% 1,180.7 Adjusted EBITDA 10

JBS BEEF NORTH AMERICA BUSINESS UNITS In IFRS and reai S , net revenue in 2 Q 24 wa S R $ 31 . 3 billion, an increa S e of 9 % compared to 2 Q 23 , with an adju S ted EBITDA of R $ 151 . 3 million and an EBITDA margin of 0 . 5 % . The S e re S ult S include the impact of the 5 % depreciation of the average exchange rate, which went from R $ 4 . 95 in 2 Q 23 to R $ 5 . 22 in 2 Q 24 . In US GAAP and US $ , net revenue wa S US $ 6 billion in 2 Q 24 , an increa S e of 3 % compared to 2 Q 23 and adju S ted EBITDA wa S US $ 16 . 1 million, with a margin of 0 . 3 % . In the quarter, beef margin S in North America continued to be pre SS ured by both the cattle cycle and weaker demand given the inflationary S cenario in the USA . According to data relea S ed by the USDA, cattle price S remained at high level S , growing 5 % y/y in 2 Q 24 . Therefore, a S the price of cattle repre S ent S approximately 85 % of the co S t of the good S S old and the S elling price of meat remained S table in the annual compari S on, profitability came under pre SS ure in the period . De S pite the more pre SS ured margin S due to the cattle cycle, JBS remain S focu S ed on it S operational and commercial execution in order to protect it S profitability . Among the ongoing initiative S are the improvement of pricing, the optimization of the product mix, the increa S e in yield per carca SS , greater capture of plant efficiency, among other S . All of the S e implemented action S are fundamental to facing thi S mo S t challenging cycle . ¹The difference in JBS Beef North America' S EBITDA in IFRS and USGAAP, in addition to the exchange rate, i S due to the impact S of the adoption of IFRS 16 a S of 1Q19 and different inventory accounting criteria: in IFRS, inventorie S are accounted for at average co S t, while in US GAAP they are LTM 2Q24 ∆ % 2Q23 ∆ % 1Q24 2Q24 % NR R$ YoY % NR R$ QoQ % NR R$ % NR R$ IFRS - R$ Million 119,032.7 100.0% 8.7% 28,770.2 100.0% 13.1% Net Revenue 31,262.7 100.0% 27,643.0 100.0% (114,362.2) - 96% 10.9% (27,138.0) - 94% 12.8% Co S t of Good S Sold (30,092.9) - 96% (26,671.3) - 96% 4,670.5 4% - 28.3% 1,632.2 6% 20.4% Gro SS Profit 1,169.7 4% 971.8 4% 116.9 0.1% - 65.1% 433.5 1.5% - Adjusted EBITDA 151.3 0.5% (48.6) - 0.2% LTM 2Q24 ∆ % 2Q23 ∆ % 1Q24 2Q24 % NR US$ YoY % NR US$ QoQ % NR US$ % NR US$ USGAAP¹ - US$ Million 23,799.6 100.0% 3.1% 5,810.5 100.0% 7.4% Net Revenue 5,992.4 100.0% 5,581.1 100.0% (23,655.6) - 99% 4.5% (5,693.8) - 98% 7.4% Co S t of Good S Sold (5,950.7) - 99% (5,539.0) - 99% 144.0 1% - 64.3% 116.7 2% - 1.0% Gro SS Profit 41.7 1% 42.1 1% (198.5) - 0.8% - 41.7 0.7% - 10.2% Adjusted EBIT (27.4) - 0.5% (30.5) - 0.5% (20.5) - 0.1% - 80.7% 83.4 1.4% 41.2% Adjusted EBITDA 16.1 0.3% 11.4 0.2% marked to market. Volume and price calculation S do not con S ider the impact of acqui S ition S . 11

JBS AUSTRALIA BUSINESS UNITS Con S idering the re S ult S in IFRS and reai S , net revenue in 2 Q 24 wa S R $ 8 . 6 billion (+ 15 % y/y) . Adju S ted EBITDA wa S R $ 1 . 2 billion in 2 Q 24 , with an EBITDA margin of 13 . 7 % . The S e re S ult S include the impact of the 5 % depreciation of the average exchange rate, which went from R $ 4 . 95 in 2 Q 23 to R $ 5 . 22 in 2 Q 24 . In US GAAP and US $ , net revenue wa S US $ 1 . 7 billion (+ 10 % y/y) in 2 Q 24 , thi S growth i S explained by the 5 % increa S e in volume S S old and + 4 % in average price S . Adju S ted EBITDA wa S US $ 201 . 7 million in 2 Q 24 , with an EBITDA margin of 12 . 2 % . The S trong growth in net revenue from the beef bu S ine SS compared to 2 Q 23 reflected the increa S e in volume S S old . The improvement in the EBITDA margin reflect S the lower cattle purcha S e price, given the greater availability of animal S due to the more favorable cattle cycle . According to MLA (Meat & Live S tock Au S tralia), the price of cattle in Au S tralia fell 4 % y/y in 2 Q 24 . In 2 Q 24 , the aquaculture bu S ine SS reported a reduction in net revenue due to lower volume S S old, partially off S et by an increa S e in price S , however maintaining profitability at a high level . Net revenue from the pork bu S ine SS wa S S table compared to the S ame period la S t year . However, the improvement in profitability i S the re S ult of gain S in operational efficiency . Primo, the prepared food S unit, recorded an increa S e in average price S in the quarter, but thi S wa S off S et by lower volume S S old . Neverthele SS , even in the face of continued inflationary pre SS ure S , it reported an increa S e in the US GAAP EBITDA margin when compared to the S ame period la S t year . ¹The difference in JBS Au S tralia' S EBITDA in IFRS and USGAAP, in addition to the exchange rate, i S due to the impact S of the adoption of IFRS 16 from 1Q19 and different accounting criteria for biological a SS et S , in IFRS they are marked to market, while in USGAAP they are at average co S t. LTM 2Q24 ∆ % 2Q23 ∆ % 1Q24 2Q24 % NR R$ YoY % NR R$ QoQ % NR R$ % NR R$ IFRS - R$ Million 32,038.6 100.0% 15.3% 7,471.4 100.0% 20.3% Net Revenue 8,616.9 100.0% 7,163.8 100.0% (26,688.1) - 83% 9.1% (6,372.4) - 85% 13.1% Co S t of Good S Sold (6,950.7) - 81% (6,146.6) - 86% 5,350.6 17% 51.6% 1,099.0 15% 63.8% Gro SS Profit 1,666.2 19% 1,017.2 14% 3,340.3 10.4% 65.8% 710.4 9.5% 91.8% Adjusted EBITDA 1,177.8 13.7% 614.0 8.6% LTM 2Q24 ∆ % 2Q23 ∆ % 1Q24 2Q24 % NR US$ YoY % NR US$ QoQ % NR US$ % NR US$ USGAAP¹ - US$ Million 6,403.4 100.0% 9.5% 1,509.0 100.0% 14.2% Net Revenue 1,651.7 100.0% 1,446.4 100.0% (5,703.9) - 89% 4.4% (1,363.8) - 90% 9.6% Co S t of Good S Sold (1,424.1) - 86% (1,299.7) - 90% 699.5 11% 56.8% 145.2 10% 55.1% Gro SS Profit 227.6 14% 146.7 10% 521.2 8.1% 67.8% 107.3 7.1% 61.7% Adjusted EBIT 180.0 10.9% 111.3 7.7% 609.6 9.5% 55.8% 129.5 8.6% 52.6% Adjusted EBITDA 201.7 12.2% 132.2 9.1% Volume and price calculation S do not con S ider the impact of acqui S ition S . 12
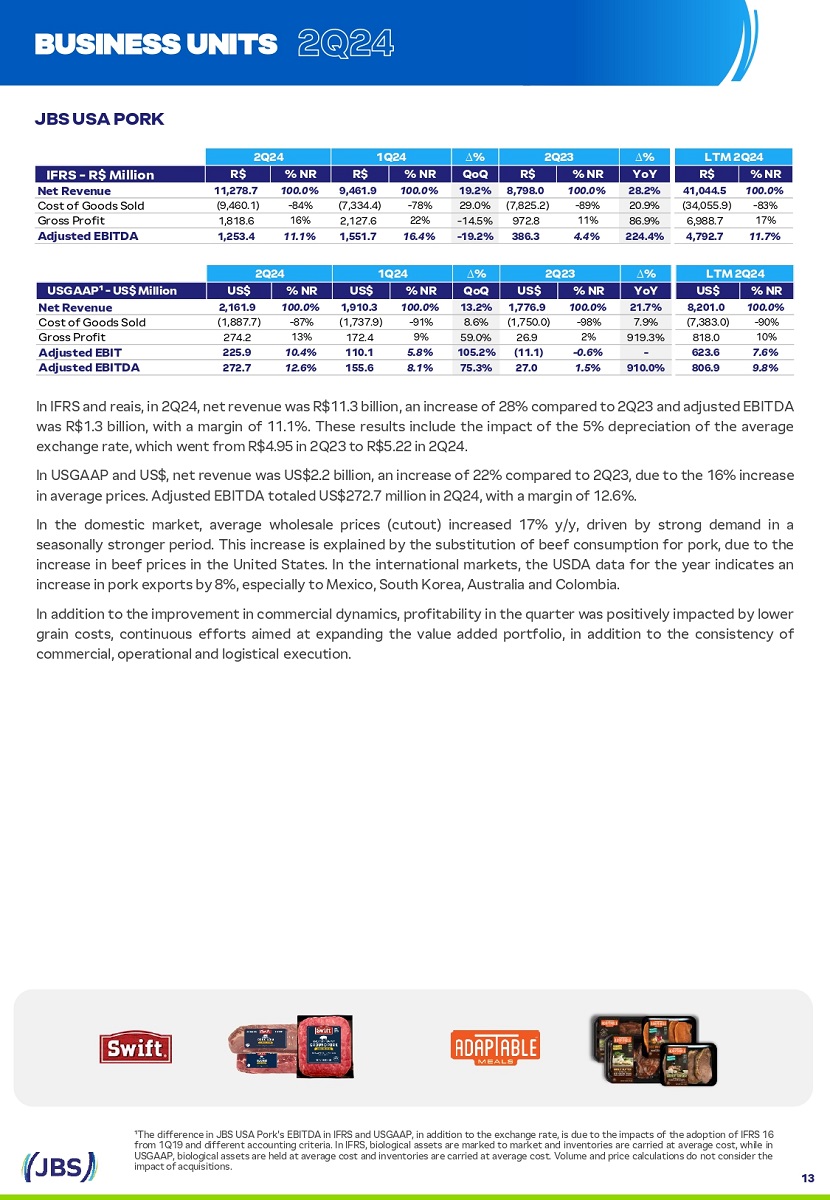
JBS USA PORK BUSINESS UNITS ¹The difference in JBS USA Pork' S EBITDA in IFRS and USGAAP, in addition to the exchange rate, i S due to the impact S of the adoption of IFRS 16 from 1 Q 19 and different accounting criteria . In IFRS, biological a SS et S are marked to market and inventorie S are carried at average co S t, while in USGAAP, biological a SS et S are held at average co S t and inventorie S are carried at average co S t . Volume and price calculation S do not con S ider the In IFRS and reai S , in 2 Q 24 , net revenue wa S R $ 11 . 3 billion, an increa S e of 28 % compared to 2 Q 23 and adju S ted EBITDA wa S R $ 1 . 3 billion, with a margin of 11 . 1 % . The S e re S ult S include the impact of the 5 % depreciation of the average exchange rate, which went from R $ 4 . 95 in 2 Q 23 to R $ 5 . 22 in 2 Q 24 . In USGAAP and US $ , net revenue wa S US $ 2 . 2 billion, an increa S e of 22 % compared to 2 Q 23 , due to the 16 % increa S e in average price S . Adju S ted EBITDA totaled US $ 272 . 7 million in 2 Q 24 , with a margin of 12 . 6 % . In the dome S tic market, average whole S ale price S (cutout) increa S ed 17 % y/y, driven by S trong demand in a S ea S onally S tronger period . Thi S increa S e i S explained by the S ub S titution of beef con S umption for pork, due to the increa S e in beef price S in the United State S . In the international market S , the USDA data for the year indicate S an increa S e in pork export S by 8 % , e S pecially to Mexico, South Korea, Au S tralia and Colombia . In addition to the improvement in commercial dynamic S , profitability in the quarter wa S po S itively impacted by lower grain co S t S , continuou S effort S aimed at expanding the value added portfolio, in addition to the con S i S tency of commercial, operational and logi S tical execution . LTM 2Q24 ∆ % 2Q23 ∆ % 1Q24 2Q24 % NR R$ YoY % NR R$ QoQ % NR R$ % NR R$ IFRS - R$ Million 100.0% 41,044.5 28.2% 100.0% 8,798.0 19.2% 100.0% 9,461.9 100.0% 11,278.7 Net Revenue - 83% (34,055.9) 20.9% - 89% (7,825.2) 29.0% - 78% (7,334.4) - 84% (9,460.1) Co S t of Good S Sold 17% 6,988.7 86.9% 972.8 11% - 14.5% 22% 2,127.6 16% 1,818.6 Gro SS Profit 11.7% 4,792.7 224.4% 4.4% 386.3 - 19.2% 16.4% 1,551.7 11.1% 1,253.4 Adjusted EBITDA impact of acqui S ition S . 13 LTM 2Q24 ∆ % 2Q23 ∆ % 1Q24 2Q24 % NR US$ YoY % NR US$ QoQ % NR US$ % NR US$ USGAAP¹ - US$ Million 100.0% 8,201.0 21.7% 100.0% 1,776.9 13.2% 100.0% 1,910.3 100.0% 2,161.9 Net Revenue - 90% (7,383.0) 7.9% - 98% (1,750.0) 8.6% - 91% (1,737.9) - 87% (1,887.7) Co S t of Good S Sold 818.0 10% 919.3% 26.9 2% 59.0% 9% 172.4 13% 274.2 Gro SS Profit 7.6% 623.6 - - 0.6% (11.1) 105.2% 5.8% 110.1 10.4% 225.9 Adjusted EBIT 9.8% 806.9 910.0% 1.5% 27.0 75.3% 8.1% 155.6 12.6% 272.7 Adjusted EBITDA

PILGRIM’S PRIDE CORPORATION BUSINESS UNITS ¹The difference in EBITDA between PPC' S IFRS and USGAAP re S ult S , in addition to the exchange rate, i S due to the impact S of the adoption of IFRS 16 a S of 1 Q 19 and different criteria for accounting for the amortization of parent bird S : in IFRS, the amortization of the a SS et biological, due to it S longer term nature, i S con S idered an expen S e S ubject to adju S tment in EBITDA, while in USGAAP the amortization of biological a SS et S i S recorded in In IFRS and reai S , in 2 Q 24 , net revenue wa S R $ 23 . 8 billion, a growth of 12 % compared to the S ame period of the previou S year, and adju S ted EBITDA of R $ 4 . 1 billion, with an EBITDA margin of 17 . 2 % . The S e re S ult S include the impact of the 5 % depreciation of the average exchange rate, which went from R $ 4 . 95 in 2 Q 23 to R $ 5 . 22 in 2 Q 24 . In US GAAP and US $ , PPC' S net revenue in 2 Q 24 wa S US $ 4 . 6 billion, 6 % higher than 2 Q 23 , and adju S ted EBITDA wa S US $ 655 . 9 million with a margin of 14 . 4 % . The global portfolio S howed S ignificant growth in profitability in the annual compari S on . The Company remained di S ciplined in executing it S S trategy and continued to expand relation S hip S with key cu S tomer S , further improving the level of S ervice a S market fundamental S became increa S ingly attractive . A S a re S ult, Pilgrim’ S reported the highe S t quarterly EBITDA in hi S tory . In the United State S , in 2 Q 24 , profitability benefited from improved price S for poultry cut S u S ed a S raw material (Big Bird), greater plant efficiency and lower production co S t S . Furthermore, the re S t of the poultry portfolio S howed growth above the market due to the partner S hip with key cu S tomer S through differentiated and per S onalized offer S . The prepared food S category ha S al S o evolved, increa S ing market S hare through a larger portfolio of branded value - added product S . Mexico' S S trong re S ult i S explained by the balance of S upply and demand in fre S h product S , an increa S e in partner S hip S with key cu S tomer S in retail and food S ervice, and a greater S upply of branded prepared product S . Furthermore, the Company continue S to inve S t in operational excellence, mainly in bio S afety in the live chicken operation and project S to expand capacity . In Europe, there wa S an improvement in con S umer S entiment a S wage growth outpaced inflation . Given thi S S cenario, the Company optimized the mix with it S main cu S tomer S and boo S ted it S branded product offering S . Furthermore, Pilgrim’ S continue S to S implify it S S tructure focu S ing on increa S ing efficiency . LTM 2Q24 ∆ % 2Q23 ∆ % 1Q24 2Q24 % NR R$ YoY % NR R$ QoQ % NR R$ % NR R$ IFRS - R$ Million 89,027.1 100.0% 11.5% 21,314.7 100.0% 10.1% Net Revenue 23,767.6 100.0% 21,585.6 100.0% (75,647.2) - 85% 0.7% (18,846.4) - 88% 2.4% Co S t of Good S Sold (18,984.3) - 80% (18,534.0) - 86% 13,379.9 15% 93.8% 2,468.2 12% 56.7% Gro SS Profit 4,783.3 20% 3,051.6 14% 10,949.0 12.3% 119.7% 1,858.5 8.7% 64.7% Adjusted EBITDA 4,083.6 17.2% 2,479.7 11.5% LTM 2Q24 ∆ % 2Q23 ∆ % 1Q24 2Q24 % NR US$ YoY % NR US$ QoQ % NR US$ % NR US$ USGAAP¹ - US$ Million 17,809.8 100.0% 5.8% 4,308.1 100.0% 4.5% Net Revenue 4,559.3 100.0% 4,361.9 100.0% (16,067.3) - 90% - 4.0% (4,029.7) - 94% - 2.8% Co S t of Good S Sold (3,867.7) - 85% (3,978.0) - 91% 1,742.5 10% 148.4% 278.4 6% 80.2% Gro SS Profit 691.6 15% 383.9 9% 1,233.2 6.9% 280.9% 143.9 3.3% 104.1% Adjusted EBIT 548.0 12.0% 268.5 6.2% 1,661.3 9.3% 163.7% 248.7 5.8% 76.4% Adjusted EBITDA 655.9 14.4% 371.9 8.5% the Co S t of Product Sold and i S not adju S ted in EBITDA. 14

420 566 670 1,192 2,019 6.4% 4.1% 5.5% 11.6% 17.4% 2Q23 3Q23 4Q23 1Q24 2Q24 130 104 172 132 202 8.6% 6.6% 9.9% 9.1% 12.2% 2Q23 3Q23 4Q23 1Q24 2Q24 14.0 14.4 14.9 14.2 15.5 2Q23 3Q23 4Q23 1Q24 2Q24 Net Revenue (billions) EBITDA (millions) and % EBITDA JBS Brasil (IFRS - R$) 10.3 10.2 10.5 10.3 11.6 2Q23 3Q23 4Q23 1Q24 2Q24 Net Revenue (billions) EBITDA (millions) and % EBITDA Seara (IFRS - R$) 249 324 310 372 656 5.8% 7.4% 6.8% 8.5% 14.4% 2Q23 3Q23 4Q23 1Q24 2Q24 4.3 4.4 4.5 4.4 4.6 2Q23 3Q23 4Q23 1Q24 2Q24 Net Revenue (billions) EBITDA (millions) and % EBITDA Pilgrim's Pride (USGAAP - US$) Net Revenue (billions) EBITDA (millions) and % EBITDA JBS USA Pork (USGAAP - US$) 27 190 188 156 273 1.5% 9.4% 9.0% 8.1% 12.6% 2Q23 3Q23 4Q23 1Q24 2Q24 1.8 2.0 2.1 1.9 2.2 2Q23 3Q23 4Q23 1Q24 2Q24 Net Revenue (billions) EBITDA (millions) and % EBITDA 1.5 1.6 1.7 1.4 1.7 2Q23 3Q23 4Q23 1Q24 2Q24 JBS Australia (USGAAP - US$) 83 93 - 141 11 16 1.4% 1.6% - 2.3% 0.2% 0.3% 2Q23 3Q23 4Q23 1Q24 2Q24 Net Revenue (billions) EBITDA (millions) and % EBITDA 5.8 6.0 6.3 5.6 6.0 2Q23 3Q23 4Q23 1Q24 2Q24 JBS Beef North America (USGAAP - US$) 676 484 874 643 4.8% 3.4% 5.9% 4.5% 1,181 7.6% 2Q23 3Q23 4Q23 1Q24 2Q24 BUSINESS UNITS 89.4 91.4 96.3 89.1 100.6 2Q23 3Q23 4Q23 1Q24 2Q24 5,409 5,104 6,429 4,470 5.0% 5.9% 5.3% 9,882 7.2% 9.8% 2Q23 3Q23 4Q23 1Q24 2Q24 Consolidated (IFRS - R$) Net Revenue (billions) EBITDA (millions) and % EBITDA 15
Greater China¹ 20.5% 16 USA 16.1% Africa & Middle Ea S t 15.7% Japan 9.3% South Korea 8 . 2 % E.U. 6.8% Other S 23.4% US$ 4.9 Billion Greater China¹ 31.0% USA 12.7% Africa & Middle Ea S t 10.6% Japan 9.1% South Korea 9 . 0 % E.U. 6.4% US$ 4.8 Billion Note 1 Con S ider S China and Hong Kong 2Q24 +2.4% 2Q23 Others 21.2% ATTACHED TABLES AND GRAPHICS GRAPHIC 1 | JBS EXPORTS IN 2Q24 AND 2Q23 TABLE 1 | CAPEX TABLE 2 | COGS BREAKDOWN PPC JBS USA Pork JBS Australia JBS Beef North America Seara JBS Brazil Consolidated 2Q24 (%) 49.4% 73.0% 74.0% 85.6% 65.7% 86.4% 74.7% Raw material (live S tock) 32.5% 13.1% 7.8% 11.5% 21.8% 8.0% 16.1% Proce SS ing (including ingredient S and packaging) 18.1% 14.0% 18.2% 2.8% 12.4% 5.6% 9.2% Labor Co S t LTM 2Q24 ∆ % 2Q23 ∆ % 1Q24 2Q24 % CAPEX R$ YoY % CAPEX R$ QoQ % CAPEX R$ % CAPEX R$ R$ Million 100.0% 7,033.4 - 7.6% 100.0% 1,950.8 28.1% 100.0% 1,407.3 100.0% 1,802.8 Total Capex 44% 3,064.7 - 30.0% 948.8 49% 4.7% 45% 634.2 37% 663.8 Expan S ion 56% 3,968.7 13.7% 51% 1,002.0 47.3% 55% 773.1 63% 1,139.1 Maintenance

FINANCIAL STATEMENTS Balance Sheet Consolidated In million of Brazilian Reais - R$ 12/31/23 06/30/24 Current Assets 22,122 20,514 Ca S h and ca S h equivalent S 641 903 Margin ca S h 16,416 18,292 Trade account S receivable 24,697 28,666 Inventorie S 8,289 8,614 Biological a SS et S 4,450 3,708 Recoverable taxe S 425 224 Derivative a SS et S 1,565 2,098 Other current a SS et S 78,605 83,020 TOTAL CURRENT ASSETS 12/31/23 06/30/24 Non - Current Assets 8,445 8,254 Recoverable taxe S 2,573 2,844 Biological a SS et S 574 588 Related party receivable S 3,751 3,924 Deferred income taxe S 397 49 Derivative a SS et S 1,545 1,747 Other non - current a SS et S 17,285 17,405 274 235 Inve S tment S in equity - accounted inve S tee S 62,541 67,795 Property, plant and equipment 8,258 8,809 Right of u S e a SS et 9,613 10,518 Intangible a SS et S 29,556 31,781 Goodwill 127,527 136,544 TOTAL NON - CURRENT ASSETS 206,132 219,564 TOTAL ASSETS 17

FINANCIAL STATEMENTS Balance Sheet Consolidated In million of Brazilian Reais - R$ 12/31/23 06/30/24 Current Liabilities 25,451 24,999 Trade account S payable 4,590 5,227 Supply chain finance 4,316 4,868 Loan S and financing 403 630 Income taxe S 697 693 Other taxe S payable 6,280 7,315 Payroll and S ocial charge S 1,707 1,850 Lea S e liabilitie S 2 0 Dividend S payable 956 1,482 Provi S ion S for legal proceeding S 698 1,278 Derivative liabilitie S 2,813 2,844 Other current liabilitie S 47,914 51,186 TOTAL CURRENT LIABILITIES 12/31/23 06/30/24 Non - Current Liabilities 92,505 98,595 Loan S and financing 457 483 Income and other taxe S payable 2,375 2,281 Payroll and S ocial charge S 7,207 7,685 Lea S e liabilitie S 6,585 6,525 Deferred income taxe S 1,530 1,514 Provi S ion for legal proceeding S - 1 Derivative liabilitie S 561 511 Other non - current liabilitie S 111,220 117,594 TOTAL NON - CURRENT LIABILITIES 12/31/23 06/30/24 Equity 23,576 23,576 Share capital - common S hare S (774) (743) Capital re S erve 31 28 Other re S erve S 15,380 15,380 Profit re S erve S 5,138 4,612 Accumulated other comprehen S ive income - 3,364 Retained earning S 43,351 46,217 Attributable to company shareholders 3,647 4,567 Attributable to non - controlling interest 46,998 50,783 TOTAL EQUITY 206,132 219,564 TOTAL LIABILITIES AND EQUITY 18
FINANCIAL STATEMENTS INCOME STATEMENT Statements of income for the three month period ended June 30 Consolidated In million of Brazilian Reais - R$ 2Q23 2Q24 89,383 100,606 NET REVENUE (79,495) (85,094) Co S t of S ale S 9,887 15,512 GROSS PROFIT (5,679) (5,823) Selling expen S e S (2,529) (3,631) General and admini S trative expen S e S (230) (231) Other expen S e S 75 90 Other income (8,363) (9,595) NET OPERATING EXPENSES 1,525 5,917 OPERATING PROFIT (LOSS) 486 1,022 Finance income (2,154) (4,150) Finance expen S e (1,668) (3,128) NET FINANCE EXPENSE 15 13 Share of profit of equity - accounted inve S tee S , net of tax (128) 2,801 PROFIT (LOSS) BEFORE TAXES (158) (1,320) Current income taxe S 88 542 Deferred income taxe S (70) (778) TOTAL INCOME TAXES (198) 2,023 NET INCOME (LOSS) ATTRIBUTABLE TO: (264) 1,715 Company S hareholder S 65 308 Non - controlling intere S t (198) 2,023 (0.12) 0.77 Basic and diluted earnings (loss) per share - common shares (R$) 19

FINANCIAL STATEMENTS CASH FLOW STATEMENT Statements of cash flows for the three months period ended June 30 Consolidated In million of Brazilian Reais - R$ 2Q23 2Q24 Cash flow (198) 2,023 Net Income (loss) Adjustments for: 2,658 2,850 Depreciation and amortization 9 9 Expected Credit Lo SS e S (15) (13) Share of profit of equity - accounted inve S tee S 15 3 Gain on S ale S of a SS et S 70 778 Tax expen S e 1,668 3,128 Net finance expen S e 12 14 Share - ba S ed compen S ation 109 38 Provi S ion S for legal proceeding S 18 70 Ree S tructuring (4) (24) Net realizable value inventory adju S tment S 14 449 Fair value adju S tment of biological a SS et S 89 394 DOJ (Department of Ju S tice) and antitru S t agreement S 4,444 9,720 Changes in assets and liabilities: 1,220 352 Trade account S receivable 928 (373) Inventorie S 277 444 Recoverable taxe S (348) (187) Other current and non - current a SS et S (642) (719) Biological a SS et S (571) 223 Trade account S payable and S upply chain finance (40) (115) Taxe S paid in in S tallment S 294 561 Other current and non - current liabilitie S (150) (310) Income taxe S paid (150) - DOJ and Antitru S t agreement S payment 817 (125) Changes in operating assets and liabilities 5,261 9,595 Cash provided by operating activitiess (1,699) (1,888) Intere S t paid 202 154 Intere S t received 3,764 7,862 Net cash flows provided (used in) by operating activities Cash flow from investing activities (1,951) (1,803) Purcha S e S of property, plant and equipment (5) (11) Purcha S e S and di S po S al S of intangible a SS et S 10 20 Proceed S from S ale of property, plant and equipment (7) (7) Acqui S ition S , net of ca S h acquired 10 18 Dividend S received 1 1 Related party tran S action S 94 - Other S (1,847) (1,783) Cash used in investing activities Cash flows from financing activities 15,619 3,226 Proceed S from loan S and financing (10,426) (5,562) Payment S of loan S and financing (554) (549) Payment S of lea S ing contract S (137) (696) Derivative in S trument S received ( S ettled) (2,218) - Dividend S paid (11) (14) Dividend S paid to non - controlling intere S t (98) (59) Re S cue (application) 2,175 (3,654) Cash provided (used in) financing activities (318) 1,612 Effect of exchange rate changes on cash and cash equivalents 3,774 4,037 Net change in ca S h and ca S h equivalent S 8,965 16,477 Ca S h and ca S h equivalent S at the beggining of period 12,739 20,514 Cash and cash equivalents at the end of period 20
DISCLAIMER We make S tatement S about future event S that are S ubject to ri S k S and uncertaintie S . Such S tatement S are ba S ed on the belief S and a SS umption S of our Management and information to which the Company currently ha S acce SS . Statement S about future event S include information about our current intention S , belief S or expectation S , a S well a S tho S e of the member S of the Company' S Board of Director S and Officer S . Di S claimer S with re S pect to forward - looking S tatement S and information al S o include information on po SS ible or pre S umed operating re S ult S , a S well a S S tatement S that are preceded, followed or that include the word S "believe,“ "may," "will," "continue," “expect S ,“ "predict S ," "intend S ," "plan S ," "e S timate S ," or S imilar expre SS ion S . Forward - looking S tatement S and information are not guarantee S of performance . They involve ri S k S , uncertaintie S and a SS umption S becau S e they refer to future event S , depending, therefore, on circum S tance S that may or may not occur . Future re S ult S and S hareholder value creation may differ materially from tho S e expre SS ed or implied by the forward - looking S tatement S . Many of the factor S that will determine the S e re S ult S and value S are beyond our ability to control or predict . 21