Exhibit 99.2
Results 3Q24 JBS
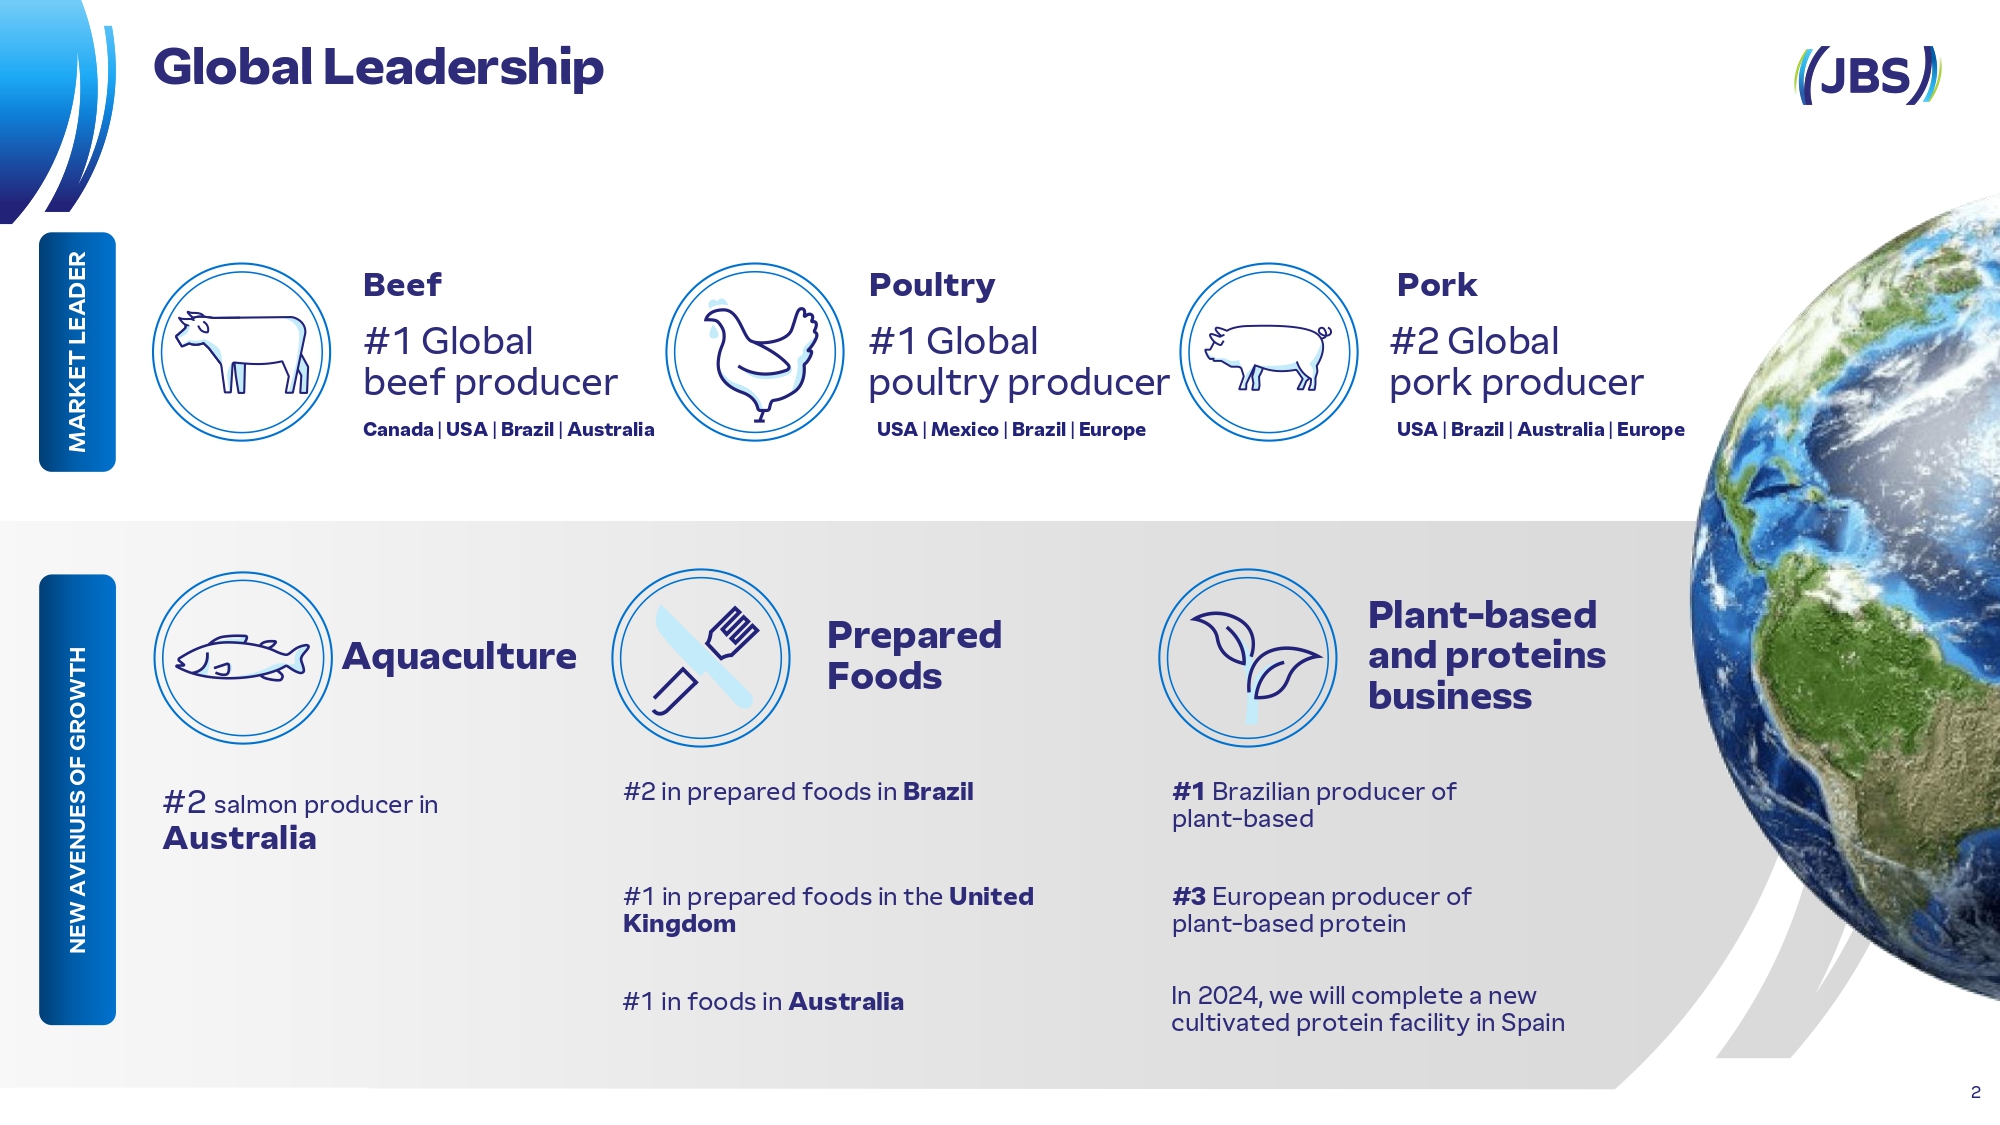
G l obal Lead ersh i p Aquaculture Plant - based and prote i ns business # 3 Eur o pe a n pr o du c e r o f pl a n t - ba se d p r o t e in #2 sa lmo n pr o duc e r in Australia P r epared Foods # 1 B r a zil i a n pr o du c e r o f plant - based # 2 in pr e pa r e d foo ds in B r az il # 1 in pr e pa r e d fo o ds in t h e U n ited Kingdom # 1 in foo ds in A us t r al i a MARK E T LEAD E R NEW AVE N U ES OF GRO WT H Beef #1 Glo bal b e ef prod uc e r C a n a d a | U S A | B r a z il | A u st r a li a 2 Poultry #1 Gl o bal p o ultry prod uc e r U S A | M e xic o | B r a z il | E u rop e Pork #2 Gl o bal po rk prod uc e r U S A | B r a z il | A u st r a li a | E u rop e In 2024, w e w i ll comp l e t e a n e w cu l t i v a t e d p r o t e in f a ci li t y in S pain
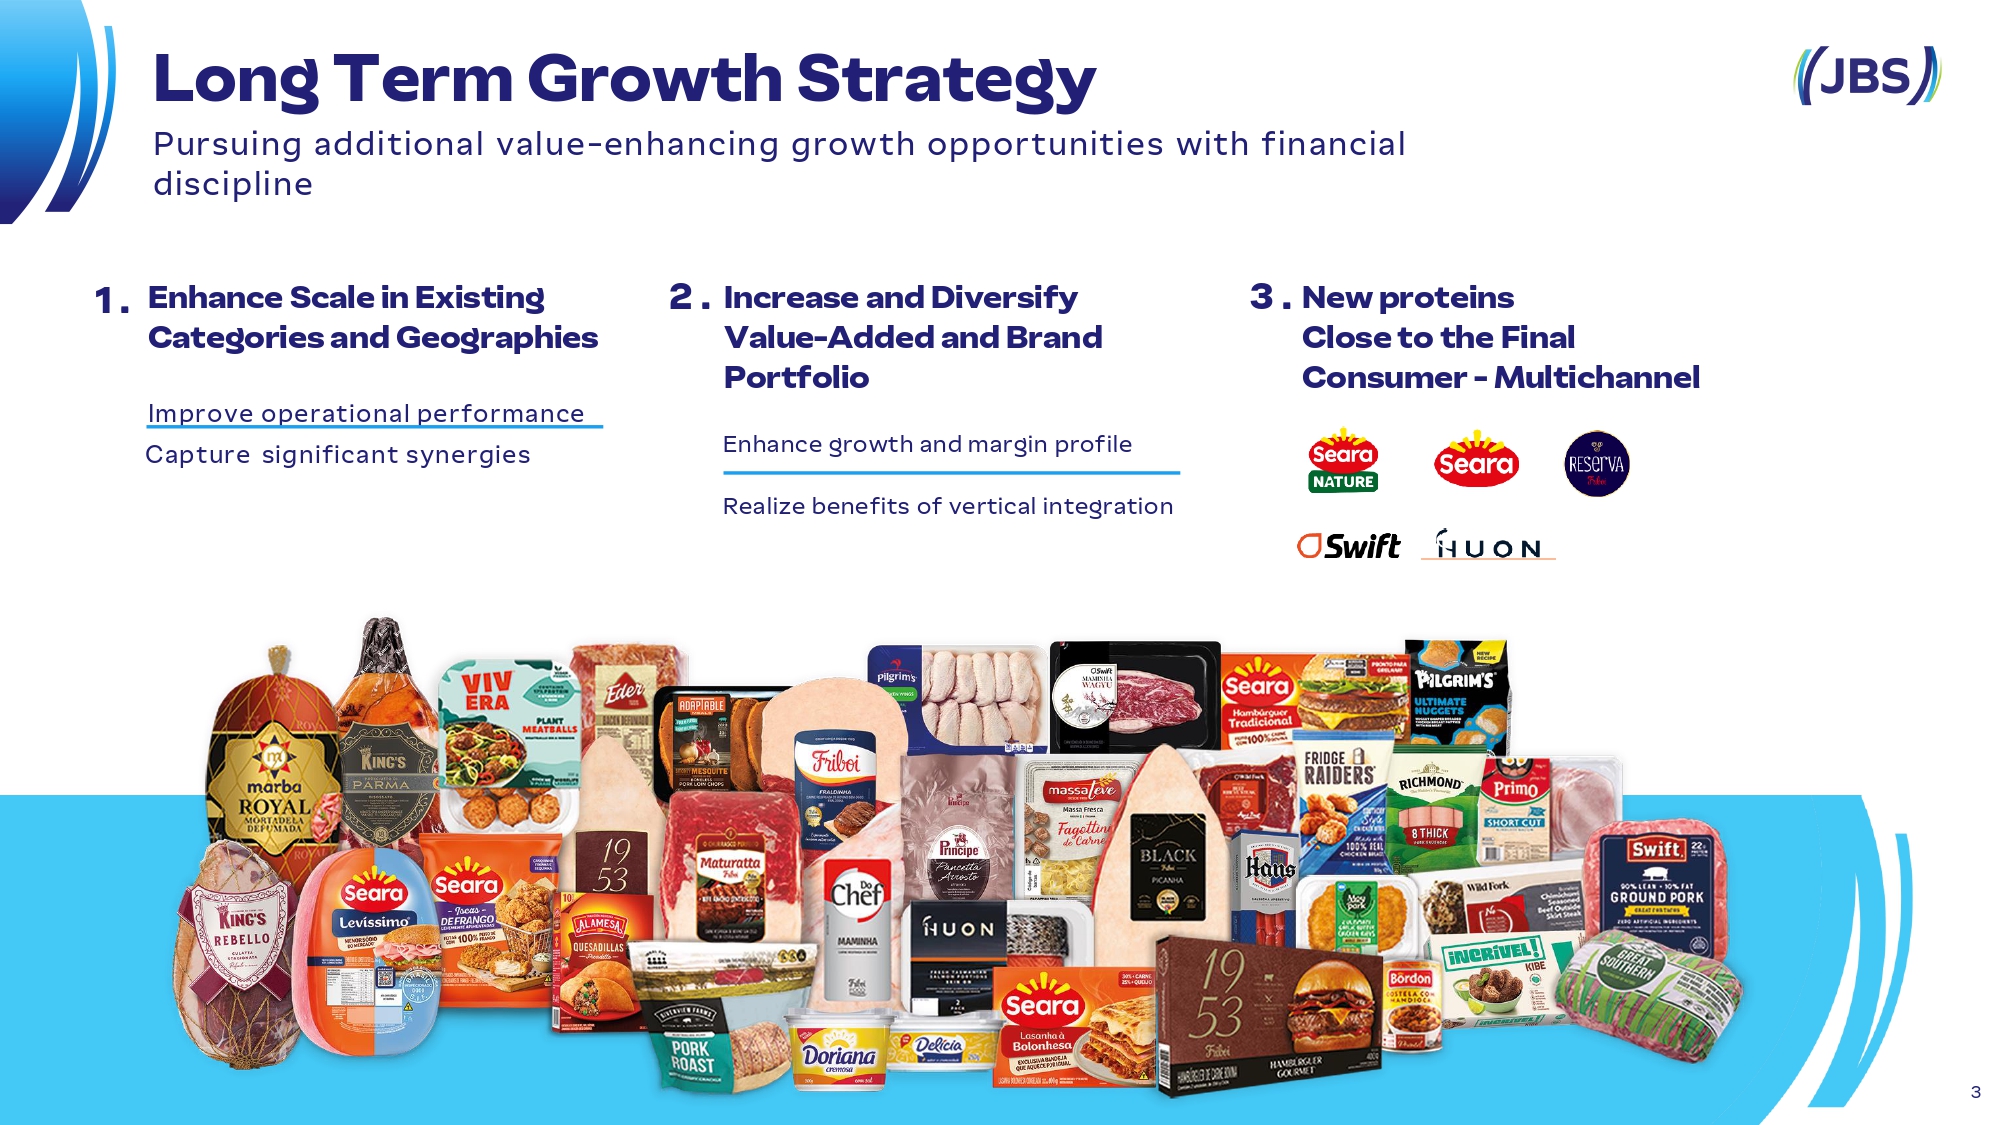
1 . En h a n ce Sca le in E xisti n g C a t e go r ies a n d Geo g r a p h ies 2 . In c r eas e a n d D iv e r si fy V a lu e - Ad d e d a n d B r a n d Portfolio Lon g Ter m Growt h Strategy Pursuing additional value - enhancing growth opportunities with financial discipline Improve operational performance Capture significant synergies Enhance growth and margin profile Realize benefits of vertical integration 3 . N e w p r ot e i n s C l ose to the F i n a l Co n su m e r - M ul tic h a nn el 3

Re v enu e b y O rig i n South A m er i c a 1% 51% Unit e d Stat e s 26% Brazil 9% Australia 7% Europe 5% Canada 3% Mexico M exic o & Cen tr al 5% America USA 49% Brazil 13% Asi a 1 3 % Afr i c a & M i d d l e E ast 4% 3 % Ca na da A u st r ali a & Ne w Zea land 3% N e t r e v e nue L TM 3 Q 2 4 ( b y d es t ina t ion ) Europe 9% Strategy Geographic & Protein Diversification B e e f P o r k L a m b P o u l t r y Aquaculture Leather Plant Bas ed C e n ter f o r In n o v a t i o n Cultivated Protein Prepared Foods 4

16.5 0 . 7 17.6 0 . 6 31. 1 36. 9 38. 6 42. 9 51.2 48. 9 49. 0 51. 1 49. 7 51. 7 52 . 3 65. 0 72. 6 72. 9 76. 7 2 . 1 1 . 9 2 . 2 2 . 8 4 . 7 4 . 0 3 . 3 4 . 2 4 . 0 5 . 0 5 . 6 8 . 5 6 . 7 3 . 5 6.4 2 0 08 2 0 09 2 0 10 2 0 11 2 0 12 2 0 13 2 0 14 2 0 15 2 0 16 2 0 17 2 0 18 2 0 19 2 0 20 2 0 21 2 0 22 2 0 23 LTM 3Q 2 4 Net Sales E B ITDA 3. 8 % 3. 7 % 6. 9 % 5.1% 5. 8 % 6. 6 % 9.2% 8. 2 % 6. 6 % 8. 2 % 9. 7 % 8.2% 10. 9 % 13. 0 % 9. 2 % 4. 7 % 8 . 3 % Margin EBITDA U SD Bil l i o n Seara PPC JBS US A P or k JBS A u s t r a l i a Consolidated JBS B r a s i l JBS Bee f Nor t h A m. Stability of Res u lts Geographic & Protein Diversification Leading to lower results volatility 3Q24 10.8 % 5
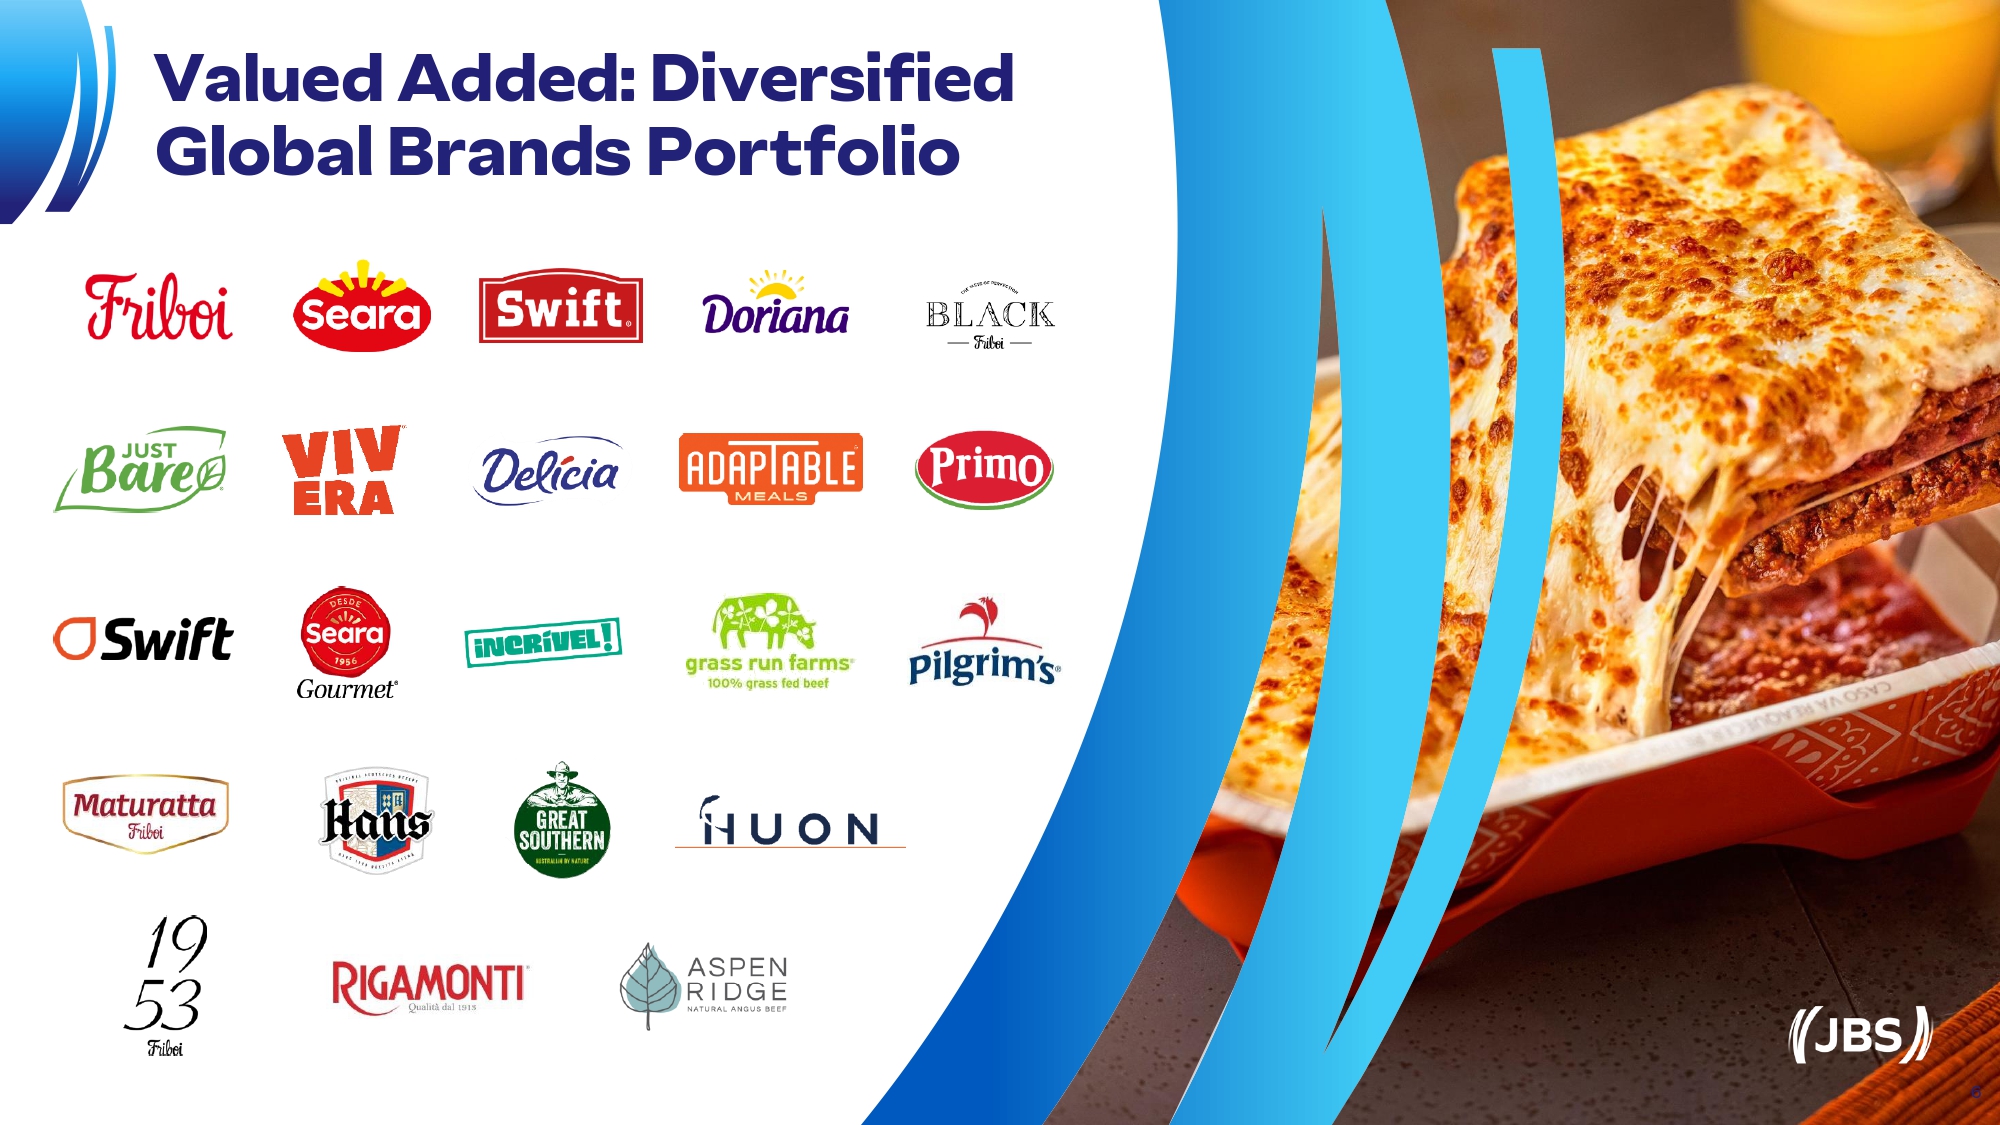
Valued Added: Diversified Globa l Brands P o rtfolio 6

13 K T e a m m e m b e r s i n A u s t r a l i a a n d N e w Z e a l a n d 155 K T e am m e m b e rs i n Br a z i l 12 K T e a m m e m b e r s i n M e x i c o 19 K T e a m m e m b e r s i n E u r o pe 72 K T e am m e m b e rs i n t he U S A a n d C a n ad a La rgest Em p l o ye r in B r azi l : 155,000 Te a m Members More Tha n 270,000 Tea m Members Glob a lly 7
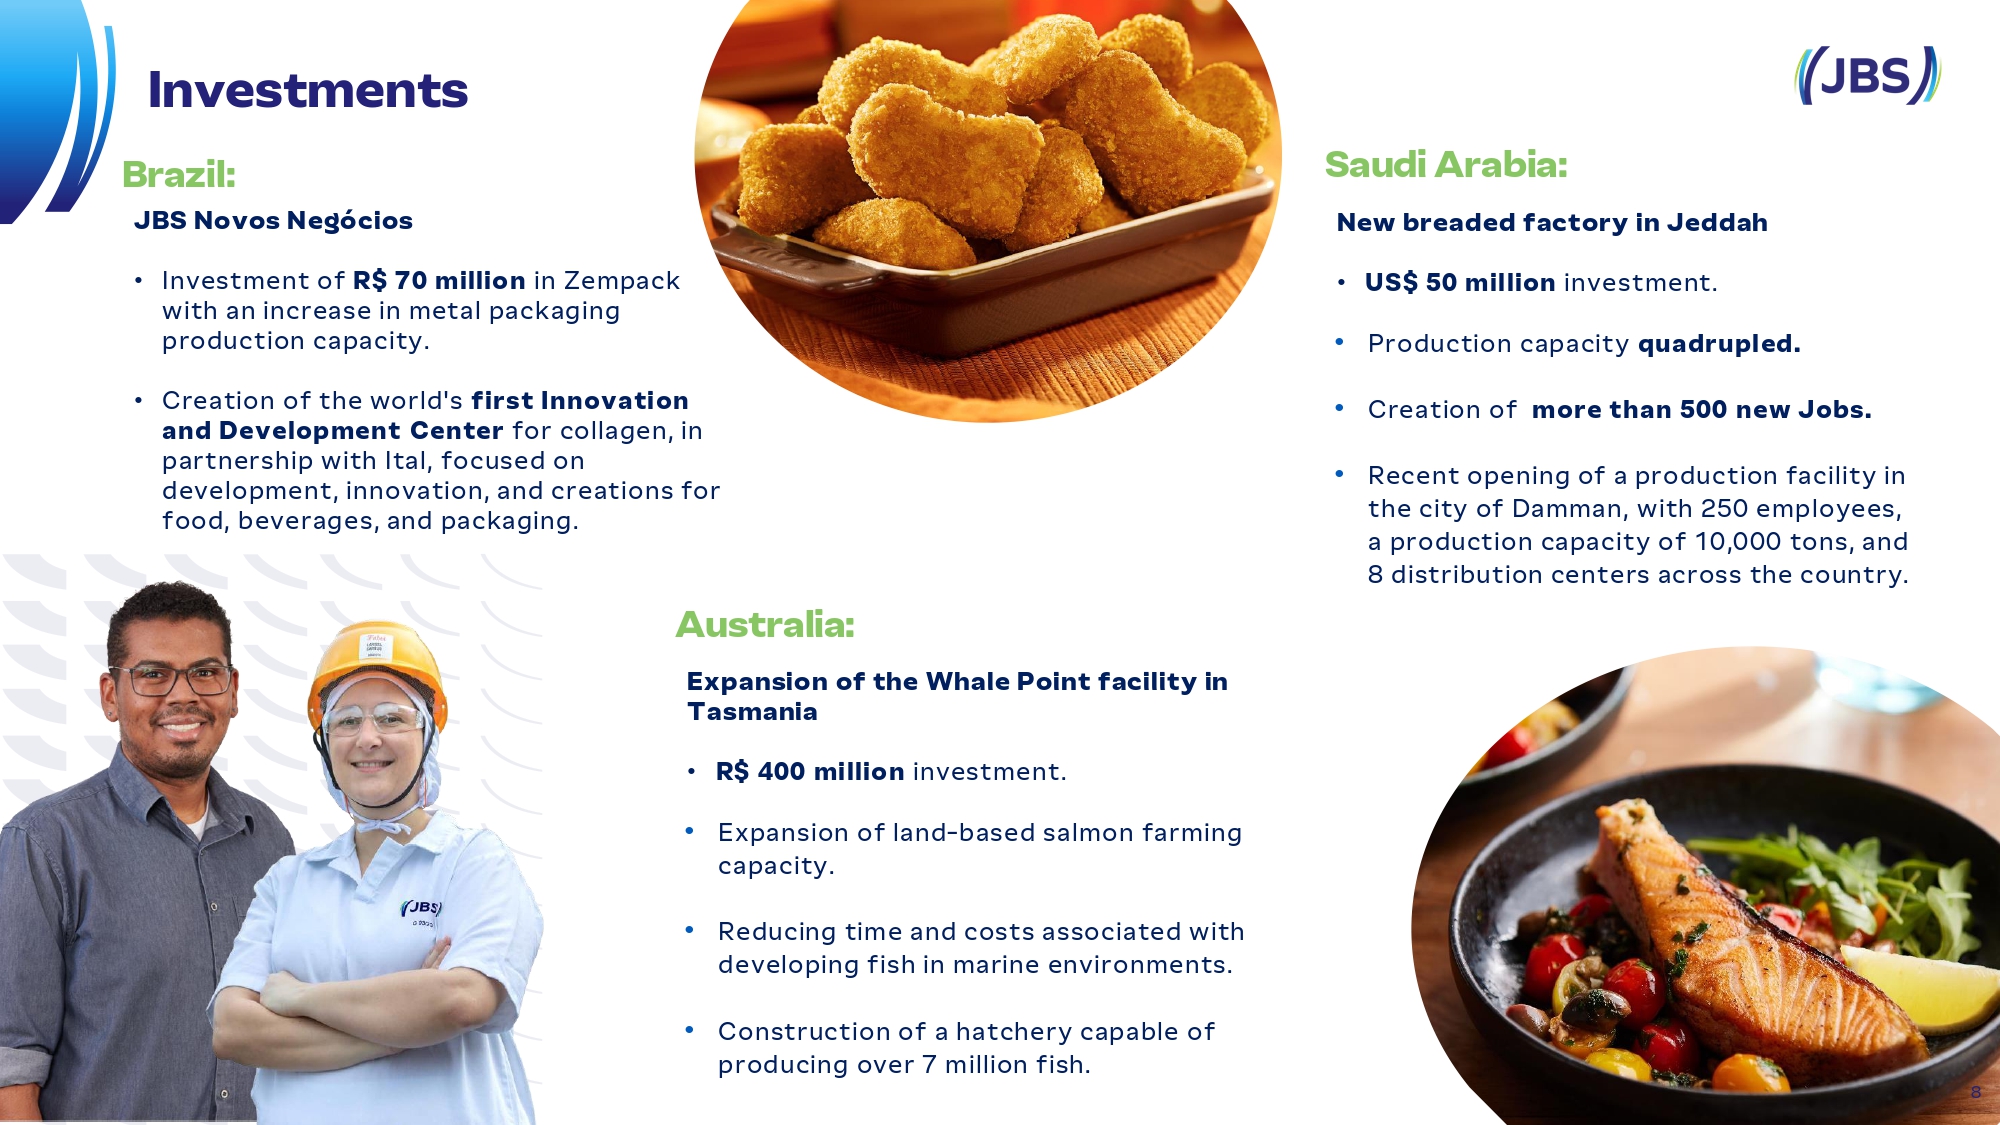
Investments Brazil: JBS Novos Negócios • Investment of R$ 70 million in Zempack with an increase in metal packaging production capacity. • Creation of the world's first Innovation and Development Center for collagen, in partnership with Ital, focused on development, innovation, and creations for food, beverages, and packaging. Australia: Expansion of the Whale Point facility in Tasmania • R$ 400 million investment. • Expansion of land - based salmon farming capacity. • Reducing time and costs associated with developing fish in marine environments. • Construction of a hatchery capable of producing over 7 million fish. Sa u di A r abia: New breaded factory in Jeddah • US$ 50 million investment. • Production capacity quadrupled. • Creation of more than 500 new Jobs. • Recent opening of a production facility in the city of Damman, with 250 employees, a production capacity of 10 , 000 tons, and 8 distribution centers across the country . 8
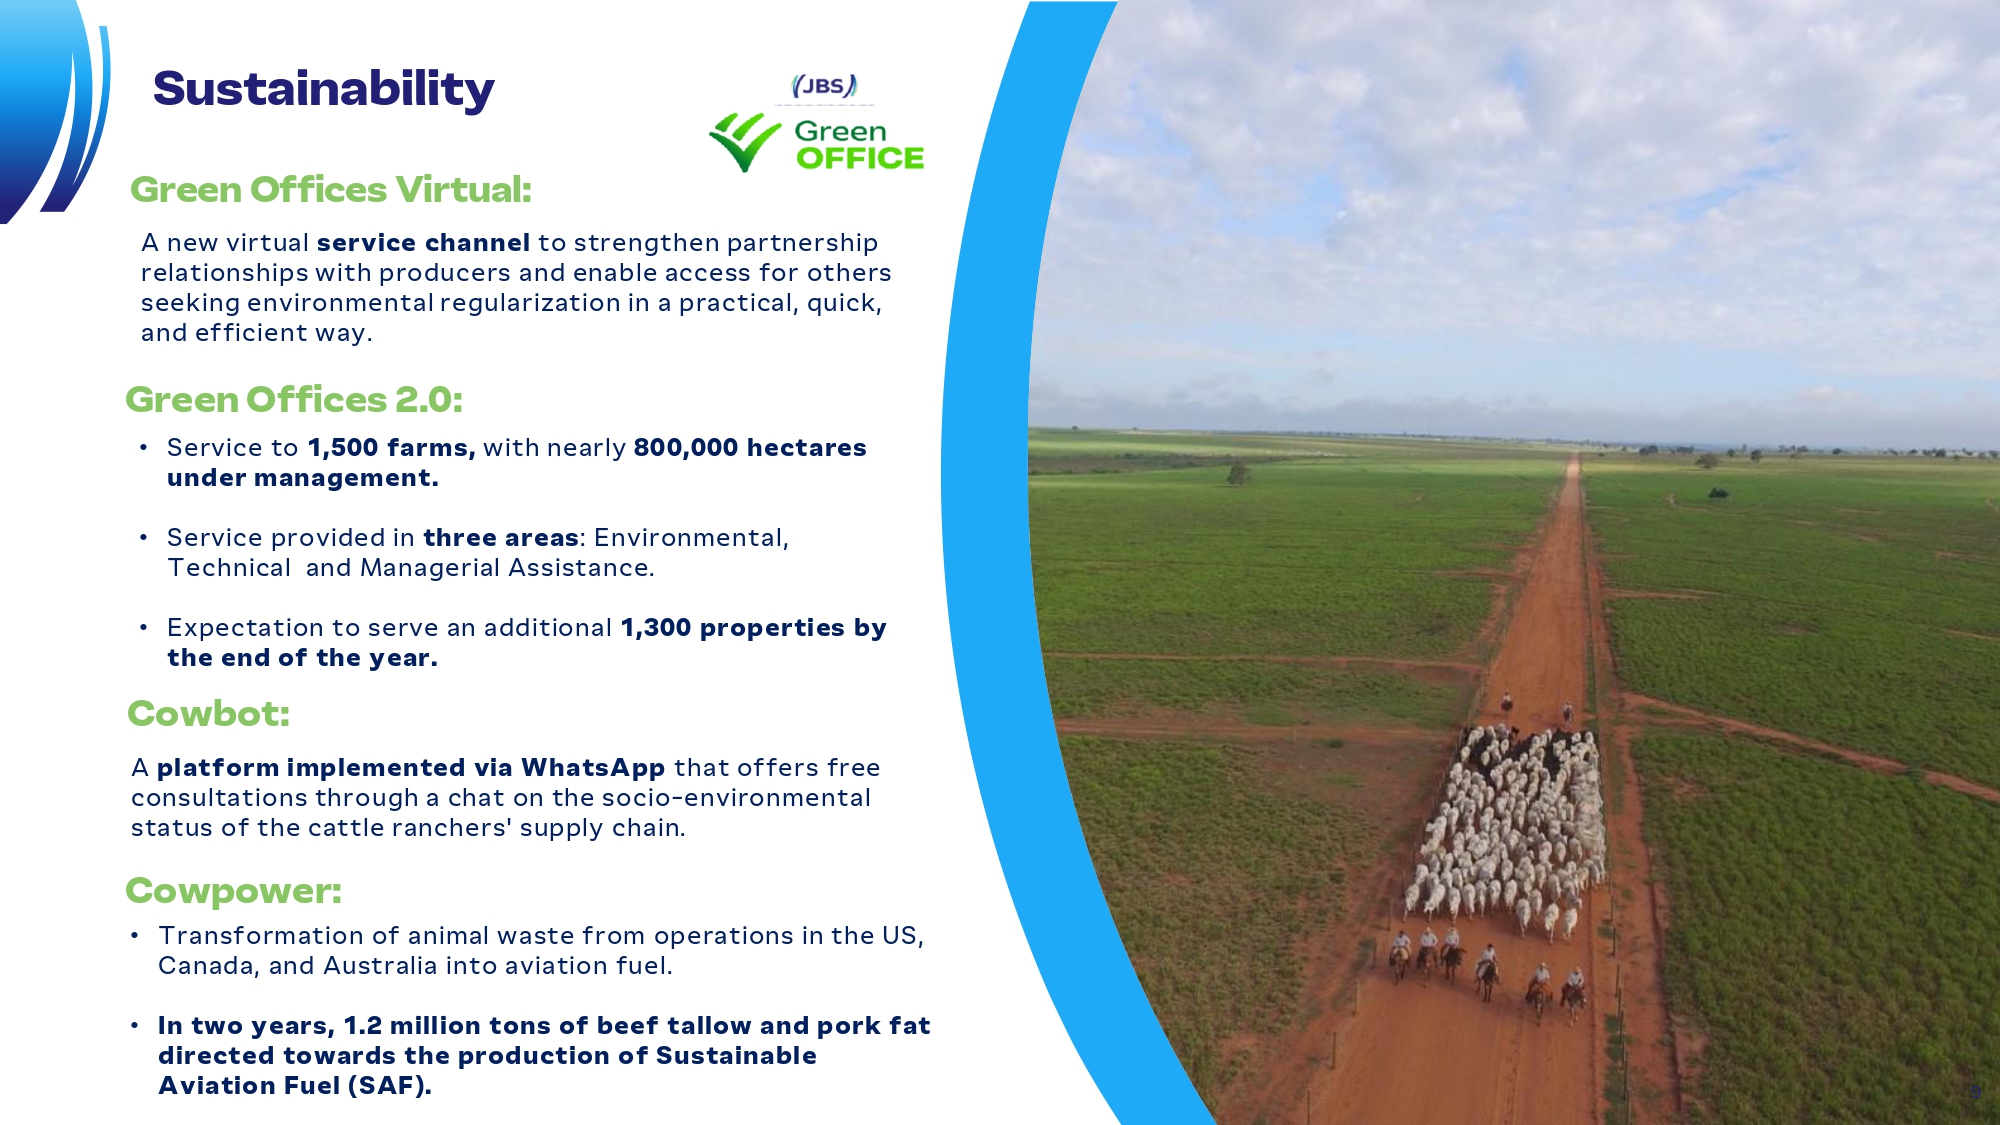
Sustainability • In two years, 1.2 million tons of beef tallow and pork fat directed towards the production of Sustainable Aviation Fuel (SAF). 9 G reen O ff ice s V irtu a l: A new virtual service channel to strengthen partnership relationships with producers and enable access for others seeking environmental regularization in a practical, quick, and efficient way. Gree n Off i ces 2. 0 : • Service to 1,500 farms, with nearly 800,000 hectares under management. • Service provided in three areas : Environmental, Technical and Managerial Assistance. • Expectation to serve an additional 1,300 properties by the end of the year. Cowbot: A platform implemented via WhatsApp that offers free consultations through a chat on the socio - environmental status of the cattle ranchers' supply chain. Cowpower: • Transformation of animal waste from operations in the US, Canada, and Australia into aviation fuel.
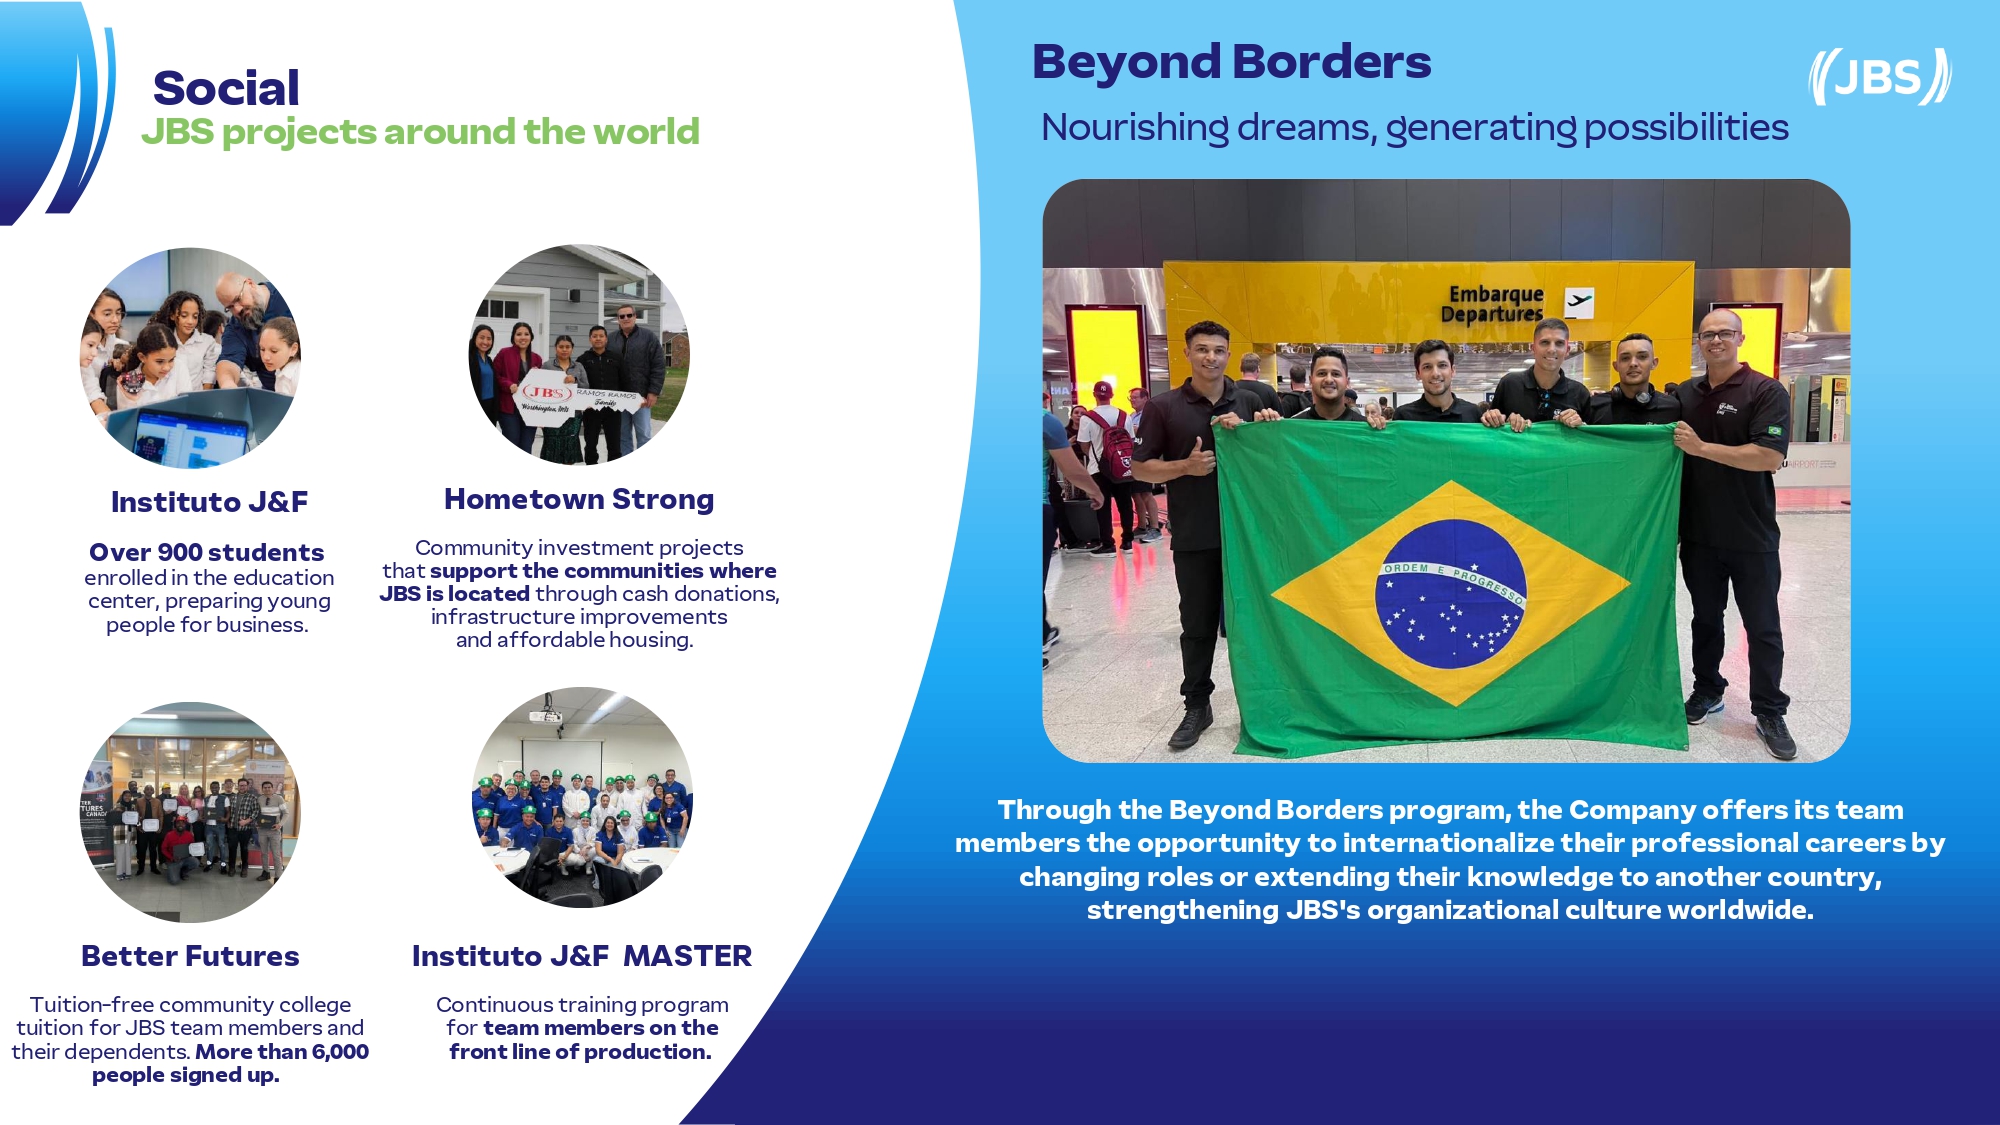
Be y ond B o rders Through the Beyond Borders program, the Company offers its team members the opportunity to internationalize their professional careers by changing roles or extending their knowledge to another country, strengthening JBS's organizational culture worldwide. I n s ti t uto J&F Over 900 st u d ent s e n roll e d in t h e e d uca tion c e n t e r, p reparing y ou n g p e op le for b usin e s s . Bett e r Futur es Tuition - fr e e c omm u n ity c oll e ge tui t ion for J B S t e am mem b e rs a n d t h e ir d e p e n d e n t s . M ore than 6 , 0 00 p e ople signe d u p. I n s ti t uto J&F M A S T ER Continuous training program for team m e m b ers on the fr ont li ne of p r od u c tion. H o m etown Str o n g C o mm u n ity i n v e s t me n t p roj e c ts t h at su p port the c o m m un iti es w h ere J B S is loc a t ed t h rou g h c a s h do n a t ion s , i n fras t ru c ture im pro v e me n ts a n d af f or d a b le h ousi n g. Social JBS proje c ts aroun d th e world No u ri shing drea m s , ge n er a t i ng poss i bil i ties

Fina n cial & Operating 11
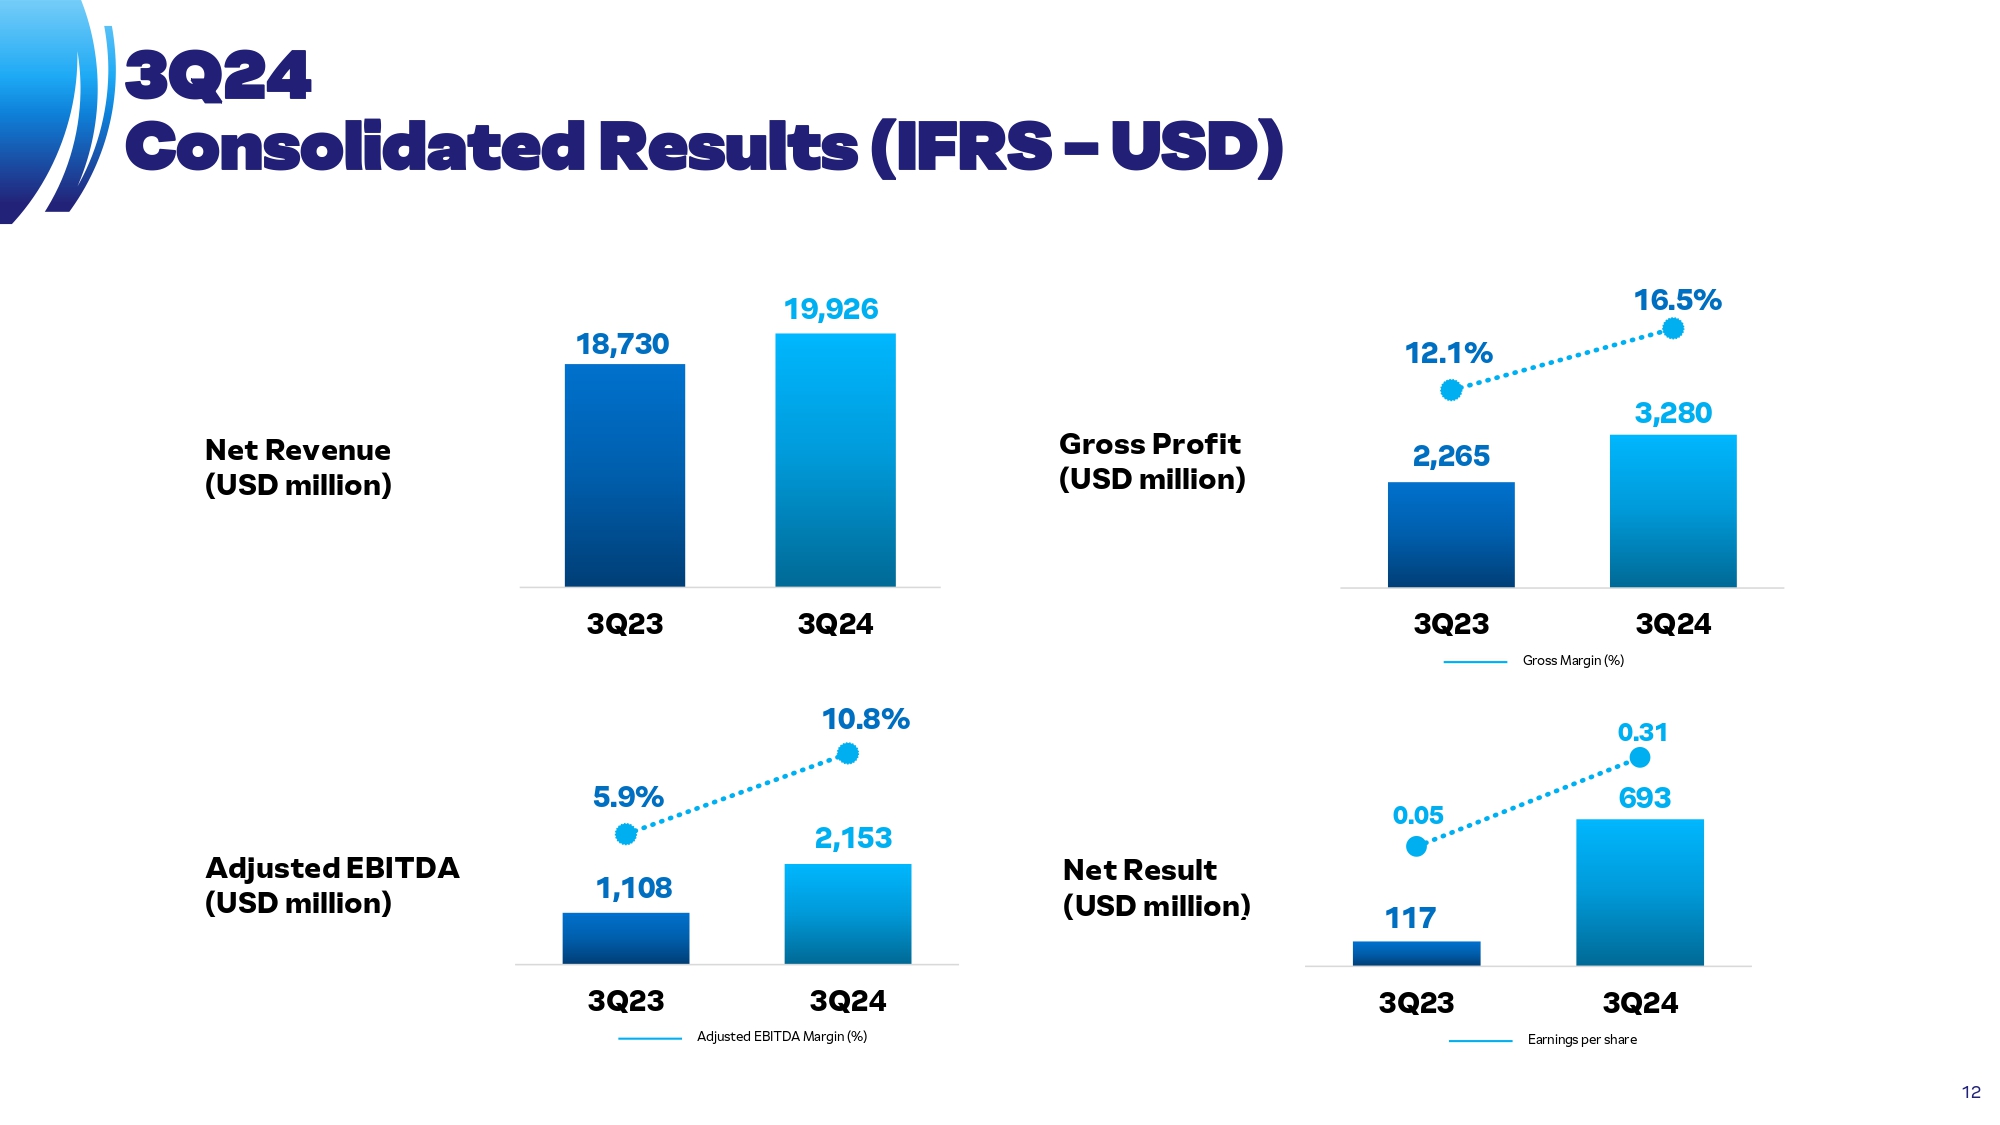
18,730 19,926 3Q 23 3Q 24 2, 2 65 3, 2 80 1 2 .1 % 1 6 .5 % 3Q23 Gro s s Mar g i n ( %) 3 Q 24 Ne t R esult (USD m i ll i o n 2 ) 3Q24 Con s olid a ted R e sults (IF R S – USD) A d ju s t ed E B I TDA (USD m i ll i on) 1, 1 08 2, 1 53 5. 9 % 1 0 .8 % 3Q 23 3Q 24 Ad just e d EB I T D A Ma r g i n ( % ) Ne t R e v e n u e (USD m i ll i on) Gross Pro f i t (USD m i ll i on) 117 12 693 0. 05 0. 31 3Q 23 3Q 24 Ea rn i n gs p er sh a re
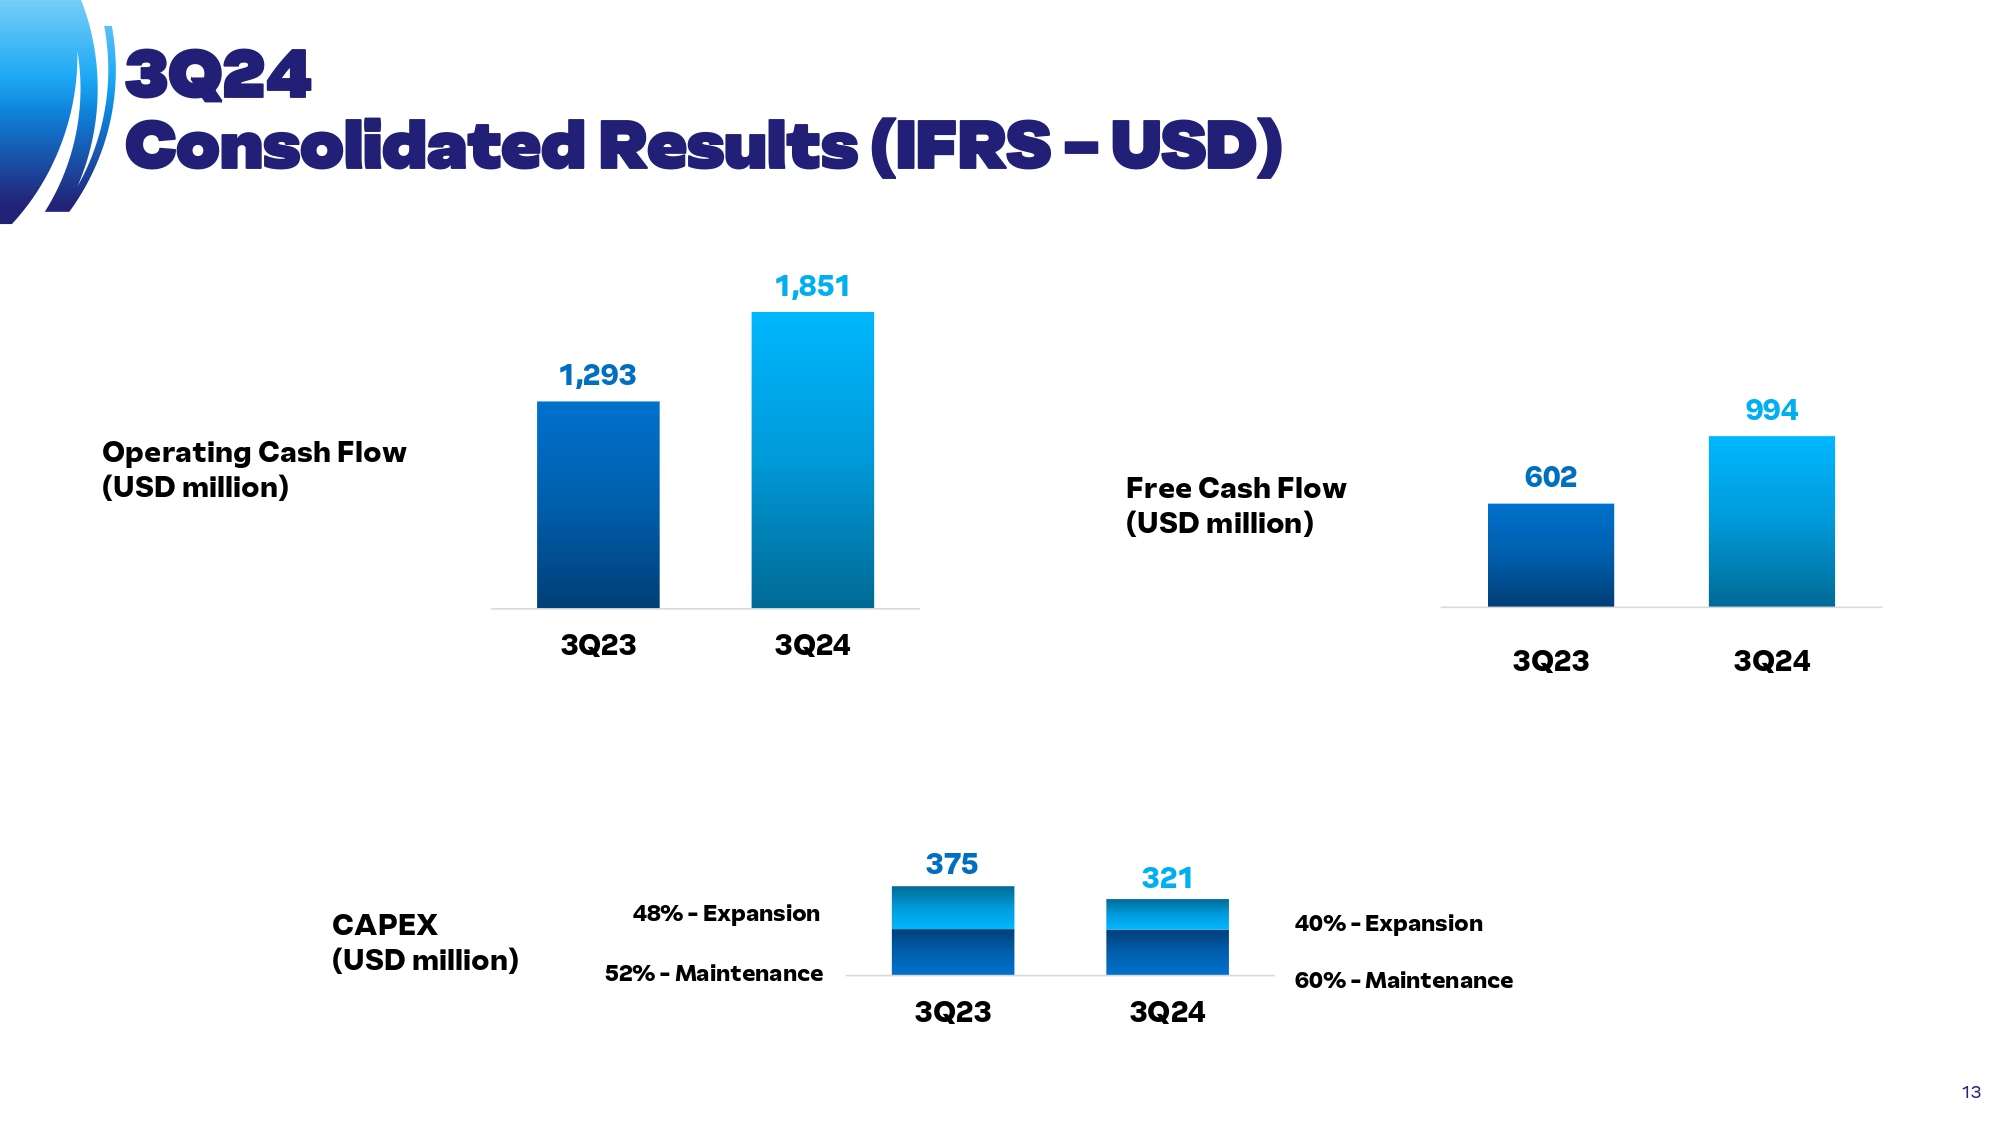
Ope r ati n g C ash F l ow (USD m i ll i on) Fr e e Cas h F l ow (USD m i ll i on) 1,851 1,293 3Q 23 3Q 24 375 321 3Q 23 3Q 24 602 994 3Q 23 3Q 24 60 % - M aint ena nce 40 % - Expans i o n 52 % - M aint ena nce 48 % - Expans i o n 3Q24 Consolid a ted Re s ults (IFRS – USD) CAPEX (USD m i ll i o n ) 13

¹ Includes available cash resources and revolving and guaranteed credit lines from JBS USA and JBS SA. De b t Profi l e Pr o forma Debt A mor t i z a t i on Sched u l e (USD M i l l i on)¹ A v e ra ge Te rm Proform a : 10 . 3 y rs A v e ra ge Proforma Cos t : 5 . 7 2 % p .a . 14 8, 602 8, 051 C a s h a nd eq u i v a l en t s Revolving c re d i t f a c i l i t i es U SD 2. 9 bil l i o n i n t h e U S Revolving c re d i t f a c i l i t i es U SD 450 m i ll i o n i n B r a zi l CRA S E ARA Oc t / 2024 Du e : 2029 / 2034 / 2040 2041 / 2042 / 2043 / 2044 Pa y me n t of Dividends Oct/2024 5,238 1,858 8 22 1,003 989 707 1,379 1 , 41 3 2, 910 2,600 2,301 745 2, 413 884 261 812 19 177 80 2, 91 4 2,914 4,686 450 450 C a s h a n d E q u i v a l e n t s C R A Se a r a Net R e s o u r c e s Dividends P r of o r ma Cash S h o r t Te r m 2 0 25 2 0 26 2 0 27 2 0 28 2 0 29 2 0 30 2 0 31 2 0 32 2 0 33 2 0 34 2 0 35 u n t i l 2 0 51 2 0 52 2 0 53
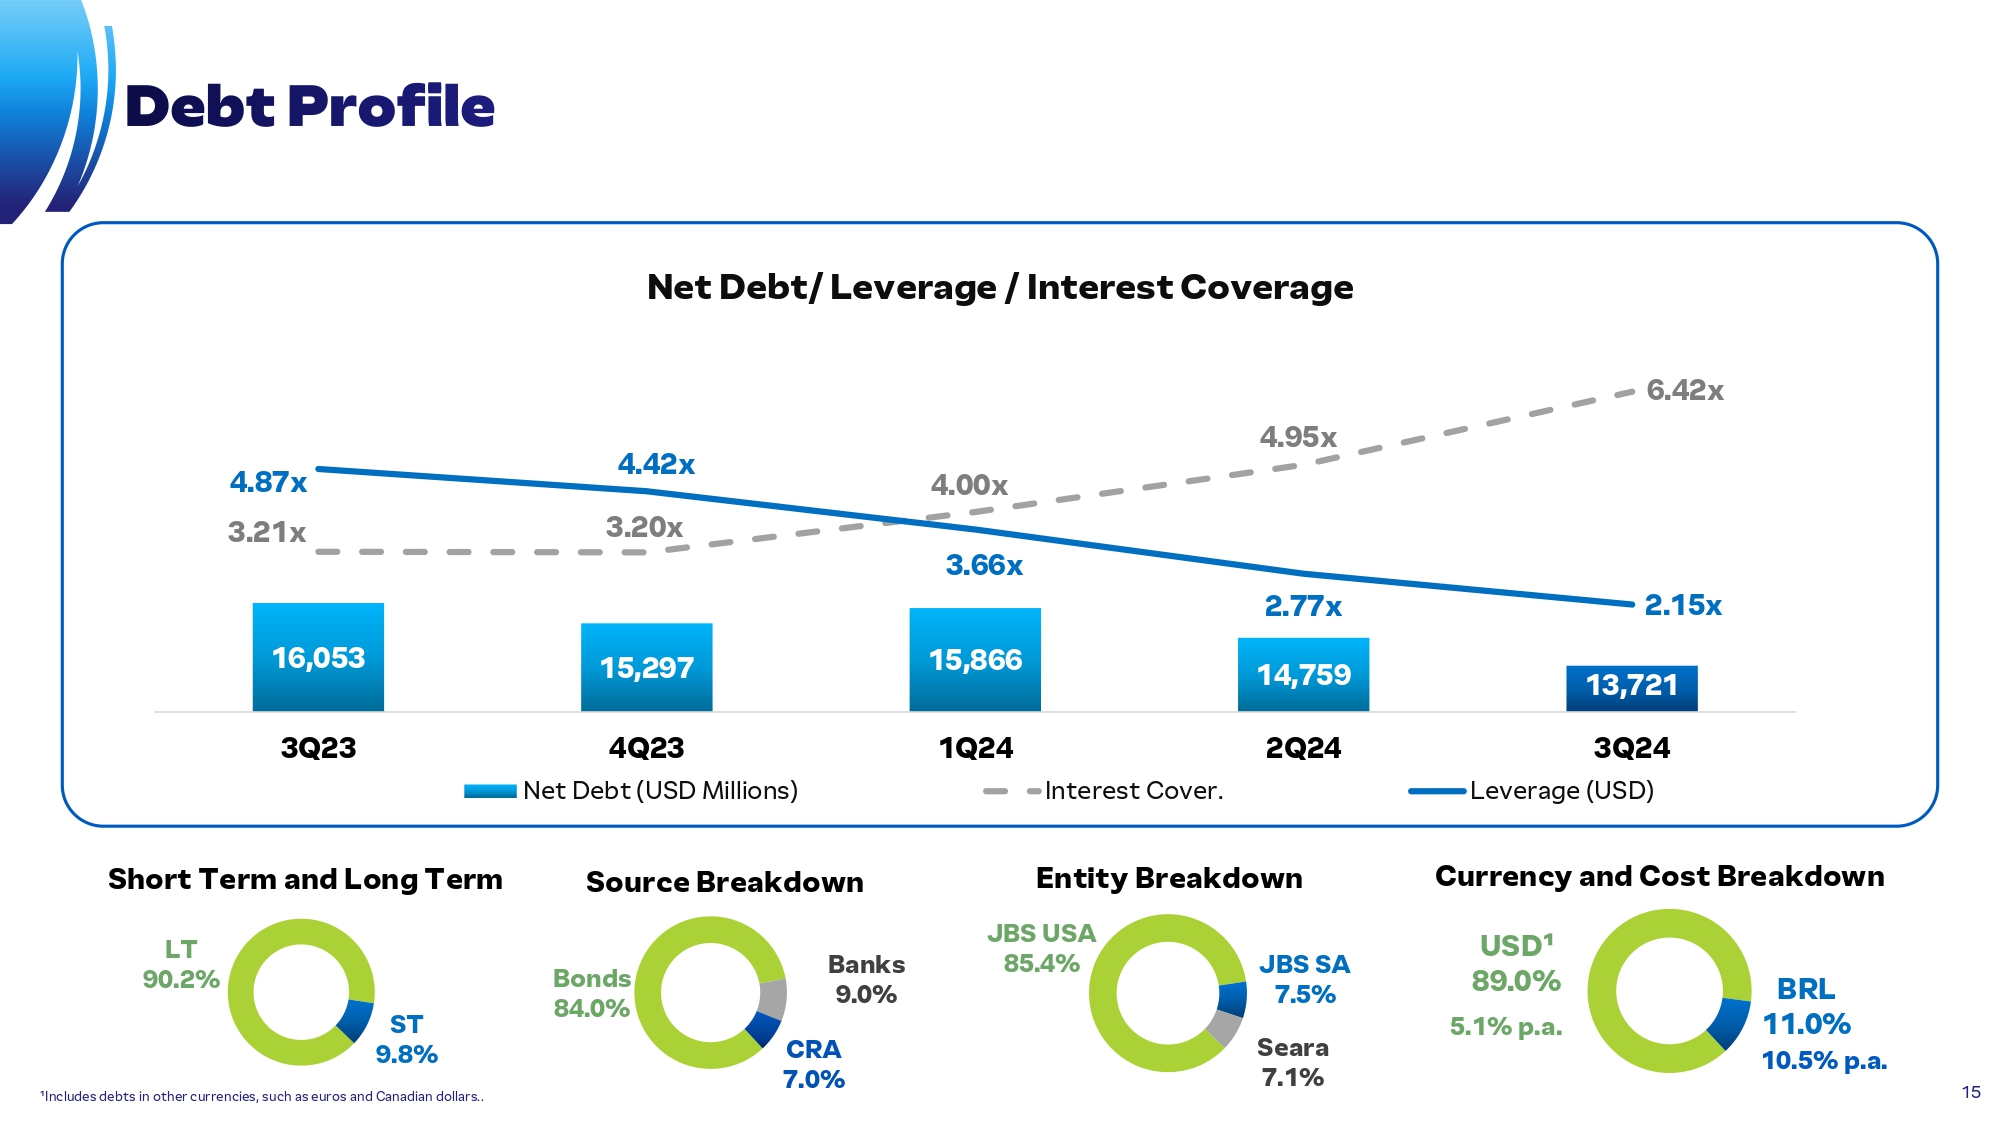
N et Debt / Lever a g e / Intere s t Cover a g e Sho r t Te r m and L ong Te r m Sou r c e Breakd o w n Curr e ncy and C ost Breakd o w n B o n ds 84.0% Ba n ks 9.0% CRA 7.0% USD¹ 8 9 .0% 5. 1 % p .a. BRL 1 1 .0% 10. 5 % p . a. De b t Profi l e 16,053 15,297 15,866 14,759 13,721 4. 0 0 x 4. 9 5 x 6. 4 2 x 4. 8 7 x 3.21x 4. 4 2 x 3.20x 3. 6 6 x 2. 7 7 x 2. 1 5 x 3Q 23 1Q 24 2Q 24 4Q23 N e t D e bt (US D Mi l li o n s ) In t e r e st C o v e r . 3Q 24 Lev e r a g e (U S D ) ST 9.8% ¹Includes debts in other currencies, such as euros and Canadian dollars.. LT 90. 2% E ntity Breakd o w n J B S U S A 85. 4 % J B S S A 7.5% S eara 7.1% 15

116 461 5. 5 % 2 1 .0 % 3Q 23 3Q 24 2, 0 92 2, 1 94 3Q 23 3Q 24 Sea r a Prod u cts Se a ra N e t Re v e n ue (I F R S - U S D m i ll i o n ) A dju s t e d EBITDA (I F R S - U S D m i ll i on and % ) 3Q24 16
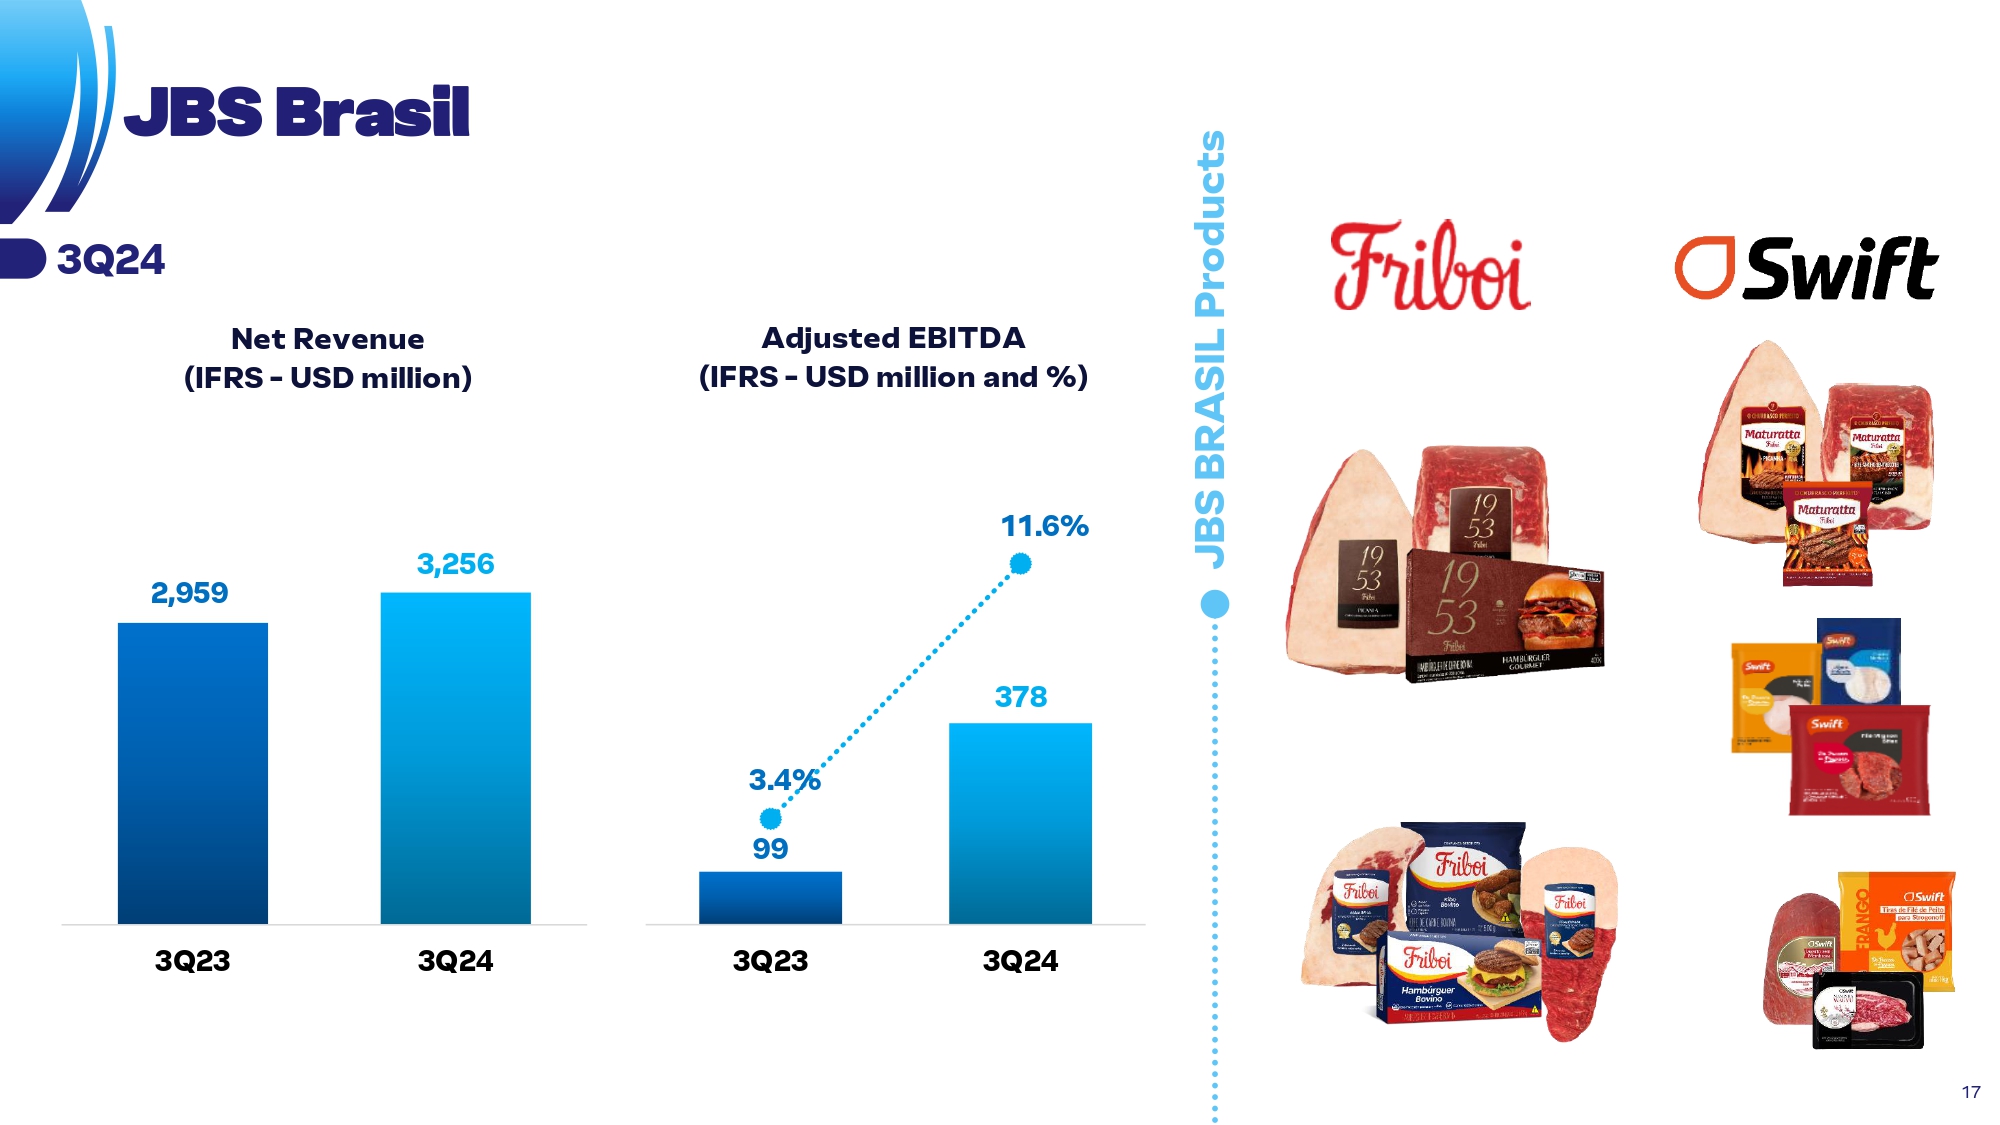
JBS BRA S IL Prod u cts 378 3.4% 99 11.6% 3Q 23 3Q 24 2, 9 59 3, 2 56 3Q 23 3Q 24 J B S Bra sil N e t Re v e n ue (I F R S - U S D m i ll i o n ) A dju s t e d EBITDA (I F R S - U S D m i ll i on and % ) 3Q24 17

5, 9 53 6, 3 13 3Q 23 3Q 24 93 37 1. 6 % 0. 6 % 3Q 23 3Q 24 JBS BEE F N ORTH A MERICA Pro du cts J B S Beef North America N e t Re v e n ue ( U S G A A P - U S D m i ll i o n ) Adjusted EBITDA ( U S G A A P - U S D m i ll i o n a n d %) 3Q24 18
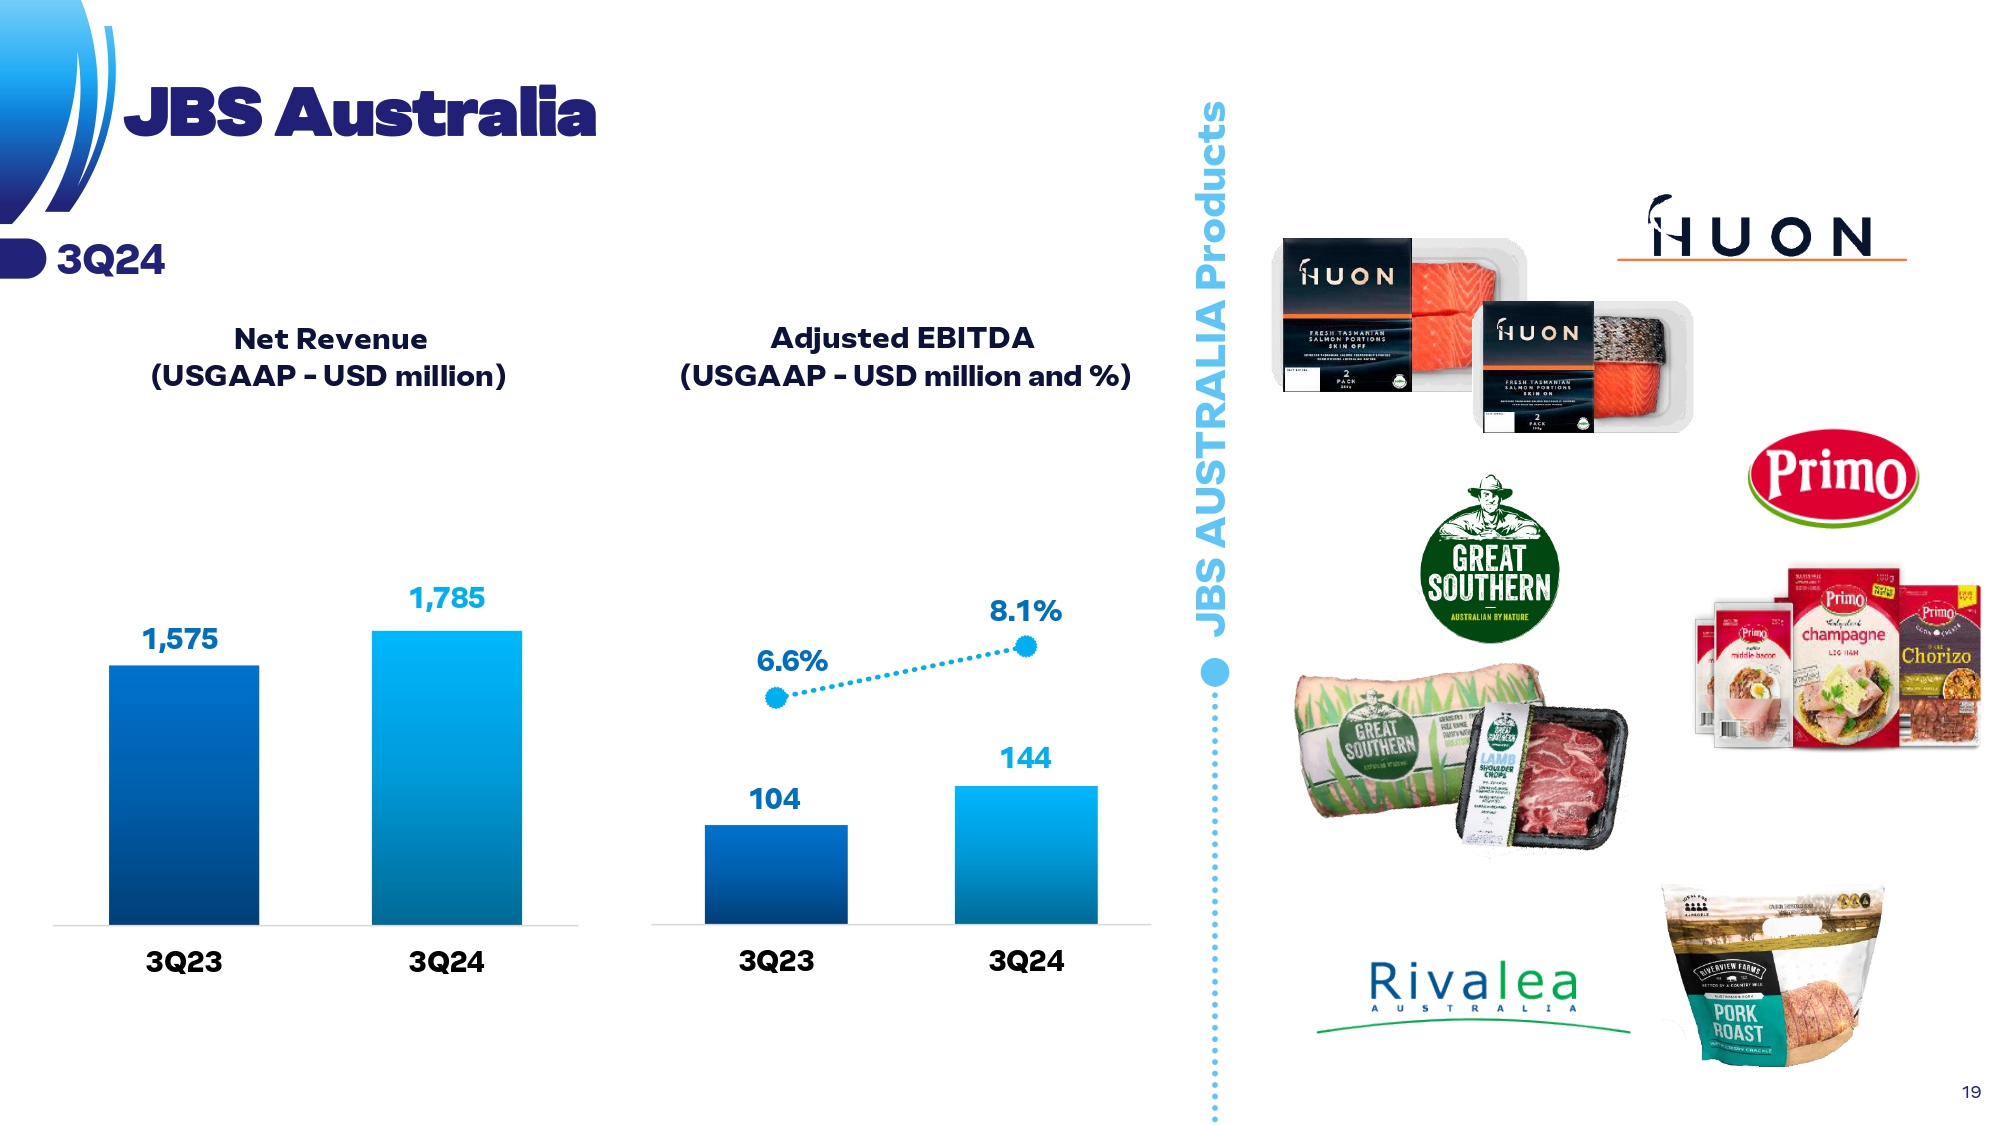
JBS A USTR A LIA Prod u cts 104 144 6. 6 % 8. 1 % 3Q 23 3 Q 24 J B S A u stralia N e t Re v e n ue ( U S G A A P - U S D m i ll i o n ) Adjusted EBITDA ( U S G A A P - U S D m i ll i o n a n d %) 3Q24 1, 5 75 19 1, 7 85 3Q 23 3Q 24

190 210 9. 4 % 1 0 .3 % 3Q 23 3 Q 24 JBS U S A PORK Pro du cts J B S USA Pork N e t Re v e n ue ( U S G A A P - U S D m i ll i o n ) Adjusted EBITDA ( U S G A A P - U S D m i ll i o n a n d %) 3Q24 2, 0 27 2, 0 43 3Q 23 3Q 24 20

324 660 7. 4 % 1 4 .4 % 3Q 23 3Q 24 PPC Prod u cts Pil g rim’s Pride N e t Re v e n ue ( U S G A A P - U S D m i ll i o n ) Adjusted EBITDA ( U S G A A P - U S D m i ll i o n a n d %) 3Q24 4, 3 60 4, 5 85 3Q 23 3Q 24 21

No t a 1: C o n s i d e ra C h i n a e H o n g K o n g E x p o r t desti n atio n s o f J BS during 3 Q 2 4 23.0% Greater China¹ 16.6% USA 13.1% Africa & Middle East 9.1% Japan 7.3% South Korea 7.3% E.U. 6.5% Mexico 4.4% Philippines 3.7% South America 3.0% Canada 5.9% Others Consolid a ted exports E x port s Revenu e in 3Q24: US$5 . 3Bi +8 . 9 % vs . 3 Q 23 A s i a corresp o nded t o ~ 51 % o f to t a l export s 22
JBS Bringing more to the table