UNITED STATES
SECURITIES AND EXCHANGE COMMISSION
Washington, D.C. 20549
FORM N-CSR
CERTIFIED SHAREHOLDER REPORT OF REGISTERED MANAGEMENT
INVESTMENT COMPANIES
Investment Company Act file number 811-22251
HATTERAS VC CO-INVESTMENT FUND II, LLC
(Exact name of registrant as specified in charter)
6601 SIX FORKS ROAD SUITE 340
RALEIGH, NORTH CAROLINA 27615
(Address of principal executive offices) (Zip code)
DAVID B. PERKINS
6601 SIX FORKS ROAD SUITE 340
RALEIGH, NORTH CAROLINA 27615
(Name and address of agent for service)
Registrant's telephone number, including area code: (919) 846-2324
Date of fiscal year end: JUNE 30
Date of reporting period: JUNE 30, 2017
Form N-CSR is to be used by management investment companies to file reports with the Commission not later than 10 days after the transmission to stockholders of any report that is required to be transmitted to stockholders under Rule 30e-1 under the Investment Company Act of 1940 (17 CFR 270.30e-1). The Commission may use the information provided on Form N-CSR in its regulatory, disclosure review, inspection, and policymaking roles.
A registrant is required to disclose the information specified by Form N-CSR, and the Commission will make this information public. A registrant is not required to respond to the collection of information contained in Form N-CSR unless the Form displays a currently valid Office of Management and Budget ("OMB") control number. Please direct comments concerning the accuracy of the information collection burden estimate and any suggestions for reducing the burden to Secretary, Securities and Exchange Commission, 450 Fifth Street, NW, Washington, DC 20549. The OMB has reviewed this collection of information under the clearance requirements of 44 U.S.C. § 3507.
ITEM 1. REPORTS TO STOCKHOLDERS.
Hatteras VC Co-Investment Fund II, LLC
(a Delaware Limited Liability Company)
Table of Contents
| Report of Independent Registered Public Accounting Firm | 1 |
| Schedule of Investments | 2-5 |
| Statement of Assets, Liabilities and Members’ Capital | 6 |
| Statement of Operations | 7 |
| Statements of Changes in Members’ Capital | 8 |
| Statement of Cash Flows | 9 |
| Notes to Financial Statements | 10-18 |
| Board of Managers (Unaudited) | 19 |
| Fund Management (Unaudited) | 20 |
| Other Information (Unaudited) | 21 |
| Privacy Policy (Unaudited) | 22-23 |
Hatteras VC Co-Investment Fund II, LLC
(a Delaware Limited Liability Company)
Report of Independent Registered Public Accounting Firm
To the Board of Managers and Members
Hatteras VC Co-Investment Fund II, LLC
Raleigh, North Carolina
We have audited the accompanying statement of assets, liabilities and members’ capital of Hatteras VC Co-Investment Fund II, LLC (the “Fund”), including the schedule of investments, as of June 30, 2017, and the related statements of operations and cash flows for the year then ended, the statements of changes in members’ capital for each of the two years in the period then ended, and the financial highlights for each of the four years in the period then ended. These financial statements and financial highlights are the responsibility of the Fund’s management. Our responsibility is to express an opinion on these financial statements and financial highlights based on our audits. The financial highlights for the period from September 1, 2012 through June 30, 2013 and the year ended August 31, 2012 were audited by other auditors whose report dated August 29, 2013 expressed an unqualified opinion on those financial highlights.
We conducted our audits in accordance with the standards of the Public Company Accounting Oversight Board (United States). Those standards require that we plan and perform the audit to obtain reasonable assurance about whether the financial statements are free of material misstatement. The Fund is not required to have, nor were we engaged to perform, an audit of its internal control over financial reporting. Our audits included consideration of internal control over financial reporting as a basis for designing audit procedures that are appropriate in the circumstances, but not for the purpose of expressing an opinion on the effectiveness of the Fund’s internal control over financial reporting. Accordingly, we express no such opinion. An audit also includes examining, on a test basis, evidence supporting the amounts and disclosures in the financial statements, assessing the accounting principles used and significant estimates made by management, as well as evaluating the overall financial statement presentation. Our procedures included confirmation of securities owned as of June 30, 2017, by correspondence with the custodian and private companies in which the Fund is invested. We believe that our audits provide a reasonable basis for our opinion.
In our opinion, the financial statements and financial highlights referred to above present fairly, in all material respects, the financial position of Hatteras VC Co-Investment Fund II, LLC as of June 30, 2017, and the results of its operations and its cash flows for the year then ended, the changes in its members’ capital for each of the two years in the period then ended, and the financial highlights for each of the four years in the period then ended, in conformity with accounting principles generally accepted in the United States of America.
Raleigh, North Carolina
August 29, 2017
1
Hatteras VC Co-Investment Fund II, LLC
(a Delaware Limited Liability Company)
SCHEDULE OF INVESTMENTS
June 30, 2017
| Description of Investment | Initial Investment Date | | Cost | | | Fair Value | | | % of
Members’
Capital | |
| Private Company: | | | | | | | | | | |
| Consumer: | | | | | | | | | | |
Sonim Technologies, Inc. a,b,c | | | | | | | | | | |
| San Mateo, California | | | | | | | | | | |
| 180,208 shares of | | | | | | | | | | |
| Series B Preferred Stock | Nov. 2009 | | $ | 167,180 | | | $ | 174,161 | | | | 2.63 | % |
| | | | | | | | | | | | | | |
Sonim Technologies, Inc. a,b,c | | | | | | | | | | | | | |
| San Mateo, California | | | | | | | | | | | | | |
| 774,944 shares of | | | | | | | | | | | | | |
| Series A Preferred Stock | Nov. 2012 | | | 174,794 | | | | 298,012 | | | | 4.49 | % |
| | | | | | | | | | | | | | |
Sonim Technologies, Inc. a,b,c | | | | | | | | | | | | | |
| San Mateo, California | | | | | | | | | | | | | |
| 164,891 shares of | | | | | | | | | | | | | |
| Series A-1 Preferred Stock | May 2016 | | | 20,295 | | | | 65,327 | | | | 0.99 | % |
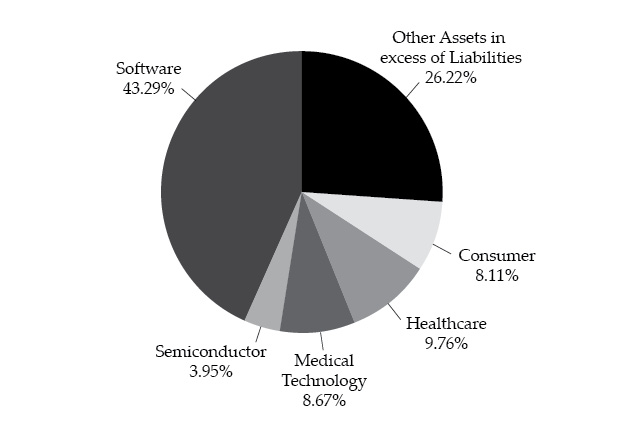
| Total Consumer | | | | 362,269 | | | | 537,500 | | | | 8.11 | % |
| | | | | | | | | | | | | | |
| Healthcare: | | | | | | | | | | | | | |
Clinipace, Inc. a,b,c | | | | | | | | | | | | | |
| Raleigh, North Carolina | | | | | | | | | | | | | |
| 3,816,881 shares of | | | | | | | | | | | | | |
| Series C Preferred Stock | Sep. 2011 | | | 500,000 | | | | 646,859 | | | | 9.76 | % |
| | | | | | | | | | | | | | |
| Medical Technology: | | | | | | | | | | | | | |
Lineagen, Inc. a,b,c | | | | | | | | | | | | | |
| Salt Lake City, Utah | | | | | | | | | | | | | |
| 12,000 shares of | | | | | | | | | | | | | |
| Common Stock | Jul. 2011 | | | — | | | | 3,120 | | | | 0.05 | % |
| | | | | | | | | | | | | | |
Lineagen, Inc. a,b,c | | | | | | | | | | | | | |
| Salt Lake City, Utah | | | | | | | | | | | | | |
| 336,117 shares of | | | | | | | | | | | | | |
| Series B Preferred Stock | Jul. 2011 | | | 300,000 | | | | 305,502 | | | | 4.61 | % |
See notes to financial statements.
2
Hatteras VC Co-Investment Fund II, LLC
(a Delaware Limited Liability Company)
SCHEDULE OF INVESTMENTS
June 30, 2017 (Continued)
Description of Investment (Continued) | Initial Investment Date | | Cost | | | Fair Value | | | % of
Members’
Capital | |
| Medical Technology (Continued): | | | | | | | | | | |
Lineagen, Inc. a,b,c | | | | | | | | | | |
| Salt Lake City, Utah | | | | | | | | | | |
| 266,003 shares of | | | | | | | | | | |
| Series C-1 Preferred Stock | Nov. 2013 | | $ | 266,003 | | | $ | 266,003 | | | | 4.01 | % |
| Total Medical Technology | | | | 566,003 | | | | 574,625 | | | | 8.67 | % |
| | | | | | | | | | | | | | |
| Semiconductor: | | | | | | | | | | | | | |
Luxtera, Inc. a,b,c | | | | | | | | | | | | | |
| Carlsbad, California | | | | | | | | | | | | | |
| 2,203,210 shares of | | | | | | | | | | | | | |
| Series C Preferred Stock | Apr. 2012 | | | 301,412 | | | | 262,194 | | | | 3.95 | % |
| | | | | | | | | | | | | | |
| Software: | | | | | | | | | | | | | |
Clustrix, Inc. a,b,c | | | | | | | | | | | | | |
| San Fransisco, California | | | | | | | | | | | | | |
| 9,667 shares of | | | | | | | | | | | | | |
| Common Stock | Dec. 2010 | | | 250,001 | | | | — | | | | 0.00 | % |
| | | | | | | | | | | | | | |
Kollective Technology. a,b,c | | | | | | | | | | | | | |
| Sunnyvale, California | | | | | | | | | | | | | |
| 45,670 shares of | | | | | | | | | | | | | |
| Common Stock | Jan. 2012 | | | — | | | | 4,382 | | | | 0.07 | % |
| | | | | | | | | | | | | | |
Kollective Technology. a,b,c | | | | | | | | | | | | | |
| Sunnyvale, California | | | | | | | | | | | | | |
| 333,334 shares of | | | | | | | | | | | | | |
| Series B Preferred Stock | Jul. 2010 | | | 250,000 | | | | 103,914 | | | | 1.57 | % |
| | | | | | | | | | | | | | |
Kollective Technology. a,b,c | | | | | | | | | | | | | |
| Sunnyvale, California | | | | | | | | | | | | | |
| 1,361,147 shares of | | | | | | | | | | | | | |
| Series C Preferred Stock | Jan. 2012 | | | 480,193 | | | | 594,860 | | | | 8.97 | % |
| | | | | | | | | | | | | | |
Posit Science Corporation a,b,c | | | | | | | | | | | | | |
| San Francisco, California | | | | | | | | | | | | | |
| 80,515 shares of | | | | | | | | | | | | | |
| Common Stock | Dec. 2009 | | | 200,000 | | | | 12,077 | | | | 0.18 | % |
See notes to financial statements.
3
Hatteras VC Co-Investment Fund II, LLC
(a Delaware Limited Liability Company)
SCHEDULE OF INVESTMENTS
June 30, 2017 (Continued)
Description of Investment (Continued) | Initial Investment Date | | Cost | | | Fair Value | | | % of
Members’
Capital | |
| Software (Continued): | | | | | | | | | | |
Posit Science Corporation a,b,c | | | | | | | | | | |
| San Francisco, California | | | | | | | | | | |
| 21,429 shares of | | | | | | | | | | |
| Series AA Preferred Stock | Sep. 2010 | | $ | 11,893 | | | $ | 12,833 | | | | 0.19 | % |
| | | | | | | | | | | | | | |
Sailthru, Inc. a,b,c | | | | | | | | | | | | | |
| New York, New York | | | | | | | | | | | | | |
| 171,141 shares of | | | | | | | | | | | | | |
| Series A Preferred Stock | Sep. 2011 | | | 299,999 | | | | 544,057 | | | | 8.21 | % |
| | | | | | | | | | | | | | |
SAVO Group Ltd. a,b,c | | | | | | | | | | | | | |
| Raleigh, North Carolina | | | | | | | | | | | | | |
| 112,313 shares of | | | | | | | | | | | | | |
| Common Stock | Jun. 2012 | | | 161,685 | | | | 52,506 | | | | 0.79 | % |
| | | | | | | | | | | | | | |
Univa Corporation a,b,c | | | | | | | | | | | | | |
| Austin, Texas | | | | | | | | | | | | | |
| 939,541 shares of | | | | | | | | | | | | | |
| Series I Preferred Stock | Oct. 2010 | | | 432,114 | | | | 1,413,843 | | | | 21.32 | % |
| | | | | | | | | | | | | | |
Univa Corporation a,b,c | | | | | | | | | | | | | |
| Austin, Texas | | | | | | | | | | | | | |
| 47,853 shares of | | | | | | | | | | | | | |
| Series II Preferred Stock | May 2014 | | | 65,894 | | | | 131,787 | | | | 1.99 | % |
| Total Software | | | | 2,151,779 | | | | 2,870,259 | | | | 43.29 | % |
| | | | | | | | | | | | | | |
| Total Investments in Private Companies (United States) | | | $ | 3,881,463 | | | $ | 4,891,437 | | | | 73.78 | % |
| | | | | | | | | | | | | | |
| Other Assets in excess of Liabilities | | | | | | | | 1,738,561 | | | | 26.22 | % |
| | | | | | | | | | | | | | |
| Members' Capital | | | | | | | $ | 6,629,998 | | | | 100.00 | % |
b | Portfolio holdings are subject to substantial restrictions as to resale. |
c | Non-marketable securities. |
The cost and fair value of restricted Private Company Investments are $3,881,463 and $4,891,437, respectively.
See notes to financial statements.
4
Hatteras VC Co-Investment Fund II, LLC
(a Delaware Limited Liability Company)
SCHEDULE OF INVESTMENTS
June 30, 2017 (Concluded)
INVESTMENT TYPE AS A PERCENTAGE OF MEMBERS’ CAPITAL AS FOLLOWS:
See notes to financial statements.
5
Hatteras VC Co-Investment Fund II, LLC
(a Delaware Limited Liability Company)
STATEMENT OF ASSETS, LIABILITIES AND MEMBERS’ CAPITAL
June 30, 2017
| Assets | | | |
| Investments in private companies, at fair value (cost $3,881,463) | | $ | 4,891,437 | |
| Cash & cash equivalents | | | 1,821,395 | |
| Receivable for investment sold | | | 1,175 | |
| Interest receivable | | | 1,168 | |
| Total assets | | | 6,715,175 | |
| | | | | |
| Liabilities and members' capital | | | | |
| Professional fees payable | | | 51,195 | |
| Management fees payable | | | 28,514 | |
| Custodian fees payable | | | 4,218 | |
| Other expenses payable | | | 1,250 | |
| Total liabilities | | | 85,177 | |
| | | | | |
| Members' capital | | | 6,629,998 | |
| Total liabilities and members' capital | | $ | 6,715,175 | |
| | | | | |
| Components of members' capital | | | | |
| Capital contributions | | $ | 10,514,912 | |
| Capital distributions | | | (1,051,605 | ) |
| Accumulated net investment loss | | | (2,743,078 | ) |
| Accumulated net realized loss from investments | | | (1,100,205 | ) |
| Accumulated net unrealized appreciation on investments | | | 1,009,974 | |
| Members' capital | | | 6,629,998 | |
| | | | | |
| Net asset value per uint | | $ | 57.81 | |
| Number of authorized units | | Unlimited | |
| Number of outstanding units | | | 114,678.93 | |
See notes to financial statements.
6
Hatteras VC Co-Investment Fund II, LLC
(a Delaware Limited Liability Company)
STATEMENT OF OPERATIONS
For the year ended June 30, 2017
| Investment income | | | |
| Interest | | $ | 13,648 | |
| Total investment income | | | 13,648 | |
| | | | | |
| Operating expenses | | | | |
| Management fee | | | 136,534 | |
| Professional fees | | | 74,930 | |
| Accounting and administration fees | | | 40,000 | |
| Board fees | | | 24,000 | |
| Custodian fees | | | 11,580 | |
| Chief Compliance Officer fee | | | 5,000 | |
| Other expenses | | | 9,491 | |
| Total operating expenses, before management fee waiver | | | 301,535 | |
| | | | | |
| Management fee waived | | | (26,948 | ) |
| Net expenses | | | 274,587 | |
| | | | | |
| Net investment loss | | | (260,939 | ) |
| | | | | |
| Net realized gain and change in unrealized appreciation on investments | | | | |
| Net realized gain from investments | | | 19,527 | |
| Net change in unrealized appreciation on investments | | | 42,185 | |
| Total net realized gain and change in unrealized appreciation on investments | | | 61,712 | |
| Net decrease in members' capital resulting from operations | | $ | (199,227 | ) |
See notes to financial statements.
7
Hatteras VC Co-Investment Fund II, LLC
(a Delaware Limited Liability Company)
STATEMENTS OF CHANGES IN MEMBERS’ CAPITAL
For the years ended June 30, 2016 and 2017
| | | Members’ Capital | |
| Members' capital, at June 30, 2015 | | $ | 9,431,683 | |
| Distribution paid | | | (1,051,605 | ) |
| Net investment loss | | | (302,788 | ) |
| Net realized gain from investments | | | 121,768 | |
| Net change in unrealized depreciation on investments | | | (1,369,833 | ) |
| Members' Capital, at June 30, 2016 | | $ | 6,829,225 | |
| Net investment loss | | | (260,939 | ) |
| Net realized gain from investments | | | 19,527 | |
| Net change in unrealized appreciation on investments | | | 42,185 | |
| Members' Capital, at June 30, 2017 | | $ | 6,629,998 | |
See notes to financial statements.
8
Hatteras VC Co-Investment Fund II, LLC
(a Delaware Limited Liability Company)
STATEMENT OF CASH FLOWS
For the year ended June 30, 2017
| Cash flows from operating activities: | | | |
| Net decrease in members' capital resulting from operations | | $ | (199,227 | ) |
| Adjustments to reconcile net decrease in members' capital resulting from operations to net cash provided by operating activities: | | | | |
| Purchases of investments | | | (181,246 | ) |
| Net proceeds on sales of investments | | | 1,363,395 | |
| Net realized gain on investments | | | (19,527 | ) |
| Net change in unrealized appreciation on investments | | | (42,185 | ) |
| Decrease in receivable for investment sold | | | 18,427 | |
| Increase in interest receivable | | | (858 | ) |
| Decrease in professional fees payable | | | (1,363 | ) |
| Decrease in management fee payable | | | (1,135 | ) |
| Decrease in custodian fees payable | | | (782 | ) |
| Net cash provided by operating activities | | | 935,499 | |
| | | | | |
| Net change in cash | | | 935,499 | |
| | | | | |
| Cash at beginning of year | | | 885,896 | |
| Cash at end of year | | $ | 1,821,395 | |
See notes to financial statements.
9
Hatteras VC Co-Investment Fund II, LLC
(a Delaware Limited Liability Company)
Notes to Financial Statements
As of and for the year ended June 30, 2017
Hatteras VC Co-Investment Fund II, LLC (the “Fund”) was organized as a limited liability company under the laws of the State of Delaware on November 7, 2008 and commenced operations on September 1, 2009. The Fund is registered under the Investment Company Act of 1940, as amended (the “1940 Act”), as a closed-end, non-diversified management investment company. The Fund is managed by Hatteras Funds, LP (the “Adviser”), an investment adviser registered with the Securities and Exchange Commission (the “SEC”) under the Investment Advisers Act of 1940, as amended. The Fund had an initial closing on September 1, 2009 (“Initial Closing”) and a final closing August 31, 2010 (“Final Closing”), as determined by the Board of Managers (the “Board”) of the Fund. The Fund’s investment period (the “Investment Period”) was three years following the Initial Closing of the Fund. The Fund was to continue until the date that is six years from the date of the Initial Closing, unless terminated earlier pursuant to applicable terms of the Fund’s limited liability company agreement (“LLC Agreement”). The term was extended for two successive one-year periods at the discretion of the Board at a meeting on August 27, 2015. At a meeting on August 21, 2017, the Board elected to extend the term of the Fund for two additional years, or until August 31, 2019. During this two-year extension, beginning September 1, 2017, the Adviser will waive the Fund’s management fee (See Note 4).
The Board has overall responsibility for the management and supervision of the business operations of the Fund on behalf of the members of the Fund (“Members”), subject to the laws of the State of Delaware and the Fund’s LLC Agreement, including authority to oversee and establish policies regarding the management, conduct and operation of the Fund’s business.
| 2. | SIGNIFICANT ACCOUNTING POLICIES |
The following is a summary of significant accounting and reporting policies used in preparing the financial statements.
The Fund’s accounting and reporting policies conform to accounting principles generally accepted within the United States of America (“U.S. GAAP”). The Fund is an investment company and applies accounting and reporting guidance in accordance with Accounting Standards Codification (“ASC”) topic 946, Financial Services - Investment Companies.
| b. | Cash & Cash Equivalents |
Cash & cash equivalents include a money market fund which has a maturity of three months or less. At times, such deposits may be in excess of federally insured limits. As of June 30, 2017, cash & cash equivalents balance which have maturity of 3 months or less is $1,821,395. The Fund has not experienced any losses in such accounts and does not believe it is exposed to any significant credit risk on such accounts.
| c. | Reclassification of Prior Year Presentation |
The prior year’s short term investment balance of $885,896, has been reclassified as cash equivalents for consistency with the current period presentation. This reclassification had no effect on the reported results of operations or members’ capital for the years ended June 30, 2016 and 2017.
| d. | Valuation of Portfolio Investments |
All private investments are recorded at fair value in accordance with the Fund’s valuation procedures. The Fund’s valuation procedures have been approved by and are subject to continued oversight by the Fund’s Board. The valuation procedures are implemented by the Adviser and the Fund’s third-party administrator, which report to the Board.
10
Hatteras VC Co-Investment Fund II, LLC
(a Delaware Limited Liability Company)
Notes to Financial Statements
As of and for the year ended June 30, 2017 (Continued)
| 2. | SIGNIFICANT ACCOUNTING POLICIES (Continued) |
| d. | Valuation of Portfolio Investments (Continued) |
Investments in Private Companies – Investments for which observable market prices in active markets do not exist are reported at fair value, as determined in good faith by the Adviser. Fair value is based on the best information available and is determined by reference to information including, but not limited to, the following: projected sales, net earnings, earnings before interest, taxes, depreciation and amortization (“EBITDA”), balance sheets, public or private transactions, valuations for publicly traded comparable companies, recent rounds of financing in the company’s stock, and/or other measures, and consideration of any other pertinent information including the types of securities held and restrictions on disposition. The amount determined to be fair value may incorporate the Adviser’s own assumptions (including appropriate risk adjustments for nonperformance and/or lack of marketability). The methods used to estimate the fair value of private companies include: (1) the market approach (whereby fair value is derived by reference to observable valuation measures for comparable companies or assets – e.g., multiplying a key performance metric of the investee company or asset, such as projected revenue or EBITDA, by a relevant valuation multiple observed in the range of comparable companies or transactions – adjusted by the Adviser for differences between the investment and the referenced comparables and in some instances by reference to option pricing models or other similar methods), (2) the income approach (e.g., the discounted cash flow method), (3) cost for a period of time after an acquisition (where such amount is determined by the Adviser to be the best indicator of fair value), and (4) based upon a recent round of financing, which usually includes referencing recent or pending transactions in the same or similar securities of the issuer. These valuation methodologies involve a significant degree of judgment. Due to the absence of readily determinable fair values and the inherent uncertainty of valuations, the estimated fair values for private companies may differ significantly from values that would have been used had a ready market for the securities existed, and the differences could be material.
The Fund classifies its assets into three levels based on the lowest level of input that is significant to the fair value measurement. The three-tier hierarchy distinguishes between (1) inputs that reflect the assumptions market participants would use in pricing an asset or liability developed based on market data obtained from sources independent of the reporting entity (observable inputs) and (2) inputs that reflect the reporting entity’s own assumptions about the assumptions market participants would use in pricing an asset or liability developed based on the best information available in the circumstances (unobservable inputs) and to establish classification of fair value measurements for disclosure purposes. Various inputs are used in determining the value of the Fund’s investments.
The inputs are summarized in the three broad levels listed below:
Valuation of Investments
| | ● | Level 1 – quoted prices (unadjusted) in active markets for identical assets and liabilities |
| | ● | Level 2 – other significant observable inputs (including quoted prices for similar investments, interest rates, prepayment speeds, credit risk, etc.) |
| | ● | Level 3 – significant unobservable inputs (including the Fund’s own assumptions in determining the fair value of investments) |
11
Hatteras VC Co-Investment Fund II, LLC
(a Delaware Limited Liability Company)
Notes to Financial Statements
As of and for the year ended June 30, 2017 (Continued)
| 2. | SIGNIFICANT ACCOUNTING POLICIES (Continued) |
| d. | Valuation of Portfolio Investments (Continued) |
The following table presents the Fund’s fair value hierarchy for those assets measured at fair value on a recurring basis as of June 30, 2017:
| | | Level 1 | | | Level 2 | | | Level 3 | | | Total | |
Private Company1 | | | | | | | | | | | | |
| Preferred Stock | | $ | — | | | $ | — | | | $ | 4,819,352 | | | $ | 4,819,352 | |
| Common Stock | | | — | | | | — | | | | 72,085 | | | | 72,085 | |
| Total Private Company | | | — | | | | — | | | | 4,891,437 | | | | 4,891,437 | |
| Total Private Company | | $ | — | | | $ | — | | | $ | 4,891,437 | | | $ | 4,891,437 | |
1 | All private companies held in the Fund are Level 3 securities. For a detailed break-out of private companies by industry classification, please refer to the Schedule of Investments. |
It is the Fund’s policy to recognize transfers into and out of all Levels at the end of the reporting period. There were no transfers among Levels 1, 2 and 3 as of June 30, 2017.
The following is a reconciliation of investments in which significant unobservable inputs (Level 3) were used in determining value:
| | | Convertible Promissory Notes | | | Preferred Stock | | | Common Stock | | | Total | |
| Balance as of July 1, 2016 | | $ | 114,415 | | | $ | 5,795,003 | | | $ | 88,868 | | | $ | 5,998,286 | |
| Net Realized Gain/(Loss) | | | (37,951 | ) | | | 452,798 | | | | (250,002 | ) | | | 164,845 | |
| Change in Unrealized Appreciation/(Depreciation) | | | (308 | ) | | | (110,781 | ) | | | 3,592 | | | | (107,497 | ) |
| Transfers In/(Out) of Investment Categories* | | | (82,531 | ) | | | (133,639 | ) | | | 216,170 | | | | — | |
| Gross Purchases | | | 42,432 | | | | 125,357 | | | | 13,457 | | | | 181,246 | |
| Gross Sales | | | (36,057 | ) | | | (1,309,386 | ) | | | — | | | | (1,345,443 | ) |
| Balance as of June 30, 2017 | | $ | — | | | $ | 4,819,352 | | | $ | 72,085 | | | $ | 4,891,437 | |
| * | Transfers in or out of investment categories reflect changes in investment categories and are represented by their balance at the beginning of the period. |
Change in unrealized depreciation included in the statement of operations attributable to Level 3 investments held as of the reporting date is $(5,817).
12
Hatteras VC Co-Investment Fund II, LLC
(a Delaware Limited Liability Company)
Notes to Financial Statements
As of and for the year ended June 30, 2017 (Continued)
| 2. | SIGNIFICANT ACCOUNTING POLICIES (Continued) |
| d. | Valuation of Portfolio Investments (Continued) |
The following is a summary of quantitative information about significant unobservable inputs used for Level 3 fair value measurements for investments held as of June 30, 2017:
| Type of Investment | Fair Value as of June 30, 2017 | Valuation Technique | Unobservable Input | Weighted Average | Range | Impact on valuation from an Increase in Input |
| Preferred Stock | $ 1,902,523 | Market Comparable Companies | Forward Revenue Multiple | 4.14x | 2.64x – 5.46x | Increase |
| | | | Discount Rate | 15.00% | 15.00% | Decrease |
| | 2,916,829 | Most Recent Capitalization | Private Financing | N/A | N/A | N/A |
| Common Stock | 16,459 | Market Comparable Companies | Forward Revenue Multiple | 4.11x | 0x – 4.50x | Increase |
| | | | Discount Rate | 15.00% | 15.00% | Decrease |
| | 55,626 | Most Recent Capitalization | Private Financing | N/A | N/A | N/A |
| Total Private Company | $ 4,891,437 | | | | | |
Investments in private companies are generally valued using most recent capitalization technique and market comparable companies techniques. The significant unobservable input used in the most recent capitalization technique is private financing. Two significant unobservable inputs used in the market comparable companies technique are the particular type of market multiple relied upon and a discount rate. Different types of multiples (e.g., forward revenue multiple) are relied upon across the Fund’s portfolio. A significant decrease in one of these multiples in isolation would result in a significantly lower fair value measurement. A significant increase in the discount rate in isolation would result in a significantly lower fair value measurement.
The significant unobservable inputs used in the fair value measurement of the Fund’s preferred and common stock are generally the financial results of privately held entities. If the financial condition of these companies were to deteriorate, or if market comparables were to fall, the value of the preferred stock or common stock in these private companies held by the Fund would be lower.
13
Hatteras VC Co-Investment Fund II, LLC
(a Delaware Limited Liability Company)
Notes to Financial Statements
As of and for the year ended June 30, 2017 (Continued)
| 2. | SIGNIFICANT ACCOUNTING POLICIES (Continued) |
Interest income is recorded on the accrual basis when earned. Interest income is not recognized when collection is doubtful, but instead, such amounts are tracked in a memorandum account. At June 30, 2017, all interest was deemed collectable. Disbursements received from investments in private companies are ordinarily accounted for as a reduction of cost, or allocated between cost and realized gains and losses dependent upon information received from the private company. Investments in private companies are recorded on a subscription effective date basis. Realized gains and losses are determined on a specific identified cost basis.
Fund expenses that are specifically attributed to the Fund are charged to the Fund and recorded on an accrual basis. Expenses of the Fund include, but are not limited to, the following: all costs and expenses related to portfolio transactions, legal fees, accounting, auditing, and tax preparation fees, custodial fees, fees for data and software providers, costs of insurance, registration expenses, management fee, and expenses of meetings of the Board.
The Fund is treated as a partnership for federal income tax purposes and therefore is not subject to U.S. federal income tax. For income tax purposes, the individual Members will be taxed upon their distributive share of each item of the Fund’s profit and loss.
The Fund has reviewed any potential tax positions as of June 30, 2017 and has determined that it does not have a liability for any unrecognized tax benefits. The Fund recognizes interest and penalties, if any, related to unrecognized tax benefits as income tax expense in the statement of operations. During the year ended June 30, 2017, the Fund did not incur any interest or penalties. The Fund files income tax returns in U.S. federal jurisdictions and various states, which remain open for examination by the tax authorities for a period of three years from when they are filed. The tax years subject to evaluation by tax authorities are 2013 to 2016 and there are no tax examinations in progress.
The Fund may make distributions to Members annually, or more frequently, at the Fund’s discretion, as permitted by applicable laws, rules and regulations. Amounts distributed will be intended to represent the amounts of distributions received by the Fund from underlying investments during the period since the last distribution (or from commencement of operations in the case of the first distribution). Any distributions to Members will be made pro-rata.
The preparation of financial statements in conformity with U.S. GAAP requires the Fund to make estimates and assumptions that affect the reported amounts of assets and liabilities and disclosure of contingent assets and liabilities at the date of the financial statements and the reported amounts of increases and decreases in Members’ capital from operations during the reporting period. Actual results could differ from those estimates.
| j. | Fair Value of Financial Instruments |
The fair value of the Fund’s assets and liabilities, which qualify as financial instruments, approximate the carrying amounts presented on the statement of assets, liabilities and members’ capital.
14
Hatteras VC Co-Investment Fund II, LLC
(a Delaware Limited Liability Company)
Notes to Financial Statements
As of and for the year ended June 30, 2017 (Continued)
| 3. | ALLOCATION OF MEMBERS’ CAPITAL |
Net profits or net losses of the Fund for each allocation period (“Allocation Period”) will be allocated among and credited to or debited against the capital accounts of the Members. Net profits or net losses will be measured as the net change in the value of the Members’ capital of the Fund, including any net change in unrealized appreciation or depreciation of investments and realized income and gains or losses and expenses during an Allocation Period, adjusted to exclude any items to be allocated among the capital accounts of the Members in accordance with the Members’ respective investment percentages. Allocation Periods generally begin on the first calendar day of each month and end at the close of business on the last day of each month.
| 4. | MANAGEMENT FEE AND RELATED PARTY TRANSACTIONS |
The Adviser is responsible for providing day-to-day investment management services to the Fund, subject to the ultimate supervision of and subject to any policies established by the Board, pursuant to the terms of an investment management agreement with the Fund (the “Investment Management Agreement”). Under the Investment Management Agreement, the Adviser is responsible for developing, implementing and supervising the Fund’s investment program.
In consideration for such services, the Fund pays the Adviser a quarterly investment “management fee” equal to 2.00% on an annualized basis of the net assets of the Fund as of each quarter-end. The Adviser has committed to waive permanently a portion of its contractual fee rate under the Investment Management Agreement as of the end of any quarter at which (or month-end during the period from the Initial Closing to the Final Closing) the cost basis of the Fund’s portfolio companies plus cash & cash equivalents is less than the Fund’s NAV as of such quarter-end (or month-end during the period from the Initial Closing to the Final Closing). When this occurs, the Adviser will waive the portion of its management fee that is in excess of the annual rate equal to 2.00% of the cost basis of the Fund’s portfolio companies plus cash & cash equivalents. The management fee for the year ended June 30, 2017 was $136,534. For the year ended June 30, 2017, the Adviser waived $26,948 of the management fee, which is not subject to recoupment. During the two-year extension that will begin on September 1, 2017 through August 31, 2019, the Adviser will waive permanently the entire management fee, which will not be subject to recoupment.
Each member of the Board who is not an “interested person” of the Fund, as defined by Section 2(a)(19) of the 1940 Act (each an “Independent Manager”), received an annual retainer of $6,000 for services on the Board and for services as a member of the audit committee of the Fund. All Board members are reimbursed by the Fund for all reasonable out-of-pocket expenses incurred by them in performing their duties. For the year ended June 30, 2017, retainers to the Independent Managers totaled $24,000 and are included in the statement of operations under Board fees. The Fund’s Chief Compliance Officer received an annual retainer of $5,000 which is included in the statement of operations under Chief Compliance Officer fee.
| 5. | ACCOUNTING, ADMINISTRATION AND CUSTODIAL AGREEMENT |
In consideration for accounting, administrative, and recordkeeping services, the Fund pays UMB Fund Services, Inc. (the “Administrator”) a monthly administration fee based on the month-end net asset value of the Fund. The Administrator also provides regulatory administrative services, transfer agency functions, and Member services at an additional cost. For the year ended June 30, 2017, the total accounting and administration fee was $40,000, and is included in the statement of operations under accounting and administration fees.
UMB Bank, n.a., an affiliate of the Administrator, serves as custodian of the Fund’s assets and provides custodial services for the Fund. The total Custodian fee of $11,580 is included in the statement of operations for the year ended June 30, 2017.
15
Hatteras VC Co-Investment Fund II, LLC
(a Delaware Limited Liability Company)
Notes to Financial Statements
As of and for the year ended June 30, 2017 (Continued)
| 6. | INVESTMENT TRANSACTIONS |
Total purchases of investments for the year ended June 30, 2017 amounted to $181,246. Total proceeds from sales, redemption, or other dispositions of investments for the year ended June 30, 2017 amounted to $1,363,395 including amounts held in escrow which the Fund believes will ultimately be collected. The cost of investments for U.S. federal income tax purposes is adjusted for items of taxable income allocated to the Fund from the investments. The Fund relies upon actual and estimated tax information provided by investments to the amounts of taxable income allocated to the Fund as of June 30, 2017.
The Fund intends to invest substantially all of its available capital in private companies. These investments will generally be restricted securities that are subject to substantial holding periods or are not traded in public markets at all, so that the Fund may not be able to resell some of its securities holdings for extended periods.
In the normal course of business, the Fund enters into contracts that provide general indemnifications. The Fund’s maximum exposure under these agreements is dependent on future claims that may be made against the Fund, and therefore cannot be established; however, based on experience, the risk of loss from such claims is considered remote.
As of June 30, 2017, the Fund did not have any outstanding investment commitments to portfolio companies.
An investment in the Fund involves significant risks, including liquidity risk, non-diversification risk and economic conditions risk, that should be carefully considered prior to investing and should only be considered by persons financially able to maintain their investment and who can afford a loss of a substantial part or all of such investment.
Liquidity risk: Transfer of the units of limited liability company interests (“Units”) of the Fund is subject to significant restrictions. Because of these restrictions and the absence of a public market for the Units, a Member may be unable to liquidate his, her or its investment even though his, her or its personal financial circumstances would make liquidation advisable or desirable. The Units will not be readily acceptable as collateral for loans and the Units are not permitted to be pledged as collateral for loans. Moreover, even if a Member were able to dispose of his, her or its Units, adverse tax consequences could result.
Non-diversification risk: If there is an industry in which the Fund concentrates its investments, the Fund may be subject to greater investment risk as companies engaged in similar businesses are more likely to be similarly affected by any adverse market conditions and other adverse industry-specific factors.
Economic conditions risk: The Fund’s investments expose Members to a range of potential economic risks that could have an adverse effect on the Fund. These may include, but are not limited to, declines in economic growth, inflation, deflation, taxation, governmental restrictions, and/or adverse regulation.
The financial highlights are intended to help an investor understand the Fund’s financial performance for past periods. The total return in the table represents the rate that a typical Member would be expected to have earned or lost on an investment in the Fund.
The ratios, total return and internal rate of return since inception amount are calculated based on the Member group taken as a whole. An individual Member’s results may vary from those shown below due to the timing of capital transactions.
16
Hatteras VC Co-Investment Fund II, LLC
(a Delaware Limited Liability Company)
Notes to Financial Statements
As of and for the year ended June 30, 2017 (Continued)
| 10. | FINANCIAL HIGHLIGHTS (Continued) |
The ratios are calculated by dividing total dollars of net investment income/(loss) or expenses, as applicable, by the average of total monthly Members’ capital. The total return amount is calculated by geometrically linking returns based on the change in the net asset value during each accounting period.
| Per Unit Operating Performance: | |
| Net Asset Value, August 31, 2011 | | $ | 86.55 | |
| Income/(loss) from investment operations: | | | | |
| Net investment loss | | | (2.78 | ) |
| Net change in unrealized appreciation on investments in private companies | | | 2.82 | |
| Total from investment operations | | | 0.04 | |
| Net Asset Value, August 31, 2012 | | $ | 86.59 | |
| Income/(loss) from investment operations: | | | | |
| Net investment loss | | | (2.59 | ) |
| Net realized loss and change in unrealized depreciation on investments in private companies | | | (15.21 | ) |
| Total from investment operations | | | (17.80 | ) |
| Net Asset Value, June 30, 2013 | | $ | 68.79 | |
| Income/(loss) from investment operations: | | | | |
| Net investment loss | | | (2.91 | ) |
| Net change in unrealized appreciation on investments in private companies | | | 13.98 | |
| Total from investment operations | | | 11.07 | |
| Net Asset Value, June 30, 2014 | | $ | 79.86 | |
| Income/(loss) from investment operations: | | | | |
| Net investment loss | | | (2.59 | ) |
| Net realized loss and change in unrealized appreciation on investments in private companies | | | 4.97 | |
| Total from investment operations | | | 2.38 | |
| Net Asset Value, June 30, 2015 | | $ | 82.24 | |
| Income/(loss) from investment operations: | | | | |
| Net investment loss | | | (2.64 | ) |
| Net realized gain and change in unrealized appreciation on investments | | | (10.88 | ) |
| Total from investment operations | | | (13.52 | ) |
| Less distributions: | | | | |
| From return of capital and capital gains | | | (9.17 | ) |
| Total distributions | | | (9.17 | ) |
| Net Asset Value, June 30, 2016 | | $ | 59.55 | |
| Income/(loss) from investment operations: | | | | |
| Net investment loss | | | (2.28 | ) |
| Net realized gain and change in unrealized appreciation on investments | | | 0.54 | |
| Total from investment operations | | | (1.74 | ) |
| Net Asset Value, June, 2017 | | $ | 57.81 | |
17
Hatteras VC Co-Investment Fund II, LLC
(a Delaware Limited Liability Company)
Notes to Financial Statements
As of and for the year ended June 30, 2017 (Concluded)
| 10. | FINANCIAL HIGHLIGHTS (Continued) |
| | | For the years ended
June 30, | | | For the period from September 1, 2012 to
June 30, 2013* | | | | |
| | | 2017 | | | 2016 | | | 2015 | | | 2014 | | | | | For the
year ended August 31,
2012 | |
Total return1 | | | (2.92 | )% | | | (27.59 | %) | | | 2.98 | % | | | 16.09 | % | | | (20.56 | %)3 | | | 0.05 | % |
| Members’ capital, end of period (000’s) | | $ | 6,630 | | | $ | 6,829 | | | $ | 9,432 | | | $ | 9,159 | | | $ | 7,889 | | | $ | 9,930 | |
| Portfolio turnover | | | 3.04 | % | | | 3.25 | % | | | 2.78 | % | | | 0.54 | % | | | 0.00 | %3 | | | 8.00 | % |
| Net investment loss: | | | | | | | | | | | | | | | | | | | | | | | | |
| Before reimbursement of placement agent fees | | | (3.85 | %) | | | (3.46 | %) | | | (3.11 | %) | | | (3.70 | %) | | | (3.58 | %)4 | | | (3.15 | %) |
| After reimbursement of placement agent fees | | | (3.85 | %) | | | (3.46 | %) | | | (3.11 | %) | | | (3.70 | %) | | | (3.58 | %)4 | | | (3.15 | %) |
Net operating expenses2: | | | | | | | | | | | | | | | | | | | | | | | | |
| Before reimbursement of placement agent fees | | | 4.05 | % | | | 3.51 | % | | | 3.25 | % | | | 3.71 | % | | | 3.62 | %4 | | | 3.29 | % |
| After reimbursement of placement agent fees | | | 4.05 | % | | | 3.51 | % | | | 3.25 | % | | | 3.71 | % | | | 3.62 | %4 | | | 3.29 | % |
| * | At a Board meeting held on August 23, 2012, the Board approved the change in fiscal year-end for the Fund from August 31 to the June 30 effective as of the end of the fiscal year ended August 31, 2012. |
1 | Internal rate of return since inception: As of June 30, 2017 was (6.76)%; As of June 30, 2016 was (7.31)%; As of June 30, 2015 was (3.30)%; As of June 30, 2014 was (4.55)%; As of June 30, 2013 was (9.30)%; As of August 31, 2012 was (4.69)%. The internal rate of return is based on change in NAV since inception. |
2 | Net operating expenses before and after waiver of the management fee for the year ended June 30, 2017 were 4.44% and 4.05% respectively, for the year ended June 30, 2016 were 3.93% and 3.51% respectively, for the year ended June 30, 2015 were 3.75% and 3.25% respectively. Net operating expenses before and after waiver of the management fee for the year ended June 30, 2014 were 3.99% and 3.71%, respectively. Net operating expenses before and after waiver of the management fee for the period from September 1, 2012 to June 30, 2013 were 3.78% and 3.62%, respectively. Net operating expenses before and after waiver of the management fee for the year ended August 31, 2012 were 3.46% and 3.29%, respectively. |
The Fund has evaluated subsequent events through the date the financial statements were issued, and determined the following required disclosure:
At a meeting of the Board held on August 21, 2017, the Board declared a distribution in the amount of $12.50 per unit, payable on September 15, 2017 to Members of record at August 31, 2017. Also, at this meeting the Board approved a two year fund extension which is described in Note 1.
18
Hatteras VC Co-Investment Fund II, LLC
(a Delaware Limited Liability Company)
BOARD OF MANAGERS
(Unaudited)
The identity of the Board members (each a “Manager”) and brief biographical information, as of June 30, 2017, is set forth below. The business address of each Manager is care of Hatteras Funds, 6601 Six Forks Road, Suite 340, Raleigh, NC 27615. The Managers serve on the Board for terms of indefinite duration. A Manager’s position in that capacity will terminate if the Manager is removed or resigns or, among other events, upon the Manager’s death, incapacity, retirement or bankruptcy. The Fund’s Statement of Additional Information includes additional information about the Managers and may be obtained without charge by calling Hatteras at 1-866-388-6292.
Name and
Date of Birth | Position(s) Held with the Fund | Length of Time Served | Principal Occupation(s) During Past 5 Years and Other Directorships Held by Manager | Number of Portfolios in Fund Complex1 Overseen by Manager |
| INTERESTED MANAGER |
David B. Perkins2
July 18, 1962 | President and Chairman of the Board of Managers of the Fund | Since Inception | President and Trustee, each fund in the Fund Complex (2004 to Present); Chief Executive Officer of Hatteras Funds, LP from 2014 to present and Founder of Hatteras Investment Partners LLC and its affiliated entities (“Hatteras Funds”) in 2003. | 8 |
| INDEPENDENT MANAGERS |
| H. Alexander Holmes May 4, 1942 | Manager; Audit Committee Member of the Fund | Since Inception | Founder, Holmes Advisory Services, LLC, a financial consultation firm (1993 to Present). | 8 |
| Steve E. Moss, CPA February 18, 1953 | Manager; Audit Committee Member of the Fund | Since Inception | Principal, Holden, Moss, Knott, Clark & Copley, PA, accountants and business consultants (1996 to Present); Member Manager, HMKCT Properties, LLC (1996 to Present). | 8 |
Gregory S. Sellers
May 5, 1959 | Manager; Audit Committee Member of the Fund | Since Inception | Chief Financial Officer and Chief Operating Officer, Spectrum Consultants, Inc., a sales and marketing firm in the senior housing industry (2015 to Present); Chief Financial Officer, Imagemark Business Services, Inc., a provider of marketing and print communications solutions (June 2009 to 2015). | 8 |
Thomas Mann
February 1, 1950 | Manager; Audit Committee Member of the Fund | Since 2012 | Private Investor (2012 to Present); Managing Director and Group Head Financial Institutions Group, Société Générale, Sales of Capital Market Solutions and Products (2003 to 2012). | 8 |
1 | The “Fund Complex” consists of the Fund, Hatteras Master Fund L.P., Hatteras Core Alternatives Fund, L.P., Hatteras Core Alternatives TEI Fund, L.P., Hatteras Core Alternatives Institutional Fund, L.P., Hatteras Core Alternatives TEI Institutional Fund, L.P., and Trust for Advisor Solutions (consisting of two funds). |
2 | Deemed to be an “interested” Manager of the Fund because of his affiliations with Hatteras Funds. |
19
Hatteras VC Co-Investment Fund II, LLC
(a Delaware Limited Liability Company)
FUND MANAGEMENT
(Unaudited)
Set forth below is the name, date of birth, position with the Fund, length of term of office, and the principal occupation for the last five years, as of June 30, 2017, of each of the persons currently serving as Executive Officer. The business address of each officer is care of Hatteras Funds, 6601 Six Forks Road, Suite 340, Raleigh, NC 27615.
Name and
Date of Birth | Position(s) Held with the Fund | Length of Time Served | Principal Occupation(s) During Past 5 Years and Other Directorships Held by Officer | Number of Portfolios in Fund Complex1 Overseen by Officer |
| OFFICERS |
| Andrew P. Chica September 7, 1975 | Chief Compliance Officer and Secretary of the Fund | Since Inception | Mr. Chica joined Hatteras Funds in November 2007 and became the Chief Compliance Officer of Hatteras Funds and each of the funds in the Fund Complex in 2008. | N/A |
| Robert Lance Baker September 17, 1971 | Treasurer of the Fund | Since Inception | Mr. Baker joined Hatteras Funds in March 2008 and is currently the Chief Financial Officer of Hatteras Funds. | N/A |
1 | The “Fund Complex” consists of the Fund, Hatteras Master Fund L.P., Hatteras Core Alternatives Fund, L.P., Hatteras Core Alternatives TEI Fund, L.P., Hatteras Core Alternatives Institutional Fund, L.P., Hatteras Core Alternatives TEI Institutional Fund, L.P., and Trust for Advisor Solutions (consisting of two funds). |
20
Hatteras VC Co-Investment Fund II, LLC
(a Delaware Limited Liability Company)
OTHER INFORMATION
(Unaudited)
PROXY VOTING
A description of the policies and procedures that the Fund uses to determine how to vote proxies relating to portfolio securities and the Fund’s record of proxies relating to portfolio securities during the most recent 12-month period ended June 30 is available (1) without charge, upon request, by calling 1-800-504-9070; or on or through the Fund’s website; or both and (2) on the SEC’s website at http: //www.sec.gov.
AVAILABILITY OF QUARTERLY PORTFOLIO SCHEDULES
The Fund files its complete schedule of portfolio holdings with the SEC for the first and third quarters of each fiscal year on Form N-Q. The Fund’s Form N-Q is available, without charge and upon request, on the SEC’s website at http://www.sec.gov or may be reviewed and copied at the SEC’s Public Reference Room in Washington.
21
Hatteras VC Co-Investment Fund II, LLC
(a Delaware Limited Liability Company)
PRIVACY POLICY
(Unaudited)
In recognition of Hatteras’ fiduciary obligations to its Clients and Hatteras’ desire to maintain its high ethical standards, Hatteras has adopted this Privacy Policy for Hatteras Funds, LP (“Hatteras”), Trust for Advisor Solutions (f/k/a Hatteras Alternative Mutual Funds Trust) and Hatteras Closed-End Funds (collectively with the Trusts referred to as the “Fund(s)”) to safeguard the personal information of its consumers and customers in accordance with SEC Regulation S-P, 17 CFR 284.30:
FACTS | WHAT DOES HATTERAS FUNDS DO WITH YOUR PERSONAL INFORMATION? |
| | |
Why? | Financial companies choose how they share your personal information. Federal law gives consumers the right to limit some but not all sharing. Federal law also requires us to tell you how we collect, share, and protect your personal information. Please read this notice carefully to understand what we do. |
| | |
What? | The types of personal information we collect and share depend on the product or service you have with us. This information can include: ● Social Security number ● account balances ● account transactions ● transaction history ● wire transfer instructions ● checking account information When you are no longer our customer, we continue to share your information as described in this notice. |
| | |
How? | All financial companies need to share customers’ personal information to run their everyday business. In the section below, we list the reasons financial companies can share their customers‘ personal information; the reasons Hatteras Funds chooses to share; and whether you can limit this sharing. |
| | | | |
Reasons we can share your personal information | Does Hatteras
Funds share? | Can you limit this sharing? |
For our everyday business purposes –
such as to process your transactions, maintain your account(s), respond to court orders and legal investigations, or report to credit bureaus | Yes | No |
For our marketing purposes –
to offer our products and services to you | No | We don’t share |
For joint marketing with other financial companies | No | We don’t share |
For our affiliates’ everyday business purposes –
information about your transactions and experiences | Yes | No |
For our affiliates’ everyday business purposes –
information about your creditworthiness | No | We don’t share |
For our affiliates to market to you | No | We don’t share |
For non-affiliates to market to you | No | We don’t share |
| | |
Questions? | Call (919) 846-2324 or go to www.hatterasfunds.com |
22
Hatteras VC Co-Investment Fund II, LLC
(a Delaware Limited Liability Company)
PRIVACY POLICY
(Unaudited) (Concluded)
What we do |
Who is providing this notice? | Funds advised by Hatteras entities. A complete list is included below. |
How does Hatteras Funds protect my personal information? | To protect your personal information from unauthorized access and use, we use security measures that comply with federal law. These measures include computer safeguards and secured files and buildings. |
How does Hatteras Funds collect my personal information? | We collect your personal information, for example, when you ● open an account ● provide account information ● give us your contact information ● make a wire transfer ● tell us where to send the money We also collect your information from others, such as credit bureaus, affiliates, or other companies. |
Why can’t I limit all sharing? | Federal law gives you the right to limit only ● sharing for affiliates’ everyday business purposes – information about your creditworthiness ● affiliates from using your information to market to you ● sharing for non-affiliates to market to you State laws and individual companies may give you additional rights to limit sharing. |
| | |
Definitions |
Affiliates | Companies related by common ownership or control. They can be financial and nonfinancial companies. ● Our affiliates include Hatteras Funds, LP, a registered investment adviser; Hatteras Capital Distributors, LLC, a registered broker- dealer; unregistered funds managed by Hatteras such as, Hatteras GPEP Fund, L.P., Hatteras GPEP Fund II, LLC, Hatteras Global Private Equity Partners International, LLC, Hatteras Late Stage VC Fund I, L.P. and Hatteras Private Equity Evergreen Fund. |
Non-affiliates | Companies not related by common ownership or control. They can be financial and nonfinancial companies. ● Hatteras Funds doesn’t share with non-affiliates so they can market to you. |
Joint marketing | A formal agreement between nonaffiliated financial companies that together market financial products or services to you. ● Hatteras Funds doesn’t jointly market. |
| | |
List of funds providing this notice |
Hatteras Core Alternatives Fund, L.P., Hatteras Core Alternatives TEI Fund, L.P., Hatteras Core Alternatives Institutional Fund, L.P., Hatteras Core Alternatives TEI Institutional Fund, L.P., Hatteras Master Fund, Hatteras Global Private Equity Partners Institutional, LLC, Hatteras GPEP Fund, LP, Hatteras GPEP Fund II, LLC, Hatteras Late Stage VC Fund I, LP, Hatteras VC Co-Investment Fund II, LLC, Hatteras Private Equity Evergreen Fund and Trust for Advisor Solutions. |
23
This page intentionally left blank.
This page intentionally left blank.
ITEM 2. CODE OF ETHICS.
(a) The registrant, as of the end of the period covered by this report, has adopted a code of ethics that applies to the registrant's principal executive officer, principal financial officer, principal accounting officer or controller, or persons performing similar functions, regardless of whether these individuals are employed by the registrant or a third party.
(c) There have been no amendments, during the period covered by this report, to a provision of the code of ethics that applies to the registrant's principal executive officer, principal financial officer, principal accounting officer or controller, or persons performing similar functions, regardless of whether these individuals are employed by the registrant or a third party, and that relates to any element of the code of ethics definition enumerated in paragraph (b) of this item.
(d) The registrant has not granted any waivers, during the period covered by this report, including an implicit waiver, from a provision of the code of ethics that applies to the registrant's principal executive officer, principal financial officer, principal accounting officer or controller, or persons performing similar functions, regardless of whether these individuals are employed by the registrant or a third party, that relates to one or more of the items set forth in paragraph (b) of this Item.
ITEM 3. AUDIT COMMITTEE FINANCIAL EXPERT.
As of the end of the period covered by the report, the registrant's board of managers has determined that Messrs. Steve E. Moss, H. Alexander Holmes, Gregory S. Sellers, and Thomas Mann are each qualified to serve as audit committee financial experts serving on its audit committee and that each is "independent," as defined by Item 3 of Form N-CSR.
ITEM 4. PRINCIPAL ACCOUNTANT FEES AND SERVICES.
Audit Fees
(a) The aggregate fees billed for each of the last two fiscal years for professional services rendered by the principal accountant for the audit of the registrant's annual financial statements or services that are normally provided by the accountant in connection with statutory and regulatory filings or engagements for those fiscal years were $49,000 for 2016 and $52,455 for 2017.
Audit-Related Fees
(b) The aggregate fees billed in each of the last two fiscal years for assurance and related services by the principal accountant that are reasonably related to the performance of the audit of the registrant's financial statements and are not reported under paragraph (a) of this Item were $0 for 2016 and $0 for 2017.
Tax Fees
(c) The aggregate fees billed in each of the last two fiscal years for professional services rendered by the principal accountant for tax compliance, tax advice, and tax planning were $0 for 2016 and $0 for 2017.
All Other Fees
(d) The aggregate fees billed in each of the last two fiscal years for products and services provided by the principal accountant, other than the services reported in paragraphs (a) through (c) of this Item were $0 for 2016 and $0 for 2017.
(e)(1) Disclose the audit committee's pre-approval policies and procedures described in paragraph (c)(7) of Rule 2-01 of Regulation S-X.
The Registrant's Audit Committee must pre-approve the audit and non-audit services of the Auditors prior to the Auditor's engagement.
(e)(2) The percentage of services described in each of paragraphs (b) through (d) of this Item that were approved by the audit committee pursuant to paragraph (c)(7)(i)(C) of Rule 2-01 of Regulation S-X are as follows:
(b) 0%
(c) 0%
(d) 0%
(f) The percentage of hours expended on the principal accountant's engagement to audit the registrant's financial statements for the most recent fiscal year that were attributed to work performed by persons other than the principal accountant's full-time, permanent employees was less than fifty percent.
(g) The aggregate non-audit fees billed by the registrant's accountant for services rendered to the registrant, and rendered to the registrant's investment adviser (not including any sub-adviser whose role is primarily portfolio management and is subcontracted with or overseen by another investment adviser), and any entity controlling, controlled by, or under common control with the adviser that provides ongoing services to the registrant for each of the last two fiscal years of the registrant were $0.
(h) The registrant's audit committee of the board of managers has considered whether the provision of non-audit services that were rendered to the registrant's investment adviser (not including any sub-adviser whose role is primarily portfolio management and is subcontracted with or overseen by another investment adviser), and any entity controlling, controlled by, or under common control with the investment adviser that provides ongoing services to the registrant that were not pre-approved pursuant to paragraph (c)(7)(ii) of Rule 2-01 of Regulation S-X is compatible with maintaining the principal accountant's independence.
ITEM 5. AUDIT COMMITTEE OF LISTED REGISTRANTS.
Not applicable.
ITEM 6. SCHEDULE OF INVESTMENTS.
| (a) | Schedule of Investments in securities of unaffiliated issuers as of the close of the reporting period is included as part of the report to shareholders filed under Item 1 of this form. |
ITEM 7. DISCLOSURE OF PROXY VOTING POLICIES AND PROCEDURES FOR CLOSED-END MANAGEMENT INVESTMENT COMPANIES.
The Proxy Voting Policies are attached herewith.
PROXY VOTING POLICIES AND PROCEDURES
The Fund has delegated proxy voting responsibilities with respect to the Fund’s portfolio securities to the Adviser, subject to the Board’s general oversight and with the direction that proxies should be voted consistent with the Fund’s best economic interests. In general, the Adviser believes that voting proxies in accordance with the policies described below will be in the best interests of the Fund. If an analyst, trader or partner of the Adviser believes that voting in accordance with stated proxy-voting guidelines would not be in the best interests of a Fund, the proxy will be referred to the Adviser’s Chief Compliance Officer for a determination of how such proxy should be voted.
The Adviser will generally vote to support management recommendations relating to routine matters such as the election of directors (where no corporate governance issues are implicated), the selection of independent auditors, an increase in or reclassification of common stock, the addition or amendment of indemnification provisions in the company’s charter or by-laws, changes in the board of directors and compensation of outside directors. The Adviser will generally vote in favor of management or shareholder proposals that the Adviser believes will maintain or strengthen the shared interests of shareholders and management, increase shareholder value, maintain or increase shareholder influence over the company’s board of directors and management and maintain or increase the rights of shareholders.
On non-routine matters, the Adviser will generally vote in favor of management proposals for mergers or reorganizations, reincorporation plans, fair-price proposals and shareholder rights plans so long as such proposals are in the best economic interests of the Fund.
If a proxy includes a matter to which none of the specific policies described above or in the Adviser’s stated proxy-voting guidelines is applicable or a matter involving an actual or potential conflict of interest as described below, the proxy will be referred to the Adviser’s Chief Compliance Officer for a determination of how such proxy should be voted.
In exercising its voting discretion, the Adviser and its employees will seek to avoid any direct or indirect conflict of interest presented by the voting decision. If any substantive aspect or foreseeable result of the matter to be voted on presents an actual or potential conflict of interest involving the Adviser (or an affiliate of the Adviser), any issuer of a security for which the Adviser (or an affiliate of the Adviser) acts as sponsor, Adviser, manager, custodian, distributor, underwriter, broker or other similar capacity or any person with whom the Adviser (or an affiliate of the Adviser) has an existing material contract or business relationship not entered into in the ordinary course of business (the Adviser and such other persons having an interest in the matter being called “Interested Persons”), the Adviser will make written disclosure of the conflict to the Independent Managers of the Fund indicating how the Adviser proposes to vote on the matter and its reasons for doing so. If the Adviser does not receive timely written instructions as to voting or non-voting on the matter from the Fund’s Independent Managers, the Adviser may take any of the following actions which it deems to be in the best interests of the Fund: (i) engage an independent third party to determine whether and how the proxy should be voted and vote or refrain from voting on the matter as determined by the third party; (ii) vote on the matter in the manner proposed to the Independent Managers if the vote is against the interests of all Interested Persons; or (iii) refrain from voting on the matter.
The Fund will be required to file Form N‑PX, with its complete proxy voting record for the twelve months ended June 30, no later than August 31 of each year. Once filed, the Fund’s Form N‑PX filing will be available: (i) without charge, upon request, by calling the Fund at 800-504-9070 or (ii) by visiting the SEC’s website at www.sec.gov.
ITEM 8. PORTFOLIO MANAGERS OF CLOSED-END MANAGEMENT INVESTMENT COMPANIES.
(a)(1) Identification of Portfolio Manager(s) or Management Team Members and Description of Role of Portfolio Manager(s) or Management Team Members
The following table provides biographical information about the members of the Investment Committee, who are primarily responsible for the day-to-day portfolio management of the Fund as of September 8, 2017:
| Name of Investment Committee Member | Title | Length of Time of Service to the Fund | Business Experience During the Past 5 Years | Role of Investment Committee Member |
| | | | | |
| David B. Perkins | Chief Executive Officer of the Investment Manager and President of the Fund | Since Inception | Mr. Perkins has been the Chief Executive Officer of Hatteras Funds, LP from 2014 to present and founded Hatteras Funds and its affiliated entities in September 2003 Prior to that, he was co-founder and Managing Partner of CapFinancial Partners, LLC. | Strategic Recommendations & Portfolio Oversight |
| Michael P. Hennen | Head of Investment Management | Since January, 28 2016 | Mr. Hennen oversees and provides strategic direction for Hatteras' investment team and his responsibilities include asset allocation, portfolio construction, and risk management. Prior to joining our team, Mr. Hennen was a Vice President at Morgan Stanley in the Graystone Research Group -- an alternative investments advisory group within Morgan Stanley-- where he led the sourcing, evaluation, execution, and monitoring of alternative investments across a variety of strategies. Before joining Morgan Stanley, Mr. Hennen was an analyst at Morningstar in Chicago. He received his Bachelor of Business Administration degree in Finance from Western Michigan University and has also earned his designation as a Chartered Financial Analyst (CFA). | Strategic Recommendations & Portfolio Oversight |
(a)(2) Other Accounts Managed by Portfolio Manager(s) or Management Team Member and Potential Conflicts of Interest
The following table provides information about portfolios and accounts other than the Fund for which the members of the Investment Committee of the Adviser are primarily responsible for the day-to-day portfolio management as of June 30, 2017:
Name of Investment Committee Member | Type of Accounts | Total Number of Accounts Managed | Total Assets | Number of Accounts Managed for Which Advisory Fee is Based on Performance | Total Assets for Which Advisory Fee is Based on Performance |
| David B. Perkins | Registered Investment Companies | 1 | $582,685,813 | 1 | $582,685,813 |
| | Other Pooled Investment Vehicles | 4 | $36,223,803 | 3 | $27,200,916 |
| | Other Accounts | 0 | $0 | 0 | $0 |
| | | | | | |
| Michael P. Hennen | Registered Investment Companies | 1 | $582,685,813 | 1 | $582,685,813 |
| | Other Pooled Investment Vehicles | 4 | $36,223,803 | 3 | $27,200,916 |
| | Other Accounts | 0 | $0 | 0 | $0 |
Potential Conflicts of Interests
Messrs. Perkins and Hennen are responsible for managing other accounts, including proprietary accounts, separate accounts and other pooled investment vehicles, including unregistered hedge funds and funds of hedge funds. Investment Committee Members may manage separate accounts or other pooled investment vehicles which may have materially higher or different fee arrangements than the registrant and may also be subject to performance-based fees. The side-by-side management of these separate accounts and/or pooled investment vehicles may raise potential conflicts of interest relating to cross trading and the allocation of investment opportunities. The Adviser has a fiduciary responsibility to manage all client accounts in a fair and equitable manner. Investment Committee Members seek to provide best execution of all securities transactions and to allocate investments to client accounts in a fair and timely manner. To this end, the Adviser developed policies and procedures designed to mitigate and manage the potential conflicts of interest that may arise from side-by-side management.
(a)(3) Compensation Structure of Portfolio Manager(s) or Management Team Members
The compensation of the members of the Investment Committee includes a combination of the following: (i) fixed annual salary; and (ii) a discretionary bonus tied to the overall profitability of the Adviser.
(a)(4) Disclosure of Securities Ownership
The following table sets forth the dollar range of equity securities beneficially owned by each member of the Investment Committee in the Fund as of June 30, 2017:
Investment Committee Member | Dollar Range of Fund Shares Beneficially Owned |
| David B. Perkins | $0 |
| Michael P. Hennen | $0 |
(b) Not applicable.
ITEM 9. PURCHASES OF EQUITY SECURITIES BY CLOSED-END MANAGEMENT INVESTMENT COMPANY AND AFFILIATED PURCHASERS.
Not applicable.
ITEM 10. SUBMISSION OF MATTERS TO A VOTE OF SECURITY HOLDERS.
There have been no material changes to the procedures by which the shareholders may recommend nominees to the registrant's board of managers, where those changes were implemented after the registrant last provided disclosure in response to the requirements of Item 407 (c)(2)(iv) of Regulation S-K (17CFR 229.407) (as required by Item 22(b)(15) of Schedule 14A (17 CFR 240.14a-101)), or this Item.
ITEM 11. CONTROLS AND PROCEDURES.
(a) The registrant's principal executive and principal financial officers, or persons performing similar functions, have concluded that the registrant's disclosure controls and procedures (as defined in Rule 30a-3(c) under the 1940 Act, as amended (the “1940 Act”) (17 CFR 270.30a-3(c))) are effective, as of a date within 90 days of the filing date of the report that includes the disclosure required by this paragraph, based on their evaluation of these controls and procedures required by Rule 30a-3(b) under the 1940 Act (17 CFR 270.30a-3(b)) and Rules13a-15(b) or 15d-15(b) under the Securities Exchange Act of 1934, as amended (17 CFR 240.13a-15(b) or 240.15d-15(b)).
(b) There were no changes in the registrant's internal control over financial reporting (as defined in Rule 30a-3(d) under the 1940 Act (17 CFR 270.30a-3(d)) that occurred during the registrant's fourth fiscal quarter of the period covered by this report that has materially affected, or is reasonably likely to materially affect, the registrant's internal control over financial reporting.
ITEM 12. EXHIBITS.
(a)(1) Code of ethics, or any amendment thereto, that is the subject of disclosure required by Item 2 is attached hereto.
(a)(2) Certifications pursuant to Rule 30a-2(a) under the 1940 Act and Section 302 of the Sarbanes-Oxley Act of 2002 are attached hereto.
(a)(3) Not applicable.
SIGNATURES
Pursuant to the requirements of the Securities Exchange Act of 1934 and the Investment Company Act of 1940, the registrant has duly caused this report to be signed on its behalf by the undersigned, thereunto duly authorized.
| (registrant) | HATTERAS VC CO-INVESTMENT FUND II, LLC | |
| | | | |
| By (Signature and Title)* | | | |
| | | /s/ David B. Perkins | |
| | | David B. Perkins, President | |
| | (principal executive officer) | |
| | | | |
| Date | September 8, 2017 | | |
Pursuant to the requirements of the Securities Exchange Act of 1934 and the Investment Company Act of 1940, this report has been signed below by the following persons on behalf of the registrant and in the capacities and on the dates indicated.
| By (Signature and Title)* | /s/ David B. Perkins | |
| | | David B. Perkins, President | |
| | | (principal executive officer) | |
| | | | |
| Date | September 8, 2017 | | |
| By (Signature and Title)* | /s/ R. Lance Baker | |
| | | R. Lance Baker, Treasurer | |
| | | (principal financial officer) | |
| | | | |
| Date | September 8, 2017 | | |
| * | Print the name and title of each signing officer under his or her signature. |