UNITED STATES
SECURITIES AND EXCHANGE COMMISSION
Washington, D.C. 20549
FORM N-CSR
CERTIFIED SHAREHOLDER REPORT OF REGISTERED MANAGEMENT INVESTMENT COMPANIES
Investment Company Act file number 811-22255
EGA Emerging Global Shares Trust
(Exact name of registrant as specified in charter)
171 East Ridgewood Avenue
Ridgewood, NJ 07450
(Address of principal executive offices) (Zip code)
Robert C. Holderith
171 East Ridgewood Avenue
Ridgewood, NJ 07450
(Name and address of agent for service)
Registrant's telephone number, including area code: 1-201-389-6872
Date of fiscal year end: March 31
Date of reporting period: September 30, 2011
Form N-CSR is to be used by management investment companies to file reports with the Commission not later than 10 days after the transmission to stockholders of any report that is required to be transmitted to stockholders under Rule 30e-1 under the Investment Company Act of 1940 (17 CFR 270.30e-1). The Commission may use the information provided on Form N-CSR in its regulatory, disclosure review, inspection, and policymaking roles.
A registrant is required to disclose the information specified by Form N-CSR, and the Commission will make this information public. A registrant is not required to respond to the collection of information contained in Form N-CSR unless the Form displays a currently valid Office of Management and Budget ("OMB") control number. Please direct comments concerning the accuracy of the information collection burden estimate and any suggestions for reducing the burden to Secretary, Securities and Exchange Commission, 450 Fifth Street, NW, Washington, DC 20549-0609. The OMB has reviewed this collection of information under the clearance requirements of 44 U.S.C. § 3507.
Item 1. Reports to Stockholders.
![]()
EGA Emerging Global Shares Trust
Semi-Annual Report
September 30, 2011
EGShares GEMS Composite ETF
(formerly Emerging Global Shares Dow Jones Emerging Markets Titans Composite Index Fund)
EGShares Basic Materials GEMS ETF
EGShares Consumer Goods GEMS ETF
EGShares Consumer Services GEMS ETF
EGShares Energy GEMS ETF
(formerly Emerging Global Shares Dow Jones Emerging Markets Energy Titans Index Fund)
EGShares Financials GEMS ETF
(formerly Emerging Global Shares Dow Jones Emerging Markets Financials Titans Index Fund)
EGShares Health Care GEMS ETF
EGShares Industrials GEMS ETF
EGShares Technology GEMS ETF
EGShares Telecom GEMS ETF
EGShares Utilities GEMS ETF
EGShares Emerging Markets Metals & Mining ETF
(formerly Emerging Global Shares Dow Jones Emerging Markets Metals & Mining Titans Index Fund)
EGShares Emerging Markets Consumer ETF
(formerly Emerging Global Shares Dow Jones Emerging Markets Consumer Titans Index Fund)
EGShares India Infrastructure ETF
(formerly Emerging Global Shares INDXX India Infrastructure Index Fund)
EGShares China Infrastructure ETF
(formerly Emerging Global Shares INDXX China Infrastructure Index Fund)
EGShares Brazil Infrastructure ETF
(formerly Emerging Global Shares INDXX Brazil Infrastructure Index Fund)
EGShares India Small Cap ETF
(formerly Emerging Global Shares INDXX India Small Cap Index Fund)
EGShares India Consumer ETF
EGShares Emerging Markets High Income Low Beta ETF
Table of Contents
Dear Shareholder:
The (Exchange Traded Fund) ETF business has again been in the spotlight over the past quarter and the commentary has not always been positive. A blend of misunderstanding by investors and regulators and outright fear from the mutual fund complex have all fueled headlines. Even a senate hearing was held to discuss the impact ETFs may have on market volatility. Most of the noise has been about ETFs that use synthetics as tools to provide underlying exposure and ETFs that are leveraged or inverse. ETFs in Europe favor synthetics while US based ETFs heavily favor holding the actual underlying securities. As you know, EGA funds invest directly in the underlying and do not use any derivatives.
The spotlight seems to be providing a clear picture of the differences, the potential benefits and the less than transparent risks of using derivatives. We view most of the press, both positive and negative, as an opportunity to tell the story of ETFs and help investors understand the differences. Look for upcoming commentary from the ETF industry, which currently has no single point of communication to provide clarity about the variety of ETF products on the market.
The best way to describe the action of the market over the last quarter is manic. The day to day outlook for the developed markets, especially the Eurozone, continues to be either very positive or catastrophic. These uncertainties and the inevitable market volatility that in brings have slowed our growth, but not caused net outflows of assets. The market’s downward bias, however, has caused our AUM (assets under management) to slip from a high of $564MM in May to $477MM at the end of Q3.
EGA has a few important milestones to be proud of. According the the National Stock Exchange (NSE), EGA’s Emerging Market Consumer ETF (ECON) was the top asset gathering emerging markets equity ETF in the year ending September 30, 2011. HILO, the Low Volatility Emerging Market Dividend ETF was number 12 in AUM out of the 26 EM equity ETFs were launched in the US during that time period. NSE data also shows that of the 26 US based ETF firms with AUM greater than $100MM, EGA was the third fastest growing (174%) during that same time period. Seven major firms saw net outflows despite a meaningful amount of fixed income ETFs at both firms. The average firm grew by 7.87%.
Despite the manic market and headwind for all equity investors, we still believe we are right in place at about the right time. As we continue to be the only US based ETF provider that is solely focused on emerging markets, we are now building a strong following under the EGShares brand.
We remain steadfast and positive on the outlook of our company.
Sincerely,

Robert C. Holderith
President
Emerging Global Advisors, LLC
Robert C. Holderith is a registered representative of ALPS Distributors, Inc.
| EGA Emerging Global Shares Trust | 1 |
Comments from the Chief Investment Officer & Director of Research
Dear Shareholder:
This letter is being written in late October and the concerns of Europe remain. It is difficult to say that uncertainty has increased when so many presume that a Greek default is certain. So we’ve moved from uncertainty in European sovereign debt risk to greater comfort of less uncertainty in European sovereign debt risk. For portfolio constructors, I do not believe that this degree of “comfort” is indeed comforting. In fact, we remain in time of overall perceived high risk. The cost of portfolio insurance (as applied to the S&P 500 via the time value of index options) remains high. During the 3rd quarter of 2011, the VIX1 index spiked at the beginning of this period from 15 to 22. It dropped back a bit to roughly 17-18 in late July. However, in the most macro of scenarios, global macroeconomic and geopolitical news of all sorts (Euro, Mideast, US, China) led to substantial market declines in the first few weeks of August. VIX spiked from 17 to 48 in two weeks. The cost of hedging an equity portfolio increased 2.8 times quickly. Only in the latter half of 1998 and during the financial crisis of 2008-2009 did VIX break above 40. These are times of perceived high risk.
That is just one data point. The effects of mass migration, in the term of asset flows, was evident in this past quarter. Currency flow favored the USD. Cash was king overall and treasuries continued to have favored status despite providing no returns. It seems zero percent return is a safe place when correlated assets fall in tandem. Fund flows moved to money market and certain bond exposures. For niche fund providers, the “risk off” mentality has been painful.
Still, Emerging Global Advisors has been resilient. Redemption orders have come but not overwhelmingly and there have been creation orders. Clearly, some keen investors still believe in buying low.
It is the outlook that remains as difficult as ever. Twain’s “It is difficult to make predictions, especially about the future” quote provides little comfort. The world needs greater economic certainty however policymakers in the US, Eurozone and Japan are not willing to push in the right direction. At the time of writing this, India has again raised its benchmark rate. China has also made clear and consistent actions to tell the markets of what it is trying to do … temper inflation to provide a soft landing. We see no such consistent policy actions in the developed world to do the opposite … provide economic growth through job creation or investments into innovation. Social unrest in the Mideast and Manhattan will surely continue.
The number one concern for us and investors of high growth markets is if their growth will be dragged down further by the policies in the Western world. Note that I find it very difficult to continue applying the term “emerging market” when they are trying to slow down their emergence while at the same time the so called developed markets are stagnant if not in risk of further economic decline. We need these growth markets.
The economic truths remain as ever. Western investors need yield and capital appreciation. The risk of economic stagnation (never mind a possibility of double dip recession), remain possible for many years if not well through this current decade. Structural issues lead to stagnation in so many forms. Will high unemployment and little wage inflation continue to apply a ceiling on US real estate prices? The balance sheets of US households cannot look promising to retailers and one can extrapolate onwards from there. Add Europe and Japan to this and hope becomes an investment strategy.
The strategy investors must realize is the tailwinds of global growth markets, especially beyond the commonly cited BRICs (Brazil/Russia/India/China) is one to get in front of. Ignoring this simple exercise in geographic diversification is a key portfolio risk for our generation. We continue to focus on the development and management of product tools that provide globally minded investors the means to ride these tailwinds.

Richard Kang
Chief Investment Officer & Director of Research
October 2011
Richard Kang is a registered representative of ALPS Distributors, Inc.
| 1 | VIX or The Chicago Board Options Exchange Volatility Index is an index that measures the implied volatility based on the value of S&P 500 index (a benchmark for large cap US stocks) option contracts. The VIX is often called the "fear gauge" since with significant market declines, investors pay more for portfolio insurance in the form of equity index options causing the price of VIX to rise. |
Investors should carefully consider the investment objectives, risks, charges and expenses of the Funds before investing. To obtain a prospectus containing this and other important information, please call (888) 800-4347 or visit www.emergingglobaladvisors.com to view or download a prospectus online. Read the prospectus carefully before you invest.
Emerging market investments involve risk of capital loss from unfavorable fluctuation in currency values, from differences in generally accepted accounting principles, from economic or political instability in other nations or increased volatility and lower trading volume. This fund will concentrate its investments in issuers of one or more particular industries to the same extent that its Underlying Index is so concentrated and to the extent permitted by applicable regulatory guidance. Concentration risk results from maintaining exposure to issuers conducting business in a specific industry.
The above commentary is for informational purposes only. Nothing in this commentary should be construed as an offer or recommendation to buy or sell a particular security. The opinions and estimates noted herein are accurate as of October 2011 and are subject to change.
| 2 | EGA Emerging Global Shares Trust |
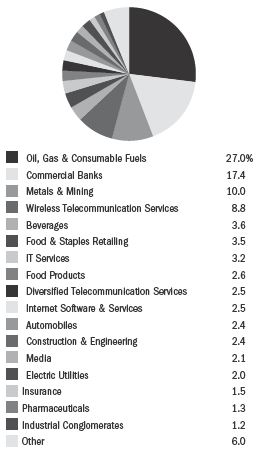
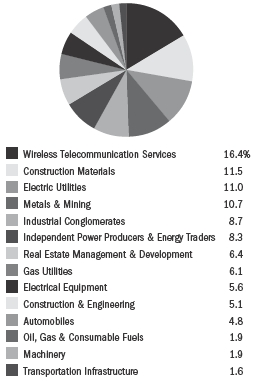
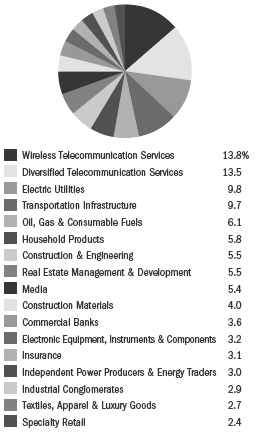
EGShares GEMS Composite ETF
(formerly Emerging Global Shares Dow Jones Emerging Markets Titans Composite Index Fund)
Industry Breakdown*
| Top Ten Holdings* | ||
| Gazprom OAO | 5.6 | % |
| America Movil SAB de CV | 4.0 | |
| Itau Unibanco Holding SA | 3.7 | |
| Petroleo Brasileiro SA | 3.5 | |
| China Construction Bank Corp. | 3.1 | |
| Industrial and Commercial Bank of China, Ltd. | 3.1 | |
| Surgutneftegas | 3.0 | |
| Vale SA | 2.9 | |
| Reliance Industries, Ltd. | 2.9 | |
| Banco Bradesco SA | 2.8 |
| * | Expressed as a percentage of total investments in securities as of 9/30/2011. Holdings are subject to change. |
EGShares GEMS Composite ETF (ticker: AGEM)
The Fund’s investment objective is to seek investment results that correspond (before fees and expenses) to the price and yield performance of the Dow Jones Emerging Markets Sector Titans Composite 100 IndexSM. The Dow Jones Emerging Markets Sector Titans Composite 100 IndexSM is comprised of a representative sample of 100 Emerging Markets companies deemed to be the 10 leading companies in each of the 10 “Industries,” as defined by the Industry Classification Benchmark (“ICB”).
Emerging market investments involve risk of capital loss from unfavorable fluctuation in currency values, from differences in generally accepted accounting principles, from economic or political instability in other nations or increased volatility and lower trading volume. This fund will concentrate its investments in issuers of one or more particular industries to the same extent that its Underlying Index is so concentrated and to the extent permitted by applicable regulatory guidance. Concentration risk results from maintaining exposure to issuers conducting business in a specific industry.
| EGA Emerging Global Shares Trust | 3 |
Portfolio Summary (Unaudited)
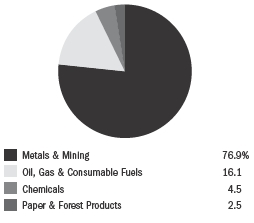
EGShares Basic Materials GEMS ETF
Industry Breakdown*
| Top Ten Holdings* | ||
| Vale SA | 10.6 | % |
| MMC Norilsk Nickel OJSC | 8.2 | |
| AngloGold Ashanti, Ltd. | 6.9 | |
| Impala Platinum Holdings, Ltd. | 5.9 | |
| China Shenhua Energy Co., Ltd. | 5.9 | |
| Gold Fields, Ltd. | 5.3 | |
| Uralkali | 4.5 | |
| Grupo Mexico SAB de CV | 4.1 | |
| Gerdau SA | 3.6 | |
| Companhia Siderurgica Nacional SA | 3.5 |
| * | Expressed as a percentage of total investments in securities as of 9/30/2011. Holdings are subject to change. |
EGShares Basic Materials GEMS ETF (ticker: LGEM)
The Fund’s investment objective is to seek investment results that correspond (before fees and expenses) to the price and yield performance of the Dow Jones Emerging Markets Basic Materials Titans 30 IndexSM. The Dow Jones Emerging Markets Basic Materials Titans 30 IndexSM is comprised of publicly traded firms in the “Basic Materials Industry,” as defined by ICB.
Emerging market investments involve risk of capital loss from unfavorable fluctuation in currency values, from differences in generally accepted accounting principles, from economic or political instability in other nations or increased volatility and lower trading volume. This fund will concentrate its investments in issuers of one or more particular industries to the same extent that its Underlying Index is so concentrated and to the extent permitted by applicable regulatory guidance. Concentration risk results from maintaining exposure to issuers conducting business in a specific industry.
| 4 | EGA Emerging Global Shares Trust |
Portfolio Summary (Unaudited)
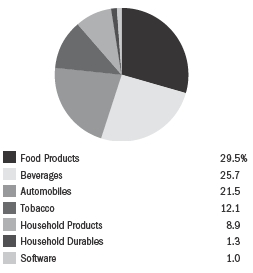
EGShares Consumer Goods GEMS ETF
Industry Breakdown*
| Top Ten Holdings* | ||
| Companhia de Bebidas das Americas | 10.4 | % |
| Astra International Tbk PT | 8.2 | |
| Fomento Economico Mexicano SAB de CV | 7.6 | |
| ITC, Ltd. | 7.1 | |
| BRF - Brasil Foods SA | 6.6 | |
| Hindustan Unilever, Ltd. | 5.0 | |
| Bajaj Auto, Ltd. | 3.8 | |
| Tiger Brands, Ltd. | 3.3 | |
| Hero Motorcorp, Ltd. | 3.3 | |
| IOI Corp. BHD | 3.2 |
| * | Expressed as a percentage of total investments in securities as of 9/30/2011. Holdings are subject to change. |
EGShares Consumer Goods GEMS ETF (ticker: GGEM)
The Fund’s investment objective is to seek investment results that correspond (before fees and expenses) to the price and yield performance of the Dow Jones Emerging Markets Consumer Goods Titans 30 IndexSM. The Dow Jones Emerging Markets Consumer Goods Titans 30 IndexSM is comprised of publicly traded firms in the “Consumer Goods Industry,” as defined by ICB.
Emerging market investments involve risk of capital loss from unfavorable fluctuation in currency values, from differences in generally accepted accounting principles, from economic or political instability in other nations or increased volatility and lower trading volume. This fund will concentrate its investments in issuers of one or more particular industries to the same extent that its Underlying Index is so concentrated and to the extent permitted by applicable regulatory guidance. Concentration risk results from maintaining exposure to issuers conducting business in a specific industry.
| EGA Emerging Global Shares Trust | 5 |
Portfolio Summary (Unaudited)
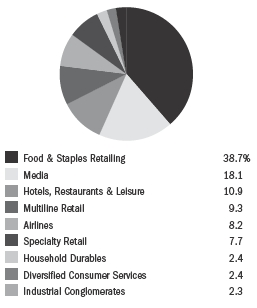
EGShares Consumer Services GEMS ETF
Industry Breakdown*
| Top Ten Holdings* | ||
| Wal-Mart de Mexico SAB de CV | 10.2 | % |
| Naspers, Ltd. | 9.4 | |
| Grupo Televisa SAB | 7.6 | |
| S.A.C.I. Falabella | 6.7 | |
| Cencosud SA | 6.4 | |
| Grupo Elektra SA de CV | 5.3 | |
| Genting BHD | 4.3 | |
| Magnit OJSC | 3.9 | |
| Ctrip.com International, Ltd. | 3.7 | |
| Shoprite Holdings, Ltd. | 3.6 |
| * | Expressed as a percentage of total investments in securities as of 9/30/2011. Holdings are subject to change. |
EGShares Consumer Services GEMS ETF (ticker: VGEM)
The Fund’s investment objective is to seek investment results that correspond (before fees and expenses) to the price and yield performance of the Dow Jones Emerging Markets Consumer Services Titans 30 IndexSM. The Dow Jones Emerging Markets Consumer Services Titans 30 IndexSM is comprised of publicly traded firms in the “Consumer Services Industry,” as defined by ICB.
Emerging market investments involve risk of capital loss from unfavorable fluctuation in currency values, from differences in generally accepted accounting principles, from economic or political instability in other nations or increased volatility and lower trading volume. This fund will concentrate its investments in issuers of one or more particular industries to the same extent that its Underlying Index is so concentrated and to the extent permitted by applicable regulatory guidance. Concentration risk results from maintaining exposure to issuers conducting business in a specific industry.
| 6 | EGA Emerging Global Shares Trust |
Portfolio Summary (Unaudited)
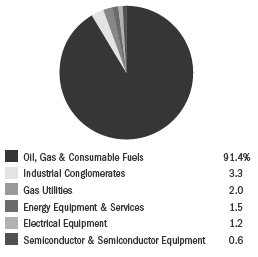
EGShares Energy GEMS ETF
(formerly Emerging Global Shares Dow Jones Emerging Markets Energy Titans Index Fund)
Industry Breakdown*
| Top Ten Holdings* | ||
| Surgutneftegas | 6.8 | % |
| Reliance Industries, Ltd. | 6.5 | |
| Gazprom OAO | 6.4 | |
| Petroleo Brasileiro SA | 6.2 | |
| CNOOC, Ltd. | 6.1 | |
| Sasol, Ltd. | 5.2 | |
| China Petroleum & Chemical Corp. | 5.1 | |
| LUKOIL OAO | 5.0 | |
| PetroChina Co., Ltd. | 5.0 | |
| NovaTek OAO | 4.8 |
| * | Expressed as a percentage of total investments in securities as of 9/30/2011. Holdings are subject to change. |
EGShares Energy GEMS ETF (ticker: OGEM)
The Fund’s investment objective is to seek investment results that correspond (before fees and expenses) to the price and yield performance of the Dow Jones Emerging Markets Oil and Gas Titans 30 IndexSM. The Dow Jones Emerging Markets Oil and Gas Titans 30 IndexSM is comprised of publicly traded firms in the “Oil and Gas Industry,” as defined by ICB.
Emerging market investments involve risk of capital loss from unfavorable fluctuation in currency values, from differences in generally accepted accounting principles, from economic or political instability in other nations or increased volatility and lower trading volume. This fund will concentrate its investments in issuers of one or more particular industries to the same extent that its Underlying Index is so concentrated and to the extent permitted by applicable regulatory guidance. Concentration risk results from maintaining exposure to issuers conducting business in a specific industry.
| EGA Emerging Global Shares Trust | 7 |
Portfolio Summary (Unaudited)
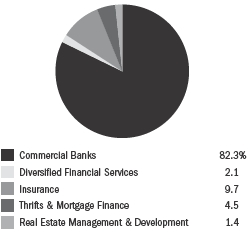
EGShares Financials GEMS ETF
(formerly Emerging Global Shares Dow Jones Emerging Markets Financials Titans Index Fund)
Industry Breakdown*
| Top Ten Holdings* | ||
| Banco Bradesco SA | 7.6 | % |
| Industrial and Commercial Bank of China, Ltd. | 7.3 | |
| Itau Unibanco Holding SA | 7.1 | |
| China Construction Bank Corp. | 6.7 | |
| Bank of China, Ltd. | 4.6 | |
| Housing Development Finance Corp., Ltd. | 4.5 | |
| ICICI Bank, Ltd. | 4.3 | |
| China Life Insurance Co., Ltd. | 4.1 | |
| Standard Bank Group, Ltd. | 4.1 | |
| Sberbank of Russia | 4.0 |
| * | Expressed as a percentage of total investments in securities as of 9/30/2011. Holdings are subject to change. |
EGShares Financials GEMS ETF (ticker: FGEM)
The Fund’s investment objective is to seek investment results that correspond (before fees and expenses) to the price and yield performance of the Dow Jones Emerging Markets Financials Titans 30 IndexSM. The Dow Jones Emerging Markets Financials Titans 30 IndexSM is comprised of publicly traded firms in the “Financials Industry,” as defined by ICB.
Emerging market investments involve risk of capital loss from unfavorable fluctuation in currency values, from differences in generally accepted accounting principles, from economic or political instability in other nations or increased volatility and lower trading volume. This fund will concentrate its investments in issuers of one or more particular industries to the same extent that its Underlying Index is so concentrated and to the extent permitted by applicable regulatory guidance. Concentration risk results from maintaining exposure to issuers conducting business in a specific industry.
| 8 | EGA Emerging Global Shares Trust |
Portfolio Summary (Unaudited)
EGShares Health Care GEMS ETF
Industry Breakdown*
| Top Ten Holdings* | ||
| Aspen Pharmacare Holdings, Ltd. | 10.2 | % |
| Dr. Reddy’s Laboratories, Ltd. | 9.1 | |
| Sun Pharmaceutical Industries, Ltd. | 8.6 | |
| Cipla, Ltd. | 7.3 | |
| Mindray Medical International, Ltd. | 5.3 | |
| Richter Gedeon Nyrt. | 4.2 | |
| Mediclinic International, Ltd. | 4.2 | |
| Sinopharm Group Co. | 4.2 | |
| Netcare, Ltd. | 4.2 | |
| Ranbaxy Laboratories, Ltd. | 4.1 |
| * | Expressed as a percentage of total investments in securities as of 9/30/2011. Holdings are subject to change. |
EGShares Health Care GEMS ETF (ticker: HGEM)
The Fund’s investment objective is to seek investment results that correspond (before fees and expenses) to the price and yield performance of the Dow Jones Emerging Markets Health Care Titans 30 IndexSM. The Dow Jones Emerging Markets Health Care Titans 30 IndexSM is comprised of publicly traded firms in the “Health Care Industry,” as defined by ICB
Emerging market investments involve risk of capital loss from unfavorable fluctuation in currency values, from differences in generally accepted accounting principles, from economic or political instability in other nations or increased volatility and lower trading volume. This fund will concentrate its investments in issuers of one or more particular industries to the same extent that its Underlying Index is so concentrated and to the extent permitted by applicable regulatory guidance. Concentration risk results from maintaining exposure to issuers conducting business in a specific industry.
| EGA Emerging Global Shares Trust | 9 |
Portfolio Summary (Unaudited)
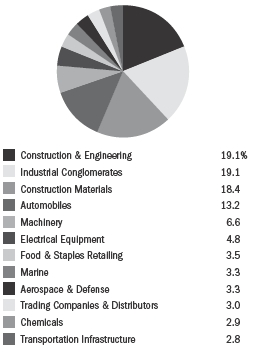
EGShares Industrials GEMS ETF
Industry Breakdown*
| Top Ten Holdings* | ||
| Larsen & Toubro, Ltd. | 10.7 | % |
| Mahindra & Mahindra, Ltd. | 6.8 | |
| Bidvest Group, Ltd. | 5.5 | |
| Sime Darby BHD | 5.4 | |
| Tata Motors, Ltd. | 5.2 | |
| Bharat Heavy Electricals, Ltd. | 4.8 | |
| United Tractors Tbk PT | 4.2 | |
| China Resources Enterprise, Ltd. | 3.5 | |
| Inversiones Argos SA | 3.5 | |
| Embraer SA | 3.3 |
| * | Expressed as a percentage of total investments in securities as of 9/30/2011. Holdings are subject to change. |
EGShares Industrials GEMS ETF (ticker: IGEM)
The Fund’s investment objective is to seek investment results that correspond (before fees and expenses) to the price and yield performance of the Dow Jones Emerging Markets Industrials Titans 30 IndexSM. The Dow Jones Emerging Markets Industrials Titans 30 IndexSM is comprised of publicly traded firms in the “Industrials Industry,” as defined by ICB.
Emerging market investments involve risk of capital loss from unfavorable fluctuation in currency values, from differences in generally accepted accounting principles, from economic or political instability in other nations or increased volatility and lower trading volume. This fund will concentrate its investments in issuers of one or more particular industries to the same extent that its Underlying Index is so concentrated and to the extent permitted by applicable regulatory guidance. Concentration risk results from maintaining exposure to issuers conducting business in a specific industry.
| 10 | EGA Emerging Global Shares Trust |
Portfolio Summary (Unaudited)
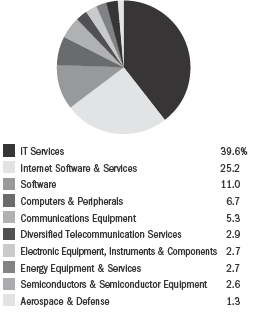
EGShares Technology GEMS ETF
Industry Breakdown*
| Top Ten Holdings* | ||
| Infosys, Ltd. | 10.9 | % |
| Baidu, Inc. | 8.9 | |
| Tata Consultancy Services, Ltd. | 7.9 | |
| Lenovo Group, Ltd. | 6.7 | |
| SINA Corp. | 4.9 | |
| NetEase.com, Inc. | 4.8 | |
| Wipro, Ltd. | 4.6 | |
| ZTE Corp. | 4.1 | |
| Mail.Ru Group Ltd. | 3.6 | |
| Satyam Computer Services, Ltd. | 3.1 |
| * | Expressed as a percentage of total investments in securities as of 9/30/2011. Holdings are subject to change. |
EGShares Technology GEMS ETF (ticker: QGEM)
The Fund’s investment objective is to seek investment results that correspond (before fees and expenses) to the price and yield performance of the Dow Jones Emerging Markets Technology Titans 30 IndexSM. The Dow Jones Emerging Markets Technology Titans 30 IndexSM is comprised of publicly traded firms in the “Technology Industry,” as defined by ICB.
Emerging market investments involve risk of capital loss from unfavorable fluctuation in currency values, from differences in generally accepted accounting principles, from economic or political instability in other nations or increased volatility and lower trading volume. This fund will concentrate its investments in issuers of one or more particular industries to the same extent that its Underlying Index is so concentrated and to the extent permitted by applicable regulatory guidance. Concentration risk results from maintaining exposure to issuers conducting business in a specific industry.
| EGA Emerging Global Shares Trust | 11 |
Portfolio Summary (Unaudited)
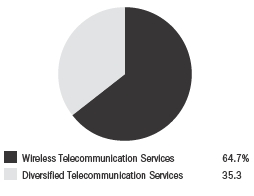
EGShares Telecom GEMS ETF
Industry Breakdown*
| Top Ten Holdings* | ||
| China Mobile, Ltd. | 13.2 | % |
| America Movil SAB de CV | 9.7 | |
| MTN Group, Ltd. | 6.1 | |
| China Unicom Hong Kong, Ltd. | 5.2 | |
| China Telecom Corp., Ltd. | 4.9 | |
| Bharti Airtel, Ltd. | 4.8 | |
| Telekomunikasi Indonesia Tbk | 4.3 | |
| Advanced Info Service PCL | 4.2 | |
| Telecomunicacoes de Sao Paulo SA | 3.9 | |
| Vodacom Group, Ltd. | 3.8 |
| * | Expressed as a percentage of total investments in securities as of 9/30/2011. Holdings are subject to change. |
EGShares Telecom GEMS ETF (ticker: TGEM)
The Fund’s investment objective is to seek investment results that correspond (before fees and expenses) to the price and yield performance of the Dow Jones Emerging Markets Telecommunications Titans 30 IndexSM. The Dow Jones Emerging Markets Telecommunications Titans 30 IndexSM is comprised of publicly traded firms in the “Telecommunications Industry,” as defined by ICB.
Emerging market investments involve risk of capital loss from unfavorable fluctuation in currency values, from differences in generally accepted accounting principles, from economic or political instability in other nations or increased volatility and lower trading volume. This fund will concentrate its investments in issuers of one or more particular industries to the same extent that its Underlying Index is so concentrated and to the extent permitted by applicable regulatory guidance. Concentration risk results from maintaining exposure to issuers conducting business in a specific industry.
| 12 | EGA Emerging Global Shares Trust |
Portfolio Summary (Unaudited)
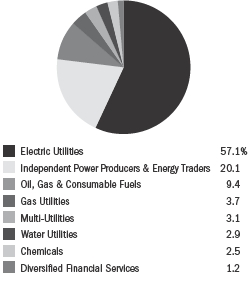
EGShares Utilities GEMS ETF
Industry Breakdown*
| Top Ten Holdings* | ||
| Ultrapar Participacoes SA | 7.9 | % |
| CEZ AS | 7.7 | |
| Companhia Energetica de Minas Gerais | 6.8 | |
| Empresa Nacional de Electricidad SA | 6.1 | |
| Enersis SA | 5.8 | |
| NTPC, Ltd. | 5.2 | |
| Federal Hydrogenerating Co. JSC | 4.5 | |
| Tenaga Nasional BHD | 4.2 | |
| Tata Power Co., Ltd. | 4.1 | |
| PGE SA | 4.0 |
| * | Expressed as a percentage of total investments in securities as of 9/30/2011. Holdings are subject to change. |
EGShares Utilities GEMS ETF (ticker: UGEM)
The Fund’s investment objective is to seek investment results that correspond (before fees and expenses) to the price and yield performance of the Dow Jones Emerging Markets Utilities Titans 30 IndexSM. The Dow Jones Emerging Markets Utilities Titans 30 IndexSM is comprised of publicly traded firms in the “Utilities Industry,” as defined by ICB.
Emerging market investments involve risk of capital loss from unfavorable fluctuation in currency values, from differences in generally accepted accounting principles, from economic or political instability in other nations or increased volatility and lower trading volume. This fund will concentrate its investments in issuers of one or more particular industries to the same extent that its Underlying Index is so concentrated and to the extent permitted by applicable regulatory guidance. Concentration risk results from maintaining exposure to issuers conducting business in a specific industry.
| EGA Emerging Global Shares Trust | 13 |
Portfolio Summary (Unaudited)
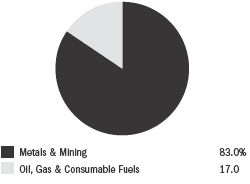
EGShares Emerging Markets Metals & Mining ETF
(formerly Emerging Global Shares Dow Jones Emerging Markets Metals & Mining Titans Index Fund)
Industry Breakdown*
| Top Ten Holdings* | ||
| MMC Norilsk Nickel OJSC | 9.7 | % |
| Vale SA | 9.6 | |
| AngloGold Ashanti, Ltd. | 7.0 | |
| China Shenhua Energy Co., Ltd. | 6.1 | |
| Impala Platinum Holdings, Ltd. | 6.0 | |
| Gold Fields, Ltd. | 5.1 | |
| Grupo Mexico SAB de CV | 4.7 | |
| Gerdau SA | 3.6 | |
| Sterlite Industries India, Ltd. | 3.6 | |
| KGHM Polska Miedz SA | 3.5 |
| * | Expressed as a percentage of total investments in securities as of 9/30/2011. Holdings are subject to change. |
EGShares Emerging Markets Metals & Mining ETF (ticker: EMT)
The Fund’s investment objective is to seek investment results that correspond (before fees and expenses) to the price and yield performance of the Dow Jones Emerging Markets Metals & Mining Titans 30 IndexSM. The Dow Jones Emerging Markets Metals & Mining Titans 30 IndexSM comprised of publicly traded firms in the “Industrial Metals and Mining Sector” and “Mining Sector,” as defined by ICB.
Emerging market investments involve risk of capital loss from unfavorable fluctuation in currency values, from differences in generally accepted accounting principles, from economic or political instability in other nations or increased volatility and lower trading volume. This fund will concentrate its investments in issuers of one or more particular industries to the same extent that its Underlying Index is so concentrated and to the extent permitted by applicable regulatory guidance. Concentration risk results from maintaining exposure to issuers conducting business in a specific industry.
| 14 | EGA Emerging Global Shares Trust |
Portfolio Summary (Unaudited)
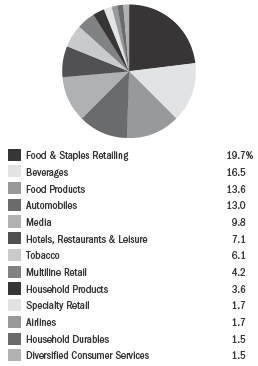
EGShares Emerging Markets Consumer ETF
(formerly Emerging Global Shares Dow Jones Emerging Markets Consumer Titans Index Fund)
Industry Breakdown*
| Top Ten Holdings* | ||
| Companhia de Bebidas das Americas | 10.8 | % |
| Astra International Tbk PT | 6.9 | |
| Wal-Mart de Mexico SAB de CV | 6.4 | |
| ITC, Ltd. | 6.1 | |
| Fomento Economico Mexicano SAB de CV | 5.6 | |
| BRF - Brasil Foods SA | 5.6 | |
| Naspers, Ltd. | 5.1 | |
| Grupo Televisa SAB | 4.7 | |
| S.A.C.I. Falabella | 4.2 | |
| Cencosud SA | 4.0 |
| * | Expressed as a percentage of total investments in securities as of 9/30/2011. Holdings are subject to change. |
EGShares Emerging Markets Consumer ETF (ticker: ECON)
The Fund’s investment objective is to seek investment results that correspond (before fees and expenses) to the price and yield performance of the Dow Jones Emerging Markets Consumer Titans 30 IndexSM. The Dow Jones Emerging Markets Consumer Titans 30 IndexSM is comprised of publicly traded firms in the “Consumer Goods Industry” and “Consumer Services Industry,” as defined by ICB.
Emerging market investments involve risk of capital loss from unfavorable fluctuation in currency values, from differences in generally accepted accounting principles, from economic or political instability in other nations or increased volatility and lower trading volume. This fund will concentrate its investments in issuers of one or more particular industries to the same extent that its Underlying Index is so concentrated and to the extent permitted by applicable regulatory guidance. Concentration risk results from maintaining exposure to issuers conducting business in a specific industry.
| EGA Emerging Global Shares Trust | 15 |
Portfolio Summary (Unaudited)
EGShares India Infrastructure ETF
(formerly Emerging Global Shares INDXX India Infrastructure Index Fund)
Industry Breakdown*
| Top Ten Holdings* | ||
| Idea Cellular, Ltd. | 7.2 | % |
| Bharti Airtel, Ltd. | 7.1 | |
| NTPC, Ltd. | 5.6 | |
| Siemens, Ltd. | 5.1 | |
| Tata Power Co., Ltd. | 5.0 | |
| GAIL India, Ltd. | 5.0 | |
| Tata Motors, Ltd. | 4.8 | |
| Larsen & Toubro, Ltd. | 4.5 | |
| Sterlite Industries (India), Ltd. | 4.4 | |
| Bharat Heavy Electricals, Ltd. | 4.4 |
| * | Expressed as a percentage of total investments in securities as of 9/30/2011. Holdings are subject to change. |
EGShares India Infrastructure ETF (ticker: INXX)
The Fund’s investment objective is to seek investment results that correspond (before fees and expenses) to the price and yield performance of the INDXX India Infrastructure Index. The INDXX India Infrastructure Index is comprised of 30 leading companies that INDXX, LLC determines to be representative of India’s infrastructure sectors.
Emerging market investments involve risk of capital loss from unfavorable fluctuation in currency values, from differences in generally accepted accounting principles, from economic or political instability in other nations or increased volatility and lower trading volume. This fund will concentrate its investments in issuers of one or more particular industries to the same extent that its Underlying Index is so concentrated and to the extent permitted by applicable regulatory guidance. Concentration risk results from maintaining exposure to issuers conducting business in a specific industry.
| 16 | EGA Emerging Global Shares Trust |
Portfolio Summary (Unaudited)
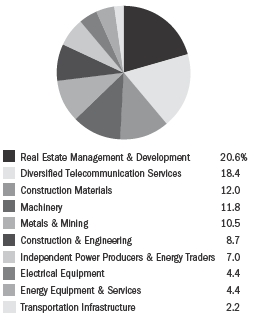
EGShares China Infrastructure ETF
(formerly Emerging Global Shares INDXX China Infrastructure Index Fund)
Industry Breakdown*
| Top Ten Holdings* | ||
| China Unicom Hong Kong, Ltd. | 9.8 | % |
| China Telecom Corp., Ltd. | 8.6 | |
| Anhui Conch Cement Co., Ltd. | 5.3 | |
| China Communications Construction Co., Ltd. | 5.0 | |
| Jiangxi Copper Co., Ltd. | 4.4 | |
| China Oilfield Services, Ltd. | 4.4 | |
| China National Building Material Co., Ltd. | 4.4 | |
| China Longyuan Power Group Corp. | 4.1 | |
| Aluminum Corp. of China, Ltd. | 4.0 | |
| Changsha Zoomlion Heavy Industry Science And | ||
| Technology Development Co., Ltd. | 3.9 |
| * | Expressed as a percentage of total investments in securities as of 9/30/2011. Holdings are subject to change. |
EGShares China Infrastructure ETF (ticker: CHXX)
The Fund’s investment objective is to seek investment results that correspond (before fees and expenses) to the price and yield performance of the INDXX China Infrastructure Index. The INDXX China Infrastructure Index is comprised of 30 leading companies that INDXX, LLC determines to be representative of China’s infrastructure sectors.
Emerging market investments involve risk of capital loss from unfavorable fluctuation in currency values, from differences in generally accepted accounting principles, from economic or political instability in other nations or increased volatility and lower trading volume. This fund will concentrate its investments in issuers of one or more particular industries to the same extent that its Underlying Index is so concentrated and to the extent permitted by applicable regulatory guidance. Concentration risk results from maintaining exposure to issuers conducting business in a specific industry.
| EGA Emerging Global Shares Trust | 17 |
Portfolio Summary (Unaudited)
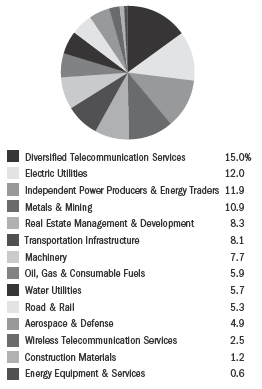
EGShares Brazil Infrastructure ETF
(formerly Emerging Global Shares INDXX Brazil Infrastructure Index Fund)
Industry Breakdown*
| Top Ten Holdings* | ||
| Telecomunicacoes de Sao Paulo SA | 10.2 | % |
| Ultrapar Participacoes SA | 5.9 | |
| CCR SA | 5.9 | |
| Companhia Energetica de Sao Paulo | 5.3 | |
| CPFL Energia SA | 5.2 | |
| Embraer SA | 4.9 | |
| BR Malls Participacoes SA | 4.8 | |
| Tractebel Energia SA | 4.3 | |
| Centrais Eletricas Brasileiras SA | 4.3 | |
| Companhia de Saneamento Basico do Estado | ||
| de Sao Paulo | 4.2 |
| * | Expressed as a percentage of total investments in securities 9/30/2011. Holdings are subject to change. |
EGShares Brazil Infrastructure ETF (ticker: BRXX)
The Fund’s investment objective is to seek investment results that correspond (before fees and expenses) to the price and yield performance of the INDXX Brazil Infrastructure Index. The INDXX Brazil Infrastructure Index is comprised of 30 leading companies that INDXX, LLC determines to be representative of Brazil’s infrastructure sectors.
Emerging market investments involve risk of capital loss from unfavorable fluctuation in currency values, from differences in generally accepted accounting principles, from economic or political instability in other nations or increased volatility and lower trading volume. This fund will concentrate its investments in issuers of one or more particular industries to the same extent that its Underlying Index is so concentrated and to the extent permitted by applicable regulatory guidance. Concentration risk results from maintaining exposure to issuers conducting business in a specific industry.
| 18 | EGA Emerging Global Shares Trust |
Portfolio Summary (Unaudited)
EGShares India Small Cap ETF
(formerly Emerging Global Shares INDXX India Small Cap Index Fund)
Industry Breakdown*
| Top Ten Holdings* | ||
| Dish TV India, Ltd. | 3.9 | % |
| Hexaware Technologies, Ltd. | 3.6 | |
| Chambal Fertilizers & Chemicals, Ltd. | 2.9 | |
| Arvind, Ltd. | 2.7 | |
| Havells India, Ltd. | 2.6 | |
| Indian Bank | 2.6 | |
| Gujarat Mineral Development Corp., Ltd. | 2.5 | |
| Amtek Auto, Ltd. | 2.4 | |
| McLeod Russel India, Ltd. | 2.4 | |
| Godrej Industries, Ltd. | 2.2 |
| * | Expressed as a percentage of total investments in securities as of 9/30/2011. Holdings are subject to change. |
EGShares India Small Cap ETF (ticker: SCIN)
The Fund’s investment objective is to seek investment results that correspond (before fees and expenses) to the price and yield performance of the INDXX India Small Cap Index. The index is a free-float market capitalization weighted stock market index comprised of a representative sample of 75 Indian companies that Indxx LLC determines to be the representative of small market cap companies in India.
Emerging market investments involve risk of capital loss from unfavorable fluctuation in currency values, from differences in generally accepted accounting principles, from economic or political instability in other nations or increased volatility and lower trading volume. This fund will concentrate its investments in issuers of one or more particular industries to the same extent that its Underlying Index is so concentrated and to the extent permitted by applicable regulatory guidance. Concentration risk results from maintaining exposure to issuers conducting business in a specific industry.
| EGA Emerging Global Shares Trust | 19 |
Portfolio Summary (Unaudited)
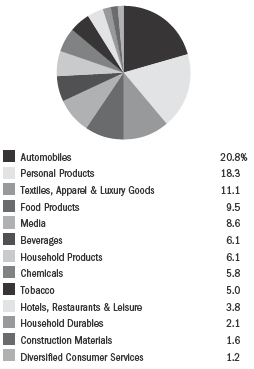
EGShares India Consumer ETF
Industry Breakdown*
| Top Ten Holdings* | ||
| Hindustan Unilever, Ltd. | 6.1 | % |
| Hero Motorcorp, Ltd. | 5.8 | |
| Asian Paints, Ltd. | 5.8 | |
| Colgate-Palmolive India, Ltd. | 5.5 | |
| Mahindra & Mahindra, Ltd. | 5.4 | |
| Nestle India, Ltd. | 5.4 | |
| Bajaj Auto, Ltd. | 5.3 | |
| Titan Industries, Ltd. | 5.3 | |
| ITC, Ltd. | 5.0 | |
| Dabur India, Ltd. | 4.9 |
| * | Expressed as a percentage of total investments in securities as of 9/30/2011. Holdings are subject to change. |
EGShares India Consumer ETF (ticker: INCO)
The Fund’s investment objective is to seek investment results that correspond (before fees and expenses) to the price and yield performance of the Indxx India Consumer Index, a 30 stock free float adjusted market capitalization index designed to measure the market performance of companies in the consumer sector of India. The index consists of common stocks that are listed on National Stock Exchange and Bombay Stock Exchange.
Emerging market investments involve risk of capital loss from unfavorable fluctuation in currency values, from differences in generally accepted accounting principles, from economic or political instability in other nations or increased volatility and lower trading volume. This fund will concentrate its investments in issuers of one or more particular industries to the same extent that its Underlying Index is so concentrated and to the extent permitted by applicable regulatory guidance. Concentration risk results from maintaining exposure to issuers conducting business in a specific industry. Small cap and mid cap companies generally will have greater volatility in price than the stocks of large companies due to limited product lines or resources or a dependency upon a particular market niche. Because the Fund only invests in Indian securities, its NAV will be much more sensitive to changes in economic, political and other factors within India than would a fund that invested in a greater variety of countries. Special risks include, among others, political and legal uncertainty, persistent religious, ethnic and border disputes, greater government control over the economy, currency fluctuations or blockage and the risk of nationalization or expropriation of assets.
| 20 | EGA Emerging Global Shares Trust |
Portfolio Summary (Unaudited)
EGShares Emerging Markets High Income Low Beta ETF
Industry Breakdown*
| Top Ten Holdings* | ||
| Kimberly-Clark de Mexico SAB de CV | 5.8 | % |
| Telecomunicacoes de Sao Paulo SA | 5.1 | |
| Philippine Long Distance Telephone Co. | 4.8 | |
| Total Access Communication PCL | 4.8 | |
| Magyar Telekom Telecommunications PLC | 4.8 | |
| DiGi.com BHD | 4.3 | |
| Pretoria Portland Cement Co., Ltd. | 4.0 | |
| Centrais Eletricas Brasileiras SA | 3.6 | |
| Public Bank BHD | 3.6 | |
| Telefonos de Mexico SAB de CV | 3.6 |
| * | Expressed as a percentage of total investments in securities as of 9/30/2011. Holdings are subject to change. |
EGShares Emerging Markets High Income Low Beta ETF (ticker: HILO)
The Fund’s investment objective is to seek investment results that correspond (before fees and expenses) to the price and yield performance of the Indxx Emerging Market High Income Low Beta Index. The index consists of as all publicly traded stocks domiciled in Emerging Markets countries, such as Argentina, Chile, Columbia, Czech Republic, Egypt, Hungary, Indonesia, Jordan, Kuwait, Malaysia, Mexico, Morocco, Peru, Philippines, Poland, Russia, Slovenia, South Africa, Ukraine, Brazil, China, India, Thailand and Turkey.
Emerging market investments involve risk of capital loss from unfavorable fluctuation in currency values, from differences in generally accepted accounting principles, from economic or political instability in other nations or increased volatility and lower trading volume. This fund will concentrate its investments in issuers of one or more particular industries to the same extent that its Underlying Index is so concentrated and to the extent permitted by applicable regulatory guidance. Concentration risk results from maintaining exposure to issuers conducting business in a specific industry.
| EGA Emerging Global Shares Trust | 21 |
Shareholder Expense Examples (Unaudited)
As a shareholder of an EGA Emerging Global Shares Trust ETF, you incur advisory fees and other Fund expenses. The following example is intended to help you understand your ongoing costs (in dollars and cents) of investing in a Fund and to compare these costs with the ongoing costs of investing in other funds. The example is based on an investment of $1,000 invested at the beginning of the period and held throughout the entire period (April 1, 2011 to September 30, 2011).
Actual expenses
The first line under each Fund in the table below provides information about actual account values and actual expenses. You may use the information in this line, together with the amount you invested, to estimate the expenses that you paid over the period. Simply divide your account value by $1,000 (for example, an $8,600 account value divided by $1,000 = 8.6), then multiply the result by the number in the first line for your Fund under the heading entitled “Expenses Paid Through 9/30/2011” to estimate the expenses you paid on your account during this period.
Hypothetical example for comparison purposes
The second line under each Fund in the table provides information about hypothetical account values and hypothetical expenses based on each Fund’s actual expense ratio and an assumed rate of return of 5% per year before expenses, which is not the Fund’s actual return. The hypothetical account values and expenses may not be used to estimate the actual ending account balance or expenses you paid for the period. You may use this information to compare the ongoing costs of investing in your Fund and other funds. To do so, compare this 5% hypothetical example with the 5% hypothetical examples that appear in the shareholder reports of the other funds.
Please note that the expenses shown in the table are meant to highlight your ongoing costs only and do not reflect any transactional costs, such as brokerage commissions paid on purchases and sales of Fund shares. Therefore, the second line under each Fund in the table is useful in comparing ongoing Fund costs only and will not help you determine the relative total costs of owning different funds. In addition, if these transactional costs were included, your costs would have been higher.
| 22 | EGA Emerging Global Shares Trust |
Shareholder Expense Examples (Unaudited) (continued)
| Beginning Account Value 3/31/2011 | Ending Account Value 9/30/2011 | Annualized Expense Ratios for the Period | Expenses Paid Through 9/30/20111 | |||||||||||||||||
| EGShares GEMS Composite ETF (Consolidated)2 | ||||||||||||||||||||
| Actual | $ | 1,000.00 | $ | 734.40 | 0.75 | % | $ | 3.25 | ||||||||||||
| Hypothetical (5% return before expenses) | $ | 1,000.00 | $ | 1,021.25 | 0.75 | % | $ | 3.79 | ||||||||||||
| EGShares Basic Materials GEMS ETF (Consolidated)2,3 | ||||||||||||||||||||
| Actual | $ | 1,000.00 | $ | 751.00 | 0.85 | % | $ | 2.01 | 4 | |||||||||||
| Hypothetical (5% return before expenses) | $ | 1,000.00 | $ | 1,020.75 | 0.85 | % | $ | 4.29 | ||||||||||||
| EGShares Consumer Goods GEMS ETF (Consolidated)2,3 | ||||||||||||||||||||
| Actual | $ | 1,000.00 | $ | 941.50 | 0.85 | % | $ | 2.23 | 4 | |||||||||||
| Hypothetical (5% return before expenses) | $ | 1,000.00 | $ | 1,020.75 | 0.85 | % | $ | 4.29 | ||||||||||||
| EGShares Consumer Services GEMS ETF3 | ||||||||||||||||||||
| Actual | $ | 1,000.00 | $ | 824.50 | 0.85 | % | $ | 2.10 | 4 | |||||||||||
| Hypothetical (5% return before expenses) | $ | 1,000.00 | $ | 1,020.75 | 0.85 | % | $ | 4.29 | ||||||||||||
| EGShares Energy GEMS ETF (Consolidated)2,3 | ||||||||||||||||||||
| Actual | $ | 1,000.00 | $ | 718.30 | 0.85 | % | $ | 3.65 | ||||||||||||
| Hypothetical (5% return before expenses) | $ | 1,000.00 | $ | 1,020.75 | 0.85 | % | $ | 4.29 | ||||||||||||
| EGShares Financials GEMS ETF (Consolidated)2,3 | ||||||||||||||||||||
| Actual | $ | 1,000.00 | $ | 697.40 | 0.85 | % | $ | 3.61 | ||||||||||||
| Hypothetical (5% return before expenses) | $ | 1,000.00 | $ | 1,020.75 | 0.85 | % | $ | 4.29 | ||||||||||||
| EGShares Health Care GEMS ETF (Consolidated)2,3 | ||||||||||||||||||||
| Actual | $ | 1,000.00 | $ | 839.50 | 0.85 | % | $ | 2.11 | 4 | |||||||||||
| Hypothetical (5% return before expenses) | $ | 1,000.00 | $ | 1,020.75 | 0.85 | % | $ | 4.29 | ||||||||||||
| EGShares Industrials GEMS ETF (Consolidated)2,3 | ||||||||||||||||||||
| Actual | $ | 1,000.00 | $ | 764.00 | 0.86 | % | $ | 2.05 | 4 | |||||||||||
| Hypothetical (5% return before expenses) | $ | 1,000.00 | $ | 1,020.70 | 0.86 | % | $ | 4.34 | ||||||||||||
| EGShares Technology GEMS ETF (Consolidated)2,3 | ||||||||||||||||||||
| Actual | $ | 1,000.00 | $ | 803.00 | 0.85 | % | $ | 2.07 | 4 | |||||||||||
| Hypothetical (5% return before expenses) | $ | 1,000.00 | $ | 1,020.75 | 0.85 | % | $ | 4.29 | ||||||||||||
| EGShares Telecom GEMS ETF (Consolidated)2,3 | ||||||||||||||||||||
| Actual | $ | 1,000.00 | $ | 909.00 | 0.85 | % | $ | 2.19 | 4 | |||||||||||
| Hypothetical (5% return before expenses) | $ | 1,000.00 | $ | 1,020.75 | 0.85 | % | $ | 4.29 | ||||||||||||
| EGShares Utilities GEMS ETF (Consolidated)2,3 | ||||||||||||||||||||
| Actual | $ | 1,000.00 | $ | 765.50 | 0.91 | % | $ | 2.17 | 4 | |||||||||||
| Hypothetical (5% return before expenses) | $ | 1,000.00 | $ | 1,020.45 | 0.91 | % | $ | 4.60 | ||||||||||||
| EGShares Emerging Markets Metals & Mining ETF (Consolidated)2 | ||||||||||||||||||||
| Actual | $ | 1,000.00 | $ | 678.60 | 0.85 | % | $ | 3.57 | ||||||||||||
| Hypothetical (5% return before expenses) | $ | 1,000.00 | $ | 1,020.75 | 0.85 | % | $ | 4.29 | ||||||||||||
| EGShares Emerging Markets Consumer ETF (Consolidated)2 | ||||||||||||||||||||
| Actual | $ | 1,000.00 | $ | 890.20 | 0.85 | % | $ | 4.02 | ||||||||||||
| Hypothetical (5% return before expenses) | $ | 1,000.00 | $ | 1,020.75 | 0.85 | % | $ | 4.29 | ||||||||||||
| EGShares India Infrastructure ETF (Consolidated)2 | ||||||||||||||||||||
| Actual | $ | 1,000.00 | $ | 757.20 | 0.85 | % | $ | 3.73 | ||||||||||||
| Hypothetical (5% return before expenses) | $ | 1,000.00 | $ | 1,020.75 | 0.85 | % | $ | 4.29 | ||||||||||||
| EGShares China Infrastructure ETF | ||||||||||||||||||||
| Actual | $ | 1,000.00 | $ | 630.40 | 0.85 | % | $ | 3.46 | ||||||||||||
| Hypothetical (5% return before expenses) | $ | 1,000.00 | $ | 1,020.75 | 0.85 | % | $ | 4.29 | ||||||||||||
| EGA Emerging Global Shares Trust | 23 |
Shareholder Expense Examples (Unaudited) (concluded)
| Beginning Account Value 3/31/2011 | Ending Account Value 9/30/2011 | Annualized Expense Ratios for the Period | Expenses Paid Through 9/30/20111 | |||||||||||||||||
| EGShares Brazil Infrastructure ETF | ||||||||||||||||||||
| Actual | $ | 1,000.00 | $ | 787.20 | 0.85 | % | $ | 3.80 | ||||||||||||
| Hypothetical (5% return before expenses) | $ | 1,000.00 | $ | 1,020.75 | 0.85 | % | $ | 4.29 | ||||||||||||
| EGShares India Small Cap ETF (Consolidated)2 | ||||||||||||||||||||
| Actual | $ | 1,000.00 | $ | 785.40 | 0.85 | % | $ | 3.79 | ||||||||||||
| Hypothetical (5% return before expenses) | $ | 1,000.00 | $ | 1,020.75 | 0.85 | % | $ | 4.29 | ||||||||||||
| EGShares India Consumer ETF (Consolidated)2,5 | ||||||||||||||||||||
| Actual | $ | 1,000.00 | $ | 912.50 | 0.89 | % | $ | 1.19 | 6 | |||||||||||
| Hypothetical (5% return before expenses) | $ | 1,000.00 | $ | 1,020.55 | 0.89 | % | $ | 4.50 | ||||||||||||
| EGShares Emerging High Income Low Beta ETF (Consolidated)2,7 | ||||||||||||||||||||
| Actual | $ | 1,000.00 | $ | 859.30 | 0.85 | % | $ | 1.23 | 8 | |||||||||||
| Hypothetical (5% return before expenses) | $ | 1,000.00 | $ | 1,020.75 | 0.85 | % | $ | 4.29 | ||||||||||||
| 1 | Expenses are calculated using each Fund’s annualized expense ratio, which includes waived fees or reimbursed expenses, multiplied by the ending account value for the period, multiplied by 183/365 (to reflect the six-month period). |
| 2 | Expenses for these Funds include the accounts of wholly-owned subsidiaries. All inter-company accounts and transactions have been eliminated in consolidation. See Note 2 in the Notes to Financial Statements. |
| 3 | The Fund commenced operations on June 23, 2011. |
| 4 | Expenses are calculated using each Fund’s annualized expense ratio, which includes waived fees or reimbursed expenses, multiplied by the ending account value for the period, multiplied by 99/365 (to reflect commencement of operations). |
| 5 | The Fund commenced operations on August 10, 2011. |
| 6 | Expenses are calculated using each Fund’s annualized expense ratio, which includes waived fees or reimbursed expenses, multiplied by the ending account value for the period, multiplied by 51/365 (to reflect commencement of operations). |
| 7 | The Fund commenced operations on August 4, 2011. |
| 8 | Expenses are calculated using each Fund’s annualized expense ratio, which includes waived fees or reimbursed expenses, multiplied by the ending account value for the period, multiplied by 57/365 (to reflect commencement of operations). |
| 24 | EGA Emerging Global Shares Trust |
Frequency Distribution of Premium and Discount (Unaudited)
The chart below presents information about differences between the per share net asset value (“NAV”) of each Fund and the market trading price of shares of each Fund. For these purposes, the “market price” is the mid-point of the highest bid and lowest offer for Fund shares as of the close of trading on the exchange where Fund shares are listed. The term “premium” is sometimes used to describe a market price in excess of NAV and the term “discount” is sometimes used to describe a market price below NAV. The chart presents information about the size and frequency of premiums or discounts. As with other exchange traded funds, the market price of Fund shares is typically slightly higher or lower than the Fund’s per share NAV. Factors that contribute to the differences between market price and NAV include the supply and demand for Fund shares and investors’ assessments of the underlying value of a Fund’s portfolio securities.
Differences between the closing times of U.S. and non-U.S. markets may contribute to differences between the NAV and market price of Fund shares. Many non-U.S. markets close prior to the close of the U.S. securities exchanges. Developments after the close of such markets as a result of ongoing price discovery may be reflected in a Fund’s market price but not in its NAV (or vice versa).
| Market Price Above or Equal to NAV | Market Price Below NAV | ||||||
| Basis Point Differential | Number of Days | % of Total Days | Number of Days | % of Total Days | |||
| EGShares GEMS Composite ETF | |||||||
| July 22, 2009*–September 30, 2011 | |||||||
| 0-24.99 | 80 | 14.44 | % | 62 | 11.19 | % | |
| 25-49.99 | 98 | 17.69 | % | 55 | 9.93 | % | |
| 50-74.99 | 60 | 10.83 | % | 38 | 6.86 | % | |
| 75-99.99 | 52 | 9.39 | % | 10 | 1.81 | % | |
| >100 | 70 | 12.63 | % | 29 | 5.23 | % | |
| Total | 360 | 64.98 | % | 194 | 35.02 | % | |
| EGShares Basic Materials GEMS ETF | |||||||
| June 23, 2011*–September 30, 2011 | |||||||
| 0-24.99 | 5 | 7.14 | % | 7 | 10.00 | % | |
| 25-49.99 | 12 | 17.14 | % | 4 | 5.71 | % | |
| 50-74.99 | 8 | 11.43 | % | 7 | 10.00 | % | |
| 75-99.99 | 6 | 8.57 | % | 2 | 2.86 | % | |
| >100 | 8 | 11.43 | % | 11 | 15.72 | % | |
| Total | 39 | 55.71 | % | 31 | 44.29 | % | |
| EGShares Consumer Goods GEMS ETF | |||||||
| June 23, 2011*–September 30, 2011 | |||||||
| 0-24.99 | 7 | 10.00 | % | 7 | 10.00 | % | |
| 25-49.99 | 9 | 12.86 | % | 5 | 7.14 | % | |
| 50-74.99 | 8 | 11.43 | % | 3 | 4.29 | % | |
| 75-99.99 | 9 | 12.86 | % | 2 | 2.86 | % | |
| >100 | 10 | 14.28 | % | 10 | 14.28 | % | |
| Total | 43 | 61.43 | % | 27 | 38.57 | % | |
| EGShares Consumer Services GEMS ETF | |||||||
| June 23, 2011*–September 30, 2011 | |||||||
| 0-24.99 | 9 | 12.86 | % | 8 | 11.43 | % | |
| 25-49.99 | 4 | 5.71 | % | 8 | 11.43 | % | |
| 50-74.99 | 6 | 8.57 | % | 8 | 11.43 | % | |
| 75-99.99 | 1 | 1.43 | % | 8 | 11.43 | % | |
| >100 | 1 | 1.43 | % | 17 | 24.28 | % | |
| Total | 21 | 30.00 | % | 49 | 70.00 | % | |
| EGShares Energy GEMS ETF | |||||||
| May 21, 2009*–September 30, 2011 | |||||||
| 0-24.99 | 69 | 11.60 | % | 50 | 8.40 | % | |
| 25-49.99 | 95 | 15.97 | % | 49 | 8.24 | % | |
| 50-74.99 | 100 | 16.81 | % | 41 | 6.89 | % | |
| 75-99.99 | 55 | 9.24 | % | 22 | 3.70 | % | |
| 100 | 64 | 10.75 | % | 50 | 8.40 | % | |
| Total | 383 | 64.37 | % | 212 | 35.63 | % | |
| EGA Emerging Global Shares Trust | 25 |
Frequency Distribution of Premium and Discount (Unaudited) (continued)
| Market Price Above or Equal to NAV | Market Price Below NAV | ||||||
| Basis Point Differential | Number of Days | % of Total Days | Number of Days | % of Total Days | |||
| EGShares Financials GEMS ETF | |||||||
| September 16, 2009*–September 30, 2011 | |||||||
| 0-24.99 | 74 | 14.40 | % | 61 | 11.87 | % | |
| 25-49.99 | 72 | 14.01 | % | 53 | 10.31 | % | |
| 50-74.99 | 43 | 8.36 | % | 49 | 9.53 | % | |
| 75-99.99 | 40 | 7.78 | % | 19 | 3.70 | % | |
| >100 | 66 | 12.84 | % | 37 | 7.20 | % | |
| Total | 295 | 57.39 | % | 219 | 42.61 | % | |
| EGShares Health Care GEMS ETF | |||||||
| June 23, 2011*–September 30, 2011 | |||||||
| 0-24.99 | 6 | 8.57 | % | 4 | 5.71 | % | |
| 25-49.99 | 11 | 15.72 | % | 6 | 8.57 | % | |
| 50-74.99 | 8 | 11.43 | % | 5 | 7.14 | % | |
| 75-99.99 | 5 | 7.14 | % | 1 | 1.43 | % | |
| >100 | 13 | 18.57 | % | 11 | 15.72 | % | |
| Total | 43 | 61.43 | % | 27 | 38.57 | % | |
| EGShares Industrials GEMS ETF | |||||||
| June 23, 2011*–September 30, 2011 | |||||||
| 0-24.99 | 7 | 10.00 | % | 4 | 5.71 | % | |
| 25-49.99 | 5 | 7.14 | % | 3 | 4.29 | % | |
| 50-74.99 | 9 | 12.86 | % | 6 | 8.57 | % | |
| 75-99.99 | 7 | 10.00 | % | 4 | 5.71 | % | |
| >100 | 13 | 18.57 | % | 12 | 17.15 | % | |
| Total | 41 | 58.57 | % | 29 | 41.43 | % | |
| EGShares Technology GEMS ETF | |||||||
| June 23, 2011*–September 30, 2011 | |||||||
| 0-24.99 | 9 | 12.86 | % | 10 | 14.28 | % | |
| 25-49.99 | 12 | 17.14 | % | 2 | 2.86 | % | |
| 50-74.99 | 9 | 12.86 | % | 4 | 5.71 | % | |
| 75-99.99 | 7 | 10.00 | % | 3 | 4.29 | % | |
| >100 | 9 | 12.86 | % | 5 | 7.14 | % | |
| Total | 46 | 65.72 | % | 24 | 34.28 | % | |
| EGShares Telecom GEMS ETF | |||||||
| June 23, 2011*–September 30, 2011 | |||||||
| 0-24.99 | 12 | 17.14 | % | 6 | 8.57 | % | |
| 25-49.99 | 13 | 18.57 | % | 8 | 11.43 | % | |
| 50-74.99 | 10 | 14.29 | % | 2 | 2.86 | % | |
| 75-99.99 | 8 | 11.43 | % | 1 | 1.43 | % | |
| >100 | 4 | 5.71 | % | 6 | 8.57 | % | |
| Total | 47 | 67.14 | % | 23 | 32.86 | % | |
| EGShares Utilities GEMS ETF | |||||||
| June 23, 2011*–September 30, 2011 | |||||||
| 0-24.99 | 5 | 7.14 | % | 9 | 12.86 | % | |
| 25-49.99 | 8 | 11.43 | % | 9 | 12.86 | % | |
| 50-74.99 | 7 | 10.00 | % | 5 | 7.14 | % | |
| 75-99.99 | 6 | 8.57 | % | 3 | 4.29 | % | |
| >100 | 3 | 4.29 | % | 15 | 21.42 | % | |
| Total | 29 | 41.43 | % | 41 | 58.57 | % | |
| 26 | EGA Emerging Global Shares Trust |
Frequency Distribution of Premium and Discount (Unaudited) (continued)
| Market Price Above or Equal to NAV | Market Price Below NAV | ||||||
| Basis Point Differential | Number of Days | % of Total Days | Number of Days | % of Total Days | |||
| EGShares Emerging Markets Metals & Mining ETF | |||||||
| May 21, 2009*–September 30, 2011 | |||||||
| 0-24.99 | 88 | 14.77 | % | 72 | 12.08 | % | |
| 25-49.99 | 76 | 12.75 | % | 48 | 8.05 | % | |
| 50-74.99 | 57 | 9.56 | % | 40 | 6.72 | % | |
| 75-99.99 | 63 | 10.57 | % | 27 | 4.53 | % | |
| >100 | 77 | 12.92 | % | 48 | 8.05 | % | |
| Total | 361 | 60.57 | % | 235 | 39.43 | % | |
| EGShares Emerging Markets Consumer ETF | |||||||
| September 14, 2010*–September 30, 2011 | |||||||
| 0-24.99 | 42 | 15.73 | % | 26 | 9.73 | % | |
| 25-49.99 | 62 | 23.22 | % | 16 | 5.99 | % | |
| 50-74.99 | 56 | 20.97 | % | 7 | 2.62 | % | |
| 75-99.99 | 30 | 11.24 | % | 3 | 1.12 | % | |
| >100 | 17 | 6.37 | % | 8 | 3.00 | % | |
| Total | 207 | 77.53 | % | 60 | 22.46 | % | |
| EGShares India Infrastructure ETF | |||||||
| August 11, 2010*–September 30, 2011 | |||||||
| 0-24.99 | 27 | 9.38 | % | 21 | 7.29 | % | |
| 25-49.99 | 35 | 12.15 | % | 20 | 6.94 | % | |
| 50-74.99 | 34 | 11.81 | % | 19 | 6.60 | % | |
| 75-99.99 | 29 | 10.07 | % | 7 | 2.43 | % | |
| >100 | 63 | 21.88 | % | 33 | 11.46 | % | |
| Total | 188 | 65.29 | % | 100 | 34.72 | % | |
| EGShares China Infrastructure ETF | |||||||
| February 17, 2010*–September 30, 2011 | |||||||
| 0-24.99 | 44 | 10.76 | % | 34 | 8.31 | % | |
| 25-49.99 | 45 | 11.00 | % | 34 | 8.31 | % | |
| 50-74.99 | 59 | 14.43 | % | 27 | 6.60 | % | |
| 75-99.99 | 38 | 9.29 | % | 18 | 4.40 | % | |
| >100 | 56 | 13.69 | % | 54 | 13.21 | % | |
| Total | 242 | 59.17 | % | 167 | 40.83 | % | |
| EGShares Brazil Infrastructure ETF | |||||||
| February 24, 2010*–September 30, 2011 | |||||||
| 0-24.99 | 6 | 1.49 | % | 9 | 2.23 | % | |
| 25-49.99 | 10 | 2.48 | % | 4 | 0.99 | % | |
| 50-74.99 | 13 | 3.23 | % | 8 | 1.98 | % | |
| 75-99.99 | 16 | 3.97 | % | 2 | 0.50 | % | |
| >100 | 328 | 81.39 | % | 7 | 1.74 | % | |
| Total | 373 | 92.56 | % | 30 | 7.44 | % | |
| EGShares India Small Cap ETF | |||||||
| July 7, 2010*–September 30, 2011 | |||||||
| 0-24.99 | 32 | 10.23 | % | 23 | 7.35 | % | |
| 25-49.99 | 33 | 10.54 | % | 20 | 6.39 | % | |
| 50-74.99 | 34 | 10.86 | % | 11 | 3.51 | % | |
| 75-99.99 | 40 | 12.78 | % | 8 | 2.56 | % | |
| >100 | 78 | 24.92 | % | 34 | 10.86 | % | |
| Total | 217 | 69.33 | % | 96 | 30.67 | % | |
| EGA Emerging Global Shares Trust | 27 |
Frequency Distribution of Premium and Discount (Unaudited) (concluded)
| Market Price Above or Equal to NAV | Market Price Below NAV | ||||||
| Basis Point Differential | Number of Days | % of Total Days | Number of Days | % of Total Days | |||
| EGShares India Consumer ETF | |||||||
| August 10, 2011*–September 30, 2011 | |||||||
| 0-24.99 | 1 | 2.78 | % | 4 | 11.11 | % | |
| 25-49.99 | 1 | 2.78 | % | 2 | 5.55 | % | |
| 50-74.99 | 2 | 5.55 | % | 2 | 5.55 | % | |
| 75-99.99 | 2 | 5.55 | % | — | 0.00 | % | |
| >100 | 17 | 47.23 | % | 5 | 13.90 | % | |
| Total | 23 | 63.89 | % | 13 | 36.11 | % | |
| EGShares Emerging Markets High Income Low Beta ETF | |||||||
| August 4, 2011*–September 30, 2011 | |||||||
| 0-24.99 | 4 | 10.00 | % | 3 | 7.50 | % | |
| 25-49.99 | 2 | 5.00 | % | — | 0.00 | % | |
| 50-74.99 | 3 | 7.50 | % | 2 | 5.00 | % | |
| 75-99.99 | 6 | 15.00 | % | 3 | 7.50 | % | |
| >100 | 15 | 37.50 | % | 2 | 5.00 | % | |
| Total | 30 | 75.00 | % | 10 | 25.00 | % | |
| * | Commencement of Operations. |
Each line in the table shows the number of trading days in which the Fund traded within the premium/discount range indicated. The number of trading days in each premium/discount range is also shown as a percentage of the total number of trading days in the period covered by each table. All data presented here represents past performance, which cannot be used to predict future results.
| 28 | EGA Emerging Global Shares Trust |
Schedule of Investments (Consolidated)†
EGShares GEMS Composite ETF
(formerly Emerging Global Shares Dow Jones Emerging Markets Titans Composite Index Fund)
September 30, 2011 (Unaudited)
| Investments | Shares | Value | ||||||
| COMMON STOCKS—99.6% | ||||||||
| Brazil—19.0% | ||||||||
| Banco Bradesco SA Preference Shares ADR | 38,595 | $ | 570,820 | |||||
| BRF—Brasil Foods SA ADR | 12,004 | 210,430 | ||||||
| Centrais Eletricas Brasileiras SA ADR | 33 | 290 | ||||||
| Companhia Brasileira de Distribuicao Grupo Pao de | ||||||||
| Acucar Preference Shares ADR | 2,397 | 73,780 | ||||||
| Companhia de Bebidas das Americas Preference | ||||||||
| Shares ADR | 14,771 | 452,731 | ||||||
| Companhia Energetica de Minas Gerais Preference | ||||||||
| Shares ADR | 7,474 | 110,914 | ||||||
| Companhia Siderurgica Nacional SA ADR | 13,895 | 110,326 | ||||||
| Gerdau SA Preference Shares ADR | 11,785 | 84,027 | ||||||
| Itau Unibanco Holding SA Preference Shares ADR | 48,713 | 756,026 | ||||||
| Petroleo Brasileiro SA ADR | 31,736 | 712,473 | ||||||
| Tele Norte Leste Participacoes SA Preference Shares ADR | 7,582 | 72,257 | ||||||
| Ultrapar Participacoes SA ADR | 7,931 | 125,548 | ||||||
| Vale SA ADR | 25,894 | 590,383 | ||||||
| Total Brazil | 3,870,005 | |||||||
| Chile—2.4% | ||||||||
| Cencosud SA | 29,968 | 161,892 | ||||||
| Empresa Nacional de Electricidad SA ADR | 2,169 | 94,004 | ||||||
| Enersis SA ADR | 4,897 | 82,808 | ||||||
| S.A.C.I. Falabella | 19,979 | 158,343 | ||||||
| Total Chile | 497,047 | |||||||
| China—23.1% | ||||||||
| Baidu, Inc. ADR* | 2,933 | 313,567 | ||||||
| Bank of China, Ltd. Class H | 1,017,623 | 320,264 | ||||||
| China Communications Construction Co., Ltd. Class H | 80,000 | 52,718 | ||||||
| China Construction Bank Corp. Class H | 1,013,350 | 623,520 | ||||||
| China Life Insurance Co., Ltd. Class H | 124,500 | 300,665 | ||||||
| China Merchants Holdings International Co., Ltd. | 12,000 | 32,679 | ||||||
| China Mobile, Ltd. | 43,000 | 425,871 | ||||||
| China Petroleum & Chemical Corp. Class H | 396,280 | 390,948 | ||||||
| China Shenhua Energy Co., Ltd. Class H | 54,770 | 218,454 | ||||||
| China Telecom Corp., Ltd. Class H | 258,000 | 164,383 | ||||||
| China Unicom Hong Kong, Ltd. ADR | 40,000 | 83,445 | ||||||
| CNOOC, Ltd. | 118,000 | 197,052 | ||||||
| Ctrip.com International, Ltd. ADR* | 2,373 | 76,316 | ||||||
| Dongfeng Motor Group Co., Ltd. Class H | 42,000 | 57,836 | ||||||
| Industrial and Commercial Bank of China, Ltd. | ||||||||
| Class H | 1,262,680 | 619,601 | ||||||
| Lenovo Group, Ltd. | 89,700 | 60,954 | ||||||
| Mindray Medical International, Ltd. ADR | 1,799 | 42,474 | ||||||
| NetEase.com, Inc. ADR* | 1,079 | 41,175 | ||||||
| PetroChina Co., Ltd. Class H | 400,000 | 496,869 | ||||||
| Shandong Weigao Group Medical Polymer Co., Ltd. | ||||||||
| Class H | 19,600 | 22,056 | ||||||
| SINA Corp.* | 1,538 | 110,136 | ||||||
| Sinopharm Group Co. Class H | 6,000 | 15,993 | ||||||
| Sohu.com, Inc.* | 686 | 33,065 | ||||||
| ZTE Corp. Class H | 5,200 | 14,963 | ||||||
| Total China | 4,715,004 | |||||||
| Czech Republic—0.6% | ||||||||
| CEZ AS | 3,149 | 121,374 | ||||||
| Egypt—0.3% | ||||||||
| Orascom Construction Industries | 1,599 | 57,074 | ||||||
| Hungary—0.2% | ||||||||
| Richter Gedeon Nyrt. | 249 | 34,103 | ||||||
| India—13.6% | ||||||||
| Bharat Heavy Electricals, Ltd. | 1,268 | 42,452 | ||||||
| Bharti Airtel, Ltd. | 9,878 | 76,240 | ||||||
| Cipla, Ltd. | 4,034 | 23,174 | ||||||
| Dr. Reddy’s Laboratories, Ltd. ADR | 2,351 | 70,060 | ||||||
| HDFC Bank, Ltd. ADR | 4,260 | 124,179 | ||||||
| Hindustan Unilever, Ltd. | 7,546 | 52,479 | ||||||
| Housing Development Finance Corp., Ltd. | 11,417 | 149,406 | ||||||
| ICICI Bank, Ltd. ADR | 7,555 | 262,309 | ||||||
| Infosys, Ltd. ADR | 10,256 | 523,774 | ||||||
| ITC, Ltd. | 24,653 | 99,669 | ||||||
| Larsen & Toubro, Ltd. GDR | 13,731 | 375,818 | ||||||
| Mahindra & Mahindra, Ltd. | 3,441 | 56,542 | ||||||
| NTPC, Ltd. | 10,007 | 34,256 | ||||||
| Ranbaxy Laboratories, Ltd. GDR | 3,060 | 32,436 | ||||||
| Reliance Industries, Ltd. GDR 144A | 18,040 | 587,382 | ||||||
| Sun Pharmaceutical Industries, Ltd. | 2,929 | 27,660 | ||||||
| Tata Consultancy Services, Ltd. | 3,399 | 71,991 | ||||||
| Tata Motors, Ltd. ADR | 5,794 | 89,112 | ||||||
| Tata Power Co., Ltd. | 14,082 | 28,710 | ||||||
| Wipro, Ltd. ADR | 5,511 | 50,977 | ||||||
| Total India | 2,778,626 | |||||||
| Indonesia—2.7% | ||||||||
| Astra International Tbk PT | 40,000 | 289,647 | ||||||
| Perusahaan Gas Negara PT | 228,000 | 69,386 | ||||||
| Telekomunikasi Indonesia Tbk PT | 209,000 | 180,705 | ||||||
| Total Indonesia | 539,738 | |||||||
| Malaysia—2.3% | ||||||||
| Genting BHD | 43,900 | 125,134 | ||||||
| IOI Corp. BHD | 115,793 | 168,657 | ||||||
| Sime Darby BHD | 43,600 | 115,265 | ||||||
| Tenaga Nasional BHD | 42,000 | 68,016 | ||||||
| Total Malaysia | 477,072 | |||||||
| Mexico—8.7% | ||||||||
| America Movil SAB de CV Series L | 727,722 | 805,613 | ||||||
| Cemex SAB de CV Series CPO* | 186,961 | 59,618 | ||||||
| Fomento Economico Mexicano SAB de CV Series UB | 42,600 | 277,229 | ||||||
| Grupo Bimbo SAB de CV Series A | 47,200 | 87,371 | ||||||
| Grupo Mexico SAB de CV Series B | 27,700 | 65,696 | ||||||
| Grupo Televisa SAB Series CPO | 53,900 | 198,260 | ||||||
| Wal-Mart de Mexico SAB de CV Series V | 120,300 | 276,617 | ||||||
| Total Mexico | 1,770,404 | |||||||
| Netherlands—0.3% | ||||||||
| VimpelCom, Ltd. ADR | 5,843 | 55,684 | ||||||
| Poland—0.3% | ||||||||
| Asseco Poland SA | 1,298 | 15,963 | ||||||
| KGHM Polska Miedz SA | 1,112 | 44,267 | ||||||
| Total Poland | 60,230 | |||||||
| Russia—14.8% | ||||||||
| Gazprom OAO ADR | 118,074 | 1,144,137 | ||||||
| LUKOIL OAO ADR | 9,118 | 463,650 | ||||||
| Magnit OJSC GDR | 5,820 | 111,278 | ||||||
| MMC Norilsk Nickel OJSC ADR | 18,486 | 401,701 | ||||||
| Mobile TeleSystems ADR | 8,209 | 100,971 | ||||||
| Rosneft Oil Co. OJSC GDR | 29,101 | 170,968 | ||||||
| Surgutneftegas ADR | 75,909 | 614,863 | ||||||
| Total Russia | 3,007,568 | |||||||
The accompanying notes are an integral part of these financial statements.
| EGA Emerging Global Shares Trust | 29 |
Schedule of Investments (Consolidated)†(continued)
EGShares GEMS Composite ETF
(formerly Emerging Global Shares Dow Jones Emerging Markets Titans Composite Index Fund)
September 30, 2011 (Unaudited)
| Investments | Shares | Value | ||||||
| South Africa—11.3% | ||||||||
| AngloGold Ashanti, Ltd. | 6,559 | $ | 276,504 | |||||
| Aspen Pharmacare Holdings, Ltd.* | 5,941 | 67,435 | ||||||
| Bidvest Group, Ltd. | 7,383 | 137,483 | ||||||
| Gold Fields, Ltd. | 12,920 | 200,668 | ||||||
| Impala Platinum Holdings, Ltd. | 12,927 | 264,117 | ||||||
| MTN Group, Ltd. | 19,923 | 328,370 | ||||||
| Naspers, Ltd. N Shares | 5,151 | 224,882 | ||||||
| Netcare, Ltd. | 23,007 | 37,347 | ||||||
| Sasol, Ltd. | 8,440 | 351,517 | ||||||
| Shoprite Holdings, Ltd. | 5,820 | 82,170 | ||||||
| Standard Bank Group, Ltd. | 22,397 | 258,514 | ||||||
| Tiger Brands, Ltd. | 2,683 | 70,086 | ||||||
| Total South Africa | 2,299,093 | |||||||
| TOTAL INVESTMENTS IN SECURITIES—99.6% | ||||||||
| (Cost: $24,908,807) | 20,283,022 | |||||||
| Other Assets in Excess of Liabilities—0.4% | 84,379 | |||||||
| Net Assets—100.0% | $ | 20,367,401 | ||||||
| † | The Consolidated Schedule of Investments includes the accounts of the wholly-owned subsidiary. All inter-company accounts and transactions have been eliminated in consolidation. See Note 2 of the Notes to Financial Statements. |
| * | Non-income producing security |
| ADR | American Depositary Receipts |
| GDR | Global Depositary Receipts |
| 144A | Series 144A securities were purchased pursuant to Rule 144A under the Securities Act of 1933 and may not be resold subject to that rule except to qualified institutional buyers. Unless otherwise noted, Series 144A securities are deemed to be liquid. |
| Summary by Industry | Value | % of Net Assets | ||||||
| Automobiles | $ | 493,137 | 2.4 | % | ||||
| Beverages | 729,960 | 3.6 | ||||||
| Commercial Banks | 3,535,233 | 17.4 | ||||||
| Communications Equipment | 14,963 | 0.1 | ||||||
| Computers & Peripherals | 60,954 | 0.3 | ||||||
| Construction & Engineering | 485,610 | 2.4 | ||||||
| Construction Materials | 59,618 | 0.3 | ||||||
| Diversified Telecommunication Services | 500,790 | 2.5 | ||||||
| Electric Utilities | 412,112 | 2.0 | ||||||
| Electrical Equipment | 42,452 | 0.2 | ||||||
| Food & Staples Retailing | 705,737 | 3.5 | ||||||
| Food Products | 536,544 | 2.6 | ||||||
| Gas Utilities | 69,386 | 0.3 | ||||||
| Health Care Equipment & Supplies | 64,530 | 0.3 | ||||||
| Health Care Providers & Services | 53,340 | 0.3 | ||||||
| Hotels, Restaurants & Leisure | 201,450 | 1.0 | ||||||
| Household Products | 52,479 | 0.2 | ||||||
| Independent Power Producers & Energy Traders | 128,260 | 0.6 | ||||||
| Industrial Conglomerates | 252,748 | 1.2 | ||||||
| Insurance | 300,665 | 1.5 | ||||||
| Internet Software & Services | 497,943 | 2.4 | ||||||
| IT Services | 646,742 | 3.2 | ||||||
| Media | 423,142 | 2.1 | ||||||
| Metals & Mining | 2,037,689 | 10.0 | ||||||
| Multiline Retail | 158,343 | 0.8 | ||||||
| Oil, Gas & Consumable Fuels | 5,473,861 | 26.9 | ||||||
| Pharmaceuticals | 254,868 | 1.2 | ||||||
| Software | 15,963 | 0.1 | ||||||
| Thrifts & Mortgage Finance | 149,406 | 0.7 | ||||||
| Tobacco | 99,669 | 0.5 | ||||||
| Transportation Infrastructure | 32,679 | 0.2 | ||||||
| Wireless Telecommunication Services | 1,792,749 | 8.8 | ||||||
| Total Investments | 20,283,022 | 99.6 | ||||||
| Other Assets in Excess of Liabilities | 84,379 | 0.4 | ||||||
| Net Assets | $ | 20,367,401 | 100.0 | % | ||||
The accompanying notes are an integral part of these financial statements.
| 30 | EGA Emerging Global Shares Trust |
Schedule of Investments (Consolidated)†
EGShares Basic Materials GEMS ETF
September 30, 2011 (Unaudited)
| Investments | Shares | Value | ||||||
| COMMON STOCKS—94.9% | ||||||||
| Brazil—16.7% | ||||||||
| Companhia Siderurgica Nacional SA ADR | 3,151 | $ | 25,019 | |||||
| Gerdau SA Preference Shares ADR | 3,574 | 25,483 | ||||||
| Vale SA Preference A Shares ADR | 3,587 | 75,327 | ||||||
| Total Brazil | 125,829 | |||||||
| Chile—2.4% | ||||||||
| Empresas CMPC SA | 5,290 | 18,101 | ||||||
| China—14.5% | ||||||||
| Aluminum Corp. of China, Ltd. Class H ADR | 885 | 9,239 | ||||||
| China Coal Energy Co., Ltd. Class H | 19,000 | 17,256 | ||||||
| China Shenhua Energy Co., Ltd. Class H | 10,500 | 41,880 | ||||||
| Jiangxi Copper Co., Ltd. Class H | 7,000 | 12,409 | ||||||
| Yanzhou Coal Mining Co., Ltd. ADR | 818 | 17,260 | ||||||
| Zijin Mining Group Co., Ltd. Class H | 36,000 | 10,590 | ||||||
| Total China | 108,634 | |||||||
| India—13.4% | ||||||||
| Coal India, Ltd. | 2,934 | 19,961 | ||||||
| Hindalco Industries, Ltd. | 5,838 | 15,669 | ||||||
| Jindal Steel & Power, Ltd. | 1,799 | 18,587 | ||||||
| Steel Authority of India, Ltd. | 4,040 | 8,715 | ||||||
| Sterlite Industries India, Ltd. ADR | 1,693 | 15,592 | ||||||
| Tata Steel, Ltd. | 2,587 | 21,940 | ||||||
| Total India | 100,464 | |||||||
| Indonesia—2.4% | ||||||||
| Bumi Resources Tbk PT | 81,000 | 17,969 | ||||||
| Mexico—3.9% | ||||||||
| Grupo Mexico SAB de CV Series B | 12,400 | 29,409 | ||||||
| Poland—2.8% | ||||||||
| KGHM Polska Miedz SA | 529 | 21,059 | ||||||
| Russia—16.4% | ||||||||
| Evraz Group SA GDR* | 674 | 10,609 | ||||||
| MMC Norilsk Nickel OJSC ADR | 2,700 | 58,671 | ||||||
| Novolipetsk Steel GDR | 520 | 10,649 | ||||||
| Severstal GDR | 1,048 | 11,046 | ||||||
| Uralkali GDR | 933 | 32,189 | ||||||
| Total Russia | 123,164 | |||||||
| South Africa—22.4% | ||||||||
| Anglo American Platinum, Ltd. | 309 | 21,294 | ||||||
| AngloGold Ashanti, Ltd. ADR | 1,183 | 48,929 | ||||||
| Gold Fields, Ltd. ADR | 2,452 | 37,565 | ||||||
| Impala Platinum Holdings, Ltd. | 2,068 | 42,252 | ||||||
| Kumba Iron Ore, Ltd. | 337 | 17,895 | ||||||
| Total South Africa | 167,935 | |||||||
| TOTAL INVESTMENTS IN SECURITIES—94.9% | ||||||||
| (Cost: $963,348) | 712,564 | |||||||
| Other Assets in Excess of Liabilities—5.1% | 38,247 | |||||||
| Net Assets—100.0% | $ | 750,811 | ||||||
| † | The Consolidated Schedule of Investments includes the accounts of the wholly-owned subsidiary. All inter-company accounts and transactions have been eliminated in consolidation. See Note 2 of the Notes to Financial Statements. |
| * | Non-income producing security |
| ADR | American Depositary Receipts |
| GDR | Global Depositary Receipts |
| Summary by Industry | Value | % of Net Assets | ||||||
| Chemicals | $ | 32,189 | 4.3 | % | ||||
| Metals & Mining | 547,948 | 73.0 | ||||||
| Oil, Gas & Consumable Fuels | 114,326 | 15.2 | ||||||
| Paper & Forest Products | 18,101 | 2.4 | ||||||
| Total Investments | 712,564 | 94.9 | ||||||
| Other Assets in Excess of Liabilities | 38,247 | 5.1 | ||||||
| Net Assets | $ | 750,811 | 100.0 | % | ||||
The accompanying notes are an integral part of these financial statements.
| EGA Emerging Global Shares Trust | 31 |
Schedule of Investments (Consolidated)†
EGShares Consumer Goods GEMS ETF
September 30, 2011 (Unaudited)
| Investments | Shares | Value | ||||||
| COMMON STOCKS—98.7% | ||||||||
| Brazil—18.0% | ||||||||
| BRF—Brasil Foods SA ADR | 3,475 | $ | 60,917 | |||||
| Companhia de Bebidas das Americas | ||||||||
| Preference Shares ADR | 3,150 | 96,548 | ||||||
| Gafisa SA ADR | 2,027 | 11,696 | ||||||
| Total Brazil | 169,161 | |||||||
| China—8.4% | ||||||||
| China Agri-Industries Holdings, Ltd. | 17,000 | 10,810 | ||||||
| Dongfeng Motor Group Co., Ltd. Class H | 20,000 | 27,541 | ||||||
| Great Wall Motor Co., Ltd. Class H | 10,000 | 11,587 | ||||||
| Guangzhou Automobile Group Co., Ltd. Class H | 20,000 | 19,705 | ||||||
| Shanda Interactive Entertainment, Ltd. ADR* | 324 | 9,571 | ||||||
| Total China | 79,214 | |||||||
| Colombia—2.7% | ||||||||
| Grupo Nutresa SA | 2,067 | 24,940 | ||||||
| India—20.3% | ||||||||
| Bajaj Auto, Ltd. | 1,112 | 34,875 | ||||||
| Hero Motorcorp, Ltd. | 767 | 30,410 | ||||||
| Hindustan Unilever, Ltd. | 6,644 | 46,206 | ||||||
| ITC, Ltd. | 16,330 | 66,020 | ||||||
| United Spirits, Ltd. | 855 | 13,892 | ||||||
| Total India | 191,403 | |||||||
| Indonesia—15.6% | ||||||||
| Astra International Tbk PT | 10,500 | 76,032 | ||||||
| Gudang Garam Tbk PT | 5,000 | 29,864 | ||||||
| Indofood Sukses Makmur Tbk PT | 34,500 | 19,821 | ||||||
| Unilever Indonesia Tbk PT | 11,500 | 21,587 | ||||||
| Total Indonesia | 147,304 | |||||||
| Malaysia—9.8% | ||||||||
| British American Tobacco Malaysia BHD | 1,200 | 16,794 | ||||||
| IOI Corp. BHD | 20,700 | 30,150 | ||||||
| Kuala Lumpur Kepong BHD | 3,600 | 23,793 | ||||||
| PPB Group BHD | 4,200 | 21,865 | ||||||
| Total Malaysia | 92,602 | |||||||
| Mexico—16.2% | ||||||||
| Coca-Cola Femsa SAB de CV ADR | 255 | 22,626 | ||||||
| Fomento Economico Mexicano SAB de CV ADR | 1,083 | 70,200 | ||||||
| Grupo Bimbo SAB de CV Series A | 15,800 | 29,247 | ||||||
| Grupo Modelo SAB de CV Series C | 2,700 | 15,302 | ||||||
| Kimberly-Clark de Mexico SAB de CV Class A | 2,900 | 14,951 | ||||||
| Total Mexico | 152,326 | |||||||
| South Africa—3.3% | ||||||||
| Tiger Brands, Ltd. | 1,181 | 30,850 | ||||||
| Thailand—2.3% | ||||||||
| Charoen Pokphand Foods Public Co., Ltd. | 25,200 | 21,686 | ||||||
| Turkey—2.1% | ||||||||
| Anadolu Efes Biracilik ve Malt Sanayii AS | 1,732 | 20,026 | ||||||
| TOTAL INVESTMENTS IN SECURITIES—98.7% | ||||||||
| (Cost: $993,265) | 929,512 | |||||||
| Other Assets in Excess of Liabilities—1.3% | 11,792 | |||||||
| Net Assets—100.0% | $ | 941,304 | ||||||
| † | The Consolidated Schedule of Investments includes the accounts of the wholly-owned subsidiary. All inter-company accounts and transactions have been eliminated in consolidation. See Note 2 of the Notes to Financial Statements. |
| * | Non-income producing security |
| ADR | American Depositary Receipts |
| Summary by Industry | Value | % of Net Assets | ||||||
| Automobiles | $ | 200,150 | 21.3 | % | ||||
| Beverages | 238,594 | 25.3 | ||||||
| Food Products | 274,079 | 29.1 | ||||||
| Household Durables | 11,696 | 1.2 | ||||||
| Household Products | 82,744 | 8.8 | ||||||
| Software | 9,571 | 1.0 | ||||||
| Tobacco | 112,678 | 12.0 | ||||||
| Total Investments | 929,512 | 98.7 | ||||||
| Other Assets in Excess of Liabilities | 11,792 | 1.3 | ||||||
| Net Assets | $ | 941,304 | 100.0 | % | ||||
The accompanying notes are an integral part of these financial statements.
| 32 | EGA Emerging Global Shares Trust |
Schedule of Investments
EGShares Consumer Services GEMS ETF
September 30, 2011 (Unaudited)
| Investments | Shares | Value | ||||||
| COMMON STOCKS—100.5% | ||||||||
| Brazil—4.6% | ||||||||
| Companhia Brasileira de Distribuicao Grupo | ||||||||
| Pao de Acucar Preference Shares ADR | 914 | $ | 28,133 | |||||
| Tam SA Preference Shares ADR | 629 | 9,800 | ||||||
| Total Brazil | 37,933 | |||||||
| Chile—16.1% | ||||||||
| Cencosud SA | 9,831 | 53,109 | ||||||
| Lan Airlines SA ADR | 1,179 | 24,346 | ||||||
| S.A.C.I. Falabella | 6,980 | 55,320 | ||||||
| Total Chile | 132,775 | |||||||
| China—7.7% | ||||||||
| Air China, Ltd. Class H | 18,000 | 12,694 | ||||||
| Ctrip.com International, Ltd. ADR* | 963 | 30,970 | ||||||
| New Oriental Education & Technology Group, Ltd. ADR* | 864 | 19,846 | ||||||
| Total China | 63,510 | |||||||
| Colombia—1.8% | ||||||||
| Almacenes Exito SA | 1,209 | 14,387 | ||||||
| Malaysia—8.9% | ||||||||
| AirAsia BHD | 14,500 | 13,762 | ||||||
| Genting BHD | 12,500 | 35,631 | ||||||
| Genting Malaysia BHD | 21,600 | 23,748 | ||||||
| Total Malaysia | 73,141 | |||||||
| Mexico—24.3% | ||||||||
| Grupo Elektra SA de CV | 570 | 43,484 | ||||||
| Grupo Televisa SAB ADR | 3,441 | 63,280 | ||||||
| TV Azteca SAB de CV Series CPO | 17,000 | 9,072 | ||||||
| Wal-Mart de Mexico SAB de CV Series V | 36,800 | 84,618 | ||||||
| Total Mexico | 200,454 | |||||||
| Philippines—2.3% | ||||||||
| SM Investments Corp. | 1,620 | 19,340 | ||||||
| Russia—5.9% | ||||||||
| Magnit OJSC GDR | 1,670 | 31,930 | ||||||
| X5 Retail Group NV GDR* | 590 | 16,343 | ||||||
| Total Russia | 48,273 | |||||||
| South Africa—22.9% | ||||||||
| Massmart Holdings, Ltd. | 756 | 13,043 | ||||||
| Naspers, Ltd. N Shares | 1,781 | 77,755 | ||||||
| Pick n Pay Stores, Ltd. | 1,474 | 6,693 | ||||||
| Shoprite Holdings, Ltd. | 2,113 | 29,832 | ||||||
| Steinhoff International Holdings, Ltd.* | 7,177 | 20,087 | ||||||
| Truworths International, Ltd. | 2,291 | 20,091 | ||||||
| Woolworths Holdings, Ltd. | 4,974 | 21,655 | ||||||
| Total South Africa | 189,156 | |||||||
| Thailand—3.0% | ||||||||
| CP ALL PCL | 16,200 | 25,015 | ||||||
| Turkey—3.0% | ||||||||
| BIM Birlesik Magazalar AS | 639 | 17,698 | ||||||
| Turk Hava Yollari Anonim Ortakligi* | 4,906 | 7,177 | ||||||
| Total Turkey | 24,875 | |||||||
| TOTAL INVESTMENTS IN SECURITIES—100.5% | ||||||||
| (Cost: $1,027,782) | 828,859 | |||||||
| Liabilities in Excess of Other Assets—(0.5)% | (4,232 | ) | ||||||
| Net Assets—100.0% | $ | 824,627 | ||||||
| * | Non-income producing security |
| ADR | American Depositary Receipts |
| GDR | Global Depositary Receipts |
| Summary by Industry | Value | % of Net Assets | ||||||
| Airlines | $ | 67,779 | 8.2 | % | ||||
| Diversified Consumer Services | 19,846 | 2.4 | ||||||
| Food & Staples Retailing | 320,801 | 38.9 | ||||||
| Hotels, Restaurants & Leisure | 90,349 | 11.0 | ||||||
| Household Durables | 20,087 | 2.4 | ||||||
| Industrial Conglomerates | 19,340 | 2.4 | ||||||
| Media | 150,107 | 18.2 | ||||||
| Multiline Retail | 76,975 | 9.3 | ||||||
| Specialty Retail | 63,575 | 7.7 | ||||||
| Total Investments | 828,859 | 100.5 | ||||||
| Liabilities in Excess of Other Assets | (4,232 | ) | (0.5 | ) | ||||
| Net Assets | $ | 824,627 | 100.0 | % | ||||
The accompanying notes are an integral part of these financial statements.
| EGA Emerging Global Shares Trust | 33 |
Schedule of Investments (Consolidated)†
EGShares Energy GEMS ETF
(formerly Emerging Global Shares Dow Jones Emerging Markets Energy Titans Index Fund)
September 30, 2011 (Unaudited)
| Investments | Shares | Value | ||||||
| COMMON STOCKS—95.9% | ||||||||
| Brazil—6.0% | ||||||||
| Petroleo Brasileiro SA ADR | 40,024 | $ | 898,539 | |||||
| Chile—3.1% | ||||||||
| Empresas Copec SA | 39,579 | 473,700 | ||||||
| China—17.6% | ||||||||
| China Oilfield Services, Ltd. Class H | 167,655 | 217,086 | ||||||
| China Petroleum & Chemical Corp. Class H | 748,066 | 738,000 | ||||||
| CNOOC, Ltd. | 529,800 | 884,730 | ||||||
| PetroChina Co., Ltd. Class H | 577,000 | 716,733 | ||||||
| Suntech Power Holdings Co., Ltd. ADR* | 38,561 | 89,076 | ||||||
| Total China | 2,645,625 | |||||||
| Colombia—3.7% | ||||||||
| Ecopetrol SA ADR | 13,754 | 554,149 | ||||||
| Hungary—1.7% | ||||||||
| MOL Hungarian Oil and Gas PLC* | 3,745 | 255,172 | ||||||
| India—16.0% | ||||||||
| Bharat Heavy Electricals, Ltd. | 5,062 | 169,472 | ||||||
| Cairn India, Ltd.* | 37,391 | 208,046 | ||||||
| GAIL India, Ltd. | 34,803 | 291,748 | ||||||
| Indian Oil Corp., Ltd. | 40,688 | 258,750 | ||||||
| Oil & Natural Gas Corp., Ltd. | 100,991 | 548,723 | ||||||
| Reliance Industries, Ltd. GDR 144A | 28,789 | 937,370 | ||||||
| Total India | 2,414,109 | |||||||
| Poland—3.7% | ||||||||
| Polski Koncern Naftowy Orlen SA* | 25,344 | 281,031 | ||||||
| Polskie Gornictwo Naftowe i Gazownictwo SA | 219,770 | 270,476 | ||||||
| Total Poland | 551,507 | |||||||
| Russia—29.2% | ||||||||
| Gazprom Neft JSC ADR | 11,247 | 196,822 | ||||||
| Gazprom OAO ADR | 94,574 | 916,422 | ||||||
| LUKOIL OAO ADR | 14,128 | 718,409 | ||||||
| NovaTek OAO GDR | 5,920 | 687,904 | ||||||
| Rosneft Oil Co. OJSC GDR* | 86,019 | 505,362 | ||||||
| Surgutneftegas ADR | 120,868 | 979,031 | ||||||
| Tatneft ADR | 15,955 | 396,322 | ||||||
| Total Russia | 4,400,272 | |||||||
| South Africa—5.0% | ||||||||
| Sasol, Ltd. | 18,122 | 754,762 | ||||||
| Thailand—7.9% | ||||||||
| PTT Aromatics & Refining PCL | 162,328 | 128,463 | ||||||
| PTT Exploration & Production PCL | 89,865 | 403,287 | ||||||
| PTT PCL | 55,989 | 468,301 | ||||||
| Thai Oil PCL | 112,146 | 183,092 | ||||||
| Total Thailand | 1,183,143 | |||||||
| Turkey—2.0% | ||||||||
| Tupras-Turkiye Petrol Rafinerileri AS | 14,378 | 297,697 | ||||||
| TOTAL INVESTMENTS IN SECURITIES—95.9% | ||||||||
| (Cost: $18,907,484) | 14,428,675 | |||||||
| Other Assets in Excess of Liabilities—4.1% | 624,010 | |||||||
| Net Assets—100.0% | $ | 15,052,685 | ||||||
| † | The Consolidated Schedule of Investments includes the accounts of the wholly-owned subsidiary. All inter-company accounts and transactions have been eliminated in consolidation. See Note 2 of the Notes to Financial Statements. |
| * | Non-income producing security |
| ADR | American Depositary Receipts |
| GDR | Global Depositary Receipts |
| 144A | Series 144A securities were purchased pursuant to Rule 144A under the Securities Act of 1933 and may not be resold subject to that rule except to qualified institutional buyers. Unless otherwise noted, Series 144A securities are deemed to be liquid. |
| Summary by Industry | Value | % of Net Assets | ||||||
| Electrical Equipment | $ | 169,472 | 1.2 | % | ||||
| Energy Equipment & Services | 217,086 | 1.5 | ||||||
| Gas Utilities | 291,748 | 1.9 | ||||||
| Industrial Conglomerates | 473,700 | 3.1 | ||||||
| Oil, Gas & Consumable Fuels | 13,187,593 | 87.6 | ||||||
| Semiconductors & Semiconductor Equipment | 89,076 | 0.6 | ||||||
| Total Investments | 14,428,675 | 95.9 | ||||||
| Other Assets in Excess of Liabilities | 624,010 | 4.1 | ||||||
| Net Assets | $ | 15,052,685 | 100.0 | % | ||||
The accompanying notes are an integral part of these financial statements.
| 34 | EGA Emerging Global Shares Trust |
Schedule of Investments (Consolidated)†
EGShares Financials GEMS ETF
(formerly Emerging Global Shares Dow Jones Emerging Markets Financials Titans Index Fund)
September 30, 2011 (Unaudited)
| Investments | Shares | Value | ||||||
| COMMON STOCKS—100.0% | ||||||||
| Brazil—15.8% | ||||||||
| Banco Bradesco SA Preference Shares ADR | 26,479 | $ | 391,624 | |||||
| Banco Santander Brasil SA ADS | 7,274 | 53,246 | ||||||
| Itau Unibanco Holding SA Preference Shares ADR | 23,565 | 365,729 | ||||||
| Total Brazil | 810,599 | |||||||
| China—34.4% | ||||||||
| Agricultural Bank of China, Ltd. Class H | 311,000 | 103,071 | ||||||
| Bank of China, Ltd. Class H | 749,079 | 235,748 | ||||||
| Bank of Communications Co., Ltd. Class H | 82,580 | 49,751 | ||||||
| BOC Hong Kong Holdings, Ltd. | 53,200 | 114,126 | ||||||
| China Construction Bank Corp. Class H | 557,100 | 342,787 | ||||||
| China Life Insurance Co., Ltd. Class H | 88,060 | 212,663 | ||||||
| China Merchants Bank Co., Ltd. Class H | 68,275 | 105,069 | ||||||
| China Overseas Land & Investment, Ltd. | 48,000 | 69,798 | ||||||
| Industrial and Commercial Bank of China, Ltd. Class H | 764,240 | 375,015 | ||||||
| Ping An Insurance Group Co. of China, Ltd. Class H | 27,800 | 157,842 | ||||||
| Total China | 1,765,870 | |||||||
| India—14.7% | ||||||||
| HDFC Bank, Ltd. ADR | 6,901 | 201,164 | ||||||
| Housing Development Finance Corp., Ltd. | 17,678 | 231,339 | ||||||
| ICICI Bank, Ltd. ADR | 6,387 | 221,757 | ||||||
| State Bank of India GDR | 1,188 | 100,386 | ||||||
| Total India | 754,646 | |||||||
| Indonesia—2.9% | ||||||||
| Bank Central Asia Tbk PT | 172,000 | 150,671 | ||||||
| Malaysia—5.5% | ||||||||
| CIMB Group Holdings BHD | 72,100 | 157,412 | ||||||
| Malayan Banking BHD | 49,300 | 123,540 | ||||||
| Total Malaysia | 280,952 | |||||||
| Poland—4.2% | ||||||||
| Bank Pekao SA | 2,182 | 88,984 | ||||||
| Powszechna Kasa Oszczednosci Bank Polski SA | 12,802 | 127,991 | ||||||
| Total Poland | 216,975 | |||||||
| Russia—5.5% | ||||||||
| Sberbank of Russia ADR* | 23,280 | 206,959 | ||||||
| VTB Bank OJSC GDR | 17,576 | 72,729 | ||||||
| Total Russia | 279,688 | |||||||
| South Africa—11.9% | ||||||||
| ABSA Group, Ltd. | 9,973 | 166,657 | ||||||
| FirstRand, Ltd. | 45,214 | 110,236 | ||||||
| Sanlam, Ltd. | 37,387 | 125,800 | ||||||
| Standard Bank Group, Ltd. | 18,107 | 208,997 | ||||||
| Total South Africa | 611,690 | |||||||
| Turkey—5.1% | ||||||||
| Akbank TAS | 25,874 | 102,136 | ||||||
| Turkiye Garanti Bankasi AS | 41,333 | 160,935 | ||||||
| Total Turkey | 263,071 | |||||||
| TOTAL INVESTMENTS IN SECURITIES—100.0% | ||||||||
| (Cost: $6,933,696) | 5,134,162 | |||||||
| Other Assets in Excess of Liabilities—0.0%** | 574 | |||||||
| Net Assets—100.0% | $ | 5,134,736 | ||||||
| † | The Consolidated Schedule of Investments includes the accounts of the wholly-owned subsidiary. All inter-company accounts and transactions have been eliminated in consolidation. See Note 2 of the Notes to Financial Statements. |
| * | Non-income producing security. |
| ** | Less than 0.05% |
| ADR | American Depositary Receipts |
| ADS | American Depository Shares |
| GDR | Global Depositary Receipts |
| Summary by Industry | Value | % of Net Assets | ||||||
| Commercial Banks | $ | 4,226,484 | 82.3 | % | ||||
| Diversified Financial Services | 110,236 | 2.1 | ||||||
| Insurance | 496,305 | 9.7 | ||||||
| Real Estate Management & Development | 69,798 | 1.4 | ||||||
| Thrifts & Mortgage Finance | 231,339 | 4.5 | ||||||
| Total Investments | 5,134,162 | 100.0 | ||||||
| Other Assets in Excess of Liabilities | 574 | 0.0 | ** | |||||
| Net Assets | $ | 5,134,736 | 100.0 | % | ||||
The accompanying notes are an integral part of these financial statements.
| EGA Emerging Global Shares Trust | 35 |
Schedule of Investments (Consolidated)†
September 30, 2011 (Unaudited)
| Investments | Shares | Value | ||||||
| COMMON STOCKS—100.8% | ||||||||
| Chile—1.3% | ||||||||
| Banmedica SA | 7,371 | $ | 10,956 | |||||
| China—17.5% | ||||||||
| China Pharmaceutical Group, Ltd. | 14,000 | 3,417 | ||||||
| Mindray Medical International, Ltd. ADR | 1,906 | 45,000 | ||||||
| Shandong Weigao Group Medical Polymer Co., Ltd. | ||||||||
| Class H | 28,000 | 31,508 | ||||||
| Shanghai Pharmaceuticals Holding Co., Ltd. Class H* | 7,600 | 16,557 | ||||||
| Sinopharm Group Co. Class H | 13,200 | 35,184 | ||||||
| WuXi PharmaTech Cayman, Inc. ADR* | 1,304 | 15,179 | ||||||
| Total China | 146,845 | |||||||
| Hungary—4.9% | ||||||||
| Egis Gyogyszergyar Nyrt. | 81 | 5,464 | ||||||
| Richter Gedeon Nyrt. | 261 | 35,746 | ||||||
| Total Hungary | 41,210 | |||||||
| India—39.9% | ||||||||
| Apollo Hospitals Enterprise, Ltd. | 1,726 | 18,331 | ||||||
| Aurobindo Pharma, Ltd. | 2,709 | 6,862 | ||||||
| Biocon, Ltd. | 1,726 | 11,896 | ||||||
| Cipla, Ltd. | 10,681 | 61,360 | ||||||
| Divi’s Laboratories, Ltd. | 1,345 | 20,199 | ||||||
| Dr. Reddy’s Laboratories, Ltd. ADR | 2,578 | 76,824 | ||||||
| Glenmark Pharmaceuticals, Ltd. | 2,959 | 19,512 | ||||||
| Piramal Healthcare, Ltd. | 1,706 | 12,457 | ||||||
| Ranbaxy Laboratories, Ltd. | 3,310 | 34,729 | ||||||
| Sun Pharmaceutical Industries, Ltd. | 7,733 | 73,027 | ||||||
| Total India | 335,197 | |||||||
| Indonesia—4.0% | ||||||||
| Kalbe Farma Tbk PT | 90,500 | 33,461 | ||||||
| Malaysia—1.2% | ||||||||
| Top Glove Corp. BHD | 8,000 | 10,299 | ||||||
| Mexico—2.1% | ||||||||
| Genomma Lab Internacional SAB de CV Class B* | 10,400 | 17,198 | ||||||
| Russia—3.5% | ||||||||
| Pharmstandard OJSC GDR* | 1,556 | 29,735 | ||||||
| South Africa—23.9% | ||||||||
| Adcock Ingram Holdings, Ltd. | 2,989 | 22,361 | ||||||
| Aspen Pharmacare Holdings, Ltd.* | 7,602 | 86,289 | ||||||
| Life Healthcare Group Holdings, Ltd. | 8,967 | 21,528 | ||||||
| Mediclinic International, Ltd. | 8,496 | 35,520 | ||||||
| Netcare, Ltd. | 21,663 | 35,166 | ||||||
| Total South Africa | 200,864 | |||||||
| Thailand—2.5% | ||||||||
| Bangkok Dusit Medical Services PCL | 5,600 | 11,530 | ||||||
| Bumrungrad Hospital PCL | 7,400 | 9,225 | ||||||
| Total Thailand | 20,755 | |||||||
| TOTAL INVESTMENTS IN SECURITIES—100.8% | ||||||||
| (Cost: $1,005,427) | 846,520 | |||||||
| Liabilities in Excess of Other Assets—(0.8)% | (6,875 | ) | ||||||
| Net Assets—100.0% | $ | 839,645 | ||||||
| † | The Consolidated Schedule of Investments includes the accounts of the wholly-owned subsidiary. All inter-company accounts and transactions have been eliminated in consolidation. See Note 2 of the Notes to Financial Statements. |
| * | Non-income producing security |
| ADR | American Depositary Receipts |
| GDR | Global Depositary Receipts |
| Summary by Industry | Value | % of Net Assets | ||||||
| Biotechnology | $ | 11,896 | 1.4 | % | ||||
| Health Care Equipment & Supplies | 86,807 | 10.3 | ||||||
| Health Care Providers & Services | 193,997 | 23.1 | ||||||
| Life Sciences Tools & Services | 35,378 | 4.2 | ||||||
| Pharmaceuticals | 518,442 | 61.8 | ||||||
| Total Investments | 846,520 | 100.8 | ||||||
| Liabilities in Excess of Other Assets | (6,875 | ) | (0.8 | ) | ||||
| Net Assets | $ | 839,645 | 100.0 | % | ||||
The accompanying notes are an integral part of these financial statements.
| 36 | EGA Emerging Global Shares Trust |
Schedule of Investments (Consolidated)†
September 30, 2011 (Unaudited)
| Investments | Shares | Value | ||||||
| COMMON STOCKS—100.5% | ||||||||
| Brazil—3.3% | ||||||||
| Embraer SA ADR | 1,001 | $ | 25,395 | |||||
| China—27.2% | ||||||||
| Anhui Conch Cement Co., Ltd. Class H | 9,000 | 24,972 | ||||||
| Beijing Enterprises Holdings, Ltd. | 4,000 | 20,348 | ||||||
| BYD Co., Ltd. Class H* | 5,500 | 9,312 | ||||||
| China Communications Construction Co., Ltd. Class H | 38,000 | 25,041 | ||||||
| China COSCO Holdings Co., Ltd. Class H | 25,000 | 10,405 | ||||||
| China Merchants Holdings International Co., Ltd. | 8,000 | 21,786 | ||||||
| China National Building Material Co., Ltd. Class H | 24,000 | 20,748 | ||||||
| China Railway Construction Corp., Ltd. Class H | 18,500 | 7,866 | ||||||
| China Railway Group, Ltd. Class H | 37,000 | 7,510 | ||||||
| China Resources Enterprise, Ltd. | 8,000 | 26,924 | ||||||
| Citic Pacific, Ltd. | 10,000 | 14,310 | ||||||
| Weichai Power Co., Ltd. Class H | 4,000 | 18,421 | ||||||
| Total China | 207,643 | |||||||
| Colombia—3.5% | ||||||||
| Inversiones Argos SA | 2,982 | 26,893 | ||||||
| Egypt—3.2% | ||||||||
| Orascom Construction Industries | 691 | 24,664 | ||||||
| India—35.8% | ||||||||
| Adani Enterprises, Ltd. | 2,132 | 22,935 | ||||||
| Ambuja Cements, Ltd. | 7,806 | 23,733 | ||||||
| Bharat Heavy Electricals, Ltd. | 1,101 | 36,861 | ||||||
| Jaiprakash Associates, Ltd. | 10,759 | 15,982 | ||||||
| Larsen & Toubro, Ltd. | 2,953 | 81,858 | ||||||
| Mahindra & Mahindra, Ltd. | 3,163 | 51,974 | ||||||
| Tata Motors, Ltd. ADR | 2,603 | 40,034 | ||||||
| Total India | 273,377 | |||||||
| Indonesia—4.3% | ||||||||
| United Tractors Tbk PT | 13,000 | 32,537 | ||||||
| Malaysia—7.4% | ||||||||
| MISC BHD | 8,200 | 15,077 | ||||||
| Sime Darby BHD | 15,600 | 41,242 | ||||||
| Total Malaysia | 56,319 | |||||||
| Mexico—4.6% | ||||||||
| Cemex SAB de CV ADR* | 7,409 | 23,412 | ||||||
| Grupo Carso SAB de CV Series A | 5,200 | 12,107 | ||||||
| Total Mexico | 35,519 | |||||||
| South Africa—8.4% | ||||||||
| Bidvest Group, Ltd. | 2,282 | 42,494 | ||||||
| Imperial Holdings, Ltd. | 1,671 | 21,877 | ||||||
| Total South Africa | 64,371 | |||||||
| Thailand—2.8% | ||||||||
| Siam Cement PCL | 2,500 | 21,071 | ||||||
| TOTAL INVESTMENTS IN SECURITIES—100.5% | ||||||||
| (Cost: $1,006,680) | 767,789 | |||||||
| Liabilities in Excess of Other Assets—(0.5)% | (3,588 | ) | ||||||
| Net Assets—100.0% | $ | 764,201 | ||||||
| † | The Consolidated Schedule of Investments includes the accounts of the wholly-owned subsidiary. All inter-company accounts and transactions have been eliminated in consolidation. See Note 2 of the Notes to Financial Statements. |
| * | Non-income producing security |
| ADR | American Depositary Receipts |
| Summary by Industry | Value | % of Net Assets | ||||||
| Aerospace & Defense | $ | 25,395 | 3.3 | % | ||||
| Automobiles | 101,320 | 13.3 | ||||||
| Chemicals | 21,877 | 2.9 | ||||||
| Construction & Engineering | 146,939 | 19.2 | ||||||
| Construction Materials | 140,829 | 18.4 | ||||||
| Electrical Equipment | 36,861 | 4.8 | ||||||
| Food & Staples Retailing | 26,924 | 3.5 | ||||||
| Industrial Conglomerates | 146,483 | 19.2 | ||||||
| Machinery | 50,958 | 6.7 | ||||||
| Marine | 25,482 | 3.3 | ||||||
| Trading Companies & Distributors | 22,935 | 3.0 | ||||||
| Transportation Infrastructure | 21,786 | 2.9 | ||||||
| Total Investments | 767,789 | 100.5 | ||||||
| Liabilities in Excess of Other Assets | (3,588 | ) | (0.5 | ) | ||||
| Net Assets | $ | 764,201 | 100.0 | % | ||||
The accompanying notes are an integral part of these financial statements.
| EGA Emerging Global Shares Trust | 37 |
Schedule of Investments (Consolidated)†
September 30, 2011 (Unaudited)
| Investments | Shares | Value | ||||||
| COMMON STOCKS—100.6% | ||||||||
| Chile—2.7% | ||||||||
| Sonda SA | 10,154 | $ | 21,725 | |||||
| China—44.1% | ||||||||
| AsiaInfo-Linkage, Inc.* | 1,758 | 12,974 | ||||||
| Baidu, Inc. ADR* | 669 | 71,523 | ||||||
| China Communications Services Corp., Ltd. Class H | 50,000 | 23,122 | ||||||
| Lenovo Group, Ltd. | 80,000 | 54,363 | ||||||
| NetEase.com, Inc. ADR* | 1,016 | 38,771 | ||||||
| SINA Corp.* | 553 | 39,600 | ||||||
| Sohu.com, Inc.* | 503 | 24,245 | ||||||
| Spreadtrum Communications, Inc. ADR | 1,157 | 20,768 | ||||||
| TCL Communication Technology Holdings, Ltd. | 25,000 | 10,469 | ||||||
| Travelsky Technology, Ltd. Class H | 35,000 | 15,511 | ||||||
| VanceInfo Technologies, Inc. ADR* | 1,456 | 9,799 | ||||||
| ZTE Corp. Class H | 11,400 | 32,803 | ||||||
| Total China | 353,948 | |||||||
| India—43.6% | ||||||||
| 3i Infotech, Ltd. | 13,570 | 7,273 | ||||||
| Financial Technologies India, Ltd. | 1,096 | 18,187 | ||||||
| GTL, Ltd. | 6,032 | 7,168 | ||||||
| Infosys, Ltd. ADR | 1,724 | 88,045 | ||||||
| Mphasis, Ltd. | 2,624 | 18,418 | ||||||
| Oracle Financial Sevices Software, Ltd.* | 523 | 20,294 | ||||||
| Patni Computer Systems, Ltd. ADR* | 1,407 | 16,406 | ||||||
| Rolta India, Ltd. | 5,721 | 9,672 | ||||||
| Satyam Computer Services, Ltd.* | 17,572 | 25,259 | ||||||
| Sterling International Enterprises, Ltd.* | 4,996 | 21,825 | ||||||
| Tata Consultancy Services, Ltd. | 3,016 | 63,879 | ||||||
| Tech Mahindra, Ltd. | 1,377 | 16,143 | ||||||
| Wipro, Ltd. ADR | 4,039 | 37,361 | ||||||
| Total India | 349,930 | |||||||
| Poland—2.5% | ||||||||
| Asseco Poland SA | 1,659 | 20,403 | ||||||
| Russia—3.7% | ||||||||
| Mail.ru Group Ltd. GDR* | 1,005 | 29,396 | ||||||
| South Africa—2.7% | ||||||||
| DataTec, Ltd. | 4,544 | 21,490 | ||||||
| Turkey—1.3% | ||||||||
| Aselsan Elektronik Sanayi Ve Ticaret AS | 2,644 | 10,437 | ||||||
| TOTAL INVESTMENTS IN SECURITIES—100.6% | ||||||||
| (Cost: $1,005,543) | 807,329 | |||||||
| Liabilities in Excess of Other Assets—(0.6)% | (4,473 | ) | ||||||
| Net Assets—100.0% | $ | 802,856 | ||||||
| † | The Consolidated Schedule of Investments includes the account of the wholly-owned subsidiary. All inter-company accounts and transactions have been eliminated in consolidation. See Note 2 of the Notes to Financial Statements. |
| * | Non-income producing security |
| ADR | American Depositary Receipts |
| GDR | Global Depositary Receipts |
| Summary by Industry | Value | % of Net Assets | ||||||
| Aerospace & Defense | $ | 10,437 | 1.3 | % | ||||
| Communications Equipment | 43,272 | 5.4 | ||||||
| Computers & Peripherals | 54,363 | 6.8 | ||||||
| Diversified Telecommunication Services | 23,122 | 2.9 | ||||||
| Electronic Equipment, Instruments & Components | 21,490 | 2.7 | ||||||
| Energy Equipment & Services | 21,825 | 2.7 | ||||||
| Internet Software & Services | 203,535 | 25.3 | ||||||
| IT Services | 319,587 | 39.8 | ||||||
| Semiconductors & Semiconductor Equipment | 20,768 | 2.6 | ||||||
| Software | 88,930 | 11.1 | ||||||
| Total Investments | 807,329 | 100.6 | ||||||
| Liabilities in Excess of Other Assets | (4,473 | ) | (0.6 | ) | ||||
| Net Assets | $ | 802,856 | 100.0 | % | ||||
The accompanying notes are an integral part of these financial statements.
| 38 | EGA Emerging Global Shares Trust |
Schedule of Investments (Consolidated)†
September 30, 2011 (Unaudited)
| Investments | Shares | Value | ||||||
| COMMON STOCKS—99.2% | ||||||||
| Brazil—9.5% | ||||||||
| Brasil Telecom SA ADR* | 740 | $ | 12,920 | |||||
| Tele Norte Leste Participacoes SA Preference Shares ADR | 1,801 | 17,164 | ||||||
| Telecomunicacoes de Sao Paulo SA Preference Shares ADR | 1,331 | 35,205 | ||||||
| Tim Participacoes SA ADR | 882 | 20,780 | ||||||
| Total Brazil | 86,069 | |||||||
| China—23.1% | ||||||||
| China Mobile, Ltd. | 12,000 | 118,848 | ||||||
| China Telecom Corp., Ltd. Class H | 70,000 | 44,600 | ||||||
| China Unicom Hong Kong, Ltd. ADR | 2,302 | 46,961 | ||||||
| Total China | 210,409 | |||||||
| Egypt—1.5% | ||||||||
| Orascom Telecom Holding SAE* | 23,871 | 13,286 | ||||||
| Hungary—1.2% | ||||||||
| Magyar Telekom Telecommunications PLC | 4,754 | 10,631 | ||||||
| India—6.0% | ||||||||
| Bharti Airtel, Ltd. | 5,605 | 43,261 | ||||||
| Reliance Communications, Ltd. | 7,505 | 10,995 | ||||||
| Total India | 54,256 | |||||||
| Indonesia—4.3% | ||||||||
| Telekomunikasi Indonesia Tbk PT ADR | 1,181 | 39,056 | ||||||
| Malaysia—9.3% | ||||||||
| Axiata Group BHD | 16,500 | 23,774 | ||||||
| DiGi.com BHD | 2,100 | 20,010 | ||||||
| Maxis BHD | 14,800 | 24,663 | ||||||
| Telekom Malaysia BHD | 13,000 | 16,655 | ||||||
| Total Malaysia | 85,102 | |||||||
| Mexico—12.3% | ||||||||
| America Movil SAB de CV Series L ADR | 3,968 | 87,613 | ||||||
| Telefonos de Mexico SAB de CV Series L ADR | 1,651 | 24,682 | ||||||
| Total Mexico | 112,295 | |||||||
| Morocco—2.2% | ||||||||
| Maroc Telecom SA | 1,201 | 20,588 | ||||||
| Netherlands—2.1% | ||||||||
| VimpelCom, Ltd. ADR | 2,011 | 19,165 | ||||||
| Philippines—2.7% | ||||||||
| Philippine Long Distance Telephone Co. ADR* | 491 | 24,319 | ||||||
| Poland—2.5% | ||||||||
| Telekomunikacja Polska SA | 4,327 | 22,879 | ||||||
| Russia—3.1% | ||||||||
| Mobile TeleSystems ADR* | 2,281 | 28,056 | ||||||
| South Africa—10.9% | ||||||||
| MTN Group, Ltd. | 3,342 | 55,083 | ||||||
| Telkom SA, Ltd. | 2,302 | 9,172 | ||||||
| Vodacom Group, Ltd. | 3,083 | 34,653 | ||||||
| Total South Africa | 98,908 | |||||||
| Thailand—4.1% | ||||||||
| Advanced Info Service PCL | 9,100 | 37,471 | ||||||
| Turkey—4.4% | ||||||||
| Turk Telekomunikasyon AS | 4,204 | 18,042 | ||||||
| Turkcell Iletisim Hizmetleri AS ADR* | 1,911 | 21,556 | ||||||
| Total Turkey | 39,598 | |||||||
| TOTAL INVESTMENTS IN SECURITIES—99.2% | ||||||||
| (Cost: $1,000,603) | 902,088 | |||||||
| Other Assets in Excess of Liabilities—0.8% | 7,142 | |||||||
| Net Assets—100.0% | $ | 909,230 | ||||||
| † | The Consolidated Schedule of Investments includes the account of the wholly-owned subsidiary. All inter-company accounts and transactions have been eliminated in consolidation. See Note 2 of the Notes to Financial Statements. |
| * | Non-income producing security |
| ADR | American Depositary Receipts |
| Summary by Industry | Value | % of Net Assets | ||||||
| Diversified Telecommunication Services | $ | 318,555 | 35.0 | % | ||||
| Wireless Telecommunication Services | 583,533 | 64.2 | ||||||
| Total Investments | 902,088 | 99.2 | ||||||
| Other Assets in Excess of Liabilities | 7,142 | 0.8 | ||||||
| Net Assets | $ | 909,230 | 100.0 | % | ||||
The accompanying notes are an integral part of these financial statements.
| EGA Emerging Global Shares Trust | 39 |
Schedule of Investments (Consolidated)†
September 30, 2011 (Unaudited)
| Investments | Shares | Value | ||||||
| COMMON STOCKS—100.8% | ||||||||
| Brazil—25.7% | ||||||||
| Centrais Eletricas Brasileiras SA ADR | 2,964 | $ | 25,994 | |||||
| Companhia de Saneamento Basico do | ||||||||
| Estado de Sao Paulo ADR | 487 | 22,573 | ||||||
| Companhia Energetica de Minas Gerais | ||||||||
| Preference Shares ADR | 3,524 | 52,296 | ||||||
| Companhia Paranaense de Energia-Copel | ||||||||
| Preference Shares ADR | 913 | 16,626 | ||||||
| CPFL Energia SA ADR | 803 | 17,786 | ||||||
| Ultrapar Participacoes SA ADR | 3,867 | 61,215 | ||||||
| Total Brazil | 196,490 | |||||||
| Chile—15.7% | ||||||||
| Companhia General de Electricidad SA | 2,700 | 11,502 | ||||||
| Colbun SA | 67,240 | 16,668 | ||||||
| Empresa Nacional de Electricidad SA ADR | 1,091 | 47,284 | ||||||
| Enersis SA ADR | 2,629 | 44,456 | ||||||
| Total Chile | 119,910 | |||||||
| China—5.3% | ||||||||
| China Resources Power Holdings Co., Ltd. | 14,000 | 21,329 | ||||||
| Datang International Power Generation Co., Ltd. Class H | 28,000 | 7,194 | ||||||
| Huaneng Power International, Inc. ADR | 715 | 12,033 | ||||||
| Total China | 40,556 | |||||||
| Colombia—2.4% | ||||||||
| Interconexion Electrica SA ESP | 3,027 | 18,199 | ||||||
| Czech Republic—7.7% | ||||||||
| CEZ AS | 1,519 | 59,131 | ||||||
| India—16.9% | ||||||||
| NTPC, Ltd. | 11,615 | 39,760 | ||||||
| Petronet LNG, Ltd. | 3,420 | 11,166 | ||||||
| Power Grid Corp. of India, Ltd. | 13,063 | 26,259 | ||||||
| Reliance Infrastructure, Ltd. | 1,410 | 10,752 | ||||||
| Rural Electrification Corp., Ltd. | 2,611 | 9,271 | ||||||
| Tata Power Co., Ltd. | 15,680 | 31,968 | ||||||
| Total India | 129,176 | |||||||
| Indonesia—3.8% | ||||||||
| Perusahaan Gas Negara PT | 94,500 | 28,759 | ||||||
| Malaysia—9.8% | ||||||||
| Petronas Chemicals Group BHD | 11,100 | 19,332 | ||||||
| Tenaga Nasional BHD | 19,800 | 32,064 | ||||||
| YTL Corp. BHD | 30,300 | 12,623 | ||||||
| YTL Power International BHD | 20,500 | 10,916 | ||||||
| Total Malaysia | 74,935 | |||||||
| Philippines—3.1% | ||||||||
| Aboitiz Power Corp. | 17,000 | 11,081 | ||||||
| Manila Electric Co. | 2,440 | 13,058 | ||||||
| Total Philippines | 24,139 | |||||||
| Poland—5.9% | ||||||||
| PGE SA | 5,261 | 31,079 | ||||||
| Tauron Polska Energia SA | 9,311 | 14,430 | ||||||
| Total Poland | 45,509 | |||||||
| Russia—4.5% | ||||||||
| Federal Hydrogenerating Co. JSC ADR | 10,077 | 34,665 | ||||||
| TOTAL INVESTMENTS IN SECURITIES—100.8% | ||||||||
| (Cost: $997,962) | 771,469 | |||||||
| Liabilities in Excess of Other Assets—(0.8)% | (5,949 | ) | ||||||
| Net Assets—100.0% | $ | 765,520 | ||||||
| † | The Consolidated Schedule of Investments includes the account of the wholly-owned subsidiary. All inter-company accounts and transactions have been eliminated in consolidation. See Note 2 of the Notes to Financial Statements. |
| * | Non-income producing security |
| ADR | American Depositary Receipts |
| Summary by Industry | Value | % of Net Assets | ||||||
| Chemicals | $ | 19,332 | 2.5 | % | ||||
| Diversified Financial Services | 9,271 | 1.2 | ||||||
| Electric Utilities | 440,267 | 57.5 | ||||||
| Gas Utilities | 28,759 | 3.8 | ||||||
| Independent Power Producers & Energy Traders | 155,348 | 20.3 | ||||||
| Multi-Utilities | 23,539 | 3.1 | ||||||
| Oil, Gas & Consumable Fuels | 72,381 | 9.5 | ||||||
| Water Utilities | 22,572 | 2.9 | ||||||
| Total Investments | 771,469 | 100.8 | ||||||
| Liabilities in Excess of Other Assets | (5,949 | ) | (0.8 | ) | ||||
| Net Assets | $ | 765,520 | 100.0 | % | ||||
The accompanying notes are an integral part of these financial statements.
| 40 | EGA Emerging Global Shares Trust |
Schedule of Investments (Consolidated)†
EGShares Emerging Markets Metals & Mining ETF
(formerly Emerging Global Shares Dow Jones Emerging Markets Metals & Mining Titans Index Fund)
September 30, 2011 (Unaudited)
| Investments | Shares | Value | ||||||
| COMMON STOCKS—99.6% | ||||||||
| Brazil—16.5% | ||||||||
| Companhia Siderurgica Nacional SA ADR | 71,194 | $ | 565,280 | |||||
| Gerdau SA Preference Shares ADR | 87,069 | 620,802 | ||||||
| Usinas Siderurgicas de Minas Gerais SA | ||||||||
| Preference A Shares ADR | 43 | 268 | ||||||
| Vale SA ADR | 71,980 | 1,641,144 | ||||||
| Total Brazil | 2,827,494 | |||||||
| China—16.4% | ||||||||
| Aluminum Corp. of China, Ltd. Class H | 473,564 | 211,696 | ||||||
| China Coal Energy Co., Ltd. Class H | 506,267 | 459,785 | ||||||
| China Shenhua Energy Co., Ltd. Class H | 260,019 | 1,037,103 | ||||||
| Jiangxi Copper Co., Ltd. Class H | 218,641 | 387,584 | ||||||
| Yanzhou Coal Mining Co., Ltd. Class H | 240,720 | 529,385 | ||||||
| Zijin Mining Group Co., Ltd. Class H | 630,900 | 185,589 | ||||||
| Total China | 2,811,142 | |||||||
| India—13.5% | ||||||||
| Coal India, Ltd. | 49,580 | 337,316 | ||||||
| Hindalco Industries, Ltd. | 116,050 | 311,481 | ||||||
| Jindal Steel & Power, Ltd. | 31,480 | 325,245 | ||||||
| JSW Steel, Ltd. | 14,380 | 173,823 | ||||||
| Steel Authority of India, Ltd. | 58,600 | 126,413 | ||||||
| Sterlite Industries India, Ltd. ADR | 67,333 | 620,137 | ||||||
| Tata Steel, Ltd. | 48,990 | 415,477 | ||||||
| Total India | 2,309,892 | |||||||
| Indonesia—3.1% | ||||||||
| Bumi Resources Tbk PT | 2,430,590 | 539,209 | ||||||
| Mexico—7.9% | ||||||||
| Grupo Mexico SAB de CV Series B | 341,125 | 809,046 | ||||||
| Industrias Penoles SAB de CV | 14,910 | 551,464 | ||||||
| Total Mexico | 1,360,510 | |||||||
| Poland—3.5% | ||||||||
| KGHM Polska Miedz SA | 15,096 | 600,950 | ||||||
| Russia—14.4% | ||||||||
| Evraz Group SA GDR* | 11,980 | 188,565 | ||||||
| MMC Norilsk Nickel OJSC ADR | 76,486 | 1,662,041 | ||||||
| Novolipetsk Steel GDR | 16,108 | 329,892 | ||||||
| Severstal GDR | 27,062 | 285,234 | ||||||
| Total Russia | 2,465,732 | |||||||
| South Africa—23.0% | ||||||||
| Anglo American Platinum, Ltd. | 8,001 | 551,374 | ||||||
| AngloGold Ashanti, Ltd. | 28,270 | 1,191,763 | ||||||
| Gold Fields, Ltd. | 56,299 | 874,413 | ||||||
| Impala Platinum Holdings, Ltd. | 50,356 | 1,028,843 | ||||||
| Kumba Iron Ore, Ltd. | 5,360 | 284,619 | ||||||
| Total South Africa | 3,931,012 | |||||||
| Turkey—1.3% | ||||||||
| Eregli Demir ve Celik Fabrikalari TAS | 129,346 | 226,075 | ||||||
| TOTAL INVESTMENTS IN SECURITIES—99.6% | ||||||||
| (Cost: $22,493,426) | 17,072,016 | |||||||
| Other Assets in Excess of Liabilities—0.4% | 64,858 | |||||||
| Net Assets—100.0% | $ | 17,136,874 | ||||||
| † | The Consolidated Schedule of Investments includes the account of the wholly-owned subsidiary. All inter-company accounts and transactions have been eliminated in consolidation. See Note 2 of the Notes to Financial Statements. |
| * | Non-income producing security |
| ADR | American Depositary Receipts |
| GDR | Global Depositary Receipts |
| Summary by Industry | Value | % of Net Assets | ||||||
| Metals & Mining | $ | 14,169,218 | 82.7 | % | ||||
| Oil, Gas & Consumable Fuels | 2,902,798 | 16.9 | ||||||
| Total Investments | 17,072,016 | 99.6 | ||||||
| Other Assets in Excess of Liabilities | 64,858 | 0.4 | ||||||
| Net Assets | $ | 17,136,874 | 100.0 | % | ||||
The accompanying notes are an integral part of these financial statements.
| EGA Emerging Global Shares Trust | 41 |
Schedule of Investments (Consolidated)†
EGShares Emerging Markets Consumer ETF
(formerly Emerging Global Shares Dow Jones Emerging Markets Consumer Titans Index Fund)
September 30, 2011 (Unaudited)
| Investments | Shares | Value | ||||||
| COMMON STOCKS—99.4% | ||||||||
| Brazil—18.2% | ||||||||
| BRF—Brasil Foods SA ADR | 710,304 | $ | 12,451,629 | |||||
| Companhia Brasileira de Distribuicao Grupo Pao de | ||||||||
| Acucar Preference Shares ADR | 143,823 | 4,426,872 | ||||||
| Companhia de Bebidas das Americas Preference | ||||||||
| Shares ADR | 787,743 | 24,144,323 | ||||||
| Total Brazil | 41,022,824 | |||||||
| Chile—9.8% | ||||||||
| Cencosud SA | 1,653,368 | 8,931,772 | ||||||
| Lan Airlines SA ADR | 181,946 | 3,757,185 | ||||||
| S.A.C.I. Falabella | 1,180,300 | 9,354,465 | ||||||
| Total Chile | 22,043,422 | |||||||
| China—5.8% | ||||||||
| Ctrip.com International, Ltd. ADR* | 166,548 | 5,356,184 | ||||||
| Dongfeng Motor Group Co., Ltd. Class H | 3,098,496 | 4,266,788 | ||||||
| New Oriental Education & Technology Group, Inc. ADR* | 146,464 | 3,364,278 | ||||||
| Total China | 12,987,250 | |||||||
| Colombia—1.6% | ||||||||
| Grupo Nutresa SA | 290,391 | 3,503,837 | ||||||
| India—13.8% | ||||||||
| Bajaj Auto, Ltd. | 158,078 | 4,957,629 | ||||||
| Hero Motorcorp, Ltd. | 110,743 | 4,390,714 | ||||||
| Hindustan Unilever, Ltd. | 1,151,693 | 8,009,528 | ||||||
| ITC, Ltd. | 3,379,673 | 13,663,609 | ||||||
| Total India | 31,021,480 | |||||||
| Indonesia—6.9% | ||||||||
| Astra International Tbk PT | 2,130,256 | 15,425,574 | ||||||
| Malaysia—6.8% | ||||||||
| Genting BHD | 2,405,220 | 6,855,913 | ||||||
| Genting Malaysia BHD | 3,325,180 | 3,655,875 | ||||||
| IOI Corp. BHD | 3,306,920 | 4,816,657 | ||||||
| Total Malaysia | 15,328,445 | |||||||
| Mexico—19.0% | ||||||||
| Fomento Economico Mexicano SAB de CV Series UB | 1,936,600 | 12,602,831 | ||||||
| Grupo Bimbo SAB de CV Series A | 2,861,100 | 5,296,131 | ||||||
| Grupo Televisa SAB Series CPO | 2,870,800 | 10,559,670 | ||||||
| Wal-Mart de Mexico SAB de CV Series V | 6,235,500 | 14,337,851 | ||||||
| Total Mexico | 42,796,483 | |||||||
| Russia—4.0% | ||||||||
| Magnit OJSC GDR | 302,493 | 5,783,666 | ||||||
| X5 Retail Group NV GDR* | 115,554 | 3,200,846 | ||||||
| Total Russia | 8,984,512 | |||||||
| South Africa—13.5% | ||||||||
| Massmart Holdings, Ltd. | 161,867 | 2,792,720 | ||||||
| Naspers, Ltd. N Shares | 259,868 | 11,345,284 | ||||||
| Shoprite Holdings, Ltd. | 326,140 | 4,604,606 | ||||||
| Steinhoff International Holdings, Ltd.* | 1,230,269 | 3,443,302 | ||||||
| Tiger Brands, Ltd. | 166,840 | 4,358,249 | ||||||
| Truworths International, Ltd. | 434,675 | 3,811,943 | ||||||
| Total South Africa | 30,356,104 | |||||||
| TOTAL INVESTMENTS IN SECURITIES—99.4% | ||||||||
| (Cost: $247,922,247) | 223,469,931 | |||||||
| Other Assets in Excess of Liabilities—0.6% | 1,433,086 | |||||||
| Net Assets—100.0% | $ | 224,903,017 | ||||||
| † | The Consolidated Schedule of Investments includes the accounts of the wholly-owned subsidiary. All inter-company accounts and transactions have been eliminated in consolidation. See Note 2 of the Notes to Financial Statements. |
| * | Non-income producing security |
| ADR | American Depositary Receipts |
| GDR | Global Depositary Receipts |
| Summary by Industry | Value | % of Net Assets | ||||||
| Airlines | $ | 3,757,185 | 1.7 | % | ||||
| Automobiles | 29,040,705 | 12.9 | ||||||
| Beverages | 36,747,154 | 16.3 | ||||||
| Diversified Consumer Services | 3,364,278 | 1.5 | ||||||
| Food & Staples Retailing | 44,078,333 | 19.6 | ||||||
| Food Products | 30,426,503 | 13.5 | ||||||
| Hotels, Restaurants & Leisure | 15,867,972 | 7.1 | ||||||
| Household Durables | 3,443,302 | 1.5 | ||||||
| Household Products | 8,009,528 | 3.6 | ||||||
| Media | 21,904,954 | 9.7 | ||||||
| Multiline Retail | 9,354,465 | 4.2 | ||||||
| Specialty Retail | 3,811,943 | 1.7 | ||||||
| Tobacco | 13,663,609 | 6.1 | ||||||
| Total Investments | 223,469,931 | 99.4 | ||||||
| Other Assets in Excess of Liabilities | 1,433,086 | 0.6 | ||||||
| Net Assets | $ | 224,903,017 | 100.0 | % | ||||
The accompanying notes are an integral part of these financial statements.
| 42 | EGA Emerging Global Shares Trust |
Schedule of Investments (Consolidated)†
EGShares India Infrastructure ETF
(formerly Emerging Global Shares INDXX India Infrastructure Index Fund)
September 30, 2011 (Unaudited)
| Investments | Shares | Value | ||||||
| COMMON STOCKS—99.6% | ||||||||
| Automobiles—4.8% | ||||||||
| Tata Motors, Ltd. | 952,283 | $ | 3,034,278 | |||||
| Construction & Engineering—5.1% | ||||||||
| IRB Infrastructure Developers, Ltd. | 123,635 | 411,359 | ||||||
| Larsen & Toubro, Ltd. | 103,010 | 2,855,465 | ||||||
| Total Construction & Engineering | 3,266,824 | |||||||
| Construction Materials—11.4% | ||||||||
| ACC, Ltd. | 118,037 | 2,647,668 | ||||||
| Ambuja Cements, Ltd. | 915,287 | 2,782,772 | ||||||
| Ultra Tech Cement, Ltd. | 80,106 | 1,867,259 | ||||||
| Total Construction Materials | 7,297,699 | |||||||
| Electric Utilities—11.0% | ||||||||
| Power Grid Corp. of India, Ltd. | 1,134,356 | 2,280,293 | ||||||
| Reliance Infrastructure, Ltd. | 199,239 | 1,519,261 | ||||||
| Tata Power Co., Ltd. | 1,574,350 | 3,209,777 | ||||||
| Total Electric Utilities | 7,009,331 | |||||||
| Electrical Equipment—5.6% | ||||||||
| Bharat Heavy Electricals, Ltd. | 83,983 | 2,811,694 | ||||||
| Suzlon Energy, Ltd.* | 1,027,040 | 764,382 | ||||||
| Total Electrical Equipment | 3,576,076 | |||||||
| Gas Utilities—6.1% | ||||||||
| GAIL India, Ltd. | 378,645 | 3,174,124 | ||||||
| Gujarat State Petronet, Ltd. | 325,750 | 702,050 | ||||||
| Total Gas Utilities | 3,876,174 | |||||||
| Independent Power Producers & Energy Traders—8.2% | ||||||||
| GMR Infrastructure, Ltd.* | 1,125,140 | 621,440 | ||||||
| NTPC, Ltd. | 1,035,433 | 3,544,469 | ||||||
| Reliance Power, Ltd.* | 700,437 | 1,097,673 | ||||||
| Total Independent Power Producers & Energy Traders | 5,263,582 | |||||||
| Industrial Conglomerates—8.7% | ||||||||
| Jaiprakash Associates, Ltd. | 1,539,763 | 2,287,244 | ||||||
| Siemens, Ltd. | 191,331 | 3,272,844 | ||||||
| Total Industrial Conglomerates | 5,560,088 | |||||||
| Machinery—1.8% | ||||||||
| Cummins India, Ltd. | 138,570 | 1,172,221 | ||||||
| Metals & Mining—10.7% | ||||||||
| Steel Authority of India, Ltd. | 799,615 | 1,724,948 | ||||||
| Sterlite Industries (India), Ltd. | 1,217,467 | 2,826,462 | ||||||
| Tata Steel, Ltd. | 268,380 | 2,276,093 | ||||||
| Total Metals & Mining | 6,827,503 | |||||||
| Oil, Gas & Consumable Fuels—1.8% | ||||||||
| Petronet LNG, Ltd. | 360,740 | 1,177,791 | ||||||
| Real Estate Management & Development—6.4% | ||||||||
| DLF, Ltd. | 585,005 | 2,614,754 | ||||||
| Housing Development & Infrastructure, Ltd.* | 272,723 | 545,446 | ||||||
| Unitech, Ltd. | 1,733,838 | 927,546 | ||||||
| Total Real Estate Management & Development | 4,087,746 | |||||||
| Transportation Infrastructure—1.6% | ||||||||
| Mundra Port and Special Economic Zone, Ltd. | 306,436 | 1,028,336 | ||||||
| Wireless Telecommunication Services—16.4% | ||||||||
| Bharti Airtel, Ltd. | 586,578 | 4,527,340 | ||||||
| Idea Cellular, Ltd.* | 2,265,072 | 4,555,581 | ||||||
| Reliance Communications, Ltd. | 938,893 | 1,375,510 | ||||||
| Total Wireless Telecommunication Services | 10,458,431 | |||||||
| TOTAL INVESTMENTS IN SECURITIES—99.6% | ||||||||
| (Cost: $86,243,115) | 63,636,080 | |||||||
| Other Assets in Excess of Liabilities—0.4% | 251,358 | |||||||
| Net Assets—100.0% | $ | 63,887,438 | ||||||
| † | The Consolidated Schedule of Investments includes the accounts of the wholly-owned subsidiary. All inter-company accounts and transactions have been eliminated in consolidation. See Note 2 of the Notes to Financial Statements. |
| * | Non-income producing security |
The accompanying notes are an integral part of these financial statements.
| EGA Emerging Global Shares Trust | 43 |
Schedule of Investments
EGShares China Infrastructure ETF
(formerly Emerging Global Shares INDXX China Infrastructure Index Fund)
September 30, 2011 (Unaudited)
| Investments | Shares | Value | ||||||
| COMMON STOCKS—99.6% | ||||||||
| Construction & Engineering—8.6% | ||||||||
| China Communications Construction Co., Ltd. Class H | 950,216 | $ | 626,174 | |||||
| China Railway Construction Corp., Ltd. Class H | 559,503 | 237,895 | ||||||
| China Railway Group, Ltd. Class H | 1,106,377 | 224,552 | ||||||
| Total Construction & Engineering | 1,088,621 | |||||||
| Construction Materials—12.0% | ||||||||
| Anhui Conch Cement Co., Ltd. Class H | 239,115 | 663,462 | ||||||
| BBMG Corp. Class H | 398,854 | 300,239 | ||||||
| China National Building Material Co., Ltd. Class H | 636,508 | 550,268 | ||||||
| Total Construction Materials | 1,513,969 | |||||||
| Diversified Telecommunication Services—18.3% | ||||||||
| China Telecom Corp., Ltd. Class H | 1,690,458 | 1,077,064 | ||||||
| China Unicom Hong Kong, Ltd. | 592,885 | 1,236,835 | ||||||
| Total Diversified Telecommunication Services | 2,313,899 | |||||||
| Electrical Equipment—4.4% | ||||||||
| Dongfang Electric Corp., Ltd. Class H | 85,184 | 222,131 | ||||||
| Shanghai Electric Group Co., Ltd. Class H | 862,559 | 335,728 | ||||||
| Total Electrical Equipment | 557,859 | |||||||
| Energy Equipment & Services—4.4% | ||||||||
| China Oilfield Services, Ltd. Class H | 426,121 | 551,758 | ||||||
| Independent Power Producers & Energy Traders—7.0% | ||||||||
| China Longyuan Power Group Corp. Class H | 617,699 | 514,964 | ||||||
| Huaneng Power International, Inc. Class H | 865,012 | 372,239 | ||||||
| Total Independent Power Producers & Energy Traders | 887,203 | |||||||
| Machinery—11.7% | ||||||||
| Changsha Zoomlion Heavy Industry Science and | ||||||||
| Technology Development Co., Ltd. Class H | 428,000 | 488,216 | ||||||
| China Rongsheng Heavy Industries Group | ||||||||
| Holdings, Ltd. | 1,121,000 | 309,599 | ||||||
| CSR Corp., Ltd. Class H | 599,155 | 215,502 | ||||||
| Weichai Power Co., Ltd. Class H | 101,418 | 467,046 | ||||||
| Total Machinery | 1,480,363 | |||||||
| Metals & Mining—10.4% | ||||||||
| Aluminum Corp. of China, Ltd. Class H | 1,124,100 | 502,504 | ||||||
| Angang Steel Co., Ltd. Class H | 290,852 | 153,930 | ||||||
| Jiangxi Copper Co., Ltd. Class H | 314,424 | 557,378 | ||||||
| Maanshan Iron & Steel Class H | 467,019 | 102,586 | ||||||
| Total Metals & Mining | 1,316,398 | |||||||
| Real Estate Management & Development—20.6% | ||||||||
| Agile Property Holdings, Ltd. | 431,798 | 285,656 | ||||||
| Country Garden Holdings Co. | 1,062,000 | 297,397 | ||||||
| Evergrande Real Estate Group, Ltd. | 1,543,771 | 483,869 | ||||||
| Guangzhou R&F Properties Co., Ltd. Class H | 301,845 | 225,664 | ||||||
| Longfor Properties Co., Ltd. | 330,796 | 332,294 | ||||||
| Renhe Commercial Holdings Co., Ltd. | 2,794,604 | 301,547 | ||||||
| Shimao Property Holdings, Ltd. | 491,665 | 375,155 | ||||||
| Soho China, Ltd. | 453,500 | 290,110 | ||||||
| Total Real Estate Management & Development | 2,591,692 | |||||||
| Transportation Infrastructure—2.2% | ||||||||
| Jiangsu Expressway Co., Ltd. Class H | 356,225 | 272,268 | ||||||
| TOTAL INVESTMENTS IN SECURITIES—99.6% | ||||||||
| (Cost: $18,616,508) | 12,574,030 | |||||||
| Other Assets in Excess of Liabilities—0.4% | 47,729 | |||||||
| Net Assets—100.0% | $ | 12,621,759 | ||||||
The accompanying notes are an integral part of these financial statements.
| 44 | EGA Emerging Global Shares Trust |
Schedule of Investments
EGShares Brazil Infrastructure ETF
(formerly Emerging Global Shares INDXX Brazil Infrastructure Index Fund)
September 30, 2011 (Unaudited)
| Investments | Shares | Value | ||||||
| COMMON STOCKS—99.0% | ||||||||
| Aerospace & Defense—4.8% | ||||||||
| Embraer SA | 532,346 | $ | 3,369,732 | |||||
| Construction Materials—1.2% | ||||||||
| Magnesita Refratarios SA* | 253,548 | 826,379 | ||||||
| Diversified Telecommunication Services—14.9% | ||||||||
| Brasil Telecom SA Preference Shares | 362,600 | 2,129,207 | ||||||
| Telecomunicacoes Brasileiras SA Preference Shares* | 161,600 | 1,169,179 | ||||||
| Telecomunicacoes de Sao Paulo SA | ||||||||
| Preference Shares | 264,824 | 7,090,506 | ||||||
| Total Diversified Telecommunication Services | 10,388,892 | |||||||
| Electric Utilities—11.9% | ||||||||
| Centrais Eletricas Brasileiras SA | 338,520 | 2,948,885 | ||||||
| Companhia Energetica de Minas Gerais | 151,530 | 1,820,401 | ||||||
| CPFL Energia SA | 322,480 | 3,570,082 | ||||||
| Total Electric Utilities | 8,339,368 | |||||||
| Energy Equipment & Services—0.6% | ||||||||
| OSX Brasil SA* | 2,000 | 385,724 | ||||||
| Independent Power Producers & Energy Traders—11.8% | ||||||||
| AES Tiete SA | 139,561 | 1,592,405 | ||||||
| Companhia Energetica de Sao Paulo | ||||||||
| Preference B Shares | 248,190 | 3,670,204 | ||||||
| Tractebel Energia SA | 213,183 | 2,981,404 | ||||||
| Total Independent Power Producers & Energy Traders | 8,244,013 | |||||||
| Machinery—7.6% | ||||||||
| Marcopolo SA Preference Shares | 386,761 | 1,437,657 | ||||||
| Randon SA Implementos e Participacoes | ||||||||
| Preference Shares | 183,563 | 1,013,614 | ||||||
| Weg SA | 287,447 | 2,883,374 | ||||||
| Total Machinery | 5,334,645 | |||||||
| Metals & Mining—10.8% | ||||||||
| Companhia Siderurgica Nacional SA | 294,800 | 2,344,107 | ||||||
| Gerdau SA | 407,050 | 2,412,148 | ||||||
| Vale SA | 121,154 | 2,773,896 | ||||||
| Total Metals & Mining | 7,530,151 | |||||||
| Oil, Gas & Consumable Fuels—5.9% | ||||||||
| Ultrapar Participacoes SA | 256,816 | 4,102,138 | ||||||
| Real Estate Management & Development—8.2% | ||||||||
| BR Malls Participacoes SA | 327,286 | 3,321,787 | ||||||
| BR Properties SA | 130,100 | 1,187,984 | ||||||
| Multiplan Empreendimentos Imobiliarios SA | 64,952 | 1,217,686 | ||||||
| Total Real Estate Management & Development | 5,727,457 | |||||||
| Road & Rail—5.2% | ||||||||
| All America Latina Logistica | 504,820 | 2,298,036 | ||||||
| Localiza Rent a Car SA | 102,506 | 1,370,060 | ||||||
| Total Road & Rail | 3,668,096 | |||||||
| Transportation Infrastructure—8.0% | ||||||||
| CCR SA | 155,632 | 4,063,829 | ||||||
| Ecorodovias Infraestrutura e Logistica SA | 100,600 | 745,185 | ||||||
| Obrascon Huarte Lain Brasil SA | 25,463 | 811,387 | ||||||
| Total Transportation Infrastructure | 5,620,401 | |||||||
| Water Utilities—5.6% | ||||||||
| Compania de Saneamento Basico do Estado | ||||||||
| de Sao Paulo | 124,321 | 2,929,455 | ||||||
| Companhia de Saneamento de Minas Gerais | 62,332 | 989,253 | ||||||
| Total Water Utilities | 3,918,708 | |||||||
| Wireless Telecommunication Services—2.5% | ||||||||
| Tim Participacoes SA | 377,437 | 1,764,931 | ||||||
| TOTAL INVESTMENTS IN SECURITIES—99.0% | ||||||||
| (Cost: $76,142,107) | 69,220,635 | |||||||
| Other Assets in Excess of Liabilities—1.0% | 704,918 | |||||||
| Net Assets—100.0% | $ | 69,925,553 | ||||||
| * | Non-income producing security |
The accompanying notes are an integral part of these financial statements.
| EGA Emerging Global Shares Trust | 45 |
Schedule of Investments (Consolidated)†
EGShares India Small Cap ETF
(formerly Emerging Global Shares INDXX India Small Cap Index Fund)
September 30, 2011 (Unaudited)
| Investments | Shares | Value | ||||||
| COMMON STOCKS—99.5% | ||||||||
| Airlines—1.2% | ||||||||
| Jet Airways India, Ltd.* | 38,768 | $ | 186,063 | |||||
| Kingfisher Airlines, Ltd.* | 243,864 | 99,836 | ||||||
| Total Airlines | 285,899 | |||||||
| Auto Components—4.5% | ||||||||
| Amtek Auto, Ltd. | 220,303 | 578,028 | ||||||
| MRF, Ltd. | 3,757 | 507,661 | ||||||
| Total Auto Components | 1,085,689 | |||||||
| Capital Markets—1.1% | ||||||||
| India Infoline, Ltd. | 127,857 | 182,877 | ||||||
| Indiabulls Securities, Ltd. | 433,630 | 74,817 | ||||||
| Total Capital Markets | 257,694 | |||||||
| Chemicals—6.3% | ||||||||
| Chambal Fertilizers & Chemicals, Ltd. | 368,832 | 706,034 | ||||||
| Godrej Industries, Ltd. | 135,063 | 539,425 | ||||||
| Nagarjuna Fertilizers & Chemicals, Ltd. | 582,385 | 280,044 | ||||||
| Total Chemicals | 1,525,503 | |||||||
| Commercial Banks—15.0% | ||||||||
| Central Bank of India | 230,907 | 484,209 | ||||||
| Development Credit Bank, Ltd.* | 335,472 | 298,654 | ||||||
| Dhanlaxmi Bank, Ltd. | 142,066 | 214,078 | ||||||
| Indian Bank | 142,113 | 620,103 | ||||||
| Jammu & Kashmir Bank, Ltd. | 22,097 | 361,989 | ||||||
| Karnataka Bank, Ltd. | 195,988 | 336,551 | ||||||
| Syndicate Bank | 178,665 | 379,584 | ||||||
| UCO Bank | 341,333 | 456,156 | ||||||
| Vijaya Bank, Ltd. | 440,237 | 490,800 | ||||||
| Total Commercial Banks | 3,642,124 | |||||||
| Computers & Peripherals—0.6% | ||||||||
| Moser Baer India, Ltd.* | 332,482 | 146,638 | ||||||
| Construction & Engineering—7.1% | ||||||||
| Alstom Projects India, Ltd. | 39,712 | 421,567 | ||||||
| Engineers India, Ltd. | 68,301 | 343,423 | ||||||
| IL&FS Engineering and Construction Co., Ltd.* | 64,052 | 115,941 | ||||||
| Praj Industries, Ltd. | 296,283 | 427,410 | ||||||
| Punj Lloyd, Ltd. | 379,848 | 419,597 | ||||||
| Total Construction & Engineering | 1,727,938 | |||||||
| Construction Materials—1.6% | ||||||||
| Century Textiles & Industries, Ltd. | 61,077 | 382,425 | ||||||
| Containers & Packaging—0.6% | ||||||||
| Everest Kanto Cylinder, Ltd. | 97,417 | 140,432 | ||||||
| Diversified Consumer Services—0.6% | ||||||||
| Aptech, Ltd. | 65,678 | 155,763 | ||||||
| Diversified Financial Services—0.8% | ||||||||
| SREI Infrastructure Finance, Ltd. | 299,125 | 207,051 | ||||||
| Diversified Telecommunication Services—1.8% | ||||||||
| Tata Communications, Ltd. | 94,628 | 360,060 | ||||||
| Tulip Telecom, Ltd. | 26,842 | 87,281 | ||||||
| Total Diversified Telecommunication Services | 447,341 | |||||||
| Electrical Equipment—2.6% | ||||||||
| Havells India, Ltd. | 83,819 | 625,455 | ||||||
| Energy Equipment & Services—0.7% | ||||||||
| BGR Energy Systems, Ltd. | 25,022 | 164,284 | ||||||
| Food Products—5.4% | ||||||||
| Bajaj Hindusthan, Ltd. | 174,381 | 137,974 | ||||||
| KS Oils, Ltd.* | 345,044 | 71,157 | ||||||
| McLeod Russel India, Ltd. | 116,578 | 566,763 | ||||||
| Ruchi Soya Industries, Ltd. | 227,992 | 523,718 | ||||||
| Triveni Turbine, Ltd.* ** | 4,128 | 1,497 | ||||||
| Total Food Products | 1,301,109 | |||||||
| Health Care Providers & Services—1.2% | ||||||||
| Fortis Healthcare, Ltd.* | 112,631 | 289,425 | ||||||
| Hotels, Restaurants & Leisure—1.1% | ||||||||
| Hotel Leelaventure, Ltd. | 358,254 | 263,707 | ||||||
| Household Durables—1.4% | ||||||||
| Videocon Industries, Ltd. | 103,198 | 353,792 | ||||||
| Independent Power Producers & Energy Traders—1.1% | ||||||||
| Jaiprakash Power Ventures, Ltd.* | 379,633 | 263,941 | ||||||
| IT Services—7.5% | ||||||||
| Core Education & Technologies, Ltd. | 88,485 | 518,443 | ||||||
| Firstsource Solutions, Ltd.* | 806,537 | 186,092 | ||||||
| Hexaware Technologies, Ltd. | 511,541 | 872,153 | ||||||
| NIIT, Ltd. | 264,041 | 237,219 | ||||||
| Total IT Services | 1,813,907 | |||||||
| Machinery—0.7% | ||||||||
| Escorts, Ltd. | 113,648 | 164,178 | ||||||
| Marine—1.7% | ||||||||
| Mercator Lines, Ltd.* | 305,372 | 151,205 | ||||||
| Shipping Corp. of India, Ltd. | 155,145 | 263,089 | ||||||
| Total Marine | 414,294 | |||||||
| Media—4.8% | ||||||||
| Deccan Chronicle Holdings, Ltd.* | 191,305 | 216,012 | ||||||
| Dish TV India, Ltd.* | 600,255 | 946,803 | ||||||
| Total Media | 1,162,815 | |||||||
| Metals & Mining—3.5% | ||||||||
| Gujarat Mineral Development Corp., Ltd. | 176,781 | 612,010 | ||||||
| Jai Corp., Ltd. | 78,243 | 126,611 | ||||||
| Prakash Industries, Ltd. | 96,103 | 102,137 | ||||||
| Total Metals & Mining | 840,758 | |||||||
| Oil, Gas & Consumable Fuels—3.7% | ||||||||
| Essar Oil, Ltd.* | 148,554 | 244,026 | ||||||
| Mangalore Refinery & Petrochemicals, Ltd. | 390,630 | 495,316 | ||||||
| Reliance Industrial Infrastructure, Ltd. | 19,715 | 160,216 | ||||||
| Total Oil, Gas & Consumable Fuels | 899,558 | |||||||
| Pharmaceuticals—1.7% | ||||||||
| Orchid Chemicals & Pharmaceuticals, Ltd. | 125,844 | 406,761 | ||||||
| Real Estate Management & Development—4.2% | ||||||||
| Ackruti City, Ltd. | 27,665 | 107,356 | ||||||
| Anant Raj Industries, Ltd. | 220,608 | 259,459 | ||||||
| Orbit Corp., Ltd. | 143,044 | 94,340 | ||||||
| Parsvnath Developers, Ltd.* | 222,631 | 294,796 | ||||||
| Sobha Developers, Ltd. | 62,391 | 276,508 | ||||||
| Total Real Estate Management & Development | 1,032,459 | |||||||
The accompanying notes are an integral part of these financial statements.
| 46 | EGA Emerging Global Shares Trust |
Schedule of Investments (Consolidated)† (continued)
EGShares India Small Cap ETF
(formerly Emerging Global Shares INDXX India Small Cap Index Fund)
September 30, 2011 (Unaudited)
| Investments | Shares | Value | ||||||
| Software—3.5% | ||||||||
| 3i Infotech, Ltd. | 281,551 | $ | 150,908 | |||||
| Financial Technologies India, Ltd. | 23,539 | 390,611 | ||||||
| Geodesic, Ltd. | 169,145 | 175,793 | ||||||
| ICSA India, Ltd. | 106,348 | 146,466 | ||||||
| Total Software | 863,778 | |||||||
| Textiles, Apparel & Luxury Goods—10.5% | ||||||||
| Alok Industries, Ltd. | 793,000 | 297,122 | ||||||
| Arvind, Ltd.* | 328,541 | 660,436 | ||||||
| Bombay Dyeing & Manufacturing Co., Ltd. | 29,679 | 223,130 | ||||||
| Bombay Rayon Fashions, Ltd. | 91,483 | 516,583 | ||||||
| Rajesh Exports, Ltd. | 173,568 | 430,775 | ||||||
| SRF, Ltd. | 66,662 | 422,499 | ||||||
| Total Textiles, Apparel & Luxury Goods | 2,550,545 | |||||||
| Thrifts & Mortgage Finance—1.6% | ||||||||
| Dewan Housing Finance Corp., Ltd. | 78,892 | 379,358 | ||||||
| Wireless Telecommunication Services—1.4% | ||||||||
| Tata Teleservices Maharashtra, Ltd.* | 962,259 | 334,998 | ||||||
| TOTAL COMMON STOCKS | ||||||||
| (Cost: $32,448,091) | 24,129,619 | |||||||
| RIGHTS—0.1% | ||||||||
| Food Products—0.1 | ||||||||
| Bajaj Hindusthan Ltd.* | ||||||||
| (cost $46,792) | 348,762 | 19,583 | ||||||
| TOTAL INVESTMENTS IN SECURITIES—99.6% | ||||||||
| (Cost: $32,494,883) | 24,149,202 | |||||||
| Other Assets in Excess of Liabilities—0.4% | 96,809 | |||||||
| Net Assets—100.0% | $ | 24,246,011 | ||||||
| † | The Consolidated Schedule of Investments includes the accounts of the wholly-owned subsidiary. All inter-company accounts and transactions have been eliminated in consolidation. See Note 2 of the Notes to Financial Statements. |
| * | Non-income producing security. |
| ** | Security has been deemed illiquid. |
The accompanying notes are an integral part of these financial statements.
| EGA Emerging Global Shares Trust | 47 |
Schedule of Investments (Consolidated)†
September 30, 2011 (Unaudited)
| Investments | Shares | Value | ||||||
| COMMON STOCKS—72.6% | ||||||||
| Automobiles—15.1% | ||||||||
| Bajaj Auto, Ltd. | 4,470 | $ | 140,188 | |||||
| Hero Motorcorp, Ltd. | 3,861 | 153,080 | ||||||
| Mahindra & Mahindra, Ltd. | 8,696 | 142,892 | ||||||
| Tata Motors, Ltd. | 26,606 | 84,775 | ||||||
| TVS Motor Co., Ltd. | 25,087 | 31,221 | ||||||
| Total Automobiles | 552,156 | |||||||
| Beverages—4.4% | ||||||||
| United Breweries, Ltd.* | 7,602 | 58,131 | ||||||
| United Spirits, Ltd. | 6,355 | 103,256 | ||||||
| Total Beverages | 161,387 | |||||||
| Chemicals—4.2% | ||||||||
| Asian Paints, Ltd. | 2,372 | 152,929 | ||||||
| Construction Materials—1.2% | ||||||||
| Century Textiles & Industries, Ltd. | 6,751 | 42,270 | ||||||
| Diversified Consumer Services—0.9% | ||||||||
| Educomp Solutions, Ltd. | 6,781 | 33,008 | ||||||
| Food Products—6.9% | ||||||||
| Kwality Dairy India, Ltd. | 5,382 | 18,599 | ||||||
| Nestle India, Ltd. | 1,642 | 142,562 | ||||||
| Tata Global Beverages, Ltd. | 51,084 | 89,495 | ||||||
| Total Food Products | 250,656 | |||||||
| Hotels, Restaurants & Leisure—2.8% | ||||||||
| Indian Hotels Co., Ltd. | 69,237 | 100,869 | ||||||
| Household Durables—1.5% | ||||||||
| TTK Prestige, Ltd. | 304 | 16,045 | ||||||
| Videocon Industries, Ltd. | 11,889 | 40,759 | ||||||
| Total Household Durables | 56,804 | |||||||
| Household Products—4.4% | ||||||||
| Hindustan Unilever, Ltd. | 23,079 | 160,505 | ||||||
| Media—6.2% | ||||||||
| Dish TV India, Ltd.* | 32,110 | 50,648 | ||||||
| Sun TV Network, Ltd. | 12,437 | 58,953 | ||||||
| ZEE Entertainment Enterprises, Ltd. | 48,834 | 117,212 | ||||||
| Total Media | 226,813 | |||||||
| Personal Products—13.3% | ||||||||
| Colgate-Palmolive India, Ltd. | 7,267 | 145,822 | ||||||
| Dabur India, Ltd. | 61,817 | 130,008 | ||||||
| Godrej Consumer Products, Ltd. | 14,565 | 119,108 | ||||||
| Marico, Ltd. | 30,407 | 89,312 | ||||||
| Total Personal Products | 484,250 | |||||||
| Textiles, Apparel & Luxury Goods—8.1% | ||||||||
| Bata India, Ltd. | 3,588 | 47,573 | ||||||
| Gitanjali Gems, Ltd. | 6,872 | 48,942 | ||||||
| Raymond, Ltd. | 3,984 | 27,182 | ||||||
| Titan Industries, Ltd. | 32,657 | 139,330 | ||||||
| VIP Industries, Ltd. | 1,733 | 32,192 | ||||||
| Total Textiles, Apparel & Luxury Goods | 295,219 | |||||||
| Tobacco—3.6% | ||||||||
| ITC, Ltd. | 32,498 | 131,386 | ||||||
| TOTAL INVESTMENTS IN SECURITIES—72.6% | ||||||||
| (Cost: $2,830,992) | 2,648,252 | |||||||
| Other Assets in Excess of Liabilities—27.4% | 1,001,464 | |||||||
| Net Assets—100.0% | $ | 3,649,716 | ||||||
| † | The Consolidated Schedule of Investments includes the accounts of the wholly-owned subsidiary. All inter-company accounts and transactions have been eliminated in consolidation. See Note 2 of the Notes to Financial Statements. |
| * | Non-income producing security |
The accompanying notes are an integral part of these financial statements.
| 48 | EGA Emerging Global Shares Trust |
Schedule of Investments (Consolidated)†
EGShares Emerging Markets High Income Low Beta ETF
September 30, 2011 (Unaudited)
| Investments | Shares | Value | ||||||
| EQUITIES—99.5% | ||||||||
| Brazil—12.2% | ||||||||
| Centrais Eletricas Brasileiras SA Class B ADR | 44,770 | $ | 523,361 | |||||
| Companhia Energetica de Minas Gerais Preference | ||||||||
| Shares ADR | 34,012 | 504,738 | ||||||
| Telecomunicacoes de Sao Paulo SA | ||||||||
| Preference Shares ADR | 28,118 | 743,721 | ||||||
| Total Brazil | 1,771,820 | |||||||
| China—14.9% | ||||||||
| Anta Sports Products, Ltd. | 330,000 | 386,178 | ||||||
| Huaneng Power International, Inc. Class H | 1,006,000 | 432,911 | ||||||
| Jiangsu Expressway Co., Ltd. Class H | 644,000 | 492,219 | ||||||
| Renhe Commercial Holdings Co., Ltd. | 3,276,000 | 353,491 | ||||||
| Zhejiang Expressway Co., Ltd. Class H | 810,000 | 494,235 | ||||||
| Total China | 2,159,034 | |||||||
| Czech Republic—2.7% | ||||||||
| CEZ AS | 10,000 | 385,437 | ||||||
| Egypt—2.4% | ||||||||
| Orascom Construction Industries GDR | 10,146 | 352,574 | ||||||
| Hungary—4.7% | ||||||||
| Magyar Telekom Telecommunications PLC | 306,928 | 686,342 | ||||||
| India—6.0% | ||||||||
| Indian Oil Corp., Ltd. | 63,119 | 401,397 | ||||||
| Oil & Natural Gas Corp., Ltd. | 86,841 | 471,841 | ||||||
| Total India | 873,238 | |||||||
| Malaysia—10.8% | ||||||||
| DiGi.com BHD | 65,500 | 624,122 | ||||||
| Plus Expressways BHD | 309,000 | 417,162 | ||||||
| Public Bank BHD | 136,700 | 522,393 | ||||||
| Total Malaysia | 1,563,677 | |||||||
| Mexico—9.4% | ||||||||
| Kimberly-Clark de Mexico SAB de CV Class A | 163,300 | 841,902 | ||||||
| Telefonos de Mexico SAB de CV Class L | 685,000 | 514,626 | ||||||
| Total Mexico | 1,356,528 | |||||||
| Philippines—4.7% | ||||||||
| Philippine Long Distance Telephone Co. ADR | 13,890 | 687,972 | ||||||
| South Africa—15.4% | ||||||||
| Aveng, Ltd. | 102,320 | 439,236 | ||||||
| JD Group, Ltd. | 73,686 | 350,139 | ||||||
| Pretoria Portland Cement Co., Ltd. | 200,548 | 580,008 | ||||||
| Reunert, Ltd. | 57,918 | 423,987 | ||||||
| Sanlam, Ltd. | 132,099 | 444,487 | ||||||
| Total South Africa | 2,237,857 | |||||||
| Thailand—13.8% | ||||||||
| Major Cineplex Group PCL | 1,030,600 | 414,428 | ||||||
| Quality Houses Co., Ltd PCL | 9,593,900 | 444,434 | ||||||
| Samart Corp. PCL | 1,797,000 | 462,474 | ||||||
| Total Access Communication PCL | 288,800 | 687,508 | ||||||
| Total Thailand | 2,008,844 | |||||||
| Turkey—2.5% | ||||||||
| Fenerbahce Sportif Hizmetler Sanayi VE Ticaret AS | 14,436 | 361,783 | ||||||
| TOTAL INVESTMENTS IN SECURITIES—99.5% | ||||||||
| (Cost: $15,190,193) | 14,445,106 | |||||||
| Other Assets in Excess of Liabilities—0.5% | 76,651 | |||||||
| Net Assets—100.0% | $ | 14,521,757 | ||||||
| † | The Consolidated Schedule of Investments includes the accounts of the wholly-owned subsidiary. All inter-company accounts and transactions have been eliminated in consolidation. See Note 2 of the Notes to Financial Statements. |
| * | Non-income producing security |
| ADR | American Depositary Receipts |
| GDR | Global Depositary Receipts |
| Summary by Industry | Value | % of Net Assets | ||||||
| Commercial Banks | $ | 522,393 | 3.6 | % | ||||
| Construction & Engineering | 791,810 | 5.4 | ||||||
| Construction Materials | 580,008 | 4.0 | ||||||
| Diversified Telecommunication Services | 1,944,689 | 13.4 | ||||||
| Electric Utilities | 1,413,536 | 9.7 | ||||||
| Electronic Equipment, Instruments & Components | 462,474 | 3.2 | ||||||
| Household Products | 841,902 | 5.8 | ||||||
| Independent Power Producers & Energy Traders | 432,911 | 3.0 | ||||||
| Industrial Conglomerates | 423,987 | 2.9 | ||||||
| Insurance | 444,487 | 3.1 | ||||||
| Media | 776,211 | 5.3 | ||||||
| Oil, Gas & Consumable Fuels | 873,238 | 6.0 | ||||||
| Real Estate Management & Development | 797,925 | 5.5 | ||||||
| Specialty Retail | 350,139 | 2.4 | ||||||
| Textiles, Apparel & Luxury Goods | 386,178 | 2.7 | ||||||
| Transportation Infrastructure | 1,403,616 | 9.7 | ||||||
| Wireless Telecommunication Services | 1,999,602 | 13.8 | ||||||
| Total Investments | 14,445,106 | 99.5 | ||||||
| Other Assets in Excess of Liabilities | 76,651 | 0.5 | ||||||
| Net Assets | $ | 14,521,757 | 100.0 | % | ||||
The accompanying notes are an integral part of these financial statements.
| EGA Emerging Global Shares Trust | 49 |
Statements of Assets and Liabilities
EGA Emerging Global Shares Trust
September 30, 2011 (Unaudited)
| EGShares GEMS Composite ETF (Consolidated) | EGShares Basic Materials GEMS ETF (Consolidated) | EGShares Consumer Goods GEMS ETF (Consolidated) | EGShares Consumer Services GEMS ETF | |||||||||
| ASSETS: | ||||||||||||
| Cost of Investments: | $ | 24,908,807 | $ | 963,348 | $ | 993,265 | $ | 1,027,782 | ||||
| Investments at value | 20,283,022 | 712,564 | 929,512 | 828,859 | ||||||||
| Cash | 113,114 | 61,348 | 33,074 | 21,171 | ||||||||
| Foreign cash* | 5,535 | 1,499 | 3,331 | 1 | ||||||||
| Restricted foreign cash†* | — | — | — | — | ||||||||
| Receivables: | ||||||||||||
| Investment securities sold | 2,139,002 | — | — | — | ||||||||
| Foreign currency sold | 22 | — | — | — | ||||||||
| Dividends and interest | 45,702 | 714 | 782 | 359 | ||||||||
| Due from sub-adviser | 684 | 6,590 | 6,896 | 7,321 | ||||||||
| Foreign tax reclaims | 756 | — | — | — | ||||||||
| Prepaid expense and other assets | 1,634 | 1,276 | 1,277 | 1,276 | ||||||||
| Total Assets | 22,589,471 | 783,991 | 974,872 | 858,987 | ||||||||
| LIABILITIES: | ||||||||||||
| Payables: | ||||||||||||
| Capital shares payable | 2,140,199 | — | — | — | ||||||||
| Foreign cash due to custodian* | — | — | — | — | ||||||||
| Accrued investment advisory fees | 5,936 | 356 | 754 | 581 | ||||||||
| Accrued Trustee fees | 385 | 13 | 14 | 12 | ||||||||
| Accrued expenses and other liabilities | 75,550 | 32,811 | 32,800 | 33,767 | ||||||||
| Total Liabilities | 2,222,070 | 33,180 | 33,568 | 34,360 | ||||||||
| NET ASSETS | $ | 20,367,401 | $ | 750,811 | $ | 941,304 | $ | 824,627 | ||||
| NET ASSETS: | ||||||||||||
| Paid-in capital | $ | 25,963,665 | $ | 1,073,014 | $ | 968,675 | $ | 990,628 | ||||
| Accumulated net investment income (loss) | 234,509 | 13,748 | 9,392 | 775 | ||||||||
| Undistributed (accumulated) net realized gain (loss) on | ||||||||||||
| investments and foreign currency translations | (1,204,094 | ) | (85,045 | ) | 27,164 | 32,150 | ||||||
| Net unrealized depreciation on investments and on | ||||||||||||
| foreign currency translations | (4,626,679 | ) | (250,906 | ) | (63,927 | ) | (198,926 | ) | ||||
| NET ASSETS | $ | 20,367,401 | $ | 750,811 | $ | 941,304 | $ | 824,627 | ||||
| Outstanding beneficial interest shares (unlimited shares | ||||||||||||
| of beneficial interest authorized, no par value) | 1,005,000 | 50,000 | 50,000 | 50,000 | ||||||||
| Net asset value per share | $ | 20.27 | $ | 15.02 | $ | 18.83 | $ | 16.49 | ||||
| * Cost of foreign cash: | $ | 5,603 | $ | 1,600 | $ | 3,501 | $ | 1 | ||||
| †* Restricted foreign cash represents deposits being held by custodian as collateral for Argentine currency contracts. |
| EGShares Energy GEMS ETF (Consolidated) | EGShares Financials GEMS ETF (Consolidated) | EGShares Health Care GEMS ETF (Consolidated) | EGShares Industrials GEMS ETF (Consolidated) | EGShares Technology GEMS ETF (Consolidated) | EGShares Telecom GEMS ETF (Consolidated) | |||||||||||||
| ASSETS: | ||||||||||||||||||
| Cost of Investments: | $ | 18,907,484 | $ | 6,933,696 | $ | 1,005,427 | $ | 1,006,680 | $ | 1,005,543 | $ | 1,000,603 | ||||||
| Investments at value | 14,428,675 | 5,134,162 | 846,520 | 767,789 | 807,329 | 902,088 | ||||||||||||
| Cash | 568,354 | 40,372 | 15,357 | 16,631 | 19,084 | 29,273 | ||||||||||||
| Foreign cash* | — | 4,620 | 2,903 | 2,928 | 1,519 | 2,677 | ||||||||||||
| Restricted foreign cash†* | 50,395 | — | — | — | — | — | ||||||||||||
| Receivables: | ||||||||||||||||||
| Investment securities sold | 161,719 | — | — | — | — | — | ||||||||||||
| Foreign currency sold | — | — | — | — | — | — | ||||||||||||
| Dividends and interest | 41,510 | 1,604 | — | 1,975 | 45 | 734 | ||||||||||||
| Due from sub-adviser | 6,046 | 6,573 | 6,604 | 6,641 | 6,942 | 6,877 | ||||||||||||
| Foreign tax reclaims | — | — | — | — | — | — | ||||||||||||
| Prepaid expense and other assets | 3,334 | 1,414 | 1,276 | 1,276 | 1,276 | 1,276 | ||||||||||||
| Total Assets | 15,260,033 | 5,188,745 | 872,660 | 797,240 | 836,195 | 942,925 | ||||||||||||
| LIABILITIES: | ||||||||||||||||||
| Payables: | ||||||||||||||||||
| Capital shares payable | — | — | — | — | — | — | ||||||||||||
| Foreign cash due to custodian* | 140,559 | — | — | — | — | — | ||||||||||||
| Accrued investment advisory fees | 4,063 | 1,326 | 373 | 354 | 729 | 697 | ||||||||||||
| Accrued Trustee fees | 397 | 114 | 13 | 14 | 14 | 13 | ||||||||||||
| Accrued expenses and other liabilities | 62,329 | 52,569 | 32,629 | 32,671 | 32,596 | 32,985 | ||||||||||||
| Total Liabilities | 207,348 | 54,009 | 33,015 | 33,039 | 33,339 | 33,695 | ||||||||||||
| NET ASSETS | $ | 15,052,685 | $ | 5,134,736 | $ | 839,645 | $ | 764,201 | $ | 802,856 | $ | 909,230 | ||||||
| NET ASSETS: | ||||||||||||||||||
| Paid-in capital | $ | 17,351,028 | $ | 6,742,836 | $ | 1,106,989 | $ | 1,085,341 | $ | 1,117,963 | $ | 1,029,309 | ||||||
| Accumulated net investment income (loss) | 249,145 | (19,047 | ) | 3,801 | 6,075 | 671 | 7,700 | |||||||||||
| Undistributed (accumulated) net realized gain (loss) on | ||||||||||||||||||
| investments and foreign currency translations | 1,936,383 | 210,558 | (112,083 | ) | (88,197 | ) | (117,467 | ) | (29,252 | ) | ||||||||
| Net unrealized depreciation on investments and on | ||||||||||||||||||
| foreign currency translations | (4,483,871 | ) | (1,799,611 | ) | (159,062 | ) | (239,018 | ) | (198,311 | ) | (98,527 | ) | ||||||
| NET ASSETS | $ | 15,052,685 | $ | 5,134,736 | $ | 839,645 | $ | 764,201 | $ | 802,856 | $ | 909,230 | ||||||
| Outstanding beneficial interest shares (unlimited shares | ||||||||||||||||||
| of beneficial interest authorized, no par value) | 700,000 | 300,000 | 50,000 | 50,000 | 50,000 | 50,000 | ||||||||||||
| Net asset value per share | $ | 21.50 | $ | 17.12 | $ | 16.79 | $ | 15.28 | $ | 16.06 | $ | 18.18 | ||||||
| * Cost of foreign cash: | $ | (86,545 | ) | $ | 4,699 | $ | 3,058 | $ | 2,985 | $ | 1,615 | $ | 2,685 | |||||
| †* Restricted foreign cash represents deposits being held by custodian as collateral for Argentine currency contracts. |
The accompanying notes are an integral part of these financial statements.
50 & 51 EGA Emerging Global Shares Trust
Statements of Assets and Liabilities (concluded)
EGA Emerging Global Shares Trust
September 30, 2011 (Unaudited)
| EGShares Utilities GEMS ETF (Consolidated) | EGShares Emerging Markets Metals & Mining ETF (Consolidated) | EGShares Emerging Markets Consumer ETF (Consolidated) | |||||||
| ASSETS: | |||||||||
| Cost of Investments: | $ | 997,962 | $ | 22,493,426 | $ | 247,922,247 | |||
| Investments at value | 771,469 | 17,072,016 | 223,469,931 | ||||||
| Cash | 15,994 | 118,187 | 1,851,754 | ||||||
| Foreign cash* | 2,262 | 6,541 | 206,782 | ||||||
| Receivables: | |||||||||
| Investment securities sold | — | — | 1,269,810 | ||||||
| Capital shares sold | — | — | — | ||||||
| Foreign currency sold | — | — | 1,227 | ||||||
| Dividends and interest | 1,206 | 11,950 | 142,687 | ||||||
| Due from sub-adviser | 6,969 | 1,459 | — | ||||||
| Foreign tax reclaims | — | 625 | — | ||||||
| Prepaid offering expenses | — | — | — | ||||||
| Prepaid expense and other assets | 1,276 | 1,693 | 3,764 | ||||||
| Total Assets | 799,176 | 17,212,471 | 226,945,955 | ||||||
| LIABILITIES: | |||||||||
| Payables: | |||||||||
| Capital shares payable | — | — | — | ||||||
| Accrued investment advisory fees | 666 | 4,966 | 52,789 | ||||||
| Accrued Trustee fees | 14 | 474 | 2,729 | ||||||
| Due to custodian | — | — | — | ||||||
| Income payable | — | — | — | ||||||
| Investment securities purchased | — | — | 1,752,186 | ||||||
| Foreign Currency Payable | — | — | — | ||||||
| Accrued sub-advisory fees | — | — | 92,877 | ||||||
| Accrued expenses and other liabilities | 32,976 | 70,157 | 142,357 | ||||||
| Total Liabilities | 33,656 | 75,597 | 2,042,938 | ||||||
| NET ASSETS | $ | 765,520 | $ | 17,136,874 | $ | 224,903,017 | |||
| NET ASSETS: | |||||||||
| Paid-in capital | $ | 1,112,436 | $ | 20,926,983 | $ | 249,386,597 | |||
| Accumulated net investment income (loss) | 10,175 | 410,447 | 1,395,318 | ||||||
| Undistributed (accumulated) net realized gain (loss) on | |||||||||
| investments and foreign currency translations | (130,566 | ) | 1,221,069 | (1,418,088 | ) | ||||
| Net unrealized depreciation on investments and on foreign | |||||||||
| currency translations | (226,525 | ) | (5,421,625 | ) | (24,460,810 | ) | |||
| NET ASSETS | $ | 765,520 | $ | 17,136,874 | $ | 224,903,017 | |||
| Outstanding beneficial interest shares (unlimited shares of | |||||||||
| beneficial interest authorized, no par value) | 50,000 | 1,100,000 | 11,100,000 | ||||||
| Net asset value per share | $ | 15.31 | $ | 15.58 | $ | 20.26 | |||
| * Cost of foreign cash: | $ | 2,273 | $ | 6,769 | $ | 213,659 | |||
| EGShares India Infrastructure ETF (Consolidated) | EGShares China Infrastructure ETF | EGShares Brazil Infrastructure ETF | EGShares India Small Cap ETF (Consolidated) | EGShares India Consumer ETF (Consolidated) | EGShares Emerging Markets High Income Low Beta ETF (Consolidated) | |||||||||||||
| ASSETS: | ||||||||||||||||||
| Cost of Investments: | $ | 86,243,115 | $ | 18,616,508 | $ | 76,142,107 | $ | 32,494,883 | $ | 2,830,992 | $ | 15,190,193 | ||||||
| Investments at value | 63,636,080 | 12,574,030 | 69,220,635 | 24,149,202 | 2,648,252 | 14,445,106 | ||||||||||||
| Cash | — | 83,224 | 128,324 | 44,757 | 87,465 | 322,590 | ||||||||||||
| Foreign cash* | 2,111,517 | — | 371 | 94,933 | 1,998 | 1,521,329 | ||||||||||||
| Receivables: | ||||||||||||||||||
| Investment securities sold | — | — | — | — | 13,641 | — | ||||||||||||
| Capital shares sold | — | — | — | — | 1,823,951 | — | ||||||||||||
| Foreign currency sold | 1,704,255 | — | — | — | — | 4,714 | ||||||||||||
| Dividends and interest | 128,088 | 26,424 | 718,340 | 39,124 | 2,530 | 33,708 | ||||||||||||
| Due from sub-adviser | — | 6,363 | — | 5,681 | 18,214 | 7,186 | ||||||||||||
| Foreign tax reclaims | — | — | — | — | — | — | ||||||||||||
| Prepaid offering expenses | — | — | — | 8,094 | — | — | ||||||||||||
| Prepaid expense and other assets | 6,624 | 1,532 | 2,285 | 1,681 | — | — | ||||||||||||
| Total Assets | 67,586,564 | 12,691,573 | 70,069,955 | 24,343,472 | 4,596,051 | 16,334,633 | ||||||||||||
| LIABILITIES: | ||||||||||||||||||
| Payables: | ||||||||||||||||||
| Capital shares payable | — | — | — | — | — | 6,029 | ||||||||||||
| Accrued investment advisory fees | 16,515 | 3,750 | 17,862 | 7,555 | 2,538 | 1,906 | ||||||||||||
| Accrued Trustee fees | 1,059 | 258 | 1,076 | 413 | 22 | 27 | ||||||||||||
| Due to custodian | 1,842,576 | — | — | — | — | — | ||||||||||||
| Income payable | — | — | — | — | — | 68,003 | ||||||||||||
| Investment securities purchased | — | — | — | — | 911,975 | 1,711,617 | ||||||||||||
| Foreign Currency Payable | 1,703,385 | — | — | — | — | — | ||||||||||||
| Accrued sub-advisory fees | 30,983 | — | 14,594 | — | — | — | ||||||||||||
| Accrued expenses and other liabilities | 104,608 | 65,805 | 110,870 | 89,493 | 31,800 | 25,294 | ||||||||||||
| Total Liabilities | 3,699,126 | 69,813 | 144,402 | 97,461 | 946,335 | 1,812,876 | ||||||||||||
| NET ASSETS | $ | 63,887,438 | $ | 12,621,760 | $ | 69,925,553 | $ | 24,246,011 | $ | 3,649,716 | $ | 14,521,757 | ||||||
| NET ASSETS: | ||||||||||||||||||
| Paid-in capital | $ | 91,043,075 | $ | 18,765,607 | $ | 79,519,042 | $ | 36,470,959 | $ | 3,853,026 | $ | 15,964,244 | ||||||
| Accumulated net investment income (loss) | 263,211 | 345,429 | 2,100,877 | 261,396 | 2,175 | (20,595 | ) | |||||||||||
| Undistributed (accumulated) net realized gain (loss) on investments and foreign currency translations | (4,808,255 | ) | (446,800 | ) | (4,711,779 | ) | (4,138,126 | ) | (22,677 | ) | (677,408 | ) | ||||||
| Net unrealized depreciation on investments and on foreign currency translations | (22,610,593 | ) | (6,042,476 | ) | (6,982,587 | ) | (8,348,218 | ) | (182,808 | ) | (744,484 | ) | ||||||
| NET ASSETS | $ | 63,887,438 | $ | 12,621,760 | $ | 69,925,553 | $ | 24,246,011 | $ | 3,649,716 | $ | 14,521,757 | ||||||
| Outstanding beneficial interest shares (unlimited shares of beneficial interest authorized, no par value) | 4,350,000 | 900,000 | 3,500,000 | 1,600,000 | 200,000 | 850,000 | ||||||||||||
| Net asset value per share | $ | 14.69 | $ | 14.02 | $ | 19.98 | $ | 15.15 | $ | 18.25 | $ | 17.08 | ||||||
| * Cost of foreign cash: | $ | 2,107,847 | $ | — | $ | 377 | $ | 96,932 | $ | 1,980 | $ | 1,521,329 | ||||||
The accompanying notes are an integral part of these financial statements.
52 & 53 EGA Emerging Global Shares Trust
Statements of Operations
EGA Emerging Global Shares Trust
For the Period April 1, 2011 Through September 30, 2011 (Unaudited)
| EGShares GEMS Composite ETF (Consolidated) | EGShares Basic Materials GEMS ETF (Consolidated)1 | EGShares Consumer Goods GEMS ETF (Consolidated)1 | EGShares Consumer Services GEMS ETF1 | ||||||||||
| INVESTMENT INCOME: | |||||||||||||
| Dividend income* | $ | 503,012 | $ | 17,192 | $ | 13,255 | $ | 3,650 | |||||
| Interest income | 2 | 1 | — | 1 | |||||||||
| Total investment income | 503,014 | 17,193 | 13,255 | 3,651 | |||||||||
| EXPENSES: | |||||||||||||
| Sub-advisory fees | 107,844 | 3,445 | 3,858 | 2,876 | |||||||||
| Administration and accounting fees | 45,386 | — | — | — | |||||||||
| Custody fees | 37,795 | 15,645 | 15,776 | 15,661 | |||||||||
| Investment advisory fees | 14,391 | 405 | 804 | 630 | |||||||||
| Legal fees | 9,989 | 435 | 440 | 417 | |||||||||
| Licensing fees | 9,531 | 2,160 | 2,165 | 2,287 | |||||||||
| Audit and tax fees | 7,179 | 8,076 | 8,076 | 8,076 | |||||||||
| Pricing fees | 6,739 | 1,256 | 1,256 | 1,256 | |||||||||
| Transfer agent fees | 5,942 | 3,177 | 3,177 | 3,177 | |||||||||
| Shareholder reporting fees | 3,587 | 119 | 120 | 443 | |||||||||
| Exchange listing fees | 2,469 | 1,354 | 1,354 | 1,354 | |||||||||
| Insurance fees | 1,011 | 40 | 40 | 39 | |||||||||
| Trustees’ fees and expenses | 1,003 | 41 | 42 | 39 | |||||||||
| Registration fees | 328 | 55 | 54 | 38 | |||||||||
| Offering fees | — | 10,143 | 10,143 | 10,143 | |||||||||
| Interest expense | — | — | 2 | — | |||||||||
| Miscellaneous fees | 793 | 25 | 28 | 25 | |||||||||
| Total expenses before reimbursements/waivers | 253,987 | 46,376 | 47,335 | 46,461 | |||||||||
| Less: Reimbursements/waivers of expenses from sub-adviser | (146,100 | ) | (42,931 | ) | (43,472 | ) | (43,585 | ) | |||||
| Net expenses | 107,887 | 3,445 | 3,863 | 2,876 | |||||||||
| Net investment income | 395,127 | 13,748 | 9,392 | 775 | |||||||||
| REALIZED AND UNREALIZED GAIN (LOSS) ON INVESTMENTS AND | |||||||||||||
| FOREIGN CURRENCY TRANSLATIONS: | |||||||||||||
| Net realized gain (loss) on: | |||||||||||||
| Investments | (193,443 | ) | (23,931 | ) | 2,857 | (11,490 | ) | ||||||
| In-Kind Redemptions | (253,050 | ) | (59,063 | ) | 25,422 | 42,846 | |||||||
| Foreign currency translations | (11,641 | ) | (2,051 | ) | (1,115 | ) | 794 | ||||||
| Net realized gain (loss) | (458,134 | ) | (85,045 | ) | 27,164 | 32,150 | |||||||
| Change in unrealized depreciation on: | |||||||||||||
| Investments | (8,285,319 | ) | (250,784 | ) | (63,753 | ) | (198,923 | ) | |||||
| Foreign currency translations | (5,143 | ) | (122 | ) | (174 | ) | (3 | ) | |||||
| Change in unrealized depreciation | (8,290,462 | ) | (250,906 | ) | (63,927 | ) | (198,926 | ) | |||||
| Net realized and unrealized loss on investments and | |||||||||||||
| foreign currency translations | (8,748,596 | ) | (335,951 | ) | (36,763 | ) | (166,776 | ) | |||||
| NET DECREASE IN NET ASSETS RESULTING FROM OPERATIONS | $ | (8,353,469 | ) | $ | (322,203 | ) | $ | (27,371 | ) | $ | (166,001 | ) | |
| * Net of foreign taxes withheld of: | $ | 47,631 | $ | 1,404 | $ | 699 | $ | 118 | |||||
| 1 Represents the period June 23, 2011 (commencement of operations) to September 30, 2011. |
| EGShares Energy GEMS ETF (Consolidated) | EGShares Financials GEMS ETF (Consolidated) | EGShares Health Care GEMS ETF (Consolidated)1 | EGShares Industrials GEMS ETF (Consolidated)1 | EGShares Technology GEMS ETF (Consolidated)1 | EGShares Telecom GEMS ETF (Consolidated)1 | |||||||||||||
| INVESTMENT INCOME: | ||||||||||||||||||
| Dividend income* | $ | 400,203 | $ | 175,937 | $ | 7,394 | $ | 9,561 | $ | 4,355 | $ | 11,241 | ||||||
| Interest income | 1 | 2 | — | — | — | — | ||||||||||||
| Total investment income | 400,204 | 175,939 | 7,394 | 9,561 | 4,355 | 11,241 | ||||||||||||
| EXPENSES: | ||||||||||||||||||
| Sub-advisory fees | 93,586 | 34,671 | 3,591 | 3,444 | 3,683 | 3,539 | ||||||||||||
| Administration and accounting fees | 47,448 | 45,386 | — | — | — | — | ||||||||||||
| Custody fees | 31,538 | 18,136 | 15,832 | 15,827 | 15,720 | 15,698 | ||||||||||||
| Investment advisory fees | 11,020 | 4,083 | 422 | 405 | 780 | 747 | ||||||||||||
| Legal fees | 7,937 | 3,237 | 428 | 438 | 439 | 436 | ||||||||||||
| Licensing fees | 10,285 | 4,746 | 2,157 | 2,163 | 2,165 | 2,159 | ||||||||||||
| Audit and tax fees | 7,178 | 7,179 | 8,076 | 8,076 | 8,076 | 8,076 | ||||||||||||
| Pricing fees | 6,739 | 6,739 | 1,256 | 1,256 | 1,256 | 1,256 | ||||||||||||
| Transfer agent fees | 5,942 | 5,942 | 3,177 | 3,177 | 3,177 | 3,177 | ||||||||||||
| Shareholder reporting fees | 2,123 | 1,587 | 117 | 120 | 120 | 119 | ||||||||||||
| Exchange listing fees | 2,469 | 2,469 | 1,354 | 1,354 | 1,354 | 1,354 | ||||||||||||
| Insurance fees | 799 | 294 | 40 | 40 | 40 | 40 | ||||||||||||
| Trustees’ fees and expenses | 778 | 328 | 40 | 41 | 42 | 41 | ||||||||||||
| Registration fees | 328 | 328 | 54 | 57 | 55 | 57 | ||||||||||||
| Offering fees | — | — | 10,144 | 10,143 | 10,143 | 10,144 | ||||||||||||
| Interest expense | — | — | — | 40 | — | — | ||||||||||||
| Miscellaneous fees | 787 | 753 | 27 | 27 | 26 | 26 | ||||||||||||
| Total expenses before reimbursements/waivers | 228,957 | 135,878 | 46,715 | 46,608 | 47,076 | 46,869 | ||||||||||||
| Less: Reimbursements/waivers of expenses from sub-adviser | (135,334 | ) | (101,206 | ) | (43,122 | ) | (43,122 | ) | (43,392 | ) | (43,328 | ) | ||||||
| Net expenses | 93,623 | 34,672 | 3,593 | 3,486 | 3,684 | 3,541 | ||||||||||||
| Net investment income | 306,581 | 141,267 | 3,801 | 6,075 | 671 | 7,700 | ||||||||||||
| REALIZED AND UNREALIZED GAIN (LOSS) ON INVESTMENTS AND | ||||||||||||||||||
| FOREIGN CURRENCY TRANSLATIONS: | ||||||||||||||||||
| Net realized gain (loss) on: | ||||||||||||||||||
| Investments | (83,954 | ) | 26,142 | (29,988 | ) | (16,334 | ) | (49,908 | ) | (2,382 | ) | |||||||
| In-Kind Redemptions | 2,154,481 | 213,425 | (80,719 | ) | (66,587 | ) | (66,017 | ) | (25,746 | ) | ||||||||
| Foreign currency translations | (3,567 | ) | (262 | ) | (1,376 | ) | (5,276 | ) | (1,542 | ) | (1,124 | ) | ||||||
| Net realized gain (loss) | 2,066,960 | 239,305 | (112,083 | ) | (88,197 | ) | (117,467 | ) | (29,252 | ) | ||||||||
| Change in unrealized depreciation on: | ||||||||||||||||||
| Investments | (9,145,635 | ) | (2,756,090 | ) | (158,907 | ) | (238,891 | ) | (198,214 | ) | (98,515 | ) | ||||||
| Foreign currency translations | (3,758 | ) | (281 | ) | (155 | ) | (127 | ) | (97 | ) | (12 | ) | ||||||
| Change in unrealized depreciation | (9,149,393 | ) | (2,756,371 | ) | (159,062 | ) | (239,018 | ) | (198,311 | ) | (98,527 | ) | ||||||
| Net realized and unrealized loss on investments and | ||||||||||||||||||
| foreign currency translations | (7,082,433 | ) | (2,517,066 | ) | (271,145 | ) | (327,215 | ) | (315,778 | ) | (127,779 | ) | ||||||
| NET DECREASE IN NET ASSETS RESULTING FROM OPERATIONS | $ | (6,775,852 | ) | $ | (2,375,799 | ) | $ | (267,344 | ) | $ | (321,140 | ) | $ | (315,107 | ) | $ | (120,079 | ) |
| * Net of foreign taxes withheld of: | $ | 54,895 | $ | 14,965 | $ | 317 | $ | 120 | $ | 211 | $ | 785 | ||||||
| 1 Represents the period June 23, 2011 (commencement of operations) to September 30, 2011. |
The accompanying notes are an integral part of these financial statements.
54 & 55 EGA Emerging Global Shares Trust
Statements of Operations
EGA Emerging Global Shares Trust
For the Period April 1, 2011 to September 30, 2011 (Unaudited)
| EGShares Utilities GEMS ETF (Consolidated)1 | EGShares Emerging Markets Metals & Mining ETF (Consolidated)1 | EGShares Emerging Markets Consumer ETF (Consolidated)1 | ||||||
| INVESTMENT INCOME: | ||||||||
| Dividend income* | $ | 13,734 | $ | 587,563 | 2,331,755 | |||
| Interest income | — | 39 | 965 | |||||
| Total investment income | 13,734 | 587,602 | 2,332,720 | |||||
| EXPENSES: | ||||||||
| Sub-advisory fees | 3,327 | 120,841 | 923,926 | |||||
| Administration and accounting fees | — | 47,448 | 36,128 | |||||
| Custody fees | 15,884 | 29,311 | 142,020 | |||||
| Investment advisory fees | 715 | 14,230 | 108,766 | |||||
| Legal fees | 437 | 11,202 | 67,169 | |||||
| Licensing fees | 2,157 | 10,341 | 55,923 | |||||
| Audit and tax fees | 8,076 | 7,179 | 7,672 | |||||
| Pricing fees | 1,256 | 6,739 | 6,739 | |||||
| Transfer agent fees | 3,177 | 5,942 | 5,942 | |||||
| Shareholder reporting fees | 118 | 3,405 | 14,268 | |||||
| Exchange listing fees | 1,354 | 2,469 | 2,469 | |||||
| Insurance fees | 40 | 1,052 | 6,579 | |||||
| Trustees’ fees and expenses | 41 | 1,124 | 6,436 | |||||
| Registration fees | 55 | 328 | 2,078 | |||||
| Offering fees | 10,144 | — | 41,987 | |||||
| Interest expense | 228 | — | — | |||||
| Miscellaneous fees | 6 | 776 | (161 | ) | ||||
| Total expenses before reimbursements/waivers | 47,015 | 262,387 | 1,427,941 | |||||
| Less: Reimbursements/waivers of expenses from sub-adviser | (43,456 | ) | (141,519 | ) | (504,208 | ) | ||
| Net expenses | 3,559 | 120,868 | 923,733 | |||||
| Net investment income | 10,175 | 466,734 | 1,408,987 | |||||
| REALIZED AND UNREALIZED GAIN (LOSS) ON INVESTMENTS AND FOREIGN | ||||||||
| CURRENCY TRANSLATIONS: | ||||||||
| Net realized gain (loss) on: | ||||||||
| Investments | (42,610 | ) | (7,995 | ) | (684,544 | ) | ||
| In-Kind Redemptions | (83,145 | ) | 1,762,013 | 253,133 | ||||
| Foreign currency translations | (4,811 | ) | 7,467 | (89,758 | ) | |||
| Net realized gain (loss) | (130,566 | ) | 1,761,485 | (521,169 | ) | |||
| Change in unrealized depreciation on: | ||||||||
| Investments | (226,493 | ) | (11,441,360 | ) | (30,618,871 | ) | ||
| Foreign currency translations | (32 | ) | (316 | ) | (7,397 | ) | ||
| Change in unrealized depreciation | (226,525 | ) | (11,441,676 | ) | (30,626,268 | ) | ||
| Net realized and unrealized loss on investments and foreign currency translations | (357,091 | ) | (9,680,191 | ) | (31,147,437 | ) | ||
| NET DECREASE IN NET ASSETS RESULTING FROM OPERATIONS | $ | (346,916 | ) | $ | (9,213,457 | ) | (29,738,450 | ) |
| * Net of foreign taxes withheld of: | $ | 1,163 | $ | 54,955 | 116,625 | |||
1 | Represents the period June 23, 2011 (commencement of operations) to September 30, 2011. |
| 2 | Represents the period August 10, 2011 (commencement of operations) to September 30, 2011. |
| 3 | Represents the period August 4, 2011 (commencement of operations) to September 30, 2011. |
| EGShares India Infrastructure ETF (Consolidated) | EGShares China Infrastructure ETF | EGShares Brazil Infrastructure ETF | EGShares India Small Cap ETF (Consolidated) | EGShares India Consumer ETF (Consolidated)2 | EGShares Emerging Markets High Income Low Beta ETF (Consolidated)3 | |||||||||||||
| INVESTMENT INCOME: | ||||||||||||||||||
| Dividend income* | $ | 590,089 | $ | 421,903 | $ | 2,358,629 | $ | 411,147 | $ | 4,704 | $ | 57,042 | ||||||
| Interest income | 50 | — | — | 5,537 | — | — | ||||||||||||
| Total investment income | 590,139 | 421,903 | 2,358,629 | 416,684 | 4,704 | 57,042 | ||||||||||||
| EXPENSES: | ||||||||||||||||||
| Sub-advisory fees | 333,139 | 83,848 | 358,920 | 143,175 | 2,526 | 9,567 | ||||||||||||
| Administration and accounting fees | 25,877 | 39,197 | 39,197 | 33,009 | — | — | ||||||||||||
| Custody fees | 104,205 | 21,733 | 81,243 | 85,954 | 15,192 | 9,744 | ||||||||||||
| Investment advisory fees | 39,222 | 9,873 | 42,256 | 17,333 | 2,538 | 1,906 | ||||||||||||
| Legal fees | 26,565 | 6,759 | 27,415 | 11,302 | 201 | 292 | ||||||||||||
| Licensing fees | 39,841 | 9,418 | 40,304 | 36,804 | 5,825 | 3,687 | ||||||||||||
| Audit and tax fees | 7,673 | 6,685 | 6,685 | 7,672 | 3,389 | 3,636 | ||||||||||||
| Pricing fees | 6,739 | 6,739 | 6,739 | 6,739 | 631 | 699 | ||||||||||||
| Transfer agent fees | 5,942 | 5,942 | 5,942 | 5,942 | 1,680 | 1,885 | ||||||||||||
| Shareholder reporting fees | 5,170 | 2,247 | 8,859 | 3,835 | 75 | 82 | ||||||||||||
| Exchange listing fees | 2,469 | 2,469 | 2,469 | 2,463 | 697 | 775 | ||||||||||||
| Insurance fees | 2,653 | 790 | 2,953 | 1,136 | 20 | 22 | ||||||||||||
| Trustees’ fees and expenses | 2,540 | 674 | 2,732 | 1,092 | 22 | 27 | ||||||||||||
| Registration fees | 1,640 | 492 | 1,639 | 1,639 | 6 | 39 | ||||||||||||
| Offering fees | 51,856 | — | — | 33,470 | 5,225 | 5,840 | ||||||||||||
| Interest expense | — | — | 62 | — | — | — | ||||||||||||
| Miscellaneous fees | 273 | 33 | 33 | 46 | 6 | 69 | ||||||||||||
| Total expenses before reimbursements/waivers | 655,804 | 196,899 | 627,448 | 391,611 | 38,033 | 38,270 | ||||||||||||
| Less: Reimbursements/waivers of expenses from sub-adviser | (322,425 | ) | (113,051 | ) | (268,466 | ) | (248,423 | ) | (35,504 | ) | (28,636 | ) | ||||||
| Net expenses | 333,379 | 83,848 | 358,982 | 143,188 | 2,529 | 9,634 | ||||||||||||
| Net investment income | 256,760 | 338,055 | 1,999,647 | 273,496 | 2,175 | 47,408 | ||||||||||||
| REALIZED AND UNREALIZED GAIN (LOSS) ON INVESTMENTS AND FOREIGN | ||||||||||||||||||
| CURRENCY TRANSLATIONS: | ||||||||||||||||||
| Net realized gain (loss) on: | ||||||||||||||||||
| Investments | (4,776,083 | ) | (1,331,038 | ) | (4,651,841 | ) | (4,118,343 | ) | (775 | ) | (426,577 | ) | ||||||
| In-Kind Redemptions | — | 932,161 | — | — | — | (197,017 | ) | |||||||||||
| Foreign currency translations | 81,845 | (838 | ) | (89,892 | ) | 14,440 | (21,902 | ) | (53,814 | ) | ||||||||
| Net realized gain (loss) | (4,694,238 | ) | (399,715 | ) | (4,741,733 | ) | (4,103,903 | ) | (22,677 | ) | (677,408 | ) | ||||||
| Change in unrealized depreciation on: | ||||||||||||||||||
| Investments | (16,447,596 | ) | (7,457,464 | ) | (16,712,042 | ) | (3,709,566 | ) | (182,740 | ) | (745,087 | ) | ||||||
| Foreign currency translations | (5,154 | ) | 2 | (72,441 | ) | (3,692 | ) | (68 | ) | 603 | ||||||||
| Change in unrealized depreciation | (16,452,750 | ) | (7,457,462 | ) | (16,784,483 | ) | (3,713,258 | ) | (182,808 | ) | (744,484 | ) | ||||||
| Net realized and unrealized loss on investments and foreign currency translations | (21,146,988 | ) | (7,857,177 | ) | (21,526,216 | ) | (7,817,161 | ) | (205,485 | ) | (1,421,892 | ) | ||||||
| NET DECREASE IN NET ASSETS RESULTING FROM OPERATIONS | $ | (20,890,228 | ) | $ | (7,519,122 | ) | $ | (19,526,569 | ) | $ | (7,543,665 | ) | $ | (203,310 | ) | $ | (1,374,484 | ) |
| * Net of foreign taxes withheld of: | $ | — | $ | 28,194 | $ | 4,027 | $ | — | $ | — | $ | 3,384 | ||||||
1 | Represents the period June 23, 2011 (commencement of operations) to September 30, 2011. |
| 2 | Represents the period August 10, 2011 (commencement of operations) to September 30, 2011. |
| 3 | Represents the period August 4, 2011 (commencement of operations) to September 30, 2011. |
The accompanying notes are an integral part of these financial statements.
56 & 57 EGA Emerging Global Shares Trust
Statements of Changes in Net Assets
EGA Emerging Global Shares Trust
| EGShares GEMS Composite ETF (Consolidated)1 | EGShares Basic Materials GEMS ETF (Consolidated) | EGShares Consumer Goods GEMS ETF (Consolidated) | EGShares Consumer Services GEMS ETF | ||||||||||||
| For the Period April 1, 2011 Through September 30, 2011 (Unaudited) | For the Year Ended March 31, 2011 | For the Period June 23, 20112 Through September 30, 2011 (Unaudited) | For the Period June 23, 20112 Through September 30, 2011 (Unaudited) | For the Period June 23, 20112 Through September 30, 2011 (Unaudited) | |||||||||||
| INCREASE (DECREASE) IN NET ASSETS RESULTING FROM | |||||||||||||||
| OPERATIONS: | |||||||||||||||
| Net investment income | $ | 395,127 | $ | 441,879 | $ | 13,748 | $ | 9,392 | $ | 775 | |||||
| Net realized gain (loss) on investments and foreign currency translations | (458,134 | ) | 323,391 | (85,045 | ) | 27,164 | 32,150 | ||||||||
| Net unrealized appreciation (depreciation) on investments and foreign currency translations | (8,290,462 | ) | 2,208,345 | (250,906 | ) | (63,927 | ) | (198,926 | ) | ||||||
| Net increase (decrease) in net assets resulting from operations | (8,353,469 | ) | 2,973,615 | (322,203 | ) | (27,371 | ) | (166,001 | ) | ||||||
| DISTRIBUTIONS TO SHAREHOLDERS: | |||||||||||||||
| Net investment income | — | (644,426 | ) | — | — | — | |||||||||
| CAPITAL SHARE TRANSACTIONS: | |||||||||||||||
| Proceeds from sale of shares | 3,572,388 | 11,669,431 | 2,000,824 | 2,001,093 | 3,017,313 | ||||||||||
| Cost of shares redeemed | (6,726,058 | ) | (13,879,381 | ) | (927,874 | ) | (1,032,450 | ) | (2,026,685 | ) | |||||
| Transaction fees | 59 | — | 64 | 32 | — | ||||||||||
| Net increase (decrease) in net assets resulting from capital share transactions | (3,153,611 | ) | (2,209,950 | ) | 1,073,014 | 968,675 | 990,628 | ||||||||
| Net Increase (Decrease) in Net Assets | (11,507,080 | ) | 119,239 | 750,811 | 941,304 | 824,627 | |||||||||
| NET ASSETS: | |||||||||||||||
| Beginning of period | 31,874,481 | 31,755,242 | — | — | — | ||||||||||
| End of period | $ | 20,367,401 | $ | 31,874,481 | $ | 750,811 | $ | 941,304 | $ | 824,627 | |||||
| Accumulated net investment income (loss) included in net assets at end of period | $ | 234,509 | $ | (160,618 | ) | $ | 13,748 | $ | 9,392 | $ | 775 | ||||
| SHARES CREATED AND REDEEMED: | |||||||||||||||
| Shares outstanding, beginning of period | 1,155,000 | 1,305,000 | — | — | — | ||||||||||
| Shares sold | 150,000 | 450,000 | 100,000 | 100,000 | 150,000 | ||||||||||
| Shares redeemed | (300,000 | ) | (600,000 | ) | (50,000 | ) | (50,000 | ) | (100,000 | ) | |||||
| Shares outstanding, end of period | 1,005,000 | 1,155,000 | 50,000 | 50,000 | 50,000 | ||||||||||
1 | On September 16, 2010 there was a 2 for 1 forward stock split. Historical share amounts have been adjusted to reflect the 2 for 1 forward stock split on a retroactive basis. |
| 2 | Commencement of operations. |
| EGShares Energy GEMS ETF (Consolidated)1 | EGShares Financials GEMS ETF (Consolidated)1 | EGShares Health Care GEMS ETF (Consolidated) | EGShares Industrials GEMS ETF (Consolidated) | EGShares Technology GEMS ETF (Consolidated) | EGShares Telecom GEMS ETF (Consolidated) | |||||||||||||||||||
| For the Period April 1, 2011 Through September 30, 2011 (Unaudited) | For the Year Ended March 31, 2011 | For the Period April 1, 2011 Through September 30, 2011 (Unaudited) | For the Year Ended March 31, 2011 | For the Period June 23, 20112 Through September 30, 2011 (Unaudited) | For the Period June 23, 20112 Through September 30, 2011 (Unaudited) | For the Period June 23, 20112 Through September 30, 2011 (Unaudited) | For the Period June 23, 20112 Through September 30, 2011 (Unaudited) | |||||||||||||||||
| INCREASE (DECREASE) IN NET ASSETS RESULTING FROM OPERATIONS: | ||||||||||||||||||||||||
| Net investment income | $ | 306,581 | $ | 123,085 | $ | 141,267 | $ | 187,531 | $ | 3,801 | $ | 6,075 | $ | 671 | $ | 7,700 | ||||||||
| Net realized gain (loss) on investments and foreign currency translations | 2,066,960 | (25,280 | ) | 239,305 | 412,798 | (112,083 | ) | (88,197 | ) | (117,467 | ) | (29,252 | ) | |||||||||||
| Net unrealized appreciation (depreciation) on investments and foreign currency translations | (9,149,393 | ) | 3,554,511 | (2,756,371 | ) | 303,701 | (159,062 | ) | (239,018 | ) | (198,311 | ) | (98,527 | ) | ||||||||||
| Net increase (decrease) in net assets resulting from operations | (6,775,852 | ) | 3,652,316 | (2,375,799 | ) | 904,030 | (267,344 | ) | (321,140 | ) | (315,107 | ) | (120,079 | ) | ||||||||||
| DISTRIBUTIONS TO SHAREHOLDERS: | ||||||||||||||||||||||||
| Net investment income | — | (144,970 | ) | — | (398,935 | ) | — | — | — | — | ||||||||||||||
| CAPITAL SHARE TRANSACTIONS: | ||||||||||||||||||||||||
| Proceeds from sale of shares | 8,376,257 | 15,043,490 | 2,276,691 | 9,604,582 | 2,001,554 | 2,002,350 | 2,002,139 | 2,000,957 | ||||||||||||||||
| Cost of shares redeemed | (11,987,437 | ) | (2,718,340 | ) | (5,811,919 | ) | (5,916,109 | ) | (894,565 | ) | (916,962 | ) | (884,176 | ) | (971,745 | ) | ||||||||
| Transaction fees | — | — | 105 | — | — | (47 | ) | — | 97 | |||||||||||||||
| Net increase (decrease) in net assets resulting from capital share transactions | (3,611,180 | ) | 12,325,150 | (3,535,123 | ) | 3,688,473 | 1,106,989 | 1,085,341 | 1,117,963 | 1,029,309 | ||||||||||||||
| Net Increase (Decrease) in Net Assets | (10,387,032 | ) | 15,832,496 | (5,910,922 | ) | 4,193,568 | 839,645 | 764,201 | 802,856 | 909,230 | ||||||||||||||
| NET ASSETS: | ||||||||||||||||||||||||
| Beginning of period | 25,439,717 | 9,607,221 | 11,045,658 | 6,852,090 | — | — | — | — | ||||||||||||||||
| End of period | $ | 15,052,685 | $ | 25,439,717 | $ | 5,134,736 | $ | 11,045,658 | $ | 839,645 | $ | 764,201 | $ | 802,856 | $ | 909,230 | ||||||||
| Accumulated net investment income (loss) included in net assets at end of period | $ | 249,145 | $ | (57,436 | ) | $ | (19,047 | ) | $ | (160,314 | ) | $ | 3,801 | $ | 6,075 | $ | 671 | $ | 7,700 | |||||
| SHARES CREATED AND REDEEMED: | ||||||||||||||||||||||||
| Shares outstanding, beginning of period | 850,000 | 400,000 | 450,000 | 300,000 | — | — | — | — | ||||||||||||||||
| Shares sold | 300,000 | 550,000 | 100,000 | 400,000 | 100,000 | 100,000 | 100,000 | 100,000 | ||||||||||||||||
| Shares redeemed | (450,000 | ) | (100,000 | ) | (250,000 | ) | (250,000 | ) | (50,000 | ) | (50,000 | ) | (50,000 | ) | (50,000 | ) | ||||||||
| Shares outstanding, end of period | 700,000 | 850,000 | 300,000 | 450,000 | 50,000 | 50,000 | 50,000 | 50,000 | ||||||||||||||||
1 | On September 16, 2010 there was a 2 for 1 forward stock split. Historical share amounts have been adjusted to reflect the 2 for 1 forward stock split on a retroactive basis. |
| 2 | Commencement of operations. |
The accompanying notes are an integral part of these financial statements.
58 & 59 EGA Emerging Global Shares Trust
Statements of Changes in Net Assets
EGA Emerging Global Shares Trust
| EGShares Utilities GEMS ETF (Consolidated) | EGShares Emerging Markets Metals & Mining ETF (Consolidated)1 | EGShares Emerging Markets Consumer ETF (Consolidated) | EGShares India Infrastructure ETF (Consolidated) | ||||||||||||||||||
| For the Period June 23, 20112 Through September 30, 2011 (Unaudited) | For the Period April 1, 2011 Through September 30, 2011 (Unaudited) | For the Year Ended March 31, 2011 | For the Period April 1, 2011 Through September 30, 2011 (Unaudited) | For the Period September 14, 20102 Through March 31, 2011 | For the Period April 1, 2011 Through September 30, 2011 (Unaudited) | For the Period August 11, 20102 Through March 31, 2011 | |||||||||||||||
| INCREASE (DECREASE) IN NET | �� | ||||||||||||||||||||
| ASSETS RESULTING FROM | |||||||||||||||||||||
| OPERATIONS: | |||||||||||||||||||||
| Net investment income | $ | 10,175 | $ | 466,734 | $ | 172,404 | $ | 1,408,987 | $ | 252,091 | $ | 256,760 | $ | 29,073 | |||||||
| Net realized gain (loss) on investments and foreign currency translations | (130,566 | ) | 1,761,485 | 275,522 | (521,169 | ) | (459,563 | ) | (4,694,238 | ) | (181,096 | ) | |||||||||
| Net unrealized appreciation (depreciation) on investments and foreign currency translations | (226,525 | ) | (11,441,676 | ) | 2,521,470 | (30,626,268 | ) | 6,165,458 | (16,452,750 | ) | (6,157,843 | ) | |||||||||
| Net increase (decrease) in net | |||||||||||||||||||||
| assets resulting from operations | (346,916 | ) | (9,213,457 | ) | 2,969,396 | (29,738,450 | ) | 5,957,986 | (20,890,228 | ) | (6,309,866 | ) | |||||||||
| DISTRIBUTIONS TO SHAREHOLDERS: | |||||||||||||||||||||
| Net investment income | — | — | (203,413 | ) | — | (115,161 | ) | — | — | ||||||||||||
| CAPITAL SHARE TRANSACTIONS: | |||||||||||||||||||||
| Proceeds from sale of shares | 2,000,985 | 2,779,851 | 14,511,574 | 64,450,041 | 199,856,513 | 993,296 | 93,889,722 | ||||||||||||||
| Cost of shares redeemed | (888,474 | ) | (14,307,986 | ) | (7,039,234 | ) | (4,421,430 | ) | (11,096,209 | ) | (1,592,681 | ) | (2,203,911 | ) | |||||||
| Transaction fees | (75 | ) | — | — | 1,546 | 8,181 | (401 | ) | 1,507 | ||||||||||||
| Net increase (decrease) in net | |||||||||||||||||||||
| assets resulting from capital | |||||||||||||||||||||
| share transactions | 1,112,436 | (11,528,135 | ) | 7,472,340 | 60,030,157 | 188,768,485 | (599,786 | ) | 91,687,318 | ||||||||||||
| Net Increase (Decrease) in | |||||||||||||||||||||
| Net Assets | 765,520 | (20,741,592 | ) | 10,238,323 | 30,291,707 | 194,611,310 | (21,490,014 | ) | 85,377,452 | ||||||||||||
| NET ASSETS: | |||||||||||||||||||||
| Beginning of period | — | 37,878,466 | 27,640,143 | 194,611,310 | — | 85,377,452 | — | ||||||||||||||
| End of period | $ | 765,520 | $ | 17,136,874 | $ | 37,878,466 | $ | 224,903,017 | $ | 194,611,310 | $ | 63,887,438 | $ | 85,377,452 | |||||||
| Accumulated net investment | |||||||||||||||||||||
| income (loss) included in net | |||||||||||||||||||||
| assets at end of period | $ | 10,175 | $ | 410,447 | $ | (56,287 | ) | $ | 1,395,318 | $ | (13,669 | ) | $ | 263,211 | $ | 6,451 | |||||
| SHARES CREATED AND REDEEMED: | |||||||||||||||||||||
| Shares outstanding, beginning | |||||||||||||||||||||
| of period | — | 1,650,000 | 1,350,000 | 8,550,000 | — | 4,400,000 | — | ||||||||||||||
| Shares sold | 100,000 | 150,000 | 650,000 | 2,750,000 | 9,050,000 | 50,000 | 4,500,000 | ||||||||||||||
| Shares redeemed | (50,000 | ) | (700,000 | ) | (350,000 | ) | (200,000 | ) | (500,000 | ) | (100,000 | ) | (100,000 | ) | |||||||
| Shares outstanding, end of period | 50,000 | 1,100,000 | 1,650,000 | 11,100,000 | 8,550,000 | 4,350,000 | 4,400,000 | ||||||||||||||
1 On September 16, 2010 there was a 3 for 1 forward stock split. Historical share amounts have been adjusted to reflect the 3 for 1 forward stock split on a retroactive basis.
2 Commencement of operations.
| EGShares China Infrastructure ETF | EGShares Brazil Infrastructure ETF | EGShares India Small Cap ETF (Consolidated) | EGShares India Consumer ETF (Consolidated) | EGShares Emerging Markets High Income Low Beta ETF (Consolidated) | ||||||||||||||||||||
| For the Period April 1, 2011 Through September 30, 2011 (Unaudited) | For the Year Ended March 31, 2011 | For the Period April 1, 2011 Through September 30, 2011 (Unaudited) | For the Year Ended March 31, 2011 | For the Period April 1, 2011 Through September 30, 2011 (Unaudited) | For the Period July 7, 20102 Through March 31, 2011 | For the Period August 10, 20112 Through September 30, 2011 (Unaudited) | For the Period August 4, 20112 Through September 30, 2011 (Unaudited) | |||||||||||||||||
| INCREASE (DECREASE) IN NET ASSETS RESULTING FROM | ||||||||||||||||||||||||
| OPERATIONS: | ||||||||||||||||||||||||
| Net investment income | $ | 338,055 | $ | 57,693 | $ | 1,999,647 | $ | 944,389 | $ | 273,496 | $ | (9,977 | ) | $ | 2,175 | $ | 47,408 | |||||||
| Net realized gain (loss) on | ||||||||||||||||||||||||
| investments and foreign | ||||||||||||||||||||||||
| currency translations | (399,715 | ) | 224,130 | (4,741,733 | ) | 43,568 | (4,103,903 | ) | (52,060 | ) | (22,677 | ) | (677,408 | ) | ||||||||||
| Net unrealized appreciation | ||||||||||||||||||||||||
| (depreciation) on investments | ||||||||||||||||||||||||
| and foreign currency | ||||||||||||||||||||||||
| translations | (7,457,462 | ) | 1,261,211 | (16,784,483 | ) | 10,009,758 | (3,713,258 | ) | (4,634,960 | ) | (182,808 | ) | (744,484 | ) | ||||||||||
| Net increase (decrease) in net | ||||||||||||||||||||||||
| assets resulting from operations | (7,519,122 | ) | 1,543,034 | (19,526,569 | ) | 10,997,715 | (7,543,665 | ) | (4,696,997 | ) | (203,310 | ) | (1,374,484 | ) | ||||||||||
| DISTRIBUTIONS TO SHAREHOLDERS: | ||||||||||||||||||||||||
| Net investment income | — | (109,650 | ) | — | (862,977 | ) | — | (34,485 | ) | — | (68,003 | ) | ||||||||||||
| CAPITAL SHARE TRANSACTIONS: | ||||||||||||||||||||||||
| Proceeds from sale of shares | 5,205,583 | 18,255,814 | 10,214,213 | 62,322,748 | 3,923,110 | 39,458,782 | 3,853,022 | 17,687,353 | ||||||||||||||||
| Cost of shares redeemed | (6,196,251 | ) | (4,792,601 | ) | (4,522,313 | ) | — | (6,860,626 | ) | — | — | (1,724,031 | ) | |||||||||||
| Transaction fees | — | — | — | — | (1,331 | ) | 1,223 | 4 | 922 | |||||||||||||||
| Net increase (decrease) in net | ||||||||||||||||||||||||
| assets resulting from capital | ||||||||||||||||||||||||
| share transactions | (990,668 | ) | 13,463,213 | 5,691,900 | 62,322,748 | (2,938,847 | ) | 39,460,005 | 3,853,026 | 15,964,244 | ||||||||||||||
| Net Increase (Decrease) in | ||||||||||||||||||||||||
| Net Assets | (8,509,790 | ) | 14,896,597 | (13,834,669 | ) | 72,457,486 | (10,482,512 | ) | 34,728,523 | 3,649,716 | 14,521,757 | |||||||||||||
| NET ASSETS: | ||||||||||||||||||||||||
| Beginning of period | 21,131,550 | 6,234,953 | 83,760,222 | 11,302,736 | 34,728,523 | — | — | — | ||||||||||||||||
| End of period | $ | 12,621,760 | $ | 21,131,550 | $ | 69,925,553 | $ | 83,760,222 | $ | 24,246,011 | $ | 34,728,523 | $ | 3,649,716 | $ | 14,521,757 | ||||||||
| Accumulated net investment | ||||||||||||||||||||||||
| income (loss) included in net | ||||||||||||||||||||||||
| assets at end of period | $ | 345,429 | $ | 7,374 | $ | 2,100,877 | $ | 101,230 | $ | 261,396 | $ | (12,100 | ) | $ | 2,175 | $ | (20,595 | ) | ||||||
| SHARES CREATED AND REDEEMED: | ||||||||||||||||||||||||
| Shares outstanding, beginning | ||||||||||||||||||||||||
| of period | 950,000 | 300,000 | 3,300,000 | 550,000 | 1,800,000 | — | — | — | ||||||||||||||||
| Shares sold | 250,000 | 900,000 | 400,000 | 2,750,000 | 200,000 | 1,800,000 | 200,000 | 950,000 | ||||||||||||||||
| Shares redeemed | (300,000 | ) | (250,000 | ) | (200,000 | ) | — | (400,000 | ) | — | — | (100,000 | ) | |||||||||||
| Shares outstanding, end of period | 900,000 | 950,000 | 3,500,000 | 3,300,000 | 1,600,000 | 1,800,000 | 200,000 | 850,000 | ||||||||||||||||
1 On September 16, 2010 there was a 3 for 1 forward stock split. Historical share amounts have been adjusted to reflect the 3 for 1 forward stock split on a retroactive basis.
2 Commencement of operations.
The accompanying notes are an integral part of these financial statements.
60 & 61 EGA Emerging Global Shares Trust
Financial Highlights
EGA Emerging Global Shares Trust
For a share outstanding throughout each period
| EGShares GEMS Composite ETF (Consolidated)1 | EGShares Basic Materials GEMS ETF (Consolidated) | EGShares Consumer Goods GEMS ETF (Consolidated) | |||||||||||||||
| For the Period April 1, 2011 Through September 30, 2011 (Unaudited) | For the Year Ended March 31, 2011 | For the Period July 22, 20092 Through March 31, 2010 | For the Period June 23, 20112 Through September 30, 2011 (Unaudited) | For the Period June 23, 20112 Through September 30, 2011 (Unaudited) | |||||||||||||
| Net asset value, beginning of period | $ | 27.60 | $ | 24.34 | $ | 20.00 | $ | 20.00 | $ | 20.00 | |||||||
| Investment operations: | �� | ||||||||||||||||
| Net investment income3 | 0.35 | 0.39 | 0.09 | 0.18 | 0.12 | ||||||||||||
| Net realized and unrealized gain (loss) on | |||||||||||||||||
| investments and foreign currency translations | (7.68 | ) | 3.48 | 4.31 | (5.16 | ) | (1.29 | ) | |||||||||
| Total from investment operations | (7.33 | ) | 3.87 | 4.40 | (4.98 | ) | (1.17 | ) | |||||||||
| Distributions to shareholders: | |||||||||||||||||
| Net investment income | — | (0.61 | ) | (0.06 | ) | — | — | ||||||||||
| Net asset value, end of period | $ | 20.27 | $ | 27.60 | $ | 24.34 | $ | 15.02 | $ | 18.83 | |||||||
| NET ASSET VALUE TOTAL RETURN4 | (26.56 | )% | 16.04 | % | 21.96 | % | (24.90 | )% | (5.85 | )% | |||||||
| RATIOS/SUPPLEMENTAL DATA: | |||||||||||||||||
| Net assets, end of period (000’s ommited) | $ | 20,367 | $ | 31,874 | $ | 31,755 | $ | 751 | $ | 941 | |||||||
| Ratios to average net assets: | |||||||||||||||||
| Expenses, net of expense reimbursements/waivers | 0.75 | %6 | 0.75 | % | 0.75 | %6 | 0.85 | %6 | 0.85 | %6 | |||||||
| Expenses, prior to expense reimbursements/waivers | 1.77 | %6 | 2.00 | % | 3.43 | %6 | 3.09 | %6 | 10.43 | %6 | |||||||
| Net investment income | 2.75 | %6 | 1.55 | % | 0.52 | %6 | 3.39 | %6 | 2.07 | %6 | |||||||
| Portfolio turnover rate | 2 | %7 | 39 | % | 6 | %7 | 18 | %7 | 28 | %7 | |||||||
| 1 | On September 16, 2010, there was a 2 for 1 forward stock split. Historical share amounts have been adjusted to reflect the 2 for 1 forward stock split on a retroactive basis. |
| 2 | Commencement of operations. |
| 3 | Based on average shares outstanding. |
| 4 | Total return is calculated assuming an initial investment made at the net asset value at the beginning of the period, reinvestment of all dividends and distributions at net asset value during the period, and redemption at net asset value on the last day of the period. Total return calculated for a period of less than one year is not annualized. The total return would have been lower if certain expenses had not been reimbursed/waived by the sub-adviser. |
| 5 | For the period ended March 31, 2010, 0.73% of the Fund’s total return consists of a voluntary reimbursement by the current and former sub-advisers for a realized investment loss, and another (1.08)% consists of a realized investment loss on a trading error. Excluding these items, total return would have been 17.88%. |
| 6 | Annualized. |
| 7 | Not annualized. |
| EGShares Consumer Services GEMS ETF (Consolidated) | EGShares Energy GEMS ETF (Consolidated)1 | EGShares Financials GEMS ETF (Consolidated)1 | |||||||||||||||||||
| For the Period June 23, 20112 Through September 30, 2011 (Unaudited) | For the Period April 1, 2011 Through September 30, 2011 (Unaudited) | For the Year Ended March 31, 2011 | For the Period May 21, 20092 Through March 31, 2010 | For the Period April 1, 2011 Through September 30, 2011 (Unaudited) | For the Year Ended March 31, 2011 | For the Period September 16, 20092 Through March 31, 2010 | |||||||||||||||
| Net asset value, beginning of period | $ | 20.00 | $ | 29.93 | $ | 24.02 | $ | 20.49 | $ | 24.55 | $ | 22.84 | $ | 20.12 | |||||||
| Investment operations: | |||||||||||||||||||||
| Net investment income3 | 0.01 | 0.38 | 0.26 | 0.09 | 0.40 | 0.42 | 0.08 | ||||||||||||||
| Net realized and unrealized gain (loss) on | |||||||||||||||||||||
| investments and foreign currency translations | (3.52 | ) | (8.81 | ) | 5.94 | 3.50 | (7.83 | ) | 2.09 | 2.71 | |||||||||||
| Total from investment operations | (3.51 | ) | (8.43 | ) | 6.20 | 3.59 | (7.43 | ) | 2.51 | 2.79 | |||||||||||
| Distributions to shareholders: | |||||||||||||||||||||
| Net investment income | — | — | (0.29 | ) | (0.06 | ) | — | (0.80 | ) | (0.07 | ) | ||||||||||
| Net asset value, end of period | $ | 16.49 | $ | 21.50 | $ | 29.93 | $ | 24.02 | $ | 17.12 | $ | 24.55 | $ | 22.84 | |||||||
| NET ASSET VALUE TOTAL RETURN4 | (17.55 | )% | (28.17 | )% | 25.96 | % | 17.53 | %5 | (30.26 | )% | 11.03 | % | 13.87 | % | |||||||
| RATIOS/SUPPLEMENTAL DATA: | |||||||||||||||||||||
| Net assets, end of period (000’s ommited) | $ | 825 | $ | 15,053 | $ | 25,440 | $ | 9,607 | $ | 5,135 | $ | 11,046 | $ | 6,852 | |||||||
| Ratios to average net assets: | |||||||||||||||||||||
| Expenses, net of expense reimbursements/waivers | 0.85 | %6 | 0.85 | %6 | 0.85 | % | 0.85 | %6 | 0.85 | %6 | 0.85 | % | 0.85 | %6 | |||||||
| Expenses, prior to expense reimbursements/waivers | 13.73 | %6 | 2.08 | %6 | 2.56 | % | 5.90 | %6 | 3.33 | %6 | 2.81 | % | 5.47 | %6 | |||||||
| Net investment income | 0.23 | %6 | 2.78 | %6 | 1.04 | % | 0.49 | %6 | 3.46 | %6 | 1.77 | % | 0.67 | %6 | |||||||
| Portfolio turnover rate | 50 | %7 | 5 | %7 | 19 | % | 49 | %7 | 14 | %7 | 39 | % | 12 | %7 | |||||||
| 1 | On September 16, 2010, there was a 2 for 1 forward stock split. Historical share amounts have been adjusted to reflect the 2 for 1 forward stock split on a retroactive basis. |
| 2 | Commencement of operations. |
| 3 | Based on average shares outstanding. |
| 4 | Total return is calculated assuming an initial investment made at the net asset value at the beginning of the period, reinvestment of all dividends and distributions at net asset value during the period, and redemption at net asset value on the last day of the period. Total return calculated for a period of less than one year is not annualized. The total return would have been lower if certain expenses had not been reimbursed/waived by the sub-adviser. |
| 5 | For the period ended March 31, 2010, 0.73% of the Fund’s total return consists of a voluntary reimbursement by the current and former sub-advisers for a realized investment loss, and another (1.08)% consists of a realized investment loss on a trading error. Excluding these items, total return would have been 17.88%. |
| 6 | Annualized. |
| 7 | Not annualized. |
The accompanying notes are an integral part of these financial statements.
62 & 63 EGA Emerging Global Shares Trust
Financial Highlights
EGA Emerging Global Shares Trust
For a share outstanding throughout each period
| EGShares Health Care GEMS ETF (Consolidated) | EGShares Industrials GEMS ETF (Consolidated) | EGShares Technology GEMS ETF (Consolidated) | |||||||
| For the Period June 23, 20111 Through September 30, 2011 (Unaudited) | For the Period June 23, 20111 Through September 30, 2011 (Unaudited) | For the Period June 23, 20111 Through September 30, 2011 (Unaudited) | |||||||
| Net asset value, beginning of period | $ | 20.00 | $ | 20.00 | $ | 20.00 | |||
| Investment operations: | |||||||||
| Net investment income2 | 0.05 | 0.08 | 0.01 | ||||||
| Net realized and unrealized gain (loss) on investments and foreign currency translations | (3.26 | ) | (4.80 | ) | (3.95 | ) | |||
| Total from investment operations | (3.21 | ) | (4.72 | ) | (3.94 | ) | |||
| Distributions to shareholders: | |||||||||
| Net investment income | — | — | — | ||||||
| Net asset value, end of period | $ | 16.79 | $ | 15.28 | $ | 16.06 | |||
| NET ASSET VALUE TOTAL RETURN3 | (16.05 | )% | (23.60 | )% | (19.70 | )% | |||
| RATIOS/SUPPLEMENTAL DATA: | |||||||||
| Net assets, end of period (000’s ommited) | $ | 840 | $ | 764 | $ | 803 | |||
| Ratios to average net assets: | |||||||||
| Expenses, net of expense reimbursements/waivers | 0.85 | %4 | 0.86 | %4,5 | 0.85 | %4 | |||
| Expenses, prior to expense reimbursements/waivers | 11.06 | %4 | 11.50 | %4 | 10.86 | %4 | |||
| Net investment income | 0.90 | %4 | 1.50 | %4 | 0.15 | %4 | |||
| Portfolio turnover rate | 27 | %6 | 42 | %6 | 29 | %6 | |||
| 1 | Commencement of operations. |
| 2 | Based on average shares outstanding. |
| 3 | Total return is calculated assuming an initial investment made at the net asset value at the beginning of the period, reinvestment of all dividends and distributions at net asset value during the period, and redemption at net asset value on the last day of the period. Total return calculated for a period of less than one year is not annualized. The total return would have been lower if certain expenses had not been reimbursed/waived by the sub-adviser. |
| 4 | Annualized. |
| 5 | The ratio includes 0.01% for EGShares Industrials GEMS ETF and 0.06% for EGShares Utilities GEMS ETF for the period ended September 30, 2011 attributed to interest expense. |
| 6 | Not annualized. |
| 7 | On September 16, 2010, there was a 3 for 1 forward stock split. Historical shares amount have been adjusted to reflect the 3 for 1 forward stock split on a retroactive basis. |
| EGShares Telecom GEMS ETF (Consolidated) | EGShares Utilities GEMS ETF (Consolidated) | EGShares Emerging Markets Metals & Mining ETF (Consolidated)7 | EGShares Emerging Markets Consumer ETF (Consolidated) | |||||||||||||||||||
| For the Period June 23, 20111 Through September 30, 2011 (Unaudited) | For the Period June 23, 20111 Through September 30, 2011 (Unaudited) | For the Period April 1, 2011 Through September 30, 2011 (Unaudited) | For the Year Ended March 31, 2011 | For the Period May 21, 20091 Through March 31, 2010 | For the Period April 1, 2011 Through September 30, 2011 (Unaudited) | For the Period September 14, 20101 Through March 31, 2011 | ||||||||||||||||
| Net asset value, beginning of period | $ | 20.00 | $ | 20.00 | $ | 22.96 | $ | 20.47 | $ | 13.73 | $ | 22.76 | $ | 20.00 | ||||||||
| Investment operations: | ||||||||||||||||||||||
| Net investment income2 | 0.10 | 0.13 | 0.35 | 0.13 | (0.01 | ) | 0.15 | 0.04 | ||||||||||||||
| Net realized and unrealized gain (loss) on investments and foreign currency translations | (1.92 | ) | (4.82 | ) | (7.73 | ) | 2.52 | 6.82 | (2.65 | ) | 2.74 | |||||||||||
| Total from investment operations | (1.82 | ) | (4.69 | ) | (7.38 | ) | 2.65 | 6.81 | (2.50 | ) | 2.78 | |||||||||||
| Distributions to shareholders: | ||||||||||||||||||||||
| Net investment income | — | — | — | (0.16 | ) | (0.07 | ) | — | (0.02 | ) | ||||||||||||
| Net asset value, end of period | $ | 18.18 | $ | 15.31 | $ | 15.58 | $ | 22.96 | $ | 20.47 | $ | 20.26 | $ | 22.76 | ||||||||
| NET ASSET VALUE TOTAL RETURN3 | (9.10 | )%3 | (23.45 | )% | (32.14 | )% | 12.95 | % | 49.69 | % | (10.98 | )% | 13.88 | % | ||||||||
| RATIOS/SUPPLEMENTAL DATA: | ||||||||||||||||||||||
| Net assets, end of period (000’s ommited) | $ | 909 | $ | 766 | $ | 17,137 | $ | 37,878 | $ | 27,640 | $ | 224,903 | $ | 194,611 | ||||||||
| Ratios to average net assets: | ||||||||||||||||||||||
| Expenses, net of expense reimbursements/waivers | 0.85 | %4 | 0.91 | %4,5 | 0.85 | %4 | 0.85 | % | 0.85 | %4 | 0.85 | %4 | 0.85 | %4 | ||||||||
| Expenses, prior to expense reimbursements/waivers | 11.26 | %4 | 12.01 | %4 | 1.85 | %4 | 1.96 | % | 4.37 | %4 | 1.31 | %4 | 1.44 | %4 | ||||||||
| Net investment income | 1.85 | %4 | 2.60 | %4 | 3.28 | %4 | 0.63 | % | (0.06 | )%4 | 1.30 | %4 | 0.37 | %4 | ||||||||
| Portfolio turnover rate | 16 | %6 | 33 | %6 | 3 | %6 | 35 | % | 17 | % | 3 | %6 | 9 | %6 | ||||||||
| 1 | Commencement of operations. |
| 2 | Based on average shares outstanding. |
| 3 | Total return is calculated assuming an initial investment made at the net asset value at the beginning of the period, reinvestment of all dividends and distributions at net asset value during the period, and redemption at net asset value on the last day of the period. Total return calculated for a period of less than one year is not annualized. The total return would have been lower if certain expenses had not been reimbursed/waived by the sub-adviser. |
| 4 | Annualized. |
| 5 | The ratio includes 0.01% for EGShares Industrials GEMS ETF and 0.06% for EGShares Utilities GEMS ETF for the period ended September 30, 2011 attributed to interest expense. |
| 6 | Not annualized. |
| 7 | On September 16, 2010, there was a 3 for 1 forward stock split. Historical shares amount have been adjusted to reflect the 3 for 1 forward stock split on a retroactive basis. |
The accompanying notes are an integral part of these financial statements.
64 & 65 EGA Emerging Global Shares Trust
Financial Highlights
EGA Emerging Global Shares Trust
For a share outstanding throughout each period
| EGShares India Infrastructure ETF (Consolidated) | EGShares China Infrastructure ETF (Consolidated) | ||||||||||||||
| For the Period April 1, 2011 Through September 30, 2011 (Unaudited) | For the Period August 11, 20101 Through March 31, 2011 | For the Period April 1, 2011 Through September 30, 2011 (Unaudited) | For the Year Ended March 31, 2011 | For the Period February 17, 20101 Through March 31, 2010 | |||||||||||
| Net asset value, beginning of period | $ | 19.40 | $ | 20.00 | $ | 22.24 | $ | 20.78 | $ | 20.09 | |||||
| Investment operations: | |||||||||||||||
| Net investment income2 | 0.06 | 0.01 | 0.35 | 0.10 | (0.02 | ) | |||||||||
| Net realized and unrealized gain (loss) on | |||||||||||||||
| investments and foreign currency translations | (4.77 | ) | (0.61 | ) | (8.57 | ) | 1.49 | 0.71 | |||||||
| Total from investment operations | (4.71 | ) | (0.60 | ) | (8.22 | ) | 1.59 | 0.69 | |||||||
| Distributions to shareholders: | |||||||||||||||
| Net investment income | — | — | — | (0.13 | ) | — | |||||||||
| Net asset value, end of period | $ | 14.69 | $ | 19.40 | $ | 14.02 | $ | 22.24 | $ | 20.78 | |||||
| NET ASSET VALUE TOTAL RETURN3 | (24.28 | )% | (3.00 | )% | (36.96 | )% | 7.69 | % | 3.43 | % | |||||
| RATIOS/SUPPLEMENTAL DATA: | |||||||||||||||
| Net assets, end of period (000’s ommited) | $ | 63,887 | $ | 85,377 | $ | 12,622 | $ | 21,132 | $ | 6,235 | |||||
| Ratios to average net assets: | |||||||||||||||
| Expenses, net of expense reimbursements/waivers | 0.85 | %4 | 0.85 | %4 | 0.85 | %4 | 0.85 | % | 0.85 | %4 | |||||
| Expenses, prior to expense reimbursements/waivers | 1.67 | %4 | 2.24 | %4 | 2.00 | %4 | 2.89 | % | 7.82 | %4 | |||||
| Net investment income (loss) | 0.66 | %4 | 0.11 | %4 | 3.43 | %4 | 0.47 | % | (0.85 | )%4 | |||||
| Portfolio turnover rate | 13 | %6 | 9 | %6 | 8 | %6 | 34 | % | 1 | %6 | |||||
| 1 | Commencement of operations. |
| 2 | Based on average shares outstanding. |
| 3 | Total return is calculated assuming an initial investment made at the net asset value at the beginning of the period, reinvestment of all dividends and distributions at net asset value during the period, and redemption at net asset value on the last day of the period. Total return calculated for a period of less than one year is not annualized. The total return would have been lower if certain expenses had not been reimbursed/waived by the sub-adviser. |
| 4 | Annualized. |
| 5 | The ratio includes 0.05% for the period ended March 31, 2011 attributed to interest expense. |
| 6 | Not annualized. |
| EGShares Brazil Infrastructure ETF | EGShares India Small Cap ETF (Consolidated) | EGShares India Consumer ETF (Consolidated) | EGShares Emerging Markets High Income Low Beta ETF | ||||||||||||||||||
| For the Period April 1, 2011 Through September 30, 2011 (Unaudited) | For the Year Ended March 31, 2011 | For the Period February 24, 20101 Through March 31, 2010 | For the Period April 1, 2011 Through September 30, 2011 (Unaudited) | For the Period July 7, 20101 Through March 31, 2011 | For the Period August 10, 20111 Through September 30, 2011 (Unaudited) | For the Period August 4, 20111 Through September 30, 2011 (Unaudited) | |||||||||||||||
| Net asset value, beginning of period | $ | 25.38 | $ | 20.55 | $ | 20.00 | $ | 19.29 | $ | 20.00 | $ | 20.00 | $ | 20.00 | |||||||
| Investment operations: | |||||||||||||||||||||
| Net investment income2 | 0.58 | 0.47 | 0.03 | 0.15 | (0.01 | ) | 0.02 | 0.12 | |||||||||||||
| Net realized and unrealized gain (loss) on investments and foreign currency translations | (5.98 | ) | 4.67 | 0.52 | 6 | (4.29 | ) | (0.68 | ) | (1.77 | ) | (2.94 | ) | ||||||||
| Total from investment operations | (5.40 | ) | 5.14 | 0.55 | (4.14 | ) | (0.69 | ) | (1.75 | ) | (2.82 | ) | |||||||||
| Distributions to shareholders: | |||||||||||||||||||||
| Net investment income | — | (0.31 | ) | — | — | (0.02 | ) | — | (0.10 | ) | |||||||||||
| Net asset value, end of period | $ | 19.98 | $ | 25.38 | $ | 20.55 | $ | 15.15 | $ | 19.29 | $ | 18.25 | $ | 17.08 | |||||||
| NET ASSET VALUE TOTAL RETURN3 | (21.28 | )% | 25.16 | % | 2.75 | % | (21.46 | )% | (3.45 | )% | (8.75 | )% | (14.07 | )% | |||||||
| RATIOS/SUPPLEMENTAL DATA: | |||||||||||||||||||||
| Net assets, end of period (000’s ommited) | $ | 69,926 | $ | 83,760 | $ | 11,303 | $ | 24,246 | $ | 34,729 | $ | 3,650 | $ | 14,522 | |||||||
| Ratios to average net assets: | |||||||||||||||||||||
| Expenses, net of expense reimbursements/waivers | 0.85 | %4 | 0.85 | % | 0.85 | %4 | 0.85 | %4 | 0.90 | %4,5 | 0.89 | %4 | 0.85 | %4 | |||||||
| Expenses, prior to expense reimbursements/waivers | 1.49 | %4 | 1.91 | % | 5.67 | %4 | 2.32 | %4 | 3.12 | %4 | 13.40 | %4 | 3.40 | %4 | |||||||
| Net investment income (loss) | 4.74 | %4 | 2.09 | % | 1.58 | %4 | 1.62 | %4 | (0.06 | )%4 | 0.77 | %4 | 4.21 | %4 | |||||||
| Portfolio turnover rate | 14 | %6 | 35 | % | 1 | %6 | 30 | %6 | 1 | %6 | 1 | %6 | 65 | %6 | |||||||
| 1 | Commencement of operations. |
| 2 | Based on average shares outstanding. |
| 3 | Total return is calculated assuming an initial investment made at the net asset value at the beginning of the period, reinvestment of all dividends and distributions at net asset value during the period, and redemption at net asset value on the last day of the period. Total return calculated for a period of less than one year is not annualized. The total return would have been lower if certain expenses had not been reimbursed/waived by the sub-adviser. |
| 4 | Annualized. |
| 5 | The ratio includes 0.05% for the period ended March 31, 2011 attributed to interest expense. |
| 6 | Not annualized. |
The accompanying notes are an integral part of these financial statements.
66 & 67 EGA Emerging Global Shares Trust
Notes to Financial Statements
September 30, 2011 (Unaudited)
1. ORGANIZATION
EGA Emerging Global Shares Trust (the “Trust”) is a Delaware statutory trust organized on September 12, 2008. The Trust is an open-end management investment company, registered under the Investment Company Act of 1940, as amended (the “1940 Act”). The Trust currently consists of thirty-two separate non-diversified series. As of the date of this report, only the following funds (each a “Fund” and collectively the “Funds”) are being publicly offered:
| Funds | Commencement of Operations |
| EGShares GEMS Composite ETF (“Composite Fund”) | |
| (formerly Emerging Global Shares Dow Jones Emerging Markets Titans Composite Index Fund) | July 22, 2009 |
| EGShares Basic Materials GEMS ETF (“Basic Materials Fund”) | June 23, 2011 |
| EGShares Consumer Goods GEMS ETF (“Consumer Goods Fund”) | June 23, 2011 |
| EGShares Consumer Services GEMS ETF (“Consumer Services Fund”) | June 23, 2011 |
| EGShares Energy GEMS ETF (“Energy Fund”) | |
| (formerly Emerging Global Shares Dow Jones Emerging Markets Energy Titans Index Fund) | May 21, 2009 |
| EGShares Financials GEMS ETF (“Financials Fund”) | |
| (formerly Emerging Global Shares Dow Jones Emerging Markets Financials Titans Index Fund) | September 16, 2009 |
| EGShares Health Care GEMS ETF (“Health Care Fund”) | June 23, 2011 |
| EGShares Industrials GEMS ETF (“Industrials Fund”) | June 23, 2011 |
| EGShares Technology GEMS ETF (“Technology Fund”) | June 23, 2011 |
| EGShares Telecom GEMS ETF (“Telecom Fund”) | June 23, 2011 |
| EGShares Utilities GEMS ETF (“Utilities Fund”) | June 23, 2011 |
| EGShares Emerging Markets Metals & Mining ETF (“Metals & Mining Fund”) | |
| (formerly Emerging Global Shares Dow Jones Emerging Markets Metals & Mining Titans Index Fund) | May 21, 2009 |
| EGShares Emerging Markets Consumer ETF (“Consumer Fund”) | |
| (formerly Emerging Global Shares Dow Jones Emerging Markets Consumer Titans Index Fund) | September 14, 2010 |
| EGShares India Infrastructure ETF (“India Infrastructure Fund”) | |
| (formerly Emerging Global Shares INDXX India Infrastructure Index Fund) | August 11, 2010 |
| EGShares China Infrastructure ETF (“China Infrastructure Fund”) | |
| (formerly Emerging Global Shares INDXX China Infrastructure Index Fund) | February 17, 2010 |
| EGShares Brazil Infrastructure ETF (“Brazil Infrastructure Fund”) | |
| (formerly Emerging Global Shares INDXX Brazil Infrastructure Index Fund) | February 24, 2010 |
| EGShares India Small Cap ETF (“India Small Cap Fund”) | |
| (formerly Emerging Global Shares INDXX India Small Cap Index Fund) | July 7, 2010 |
| EGShares India Consumer ETF (“India Consumer Fund”) | August 10, 2011 |
| EGShares Emerging Markets High Income Low Beta ETF (“High Income Low Beta Fund”) | August 4, 2011 |
The Composite Fund’s investment objective is to seek investment results that correspond (before fees and expenses) to the price and yield performance of the Dow Jones Emerging Markets Sector Titans Composite 100 IndexSM. The Dow Jones Emerging Markets Sector Titans Composite 100 IndexSM is comprised of a representative sample of 100 Emerging Markets companies deemed to be the 10 leading companies in each of the 10 “Industries,” as defined by the Industry Classification Benchmark (“ICB”).
The Basic Materials Fund’s investment objective is to seek investment results that correspond (before fees and expenses) to the price and yield performance of the Dow Jones Emerging Markets Basic Materials Titans 30 IndexSM. The Dow Jones Emerging Markets Basic Materials Titans 30 IndexSM is comprised of publicly traded firms in the “Basic Materials Industry,” as defined by ICB.
The Consumer Goods Fund’s investment objective is to seek investment results that correspond (before fees and expenses) to the price and yield performance of the Dow Jones Emerging Markets Consumer Goods Titans 30 IndexSM. The Dow Jones Emerging Markets Consumer Goods Titans 30 IndexSM is comprised of publicly traded firms in the “Consumer Goods Industry,” as defined by ICB.
The Consumer Services Fund’s investment objective is to seek investment results that correspond (before fees and expenses) to the price and yield performance of the Dow Jones Emerging Markets Consumer Services Titans 30 IndexSM. The Dow Jones Emerging Markets Consumer Services Titans 30 IndexSM is comprised of publicly traded firms in the “Consumer Services Industry,” as defined by ICB.
The Energy Fund’s investment objective is to seek investment results that correspond (before fees and expenses) to the price and yield performance of the Dow Jones Emerging Markets Oil and Gas Titans 30 IndexSM. The Dow Jones Emerging Markets Oil and Gas Titans 30 IndexSM is comprised of publicly traded firms in the “Oil and Gas Industry,” as defined by ICB.
| 68 | EGA Emerging Global Shares Trust |
Notes to Financial Statements (continued)
September 30, 2011 (Unaudited)
The Financials Fund’s investment objective is to seek investment results that correspond (before fees and expenses) to the price and yield performance of the Dow Jones Emerging Markets Financials Titans 30 IndexSM. The Dow Jones Emerging Markets Financials Titans 30 IndexSM is comprised of publicly traded firms in the “Financials Industry,” as defined by ICB.
The Health Care Fund’s investment objective is to seek investment results that correspond (before fees and expenses) to the price and yield performance of the Dow Jones Emerging Markets Health Care Titans 30 IndexSM. The Dow Jones Emerging Markets Health Care Titans 30 IndexSM is comprised of publicly traded firms in the “Health Care Industry,” as defined by ICB.
The Industrials Fund’s investment objective is to seek investment results that correspond (before fees and expenses) to the price and yield performance of the Dow Jones Emerging Markets Industrials Titans 30 IndexSM. The Dow Jones Emerging Markets Industrials Titans 30 IndexSM is comprised of publicly traded firms in the “Industrials Industry,” as defined by ICB.
The Technology Fund’s investment objective is to seek investment results that correspond (before fees and expenses) to the price and yield performance of the Dow Jones Emerging Markets Technology Titans 30 IndexSM. The Dow Jones Emerging Markets Technology Titans 30 IndexSM is comprised of publicly traded firms in the “Technology Industry,” as defined by ICB.
The Telecom Fund’s investment objective is to seek investment results that correspond (before fees and expenses) to the price and yield performance of the Dow Jones Emerging Markets Telecommunications Titans 30 IndexSM. The Dow Jones Emerging Markets Telecommunications Titans 30 IndexSM is comprised of publicly traded firms in the “Telecommunications Industry,” as defined by ICB.
The Utilities Fund’s investment objective is to seek investment results that correspond (before fees and expenses) to the price and yield performance of the Dow Jones Emerging Markets Utilities Titans 30 IndexSM. The Dow Jones Emerging Markets Utilities Titans 30 IndexSM is comprised of publicly traded firms in the “Utilities Industry,” as defined by ICB.
The Metals & Mining Fund’s investment objective is to seek investment results that correspond (before fees and expenses) to the price and yield performance of the Dow Jones Emerging Markets Metals & Mining Titans 30 IndexSM. The Dow Jones Emerging Markets Metals & Mining Titans 30 IndexSM comprised of publicly traded firms in the “Industrial Metals and Mining Sector” and “Mining Sector,” as defined by ICB.
The Consumer Fund’s investment objective is to seek investment results that correspond (before fees and expenses) to the price and yield performance of the Dow Jones Emerging Markets Consumer Titans 30 IndexSM. The Dow Jones Emerging Markets Consumer Titans 30 IndexSM is comprised of publicly traded firms in the “Consumer Goods Industry” and “Consumer Services Industry,” as defined by ICB.
The India Infrastructure Fund’s investment objective is to seek investment results that correspond (before fees and expenses) to the price and yield performance of the INDXX India Infrastructure Index. The INDXX India Infrastructure Index is comprised of 30 leading companies that INDXX, LLC determines to be representative of India’s infrastructure sectors.
The China Infrastructure Fund’s investment objective is to seek investment results that correspond (before fees and expenses) to the price and yield performance of the INDXX China Infrastructure Index. The INDXX China Infrastructure Index is comprised of 30 leading companies that INDXX, LLC determines to be representative of China’s infrastructure sectors.
The Brazil Infrastructure Fund’s investment objective is to seek investment results that correspond (before fees and expenses) to the price and yield performance of the INDXX Brazil Infrastructure Index. The INDXX Brazil Infrastructure Index is comprised of 30 leading companies that INDXX, LLC determines to be representative of Brazil’s infrastructure sectors.
The India Small Cap Fund’s investment objective is to seek investment results that correspond (before fees and expenses) to the price and yield performance of the INDXX India Small Cap Index. The INDXX India Small Cap Index is comprised of a representative sample of 75 emerging markets companies that INDXX, LLC determines to be representative of small capitalization companies domiciled in India.
The India Consumer Fund’s investment objective is to seek investment results that correspond (before fees and expenses) to the price and yield performance of the INDXX India Consumer Index. The INDXX India Consumer Index is comprised of 30 leading companies that INDXX, LLC determines to be representative of India’s consumer sectors.
The High Income Low Beta Fund’s investment objective is to seek investment results that correspond (before fees and expenses) to the price and yield performance of the INDXX Emerging Market High Income Low Beta Index. The INDXX Emerging Market High Income Low Beta Index is comprised of a representative sample of 30 emerging markets companies that INDXX, LLC determines to have lower relative volatility (i.e., low beta) than the broad market benchmark indices of the local exchanges in which the component securities trade.
2. CONSOLIDATION OF SUBSIDIARIES
The Consolidated Schedules of Investments, Consolidated Statements of Asset and Liabilities, of Operations and of Changes in Net Assets and the Consolidated Financial Highlights of the Funds listed below include the accounts of wholly-owned subsidiaries. All inter-company accounts and transactions have been eliminated in consolidation.
| EGA Emerging Global Shares Trust | 69 |
Notes to Financial Statements (continued)
September 30, 2011 (Unaudited)
| Fund | Wholly-owned Subsidiary |
| Composite Fund | EGShares Composite Mauritius |
| Basic Materials Fund | EGShares Basic Materials Mauritius |
| Consumer Goods Fund | EGShares Consumer Goods Mauritius |
| Energy Fund | EGShares Energy Fund Mauritius |
| Financials Fund | EGShares Financials Fund Mauritius |
| Health Care Fund | EGShares Health Care Mauritius |
| Industrials Fund | EGShares Industrials Mauritius |
| Technology Fund | EGShares Technology Mauritius |
| Telecom Fund | EGShares Telecom Mauritius |
| Utilities Fund | EGShares Utilities Mauritius |
| Metals & Mining Fund | EGShares Metals & Mining Mauritius |
| Consumer Fund | EGShares Consumer Mauritius |
| India Infrastructure Fund | EGShares India Infrastructure Mauritius |
| India Small Cap Fund | EGShares India Small Cap Mauritius |
| India Consumer Fund | EGShares India Consumer Mauritius |
| High Income Low Beta Fund | EGShares High Income Low Beta Mauritius |
The Composite Fund, Basic Materials Fund, Consumer Goods Fund, Energy Fund, Financials Fund, Health Care Fund, Industrials Fund, Technology Fund, Telecom Fund, Utilities Fund, Metals & Mining Fund and Consumer Fund may invest its assets in a wholly-owned subsidiary in Mauritius, which in turn invests virtually all of its assets in Indian securities, based on the number of Indian securities that are included in each Funds’ respective Index.
The India Infrastructure Fund, India Small Cap Fund, India Consumer Fund and High Income Low Beta Fund invest substantially all of their assets in wholly owned subsidiaries in Mauritius, which in turn, invests at least 90% of their assets in Indian securities, and to some extent ADRs and GDRs, based on the number of Indian securities that are included in each Funds’ respective Index.
By investing in a wholly owned subsidiary, the Composite Fund, the Basic Materials Fund, the Consumer Goods Fund, the Energy Fund, the Financials Fund, the Health Care Fund, the Industrials Fund, the Technology Fund, the Telecom Fund, the Utilities Fund, the Metals & Mining Fund, the Consumer Fund, the India Infrastructure Fund, the India Small Cap Fund, the India Consumer Fund and the High Income Low Beta Fund each obtain benefits under the tax treaty between Mauritius and India. Each subsidiary may be subject to withholding taxes imposed by the Indian government on dividends, interest and realized capital gains should new legislation be passed to modify the current tax treaty with Mauritius. Any change in the provision of this treaty could result in the imposition of withholding and other taxes on these Funds by authorities in India. This would reduce the return on investment and the return received by each Fund’s shareholders.
A summary of each Fund’s investment in its corresponding subsidiary is as follows:
| Fund | Inception Date of Subsidiary | Subsidiary Net Assets at September 30, 2011 | % of Fund’s Total Net assets at September 30, 2011 | ||
| Composite Fund | September 19, 2011 | $ | 736,205 | 3.6 | % |
| Basic Materials Fund | June 23, 2011 | 90,060 | 12.0 | ||
| Consumer Goods Fund | June 23, 2011 | 194,808 | 20.7 | ||
| Energy Fund | June 27, 2011 | 1,492,927 | 9.9 | ||
| Financials Fund | June 27, 2011 | 231,421 | 4.5 | ||
| Health Care Fund | June 23, 2011 | 261,443 | 31.1 | ||
| Industrials Fund | June 23, 2011 | 237,692 | 31.1 | ||
| Technology Fund | June 23, 2011 | 209,946 | 26.1 | ||
| Telecom Fund | June 23, 2011 | 54,492 | 6.0 | ||
| Utilities Fund | June 23, 2011 | 131,589 | 17.2 | ||
| Metals & Mining Fund | September 19, 2011 | 1,695,346 | 9.9 | ||
| Consumer Fund | September 14, 2010 | 31,251,024 | 13.9 | ||
| India Infrastructure Fund | August 11, 2010 | 63,960,606 | 100.1 | ||
| India Small Cap Fund | July 7, 2010 | 24,285,807 | 100.2 | ||
| India Consumer Fund | August 10, 2011 | 3,582,245 | 98.2 | ||
| High Income Low Beta Fund | August 4, 2011 | 1,051,092 | 7.2 | ||
| 70 | EGA Emerging Global Shares Trust |
Notes to Financial Statements (continued)
September 30, 2011 (Unaudited)
3. SIGNIFICANT ACCOUNTING POLICIES
These financial statements are prepared in accordance with accounting principles generally accepted in the United States of America (“GAAP”), which requires management to make estimates and assumptions that affect the reported amounts of assets and liabilities, the disclosure of contingent assets and liabilities at the date of the financial statements, and the reported amounts of increases and decreases in net assets from operations during the reporting period. Actual amounts could differ from these estimates. The following summarizes the significant accounting policies of the Funds.
Indemnifications
In the normal course of business, the Trust enters into contracts that contain a variety of representations that provide general indemnifications. The Trust’s maximum exposure under these arrangements cannot be known as this would involve future claims that may be made against the Trust that have not yet occurred; however, the Trust expects any risk of loss to be remote.
Investment Valuation
The Net Asset Value (“NAV”) per share is computed as of the scheduled close of regular trading on the New York Stock Exchange (“NYSE”), ordinarily 4:00 p.m. Eastern time, on each day during which the NYSE is open for trading. The NAV per share of a Fund is computed by dividing the value of the Fund’s portfolio securities, cash and other assets (including accrued interest), less all liabilities (including accrued expenses), by the total number of shares outstanding at the time such computation is made.
Securities Valuation
Equity securities (including American Depositary Receipts and Global Depositary Receipts) are valued at the last reported sale price on the principal exchange on which such securities are traded, as of the close of regular trading on the NYSE on the day the securities are being valued or, if there are no sales, at the mean of the most recent bid and asked prices. Equity securities that are traded in over-the-counter markets are valued at the NASDAQ Official Closing Price as of the close of regular trading on the NYSE on the day the securities are valued or, if there are no sales, at the mean of the most recent bid and asked prices. Securities for which market quotations are not readily available, including restricted securities, are valued by a method that the Board of Trustees (the “Board”) believes accurately reflects fair value. The value of assets denominated in foreign currencies is converted into U.S. dollars using exchange rates deemed appropriate by the Funds. Use of a rate different from the rate used by Dow Jones Indices or INDXX Indices may adversely affect a Fund’s ability to track its Underlying Index.
Foreign Currency Translations
Investments denominated in foreign currencies are subject to additional risk factors as compared to investments denominated in U.S. dollars. The value of an investment denominated in a foreign currency could change significantly as foreign currencies strengthen or weaken relative to the U.S. dollar. Generally, when the U.S. dollar gains in value against a foreign currency, an investment traded in that foreign currency loses value because that currency is worth fewer U.S. dollars. Risks related to foreign currencies also include those related to economic or political developments, market inefficiencies or a higher risk that essential investment information may be incomplete, unavailable or inaccurate. A U.S. dollar investment in Depositary Receipts or Ordinary Shares of foreign issuers traded on U.S. exchanges is indirectly subject to foreign currency risk to the extent that the issuer conducts its principal business in markets where transactions are denominated in foreign currencies.
Portfolio securities and other assets and liabilities denominated in foreign currencies are translated into U.S. dollars based on the exchange rate of such currencies against U.S. dollars on the date of valuation. Purchases and sales of securities and income items denominated in foreign currencies are translated into U.S. dollars at the exchange rate in effect on the transaction date.
The Funds do not separately report the effect of changes in foreign exchange rates from changes in market prices on securities held. Such changes are included in net realized and unrealized gain or loss from investments.
Realized foreign exchange gains or losses arise from sales of foreign currencies, currency gains or losses realized between the trade and settlement dates on securities transactions and the difference between the recorded amounts of dividends, interest, and foreign withholding taxes, and the U.S. dollar equivalent of the amounts actually received or paid. Net unrealized foreign exchange gains and losses arise from changes in foreign exchange rates on foreign denominated assets and liabilities other than investments in securities held at the end of the reporting period.
Security Transactions and Related Income
Investment transactions are recorded on trade date. The Funds determine the gain or loss realized from the investment transactions by comparing the identified cost, which is the same basis used for federal income tax purposes, with the net sales proceeds. Dividend income is recorded on the ex-dividend date. Interest income is recorded on the accrual basis. Discounts are accreted and premiums are amortized on securities purchased over the lives of the respective securities.
| EGA Emerging Global Shares Trust | 71 |
Notes to Financial Statements (continued)
September 30, 2011 (Unaudited)
Federal Income Taxes
The Composite Fund, Metals & Mining Fund, Energy Fund, Financials Fund, China Infrastructure Fund and Brazil Infrastructure Fund have qualified and continue to qualify, and the Consumer Fund, India Infrastructure Fund, India Small Cap Fund, Basic Materials Fund, Consumer Goods Fund, Consumer Services Fund, Health Care Fund, Industrials Fund, Technology Fund, Telecom Fund, Utilities Fund, India Consumer Fund and High Income Low Beta Fund intend to qualify as a “regulated investment company” under Subchapter M of the Internal Revenue Code. If so qualified, a Fund will not be subject to federal income tax to the extent it distributes substantially all of its net investment income and capital gains to shareholders. Each Fund expects to declare and pay all of its net investment income, if any, to shareholders as dividends annually, and will also declare and pay net realized capital gains, if any, at least annually, except where the costs of such distributions exceed the amount of tax that the distributions are intended to avoid, in which case the Fund will pay the applicable tax. A Fund may distribute such income dividends and capital gains more frequently, if necessary, in order to reduce or eliminate federal excise or income taxes on the Fund. Distributions to shareholders are recorded on the ex-dividend date.
The Funds are subject to accounting standards that provide guidance for how uncertain tax positions should be recognized, measured, presented and disclosed in the financial statements. These standards require the evaluation of tax positions taken or expected to be taken by the Funds and whether the tax positions are “more-likely-than-not” of being sustained by the applicable tax authority. Tax positions not deemed to meet the more-likely-than-not threshold would be recorded as a tax benefit or expense in the current year. Accounting for uncertainty in income taxes requires management of the Funds to analyze all open tax years as defined by IRS statute of limitations, for all major jurisdictions, including federal tax authorities and certain state tax authorities. Open tax years are those years that are open for examination by the relevant income taxing authority. As of March 31, 2011, open Federal and state income tax years include the tax years or periods ended March 31, 2010 and March 31, 2011. The Funds have no examinations in progress.
There is no tax liability resulting from uncertain income tax positions taken or expected to be taken. The Funds are also not aware of any tax positions for which it is reasonably possible that the total amounts of unrecognized tax expense will significantly change in the next twelve months.
Expenses
Expenses of the Trust, which are directly identifiable to a specific Fund, are applied to that Fund. Expenses which are not readily identifiable to a specific Fund are allocated in such a manner as deemed equitable, taking into consideration the nature and type of expense and the relative net assets of each Fund in the Trust.
Offering Expenses
Costs incurred in connection with the initial offering of the Funds are being amortized over a 12-month period from inception of the Fund.
4. CONCENTRATION OF MARKET RISK
The India Infrastructure Fund, India Small Cap Fund and India Consumer Fund, only invest in Indian securities, therefore, their NAVs will be much more sensitive to changes in economic, political and other factors within India than would a fund that invested in a greater variety of countries.
The China Infrastructure Fund only invests in Chinese securities, therefore, its NAV will be much more sensitive to changes in economic, political and other factors within China than would a fund that invested in a greater variety of countries.
The Brazil Infrastructure Fund only invests in Brazilian securities, therefore, its NAV will be much more sensitive to changes in economic, political and other factors within Brazil than would a fund that invested in a greater variety of countries.
Investments in emerging market securities are subject to even greater risks than for foreign investments generally, including increased risks of: illiquidity of securities; price volatility; inflation or deflation; restrictions on foreign investment; nationalization; higher taxation; economic and political instability; pervasive corruption and crime; less governmental regulation; and less developed legal systems.
The Basic Materials Fund concentrates its investments in the basic materials industry, and as such, may be adversely affected by increased price volatility of securities in that industry, and may be more susceptible to adverse economic, market, political or regulatory occurrences affecting that industry. Issuers in the basic materials industry are at risk for environmental damage and product liability claims and may be adversely affected by depletion of resources, technical progress, labor relations and governmental regulations.
The Consumer Fund, Consumer Goods Fund, Consumer Services Fund and India Consumer Fund concentrate their investments in the consumer industry, and as such, may be adversely affected by increased price volatility of securities in that industry, and may be more susceptible to adverse economic, market, political or regulatory occurrences affecting that industry. The success of consumer goods and consumer services suppliers and retailers is tied closely to the performance of the domestic and international economy, interest rates, currency exchange rates, competition, preferences, and consumer confidence.
| 72 | EGA Emerging Global Shares Trust |
Notes to Financial Statements (continued)
September 30, 2011 (Unaudited)
The Energy Fund concentrates its investments in the oil and gas industry, and as such, may be adversely affected by increased price volatility of securities in that industry, and may be more susceptible to adverse economic, market, political or regulatory occurrences affecting that industry. The profitability of companies in the oil and gas industry (including alternative energy suppliers) is related to worldwide energy prices, exploration, and production spending.
The Financials Fund concentrates its investments in the financials industry, and as such may be adversely affected by increased price volatility of securities in that industry, and may be more susceptible to adverse economic, market, political or regulatory occurrences affecting that industry. Companies in the financials industry are subject to extensive governmental regulation, which may adversely affect the scope of their activities, the prices they can charge and the amount of capital they must maintain.
The Health Care Fund concentrates its investments in the health care industry, and as such, may be adversely affected by increased price volatility of securities in that industry, and may be more susceptible to adverse economic, market, political or regulatory occurrences affecting that industry. The profitability of companies in the health care industry may be affected by extensive government regulation, restriction on government reimbursement for medical expenses, rising costs of medical products and services, pricing pressure, an increased emphasis on outpatient services, limited number of products, industry innovation, changes in technologies and other market developments.
The Industrials Fund concentrates its investments in the industrials industry, and as such, may be adversely affected by increased price volatility of securities in that industry, and may be more susceptible to adverse economic, market, political or regulatory occurrences affecting that industry. Government regulation, world events and economic conditions affect the performance of companies in the industrials industry.
The Technology Fund concentrates its investments in the technology industry, and as such, may be adversely affected by increased price volatility of securities in that industry, and may be more susceptible to adverse economic, market, political or regulatory occurrences affecting that industry. Technology companies may be affected by intense competition, obsolescence of existing technology, general economic conditions, government regulation and may have limited product lines, markets, financial resources or personnel.
The Telecom Fund concentrates its investments in the telecommunications industry, and as such, may be adversely affected by increased price volatility of securities in that industry, and may be more susceptible to adverse economic, market, political or regulatory occurrences affecting that industry. The global telecommunications market is characterized by increasing competition and government regulation.
The Utilities Fund concentrates its investments in the utilities industry, and as such, may be adversely affected by increased price volatility of securities in that industry, and may be more susceptible to adverse economic, market, political or regulatory occurrences affecting that industry. Companies in the utilities industry may be adversely affected by changes in exchange rates, domestic and international competition, and governmental limitation on rates charged to customers.
The Metals & Mining Fund concentrates its investments in the metals and mining industry, and as such, may be adversely affected by increased price volatility of securities in that industry, and may be more susceptible to adverse economic, market, political or regulatory occurrences affecting that industry. Securities of companies involved in metals and mining may be subject to broad price fluctuations, reflecting volatility of energy and basic materials prices and possible instability of supply of various basic resources.
The India Infrastructure Fund, China Infrastructure Fund, and Brazil Infrastructure Fund concentrate their investments in the infrastructure sector, and as such, may be adversely affected by increased price volatility of securities in that sector, and may be more susceptible to adverse economic, market, political or regulatory occurrences affecting that sector.
5. DISTRIBUTION AGREEMENT
ALPS Distributors, Inc., (the “Distributor”) serves as the distributor of Creation Units for the Funds pursuant to a distribution agreement. The Distributor does not maintain a secondary market in shares. The Funds have adopted a Distribution and Service Plan (the “Plan”) pursuant to Rule 12b-1 under the 1940 Act. In accordance with the Plan, each Fund is authorized to pay an amount up to 0.25% of its average daily net assets each year for certain distribution-related activities. For the period ended September 30, 2011, no fees were paid by the Funds under the Plan, and there are no current plans to impose these fees.
| EGA Emerging Global Shares Trust | 73 |
Notes to Financial Statements (continued)
September 30, 2011 (Unaudited)
6. FEDERAL INCOME TAX MATTERS
For the period ended September 30, 2011, federal tax cost of investments and net unrealized appreciation (depreciation) were as follows:
| Funds | Federal Tax Cost of Investments | Gross Unrealized Appreciation | Gross Unrealized Depreciation | Net Unrealized Appreciation (Depreciation) | ||||||||||||
| Composite Fund* | $ | 25,175,388 | $ | 617,296 | $ | (5,509,662 | ) | $ | (4,892,366 | ) | ||||||
| Basic Materials Fund | 963,348 | 1,913 | (252,697 | ) | (250,784 | ) | ||||||||||
| Consumer Goods Fund | 993,265 | 14,465 | (78,218 | ) | (63,753 | ) | ||||||||||
| Consumer Services Fund | 1,027,782 | 8,270 | (207,193 | ) | (198,923 | ) | ||||||||||
| Energy Fund* | 18,980,628 | 54,460 | (4,606,413 | ) | (4,551,953 | ) | ||||||||||
| Financials Fund* | 7,079,397 | 25,430 | (1,970,665 | ) | (1,945,235 | ) | ||||||||||
| Health Care Fund | 1,005,427 | 2,745 | (161,652 | ) | (158,907 | ) | ||||||||||
| Industrials Fund | 1,006,680 | 7,973 | (246,864 | ) | (238,891 | ) | ||||||||||
| Technology Fund | 1,005,543 | 15,991 | (214,205 | ) | (198,214 | ) | ||||||||||
| Telecom Fund | 1,000,603 | 20,330 | (118,845 | ) | (98,515 | ) | ||||||||||
| Utilities Fund | 997,962 | — | (226,493 | ) | (226,493 | ) | ||||||||||
| Metals & Mining Fund* | 22,583,493 | 347,484 | (5,858,961 | ) | (5,511,477 | ) | ||||||||||
| Consumer Fund* | 248,435,270 | 6,686,059 | (31,651,398 | ) | (24,965,339 | ) | ||||||||||
| India Infrastructure Fund* | 86,429,164 | 2,265,277 | (25,058,361 | ) | (22,793,084 | ) | ||||||||||
| China Infrastructure Fund* | 18,660,782 | 606,611 | (6,693,363 | ) | (6,086,752 | ) | ||||||||||
| Brazil Infrastructure Fund* | 76,651,180 | 3,215,277 | (10,645,822 | ) | (7,430,545 | ) | ||||||||||
| India Small Cap Fund* | 32,532,831 | 1,825,275 | (10,208,904 | ) | (8,383,629 | ) | ||||||||||
| India Consumer Fund | 2,830,992 | 336,665 | (519,405 | ) | (182,740 | ) | ||||||||||
| High Income Low Beta Fund | 15,190,193 | 49,865 | (794,952 | ) | (745,087 | ) | ||||||||||
| * | Cost of investments on a tax basis, includes the adjustment for financial reporting purposes, as of the most recently completed Federal income Tax reporting period end. |
The differences between book basis and tax basis components of net assets are primarily attributable to tax deferral of losses on wash sales, expensing of organization cost, mark to market on Passive Foreign Investment Companies securities and deferral of post-October losses. For the period ended March 31, 2011, the components of accumulated earnings (losses) on a tax-basis were as follows:
| Funds | Undistributed Ordinary Income | Accumulated Capital and Other Losses | Net Unrealized Appreciation (Depreciation) | Total Accumulated Earnings (Losses) | ||||||||||||
| Composite Fund | $ | — | $ | (639,998 | ) | $ | 3,397,203 | $ | 2,757,205 | |||||||
| Energy Fund | — | (114,869 | ) | 4,592,378 | 4,477,509 | |||||||||||
| Financials Fund | — | (41,390 | ) | 809,089 | 767,699 | |||||||||||
| Metals & Mining Fund | — | (506,638 | ) | 5,929,986 | 5,423,348 | |||||||||||
| Consumer Fund | — | (390,872 | ) | 5,645,742 | 5,254,870 | |||||||||||
| India Infrastructure Fund | 78,483 | — | (6,343,892 | ) | (6,265,409 | ) | ||||||||||
| China Infrastructure Fund | 7,374 | (2,811 | ) | 1,370,712 | 1,375,275 | |||||||||||
| Brazil Infrastructure Fund | 826,481 | (186,223 | ) | 9,292,823 | 9,933,081 | |||||||||||
| India Small Cap Fund | — | (8,375 | ) | (4,672,908 | ) | (4,681,283 | ) | |||||||||
For financial reporting purposes, capital accounts are adjusted to reflect the tax character of permanent book/tax differences. Reclassifications are primarily due to tax treatment of redemptions in kind and tax treatment of currency gains and losses. Results of operations and net assets were not affected by these reclassifications.
| 74 | EGA Emerging Global Shares Trust |
Notes to Financial Statements (continued)
September 30, 2011 (Unaudited)
Certain net losses incurred after October 31 and within the taxable year or period are deemed to arise on the first business day of the Funds’ next taxable year. For the period ended March 31, 2011, the Funds deferred to April 1, 2011 post October losses of:
| Funds | Post October Currency Losses | Post October Capital Losses | ||||||
| Composite Fund | $ | — | $ | 21,758 | ||||
| Energy Fund | 2,345 | 57,433 | ||||||
| Financials Fund | — | 25,926 | ||||||
| Metals & Mining Fund | 1,254 | — | ||||||
| Consumer Fund | 6,976 | 383,897 | ||||||
| India Infrastructure Fund | — | — | ||||||
| China Infrastructure Fund | — | — | ||||||
| Brazil Infrastructure Fund | — | 186,223 | ||||||
| India Small Cap Fund | 8,375 | — | ||||||
For the period ended March 31, 2011, the Funds listed below had net capital loss carryforwards for federal income tax purposes which are available for offset against future taxable net capital gains. The amounts were determined after adjustments for certain differences between financial reporting and tax purposes, such as wash sale losses. Accordingly, no capital gain distributions are expected to be paid to shareholders of these Funds until future net capital gains have been realized in excess of the available capital loss carryforwards. There is no assurance that any Fund will be able to utilize all of its capital loss carryforwards before they expire. These loss carryforwards expire in amounts and fiscal years as follows:
| Funds | Fiscal Year 2018 | Fiscal Year 2019 | ||||||
| Composite Fund | $ | — | $ | 586,695 | ||||
| Energy Fund* | — | — | ||||||
| Financials Fund | — | — | ||||||
| Metals & Mining Fund | 26,475 | 423,874 | ||||||
| Consumer Fund | — | — | ||||||
| India Infrastructure Fund | — | — | ||||||
| China Infrastructure Fund | — | 2,811 | ||||||
| Brazil Infrastructure Fund | — | — | ||||||
| India Small Cap Fund | — | — | ||||||
| * | During the period ended March 31, 2011, the Energy Fund utilized capital loss carryforward of $35,360 to offset realized gains. |
7. FAIR VALUE MEASUREMENT
Financial Accounting Standards Board’s Accounting Standards Codification, Section 820-10, Fair Value Measurements and Disclosures defines fair value, establishes a framework for measuring fair value in accordance with GAAP, and expands disclosure about fair value measurements. It also provides guidance on determining when there has been a significant decrease in the volume and level of activity for an asset or liability, when a transaction is not orderly, and how that information must be incorporated into a fair value measurement. Under Fair Value Measurements and Disclosures, various inputs are used in determining the value of the Fund’s investments. These inputs are summarized in the three broad levels as follows:
Level 1 — Unadjusted quoted prices in active markets for identical assets or liabilities.
Level 2 — Observable inputs other than quoted prices included in Level 1 that are observable for the asset or liability, either directly or indirectly. These inputs may include quoted prices for the identical instrument on an inactive market, prices for similar securities, interest rates, prepayment speeds, credit risk, yield curves, default rates and similar data.
Level 3 — Unobservable inputs for the asset or liability, to the extent relevant observable inputs are not available; representing the Funds’ own assumptions about the assumptions a market participant would use in valuing the asset or liability, and would be based on the best information available.
The availability of observable inputs can vary from security to security and is affected by a wide variety of factors, including, for example, the type of security, whether the security is new and not yet established in the marketplace, the liquidity of markets, and other characteristics particular to the security. To the extent that valuation is based on models or inputs that are less observable or unobservable in the market, the determination of fair value requires more judgment. Accordingly, the degree of judgment exercised in determining fair value is greatest for instruments categorized in Level 3.
| EGA Emerging Global Shares Trust | 75 |
Notes to Financial Statements (continued)
September 30, 2011 (Unaudited)
The Funds have adopted the Accounting Standard Update, Fair Value Measurements and Disclosures (Topic 820): Improving Disclosures about Fair Value Measurements which provides guidance on how investment assets and liabilities are to be valued and disclosed. Specifically, the amendment requires reporting entities to disclose i) the input and valuation techniques used to measure fair value for both recurring and nonrecurring fair value measurements, for Level 2 or Level 3 positions ii) transfers between all levels (including Level 1 and Level 2) will be required to be disclosed on a gross basis (i.e. transfers out must be disclosed separately from transfers in) as well as the reason(s) for the transfer and iii) purchases, sales, issuances and settlements must be shown on a gross basis in the Level 3 roll forward rather than as one net number.
The inputs or methodology used for valuing securities are not necessarily an indication of the risk associated with investing in those securities. The following summarizes inputs used as of September 30, 2011 in valuing the Funds’ assets and liabilities carried at fair value:
| Quoted Prices in Active Market (Level 1) | Other Significant Inputs (Level 2) | ||||||||||||||||||
| Funds | Common Stocks | Common Stocks | Rights | Significant Unobservable Inputs (Level 3) | Total | ||||||||||||||
| Composite Fund* | $ | 20,283,022 | $ | — | $ | — | $ | — | $ | 20,283,022 | |||||||||
| Basic Materials Fund* | 712,564 | — | — | — | 712,564 | ||||||||||||||
| Consumer Goods Fund* | 929,512 | — | — | — | 929,512 | ||||||||||||||
| Consumer Services Fund* | 828,859 | — | — | — | 828,859 | ||||||||||||||
| Energy Fund* | 14,428,675 | — | — | — | 14,428,675 | ||||||||||||||
| Financials Fund* | 5,134,162 | — | — | — | 5,134,162 | ||||||||||||||
| Health Care Fund* | 846,520 | — | — | — | 846,520 | ||||||||||||||
| Industrials Fund* | 767,789 | — | — | — | 767,789 | ||||||||||||||
| Technology Fund* | 807,329 | — | — | — | 807,329 | ||||||||||||||
| Telecom Fund* | 902,088 | — | — | — | 902,088 | ||||||||||||||
| Utilities Fund* | 771,469 | — | — | — | 771,469 | ||||||||||||||
| Metals & Mining Fund* | 17,072,016 | — | — | — | 17,072,016 | ||||||||||||||
| Consumer Fund* | 223,469,931 | — | — | — | 223,469,931 | ||||||||||||||
| India Infrastructure Fund** | 63,636,080 | — | — | — | 63,636,080 | ||||||||||||||
| China Infrastructure Fund** | 12,574,030 | — | — | — | 12,574,030 | ||||||||||||||
| Brazil Infrastructure Fund** | 69,220,635 | — | — | — | 69,220,635 | ||||||||||||||
| India Small Cap Fund** | 24,128,122 | 1,497 | 19,583 | 24,149,202 | |||||||||||||||
| India Consumer Fund** | 2,648,252 | — | — | — | 2,648,252 | ||||||||||||||
| High Income Low Beta Fund* | 14,445,106 | — | — | — | 14,445,106 | ||||||||||||||
| * | Please refer to the schedule of investments to view securities segregated by country. |
| ** | Please refer to the schedule of investments to view securities segregated by industry type. |
Reconciliation of investments in which significant unobservable inputs (Level 3) were used in determining fair value during the period ended September 30, 2011:
| Brazil Infrastructure Fund | Receipts | |||
| Balance as of 3/31/2011 | $ | 2,562,523 | ||
| Receipt exercised and exchanged for preferred stock | (2,361,269 | ) | ||
| Change in unrealized depreciation | (201,254 | ) | ||
| Balance as of 9/30/2011 | $ | — | ||
| Net change in unrealized appreciation (depreciation) for investment securities still held at 9/30/11 | $ | — | ||
To estimate fair value, an industry standard valuation model was used based on market approach. The significant input for the valuation model was to value the receipt at the price of its respective parent company.
There were no transfers between Level 1 and Level 2 securities. The Funds did not hold any Level 3 securities as of September 30, 2011.
| 76 | EGA Emerging Global Shares Trust |
Notes to Financial Statements (continued)
September 30, 2011 (Unaudited)
8. INVESTMENT TRANSACTIONS
During the period ended September 30, 2011, the cost of purchases and proceeds from sales of investments (excluding cost of in-kind transactions, proceeds from in-kind sales, and short-term investments) were:
| Funds | Purchases | Sales | ||||||
| Composite Fund | $ | 2,092,267 | $ | 638,309 | ||||
| Basic Materials Fund | 330,722 | 198,203 | ||||||
| Consumer Goods Fund | 660,039 | 343,575 | ||||||
| Consumer Services Fund | 771,528 | 484,652 | ||||||
| Energy Fund | 4,167,020 | 1,031,158 | ||||||
| Financials Fund | 1,628,271 | 1,114,551 | ||||||
| Health Care Fund | 682,939 | 311,055 | ||||||
| Industrials Fund | 909,790 | 481,693 | ||||||
| Technology Fund | 619,059 | 247,134 | ||||||
| Telecom Fund | 402,098 | 197,962 | ||||||
| Utilities Fund | 722,105 | 366,517 | ||||||
| Metals & Mining Fund | 3,573,329 | 909,604 | ||||||
| Consumer Fund | 35,355,857 | 5,491,398 | ||||||
| India Infrastructure Fund | 9,819,225 | 10,088,636 | ||||||
| China Infrastructure Fund | 1,869,160 | 1,544,207 | ||||||
| Brazil Infrastructure Fund | 18,988,501 | 11,631,769 | ||||||
| India Small Cap Fund | 9,762,604 | 12,382,036 | ||||||
| India Consumer Fund | 2,845,470 | 13,703 | ||||||
| High Income Low Beta Fund | 10,280,078 | 4,349,798 | ||||||
For the period ended September 30, 2011, the cost of in-kind transactions and proceeds from in-kind sales were as follows:
| Funds | Purchases | Sales | ||||||
| Composite Fund | $ | 1,257,683 | $ | 5,645,629 | ||||
| Basic Materials Fund | 1,705,799 | 791,977 | ||||||
| Consumer Goods Fund | 1,346,330 | 697,809 | ||||||
| Consumer Services Fund | 2,251,711 | 1,542,162 | ||||||
| Energy Fund | 3,011,182 | 10,049,262 | ||||||
| Financials Fund | 1,017,019 | 5,003,481 | ||||||
| Health Care Fund | 1,336,815 | 592,564 | ||||||
| Industrials Fund | 1,181,955 | 520,450 | ||||||
| Technology Fund | 1,387,904 | 637,170 | ||||||
| Telecom Fund | 1,605,082 | 780,486 | ||||||
| Utilities Fund | 1,367,385 | 599,256 | ||||||
| Metals & Mining Fund | — | 13,629,402 | ||||||
| Consumer Fund | 32,994,860 | 2,610,638 | ||||||
| India Infrastructure Fund | — | — | ||||||
| China Infrastructure Fund | 4,486,983 | 5,556,473 | ||||||
| Brazil Infrastructure Fund | — | — | ||||||
| India Small Cap Fund | — | — | ||||||
| India Consumer Fund | — | — | ||||||
| High Income Low Beta Fund | 11,026,403 | 1,142,896 | ||||||
| EGA Emerging Global Shares Trust | 77 |
Notes to Financial Statements (continued)
September 30, 2011 (Unaudited)
9. INVESTMENT ADVISORY AND OTHER AGREEMENTS
The Trust has entered into an Investment Advisory Agreement (the “Advisory Agreement”) with ALPS Advisors, Inc. (“ALPS” or the “Adviser”). The Adviser acts as the Funds’ investment adviser pursuant to an advisory agreement with the Trust on behalf of the Funds. Pursuant to the Advisory Agreement, the Adviser has overall supervisory responsibility for the general management and investment of each Fund’s securities portfolio, and has ultimate responsibility (subject to oversight by the Trust’s Board of Trustees) for oversight of the Trust’s sub-adviser. For its services, the Trust pays the Adviser an annual management fee, accrued daily at the rate of 1/365th of the applicable advisory fee rate and payable monthly as soon as practicable after the last day of each month. The annual management fee for the following Funds consists of the greater of $400,000 or 0.10% of each Fund’s average daily net assets during the month, but not to exceed $1,000,000 per year:
| Composite Fund | Basic Materials Fund |
| Energy Fund | Financials Fund |
| Health Care Fund | Industrials Fund |
| Metals & Mining Fund | Consumer Fund |
| India Infrastructure Fund | China Infrastructure Fund |
| Brazil Infrastructure Fund | India Small Cap Fund |
In addition, the annual management fee for the Funds listed below consist of the greater of $400,000 plus $33,333.33 per Fund minus any management fees paid to the Adviser by the Funds detailed above, or 0.10% of the average daily net assets of each Fund listed below, but not to exceed annually $1,000,000 plus $83,333.33 for each Fund minus any management fees paid to the Adviser by the Funds detailed above:
| Consumer Goods Fund | Consumer Services Fund |
| Technology Fund | Telecom Fund |
| Utilities Fund | India Consumer Fund |
| High Income Low Beta Fund |
From time to time, the Adviser may waive all or a portion of its fee.
Emerging Global Advisors, LLC (“EGA”) serves as the sub-adviser to the Funds and provides investment advice and management services to the Funds. EGA supervises the day-to-day investment and reinvestment of the assets in each Fund and is responsible for designating the Deposit Securities and for monitoring each Fund’s adherence to its investment mandate. For its investment sub-advisory services, EGA receives from the Funds an annual fee equal to 0.75% of the average daily net assets of Composite Fund and 0.85% of the average daily net assets of each of the other Funds.
The Trust and EGA have entered into a written fee waiver and expense reimbursement agreement pursuant to which EGA has agreed to reduce and/or reimburse expenses to the extent necessary to prevent the annual operating expenses of each Fund (excluding any taxes, interest, brokerage fees and non-routine expenses) from exceeding 0.85% of average daily net assets (0.75% for Composite Fund and 0.89% for India Consumer Fund) at least until July 31, 2012. Under this fee waiver and expense assumption agreement, EGA retains the right to seek reimbursement from each Fund of fees previously waived or expenses previously assumed to the extent such fees were waived or expenses were assumed within three years of such reimbursement, and provided such reimbursement does not cause a Fund to exceed any applicable fee waiver or expense limitation agreement that was in place at the time the fees were waived or expenses assumed.
On July 19, 2011, ALPS Holdings, Inc., parent company to the Adviser, announced that it signed a definitive agreement to be acquired by DST Systems, Inc. (the “Transaction”). If completed, the Transaction will cause a change of control of the Adviser, which will terminate the current investment advisory agreement between the Adviser and the Funds. At a meeting held on July 28, 2011, the Funds’ Board considered and approved: (1) a new investment advisory agreement between the Adviser and the Funds; and (2) the submission of a proposal to the Funds’ shareholders to approve the new investment advisory agreement.
Shareholders of each Fund (except the High Income Low Beta Fund and the India Consumer Fund) who owned shares as of August 11, 2011, received a proxy statement for a special meeting of shareholders (“Special Meeting”) that was held on September 27, 2011 for the purpose of voting on approval of the new investment advisory agreement. In a manner consistent with the Trust’s by-laws, the Board adjourned the Special Meeting prior to a shareholder vote with plans to reconvene in the future.
With respect to the High Income Low Beta Fund and the India Consumer Fund, the new investment advisory agreement for the Fund was approved by sole shareholder consent on July 29, 2011, and it will become effective upon the closing of the Transaction.
| 78 | EGA Emerging Global Shares Trust |
Notes to Financial Statements (continued)
September 30, 2011 (Unaudited)
The amounts EGA reimbursed, the amounts available for potential future recoupment by EGA and the expiration schedule at September 30, 2011 are as follows:
| Potential Recoupment Amounts Expiring | |||||||||||||||||||
| Funds | Expenses Reimbursed/Waived | March 31, 2013 | March 30, 2014 | September 30, 2014 | Total Potential Recoupment Amount | ||||||||||||||
| Composite Fund | $ | 146,100 | $ | 302,447 | $ | 355,407 | $ | 146,100 | $ | 803,954 | |||||||||
| Basic Materials Fund | 42,931 | — | — | 42,931 | 42,931 | ||||||||||||||
| Consumer Goods Fund | 43,472 | — | — | 43,472 | 43,472 | ||||||||||||||
| Consumer Services Fund | 43,585 | — | — | 43,585 | 43,585 | ||||||||||||||
| Energy Fund | 135,334 | 318,362 | 202,602 | 135,334 | 656,298 | ||||||||||||||
| Financials Fund | 101,206 | 125,612 | 207,810 | 101,206 | 434,628 | ||||||||||||||
| Health Care Fund | 43,122 | — | — | 43,122 | 43,122 | ||||||||||||||
| Industrials Fund | 43,122 | — | — | 43,122 | 43,122 | ||||||||||||||
| Technology Fund | 43,392 | — | — | 43,392 | 43,392 | ||||||||||||||
| Telecom Fund | 43,328 | — | — | 43,328 | 43,328 | ||||||||||||||
| Utilities Fund | 43,456 | — | — | 43,456 | 43,456 | ||||||||||||||
| Metals & Mining Fund | 141,519 | 344,869 | 301,755 | 141,519 | 788,143 | ||||||||||||||
| Consumer Fund | 504,208 | — | 403,405 | 504,208 | 907,613 | ||||||||||||||
| India Infrastructure Fund | 322,425 | — | 381,030 | 322,425 | 703,455 | ||||||||||||||
| China Infrastructure Fund | 113,051 | 34,768 | 247,399 | 113,051 | 395,218 | ||||||||||||||
| Brazil Infrastructure Fund | 268,466 | 32,912 | 478,083 | 268,466 | 779,461 | ||||||||||||||
| India Small Cap Fund | 248,423 | — | 356,162 | 248,423 | 604,585 | ||||||||||||||
| India Consumer Fund | 35,504 | — | — | 35,504 | 35,504 | ||||||||||||||
| High Income Low Beta Fund | 28,636 | — | — | 28,636 | 28,636 | ||||||||||||||
The Bank of New York Mellon serves as the Funds’ Administrator, Custodian, Fund Accountant and Transfer Agent pursuant to a Fund Administration and Accounting Agreement, a Custody Agreement and a Transfer Agency and Service Agreement, as the case may be.
ALPS Fund Services, Inc. (“AFS”), an affiliate of the Adviser and the Distributor, provides a Chief Compliance Officer and an Anti-Money Laundering Officer as well as certain additional compliance support functions under a Compliance Services Agreement. AFS also provides a Principal Financial Officer to the Trust under a PFO Services Agreement. As compensation for the foregoing services, AFS receives certain out of pocket costs, and fixed and asset-based fees, which are accrued daily and paid monthly by the funds. Compensation for such services is included under the Advisory Agreement.
10. PAYMENTS BY AFFILIATES AND NET GAINS (LOSSES) REALIZED ON TRADING ERROR
As a result of a trade error by the Energy Fund’s former sub-adviser, the Energy Fund experienced an aggregate loss of $73,832, of which $25,000 was reimbursed by the former sub-adviser and $25,000 was reimbursed by EGA, resulting in a net loss to the Energy Fund of $23,832, for the period ended March 31, 2010.
11. CREATION AND REDEMPTION TRANSACTIONS
The Funds issue and redeem Shares on a continuous basis at NAV in blocks of 50,000 shares called “Creation Units.” Except when aggregated in Creation Units, shares are not redeemable securities of a Fund.
Only “Authorized Participants” may purchase or redeem shares directly from a Fund. An Authorized Participant is either (i) a broker-dealer or other participant in the clearing process through the Continuous Net Settlement System of the National Securities Clearing Corporation or (ii) a DTC participant and, in each case, must have executed a Participant Agreement with Distributors. Most retail investors will not qualify as Authorized Participants or do not have the resources to buy and sell whole Creation Units. Therefore, they will be unable to purchase or redeem the shares directly from the Funds. Rather, most retail investors will purchase shares in the secondary market with the assistance of a broker and will be subject to customary brokerage commissions or fees.
Except as discussed below, the consideration for the purchase of Creation Units of a Fund generally consists of the in-kind deposit of a designated portfolio of equity securities, which constitutes an optimized representation of the corresponding Index and an amount of cash. The consideration for the purchase of Creation Units of the Brazil Infrastructure Fund consists solely or partially for cash in U.S. dollars. The consideration for the purchase of Creation Units of a Fund that invests its assets in a wholly owned subsidiary in Mauritius will consist solely or partially for cash in U.S. dollars based on the number of Indian securities included in a Fund’s corresponding Underlying Index. Investors transacting in Creation Units for cash pay an additional variable charge to compensate the relevant Fund for brokerage and market impact expenses relating to investing in portfolio securities.
| EGA Emerging Global Shares Trust | 79 |
Notes to Financial Statements (continued)
September 30, 2011 (Unaudited)
12. TRUSTEES’ FEES
The Trust compensates each Trustee who is not an employee of the Adviser, EGA or its affiliates. The interested Trustees do not receive any compensation from the Trust for serving as Trustees.
13. THE REGULATED INVESTMENT COMPANY MODERNIZATION ACT
Under the recently enacted Regulated Investment Company Modernization Act of 2010, the Funds will be permitted to carry forward capital losses incurred in taxable years beginning after December 22, 2010 for an unlimited period. However, any losses incurred during these future taxable years will be required to be utilized prior to the losses incurred in pre-enactment taxable years. As a result of this ordering rule, pre-enactment capital loss carryforwards may have an increased likelihood to expire unused. Additionally, post-enactment capital losses that are carried forward will retain their character as either short-term or long-term capital losses rather than being considered all short-term under previous law.
14. NEW ACCOUNTING PRONOUNCEMENTS
In April 2011, the Financial Accounting Standards Board (“FASB”) issued Accounting Standards Update (“ASU”) No. 2011-03 “Reconsideration of Effective control for Repurchase Agreements”. The objective of ASU 2011-03 is to improve the accounting for repurchase agreements and other agreements that both entitle and obligate a transferor to repurchase or redeem financial assets before their maturity. Under previous guidance, whether or not to account for a transaction as a sale was based on, in part, if the entity maintained effective control over the transferred financial assets. ASU 2011-03 removes the transferor’s ability criterion from the effective control assessment. This guidance is effective prospectively for interim and annual reporting periods beginning on or after December 15, 2011. At this time, management is evaluating the implications of ASU No. 2011-03 and its impact on the financial statements has not been determined.
In May 2011, the FASB issued ASU No. 2011-04 “Amendments to Achieve Common Fair Value Measurement and Disclosure Requirements in U.S. GAAP and IFRSs”. ASU 2011-04 includes common requirements for measurement of and disclosure about fair value between U.S. GAAP and IFRS. ASU 2011-04 will require reporting entities to disclose the following information for fair value measurements categorized within Level 3 of the fair value hierarchy: quantitative information about the unobservable inputs used in the fair value measurement, the valuation processes used by the reporting entity and a narrative description of the sensitivity of the fair value measurement to changes in unobservable inputs and the interrelationships between those unobservable inputs. In addition, ASU 2011-04 will require reporting entities to make disclosures about amounts and reasons for all transfers in and out of Level 1 and Level 2 fair value measurements. The new and revised disclosures are effective for interim and annual reporting periods beginning after December 15, 2011. Management is currently evaluating the implications of ASU No. 2011-04 and its impact on the financial statements.
15. FUND NAME CHANGES
The Board approved effective June 23, 2011, the following Fund name and NYSE Arca symbol changes:
| Prior Fund Name | New Fund Name | Prior NYSE Arca Symbol | New NYSE Arca Symbol |
| Emerging Global Shares Dow Jones Emerging Markets Titans Composite Index Fund | EGShares GEMS Composite ETF | EEG | AGEM |
| Emerging Global Shares Dow Jones Emerging Markets Energy Titans Index Fund | EGShares Energy GEMS ETF | EEO | OGEM |
| Emerging Global Shares Dow Jones Emerging Markets Financials Titans Index Fund | EGShares Financials GEMS ETF | EFN | FGEM |
The Board approved effective June 23, 2011, the following Fund name change:
| Prior Fund Name | New Fund Name |
| Emerging Global Shares Dow Jones Emerging Markets Metals & Mining Titans Index Fund | EGShares Emerging Markets Metals & Mining ETF |
| 80 | EGA Emerging Global Shares Trust |
Notes to Financial Statements (concluded)
September 30, 2011 (Unaudited)
The Board approved effective July 29, 2011, the following Fund name changes:
| Prior Fund Name | New Fund Name |
| Emerging Global Shares Dow Jones Emerging Markets Consumer Titans Index Fund | EGShares Emerging Markets Consumer ETF |
| Emerging Global Shares INDXX India Infrastructure Index Fund | EGShares India Infrastructure ETF |
| Emerging Global Shares INDXX China Infrastructure Index Fund | EGShares China Infrastructure ETF |
| Emerging Global Shares INDXX Brazil Infrastructure Index Fund | EGShares Brazil Infrastructure ETF |
| Emerging Global Shares INDXX India Small Cap Index Fund | EGShares India Small Cap ETF |
16. SUBSEQUENT EVENTS
The Board approved effective October 28, 2011, the following Fund name change:
| Current Fund Name | New Fund Name |
| EGShares Emerging Markets High Income Low Beta ETF | EGShares Low Volatility Emerging Markets Dividend ETF |
The Funds have evaluated subsequent events through the date of issuance of this report and have determined, other than the disclosures stated; there are no material events that impacted the Funds’ financial statements.
| EGA Emerging Global Shares Trust | 81 |
Board Review and Approval of Advisory Contracts
A. Board Review and Approval of Previous Investment Advisory Agreement
At the February 24, 2011 Board of Trustees (the “Board”) meeting (the “February 2011 Meeting”), the Board, including those Trustees who are not “interested persons” (as that term is defined in the Investment Company Act of 1940, as amended (“1940 Act”)) of the Trust (the “Independent Trustees”), had approved ALPS Advisors to continue to serve as investment adviser to EGShares Energy GEMS ETF, EGShares Emerging Markets Metals & Mining ETF, EGShares GEMS Composite ETF, EGShares Financials GEMS ETF, EGShares China Infrastructure ETF, EGShares Brazil Infrastructure ETF, EGShares India Small Cap ETF, EGShares India Infrastructure ETF, EGShares Emerging Markets Consumer ETF, EGShares Basic Materials GEMS ETF, EGShares Health Care GEMS ETF and EGShares Industrials GEMS ETF (the “Original Funds”). At that meeting, the Board approved the continuation of the investment advisory agreement (the “Original ALPS Advisory Agreement”) between ALPS Advisors and the Trust with respect to each Original Fund, upon the same terms and conditions set forth therein, for the period April 17, 2011 until April 17, 2012.
At the May 19, 2011 Board meeting (the “May 2011 Meeting”), the Board, including the Independent Trustees, approved ALPS Advisors to serve as investment adviser to each Original Fund and to each additional series of the Trust offered to the public (the “Additional Funds” and, together with the Original Funds, the “Funds”). At that meeting, the Board approved an Amended and Restated Investment Advisory Agreement (the “Amended and Restated Advisory Agreement”) between ALPS Advisors and the Trust with respect to each Fund for the period May 19, 2011 until April 17, 2012. Under the Amended and Restated Advisory Agreement, the annual management fee paid by the Trust to ALPS Advisors is based on total assets of the Trust. For the “Original Funds, the annual management fee paid by the Trust to the Adviser is subject to both a minimum amount and a cap. For the Additional Funds, the minimum amount and the cap rise proportionately. The annual management fee paid by the Additional Funds is credited for the annual management fees paid by the Original Funds. The advisory fees paid to ALPS Advisors by the Original Funds, including the minimum and maximum fees, cannot be increased without shareholder approval. Accordingly, under the Amended and Restated Advisory Agreement, the advisory fee for the Original Funds (including the minimum and maximum fees) remained unchanged, and therefore shareholder approval by the Original Funds was not required to adopt the Amended and Restated Investment Advisory Agreement.
At the February 2011 Meeting, the Board had approved EGA to continue to serve as investment sub-adviser to EGShares GEMS Composite ETF, EGShares Emerging Markets Metals & Mining ETF, EGShares Emerging Markets Consumer ETF, EGShares Energy GEMS ETF, EGShares Financials GEMS ETF, EGShares China Infrastructure ETF, EGShares Brazil Infrastructure ETF, EGShares India Infrastructure ETF, and EGShares India Small Cap ETF (the “Operational Funds”). At that meeting, the Board approved the continuation of the sub-advisory agreement (the “Sub-Advisory Agreement”) between EGA and the Trust with respect to each Operational Fund, upon the same terms and conditions set forth therein, for the period April 17, 2011 until April 17, 2012.
At the May 2011 Meeting, the Board approved EGA to continue to serve as investment sub-adviser to EGShares Basic Materials GEMS ETF, EGShares Consumer Goods GEMS ETF, EGShares Consumer Services GEMS ETF, EGShares Health Care GEMS ETF, EGShares Industrials GEMS ETF, EGShares Technology GEMS ETF, EGShares Telecom GEMS ETF, EGShares Utilities GEMS ETF, Emerging Global Shares INDXX China Mid Cap Index Fund, Emerging Global Shares INDXX Brazil Mid Cap Index Fund (the “Non-Operational Funds”) and approved the continuation of the Sub-Advisory Agreement between EGA and the Trust with respect to each Non-Operational Fund, upon the same terms and conditions set forth therein, for the period May 19, 2011 until April 17, 2012.
In connection with considering approval of the Amended and Restated Advisory Agreement and the Sub-Advisory Agreement at the May 2011 Meeting, the Independent Trustees met in executive session with independent counsel, who provided assistance and advice. In considering whether to approve the Amended and Restated Investment Advisory Agreement and the continuation of the Sub-Advisory Agreement, the Independent Trustees reviewed the materials provided in advance of the May 2011 Meeting, together with the materials provided at the February 2011 Meeting by ALPS Advisors and EGA, including: (i) clean and blacklined copies of the Amended and Restated Advisory Agreement with ALPS Advisors; (ii) a copy of the Sub-Advisory Agreement with EGA and all amendments thereto; (iii) information describing the nature, quality, and extent of the services that ALPS Advisors will provide to EGShares Consumer Goods GEMS ETF, EGShares Consumer Services GEMS ETF, EGShares Technology GEMS ETF, EGShares Telecom GEMS ETF, EGShares Utilities GEMS ETF, EGShares China Mid Cap ETF, and EGShares Brazil Mid Cap ETF (the “New Funds”), and the fees that ALPS Advisors will charge for such services; (iv) information describing the nature, quality, and extent of the services that EGA will provide to the Non-Operational Funds, and the fees that EGA will charge for such services; (v) information concerning the financial condition, business, operations and compliance program of ALPS Advisors; (vi) information concerning the financial condition, business and operations, portfolio management team and compliance program of EGA; (vii) a copy of the current Form ADV for each of ALPS Advisors and EGA; and (viii) memoranda from Stradley Ronon on the responsibilities of trustees in considering investment advisory arrangements under the 1940 Act. In addition, the Independent Trustees received data compiled by ETF Database comparing the proposed fee rate for advisory services to be charged to the Trust to fees paid by other exchange-traded funds (“ETFs”) with similar investment objectives and policies at various asset levels.
During their review of this information, the Independent Trustees focused on and analyzed the factors that the Independent Trustees deemed relevant, including: the nature, quality, and extent of the services to be provided to the New Funds and Non-Operational Funds by ALPS Advisors and EGA, respectively; the personnel and operations of ALPS Advisors and EGA; the proposed expense levels of the New Funds
| 82 | EGA Emerging Global Shares Trust |
Board Review and Approval of Advisory Contracts (continued)
and Non-Operational Funds as set forth in the ETF Database report; the anticipated profitability, if any, to ALPS Advisors and EGA under the Amended and Restated Advisory Agreement and Sub-Advisory Agreement, respectively; any “fall-out” benefits to ALPS Advisors and EGA (i.e., the ancillary benefits realized due to a relationship with the Trust); the effect of asset growth on the New Funds’ and Non-Operational Funds’ expenses; and possible conflicts of interest. In particular, the Independent Trustees considered and discussed the following:
1. Amended and Restated Investment Advisory Agreement with ALPS Advisors
(a) The nature, extent, and quality of services to be provided to the New Funds by ALPS Advisors. The Independent Trustees reviewed the services that ALPS Advisors would provide to the New Funds. In connection with the investment advisory services to be provided to the New Funds, the Independent Trustees noted the responsibilities that ALPS Advisors would have as the New Funds’ investment adviser, including: overall supervisory responsibility for the general management and investment of each New Fund’s securities portfolio; ultimate responsibility, subject to oversight by the Board, for oversight of the Trust’s sub-adviser; responsibility for daily monitoring of tracking error and quarterly reporting to the Board; and the implementation of Board directives as they relate to the New Funds.
The Independent Trustees reviewed ALPS Advisors’ experience, resources, and strengths in managing other ETFs, including the Funds of the Trust currently operating. Based on their consideration and review of the foregoing information, the Independent Trustees determined that the New Funds were likely to benefit from the nature, quality, and extent of these services, as well as ALPS Advisors’ ability to render such services based on its experience, operations, and resources.
(b) Comparison of services to be provided and fees to be charged by ALPS Advisors and other investment advisers to similar clients, and the cost of the services to be provided and profits to be realized by ALPS Advisors from the relationship with the New Funds. The Independent Trustees then compared both the services to be rendered and the proposed fees to be paid pursuant the Amended and Restated Advisory Agreement with ALPS Advisors, and to contracts of other investment advisers with respect to similar ETFs, including the Funds of the Trust currently operating. In particular, the Independent Trustees compared each New Fund’s proposed advisory fee and projected expense ratios for its first year of operations to other ETFs considered to be in each New Fund’s peer group, as determined by ETF Database. It was noted that EGA has entered into an expense limitation agreement whereby EGA agreed to reimburse expenses and/or waive fees to keep the expenses of each New Fund from exceeding: (i) 0.89% for New Funds that will invest in a related Mauritius company; or (ii) 0.85% for New Funds that will not invest in a related Mauritius company, of the average daily net assets for at least the first year of operations.
After comparing each New Fund’s proposed fee with those of other ETFs in such New Fund’s peer group, and in light of the nature, quality, and extent of services proposed to be provided by ALPS Advisors and the costs expected to be incurred by ALPS Advisors in rendering those services, the Independent Trustees concluded that the fees proposed to be paid to ALPS Advisors with respect to each New Fund was fair and reasonable.
(c) ALPS Advisors’ profitability and the extent to which economies of scale would be realized as the New Funds grow and whether fee levels would reflect such economies of scale.
The Independent Trustees next considered potential economies of scale and the anticipated costs and projected profitability of ALPS Advisors in connection with its serving as investment adviser to the New Funds, including operational costs. The Independent Trustees recognized the uncertainty in launching a new investment product and estimating future asset levels. The Board noted that because ALPS is subject to a maximum flat rate fee, its fee as a percentage of assets under management will eventually begin to decline as asset levels increase.
(d) Investment performance of ALPS Advisors. Because the New Funds had not commenced operations, the Independent Trustees could not consider the investment performance of the New Funds, but did take into account the investment performance of the Funds of the Trust currently operating, for which ALPS Advisors serves as investment adviser
Conclusion. No single factor was determinative to the decision of the Independent Trustees. Based on the foregoing and such other matters as were deemed relevant, the Independent Trustees concluded that the proposed advisory fee rates and projected total expense ratios are reasonable in relation to the services to be provided by ALPS Advisors to the New Funds, as well as the costs to be incurred and benefits to be gained by ALPS Advisors in providing such services. As a result, the Independent Trustees decided to recommend to the Board the approval of the Amended and Restated Advisory Agreement with ALPS Advisors.
2. Continuation of Sub-Advisory Agreement with EGA
(a) The nature, extent, and quality of services to be provided to the Non-Operational Funds by EGA. The Independent Trustees reviewed the services that EGA would provide to the Non-Operational Funds. In connection with the sub-advisory services to be provided to the Non-Operational Funds, the Independent Trustees noted the significant responsibilities that EGA would have as the Non-Operational Funds’ sub-adviser, including: implementation of the investment management program of each New Fund; management of the day-to-day investment and reinvestment of the assets in each New Fund; determining daily baskets of deposit securities and cash components; executing portfolio security trades for purchases and redemptions of New Fund shares conducted on a cash-in-lieu basis; making determinations with respect to alternative cash management vehicles and securities lending collateral investments; management of intermediate Mauritius entities for those Non-Operational Funds with significant investments in India; and oversight of general portfolio compliance with relevant law.
| EGA Emerging Global Shares Trust | 83 |
Board Review and Approval of Advisory Contracts (continued)
The Independent Trustees reviewed EGA’s experience, resources, strengths and its performance as a sub-adviser to the currently operating Funds of the Trust. In response to a question, Mr. Holderith reiterated the financial viability of EGA he had reported on earlier in the May 2011 Meeting. Based on their consideration and review of the foregoing information, the Independent Trustees determined that the Non-Operational Funds were likely to benefit from the nature, quality, and extent of these services, as well as EGA’s ability to render such services based on its experience, operations and resources.
(b) Comparison of services to be provided and fees to be charged by EGA and other investment advisers to similar clients, and the cost of the services to be provided and profits to be realized by EGA from the relationship with the Non-Operational Funds. The Independent Trustees then compared both the services to be rendered and the proposed fees to be paid for sub-advisory services to those of other investment advisers of similar ETFs. In particular, the Independent Trustees compared each Non-Operational Fund’s proposed advisory fee and projected expense ratio for the first year of operations to other ETFs considered to be in each Non-Operational Fund’s peer group, as chosen by ETF Database, including the currently operating series of the Trust. The Board noted that each Non-Operational Fund’s proposed management fee and expenses (after giving effect to the fee waiver and expense limitation arrangements) was generally at the top of the range of the Non-Operational Fund’s peer group.
The Independent Trustees noted that the proposed sub-advisory fee of the EGShares Basic Materials GEMS ETF was at the maximum range of fees charged by other funds in the Fund’s peer group, as chosen by ETF Database. The Independent Trustees also noted that the projected total expenses (both including and excluding the proposed fee waiver and expense limitation arrangements) of the Fund were at the maximum range of total expenses of other funds in the Fund’s peer group, as chosen by ETF Database.
The Independent Trustees noted that the proposed sub-advisory fee of the EGShares Consumer Goods GEMS ETF was at the maximum range of fees charged by other funds in the Fund’s peer group, as chosen by ETF Database. The Independent Trustees also noted that the projected total expenses (both including and excluding the proposed fee waiver and expense limitation arrangements) of the Fund were at the maximum range of total expenses of other funds in the Fund’s peer group, as chosen by ETF Database.
The Independent Trustees noted that the proposed sub-advisory fee of the EGShares Consumer Services GEMS ETF was at the maximum range of fees charged by other funds in the Fund’s peer group, as chosen by ETF Database. The Independent Trustees also noted that the projected total expenses (both including and excluding the proposed fee waiver and expense limitation arrangements) of the Fund were at the maximum range of total expenses of other funds in the Fund’s peer group, as chosen by ETF Database.
The Independent Trustees noted that the proposed sub-advisory fee of the EGShares Health Care GEMS ETF was at the maximum range of fees charged by other funds in the Fund’s peer group, as chosen by ETF Database. The Independent Trustees also noted that the projected total expenses (both including and excluding the proposed fee waiver and expense limitation arrangements) of the Fund were at the maximum range of total expenses of other funds in the Fund’s peer group, as chosen by ETF Database.
The Independent Trustees noted that the proposed sub-advisory fee of the EGShares Industrials GEMS ETF was at the maximum range of fees charged by other funds in the Fund’s peer group, as chosen by ETF Database. The Independent Trustees also noted that the projected total expenses (both including and excluding the proposed fee waiver and expense limitation arrangements) of the Fund were at the maximum range of total expenses of other funds in the Fund’s peer group, as chosen by ETF Database.
The Independent Trustees noted that the proposed sub-advisory fee of the EGShares Technology GEMS ETF was at the maximum range of fees charged by other funds in the Fund’s peer group, as chosen by ETF Database. The Independent Trustees also noted that the projected total expenses (both including and excluding the proposed fee waiver and expense limitation arrangements) of the Fund were at the maximum range of total expenses of other funds in the Fund’s peer group, as chosen by ETF Database.
The Independent Trustees noted that the proposed sub-advisory fee of the EGShares Telecom GEMS ETF was at the maximum range of fees charged by other funds in the Fund’s peer group, as chosen by ETF Database. The Independent Trustees also noted that the projected total expenses (both including and excluding the proposed fee waiver and expense limitation arrangements) of the Fund were at the maximum range of total expenses of other funds in the Fund’s peer group, as chosen by ETF Database.
The Independent Trustees noted that the proposed sub-advisory fee of the EGShares Utilities GEMS ETF was at the maximum range of fees charged by other funds in the Fund’s peer group, as chosen by ETF Database. The Independent Trustees also noted that the projected total expenses (both including and excluding the proposed fee waiver and expense limitation arrangements) of the Fund were at the maximum range of total expenses of other funds in the Fund’s peer group, as chosen by ETF Database.
The Independent Trustees noted that the proposed sub-advisory fee of the EGShares China Mid Cap ETF was at the maximum range of fees charged by other funds in the Fund’s peer group, as chosen by ETF Database. The Independent Trustees also noted that the projected total expenses (both including and excluding the proposed fee waiver and expense limitation arrangements) of the Fund were at the maximum range of total expenses of other funds in the Fund’s peer group, as chosen by ETF Database.
| 84 | EGA Emerging Global Shares Trust |
Board Review and Approval of Advisory Contracts (continued)
The Independent Trustees noted that the proposed sub-advisory fee of the EGShares Brazil Mid Cap ETF was at the maximum range of fees charged by other funds in the Fund’s peer group, as chosen by ETF Database. The Independent Trustees also noted that the projected total expenses (both including and excluding the proposed fee waiver and expense limitation arrangements) of the Fund were at the maximum range of total expenses of other funds in the Fund’s peer group, as chosen by ETF Database.
The Independent Trustees considered the appropriateness of the proposed sub-advisory fees and expense ratios of the Non-Operational Funds compared to the fees and expenses of similar ETFs. The Independent Trustees also considered the costs, including operational costs, and projected profitability of EGA in connection with its serving as sub-adviser to each Non-Operational Fund. The Board noted the additional costs of operating the Non-Operational Funds that will invest in a related Mauritius company in order to invest directly in Indian companies. The Independent Trustees further noted the additional costs associated with registering and operating each of the Mauritius companies. The Independent Trustees noted EGA’s commitment initially to limit each Non-Operational Fund’s expenses through a written fee waiver and expense reimbursement agreement with the Trust, including the circumstances in which the Trust would have to repay fees in excess of the expense cap that were borne by EGA. After comparing each Non-Operational Fund’s proposed fee and expenses with those of other ETFs in the Non-Operational Fund’s peer group, including for those Non-Operational Funds whose fees and expenses were in the maximum range compared to their peer groups, and in light of the nature, quality, and extent of services proposed to be provided by EGA and the costs expected to be incurred by EGA in rendering those services and capping the Non-Operational Funds’ expenses, the Independent Trustees concluded that the fees proposed to be paid to EGA with respect to each Non-Operational Fund was fair and reasonable.
(c) EGA’s profitability and the extent to which economies of scale would be realized as each Non-Operational Funds grows and whether fee levels would reflect such economies of scale. The Independent Trustees considered potential economies of scale. The Independent Trustees were informed that the Non-Operational Funds were not yet a sufficient size to be experiencing economies of scale, and that EGA would consider addressing economies of scale when assets under management reached appropriate levels.
(d) Investment performance of EGA. Because the Non-Operational Funds had not commenced operations, the Independent Trustees could not consider the investment performance of the Non-Operational Funds, but did take into account the investment performance of the currently operating series of the Trust, for which EGA serves as sub-adviser.
Conclusion. No single factor was determinative to the decision of the Independent Trustees. Based on the foregoing and such other matters as were deemed relevant, such as the proposed fee waiver and expense limitation arrangement, the Independent Trustees concluded that the proposed sub-advisory fees and projected total expense ratios are reasonable in relation to the services to be provided by EGA to the Non-Operational Funds, as well as the costs to be incurred and benefits to be gained by EGA in providing such services. As a result, the Independent Trustees determined that the continuation of the Sub-Advisory Agreement with EGA was in the best interests of each Non-Operational Fund.
B. Board Review and Approval of New Investment Advisory Agreement
On July 19, 2011, ALPS Holdings, Inc., parent company to ALPS Advisors, announced that it signed a definitive agreement to be acquired by DST Systems, Inc. (“DST”) through a merger with a wholly owned DST subsidiary (the “Transaction”).
ALPS Advisors currently serves as the investment adviser to each Fund pursuant to an Amended and Restated Advisory Agreement (the “Current Advisory Agreement”). Under the 1940 Act, the Transaction, if consummated, will result in the automatic termination of the Current Advisory Agreement. In order for the management of each Fund to continue uninterrupted, the Board approved a new investment advisory agreement (the “New Investment Advisory Agreements”) with the Trust, subject to shareholder approval.
At an in-person Board meeting held on July 28, 2011 (the “July 2011 Meeting”), the Board of Trustees, including the Independent Trustees, discussed and approved the New Investment Advisory Agreement between ALPS Advisors and the Trust, on behalf of each of the Funds, and determined to recommend that shareholders of each Fund (“Shareholders”) approve the New Investment Advisory Agreement. The Independent Trustees had requested and been provided with detailed materials relating to DST, ALPS Advisors and the Transaction in advance of the July 2011 Meeting. The Independent Trustees had met in executive session with their independent legal counsel prior to and during the July 2011 Meeting to discuss the proposed Transaction and its possible effect on the Funds. At the July 2011 Meeting, the Trustees discussed the Transaction with ALPS Advisors management and a representative of DST, including the strategic rationale for the Transaction, and DST’s general plans and intentions regarding ALPS Advisors. At the July 2011 Meeting, representatives of ALPS Advisors and DST responded to questions from the Board.
In connection with the Board’s review of the New Investment Advisory Agreement, ALPS Advisors and DST advised the Trustees about a variety of matters, including the following:
No material changes are currently contemplated as a result of the Transaction in the nature, quality, or extent of services currently provided to the Funds and their Shareholders, including investment management, distribution, or other Shareholder services.
No material changes are currently contemplated in the management, operation or key personnel of ALPS Advisors under DST.
| EGA Emerging Global Shares Trust | 85 |
Board Review and Approval of Advisory Contracts (continued)
DST has agreed that it will, and will cause each of its affiliates to, conduct its business and use commercially reasonable efforts to enable reliance upon the conditions of Section 15(f) of the 1940 Act in relation to the investment advisory services provided by ALPS Advisors to each Fund, including not imposing any “unfair burden” on the Funds for at least two years from the closing of the Transaction (the “Closing”).
In addition to the information provided by ALPS Advisors and DST as described above, the Board also considered, among other factors, the following:
The reputation, financial strength, and resources of DST.
The terms and conditions of the New Investment Advisory Agreement, including that each Fund’s contractual fee rate will remain the same as the terms, conditions and contractual fee rate under the Current Advisory Agreement.
At the February 2011 Meeting and May 2011 Meeting, the Board had performed a full annual review of the Current Investment Advisory Agreement as required by the 1940 Act and determined that ALPS Advisors has the capabilities, resources, and personnel necessary to provide the investment management services currently provided to each Fund. The Board also determined at its previous meetings that the management fees paid by each Fund represented reasonable compensation to ALPS Advisors in light of the services provided, the costs to ALPS Advisors of providing those services, economies of scale experienced by ALPS Advisors, if any, and the fees and other expenses paid by similar funds (based on information provided by ETF Database) and in light of such other matters that the Board considered relevant in the exercise of its reasonable judgment.
ALPS Holdings has agreed to pay all expenses of the Funds in connection with the Board’s consideration of the New Investment Advisory Agreement and related agreements and all costs of this proxy solicitation. As a result, the Funds will bear no costs in obtaining Shareholder approval of the New Investment Advisory Agreement.
EGA will continue as the sub-advisor to the Trust after the Closing, and will continue to manage the day-to-day investment and reinvestment of the assets in each Fund.
Certain of these considerations are discussed in more detail below.
In considering whether to approve the New Investment Advisory Agreement, the Independent Trustees reviewed the materials distributed in advance of the July 2011 Meeting, together with the materials provided at the February 2011 Meeting and May 2011 Meeting by ALPS Advisors, including: (i) the New Investment Advisory Agreement; (ii) memoranda from ALPS Advisors regarding the Transaction; (iii) profile information regarding DST; (iv) information describing the nature, quality, and extent of the services that ALPS Advisors will provide to the Funds, and the fees that ALPS Advisors will charge for such services; (v) information concerning the financial condition, business, operations and compliance program of ALPS Advisors; (vi) memoranda from Stradley Ronon on the ramifications for the Trust of the sale of equity interests of ALPS; and (vii) memoranda from Stradley Ronon on the responsibilities of trustees in considering investment advisory arrangements under the 1940 Act. In addition, the Independent Trustees reviewed the data previously received from ETF Database comparing the proposed fee rate for advisory services to be charged to the Trust to fees paid by other ETFs with similar investment objectives and policies at various asset levels.
During their review of this information, the Independent Trustees focused on and analyzed the factors that the Independent Trustees deemed relevant, including: the nature, quality, and extent of the services to be provided to the Funds by ALPS Advisors; the personnel and operations of ALPS Advisors; the anticipated profitability, if any, to ALPS Advisors under the New Investment Advisory Agreement; any “fall-out” benefits to ALPS Advisors (i.e., the ancillary benefits realized due to a relationship with the Trust); possible conflicts of interest; and alternatives to approving the New Advisory Agreement.
In making its decision to approve the New Investment Advisory Agreement, the Independent Trustees gave attention to all information furnished. The following discussion identifies the primary factors taken into account by the Board in approving the New Investment Advisory Agreement.
(a) The nature, extent, and quality of services provided to the Funds by ALPS Advisors. The Board considered services provided by ALPS Advisors and its affiliates to the Funds and their Shareholders. In reviewing the nature, extent, and quality of services, the Board considered that the New Investment Advisory Agreement will be substantially identical to the Current Investment Advisory Agreement, and therefore considered the review conducted at the February 2011 Meeting and the May 2011 Meeting. In this regard, the Board noted ALPS Advisors’ responsibilities as the Funds’ investment adviser, including: overall supervisory responsibility for the general management and investment of each Fund’s securities portfolio; ultimate responsibility, subject to oversight by the Board, for oversight of EGA as sub-adviser to the Trust; responsibility for daily monitoring of tracking error and quarterly reporting to the Board; and implementation of Board directives as they relate to the Funds.
| 86 | EGA Emerging Global Shares Trust |
Board Review and Approval of Advisory Contracts (concluded)
The Board reviewed ALPS Advisors’ experience, resources, and strengths in managing other ETFs, including the Funds. The Board also considered the fact that the Funds operate under an exemption obtained by ALPS Advisors from the SEC, and that ALPS Advisors is ultimately responsible for overseeing compliance with the exemptive order. Based on their consideration and review of the foregoing information, the Board determined that the Funds were likely to continue to benefit from the nature, quality, and extent of these services, as well as ALPS Advisors’ ability to render such services based on its experience, operations, and resources.
(b) Comparison of services provided and fees charged by ALPS Advisors and other investment advisers to similar clients, and the cost of the services provided and profits realized by ALPS Advisors from the relationship with the Funds. The Board considered the expense comparison data for the Funds that it had previously considered at the February 2011 Meeting and May 2011 Meeting. At those meetings, the Board reviewed information on pricing levels and fee structures for the Funds and a comparative group of similar funds as selected by ETF Database (the “Expense Group”). The Board focused on the comparative analysis of the effective management fees and total expense ratios of each Fund versus the effective management fees and expense ratios of the Expense Group. The Board had also previously reviewed the costs and profitability of ALPS Advisors in connection with its serving as investment adviser to each Fund, including operational costs, at the February 2011 Meeting and May 2011 Meeting. The Board further noted that, consistent with Section 15(f) of the 1940 Act, DST had agreed that no “unfair burden” would be imposed on the Funds for the first two years after the Closing.
(c) ALPS Advisors’ profitability and the extent to which economies of scale were realized as the Funds grow and whether fee levels would reflect such economies of scale. The Board next considered economies of scale. The Board had previously reviewed the costs and profitability of ALPS Advisors in connection with its serving as investment adviser to each Fund, including operational costs, at the February 2011 Meeting and May 2011 Meeting. The Board noted that because ALPS Advisors is subject to a maximum flat rate fee, its fee as a percentage of assets under management could eventually begin to decline as asset levels increase.
(d) Investment performance of ALPS Advisors. The Board considered the investment performance of the Funds, including tracking error. Although the Board considered performance reports provided throughout the year, the Board gave particular weight to the approval of the Current Investment Advisory Agreement at the February 2011 Meeting and May 2011 Meeting. The Board considered each Fund’s investment performance compared to the benchmark index that each Fund uses for comparison in its prospectus and shareholder reports. The Board also considered each Fund’s investment performance compared to the average of the respective Fund’s peer group.
The Board also considered information about the premium/discount history of the Funds previously considered at prior Board meetings, which illustrated the number of times that the market price of the Funds trading on the secondary market closed above or below the net asset value (“NAV”) of the Funds, and by how much, measured in basis points. The Board also noted the proposed continuity of ALPS Advisors’ operations.
(e) Fall-Out Benefits. The Board concluded that DST and ALPS Holdings may derive reputational and other benefits from their association with the Trust, including service relationships with ALPS Fund Services, Inc. and ALPS Distributors, Inc., the extent to which ALPS Holdings might derive ancillary benefits from Fund operations, including the potential for procuring additional business as a result of the prestige and visibility associated with its role as service provider to the Trust.
Conclusion. No single factor was determinative to the decision of the Board. Based on the foregoing and such other matters as were deemed relevant, the Board concluded that the advisory fee rates were reasonable in relation to the services provided by ALPS Advisors to each Fund, as well as the costs incurred and benefits gained by ALPS Advisors in providing such services. The Board also found the advisory fee rates to be reasonable in comparison to the advisory fee rates charged by advisers to other comparable ETFs of similar size with comparable launch dates. The Board has concluded that the Transaction would not result in an increase in advisory fee rates, and was not expected to result in a decrease in quality or quantity of services from ALPS Advisors, or impose an “unfair burden” on the Funds. The Board concluded that each Fund’s investment performance, including tracking error and premium/discount, was acceptable in light of, among other things, the complexities of the markets in which it invests. As a result, the Board, including a majority of the Independent Trustees, approved the New Investment Advisory Agreement, concluding that the advisory fee rates under each are reasonable in relation to the services provided and that the New Investment Advisory Agreement is in the best interests of the Shareholders.
| EGA Emerging Global Shares Trust | 87 |
Board of Trustees and Officers (Unaudited)
The Trustees and officers of the Trust, along with their principal occupations over the past five years and their affiliations, if any, with EGA, are listed below. Unless otherwise noted, the address of each Trustee of the Trust is 171 East Ridgewood Ave., Ridgewood, NJ 07450.
| Name and Year of Birth | Position(s) Held with Trust | Term of Office1 and Length of Time Served | Principal Occupation(s) During Past 5 Years | Number of Portfolios in Fund Complex 2 Overseen by Trustee | Other Directorships Held by Trustee |
| Independent Trustees | |||||
| Robert Willens, 1946 | Trustee | Since 2009 | Robert Willens, LLC (tax consulting), President, since January, 2008; Lehman Brothers, Inc., Managing Director, Equity Research Department, January 2004 to January 2008. | 32 | Daxor Corp. (Medical Products and Biotechnology), since 2004. |
| Ron Safir, 1951 | Trustee | Since 2009 | Retired, since 2008; UBS Wealth Management, Chief Administrative Officer, February 1971 to December 2008. | 32 | None |
| Jeffrey D. Haroldson, 1957 | Trustee | Since 2009 | HDG Mansur Capital Group, LLC, President and Chief Operating Officer, since 2004; HSBC Securities (USA), Inc., Executive Managing Director, Head of Investment and Merchant Banking, 2000 to 2003. | 32 | None |
| Interested Trustees | |||||
| Robert C. Holderith3, 1960 | Trustee and President | Since 2008 | Emerging Global Advisors, LLC, Managing Member and Chief Executive Officer, since September 2008; ProFund Advisors, Managing Director, Institutional Sales & Investment Analytics, June 2006 to August 2008; UBS Financial Services, Inc., Director, January 2000 to May 2006. | 32 | None |
| James J. Valenti3, 1947 | Trustee and Secretary | Since 2008 | Emerging Global Advisors, LLC, Member and Chief Administrative Officer, since September 2008; Private Investor and Independent Consultant, June 2007 to September 2008; Senior Loan Consultant, Bridgepoint Mortgage Company, June 2006 to June 2007; Mercedes Benz, North America, Sales Representative, November 2000 to June 2006. | 32 | None |
| 1 | Each Trustee holds office for an indefinite term. |
| 2 | The “Fund Complex” consists of the Trust, which consists of thirty-two Funds. |
| 3 | Mr. Holderith and Mr. Valenti are considered to be “interested persons” of the Trust as defined in the 1940 Act, due to their relationship with EGA, the Funds’ sub-adviser. |
| 88 | EGA Emerging Global Shares Trust |
Board of Trustees and Officers (Unaudited) (concluded)
| Name and Year of Birth | Position(s) Held with the Trust | Term of Office1 and Length of Time Served | Principal Occupation(s) During Past 5 Years |
| Officers | |||
| Thomas A. Carter ALPS Fund Services, Inc. 1290 Broadway Suite 1100 Denver, CO 80203 1966 | Treasurer | Since 2009 | ALPS Fund Services, Inc., Directors, since October 2005; ALPS Advisors, Inc., President and Directors, since September 2008; ALPS Distributors, Inc., President and Director, since September 2008; FTAM Funds Distributor, Inc., President and Director, since September 2008; ALPS Holdings, Inc., Director, since October 2005; and ALPS ETF Trust, President and Trustee, since March 2008. |
| Melanie H. Zimdars ALPS Fund Services, Inc. 1290 Broadway Suite 1100 Denver, CO 80203 1976 | Chief Compliance Officer | Since 2010 | ALPS Fund Services, Inc., Deputy Chief Compliance Officer, since September 2009; ALPS ETF Trust, Chief Compliance Officer, since December 2009; EGA Emerging Global Shares Trust, Chief Compliance Officer, since March 2010; Financial Investors Variable Insurance Trust, Chief Compliance Officer, since September 2009; Liberty All-Star Growth Fund, Inc., Chief Compliance Officer, since December 2009; Liberty All-Star Equity Fund, Chief Compliance Officer, since December 2009; Wasatch Funds, Principal Financial Officer, Treasurer and Secretary, February 2007 to December 2008; Wasatch Funds, Assistant Treasurer, November 2006 to February 2007; Wasatch Funds, Senior Compliance Officer, 2005 to December 2008. |
| 1 | Officers of the Trust are elected by the Trustees and serve at the pleasure of the Board. |
| EGA Emerging Global Shares Trust | 89 |
General Information (Unaudited)
Investment Advisor
ALPS Advisors, Inc.
1290 Broadway, Suite 1100
Denver, CO 80203
Sub-Adviser
Emerging Global Advisors, LLC
171 East Ridgewood Ave.
Ridgewood, NJ 07450
Distributor
ALPS Distributors, Inc.
1290 Broadway, Suite 1100
Denver, CO 80203
Administrator, Custodian and Transfer Agent
The Bank of New York Mellon
101 Barclay Street
New York, NY 10286
Independent Registered Public Accounting Firm
BBD, LLP
1835 Market Street, 26th Floor
Philadelphia, PA 19103
You may obtain a description of the EGA Funds proxy voting, policies, procedures and information regarding how each Fund voted proxies relating to portfolio securities during the most recent 12-month period ending June 30 (available by August 31) without charge, upon request, by calling 1-888-800-4347 or visiting the funds website www.egshares.com, or by accessing the SEC’s website at www.sec.gov. Such reports may be reviewed and copied at the SEC’s Public Reference Room in Washington, DC. Information on the operation of the Public Reference Room may be obtained by calling 202-942-8090.
Each of the Funds’ premium/discount information that is current o the most recent quarter-end is available by visiting www.egshares.com or by calling 1-201-389-6872.
The Trust files complete schedules of the portfolio holdings with the SEC for the first and third quarters on Form N-Q. The Form N-Q is available without charge, upon request, by calling 1-800-SEC-0330, or by accessing the SEC’s website, at www.sec.gov. It may also be reviewed and copied at the SEC’s Public Reference Room in Washington, DC.
This report has been prepared for shareholders and may be distributed to others only if preceded or accompanied by an effective prospectus, which includes information regarding the Funds’ objectives and polices, experience of its management, marketability of shares and other information.
| 90 | EGA Emerging Global Shares Trust |
![]()
171 East Ridgewood Avenue
Ridgewood, NJ 07450
(201) 389-6872
470 Park Avenue South, 8th Floor
New York, NY 10016
(888) 800-4EGS (4347)
www.egshares.com
EGA Emerging Global Shares Trust
EGShares GEMS Composite ETF
(formerly Emerging Global Shares Dow Jones Emerging Markets Titans Composite Index Fund)
EGShares Basic Materials GEMS ETF
EGShares Consumer Goods GEMS ETF
EGShares Consumer Services GEMS ETF
EGShares Energy GEMS ETF
(formerly Emerging Global Shares Dow Jones Emerging Markets Energy Titans Index Fund)
EGShares Financials GEMS ETF
(formerly Emerging Global Shares Dow Jones Emerging Markets Financials Titans Index Fund)
EGShares Health Care GEMS ETF
EGShares Industrials GEMS ETF
EGShares Technology GEMS ETF
EGShares Telecom GEMS ETF
EGShares Utilities GEMS ETF
EGShares Emerging Markets Metals & Mining ETF
(formerly Emerging Global Shares Dow Jones Emerging Markets Metals & Mining Titans Index Fund)
EGShares Emerging Markets Consumer ETF
(formerly Emerging Global Shares Dow Jones Emerging Markets Consumer Titans Index Fund)
EGShares India Infrastructure ETF
(formerly Emerging Global Shares INDXX India Infrastructure Index Fund)
EGShares China Infrastructure ETF
(formerly Emerging Global Shares INDXX China Infrastructure Index Fund)
EGShares Brazil Infrastructure ETF
(formerly Emerging Global Shares INDXX Brazil Infrastructure Index Fund)
EGShares India Small Cap ETF
(formerly Emerging Global Shares INDXX India Small Cap Index Fund)
EGShares India Consumer ETF
EGShares Emerging Markets High Income Low Beta ETF
Emerging Global Shares are distributed by ALPS Distributors Inc.
Item 2. Code of Ethics.
Not Applicable for the semi-annual reporting period.
Item 3. Audit Committee Financial Expert.
Not Applicable for the semi-annual reporting period.
Item 4. Principal Accountant Fees and Services.
Not Applicable for the semi-annual reporting period.
Item 5. Audit Committee of Listed Registrants.
Not Applicable for the semi-annual reporting period.
Item 6. Schedule of Investments.
(a) Schedule is included as part of the report to shareholders filed under Item 1 of this Form.
(b) Not Applicable.
Item 7. Disclosure of Proxy Voting Policies and Procedures for Closed-End Management Investment Companies.
Not Applicable.
Item 8. Portfolio Managers of Closed-End Management Investment Companies.
Not Applicable.
Item 9. Purchases of Equity Securities by Closed-End Management Investment Company & Affiliated Purchasers.
Not Applicable.
Item 10. Submission of Matters to a Vote of Security Holders.
Not Applicable.
Item 11. Controls and Procedures.
(a) The Chief Executive Officer and Chief Financial Officer have evaluated the Registrant's disclosure controls and procedures within 90 days of the filing date of this report and have concluded that these controls and procedures are effective.
(b) There were no significant changes in the Registrant's internal controls over financial reporting or in other factors that could significantly affect these controls subsequent to the date of their evaluation.
Item 12. Exhibits.
(a) Any code of ethics, or amendment thereto, that is the subject of the disclosure required by Item 2, to the extent that the Registrant intends to satisfy the Item 2 requirements through filing of an exhibit: Not applicable at this time.
(b) Certifications for each Principal Executive Officer and Principal Financial Officer of the Registrant as required by Rule 30a-2(a) under the 1940 Act (17CFR 270.30a-(a)).
SIGNATURES
Pursuant to the requirements of the Securities Exchange Act of 1934 and the Investment Company Act of 1940, the Registrant has duly caused this report to be signed on its behalf by the undersigned, thereunto duly authorized.
Registrant: EGA Emerging Global Shares Trust
By: /s/ Robert C. Holderith
Robert C. Holderith, Chief Executive Officer
Date: November 22, 2011
Pursuant to the requirements of the Securities Exchange Act of 1934 and the Investment Company Act of 1940, this report has been signed below by the following persons on behalf of the Registrant and in the capacities and on the dates indicated.
Registrant: EGA Emerging Global Shares Trust
By: /s/ Robert C. Holderith
Robert C. Holderith, Chief Executive Officer
Date: November 22, 2011
By: /s/ Thomas A. Carter
Thomas A. Carter, Chief Financial Officer
Date: November 22, 2011