UNITED STATES
SECURITIES AND EXCHANGE COMMISSION
Washington, D.C. 20549
FORM N-CSR
CERTIFIED SHAREHOLDER REPORT OF REGISTERED MANAGEMENT INVESTMENT COMPANIES
Investment Company Act file number 811-22255
Columbia ETF Trust II
(Exact name of registrant as specified in charter)
225 Franklin Street
Boston, MA 02110
(Address of principal executive offices) (Zip code)
Ryan Larrenaga
c/o Columbia Management Investment Advisers, LLC
225 Franklin Street
Boston, MA 02110
(Name and address of agent for service)
Registrant’s telephone number, including area code: (800) 345-6611
Date of fiscal year end: March 31
Date of reporting period: March 31, 2017
Form N-CSR is to be used by management investment companies to file reports with the Commission not later than 10 days after the transmission to stockholders of any report that is required to be transmitted to stockholders under Rule 30e-1 under the Investment Company Act of 1940 (17 CFR 270.30e-1). The Commission may use the information provided on Form N-CSR in its regulatory, disclosure review, inspection, and policymaking roles.
A registrant is required to disclose the information specified by Form N-CSR, and the Commission will make this information public. A registrant is not required to respond to the collection of information contained in Form N-CSR unless the Form displays a currently valid Office of Management and Budget (“OMB”) control number. Please direct comments concerning the accuracy of the information collection burden estimate and any suggestions for reducing the burden to Secretary, Securities and Exchange Commission, 450 Fifth Street, NW, Washington, DC 20549-0609. The OMB has reviewed this collection of information under the clearance requirements of 44 U.S.C. § 3507.
Item 1. Reports to Stockholders.

ANNUAL REPORT
March 31, 2017

Columbia Beyond BRICs ETF
Columbia EM Core ex-China ETF
Columbia EM Quality Dividend ETF
Columbia EM Strategic Opportunities ETF
Columbia Emerging Markets Consumer ETF
Columbia Emerging Markets Core ETF
Columbia India Consumer ETF
Columbia India Infrastructure ETF
Columbia India Small Cap ETF

 Dear Shareholders,
While emotions have run high following the outcome of the U.S. Presidential election, it remains unclear how the Trump presidency will unfold in terms of policy. We have a sense of the priorities espoused by the President over the past eighteen months, but campaign priorities are not always realized and are often never pursued. What seems certain is that, while some investors have already priced expectations into the market, others have retreated, preferring instead a wait and see approach. The outcome of such behaviors appears to have created conditions ripe for ongoing market volatility.
While volatility in the financial markets can be stressful, volatility itself is not a new phenomenon. Other factors that have been at the root cause of recent volatility include uncertainty following the United Kingdom's vote to exit the European Union (Brexit), speculation around the Federal Reserve's decision to increase interest rates, divergent central bank policy and geopolitical unrest. The point is, financial markets have fluctuated for years and may be expected to continue to fluctuate — sometimes wildly. If anything, such volatility seems to be the new normal, perhaps exacerbated by access to information and development of technological tools which have enabled investors to react rapidly to real and perceived change. So what can you do?
Position your portfolio for the reality of market volatility
That there is a historical precedent for market volatility, or even an acceptance that it may persist, offers little comfort. A measured and strategic approach remains the best strategy for investors to stay on track in achieving their investment goals.
Step 1: Review your investment goals
Take this opportunity to review your investment goals and the strategies you are pursuing to achieve those goals in order to remain focused on what's important to you. It is entirely possible that your goals have changed in response either to your life situation or to changes in the market. Accept what you can't control — volatility, and focus on what you can — your investment goals and strategies.
Step 2: Reassess your risk tolerance
Sit down with your financial advisor to discuss your investment goals and strategies, as well as any changes to your tolerance for risk. Consider your investment horizon. Increased market volatility and a new investment horizon may impact the strategies that can best help you achieve your investment goals. Remember, achieving your investment goals may require a certain amount of risk. Ultimately, you must maintain vigilance in reassessing your risk tolerance and the strategies you have selected in pursuit of your investment goals, and awareness of how those strategies may react to market volatility.
Step 3: Remain calm and focus on your long-term plan
Remember, investing is about the long game. Short term events are not necessarily evidence of a longer term reality. Investors who attempt to time the market too often end up reacting to a down turn by selling low and then compounding the problem by waiting on the sidelines, ultimately missing the right opportunity to reinvest.
As long as there is a market, there will be volatility. How you respond to that volatility can make a big difference in the measure of your success as an investor. Talk to your financial advisor about how working with Columbia Threadneedle Investments may help you position your portfolio for the reality of ongoing volatility and, perhaps, even turn such volatility into investment opportunity.
Sincerely,

Christopher O. Petersen
President, Columbia ETF Trust II
Investors should consider the investment objectives, risks, charges and expenses of an exchange-traded fund (ETF) carefully before investing. For a free prospectus and summary prospectus, which contains this and other important information about an ETF, visit columbiathreadneedleetf.com. The prospectus and summary prospectus should be read carefully before investing.
Columbia Threadneedle Investments (Columbia Threadneedle) is the global brand name of the Columbia and Threadneedle group of companies.
Columbia ETF Trust II is managed by Columbia Management Investment Advisers, LLC and is distributed by ALPS Distributors, Inc., which is not affiliated with Columbia Management Investment Advisers, LLC or its parent company, Ameriprise Financial, Inc.
© 2017 Columbia Management Investment Advisers, LLC. All rights reserved.
Columbia Beyond BRICs ETF
Performance Overview | | | 2 | | |
Manager Discussion of Fund Performance | | | 4 | | |
Columbia EM Core ex-China ETF
Performance Overview | | | 7 | | |
Manager Discussion of Fund Performance | | | 9 | | |
Columbia EM Quality Dividend ETF
Performance Overview | | | 12 | | |
Manager Discussion of Fund Performance | | | 14 | | |
Columbia EM Strategic Opportunities ETF
Performance Overview | | | 17 | | |
Manager Discussion of Fund Performance | | | 19 | | |
Columbia Emerging Markets Consumer ETF
Performance Overview | | | 21 | | |
Manager Discussion of Fund Performance | | | 23 | | |
Columbia Emerging Markets Core ETF
Performance Overview | | | 25 | | |
Manager Discussion of Fund Performance | | | 27 | | |
Columbia India Consumer ETF
Performance Overview | | | 30 | | |
Manager Discussion of Fund Performance | | | 32 | | |
Columbia India Infrastructure ETF
Performance Overview | | | 34 | | |
Manager Discussion of Fund Performance | | | 36 | | |
Columbia India Small Cap ETF
Performance Overview | | | 38 | | |
Manager Discussion of Fund Performance | | | 40 | | |
Understanding Your Fund's Expenses | | | 42 | | |
Frequency Distribution of Premiums and Discounts | | | 43 | | |
Portfolio of Investments | | | 46 | | |
Statement of Assets and Liabilities | | | 76 | | |
Statement of Operations | | | 79 | | |
Statement of Changes in Net Assets | | | 82 | | |
Financial Highlights | | | 87 | | |
Notes to Financial Statements | | | 96 | | |
Report of Independent Registered Public Accounting Firm | | | 106 | | |
Federal Income Tax Information | | | 107 | | |
Trustees and Officers | | | 108 | | |
Important Information About This Report | | | 114 | | |
Fund Investment Manager
Columbia Management Investment
Advisers, LLC
225 Franklin Street
Boston, MA 02110
Fund Distributor
ALPS Distributors, Inc.
1290 Broadway
Suite 1100
Denver, CO 80203
ALPS Distributors, Inc. is not affiliated with Columbia Management Investment Advisers, LLC.
Fund Custodian
The Bank of New York Mellon Corp.
101 Barclay Street
New York, NY 10286
Fund Transfer Agent
The Bank of New York Mellon Corp.
101 Barclay Street
New York, NY 10286
The Bank of New York Mellon Corp. is not affiliated with Columbia Management Investment Advisers, LLC.
For more information about any of the ETFs, please visit columbiathreadneedleetf.com or call 888.800.4347.
The views expressed in this report reflect the current views of the respective parties. These views are not guarantees of future performance and involve certain risks, uncertainties and assumptions that are difficult to predict, so actual outcomes and results may differ significantly from the views expressed. These views are subject to change at any time based upon economic, market or other conditions and the respective parties disclaim any responsibility to update such views. These views may not be relied on as investment advice and, because investment decisions for a Columbia ETF are based on numerous factors, may not be relied on as an indication of trading intent on behalf of any particular Columbia ETF. References to specific securities should not be construed as a recommendation or investment advice.
PERFORMANCE OVERVIEW
Columbia Beyond BRICs ETF
Columbia Beyond BRICs ETF (the Fund) seeks investment results that correspond (before fees and expenses) to the price and yield performance of the FTSE Beyond BRICs Net of Tax Index USD.
Average Annual Total Returns (%) (for period ended March 31, 2017)
| | | Inception | | 1 Year | | Life | |
Market Price | | 08/15/12 | | | 4.01 | | | | -2.66 | | |
Net Asset Value | | 08/15/12 | | | 5.12 | | | | -2.48 | | |
Tracked Index(1) | | | | | | | 6.58 | | | | -0.66 | | |
(1) The Tracked Index reflects the Indxx Beyond BRICs Index through October 25, 2013 and the FTSE Beyond BRICs Net of Tax Index USD thereafter.
All results shown assume reinvestment of distributions during the period. Returns do not reflect the deduction of taxes that a shareholder may pay on Fund distributions or on the redemption of Fund shares. Performance results reflect the effect of any fee waivers or reimbursements of Fund expenses by the Fund's former investment manager or Columbia Management Investment Advisers, LLC (Columbia Management or the Investment Manager). Absent these fee waivers or expense reimbursement arrangements, performance results would have been lower.
The performance information shown represents past performance and is not a guarantee of future results. The investment return and principal value of your investment will fluctuate so that your shares, when redeemed, may be worth more or less than their original cost. Current performance may be lower or higher than the performance information shown. You may obtain performance information current to the most recent month-end by visiting columbiathreadneedleetf.com.
Columbia Management took over portfolio management in September 2016 upon its acquisition of the Fund's previous investment manager.
The price used to calculate Market Price return is based on the midpoint of the 4:00 PM Eastern (U.S.) bid/ask spread on the NYSE and does not represent returns an investor would receive if shares were traded at other times.
The Fund's shares may trade above or below their net asset value. The net asset value of the Fund will generally fluctuate with changes in the market value of the Fund's holdings. The market prices of shares, however, will generally fluctuate in accordance with changes in net asset value as well as the relative supply of, and demand for, shares on the exchange. The trading price of shares may deviate significantly from the net asset value.
The FTSE Beyond BRICs Net of Tax Index USD is a market capitalization-weighted index designed to represent the performance of a diversified basket of 90 liquid companies in emerging and frontier markets excluding Brazil, Russia, India, China (BRIC), Taiwan and Argentina as defined by FTSE's Country Classification System. The index has 75% exposure to emerging markets and 25% to frontier markets at rebalance.
Indices are not available for investment, are not professionally managed and do not reflect sales charges, fees, brokerage commissions, taxes or other expenses of investing. Securities in the Fund may not match those in an index.
Annual Report 2017
2
PERFORMANCE OVERVIEW (continued)
Columbia Beyond BRICs ETF
Performance of a Hypothetical $10,000 Investment (August 15, 2012 – March 31, 2017)

The chart above shows the change in value of a hypothetical $10,000 investment made on the Fund's inception, and does not reflect the deduction of taxes or brokerage commissions that a shareholder may pay on Fund distributions or on the redemption of Fund shares.
Annual Report 2017
3
MANAGER DISCUSSION OF FUND PERFORMANCE
Columbia Beyond BRICs ETF
Portfolio Management
Christopher Lo, Ph.D., CFA
Frank Vallario
Top Ten Holdings (%)
(at March 31, 2017) | |
Naspers, Ltd. N Shares
(South Africa) | | | 3.3 | | |
America Movil SAB de CV
Series L (Mexico) | | | 2.7 | | |
Fomento Economico
Mexicano SAB de CV
Series UBD (Mexico) | | | 2.5 | | |
PTT PCL NVDR (Thailand) | | | 2.4 | | |
PT Telekomunikasi Indonesia
Persero Tbk (Indonesia) | | | 2.3 | | |
PT Bank Central Asia Tbk
(Indonesia) | | | 2.2 | | |
Safaricom, Ltd. (Kenya) | | | 2.2 | | |
Vietnam Dairy Products JSC
(Vietnam) | | | 2.2 | | |
Public Bank Bhd (Malaysia) | | | 2.0 | | |
Square Pharmaceuticals, Ltd.
(Bangladesh) | | | 2.0 | | |
Percentages indicated are based upon total investments.
For further detail about these holdings, please refer to the section entitled "Portfolio of Investments."
Fund holdings are as of the date given, are subject to change at any time, and are not recommendations to buy or sell any security.
For the 12-month period that ended March 31, 2017, the Fund returned 5.12% based on net asset value (NAV) and 4.01% based on market price. The Fund's Tracked Index, the FTSE Beyond BRICs Index, returned 6.58% during the same time period.
The Fund's NAV on March 31, 2016 was $15.77 and it ended the annual period on March 31, 2017 with a NAV of $16.14. The Fund's market price on March 31, 2017 was $16.00 per share.
Emerging market equities posted gains despite geopolitical uncertainty
The annual period ended March 31, 2017 began on a positive note for emerging market equities. All eyes were on the weakness of the U.S. dollar and the rally in commodities prices. The subsequent surge in U.S. dollar strength coincided with the April 2016 Federal Reserve (Fed) press release that indicated a June 2016 interest rate hike in the U.S. was a distinct possibility, as expectations of Fed normalization of monetary policy persisted. Emerging market equities, however, then traded in a narrow band and were essentially flat for most of the early months of the annual period. Interestingly, despite the turn in the U.S. dollar, commodities prices continued to move upward, with part of such strength likely driven by better economic numbers out of China during the summer months. Several other notable macro events affecting the emerging markets during the summer of 2016 included the Philippines' election victory of populist outsider and former mayor of Davao, Rodrigo Duterte, as president on May 9th; the impeachment of Brazilian president Dilma Rousseff on May 12th; and the surprise U.K. vote result on the referendum to leave the European Union, popularly known as Brexit, announced on June 24th.
Emerging market equities experienced a stretch of robust performance heading into the fall months, outpacing developed market equities significantly during the third quarter of 2016. Much of this rally was fueled by improvements in China's economy. Brazil also gained momentum after putting an end to the President Rousseff era with her impeachment. Indonesia performed well, too, on lower interest rates, higher foreign exchange reserves and better capital flows on the back of a successful tax amnesty program.
In the fourth quarter of 2016, political uncertainty again came to the fore with the passing of King Bhumibol of Thailand, followed a month later with the surprise Trump election victory in the U.S. on November 8th. In the week following the U.S. election, the U.S. stock market traded up, while emerging market equities, as measured by the MSCI Emerging Markets Index, declined 4.16%. Also on November 8th, the Indian government announced it was withdrawing all 500 and 1000 rupee notes from circulation to counter "black money," that is, money earned illegally from black market activities. As a result, the Indian equity market sold off 8.5% in the week following the announcement.
After struggling in November and December 2016, emerging market equities staged a strong rally during the first quarter of 2017. Investors seemed more comfortable as U.S. interest rates eased a bit after the
Annual Report 2017
4
MANAGER DISCUSSION OF FUND PERFORMANCE (continued)
Columbia Beyond BRICs ETF
initial "Trump spike" late in 2016. Positive economic data out of China and Indian market strength further drove the rally. The South Korean equity market also posted healthy gains, and the South Korean won was one of the strong emerging market currencies, despite, or perhaps because of, the impeachment of President Park Geun-hye.
Contributors and detractors
Constituents in the financials, information technology and telecommunication services sectors detracted most from the Fund's results during the annual period. Partially offsetting these detractors were constituents in the materials, consumer discretionary and health care sectors, which contributed positively to results.
From a country perspective, constituents in Malaysia, Mexico and Brazil detracted the most from results during the annual period. Conversely, constituents in South Vietnam, Indonesia and Hong Kong contributed most positively to results.
Positions in integrated financial services group Standard Bank Group; diversified financial services firm FirstRand; and communication services provider MTN Group, each a South African company, detracted most. Each generated a negative absolute return during the annual period. Positions in Bank Muscat, an Oman-based financial services provider; Fomento Economico Mexicano (FEMSA), a Mexico-based non-alcoholic beverage producer; and Bank Central Asia, an Indonesian bank contributed most positively. Each posted a positive absolute return during the annual period.
Country Breakdown (%)
(at March 31, 2017) | |
Bangladesh | | | 2.6 | | |
Chile | | | 1.1 | | |
Colombia | | | 0.3 | | |
Czech Republic | | | 0.4 | | |
Indonesia | | | 9.9 | | |
Kenya | | | 3.4 | | |
Malaysia | | | 10.9 | | |
Mexico | | | 15.7 | | |
Morocco | | | 3.7 | | |
Nigeria | | | 5.4 | | |
Oman | | | 1.7 | | |
Philippines | | | 4.5 | | |
Poland | | | 3.3 | | |
Qatar | | | 1.3 | | |
Romania | | | 1.9 | | |
South Africa | | | 14.6 | | |
Thailand | | | 8.3 | | |
Turkey | | | 2.7 | | |
United Arab Emirates | | | 2.3 | | |
Vietnam | | | 6.0 | | |
Total | | | 100.0 | | |
Country Breakdown is based primarily on issuer's place of risk. Percentages indicated are based upon total investments. The Fund's portfolio composition is subject to change.
Equity Sector Breakdown (%)
(at March 31, 2017) | |
Basic Materials | | | 5.1 | | |
Consumer Goods | | | 11.1 | | |
Consumer Services | | | 10.8 | | |
Financials | | | 38.3 | | |
Health Care | | | 4.1 | | |
Industrials | | | 7.1 | | |
Oil & Gas | | | 5.2 | | |
Telecommunications | | | 15.8 | | |
Utilities | | | 2.5 | | |
Total | | | 100.0 | | |
Percentages indicated are based upon total equity investments. The Fund's portfolio composition is subject to change.
Annual Report 2017
5
MANAGER DISCUSSION OF FUND PERFORMANCE (continued)
Columbia Beyond BRICs ETF
Investment Risks
Emerging market investments involve risk of capital loss from unfavorable fluctuation in currency values, from differences in generally accepted accounting principles, from economic or political instability in other nations or increased volatility and lower trading volume. This Fund is non-diversified and, as a result, may have greater volatility than diversified-funds. This Fund will concentrate its investments in issuers of one or more particular industries to the same extent that its underlying index is so concentrated and to the extent permitted by applicable laws and regulatory guidance. Concentration risk results from maintaining exposure to issuers conducting business in a specific industry. Small-cap and mid-cap companies generally will have greater volatility in price than the stocks of large companies due to limited product lines or resources or a dependency upon a particular market niche. One cannot invest directly in an Index. See the Fund's prospectus for more information on these and other risks.
Trading Discount to NAV Risks
The Fund's shares may trade above or below their net asset value. The net asset value of the Fund will generally fluctuate with changes in the market value of the Fund's holdings. The market prices of shares, however, will generally fluctuate in accordance with changes in net asset value as well as the relative supply of, and demand for, shares on the exchange. The trading price of shares may deviate significantly from the net asset value.
Annual Report 2017
6
PERFORMANCE OVERVIEW
Columbia EM Core ex-China ETF
Columbia EM Core ex-China ETF (the Fund) seeks investment results that correspond (before fees and expenses) to the price and yield performance of the Beta Thematic Emerging Markets ex-China Index.
Average Annual Total Returns (%) (for period ended March 31, 2017)
| | | Inception | | 1 Year | | Life | |
Market Price | | 09/02/15 | | | 23.20 | | | | 20.15 | | |
Net Asset Value | | 09/02/15 | | | 18.83 | | | | 17.76 | | |
MSCI Emerging Markets Index (Net) | | | | | | | 17.22 | | | | 14.36 | | |
Beta Thematic Emerging Markets ex-China Index | | | | | | | 18.45 | | | | 17.60 | | |
All results shown assume reinvestment of distributions during the period. Returns do not reflect the deduction of taxes that a shareholder may pay on Fund distributions or on the redemption of Fund shares. Performance results reflect the effect of any fee waivers or reimbursements of Fund expenses by the Fund's former investment manager or Columbia Management. Absent these fee waivers or expense reimbursement arrangements, performance results would have been lower.
The performance information shown represents past performance and is not a guarantee of future results. The investment return and principal value of your investment will fluctuate so that your shares, when redeemed, may be worth more or less than their original cost. Current performance may be lower or higher than the performance information shown. You may obtain performance information current to the most recent month-end by visiting columbiathreadneedleetf.com.
Columbia Management took over portfolio management in September 2016 upon its acquisition of the Fund's previous investment manager.
The price used to calculate Market Price return is based on the midpoint of the 4:00 PM Eastern (U.S.) bid/ask spread on the NYSE and does not represent returns an investor would receive if shares were traded at other times.
The Fund's shares may trade above or below their net asset value. The net asset value of the Fund will generally fluctuate with changes in the market value of the Fund's holdings. The market prices of shares, however, will generally fluctuate in accordance with changes in net asset value as well as the relative supply of, and demand for, shares on the exchange. The trading price of shares may deviate significantly from the net asset value.
The MSCI Emerging Markets Index (Net) is a free float-adjusted market capitalization index that is designed to measure market performance of emerging markets.
The Beta Thematic Emerging Markets ex-China Index is a market capitalization-weighted index designed to provide broad, core emerging markets equity exposure by measuring the stock performance of up to 700 companies, excluding those listed or domiciled in China or Hong Kong.
Indices are not available for investment, are not professionally managed and do not reflect sales charges, fees, brokerage commissions, taxes (except the MSCI Emerging Markets Index (Net), which reflects reinvested dividends net of withholding taxes) or other expenses of investing. Securities in the Fund may not match those in an index.
Annual Report 2017
7
PERFORMANCE OVERVIEW (continued)
Columbia EM Core ex-China ETF
Performance of a Hypothetical $10,000 Investment (September 2, 2015 – March 31, 2017)
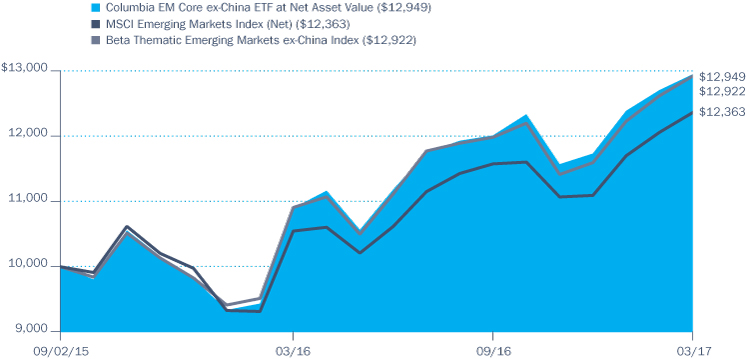
The chart above shows the change in value of a hypothetical $10,000 investment made on the Fund's inception, and does not reflect the deduction of taxes or brokerage commissions that a shareholder may pay on Fund distributions or on the redemption of Fund shares.
Annual Report 2017
8
MANAGER DISCUSSION OF FUND PERFORMANCE
Columbia EM Core ex-China ETF
For the 12-month period that ended March 31, 2017, the Fund returned 18.83% based on net asset value (NAV) and 23.20% based on market price. The MSCI Emerging Markets Index (Net) returned 17.22% and the Beta Thematic Emerging Markets ex-China Index, returned 18.45% during the same time period.
The Fund's NAV on March 31, 2016 was $21.23 and it ended the annual period on March 31, 2017 with a NAV of $24.91. The Fund's market price on March 31, 2017 was $25.72 per share.
Emerging market equities posted gains despite geopolitical uncertainty
The annual period ended March 31, 2017 began on a positive note for emerging market equities. All eyes were on the weakness of the U.S. dollar and the rally in commodities prices. The subsequent surge in U.S. dollar strength coincided with the April 2016 Federal Reserve (Fed) press release that indicated a June 2016 interest rate hike in the U.S. was a distinct possibility, as expectations of Fed normalization of monetary policy persisted. Emerging market equities, however, then traded in a narrow band and were essentially flat for most of the early months of the annual period. Interestingly, despite the turn in the U.S. dollar, commodities prices continued to move upward, with part of such strength likely driven by better economic numbers out of China during the summer months. Several other notable macro events affecting the emerging markets during the summer of 2016 included the Philippines' election victory of populist outsider and former mayor of Davao, Rodrigo Duterte, as president on May 9th; the impeachment of Brazilian president Dilma Rousseff on May 12th; and the surprise U.K. vote result on the referendum to leave the European Union, popularly known as Brexit, announced on June 24th.
Emerging market equities experienced a stretch of robust performance heading into the fall months, outpacing developed market equities significantly during the third quarter of 2016. Much of this rally was fueled by improvements in China's economy. Brazil also gained momentum after putting an end to the President Rousseff era with her impeachment. Indonesia performed well, too, on lower interest rates, higher foreign exchange reserves and better capital flows on the back of a successful tax amnesty program.
In the fourth quarter of 2016, political uncertainty again came to the fore with the passing of King Bhumibol of Thailand, followed a month later with the surprise Trump election victory in the U.S. on November 8th. In the week following the U.S. election, the U.S. stock market traded up, while emerging market equities, as measured by the MSCI Emerging Markets Index, declined 4.16%. Also on November 8th, the Indian government announced it was withdrawing all 500 and 1000 rupee notes from circulation to counter "black money," that is, money earned illegally from black market activities. As a result, the Indian equity market sold off 8.5% in the week following the announcement.
After struggling in November and December 2016, emerging market equities staged a strong rally during the first quarter of 2017. Investors
Portfolio Management
Christopher Lo, Ph.D., CFA
Frank Vallario
Top Ten Holdings (%)
(at March 31, 2017) | |
Samsung Electronics Co., Ltd.
(South Korea) | | | 5.9 | | |
Taiwan Semiconductor
Manufacturing Co., Ltd.
(Taiwan) | | | 4.4 | | |
HDFC Bank, Ltd. ADR (India) | | | 3.8 | | |
ICICI Bank, Ltd. ADR (India) | | | 3.0 | | |
Tata Motors, Ltd. ADR (India) | | | 2.6 | | |
Infosys, Ltd. ADR (India) | | | 2.6 | | |
Itau Unibanco Holding SA
Preference Shares (Brazil) | | | 2.5 | | |
Petroleo Brasileiro SA
Preference Shares (Brazil) | | | 2.3 | | |
Vale SA Preference Shares
(Brazil) | | | 2.2 | | |
Naspers, Ltd. N Shares
(South Africa) | | | 1.9 | | |
Percentages indicated are based upon total investments.
For further detail about these holdings, please refer to the section entitled "Portfolio of Investments."
Fund holdings are as of the date given, are subject to change at any time, and are not recommendations to buy or sell any security.
Annual Report 2017
9
MANAGER DISCUSSION OF FUND PERFORMANCE (continued)
Columbia EM Core ex-China ETF
Country Breakdown (%)
(at March 31, 2017) | |
Brazil | | | 14.2 | | |
Chile | | | 1.2 | | |
India | | | 12.0 | | |
Indonesia | | | 3.6 | | |
Malaysia | | | 2.5 | | |
Mexico | | | 7.0 | | |
Peru | | | 0.7 | | |
Philippines | | | 1.5 | | |
Poland | | | 2.1 | | |
Russia | | | 4.1 | | |
South Africa | | | 9.6 | | |
South Korea | | | 20.5 | | |
Taiwan | | | 14.8 | | |
Thailand | | | 4.1 | | |
Turkey | | | 2.1 | | |
Total | | | 100.0 | | |
Country Breakdown is based primarily on issuer's place of risk. Percentages indicated are based upon total investments. The Fund's portfolio composition is subject to change.
Equity Sector Breakdown (%)
(at March 31, 2017) | |
Consumer Discretionary | | | 10.2 | | |
Consumer Staples | | | 10.0 | | |
Energy | | | 6.7 | | |
Financials | | | 28.7 | | |
Health Care | | | 2.3 | | |
Industrials | | | 5.4 | | |
Information Technology | | | 18.3 | | |
Materials | | | 11.3 | | |
Real Estate | | | 0.7 | | |
Telecommunication Services | | | 4.6 | | |
Utilities | | | 1.8 | | |
Total | | | 100.0 | | |
Percentages indicated are based upon total equity investments. The Fund's portfolio composition is subject to change.
seemed more comfortable as U.S. interest rates eased a bit after the initial "Trump spike" late in 2016. Positive economic data out of China and Indian market strength further drove the rally. The South Korean equity market also posted healthy gains, and the South Korean won was one of the strong emerging market currencies, despite, or perhaps because of, the impeachment of President Park Geun-hye.
Contributors and detractors
Constituents in the energy, materials and financials sectors contributed most positively to the Fund's results during the annual period. Partially offsetting these positive contributors were constituents in the information technology, consumer staples and industrials sectors, which detracted from results.
From a country perspective, constituents in Brazil, South Korea and Hong Kong contributed most positively to the Fund's results. Conversely, constituents in China, Mexico and India detracted the most from results during the annual period.
Positions in Samsung Electronics, a South Korea-based consumer and industrial electronic equipment and products manufacturer; Vale, a Brazilian metals producer; and Petroleo Brasileiro (Petrobras), a Brazilian oil and gas exploration and production company contributed most positively. Samsung Electronics and Petrobras each posted a robust double-digit absolute gain, and Vale generated a triple-digit absolute gain during the annual period. Positions in Infosys, an India-based consulting and software services firm; Steinhoff International Holdings, a South African integrated discount retailer; and IHH Healthcare, a Malaysian-based healthcare services provider detracted most. Each produced a double-digit negative absolute return during the annual period.
Annual Report 2017
10
MANAGER DISCUSSION OF FUND PERFORMANCE (continued)
Columbia EM Core ex-China ETF
Investment Risks
Emerging market investments involve risk of capital loss from unfavorable fluctuation in currency values, from differences in generally accepted accounting principles, from economic or political instability in other nations or increased volatility and lower trading volume. This Fund is non-diversified and, as a result, may have greater volatility than diversified-funds. This Fund will concentrate its investments in issuers of one or more particular industries to the same extent that its underlying index is so concentrated and to the extent permitted by applicable laws and regulatory guidance. Concentration risk results from maintaining exposure to issuers conducting business in a specific industry. Small-cap and mid-cap companies generally will have greater volatility in price than the stocks of large companies due to limited product lines or resources or a dependency upon a particular market niche. One cannot invest directly in an Index. See the Fund's prospectus for more information on these and other risks.
Trading Discount to NAV Risks
The Fund's shares may trade above or below their net asset value. The net asset value of the Fund will generally fluctuate with changes in the market value of the Fund's holdings. The market prices of shares, however, will generally fluctuate in accordance with changes in net asset value as well as the relative supply of, and demand for, shares on the exchange. The trading price of shares may deviate significantly from the net asset value.
Annual Report 2017
11
PERFORMANCE OVERVIEW
Columbia EM Quality Dividend ETF
Columbia EM Quality Dividend ETF (the Fund) seeks investment results that correspond (before fees and expenses) to the price and yield performance of the Beta AdvantageSM Emerging Markets Quality Dividend Index.
Average Annual Total Returns (%) (for period ended March 31, 2017)
| | | Inception | | 1 Year | | 5 Years | | Life | |
Market Price | | 08/04/11 | | | 11.09 | | | | -3.82 | | | | -2.91 | | |
Net Asset Value | | 08/04/11 | | | 10.05 | | | | -3.77 | | | | -2.92 | | |
MSCI Emerging Markets Index (Net) | | | | | | | 17.22 | | | | 0.81 | | | | -0.09 | | |
Tracked Index(1) | | | | | | | 12.59 | | | | -2.44 | | | | -1.51 | | |
(1) The Tracked Index reflects the Indxx Emerging Market High Income Low Beta Index through January 31, 2014, the FTSE Emerging All Cap ex-Taiwan Low Volatility Dividend Net Tax Index from February 3, 2014 through January 23, 2015, and the Beta AdvantageSM Emerging Markets Quality Dividend Index thereafter.
All results shown assume reinvestment of distributions during the period. Returns do not reflect the deduction of taxes that a shareholder may pay on Fund distributions or on the redemption of Fund shares. Performance results reflect the effect of any fee waivers or reimbursements of Fund expenses by the Fund's former investment manager or Columbia Management. Absent these fee waivers or expense reimbursement arrangements, performance results would have been lower.
The performance information shown represents past performance and is not a guarantee of future results. The investment return and principal value of your investment will fluctuate so that your shares, when redeemed, may be worth more or less than their original cost. Current performance may be lower or higher than the performance information shown. You may obtain performance information current to the most recent month-end by visiting columbiathreadneedleetf.com.
Columbia Management took over portfolio management in September 2016 upon its acquisition of the Fund's previous investment manager.
The price used to calculate Market Price return is based on the midpoint of the 4:00 PM Eastern (U.S.) bid/ask spread on the NYSE and does not represent returns an investor would receive if shares were traded at other times.
The Fund's shares may trade above or below their net asset value. The net asset value of the Fund will generally fluctuate with changes in the market value of the Fund's holdings. The market prices of shares, however, will generally fluctuate in accordance with changes in net asset value as well as the relative supply of, and demand for, shares on the exchange. The trading price of shares may deviate significantly from the net asset value.
The MSCI Emerging Markets Index (Net) is a free float-adjusted market capitalization index that is designed to measure market performance of emerging markets.
The Beta AdvantageSM Emerging Markets Quality Dividend Index is an equal-weighted index designed to represent a portfolio of approximately 50 companies in developing markets, which is expected to have a higher dividend yield than the average dividend yield of companies included in the developing markets universe as defined by Columbia Management.
Indices are not available for investment, are not professionally managed and do not reflect sales charges, fees, brokerage commissions, taxes (except the MSCI Emerging Markets Index (Net), which reflects reinvested dividends net of withholding taxes) or other expenses of investing. Securities in the Fund may not match those in an index.
Annual Report 2017
12
PERFORMANCE OVERVIEW (continued)
Columbia EM Quality Dividend ETF
Performance of a Hypothetical $10,000 Investment (August 4, 2011 – March 31, 2017)

The chart above shows the change in value of a hypothetical $10,000 investment made on the Fund's inception, and does not reflect the deduction of taxes or brokerage commissions that a shareholder may pay on Fund distributions or on the redemption of Fund shares.
Annual Report 2017
13
MANAGER DISCUSSION OF FUND PERFORMANCE
Columbia EM Quality Dividend ETF
Portfolio Management
Christopher Lo, Ph.D., CFA
Frank Vallario
Top Ten Holdings (%)
(at March 31, 2017) | |
AirAsia Bhd (Malaysia) | | | 2.2 | | |
| BRF SA (Brazil) | | | 2.2 | | |
Lojas Renner SA (Brazil) | | | 2.1 | | |
WEG SA (Brazil) | | | 2.1 | | |
Ambev SA (Brazil) | | | 2.1 | | |
Pegatron Corp. (Taiwan) | | | 2.1 | | |
Petronas Chemicals
Group Bhd (Malaysia) | | | 2.1 | | |
Intouch Holdings PCL NVDR
(Thailand) | | | 2.1 | | |
Axiata Group Bhd (Malaysia) | | | 2.1 | | |
Banco Bradesco SA
Preference Shares (Brazil) | | | 2.1 | | |
Percentages indicated are based upon total investments.
For further detail about these holdings, please refer to the section entitled "Portfolio of Investments."
Fund holdings are as of the date given, are subject to change at any time, and are not recommendations to buy or sell any security.
For the 12-month period that ended March 31, 2017, the Fund returned 10.05% based on net asset value (NAV) and 11.09% based on market price. The MSCI Emerging Markets Index (Net) returned 17.22% and the Fund's Tracked Index, the Beta AdvantageSM Emerging Markets Quality Dividend Index returned 12.59% during the same time period.
The Fund's NAV on March 31, 2016 was $12.81 and it ended the annual period on March 31, 2017 with a NAV of $13.77. The Fund's market price on March 31, 2017 was $13.78 per share.
Emerging market equities posted gains despite geopolitical uncertainty
The annual period ended March 31, 2017 began on a positive note for emerging market equities. All eyes were on the weakness of the U.S. dollar and the rally in commodities prices. The subsequent surge in U.S. dollar strength coincided with the April 2016 Federal Reserve (Fed) press release that indicated a June 2016 interest rate hike in the U.S. was a distinct possibility, as expectations of Fed normalization of monetary policy persisted. Emerging market equities, however, then traded in a narrow band and were essentially flat for most of the early months of the annual period. Interestingly, despite the turn in the U.S. dollar, commodities prices continued to move upward, with part of such strength likely driven by better economic numbers out of China during the summer months. Several other notable macro events affecting the emerging markets during the summer of 2016 included the Philippines' election victory of populist outsider and former mayor of Davao, Rodrigo Duterte, as president on May 9th; the impeachment of Brazilian president Dilma Rousseff on May 12th; and the surprise U.K. vote result on the referendum to leave the European Union, popularly known as Brexit, announced on June 24th.
Emerging market equities experienced a stretch of robust performance heading into the fall months, outpacing developed market equities significantly during the third quarter of 2016. Much of this rally was fueled by improvements in China's economy. Brazil also gained momentum after putting an end to the President Rousseff era with her impeachment. Indonesia performed well, too, on lower interest rates, higher foreign exchange reserves and better capital flows on the back of a successful tax amnesty program.
In the fourth quarter of 2016, political uncertainty again came to the fore with the passing of King Bhumibol of Thailand, followed a month later with the surprise Trump election victory in the U.S. on November 8th. In the week following the U.S. election, the U.S. stock market traded up, while emerging market equities, as measured by the MSCI Emerging Markets Index, declined 4.16%. Also on November 8th, the Indian government announced it was withdrawing all 500 and 1000 rupee notes from circulation to counter "black money," that is, money earned illegally from black market activities. As a result, the Indian equity market sold off 8.5% in the week following the announcement.
After struggling in November and December 2016, emerging market equities staged a strong rally during the first quarter of 2017. Investors
Annual Report 2017
14
MANAGER DISCUSSION OF FUND PERFORMANCE (continued)
Columbia EM Quality Dividend ETF
seemed more comfortable as U.S. interest rates eased a bit after the initial "Trump spike" late in 2016. Positive economic data out of China and Indian market strength further drove the rally. The South Korean equity market also posted healthy gains, and the South Korean won was one of the strong emerging market currencies, despite, or perhaps because of, the impeachment of President Park Geun-hye.
Contributors and detractors
Constituents in the information technology, consumer staples and energy sectors detracted most from the Fund's results during the annual period. Partially offsetting these detractors were constituents in the financials, real estate and consumer discretionary sectors, which contributed most positively to results.
From a country perspective, constituents in Thailand, Malaysia and Turkey detracted most from results. Conversely, constituents in Mexico, Taiwan and Hong Kong contributed most positively to results during the annual period.
Positions in Airports of Thailand, a Thai airport operator; BRF, a Brazilian food processor; and Turkiye Petrol Rafinerileri (Tupras), a Turkish petroleum refiner detracted most. Airports of Thailand posted a modestly positive absolute return, while BRF and Tupras each posted a double-digit negative absolute return during the annual period. Positions in Itausa-Investimentos Itau, a Brazilian diversified holding company; Banco Bradesco, a Brazilian commercial bank; and Pegatron, a Taiwan-based technology hardware and equipment company contributed most positively. Each produced a robust double-digit absolute gain during the annual period.
Country Breakdown (%)
(at March 31, 2017) | |
Brazil | | | 18.4 | | |
Chile | | | 2.0 | | |
Hong Kong | | | 6.1 | | |
Indonesia | | | 8.0 | | |
Kenya | | | 1.9 | | |
Malaysia | | | 10.4 | | |
Philippines | | | 2.0 | | |
South Africa | | | 8.9 | | |
Taiwan | | | 18.1 | | |
Thailand | | | 18.2 | | |
Turkey | | | 4.0 | | |
United Arab Emirates | | | 2.0 | | |
Total | | | 100.0 | | |
Country Breakdown is based primarily on issuer's place of risk. Percentages indicated are based upon total investments. The Fund's portfolio composition is subject to change.
Equity Sector Breakdown (%)
(at March 31, 2017) | |
Consumer Discretionary | | | 13.7 | | |
Consumer Staples | | | 16.1 | | |
Financials | | | 15.7 | | |
Health Care | | | 1.6 | | |
Industrials | | | 12.3 | | |
Information Technology | | | 6.1 | | |
Materials | | | 8.1 | | |
Real Estate | | | 2.0 | | |
Telecommunication Services | | | 16.3 | | |
Utilities | | | 8.1 | | |
Total | | | 100.0 | | |
Percentages indicated are based upon total equity investments. The Fund's portfolio composition is subject to change.
Annual Report 2017
15
MANAGER DISCUSSION OF FUND PERFORMANCE (continued)
Columbia EM Quality Dividend ETF
Investment Risks
Emerging market investments involve risk of capital loss from unfavorable fluctuation in currency values, from differences in generally accepted accounting principles, from economic or political instability in other nations or increased volatility and lower trading volume. This Fund is non-diversified and, as a result, may have greater volatility than diversified-funds. This Fund will concentrate its investments in issuers of one or more particular industries to the same extent that its underlying index is so concentrated and to the extent permitted by applicable laws and regulatory guidance. Concentration risk results from maintaining exposure to issuers conducting business in a specific industry. Small-cap and mid-cap companies generally will have greater volatility in price than the stocks of large companies due to limited product lines or resources or a dependency upon a particular market niche. One cannot invest directly in an Index. See the Fund's prospectus for more information on these and other risks.
Trading Discount to NAV Risks
The Fund's shares may trade above or below their net asset value. The net asset value of the Fund will generally fluctuate with changes in the market value of the Fund's holdings. The market prices of shares, however, will generally fluctuate in accordance with changes in net asset value as well as the relative supply of, and demand for, shares on the exchange. The trading price of shares may deviate significantly from the net asset value.
Annual Report 2017
16
PERFORMANCE OVERVIEW
Columbia EM Strategic Opportunities ETF
Columbia EM Strategic Opportunities ETF (the Fund) seeks investment results that correspond (before fees and expenses) to the price and yield performance of the S&P Emerging Markets Strategic Opportunities Index.
Average Annual Total Returns (%) (for period ended March 31, 2017)
| | | Inception | | 1 Year | | Life | |
Market Price | | 08/15/12 | | | 3.42 | | | | 0.47 | | |
Net Asset Value | | 08/15/12 | | | 3.08 | | | | 0.54 | | |
Tracked Index(1) | | | | | | | 3.72 | | | | 1.80 | | |
(1) The Tracked Index reflects the Indxx Emerging Markets Domestic Demand Index through January 31, 2014 and the S&P Emerging Markets Strategic Opportunities Index thereafter.
All results shown assume reinvestment of distributions during the period. Returns do not reflect the deduction of taxes that a shareholder may pay on Fund distributions or on the redemption of Fund shares. Performance results reflect the effect of any fee waivers or reimbursements of Fund expenses by the Fund's former investment manager or Columbia Management. Absent these fee waivers or expense reimbursement arrangements, performance results would have been lower.
The performance information shown represents past performance and is not a guarantee of future results. The investment return and principal value of your investment will fluctuate so that your shares, when redeemed, may be worth more or less than their original cost. Current performance may be lower or higher than the performance information shown. You may obtain performance information current to the most recent month-end by visiting columbiathreadneedleetf.com.
Columbia Management took over portfolio management in September 2016 upon its acquisition of the Fund's previous investment manager.
The price used to calculate Market Price return is based on the midpoint of the 4:00 PM Eastern (U.S.) bid/ask spread on the NYSE and does not represent returns an investor would receive if shares were traded at other times.
The Fund's shares may trade above or below their net asset value. The net asset value of the Fund will generally fluctuate with changes in the market value of the Fund's holdings. The market prices of shares, however, will generally fluctuate in accordance with changes in net asset value as well as the relative supply of, and demand for, shares on the exchange. The trading price of shares may deviate significantly from the net asset value.
The S&P Emerging Markets Strategic Opportunities Index is a 50-stock free-float market capitalization-weighted index designed to measure the performance of companies in emerging markets that are tied to domestic demand, specifically those in consumer staples, consumer discretionary, telecommunications services, health care and the utilities sectors.
Indices are not available for investment, are not professionally managed and do not reflect sales charges, fees, brokerage commissions, taxes or other expenses of investing. Securities in the Fund may not match those in an index.
Annual Report 2017
17
PERFORMANCE OVERVIEW (continued)
Columbia EM Strategic Opportunities ETF
Performance of a Hypothetical $10,000 Investment (August 15, 2012 – March 31, 2017)
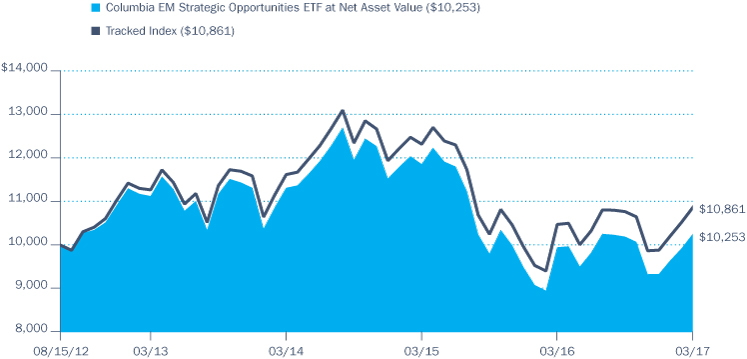
The chart above shows the change in value of a hypothetical $10,000 investment made on the Fund's inception, and does not reflect the deduction of taxes or brokerage commissions that a shareholder may pay on Fund distributions or on the redemption of Fund shares.
Annual Report 2017
18
MANAGER DISCUSSION OF FUND PERFORMANCE
Columbia EM Strategic Opportunities ETF
For the 12-month period that ended March 31, 2017, the Fund returned 3.08% based on net asset value (NAV) and 3.42% based on market price. The Fund's Tracked Index, the S&P Emerging Markets Strategic Opportunities Index, returned 3.72% during the same time period.
The Fund's NAV on March 31, 2016 was $18.79 and it ended the annual period on March 31, 2017 with a NAV of $18.91. The Fund's market price on March 31, 2017 was $18.85 per share.
Emerging market equities posted gains despite geopolitical uncertainty
The annual period ended March 31, 2017 began on a positive note for emerging market equities. All eyes were on the weakness of the U.S. dollar and the rally in commodities prices. The subsequent surge in U.S. dollar strength coincided with the April 2016 Federal Reserve (Fed) press release that indicated a June 2016 interest rate hike in the U.S. was a distinct possibility, as expectations of Fed normalization of monetary policy persisted. Emerging market equities, however, then traded in a narrow band and were essentially flat for most of the early months of the annual period. Interestingly, despite the turn in the U.S. dollar, commodities prices continued to move upward, with part of such strength likely driven by better economic numbers out of China during the summer months. Several other notable macro events affecting the emerging markets during the summer of 2016 included the Philippines' election victory of populist outsider and former mayor of Davao, Rodrigo Duterte, as president on May 9th; the impeachment of Brazilian president Dilma Rousseff on May 12th; and the surprise U.K. vote result on the referendum to leave the European Union, popularly known as Brexit, announced on June 24th.
Emerging market equities experienced a stretch of robust performance heading into the fall months, outpacing developed market equities significantly during the third quarter of 2016. Much of this rally was fueled by improvements in China's economy. Brazil also gained momentum after putting an end to the President Rousseff era with her impeachment. Indonesia performed well, too, on lower interest rates, higher foreign exchange reserves and better capital flows on the back of a successful tax amnesty program.
In the fourth quarter of 2016, political uncertainty again came to the fore with the passing of King Bhumibol of Thailand, followed a month later with the surprise Trump election victory in the U.S. on November 8th. In the week following the U.S. election, the U.S. stock market traded up, while emerging market equities, as measured by the MSCI Emerging Markets Index, declined 4.16%. Also on November 8th, the Indian government announced it was withdrawing all 500 and 1000 rupee notes from circulation to counter "black money," that is, money earned illegally from black market activities. As a result, the Indian equity market sold off 8.5% in the week following the announcement.
After struggling in November and December 2016, emerging market equities staged a strong rally during the first quarter of 2017. Investors seemed more comfortable as U.S. interest rates eased a bit after the
Portfolio Management
Christopher Lo, Ph.D., CFA
Frank Vallario
Top Ten Holdings (%)
(at March 31, 2017) | |
Ambev SA ADR (Brazil) | | | 5.1 | | |
Naspers, Ltd. N Shares
(South Africa) | | | 5.0 | | |
China Mobile, Ltd. (China) | | | 4.7 | | |
JD.com, Inc. ADR (China) | | | 4.7 | | |
Fomento Economico
Mexicano SAB de CV ADR
(Mexico) | | | 4.2 | | |
America Movil SAB de CV
Class L ADR (Mexico) | | | 4.0 | | |
PT Telekomunikasi Indonesia
Persero Tbk ADR (Indonesia) | | | 3.6 | | |
Ctrip.com International, Ltd.
ADR (China) | | | 3.6 | | |
MTN Group, Ltd. (South Africa) | | | 3.4 | | |
Steinhoff International
Holdings NV (South Africa) | | | 3.0 | | |
Percentages indicated are based upon total investments.
For further detail about these holdings, please refer to the section entitled "Portfolio of Investments."
Fund holdings are as of the date given, are subject to change at any time, and are not recommendations to buy or sell any security.
Country Breakdown (%)
(at March 31, 2017) | |
Brazil | | | 8.2 | | |
China | | | 25.3 | | |
Hong Kong | | | 1.3 | | |
India | | | 15.2 | | |
Indonesia | | | 6.1 | | |
Malaysia | | | 3.7 | | |
Mexico | | | 13.1 | | |
Russia | | | 3.8 | | |
South Africa | | | 18.9 | | |
Thailand | | | 4.4 | | |
Total | | | 100.0 | | |
Country Breakdown is based primarily on issuer's place of risk. Percentages indicated are based upon total investments. The Fund's portfolio composition is subject to change.
Annual Report 2017
19
MANAGER DISCUSSION OF FUND PERFORMANCE (continued)
Columbia EM Strategic Opportunities ETF
Equity Sector Breakdown (%)
(at March 31, 2017) | |
Consumer Discretionary | | | 29.8 | | |
Consumer Staples | | | 30.3 | | |
Health Care | | | 8.4 | | |
Telecommunication Services | | | 27.4 | | |
Utilities | | | 4.1 | | |
Total | | | 100.0 | | |
Percentages indicated are based upon total equity investments. The Fund's portfolio composition is subject to change.
Investment Risks
Emerging market investments involve risk of capital loss from unfavorable fluctuation in currency values, from differences in generally accepted accounting principles, from economic or political instability in other nations or increased volatility and lower trading volume. This Fund is non-diversified and, as a result, may have greater volatility than diversified-funds. This Fund will concentrate its investments in issuers of one or more particular industries to the same extent that its underlying index is so concentrated and to the extent permitted by applicable laws and regulatory guidance. Concentration risk results from maintaining exposure to issuers conducting business in a specific industry. Small-cap and mid-cap companies generally will have greater volatility in price than the stocks of large companies due to limited product lines or resources or a dependency upon a particular market niche. One cannot invest directly in an Index. See the Fund's prospectus for more information on these and other risks.
Trading Discount to NAV Risks
The Fund's shares may trade above or below their net asset value. The net asset value of the Fund will generally fluctuate with changes in the market value of the Fund's holdings. The market prices of shares, however, will generally fluctuate in accordance with changes in net asset value as well as the relative supply of, and demand for, shares on the exchange. The trading price of shares may deviate significantly from the net asset value.
initial "Trump spike" late in 2016. Positive economic data out of China and Indian market strength further drove the rally. The South Korean equity market also posted healthy gains, and the South Korean won was one of the strong emerging market currencies, despite, or perhaps because of, the impeachment of President Park Geun-hye.
Contributors and detractors
Constituents in the information technology, telecommunication services and health care sectors detracted most from the Fund's results during the annual period. Partially offsetting these detractors were constituents in industrials and real estate, the only two sectors to contribute positively to the Fund's results.
From a country perspective, constituents in China, Mexico and South Africa detracted most from results. Conversely, constituents in Indonesia, Poland and Turkey contributed most positively to results during the annual period.
Positions in Steinhoff International Holdings, a South African integrated discount retailer; America Movil, a Mexican wireless communications provider; and Sun Pharmaceutical Industries, an Indian pharmaceuticals manufacturer detracted most. Each posted a negative return during the annual period. Positions in Naspers, a South African media company; JD.com, a Chinese online direct sales company; and Telekomunikasi Indonesia Persero, an Indonesia telecommunications company contributed most positively. Each produced a solid double-digit gain during the annual period.
Annual Report 2017
20
PERFORMANCE OVERVIEW
Columbia Emerging Markets Consumer ETF
Columbia Emerging Markets Consumer ETF (the Fund) seeks investment results that correspond (before fees and expenses) to the price and yield performance of the Dow Jones Emerging Markets Consumer Titans 30TM Index.
Average Annual Total Returns (%) (for period ended March 31, 2017)
| | | Inception | | 1 Year | | 5 Years | | Life | |
Market Price | | 09/14/10 | | | 10.75 | | | | 0.83 | | | | 4.12 | | |
Net Asset Value | | 09/14/10 | | | 10.35 | | | | 0.82 | | | | 4.07 | | |
Dow Jones Emerging Markets Consumer Titans 30TM Index | | | | | | | 11.02 | | | | 1.96 | | | | 5.35 | | |
All results shown assume reinvestment of distributions during the period. Returns do not reflect the deduction of taxes that a shareholder may pay on Fund distributions or on the redemption of Fund shares. Performance results reflect the effect of any fee waivers or reimbursements of Fund expenses by the Fund's former investment manager or Columbia Management. Absent these fee waivers or expense reimbursement arrangements, performance results would have been lower.
The performance information shown represents past performance and is not a guarantee of future results. The investment return and principal value of your investment will fluctuate so that your shares, when redeemed, may be worth more or less than their original cost. Current performance may be lower or higher than the performance information shown. You may obtain performance information current to the most recent month-end by visiting columbiathreadneedleetf.com.
Columbia Management took over portfolio management in September 2016 upon its acquisition of the Fund's previous investment manager.
The price used to calculate Market Price return is based on the midpoint of the 4:00 PM Eastern (U.S.) bid/ask spread on the NYSE and does not represent returns an investor would receive if shares were traded at other times.
The Fund's shares may trade above or below their net asset value. The net asset value of the Fund will generally fluctuate with changes in the market value of the Fund's holdings. The market prices of shares, however, will generally fluctuate in accordance with changes in net asset value as well as the relative supply of, and demand for, shares on the exchange. The trading price of shares may deviate significantly from the net asset value.
The Dow Jones Emerging Markets Consumer Titans 30TM Index is a free-float market capitalization-weighted index that measures the performance of 30 leading emerging market companies in the Consumer Goods and Consumer Services Industries as defined by S&P Dow Jones Indexes.
Indices are not available for investment, are not professionally managed and do not reflect sales charges, fees, brokerage commissions, taxes or other expenses of investing. Securities in the Fund may not match those in an index.
Annual Report 2017
21
PERFORMANCE OVERVIEW (continued)
Columbia Emerging Markets Consumer ETF
Performance of a Hypothetical $10,000 Investment (September 14, 2010 – March 31, 2017)
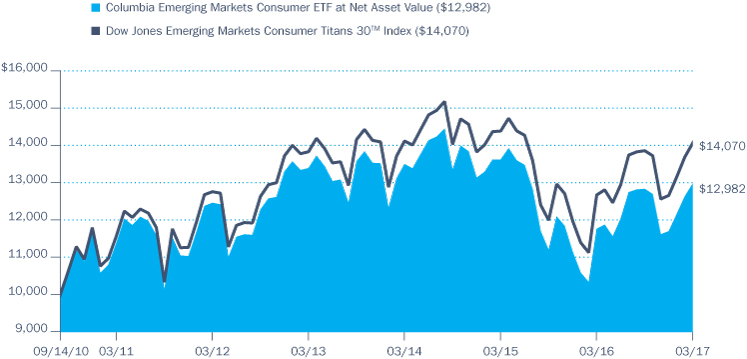
The chart above shows the change in value of a hypothetical $10,000 investment made on the Fund's inception, and does not reflect the deduction of taxes or brokerage commissions that a shareholder may pay on Fund distributions or on the redemption of Fund shares.
Annual Report 2017
22
MANAGER DISCUSSION OF FUND PERFORMANCE
Columbia Emerging Markets Consumer ETF
For the 12-month period that ended March 31, 2017, the Fund returned 10.35% based on net asset value and 10.75% based on market price. The Dow Jones Emerging Markets Consumer Titans 30TM Index, returned 11.02% during the same period.
The Fund's NAV on March 31, 2016 was $22.60 and it ended the annual period on March 31, 2017 with a NAV of $24.75. The Fund's market price on March 31, 2017 was $24.83 per share.
Emerging market equities posted gains despite geopolitical uncertainty
The annual period ended March 31, 2017 began on a positive note for emerging market equities. All eyes were on the weakness of the U.S. dollar and the rally in commodities prices. The subsequent surge in U.S. dollar strength coincided with the April 2016 Federal Reserve (Fed) press release that indicated a June 2016 interest rate hike in the U.S. was a distinct possibility, as expectations of Fed normalization of monetary policy persisted. Emerging market equities, however, then traded in a narrow band and were essentially flat for most of the early months of the annual period. Interestingly, despite the turn in the U.S. dollar, commodities prices continued to move upward, with part of such strength likely driven by better economic numbers out of China during the summer months. Several other notable macro events affecting the emerging markets during the summer of 2016 included the Philippines' election victory of populist outsider and former mayor of Davao, Rodrigo Duterte, as president on May 9th; the impeachment of Brazilian president Dilma Rousseff on May 12th; and the surprise U.K. vote result on the referendum to leave the European Union, popularly known as Brexit, announced on June 24th.
Emerging market equities experienced a stretch of robust performance heading into the fall months, outpacing developed market equities significantly during the third quarter of 2016. Much of this rally was fueled by improvements in China's economy. Brazil also gained momentum after putting an end to the President Rousseff era with her impeachment. Indonesia performed well, too, on lower interest rates, higher foreign exchange reserves and better capital flows on the back of a successful tax amnesty program.
In the fourth quarter of 2016, political uncertainty again came to the fore with the passing of King Bhumibol of Thailand, followed a month later with the surprise Trump election victory in the U.S. on November 8th. In the week following the U.S. election, the U.S. stock market traded up, while emerging market equities, as measured by the MSCI Emerging Markets Index, declined 4.16%. Also on November 8th, the Indian government announced it was withdrawing all 500 and 1000 rupee notes from circulation to counter "black money," that is, money earned illegally from black market activities. As a result, the Indian equity market sold off 8.5% in the week following the announcement.
After struggling in November and December 2016, emerging market equities staged a strong rally during the first quarter of 2017. Investors seemed more comfortable as U.S. interest rates eased a bit after the
Portfolio Management
Christopher Lo, Ph.D., CFA
Frank Vallario
Top Ten Holdings (%)
(at March 31, 2017) | |
Naspers, Ltd. N Shares
(South Africa) | | | 10.2 | | |
JD.com, Inc. ADR (China) | | | 5.9 | | |
Ambev SA ADR (Brazil) | | | 5.5 | | |
Ctrip.com International, Ltd.
ADR (China) | | | 4.6 | | |
Fomento Economico
Mexicano SAB de CV Series
UBD (Mexico) | | | 4.6 | | |
Steinhoff International
Holdings NV (South Africa) | | | 4.1 | | |
Tata Motors, Ltd. ADR (India) | | | 3.8 | | |
ITC, Ltd. (India) | | | 3.8 | | |
PT Astra International Tbk
(Indonesia) | | | 3.7 | | |
Grupo Televisa SAB Series
CPO (Mexico) | | | 3.6 | | |
Percentages indicated are based upon total investments.
For further detail about these holdings, please refer to the section entitled "Portfolio of Investments."
Fund holdings are as of the date given, are subject to change at any time, and are not recommendations to buy or sell any security.
Country Breakdown (%)
(at March 31, 2017) | |
Brazil | | | 10.5 | | |
Chile | | | 3.0 | | |
China | | | 21.1 | | |
India | | | 14.3 | | |
Indonesia | | | 3.8 | | |
Malaysia | | | 2.0 | | |
Mexico | | | 11.8 | | |
Philippines | | | 2.6 | | |
Russia | | | 3.4 | | |
South Africa | | | 22.3 | | |
Thailand | | | 5.2 | | |
Total | | | 100.0 | | |
Country Breakdown is based primarily on issuer's place of risk. Percentages indicated are based upon total investments. The Fund's portfolio composition is subject to change.
Annual Report 2017
23
MANAGER DISCUSSION OF FUND PERFORMANCE (continued)
Columbia Emerging Markets Consumer ETF
Equity Sector Breakdown (%)
(at March 31, 2017) | |
Consumer Goods | | | 44.2 | | |
Consumer Services | | | 52.0 | | |
Industrials | | | 3.8 | | |
Total | | | 100.0 | | |
Percentages indicated are based upon total equity investments. The Fund's portfolio composition is subject to change.
Investment Risks
Emerging market investments involve risk of capital loss from unfavorable fluctuation in currency values, from differences in generally accepted accounting principles, from economic or political instability in other nations or increased volatility and lower trading volume. This Fund is non-diversified and, as a result, may have greater volatility than diversified-funds. This Fund will concentrate its investments in issuers of one or more particular industries to the same extent that its underlying index is so concentrated and to the extent permitted by applicable laws and regulatory guidance. Concentration risk results from maintaining exposure to issuers conducting business in a specific industry. Small-cap and mid-cap companies generally will have greater volatility in price than the stocks of large companies due to limited product lines or resources or a dependency upon a particular market niche. One cannot invest directly in an Index. See the Fund's prospectus for more information on these and other risks.
Trading Discount to NAV Risks
The Fund's shares may trade above or below their net asset value. The net asset value of the Fund will generally fluctuate with changes in the market value of the Fund's holdings. The market prices of shares, however, will generally fluctuate in accordance with changes in net asset value as well as the relative supply of, and demand for, shares on the exchange. The trading price of shares may deviate significantly from the net asset value.
initial "Trump spike" late in 2016. Positive economic data out of China and Indian market strength further drove the rally. The South Korean equity market also posted healthy gains, and the South Korean won was one of the strong emerging market currencies, despite, or perhaps because of, the impeachment of President Park Geun-hye.
Contributors and detractors
Constituents in the information technology, consumer staples and financials sectors detracted most from the Fund's results during the annual period. Partially offsetting these detractors were constituents in the telecommunication services, health care and utilities sectors, which contributed most positively to results.
From a country perspective, constituents in Mexico, China and Brazil detracted most from results. Conversely, constituents in India, Thailand and Turkey contributed most positively to results during the annual period.
Positions in Steinhoff International Holdings, a South African integrated discount retailer; Fomento Economico Mexicano (FEMSA), a Mexico-based non-alcoholic beverage producer; and Genting, a Malaysian diversified investment holding detracted most. Each posted a negative return during the annual period. Positions in Naspers, a South African media company; Maruti Suzuki India, an Indian auto manufacturer and exporter; and JD.com, a Chinese online direct sales company contributed most positively. Each produced a solid double-digit gain during the annual period.
Annual Report 2017
24
PERFORMANCE OVERVIEW
Columbia Emerging Markets Core ETF
Columbia Emerging Markets Core ETF (the Fund) seeks investment results that correspond (before fees and expenses) to the price and yield performance of the S&P Emerging Markets Core IndexSM.
Average Annual Total Returns (%) (for period ended March 31, 2017)
| | | Inception | | 1 Year | | Life | |
Market Price | | 10/16/12 | | | 11.81 | | | | 0.58 | | |
Net Asset Value | | 10/16/12 | | | 10.08 | | | | 0.50 | | |
S&P Emerging Markets Core IndexSM | | | | | | | 11.01 | | | | 1.37 | | |
All results shown assume reinvestment of distributions during the period. Returns do not reflect the deduction of taxes that a shareholder may pay on Fund distributions or on the redemption of Fund shares. Performance results reflect the effect of any fee waivers or reimbursements of Fund expenses by the Fund's former investment manager or Columbia Management. Absent these fee waivers or expense reimbursement arrangements, performance results would have been lower.
The performance information shown represents past performance and is not a guarantee of future results. The investment return and principal value of your investment will fluctuate so that your shares, when redeemed, may be worth more or less than their original cost. Current performance may be lower or higher than the performance information shown. You may obtain performance information current to the most recent month-end by visiting columbiathreadneedleetf.com.
Columbia Management took over portfolio management in September 2016 upon its acquisition of the Fund's previous investment manager.
The price used to calculate Market Price return is based on the midpoint of the 4:00 PM Eastern (U.S.) bid/ask spread on the NYSE and does not represent returns an investor would receive if shares were traded at other times.
The Fund's shares may trade above or below their net asset value. The net asset value of the Fund will generally fluctuate with changes in the market value of the Fund's holdings. The market prices of shares, however, will generally fluctuate in accordance with changes in net asset value as well as the relative supply of, and demand for, shares on the exchange. The trading price of shares may deviate significantly from the net asset value.
The S&P Emerging Markets Core IndexSM is a modified equal-weighted index designed to measure the market performance of up to 116 companies that S&P determines to be representative of all industries domiciled in emerging market countries, subject to a 15% country cap.
Indices are not available for investment, are not professionally managed and do not reflect sales charges, fees, brokerage commissions, taxes or other expenses of investing. Securities in the Fund may not match those in an index.
Annual Report 2017
25
PERFORMANCE OVERVIEW (continued)
Columbia Emerging Markets Core ETF
Performance of a Hypothetical $10,000 Investment (October 16, 2012 – March 31, 2017)
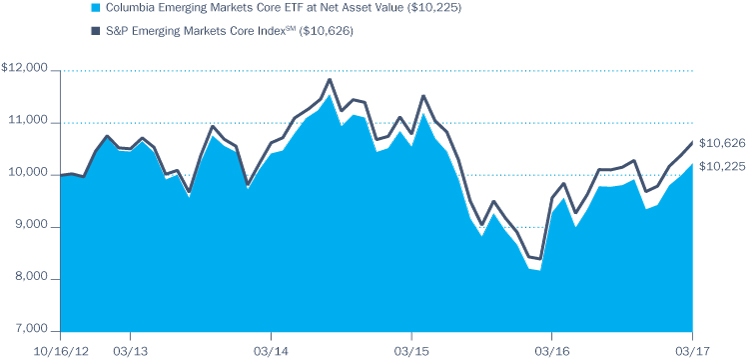
The chart above shows the change in value of a hypothetical $10,000 investment made on the Fund's inception, and does not reflect the deduction of taxes or brokerage commissions that a shareholder may pay on Fund distributions or on the redemption of Fund shares.
Annual Report 2017
26
MANAGER DISCUSSION OF FUND PERFORMANCE
Columbia Emerging Markets Core ETF
For the 12-month period that ended March 31, 2017, the Fund returned 10.08% based on net asset value (NAV) and 11.81% based on market price. The S&P Emerging Markets Core IndexTM (the Index) returned 11.01% during the same period.
The Fund's NAV on March 31, 2016 was $17.58 and it ended the annual period on March 31, 2017 with a NAV of $19.09. The Fund's market price on March 31, 2017 was $19.16 per share.
Emerging market equities posted gains despite geopolitical uncertainty
The annual period ended March 31, 2017 began on a positive note for emerging market equities. All eyes were on the weakness of the U.S. dollar and the rally in commodities prices. The subsequent surge in U.S. dollar strength coincided with the April 2016 Federal Reserve (Fed) press release that indicated a June 2016 interest rate hike in the U.S. was a distinct possibility, as expectations of Fed normalization of monetary policy persisted. Emerging market equities, however, then traded in a narrow band and were essentially flat for most of the early months of the annual period. Interestingly, despite the turn in the U.S. dollar, commodities prices continued to move upward, with part of such strength likely driven by better economic numbers out of China during the summer months. Several other notable macro events affecting the emerging markets during the summer of 2016 included the Philippines' election victory of populist outsider and former mayor of Davao, Rodrigo Duterte, as president on May 9th; the impeachment of Brazilian president Dilma Rousseff on May 12th; and the surprise U.K. vote result on the referendum to leave the European Union, popularly known as Brexit, announced on June 24th.
Emerging market equities experienced a stretch of robust performance heading into the fall months, outpacing developed market equities significantly during the third quarter of 2016. Much of this rally was fueled by improvements in China's economy. Brazil also gained momentum after putting an end to the President Rousseff era with her impeachment. Indonesia performed well, too, on lower interest rates, higher foreign exchange reserves and better capital flows on the back of a successful tax amnesty program.
In the fourth quarter of 2016, political uncertainty again came to the fore with the passing of King Bhumibol of Thailand, followed a month later with the surprise Trump election victory in the U.S. on November 8th. In the week following the U.S. election, the U.S. stock market traded up, while emerging market equities, as measured by the MSCI Emerging Markets Index, declined 4.16%. Also on November 8th, the Indian government announced it was withdrawing all 500 and 1000 rupee notes from circulation to counter "black money," that is, money earned illegally from black market activities. As a result, the Indian equity market sold off 8.5% in the week following the announcement.
After struggling in November and December 2016, emerging market equities staged a strong rally during the first quarter of 2017. Investors seemed more comfortable as U.S. interest rates eased a bit after the
Portfolio Management
Christopher Lo, Ph.D., CFA
Frank Vallario
Top Ten Holdings (%)
(at March 31, 2017) | |
Wal-Mart de Mexico SAB
de CV (Mexico) | | | 1.4 | | |
Fibra Uno Administracion
SA de CV (Mexico) | | | 1.4 | | |
Kimberly-Clark de Mexico
SAB de CV Class A (Mexico) | | | 1.3 | | |
Grupo Aeroportuario del
Pacifico SAB de CV Class B
(Mexico) | | | 1.3 | | |
Alfa SAB de CV Class A
(Mexico) | | | 1.3 | | |
SM Investments Corp.
(Philippines) | | | 1.3 | | |
Ambev SA ADR (Brazil) | | | 1.3 | | |
PT Telekomunikasi Indonesia
Persero Tbk ADR (Indonesia) | | | 1.3 | | |
Cyfrowy Polsat SA (Poland) | | | 1.3 | | |
Grupo Aeroportuario del
Sureste SAB de CV Class B
(Mexico) | | | 1.3 | | |
Percentages indicated are based upon total investments.
For further detail about these holdings, please refer to the section entitled "Portfolio of Investments."
Fund holdings are as of the date given, are subject to change at any time, and are not recommendations to buy or sell any security.
Annual Report 2017
27
MANAGER DISCUSSION OF FUND PERFORMANCE (continued)
Columbia Emerging Markets Core ETF
Country Breakdown (%)
(at March 31, 2017) | |
Brazil | | | 8.7 | | |
Chile | | | 1.3 | | |
China | | | 13.7 | | |
Hong Kong | | | 1.3 | | |
India | | | 15.5 | | |
Indonesia | | | 3.8 | | |
Malaysia | | | 6.3 | | |
Mexico | | | 15.5 | | |
Peru | | | 1.2 | | |
Philippines | | | 4.9 | | |
Poland | | | 2.5 | | |
Russia | | | 5.0 | | |
South Africa | | | 14.1 | | |
Thailand | | | 3.7 | | |
Turkey | | | 1.3 | | |
United Arab Emirates | | | 1.2 | | |
Total | | | 100.0 | | |
Country Breakdown is based primarily on issuer's place of risk. Percentages indicated are based upon total investments. The Fund's portfolio composition is subject to change.
Equity Sector Breakdown (%)
(at March 31, 2017) | |
Consumer Discretionary | | | 20.2 | | |
Consumer Staples | | | 15.2 | | |
Energy | | | 5.1 | | |
Financials | | | 12.2 | | |
Health Care | | | 7.6 | | |
Industrials | | | 10.9 | | |
Information Technology | | | 6.2 | | |
Materials | | | 8.6 | | |
Real Estate | | | 5.7 | | |
Telecommunication Services | | | 4.4 | | |
Utilities | | | 3.9 | | |
Total | | | 100.0 | | |
Percentages indicated are based upon total equity investments. The Fund's portfolio composition is subject to change.
initial "Trump spike" late in 2016. Positive economic data out of China and Indian market strength further drove the rally. The South Korean equity market also posted healthy gains, and the South Korean won was one of the strong emerging market currencies, despite, or perhaps because of, the impeachment of President Park Geun-hye.
Contributors and detractors
Constituents in the information technology, consumer discretionary and health care sectors detracted most from the Fund's results during the annual period. Partially offsetting these detractors were constituents in the materials, telecommunication services and energy sectors, which contributed most positively to results.
From a country perspective, constituents in China, Mexico and South Africa detracted most from. Conversely, constituents in Brazil, Indonesia and India contributed most positively to results during the annual period.
Positions in LPP, a Polish clothing designer and distributor; Airports of Thailand, a Thai airport operator; and Alfa, a Mexican diversified industrials company detracted most. Each posted a modestly negative return during the annual period. Positions in Vale, a Brazilian metals producer; Petroleo Brasileiro (Petrobras), a Brazilian oil and gas exploration and production company; and Telekomunikasi Indonesia Persero, an Indonesia telecommunications company contributed most positively. Vale posted a triple-digit gain, and Petrobras and Telekomunikasi Indonesia Persero each produced a robust double-digit gain during the annual period.
Annual Report 2017
28
MANAGER DISCUSSION OF FUND PERFORMANCE (continued)
Columbia Emerging Markets Core ETF
Investment Risks
Emerging market investments involve risk of capital loss from unfavorable fluctuation in currency values, from differences in generally accepted accounting principles, from economic or political instability in other nations or increased volatility and lower trading volume. This Fund is non-diversified and, as a result, may have greater volatility than diversified-funds. This Fund will concentrate its investments in issuers of one or more particular industries to the same extent that its underlying index is so concentrated and to the extent permitted by applicable laws and regulatory guidance. Concentration risk results from maintaining exposure to issuers conducting business in a specific industry. Small-cap and mid-cap companies generally will have greater volatility in price than the stocks of large companies due to limited product lines or resources or a dependency upon a particular market niche. One cannot invest directly in an Index. See the Fund's prospectus for more information on these and other risks.
Trading Discount to NAV Risks
The Fund's shares may trade above or below their net asset value. The net asset value of the Fund will generally fluctuate with changes in the market value of the Fund's holdings. The market prices of shares, however, will generally fluctuate in accordance with changes in net asset value as well as the relative supply of, and demand for, shares on the exchange. The trading price of shares may deviate significantly from the net asset value.
Annual Report 2017
29
PERFORMANCE OVERVIEW
Columbia India Consumer ETF
Columbia India Consumer ETF (the Fund) seeks investment results that correspond (before fees and expenses) to the price and yield performance of the Indxx India Consumer Index.
Average Annual Total Returns (%) (for period ended March 31, 2017)
| | | Inception | | 1 Year | | 5 Years | | Life | |
Market Price | | 08/10/11 | | | 23.67 | | | | 15.13 | | | | 12.34 | | |
Net Asset Value | | 08/10/11 | | | 23.06 | | | | 15.00 | | | | 12.24 | | |
Indxx India Consumer Index | | | | | | | 24.65 | | | | 16.85 | | | | 13.99 | | |
All results shown assume reinvestment of distributions during the period. Returns do not reflect the deduction of taxes that a shareholder may pay on Fund distributions or on the redemption of Fund shares. Performance results reflect the effect of any fee waivers or reimbursements of Fund expenses by the Fund's former investment manager or Columbia Management. Absent these fee waivers or expense reimbursement arrangements, performance results would have been lower.
The performance information shown represents past performance and is not a guarantee of future results. The investment return and principal value of your investment will fluctuate so that your shares, when redeemed, may be worth more or less than their original cost. Current performance may be lower or higher than the performance information shown. You may obtain performance information current to the most recent month-end by visiting columbiathreadneedleetf.com.
Columbia Management took over portfolio management in September 2016 upon its acquisition of the Fund's previous investment manager.
The price used to calculate Market Price return is based on the midpoint of the 4:00 PM Eastern (U.S.) bid/ask spread on the NYSE and does not represent returns an investor would receive if shares were traded at other times.
The Fund's shares may trade above or below their net asset value. The net asset value of the Fund will generally fluctuate with changes in the market value of the Fund's holdings. The market prices of shares, however, will generally fluctuate in accordance with changes in net asset value as well as the relative supply of, and demand for, shares on the exchange. The trading price of shares may deviate significantly from the net asset value.
The Indxx India Consumer Index is a modified equal-weighted index designed to measure the market performance of up to 116 companies that S&P determines to be representative of all industries domiciled in emerging market countries, subject to a 15% country cap.
Indices are not available for investment, are not professionally managed and do not reflect sales charges, fees, brokerage commissions, taxes or other expenses of investing. Securities in the Fund may not match those in an index.
Annual Report 2017
30
PERFORMANCE OVERVIEW (continued)
Columbia India Consumer ETF
Performance of a Hypothetical $10,000 Investment (August 10, 2011 – March 31, 2017)
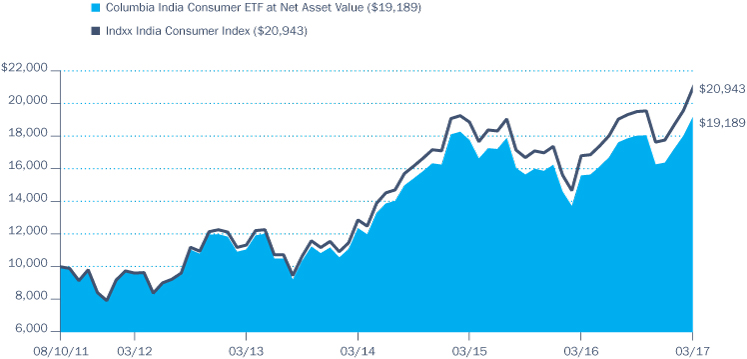
The chart above shows the change in value of a hypothetical $10,000 investment made on the Fund's inception, and does not reflect the deduction of taxes or brokerage commissions that a shareholder may pay on Fund distributions or on the redemption of Fund shares.
Annual Report 2017
31
MANAGER DISCUSSION OF FUND PERFORMANCE
Columbia India Consumer ETF
Portfolio Management
Christopher Lo, Ph.D., CFA
Frank Vallario
Top Ten Holdings (%)
(at March 31, 2017) | |
Nestle India, Ltd. | | | 5.2 | | |
Britannia Industries Ltd. | | | 5.0 | | |
Zee Entertainment
Enterprises, Ltd. | | | 4.9 | | |
Hindustan Unilever, Ltd. | | | 4.9 | | |
Motherson Sumi Systems, Ltd. | | | 4.8 | | |
Godrej Consumer Products, Ltd. | | | 4.8 | | |
Maruti Suzuki India, Ltd. | | | 4.8 | | |
Bosch, Ltd. | | | 4.7 | | |
Tata Motors, Ltd. | | | 4.7 | | |
Mahindra & Mahindra, Ltd. | | | 4.7 | | |
Percentages indicated are based upon total investments.
For further detail about these holdings, please refer to the section entitled "Portfolio of Investments."
Fund holdings are as of the date given, are subject to change at any time, and are not recommendations to buy or sell any security.
Equity Sector Breakdown (%)
(at March 31, 2017) | |
Consumer Goods | | | 81.3 | | |
Consumer Services | | | 6.2 | | |
Industrials | | | 12.5 | | |
Total | | | 100.0 | | |
Percentages indicated are based upon total equity investments. The Fund's portfolio composition is subject to change.
For the 12-month period that ended March 31, 2017, the Fund returned 23.06% based on net asset value (NAV) and 23.67% based on market price. The Indxx India Consumer Index, returned 24.65% during the same time period.
The Fund's NAV on March 31, 2016 was $31.16 and it ended the annual period on March 31, 2017 with a NAV of $38.31. The Fund's market price on March 31, 2017 was $38.51 per share.
Indian equities posted robust returns amidst strong economic growth
The Indian equity market posted robust gains during the annual period ended March 31, 2017 amidst strong economic growth. Indeed, India is currently the fastest growing large economy in the world with more than 7% real Gross Domestic Product (GDP) growth. Several monetary, fiscal and political factors further supported the performance of the equity market in India during the annual period.
In June 2016, India's central bank governor Raghuram Rajan announced he would step down when his term ended in early September 2016. Finance Minister Arun Jaitley said the government appreciated the work done by Rajan and respected his decision to return to academia. While there was some short-term nervousness initially, investors were calmed when in early August 2016, Indian Prime Minister Narendra Modi appointed Urjit Patel as the governor of the Reserve Bank of India, ending months of speculation about who would be Rajan's successor and signaling that prudent monetary policy would continue to be the norm. Patel had been guiding the monetary policy as a deputy governor since 2013, playing a key role in developing the country's monetary policy framework, which has focused on reining in inflation and imparting stability to the currency. Most investors appeared to believe that, with a global perspective and a solid academic background, Patel's appointment would ensure a smooth transition and continuity in monetary policy, as India puts in place major structural reforms to transition to a higher economic growth path.
On the fiscal front, on November 8, 2016, the Indian government announced it was withdrawing high-denomination banknotes in the nation's biggest crackdown against corruption in almost four decades. All 500 and 1000 rupee notes would cease to be legal tender, Prime Minister Modi announced in an unscheduled address to the nation. The notes in circulation would need to be deposited in banks by the end of December 2016. Chaos prevailed across the country, as people lined up outside cash dispensing machines and banks following the announcement, and the Indian equity market sold off 8.5% in the week following the announcement. While this action sparked a surge in cash deposits, briefly impacted consumption and caused some near-term pain, the move also raised hopes the added liquidity would allow banks to lower lending rates more aggressively and support a healthier India over the long term.
In the first quarter of 2017, the Indian equity market rallied, supported by political events. In mid-March 2017, with an overwhelming victory in
Annual Report 2017
32
MANAGER DISCUSSION OF FUND PERFORMANCE (continued)
Columbia India Consumer ETF
India's most important state election, Prime Minister Modi secured his place as the country's most influential leader, eclipsing his rivals and positioning his party for a second term in 2019. Prime Minister Modi's success is widely anticipated to allow him to aggressively push his economic agenda, although he will still face entrenched opposition to some reforms in the upper house of India's parliament. That said, one of his reforms, the Goods and Services Tax (GST) bill was passed by India's parliament at the end of March 2017, paving the way for all the Indian states to pass the States' GST Bill. After this is accomplished, a new indirect tax regime can be rolled out, enabling the government to implement the landmark bill on its target date of July 1, 2017. It is widely anticipated that the final nod to the fixation of GST rates for major commodities and services will be given at the next meeting of the GST council in mid-May 2017.
Contributors and detractors
Constituents in the information technology, financials and materials sectors detracted most from the Fund's results during the annual period. Partially offsetting these detractors were constituents in the consumer discretionary, consumer staples and telecommunication services sectors, which contributed most positively to results.
Positions in United Spirits, an alcoholic beverage manufacturer and distributor; GlaxoSmithKline Consumer Healthcare, a malted milk food products manufacturer; and United Breweries, another alcoholic beverage manufacturer detracted most. Each posted a negative return during the annual period. Positions in Maruti Suzuki India, an auto manufacturer and exporter; Zee Entertainment Enterprises, a media content producer and developer; and MRF, an automobile components manufacturer and distributor contributed most positively. Each produced a robust double-digit gain during the annual period.
Investment Risks
Emerging market investments involve risk of capital loss from unfavorable fluctuation in currency values, from differences in generally accepted accounting principles, from economic or political instability in other nations or increased volatility and lower trading volume. This Fund is non-diversified and, as a result, may have greater volatility than diversified-funds. This Fund will concentrate its investments in issuers of one or more particular industries to the same extent that its underlying index is so concentrated and to the extent permitted by applicable laws and regulatory guidance. Concentration risk results from maintaining exposure to issuers conducting business in a specific industry. Small-cap and mid-cap companies generally will have greater volatility in price than the stocks of large companies due to limited product lines or resources or a dependency upon a particular market niche. One cannot invest directly in an Index. See the Fund's prospectus for more information on these and other risks.
Trading Discount to NAV Risks
The Fund's shares may trade above or below their net asset value. The net asset value of the Fund will generally fluctuate with changes in the market value of the Fund's holdings. The market prices of shares, however, will generally fluctuate in accordance with changes in net asset value as well as the relative supply of, and demand for, shares on the exchange. The trading price of shares may deviate significantly from the net asset value.
Annual Report 2017
33
PERFORMANCE OVERVIEW
Columbia India Infrastructure ETF
Columbia India Infrastructure ETF (the Fund) seeks investment results that correspond (before fees and expenses) to the price and yield performance of the Indxx India Infrastructure Index.
Average Annual Total Returns (%) (for period ended March 31, 2017)
| | | Inception | | 1 Year | | 5 Years | | Life | |
Market Price | | 08/11/10 | | | 30.93 | | | | 0.82 | | | | -3.65 | | |
Net Asset Value | | 08/11/10 | | | 30.61 | | | | 0.57 | | | | -3.74 | | |
Indxx India Infrastructure Index | | | | | | | 32.57 | | | | 1.68 | | | | -2.65 | | |
All results shown assume reinvestment of distributions during the period. Returns do not reflect the deduction of taxes that a shareholder may pay on Fund distributions or on the redemption of Fund shares. Performance results reflect the effect of any fee waivers or reimbursements of Fund expenses by the Fund's former investment manager or Columbia Management. Absent these fee waivers or expense reimbursement arrangements, performance results would have been lower.
The performance information shown represents past performance and is not a guarantee of future results. The investment return and principal value of your investment will fluctuate so that your shares, when redeemed, may be worth more or less than their original cost. Current performance may be lower or higher than the performance information shown. You may obtain performance information current to the most recent month-end by visiting columbiathreadneedleetf.com.
Columbia Management took over portfolio management in September 2016 upon its acquisition of the Fund's previous investment manager.
The price used to calculate Market Price return is based on the midpoint of the 4:00 PM Eastern (U.S.) bid/ask spread on the NYSE and does not represent returns an investor would receive if shares were traded at other times.
The Fund's shares may trade above or below their net asset value. The net asset value of the Fund will generally fluctuate with changes in the market value of the Fund's holdings. The market prices of shares, however, will generally fluctuate in accordance with changes in net asset value as well as the relative supply of, and demand for, shares on the exchange. The trading price of shares may deviate significantly from the net asset value.
The Indxx India Infrastructure Index is a maximum 30-stock free-float adjusted market capitalization-weighted index designed to measure the market performance of companies in the infrastructure industry in India, as defined by Indxx's proprietary methodology. The index consists of common stocks listed on the primary exchange of India and ADRs and GDRs.
Indices are not available for investment, are not professionally managed and do not reflect sales charges, fees, brokerage commissions, taxes or other expenses of investing. Securities in the Fund may not match those in an index.
Annual Report 2017
34
PERFORMANCE OVERVIEW (continued)
Columbia India Infrastructure ETF
Performance of a Hypothetical $10,000 Investment (August 11, 2010 – March 31, 2017)
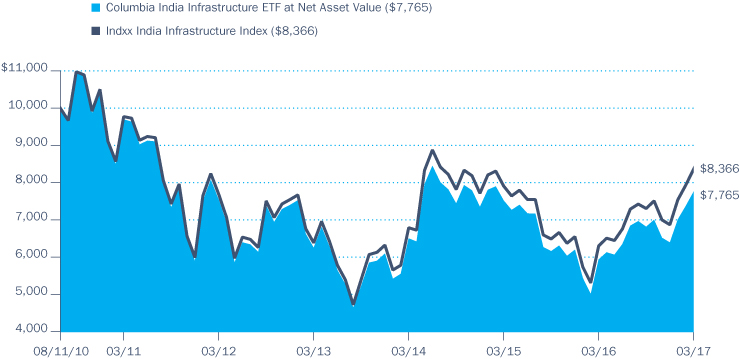
The chart above shows the change in value of a hypothetical $10,000 investment made on the Fund's inception, and does not reflect the deduction of taxes or brokerage commissions that a shareholder may pay on Fund distributions or on the redemption of Fund shares.
Annual Report 2017
35
MANAGER DISCUSSION OF FUND PERFORMANCE
Columbia India Infrastructure ETF
Portfolio Management
Christopher Lo, Ph.D., CFA
Frank Vallario
Top Ten Holdings (%)
(at March 31, 2017) | |
Vedanta, Ltd. | | | 7.1 | | |
GAIL India, Ltd. | | | 5.7 | | |
Adani Ports and Special
Economic Zone, Ltd. | | | 5.7 | | |
Eicher Motors, Ltd. | | | 5.1 | | |
Bharti Airtel, Ltd. | | | 5.0 | | |
NTPC, Ltd. | | | 4.8 | | |
Larsen & Toubro, Ltd. | | | 4.7 | | |
UltraTech Cement, Ltd. | | | 4.6 | | |
JSW Steel, Ltd. | | | 4.5 | | |
Bharti Infratel, Ltd. | | | 4.2 | | |
Percentages indicated are based upon total investments.
For further detail about these holdings, please refer to the section entitled "Portfolio of Investments."
Fund holdings are as of the date given, are subject to change at any time, and are not recommendations to buy or sell any security.
Equity Sector Breakdown (%)
(at March 31, 2017) | |
Basic Materials | | | 14.2 | | |
Consumer Goods | | | 5.2 | | |
Financials | | | 1.6 | | |
Industrials | | | 45.3 | | |
Oil & Gas | | | 5.7 | | |
Telecommunications | | | 13.1 | | |
Utilities | | | 14.9 | | |
Total | | | 100.0 | | |
Percentages indicated are based upon total equity investments. The Fund's portfolio composition is subject to change.
For the 12-month period that ended March 31, 2017, the Fund returned 30.61% based on net asset value (NAV) and 30.93% based on market price. The Indxx India Infrastructure Index, returned 32.57% during the same time period.
The Fund's NAV on March 31, 2016 was $10.24 and it ended the annual period on March 31, 2017 with a NAV of $12.98. The Fund's market price on March 31, 2017 was $13.06 per share.
Indian equities posted robust returns amidst strong economic growth
The Indian equity market posted robust gains during the annual period ended March 31, 2017 amidst strong economic growth. Indeed, India is currently the fastest growing large economy in the world with more than 7% real Gross Domestic Product (GDP) growth. Several monetary, fiscal and political factors further supported the performance of the equity market in India during the annual period.
In June 2016, India's central bank governor Raghuram Rajan announced he would step down when his term ended in early September 2016. Finance Minister Arun Jaitley said the government appreciated the work done by Rajan and respected his decision to return to academia. While there was some short-term nervousness initially, investors were calmed when in early August 2016, Indian Prime Minister Narendra Modi appointed Urjit Patel as the governor of the Reserve Bank of India, ending months of speculation about who would be Rajan's successor and signaling that prudent monetary policy would continue to be the norm. Patel had been guiding the monetary policy as a deputy governor since 2013, playing a key role in developing the country's monetary policy framework, which has focused on reining in inflation and imparting stability to the currency. Most investors appeared to believe that, with a global perspective and a solid academic background, Patel's appointment would ensure a smooth transition and continuity in monetary policy, as India puts in place major structural reforms to transition to a higher economic growth path.
On the fiscal front, on November 8, 2016, the Indian government announced it was withdrawing high-denomination banknotes in the nation's biggest crackdown against corruption in almost four decades. All 500 and 1000 rupee notes would cease to be legal tender, Prime Minister Modi announced in an unscheduled address to the nation. The notes in circulation would need to be deposited in banks by the end of December 2016. Chaos prevailed across the country, as people lined up outside cash dispensing machines and banks following the announcement, and the Indian equity market sold off 8.5% in the week following the announcement. While this action sparked a surge in cash deposits, briefly impacted consumption and caused some near-term pain, the move also raised hopes the added liquidity would allow banks to lower lending rates more aggressively and support a healthier India over the long term.
In the first quarter of 2017, the Indian equity market rallied, supported by political events. In mid-March 2017, with an overwhelming victory in
Annual Report 2017
36
MANAGER DISCUSSION OF FUND PERFORMANCE (continued)
Columbia India Infrastructure ETF
India's most important state election, Prime Minister Modi secured his place as the country's most influential leader, eclipsing his rivals and positioning his party for a second term in 2019. Prime Minister Modi's success is widely anticipated to allow him to aggressively push his economic agenda, although he will still face entrenched opposition to some reforms in the upper house of India's parliament. That said, one of his reforms, the Goods and Services Tax (GST) bill was passed by India's parliament at the end of March 2017, paving the way for all the Indian states to pass the States' GST Bill. After this is accomplished, a new indirect tax regime can be rolled out, enabling the government to implement the landmark bill on its target date of July 1, 2017. It is widely anticipated that the final nod to the fixation of GST rates for major commodities and services will be given at the next meeting of the GST council in mid-May 2017.
Contributors and detractors
Constituents in the industrials, materials and utilities sectors contributed most positively to the Fund's results during the annual period. Partially offsetting these positive contributors were constituents in the information technology, telecommunication services and financials sectors, which detracted most from during the annual period.
Positions in Vedanta, a base metals miner; Gail India, a utilities company; and NTPC, another utilities company, contributed most positively. Vedanta posted a triple-digit gain, and Gail India and NTPC each produced a robust double-digit gain during the annual period. Positions in Idea Cellular, a telecommunication services company; Bharti Infratel, a telecommunication infrastructure company; and ACC, a cement manufacturer detracted most. Each posted a negative return during the annual period.
Investment Risks
Emerging market investments involve risk of capital loss from unfavorable fluctuation in currency values, from differences in generally accepted accounting principles, from economic or political instability in other nations or increased volatility and lower trading volume. This Fund is non-diversified and, as a result, may have greater volatility than diversified-funds. This Fund will concentrate its investments in issuers of one or more particular industries to the same extent that its underlying index is so concentrated and to the extent permitted by applicable laws and regulatory guidance. Concentration risk results from maintaining exposure to issuers conducting business in a specific industry. Small-cap and mid-cap companies generally will have greater volatility in price than the stocks of large companies due to limited product lines or resources or a dependency upon a particular market niche. One cannot invest directly in an Index. See the Fund's prospectus for more information on these and other risks.
Trading Discount to NAV Risks
The Fund's shares may trade above or below their net asset value. The net asset value of the Fund will generally fluctuate with changes in the market value of the Fund's holdings. The market prices of shares, however, will generally fluctuate in accordance with changes in net asset value as well as the relative supply of, and demand for, shares on the exchange. The trading price of shares may deviate significantly from the net asset value.
Annual Report 2017
37
PERFORMANCE OVERVIEW
Columbia India Small Cap ETF
Columbia India Small Cap ETF (the Fund) seeks investment results that correspond (before fees and expenses) to the price and yield performance of the Indxx India Small Cap Index.
Average Annual Total Returns (%) (for period ended March 31, 2017)
| | | Inception | | 1 Year | | 5 Years | | Life | |
Market Price | | 07/07/10 | | | 36.29 | | | | 5.82 | | | | -0.37 | | |
Net Asset Value | | 07/07/10 | | | 35.62 | | | | 5.85 | | | | -0.44 | | |
Indxx India Small Cap Index | | | | | | | 37.55 | | | | 7.59 | | | | 1.08 | | |
All results shown assume reinvestment of distributions during the period. Returns do not reflect the deduction of taxes that a shareholder may pay on Fund distributions or on the redemption of Fund shares. Performance results reflect the effect of any fee waivers or reimbursements of Fund expenses by the Fund's former investment manager or Columbia Management. Absent these fee waivers or expense reimbursement arrangements, performance results would have been lower.
The performance information shown represents past performance and is not a guarantee of future results. The investment return and principal value of your investment will fluctuate so that your shares, when redeemed, may be worth more or less than their original cost. Current performance may be lower or higher than the performance information shown. You may obtain performance information current to the most recent month-end by visiting columbiathreadneedleetf.com.
Columbia Management took over portfolio management in September 2016 upon its acquisition of the Fund's previous investment manager.
The price used to calculate Market Price return is based on the midpoint of the 4:00 PM Eastern (U.S.) bid/ask spread on the NYSE and does not represent returns an investor would receive if shares were traded at other times.
The Fund's shares may trade above or below their net asset value. The net asset value of the Fund will generally fluctuate with changes in the market value of the Fund's holdings. The market prices of shares, however, will generally fluctuate in accordance with changes in net asset value as well as the relative supply of, and demand for, shares on the exchange. The trading price of shares may deviate significantly from the net asset value.
The Indxx India Small Cap Index is a maximum 75-stock free-float adjusted market capitalization-weighted index designed to measure the market performance of companies in the small cap segment in India. The index consists of securities listed on the primary stock exchange of India.
Indices are not available for investment, are not professionally managed and do not reflect sales charges, fees, brokerage commissions, taxes or other expenses of investing. Securities in the Fund may not match those in an index.
Annual Report 2017
38
PERFORMANCE OVERVIEW (continued)
Columbia India Small Cap ETF
Performance of a Hypothetical $10,000 Investment (July 7, 2010 – March 31, 2017)
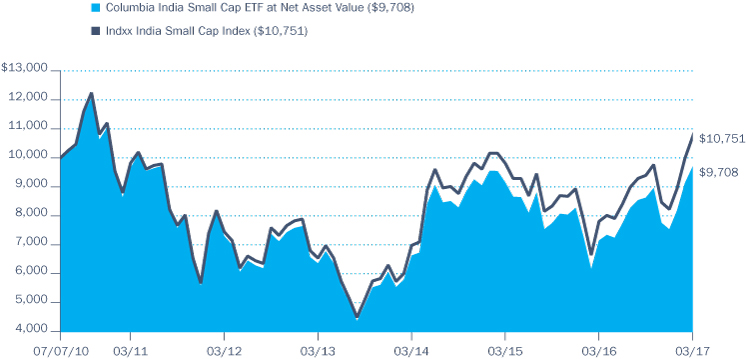
The chart above shows the change in value of a hypothetical $10,000 investment made on the Fund's inception, and does not reflect the deduction of taxes or brokerage commissions that a shareholder may pay on Fund distributions or on the redemption of Fund shares.
Annual Report 2017
39
MANAGER DISCUSSION OF FUND PERFORMANCE
Columbia India Small Cap ETF
Portfolio Management
Christopher Lo, Ph.D., CFA
Frank Vallario
Top Ten Holdings (%)
(at March 31, 2017) | |
Suzlon Energy, Ltd. | | | 3.7 | | |
Tata Global Beverages, Ltd. | | | 3.5 | | |
Escorts, Ltd. | | | 3.4 | | |
Karur Vysya Bank, Ltd. (The) | | | 3.1 | | |
Multi Commodity Exchange of
India, Ltd. | | | 2.5 | | |
Manappuram Finance, Ltd. | | | 2.4 | | |
Gujarat Pipavav Port, Ltd. | | | 2.3 | | |
Mindtree, Ltd. | | | 2.2 | | |
Reliance Communications, Ltd. | | | 2.2 | | |
Sintex Industries, Ltd. | | | 2.2 | | |
Percentages indicated are based upon total investments.
For further detail about these holdings, please refer to the section entitled "Portfolio of Investments."
Fund holdings are as of the date given, are subject to change at any time, and are not recommendations to buy or sell any security.
Equity Sector Breakdown (%)
(at March 31, 2017) | |
Basic Materials | | | 3.6 | | |
Consumer Goods | | | 15.8 | | |
Consumer Services | | | 9.6 | | |
Financials | | | 20.9 | | |
Health Care | | | 4.9 | | |
Industrials | | | 26.2 | | |
Oil & Gas | | | 5.1 | | |
Technology | | | 7.8 | | |
Telecommunications | | | 2.2 | | |
Utilities | | | 3.9 | | |
Total | | | 100.0 | | |
Percentages indicated are based upon total equity investments. The Fund's portfolio composition is subject to change.
For the 12-month period that ended March 31, 2017, the Fund returned 35.62% based on net asset value (NAV) and 36.29% based on market price. The Indxx India Small Cap Index (the Index) returned 37.55% during the same period.
The Fund's NAV on March 31, 2016 was $13.59 and it ended the annual period on March 31, 2017 with a NAV of $18.26. The Fund's market price on March 31, 2017 was $18.35 per share.
Indian equities posted robust returns amidst strong economic growth
The Indian equity market posted robust gains during the annual period ended March 31, 2017 amidst strong economic growth. Indeed, India is currently the fastest growing large economy in the world with more than 7% real Gross Domestic Product (GDP) growth. Several monetary, fiscal and political factors further supported the performance of the equity market in India during the annual period.
In June 2016, India's central bank governor Raghuram Rajan announced he would step down when his term ended in early September 2016. Finance Minister Arun Jaitley said the government appreciated the work done by Rajan and respected his decision to return to academia. While there was some short-term nervousness initially, investors were calmed when in early August 2016, Indian Prime Minister Narendra Modi appointed Urjit Patel as the governor of the Reserve Bank of India, ending months of speculation about who would be Rajan's successor and signaling that prudent monetary policy would continue to be the norm. Patel had been guiding the monetary policy as a deputy governor since 2013, playing a key role in developing the country's monetary policy framework, which has focused on reining in inflation and imparting stability to the currency. Most investors appeared to believe that, with a global perspective and a solid academic background, Patel's appointment would ensure a smooth transition and continuity in monetary policy, as India puts in place major structural reforms to transition to a higher economic growth path.
On the fiscal front, on November 8, 2016, the Indian government announced it was withdrawing high-denomination banknotes in the nation's biggest crackdown against corruption in almost four decades. All 500 and 1000 rupee notes would cease to be legal tender, Prime Minister Modi announced in an unscheduled address to the nation. The notes in circulation would need to be deposited in banks by the end of December 2016. Chaos prevailed across the country, as people lined up outside cash dispensing machines and banks following the announcement, and the Indian equity market sold off 8.5% in the week following the announcement. While this action sparked a surge in cash deposits, briefly impacted consumption and caused some near-term pain, the move also raised hopes the added liquidity would allow banks to lower lending rates more aggressively and support a healthier India over the long term.
In the first quarter of 2017, the Indian equity market rallied, supported by political events. In mid-March 2017, with an overwhelming victory in
Annual Report 2017
40
MANAGER DISCUSSION OF FUND PERFORMANCE (continued)
Columbia India Small Cap ETF
India's most important state election, Prime Minister Modi secured his place as the country's most influential leader, eclipsing his rivals and positioning his party for a second term in 2019. Prime Minister Modi's success is widely anticipated to allow him to aggressively push his economic agenda, although he will still face entrenched opposition to some reforms in the upper house of India's parliament. That said, one of his reforms, the Goods and Services Tax (GST) bill was passed by India's parliament at the end of March 2017, paving the way for all the Indian states to pass the States' GST Bill. After this is accomplished, a new indirect tax regime can be rolled out, enabling the government to implement the landmark bill on its target date of July 1, 2017. It is widely anticipated that the final nod to the fixation of GST rates for major commodities and services will be given at the next meeting of the GST council in mid-May 2017.
Contributors and detractors
Constituents in the financials, industrials and utilities sectors contributed most positively to the Fund's results during the annual period. Partially offsetting these positive contributors were constituents in information technology and energy, the only two sectors that detracted from the Fund's results during the annual period.
Positions in Federal Bank, electrical equipment manufacturer and servicer CG Power and Industrial Solutions and consumer finance solutions provider Bharat Financial Inclusion contributed most positively. Each produced a robust double-digit gain during the annual period. Positions in Infibeam, an online shopping website owner and operator; Just Dial, a local search engine operator; and Intellect Design Arena, a financial technology firm detracted most. Each posted a double-digit negative return during the annual period.
Investment Risks
Emerging market investments involve risk of capital loss from unfavorable fluctuation in currency values, from differences in generally accepted accounting principles, from economic or political instability in other nations or increased volatility and lower trading volume. This Fund is non-diversified and, as a result, may have greater volatility than diversified-funds. This Fund will concentrate its investments in issuers of one or more particular industries to the same extent that its underlying index is so concentrated and to the extent permitted by applicable laws and regulatory guidance. Concentration risk results from maintaining exposure to issuers conducting business in a specific industry. Small-cap and mid-cap companies generally will have greater volatility in price than the stocks of large companies due to limited product lines or resources or a dependency upon a particular market niche. One cannot invest directly in an Index. See the Fund's prospectus for more information on these and other risks.
Trading Discount to NAV Risks
The Fund's shares may trade above or below their net asset value. The net asset value of the Fund will generally fluctuate with changes in the market value of the Fund's holdings. The market prices of shares, however, will generally fluctuate in accordance with changes in net asset value as well as the relative supply of, and demand for, shares on the exchange. The trading price of shares may deviate significantly from the net asset value.
Annual Report 2017
41
UNDERSTANDING YOUR FUND'S EXPENSES
(Unaudited)
As a shareholder of a Fund, you incur ongoing costs, including investment management fees. The following example is intended to help you understand your ongoing costs (in dollars and cents) of investing in a Fund and to compare these costs with the ongoing costs of investing in other funds.
The examples are based on an initial investment of $1,000 invested at the beginning of the period and held for the period ended March 31, 2017.
Actual Expenses
The information under each column in the table below entitled "Actual" provides information about actual account values and actual expenses. You may use the information in these columns, together with the amount you invested, to estimate the expenses that you paid over the period. Simply divide your account value by $1,000 (for example, an $8,600 account value divided by $1,000 = 8.6), then multiply the result by the number for your Fund under the heading entitled "Expenses Paid for the Period 10/1/2016 to 3/31/2017" to estimate the expenses you paid on your account during this period.
Hypothetical Example For Comparison Purposes
The information under each column in the table entitled "Hypothetical" provides information about hypothetical account values and hypothetical expenses based on each Fund's actual expense ratio and an assumed rate of return of 5% per year before expenses, which is not the Fund's actual return. The hypothetical account values and expenses may not be used to estimate the actual ending account balance or expenses you paid for the period. You may use this information to compare the ongoing costs of investing in your Fund and other funds. To do so, compare this 5% hypothetical example with the 5% hypothetical examples that appear in the shareholder reports of the other funds.
Please note that the expenses shown in the table are meant to highlight your ongoing costs only and do not reflect any transactional costs, such as brokerage commissions paid on purchases and sales of Fund shares. Therefore, the ending account values and expenses paid for the period in the table is useful in comparing ongoing Fund costs only and will not help you determine the relative total costs of owning different funds. In addition, if these transactional costs were included, your costs would have been higher.
October 1, 2016 – March 31, 2017
| | | Beginning Account Value
($) | | Ending Account Value
($) | | Expenses Paid For the
Period ($) | | Annualized Expense
Ratios for the
Period (%) | |
| | | Actual | | Hypothetical | | Actual | | Hypothetical | | Actual | | Hypothetical | | Actual | |
Columbia Beyond
BRICs ETF | | | 1,000.00 | | | | 1,000.00 | | | | 1,032.80 | | | | 1,022.04 | | | | 2.94 | | | | 2.92 | | | | 0.58 | | |
Columbia EM Core
ex-China ETF | | | 1,000.00 | | | | 1,000.00 | | | | 1,078.10 | | | | 1,023.19 | | | | 1.81 | | | | 1.77 | | | | 0.35 | | |
Columbia EM Quality
Dividend ETF | | | 1,000.00 | | | | 1,000.00 | | | | 1,027.60 | | | | 1,020.69 | | | | 4.30 | | | | 4.28 | | | | 0.85 | | |
Columbia EM Strategic
Opportunities ETF | | | 1,000.00 | | | | 1,000.00 | | | | 1,006.10 | | | | 1,021.69 | | | | 3.25 | | | | 3.28 | | | | 0.65 | | |
Columbia Emerging
Markets Consumer ETF | | | 1,000.00 | | | | 1,000.00 | | | | 1,011.30 | | | | 1,020.69 | | | | 4.26 | | | | 4.28 | | | | 0.85 | | |
Columbia Emerging
Markets Core ETF | | | 1,000.00 | | | | 1,000.00 | | | | 1,042.10 | | | | 1,021.44 | | | | 3.56 | | | | 3.53 | | | | 0.70 | | |
Columbia India
Consumer ETF | | | 1,000.00 | | | | 1,000.00 | | | | 1,064.60 | | | | 1,020.49 | | | | 4.58 | | | | 4.48 | | | | 0.89 | | |
Columbia India
Infrastructure ETF | | | 1,000.00 | | | | 1,000.00 | | | | 1,138.30 | | | | 1,020.04 | | | | 5.22 | | | | 4.94 | | | | 0.98 | | |
Columbia India
Small Cap ETF | | | 1,000.00 | | | | 1,000.00 | | | | 1,124.50 | | | | 1,020.64 | | | | 4.56 | | | | 4.33 | | | | 0.86 | | |
Expenses are calculated using the Fund's annualized expense ratio, multiplied by the average account value over the period, then multiplied by the number of days in the Fund's most recent fiscal half-year and divided by 365.
Expense ratios reflect expense caps through the period ended March 31, 2017. Expense ratios for the most recent fiscal half-year may differ from expense ratios based on the one year data in the Financial Highlights due to changes in the expense caps.
Had the Investment Manager not waived fees or reimbursed a portion of expenses, account values at the end of the period would have been reduced.
Annual Report 2017
42
FREQUENCY DISTRIBUTION OF PREMIUMS AND DISCOUNTS
(Unaudited)
The tables that follow present information about the differences between the daily market price on secondary markets for shares of a Fund and that Fund's net asset value. Net asset value, or "NAV", is the price per share at which each Fund issues and redeems shares. It is calculated in accordance with the standard formula for valuing fund shares. The "Market Price" of each Fund generally is determined using the midpoint between the highest bid and the lowest offer on the stock exchange on which the shares of such Fund are listed for trading, as of the time that the Fund's NAV is calculated. Each Fund's Market Price may be at, above or below its NAV. The NAV of each Fund will fluctuate with changes in the market value of its portfolio holdings. The Market Price of each Fund will fluctuate in accordance with changes in its NAV, as well as market supply and demand.
Premiums or discounts are the differences (expressed as a percentage) between the NAV and Market Price of a Fund on a given day, generally at the time NAV is calculated. A premium is the amount that a Fund is trading above the reported NAV, expressed as a percentage of the NAV. A discount is the amount that a Fund is trading below the reported NAV, expressed as a percentage of the NAV. The following information shows the frequency distributions of premiums and discounts for each of the Funds.
The information shown for each Fund is for the period from inception date of such Fund through March 31, 2017.
Each line in the table shows the number of trading days in which the Fund traded within the premium/discount range indicated. All data presented here represents past performance, which cannot be used to predict future results.
| | | | | Market Price Above
or Equal to NAV | | Market Price Below NAV | |
| | | Basis Point Differential | | Number of
Days | | Number of
Days | |
Columbia Beyond BRICs ETF | | | | | | | |
August 15, 2012 – March 31, 2017 | | | | | | | |
| | | | 0 - 49.9 | | | | 279 | | | | 201 | | |
| | | | 50 - 99.9 | | | | 324 | | | | 161 | | |
| | | | 100 - 199.9 | | | | 116 | | | | 73 | | |
| | | | > 200 | | | | 5 | | | | 5 | | |
| | | Total | | | 724 | | | | 440 | | |
| | | | | Market Price Above
or Equal to NAV | | Market Price Below NAV | |
| | | Basis Point Differential | | Number of
Days | | Number of
Days | |
Columbia EM Core ex-China ETF | | | | | | | |
September 2, 2015 – March 31, 2017 | | | | | | | |
| | | | 0 - 49.9 | | | | 115 | | | | 47 | | |
| | | | 50 - 99.9 | | | | 139 | | | | 19 | | |
| | | | 100 - 199.9 | | | | 67 | | | | 5 | | |
| | | | > 200 | | | | 6 | | | | 0 | | |
| | | Total | | | 327 | | | | 71 | | |
Annual Report 2017
43
FREQUENCY DISTRIBUTION OF PREMIUMS AND DISCOUNTS (continued)
(Unaudited)
| | | | | Market Price Above
or Equal to NAV | | Market Price Below NAV | |
| | | Basis Point Differential | | Number of
Days | | Number of
Days | |
Columbia EM Quality Dividend ETF | | | | | | | |
August 4, 2011 – March 31, 2017 | | | | | | | |
| | | | 0 - 49.9 | | | | 379 | | | | 418 | | |
| | | | 50 - 99.9 | | | | 179 | | | | 266 | | |
| | | | 100 - 199.9 | | | | 48 | | | | 112 | | |
| | | | > 200 | | | | 8 | | | | 14 | | |
| | | Total | | | 614 | | | | 810 | | |
| | | | | Market Price Above
or Equal to NAV | | Market Price Below NAV | |
| | | Basis Point Differential | | Number of
Days | | Number of
Days | |
Columbia EM Strategic Opportunities ETF | | | | | | | |
August 15, 2012 – March 31, 2017 | | | | | | | |
| | | | 0 - 49.9 | | | | 327 | | | | 243 | | |
| | | | 50 - 99.9 | | | | 336 | | | | 119 | | |
| | | | 100 - 199.9 | | | | 96 | | | | 37 | | |
| | | | > 200 | | | | 4 | | | | 2 | | |
| | | Total | | | 763 | | | | 401 | | |
| | | | | Market Price Above
or Equal to NAV | | Market Price Below NAV | |
| | | Basis Point Differential | | Number of
Days | | Number of
Days | |
Columbia Emerging Markets Consumer ETF | | | | | | | |
September 14, 2010 – March 31, 2017 | | | | | | | |
| | | | 0 - 49.9 | | | | 728 | | | | 365 | | |
| | | | 50 - 99.9 | | | | 328 | | | | 128 | | |
| | | | 100 - 199.9 | | | | 48 | | | | 43 | | |
| | | | > 200 | | | | 6 | | | | 3 | | |
| | | Total | | | 1110 | | | | 539 | | |
| | | | | Market Price Above
or Equal to NAV | | Market Price Below NAV | |
| | | Basis Point Differential | | Number of
Days | | Number of
Days | |
Columbia Emerging Markets Core ETF | | | | | | | |
October 16, 2012 – March 31, 2017 | | | | | | | |
| | | | 0 - 49.9 | | | | 349 | | | | 235 | | |
| | | | 50 - 99.9 | | | | 243 | | | | 122 | | |
| | | | 100 - 199.9 | | | | 64 | | | | 95 | | |
| | | | > 200 | | | | 4 | | | | 9 | | |
| | | Total | | | 660 | | | | 461 | | |
Annual Report 2017
44
FREQUENCY DISTRIBUTION OF PREMIUMS AND DISCOUNTS (continued)
(Unaudited)
| | | | | Market Price Above
or Equal to NAV | | Market Price Below NAV | |
| | | Basis Point Differential | | Number of
Days | | Number of
Days | |
Columbia India Consumer ETF | | | | | | | |
August 10, 2011 – March 31, 2017 | | | | | | | |
| | | | 0 - 49.9 | | | | 334 | | | | 289 | | |
| | | | 50 - 99.9 | | | | 274 | | | | 143 | | |
| | | | 100 - 199.9 | | | | 227 | | | | 82 | | |
| | | | > 200 | | | | 59 | | | | 12 | | |
| | | Total | | | 894 | | | | 526 | | |
| | | | | Market Price Above
or Equal to NAV | | Market Price Below NAV | |
| | | Basis Point Differential | | Number of
Days | | Number of
Days | |
Columbia India Infrastructure ETF | | | | | | | |
August 11, 2010 – March 31, 2017 | | | | | | | |
| | | | 0 - 49.9 | | | | 399 | | | | 296 | | |
| | | | 50 - 99.9 | | | | 292 | | | | 242 | | |
| | | | 100 - 199.9 | | | | 222 | | | | 145 | | |
| | | | > 200 | | | | 39 | | | | 37 | | |
| | | Total | | | 952 | | | | 720 | | |
| | | | | Market Price Above
or Equal to NAV | | Market Price Below NAV | |
| | | Basis Point Differential | | Number of
Days | | Number of
Days | |
Columbia India Small Cap ETF | | | | | | | |
July 7, 2010 – March 31, 2017 | | | | | | | |
| | | | 0 - 49.9 | | | | 363 | | | | 324 | | |
| | | | 50 - 99.9 | | | | 228 | | | | 259 | | |
| | | | 100 - 199.9 | | | | 194 | | | | 242 | | |
| | | | > 200 | | | | 35 | | | | 52 | | |
| | | Total | | | 820 | | | | 877 | | |
Annual Report 2017
45
PORTFOLIO OF INVESTMENTS
Columbia Beyond BRICs ETF
March 31, 2017
(Percentages represent value of investments compared to net assets)
Common Stocks — 98.6%
Issuer | | Shares | | Value ($) | |
BANGLADESH — 2.5% | |
Bangladesh Steel Re-Rolling Mills, Ltd. | | | 229,598 | | | | 413,314 | | |
Square Pharmaceuticals, Ltd. | | | 402,932 | | | | 1,395,933 | | |
Total Bangladesh | | | | | 1,809,247 | | |
CHILE — 1.1% | |
Cencosud SA | | | 114,158 | | | | 349,627 | | |
S.A.C.I. Falabella | | | 49,124 | | | | 411,767 | | |
Total Chile | | | | | 761,394 | | |
COLOMBIA — 0.3% | |
Ecopetrol SA(a) | | | 497,801 | | | | 232,226 | | |
CZECH REPUBLIC — 0.4% | |
CEZ AS | | | 16,139 | | | | 278,498 | | |
INDONESIA — 9.8% | |
PT Astra International Tbk | | | 2,039,993 | | | | 1,320,396 | | |
PT Bank Central Asia Tbk | | | 1,244,501 | | | | 1,545,645 | | |
PT Bank Mandiri Persero Tbk | | | 941,657 | | | | 826,790 | | |
PT Bank Rakyat Indonesia Persero Tbk | | | 1,091,542 | | | | 1,062,831 | | |
PT Gudang Garam Tbk | | | 46,547 | | | | 228,884 | | |
PT Telekomunikasi Indonesia
Persero Tbk | | | 5,117,105 | | | | 1,585,955 | | |
PT Unilever Indonesia Tbk | | | 115,424 | | | | 375,276 | | |
Total Indonesia | | | | | 6,945,777 | | |
KENYA — 3.4% | |
Equity Group Holdings, Ltd.(a) | | | 2,730,929 | | | | 875,383 | | |
Safaricom, Ltd. | | | 8,789,544 | | | | 1,536,783 | | |
Total Kenya | | | | | 2,412,166 | | |
MALAYSIA — 10.7% | |
Axiata Group Bhd | | | 459,300 | | | | 525,151 | | |
CIMB Group Holdings Bhd | | | 572,600 | | | | 720,683 | | |
DiGi.Com Bhd | | | 376,500 | | | | 436,435 | | |
IHH Healthcare Bhd | | | 281,800 | | | | 382,058 | | |
Malayan Banking Bhd | | | 569,200 | | | | 1,147,275 | | |
MISC Bhd | | | 148,600 | | | | 245,792 | | |
Petronas Chemicals Group Bhd | | | 290,600 | | | | 505,620 | | |
Petronas Gas Bhd | | | 79,900 | | | | 356,756 | | |
Public Bank Bhd | | | 315,520 | | | | 1,418,788 | | |
Sime Darby Bhd | | | 356,800 | | | | 748,188 | | |
Common Stocks (continued)
Issuer | | Shares | | Value ($) | |
Tenaga Nasional Bhd | | | 361,500 | | | | 1,120,728 | | |
Total Malaysia | | | | | 7,607,474 | | |
MEXICO — 15.5% | |
Alfa SAB de CV Class A | | | 259,256 | | | | 377,167 | | |
America Movil SAB de CV Series L | | | 2,720,150 | | | | 1,917,984 | | |
Arca Continental SAB de CV | | | 26,122 | | | | 180,442 | | |
Cemex SAB de CV Series CPO(a) | | | 1,178,433 | | | | 1,060,544 | | |
Fomento Economico Mexicano SAB de
CV Series UBD | | | 199,353 | | | | 1,757,476 | | |
Grupo Bimbo SAB de CV Series A | | | 172,456 | | | | 426,604 | | |
Grupo Financiero Banorte SAB de
CV Class O | | | 209,802 | | | | 1,199,273 | | |
Grupo Financiero Inbursa SAB de
CV Class O | | | 189,446 | | | | 312,120 | | |
Grupo Mexico SAB de CV Series B | | | 359,953 | | | | 1,075,607 | | |
Grupo Televisa SAB Series CPO | | | 229,427 | | | | 1,181,112 | | |
Industrias Penoles SAB de CV | | | 11,659 | | | | 299,000 | | |
Wal-Mart de Mexico SAB de CV | | | 518,417 | | | | 1,187,995 | | |
Total Mexico | | | | | 10,975,324 | | |
MOROCCO — 3.7% | |
Attijariwafa Bank | | | 32,347 | | | | 1,289,361 | | |
Maroc Telecom | | | 96,915 | | | | 1,325,995 | | |
Total Morocco | | | | | 2,615,356 | | |
NIGERIA — 5.4% | |
Guaranty Trust Bank PLC | | | 16,943,125 | | | | 1,378,480 | | |
Nigerian Breweries PLC | | | 2,816,349 | | | | 1,168,686 | | |
Zenith Bank PLC | | | 27,477,717 | | | | 1,261,434 | | |
Total Nigeria | | | | | 3,808,600 | | |
OMAN — 1.7% | |
Bank Muscat SAOG | | | 1,184,128 | | | | 1,181,052 | | |
PHILIPPINES — 4.4% | |
Ayala Corp. | | | 24,370 | | | | 410,416 | | |
Ayala Land, Inc. | | | 236,900 | | | | 156,045 | | |
BDO Unibank, Inc. | | | 175,986 | | | | 412,475 | | |
JG Summit Holdings, Inc. | | | 310,750 | | | | 503,827 | | |
PLDT, Inc. | | | 4,545 | | | | 149,100 | | |
SM Investments Corp. | | | 48,184 | | | | 669,342 | | |
SM Prime Holdings, Inc. | | | 932,400 | | | | 525,898 | | |
The accompanying Notes to Financial Statements are an integral part of these financial statements.
Annual Report 2017
46
PORTFOLIO OF INVESTMENTS (continued)
Columbia Beyond BRICs ETF
March 31, 2017
Common Stocks (continued)
Issuer | | Shares | | Value ($) | |
Universal Robina Corp. | | | 88,950 | | | | 289,852 | | |
Total Philippines | | | | | 3,116,955 | | |
POLAND — 3.2% | |
Bank Pekao SA | | | 15,770 | | | | 525,806 | | |
Polski Koncern Naftowy Orlen SA | | | 32,364 | | | | 816,871 | | |
Polskie Gornictwo Naftowe i
Gazownictwo SA | | | 175,771 | | | | 262,639 | | |
Powszechna Kasa Oszczednosci Bank
Polski SA(a) | | | 87,019 | | | | 704,156 | | |
Total Poland | | | | | 2,309,472 | | |
QATAR — 1.3% | |
Qatar National Bank QPSC | | | 23,444 | | | | 940,696 | | |
ROMANIA — 1.9% | |
Banca Transilvania SA | | | 2,136,283 | | | | 1,334,973 | | |
SOUTH AFRICA — 14.4% | |
Aspen Pharmacare Holdings, Ltd. | | | 28,126 | | | | 576,249 | | |
Barclays Africa Group, Ltd. | | | 33,184 | | | | 345,260 | | |
FirstRand, Ltd. | | | 238,813 | | | | 825,682 | | |
MTN Group, Ltd. | | | 141,024 | | | | 1,283,112 | | |
Naspers, Ltd. N Shares | | | 13,562 | | | | 2,341,458 | | |
Nedbank Group, Ltd. | | | 16,807 | | | | 302,705 | | |
Remgro, Ltd. | | | 41,430 | | | | 636,771 | | |
Sanlam, Ltd. | | | 137,380 | | | | 690,243 | | |
Sasol, Ltd. | | | 43,548 | | | | 1,268,531 | | |
Shoprite Holdings, Ltd. | | | 33,948 | | | | 490,152 | | |
Standard Bank Group, Ltd. | | | 94,856 | | | | 1,016,914 | | |
Vodacom Group, Ltd. | | | 39,605 | | | | 448,958 | | |
Total South Africa | | | | | 10,226,035 | | |
THAILAND — 8.1% | |
Advanced Info Service PCL NVDR | | | 121,500 | | | | 629,378 | | |
Airports of Thailand PCL NVDR | | | 437,800 | | | | 500,070 | | |
Common Stocks (continued)
Issuer | | Shares | | Value ($) | |
Bangkok Dusit Medical Services
PCL NVDR | | | 882,600 | | | | 544,522 | | |
| CP ALL PCL NVDR | | | 529,100 | | | | 908,458 | | |
PTT Exploration & Production PCL NVDR | | | 141,400 | | | | 382,690 | | |
PTT PCL NVDR | | | 147,500 | | | | 1,661,186 | | |
Siam Commercial Bank PCL NVDR | | | 243,700 | | | | 1,156,002 | | |
Total Thailand | | | | | 5,782,306 | | |
TURKEY — 2.6% | |
Akbank TAS | | | 205,814 | | | | 482,087 | | |
KOC Holding AS | | | 63,963 | | | | 269,612 | | |
Turk Telekomunikasyon AS | | | 52,968 | | | | 85,816 | | |
Turkcell Iletisim Hizmetleri AS(a) | | | 79,907 | | | | 262,652 | | |
Turkiye Garanti Bankasi AS | | | 211,875 | | | | 515,484 | | |
Turkiye Is Bankasi Class C(a) | | | 136,178 | | | | 247,926 | | |
Total Turkey | | | | | 1,863,577 | | |
UNITED ARAB EMIRATES — 2.2% | |
Emaar Properties PJSC | | | 356,197 | | | | 707,933 | | |
Emirates Telecommunications
Group Co. PJSC | | | 176,597 | | | | 867,840 | | |
Total United Arab Emirates | | | | | 1,575,773 | | |
VIETNAM — 6.0% | |
Hoa Phat Group JSC | | | 733,372 | | | | 984,597 | | |
Saigon Securities, Inc. | | | 421,540 | | | | 441,825 | | |
Vietnam Dairy Products JSC | | | 239,500 | | | | 1,508,255 | | |
Vingroup JSC(a) | | | 707,132 | | | | 1,298,973 | | |
Total Vietnam | | | | | 4,233,650 | | |
Total Investments
(Cost: $78,735,925) | | | | | 70,010,551 | | |
Other Assets & Liabilities, Net | | | | | 1,007,423 | | |
Net Assets | | | | | 71,017,974 | | |
Notes to Portfolio of Investments
(a) Non-income producing security.
Abbreviation Legend
NVDR Non-Voting Depositary Receipts
PJSC Private Joint Stock Company
The accompanying Notes to Financial Statements are an integral part of these financial statements.
Annual Report 2017
47
PORTFOLIO OF INVESTMENTS (continued)
Columbia Beyond BRICs ETF
March 31, 2017
The Fund categorizes its fair value measurements according to a three-level hierarchy that maximizes the use of observable inputs and minimizes the use of unobservable inputs by prioritizing that the most observable input be used when available. Observable inputs are those that market participants would use in pricing an investment based on market data obtained from sources independent of the reporting entity. Unobservable inputs are those that reflect the Fund's assumptions about the information market participants would use in pricing an investment. An investment's level within the fair value hierarchy is based on the lowest level of any input that is deemed significant to the asset's or liability's fair value measurement. The input levels are not necessarily an indication of the risk or liquidity associated with investments at that level. For example, certain U.S. government securities are generally high quality and liquid, however, they are reflected as Level 2 because the inputs used to determine fair value may not always be quoted prices in an active market.
Fair value inputs are summarized in the three broad levels listed below:
> Level 1 — Valuations based on quoted prices for investments in active markets that the Fund has the ability to access at the measurement date (including NAV for open-end mutual funds). Valuation adjustments are not applied to Level 1 investments.
> Level 2 — Valuations based on other significant observable inputs (including quoted prices for similar securities, interest rates, prepayment speeds, credit risks, etc.).
> Level 3 — Valuations based on significant unobservable inputs (including the Fund's own assumptions and judgment in determining the fair value of investments).
Inputs that are used in determining fair value of an investment may include price information, credit data, volatility statistics, and other factors. These inputs can be either observable or unobservable. The availability of observable inputs can vary between investments, and is affected by various factors such as the type of investment, and the volume and level of activity for that investment or similar investments in the marketplace. The inputs will be considered by the Investment Manager, along with any other relevant factors in the calculation of an investment's fair value. The Fund uses prices and inputs that are current as of the measurement date, which may include periods of market dislocations. During these periods, the availability of prices and inputs may be reduced for many investments. This condition could cause an investment to be reclassified between the various levels within the hierarchy.
Investments falling into the Level 3 category are primarily supported by quoted prices from brokers and dealers participating in the market for those investments. However, these may be classified as Level 3 investments due to lack of market transparency and corroboration to support these quoted prices. Additionally, valuation models may be used as the pricing source for any remaining investments classified as Level 3. These models may rely on one or more significant unobservable inputs and/or significant assumptions by the Investment Manager. Inputs used in valuations may include, but are not limited to, financial statement analysis, capital account balances, discount rates and estimated cash flows, and comparable company data.
Under the direction of the Fund's Board of Trustees (the Board), the Investment Manager's Valuation Committee (the Committee) is responsible for overseeing the valuation procedures approved by the Board. The Committee consists of voting and non-voting members from various groups within the Investment Manager's organization, including operations and accounting, trading and investments, compliance, risk management and legal.
The Committee meets at least monthly to review and approve valuation matters, which may include a description of specific valuation determinations, data regarding pricing information received from approved pricing vendors and brokers and the results of Board-approved valuation control policies and procedures (the Policies). The Policies address, among other things, instances when market quotations are or are not readily available, including recommendation of third party pricing vendors and a determination of appropriate pricing methodologies; events that require specific valuation determinations and assessment of fair value techniques; securities with a potential for stale pricing, including those that are illiquid, restricted, or in default; and the effectiveness of third-party pricing vendors, including periodic reviews of vendors. The Committee meets more frequently, as needed, to discuss additional valuation matters, which may include the need to review back-testing results, review time-sensitive information or approve related valuation actions. The Committee reports to the Board, with members of the Committee meeting with the Board at each of its regularly scheduled meetings to discuss valuation matters and actions during the period, similar to those described earlier.
For investments categorized as Level 3, the Committee monitors information similar to that described above, which may include: (i) data specific to the issuer or comparable issuers, (ii) general market or specific sector news and (iii) quoted prices and specific or similar security transactions. The Committee considers this data and any changes from prior periods in order to assess the reasonableness of observable and unobservable inputs, any assumptions or internal models used to value those securities and changes in fair value. This data is also used to corroborate, when available, information received from approved pricing vendors and brokers. Various factors impact the frequency of monitoring this information (which may occur as often as daily). However, the Committee may determine that changes to inputs, assumptions and models are not required as a result of the monitoring procedures performed.
The accompanying Notes to Financial Statements are an integral part of these financial statements.
Annual Report 2017
48
PORTFOLIO OF INVESTMENTS (continued)
Columbia Beyond BRICs ETF
March 31, 2017
Fair Value Measurements (continued)
The following table is a summary of the inputs used to value the Fund's investments as of March 31, 2017:
Valuation Inputs | | Level 1
Quoted Prices in Active
Markets for Identical
Assets ($) | | Level 2
Other Significant
Observable Inputs ($) | | Level 3
Significant
Unobservable Inputs ($) | | Total ($) | |
Common Stocks | |
Bangladesh | | | 1,809,247 | | | | — | | | | — | | | | 1,809,247 | | |
Chile | | | 761,394 | | | | — | | | | — | | | | 761,394 | | |
Colombia | | | 232,226 | | | | — | | | | — | | | | 232,226 | | |
Czech Republic | | | 278,498 | | | | — | | | | — | | | | 278,498 | | |
Indonesia | | | 6,945,777 | | | | — | | | | — | | | | 6,945,777 | | |
Kenya | | | 2,412,166 | | | | — | | | | — | | | | 2,412,166 | | |
Malaysia | | | 7,607,474 | | | | — | | | | — | | | | 7,607,474 | | |
Mexico | | | 10,975,324 | | | | — | | | | — | | | | 10,975,324 | | |
Morocco | | | 2,615,356 | | | | — | | | | — | | | | 2,615,356 | | |
Nigeria | | | 3,808,600 | | | | — | | | | — | | | | 3,808,600 | | |
Oman | | | 1,181,052 | | | | — | | | | — | | | | 1,181,052 | | |
Philippines | | | 3,116,955 | | | | — | | | | — | | | | 3,116,955 | | |
Poland | | | 2,309,472 | | | | — | | | | — | | | | 2,309,472 | | |
Qatar | | | 940,696 | | | | — | | | | — | | | | 940,696 | | |
Romania | | | 1,334,973 | | | | — | | | | — | | | | 1,334,973 | | |
South Africa | | | 10,226,035 | | | | — | | | | — | | | | 10,226,035 | | |
Thailand | | | 5,782,306 | | | | — | | | | — | | | | 5,782,306 | | |
Turkey | | | 1,863,577 | | | | — | | | | — | | | | 1,863,577 | | |
United Arab Emirates | | | 1,575,773 | | | | — | | | | — | | | | 1,575,773 | | |
Vietnam | | | 4,233,650 | | | | — | | | | — | | | | 4,233,650 | | |
Total Common Stocks | | | 70,010,551 | | | | — | | | | — | | | | 70,010,551 | | |
Total Investments | | | 70,010,551 | | | | — | | | | — | | | | 70,010,551 | | |
See the Portfolio of Investments for all investment classifications not indicated in the table.
There were no transfers of financial assets between levels during the period.
The accompanying Notes to Financial Statements are an integral part of these financial statements.
Annual Report 2017
49
PORTFOLIO OF INVESTMENTS
Columbia EM Core ex-China ETF
March 31, 2017
(Percentages represent value of investments compared to net assets)
Common Stocks — 88.4%
Issuer | | Shares | | Value ($) | |
BRAZIL — 4.2% | |
Ambev SA | | | 22,658 | | | | 130,170 | | |
Banco do Brasil SA | | | 5,075 | | | | 53,980 | | |
BM&FBovespa SA — Bolsa de Valores
Mercadorias e Futuros | | | 11,244 | | | | 68,316 | | |
| BRF SA | | | 5,266 | | | | 64,039 | | |
Cielo SA | | | 4,967 | | | | 44,289 | | |
Itausa — Investimentos Itau SA(a) | | | 713 | | | | 2,133 | | |
Kroton Educacional SA | | | 12,411 | | | | 51,912 | | |
Ultrapar Participacoes SA | | | 2,334 | | | | 52,650 | | |
Total Brazil | | | | | 467,489 | | |
CHILE — 1.2% | |
Cencosud SA | | | 13,758 | | | | 42,136 | | |
Cia Cervecerias Unidas SA | | | 3,392 | | | | 42,616 | | |
Empresas COPEC SA | | | 4,388 | | | | 47,533 | | |
Total Chile | | | | | 132,285 | | |
INDIA — 11.8% | |
HDFC Bank, Ltd. ADR | | | 5,624 | | | | 423,037 | | |
ICICI Bank, Ltd. ADR | | | 37,953 | | | | 326,396 | | |
Infosys, Ltd. ADR | | | 18,203 | | | | 287,607 | | |
Tata Motors, Ltd. ADR | | | 8,115 | | | | 289,300 | | |
Total India | | | | | 1,326,340 | | |
INDONESIA — 3.6% | |
PT Astra International Tbk | | | 131,076 | | | | 84,840 | | |
PT Bank Central Asia Tbk | | | 114,144 | | | | 141,765 | | |
PT Bank Mandiri Persero Tbk | | | 97,928 | | | | 85,982 | | |
PT Telekomunikasi Indonesia
Persero Tbk | | | 284,518 | | | | 88,181 | | |
Total Indonesia | | | | | 400,768 | | |
MALAYSIA — 2.5% | |
IHH Healthcare Bhd | | | 90,500 | | | | 122,698 | | |
Sime Darby Bhd | | | 25,700 | | | | 53,891 | | |
Tenaga Nasional Bhd | | | 32,100 | | | | 99,517 | | |
Total Malaysia | | | | | 276,106 | | |
MEXICO — 6.8% | |
Alfa SAB de CV Class A | | | 42,357 | | | | 61,621 | | |
Cemex SAB de CV Series CPO(a) | | | 107,996 | | | | 97,192 | | |
Coca-Cola Femsa SAB de CV Series L | | | 15,613 | | | | 111,480 | | |
Common Stocks (continued)
Issuer | | Shares | | Value ($) | |
Fibra Uno Administracion SA de CV | | | 22,417 | | | | 38,183 | | |
Fomento Economico Mexicano SAB de
CV Series UBD | | | 5,296 | | | | 46,689 | | |
Grupo Bimbo SAB de CV Series A | | | 33,673 | | | | 83,297 | | |
Grupo Mexico SAB de CV Series B | | | 38,911 | | | | 116,274 | | |
Grupo Televisa SAB Series CPO | | | 20,615 | | | | 106,128 | | |
Wal-Mart de Mexico SAB de CV | | | 47,302 | | | | 108,396 | | |
Total Mexico | | | | | 769,260 | | |
PERU — 0.7% | |
Credicorp, Ltd. | | | 252 | | | | 41,151 | | |
Southern Copper Corp. | | | 1,093 | | | | 39,228 | | |
Total Peru | | | | | 80,379 | | |
PHILIPPINES — 1.4% | |
JG Summit Holdings, Inc. | | | 39,150 | | | | 63,475 | | |
PLDT, Inc. | | | 1,620 | | | | 53,144 | | |
SM Investments Corp. | | | 3,380 | | | | 46,953 | | |
Total Philippines | | | | | 163,572 | | |
POLAND — 2.1% | |
Powszechna Kasa Oszczednosci
Bank Polski SA(a) | | | 15,573 | | | | 126,016 | | |
Powszechny Zaklad Ubezpieczen SA | | | 12,258 | | | | 107,669 | | |
Total Poland | | | | | 233,685 | | |
RUSSIA — 4.0% | |
Gazprom PJSC ADR | | | 21,697 | | | | 96,985 | | |
LUKOIL PJSC ADR | | | 3,730 | | | | 197,541 | | |
Sberbank of Russia PJSC ADR | | | 13,165 | | | | 151,924 | | |
Total Russia | | | | | 446,450 | | |
SOUTH AFRICA — 9.4% | |
Aspen Pharmacare Holdings, Ltd. | | | 2,982 | | | | 61,096 | | |
Bid Corp., Ltd. | | | 7,193 | | | | 139,314 | | |
Bidvest Group, Ltd. (The) | | | 7,392 | | | | 84,826 | | |
FirstRand, Ltd. | | | 11,625 | | | | 40,193 | | |
MTN Group, Ltd. | | | 8,831 | | | | 80,349 | | |
Naspers, Ltd. N Shares | | | 1,214 | | | | 209,595 | | |
Redefine Properties, Ltd. | | | 45,487 | | | | 37,350 | | |
Remgro, Ltd. | | | 2,971 | | | | 45,664 | | |
Sanlam, Ltd. | | | 14,118 | | | | 70,933 | | |
Sasol, Ltd. | | | 3,576 | | | | 104,167 | | |
The accompanying Notes to Financial Statements are an integral part of these financial statements.
Annual Report 2017
50
PORTFOLIO OF INVESTMENTS (continued)
Columbia EM Core ex-China ETF
March 31, 2017
Common Stocks (continued)
Issuer | | Shares | | Value ($) | |
Standard Bank Group, Ltd. | | | 6,084 | | | | 65,224 | | |
Steinhoff International Holdings NV | | | 24,098 | | | | 115,325 | | |
Total South Africa | | | | | 1,054,036 | | |
SOUTH KOREA — 20.1% | |
Amorepacific Corp. | | | 134 | | | | 33,611 | | |
Celltrion, Inc.(a) | | | 940 | | | | 75,735 | | |
Hana Financial Group, Inc. | | | 1,651 | | | | 54,551 | | |
Hyundai Motor Co. | | | 1,223 | | | | 172,246 | | |
KB Financial Group, Inc. | | | 4,167 | | | | 182,583 | | |
Kia Motors Corp. | | | 2,800 | | | | 92,766 | | |
Korea Electric Power Corp. | | | 2,277 | | | | 94,578 | | |
KT&G Corp. | | | 877 | | | | 76,462 | | |
LG Chem, Ltd. | | | 210 | | | | 55,209 | | |
LG Household & Health Care, Ltd. | | | 35 | | | | 25,382 | | |
NAVER Corp. | | | 127 | | | | 97,098 | | |
POSCO | | | 532 | | | | 138,435 | | |
Samsung C&T Corp. | | | 479 | | | | 54,612 | | |
Samsung Electronics Co., Ltd. | | | 351 | | | | 646,571 | | |
Samsung Fire & Marine Insurance Co., Ltd. | | | 143 | | | | 34,270 | | |
Shinhan Financial Group Co., Ltd. | | | 3,991 | | | | 166,306 | | |
SK Hynix, Inc. | | | 3,351 | | | | 151,324 | | |
SK Telecom Co., Ltd. | | | 449 | | | | 101,179 | | |
Total South Korea | | | | | 2,252,918 | | |
TAIWAN — 14.6% | |
Advanced Semiconductor Engineering, Inc. | | | 43,616 | | | | 55,701 | | |
Cathay Financial Holding Co., Ltd. | | | 53,376 | | | | 85,669 | | |
China Steel Corp. | | | 119,717 | | | | 99,822 | | |
Chunghwa Telecom Co., Ltd. | | | 33,097 | | | | 112,350 | | |
CTBC Financial Holding Co., Ltd. | | | 98,687 | | | | 60,983 | | |
Far Eastern New Century Corp. | | | 98,396 | | | | 85,287 | | |
Formosa Chemicals & Fibre Corp. | | | 17,005 | | | | 52,905 | | |
Formosa Plastics Corp. | | | 36,822 | | | | 109,826 | | |
Hon Hai Precision Industry Co., Ltd. | | | 62,262 | | | | 186,730 | | |
MediaTek, Inc. | | | 8,805 | | | | 62,390 | | |
Nan Ya Plastics Corp. | | | 52,044 | | | | 123,324 | | |
President Chain Store Corp. | | | 14,007 | | | | 115,407 | | |
Taiwan Semiconductor Manufacturing
Co., Ltd. | | | 77,416 | | | | 482,216 | | |
Total Taiwan | | | | | 1,632,610 | | |
Common Stocks (continued)
Issuer | | Shares | | Value ($) | |
THAILAND — 4.0% | |
Airports of Thailand PCL NVDR | | | 65,000 | | | | 74,245 | | |
BTS Group Holdings PCL NVDR | | | 274,100 | | | | 67,403 | | |
| CP ALL PCL NVDR | | | 27,700 | | | | 47,561 | | |
PTT PCL | | | 7,600 | | | | 85,594 | | |
Siam Cement PCL (The) | | | 4,600 | | | | 72,288 | | |
Siam Commercial Bank PCL (The) | | | 22,100 | | | | 104,832 | | |
Total Thailand | | | | | 451,923 | | |
TURKEY — 2.0% | |
Haci Omer Sabanci Holding AS | | | 22,064 | | | | 60,588 | | |
Turkiye Garanti Bankasi AS | | | 35,630 | | | | 86,686 | | |
Turkiye Is Bankasi Class C(a) | | | 43,485 | | | | 79,169 | | |
Total Turkey | | | | | 226,443 | | |
Total Common Stocks
(Cost: $8,778,611) | | | | | 9,914,264 | | |
Preferred Stocks — 9.8%
BRAZIL — 9.8% | |
Banco Bradesco SA Preference Shares | | | 8,169 | | | | 83,312 | | |
Cia Brasileira de Distribuicao
Preference Shares | | | 1,889 | | | | 35,758 | | |
Itau Unibanco Holding SA
Preference Shares | | | 23,026 | | | | 274,866 | | |
Itausa — Investimentos Itau SA
Preference Shares | | | 43,535 | | | | 130,264 | | |
Petroleo Brasileiro SA Preference Shares(a) | | | 55,581 | | | | 253,664 | | |
Telefonica Brasil SA Preference Shares | | | 5,037 | | | | 74,168 | | |
Vale SA Preference Shares | | | 27,485 | | | | 244,209 | | |
Total Brazil | | | | | 1,096,241 | | |
Total Preferred Stocks
(Cost: $681,212) | | | | | 1,096,241 | | |
Total Investments
(Cost: $9,459,823) | | | | | 11,010,505 | | |
Other Assets & Liabilities, Net | | | | | 198,464 | | |
Net Assets | | | | | 11,208,969 | | |
The accompanying Notes to Financial Statements are an integral part of these financial statements.
Annual Report 2017
51
PORTFOLIO OF INVESTMENTS (continued)
Columbia EM Core ex-China ETF
March 31, 2017
Notes to Portfolio of Investments
(a) Non-income producing security.
Abbreviation Legend
ADR American Depositary Receipts
NVDR Non-Voting Depositary Receipts
PJSC Private Joint Stock Company
Fair Value Measurements
The Fund categorizes its fair value measurements according to a three-level hierarchy that maximizes the use of observable inputs and minimizes the use of unobservable inputs by prioritizing that the most observable input be used when available. Observable inputs are those that market participants would use in pricing an investment based on market data obtained from sources independent of the reporting entity. Unobservable inputs are those that reflect the Fund's assumptions about the information market participants would use in pricing an investment. An investment's level within the fair value hierarchy is based on the lowest level of any input that is deemed significant to the asset's or liability's fair value measurement. The input levels are not necessarily an indication of the risk or liquidity associated with investments at that level. For example, certain U.S. government securities are generally high quality and liquid, however, they are reflected as Level 2 because the inputs used to determine fair value may not always be quoted prices in an active market.
Fair value inputs are summarized in the three broad levels listed below:
> Level 1 — Valuations based on quoted prices for investments in active markets that the Fund has the ability to access at the measurement date (including NAV for open-end mutual funds). Valuation adjustments are not applied to Level 1 investments.
> Level 2 — Valuations based on other significant observable inputs (including quoted prices for similar securities, interest rates, prepayment speeds, credit risks, etc.).
> Level 3 — Valuations based on significant unobservable inputs (including the Fund's own assumptions and judgment in determining the fair value of investments).
Inputs that are used in determining fair value of an investment may include price information, credit data, volatility statistics, and other factors. These inputs can be either observable or unobservable. The availability of observable inputs can vary between investments, and is affected by various factors such as the type of investment, and the volume and level of activity for that investment or similar investments in the marketplace. The inputs will be considered by the Investment Manager, along with any other relevant factors in the calculation of an investment's fair value. The Fund uses prices and inputs that are current as of the measurement date, which may include periods of market dislocations. During these periods, the availability of prices and inputs may be reduced for many investments. This condition could cause an investment to be reclassified between the various levels within the hierarchy.
Investments falling into the Level 3 category are primarily supported by quoted prices from brokers and dealers participating in the market for those investments. However, these may be classified as Level 3 investments due to lack of market transparency and corroboration to support these quoted prices. Additionally, valuation models may be used as the pricing source for any remaining investments classified as Level 3. These models may rely on one or more significant unobservable inputs and/or significant assumptions by the Investment Manager. Inputs used in valuations may include, but are not limited to, financial statement analysis, capital account balances, discount rates and estimated cash flows, and comparable company data.
Under the direction of the Fund's Board of Trustees (the Board), the Investment Manager's Valuation Committee (the Committee) is responsible for overseeing the valuation procedures approved by the Board. The Committee consists of voting and non-voting members from various groups within the Investment Manager's organization, including operations and accounting, trading and investments, compliance, risk management and legal.
The Committee meets at least monthly to review and approve valuation matters, which may include a description of specific valuation determinations, data regarding pricing information received from approved pricing vendors and brokers and the results of Board-approved valuation control policies and procedures (the Policies). The Policies address, among other things, instances when market quotations are or are not readily available, including recommendation of third party pricing vendors and a determination of appropriate pricing methodologies; events that require specific valuation determinations and assessment of fair value techniques; securities with a potential for stale pricing, including those that are illiquid, restricted, or in default; and the effectiveness of third-party pricing vendors, including periodic reviews of vendors. The Committee meets more frequently, as needed, to discuss additional valuation matters, which may include the need to review back-testing results, review time-sensitive information or approve related valuation actions. The Committee reports to the Board, with members of the Committee meeting with the Board at each of its regularly scheduled meetings to discuss valuation matters and actions during the period, similar to those described earlier.
For investments categorized as Level 3, the Committee monitors information similar to that described above, which may include: (i) data specific to the issuer or comparable issuers, (ii) general market or specific sector news and (iii) quoted prices and specific or similar security transactions. The Committee considers this data and any changes from prior periods in order to assess the reasonableness of observable
The accompanying Notes to Financial Statements are an integral part of these financial statements.
Annual Report 2017
52
PORTFOLIO OF INVESTMENTS (continued)
Columbia EM Core ex-China ETF
March 31, 2017
Fair Value Measurements (continued)
and unobservable inputs, any assumptions or internal models used to value those securities and changes in fair value. This data is also used to corroborate, when available, information received from approved pricing vendors and brokers. Various factors impact the frequency of monitoring this information (which may occur as often as daily). However, the Committee may determine that changes to inputs, assumptions and models are not required as a result of the monitoring procedures performed.
The following table is a summary of the inputs used to value the Fund's investments as of March 31, 2017:
Valuation Inputs | | Level 1
Quoted Prices in Active
Markets for Identical
Assets ($) | | Level 2
Other Significant
Observable Inputs ($) | | Level 3
Significant
Unobservable Inputs ($) | | Total ($) | |
Common Stocks | |
Brazil | | | 467,489 | | | | — | | | | — | | | | 467,489 | | |
Chile | | | 132,285 | | | | — | | | | — | | | | 132,285 | | |
India | | | 1,326,340 | | | | — | | | | — | | | | 1,326,340 | | |
Indonesia | | | 400,768 | | | | — | | | | — | | | | 400,768 | | |
Malaysia | | | 276,106 | | | | — | | | | — | | | | 276,106 | | |
Mexico | | | 769,260 | | | | — | | | | — | | | | 769,260 | | |
Peru | | | 80,379 | | | | — | | | | — | | | | 80,379 | | |
Philippines | | | 163,572 | | | | — | | | | — | | | | 163,572 | | |
Poland | | | 233,685 | | | | — | | | | — | | | | 233,685 | | |
Russia | | | 446,450 | | | | — | | | | — | | | | 446,450 | | |
South Africa | | | 1,054,036 | | | | — | | | | — | | | | 1,054,036 | | |
South Korea | | | 2,252,918 | | | | — | | | | — | | | | 2,252,918 | | |
Taiwan | | | 1,632,610 | | | | — | | | | — | | | | 1,632,610 | | |
Thailand | | | 451,923 | | | | — | | | | — | | | | 451,923 | | |
Turkey | | | 226,443 | | | | — | | | | — | | | | 226,443 | | |
Total Common Stocks | | | 9,914,264 | | | | — | | | | — | | | | 9,914,264 | | |
Preferred Stocks | |
Brazil | | | 1,096,241 | | | | — | | | | — | | | | 1,096,241 | | |
Total Preferred Stocks | | | 1,096,241 | | | | — | | | | — | | | | 1,096,241 | | |
Total Investments | | | 11,010,505 | | | | — | | | | — | | | | 11,010,505 | | |
See the Portfolio of Investments for all investment classifications not indicated in the table.
There were no transfers of financial assets between levels during the period.
The accompanying Notes to Financial Statements are an integral part of these financial statements.
Annual Report 2017
53
PORTFOLIO OF INVESTMENTS
Columbia EM Quality Dividend ETF
March 31, 2017
(Percentages represent value of investments compared to net assets)
Common Stocks — 95.4%
Issuer | | Shares | | Value ($) | |
BRAZIL — 14.3% | |
Ambev SA | | | 47,289 | | | | 271,674 | | |
BM&FBovespa SA — Bolsa de Valores
Mercadorias e Futuros | | | 43,219 | | | | 262,585 | | |
| BRF SA | | | 23,006 | | | | 279,772 | | |
Itausa — Investimentos Itau SA(a) | | | 1,613 | | | | 4,826 | | |
JBS SA | | | 74,755 | | | | 240,397 | | |
Kroton Educacional SA | | | 63,210 | | | | 264,391 | | |
Lojas Renner SA | | | 31,339 | | | | 274,406 | | |
WEG SA | | | 49,913 | | | | 273,543 | | |
Total Brazil | | | | | 1,871,594 | | |
CHILE — 2.0% | |
Aguas Andinas SA Class A | | | 451,565 | | | | 262,378 | | |
HONG KONG — 6.1% | |
CLP Holdings, Ltd. | | | 25,291 | | | | 264,414 | | |
Hong Kong & China Gas Co., Ltd. | | | 133,584 | | | | 267,117 | | |
Hong Kong Exchanges & Clearing, Ltd. | | | 10,382 | | | | 261,303 | | |
Total Hong Kong | | | | | 792,834 | | |
INDONESIA — 7.9% | |
PT Bank Rakyat Indonesia Persero Tbk | | | 265,994 | | | | 258,998 | | |
PT Hanjaya Mandala Sampoerna Tbk | | | 871,003 | | | | 254,918 | | |
PT Surya Citra Media Tbk | | | 1,285,885 | | | | 260,545 | | |
PT Telekomunikasi Indonesia
Persero Tbk | | | 858,563 | | | | 266,096 | | |
Total Indonesia | | | | | 1,040,557 | | |
KENYA — 1.9% | |
Safaricom, Ltd. | | | 1,460,094 | | | | 255,286 | | |
MALAYSIA — 10.3% | |
AirAsia Bhd | | | 403,500 | | | | 286,293 | | |
Axiata Group Bhd | | | 233,800 | | | | 267,321 | | |
Maxis Bhd | | | 182,400 | | | | 265,429 | | |
Petronas Chemicals Group Bhd | | | 154,700 | | | | 269,165 | | |
Public Bank Bhd | | | 58,200 | | | | 261,706 | | |
Total Malaysia | | | | | 1,349,914 | | |
PHILIPPINES — 2.0% | |
Aboitiz Power Corp. | | | 309,400 | | | | 257,448 | | |
Common Stocks (continued)
Issuer | | Shares | | Value ($) | |
SOUTH AFRICA — 8.8% | |
Netcare, Ltd. | | | 107,376 | | | | 205,002 | | |
Sasol, Ltd. | | | 9,129 | | | | 265,923 | | |
Standard Bank Group, Ltd. | | | 20,634 | | | | 221,209 | | |
Truworths International, Ltd. | | | 35,334 | | | | 228,230 | | |
Woolworths Holdings, Ltd. | | | 44,667 | | | | 232,883 | | |
Total South Africa | | | | | 1,153,247 | | |
TAIWAN — 18.0% | |
Cathay Financial Holding Co., Ltd. | | | 157,909 | | | | 253,445 | | |
Chunghwa Telecom Co., Ltd. | | | 76,696 | | | | 260,351 | | |
Formosa Plastics Corp. | | | 86,260 | | | | 257,280 | | |
Hon Hai Precision Industry Co., Ltd. | | | 87,608 | | | | 262,745 | | |
Nan Ya Plastics Corp. | | | 111,987 | | | | 265,366 | | |
Pegatron Corp. | | | 91,150 | | | | 269,762 | | |
Taiwan Mobile Co., Ltd. | | | 72,041 | | | | 264,730 | | |
Taiwan Semiconductor Manufacturing
Co., Ltd. | | | 41,147 | | | | 256,300 | | |
Uni-President Enterprises Corp. | | | 138,128 | | | | 259,026 | | |
Total Taiwan | | | | | 2,349,005 | | |
THAILAND — 18.1% | |
Advanced Info Service PCL NVDR | | | 51,400 | | | | 266,255 | | |
Airports of Thailand PCL NVDR | | | 226,900 | | | | 259,173 | | |
Berli Jucker PCL NVDR | | | 192,100 | | | | 259,953 | | |
| CP ALL PCL NVDR | | | 153,200 | | | | 263,043 | | |
Home Product Center PCL NVDR | | | 931,000 | | | | 261,452 | | |
Intouch Holdings PCL NVDR | | | 165,000 | | | | 267,697 | | |
Robinson Department Store PCL NVDR(a) | | | 140,500 | | | | 261,681 | | |
Thai Beverage PCL | | | 392,700 | | | | 264,180 | | |
Thai Union Group PCL NVDR | | | 424,200 | | | | 264,180 | | |
Total Thailand | | | | | 2,367,614 | | |
TURKEY — 4.0% | |
KOC Holding AS | | | 61,242 | | | | 258,142 | | |
Turkiye Sise ve Cam Fabrikalari AS | | | 227,911 | | | | 260,978 | | |
Total Turkey | | | | | 519,120 | | |
UNITED ARAB EMIRATES — 2.0% | |
Emaar Properties PJSC | | | 130,823 | | | | 260,007 | | |
Total Common Stocks
(Cost: $12,461,218) | | | | | 12,479,004 | | |
The accompanying Notes to Financial Statements are an integral part of these financial statements.
Annual Report 2017
54
PORTFOLIO OF INVESTMENTS (continued)
Columbia EM Quality Dividend ETF
March 31, 2017
Preferred Stocks — 4.0%
Issuer | | Shares | | Value ($) | |
BRAZIL — 4.0% | |
Banco Bradesco SA Preference Shares | | | 26,194 | | | | 267,142 | | |
Itausa — Investimentos Itau SA
Preference Shares | | | 84,826 | | | | 253,814 | | |
Total Brazil | | | | | 520,956 | | |
Total Preferred Stocks
(Cost: $334,291) | | | | | 520,956 | | |
Total Investments
(Cost: $12,795,509) | | | | | 12,999,960 | | |
Other Assets & Liabilities, Net | | | | | 80,090 | | |
Net Assets | | | | | 13,080,050 | | |
Notes to Portfolio of Investments
(a) Non-income producing security.
Abbreviation Legend
NVDR Non-Voting Depositary Receipts
PJSC Private Joint Stock Company
Fair Value Measurements
The Fund categorizes its fair value measurements according to a three-level hierarchy that maximizes the use of observable inputs and minimizes the use of unobservable inputs by prioritizing that the most observable input be used when available. Observable inputs are those that market participants would use in pricing an investment based on market data obtained from sources independent of the reporting entity. Unobservable inputs are those that reflect the Fund's assumptions about the information market participants would use in pricing an investment. An investment's level within the fair value hierarchy is based on the lowest level of any input that is deemed significant to the asset's or liability's fair value measurement. The input levels are not necessarily an indication of the risk or liquidity associated with investments at that level. For example, certain U.S. government securities are generally high quality and liquid, however, they are reflected as Level 2 because the inputs used to determine fair value may not always be quoted prices in an active market.
Fair value inputs are summarized in the three broad levels listed below:
> Level 1 — Valuations based on quoted prices for investments in active markets that the Fund has the ability to access at the measurement date (including NAV for open-end mutual funds). Valuation adjustments are not applied to Level 1 investments.
> Level 2 — Valuations based on other significant observable inputs (including quoted prices for similar securities, interest rates, prepayment speeds, credit risks, etc.).
> Level 3 — Valuations based on significant unobservable inputs (including the Fund's own assumptions and judgment in determining the fair value of investments).
Inputs that are used in determining fair value of an investment may include price information, credit data, volatility statistics, and other factors. These inputs can be either observable or unobservable. The availability of observable inputs can vary between investments, and is affected by various factors such as the type of investment, and the volume and level of activity for that investment or similar investments in the marketplace. The inputs will be considered by the Investment Manager, along with any other relevant factors in the calculation of an investment's fair value. The Fund uses prices and inputs that are current as of the measurement date, which may include periods of market dislocations. During these periods, the availability of prices and inputs may be reduced for many investments. This condition could cause an investment to be reclassified between the various levels within the hierarchy.
Investments falling into the Level 3 category are primarily supported by quoted prices from brokers and dealers participating in the market for those investments. However, these may be classified as Level 3 investments due to lack of market transparency and corroboration to support these quoted prices. Additionally, valuation models may be used as the pricing source for any remaining investments classified as Level 3. These models may rely on one or more significant unobservable inputs and/or significant assumptions by the Investment Manager. Inputs
The accompanying Notes to Financial Statements are an integral part of these financial statements.
Annual Report 2017
55
PORTFOLIO OF INVESTMENTS (continued)
Columbia EM Quality Dividend ETF
March 31, 2017
Fair Value Measurements (continued)
used in valuations may include, but are not limited to, financial statement analysis, capital account balances, discount rates and estimated cash flows, and comparable company data.
Under the direction of the Fund's Board of Trustees (the Board), the Investment Manager's Valuation Committee (the Committee) is responsible for overseeing the valuation procedures approved by the Board. The Committee consists of voting and non-voting members from various groups within the Investment Manager's organization, including operations and accounting, trading and investments, compliance, risk management and legal.
The Committee meets at least monthly to review and approve valuation matters, which may include a description of specific valuation determinations, data regarding pricing information received from approved pricing vendors and brokers and the results of Board-approved valuation control policies and procedures (the Policies). The Policies address, among other things, instances when market quotations are or are not readily available, including recommendation of third party pricing vendors and a determination of appropriate pricing methodologies; events that require specific valuation determinations and assessment of fair value techniques; securities with a potential for stale pricing, including those that are illiquid, restricted, or in default; and the effectiveness of third-party pricing vendors, including periodic reviews of vendors. The Committee meets more frequently, as needed, to discuss additional valuation matters, which may include the need to review back-testing results, review time-sensitive information or approve related valuation actions. The Committee reports to the Board, with members of the Committee meeting with the Board at each of its regularly scheduled meetings to discuss valuation matters and actions during the period, similar to those described earlier.
For investments categorized as Level 3, the Committee monitors information similar to that described above, which may include: (i) data specific to the issuer or comparable issuers, (ii) general market or specific sector news and (iii) quoted prices and specific or similar security transactions. The Committee considers this data and any changes from prior periods in order to assess the reasonableness of observable and unobservable inputs, any assumptions or internal models used to value those securities and changes in fair value. This data is also used to corroborate, when available, information received from approved pricing vendors and brokers. Various factors impact the frequency of monitoring this information (which may occur as often as daily). However, the Committee may determine that changes to inputs, assumptions and models are not required as a result of the monitoring procedures performed.
The following table is a summary of the inputs used to value the Fund's investments as of March 31, 2017:
Valuation Inputs | | Level 1
Quoted Prices in Active
Markets for Identical
Assets ($) | | Level 2
Other Significant
Observable Inputs ($) | | Level 3
Significant
Unobservable Inputs ($) | | Total ($) | |
Common Stocks | |
Brazil | | | 1,871,594 | | | | — | | | | — | | | | 1,871,594 | | |
Chile | | | 262,378 | | | | — | | | | — | | | | 262,378 | | |
Hong Kong | | | 792,834 | | | | — | | | | — | | | | 792,834 | | |
Indonesia | | | 1,040,557 | | | | — | | | | — | | | | 1,040,557 | | |
Kenya | | | 255,286 | | | | — | | | | — | | | | 255,286 | | |
Malaysia | | | 1,349,914 | | | | — | | | | — | | | | 1,349,914 | | |
Philippines | | | 257,448 | | | | — | | | | — | | | | 257,448 | | |
South Africa | | | 1,153,247 | | | | — | | | | — | | | | 1,153,247 | | |
Taiwan | | | 2,349,005 | | | | — | | | | — | | | | 2,349,005 | | |
Thailand | | | 2,367,614 | | | | — | | | | — | | | | 2,367,614 | | |
Turkey | | | 519,120 | | | | — | | | | — | | | | 519,120 | | |
United Arab Emirates | | | 260,007 | | | | — | | | | — | | | | 260,007 | | |
Total Common Stocks | | | 12,479,004 | | | | — | | | | — | | | | 12,479,004 | | |
Preferred Stocks | |
Brazil | | | 520,956 | | | | — | | | | — | | | | 520,956 | | |
Total Preferred Stocks | | | 520,956 | | | | — | | | | — | | | | 520,956 | | |
Total Investments | | | 12,999,960 | | | | — | | | | — | | | | 12,999,960 | | |
See the Portfolio of Investments for all investment classifications not indicated in the table.
There were no transfers of financial assets between levels during the period.
The accompanying Notes to Financial Statements are an integral part of these financial statements.
Annual Report 2017
56
PORTFOLIO OF INVESTMENTS (Consolidated)
Columbia EM Strategic Opportunities ETF
March 31, 2017
(Percentages represent value of investments compared to net assets)
Common Stocks — 99.5%
Issuer | | Shares | | Value ($) | |
BRAZIL — 8.2% | |
Ambev SA ADR | | | 66,337 | | | | 382,101 | | |
| BRF SA ADR | | | 10,175 | | | | 124,644 | | |
Telefonica Brasil SA ADR | | | 7,435 | | | | 110,410 | | |
Total Brazil | | | | | 617,155 | | |
CHINA — 25.2% | |
Belle International Holdings, Ltd. | | | 94,770 | | | | 61,582 | | |
BYD Co., Ltd. Class H | | | 9,573 | | | | 53,091 | | |
China Mengniu Dairy Co., Ltd. | | | 45,775 | | | | 94,831 | | |
China Mobile, Ltd. | | | 32,603 | | | | 356,802 | | |
China Telecom Corp., Ltd. Class H | | | 249,059 | | | | 121,461 | | |
China Unicom Hong Kong, Ltd. | | | 108,389 | | | | 145,048 | | |
Ctrip.com International, Ltd. ADR(a) | | | 5,509 | | | | 270,767 | | |
Guangdong Investment, Ltd. | | | 49,972 | | | | 71,246 | | |
Hengan International Group Co., Ltd. | | | 12,868 | | | | 95,705 | | |
JD.com, Inc. ADR(a) | | | 11,416 | | | | 355,152 | | |
New Oriental Education & Technology
Group, Inc. ADR(a) | | | 1,852 | | | | 111,824 | | |
Sinopharm Group Co., Ltd. Class H | | | 21,326 | | | | 98,926 | | |
Vipshop Holdings, Ltd. ADR(a) | | | 5,115 | | | | 68,234 | | |
Total China | | | | | 1,904,669 | | |
HONG KONG — 1.3% | |
WH Group, Ltd.(b) | | | 117,932 | | | | 101,672 | | |
INDIA — 15.1% | |
Bharti Airtel, Ltd. | | | 23,682 | | | | 127,665 | | |
Hindustan Unilever, Ltd. | | | 11,968 | | | | 168,042 | | |
ITC, Ltd. | | | 48,784 | | | | 210,582 | | |
Lupin, Ltd. | | | 3,972 | | | | 88,401 | | |
Mahindra & Mahindra, Ltd. | | | 4,338 | | | | 85,972 | | |
NTPC, Ltd. | | | 35,525 | | | | 90,816 | | |
Sun Pharmaceutical Industries, Ltd. | | | 19,382 | | | | 205,401 | | |
Tata Motors, Ltd. ADR | | | 2,824 | | | | 100,676 | | |
Zee Entertainment Enterprises, Ltd. | | | 7,804 | | | | 64,363 | | |
Total India | | | | | 1,141,918 | | |
INDONESIA — 6.1% | |
PT Astra International Tbk | | | 288,577 | | | | 186,783 | | |
PT Telekomunikasi Indonesia Persero
Tbk ADR | | | 8,736 | | | | 272,301 | | |
Total Indonesia | | | | | 459,084 | | |
Common Stocks (continued)
Issuer | | Shares | | Value ($) | |
MALAYSIA — 3.7% | |
Axiata Group Bhd | | | 58,000 | | | | 66,316 | | |
IHH Healthcare Bhd | | | 45,800 | | | | 62,095 | | |
Tenaga Nasional Bhd | | | 48,700 | | | | 150,980 | | |
Total Malaysia | | | | | 279,391 | | |
MEXICO — 13.0% | |
America Movil SAB de CV Class L ADR | | | 21,302 | | | | 301,849 | | |
Fomento Economico Mexicano SAB
de CV ADR | | | 3,597 | | | | 318,407 | | |
Grupo Televisa SAB ADR | | | 6,823 | | | | 176,989 | | |
Wal-Mart de Mexico SAB de CV | | | 81,927 | | | | 187,742 | | |
Total Mexico | | | | | 984,987 | | |
RUSSIA — 3.7% | |
Magnit PJSC GDR | | | 4,833 | | | | 184,621 | | |
Mobile TeleSystems PJSC ADR | | | 8,969 | | | | 98,928 | | |
Total Russia | | | | | 283,549 | | |
SOUTH AFRICA — 18.8% | |
Aspen Pharmacare Holdings, Ltd. | | | 5,817 | | | | 119,179 | | |
Mediclinic International PLC | | | 6,353 | | | | 56,467 | | |
Mr Price Group, Ltd. | | | 3,650 | | | | 43,526 | | |
MTN Group, Ltd. | | | 28,414 | | | | 258,526 | | |
Naspers, Ltd. N Shares | | | 2,189 | | | | 377,927 | | |
Shoprite Holdings, Ltd. | | | 6,336 | | | | 91,481 | | |
Steinhoff International Holdings NV | | | 46,549 | | | | 222,769 | | |
Tiger Brands, Ltd. | | | 3,056 | | | | 91,267 | | |
Vodacom Group, Ltd. | | | 9,082 | | | | 102,953 | | |
Woolworths Holdings, Ltd. | | | 11,780 | | | | 61,418 | | |
Total South Africa | | | | | 1,425,513 | | |
THAILAND — 4.4% | |
Advanced Info Service PCL | | | 19,200 | | | | 99,457 | | |
| CP ALL PCL NVDR | | | 73,600 | | | | 126,370 | | |
Thai Beverage PCL | | | 155,700 | | | | 104,744 | | |
Total Thailand | | | | | 330,571 | | |
Total Investments
(Cost: $8,163,660) | | | | | 7,528,509 | | |
Other Assets & Liabilities, Net | | | | | 34,090 | | |
Net Assets | | | | | 7,562,599 | | |
The accompanying Notes to Financial Statements are an integral part of these financial statements.
Annual Report 2017
57
PORTFOLIO OF INVESTMENTS (Consolidated) (continued)
Columbia EM Strategic Opportunities ETF
March 31, 2017
Notes to Consolidated Portfolio of Investments
(a) Non-income producing security.
(b) Represents privately placed and other securities and instruments exempt from SEC registration (collectively, private placements), such as Section 4(a)(2) and Rule 144A eligible securities, which are often sold only to qualified institutional buyers. The Fund may invest in private placements determined to be liquid as well as those determined to be illiquid. Private placements may be determined to be liquid under guidelines established by the Fund's Board of Trustees. At March 31, 2017, the value of this security amounted to $101,672 or 1.34% of net assets.
Abbreviation Legend
ADR American Depositary Receipts
GDR Global Depositary Receipts
NVDR Non-Voting Depositary Receipts
PJSC Private Joint Stock Company
Fair Value Measurements
The Fund categorizes its fair value measurements according to a three-level hierarchy that maximizes the use of observable inputs and minimizes the use of unobservable inputs by prioritizing that the most observable input be used when available. Observable inputs are those that market participants would use in pricing an investment based on market data obtained from sources independent of the reporting entity. Unobservable inputs are those that reflect the Fund's assumptions about the information market participants would use in pricing an investment. An investment's level within the fair value hierarchy is based on the lowest level of any input that is deemed significant to the asset's or liability's fair value measurement. The input levels are not necessarily an indication of the risk or liquidity associated with investments at that level. For example, certain U.S. government securities are generally high quality and liquid, however, they are reflected as Level 2 because the inputs used to determine fair value may not always be quoted prices in an active market.
Fair value inputs are summarized in the three broad levels listed below:
> Level 1 — Valuations based on quoted prices for investments in active markets that the Fund has the ability to access at the measurement date (including NAV for open-end mutual funds). Valuation adjustments are not applied to Level 1 investments.
> Level 2 — Valuations based on other significant observable inputs (including quoted prices for similar securities, interest rates, prepayment speeds, credit risks, etc.).
> Level 3 — Valuations based on significant unobservable inputs (including the Fund's own assumptions and judgment in determining the fair value of investments).
Inputs that are used in determining fair value of an investment may include price information, credit data, volatility statistics, and other factors. These inputs can be either observable or unobservable. The availability of observable inputs can vary between investments, and is affected by various factors such as the type of investment, and the volume and level of activity for that investment or similar investments in the marketplace. The inputs will be considered by the Investment Manager, along with any other relevant factors in the calculation of an investment's fair value. The Fund uses prices and inputs that are current as of the measurement date, which may include periods of market dislocations. During these periods, the availability of prices and inputs may be reduced for many investments. This condition could cause an investment to be reclassified between the various levels within the hierarchy.
Investments falling into the Level 3 category are primarily supported by quoted prices from brokers and dealers participating in the market for those investments. However, these may be classified as Level 3 investments due to lack of market transparency and corroboration to support these quoted prices. Additionally, valuation models may be used as the pricing source for any remaining investments classified as Level 3. These models may rely on one or more significant unobservable inputs and/or significant assumptions by the Investment Manager. Inputs used in valuations may include, but are not limited to, financial statement analysis, capital account balances, discount rates and estimated cash flows, and comparable company data.
Under the direction of the Fund's Board of Trustees (the Board), the Investment Manager's Valuation Committee (the Committee) is responsible for overseeing the valuation procedures approved by the Board. The Committee consists of voting and non-voting members from various groups within the Investment Manager's organization, including operations and accounting, trading and investments, compliance, risk management and legal.
The Committee meets at least monthly to review and approve valuation matters, which may include a description of specific valuation determinations, data regarding pricing information received from approved pricing vendors and brokers and the results of Board-approved valuation control policies and procedures (the Policies). The Policies address, among other things, instances when market quotations are or are not readily available, including recommendation of third party pricing vendors and a determination of appropriate pricing methodologies; events that require specific valuation determinations and assessment of fair value techniques; securities with a potential for stale pricing, including those that are illiquid, restricted, or in default; and the effectiveness of third-party pricing vendors, including periodic reviews of vendors. The Committee meets more frequently, as needed, to discuss additional valuation matters, which may include the need to review
The accompanying Notes to Financial Statements are an integral part of these financial statements.
Annual Report 2017
58
PORTFOLIO OF INVESTMENTS (Consolidated) (continued)
Columbia EM Strategic Opportunities ETF
March 31, 2017
Fair Value Measurements (continued)
back-testing results, review time-sensitive information or approve related valuation actions. The Committee reports to the Board, with members of the Committee meeting with the Board at each of its regularly scheduled meetings to discuss valuation matters and actions during the period, similar to those described earlier.
For investments categorized as Level 3, the Committee monitors information similar to that described above, which may include: (i) data specific to the issuer or comparable issuers, (ii) general market or specific sector news and (iii) quoted prices and specific or similar security transactions. The Committee considers this data and any changes from prior periods in order to assess the reasonableness of observable and unobservable inputs, any assumptions or internal models used to value those securities and changes in fair value. This data is also used to corroborate, when available, information received from approved pricing vendors and brokers. Various factors impact the frequency of monitoring this information (which may occur as often as daily). However, the Committee may determine that changes to inputs, assumptions and models are not required as a result of the monitoring procedures performed.
The following table is a summary of the inputs used to value the Fund's investments as of March 31, 2017:
Valuation Inputs | | Level 1
Quoted Prices in Active
Markets for Identical
Assets ($) | | Level 2
Other Significant
Observable Inputs ($) | | Level 3
Significant
Unobservable Inputs ($) | | Total ($) | |
Common Stocks | |
Brazil | | | 617,155 | | | | — | | | | — | | | | 617,155 | | |
China | | | 1,904,669 | | | | — | | | | — | | | | 1,904,669 | | |
Hong Kong | | | 101,672 | | | | — | | | | — | | | | 101,672 | | |
India | | | 1,141,918 | | | | — | | | | — | | | | 1,141,918 | | |
Indonesia | | | 459,084 | | | | — | | | | — | | | | 459,084 | | |
Malaysia | | | 279,391 | | | | — | | | | — | | | | 279,391 | | |
Mexico | | | 984,987 | | | | — | | | | — | | | | 984,987 | | |
Russia | | | 283,549 | | | | — | | | | — | | | | 283,549 | | |
South Africa | | | 1,425,513 | | | | — | | | | — | | | | 1,425,513 | | |
Thailand | | | 330,571 | | | | — | | | | — | | | | 330,571 | | |
Total Common Stocks | | | 7,528,509 | | | | — | | | | — | | | | 7,528,509 | | |
Total Investments | | | 7,528,509 | | | | — | | | | — | | | | 7,528,509 | | |
See the Consolidated Portfolio of Investments for all investment classifications not indicated in the table.
There were no transfers of financial assets between levels during the period.
The accompanying Notes to Financial Statements are an integral part of these financial statements.
Annual Report 2017
59
PORTFOLIO OF INVESTMENTS (Consolidated)
Columbia Emerging Markets Consumer ETF
March 31, 2017
(Percentages represent value of investments compared to net assets)
Common Stocks — 99.7%
Issuer | | Shares | | Value ($) | |
BRAZIL — 10.5% | |
Ambev SA ADR | | | 7,103,632 | | | | 40,916,920 | | |
| BRF SA ADR | | | 1,593,926 | | | | 19,525,594 | | |
Lojas Renner SA | | | 1,990,252 | | | | 17,426,733 | | |
Total Brazil | | | | | 77,869,247 | | |
CHILE — 3.0% | |
S.A.C.I. Falabella | | | 2,679,710 | | | | 22,461,879 | | |
CHINA — 21.0% | |
Belle International Holdings, Ltd. | | | 22,004,895 | | | | 14,299,005 | | |
China Mengniu Dairy Co., Ltd. | | | 8,263,372 | | | | 17,118,997 | | |
Ctrip.com International Ltd. ADR(a) | | | 698,391 | | | | 34,325,918 | | |
Hengan International Group Co., Ltd. | | | 2,156,981 | | | | 16,042,399 | | |
JD.com, Inc. ADR(a) | | | 1,399,035 | | | | 43,523,979 | | |
Vipshop Holdings, Ltd. ADR(a) | | | 1,161,816 | | | | 15,498,625 | | |
Want Want China Holdings, Ltd. | | | 21,517,007 | | | | 14,895,644 | | |
Total China | | | | | 155,704,567 | | |
INDIA — 14.3% | |
Hindustan Unilever, Ltd. | | | 1,726,133 | | | | 24,236,571 | | |
ITC, Ltd. | | | 6,422,290 | | | | 27,722,613 | | |
Maruti Suzuki India, Ltd. | | | 276,095 | | | | 25,577,958 | | |
Tata Motors, Ltd. ADR | | | 789,837 | | | | 28,157,689 | | |
Total India | | | | | 105,694,831 | | |
INDONESIA — 3.7% | |
PT Astra International Tbk | | | 42,766,749 | | | | 27,681,003 | | |
MALAYSIA — 2.0% | |
Genting Bhd | | | 6,861,262 | | | | 14,868,264 | | |
Common Stocks (continued)
Issuer | | Shares | | Value ($) | |
MEXICO — 11.8% | |
Fomento Economico Mexicano SAB de
CV Series UBD | | | 3,870,983 | | | | 34,126,203 | | |
Grupo Televisa SAB Series CPO | | | 5,200,272 | | | | 26,771,496 | | |
Wal-Mart de Mexico SAB de CV | | | 11,575,168 | | | | 26,525,447 | | |
Total Mexico | | | | | 87,423,146 | | |
PHILIPPINES — 2.6% | |
SM Investments Corp. | | | 1,382,132 | | | | 19,199,721 | | |
RUSSIA — 3.4% | |
Magnit PJSC GDR | | | 661,148 | | | | 25,255,854 | | |
SOUTH AFRICA — 22.2% | |
Mr Price Group, Ltd. | | | 968,834 | | | | 11,553,393 | | |
Naspers, Ltd. N Shares | | | 438,738 | | | | 75,747,439 | | |
Shoprite Holdings, Ltd. | | | 1,130,783 | | | | 16,326,622 | | |
Steinhoff International Holdings NV | | | 6,320,198 | | | | 30,246,451 | | |
Tiger Brands, Ltd. | | | 544,568 | | | | 16,263,429 | | |
Woolworths Holdings, Ltd. | | | 2,760,473 | | | | 14,392,443 | | |
Total South Africa | | | | | 164,529,777 | | |
THAILAND — 5.2% | |
| CP ALL PCL | | | 11,776,083 | | | | 20,219,393 | | |
Thai Beverage PCL | | | 26,909,200 | | | | 18,102,518 | | |
Total Thailand | | | | | 38,321,911 | | |
Total Investments
(Cost: $720,433,577) | | | | | 739,010,200 | | |
Other Assets & Liabilities, Net | | | | | 2,160,790 | | |
Net Assets | | | | | 741,170,990 | | |
Notes to Consolidated Portfolio of Investments
(a) Non-income producing security.
Abbreviation Legend
ADR American Depositary Receipts
GDR Global Depositary Receipts
PJSC Private Joint Stock Company
The accompanying Notes to Financial Statements are an integral part of these financial statements.
Annual Report 2017
60
PORTFOLIO OF INVESTMENTS (Consolidated) (continued)
Columbia Emerging Markets Consumer ETF
March 31, 2017
The Fund categorizes its fair value measurements according to a three-level hierarchy that maximizes the use of observable inputs and minimizes the use of unobservable inputs by prioritizing that the most observable input be used when available. Observable inputs are those that market participants would use in pricing an investment based on market data obtained from sources independent of the reporting entity. Unobservable inputs are those that reflect the Fund's assumptions about the information market participants would use in pricing an investment. An investment's level within the fair value hierarchy is based on the lowest level of any input that is deemed significant to the asset's or liability's fair value measurement. The input levels are not necessarily an indication of the risk or liquidity associated with investments at that level. For example, certain U.S. government securities are generally high quality and liquid, however, they are reflected as Level 2 because the inputs used to determine fair value may not always be quoted prices in an active market.
Fair value inputs are summarized in the three broad levels listed below:
> Level 1 — Valuations based on quoted prices for investments in active markets that the Fund has the ability to access at the measurement date (including NAV for open-end mutual funds). Valuation adjustments are not applied to Level 1 investments.
> Level 2 — Valuations based on other significant observable inputs (including quoted prices for similar securities, interest rates, prepayment speeds, credit risks, etc.).
> Level 3 — Valuations based on significant unobservable inputs (including the Fund's own assumptions and judgment in determining the fair value of investments).
Inputs that are used in determining fair value of an investment may include price information, credit data, volatility statistics, and other factors. These inputs can be either observable or unobservable. The availability of observable inputs can vary between investments, and is affected by various factors such as the type of investment, and the volume and level of activity for that investment or similar investments in the marketplace. The inputs will be considered by the Investment Manager, along with any other relevant factors in the calculation of an investment's fair value. The Fund uses prices and inputs that are current as of the measurement date, which may include periods of market dislocations. During these periods, the availability of prices and inputs may be reduced for many investments. This condition could cause an investment to be reclassified between the various levels within the hierarchy.
Investments falling into the Level 3 category are primarily supported by quoted prices from brokers and dealers participating in the market for those investments. However, these may be classified as Level 3 investments due to lack of market transparency and corroboration to support these quoted prices. Additionally, valuation models may be used as the pricing source for any remaining investments classified as Level 3. These models may rely on one or more significant unobservable inputs and/or significant assumptions by the Investment Manager. Inputs used in valuations may include, but are not limited to, financial statement analysis, capital account balances, discount rates and estimated cash flows, and comparable company data.
Under the direction of the Fund's Board of Trustees (the Board), the Investment Manager's Valuation Committee (the Committee) is responsible for overseeing the valuation procedures approved by the Board. The Committee consists of voting and non-voting members from various groups within the Investment Manager's organization, including operations and accounting, trading and investments, compliance, risk management and legal.
The Committee meets at least monthly to review and approve valuation matters, which may include a description of specific valuation determinations, data regarding pricing information received from approved pricing vendors and brokers and the results of Board-approved valuation control policies and procedures (the Policies). The Policies address, among other things, instances when market quotations are or are not readily available, including recommendation of third party pricing vendors and a determination of appropriate pricing methodologies; events that require specific valuation determinations and assessment of fair value techniques; securities with a potential for stale pricing, including those that are illiquid, restricted, or in default; and the effectiveness of third-party pricing vendors, including periodic reviews of vendors. The Committee meets more frequently, as needed, to discuss additional valuation matters, which may include the need to review back-testing results, review time-sensitive information or approve related valuation actions. The Committee reports to the Board, with members of the Committee meeting with the Board at each of its regularly scheduled meetings to discuss valuation matters and actions during the period, similar to those described earlier.
For investments categorized as Level 3, the Committee monitors information similar to that described above, which may include: (i) data specific to the issuer or comparable issuers, (ii) general market or specific sector news and (iii) quoted prices and specific or similar security transactions. The Committee considers this data and any changes from prior periods in order to assess the reasonableness of observable and unobservable inputs, any assumptions or internal models used to value those securities and changes in fair value. This data is also used to corroborate, when available, information received from approved pricing vendors and brokers. Various factors impact the frequency of monitoring this information (which may occur as often as daily). However, the Committee may determine that changes to inputs, assumptions and models are not required as a result of the monitoring procedures performed.
The accompanying Notes to Financial Statements are an integral part of these financial statements.
Annual Report 2017
61
PORTFOLIO OF INVESTMENTS (Consolidated) (continued)
Columbia Emerging Markets Consumer ETF
March 31, 2017
Fair Value Measurements (continued)
The following table is a summary of the inputs used to value the Fund's investments as of March 31, 2017:
Valuation Inputs | | Level 1
Quoted Prices in Active
Markets for Identical
Assets ($) | | Level 2
Other Significant
Observable Inputs ($) | | Level 3
Significant
Unobservable Inputs ($) | | Total ($) | |
Common Stocks | |
Brazil | | | 77,869,247 | | | | — | | | | — | | | | 77,869,247 | | |
Chile | | | 22,461,879 | | | | — | | | | — | | | | 22,461,879 | | |
China | | | 155,704,567 | | | | — | | | | — | | | | 155,704,567 | | |
India | | | 105,694,831 | | | | — | | | | — | | | | 105,694,831 | | |
Indonesia | | | 27,681,003 | | | | — | | | | — | | | | 27,681,003 | | |
Malaysia | | | 14,868,264 | | | | — | | | | — | | | | 14,868,264 | | |
Mexico | | | 87,423,146 | | | | — | | | | — | | | | 87,423,146 | | |
Philippines | | | 19,199,721 | | | | — | | | | — | | | | 19,199,721 | | |
Russia | | | 25,255,854 | | | | — | | | | — | | | | 25,255,854 | | |
South Africa | | | 164,529,777 | | | | — | | | | — | | | | 164,529,777 | | |
Thailand | | | 38,321,911 | | | | — | | | | — | | | | 38,321,911 | | |
Total Common Stocks | | | 739,010,200 | | | | — | | | | — | | | | 739,010,200 | | |
Total Investments | | | 739,010,200 | | | | — | | | | — | | | | 739,010,200 | | |
See the Consolidated Portfolio of Investments for all investment classifications not indicated in the table.
There were no transfers of financial assets between levels during the period.
The accompanying Notes to Financial Statements are an integral part of these financial statements.
Annual Report 2017
62
PORTFOLIO OF INVESTMENTS (Consolidated)
Columbia Emerging Markets Core ETF
March 31, 2017
(Percentages represent value of investments compared to net assets)
Common Stocks — 97.1%
Issuer | | Shares | | Value ($) | |
BRAZIL — 6.2% | |
Ambev SA ADR | | | 10,819 | | | | 62,317 | | |
| BRF SA ADR | | | 4,608 | | | | 56,448 | | |
| CPFL Energia SA ADR | | | 3,640 | | | | 59,659 | | |
Petroleo Brasileiro SA ADR(a) | | | 6,242 | | | | 60,485 | | |
Vale SA ADR | | | 6,176 | | | | 58,672 | | |
Total Brazil | | | | | 297,581 | | |
CHILE — 1.3% | |
S.A.C.I. Falabella | | | 7,270 | | | | 60,939 | | |
CHINA — 13.6% | |
AAC Technologies Holdings, Inc. | | | 1,762 | | | | 20,621 | | |
Alibaba Group Holding, Ltd. ADR(a) | | | 179 | | | | 19,302 | | |
Baidu, Inc. ADR(a) | | | 106 | | | | 18,287 | | |
Bank of China, Ltd. Class H | | | 37,359 | | | | 18,556 | | |
Belle International Holdings, Ltd. | | | 27,224 | | | | 17,690 | | |
China Communications Construction
Co., Ltd. Class H | | | 13,000 | | | | 18,334 | | |
China Construction Bank Corp. Class H | | | 23,398 | | | | 18,817 | | |
China Everbright International, Ltd. | | | 12,866 | | | | 17,317 | | |
China Life Insurance Co., Ltd. ADR | | | 1,156 | | | | 17,721 | | |
China Mobile, Ltd. ADR | | | 326 | | | | 18,005 | | |
China Overseas Land & Investment, Ltd. | | | 5,460 | | | | 15,597 | | |
China Pacific Insurance Group Co., Ltd.
Class H | | | 4,912 | | | | 17,729 | | |
China Railway Signal & Communication
Corp., Ltd. Class H(b) | | | 22,950 | | | | 18,486 | | |
China Resources Land, Ltd. | | | 6,804 | | | | 18,386 | | |
China Unicom Hong Kong, Ltd. ADR | | | 1,405 | | | | 18,925 | | |
CITIC, Ltd. | | | 12,921 | | | | 18,422 | | |
CNOOC, Ltd. | | | 15,712 | | | | 18,762 | | |
Ctrip.com International, Ltd. ADR(a) | | | 390 | | | | 19,168 | | |
Guangdong Investment, Ltd. | | | 14,000 | | | | 19,960 | | |
Haitong Securities Co., Ltd. Class H | | | 10,168 | | | | 17,192 | | |
Hanergy Thin Film Power Group, Ltd.(a)(c) | | | 60,421 | | | | 603 | | |
Hengan International Group Co., Ltd. | | | 1,972 | | | | 14,667 | | |
Industrial and Commercial Bank of
China, Ltd. Class H | | | 28,321 | | | | 18,513 | | |
JD.com, Inc. ADR(a) | | | 589 | | | | 18,324 | | |
Lenovo Group, Ltd. | | | 30,216 | | | | 19,907 | | |
NetEase, Inc. ADR | | | 63 | | | | 17,892 | | |
Common Stocks (continued)
Issuer | | Shares | | Value ($) | |
New Oriental Education & Technology
Group, Inc. ADR(a) | | | 366 | | | | 22,099 | | |
PICC Property & Casualty Co., Ltd. Class H | | | 12,364 | | | | 19,059 | | |
Ping An Insurance Group Co. of China,
Ltd. Class H | | | 3,624 | | | | 20,285 | | |
Semiconductor Manufacturing
International Corp.(a) | | | 13,827 | | | | 17,116 | | |
Shenzhou International Group
Holdings, Ltd. | | | 3,000 | | | | 18,935 | | |
Sinopharm Group Co., Ltd. Class H | | | 4,075 | | | | 18,903 | | |
Tencent Holdings, Ltd. | | | 615 | | | | 17,631 | | |
Want Want China Holdings, Ltd. | | | 28,150 | | | | 19,487 | | |
Xinyi Solar Holdings, Ltd.(a) | | | 55,066 | | | | 17,572 | | |
ZTE Corp. Class H | | | 11,109 | | | | 20,384 | | |
Total China | | | | | 648,654 | | |
HONG KONG — 1.3% | |
Alibaba Pictures Group, Ltd.(a) | | | 112,521 | | | | 20,415 | | |
GCL-Poly Energy Holdings, Ltd.(a) | | | 139,426 | | | | 18,479 | | |
Haier Electronics Group Co., Ltd. | | | 9,292 | | | | 21,282 | | |
Total Hong Kong | | | | | 60,176 | | |
INDIA — 15.5% | |
Adani Ports and Special Economic
Zone, Ltd.(a) | | | 9,529 | | | | 49,835 | | |
Dr. Reddy's Laboratories, Ltd. | | | 1,025 | | | | 41,552 | | |
Hindustan Unilever, Ltd. | | | 3,356 | | | | 47,122 | | |
Housing Development Finance Corp., Ltd. | | | 2,138 | | | | 49,457 | | |
Infosys, Ltd. ADR | | | 2,817 | | | | 44,509 | | |
ITC, Ltd. | | | 11,070 | | | | 47,785 | | |
Larsen & Toubro, Ltd. | | | 1,981 | | | | 48,046 | | |
Lupin, Ltd. | | | 2,019 | | | | 44,935 | | |
Mahindra & Mahindra, Ltd. | | | 2,244 | | | | 44,472 | | |
Maruti Suzuki India, Ltd. | | | 498 | | | | 46,136 | | |
NTPC, Ltd. | | | 18,595 | | | | 47,536 | | |
Reliance Industries, Ltd.(a) | | | 2,263 | | | | 46,034 | | |
Sun Pharmaceutical Industries, Ltd. | | | 4,295 | | | | 45,516 | | |
Tata Consultancy Services, Ltd. | | | 1,163 | | | | 43,554 | | |
Tata Motors, Ltd. ADR | | | 1,239 | | | | 44,170 | | |
Zee Entertainment Enterprises, Ltd. | | | 5,694 | | | | 46,961 | | |
Total India | | | | | 737,620 | | |
The accompanying Notes to Financial Statements are an integral part of these financial statements.
Annual Report 2017
63
PORTFOLIO OF INVESTMENTS (Consolidated) (continued)
Columbia Emerging Markets Core ETF
March 31, 2017
Common Stocks (continued)
Issuer | | Shares | | Value ($) | |
INDONESIA — 3.8% | |
PT Astra International Tbk | | | 92,814 | | | | 60,074 | | |
PT Telekomunikasi Indonesia
Persero Tbk ADR | | | 1,970 | | | | 61,405 | | |
PT Unilever Indonesia Tbk | | | 18,329 | | | | 59,593 | | |
Total Indonesia | | | | | 181,072 | | |
MALAYSIA — 6.2% | |
Genting Bhd | | | 27,800 | | | | 60,242 | | |
Genting Malaysia Bhd | | | 48,200 | | | | 59,358 | | |
IHH Healthcare Bhd | | | 43,400 | | | | 58,841 | | |
Sime Darby Bhd | | | 28,600 | | | | 59,973 | | |
Tenaga Nasional Bhd | �� | | 19,000 | | | | 58,904 | | |
Total Malaysia | | | | | 297,318 | | |
MEXICO — 15.4% | |
Alfa SAB de CV Class A | | | 43,045 | | | | 62,622 | | |
America Movil SAB de CV Class L ADR | | | 4,259 | | | | 60,350 | | |
Cemex SAB de CV Series CPO(a) | | | 66,830 | | | | 60,144 | | |
Fibra Uno Administracion SA de CV | | | 39,076 | | | | 66,558 | | |
Fomento Economico Mexicano SAB
de CV ADR | | | 663 | | | | 58,689 | | |
Grupo Aeroportuario del Pacifico SAB
de CV Class B | | | 6,514 | | | | 62,988 | | |
Grupo Aeroportuario del Sureste SAB
de CV Class B | | | 3,544 | | | | 61,166 | | |
Grupo Mexico SAB de CV Series B | | | 19,158 | | | | 57,248 | | |
Grupo Televisa SAB ADR | | | 2,229 | | | | 57,820 | | |
Kimberly-Clark de Mexico SAB de CV
Class A | | | 29,307 | | | | 63,223 | | |
Megacable Holdings SAB de CV
Series CPO | | | 15,310 | | | | 58,983 | | |
Wal-Mart de Mexico SAB de CV | | | 29,202 | | | | 66,919 | | |
Total Mexico | | | | | 736,710 | | |
PERU — 1.2% | |
Southern Copper Corp. | | | 1,620 | | | | 58,142 | | |
PHILIPPINES — 4.9% | |
Ayala Land, Inc. | | | 81,700 | | | | 53,815 | | |
Jollibee Foods Corp. | | | 15,180 | | | | 59,752 | | |
SM Investments Corp. | | | 4,490 | | | | 62,372 | | |
SM Prime Holdings, Inc. | | | 101,300 | | | | 57,136 | | |
Total Philippines | | | | | 233,075 | | |
Common Stocks (continued)
Issuer | | Shares | | Value ($) | |
POLAND — 2.5% | |
Cyfrowy Polsat SA(a) | | | 10,038 | | | | 61,313 | | |
Powszechny Zaklad Ubezpieczen SA | | | 6,570 | | | | 57,708 | | |
Total Poland | | | | | 119,021 | | |
RUSSIA — 5.0% | |
Gazprom PJSC ADR | | | 1,483 | | | | 6,666 | | |
Gazprom PJSC ADR | | | 11,496 | | | | 51,387 | | |
LUKOIL PJSC ADR | | | 55 | | | | 2,919 | | |
LUKOIL PJSC ADR | | | 1,070 | | | | 56,667 | | |
Magnit PJSC GDR | | | 1,598 | | | | 61,044 | | |
MMC Norilsk Nickel PJSC ADR | | | 3,103 | | | | 48,779 | | |
MMC Norilsk Nickel PJSC ADR | | | 741 | | | | 11,626 | | |
Total Russia | | | | | 239,088 | | |
SOUTH AFRICA — 14.1% | |
Aspen Pharmacare Holdings, Ltd. | | | 2,568 | | | | 52,613 | | |
FirstRand, Ltd. | | | 13,762 | | | | 47,581 | | |
Mediclinic International PLC | | | 6,021 | | | | 53,516 | | |
MTN Group, Ltd. | | | 5,739 | | | | 52,217 | | |
Naspers, Ltd. N Shares | | | 329 | | | | 56,801 | | |
Netcare, Ltd. | | | 23,044 | | | | 43,996 | | |
Remgro, Ltd. | | | 3,148 | | | | 48,384 | | |
Sanlam, Ltd. | | | 10,302 | | | | 51,761 | | |
Sasol, Ltd. ADR | | | 1,860 | | | | 54,684 | | |
Shoprite Holdings, Ltd. | | | 3,584 | | | | 51,747 | | |
Steinhoff International Holdings NV | | | 11,284 | | | | 54,002 | | |
Tiger Brands, Ltd. | | | 1,723 | | | | 51,457 | | |
Woolworths Holdings, Ltd. | | | 10,123 | | | | 52,779 | | |
Total South Africa | | | | | 671,538 | | |
THAILAND — 3.7% | |
Airports of Thailand PCL NVDR | | | 51,100 | | | | 58,368 | | |
| CP ALL PCL NVDR | | | 34,800 | | | | 59,751 | | |
Siam Cement PCL NVDR | | | 3,800 | | | | 59,716 | | |
Total Thailand | | | | | 177,835 | | |
TURKEY — 1.2% | |
Haci Omer Sabanci Holding AS | | | 21,695 | | | | 59,575 | | |
UNITED ARAB EMIRATES — 1.2% | |
Emaar Properties PJSC | | | 29,185 | | | | 58,004 | | |
Total Common Stocks
(Cost $4,448,744) | | | | | 4,636,348 | | |
The accompanying Notes to Financial Statements are an integral part of these financial statements.
Annual Report 2017
64
PORTFOLIO OF INVESTMENTS (Consolidated) (continued)
Columbia Emerging Markets Core ETF
March 31, 2017
Preferred Stocks — 2.5%
Issuer | | Shares | | Value ($) | |
BRAZIL — 2.5% | |
Banco Bradesco SA Preference
Shares ADR | | | 5,728 | | | | 58,655 | | |
Itau Unibanco Holding SA Preference
Shares ADR | | | 4,754 | | | | 57,381 | | |
Total Brazil | | | | | 116,036 | | |
Total Preferred Stocks
(Cost $81,381) | | | | | 116,036 | | |
Total Investments
(Cost: $4,530,125) | | | | | 4,752,384 | | |
Other Assets & Liabilities, Net | | | | | 19,915 | | |
Net Assets | | | | | 4,772,299 | | |
Notes to Consolidated Portfolio of Investments
(a) Non-income producing security.
(b) Represents privately placed and other securities and instruments exempt from SEC registration (collectively, private placements), such as Section 4(a)(2) and Rule 144A eligible securities, which are often sold only to qualified institutional buyers. The Fund may invest in private placements determined to be liquid as well as those determined to be illiquid. Private placements may be determined to be liquid under guidelines established by the Fund's Board of Trustees. At March 31, 2017, the value of this security amounted to $18,486, or 0.39% of net assets.
(c) Represents fair value as determined in good faith under procedures approved by the Board of Trustees. At March 31, 2017, the value of this security amounted to $603, which represents less than 0.01% of net assets.
Abbreviation Legend
ADR American Depositary Receipts
GDR Global Depositary Receipts
NVDR Non-Voting Depositary Receipts
PJSC Private Joint Stock Company
Fair Value Measurements
The Fund categorizes its fair value measurements according to a three-level hierarchy that maximizes the use of observable inputs and minimizes the use of unobservable inputs by prioritizing that the most observable input be used when available. Observable inputs are those that market participants would use in pricing an investment based on market data obtained from sources independent of the reporting entity. Unobservable inputs are those that reflect the Fund's assumptions about the information market participants would use in pricing an investment. An investment's level within the fair value hierarchy is based on the lowest level of any input that is deemed significant to the asset's or liability's fair value measurement. The input levels are not necessarily an indication of the risk or liquidity associated with investments at that level. For example, certain U.S. government securities are generally high quality and liquid, however, they are reflected as Level 2 because the inputs used to determine fair value may not always be quoted prices in an active market.
Fair value inputs are summarized in the three broad levels listed below:
> Level 1 — Valuations based on quoted prices for investments in active markets that the Fund has the ability to access at the measurement date (including NAV for open-end mutual funds). Valuation adjustments are not applied to Level 1 investments.
> Level 2 — Valuations based on other significant observable inputs (including quoted prices for similar securities, interest rates, prepayment speeds, credit risks, etc.).
> Level 3 — Valuations based on significant unobservable inputs (including the Fund's own assumptions and judgment in determining the fair value of investments).
The accompanying Notes to Financial Statements are an integral part of these financial statements.
Annual Report 2017
65
PORTFOLIO OF INVESTMENTS (Consolidated) (continued)
Columbia Emerging Markets Core ETF
March 31, 2017
Fair Value Measurements (continued)
Inputs that are used in determining fair value of an investment may include price information, credit data, volatility statistics, and other factors. These inputs can be either observable or unobservable. The availability of observable inputs can vary between investments, and is affected by various factors such as the type of investment, and the volume and level of activity for that investment or similar investments in the marketplace. The inputs will be considered by the Investment Manager, along with any other relevant factors in the calculation of an investment's fair value. The Fund uses prices and inputs that are current as of the measurement date, which may include periods of market dislocations. During these periods, the availability of prices and inputs may be reduced for many investments. This condition could cause an investment to be reclassified between the various levels within the hierarchy.
Investments falling into the Level 3 category are primarily supported by quoted prices from brokers and dealers participating in the market for those investments. However, these may be classified as Level 3 investments due to lack of market transparency and corroboration to support these quoted prices. Additionally, valuation models may be used as the pricing source for any remaining investments classified as Level 3. These models may rely on one or more significant unobservable inputs and/or significant assumptions by the Investment Manager. Inputs used in valuations may include, but are not limited to, financial statement analysis, capital account balances, discount rates and estimated cash flows, and comparable company data.
Under the direction of the Fund's Board of Trustees (the Board), the Investment Manager's Valuation Committee (the Committee) is responsible for overseeing the valuation procedures approved by the Board. The Committee consists of voting and non-voting members from various groups within the Investment Manager's organization, including operations and accounting, trading and investments, compliance, risk management and legal.
The Committee meets at least monthly to review and approve valuation matters, which may include a description of specific valuation determinations, data regarding pricing information received from approved pricing vendors and brokers and the results of Board-approved valuation control policies and procedures (the Policies). The Policies address, among other things, instances when market quotations are or are not readily available, including recommendation of third party pricing vendors and a determination of appropriate pricing methodologies; events that require specific valuation determinations and assessment of fair value techniques; securities with a potential for stale pricing, including those that are illiquid, restricted, or in default; and the effectiveness of third-party pricing vendors, including periodic reviews of vendors. The Committee meets more frequently, as needed, to discuss additional valuation matters, which may include the need to review back-testing results, review time-sensitive information or approve related valuation actions. The Committee reports to the Board, with members of the Committee meeting with the Board at each of its regularly scheduled meetings to discuss valuation matters and actions during the period, similar to those described earlier.
For investments categorized as Level 3, the Committee monitors information similar to that described above, which may include: (i) data specific to the issuer or comparable issuers, (ii) general market or specific sector news and (iii) quoted prices and specific or similar security transactions. The Committee considers this data and any changes from prior periods in order to assess the reasonableness of observable and unobservable inputs, any assumptions or internal models used to value those securities and changes in fair value. This data is also used to corroborate, when available, information received from approved pricing vendors and brokers. Various factors impact the frequency of monitoring this information (which may occur as often as daily). However, the Committee may determine that changes to inputs, assumptions and models are not required as a result of the monitoring procedures performed.
The following table is a summary of the inputs used to value the Fund's investments as of March 31, 2017:
Valuation Inputs | | Level 1
Quoted Prices in Active
Markets for Identical
Assets ($) | | Level 2
Other Significant
Observable Inputs ($) | | Level 3
Significant
Unobservable Inputs ($) | | Total ($) | |
Common Stocks | |
Brazil | | | 297,581 | | | | — | | | | — | | | | 297,581 | | |
Chile | | | 60,939 | | | | — | | | | — | | | | 60,939 | | |
China | | | 648,051 | | | | — | | | | 603 | | | | 648,654 | | |
Hong Kong | | | 60,176 | | | | — | | | | — | | | | 60,176 | | |
India | | | 737,620 | | | | — | | | | — | | | | 737,620 | | |
Indonesia | | | 181,072 | | | | — | | | | — | | | | 181,072 | | |
Malaysia | | | 297,318 | | | | — | | | | — | | | | 297,318 | | |
Mexico | | | 736,710 | | | | — | | | | — | | | | 736,710 | | |
Peru | | | 58,142 | | | | — | | | | — | | | | 58,142 | | |
Philippines | | | 233,075 | | | | — | | | | — | | | | 233,075 | | |
Poland | | | 119,021 | | | | — | | | | — | | | | 119,021 | | |
The accompanying Notes to Financial Statements are an integral part of these financial statements.
Annual Report 2017
66
PORTFOLIO OF INVESTMENTS (Consolidated) (continued)
Columbia Emerging Markets Core ETF
March 31, 2017
Fair Value Measurements (continued)
Valuation Inputs | | Level 1
Quoted Prices in Active
Markets for Identical
Assets ($) | | Level 2
Other Significant
Observable Inputs ($) | | Level 3
Significant
Unobservable Inputs ($) | | Total ($) | |
Russia | | | 239,088 | | | | — | | | | — | | | | 239,088 | | |
South Africa | | | 671,538 | | | | — | | | | — | | | | 671,538 | | |
Thailand | | | 177,835 | | | | — | | | | — | | | | 177,835 | | |
Turkey | | | 59,575 | | | | — | | | | — | | | | 59,575 | | |
United Arab Emirates | | | 58,004 | | | | — | | | | — | | | | 58,004 | | |
Total Common Stocks | | | 4,635,745 | | | | — | | | | 603 | | | | 4,636,348 | | |
Preferred Stocks | |
Brazil | | | 116,036 | | | | — | | | | — | | | | 116,036 | | |
Total Preferred Stocks | | | 116,036 | | | | — | | | | — | | | | 116,036 | | |
Total Investments | | | 4,751,781 | | | | — | | | | 603 | | | | 4,752,384 | | |
See the Consolidated Portfolio of Investments for all investment classifications not indicated in the table.
Financial assets were transferred from Level 3 to Level 1 as the market for these assets was deemed to be active during the period and fair values were consequently obtained using quoted prices for identical assets rather than being based upon other observable market inputs as of year-end.
The following table shows transfers between Level 1 and Level 3 of the fair value hierarchy:
Transfers In | | Transfers Out | |
| Level 1 ($) | | Level 3 ($) | | Level 1 ($) | | Level 3 ($) | |
| | 15,914 | | | | — | | | | — | | | | 15,914 | | |
Transfers between Level 1 and Level 3 are determined based on the fair value at the beginning of the period for security positions held throughout the period.
There were no transfers of financial assets between Levels 1 and 2 during the period.
There were no transfers of financial assets between Levels 2 and 3 during the period.
The Fund's assets assigned to the Level 3 category are valued utilizing the valuation technique deemed the most appropriate in the circumstances. Certain common stocks classified as Level 3 securities are valued using the market approach. To determine fair value for these securities, management considered various factors which may have included, but were not limited to, the halt price of the security, discount rates observed in the market for similar assets as well as the movement in certain foreign or domestic market indices. Significant increases (decreases) to any of these inputs would result in a significantly lower (higher) fair value measurement. Generally, a change in observable yields on comparable securities would result in a directionally similar change to discount rates.
The accompanying Notes to Financial Statements are an integral part of these financial statements.
Annual Report 2017
67
PORTFOLIO OF INVESTMENTS (Consolidated)
Columbia India Consumer ETF
March 31, 2017
(Percentages represent value of investments compared to net assets)
Common Stocks — 99.5%
Issuer | | Shares | | Value ($) | |
CONSUMER GOODS — 80.8% | |
Aditya Birla Fashion and Retail, Ltd.(a) | | | 973,590 | | | | 2,306,719 | | |
Bajaj Auto, Ltd. | | | 94,047 | | | | 4,063,204 | | |
Bosch, Ltd. | | | 11,875 | | | | 4,160,639 | | |
Britannia Industries Ltd. | | | 83,584 | | | | 4,342,996 | | |
Colgate-Palmolive India, Ltd. | | | 188,382 | | | | 2,888,031 | | |
Dabur India, Ltd. | | | 796,566 | | | | 3,402,288 | | |
Emami, Ltd. | | | 88,956 | | | | 1,458,078 | | |
Exide Industries, Ltd. | | | 598,510 | | | | 2,067,848 | | |
GlaxoSmithKline Consumer
Healthcare, Ltd. | | | 16,470 | | | | 1,307,772 | | |
Godrej Consumer Products, Ltd. | | | 163,256 | | | | 4,202,142 | | |
Hero MotoCorp, Ltd. | | | 81,296 | | | | 4,033,751 | | |
Hindustan Unilever, Ltd. | | | 308,361 | | | | 4,329,686 | | |
Marico, Ltd. | | | 734,486 | | | | 3,335,077 | | |
Maruti Suzuki India, Ltd. | | | 45,288 | | | | 4,195,565 | | |
Motherson Sumi Systems, Ltd.(a) | | | 737,201 | | | | 4,222,146 | | |
MRF, Ltd. | | | 3,533 | | | | 3,316,425 | | |
Nestle India, Ltd. | | | 43,899 | | | | 4,516,422 | | |
Page Industries, Ltd. | | | 5,201 | | | | 1,171,060 | | |
Procter & Gamble Hygiene & Health
Care, Ltd. | | | 13,552 | | | | 1,584,489 | | |
Common Stocks (continued)
Issuer | | Shares | | Value ($) | |
Rajesh Exports, Ltd. | | | 77,272 | | | | 721,074 | | |
Titan Co., Ltd.(a) | | | 452,653 | | | | 3,225,767 | | |
TVS Motor Co., Ltd. | | | 256,803 | | | | 1,703,715 | | |
United Breweries, Ltd. | | | 93,718 | | | | 1,112,464 | | |
United Spirits, Ltd.(a) | | | 80,357 | | | | 2,691,189 | | |
Whirlpool of India, Ltd.(a) | | | 44,833 | | | | 843,497 | | |
Total | | | | | 71,202,044 | | |
CONSUMER SERVICES — 6.2% | |
Sun TV Network, Ltd. | | | 94,170 | | | | 1,146,616 | | |
Zee Entertainment Enterprises, Ltd. | | | 525,036 | | | | 4,330,223 | | |
Total | | | | | 5,476,839 | | |
INDUSTRIALS — 12.5% | |
Bharat Forge, Ltd. | | | 171,226 | | | | 2,747,896 | | |
Mahindra & Mahindra, Ltd. | | | 206,024 | | | | 4,083,041 | | |
Tata Motors, Ltd. | | | 574,803 | | | | 4,123,693 | | |
Total | | | | | 10,954,630 | | |
Total Investments
(Cost: $71,231,411) | | | | | 87,633,513 | | |
Other Assets & Liabilities, Net | | | | | 467,992 | | |
Net Assets | | | | | 88,101,505 | | |
Notes to Consolidated Portfolio of Investments
(a) Non-income producing security.
Fair Value Measurements
The Fund categorizes its fair value measurements according to a three-level hierarchy that maximizes the use of observable inputs and minimizes the use of unobservable inputs by prioritizing that the most observable input be used when available. Observable inputs are those that market participants would use in pricing an investment based on market data obtained from sources independent of the reporting entity. Unobservable inputs are those that reflect the Fund's assumptions about the information market participants would use in pricing an investment. An investment's level within the fair value hierarchy is based on the lowest level of any input that is deemed significant to the asset's or liability's fair value measurement. The input levels are not necessarily an indication of the risk or liquidity associated with investments at that level. For example, certain U.S. government securities are generally high quality and liquid, however, they are reflected as Level 2 because the inputs used to determine fair value may not always be quoted prices in an active market.
Fair value inputs are summarized in the three broad levels listed below:
> Level 1 — Valuations based on quoted prices for investments in active markets that the Fund has the ability to access at the measurement date (including NAV for open-end mutual funds). Valuation adjustments are not applied to Level 1 investments.
> Level 2 — Valuations based on other significant observable inputs (including quoted prices for similar securities, interest rates, prepayment speeds, credit risks, etc.).
> Level 3 — Valuations based on significant unobservable inputs (including the Fund's own assumptions and judgment in determining the fair value of investments).
The accompanying Notes to Financial Statements are an integral part of these financial statements.
Annual Report 2017
68
PORTFOLIO OF INVESTMENTS (Consolidated) (continued)
Columbia India Consumer ETF
March 31, 2017
Fair Value Measurements (continued)
Inputs that are used in determining fair value of an investment may include price information, credit data, volatility statistics, and other factors. These inputs can be either observable or unobservable. The availability of observable inputs can vary between investments, and is affected by various factors such as the type of investment, and the volume and level of activity for that investment or similar investments in the marketplace. The inputs will be considered by the Investment Manager, along with any other relevant factors in the calculation of an investment's fair value. The Fund uses prices and inputs that are current as of the measurement date, which may include periods of market dislocations. During these periods, the availability of prices and inputs may be reduced for many investments. This condition could cause an investment to be reclassified between the various levels within the hierarchy.
Investments falling into the Level 3 category are primarily supported by quoted prices from brokers and dealers participating in the market for those investments. However, these may be classified as Level 3 investments due to lack of market transparency and corroboration to support these quoted prices. Additionally, valuation models may be used as the pricing source for any remaining investments classified as Level 3. These models may rely on one or more significant unobservable inputs and/or significant assumptions by the Investment Manager. Inputs used in valuations may include, but are not limited to, financial statement analysis, capital account balances, discount rates and estimated cash flows, and comparable company data.
Under the direction of the Fund's Board of Trustees (the Board), the Investment Manager's Valuation Committee (the Committee) is responsible for overseeing the valuation procedures approved by the Board. The Committee consists of voting and non-voting members from various groups within the Investment Manager's organization, including operations and accounting, trading and investments, compliance, risk management and legal.
The Committee meets at least monthly to review and approve valuation matters, which may include a description of specific valuation determinations, data regarding pricing information received from approved pricing vendors and brokers and the results of Board-approved valuation control policies and procedures (the Policies). The Policies address, among other things, instances when market quotations are or are not readily available, including recommendation of third party pricing vendors and a determination of appropriate pricing methodologies; events that require specific valuation determinations and assessment of fair value techniques; securities with a potential for stale pricing, including those that are illiquid, restricted, or in default; and the effectiveness of third-party pricing vendors, including periodic reviews of vendors. The Committee meets more frequently, as needed, to discuss additional valuation matters, which may include the need to review back-testing results, review time-sensitive information or approve related valuation actions. The Committee reports to the Board, with members of the Committee meeting with the Board at each of its regularly scheduled meetings to discuss valuation matters and actions during the period, similar to those described earlier.
For investments categorized as Level 3, the Committee monitors information similar to that described above, which may include: (i) data specific to the issuer or comparable issuers, (ii) general market or specific sector news and (iii) quoted prices and specific or similar security transactions. The Committee considers this data and any changes from prior periods in order to assess the reasonableness of observable and unobservable inputs, any assumptions or internal models used to value those securities and changes in fair value. This data is also used to corroborate, when available, information received from approved pricing vendors and brokers. Various factors impact the frequency of monitoring this information (which may occur as often as daily). However, the Committee may determine that changes to inputs, assumptions and models are not required as a result of the monitoring procedures performed.
The following table is a summary of the inputs used to value the Fund's investments as of March 31, 2017:
Valuation Inputs | | Level 1
Quoted Prices in Active
Markets for Identical
Assets ($) | | Level 2
Other Significant
Observable Inputs ($) | | Level 3
Significant
Unobservable Inputs ($) | | Total ($) | |
Common Stocks | |
Consumer Goods | | | 71,202,044 | | | | — | | | | — | | | | 71,202,044 | | |
Consumer Services | | | 5,476,839 | | | | — | | | | — | | | | 5,476,839 | | |
Industrials | | | 10,954,630 | | | | — | | | | — | | | | 10,954,630 | | |
Total Common Stocks | | | 87,633,513 | | | | — | | | | — | | | | 87,633,513 | | |
Total Investments | | | 87,633,513 | | | | — | | | | — | | | | 87,633,513 | | |
See the Consolidated Portfolio of Investments for all investment classifications not indicated in the table.
There were no transfers of financial assets between levels during the period.
The accompanying Notes to Financial Statements are an integral part of these financial statements.
Annual Report 2017
69
PORTFOLIO OF INVESTMENTS (Consolidated)
Columbia India Infrastructure ETF
March 31, 2017
(Percentages represent value of investments compared to net assets)
Common Stocks — 99.5%
Issuer | | Shares | | Value ($) | |
BASIC MATERIALS — 14.1% | |
JSW Steel, Ltd. | | | 641,880 | | | | 1,860,350 | | |
NMDC, Ltd. | | | 520,103 | | | | 1,066,077 | | |
Vedanta, Ltd. | | | 693,293 | | | | 2,935,565 | | |
Total | | | | | 5,861,992 | | |
CONSUMER GOODS — 5.2% | |
Aditya Birla Nuvo, Ltd. | | | 36,621 | | | | 856,351 | | |
Cummins India, Ltd. | | | 89,135 | | | | 1,303,291 | | |
Total | | | | | 2,159,642 | | |
FINANCIALS — 1.6% | |
DLF, Ltd.(a) | | | 293,855 | | | | 672,697 | | |
INDUSTRIALS — 45.1% | |
ACC, Ltd. | | | 61,248 | | | | 1,363,944 | | |
Adani Ports and Special Economic
Zone, Ltd.(a) | | | 450,181 | | | | 2,354,377 | | |
Ambuja Cements, Ltd. | | | 450,501 | | | | 1,641,812 | | |
Ashok Leyland, Ltd. | | | 902,989 | | | | 1,175,756 | | |
Bharat Heavy Electricals, Ltd. | | | 592,982 | | | | 1,487,135 | | |
Container Corp. of India, Ltd. | | | 55,267 | | | | 1,084,062 | | |
Eicher Motors, Ltd.(a) | | | 5,345 | | | | 2,106,186 | | |
Havells India, Ltd. | | | 135,610 | | | | 972,671 | | |
Larsen & Toubro, Ltd. | | | 80,740 | | | | 1,958,226 | | |
NBCC India, Ltd. | | | 59,022 | | | | 156,383 | | |
Shree Cement, Ltd. | | | 5,273 | | | | 1,387,229 | | |
Common Stocks (continued)
Issuer | | Shares | | Value ($) | |
Siemens, Ltd. | | | 58,439 | | | | 1,129,632 | | |
UltraTech Cement, Ltd. | | | 30,994 | | | | 1,901,953 | | |
Total | | | | | 18,719,366 | | |
OIL & GAS — 5.7% | |
GAIL India, Ltd. | | | 405,602 | | | | 2,354,534 | | |
TELECOMMUNICATIONS — 13.0% | |
Bharti Airtel, Ltd. | | | 380,439 | | | | 2,050,861 | | |
Bharti Infratel, Ltd. | | | 349,641 | | | | 1,754,801 | | |
Idea Cellular, Ltd. | | | 818,895 | | | | 1,082,654 | | |
Tata Communications, Ltd. | | | 46,714 | | | | 519,440 | | |
Total | | | | | 5,407,756 | | |
UTILITIES — 14.8% | |
JSW Energy, Ltd. | | | 198,009 | | | | 191,194 | | |
NTPC, Ltd. | | | 771,658 | | | | 1,972,668 | | |
Petronet LNG, Ltd. | | | 196,818 | | | | 1,221,948 | | |
Reliance Infrastructure, Ltd. | | | 89,029 | | | | 779,646 | | |
Reliance Power, Ltd.(a) | | | 460,377 | | | | 340,311 | | |
Tata Power Co., Ltd. (The) | | | 1,186,865 | | | | 1,651,394 | | |
Total | | | | | 6,157,161 | | |
Total Investments
(Cost: $32,025,358) | | | | | 41,333,148 | | |
Other Assets & Liabilities, Net | | | | | 195,530 | | |
Net Assets | | | | | 41,528,678 | | |
Notes to Consolidated Portfolio of Investments
(a) Non-income producing security.
Fair Value Measurements
The Fund categorizes its fair value measurements according to a three-level hierarchy that maximizes the use of observable inputs and minimizes the use of unobservable inputs by prioritizing that the most observable input be used when available. Observable inputs are those that market participants would use in pricing an investment based on market data obtained from sources independent of the reporting entity. Unobservable inputs are those that reflect the Fund's assumptions about the information market participants would use in pricing an investment. An investment's level within the fair value hierarchy is based on the lowest level of any input that is deemed significant to the asset's or liability's fair value measurement. The input levels are not necessarily an indication of the risk or liquidity associated with investments at that level. For example, certain U.S. government securities are generally high quality and liquid, however, they are reflected as Level 2 because the inputs used to determine fair value may not always be quoted prices in an active market.
The accompanying Notes to Financial Statements are an integral part of these financial statements.
Annual Report 2017
70
PORTFOLIO OF INVESTMENTS (Consolidated) (continued)
Columbia India Infrastructure ETF
March 31, 2017
Fair Value Measurements (continued)
Fair value inputs are summarized in the three broad levels listed below:
> Level 1 — Valuations based on quoted prices for investments in active markets that the Fund has the ability to access at the measurement date (including NAV for open-end mutual funds). Valuation adjustments are not applied to Level 1 investments.
> Level 2 — Valuations based on other significant observable inputs (including quoted prices for similar securities, interest rates, prepayment speeds, credit risks, etc.).
> Level 3 — Valuations based on significant unobservable inputs (including the Fund's own assumptions and judgment in determining the fair value of investments).
Inputs that are used in determining fair value of an investment may include price information, credit data, volatility statistics, and other factors. These inputs can be either observable or unobservable. The availability of observable inputs can vary between investments, and is affected by various factors such as the type of investment, and the volume and level of activity for that investment or similar investments in the marketplace. The inputs will be considered by the Investment Manager, along with any other relevant factors in the calculation of an investment's fair value. The Fund uses prices and inputs that are current as of the measurement date, which may include periods of market dislocations. During these periods, the availability of prices and inputs may be reduced for many investments. This condition could cause an investment to be reclassified between the various levels within the hierarchy.
Investments falling into the Level 3 category are primarily supported by quoted prices from brokers and dealers participating in the market for those investments. However, these may be classified as Level 3 investments due to lack of market transparency and corroboration to support these quoted prices. Additionally, valuation models may be used as the pricing source for any remaining investments classified as Level 3. These models may rely on one or more significant unobservable inputs and/or significant assumptions by the Investment Manager. Inputs used in valuations may include, but are not limited to, financial statement analysis, capital account balances, discount rates and estimated cash flows, and comparable company data.
Under the direction of the Fund's Board of Trustees (the Board), the Investment Manager's Valuation Committee (the Committee) is responsible for overseeing the valuation procedures approved by the Board. The Committee consists of voting and non-voting members from various groups within the Investment Manager's organization, including operations and accounting, trading and investments, compliance, risk management and legal.
The Committee meets at least monthly to review and approve valuation matters, which may include a description of specific valuation determinations, data regarding pricing information received from approved pricing vendors and brokers and the results of Board-approved valuation control policies and procedures (the Policies). The Policies address, among other things, instances when market quotations are or are not readily available, including recommendation of third party pricing vendors and a determination of appropriate pricing methodologies; events that require specific valuation determinations and assessment of fair value techniques; securities with a potential for stale pricing, including those that are illiquid, restricted, or in default; and the effectiveness of third-party pricing vendors, including periodic reviews of vendors. The Committee meets more frequently, as needed, to discuss additional valuation matters, which may include the need to review back-testing results, review time-sensitive information or approve related valuation actions. The Committee reports to the Board, with members of the Committee meeting with the Board at each of its regularly scheduled meetings to discuss valuation matters and actions during the period, similar to those described earlier.
For investments categorized as Level 3, the Committee monitors information similar to that described above, which may include: (i) data specific to the issuer or comparable issuers, (ii) general market or specific sector news and (iii) quoted prices and specific or similar security transactions. The Committee considers this data and any changes from prior periods in order to assess the reasonableness of observable and unobservable inputs, any assumptions or internal models used to value those securities and changes in fair value. This data is also used to corroborate, when available, information received from approved pricing vendors and brokers. Various factors impact the frequency of monitoring this information (which may occur as often as daily). However, the Committee may determine that changes to inputs, assumptions and models are not required as a result of the monitoring procedures performed.
The accompanying Notes to Financial Statements are an integral part of these financial statements.
Annual Report 2017
71
PORTFOLIO OF INVESTMENTS (Consolidated) (continued)
Columbia India Infrastructure ETF
March 31, 2017
Fair Value Measurements (continued)
The following table is a summary of the inputs used to value the Fund's investments as of March 31, 2017:
Valuation Inputs | | Level 1
Quoted Prices in Active
Markets for Identical
Assets ($) | | Level 2
Other Significant
Observable Inputs ($) | | Level 3
Significant
Unobservable Inputs ($) | | Total ($) | |
Common Stocks | |
Basic Materials | | | 5,861,992 | | | | — | | | | — | | | | 5,861,992 | | |
Consumer Goods | | | 2,159,642 | | | | — | | | | — | | | | 2,159,642 | | |
Financials | | | 672,697 | | | | — | | | | — | | | | 672,697 | | |
Industrials | | | 18,719,366 | | | | — | | | | — | | | | 18,719,366 | | |
Oil & Gas | | | 2,354,534 | | | | — | | | | — | | | | 2,354,534 | | |
Telecommunications | | | 5,407,756 | | | | — | | | | — | | | | 5,407,756 | | |
Utilities | | | 6,157,161 | | | | — | | | | — | | | | 6,157,161 | | |
Total Common Stocks | | | 41,333,148 | | | | — | | | | — | | | | 41,333,148 | | |
Total Investments | | | 41,333,148 | | | | — | | | | — | | | | 41,333,148 | | |
See the Consolidated Portfolio of Investments for all investment classifications not indicated in the table.
There were no transfers of financial assets between levels during the period.
The accompanying Notes to Financial Statements are an integral part of these financial statements.
Annual Report 2017
72
PORTFOLIO OF INVESTMENTS (Consolidated)
Columbia India Small Cap ETF
March 31, 2017
(Percentages represent value of investments compared to net assets)
Common Stocks — 99.7%
Issuer | | Shares | | Value ($) | |
BASIC MATERIALS — 3.6% | |
Advanced Enzyme Technologies, Ltd.(a) | | | 7,050 | | | | 223,594 | | |
Gujarat Narmada Valley Fertilizers &
Chemicals, Ltd. | | | 86,170 | | | | 380,921 | | |
MOIL, Ltd. | | | 43,217 | | | | 208,814 | | |
NOCIL, Ltd. | | | 79,638 | | | | 115,039 | | |
Total | | | | | 928,368 | | |
CONSUMER GOODS — 15.8% | |
Balrampur Chini Mills, Ltd. | | | 120,779 | | | | 270,351 | | |
Bata India, Ltd. | | | 54,997 | | | | 481,028 | | |
Bombay Dyeing & Manufacturing Co., Ltd. | | | 167,649 | | | | 214,289 | | |
Ceat, Ltd.(a) | | | 14,500 | | | | 295,839 | | |
Delta Corp., Ltd. | | | 97,962 | | | | 273,210 | | |
Godfrey Phillips India, Ltd. | | | 13,693 | | | | 238,940 | | |
Indo Count Industries, Ltd. | | | 76,405 | | | | 232,327 | | |
JK Tyre & Industries, Ltd. | | | 159,309 | | | | 323,721 | | |
Kaveri Seed Co., Ltd.(a) | | | 24,204 | | | | 208,065 | | |
Kwality, Ltd. | | | 45,514 | | | | 109,518 | | |
PC Jeweller, Ltd. | | | 25,820 | | | | 166,209 | | |
Raymond, Ltd. | | | 33,021 | | | | 322,226 | | |
Tata Global Beverages, Ltd. | | | 389,796 | | | | 903,731 | | |
Total | | | | | 4,039,454 | | |
CONSUMER SERVICES — 9.6% | |
Cox & Kings, Ltd. | | | 75,880 | | | | 270,169 | | �� |
Infibeam Incorporation, Ltd.(a) | | | 21,290 | | | | 310,539 | | |
Jet Airways India, Ltd.(a) | | | 26,773 | | | | 216,831 | | |
Jubilant Foodworks, Ltd. | | | 32,433 | | | | 553,087 | | |
PVR, Ltd. | | | 19,222 | | | | 423,677 | | |
SpiceJet, Ltd.(a) | | | 216,427 | | | | 338,964 | | |
TV18 Broadcast, Ltd.(a) | | | 511,586 | | | | 330,894 | | |
Total | | | | | 2,444,161 | | |
FINANCIALS — 20.8% | |
Allahabad Bank(a) | | | 238,948 | | | | 270,281 | | |
Andhra Bank | | | 248,726 | | | | 221,971 | | |
Can Fin Homes, Ltd. | | | 8,706 | | | | 284,428 | | |
Capital First, Ltd. | | | 30,934 | | | | 372,771 | | |
Housing Development &
Infrastructure, Ltd.(a) | | | 255,732 | | | | 322,742 | | |
IFCI, Ltd.(a) | | | 696,665 | | | | 318,104 | | |
Indiabulls Real Estate, Ltd.(a) | | | 187,138 | | | | 252,169 | | |
Common Stocks (continued)
Issuer | | Shares | | Value ($) | |
Karnataka Bank, Ltd. (The) | | | 247,429 | | | | 536,125 | | |
Karur Vysya Bank, Ltd. (The) | | | 455,451 | | | | 785,563 | | |
Manappuram Finance, Ltd. | | | 405,027 | | | | 612,203 | | |
Multi Commodity Exchange of India, Ltd. | | | 33,787 | | | | 627,012 | | |
Oriental Bank of Commerce | | | 135,828 | | | | 294,623 | | |
Syndicate Bank(a) | | | 230,931 | | | | 253,389 | | |
Unitech, Ltd.(a) | | | 1,881,092 | | | | 162,226 | | |
Total | | | | | 5,313,607 | | |
HEALTH CARE — 4.9% | |
Dishman Pharmaceuticals &
Chemicals, Ltd. | | | 58,725 | | | | 261,091 | | |
Dr Lal PathLabs, Ltd.(b) | | | 24,135 | | | | 359,618 | | |
Granules India, Ltd. | | | 89,969 | | | | 192,380 | | |
Marksans Pharma, Ltd. | | | 199,678 | | | | 144,988 | | |
Wockhardt, Ltd. | | | 25,884 | | | | 286,703 | | |
Total | | | | | 1,244,780 | | |
INDUSTRIALS — 26.1% | |
BEML, Ltd. | | | 18,025 | | | | 378,071 | | |
Crompton Greaves, Ltd.(a) | | | 380,112 | | | | 454,542 | | |
Escorts, Ltd. | | | 104,111 | | | | 863,784 | | |
Force Motors, Ltd.(a) | | | 4,715 | | | | 325,813 | | |
Gayatri Projects, Ltd. | | | 76,514 | | | | 170,267 | | |
Gujarat Pipavav Port, Ltd. | | | 230,896 | | | | 587,063 | | |
Hindustan Construction Co., Ltd.(a) | | | 689,594 | | | | 420,011 | | |
India Cements, Ltd. | | | 165,648 | | | | 414,407 | | |
IRB Infrastructure Developers, Ltd. | | | 140,872 | | | | 512,854 | | |
Jain Irrigation Systems, Ltd. | | | 287,842 | | | | 416,016 | | |
Jaiprakash Associates, Ltd.(a) | | | 1,389,998 | | | | 294,332 | | |
Kesoram Industries, Ltd.(a) | | | 95,333 | | | | 209,722 | | |
NCC, Ltd. | | | 308,202 | | | | 388,961 | | |
NIIT, Ltd.(a) | | | 95,749 | | | | 124,156 | | |
Nilkamal, Ltd. | | | 5,046 | | | | 151,679 | | |
Reliance Defence and Engineering, Ltd.(a) | | | 119,086 | | | | 123,240 | | |
Sintex Industries, Ltd. | | | 339,668 | | | | 553,167 | | |
V-Guard Industries, Ltd. | | | 106,763 | | | | 285,096 | | |
Total | | | | | 6,673,181 | | |
OIL & GAS — 5.0% | |
Aban Offshore, Ltd.(a) | | | 29,321 | | | | 101,665 | | |
Chennai Petroleum Corp., Ltd. | | | 45,919 | | | | 256,732 | | |
The accompanying Notes to Financial Statements are an integral part of these financial statements.
Annual Report 2017
73
PORTFOLIO OF INVESTMENTS (Consolidated) (continued)
Columbia India Small Cap ETF
March 31, 2017
Common Stocks (continued)
Issuer | | Shares | | Value ($) | |
Suzlon Energy, Ltd.(a) | | | 3,174,817 | | | | 933,842 | | |
Total | | | | | 1,292,239 | | |
TECHNOLOGY — 7.8% | |
Hexaware Technologies, Ltd. | | | 81,995 | | | | 271,423 | | |
Intellect Design Arena, Ltd.(a) | | | 56,305 | | | | 99,716 | | |
Just Dial, Ltd.(a) | | | 24,726 | | | | 200,881 | | |
KPIT Technologies, Ltd. | | | 115,313 | | | | 230,324 | | |
Mindtree, Ltd. | | | 81,302 | | | | 567,117 | | |
NIIT Technologies, Ltd. | | | 38,026 | | | | 255,088 | | |
Tata Elxsi, Ltd. | | | 16,138 | | | | 364,065 | | |
Total | | | | | 1,988,614 | | |
Common Stocks (continued)
Issuer | | Shares | | Value ($) | |
TELECOMMUNICATIONS — 2.2% | |
Reliance Communications, Ltd.(a) | | | 945,498 | | | | 557,674 | | |
UTILITIES — 3.9% | |
GMR Infrastructure, Ltd.(a) | | | 2,179,172 | | | | 536,948 | | |
Mahanagar Gas, Ltd. | | | 9,312 | | | | 128,405 | | |
PTC India, Ltd. | | | 229,858 | | | | 330,619 | | |
Total | | | | | 995,972 | | |
Total Investments
(Cost: $24,359,629) | | | | | 25,478,050 | | |
Other Assets & Liabilities, Net | | | | | 86,835 | | |
Net Assets | | | | | 25,564,885 | | |
Notes to Consolidated Portfolio of Investments
(a) Non-income producing security.
(b) Represents privately placed and other securities and instruments exempt from SEC registration (collectively, private placements), such as Section 4(a)(2) and Rule 144A eligible securities, which are often sold only to qualified institutional buyers. The Fund may invest in private placements determined to be liquid as well as those determined to be illiquid. Private placements may be determined to be liquid under guidelines established by the Fund's Board of Trustees. At March 31, 2017, the value of this security amounted to $359,618, or 1.40% of net assets.
Fair Value Measurements
The Fund categorizes its fair value measurements according to a three-level hierarchy that maximizes the use of observable inputs and minimizes the use of unobservable inputs by prioritizing that the most observable input be used when available. Observable inputs are those that market participants would use in pricing an investment based on market data obtained from sources independent of the reporting entity. Unobservable inputs are those that reflect the Fund's assumptions about the information market participants would use in pricing an investment. An investment's level within the fair value hierarchy is based on the lowest level of any input that is deemed significant to the asset's or liability's fair value measurement. The input levels are not necessarily an indication of the risk or liquidity associated with investments at that level. For example, certain U.S. government securities are generally high quality and liquid, however, they are reflected as Level 2 because the inputs used to determine fair value may not always be quoted prices in an active market.
Fair value inputs are summarized in the three broad levels listed below:
> Level 1 — Valuations based on quoted prices for investments in active markets that the Fund has the ability to access at the measurement date (including NAV for open-end mutual funds). Valuation adjustments are not applied to Level 1 investments.
> Level 2 — Valuations based on other significant observable inputs (including quoted prices for similar securities, interest rates, prepayment speeds, credit risks, etc.).
> Level 3 — Valuations based on significant unobservable inputs (including the Fund's own assumptions and judgment in determining the fair value of investments).
Inputs that are used in determining fair value of an investment may include price information, credit data, volatility statistics, and other factors. These inputs can be either observable or unobservable. The availability of observable inputs can vary between investments, and is affected by various factors such as the type of investment, and the volume and level of activity for that investment or similar investments in the marketplace. The inputs will be considered by the Investment Manager, along with any other relevant factors in the calculation of an investment's fair value. The Fund uses prices and inputs that are current as of the measurement date, which may include periods of market dislocations. During these periods, the availability of prices and inputs may be reduced for many investments. This condition could cause an investment to be reclassified between the various levels within the hierarchy.
Investments falling into the Level 3 category are primarily supported by quoted prices from brokers and dealers participating in the market for those investments. However, these may be classified as Level 3 investments due to lack of market transparency and corroboration to support these quoted prices. Additionally, valuation models may be used as the pricing source for any remaining investments classified as Level 3.
The accompanying Notes to Financial Statements are an integral part of these financial statements.
Annual Report 2017
74
PORTFOLIO OF INVESTMENTS (Consolidated) (continued)
Columbia India Small Cap ETF
March 31, 2017
Fair Value Measurements (continued)
These models may rely on one or more significant unobservable inputs and/or significant assumptions by the Investment Manager. Inputs used in valuations may include, but are not limited to, financial statement analysis, capital account balances, discount rates and estimated cash flows, and comparable company data.
Under the direction of the Fund's Board of Trustees (the Board), the Investment Manager's Valuation Committee (the Committee) is responsible for overseeing the valuation procedures approved by the Board. The Committee consists of voting and non-voting members from various groups within the Investment Manager's organization, including operations and accounting, trading and investments, compliance, risk management and legal.
The Committee meets at least monthly to review and approve valuation matters, which may include a description of specific valuation determinations, data regarding pricing information received from approved pricing vendors and brokers and the results of Board-approved valuation control policies and procedures (the Policies). The Policies address, among other things, instances when market quotations are or are not readily available, including recommendation of third party pricing vendors and a determination of appropriate pricing methodologies; events that require specific valuation determinations and assessment of fair value techniques; securities with a potential for stale pricing, including those that are illiquid, restricted, or in default; and the effectiveness of third-party pricing vendors, including periodic reviews of vendors. The Committee meets more frequently, as needed, to discuss additional valuation matters, which may include the need to review back-testing results, review time-sensitive information or approve related valuation actions. The Committee reports to the Board, with members of the Committee meeting with the Board at each of its regularly scheduled meetings to discuss valuation matters and actions during the period, similar to those described earlier.
For investments categorized as Level 3, the Committee monitors information similar to that described above, which may include: (i) data specific to the issuer or comparable issuers, (ii) general market or specific sector news and (iii) quoted prices and specific or similar security transactions. The Committee considers this data and any changes from prior periods in order to assess the reasonableness of observable and unobservable inputs, any assumptions or internal models used to value those securities and changes in fair value. This data is also used to corroborate, when available, information received from approved pricing vendors and brokers. Various factors impact the frequency of monitoring this information (which may occur as often as daily). However, the Committee may determine that changes to inputs, assumptions and models are not required as a result of the monitoring procedures performed.
The following table is a summary of the inputs used to value the Fund's investments as of March 31, 2017:
Valuation Inputs | | Level 1
Quoted Prices in Active
Markets for Identical
Assets ($) | | Level 2
Other Significant
Observable Inputs ($) | | Level 3
Significant
Unobservable Inputs ($) | | Total ($) | |
Common Stocks | |
Basic Materials | | | 928,368 | | | | — | | | | — | | | | 928,368 | | |
Consumer Goods | | | 4,039,454 | | | | — | | | | — | | | | 4,039,454 | | |
Consumer Services | | | 2,444,161 | | | | — | | | | — | | | | 2,444,161 | | |
Financials | | | 5,313,607 | | | | — | | | | — | | | | 5,313,607 | | |
Health Care | | | 1,244,780 | | | | — | | | | — | | | | 1,244,780 | | |
Industrials | | | 6,673,181 | | | | — | | | | — | | | | 6,673,181 | | |
Oil & Gas | | | 1,292,239 | | | | — | | | | — | | | | 1,292,239 | | |
Technology | | | 1,988,614 | | | | — | | | | — | | | | 1,988,614 | | |
Telecommunications | | | 557,674 | | | | — | | | | — | | | | 557,674 | | |
Utilities | | | 995,972 | | | | — | | | | — | | | | 995,972 | | |
Total Common Stocks | | | 25,478,050 | | | | — | | | | — | | | | 25,478,050 | | |
Total Investments | | | 25,478,050 | | | | — | | | | — | | | | 25,478,050 | | |
See the Consolidated Portfolio of Investments for all investment classifications not indicated in the table.
There were no transfers of financial assets between levels during the period.
The accompanying Notes to Financial Statements are an integral part of these financial statements.
Annual Report 2017
75
STATEMENT OF ASSETS AND LIABILITIES
March 31, 2017
| | | Columbia
Beyond
BRICs ETF | | Columbia EM Core
ex-China ETF | | Columbia EM
Quality
Dividend ETF | |
Assets | |
Investments, at cost: | | $ | 78,735,925 | | | $ | 9,459,823 | | | $ | 12,795,509 | | |
Investments, at value | | | 70,010,551 | | | | 11,010,505 | | | | 12,999,960 | | |
Cash | | | 56,768 | | | | 124,704 | | | | 57,334 | | |
Foreign cash (identified cost $545,087, $—, $—) | | | 558,217 | | | | — | | | | — | | |
Receivable for: | |
Investment sold | | | 456,476 | | | | 50,084 | | | | — | | |
Capital shares sold | | | 11,321 | | | | — | | | | — | | |
Dividends | | | 491,396 | | | | 46,855 | | | | 34,922 | | |
Spot foreign currency contracts | | | — | | | | — | | | | — | | |
Foreign tax reclaims | | | 5,826 | | | | 152 | | | | 339 | | |
Expense reimbursement due from Investment Manager | | | 16,122 | | | | 3,308 | | | | — | | |
Total assets | | | 71,606,677 | | | | 11,235,608 | | | | 13,092,555 | | |
Liabilities | |
Payable for: | |
Investment purchased | | | 537,948 | | | | 19,630 | | | | — | | |
Capital shares purchased | | | — | | | | — | | | | — | | |
Investment management fees | | | 50,755 | | | | 6,616 | | | | 9,407 | | |
Due to custodian | | | — | | | | — | | | | 3,098 | | |
Income payable | | | — | | | | — | | | | — | | |
Accrued expenses and other liabilities | | | — | | | | 393 | | | | — | | |
Total liabilities | | | 588,703 | | | | 26,639 | | | | 12,505 | | |
Net assets applicable to outstanding capital stock | | $ | 71,017,974 | | | $ | 11,208,969 | | | $ | 13,080,050 | | |
Represented by | |
Paid-in capital | | $ | 139,614,823 | | | $ | 9,771,018 | | | $ | 40,960,010 | | |
Undistributed (accumulated) net investment income (loss) | | | 550,404 | | | | 18,063 | | | | 511 | | |
Accumulated net realized loss on investments and foreign currency
transactions | | | (60,436,273 | ) | | | (132,820 | ) | | | (28,085,355) | | |
Net unrealized appreciation (depreciation) on: | |
Investments | | | (8,725,374 | ) | | | 1,550,682 | | | | 204,451 | | |
Foreign curency translations | | | 14,394 | | | | 2,026 | | | | 433 | | |
Total — representing net assets applicable to outstanding capital stock | | $ | 71,017,974 | | | $ | 11,208,969 | | | $ | 13,080,050 | | |
Shares outstanding | | | 4,400,000 | | | | 450,000 | | | | 950,000 | | |
Net asset value per share | | $ | 16.14 | | | $ | 24.91 | | | $ | 13.77 | | |
The accompanying Notes to Financial Statements are an integral part of these financial statements.
Annual Report 2017
76
STATEMENT OF ASSETS AND LIABILITIES (continued)
March 31, 2017
| | | Columbia EM
Strategic
Opportunities ETF
(Consolidated) | | Columbia Emerging
Markets Consumer
ETF (Consolidated) | | Columbia Emerging
Markets Core ETF
(Consolidated) | |
Assets | |
Investments, at cost: | | $ | 8,163,660 | | | $ | 720,433,577 | | | $ | 4,530,125 | | |
Investments, at value | | | 7,528,509 | | | | 739,010,200 | | | | 4,752,384 | | |
Cash | | | — | | | | 2,556,860 | | | | 21,167 | | |
Foreign cash (identified cost $—, $423,814, $447) | | | 1 | | | | 423,732 | | | | 447 | | |
Receivable for: | |
Investment sold | | | 23,105 | | | | 49,742 | | | | — | | |
Capital shares sold | | | — | | | | 2,069,652 | | | | — | | |
Dividends | | | 6,364 | | | | 150,665 | | | | 1,037 | | |
Spot foreign currency contracts | | | 129,868 | | | | — | | | | — | | |
Foreign tax reclaims | | | — | | | | — | | | | 96 | | |
Expense reimbursement due from Investment Manager | | | 1,459 | | | | — | | | | — | | |
Total assets | | | 7,689,306 | | | | 744,260,851 | | | | 4,775,131 | | |
Liabilities | |
Payable for: | |
Investment purchased | | | — | | | | 2,564,276 | | | | — | | |
Capital shares purchased | | | 23,468 | | | | — | | | | — | | |
Investment management fees | | | 6,216 | | | | 525,585 | | | | 2,832 | | |
Due to custodian | | | 97,023 | | | | — | | | | — | | |
Income payable | | | — | | | | — | | | | — | | |
Accrued expenses and other liabilities | | | — | | | | — | | | | — | | |
Total liabilities | | | 126,707 | | | | 3,089,861 | | | | 2,832 | | |
Net assets applicable to outstanding capital stock | | $ | 7,562,599 | | | $ | 741,170,990 | | | $ | 4,772,299 | | |
Represented by | |
Paid-in capital | | $ | 11,761,894 | | | $ | 874,439,532 | | | $ | 5,359,831 | | |
Undistributed (accumulated) net investment income (loss) | | | 15,590 | | | | (23,291 | ) | | | 13,328 | | |
Accumulated net realized loss on investments and foreign currency
transactions | | | (3,579,735 | ) | | | (151,826,579 | ) | | | (823,083 | ) | |
Net unrealized appreciation (depreciation) on: | |
Investments | | | (635,151 | ) | | | 18,576,623 | | | | 222,259 | | |
Foreign curency translations | | | 1 | | | | 4,705 | | | | (36 | ) | |
Total — representing net assets applicable to outstanding capital stock | | $ | 7,562,599 | | | $ | 741,170,990 | | | $ | 4,772,299 | | |
Shares outstanding | | | 400,000 | | | | 29,950,000 | | | | 250,000 | | |
Net asset value per share | | $ | 18.91 | | | $ | 24.75 | | | $ | 19.09 | | |
The accompanying Notes to Financial Statements are an integral part of these financial statements.
Annual Report 2017
77
STATEMENT OF ASSETS AND LIABILITIES (continued)
March 31, 2017
| | | Columbia India
Consumer ETF
(Consolidated) | | Columbia India
Infrastructure ETF
(Consolidated) | | Columbia India
Small Cap ETF
(Consolidated) | |
Assets | |
Investments, at cost: | | $ | 71,231,411 | | | $ | 32,025,358 | | | $ | 24,359,629 | | |
Investments, at value | | | 87,633,513 | | | | 41,333,148 | | | | 25,478,050 | | |
Cash | | | 525,306 | | | | 112,166 | | | | — | | |
Foreign cash (identified cost $6,872, $33,127, $25,164) | | | 7,251 | | | | 33,240 | | | | 25,627 | | |
Receivable for: | |
Investment sold | | | — | | | | — | | | | — | | |
Capital shares sold | | | — | | | | — | | | | — | | |
Dividends | | | — | | | | 79,080 | | | | — | | |
Spot foreign currency contracts | | | — | | | | — | | | | 617,713 | | |
Foreign tax reclaims | | | — | | | | — | | | | — | | |
Expense reimbursement due from Investment Manager | | | — | | | | — | | | | — | | |
Total assets | | | 88,166,070 | | | | 41,557,634 | | | | 26,121,390 | | |
Liabilities | |
Payable for: | |
Investment purchased | | | — | | | | — | | | | — | | |
Capital shares purchased | | | — | | | | — | | | | — | | |
Investment management fees | | | 64,565 | | | | 28,956 | | | | 16,585 | | |
Due to custodian | | | — | | | | — | | | | 539,913 | | |
Income payable | | | — | | | | — | | | | 7 | | |
Accrued expenses and other liabilities | | | — | | | | — | | | | — | | |
Total liabilities | | | 64,565 | | | | 28,956 | | | | 556,505 | | |
Net assets applicable to outstanding capital stock | | $ | 88,101,505 | | | $ | 41,528,678 | | | $ | 25,564,885 | | |
Represented by | |
Paid-in capital | | | $80,962,339 | | | $ | 95,174,122 | | | $ | 36,635,632 | | |
Undistributed (accumulated) net investment income (loss) | | | 49,782 | | | | 40,258 | | | | (17,874 | ) | |
Accumulated net realized loss on investments and foreign currency
transactions | | | (9,313,097 | ) | | | (62,993,605 | ) | | | (12,171,757 | ) | |
Net unrealized appreciation (depreciation) on: | |
Investments | | | 16,402,102 | | | | 9,307,790 | | | | 1,118,421 | | |
Foreign curency translations | | | 379 | | | | 113 | | | | 463 | | |
Total — representing net assets applicable to outstanding capital stock | | $ | 88,101,505 | | | $ | 41,528,678 | | | $ | 25,564,885 | | |
Shares outstanding | | | 2,300,000 | | | | 3,200,000 | | | | 1,400,000 | | |
Net asset value per share | | $ | 38.31 | | | $ | 12.98 | | | $ | 18.26 | | |
The accompanying Notes to Financial Statements are an integral part of these financial statements.
Annual Report 2017
78
STATEMENT OF OPERATIONS
For the Year Ended March 31, 2017
| | | Columbia Beyond
BRICs ETF | | Columbia EM Core
ex-China ETF | | Columbia EM
Quality Dividend
ETF | |
Investment Income | |
Dividends | | $ | 2,578,493 | | | $ | 229,848 | | | $ | 593,355 | | |
Interest | | | 21 | | | | — | | | | 536 | | |
Foreign taxes withheld | | | (244,844 | ) | | | (30,203 | ) | | | (64,554 | ) | |
Total income | | | 2,333,670 | | | | 199,645 | | | | 529,337 | | |
Expenses: | |
Excise tax | | | — | | | | — | | | | — | | |
Investment management fees | | | 719,907 | | | | 64,866 | | | | 123,625 | | |
Mauritius taxes paid | | | — | | | | — | | | | — | | |
Total expenses | | | 719,907 | | | | 64,866 | | | | 123,625 | | |
Fees waived by the Investment Manager and its affiliates | | | (228,676 | ) | | | (32,433 | ) | | | — | | |
Total net expenses | | | 491,231 | | | | 32,433 | | | | 123,625 | | |
Net investment income (loss) | | | 1,842,439 | | | | 167,212 | | | | 405,712 | | |
Realized and unrealized gain (loss) — net | |
Net realized gain (loss) on: | |
Investments | | | (7,322,421 | ) | | | (111,714 | ) | | | (97,233 | ) | |
In-kind transactions | | | (674,977 | ) | | | — | | | | (25,464 | ) | |
Foreign currency translations | | | (422,588 | ) | | | (28,604 | ) | | | (71,522 | ) | |
Net realized gain (loss) | | | (8,419,986 | ) | | | (140,318 | ) | | | (194,219 | ) | |
Change in net unrealized appreciation (depreciation) on: | |
Investments | | | 9,880,974 | | | | 1,477,180 | | | | 1,029,381 | | |
Foreign currency translations | | | 6,371 | | | | 1,853 | | | | (5,169 | ) | |
Net change in unrealized appreciation (depreciation) | | | 9,887,345 | | | | 1,479,033 | | | | 1,024,212 | | |
Net realized and unrealized gain (loss) | | | 1,467,359 | | | | 1,338,715 | | | | 829,993 | | |
Net increase (decrease) in net assets resulting from operations | | $ | 3,309,798 | | | $ | 1,505,927 | | | $ | 1,235,705 | | |
The accompanying Notes to Financial Statements are an integral part of these financial statements.
Annual Report 2017
79
STATEMENT OF OPERATIONS (continued)
For the Year Ended March 31, 2017
| | | Columbia EM
Strategic
Opportunities ETF
(Consolidated) | | Columbia Emerging
Markets Consumer
ETF (Consolidated) | | Columbia Emerging
Markets Core ETF
(Consolidated) | |
Investment Income | |
Dividends | | $ | 292,608 | | | $ | 11,715,527 | | | $ | 110,597 | | |
Interest | | | — | | | | — | | | | — | | |
Foreign taxes withheld | | | (28,148 | ) | | | (939,199 | ) | | | (11,774 | ) | |
Total income | | | 264,460 | | | | 10,776,328 | | | | 98,823 | | |
Expenses: | |
Excise tax | | | — | | | | 6,014 | | | | 32 | | |
Investment management fees | | | 104,723 | | | | 5,652,827 | | | | 32,240 | | |
Mauritius taxes paid | | | — | | | | 12,728 | | | | — | | |
Total expenses | | | 104,723 | | | | 5,671,569 | | | | 32,272 | | |
Fees waived by the Investment Manager and its affiliates | | | (24,654 | ) | | | — | | | | — | | |
Total net expenses | | | 80,069 | | | | 5,671,569 | | | | 32,272 | | |
Net investment income (loss) | | | 184,391 | | | | 5,104,759 | | | | 66,551 | | |
Realized and unrealized gain (loss) — net | |
Net realized gain (loss) on: | |
Investments | | | (815,713 | ) | | | (27,899,635 | ) | | | (252,117 | ) | |
In-kind transactions | | | (244,823 | ) | | | 1,544,727 | | | | 95,453 | | |
Foreign currency translations | | | 3,027 | | | | 30,904 | | | | (119 | ) | |
Net realized gain (loss) | | | (1,057,509 | ) | | | (26,324,004 | ) | | | (156,783 | ) | |
Change in net unrealized appreciation (depreciation) on: | |
Investments | | | 811,319 | | | | 83,732,689 | | | | 548,635 | | |
Foreign currency translations | | | (1,451 | ) | | | (5,007 | ) | | | (240 | ) | |
Net change in unrealized appreciation (depreciation) | | | 809,868 | | | | 83,727,682 | | | | 548,395 | | |
Net realized and unrealized gain (loss) | | | (247,641 | ) | | | 57,403,678 | | | | 391,612 | | |
Net increase (decrease) in net assets resulting from operations | | $ | (63,250 | ) | | $ | 62,508,437 | | | $ | 458,163 | | |
The accompanying Notes to Financial Statements are an integral part of these financial statements.
Annual Report 2017
80
STATEMENT OF OPERATIONS (continued)
For the Year Ended March 31, 2017
| | | Columbia India
Consumer ETF
(Consolidated) | | Columbia India
Infrastructure ETF
(Consolidated) | | Columbia India
Small Cap ETF
(Consolidated) | |
Investment Income | |
Dividends | | $ | 628,274 | | | $ | 525,021 | | | $ | 149,164 | | |
Interest | | | — | | | | — | | | | — | | |
Foreign taxes withheld | | | — | | | | — | | | | — | | |
Total income | | | 628,274 | | | | 525,021 | | | | 149,164 | | |
Expenses: | |
Excise tax | | | — | | | | — | | | | — | | |
Investment management fees | | | 702,511 | | | | 355,103 | | | | 170,540 | | |
Mauritius taxes paid | | | 651 | | | | 53,823 | | | | 2,157 | | |
Total expenses | | | 703,162 | | | | 408,926 | | | | 172,697 | | |
Fees waived by the Investment Manager and its affiliates | | | — | | | | — | | | | — | | |
Total net expenses | | | 703,162 | | | | 408,926 | | | | 172,697 | | |
Net investment income (loss) | | | (74,888 | ) | | | 116,095 | | | | (23,533 | ) | |
Realized and unrealized gain (loss) — net | |
Net realized gain (loss) on: | |
Investments | | | 411,671 | | | | (993,606 | ) | | | 2,790,725 | | |
In-kind transactions | | | — | | | | — | | | | — | | |
Foreign currency translations | | | 124,670 | | | | (74,698 | ) | | | 66,078 | | |
Net realized gain (loss) | | | 536,341 | | | | (1,068,304 | ) | | | 2,856,803 | | |
Change in net unrealized appreciation (depreciation) on: | |
Investments | | | 16,323,119 | | | | 10,976,366 | | | | 3,589,681 | | |
Foreign currency translations | | | (189 | ) | | | (374 | ) | | | 118 | | |
Net change in unrealized appreciation (depreciation) | | | 16,322,930 | | | | 10,975,992 | | | | 3,589,799 | | |
Net realized and unrealized gain (loss) | | | 16,859,271 | | | | 9,907,688 | | | | 6,446,602 | | |
Net increase (decrease) in net assets resulting from operations | | $ | 16,784,383 | | | $ | 10,023,783 | | | $ | 6,423,069 | | |
The accompanying Notes to Financial Statements are an integral part of these financial statements.
Annual Report 2017
81
STATEMENT OF CHANGES IN NET ASSETS
| | Columbia Beyond BRICs ETF | | Columbia EM Core ex-China ETF | |
| | | For the
Year Ended
March 31,
2017 | | For the
Year Ended
March 31,
2016 | | For the
Year Ended
March 31,
2017 | | For the Period
September 2, 2015(a)
Through
March 31, 2016 | |
Operations | |
Net investment income | | $ | 1,842,439 | | | $ | 4,676,451 | | | $ | 167,212 | | | $ | 17,020 | | |
Net realized gain (loss) | | | (8,419,986 | ) | | | (69,123,203 | ) | | | (140,318 | ) | | | (27,085 | ) | |
Net change in unrealized appreciation (depreciation) | | | 9,887,345 | | | | 8,073,359 | | | | 1,479,033 | | | | 73,675 | | |
Net increase (decrease) in net assets resulting from operations | | | 3,309,798 | | | | (56,373,393 | ) | | | 1,505,927 | | | | 63,610 | | |
Distributions to shareholders | |
Net investment income | | | (1,842,516 | ) | | | (6,442,630 | ) | | | (126,499 | ) | | | (25,672 | ) | |
Shareholder transactions | |
Proceeds from shares sold | | | 6,254,796 | | | | 9,095,023 | | | | 8,767,910 | | | | 2,003,012 | | |
Cost of shares redeemed | | | (28,946,398 | ) | | | (155,077,249 | ) | | | — | | | | (979,263 | ) | |
Transaction fees | | | — | | | | — | | | | (56 | ) | | | — | | |
Net increase (decrease) in net assets reulting from
shareholder transactions | | | (22,691,602 | ) | | | (145,982,226 | ) | | | 8,767,854 | | | | 1,023,749 | | |
Increase (decrease) in net assets | | | (21,224,320 | ) | | | (208,798,249 | ) | | | 10,147,282 | | | | 1,061,687 | | |
Net assets | |
Net assets at beginning of year | | | 92,242,294 | | | | 301,040,543 | | | | 1,061,687 | | | | — | | |
Net assets at end of year | | $ | 71,017,974 | | | $ | 92,242,294 | | | $ | 11,208,969 | | | $ | 1,061,687 | | |
Undistributed (accumulated) net investment income (loss) | | $ | 550,404 | | | $ | 971,474 | | | $ | 18,063 | | | $ | 2,891 | | |
Capital stock activity | |
Shares outstanding, beginning of year | | | 5,850,000 | | | | 15,150,000 | | | | 50,000 | | | | — | | |
Subsciptions | | | 400,000 | | | | 500,000 | | | | 400,000 | | | | 100,000 | | |
Redemptions | | | (1,850,000 | ) | | | (9,800,000 | ) | | | — | | | | (50,000 | ) | |
Shares outstanding, end of year | | | 4,400,000 | | | | 5,850,000 | | | | 450,000 | | | | 50,000 | | |
(a) Commencement of operations.
The accompanying Notes to Financial Statements are an integral part of these financial statements.
Annual Report 2017
82
STATEMENT OF CHANGES IN NET ASSETS (continued)
| | | Columbia EM Quality
Dividend ETF | | Columbia EM Strategic
Opportunities ETF
(Consolidated) | |
| | | For the
Year Ended
March 31,
2017 | | For the
Year Ended
March 31,
2016 | | For the
Year Ended
March 31,
2017 | | For the
Year Ended
March 31,
2016 | |
Operations | |
Net investment income | | $ | 405,712 | | | $ | 578,085 | | | $ | 184,391 | | | $ | 435,911 | | |
Net realized gain (loss) | | | (194,219 | ) | | | (2,158,928 | ) | | | (1,057,509 | ) | | | (3,529,041 | ) | |
Net change in unrealized appreciation (depreciation) | | | 1,024,212 | | | | (301,020 | ) | | | 809,868 | | | | (3,486,431 | ) | |
Net increase (decrease) in net assets resulting from operations | | | 1,235,705 | | | | (1,881,863 | ) | | | (63,250 | ) | | | (6,579,561 | ) | |
Distributions to shareholders | |
Net investment income | | | (331,695 | ) | | | (552,553 | ) | | | (222,458 | ) | | | (428,513 | ) | |
Shareholder transactions | |
Proceeds from shares sold | | | 656,756 | | | | — | | | | — | | | | 6,892,494 | | |
Cost of shares redeemed | | | (4,492,266 | ) | | | (6,487,251 | ) | | | (7,181,808 | ) | | | (20,647,452 | ) | |
Transaction fees | | | — | | | | (1,532 | ) | | | (1,951 | ) | | | (3,177 | ) | |
Net increase (decrease) in net assets reulting from shareholder transactions | | | (3,835,510 | ) | | | (6,488,783 | ) | | | (7,183,759 | ) | | | (13,758,135 | ) | |
Increase (decrease) in net assets | | | (2,931,500 | ) | | | (8,923,199 | ) | | | (7,469,467 | ) | | | (20,766,209 | ) | |
Net assets | |
Net assets at beginning of year | | | 16,011,550 | | | | 24,934,749 | | | | 15,032,066 | | | | 35,798,275 | | |
Net assets at end of year | | $ | 13,080,050 | | | $ | 16,011,550 | | | $ | 7,562,599 | | | $ | 15,032,066 | | |
Undistributed (accumulated) net investment income (loss) | | $ | 511 | | | $ | (1,984 | ) | | $ | 15,590 | | | $ | 50,630 | | |
Capital stock activity | |
Shares outstanding, beginning of year | | | 1,250,000 | | | | 1,750,000 | | | | 800,000 | | | | 1,550,000 | | |
Subsciptions | | | 50,000 | | | | — | | | | — | | | | 350,000 | | |
Redemptions | | | (350,000 | ) | | | (500,000 | ) | | | (400,000 | ) | | | (1,100,000 | ) | |
Shares outstanding, end of year | | | 950,000 | | | | 1,250,000 | | | | 400,000 | | | | 800,000 | | |
The accompanying Notes to Financial Statements are an integral part of these financial statements.
Annual Report 2017
83
STATEMENT OF CHANGES IN NET ASSETS (continued)
| | | Columbia Emerging Markets
Consumer ETF (Consolidated) | | Columbia Emerging Markets
Core ETF (Consolidated) | |
| | | For the
Year Ended
March 31,
2017 | | For the
Year Ended
March 31,
2016 | | For the
Year Ended
March 31,
2017 | | For the
Year Ended
March 31,
2016 | |
Operations | |
Net investment income (loss) | | $ | 5,104,759 | | | $ | 6,926,431 | | | $ | 66,551 | | | $ | 86,601 | | |
Net realized gain (loss) | | | (26,324,004 | ) | | | (75,169,970 | ) | | | (156,783 | ) | | | (580,213 | ) | |
Net change in unrealized appreciation (depreciation) | | | 83,727,682 | | | | (76,773,402 | ) | | | 548,395 | | | | (227,659 | ) | |
Net increase (decrease) in net assets resulting from operations | | | 62,508,437 | | | | (145,016,941 | ) | | | 458,163 | | | | (721,271 | ) | |
Distributions to shareholders | |
Net investment income | | | (4,854,400 | ) | | | (6,520,768 | ) | | | (58,710 | ) | | | (77,847 | ) | |
Shareholder transactions | |
Proceeds from shares sold | | | 82,309,612 | | | | 73,668,244 | | | | — | | | | 1,008,047 | | |
Cost of shares redeemed | | | (11,152,187 | ) | | | (454,930,424 | ) | | | (899,537 | ) | | | — | | |
Transaction fees | | | (158 | ) | | | 1,341 | | | | (2,478 | ) | | | (2,171 | ) | |
Net increase (decrease) in net assets reulting from shareholder
transactions | | | 71,157,267 | | | | (381,260,839 | ) | | | (902,015 | ) | | | 1,005,876 | | |
Increase (decrease) in net assets | | | 128,811,304 | | | | (532,798,548 | ) | | | (502,562 | ) | | | 206,758 | | |
Net assets | |
Net assets at beginning of year | | | 612,359,686 | | | | 1,145,158,234 | | | | 5,274,861 | | | | 5,068,103 | | |
Net assets at end of year | | $ | 741,170,990 | | | $ | 612,359,686 | | | $ | 4,772,299 | | | $ | 5,274,861 | | |
Undistributed (accumulated) net investment income (loss) | | $ | (23,291 | ) | | $ | (309,437 | ) | | $ | 13,328 | | | $ | 4,780 | | |
Capital stock activity | |
Shares outstanding, beginning of year | | | 27,100,000 | | | | 43,300,000 | | | | 300,000 | | | | 250,000 | | |
Subsciptions | | | 3,350,000 | | | | 3,100,000 | | | | — | | | | 50,000 | | |
Redemptions | | | (500,000 | ) | | | (19,300,000 | ) | | | (50,000 | ) | | | — | | |
Shares outstanding, end of year | | | 29,950,000 | | | | 27,100,000 | | | | 250,000 | | | | 300,000 | | |
The accompanying Notes to Financial Statements are an integral part of these financial statements.
Annual Report 2017
84
STATEMENT OF CHANGES IN NET ASSETS (continued)
| | | Columbia India Consumer ETF
(Consolidated) | | Columbia India Infrastructure
ETF (Consolidated) | |
| | | For the
Year Ended
March 31,
2017 | | For the
Year Ended
March 31,
2016 | | For the
Year Ended
March 31,
2017 | | For the
Year Ended
March 31,
2016 | |
Operations | |
Net investment income (loss) | | $ | (74,888 | ) | | $ | 98,516 | | | $ | 116,095 | | | $ | 1,204,099 | | |
Net realized gain (loss) | | | 536,341 | | | | (8,230,437 | ) | | | (1,068,304 | ) | | | (8,594,761 | ) | |
Net change in unrealized appreciation (depreciation) | | | 16,322,930 | | | | (4,436,125 | ) | | | 10,975,992 | | | | (4,228,116 | ) | |
Net increase (decrease) in net assets resulting from operations | | | 16,784,383 | | | | (12,568,046 | ) | | | 10,023,783 | | | | (11,618,778 | ) | |
Distributions to shareholders | |
Net investment income | | | (72,600 | ) | | | — | | | | (1,015,616 | ) | | | (369,715 | ) | |
Shareholder transactions | |
Proceeds from shares sold | | | 15,312,097 | | | | 18,805,894 | | | | 3,069,689 | | | | 15,149,937 | | |
Cost of shares redeemed | | | (15,598,335 | ) | | | (23,265,499 | ) | | | (10,483,631 | ) | | | (10,954,836 | ) | |
Transaction fees | | | (3,220 | ) | | | (3,264 | ) | | | (3,795 | ) | | | (3,988 | ) | |
Net increase (decrease) in net assets reulting from shareholder
transactions | | | (289,458 | ) | | | (4,462,869 | ) | | | (7,417,737 | ) | | | 4,191,113 | | |
Increase (decrease) in net assets | | | 16,422,325 | | | | (17,030,915 | ) | | | 1,590,430 | | | | (7,797,380 | ) | |
Net assets | |
Net assets at beginning of year | | | 71,679,180 | | | | 88,710,095 | | | | 39,938,248 | | | | 47,735,628 | | |
Net assets at end of year | | $ | 88,101,505 | | | $ | 71,679,180 | | | $ | 41,528,678 | | | $ | 39,938,248 | | |
Undistributed (accumulated) net investment income (loss) | | $ | 49,782 | | | $ | 73,483 | | | $ | 40,258 | | | $ | 1,014,477 | | |
Capital stock activity | |
Shares outstanding, beginning of year | | | 2,300,000 | | | | 2,500,000 | | | | 3,900,000 | | | | 3,650,000 | | |
Subsciptions | | | 450,000 | | | | 550,000 | | | | 250,000 | | | | 1,250,000 | | |
Redemptions | | | (450,000 | ) | | | (750,000 | ) | | | (950,000 | ) | | | (1,000,000 | ) | |
Shares outstanding, end of year | | | 2,300,000 | | | | 2,300,000 | | | | 3,200,000 | | | | 3,900,000 | | |
The accompanying Notes to Financial Statements are an integral part of these financial statements.
Annual Report 2017
85
STATEMENT OF CHANGES IN NET ASSETS (continued)
| | | Columbia India Small Cap ETF
(Consolidated) | |
| | | For the
Year Ended
March 31,
2017 | | For the
Year Ended
March 31,
2016 | |
Operations | |
Net investment income (loss) | | $ | (23,533 | ) | | $ | 92,229 | | |
Net realized gain (loss) | | | 2,856,803 | | | | (5,033,514 | ) | |
Net change in unrealized appreciation (depreciation) | | | 3,589,799 | | | | (1,213,602 | ) | |
Net increase (decrease) in net assets resulting from operations | | | 6,423,069 | | | | (6,154,887 | ) | |
Distributions to shareholders | |
Net investment income | | | (160,975 | ) | | | (132,552 | ) | |
Shareholder transactions | |
Proceeds from shares sold | | | 2,653,031 | | | | — | | |
Cost of shares redeemed | | | (2,373,895 | ) | | | (3,528,774 | ) | |
Transaction fees | | | (3,344 | ) | | | (6,360 | ) | |
Net increase (decrease) in net assets reulting from shareholder transactions | | | 275,792 | | | | (3,535,134 | ) | |
Increase (decrease) in net assets | | | 6,537,886 | | | | (9,822,573 | ) | |
Net assets | |
Net assets at beginning of year | | | 19,026,999 | | | | 28,849,572 | | |
Net assets at end of year | | $ | 25,564,885 | | | $ | 19,026,999 | | |
Undistributed (accumulated) net investment income (loss) | | $ | (17,874 | ) | | $ | 98,180 | | |
Capital stock activity | |
Shares outstanding, beginning of year | | | 1,400,000 | | | | 1,650,000 | | |
Subsciptions | | | 150,000 | | | | — | | |
Redemptions | | | (150,000 | ) | | | (250,000 | ) | |
Shares outstanding, end of year | | | 1,400,000 | | | | 1,400,000 | | |
The accompanying Notes to Financial Statements are an integral part of these financial statements.
Annual Report 2017
86
FINANCIAL HIGHLIGHTS
Columbia Beyond BRICs ETF
| | | For the Year Ended March 31, | |
| | | 2017 | | 2016 | | 2015 | | 2014 | | 2013(a) | |
Per share data | |
Net asset value, beginning of year | | $ | 15.77 | | | $ | 19.87 | | | $ | 21.01 | | | $ | 21.97 | | | $ | 20.00 | | |
Net investment income(b) | | | 0.34 | | | | 0.40 | | | | 0.56 | | | | 0.99 | | | | 0.17 | | |
Net realized and unrealized gain (loss) | | | 0.43 | | | | (3.83 | ) | | | (1.43 | ) | | | (1.77 | ) | | | 1.91 | | |
Total from investment operations | | | 0.77 | | | | (3.43 | ) | | | (0.87 | ) | | | (0.78 | ) | | | 2.08 | | |
Less distributions to shareholders: | |
Net investment income | | | (0.40 | ) | | | (0.67 | ) | | | (0.25 | ) | | | (0.18 | ) | | | (0.11 | ) | |
Net realized gains | | | — | | | | — | | | | (0.02 | ) | | | — | | | | — | | |
Total distribution to shareholders | | | (0.40 | ) | | | (0.67 | ) | | | (0.27 | ) | | | (0.18 | ) | | | (0.11 | ) | |
Net asset value, end of year | | $ | 16.14 | | | $ | 15.77 | | | $ | 19.87 | | | $ | 21.01 | | | $ | 21.97 | | |
Total Return at NAV(c) | | | 5.12 | % | | | (17.05 | )% | | | (4.16 | )% | | | (3.51 | )% | | | 10.41 | % | |
Total Return at Market(c) | | | 4.01 | % | | | (17.00 | )% | | | (4.78 | )% | | | (3.66 | )% | | | 11.46 | % | |
Ratios to average net assets of: | |
Expenses, prior to expense reimbursements/waivers(d)(e) | | | 0.85 | % | | | 0.85 | % | | | 0.85 | % | | | 0.85 | % | | | 2.43 | %(f) | |
Expenses, net of expense reimbursements/waivers(d)(e) | | | 0.58 | % | | | 0.58 | % | | | 0.58 | % | | | 0.66 | % | | | 0.85 | %(f) | |
Net Investment income, net of reimbursement/waivers | | | 2.18 | % | | | 2.26 | % | | | 2.65 | % | | | 4.92 | % | | | 1.26 | %(f) | |
Supplemental data | |
Net assets, end of year (in thousands) | | $ | 71,018 | | | $ | 92,242 | | | $ | 301,041 | | | $ | 49,385 | | | $ | 7,688 | | |
Portfolio turnover rate(g) | | | 36 | % | | | 32 | % | | | 33 | % | | | 63 | % | | | 1 | %(h) | |
Notes to Financial Highlights
(a) Based on operations from August 15, 2012 (commencement of operations) through the stated period end.
(b) Based on average shares outstanding.
(c) Total Return at Net Asset Value is calculated assuming an initial investment made at the net asset value at the beginning of the period, reinvestment of all dividends and distributions at net asset value during the period and redemption on the last day of the period. Total Return at Market is calculated assuming an initial investment made at the market price at the beginning of the period, reinvestment of all dividends and distributions at market price during the period and redemption on the last day of the period. The total return would have been lower if certain expenses had not been reimbursed/waived by the Investment Manager. The price used to calculate Market Price return is based on the midpoint of the 4:00 PM Eastern (U.S.) bid/ask spread on the NYSE and does not represent returns an investor would receive if shares were traded at other times. Total return calculated for a period of less than one year is not annualized.
(d) Effective April 1, 2013, EGA replaced the fee and expense structure with a Unitary Fee (as defined in Note 3).
(e) Effective October 1, 2013 the Fund entered into a fee waiver agreement pursuant to which the Investment Manager has agreed to waive its investment management fee to 0.58% of the Fund's average daily net assets.
(f) Annualized.
(g) The portfolio turnover rate is calculated without regard to purchase and sales transactions of short-term instruments, certain derivatives and in-kind transactions, if any. If such transactions were included, the Fund's portfolio turnover may be higher.
(h) Not annualized.
The accompanying Notes to Financial Statements are an integral part of these financial statements.
Annual Report 2017
87
FINANCIAL HIGHLIGHTS
Columbia EM Core ex-China ETF
| | | For the Year Ended March 31, | |
| | | 2017 | | 2016(a) | |
Per share data | |
Net asset value, beginning of year | | $ | 21.23 | | | $ | 20.00 | | |
Net investment income(b) | | | 0.41 | | | | 0.22 | | |
Net realized and unrealized gain | | | 3.55 | | | | 1.52 | | |
Total from investment operations | | | 3.96 | | | | 1.74 | | |
Less distributions to shareholders: | |
Net investment income | | | (0.28 | ) | | | (0.51 | ) | |
Net asset value, end of year | | $ | 24.91 | | | $ | 21.23 | | |
Total Return at NAV(c) | | | 18.83 | % | | | 8.98 | % | |
Total Return at Market(c) | | | 23.20 | % | | | 8.49 | % | |
Ratios to average net assets of: | |
Expenses, prior to expense reimbursements/waivers | | | 0.70 | % | | | 0.70 | %(d) | |
Expenses, net of expense reimbursements/waivers | | | 0.35 | % | | | 0.35 | %(d) | |
Net Investment income, net of reimbursement/waivers | | | 1.80 | % | | | 1.92 | %(d) | |
Supplemental data | |
Net assets, end of year (in thousands) | | $ | 11,209 | | | $ | 1,062 | | |
Portfolio turnover rate(e) | | | 30 | % | | | 45 | %(f) | |
Notes to Financial Highlights
(a) Based on operations from September 2, 2015 (commencement of operations) through the stated period end.
(b) Based on average shares outstanding.
(c) Total Return at Net Asset Value is calculated assuming an initial investment made at the net asset value at the beginning of the period, reinvestment of all dividends and distributions at net asset value during the period and redemption on the last day of the period. Total Return at Market is calculated assuming an initial investment made at the market price at the beginning of the period, reinvestment of all dividends and distributions at market price during the period and redemption on the last day of the period. The total return would have been lower if certain expenses had not been reimbursed/waived by the Investment Manager. The price used to calculate Market Price return is based on the midpoint of the 4:00 PM Eastern (U.S.) bid/ask spread on the NYSE and does not represent returns an investor would receive if shares were traded at other times. Total return calculated for a period of less than one year is not annualized.
(d) Annualized.
(e) The portfolio turnover rate is calculated without regard to purchase and sales transactions of short-term instruments, certain derivatives and in-kind transactions, if any. If such transactions were included, the Fund's portfolio turnover may be higher.
(f) Not annualized.
The accompanying Notes to Financial Statements are an integral part of these financial statements.
Annual Report 2017
88
FINANCIAL HIGHLIGHTS
Columbia EM Quality Dividend ETF
| | | For the Year Ended March 31, | |
| | | 2017 | | 2016 | | 2015 | | 2014 | | 2013 | |
Per share data | |
Net asset value, beginning of year | | $ | 12.81 | | | $ | 14.25 | | | $ | 16.15 | | | $ | 19.80 | | | $ | 20.09 | | |
Net investment income(a) | | | 0.37 | | | | 0.38 | | | | 0.77 | | | | 0.64 | | | | 0.86 | | |
Net realized and unrealized gain (loss) | | | 0.90 | | | | (1.45 | ) | | | (2.08 | ) | | | (3.61 | ) | | | (0.09 | ) | |
Total from investment operations | | | 1.27 | | | | (1.07 | ) | | | (1.31 | ) | | | (2.97 | ) | | | 0.77 | | |
Less distributions to shareholders: | |
Net investment income | | | (0.31 | ) | | | (0.37 | ) | | | (0.59 | ) | | | (0.65 | ) | | | (1.06 | ) | |
Return of capital | | | — | | | | — | | | | — | | | | (0.03 | ) | | | — | | |
Total distribution to shareholders | | | (0.31 | ) | | | (0.37 | ) | | | (0.59 | ) | | | (0.68 | ) | | | (1.06 | ) | |
Net asset value, end of year | | $ | 13.77 | | | $ | 12.81 | | | $ | 14.25 | | | $ | 16.15 | | | $ | 19.80 | | |
Total Return at NAV(b) | | | 10.05 | % | | | (7.38 | )% | | | (8.37 | )% | | | (15.14 | )% | | | 4.12 | % | |
Total Return at Market(b) | | | 11.09 | % | | | (7.78 | )% | | | (8.34 | )% | | | (15.98 | )% | | | 4.33 | % | |
Ratios to average net assets of: | |
Expenses, prior to expense reimbursements/waivers(c) | | | 0.85 | % | | | 0.85 | % | | | 0.89 | %(d) | | | 0.85 | % | | | 1.43 | % | |
Expenses, net of expense reimbursements/waivers(c) | | | 0.85 | % | | | 0.85 | % | | | 0.89 | %(d) | | | 0.85 | % | | | 0.85 | % | |
Net Investment income, net of reimbursement/waivers | | | 2.79 | % | | | 2.88 | % | | | 4.76 | % | | | 3.54 | % | | | 4.45 | % | |
Supplemental data | |
Net assets, end of year (in thousands) | | $ | 13,080 | | | $ | 16,012 | | | $ | 24,935 | | | $ | 57,335 | | | $ | 89,122 | | |
Portfolio turnover rate(e) | | | 100 | % | | | 85 | % | | | 168 | % | | | 137 | % | | | 86 | % | |
Notes to Financial Highlights
(a) Based on average shares outstanding.
(b) Total Return at Net Asset Value is calculated assuming an initial investment made at the net asset value at the beginning of the period, reinvestment of all dividends and distributions at net asset value during the period and redemption on the last day of the period. Total Return at Market is calculated assuming an initial investment made at the market price at the beginning of the period, reinvestment of all dividends and distributions at market price during the period and redemption on the last day of the period. The total return would have been lower if certain expenses had not been reimbursed/waived by the Investment Manager. The price used to calculate Market Price return is based on the midpoint of the 4:00 PM Eastern (U.S.) bid/ask spread on the NYSE and does not represent returns an investor would receive if shares were traded at other times. Total return calculated for a period of less than one year is not annualized.
(c) Effective April 1, 2013, EGA replaced the fee and expense structure with a Unitary Fee (as defined in Note 3).
(d) The ratio includes 0.04% for the period ended March 31, 2015 attributed to tax expense, which is outside the Unitary Fee (as defined in Note 3).
(e) The portfolio turnover rate is calculated without regard to purchase and sales transactions of short-term instruments, certain derivatives and in-kind transactions, if any. If such transactions were included, the Fund's portfolio turnover may be higher.
The accompanying Notes to Financial Statements are an integral part of these financial statements.
Annual Report 2017
89
FINANCIAL HIGHLIGHTS
Columbia EM Strategic Opportunities ETF (Consolidated)
| | | For the Year Ended March 31, | |
| | | 2017 | | 2016 | | 2015 | | 2014 | | 2013(a) | |
Per share data | |
Net asset value, beginning of year | | $ | 18.79 | | | $ | 23.10 | | | $ | 22.31 | | | $ | 22.16 | | | $ | 20.00 | | |
Net investment income(b) | | | 0.28 | | | | 0.32 | | | | 0.34 | | | | 0.23 | | | | 0.13 | | |
Net realized and unrealized gain (loss) | | | 0.24 | (c) | | | (4.06 | ) | | | 0.73 | | | | 0.14 | | | | 2.11 | | |
Total from investment operations | | | 0.52 | | | | (3.74 | ) | | | 1.07 | | | | 0.37 | | | | 2.24 | | |
Less distributions to shareholders: | |
Net investment income | | | (0.40 | ) | | | (0.57 | ) | | | (0.28 | ) | | | (0.22 | ) | | | (0.08 | ) | |
Net asset value, end of year | | $ | 18.91 | | | $ | 18.79 | | | $ | 23.10 | | | $ | 22.31 | | | $ | 22.16 | | |
Total Return at NAV(d) | | | 3.08 | % | | | (16.10 | )% | | | 4.82 | % | | | 1.70 | % | | | 11.23 | % | |
Total Return at Market(d) | | | 3.42 | % | | | (17.02 | )% | | | 4.84 | % | | | 1.32 | % | | | 12.13 | % | |
Ratios to average net assets of: | |
Expenses, prior to expense reimbursements/waivers(e)(f) | | | 0.85 | % | | | 0.85 | % | | | 0.85 | % | | | 0.85 | % | | | 4.53 | %(g) | |
Expenses, net of expense reimbursements/waivers(e)(f) | | | 0.65 | % | | | 0.84 | % | | | 0.85 | % | | | 0.85 | % | | | 0.85 | %(g) | |
Net Investment income, net of reimbursement/waivers | | | 1.50 | % | | | 1.53 | % | | | 1.43 | % | | | 1.09 | % | | | 1.02 | %(g) | |
Supplemental data | |
Net assets, end of year (in thousands) | | $ | 7,563 | | | $ | 15,032 | | | $ | 35,798 | | | $ | 23,429 | | | $ | 2,216 | | |
Portfolio turnover rate(h) | | | 20 | % | | | 38 | % | | | 8 | % | | | 159 | % | | | 57 | %(i) | |
Notes to Consolidated Financial Highlights
(a) Based on operations from August 15, 2012 (commencement of operations) through the stated period end.
(b) Based on average shares outstanding.
(c) The realized and unrealized gain on investments and foreign currency transactions does not accord with the amounts reported in the Statement of Operations due to the timing of subscriptions of fund shares in relation to the investment performance during the period and contributions made by Authorized Participants to compensate the Fund for additional costs incurred in purchasing securities that were not transferred in kind (See Note 1).
(d) Total Return at Net Asset Value is calculated assuming an initial investment made at the net asset value at the beginning of the period, reinvestment of all dividends and distributions at net asset value during the period and redemption on the last day of the period. Total Return at Market is calculated assuming an initial investment made at the market price at the beginning of the period, reinvestment of all dividends and distributions at market price during the period and redemption on the last day of the period. The total return would have been lower if certain expenses had not been reimbursed/waived by the Investment Manager. The price used to calculate Market Price return is based on the midpoint of the 4:00 PM Eastern (U.S.) bid/ask spread on the NYSE and does not represent returns an investor would receive if shares were traded at other times. Total return calculated for a period of less than one year is not annualized.
(e) Effective April 1, 2013, EGA replaced the fee and expense structure with a Unitary Fee (as defined in Note 3).
(f) Effective March 1, 2016, the Fund entered into a fee waiver agreement pursuant to which the Advisor has agreed to waive its advisory fee to 0.65% of the Fund's average daily net assets (See Note 3).
(g) Annualized.
(h) The portfolio turnover rate is calculated without regard to purchase and sales transactions of short-term instruments, certain derivatives and in-kind transactions, if any. If such transactions were included, the Fund's portfolio turnover may be higher.
(i) Not annualized.
The accompanying Notes to Financial Statements are an integral part of these financial statements.
Annual Report 2017
90
FINANCIAL HIGHLIGHTS
Columbia Emerging Markets Consumer ETF (Consolidated)
| | | For the Year Ended March 31, | |
| | | 2017 | | 2016 | | 2015 | | 2014 | | 2013 | |
Per share data | |
Net asset value, beginning of year | | $ | 22.60 | | | $ | 26.45 | | | $ | 26.53 | | | $ | 26.51 | | | $ | 24.77 | | |
Net investment income(a) | | | 0.18 | | | | 0.21 | | | | 0.25 | | | | 0.31 | | | | 0.17 | | |
Net realized and unrealized gain (loss) | | | 2.13 | | | | (3.83 | ) | | | (0.03 | ) | | | (0.09 | ) | | | 1.68 | | |
Total from investment operations | | | 2.31 | | | | (3.62 | ) | | | 0.22 | | | | 0.22 | | | | 1.85 | | |
Less distributions to shareholders: | |
Net investment income | | | (0.16 | ) | | | (0.23 | ) | | | (0.30 | ) | | | (0.20 | ) | | | (0.11 | ) | |
Net asset value, end of year | | $ | 24.75 | | | $ | 22.60 | | | $ | 26.45 | | | $ | 26.53 | | | $ | 26.51 | | |
Total Return at NAV(b) | | | 10.35 | % | | | (13.63 | )% | | | 0.88 | % | | | 0.82 | % | | | 7.46 | % | |
Total Return at Market(b) | | | 10.75 | % | | | (13.64 | )% | | | 0.74 | % | | | 0.59 | % | | | 7.52 | % | |
Ratios to average net assets of: | |
Expenses, prior to expense reimbursements/waivers(c) | | | 0.85 | %(d) | | | 0.85 | % | | | 0.83 | % | | | 0.84 | % | | | 1.23 | % | |
Expenses, net of expense reimbursements/waivers(c) | | | 0.85 | %(d) | | | 0.85 | % | | | 0.83 | % | | | 0.84 | % | | | 0.85 | % | |
Net Investment income, net of reimbursement/waivers | | | 0.77 | % | | | 0.86 | % | | | 0.92 | % | | | 1.20 | % | | | 0.68 | % | |
Supplemental data | |
Net assets, end of year (in thousands) | | $ | 741,171 | | | $ | 612,360 | | | $ | 1,145,158 | | | $ | 1,233,683 | | | $ | 885,476 | | |
Portfolio turnover rate(e) | | | 17 | % | | | 32 | % | | | 12 | % | | | 14 | % | | | 7 | % | |
Notes to Consolidated Financial Highlights
(a) Based on average shares outstanding.
(b) Total Return at Net Asset Value is calculated assuming an initial investment made at the net asset value at the beginning of the period, reinvestment of all dividends and distributions at net asset value during the period and redemption on the last day of the period. Total Return at Market is calculated assuming an initial investment made at the market price at the beginning of the period, reinvestment of all dividends and distributions at market price during the period and redemption on the last day of the period. The total return would have been lower if certain expenses had not been reimbursed/waived by the Investment Manager. The price used to calculate Market Price return is based on the midpoint of the 4:00 PM Eastern (U.S.) bid/ask spread on the NYSE and does not represent returns an investor would receive if shares were traded at other times. Total return calculated for a period of less than one year is not annualized.
(c) Effective April 1, 2013, EGA replaced the fee and expense structure with a Unitary Fee (as defined in Note 3).
(d) The ratio includes less than 0.01% for the year ended March 31, 2017 attributed to tax expense, which is outside the Unitary Fee (as defined in Note 3).
(e) The portfolio turnover rate is calculated without regard to purchase and sales transactions of short-term instruments, certain derivatives and in-kind transactions, if any. If such transactions were included, the Fund's portfolio turnover may be higher.
The accompanying Notes to Financial Statements are an integral part of these financial statements.
Annual Report 2017
91
FINANCIAL HIGHLIGHTS
Columbia Emerging Markets Core ETF (Consolidated)
| | | For the Year Ended March 31, | |
| | | 2017 | | 2016 | | 2015 | | 2014 | | 2013(a) | |
Per share data | |
Net asset value, beginning of year | | $ | 17.58 | | | $ | 20.27 | | | $ | 20.44 | | | $ | 20.87 | | | $ | 20.00 | | |
Net investment income(b) | | | 0.26 | | | | 0.30 | | | | 0.38 | | | | 0.36 | | | | 0.09 | | |
Net realized and unrealized gain (loss) | | | 1.48 | | | | (2.73 | ) | | | (0.13 | ) | | | (0.44 | ) | | | 0.82 | | |
Total from investment operations | | | 1.74 | | | | (2.43 | ) | | | 0.25 | | | | (0.08 | ) | | | 0.91 | | |
Less distributions to shareholders: | |
Net investment income | | | (0.23 | ) | | | (0.26 | ) | | | (0.42 | ) | | | (0.35 | ) | | | (0.04 | ) | |
Net asset value, end of year | | $ | 19.09 | | | $ | 17.58 | | | $ | 20.27 | | | $ | 20.44 | | | $ | 20.87 | | |
Total Return at NAV(c) | | | 10.08 | % | | | (11.91 | )% | | | 1.22 | % | | | (0.36 | )% | | | 4.55 | % | |
Total Return at Market(c) | | | 11.81 | % | | | (13.51 | )% | | | 1.87 | % | | | (1.02 | )% | | | 5.25 | % | |
Ratios to average net assets of: | |
Expenses, prior to expense reimbursements/waivers(d) | | | 0.70 | %(e) | | | 0.70 | % | | | 0.71 | %(f) | | | 0.70 | % | | | 11.94 | %(g) | |
Expenses, net of expense reimbursements/waivers(d) | | | 0.70 | %(e) | | | 0.70 | % | | | 0.71 | %(f) | | | 0.70 | % | | | 0.70 | %(g) | |
Net Investment income, net of reimbursement/waivers | | | 1.44 | % | | | 1.66 | % | | | 1.78 | % | | | 1.76 | % | | | 0.96 | %(g) | |
Supplemental data | |
Net assets, end of year (in thousands) | | $ | 4,772 | | | $ | 5,275 | | | $ | 5,068 | | | $ | 4,088 | | | $ | 4,173 | | |
Portfolio turnover rate(h) | | | 33 | % | | | 38 | % | | | 20 | % | | | 16 | % | | | 3 | %(i) | |
Notes to Consolidated Financial Highlights
(a) Based on operations from October 16, 2012 (commencement of operations) through the stated period end.
(b) Based on average shares outstanding.
(c) Total Return at Net Asset Value is calculated assuming an initial investment made at the net asset value at the beginning of the period, reinvestment of all dividends and distributions at net asset value during the period and redemption on the last day of the period. Total Return at Market is calculated assuming an initial investment made at the market price at the beginning of the period, reinvestment of all dividends and distributions at market price during the period and redemption on the last day of the period. The total return would have been lower if certain expenses had not been reimbursed/waived by the Investment Manager. The price used to calculate Market Price return is based on the midpoint of the 4:00 PM Eastern (U.S.) bid/ask spread on the NYSE and does not represent returns an investor would receive if shares were traded at other times. Total return calculated for a period of less than one year is not annualized.
(d) Effective April 1, 2013, EGA replaced the fee and expense structure with a Unitary Fee (as defined in Note 3).
(e) The ratio includes less than 0.01% for the year ended March 31, 2017 attributed to tax expense, which is outside the Unitary Fee (as defined in Note 3).
(f) The ratio includes 0.01% for the year ended March 31, 2015 attributed to tax expense, which is outside the Unitary Fee (as defined in Note 3).
(g) Annualized.
(h) The portfolio turnover rate is calculated without regard to purchase and sales transactions of short-term instruments, certain derivatives and in-kind transactions, if any. If such transactions were included, the Fund's portfolio turnover may be higher.
(i) Not annualized.
The accompanying Notes to Financial Statements are an integral part of these financial statements.
Annual Report 2017
92
FINANCIAL HIGHLIGHTS
Columbia India Consumer ETF (Consolidated)
| | | For the Year Ended March 31, | |
| | | 2017 | | 2016 | | 2015 | | 2014 | | 2013 | |
Per share data | |
Net asset value, beginning of year | | $ | 31.16 | | | $ | 35.48 | | | $ | 24.72 | | | $ | 22.10 | | | $ | 19.08 | | |
Net investment income (loss)(a) | | | (0.03 | ) | | | 0.04 | | | | (0.12 | ) | | | 0.11 | | | | (0.00 | )(b) | |
Net realized and unrealized gain (loss) | | | 7.21 | | | | (4.36 | ) | | | 10.91 | | | | 2.51 | | | | 3.02 | | |
Total from investment operations | | | 7.18 | | | | (4.32 | ) | | | 10.79 | | | | 2.62 | | | | 3.02 | | |
Less distributions to shareholders: | |
Net investment income | | | (0.03 | ) | | | — | | | | (0.03 | ) | | | — | | | | — | | |
Net asset value, end of year | | $ | 38.31 | | | $ | 31.16 | | | $ | 35.48 | | | $ | 24.72 | | | $ | 22.10 | | |
Total Return at NAV(c) | | | 23.06 | % | | | (12.18 | )% | | | 43.64 | % | | | 11.86 | % | | | 15.83 | % | |
Total Return at Market(c) | | | 23.67 | % | | | (12.57 | )% | | | 44.04 | % | | | 12.08 | % | | | 15.89 | % | |
Ratios to average net assets of: | |
Expenses, prior to expense reimbursements/waivers(d) | | | 0.89 | %(e) | | | 0.89 | % | | | 0.90 | %(f) | | | 0.89 | % | | | 4.31 | % | |
Expenses, net of expense reimbursements/waivers(d) | | | 0.89 | %(e) | | | 0.89 | % | | | 0.90 | %(f) | | | 0.89 | % | | | 0.89 | % | |
Net Investment income (loss), net of reimbursement/waivers | | | (0.09 | )% | | | 0.13 | % | | | (0.36 | )% | | | 0.50 | % | | | (0.00 | )%(b) | |
Supplemental data | |
Net assets, end of year (in thousands) | | $ | 88,102 | | | $ | 71,679 | | | $ | 88,710 | | | $ | 4,945 | | | $ | 6,631 | | |
Portfolio turnover rate(g) | | | 31 | % | | | 47 | % | | | 82 | % | | | 43 | % | | | 50 | % | |
Notes to Consolidated Financial Highlights
(a) Based on average shares outstanding.
(b) Rounds to zero.
(c) Total Return at Net Asset Value is calculated assuming an initial investment made at the net asset value at the beginning of the period, reinvestment of all dividends and distributions at net asset value during the period and redemption on the last day of the period. Total Return at Market is calculated assuming an initial investment made at the market price at the beginning of the period, reinvestment of all dividends and distributions at market price during the period and redemption on the last day of the period. The total return would have been lower if certain expenses had not been reimbursed/waived by the Investment Manager. The price used to calculate Market Price return is based on the midpoint of the 4:00 PM Eastern (U.S.) bid/ask spread on the NYSE and does not represent returns an investor would receive if shares were traded at other times. Total return calculated for a period of less than one year is not annualized.
(d) Effective April 1, 2013, EGA replaced the fee and expense structure with a Unitary Fee (as defined in Note 3).
(e) The ratio includes less than 0.01% for the year ended March 31, 2017 attributed to tax expense, which is outside the Unitary Fee (as defined in Note 3).
(f) The ratio includes 0.01% for the year ended March 31, 2015 attributed to tax expense, which is outside the Unitary Fee (as defined in Note 3).
(g) The portfolio turnover rate is calculated without regard to purchase and sales transactions of short-term instruments, certain derivatives and in-kind transactions, if any. If such transactions were included, the Fund's portfolio turnover may be higher.
The accompanying Notes to Financial Statements are an integral part of these financial statements.
Annual Report 2017
93
FINANCIAL HIGHLIGHTS
Columbia India Infrastructure ETF (Consolidated)
| | | For the Year Ended March 31, | |
| | | 2017 | | 2016 | | 2015 | | 2014 | | 2013 | |
Per share data | |
Net asset value, beginning of year | | $ | 10.24 | | | $ | 13.08 | | | $ | 11.35 | | | $ | 12.27 | | | $ | 14.99 | | |
Net investment income(a) | | | 0.03 | | | | 0.30 | | | | 0.12 | | | | 0.13 | | | | 0.07 | | |
Net realized and unrealized gain (loss) | | | 3.03 | | | | (3.04 | ) | | | 1.65 | (b) | | | 0.27 | | | | (2.60 | ) | |
Total from investment operations | | | 3.06 | | | | (2.74 | ) | | | 1.77 | | | | 0.40 | | | | (2.53 | ) | |
Less distributions to shareholders: | |
Net investment income | | | (0.32 | ) | | | (0.10 | ) | | | (0.04 | ) | | | (1.32 | ) | | | (0.19 | ) | |
Net asset value, end of year | | $ | 12.98 | | | $ | 10.24 | | | $ | 13.08 | | | $ | 11.35 | | | $ | 12.27 | | |
Total Return at NAV(c) | | | 30.61 | % | | | (21.00 | )% | | | 15.59 | % | | | 4.04 | % | | | (17.08 | )% | |
Total Return at Market(c) | | | 30.93 | % | | | (21.41 | )% | | | 15.93 | % | | | 4.49 | % | | | (16.45 | )% | |
Ratios to average net assets of: | |
Expenses, prior to expense reimbursements/waivers(d) | | | 0.98 | %(e) | | | 0.88 | %(f) | | | 0.88 | %(g) | | | 0.86 | %(h) | | | 1.61 | % | |
Expenses, net of expense reimbursements/waivers(d) | | | 0.98 | %(e) | | | 0.88 | %(f) | | | 0.88 | %(g) | | | 0.86 | %(h) | | | 0.85 | % | |
Net Investment income, net of reimbursement/waivers | | | 0.28 | % | | | 2.68 | % | | | 0.90 | % | | | 1.18 | % | | | 0.53 | % | |
Supplemental data | |
Net assets, end of year (in thousands) | | $ | 41,529 | | | $ | 39,938 | | | $ | 47,736 | | | $ | 17,586 | | | $ | 51,513 | | |
Portfolio turnover rate(i) | | | 34 | % | | | 59 | % | | | 75 | % | | | 76 | % | | | 24 | % | |
Notes to Consolidated Financial Highlights
(a) Based on average shares outstanding.
(b) The realized and unrealized gain on investments and foreign currency transactions does not accord with the amounts reported in the Statement of Operations due to the timing of subscriptions of fund shares in relation to the investment performance during the period and contributions made by Authorized Participants to compensate the Fund for additional costs incurred in purchasing securities that were not transferred in kind (See Note 1).
(c) Total Return at Net Asset Value is calculated assuming an initial investment made at the net asset value at the beginning of the period, reinvestment of all dividends and distributions at net asset value during the period and redemption on the last day of the period. Total Return at Market is calculated assuming an initial investment made at the market price at the beginning of the period, reinvestment of all dividends and distributions at market price during the period and redemption on the last day of the period. The total return would have been lower if certain expenses had not been reimbursed/waived by the Investment Manager. The price used to calculate Market Price return is based on the midpoint of the 4:00 PM Eastern (U.S.) bid/ask spread on the NYSE and does not represent returns an investor would receive if shares were traded at other times. Total return calculated for a period of less than one year is not annualized.
(d) Effective April 1, 2013, EGA replaced the fee and expense structure with a Unitary Fee (as defined in Note 3).
(e) The ratio includes 0.13% for the year ended March 31, 2017 attributed to tax expense, which is outside the Unitary Fee (as defined in Note 3).
(f) The ratio includes 0.03% for the year ended March 31, 2016 attributed to tax expense, which is outside the Unitary Fee (as defined in Note 3).
(g) The ratio includes 0.03% for the year ended March 31, 2015 attributed to tax expense, which is outside the Unitary Fee (as defined in Note 3).
(h) The ratio includes 0.01% for the year ended March 31, 2014 attributed to tax expense, which is outside the Unitary Fee (as defined in Note 3).
(i) The portfolio turnover rate is calculated without regard to purchase and sales transactions of short-term instruments, certain derivatives and in-kind transactions, if any. If such transactions were included, the Fund's portfolio turnover may be higher.
The accompanying Notes to Financial Statements are an integral part of these financial statements.
Annual Report 2017
94
FINANCIAL HIGHLIGHTS
Columbia India Small Cap ETF (Consolidated)
| | | For the Year Ended March 31, | |
| | | 2017 | | 2016 | | 2015 | | 2014 | | 2013 | |
Per share data | |
Net asset value, beginning of year | | $ | 13.59 | | | $ | 17.48 | | | $ | 12.74 | | | $ | 12.45 | | | $ | 14.39 | | |
Net investment income (loss)(a) | | | (0.02 | ) | | | 0.06 | | | | 0.05 | | | | 0.26 | | | | 0.10 | | |
Net realized and unrealized gain (loss) | | | 4.82 | | | | (3.86 | ) | | | 4.77 | | | | 0.25 | | | | (1.94 | ) | |
Total from investment operations | | | 4.80 | | | | (3.80 | ) | | | 4.82 | | | | 0.51 | | | | (1.84 | ) | |
Less distributions to shareholders: | |
Net investment income | | | (0.13 | ) | | | (0.09 | ) | | | (0.08 | ) | | | (0.22 | ) | | | (0.10 | ) | |
Return of capital | | | — | | | | — | | | | — | | | | — | | | | (0.00 | )(b) | |
Total distribution to shareholders | | | (0.13 | ) | | | (0.09 | ) | | | (0.08 | ) | | | (0.22 | ) | | | (0.10 | ) | |
Net asset value, end of year | | $ | 18.26 | | | $ | 13.59 | | | $ | 17.48 | | | $ | 12.74 | | | $ | 12.45 | | |
Total Return at NAV(c) | | | 35.62 | % | | | (21.78 | )% | | | 37.86 | % | | | 4.29 | % | | | (12.87 | )% | |
Total Return at Market(c) | | | 36.29 | % | | | (22.27 | )% | | | 39.17 | % | | | 4.30 | % | | | (13.69 | )% | |
Ratios to average net assets of: | |
Expenses, prior to expense reimbursements/waivers(d) | | | 0.86 | %(e) | | | 0.86 | %(f) | | | 0.92 | %(g) | | | 0.86 | %(h) | | | 2.09 | % | |
Expenses, net of expense reimbursements/waivers(d) | | | 0.86 | %(e) | | | 0.86 | %(f) | | | 0.92 | %(g) | | | 0.86 | %(h) | | | 0.85 | % | |
Net Investment income (loss), net of reimbursement/waivers | | | (0.12 | )% | | | 0.40 | % | | | 0.33 | % | | | 2.36 | % | | | 0.76 | % | |
Supplemental data | |
Net assets, end of year (in thousands) | | $ | 25,565 | | | $ | 19,027 | | | $ | 28,850 | | | $ | 16,560 | | | $ | 21,163 | | |
Portfolio turnover rate(i) | | | 71 | % | | | 45 | % | | | 117 | % | | | 56 | % | | | 43 | % | |
Notes to Consolidated Financial Highlights
(a) Based on average shares outstanding.
(b) Rounds to zero.
(c) Total Return at Net Asset Value is calculated assuming an initial investment made at the net asset value at the beginning of the period, reinvestment of all dividends and distributions at net asset value during the period and redemption on the last day of the period. Total Return at Market is calculated assuming an initial investment made at the market price at the beginning of the period, reinvestment of all dividends and distributions at market price during the period and redemption on the last day of the period. The total return would have been lower if certain expenses had not been reimbursed/waived by the Investment Manager. The price used to calculate Market Price return is based on the midpoint of the 4:00 PM Eastern (U.S.) bid/ask spread on the NYSE and does not represent returns an investor would receive if shares were traded at other times. Total return calculated for a period of less than one year is not annualized.
(d) Effective April 1, 2013, EGA replaced the fee and expense structure with a Unitary Fee (as defined in Note 3).
(e) The ratio includes 0.01% for the year ended March 31, 2017 attributed to tax expense, which is outside the Unitary Fee (as defined in Note 3).
(f) The ratio includes 0.01% for the year ended March 31, 2016 attributed to tax expense, which is outside the Unitary Fee (as defined in Note 3).
(g) The ratio includes 0.07% for the year ended March 31, 2015 attributed to tax expense, which is outside the Unitary Fee (as defined in Note 3).
(h) The ratio includes 0.01% for the year ended March 31, 2014 attributed to tax expense, which is outside the Unitary Fee (as defined in Note 3).
(i) The portfolio turnover rate is calculated without regard to purchase and sales transactions of short-term instruments, certain derivatives and in-kind transactions, if any. If such transactions were included, the Fund's portfolio turnover may be higher.
The accompanying Notes to Financial Statements are an integral part of these financial statements.
Annual Report 2017
95
NOTES TO FINANCIAL STATEMENTS
March 31, 2017
Note 1. Organization
Columbia ETF Trust II (the Trust) is registered under the Investment Company Act of 1940, as amended (the 1940 Act), as an open-end management investment company organized as a Delaware statutory trust. The Trust may issue an unlimited number of shares (without par value).
Information presented in these financial statements pertains to the following series of the Trust (each, a Fund and collectively, the Funds): Columbia Beyond BRICs ETF, Columbia EM Core ex-China ETF, Columbia EM Quality Dividend ETF, Columbia EM Strategic Opportunities ETF, Columbia Emerging Markets Consumer ETF, Columbia Emerging Markets Core ETF, Columbia India Consumer ETF, Columbia India Infrastructure ETF, and Columbia India Small Cap ETF. Each Fund is a diversified fund, except for Columbia EM Core ex-China ETF, Columbia Emerging Markets Consumer ETF, Columbia India Consumer ETF, Columbia India Infrastructure ETF, and Columbia India Small Cap ETF.
On May 11, 2016, Columbia Management Investment Advisers, LLC (Columbia Management or the investment manager), a wholly-owned subsidiary of Ameriprise Financial, Inc. (Ameriprise Financial), entered into an agreement to acquire Emerging Global Advisors, LLC, the Funds' former investment manager (EGA), including the business of serving as investment adviser to the Funds (the Transaction). Columbia Management completed the Transaction on September 1, 2016 (the Closing). In connection with the Closing, certain changes have occurred, including a change in the entity serving as each Fund's investment adviser.
On September 14, 2016, the Board of Trustees approved changes to the names of the Funds and the Trust effective October 19, 2016. Prior to October 19, 2016, the Trust was named EGA Emerging Global Shares Trust. In addition, the Funds changed their names as follows:
Former Fund Name | | Current Fund Name (effective
October 19, 2016) | |
EGShares Beyond BRICs ETF | | Columbia Beyond BRICs ETF | |
EGShares EM Core ex-China ETF | | Columbia EM Core ex-China ETF | |
EGShares EM Quality Dividend ETF | | Columbia EM Quality Dividend ETF | |
EGShares EM Strategic
Opportunities ETF | | Columbia EM Strategic
Opportunities ETF | |
EGShares Emerging Markets
Consumer ETF | | Columbia Emerging Markets
Consumer ETF | |
EGShares Emerging Markets
Core ETF | | Columbia Emerging Markets
Core ETF | |
Former Fund Name | | Current Fund Name (effective
October 19, 2016) | |
EGShares India Consumer ETF | | Columbia India Consumer ETF | |
EGShares India Infrastructure ETF | | Columbia India Infrastructure ETF | |
EGShares India Small Cap ETF | | Columbia India Small Cap ETF | |
The classifications and presentations within the Portfolios of Investments are consistent with other funds in the Columbia Fund family and may not depict the same classifications and presentations in certain marketing materials.
Basis for Consolidation
The Consolidated Portfolios of Investments; Consolidated Statements of Assets and Liabilities, of Operations and of Changes in Net Assets; and the Consolidated Financial Highlights of the Funds listed below include the accounts of wholly owned subsidiaries. All inter-company accounts and transactions have been eliminated in consolidations.
Funds | | Wholly Owned Subsidiary | |
Columbia EM Strategic
Opportunities ETF | | EG Shares Emerging Markets
Domestic Demand Mauritius | |
Columbia Emerging Markets
Consumer ETF | | EG Shares Consumer Mauritius
| |
Columbia Emerging Markets
Core ETF | | EG Shares Emerging Markets Core
Mauritius | |
Columbia EM Quality
Dividend ETF* | | EG Shares High Income/Low Beta
Mauritius* | |
Columbia India Consumer ETF
| | EG Shares India Consumer
Mauritius | |
Columbia India Infrastructure ETF
| | EG Shares India Infrastructure
Mauritius | |
Columbia India Small Cap ETF
| | EG Shares India Small Cap
Mauritius | |
*EG Shares High Income/Low Beta Mauritius was closed effective June 23, 2015 and is no longer a subsidiary of the Columbia EM Quality Dividend ETF.
As of the date of this report, the Columbia EM Strategic Opportunities ETF, Columbia Emerging Markets Consumer ETF and Columbia Emerging Markets Core ETF may each invest its respective assets in a separate wholly owned subsidiary in Mauritius, which in turn invests substantially all (but at least 90%) of its assets in Indian securities.
As of the date of this report, each of the Columbia India Consumer ETF, Columbia India Infrastructure ETF and Columbia India Small Cap ETF invest substantially all of their respective assets in separate wholly owned subsidiaries in Mauritius, which in turn invest at least 90% of their respective assets in Indian securities.
By investing in a wholly owned subsidiary, each Fund listed in the table above obtains potential tax benefits
Annual Report 2017
96
NOTES TO FINANCIAL STATEMENTS (continued)
March 31, 2017
under a tax treaty between Mauritius and India if the Funds' subsidiary satisfies certain limitations on benefit conditions under the treaty. India and Mauritius signed a protocol amending the India-Mauritius tax treaty, which will likely result in the imposition of Indian tax on gains resulting from the alienation of shares in an Indian company if the shares were acquired by a subsidiary on or after April 1, 2017. From April 1, 2017 through March 31, 2019, such gains will be taxed at 50% of the
applicable Indian tax rate under certain circumstances, which none of the Funds qualify for. Gains resulting from the alienation of shares acquired by a Subsidiary prior to April 1, 2017 will continue to be exempt from Indian tax under the India-Mauritius tax treaty. These changes will likely reduce each Fund's return on investments in shares of Indian companies as well as the returns received by each Fund's shareholders. For more information, see India-Mauritius Tax Treaty Risk.
A summary of each Fund's investment in its corresponding subsidiary is as follows:
Funds | | % of Consolidated
Fund Net Assets | | Net Assets ($) | | Net Investment
Income (Loss) ($) | | Net Realized
Gain (Loss) ($) | | Net Change in
Unrealized Appreciation
(Depreciation) ($) | |
Columbia EM Strategic Opportunities ETF | | | 13.8 | | | | 1,041,814 | | | | 17,643 | | | | (20,989 | ) | | | 16,645 | | |
Columbia Emerging Markets Consumer ETF | | | 10.5 | | | | 77,606,885 | | | | 569,995 | | | | 518,798 | | | | 14,927,194 | | |
Columbia Emerging Markets Core ETF | | | 13.6 | | | | 649,108 | | | | 6,004 | | | | 385 | | | | 104,975 | | |
Columbia India Consumer ETF | | | 99.5 | | | | 87,640,736 | | | | 628,542 | | | | 536,341 | | | | 16,323,119 | | |
Columbia India Infrastructure ETF | | | 99.8 | | | | 41,445,496 | | | | 525,367 | | | | (1,068,304 | ) | | | 10,976,366 | | |
Columbia India Small Cap ETF | | | 100.1 | | | | 25,590,253 | | | | 149,253 | | | | 2,856,803 | | | | 3,589,681 | | |
Fund Shares
The market prices of each Fund's shares may differ to some degree from the Fund's net asset value (NAV). Unlike conventional mutual funds, each Fund issues and redeems shares on a continuous basis, at NAV, only in a large specified number of shares, each called a "Creation Unit." A Creation Unit consists of 50,000 shares. Creation Units are issued and redeemed generally in-kind for a basket of securities and/or for cash. Investors such as market makers, large investors and institutions who wish to deal in Creation Units directly with a Fund must have entered into an authorized participant agreement (Authorized Participants) with the principal underwriter and the transfer agent, or purchase through a dealer that has entered into such an agreement. Authorized participants may purchase or redeem Fund shares directly from the Fund only in Creation Units. The Funds' shares are also listed on the New York Stock Exchange for which investors can purchase and sell shares on the secondary market through a broker at market prices which may differ from the NAV of the Fund.
Note 2. Summary of Significant Accounting Policies
Basis of Preparation
Each Fund is an investment company that applies the accounting and reporting guidance in the Financial Accounting Standards Board (FASB) Accounting Standards Codification Topic 946, Financial Services — Investment Companies (ASC 946). The financial
statements are prepared in accordance with U.S. generally accepted accounting principles (GAAP), which requires management to make certain estimates and assumptions that affect the reported amounts of assets and liabilities, the disclosure of contingent assets and liabilities at the date of the financial statements, and the reported amounts of income and expenses during the reporting period. Actual amounts could differ from those estimates. The following is a summary of significant accounting policies followed by the Funds in the preparation of their financial statements.
Security Valuation
All equity securities are valued at the close of business of the New York Stock Exchange. Equity securities are valued at the last quoted sales price on the principal exchange or market on which they trade, except for securities traded on the NASDAQ Stock market, which are valued at the NASDAQ official close price. Unlisted securities or listed securities for which there were no sales during the day are valued at the mean of the latest quoted bid and ask prices on such exchanges or markets.
Foreign equity securities are valued based on the closing price on the foreign exchange in which such securities are primarily traded. If any foreign equity security closing prices are not readily available, the securities are valued at the mean of the latest quoted bid and ask prices on such exchanges or markets. Foreign currency exchange rates are generally determined at the close of London's exchange at 11:00 a.m. Eastern (U.S.) time.
Annual Report 2017
97
NOTES TO FINANCIAL STATEMENTS (continued)
March 31, 2017
Investments for which market quotations are not readily available, or that have quotations which management believes are not reflective of market value or reliable, are valued at fair value as determined in good faith under procedures approved by and under the general supervision of the Board of Trustees. If a security or class of securities (such as foreign securities) is valued at fair value, such value is likely to be different from the quoted or published price for the security.
The determination of fair value often requires significant judgment. To determine fair value, management may use assumptions including but not limited to future cash flows and estimated risk premiums. Multiple inputs from various sources may be used to determine fair value.
GAAP requires disclosure regarding the inputs and valuation techniques used to measure fair value and any changes in valuation inputs or techniques. In addition, investments shall be disclosed by major category. This information is disclosed following the Fund's Portfolio of Investments.
Foreign Currency Transactions and Translations
The values of all assets and liabilities denominated in foreign currencies are generally translated into U.S. dollars at exchange rates determined at the close of the London Stock Exchange on any given day. Net realized and unrealized gains (losses) on foreign currency transactions and translations include gains (losses) arising from the fluctuation in exchange rates between trade and settlement dates on securities transactions, gains (losses) arising from the disposition of foreign currency and currency gains (losses) between the accrual and payment dates on dividends, interest income and foreign withholding taxes.
For financial statement purposes, the Funds do not distinguish that portion of gains (losses) on investments which is due to changes in foreign exchange rates from that which is due to changes in market prices of the investments. Such fluctuations are included with the net realized and unrealized gains (losses) on investments in the Statement of Operations.
Security Transactions
Security transactions are accounted for on the trade date. Cost is determined and gains (losses) are based upon the specific identification method for both financial statement and federal income tax purposes.
Income Recognition
Corporate actions and dividend income are generally recorded net of any non-reclaimable tax withholdings, on
the ex-dividend date or upon receipt of ex-dividend notification in the case of certain foreign securities.
Interest income is recorded on an accrual basis.
Awards from class action litigation are recorded as a reduction of cost basis if the Fund still owns the applicable securities on the payment date. If the Fund no longer owns the applicable securities, the proceeds are recorded as realized gains.
Expenses
General expenses of the Trust are allocated to the Funds based upon relative net assets or other expense allocation methodologies determined by the nature of the expense. Expenses directly attributable to a Fund are charged to that Fund.
Determination of Net Asset Value
The NAV per share of each Fund is computed by dividing the value of the net assets of a Fund by the total number of outstanding shares of that Fund, rounded to the nearest cent, at the close of regular trading (ordinarily 4:00 p.m. Eastern Time) every day the New York Stock Exchange is open.
Federal Income Tax Status
For federal income tax purposes, each Fund is treated as a separate entity. Each Fund intends to qualify each year as a regulated investment company under Subchapter M of the Internal Revenue Code, as amended, and will distribute substantially all of its taxable income (including net short-term capital gains), if any, for its tax year, and as such will not be subject to federal income taxes. In addition, each Fund intends to distribute in each calendar year substantially all of its net investment income, capital gains and certain other amounts, if any, such that the Fund should not be subject to federal excise tax. Therefore, no federal income or excise tax provisions are recorded.
Foreign taxes
The Funds may be subject to foreign taxes on income, gains on investments or currency repatriation, a portion of which may be recoverable. The Fund will accrue such taxes and recoveries, as applicable, based upon its current interpretation of tax rules and regulations that exist in the markets in which it invests.
Realized gains in certain countries may be subject to foreign taxes at the Fund level, based on statutory rates. The Fund accrues for such foreign taxes on realized and unrealized gains at the appropriate rate for each jurisdiction, as applicable. The amount, if any, is disclosed as a liability on the Statement of Assets and Liabilities.
Annual Report 2017
98
NOTES TO FINANCIAL STATEMENTS (continued)
March 31, 2017
Distributions to Shareholders
Distributions from net investment income, if any, are declared and paid each calendar quarter for Columbia EM Quality Dividend ETF. The remaining Funds declare and distribute net investment income annually. Net realized capital gains, if any, are distributed at least annually. Income distributions and capital gain distributions are determined in accordance with federal income tax regulations, which may differ from GAAP.
Guarantees and Indemnifications
Under the Trust's organizational documents and, in some cases by contract, its officers and trustees are indemnified against certain liabilities arising out of the performance of their duties to the Trust or its funds. In addition, certain of the Funds' contracts with their service providers contain general indemnification clauses. The Funds' maximum exposure under these arrangements is unknown since the amount of any future claims that may be made against the Funds cannot be determined, and the Funds have no historical basis for predicting the likelihood of any such claims.
Investment Company Reporting Modernization
In October 2016, the U.S. Securities and Exchange Commission adopted new rules and forms, and amendments to certain current rules and forms, to modernize reporting and disclosure of information by registered investment companies. The amendments to Regulation S-X will require standardized, enhanced disclosure about derivatives in investment company financial statements, and will also change the rules governing the form and content of such financial statements. The amendments to Regulation S-X take effect on August 1, 2017. At this time, management is assessing the anticipated impact of these regulatory developments.
Note 3. Fees and Other Transactions with Affiliates
Investment Management Fees
Effective September 1, 2016, Columbia Management, under the Investment Management Services Agreement (the New Agreement) for Columbia Beyond BRICs ETF, Columbia EM Core ex-China ETF, Columbia EM Quality Dividend ETF, Columbia Emerging Markets Consumer ETF and Columbia India Small Cap ETF and under the Interim Investment Advisory Agreement for Columbia India Infrastructure ETF, Columbia India Consumer ETF, Columbia Emerging Markets Core ETF and Columbia EM Strategic Opportunities ETF (the Interim Agreement ETFs), determines which securities will be purchased,
held or sold. Effective September 30, 2016, shareholders of the Interim Agreement ETFs approved the New Agreement and subsequently, effective October 1, 2016, the Interim Agreement ETFs began operating under the New Agreement. The investment management fee is a unitary fee paid monthly to the Investment Manager at an annual rate based on each Fund's average daily net assets. In return for this fee, the Investment Manager pays the operating costs and expenses of each Fund other than the following expenses (which will be paid by the Fund): taxes; interest incurred on borrowing by the Fund (including but not limited to overdraft fees), if any; brokerage expenses, fees, commission and other portfolio transaction expenses (including but not limited to service fees charged by custodians of depository receipts and scrip fees related to registrations on foreign exchanges); interest and fee expense related to the Fund's participation in inverse floater structures; infrequent and/or unusual expenses, including without limitation litigation expenses (including but not limited to arbitrations and indemnification expenses); distribution and/or service fees; expenses incurred in connection with lending securities; and any other infrequent and/or unusual expenses approved by the Board of Trustees.
Prior to September 1, 2016, the Funds also had a unitary fee structure pursuant to which EGA was contractually obligated to pay all ordinary operating expenses of the Funds, except for the fee payment under the investment advisory agreements between EGA and the Trust, payments under each series' Rule 12b-1 plan (if ever implemented), brokerage expenses, taxes, interest, litigation expenses and other non-routine or extraordinary expenses. The investment management fee is an annual fee that is equal to a percentage of each Fund's average daily net assets and is paid as follows:
Fund | | Assets
(billions) | | Investment
Management
Fee Rate (%) | |
Columbia Beyond BRICs ETF | | All | | | 0.85 | | |
Columbia EM Core ex-China ETF | | All | | | 0.70 | | |
Columbia EM Quality Dividend ETF | | All | | | 0.85 | | |
Columbia EM Strategic Opportunities ETF | | All | | | 0.85 | | |
Columbia Emerging Markets
Consumer ETF
| | $ | 0 - $1.0
>$1.0 - $2.0
>$2.0 | | | | 0.85
0.75
0.70 | | |
Columbia Emerging Markets Core ETF | | All | | | 0.70 | | |
Columbia India Consumer ETF | | All | | | 0.89 | | |
Columbia India Infrastructure ETF | | All | | | 0.85 | | |
Columbia India Small Cap ETF | | All | | | 0.85 | | |
Annual Report 2017
99
NOTES TO FINANCIAL STATEMENTS (continued)
March 31, 2017
The annualized effective management services fee rate for the year ended March 31, 2017 was 0.85% of the Columbia Emerging Markets Consumer ETF's average daily net assets.
The Investment Manager has contractually agreed to waive all or a portion of the investment management fee for the periods disclosed below, so that each Fund's investment management fee is limited as a percentage of the respective Fund's average daily net assets:
| | | September 1, 2016
Through
August 31, 2018 | | Prior to
September 1, 2016 | |
Columbia Beyond
BRICs ETF | | | 0.58 | % | | | 0.58 | % | |
Columbia EM Core
ex-China ETF | | | 0.35 | | | | 0.35 | | |
Columbia EM Strategic
Opportunities ETF | | | 0.65 | | | | 0.65 | | |
Other Expenses
Other expenses are for, among other things, miscellaneous expenses of the Funds or the Board of Trustees, including payments to Board Services Corp., a company providing limited administrative services to the Funds and the Board of Trustees. That company's expenses include boardroom and office expense, employee compensation, employee health and retirement benefits, and certain other expenses. The other expenses allocated to the Funds are payable by the Investment Manager. This arrangement became effective September 1, 2016.
Compensation of Board Members
Members of the Board of Trustees, who are not officers or employees of the Investment Manager or Ameriprise Financial, are compensated for their services to the Funds as disclosed in the Statement of Operations. Under a Deferred Compensation Plan (the Plan), these
members of the Board of Trustees may elect to defer payment of up to 100% of their compensation. Deferred amounts are treated as though equivalent dollar amounts had been invested in shares of certain funds managed by the Investment Manager. Each Fund's liability for these amounts is adjusted for market value changes and remains in the Fund until distributed in accordance with the Plan. All amounts payable under the Plan constitute a general unsecured obligation of the Funds. The expenses of the compensation of the members of the Board of Trustees that are allocated to the Funds are payable by the Investment Manager. This arrangement became effective September 1, 2016.
Compensation of Chief Compliance Officer
The Board of Trustees has appointed a Chief Compliance Officer to the Funds in accordance with federal securities regulations. A portion of the Chief Compliance Officer's total compensation is allocated to the Funds, along with other affiliated funds governed by the Board of Trustees, based on relative net assets. The expenses of the Chief Compliance Officer allocated to the Funds are payable by the Investment Manager. This arrangement became effective September 1, 2016. The total amount allocated to all affiliated funds governed by the Board of Trustees will not exceed $40,000 annually.
Distribution and Service Fees
ALPS Distributors, Inc., (the Distributor) serves as the distributor for the Funds. The Funds have adopted a distribution and service plan (the Plan). Under the Plan, the Funds are authorized to pay distribution fees to the Distributor and other firms that provide distribution and shareholder services at the maximum annual rate of 0.25% of average daily net assets of each Fund. No distribution or service fees are currently paid by the Funds or have been approved for payment by the Board of Trustees, however, and there are no current plans to impose these fees.
Note 4. Federal Tax Information
The timing and character of income and capital gain distributions are determined in accordance with income tax regulations, which may differ from GAAP because of temporary or permanent book to tax differences.
At March 31, 2017, these differences are primarily due to differing treatments for deferral/reversal of wash sale losses, foreign currency transactions and passive foreign investment company (PFIC) holdings. To the extent these differences are permanent, reclassifications are made among the components of the applicable Fund's net assets in the Statement of Assets and Liabilities.
Annual Report 2017
100
NOTES TO FINANCIAL STATEMENTS (continued)
March 31, 2017
Temporary differences do not require reclassifications. In the Statement of Assets and Liabilities the following reclassifications were made:
Funds | | Undistributed (excess of
distributions over) Net
Investment Income ($) | | Accumulated
Net Realized
Gain (Loss) ($) | | Paid-in Capital
Increase
(Decrease) ($) | |
Columbia Beyond BRICs ETF | | | (420,993 | ) | | | 2,578,223 | | | | (2,157,230 | ) | |
Columbia EM Core ex-China ETF | | | (25,541 | ) | | | 25,541 | | | | — | | |
Columbia EM Quality Dividend ETF | | | (71,522 | ) | | | 127,965 | | | | (56,443 | ) | |
Columbia EM Strategic Opportunities ETF | | | 3,027 | | | | 388,292 | | | | (391,319 | ) | |
Columbia Emerging Markets Consumer ETF | | | 35,787 | | | | (51,315 | ) | | | 15,528 | | |
Columbia Emerging Markets Core ETF | | | 707 | | | | (88,110 | ) | | | 87,403 | | |
Columbia India Consumer ETF | | | 123,787 | | | | (124,670 | ) | | | 883 | | |
Columbia India Infrastructure ETF | | | (74,698 | ) | | | 74,698 | | | | — | | |
Columbia India Small Cap ETF | | | 68,454 | | | | (68,454 | ) | | | — | | |
Net investment income (loss) and net realized gains (losses), as disclosed in the Statement of Operations, and net assets were not affected by these reclassifications.
The tax character of distributions paid during the years indicated was as follows:
| | Year Ended
March 31, 2017 | | Year Ended
March 31, 2016 | |
Funds | | Ordinary
Income ($) | | Ordinary
Income ($) | |
Columbia Beyond BRICs ETF | | | 1,842,516 | | | | 6,442,630 | | |
Columbia EM Core ex-China ETF | | | 126,499 | | | | 25,672 | | |
Columbia EM Quality Dividend ETF | | | 331,695 | | | | 552,553 | | |
Columbia EM Strategic Opportunities ETF | | | 222,458 | | | | 428,513 | | |
Columbia Emerging Markets Consumer ETF | | | 4,854,400 | | | | 6,520,768 | | |
Columbia Emerging Markets Core ETF | | | 58,710 | | | | 77,847 | | |
Columbia India Consumer ETF | | | 72,600 | | | | — | | |
Columbia India Infrastructure ETF | | | 1,015,616 | | | | 369,715 | | |
Columbia India Small Cap ETF | | | 160,975 | | | | 132,552 | | |
Short-term capital gain distributions, if any, are considered ordinary income distributions for tax purposes.
At March 31, 2017, the components of distributable earnings on a tax basis were as follows:
| Funds Undistributed | | Capital
Ordinary
Income ($) | | Net Unrealized
Loss
Carryforwards ($) | | Total Accumulated
Appreciation
(Depreciation) ($) | | Earnings
(Losses) ($) | |
Columbia Beyond BRICs ETF | | | 550,404 | | | | (56,395,798 | ) | | | (12,751,455 | ) | | | (68,596,849 | ) | |
Columbia EM Core ex-China ETF | | | 22,019 | | | | (98,392 | ) | | | 1,514,324 | | | | 1,437,951 | | |
Columbia EM Quality Dividend ETF | | | 511 | | | | (27,996,655 | ) | | | 116,184 | | | | (27,879,960 | ) | |
Columbia EM Strategic Opportunities ETF | | | 15,590 | | | | (3,417,489 | ) | | | (797,396 | ) | | | (4,199,295 | ) | |
Columbia Emerging Markets Consumer ETF | | | 491,299 | | | | (136,990,154 | ) | | | 3,230,313 | | | | (133,268,542 | ) | |
Columbia Emerging Markets Core ETF | | | 19,904 | | | | (802,977 | ) | | | 195,541 | | | | (587,532 | ) | |
Columbia India Consumer ETF | | | 49,782 | | | | (7,312,658 | ) | | | 14,402,042 | | | | 7,139,166 | | |
Columbia India Infrastructure ETF | | | 41,370 | | | | (57,717,708 | ) | | | 4,030,894 | | | | (53,645,444 | ) | |
Columbia India Small Cap ETF | | | 49,345 | | | | (11,782,187 | ) | | | 662,095 | | | | (11,070,747 | ) | |
Annual Report 2017
101
NOTES TO FINANCIAL STATEMENTS (continued)
March 31, 2017
At March 31, 2017, the cost of investments for federal income tax purposes along with the aggregate gross unrealized appreciation and depreciation based on that cost was:
Funds | | Tax Cost ($) | | Gross
Unrealized
Appreciation ($) | | Gross
Unrealized
Depreciation ($) | | Net
Appreciation
(Depreciation) ($) | |
Columbia Beyond BRICs ETF | | | 82,776,400 | | | | 4,159,626 | | | | (16,925,475 | ) | | | (12,765,849 | ) | |
Columbia EM Core ex-China ETF | | | 9,498,207 | | | | 1,882,339 | | | | (370,041 | ) | | | 1,512,298 | | |
Columbia EM Quality Dividend ETF | | | 12,884,209 | | | | 864,016 | | | | (748,265 | ) | | | 115,751 | | |
Columbia EM Strategic Opportunities ETF | | | 8,325,906 | | | | 581,749 | | | | (1,379,146 | ) | | | (797,397 | ) | |
Columbia Emerging Markets Consumer ETF | | | 735,784,592 | | | | 116,414,213 | | | | (113,188,605 | ) | | | 3,225,608 | | |
Columbia Emerging Markets Core ETF | | | 4,556,807 | | | | 628,233 | | | | (432,656 | ) | | | 195,577 | | |
Columbia India Consumer ETF | | | 73,231,850 | | | | 16,888,067 | | | | (2,486,404 | ) | | | 14,401,663 | | |
Columbia India Infrastructure ETF | | | 37,302,367 | | | | 8,229,584 | | | | (4,198,803 | ) | | | 4,030,781 | | |
Columbia India Small Cap ETF | | | 24,816,418 | | | | 2,911,879 | | | | (2,250,247 | ) | | | 661,632 | | |
The following capital loss carryforward, determined at March 31, 2017, may be available to reduce taxable income arising from future net realized gains on investments, if any, to the extent permitted by the Internal Revenue Code:
| | | Carryforwards with No Expiration | |
Funds | | Short-Term Capital Loss
Carryforward ($) | | Long-Term Capital Loss
Carryforward ($) | |
Columbia Beyond BRICs ETF | | | 17,902,657 | | | | 38,493,141 | | |
Columbia EM Core ex-China ETF | | | 98,183 | | | | 209 | | |
Columbia EM Quality Dividend ETF | | | 21,759,775 | | | | 6,236,880 | | |
Columbia EM Strategic Opportunities ETF | | | 1,789,212 | | | | 1,628,277 | | |
Columbia Emerging Markets Consumer ETF | | | 865,714 | | | | 136,124,440 | | |
Columbia Emerging Markets Core ETF | | | 154,352 | | | | 648,625 | | |
Columbia India Consumer ETF | | | 5,017,068 | | | | 2,295,590 | | |
Columbia India Infrastructure ETF | | | 16,659,491 | | | | 41,058,217 | | |
Columbia India Small Cap ETF | | | 2,606,001 | | | | 9,176,186 | | |
Capital loss carryforwards with no expiration are required to be utilized prior to any capital losses which carry an expiration date. As a result of this ordering rule, capital loss carryforwards which carry an expiration date may be more likely to expire unused.
Management of the Funds has concluded that there are no significant uncertain tax positions in the Funds that would require recognition in the financial statements. However, management's conclusion may be subject to review and adjustments at a later date based on factors including, but not limited to, new tax laws, regulations, and administrative interpretations (including relevant court decisions). Generally the Funds' federal tax returns for the prior three fiscal years remain subject to examination by the Internal Revenue Service.
Note 5. Portfolio Information
The cost of purchases and proceeds from sales of securities, excluding short-term investments and in-kind transactions, for the year ended March 31, 2017, were as follows:
Funds | | Purchases ($) | | Sales ($) | |
Columbia Beyond BRICs ETF | | | 29,763,846 | | | | 38,526,756 | | |
Columbia EM Core ex-China ETF | | | 7,642,765 | | | | 2,706,992 | | |
Columbia EM Quality Dividend ETF | | | 14,404,536 | | | | 16,547,655 | | |
Columbia EM Strategic Opportunities ETF | | | 2,448,737 | | | | 3,660,997 | | |
Annual Report 2017
102
NOTES TO FINANCIAL STATEMENTS (continued)
March 31, 2017
Funds | | Purchases ($) | | Sales ($) | |
Columbia Emerging Markets Consumer ETF | | | 124,644,884 | | | | 114,464,251 | | |
Columbia Emerging Markets Core ETF | | | 1,503,185 | | | | 1,712,129 | | |
Columbia India Consumer ETF | | | 24,528,116 | | | | 25,111,346 | | |
Columbia India Infrastructure ETF | | | 14,192,833 | | | | 22,583,402 | | |
Columbia India Small Cap ETF | | | 14,473,357 | | | | 14,377,882 | | |
The amount of purchase and sale activity impacts the portfolio turnover rate reported in the Financial Highlights.
Note 6. In-Kind Transactions
The Funds may accept in-kind contributions and redemptions. In-kind contributions are accounted for at the fair market value of the in-kind securities contributed on the date of contribution. For the period ended March 31, 2017, the cost basis of in-kind purchases and sales was as follows:
Funds | | Purchases ($) | | Sales ($) | |
Columbia Beyond BRICs ETF | | | 3,609,275 | | | | 17,119,804 | | |
Columbia EM Core ex-China ETF | | | 3,658,206 | | | | — | | |
Columbia EM Quality Dividend ETF | | | 298,467 | | | | 2,135,297 | | |
Columbia EM Strategic Opportunities ETF | | | — | | | | 5,988,162 | | |
Columbia Emerging Markets Consumer ETF | | | 68,959,627 | | | | 9,360,618 | | |
Columbia Emerging Markets Core ETF | | | — | | | | 688,130 | | |
Columbia India Consumer ETF | | | — | | | | — | | |
Columbia India Infrastructure ETF | | | — | | | | — | | |
Columbia India Small Cap ETF | | | — | | | | — | | |
Note 7. Significant Risks
Emerging Markets Risk
The Funds are subject to emerging markets risk. Investments in emerging market securities are subject to even greater risks than for foreign investments generally, including increased risks of: illiquidity of securities; price volatility; inflation or deflation; restrictions on foreign investment; nationalization; higher taxation; economic and political instability; pervasive corruption and crime; less governmental regulation; and less developed legal systems. These risks may be greater for investments in frontier markets.
Concentration Risk
Each Fund concentrates its investments in a particular sector or a group of sectors to approximately the same extent as its respective underlying index, and as such, may be adversely affected by increased price volatility of securities in those sectors, and may be more susceptible to adverse economic, market, political or regulatory occurrences affecting those sectors.
Country and Regional Risk
Each Fund will invest in specific countries or geographic regions to approximately the same extent as its
underlying index. To the extent that a Fund invests a significant portion of its assets in a particular country or a specific geographic region, the Fund will generally have more exposure to that country's or region's economic risks. In the event of economic or political turmoil or a deterioration of diplomatic relations in a country or region where a substantial portion of a Fund's assets are invested, the Fund may experience increased volatility or illiquidity of its portfolio holdings, which may adversely affect that Fund's performance.
Infrastructure Concentration Risk
Because the Columbia India Infrastructure ETF concentrates its investments in the infrastructure sectors of India, the Fund may be adversely affected by increased price volatility of securities in that sector, and may be more susceptible to adverse economic, market, political or regulatory occurrences affecting that sector.
Consumer Concentration Risk
Because the Columbia Emerging Markets Consumer ETF and Columbia India Consumer ETF concentrate their investments in the consumer goods and consumer services sectors (specifically the consumer goods and consumer services sectors of India for the Columbia India Consumer ETF), these Funds may be adversely
Annual Report 2017
103
NOTES TO FINANCIAL STATEMENTS (continued)
March 31, 2017
affected by increased price volatility of securities in those sectors, and may be more susceptible to adverse economic, market, political or regulatory occurrences affecting those sectors. The success of consumer goods and consumer services suppliers and retailers is tied closely to the performance of the domestic and international economy, interest rates, currency exchange rates, competition, preferences, and consumer confidence.
Domestic Demand Concentration Risk
Because the Columbia EM Strategic Opportunities ETF concentrates its investments in the consumer staples, consumer discretionary, telecommunications services, healthcare and/or utilities sectors, the Fund may be adversely affected by increased price volatility of securities in those sectors, and may be more susceptible to adverse economic, market, political or regulatory occurrences affecting those sectors.
Financials Concentration Risk
Columbia Beyond BRICs ETF, Columbia EM Core ex-China ETF and Columbia India Small Cap ETF have concentrated investments in the financials sector. Because companies in the financials sector are subject to extensive governmental regulation, which may adversely affect the scope of their activities, the prices they can charge and the amount of capital they must maintain, these Funds may be adversely affected.
Industrials Concentration Risk
Columbia India Infrastructure ETF and Columbia India Small Cap ETF may be more susceptible to the particular risks that may affect companies in the industrials sector than if they were invested in a wider variety of companies in unrelated industries. The performance of companies in the industrials sector may be affected by government regulation, world events and economic conditions.
Consumer Discretionary Concentration Risk
Columbia Emerging Markets Core ETF may be more susceptible to the particular risks that may affect companies in the consumer discretionary sector than if it were invested in a wider variety of companies in unrelated sectors. Companies in the consumer discretionary sector are subject to certain risks, including fluctuations in the performance of the overall domestic and international economy, interest rate changes, increased competition and consumer confidence. Performance of such companies may be affected by factors including reduced disposable household income,
reduced consumer spending, changing demographics and consumer tastes.
India Concentration Risk
Because the Columbia India Consumer ETF, Columbia India Infrastructure ETF and Columbia India Small Cap ETF invest predominantly in Indian securities, their NAVs will be much more sensitive to changes in economic, political and other factors within India than would a fund that invested in a greater variety of countries. Special risks include, among others, political and legal uncertainty, persistent religious, ethnic and border disputes, greater government control over the economy, currency fluctuations or blockage and the risk of nationalization or expropriation of assets.
Small Cap and Mid Cap Companies Risk
The Columbia India Small Cap ETF primarily invests in small capitalization companies. Small cap companies may have greater volatility in price than the stocks of large cap companies due to limited product lines or resources or a dependency upon a particular market niche.
Non-Diversification Risk
Columbia EM Core ex-China ETF, Columbia Emerging Markets Consumer ETF, Columbia India Consumer ETF, Columbia India Infrastructure ETF and Columbia India Small Cap ETF are non-diversified funds. A non-diversified fund is permitted to invest a greater percentage of its total assets in fewer issuers than a diversified fund. The Fund may, therefore, have a greater risk of loss from a few issuers than a similar fund that invests more broadly.
India-Mauritius Tax Treaty Risk
Each of the Columbia EM Strategic Opportunities ETF, Columbia Emerging Markets Consumer ETF, Columbia Emerging Markets Core ETF, Columbia India Consumer ETF, Columbia India Infrastructure ETF and Columbia India Small Cap ETF and their respective Subsidiary rely on the Double Tax Avoidance Agreement (DTAA) between India and Mauritius for relief from certain Indian taxes. On May 10, 2016, India and Mauritius signed a protocol amending the India-Mauritius tax treaty with respect to alienation of shares in Indian companies acquired on or after April 1, 2017, which will likely result in higher taxes paid by the Fund and, therefore, lower returns for the Funds and their shareholders. Additional changes to the India-Mauritius tax treaty could result in additional taxes, which could result in further higher taxes and lower returns for the Funds and their shareholders.
Annual Report 2017
104
NOTES TO FINANCIAL STATEMENTS (continued)
March 31, 2017
Additionally, India has introduced general anti-avoidance rules (GAAR), the application of which might result in the Subsidiary not being entitled to the benefits of a tax treaty between Mauritius and India, which could result in the imposition by India of various taxes on Indian securities invested in by the Subsidiary (and indirectly the Fund).
Note 8. Subsequent Events
Management has evaluated the events and transactions that have occurred through the date the financial statements were issued. Other than as noted in Note 1 above, there were no items requiring adjustment of the financial statements or additional disclosure.
Note 9. Information Regarding Pending and Settled Legal Proceedings
Ameriprise Financial and certain of its affiliates have historically been involved in a number of legal, arbitration and regulatory proceedings, including routine litigation, class actions, and governmental actions, concerning matters arising in connection with the conduct of their business activities. Ameriprise Financial believes that the Funds are not currently the subject of, and that neither Ameriprise Financial nor any of its affiliates are the subject of, any pending legal, arbitration or regulatory proceedings that are likely to have a material adverse effect on the Funds or the ability of Ameriprise Financial or its affiliates to perform under their contracts with the Funds. Ameriprise Financial is required to make quarterly (10-Q), annual (10-K) and, as necessary, 8-K filings with the Securities and Exchange Commission (SEC) on legal and regulatory matters that relate to Ameriprise Financial and its affiliates. Copies of these filings may be obtained by accessing the SEC website at www.sec.gov.
There can be no assurance that these matters, or the adverse publicity associated with them, will not result in increased fund redemptions, reduced sale of fund shares or other adverse consequences to the Funds. Further, although we believe proceedings are not likely to have a material adverse effect on the Funds or the ability of Ameriprise Financial or its affiliates to perform under their contracts with the Funds, these proceedings are subject to uncertainties and, as such, we are unable to estimate the possible loss or range of loss that may result. An adverse outcome in one or more of these proceedings could result in adverse judgments, settlements, fines, penalties or other relief that could have a material adverse effect on the consolidated financial condition or results of operations of Ameriprise Financial.
Annual Report 2017
105
REPORT OF INDEPENDENT REGISTERED PUBLIC ACCOUNTING FIRM
To the Board of Trustees and Shareholders of
Columbia ETF Trust II (formerly known as EGA Emerging Global Shares Trust)
In our opinion, the accompanying statements of assets and liabilities (Consolidated, as applicable), including the portfolios of investments (Consolidated, as applicable), and the related statements of operations and of changes in net assets (Consolidated, as applicable) and the financial highlights (Consolidated, as applicable), present fairly, in all material respects, the financial position of Columbia Beyond BRICs ETF (formerly EGShares Beyond BRICs ETF), Columbia EM Core ex-China ETF (formerly EGShares EM Core ex-China ETF), Columbia EM Quality Dividend ETF (formerly EGShares EM Quality Dividend ETF), Columbia EM Strategic Opportunities ETF (formerly EGShares EM Strategic Opportunities ETF), Columbia Emerging Markets Consumer ETF (formerly EGShares Emerging Markets Consumer ETF), Columbia Emerging Markets Core ETF (formerly EGShares Emerging Markets Core ETF), Columbia India Consumer ETF (formerly India Consumer ETF), Columbia India Infrastructure ETF (formerly EGShares India Infrastructure ETF), Columbia India Small Cap ETF (formerly EGShares India Small Cap ETF) (the "Funds", each of the portfolios comprising Columbia ETF Trust II) as of March 31, 2017, and the results of their operations, the changes of their net assets and the financial highlights for the year then ended, in conformity with accounting principles generally accepted in the United States of America. These financial statements and financial highlights (hereafter referred to as "financial statements") are the responsibility of the Funds' management. Our responsibility is to express an opinion on these financial statements based on our audits. We conducted our audits of these financial statements in accordance with the standards of the Public Company Accounting Oversight Board (United States). Those standards require that we plan and perform the audit to obtain reasonable assurance about whether the financial statements are free of material misstatement. An audit includes examining, on a test basis, evidence supporting the amounts and disclosures in the financial statements, assessing the accounting principles used and significant estimates made by management, and evaluating the overall financial statement presentation. We believe that our audits, which included confirmation of securities as of March 31, 2017 by correspondence with the custodian and broker, provide a reasonable basis for our opinion.
The statements of changes in net assets (Consolidated, as applicable) and the financial highlights (Consolidated, as applicable) of the Funds for the period ended on and prior to March 31, 2016 were audited by another independent registered public accounting firm whose report dated May 26, 2016 expressed an unqualified opinion on those statements and highlights.
PricewaterhouseCoopers LLP
Minneapolis, MN
May 22, 2017
Annual Report 2017
106
FEDERAL INCOME TAX INFORMATION
(Unaudited)
The Funds hereby designate the following tax attributes for the fiscal year ended March 31, 2017. Shareholders will be notified in early 2018 of the amounts for use in preparing 2017 income tax returns.
| | Qualified
dividend
income | | Foreign
taxes
paid | | Foreign
taxes
paid per
share | | Foreign
source
income | | Foreign
source
income
per share | |
Columbia Beyond BRICs ETF | | | 84.53 | % | | $ | 244,845 | | | $ | 0.06 | | | $ | 2,595,158 | | | $ | 0.59 | | |
Columbia EM Core ex-China ETF | | | 63.10 | % | | $ | 27,398 | | | $ | 0.06 | | | $ | 203,907 | | | $ | 0.45 | | |
Columbia EM Quality Dividend ETF | | | 70.98 | % | | $ | 64,509 | | | $ | 0.07 | | | $ | 595,805 | | | $ | 0.63 | | |
Columbia EM Strategic Opportunities ETF | | | 100.00 | % | | $ | 17,546 | | | $ | 0.04 | | | $ | 193,195 | | | $ | 0.48 | | |
Columbia Emerging Markets Consumer ETF | | | 100.00 | % | | $ | 848,365 | | | $ | 0.03 | | | $ | 9,524,986 | | | $ | 0.32 | | |
Columbia Emerging Markets Core ETF | | | 100.00 | % | | $ | 7,620 | | | $ | 0.03 | | | $ | 65,080 | | | $ | 0.26 | | |
Columbia India Consumer ETF | | | 100.00 | % | | $ | — | | | $ | — | | | $ | — | | | $ | — | | |
Columbia India Infrastructure ETF | | | 100.00 | % | | $ | — | | | $ | — | | | $ | — | | | $ | — | | |
Columbia India Small Cap ETF | | | 100.00 | % | | $ | — | | | $ | — | | | $ | — | | | $ | — | | |
Qualified dividend income. For taxable, non-corporate shareholders, the percentage of ordinary income distributed during the fiscal year that represents qualified dividend income subject to reduced tax rates.
Foreign Taxes. The Fund makes the election to pass through to shareholders the foreign taxes paid. Eligible shareholders may claim a foreign tax credit. These taxes, and the corresponding foreign source income, are provided.
Annual Report 2017
107
Shareholders elect the Board that oversees the Funds' operations. The Board appoints officers who are responsible for day-to-day business decisions based on policies set by the Board. The following table provides basic biographical information about the Funds' Trustees as of the date of this report, including their principal occupations during the past five years, although specific titles for individuals may have varied over the period. Certain Trustees may have served as a Trustee to other Funds in the Columbia Funds Complex prior to the date set forth in the Position Held with the Trusts and Length of Service column. Under current Board policy, Trustees not affiliated with the Investment Manager generally may serve through the end of the calendar year in which they reach either the mandatory retirement age established by the Board or the fifteenth anniversary of the first Columbia Funds board meeting they attended as a member of the Board.
Independent Trustees
Name,
Address,
Year of Birth | | Position Held With
the Trusts and Length of
Service | | Principal Occupation(s)
During the Past Five Years
and Other Relevant
Professional Experience | | Number of
Funds in the
Columbia Funds
Complex
Overseen | | Other Directorships
Held by Trustee During
the Past Five Years | |
George S. Batejan
c/o Columbia
Management Investment Advisers, LLC,
225 Franklin Street,
Mail Drop BX32 05228,
Boston, MA 02110
1953 | | Trustee since January 2017 for each Trust | | Executive Vice President, Global Head of Technology and Operations, Janus Capital Group, Inc., 2010-2016 | | | 124 | | | Advisory Board Member, University of Colorado Business School (Executive Committee, Nominating Committee and Governance Committee) since November 2015; former Chairman of the Board, NICSA (National Investment Company Services Association), 2014-2016; former Director, Intech Investment Management, 2011-2016; former Board Member, Metro Denver Chamber of Commerce, 2015-2016 | |
Kathleen Blatz
c/o Columbia Management Investment Advisers, LLC,
225 Franklin Street,
Mail Drop BX32 05228,
Boston, MA 02110
1954 | | Trustee since May 2011 for CET, April 2016 for CET I and September 2016 for CET II | | Attorney, specializing in arbitration and mediation; Chief Justice, Minnesota Supreme Court, 1998-2006; Associate Justice, Minnesota Supreme Court, 1996-1998; Fourth Judicial District Court Judge, Hennepin County, 1994-1996; Attorney in private practice and public service, 1984-1993; State Representative, Minnesota House of Representatives, 1979-1993, which included service on the Tax and Financial Institutions and Insurance Committees; Member of the Board of the Minnesota Sports Facilities Authority since 2017 | | | 126 | | | Trustee, BlueCross BlueShield of Minnesota (Chair of the Business Development Committee) since 2009; Chair of the Robina Foundation since August 2013 | |
Annual Report 2017
108
TRUSTEES AND OFFICERS (continued)
Independent Trustees (continued)
Name,
Address,
Year of Birth | | Position Held With
the Trusts and Length of
Service | | Principal Occupation(s)
During the Past Five Years
and Other Relevant
Professional Experience | | Number of
Funds in the
Columbia Funds
Complex
Overseen | | Other Directorships
Held by Trustee During
the Past Five Years | |
Edward J. Boudreau, Jr.
c/o Columbia Management Investment Advisers, LLC,
225 Franklin Street,
Mail Drop BX32 05228,
Boston, MA 02110
1944 | | Trustee since April 2013 for CET, April 2016 for CET I and September 2016 for CET II | | Managing Director, E.J. Boudreau & Associates (consulting) since 2000; FINRA Industry Arbitrator, 2002-present; Chairman and Chief Executive Officer, John Hancock Investments (asset management), Chairman and Interested Trustee for open-end and closed-end funds offered by John Hancock, 1989-2000; John Hancock Mutual Life Insurance Company, including Senior Vice President and Treasurer and Senior Vice President Information Technology, 1968-1988 | | | 124 | | | Former Trustee, Boston Museum of Science (Chair of Finance Committee), 1985-2013; former Trustee, BofA Funds Series Trust (11 funds), 2005-2011 | |
Pamela G. Carlton
c/o Columbia Management Investment Advisers, LLC,
225 Franklin Street,
Mail Drop BX32 05228,
Boston, MA 02110
1954 | | Trustee since May 2011 for CET, April 2016 for CET I and September 2016 for CET II | | President, Springboard- Partners in Cross Cultural Leadership (consulting company) since 2003; Managing Director of US Equity Research, JP Morgan Chase, 1999-2003; Director of US Equity Research, Chase Asset Management, 1996-1999; Co-Director Latin America Research, 1993-1996, COO Global Research, 1992-1996, Co-Director of US Research, 1991-1992, Investment Banker, Morgan Stanley, 1982-1991 | | | 126 | | | Trustee, New York Presbyterian Hospital Board (Executive Committee and Chair of Human Resources Committee) since 1996 | |
William P. Carmichael
c/o Columbia Management Investment Advisers, LLC,
225 Franklin Street,
Mail Drop BX32 05228,
Boston, MA 02110
1943 | | Trustee since April 2013 for CET, April 2016 for CET I and September 2016 for CET II | | Retired; Co-founder, The Succession Fund (provides exit strategies to owners of privately held companies), 1998-2007; Adjunct Professor of Finance, Kelley School of Business, Indiana University, 1993-2007; Senior Vice President, Sara Lee Corporation, 1991-1993; Senior Vice President and Chief Financial Officer, Beatrice Foods Company, 1984-1990; Vice President, Esmark, Inc., 1973-1984; Associate, Price Waterhouse, 1968-1972 | | | 126 | | | Director, The Finish Line (athletic shoes and apparel) since July 2003; Director, hhgregg since May, 2015; former Director, Cobra Electronics Corporation (electronic equipment manufacturer), 1994-August 2014; former Director, Spectrum Brands, Inc. (consumer products), 2002-2009; former Director, Simmons Company (bedding), 2004-2010; former Trustee, BofA Funds Series Trust (11 funds) 2003-2011; former Director, McMoRan Exploration Company (oil and gas exploration and development) 2010-2013; former Director, International Textile Corp., 2012-2016 | |
Annual Report 2017
109
TRUSTEES AND OFFICERS (continued)
Independent Trustees (continued)
Name,
Address,
Year of Birth | | Position Held With
the Trusts and Length of
Service | | Principal Occupation(s)
During the Past Five Years
and Other Relevant
Professional Experience | | Number of
Funds in the
Columbia Funds
Complex
Overseen | | Other Directorships
Held by Trustee During
the Past Five Years | |
Patricia M. Flynn
c/o Columbia Management Investment Advisers, LLC,
225 Franklin Street,
Mail Drop BX32 05228,
Boston, MA 02110
1950 | | Trustee since May 2011 for CET, April 2016 for CET I and September 2016 for CET II | | Trustee Professor of Economics and Management, Bentley University since 1976 (also teaches and conducts research on corporate governance); Dean, McCallum Graduate School of Business, Bentley University, 1992-2002 | | | 126 | | | Trustee, MA Taxpayers Foundation since 1997; Board of Governors, Innovation Institute, MA Technology Collaborative since 2010 | |
William A. Hawkins
c/o Columbia Management Investment Advisers, LLC,
225 Franklin Street,
Mail Drop BX32 05228,
Boston, MA 02110
1942 | | Chair of the Board since November 2015; Trustee since April 2013 for CET, April 2016 for CET I and September 2016 for CET II | | Managing Director, Overton Partners (financial consulting), since August 2010; President and Chief Executive Officer, California General Bank, N.A., January 2008-August 2010; Operation Hope, COO, 2004-2007; IndyMac Bancorp, President, CBG, 1999-2003; American General Bank, President, 1997-1999; Griffin Financial Services, CEO, 1981-1997; The Griffin Funds, CEO, 1992-1998 | | | 126 | | | Former Trustee, BofA Funds Series Trust (11 funds) 2005-2015 | |
Catherine James Paglia
c/o Columbia Management Investment Advisers, LLC,
225 Franklin Street,
Mail Drop BX32 05228,
Boston, MA 02110
1952 | | Trustee since May 2011 for CET, April 2016 for CET I and September 2016 for CET II | | Director, Enterprise Asset Management, Inc. (private real estate and asset management company) since September 1998; Managing Director and Partner, Interlaken Capital, Inc., 1989-1997; Managing Director, Morgan Stanley, 1982-1989; Vice President, Investment Banking, 1980-1982, Associate, Investment Banking, 1976-1980, Dean Witter Reynolds, Inc. | | | 126 | | | Director, Valmont Industries, Inc. (irrigation systems manufacturer) since 2012; Trustee, Carleton College (on the Investment Committee); Trustee, Carnegie Endowment for International Peace (on the Investment Committee) | |
Minor M. Shaw
c/o Columbia Management Investment Advisers, LLC,
225 Franklin Street,
Mail Drop BX32 05228,
Boston, MA 02110
1947 | | Trustee since April 2013 for CET, April 2016 for CET I and September 2016 for CET II | | President, Micco LLC (private investments) since 2011; President, Micco Corp. (family investment business), 1998-2011 | | | 126 | | | Director, BlueCross BlueShield of South Carolina since April 2008; Advisory Board member, Duke Energy Corp. since October 2016; Chair of the Duke Endowment; Director, National Association of Corporate Directors, Carolinas Chapter, since 2013; Chair of Greenville — Spartanburg Airport Commission; former Trustee, BofA Funds Series Trust (11 funds), 2003-2011; former Director, Piedmont Natural Gas, 2004-2016 | |
Annual Report 2017
110
TRUSTEES AND OFFICERS (continued)
Independent Trustees (continued)
Name,
Address,
Year of Birth | | Position Held With
the Trusts and Length of
Service | | Principal Occupation(s)
During the Past Five Years
and Other Relevant
Professional Experience | | Number of
Funds in the
Columbia Funds
Complex
Overseen | | Other Directorships
Held by Trustee During
the Past Five Years | |
John G. Taft
c/o Columbia Management Investment Advisers, LLC,
225 Franklin Street,
Mail Drop BX32 05228,
Boston, MA 02110
1955 | | Trustee since January 2017 for each Trust | | Chief Executive Officer, RBC Wealth Management (a division of RBC Capital Markets LLC), 2005-2016 | | | 124 | | | Trustee, Andy Warhol Foundation for Visual Arts (Finance Committee) since 2014; former Director, RBC Global Asset Management — U.S., 2001-2016 | |
Alison Taunton-Rigby
c/o Columbia Management Investment Advisers, LLC,
225 Franklin Street,
Mail Drop BX32 05228,
Boston, MA 02110
1944 | | Trustee since May 2011 for CET, April 2016 for CET I and September 2016 for CET II | | President, Chief Executive Officer (CEO) and Director, RiboNovix, Inc., 2003-2010; President and CEO, CMT Inc., 2001-2003; President and CEO, Aquila Biopharmaceuticals Inc., 1997-2000; President and CEO, Cambridge Biotechnology Corporation, 1995-1997; President and CEO, Mitotix Inc., 1993-1994 | | | 126 | | | Director, Boston Children's Hospital since 2002; Director, ICI Mutual Insurance Company, since 2011; Director, Blumont/IRD since 2016; Director, Mount Ida College since 2016; former Director, Abt Associates (government contractor), 2001-2016; former Director, Healthways, Inc. (health and well-being solutions), 2005-2016 | |
Interested Trustee Not Affiliated with Investment Manager*
Name,
Address,
Year of Birth | | Position Held With
the Trusts and Length of
Service | | Principal Occupation(s)
During the Past Five Years
and Other Relevant
Professional Experience | | Number of
Funds in the
Columbia Funds
Complex
Overseen | | Other Directorships
Held by Trustee During
the Past Five Years | |
Anthony M. Santomero
c/o Columbia Management Investment Advisers, LLC,
225 Franklin Street,
Mail Drop BX32 05228,
Boston, MA 02110
1946 | | Trustee since April 2013 for CET, April 2016 for CET I and September 2016 for CET II | | Richard K. Mellon Professor Emeritus of Finance, The Wharton School, University of Pennsylvania, since 2002; Senior Advisor, McKinsey & Company (consulting), 2006-2008; President, Federal Reserve Bank of Philadelphia, 2000-2006; Professor of Finance, The Wharton School, University of Pennsylvania, 1972-2002 | | | 124 | | | Trustee, Penn Mutual Life Insurance Company since March 2008; Director, Renaissance Reinsurance Ltd. since May 2008; Director, Citigroup Inc. since 2009; Director, Citibank, N.A. since 2009; former Trustee, BofA Funds Series Trust (11 funds), 2008-2011 | |
* Dr. Santomero is not an affiliated person of the Investment Manager or Ameriprise Financial. However, he is currently deemed by the Funds to be an "interested person" (as defined in the 1940 Act) of the Funds because he serves as a Director of Citigroup Inc. and Citibank, N.A., companies that may directly or through subsidiaries and affiliates engage from time-to-time in brokerage execution, principal transactions and lending relationships with the Funds or accounts advised/managed by the Investment Manager.
Annual Report 2017
111
TRUSTEES AND OFFICERS (continued)
Interested Trustee Affiliated with Investment Manager*
Name,
Address,
Year of Birth | | Position Held With
the Trusts and Length of
Service | | Principal Occupation(s)
During the Past Five Years
and Other Relevant
Professional Experience | | Number of
Funds in the
Columbia Funds
Complex
Overseen | | Other Directorships
Held by Trustee During
the Past Five Years | |
William F. Truscott
c/o Columbia Management Investment Advisers, LLC,
225 Franklin St.
Boston, MA 02110
1960 | | Trustee and Senior Vice President since May 2011 for CET, April 2016 for CET I and September 2016 for CET II | | Chairman of the Board and President, Columbia Management Investment Advisers, LLC since May 2010 and February 2012, respectively; Chief Executive Officer, Global Asset Management, Ameriprise Financial, Inc. since September 2012 (previously Chief Executive Officer, U.S. Asset Management & President, Annuities, May 2010-September 2012); Director and Chief Executive Officer, Columbia Management Investment Distributors, Inc. since May 2010 and February 2012, respectively; Chairman of the Board and Chief Executive Officer, RiverSource Distributors, Inc. since 2006; Director, Threadneedle Asset Management Holdings, SARL since 2014; President and Chief Executive Officer, Ameriprise Certificate Company, 2006-August 2012. | | | 183 | | | Chairman of the Board, Columbia Management Investment Advisers, LLC since May 2010; Director, Columbia Management Investment Distributors, Inc. since May 2010; Former Director, Ameriprise Certificate Company, 2006-January 2013 | |
* Interested person (as defined under the 1940 Act) by reason of being an officer, director, security holder and/or employee of the Investment Manager or Ameriprise Financial.
The Statement of Additional Information has additional information about the Fund's Board members and is available without charge, upon request by calling 888.800.4347 or visiting columbiathreadneedleetf.com.
Annual Report 2017
112
TRUSTEES AND OFFICERS (continued)
The Board has appointed officers who are responsible for day-to-day business decisions based on policies it has established. The officers serve at the pleasure of the Board. The following table provides basic information about the Officers of the Funds as of the date of this report, including principal occupations during the past five years, although their specific titles may have varied over the period. In addition to Mr. Truscott, who is Senior Vice President, the Funds' other officers are:
Fund Officers
Name,
Address and
Year of Birth | | Position and Year
First Appointed to
Position for any Fund
in the Columbia
Funds Complex or a
Predecessor Thereof | | Principal Occupation(s) During Past Five Years | |
Christopher O. Petersen
5228 Ameriprise Financial Center
Minneapolis, MN 55474
Born 1970 | | President and Principal Executive Officer (2015) | | Vice President and Lead Chief Counsel, Ameriprise Financial, Inc. since January 2015 (previously, Vice President and Chief Counsel January 2010-December 2014); officer of Columbia Funds and affiliated funds since 2007. | |
Michael G. Clarke
225 Franklin Street
Boston, MA 02110
Born 1969 | | Treasurer (2011), Chief Financial Officer (2009) and Chief Accounting Officer (2015) | | Vice President — Mutual Fund Administration, Columbia Management Investment Advisers, LLC, since May 2010; senior officer of Columbia Funds and affiliated funds since 2002. | |
Paul B. Goucher
100 Park Avenue
New York, NY 10017
Born 1968 | | Senior Vice President (2011), Chief Legal Officer (2015) and Assistant Secretary (2008) | | Senior Vice President and Assistant General Counsel, Ameriprise Financial, Inc. since January 2017 (previously Vice President and Lead Chief Counsel, November 2008-January 2017 and January 2013-January 2017, respectively; and Chief Counsel, January 2010-January 2013); Vice President, Chief Legal Officer and Assistant Secretary, Columbia Management Investment Advisers, LLC since May 2010. | |
Thomas P. McGuire
225 Franklin Street
Boston, MA 02110
Born 1972 | | Senior Vice President and Chief Compliance Officer (2012) | | Vice President — Asset Management Compliance, Ameriprise Financial, Inc., since May 2010; Chief Compliance Officer, Ameriprise Certificate Company since September 2010. | |
Colin Moore
225 Franklin Street
Boston, MA 02110
Born 1958 | | Senior Vice President (2010) | | Executive Vice President and Global Chief Investment Officer, Ameriprise Financial, Inc., since July 2013; Executive Vice President and Global Chief Investment Officer, Columbia Management Investment Advisers, LLC since July 2013 (previously Director and Global Chief Investment Officer, 2010-2013). | |
Michael E. DeFao
225 Franklin Street
Boston, MA 02110
Born 1968 | | Vice President (2011) and Assistant Secretary (2010) | | Vice President and Chief Counsel, Ameriprise Financial, Inc. since May 2010. | |
Amy Johnson
5228 Ameriprise Financial Center
Minneapolis, MN 55474
Born 1965 | | Vice President (2006) | | Managing Director and Global Head of Operations, Columbia Management Investment Advisers, LLC since April 2016 (previously Managing Director and Chief Operating Officer, 2010-2016). | |
Lyn Kephart-Strong
5228 Ameriprise Financial Center
Minneapolis, MN 55474
Born 1960 | | Vice President (2015) | | President, Columbia Management Investment Services Corp. since October 2014; Vice President & Resolution Officer, Ameriprise Trust Company since August 2009. | |
Ryan C. Larrenaga
225 Franklin Street
Boston, MA 02110
Born 1970 | | Vice President and Secretary (2015) | | Vice President and Group Counsel, Ameriprise Financial, Inc. since August 2011; officer of Columbia Funds and affiliated funds since 2005. | |
Annual Report 2017
113
IMPORTANT INFORMATION ABOUT THIS REPORT
Voting Policies, Procedures and Record
A description of the Trust's proxy voting policies and procedures that the Trust uses to determine how to vote proxies relating to portfolio securities, and each Fund's proxy voting record for the most recent twelve-month period ended June 30 is available, without charge, by visiting columbiathreadneedleetf.com or searching the website of the Securities and Exchange Commission (the SEC) at sec.gov.
Shareholder Reports and Quarterly Portfolio Disclosure
The Funds are required to file their complete schedule of portfolio holdings with the SEC for their first and third quarters on Form N-Q. Copies of the filings are available without charge, upon request on the SEC's website at sec.gov. You can also obtain copies of Form N-Q by (i) visiting the SEC's Public Reference Room in Washington, DC (information on the operation of the Public Reference Room may be obtained by calling 1-800-SEC-0330); (ii) sending your request and a duplicating fee to the SEC's Public Reference Room, Washington, DC 20549-0102; or (iii) sending your request electronically to publicinfo@sec.gov.
Annual Report 2017
114
This page intentionally left blank.
Annual Report 2017
115
This page intentionally left blank.
Annual Report 2017
116
This page intentionally left blank.
Annual Report 2017
117
Columbia ETF Trust II
225 Franklin Street
Boston, MA 02110

Investors should consider the investment objectives, risks, charges and expenses of an exchange-traded fund (ETF) carefully before investing. For a free prospectus and summary prospectus, which contains this and other important information about the ETFs, visit columbiathreadneedleetf.com. Read the prospectus and summary prospectus carefully before investing. Columbia Management Investment Advisers, LLC serves as the investment manager to the ETFs. The ETFs are distributed by ALPS Distributors, Inc., which is not affiliated with Columbia Management Investment Advisers, LLC, or its parent company, Ameriprise Financial, Inc.
© 2017 Columbia Management Investment Advisers, LLC.
columbiathreadneedleetf.com
ANN280_03_G01_(05/17)
Item 2. Code of Ethics.
(a) The registrant has adopted a code of ethics that applies to the registrant’s principal executive officer, principal financial officer, principal accounting officer or controller, or persons performing similar functions, regardless of whether these individuals are employed by the registrant or a third party.
(b) During the period covered by this report, there were not any amendments to a provision of the code of ethics adopted in 2(a) above.
(c) During the period covered by this report, there were no waivers, including any implicit waivers, from a provision of the code of ethics described in 2(a) above that relates to one or more of the items set forth in paragraph (b) of this item’s instructions.
Item 3. Audit Committee Financial Expert.
The registrant’s Board of Trustees has determined that Edward J. Boudreau, Pamela G. Carlton, William A. Hawkins, Alison Taunton-Rigby and John Taft, each of whom are members of the registrant’s Board of Trustees and Audit Committee, each qualify as an audit committee financial expert. Mr. Boudreau, Ms. Carlton, Mr. Hawkins, Ms. Taunton-Rigby and Mr. Taft are each independent trustees, as defined in paragraph (a)(2) of this item’s instructions.
Item 4. Principal Accountant Fees and Services.
Fee information below is disclosed for the nine series of the registrant whose reports to stockholders are included in this annual filing. During the period, the registrant had a change in independent accountant.
(a) Audit Fees. Aggregate Audit Fees billed by the principal accountant for professional services rendered during the fiscal years ended March 31, 2017 and March 31, 2016 are approximately as follows:
2017 | 2016 |
| |
$121,500 | $110,750 |
Audit Fees include amounts related to the audit of the registrant’s annual financial statements or services that are normally provided by the accountant in connection with statutory and regulatory filings or engagements for those fiscal years.
(b) Audit-Related Fees. Aggregate Audit-Related Fees billed to the registrant by the principal accountant for professional services rendered during the fiscal years ended March 31, 2017 and March 31, 2016 are approximately as follows:
Audit-Related Fees include amounts for assurance and related services by the principal accountant that are reasonably related to the performance of the audit of the registrant’s financial statements and are not reported in Audit Fees above.
During the fiscal years ended March 31, 2017 and March 31, 2016, there were no Audit-Related Fees billed by the registrant’s principal accountant to the registrant’s investment adviser (not including any sub-adviser whose role is primarily portfolio management and is subcontracted with or overseen by another investment adviser) and any entity controlling, controlled by, or under common control with the adviser that provides ongoing services to the registrant for an engagement that related directly to the operations and financial reporting of the registrant.
(c) Tax Fees. Aggregate Tax Fees billed by the principal accountant to the registrant for professional services rendered during the fiscal years ended March 31, 2017 and March 31, 2016 are approximately as follows:
Tax Fees include amounts for the review of annual tax returns, the review of required shareholder distribution calculations and typically include amounts for professional services by the principal accountant for tax compliance, tax advice and tax planning.
During the fiscal years ended March 31, 2017 and March 31, 2016, there were no Tax Fees billed by the registrant’s principal accountant to the registrant’s investment adviser (not including any sub-adviser whose role is primarily portfolio management and is subcontracted with or overseen by another investment adviser) and any entity controlling, controlled by, or under common control with the adviser that provides ongoing services to the registrant for an engagement that related directly to the operations and financial reporting of the registrant.
(d) All Other Fees. Aggregate All Other Fees billed by the principal accountant to the registrant for professional services rendered during the fiscal years ended March 31, 2017 and March 31, 2016 are approximately as follows:
All Other Fees include amounts for products and services provided by the principal accountant, other than the services reported in paragraphs (a) through (c) above.
During the fiscal years ended March 31, 2017 and March 31, 2016, there were no Aggregate All Other Fees billed by the registrant’s principal accountant to the registrant’s investment adviser (not including any sub-adviser whose role is primarily portfolio management and is subcontracted with or overseen by another investment adviser) and any entity controlling, controlled by, or under common control with the adviser that provides ongoing services to the registrant for an engagement that related directly to the operations and financial reporting of the registrant.
(e)(1) Audit Committee Pre-Approval Policies and Procedures
The registrant’s Audit Committee is required to pre-approve the engagement of the registrant’s independent auditors to provide audit and non-audit services to the registrant and non-audit services to its investment adviser (excluding any sub-adviser whose role is primarily portfolio management and is sub-contracted or overseen by another investment adviser (the “Adviser”) or any entity controlling, controlled by or under common control with the Adviser that provides ongoing services to the Fund (a “Control Affiliate”) if the engagement relates directly to the operations and financial reporting of the registrant.
The Audit Committee has adopted a Policy for Engagement of Independent Auditors for Audit and Non-Audit Services (the “Policy”). The Policy sets forth the understanding of the Audit Committee regarding the engagement of the registrant’s independent accountants to provide (i) audit and permissible audit-related, tax and other services to the registrant (“Fund Services”); (ii) non-audit services to the registrant’s Adviser and any Control Affiliates, that relates directly to the operations and financial reporting of a Fund (“Fund-related Adviser Services”); and (iii) certain other audit and non-audit services to the registrant’s Adviser and its Control Affiliates. A service will require specific pre-approval by the Audit Committee if it is to be provided by the Fund’s independent auditor; provided, however, that pre-approval of non-audit services to the Fund, the Adviser or Control Affiliates may be waived if certain de minimis requirements set forth in the SEC’s rules are met.
Under the Policy, the Audit Committee may delegate pre-approval authority to any pre-designated member or members who are independent board members. The member(s) to whom such authority is delegated must report, for informational purposes only, any pre-approval decisions to the Audit Committee at its next regular meeting. The Audit Committee’s responsibilities with respect to the pre-approval of services performed by the independent auditor may not be delegated to management.
On an annual basis, at a regularly scheduled Audit Committee meeting, the Fund’s Treasurer or other Fund officer shall submit to the Audit Committee a schedule of the types of Fund Services and Fund-related Adviser Services that are subject to specific pre-approval. This schedule will provide a description of each type of service that is subject to specific pre-approval, along with total projected fees for each service. The pre-approval will generally cover a one-year period. The Audit Committee will review and approve the types of services and the projected fees for the next one-year period and may add to, or subtract from, the list of pre-approved services from time to time, based on subsequent determinations. This specific approval acknowledges that the Audit Committee is in agreement with the specific types of services that the independent auditor will be permitted to perform and the projected fees for each service.
The Fund’s Treasurer or other Fund officer shall report to the Audit Committee at each of its regular meetings regarding all Fund Services or Fund-related Adviser Services provided since the last such report was rendered, including a description of the services, by category, with forecasted fees for the annual reporting period, proposed changes requiring specific pre-approval and a description of services provided by the independent auditor, by category, with actual fees during the current reporting period.
*****
(e)(2) 100% of the services performed for items (b) through (d) above during 2017 and 2016 were pre-approved by the registrant’s Audit Committee.
(f) Not applicable.
(g) The aggregate non-audit fees billed by the registrant’s accountant for services rendered to the registrant, and rendered to the registrant’s investment adviser (not including any sub-adviser whose role is primarily portfolio management and is subcontracted with or overseen by another investment adviser), and any entity controlling, controlled by, or under common control with the adviser that provides ongoing services to the registrant for the fiscal years ended March 31, 2017 and March 31, 2016 are approximately as follows:
(h) The registrant’s Audit Committee of the Board of Directors has considered whether the provision of non-audit services that were rendered to the registrant’s adviser (not including any sub-adviser whose role is primarily portfolio management and is subcontracted with or overseen by another investment adviser), and any entity controlling, controlled by, or under common control with the investment adviser that provides ongoing services to the registrant that were not pre-approved pursuant to paragraph (c)(7)(ii) of Rule 2-01 of Regulation S-X, is compatible with maintaining the principal accountant’s independence.
Item 5. Audit Committee of Listed Registrants.
(a) The Registrant is an issuer as defined in Section 10A-3 of the Securities Exchange Act of 1934 and has a separately-designated standing Audit Committee in accordance with Section 3(a)(58)(A) of such Act. The Board’s independent Trustees, Edward J. Boudreau, Pamela G. Carlton, William A. Hawkins, Alison Taunton-Rigby and John Taft are all members of the Audit Committee.
(b) Not Applicable.
Item 6. Investments
(a) The registrant’s “Schedule I – Investments in securities of unaffiliated issuers” (as set forth in 17 CFR 210.12-12) is included in Item 1 of this Form N-CSR.
(b) Not applicable.
Item 7. Disclosure of Proxy Voting Policies and Procedures for Closed-End Management Investment Companies.
Not applicable.
Item 8. Portfolio Managers of Closed-End Management Investment Companies.
Not applicable.
Item 9. Purchases of Equity Securities by Closed-End Management Investment Company and Affiliated Purchasers.
Not applicable.
Item 10. Submission of Matters to a Vote of Security Holders.
There were no material changes to the procedures by which shareholders may recommend nominees to the registrant’s board of directors.
Item 11. Controls and Procedures.
(a) The registrant’s principal executive officer and principal financial officers, based on their evaluation of the registrant’s disclosure controls and procedures as of a date within 90 days of the filing of this report, have concluded that such controls and procedures are adequately designed to ensure that material information required to be disclosed by the registrant in Form N-CSR is accumulated and communicated to the registrant’s management, including the principal executive officer and principal financial officer, or persons performing similar functions, as appropriate to allow timely decisions regarding required disclosure.
(b) There was no change in the registrant’s internal controls over financial reporting that occurred during the registrant’s second fiscal quarter of the period covered by this report that has materially affected, or is reasonably likely to materially affect, the registrant’s internal control over financial reporting.
Item 12. Exhibits.
(a)(1) Code of ethics required to be disclosed under Item 2 of Form N-CSR attached hereto as Exhibit 99.CODE ETH.
(a)(2) Certifications pursuant to Rule 30a-2(a) under the Investment Company Act of 1940 (17 CFR 270.30a-2(a)) attached hereto as Exhibit 99.CERT.
(a)(3) Not applicable.
(b) Certification pursuant to Rule 30a-2(b) under the Investment Company Act of 1940 (17 CFR 270.30a-2(b)) attached hereto as Exhibit 99.906CERT.
SIGNATURES
Pursuant to the requirements of the Securities Exchange Act of 1934 and the Investment Company Act of 1940, the registrant has duly caused this report to be signed on its behalf by the undersigned, thereunto duly authorized.
(Registrant) | | Columbia ETF Trust II | |
| | |
| | |
By (Signature and Title) | /s/ Christopher O. Petersen | |
| Christopher O. Petersen, President and Principal Executive Officer | |
| | |
| | |
| | |
Date | | | | | May 22, 2017 | |
| | | | | | | |
Pursuant to the requirements of the Securities Exchange Act of 1934 and the Investment Company Act of 1940, this report has been signed below by the following persons on behalf of the registrant and in the capacities and on the dates indicated.
By (Signature and Title) | /s/ Christopher O. Petersen | |
| Christopher O. Petersen, President and Principal Executive Officer | |
| | |
| | |
| | |
Date | | | | | May 22, 2017 | |
| | |
| | |
By (Signature and Title) | /s/ Michael G. Clarke | |
| Michael G. Clarke, Treasurer and Chief Financial Officer | |
| | |
| | |
| | |
Date | | | | | May 22, 2017 | |
| | | | | | | |