UNITED STATES
SECURITIES AND EXCHANGE COMMISSION
Washington, D.C. 20549
FORM N-CSR
CERTIFIED SHAREHOLDER REPORT OF REGISTERED
MANAGEMENT INVESTMENT COMPANIES
Investment Company Act file number | 811-22255 | |||||||
| ||||||||
Columbia ETF Trust II | ||||||||
(Exact name of registrant as specified in charter) | ||||||||
| ||||||||
225 Franklin Street |
| 02110 | ||||||
(Address of principal executive offices) |
| (Zip code) | ||||||
| ||||||||
Christopher O. Petersen, Esq. c/o Columbia Management Investment Advisers, LLC 225 Franklin Street Boston, Massachusetts 02110
Ryan Larrenaga c/o Columbia Management Investment Advisers, LLC | ||||||||
(Name and address of agent for service) | ||||||||
| ||||||||
Registrant’s telephone number, including area code: | (800) 345-6611 |
| ||||||
| ||||||||
Date of fiscal year end: | March 31 |
| ||||||
| ||||||||
Date of reporting period: | March 31, 2019 |
| ||||||
Form N-CSR is to be used by management investment companies to file reports with the Commission not later than 10 days after the transmission to stockholders of any report that is required to be transmitted to stockholders under Rule 30e-1 under the Investment Company Act of 1940 (17 CFR 270.30e-1). The Commission may use the information provided on Form N-CSR in its regulatory, disclosure review, inspection, and policymaking roles.
A registrant is required to disclose the information specified by Form N-CSR, and the Commission will make this information public. A registrant is not required to respond to the collection of information contained in Form N-CSR unless the Form displays a currently valid Office of Management and Budget (“OMB”) control number. Please direct comments concerning the accuracy of the information collection burden estimate and any suggestions for reducing the burden to Secretary, Securities and Exchange Commission, 100 F Street, NE, Washington, DC 20549. The OMB has reviewed this collection of information under the clearance requirements of 44 U.S.C. § 3507.
Item 1. Reports to Stockholders.

ANNUAL REPORT
March 31, 2019

COLUMBIA ETF TRUST II
Columbia Beyond BRICs ETF
Columbia EM Core ex-China ETF
Columbia EM Quality Dividend ETF
Columbia Emerging Markets Consumer ETF
Columbia India Consumer ETF
Columbia India Infrastructure ETF
Columbia India Small Cap ETF
Beginning on January 1, 2021, as permitted by regulations adopted by the Securities and Exchange Commission, paper copies of the Funds' annual and semiannual shareholder reports like this one will no longer be sent by mail, unless you specifically request paper copies of the reports. Instead, the reports will be made available on the Funds' website (columbiathreadneedleus.com/etfs), and each time a report is posted you will be notified by mail and provided with a website address to access the report.
If you have already elected to receive shareholder reports electronically, you will not be affected by this change and you need not take any action. You may elect to receive shareholder reports and other communications from the Funds electronically at any time by contacting your financial intermediary (such as a broker-dealer or bank).
You may elect to receive all future reports in paper free of charge. You can contact your financial intermediary to request that you continue receiving paper copies of your shareholder reports. Your election to receive paper reports will apply to all Columbia Funds held in your account.

TABLE OF CONTENTS
Columbia Beyond BRICs ETF | |||||||
| Fund at a Glance | 2 | ||||||
| Manager Discussion of Fund Performance | 5 | ||||||
Columbia EM Core ex-China ETF | |||||||
| Fund at a Glance | 7 | ||||||
| Manager Discussion of Fund Performance | 10 | ||||||
Columbia EM Quality Dividend ETF | |||||||
| Fund at a Glance | 12 | ||||||
| Manager Discussion of Fund Performance | 15 | ||||||
Columbia Emerging Markets Consumer ETF | |||||||
| Fund at a Glance | 17 | ||||||
| Manager Discussion of Fund Performance | 20 | ||||||
Columbia India Consumer ETF | |||||||
| Fund at a Glance | 22 | ||||||
| Manager Discussion of Fund Performance | 24 | ||||||
Columbia India Infrastructure ETF | |||||||
| Fund at a Glance | 26 | ||||||
| Manager Discussion of Fund Performance | 28 | ||||||
Columbia India Small Cap ETF | |||||||
| Fund at a Glance | 30 | ||||||
| Manager Discussion of Fund Performance | 32 | ||||||
| Understanding Your Fund's Expenses | 34 | ||||||
| Frequency Distribution of Premiums and Discounts | 35 | ||||||
| Portfolio of Investments | 37 | ||||||
| Statement of Assets and Liabilities | 62 | ||||||
| Statement of Operations | 65 | ||||||
| Statement of Changes in Net Assets | 68 | ||||||
| Financial Highlights | 72 | ||||||
| Notes to Financial Statements | 79 | ||||||
| Report of Independent Registered Public Accounting Firm | 91 | ||||||
| Federal Income Tax Information | 92 | ||||||
| Trustees and Officers | 93 | ||||||
| Additional Information | 99 | ||||||
Columbia ETF Trust II | Annual Report 2019
FUND AT A GLANCE
Columbia Beyond BRICs ETF
Investment objective
Columbia Beyond BRICs ETF (the Fund) seeks investment results that correspond (before fees and expenses) to the price and yield performance of the FTSE Beyond BRICs Net of Tax Index.
Portfolio management
Christopher Lo, CFA
Portfolio Manager
Managed Fund since 2016
The Board of Trustees of Columbia ETF Trust II, based upon the recommendation of the Investment Manager, determined to close and liquidate the Fund. The last day of trading for the Fund on the NYSE Arca Exchange is expected to be June 14, 2019. On or about June 21, 2019, the Fund will make a liquidating distribution to remaining shareholders equal to the shareholder's proportionate interest in the net assets of the Fund.
Average annual total returns (%) (for period ended March 31, 2019)
Inception | 1 Year | 5 Years | Life | ||||||||||||||||
Market Price | 08/15/12 | -10.15 | -1.43 | -0.01 | |||||||||||||||
Net Asset Value | 08/15/12 | -9.46 | -1.25 | 0.01 | |||||||||||||||
Tracked Index(1) | -9.01 | -0.02 | 1.57 | ||||||||||||||||
(1) The Tracked Index reflects the Indxx Beyond BRICs Index through October 25, 2013 and the FTSE Beyond BRICs Net of Tax Index USD thereafter.
All results shown assume reinvestment of distributions during the period. Returns do not reflect the deduction of taxes that a shareholder may pay on Fund distributions or on the redemption of Fund shares. Performance results reflect the effect of any fee waivers or reimbursements of Fund expenses by the Fund's former investment manager or Columbia Management Investment Advisers, LLC (Columbia Management or the Investment Manager). Absent these fee waivers or expense reimbursement arrangements, performance results would have been lower.
The performance information shown represents past performance and is not a guarantee of future results. The investment return and principal value of your investment will fluctuate so that your shares, when redeemed, may be worth more or less than their original cost. Current performance may be lower or higher than the performance information shown. You may obtain performance information current to the most recent month-end by visiting columbiathreadneedleus.com/etfs.
Columbia Management took over portfolio management in September 2016 upon its acquisition of the Fund's previous investment manager.
The price used to calculate Market Price return is based on the midpoint of the 4:00 PM Eastern (U.S.) bid/ask spread on the NYSE and does not represent returns an investor would receive if shares were traded at other times.
The Fund's shares may trade above or below their net asset value. The net asset value of the Fund will generally fluctuate with changes in the market value of the Fund's holdings. The market prices of shares, however, will generally fluctuate in accordance with changes in net asset value as well as the relative supply of, and demand for, shares on the exchange. The trading price of shares may deviate significantly from the net asset value.
The FTSE Beyond BRICs Index is a market capitalization-weighted index designed to represent the performance of a diversified basket of 90 liquid companies in emerging and frontier markets excluding Brazil, Russia, India, China (BRIC), Taiwan and Argentina as defined by FTSE's Country Classification System. The index has 75% exposure to emerging markets and 25% to frontier markets at rebalance.
Indices are not available for investment, are not professionally managed and do not reflect sales charges, fees, brokerage commissions, taxes or other expenses of investing. Securities in the Fund may not match those in an index.
Columbia ETF Trust II | Annual Report 2019
2
FUND AT A GLANCE (continued)
Columbia Beyond BRICs ETF
Performance of a hypothetical $10,000 investment (August 15, 2012 — March 31, 2019)
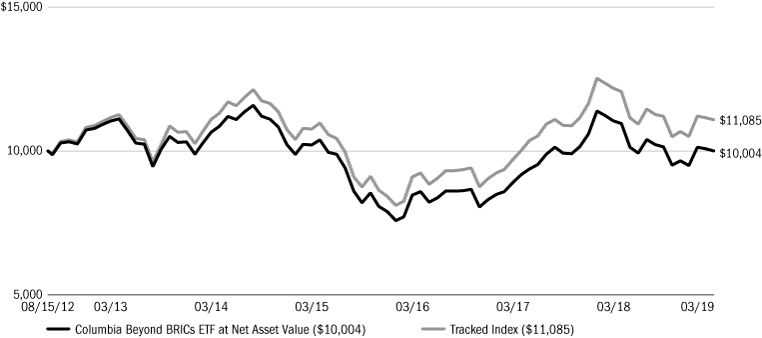
The chart above shows the change in value of a hypothetical $10,000 investment made on the Fund's inception, and does not reflect the deduction of taxes or brokerage commissions that a shareholder may pay on Fund distributions or on the redemption of Fund shares.
Top ten holdings (%) (at March 31, 2019)
Naspers, Ltd. N Shares (South Africa) | 3.6 | ||||||
Qatar National Bank QPSC (Qatar) | 2.6 | ||||||
PTT PCL NVDR (Thailand) | 2.5 | ||||||
America Movil SAB de CV Series L (Mexico) | 2.3 | ||||||
Fomento Economico Mexicano SAB de CV Series UBD (Mexico) | 2.3 | ||||||
PT Bank Central Asia Tbk (Indonesia) | 2.2 | ||||||
Banca Transilvania SA (Romania) | 2.1 | ||||||
Safaricom PLC (Kenya) | 2.1 | ||||||
National Bank of Kuwait SAKP (Kuwait) | 2.1 | ||||||
Guaranty Trust Bank PLC (Nigeria) | 2.1 | ||||||
Percentages indicated are based upon total investments (excluding Money Market Funds and derivatives, if any).
For further detail about these holdings, please refer to the section entitled "Portfolio of Investments."
Fund holdings are as of the date given, are subject to change at any time, and are not recommendations to buy or sell any security.
Country breakdown (%) (at March 31, 2019)
Bangladesh | 5.5 | ||||||
Chile | 3.4 | ||||||
Colombia | 0.6 | ||||||
Czech Republic | 0.4 | ||||||
Hungary | 1.2 | ||||||
Indonesia | 9.4 | ||||||
Kenya | 3.4 | ||||||
Kuwait | 2.9 | ||||||
Malaysia | 8.2 | ||||||
Mexico | 11.1 | ||||||
Morocco | 3.8 | ||||||
Nigeria | 3.9 | ||||||
Philippines | 3.5 | ||||||
Qatar | 3.9 | ||||||
Romania | 2.1 | ||||||
South Africa | 14.8 | ||||||
Thailand | 12.4 | ||||||
United Arab Emirates | 3.0 | ||||||
United States(a) | 0.5 | ||||||
Vietnam | 6.0 | ||||||
Total | 100.0 | ||||||
Country Breakdown is based primarily on issuer's place of organization/incorporation. Percentages indicated are based upon total investments and excludes investments in derivatives, if any. The Fund's portfolio composition is subject to change.
(a) Includes investments in Money Market Funds.
Columbia ETF Trust II | Annual Report 2019
3
FUND AT A GLANCE (continued)
Columbia Beyond BRICs ETF
Equity sector breakdown (%) (at March 31, 2019)
Communication Services | 14.0 | ||||||
Consumer Discretionary | 5.4 | ||||||
Consumer Staples | 8.7 | ||||||
Energy | 4.8 | ||||||
Financials | 43.5 | ||||||
Health Care | 3.5 | ||||||
Industrials | 2.9 | ||||||
Materials | 9.1 | ||||||
Real Estate | 3.7 | ||||||
Utilities | 4.4 | ||||||
Total | 100.0 | ||||||
Percentages indicated are based upon total equity investments. The Fund's portfolio composition is subject to change.
Columbia ETF Trust II | Annual Report 2019
4
MANAGER DISCUSSION OF FUND PERFORMANCE
Columbia Beyond BRICs ETF (BBRC)
For the 12-month period that ended March 31, 2019, the Fund returned -9.46% based on net asset value (NAV) and -10.15% based on market price. The Fund's Tracked Index, the FTSE Beyond BRICS Index, returned -9.01%.
The Fund's NAV on March 31, 2018 was $19.49, and it ended the annual period on March 31, 2019 with an NAV of $16.70. The Fund's market price on March 31, 2019 was $16.66 per share.
Emerging market equities struggled amid escalating trade tensions and more
Emerging market equities underperformed both U.S. and developed market international equities during the annual period. The MSCI Emerging Markets Index (Net) returned -7.41% during the annual period, as compared to S&P 500 Index and MSCI EAFE Index (Net) returns of 9.50% and -3.71%, respectively, for the same time period.
Emerging market equities had a challenging start to the annual period, primarily because of escalating trade tensions between the U.S. and China, a hawkish U.S. Federal Reserve (Fed) and resultant currency pressures. Fed tightening, rising bond yields and a stronger U.S. dollar weighed on emerging market currencies. Emerging market equities declined in the third quarter of 2018 as well. The quarter started positively with political developments in Latin America. Brazilian equities initially rebounded, driven by strong earnings results and reduced political uncertainty. Positive trade rhetoric from the Mexican president-elect also boosted investor sentiment, as his inclination toward a re-negotiation of the North American Free Trade Agreement and maintaining fiscal prudence mitigated concerns. However, Chinese equities fell, as the U.S. heightened the trade conflict by threatening to impose tariffs on an additional $267 billion worth of Chinese imports in addition to those already announced. Further, U.S. sanctions and concerns around central bank policy in the face of rising inflation spurred a sell-off in Turkish assets.
Emerging equity markets, like most global equity markets, ended calendar year 2018 on a down note, led by the threat of slowing global economic growth and tightening liquidity. Emerging market equities remained particularly challenged, primarily around persistent U.S.-China trade tensions and the resultant concerns of a Chinese economic slowdown. The success of Jair Bolsonaro in the Brazilian elections brought some relief for markets as did a subsequent temporary truce in the U.S.-China trade war and the accommodative stance of the Chinese government, particularly toward the private sector. But the optimism was short-lived following the arrest of technology company Huawei's Chief Financial Officer. Asian equities broadly suffered, including the equity markets of China, South Korea, Taiwan and Hong Kong. Elsewhere, falling oil prices and geopolitical tensions dampened Russian equities, though Turkish equities rallied as political tensions began to fade.
Following on the heels of a trying year in 2018, emerging market equities, like global equities broadly, came roaring back in the first quarter of 2019. Much of the impetus for the strong equity recovery can be attributed to an abrupt change in monetary policy direction by the Fed, where its bias shifted from a tightening mode to a more dovish stance. Other contributing factors to the sharp market turnaround included a sizable fiscal and monetary stimulus program in China, which seems to have had a fairly immediate impact based on leading economic indicators, and progress made on trade talks between the U.S. and China.
Contributors and detractors
Constituents in the financials, materials and energy sectors detracted most from the Fund's absolute returns during the annual period. Constituents in the information technology, consumer discretionary and utilities sectors contributed most positively to the Fund's absolute returns during the annual period.
From a country perspective, constituents in South Africa, Mexico and Malaysia detracted most from the Fund's absolute returns during the annual period. Conversely, constituents in United Arab Emirates, Qatar and Indonesia contributed most positively to the Fund's absolute returns during the annual period.
Positions in South African communication services provider MTN Group, Vietnamese industrial production company Hoa Phat Group and Mexican telecommunication services provider America Movil detracted most. Each generated a double-digit negative absolute return during the annual period. Positions in United Arab Emirates bank First Abu Dhabi Bank,
Columbia ETF Trust II | Annual Report 2019
5
MANAGER DISCUSSION OF FUND PERFORMANCE (continued)
Columbia Beyond BRICs ETF (BBRC)
Bangladesh utilities company United Power Generation & Distribution Company and Qatari bank Qatar National Bank contributed most positively. Each generated a double-digit absolute gain during the annual period.
The MSCI EAFE Index (Net) is a free float-adjusted market capitalization index that is designed to measure the equity market performance of developed markets, excluding the U.S. and Canada. The index is compiled from a composite of securities markets of Europe, Australasia and the Far East and is widely recognized by investors in foreign markets as the measurement index for portfolios of non-North American securities.
The MSCI Emerging Markets Index (Net) is a free float-adjusted market capitalization index that is designed to measure market performance of emerging markets.
The S&P 500 Index, an unmanaged index, measures the performance of 500 widely held, large-capitalization U.S. stocks and is frequently used as a general measure of market performance.
Investing involves risks, including the risk of loss of principal. Market risk may affect a single issuer, sector of the economy, industry or the market as a whole. The Fund is passively managed and seeks to track the performance of an index. The Fund may not sell a poorly performing security unless it was removed from the index. There is no guarantee that the index will achieve positive returns. Risk exists that the index provider may not follow its methodology for index construction. Errors may result in a negative fund performance. The Fund's net value will generally decline when the market value of its targeted index declines. Foreign investments subject the Fund to risks, including political, economic, market, social and other risks impacting a particular country, as well as to currency instabilities and less stringent financial and accounting standards generally applicable to U.S. issuers. These risks are enhanced for emerging or frontier market issuers. Investment in or exposure to foreign currencies subjects the Fund to currency fluctuation and risk of loss. Investments in small- and mid-cap companies involve risks and volatility greater than investments in larger, more established companies. The Fund concentrates its investments in issuers of one or more particular industries to the same extent as the underlying index. Although the Fund's shares are listed on an exchange, there can be no assurance that an active, liquid or otherwise orderly trading market for shares will be established or maintained. Active market trading may increase portfolio turnover, transaction costs and tracking error to the targeted index. The Fund may have portfolio turnover, which may cause an adverse cost impact. There may be additional portfolio turnover risk as active market trading of the Fund's shares may cause more frequent creation or redemption activities that could, in certain circumstances, increase the number of portfolio transactions as well as tracking error to the Index and as high levels of transactions increase brokerage and other transaction costs and may result in increased taxable capital gains. See the Fund's prospectus for more information on these and other risks.
The views expressed in this report reflect the current views of the respective parties. These views are not guarantees of future performance and involve certain risks, uncertainties and assumptions that are difficult to predict, so actual outcomes and results may differ significantly from the views expressed. These views are subject to change at any time based upon economic, market or other conditions and the respective parties disclaim any responsibility to update such views. These views may not be relied on as investment advice and, because investment decisions for a Columbia ETF are based on numerous factors, may not be relied on as an indication of trading intent on behalf of any particular Columbia ETF. References to specific securities should not be construed as a recommendation or investment advice.
Columbia ETF Trust II | Annual Report 2019
6
FUND AT A GLANCE
Columbia EM Core ex-China ETF
Investment objective
Columbia EM Core ex-China ETF (the Fund) seeks investment results that correspond (before fees and expenses) to the price and yield performance of the Beta Thematic Emerging Markets ex-China Index.
Portfolio management
Christopher Lo, CFA
Portfolio Manager
Managed Fund since 2016
Average annual total returns (%) (for period ended March 31, 2019)
Inception | 1 Year | Life | |||||||||||||
Market Price | 09/02/15 | -7.37 | 11.80 | ||||||||||||
Net Asset Value | 09/02/15 | -6.38 | 11.74 | ||||||||||||
MSCI Emerging Markets Index (Net) | -7.41 | 10.51 | |||||||||||||
Beta Thematic Emerging Markets ex-China Index | -8.44 | 10.19 | |||||||||||||
All results shown assume reinvestment of distributions during the period. Returns do not reflect the deduction of taxes that a shareholder may pay on Fund distributions or on the redemption of Fund shares. Performance results reflect the effect of any fee waivers or reimbursements of Fund expenses by the Fund's former investment manager or Columbia Management Investment Advisors, LLC (Columbia Management or the Investment Manager). Absent these fee waivers or expense reimbursement arrangements, performance results would have been lower.
The performance information shown represents past performance and is not a guarantee of future results. The investment return and principal value of your investment will fluctuate so that your shares, when redeemed, may be worth more or less than their original cost. Current performance may be lower or higher than the performance information shown. You may obtain performance information current to the most recent month-end by visiting columbiathreadneedleus.com/etfs.
Columbia Management took over portfolio management in September 2016 upon its acquisition of the Fund's previous investment manager.
The price used to calculate Market Price return is based on the midpoint of the 4:00 PM Eastern (U.S.) bid/ask spread on the NYSE and does not represent returns an investor would receive if shares were traded at other times.
The Fund's shares may trade above or below their net asset value. The net asset value of the Fund will generally fluctuate with changes in the market value of the Fund's holdings. The market prices of shares, however, will generally fluctuate in accordance with changes in net asset value as well as the relative supply of, and demand for, shares on the exchange. The trading price of shares may deviate significantly from the net asset value.
The MSCI Emerging Markets Index (Net) is a free float-adjusted market capitalization index that is designed to measure market performance of emerging markets.
The Beta Thematic Emerging Markets ex-China Index is a market capitalization-weighted index designed to provide broad, core emerging markets equity exposure by measuring the stock performance of up to 700 companies, excluding those listed or domiciled in China or Hong Kong.
Indices are not available for investment, are not professionally managed and do not reflect sales charges, fees, brokerage commissions, taxes (except the MSCI Emerging Markets Index (Net), which reflects reinvested dividends net of withholding taxes) or other expenses of investing. Securities in the Fund may not match those in an index.
Columbia ETF Trust II | Annual Report 2019
7
FUND AT A GLANCE (continued)
Columbia EM Core ex-China ETF
Performance of a hypothetical $10,000 investment (September 2, 2015 — March 31, 2019)
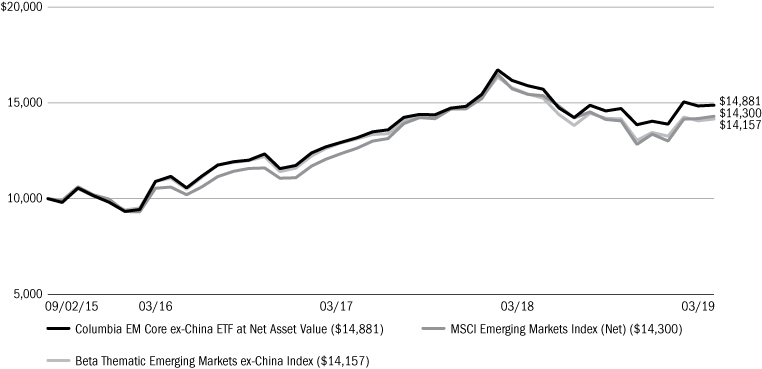
The chart above shows the change in value of a hypothetical $10,000 investment made on the Fund's inception, and does not reflect the deduction of taxes or brokerage commissions that a shareholder may pay on Fund distributions or on the redemption of Fund shares.
Top ten holdings (%) (at March 31, 2019)
Samsung Electronics Co., Ltd. (South Korea) | 6.6 | ||||||
Taiwan Semiconductor Manufacturing Co., Ltd. (Taiwan) | 5.4 | ||||||
Infosys, Ltd. ADR (India) | 3.5 | ||||||
ICICI Bank, Ltd. ADR (India) | 3.5 | ||||||
LUKOIL PJSC ADR (Russia) | 2.9 | ||||||
Naspers, Ltd. N Shares (South Africa) | 2.7 | ||||||
Petroleo Brasileiro SA Preference Shares (Brazil) | 2.2 | ||||||
Vale SA (Brazil) | 2.0 | ||||||
Itau Unibanco Holding SA Preference Shares (Brazil) | 2.0 | ||||||
BTS Group Holdings PCL NVDR (Thailand) | 1.9 | ||||||
Percentages indicated are based upon total investments (excluding Money Market Funds and derivatives, if any).
For further detail about these holdings, please refer to the section entitled "Portfolio of Investments."
Fund holdings are as of the date given, are subject to change at any time, and are not recommendations to buy or sell any security.
Country breakdown (%) (at March 31, 2019)
Brazil | 9.3 | ||||||
Chile | 1.4 | ||||||
India | 13.1 | ||||||
Indonesia | 3.8 | ||||||
Malaysia | 4.0 | ||||||
Mexico | 3.5 | ||||||
Philippines | 2.3 | ||||||
Poland | 2.3 | ||||||
Russia | 5.3 | ||||||
South Africa | 10.0 | ||||||
South Korea | 16.9 | ||||||
Taiwan | 19.8 | ||||||
Thailand | 6.8 | ||||||
Turkey | 0.7 | ||||||
United Kingdom | 0.5 | ||||||
United States(a) | 0.3 | ||||||
Total | 100.0 | ||||||
Country Breakdown is based primarily on issuer's place of organization/incorporation. Percentages indicated are based upon total investments and excludes investments in derivatives, if any. The Fund's portfolio composition is subject to change.
(a) Includes investments in Money Market Funds.
Columbia ETF Trust II | Annual Report 2019
8
FUND AT A GLANCE (continued)
Columbia EM Core ex-China ETF
Equity sector breakdown (%) (at March 31, 2019)
Communication Services | 3.3 | ||||||
Consumer Discretionary | 9.0 | ||||||
Consumer Staples | 7.2 | ||||||
Energy | 9.4 | ||||||
Financials | 24.6 | ||||||
Health Care | 3.1 | ||||||
Industrials | 5.8 | ||||||
Information Technology | 22.7 | ||||||
Materials | 11.0 | ||||||
Real Estate | 1.8 | ||||||
Utilities | 2.1 | ||||||
Total | 100.0 | ||||||
Percentages indicated are based upon total equity investments. The Fund's portfolio composition is subject to change.
Columbia ETF Trust II | Annual Report 2019
9
MANAGER DISCUSSION OF FUND PERFORMANCE
Columbia EM Core ex-China ETF (XCEM)
For the 12-month period that ended March 31, 2019, the Fund returned -6.38% based on net asset value (NAV) and -7.37% based on market price. The MSCI Emerging Markets Index (Net) returned -7.41%, and the Beta Thematic Emerging Markets ex-China Index returned -8.44% during the same time period.
The Fund's NAV on March 31, 2018 was $28.03, and it ended the annual period on March 31, 2019 with an NAV of $25.40. The Fund's market price on March 31, 2019 was $25.51 per share.
Emerging market equities struggled amid escalating trade tensions and more
Emerging market equities underperformed both U.S. and developed market international equities during the annual period. The MSCI Emerging Markets Index (Net) returned -7.41% during the annual period, as compared to S&P 500 Index and MSCI EAFE Index (Net) returns of 9.50% and -3.71%, respectively, for the same time period.
Emerging market equities had a challenging start to the annual period, primarily because of escalating trade tensions between the U.S. and China, a hawkish U.S. Federal Reserve (Fed) and resultant currency pressures. Fed tightening, rising bond yields and a stronger U.S. dollar weighed on emerging market currencies. Emerging market equities declined in the third quarter of 2018 as well. The quarter started positively with political developments in Latin America. Brazilian equities initially rebounded, driven by strong earnings results and reduced political uncertainty. Positive trade rhetoric from the Mexican president-elect also boosted investor sentiment, as his inclination toward a re-negotiation of the North American Free Trade Agreement and maintaining fiscal prudence mitigated concerns. However, Chinese equities fell, as the U.S. heightened the trade conflict by threatening to impose tariffs on an additional $267 billion worth of Chinese imports in addition to those already announced. Further, U.S. sanctions and concerns around central bank policy in the face of rising inflation spurred a sell-off in Turkish assets.
Emerging equity markets, like most global equity markets, ended calendar year 2018 on a down note, led by the threat of slowing global economic growth and tightening liquidity. Emerging market equities remained particularly challenged, primarily around persistent U.S.-China trade tensions and the resultant concerns of a Chinese economic slowdown. The success of Jair Bolsonaro in the Brazilian elections brought some relief for markets as did a subsequent temporary truce in the U.S.-China trade war and the accommodative stance of the Chinese government, particularly toward the private sector. But the optimism was short-lived following the arrest of technology company Huawei's Chief Financial Officer. Asian equities broadly suffered, including the equity markets of China, South Korea, Taiwan and Hong Kong. Elsewhere, falling oil prices and geopolitical tensions dampened Russian equities, though Turkish equities rallied as political tensions began to fade.
Following on the heels of a trying year in 2018, emerging market equities, like global equities broadly, came roaring back in the first quarter of 2019. Much of the impetus for the strong equity recovery can be attributed to an abrupt change in monetary policy direction by the Fed, where its bias shifted from a tightening mode to a more dovish stance. Other contributing factors to the sharp market turnaround included a sizable fiscal and monetary stimulus program in China, which seems to have had a fairly immediate impact based on leading economic indicators, and progress made on trade talks between the U.S. and China.
Contributors and detractors
Constituents in the communication services, industrials and energy sectors contributed most positively to the Fund's absolute returns during the annual period. Constituents in information technology, health care and consumer discretionary detracted most from absolute returns during the annual period.
From a country perspective, constituents in India, Thailand and Indonesia contributed most positively to the Fund's absolute returns during the annual period. Conversely, constituents in South Korea, South Africa and Turkey detracted most from absolute returns during the annual period.
Positions in India-based bank Icici Bank, India-based technology services company Infosys and Russian energy company Lukoil contributed most positively. Each generated a double-digit absolute gain during the annual period. Positions in
Columbia ETF Trust II | Annual Report 2019
10
MANAGER DISCUSSION OF FUND PERFORMANCE (continued)
Columbia EM Core ex-China ETF (XCEM)
South Korea-based biotechnology firm Celltrion, India-based auto manufacturer Tata Motors and South Korea-based electronic equipment and products manufacturer Samsung Electronics detracted most. Each produced a double-digit negative absolute return during the annual period.
The MSCI EAFE Index (Net) is a free float-adjusted market capitalization index that is designed to measure the equity market performance of developed markets, excluding the U.S. and Canada. The index is compiled from a composite of securities markets of Europe, Australasia and the Far East and is widely recognized by investors in foreign markets as the measurement index for portfolios of non-North American securities.
The MSCI Emerging Markets Index (Net) is a free float-adjusted market capitalization index that is designed to measure market performance of emerging markets.
The S&P 500 Index, an unmanaged index, measures the performance of 500 widely held, large-capitalization U.S. stocks and is frequently used as a general measure of market performance.
Investing involves risks, including the risk of loss of principal. Market risk may affect a single issuer, sector of the economy, industry or the market as a whole. The Fund is passively managed and seeks to track the performance of an index. The Fund may not sell a poorly performing security unless it was removed from the index. There is no guarantee that the index will achieve positive returns. Risk exists that the index provider may not follow its methodology for index construction. Errors may result in a negative fund performance. The Fund's net value will generally decline when the market value of its targeted index declines. Foreign investments subject the Fund to risks, including political, economic, market, social and other risks impacting a particular country, as well as to currency instabilities and less stringent financial and accounting standards generally applicable to U.S. issuers. These risks are enhanced for emerging or frontier market issuers. Investment in or exposure to foreign currencies subjects the Fund to currency fluctuation and risk of loss. Investments in small- and mid-cap companies involve risks and volatility greater than investments in larger, more established companies. The Fund concentrates its investments in issuers of one or more particular industries to the same extent as the underlying index. Although the Fund's shares are listed on an exchange, there can be no assurance that an active, liquid or otherwise orderly trading market for shares will be established or maintained. Active market trading may increase portfolio turnover, transaction costs and tracking error to the targeted index. The Fund may have portfolio turnover, which may cause an adverse cost impact. There may be additional portfolio turnover risk as active market trading of the Fund's shares may cause more frequent creation or redemption activities that could, in certain circumstances, increase the number of portfolio transactions as well as tracking error to the Index and as high levels of transactions increase brokerage and other transaction costs and may result in increased taxable capital gains. See the Fund's prospectus for more information on these and other risks.
The views expressed in this report reflect the current views of the respective parties. These views are not guarantees of future performance and involve certain risks, uncertainties and assumptions that are difficult to predict, so actual outcomes and results may differ significantly from the views expressed. These views are subject to change at any time based upon economic, market or other conditions and the respective parties disclaim any responsibility to update such views. These views may not be relied on as investment advice and, because investment decisions for a Columbia ETF are based on numerous factors, may not be relied on as an indication of trading intent on behalf of any particular Columbia ETF. References to specific securities should not be construed as a recommendation or investment advice.
Columbia ETF Trust II | Annual Report 2019
11
FUND AT A GLANCE
Columbia EM Quality Dividend ETF
Investment objective
Columbia EM Quality Dividend ETF (the Fund) seeks investment results that correspond (before fees and expenses) to the price and yield performance of the Beta Advantage® Emerging Markets Quality Dividend Index.
Portfolio management
Christopher Lo, CFA
Portfolio Manager
Managed Fund since 2016
The Board of Trustees of Columbia ETF Trust II, based upon the recommendation of the Investment Manager, determined to close and liquidate the Fund. The last day of trading for the Fund on the NYSE Arca Exchange is expected to be June 14, 2019. On or about June 21, 2019, the Fund will make a liquidating distribution to remaining shareholders equal to the shareholder's proportionate interest in the net assets of the Fund.
Average annual total returns (%) (for period ended March 31, 2019)
Inception | 1 Year | 5 Years | Life | ||||||||||||||||
Market Price | 08/04/11 | -10.44 | 0.23 | -1.20 | |||||||||||||||
Net Asset Value | 08/04/11 | -9.01 | 0.22 | -1.15 | |||||||||||||||
MSCI Emerging Markets Index (Net) | -7.41 | 3.68 | 1.85 | ||||||||||||||||
Tracked Index(1) | -7.98 | 1.96 | 0.31 | ||||||||||||||||
(1) The Tracked Index reflects the Indxx Emerging Market High Income Low Beta Index through January 31, 2014, the FTSE Emerging All Cap ex Taiwan Low Volatility Dividend Net Tax Index from February 3, 2014 through January 23, 2015, and the Beta Advantage® Emerging Markets Quality Dividend Index thereafter.
All results shown assume reinvestment of distributions during the period. Returns do not reflect the deduction of taxes that a shareholder may pay on Fund distributions or on the redemption of Fund shares. Performance results reflect the effect of any fee waivers or reimbursements of Fund expenses by the Fund's former investment manager or Columbia Management Investment Advisers, LLC (Columbia Management or the Investment Manager). Absent these fee waivers or expense reimbursement arrangements, performance results would have been lower.
The performance information shown represents past performance and is not a guarantee of future results. The investment return and principal value of your investment will fluctuate so that your shares, when redeemed, may be worth more or less than their original cost. Current performance may be lower or higher than the performance information shown. You may obtain performance information current to the most recent month-end by visiting columbiathreadneedleus.com/etfs.
Columbia Management took over portfolio management in September 2016 upon its acquisition of the Fund's previous investment manager.
The price used to calculate Market Price return is based on the midpoint of the 4:00 PM Eastern (U.S.) bid/ask spread on the NYSE and does not represent returns an investor would receive if shares were traded at other times.
The Fund's shares may trade above or below their net asset value. The net asset value of the Fund will generally fluctuate with changes in the market value of the Fund's holdings. The market prices of shares, however, will generally fluctuate in accordance with changes in net asset value as well as the relative supply of, and demand for, shares on the exchange. The trading price of shares may deviate significantly from the net asset value.
The MSCI Emerging Markets Index (Net) is a free float-adjusted market capitalization index that is designed to measure market performance of emerging markets.
The Beta Advantage® Emerging Markets Quality Dividend Index is an equal-weighted index designed to represent a portfolio of approximately 50 companies in developing markets, which is expected to have a higher dividend yield than the average dividend yield of companies included in the developing markets universe as defined by Columbia Management.
Indices are not available for investment, are not professionally managed and do not reflect sales charges, fees, brokerage commissions, taxes (except the MSCI Emerging Markets Index (Net), which reflects reinvested dividends net of withholding taxes) or other expenses of investing. Securities in the Fund may not match those in an index.
Columbia ETF Trust II | Annual Report 2019
12
FUND AT A GLANCE (continued)
Columbia EM Quality Dividend ETF
Performance of a hypothetical $10,000 investment (August 4, 2011 — March 31, 2019)
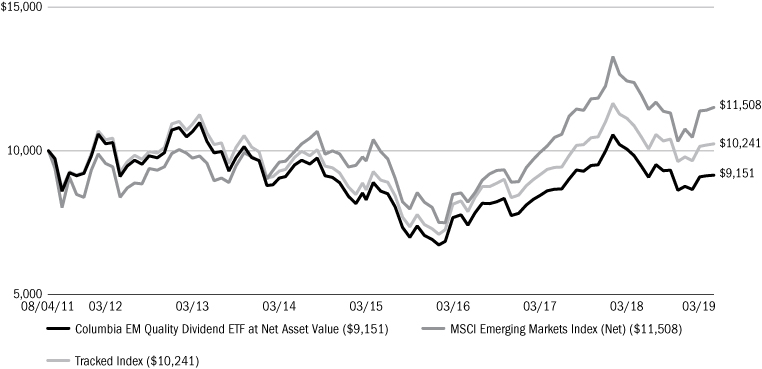
The chart above shows the change in value of a hypothetical $10,000 investment made on the Fund's inception, and does not reflect the deduction of taxes or brokerage commissions that a shareholder may pay on Fund distributions or on the redemption of Fund shares.
Top ten holdings (%) (at March 31, 2019)
Bharat Petroleum Corp., Ltd. (India) | 2.1 | ||||||
Link REIT (Hong Kong) | 2.1 | ||||||
Grupo Mexico SAB de CV Series B (Mexico) | 2.1 | ||||||
Indian Oil Corp., Ltd. (India) | 2.1 | ||||||
PT Telekomunikasi Indonesia Persero Tbk (Indonesia) | 2.1 | ||||||
Formosa Chemicals & Fibre Corp. (Taiwan) | 2.1 | ||||||
Nan Ya Plastics Corp. (Taiwan) | 2.1 | ||||||
CK Asset Holdings Ltd. (Hong Kong) | 2.1 | ||||||
Vale SA (Brazil) | 2.0 | ||||||
Formosa Plastics Corp. (Taiwan) | 2.0 | ||||||
Percentages indicated are based upon total investments (excluding Money Market Funds and derivatives, if any).
For further detail about these holdings, please refer to the section entitled "Portfolio of Investments."
Fund holdings are as of the date given, are subject to change at any time, and are not recommendations to buy or sell any security.
Country breakdown (%) (at March 31, 2019)
Brazil | 6.0 | ||||||
Chile | 4.1 | ||||||
China | 9.8 | ||||||
Colombia | 2.0 | ||||||
Hong Kong | 10.2 | ||||||
India | 12.2 | ||||||
Indonesia | 7.9 | ||||||
Kenya | 2.0 | ||||||
Malaysia | 11.9 | ||||||
Mexico | 4.1 | ||||||
Poland | 1.9 | ||||||
Qatar | 2.0 | ||||||
South Africa | 4.0 | ||||||
South Korea | 5.7 | ||||||
Taiwan | 12.2 | ||||||
Thailand | 2.0 | ||||||
United Arab Emirates | 2.0 | ||||||
Total | 100.0 | ||||||
Country Breakdown is based primarily on issuer's place of organization/incorporation. Percentages indicated are based upon total investments and excludes investments in derivatives, if any. The Fund's portfolio composition is subject to change.
Columbia ETF Trust II | Annual Report 2019
13
FUND AT A GLANCE (continued)
Columbia EM Quality Dividend ETF
Equity sector breakdown (%) (at March 31, 2019)
Communication Services | 9.9 | ||||||
Consumer Discretionary | 2.0 | ||||||
Consumer Staples | 10.0 | ||||||
Energy | 11.9 | ||||||
Financials | 19.9 | ||||||
Information Technology | 9.8 | ||||||
Materials | 18.4 | ||||||
Real Estate | 6.1 | ||||||
Utilities | 12.0 | ||||||
Total | 100.0 | ||||||
Percentages indicated are based upon total equity investments. The Fund's portfolio composition is subject to change.
Columbia ETF Trust II | Annual Report 2019
14
MANAGER DISCUSSION OF FUND PERFORMANCE
Columbia EM Quality Dividend ETF (HILO)
For the 12-month period that ended March 31, 2019, the Fund returned -9.01% based on net asset value (NAV) and -10.44% based on market price. The MSCI Emerging Markets Index (Net) returned -7.41%, and the Fund's Tracked Index, the Beta Advantage® Emerging Markets Quality Dividend Index, returned -7.98% during the same time period.
The Fund's NAV on March 31, 2018 was $16.00, and it ended the annual period on March 31, 2019 with an NAV of $14.10. The Fund's market price on March 31, 2019 was $14.04 per share.
Emerging market equities struggled amid escalating trade tensions and more
Emerging market equities underperformed both U.S. and developed market international equities during the annual period. The MSCI Emerging Markets Index (Net) returned -7.41% during the annual period, as compared to S&P 500 Index and MSCI EAFE Index (Net) returns of 9.50% and -3.71%, respectively, for the same time period.
Emerging market equities had a challenging start to the annual period, primarily because of escalating trade tensions between the U.S. and China, a hawkish U.S. Federal Reserve (Fed) and resultant currency pressures. Fed tightening, rising bond yields and a stronger U.S. dollar weighed on emerging market currencies. Emerging market equities declined in the third quarter of 2018 as well. The quarter started positively with political developments in Latin America. Brazilian equities initially rebounded, driven by strong earnings results and reduced political uncertainty. Positive trade rhetoric from the Mexican president-elect also boosted investor sentiment, as his inclination toward a re-negotiation of the North American Free Trade Agreement and maintaining fiscal prudence mitigated concerns. However, Chinese equities fell, as the U.S. heightened the trade conflict by threatening to impose tariffs on an additional $267 billion worth of Chinese imports in addition to those already announced. Further, U.S. sanctions and concerns around central bank policy in the face of rising inflation spurred a sell-off in Turkish assets.
Emerging equity markets, like most global equity markets, ended calendar year 2018 on a down note, led by the threat of slowing global economic growth and tightening liquidity. Emerging market equities remained particularly challenged, primarily around persistent U.S.-China trade tensions and the resultant concerns of a Chinese economic slowdown. The success of Jair Bolsonaro in the Brazilian elections brought some relief for markets as did a subsequent temporary truce in the U.S.-China trade war and the accommodative stance of the Chinese government, particularly toward the private sector. But the optimism was short-lived following the arrest of technology company Huawei's Chief Financial Officer. Asian equities broadly suffered, including the equity markets of China, South Korea, Taiwan and Hong Kong. Elsewhere, falling oil prices and geopolitical tensions dampened Russian equities, though Turkish equities rallied as political tensions began to fade.
Following on the heels of a trying year in 2018, emerging market equities, like global equities broadly, came roaring back in the first quarter of 2019. Much of the impetus for the strong equity recovery can be attributed to an abrupt change in monetary policy direction by the Fed, where its bias shifted from a tightening mode to a more dovish stance. Other contributing factors to the sharp market turnaround included a sizable fiscal and monetary stimulus program in China, which seems to have had a fairly immediate impact based on leading economic indicators, and progress made on trade talks between the U.S. and China.
Contributors and detractors
Constituents in the energy, industrials and information technology sectors detracted most from the Fund's absolute returns during the annual period. Constituents in consumer discretionary, financials and health care contributed most positively to absolute returns during the annual period.
From a country perspective, constituents in Brazil, South Africa and China detracted most from absolute returns during the annual period. Conversely, constituents in Hong Kong, Qatar and Kenya contributed most positively to the Fund's absolute returns during the annual period.
Positions in China-based acoustic components manufacturer AAC Technologies, Brazilian highway manager CCR and Brazilian energy company Ultrapar Participacoes detracted most. Each generated a double-digit negative absolute return
Columbia ETF Trust II | Annual Report 2019
15
MANAGER DISCUSSION OF FUND PERFORMANCE (continued)
Columbia EM Quality Dividend ETF (HILO)
during the annual period. Positions in Qatari bank Qatar National Bank, Hong Kong-based retail real estate investment trust Link REIT and India-based technology services company Infosys contributed most positively. Each of these companies produced a double-digit absolute gain during the annual period.
The MSCI EAFE Index (Net) is a free float-adjusted market capitalization index that is designed to measure the equity market performance of developed markets, excluding the U.S. and Canada. The index is compiled from a composite of securities markets of Europe, Australasia and the Far East and is widely recognized by investors in foreign markets as the measurement index for portfolios of non-North American securities.
The MSCI Emerging Markets Index (Net) is a free float-adjusted market capitalization index that is designed to measure market performance of emerging markets.
The S&P 500 Index, an unmanaged index, measures the performance of 500 widely held, large-capitalization U.S. stocks and is frequently used as a general measure of market performance.
Investing involves risks, including the risk of loss of principal. Market risk may affect a single issuer, sector of the economy, industry or the market as a whole. The Fund is passively managed and seeks to track the performance of an index. The Fund may not sell a poorly performing security unless it was removed from the index. There is no guarantee that the index will achieve positive returns. Risk exists that the index provider may not follow its methodology for index construction. Errors may result in a negative fund performance. The Fund's net value will generally decline when the market value of its targeted index declines. Foreign investments subject the Fund to risks, including political, economic, market, social and other risks impacting a particular country, as well as to currency instabilities and less stringent financial and accounting standards generally applicable to U.S. issuers. These risks are enhanced for emerging or frontier market issuers. Investment in or exposure to foreign currencies subjects the Fund to currency fluctuation and risk of loss. Investments in small- and mid-cap companies involve risks and volatility greater than investments in larger, more established companies. The Fund concentrates its investments in issuers of one or more particular industries to the same extent as the underlying index. Although the Fund's shares are listed on an exchange, there can be no assurance that an active, liquid or otherwise orderly trading market for shares will be established or maintained. Active market trading may increase portfolio turnover, transaction costs and tracking error to the targeted index. The Fund may have portfolio turnover, which may cause an adverse cost impact. There may be additional portfolio turnover risk as active market trading of the Fund's shares may cause more frequent creation or redemption activities that could, in certain circumstances, increase the number of portfolio transactions as well as tracking error to the Index and as high levels of transactions increase brokerage and other transaction costs and may result in increased taxable capital gains. Dividend quality is not guaranteed and the amount, if any, can vary over time. See the Fund's prospectus for more information on these and other risks.
The views expressed in this report reflect the current views of the respective parties. These views are not guarantees of future performance and involve certain risks, uncertainties and assumptions that are difficult to predict, so actual outcomes and results may differ significantly from the views expressed. These views are subject to change at any time based upon economic, market or other conditions and the respective parties disclaim any responsibility to update such views. These views may not be relied on as investment advice and, because investment decisions for a Columbia ETF are based on numerous factors, may not be relied on as an indication of trading intent on behalf of any particular Columbia ETF. References to specific securities should not be construed as a recommendation or investment advice.
Columbia ETF Trust II | Annual Report 2019
16
FUND AT A GLANCE
Columbia Emerging Markets Consumer ETF
Investment objective
Columbia Emerging Markets Consumer ETF (the Fund) seeks investment results that correspond (before fees and expenses) to the price and yield performance of the Dow Jones Emerging Markets Consumer TitansTM Index.
Portfolio management
Christopher Lo, CFA
Portfolio Manager
Managed Fund since 2016
Average annual total returns (%) (for period ended March 31, 2019)
Inception | 1 Year | 5 Years | Life | ||||||||||||||||
Market Price | 09/14/10 | -13.90 | -2.33 | 2.17 | |||||||||||||||
Net Asset Value | 09/14/10 | -13.08 | -2.25 | 2.21 | |||||||||||||||
Dow Jones Emerging Markets Consumer TitansTM Index* | -12.28 | -1.20 | 3.38 | ||||||||||||||||
* As of 3/18/2019, the index name changed from Dow Jones Emerging Markets Consumer Titans 30TM Index to Dow Jones Emerging Markets Consumer TitansTM Index.
All results shown assume reinvestment of distributions during the period. Returns do not reflect the deduction of taxes that a shareholder may pay on Fund distributions or on the redemption of Fund shares. Performance results reflect the effect of any fee waivers or reimbursements of Fund expenses by the Fund's former investment manager or Columbia Management Investment Advisers, LLC (Columbia Management or the Investment Manager). Absent these fee waivers or expense reimbursement arrangements, performance results would have been lower.
The performance information shown represents past performance and is not a guarantee of future results. The investment return and principal value of your investment will fluctuate so that your shares, when redeemed, may be worth more or less than their original cost. Current performance may be lower or higher than the performance information shown. You may obtain performance information current to the most recent month-end by visiting columbiathreadneedleus.com/etfs.
Columbia Management took over portfolio management in September 2016 upon its acquisition of the Fund's previous investment manager.
The price used to calculate Market Price return is based on the midpoint of the 4:00 PM Eastern (U.S.) bid/ask spread on the NYSE and does not represent returns an investor would receive if shares were traded at other times.
The Fund's shares may trade above or below their net asset value. The net asset value of the Fund will generally fluctuate with changes in the market value of the Fund's holdings. The market prices of shares, however, will generally fluctuate in accordance with changes in net asset value as well as the relative supply of, and demand for, shares on the exchange. The trading price of shares may deviate significantly from the net asset value.
The Dow Jones Emerging Markets Consumer TitansTM Index is a free-float market capitalization-weighted index that measures the performance of 60 leading emerging market companies in the Consumer Discretionary, Consumer Staples, and Communication Services sectors as defined by the S&P Dow Jones Indexes.
Indices are not available for investment, are not professionally managed and do not reflect sales charges, fees, brokerage commissions, taxes or other expenses of investing. Securities in the Fund may not match those in an index.
Columbia ETF Trust II | Annual Report 2019
17
FUND AT A GLANCE (continued)
Columbia Emerging Markets Consumer ETF
Performance of a hypothetical $10,000 investment (September 14, 2010 — March 31, 2019)

The chart above shows the change in value of a hypothetical $10,000 investment made on the Fund's inception, and does not reflect the deduction of taxes or brokerage commissions that a shareholder may pay on Fund distributions or on the redemption of Fund shares.
Top ten holdings (%) (at March 31, 2019)
Tencent Holdings, Ltd. (China) | 5.0 | ||||||
Alibaba Group Holding, Ltd. ADR (China) | 4.9 | ||||||
China Mobile, Ltd. (China) | 4.9 | ||||||
Baidu, Inc. ADR (China) | 4.8 | ||||||
Hindustan Unilever, Ltd. (India) | 4.7 | ||||||
Chunghwa Telecom Co., Ltd. (Taiwan) | 3.9 | ||||||
Uni-President Enterprises Corp. (Taiwan) | 3.5 | ||||||
ITC, Ltd. (India) | 3.3 | ||||||
Maruti Suzuki India, Ltd. (India) | 3.1 | ||||||
JD.com, Inc. ADR (China) | 3.0 | ||||||
Percentages indicated are based upon total investments (excluding Money Market Funds and derivatives, if any).
For further detail about these holdings, please refer to the section entitled "Portfolio of Investments."
Fund holdings are as of the date given, are subject to change at any time, and are not recommendations to buy or sell any security.
Country breakdown (%) (at March 31, 2019)
Brazil | 7.2 | ||||||
Chile | 1.5 | ||||||
China | 42.8 | ||||||
Hong Kong | 0.4 | ||||||
India | 16.6 | ||||||
Indonesia | 3.2 | ||||||
Mexico | 3.6 | ||||||
Russia | 4.5 | ||||||
South Africa | 4.5 | ||||||
Taiwan | 10.6 | ||||||
Thailand | 3.8 | ||||||
United Arab Emirates | 0.9 | ||||||
United States(a) | 0.4 | ||||||
Total | 100.0 | ||||||
Country Breakdown is based primarily on issuer's place of organization/incorporation. Percentages indicated are based upon total investments and excludes investments in derivatives, if any. The Fund's portfolio composition is subject to change.
(a) Includes investments in Money Market Funds.
Columbia ETF Trust II | Annual Report 2019
18
FUND AT A GLANCE (continued)
Columbia Emerging Markets Consumer ETF
Equity sector breakdown (%) (at March 31, 2019)
Communication Services | 39.2 | ||||||
Consumer Discretionary | 30.9 | ||||||
Consumer Staples | 29.9 | ||||||
Total | 100.0 | ||||||
Percentages indicated are based upon total equity investments. The Fund's portfolio composition is subject to change.
Columbia ETF Trust II | Annual Report 2019
19
MANAGER DISCUSSION OF FUND PERFORMANCE
Columbia Emerging Markets Consumer ETF (ECON)
Effective prior to the market open on March 18, 2019, the Fund's benchmark, the Dow Jones Emerging Markets Consumer Titans 30TM Index changed its name to the Dow Jones Emerging Markets Consumer TitansTM Index and modified its construction criteria to more effectively and comprehensively capture the emerging market consumer theme while limiting geographic and single stock concentration. The revised Dow Jones Emerging Markets Consumer TitansTM Index is designed to measure the performance of 60 leading emerging market companies classified in the GICS consumer discretionary, consumer staples and communication services sectors.
For the 12-month period that ended March 31, 2019, the Fund returned -13.08% based on net asset value (NAV) and -13.90% based on market price. The Dow Jones Emerging Markets Consumer TitansTM Index returned -12.28%, during the same time period.
The Fund's NAV on March 31, 2018 was $26.34, and it ended the annual period on March 31, 2019 with an NAV of $22.67. The Fund's market price on March 31, 2019 was $22.60 per share.
Emerging market equities struggled amid escalating trade tensions and more
Emerging market equities underperformed both U.S. and developed market international equities during the annual period. The MSCI Emerging Markets Index (Net) returned -7.41% during the annual period, as compared to S&P 500 Index and MSCI EAFE Index (Net) returns of 9.50% and -3.71%, respectively, for the same time period.
Emerging market equities had a challenging start to the annual period, primarily because of escalating trade tensions between the U.S. and China, a hawkish U.S. Federal Reserve (Fed) and resultant currency pressures. Fed tightening, rising bond yields and a stronger U.S. dollar weighed on emerging market currencies. Emerging market equities declined in the third quarter of 2018 as well. The quarter started positively with political developments in Latin America. Brazilian equities initially rebounded, driven by strong earnings results and reduced political uncertainty. Positive trade rhetoric from the Mexican president-elect also boosted investor sentiment, as his inclination toward a re-negotiation of the North American Free Trade Agreement and maintaining fiscal prudence mitigated concerns. However, Chinese equities fell, as the U.S. heightened the trade conflict by threatening to impose tariffs on an additional $267 billion worth of Chinese imports in addition to those already announced. Further, U.S. sanctions and concerns around central bank policy in the face of rising inflation spurred a sell-off in Turkish assets.
Emerging equity markets, like most global equity markets, ended calendar year 2018 on a down note, led by the threat of slowing global economic growth and tightening liquidity. Emerging market equities remained particularly challenged, primarily around persistent U.S.-China trade tensions and the resultant concerns of a Chinese economic slowdown. The success of Jair Bolsonaro in the Brazilian elections brought some relief for markets as did a subsequent temporary truce in the U.S.-China trade war and the accommodative stance of the Chinese government, particularly toward the private sector. But the optimism was short-lived following the arrest of technology company Huawei's Chief Financial Officer. Asian equities broadly suffered, including the equity markets of China, South Korea, Taiwan and Hong Kong. Elsewhere, falling oil prices and geopolitical tensions dampened Russian equities, though Turkish equities rallied as political tensions began to fade.
Following on the heels of a trying year in 2018, emerging market equities, like global equities broadly, came roaring back in the first quarter of 2019. Much of the impetus for the strong equity recovery can be attributed to an abrupt change in monetary policy direction by the Fed, where its bias shifted from a tightening mode to a more dovish stance. Other contributing factors to the sharp market turnaround included a sizable fiscal and monetary stimulus program in China, which seems to have had a fairly immediate impact based on leading economic indicators, and progress made on trade talks between the U.S. and China.
Columbia ETF Trust II | Annual Report 2019
20
MANAGER DISCUSSION OF FUND PERFORMANCE (continued)
Columbia Emerging Markets Consumer ETF (ECON)
Contributors and detractors
Constituents in the consumer discretionary, consumer staples and energy sectors detracted most from the Fund's absolute returns during the annual period. Constituents in information technology, financials and health care contributed most positively to the Fund's absolute returns during the annual period.
From a country perspective, constituents in South Africa, Brazil and China detracted most from absolute returns during the annual period. Conversely, constituents in Indonesia, Taiwan and United Arab Emirates contributed most positively to the Fund's absolute returns during the annual period.
Positions in Brazilian beverage producer and distributor Ambev, India-based auto manufacturer Tata Motors and South African consumer staples retailer Shoprite Holdings detracted most. Each of these companies produced a double-digit negative absolute return during the annual period. Positions in China-based educational services provider Tal Education Group, India-based consumer products manufacturer Hindustan Unilever and India-based diversified consumer products company ITC contributed most positively. Each generated a double-digit absolute gain during the annual period.
The MSCI EAFE Index (Net) is a free float-adjusted market capitalization index that is designed to measure the equity market performance of developed markets, excluding the U.S. and Canada. The index is compiled from a composite of securities markets of Europe, Australasia and the Far East and is widely recognized by investors in foreign markets as the measurement index for portfolios of non-North American securities.
The MSCI Emerging Markets Index (Net) is a free float-adjusted market capitalization index that is designed to measure market performance of emerging markets.
The S&P 500 Index, an unmanaged index, measures the performance of 500 widely held, large-capitalization U.S. stocks and is frequently used as a general measure of market performance.
Investing involves risks, including the risk of loss of principal. Market risk may affect a single issuer, sector of the economy, industry or the market as a whole. The Fund is passively managed and seeks to track the performance of an index. The Fund may not sell a poorly performing security unless it was removed from the index. There is no guarantee that the index will achieve positive returns. Risk exists that the index provider may not follow its methodology for index construction. Errors may result in a negative fund performance. The Fund's net value will generally decline when the market value of its targeted index declines. Foreign investments subject the Fund to risks, including political, economic, market, social and other risks impacting a particular country, as well as to currency instabilities and less stringent financial and accounting standards generally applicable to U.S. issuers. These risks are enhanced for emerging or frontier market issuers. Investment in or exposure to foreign currencies subjects the Fund to currency fluctuation and risk of loss. Investments in small- and mid-cap companies involve risks and volatility greater than investments in larger, more established companies. The Fund concentrates its investments in issuers of one or more particular industries to the same extent as the underlying index. Although the Fund's shares are listed on an exchange, there can be no assurance that an active, liquid or otherwise orderly trading market for shares will be established or maintained. Active market trading may increase portfolio turnover, transaction costs and tracking error to the targeted index. The Fund may have portfolio turnover, which may cause an adverse cost impact. There may be additional portfolio turnover risk as active market trading of the Fund's shares may cause more frequent creation or redemption activities that could, in certain circumstances, increase the number of portfolio transactions as well as tracking error to the Index and as high levels of transactions increase brokerage and other transaction costs and may result in increased taxable capital gains. See the Fund's prospectus for more information on these and other risks.
The views expressed in this report reflect the current views of the respective parties. These views are not guarantees of future performance and involve certain risks, uncertainties and assumptions that are difficult to predict, so actual outcomes and results may differ significantly from the views expressed. These views are subject to change at any time based upon economic, market or other conditions and the respective parties disclaim any responsibility to update such views. These views may not be relied on as investment advice and, because investment decisions for a Columbia ETF are based on numerous factors, may not be relied on as an indication of trading intent on behalf of any particular Columbia ETF. References to specific securities should not be construed as a recommendation or investment advice.
Columbia ETF Trust II | Annual Report 2019
21
FUND AT A GLANCE
Columbia India Consumer ETF
Investment objective
Columbia India Consumer ETF (the Fund) seeks investment results that correspond (before fees and expenses) to the price and yield performance of the Indxx India Consumer Index.
Portfolio management
Christopher Lo, CFA
Portfolio Manager
Managed Fund since 2016
Average annual total returns (%) (for period ended March 31, 2019)
Inception | 1 Year | 5 Years | Life | ||||||||||||||||
Market Price | 08/10/11 | -8.44 | 11.34 | 10.32 | |||||||||||||||
Net Asset Value | 08/10/11 | -8.03 | 11.30 | 10.27 | |||||||||||||||
Indxx India Consumer Index | -6.72 | 12.93 | 11.91 | ||||||||||||||||
All results shown assume reinvestment of distributions during the period. Returns do not reflect the deduction of taxes that a shareholder may pay on Fund distributions or on the redemption of Fund shares. Performance results reflect the effect of any fee waivers or reimbursements of Fund expenses by the Fund's former investment manager or Columbia Management Investment Advisers, LLC (Columbia Management or the Investment Manager). Absent these fee waivers or expense reimbursement arrangements, performance results would have been lower.
The performance information shown represents past performance and is not a guarantee of future results. The investment return and principal value of your investment will fluctuate so that your shares, when redeemed, may be worth more or less than their original cost. Current performance may be lower or higher than the performance information shown. You may obtain performance information current to the most recent month-end by visiting columbiathreadneedleus.com/etfs.
Columbia Management took over portfolio management in September 2016 upon its acquisition of the Fund's previous investment manager.
The price used to calculate Market Price return is based on the midpoint of the 4:00 PM Eastern (U.S.) bid/ask spread on the NYSE and does not represent returns an investor would receive if shares were traded at other times.
The Fund's shares may trade above or below their net asset value. The net asset value of the Fund will generally fluctuate with changes in the market value of the Fund's holdings. The market prices of shares, however, will generally fluctuate in accordance with changes in net asset value as well as the relative supply of, and demand for, shares on the exchange. The trading price of shares may deviate significantly from the net asset value.
The Indxx India Consumer Index is a maximum 30-stock free-float adjusted market capitalization weighted index designed to measure the market performance of companies in the consumer industry in India as defined by Indxx's proprietary methodology. The index consists of common stocks listed on the primary exchange of India.
Indices are not available for investment, are not professionally managed and do not reflect sales charges, fees, brokerage commissions, taxes or other expenses of investing. Securities in the Fund may not match those in an index.
Columbia ETF Trust II | Annual Report 2019
22
FUND AT A GLANCE (continued)
Columbia India Consumer ETF
Performance of a hypothetical $10,000 investment (August 10, 2011 — March 31, 2019)
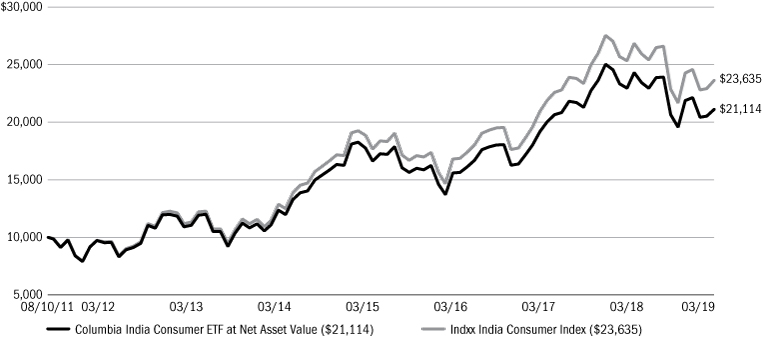
The chart above shows the change in value of a hypothetical $10,000 investment made on the Fund's inception, and does not reflect the deduction of taxes or brokerage commissions that a shareholder may pay on Fund distributions or on the redemption of Fund shares.
Top ten holdings (%) (at March 31, 2019)
Nestle India, Ltd. | 5.3 | ||||||
Titan Co., Ltd. | 5.3 | ||||||
ITC, Ltd. | 5.0 | ||||||
Britannia Industries Ltd. | 4.9 | ||||||
Mahindra & Mahindra, Ltd. | 4.9 | ||||||
Hindustan Unilever, Ltd. | 4.9 | ||||||
Bajaj Auto, Ltd. | 4.8 | ||||||
Tata Motors, Ltd. | 4.7 | ||||||
Maruti Suzuki India, Ltd. | 4.7 | ||||||
Eicher Motors, Ltd. | 4.6 | ||||||
Percentages indicated are based upon total investments (excluding Money Market Funds and derivatives, if any).
For further detail about these holdings, please refer to the section entitled "Portfolio of Investments."
Fund holdings are as of the date given, are subject to change at any time, and are not recommendations to buy or sell any security.
Equity sector breakdown (%) (at March 31, 2019)
Consumer Discretionary | 54.3 | ||||||
Consumer Staples | 45.7 | ||||||
Total | 100.0 | ||||||
Percentages indicated are based upon total equity investments. The Fund's portfolio composition is subject to change.
Columbia ETF Trust II | Annual Report 2019
23
MANAGER DISCUSSION OF FUND PERFORMANCE
Columbia India Consumer ETF (INCO)
For the 12-month period that ended March 31, 2019, the Fund returned -8.03% based on net asset value (NAV) and -8.44% based on market price. The Indxx India Consumer Index returned -6.72% during the same time period.
The Fund's NAV on March 31, 2018 was $45.81, and it ended the annual period on March 31, 2019 with an NAV of $42.08. The Fund's market price on March 31, 2019 was $42.23 per share.
Indian equities gained despite rising crude prices and financial sector concerns
The Indian equity market enjoyed solid returns during the annual period despite rising crude oil prices and financial sector concerns. The MSCI India Index returned 6.75% for the annual period, significantly outperforming the -7.41% return of the MSCI Emerging Markets Index (Net). Still, there were challenges. Brent crude oil rose to as high as $85 per barrel in October 2018, the highest level seen since November 2014. This increase was a result of the Organization of Petroleum Exporting Countries (OPEC) refusing to ramp up production, and the U.S. persuading buyers to cut down imports of Iranian oil. As the world's third largest oil importer, India faced the brunt of the rising crude oil prices, a situation exacerbated by a depreciating rupee. The annual period also saw a major liquidity issue surrounding Infrastructure Leasing and Financial Services, an Indian infrastructure development and finance company. The lender defaulted on its short-term commercial papers, which rocked the debt market. Throughout September and October 2018, the Indian equity market declined substantially on the back of non-banking financial company sector liquidity fears. Further pressuring investor sentiment was Finance Minister Arun Jaitley re-introducing a long-term capital gains tax and levying a tax on profits generated from assets such as shares and share-oriented products. On the positive side, Indian Prime Minister Narendra Modi's government released on February 1, 2019 its last budget before the April 2019 general elections. It focused on supporting farmers and those economically less privileged, while continuing its push toward better physical and social infrastructure. India's general election was scheduled to begin on April 11, 2019, and after seven phases, the results are anticipated to be reported on May 23. Campaign promises of both Modi's Bharatiya Janata Party (BJP) and Gandhi's Indian National Congress include increased spending to provide income support to the poor and to farmers. Also, BJP has pledged to spend significant monies on infrastructure. If campaign promises are implemented, such spending should help support demand in consumer-oriented sectors.
Importantly, the fundamentals for India and its economy remained strong during the annual period. Its policy-driven, largely domestic-based economic growth, in synchronization with global economic growth, provided a tailwind for its equity market performance.
Contributors and detractors
Constituents in consumer discretionary, information technology and energy detracted most from the Fund's absolute returns during the annual period. Consumer staples, materials and utilities contributed most positively to the Fund's absolute returns during the annual period.
Positions in auto manufacturer Maruti Suzuki India, motorcycle manufacturer Hero MotoCorp and auto manufacturer Tata Motors detracted most. Each generated a double-digit negative absolute return during the annual period. Positions in food products manufacturer Nestle India, diversified consumer products manufacturer Hindustan Unilever and jewelry manufacturer and retailer and perfume producer Titan contributed most positively. Each of these companies produced a double-digit absolute gain during the annual period.
The MSCI Emerging Markets Index (Net) is a free float-adjusted market capitalization index that is designed to measure market performance of emerging markets.
The MSCI India Index is designed to measure the performance of the large and mid-cap segments of the Indian market. With 79 constituents, the index covers approximately 85% of the Indian equity universe.
Investing involves risks, including the risk of loss of principal. Market risk may affect a single issuer, sector of the economy, industry or the market as a whole. The Fund is passively managed and seeks to track the performance of an index. The Fund may not sell a poorly performing security unless it was removed from the index. There is no guarantee that the index will achieve positive returns. Risk exists that the index provider may not follow its methodology for index construction. Errors may result in a negative fund performance. The Fund's net value will generally decline when the market value
Columbia ETF Trust II | Annual Report 2019
24
MANAGER DISCUSSION OF FUND PERFORMANCE (continued)
Columbia India Consumer ETF (INCO)
of its targeted index declines. Foreign investments subject the Fund to risks, including political, economic, market, social and other risks impacting a particular country, as well as to currency instabilities and less stringent financial and accounting standards generally applicable to U.S. issuers. These risks are enhanced for emerging market issuers. Investment in or exposure to foreign currencies subjects the Fund to currency fluctuation and risk of loss. Investments in small- and mid-cap companies involve risks and volatility greater than investments in larger, more established companies. The Fund concentrates its investments in issuers of one or more particular industries to the same extent as the underlying index. Concentration in the India region, where issuers tend to be less developed than U.S. issuers, presents increased risk of loss than a fund that does not concentrate its investments. Investments in a narrowly focused sector such as consumer may exhibit higher volatility than investments with a broader focus. Although the Fund's shares are listed on an exchange, there can be no assurance that an active, liquid or otherwise orderly trading market for shares will be established or maintained. Active market trading may increase portfolio turnover, transaction costs and tracking error to the targeted index. The Fund may have portfolio turnover, which may cause an adverse cost impact. There may be additional portfolio turnover risk as active market trading of the Fund's shares may cause more frequent creation or redemption activities that could, in certain circumstances, increase the number of portfolio transactions as well as tracking error to the Index and as high levels of transactions increase brokerage and other transaction costs and may result in increased taxable capital gains. See the Fund's prospectus for more information on these and other risks.
The views expressed in this report reflect the current views of the respective parties. These views are not guarantees of future performance and involve certain risks, uncertainties and assumptions that are difficult to predict, so actual outcomes and results may differ significantly from the views expressed. These views are subject to change at any time based upon economic, market or other conditions and the respective parties disclaim any responsibility to update such views. These views may not be relied on as investment advice and, because investment decisions for a Columbia ETF are based on numerous factors, may not be relied on as an indication of trading intent on behalf of any particular Columbia ETF. References to specific securities should not be construed as a recommendation or investment advice.
Columbia ETF Trust II | Annual Report 2019
25
FUND AT A GLANCE
Columbia India Infrastructure ETF
Investment objective
Columbia India Infrastructure ETF (the Fund) seeks investment results that correspond (before fees and expenses) to the price and yield performance of the Indxx India Infrastructure Index.
Portfolio management
Christopher Lo, CFA
Portfolio Manager
Managed Fund since 2016
The Board of Trustees of Columbia ETF Trust II, based upon the recommendation of the Investment Manager, determined to close and liquidate the Fund. The last day of trading for the Fund on the NYSE Arca Exchange is expected to be June 14, 2019. On or about June 21, 2019, the Fund will make a liquidating distribution to remaining shareholders equal to the shareholder's proportionate interest in the net assets of the Fund.
Average annual total returns (%) (for period ended March 31, 2019)
Inception | 1 Year | 5 Years | Life | ||||||||||||||||
Market Price | 08/11/10 | -14.36 | 2.20 | -3.57 | |||||||||||||||
Net Asset Value | 08/11/10 | -12.39 | 2.52 | -3.46 | |||||||||||||||
Indxx India Infrastructure Index | -11.41 | 3.65 | -2.36 | ||||||||||||||||
All results shown assume reinvestment of distributions during the period. Returns do not reflect the deduction of taxes that a shareholder may pay on Fund distributions or on the redemption of Fund shares. Performance results reflect the effect of any fee waivers or reimbursements of Fund expenses by the Fund's former investment manager or Columbia Management Investment Advisers, LLC (Columbia Management or the Investment Manager). Absent these fee waivers or expense reimbursement arrangements, performance results would have been lower.
The performance information shown represents past performance and is not a guarantee of future results. The investment return and principal value of your investment will fluctuate so that your shares, when redeemed, may be worth more or less than their original cost. Current performance may be lower or higher than the performance information shown. You may obtain performance information current to the most recent month-end by visiting columbiathreadneedleus.com/etfs.
Columbia Management took over portfolio management in September 2016 upon its acquisition of the Fund's previous investment manager.
The price used to calculate Market Price return is based on the midpoint of the 4:00 PM Eastern (U.S.) bid/ask spread on the NYSE and does not represent returns an investor would receive if shares were traded at other times.
The Fund's shares may trade above or below their net asset value. The net asset value of the Fund will generally fluctuate with changes in the market value of the Fund's holdings. The market prices of shares, however, will generally fluctuate in accordance with changes in net asset value as well as the relative supply of, and demand for, shares on the exchange. The trading price of shares may deviate significantly from the net asset value.
The Indxx India Infrastructure Index is a maximum 30-stock free-float adjusted market capitalization-weighted index designed to measure the market performance of companies in the infrastructure industry in India, as defined by Indxx's proprietary methodology. The index consists of common stocks listed on the primary exchange of India and ADRs & GDRs.
Indices are not available for investment, are not professionally managed and do not reflect sales charges, fees, brokerage commissions, taxes or other expenses of investing. Securities in the Fund may not match those in an index.
Columbia ETF Trust II | Annual Report 2019
26
FUND AT A GLANCE (continued)
Columbia India Infrastructure ETF
Performance of a hypothetical $10,000 investment (August 11, 2010 — March 31, 2019)

The chart above shows the change in value of a hypothetical $10,000 investment made on the Fund's inception, and does not reflect the deduction of taxes or brokerage commissions that a shareholder may pay on Fund distributions or on the redemption of Fund shares.
Top ten holdings (%) (at March 31, 2019)
Larsen & Toubro, Ltd. | 5.6 | ||||||
Power Grid Corp. of India, Ltd. | 5.5 | ||||||
NTPC, Ltd. | 5.2 | ||||||
Adani Ports and Special Economic Zone, Ltd. | 5.1 | ||||||
UltraTech Cement, Ltd. | 5.1 | ||||||
GAIL India, Ltd. | 5.0 | ||||||
Bharti Airtel, Ltd. | 4.6 | ||||||
Hindalco Industries, Ltd. | 4.6 | ||||||
Tata Steel, Ltd. | 4.5 | ||||||
Grasim Industries Ltd. | 4.5 | ||||||
Percentages indicated are based upon total investments (excluding Money Market Funds and derivatives, if any).
For further detail about these holdings, please refer to the section entitled "Portfolio of Investments."
Fund holdings are as of the date given, are subject to change at any time, and are not recommendations to buy or sell any security.
Equity sector breakdown (%) (at March 31, 2019)
Communication Services | 12.5 | ||||||
Consumer Discretionary | 3.9 | ||||||
Energy | 3.2 | ||||||
Industrials | 26.8 | ||||||
Materials | 32.2 | ||||||
Real Estate | 1.6 | ||||||
Utilities | 19.8 | ||||||
Total | 100.0 | ||||||
Percentages indicated are based upon total equity investments. The Fund's portfolio composition is subject to change.
Columbia ETF Trust II | Annual Report 2019
27
MANAGER DISCUSSION OF FUND PERFORMANCE
Columbia India Infrastructure ETF (INXX)
For the 12-month period that ended March 31, 2019, the Fund returned -12.39% based on net asset value (NAV) and -14.36% based on market price. The Indxx India Infrastructure Index returned -11.41% during the same time period.
The Fund's NAV on March 31, 2018 was $13.98, and it ended the annual period on March 31, 2019 with an NAV of $12.08. The Fund's market price on March 31, 2019 was $11.96 per share.
Indian equities gained despite rising crude prices and financial sector concerns
The Indian equity market enjoyed solid returns during the annual period despite rising crude oil prices and financial sector concerns. The MSCI India Index returned 6.75% for the annual period, significantly outperforming the -7.41% return of the MSCI Emerging Markets Index (Net). Still, there were challenges. Brent crude oil rose to as high as $85 per barrel in October 2018, the highest level seen since November 2014. This increase was a result of the Organization of Petroleum Exporting Countries (OPEC) refusing to ramp up production, and the U.S. persuading buyers to cut down imports of Iranian oil. As the world's third largest oil importer, India faced the brunt of the rising crude oil prices, a situation exacerbated by a depreciating rupee. The annual period also saw a major liquidity issue surrounding Infrastructure Leasing and Financial Services, an Indian infrastructure development and finance company. The lender defaulted on its short-term commercial papers, which rocked the debt market. Throughout September and October 2018, the Indian equity market declined substantially on the back of non-banking financial company sector liquidity fears. Further pressuring investor sentiment was Finance Minister Arun Jaitley re-introducing a long-term capital gains tax and levying a tax on profits generated from assets such as shares and share-oriented products. On the positive side, Indian Prime Minister Narendra Modi's government released on February 1, 2019 its last budget before the April 2019 general elections. It focused on supporting farmers and those economically less privileged, while continuing its push toward better physical and social infrastructure. India's general election was scheduled to begin on April 11, 2019, and after seven phases, the results are anticipated to be reported on May 23. Campaign promises of both Modi's Bharatiya Janata Party (BJP) and Gandhi's Indian National Congress include increased spending to provide income support to the poor and to farmers. Also, BJP has pledged to spend significant monies on infrastructure. If campaign promises are implemented, such spending should help support demand in consumer-oriented sectors.
Importantly, the fundamentals for India and its economy remained strong during the annual period. Its policy-driven, largely domestic-based economic growth, in synchronization with global economic growth, provided a tailwind for its equity market performance.
Contributors and detractors
Constituents in the materials, information technology and energy sectors detracted most from the Fund's absolute returns during the annual period. Constituents in the consumer discretionary sector contributed positively to the Fund's absolute returns during the annual period.
Positions in commercial vehicles manufacturer Eicher Motors, transportation equipment manufacturer Ashok Leyland and telecommunication services provider Vodafone Idea detracted most. Each generated a double-digit negative absolute return during the annual period. Positions in electrical equipment manufacturer Havells India, integrated steel producer JSW Steel and utilities company Power Grid Corp of India contributed most positively. Havells India produced a double-digit absolute gain during the annual period; JSW Steel posted a modestly negative absolute return during the annual period; and Power Grid Corp of India generated a single-digit absolute gain during the annual period.
The MSCI Emerging Markets Index (Net) is a free float-adjusted market capitalization index that is designed to measure market performance of emerging markets.
The MSCI India Index is designed to measure the performance of the large and mid-cap segments of the Indian market. With 79 constituents, the index covers approximately 85% of the Indian equity universe.
Investing involves risks, including the risk of loss of principal. Market risk may affect a single issuer, sector of the economy, industry or the market as a whole. The Fund is passively managed and seeks to track the performance of an index. The Fund may not sell a poorly performing security unless it was removed from the index. There is no guarantee that the index will achieve positive returns. Risk exists that the index provider may not follow its
Columbia ETF Trust II | Annual Report 2019
28
MANAGER DISCUSSION OF FUND PERFORMANCE (continued)
Columbia India Infrastructure ETF (INXX)
methodology for index construction. Errors may result in a negative fund performance. The Fund's net value will generally decline when the market value of its targeted index declines. Foreign investments subject the Fund to risks, including political, economic, market, social and other risks impacting a particular country, as well as to currency instabilities and less stringent financial and accounting standards generally applicable to U.S. issuers. These risks are enhanced for emerging market issuers. Investment in or exposure to foreign currencies subjects the Fund to currency fluctuation and risk of loss. Investments in small- and mid-cap companies involve risks and volatility greater than investments in larger, more established companies. The Fund concentrates its investments in issuers of one or more particular industries to the same extent as the underlying index. Concentration in the India region, where issuers tend to be less developed than U.S. issuers, presents increased risk of loss than a fund that does not concentrate its investments. Investments in a narrowly focused sector such as consumer may exhibit higher volatility than investments with a broader focus. Although the Fund's shares are listed on an exchange, there can be no assurance that an active, liquid or otherwise orderly trading market for shares will be established or maintained. Active market trading may increase portfolio turnover, transaction costs and tracking error to the targeted index. The Fund may have portfolio turnover, which may cause an adverse cost impact. There may be additional portfolio turnover risk as active market trading of the Fund's shares may cause more frequent creation or redemption activities that could, in certain circumstances, increase the number of portfolio transactions as well as tracking error to the Index and as high levels of transactions increase brokerage and other transaction costs and may result in increased taxable capital gains. See the Fund's prospectus for more information on these and other risks.
The views expressed in this report reflect the current views of the respective parties. These views are not guarantees of future performance and involve certain risks, uncertainties and assumptions that are difficult to predict, so actual outcomes and results may differ significantly from the views expressed. These views are subject to change at any time based upon economic, market or other conditions and the respective parties disclaim any responsibility to update such views. These views may not be relied on as investment advice and, because investment decisions for a Columbia ETF are based on numerous factors, may not be relied on as an indication of trading intent on behalf of any particular Columbia ETF. References to specific securities should not be construed as a recommendation or investment advice.
Columbia ETF Trust II | Annual Report 2019
29
FUND AT A GLANCE
Columbia India Small Cap ETF
Investment objective
Columbia India Small Cap ETF (the Fund) seeks investment results that correspond (before fees and expenses) to the price and yield performance of the Indxx India Small Cap Index.
Portfolio management
Christopher Lo, CFA
Portfolio Manager
Managed Fund since 2016
The Board of Trustees of Columbia ETF Trust II, based upon the recommendation of the Investment Manager, determined to close and liquidate the Fund. The last day of trading for the Fund on the NYSE Arca Exchange is expected to be June 14, 2019. On or about June 21, 2019, the Fund will make a liquidating distribution to remaining shareholders equal to the shareholder's proportionate interest in the net assets of the Fund.
Average annual total returns (%) (for period ended March 31, 2019)
Inception | 1 Year | 5 Years | Life | ||||||||||||||||
Market Price | 07/07/10 | -22.98 | 4.26 | -2.31 | |||||||||||||||
Net Asset Value | 07/07/10 | -22.00 | 4.18 | -2.32 | |||||||||||||||
Indxx India Small Cap Index | -20.41 | 5.67 | -0.94 | ||||||||||||||||
All results shown assume reinvestment of distributions during the period. Returns do not reflect the deduction of taxes that a shareholder may pay on Fund distributions or on the redemption of Fund shares. Performance results reflect the effect of any fee waivers or reimbursements of Fund expenses by the Fund's former investment manager or Columbia Management Investment Advisers, LLC (Columbia Management or the Investment Manager). Absent these fee waivers or expense reimbursement arrangements, performance results would have been lower.
The performance information shown represents past performance and is not a guarantee of future results. The investment return and principal value of your investment will fluctuate so that your shares, when redeemed, may be worth more or less than their original cost. Current performance may be lower or higher than the performance information shown. You may obtain performance information current to the most recent month-end by visiting columbiathreadneedleus.com/etfs.
Columbia Management took over portfolio management in September 2016 upon its acquisition of the Fund's previous investment manager.
The price used to calculate Market Price return is based on the midpoint of the 4:00 PM Eastern (U.S.) bid/ask spread on the NYSE and does not represent returns an investor would receive if shares were traded at other times.
The Fund's shares may trade above or below their net asset value. The net asset value of the Fund will generally fluctuate with changes in the market value of the Fund's holdings. The market prices of shares, however, will generally fluctuate in accordance with changes in net asset value as well as the relative supply of, and demand for, shares on the exchange. The trading price of shares may deviate significantly from the net asset value.
The Indxx India Small Cap Index is a maximum 75-stock free-float adjusted market capitalization-weighted index designed to measure the market performance of companies in the small cap segment in India. The index consists of securities listed on the primary stock exchange of India.
Indices are not available for investment, are not professionally managed and do not reflect sales charges, fees, brokerage commissions, taxes or other expenses of investing. Securities in the Fund may not match those in an index.
Columbia ETF Trust II | Annual Report 2019
30
FUND AT A GLANCE (continued)
Columbia India Small Cap ETF
Performance of a hypothetical $10,000 Investment (July 7, 2010 — March 31, 2019)

The chart above shows the change in value of a hypothetical $10,000 investment made on the Fund's inception, and does not reflect the deduction of taxes or brokerage commissions that a shareholder may pay on Fund distributions or on the redemption of Fund shares.
Top ten holdings (%) (at March 31, 2019)
IDFC Ltd. | 2.9 | ||||||
Mahanagar Gas, Ltd. | 2.8 | ||||||
Kajaria Ceramics Ltd. | 2.7 | ||||||
NIIT Technologies, Ltd. | 2.6 | ||||||
Escorts, Ltd. | 2.6 | ||||||
DCB Bank, Ltd. | 2.6 | ||||||
Century Textiles & Industries, Ltd. | 2.6 | ||||||
NCC, Ltd. | 2.6 | ||||||
VIP Industries, Ltd. | 2.5 | ||||||
Dewan Housing Finance Corp., Ltd. | 2.4 | ||||||
Percentages indicated are based upon total investments (excluding Money Market Funds and derivatives, if any).
For further detail about these holdings, please refer to the section entitled "Portfolio of Investments."
Fund holdings are as of the date given, are subject to change at any time, and are not recommendations to buy or sell any security.
Equity sector breakdown (%) (at March 31, 2019)
Communication Services | 5.8 | ||||||
Consumer Discretionary | 10.1 | ||||||
Consumer Staples | 6.6 | ||||||
Energy | 0.7 | ||||||
Financials | 23.5 | ||||||
Health Care | 5.8 | ||||||
Industrials | 20.8 | ||||||
Information Technology | 11.3 | ||||||
Materials | 8.4 | ||||||
Real Estate | 1.6 | ||||||
Utilities | 5.4 | ||||||
Total | 100.0 | ||||||
Percentages indicated are based upon total equity investments. The Fund's portfolio composition is subject to change.
Columbia ETF Trust II | Annual Report 2019
31
MANAGER DISCUSSION OF FUND PERFORMANCE
Columbia India Small Cap ETF (SCIN)
For the 12-month period that ended March 31, 2019, the Fund returned -22.00% based on net asset value (NAV) and -22.98% based on market price. The Indxx India Small Cap Index returned -20.41% during the same time period.
The Fund's NAV on March 31, 2018 was $19.50, and it ended the annual period on March 31, 2019 with an NAV of $15.21. The Fund's market price on March 31, 2019 was $15.22 per share.
Indian equities gained despite rising crude prices and financial sector concerns
The Indian equity market enjoyed solid returns during the annual period despite rising crude oil prices and financial sector concerns. The MSCI India Index returned 6.75% for the annual period, significantly outperforming the -7.41% return of the MSCI Emerging Markets Index (Net). Still, there were challenges. Brent crude oil rose to as high as $85 per barrel in October 2018, the highest level seen since November 2014. This increase was a result of the Organization of Petroleum Exporting Countries (OPEC) refusing to ramp up production, and the U.S. persuading buyers to cut down imports of Iranian oil. As the world's third largest oil importer, India faced the brunt of the rising crude oil prices, a situation exacerbated by a depreciating rupee. The annual period also saw a major liquidity issue surrounding Infrastructure Leasing and Financial Services, an Indian infrastructure development and finance company. The lender defaulted on its short-term commercial papers, which rocked the debt market. Throughout September and October 2018, the Indian equity market declined substantially on the back of non-banking financial company sector liquidity fears. Further pressuring investor sentiment was Finance Minister Arun Jaitley re-introducing a long-term capital gains tax and levying a tax on profits generated from assets such as shares and share-oriented products. On the positive side, Indian Prime Minister Narendra Modi's government released on February 1, 2019 its last budget before the April 2019 general elections. It focused on supporting farmers and those economically less privileged, while continuing its push toward better physical and social infrastructure. India's general election was scheduled to begin on April 11, 2019, and after seven phases, the results are anticipated to be reported on May 23. Campaign promises of both Modi's Bharatiya Janata Party (BJP) and Gandhi's Indian National Congress include increased spending to provide income support to the poor and to farmers. Also, BJP has pledged to spend significant monies on infrastructure. If campaign promises are implemented, such spending should help support demand in consumer-oriented sectors.
Importantly, the fundamentals for India and its economy remained strong during the annual period. Its policy-driven, largely domestic-based economic growth, in synchronization with global economic growth, provided a tailwind for its equity market performance.
Contributors and detractors
Constituents in the information technology, materials and financials sectors detracted most from absolute returns during the annual period. Constituents in the communication services and utilities sectors contributed most positively to the Fund's absolute returns.
Positions in automotive technology solutions provider Birlasoft India, home improvement and building products retailer Shankara Building Products and plastic storage and material handling products company Sintex Plastics Technology detracted most. Each generated a double-digit negative absolute return during the annual period. Positions in ethyl alcohol, ethanol and organic manure manufacturer Balrampur Chini Mills, fermentation systems engineering firm Praj Industries and search engine operator Just Dial contributed most positively. Each produced a double-digit absolute gain during the annual period.
The MSCI Emerging Markets Index (Net) is a free float-adjusted market capitalization index that is designed to measure market performance of emerging markets.
The MSCI India Index is designed to measure the performance of the large and mid-cap segments of the Indian market. With 79 constituents, the index covers approximately 85% of the Indian equity universe.
Investing involves risks, including the risk of loss of principal. Market risk may affect a single issuer, sector of the economy, industry or the market as a whole. The Fund is passively managed and seeks to track the performance of an index. The Fund may not sell a poorly performing security unless it was removed from the index. There is no guarantee that the index will achieve positive returns. Risk exists that the index provider may not follow its
Columbia ETF Trust II | Annual Report 2019
32
MANAGER DISCUSSION OF FUND PERFORMANCE (continued)
Columbia India Small Cap ETF (SCIN)
methodology for index construction. Errors may result in a negative fund performance. The Fund's net value will generally decline when the market value of its targeted index declines. Foreign investments subject the Fund to risks, including political, economic, market, social and other risks impacting a particular country, as well as to currency instabilities and less stringent financial and accounting standards generally applicable to U.S. issuers. These risks are enhanced for emerging market issuers. Investment in or exposure to foreign currencies subjects the Fund to currency fluctuation and risk of loss. Investments in small- and mid-cap companies involve risks and volatility greater than investments in larger, more established companies. The Fund concentrates its investments in issuers of one or more particular industries to the same extent as the underlying index. Concentration in the India region, where issuers tend to be less developed than U.S. issuers, presents increased risk of loss than a fund that does not concentrate its investments. Investments in a narrowly focused sector such as consumer may exhibit higher volatility than investments with a broader focus. Although the Fund's shares are listed on an exchange, there can be no assurance that an active, liquid or otherwise orderly trading market for shares will be established or maintained. Active market trading may increase portfolio turnover, transaction costs and tracking error to the targeted index. The Fund may have portfolio turnover, which may cause an adverse cost impact. There may be additional portfolio turnover risk as active market trading of the Fund's shares may cause more frequent creation or redemption activities that could, in certain circumstances, increase the number of portfolio transactions as well as tracking error to the Index and as high levels of transactions increase brokerage and other transaction costs and may result in increased taxable capital gains. See the Fund's prospectus for more information on these and other risks.
The views expressed in this report reflect the current views of the respective parties. These views are not guarantees of future performance and involve certain risks, uncertainties and assumptions that are difficult to predict, so actual outcomes and results may differ significantly from the views expressed. These views are subject to change at any time based upon economic, market or other conditions and the respective parties disclaim any responsibility to update such views. These views may not be relied on as investment advice and, because investment decisions for a Columbia ETF are based on numerous factors, may not be relied on as an indication of trading intent on behalf of any particular Columbia ETF. References to specific securities should not be construed as a recommendation or investment advice.
Columbia ETF Trust II | Annual Report 2019
33
UNDERSTANDING YOUR FUND'S EXPENSES
(Unaudited)
As a shareholder of a Fund, you incur ongoing costs, including investment management fees. The following example is intended to help you understand your ongoing costs (in dollars and cents) of investing in a fund and to compare these costs with the ongoing costs of investing in other funds.
The examples are based on an initial investment of $1,000 invested at the beginning of the period and held for the period ended March 31, 2019.
Actual Expenses
The information under each column in the table below entitled "Actual" provides information about actual account values and actual expenses. You may use the information in these columns, together with the amount you invested, to estimate the expenses that you paid over the period. Simply divide your account value by $1,000 (for example, an $8,600 account value divided by $1,000 = 8.6), then multiply the result by the number for your Fund under the heading entitled "Expenses paid for the period" to estimate the expenses you paid on your account during this period.
Hypothetical Example For Comparison Purposes
The information under each column in the table entitled "Hypothetical" provides information about hypothetical account values and hypothetical expenses based on each Fund's actual expense ratio and an assumed rate of return of 5% per year before expenses, which is not the Fund's actual return. The hypothetical account values and expenses may not be used to estimate the actual ending account balance or expenses you paid for the period. You may use this information to compare the ongoing costs of investing in your Fund and other funds. To do so, compare this 5% hypothetical example with the 5% hypothetical examples that appear in the shareholder reports of the other funds.
Please note that the expenses shown in the table are meant to highlight your ongoing costs only and do not reflect any transactional costs, such as brokerage commissions paid on purchases and sales of Fund shares. Therefore, the ending account values and expenses paid for the period in the table is useful in comparing ongoing Fund costs only and will not help you determine the relative total costs of owning different funds. In addition, if these transactional costs were included, your costs would have been higher.
October 1, 2018 — March 31, 2019
| Beginning account value ($) | Ending account value ($) | Expenses paid for the period ($) | Annualized expense ratios for the period (%) | ||||||||||||||||||||||||||||
Actual | Hypothetical | Actual | Hypothetical | Actual | Hypothetical | Actual | |||||||||||||||||||||||||
Columbia Beyond BRICs ETF | 1,000.00 | 1,000.00 | 986.40 | 1,021.79 | 3.12 | 3.18 | 0.63 | ||||||||||||||||||||||||
Columbia EM Core ex-China ETF | 1,000.00 | 1,000.00 | 1,012.00 | 1,023.19 | 1.76 | 1.77 | 0.35 | ||||||||||||||||||||||||
Columbia EM Quality Dividend ETF | 1,000.00 | 1,000.00 | 981.40 | 1,021.94 | 2.96 | 3.02 | 0.60 | ||||||||||||||||||||||||
Columbia Emerging Markets Consumer ETF | 1,000.00 | 1,000.00 | 1,022.10 | 1,021.84 | 3.13 | 3.13 | 0.62 | ||||||||||||||||||||||||
Columbia India Consumer ETF | 1,000.00 | 1,000.00 | 1,022.60 | 1,021.09 | 3.88 | 3.88 | 0.77 | ||||||||||||||||||||||||
Columbia India Infrastructure ETF | 1,000.00 | 1,000.00 | 1,030.10 | 1,020.24 | 4.76 | 4.73 | 0.94 | ||||||||||||||||||||||||
Columbia India Small Cap ETF | 1,000.00 | 1,000.00 | 1,078.70 | 1,021.19 | 3.89 | 3.78 | 0.75 | ||||||||||||||||||||||||
Expenses are calculated using the Fund's annualized expense ratio, multiplied by the average account value over the period, then multiplied by the number of days in the Fund's most recent fiscal half-year and divided by 365.
Columbia ETF Trust II | Annual Report 2019
34
FREQUENCY DISTRIBUTION OF PREMIUMS
AND DISCOUNTS (Unaudited)
The tables that follow present information about the differences between the daily market price on secondary markets for shares of a Fund and that Fund's net asset value. Net asset value, or "NAV", is the price per share at which each Fund issues and redeems shares. It is calculated in accordance with the standard formula for valuing fund shares. The "Market Price" of each Fund generally is determined using the midpoint between the highest bid and the lowest offer on the stock exchange on which the shares of such Fund are listed for trading, as of the time that the Fund's NAV is calculated. Each Fund's Market Price may be at, above or below its NAV. The NAV of each Fund will fluctuate with changes in the market value of its portfolio holdings. The Market Price of each Fund will fluctuate in accordance with changes in its NAV, as well as market supply and demand.
Premiums or discounts are the differences (expressed as a percentage) between the NAV and Market Price of a Fund on a given day, generally at the time NAV is calculated. A premium is the amount that a Fund is trading above the reported NAV, expressed as a percentage of the NAV. A discount is the amount that a Fund is trading below the reported NAV, expressed as a percentage of the NAV. The following information shows the frequency distributions of premiums and discounts for each of the Funds.
The information shown for each Fund is for the period from inception date of such Fund through March 31, 2019.
Each line in the table shows the number of trading days in which the Fund traded within the premium/discount range indicated. All data presented here represents past performance, which cannot be used to predict future results.
| Market Price Above or Equal to NAV | Market Price Below NAV | ||||||||||||||
Basis Point Differential | Number of Days | Number of Days | |||||||||||||
| Columbia Beyond BRICs ETF August 15, 2012 – March 31, 2019 | |||||||||||||||
0 - 49.9 | 365 | 361 | |||||||||||||
50 - 99.9 | 336 | 327 | |||||||||||||
100 - 199.9 | 120 | 140 | |||||||||||||
> 200 | 5 | 11 | |||||||||||||
| Total | 826 | 839 | |||||||||||||
| Market Price Above or Equal to NAV | Market Price Below NAV | ||||||||||||||
Basis Point Differential | Number of Days | Number of Days | |||||||||||||
| Columbia EM Core ex-China ETF September 2, 2015 – March 31, 2019 | |||||||||||||||
0 - 49.9 | 248 | 150 | |||||||||||||
50 - 99.9 | 262 | 57 | |||||||||||||
100 - 199.9 | 149 | 20 | |||||||||||||
> 200 | 12 | 1 | |||||||||||||
| Total | 671 | 228 | |||||||||||||
| Market Price Above or Equal to NAV | Market Price Below NAV | ||||||||||||||
Basis Point Differential | Number of Days | Number of Days | |||||||||||||
| Columbia EM Quality Dividend ETF August 4, 2011 – March 31, 2019 | |||||||||||||||
0 - 49.9 | 430 | 528 | |||||||||||||
50 - 99.9 | 189 | 464 | |||||||||||||
100 - 199.9 | 50 | 230 | |||||||||||||
> 200 | 8 | 26 | |||||||||||||
| Total | 677 | 1248 | |||||||||||||
Columbia ETF Trust II | Annual Report 2019
35
FREQUENCY DISTRIBUTION OF PREMIUMS
AND DISCOUNTS (continued) (Unaudited)
| Market Price Above or Equal to NAV | Market Price Below NAV | ||||||||||||||
Basis Point Differential | Number of Days | Number of Days | |||||||||||||
| Columbia Emerging Markets Consumer ETF September 14, 2010 – March 31, 2019 | |||||||||||||||
0 - 49.9 | 892 | 502 | |||||||||||||
50 - 99.9 | 383 | 229 | |||||||||||||
100 - 199.9 | 58 | 63 | |||||||||||||
> 200 | 8 | 15 | |||||||||||||
Total | 1341 | 809 | |||||||||||||
| Market Price Above or Equal to NAV | Market Price Below NAV | ||||||||||||||
Basis Point Differential | Number of Days | Number of Days | |||||||||||||
| Columbia India Consumer ETF August 10, 2011 – March 31, 2019 | |||||||||||||||
0 - 49.9 | 523 | 400 | |||||||||||||
50 - 99.9 | 362 | 196 | |||||||||||||
100 - 199.9 | 261 | 102 | |||||||||||||
> 200 | 61 | 16 | |||||||||||||
Total | 1207 | 714 | |||||||||||||
| Market Price Above or Equal to NAV | Market Price Below NAV | ||||||||||||||
Basis Point Differential | Number of Days | Number of Days | |||||||||||||
| Columbia India Infrastructure ETF August 11, 2010 – March 31, 2019 | |||||||||||||||
0 - 49.9 | 525 | 435 | |||||||||||||
50 - 99.9 | 359 | 324 | |||||||||||||
100 - 199.9 | 244 | 201 | |||||||||||||
> 200 | 40 | 45 | |||||||||||||
| Total | 1168 | 1005 | |||||||||||||
| Market Price Above or Equal to NAV | Market Price Below NAV | ||||||||||||||
Basis Point Differential | Number of Days | Number of Days | |||||||||||||
| Columbia India Small Cap ETF July 7, 2010 – March 31, 2019 | |||||||||||||||
0 - 49.9 | 493 | 435 | |||||||||||||
50 - 99.9 | 306 | 339 | |||||||||||||
100 - 199.9 | 242 | 284 | |||||||||||||
> 200 | 40 | 59 | |||||||||||||
| Total | 1081 | 1117 | |||||||||||||
Columbia ETF Trust II | Annual Report 2019
36
PORTFOLIO OF INVESTMENTS
Columbia Beyond BRICs ETF
March 31, 2019
(Percentages represent value of investments compared to net assets)
Investments in Securities
Common Stocks 99.0%
Issuer | Shares | Value ($) | |||||||||
Bangladesh 5.5% | |||||||||||
BRAC Bank Ltd.(a) | 182,352 | 167,180 | |||||||||
GrameenPhone, Ltd. | 45,902 | 221,793 | |||||||||
Square Pharmaceuticals, Ltd. | 153,518 | 488,148 | |||||||||
United Power Generation and Distribution Co. Ltd. | 103,099 | 492,904 | |||||||||
Total Bangladesh | 1,370,025 | ||||||||||
Chile 3.3% | |||||||||||
Banco de Chile | 799,518 | 117,717 | |||||||||
Banco Santander Chile | 1,783,976 | 134,203 | |||||||||
Empresas CMPC SA | 32,123 | 113,296 | |||||||||
Empresas COPEC SA | 14,022 | 178,036 | |||||||||
Enel Americas SA | 793,770 | 141,122 | |||||||||
S.A.C.I. Falabella | 20,766 | 154,416 | |||||||||
Total Chile | 838,790 | ||||||||||
Colombia 0.6% | |||||||||||
Ecopetrol SA | 136,479 | 146,313 | |||||||||
Czech Republic 0.4% | |||||||||||
CEZ AS | 4,547 | 106,832 | |||||||||
Hungary 1.1% | |||||||||||
OTP Bank Nyrt. | 6,565 | 288,782 | |||||||||
Indonesia 9.3% | |||||||||||
PT Astra International Tbk | 582,532 | 299,652 | |||||||||
PT Bank Central Asia Tbk | 277,808 | 541,375 | |||||||||
PT Bank Mandiri Persero Tbk(a) | 533,003 | 278,853 | |||||||||
PT Bank Negara Indonesia Persero Tbk(a) | 212,981 | 140,591 | |||||||||
PT Bank Rakyat Indonesia Persero Tbk | 1,523,256 | 440,717 | |||||||||
PT Hanjaya Mandala Sampoerna Tbk | 251,615 | 66,261 | |||||||||
PT Telekomunikasi Indonesia Persero Tbk | 1,336,010 | 370,593 | |||||||||
PT Unilever Indonesia Tbk | 33,010 | 114,109 | |||||||||
PT United Tractors Tbk | 43,590 | 82,803 | |||||||||
Total Indonesia | 2,334,954 | ||||||||||
Kenya 3.4% | |||||||||||
Equity Group Holdings PLC | 775,795 | 320,328 | |||||||||
Safaricom PLC | 1,917,811 | 524,424 | |||||||||
Total Kenya | 844,752 | ||||||||||
Common Stocks (continued)
Issuer | Shares | Value ($) | |||||||||
Kuwait 2.9% | |||||||||||
Kuwait Finance House KSCP | 93,883 | 215,490 | |||||||||
National Bank of Kuwait SAKP | 175,039 | 518,037 | |||||||||
Total Kuwait | 733,527 | ||||||||||
Malaysia 8.1% | |||||||||||
Axiata Group Bhd | 127,913 | 130,028 | |||||||||
CIMB Group Holdings Bhd | 193,906 | 244,609 | |||||||||
DiGi.Com Bhd | 105,425 | 117,497 | |||||||||
IHH Healthcare Bhd | 85,606 | 120,991 | |||||||||
Malayan Banking Bhd | 168,213 | 381,956 | |||||||||
Petronas Chemicals Group Bhd | 81,499 | 182,861 | |||||||||
Public Bank Bhd | 88,724 | 503,331 | |||||||||
Tenaga Nasional Bhd | 113,896 | 353,196 | |||||||||
Total Malaysia | 2,034,469 | ||||||||||
Mexico 11.1% | |||||||||||
America Movil SAB de CV Series L | 789,837 | 565,173 | |||||||||
Arca Continental SAB de CV | 11,195 | 62,406 | |||||||||
Cemex SAB de CV Series CPO(a) | 434,494 | 203,163 | |||||||||
| Fomento Economico Mexicano SAB de CV Series UBD | 60,500 | 558,761 | |||||||||
Grupo Elektra, SAB de CV(a) | 1,863 | 100,790 | |||||||||
Grupo Financiero Banorte SAB de CV Class O | 80,972 | 440,561 | |||||||||
Grupo Mexico SAB de CV Series B | 103,203 | 283,898 | |||||||||
Grupo Televisa SAB Series CPO | 71,670 | 158,840 | |||||||||
Wal-Mart de Mexico SAB de CV | 148,519 | 397,531 | |||||||||
Total Mexico | 2,771,123 | ||||||||||
Morocco 3.8% | |||||||||||
Attijariwafa Bank | 10,663 | 468,914 | |||||||||
Maroc Telecom | 32,341 | 480,209 | |||||||||
Total Morocco | 949,123 | ||||||||||
Nigeria 3.9% | |||||||||||
Guaranty Trust Bank PLC | 5,100,361 | 509,330 | |||||||||
Zenith Bank PLC | 7,560,035 | 456,534 | |||||||||
Total Nigeria | 965,864 | ||||||||||
The accompanying Notes to Financial Statements are an integral part of these financial statements.
Columbia ETF Trust II | Annual Report 2019
37
PORTFOLIO OF INVESTMENTS (continued)
Columbia Beyond BRICs ETF
March 31, 2019
Common Stocks (continued)
Issuer | Shares | Value ($) | |||||||||
Philippines 3.5% | |||||||||||
Ayala Corp. | 7,090 | 126,921 | |||||||||
Ayala Land, Inc. | 199,577 | 170,653 | |||||||||
BDO Unibank, Inc. | 56,357 | 143,603 | |||||||||
SM Investments Corp. | 13,901 | 247,258 | |||||||||
SM Prime Holdings, Inc. | 260,060 | 197,608 | |||||||||
Total Philippines | 886,043 | ||||||||||
Qatar 3.9% | |||||||||||
Industries Qatar QSC | 5,759 | 195,987 | |||||||||
Qatar Islamic Bank SAQ | 3,336 | 138,956 | |||||||||
Qatar National Bank QPSC | 12,791 | 634,149 | |||||||||
Total Qatar | 969,092 | ||||||||||
Romania 2.1% | |||||||||||
Banca Transilvania SA | 1,090,889 | 531,785 | |||||||||
South Africa 14.7% | |||||||||||
Absa Group Ltd. | 17,596 | 185,584 | |||||||||
Aspen Pharmacare Holdings, Ltd. | 9,256 | 59,677 | |||||||||
FirstRand, Ltd. | 79,086 | 345,272 | |||||||||
MTN Group, Ltd. | 44,764 | 275,079 | |||||||||
MultiChoice Group Ltd.(a) | 10,602 | 88,734 | |||||||||
Naspers, Ltd. N Shares | 3,885 | 897,659 | |||||||||
Nedbank Group, Ltd. | 9,828 | 171,219 | |||||||||
Old Mutual Ltd. | 120,092 | 182,121 | |||||||||
Remgro, Ltd. | 12,803 | 164,472 | |||||||||
Sanlam, Ltd. | 43,277 | 221,348 | |||||||||
Sasol, Ltd. | 13,847 | 432,081 | |||||||||
Shoprite Holdings, Ltd. | 11,725 | 128,956 | |||||||||
Standard Bank Group, Ltd. | 31,758 | 407,907 | |||||||||
Vodacom Group, Ltd. | 15,789 | 121,998 | |||||||||
Total South Africa | 3,682,107 | ||||||||||
Thailand 12.4% | |||||||||||
Advanced Info Service PCL NVDR | 32,171 | 186,528 | |||||||||
Airports of Thailand PCL NVDR | 123,628 | 264,903 | |||||||||
Bangkok Bank PCL NVDR | 14,575 | 95,069 | |||||||||
Common Stocks (continued)
Issuer | Shares | Value ($) | |||||||||
Bangkok Dusit Medical Services PCL NVDR | 253,007 | 197,718 | |||||||||
Central Pattana PCL NVDR | 71,147 | 164,220 | |||||||||
| CP ALL PCL NVDR | 150,245 | 353,894 | |||||||||
Indorama Ventures PCL NVDR | 51,426 | 80,619 | |||||||||
Kasikornbank PCL NVDR | 33,903 | 200,309 | |||||||||
PTT Exploration & Production PCL NVDR | 39,789 | 157,350 | |||||||||
PTT Global Chemical PCL NVDR NVDR | 58,517 | 124,004 | |||||||||
PTT PCL NVDR | 411,930 | 623,055 | |||||||||
Siam Cement PCL (The) NVDR | 24,188 | 367,374 | |||||||||
Siam Commercial Bank PCL NVDR | 69,300 | 288,250 | |||||||||
Total Thailand | 3,103,293 | ||||||||||
United Arab Emirates 3.0% | |||||||||||
Dubai Islamic Bank PJSC | 47,361 | 63,181 | |||||||||
Emaar Properties PJSC | 101,069 | 128,775 | |||||||||
Emirates Telecommunications Group Co. PJSC | 50,108 | 227,819 | |||||||||
First Abu Dhabi Bank PJSC | 78,209 | 324,921 | |||||||||
Total United Arab Emirates | 744,696 | ||||||||||
Vietnam 6.0% | |||||||||||
Bank for Foreign Trade of Vietnam JSC | 99,620 | 288,934 | |||||||||
Hoa Phat Group JSC(a) | 338,846 | 470,214 | |||||||||
No Va Land Investment Group Corp.(a) | 107,694 | 258,978 | |||||||||
Vietnam Dairy Products JSC | 82,074 | 476,796 | |||||||||
Total Vietnam | 1,494,922 | ||||||||||
| Total Common Stocks (Cost: $24,335,358) | 24,796,492 | ||||||||||
Money Market Funds 0.5%
Shares | Value ($) | ||||||||||
| Goldman Sachs Financial Square Funds — Treasury Instruments Fund, Institutional Shares, 2.263%(b) | 136,124 | 136,124 | |||||||||
| Total Money Market Funds (Cost $136,124) | 136,124 | ||||||||||
| Total Investments in Securities (Cost: $24,471,482) | 24,932,616 | ||||||||||
Other Assets & Liabilities, Net | 113,026 | ||||||||||
Net Assets | 25,045,642 | ||||||||||
The accompanying Notes to Financial Statements are an integral part of these financial statements.
Columbia ETF Trust II | Annual Report 2019
38
PORTFOLIO OF INVESTMENTS (continued)
Columbia Beyond BRICs ETF
March 31, 2019
Notes to Portfolio of Investments
(a) Non-income producing investment.
(b) The rate shown is the seven-day current annualized yield at March 31, 2019.
Abbreviation Legend
NVDR Non-Voting Depositary Receipts
PJSC Private Joint Stock Company
Fair Value Measurements
The Fund categorizes its fair value measurements according to a three-level hierarchy that maximizes the use of observable inputs and minimizes the use of unobservable inputs by prioritizing that the most observable input be used when available. Observable inputs are those that market participants would use in pricing an investment based on market data obtained from sources independent of the reporting entity. Unobservable inputs are those that reflect the Fund's assumptions about the information market participants would use in pricing an investment. An investment's level within the fair value hierarchy is based on the lowest level of any input that is deemed significant to the asset's or liability's fair value measurement. The input levels are not necessarily an indication of the risk or liquidity associated with investments at that level. For example, certain U.S. government securities are generally high quality and liquid, however, they are reflected as Level 2 because the inputs used to determine fair value may not always be quoted prices in an active market.
Fair value inputs are summarized in the three broad levels listed below:
• Level 1 – Valuations based on quoted prices for investments in active markets that the Fund has the ability to access at the measurement date. Valuation adjustments are not applied to Level 1 investments.
• Level 2 – Valuations based on other significant observable inputs (including quoted prices for similar securities, interest rates, prepayment speeds, credit risks, etc.).
• Level 3 – Valuations based on significant unobservable inputs (including the Fund's own assumptions and judgment in determining the fair value of investments).
Inputs that are used in determining fair value of an investment may include price information, credit data, volatility statistics, and other factors. These inputs can be either observable or unobservable. The availability of observable inputs can vary between investments, and is affected by various factors such as the type of investment, and the volume and level of activity for that investment or similar investments in the marketplace. The inputs will be considered by the Investment Manager, along with any other relevant factors in the calculation of an investment's fair value. The Fund uses prices and inputs that are current as of the measurement date, which may include periods of market dislocations. During these periods, the availability of prices and inputs may be reduced for many investments. This condition could cause an investment to be reclassified between the various levels within the hierarchy.
Investments falling into the Level 3 category are primarily supported by quoted prices from brokers and dealers participating in the market for those investments. However, these may be classified as Level 3 investments due to lack of market transparency and corroboration to support these quoted prices. Additionally, valuation models may be used as the pricing source for any remaining investments classified as Level 3. These models may rely on one or more significant unobservable inputs and/or significant assumptions by the Investment Manager. Inputs used in valuations may include, but are not limited to, financial statement analysis, capital account balances, discount rates and estimated cash flows, and comparable company data.
Under the direction of the Fund's Board of Trustees (the Board), the Investment Manager's Valuation Committee (the Committee) is responsible for overseeing the valuation procedures approved by the Board. The Committee consists of voting and non-voting members from various groups within the Investment Manager's organization, including operations and accounting, trading and investments, compliance, risk management and legal.
The Committee meets at least monthly to review and approve valuation matters, which may include a description of specific valuation determinations, data regarding pricing information received from approved pricing vendors and brokers and the results of Board-approved valuation control policies and procedures (the Policies). The Policies address, among other things, instances when market quotations are or are not readily available, including recommendations of third party pricing vendors and a determination of appropriate pricing methodologies; events that require specific valuation determinations and assessment of fair value techniques; securities with a potential for stale pricing, including those that are illiquid, restricted, or in default; and the effectiveness of third-party pricing vendors, including periodic reviews of vendors. The Committee meets more frequently, as needed, to discuss additional valuation matters, which may include the need to review back-testing results, review time-sensitive information or approve related valuation actions. The Committee reports to the Board, with members of the Committee meeting with the Board at each of its regularly scheduled meetings to discuss valuation matters and actions during the period, similar to those described earlier.
For investments categorized as Level 3, the Committee monitors information similar to that described above, which may include: (i) data specific to the issuer or comparable issuers, (ii) general market or specific sector news and (iii) quoted prices and specific or similar security transactions. The Committee considers this data and any changes from prior periods in order to assess the reasonableness of observable and unobservable inputs, any assumptions or internal models used to value those securities and changes in fair value. This data is also used to corroborate, when available, information received from approved pricing vendors and brokers. Various factors impact the frequency of monitoring this information (which may occur as often as daily). However, the Committee may determine that changes to inputs, assumptions and models are not required as a result of the monitoring procedures performed.
The accompanying Notes to Financial Statements are an integral part of these financial statements.
Columbia ETF Trust II | Annual Report 2019
39
PORTFOLIO OF INVESTMENTS (continued)
Columbia Beyond BRICs ETF
March 31, 2019
Fair Value Measurements (continued)
The following table is a summary of the inputs used to value the Fund's investments at March 31, 2019:
| Level 1 quoted prices in active markets for identical assets ($) | Level 2 other significant observable inputs ($) | Level 3 significant unobservable inputs ($) | Total ($) | ||||||||||||||||
Investments in Securities | |||||||||||||||||||
Common Stocks | |||||||||||||||||||
Bangladesh | 1,370,025 | — | — | 1,370,025 | |||||||||||||||
Chile | 838,790 | — | — | 838,790 | |||||||||||||||
Colombia | 146,313 | — | — | 146,313 | |||||||||||||||
Czech Republic | 106,832 | — | — | 106,832 | |||||||||||||||
Hungary | 288,782 | — | — | 288,782 | |||||||||||||||
Indonesia | 2,334,954 | — | — | 2,334,954 | |||||||||||||||
Kenya | 844,752 | — | — | 844,752 | |||||||||||||||
Kuwait | 733,527 | — | — | 733,527 | |||||||||||||||
Malaysia | 2,034,469 | — | — | 2,034,469 | |||||||||||||||
Mexico | 2,771,123 | — | — | 2,771,123 | |||||||||||||||
Morocco | 949,123 | — | — | 949,123 | |||||||||||||||
Nigeria | 965,864 | — | — | 965,864 | |||||||||||||||
Philippines | 886,043 | — | — | 886,043 | |||||||||||||||
Qatar | 969,092 | — | — | 969,092 | |||||||||||||||
Romania | 531,785 | — | — | 531,785 | |||||||||||||||
South Africa | 3,682,107 | — | — | 3,682,107 | |||||||||||||||
Thailand | 3,103,293 | — | — | 3,103,293 | |||||||||||||||
United Arab Emirates | 744,696 | — | — | 744,696 | |||||||||||||||
Vietnam | 1,494,922 | — | — | 1,494,922 | |||||||||||||||
Total Common Stocks | 24,796,492 | — | — | 24,796,492 | |||||||||||||||
Money Market Funds | 136,124 | — | — | 136,124 | |||||||||||||||
Total Investments in Securities | 24,932,616 | — | — | 24,932,616 | |||||||||||||||
See the Portfolio of Investments for all investment classifications not indicated in the table.
There were no transfers of financial assets between levels during the period.
The accompanying Notes to Financial Statements are an integral part of these financial statements.
Columbia ETF Trust II | Annual Report 2019
40
PORTFOLIO OF INVESTMENTS
Columbia EM Core ex-China ETF
March 31, 2019
(Percentages represent value of investments compared to net assets)
Investments in Securities
Common Stocks 93.3%
Issuer | Shares | Value ($) | |||||||||
Brazil 3.2% | |||||||||||
B3 SA — Brasil Bolsa Balcao | 9,944 | 82,073 | |||||||||
Banco do Brasil SA | 4,157 | 52,041 | |||||||||
Vale SA | 17,603 | 230,367 | |||||||||
Total Brazil | 364,481 | ||||||||||
Chile 1.3% | |||||||||||
Cia Cervecerias Unidas SA | 4,459 | 63,838 | |||||||||
Empresas COPEC SA | 7,214 | 91,595 | |||||||||
Total Chile | 155,433 | ||||||||||
India 13.0% | |||||||||||
Dr. Reddy's Laboratories, Ltd. ADR | 3,150 | 127,575 | |||||||||
HDFC Bank, Ltd. ADR | 1,779 | 206,204 | |||||||||
ICICI Bank, Ltd. ADR | 34,481 | 395,152 | |||||||||
Infosys, Ltd. ADR | 36,160 | 395,229 | |||||||||
Tata Motors, Ltd. ADR(a) | 6,544 | 82,192 | |||||||||
Vedanta, Ltd. ADR | 9,759 | 103,055 | |||||||||
Wipro, Ltd. ADR | 25,601 | 101,892 | |||||||||
WNS Holdings, Ltd. ADR(a) | 1,447 | 77,082 | |||||||||
Total India | 1,488,381 | ||||||||||
Indonesia 3.8% | |||||||||||
PT Astra International Tbk | 116,514 | 59,934 | |||||||||
PT Bank Central Asia Tbk | 106,908 | 208,336 | |||||||||
PT Bank Mandiri Persero Tbk(a) | 179,858 | 94,097 | |||||||||
PT Telekomunikasi Indonesia Persero Tbk | 255,058 | 70,750 | |||||||||
Total Indonesia | 433,117 | ||||||||||
Malaysia 3.9% | |||||||||||
Dialog Group Bhd | 203,000 | 157,627 | |||||||||
IHH Healthcare Bhd | 83,400 | 117,873 | |||||||||
Petronas Dagangan Bhd | 14,300 | 87,569 | |||||||||
Tenaga Nasional Bhd | 29,000 | 89,930 | |||||||||
Total Malaysia | 452,999 | ||||||||||
Mexico 3.5% | |||||||||||
Cemex SAB de CV Series CPO(a) | 58,517 | 27,362 | |||||||||
Coca-Cola Femsa SAB de CV Series L | 14,246 | 94,234 | |||||||||
Common Stocks (continued)
Issuer | Shares | Value ($) | |||||||||
Grupo Bimbo SAB de CV Series A | 29,598 | 61,919 | |||||||||
Grupo Mexico SAB de CV Series B | 35,324 | 97,172 | |||||||||
Wal-Mart de Mexico SAB de CV | 43,629 | 116,779 | |||||||||
Total Mexico | 397,466 | ||||||||||
Philippines 2.3% | |||||||||||
Aboitiz Power Corp. | 75,300 | 50,764 | |||||||||
Jollibee Foods Corp. | 9,440 | 56,989 | |||||||||
Manila Electric Co. | 5,620 | 40,670 | |||||||||
Puregold Price Club, Inc. | 44,500 | 40,763 | |||||||||
SM Investments Corp. | 4,110 | 73,105 | |||||||||
Total Philippines | 262,291 | ||||||||||
Poland 2.3% | |||||||||||
Powszechna Kasa Oszczednosci Bank Polski SA | 14,512 | 146,034 | |||||||||
Powszechny Zaklad Ubezpieczen SA | 10,714 | 113,181 | |||||||||
Total Poland | 259,215 | ||||||||||
Russia 5.3% | |||||||||||
Gazprom PJSC ADR | 21,695 | 97,931 | |||||||||
LUKOIL PJSC ADR | 3,725 | 333,760 | |||||||||
Sberbank of Russia PJSC ADR | 13,162 | 174,528 | |||||||||
Total Russia | 606,219 | ||||||||||
South Africa 10.0% | |||||||||||
AngloGold Ashanti, Ltd. | 4,923 | 65,403 | |||||||||
Bid Corp., Ltd. | 5,483 | 113,300 | |||||||||
Bidvest Group, Ltd. (The) | 6,822 | 91,535 | |||||||||
Coronation Fund Managers, Ltd. | 19,014 | 60,571 | |||||||||
FirstRand, Ltd. | 17,463 | 76,240 | |||||||||
Hyprop Investments, Ltd. | 11,459 | 56,003 | |||||||||
MTN Group, Ltd. | 7,227 | 44,411 | |||||||||
Naspers, Ltd. N Shares | 1,343 | 310,310 | |||||||||
Sanlam, Ltd. | 12,712 | 65,018 | |||||||||
Sasol, Ltd. | 3,287 | 102,567 | |||||||||
Standard Bank Group, Ltd. | 6,897 | 88,587 | |||||||||
Woolworths Holdings, Ltd. | 21,107 | 68,028 | |||||||||
Total South Africa | 1,141,973 | ||||||||||
The accompanying Notes to Financial Statements are an integral part of these financial statements.
Columbia ETF Trust II | Annual Report 2019
41
PORTFOLIO OF INVESTMENTS (continued)
Columbia EM Core ex-China ETF
March 31, 2019
Common Stocks (continued)
Issuer | Shares | Value ($) | |||||||||
South Korea 16.9% | |||||||||||
Celltrion, Inc.(a) | 708 | 112,877 | |||||||||
Hana Financial Group, Inc. | 1,965 | 63,013 | |||||||||
Hyundai Mobis Co., Ltd. | 286 | 52,534 | |||||||||
Hyundai Motor Co. | 873 | 91,907 | |||||||||
KB Financial Group, Inc. | 3,625 | 133,650 | |||||||||
Kia Motors Corp. | 2,328 | 72,500 | |||||||||
KT&G Corp. | 798 | 72,763 | |||||||||
LG Electronics, Inc. | 1,034 | 68,411 | |||||||||
POSCO | 494 | 110,106 | |||||||||
Samsung Electro-Mechanics Co., Ltd. | 607 | 55,882 | |||||||||
Samsung Electronics Co., Ltd. | 19,161 | 753,712 | |||||||||
Shinhan Financial Group Co., Ltd. | 3,708 | 137,200 | |||||||||
SK Hynix, Inc. | 3,121 | 204,016 | |||||||||
Total South Korea | 1,928,571 | ||||||||||
Taiwan 19.8% | |||||||||||
ASE Industrial Holding Co., Ltd.(a) | 18,160 | 39,772 | |||||||||
Catcher Technology Co., Ltd. | 7,000 | 53,828 | |||||||||
Chang Hwa Commercial Bank, Ltd. | 89,796 | 53,754 | |||||||||
China Steel Corp. | 109,015 | 89,489 | |||||||||
Chipbond Technology Corp. | 30,858 | 71,086 | |||||||||
Chunghwa Telecom Co., Ltd. | 30,597 | 108,706 | |||||||||
CTBC Financial Holding Co., Ltd. | 85,911 | 57,004 | |||||||||
Eva Airways Corp. | 110,992 | 54,379 | |||||||||
Far Eastern New Century Corp. | 88,772 | 87,705 | |||||||||
Far EasTone Telecommunications Co., Ltd. | 35,034 | 84,458 | |||||||||
Formosa Chemicals & Fibre Corp. | 14,371 | 52,223 | |||||||||
Formosa Petrochemical Corp. | 14,144 | 53,005 | |||||||||
Formosa Plastics Corp. | 34,090 | 121,116 | |||||||||
Formosa Taffeta Co., Ltd. | 45,002 | 53,733 | |||||||||
Hon Hai Precision Industry Co., Ltd. | 60,953 | 145,359 | |||||||||
Makalot Industrial Co., Ltd. | 5,144 | 36,051 | |||||||||
MediaTek, Inc. | 7,814 | 71,623 | |||||||||
Nan Ya Plastics Corp. | 48,364 | 123,811 | |||||||||
Common Stocks (continued)
Issuer | Shares | Value ($) | |||||||||
President Chain Store Corp. | 10,839 | 106,735 | |||||||||
Taiwan Business Bank | 158,144 | 61,574 | |||||||||
Taiwan Mobile Co., Ltd. | 17,942 | 64,909 | |||||||||
Taiwan Semiconductor Manufacturing Co., Ltd. | 77,017 | 613,477 | |||||||||
Uni-President Enterprises Corp. | 22,846 | 55,446 | |||||||||
Total Taiwan | 2,259,243 | ||||||||||
Thailand 6.8% | |||||||||||
Airports of Thailand PCL NVDR | 60,400 | 129,422 | |||||||||
BTS Group Holdings PCL NVDR | 622,555 | 215,790 | |||||||||
| CP ALL PCL NVDR | 24,000 | 56,531 | |||||||||
Home Product Center PCL NVDR | 135,400 | 65,279 | |||||||||
Ratchaburi Electricity Generating Holding PCL | 32,300 | 59,541 | |||||||||
Siam Cement PCL (The) | 4,100 | 62,272 | |||||||||
Siam Commercial Bank PCL (The) | 19,600 | 81,525 | |||||||||
| Tesco Lotus Retail Growth Freehold & Leasehold Property Fund | 99,400 | 65,149 | |||||||||
Thai Union Group PCL NVDR | 64,696 | 39,346 | |||||||||
Total Thailand | 774,855 | ||||||||||
Turkey 0.7% | |||||||||||
Emlak Konut Gayrimenkul Yatirim Ortakligi AS | 304,417 | 82,441 | |||||||||
United Kingdom 0.5% | |||||||||||
Mondi PLC | 2,705 | 59,625 | |||||||||
| Total Common Stocks (Cost: $9,165,058) | 10,666,310 | ||||||||||
Preferred Stocks 6.0%
Issuer | Shares | Value ($) | |||||||||
Brazil 6.0% | |||||||||||
Banco Bradesco SA Preference Shares | 8,969 | 98,962 | |||||||||
Itau Unibanco Holding SA Preference Shares | 25,123 | 222,264 | |||||||||
Itausa — Investimentos Itau SA Preference Shares | 38,614 | 118,867 | |||||||||
Petroleo Brasileiro SA Preference Shares | 34,471 | 248,543 | |||||||||
Total Brazil | 688,636 | ||||||||||
| Total Preferred Stocks (Cost: $397,769) | 688,636 | ||||||||||
The accompanying Notes to Financial Statements are an integral part of these financial statements.
Columbia ETF Trust II | Annual Report 2019
42
PORTFOLIO OF INVESTMENTS (continued)
Columbia EM Core ex-China ETF
March 31, 2019
Warrants 0.0%
Issuer | Shares | Value ($) | |||||||||
Thailand 0.0% | |||||||||||
BTS Group Holdings PCL, expiring 12/29/19(a) | 56,295 | 1,987 | |||||||||
| Total Warrants (Cost $0) | 1,987 | ||||||||||
Money Market Funds 0.3%
Shares | Value ($) | ||||||||||
| Goldman Sachs Financial Square Funds — Treasury Instruments Fund, Institutional Shares, 2.263%(b) | 31,980 | 31,980 | |||||||||
| Total Money Market Funds (Cost $31,980) | 31,980 | ||||||||||
| Total Investments in Securities (Cost: $9,594,807) | 11,388,913 | ||||||||||
Other Assets & Liabilities, Net | 42,178 | ||||||||||
Net Assets | 11,431,091 | ||||||||||
Notes to Portfolio of Investments
(a) Non-income producing investment.
(b) The rate shown is the seven-day current annualized yield at March 31, 2019.
Abbreviation Legend
ADR American Depositary Receipts
NVDR Non-Voting Depositary Receipts
PJSC Private Joint Stock Company
Fair Value Measurements
The Fund categorizes its fair value measurements according to a three-level hierarchy that maximizes the use of observable inputs and minimizes the use of unobservable inputs by prioritizing that the most observable input be used when available. Observable inputs are those that market participants would use in pricing an investment based on market data obtained from sources independent of the reporting entity. Unobservable inputs are those that reflect the Fund's assumptions about the information market participants would use in pricing an investment. An investment's level within the fair value hierarchy is based on the lowest level of any input that is deemed significant to the asset's or liability's fair value measurement. The input levels are not necessarily an indication of the risk or liquidity associated with investments at that level. For example, certain U.S. government securities are generally high quality and liquid, however, they are reflected as Level 2 because the inputs used to determine fair value may not always be quoted prices in an active market.
Fair value inputs are summarized in the three broad levels listed below:
• Level 1 – Valuations based on quoted prices for investments in active markets that the Fund has the ability to access at the measurement date. Valuation adjustments are not applied to Level 1 investments.
• Level 2 – Valuations based on other significant observable inputs (including quoted prices for similar securities, interest rates, prepayment speeds, credit risks, etc.).
• Level 3 – Valuations based on significant unobservable inputs (including the Fund's own assumptions and judgment in determining the fair value of investments).
Inputs that are used in determining fair value of an investment may include price information, credit data, volatility statistics, and other factors. These inputs can be either observable or unobservable. The availability of observable inputs can vary between investments, and is affected by various factors such as the type of investment, and the volume and level of activity for that investment or similar investments in the marketplace. The inputs will be considered by the Investment Manager, along with any other relevant factors in the calculation of an investment's fair value. The Fund uses prices and inputs that are current as of the measurement date, which may include periods of market dislocations. During these periods, the availability of prices and inputs may be reduced for many investments. This condition could cause an investment to be reclassified between the various levels within the hierarchy.
The accompanying Notes to Financial Statements are an integral part of these financial statements.
Columbia ETF Trust II | Annual Report 2019
43
PORTFOLIO OF INVESTMENTS (continued)
Columbia EM Core ex-China ETF
March 31, 2019
Fair Value Measurements (continued)
Investments falling into the Level 3 category are primarily supported by quoted prices from brokers and dealers participating in the market for those investments. However, these may be classified as Level 3 investments due to lack of market transparency and corroboration to support these quoted prices. Additionally, valuation models may be used as the pricing source for any remaining investments classified as Level 3. These models may rely on one or more significant unobservable inputs and/or significant assumptions by the Investment Manager. Inputs used in valuations may include, but are not limited to, financial statement analysis, capital account balances, discount rates and estimated cash flows, and comparable company data.
Under the direction of the Fund's Board of Trustees (the Board), the Investment Manager's Valuation Committee (the Committee) is responsible for overseeing the valuation procedures approved by the Board. The Committee consists of voting and non-voting members from various groups within the Investment Manager's organization, including operations and accounting, trading and investments, compliance, risk management and legal.
The Committee meets at least monthly to review and approve valuation matters, which may include a description of specific valuation determinations, data regarding pricing information received from approved pricing vendors and brokers and the results of Board-approved valuation control policies and procedures (the Policies). The Policies address, among other things, instances when market quotations are or are not readily available, including recommendations of third party pricing vendors and a determination of appropriate pricing methodologies; events that require specific valuation determinations and assessment of fair value techniques; securities with a potential for stale pricing, including those that are illiquid, restricted, or in default; and the effectiveness of third-party pricing vendors, including periodic reviews of vendors. The Committee meets more frequently, as needed, to discuss additional valuation matters, which may include the need to review back-testing results, review time-sensitive information or approve related valuation actions. The Committee reports to the Board, with members of the Committee meeting with the Board at each of its regularly scheduled meetings to discuss valuation matters and actions during the period, similar to those described earlier.
For investments categorized as Level 3, the Committee monitors information similar to that described above, which may include: (i) data specific to the issuer or comparable issuers, (ii) general market or specific sector news and (iii) quoted prices and specific or similar security transactions. The Committee considers this data and any changes from prior periods in order to assess the reasonableness of observable and unobservable inputs, any assumptions or internal models used to value those securities and changes in fair value. This data is also used to corroborate, when available, information received from approved pricing vendors and brokers. Various factors impact the frequency of monitoring this information (which may occur as often as daily). However, the Committee may determine that changes to inputs, assumptions and models are not required as a result of the monitoring procedures performed.
The accompanying Notes to Financial Statements are an integral part of these financial statements.
Columbia ETF Trust II | Annual Report 2019
44
PORTFOLIO OF INVESTMENTS (continued)
Columbia EM Core ex-China ETF
March 31, 2019
Fair Value Measurements (continued)
The following table is a summary of the inputs used to value the Fund's investments at March 31, 2019:
| Level 1 quoted prices in active markets for identical assets ($) | Level 2 other significant observable inputs ($) | Level 3 significant unobservable inputs ($) | Total ($) | ||||||||||||||||
Investments in Securities | |||||||||||||||||||
Common Stocks | |||||||||||||||||||
Brazil | 364,481 | — | — | 364,481 | |||||||||||||||
Chile | 155,433 | — | — | 155,433 | |||||||||||||||
India | 1,488,381 | — | — | 1,488,381 | |||||||||||||||
Indonesia | 433,117 | — | — | 433,117 | |||||||||||||||
Malaysia | 452,999 | — | — | 452,999 | |||||||||||||||
Mexico | 397,466 | — | — | 397,466 | |||||||||||||||
Philippines | 262,291 | — | — | 262,291 | |||||||||||||||
Poland | 259,215 | — | — | 259,215 | |||||||||||||||
Russia | 606,219 | — | — | 606,219 | |||||||||||||||
South Africa | 1,141,973 | — | — | 1,141,973 | |||||||||||||||
South Korea | 1,928,571 | — | — | 1,928,571 | |||||||||||||||
Taiwan | 2,259,243 | — | — | 2,259,243 | |||||||||||||||
Thailand | 774,855 | — | — | 774,855 | |||||||||||||||
Turkey | 82,441 | — | — | 82,441 | |||||||||||||||
United Kingdom | 59,625 | — | — | 59,625 | |||||||||||||||
Total Common Stocks | 10,666,310 | — | — | 10,666,310 | |||||||||||||||
Preferred Stocks | |||||||||||||||||||
Brazil | 688,636 | — | — | 688,636 | |||||||||||||||
Total Preferred Stocks | 688,636 | — | — | 688,636 | |||||||||||||||
Warrants | |||||||||||||||||||
Thailand | 1,987 | — | — | 1,987 | |||||||||||||||
Total Warrants | 1,987 | — | — | 1,987 | |||||||||||||||
Money Market Funds | 31,980 | — | — | 31,980 | |||||||||||||||
Total Investments in Securities | 11,388,913 | — | — | 11,388,913 | |||||||||||||||
See the Portfolio of Investments for all investment classifications not indicated in the table.
There were no transfers of financial assets between levels during the period.
The accompanying Notes to Financial Statements are an integral part of these financial statements.
Columbia ETF Trust II | Annual Report 2019
45
PORTFOLIO OF INVESTMENTS
Columbia EM Quality Dividend ETF
March 31, 2019
(Percentages represent value of investments compared to net assets)
Investments in Securities
Common Stocks 97.3%
Issuer | Shares | Value ($) | |||||||||
Brazil 6.0% | |||||||||||
Cielo SA | 44,032 | 107,373 | |||||||||
Suzano Papel e Celulose SA | 9,556 | 114,303 | |||||||||
Vale SA | 8,763 | 114,680 | |||||||||
Total Brazil | 336,356 | ||||||||||
Chile 2.0% | |||||||||||
Enel Americas SA | 643,583 | 114,421 | |||||||||
China 9.8% | |||||||||||
Bank of China, Ltd. Class H | 241,274 | 109,419 | |||||||||
China Construction Bank Corp. Class H | 127,243 | 109,089 | |||||||||
China Mobile, Ltd. | 10,782 | 109,881 | |||||||||
Industrial & Commercial Bank of China, Ltd. Class H | 148,165 | 108,529 | |||||||||
Ping An Insurance Group Co. of China, Ltd. Class H | 10,209 | 114,316 | |||||||||
Total China | 551,234 | ||||||||||
Colombia 2.0% | |||||||||||
Ecopetrol SA | 102,869 | 110,281 | |||||||||
Hong Kong 10.1% | |||||||||||
CK Asset Holdings Ltd. | 12,948 | 115,131 | |||||||||
CLP Holdings, Ltd. | 9,688 | 112,307 | |||||||||
Hang Seng Bank Ltd. | 4,609 | 113,729 | |||||||||
Hong Kong Exchanges & Clearing, Ltd. | 3,237 | 112,821 | |||||||||
Link REIT | 10,029 | 117,283 | |||||||||
Total Hong Kong | 571,271 | ||||||||||
India 12.1% | |||||||||||
Bharat Petroleum Corp., Ltd. | 20,481 | 117,535 | |||||||||
GAIL India, Ltd. | 22,241 | 111,614 | |||||||||
Indian Oil Corp., Ltd. | 49,418 | 116,171 | |||||||||
Infosys, Ltd. | 10,444 | 112,144 | |||||||||
ITC, Ltd. | 26,027 | 111,679 | |||||||||
Power Grid Corp. of India, Ltd. | 39,099 | 111,695 | |||||||||
Total India | 680,838 | ||||||||||
Indonesia 7.9% | |||||||||||
PT Astra International Tbk | 219,876 | 113,103 | |||||||||
PT Gudang Garam Tbk | 18,558 | 108,429 | |||||||||
Common Stocks (continued)
Issuer | Shares | Value ($) | |||||||||
PT Telekomunikasi Indonesia Persero Tbk | 417,305 | 115,755 | |||||||||
PT United Tractors Tbk | 56,935 | 108,153 | |||||||||
Total Indonesia | 445,440 | ||||||||||
Kenya 1.9% | |||||||||||
Safaricom PLC | 402,379 | 110,030 | |||||||||
Malaysia 11.8% | |||||||||||
Malayan Banking Bhd | 49,200 | 111,717 | |||||||||
Maxis Bhd | 82,258 | 107,998 | |||||||||
Nestle Malaysia Bhd | 3,100 | 111,471 | |||||||||
Petronas Chemicals Group Bhd | 50,590 | 113,510 | |||||||||
Petronas Gas Bhd | 25,600 | 110,489 | |||||||||
Tenaga Nasional Bhd | 35,531 | 110,183 | |||||||||
Total Malaysia | 665,368 | ||||||||||
Mexico 4.1% | |||||||||||
Grupo Mexico SAB de CV Series B | 42,448 | 116,769 | |||||||||
Wal-Mart de Mexico SAB de CV | 42,582 | 113,977 | |||||||||
Total Mexico | 230,746 | ||||||||||
Poland 1.9% | |||||||||||
Polski Koncern Naftowy Orlen SA | 4,288 | 109,206 | |||||||||
Qatar 2.0% | |||||||||||
Qatar National Bank QPSC | 2,276 | 112,839 | |||||||||
South Africa 3.9% | |||||||||||
Standard Bank Group, Ltd. | 8,905 | 114,378 | |||||||||
Vodacom Group, Ltd. | 14,025 | 108,368 | |||||||||
Total South Africa | 222,746 | ||||||||||
South Korea 5.7% | |||||||||||
KB Financial Group, Inc. | 2,992 | 110,312 | |||||||||
Samsung Electronics Co., Ltd. | 2,732 | 107,465 | |||||||||
S-Oil Corp. | 1,323 | 104,432 | |||||||||
Total South Korea | 322,209 | ||||||||||
Taiwan 12.1% | |||||||||||
Formosa Chemicals & Fibre Corp. | 31,797 | 115,549 | |||||||||
Formosa Plastics Corp. | 32,240 | 114,543 | |||||||||
Nan Ya Plastics Corp. | 45,011 | 115,227 | |||||||||
The accompanying Notes to Financial Statements are an integral part of these financial statements.
Columbia ETF Trust II | Annual Report 2019
46
PORTFOLIO OF INVESTMENTS (continued)
Columbia EM Quality Dividend ETF
March 31, 2019
Common Stocks (continued)
Issuer | Shares | Value ($) | |||||||||
Taiwan Semiconductor Manufacturing Co., Ltd. | 13,947 | 111,094 | |||||||||
Uni-President Enterprises Corp. | 46,899 | 113,822 | |||||||||
Yageo Corp. | 10,592 | 111,005 | |||||||||
Total Taiwan | 681,240 | ||||||||||
Thailand 2.0% | |||||||||||
PTT Global Chemical PCL NVDR | 52,608 | 111,482 | |||||||||
United Arab Emirates 2.0% | |||||||||||
Emaar Properties PJSC | 87,951 | 112,061 | |||||||||
| Total Common Stocks (Cost: $5,445,570) | 5,487,768 | ||||||||||
Preferred Stocks 2.0%
Issuer | Shares | Value ($) | |||||||||
Chile 2.0% | |||||||||||
Sociedad Quimica y Minera de Chile SA Class B | 2,950 | 113,361 | |||||||||
| Total Preferred Stocks (Cost $143,800) | 113,361 | ||||||||||
| Total Investments in Securities (Cost: $5,589,370) | 5,601,129 | ||||||||||
Other Assets & Liabilities, Net | 38,852 | ||||||||||
Net Assets | 5,639,981 | ||||||||||
Abbreviation Legend
NVDR Non-Voting Depositary Receipts
PJSC Private Joint Stock Company
Fair Value Measurements
The Fund categorizes its fair value measurements according to a three-level hierarchy that maximizes the use of observable inputs and minimizes the use of unobservable inputs by prioritizing that the most observable input be used when available. Observable inputs are those that market participants would use in pricing an investment based on market data obtained from sources independent of the reporting entity. Unobservable inputs are those that reflect the Fund's assumptions about the information market participants would use in pricing an investment. An investment's level within the fair value hierarchy is based on the lowest level of any input that is deemed significant to the asset's or liability's fair value measurement. The input levels are not necessarily an indication of the risk or liquidity associated with investments at that level. For example, certain U.S. government securities are generally high quality and liquid, however, they are reflected as Level 2 because the inputs used to determine fair value may not always be quoted prices in an active market.
Fair value inputs are summarized in the three broad levels listed below:
• Level 1 – Valuations based on quoted prices for investments in active markets that the Fund has the ability to access at the measurement date. Valuation adjustments are not applied to Level 1 investments.
• Level 2 – Valuations based on other significant observable inputs (including quoted prices for similar securities, interest rates, prepayment speeds, credit risks, etc.).
• Level 3 – Valuations based on significant unobservable inputs (including the Fund's own assumptions and judgment in determining the fair value of investments).
Inputs that are used in determining fair value of an investment may include price information, credit data, volatility statistics, and other factors. These inputs can be either observable or unobservable. The availability of observable inputs can vary between investments, and is affected by various factors such as the type of investment, and the volume and level of activity for that investment or similar investments in the marketplace. The inputs will be considered by the Investment Manager, along with any other relevant factors in the calculation of an investment's fair value. The Fund uses prices and inputs that are current as of the measurement date, which may include periods of market dislocations. During these periods, the availability of prices and inputs may be reduced for many investments. This condition could cause an investment to be reclassified between the various levels within the hierarchy.
Investments falling into the Level 3 category are primarily supported by quoted prices from brokers and dealers participating in the market for those investments. However, these may be classified as Level 3 investments due to lack of market transparency and corroboration to support these quoted prices. Additionally, valuation models may be used as the pricing source for any remaining investments classified as Level 3. These models may rely on one or more significant unobservable inputs and/or significant assumptions by the Investment Manager. Inputs used in valuations may include, but are not limited to, financial statement analysis, capital account balances, discount rates and estimated cash flows, and comparable company data.
Under the direction of the Fund's Board of Trustees (the Board), the Investment Manager's Valuation Committee (the Committee) is responsible for overseeing the valuation procedures approved by the Board. The Committee consists of voting and non-voting members from various groups within the Investment Manager's organization, including operations and accounting, trading and investments, compliance, risk management and legal.
The accompanying Notes to Financial Statements are an integral part of these financial statements.
Columbia ETF Trust II | Annual Report 2019
47
PORTFOLIO OF INVESTMENTS (continued)
Columbia EM Quality Dividend ETF
March 31, 2019
Fair Value Measurements (continued)
The Committee meets at least monthly to review and approve valuation matters, which may include a description of specific valuation determinations, data regarding pricing information received from approved pricing vendors and brokers and the results of Board-approved valuation control policies and procedures (the Policies). The Policies address, among other things, instances when market quotations are or are not readily available, including recommendations of third party pricing vendors and a determination of appropriate pricing methodologies; events that require specific valuation determinations and assessment of fair value techniques; securities with a potential for stale pricing, including those that are illiquid, restricted, or in default; and the effectiveness of third-party pricing vendors, including periodic reviews of vendors. The Committee meets more frequently, as needed, to discuss additional valuation matters, which may include the need to review back-testing results, review time-sensitive information or approve related valuation actions. The Committee reports to the Board, with members of the Committee meeting with the Board at each of its regularly scheduled meetings to discuss valuation matters and actions during the period, similar to those described earlier.
For investments categorized as Level 3, the Committee monitors information similar to that described above, which may include: (i) data specific to the issuer or comparable issuers, (ii) general market or specific sector news and (iii) quoted prices and specific or similar security transactions. The Committee considers this data and any changes from prior periods in order to assess the reasonableness of observable and unobservable inputs, any assumptions or internal models used to value those securities and changes in fair value. This data is also used to corroborate, when available, information received from approved pricing vendors and brokers. Various factors impact the frequency of monitoring this information (which may occur as often as daily). However, the Committee may determine that changes to inputs, assumptions and models are not required as a result of the monitoring procedures performed.
The following table is a summary of the inputs used to value the Fund's investments at March 31, 2019:
| Level 1 quoted prices in active markets for identical assets ($) | Level 2 other significant observable inputs ($) | Level 3 significant unobservable inputs ($) | Total ($) | ||||||||||||||||
Investments in Securities | |||||||||||||||||||
Common Stocks | |||||||||||||||||||
Brazil | 336,356 | — | — | 336,356 | |||||||||||||||
Chile | 114,421 | — | — | 114,421 | |||||||||||||||
China | 551,234 | — | — | 551,234 | |||||||||||||||
Colombia | 110,281 | — | — | 110,281 | |||||||||||||||
Hong Kong | 571,271 | — | — | 571,271 | |||||||||||||||
India | 680,838 | — | — | 680,838 | |||||||||||||||
Indonesia | 445,440 | — | — | 445,440 | |||||||||||||||
Kenya | 110,030 | — | — | 110,030 | |||||||||||||||
Malaysia | 665,368 | — | — | 665,368 | |||||||||||||||
Mexico | 230,746 | — | — | 230,746 | |||||||||||||||
Poland | 109,206 | — | — | 109,206 | |||||||||||||||
Qatar | 112,839 | — | — | 112,839 | |||||||||||||||
South Africa | 222,746 | — | — | 222,746 | |||||||||||||||
South Korea | 322,209 | — | — | 322,209 | |||||||||||||||
Taiwan | 681,240 | — | — | 681,240 | |||||||||||||||
Thailand | 111,482 | — | — | 111,482 | |||||||||||||||
United Arab Emirates | 112,061 | — | — | 112,061 | |||||||||||||||
Total Common Stocks | 5,487,768 | — | — | 5,487,768 | |||||||||||||||
Preferred Stocks | |||||||||||||||||||
Chile | 113,361 | — | — | 113,361 | |||||||||||||||
Total Preferred Stocks | 113,361 | — | — | 113,361 | |||||||||||||||
Total Investments in Securities | 5,601,129 | — | — | 5,601,129 | |||||||||||||||
See the Portfolio of Investments for all investment classifications not indicated in the table.
There were no transfers of financial assets between levels during the period.
The accompanying Notes to Financial Statements are an integral part of these financial statements.
Columbia ETF Trust II | Annual Report 2019
48
PORTFOLIO OF INVESTMENTS
Columbia Emerging Markets Consumer ETF
March 31, 2019
(Percentages represent value of investments compared to net assets)
Investments in Securities
Common Stocks 96.1%
Issuer | Shares | Value ($) | |||||||||
Brazil 3.8% | |||||||||||
Lojas Americanas SA | 144,605 | 491,219 | |||||||||
Lojas Renner SA | 602,843 | 6,784,830 | |||||||||
Raia Drogasil SA | 218,538 | 3,666,915 | |||||||||
Total Brazil | 10,942,964 | ||||||||||
Chile 1.4% | |||||||||||
Cencosud SA | 788,888 | 1,365,794 | |||||||||
S.A.C.I. Falabella | 382,405 | 2,843,557 | |||||||||
Total Chile | 4,209,351 | ||||||||||
China 42.8% | |||||||||||
58.com, Inc. ADR(a) | 31,118 | 2,043,830 | |||||||||
Alibaba Group Holding, Ltd. ADR(a) | 78,007 | 14,232,377 | |||||||||
ANTA Sports Products, Ltd. | 307,397 | 2,091,096 | |||||||||
Autohome, Inc. ADR(a) | 19,131 | 2,011,051 | |||||||||
Baidu, Inc. ADR(a) | 84,390 | 13,911,692 | |||||||||
BYD Co., Ltd. Class H | 212,539 | 1,280,657 | |||||||||
China Mengniu Dairy Co., Ltd.(a) | 939,600 | 3,495,095 | |||||||||
China Mobile, Ltd. | 1,392,305 | 14,189,186 | |||||||||
China Resources Beer Holdings Co., Ltd. | 482,348 | 2,030,790 | |||||||||
China Telecom Corp., Ltd. Class H | 4,811,152 | 2,672,198 | |||||||||
China Tower Corp. Ltd. Class H(a)(b) | 15,367,892 | 3,563,024 | |||||||||
China Unicom Hong Kong, Ltd. | 2,015,528 | 2,554,730 | |||||||||
Ctrip.com International, Ltd. ADR(a) | 132,314 | 5,780,799 | |||||||||
Dongfeng Motor Group Co., Ltd. Class H | 911,320 | 912,487 | |||||||||
Geely Automobile Holdings, Ltd. | 1,930,738 | 3,689,332 | |||||||||
Guangzhou Automobile Group Co., Ltd. Class H | 976,555 | 1,153,213 | |||||||||
Hengan International Group Co., Ltd. | 251,592 | 2,205,050 | |||||||||
JD.com, Inc. ADR(a) | 283,838 | 8,557,716 | |||||||||
NetEase, Inc. ADR | 25,496 | 6,156,009 | |||||||||
| New Oriental Education & Technology Group, Inc. ADR(a) | 40,567 | 3,654,681 | |||||||||
TAL Education Group ADR(a) | 123,290 | 4,448,303 | |||||||||
Tencent Holdings, Ltd. | 311,538 | 14,326,871 | |||||||||
Want Want China Holdings, Ltd. | 2,201,179 | 1,828,252 | |||||||||
Weibo Corp. ADR(a) | 21,883 | 1,356,527 | |||||||||
Common Stocks (continued)
Issuer | Shares | Value ($) | |||||||||
Yum China Holdings, Inc. | 131,396 | 5,900,994 | |||||||||
Total China | 124,045,960 | ||||||||||
Hong Kong 0.4% | |||||||||||
Haier Electronics Group Co., Ltd.(a) | 427,605 | 1,241,969 | |||||||||
India 16.6% | |||||||||||
Bharti Airtel, Ltd. | 1,009,580 | 4,854,437 | |||||||||
Hero MotoCorp, Ltd. | 74,887 | 2,759,982 | |||||||||
Hindustan Unilever, Ltd. | 546,654 | 13,468,481 | |||||||||
ITC, Ltd. | 2,236,484 | 9,596,461 | |||||||||
Mahindra & Mahindra, Ltd. | 465,833 | 4,531,575 | |||||||||
Maruti Suzuki India, Ltd. | 92,477 | 8,907,361 | |||||||||
Titan Co., Ltd. | 237,807 | 3,919,739 | |||||||||
Total India | 48,038,036 | ||||||||||
Indonesia 3.2% | |||||||||||
PT Astra International Tbk | 6,721,115 | 3,457,315 | |||||||||
PT Telekomunikasi Indonesia Persero Tbk | 16,117,462 | 4,470,785 | |||||||||
PT Unilever Indonesia Tbk | 380,020 | 1,313,658 | |||||||||
Total Indonesia | 9,241,758 | ||||||||||
Mexico 3.6% | |||||||||||
Coca-Cola Femsa SAB de CV Series L | 142,753 | 944,278 | |||||||||
| Fomento Economico Mexicano SAB de CV Series UBD | 505,177 | 4,665,677 | |||||||||
Grupo Televisa SAB Series CPO | 594,656 | 1,317,915 | |||||||||
Wal-Mart de Mexico SAB de CV | 1,328,902 | 3,556,984 | |||||||||
Total Mexico | 10,484,854 | ||||||||||
Russia 4.5% | |||||||||||
Magnit PJSC GDR | 269,183 | 3,795,480 | |||||||||
X5 Retail Group NV GDR | 93,215 | 2,322,918 | |||||||||
Yandex NV Class A(a) | 199,336 | 6,845,198 | |||||||||
Total Russia | 12,963,596 | ||||||||||
South Africa 4.5% | |||||||||||
Shoprite Holdings, Ltd. | 578,756 | 6,365,363 | |||||||||
Vodacom Group, Ltd. | 874,119 | 6,754,136 | |||||||||
Total South Africa | 13,119,499 | ||||||||||
The accompanying Notes to Financial Statements are an integral part of these financial statements.
Columbia ETF Trust II | Annual Report 2019
49
PORTFOLIO OF INVESTMENTS (continued)
Columbia Emerging Markets Consumer ETF
March 31, 2019
Common Stocks (continued)
Issuer | Shares | Value ($) | |||||||||
Taiwan 10.6% | |||||||||||
Chunghwa Telecom Co., Ltd. | 3,182,527 | 11,306,978 | |||||||||
President Chain Store Corp. | 470,032 | 4,628,566 | |||||||||
Taiwan Mobile Co., Ltd. | 1,346,137 | 4,869,949 | |||||||||
Uni-President Enterprises Corp. | 4,138,842 | 10,044,788 | |||||||||
Total Taiwan | 30,850,281 | ||||||||||
Thailand 3.8% | |||||||||||
Advanced Info Service PCL | 522,900 | 3,031,782 | |||||||||
| CP ALL PCL | 2,149,805 | 5,063,744 | |||||||||
Thai Beverage PCL | 4,783,044 | 2,983,885 | |||||||||
Total Thailand | 11,079,411 | ||||||||||
United Arab Emirates 0.9% | |||||||||||
Emirates Telecommunications Group Co. PJSC | 581,897 | 2,645,634 | |||||||||
| Total Common Stocks (Cost: $284,081,555) | 278,863,313 | ||||||||||
Preferred Stocks 3.5%
Issuer | Shares | Value ($) | |||||||||
Brazil 3.5% | |||||||||||
Cia Brasileira de Distribuicao Preference Shares | 131,542 | 3,091,408 | |||||||||
Lojas Americanas SA Preference Shares | 621,613 | 2,678,636 | |||||||||
Telefonica Brasil SA Preference Shares | 346,753 | 4,232,281 | |||||||||
Total Brazil | 10,002,325 | ||||||||||
| Total Preferred Stocks (Cost: $10,820,523) | 10,002,325 | ||||||||||
Money Market Funds 0.4%
Shares | Value ($) | ||||||||||
| Goldman Sachs Financial Square Funds — Treasury Instruments Fund, Institutional Shares, 2.263%(c) | 1,160,736 | 1,160,736 | |||||||||
| Total Money Market Funds (Cost $1,160,736) | 1,160,736 | ||||||||||
| Total Investments in Securities (Cost: $296,062,814) | 290,026,374 | ||||||||||
Other Assets & Liabilities, Net | 92,287 | ||||||||||
Net Assets | 290,118,661 | ||||||||||
Notes to Portfolio of Investments
(a) Non-income producing investment.
(b) Represents privately placed and other securities and instruments exempt from SEC registration (collectively, private placements), such as Section 4(a)(2) and Rule 144A eligible securities, which are often sold only to qualified institutional buyers. The Fund may invest in private placements determined to be liquid as well as those determined to be illiquid. Private placements may be determined to be liquid under guidelines established by the Fund's Board of Trustees. At March 31, 2019, the total value of these securities amounted to $3,563,024, which represents 1.23% of net assets.
(c) The rate shown is the seven-day current annualized yield at March 31, 2019.
Abbreviation Legend
ADR American Depositary Receipts
GDR Global Depositary Receipts
PJSC Private Joint Stock Company
The accompanying Notes to Financial Statements are an integral part of these financial statements.
Columbia ETF Trust II | Annual Report 2019
50
PORTFOLIO OF INVESTMENTS (continued)
Columbia Emerging Markets Consumer ETF
March 31, 2019
Fair Value Measurements
The Fund categorizes its fair value measurements according to a three-level hierarchy that maximizes the use of observable inputs and minimizes the use of unobservable inputs by prioritizing that the most observable input be used when available. Observable inputs are those that market participants would use in pricing an investment based on market data obtained from sources independent of the reporting entity. Unobservable inputs are those that reflect the Fund's assumptions about the information market participants would use in pricing an investment. An investment's level within the fair value hierarchy is based on the lowest level of any input that is deemed significant to the asset's or liability's fair value measurement. The input levels are not necessarily an indication of the risk or liquidity associated with investments at that level. For example, certain U.S. government securities are generally high quality and liquid, however, they are reflected as Level 2 because the inputs used to determine fair value may not always be quoted prices in an active market.
Fair value inputs are summarized in the three broad levels listed below:
• Level 1 – Valuations based on quoted prices for investments in active markets that the Fund has the ability to access at the measurement date. Valuation adjustments are not applied to Level 1 investments.
• Level 2 – Valuations based on other significant observable inputs (including quoted prices for similar securities, interest rates, prepayment speeds, credit risks, etc.).
• Level 3 – Valuations based on significant unobservable inputs (including the Fund's own assumptions and judgment in determining the fair value of investments).
Inputs that are used in determining fair value of an investment may include price information, credit data, volatility statistics, and other factors. These inputs can be either observable or unobservable. The availability of observable inputs can vary between investments, and is affected by various factors such as the type of investment, and the volume and level of activity for that investment or similar investments in the marketplace. The inputs will be considered by the Investment Manager, along with any other relevant factors in the calculation of an investment's fair value. The Fund uses prices and inputs that are current as of the measurement date, which may include periods of market dislocations. During these periods, the availability of prices and inputs may be reduced for many investments. This condition could cause an investment to be reclassified between the various levels within the hierarchy.
Investments falling into the Level 3 category are primarily supported by quoted prices from brokers and dealers participating in the market for those investments. However, these may be classified as Level 3 investments due to lack of market transparency and corroboration to support these quoted prices. Additionally, valuation models may be used as the pricing source for any remaining investments classified as Level 3. These models may rely on one or more significant unobservable inputs and/or significant assumptions by the Investment Manager. Inputs used in valuations may include, but are not limited to, financial statement analysis, capital account balances, discount rates and estimated cash flows, and comparable company data.
Under the direction of the Fund's Board of Trustees (the Board), the Investment Manager's Valuation Committee (the Committee) is responsible for overseeing the valuation procedures approved by the Board. The Committee consists of voting and non-voting members from various groups within the Investment Manager's organization, including operations and accounting, trading and investments, compliance, risk management and legal.
The Committee meets at least monthly to review and approve valuation matters, which may include a description of specific valuation determinations, data regarding pricing information received from approved pricing vendors and brokers and the results of Board-approved valuation control policies and procedures (the Policies). The Policies address, among other things, instances when market quotations are or are not readily available, including recommendations of third party pricing vendors and a determination of appropriate pricing methodologies; events that require specific valuation determinations and assessment of fair value techniques; securities with a potential for stale pricing, including those that are illiquid, restricted, or in default; and the effectiveness of third-party pricing vendors, including periodic reviews of vendors. The Committee meets more frequently, as needed, to discuss additional valuation matters, which may include the need to review back-testing results, review time-sensitive information or approve related valuation actions. The Committee reports to the Board, with members of the Committee meeting with the Board at each of its regularly scheduled meetings to discuss valuation matters and actions during the period, similar to those described earlier.
For investments categorized as Level 3, the Committee monitors information similar to that described above, which may include: (i) data specific to the issuer or comparable issuers, (ii) general market or specific sector news and (iii) quoted prices and specific or similar security transactions. The Committee considers this data and any changes from prior periods in order to assess the reasonableness of observable and unobservable inputs, any assumptions or internal models used to value those securities and changes in fair value. This data is also used to corroborate, when available, information received from approved pricing vendors and brokers. Various factors impact the frequency of monitoring this information (which may occur as often as daily). However, the Committee may determine that changes to inputs, assumptions and models are not required as a result of the monitoring procedures performed.
The accompanying Notes to Financial Statements are an integral part of these financial statements.
Columbia ETF Trust II | Annual Report 2019
51
PORTFOLIO OF INVESTMENTS (continued)
Columbia Emerging Markets Consumer ETF
March 31, 2019
Fair Value Measurements (continued)
The following table is a summary of the inputs used to value the Fund's investments at March 31, 2019:
| Level 1 quoted prices in active markets for identical assets ($) | Level 2 other significant observable inputs ($) | Level 3 significant unobservable inputs ($) | Total ($) | ||||||||||||||||
Investments in Securities | |||||||||||||||||||
Common Stocks | |||||||||||||||||||
Brazil | 10,942,964 | — | — | 10,942,964 | |||||||||||||||
Chile | 4,209,351 | — | — | 4,209,351 | |||||||||||||||
China | 124,045,960 | — | — | 124,045,960 | |||||||||||||||
Hong Kong | 1,241,969 | — | — | 1,241,969 | |||||||||||||||
India | 48,038,036 | — | — | 48,038,036 | |||||||||||||||
Indonesia | 9,241,758 | — | — | 9,241,758 | |||||||||||||||
Mexico | 10,484,854 | — | — | 10,484,854 | |||||||||||||||
Russia | 12,963,596 | — | — | 12,963,596 | |||||||||||||||
South Africa | 13,119,499 | — | — | 13,119,499 | |||||||||||||||
Taiwan | 30,850,281 | — | — | 30,850,281 | |||||||||||||||
Thailand | 11,079,411 | — | — | 11,079,411 | |||||||||||||||
United Arab Emirates | 2,645,634 | — | — | 2,645,634 | |||||||||||||||
Total Common Stocks | 278,863,313 | — | — | 278,863,313 | |||||||||||||||
Preferred Stocks | |||||||||||||||||||
Brazil | 10,002,325 | — | — | 10,002,325 | |||||||||||||||
Total Preferred Stocks | 10,002,325 | — | — | 10,002,325 | |||||||||||||||
Money Market Funds | 1,160,736 | — | — | 1,160,736 | |||||||||||||||
Total Investments in Securities | 290,026,374 | — | — | 290,026,374 | |||||||||||||||
See the Portfolio of Investments for all investment classifications not indicated in the table.
There were no transfers of financial assets between levels during the period.
The accompanying Notes to Financial Statements are an integral part of these financial statements.
Columbia ETF Trust II | Annual Report 2019
52
PORTFOLIO OF INVESTMENTS (Consolidated)
Columbia India Consumer ETF
March 31, 2019
(Percentages represent value of investments compared to net assets)
Investments in Securities
Common Stocks 100.4%
Issuer | Shares | Value ($) | |||||||||
Consumer Discretionary 54.5% | |||||||||||
Aditya Birla Fashion and Retail, Ltd.(a) | 451,389 | 1,435,779 | |||||||||
Bajaj Auto, Ltd. | 150,446 | 6,322,099 | |||||||||
Bharat Forge, Ltd. | 391,208 | 2,893,612 | |||||||||
Bosch, Ltd. | 14,923 | 3,917,322 | |||||||||
Eicher Motors, Ltd. | 20,338 | 6,032,467 | |||||||||
Exide Industries, Ltd. | 701,838 | 2,215,691 | |||||||||
Future Retail, Ltd.(a) | 273,334 | 1,790,727 | |||||||||
Hero MotoCorp, Ltd. | 161,799 | 5,963,148 | |||||||||
Jubilant Foodworks, Ltd. | 118,355 | 2,467,046 | |||||||||
Mahindra & Mahindra, Ltd. | 663,787 | 6,457,251 | |||||||||
Maruti Suzuki India, Ltd. | 63,776 | 6,142,888 | |||||||||
Motherson Sumi Systems, Ltd. | 1,957,211 | 4,229,441 | |||||||||
MRF, Ltd. | 4,136 | 3,462,069 | |||||||||
Page Industries, Ltd. | 6,964 | 2,510,382 | |||||||||
Rajesh Exports, Ltd. | 225,581 | 2,168,541 | |||||||||
Tata Motors, Ltd.(a) | 2,448,136 | 6,157,888 | |||||||||
Titan Co., Ltd. | 422,060 | 6,956,755 | |||||||||
Total | 71,123,106 | ||||||||||
Consumer Staples 45.9% | |||||||||||
Avenue Supermarts, Ltd.(a)(b) | 166,915 | 3,544,549 | |||||||||
Britannia Industries Ltd. | 145,143 | 6,464,651 | |||||||||
Colgate-Palmolive India, Ltd. | 221,168 | 4,016,781 | |||||||||
Common Stocks (continued)
Issuer | Shares | Value ($) | |||||||||
Dabur India, Ltd. | 925,200 | 5,459,715 | |||||||||
GlaxoSmithKline Consumer Healthcare, Ltd. | 19,221 | 2,010,693 | |||||||||
Godrej Consumer Products, Ltd. | 574,542 | 5,689,438 | |||||||||
Hindustan Unilever, Ltd. | 261,437 | 6,441,294 | |||||||||
ITC, Ltd. | 1,522,698 | 6,533,699 | |||||||||
Marico, Ltd. | 861,669 | 4,311,766 | |||||||||
Nestle India, Ltd. | 44,005 | 6,962,636 | |||||||||
Procter & Gamble Hygiene & Health Care, Ltd. | 15,840 | 2,477,134 | |||||||||
United Breweries, Ltd. | 107,579 | 2,166,022 | |||||||||
United Spirits, Ltd.(a) | 467,106 | 3,734,825 | |||||||||
Total | 59,813,203 | ||||||||||
| Total Common Stocks (Cost: $110,267,028) | 130,936,309 | ||||||||||
Money Market Funds 0.1%
Shares | Value ($) | ||||||||||
| Goldman Sachs Financial Square Funds — Treasury Instruments Fund, Institutional Shares, 2.263%(c) | 159,999 | 159,999 | |||||||||
| Total Money Market Funds (Cost $159,999) | 159,999 | ||||||||||
| Total Investments in Securities (Cost: $110,427,027) | 131,096,308 | ||||||||||
Other Assets & Liabilities, Net | (660,064 | ) | |||||||||
Net Assets | 130,436,244 | ||||||||||
Notes to Consolidated Portfolio of Investments
(a) Non-income producing investment.
(b) Represents privately placed and other securities and instruments exempt from SEC registration (collectively, private placements), such as Section 4(a)(2) and Rule 144A eligible securities, which are often sold only to qualified institutional buyers. The Fund may invest in private placements determined to be liquid as well as those determined to be illiquid. Private placements may be determined to be liquid under guidelines established by the Fund's Board of Trustees. At March 31, 2019, the total value of these securities amounted to $3,544,549, which represents 2.72% of net assets.
(c) The rate shown is the seven-day current annualized yield at March 31, 2019.
Fair Value Measurements
The Fund categorizes its fair value measurements according to a three-level hierarchy that maximizes the use of observable inputs and minimizes the use of unobservable inputs by prioritizing that the most observable input be used when available. Observable inputs are those that market participants would use in pricing an investment based on market data obtained from sources independent of the reporting entity. Unobservable inputs are those that reflect the Fund's assumptions about the information market participants would use in pricing an investment. An investment's level within the fair value hierarchy is based on the lowest level of any input that is deemed significant to the asset's or liability's fair value measurement. The input levels are not necessarily an indication of the risk or liquidity associated with investments at that level. For example, certain U.S. government securities are generally high quality and liquid, however, they are reflected as Level 2 because the inputs used to determine fair value may not always be quoted prices in an active market.
The accompanying Notes to Financial Statements are an integral part of these financial statements.
Columbia ETF Trust II | Annual Report 2019
53
PORTFOLIO OF INVESTMENTS (Consolidated) (continued)
Columbia India Consumer ETF
March 31, 2019
Fair Value Measurements (continued)
Fair value inputs are summarized in the three broad levels listed below:
• Level 1 – Valuations based on quoted prices for investments in active markets that the Fund has the ability to access at the measurement date. Valuation adjustments are not applied to Level 1 investments.
• Level 2 – Valuations based on other significant observable inputs (including quoted prices for similar securities, interest rates, prepayment speeds, credit risks, etc.).
• Level 3 – Valuations based on significant unobservable inputs (including the Fund's own assumptions and judgment in determining the fair value of investments).
Inputs that are used in determining fair value of an investment may include price information, credit data, volatility statistics, and other factors. These inputs can be either observable or unobservable. The availability of observable inputs can vary between investments, and is affected by various factors such as the type of investment, and the volume and level of activity for that investment or similar investments in the marketplace. The inputs will be considered by the Investment Manager, along with any other relevant factors in the calculation of an investment's fair value. The Fund uses prices and inputs that are current as of the measurement date, which may include periods of market dislocations. During these periods, the availability of prices and inputs may be reduced for many investments. This condition could cause an investment to be reclassified between the various levels within the hierarchy.
Investments falling into the Level 3 category are primarily supported by quoted prices from brokers and dealers participating in the market for those investments. However, these may be classified as Level 3 investments due to lack of market transparency and corroboration to support these quoted prices. Additionally, valuation models may be used as the pricing source for any remaining investments classified as Level 3. These models may rely on one or more significant unobservable inputs and/or significant assumptions by the Investment Manager. Inputs used in valuations may include, but are not limited to, financial statement analysis, capital account balances, discount rates and estimated cash flows, and comparable company data.
Under the direction of the Fund's Board of Trustees (the Board), the Investment Manager's Valuation Committee (the Committee) is responsible for overseeing the valuation procedures approved by the Board. The Committee consists of voting and non-voting members from various groups within the Investment Manager's organization, including operations and accounting, trading and investments, compliance, risk management and legal.
The Committee meets at least monthly to review and approve valuation matters, which may include a description of specific valuation determinations, data regarding pricing information received from approved pricing vendors and brokers and the results of Board-approved valuation control policies and procedures (the Policies). The Policies address, among other things, instances when market quotations are or are not readily available, including recommendations of third party pricing vendors and a determination of appropriate pricing methodologies; events that require specific valuation determinations and assessment of fair value techniques; securities with a potential for stale pricing, including those that are illiquid, restricted, or in default; and the effectiveness of third-party pricing vendors, including periodic reviews of vendors. The Committee meets more frequently, as needed, to discuss additional valuation matters, which may include the need to review back-testing results, review time-sensitive information or approve related valuation actions. The Committee reports to the Board, with members of the Committee meeting with the Board at each of its regularly scheduled meetings to discuss valuation matters and actions during the period, similar to those described earlier.
For investments categorized as Level 3, the Committee monitors information similar to that described above, which may include: (i) data specific to the issuer or comparable issuers, (ii) general market or specific sector news and (iii) quoted prices and specific or similar security transactions. The Committee considers this data and any changes from prior periods in order to assess the reasonableness of observable and unobservable inputs, any assumptions or internal models used to value those securities and changes in fair value. This data is also used to corroborate, when available, information received from approved pricing vendors and brokers. Various factors impact the frequency of monitoring this information (which may occur as often as daily). However, the Committee may determine that changes to inputs, assumptions and models are not required as a result of the monitoring procedures performed.
The following table is a summary of the inputs used to value the Fund's investments at March 31, 2019:
| Level 1 quoted prices in active markets for identical assets ($) | Level 2 other significant observable inputs ($) | Level 3 significant unobservable inputs ($) | Total ($) | ||||||||||||||||
Investments in Securities | |||||||||||||||||||
Common Stocks | |||||||||||||||||||
Consumer Discretionary | 71,123,106 | — | — | 71,123,106 | |||||||||||||||
Consumer Staples | 59,813,203 | — | — | 59,813,203 | |||||||||||||||
Total Common Stocks | 130,936,309 | — | — | 130,936,309 | |||||||||||||||
Money Market Funds | 159,999 | — | — | 159,999 | |||||||||||||||
Total Investments in Securities | 131,096,308 | — | — | 131,096,308 | |||||||||||||||
See the Consolidated Portfolio of Investments for all investment classifications not indicated in the table.
There were no transfers of financial assets between levels during the period.
The accompanying Notes to Financial Statements are an integral part of these financial statements.
Columbia ETF Trust II | Annual Report 2019
54
PORTFOLIO OF INVESTMENTS
Columbia India Infrastructure ETF
March 31, 2019
(Percentages represent value of investments compared to net assets)
Investments in Securities
Common Stocks 98.1%
Issuer | Shares | Value ($) | |||||||||
Communication Services 11.0% | |||||||||||
Bharti Airtel, Ltd. | 299,959 | 1,442,315 | |||||||||
Bharti Infratel, Ltd. | 262,286 | 1,186,581 | |||||||||
Tata Communications, Ltd. | 24,952 | 220,705 | |||||||||
Vodafone Idea, Ltd.(a) | 2,323,796 | 612,187 | |||||||||
Total | 3,461,788 | ||||||||||
Consumer Discretionary 3.9% | |||||||||||
Eicher Motors, Ltd. | 4,091 | 1,213,434 | |||||||||
Energy 3.2% | |||||||||||
Petronet LNG, Ltd. | 276,546 | 1,004,188 | |||||||||
Industrials 26.7% | |||||||||||
Adani Ports and Special Economic Zone, Ltd. | 294,156 | 1,605,703 | |||||||||
Ashok Leyland, Ltd. | 708,061 | 933,179 | |||||||||
Bharat Heavy Electricals, Ltd. | 511,951 | 553,890 | |||||||||
Container Corp. Of India, Ltd. | 101,567 | 770,164 | |||||||||
Cummins India, Ltd. | 51,272 | 552,132 | |||||||||
Havells India, Ltd. | 82,529 | 920,298 | |||||||||
Larsen & Toubro, Ltd. | 86,913 | 1,738,009 | |||||||||
Siemens, Ltd. | 32,636 | 531,787 | |||||||||
Voltas, Ltd. | 84,733 | 769,905 | |||||||||
Total | 8,375,067 | ||||||||||
Materials 32.0% | |||||||||||
Grasim Industries Ltd. | 114,431 | 1,417,194 | |||||||||
Hindalco Industries, Ltd. | 483,498 | 1,434,267 | |||||||||
JSW Steel, Ltd. | 288,942 | 1,222,295 | |||||||||
NMDC, Ltd. | 320,928 | 483,882 | |||||||||
Shree Cement, Ltd. | 3,145 | 847,488 | |||||||||
Steel Authority of India, Ltd.(a) | 382,169 | 296,522 | |||||||||
Tata Steel, Ltd. | 189,376 | 1,424,250 | |||||||||
Common Stocks (continued)
Issuer | Shares | Value ($) | |||||||||
UltraTech Cement, Ltd. | 27,447 | 1,584,160 | |||||||||
Vedanta, Ltd. | 507,353 | 1,350,866 | |||||||||
Total | 10,060,924 | ||||||||||
Real Estate 1.6% | |||||||||||
DLF, Ltd. | 168,852 | 493,455 | |||||||||
Utilities 19.7% | |||||||||||
GAIL India, Ltd. | 310,691 | 1,559,173 | |||||||||
Indraprastha Gas, Ltd. | 132,119 | 582,544 | |||||||||
NTPC, Ltd. | 830,149 | 1,614,162 | |||||||||
Power Grid Corp. of India, Ltd. | 598,846 | 1,710,742 | |||||||||
Tata Power Co., Ltd. (The) | 681,005 | 725,488 | |||||||||
Total | 6,192,109 | ||||||||||
| Total Common Stocks (Cost: $29,354,526) | 30,800,965 | ||||||||||
Rights 1.4%
Issuer | Shares | Value ($) | |||||||||
Communication Services 1.4% | |||||||||||
Vodafone Idea, Ltd., expiring 4/29/19(a) | 5,320,269 | 441,596 | |||||||||
| Total Rights (Cost: $574,112) | 441,596 | ||||||||||
Money Market Funds 0.5%
Shares | Value ($) | ||||||||||
| Goldman Sachs Financial Square Funds — Treasury Instruments Fund, Institutional Shares, 2.263%(b) | 152,972 | 152,972 | |||||||||
| Total Money Market Funds (Cost $152,972) | 152,972 | ||||||||||
| Total Investments in Securities (Cost: $30,081,610) | 31,395,533 | ||||||||||
Other Assets & Liabilities, Net | 6,447 | ||||||||||
Net Assets | 31,401,980 | ||||||||||
Notes to Portfolio of Investments
(a) Non-income producing investment.
(b) The rate shown is the seven-day current annualized yield at March 31, 2019.
The accompanying Notes to Financial Statements are an integral part of these financial statements.
Columbia ETF Trust II | Annual Report 2019
55
PORTFOLIO OF INVESTMENTS (continued)
Columbia India Infrastructure ETF
March 31, 2019
Fair Value Measurements
The Fund categorizes its fair value measurements according to a three-level hierarchy that maximizes the use of observable inputs and minimizes the use of unobservable inputs by prioritizing that the most observable input be used when available. Observable inputs are those that market participants would use in pricing an investment based on market data obtained from sources independent of the reporting entity. Unobservable inputs are those that reflect the Fund's assumptions about the information market participants would use in pricing an investment. An investment's level within the fair value hierarchy is based on the lowest level of any input that is deemed significant to the asset's or liability's fair value measurement. The input levels are not necessarily an indication of the risk or liquidity associated with investments at that level. For example, certain U.S. government securities are generally high quality and liquid, however, they are reflected as Level 2 because the inputs used to determine fair value may not always be quoted prices in an active market.
Fair value inputs are summarized in the three broad levels listed below:
• Level 1 – Valuations based on quoted prices for investments in active markets that the Fund has the ability to access at the measurement date. Valuation adjustments are not applied to Level 1 investments.
• Level 2 – Valuations based on other significant observable inputs (including quoted prices for similar securities, interest rates, prepayment speeds, credit risks, etc.).
• Level 3 – Valuations based on significant unobservable inputs (including the Fund's own assumptions and judgment in determining the fair value of investments).
Inputs that are used in determining fair value of an investment may include price information, credit data, volatility statistics, and other factors. These inputs can be either observable or unobservable. The availability of observable inputs can vary between investments, and is affected by various factors such as the type of investment, and the volume and level of activity for that investment or similar investments in the marketplace. The inputs will be considered by the Investment Manager, along with any other relevant factors in the calculation of an investment's fair value. The Fund uses prices and inputs that are current as of the measurement date, which may include periods of market dislocations. During these periods, the availability of prices and inputs may be reduced for many investments. This condition could cause an investment to be reclassified between the various levels within the hierarchy.
Investments falling into the Level 3 category are primarily supported by quoted prices from brokers and dealers participating in the market for those investments. However, these may be classified as Level 3 investments due to lack of market transparency and corroboration to support these quoted prices. Additionally, valuation models may be used as the pricing source for any remaining investments classified as Level 3. These models may rely on one or more significant unobservable inputs and/or significant assumptions by the Investment Manager. Inputs used in valuations may include, but are not limited to, financial statement analysis, capital account balances, discount rates and estimated cash flows, and comparable company data.
Under the direction of the Fund's Board of Trustees (the Board), the Investment Manager's Valuation Committee (the Committee) is responsible for overseeing the valuation procedures approved by the Board. The Committee consists of voting and non-voting members from various groups within the Investment Manager's organization, including operations and accounting, trading and investments, compliance, risk management and legal.
The Committee meets at least monthly to review and approve valuation matters, which may include a description of specific valuation determinations, data regarding pricing information received from approved pricing vendors and brokers and the results of Board-approved valuation control policies and procedures (the Policies). The Policies address, among other things, instances when market quotations are or are not readily available, including recommendations of third party pricing vendors and a determination of appropriate pricing methodologies; events that require specific valuation determinations and assessment of fair value techniques; securities with a potential for stale pricing, including those that are illiquid, restricted, or in default; and the effectiveness of third-party pricing vendors, including periodic reviews of vendors. The Committee meets more frequently, as needed, to discuss additional valuation matters, which may include the need to review back-testing results, review time-sensitive information or approve related valuation actions. The Committee reports to the Board, with members of the Committee meeting with the Board at each of its regularly scheduled meetings to discuss valuation matters and actions during the period, similar to those described earlier.
For investments categorized as Level 3, the Committee monitors information similar to that described above, which may include: (i) data specific to the issuer or comparable issuers, (ii) general market or specific sector news and (iii) quoted prices and specific or similar security transactions. The Committee considers this data and any changes from prior periods in order to assess the reasonableness of observable and unobservable inputs, any assumptions or internal models used to value those securities and changes in fair value. This data is also used to corroborate, when available, information received from approved pricing vendors and brokers. Various factors impact the frequency of monitoring this information (which may occur as often as daily). However, the Committee may determine that changes to inputs, assumptions and models are not required as a result of the monitoring procedures performed.
The accompanying Notes to Financial Statements are an integral part of these financial statements.
Columbia ETF Trust II | Annual Report 2019
56
PORTFOLIO OF INVESTMENTS (continued)
Columbia India Infrastructure ETF
March 31, 2019
Fair Value Measurements (continued)
The following table is a summary of the inputs used to value the Fund's investments at March 31, 2019:
| Level 1 quoted prices in active markets for identical assets ($) | Level 2 other significant observable inputs ($) | Level 3 significant unobservable inputs ($) | Total ($) | ||||||||||||||||
Investments in Securities | |||||||||||||||||||
Common Stocks | |||||||||||||||||||
Communication Services | 3,461,788 | — | — | 3,461,788 | |||||||||||||||
Consumer Discretionary | 1,213,434 | — | — | 1,213,434 | |||||||||||||||
Energy | 1,004,188 | — | — | 1,004,188 | |||||||||||||||
Industrials | 8,375,067 | — | — | 8,375,067 | |||||||||||||||
Materials | 10,060,924 | — | — | 10,060,924 | |||||||||||||||
Real Estate | 493,455 | — | — | 493,455 | |||||||||||||||
Utilities | 6,192,109 | — | — | 6,192,109 | |||||||||||||||
Total Common Stocks | 30,800,965 | — | — | 30,800,965 | |||||||||||||||
Rights | |||||||||||||||||||
Communication Services | — | 441,596 | — | 441,596 | |||||||||||||||
Total Rights | — | 441,596 | — | 441,596 | |||||||||||||||
Money Market Funds | 152,972 | — | — | 152,972 | |||||||||||||||
Total Investments in Securities | 30,953,937 | 441,596 | — | 31,395,533 | |||||||||||||||
See the Portfolio of Investments for all investment classifications not indicated in the table.
The Fund's assets assigned to the Level 2 input category are generally valued using the market approach, in which a security's value is determined through reference to prices and information from market transactions for similar or identical assets.
There were no transfers of financial assets between levels during the period.
The accompanying Notes to Financial Statements are an integral part of these financial statements.
Columbia ETF Trust II | Annual Report 2019
57
PORTFOLIO OF INVESTMENTS
Columbia India Small Cap ETF
March 31, 2019
(Percentages represent value of investments compared to net assets)
Investments in Securities
Common Stocks 99.5%
Issuer | Shares | Value ($) | |||||||||
Communication Services 5.8% | |||||||||||
Dish TV India, Ltd. | 316,500 | 177,724 | |||||||||
Just Dial, Ltd.(a) | 19,381 | 168,827 | |||||||||
PVR, Ltd. | 13,884 | 330,029 | |||||||||
TV18 Broadcast, Ltd.(a) | 314,654 | 161,245 | |||||||||
Total | 837,825 | ||||||||||
Consumer Discretionary 10.0% | |||||||||||
Arvind, Ltd. | 79,089 | 103,835 | |||||||||
Bajaj Electricals Ltd. | 18,003 | 145,037 | |||||||||
Bombay Dyeing & Manufacturing Co., Ltd. | 54,172 | 105,529 | |||||||||
Ceat, Ltd. | 8,461 | 136,780 | |||||||||
KPIT Engineering Ltd.(a)(b)(c) | 244,608 | 288,304 | |||||||||
PC Jeweller, Ltd. | 82,894 | 98,360 | |||||||||
Raymond, Ltd. | 17,862 | 209,239 | |||||||||
VIP Industries, Ltd. | 51,784 | 361,311 | |||||||||
Total | 1,448,395 | ||||||||||
Consumer Staples 6.5% | |||||||||||
Avanti Feeds Ltd. | 20,914 | 123,416 | |||||||||
Balrampur Chini Mills, Ltd. | 68,999 | 136,554 | |||||||||
Bombay Burmah Trading Co. | 8,655 | 162,330 | |||||||||
Godfrey Phillips India, Ltd. | 7,916 | 132,449 | |||||||||
Kaveri Seed Co., Ltd. | 14,897 | 98,887 | |||||||||
Radico Khaitan, Ltd. | 36,226 | 206,610 | |||||||||
Venky's India, Ltd. | 2,497 | 81,726 | |||||||||
Total | 941,972 | ||||||||||
Energy 0.8% | |||||||||||
Chennai Petroleum Corp., Ltd. | 26,892 | 106,093 | |||||||||
Financials 23.3% | |||||||||||
Allahabad Bank(a) | 113,734 | 89,641 | |||||||||
Can Fin Homes Ltd. | 30,414 | 153,157 | |||||||||
DCB Bank, Ltd. | 127,365 | 376,350 | |||||||||
Dewan Housing Finance Corp., Ltd. | 158,228 | 343,179 | |||||||||
Equitas Holdings Ltd.(a) | 142,411 | 281,430 | |||||||||
IDFC Ltd. | 615,544 | 413,621 | |||||||||
Common Stocks (continued)
Issuer | Shares | Value ($) | |||||||||
Indian Energy Exchange Ltd.(d) | 65,076 | 154,999 | |||||||||
Karnataka Bank, Ltd. (The) | 149,712 | 288,834 | |||||||||
Oriental Bank of Commerce(a) | 48,596 | 81,549 | |||||||||
Reliance Capital, Ltd. | 72,373 | 213,645 | |||||||||
Repco Home Finance, Ltd. | 21,110 | 141,454 | |||||||||
South Indian Bank Ltd. (The) | 861,049 | 205,086 | |||||||||
Syndicate Bank(a) | 212,050 | 132,235 | |||||||||
Ujjivan Financial Services Ltd. | 40,568 | 203,674 | |||||||||
Union Bank of India(a) | 211,454 | 291,808 | |||||||||
Total | 3,370,662 | ||||||||||
Health Care 5.8% | |||||||||||
Ajanta Pharma Ltd. | 13,108 | 195,877 | |||||||||
Granules India, Ltd. | 74,332 | 122,805 | |||||||||
Strides Pharma Science Ltd. | 32,550 | 221,965 | |||||||||
Sun Pharma Advanced Research Co., Ltd.(a) | 33,826 | 93,311 | |||||||||
Suven Life Sciences, Ltd. | 25,470 | 95,924 | |||||||||
Wockhardt, Ltd.(a) | 15,943 | 101,952 | |||||||||
Total | 831,834 | ||||||||||
Industrials 20.7% | |||||||||||
BEML, Ltd. | 10,610 | 155,080 | |||||||||
CG Power and Industrial Solutions, Ltd.(a) | 227,837 | 140,435 | |||||||||
Dilip Buildcon Ltd.(d) | 17,066 | 158,035 | |||||||||
Engineers India, Ltd. | 168,438 | 285,208 | |||||||||
Escorts, Ltd. | 32,818 | 377,117 | |||||||||
Graphite India Ltd. | 35,103 | 226,453 | |||||||||
Hindustan Construction Co., Ltd.(a) | 402,693 | 87,194 | |||||||||
IRB Infrastructure Developers, Ltd. | 82,954 | 173,452 | |||||||||
Jain Irrigation Systems, Ltd. | 169,950 | 144,497 | |||||||||
Kajaria Ceramics Ltd. | 45,085 | 383,881 | |||||||||
NCC, Ltd. | 227,951 | 371,336 | |||||||||
Praj Industries, Ltd. | 53,228 | 119,172 | |||||||||
Suzlon Energy, Ltd.(a) | 1,698,202 | 150,761 | |||||||||
V-Guard Industries, Ltd. | 66,890 | 214,695 | |||||||||
Total | 2,987,316 | ||||||||||
The accompanying Notes to Financial Statements are an integral part of these financial statements.
Columbia ETF Trust II | Annual Report 2019
58
PORTFOLIO OF INVESTMENTS (continued)
Columbia India Small Cap ETF
March 31, 2019
Common Stocks (continued)
Issuer | Shares | Value ($) | |||||||||
Information Technology 11.3% | |||||||||||
Birlasoft Ltd. | 127,308 | 181,291 | |||||||||
Firstsource Solutions, Ltd. | 147,059 | 99,667 | |||||||||
Intellect Design Arena, Ltd.(a) | 37,274 | 109,414 | |||||||||
NIIT Technologies, Ltd. | 19,894 | 380,750 | |||||||||
Persistent Systems Ltd. | 28,402 | 258,109 | |||||||||
Tata Elxsi, Ltd. | 19,020 | 264,427 | |||||||||
Vakrangee Ltd. | 333,767 | 242,345 | |||||||||
Zensar Technologies Ltd. | 26,758 | 88,878 | |||||||||
Total | 1,624,881 | ||||||||||
Materials 8.3% | |||||||||||
Century Textiles & Industries, Ltd. | 27,669 | 372,688 | |||||||||
Gujarat Narmada Valley Fertilizers & Chemicals, Ltd. | 49,794 | 219,913 | |||||||||
Gujarat State Fertilizers & Chemicals Ltd. | 119,930 | 180,479 | |||||||||
India Cements, Ltd. (The) | 104,581 | 163,495 | |||||||||
JK Paper, Ltd. | 45,675 | 93,526 | |||||||||
Phillips Carbon Black, Ltd. | 42,474 | 108,185 | |||||||||
Prakash Industries, Ltd.(a) | 48,469 | 62,655 | |||||||||
Total | 1,200,941 | ||||||||||
Real Estate 1.6% | |||||||||||
Housing Development & Infrastructure, Ltd.(a) | 153,124 | 57,138 | |||||||||
Indiabulls Real Estate, Ltd.(a) | 132,297 | 176,078 | |||||||||
Total | 233,216 | ||||||||||
Common Stocks (continued)
Issuer | Shares | Value ($) | |||||||||
Utilities 5.4% | |||||||||||
Mahanagar Gas, Ltd. | 26,064 | 396,951 | |||||||||
PTC India, Ltd. | 132,212 | 140,180 | |||||||||
Reliance Infrastructure, Ltd. | 79,633 | 157,484 | |||||||||
Reliance Power, Ltd.(a) | 537,938 | 88,136 | |||||||||
Total | 782,751 | ||||||||||
| Total Common Stocks (Cost: $14,156,425) | 14,365,886 | ||||||||||
Money Market Funds 0.6%
Shares | Value ($) | ||||||||||
| Goldman Sachs Financial Square Funds — Treasury Instruments Fund, Institutional Shares, 2.263%(e) | 92,658 | 92,658 | |||||||||
| Total Money Market Funds (Cost $92,658) | 92,658 | ||||||||||
| Total Investments in Securities (Cost: $14,249,083) | 14,458,544 | ||||||||||
Other Assets & Liabilities, Net | (8,442 | ) | |||||||||
Net Assets | 14,450,102 | ||||||||||
Notes to Portfolio of Investments
(a) Non-income producing investment.
(b) Represents fair value as determined in good faith under procedures approved by the Board of Trustees. At March 31, 2019, the value of these securities amounted to $288,304, which represents less than 2.00% of net assets.
(c) Valuation based on significant unobservable inputs.
(d) Represents privately placed and other securities and instruments exempt from SEC registration (collectively, private placements), such as Section 4(a)(2) and Rule 144A eligible securities, which are often sold only to qualified institutional buyers. The Fund may invest in private placements determined to be liquid as well as those determined to be illiquid. Private placements may be determined to be liquid under guidelines established by the Fund's Board of Trustees. At March 31, 2019, the total value of these securities amounted to $313,034, which represents 2.17% of net assets.
(e) The rate shown is the seven-day current annualized yield at March 31, 2019.
The accompanying Notes to Financial Statements are an integral part of these financial statements.
Columbia ETF Trust II | Annual Report 2019
59
PORTFOLIO OF INVESTMENTS (continued)
Columbia India Small Cap ETF
March 31, 2019
Fair Value Measurements
The Fund categorizes its fair value measurements according to a three-level hierarchy that maximizes the use of observable inputs and minimizes the use of unobservable inputs by prioritizing that the most observable input be used when available. Observable inputs are those that market participants would use in pricing an investment based on market data obtained from sources independent of the reporting entity. Unobservable inputs are those that reflect the Fund's assumptions about the information market participants would use in pricing an investment. An investment's level within the fair value hierarchy is based on the lowest level of any input that is deemed significant to the asset's or liability's fair value measurement. The input levels are not necessarily an indication of the risk or liquidity associated with investments at that level. For example, certain U.S. government securities are generally high quality and liquid, however, they are reflected as Level 2 because the inputs used to determine fair value may not always be quoted prices in an active market.
Fair value inputs are summarized in the three broad levels listed below:
• Level 1 – Valuations based on quoted prices for investments in active markets that the Fund has the ability to access at the measurement date. Valuation adjustments are not applied to Level 1 investments.
• Level 2 – Valuations based on other significant observable inputs (including quoted prices for similar securities, interest rates, prepayment speeds, credit risks, etc.).
• Level 3 – Valuations based on significant unobservable inputs (including the Fund's own assumptions and judgment in determining the fair value of investments).
Inputs that are used in determining fair value of an investment may include price information, credit data, volatility statistics, and other factors. These inputs can be either observable or unobservable. The availability of observable inputs can vary between investments, and is affected by various factors such as the type of investment, and the volume and level of activity for that investment or similar investments in the marketplace. The inputs will be considered by the Investment Manager, along with any other relevant factors in the calculation of an investment's fair value. The Fund uses prices and inputs that are current as of the measurement date, which may include periods of market dislocations. During these periods, the availability of prices and inputs may be reduced for many investments. This condition could cause an investment to be reclassified between the various levels within the hierarchy.
Investments falling into the Level 3 category are primarily supported by quoted prices from brokers and dealers participating in the market for those investments. However, these may be classified as Level 3 investments due to lack of market transparency and corroboration to support these quoted prices. Additionally, valuation models may be used as the pricing source for any remaining investments classified as Level 3. These models may rely on one or more significant unobservable inputs and/or significant assumptions by the Investment Manager. Inputs used in valuations may include, but are not limited to, financial statement analysis, capital account balances, discount rates and estimated cash flows, and comparable company data.
Under the direction of the Fund's Board of Trustees (the Board), the Investment Manager's Valuation Committee (the Committee) is responsible for overseeing the valuation procedures approved by the Board. The Committee consists of voting and non-voting members from various groups within the Investment Manager's organization, including operations and accounting, trading and investments, compliance, risk management and legal.
The Committee meets at least monthly to review and approve valuation matters, which may include a description of specific valuation determinations, data regarding pricing information received from approved pricing vendors and brokers and the results of Board-approved valuation control policies and procedures (the Policies). The Policies address, among other things, instances when market quotations are or are not readily available, including recommendations of third party pricing vendors and a determination of appropriate pricing methodologies; events that require specific valuation determinations and assessment of fair value techniques; securities with a potential for stale pricing, including those that are illiquid, restricted, or in default; and the effectiveness of third-party pricing vendors, including periodic reviews of vendors. The Committee meets more frequently, as needed, to discuss additional valuation matters, which may include the need to review back-testing results, review time-sensitive information or approve related valuation actions. The Committee reports to the Board, with members of the Committee meeting with the Board at each of its regularly scheduled meetings to discuss valuation matters and actions during the period, similar to those described earlier.
For investments categorized as Level 3, the Committee monitors information similar to that described above, which may include: (i) data specific to the issuer or comparable issuers, (ii) general market or specific sector news and (iii) quoted prices and specific or similar security transactions. The Committee considers this data and any changes from prior periods in order to assess the reasonableness of observable and unobservable inputs, any assumptions or internal models used to value those securities and changes in fair value. This data is also used to corroborate, when available, information received from approved pricing vendors and brokers. Various factors impact the frequency of monitoring this information (which may occur as often as daily). However, the Committee may determine that changes to inputs, assumptions and models are not required as a result of the monitoring procedures performed.
The accompanying Notes to Financial Statements are an integral part of these financial statements.
Columbia ETF Trust II | Annual Report 2019
60
PORTFOLIO OF INVESTMENTS (continued)
Columbia India Small Cap ETF
March 31, 2019
Fair Value Measurements (continued)
The following table is a summary of the inputs used to value the Fund's investments at March 31, 2019:
| Level 1 quoted prices in active markets for identical assets ($) | Level 2 other significant observable inputs ($) | Level 3 significant unobservable inputs ($) | Total ($) | ||||||||||||||||
Investments in Securities | |||||||||||||||||||
Common Stocks | |||||||||||||||||||
Communication Services | 837,825 | — | — | 837,825 | |||||||||||||||
Consumer Discretionary | 1,160,091 | — | 288,304 | 1,448,395 | |||||||||||||||
Consumer Staples | 941,972 | — | — | 941,972 | |||||||||||||||
Energy | 106,093 | — | — | 106,093 | |||||||||||||||
Financials | 3,370,662 | — | — | 3,370,662 | |||||||||||||||
Health Care | 831,834 | — | — | 831,834 | |||||||||||||||
Industrials | 2,987,316 | — | — | 2,987,316 | |||||||||||||||
Information Technology | 1,624,881 | — | — | 1,624,881 | |||||||||||||||
Materials | 1,200,941 | — | — | 1,200,941 | |||||||||||||||
Real Estate | 233,216 | — | — | 233,216 | |||||||||||||||
Utilities | 782,751 | — | — | 782,751 | |||||||||||||||
Total Common Stocks | 14,077,582 | — | 288,304 | 14,365,886 | |||||||||||||||
Money Market Funds | 92,658 | — | — | 92,658 | |||||||||||||||
Total Investments in Securities | 14,170,240 | — | 288,304 | 14,458,544 | |||||||||||||||
See the Portfolio of Investments for all investment classifications not indicated in the table.
There were no transfers of financial assets between levels during the period.
The following table is a reconciliation of Level 3 assets for which significant observable and unobservable inputs were used to determine fair value:
| Balance as of 03/31/2018 ($) | Increase (decrease) in accrued discounts/ premiums ($) | Realized gain (loss) ($) | Change in unrealized appreciation (depreciation)(a) ($) | Purchases ($) | Sales ($) | Transfers into Level 3 ($) | Transfers out of Level 3 ($) | Balance as of 03/31/2019 ($) | |||||||||||||||||||||||||||||||
Common Stocks | — | — | — | 7,677 | 280,627 | — | — | — | 288,304 | ||||||||||||||||||||||||||||||
Total | — | — | — | 7,677 | 280,627 | — | — | — | 288,304 | ||||||||||||||||||||||||||||||
(a) Change in unrealized appreciation (depreciation) relating to securities held at March 31, 2019 was $7,677 which is comprised of Common Stocks.
The Fund's assets assigned to the Level 3 category are valued utilizing the valuation technique deemed the most appropriate in the circumstances. Certain common stocks classified as Level 3 are valued using a market approach. To determine fair value for these securities, management considered various factors which may have included, but were not limited to, estimated cash flows of the securities, observed yields on securities deemed comparable, the subscription prices of the security, closing prices of similar securities from the issuer and single market quotation from broker dealers. Significant increases (decreases) to any of these inputs would result in a significantly higher (lower) fair value measurement.
The accompanying Notes to Financial Statements are an integral part of these financial statements.
Columbia ETF Trust II | Annual Report 2019
61
STATEMENT OF ASSETS AND LIABILITIES
March 31, 2019
| Columbia Beyond BRICs ETF | Columbia EM Core ex-China ETF | Columbia EM Quality Dividend ETF | |||||||||||||
Assets | |||||||||||||||
Investments in securities, at value | |||||||||||||||
Unaffiliated issuers (cost $24,471,482, $9,594,807 and $5,589,370, respectively) | $ | 24,932,616 | $ | 11,388,913 | $ | 5,601,129 | |||||||||
Cash | — | — | 13,929 | ||||||||||||
Foreign currency (cost $1,484, $847 and $1,132, respectively) | 1,484 | 846 | 1,132 | ||||||||||||
Receivable for: | |||||||||||||||
Investments sold | — | — | 2,766 | ||||||||||||
Dividends | 101,376 | 44,650 | 14,620 | ||||||||||||
Foreign tax reclaims | 25,156 | 303 | 9,406 | ||||||||||||
Total assets | 25,060,632 | 11,434,712 | 5,642,982 | ||||||||||||
Liabilities | |||||||||||||||
Due to custodian | — | — | — | ||||||||||||
Payable for: | |||||||||||||||
Capital shares purchased | — | — | — | ||||||||||||
Investments management fees | 13,218 | 3,377 | 3,001 | ||||||||||||
Foreign capital gains taxes deferred | — | — | — | ||||||||||||
Accrued expenses and other liabilities | 1,772 | 244 | — | ||||||||||||
Total liabilities | 14,990 | 3,621 | 3,001 | ||||||||||||
Net assets applicable to outstanding capital stock | $ | 25,045,642 | $ | 11,431,091 | $ | 5,639,981 | |||||||||
Represented by: | |||||||||||||||
Paid-in capital | $ | 87,674,902 | $ | 10,122,033 | $ | 33,047,070 | |||||||||
Total distributable earnings (loss) (Note 2) | (62,629,260 | ) | 1,309,058 | (27,407,089 | ) | ||||||||||
Total — representing net assets applicable to outstanding capital stock | $ | 25,045,642 | $ | 11,431,091 | $ | 5,639,981 | |||||||||
Shares outstanding | 1,500,000 | 450,000 | 400,000 | ||||||||||||
Net asset value per share | $ | 16.70 | $ | 25.40 | $ | 14.10 | |||||||||
The accompanying Notes to Financial Statements are an integral part of these financial statements.
Columbia ETF Trust II | Annual Report 2019
62
STATEMENT OF ASSETS AND LIABILITIES (continued)
March 31, 2019
| Columbia Emerging Markets Consumer ETF | Columbia India Consumer ETF (Consolidated) | Columbia India Infrastructure ETF | |||||||||||||
Assets | |||||||||||||||
Investments in securities, at value | |||||||||||||||
Unaffiliated issuers (cost $296,062,814, $110,427,027 and $30,081,610, respectively) | $ | 290,026,374 | $ | 131,096,308 | $ | 31,395,533 | |||||||||
Cash | — | 961 | — | ||||||||||||
Foreign currency (cost $—, $12 and $—, respectively) | — | 13 | — | ||||||||||||
Receivable for: | |||||||||||||||
Investments sold | 1,212,271 | — | — | ||||||||||||
Dividends | 278,385 | 326 | 25,775 | ||||||||||||
Foreign tax reclaims | 14,378 | — | — | ||||||||||||
Total assets | 291,531,408 | 131,097,608 | 31,421,308 | ||||||||||||
Liabilities | |||||||||||||||
Due to custodian | 749 | — | — | ||||||||||||
Payable for: | |||||||||||||||
Capital shares purchased | 1,264,844 | — | — | ||||||||||||
Investments management fees | 147,154 | 83,808 | 19,328 | ||||||||||||
Foreign capital gains taxes deferred | — | 577,251 | — | ||||||||||||
Accrued expenses and other liabilities | — | 305 | — | ||||||||||||
Total liabilities | 1,412,747 | 661,364 | 19,328 | ||||||||||||
Net assets applicable to outstanding capital stock | $ | 290,118,661 | $ | 130,436,244 | $ | 31,401,980 | |||||||||
Represented by: | |||||||||||||||
Paid-in capital | $ | 498,944,218 | $ | 115,397,035 | $ | 88,065,221 | |||||||||
Total distributable earnings (loss) (Note 2) | (208,825,557 | ) | 15,039,209 | (56,663,241 | ) | ||||||||||
Total — representing net assets applicable to outstanding capital stock | $ | 290,118,661 | $ | 130,436,244 | $ | 31,401,980 | |||||||||
Shares outstanding | 12,800,000 | 3,100,000 | 2,600,000 | ||||||||||||
Net asset value per share | $ | 22.67 | $ | 42.08 | $ | 12.08 | |||||||||
The accompanying Notes to Financial Statements are an integral part of these financial statements.
Columbia ETF Trust II | Annual Report 2019
63
STATEMENT OF ASSETS AND LIABILITIES (continued)
March 31, 2019
| Columbia India Small Cap ETF | |||||||
Assets | |||||||
Investments in securities, at value | |||||||
Unaffiliated issuers (cost $14,249,083) | $ | 14,458,544 | |||||
Cash | — | ||||||
Foreign currency (cost $—) | — | ||||||
Receivable for: | |||||||
Investments sold | — | ||||||
Dividends | 713 | ||||||
Foreign tax reclaims | — | ||||||
Total assets | 14,459,257 | ||||||
Liabilities | |||||||
Due to custodian | — | ||||||
Payable for: | |||||||
Capital shares purchased | — | ||||||
Investments management fees | 9,155 | ||||||
Foreign capital gains taxes deferred | — | ||||||
Accrued expenses and other liabilities | — | ||||||
Total liabilities | 9,155 | ||||||
Net assets applicable to outstanding capital stock | $ | 14,450,102 | |||||
Represented by: | |||||||
Paid-in capital | $ | 29,329,113 | |||||
Total distributable earnings (loss) (Note 2) | (14,879,011 | ) | |||||
Total — representing net assets applicable to outstanding capital stock | $ | 14,450,102 | |||||
Shares outstanding | 950,000 | ||||||
Net asset value per share | $ | 15.21 | |||||
The accompanying Notes to Financial Statements are an integral part of these financial statements.
Columbia ETF Trust II | Annual Report 2019
64
STATEMENT OF OPERATIONS
For the Year Ended March 31, 2019
| Columbia Beyond BRICs ETF | Columbia EM Core ex-China ETF | Columbia EM Quality Dividend ETF | |||||||||||||
Investment Income: | |||||||||||||||
Dividends — unaffiliated issuers | $ | 1,907,787 | $ | 309,929 | $ | 348,365 | |||||||||
Foreign taxes withheld | (164,637 | ) | (40,380 | ) | (32,765 | ) | |||||||||
Total income | 1,743,150 | 269,549 | 315,600 | ||||||||||||
Expenses: | |||||||||||||||
Investment management fees | 365,515 | 43,507 | 47,889 | ||||||||||||
Mauritius taxes paid | — | — | — | ||||||||||||
Line of credit interest | — | — | — | ||||||||||||
Overdraft expense | 7,358 | 21 | 535 | ||||||||||||
Total expenses | 372,873 | 43,528 | 48,424 | ||||||||||||
Fees waived by the Investment Manager and its affiliates | (61,339 | ) | (10,831 | ) | — | ||||||||||
Total net expenses | 311,534 | 32,697 | 48,424 | ||||||||||||
Net investment income | 1,431,616 | 236,852 | 267,176 | ||||||||||||
Realized and unrealized gain (loss) — net | |||||||||||||||
Net realized gain (loss) on: | |||||||||||||||
Investments — unaffiliated issuers | (2,322,850 | ) | (409,532 | ) | (466,883 | ) | |||||||||
In-kind transactions | (1,624,353 | ) | — | 69,832 | |||||||||||
Foreign currency translations | (78,245 | ) | (6,172 | ) | (28,538 | ) | |||||||||
Net realized loss | (4,025,448 | ) | (415,704 | ) | (425,589 | ) | |||||||||
Change in net unrealized appreciation (depreciation) on: | |||||||||||||||
Investments — unaffiliated issuers | (5,329,271 | ) | (422,049 | ) | (855,380 | ) | |||||||||
Foreign capital gains tax | — | — | — | ||||||||||||
Foreign currency translations | (2,531 | ) | (380 | ) | (1,325 | ) | |||||||||
Net change in unrealized depreciation | (5,331,802 | ) | (422,429 | ) | (856,705 | ) | |||||||||
Net realized and unrealized loss | (9,357,250 | ) | (838,133 | ) | (1,282,294 | ) | |||||||||
Net decrease in net assets resulting from operations | $ | (7,925,634 | ) | $ | (601,281 | ) | $ | (1,015,118 | ) | ||||||
The accompanying Notes to Financial Statements are an integral part of these financial statements.
Columbia ETF Trust II | Annual Report 2019
65
STATEMENT OF OPERATIONS (continued)
For the Year Ended March 31, 2019
| Columbia Emerging Markets Consumer ETF(a) (Consolidated) | Columbia India Consumer ETF (Consolidated) | Columbia India Infrastructure ETF(b) (Consolidated) | |||||||||||||
Investment Income: | |||||||||||||||
Dividends — unaffiliated issuers | $ | 8,650,029 | $ | 1,430,962 | $ | 737,452 | |||||||||
Interest | 24,430 | — | — | ||||||||||||
Foreign taxes withheld | (617,794 | ) | — | — | |||||||||||
Total income | 8,056,665 | 1,430,962 | 737,452 | ||||||||||||
Expenses: | |||||||||||||||
Investment management fees | 2,836,748 | 1,036,908 | 264,161 | ||||||||||||
Mauritius taxes paid | 52,942 | 31,796 | 43,722 | ||||||||||||
Line of credit interest | — | — | 2,167 | ||||||||||||
Overdraft expense | 35,845 | — | 14,488 | ||||||||||||
Total expenses | 2,925,535 | 1,068,704 | 324,538 | ||||||||||||
Net investment income | 5,131,130 | 362,258 | 412,914 | ||||||||||||
Realized and unrealized gain (loss) — net | |||||||||||||||
Net realized gain (loss) on: | |||||||||||||||
Investments — unaffiliated issuers | (26,138,022 | ) | 2,790,427 | 3,233,147 | |||||||||||
In-kind transactions | 6,704,594 | — | — | ||||||||||||
Foreign currency translations | (721,209 | ) | (167,903 | ) | (65,981 | ) | |||||||||
Net realized gain (loss) | (20,154,637 | ) | 2,622,524 | 3,167,166 | |||||||||||
Change in net unrealized appreciation (depreciation) on: | |||||||||||||||
Investments — unaffiliated issuers | (89,089,306 | ) | (13,900,179 | ) | (8,950,143 | ) | |||||||||
Foreign capital gains tax | — | (577,251 | ) | — | |||||||||||
Foreign currency translations | (6,529 | ) | 8 | (17 | ) | ||||||||||
Net change in unrealized depreciation | (89,095,835 | ) | (14,477,422 | ) | (8,950,160 | ) | |||||||||
Net realized and unrealized loss | (109,250,472 | ) | (11,854,898 | ) | (5,782,994 | ) | |||||||||
Net decrease in net assets resulting from operations | $ | (104,119,342 | ) | $ | (11,492,640 | ) | $ | (5,370,080 | ) | ||||||
(a) EG Shares Consumer Mauritius, the Fund's Subsidiary, was liquidated on November 30, 2018.
(b) EG Shares India Infrastructure Mauritius, the Fund's Subsidiary, was liquidated on November 16, 2018.
The accompanying Notes to Financial Statements are an integral part of these financial statements.
Columbia ETF Trust II | Annual Report 2019
66
STATEMENT OF OPERATIONS (continued)
For the Year Ended March 31, 2019
| Columbia India Small Cap ETF(a) (Consolidated) | |||||||
Investment Income: | |||||||
Dividends — unaffiliated issuers | $ | 479,849 | |||||
Foreign taxes withheld | — | ||||||
Total income | 479,849 | ||||||
Expenses: | |||||||
Investment management fees | 145,780 | ||||||
Mauritius taxes paid | 1,010 | ||||||
Line of credit interest | — | ||||||
Overdraft expense | 3,020 | ||||||
Total expenses | 149,810 | ||||||
Net investment income | 330,039 | ||||||
Realized and unrealized gain (loss) — net | |||||||
Net realized gain (loss) on: | |||||||
Investments — unaffiliated issuers | (8,431,975 | ) | |||||
In-kind transactions | — | ||||||
Foreign currency translations | (9,084 | ) | |||||
Net realized loss | (8,441,059 | ) | |||||
Change in net unrealized appreciation (depreciation) on: | |||||||
Investments — unaffiliated issuers | 2,814,309 | ||||||
Foreign capital gains tax | — | ||||||
Foreign currency translations | 1,422 | ||||||
Net change in unrealized appreciation | 2,815,731 | ||||||
Net realized and unrealized loss | (5,625,328 | ) | |||||
Net decrease in net assets resulting from operations | $ | (5,295,289 | ) | ||||
(a) EG Shares India Small Cap Mauritius, the Fund's Subsidiary, was liquidated on August 24, 2018.
The accompanying Notes to Financial Statements are an integral part of these financial statements.
Columbia ETF Trust II | Annual Report 2019
67
STATEMENT OF CHANGES IN NET ASSETS
Columbia Beyond BRICs ETF | Columbia EM Core ex-China ETF | ||||||||||||||||||
| Year Ended March 31, 2019 | Year Ended March 31, 2018 | Year Ended March 31, 2019 | Year Ended March 31, 2018 | ||||||||||||||||
Operations | |||||||||||||||||||
Net investment income | $ | 1,431,616 | $ | 1,947,687 | $ | 236,852 | $ | 230,653 | |||||||||||
Net realized gain (loss) | (4,025,448 | ) | (1,284,006 | ) | (415,704 | ) | 1,044,388 | ||||||||||||
Net change in unrealized appreciation (depreciation) | (5,331,802 | ) | 14,501,873 | (422,429 | ) | 663,520 | |||||||||||||
Net increase (decrease) in net assets resulting from operations | (7,925,634 | ) | 15,165,554 | (601,281 | ) | 1,938,561 | |||||||||||||
Distributions to shareholders | |||||||||||||||||||
Net investment income and net realized gains | (1,602,594 | ) | — | (269,920 | ) | — | |||||||||||||
Net investment income | — | (1,818,029 | ) | — | (212,870 | ) | |||||||||||||
Net realized gain | — | — | — | (617,043 | ) | ||||||||||||||
Total distributions to shareholders (Note 2) | (1,602,594 | ) | (1,818,029 | ) | (269,920 | ) | (829,913 | ) | |||||||||||
Shareholder transactions | |||||||||||||||||||
Proceeds from shares sold | — | — | 2,491,783 | 3,931,470 | |||||||||||||||
Cost of shares redeemed | (36,553,343 | ) | (13,238,286 | ) | — | (6,438,578 | ) | ||||||||||||
Net increase (decrease) in net assets resulting from shareholder transactions | (36,553,343 | ) | (13,238,286 | ) | 2,491,783 | (2,507,108 | ) | ||||||||||||
Increase (decrease) in net assets | (46,081,571 | ) | 109,239 | 1,620,582 | (1,398,460 | ) | |||||||||||||
Net Assets: | |||||||||||||||||||
Net assets at beginning of year | 71,127,213 | 71,017,974 | 9,810,509 | 11,208,969 | |||||||||||||||
Net assets at end of year | $ | 25,045,642 | $ | 71,127,213 | $ | 11,431,091 | $ | 9,810,509 | |||||||||||
Undistributed (accumulated) net investment income (loss) | $ | 198,405 | $ | 447,628 | $ | 52,149 | $ | 38,617 | |||||||||||
Capital stock activity | |||||||||||||||||||
Shares outstanding, beginning of year | 3,650,000 | 4,400,000 | 350,000 | 450,000 | |||||||||||||||
Subscriptions | — | — | 100,000 | 150,000 | |||||||||||||||
Redemptions | (2,150,000 | ) | (750,000 | ) | — | (250,000 | ) | ||||||||||||
Shares outstanding, end of year | 1,500,000 | 3,650,000 | 450,000 | 350,000 | |||||||||||||||
The accompanying Notes to Financial Statements are an integral part of these financial statements.
Columbia ETF Trust II | Annual Report 2019
68
STATEMENT OF CHANGES IN NET ASSETS (continued)
Columbia EM Quality Dividend ETF | Columbia Emerging Markets Consumer ETF(a) (Consolidated) | ||||||||||||||||||
| Year Ended March 31, 2019 | Year Ended March 31, 2018 | Year Ended March 31, 2019 | Year Ended March 31, 2018 | ||||||||||||||||
Operations | |||||||||||||||||||
Net investment income | $ | 267,176 | $ | 312,749 | $ | 5,131,130 | $ | 3,316,550 | |||||||||||
Net realized gain (loss) | (425,589 | ) | 1,193,776 | (20,154,637 | ) | (11,616,922 | ) | ||||||||||||
Net change in unrealized appreciation (depreciation) | (856,705 | ) | 662,997 | (89,095,835 | ) | 64,475,955 | |||||||||||||
Net increase (decrease) in net assets resulting from operations | (1,015,118 | ) | 2,169,522 | (104,119,342 | ) | 56,175,583 | |||||||||||||
Distributions to shareholders | |||||||||||||||||||
Net investment income and net realized gains | (238,019 | ) | — | (2,714,200 | ) | — | |||||||||||||
Net investment income | — | (279,712 | ) | — | (3,335,918 | ) | |||||||||||||
Total distributions to shareholders (Note 2) | (238,019 | ) | (279,712 | ) | (2,714,200 | ) | (3,335,918 | ) | |||||||||||
Shareholder transactions | |||||||||||||||||||
Proceeds from shares sold | — | — | — | 102,899,683 | |||||||||||||||
Cost of shares redeemed | (4,309,714 | ) | (3,767,028 | ) | (412,983,788 | ) | (87,000,586 | ) | |||||||||||
Transaction fees | — | — | 24,964 | 1,275 | |||||||||||||||
Net increase (decrease) in net assets resulting from shareholder transactions | (4,309,714 | ) | (3,767,028 | ) | (412,958,824 | ) | 15,900,372 | ||||||||||||
Increase (decrease) in net assets | (5,562,851 | ) | (1,877,218 | ) | (519,792,366 | ) | 68,740,037 | ||||||||||||
Net Assets: | |||||||||||||||||||
Net assets at beginning of year | 11,202,832 | 13,080,050 | 809,911,027 | 741,170,990 | |||||||||||||||
Net assets at end of year | $ | 5,639,981 | $ | 11,202,832 | $ | 290,118,661 | $ | 809,911,027 | |||||||||||
Undistributed (accumulated) net investment income (loss) | $ | 2,431 | $ | (9,998 | ) | $ | 1,147,300 | $ | (666,235 | ) | |||||||||
Capital stock activity | |||||||||||||||||||
Shares outstanding, beginning of year | 700,000 | 950,000 | 30,750,000 | 29,950,000 | |||||||||||||||
Subscriptions | — | — | — | 3,900,000 | |||||||||||||||
Redemptions | (300,000 | ) | (250,000 | ) | (17,950,000 | ) | (3,100,000 | ) | |||||||||||
Shares outstanding, end of year | 400,000 | 700,000 | 12,800,000 | 30,750,000 | |||||||||||||||
(a) EG Shares Consumer Mauritius, the Fund's Subsidiary, was liquidated on November 30, 2018.
The accompanying Notes to Financial Statements are an integral part of these financial statements.
Columbia ETF Trust II | Annual Report 2019
69
STATEMENT OF CHANGES IN NET ASSETS (continued)
| Columbia India Consumer ETF (Consolidated) | Columbia India Infrastructure ETF(a) (Consolidated) | ||||||||||||||||||
| Year Ended March 31, 2019 | Year Ended March 31, 2018 | Year Ended March 31, 2019 | Year Ended March 31, 2018 | ||||||||||||||||
Operations | |||||||||||||||||||
Net investment income | $ | 362,258 | $ | 16,257 | $ | 412,914 | $ | 655,425 | |||||||||||
Net realized gain | 2,622,524 | 1,435,618 | 3,167,166 | 1,537,495 | |||||||||||||||
Net change in unrealized appreciation (depreciation) | (14,477,422 | ) | 18,166,972 | (8,950,160 | ) | 956,065 | |||||||||||||
Net increase (decrease) in net assets resulting from operations | (11,492,640 | ) | 19,618,847 | (5,370,080 | ) | 3,148,985 | |||||||||||||
Distributions to shareholders | |||||||||||||||||||
Net investment income and net realized gains | (167,832 | ) | — | (433,673 | ) | — | |||||||||||||
Net investment income | — | (79,763 | ) | — | (363,029 | ) | |||||||||||||
Total distributions to shareholders (Note 2) | (167,832 | ) | (79,763 | ) | (433,673 | ) | (363,029 | ) | |||||||||||
Shareholder transactions | |||||||||||||||||||
Proceeds from shares sold | — | 52,477,343 | — | 23,501,348 | |||||||||||||||
Cost of shares redeemed | (2,192,452 | ) | (15,827,789 | ) | (12,406,577 | ) | (18,202,473 | ) | |||||||||||
Transaction fees | — | (975 | ) | — | (1,199 | ) | |||||||||||||
Net increase (decrease) in net assets resulting from shareholder transactions | (2,192,452 | ) | 36,648,579 | (12,406,577 | ) | 5,297,676 | |||||||||||||
Increase (decrease) in net assets | (13,852,924 | ) | 56,187,663 | (18,210,330 | ) | 8,083,632 | |||||||||||||
Net Assets: | |||||||||||||||||||
Net assets at beginning of year | 144,289,168 | 88,101,505 | 49,612,310 | 41,528,678 | |||||||||||||||
Net assets at end of year | $ | 130,436,244 | $ | 144,289,168 | $ | 31,401,980 | $ | 49,612,310 | |||||||||||
Undistributed (accumulated) net investment income (loss) | $ | (165,192 | ) | $ | (211,068 | ) | $ | 128,461 | $ | 214,089 | |||||||||
Capital stock activity | |||||||||||||||||||
Shares outstanding, beginning of year | 3,150,000 | 2,300,000 | 3,550,000 | 3,200,000 | |||||||||||||||
Subscriptions | — | 1,200,000 | — | 1,600,000 | |||||||||||||||
Redemptions | (50,000 | ) | (350,000 | ) | (950,000 | ) | (1,250,000 | ) | |||||||||||
Shares outstanding, end of year | 3,100,000 | 3,150,000 | 2,600,000 | 3,550,000 | |||||||||||||||
(a) EG Shares India Infrastructure Mauritius, the Fund's Subsidiary, was liquidated on November 16, 2018.
The accompanying Notes to Financial Statements are an integral part of these financial statements.
Columbia ETF Trust II | Annual Report 2019
70
STATEMENT OF CHANGES IN NET ASSETS (continued)
| Columbia India Small Cap ETF(a) (Consolidated) | |||||||||||
| Year Ended March 31, 2019 | Year Ended March 31, 2018 | ||||||||||
Operations | |||||||||||
Net investment income | $ | 330,039 | $ | 4,915 | |||||||
Net realized gain (loss) | (8,441,059 | ) | 5,356,315 | ||||||||
Net change in unrealized appreciation (depreciation) | 2,815,731 | (3,725,155 | ) | ||||||||
Net increase (decrease) in net assets resulting from operations | (5,295,289 | ) | 1,636,075 | ||||||||
Distributions to shareholders | |||||||||||
Net investment income | — | (247,725 | ) | ||||||||
Shareholder transactions | |||||||||||
Proceeds from shares sold | — | 7,647,176 | |||||||||
Cost of shares redeemed | (8,536,653 | ) | (6,314,661 | ) | |||||||
Transaction fees | — | (3,706 | ) | ||||||||
Net increase (decrease) in net assets resulting from shareholder transactions | (8,536,653 | ) | 1,328,809 | ||||||||
Increase (decrease) in net assets | (13,831,942 | ) | 2,717,159 | ||||||||
Net Assets: | |||||||||||
Net assets at beginning of year | 28,282,044 | 25,564,885 | |||||||||
Net assets at end of year | $ | 14,450,102 | $ | 28,282,044 | |||||||
Undistributed (accumulated) net investment income (loss) | $ | — | $ | (427,545 | ) | ||||||
Capital stock activity | |||||||||||
Shares outstanding, beginning of year | 1,450,000 | 1,400,000 | |||||||||
Subscriptions | — | 350,000 | |||||||||
Redemptions | (500,000 | ) | (300,000 | ) | |||||||
Shares outstanding, end of year | 950,000 | 1,450,000 | |||||||||
(a) EG Shares India Small Cap Mauritius, the Fund's Subsidiary, was liquidated on August 24, 2018.
The accompanying Notes to Financial Statements are an integral part of these financial statements.
Columbia ETF Trust II | Annual Report 2019
71
FINANCIAL HIGHLIGHTS
The following tables are intended to help you understand each Fund's financial performance. Per share net investment income (loss) amounts are calculated based on average shares outstanding during the period. Total return assumes reinvestment of all dividends and distributions, if any. Total Return at NAV is calculated assuming an initial investment made at the net asset value at the beginning of the period, reinvestment of all dividends and distributions at net asset value during the period and redemption on the last day of the period. Total Return at Market is calculated assuming an initial investment made at the market price at the beginning of the period, reinvestment of all dividends and distributions at market price during the period and redemption on the last day of the period. The total return would have been lower if certain expenses had not been reimbursed/waived by the Investment Manager. The price used to calculate Total Return at Market is based on the midpoint of the 4:00 PM Eastern (U.S.) bid/ask spread on the NYSE and does not represent returns an investor would receive if shares were traded at other times. Total return and portfolio turnover are not annualized for periods of less than one year. The portfolio turnover rate is calculated without regard to purchase and sales transactions of short-term instruments, certain derivatives and in-kind transactions, if any. If such transactions were included, the Fund's portfolio turnover rate may be higher.
Columbia Beyond BRICs ETF
Year Ended March 31, | |||||||||||||||||||||||
2019 | 2018 | 2017 | 2016 | 2015 | |||||||||||||||||||
Per share data | |||||||||||||||||||||||
Net asset value, beginning of year | $ | 19.49 | $ | 16.14 | $ | 15.77 | $ | 19.87 | $ | 21.01 | |||||||||||||
Income (loss) from investment operations: | |||||||||||||||||||||||
Net investment income | 0.49 | 0.49 | 0.34 | 0.40 | 0.56 | ||||||||||||||||||
Net realized and unrealized gain (loss) | (2.39 | ) | 3.36 | 0.43 | (3.83 | ) | (1.43 | ) | |||||||||||||||
Total from investment operations | (1.90 | ) | 3.85 | 0.77 | (3.43 | ) | (0.87 | ) | |||||||||||||||
Less distributions to shareholders: | |||||||||||||||||||||||
Net investment income | (0.89 | ) | (0.50 | ) | (0.40 | ) | (0.67 | ) | (0.25 | ) | |||||||||||||
Net realized gains | — | — | — | — | (0.02 | ) | |||||||||||||||||
Total distribution to shareholders | (0.89 | ) | (0.50 | ) | (0.40 | ) | (0.67 | ) | (0.27 | ) | |||||||||||||
Net asset value, end of year | $ | 16.70 | $ | 19.49 | $ | 16.14 | $ | 15.77 | $ | 19.87 | |||||||||||||
Total Return at NAV | (9.46 | )% | 24.11 | % | 5.12 | % | (17.05 | )% | (4.16 | )% | |||||||||||||
Total Return at Market | (10.15 | )% | 25.97 | % | 4.01 | % | (17.00 | )% | (4.78 | )% | |||||||||||||
Ratios to average net assets: | |||||||||||||||||||||||
Total gross expenses(a) | 0.72 | %(b) | 0.86 | %(c) | 0.85 | % | 0.85 | % | 0.85 | % | |||||||||||||
Total net expenses(a)(d) | 0.60 | %(b) | 0.59 | %(c) | 0.58 | % | 0.58 | % | 0.58 | % | |||||||||||||
Net Investment income | 2.75 | % | 2.69 | % | 2.18 | % | 2.26 | % | 2.65 | % | |||||||||||||
Supplemental data | |||||||||||||||||||||||
Net assets, end of year (in thousands) | $ | 25,046 | $ | 71,127 | $ | 71,018 | $ | 92,242 | $ | 301,041 | |||||||||||||
Portfolio turnover | 23 | % | 34 | % | 36 | % | 32 | % | 33 | % | |||||||||||||
Notes to Financial Highlights
(a) In addition to the fees and expenses that the Fund bears directly, the Fund indirectly bears a pro rata share of the fees and expenses of any other funds in which it invests. Such indirect expenses are not included in the Fund's reported expense ratios.
(b) The ratio includes 0.01% for the year ended March 31, 2019 attributed to overdraft expense, which is outside the Unitary Fee (as defined in Note 3).
(c) The ratio includes 0.01% for the year ended March 31, 2018 attributed to line of credit interest expense, overdraft expense and tax expense, which is outside the Unitary Fee (as defined in Note 3).
(d) Total net expenses include the impact of certain fee waivers/expense reimbursements made by the Investment Manager and certain of its affiliates, if applicable.
The accompanying Notes to Financial Statements are an integral part of these financial statements.
Columbia ETF Trust II | Annual Report 2019
72
FINANCIAL HIGHLIGHTS
Columbia EM Core ex-China ETF
Year Ended March 31, | |||||||||||||||||||
2019 | 2018 | 2017 | 2016(a) | ||||||||||||||||
Per share data | |||||||||||||||||||
Net asset value, beginning of year | $ | 28.03 | $ | 24.91 | $ | 21.23 | $ | 20.00 | |||||||||||
Income (loss) from investment operations: | |||||||||||||||||||
Net investment income | 0.65 | 0.66 | 0.41 | 0.22 | |||||||||||||||
Net realized and unrealized gain (loss) | (2.51 | ) | 4.83 | 3.55 | 1.52 | ||||||||||||||
Total from investment operations | (1.86 | ) | 5.49 | 3.96 | 1.74 | ||||||||||||||
Less distributions to shareholders: | |||||||||||||||||||
Net investment income | (0.62 | ) | (0.61 | ) | (0.28 | ) | (0.51 | ) | |||||||||||
Net realized gains | (0.15 | ) | (1.76 | ) | — | — | |||||||||||||
Total distribution to shareholders | (0.77 | ) | (2.37 | ) | (0.28 | ) | (0.51 | ) | |||||||||||
Net asset value, end of year | $ | 25.40 | $ | 28.03 | $ | 24.91 | $ | 21.23 | |||||||||||
Total Return at NAV | (6.38 | )% | 22.76 | % | 18.83 | % | 8.98 | % | |||||||||||
Total Return at Market | (7.37 | )% | 20.45 | % | 23.20 | % | 8.49 | % | |||||||||||
Ratios to average net assets: | |||||||||||||||||||
Total gross expenses(b) | 0.47 | %(c) | 0.70 | %(d) | 0.70 | % | 0.70 | %(e) | |||||||||||
Total net expenses(b)(f) | 0.35 | %(c) | 0.35 | %(d) | 0.35 | % | 0.35 | %(e) | |||||||||||
Net Investment income | 2.54 | % | 2.40 | % | 1.80 | % | 1.92 | %(e) | |||||||||||
Supplemental data | |||||||||||||||||||
Net assets, end of year (in thousands) | $ | 11,431 | $ | 9,811 | $ | 11,209 | $ | 1,062 | |||||||||||
Portfolio turnover | 24 | % | 37 | % | 30 | % | 45 | % | |||||||||||
Notes to Financial Highlights
(a) Based on operations from September 2, 2015 (commencement of operations) through the stated period end.
(b) In addition to the fees and expenses that the Fund bears directly, the Fund indirectly bears a pro rata share of the fees and expenses of any other funds in which it invests. Such indirect expenses are not included in the Fund's reported expense ratios.
(c) The ratio includes less than 0.01% for the year ended March 31, 2019 attributed to overdraft expense, which is outside the Unitary Fee (as defined in Note 3).
(d) The ratio includes less than 0.01% for the year ended March 31, 2018 attributed to line of credit interest expense, overdraft expense and tax expense, which is outside the Unitary Fee (as defined in Note 3).
(e) Annualized.
(f) Total net expenses include the impact of certain fee waivers/expense reimbursements made by the Investment Manager and certain of its affiliates, if applicable.
The accompanying Notes to Financial Statements are an integral part of these financial statements.
Columbia ETF Trust II | Annual Report 2019
73
FINANCIAL HIGHLIGHTS
Columbia EM Quality Dividend ETF
Year Ended March 31, | |||||||||||||||||||||||
2019 | 2018 | 2017 | 2016 | 2015 | |||||||||||||||||||
Per share data | |||||||||||||||||||||||
Net asset value, beginning of year | $ | 16.00 | $ | 13.77 | $ | 12.81 | $ | 14.25 | $ | 16.15 | |||||||||||||
Income (loss) from investment operations: | |||||||||||||||||||||||
Net investment income | 0.48 | 0.38 | 0.37 | 0.38 | 0.77 | ||||||||||||||||||
Net realized and unrealized gain (loss) | (1.93 | ) | 2.21 | 0.90 | (1.45 | ) | (2.08 | ) | |||||||||||||||
Total from investment operations | (1.45 | ) | 2.59 | 1.27 | (1.07 | ) | (1.31 | ) | |||||||||||||||
Less distributions to shareholders: | |||||||||||||||||||||||
Net investment income | (0.45 | ) | (0.36 | ) | (0.31 | ) | (0.37 | ) | (0.59 | ) | |||||||||||||
Net asset value, end of year | $ | 14.10 | $ | 16.00 | $ | 13.77 | $ | 12.81 | $ | 14.25 | |||||||||||||
Total Return at NAV | (9.01 | )% | 18.96 | % | 10.05 | % | (7.38 | )% | (8.37 | )% | |||||||||||||
Total Return at Market | (10.44 | )% | 20.31 | % | 11.09 | % | (7.78 | )% | (8.34 | )% | |||||||||||||
Ratios to average net assets: | |||||||||||||||||||||||
Total gross expenses(a) | 0.60 | %(b) | 0.82 | %(c) | 0.85 | % | 0.85 | % | 0.89 | %(d) | |||||||||||||
Total net expenses(a)(e) | 0.60 | %(b) | 0.82 | %(c) | 0.85 | % | 0.85 | % | 0.89 | %(d) | |||||||||||||
Net Investment income | 3.29 | % | 2.55 | % | 2.79 | % | 2.88 | % | 4.76 | % | |||||||||||||
Supplemental data | |||||||||||||||||||||||
Net assets, end of year (in thousands) | $ | 5,640 | $ | 11,203 | $ | 13,080 | $ | 16,012 | $ | 24,935 | |||||||||||||
Portfolio turnover | 71 | % | 91 | % | 100 | % | 85 | % | 168 | % | |||||||||||||
Notes to Financial Highlights
(a) In addition to the fees and expenses that the Fund bears directly, the Fund indirectly bears a pro rata share of the fees and expenses of any other funds in which it invests. Such indirect expenses are not included in the Fund's reported expense ratios.
(b) The ratio includes 0.01% for the year ended March 31, 2019 attributed to overdraft expense, which is outside the Unitary Fee (as defined in Note 3).
(c) The ratio includes 0.01% for the year ended March 31, 2018 attributed to overdraft expense and tax expense, which is outside the Unitary Fee (as defined in Note 3).
(d) The ratio includes 0.04% for the year ended March 31, 2015 attributed to tax expense, which is outside the Unitary Fee (as defined in Note 3).
(e) Total net expenses include the impact of certain fee waivers/expense reimbursements made by the Investment Manager and certain of its affiliates, if applicable.
The accompanying Notes to Financial Statements are an integral part of these financial statements.
Columbia ETF Trust II | Annual Report 2019
74
FINANCIAL HIGHLIGHTS
Columbia Emerging Markets Consumer ETF(a) (Consolidated)
Year Ended March 31, | |||||||||||||||||||||||
2019 | 2018 | 2017 | 2016 | 2015 | |||||||||||||||||||
Per share data | |||||||||||||||||||||||
Net asset value, beginning of year | $ | 26.34 | $ | 24.75 | $ | 22.60 | $ | 26.45 | $ | 26.53 | |||||||||||||
Income (loss) from investment operations: | |||||||||||||||||||||||
Net investment income | 0.25 | 0.10 | 0.18 | 0.21 | 0.25 | ||||||||||||||||||
Net realized and unrealized gain (loss) | (3.72 | ) | 1.59 | 2.13 | (3.83 | ) | (0.03 | ) | |||||||||||||||
Total from investment operations | (3.47 | ) | 1.69 | 2.31 | (3.62 | ) | 0.22 | ||||||||||||||||
Less distributions to shareholders: | |||||||||||||||||||||||
Net investment income | (0.20 | ) | (0.10 | ) | (0.16 | ) | (0.23 | ) | (0.30 | ) | |||||||||||||
Net asset value, end of year | $ | 22.67 | $ | 26.34 | $ | 24.75 | $ | 22.60 | $ | 26.45 | |||||||||||||
Total Return at NAV | (13.08 | )% | 6.81 | % | 10.35 | % | (13.63 | )% | 0.88 | % | |||||||||||||
Total Return at Market | (13.90 | )% | 7.16 | % | 10.75 | % | (13.64 | )% | 0.74 | % | |||||||||||||
Ratios to average net assets: | |||||||||||||||||||||||
Total gross expenses(b) | 0.61 | %(c) | 0.81 | %(d) | 0.85 | %(e) | 0.85 | % | 0.83 | % | |||||||||||||
Total net expenses(b)(f) | 0.61 | %(c) | 0.81 | %(d) | 0.85 | %(e) | 0.85 | % | 0.83 | % | |||||||||||||
Net Investment income | 1.07 | % | 0.37 | % | 0.77 | % | 0.86 | % | 0.92 | % | |||||||||||||
Supplemental data | |||||||||||||||||||||||
Net assets, end of year (in thousands) | $ | 290,119 | $ | 809,911 | $ | 741,171 | $ | 612,360 | $ | 1,145,158 | |||||||||||||
Portfolio turnover | 61 | % | 27 | % | 17 | % | 32 | % | 12 | % | |||||||||||||
Notes to Financial Highlights
(a) EG Shares Consumer Mauritius, the Fund's Subsidiary, was liquidated on November 30, 2018.
(b) In addition to the fees and expenses that the Fund bears directly, the Fund indirectly bears a pro rata share of the fees and expenses of any other funds in which it invests. Such indirect expenses are not included in the Fund's reported expense ratios.
(c) The ratio includes 0.02% for the year ended March 31, 2019 attributed to overdraft expense and tax expense, which is outside the Unitary Fee (as defined in Note 3).
(d) The ratio includes less than 0.01% for the year ended March 31, 2018 attributed to overdraft expense and tax expense, which is outside the Unitary Fee (as defined in Note 3).
(e) The ratio includes less than 0.01% for the year ended March 31, 2017 attributed to tax expense, which is outside the Unitary Fee (as defined in Note 3).
(f) Total net expenses include the impact of certain fee waivers/expense reimbursements made by the Investment Manager and certain of its affiliates, if applicable.
The accompanying Notes to Financial Statements are an integral part of these financial statements.
Columbia ETF Trust II | Annual Report 2019
75
FINANCIAL HIGHLIGHTS
Columbia India Consumer ETF (Consolidated)
Year Ended March 31, | |||||||||||||||||||||||
2019 | 2018 | 2017 | 2016 | 2015 | |||||||||||||||||||
Per share data | |||||||||||||||||||||||
Net asset value, beginning of year | $ | 45.81 | $ | 38.31 | $ | 31.16 | $ | 35.48 | $ | 24.72 | |||||||||||||
Income (loss) from investment operations: | |||||||||||||||||||||||
Net investment income (loss) | 0.12 | 0.01 | (0.03 | ) | 0.04 | (0.12 | ) | ||||||||||||||||
Net realized and unrealized gain (loss) | (3.80 | ) | 7.52 | 7.21 | (4.36 | ) | 10.91 | ||||||||||||||||
Total from investment operations | (3.68 | ) | 7.53 | 7.18 | (4.32 | ) | 10.79 | ||||||||||||||||
Less distributions to shareholders: | |||||||||||||||||||||||
Net investment income | (0.05 | ) | (0.03 | ) | (0.03 | ) | — | (0.03 | ) | ||||||||||||||
Net asset value, end of year | $ | 42.08 | $ | 45.81 | $ | 38.31 | $ | 31.16 | $ | 35.48 | |||||||||||||
Total Return at NAV | (8.03 | )% | 19.64 | % | 23.06 | % | (12.18 | )% | 43.64 | % | |||||||||||||
Total Return at Market | (8.44 | )% | 19.98 | % | 23.67 | % | (12.57 | )% | 44.04 | % | |||||||||||||
Ratios to average net assets: | |||||||||||||||||||||||
Total gross expenses(a) | 0.77 | %(b) | 0.87 | %(c) | 0.89 | %(d) | 0.89 | % | 0.90 | %(e) | |||||||||||||
Total net expenses(a)(f) | 0.77 | %(b) | 0.87 | %(c) | 0.89 | %(d) | 0.89 | % | 0.90 | %(e) | |||||||||||||
Net Investment income (loss) | 0.26 | % | 0.01 | % | (0.09 | )% | 0.13 | % | (0.36 | )% | |||||||||||||
Supplemental data | |||||||||||||||||||||||
Net assets, end of year (in thousands) | $ | 130,436 | $ | 144,289 | $ | 88,102 | $ | 71,679 | $ | 88,710 | |||||||||||||
Portfolio turnover | 15 | % | 28 | % | 31 | % | 47 | % | 82 | % | |||||||||||||
Notes to Financial Highlights
(a) In addition to the fees and expenses that the Fund bears directly, the Fund indirectly bears a pro rata share of the fees and expenses of any other funds in which it invests. Such indirect expenses are not included in the Fund's reported expense ratios.
(b) The ratio includes 0.02% for the year ended March 31, 2019 attributed to tax expense, which is outside the Unitary Fee (as defined in Note 3).
(c) The ratio includes 0.01% for the year ended March 31, 2018 attributed to line of credit interest expense and tax expense, which is outside the Unitary Fee (as defined in Note 3).
(d) The ratio includes less than 0.01% for the year ended March 31, 2017 attributed to tax expense, which is outside the Unitary Fee (as defined in Note 3).
(e) The ratio includes 0.01% for the year ended March 31, 2015 attributed to tax expense, which is outside the Unitary Fee (as defined in Note 3).
(f) Total net expenses include the impact of certain fee waivers/expense reimbursements made by the Investment Manager and certain of its affiliates, if applicable.
The accompanying Notes to Financial Statements are an integral part of these financial statements.
Columbia ETF Trust II | Annual Report 2019
76
FINANCIAL HIGHLIGHTS
Columbia India Infrastructure ETF(a) (Consolidated)
Year Ended March 31, | |||||||||||||||||||||||
2019 | 2018 | 2017 | 2016 | 2015 | |||||||||||||||||||
Per share data | |||||||||||||||||||||||
Net asset value, beginning of year | $ | 13.98 | $ | 12.98 | $ | 10.24 | $ | 13.08 | $ | 11.35 | |||||||||||||
Income (loss) from investment operations: | |||||||||||||||||||||||
Net investment income | 0.15 | 0.18 | 0.03 | 0.30 | 0.12 | ||||||||||||||||||
Net realized and unrealized gain (loss) | (1.89 | ) | 0.92 | 3.03 | (3.04 | ) | 1.65 | (b) | |||||||||||||||
Total from investment operations | (1.74 | ) | 1.10 | 3.06 | (2.74 | ) | 1.77 | ||||||||||||||||
Less distributions to shareholders: | |||||||||||||||||||||||
Net investment income | (0.16 | ) | (0.10 | ) | (0.32 | ) | (0.10 | ) | (0.04 | ) | |||||||||||||
Net asset value, end of year | $ | 12.08 | $ | 13.98 | $ | 12.98 | $ | 10.24 | $ | 13.08 | |||||||||||||
Total Return at NAV | (12.39 | )% | 8.41 | % | 30.61 | % | (21.00 | )% | 15.59 | % | |||||||||||||
Total Return at Market | (14.36 | )% | 9.13 | % | 30.93 | % | (21.41 | )% | 15.93 | % | |||||||||||||
Ratios to average net assets: | |||||||||||||||||||||||
Total gross expenses(c) | 0.92 | %(d) | 0.84 | %(e) | 0.98 | %(f) | 0.88 | %(g) | 0.88 | %(h) | |||||||||||||
Total net expenses(c)(i) | 0.92 | %(d) | 0.84 | %(e) | 0.98 | %(f) | 0.88 | %(g) | 0.88 | %(h) | |||||||||||||
Net Investment income | 1.17 | % | 1.25 | % | 0.28 | % | 2.68 | % | 0.90 | % | |||||||||||||
Supplemental data | |||||||||||||||||||||||
Net assets, end of year (in thousands) | $ | 31,402 | $ | 49,612 | $ | 41,529 | $ | 39,938 | $ | 47,736 | |||||||||||||
Portfolio turnover | 88 | % | 54 | % | 34 | % | 59 | % | 75 | % | |||||||||||||
Notes to Financial Highlights
(a) EG Shares India Infrastructure Mauritius, the Fund's Subsidiary, was liquidated on November 16, 2018.
(b) The realized and unrealized gain on investments and foreign currency transactions does not accord with the amounts reported in the Statement of Operations due to the timing of subscriptions of fund shares in relation to the investment performance during the period and contributions made by Authorized Participants to compensate the Fund for additional costs incurred in purchasing securities that were not transferred in kind (See Note 1).
(c) In addition to the fees and expenses that the Fund bears directly, the Fund indirectly bears a pro rata share of the fees and expenses of any other funds in which it invests. Such indirect expenses are not included in the Fund's reported expense ratios.
(d) The ratio includes 0.17% for the year ended March 31, 2019 attributed to line of credit interest expense, overdraft expense and tax expense, which is outside the Unitary Fee (as defined in Note 3).
(e) The ratio includes 0.01% for the year ended March 31, 2018 attributed to overdraft expense and tax expense, which is outside the Unitary Fee (as defined in Note 3).
(f) The ratio includes 0.13% for the year ended March 31, 2017 attributed to tax expense, which is outside the Unitary Fee (as defined in Note 3).
(g) The ratio includes 0.03% for the year ended March 31, 2016 attributed to tax expense, which is outside the Unitary Fee (as defined in Note 3).
(h) The ratio includes 0.03% for the year ended March 31, 2015 attributed to tax expense, which is outside the Unitary Fee (as defined in Note 3).
(i) Total net expenses include the impact of certain fee waivers/expense reimbursements made by the Investment Manager and certain of its affiliates, if applicable.
The accompanying Notes to Financial Statements are an integral part of these financial statements.
Columbia ETF Trust II | Annual Report 2019
77
FINANCIAL HIGHLIGHTS
Columbia India Small Cap ETF(a) (Consolidated)
Year Ended March 31, | |||||||||||||||||||||||
2019 | 2018 | 2017 | 2016 | 2015 | |||||||||||||||||||
Per share data | |||||||||||||||||||||||
Net asset value, beginning of year | $ | 19.50 | $ | 18.26 | $ | 13.59 | $ | 17.48 | $ | 12.74 | |||||||||||||
Income (loss) from investment operations: | |||||||||||||||||||||||
Net investment income (loss) | 0.28 | 0.00 | (b) | (0.02 | ) | 0.06 | 0.05 | ||||||||||||||||
Net realized and unrealized gain (loss) | (4.57 | ) | 1.41 | 4.82 | (3.86 | ) | 4.77 | ||||||||||||||||
Total from investment operations | (4.29 | ) | 1.41 | 4.80 | (3.80 | ) | 4.82 | ||||||||||||||||
Less distributions to shareholders: | |||||||||||||||||||||||
Net investment income | — | (0.17 | ) | (0.13 | ) | (0.09 | ) | (0.08 | ) | ||||||||||||||
Net asset value, end of year | $ | 15.21 | $ | 19.50 | $ | 18.26 | $ | 13.59 | $ | 17.48 | |||||||||||||
Total Return at NAV | (22.00 | )% | 7.61 | % | 35.62 | % | (21.78 | )% | 37.86 | % | |||||||||||||
Total Return at Market | (22.98 | )% | 8.51 | % | 36.29 | % | (22.27 | )% | 39.17 | % | |||||||||||||
Ratios to average net assets: | |||||||||||||||||||||||
Total gross expenses(c) | 0.77 | %(d) | 0.86 | %(e) | 0.86 | %(f) | 0.86 | %(g) | 0.92 | %(h) | |||||||||||||
Total net expenses(c)(i) | 0.77 | %(d) | 0.86 | %(e) | 0.86 | %(f) | 0.86 | %(g) | 0.92 | %(h) | |||||||||||||
Net Investment income (loss) | 1.70 | % | 0.02 | % | (0.12 | )% | 0.40 | % | 0.33 | % | |||||||||||||
Supplemental data | |||||||||||||||||||||||
Net assets, end of year (in thousands) | $ | 14,450 | $ | 28,282 | $ | 25,565 | $ | 19,027 | $ | 28,850 | |||||||||||||
Portfolio turnover | 84 | % | 107 | % | 71 | % | 45 | % | 117 | % | |||||||||||||
Notes to Financial Highlights
(a) EG Shares India Small Cap Mauritius, the Fund's Subsidiary, was liquidated on August 24, 2018.
(b) Rounds to zero.
(c) In addition to the fees and expenses that the Fund bears directly, the Fund indirectly bears a pro rata share of the fees and expenses of any other funds in which it invests. Such indirect expenses are not included in the Fund's reported expense ratios.
(d) The ratio includes 0.02% for the year ended March 31, 2019 attributed to overdraft expense and tax expense, which is outside the Unitary Fee (as defined in Note 3).
(e) The ratio includes 0.02% for the year ended March 31, 2018 attributed to line of credit interest expense, overdraft expense and tax expense, which is outside the Unitary Fee (as defined in Note 3).
(f) The ratio includes 0.01% for the year ended March 31, 2017 attributed to tax expense, which is outside the Unitary Fee (as defined in Note 3).
(g) The ratio includes 0.01% for the year ended March 31, 2016 attributed to tax expense, which is outside the Unitary Fee (as defined in Note 3).
(h) The ratio includes 0.07% for the year ended March 31, 2015 attributed to tax expense, which is outside the Unitary Fee (as defined in Note 3).
(i) Total net expenses include the impact of certain fee waivers/expense reimbursements made by the Investment Manager and certain of its affiliates, if applicable.
The accompanying Notes to Financial Statements are an integral part of these financial statements.
Columbia ETF Trust II | Annual Report 2019
78
NOTES TO FINANCIAL STATEMENTS
March 31, 2019
Note 1. Organization
Columbia ETF Trust II (the Trust) is registered under the Investment Company Act of 1940, as amended (the 1940 Act), as an open-end registered investment company organized as a Delaware statutory trust. The Trust may issue an unlimited number of shares (without par value).
Information presented in these financial statements pertains to the following series of the Trust (each, a Fund and collectively, the Funds): Columbia Beyond BRICs ETF, Columbia EM Core ex-China ETF, Columbia EM Quality Dividend ETF, Columbia Emerging Markets Consumer ETF, Columbia India Consumer ETF, Columbia India Infrastructure ETF, and Columbia India Small Cap ETF. Columbia Beyond BRICs ETF and Columbia EM Quality Dividend ETF are currently classified as diversified funds. Columbia EM Core ex-China ETF, Columbia Emerging Markets Consumer ETF, Columbia India Consumer ETF, Columbia India Infrastructure ETF and Columbia India Small Cap ETF are currently classified as non-diversified funds.
Basis for Consolidation
The Consolidated Portfolio of Investments; Consolidated Statements of Assets and Liabilities, of Operations and of Changes in Net Assets; and the Consolidated Financial Highlights of the Funds listed below include (or previously included) the accounts of wholly owned subsidiaries (each, a Subsidiary and collectively, the Subsidiaries) located in the Republic of Mauritius (Mauritius). All inter-company accounts and transactions have been eliminated in consolidations.
Fund | Wholly owned subsidiary | ||||||
Columbia Emerging Markets Consumer ETF | EG Shares Consumer Mauritius | ||||||
Columbia India Consumer ETF | EG Shares India Consumer Mauritius | ||||||
Columbia India Infrastructure ETF | EG Shares India Infrastructure Mauritius | ||||||
Columbia India Small Cap ETF | EG Shares India Small Cap Mauritius | ||||||
As of the date of this report, Columbia India Consumer ETF invests in Indian securities both directly (in India), and through its corresponding Subsidiary, which in turn invests virtually all of its assets in Indian securities.
As of the date of this report, Columbia Emerging Markets Consumer ETF, Columbia India Infrastructure ETF and Columbia India Small Cap ETF have transitioned all of their Indian securities out of their corresponding Subsidiary and hold investments in Indian securities directly in the Fund.
Each Fund listed in the table above has historically relied on a tax treaty between India and Mauritius for relief from certain Indian taxes. The enactment of general anti-avoidance rules in India, the signing of a protocol amending the India-Mauritius tax treaty, and enactment of a 10% tax on long-term capital gains from sales of Indian shares after March 31, 2018 (not otherwise exempt under a tax treaty) have resulted in the imposition of additional taxes by India on each Fund and Subsidiary listed in the table above. For more information, see India-Mauritius Tax Treaty Risk.
A summary of each Fund's investment in its corresponding Subsidiary is as follows:
Funds | % of consolidated fund net assets | Net assets ($) | Net investment income (loss) ($) | Net realized gain (loss) ($) | Net change in unrealized appreciation (depreciation) ($) | ||||||||||||||||||
Columbia Emerging Markets Consumer ETF | 0.0 | % | — | 955,012 | 36,926,304 | (37,343,283 | ) | ||||||||||||||||
Columbia India Consumer ETF | 72.5 | % | 94,548,810 | 1,218,907 | 3,436,219 | (11,663,047 | ) | ||||||||||||||||
Columbia India Infrastructure ETF | 0.0 | % | — | 374,050 | 3,216,931 | (10,263,968 | ) | ||||||||||||||||
Columbia India Small Cap ETF | 0.0 | % | — | 17,641 | (1,565,514 | ) | 1,278,558 | ||||||||||||||||
Columbia ETF Trust II | Annual Report 2019
79
NOTES TO FINANCIAL STATEMENTS (continued)
March 31, 2019
Fund shares
The market prices of each Fund's shares may differ to some degree from the Fund's net asset value (NAV). Unlike conventional mutual funds, each Fund issues and redeems shares on a continuous basis, at NAV, only in a large specified number of shares, each called a "Creation Unit." A Creation Unit consists of 50,000 shares. Creation Units are issued and redeemed generally in-kind for a basket of securities and/or for cash. Investors such as market makers, large investors and institutions who wish to deal in Creation Units directly with a Fund must have entered into an authorized participant agreement (Authorized Participants) with the Fund's principal underwriter and the transfer agent, or purchase through a dealer that has entered into such an agreement. Authorized participants may purchase or redeem Fund shares directly from the Fund only in Creation Units. The Funds' shares are also listed on the New York Stock Exchange for which investors can purchase and sell shares on the secondary market through a broker at market prices which may differ from the NAV of the Fund.
Note 2. Summary of significant accounting policies
Basis of preparation
Each Fund is an investment company that applies the accounting and reporting guidance in the Financial Accounting Standards Board (FASB) Accounting Standards Codification Topic 946, Financial Services — Investment Companies (ASC 946). The financial statements are prepared in accordance with U.S. generally accepted accounting principles (GAAP), which requires management to make certain estimates and assumptions that affect the reported amounts of assets and liabilities, the disclosure of contingent assets and liabilities at the date of the financial statements and the reported amounts of income and expenses during the reporting period. Actual results could differ from those estimates.
The following is a summary of significant accounting policies followed by the Funds in the preparation of their financial statements.
Security valuation
All equity securities and exchange-traded funds are valued at the close of business of the New York Stock Exchange. Equity securities and exchange-traded funds are valued at the last quoted sales price on the principal exchange or market on which they trade, except for securities traded on the NASDAQ Stock Market, which are valued at the NASDAQ official close price. Unlisted securities or listed securities for which there were no sales during the day are valued at the mean of the latest quoted bid and ask prices on such exchanges or markets.
Foreign equity securities are valued based on the closing price on the foreign exchange in which such securities are primarily traded. If any foreign equity security closing prices are not readily available, the securities are valued at the mean of the latest quoted bid and ask prices on such exchanges or markets. Foreign currency exchange rates are generally determined at the close of London's exchange at 11:00 a.m. Eastern (U.S.) time.
Investments for which market quotations are not readily available, or that have quotations which management believes are not reflective of market value or reliable, are valued at fair value as determined in good faith under procedures approved by and under the general supervision of the Board of Trustees. If a security or class of securities (such as foreign securities) is valued at fair value, such value is likely to be different from the quoted or published price for the security.
The determination of fair value often requires significant judgment. To determine fair value, management may use assumptions including but not limited to future cash flows and estimated risk premiums. Multiple inputs from various sources may be used to determine fair value.
GAAP requires disclosure regarding the inputs and valuation techniques used to measure fair value and any changes in valuation inputs or techniques. In addition, investments shall be disclosed by major category. This information is disclosed following the Funds' Portfolio of Investments.
Columbia ETF Trust II | Annual Report 2019
80
NOTES TO FINANCIAL STATEMENTS (continued)
March 31, 2019
Foreign currency transactions and translation
The values of all assets and liabilities denominated in foreign currencies are generally translated into U.S. dollars at exchange rates determined at the close of the London Stock Exchange on any given day. Net realized and unrealized gains (losses) on foreign currency transactions and translations include gains (losses) arising from the fluctuation in exchange rates between trade and settlement dates on securities transactions, gains (losses) arising from the disposition of foreign currency and currency gains (losses) between the accrual and payment dates on dividends, interest income and foreign withholding taxes.
For financial statement purposes, the Funds do not distinguish that portion of gains (losses) on investments which is due to changes in foreign exchange rates from that which is due to changes in market prices of the investments. Such fluctuations are included with the net realized and unrealized gains (losses) on investments in the Statement of Operations.
Security transactions
Security transactions are accounted for on the trade date. Cost is determined and gains (losses) are based upon the specific identification method for both financial statement and federal income tax purposes.
Income recognition
Corporate actions and dividend income are generally recorded net of any non-reclaimable tax withholdings, on the ex-dividend date or upon receipt of ex-dividend notification in the case of certain foreign securities.
Interest income is recorded on an accrual basis.
Awards from class action litigation are recorded as a reduction of cost basis if the Fund still owns the applicable securities on the payment date. If the Fund no longer owns the applicable securities, the proceeds are recorded as realized gains.
Expenses
General expenses of the Trust are allocated to the Funds based upon relative net assets or other expense allocation methodologies determined by the nature of the expense. Expenses directly attributable to a Fund are charged to that Fund.
Determination of net asset value
The NAV per share of each Fund is computed by dividing the value of the net assets of a Fund by the total number of outstanding shares of that Fund, rounded to the nearest cent, at the close of regular trading (ordinarily 4:00 p.m. Eastern Time) every day the New York Stock Exchange is open.
Federal income tax status
For federal income tax purposes, each Fund is treated as a separate entity. Each Fund intends to qualify each year as a regulated investment company under Subchapter M of the Internal Revenue Code, as amended, and will distribute substantially all of its investment company taxable income and net capital gain, if any, for its tax year, and as such will not be subject to federal income taxes. In addition, each Fund intends to distribute in each calendar year substantially all of its ordinary income, capital gain net income and certain other amounts, if any, such that the Fund should not be subject to federal excise tax. Therefore, no federal income or excise tax provisions are recorded.
Foreign taxes
The Funds may be subject to foreign taxes on income, gains on investments or currency repatriation, a portion of which may be recoverable. The Fund will accrue such taxes and recoveries, as applicable, based upon its current interpretation of tax rules and regulations that exist in the markets in which it invests.
Columbia ETF Trust II | Annual Report 2019
81
NOTES TO FINANCIAL STATEMENTS (continued)
March 31, 2019
Realized gains in certain countries may be subject to foreign taxes at the Fund level, based on statutory rates. The Fund accrues for such foreign taxes on realized and unrealized gains at the appropriate rate for each jurisdiction, as applicable. The amount, if any, is disclosed as a liability on the Statement of Assets and Liabilities.
Distributions to shareholders
Distributions from net investment income, if any, are declared and paid each calendar quarter for Columbia EM Quality Dividend ETF. The remaining Funds declare and distribute net investment income annually. Net realized capital gains, if any, are distributed at least annually. Income distributions and capital gain distributions are determined in accordance with federal income tax regulations, which may differ from GAAP.
Guarantees and indemnifications
Under the Trust's organizational documents and, in some cases, by contract, its officers and trustees are indemnified against certain liabilities arising out of the performance of their duties to the Trust or its funds. In addition, certain of the Funds' contracts with their service providers contain general indemnification clauses. The Funds' maximum exposure under these arrangements is unknown since the amount of any future claims that may be made against the Funds cannot be determined, and the Funds have no historical basis for predicting the likelihood of any such claims.
Recent accounting pronouncements
Accounting Standards Update 2017-08 Premium Amortization on Purchased Callable Debt Securities
In March 2017, the Financial Accounting Standards Board issued Accounting Standards Update (ASU) No. 2017-08 Premium Amortization on Purchased Callable Debt Securities. ASU No. 2017-08 updates the accounting standards to shorten the amortization period for certain purchased callable debt securities, held at a premium, to be amortized to the earliest call date. The update applies to securities with explicit, noncontingent call features that are callable at fixed prices and on preset dates. The standard is effective for annual periods beginning after December 15, 2018 and interim periods within those fiscal years. Management does not expect the implementation of this guidance to have a material impact on the financial statement amounts and footnote disclosures.
Accounting Standards Update 2018-13 Disclosure Framework — Changes to the Disclosure Requirements for Fair Value Measurement
In August 2018, the Financial Accounting Standards Board issued Accounting Standards Update (ASU) No. 2018-13 Disclosure Framework — Changes to the Disclosure Requirements for Fair Value Measurement. ASU No. 2018-13, in addition to other modifications and additions, removes the requirement to disclose the amount and reasons for transfers between Level 1 and Level 2 of the fair value hierarchy and the policy for the timing of transfers between levels. The standard is effective for annual periods beginning after December 15, 2019 and interim periods within those fiscal years. At this time, management is evaluating the implication of this guidance and the impact it will have on the financial statement disclosures, if any.
Disclosure Update and Simplification
In September 2018, the Securities and Exchange Commission (SEC) released Final Rule 33-10532, Disclosure Update and Simplification, which amends certain financial statement disclosure requirements that the SEC determined to be redundant, outdated, or superseded in light of other SEC disclosure requirements, GAAP, or changes in the information environment. As a result of the amendments, management implemented disclosure changes which included removing the components of distributable earnings presented on the Statement of Assets and Liabilities and combining income and gain distributions paid to shareholders as presented on the Statement of Changes in Net Assets. Any values presented to meet prior year requirements were left unchanged. The amendments had no effect on the Funds' net assets or results of operation.
Columbia ETF Trust II | Annual Report 2019
82
NOTES TO FINANCIAL STATEMENTS (continued)
March 31, 2019
Note 3. Investment management fees
Under an Investment Management Services Agreement, Columbia Management Investment Advisers, LLC (the Investment Manager), a wholly-owned subsidiary of Ameriprise Financial, Inc. (Ameriprise Financial), determines which securities will be purchased, held or sold. The investment management fee is a unitary fee paid monthly to the Investment Manager at an annual rate based on each Fund's average daily net assets. In return for this fee, the Investment Manager pays the operating costs and expenses of each Fund other than the following expenses (which will be paid by the Fund): taxes; interest incurred on borrowing by the Funds (including but not limited to overdraft fees), if any; brokerage expenses, fees, commissions and other portfolio transaction expenses (including but not limited to service fees charged by custodians of depository receipts and scrip fees related to registrations on foreign exchanges); interest and fee expense related to the Funds' participation in inverse floater structures; infrequent and/or unusual expenses, including without limitation litigation expenses (including but not limited to arbitrations and indemnification expenses); distribution and/or service fees; expenses incurred in connection with lending securities; and any other expenses approved by the Board of Trustees.
The investment management fee is an annual fee that is equal to a percentage of each Fund's average daily net assets and is paid as follows:
Effective August 1, 2018 | Prior to August 1, 2018 | ||||||||||||||||||
Fund | Assets (billions) | Investment management fee rate (%) | Assets (billions) | Investment management fee rate (%) | |||||||||||||||
Columbia Beyond BRICs ETF | All | 0.59 | All | 0.85 | |||||||||||||||
Columbia EM Core ex-China ETF | All | 0.35 | All | 0.70 | |||||||||||||||
Columbia EM Quality Dividend ETF | All | 0.59 | All | 0.59 | |||||||||||||||
Columbia Emerging Markets Consumer ETF | All | 0.59 | All | 0.59 | |||||||||||||||
Columbia India Consumer ETF | All | 0.75 | All | 0.75 | |||||||||||||||
Columbia India Infrastructure ETF | All | 0.75 | All | 0.75 | |||||||||||||||
Columbia India Small Cap ETF | All | 0.75 | All | 0.75 | |||||||||||||||
The effective management services fee rate for the year ended March 31, 2019 was as follows:
Fund | Effective investment management fee rate (%) | ||||||
Columbia Beyond BRICs ETF | 0.70 | ||||||
Columbia EM Core ex-China ETF | 0.47 | ||||||
Columbia EM Quality Dividend ETF | 0.59 | ||||||
Columbia Emerging Markets Consumer ETF | 0.59 | ||||||
Columbia India Consumer ETF | 0.75 | ||||||
Columbia India Infrastructure ETF | 0.75 | ||||||
Columbia India Small Cap ETF | 0.75 | ||||||
The Investment Manager had contractually agreed to waive all or a portion of the investment management fee for the periods disclosed below, so that each Fund's investment management fee was limited as a percentage of the respective Fund's average daily net assets to the annual rate noted below:
Fund | Prior to September 1, 2018 | ||||||
Columbia Beyond BRICs ETF | 0.58 | % | |||||
Columbia EM Core ex-China ETF | 0.35 | ||||||
Columbia ETF Trust II | Annual Report 2019
83
NOTES TO FINANCIAL STATEMENTS (continued)
March 31, 2019
Compensation of board members
Members of the Board of Trustees who are not officers or employees of the Investment Manager or Ameriprise Financial are compensated for their services to the Funds as disclosed in the Statement of Operations. Under a Deferred Compensation Plan (the Deferred Plan), these members of the Board of Trustees may elect to defer payment of up to 100% of their compensation. Deferred amounts are treated as though equivalent dollar amounts had been invested in shares of certain funds managed by the Investment Manager. Each Fund's liability for these amounts is adjusted for market value changes and remains in the Fund until distributed in accordance with the Deferred Plan. All amounts payable under the Deferred Plan constitute a general unsecured obligation of the Funds. The expenses of the compensation of the members of the Board of Trustees that are allocated to the Fund are payable by the Investment Manager.
Compensation of Chief Compliance Officer
The Board of Trustees has appointed a Chief Compliance Officer to the Funds in accordance with federal securities regulations. A portion of the Chief Compliance Officer's total compensation is allocated to the Funds, along with other allocations to affiliated registered investment companies managed by the Investment Manager and its affiliates, based on relative net assets. The expenses of the Chief Compliance Officer allocated to the Funds are payable by the Investment Manager.
Distribution and service fees
ALPS Distributors, Inc., (the Distributor) serves as the distributor for the Funds. The Funds have adopted a distribution and service plan (the Plan). Under the Plan, the Funds are authorized to pay distribution fees to the Distributor and other firms that provide distribution and shareholder services at the maximum annual rate of 0.25% of average daily net assets of each Fund. No distribution or service fees are currently paid by the Funds or have been approved for payment by the Board of Trustees, and there are no current plans to impose these fees.
Note 4. Federal tax information
The timing and character of income and capital gain distributions are determined in accordance with income tax regulations, which may differ from GAAP because of temporary or permanent book to tax differences.
At March 31, 2019, these differences are primarily due to differing treatments for deferral/reversal of wash sale losses, foreign currency transactions, disallowed capital gains (losses) on a redemption in-kind, re-characterization of distributions for investments and passive foreign investment company (PFIC) holdings. To the extent these differences are permanent, reclassifications are made among the components of the applicable Fund's net assets in the Statement of Assets and Liabilities. Temporary differences do not require reclassifications.
In the Statement of Assets and Liabilities the following reclassifications were made:
| Funds | Undistributed (excess of distributions over) net investment income ($) | Accumulated net realized gain (loss) ($) | Paid-in capital increase (decrease) ($) | ||||||||||||
Columbia Beyond BRICs ETF | (78,245 | ) | 2,046,170 | (1,967,925 | ) | ||||||||||
Columbia EM Core ex-China ETF | (6,096 | ) | 6,096 | — | |||||||||||
Columbia EM Quality Dividend ETF | (16,728 | ) | (31,266 | ) | 47,994 | ||||||||||
Columbia Emerging Markets Consumer ETF | (603,395 | ) | (2,860,263 | ) | 3,463,658 | ||||||||||
Columbia India Consumer ETF | (148,550 | ) | 167,903 | (19,353 | ) | ||||||||||
Columbia India Infrastructure ETF | (64,869 | ) | 64,869 | — | |||||||||||
Columbia India Small Cap ETF | 97,506 | 727 | (98,233 | ) | |||||||||||
Columbia ETF Trust II | Annual Report 2019
84
NOTES TO FINANCIAL STATEMENTS (continued)
March 31, 2019
Net investment income (loss) and net realized gains (losses), as disclosed in the Statement of Operations, and net assets were not affected by these reclassifications.
The tax character of distributions paid during the years indicated was as follows:
Year Ended March 31, 2019 | Year Ended March 31, 2018 | ||||||||||||||||||||||||||
| Funds | Ordinary income ($) | Long-term capital gain ($) | Total ($) | Ordinary income ($) | Long-term capital gain ($) | Total ($) | |||||||||||||||||||||
Columbia Beyond BRICs ETF | 1,602,594 | — | 1,602,594 | 1,818,029 | — | 1,818,029 | |||||||||||||||||||||
Columbia EM Core ex-China ETF | 224,521 | 45,399 | 269,920 | 308,666 | 521,247 | 829,913 | |||||||||||||||||||||
Columbia EM Quality Dividend ETF | 238,019 | — | 238,019 | 279,712 | — | 279,712 | |||||||||||||||||||||
Columbia Emerging Markets Consumer ETF | 2,714,200 | — | 2,714,200 | 3,335,918 | — | 3,335,918 | |||||||||||||||||||||
Columbia India Consumer ETF | 167,832 | — | 167,832 | 79,763 | — | 79,763 | |||||||||||||||||||||
Columbia India Infrastructure ETF | 433,673 | — | 433,673 | 363,029 | — | 363,029 | |||||||||||||||||||||
Columbia India Small Cap ETF | — | — | — | 247,725 | — | 247,725 | |||||||||||||||||||||
Short-term capital gain distributions, if any, are considered ordinary income distributions for tax purposes.
At March 31, 2019, the components of distributable earnings on a tax basis were as follows:
| Funds | Undistributed ordinary income ($) | Undistributed long-term capital gains ($) | Capital loss carryforwards ($) | Net unrealized appreciation (depreciation) ($) | |||||||||||||||
Columbia Beyond BRICs ETF | 198,405 | — | (61,479,061 | ) | (1,348,604 | ) | |||||||||||||
Columbia EM Core ex-China ETF | 64,208 | — | (468,339 | ) | 1,713,189 | ||||||||||||||
Columbia EM Quality Dividend ETF | 38,244 | — | (27,327,654 | ) | (117,679 | ) | |||||||||||||
Columbia Emerging Markets Consumer ETF | 1,147,300 | — | (202,083,868 | ) | (7,888,989 | ) | |||||||||||||
Columbia India Consumer ETF | — | — | (2,518,272 | ) | 17,722,673 | ||||||||||||||
Columbia India Infrastructure ETF | 128,461 | — | (52,619,357 | ) | (4,172,345 | ) | |||||||||||||
Columbia India Small Cap ETF | — | — | (14,773,105 | ) | (105,906 | ) | |||||||||||||
At March 31, 2019, the cost of all investments for federal income tax purposes along with the aggregate gross unrealized appreciation and depreciation based on that cost was:
| Funds | Tax cost ($) | Gross unrealized appreciation ($) | Gross unrealized depreciation ($) | Net appreciation (depreciation) ($) | |||||||||||||||
Columbia Beyond BRICs ETF | 26,279,177 | 3,378,980 | (4,725,541 | ) | (1,346,561 | ) | |||||||||||||
Columbia EM Core ex-China ETF | 9,675,417 | 2,035,767 | (322,271 | ) | 1,713,496 | ||||||||||||||
Columbia EM Quality Dividend ETF | 5,718,225 | 424,584 | (541,680 | ) | (117,096 | ) | |||||||||||||
Columbia Emerging Markets Consumer ETF | 297,913,251 | 16,368,710 | (24,255,587 | ) | (7,886,877 | ) | |||||||||||||
Columbia India Consumer ETF | 112,796,385 | 28,563,598 | (10,263,675 | ) | 18,299,923 | ||||||||||||||
Columbia India Infrastructure ETF | 35,567,763 | 1,993,666 | (6,165,896 | ) | (4,172,230 | ) | |||||||||||||
Columbia India Small Cap ETF | 14,564,449 | 531,492 | (637,397 | ) | (105,905 | ) | |||||||||||||
Tax cost of investments and unrealized appreciation/(depreciation) may also include timing differences that do not constitute adjustments to tax basis.
Columbia ETF Trust II | Annual Report 2019
85
NOTES TO FINANCIAL STATEMENTS (continued)
March 31, 2019
The following capital loss carryforward, determined at March 31, 2019, may be available to reduce taxable income arising from future net realized gains on investments, if any, to the extent permitted by the Internal Revenue Code:
| Funds | No expiration short-term ($) | No expiration long-term ($) | Total ($) | Utilized ($) | Expired ($) | ||||||||||||||||||
Columbia Beyond BRICs ETF | 17,918,647 | 43,560,414 | 61,479,061 | — | — | ||||||||||||||||||
Columbia EM Core ex-China ETF | — | — | — | — | — | ||||||||||||||||||
Columbia EM Quality Dividend ETF | 21,430,417 | 5,897,237 | 27,327,654 | — | — | ||||||||||||||||||
Columbia Emerging Markets Consumer ETF | 5,503,691 | 196,580,177 | 202,083,868 | — | — | ||||||||||||||||||
Columbia India Consumer ETF | 2,518,272 | — | 2,518,272 | 3,004,148 | — | ||||||||||||||||||
Columbia India Infrastructure ETF | 16,835,384 | 35,783,973 | 52,619,357 | 3,438,824 | — | ||||||||||||||||||
Columbia India Small Cap ETF | 6,379,617 | 8,393,488 | 14,773,105 | — | — | ||||||||||||||||||
Capital loss carryforwards with no expiration are required to be utilized prior to any capital losses which carry an expiration date. As a result of this ordering rule, capital loss carryforwards which carry an expiration date, if any, may be more likely to expire unused.
Under current tax rules, regulated investment companies can elect to treat certain late-year ordinary losses incurred and post-October capital losses (capital losses realized after October 31) as arising on the first day of the following taxable year. At March 31, 2019, the Funds will elect to treat the following late-year ordinary losses and post-October capital losses as arising on April 1, 2019.
| Funds | Late year ordinary losses ($) | Post-October capital losses ($) | |||||||||
Columbia Beyond BRICs ETF | — | — | |||||||||
Columbia EM Core ex-China ETF | — | 468,339 | |||||||||
Columbia EM Quality Dividend ETF | — | — | |||||||||
Columbia Emerging Markets Consumer ETF | — | — | |||||||||
Columbia India Consumer ETF | 165,192 | — | |||||||||
Columbia India Infrastructure ETF | — | — | |||||||||
Columbia India Small Cap ETF | — | — | |||||||||
Management of the Funds has concluded that there are no significant uncertain tax positions in the Funds that would require recognition in the financial statements. However, management's conclusion may be subject to review and adjustment at a later date based on factors including, but not limited to, new tax laws, regulations, and administrative interpretations (including relevant court decisions). Generally, the Funds' federal tax returns for the prior three fiscal years remain subject to examination by the Internal Revenue Service.
Note 5. Portfolio information
The cost of purchases and proceeds from sales of securities, excluding short-term investments and in-kind transactions, for the year ended March 31, 2019, were as follows:
| Funds | Purchases ($) | Proceeds from sales ($) | |||||||||
Columbia Beyond BRICs ETF | 11,847,408 | 28,828,234 | |||||||||
Columbia EM Core ex-China ETF | 3,608,072 | 2,233,816 | |||||||||
Columbia EM Quality Dividend ETF | 5,811,941 | 8,271,488 | |||||||||
Columbia Emerging Markets Consumer ETF | 293,599,851 | 384,557,833 | |||||||||
Columbia India Consumer ETF | 20,676,608 | 24,853,692 | |||||||||
Columbia India Infrastructure ETF | 31,275,967 | 44,347,762 | |||||||||
Columbia India Small Cap ETF | 16,202,635 | 24,499,528 | |||||||||
The amount of purchase and sale activity impacts the portfolio turnover rate reported in the Financial Highlights.
Columbia ETF Trust II | Annual Report 2019
86
NOTES TO FINANCIAL STATEMENTS (continued)
March 31, 2019
Note 6. In-kind transactions
The Funds may accept in-kind contributions and redemptions. In-kind contributions are accounted for at the fair market value of the in-kind securities contributed on the date of contribution. For the year ended March 31, 2019, the cost basis of securities contributed was as follows:
Funds | Contributions ($) | ||||||
Columbia Beyond BRICs ETF | — | ||||||
Columbia EM Core ex-China ETF | 1,079,869 | ||||||
Columbia EM Quality Dividend ETF | — | ||||||
Columbia Emerging Markets Consumer ETF | — | ||||||
Columbia India Consumer ETF | — | ||||||
Columbia India Infrastructure ETF | — | ||||||
Columbia India Small Cap ETF | — | ||||||
Proceeds from the sales of securities include the value of securities delivered through an in-kind redemption of certain Fund shares. Net realized gains on these securities are not taxable to remaining shareholders in the Fund. For the year ended March 31, 2019, the in-kind redemptions were as follows:
| Funds | Cost basis ($) | Proceeds from sales ($) | Net realized gain (loss) ($) | ||||||||||||
Columbia Beyond BRICs ETF | 21,159,337 | 19,534,984 | (1,624,353 | ) | |||||||||||
Columbia EM Core ex-China ETF | — | — | — | ||||||||||||
Columbia EM Quality Dividend ETF | 1,747,011 | 1,816,843 | 69,832 | ||||||||||||
Columbia Emerging Markets Consumer ETF | 313,423,840 | 320,128,434 | 6,704,594 | ||||||||||||
Columbia India Consumer ETF | — | — | — | ||||||||||||
Columbia India Infrastructure ETF | — | — | — | ||||||||||||
Columbia India Small Cap ETF | — | — | — | ||||||||||||
Note 7. Line of credit
Each Fund has access to a revolving credit facility with a syndicate of banks led by Citibank, N.A., HSBC Bank USA, N.A. and JPMorgan Chase Bank, N.A. whereby the Funds may borrow for the temporary funding of shareholder redemptions or for other temporary or emergency purposes. The credit facility, which is a collective agreement between the Fund and certain other funds managed by the Investment Manager or an affiliated investment manager, severally and not jointly, permits collective borrowings up to $1 billion. Interest is charged to each participating fund based on its borrowings at a rate equal to the higher of (i) the federal funds effective rate, (ii) the one-month LIBOR rate and (iii) the overnight bank funding rate, plus in each case, 1.00%. Each borrowing under the credit facility matures no later than 60 days after the date of borrowing. The Fund also pays a commitment fee equal to its pro rata share of the unused amount of the credit facility at a rate of 0.15% per annum. The commitment fee is included in other expenses in the Statement of Operations. This agreement expires annually in December unless extended or renewed.
During the year ended March 31, 2019, Columbia Beyond BRICs ETF, Columbia EM Core ex-China ETF, Columbia EM Quality Dividend ETF, Columbia Emerging Markets Consumer ETF, Columbia India Consumer ETF and Columbia India Small Cap ETF had no borrowings.
During the year ended March 31, 2019, the following Fund had borrowings:
Fund | Average daily loan balance ($) | Weighted average interest rate (%) | Days outstanding | ||||||||||||
Columbia India Infrastructure ETF | 8,200,000 | 3.17 | 3 | ||||||||||||
Columbia ETF Trust II | Annual Report 2019
87
NOTES TO FINANCIAL STATEMENTS (continued)
March 31, 2019
Interest expense incurred by the Funds is recorded as a line of credit interest expense in the Statement of Operations. There were no outstanding borrowings at March 31, 2019.
Note 8. Significant risks
Concentration risk
Each Fund concentrates its investments in a particular sector or a group of sectors to approximately the same extent as its respective underlying index, and as such, may be adversely affected by increased price volatility of securities in those sectors, and may be more susceptible to adverse economic, market, political or regulatory occurrences affecting those sectors.
Consumer concentration risk
Because Columbia Emerging Markets Consumer ETF and Columbia India Consumer ETF concentrate their investments in the consumer goods and consumer services sectors (specifically the consumer goods and consumer services sectors of India for the Columbia India Consumer ETF), these Funds may be adversely affected by increased price volatility of securities in those sectors, and may be more susceptible to adverse economic, market, political or regulatory occurrences affecting those sectors. The success of consumer goods and consumer services suppliers and retailers is tied closely to the performance of the domestic and international economy, interest rates, currency exchange rates, competition, preferences, and consumer confidence.
Country and regional risk
Each Fund will invest in specific countries or geographic regions to approximately the same extent as its underlying index. To the extent that a Fund invests a significant portion of its assets in a particular country or a specific geographic region, the Fund will generally have more exposure to that country's or region's economic risks. In the event of economic or political turmoil or a deterioration of diplomatic relations in a country or region where a substantial portion of a Fund's assets are invested, the Fund may experience increased volatility or illiquidity of its portfolio holdings, which may adversely affect that Fund's performance.
Emerging markets risk
The Funds are subject to emerging markets risk. Investments in emerging market securities are subject to even greater risks than for foreign investments generally, including increased risks of: illiquidity of securities; price volatility; inflation or deflation; restrictions on foreign investment; nationalization; higher taxation; economic and political instability; pervasive corruption and crime; less governmental regulation; and less developed legal systems. These risks may be greater for investments in frontier markets.
Financial concentration risk
Columbia Beyond BRICs ETF, Columbia EM Core ex-China ETF and Columbia India Small Cap ETF have concentrated investments in the financials sector. Because companies in the financials sector are subject to extensive governmental regulation, which may adversely affect the scope of their activities, the prices they can charge and the amount of capital they must maintain, these Funds may be adversely affected.
India concentration risk
Because Columbia India Consumer ETF, Columbia India Infrastructure ETF and Columbia India Small Cap ETF invest predominantly in Indian securities, their NAVs will be much more sensitive to changes in economic, political and other factors within India than would a fund that invested in a greater variety of countries. Special risks include, among others, political and legal uncertainty, persistent religious, ethnic and border disputes, greater government control over the economy, currency fluctuations or blockage and the risk of nationalization or expropriation of assets.
Columbia ETF Trust II | Annual Report 2019
88
NOTES TO FINANCIAL STATEMENTS (continued)
March 31, 2019
India-Mauritius tax treaty risk
Each of Columbia Emerging Markets Consumer ETF, Columbia India Consumer ETF, Columbia India Infrastructure ETF and Columbia India Small Cap ETF, and the respective Subsidiary of each, has historically relied on a tax treaty between India and Mauritius for relief from certain Indian taxes. As of the date of this report, Columbia Emerging Markets Consumer ETF, Columbia India Infrastructure ETF and Columbia India Small Cap ETF have transitioned all of their Indian securities out of their corresponding Subsidiary and hold all investments in Indian securities directly in the Fund. India and Mauritius agreed to an amended protocol with respect to gains resulting from the alienation of shares in Indian companies acquired on or after April 1, 2017, resulting in higher taxes paid indirectly by a Fund for sales of Indian investments held through a Mauritius Subsidiary and, therefore, lower returns for such Fund and its shareholders. Gains realized in a Mauritius Subsidiary resulting from the alienation of Indian shares acquired prior to April 1, 2017 will continue to be exempt from Indian tax under the India-Mauritius tax treaty. Additionally, India has enacted general anti-avoidance rules, and a 10% tax on long-term capital gains resulting from the alienation of Indian shares after March 31, 2018, to the extent that such gains are not otherwise exempt or reduced under a tax treaty, resulting in the imposition by India of additional taxes on Indian securities invested in by a Fund or its Subsidiary.
Industrials concentration risk
Columbia India Infrastructure ETF and Columbia India Small Cap ETF may be more susceptible to the particular risks that may affect companies in the industrials sector than if it was invested in a wider variety of companies in unrelated sectors. The performance of companies in the industrials sector may be affected by government regulation, world events and economic conditions.
Infrastructure concentration risk
Because Columbia India Infrastructure ETF concentrates its investments in the infrastructure sectors of India, the Fund may be adversely affected by increased price volatility of securities in that sector, and may be more susceptible to adverse economic, market, political or regulatory occurrences affecting that sector.
Materials concentration risk
Columbia India Infrastructure ETF may be more susceptible to the particular risks that may affect companies in the materials sector than if it was invested in a wider variety of companies in unrelated sectors. Companies in the materials sector are subject to certain risks, including that many materials companies are significantly affected by the level and volatility of commodity prices, exchange rates, import controls, worldwide competition, environmental policies and consumer demand. Performance of such companies may be affected by factors including, among others, that at times worldwide production of industrial materials has exceeded demand as a result of overbuilding or economic downturns, leading to poor investment returns or losses. Other risks may include liabilities for environmental damage and general civil liabilities, depletion of resources, and mandated expenditures for safety and pollution control. The materials sector may also be affected by economic cycles, technical progress, labor relations, and government regulations.
Non-diversification risk
Columbia EM Core ex-China ETF, Columbia Emerging Markets Consumer ETF, Columbia India Consumer ETF, Columbia India Infrastructure ETF and Columbia India Small Cap ETF are non-diversified funds. A non-diversified fund is permitted to invest a greater percentage of its total assets in fewer issuers than a diversified fund. The Fund may, therefore, have a greater risk of loss from a few issuers than a similar fund that invests more broadly.
Small cap companies risk
Columbia India Small Cap ETF primarily invests in small capitalization companies. Small cap companies may have greater volatility in price than the stocks of large cap companies due to limited product lines or resources or a dependency upon a particular market niche.
Columbia ETF Trust II | Annual Report 2019
89
NOTES TO FINANCIAL STATEMENTS (continued)
March 31, 2019
Technology and technology-related investment risk
Columbia EM Core ex-China ETF may be more susceptible to the particular risks that may affect companies in the information technology sector, as well as other technology-related sectors (collectively, the technology sectors) than if it was invested in a wider variety of companies in unrelated sectors. Companies in the technology sectors are subject to certain risks, including the risk that new services, equipment or technologies will not be accepted by consumers and businesses or will become rapidly obsolete. Performance of such companies may be affected by factors including obtaining and protecting patents (or the failure to do so) and significant competitive pressures, including aggressive pricing of their products or services, new market entrants, competition for market share and short product cycles due to an accelerated rate of technological developments. Such competitive pressures may lead to limited earnings and/or falling profit margins. As a result, the value of their securities may fall or fail to rise. In addition, many technology sector companies have limited operating histories and prices of these companies' securities historically have been more volatile than other securities, especially over the short term.
Note 9. Subsequent events
Management has evaluated the events and transactions that have occurred through the date the financial statements were issued. Other than as noted below, there were no items requiring adjustment of the financial statements or additional disclosure.
The Board of Trustees of Columbia ETF Trust II, based upon the recommendation of the Investment Manager, determined to close and liquidate each of Columbia Beyond BRICs ETF, Columbia EM Quality Dividend ETF, Columbia India Infrastructure ETF, and Columbia India Small Cap ETF (each a Liquidating Fund and together the Liquidating Funds). The last day of trading for the Liquidating Funds on the NYSE Arca Exchange is expected to be June 14, 2019. On or about June 21, 2019, each Liquidating Fund will make a liquidating distribution to remaining shareholders equal to the shareholder's proportionate interest in the net assets of the Liquidating Fund.
Note 10. Information regarding pending and settled legal proceedings
Ameriprise Financial and certain of its affiliates have historically been involved in a number of legal, arbitration and regulatory proceedings, including routine litigation, class actions, and governmental actions, concerning matters arising in connection with the conduct of their business activities. Ameriprise Financial believes that the Funds are not currently the subject of, and that neither Ameriprise Financial nor any of its affiliates are the subject of, any pending legal, arbitration or regulatory proceedings that are likely to have a material adverse effect on the Funds or the ability of Ameriprise Financial or its affiliates to perform under their contracts with the Funds. Ameriprise Financial is required to make quarterly (10-Q), annual (10-K) and, as necessary, 8-K filings with the Securities and Exchange Commission (SEC) on legal and regulatory matters that relate to Ameriprise Financial and its affiliates. Copies of these filings may be obtained by accessing the SEC website at www.sec.gov.
There can be no assurance that these matters, or the adverse publicity associated with them, will not result in increased Fund redemptions, reduced sale of Fund shares or other adverse consequences to the Funds. Further, although we believe proceedings are not likely to have a material adverse effect on the Funds or the ability of Ameriprise Financial or its affiliates to perform under their contracts with the Funds, these proceedings are subject to uncertainties and, as such, we are unable to estimate the possible loss or range of loss that may result. An adverse outcome in one or more of these proceedings could result in adverse judgments, settlements, fines, penalties or other relief that could have a material adverse effect on the consolidated financial condition or results of operations of Ameriprise Financial.
Columbia ETF Trust II | Annual Report 2019
90
REPORT OF INDEPENDENT REGISTERED PUBLIC ACCOUNTING FIRM
To the Board of Trustees of Columbia ETF Trust II and Shareholders of each of the Funds listed in the table below
Opinions on the Financial Statements
We have audited the accompanying statements of assets and liabilities, including the portfolios of investments, of each of the Funds listed in the table below (seven of the funds constituting Columbia ETF Trust II, hereafter collectively referred to as the "Funds") as of March 31, 2019, the related statements of operations and of changes in net assets for each of the periods indicated in the table below, including the related notes, and the financial highlights for each of the periods indicated therein (collectively referred to as the "financial statements"). In our opinion, the financial statements present fairly, in all material respects, the financial position of each of the Funds as of March 31, 2019, the results of each of their operations and the changes in each of their net assets for the periods indicated in the table below, and each of the financial highlights for each of the periods indicated therein in conformity with accounting principles generally accepted in the United States of America.
Columbia Beyond BRICs ETF(1)
Columbia EM Core ex-China ETF(1)
Columbia EM Quality Dividend ETF(1)
Columbia Emerging Markets Consumer ETF(3)
Columbia India Consumer ETF(2)
Columbia India Infrastructure ETF(3)
Columbia India Small Cap ETF(3)
(1) The statement of assets and liabilities, including the portfolio of investments, as of March 31, 2019, the related statement of operations for the year ended March 31, 2019, the statements of changes in net assets for each of the two years in the period ended March 31, 2019, including the related notes, and the financial highlights for each of the three years in the period ended March 31, 2019
(2) The statement of assets and liabilities (consolidated), including the portfolio of investments (consolidated), as of March 31, 2019, the related statement of operations (consolidated) for the year ended March 31, 2019, the statements of changes in net assets (consolidated) for each of the two years in the period ended March 31, 2019, including the related notes, and the financial highlights (consolidated) for each of the three years in the period ended March 31, 2019
(3) The statement of assets and liabilities, including the portfolio of investments, as of March 31, 2019, the related statement of operations (consolidated) for the year ended March 31, 2019, the statements of changes in net assets (consolidated) for each of the two years in the period ended March 31, 2019, including the related notes, and the financial highlights (consolidated) for each of the three years in the period ended March 31, 2019
The financial statements of the Funds as of and for the year ended March 31, 2016, and the financial highlights for each of the periods ended on or prior to March 31, 2016 (not presented herein, other than the financial highlights) were audited by other auditors whose report dated May 26, 2016 expressed unqualified opinions on those financial statements and financial highlights.
Basis for Opinions
These financial statements are the responsibility of the Funds' management. Our responsibility is to express an opinion on the Funds' financial statements based on our audits. We are a public accounting firm registered with the Public Company Accounting Oversight Board (United States) (PCAOB) and are required to be independent with respect to the Funds in accordance with the U.S. federal securities laws and the applicable rules and regulations of the Securities and Exchange Commission and the PCAOB.
We conducted our audits of these financial statements in accordance with the standards of the PCAOB. Those standards require that we plan and perform the audit to obtain reasonable assurance about whether the financial statements are free of material misstatement, whether due to error or fraud.
Our audits included performing procedures to assess the risks of material misstatement of the financial statements, whether due to error or fraud, and performing procedures that respond to those risks. Such procedures included examining, on a test basis, evidence regarding the amounts and disclosures in the financial statements. Our audits also included evaluating the accounting principles used and significant estimates made by management, as well as evaluating the overall presentation of the financial statements. Our procedures included confirmation of securities owned as of March 31, 2019 by correspondence with the custodian, transfer agent and brokers; when replies were not received from brokers, we performed other auditing procedures. We believe that our audits provide a reasonable basis for our opinions.
/s/PricewaterhouseCoopers LLP
Minneapolis, Minnesota
May 21, 2019
We have served as the auditor of one or more investment companies within the Columbia Funds Complex since 1977.
Columbia ETF Trust II | Annual Report 2019
91
FEDERAL INCOME TAX INFORMATION
(Unaudited)
The Funds hereby designate the following tax attributes for the fiscal year ended March 31, 2019. Shareholders will be notified in early 2020 of the amounts for use in preparing 2019 income tax returns.
| Qualified dividend income | Foreign taxes paid | Foreign taxes paid per share | Foreign source income | Foreign source income per share | |||||||||||||||||||
Columbia Beyond BRICs ETF | 81.74 | % | $ | 164,637 | $ | 0.11 | $ | 1,902,755 | $ | 1.27 | |||||||||||||
Columbia EM Core ex-China ETF | 52.73 | % | $ | 40,380 | $ | 0.09 | $ | 308,812 | $ | 0.69 | |||||||||||||
Columbia EM Quality Dividend ETF | 54.21 | % | $ | 32,764 | $ | 0.08 | $ | 347,707 | $ | 0.87 | |||||||||||||
Columbia Emerging Markets Consumer ETF | 100.00 | % | $ | 531,478 | $ | 0.04 | $ | 8,560,990 | $ | 0.67 | |||||||||||||
Columbia India Consumer ETF | 100.00 | % | $ | — | $ | — | $ | — | $ | — | |||||||||||||
Columbia India Infrastructure ETF | 100.00 | % | $ | — | $ | — | $ | — | $ | — | |||||||||||||
Columbia India Small Cap ETF | 0.00 | % | $ | — | $ | — | $ | — | $ | — | |||||||||||||
Qualified dividend income. For taxable, non-corporate shareholders, the percentage of ordinary income distributed during the fiscal year that represents qualified dividend income subject to reduced tax rates.
Foreign Taxes. The Fund makes the election to pass through to shareholders the foreign taxes paid. Eligible shareholders may claim a foreign tax credit. These taxes, and the corresponding foreign source income, are provided.
Columbia ETF Trust II | Annual Report 2019
92
TRUSTEES AND OFFICERS
The Board oversees the Funds' operations and appoints officers who are responsible for day-to-day business decisions based on policies set by the Board. The following table provides basic biographical information about the Funds' Trustees as of the printing of this report, including their principal occupations during the past five years, although specific titles for individuals may have varied over the period. Certain Trustees may have served as a Trustee to other Funds in the Columbia Funds Complex prior to the date set forth in the Position Held with the Trusts and Length of Service column. Under current Board policy, Trustees not affiliated with the Investment Manager generally may serve through the end of the calendar year in which they reach the mandatory retirement age established by the Board.
Independent trustees
| Name, address, year of birth | Position held with the Trusts and length of service | Principal occupation(s) during the past five years and other relevant professional experience | Number of Funds in the Columbia Funds complex overseen | Other directorships held by Trustee during the past five years | |||||||||||||||
| George S. Batejan c/o Columbia Management Investment Advisers, LLC, 225 Franklin Street, Mail Drop BX32 05228, Boston, MA 02110 1953 | Trustee since January 2017 for each Trust | Executive Vice President, Global Head of Technology and Operations, Janus Capital Group, Inc., 2010-2016 | 123 | Former Chairman of the Board, NICSA (National Investment Company Services Association) (Executive Committee, Nominating Committee and Governance Committee), 2014-2016; former Director, Intech Investment Management, 2011-2016; former Board Member, Metro Denver Chamber of Commerce, 2015-2016; former Advisory Board Member, University of Colorado Business School, 2015-2018 | |||||||||||||||
| Kathleen Blatz c/o Columbia Management Investment Advisers, LLC, 225 Franklin Street, Mail Drop BX32 05228, Boston, MA 02110 1954 | Trustee since April 2016 for CET I and September 2016 for CET II | Attorney, specializing in arbitration and mediation; Chief Justice, Minnesota Supreme Court, 1998-2006; Associate Justice, Minnesota Supreme Court, 1996-1998; Fourth Judicial District Court Judge, Hennepin County, 1994-1996; Attorney in private practice and public service, 1984-1993; State Representative, Minnesota House of Representatives, 1979-1993, which included service on the Tax and Financial Institutions and Insurance Committees; Member and Interim Chair, Minnesota Sports Facilities Authority, January-July 2017; Interim President and Chief Executive Officer, Blue Cross and Blue Shield of Minnesota (health care insurance), February-July 2018 | 123 | Trustee, BlueCross BlueShield of Minnesota since 2009 (Chair of the Business Development Committee 2014-2017; Chair of the Governance Committee since 2017); Chair of the Robina Foundation since August 2013; former Member and Chair of the Board, Minnesota Sports Facilities Authority, January 2017-July 2017 | |||||||||||||||
Columbia ETF Trust II | Annual Report 2019
93
TRUSTEES AND OFFICERS (continued)
Independent trustees (continued)
| Name, address, year of birth | Position held with the Trusts and length of service | Principal occupation(s) during the past five years and other relevant professional experience | Number of Funds in the Columbia Funds complex overseen | Other directorships held by Trustee during the past five years | |||||||||||||||
| Edward J. Boudreau, Jr. c/o Columbia Management Investment Advisers, LLC, 225 Franklin Street, Mail Drop BX32 05228, Boston, MA 02110 1944 | Chair of the Board since January 2018; Trustee since April 2016 for CET I and September 2016 for CET II | Managing Director, E.J. Boudreau & Associates (consulting) since 2000; FINRA Industry Arbitrator, 2002-present; Chairman and Chief Executive Officer, John Hancock Investments (asset management), Chairman and Interested Trustee for open-end and closed-end funds offered by John Hancock, 1989-2000; John Hancock Mutual Life Insurance Company, including Senior Vice President and Treasurer and Senior Vice President Information Technology, 1968-1988 | 123 | Former Trustee, Boston Museum of Science (Chair of Finance Committee), 1985-2013; former Trustee, BofA Funds Series Trust (11 funds), 2005-2011 | |||||||||||||||
| Pamela G. Carlton c/o Columbia Management Investment Advisers, LLC, 225 Franklin Street, Mail Drop BX32 05228, Boston, MA 02110 1954 | Trustee since April 2016 for CET I and September 2016 for CET II | President, Springboard — Partners in Cross Cultural Leadership (consulting company) since 2003; Managing Director of US Equity Research, JP Morgan Chase, 1999-2003; Director of US Equity Research, Chase Asset Management, 1996-1999; Co-Director Latin America Research, 1993-1996, COO Global Research, 1992-1996, Co-Director of US Research, 1991-1992, Investment Banker, Morgan Stanley, 1982-1991 | 123 | Trustee, New York Presbyterian Hospital Board (Executive Committee and Chair of Human Resources Committee) since 1996; Director, Laurel Road Bank (Audit Committee) since 2017 | |||||||||||||||
| Patricia M. Flynn c/o Columbia Management Investment Advisers, LLC, 225 Franklin Street, Mail Drop BX32 05228, Boston, MA 02110 1950 | Trustee since April 2016 for CET I and September 2016 for CET II | Trustee Professor of Economics and Management, Bentley University since 1976 (also teaches and conducts research on corporate governance); Dean, McCallum Graduate School of Business, Bentley University, 1992-2002 | 123 | Trustee, MA Taxpayers Foundation since 1997; Board of Directors, The MA Business Roundtable since 2003; Board of Governors, Innovation Institute, MA Technology Collaborative since 2010 | |||||||||||||||
| Brian J. Gallagher c/o Columbia Management Investment Advisers, LLC, 225 Franklin Street Mail Drop BX32 05228, Boston, MA 02110 1954 | Trustee since December 2017 for each Trust | Retired; Partner with Deloitte & Touche LLP and its predecessors, 1977-2016 | 121 | Trustee, Catholic Schools Foundation since 2004 | |||||||||||||||
| Catherine James Paglia c/o Columbia Management Investment Advisers, LLC, 225 Franklin Street, Mail Drop BX32 05228, Boston, MA 02110 1952 | Trustee since April 2016 for CET I and September 2016 for CET II | Director, Enterprise Asset Management, Inc. (private real estate and asset management company) since September 1998; Managing Director and Partner, Interlaken Capital, Inc., 1989-1997; Managing Director, Morgan Stanley, 1982-1989; Vice President, Investment Banking, 1980-1982, Associate, Investment Banking, 1976-1980, Dean Witter Reynolds, Inc. | 123 | Director, Valmont Industries, Inc. (irrigation systems manufacturer) since 2012; Trustee, Carleton College (on the Investment Committee); Trustee, Carnegie Endowment for International Peace (on the Investment Committee) | |||||||||||||||
Columbia ETF Trust II | Annual Report 2019
94
TRUSTEES AND OFFICERS (continued)
Independent trustees (continued)
| Name, address, year of birth | Position held with the Trusts and length of service | Principal occupation(s) during the past five years and other relevant professional experience | Number of Funds in the Columbia Funds complex overseen | Other directorships held by Trustee during the past five years | |||||||||||||||
| Anthony M. Santomero c/o Columbia Management Investment Advisers, LLC, 225 Franklin Street, Mail Drop BX32 05228, Boston, MA 02110 1946 | Trustee since April 2016 for CET I and September 2016 for CET II | Richard K. Mellon Professor Emeritus of Finance, The Wharton School, University of Pennsylvania, since 2002; Senior Advisor, McKinsey & Company (consulting), 2006-2008; President, Federal Reserve Bank of Philadelphia, 2000-2006; Professor of Finance, The Wharton School, University of Pennsylvania, 1972-2002 | 123 | Trustee, Penn Mutual Life Insurance Company since March 2008; Director, Renaissance Reinsurance Ltd. since May 2008; former Trustee, BofA Funds Series Trust (11 funds), 2008-2011; former Director, Citigroup Inc. and Citibank, N.A., 2009-2019 | |||||||||||||||
| Minor M. Shaw c/o Columbia Management Investment Advisers, LLC, 225 Franklin Street, Mail Drop BX32 05228, Boston, MA 02110 1947 | Trustee since April 2016 for CET I and September 2016 for CET II | President, Micco LLC (private investments) since 2011; President, Micco Corp. (family investment business), 1998-2011 | 123 | Director, BlueCross BlueShield of South Carolina since April 2008; Board Chair, Hollingsworth Funds since 2016; Advisory Board member, Duke Energy Corp. since October 2016; Chair of the Duke Endowment; Chair of Greenville — Spartanburg Airport Commission; former Trustee, BofA Funds Series Trust (11 funds), 2003-2011; former Director, Piedmont Natural Gas, 2004-2016; former Director, National Association of Corporate Directors, Carolinas Chapter, 2013-2018 | |||||||||||||||
| Sandra Yeager c/o Columbia Management Investment Advisers, LLC, 225 Franklin Street Mail Drop BX32 05228, Boston, MA 02110 1964 | Trustee since 12/17 | Retired; President and founder, Hanoverian Capital, LLC (SEC registered investment advisor firm), 2008-2016; Managing Director, DuPont Capital, 2006-2008; Managing Director, Morgan Stanley Investment Management, 2004-2006; Senior Vice President, Alliance Bernstein, 1990-2004 | 121 | Director, NAPE Education Foundation since October 2016 | |||||||||||||||
Columbia ETF Trust II | Annual Report 2019
95
TRUSTEES AND OFFICERS (continued)
Interested trustee affiliated with Investment Manager*
| Name, address, year of birth | Position held with the Trusts and length of service | Principal occupation(s) during the past five years and other relevant professional experience | Number of Funds in the Columbia Funds complex overseen | Other directorships held by Trustee during the past five years | |||||||||||||||
| William F. Truscott c/o Columbia Management Investment Advisers, LLC, 225 Franklin St.Boston, MA 02110 1960 | Trustee and Senior Vice President since April 2016 for CET I and September 2016 for CET II | Chairman of the Board and President, Columbia Management Investment Advisers, LLC since May 2010 and February 2012, respectively; Chief Executive Officer, Global Asset Management, Ameriprise Financial, Inc. since September 2012 (previously Chief Executive Officer, U.S. Asset Management & President, Annuities, May 2010-September 2012); Director and Chief Executive Officer, Columbia Management Investment Distributors, Inc. since May 2010 and February 2012, respectively; Chairman of the Board and Chief Executive Officer, RiverSource Distributors, Inc. since 2006; Director, Threadneedle Asset Management Holdings, SARL since 2014; President and Chief Executive Officer, Ameriprise Certificate Company, 2006-August 2012. | 192 | Chairman of the Board, Columbia Management Investment Advisers, LLC since May 2010; Director, Columbia Management Investment Distributors, Inc. since May 2010; former Director, Ameriprise Certificate Company, 2006-January 2013 | |||||||||||||||
* Interested person (as defined under the 1940 Act) by reason of being an officer, director, security holder and/or employee of the Investment Manager or Ameriprise Financial.
The Statement of Additional Information has additional information about the Funds' Board members and is available without charge, upon request by calling 888.800.4347 or visiting columbiathreadneedleus.com/etfs.
Columbia ETF Trust II | Annual Report 2019
96
TRUSTEES AND OFFICERS (continued)
The Board has appointed officers who are responsible for day-to-day business decisions based on policies it has established. The officers serve at the pleasure of the Board. The following table provides basic information about the Officers of the Funds as of the printing of this report, including principal occupations during the past five years, although their specific titles may have varied over the period. In addition to Mr. Truscott, who is Senior Vice President, the Funds' other officers are:
Fund officers
| Name, address and year of birth | Position and year first appointed to position for any Fund in the Columbia Funds complex or a predecessor thereof | Principal occupation(s) during past five years | |||||||||
| Christopher O. Petersen 5228 Ameriprise Financial Center Minneapolis, MN 55474 Born 1970 | President and Principal Executive Officer (2015) | Vice President and Lead Chief Counsel, Ameriprise Financial, Inc. since January 2015 (previously, Vice President and Chief Counsel, January 2010-December 2014); officer of Columbia Funds and affiliated funds since 2007. | |||||||||
| Michael G. Clarke 225 Franklin Street Boston, MA 02110 Born 1969 | Chief Financial Officer (Principal Financial Officer) (2009) and Senior Vice President (2019) | Vice President — Accounting and Tax, Columbia Management Investment Advisers, LLC, since May 2010; senior officer of Columbia Funds and affiliated funds since 2002 (previously, Treasurer and Chief Accounting Officer, January 2009-January 2019 and December 2015-January 2019, respectively). | |||||||||
| Marybeth Pilat 225 Franklin Street Boston, MA 02110 Born 1968 | Treasurer and Chief Accounting Officer (Principal Accounting Officer) (2019) | Vice President — Product Pricing and Administration, Columbia Management Investment Advisers, LLC, since May 2017; Director — Fund Administration, Calvert Investments, August 2015-March 2017; Vice President — Fund Administration, Legg Mason, May 2015-July 2015; Vice President — Fund Administration, Columbia Management Investment Advisers, LLC, May 2010-April 2015. | |||||||||
| Paul B. Goucher 485 Lexington Avenue New York, NY 10017 Born 1968 | Senior Vice President (2011), and Assistant Secretary (2008) | Senior Vice President and Assistant General Counsel, Ameriprise Financial, Inc. since January 2017 (previously Vice President and Lead Chief Counsel, November 2008-January 2017 and January 2013-January 2017, respectively); Vice President, Chief Legal Officer and Assistant Secretary, Columbia Management Investment Advisers, LLC since March 2015 (previously Vice President and Assistant Secretary, May 2010-March 2015). | |||||||||
| Thomas P. McGuire 225 Franklin Street Boston, MA 02110 Born 1972 | Senior Vice President and Chief Compliance Officer (2012) | Vice President — Asset Management Compliance, Ameriprise Financial, Inc., since May 2010; Chief Compliance Officer, Ameriprise Certificate Company since September 2010. | |||||||||
| Colin Moore 225 Franklin Street Boston, MA 02110 Born 1958 | Senior Vice President (2010) | Executive Vice President and Global Chief Investment Officer, Ameriprise Financial, Inc., since July 2013; Executive Vice President and Global Chief Investment Officer, Columbia Management Investment Advisers, LLC since July 2013. | |||||||||
| Ryan C. Larrenaga 225 Franklin Street Boston, MA 02110 Born 1970 | Senior Vice President (2017), Chief Legal Officer (2017), and Secretary (2015) | Vice President and Chief Counsel, Ameriprise Financial, Inc. since August 2018 (previously, Vice President and Group Counsel, August 2011-August 2018); officer of Columbia Funds and affiliated funds since 2005. | |||||||||
| Michael E. DeFao 225 Franklin Street Boston, MA 02110 Born 1968 | Vice President (2011) and Assistant Secretary (2010) | Vice President and Chief Counsel, Ameriprise Financial, Inc. since May 2010. | |||||||||
Columbia ETF Trust II | Annual Report 2019
97
TRUSTEES AND OFFICERS (continued)
Fund officers (continued)
| Name, address and year of birth | Position and year first appointed to position for any Fund in the Columbia Funds complex or a predecessor thereof | Principal occupation(s) during past five years | |||||||||
| Amy Johnson 5228 Ameriprise Financial Center Minneapolis, MN 55474 Born 1965 | Vice President (2006) | Managing Director and Global Head of Operations, Columbia Management Investment Advisers, LLC since April 2016 (previously Managing Director and Chief Operating Officer, 2010-2016). | |||||||||
| Lyn Kephart-Strong 5228 Ameriprise Financial Center Minneapolis, MN 55474 Born 1960 | Vice President (2015) | President, Columbia Management Investment Services Corp. since October 2014; Vice President & Resolution Officer, Ameriprise Trust Company since August 2009. | |||||||||
Columbia ETF Trust II | Annual Report 2019
98
ADDITIONAL INFORMATION
Proxy voting policies and procedures
A description of the Trust's proxy voting policies and procedures that the Trust uses to determine how to vote proxies relating to portfolio securities, and each Fund's proxy voting record for the most recent twelve-month period ended June 30 is available, without charge, by visiting columbiathreadneedleus.com/etfs or searching the website of the Securities and Exchange Commission (the SEC) at sec.gov.
Quarterly schedule of investments
The Funds file a complete schedule of portfolio holdings with the SEC for the first and third quarters of each fiscal year on Form N-Q or Form N-PORT (available for filings after March 31, 2019). The Funds' Form N-Q or Form N-PORT is available on the SEC's website at sec.gov. Each Fund's complete schedule of portfolio holdings, as filed on Form N-Q or Form N-PORT, can also be obtained without charge, upon request, by calling 888.800.4347.
Additional Fund information
For more information about the Funds, please visit columbiathreadneedleus.com/etfs or call 888.800.4347.
Fund investment manager
Columbia Management Investment Advisers, LLC
225 Franklin Street
Boston, MA 02110
Fund distributor
ALPS Distributors, Inc.
1290 Broadway
Suite 1100
Denver, CO 80203
ALPS Distributors, Inc. is not affiliated with Columbia Management Investment Advisers, LLC.
Fund administrator, custodian & transfer agent
The Bank of New York Mellon Corp.
240 Greenwich Street
New York, NY 10286
The Bank of New York Mellon Corp. is not affiliated with Columbia Management Investment Advisers, LLC.
Columbia ETF Trust II | Annual Report 2019
99
[THIS PAGE INTENTIONALLY LEFT BLANK]
Columbia ETF Trust II | Annual Report 2019
100
[THIS PAGE INTENTIONALLY LEFT BLANK]
Columbia ETF Trust II | Annual Report 2019
101
Columbia ETF Trust II
225 Franklin Street
Boston, MA 02110

Investors should consider the investment objectives, risks, charges and expenses of an exchange-traded fund (ETF) carefully before investing. For a free prospectus and summary prospectus, which contains this and other important information about the ETFs, visit columbiathreadneedleus.com/etfs. Read the prospectus and summary prospectus carefully before investing. Columbia Management Investment Advisers, LLC serves as the investment manager to the ETFs. The ETFs are distributed by ALPS Distributors, Inc., which is not affiliated with Columbia Management Investment Advisers, LLC, or its parent company, Ameriprise Financial, Inc.
© 2019 Columbia Management Investment Advisers, LLC.
columbiathreadneedleus.com/etfs
ANN280_03_J01_(5/19)
Item 2. Code of Ethics.
(a) The registrant has adopted a code of ethics that applies to the registrant’s principal executive officer, principal financial officer, principal accounting officer or controller, or persons performing similar functions, regardless of whether these individuals are employed by the registrant or a third party.
(b) During the period covered by this report, there were not any amendments to a provision of the code of ethics that applies to the registrant’s principal executive officer, principal financial officer, principal accounting officer or controller, or persons performing similar functions, regardless of whether these individuals are employed by the registrant or a third party, and that relates to any element of the code of ethics definition enumerated in paragraph (b) of this Item.
(c) During the period covered by this report, there were no waivers, including any implicit waivers, from a provision of the code of ethics to the registrant’s principal executive officer, principal financial officer, principal accounting officer or controller, or persons performing similar functions, regardless of whether these individuals are employed by the registrant or a third party that relates to one or more of the items set forth in paragraph (b) of this Item.
Item 3. Audit Committee Financial Expert.
The registrant’s Board of Trustees has determined that Pamela G. Carlton, Anthony M. Santomero, Brian J. Gallagher and Catherine James Paglia, each of whom are members of the registrant’s Board of Trustees and Audit Committee, each qualify as an audit committee financial expert. Ms. Carlton, Mr. Santomero, Mr. Gallagher and Ms. Paglia are each independent trustees, as defined in paragraph (a)(2) of this item’s instructions.
Item 4. Principal Accountant Fees and Services.
Fee information below is disclosed for the seven series of the registrant whose reports to stockholders are included in this annual filing. Fiscal Year 2018 also includes fees from two funds that liquidated during the period.
(a) Audit Fees. Aggregate Audit Fees billed by the principal accountant for professional services rendered during the fiscal years ended March 31, 2019 and March 31, 2018 are approximately as follows:
2019 |
| 2018 |
| ||
$ | 94,500 |
| $ | 94,500 |
|
Audit Fees include amounts related to the audit of the registrant’s annual financial statements or services that are normally provided by the accountant in connection with statutory and regulatory filings or engagements for those fiscal years.
(b) Audit-Related Fees. Aggregate Audit-Related Fees billed to the registrant by the principal accountant for professional services rendered during the fiscal years ended March 31, 2019 and March 31, 2018 are approximately as follows:
2019 |
| 2018 |
| ||
$ | 0 |
| $ | 0 |
|
Audit-Related Fees include amounts for assurance and related services by the principal accountant that are reasonably related to the performance of the audit of the registrant’s financial statements and are not reported in Audit Fees above. In fiscal year 2019, Audit-Related Fees consist of agreed-upon procedures performed for semi-annual shareholder reports.
During the fiscal years ended March 31, 2019 and March 31, 2018, there were no Audit-Related Fees billed by the registrant’s principal accountant to the registrant’s investment adviser (not including any sub-adviser whose role is primarily portfolio management and is subcontracted with or overseen by another investment adviser) and any entity controlling, controlled by, or under common control with the adviser that provides ongoing services to the registrant for an engagement that related directly to the operations and financial reporting of the registrant.
(c) Tax Fees. Aggregate Tax Fees billed by the principal accountant to the registrant for professional services rendered during the fiscal years ended March 31, 2019 and March 31, 2018 are approximately as follows:
2019 |
| 2018 |
| ||
$ | 78,100 |
| $ | 89,100 |
|
Tax Fees include amounts for the review of annual tax returns, the review of required shareholder distribution calculations and typically include amounts for professional services by the principal accountant for tax compliance, tax advice and tax planning. Fiscal Year 2018 also includes Tax Fees for agreed-upon procedures related to a fund liquidation and a final tax return.
During the fiscal years ended March 31, 2019 and March 31, 2018, there were no Tax Fees billed by the registrant’s principal accountant to the registrant’s investment adviser (not including any sub-adviser whose role is primarily portfolio management and is subcontracted with or overseen by another investment adviser) and any entity controlling, controlled by, or under common control with the adviser that provides ongoing services to the registrant for an engagement that related directly to the operations and financial reporting of the registrant.
(d) All Other Fees. Aggregate All Other Fees billed by the principal accountant to the registrant for professional services rendered during the fiscal years ended March 31, 2019 and March 31, 2018 are approximately as follows:
2019 |
| 2018 |
| ||
$ | 0 |
| $ | 0 |
|
All Other Fees include amounts for products and services provided by the principal accountant, other than the services reported in paragraphs (a) through (c) above.
During the fiscal years ended March 31, 2019 and March 31, 2018, there were no Aggregate All Other Fees billed by the registrant’s principal accountant to the registrant’s investment adviser (not including any sub-adviser whose role is primarily portfolio management and is subcontracted with or overseen by another investment adviser) and any entity controlling, controlled by, or under common control with the adviser that provides ongoing services to the registrant for an engagement that related directly to the operations and financial reporting of the registrant.
(e)(1) Audit Committee Pre-Approval Policies and Procedures
The registrant’s Audit Committee is required to pre-approve the engagement of the registrant’s independent auditors to provide audit and non-audit services to the registrant and non-audit services to its investment adviser (excluding any sub-adviser whose role is primarily portfolio management and is sub-contracted or overseen by another investment adviser (the “Adviser”) or any entity controlling, controlled by or under common control with the Adviser that provides ongoing services to the Fund (a “Control Affiliate”) if the engagement relates directly to the operations and financial reporting of the registrant.
The Audit Committee has adopted a Policy for Engagement of Independent Auditors for Audit and Non-Audit Services (the “Policy”). The Policy sets forth the understanding of the Audit Committee regarding the engagement of the registrant’s independent accountants to provide (i) audit and permissible audit-related, tax and other services to the registrant (“Fund Services”); (ii) non-audit services to the registrant’s Adviser and any Control Affiliates, that relates directly to the operations and financial reporting of a Fund (“Fund-related Adviser Services”); and (iii) certain other audit and non-audit services to the registrant’s Adviser and its Control Affiliates. A service will require specific pre-approval by the Audit Committee if it is to be provided by the Fund’s independent auditor; provided, however, that pre-approval of non-audit services to the Fund, the Adviser or Control Affiliates may be waived if certain de minimis requirements set forth in the SEC’s rules are met.
Under the Policy, the Audit Committee may delegate pre-approval authority to any pre-designated member or members who are independent board members. The member(s) to whom such authority is delegated must report, for informational purposes only, any pre-approval decisions to the Audit Committee at its next regular meeting. The Audit Committee’s responsibilities with respect to the pre-approval of services performed by the independent auditor may not be delegated to management.
On an annual basis, at a regularly scheduled Audit Committee meeting, the Fund’s Treasurer or other Fund officer shall submit to the Audit Committee a schedule of the types of Fund Services and Fund-related Adviser Services that are subject to specific pre-approval. This schedule will provide a description of each type of service that is subject to specific pre-approval, along with total projected fees for each service. The pre-approval will generally cover a one-year period. The Audit Committee will review and approve the types of services and the projected fees for the next one-year period and may add to, or subtract from, the list of pre-approved services from time to time, based on subsequent determinations. This specific approval acknowledges that the Audit Committee is in agreement with the specific types of services that the independent auditor will be permitted to perform and the projected fees for each service.
The Fund’s Treasurer or other Fund officer shall report to the Audit Committee at each of its regular meetings regarding all Fund Services or Fund-related Adviser Services provided since the last such report was rendered, including a description of the services, by category, with forecasted fees for the
annual reporting period, proposed changes requiring specific pre-approval and a description of services provided by the independent auditor, by category, with actual fees during the current reporting period.
*****
(e)(2) 100% of the services performed for items (b) through (d) above during 2019 and 2018 were pre-approved by the registrant’s Audit Committee.
(f) Not applicable.
(g) The aggregate non-audit fees billed by the registrant’s accountant for services rendered to the registrant, and rendered to the registrant’s investment adviser (not including any sub-adviser whose role is primarily portfolio management and is subcontracted with or overseen by another investment adviser), and any entity controlling, controlled by, or under common control with the adviser that provides ongoing services to the registrant for the fiscal years ended March 31, 2019 and March 31, 2018 are approximately as follows:
2019 |
| 2018 |
| ||
$ | 78,100 |
| $ | 89,100 |
|
(h) The registrant’s Audit Committee of the Board of Directors has considered whether the provision of non-audit services that were rendered to the registrant’s adviser (not including any sub-adviser whose role is primarily portfolio management and is subcontracted with or overseen by another investment adviser), and any entity controlling, controlled by, or under common control with the investment adviser that provides ongoing services to the registrant that were not pre-approved pursuant to paragraph (c)(7)(ii) of Rule 2-01 of Regulation S-X, is compatible with maintaining the principal accountant’s independence.
Item 5. Audit Committee of Listed Registrants.
(a) The Registrant is an issuer as defined in Section 10A-3 of the Securities Exchange Act of 1934 and has a separately-designated standing Audit Committee in accordance with Section 3(a)(58)(A) of such Act. The Board’s independent Trustees, Pamela G. Carlton, Anthony Santomero, Brian J. Gallagher and Catherine James Paglia are all members of the Audit Committee.
(b) Not Applicable.
Item 6. Investments
(a) The registrant’s “Schedule I — Investments in securities of unaffiliated issuers” (as set forth in 17 CFR 210.12-12) is included in Item 1 of this Form N-CSR.
(b) Not applicable.
Item 7. Disclosure of Proxy Voting Policies and Procedures for Closed-End Management Investment Companies.
Not applicable.
Item 8. Portfolio Managers of Closed-End Management Investment Companies.
Not applicable.
Item 9. Purchases of Equity Securities by Closed-End Management Investment Company and Affiliated Purchasers.
Not applicable.
Item 10. Submission of Matters to a Vote of Security Holders.
There were no material changes to the procedures by which shareholders may recommend nominees to the registrant’s board of directors.
Item 11. Controls and Procedures.
(a) The registrant’s principal executive officer and principal financial officers, based on their evaluation of the registrant’s disclosure controls and procedures as of a date within 90 days of the filing of this report, have concluded that such controls and procedures are adequately designed to ensure that information required to be disclosed by the registrant in Form N-CSR is accumulated and communicated to the registrant’s management, including the principal executive officer and principal financial officer, or persons performing similar functions, as appropriate to allow timely decisions regarding required disclosure.
(b) There was no change in the registrant’s internal controls over financial reporting that occurred during the period covered by this report that has materially affected, or is reasonably likely to materially affect, the registrant’s internal control over financial reporting.
Item 12. Disclosure of Securities Lending Activities for Closed-End Management Investment Companies.
Not applicable.
Item 13. Exhibits.
(a)(1) Code of ethics required to be disclosed under Item 2 of Form N-CSR attached hereto as Exhibit 99.CODE ETH.
(a)(2) Certifications pursuant to Rule 30a-2(a) under the Investment Company Act of 1940 (17 CFR 270.30a-2(a)) attached hereto as Exhibit 99.CERT.
(a)(3) Not applicable.
(a)(4) Not applicable.
(b) Certification pursuant to Rule 30a-2(b) under the Investment Company Act of 1940 (17 CFR 270.30a-2(b)) attached hereto as Exhibit 99.906CERT.
SIGNATURES
Pursuant to the requirements of the Securities Exchange Act of 1934 and the Investment Company Act of 1940, the registrant has duly caused this report to be signed on its behalf by the undersigned, thereunto duly authorized.
(Registrant) | Columbia ETF Trust II | ||||
|
| ||||
By (Signature and Title)* | /s/ Christopher O. Petersen | ||||
| Christopher O. Petersen, President and Principal Executive Officer | ||||
|
| ||||
Date | 5/21/2019 |
| |||
Pursuant to the requirements of the Securities Exchange Act of 1934 and the Investment Company Act of 1940, this report has been signed below by the following persons on behalf of the registrant and in the capacities and on the dates indicated.
By (Signature and Title)* | /s/ Christopher O. Petersen | ||
| Christopher O. Petersen, President and Principal Executive Officer | ||
|
| ||
Date | 5/21/2019 | ||
|
| ||
By (Signature and Title)* | /s/ Michael G. Clarke | ||
| Michael G. Clarke, Chief Financial Officer | ||
|
| ||
Date | 5/21/2019 | ||
* Print the name and title of each signing officer under his or her signature.