Exhibit 99.1
|

Exhibit 99.1
invitel
Invitel Holdings A/S
Investor Presentation
invitel
|
2
Disclaimer
This presentation of Invitel Holdings A/S (the “Company”) contains “forward-looking statements”, as that term is defined in the Private Securities Litigation Reform Act of 1995. The Company claims the protection of the safe harbor for forward-looking statements contained in the Private Securities Litigation Reform Act of 1995. These and all forward-looking statements are only predictions or statements of current plans that are constantly under review by the Company. Forward-looking statements by their nature address matters that are, to different degrees, uncertain. These forward-looking statements are all based on currently available operating, financial, and competitive information and are subject to various risks and uncertainties. Actual results could differ materially from those expressed in our forward-looking statements for a variety of reasons, including: fluctuation in foreign exchange rates and interest rates; changes in Hungarian and Central and Eastern European economic conditions and consumer and business spending; the rate of growth of the Internet; the amount that the Company invests in new business opportunities and the timing of those investments; the mix of services sold; competition; management of growth and expansion; future integration of acquired businesses; the performance of our IT Systems; technological changes; the Company’s significant indebtedness; and government regulation. Additional information concerning factors that could cause actual results to differ materially from those in the forward-looking statements is contained in the Company’s filings with the Securities and Exchange Commission, which are available on the Company’s website, www.invitel.hu and on the SEC’s website, www.sec.gov. Accordingly, investors are cautioned not to place undue reliance on forward-looking statements, which speak only as of the date on which they are made. The Company does not undertake to update such statements to reflect the impact of circumstances or events that arise after the date the statements are made. Investors should, however, consult any further disclosures the Company may make in its reports filed with the SEC.
invitel
|
Invitel management and Mid Europa Directors 3
Management
MARTIN LEA – Chief Executive Officer
• Director and CEO of Invitel since June 2004
• 29 years experience in telecom, data communications and support sectors
ROBERT BOWKER – Chief Financial Officer
• Director and CFO of Invitel since May 2004
• 12 years experience in the telecom and finance sectors
Board of Directors
CRAIG BUTCHER
• Senior Partner of Mid Europa
• Served or serves on the Boards of Invitel, Karneval, Ceske Radiokommunikace, T-Mobile, Czech Republic and Bite
NIKOLAUS BETHLEN
• Associate Director of Mid Europa
• Serves on the Boards of Orange Austria and Ceske Radiokommunikace
invitel
 |
2009 – a year of extensive corporate activity 4
February 2009:
• Completion of reorganisation as a Danish limited liability company
March 2009:
• Refinancing of existing credit facilities through a combination of c. €200m of senior credit facilities and a €34 million shareholder loan from TDC
November 2009:
• Mid Europa Partners’ (“Mid Europa”) acquisition of TDC’s majority stake of 64.6%
• Simultaneous deleveraging through repurchase and cancellation of €85 million of cash pay notes and an €11 million partial repayment of loans
• Purchase by Mid Europa of €150 million of PIK notes (87% of entire issue)
• External leverage at Invitel now reduced to 2.8x pro forma for transaction
• On 27th November, 2009 Mid Europa also completed the purchase of Icelandic investor Straumur’s stake in Invitel; increased Mid Europa’s total ownership to 74.4%
invitel
 |
Mid Europa acquisition – summary overview 5
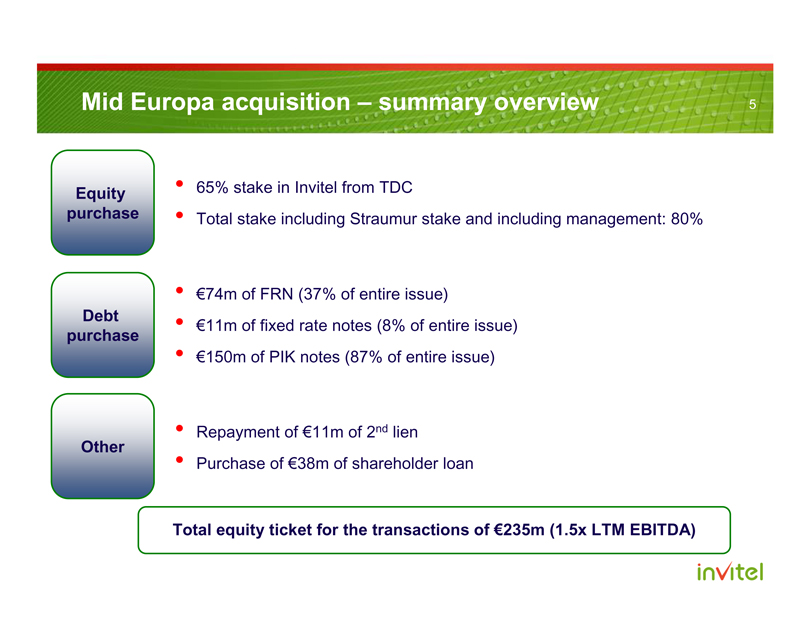
Equity purchase
• 65% stake in Invitel from TDC
• Total stake including Straumur stake and including management: 80%
Debt purchase
• €74m of FRN (37% of entire issue)
• €11m of fixed rate notes (8% of entire issue)
• €150m of PIK notes (87% of entire issue)
Other
• Repayment of €11m of 2nd lien
• Purchase of €38m of shareholder loan
Total equity ticket for the transactions of €235m (1.5x LTM EBITDA)
invitel
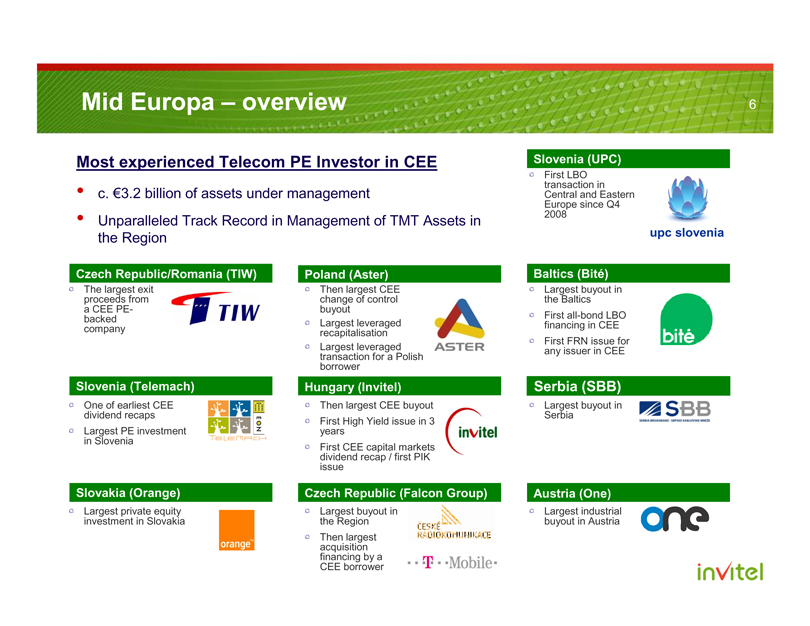 |
Mid Europa – overview 6
Most experienced Telecom PE Investor in CEE
• c. €3.2 billion of assets under management
• Unparalleled Track Record in Management of TMT Assets in the Region
Czech Republic/Romania (TIW)
The largest exit proceeds from a CEE PE-backed company
Slovenia (Telemach)
One of earliest CEE dividend recaps
Largest PE investment in Slovenia
Slovakia (Orange)
Largest private equity investment in Slovakia
Poland (Aster)
Then largest CEE change of control buyout
Largest leveraged recapitalisation
Largest leveraged transaction for a Polish borrower
Hungary (Invitel)
Then largest CEE buyout
First High Yield issue in 3 years
First CEE capital markets dividend recap / first PIK issue
Czech Republic (Falcon Group)
Largest buyout in the Region
Then largest acquisition financing by a CEE borrower
Slovenia (UPC)
First LBO transaction in Central and Eastern Europe since Q4 2008
Baltics (Bité)
Largest buyout in the Baltics
First all-bond LBO financing in CEE
First FRN issue for any issuer in CEE
Serbia (SBB)
Largest buyout in Serbia
Austria (One)
Largest industrial buyout in Austria
invitel
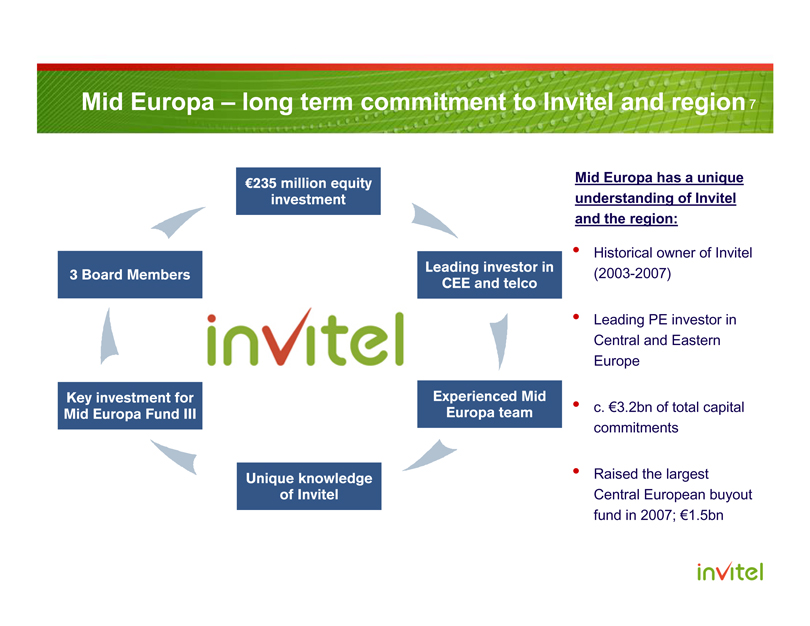 |
Mid Europa – long term commitment to Invitel and region 7
€235 million equity investment
Leading investor in CEE and telco
Experienced Mid Europa team
Unique knowledge of Invitel
Key investment for Mid Europa Fund III
3 Board Members
invitel
Mid Europa has a unique understanding of Invitel and the region:
• Historical owner of Invitel (2003-2007)
• Leading PE investor in Central and Eastern Europe
• c. €3.2bn of total capital commitments
• Raised the largest Central European buyout fund in 2007; €1.5bn
invitel
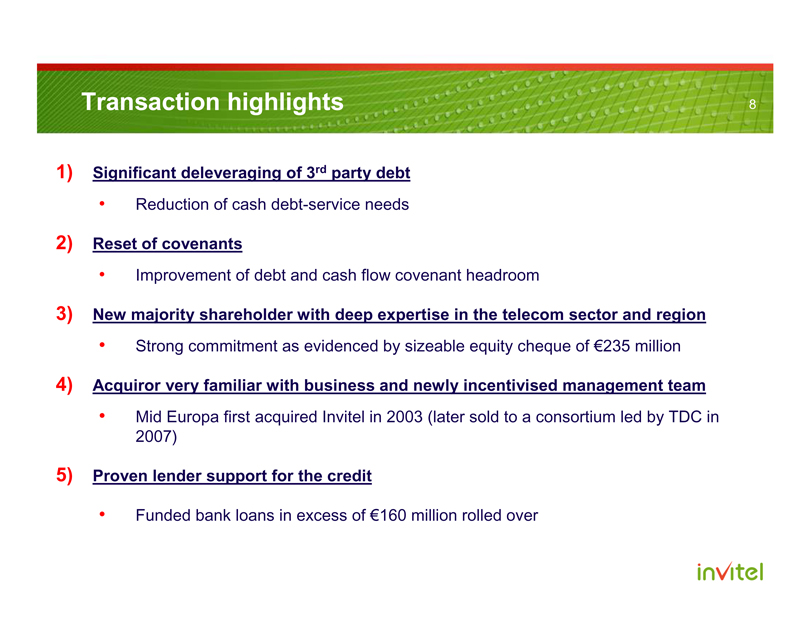 |
Transaction highlights 8
1) Significant deleveraging of 3rd party debt
• Reduction of cash debt-service needs
2) Reset of covenants
• Improvement of debt and cash flow covenant headroom
3) New majority shareholder with deep expertise in the telecom sector and region
• Strong commitment as evidenced by sizeable equity cheque of €235 million
4) Acquiror very familiar with business and newly incentivised management team
• Mid Europa first acquired Invitel in 2003 (later sold to a consortium led by TDC in 2007)
5) Proven lender support for the credit
• Funded bank loans in excess of €160 million rolled over
invitel
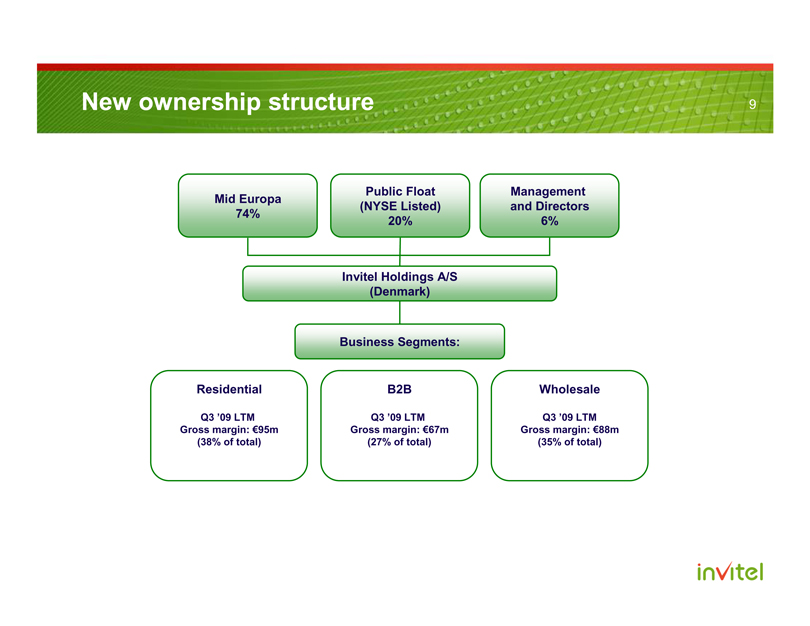 |
New ownership structure 9
Mid Europa 74%
Public Float (NYSE Listed) 20%
Management and Directors 6%
Invitel Holdings A/S (Denmark)
Business Segments:
Residential
Q3 ’09 LTM Gross margin: €95m (38% of total)
B2B
Q3 ’09 LTM Gross margin: €67m (27% of total)
Wholesale
Q3 ’09 LTM Gross margin: €88m (35% of total)
invitel
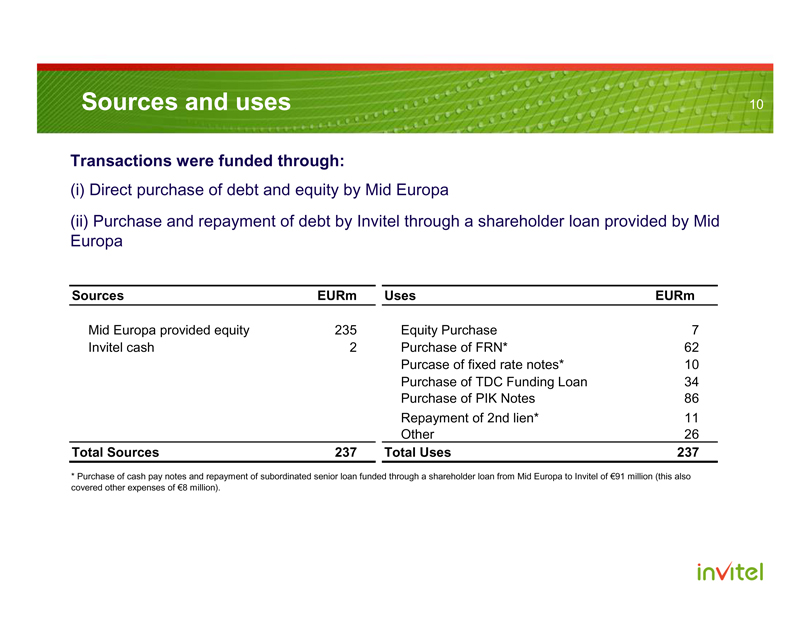 |
Sources and uses 10
Transactions were funded through:
(i) Direct purchase of debt and equity by Mid Europa
(ii) Purchase and repayment of debt by Invitel through a shareholder loan provided by Mid Europa
Sources EURm
Mid Europa provided equity
235
Invitel cash 2
Total Sources 237
Uses EURm
Equity Purchase 7
Purchase of FRN* 62
Purchase of fixed rate notes* 10
Purchase of TDC Funding Loan 34
Purchase of PIK Notes 86
Repayment of 2nd lien* 11
Other 26
Total Uses 237
* Purchase of cash pay notes and repayment of subordinated senior loan funded through a shareholder loan from Mid Europa to Invitel of €91 million (this also covered other expenses of €8 million).
invitel
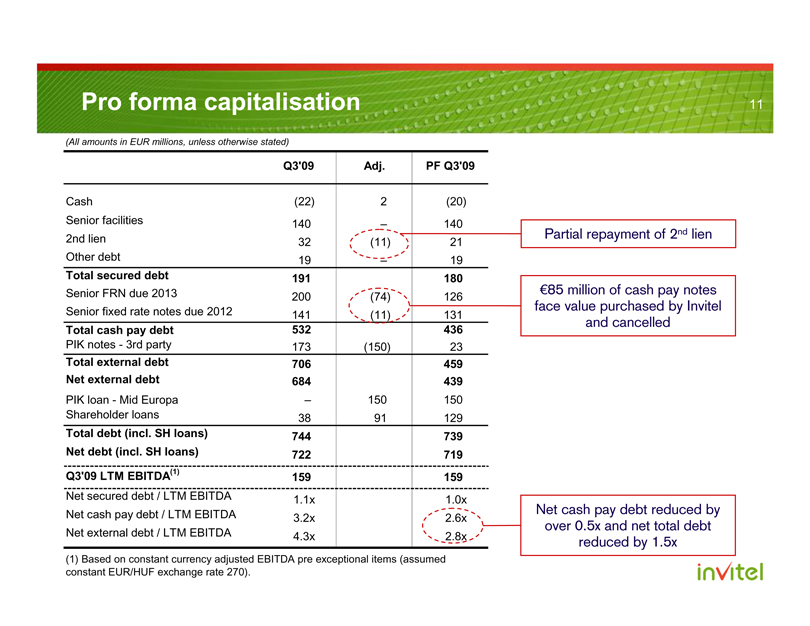 |
Pro forma capitalisation 11
(All amounts in EUR millions, unless otherwise stated)
Q3’09 Adj. PF Q3’09
Cash (22) 2 (20)
Senior facilities 140 – 140
2nd lien 32(11) 21
Other debt 19 – 19
Total secured debt 191 180
Senior FRN due 2013 200 (74) 126
Senior fixed rate notes due 2012 141 (11) 131
Total cash pay debt 532 436
PIK notes - 3rd party 173 (150) 23
Total external debt 706 459
Net external debt 684 439
PIK loan - Mid Europa – 150 150
Shareholder loans 38 91 129
Total debt (incl. SH loans) 744 739
Net debt (incl. SH loans) 722 719
Q3’09 LTM EBITDA(1) 159 159
Net secured debt / LTM EBITDA 1.1x 1.0x
Net cash pay debt / LTM EBITDA 3.2x 2.6x
Net external debt / LTM EBITDA 4.3x 2.8x
(1) Based on constant currency adjusted EBITDA pre exceptional items (assumed constant EUR/HUF exchange rate 270).
Partial repayment of 2nd lien
€85 million of cash pay notes face value purchased by Invitel and cancelled
Net cash pay debt reduced by over 0.5x and net total debt reduced by 1.5x
invitel
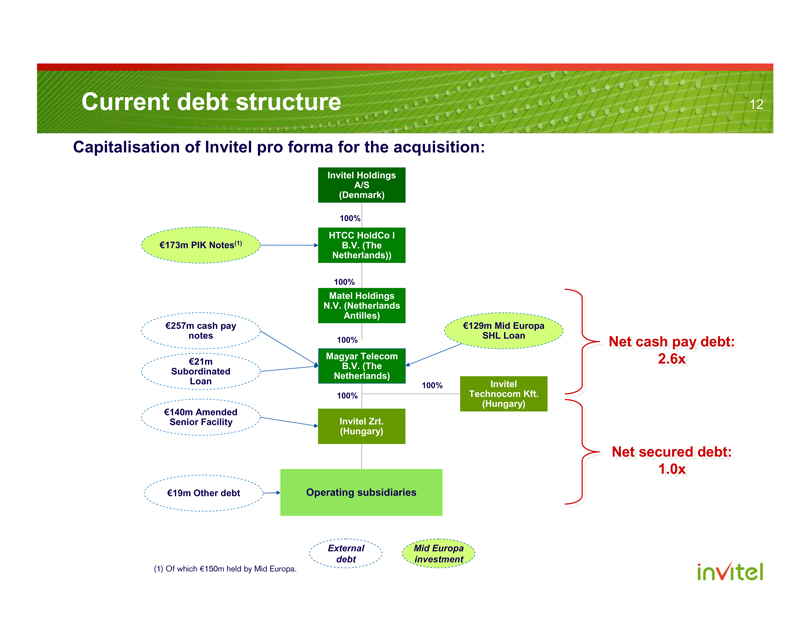 |
Current debt structure 12
Capitalisation of Invitel pro forma for the acquisition:
Invitel Holdings A/S (Denmark)
100%
HTCC HoldCo I B.V. (The Netherlands))
100%
€173m PIK Notes(1)
Matel Holdings N.V. (Netherlands Antilles)
100%
€257m cash pay notes
€21m Subordinated Loan
€129m Mid Europa SHL Loan
Magyar Telecom B.V. (The Netherlands)
100% 100%
€140m Amended Senior Facility
Invitel Zrt. (Hungary)
Invitel Technocom Kft. (Hungary)
€19m Other debt Operating subsidiaries
External debt
Mid Europa investment
(1) Of which €150m held by Mid Europa.
Net cash pay debt: 2.6x
Net secured debt: 1.0x
invitel
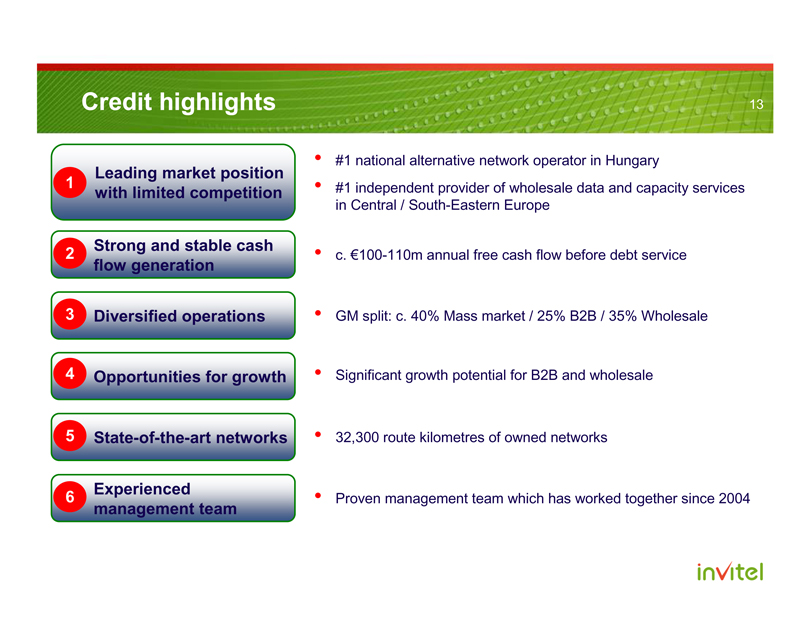 |
Credit highlights 13
1 Leading market position with limited competition
2 Strong and stable cash flow generation
3 Diversified operations
4 Opportunities for growth
5 State-of-the-art networks
6 Experienced management team
• #1 national alternative network operator in Hungary
• #1 independent provider of wholesale data and capacity services in Central / South-Eastern Europe
• c. €100-110m annual free cash flow before debt service
• GM split: c. 40% Mass market / 25% B2B / 35% Wholesale
• Significant growth potential for B2B and wholesale
• 32,300 route kilometres of owned networks
• Proven management team which has worked together since 2004
invitel
|
Agenda 14
1) Introduction
2) Company overview
3) 2009 YTD trading update
Invitel
|
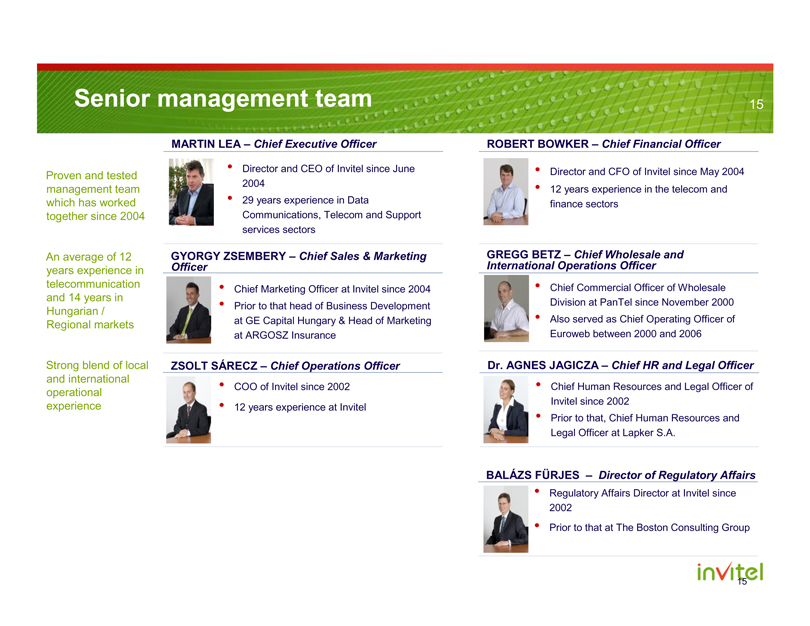
Senior management team 15
MARTIN LEA – Chief Executive Officer
• Director and CEO of Invitel since June Proven and tested 2004 management team which has worked
• 29 years experience in Data together since 2004 Communications, Telecom and Support services sectors
An average of 12 GYORGY ZSEMBERY – Chief Sales & Marketing years experience in Officer telecommunication
• Chief Marketing Officer at Invitel since 2004 and 14 years in
• Prior to that head of Business Development Hungarian / Regional markets at GE Capital Hungary & Head of Marketing at ARGOSZ Insurance
Strong blend of local ZSOLT SÁRECZ – Chief Operations Officer and international
• COO of Invitel since 2002 operational experience
• 12 years experience at Invitel
ROBERT BOWKER – Chief Financial Officer
• Director and CFO of Invitel since May 2004
• 12 years experience in the telecom and finance sectors
GREGG BETZ – Chief Wholesale and International Operations Officer
• Chief Commercial Officer of Wholesale Division at PanTel since November 2000
• Also served as Chief Operating Officer of Euroweb between 2000 and 2006
Dr. AGNES JAGICZA – Chief HR and Legal Officer
• Chief Human Resources and Legal Officer of Invitel since 2002
• Prior to that, Chief Human Resources and Legal Officer at Lapker S.A.
BALÁZS FÜRJES – Director of Regulatory Affairs
• Regulatory Affairs Director at Invitel since 2002
• Prior to that at The Boston Consulting Group
Invitel
15
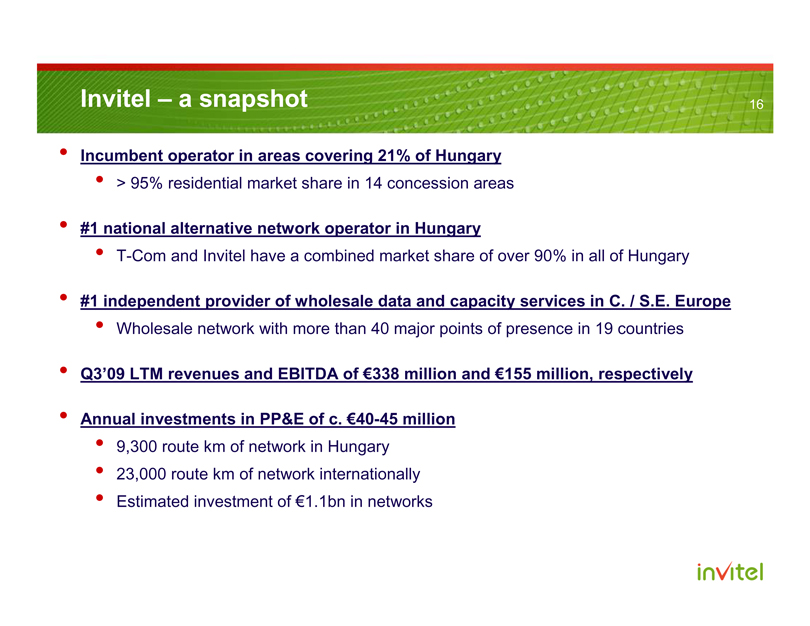 |
Invitel – a snapshot 16
• Incumbent operator in areas covering 21% of Hungary
• > 95% residential market share in 14 concession areas
• #1 national alternative network operator in Hungary
• T-Com and Invitel have a combined market share of over 90% in all of Hungary
• #1 independent provider of wholesale data and capacity services in C. / S.E. Europe
• Wholesale network with more than 40 major points of presence in 19 countries
• Q3’09 LTM revenues and EBITDA of €338 million and €155 million, respectively
• Annual investments in PP&E of c. €40-45 million
• 9,300 route km of network in Hungary
• 23,000 route km of network internationally
• Estimated investment of €1.1bn in networks
Invitel
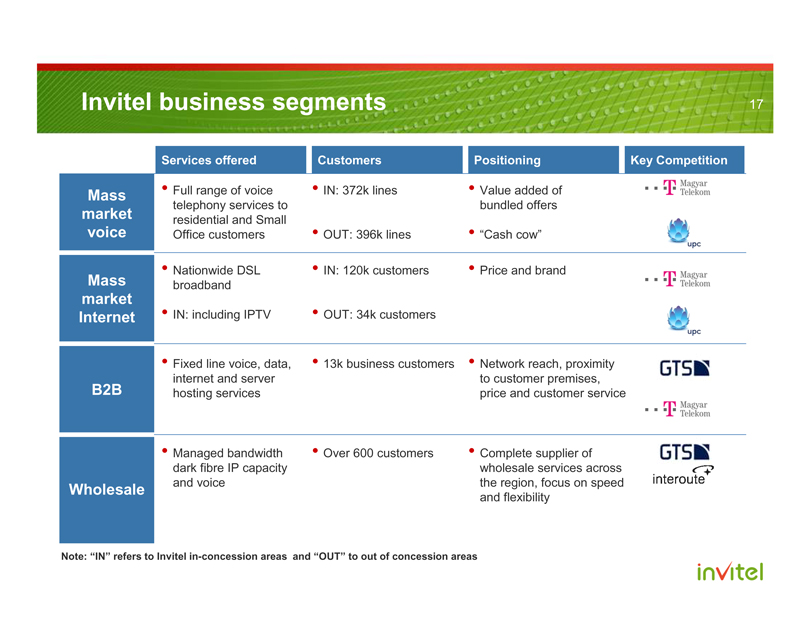 |
Invitel business segments 17
Services offered Customers Positioning Key Competition
Mass market voice • Full range of voice telephony services to residential and Small Office customers • IN: 372k lines • Value added of bundled offers T Magyar Telekom
• OUT: 396k lines • “Cash cow” upc
Mass market Internet • Nationwide DSL broadband • IN: 120k customers • Price and brand T Magyar Telekom
• IN: including IPTV • OUT: 34k customers upc
B2B
• Fixed line voice, data, internet and server hosting services
• 13k business customers
• Network reach, proximity to customer premises, price and customer service GTS T Magyar Telekom
Wholesale
• Managed bandwidth dark fibre IP capacity and voice • Over 600 customers • Complete supplier of wholesale services across the region, focus on speed and flexibility GTS interoute
Note: “IN” refers to Invitel in-concession areas and “OUT” to out of concession areas
invitel
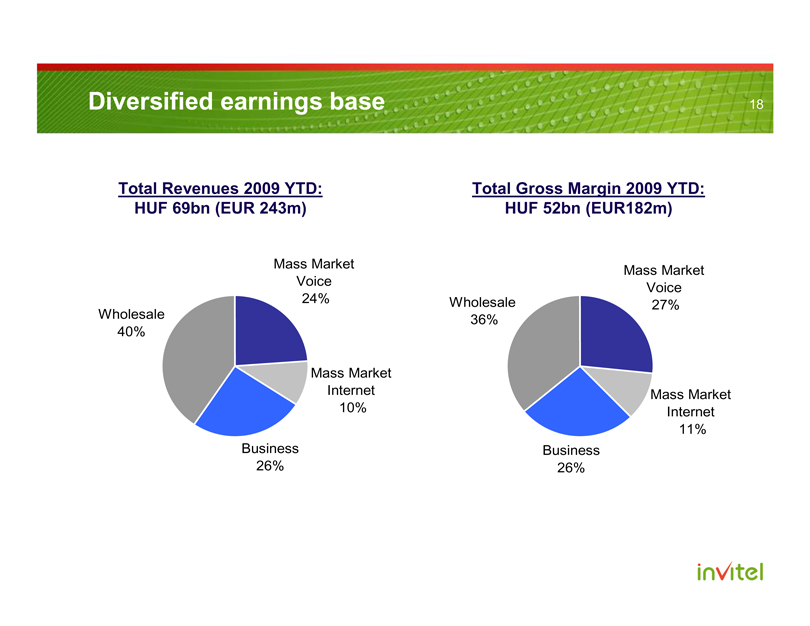 |
Diversified earnings base 18
Total Revenues 2009 YTD: Total Gross Margin 2009 YTD: HUF 69bn (EUR 243m) HUF 52bn (EUR182m)
Mass Market
Mass Market Voice Voice 24% Wholesale Wholesale 27% 36% 40%
Mass Market
Internet Mass Market 10% Internet 11% Business Business 26% 26%
invitel
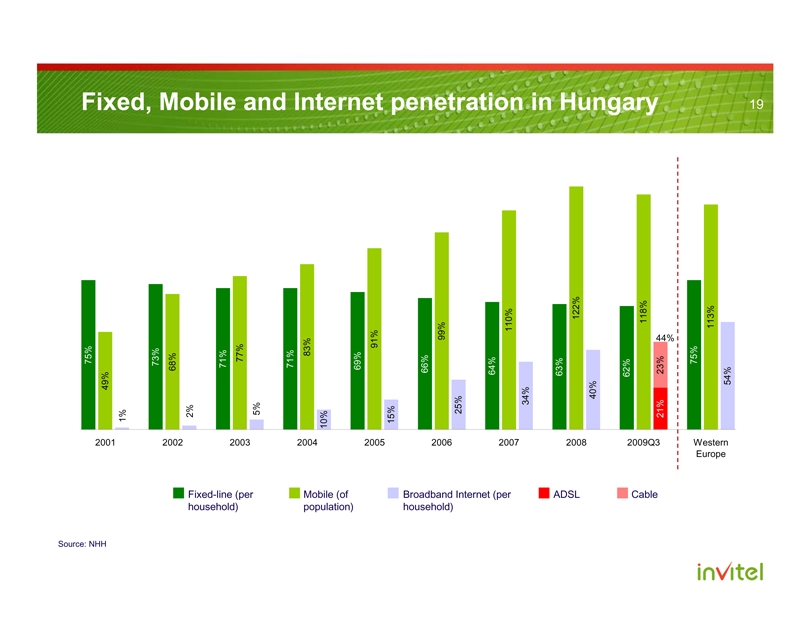 |
Fixed, Mobile and Internet penetration in Hungary 19
75% 73% 71% 71% 69% 66% 64% 63% 62% 75%
49% 68% 77% 83% 91% 99% 110% 122% 118% 113%
1% 2% 5% 10% 15% 25% 34% 40% 44% 54%
21% 23%
2001 2002 2003 2004 2005 2006 2007 2008 2009Q3 Western Europe
Fixed-line (per household) Mobile (of population) Broadband Internet (per household) ADSL Cable
Source: NHH
invitel
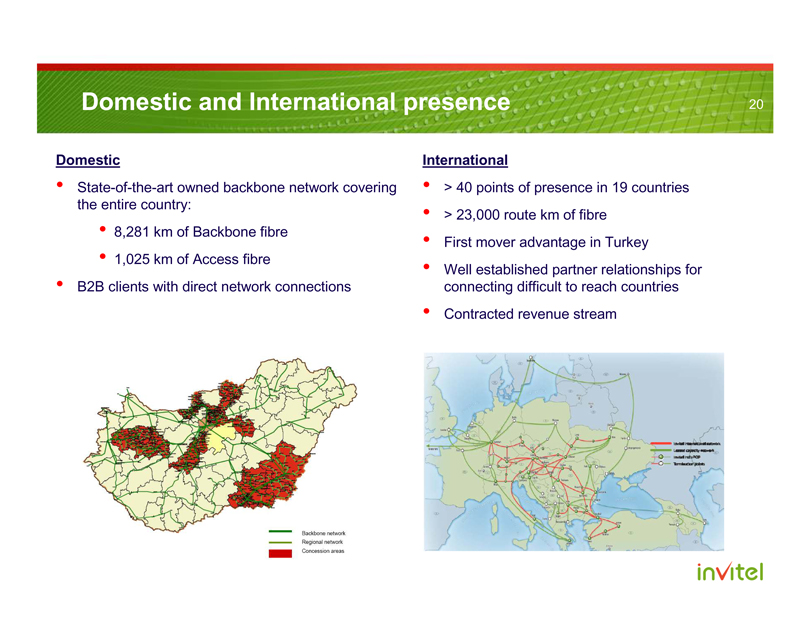 |
Domestic and International presence 20
Domestic
• State-of-the-art owned backbone network covering the entire country:
• 8,281 km of Backbone fibre
• 1,025 km of Access fibre
• B2B clients with direct network connections
Backbone network
Regional network
Concession areas
International
• > 40 points of presence in 19 countries
• > 23,000 route km of fibre
• First mover advantage in Turkey
• Well established partner relationships for connecting difficult to reach countries
• Contracted revenue stream
invitel
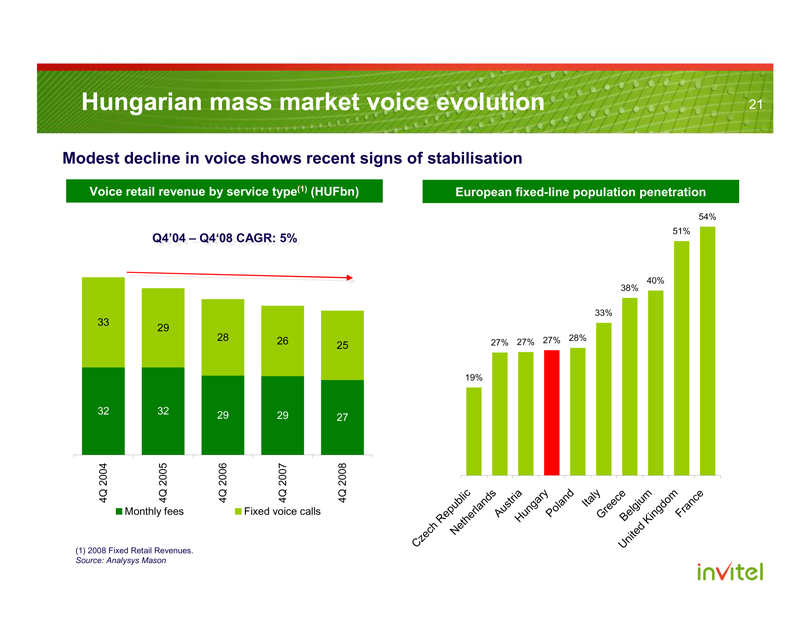 |
Hungarian mass market voice evolution 21
Modest decline in voice shows recent signs of stabilisation
Voice retail revenue by service type(1) (HUFbn)
Q4’04 – Q4‘08 CAGR: 5%
33 29 28 26 25
32 32 29 29 27
4Q 2004 4Q 2005 4Q 2006 4Q 2007 4Q 2008
Monthly fees
Fixed voice calls
European fixed-line population penetration
19% 27% 27% 27% 28% 33% 38% 40% 51% 54%
Czech Republic Netherlands Austria Hungary Poland Italy Greece Belgium United Kingdom France
(1) 2008 Fixed Retail Revenues.
Source: Analysys Mason
invitel
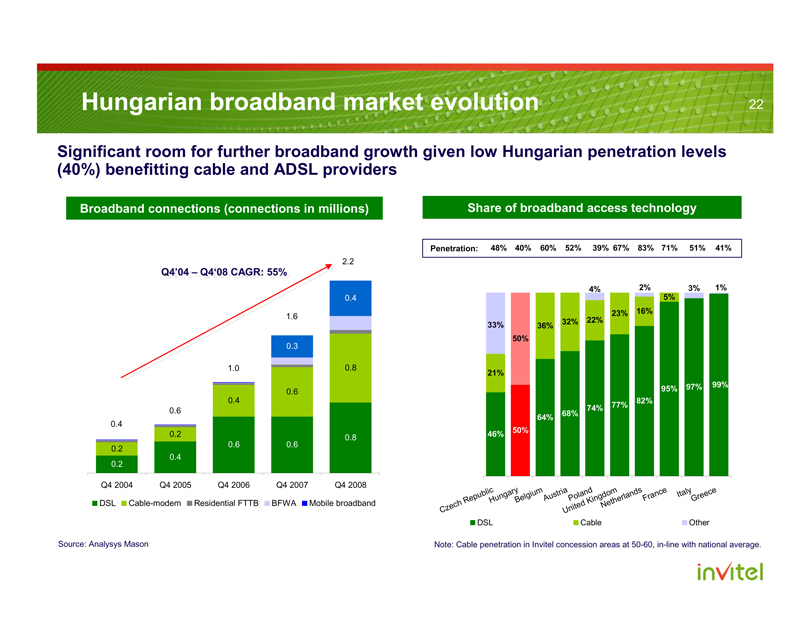 |
Hungarian broadband market evolution 22
Significant room for further broadband growth given low Hungarian penetration levels (40%) benefitting cable and ADSL providers
Broadband connections (connections in millions) Share of broadband access technology
Penetration: 48% 40% 60% 52% 39% 67% 83% 71% 51% 41%
2.2
Q4’04 – Q4‘08 CAGR: 55%
4% 2% 3% 1%
0.4 5% 23% 16%
1.6
32% 22% 33% 36% 50%
0.3
1.0 0.8
21%
97% 99%
0.6 95%
0.4 82% 77%
0.6 74% 68% 64%
0.4 50%
0.2 46%
0.8
0.6 0.6
0.2
0.4
0.2
Q4 2004 Q4 2005 Q4 2006 Q4 2007 Q4 2008
Czech Republic Hungary Belgium Austria Poland United Kingdom Netherlands France Italy Greece
DSL Cable-modem Residential FTTB BFWA Mobile broadband
DSL Cable Other
Source: Analysys Mason
Note: Cable penetration in Invitel concession areas at 50-60, in-line with national average.
invitel
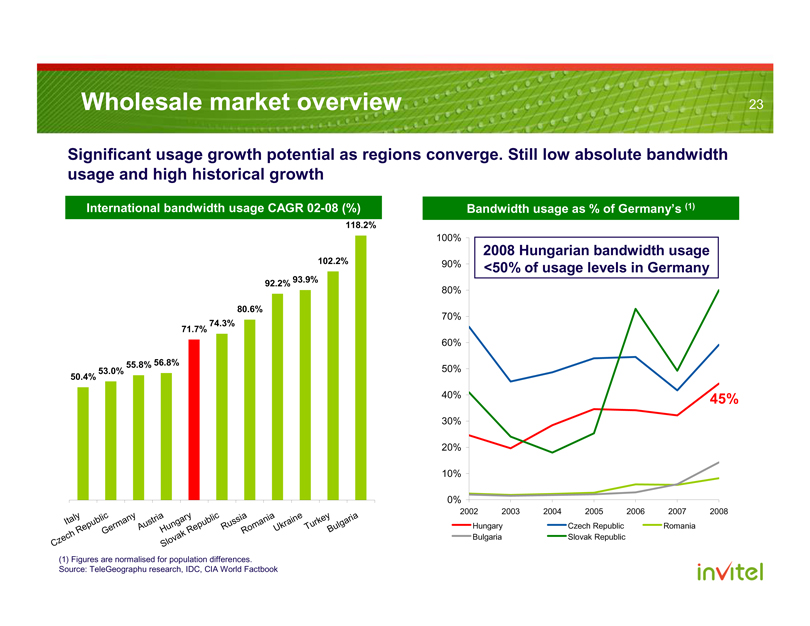 |
Wholesale market overview 23
Significant usage growth potential as regions converge. Still low absolute bandwidth usage and high historical growth
International bandwidth usage CAGR 02-08 (%) Bandwidth usage as % of Germany’s (1)
118.2%
100%
2008 Hungarian bandwidth usage
102.2% 90%
<50% of usage levels in Germany
93.9%
92.2% 80%
80.6% 70%
74.3%
71.7%
60%
55.8% 56.8%
53.0% 50%
50.4%
40% 45% 30%
20%
10%
0%
2002 2003 2004 2005 2006 2007 2008
Italy Czech Republic Germany Austria Hungary Slovak Republic Russia Romania Ukraine Turkey Bulgaria
Hungary Czech Republic Romania
Bulgaria Slovak Republic
(1) Figures are normalised for population differences.
Source: TeleGeographu research, IDC, CIA World Factbook
invitel
 |
Strategy for success 24
B2B revenue and market share expansion nationwide
• Growth of customer base
• Focus on large account opportunities
• Increased competitiveness and ARPU growth through portfolio development
Leverage regional network and position as #1 wholesale capacity provider in C/SE Europe
• Sale of network capacity to other blue chip service providers
• Exploit capacity demand in region
• Turkey, leverage unique opportunity
Maximise IN concession voice revenue and cash flow
• Migration of customers from traffic to subscription based packages
• Retaining customers through win back and loyalty programmes
• Continued innovation of bundles
Capitalise on broadband growth both in and OUT of concession
• Maintaining a broad mix of sales channels
• In LTO, bundle with IPTV/Voice to complete with cable operators
• Maintain competitive position price / bandwidth
invitel
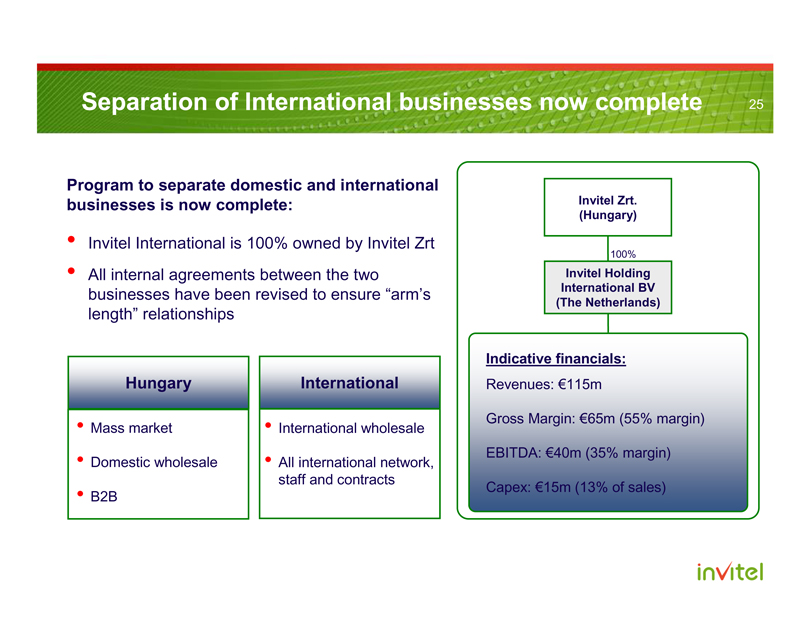 |
Separation of International businesses now complete 25
Program to separate domestic and international businesses is now complete:
• Invitel International is 100% owned by Invitel Zrt
• All internal agreements between the two businesses have been revised to ensure “arm’s length” relationships
Hungary
• Mass market
• Domestic wholesale
• B2B
International
• International wholesale
• All international network, staff and contracts
Invitel Zrt. (Hungary)
100%
Invitel Holding International BV (The Netherlands)
Indicative financials:
Revenues: €115m
Gross Margin: €65m (55% margin)
EBITDA: €40m (35% margin)
Capex: €15m (13% of sales)
invitel
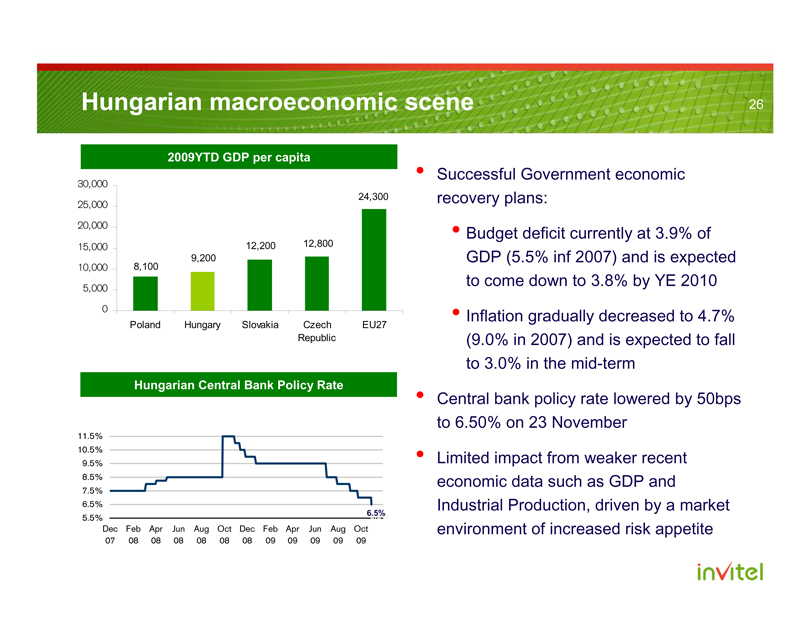 |
Hungarian macroeconomic scene 26
2009YTD GDP per capita
30,000 25,000 20,000 15,000 10,000 5,000 0
8,100 9,200 12,200 12,800 24,300
Poland Hungary Slovakia Czech Republic EU27
Hungarian Central Bank Policy Rate
11.5% 10.5% 9.5% 8.5% 7.5% 6.5% 5.5% 6.5%
Dec Feb Apr Jun Aug Oct Dec Feb Apr Jun Aug Oct
07 08 08 08 08 08 08 09 09 09 09 09
• Successful Government economic recovery plans:
• Budget deficit currently at 3.9% of GDP (5.5% inf 2007) and is expected to come down to 3.8% by YE 2010
• Inflation gradually decreased to 4.7% (9.0% in 2007) and is expected to fall to 3.0% in the mid-term
• Central bank policy rate lowered by 50bps to 6.50% on 23 November
• Limited impact from weaker recent economic data such as GDP and Industrial Production, driven by a market environment of increased risk appetite
invitel
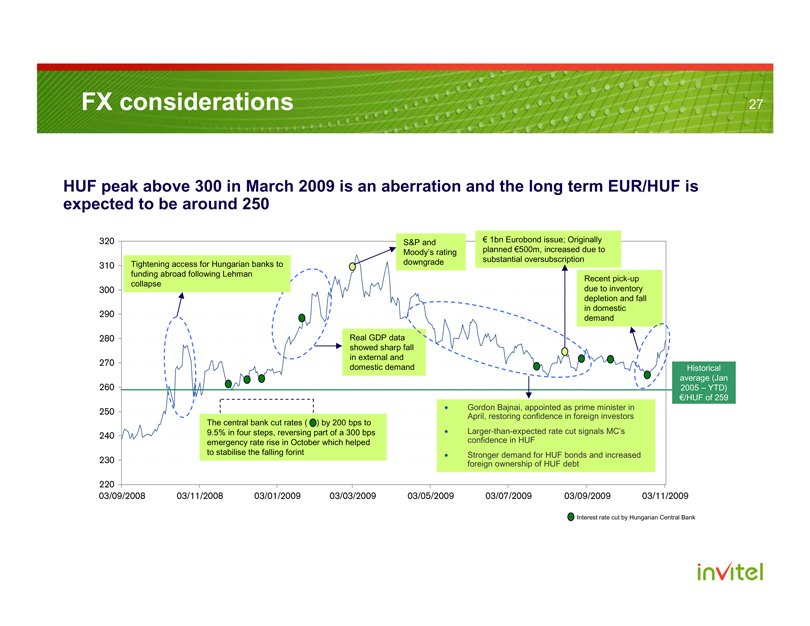 |
FX considerations 27
HUF peak above 300 in March 2009 is an aberration and the long term EUR/HUF is expected to be around 250
320 310 300 290 280 270 260 250 240 230 220
Tightening access for Hungarian banks to funding abroad following Lehman collapse
S&P and Moody’s rating downgrade
€ 1bn Eurobond issue; Originally planned €500m, increased due to substantial oversubscription
Real GDP data showed sharp fall in external and domestic demand
Recent pick-up due to inventory depletion and fall in domestic demand
The central bank cut rates ( ) by 200 bps to 9.5% in four steps, reversing part of a 300 bps emergency rate rise in October which helped to stabilise the falling forint
• Gordon Bajnai, appointed as prime minister in April, restoring confidence in foreign investors
• Larger-than-expected rate cut signals MC’s confidence in HUF
• Stronger demand for HUF bonds and increased foreign ownership of HUF debt
03/09/2008 03/11/2008 03/01/2009 03/03/2009 03/05/2009 03/07/2009 03/09/2009 03/11/2009
Historical average (Jan 2005 – YTD) €/HUF of 259
Interest rate cut by Hungarian Central Bank
invitel
|
28
Agenda
1) Introduction
2) Company overview
3) 2009 YTD trading update
invitel
|
Highlights for the period ended Sep 30, 2009 29
• Following the reorganization in February 2009, Invitel Holdings, as a foreign registrant with the SEC, is permitted to report its results in EUR
• HUF depreciated against the EUR by 15% during the nine months ended September 30, 2009 compared to the same the period in 2008
• Pro-forma(1) consolidated revenue in HUF decreased by 5% for the nine months 2009 compared to the prior year
• Pro-forma(1) consolidated gross margin in HUF increased by 0.1% for the nine months 2009 compared to 2008
• Pro-forma(1) gross margin percentage was 75% and 71%, respectively, for the nine months 2009 and 2008
(1) Assumes that Invitel Holdings A/S, Invitel, Tele2 Hungary and Memorex had been combined as of the beginning of the applicable period
invitel
 |
Highlights for the period ended Sep 30, 2009 (cont’d) 30
• Pro-forma(1) consolidated adjusted operating expenses in HUF decreased by 1% for the nine months 2009 compared to 2008
• Pro-forma EBITDA in HUF grew by 7% to HUF29bn for the nine months 2009 compared to 2008
• Pro-forma(1) EBITDA margin was 42% and 37%, respectively, for the nine months 2009 and 2008
• Pro-forma(1) capital expenditure in HUF decreased by 42% for the nine months 2009 vs. 2008
(1) Assumes that Invitel Holdings A/S, Invitel, Tele2 Hungary and Memorex had been combined as of the beginning of the applicable period
invitel
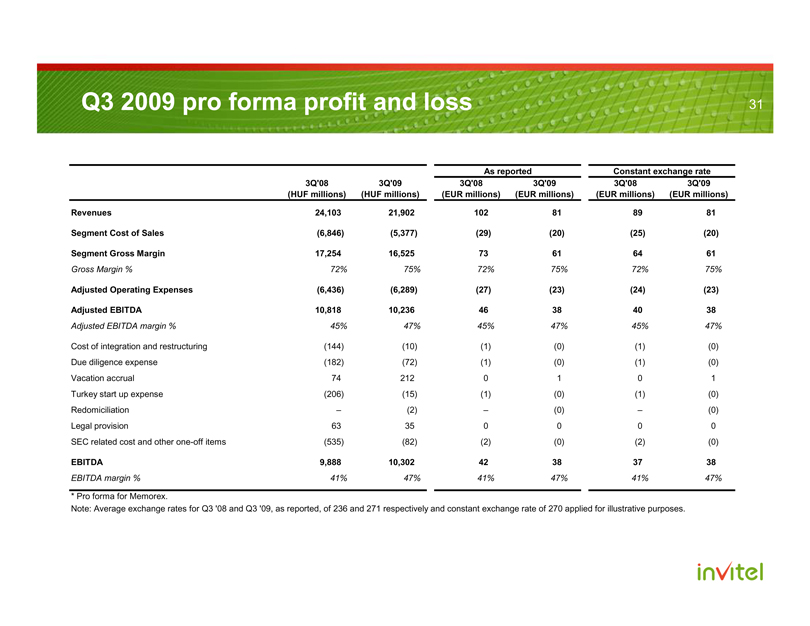 |
Q3 2009 pro forma profit and loss 31
As reported Constant exchange rate 3Q’08 3Q’09 3Q’08 3Q’09 3Q’08 3Q’09 (HUF millions) (HUF millions) (EUR millions) (EUR millions) (EUR millions) (EUR millions)
Revenues 24,103 21,902 102 81 89 81
Segment Cost of Sales (6,846) (5,377) (29) (20) (25) (20)
Segment Gross Margin 17,254 16,525 73 61 64 61
Gross Margin % 72% 75% 72% 75% 72% 75%
Adjusted Operating Expenses (6,436) (6,289) (27) (23) (24) (23)
Adjusted EBITDA 10,818 10,236 46 38 40 38
Adjusted EBITDA margin % 45% 47% 45% 47% 45% 47%
Cost of integration and restructuring (144) (10) (1) (0) (1) (0)
Due diligence expense (182) (72) (1) (0) (1) (0)
Vacation accrual 74 212 0 1 0 1
Turkey start up expense (206) (15) (1) (0) (1) (0)
Redomiciliation – (2) – (0) – (0)
Legal provision 63 35 0 0 0 0
SEC related cost and other one-off items (535) (82) (2) (0) (2) (0)
EBITDA 9,888 10,302 42 38 37 38
EBITDA margin % 41% 47% 41% 47% 41% 47%
* Pro forma for Memorex.
Note: Average exchange rates for Q3 ‘08 and Q3 ‘09, as reported, of 236 and 271 respectively and constant exchange rate of 270 applied for illustrative purposes.
invitel
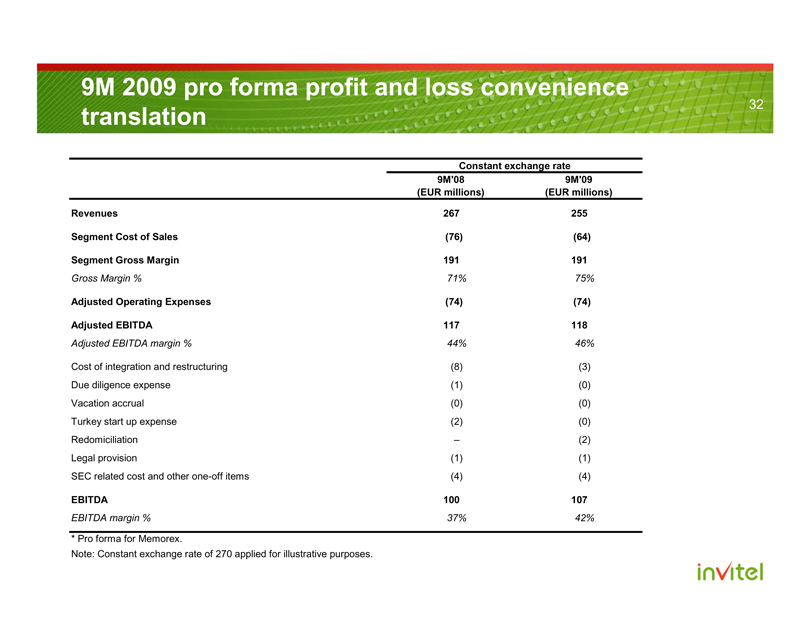 |
9M 2009 pro forma profit and loss convenience translation 32
Constant exchange rate
9M’08 9M’09
(EUR millions) (EUR millions)
Revenues 267 255
Segment Cost of Sales (76) (64)
Segment Gross Margin 191 191
Gross Margin % 71% 75%
Adjusted Operating Expenses (74) (74)
Adjusted EBITDA 117 118
Adjusted EBITDA margin % 44% 46%
Cost of integration and restructuring (8) (3)
Due diligence expense (1) (0)
Vacation accrual (0) (0)
Turkey start up expense (2) (0)
Redomiciliation – (2)
Legal provision (1) (1)
SEC related cost and other one-off items (4) (4)
EBITDA 100 107
EBITDA margin % 37% 42%
* Pro forma for Memorex.
Note: Constant exchange rate of 270 applied for illustrative purposes.
invitel
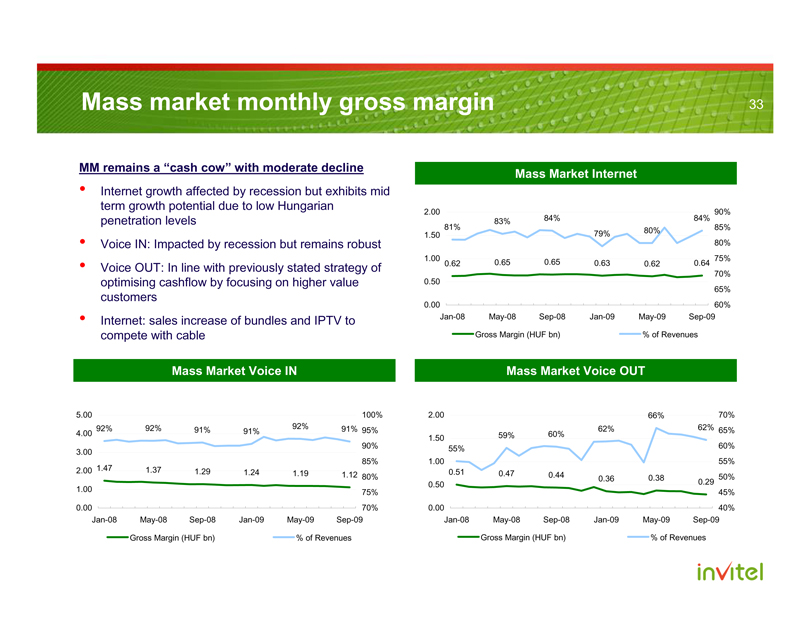 |
Mass market monthly gross margin 33
MM remains a “cash cow” with moderate decline
• Internet growth affected by recession but exhibits mid term growth potential due to low Hungarian penetration levels
• Voice IN: Impacted by recession but remains robust
• Voice OUT: In line with previously stated strategy of optimising cashflow by focusing on higher value customers
• Internet: sales increase of bundles and IPTV to compete with cable
Mass Market Internet
2.00 1.50 1.00 0.50 0.00
90% 85% 80% 75% 70% 65% 60%
84% 84% 81% 83% 80% 79%
0.62 0.65 0.65 0.63 0.62 0.64
Jan-08 May-08 Sep-08 Jan-09 May-09 Sep-09
Gross Margin (HUF bn) % of Revenues
Mass Market Voice IN
5.00 4.00 3.00 2.00 1.00 0.00
100% 95% 90% 85% 80% 75% 70%
92% 92% 92% 91% 91% 91%
1.47 1.37
1.29 1.24 1.19
1.12
Jan-08 May-08 Sep-08 Jan-09 May-09 Sep-09
Gross Margin (HUF bn) % of Revenues
Mass Market Voice OUT
2.00 1.50 1.00 0.50 0.00
70% 65% 60% 55% 50% 45% 40%
Jan-08 May-08 Sep-08 Jan-09 May-09 Sep-09
Gross Margin (HUF bn) % of Revenues
66% 62% 62% 59% 60% 55% 0.51 0.47 0.44 0.38 0.36 0.29
invitel
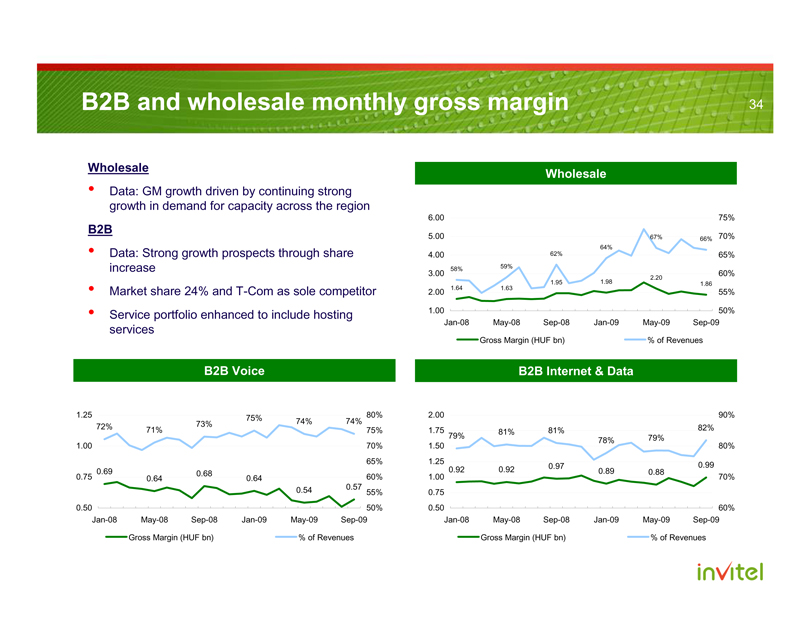 |
B2B and wholesale monthly gross margin 34
Wholesale
• Data: GM growth driven by continuing strong growth in demand for capacity across the region
B2B
• Data: Strong growth prospects through share increase
• Market share 24% and T-Com as sole competitor
• Service portfolio enhanced to include hosting services
Wholesale
6.00 5.00 4.00 3.00 2.00 1.00
75% 70% 65% 60% 55% 50%
Jan-08 May-08 Sep-08 Jan-09 May-09 Sep-09
Gross Margin (HUF bn) % of Revenues
67% 66% 64% 62%
59% 58%
1.95 1.98 2.20
1.64 1.63 1.86
B2B Voice
1.25 1.00 0.75 0.50
80% 75% 70% 65% 60% 55% 50%
Jan-08 May-08 Sep-08 Jan-09 May-09 Sep-09
Gross Margin (HUF bn) % of Revenues
75%
72% 73% 74% 74% 71%
0.69 0.68
0.64 0.64
0.57
0.54
B2B Internet & Data
2.00 1.75 1.50 1.25 1.00 0.75 0.50
90% 80% 70% 60%
Jan-08 May-08 Sep-08 Jan-09 May-09 Sep-09
Gross Margin (HUF bn) % of Revenues
81% 82% 81% 79% 79% 78%
0.97 0.99
0.92 0.92 0.89 0.88
invitel
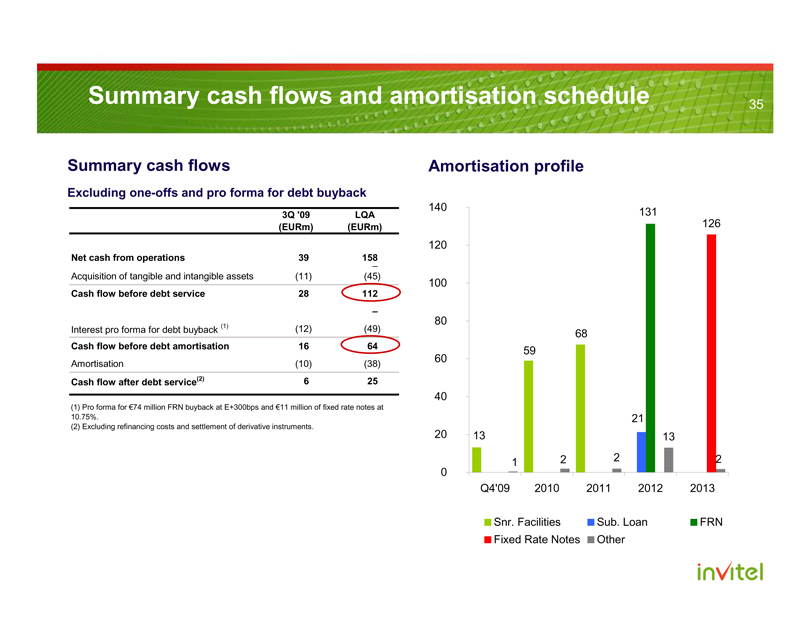 |
Summary cash flows and amortisation schedule
35
Summary cash flows
Excluding one-offs and pro forma for debt buyback
3Q’09 LQA
(EURm) (EURm)
Net cash from operations 39 158
–
Acquisition of tangible and intangible assets (11) (45)
Cash flow before debt service 28 112
–
Interest pro forma for debt buyback (1) (12) (49)
Cash flow before debt amortisation 16 64
Amortisation (10) (38)
Cash flow after debt service (2) 6 25
(1) Pro forma for €74 million FRN buyback at E+300bps and €11 million of fixed rate notes at 10.75%.
(2) Excluding refinancing costs and settlement of derivative instruments.
Amortisation profile
140 120 100 80 60 40 20 0
13 1 59 2 68 2 21 131 13 126 2
Q4’09 2010 2011 2012 2013
Snr. Facilities Sub. Loan FRN
Fixed Rate Notes Other
invitel
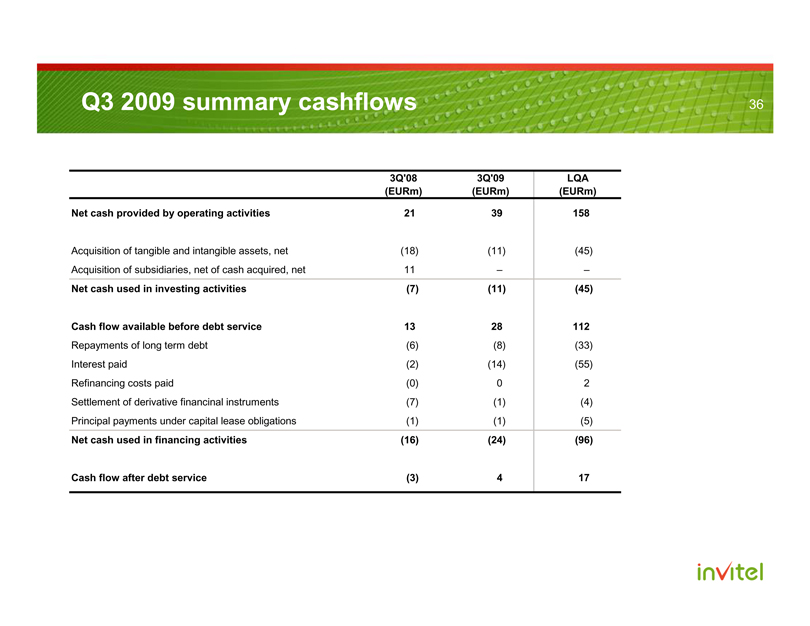 |
Q3 2009 summary cashflows 36
3Q’08 3Q’09 LQA (EURm) (EURm) (EURm)
Net cash provided by operating activities 21 39 158
Acquisition of tangible and intangible assets, net (18) (11) (45)
Acquisition of subsidiaries, net of cash acquired, net 11 – –
Net cash used in investing activities (7) (11) (45)
Cash flow available before debt service 13 28 112
Repayments of long term debt (6) (8) (33)
Interest paid (2) (14) (55)
Refinancing costs paid (0) 0 2
Settlement of derivative financinal instruments (7) (1) (4)
Principal payments under capital lease obligations (1) (1) (5)
Net cash used in financing activities (16) (24) (96)
Cash flow after debt service (3) 4 17
invitel
 |
Credit highlights 37
1 Leading market position with limited competition
2 Strong and stable cash flow generation
3 Diversified operations
4 Opportunities for growth
5 State-of-the-art networks
6 Experienced management team
· #1 national alternative network operator in Hungary
· #1 independent provider of wholesale data and capacity services in Central / South-Eastern Europe
· c. €100-110m annual free cash flow before debt service
· GM split: c. 40% Mass market / 25% B2B / 35% Wholesale
· Significant growth potential for B2B and wholesale
· 32,300 route kilometres of owned networks
· Proven management team which has worked together since 2004
invitel