UNITED STATES
SECURITIES AND EXCHANGE COMMISSION
WASHINGTON, DC 20549
FORM 10-K
| x | ANNUAL REPORT PURSUANT TO SECTION 13 OR 15(d) OF THE SECURITIES EXCHANGE ACT OF 1934 |
For the fiscal year ended December 31, 2011
or
| ¨ | TRANSITION REPORT PURSUANT TO SECTION 13 OR 15(d) OF THE SECURITIES EXCHANGE ACT OF 1934 |
For the transition period from to
Commission File Number 000-51274
THE FRONTIER FUND
FRONTIER DIVERSIFIED SERIES; FRONTIER DYNAMIC SERIES; FRONTIER LONG/SHORT COMMODITY
SERIES; FRONTIER MASTERS SERIES; BALANCED SERIES; BERKELEY/GRAHAM/TIVERTON SERIES;
CURRENCY SERIES; LONG ONLY COMMODITY SERIES; MANAGED FUTURES INDEX SERIES; WINTON SERIES; WINTON/GRAHAM SERIES
(Exact Name of Registrant as specified in Its Charter)
| | |
| Delaware | | 36-6815533 |
(State or Other Jurisdiction of Incorporation or Organization) | | (IRS Employer Identification No.) |
| |
c/o Equinox Fund Management, LLC 1775 Sherman Street, Suite 2500, Denver, Colorado | | 80203 |
| (Address of Principal Executive Offices) | | (Zip Code) |
Registrant’s Telephone Number, Including Area Code: (303) 837-0600
Securities registered pursuant to Section 12(b) of the Act: None
Securities registered pursuant to Section 12(g) of the Act:
Title of Each Class
Frontier Diversified Series Class 1, Class 2 and Class 3 Units;
Frontier Dynamic Series Class 1, Class 2 and Class 3 Units;
Frontier Long/Short Commodity Series Class 1, Class 2, Class 3, Class 1a, Class 2a and Class 3a Units;
Frontier Masters Series Class 1, Class 2 and Class 3 Units;
Balanced Series Class 1, Class 2, Class 3, Class 1a, Class 2a and Class 3a Units;
Berkeley/Graham/Tiverton Series Class 1, Class 2 and Class 3 Units;
Currency Series Class 1, Class 2 and Class 3 Units;
Long Only Commodity Series Class 1, Class 2 and Class 3 Units;
Managed Futures Index Series Class 1, Class 2 and Class 3 Units
Winton Series Class 1, Class 2 and Class 3 Units;
Winton/Graham Series Class 1, Class 2 and Class 3 Units
Indicate by check mark if the registrant is a well-known seasoned issuer, as defined in Rule 405 of the Securities Act. Yes ¨ No x
Indicate by check mark if the registrant is not required to file reports pursuant to Section 13 or Section 15(d) of the Act. Yes ¨ No x
Indicate by check mark whether the registrant: (1) has filed all reports required to be filed by Section 13 or 15(d) of the Securities Exchange Act of 1934 during the preceding 12 months (or for such shorter period that the registrant was required to file such reports), and (2) has been subject to such filing requirements for the past 90 days. Yes x No ¨
Indicate by check mark whether the registrant has submitted electronically and posted on its corporate Web site, if any, every Interactive Data File required to be submitted and posted pursuant to Rule 405 of Regulation S-T (§232.405 of this chapter) during the preceding 12 months (or for such shorter period that the registrant was required to submit and post such files). Yes x No ¨
Indicate by check mark if disclosure of delinquent filers pursuant to Item 405 of Regulation S-K (§229.405) is not contained herein, and will not be contained, to the best of registrant’s knowledge, in definitive proxy or information statements incorporated by reference in Part III of this Form 10-K or any amendment to this Form 10-K. x
Indicate by check mark whether the registrant is a large accelerated filer, an accelerated filer, a non-accelerated filer or a smaller reporting company. See the definitions of “large accelerated filer,” “accelerated filer” and “smaller reporting company” in Rule 12b-2 of the Exchange Act. (Check One):
| | | | | | |
| Large Accelerated Filer | | ¨ | | Accelerated Filer | | ¨ |
| | | |
| Non–Accelerated Filer | | x (Do not check if a smaller reporting company) | | Smaller Reporting Company | | ¨ |
Indicate by check mark whether the registrant is a shell company (as defined in Rule 12b-2 of the Exchange Act). Yes ¨ No x
The Frontier Fund’s units of beneficial interest are not traded on any market and, accordingly, do not have an aggregate market value. Units outstanding as of June 30, 2011 were: 1,327,025 for the Frontier Diversified Series, 16,639 for the Frontier Dynamic Series, 476,218 for the Frontier Long/Short Commodity Series, 541,201 for the Frontier Masters Series, 2,133,093 for the Balanced Series, 465,799 for the Berkeley/Graham/Tiverton Series, 68,088 for the Currency Series, 28,645 for the Long Only Commodity Series, 30,969 for the Managed Futures Index Series, 359,487 for the Winton Series and 310,686 for the Winton/Graham Series. Units outstanding as of December 31, 2011 were: 1,320,682for the Frontier Diversified Series, 0 for the Frontier Dynamic Series, 499,966 for the Frontier Long/Short Commodity Series, 518,762 for the Frontier Masters Series, 1,953,014 for the Balanced Series, 426,174 for the Berkeley/Graham/Tiverton Series, 61,036 for the Currency Series, 0 for the Long Only Commodity Series, 0 for the Managed Futures Index Series, 342,279 for the Winton Series and 282,832 for the Winton/Graham Series.
Documents Incorporated by Reference
Portions of the Prospectus filed by the registrant on April 29, 2011 pursuant to Rule 424(b)(3) of the Securities Act (File No. 333-164629) are incorporated by reference into Part I and Part II of this report.
Special Note About Forward-Looking Statements
THIS ANNUAL REPORT CONTAINS STATEMENTS WHICH CONSTITUTE FORWARD-LOOKING STATEMENTS WITHIN THE MEANING OF THE PRIVATE SECURITIES LITIGATION REFORM ACT OF 1995 AND OTHER FEDERAL SECURITIES LAWS. THESE FORWARD-LOOKING STATEMENTS REFLECT THE MANAGING OWNER’S CURRENT EXPECTATIONS ABOUT THE FUTURE RESULTS, PERFORMANCE, PROSPECTS AND OPPORTUNITIES OF THE TRUST. THE MANAGING OWNER HAS TRIED TO IDENTIFY THESE FORWARD-LOOKING STATEMENTS BY USING WORDS SUCH AS “MAY,” “WILL,” “EXPECT,” “ANTICIPATE,” “BELIEVE,” “INTEND,” “SHOULD,” “ESTIMATE” OR THE NEGATIVE OF THOSE TERMS OR SIMILAR EXPRESSIONS. THESE FORWARD-LOOKING STATEMENTS ARE BASED ON INFORMATION CURRENTLY AVAILABLE TO THE MANAGING OWNER AND ARE SUBJECT TO A NUMBER OF RISKS, UNCERTAINTIES AND OTHER FACTORS, BOTH KNOWN, SUCH AS THOSE DESCRIBED IN THE “RISK FACTORS” SECTION UNDER ITEM 1A AND ELSEWHERE IN THIS REPORT, AND UNKNOWN, THAT COULD CAUSE THE TRUST’S ACTUAL RESULTS, PERFORMANCE, PROSPECTS OR OPPORTUNITIES TO DIFFER MATERIALLY FROM THOSE EXPRESSED IN, OR IMPLIED BY, THESE FORWARD-LOOKING STATEMENTS.
YOU SHOULD NOT PLACE UNDUE RELIANCE ON ANY FORWARD-LOOKING STATEMENTS. EXCEPT AS EXPRESSLY REQUIRED BY THE FEDERAL SECURITIES LAWS, THE MANAGING OWNER UNDERTAKES NO OBLIGATION TO PUBLICLY UPDATE OR REVISE ANY FORWARD-LOOKING STATEMENTS OR THE RISKS, UNCERTAINTIES OR OTHER FACTORS DESCRIBED HEREIN, AS A RESULT OF NEW INFORMATION, FUTURE EVENTS OR CHANGED CIRCUMSTANCES OR FOR ANY OTHER REASON AFTER THE DATE OF THIS REPORT.
UNLESS EXPRESSLY STATED OTHERWISE, ALL INFORMATION IN THIS REPORT IS AS OF DECEMBER 31, 2011, AND THE MANAGING OWNER UNDERTAKES NO OBLIGATION TO UPDATE THIS INFORMATION.
Table of Contents
Part I
Overview
The Frontier Fund, which is referred to in this report as “the Trust”, was formed on August 8, 2003, as a Delaware statutory trust. The Trust is a multi-advisor commodity pool, as described in Commodity Futures Trading Commission (the “CFTC”) Regulation § 4.10(d)(2). The Trust has authority to issue separate series, or each, a Series, of units of beneficial interest (the “Units”) pursuant to the requirements of the Delaware Statutory Trust Act, as amended (the “Trust Act”). The assets of each Series are valued and accounted for separately from the assets of other Series. The Trust is not registered as an investment company under the Investment Company Act of 1940, as amended (the “Investment Company Act”). It is managed by its Managing Owner, Equinox Fund Management, LLC.
Purchasers of Units are limited owners of the Trust (“Limited Owners”) with respect to beneficial interests of the Series’ Units purchased. The Trust Act provides that, except as otherwise provided in the amended and restated declaration of trust and trust agreement of the Trust dated as of August 8, 2003, by and among the Managing Owner, Wilmington Trust Company as trustee and the unitholders from time to time (the “Trust Agreement”), unitholders in a Delaware statutory trust will have the same limitation of liability as do stockholders of private corporations organized under the General Corporation Law of the State of Delaware. The Trust Agreement confers substantially the same limited liability, and contains the same limited exceptions thereto, as would a limited partnership agreement for a Delaware limited partnership engaged in like transactions as the Trust. In addition, pursuant to the Trust Agreement, the Managing Owner of the Trust is liable for obligations of a Series in excess of that Series’ assets. Limited Owners do not have any such liability. The Managing Owner will make contributions to Series of the Trust necessary to maintain at least a 1% interest in the aggregate capital, profits and losses of all Series.
The Trust has been organized to pool assets of investor funds for the purpose of trading in the United States (“U.S.”) and international markets for currencies, interest rates, stock indices, agricultural and energy products, precious and base metals and other commodities. The Trust may also engage in futures contracts, forwards, option contracts and other interest in derivative instruments, including swap contracts (“Swaps”).
The Trust has eleven (11) separate and distinct Series of Units issued and outstanding: Frontier Diversified Series, Frontier Dynamic Series (closed to outside investors effective July 15, 2011 and existing outside investors liquidated as of July 15, 2011), Frontier Long/Short Commodity Series, Frontier Masters Series, Balanced Series, Berkeley/Graham/Tiverton Series (formerly Campbell/Graham/Tiverton Series), Currency Series, Long Only Commodity Series (ceased trading operations as of December 21, 2011), Managed Futures Index Series (ceased trading operations as of December 21, 2011), Winton Series and Winton/Graham Series (each a “Series” and collectively, the “Series”). The Trust may issue additional Series of Units.
The Trust, with respect to each Series:
| | • | | engages in the speculative trading of a diversified portfolio of futures, forward (including interbank foreign currencies), options contracts and other derivative instruments (including swap contracts), and may, from time to time, engage in cash and spot transactions; |
| | • | | allocates funds to a limited liability trading company or companies (“Trading Company”). Except as otherwise described in these notes, each Trading Company has one-year renewable contracts with its own independent commodity trading advisor(s), or each, a Trading Advisor, that will manage all or a portion of such Trading Company’s assets and make the trading decisions for the assets of each Series vested in such Trading Company. Each Trading Company will segregate its assets from any other Trading Company; |
| | • | | maintains separate, distinct records for each Series, and accounts for the assets of each Series separately from the other Series; |
| | • | | calculates the Net Asset Value (“NAV”) of its Units for each Series separately from the other Series; |
| | • | | has an investment objective of increasing the value of each Series’ Units over the long term (capital appreciation), while controlling risk and volatility; further, to offer exposure to the investment programs of individual Trading Advisors and to specific instruments (currencies); |
1
| | • | | maintains each Series of Units in three or six sub-classes—Class 1, Class 1a, Class 2, Class 2a, Class 3, and Class 3a. Investors who have purchased Class 1 or Class 1a Units of any Series are charged a service fee of up to three percent (3.0%) annually of the NAV of each Unit purchased, for the benefit of Selling Agents selling such Class 1 or Class 1a Units. The initial service fee, which is amortized monthly at an annual rate of up to three percent (3.0%) of the average daily NAV of Class 1 or Class 1a of such Series, is prepaid to Equinox Fund Management, LLC (the “Managing Owner”) by each Series, and paid to the selling agents by the Managing Owner in the month following sale; provided, however, that investors who redeem all or a portion of their Class 1 or Class 1a Units of any Series during the first twelve (12) months following the effective date of their purchase are subject to a redemption fee of up to three percent (3.0%) of the NAV at which such investor redeemed to reimburse the Managing Owner for the then-unamortized balance of the prepaid initial service fee. With respect to Class 2 and Class 2a Units of any Series, the Managing Owner pays an ongoing service fee to Selling Agents of up to one half percent (0.5%) annually of the NAV of each Class 2 or Class 2a Unit (of which 0.25% will be charged to Limited Owners holding Class 2 Units of the Frontier Diversified Series, Frontier Dynamic Series and Frontier Masters Series or Class 2a Units of the Frontier Long/Short Commodity Series) sold until such Class 2 or Class 2a Units which are subject to the fee limitation are reclassified as Class 3 or Class 3a Units of the applicable Series. The Managing Owner may also pay Selling Agents certain additional fees and expenses for administrative and other services rendered and expenses incurred by such Selling Agents; and |
| | • | | all payments made to Selling Agents who are members of the Financial Industry Regulatory Authority, Inc. (“FINRA”) and their associated persons that constitute underwriting compensation will be subject to the limitations set forth in Rule 2310(b)(4)(B)(ii) (formerly Rule 2810(b)(4)(B)(ii)) of the Conduct Rules of FINRA (“Rule 2310”). An investor’s Class 1 Units or Class 2 Units of any Series, or Class 1a Units or Class 2a Units of the Frontier Long/Short Commodity Series or Balanced Series will be classified as Class 3 or Class 3a Units of such Series, as applicable, when the Managing Owner determines that the fee limitation set forth in Rule 2310 with respect to such Units has been reached or will be reached. No service fees are paid with respect to Class 3 or Class 3a Units. Units of any Class in a Series may be redeemed, in whole or in part, on a daily basis, at the then current NAV per Unit for such Series on the day of the week after the date the Managing Owner is in receipt of a redemption request for at least one (1) Business Day to be received by the Managing Owner prior to 4:00 PM in New York. |
The assets of any particular Series include only those funds and other assets that are paid to, held by or distributed to the Trust on account of and for the benefit of that Series. Under the “Inter-Series Limitation on Liability” expressly provided for under Section 3804(a) of the Trust Act, separate and distinct records of the cash and equivalents, although pooled for maximizing returns, is maintained in the books and records of each Series.
As of December 31, 2011, the total Units outstanding of each Series of the Trust was 1,320,682 with respect to the Frontier Diversified Series, 0 with respect to the Frontier Dynamic Series, 499,966 with respect to the Frontier Long/Short Commodity Series, 518,762 with respect to the Frontier Masters Series. 1,953,014 with respect to the Balanced Series, 426,174 with respect to the Berkeley/Graham/Tiverton Series, 61,036 with respect to the Currency Series, 0 with respect to the Long Only Commodity Series, 0 with respect to the Managed Futures Index Series, 342,279 with respect to the Winton Series and 282,832 with respect to the Winton/Graham Series.
As of December 31, 2011, the Winton Series had invested a portion of its assets in a single Trading Company. A single Trading Advisor manages 100% of the assets invested in such Trading Company. The Currency Series invests a portion of its assets in a single Trading Company, which allocates assets to one Swap. Each of the Frontier Diversified Series, Frontier Long/Short Commodity Series, Frontier Masters Series, Balanced Series, Berkeley/Graham/Tiverton Series, and Winton/Graham Series have invested a portion of its assets in several different Trading Companies and have multiple Trading Advisors that manage the assets invested in such Trading Companies.
In November 2010, the Berkeley/Graham/Tiverton Series invested a portion of its assets in Berkeley Quantitative Colorado Fund LLC, an unaffiliated company, managed by an affiliate of Berkeley Quantitative L.P. Through this investment, Berkeley Quantitative L.P. became a commodity trading advisor to the Series.
During July, 2011, the Currency Series liquidated its interest in an option basket and realized a decrease in fair value greater than had previously been recorded as unrealized loss. The Managing Owner determined to make a one-time discretionary administrative adjustment by payment to the Currency Series of $390,589 to reimburse the effect of the loss on the investors in the series, exclusive of the inter-series payables’ interests, recorded in the Statements of Operations as net increase from payments by Managing Owner.
2
Trading Advisors are responsible for the trading decisions of the respective Trading Companies for which they trade. It is expected that between 10% and 30% of each Series’ assets normally will be invested in one or more Trading Companies to be committed as margin for trading positions but from time to time these percentages may be substantially more or less. The remainder of each Series’ assets are maintained at the Trust level for cash management. Each of the respective Series has invested monies into pooled cash management assets which have included purchases of custom time deposits, U.S. Treasury securities and credit default swaps. Each Series’ ownership in these investments is based on its percentage ownership in the pooled cash management assets on the reporting date.
The Balanced Series, for purposes of diversification of investments and trading advisors through the Series’ access to trading companies in which the Balanced Series does not have a direct interest, advanced funds to the Frontier Diversified Series, Frontier Dynamic Series, Frontier Masters Series and the Currency Series. These advances have all been paid as of December 31, 2011.
The Trading Advisors were selected based upon the Managing Owner’s evaluation of each Trading Advisor’s past performance, trading portfolios and strategies, as well as how each Trading Advisor’s performance, portfolio and strategies complement and differ from those of the other Trading Advisors. As of December 31, 2011, none of the Trading Advisors or any of their principals had any beneficial interest in the Trust, but any of them are free to acquire such beneficial interest.
Equinox Fund Management, LLC, a Delaware limited liability company formed in June 2003, is the managing owner of the Trust (the “Managing Owner”). The Managing Owner became registered with the Commodity Futures Trading Commission (“CFTC”) as a commodity pool operator (“CPO”), as of August 6, 2003, and has been a member of the National Futures Association (the “NFA”) in such capacity since that date. The Managing Owner’s main business office is located at 1775 Sherman Street, Suite 2500, Denver, Colorado 80203, telephone (303) 837-0600. A description of the Managing Owner’s responsibilities to the Trust is contained in a Prospectus dated April 29, 2011 pursuant to Rule 424(b)(3) of the Securities Act of 1933, as amended (File No. 333-164629), which is referred to herein as the “Prospectus,” under the section captioned “The Managing Owner,” and such description is incorporated herein by reference from the Prospectus.
Regulation
Under the Commodity Exchange Act, as amended, (the “Commodity Exchange Act”) commodity exchanges and commodity futures trading are subject to regulation by the CFTC. The NFA, a registered futures association under the Commodity Exchange Act, is the only non-exchange self-regulatory organization for commodity industry professionals. The CFTC has delegated responsibility to the NFA for the registration of “commodity trading advisors,” “commodity pool operators,” “futures commission merchants,” “introducing brokers” and their respective “associated persons” and “floor brokers.” The Commodity Exchange Act requires “commodity pool operators,” such as the Managing Owner, “commodity trading advisors,” and commodity brokers or “futures commission merchants,” such as the Trust’s commodity brokers, to be registered and to comply with various reporting and recordkeeping requirements. The Managing Owner and the Trust’s commodity brokers are members of the NFA. The CFTC may suspend a commodity pool operator’s or a commodity trading advisor’s registration if it finds that its trading practices tend to disrupt orderly market conditions, or as the result of violations of the Commodity Exchange Act or rules and regulations promulgated thereunder. In the event that the Managing Owner’s registration as a commodity pool operator were terminated or suspended, the Managing Owner would be unable to continue to manage the business of the Trust. Should the Managing Owner’s registration be suspended, termination of the Trust may result.
In addition to such registration requirements, the CFTC and certain commodity exchanges have established limits on the maximum net long and net short positions that any person, including the Trust, may hold or control in particular commodities. Most exchanges also limit the maximum changes in futures contract prices that may occur during a single trading day. The Trust also trades in dealer markets for forward and swap contracts, which are not regulated by the CFTC. Federal and state banking authorities also do not regulate forward trading or forward dealers. In addition, the Trust trades on foreign commodity exchanges, which are not subject to regulation by any U.S. government agency.
Operations
A description of the business of the Trust, including trading approaches for each Series of Units, rights and obligations of the limited owners, compensation arrangements and fees and expenses is contained in the Prospectus, under the sections captioned “Risk Disclosure Statement,” “Summary,” “Risk Factors,” “The Frontier Fund,” “The Offering,” “Trading Limitations, Policies and Swaps,” “The Trustee,” “The Managing Owner,” “Actual and Potential Conflicts of Interest,” “Fees and Expenses” and the appendix attached to the Prospectus for each Series of Units, and such description is incorporated herein by reference from the Prospectus.
3
The Trading Companies for each Series of Units engage in the speculative trading of a diversified portfolio of futures, forward (including interbank foreign currencies) and options contracts and other derivative instruments (including Swaps) and may, from time to time, engage in cash and spot transactions. A brief description of the Trust’s main types of investments is set forth below:
| | • | | A futures contract is a standardized contract traded on an exchange that calls for the future delivery of a specified quantity of a commodity at a specified time and place. |
| | • | | A forward contract is an individually negotiated contract between principals, not traded on an exchange, to buy or sell a specified quantity of a commodity at or before a specified date at a specified price. |
| | • | | An option on a futures contract, forward contract or a commodity gives the buyer of the option the right, but not the obligation, to buy or sell a futures contract, forward contract or a commodity, as applicable, at a specified price on or before a specified date. Options on futures contracts are standardized contracts traded on an exchange, while options on forward contracts and commodities, referred to collectively in this prospectus as over-the-counter options, generally are individually negotiated, principal-to-principal contracts not traded on an exchange. |
| | • | | A swap contract generally involves an exchange of a stream of payments between the contracting parties. Swap contracts generally are not uniform and not exchange-traded. |
Certain of the Trading Companies have entered into contractual arrangements with independent commodity trading advisors that will manage all or a portion of such Trading Company’s assets and make the trading decisions with respect to the assets of such Trading Company.
Selection and Replacement of Trading Advisors
The managing owner is ultimately responsible for the selection, retention and termination of the trading advisors and swap reference trading programs on behalf of each series. The Bornhoft Group Corporation, pursuant to the terms of an administrative services agreement, provides recommendations to the managing owner regarding the selection, retention and termination of trading advisors and swap reference trading programs. The actual allocation among trading advisors for each series will vary based upon the relative trading performance of the trading advisors and/or reference programs, and the managing owner may otherwise vary such percentages from time to time in its sole discretion. The managing owner, in consultation with The Bornhoft Group Corporation, will adjust its allocations and rebalance the portfolio of any series among trading advisors to maintain weightings that it believes will most likely achieve capital growth within the investment guidelines of the relevant series.
The Bornhoft Group Corporation utilizes certain quantitative and qualitative analysis in connection with the identification, evaluation and selection of the trading advisors. The Bornhoft Group Corporation’s proprietary and commercial analytical software programs and comprehensive trading advisor database provide the quantitative basis for the trading advisor selection, portfolio implementation process, and ongoing risk management, monitoring, and review.
In 1983, the principals of The Bornhoft Group Corporation began compiling its proprietary database of the leading United States and internationally based alternative investment programs. Trading advisors are monitored and performance data is entered on a daily, monthly, quarterly or bi-annual basis according to internal ranking systems.
The Bornhoft Group Corporation’s research department is continually refining ways to assimilate vast amounts of trading advisor performance data and due-diligence information. The proprietary and commercial database of alternative investment programs is always increasing. Research team members regularly interact with trading advisors throughout the due diligence and monitoring process. Only those programs that have met strict quantitative and qualitative review are considered as potential managers of client assets. Following is a summary of the quantitative and qualitative analysis:
Quantitative Analysis
The Bornhoft Group Corporation’s analytical software system applies a variety of statistical measures towards the evaluation of current and historical advisor performance data. Statistical measures include but are not limited to: (1) risk/reward analysis, (2) time window analysis, (3) risk analysis, (4) correlation analysis, (5) statistical overlays and (6) performance cycle analysis.
4
Qualitative Analysis
Although quantitative analysis statistically identifies the top performing trading advisors, qualitative analysis plays a major role in the trading advisor evaluation and final selection process. Each trading advisor in The Bornhoft Group Corporation’s top decile universe initially undergoes extensive qualitative review by The Bornhoft Group Corporation’s research department, as well as continual monitoring. This analysis generally includes, but is not limited to: (1) preliminary information and due diligence, (2) background review, (3) onsite due diligence, (4) extensive due diligence questionnaires and (5) written review and periodic updates. This information allows a thorough review of each trading advisor’s trading philosophy, trading systems and corporate structure.
Multi-Manager Approach
A multi-manager approach to portfolio management provides diversification of trading advisors and access to broader global markets. Multiple trading advisors can provide diversification across trading methodologies, trading time horizons, and markets traded. Additionally, multi-manager portfolios tend to provide a greater level of professional management with ongoing risk management and review. The result can be more consistent returns with lower volatility.
The trading system of each of the major commodity trading advisors used by the Trading Companies is as follows:
| | |
Major Commodity Trading Advisor | | Trading System Style |
Beach Horizon LLP | | Discretionary/Systematic |
Cantab Capital Partners LLP | | Discretionary/Systematic |
Global Advisors (Jersey) Limited | | Discretionary/Systematic |
Graham Capital Management, L.P. | | Discretionary/Systematic |
Mesirow Financial Commodities Management, LLC | | Discretionary/Systematic |
Quantitative Investment Management, LLC | | Discretionary/Systematic |
QuantMetrics Capital Management LLP | | Discretionary/Systematic |
Red Oak Commodity Advisors, Inc. | | Discretionary/Systematic |
Rosetta Capital Management, LLC | | Discretionary/Systematic |
Skyline Management, Inc. | | Discretionary/Systematic |
Tiverton Trading | | Discretionary/Systematic |
Transtrend B.V. | | Discretionary/Systematic |
Winton Capital Management Ltd. | | Discretionary/Systematic |
A commodity trading advisor (“CTA”) that may be allocated at least 10% of the assets of any Series is referred to herein as a major CTA. A non-major CTA in respect of any Series is a CTA whose allocation will be less than 10% of such Series’ assets.
As of December 31, 2011, the allocation of the assets of each applicable Series of the Trust between the Trading Advisors was as follows:
| | | | | | | | | | | | | | | | | | | | | | | | | | | | |
| | | Allocation as of December 31, 2011 (expressed as a percentage of aggregate notional exposure to commodity trading programs) | |
| | | | |
| | | Frontier Diversified | | | Frontier Long/Short | | | Frontier Masters | | | | | | Berkeley/Graham/ | | | | | | Winton/Graham | |
Advisor | | Series | | | Commodity Series | | | Series | | | Balanced Series | | | Tiverton Series * | | | Winton Series | | | Series | |
Beach Horizon LLP | | | — | | | | 16 | % | | | — | | | | — | | | | — | | | | — | | | | — | |
Berkeley Quantitative LP | | | — | | | | — | | | | — | | | | — | | | | 32 | % | | | — | | | | — | |
Cantab Capital Partners LLP | | | 9 | % | | | — | | | | 24 | % | | | 9 | % | | | — | | | | — | | | | — | |
Global Advisors (Jersey) Limited | | | — | | | | 16 | % | | | — | | | | — | | | | — | | | | — | | | | — | |
Graham Capital Management, L.P. | | | 4 | % | | | — | | | | — | | | | — | | | | 37 | % | | | — | | | | 58 | % |
Mesirow Financial Commodities Management, LLC | | | — | | | | 13 | % | | | — | | | | — | | | | — | | | | — | | | | — | |
Quantitative Investment Management, LLC | | | 19 | % | | | — | | | | — | | | | 18 | % | | | — | | | | — | | | | — | |
QuantMetrics Capital Management LLP | | | 4 | % | | | — | | | | — | | | | — | | | | — | | | | — | | | | — | |
Red Oak Commodity Advisors, Inc. | | | — | | | | 14 | % | | | — | | | | — | | | | — | | | | — | | | | — | |
Rosetta Capital Management, LLC | | | — | | | | 9 | % | | | — | | | | — | | | | — | | | | — | | | | — | |
Skyline Management, Inc. | | | — | | | | 9 | % | | | — | | | | — | | | | — | | | | — | | | | — | |
Tiverton Trading | | | 16 | % | | | — | | | | 22 | % | | | 16 | % | | | 31 | % | | | — | | | | — | |
Transtrend B.V. | | | — | | | | — | | | | 32 | % | | | 3 | % | | | — | | | | — | | | | — | |
Winton Capital Management Ltd. | | | 12 | % | | | — | | | | 23 | % | | | 12 | % | | | — | | | | 100 | % | | | 42 | % |
| * | As of February 29, 2012, Berkeley Quantitative L.P. no longer provides trading advisory services to The Frontier Fund or any trading company managed by the Managing Owner of The Frontier Fund. As of February 28, 2011, trading advisor services of Campbell & Company, Inc. were terminated, and as of March 4, 2011 the Campbell/Graham/Tiverton Series of The Frontier Fund was renamed Berkeley/Graham/Tiverton Series. |
5
A description of the trading strategies of the major commodity trading advisors, including general trading focus and registration as a commodity pool operator and/or an investment adviser, and a description of the advisory agreements with the commodity trading advisors is contained in the Prospectus, under the section captioned “Summary of Agreements—Advisory Agreements” and the appendix attached to the Prospectus for each Series of Units, containing a description of each major commodity trading advisor and its trading program, and such description is incorporated herein by reference from the Prospectus.
Financial Information about Geographic Areas
Although the Trust trades in the global futures and forward markets, it does not have operations outside of the U.S.
Employees
The Trust has no employees. The Trust is managed solely by the Managing Owner in its capacity as the managing owner of the Trust pursuant to the Trust Agreement.
Available Information
The Trust files quarterly, annual and current reports with the Securities and Exchange Commission (“SEC”). These reports are posted athttp://thefrontierfund.com, and are also available to read and copy at the SEC’s Public Reference Facilities in Washington, D.C. at 450 Fifth Street, N.W., Washington, D.C. 20549. Please call the SEC’s toll free number, 1-800-SEC-0330, for further information or visithttp://www.sec.gov.
Additional Information
As of February 29, 2012, Equinox Fund Management, LLC, the managing owner of The Frontier Fund, terminated The Frontier Fund’s advisory agreement with Berkeley Quantitative LP (“Berkeley”). Berkeley will no longer provide trading advisory services to The Frontier Fund or any trading company managed by the managing owner of The Frontier Fund. Effective March 1, 2012, Berkeley/Graham/Tiverton Series became known as the Tiverton/Graham/Transtrend Series.
6
The Trust is a venture in a high-risk business. An investment in the Units of each Series is very speculative. You should make an investment in one or more of the Series only after consulting with independent, qualified sources of investment and tax advice and only if your financial condition will permit you to bear the risk of a total loss of your investment. You should consider an investment in the Units only as a long-term investment. Moreover, to evaluate the risks of this investment properly, you must familiarize yourself with the relevant terms and concepts relating to commodities trading and the regulation of commodities trading, which are discussed in the Prospectus in the Statement of Additional Information below, in the section captioned “The Futures Markets,” which is incorporated herein by reference.
You should carefully consider all the information we have included or incorporated by reference in this Form 10-K and our subsequent periodic filings with the SEC. In particular, you should carefully consider the risk factors described below and read the risks and uncertainties as set forth in the “Management’s Discussion and Analysis of Financial Condition and Results of Operations” Section of this Form 10-K. Any of the following risks and uncertainties could materially adversely affect the Trust, its trading activities, operating results, financial condition and NAV and therefore could negatively impact the value of your investment. The information contained herein does not constitute investment, legal or tax advice. You should not invest in the Units unless you can afford to lose all of your investment.
Market Risks
The commodity interest markets in which the Trading Advisors trade are highly volatile, which could cause substantial losses and may cause you to lose your entire investment.
Commodity interest contracts are highly volatile and are subject to occasional rapid and substantial fluctuations. Consequently, you could lose all or substantially all of your investment in the Units of any Series should such Series’ trading positions suddenly turn unprofitable. The profitability of any Series depends primarily on the ability of its Trading Advisor(s) to predict these fluctuations accurately. Price movements for commodity interests are influenced by, among other things:
| | • | | changes in interest rates; |
| | • | | governmental, agricultural, trade, fiscal, monetary and exchange control programs and policies; |
| | • | | weather and climate conditions; |
| | • | | natural disasters, such as hurricanes; |
| | • | | changing supply and demand relationships; |
| | • | | changes in balances of payments and trade; |
| | • | | U.S. and international rates of inflation; |
| | • | | currency devaluations and revaluations; |
| | • | | U.S. and international political and economic events; and |
| | • | | changes in philosophies and emotions of market participants. |
The Trading Advisors’ technical trading methods may not take account of these factors except as they may be reflected in the technical input data analyzed by the Trading Advisors.
In addition, governments from time to time intervene, directly and by regulation, in certain markets, often with the intent to influence prices directly. The effects of governmental intervention may be particularly significant at certain times in the financial instrument and currency markets, and this intervention may cause these markets to move rapidly.
Futures, forward and options trading is volatile and may cause large losses.
A principal risk in futures, forward and options trading is volatile performance. Because the trading decisions for each of the Trust’s Winton Series and Managed Futures Index Series will be made by a single Trading Advisor, the trading for each such Series is similar to a single advisor fund in which one trading advisor makes all the trading decisions. In single advisor funds, volatility may increase as compared to a fund with several trading advisors who, collectively, can diversify risk to a greater extent (assuming those advisors are non-correlated with each other).
Options trading can be more volatile and expensive than futures trading and may cause large losses.
Certain Trading Advisors may trade options on futures. Although successful options trading require many of the same skills as successful futures trading, the risks involved are somewhat different. For example, the assessment of near-term market volatility—which is directly reflected in the price of outstanding options—can be of much greater significance in trading options than it is in many long-term futures strategies. If market volatility is incorrectly predicted, the use of options can be extremely expensive.
7
The trading on behalf of each Series will be highly leveraged, which means that sharp declines in price could lead to large losses.
Because the amount of margin funds necessary to be deposited with a Futures Clearing Broker to enter into a futures, forward contract or option position is typically about 2% to 10% of the total value of the contract, each Trading Advisor may take positions on behalf of a Series with face values equal to several times such Series’ NAV. These low margin requirements provide a large amount of leverage. As a result of this leveraging, even a small movement in the price of a contract can cause major losses. Any purchase or sale of a futures or forward contract may result in losses that substantially exceed the amount invested in the contract. For example, if $2,200 in margin is required to hold one U.S. Treasury bond futures contract with a face value of $100,000, a $2,200 decrease in the value of that contract could, if the contract is then closed out, result in a complete loss of the margin deposit, not even taking into account deductions of fees and/or commissions. If severe short-term price declines occur, such declines could force the liquidation of open positions with large losses. Leverage is normally monitored through the margin-to-equity ratio employed by each Trading Advisor. Under normal circumstances, the Trading Advisors will vary between a 10% to 30% margin-to-equity ratio.
8
Futures, forward and options trading may be illiquid and may cause large losses.
Although each Series generally will purchase and sell actively traded contracts, orders may not be executed at or near the desired price, particularly in thinly traded markets, in markets that lack trading liquidity, or because of applicable “daily price fluctuation limits,” “speculative position limits” or market disruptions. If market illiquidity or disruptions occur, then major losses could result. Some Trading Advisors have encountered illiquid situations in the past and may encounter others in the future.
Options are volatile and inherently leveraged, and sharp movements in prices could cause the Trust to incur large losses.
Certain Trading Advisors may use options on futures contracts, forward contracts or commodities to generate premium income or speculative gains. Options involve risks similar to futures, because options are subject to sudden price movements and are highly leveraged, in that payment of a relatively small purchase price, called a premium, gives the buyer the right to acquire an underlying futures contract, forward contract or commodity that has a face value substantially greater than the premium paid. The buyer of an option risks losing the entire purchase price of the option. The writer, or seller, of an option risks losing the difference between the purchase price received for the option and the price of the futures contract, forward contract or commodity underlying the option that the writer must purchase or deliver upon exercise of the option. There is no limit on the potential loss. Specific market movements of the futures contracts, forward contracts or commodities underlying an option cannot accurately be predicted. In addition, over-the-counter options present risks in addition to those associated with exchange-traded options, as discussed immediately below.
Exchanges of futures for physicals may adversely affect performance.
Certain Trading Advisors may engage in exchanges of futures for physicals for client accounts. An exchange of futures for physicals is a transaction permitted under the rules of many futures exchanges in which two parties holding futures positions may close out their positions without making an open, competitive trade on the exchange. Generally, the holder of a short futures position buys the physical commodity, while the holder of a long futures position sells the physical commodity. The prices at which such transactions are executed are negotiated between the parties. If a Trading Advisor engaging in exchanges of futures for physicals were prevented from such trading as a result of regulatory changes, the performance of client accounts of such Trading Advisor could be adversely affected.
Cash flow needs may cause positions to be closed which may cause substantial losses.
Certain Trading Advisors may trade options on futures. Futures contract gains and losses are marked-to-market daily for purposes of determining margin requirements. Option positions generally are not marked-to-market daily, although short option positions will require additional margin if the market moves against the position. Due to these differences in margin treatment between futures and options, there may be periods in which positions on both sides must be closed down prematurely due to short term cash flow needs. If this occurs during an adverse move in a spread or straddle relationship, then a substantial loss could occur.
The Trading Companies and Trust may enter into Swap and similar transactions which may create risks.
Swaps are not traded on exchanges and are not subject to the same type of government regulation as exchange markets. As a result, many of the protections afforded to participants on organized exchanges and in a regulated environment are not available in connection with these transactions.
The swap markets are “principals’ markets,” in which performance with respect to a Swap is the responsibility only of the counterparty to the contract, and not of any exchange or clearinghouse. As a result, each Trading Company is subject to the risk of the inability or refusal to perform with respect to Swaps on the part of the counterparties. There are no limitations on daily price movements in Swaps. Speculative position limits are not applicable to Swaps, although the counterparties to Swaps may limit the size or duration of positions as a consequence of credit considerations. Participants in the swap markets are not required to make continuous markets in the Swaps they trade. Participants could refuse to quote prices for Swaps or quote prices with an unusually wide spread between the price at which they are prepared to buy and the price at which they are prepared to sell. In the case of any Swap that references a fund or program managed by a Trading Advisor, certain or all of the risks disclosed in this Form 10-K in relation to the Trading Advisors also may apply, indirectly, in relation to the relevant Series’ investment in such Swap.
The recently enacted Dodd-Frank Wall Street Reform and Consumer Protection Act will affect the manner in which OTC swap transactions are traded and the credit risk associated with such trading. Any changes will likely impact the way swaps are traded and could impact the trading strategy of the trust, as well as make it more expensive to trade swaps.
There are no limitations on daily price movements in swaps. Speculative position limits are not applicable to swaps, although the counterparties to swaps may limit the size or duration of positions as a consequence of credit considerations. Participants in the swap markets are not required to make continuous markets in the swaps they trade. Participants could refuse to quote prices for swaps or quote prices with an unusually wide spread between the price at which they are prepared to buy and the price at which they are prepared to sell. In the case of any swap that references a fund or program managed by a trading advisor, certain or all of the risks disclosed in this report in relation to the trading advisors also may apply, indirectly, in relation to the relevant series’ investment in such swap.
9
The Trading on Behalf of Each Series Will Be Margined, Which Means that Sharp Declines in Prices Could Lead to Large Losses.
Because the amount of margin funds necessary to be deposited with a futures clearing broker to enter into a futures, forward contract or option position is typically about 2% to 10% of the total value of the contract, each trading advisor may take positions on behalf of a series with face values equal to several times such series’ net asset value. These low margin requirements provide a large amount of leverage. As a result of margining, even a small movement in the price of a contract can cause major losses. Any purchase or sale of a futures or forward contract or option position may result in losses that substantially exceed the amount invested. If severe short-term price declines occur, such declines could force the liquidation of open positions with large losses. Margin is normally monitored through the margin-to-equity ratio employed by each trading advisor. Under normal circumstances, the trading advisors will vary between a 10% to 30% margin-to-equity ratio. In addition, OTC transactions present risks in addition to those associated with exchange-traded contracts, as discussed immediately below.
OTC Transactions Are Subject to Little, if Any, Regulation and May Be Subject to the Risk of Counterparty Default.
A portion of each series’ assets may be used to trade OTC commodity interest contracts, such as forward contracts, option contracts in foreign currencies and other commodities, or swaps or spot contracts. OTC contracts are typically traded on a principal-to-principal basis through dealer markets that are dominated by major money center and investment banks and other institutions and are essentially unregulated by the CFTC. You therefore do not receive the protection of CFTC regulation or the statutory scheme of the Commodity Exchange Act in connection with this trading activity. The markets for OTC contracts rely upon the integrity of market participants in lieu of the additional regulation imposed by the CFTC on participants in the futures markets. The lack of regulation in these markets could expose a series in certain circumstances to significant losses in the event of trading abuses or financial failure by participants.
Each series also faces the risk of non-performance by the counterparties to the OTC contracts. Unlike in futures contracts, the counterparty to these contracts is generally a single bank or other financial institution, rather than a clearing organization backed by a group of financial institutions. As a result, there will be greater counterparty credit risk in these transactions. The clearing member, clearing organization or other counterparty may not be able to meet its obligations, in which case the applicable series could suffer significant losses on these contracts.
The recently enacted Dodd-Frank Act will affect the manner in which OTC swap transactions are traded and the credit risk associated with such trading. Depending upon actions taken by regulatory authorities, these changes may also affect the manner of trading of OTC foreign currency transactions. Transactions that have been entered into prior to implementation of the provisions of the Dodd-Frank Act will remain in effect. Accordingly, even after the new regulatory framework is fully implemented, the risks of OTC foreign exchange transactions will continue to exist with respect to transactions entered into prior to the implementation of the provisions of the Dodd-Frank Act. Additionally, any changes will likely impact the way swaps are traded and could impact the trading strategy of the trust, as well as make it more expensive to trade swaps.
The Dodd-Frank Act also requires the CFTC to adopt speculative position limits in certain commodities across futures markets, OTC transactions that perform a significant price discovery function and contracts traded on a foreign board of trade having direct market access from the U.S. that settle against the price of futures contracts traded on a U.S. market. The CFTC adopted such limitations in fall 2011. Such limits may adversely affect the profitability of the trust.
Credit Default Swaps.
A credit default swap enables an investor to buy or sell protection against a credit event with respect to an issuer, such as an issuer’s failure to make timely payments of interest or principal on its debt obligations, bankruptcy or restructuring. The terms of the instrument are generally negotiated by the trust and the swap counterparty. A credit default swap may be embedded within a structured note or other derivative instrument.
10
Generally, if the trust buys credit protection using a credit default swap, the trust will make fixed payments to the counterparty and if a credit event occurs with respect to the applicable issuer, the trust will deliver the issuer’s defaulted bonds underlying the swap to the swap counterparty and the counterparty will pay the trust par for the bonds. If the trust sells credit protection using a credit default swap, generally the trust will receive fixed payments from the counterparty and if a credit event occurs with respect to the applicable issuer, the trust will pay the swap counterparty par for the issuer’s defaulted bonds and the swap counterparty will deliver the bonds to the trust. Alternatively, a credit default swap may be cash settled and the buyer of protection would receive the difference between the par value and the market value of the issuer’s defaulted bonds from the seller of protection. If the credit default swap is on a basket of issuers, the notional value of the swap is reduced by the amount represented by that issuer, and the fixed payments are then made on the reduced notional value.
Risks of Credit Default Swaps.
Credit default swaps are subject to credit risk of the underlying issuer and to counterparty credit risk. If the counterparty fails to meet its obligations, the trust may lose money. Credit default swaps are also subject to the risk that the trust will not properly assess the risk of the underlying issuer. If the trust is selling credit protection, there is a risk that a credit event will occur and that the trust will have to pay the counterparty. If the trust is buying credit protection, there is a risk that no credit event will occur and the trust will receive no benefit for the premium paid.
Non-affiliated Trading Companies may incur substantial losses.
Additional risk of trading loss from investment in an unaffiliated Trading Company may result from the Managing Owner’s inability to directly control or stop trading in the event of exercise of certain withdrawal provisions in the investment agreement.
Over-the-counter transactions are subject to little, if any, regulation and may be subject to the risk of counterparty default.
A portion of each Series’ assets may be used to trade over-the-counter commodity interest contracts, such as forward contracts, option contracts in foreign currencies and other commodities, or swap or spot contracts. Over-the-counter contracts are typically traded on a principal-to-principal basis through dealer markets that are dominated by major money center and investment banks and other institutions and are essentially unregulated by the CFTC. You therefore do not receive the protection of CFTC regulation or the statutory scheme of the Commodity Exchange Act in connection with this trading activity by any Trading Advisor. The markets for over-the-counter contracts rely upon the integrity of market participants in lieu of the additional regulation imposed by the CFTC on participants in the futures markets. The lack of regulation in these markets could expose a Series in certain circumstances to significant losses in the event of trading abuses or financial failure by participants.
Each Series also faces the risk of non-performance by the counterparties to the over-the-counter contracts. Unlike in futures contracts, the counterparty to these contracts is generally a single bank or other financial institution, rather than a clearing organization backed by a group of financial institutions. As a result, there will be greater counterparty credit risk in these transactions. The clearing member, clearing organization or other counterparty may not be able to meet its obligations, in which case the applicable Series could suffer significant losses on these contracts.
Your investment could be illiquid.
A Trading Advisor may not always be able to liquidate its commodity interest positions at the desired time or price. It is difficult to execute a trade at a specific price when there is a relatively small volume of buy and sell orders in a market. A market disruption, such as a foreign government taking political actions that disrupt the market in its currency or in a major export, can also make it difficult to liquidate a position. Alternatively, limits imposed by futures exchanges or other regulatory organizations, such as speculative position limits and daily price fluctuation limits, may contribute to a lack of liquidity with respect to some commodity interests.
Unexpected market illiquidity may cause major losses to investors at any time or from time to time. The large face value of the positions that the Trading Advisors will acquire for each Series increases the risk of illiquidity by both making its positions more difficult to liquidate at favorable prices and increasing the losses incurred while trying to do so.
Also, there is not likely to be a secondary market for the Units. While the Units have redemption rights and exchange rights, there are restrictions. For example, transfers of Units are permitted only with the prior written consent of the Managing Owner and provided that conditions specified in the Trust Agreement are satisfied.
11
Redemptions may be temporarily suspended.
The Managing Owner may suspend temporarily any redemption for some or all Series up to 30 days if the effect of the redemption, either alone or in conjunction with other redemptions, would be to impair the Trust’s ability to operate in pursuit of its objectives (for example, if the Managing Owner believes a redemption, if allowed, would materially advantage one investor over another investor). The Managing Owner anticipates suspending redemptions only under extreme circumstances, such as a natural disaster, force majeure, act of war, terrorism or other event which results in the closure of financial markets. During any suspension of redemptions, a redeeming Limited Owner invested in a Series for which redemptions were suspended would remain subject to market risk with respect to such Series.
New exchange-traded commodity interest contracts, including security futures, are characterized by a higher degree of illiquidity and volatility, which may subject investors in those contracts to increased losses.
Certain Trading Advisors may trade newly developed futures contracts, including without limitation, security futures contracts. Traditionally, only those commodity interest contracts approved by the CFTC may be traded on U.S. futures exchanges. Likewise, foreign regulatory authorities are typically required to authorize the trading of new commodity interest contracts on foreign exchanges. Periodically, the CFTC or other foreign regulatory authorities may designate additional contracts as approved contracts. If any of the Trading Advisors determine that it is appropriate to trade in a new contract, they may do so on behalf of the Series for which they trade. Because these contracts will be new, the trading strategies of the Trading Advisors may not be applicable to, or advisable for, these contracts. The markets in new contracts, moreover, have been historically both illiquid and highly volatile for some period of time after the contract begins trading. These contracts therefore present significant risk potential.
The above risks are particularly applicable to the markets for security futures contracts. Security futures contracts are a class of financial instruments that allow the trading of futures contracts on individual U.S. equity securities or on narrow-based stock indices, which are indices made up of a small group of stocks that allow an investor to take a position in a concentrated area of the equities market. Security futures contracts have only been trading in the U.S. since November 2002 and the markets for these contracts generally have been characterized by very limited volumes when compared to futures markets generally. As a result, a Trading Advisor that trades security futures contracts could at times find it difficult to buy or sell a security futures contract at a favorable price, which could result in losses to the applicable Series.
Certain Trading Advisors may purchase and sell single stock futures contracts and other security futures products. A single stock future obligates the seller to deliver (and the purchaser to take delivery of) a specified equity security to settle the futures transaction. Other security futures products include “narrow-based” stock index futures contracts (in general, contracts based on the value of nine or fewer securities in a specific market or industry sector, such as energy, health care or banking) and futures contracts based on exchange-traded funds that are designed to track the value of broader stock market indices (such as the Dow Jones Industrial Average (the “DJIA”) or the NASDAQ 100 Index). Single stock futures and other security futures products are relatively illiquid and trade on a limited number of exchanges. The margin required with respect to single stock futures (usually at least 20% of the face value of the contract) generally is higher than the margin required with respect to other types of futures contracts (in some cases as low as 2% of the face value of the contract). The resulting lower level of leverage available to the Trading Advisors with respect to security futures products may adversely affect the respective Trading Company’s performance. Security futures products are typically traded on electronic trading platforms and are subject to risks related to system access, varying response time, security and system or component failure. In addition, although the Clearing Brokers will be required to segregate the Trading Company’s trades, positions and funds from those of each Clearing Broker itself as required by CFTC regulations, the insurance provided to securities customers by the Securities Investor Protection Corporation (the “SIPC”) will not be applicable to the Trading Company’s security futures positions because SIPC protection does not apply to futures accounts.
An investment in the Trust may not diversify an overall portfolio and portfolio risk may be increased.
Historically, managed futures have been generally non-correlated to the performance of other asset classes such as stocks and bonds. Non-correlation means that there is no statistically valid relationship between the performance of futures and other commodity interest transactions, on the one hand, and stocks or bonds, on the other hand. Non-correlation should not be confused with negative correlation, where the performance of two asset classes would be opposite of each other. Because of this non-correlation, the results of each Series cannot be expected to be automatically profitable during unfavorable periods for the stock market, or vice versa. If, however, a Series does not perform in a non-correlated manner with respect to the general financial markets or does not perform successfully, you will obtain little or no diversification benefits by investing in the Units. The Units may have no gains to offset your losses from other investments, and you may suffer losses on your investment in the Units at the same time losses on your other investments are increasing. You should therefore not consider the Units to be a hedge against losses in your core stock and bond portfolios.
12
Trading in international markets creates exposure to credit and regulatory risk.
A substantial portion of the Trading Advisors’ trades are expected to take place on markets or exchanges outside the United States. There is no limit to the amount of assets of any Series that may be committed to trading on foreign markets. The risk of loss in trading foreign futures and options on futures contracts can be substantial. Participation in foreign futures and options on futures contracts involves the execution and clearing of trades on, or subject to the rules of, a foreign board of trade or exchange. Some of these foreign markets, in contrast to U.S. exchanges, are so-called principals’ markets in which performance is the responsibility only of the individual counterparty with whom the trader has entered into a commodity interest transaction and not of the exchange or clearing corporation. In these kinds of markets, there is risk of bankruptcy or other failure or refusal to perform by the counterparty.
Some foreign markets present additional risk, because they are not subject to the same degree of regulation as their U.S. counterparts. None of the CFTC, the NFA or any domestic exchange regulates activities on any foreign boards of trade or exchanges (such as the execution, delivery and clearing of transactions) or has the power to compel enforcement of the rules of a foreign board of trade or exchange or of any applicable foreign laws. Similarly, the rights of market participants, in the event of the insolvency or bankruptcy of a foreign market or broker are also likely to be more limited than in the case of U.S. markets or brokers. As a result, in these markets, there is less legal and regulatory protection than that available domestically.
Additionally, trading on foreign exchanges is subject to the risks presented by exchange controls, expropriation, increased tax burdens and exposure to local economic declines and political instability. An adverse development with respect to any of these variables could reduce the profit or increase the loss earned on trades in the affected international markets.
International trading activities are subject to foreign exchange risk.
The price of any foreign futures, options on futures or other commodity interest contract and, therefore, the potential profit and loss on such contract, may be affected by any variance in the foreign exchange rate between the time the order is placed and the time it is liquidated, offset or exercised. As a result, if changes in the value of the local currency relative to the U.S. Dollar occur, then such changes may cause losses even if the contract traded is profitable.
International trading may cause exposure to losses resulting from foreign exchanges that are less developed or less reliable than U.S. exchanges.
Some foreign exchanges also may be in a more developmental stage so that prior price histories may not be indicative of current price dynamics. In addition, Trading Advisors may not have the same access to certain positions on foreign trading exchanges as do local traders, and the historical market data on which the Trading Advisors base their strategies may not be as reliable or accessible as it is in the United States. As a result, Trading Advisors entering into transactions on foreign exchanges may incur losses on behalf of the applicable Series.
Trading Risks
There are disadvantages to making trading decisions based on technical analysis.
Most of the Trading Advisors except certain Trading Advisors trading for the Frontier Long/Short Commodity Series may base their trading decisions on trading strategies that use mathematical analyses of technical factors relating to past market performance. The buy and sell signals generated by a technical, trend-following trading strategy are derived from a study of actual daily, weekly and monthly price fluctuations, volume variations and changes in open interest in the markets. The profitability of any technical, trend-following trading strategy depends upon the occurrence in the future of significant, sustained price moves in some of the markets traded. A danger for trend-following traders is whip-saw markets, that is, markets in which a potential price trend may start to develop but reverses before an actual trend is realized. A pattern of false starts may generate repeated entry and exit signals in technical systems, resulting in unprofitable transactions. In the past, there have been prolonged periods without sustained price moves. Presumably these periods will continue to occur. Periods without sustained price moves may produce substantial losses for trend-following trading strategies. Further, any factor that may lessen the prospect of these types of moves in the future, such as increased governmental control of, or participation in, the relevant markets, may reduce the prospect that any trend- following trading strategy will be profitable in the future.
There are disadvantages to making trading decisions based on fundamental analysis.
Certain Trading Advisors will base their decisions on trading strategies which utilize in whole or in part fundamental analysis of underlying market forces. Fundamental analysis attempts to examine factors external to the trading market which affect the supply and demand for a particular commodity interest in order to predict future prices. Such analysis may not result in profitable trading because certain Trading Advisors may not have knowledge of all factors affecting supply and demand or may incorrectly interpret the information they do have. Furthermore, prices may often be affected by unrelated or unexpected factors and fundamental analysis may not enable the Trading Advisor to determine whether its previous decisions were incorrect in sufficient time to avoid substantial losses. In addition, fundamental analysis assumes that commodity markets are inefficient—i.e., that commodity prices do not always reflect all available information—which some market analysts dispute.
13
The risk management approaches of one or all of the Trading Advisors may not be fully effective, and a Series may incur losses.
The mechanisms employed by each Trading Advisor to monitor and manage the risks associated with its trading activities on behalf of the Series for which it trades may not succeed in mitigating all identified risks. Even if a Trading Advisor’s risk management approaches are fully effective, it cannot anticipate all risks that it may face. If one or more of the Trading Advisors fails to identify and adequately monitor and manage all of the risks associated with its trading activities, the Series for which it trades may suffer losses.
Increased competition from other trend-following traders could reduce the Trading Advisors’ profitability.
There has been a dramatic increase over the past 15 to 25 years in the amount of assets managed by trend-following trading systems like those that some of the Trading Advisors may employ. This means increased trading competition among a larger number of market participants for transactions at favorable prices, which could operate to the detriment of some or all Series by preventing the Trading Advisors from effecting transactions at the desired prices. It may become more difficult for the Trading Advisors to implement their trading strategies if other commodity trading advisors using technical systems are also attempting to initiate or liquidate commodity positions at the same time as the Trading Advisors.
Discretionary decision-making may result in missed opportunities or losses.
Because each of the Trading Advisors’ strategies involves some discretionary aspects in addition to their technical factors, certain Trading Advisors may occasionally use discretion in investing the assets of a Series. For example, the Trading Advisors often use discretion in selecting contracts and markets to be followed. In exercising such discretion, such Trading Advisor may take positions opposite to those recommended by the Trading Advisor’s trading system or signals. Discretionary decision making may also result in a Trading Advisor’s failing to capitalize on certain price trends or making unprofitable trades in a situation where another trader relying solely on a systematic approach might not have done so. Furthermore, such use of discretion may not enable the Series to avoid losses, and in fact, such use of discretion may cause the Series to forego profits which it may have otherwise earned had such discretion not been used.
Speculative position limits and daily price fluctuation limits may force the alteration of trading decisions which may cause a Series to forego profitable trades or strategies.
The CFTC and U.S. exchanges have established limits, known as speculative position limits, on the maximum net long or net short positions that any person may hold or control in certain futures and options on futures contracts. Most exchanges also impose limits, known as daily limits, on the amount of fluctuation in certain futures and options on futures contracts in a single trading day. All accounts controlled by a particular Trading Advisor and its principals are combined for speculative position limit purposes. If positions in those accounts were to approach the level of the particular speculative position limit, or if prices were to approach the level of the daily limit, these limits could cause a modification of the particular Trading Advisor’s trading decisions or force liquidation of certain futures or options on futures positions. If one or more of the Trading Advisors must take either of these actions, one or more Series may be required to forego profitable trades or strategies.
Increases in assets under management of any of the Trading Advisors may affect trading decisions and may cause losses.
In general, none of the Trading Advisors intends to limit the amount of additional equity that it may manage, and each will continue to seek major new accounts. The more equity a Trading Advisor manages, the more difficult it may be for it to trade profitably because of the difficulty of trading larger positions without adversely affecting prices and performance and of managing risk associated with larger positions. Accordingly, future increases in equity under management may require a Trading Advisor to modify its trading decisions for a Series because it cannot deploy all the assets in the commodities which it desires to trade. Furthermore, if the Trading Advisors for a Series cannot manage any additional allocation from the Trust, the Managing Owner may add additional Trading Advisors for such Series who may have less experience or less favorable performance than the existing Trading Advisors.
Factors beyond a Trading Advisor’s control may cause a Trading Advisor to deviate from its trading program or strategy.
Economic, market and other conditions may cause a Trading Advisor to deviate from its stated trading program or strategy. There can be no guarantee that any Trading Advisor would alert the Managing Owner to such a change.
The use of multiple Trading Advisors may result in offsetting or opposing trading positions and may also require one Trading Advisor to fund the margin requirements of another Trading Advisor.
The use of multiple Trading Advisors for the Frontier Diversified Series, Frontier Masters Series, Balanced Series, Winton/Graham Series, Berkeley/Graham/Tiverton Series, Currency Series and Frontier Long/Short Commodity Series may result in developments or
14
positions that adversely affect the respective Series’ NAV. For example, because the Trading Advisors trading for the Frontier Diversified Series, Frontier Masters Series, Balanced Series, Winton/Graham Series, Berkeley/Graham/Tiverton Series, Currency Series and Frontier Long/Short Commodity Series will be acting independently, such Series could buy and sell the same futures contract, thereby incurring additional expenses but with no net change in its holdings. The Trading Advisors also may compete, from time to time, for the same trades or other transactions, increasing the cost to such Series of making trades or transactions or causing some of them to be foregone altogether. Even though the margin requirements resulting from each Trading Advisor’s trading for any such Series ordinarily will be met from that Trading Advisor’s allocated net assets of such Series, a Trading Advisor for the Frontier Diversified Series, Frontier Masters Series, Balanced Series, Winton/Graham Series, Berkeley/Graham/Tiverton Series, Currency Series, or Frontier Long/Short Commodity Series may incur losses of such magnitude that such Series is unable to meet margin calls from the allocated net assets of that Trading Advisor. If losses of such magnitude were to occur, the Clearing Brokers for the Trading Company or Trading Companies in which such Series invests its assets may require liquidations and contributions from the allocated net assets of another Trading Advisor for such Series.
The Trading Advisors’ trading programs bear some similarities and, therefore, may lessen the benefits to the Balanced Series, Winton/Graham Series, Berkeley/Graham/Tiverton Series, Currency Series and Frontier Long/Short Commodity Series of having multiple Trading Advisors.
Each Trading Advisor has, over time, developed and modified the program it will use in trading. Nevertheless, the Trading Advisors’ trading programs have some similarities. These similarities may, in fact, mitigate the positive effect of having multiple Trading Advisors for the Frontier Diversified Series, Frontier Masters Series, Balanced Series, Winton/Graham Series, Berkeley/Graham/Tiverton Series, Currency Series and Frontier Long/Short Commodity Series. For example, in periods where one Trading Advisor experiences a draw-down, it is possible that these similarities will cause the other Trading Advisors to also experience a draw-down.
Each Series, other than the Frontier Dynamic Series and Long Only Commodity Series rely on their Trading Advisor(s) for success, and if a Trading Advisor’s trading is unsuccessful, the Series may incur losses.
The Trading Advisor(s) for each Series, other than the Frontier Dynamic Series and Long Only Commodity Series (which invested only in Swaps referencing two indexes) will make the commodity trading decisions for that Series. Therefore, the success of each Series largely depends on the judgment and ability of the Trading Advisors. A Trading Advisor’s trading for any Series may not prove successful under all or any market conditions. If a Trading Advisor’s trading is unsuccessful, the applicable Series may incur losses.
The Trading Advisors or their trading strategies may not continually serve the Series which may put such Series at a disadvantage or incur losses for such Series.
It is possible that (i) any Trading Advisor or the Managing Owner will exercise its rights to terminate the Advisory Agreement for any Series under certain conditions, (ii) the Advisory Agreement with any Trading Advisor, once it expires, will not be renewed on the same terms as the current Advisory Agreement for that Trading Advisor, or (iii) if assets of any Series allocated to a particular Trading Advisor are reallocated to a new or different Trading Advisor, the new or different Trading Advisor will not manage such assets on terms as favorable to such Series as those negotiated with the Trading Advisor to which such assets were previously allocated, and the Managing Owner may charge such Series incentive fees based on the performance of the Trading Advisor managing the reallocated assets even though the Series has not recouped the losses sustained by the previous Trading Advisor.
Each Trading Advisor’s past performance record is inconsistent, and the Trading Advisor’s trading for a Series could be similarly inconsistent and incur losses.
The performance records of each Trading Advisor reflect significant variations in profitability from period to period. It is possible that a Trading Advisor’s trading for the Series will similarly vary from period to period, resulting in losses to such Series.
Each Trading Advisor advises other clients and may achieve more favorable results for its other accounts.
Each of the Trading Advisors currently manages other trading accounts, and each will remain free to manage additional accounts, including its own accounts, in the future. A Trading Advisor may vary the trading strategies applicable to the Series for which it trades from those used for its other managed accounts, or its other managed accounts may impose a different cost structure than that of the Series for which it trades. Consequently, the results any Trading Advisor achieves for the Series for which it trades may not be similar to those achieved for other accounts managed by the Trading Advisor or its affiliates at the same time. Moreover, it is possible that those other accounts managed by the Trading Advisor or its affiliates may compete with the Series for which it trades for the same or similar positions in the commodity interest markets and that those other accounts may make trades at better prices than the Series for which it trades.
A Trading Advisor may also have a financial incentive to favor other accounts because the compensation received from those other accounts exceeds, or may in the future exceed, the compensation that it receives from managing the account of the Series for which it trades. Because records with respect to other accounts are not accessible to investors in the Units, investors will not be able to determine if any Trading Advisor is favoring other accounts.
15
The Trading Advisors’ positions may be concentrated from time to time, which may render each Series susceptible to larger losses than if the positions were more diversified.
One or more of the Trading Advisors may from time to time cause a Series to hold a few, relatively large positions in relation to its assets. Consequently, a loss in any such position could result in a proportionately greater loss to such Series than if such Series’ assets had been spread among a wider number of instruments.
Markets or positions may be correlated and may expose a Series to significant risk of loss.
Different markets traded or individual positions held by a Series of Units may be highly correlated to one another at times. Accordingly, a significant change in one such market or position may affect other such markets or positions. The Trading Advisors cannot always predict correlation. Correlation may expose such Series of Units both to significant risk of loss and significant potential for profit.
Turnover in each Series’ portfolio may be high which could result in higher brokerage commissions and transaction fees and expenses.
Each Trading Advisor will make certain trading decisions on the basis of short-term market considerations. The portfolio turnover rate may be substantial at times, either due to such decisions or to “whip-saw” market conditions and result in one or more Series incurring substantial brokerage commissions and other transaction fees and expenses.
Operating Risks
Past performance is not necessarily indicative of future performance.
The Managing Owner has selected each Trading Advisor to manage the assets of each Series because each Trading Advisor performed well through the date of its selection. You must consider, however, the uncertain significance of past performance, and you should not rely to a substantial degree on the Trading Advisors’ or the Managing Owner’s records to date for predictive purposes. You should not assume that any Trading Advisor’s future trading decisions will create profit, avoid substantial losses or result in performance for the Series comparable to that Trading Advisor’s or to the Managing Owner’s past performance. In fact, as a significant amount of academic study has shown, futures funds more frequently than not under-perform the past performance records included in their prospectuses.
Because you and other investors will acquire exchange and redeem Units at different times, you may experience a loss on your Units even though the Series in which you have invested as a whole is profitable and even though other investors in that Series experience a profit. The past performance of any Series may not be representative of each investor’s investment experience in it.
Likewise, you and other investors will invest in different Series managed by different Trading Advisors. Each Series’ assets are valued and accounted for separately from every other Series.
Consequently, the past performance of one Series has no bearing on the past performance of another Series. You cannot, for example, consider the Balanced Series’ past performance in deciding whether to invest in any other Series.
There is no “principal protection” feature, and you could lose your entire investment.
The Trust is not guaranteed as to principal, so you are not assured of any minimum return. Therefore, you could lose your entire investment (including any undistributed profits), in addition to losing the use of your subscription funds for the period you maintain an investment in any Series.
You have limited performance information on which to evaluate an investment in a Series.
Certain of the Series have limited performance histories upon which to evaluate your investment in such Series. Although past performance is not necessarily indicative of future results, if any such Series had a longer performance history, such performance history might provide you with more information on which to base your investment decision for such Series. As such Series have limited performance histories, you will have to make your decision to invest in any such Series without such possibly useful information.
16
Each Series is charged substantial fees and expenses regardless of profitability.
Each Series is charged brokerage charges, over-the-counter dealer spreads and related transaction fees and expenses and management fees in all cases regardless of whether any Series’ activities are profitable. In addition, the Managing Owner charges each Series an incentive fee based on a percentage of trading profits earned on the Series’ net assets and the Managing Owner pays all or a portion of such incentive fees to the Trading Advisor(s) for such Series. Because the Balanced Series, Winton/Graham Series, Berkeley/Graham/Tiverton Series, Frontier Diversified Series, Frontier Masters Series and Frontier Long/Short Commodity Series may each employ multiple Trading Advisors, it is possible that such Series could pay substantial incentive fees out of the assets of any such Series with respect to one or more Trading Advisors in a year in which such Series has no net trading profits or in which it actually loses money. In addition, each Series must earn trading gains sufficient to compensate for these fees and expenses before it can earn any profit.
Differing levels of fees received may create an incentive for the Managing Owner to favor certain Series over others.
The Managing Owner charges the various Series differing levels of fees. This may create an incentive for the Managing Owner to favor certain Series over other Series in, among other things, the amount of time and effort spent managing any given Series and the selection of Trading Advisors for a given Series.
The Managing Owner and its principals may maintain differing levels of beneficial ownership among the different Series.
The Managing Owner and its principals may maintain differing levels of beneficial ownership among the various Series of the Trust. Such varying levels of beneficial ownership may create an incentive for the Managing Owner and/or its principals to favor one Series over another in the amount of time and effort spent managing the Series or in the decisions made for the Series.
You may not be able to purchase Class 2 Units or Class 2a Units unless you have a particular relationship with a Selling Agent or if Class 2 Units or Class 2a Units are not available for purchase.
In order to purchase Class 2 Units or Class 2a Units of any Series, you must have an arrangement with a Selling Agent where you directly compensate such Selling Agent for services rendered in connection with investments, including an investment in the Trust (such arrangements commonly referred to as “wrap-accounts”). If you do not have such an arrangement with a Selling Agent, then you will only be able to purchase Class 1 Units or Class 1a Units in any Series, which will result in you being charged higher service fees.
Whether you have such an arrangement with a Selling Agent will depend on your relationship with such Selling Agent. Neither the Trust nor the Managing Owner has any control over the type of arrangement you have with a Selling Agent.
In addition, the Class 2 Units and Class 2a Units represent only a small portion of the total amount of Units which are currently registered with the SEC for sale by the Trust. Therefore, even if you have such an arrangement with a Selling Agent, Class 2 Units and Class 2a Units may not be available to you for purchase.
The Trust may incur higher fees and expenses upon renewing existing or entering into new contractual relationships.
The clearing agreements between the Clearing Brokers and the Trading Companies generally are terminable by the Clearing Brokers once the Clearing Broker has given the Trading Company the required notice. Upon termination of a clearing agreement, the Managing Owner may be required to renegotiate that agreement or make other arrangements for obtaining services if the Trust intends to continue trading in commodity interest contracts at its present level of capacity. The services of the Clearing Brokers may not be available, or even if available, these services may not be available on the terms as favorable as those contained in the expired or terminated clearing agreements.
Likewise, upon termination of any of the Advisory Agreements entered into between the Trust and each Trading Advisor, the Managing Owner may be required to renegotiate the contracts or make other arrangements for obtaining commodity trading advisory services. The services of the particular Trading Advisor may not be available, or these services may not be available on terms as favorable as those contained in the expired or terminated advisory contract. There is severe competition for the services of qualified commodity trading advisors, and the Managing Owner may not be able to retain replacement or additional Trading Advisors on acceptable terms. This could result in losses to one or more Series and/or the inability of one or more Series to achieve its investment objectives. Moreover, if an advisory contract is renegotiated or additional or substitute Trading Advisors are retained by the Managing Owner on behalf of one or more Series, the fee structures of the new or additional arrangements may not be as favorable to the affected Series as are those currently in place
The incentive fees could be an incentive to the Trading Advisors to make riskier investments.
Each Trading Advisor employs a speculative strategy and the Managing Owner pays each Trading Advisor incentive fees based on the trading profits earned by it for the applicable Series. Accordingly, each of the Trading Advisors has a financial incentive to make
17
investments that are riskier than might be made if a Series’ assets were managed by a Trading Advisor that did not receive performance-based compensation. For example, if an investment earns large amounts of trading profits, the Trading Advisor making such an investment may earn a larger incentive fee. Therefore, a Trading Advisor may decide to make an investment with potential for large amounts of trading profits, despite the fact that such investment may have a high degree of risk. If the investment is unsuccessful, the Series could incur losses. Conversely, a Trading Advisor that does not receive any performance-based incentive fees might not make such a risky investment.
The interest rate floor for certain Series may create financial risk for such Series.
With respect to the Winton/Graham Series, Winton Series, Berkeley/Graham/Tiverton Series, Currency Series and the Class 1 and Class 2 of the Balanced Series, the Trust has agreed to pay all interest income earned by it to the Managing Owner up to a cap of 2.0% annually of the NAV of such Series. To the extent that the interest income earned by the Trust falls below 0.75% annually, the Trust will be obligated to pay the Managing Owner the difference between the interest income that is allocated to each of such Series and 0.75%. Such shortfall will be charged pro rata across such Series of Units. Accordingly, if interest rates fall, then you could be charged a portion of such interest income shortfall which would reduce the value of your Units in such Series.
In October 2008, the Trust invested approximately $272 million in custom time deposits with U.S. Bank N.A. The time deposits earn a guaranteed fixed interest rate of 3.75% and will mature six months from the deposit date and be subject to automatic six-month rollovers through October 2013. In September 2009, the Trust invested approximately $100 million in custom time deposits with U.S. Bank N.A. The time deposits earn a guaranteed fixed interest rate of 2.17% and will mature six months from the deposit date and be subject to automatic six-month rollovers through October 2014. In April 2010, the Trust invested approximately $50 million in custom time deposits with U.S. Bank N.A. In May 2011, July 2011 and August 2011, the Trust redeemed approximately $25 million, $25 million and $50 million, respectively, in custom time deposits held with U.S. Bank N.A which represented a full liquidation of the 2.17% investment tranche. The time deposits earn a guaranteed fixed interest rate of 2.40% and will mature six months from the deposit date and be subject to automatic six-month rollovers through October 2015.
Other assets of the Trust earn interest at different rates. There can be no assurance that the interest income of the Trust can be maintained above the 0.75% shortfall level due to the uncertainties of the duration and extent of a low interest rate environment.
You have limited rights, and you cannot prevent the Trust from taking actions which could cause losses.
Pursuant to the Trust Agreement, you will exercise no control over the Trust’s day-to-day business. Therefore, the Trust may take certain actions and enter into certain transactions or agreements of which you have no approval. For example, the Trust may retain a Trading Advisor for a Series in which you are invested, and such Trading Advisor may ultimately incur losses for the Series. As a Limited Owner, you have no ability to determine or influence the hiring, retention or firing of such Trading Advisor. However, certain actions, such as termination or dissolution of a Series, or replacement of Managing Member, may be taken, or approved, upon the affirmative vote of Limited Owners holding Units representing at least a majority (over 50%) of the NAV of the Series (excluding Units owned by the Managing Owner and its affiliates).
You may not be able to establish a basis for liability against a Trading Advisor, a Clearing Broker or the Swap Counterparty.
Each Trading Advisor, each Clearing Broker and each Swap counterparty acts only as a trading advisor, clearing broker or swap counterparty, respectively, to the applicable Series and Trading Company. None of these parties acts in such capacity to you. Therefore, you have no contractual privities with the Trading Advisors, the Clearing Brokers or any Swap counterparty. Due to this lack of contractual privities, you will likely not be able to establish a basis for liability against a Trading Advisor, a Clearing Broker or any Swap counterparty.
An unanticipated number of redemption requests during a short period of time could have an adverse effect on the NAV of a Series.
If a substantial number of requests for redemption of Units in a Series are received by the Trust during a relatively short period of time, such Series may not be able to satisfy the requests from funds not committed to trading. As a consequence, it could be necessary to liquidate positions in such Series’ trading positions before the time that the applicable Trading Advisor(s)’ trading strategies would dictate liquidation. If this were to occur, it could affect adversely the NAV per Unit of such Series and each Class within such Series, not only for Limited Owners redeeming units but also for non-redeeming Limited Owners. Your redemption price for Units in a Series is based on the NAV per Unit of such Series, which value could be less than the initial price you paid for your Units.
Reserves for contingent liabilities may be established upon redemption, and the Trust may withhold a portion of your redemption amount.
The Trust may find it necessary upon redemption by you to set up a reserve for undetermined or contingent liabilities and withhold a certain portion of your redemption amount. This could occur, for example, in the event some of the positions of the Series in which you were invested were illiquid, if there are any assets which cannot be properly valued on the redemption date, or if there is any pending transaction or claim by or against the Trust involving or which may affect your book capital account or your obligations of which the Trust cannot, in the sole judgment and discretion of the Managing Owner, be then ascertained.
18
Conflicts of interest exist in the structure and operation of the Trust.
A number of actual and potential conflicts of interest exist in the operation of the Trust’s business. The Managing Owner, the Trading Advisors and their respective principals, all of which are engaged in other investment activities, are not required to devote substantially all of their time to the Trust’s business, which also presents the potential for numerous conflicts of interest with the Trust.
As a result of these and other relationships, parties involved with the Trust have a financial incentive to act in a manner other than in the best interests of the Trust and its Limited Owners. The Managing Owner has not established, and has no plans to establish, any formal procedures to resolve these and other conflicts of interest. Consequently, there is no independent control over how the Managing Owner will resolve these conflicts on which investors can rely in ensuring that the Trust is treated equitably.
The failure or bankruptcy of one of its Futures Clearing Brokers, banks or other custodians could result in a substantial loss of one or more Series’ assets.
Under CFTC regulations, a futures commission merchant maintains customers’ assets in a bulk segregated account. If a Futures Clearing Broker fails to do so, or is unable to satisfy a substantial deficit in a customer account, its other customers may be subject to risk of loss of their funds in the event of that Futures Clearing Broker’s bankruptcy. In that event, the Futures Clearing Broker’s customers, such as one or more Trading Companies which utilize such Futures Clearing Broker, are entitled to recover, even in respect of property specifically traceable to them, only a proportional share of all property available for distribution to all that Futures Clearing Broker’s customers. Each Series also may be subject to the risk of the failure of, or delay in performance by, any exchanges and markets and their clearing organizations, if any, on which commodity interest contracts are traded.
Other institutions such as banks will have custody of the assets of the Trust. Such institutions may encounter financial difficulties that impair the Trust’s operating capabilities or capital position. The Managing Owner will attempt to limit the Trust’s deposits and transactions to well-capitalized institutions in an effort to mitigate such risks, but there can be no assurance that even a well-capitalized, major institution will not become bankrupt.
You will not be able to review any Series’ holdings on a daily basis, and you may suffer unanticipated losses.
The Trading Advisors make trading decisions on behalf of the assets of each Series other than the Frontier Dynamic Series and Long Only Commodity Series. While the Trading Advisors receive daily trade confirmations from the Clearing Brokers of each transaction entered into on behalf of each Series for which they manage the trading of, each Series’ trading results are only reported to investors monthly in summary fashion. Accordingly, an investment in the Units does not offer investors the same transparency that a personal trading account offers in that you will not have access to detailed information concerning the positions held on behalf of any Series. As a result, you may suffer unanticipated losses as a result of the Series’ portfolio holdings.
The Trust could terminate before you achieve your investment objective causing potential loss of your investment or upsetting your investment portfolio.
Unforeseen circumstances, including substantial losses, withdrawal of the Trust’s Managing Owner or suspension or revocation of the Managing Owner’s or any of the registered Trading Advisors’ respective registrations under the Commodity Exchange Act or memberships in the NFA could cause the Trust to terminate before its stated termination date of December 31, 2053. The Trust’s termination would cause the liquidation and potential loss of your investment and could upset the overall maturity and timing of your investment portfolio.
The Trust is not a regulated investment company and thus is subject to different protections than a regulated investment company.
The Trust is not an investment company subject to the Investment Company Act. Accordingly, you do not have the protections afforded by that statute. For example, the Investment Company Act requires investment companies to have a majority of disinterested directors and regulates the relationship between the investment company and its investment adviser. Since the Trust is not a registered investment company, you will not benefit from such protections.
Litigation could result in substantial additional expenses.
The Trust could be named as a defendant in a lawsuit or regulatory action arising out of the activities of the Managing Owner or the Trading Advisors. If this happens, the Trust will bear the costs of defending such suit or action and will be at further risk if its defense is unsuccessful which could result in losses to your investment.
19
Dilution could occur as a result of the initial service fee and/or on-going service fee.
Investors who subscribe for larger amounts of Units will pay initial service fees and/or on-going service fees at reduced levels. The reduction of the initial service fee and/or on-going service fee will be effectuated through the issuance of additional Units to such investors. If such additional Units are issued to such investors, then the dilution of the other investors in such Series will result. Therefore, effectively, the other owners of Units of such Series will bear the cost of the reduction of the initial service fees and/or on-going service fees for the larger Unit owners because they will receive a smaller portion of the profits earned by such Series
The Managing Owner is leanly staffed and relies heavily on its key personnel to manage the Trust’s trading activities. The loss of such personnel could adversely affect the Trust.
In managing and directing the day-to-day activities and affairs of the Trust, the Managing Owner relies heavily on its principals. The Managing Owner is leanly staffed, although there are back-up personnel for every key function. If any of its key persons were to leave or be unable to carry out his or her present responsibilities, it may have an adverse effect on the management of the Trust.
In addition, under the operating agreement of the Managing Owner, Mr. Bornhoft’s ability to serve as the Manager of the Managing Owner is dependent upon certain factors. If Mr. Bornhoft ceases to be the Manager of the Managing Owner, the Trust could be adversely affected.
20
The Managing Owner places significant reliance on the Trading Advisors and their key personnel and the loss of such personnel could adversely affect a Series.
The Managing Owner relies on the Trading Advisors to achieve trading gains for each Series, entrusting each of them with the responsibility for, and discretion over, the investment of their allocated portions of the Trust’s assets. The Trading Advisors, in turn, are dependent on the services of a limited number of persons to develop and refine their trading approaches and strategies and execute the trading transactions. The loss of the services of any Trading Advisor’s principals or key employees, or the failure of those principals or key employees to function effectively as a team, may have an adverse effect on that Trading Advisor’s ability to manage its trading activities successfully or may cause the Trading Advisor to cease operations entirely, either of which, in turn, could negatively impact one or more Series’ performance. Each of the Trading Advisors is wholly (or majority) owned and controlled, directly or indirectly, by single individuals who have major roles in developing, refining and implementing the Trading Advisor’s trading strategies and operating its business. The death, incapacity or other prolonged unavailability of such individuals likely would greatly hinder these Trading Advisors’ operations, and could result in their ceasing operations entirely, which could adversely affect the value of your investment.
The Managing Owner may terminate, replace and/or add Trading Advisors in its sole discretion which may disrupt trading, adversely affecting the Net Asset Value of a Series.
The Managing Owner may terminate, substitute or retain Trading Advisors on behalf of each Series in its sole discretion. The addition of a new Trading Advisor and/or the removal of one of the current Trading Advisors may cause disruptions in trading as assets are reallocated and new Trading Advisors transition over, which may have an adverse effect on the NAV of the affected Series.
The Managing Owner’s allocation of the Trust’s assets among Trading Advisors may result in less than optimal performance by the Trust.
The Managing Owner may reallocate assets among the Trading Advisors for the Frontier Diversified Series, Frontier Masters Series, Balanced Series, Winton/Graham Series, Berkeley/Graham/Tiverton Series, Currency Series or Frontier Long/Short Commodity Series upon termination of a Trading Advisor or retention of a new Trading Advisor or at the commencement of any month. Consequently, the net assets for such Series may be allocated among the Trading Advisors in a different manner than the currently anticipated allocation. The Managing Owner’s allocation of assets of any such Series will directly affect the profitability of the trading of the Frontier Diversified Series, Frontier Masters Series, Balanced Series, Winton/Graham Series, Berkeley/Graham/Tiverton Series, Currency Series and Frontier Long/Short Commodity Series, possibly in an adverse manner. For example, a Trading Advisor for a Series may experience a high rate of return but may be managing only a small percentage of the net assets of such Series. In this case, the Trading Advisor’s performance could have a minimal effect on the NAV of such Series.
Third parties may infringe or otherwise violate a Trading Advisor’s intellectual property rights or assert that a Trading Advisor has infringed or otherwise violated their intellectual property rights, which may result in significant costs and diverted attention.
Third parties may obtain and use a Trading Advisor’s intellectual property or technology, including its trading program software, without permission. Any unauthorized use of a Trading Advisor’s proprietary software and other technology could adversely affect its competitive advantage. Proprietary software and other technology are becoming increasingly easy to duplicate, particularly as employees with proprietary knowledge leave the owner or licensed user of that software or other technology. Each Trading Advisor may have difficulty monitoring unauthorized uses of its proprietary software and other technology. The precautions it has taken may not prevent misappropriation or infringement of its proprietary software and other technology. Also, third parties may independently develop proprietary software and other technology similar to that of a Trading Advisor or claim that the Trading Advisor has violated their intellectual property rights, including their copyrights, trademark rights, trade names, trade secrets and patent rights. As a result, a Trading Advisor may have to litigate in the future to protect its trade secrets, determine the validity and scope of other parties’ proprietary rights, defend itself against claims that it has infringed or otherwise violated other parties’ rights, or defend itself against claims that its rights are invalid. Any litigation of this type, even if the Trading Advisor is successful and regardless of the merits, may result in significant costs, divert its resources from the manager of the Series’ assets, or require it to change its proprietary software and other technology or enter into royalty or licensing agreements.
The success of each Series depends on the ability of the personnel of its Trading Advisor(s) to accurately implement their trading systems, and any failure to do so could subject a Series to losses on such transactions.
The Trading Advisors’ computerized trading systems rely on the Trading Advisors’ personnel to accurately process the systems’ outputs and execute the transactions called for by the systems. In addition, each Trading Advisor relies on its staff to properly operate and maintain its computer and communications systems upon which the trading systems rely. Execution and operation of each Trading Advisor’s systems is therefore subject to human errors. Any failure, inaccuracy or delay in implementing any of the Trading Advisors’ systems and executing transactions could impair its ability to identify profit opportunities and benefit from them. It could also result in decisions to undertake transactions based on inaccurate or incomplete information. This could cause substantial losses on transactions.
21
A Series may experience substantial losses on transactions if the computer or communications systems of its Trading Advisor(s) fail.
Each Trading Advisor’s trading activities, including its risk management, depends on the integrity and performance of the computer and communications systems supporting it. Extraordinary transaction volume, hardware or software failure, power or telecommunications failure, a natural disaster or other catastrophe could cause any Trading Advisor’s computer systems to operate at an unacceptably slow speed or even fail. Any significant degradation or failure of the systems that a Trading Advisor uses to gather and analyze information, enter orders, process data, monitor risk levels and otherwise engage in trading activities may result in substantial losses on transactions, liability to other parties, lost profit opportunities, damages to the Trading Advisors’, the Managing Owner’s and the Trust’s reputations, increased operational expenses and diversion of technical resources.
Each Trading Advisor depends on the reliable performance of the computer or communications systems of third parties, such as brokers and futures exchanges, and may experience substantial losses on transactions if they fail.
Each Trading Advisor depends on the proper and timely function of complex computer and communications systems maintained and operated by the futures exchanges, brokers and other data providers that the Trading Advisor uses to conduct its trading activities. Failure or inadequate performance of any of these systems could adversely affect the Trading Advisor’s ability to complete transactions, including its ability to close out positions, and result in lost profit opportunities and significant losses on commodity interest transactions. This could have a material adverse effect on revenues and materially reduce the Trust’s available capital. For example, unavailability of price quotations from third parties may make it difficult or impossible for a Trading Advisor to use its proprietary software that it relies upon to conduct its trading activities. Unavailability of records from brokerage firms can make it difficult or impossible for the Trading Advisor to accurately determine which transactions have been executed or the details, including price and time, of any transaction executed. This unavailability of information also may make it difficult or impossible for the Trading Advisor to reconcile its records of transactions with those of another party or to accomplish settlement of executed transactions.
If a Trading Advisor, or third parties on whom a Trading Advisor depends, or Managing Owner or sub-service providers on whom the Managing Owner depends fail to upgrade computer and communications systems, the Trust’s financial condition could be harmed.
The development of complex communications and new technologies may render the existing computer and communication systems supporting the Trading Advisors’ trading activities and the Managing Owner, or sub-service providers’ administrative functions obsolete. In addition, these computer and communications systems must be compatible with those of third parties, such as the systems of exchanges, the Clearing Brokers and the executing brokers used by the Trading Advisors. As a result, if these third parties upgrade their systems, the Trading Advisors will need to make corresponding upgrades to continue effectively its trading activities. The Trust’s future success will depend on each Trading Advisor’s and third parties on whom a Trading Advisor depends, the Managing Owner or sub-service providers ability to respond to changing technologies on a timely and cost-effective basis.
A Series may experience substantial delays in reporting results if the computer or communications systems of the Managing Owner or designated sub-service provider(s) fail.
The Managing Owner and it’s sub-service providers, including its risk management, fund administration, valuation and transfer agency depends on the integrity and performance of the computer and communications systems supporting it. Extraordinary transaction volume, hardware or software failure, power or telecommunications failure, a natural disaster or other catastrophe could cause any Managing Owners or sub-service provider’s computer systems to operate at an unacceptably slow speed or even fail. Any significant degradation or failure of the systems that a Managing Owner or a sub-service provider uses to gather and analyze information, enter orders, process data, value positions, monitor risk levels and otherwise engage in risk monitoring, fund administrative, or transfer agency functions may result in substantial delays in reporting financial results, inaccurate financial results, regulatory violations, and damage to the Managing Owner’s and the Trust’s reputations, increased operational expenses and diversion of technical resources.
The occurrences of a technology security breach of network or investor databases, the inappropriate dissemination of confidential investor data, or other failures to safeguard confidential investor data could have a negative impact on the Managing Owner, sub-service providers, and the Trust’s reputation and materially affect profitability, .
The Managing Owner and it’s sub-service providers, including its risk management, fund administration, valuation and transfer agency depends on the integrity and security features of the computer and communications systems supporting it to adequately safeguard confidential investor data. Improperly designed network security features, failure to securely maintain investor documents, failure to encrypt confidential data for internal or external communications, failure to complete background checks on employees, and inappropriately trained or monitored employees at the Managing Owner or designated sub-service providers may result in a compromise to confidential investor data which may result in regulatory violations, litigation risk, and damage to the Managing Owner’s and the Trust’s reputations and materially financial losses to the Managing Owner.
22
The occurrence of a terrorist attack, or the outbreak, continuation or expansion of war or other hostilities, pandemics or natural disasters could disrupt trading activity and materially affect profitability.
The operations of the Managing Owner, the Trading Advisors, the Trust, the exchanges, brokers and counterparties with which the Managing Owner, the Trading Advisors and the Trust do business, and the markets in which the Managing Owner, the Trading Advisors and the Trust do business could be severely disrupted in the event of a major terrorist attack or the outbreak, continuation or expansion of war or other hostilities. Ongoing wars and other disputes among nations, global anti-terrorism initiatives and political unrest in the Middle East and Southeast Asia continue to present such risks. Additionally, a serious pandemic, such as avian influenza, or a natural disaster, such as a hurricane, could severely disrupt the global economy.
If any of the Trading Advisors are unable to attract and retain qualified employees, its ability to conduct trading activities may be adversely affected.
Each Series’ future success and growth depends on each Trading Advisor’s ability to attract and retain employees that fit into its culture. There is intense competition for the limited pool of qualified personnel that meets these criteria. If any Trading Advisor is unable to attract and retain qualified personnel, then its ability to successfully execute its trading strategies may be diminished.
Regulation of the commodity interest markets is extensive and constantly changing; future regulatory developments are impossible to predict and may significantly and adversely affect the Trust.
The futures, options on futures and security futures markets are subject to comprehensive statutes, regulations and margin requirements. Recent legislation has created a new multi-tiered structure of exchanges in the United States subject to varying degrees of regulation, and rules and interpretations regarding various aspects of this new regulatory structure have only recently been proposed or finalized. Traditional futures exchanges, which are now called designated contract markets, are now subject to more streamlined and flexible core principles rather than the prior statutory and regulatory mandates. However, with respect to these traditional futures exchanges, the CFTC and the exchanges are authorized to take extraordinary actions in the event of a market emergency, including, for example, the retroactive implementation of speculative position limits or higher margin requirements, the establishment of daily limits and the suspension of trading. The regulation of commodity interest transactions in the United States is a rapidly changing area of law and is subject to ongoing modification by governmental and judicial action. In addition, various national governments have expressed concern regarding the disruptive effects of speculative trading in the currency markets and the need to regulate the derivatives markets in general. The effect of any future regulatory change is impossible to predict, but could be substantial and adverse.
Tax and ERISA Risks
You are strongly urged to consult your own tax advisor and counsel about the possible tax consequences to you of an investment in the Trust. Tax consequences may differ for different investors, and you could be affected by changes in the tax laws.
Your tax liability may exceed distributions to you.
Cash is distributed to Limited Owners at the sole discretion of the Managing Owner, and the Managing Owner does not currently intend to make any such distribution. Nevertheless, you will be taxed each year on your share of the Trust’s income and gain allocable to the Series of Units in which you invest, regardless of whether you redeem any Units or receive any cash distributions from the Trust.
You could owe taxes on your share of the Trust’s ordinary income despite overall losses.
Gain or loss on domestic futures and options on futures as well as on most foreign currency contracts will generally be taxed as capital gains or losses for Federal income tax purposes. Interest income and other ordinary income earned generally cannot be offset by capital losses. Consequently, you could owe taxes on your allocable share of ordinary income for a calendar year even if the Series in which you hold Units reports a net trading loss for that year. Also, your ability to deduct particular operating expenses allocable to your Series may be subject to limitations for purposes of calculating your Federal and/or state and local income tax liability.
You may be taxed on gains that the Trust never realizes.
Because a substantial portion of the Trust’s open positions are “marked-to-market” at the end of each year, some of your tax liability for each year will be based on unrealized gains that the Trust may never actually realize.
23
Partnership treatment is not assured, and if the Trust is not treated as a Partnership, you could suffer adverse tax consequences.
The Managing Owner believes that the Trust will be treated as a partnership for Federal income tax purposes and, assuming that at least 90% of the gross income of the Trust will constitute “qualifying income” within the meaning of Section 7704(d) of the Code, will not be a treated as a publicly traded partnership treated as a corporation. The Managing Owner believes it is likely, but not certain, that the Trust will meet this income test. The Trust has not requested, and does not intend to request, a ruling from the Internal Revenue Service (the “Service”), concerning its tax treatment.
If the Trust were to be treated as a corporation for Federal income tax purposes: the net income of the Trust would be taxed at corporate income tax rates, thereby substantially reducing its distributable cash; you would not be allowed to deduct losses of the Trust; and distributions to you, other than liquidating distributions, would constitute dividends to the extent of the current or accumulated earnings and profits of the Trust and would be taxable as such.
There is the possibility of a tax audit which could result in additional taxes to you.
The Trust’s tax returns may be audited by a taxing authority, and an audit could result in adjustments to the Trust’s returns. If an audit results in an adjustment, you may be compelled to file amended returns and to pay additional taxes plus interest and penalties.
The investment of Benefit Plan Investors may be limited or prohibited if any or all of the Series are deemed to hold plan assets or if the Trading Advisors have pre-existing fiduciary relationships with certain investing Benefit Plan Investors.
Special considerations apply to investments in the Trust by individual retirement accounts, pension, profit-sharing, stock bonus, Keogh, welfare benefit and other employee benefit plans whether or not subject to ERISA or Section 4975 of the Code, or each a Plan, and further considerations apply to investments in the Trust by a Plan that is subject to Part 4 of Subtitle B of Title I of ERISA or Section 4975 of the Code, or an ERISA Plan, and any entity whose underlying assets include plan assets by reason of an ERISA Plan’s investment in such entity, or such entities together with ERISA Plans, Benefit Plan Investors. While the assets of any Series (and Class of any Series) are intended not to constitute plan assets with respect to any Benefit Plan Investors, the United States Department of Labor or the DOL or a court could disagree. If the DOL were to find that the assets of some or all of the Series are plan assets, the Managing Owner and the Trading Advisor(s) to such Series would be fiduciaries, certain transactions in the Trust could be prohibited, and the Managing Owner would then have the right to mandatorily redeem out any Limited Owner which is a Benefit Plan Investor. For example, if the Trust were deemed to hold plan assets, the Trading Advisors may have to refrain from directing certain transactions that are currently contemplated. Furthermore, whether or not the Trust is deemed to hold plan assets, if an ERISA Plan has certain pre-existing relationships with the Managing Owner, one or more Trading Advisors, the Selling Agents or a Clearing Broker, investment in a Series may be limited or prohibited.
Foreign investors may face exchange rate risk and local tax consequences.
Foreign investors should note that the Units are denominated in U.S. Dollars and that changes in the rates of exchange between currencies may cause the value of their investment to decrease.
Regulatory Risks
Government regulations may change and adversely affect the Trust.
Considerable regulatory attention has recently been focused on publicly distributed partnerships, and, in particular, on “commodity pools” such as the Trust. In addition, tax law revisions could have a materially adverse effect on the Trust. Concern has also been expressed about speculative pools of capital trading in the currency markets, because these pools have the potential to disrupt central banks’ attempts to influence exchange rates. In the current environment, you must recognize the possibility that future regulatory changes may alter, perhaps to a material extent, the nature of an investment in any Series of the Trust or the overall operation of the Trust.
Failure of the Trust’s other counterparties may result in losses to the Trust.
The Trust may be unable to recover any of its assets in the event of the bankruptcy of any unregulated or over-the-counter counterparty with whom it trades. Such inability to recover the Trust’s assets may result in losses to your investment.
CFTC registrations could be terminated which could adversely affect the Trust or a Series.
If the Commodity Exchange Act registrations or NFA memberships of the Managing Owner or the registered Trading Advisors were no longer effective, these entities would not be able to act for the Trust. If the Managing Owner or a registered Trading Advisor were unable to act for the Trust or a Series, it could adversely affect the Trust or such Series.
For example, if the Managing Owner’s registration as a commodity pool operator, or CPO, under the Commodity Exchange Act or the Managing Owner’s membership as a CPO with the NFA were suspended, revoked or terminated, unless there were at least one remaining managing owner whose registration or membership has not been suspended, revoked or terminated, the Trust will be required to dissolve.
24
Likewise, if a registered Trading Advisor’s registration as a commodity trading advisor under the Commodity Exchange Act or such Trading Advisor’s membership as a commodity trading advisor with the NFA were suspended, revoked or terminated, the Trust would remove such Trading Advisor as a trading advisor for the applicable Series. The Managing Owner would then either terminate the Series or hire another commodity trading advisor to act as Trading Advisor for such Series.
The Trust and the Managing Owner have been represented by unified counsel, and you will not benefit from further review of your investment by independent counsel.
The Trust and the Managing Owner have been represented by unified counsel. To the extent that the Trust, the Managing Owner or you could benefit by further independent review, such benefit will not be available.
The foregoing risk factors are not a complete explanation of all the risks involved in purchasing interests in a fund that invests in the highly speculative, highly leveraged trading of futures, forwards and options. You should read this entire Form 10-K and the Prospectus before determining to subscribe for Units.
| Item 1B. | UNRESOLVED STAFF COMMENTS. |
None.
The Trust does not own or use any physical properties in the conduct of its business. Its assets currently consist of cash items such as custom time deposits, and, through each Trading Company, U.S. and international futures and forward contracts and other interests in derivative instruments, including options contracts on futures, forwards and swap contracts. The Managing Owner’s main office is located at 1775 Sherman Street, Suite 2500, Denver, Colorado 80203.
| Item 3. | LEGAL PROCEEDINGS. |
There are no material legal proceedings to which the Trust or any of its affiliates is a party or of which any of their assets are the subject.
| Item 4. | MINE SAFETY DISCLOSURES |
Not applicable.
25
Part II
| Item 5. | MARKET FOR REGISTRANT’S COMMON EQUITY, RELATED STOCKHOLDER MATTERS AND ISSUER PURCHASES OF EQUITY SECURITIES. |
No Units in any Series are publicly traded. The Units in each Series may be redeemed, in whole or in part, on a daily basis, subject to a notice requirement set forth in the Prospectus. Except as otherwise set forth in the Prospectus, Units will be redeemed at a redemption price equal to 100% of the NAV per Unit of the applicable Series, calculated as of the point described in the Prospectus. The redemption of Units has no impact on the value of Units that remain outstanding. The Managing Owner may temporarily suspend redemptions under limited circumstances described in the Prospectus. The right to obtain redemption of Units of a Series is contingent upon such Series’ having property sufficient to discharge its liabilities on the date of redemption.
Further, if a Limited Owner redeems all or a portion of its Class 1 Units of any Series on or before the end of twelve full months following the effective date of the purchase of the Units being redeemed, such Limited Owner is charged a redemption fee of up to 3.0% of the NAV at which the Units are redeemed. The redemption fee charged will depend on, among other things, the particular Series of Units being redeemed. The Trust Agreement also contains restrictions on the transfer or assignment of the Units.
The Managing Owner has the sole discretion in determining what distributions, if any, the Trust will make to the Limited Owners. The Trust has not affected distributions on the Units in any Series as of the date hereof and the Managing Owner does not intend to effect any distributions in the foreseeable future.
The proceeds of offerings are deposited in the bank and brokerage accounts of the Trust and the Trading Companies for the purpose of engaging in trading activities in accordance with the Trust’s trading policies and its Trading Advisors’ respective trading strategies.
The following table shows the number of Limited Owners and the number of Units outstanding in each Class of each Series as of March 6, 2012:
| | | | | | | | |
| | | Number of
Limited Owners | | | Number of
Units Outstanding | |
Frontier Diversified (Class 1) | | | 2,249 | | | | 721,471 | |
Frontier Diversified (Class 2) | | | 1,108 | | | | 570,545 | |
Frontier Dynamic (Class 1) | | | — | | | | — | |
Frontier Dynamic (Class 2) | | | — | | | | — | |
Frontier Long/Short Commodity Series (Class 1) | | | 29 | | | | 12,357 | |
Frontier Long/Short Commodity Series (Class 2) | | | 321 | | | | 52,665 | |
Frontier Long/Short Commodity Series (Class 1a) | | | 1,004 | | | | 166,226 | |
Frontier Long/Short Commodity Series (Class 2a) | | | 303 | | | | 88,297 | |
Frontier Long/Short Commodity Series (Class 3) | | | 1,410 | | | | 175,405 | |
Frontier Masters Series (Class 1) | | | 1,058 | | | | 347,568 | |
Frontier Masters Series (Class 2) | | | 449 | | | | 168,118 | |
Balanced Series (Class 1) | | | 6,212 | | | | 1,432,070 | |
Balanced Series (Class 1a) | | | 71 | | | | 12,936 | |
Balanced Series (Class 2) | | | 1,232 | | | | 377,413 | |
Balanced Series (Class 2a) | | | 61 | | | | 13,435 | |
26
| | | | | | | | |
| | | Number of
Limited Owners | | | Number of
Units Outstanding | |
Balanced Series (Class 3a) | | | 137 | | | | 27,219 | |
Berkeley/Graham/Tiverton Series (Class 1) | | | 2,154 | | | | 370,141 | |
Berkeley/Graham/Tiverton Series (Class 2) | | | 199 | | | | 38,529 | |
Currency Series (Class 1) | | | 247 | | | | 55,024 | |
Currency Series (Class 2) | | | 20 | | | | 852 | |
Long Only Commodity Series (Class 1) | | | — | | | | — | |
Long Only Commodity Series (Class 2) | | | — | | | | — | |
Long Only Commodity Series (Class 3) | | | — | | | | — | |
Managed Futures Index Series (Class 1) | | | — | | | | — | |
Managed Futures Index Series (Class 2) | | | — | | | | — | |
Managed Futures Index Series (Class 3) | | | — | | | | — | |
Winton Series (Class 1) | | | 1,187 | | | | 267,391 | |
Winton Series (Class 2) | | | 73 | | | | 70,348 | |
Winton/Graham Series (Class 1) | | | 1,159 | | | | 219,917 | |
Winton/Graham Series (Class 2) | | | 170 | | | | 41,664 | |
No Units are authorized for issuance by the Trust under equity compensation plans. During the year ended December 31, 2011, no unregistered Units were sold by the Trust. In addition, the Trust did not repurchase any Units under a formal repurchase plan. All Unit redemptions during the year ended December 31, 2011 were in the ordinary course of business. There have not been any purchases of equity securities by the trust or any affiliated purchasers during the year ended December 31, 2011.
| ITEM 6. | SELECTED FINANCIAL DATA. |
The selected financial information as of and for the years ended December 31, 2011, 2010, 2009, 2008 and 2007 is taken from the financial statements of the Trust included in section F of this filing and previous filings.
You should read this information in conjunction with “Management’s Discussion and Analysis of Financial Condition and Results of Operations” and our financial statements and the related notes included therewith. Results from past periods are not necessarily indicative of results that may be expected for any future period.
27
AS OF AND FOR THE YEAR ENDED DECEMBER 31, 2011
| | | | | | | | | | | | | | | | |
| | | Frontier Diversified | | | Frontier Dynamic | | | Frontier Long/Short | | | Frontier Masters | |
| | | Series | | | Series (1) | | | Commodity Series | | | Series | |
Interest - net | | $ | 2,399,088 | | | $ | 250,426 | | | $ | 1,371,889 | | | $ | 1,026,007 | |
Total expenses | | | 12,210,432 | | | | 428,134 | | | | 8,087,479 | | | | 4,466,240 | |
Net gain / (loss) on investments | | | 5,428,786 | | | | 115,076 | | | | 17,234,688 | | | | 2,393,047 | |
Net increase/(decrease) in owners’ capital resulting from operations attributable to controlling interests | | | (4,382,558 | ) | | | (62,632 | ) | | | 4,459,637 | | | | (1,019,452 | ) |
Net income / (loss) per unit - Class 1 | | | (4.18 | ) | | | (3.89 | ) | | | 3.40 | | | | (2.71 | ) |
Net income / (loss) per unit - Class 1a | | | — | | | | — | | | | 3.75 | | | | — | |
Net income / (loss) per unit - Class 2 | | | (2.50 | ) | | | (3.14 | ) | | | 8.71 | | | | (0.98 | ) |
Net income / (loss) per unit - Class 2a | | | — | | | | — | | | | 6.05 | | | | — | |
Net income / (loss) per unit - Class 3 | | | — | | | | — | | | | 8.70 | | | | — | |
Total assets | | | 135,642,082 | | | | — | | | | 107,793,563 | | | | 53,200,171 | |
Total owners’ capital - Class 1 | | | 72,424,906 | | | | — | | | | 4,159,047 | | | | 34,090,136 | |
Total owners’ capital - Class 1a | | | — | | | | — | | | | 18,891,395 | | | | — | |
Total owners’ capital - Class 2 | | | 61,548,698 | | | | — | | | | 9,188,762 | | | | 18,734,861 | |
Total owners’ capital - Class 2a | | | — | | | | — | | | | 10,911,464 | | | | — | |
Total owners’ capital - Class 3 | | | — | | | | — | | | | 27,810,058 | | | | — | |
Total net asset value per unit - Class 1 | | | 99.40 | | | | 88.05 | | | | 136.13 | | | | 100.25 | |
Total net asset value per unit - Class 1a | | | — | | | | — | | | | 121.71 | | | | — | |
Total net asset value per unit - Class 2 | | | 103.96 | | | | 91.26 | | | | 161.97 | | | | 104.83 | |
Total net asset value per unit - Class 2a | | | — | | | | — | | | | 127.23 | | | | — | |
Total net asset value per unit - Class 3 | | | — | | | | — | | | | 161.96 | | | | — | |
| | | | |
| | | Balanced | | | Berkeley/Graham/ | | | Currency | | | Long Only | |
| | | Series | | | Tiverton Series (2) | | | Series | | | Commodity Series (1) | |
Interest - net | | $ | 534,877 | | | $ | 106,784 | | | $ | 61,690 | | | $ | 60,039 | |
Total expenses | | | 24,591,620 | | | | 2,973,773 | | | | 294,981 | | | | 89,977 | |
Net gain / (loss) on investments | | | 5,648,268 | | | | (6,401,143 | ) | | | (387,646 | ) | | | (49,181 | ) |
Net increase/(decrease) in owners’ capital resulting from operations attributable to controlling interests | | | (12,244,073 | ) | | | (9,268,132 | ) | | | (620,937 | ) | | | (79,119 | ) |
Net income / (loss) per unit - Class 1 | | | (7.45 | ) | | | (19.44 | ) | | | (8.61 | ) | | | (7.00 | ) |
Net income / (loss) per unit - Class 1a | | | (7.91 | ) | | | — | | | | — | | | | — | |
Net income / (loss) per unit - Class 2 | | | (4.44 | ) | | | (19.89 | ) | | | (7.82 | ) | | | (5.83 | ) |
Net income / (loss) per unit - Class 2a | | | (5.31 | ) | | | — | | | | — | | | | — | |
Net income / (loss) per unit - Class 3 | | | (5.30 | ) | | | — | | | | — | | | | (6.00 | ) |
Total assets | | | 301,978,826 | | | | 40,083,210 | | | | 4,354,420 | | | | 1,453,084 | |
Total owners’ capital - Class 1 | | | 183,785,318 | | | | 35,180,631 | | | | 4,228,350 | | | | — | |
Total owners’ capital - Class 1a | | | 2,536,559 | | | | — | | | | — | | | | — | |
Total owners’ capital - Class 2 | | | 63,372,567 | | | | 4,433,341 | | | | 91,007 | | | | — | |
Total owners’ capital - Class 2a | | | 2,784,830 | | | | — | | | | — | | | | — | |
Total owners’ capital - Class 3a | | | 2,952,802 | | | | — | | | | — | | | | — | |
Total net asset value per unit - Class 1 | | | 124.50 | | | | 91.02 | | | | 70.48 | | | | 87.11 | |
Total net asset value per unit - Class 1a | | | 108.45 | | | | — | | | | — | | | | — | |
Total net asset value per unit - Class 2 | | | 155.02 | | | | 111.84 | | | | 87.61 | | | | 97.88 | |
Total net asset value per unit - Class 2a | | | 128.35 | | | | — | | | | — | | | | — | |
Total net asset value per unit - Class 3 | | | 128.36 | | | | — | | | | — | | | | 97.88 | |
| | | | |
| | | Managed Futures | | | Winton | | | Winton/Graham | | | | |
| | | Index Series (1) | | | Series | | | Series | | | | |
Interest - net | | $ | 82,283 | | | $ | 457,889 | | | $ | 217,875 | | | | | |
Total expenses | | | 125,207 | | | | 3,596,286 | | | | 2,926,790 | | | | | |
Net gain / (loss) on investments | | | (315,353 | ) | | | 5,865,030 | | | | (2,260,583 | ) | | | | |
Net increase/(decrease) in owners’ capital resulting from operations attributable to controlling interests | | | (358,277 | ) | | | 2,726,633 | | | | (4,498,779 | ) | | | | |
Net income / (loss) per unit - Class 1 | | | (11.13 | ) | | | 6.09 | | | | (15.10 | ) | | | | |
Net income / (loss) per unit - Class 2 | | | (9.93 | ) | | | 11.83 | | | | (14.34 | ) | | | | |
Net income / (loss) per unit - Class 3 | | | (6.97 | ) | | | — | | | | — | | | | | |
Total assets | | | 1,242,112 | | | | 50,363,648 | | | | 31,026,648 | | | | | |
Total owners’ capital - Class 1 | | | — | | | | 38,345,799 | | | | 24,783,519 | | | | | |
Total owners’ capital - Class 2 | | | — | | | | 11,702,325 | | | | 5,990,168 | | | | | |
Total net asset value per unit - Class 1 | | | 106.83 | | | | 141.13 | | | | 104.73 | | | | | |
Total net asset value per unit - Class 2 | | | 119.76 | | | | 165.82 | | | | 129.70 | | | | | |
Total net asset value per unit - Class 3 | | | 119.76 | | | | — | | | | — | | | | | |
| (1) | Net asset value per unit represents the liquidation value of the Series |
| (2) | Formerly known as the Campbell/Graham/Tiverton Series |
28
AS OF AND FOR THE YEAR ENDED DECEMBER 31, 2010
| | | | | | | | | | | | | | | | |
| | | Frontier Diversified | | | Frontier Dynamic | | | Frontier Long/Short | | | Frontier Masters | |
| | | Series | | | Series | | | Commodity Series | | | Series | |
Interest - net | | $ | 2,225,700 | | | $ | 454,918 | | | $ | 1,120,080 | | | $ | 941,795 | |
Total expenses | | | 9,452,058 | | | | 779,081 | | | | 8,021,021 | | | | 3,767,056 | |
Net gain / (loss) on investments | | | 18,519,243 | | | | 347,884 | | | | 15,903,113 | | | | 8,845,121 | |
Net increase/(decrease) in owners’ capital resulting from operations attributable to controlling interests | | | 11,135,880 | | | | 23,721 | | | | 11,915,293 | | | | 6,019,860 | |
Net income / (loss) per unit - Class 1 | | | 6.78 | | | | 0.51 | | | | 18.96 | | | | 8.50 | |
Net income / (loss) per unit - Class 1a | | | — | | | | — | | | | 16.47 | | | | — | |
Net income / (loss) per unit - Class 2 | | | 8.69 | | | | 2.15 | | | | 25.77 | | | | 10.44 | |
Net income / (loss) per unit - Class 2a | | | — | | | | — | | | | 18.70 | | | | — | |
Net income / (loss) per unit - Class 3 | | | — | | | | — | | | | 25.77 | | | | — | |
Total assets | | | 162,415,657 | | | | 30,128,892 | | | | 79,526,348 | | | | 67,230,426 | |
Total owners’ capital - Class 1 | | | 90,022,131 | | | | 1,219,222 | | | | 31,185,756 | | | | 41,213,675 | |
Total owners’ capital - Class 1a | | | — | | | | — | | | | 5,652,309 | | | | — | |
Total owners’ capital - Class 2 | | | 69,473,841 | | | | 413,700 | | | | 15,584,978 | | | | 25,062,055 | |
Total owners’ capital - Class 2a | | | — | | | | — | | | | 3,761,826 | | | | — | |
Total owners’ capital - Class 3 | | | — | | | | — | | | | 20,998,571 | | | | — | |
Total net asset value per unit - Class 1 | | | 103.58 | | | | 91.94 | | | | 132.73 | | | | 102.96 | |
Total net asset value per unit - Class 1a | | | — | | | | — | | | | 117.96 | | | | — | |
Total net asset value per unit - Class 2 | | | 106.46 | | | | 94.40 | | | | 153.26 | | | | 105.81 | |
Total net asset value per unit - Class 2a | | | — | | | | — | | | | 121.18 | | | | — | |
Total net asset value per unit - Class 3 | | | — | | | | — | | | | 153.26 | | | | — | |
| | | | |
| | | Balanced | | | Berkeley/Graham/ | | | Currency | | | Long Only | |
| | | Series | | | Tiverton Series (1) | | | Series | | | Commodity Series | |
Interest - net | | $ | 404,451 | | | $ | 8,268 | | | $ | 129,943 | | | $ | 83,311 | |
Total expenses | | | 26,553,122 | | | | 4,848,257 | | | | 483,015 | | | | 138,332 | |
Net gain / (loss) on investments | | | 82,334,394 | | | | 10,645,135 | | | | 522,823 | | | | 522,102 | |
Net increase/(decrease) in owners’ capital resulting from operations attributable to controlling interests | | | 41,691,751 | | | | 3,912,601 | | | | 169,751 | | | | 467,081 | |
Net income / (loss) per unit - Class 1 | | | 13.41 | | | | 5.81 | | | | 1.09 | | | | 10.52 | |
Net income / (loss) per unit - Class 1a | | | 10.86 | | | | — | | | | — | | | | — | |
Net income / (loss) per unit - Class 2 | | | 20.45 | | | | 10.63 | | | | 4.09 | | | | 13.41 | |
Net income / (loss) per unit - Class 2a | | | 16.06 | | | | — | | | | — | | | | — | |
Net income / (loss) per unit - Class 3 | | | 16.06 | | | | — | | | | — | | | | — | |
Total assets | | | 436,618,030 | | | | 71,057,049 | | | | 20,066,030 | | | | 4,207,081 | |
Total owners’ capital - Class 1 | | | 287,807,510 | | | | 61,842,996 | | | | 6,381,882 | | | | 3,348,953 | |
Total owners’ capital - Class 1a | | | 5,120,558 | | | | — | | | | — | | | | — | |
Total owners’ capital - Class 2 | | | 76,715,728 | | | | 8,386,332 | | | | 757,518 | | | | 844,278 | |
Total owners’ capital - Class 2a | | | 3,562,374 | | | | — | | | | — | | | | — | |
Total owners’ capital - Class 3a | | | 3,691,280 | | | | — | | | | — | | | | — | |
Total net asset value per unit - Class 1 | | | 131.95 | | | | 110.46 | | | | 79.09 | | | | 94.11 | |
Total net asset value per unit - Class 1a | | | 116.36 | | | | — | | | | — | | | | — | |
Total net asset value per unit - Class 2 | | | 159.46 | | | | 131.73 | | | | 95.43 | | | | 103.71 | |
Total net asset value per unit - Class 2a | | | 133.66 | | | | — | | | | — | | | | — | |
Total net asset value per unit - Class 3 | | | 133.66 | | | | — | | | | — | | | | — | |
| | | | |
| | | Managed Futures | | | Winton | | | Winton/Graham | | | | |
| | | Index Series | | | Series | | | Series | | | | |
Interest - net | | $ | 51,321 | | | $ | 306,338 | | | $ | 263,156 | | | | | |
Total expenses | | | 179,735 | | | | 3,812,097 | | | | 4,321,685 | | | | | |
Net gain / (loss) on investments | | | 432,488 | | | | 12,010,660 | | | | 11,966,369 | | | | | |
Net increase/(decrease) in owners’ capital resulting from operations attributable to controlling interests | | | 304,074 | | | | 8,504,901 | | | | 5,263,217 | | | | | |
Net income / (loss) per unit - Class 1 | | | 5.42 | | | | 17.47 | | | | 9.77 | | | | | |
Net income / (loss) per unit - Class 2 | | | 8.41 | | | | 23.89 | | | | 15.65 | | | | | |
Total assets | | | 5,180,194 | | | | 61,570,878 | | | | 64,282,827 | | | | | |
Total owners’ capital - Class 1 | | | 1,388,452 | | | | 49,350,981 | | | | 45,898,246 | | | | | |
Total owners’ capital - Class 2 | | | 3,772,011 | | | | 11,368,456 | | | | 11,612,192 | | | | | |
Total net asset value per unit - Class 1 | | | 117.96 | | | | 135.04 | | | | 119.83 | | | | | |
Total net asset value per unit - Class 2 | | | 129.69 | | | | 153.99 | | | | 144.04 | | | | | |
| (1) | Formerly known as the Campbell/Graham/Tiverton Series |
29
AS OF AND FOR THE YEAR ENDED DECEMBER 31, 2009
| | | | | | | | | | | | | | | | |
| | | Frontier Diversified | | | Frontier Dynamic | | | Frontier Long/Short | | | Frontier Masters | |
| | | Series * | | | Series * | | | Commodity Series ** | | | Series *** | |
Interest - net | | $ | 489,238 | | | $ | 269,363 | | | $ | 1,213,141 | | | $ | 292,218 | |
Total expenses | | | 1,325,693 | | | | 435,159 | | | | 6,847,493 | | | | 886,162 | |
Net gain / (loss) on investments | | | (470,461 | ) | | | 129,144 | | | | 28,920,002 | | | | (312,999 | ) |
Net increase/(decrease) in owners’ capital resulting from operations attributable to controlling interests | | | (1,306,916 | ) | | | (36,652 | ) | | | 8,527,351 | | | | (906,943 | ) |
Net income / (loss) per unit - Class 1 | | | (3.20 | ) | | | (8.57 | ) | | | 13.38 | | | | (5.54 | ) |
Net income / (loss) per unit - Class 1a | | | — | | | | — | | | | 1.49 | | | | — | |
Net income / (loss) per unit - Class 2 | | | (2.23 | ) | | | (7.75 | ) | | | 18.21 | | | | (4.63 | ) |
Net income / (loss) per unit - Class 2a | | | — | | | | — | | | | 2.48 | | | | — | |
Net income / (loss) per unit - Class 3 | | | — | | | | — | | | | 4.79 | | | | — | |
Total assets | | | 68,990,618 | | | | 28,606,956 | | | | 69,635,857 | | | | 43,734,039 | |
Total owners’ capital - Class 1 | | | 32,960,540 | | | | 606,255 | | | | 45,759,225 | | | | 14,723,330 | |
Total owners’ capital - Class 1a | | | — | | | | — | | | | 1,092,016 | | | | — | |
Total owners’ capital - Class 2 | | | 23,355,579 | | | | 290,662 | | | | 14,986,103 | | | | 8,563,857 | |
Total owners’ capital - Class 2a | | | — | | | | — | | | | 876,532 | | | | — | |
Total owners’ capital - Class 3 | | | — | | | | — | | | | 6,140,056 | | | | — | |
Total net asset value per unit - Class 1 | | | 96.80 | | | | 91.43 | | | | 113.77 | | | | 94.46 | |
Total net asset value per unit - Class 1a | | | — | | | | — | | | | 101.49 | | | | — | |
Total net asset value per unit - Class 2 | | | 97.77 | | | | 92.25 | | | | 127.49 | | | | 95.37 | |
Total net asset value per unit - Class 2a | | | — | | | | — | | | | 102.48 | | | | — | |
Total net asset value per unit - Class 3 | | | — | | | | — | | | | 127.49 | | | | — | |
| | | | |
| | | Balanced | | | Berkeley/Graham/ | | | Currency | | | Long Only | |
| | | Series **** | | | Tiverton Series (1) | | | Series | | | Commodity Series | |
Interest - net | | $ | 901,710 | | | $ | 293,910 | | | $ | 88,884 | | | $ | 76,629 | |
Total expenses | | | 19,999,746 | | | | 5,084,022 | | | | 603,794 | | | | 143,176 | |
Net gain / (loss) on investments | | | (491,297 | ) | | | (697,472 | ) | | | (2,057,466 | ) | | | 859,729 | |
Net increase/(decrease) in owners’ capital resulting from operations attributable to controlling interests | | | (19,150,902 | ) | | | (4,151,058 | ) | | | (2,572,376 | ) | | | 793,182 | |
Net income / (loss) per unit - Class 1 | | | (6.63 | ) | | | (5.89 | ) | | | (18.19 | ) | | | 13.28 | |
Net income / (loss) per unit - Class 1a | | | (6.59 | ) | | | — | | | | — | | | | — | |
Net income / (loss) per unit - Class 2 | | | (3.43 | ) | | | (3.04 | ) | | | (17.96 | ) | | | 15.84 | |
Net income / (loss) per unit - Class 2a | | | (3.70 | ) | | | — | | | | — | | | | — | |
Net income / (loss) per unit - Class 3 | | | (4.37 | ) | | | — | | | | — | | | | — | |
Total assets | | | 407,656,964 | | | | 79,864,025 | | | | 22,527,333 | | | | 4,680,691 | |
Total owners’ capital - Class 1 | | | 286,024,307 | | | | 69,447,366 | | | | 7,934,382 | | | | 3,711,581 | |
Total owners’ capital - Class 1a | | | 9,150,114 | | | | — | | | | — | | | | — | |
Total owners’ capital - Class 2 | | | 77,372,166 | | | | 9,914,994 | | | | 2,273,746 | | | | 954,744 | |
Total owners’ capital - Class 2a | | | 3,298,566 | | | | — | | | | — | | | | — | |
Total owners’ capital - Class 3a | | | 1,170,746 | | | | — | | | | — | | | | — | |
Total net asset value per unit - Class 1 | | | 118.54 | | | | 104.65 | | | | 78.00 | | | | 83.59 | |
Total net asset value per unit - Class 1a | | | 105.50 | | | | — | | | | — | | | | — | |
Total net asset value per unit - Class 2 | | | 139.01 | | | | 121.10 | | | | 91.34 | | | | 90.30 | |
Total net asset value per unit - Class 2a | | | 117.60 | | | | — | | | | — | | | | — | |
Total net asset value per unit - Class 3 | | | 117.60 | | | | — | | | | — | | | | — | |
| | | | |
| | | Managed Futures | | | Winton | | | Winton/Graham | | | | |
| | | Index Series | | | Series | | | Series | | | | |
Interest - net | | $ | 67,985 | | | $ | 361,106 | | | $ | 259,485 | | | | | |
Total expenses | | | 139,823 | | | | 3,375,280 | | | | 3,626,096 | | | | | |
Net gain / (loss) on investments | | | (490,441 | ) | | | (7,737,998 | ) | | | 3,919,086 | | | | | |
Net increase/(decrease) in owners’ capital resulting from operations attributable to controlling interests | | | (562,279 | ) | | | (6,685,179 | ) | | | (2,795,125 | ) | | | | |
Net income / (loss) per unit - Class 1 | | | (19.64 | ) | | | (12.84 | ) | | | (6.12 | ) | | | | |
Net income / (loss) per unit - Class 2 | | | (18.42 | ) | | | (9.94 | ) | | | (3.10 | ) | | | | |
Total assets | | | 3,799,854 | | | | 58,778,262 | | | | 68,237,504 | | | | | |
Total owners’ capital - Class 1 | | | 1,831,435 | | | | 48,198,317 | | | | 48,168,395 | | | | | |
Total owners’ capital - Class 2 | | | 1,941,774 | | | | 10,203,862 | | | | 12,522,478 | | | | | |
Total net asset value per unit - Class 1 | | | 112.54 | | | | 117.57 | | | | 110.06 | | | | | |
Total net asset value per unit - Class 2 | | | 121.28 | | | | 130.10 | | | | 128.39 | | | | | |
| (1) | Formerly known as the Campbell/Graham/Tiverton Series |
| * | The Frontier Diversified Series and Frontier Dynamic Series began trading operations on June 9, 2009 |
| ** | The Frontier Long/Short Commodity Series Class 3 Units began trading on May 29, 2009 and Class 1a and 2a Units began trading on June 8, 2009 |
| *** | The Frontier Masters Series began trading operations on June 9, 2009 |
| **** | The Balanced Series Class 3a Units began trading on June 3, 2009 |
30
AS OF AND FOR THE YEAR ENDED DECEMBER 31, 2008
| | | | | | | | | | | | | | | | |
| | | Balanced | | | Winton | | | Berkeley/Graham/ | | | Currency | |
| | | Series | | | Series | | | Tiverton Series (1) | | | Series | |
Interest - net | | $ | 1,613,778 | | | $ | 316,243 | | | $ | 331,073 | | | $ | 122,102 | |
Total expenses | | | 24,610,998 | | | | 5,016,448 | | | | 7,012,949 | | | | 645,010 | |
Net increase/(decrease) in owners’ capital resulting from operations attributable to controlling interests | | | 100,495,769 | | | | 15,824,382 | | | | 24,168,791 | | | | (268,237 | ) |
Net income / (loss) | | | 60,158,339 | | | | 8,454,614 | | | | 12,752,188.00 | | | | (791,145 | ) |
Net income / (loss) per unit - Class 1 | | | 23.71 | | | | 16.58 | | | | 18.64 | | | | (4.47 | ) |
Net income / (loss) per unit - Class 1a | | | 21.19 | | | | — | | | | — | | | | — | |
Net income / (loss) per unit - Class 2 | | | 30.44 | | | | 21.43 | | | | 23.94 | | | | (1.70 | ) |
Net income / (loss) per unit - Class 2a | | | 25.83 | | | | — | | | | — | | | | — | |
Total assets | | | 347,440,077 | | | | 85,496,323 | | | | 81,004,444 | | | | 29,828,596 | |
Total owners’ capital - Class 1 | | | 264,686,994 | | | | 62,283,659 | | | | 69,957,155 | | | | 11,900,185 | |
Total owners’ capital - Class 2 | | | 68,996,013 | | | | 11,743,367 | | | | 7,807,774.00 | | | | 2,946,600 | |
Total net asset value per unit - Class 1 | | | 125.17 | | | | 130.41 | | | | 110.54 | | | | 96.19 | |
Total net asset value per unit - Class 1a | | | 112.09 | | | | — | | | | — | | | | — | |
Total net asset value per unit - Class 2 | | | 142.44 | | | | 140.04 | | | | 124.14 | | | | 109.30 | |
Total net asset value per unit - Class 2a | | | 121.30 | | | | — | | | | — | | | | — | |
| | | | |
| | | Winton/Graham | | | Long Only | | | Frontier Long/Short | | | Managed Futures | |
| | | Series | | | Commodity Series | | | Commodity Series | | | Index Series | |
Interest - net | | $ | 100,204 | | | $ | 112,372 | | | $ | 921,454 | | | $ | 35,362 | |
Total expenses | | | 1,991,962 | | | | 213,005 | | | | 4,844,371 | | | | 69,230 | |
Net increase/(decrease) in owners’ capital resulting from operations attributable to controlling interests | | | 6,276,258 | | | | (2,596,899 | ) | | | 12,587,486 | | | | 701,670 | |
Net income / (loss) | | | 4,384,500 | | | | (2,697,532 | ) | | | (2,336,474 | ) | | | 667,802 | |
Net income / (loss) per unit - Class 1 | | | 21.14 | | | | (40.48 | ) | | | (1.08 | ) | | | 31.59 | |
Net income / (loss) per unit - Class 2 | | | 27.12 | | | | (40.58 | ) | | | 2.09 | | | | 35.28 | |
Total assets | | | 51,029,789 | | | | 5,037,278 | | | | 74,686,379 | | | | 3,442,690 | |
Total owners’ capital - Class 1 | | | 35,760,835 | | | | 3,254,226 | | | | 46,525,406 | | | | 2,266,977 | |
Total owners’ capital - Class 2 | | | 14,434,394 | | | | 788,247 | | | | 11,206,889 | | | | 1,136,074 | |
Total net asset value per unit - Class 1 | | | 116.18 | | | | 70.31 | | | | 100.39 | | | | 132.18 | |
Total net asset value per unit - Class 2 | | | 131.49 | | | | 74.46 | | | | 109.28 | | | | 139.70 | |
| (1) | Formerly known as the Campbell/Graham/Tiverton Series |
31
AS OF AND FOR THE YEAR ENDED DECEMBER 31, 2007
| | | | | | | | | | | | | | | | |
| | | Balanced | | | Winton | | | Berkeley/Graham/ | | | Currency | |
| | | Series | | | Series | | | Tiverton Series (1) | | | Series | |
Interest - net | | $ | 6,823,418 | | | $ | 563,371 | | | $ | 1,614,470 | | | $ | 435,431 | |
Total expenses | | | 19,654,933 | | | | 1,718,813 | | | | 4,346,128 | | | | 458,545 | |
Net increase/(decrease) in owners’ capital resulting from operations | | | 4,789,018 | | | | 4,995,445 | | | | 1,730,298 | | | | (90,083 | ) |
Net income / (loss) | | | (13,183,593 | ) | | | 3,840,003 | | | | (2,336,186.00 | ) | | | (113,197 | ) |
Net income / (loss) per unit - Class 1 | | | (5.20 | ) | | | 8.18 | | | | (4.37 | ) | | | (0.50 | ) |
Net income / (loss) per unit - Class 1a | | | (5.07 | ) | | | — | | | | — | | | | — | |
Net income / (loss) per unit - Class 2 | | | (2.24 | ) | | | 11.80 | | | | (1.66 | ) | | | 2.77 | |
Net income / (loss) per unit - Class 2a | | | (2.41 | ) | | | — | | | | — | | | | — | |
Total assets | | | 284,867,427 | | | | 46,779,088 | | | | 74,655,994 | | | | 15,232,200 | |
Total owners’ capital - Class 1 | | | 210,379,248 | | | | 35,664,260 | | | | 55,530,902 | | | | 9,791,812 | |
Total owners’ capital - Class 2 | | | 47,205,598 | | | | 10,374,901 | | | | 5,820,002.00 | | | | 800,194 | |
Total net asset value per unit - Class 1 | | | 101.46 | | | | 113.83 | | | | 91.90 | | | | 100.66 | |
Total net asset value per unit - Class 1a | | | 90.90 | | | | — | | | | — | | | | — | |
Total net asset value per unit - Class 2 | | | 112.00 | | | | 118.61 | | | | 100.20 | | | | 111.00 | |
Total net asset value per unit - Class 2a | | | 95.47 | | | | — | | | | — | | | | — | |
| | | | |
| | | Winton/Graham | | | Long Only | | | Frontier Long/Short | | | Managed Futures | |
| | | Series | | | Commodity Series | | | Commodity Series | | | Index Series | |
Interest - net | | $ | 206,887 | | | $ | 509,099 | | | $ | 1,051,098 | | | $ | 165,165 | |
Total expenses | | | 593,562 | | | | 329,370 | | | | 2,696,846 | | | | 120,630 | |
Net increase/(decrease) in owners’ capital resulting from operations | | | 1,258,686 | | | | 545,270 | | | | (233,874 | ) | | | 429 | |
Net income / (loss) | | | 872,011 | | | | 724,999 | | | | 432,147 | | | | 44,964 | |
Net income / (loss) per unit - Class 1 | | | 10.34 | | | | 15.34 | | | | 1.05 | | | | 3.84 | |
Net income / (loss) per unit - Class 2 | | | 14.12 | | | | 17.91 | | | | 4.26 | | | | 5.99 | |
Total assets | | | 7,955,224 | | | | 5,051,981 | | | | 50,619,254 | | | | 971,247 | |
Total owners’ capital - Class 1 | | | 6,060,207 | | | | 4,730,889 | | | | 31,092,746 | | | | 621,740 | |
Total owners’ capital - Class 2 | | | 1,808,776 | | | | 299,179 | | | | 3,658,890 | | | | 335,709 | |
Total net asset value per unit - Class 1 | | | 95.04 | | | | 110.79 | | | | 101.47 | | | | 100.59 | |
Total net asset value per unit - Class 2 | | | 104.37 | | | | 115.04 | | | | 107.19 | | | | 104.42 | |
| (1) | Formerly known as the Campbell/Graham/Tiverton Series |
32
Supplementary Quarterly Financial Information
The following summarized quarterly financial information presents the Trust’s results of operations for the three-month periods ended March 31, June 30, September 30, and December 31, 2011.
| | | | | | | | | | | | | | | | |
| | | 1st Quarter | | | 2nd Quarter | | | 3rd Quarter | | | 4th Quarter | |
| | | 2011 (unaudited) | | | 2011 (unaudited) | | | 2011 (unaudited) | | | 2011 (unaudited) | |
Frontier Diversified Series: | | | | | | | | | | | | | | | | |
Net gain (loss) on investments | | $ | 7,998,695 | | | $ | (4,314,530 | ) | | $ | 1,334,498 | | | $ | 410,123 | |
Net increase/(decrease) in capital resulting from operations attributable to controlling interests | | $ | 4,892,615 | | | $ | (6,729,532 | ) | | $ | (1,280,379 | ) | | $ | (1,265,262 | ) |
Increase (decrease) in net asset value per Class 1 units | | $ | 2.98 | | | $ | (4.93 | ) | | $ | (1.16 | ) | | $ | (1.07 | ) |
Increase (decrease) in net asset value per Class 2 units | | $ | 3.54 | | | $ | (4.63 | ) | | $ | (0.75 | ) | | $ | (0.66 | ) |
Net asset value per Class 1 units | | $ | 106.56 | | | $ | 101.63 | | | $ | 100.47 | | | $ | 99.40 | |
Net asset value per Class 2 units | | $ | 110.00 | | | $ | 105.37 | | | $ | 104.62 | | | $ | 103.96 | |
Frontier Dynamic Series: | | | | | | | | | | | | | | | | |
Net gain (loss) on investments | | $ | 48,411 | | | $ | 90,756 | | | $ | (24,091 | ) | | $ | 0 | |
Net increase/(decrease) in capital resulting from operations attributable to controlling interests | | $ | (37,036 | ) | | $ | 10,931 | | | $ | (36,527 | ) | | $ | 0 | |
Increase (decrease) in net asset value per Class 1 units | | $ | (2.22 | ) | | $ | 0.52 | | | $ | (2.19 | ) | | $ | 0.00 | |
Increase (decrease) in net asset value per Class 2 units | | $ | (1.88 | ) | | $ | 0.95 | | | $ | (2.21 | ) | | $ | 0.00 | |
Net asset value per Class 1 units | | $ | 89.72 | | | $ | 90.24 | | | $ | 88.05 | (1) | | $ | 88.05 | (1) |
Net asset value per Class 2 units | | $ | 92.52 | | | $ | 93.47 | | | $ | 91.26 | (1) | | $ | 91.26 | (1) |
Frontier Long/Short Commodity Series: | | | | | | | | | | | | | | | | |
Net gain (loss) on investments | | $ | 12,080,344 | | | $ | (1,817,531 | ) | | $ | 1,911,273 | | | $ | 5,060,602 | |
Net increase/(decrease) in capital resulting from operations attributable to controlling interests | | $ | 9,393,470 | | | $ | (3,438,598 | ) | | $ | (1,660,506 | ) | | $ | 165,271 | |
Increase (decrease) in net asset value per Class 1 units | | $ | 15.59 | | | $ | (7.80 | ) | | $ | (3.92 | ) | | $ | (0.47 | ) |
Increase (decrease) in net asset value per Class 1a units | | $ | 13.56 | | | $ | (6.76 | ) | | $ | (3.09 | ) | | $ | 0.04 | |
Increase (decrease) in net asset value per Class 2 units | | $ | 19.28 | | | $ | (7.85 | ) | | $ | (3.38 | ) | | $ | 0.66 | |
Increase (decrease) in net asset value per Class 2a units | | $ | 14.51 | | | $ | (6.41 | ) | | $ | (2.65 | ) | | $ | 0.60 | |
Increase (decrease) in net asset value per Class 3 units | | $ | 19.27 | | | $ | (7.85 | ) | | $ | (3.38 | ) | | $ | 0.66 | |
Net asset value per Class 1 units | | $ | 148.32 | | | $ | 140.52 | | | $ | 136.60 | | | $ | 136.13 | |
Net asset value per Class 1a units | | $ | 131.52 | | | $ | 124.76 | | | $ | 121.67 | | | $ | 121.71 | |
Net asset value per Class 2 units | | $ | 172.54 | | | $ | 164.69 | | | $ | 161.31 | | | $ | 161.97 | |
Net asset value per Class 2a units | | $ | 135.69 | | | $ | 129.28 | | | $ | 126.63 | | | $ | 127.23 | |
Net asset value per Class 3 units | | $ | 172.53 | | | $ | 164.68 | | | $ | 161.30 | | | $ | 161.97 | |
Frontier Masters Series: | | | | | | | | | | | | | | | | |
Net gain (loss) on investments | | $ | 1,799,713 | | | $ | (1,921,266 | ) | | $ | 3,257,219 | | | $ | (742,619 | ) |
Net increase/(decrease) in capital resulting from operations attributable to controlling interests | | $ | 178,234 | | | $ | (2,019,603 | ) | | $ | 2,140,082 | | | $ | (1,318,165 | ) |
Increase (decrease) in net asset value per Class 1unit | | $ | 0.15 | | | $ | (4.10 | ) | | $ | 3.75 | | | $ | (2.51 | ) |
Increase (decrease) in net asset value per Class 2 unit | | $ | 0.61 | | | $ | (3.79 | ) | | $ | 4.37 | | | $ | (2.17 | ) |
Net asset value per Class 1 unit | | $ | 103.11 | | | $ | 99.01 | | | $ | 102.76 | | | $ | 100.25 | |
Net asset value per Class 2 unit | | $ | 106.42 | | | $ | 102.63 | | | $ | 107.00 | | | $ | 104.83 | |
Balanced Series: | | | | | | | | | | | | | | | | |
Net gain (loss) on investments | | $ | 20,887,170 | | | $ | (16,522,087 | ) | | $ | 3,644,425 | | | $ | (2,361,240 | ) |
Net increase/(decrease) in capital resulting from operations attributable to controlling interests | | $ | 13,296,211 | | | $ | (13,513,467 | ) | | $ | (9,337,840 | ) | | $ | (2,688,977 | ) |
Increase (decrease) in net asset value per Class 1 units | | $ | 4.42 | | | $ | (5.91 | ) | | $ | (4.43 | ) | | $ | (1.53 | ) |
Increase (decrease) in net asset value per Class 1a units | | $ | 3.63 | | | $ | (5.60 | ) | | $ | (4.31 | ) | | $ | (1.63 | ) |
Increase (decrease) in net asset value per Class 2 units | | $ | 6.56 | | | $ | (6.00 | ) | | $ | (4.26 | ) | | $ | (0.74 | ) |
Increase (decrease) in net asset value per Class 2a units | | $ | 5.18 | | | $ | (5.49 | ) | | $ | (4.04 | ) | | $ | (0.96 | ) |
Increase (decrease) in net asset value per Class 3a units | | $ | 5.19 | | | $ | (5.49 | ) | | $ | (4.05 | ) | | $ | (0.95 | ) |
Net asset value per Class 1 units | | $ | 136.37 | | | $ | 130.46 | | | $ | 126.03 | | | $ | 124.50 | |
Net asset value per Class 1a units | | $ | 119.99 | | | $ | 114.39 | | | $ | 110.08 | | | $ | 108.45 | |
Net asset value per Class 2 units | | $ | 166.02 | | | $ | 160.02 | | | $ | 155.76 | | | $ | 155.02 | |
Net asset value per Class 2a units | | $ | 138.84 | | | $ | 133.35 | | | $ | 129.31 | | | $ | 128.35 | |
Net asset value per Class 3a units | | $ | 138.85 | | | $ | 133.36 | | | $ | 129.31 | | | $ | 128.36 | |
33
| | | | | | | | | | | | | | | | |
| | | 1st Quarter | | | 2nd Quarter | | | 3rd Quarter | | | 4th Quarter | |
| | | 2011 (unaudited) | | | 2011 (unaudited) | | | 2011 (unaudited) | | | 2011 (unaudited) | |
Berkeley/Graham/Tiverton Series: (2) | | | | | | | | | | | | | | | | |
Net gain (loss) on investments | | $ | (134,693 | ) | | $ | (3,125,440 | ) | | $ | (313,891 | ) | | $ | (2,827,119 | ) |
Net increase/(decrease) in capital resulting from operations attributable to controlling interests | | $ | (1,047,645 | ) | | $ | (3,871,983 | ) | | $ | (918,255 | ) | | $ | (3,430,249 | ) |
Increase (decrease) in net asset value per Class 1 units | | $ | (1.83 | ) | | $ | (7.82 | ) | | $ | (2.80 | ) | | $ | (6.99 | ) |
Increase (decrease) in net asset value per Class 2 units | | $ | (1.23 | ) | | $ | (8.48 | ) | | $ | (1.60 | ) | | $ | (8.58 | ) |
Net asset value per Class 1 units | | $ | 108.63 | | | $ | 100.81 | | | $ | 98.73 | | | $ | 91.02 | |
Net asset value per Class 2 units | | $ | 130.50 | | | $ | 122.02 | | | $ | 120.42 | | | $ | 111.84 | |
Currency Series: | | | | | | | | | | | | | | | | |
Net gain (loss) on investments | | $ | (223,904 | ) | | $ | 46,073 | | | $ | (138,127 | ) | | $ | (71,688 | ) |
Net increase/(decrease) in capital resulting from operations attributable to controlling interests | | $ | (302,842 | ) | | $ | (30,899 | ) | | $ | (177,864 | ) | | $ | (109,332 | ) |
Increase (decrease) in net asset value per Class 1 units | | $ | (3.50 | ) | | $ | (0.85 | ) | | $ | (2.63 | ) | | $ | (1.63 | ) |
Increase (decrease) in net asset value per Class 2 units | | $ | (3.55 | ) | | $ | (0.34 | ) | | $ | (2.57 | ) | | $ | (1.36 | ) |
Net asset value per Class 1 units | | $ | 75.59 | | | $ | 74.74 | | | $ | 72.11 | | | $ | 70.48 | |
Net asset value per Class 2 units | | $ | 91.88 | | | $ | 91.54 | | | $ | 88.97 | | | $ | 87.61 | |
Long Only Commodity Series: | | | | | | | | | | | | | | | | |
Net gain (loss) on investments | | $ | 254,386 | | | $ | (187,542 | ) | | $ | (232,094 | ) | | $ | 116,069 | |
Net increase/(decrease) in capital resulting from operations attributable to controlling interests | | $ | 241,160 | | | $ | (198,577 | ) | | $ | (235,856 | ) | | $ | 114,154 | |
Increase (decrease) in net asset value per Class 1 units | | $ | 5.48 | | | $ | (5.71 | ) | | $ | (13.08 | ) | | $ | 6.31 | |
Increase (decrease) in net asset value per Class 2 units | | $ | 6.58 | | | $ | (5.81 | ) | | $ | (14.10 | ) | | $ | 7.50 | |
Increase (decrease) in net asset value per Class 3 units | | $ | 6.41 | | | $ | (5.81 | ) | | $ | (14.10 | ) | | $ | 7.50 | |
Net asset value per Class 1 units | | $ | 99.59 | | | $ | 93.59 | | | $ | 80.80 | | | $ | 87.11 | (1) |
Net asset value per Class 2 units | | $ | 110.29 | | | $ | 104.48 | | | $ | 90.38 | | | $ | 97.88 | (1) |
Net asset value per Class 3 units | | $ | 110.29 | | | $ | 104.48 | | | $ | 90.38 | | | $ | 97.88 | (1) |
Managed Futures Index Series: | | | | | | | | | | | | | | | | |
Net gain (loss) on investments | | $ | (199,900 | ) | | $ | (277,223 | ) | | $ | 667,651 | | | $ | (505,881 | ) |
Net increase/(decrease) in capital resulting from operations attributable to controlling interests | | $ | (213,526 | ) | | $ | (289,038 | ) | | $ | 655,479 | | | $ | (511,192 | ) |
Increase (decrease) in net asset value per Class 1 units | | $ | (5.46 | ) | | $ | (8.55 | ) | | $ | 18.86 | | | $ | (15.98 | ) |
Increase (decrease) in net asset value per Class 2 units | | $ | (5.40 | ) | | $ | (8.86 | ) | | $ | 21.63 | | | $ | (17.30 | ) |
Increase (decrease) in net asset value per Class 3 units | | $ | (2.44 | ) | | $ | (8.87 | ) | | $ | 21.64 | | | $ | (17.30 | ) |
Net asset value per Class 1 units | | $ | 112.50 | | | $ | 103.95 | | | $ | 122.81 | | | $ | 106.83 | (1) |
Net asset value per Class 2 units | | $ | 124.29 | | | $ | 115.43 | | | $ | 137.06 | | | $ | 119.76 | (1) |
Net asset value per Class 3 units | | $ | 124.29 | | | $ | 115.42 | | | $ | 137.06 | | | $ | 119.76 | (1) |
Winton Series: | | | | | | | | | | | | | | | | |
Net gain (loss) on investments | | $ | 1,607,792 | | | $ | (865,295 | ) | | $ | 4,877,311 | | | $ | 245,222 | |
Net increase/(decrease) in capital resulting from operations attributable to controlling interests | | $ | 692,438 | | | $ | (1,464,715 | ) | | $ | 3,756,578 | | | $ | (257,668 | ) |
Increase (decrease) in net asset value per Class 1 units | | $ | 1.36 | | | $ | (4.27 | ) | | $ | 9.94 | | | $ | (0.94 | ) |
Increase (decrease) in net asset value per Class 2 units | | $ | 2.71 | | | $ | (3.78 | ) | | $ | 12.75 | | | $ | 0.15 | |
Net asset value per Class 1 units | | $ | 136.40 | | | $ | 132.13 | | | $ | 142.07 | | | $ | 141.13 | |
Net asset value per Class 2 units | | $ | 156.70 | | | $ | 152.92 | | | $ | 165.67 | | | $ | 165.82 | |
Winton/Graham Series: | | | | | | | | | | | | | | | | |
Net gain (loss) on investments | | $ | 47,962 | | | $ | (845,492 | ) | | $ | 639,990 | | | $ | (2,103,043 | ) |
Net increase/(decrease) in capital resulting from operations attributable to controlling interests | | $ | (447,404 | ) | | $ | (1,396,441 | ) | | $ | (75,705 | ) | | $ | (2,579,229 | ) |
Increase (decrease) in net asset value per Class 1 units | | $ | (1.16 | ) | | $ | (4.82 | ) | | $ | (0.54 | ) | | $ | (8.58 | ) |
Increase (decrease) in net asset value per Class 2 units | | $ | (0.34 | ) | | $ | (4.80 | ) | | $ | 0.39 | | | $ | (9.59 | ) |
Net asset value per Class 1 units | | $ | 118.67 | | | $ | 113.85 | | | $ | 113.31 | | | $ | 104.73 | |
Net asset value per Class 2 units | | $ | 143.70 | | | $ | 138.90 | | | $ | 139.29 | | | $ | 129.70 | |
| (1) | Net asset value per unit represents the liquidation value. |
| (2) | Formerly known as the Campbell/Graham/Tiverton Series |
34
The following summarized quarterly financial information presents the Trust’s results of operations for the three-month periods ended March 31, June 30, September 30, and December 31, 2010.
| | | | | | | | | | | | | | | | |
| | | 1st Quarter | | | 2nd Quarter | | | 3rd Quarter | | | 4th Quarter | |
| | | 2010 (unaudited) | | | 2010 (unaudited) | | | 2010 (unaudited) | | | 2010 (unaudited) | |
Frontier Diversified Series: | | | | | | | | | | | | | | | | |
Net gain (loss) on investments | | $ | 351,430 | | | $ | 3,375,455 | | | $ | 7,158,422 | | | $ | 7,633,936 | |
Net increase/(decrease) in capital resulting from operations attributable to controlling interests | | $ | (268,401 | ) | | $ | 2,025,182 | | | $ | 5,010,322 | | | $ | 4,682,787 | |
Increase (decrease) in net asset value per Class 1 units | | $ | (1.31 | ) | | $ | 2.02 | | | $ | 3.18 | | | $ | 2.89 | |
Increase (decrease) in net asset value per Class 2 units | | $ | (0.91 | ) | | $ | 2.48 | | | $ | 3.69 | | | $ | 3.43 | |
Net asset value per Class 1 units | | $ | 95.49 | | | $ | 97.51 | | | $ | 100.69 | | | $ | 103.58 | |
Net asset value per Class 2 units | | $ | 96.86 | | | $ | 99.34 | | | $ | 103.03 | | | $ | 106.46 | |
Frontier Dynamic Series: | | | | | | | | | | | | | | | | |
Net gain (loss) on investments | | $ | 66,083 | | | $ | 71,162 | | | $ | 107,701 | | | $ | 102,938 | |
Net increase/(decrease) in capital resulting from operations attributable to controlling interests | | $ | (7,586 | ) | | $ | (11,187 | ) | | $ | 26,764 | | | $ | 15,730 | |
Increase (decrease) in net asset value per Class 1 units | | $ | (0.82 | ) | | $ | (0.82 | ) | | $ | 1.36 | | | $ | 0.79 | |
Increase (decrease) in net asset value per Class 2 units | | $ | (0.43 | ) | | $ | (0.43 | ) | | $ | 1.79 | | | $ | 1.22 | |
Net asset value per Class 1 units | | $ | 90.61 | | | $ | 89.79 | | | $ | 91.15 | | | $ | 91.94 | |
Net asset value per Class 2 units | | $ | 91.82 | | | $ | 91.39 | | | $ | 93.18 | | | $ | 94.40 | |
Frontier Long/Short Commodity Series: | | | | | | | | | | | | | | | | |
Net gain (loss) on investments | | $ | (3,246,178 | ) | | $ | (590,859 | ) | | $ | 7,893,906 | | | $ | 11,846,244 | |
Net increase/(decrease) in capital resulting from operations attributable to controlling interests | | $ | (1,405,236 | ) | | $ | (2,110,378 | ) | | $ | 6,312,983 | | | $ | 9,117,924 | |
Increase (decrease) in net asset value per Class 1 units | | $ | (2.61 | ) | | $ | (3.91 | ) | | $ | 10.30 | | | $ | 15.18 | |
Increase (decrease) in net asset value per Class 1a units | | $ | (2.18 | ) | | $ | (3.23 | ) | | $ | 9.14 | | | $ | 12.74 | |
Increase (decrease) in net asset value per Class 2 units | | $ | (2.00 | ) | | $ | (3.51 | ) | | $ | 12.73 | | | $ | 18.55 | |
Increase (decrease) in net asset value per Class 2a units | | $ | (1.80 | ) | | $ | (2.84 | ) | | $ | 9.77 | | | $ | 13.57 | |
Increase (decrease) in net asset value per Class 3 units | | $ | (2.01 | ) | | $ | (3.51 | ) | | $ | 12.74 | | | $ | 18.55 | |
Net asset value per Class 1a units | | $ | 111.16 | | | $ | 107.25 | | | $ | 117.55 | | | $ | 132.73 | |
Net asset value per Class 1 units | | $ | 99.31 | | | $ | 96.08 | | | $ | 105.22 | | | $ | 117.96 | |
Net asset value per Class 2 units | | $ | 125.49 | | | $ | 121.98 | | | $ | 134.71 | | | $ | 153.26 | |
Net asset value per Class 2a units | | $ | 100.68 | | | $ | 97.84 | | | $ | 107.61 | | | $ | 121.18 | |
Net asset value per Class 3 units | | $ | 125.48 | | | $ | 121.97 | | | $ | 134.71 | | | $ | 153.26 | |
Frontier Masters Series: | | | | | | | | | | | | | | | | |
Net gain (loss) on investments | | $ | 847,669 | | | $ | 42,902 | | | $ | 4,601,601 | | | $ | 3,352,949 | |
Net increase/(decrease) in capital resulting from operations attributable to controlling interests | | $ | 447,459 | | | $ | (487,430 | ) | | $ | 3,691,953 | | | $ | 2,367,878 | |
Increase (decrease) in net asset value per Class 1unit | | $ | 0.24 | | | $ | (1.04 | ) | | $ | 5.73 | | | $ | 3.57 | |
Increase (decrease) in net asset value per Class 2 unit | | $ | 0.66 | | | $ | (0.64 | ) | | $ | 6.29 | | | $ | 4.13 | |
Net asset value per Class 1 unit | | $ | 94.70 | | | $ | 93.66 | | | $ | 99.39 | | | $ | 102.96 | |
Net asset value per Class 2 unit | | $ | 96.03 | | | $ | 95.39 | | | $ | 101.68 | | | $ | 105.81 | |
Balanced Series: | | | | | | | | | | | | | | | | |
Net gain (loss) on investments | | $ | (265,444 | ) | | $ | 20,354,107 | | | $ | 31,652,538 | | | $ | 30,593,193 | |
Net increase/(decrease) in capital resulting from operations attributable to controlling interests | | $ | (2,009,334 | ) | | $ | 10,199,358 | | | $ | 18,815,391 | | | $ | 14,686,336 | |
Increase (decrease) in net asset value per Class 1 units | | $ | (0.73 | ) | | $ | 3.08 | | | $ | 6.22 | | | $ | 4.84 | |
Increase (decrease) in net asset value per Class 1a units | | $ | (0.84 | ) | | $ | 2.51 | | | $ | 5.25 | | | $ | 3.94 | |
Increase (decrease) in net asset value per Class 2 units | | $ | 0.17 | | | $ | 4.72 | | | $ | 8.56 | | | $ | 7.00 | |
Increase (decrease) in net asset value per Class 2a units | | $ | (0.07 | ) | | $ | 3.73 | | | $ | 6.90 | | | $ | 5.50 | |
Increase (decrease) in net asset value per Class 3a units | | $ | (0.06 | ) | | $ | 3.73 | | | $ | 6.87 | | | $ | 5.52 | |
Net asset value per Class 1 units | | $ | 117.81 | | | $ | 120.89 | | | $ | 127.11 | | | $ | 131.95 | |
Net asset value per Class 1a units | | $ | 104.66 | | | $ | 107.17 | | | $ | 112.42 | | | $ | 116.36 | |
Net asset value per Class 2 units | | $ | 139.18 | | | $ | 143.90 | | | $ | 152.46 | | | $ | 159.46 | |
Net asset value per Class 2a units | | $ | 117.53 | | | $ | 121.26 | | | $ | 128.16 | | | $ | 133.66 | |
Net asset value per Class 3a units | | $ | 117.54 | | | $ | 121.27 | | | $ | 128.14 | | | $ | 133.66 | |
35
| | | | | | | | | | | | | | | | |
| | | 1st Quarter | | | 2nd Quarter | | | 3rd Quarter | | | 4th Quarter | |
| | | 2010 (unaudited) | | | 2010 (unaudited) | | | 2010 (unaudited) | | | 2010 (unaudited) | |
Berkeley/Graham/Tiverton Series: (1) | | | | | | | | | | | | | | | | |
Net gain (loss) on investments | | $ | (1,177,468 | ) | | $ | 980,753 | | | $ | 5,546,389 | | | $ | 5,295,461 | |
Net increase/(decrease) in capital resulting from operations attributable to controlling interests | | $ | (2,522,861 | ) | | $ | (244,215 | ) | | $ | 3,354,806 | | | $ | 3,324,871 | |
Increase (decrease) in net asset value per Class 1 units | | $ | (3.40 | ) | | $ | (0.47 | ) | | $ | 4.84 | | | $ | 4.84 | |
Increase (decrease) in net asset value per Class 2 units | | $ | (3.07 | ) | | $ | 0.34 | | | $ | 6.63 | | | $ | 6.73 | |
Net asset value per Class 1 units | | $ | 101.25 | | | $ | 100.78 | | | $ | 105.62 | | | $ | 110.46 | |
Net asset value per Class 2 units | | $ | 118.03 | | | $ | 118.37 | | | $ | 125.00 | | | $ | 131.73 | |
Currency Series: | | | | | | | | | | | | | | | | |
Net gain (loss) on investments | | $ | 257,227 | | | $ | 161,214 | | | $ | 181,704 | | | $ | (77,322 | ) |
Net increase/(decrease) in capital resulting from operations attributable to controlling interests | | $ | 170,677 | | | $ | 69,440 | | | $ | 91,601 | | | $ | (161,967 | ) |
Increase (decrease) in net asset value per Class 1 units | | $ | 1.50 | | | $ | 0.52 | | | $ | 0.89 | | | $ | (1.82 | ) |
Increase (decrease) in net asset value per Class 2 units | | $ | 2.45 | | | $ | 1.32 | | | $ | 1.78 | | | $ | (1.46 | ) |
Net asset value per Class 1 units | | $ | 79.50 | | | $ | 80.02 | | | $ | 80.91 | | | $ | 79.09 | |
Net asset value per Class 2 units | | $ | 93.79 | | | $ | 95.11 | | | $ | 96.89 | | | $ | 95.43 | |
Long Only Commodity Series: | | | | | | | | | | | | | | | | |
Net gain (loss) on investments | | $ | (169,833 | ) | | $ | (246,070 | ) | | $ | 389,776 | | | $ | 548,229 | |
Net increase/(decrease) in capital resulting from operations attributable to controlling interests | | $ | (183,546 | ) | | $ | (259,083 | ) | | $ | 376,775 | | | $ | 532,935 | |
Increase (decrease) in net asset value per Class 1 units | | $ | (3.39 | ) | | $ | (4.99 | ) | | $ | 7.63 | | | $ | 11.27 | |
Increase (decrease) in net asset value per Class 2 units | | $ | (3.24 | ) | | $ | (5.01 | ) | | $ | 8.79 | | | $ | 12.87 | |
Net asset value per Class 1 units | | $ | 80.20 | | | $ | 75.21 | | | $ | 82.84 | | | $ | 94.11 | |
Net asset value per Class 2 units | | $ | 87.06 | | | $ | 82.05 | | | $ | 90.84 | | | $ | 103.71 | |
Managed Futures Index Series: | | | | | | | | | | | | | | | | |
Net gain (loss) on investments | | $ | (39,308 | ) | | $ | 236,311 | | | $ | 29,166 | | | $ | 206,319 | |
Net increase/(decrease) in capital resulting from operations attributable to controlling interests | | $ | (69,501 | ) | | $ | 194,676 | | | $ | (5,956 | ) | | $ | 184,855 | |
Increase (decrease) in net asset value per Class 1 units | | $ | (1.00 | ) | | $ | 3.47 | | | $ | (0.45 | ) | | $ | 3.40 | |
Increase (decrease) in net asset value per Class 2 units | | $ | (0.48 | ) | | $ | 4.38 | | | $ | 0.14 | | | $ | 4.37 | |
Net asset value per Class 1 units | | $ | 111.54 | | | $ | 115.01 | | | $ | 114.56 | | | $ | 117.96 | |
Net asset value per Class 2 units | | $ | 120.80 | | | $ | 125.18 | | | $ | 125.32 | | | $ | 129.69 | |
Winton Series: | | | | | | | | | | | | | | | | |
Net gain (loss) on investments | | $ | 3,631,250 | | | $ | 2,548,316 | | | $ | 2,426,391 | | | $ | 3,404,703 | |
Net increase/(decrease) in capital resulting from operations attributable to controlling interests | | $ | 2,860,297 | | | $ | 1,772,670 | | | $ | 1,642,249 | | | $ | 2,229,685 | |
Increase (decrease) in net asset value per Class 1 units | | $ | 5.78 | | | $ | 3.53 | | | $ | 3.43 | | | $ | 4.73 | |
Increase (decrease) in net asset value per Class 2 units | | $ | 7.41 | | | $ | 4.99 | | | $ | 4.98 | | | $ | 6.51 | |
Net asset value per Class 1 units | | $ | 123.35 | | | $ | 126.88 | | | $ | 130.31 | | | $ | 135.04 | |
Net asset value per Class 2 units | | $ | 137.51 | | | $ | 142.50 | | | $ | 147.48 | | | $ | 153.99 | |
Winton/Graham Series: | | | | | | | | | | | | | | | | |
Net gain (loss) on investments | | $ | (457,522 | ) | | $ | 1,834,176 | | | $ | 3,706,234 | | | $ | 6,883,481 | |
Net increase/(decrease) in capital resulting from operations attributable to controlling interests | | $ | (277,673 | ) | | $ | 764,172 | | | $ | 1,699,715 | | | $ | 3,077,003 | |
Increase (decrease) in net asset value per Class 1 units | | $ | (0.59 | ) | | $ | 1.23 | | | $ | 3.20 | | | $ | 5.93 | |
Increase (decrease) in net asset value per Class 2 units | | $ | 0.26 | | | $ | 2.42 | | | $ | 4.82 | | | $ | 8.15 | |
Net asset value per Class 1 units | | $ | 109.47 | | | $ | 110.70 | | | $ | 113.90 | | | $ | 119.83 | |
Net asset value per Class 2 units | | $ | 128.65 | | | $ | 131.07 | | | $ | 135.89 | | | $ | 144.04 | |
| (1) | Formerly known as the Campbell/Graham/Tiverton Series |
36
The following summarized quarterly financial information presents the Trust’s results of operations for the three-month periods ended March 31, June 30, September 30, and December 31, 2009.
| | | | | | | | | | | | | | | | |
| | | 1st Quarter | | | 2nd Quarter | | | 3rd Quarter | | | 4th Quarter | |
| | | 2009 (unaudited) | | | 2009 (unaudited) | | | 2009 (unaudited) | | | 2009 (unaudited) | |
Frontier Diversified Series: * | | | | | | | | | | | | | | | | |
Net gain (loss) on investments | | | — | | | $ | 73,699 | | | $ | 416,034 | | | $ | (960,194 | ) |
Net increase/(decrease) in capital resulting from operations attributable to controlling interests | | | — | | | $ | (1,011 | ) | | $ | 148,749 | | | $ | (1,454,654 | ) |
Increase (decrease) in net asset value per Class 1 units | | | — | | | $ | (1.89 | ) | | $ | 0.84 | | | $ | (2.15 | ) |
Increase (decrease) in net asset value per Class 2 units | | | — | | | $ | (1.79 | ) | | $ | 1.29 | | | $ | (1.73 | ) |
Net asset value per Class 1 units | | | — | | | $ | 98.11 | | | $ | 98.95 | | | $ | 96.80 | |
Net asset value per Class 2 units | | | — | | | $ | 98.21 | | | $ | 99.50 | | | $ | 97.77 | |
Frontier Dynamic Series: * | | | | | | | | | | | | | | | | |
Net gain (loss) on investments | | | — | | | $ | 15,045 | | | $ | 63,150 | | | $ | 50,949 | |
Net increase/(decrease) in capital resulting from operations attributable to controlling interests | | | — | | | $ | (1,582 | ) | | $ | (1,858 | ) | | $ | (33,212 | ) |
Increase (decrease) in net asset value per Class 1 units | | | — | | | $ | (2.93 | ) | | $ | (0.51 | ) | | $ | (5.13 | ) |
Increase (decrease) in net asset value per Class 2 units | | | — | | | $ | (2.82 | ) | | $ | (0.09 | ) | | $ | (4.84 | ) |
Net asset value per Class 1 units | | | — | | | $ | 97.07 | | | $ | 96.56 | | | $ | 91.43 | |
Net asset value per Class 2 units | | | — | | | $ | 97.18 | | | $ | 97.09 | | | $ | 92.25 | |
Frontier Long/Short Commodity Series: ** | | | | | | | | | | | | | | | | |
Net gain (loss) on investments | | $ | 10,799,151 | | | $ | 6,623,732 | | | $ | 1,658,892 | | | $ | 9,838,227 | |
Net increase/(decrease) in capital resulting from operations attributable to controlling interests | | $ | 2,244,293 | | | $ | 3,172,418 | | | $ | 784,707 | | | $ | 2,325,933 | |
Increase (decrease) in net asset value per Class 1 units | | $ | 3.75 | | | $ | 5.04 | | | $ | 1.04 | | | $ | 3.55 | |
Increase (decrease) in net asset value per Class 1a units | | | — | | | $ | (2.47 | ) | | $ | 1.04 | | | $ | 2.92 | |
Increase (decrease) in net asset value per Class 2 units | | $ | 4.92 | | | $ | 6.32 | | | $ | 2.06 | | | $ | 4.91 | |
Increase (decrease) in net asset value per Class 2a units | | | — | | | $ | (2.36 | ) | | $ | 1.45 | | | $ | 3.39 | |
Increase (decrease) in net asset value per Class 3 units | | | — | | | $ | (2.19 | ) | | $ | 2.07 | | | $ | 4.91 | |
Net asset value per Class 1a units | | $ | 104.14 | | | $ | 109.18 | | | $ | 110.22 | | | $ | 113.77 | |
Net asset value per Class 1 units | | | — | | | $ | 97.53 | | | $ | 98.57 | | | $ | 101.49 | |
Net asset value per Class 2 units | | $ | 114.20 | | | $ | 120.52 | | | $ | 122.58 | | | $ | 127.49 | |
Net asset value per Class 2a units | | | — | | | $ | 97.64 | | | | 99.09 | | | | 102.48 | |
Net asset value per Class 3 units | | | — | | | $ | 120.51 | | | | 122.58 | | | | 127.49 | |
Frontier Masters Series: *** | | | | | | | | | | | | | | | | |
Net gain (loss) on investments | | | — | | | $ | 48,703 | | | $ | 265,945 | | | $ | (627,647 | ) |
Net increase/(decrease) in capital resulting from operations attributable to controlling interests | | | — | | | $ | (1,087 | ) | | $ | 82,865 | | | $ | (988,721 | ) |
Increase (decrease) in net asset value per Class 1unit | | | — | | | $ | (2.03 | ) | | $ | 0.35 | | | $ | (3.86 | ) |
Increase (decrease) in net asset value per Class 2 unit | | | — | | | $ | (1.92 | ) | | $ | 0.79 | | | $ | (3.50 | ) |
Net asset value per Class 1 unit | | | — | | | $ | 97.97 | | | $ | 98.32 | | | $ | 94.46 | |
Net asset value per Class 2 unit | | | — | | | $ | 98.08 | | | $ | 98.87 | | | $ | 95.37 | |
Balanced Series: **** | | | | | | | | | | | | | | | | |
Net gain (loss) on investments | | $ | 4,556,262 | | | $ | (11,122,820 | ) | | $ | 11,975,473 | | | $ | (5,900,212 | ) |
Net increase/(decrease) in capital resulting from operations attributable to controlling interests | | $ | 247,088 | | | $ | (12,788,359 | ) | | $ | 5,151,354 | | | $ | (11,760,985 | ) |
Increase (decrease) in net asset value per Class 1 units | | $ | 0.04 | | | $ | (4.15 | ) | | $ | 1.39 | | | $ | (3.91 | ) |
Increase (decrease) in net asset value per Class 1a units | | $ | (0.23 | ) | | $ | (3.72 | ) | | $ | 1.07 | | | $ | (3.71 | ) |
Increase (decrease) in net asset value per Class 2 units | | $ | 1.10 | | | $ | (3.70 | ) | | $ | 2.68 | | | $ | (3.51 | ) |
Increase (decrease) in net asset value per Class 2a units | | $ | 0.65 | | | $ | (3.22 | ) | | $ | 2.09 | | | $ | (3.22 | ) |
Increase (decrease) in net asset value per Class 3a units | | | — | | | $ | (3.23 | ) | | $ | 2.08 | | | $ | (3.22 | ) |
Net asset value per Class 1 units | | $ | 125.21 | | | $ | 121.06 | | | $ | 122.45 | | | $ | 118.54 | |
Net asset value per Class 1a units | | $ | 111.86 | | | $ | 108.14 | | | $ | 109.21 | | | $ | 105.50 | |
Net asset value per Class 2 units | | $ | 143.54 | | | $ | 139.84 | | | $ | 142.52 | | | $ | 139.01 | |
Net asset value per Class 2a units | | $ | 121.95 | | | $ | 118.73 | | | $ | 120.82 | | | $ | 117.60 | |
Net asset value per Class 3a units | | | — | | | $ | 118.74 | | | $ | 120.82 | | | $ | 117.60 | |
| * | The Frontier Diversified Series and Frontier Dynamic Series began trading operations on June 9, 2009 |
| ** | The Frontier Long/Short Commodity Series Class 3 Units began trading on May 29, 2009 and Class 1a and 2a Units began trading on June 8, 2009 |
| *** | The Frontier Masters Series began trading operations on June 9, 2009 |
| **** | The Balanced Series Class 3a Units began trading on June 3, 2009 |
37
| | | | | | | | | | | | | | | | |
| | | 1st Quarter | | | 2nd Quarter | | | 3rd Quarter | | | 4th Quarter | |
| | | 2009 (unaudited) | | | 2009 (unaudited) | | | 2009 (unaudited) | | | 2009 (unaudited) | |
Berkeley/Graham/Tiverton Series: (1) | | | | | | | | | | | | | | | | |
Net gain (loss) on investments | | $ | (1,581,458 | ) | | $ | (3,984,875 | ) | | $ | 4,010,009 | | | $ | 858,852 | |
Net increase/(decrease) in capital resulting from operations attributable to controlling interests | | $ | (2,084,257 | ) | | $ | (4,332,755 | ) | | $ | 2,645,100 | | | $ | (379,146 | ) |
Increase (decrease) in net asset value per Class 1 units | | $ | (2.91 | ) | | $ | (5.60 | ) | | $ | 3.26 | | | $ | (0.64 | ) |
Increase (decrease) in net asset value per Class 2 units | | $ | (2.37 | ) | | $ | (5.48 | ) | | $ | 4.63 | | | $ | 0.18 | |
Net asset value per Class 1 units | | $ | 107.63 | | | $ | 102.03 | | | $ | 105.29 | | | $ | 104.65 | |
Net asset value per Class 2 units | | $ | 121.77 | | | $ | 116.29 | | | $ | 120.92 | | | $ | 121.10 | |
Currency Series: | | | | | | | | | | | | | | | | |
Net gain (loss) on investments | | $ | (674,397 | ) | | $ | (268,315 | ) | | $ | (434,040 | ) | | $ | (680,714 | ) |
Net increase/(decrease) in capital resulting from operations attributable to controlling interests | | $ | (826,574 | ) | | $ | (405,856 | ) | | $ | (555,437 | ) | | $ | (784,509 | ) |
Increase (decrease) in net asset value per Class 1 units | | $ | (5.56 | ) | | $ | (2.85 | ) | | $ | (3.91 | ) | | $ | (5.87 | ) |
Increase (decrease) in net asset value per Class 2 units | | $ | (5.55 | ) | | $ | (2.51 | ) | | $ | (3.77 | ) | | $ | (6.13 | ) |
Net asset value per Class 1 units | | $ | 90.63 | | | $ | 87.78 | | | $ | 83.87 | | | $ | 78.00 | |
Net asset value per Class 2 units | | $ | 103.75 | | | $ | 101.24 | | | $ | 97.47 | | | $ | 91.34 | |
Long Only Commodity Series: | | | | | | | | | | | | | | | | |
Net gain (loss) on investments | | $ | (232,988 | ) | | $ | 568,267 | | | $ | 156,775 | | | $ | 367,675 | |
Net increase/(decrease) in capital resulting from operations attributable to controlling interests | | $ | (246,383 | ) | | $ | 550,537 | | | $ | 139,097 | | | $ | 349,931 | |
Increase (decrease) in net asset value per Class 1 units | | $ | (4.27 | ) | | $ | 9.09 | | | $ | 2.35 | | | $ | 6.11 | |
Increase (decrease) in net asset value per Class 2 units | | $ | (4.18 | ) | | $ | 10.07 | | | $ | 2.75 | | | $ | 7.20 | |
Net asset value per Class 1 units | | $ | 66.04 | | | $ | 75.13 | | | $ | 77.48 | | | $ | 83.59 | |
Net asset value per Class 2 units | | $ | 70.28 | | | $ | 80.35 | | | $ | 83.10 | | | $ | 90.30 | |
Managed Futures Index Series: | | | | | | | | | | | | | | | | |
Net gain (loss) on investments | | $ | (208,699 | ) | | $ | (51,586 | ) | | $ | (82,380 | ) | | $ | (147,776 | ) |
Net increase/(decrease) in capital resulting from operations attributable to controlling interests | | $ | (225,763 | ) | | $ | (67,634 | ) | | $ | (101,164 | ) | | $ | (167,718 | ) |
Increase (decrease) in net asset value per Class 1 units | | $ | (8.50 | ) | | $ | (2.87 | ) | | $ | (3.08 | ) | | $ | (5.19 | ) |
Increase (decrease) in net asset value per Class 2 units | | $ | (8.37 | ) | | $ | (2.44 | ) | | $ | (2.65 | ) | | $ | (4.96 | ) |
Net asset value per Class 1 units | | $ | 123.68 | | | $ | 120.81 | | | $ | 117.73 | | | $ | 112.54 | |
Net asset value per Class 2 units | | $ | 131.33 | | | $ | 128.89 | | | $ | 126.24 | | | $ | 121.28 | |
Winton Series: | | | | | | | | | | | | | | | | |
Net gain (loss) on investments | | $ | (1,393,512 | ) | | $ | (8,138,222 | ) | | $ | 1,155,872 | | | $ | 637,864 | |
Net increase/(decrease) in capital resulting from operations attributable to controlling interests | | $ | (1,551,743 | ) | | $ | (5,410,519 | ) | | $ | 416,891 | | | $ | (139,808 | ) |
Increase (decrease) in net asset value per Class 1 units | | $ | (2.98 | ) | | $ | (9.99 | ) | | $ | 0.68 | | | $ | (0.55 | ) |
Increase (decrease) in net asset value per Class 2 units | | $ | (2.18 | ) | | $ | (9.86 | ) | | $ | 1.72 | | | $ | 0.38 | |
Net asset value per Class 1 units | | $ | 127.43 | | | $ | 117.44 | | | $ | 118.12 | | | $ | 117.57 | |
Net asset value per Class 2 units | | $ | 137.86 | | | $ | 128.00 | | | $ | 129.72 | | | $ | 130.10 | |
Winton/Graham Series: | | | | | | | | | | | | | | | | |
Net gain (loss) on investments | | $ | (924,910 | ) | | $ | (2,549,438 | ) | | $ | 6,524,420 | | | $ | 869,014 | |
Net increase/(decrease) in capital resulting from operations attributable to controlling interests | | $ | (1,450,561 | ) | | $ | (3,623,010 | ) | | $ | 2,657,692 | | | $ | (379,246 | ) |
Increase (decrease) in net asset value per Class 1 units | | $ | (3.06 | ) | | $ | (6.67 | ) | | $ | 4.49 | | | $ | (0.88 | ) |
Increase (decrease) in net asset value per Class 2 units | | $ | (2.50 | ) | | $ | (6.69 | ) | | $ | 6.14 | | | $ | (0.05 | ) |
Net asset value per Class 1 units | | $ | 113.12 | | | $ | 106.45 | | | $ | 110.94 | | | $ | 110.06 | |
Net asset value per Class 2 units | | $ | 128.99 | | | $ | 122.30 | | | $ | 128.44 | | | $ | 128.39 | |
| (1) | Formerly known as the Campbell/Graham/Tiverton Series |
38
| Item 7. | MANAGEMENT’S DISCUSSION AND ANALYSIS OF FINANCIAL CONDITION AND RESULTS OF OPERATIONS. |
Overview
The Trust is a Delaware statutory trust formed on August 8, 2003. The Trust is a multi-advisor commodity pool, as described in CFTC Regulation § 4.10(d)(2). The Trust is authorized to issue multiple Series of Units, pursuant to the requirements of the Trust Act. The assets of each Series are held and accounted for in separate and distinct records separately from the assets of other Series. The Trust is managed by the Managing Owner, and its term will expire on December 31, 2053 (unless terminated earlier in certain circumstances).
The Trust, with respect to each Series of Units, engages in the speculative trading of a diversified portfolio of futures, forward (including interbank foreign currencies) and options contracts and other derivative instruments (including Swaps). The Trust allocates funds to affiliated Trading Companies, each of which has one-year renewable contracts with its own independent Trading Advisor(s) that will manage all or a portion of the applicable Trading Company’s assets, and make the trading decisions for the assets of each Series vested in such Trading Company. In November 2010, the Berkeley/Graham/Tiverton Series invested a portion of its assets in an unaffiliated Trading Company, Berkeley Quantitative Colorado Fund LLC which was liquidated on March 16, 2012. The assets of each Trading Company will be segregated from the assets of each other Trading Company. The Trust has an investment objective of increasing the value of the Units over the long term (capital appreciation), while controlling risk and volatility; further, to offer exposure to the investment programs of individual Trading Advisors and to specific instruments (currencies). For additional overview of the Trust’s structure and business activities, see Item 1 “BUSINESS.”
Critical Accounting Policies and Estimates
The preparation of financial statements in conformity with accounting principles generally accepted in the United States (“GAAP”) requires the Managing Owner to adopt accounting policies and make estimates and assumptions that affect amounts reported in the Trust’s financial statements. The Trust’s most significant accounting policy, described below, includes the valuation of its futures and forward contracts, options contracts, swap contracts, U.S. treasury securities and investments in unconsolidated Trading Companies, as well as the carrying value of the custom time deposits. The majority of these investments are exchange traded contracts valued upon exchange settlement prices or non-exchange traded contracts and obligations with valuation based on third-party quoted dealer values on the Interbank market.
The Trust’s other significant accounting policies are described in detail in Note 2 of the financial statements.
Investment Transactions and Valuation
The Managing Owner has evaluated the nature and type of transactions processed and estimates that it makes in preparing the Trust’s financial statements and related disclosures and has adoptedAccounting Standard Codification (“ASC”) 820,Fair Value Measurements and Disclosure, and implemented the framework for measuring fair value for assets and liabilities.
The Trust utilizes valuation techniques that are consistent with the market approach per the requirement of ASC 820 for the valuation of futures (exchange traded) contracts, forward (non-exchange traded) contracts, option contracts, swap contracts and other non-cash assets. The market approach uses prices and other relevant information generated by market transactions involving identical or comparable assets or liabilities. The Trust applies the valuation techniques in a consistent manner for each asset or liability. The Trust records all investments at fair value in its Statements of Financial Condition, with changes in fair value reported as a component of net gain/(loss) on investments in the Statements of Operations.
Inputs to valuation techniques refer to the assumptions that market participants would use in pricing the assets or liabilities. Inputs may be observable, meaning those that reflect the assumptions market participants would use in pricing the financial asset or liability based on market data obtained from independent sources, or unobservable, meaning those that reflect the reporting entity’s own assumptions about the assumptions market participants would use in pricing the financial asset or liability based on the best information available in the circumstances.
In addition, the Trust monitors counterparty credit risk and incorporates any identified risk factors when assigning input levels to underlying financial assets or liabilities. In that regard ASC 820 establishes a fair value hierarchy for valuation inputs that gives the highest priority to quoted prices in active markets for identical financial assets and the lowest priority to unobservable inputs. A full disclosure of the fair value hierarchy is presented in Note 3 of the financial statements—Fair Value Measurements.
39
Liquidity and Capital Resources
The Trust will raise additional capital only through the sale of Units offered pursuant to the continuing offering, and does not intend to raise any capital through borrowing. Due to the nature of the Trust’s business, it makes no capital expenditures and has no capital assets that are not operating capital or assets.
The Managing Owner is responsible for the payment of all of the ordinary expenses associated with the organization of the Trust and the offering of each Series of Units, except for the initial and ongoing service fee, if any, and no Series will be required to reimburse these expenses. As a result, 100% of each Series’ offering proceeds are initially available for that Series’ trading activities.
A portion of each Trading Company’s assets is used as margin to maintain that Trading Company’s forward currency contract positions, and another portion is deposited in cash in segregated accounts in the name of each Trading Company maintained for each Trading Company at the clearing brokers in accordance with CFTC segregation requirements. At December 31, 2011, cash deposited at the clearing brokers was $74,736,294 for the Balanced Series, $47,822,021 for the Frontier Long/Short Commodity Series, and $5,107,749 for the Frontier Masters Series. The clearing brokers are expected to credit each Trading Company with approximately 80%-100% of the interest earned on its average net assets on deposit with the clearing brokers each month. Currently, with the Federal Funds target rate at 0.00% to 0.25%, this amount is estimated to be 0.00%. In an attempt to increase interest income earned, the Managing Owner also may invest the non-margin assets in U.S. government securities which include any security issued or guaranteed as to principal or interest by the U.S., or by a person controlled by or supervised by and acting as an instrumentality of the government of the U.S. pursuant to authority granted by Congress or any certificate of deposit for any of the foregoing, including U.S. treasury bonds, U.S. treasury bills and issues of agencies of the U.S. government, and certain cash items such as money market funds and time deposits. Aggregate interest income from all sources, including assets held at clearing brokers, up to 2% (annualized) is paid to the Managing Owner by the Balanced Series (Class 1 and Class 2 only), Winton Series, Berkeley/Graham/Tiverton Series, Currency Series, and Winton/Graham Series. For the Balanced Series (Class 1a and Class 2a only), Long Only Commodity Series, Frontier Long/Short Commodity Series and Managed Futures Index Series, 20% of the total interest allocated to each Series is paid to the Managing Owner.
Approximately 10% to 30% of the Trust’s assets are expected to be committed as required margin for futures contracts and forwards and options trading and held by the respective broker, although the amount committed may vary significantly. Such assets are maintained in the form of cash or U.S. treasury bills in segregated accounts with the futures broker pursuant to the Commodity Exchange Act and regulations there under. Approximately 2% to 6% of the Trust’s assets are expected to be deposited with over-the-counter counterparties in order to initiate and maintain forward and swap contracts. Such assets are not held in segregation or otherwise regulated under the Commodity Exchange Act, unless such over-the-counter counterparty is registered as a futures commission merchant. These assets are held in either U.S. government securities or short-term time deposits with U.S.-regulated bank affiliates of the over-the-counter counterparties. The remaining approximately 64% to 88% of the Trust’s assets will normally be invested in cash equivalents and short-term investments, such as money market funds and time deposits and held by the clearing broker, the over-the-counter counterparties and by U.S. federally chartered banks. As of December 31, 2011, total cash and cash equivalents and custom time deposits held at banking institutions were $80,295,258 for the Frontier Diversified Series, $46,107,395 for the Frontier Long/Short Commodity Series, $35,135,275 for the Frontier Masters Series, $142,443,180 for the Balanced Series, $21,128,515 for the Berkeley/Graham/Tiverton Series, $1,668,188 for the Currency Series, $1,452,927 for the Long Only Commodity Series, $1,241,857 for the Managed Futures Index Series, $37,632,902 for the Winton Series, and $18,623,389 for the Winton/Graham Series.
As a commodity pool, the Registrant has large cash positions. Such cash positions are used to pay margin for the trading of futures, forwards and options, and also to pay redemptions. Generally, the Registrant has not been forced to liquidate positions to fund redemptions. During the fiscal year ending December 31, 2011, the Registrant was able to pay all redemptions.
Off-Balance Sheet Risk
The term “off-balance sheet risk” refers to an unrecorded potential liability that, even though it does not appear on the balance sheet, may result in future obligation or loss. Each Trading Company trades in futures, forward and swap contracts and is therefore a party to financial instruments with elements of off-balance sheet market and credit risk. In entering into these contracts there exists a market risk that such contracts may be significantly influenced by market conditions, such as interest rate volatility, resulting in such contracts being less valuable. If the markets should move against all of the futures interests positions held by a Trading Company in respect of any Series at the same time, and if the Trading Advisor(s) of such Trading Company are unable to offset such futures interests positions, such Trading Company could lose all of its assets and the holders of Units of such Series would realize a 100% loss. The Managing Owner seeks to minimize market risk through real-time monitoring of open positions and the level of diversification of each Trading Advisor’s portfolio. It is anticipated that any Trading Advisor’s margin-to-equity ratio will typically not exceed approximately 35% although the actual ratio could be higher or lower from time to time.
40
In addition to market risk, trading futures, forward and swap contracts entails credit risk which is the risk that a counterparty will not be able to meet its obligations to a Trading Company. The counterparty for futures contracts traded in the U.S. and on most foreign exchanges is the clearinghouse associated with such exchange. In general, clearinghouses are backed by the corporate members of the clearinghouse who are required to share any financial burden resulting from the non-performance by one of their members and, as such, should significantly reduce this credit risk. In cases where the clearinghouse is not backed by the clearing members, like some foreign exchanges, it is normally backed by a consortium of banks or other financial institutions. Some non-U.S. exchanges, in contrast to U.S. exchanges are principals’ markets in which performance is the responsibility only of the individual counterparty with whom the Trading Company has entered into the transaction with and not of the exchange or clearing corporation. In these kinds of markets, there is risk of bankruptcy or other failure or refusal to perform by the counterparty.
In the case of forward contracts traded on the interbank market and swaps, neither is traded on an exchange. The counterparty is generally a single bank or other financial institution, rather than a group of financial institutions; thus, there may be a greater counterparty credit risk. The Managing Owner expects the Trading Advisors to trade only with those counterparties which it believes to be creditworthy. All positions of each Trading Company are valued each day on a mark-to-market basis. There can be no assurance that any clearing member, clearinghouse or other counterparty will be able to meet its obligations to any Trading Company.
The Trust has entered into agreements, which provide for the indemnification of futures clearing brokers, currency trading companies, and commodity trading advisers, among others, against losses, costs, claims and liabilities arising from the performance of their individual obligations under such agreements, except for gross negligence or bad faith. The Trust has had no prior claims or payments pursuant to these agreements. The Trust’s individual maximum exposure under these arrangements is unknown, as this would involve future claims that may be made against the Trust that have not yet occurred. However, based on experience the Trust expects the risk of loss to be remote.
Disclosure of Contractual Obligations
The business of the Trust is the speculative trading of commodity interests. The majority of the Trust’s futures and forward positions, which may be categorized as “purchase obligations” under Item 303 of Regulation S-K, are short-term. That is, they are held for less than one year. Because the Trust does not enter into other long-term debt obligations, capital lease obligations, operating lease obligations or other long-term liabilities that would otherwise be reflected on the Trust’s Statement of Financial Condition, a table of contractual obligations has not been presented.
Results of Operations
Series Returns and Other Information
The returns for each Series and Class of Units for the twelve months ended December 31, 2011, and related information, are discussed below. The activities of the Trust on a consolidated basis are explained through the activity of the underlying Series. Please refer to the discussion of the Series activities in relation to the Trust on a consolidated basis.
Each Series had exposure to commodity interest positions within one or more sectors during fiscal 2011. The performance of each Series was impacted over the course of the year by, among other things, the relative performance of the relevant sector or sectors and the commodities within those sectors, the changing allocations among, and the specific positions taken by the Series’ Trading Advisors in, the relevant sector(s) and commodities, and the timing of entries and exits. For certain of the Series, a sector attribution chart has been included at the end of the relevant discussion. Each chart depicts the performance of the relevant Series’ positions within each of the relevant sectors (determined by the Managing Owner using monthly gross return and NAV figures, with various adjustments to net out a proportional allocation of the fees and expenses chargeable to the Series) during the fourth quarter (except as otherwise noted) and for the full calendar year.
Frontier Diversified Series
2011
The Frontier Diversified Series – Class 1 NAV lost 4.0% for the twelve months ended December 31, 2011, net of fees and expenses; the Frontier Diversified Series – Class 2 NAV lost 2.3% for the twelve months ended December 31, 2011 net of fees and expenses. For the twelve months ended December 31, 2011 the Frontier Diversified Series recorded a net gain on investments of $5,428,786, net investment income of $2,399,088, and total expenses of $12,210,432, resulting in a net decrease in Owners’ capital from operations of $4,382,558. The NAV per Unit, Class 1, decreased from $103.58 at December 31, 2010, to $99.40 as of December 31, 2011. The NAV per Unit, Class 2, decreased from $106.46 at December 31, 2010, to $103.96 as of December 31, 2011. Total Class 1 subscriptions and redemptions for the period were $26,631,502 and $41,207,525, respectively. Total Class 2 subscriptions and redemptions for the period were $17,859,192 and $24,442,979, respectively. Ending capital at December 31, 2011, was $72,424,906for Class 1 and $61,548,698 for Class 2.
41
The Frontier Diversified Series may have both long and short exposure to the Interest Rates, Currencies, Stock Indices, Energies, Metals, and Commodities sectors.
Sector Attribution for the Frontier Diversified Series

Two of the six sectors traded in the Frontier Diversified Series were profitable in 2011. Energies and Interest Rates were profitable while Metals, Currencies, Agriculturals and Stock Indices finished negative for the year.
In terms of major CTA performance, four of the seven major CTAs in the Frontier Diversified Series were profitable in 2011. QIM, Cantab, Quantmetrics and Winton were profitable while Graham, Tiverton and Transtrend finished negative for the year.
Frontier Dynamic Series
2011
The Frontier Dynamic Series – Class 1 NAV lost 4.2% for the period ended July 15, 2011 (the date trading operations were ended), net of fees and expenses; the Frontier Dynamic Series – Class 2 NAV lost 3.3% for the period ended July 15, 2011, net of fees and expenses.
For the period ended July 15, 2011, the Frontier Dynamic Series recorded a net gain on investments of $115,076, net investment income of $250,426, and total expenses of $428,134, resulting in a net decrease in Owners’ capital from operations of $62,632. The NAV per Unit, Class 1, decreased from $91.94 at December 31, 2010, to $88.05 as of July 15, 2011. The NAV per Unit, Class 2, decreased from $94.40 at December 31, 2010, to $91.26 as of July 15, 2011. Total Class 1 subscriptions and redemptions for the period were $165,200 and $1,331,791, respectively. Total Class 2 subscriptions and redemptions for the period were $41,500 and $445,199, respectively. Ending capital at December 31, 2011, was $0 for Class 1 and $0 for Class 2.
The Frontier Dynamic Series may have had both long and short exposure to the Interest Rates, Currencies, Stock Indices, Energies, Metals, and Commodities sectors. The Dynamic Series invested in an option market basket of which the underlying investments are not transparent to the Trust. Therefore there are no Sector Attribution charts for the Dynamic Series.
42
Frontier Long/Short Commodity Series
2011
The Frontier Long/Short Commodity Series – Class 1 NAV gained 2.6% for the twelve months ended December 31, 2011, net of fees and expenses; the Frontier Long/Short Commodity Series – Class 2 NAV gained 5.7% for the twelve months ended December 31, 2011, net of fees and expenses; the Frontier Long/Short Commodity Series – Class 3 NAV gained 5.7% for the twelve months ended December 31, 2011, net of fees and expenses; the Frontier Long/Short Commodity Series – Class 1 a NAV gained 3.2% for the twelve months ended December 31, 2011, net of fees and expenses; the Frontier Long/Short Commodity Series – Class 2a NAV gained 5.0% for the twelve months ended December 31, 2011, net of fees and expenses.
For the twelve months ended December 31, 2011, the Frontier Long/Short Commodity Series recorded net gain on investments of $17,234,688, net investment income of $1,371,889, and total expenses of $8,087,479, resulting in a net increase in Owners’ capital from operations attributable to controlling interests of $4,459,637 after operations attributable to non-controlling interests of ($6,059,461). The NAV per Unit, Class 1, increased from $132.73 at December 31, 2010, to $136.13 as of December 31, 2011. The NAV per Unit, Class 2, increased from $153.26 at December 31, 2010, to $161.97 as of December 31, 2010. The NAV per Unit, Class 3, increased from $153.26 at December 31, 2010, to $161.96 as of December 31, 2011. The NAV per Unit, Class 1a, increased from $117.96 at December 31, 2010, to $121.71 as of December 31, 2011. The NAV per Unit, Class 2a, increased from $121.18 at December 31, 2010, to $127.23 as of December 31, 2011. Total Class 1 subscriptions and redemptions for the twelve months were $75,898 and $29,615,581, respectively. Total Class 2 redemptions for the twelve months were $7,732,419. There were no Class 2 subscriptions. Total Class 3 subscriptions and redemptions for the twelve months were $19,475,762 and $13,879,097, respectively. Total Class 1a subscriptions and redemptions for the twelve months were $14,327,910 and $617,869, respectively. Total Class 2a subscriptions and redemptions for the twelve months were $7,830,730 and $547,685, respectively. Ending capital at December 31, 2011, was $4,159,047 for Class 1, $9,188,762 for Class 2, $27,810,058 for Class 3, $18,891,395 for Class 1a and $10,911,464 for Class 2a.
The Frontier Long/Short Commodity Series may have both long and short exposure to the Interest Rates, Currencies, Stock Indices, Energies, Metals, and Commodities sectors, although the majority of the exposure will typically be in the Energies, Metals, and Commodities sectors.
Sector Attribution for the Frontier Long/Short Commodity Series

43

Four of the seven sectors traded in the Frontier Long/Short Commodity Series were profitable in 2011. Precious Metals, Energies, Financials and Softs were positive while Base Metals, Grains were down for the year.
In terms of major CTA performance, two of the six major CTAs in the Frontier Long/Short Commodity Series were profitable in 2011. Rosetta and Strategic Ag were positive while Beach Horizon, Global Advisors, Red Oak and Mesirow were negative for the year.
Frontier Masters Series
2011
The Frontier Masters Series – Class 1 NAV lost 2.6% for the twelve months ended December 31, 2011, net of fees and expenses; the Frontier Masters Series – Class 2 NAV lost 0.9% for the twelve months ended December 31, 2011, net of fees and expenses.
For the period ended December 31, 2011 the Frontier Masters Series recorded a net gain on investments of $2,393,047, net investment income of $1,026,007, and total expenses of $4,466,240, resulting in a net decrease in Owners’ capital from operations attributable to
44
controlling interests of $1,019,452 after operations attributable to non-controlling interests of $27,734. The NAV per Unit, Class 1, decreased from $102.96 at December 31, 2010, to $100.25 as of December 31, 2011. The NAV per Unit, Class 2, decreased from $105.81 at December 31, 2010, to $104.83 as of December 31, 2011. Total Class 1 subscriptions and redemptions for the period were $8,975,267 and $15,268,645, respectively. Total Class 2 subscriptions and redemptions for the period were $3,222,236 and $9,360,139, respectively. Ending capital at December 31, 2011, was $34,090,136 for Class 1 and $18,734,861for Class 2.
The Frontier Masters Series may have both long and short exposure to the Interest Rates, Currencies, Stock Indices, Energies, Metals, and Commodities sectors.
Sector Attribution for the Frontier Masters Series
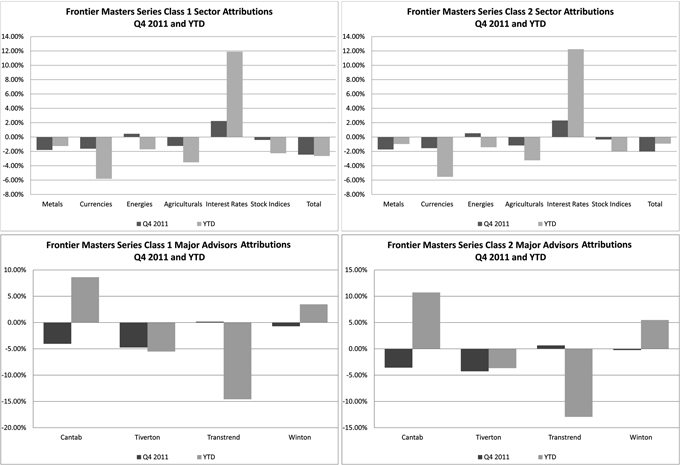
One of the six sectors traded in the Frontier Masters Series was profitable in 2011. Interest Rates was positive while Metals, Currencies, Energies, Agriculturals and Stock Indices were negative for the year.
In terms of major CTA performance, two of the four major CTAs in the Frontier Masters Series were profitable during the year. Cantab and Winton were positive while Transtrend and Tiverton finished negative for the year.
Balanced Series
2011
The Balanced Series – Class 1 NAV lost 5.6% for the twelve months ended December 31, 2011, net of fees and expenses; the Balanced Series – Class 1a NAV lost 6.8% for the twelve months ended December 31, 2011, net of fees and expenses; the Balanced Series – Class 2 NAV lost 2.8% for the twelve months ended December 31, 2011, net of fees and expenses; the Balanced Series – Class 2a NAV lost 4.0% for the twelve months ended December 31, 2011, net of fees and expenses; the Balanced Series – Class 3a NAV lost 4.0% for the twelve months ended December 31, 2011, net of fees and expenses.
For the twelve months ended December 31, 2011, the Balanced Series recorded net gain on investments of $5,648,268, net investment income of $534,877, and total expenses of $24,591,620, resulting in a net decrease in Owners’ capital from operations attributable to controlling interests of $12,244,073 after operations attributable to non- controlling interests of $6,164,402. The NAV per Unit, Class 1, decreased from $131.95 at December 31, 2010, to $124.50 at December 31, 2011. For Class 1a, the NAV per Unit decreased from
45
$116.36 at December 31, 2010, to $108.45 at December 31, 2011. The NAV per Unit, Class 2, decreased from $159.46 at December 31, 2010, to $155.02 at December 31, 2011. For Class 2a, the NAV per Unit decreased from $133.66 at December 31, 2010, to $128.35 at December 31, 2011. For Class 3a, the NAV per Unit decreased from $133.66 at December 31, 2010, to $128.36 at December 31, 2011. Total Class 1 subscriptions and redemptions for the twelve months were $680,177 and $94,481,950, respectively. Total Class 1a subscriptions and redemptions for the twelve month period were $5,618 and $2,387,579, respectively. Total Class 2 subscriptions and redemptions for the twelve months were $1,266,575 and $13,042,325, respectively. Total Class 2a redemptions for the twelve month period were $652,135. There were no Class 2a subscriptions. Total Class 3a subscriptions and redemptions for the period were $810,623 and $1,420,305, respectively. Ending capital at December 31, 2011, was $183,785,318 for Class 1, $2,536,559 for Class 1a, $63,372,567 for Class 2, $2,784,830 for Class 2a and $2,952,802 for Class 3a.
The Balanced Series may have both long and short exposure to the Interest Rates, Currencies, Stock Indices, Energies, Metals, and Commodities sectors.
Sector Attribution for the Frontier Balanced Series

46
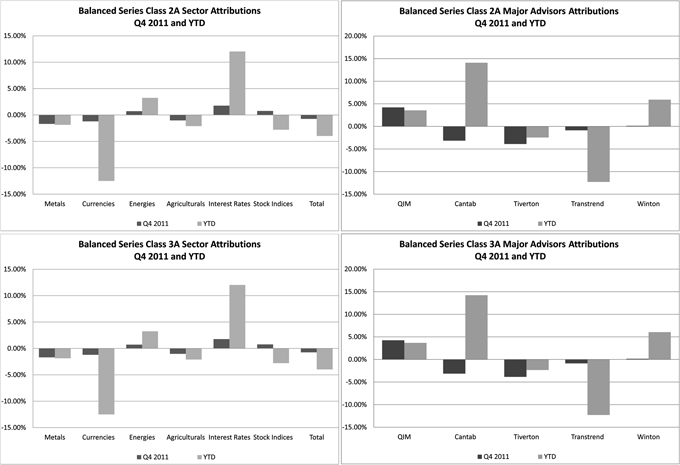
Two of the six sectors traded in the Balanced Series were profitable in 2011. Energies and Interest Rates were profitable while Metals, Currencies, Agriculturals and Stock Indices finished negative for the year.
In terms of major CTA performance, three of the five major CTAs in the Balanced Series were profitable in 2011. QIM, Cantab and Winton were profitable while Tiverton and Transtrend finished negative for the year.
Effective July 2011, Cantab Capital Partners has been designated as a major CTA to the Balanced Series. QuantMetrics Capital Management, that previously was a major CTA to the Series, has been designated as a non-major CTA to the Series.
Berkeley/Graham/Tiverton Series (Formerly the Campbell/Graham/Tiverton Series)
2011
The Berkeley/Graham/Tiverton Series – Class 1 NAV lost 17.6% for the twelve months ended December 31, 2011, net of fees and expenses; the Berkeley/Graham/Tiverton Series – Class 2 NAV lost 15.1% for the twelve months ended December 31, 2011, net of fees and expenses.
For the twelve months ended December 31, 2011, the Berkeley/Graham/Tiverton Series recorded net loss on investments of $6,401,143, net investment income of $106,784, and total expenses of $2,973,773, resulting in a net decrease in Owners’ capital from operations of $9,268,132. The NAV per Unit, Class 1, decreased from $110.46 at December 31, 2010, to $91.02 as of December 31, 2011. The NAV per Unit, Class 2, decreased from $131.73 at December 31, 2010, to $111.84 as of December 31, 2011. Total Class 1 subscriptions and redemptions for the twelve months ended December 31, 2011, were $73,374 and $18,343,967, respectively. Total Class 2 redemptions for the twelve months ended December 31, 2011, were $3,076,631. There were no Class 2 subscriptions. Ending capital at December 31, 2011, was $35,180,631 for Class 1 and $4,433,341 for Class 2.
The Berkeley/Graham/Tiverton Series may have both long and short exposure to the Interest Rates, Currencies, Stock Indices, Energies, Metals, and Commodities sectors.
47
Sector Attribution for the Berkeley/Graham/Tiverton Series
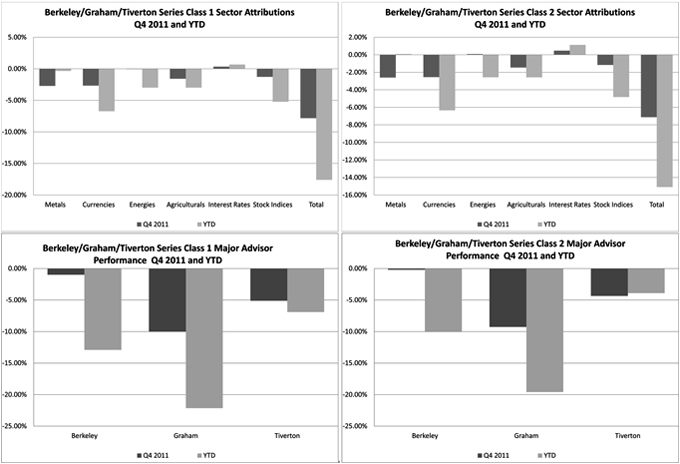
Two of the six sectors traded in the Berkeley/Graham/Tiverton Series were profitable in 2011. Metals and Interest Rates were positive while Energies, Currencies, Agriculturals and Stock Indices were negative for the year.
In terms of major CTA performance, Tiverton, Berkeley and Graham finished negative for the year.
48
Currency Series
2011
The Currency Series – Class 1 NAV lost 10.9% for the twelve months ended December 31, 2011, net of fees and expenses; the Currency Series – Class 2 NAV lost 8.2% for the twelve months ended December 31, 2011, net of fees and expenses.
For the twelve months ended December 31, 2011, the Currency Series recorded net loss on investments of $387,646, net investment income of $61,690, and total expenses of $294,981, resulting in a net decrease in Owners’ capital from operations of $620,937. The NAV per Unit, Class 1, decreased from $79.09 at December 31, 2010, to $70.48 as of December 31, 2011. The NAV per Unit, Class 2, decreased from $95.43 at December 31, 2010, to $87.61 as of December 31, 2011. Total Class 1 subscriptions and redemptions for the twelve months ended December 31, 2011 were $58,429, and $1,610,039, respectively. Total Class 2 redemptions for the twelve months ended December 31, 2011, were $647,496. There were no Class 2 subscriptions. Ending capital at December 31, 2011, was $4,228,350 for Class 1 and $91,007 for Class 2.
The Currency Series may have both long and short exposure to the Currencies sector only. Because all returns are from the Currencies sector, there are no Sector Attribution charts for the Currency Series.
Long Only Commodity Series
2011
The Long Only Commodity Series – Class 1 NAV lost 7.4% for the period ended December 21, 2011, net of fees and expenses; the Long Only Commodity Series – Class 2 NAV lost 5.6% for the period ended December 21, 2011, net of fees and expenses; the Long Only Commodity Series – Class 3 NAV lost 5.8% from the beginning of operations on January 14, 2011 to December 21, 2011, net of fees and expenses;
For the period ended December 21, 2011, the Long Only Commodity Series recorded net loss on investments of $49,181, net investment income of $60,039, and total expenses of $89,977, resulting in a net decrease in Owners’ capital from operations of $79,119. The NAV per Unit, Class 1, decreased from $94.11 at December 21, 2010 to $87.11 as of December 21, 2011. The NAV per Unit, Class 2, decreased from $103.71 at December 31, 2010, to $97.88 as of December 21, 2011. The NAV per Unit, Class 3, decreased from $126.73 at January 14, 2011(the beginning of operations,) to $119.76 as of December 21, 2011. Total Class 1 subscriptions and redemptions for the period were $1,084 and $3,330,733, respectively. Total Class 2 redemptions for the period were $864,130. There were no Class 2 subscriptions. Total Class 3 subscriptions and redemptions for the period were $1,635,478 and $1,555,811, respectively. The Long Only Commodity Series ceased trading operations on December 21, 2011 and redeemed all existing units. As such, ending capital at December 31, 2011, was $0 for all Classes.
The Long Only Commodity Series may have had long-only exposure in the Energies, Metals, and Commodities sectors. The Long Only Commodity Series invested approximately equally in the Jefferies Commodity Performance Index and the Reuters/Jefferies CRB Index. There are no Sector Attribution charts for the Long Only Commodity Series.
Managed Futures Index Series
2011
The Managed Futures Index Series – Class 1 NAV lost 9.4% for the period ended December 21, 2011, net of fees and expenses; the Managed Futures Index Series – Class 2 NAV lost 7.7% for the period ended December 21, 2011, net of fees and expenses; the Managed Futures Index Series – Class 3 NAV lost 5.4% from the beginning of operations on January 14, 2011 to December 21, 2011, net of fees and expenses.
For the period ended December 21, 2011, the Managed Futures Index Series recorded a net loss on investments of $315,353, net investment income of $82,283, and total expenses of $125,207, resulting in a net decrease in Owners’ capital from operations of $358,277. The NAV per Unit, Class 1, decreased from $117.96 at December 31, 2010, to $106.83 as of December 21, 2011. The NAV per Unit, Class 2, decreased from $129.69 at December 31, 2010, to $119.76 as of December 31, 2011. The NAV per Unit, Class 3, decreased from $126.73 at January 14, 2011 (the beginning of operations) to $119.76 as of December 21, 2011. Total Class 1 redemptions for the period were $2,200,563. There were no Class 1 subscriptions. Total Class 2 redemptions for the period were $3,506,841. There were no Class 2 subscriptions. Total Class 3 subscriptions and redemptions for the period were $375,118 and $360,212, respectively. The Managed Futures Index Series ceased trading operations on December 21, 2011 and redeemed all existing units. As such, ending capital at December 31, 2011, was $0 for all Classes.
The Managed Futures Index Series may have had both long and short exposure to the Interest Rates, Currencies, Stock Indices, Energies, Metals, and Commodities sectors.
49
Sector Attribution for the Managed Futures Index Series
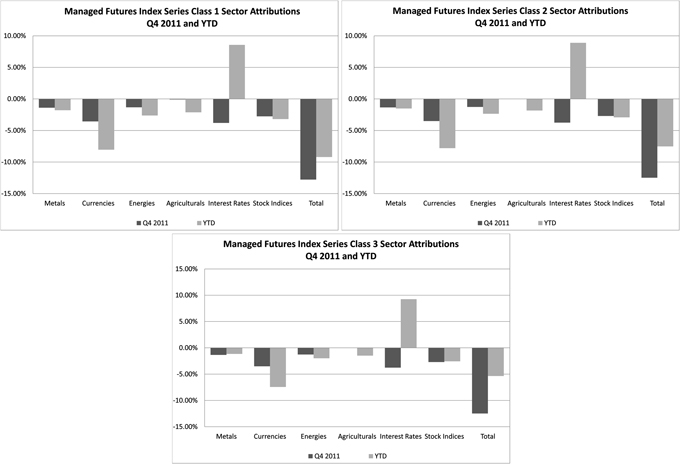
One of the six sectors traded in the Managed Futures Index Series was profitable in 2011. Interest Rates were profitable while Metals, Currencies, Energies Agriculturals and Stock Indices were negative for the year.
Please note that November 2011 was the last full trading month for the Managed Futures Index Series.
Winton Series
2011
The Winton Series – Class 1 NAV gained 4.5% for the twelve months ended December 31, 2011, net of fees and expenses; the Winton Series – Class 2 NAV gained 7.7% for the twelve months ended December 31, 2011, net of fees and expenses.
For the twelve months ended December 31, 2011, the Winton Series recorded net gain on investments of $5,865,030, net investment income of $457,889, and total expenses of $3,596,286, resulting in a net increase in Owners’ capital from operations of $2,726,633. The NAV per Unit, Class 1, increased from $135.04 at December 31, 2010, to $141.13 as of December 31, 2011. The NAV per Unit, Class 2, increased from $153.99 at December 31, 2010, to $165.82 as of December 31, 2011. Total Class 1 subscriptions for the year were $256,132 and redemptions were $13,146,425. Total Class 2 redemptions for the year were $507,653. There were no Class 2 subscriptions. Ending capital at December 31, 2011, was $38,345,799 for Class 1 and $11,702,325 for Class 2.
The Winton Series may have both long and short exposure to the Interest Rates, Currencies, Stock Indices, Energies, Metals, and Commodities sectors.
50
Sector Attribution for the Winton Series
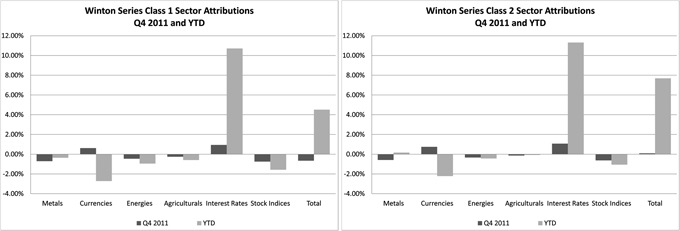
Two of the six sectors traded in the Winton Series were profitable in 2011. Metals and Interest Rates were positive while Currencies, Energies, Agriculturals and Stock Indices were negative for the year.
Winton/Graham Series
2011
The Winton/Graham Series – Class 1 NAV lost 12.6% for the twelve months ended December 31, 2011, net of fees and expenses; the Winton/Graham Series – Class 2 NAV lost 10.0% for the twelve months ended December 31, 2011, net of fees and expenses. For the twelve months ended December 31, 2011, the Winton/Graham Series recorded net loss on investments of $2,260,583, net investment income of $217,875, and total expenses of $2,926,790, resulting in a net decrease in Owners’ capital from operations of $4,498,779, after non-controlling interest of $470,719. The NAV per Unit, Class 1, decreased from $119.83 at December 31, 2010, to $104.73 as of December 31, 2011. The NAV per Unit, Class 2, decreased from $144.04 at December 31, 2010, to $129.70 as of December 31, 2011. Total Class 1 subscriptions and redemptions for the twelve months were $111,245 and $17,353,576, respectively. Total Class 2 redemptions for the twelve months were $4,995,641. There were no Class 2 subscriptions. Ending capital at December 31, 2011, was $24,783,519 for Class 1 and $5,990,168 for Class 2.
The Winton/Graham Series may have both long and short exposure to the Interest Rates, Currencies, Stock Indices, Energies, Metals, and Commodities sectors.
51
Sector Attribution for the Winton/Graham Series
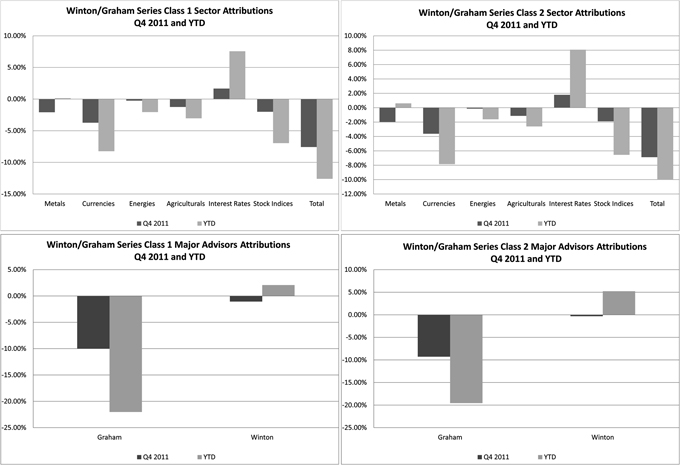
Two of the six sectors traded in the Winton/Graham Series were profitable in 2011. Metals and Interest Rates were positive while Stock Indices, Energies, Agriculturals and Currencies were negative for the year.
In terms of major CTA performance, Winton was positive while Graham was negative for the year.
Results of Operations
Market Conditions for Twelve Months Ended December 31, 2010
January 2010
Interest Rates
The Federal Open Market Committee (FOMC) decided in January to maintain the target range for the federal funds rate at 0% to 0.25%. The FOMC anticipates that economic conditions, including low rates of resource utilization, subdued inflation trends, and stable inflation expectations, are likely to warrant exceptionally low levels of the federal funds rate for an extended period. U.S. and European interest rate futures, across the curve, climbed steadily during January to finish higher.
Currencies
The U.S. Dollar index continued to strengthen during January, finishing up 2.0% for the month. The Euro and the British Pound weakened against the U.S. Dollar, down 3.2% and 1.2%, respectively. The Japanese Yen strengthened against the U.S. Dollar, up 3.1%. The Canadian Dollar and the Australian Dollar weakened against their U.S. counterpart finishing lower by 1.6% and 1.5%, respectively.
Stock Indices
Most of the major U.S. and European stock indices reversed their upward trend to finish lower for January. The Dow Jones Industrial Average (DJIA), the S&P 500 Index and the NASDAQ Composite Index weakened by 3.5%, 3.7% and 5.4%, respectively, for the month. In Europe, FTSE index futures dropped 4.9%, CAC-40 futures finished lower by 6.3% and DAX index futures were down 6.9% for the month.
52
Energy
Most energy futures weakened in January. Crude oil futures finished lower by 8.9% settling at $73/bbl. Gasoline, heating oil and natural gas futures also dropped, down 7.6%, 9.8% and 7.2%, respectively for the month.
Metals
Gold futures continued to drop during the month, finishing lower by 1.3% at $1,084/oz. Silver futures also weakened, down 3.9% in January. Platinum and palladium futures strengthened during the month, finishing up 2.4% and 0.9%, respectively. Copper reversed its upward trend since September 2009 to finish lower by 8.9% for the month.
Agriculturals
The soybean complex dropped sharply in January. Soybean oil, soybeans and soybean meal dropped 11.4%, 12.9% and 10.6% respectively. Corn and wheat futures also dropped, down 14.0% and 12.5% in January. Cotton futures reversed its upward trend since September 2009 to finish lower by 8.7%. Sugar futures continued to climb, up 10.9% for January.
February 2010
Interest Rates
Global markets were jolted by events from the East and the West during February, both of which point towards a tightening of deflationary pressures on a large part of the world’s economy. The ongoing fiscal crisis in Greece dominated the markets until mid month. European Union leaders declared that the European Union (“EU”) member states would do whatever was required to preserve the Euro. Chinese monetary authorities announced mid month a surprise further tightening of monetary policy to prevent overheating and cool asset inflation. For the second time in a month, Chinese banks’ reserve requirements were increased to restrain their loan growth, which has fueled a potential new bubble. Being one of the largest economies in the world, behind the U.S. and Japan, China’s requirement on bank reserves could have a constraining effect on the market. U.S. and European interest rate futures, across the curve, finished slightly up for the month.
Currencies
The U.S. dollar index continued to strengthen during February, finishing up 1.1% for the month. The difficulties facing Greece and other European borrowers with large budget deficits put downward pressure on the Euro. The Euro continued to weaken against the U.S. Dollar, down 1.7% for the month. The Japanese Yen strengthened against the U.S. Dollar, up 1.5%. The Canadian Dollar and the Australian Dollar also strengthened against their U.S. counterpart, finishing higher by 1.8% and 1.3%, respectively, in February. The British Pound weakened against the U.S. Dollar, down 4.6% for the month.
Stock Indices
Most of the major U.S. and European stock indices finished higher in February. The DJIA, the S&P 500 Index and the NASDAQ Composite Index strengthened by 2.6%, 2.9% and 4.2%, respectively, for the month. In Europe, FTSE index futures finished higher by 4.8%, CAC-40 futures finished up by 0.4% and DAX index futures strengthened by 0.8%.
Energy
Most energy futures strengthened in February. Crude oil futures finished higher by 8.6% settling at $79.66/bbl. Gasoline and heating oil futures also strengthened, up 8.2% and 6.0%, respectively, for the month. Natural gas futures finished the month lower by 6.0%.
Metals
The recent crises in the Euro zone and increasing inflation expectations have been contributing to the rise in precious metal prices in February. Gold futures finished up 3.2% at $1,119/oz in February. Silver futures strengthened by 1.9%. Platinum, palladium and copper futures also strengthened during the month, finishing up 2.3%, 5.0% and 7.1%, respectively.
Agriculturals
The soybean complex finished higher in February. Corn and wheat futures also strengthened, up 5.8% and 6.3% for the month. Sugar futures reversed its upward trend, finishing lower by 17.5%. Cocoa futures also weakened during the month, down 9.7%. Cotton rallied during the February, finishing up 16.7%.
53
March 2010
Interest Rates
Some degree of optimism about the U.S. economy has resurfaced. Recent U.S. data suggests that economic activity has continued to strengthen and that the labor market is stabilizing. Household spending is expanding at a moderate rate, yet constrained by high unemployment, modest income growth, lower housing wealth, and tight credit. Business spending on equipment and software has risen significantly. However, employers remain reluctant to add to payrolls. To provide support to mortgage lending and housing markets the Federal Reserve has been purchasing $1.25 trillion of agency mortgage-backed securities and about $175 billion of agency debt over the last year. These purchases are coming to an end, as the last transactions were executed in March. The ongoing fiscal crisis in Greece continued to put pressure on Greek government bonds in March. Disagreement among Euro-zone countries over the implementation of the aid program contributed to the sharp yield increase on the 10-year Greek government bond. Some economists say the sharp rise in borrowing costs is contributing to a spiral that could eventually force Greece to a default. U.S. interest rate futures, across the curve, finished down for the month. European interest rate futures finished the month higher.
Currencies
The U.S. Dollar index continued to strengthen during March, finishing up 0.9% for the month. The Euro and the British Pound continued to weaken against the U.S. Dollar, down 0.9% and 0.4%, respectively, for the month. The Japanese Yen weakened as well against the U.S. Dollar, down 4.8%. The Canadian Dollar and the Australian Dollar continued to strengthen against their U.S. counterpart, finishing higher by 3.6% and 2.4%, respectively, in March.
Stock Indices
Most of the major U.S. and European stock indices finished higher in March. The DJIA, the S&P 500 Index and the NASDAQ Composite Index strengthened by 5.1%, 5.9% and 7.1%, respectively, for the month. In Europe, FTSE index futures finished higher by 6.3%, CAC-40 futures finished up by 7.2% and DAX index futures strengthened by 9.8%.
Energy
Most energy futures strengthened in March. Crude oil futures finished higher by 4.7% settling at $83.76/bbl. Gasoline and heating oil futures also strengthened, up 5.2% and 6.4%, respectively, for the month. Natural gas plummeted in March, finishing lower by 20.7%.
Metals
Gold futures finished slightly down in March, 0.5% at $1,114/oz. Silver futures strengthened by 6.1%. Platinum, palladium and copper futures also strengthened during the month, finishing up 6.6%, 10.7% and 8.2%, respectively.
Agriculturals
Rough rice, corn and wheat futures weakened significantly in March, down 11.2%, 13.2% and 11.3%, respectively, for the month. Sugar futures dropped significantly, finishing lower by 29.7%. Live cattle and feeder cattle futures, that have been on an upward trend since December last year, continued to strengthen, up 3.5% and 9.2%, respectively, for March.
April 2010
Interest Rates
Recent U.S. data suggests that economic activity has continued to strengthen and that the labor market is improving. Growth in household spending has picked up recently but remains constrained by high unemployment, modest income growth, lower housing wealth, and tight credit. In Europe, the ongoing fiscal crisis in Greece continued to put pressure on the Euro zone. The concern increased that Greece’s debt troubles would spread throughout Europe, possibly putting a dent in the global economic recovery. U.S. and German interest rate futures, across the curve, finished the month higher because of a flight to quality.
Currencies
The U.S. Dollar index continued to climb during April, finishing up 1.0% for the month. The Euro continued to weaken against the U.S. Dollar, down 1.9% for the month. The Japanese Yen also weakened against the U.S. Dollar, down 0.4%. The British Pound and the Australian Dollar strengthened against the U.S. Dollar, finishing higher by 0.6% and 0.8%, respectively, in April.
Stock Indices
Most of the major U.S. stock indices finished higher in April. The DJIA, the S&P 500 Index and the NASDAQ Composite Index strengthened by 1.4%, 1.5% and 2.6%, respectively, for the month. In Europe, the uncertainty around Greece and other debt-troubled countries contributed to European stock indices finishing lower in April. FTSE index futures fell 3.1%, CAC-40 futures finished lower by 5.1% and DAX index futures finished down 1.0%.
54
Energy
Crude oil futures for September delivery finished higher by 2.3% settling at $86.15/bbl. Gasoline and heating oil futures also strengthened, up 4.3% and 5.7%, respectively, for the month. Natural gas continued to drop in April, finishing down 1.1%.
Metals
Uncertainty over the Euro contributed to the increase in gold prices in April, as investors turned to precious metals as an alternative vehicle to currencies. Gold futures for September delivery finished up 5.9% at $1,180/oz. Silver, platinum and palladium futures strengthened as well, finishing up 6.2%, 6.0% and 15.8%, respectively, for the month.
Agriculturals
Corn and wheat futures strengthened in April, finishing up 5.3% and 8.4%, respectively, for the month. Sugar futures continued to drop, finishing down by 8.2%. Cocoa and cotton strengthened in April, up 7.9% and 2.8%, respectively.
May 2010
Interest Rates
U.S. and German interest rate futures, across the curve, finished higher in May. In Europe, there is a concern that the ongoing debt crisis in Greece may spread to Hungary. Government officials in Hungary raised concerns about the nation suffering the type of debt problems that led to a massive bailout for Greece. The potential losses on the Hungarian debt will likely be shouldered by European banks that are already strained due to the Greek debt crisis. The Federal Reserve reestablished U.S. Dollar liquidity swap facilities with Bank of England, the European Central Bank, the Swiss National Bank, Bank of Canada, and the Bank of Japan in May, as a response to the re-emerging strains in short term funding markets in Europe.
Currencies
The U.S. Dollar index continued to climb during May, finishing up 5.8% for the month. The Euro remained under severe pressure during the month, battered by continued concerns over the state of sovereign debt. The Euro and the British Pound weakened against the U.S. Dollar, down 7.4% and 4.8% for the month. The Australian and Canadian Dollars also weakened against their U.S. counterpart, down 8.5% and 2.6%, respectively. The Japanese Yen strengthened against the U.S. Dollar, up 2.8% for the month.
Stock Indices
Renewed worries about the euro zone sent investors scurrying toward safer assets. Most of the major U.S. and European stock indices finished lower in May. The DJIA, the S&P 500 Index and the NASDAQ Composite Index dropped by 7.9%, 8.2% and 8.3%, respectively, for the month. In Europe, FTSE index futures fell 5.2%, CAC-40 futures finished lower by 4.7% and DAX index futures finished down 2.2%.
Energy
Fresh doubts about the prospects for economic recovery in the U.S., the world’s biggest oil consumer, contributed to the drop in crude oil futures prices in May. Crude oil futures for July delivery finished lower by 16.3% settling at $74.44/bbl for the month. Gasoline and heating oil futures also weakened, down 15.6% and 14.3%, respectively. Natural gas strengthened in May, up 7.2%.
Metals
Uncertainty over the Euro contributed to the increase in gold prices in May, as investors turned to gold as an alternative vehicle to currencies. Gold futures for August delivery finished up 2.8% at $1,218/oz for the month. Silver, platinum and palladium futures weakened, finishing down 1.2%, 11.2%, and 16.8%, respectively, in May.
Agriculturals
Rough rice, corn and wheat futures weakened in May, finishing down 7.7%, 4.3% and 9.0%, respectively, for the month. Lumber dropped considerably in May, finishing down 26.2%. Lumber’s downturn began in late April shortly before the expiration of a federal tax break for U.S. home buyers. That tax break ended April 30 and lumber investors believed that its expiration would slow demand for newly built homes.
55
June 2010
Interest Rates
U.S. and German interest rate futures, across the curve, finished higher in September. Even if the worst of the recent financial-market turmoil tied to Europe’s sovereign-debt crisis appears to have passed, there are still reasons to be concerned. The International Monetary Fund (“IMF”) said in an update of its World Economic Outlook that downside risks to the global economy had risen sharply and that “the new forecasts hinge on implementation of policies to rebuild confidence and stability, particularly in the euro area.” Since May 2010, the European Central Bank has purchased nearly $76 billion in government debt of Greece and other vulnerable countries. The government-debt purchase program has been controversial in Europe, particularly in Germany, where the practice fuels fears of a loss of central-bank independence and increases in the money supply, which could lead to inflation.
Currencies
The U.S. Dollar index dropped slightly in September, down 0.7% for the month. The Euro weakened against the U.S. Dollar, down 0.6% for the month. The Australian and Canadian Dollars also weakened against their U.S. counterpart, down 0.6% and 1.8%, respectively. The British Pound, the Swiss Franc and the Japanese Yen strengthened against the U.S. Dollar, up 2.8%, 7.2% and 3.2% for the month.
Stock Indices
Most of the major U.S. and European stock indices finished lower in September. The DJIA, the S&P 500 Index and the NASDAQ Composite Index dropped by 3.6%, 5.4% and-6.5%, respectively, for the month. In Europe, FTSE index futures fell 6.2%, CAC-40 futures finished lower by 3.1% and DAX index futures finished down 1.1%.
Energy
Crude oil futures for August delivery finished up 0.6%, settling at $75.63/bbl for the month. Gasoline and natural gas futures also strengthened, up 1.5% and 4.7%, respectively. Heating oil futures dropped in September, down 0.5%.
Metals
Gold futures for August delivery strengthened, up 2.5%, finishing at $1246/oz for the month. Silver futures also strengthened, finishing up 1.3%. Platinum and palladium futures weakened, finishing down 1.2% and 4.1%, respectively, in September.
Agriculturals
Rough rice futures continued its downward path, finishing lower by 17.0% in September. Since mid-December 2009, rough rice futures have dropped nearly 41%. Coffee futures saw a mid-September surge to sharply higher levels, up 22.1% for the month. Lumber continued to drop in September, finishing down 11.6%.
July 2010
Interest Rates
U.S. interest rate futures, across the curve, continued climbing to finish higher in July. Demand in all areas of the bond market is strong and it seems to be signaling economic fear despite the stock market’s summer rally. Economic data is showing that the one-year-old recovery from the worst recession in decades is losing momentum. The unemployment rate remains painfully high. Since February 2009 the jobless rate has climbed from 8.1% to 9.5% and the private industry has shed two million jobs. Employers still don’t seem confident enough to add new workers. A record 6.7 million Americans have now been out of work for at least six months and, 18 months after the $862 billion stimulus bill passed in 2009, there are still five job seekers for every job opening. In less than two years, federal spending has increased dramatically and the national debt has skyrocketed from $9.3 trillion to $13.3 trillion.
Currencies
The U.S. Dollar index continued to drop in July, down 5.2% for the month. The Euro strengthened against the U.S. Dollar, up 6.7% for the month. The British Pound, the Swiss Franc and the Japanese Yen also strengthened against the U.S Dollar, up 5.0%, 3.5% and 2.3%, respectively, for the month. The Australian and Canadian Dollars also gained against their U.S. counterpart, up 7.6% and 3.3%, respectively.
Stock Indices
Most of the major U.S. and European stock indices finished higher in July. DJIA, the S&P 500 Index and the NASDAQ Composite Index gained 7.1%, 6.9% and 6.9%, respectively, for the month. In Europe, FTSE index futures finished up 9.2%, CAC-40 futures finished up 7.6% and DAX index futures gained 4.4%.
Energy
Crude oil futures for September delivery finished up 3.7%, settling at $78.95/bbl for the month. Gasoline, heating oil and natural gas futures also strengthened, up 3.4%, 2.2% and 5.8%, respectively.
56
Metals
Gold and silver futures dropped in July, finishing lower by 5.3% and 3.8%, respectively. Platinum, palladium and copper futures strengthened, up 2.6%, 12.5%, 12.2%, respectively, for the month.
Agriculturals
Wheat futures surged to sharply higher levels in July, up 37.7% for the month, which would suggests a world in panic over supplies of the grain. Although there has been no significant surge in export demand for U.S. wheat, the worst Russian drought in 130 years could cut into supplies from the world’s third largest exporter. Rough rice futures reversed its downward path, finishing up 9.0% in July. Corn and the soybean complex finished higher in July.
August 2010
Interest Rates
U.S. and European interest rate futures, across the curve, continued climbing to finish higher in August. Recent U.S. data suggests that economic activity has slowed down and that the one-year-old recovery from the worst recession in decades is losing momentum. The unemployment rate remains painfully high and employers still do not seem confident enough to add new workers.
Currencies
The U.S. Dollar index finished higher by 2.0% in August. The Euro and The British Pound weakened against the U.S. Dollar, down 2.9% and 2.2%, respectively, for the month. The Japanese Yen and the Swiss Franc strengthened against the U.S. Dollar, up 2.7% and 2.6%, respectively, for the month. The Australian and Canadian Dollars weakened against their U.S. counterpart, down 1.5% and 3.4%, respectively in August.
Stock Indices
Most of the major U.S. and European stock indices finished lower in August. The DJIA, the S&P 500 Index and the NASDAQ Composite Index weakened by 4.3%, 4.7% and 6.2%, respectively, for the month. In Europe, FTSE index futures finished down 0.8%, CAC-40 futures weakened by 4.5% and DAX index futures finished lower by 4.2%.
Energy
Crude oil futures for October delivery finished down 9.4%, settling at $71.92/bbl for the month. Gasoline, heating oil and natural gas futures also weakened, down 8.2%, 5.8% and 22.6%, respectively in August.
Metals
Gold and silver futures strengthened in August, finishing up 5.6% and 7.6%, respectively. Platinum futures weakened, down 3.4% for August. Palladium futures finished the month nearly unchanged.
Agriculturals
Corn continued to climb in August, up 8.0% for the month. Cotton futures also strengthened, finishing the month up 9.4%. Cocoa futures weakened, finishing down 12.3%.
September 2010
Interest Rates
Short and mid-term U.S. interest rate futures continued climbing to finish higher in September, while long-term U.S. interest rates finished lower. Recent U.S. data indicates that the pace of the economic recovery has slowed in recent months. Household spending remains constrained by high unemployment, modest income growth, lower housing wealth, and tight credit. In Europe, German interest rate futures, across the curve, finished the month down.
Currencies
The U.S. Dollar index dropped by 5.4% in September. The Euro and The British Pound strengthened against the U.S. Dollar, finishing up 7.5% and 2.4%, respectively, for the month. The Australian and Canadian Dollars also strengthened against their U.S. counterpart, up 8.6% and 3.5%, respectively in September.
57
Stock Indices
Most of the major U.S. and European stock indices finished higher in September. The DJIA, the S&P 500 Index and the NASDAQ Composite Index strengthened by 7.7%, 8.8% and 12.0%, respectively, for the month. In Europe, FTSE index futures finished up 6.5%, CAC-40 futures strengthened by 7.0& and DAX index futures finished up 5.5%.
Energy
Crude oil futures for November delivery finished up 8.7%, settling at $79.97/bbl for the month. Gasoline and heating oil futures also strengthened, finishing at 9.4% and 12.5%, respectively, in September. Natural gas futures continued to weaken, down 6.7% in September.
Metals
Most precious metals futures strengthened in September. Gold and silver futures finished up 4.7% and 12.3%, respectively. Platinum, palladium and copper futures also finished up, 8.5%, 13.8% and 8.4%, respectively.
Agriculturals
Rough rice and corn futures continued their climb since July this year, up 10.8% and 12.9%, respectively, in September. Cotton futures climbed as well fueled by increased demand from China and expected poor harvests that will keep the global supply tight, up 18.2% for the month. Sugar futures have also seen dramatic increase in prices during the last few months, up 21.5% for September.
October 2010
Interest Rates
To promote a stronger pace of economic recovery the U.S. Federal Reserve recently announced that it intends to purchase an additional $600 billion of long-term Treasury securities by the middle of 2011. This decision has incited controversy not only domestically, but internationally. Emerging economies have perceived the Fed’s action as an intentional devaluing of the U.S. Dollar, a policy which could potentially wreak havoc upon their own economies. U.S. and European interest rate futures exhibited little directional movement in October, with significant volatility.
Currencies
The U.S. Dollar continued to decline in October, although at a slower rate than in September. The U.S. Dollar index dropped 1.8% for the month. The Euro and The British Pound strengthened against the U.S. Dollar, finishing up 2.3% and 2.0%, respectively, for the month. The Australian and Canadian Dollars also strengthened against their U.S. counterpart, up 1.7% and 1.0%, respectively in October.
Stock Indices
Most of the major U.S. and European stock indices finished higher in October. The DJIA, the S&P 500 Index and the NASDAQ Composite Index strengthened by 3.1%, 3.9% and 5.9%, respectively, for the month. In Europe, FTSE index futures finished up 2.4%, CAC-40 futures strengthened by 3.3% and DAX index futures finished up 6.2%.
Energy
Crude oil futures for December delivery finished up 0.6%, settling at $81.43/bbl for the month. Gasoline also strengthened, finishing up 0.8% in October. Heating oil and natural gas futures weakened, down 2.0% and 2.0%, respectively, for the month.
Metals
October witnessed significant price increases in raw materials such as metals and agricultural products. We are now in an environment in which the U.S. Dollar is weakening, commodity prices are increasing, and precious metal prices are increasing rapidly. The rise in precious metal prices, in particular, denotes a loss of faith in the U.S. Dollar. Gold and silver futures finished up 3.7% and 12.3%, respectively, in October. Platinum, palladium and copper futures also strengthened during the month, 2.9%, 12.9% and 2.2%, respectively.
Agriculturals
Rough rice and corn futures continued their climb since July this year, up 17.4% and 14.9%, respectively, in October. Cotton futures climbed as well, fueled by increased demand from China and expected poor harvests that will keep the global supply tight, up 19.9% for the month. Sugar futures have also seen dramatic increase in prices during the last few months, up 24% for October.
58
November 2010
Interest Rates
U.S. interest rate futures finished the month lower and European interest rate futures exhibited little directional movement in November. In the face of Euro zone problems due to Irish bank failures, short-term interest rate futures, in particular, were extremely volatile during the second half of the month.
Currencies
The U.S. Dollar strengthened in November. The U.S. Dollar index finished up 5.1% for the month. The Euro and The British Pound weakened against the U.S. Dollar, finishing 6.9% and 3.0%, respectively, for the month. The Australian and Canadian Dollars also weakened against the U.S. Dollar, down 2.5% and 0.7%, respectively in November.
Stock Indices
The major U.S. stock indices reversed the upward trend over the last few months, finishing lower in November. The DJIA, the S&P 500 Index and the NASDAQ Composite Index weakened by 1.0%, 0.2% and 0.4%, respectively, for the month. In Europe, FTSE index futures finished down 2.1%, CAC-40 futures weakened by 5.2% and DAX index futures finished up 1.3%.
Energy
Crude oil futures for January delivery finished up 2.4%, settling at $84.11/bbl for the month. Gasoline and Heating oil futures also strengthened, finishing up 5.7% and 2.8%, respectively, in November. Natural gas futures weakened, down 2.0% for the month.
Metals
Gold and silver futures continued their upward trend, up 1.9% and 14.6%, respectively, in November. Palladium and copper futures also strengthened during the month, up 8.7% and 2.2%, respectively. Platinum futures finished lower by 2.4%.
Agriculturals
Rough rice and corn futures reversed their upward trend, finishing lower by 5.7% and 8.6%, respectively, in November. Wheat futures also dropped, finishing down 8.8% for November. After rallying the first part of the month, Cotton futures, reversed and finished down 2.6%.
December 2010
Interest Rates
Similar to November, U.S. interest rate futures finished the month lower in spite of the Fed’s QE2 program. German rate futures fell during the first part of the month, recovering in the second part to finish little changed.
Currencies
After a strong November, the U.S. Dollar fell in December. The U.S. Dollar index finished down 2.7% for the month. The Euro strengthened against the U.S. Dollar, finishing up 3.1% for the month. The Australian and Canadian Dollars also strengthened against their U.S. counterpart, up 6.7% and 2.8%, respectively in December.
Stock Indices
After a weaker November, the major U.S. stock indices continued the upward trend of the last several months, finishing higher in December. The DJIA, the S&P 500 Index and the NASDAQ Composite Index strengthened by 5.2%, 6.5% and 6.2%, respectively, for the month. In Europe, FTSE index futures finished up 7.1%, CAC-40 futures strengthened by 5.1% and DAX index futures finished up 3.0%.
59
Energy
Crude oil futures for March delivery finished the month up 8.4%. Gasoline and heating oil futures also strengthened, finishing up 11.0% and 8.9%, respectively, in December. Natural gas futures were range-bound but still finished the month up slightly more than 6%.
Metals
Gold continued to be range-bound while silver futures continued their upward trend, up 2.5% and 9.7%, respectively, in December. Fears of commodity inflation are growing as palladium and copper futures also strengthened during the month, 14.3% and 16.3%, respectively. Platinum futures finished higher by 6.4%.
Agriculturals
Corn futures continued their upward trend, finishing higher by 15.6% in December. Wheat futures also rose, finishing up 15% for December. After rallying the first part of the month, Cotton futures reversed and finished up 23.4%.
Series Returns and Other Information
The returns for each Series and Class of Units for the twelve months ended December 31, 2010, and related information, are discussed below. Each Series had exposure to commodity interest positions within one or more sectors during fiscal 2010. The performance of each Series was impacted over the course of the year by, among other things, the relative performance of the relevant sector or sectors and the commodities within those sectors, the changing allocations among, and the specific positions taken by the Series’ Trading Advisors in, the relevant sector(s) and commodities, and the timing of entries and exits. For certain of the Series, a sector attribution chart has been included at the end of the relevant discussion. Each chart depicts the performance of the relevant Series’ positions within each of the relevant sectors (determined by the Managing Owner using monthly gross return and NAV figures, with various adjustments to net out a proportional allocation of the fees and expenses chargeable to the Series) during the fourth quarter (except as otherwise noted) and for the full calendar year. Charts depicting the performance of the various Series’ positions within each of the relevant sectors during the prior three quarters were included in the Trust’s quarterly reports on Form 10-Q previously filed.
Frontier Diversified Series
2010
The Frontier Diversified Series – Class 1 NAV gained 7.0% for the twelve months ended December 31, 2010, net of fees and expenses; the Frontier Diversified Series – Class 2 NAV gained 8.9% for the twelve months ended December 31, 2010, net of fees and expenses. For the twelve months ended December 31, 2010 the Frontier Diversified Series recorded a net gain on investments of $18,519,243, net income of $2,225,700, and total expenses of $9,452,058, resulting in a net increase in Owners’ capital from operations of $11,449,890 after non-controlling interests of $157,005. The NAV per Unit, Class 1, increased from $96.80 at December 31, 2009, to $103.58 as of December 31, 2010. The NAV per Unit, Class 2, increased from $97.77 at December 31, 2009, to $106.46 as of December 31, 2010. Total Class 1 subscriptions and redemptions for the period were $56,557,502 and $5,635,008, respectively. Total Class 2 subscriptions and redemptions for the period were $43,467,656 and $2,660,187, respectively. Ending capital at December 31, 2010, was $90,022,131 for Class 1 and $69,473,841 for Class 2.
The Frontier Diversified Series may have both long and short exposure to the Interest Rates, Currencies, Stock Indices, Energies, Metals, and Commodities sectors. See comments above underMarket Conditions for Twelve Months Ended December 31, 2010,for additional information regarding these sectors.
60
Sector Attribution for the Frontier Diversified Series
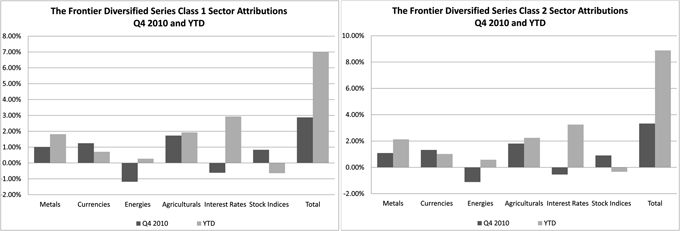
Frontier Dynamic Series
2010
The Frontier Dynamic Series – Class 1 NAV gained 0.6% for the twelve months ended December 31, 2010, net of fees and expenses; the Frontier Dynamic Series – Class 2 NAV gained 2.3% for the twelve months ended December 31, 2010, net of fees and expenses.
For the twelve months ended December 31, 2010 the Frontier Dynamic Series recorded a net gain on investments of $347,884, net investment income of $454,918, and total expenses of $779,081, resulting in a net increase in Owners’ capital from operations of $23,721. The NAV per Unit, Class 1, decreased from $91.43 at December 31, 2009, to $91.94 as of December 31, 2010. The NAV per Unit, Class 2, increased from $92.25 at December 31, 2009, to $94.40 as of December 31, 2010. Total Class 1 subscriptions and redemptions for the period were $860,542 and $261,947, respectively. Total Class 2 subscriptions and redemptions for the period were $133,094 and $19,405, respectively. Ending capital at December 31, 2010, was $1,219,222 for Class 1 and $413,700 for Class 2.
The Frontier Dynamic Series may have both long and short exposure to the Interest Rates, Currencies, Stock Indices, Energies, Metals, and Commodities sectors. See comments above underMarket Conditions for Twelve Months Ended December 31, 2010,for additional information regarding these sectors.
The Dynamic Series invests in an option market basket of which the underlying investments are not transparent to the Trust. Therefore there are no Sector Attribution charts for the Dynamic Series.
Frontier Long/Short Commodity Series
2010
The Frontier Long/Short Commodity Series – Class 1 NAV gained 16.7% for the twelve months ended December 31, 2010, net of fees and expenses; the Frontier Long/Short Commodity Series – Class 2 NAV gained 20.2% for the twelve months ended December 31, 2010, net of fees and expenses; the Frontier Long/Short Commodity Series – Class 3 NAV gained 20.2% for the twelve months ended December 31, 2010, net of fees and expenses; the Frontier Long/Short Commodity Series – Class 1 a NAV gained 16.2% for the twelve months ended December 31, 2010, net of fees and expenses; the Frontier Long/Short Commodity Series – Class 2a NAV gained 18.2% for the twelve months ended December 31, 2010, net of fees and expenses.
For the twelve months ended December 31, 2010, the Frontier Long/Short Commodity Series recorded net gain on investments of $15,903,113, net investment income of $1,120,080, and total expenses of $8,021,021, resulting in a net increase in Owners’ capital from operations of $11,915,293 after non-controlling interests of $2,913,121. The NAV per Unit, Class 1, increased from $113.77 at December 31, 2009, to $132.73 as of December 31, 2010. The NAV per Unit, Class 2, increased from $127.49 at December 31, 2009, to $153.26 as of December 31, 2010. The NAV per Unit, Class 3, increased from $127.49 at December 31, 2009, to $153.26 as of December 31, 2010. The NAV per Unit, Class 1a, increased from $101.49 at December 31, 2009, to $117.96 as of December 31, 2010. The NAV per Unit, Class 2a, increased from $102.48 at December 31, 2009, to $121.18 as of September 30, 2010. Total Class 1 subscriptions and redemptions for the twelve months were $119,434 and $19,502,051, respectively. Total Class 2 redemptions for the twelve months were $2,103,245. There were no subscriptions. Total Class 3 subscriptions and redemptions for the twelve months were $14,889,732 and $3,211,460, respectively. Total Class 1a subscriptions and redemptions for the twelve months were $4,247,899 and $404,900, respectively. Total Class 2a subscriptions and redemptions for the twelve months were $2,527,455 and $148,649, respectively. Ending capital at December 31, 2010, was $31,185,756 for Class 1, $15,584,978 for Class 2, $20,998,571 for Class 3, $5,652,309 for Class 1a and $3,761,826 for Class 2a.
61
The Frontier Long/Short Commodity Series may have both long and short exposure to the Interest Rates, Currencies, Stock Indices, Energies, Metals, and Commodities sectors, although the majority of the exposure will typically be in the Energies, Metals, and Commodities sectors. See comments above underMarket Conditions for Twelve Months Ended December 31, 2010, for additional information regarding these sectors.
Sector Attribution for the Frontier Long/Short Commodity Series
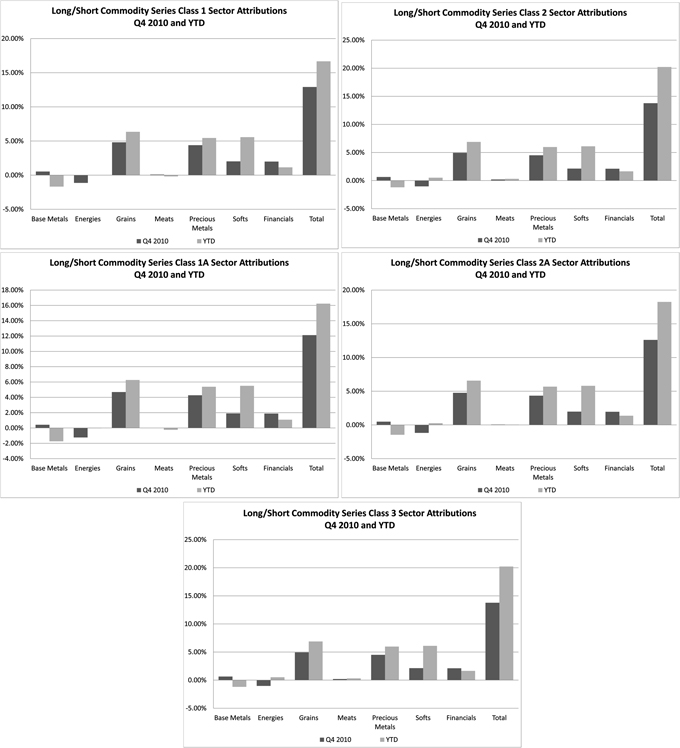
Frontier Masters Series
2010
The Frontier Masters Series – Class 1 NAV gained 9.0% for the twelve months ended December 31, 2010, net of fees and expenses; the Frontier Masters Series – Class 2 NAV gained 10.9% for the twelve months ended December 31, 2010, net of fees and expenses.
62
For the period ended December 31, 2010 the Frontier Masters Series recorded a net gain on investments of $8,845,121, net investment income of $941,795, and total expenses of $3,767,056, resulting in a net increase in Owners’ capital from operations of $6,019,860. The NAV per Unit, Class 1, increased from $94.46 at December 31, 2009, to $102.96 as of December 31, 2010. The NAV per Unit, Class 2, increased from $95.37 at December 31, 2009, to $105.81 as of December 31, 2010. Total Class 1 subscriptions and redemptions for the period were $26,672,742 and $3,606,610, respectively. Total Class 2 subscriptions and redemptions for the period were $16,395,263 and $2,492,712, respectively. Ending capital at December 31, 2010, was $41,213,675 for Class 1 and $25,062,055for Class 2.
The Frontier Masters Series may have both long and short exposure to the Interest Rates, Currencies, Stock Indices, Energies, Metals, and Commodities sectors. See comments above underMarket Conditions for Twelve Months Ended December 31, 2010, for additional information regarding these sectors.
Sector Attribution for the Frontier Masters Series

Balanced Series
2010
The Balanced Series – Class 1 NAV gained 11.3% for the twelve months ended December 31, 2010, net of fees and expenses; the Balanced Series – Class 1a NAV gained 10.3% for the twelve months ended December 31, 2010, net of fees and expenses; the Balanced Series – Class 2 NAV gained 14.7% for the twelve months ended December 31, 2010, net of fees and expenses; the Balanced Series – Class 2a NAV gained 13.7% for the twelve months ended December 31, 2010, net of fees and expenses; the Balanced Series – Class 3a NAV gained 14.9% for the twelve months ended December 31, 2010, net of fees and expenses.
For the twelve months ended December 31, 2010, the Balanced Series recorded net gain on investments of $82,334,394, net investment income of $404,451, and total expenses of $26,553,122, resulting in a net increase in Owners’ capital from operations of $41,691,751 after non- controlling interests of ($14,493,972). The NAV per Unit, Class 1, increased from $118.54 at December 31, 2009, to $131.95 at December 31, 2010. For Class 1a, the NAV per Unit increased from $105.50 at December 31, 2009, to $116.36 at December 31, 2010. The NAV per Unit, Class 2, increased from $139.01 at December 31, 2009, to $159.46 at December 31, 2010. For Class 2a, the NAV per Unit increased from $117.60 at December 31, 2009, to $133.66 at December 31, 2010. For Class 3a, the NAV per Unit increased from $117.60 at December 31, 2009, to $133.66 at December 31, 2010. Total Class 1 subscriptions and redemptions for the twelve months were $733,684 and $29,047,428, respectively. Total Class 1a subscriptions and redemptions for the twelve month period were $25,858 and $4,516,519, respectively. Total Class 2 subscriptions and redemptions for the twelve months were $14,425 and $10,887,458, respectively. Total Class 2a redemptions for the twelve month period were $163,315. There were no subscriptions. Total Class 3a subscriptions and redemptions for the period were $3,412,987 and $1,382,434, respectively. Ending capital at December 31, 2010, was $287,807,510 for Class 1, $5,120,558 for Class 1a, $76,715,728 for Class 2, $3,562,374 for Class 2a and $3,691,280 for Class 3a.
The Balanced Series may have both long and short exposure to the Interest Rates, Currencies, Stock Indices, Energies, Metals, and Commodities sectors. See comments above underMarket Conditions for Twelve Months Ended December 31, 2010, for additional information regarding these sectors.
63
Sector Attribution for the Frontier Balanced Series

Berkeley/Graham/Tiverton Series (Formerly the Campbell/Graham/Tiverton Series)
2010
The Berkeley/Graham/Tiverton Series – Class 1 NAV gained 5.6% for the twelve months ended December 31, 2010, net of fees and expenses; the Berkeley/Graham/Tiverton Series – Class 2 NAV gained 8.8% for the twelve months ended December 31, 2010, net of fees and expenses.
64
For the twelve months ended December 31, 2010, the Berkeley/Graham/Tiverton Series recorded net gain on investments of $10,645,135, net investment income of $8,268, and total expenses of $4,848,257, resulting in a net increase in Owners’ capital from operations of $3,912,601 after non-controlling interests of ($1,892,545). The NAV per Unit, Class 1, increased from $104.65 at December 31, 2009, to $110.46 as of December 31, 2010. The NAV per Unit, Class 2, increased from $121.10 at December 31, 2009, to $131.73 as of December 31, 2010. Total Class 1 subscriptions and redemptions for the twelve months ended December 31, 2010, were $124,546 and $10,995,712, respectively. Total Class 2 redemptions for the twelve months ended December 31, 2010, were $2,174,467. There were no subscriptions. Ending capital at December 31, 2010, was $61,842,996 for Class 1 and $8,386,332 for Class 2.
The Berkeley/Graham/Tiverton Series may have both long and short exposure to the Interest Rates, Currencies, Stock Indices, Energies, Metals, and Commodities sectors. See comments above underMarket Conditions for Twelve Months Ended December 31, 2010, for additional information regarding these sectors.
Sector Attribution for the Berkeley/Graham/Tiverton Series
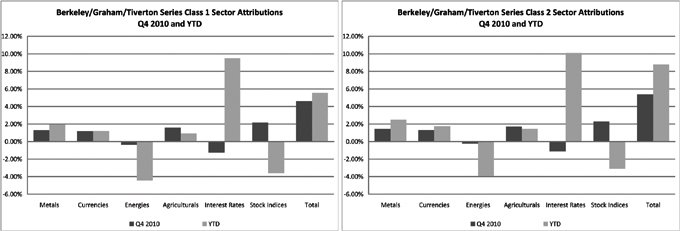
Currency Series
2010
The Currency Series – Class 1 NAV gained 1.4% for the twelve months ended December 31, 2010, net of fees and expenses; the Currency Series – Class 2 NAV gained 4.5% for the twelve months ended December 31, 2010, net of fees and expenses.
For the twelve months ended December 31, 2010, the Currency Series recorded net gain on investments of $522,823, net investment income of $129,943, and total expenses of $483,015, resulting in a net increase in Owners’ capital from operations of $169,751. The NAV per Unit, Class 1, increased from $78.00 at December 31, 2009, to $79.09as of December 31, 2010. The NAV per Unit, Class 2, increased from $91.34 at December 31, 2009, to $95.43 as of December 31, 2010. Total Class 1 subscriptions and redemptions for the twelve months ending December 31, 2010 were $65,957, and $1,751,140, respectively. Total Class 2 redemptions for the twelve months ending December 31, 2010, was $1,553,296. There were no subscriptions. Ending capital at December 31, 2010, was $6,381,882 for Class 1 and $757,518 for Class 2.
The Currency Series may have both long and short exposure to the Currencies sector only. See comments above underMarket Conditions for Twelve Months Ended December 31, 2010, for additional information regarding these sectors.
Because all returns are from the Currencies sector, there are no Sector Attribution charts for the Currency Series.
Long Only Commodity Series
2010
The Long Only Commodity Series – Class 1 NAV gained 12.6% for the twelve months ended December 31, 2010, net of fees and expenses; the Long Only Commodity Series – Class 2 NAV gained 14.9% for the twelve months ended December 31, 2010, net of fees and expenses.
65
For the twelve months ended December 31, 2010, the Long Only Commodity Series recorded net gain on investments of $522,102, net investment income of $83,311, and total expenses of $138,332, resulting in a net increase in Owners’ capital from operations of $467,081. The NAV per Unit, Class 1, increased from $83.59 at December 31, 2009 to $94.11 as of December 31, 2010. The NAV per Unit, Class 2, increased from $90.30 at December 31, 2009, to $103.71 as of December 31, 2010. Total Class 1 subscriptions and redemptions for the twelve months were $935 and $731,802, respectively. Total Class 2 redemptions for the twelve months were $209,308. There were no subscriptions. Ending capital at December 31, 2010, was $3,348,953 for Class 1 and $844,278 for Class 2.
The Long Only Commodity Series may have long-only exposure in the Energies, Metals, and Commodities sectors. See comments above underMarket Conditions for Twelve Months Ended December 31, 2010, for additional information regarding these sectors.
The Long Only Commodity Series invests approximately equally in the Jefferies Commodity Performance Index and the Reuters/Jefferies CRB Index. There are no Sector Attribution charts for the Long Only Commodity Series.
Managed Futures Index Series
2010
The Managed Futures Index Series – Class 1 NAV gained 4.8% for the twelve months ended December 31, 2010, net of fees and expenses; the Managed Futures Index Series – Class 2 NAV gained 6.9% for the twelve months ended December 31, 2010, net of fees and expenses.
For the twelve months ended December 31, 2010 the Managed Futures Index Series recorded a net gain on investments of $432,488, net investment income of $51,321, and total expenses of $179,735, resulting in a net increase in Owners’ capital from operations of $304,074. The NAV per Unit, Class 1, increased from $112.54 at December 31, 2009, to $117.96 as of December 31, 2010. The NAV per Unit, Class 2, increased from $121.28 at December 31, 2009, to $129.69 as of December 31, 2010. Total Class 1 redemptions for the twelve months were $518,756. There were no subscriptions. Total Class 2 subscriptions and redemptions for the twelve months were $2,000,000 and $398,064, respectively. Ending capital at December 31, 2010, was $1,388,452 for Class 1 and $3,772,011 for Class 2.
The Managed Futures Index Series may have both long and short exposure to the Interest Rates, Currencies, Stock Indices, Energies, Metals, and Commodities sectors. See comments above underMarket Conditions for Twelve Months Ended December 31, 2010,for additional information regarding these sectors.
Sector Attribution for the Managed Futures Index Series
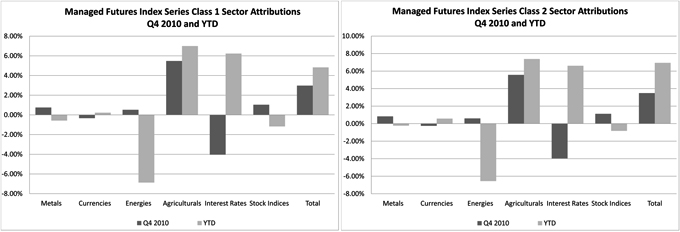
Winton Series
2010
The Winton Series – Class 1 NAV gained 14.9% for the twelve months ended December 31, 2010, net of fees and expenses; the Winton Series – Class 2 NAV gained 18.4% for the twelve months ended December 31, 2010, net of fees and expenses.
For the twelve months ended December 31, 2010, the Winton Series recorded net gain on investments of $12,010,660, net investment income of $306,338, and total expenses of $3,812,097, resulting in a net increase in Owners’ capital from operations of $8,504,901. The NAV per Unit, Class 1, increased from $117.57 at December 31, 2009, to $135.04 as of December 31, 2010. The NAV per Unit, Class 2, increased from $130.10 at December 31, 2009, to $153.99 as of December 31, 2010. Total Class 1 subscriptions for the twelve months were $277,520 and redemptions were $5,850,898. Total Class 2 redemptions for the twelve month period were $614,265. There were no subscriptions. Ending capital at December 31, 2010, was $49,350,981 for Class 1 and $11,368,456 for Class 2.
66
The Winton Series may have both long and short exposure to the Interest Rates, Currencies, Stock Indices, Energies, Metals, and Commodities sectors. See comments above underMarket Conditions for Twelve Months Ended December 31, 2010, for additional information regarding these sectors.
Sector Attribution for the Winton Series

Winton/Graham Series
2010
The Winton/Graham Series – Class 1 NAV gained 8.9% for the twelve months ended December 31, 2010, net of fees and expenses; the Winton/Graham Series – Class 2 NAV gained 12.2% for the twelve months ended December 31, 2010, net of fees and expenses. For the twelve months ended December 31, 2010, the Winton/Graham Series recorded net gain on investments of $11,966,369, net investment income of $263,156, and total expenses of $4,321,685, resulting in a net increase in Owners’ capital from operations of $5,263,217, after non-controlling interest of ($2,644,623). The NAV per Unit, Class 1, increased from $110.06 at December 31, 2009, to $119.83 as of December 31, 2010. The NAV per Unit, Class 2, increased from $128.39 at December 31, 2009, to $144.04 as of December 31, 2010. Total Class 1 subscriptions and redemptions for the twelve months were $143,516 and $6,276,569, respectively. Total Class 2 redemptions for the twelve months were $2,310,599. There were no subscriptions. Ending capital at December 31, 2010, was $45,898,246 for Class 1 and $11,612,192 for Class 2.
The Winton/Graham Series may have both long and short exposure to the Interest Rates, Currencies, Stock Indices, Energies, Metals, and Commodities sectors. See comments above underMarket Conditions for Twelve Months Ended December 31, 2010, for additional information regarding these sectors.
Sector Attribution for the Winton/Graham Series
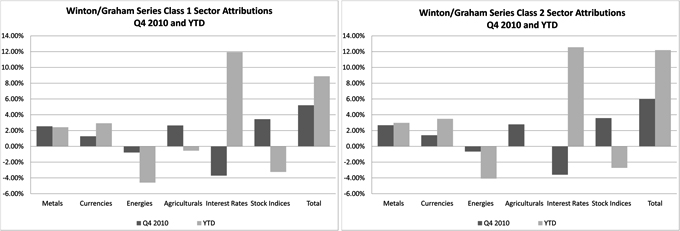
67
Results of Operations
Market Conditions for Twelve Months Ended December 31, 2009
January 2009
Interest Rates
The Federal Open Market Committee decided to keep its target range for the federal funds rate at 0 to 0.25 percent in January, as economic data suggested that the economy has weakened further. The Federal Open Market Committee continued to purchase large quantities of agency debt and mortgage-backed securities to provide support to the mortgage and housing markets, and announced that it will employ all available tools to promote sustainable economic growth, including possibly purchasing long-term U.S. Treasury notes. U.S. interest rate futures, as well as European interest rate futures, finished mixed for the month.
Currencies
The U.S. Dollar strengthened against most other major currencies in January. The U.S. Dollar Index recouped the December loss and finished the month up 5.8%. The Euro and the British Pound weakened against the U.S. Dollar, finishing lower by -8.3% and -0.6% respectively for the month. The Australian Dollar and the Canadian Dollar also weakened again their U.S. counterpart, finishing down 9.6% and 0.7% respectively. The Swiss Franc weakened against the U.S. Dollar, down 7.7% and the Japanese Yen gained against the U.S. dollar, up 0.9%.
Stock Indices
All major U.S. and European stock indices weakened in January. The Dow Jones Industrial Average (DJIA) finished the month down 8.8%, and the S&P 500 Index and NASDAQ Composite Index dropped 8.6% and 6.4% respectively in January. The DJIA, S&P 500 Index and NASDAQ Composite Index have dropped 30.7%, 35.6% and 37.6% respectively since August 2008. In Europe, FTSE index futures finished down 6.8%, CAC-40 futures dropped 8.4% and DAX index futures finished lower by 10.3% for the month.
Energy
Crude oil futures for March delivery finished the month down 14.2%. Crude oil futures have dropped more than 60.7% since August last year. Natural gas futures and heating oil futures for March delivery dropped as well, finishing lower by 21.9% and 2.3%. Gasoline futures prices finished the month up 14.3%.
Metals
Gold futures for April delivery finished up 4.9% settling at $928/oz. Silver, platinum and palladium futures also finished higher, up 11.2%, 5.3% and 2.4% respectively. Copper futures finished higher by 4.1%.
Agriculturals
Corn and wheat futures for March delivery weakened in January, finishing down 6.9% and 7.0% respectively. Rough rice futures dropped sharply during the month, finishing lower by 22.8%. Soybean oil futures dropped 2.6% and soybean futures for March delivery finished the month unchanged. Cocoa futures and coffee futures for March 2009 delivery finished the month higher by 4.0% and 6.1% respectively. Lumber futures continued its downward path finishing lower by 21.1% for the month.
February 2009
Interest Rates
European rate futures continued to climb on bad news regarding toxic assets in European banks, U.S. rate futures were flat to slightly down. There is general consensus that much of the bad news about U.S. banks has already been addressed, while Europe is still to deal with its toxic asset problems.
Currencies
The U.S. Dollar strengthened against most other major currencies in February. The U.S. Dollar Index continued its January gains and finished February up 2.3%. The Euro and the British Pound continued their declines against the U.S. Dollar, finishing lower by 1.2% and 1.6% respectively for the month.
Stock Indices
All major U.S. and European stock indices continued their dramatic declines in February, as the new U.S. administration struggled with resolving the complex economic issues before the nation, and passed a huge spending bill in an attempt to stimulate the economy. The DJIA plummeted 11.7%, with global markets responding to the economic downturn.
68
Energy
Crude oil and natural gas futures continued their declines in February on continuing weak demand.
Metals
Gold futures for April delivery finished up 1.5% for the month. Silver, platinum and palladium futures also finished higher, up 4.2%, 9.5% and .66% respectively. Copper futures finished higher by 3.7%.
Agriculturals
Corn and wheat futures for May continued their declines in February, finishing down 8.0% and 10.2% respectively. The soybean complex was down for the month, with meats mixed. With the softs, sugar showed a 5.6% gain, and cotton, coffee, and cocoa showing substantial declines.
March 2009
Interest Rates
The Federal Open Market Committee decided on March 18th to maintain the target range for the federal funds rate at 0 to 0.25 %, and anticipates that the weak economic conditions are likely to warrant exceptionally low levels of the federal funds rate for an extended period of time. To support the mortgage lending and housing markets, the Federal Open Market Committee decided to increase the size of the Federal Reserve’s balance sheet further by purchasing an additional $750 billion of agency mortgage-backed securities, bringing its total purchases of these securities to up to $1.25 trillion this year. In addition, the Committee decided to increase its purchases of agency debt this year to a total of $200 billion and to purchase up to $300 billion of longer-term Treasury securities over the next six months. U.S. interest rate futures, as well as European interest rate futures, finished higher for the month.
Currencies
The U.S. Dollar weakened against most other major currencies in March. The U.S. Dollar Index finished the month down 2.7%. The Euro and the Swiss Franc strengthened against the U.S. Dollar, finishing up 4.6% and 2.7% respectively. The Australian Dollar and the Canadian Dollar also strengthened against their U.S. counterpart, finishing up 8.2% and 1.2% respectively. The Japanese Yen weakened against the U.S. Dollar, down 1.4% and British Pound finished the month nearly unchanged against the U.S. Dollar.
Stock Indices
All major U.S. and European stock indices strengthened in March. The DJIA finished the month up 7.7%, and the S&P 500 Index and NASDAQ Composite Index gained 8.5% and 10.9% respectively. In Europe, FTSE index futures finished up 3.6%, CAC-40 futures gained 4.6% and DAX index futures finished higher by 6.5% for the month.
Energy
Crude oil futures, heating oil futures and gasoline futures for May delivery finished the month up 5.9%, 7.1% and 3.6% respectively. Natural gas futures finished the month down 11.7%.
Metals
Gold futures for June delivery finished the month down 2.1% settling at $925/oz. Silver futures also finished lower for the month, down 1.0%. Platinum, palladium and copper futures finished higher in March, up 3.6%, 11.8% and 19.9% respectively.
Agriculturals
Corn and soybean futures for May delivery strengthened in March, finishing up 12.7% and 9.2% respectively. Cotton, cocoa and coffee futures for May delivery finished the month higher by 7.4%, 8.4% and 3.4% respectively. Live cattle and lean hogs finished the month slightly down.
April 2009
Interest Rates
The FOMC decided in April to maintain the target range for the Fed Funds rate at 0 to 0.25 percent, as recent economic data suggests that the economy continues to contract. To support the mortgage lending and housing markets, the FOMC has decided to purchase $1.25 trillion of agency mortgage-backed securities this year. In addition, the Committee has decided to increase its purchases of agency debt this year to a total of $200 billion and to purchase up to $300 billion of longer-term Treasury securities over the next six months. U.S. interest rate futures finished lower for the month and European interest rate futures finished mixed for the month.
69
Currencies
The U.S. Dollar weakened against most other major currencies in April. The U.S. Dollar index finished the month down 0.9%. The British Pound strengthened against the U.S. dollar, finishing up 3.2%. The Australian Dollar and the Canadian Dollar also strengthened against their U.S. counterpart, finishing up 5.0% and 5.7%, respectively. The Euro weakened slightly against the U.S. Dollar, down 0.2% and the Japanese Yen finished the month up 0.3% against the U.S. dollar.
Stock Indices
All major U.S. and European stock indices continued to strengthen in April. The DJIA finished the month up 7.3%, and the S&P 500 Index and NASDAQ Composite Index gained 9.4% and 12.4% respectively. In Europe, FTSE index futures finished up 7.6%, CAC-40 futures gained 12.3% and DAX index futures finished higher by 16.2% for the month.
Energy
Natural gas futures continued their downward path, finishing down 13.8% in April. Natural gas futures have dropped more than 40% since December 2008. Gasoline futures for June delivery finished the month up 2.5%. Crude oil futures and heating oil futures finished lower by 0.5% and 3.9%, respectively.
Metals
Gold futures for June delivery finished the month down 3.7% settling at $891/oz. Copper futures continued to climb, up 10.4% for the month. Silver, platinum and palladium finished lower in April, down 5.3%, 2.0% and 0.3%, respectively.
Agriculturals
The soybean complex was up for the month; soybean oil futures for July delivery finished up 7.6%, soybeans and soybean meal futures finished higher by 11.0% and 13.3% respectively. Corn and wheat futures for July delivery finished slightly down 2.7% and 1.6% respectively. Cotton continued its upward path, finishing up 14.8% for the month.
May 2009
Interest Rates
U.S. interest rate futures at the longer end of the curve moved significantly lower in May, as investors digested the inflationary potential of the massive borrowing planned by the Federal Reserve. Standard & Poor’s moved its outlook on UK sovereign debt from “stable” to “negative” in response to skyrocketing public debt. Fear of a similar downgrade occurring to the U.S. and rumors of large investors, especially China, diversifying away from the U.S. Dollar caused a widespread pullback in bond prices in the U.S., Great Britain, and across Europe.
Currencies
The U.S. Dollar continued to weaken against most other major currencies in May. The U.S. Dollar index which measures the performance of the U.S. Dollar against a basket of currencies, finished down 6.4%. The Euro and the British Pound strengthened against the U.S. Dollar, finishing up 7.0% and 9.5% respectively. The Australian Dollar and the Canadian Dollar also continued their climb against their U.S. counterpart, finishing up 10.4% and 9.3% respectively. The Japanese Yen finished the month up 3.5% against the U.S. Dollar.
Stock Indices
All major U.S. and European stock indices continued to strengthen in May. The DJIA finished the month up 4.1%, and the S&P 500 Index and NASDAQ Composite Index gained 5.3% and 3.3% respectively. In Europe, FTSE index futures finished up 6.6%, CAC-40 futures gained 8.4% and DAX index futures finished higher by 4.8% for the month.
Energy
Energy futures saw an upswing in prices in May. Crude oil futures, heating oil futures and gasoline futures for July delivery gained 26.8%, 22.5% and 28.8% for the month. Natural gas futures regained some of the April loss, finishing higher by 9.1%.
Metals
The combination of a declining U.S. Dollar, low interest rates and inflation expectations has been contributing to the rise in precious metals futures prices recently. Silver futures for July delivery strengthened during the month, finishing higher by 26.7%. Gold futures for June delivery finished the month up 9.8% settling at $979/oz. Platinum and palladium finished higher by 8.1% and 8.3% respectively. Copper futures continued to climb, up 7.3% for the month.
70
Agriculturals
The soybean complex was up for the month; soybean oil futures for July delivery finished up 7.0%, soybeans and soybean meal futures finished higher by 12.2% and 15.7% respectively. Corn and wheat futures for July delivery also finished higher, up 8.1% and 18.8% for the month. Coffee and cocoa futures prices for July delivery also strengthened, finishing higher by 18.6% and 9.0% for the month.
June 2009
Interest Rates
After a dramatic early-month sell-off, short-term interest rate futures on both sides of the Atlantic recovered to finish the month nearly unchanged. Longer term U.S. rate futures finished the month unchanged to slightly down, but the European BOBL (5-year note) and Bund (10-year note) were up strongly in anticipation of continued recession and banking problems in the Euro zone.
Currencies
The U.S. Dollar strengthened slightly in June. The U.S. Dollar index, which measures the performance of the U.S. Dollar against a basket of currencies, finished up 1.0%. The Euro weakened against the U.S. Dollar, finishing lower by 0.9%. The British Pound continued to strengthen again the U.S. Dollar, up 1.6% for the month. The Australian Dollar also continued climbing against its U.S. counterpart, finishing up 0.6%. The Canadian Dollar lost against the U.S. Dollar, finishing lower by 6.1%. The Japanese Yen finished the month down 1.1 % against the U.S. Dollar.
Stock Indices
The DJIA finished the month slightly lower, 0.6% for the month. The NASDAQ Composite Index gained 3.4% while the S&P 500 Index finished the month nearly unchanged. All major European stock indices weakened in June. FTSE index futures finished down 3.8%, CAC-40 futures lost 4.4% and DAX index futures finished lower by 3.1% for the month.
Energy
Crude oil futures, heating oil futures and gasoline futures for August delivery gained 4.2%, 4.4% and 1.2%, respectively, for the month. Natural gas futures for August delivery finished lower by 3.1% in June.
Metals
Gold futures for August delivery weakened during the month, finishing lower by 5.4% settling at $927/oz. Silver futures for September delivery finished the month lower as well, down 13.0%. Palladium finished higher by 5.7% and platinum dropped 1.4%. Copper futures continued to climb, up 3.1% for the month.
Agriculturals
Corn and wheat futures dropped during the month, down 20.0% and 18.5% respectively. The soybean complex also dropped; soybean oil futures finished down 10.0%, soybeans and soybean meal futures finished lower by 7.7% and 5.2% respectively. Coffee and orange juice futures weakened as well, finishing down 14.0% and 19.0% respectively
July 2009
Interest Rates
Interest rate futures on both sides of the Atlantic finished mixed to slightly up after a range-bound performance in July. Health care dominated the debate in the U.S., and there was little financial news to push the market one way or the other.
Currencies
The U.S. Dollar weakened in July. The US Dollar Index, which measures the performance of the U.S. Dollar against a basket of currencies, finished down 2.2%. The Euro strengthened against the U.S. Dollar, finishing higher by 1.6%. The British Pound continued to strengthen against the U.S. Dollar, up 1.6% for the month. In spite of volatile energy prices, both the Australian and Canadian Dollars also continued climbing against their U.S. counterpart, finishing up 3.7% and 7.9%, respectively. The Japanese Yen finished the month up 1.8% against the U.S. Dollar.
71
Stock Indices
Stock markets around the world were quite strong in July. The DJIA finished the month higher by 8.6% for the month. The NASDAQ Composite Index gained 8.5% while the S&P 500 Index finished the month up by 7.4%. All major European stock indices strengthened in July. FTSE index futures finished up 7.9%, CAC-40 futures gained 8.7% and DAX index futures finished higher by 10.7% for the month.
Energy
After a volatile month, the energy complex finished little changed in July. Crude oil and heating oil futures for September delivery lost 2.0% and 0.3%, respectively, while gasoline futures gained 6.1% for the month. Natural gas futures for September delivery finished lower by 8.3% in July.
Metals
Gold futures for December delivery strengthened during the month, finishing higher by 2.8%, settling at $956/oz. Silver futures for September delivery finished the month higher as well, up 2.5%. Palladium finished higher by 5.4% and platinum gained 2.4%. Copper futures continued to climb, finishing up +15.5% for the month.
Agriculturals
Corn and wheat futures dropped during the month, down 4.8% and 2.3%, respectively. After a volatile month, the soybean complex finished little changed. After a dramatic drop in June, coffee strengthened, gaining 6.6%.
August 2009
Interest Rates
After falling earlier in the month, interest rate futures on both sides of the Atlantic recovered. While European rate futures finished little changed, American futures continued climbing to close out August significantly higher, especially those at the shorter end of the curve.
Currencies
With many traders on vacation and not much news to excite the ones who remained, both the U.S. Dollar and the Euro traded in tight ranges throughout August. The British Pound weakened slightly against the U.S. Dollar, down 2.6% for the month. The Japanese Yen also weakened, finishing down 1.6% against the U.S. Dollar.
Stock Indices
Stock markets around the world took a breather to consolidate the gains from July, and generally finished August somewhat higher, as well. The DJIA finished the month higher by 3.5%. The NASDAQ Composite Index gained 1.5% while the S&P 500 Index finished the month up by 3.4%. Some of the major European stock indices were more volatile in August, with FTSE index futures finishing up 7.6% and CAC-40 futures gaining 7.3%. DAX index futures finished higher by 2.5% for the month.
Energy
Energy prices fell slightly in August, with October crude prices down 1.7%. Heating oil and gasoline futures were also down, 2.9% and 4.7%, respectively. The big mover of the month was natural gas, as healthy supplies and a relatively cool summer drove prices down 24%.
Metals
Gold futures for December delivery remained in a tight trading range during the month, finishing almost unchanged at $953/oz. Silver futures for December delivery finished the month higher, up 6.8%. Palladium finished higher by 10.4% and platinum gained 2.5%. Copper futures continued to climb, finishing up 7.5% for the month.
72
Agriculturals
After starting the month with a rally, corn and wheat futures continued to fall, down 5.7% and 10.3%, respectively. The soybean complex had another volatile month but finished little changed.
September 2009
Interest Rates
Recent data suggests that economic activity has picked up to some extent. Financial markets have improved and activity in the housing sector has increased. However, businesses are still cutting back on fixed investment and staffing, though at a slower pace. Interest rate futures, across the curve and on both sides of the Atlantic, finished higher for the month.
Currencies
The U.S. Dollar index dropped during the month, finishing down 1.9%. The Euro strengthened against the U.S. Dollar, up 2.1% for the month. The Canadian Dollar and the Australian Dollar strengthened against their U.S. counterpart as well, finishing up 2.3% and 4.6%, respectively. The British Pound continued to weaken against the U.S. Dollar, down 1.9% for the month. The Japanese Yen strengthened, finishing up 3.8% against the U.S. dollar.
Stock Indices
The DJIA finished September higher by 2.8%. The S&P 500 Index and the NASDAQ Composite Index gained as well, up 3.6% and 1.5%, respectively. Most of the major European stock indices also finished higher. FTSE index futures gained 4.5%, CAC-40 futures finished up 3.7% and DAX index futures finished higher by 4.0% for the month.
Energy
Crude oil futures finished the month nearly unchanged. Heating oil and gasoline futures finished down 0.4% and 2.8%, respectively. Natural gas futures recouped most of the August loss, up 21.1% for the month.
Metals
Most precious metals futures finished higher in September. Gold futures for December delivery finished higher by 5.9% at $1,009/oz. Silver futures for December delivery also finished higher, up 11.6% for the month. Palladium and platinum also gained, up 1.9% and 4.3% in September. Copper futures remained in a tight trading range during the month, finishing nearly unchanged.
Agriculturals
Wheat futures continued to fall in September, down 8.3%. The soybean complex had another volatile month but finished lower. Corn recouped some of the August loss, finishing higher by 4.3%. Coffee futures rallied mid-month, but dropped later in the month to finish 4.5%.
October 2009
Interest Rates
After falling earlier in the month, short and mid-term U.S. interest rate futures recovered and finished slightly higher. Long-term U.S. interest rate futures finished the month down. Short and mid-term European rate futures finished nearly un-changed, while the long-term European rate futures finished slightly higher.
Currencies
The U.S. Dollar index dropped slightly during the month, finishing down 0.5%. The Euro strengthened against the U.S. Dollar, up 0.5% for the month. The British Pound recouped the September loss against the U.S. Dollar, finishing up 2.9%. The Australian Dollar strengthened against the U.S. Dollar as well, up 1.9% for the month. The Canadian Dollar and the Japanese Yen weakened against the U.S. Dollar, finishing lower by 1.4% and 0.5%, respectively.
Stock Indices
The S&P 500 Index and the NASDAQ Composite Index dropped during October, down 2.0% and 3.6%, respectively. The DJIA finished October nearly unchanged. Most of the major European stock indices also finished lower in October. FTSE index futures dropped 2.5%, CAC-40 futures finished down 5.8% and DAX index futures finished lower by 5.2% for the month.
73
Energy
Crude oil futures, gasoline futures and heating oil futures strengthened in October, finishing up 8.5%, 11.0% and 7.9%, respectively. Natural gas futures dropped the latter part of the month, finishing down 11.1%.
Metals
Gold futures for December delivery continued to climb, up 3.1% for the month, finishing at $1,040/oz. Copper, platinum and palladium also strengthened finishing up 4.8%, 1.7% and 8.0%, respectively. Silver futures for December delivery dropped, finishing down 2.4% for the month.
Agriculturals
Wheat futures recouped the September loss, up 8.0% for October. The soybean complex jumped mid-month and finished higher for the month. Corn and rice finished higher as well, up 6.4% and 8.3% respectively. Orange juice futures rallied mid-month, and finished higher by 21.9%.
November 2009
Interest Rates
Recent data suggests that economic activity has continued to pick up. Activity in the housing sector has increased over recent months, although conditions in financial markets are roughly unchanged. Businesses are still cutting back on fixed investment and staffing, though at a slower pace. In these circumstances, the Federal Reserve has decided to continue to maintain the target range for the federal funds rate at 0 to 1/4 percent. U.S. and European interest rate futures, across the curve, climbed steadily during the month to finish higher.
Currencies
The U.S. Dollar index continued to drop during November, finishing down 1.9% for the month. The Euro and the Japanese yen strengthened against the U.S. Dollar, up 4.3% and 1.9%, respectively, for the month. The Australian Dollar and the Canadian Dollar also strengthened against their U.S. counterpart, up 1.8% and 2.7%, respectively, for November. The British Pound finished the month nearly unchanged.
Stock Indices
Most of the major U.S. and European stock indices finished higher in November. The DJIA, the S&P 500 Index and the NASDAQ Composite Index strengthened, finishing up 6.5%, 5.7% and 4.9%, respectively, for the month. In Europe, FTSE index futures gained 4.9%, CAC-40 futures finished up 3.7% and DAX index futures finished higher by 4.7% for the month.
Energy
Natural gas futures continued to drop in November, finishing down 10.1%. Gasoline futures gained 1.5%, while crude oil and heating oil futures finished the month nearly unchanged.
Metals
As the U.S. Dollar continued to drop in November, precious metals finished higher. Gold futures for February delivery continued to climb, up 13.5% for the month, finishing at $1,182/oz. Copper, silver, platinum and palladium also strengthened finishing up 6.8%, 13.8%, 10.1% and 12.9%, respectively.
Agriculturals
Corn and Wheat futures continued to climb in November, up 10.1% and 14.5%, respectively, for the month. The soybean complex also strengthened for the month. Lumber futures rallied mid-month, and finished higher by 16.7% for November.
December 2009
Interest Rates
U.S. and European interest rate futures, across the curve, dropped during December to finish lower. The decrease was widely seen to be due to optimism about the worldwide economy.
74
Currencies
The U.S. Dollar index strengthened during December, finishing up 4.0% for the month. The Euro, British Pound and Japanese Yen weakened against the U.S. Dollar, down 4.5%, 1.7% and 7.1%, respectively, for the month. The Canadian Dollar strengthened against the U.S. Dollar, up 0.3%.
Stock Indices
Most of the major U.S. and European stock indices continued to strengthen in December. The DJIA, the S&P 500 Index and the NASDAQ Composite Index finished up 0.8%, 1.8% and 5.8%, respectively, for the month. In Europe, FTSE index futures gained 3.6%, CAC-40 futures finished up 6.6% and DAX index futures finished higher by 5.2% for the month.
Energy
Natural gas futures recouped the November loss, up 12.7% for December. Gasoline, heating oil and crude oil futures finished slightly higher, up 0.8%, 1.8% and 0.9%, respectively for the month.
Metals
Gold futures reversed its upward trend and dropped steadily during the month, finishing lower by 7.2% at $1,096/oz. Silver futures also weakened, down 9.1% in December. Copper and palladium strengthened finishing up 5.3% and 11.6%, respectively, for the month.
Agriculturals
Rough rice dropped mid-month, finishing December down 4.4%. Wheat futures also dropped, finishing down 8.0% for the month. Sugar futures rallied the latter part of the month, up 19.0% for December. Lumber futures dropped in the beginning of the month to finish lower by 11.7% for December.
75
Series Returns and Other Information
The returns for each Series and Class of Units for the twelve months ended December 31, 2009, and related information, are discussed below. Each Series had exposure to commodity interest positions within one or more sectors during fiscal 2009. The performance of each Series was impacted over the course of the year by, among other things, the relative performance of the relevant sector or sectors and the commodities within those sectors, the changing allocations among, and the specific positions taken by the Series’ Trading Advisors in, the relevant sector(s) and commodities, and the timing of entries and exits. For certain of the Series, a sector attribution chart has been included at the end of the relevant discussion. Each chart depicts the performance of the relevant Series’ positions within each of the relevant sectors (determined by the Managing Owner using monthly gross return and NAV figures, with various adjustments to net out a proportional allocation of the fees and expenses chargeable to the Series) during the fourth quarter (except as otherwise noted) and for the full calendar year. See comments above underMarket Condition for Twelve Months Ended December 31, 2009 for information regarding the market performance of each sector on a month-by-month basis during the year. Charts depicting the performance of the various Series’ positions within each of the relevant sectors during the prior three quarters were included in the Trust’s quarterly reports on Form 10-Q previously filed.
Frontier Diversified Series
2009
The Frontier Diversified Series began trading operations on June 9, 2009. The Frontier Diversified Series–Class 1 NAV lost 3.2% since the beginning of operation through the period ended December 31, 2009, net of fees and expenses; the Frontier Diversified Series–Class 2 NAV lost 2.2% since the beginning of operations through the period ended December 31, 2009, net of fees and expenses.
For the period ended December 31, 2009 the Frontier Diversified Series recorded a net loss on investments of $470,461, net investment income of $489,238, and total expenses of $1,325,693, resulting in a net decrease in Owners’ capital from operations of $1,306,916. The NAV per Unit, Class 1, decreased from $100.00 at June 8, 2009, to $96.80 as of December 31, 2009. The Net Asset Value per Unit, Class 2, decreased from $100.00 at June 8, 2009, to $97.77 as of December 31, 2009. Total Class 1 subscriptions for the period were $33,810,390 and redemptions were $10,924. Total Class 2 subscriptions for the period were $23,982,063 and redemptions were $158,494. Ending capital at December 31, 2009, was $32,960,540 for Class 1 and $23,355,579 for Class 2.
The Frontier Diversified Series may have both long and short exposure to the Interest Rates, Currencies, Stock Indices, Energies, Metals, and Commodities sectors. See comments above underMarket Conditions for Twelve Months Ended December 31, 2009,for additional information regarding these sectors.
Sector Attribution for the Frontier Diversified Series
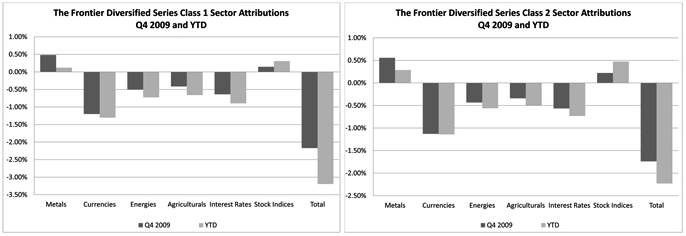
Frontier Dynamic Series
2009
The Frontier Dynamic Series began trading operations on June 9, 2009. The Frontier Dynamic Series–Class 1 NAV lost 8.6% since the beginning of operations through the period ended December 31, 2009, net of fees and expenses; the Frontier Dynamic Series–Class 2 NAV lost 7.8% since the beginning of operation through the period ended December 31, 2009 net of fees and expenses.
For the period ended December 31, 2009 the Frontier Dynamic Series recorded a net gain on investments of $129,144, net investment income of $269,363, and total expenses of $435,159, resulting in a net decrease in Owners’ capital from operations of $36,652. The NAV per Unit, Class 1, decreased from $100.00 at June 8, 2009, to $91.43 as of December 31, 2009. The NAV per Unit, Class 2,
76
decreased from $100.00 at June 8, 2009, to $92.25 as of December 31, 2009. Total Class 1 subscriptions for the period were $628,769. There were no redemptions. Total Class 2 subscriptions for the period were $304,800. There were no redemptions. Ending capital at December 31, 2009, was $606,255 for Class 1 and $290,662 for Class 2.
The Frontier Dynamic Series may have both long and short exposure to the Interest Rates, Currencies, Stock Indices, Energies, Metals, and Commodities sectors. See comments above underMarket Conditions for Twelve Months Ended December 31, 2009,for additional information regarding these sectors.
The Frontier Dynamic Series invests in an option market basket of which the underlying investments are not transparent to the Trust. Therefore there are no Sector Attribution charts for the Frontier Dynamic Series.
Frontier Long/Short Commodity Series
2009
The Frontier Long/Short Commodity Series Class 3 began trading operations on May 29, 2009 and Classes 1a and 2a began trading operations on June 8, 2009.
The Frontier Long/Short Commodity Series–Class 1 NAV gained 13.3% for the twelve months ended December 31, 2009, net of fees and expenses; the Frontier Long/Short Commodity Series–Class 2 NAV gained 16.7% for the twelve months ended December 31, 2009, net of fees and expenses; the Frontier Long/Short Commodity Series–Class 3 NAV gained 3.9% since the beginning of operations through the period ended December 31, 2009; the Frontier Long/Short Commodity Series–Class 1a NAV gained 1.5% since the beginning of operations through the period ended December 31, 2009; the Frontier Long/Short Commodity Series–Class 2a NAV gained 2.5% since the beginning of operations through the period ended December 31, 2009.
For the twelve months ended December 31, 2009, the Frontier Long/Short Commodity Series recorded net gain on investments of $28,920,002, net investment income of $1,213,141, and total expenses of $6,847,493, resulting in a net increase in Owners’ capital from operations of $8,527,351 after non-controlling interests of ($14,758,299). The NAV per Unit, Class 1, increased from $100.39 at December 31, 2008, to $113.77 as of December 31, 2009. The NAV per Unit, Class 2, increased from $109.28 at December 31, 2008, to $127.49 as of December 31, 2009. The NAV per Unit, Class 3, increased from $122.70 at the start of operations, to $127.49 as of December 31, 2009. The NAV per Unit, Class 1a, increased from $100.00 at the start of operations, to $101.49 as of December 31, 2009. The NAV per Unit, Class 2a, increased from $100.00 at the start of operations, to $102.48 as of December 31, 2009. Total Class 1 subscriptions and redemptions for the twelve months ended December 31, 2009 were $7,069,581 and $14,009,386, respectively. Total Class 2 subscriptions and redemptions for the twelve months ended December 31, 2009 were $3,221,195 and $1,557,461, respectively. Total Class 3 subscriptions and redemptions from the start of operations through December 31, 2009 were $6,746,852 and $821,589, respectively. Total Class 1a subscriptions from the start of operations through December 31, 2009 were $1,080,344. There were no redemptions. Total Class 2a subscriptions from the start of operations through December 31, 2009 were $864,750. There were no redemptions. Ending capital at December 31, 2009, was $45,759,225 for Class 1, $14,986,103 for Class 2, $6,140,056 for Class 3, $1,092,016 for Class 1a and $876,532 for Class 2a.
77
The Long/Short Commodity Series had exposure to commodity interest positions within the Interest Rates, Currencies, Stock Indices, Energies, Metals and Commodities sectors during 2009. Typically, the majority of the exposure is to the Energies, Metals and Commodities sectors. See comments above underMarket Conditions for Twelve Months Ended December 31, 2009, for additional information regarding these sectors.
Sector Attribution for the Long/Short Commodity Series
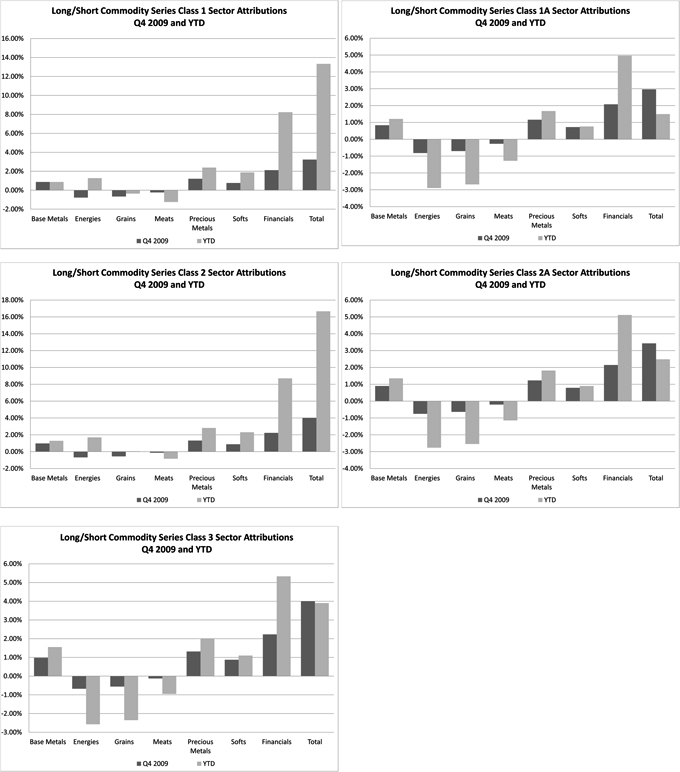
Frontier Masters Series
2009
The Frontier Masters Series began trading operations on June 9, 2009. The Frontier Masters Series–Class 1 NAV lost 5.5% since the beginning of operations through the period ended December 31, 2009, net of fees and expenses; the Frontier Masters Series–Class 2 NAV lost 4.6% since the beginning of operations through the period ended December 31, 2009, net of fees and expenses.
78
For the period ended December 31, 2009 the Frontier Masters Series recorded a net loss on investments of $312,999, net investment income of $292,218, and total expenses of $886,162, resulting in a net decrease in Owners’ capital from operations of $906,943. The NAV per Unit, Class 1, decreased from $100.00 at June 8, 2009, to $94.46 as of December 31, 2009. The NAV per Unit, Class 2, decreased from $100.00 at June 8, 2009, to $95.37 as of December 31, 2009. Total Class 1 subscriptions and redemptions for the period were $15,344,142 and $4,896, respectively. Total Class 2 subscriptions for the period were $8,854,884. There were no redemptions. Ending capital at December 31, 2009, was $14,723,330 for Class 1 and $8,563,857 for Class 2.
The Frontier Masters Series may have both long and short exposure to the Interest Rates, Currencies, Stock Indices, Energies, Metals, and Commodities sectors. See comments above underMarket Conditions for Twelve Months Ended December 31, 2009, for additional information regarding these sectors.
Sector Attribution for the Frontier Masters Series
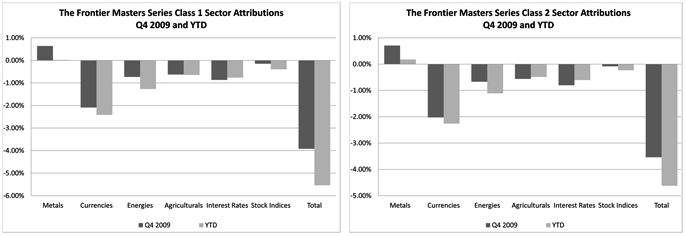
Balanced Series
2009
The Balanced Series–Class 1 NAV lost 5.3% for the twelve months ended December 31, 2009, net of fees and expenses; the Balanced Series–Class 1a NAV lost 5.9% for the twelve months ended December 31, 2009, net of fees and expenses; the Balanced Series–Class 2 NAV lost 2.4% for the twelve months ended December 31, 2009, net of fees and expenses; the Balanced Series–Class 2a NAV lost 3.1% for the twelve months ended December 31, 2009, net of fees and expenses; the Balanced Series–Class 3a NAV lost 3.6% since the beginning of operations through December 31, 2009, net of fees and expenses.
For the twelve months ended December 31, 2009, the Balanced Series recorded net loss on investments of $491,297, net investment income of $901,710, and total expenses of $19,999,746, resulting in a net decrease in Owners’ capital from operations of $19,150,902 after non-controlling interests of $438,431. The NAV per Unit, Class 1, decreased from $125.17 at December 31, 2008, to $118.54 at December 31, 2009. For Class 1a, the NAV per Unit decreased from $112.09 at December 31, 2008, to $105.50 at December 31, 2009. The NAV per Unit, Class 2, decreased from $142.44 at December 31, 2008, to $139.01 at December 31, 2009. For Class 2a, the NAV per Unit decreased from $121.30 at December 31, 2008, to $117.60 at December 31, 2009. For Class 3, the NAV per Unit decreased from $121.97 at the start of operations, to $117.60 at December 31, 2009.Total Class 1 subscriptions and redemptions for the twelve months were $75,585,729 and $29,735,827, respectively. Total Class 1a subscriptions and redemptions for the twelve-month period were $3,817,405 and $2,204,487, respectively. Total Class 2 subscriptions and redemptions for the twelve months were $25,917,174 and $13,622,072, respectively. Total Class 2a subscriptions and redemptions for the twelve month period were $1,802,211 and $282,240, respectively. Total Class 3 subscriptions and redemptions from the start of operations through December 31, 2009 were $1,241,589 and $35,688, respectively. Ending capital at December 31, 2009, was $286,024,307 for Class 1, $9,150,114 for Class 1a, $77,372,166 for Class 2, $3,298,566 for Class 2a, and $1,170,746 for Class 3.
79
The Balanced Series had exposure to commodity interest positions within the Interest Rates, Currencies, Stock Indices, Energies, Metals and Commodities sectors during fiscal 2009. See comments above underMarket Conditions for Twelve Months Ended December 31, 2009, for additional information regarding these sectors.
Sector Attribution for the Balanced Series

Berkeley/Graham/Tiverton Series (Formerly the Campbell/Graham/Tiverton Series)
2009
The Berkeley/Graham/Tiverton Series–Class 1 NAV lost 5.3% for the twelve months ended December 31, 2009, net of fees and expenses; the Berkeley/Graham/Tiverton Series–Class 2 NAV lost 2.4% for the twelve months ended December 31, 2009, net of fees and expenses.
For the twelve months ended December 31, 2009, the Berkeley/Graham/Tiverton Series recorded net loss on investments of $697,472, net investment income of $293,910, and total expenses of $5,084,022, resulting in a net decrease in Owners’ capital from operations of $4,151,058 after non-controlling interests of $1,336,526. The NAV per Unit, Class 1, decreased from $110.54 at December 31, 2008, to $104.65 as of December 31, 2009. The NAV per Unit, Class 2, decreased from $124.14 at December 31, 2008, to $121.10 as of December 31, 2009. Total Class 1 subscriptions for the twelve months ended December 31, 2009, were $10,924,243 and
80
redemptions were $7,507,650. Total Class 2 subscriptions and redemptions for the twelve months ended December 31, 2009, were $4,025,676, and $1,693,780, respectively. Ending capital at December 31, 2009, was $69,447,366 for Class 1 and $9,914,994 for Class 2. The Berkeley/Graham/Tiverton Series had exposure to commodity interest positions within the Interest Rates, Currencies, Stock Indices, Energies, Metals and Commodities sectors during 2009. See comments above underMarket Conditions for Twelve Months Ended December 31, 2009, for additional information regarding these sectors.
Sector Attribution for the Berkeley/Graham/Tiverton Series
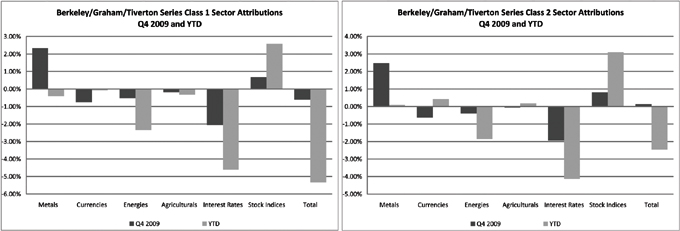
Currency Series
2009
The Currency Series–Class 1 NAV lost 18.9% for the twelve months ended December 31, 2009, net of fees and expenses; the Currency Series–Class 2 NAV lost 16.4% for the twelve months ended December 31, 2009, net of fees and expenses.
For the twelve months ended December 31, 2009, the Currency Series recorded net loss on investments of $2,057,466, net investment income of $88,884, and total expenses of $603,794, resulting in a net decrease in Owners’ capital from operations of $2,572,376. The NAV per Unit, Class 1, decreased from $96.19 at December 31, 2008, to $78.00 as of December 31, 2009. The NAV per Unit, Class 2, decreased from $109.30 at December 31, 2008, to $91.34 as of December 31, 2009. Total Class 1 subscriptions and redemptions for the twelve months ending December 31, 2009 were $570,243, and $2,434,358, respectively. Total Class 2 subscriptions and redemptions for the twelve months ending December 31, 2009 were $82,125 and $284,291, respectively. Ending capital at December 31, 2009, was $7,934,382 for Class 1 and $2,273,746 for Class 2. All commodity interest positions of the Currency Series during 2009 were within the Currencies sector.
Long Only Commodity Series
2009
The Long Only Commodity Series–Class 1 NAV gained 18.9% for the twelve months ended December 31, 2009, net of fees and expenses; the Long Only Commodity Series–Class 2 NAV gained 21.3% for the twelve months ended December 31, 2009, net of fees and expenses.
For the twelve months ended December 31, 2009, the Long Only Commodity Series recorded net gain on investments of $859,729, net investment income of $76,629, and total expenses of $143,176, resulting in a net increase in Owners’ capital from operations of $793,182. The NAV per Unit, Class 1, increased from $70.31 at December 31, 2008 to $83.59 as of December 31, 2009. The NAV per Unit, Class 2, increased from $74.46 at December 31, 2008, to $90.30 as of December 31, 2009. Total Class 1 subscriptions and redemptions for the twelve months ended December 31, 2009 were $409,347 and $572,400, respectively. Total Class 2 subscriptions and redemptions for the twelve months ended December 31, 2009 were $86,800 and $93,077, respectively. Ending capital at December 31, 2009, was $3,711,581 for Class 1 and $954,744 for Class 2.
The Long Only Commodity Series had exposure to long commodity interest positions within the Energies, Metals and Commodities sectors during 2009.
81
The Long Only Commodity Series invests approximately equally in the Jefferies Commodity Performance Index and the Reuters/Jefferies CRB Index. Since the Series invests only in such indices, no Sector Attributions charts for the Long Only Commodity Series are included.
Managed Futures Index Series
2009
The Managed Futures Index Series–Class 1 NAV lost 14.9% for the twelve months ended December 31, 2009, net of fees and expenses; the Managed Futures Index Series–Class 2 NAV lost 13.2% for the twelve months ended December 31, 2009, net of fees and expenses.
For the twelve months ended December 31, 2009, the Managed Futures Index Series recorded a net loss on investments of $490,441, net investment income of $67,985, and total expenses of $139,823, resulting in a net decrease in Owners’ capital from operations of $562,279. The NAV per Unit, Class 1, decreased from $132.18 at December 31, 2008, to $112.54 as of December 31, 2009. The NAV per Unit, Class 2, decreased from $139.70 at December 31, 2008, to $121.28 as of December 31, 2009. Total Class 1 subscriptions and redemptions for the twelve months ended December 31, 2009 were $708,699 and $822,446, respectively. Total Class 2 subscriptions and redemptions for the twelve months ended December 31, 2009 were $1,271,138 and $224,954, respectively. Ending capital at December 31, 2009, was $1,831,435 for Class 1 and $1,941,774 for Class 2. The Managed Futures Index Series had exposure to commodity interest positions within the Interest Rates, Currencies, Stock Indices, Energies, Metals and Commodities sectors during 2009. See comments above underMarket Conditions for Twelve Months Ended December 31, 2009, for additional information regarding these sectors.
Sector Attribution for the Managed Futures Index Series
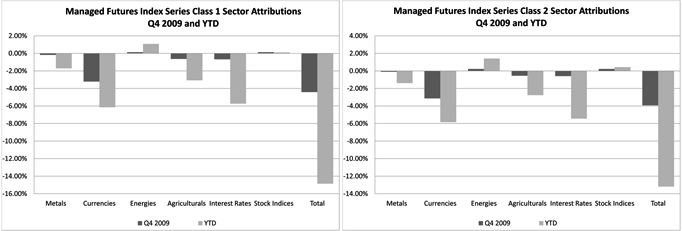
Winton Series
2009
The Winton Series–Class 1 NAV lost 9.8% for the twelve months ended December 31, 2009, net of fees and expenses; the Winton Series–Class 2 NAV lost 7.1% for the twelve months ended December 31, 2009, net of fees and expenses.
For the twelve months ended December 31, 2009, the Winton Series recorded net loss on investments of $7,737,998, net investment income of $361,106, and total expenses of $3,375,280, resulting in a net decrease in Owners’ capital from operations of $6,685,179, after minority interests of $4,066,993. The NAV per Unit, Class 1, decreased from $130.41 at December 31, 2008, to $117.57 as of December 31, 2009. The NAV per Unit, Class 2, decreased from $140.04 at December 31, 2008, to $130.10 as of December 31, 2009. Total Class 1 subscriptions for the twelve months were $287,976 and redemptions were $8,522,436. Total Class 2 subscriptions and redemptions for the twelve-month period were $200,000, and $905,208, respectively. Ending capital at December 31, 2009, was $48,198,317 for Class 1 and $10,203,862 for Class 2.
82
The Winton Series had exposure to commodity interest positions within the Interest Rates, Currencies, Stock Indices, Energies, Metals and Commodities sectors during 2009. See comments above underMarket Conditions for Twelve Months Ended December 31, 2009, for additional information regarding these sectors.
Sector Attribution for the Winton Series
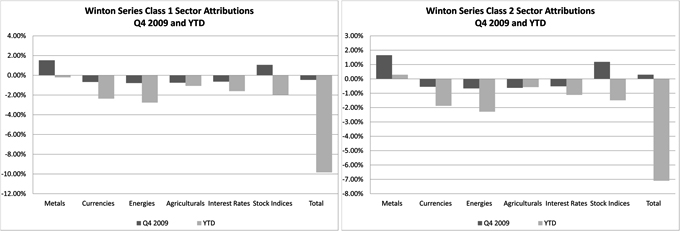
Winton/Graham Series
2009
The Winton/Graham Series–Class 1 NAV lost 5.3% for the twelve months ended December 31, 2009, net of fees and expenses; the Winton/Graham Series–Class 2 NAV lost 2.4% for the twelve months ended December 31, 2009, net of fees and expenses.
For the twelve months ended December 31, 2009, the Winton/Graham Series recorded net gain on investments of $3,919,086, net investment income of $259,485, and total expenses of $3,626,096, resulting in a net decrease in Owners’ capital from operations of $2,795,125 after non-controlling interests of ($3,347,600). The NAV per Unit, Class 1, decreased from $116.18 at December 31, 2008, to $110.06 as of December 31, 2009. The NAV per Unit, Class 2, decreased from $131.49 at December 31, 2008, to $128.39 as of December 31, 2009. Total Class 1 subscriptions and redemptions for the twelve months ended December 31, 2009 were $20,207,122 and $5,384,099, respectively. Total Class 2 subscriptions and redemptions for the twelve months ended December 31, 2009 were $360,401 and $1,892,655, respectively. Ending capital at December 31, 2009, was $48,168,395 for Class 1 and $12,522,478 for Class 2. The Winton/Graham Series had exposure to commodity interest positions within the Interest Rates, Currencies, Stock Indices, Energies, Metals and Commodities sectors during 2009. See comments above underMarket Conditions for Twelve Months Ended December 31, 2009, for additional information regarding these sectors.
Sector Attribution for the Winton/Graham Series
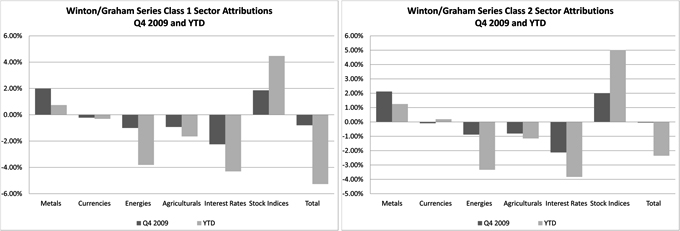
83
| Item 7A. | QUANTITATIVE AND QUALITATIVE DISCLOSURES ABOUT MARKET RISK. |
The Trust is a speculative commodity pool. The market sensitive instruments which are held by the Trading Companies in which the Series are invested are acquired for speculative trading purposes, and all or a substantial amount of the Series’ assets are subject to the risk of trading loss. Unlike an operating company, the risk of market sensitive instruments is integral, not incidental, to the Series’ main line of business.
Market movements result in frequent changes in the fair market value of each Trading Company’s open positions and, consequently, in each Series of the Trust’s earnings and cash flow. The Trading Companies’ and consequently the Series’ market risk is influenced by a wide variety of factors, including the level and volatility of exchange rates, interest rates, equity price levels, the market value of financial instruments and contracts, the diversification effects among the open positions and the liquidity of the markets in which trades are made.
Each Trading Company rapidly acquires and liquidates both long and short positions in a wide range of different markets. Consequently, it is not possible to predict how a particular future market scenario will affect performance, and the past performance for any Series is not necessarily indicative of the future results of such Series.
Additional risk of trading loss from investment in an unaffiliated Trading Company may result from the Managing Owner’s inability to directly control or stop trading in the event of exercise of certain withdrawal provisions in the investment agreement.
The Trading Companies’ and consequently the Series’ primary market risk exposures as well as the strategies used and to be used by the Trading Advisors for managing such exposures are subject to numerous uncertainties, contingencies and risks, any one of which could cause the actual results of the Trust’s and the Managing Owner’s risk controls to differ materially from the objectives of such strategies. Government interventions, defaults and expropriations, illiquid markets, the emergence of dominant fundamental factors, political upheavals, changes in historical price relationships, an influx of new market participants, increased regulation and many other factors could result in material losses as well as in material changes to the risk exposures and the risk management strategies of the Trading Companies and consequently the Trust. There can be no assurance that the Trading Companies’ current market exposure and/or risk management strategies will not change materially or that any such strategies will be effective in either the short- or long-term. Investors must be prepared to lose all or substantially all of their investment in a Series.
Quantitative Market Risk
Trading Risk
The Series’ approximate risk exposure in the various market sectors traded by its trading advisors is quantified below in terms of value at risk. Due to the Series’ mark-to-market accounting, any loss in the fair value of the Series’ (through the Trading Companies) open positions is directly reflected in the Series’ earnings, realized or unrealized.
Exchange maintenance margin requirements have been used by the Trust as the measure of its value at risk. Maintenance margin requirements are set by exchanges to equal or exceed the maximum losses reasonably expected to be incurred in the fair value of any given contract in 95% to 99% of any one-day interval. The maintenance margin levels are established by brokers, dealers and exchanges using historical price studies as well as an assessment of current market volatility and economic fundamentals to provide a probabilistic estimate of the maximum expected near-term one-day price fluctuation. Maintenance margin has been used rather than the more generally available initial margin, because initial margin includes a credit risk component that is not relevant to value at risk.
In the case of market sensitive instruments that are not exchange-traded, including currencies and some energy products and metals, the margin requirements for the equivalent futures positions have been used as value at risk. In those cases in which a futures-equivalent margin is not available, dealers��� margins have been used.
In the case of contracts denominated in foreign currencies, the value at risk figures include foreign currency margin amounts converted into U.S. Dollars with an incremental adjustment to reflect the exchange rate risk inherent to the Series, which is valued in U.S. Dollars, in expressing value at risk in a functional currency other than U.S. Dollars.
In quantifying each Series’ value at risk, 100% positive correlation in the different positions held in each market risk category has been assumed. Consequently, the margin requirements applicable to the open contracts have simply been aggregated to determine each trading category’s aggregate value at risk. The diversification effects resulting from the fact that the Series’ positions held through the Trading Companies are rarely, if ever, 100% positively correlated have not been reflected.
84
Value at Risk by Market Sectors
The following table presents the trading value at risk associated with each Series’ exposure to open positions (as held by the Trading Companies) by market sector as of December 31, 2011 and 2010. All open position trading risk exposures of the Series have been included in calculating the figures set forth below.
85
Frontier Diversified Series: (1)
| | | | | | | | | | | | | | | | |
MARKET SECTOR | | December 31, 2011 | | | December 31, 2010 | |
| | VALUE
AT RISK | | | % OF TOTAL
CAPITALIZATION | | | VALUE
AT RISK | | | % OF TOTAL
CAPITALIZATION | |
Interest Rates | | $ | 5,973,146 | | | | 4.5 | % | | $ | 2,922,054 | | | | 1.8 | % |
Currencies | | $ | 4,110,056 | | | | 3.1 | % | | $ | 2,240,613 | | | | 1.4 | % |
Stock Indices | | $ | 2,947,326 | | | | 2.2 | % | | $ | 6,404,181 | | | | 4.0 | % |
Metals | | $ | 267,495 | | | | 0.2 | % | | $ | 1,371,891 | | | | 0.9 | % |
Agriculturals/Softs | | $ | 2,060,410 | | | | 1.5 | % | | $ | 5,305,078 | | | | 3.3 | % |
Energy | | $ | 2,137,689 | | | | 1.6 | % | | $ | 7,868,442 | | | | 4.9 | % |
Total: | | $ | 17,496,122 | | | | 13.1 | % | | $ | 26,112,259 | | | | 16.3 | % |
Twelve Months Ended December 31, 2011
Frontier Dynamic Series: (2), (7)
| | | | | | | | | | | | | | | | |
| | | December 31, 2011 | | | December 31, 2010 | |
MARKET SECTOR | | VALUE
AT RISK | | | % OF TOTAL
CAPITALIZATION | | | VALUE
AT RISK | | | % OF TOTAL
CAPITALIZATION | |
Interest Rates | | $ | — | | | | 0.0 | % | | $ | — | | | | — | |
Currencies | | $ | — | | | | 0.0 | % | | $ | — | | | | — | |
Stock Indices | | $ | — | | | | 0.0 | % | | $ | — | | | | — | |
Metals | | $ | — | | | | 0.0 | % | | $ | — | | | | — | |
Agriculturals/Softs | | $ | — | | | | 0.0 | % | | $ | — | | | | — | |
Energy | | $ | — | | | | 0.0 | % | | $ | — | | | | — | |
Total: | | $ | — | | | | 0.0 | % | | $ | — | | | | — | |
86
Frontier Long/Short Commodity Series:
| | | | | | | | | | | | | | | | |
MARKET SECTOR | | December 31, 2011 | | | December 31, 2010 | |
| | VALUE
AT RISK | | | % OF TOTAL
CAPITALIZATION | | | VALUE
AT RISK | | | % OF TOTAL
CAPITALIZATION | |
Interest Rates | | $ | 1,033,509 | | | | 1.5 | % | | $ | 322,364 | | | | 0.4 | % |
Currencies | | $ | 460,279 | | | | 0.6 | % | | $ | 242,199 | | | | 0.3 | % |
Stock Indices | | $ | 681,982 | | | | 1.0 | % | | $ | 411,536 | | | | 0.5 | % |
Metals | | $ | 406,988 | | | | 0.6 | % | | $ | 329,861 | | | | 0.4 | % |
Agriculturals/Softs | | $ | 2,736,200 | | | | 3.9 | % | | $ | 3,206,941 | | | | 4.2 | % |
Energy | | $ | 4,843,829 | | | | 6.8 | % | | $ | 4,762,766 | | | | 6.2 | % |
Total: | | $ | 10,162,787 | | | | 14.4 | % | | $ | 9,275,667 | | | | 12.0 | % |
Frontier Masters Series: (3)
| | | | | | | | | | | | | | | | |
MARKET SECTOR | | December 31, 2011 | | | December 31, 2010 | |
| | VALUE
AT RISK | | | % OF TOTAL
CAPITALIZATION | | | VALUE
AT RISK | | | % OF TOTAL
CAPITALIZATION | |
Interest Rates | | $ | 1,517,381 | | | | 2.9 | % | | $ | 835,668 | | | | 1.3 | % |
Currencies | | $ | 1,168,162 | | | | 2.2 | % | | $ | 424,749 | | | | 0.6 | % |
Stock Indices | | $ | 551,850 | | | | 1.0 | % | | $ | 756,786 | | | | 1.1 | % |
Metals | | $ | 224,102 | | | | 0.4 | % | | $ | 277,901 | | | | 0.4 | % |
Agriculturals/Softs | | $ | 612,343 | | | | 1.2 | % | | $ | 251,661 | | | | 0.4 | % |
Energy | | $ | 499,134 | | | | 0.9 | % | | $ | 203,123 | | | | 0.3 | % |
Total: | | $ | 4,572,972 | | | | 8.6 | % | | $ | 2,749,888 | | | | 4.1 | % |
Balanced Series: (4) (5)
| | | | | | | | | | | | | | | | |
MARKET SECTOR | | December 31, 2011 | | | December 31, 2010 | |
| | VALUE
AT RISK | | | % OF TOTAL
CAPITALIZATION | | | VALUE
AT RISK | | | % OF TOTAL
CAPITALIZATION | |
Interest Rates | | $ | 12,658,095 | | | | 5.0 | % | | $ | 8,353,253 | | | | 2.2 | % |
Currencies | | $ | 9,980,695 | | | | 3.9 | % | | $ | 6,381,910 | | | | 1.7 | % |
Stock Indices | | $ | 6,408,240 | | | | 2.5 | % | | $ | 18,517,071 | | | | 4.9 | % |
Metals | | $ | 530,322 | | | | 0.2 | % | | $ | 3,908,168 | | | | 1.0 | % |
Agriculturals/Softs | | $ | 4,171,096 | | | | 1.6 | % | | $ | 15,220,938 | | | | 4.0 | % |
Energy | | $ | 4,239,430 | | | | 1.7 | % | | $ | 22,499,117 | | | | 6.0 | % |
Total: | | $ | 37,987,878 | | | | 14.9 | % | | $ | 74,880,457 | | | | 19.8 | % |
Berkeley/Graham/Tiverton Series:
| | | | | | | | | | | | | | | | |
MARKET SECTOR | | December 31, 2011 | | | December 31, 2010 | |
| | VALUE
AT RISK | | | % OF TOTAL
CAPITALIZATION | | | VALUE
AT RISK | | | % OF TOTAL
CAPITALIZATION | |
Interest Rates | | $ | 1,987,350 | | | | 5.0 | % | | $ | 718,098 | | | | 1.0 | % |
Currencies | | $ | 2,181,879 | | | | 5.5 | % | | $ | 1,434,603 | | | | 2.0 | % |
Stock Indices | | $ | 821,477 | | | | 2.1 | % | | $ | 1,023,873 | | | | 1.5 | % |
Metals | | $ | 20,795 | | | | 0.1 | % | | $ | 206,109 | | | | 0.3 | % |
Agriculturals/Softs | | $ | 693,002 | | | | 1.7 | % | | $ | 327,581 | | | | 0.5 | % |
Energy | | $ | 323,096 | | | | 0.8 | % | | $ | 233,916 | | | | 0.3 | % |
Total: | | $ | 6,027,599 | | | | 15.2 | % | | $ | 3,944,180 | | | | 5.6 | % |
87
Currency Series: (6)
| | | | | | | | | | | | | | | | |
MARKET SECTOR | | December 31, 2011 | | | December 31, 2010 | |
| | VALUE
AT RISK | | | % OF TOTAL
CAPITALIZATION | | | VALUE
AT RISK | | | % OF TOTAL
CAPITALIZATION | |
Interest Rates | | $ | — | | | | 0 | % | | $ | — | | | | 0 | % |
Currencies | | $ | 940,205 | | | | 21.8 | % | | $ | 381,279 | | | | 1.9 | % |
Stock Indices | | $ | — | | | | 0 | % | | $ | — | | | | 0 | % |
Metals | | $ | — | | | | 0 | % | | $ | — | | | | 0 | % |
Agriculturals/Softs | | $ | — | | | | 0 | % | | $ | — | | | | 0 | % |
Energy | | $ | — | | | | 0 | % | | $ | — | | | | 0 | % |
Total: | | $ | 940,205 | | | | 21.8 | % | | $ | 381,279 | | | | 1.9 | % |
Long Only Commodity Series: (7)
| | | | | | | | | | | | | | | | |
MARKET SECTOR | | December 31, 2011 | | | December 31, 2010 | |
| | VALUE
AT RISK | | | % OF TOTAL
CAPITALIZATION | | | VALUE
AT RISK | | | % OF TOTAL
CAPITALIZATION | |
Interest Rates | | $ | — | | | | 0.0 | % | | $ | — | | | | 0.0 | % |
Currencies | | $ | — | | | | 0.0 | % | | $ | — | | | | 0.0 | % |
Stock Indices | | $ | — | | | | 0.0 | % | | $ | — | | | | 0.0 | % |
Metals | | $ | — | | | | 0.0 | % | | $ | 97,920 | | | | 2.3 | % |
Agriculturals/Softs | | $ | — | | | | 0.0 | % | | $ | 138,720 | | | | 3.3 | % |
Energy | | $ | — | | | | 0.0 | % | | $ | 171,360 | | | | 4.1 | % |
Total: | | $ | — | | | | 0.0 | % | | $ | 408,000 | | | | 9.7 | % |
Managed Futures Index Series: (7)
| | | | | | | | | | | | | | | | |
MARKET SECTOR | | December 31, 2011 | | | December 31, 2010 | |
| | VALUE
AT RISK | | | % OF TOTAL
CAPITALIZATION | | | VALUE
AT RISK | | | % OF TOTAL
CAPITALIZATION | |
Interest Rates | | $ | — | | | | 0.0 | % | | $ | 144,635 | | | | 2.8 | % |
Currencies | | $ | — | | | | 0.0 | % | | $ | 338,036 | | | | 6.6 | % |
Stock Indices | | $ | — | | | | 0.0 | % | | $ | 105,228 | | | | 2.0 | % |
Metals | | $ | — | | | | 0.0 | % | | $ | 37,502 | | | | 0.7 | % |
Agriculturals/Softs | | $ | — | | | | 0.0 | % | | $ | 94,797 | | | | 1.8 | % |
Energy | | $ | — | | | | 0.0 | % | | $ | 44,273 | | | | 0.9 | % |
Total: | | $ | — | | | | 0.0 | % | | $ | 764,471 | | | | 14.8 | % |
Winton Series:
| | | | | | | | | | | | | | | | |
MARKET SECTOR | | December 31, 2011 | | | December 31, 2010 | |
| | VALUE
AT RISK | | | % OF TOTAL
CAPITALIZATION | | | VALUE
AT RISK | | | % OF TOTAL
CAPITALIZATION | |
Interest Rates | | $ | 1,435,740 | | | | 2.9 | % | | $ | 732,649 | | | | 1.2 | % |
Currencies | | $ | 1,562,233 | | | | 3.1 | % | | $ | 1,247,838 | | | | 2.1 | % |
Stock Indices | | $ | 346,133 | | | | 0.7 | % | | $ | 950,979 | | | | 1.6 | % |
Metals | | $ | 153,107 | | | | 0.3 | % | | $ | 274,568 | | | | 0.5 | % |
Agriculturals/Softs | | $ | 411,136 | | | | 0.8 | % | | $ | 675,764 | | | | 1.1 | % |
Energy | | $ | 80,743 | | | | 0.2 | % | | $ | 259,374 | | | | 0.4 | % |
Total: | | $ | 3,989,092 | | | | 8.0 | % | | $ | 4,141,172 | | | | 6.9 | % |
88
Winton/Graham Series:
| | | | | | | | | | | | | | | | |
MARKET SECTOR | | December 31, 2011 | | | December 31, 2010 | |
| | VALUE
AT RISK | | | % OF TOTAL
CAPITALIZATION | | | VALUE
AT RISK | | | % OF TOTAL
CAPITALIZATION | |
Interest Rates | | $ | 2,634,892 | | | | 8.6 | % | | $ | 1,277,380 | | | | 2.2 | % |
Currencies | | $ | 2,502,412 | | | | 8.1 | % | | $ | 2,303,772 | | | | 4.0 | % |
Stock Indices | | $ | 933,122 | | | | 3.0 | % | | $ | 1,627,973 | | | | 2.8 | % |
Metals | | $ | 226,400 | | | | 0.7 | % | | $ | 322,999 | | | | 0.6 | % |
Agriculturals/Softs | | $ | 845,163 | | | | 2.7 | % | | $ | 721,077 | | | | 1.3 | % |
Energy | | $ | 325,600 | | | | 1.1 | % | | $ | 418,361 | | | | 0.7 | % |
Total: | | $ | 7,467,589 | | | | 24.2 | % | | $ | 6,671,562 | | | | 11.6 | % |
| (1) | As of December 31, 2010, a portion of the assets of the Frontier Diversified Series was invested in an Option basket of futures contracts with a notional value of $15,569,595. Margin information is not available for this contract therefore no value at risk calculations were included in the table for this investment. |
| (2) | As of December 31, 2010, a portion of the assets of the Frontier Dynamic Series was invested in an Option basket of futures contracts with a notional value of $27,048,602. Margin information is not available for this contract therefore no value at risk calculations were included in the table for this investment. |
| (3) | As of December 31, 2010, a portion of the assets of the Frontier Masters Series was invested in an Option basket of futures contracts with a notional value of $26,242,246. Margin information is not available for this contract therefore no value at risk calculations were included in the table for this investment. |
| (4) | As of December 31, 2010, a portion of the assets of the Balanced Series was invested in the Currency Series and the Frontier Dynamic Series. The Balanced Series effective ownership in these Series as of December 31, 2010 was 63.9 and 94.0%, respectively. Including its investment in these Series, total value at risk for the Balanced Series would be $74,880,457, or 19.8% of capitalization as of December 31, 2010. |
| (5) | As of December 31, 2011 and December 31, 2010, a portion of the assets of the Balanced Series was invested in an Option basket of futures contracts with a notional value of $14,129,540 and 68,460,196, respectively. As of December 31, 2011, a portion of the assets of the Balanced Series was invested separate Option basket of futures contracts with a notional value of $23,551,287. Margin information is not available for these contracts therefore no value at risk calculations were included in the table for this investment. |
| (6) | As December 31, 2010, a portion of the assets of the Currency Series was invested in an Option basket of futures contracts with a notional value of $11,567,063. Margin information is not available for this contract therefore no value at risk calculations were included in the table for this investment. |
| (7) | The Frontier Dynamic Series, Long/Only Commodity Series and Managed Futures Index Series ceased trading operations during 2011. |
Value at Risk: Foreign Markets
The following table presents the portion of trading value at risk associated with each Series’ exposure to open positions (as held by the Trading Companies) by market sector as of December 31, 2011 and 2010, on foreign markets. All open position trading risk exposures of the Series have been included in calculating the figures set forth below.
Frontier Diversified Series: (1)
| | | | | | | | | | | | | | | | |
MARKET SECTOR | | December 31, 2011 | | | December 31, 2010 | |
| | VALUE
AT RISK | | | % OF TOTAL
CAPITALIZATION | | | VALUE
AT RISK | | | % OF TOTAL
CAPITALIZATION | |
Interest Rates | | $ | 3,369,219 | | | | 2.5 | % | | $ | 1,926,805 | | | | 1.2 | % |
Currencies | | $ | 1,228,013 | | | | 0.9 | % | | $ | 546,042 | | | | 0.3 | % |
Stock Indices | | $ | 1,308,974 | | | | 1.0 | % | | $ | 2,208,762 | | | | 1.4 | % |
Metals | | $ | 98,304 | | | | 0.1 | % | | $ | — | | | | 0.0 | % |
Agriculturals/Softs | | $ | 105,897 | | | | 0.1 | % | | $ | 82,136 | | | | 0.1 | % |
Energy | | $ | 217,312 | | | | 0.2 | % | | $ | 12,360 | | | | 0.0 | % |
Total: | | $ | 6,327,719 | | | | 4.8 | % | | $ | 4,776,105 | | | | 3.0 | % |
89
Frontier Dynamic Series: (2),(7)
| | | | | | | | | | | | | | | | |
MARKET SECTOR | | December 31, 2011 | | | December 31, 2010 | |
| | VALUE
AT RISK | | | % OF TOTAL
CAPITALIZATION | | | VALUE
AT RISK | | | % OF TOTAL
CAPITALIZATION | |
Interest Rates | | $ | — | | | | 0.0 | % | | $ | — | | | | 0.0 | % |
Currencies | | $ | — | | | | 0.0 | % | | $ | — | | | | 0.0 | % |
Stock Indices | | $ | — | | | | 0.0 | % | | $ | — | | | | 0.0 | % |
Metals | | $ | — | | | | 0.0 | % | | $ | — | | | | 0.0 | % |
Agriculturals/Softs | | $ | — | | | | 0.0 | % | | $ | — | | | | 0.0 | % |
Energy | | $ | — | | | | 0.0 | % | | $ | — | | | | 0.0 | % |
Total: | | $ | — | | | | 0.0 | % | | $ | — | | | | 0.0 | % |
Frontier Long/Short Commodity Series:
| | | | | | | | | | | | | | | | |
MARKET SECTOR | | December 31, 2011 | | | December 31, 2010 | |
| | VALUE
AT RISK | | | % OF TOTAL
CAPITALIZATION | | | VALUE
AT RISK | | | % OF TOTAL
CAPITALIZATION | |
Interest Rates | | $ | 515,192 | | | | 0.7 | % | | $ | 66,120 | | | | 0.1 | % |
Currencies | | $ | — | | | | 0.0 | % | | $ | 1,254 | | | | 0.0 | % |
Stock Indices | | $ | 206,023 | | | | 0.3 | % | | $ | 85,572 | | | | 0.1 | % |
Metals | | $ | 228,484 | | | | 0.3 | % | | $ | — | | | | 0.0 | % |
Agriculturals/Softs | | $ | 74,490 | | | | 0.1 | % | | $ | 3,384 | | | | 0.0 | % |
Energy | | $ | 578,064 | | | | 0.8 | % | | $ | 30,730 | | | | 0.0 | % |
Total: | | $ | 1,602,253 | | | | 2.2 | % | | $ | 187,060 | | | | 0.2 | % |
Frontier Masters Series: (3)
| | | | | | | | | | | | | | | | |
MARKET SECTOR | | December 31, 2011 | | | December 31, 2010 | |
| | VALUE
AT RISK | | | % OF TOTAL
CAPITALIZATION | | | VALUE
AT RISK | | | % OF TOTAL
CAPITALIZATION | |
Interest Rates | | $ | 1,187,798 | | | | 2.2 | % | | $ | 410,199 | | | | 0.6 | % |
Currencies | | $ | 131,064 | | | | 0.2 | % | | $ | 58,054 | | | | 0.1 | % |
Stock Indices | | $ | 198,234 | | | | 0.4 | % | | $ | 356,351 | | | | 0.5 | % |
Metals | | $ | 42,731 | | | | 0.1 | % | | $ | — | | | | 0.0 | % |
Agriculturals/Softs | | $ | 21,356 | | | | 0.0 | % | | $ | 5,516 | | | | 0.0 | % |
Energy | | $ | 131,577 | | | | 0.2 | % | | $ | — | | | | 0.0 | % |
Total: | | $ | 1,712,760 | | | | 3.1 | % | | $ | 830,120 | | | | 1.2 | % |
Balanced Series: (4), (5)
| | | | | | | | | | | | | | | | |
MARKET SECTOR | | December 31, 2011 | | | December 31, 2010 | |
| | VALUE
AT RISK | | | % OF TOTAL
CAPITALIZATION | | | VALUE
AT RISK | | | % OF TOTAL
CAPITALIZATION | |
Interest Rates | | $ | 7,028,828 | | | | 2.8 | % | | $ | 5,521,643 | | | | 1.5 | % |
Currencies | | $ | 3,874,144 | | | | 1.5 | % | | $ | 1,642,252 | | | | 0.4 | % |
Stock Indices | | $ | 2,844,170 | | | | 1.1 | % | | $ | 6,375,104 | | | | 1.7 | % |
Metals | | $ | 182,364 | | | | 0.1 | % | | $ | — | | | | 0.0 | % |
Agriculturals/Softs | | $ | 217,728 | | | | 0.1 | % | | $ | 238,151 | | | | 0.1 | % |
Energy | | $ | 429,114 | | | | 0.2 | % | | $ | 34,412 | | | | 0.0 | % |
Total: | | $ | 14,576,348 | | | | 5.8 | % | | $ | 13,811,562 | | | | 3.7 | % |
90
Berkeley/Graham/Tiverton Series:
| | | | | | | | | | | | | | | | |
MARKET SECTOR | | December 31, 2011 | | | December 31, 2010 | |
| | VALUE
AT RISK | �� | | % OF TOTAL
CAPITALIZATION | | | VALUE
AT RISK | | | % OF TOTAL
CAPITALIZATION | |
Interest Rates | | $ | 1,228,296 | | | | 3.1 | % | | $ | 557,652 | | | | 0.8 | % |
Currencies | | $ | 1,235,691 | | | | 3.1 | % | | $ | 1,110,441 | | | | 1.6 | % |
Stock Indices | | $ | 388,937 | | | | 1.0 | % | | $ | 317,512 | | | | 0.5 | % |
Metals | | $ | 13,393 | | | | 0.0 | % | | $ | — | | | | 0.0 | % |
Agriculturals/Softs | | $ | 22,951 | | | | 0.0 | % | | $ | 4,760 | | | | 0.0 | % |
Energy | | $ | — | | | | 0.0 | % | | $ | — | | | | 0.0 | % |
Total: | | $ | 2,889,268 | | | | 7.2 | % | | $ | 1,990,365 | | | | 2.9 | % |
Currency Series: (6)
| | | | | | | | | | | | | | | | |
MARKET SECTOR | | December 31, 2011 | | | December 31, 2010 | |
| | VALUE
AT RISK | | | % OF TOTAL
CAPITALIZATION | | | VALUE
AT RISK | | | % OF TOTAL
CAPITALIZATION | |
Interest Rates | | $ | — | | | | 0 | % | | $ | — | | | | 0 | % |
Currencies | | $ | 940,205 | | | | 21.8 | % | | $ | 381,279 | | | | 1.9 | % |
Stock Indices | | $ | — | | | | 0 | % | | $ | — | | | | 0 | % |
Metals | | $ | — | | | | 0 | % | | $ | — | | | | 0 | % |
Agriculturals/Softs | | $ | — | | | | 0 | % | | $ | — | | | | 0 | % |
Energy | | $ | — | | | | 0 | % | | $ | — | | | | 0 | % |
Total: | | $ | 940,205 | | | | 21.8 | % | | $ | 381,279 | | | | 1.9 | % |
Long Only Commodity Series: (7)
| | | | | | | | | | | | | | | | |
MARKET SECTOR | | December 31, 2011 | | | December 31, 2010 | |
| | VALUE
AT RISK | | | % OF TOTAL
CAPITALIZATION | | | VALUE
AT RISK | | | % OF TOTAL
CAPITALIZATION | |
Interest Rates | | $ | — | | | | 0.0 | % | | $ | — | | | | 0.0 | % |
Currencies | | $ | — | | | | 0.0 | % | | $ | — | | | | 0.0 | % |
Stock Indices | | $ | — | | | | 0.0 | % | | $ | — | | | | 0.0 | % |
Metals | | $ | — | | | | 0.0 | % | | $ | — | | | | 0.0 | % |
Agriculturals/Softs | | $ | — | | | | 0.0 | % | | $ | — | | | | 0.0 | % |
Energy | | $ | — | | | | 0.0 | % | | $ | — | | | | 0.0 | % |
Total: | | $ | — | | | | 0.0 | % | | $ | — | | | | 0.0 | % |
Managed Futures Index Series: (7)
| | | | | | | | | | | | | | | | |
MARKET SECTOR | | December 31, 2011 | | | December 31, 2010 | |
| | VALUE
AT RISK | | | % OF TOTAL
CAPITALIZATION | | | VALUE
AT RISK | | | % OF TOTAL
CAPITALIZATION | |
Interest Rates | | $ | — | | | | 0.0 | % | | $ | 92,028 | | | | 1.8 | % |
Currencies | | $ | — | | | | 0.0 | % | | $ | 261,469 | | | | 5.1 | % |
Stock Indices | | $ | — | | | | 0.0 | % | | $ | 26,578 | | | | 0.5 | % |
Metals | | $ | — | | | | 0.0 | % | | $ | — | | | | 0.0 | % |
Agriculturals/Softs | | $ | — | | | | 0.0 | % | | $ | — | | | | 0.0 | % |
Energy | | $ | — | | | | 0.0 | % | | $ | — | | | | 0.0 | % |
Total: | | $ | — | | | | 0.0 | % | | $ | 380,075 | | | | 7.4 | % |
91
Winton Series:
| | | | | | | | | | | | | | | | |
MARKET SECTOR | | December 31, 2011 | | | December 31, 2010 | |
| | VALUE
AT RISK | | | % OF TOTAL
CAPITALIZATION | | | VALUE
AT RISK | | | % OF TOTAL
CAPITALIZATION | |
Interest Rates | | $ | 892,630 | | | | 1.8 | % | | $ | 493,895 | | | | 0.8 | % |
Currencies | | $ | 335,093 | | | | 0.7 | % | | $ | 169,102 | | | | 0.3 | % |
Stock Indices | | $ | 174,744 | | | | 0.3 | % | | $ | 372,542 | | | | 0.6 | % |
Metals | | $ | 105,880 | | | | 0.2 | % | | $ | — | | | | 0.0 | % |
Agriculturals/Softs | | $ | 21,894 | | | | 0.0 | % | | $ | 18,104 | | | | 0.0 | % |
Energy | | $ | — | | | | 0.0 | % | | $ | — | | | | 0.0 | % |
Total: | | $ | 1,530,241 | | | | 3.0 | % | | $ | 1,053,643 | | | | 1.7 | % |
Winton/Graham Series:
| | | | | | | | | | | | | | | | |
MARKET SECTOR | | December 31, 2011 | | | December 31, 2010 | |
| | VALUE
AT RISK | | | % OF TOTAL
CAPITALIZATION | | | VALUE
AT RISK | | | % OF TOTAL
CAPITALIZATION | |
Interest Rates | | $ | 1,630,456 | | | | 5.3 | % | | $ | 946,871 | | | | 1.6 | % |
Currencies | | $ | 1,432,450 | | | | 4.7 | % | | $ | 1,397,419 | | | | 2.4 | % |
Stock Indices | | $ | 476,443 | | | | 1.5 | % | | $ | 574,458 | | | | 1.0 | % |
Metals | | $ | 197,044 | | | | 0.6 | % | | $ | — | | | | 0.0 | % |
Agriculturals/Softs | | $ | 32,391 | | | | 0.1 | % | | $ | 16,207 | | | | 0.0 | % |
Energy | | $ | — | | | | 0.0 | % | | $ | — | | | | 0.0 | % |
Total: | | $ | 3,768,784 | | | | 12.2 | % | | $ | 2,934,955 | | | | 5.0 | % |
| (1) | As of December 31, 2010, a portion of the assets of the Frontier Diversified Series was invested in an Option basket of futures contracts with a notional value of $15,569,595. Margin information is not available for this contract therefore no value at risk calculations were included in the table for this investment. |
| (2) | As of December 31, 2010, a portion of the assets of the Frontier Dynamic Series was invested in an Option basket of futures contracts with a notional value of $27,048,602. Margin information is not available for this contract therefore no value at risk calculations were included in the table for this investment. |
| (3) | As of December 31, 2010, a portion of the assets of the Frontier Masters Series was invested in an Option basket of futures contracts with a notional value of $26,242,246. Margin information is not available for this contract therefore no value at risk calculations were included in the table for this investment. |
| (4) | As of December 31, 2010, a portion of the assets of the Balanced Series was invested in the Currency Series and the Frontier Dynamic Series. The Balanced Series effective ownership in these Series as of December 31, 2010 was 63.9 and 94.0%, respectively. Including its investment in these Series, total value at risk for the Balanced Series would be $74,880,457, or 19.8% of capitalization as of December 31, 2010. |
| (5) | As of December 31, 2011 and December 31, 2010, a portion of the assets of the Balanced Series was invested in an Option basket of futures contracts with a notional value of $14,129,540 and 68,460,196, respectively. As of December 31, 2011, a portion of the assets of the Balanced Series was invested in a separate Option basket of futures contracts with a notional value of $23,551,287. Margin information is not available for these contracts therefore no value at risk calculations were included in the table for this investment. |
| (6) | As December 31, 2010, a portion of the assets of the Currency Series was invested in an Option basket of futures contracts with a notional value of $11,567,063. Margin information is not available for this contract therefore no value at risk calculations were included in the table for this investment. |
| (7) | The Frontier Dynamic Series, Long/Only Commodity Series and Managed Futures Index Series ceased trading operations during 2011. |
Material Limitations on Value at Risk as an Assessment of Market Risk
The face value of the market sector instruments held on behalf of the Series is typically many times the applicable maintenance margin requirement, which generally ranges between approximately 1% and 10% of contract face value, as well as many times the capitalization of the Series. The magnitude of each Series’ open positions creates a risk of ruin not typically found in most other investment vehicles. Because of the size of their positions, certain market conditions, although unusual, but historically recurring from time to time, could cause a Series to incur severe losses over a short period of time. The value at risk table above, as well as the past performance of the Series, gives no indication of this risk of ruin.
92
Non-Trading Risk
The Series have non-trading market risk on their foreign cash balances not needed for margin. However, these balances, as well as the market risk they represent, are immaterial. The Series also have non-trading market risk as a result of investing a portion of their available assets in U.S. government securities which include any security issued or guaranteed as to principal or interest by the U.S., or by a person controlled by or supervised by and acting as an instrumentality of the government of the U.S. pursuant to authority granted by Congress of the U.S. or any certificate of deposit for any of the foregoing, including U.S. treasury bonds, U.S. treasury bills and issues of agencies of the U.S. government, and certain cash items such as money market funds, certificates of deposit (under nine months) and time deposits. The market risk represented by these investments is also immaterial.
Qualitative Market Risk
The following are the primary trading risk exposures of the Series of the Trust as of December 31, 2011, by market sector.
Interest rates
Interest rate risk is one of the principal market exposures of each Series. Interest rate movements directly affect the price of interest rate futures positions held and indirectly the value of a Trading Company’s stock index and currency positions. Interest rate movements in one country as well as relative interest rate movements between countries materially impact profitability. The primary interest rate exposure is to interest rate fluctuations in the U.S. and the other G-8 countries. However, the Trading Companies also may take futures positions on the government debt of smaller nations. The Managing Owner anticipates that G-8 interest rates will remain the primary market exposure of each Trading Company and accordingly of each Series for the foreseeable future. The changes in interest rates which are expected to have the most effect on the Series are changes in long-term, as opposed to short-term rates. Most of the speculative positions to be held by the Trading Companies will be in medium- to long-term instruments. Consequently, even a material change in short-term rates is expected to have little effect on the Series if the medium- to long-term rates remain steady. Aggregate interest income from all sources, including assets held at clearing brokers, up to 2% (annualized) is paid to the Managing Owner by the Balanced Series (Class 1 and Class 2 only), Winton Series, Berkeley/Graham/Tiverton Series, Currency Series and Winton/Graham Series. For the Frontier Diversified Series, Frontier Dynamic Series, Frontier Long/Short Commodity Series, Frontier Masters, Series, Balanced Series (Class 1a and Class 2a only), Long Only Commodity Series and Managed Futures Index Series, 20% of the total interest allocated to each Series is paid to the Managing Owner. In addition, if interest rates fall below 0.75%, the Managing Owner is paid the difference between the Trust’s annualized interest income that is allocated to each of such Series and 0.75%. Interest income above what is paid to the Managing Owner is retained by the Series.
Currencies
Exchange rate risk is a significant market exposure of each Series of the Trust in general and the Currency Series in particular. For each Series of the Trust in general, and the Currency Series in particular, currency exposure is to exchange rate fluctuations, primarily fluctuations that disrupt the historical pricing relationships between different currencies and currency pairs. These fluctuations are influenced by interest rate changes as well as political and general economic conditions. The Trading Advisors on behalf of a Series trade in a large number of currencies, including cross-rates, which are positions between two currencies other than the U.S. Dollar. The Managing Owner does not anticipate that the risk profile of the Series’ currency sector will change significantly in the future.
Stock Indices
For each Series (other than the Currency Series), its primary equity exposure is equity price risk in the G-8 countries as well as other smaller jurisdictions. Each Series of the Trust (other than the Currency Series) is primarily exposed to the risk of adverse price trends or static markets in the major U.S., European and Japanese indices.
Metals
For each Series (other than the Currency Series), its metals market exposure is fluctuations in the price of both precious metals, including gold and silver, as well as base metals including aluminum, copper, nickel and zinc. Some metals, such as gold, are used as surrogate stores of value, in place of hard currency, and thus have an associated currency or interest rate risk associated with them relative to their price in a specific currency. Other metals, such as silver, platinum, copper and steel, have substantial industrial applications, and may be subject to forces affecting industrial production and demand.
Agriculturals/Softs
Each Series (other than the Currency Series) may also invest in raw commodities and may thus have exposure to agricultural price movements, which are often directly affected by severe or unexpected weather conditions or by political events in countries that comprise significant sources of commodity supply.
93
Energy
For each Series (other than the Currency Series), its primary energy market exposure is in oil, gas and other energy product price movements, often resulting from political developments and ongoing conflicts in the Middle East. Oil and gas prices can be volatile and substantial profits and losses have been and are expected to continue to be experienced in this market.
Other Trading Risks
As a result of leverage, small changes in the price of a Trading Company’s positions may result in substantial losses for a Series. Futures, forwards and options are typically traded on margin. This means that a small amount of capital can be used to invest in contracts of much greater total value. The resulting leverage means that a relatively small change in the market price of a contract can produce a substantial loss. Like other leveraged investments, any purchase or sale of a contract may result in losses in excess of the amount invested in that contract. The Trading Companies may lose more than their initial margin deposits on a trade.
The Trading Companies’ trading is subject to execution risks. Market conditions may make it impossible for the Trading Advisors to execute a buy or sell order at the desired price, or to close out an open position. Daily price fluctuation limits are established by the exchanges and approved by the CFTC. When the market price of a contract reaches its daily price fluctuation limit, no trades can be executed at prices outside the limit. The holder of a contract may therefore be locked into an adverse price movement for several days or more and lose considerably more than the initial margin put up to establish the position. Thinly traded or illiquid markets also can make it difficult or impossible to execute trades.
The Trading Advisor’s positions are subject to speculative limits. The CFTC and domestic exchanges have established speculative position limits on the maximum futures position which any person, or group of persons acting in concert, may hold or control in particular futures contracts or options on futures contracts traded on U.S. commodity exchanges. Under current regulations, other accounts of the Trading Advisors are combined with the positions held by them on behalf of the applicable Trading Company for position limit purposes. This trading could preclude additional trading in these commodities by the Trading Advisors for the accounts of the Series.
Systematic strategies do not consider fundamental types of data and do not have the benefit of discretionary decision making. The assets of the Series are allocated to Trading Advisors that rely on technical, systematic strategies that do not take into account factors external to the market itself (although certain of these strategies may have minor discretionary elements incorporated into their systematic strategy). The widespread use of technical trading systems frequently results in numerous trading advisors attempting to execute similar trades at or about the same time, altering trading patterns and affecting market liquidity. Furthermore, the profit potential of trend-following systems may be diminished by the changing character of the markets, which may make historical price data (on which technical programs are based) only marginally relevant to future market patterns. Systematic strategies are developed on the basis of a statistical analysis of market prices. Consequently, any factor external to the market itself that dominates prices that a discretionary decision maker may take into account may cause major losses for a systematic strategy. For example, a pending political or economic event may be very likely to cause a major price movement, but a systematic strategy may continue to maintain positions indicated by its trading method that might incur major losses if the event proved to be adverse.
However, because certain of the Trading Advisors’ strategies involve some discretionary aspects in addition to their technical factors, certain of the Trading Advisors may occasionally use discretion in investing the assets of a Trading Company. For example, the Trading Advisors often use discretion in selecting contracts and markets to be followed. In exercising such discretion, such Trading Advisor may take positions opposite to those recommended by the Trading Advisor’s trading system or signals. Discretionary decision making may also result in a Trading Advisor failing to capitalize on certain price trends or making unprofitable trades in a situation where another trader relying solely on a systematic approach might not have done so. Furthermore, such use of discretion may not enable the relevant Series of the Trust to avoid losses, and in fact, such use of discretion may cause such Series to forego profits which it may have otherwise earned had such discretion not been used.
Qualitative Disclosures Regarding Means of Managing Risk Exposure
The means by which the Managing Owner attempts to manage the risk of the Trust’s open positions is essentially the same in all market categories traded. The Managing Owner applies risk management policies to trading which generally are designed to limit the total exposure of assets under management. In addition, the Managing Owner follows diversification guidelines which are often formulated in terms of the balanced volatility between markets and correlated groups.
94
| Item 8. | FINANCIAL STATEMENTS AND SUPPLEMENTARY DATA. |
Financial statements meeting the requirements of Regulation S-X appear beginning on page F-1 of this report. The supplementary financial information specified by Item 302 of Regulation S-K is included in this report under the heading “Selected Financial Data” above.
| Item 9. | CHANGES IN AND DISAGREEMENTS WITH ACCOUNTANTS ON ACCOUNTING AND FINANCIAL DISCLOSURE. |
None.
| Item 9A. | CONTROLS AND PROCEDURES |
Evaluation of Disclosure Controls and Procedures
Under the supervision and with the participation of the management of the Managing Owner, including its Chief Executive Officer and Principal Financial Officer, the Trust evaluated the effectiveness of the design and operation of the disclosure controls and procedures (as defined in Rule 13a-15(e) under the Securities Exchange Act of 1934, as amended (the “Exchange Act”)), for the Trust and each Series as of December 31, 2011 (the “Evaluation Date”). Any control system, no matter how well designed and operated, can provide only reasonable (not absolute) assurance that its objectives will be met. Furthermore, no evaluation of controls can provide absolute assurance that all control issues and instances of fraud, if any, have been detected. Based upon our evaluation, the Chief Executive Officer and Principal Financial Officer of the Managing Owner concluded that, as of the Evaluation Date, the disclosure controls and procedures for the Trust and each Series were effective to provide reasonable assurance that they are timely alerted to the material information relating to the Trust and each Series required to be included in the Trust’s periodic SEC filings.
Report on Management’s Assessment of Internal Control over Financial Reporting
The management of the Managing Owner is responsible for establishing and maintaining adequate internal control over financial reporting by the Trust.
The Managing Owner’s internal control over financial reporting is a process designed to provide reasonable assurance regarding the reliability of financial reporting and the preparation of financial statements for external purposes in accordance with accounting principles generally accepted in the United States. The internal control over financial reporting for the Trust and each Series includes those policies and procedures that (i) pertain to the maintenance of records that, in reasonable detail, accurately and fairly reflect the transactions and dispositions of assets; (ii) provide reasonable assurance that transactions are recorded as necessary to permit preparation of financial statements in accordance with accounting principles generally accepted in the United States, and that receipts and expenditures are being made only in accordance with authorizations of the management of the Managing Owner; and (iii) provide reasonable assurance regarding prevention or timely detection of unauthorized acquisition, use or disposition of assets that could have a material effect on the financial statements of the Trust or any Series.
Because of its inherent limitations, internal control over financial reporting may not prevent or detect misstatements. All internal control systems, no matter how well designed, have inherent limitations, including the possibility of human error and the circumvention of overriding controls. Accordingly, even effective internal control over financial reporting can provide only reasonable assurance with respect to financial statement preparation. Also, projections of any evaluation of effectiveness to future periods are subject to the risk that controls may become inadequate because of changes in conditions, or that the degree of compliance with the policies or procedures may deteriorate.
Management assessed the effectiveness of the internal control over financial reporting for the Trust and each Series as of December 31, 2011, based on the framework set forth by the Committee of Sponsoring Organizations of the Treadway Commission (COSO) in its report entitled Internal Control-Integrated Framework. Based on that assessment, management concluded that, as of December 31, 2011, the internal control over financial reporting for the Trust and each Series is effective based on the criteria established in Internal Control-Integrated Framework.
This annual report does not include an attestation report of the Trust’s independent registered public accounting firm regarding internal control over financial reporting. Management’s report was not subject to attestation by the Trust’s independent registered public accounting firm pursuant to the rules of the SEC that permit the Trust to provide only management’s report in this annual report.
Changes in Internal Control Over Financial Reporting.
There were no changes in the Trust’s internal control over financial reporting during the year ended December 31, 2011, that have materially affected, or are reasonably likely to materially affect, the Trust’s internal control over financial reporting.
95
Scope of Exhibit 31 Certifications
The certifications of the Chief Executive Officer and the Principal Financial Officer of the Managing Owner included as Exhibits 31.1 and 31.2, respectively, to this Form 10-K apply not only to the Trust as a whole but also to each Series individually.
| Item 9B. | OTHER INFORMATION. |
None.
96
Part III
| Item 10. | DIRECTORS, EXECUTIVE OFFICERS AND CORPORATE GOVERNANCE. |
The Trust has no directors or executive officers and also does not have any employees. The Trust is managed solely by Equinox Fund Management, LLC, a Delaware limited liability company formed in June 2003, in the capacity as managing owner. The Managing Owner became registered with the CFTC as CPO as of August 6, 2003, and has been a member in the National Futures Association (the “NFA”), in such capacity since that date.
Principals of the Managing Owner
The current officers and directors of the Managing Owner are as follows:
Robert J. Enckis the President and Chief Executive Officer of the Managing Owner, and serves as a member of the management committee, or the Executive Committee. Mr. Enck has been listed as a principal of the Managing Owner since July 2007. Mr. Enck joined the Managing Owner on March 1, 2007, with more than 20 years of extensive management experience with large, highly regulated health care organizations such as Bristol-Myers Squibb and Quintiles as well as with more entrepreneurial venture capital funded organizations. Most recently, from March 2003 to March 2007, Mr. Enck was the Senior Managing Director of The Hermes Group LLC, an advisory firm that specialized in management advisory services, as well as merger and acquisition-related services. At the Hermes Group, Mr. Enck was a member of the ownership team that acquired Ascendia Brands (formerly Lander Company), a $200 million health and beauty care company. As part of this team, Mr. Enck focused on acquisitions, marketing, outsourcing initiatives and the reverse merger of Lander into a public company. Prior to joining Hermes, from March 2001 to March 2003, Mr. Enck served as a General Manager and Vice President within Quintiles Transnational, a multi-national pharmaceutical services firm with nearly two billion dollars in annual revenues. Mr. Enck joined Quintiles as a result of Quintiles’ acquisition of Beansprout Networks, where Mr. Enck served as CEO. As CEO of Beansprout, Mr. Enck conceived of and executed a dramatic refocus of the company and engineered the successful transaction with Quintiles. Prior to joining Beansprout, from September 1998 to March 2001, Mr. Enck was President of Rx Remedy Information Services, a company focused on providing pharmaceutical firms with longitudinal patient-reported health care information. Before that, Mr. Enck was with Summit Medical Systems from January 1994 to September 1998, where he held a number of senior-level positions, including President and General Manager of its subsidiary, Medical Information Systems (MIS), as well as Vice President of Sales and Marketing of parent company, Summit. Mr. Enck joined Summit when it was a private firm and was a member of the management team that grew the business and conducted a successful IPO. Additionally, Mr. Enck served as President of MIS, where he executed its sale to United Healthcare. Earlier, he spent nine years with Bristol-Myers Squibb and held management positions in the areas of managed care, government programs and sales management. Mr. Enck holds a B.S. degree in Natural Sciences from St. John’s University, Collegeville, MN and an MBA in Management from the University of St. Thomas, St. Paul, MN.
Richard E. Bornhoft is the Chairman of the Executive Committee and Chief Investment Officer of the Managing Owner. Mr. Bornhoft has been listed as a principal and registered as an associated person of the Managing Owner since August 2003. Mr. Bornhoft also is President of The Bornhoft Group Corporation, or The Bornhoft Group, and has been listed as a principal and registered as an associated person of The Bornhoft Group since September 1985 and November 1985, respectively. Mr. Bornhoft is also a principal of Bornhoft Group Securities Corporation, a registered broker/dealer. Mr. Bornhoft was a principal of SectorQuant Capital Management, LLC an investment adviser registered under the Investment Advisers Act from July 2002 until March 2009. Mr. Bornhoft has over 25 years of experience in advising both private and institutional clientele in the alternative investment industry, beginning his career in June 1979. The Bornhoft Group was formed in 1985 as an investment management firm, providing alternative investments (i.e., investments other than long-only investments in publicly-traded stocks, bonds and cash-equivalent securities) to institutions and high net worth investors. Over the past two decades, Mr. Bornhoft has been responsible for the planning and execution of The Bornhoft Group’s business strategy. This responsibility has included such tasks as the design and implementation of the asset allocation, valuation and risk management systems, and the management of client assets into alternative investment products and services. His company has designed and operated managed futures portfolios for approximately 20 pension plans, corporations and banking institutions throughout the world. From March 1990 to June 1997, Mr. Bornhoft was a principal and associated person of Hart-Bornhoft Group, Inc, a registered CTA and CPO. From July 1996 to September 2000, Mr. Bornhoft was a principal and associated person of Covenant Portfolio Management Inc., a registered CTA and CPO, and from December 1997 to March 2001, Mr. Bornhoft was a principal and associated person of Warwick Capital Management, Inc., a registered CTA. From June 1998 to August 2001, Mr. Bornhoft was a principal and associated person of The Bornhoft Advisory Group Corporation, a registered CTA. Prior to forming The Bornhoft Group in September 1985, from February 1983 to August 1985, Mr. Bornhoft was Vice-President of Product Development for the Managed Account Corporation, an investment-consulting firm that offered managed futures products to its clientele. From June 1979 to August 1985, he held various positions at a guaranteed introducing broker of Geldermann, Inc., a Chicago-based futures brokerage firm and registered FCM, including a Denver branch manager. Additional activities included developing managed futures trading systems and advising client assets in managed futures. He has served on numerous arbitration boards and various committees of certain regulatory and industry organizations and is a frequent speaker at international conferences and symposiums on alternative investments. He has written numerous articles in leading financial publications and is a contributing author to The Handbook of Managed Futures – Performance, Evaluation and Analysis (McGraw-Hill, 1997) and Searching for Alpha—The Quest for Exceptional Investment Performance (Wiley, 2000). Mr. Bornhoft was a founding principal of Morningstar Hedge Inc. He currently holds SEC/FINRA Series 7, 24 and 63 registrations, in addition to a CFTC/NFA Series 3 registration.
97
S. Brent Balesis the Principal Financial Officer and Principal Accounting Officer of the Managing Owner. Mr. Bales has been listed as a principal of the Managing Owner since August 2003. Mr. Bales is also the Vice President of Finance for The Bornhoft Group. Mr. Bales joined The Bornhoft Group in June 2000 and has been listed as a principal thereof since December 2001. Prior to that, from June 1992 through June 2000, he was employed as the Controller of Colorado Pen Company. Mr. Bales’ responsibilities include supervision of all accounting activities, valuation of client portfolios and monitoring of risk management systems. Mr. Bales has over 25 years of experience in finance, accounting and the operation of businesses, as well as over 15 years of experience in senior management positions with various start-up and developmental businesses. His past experience includes tenures with Touche Ross & Co. and other corporations with responsibilities that encompassed auditing, revenue and cost accounting, cash management and tax audit representation. Mr. Bales received his Bachelor’s degree in Accounting in 1973 from University of Denver and his Certified Public Accountant certification in 1977.
Frank J. Codeyis the Chief Operating Officer of the Managing Owner. Mr. Codey joined the Managing Owner in August 2011 and is responsible for the functional operations and infrastructure, support strategy, and third-party relationships of the Managing Owner. Mr. Codey has 25 years of experience in the financial services industry in senior operations and administrative roles. He spent most of his career at Bear Stearns & Co. Inc., an investment bank, from February 1987 until its merger with JP Morgan in June 2008. During this tenure, he held certain operations management roles and managed the Fixed Income Prime Brokerage business as well as other fee-based service offerings as a Senior Managing Director. In conjunction with the merger, Mr. Codey joined JP Morgan as an Executive Director with oversight for the Fixed Income Securities Prime Brokerage businesses of both firms. In June 2009, Mr. Codey left JP Morgan and started his own consulting company, The Colt Group, LLC, which provides advisory services to hedge funds and broker-dealers in the areas of reorganization, operational infrastructure and controls, risk management, and financing and liquidity management. Mr. Codey served as the Director of Operations at Braver Stern Securities LLC, a broker-dealer specializing in residential and commercial mortgage-backed securities from April 2010 until March 2011. Mr. Codey holds a BS in Business Administration with a concentration in Finance from Boston University, and securities licenses Series 7, 24, and 63.
Jason H. Gerbis the Chief Compliance Officer of the Managing Owner. Mr. Gerb joined the Managing Owner in July, 2011 and has been listed as a principal of the Managing Owner since October, 2011. Mr. Gerb is responsible for all compliance and regulatory oversight at Equinox. His duties include implementing and revising the necessary systems, policies, and procedures for compliance with all applicable securities laws and regulations. Prior to joining Equinox in 2011, Mr. Gerb spent six years with FINRA as a Principal Examiner, where he led teams conducting complex examinations of member firms’ operations and sales practices for compliance with NASD, FINRA, MSRB, and SEC rules and regulatory guidelines. He was also a member of FINRA’s national Regulatory Expert team concentrating on complex mutual fund and variable product sales practice issues. Mr. Gerb was employed with FINRA from May, 2005 until July, 2011. Mr. Gerb holds a Certified Mutual Fund Specialist (CMFS) designation from the Boston Institute of Finance and is a member of the Association of Certified Fraud Examiners (ACFE) and the National Society of Compliance Professionals (NSCP). He also holds the Series 7, 24, and 66 licenses. Mr. Gerb graduated from Montclair State University with a BA in Political Science and a minor in Pre-Law.
Executive Committee of the Managing Owner
The Executive Committee is responsible for the general oversight of the Managing Owner’s business and the Frontier Fund and functions like a board of directors of a corporation. The members of the Executive Committee are Richard E. Bornhoft, David DeMuth and Robert J. Enck.
Robert J. Enck—Mr. Enck’s biography appears above under the caption“The Managing Owner—Principals of the Managing Owner.”
Richard E. Bornhoft—Mr. Bornhoft’s biography appears above under the caption“The Managing Owner—Principals of the Managing Owner.”
David P. DeMuthis a member of the Executive Committee of the Managing Owner. In May 2006, he co-founded CFO Consulting Partners LLC, an entity which provides interim CFO services to public and private companies. Prior to co-founding CFO Consulting Partners LLC, he was an independent consultant providing accounting and risk management services from March 2002 to April 2006, Interim Co-Chief Financial Officer and Treasurer at Kodak Polychrome Graphics (a $2 billion global manufacturer of graphic arts materials) from September 1999 to March 2002, CFO of Troy Corporation (a $150 million global specialty chemical manufacturer) from June 1996 to September 1999, Division Vice President of Continental Grain Company (a multi-billion provider of commodities and financial services) from August 1990 to June 1996, Treasurer of National Starch and Chemical Company (a $3 billion global specialty chemical manufacturer) from March 1986 to August 1990, and Director of Tax Services at PepsiCo Inc. (a multi-billion global consumer products (beverage and food) company) from May 1980 to March 1986. His industry experience includes technology, real estate development, financial services, specialty chemicals, global manufacturing/distribution, graphic arts and consumer products. His global focus is Risk Management, Internal Controls, Structured Capital Market Transactions and Regulatory Compliance. He has developed complex global strategies to manage financial reporting, financial and operations risks and compliance with regulatory authorities (SEC, tax, etc.). He was an accountant with KPMG, an accounting firm, from September 1974 to May 1980. Mr. DeMuth holds a BS in Accounting from Loyola University, and an MBA in Finance from LaSalle University. He is a Certified Public Accountant (CPA).
98
The sole members of the Managing Owner are Plimpton Capital, LLC and The Bornhoft Group which have been registered as principals of the Managing Owner since August 2003.
There is not currently any material administrative, civil, or criminal action--whether pending, on appeal or concluded--against the trust, its principals or the managing owner.
Section 16(a) Beneficial Ownership Reporting Compliance
Section 16 of the Exchange Act requires an issuer’s directors and certain executive officers and certain other beneficial owners of the issuer’s equity securities to periodically file notices of changes in their beneficial ownership with the SEC. The Trust does not have any directors or officers. However, the officers of the Managing Owner, as well as the Managing Owner itself, file such notices regarding their beneficial ownership in the Trust, if any.
Audit Committee Financial Expert
The Trust does not have a board of directors but instead is operated and managed by the Managing Owner. The Executive Committee of the Managing Owner has created an audit committee of the Trust consisting of all of the Executive Committee’s members. The Executive Committee of the Managing Owner, in its capacity as the audit committee for the Trust, has determined that Robert J. Enck, the Chief Executive Officer of the Managing Owner, qualifies as an “audit committee financial expert” in accordance with the applicable rules and regulations of the SEC. Mr. Enck is not independent of management.
Code of Ethics
The Trust has not adopted a code of ethics because it does not have any officers or employees. The Managing Owner has adopted a code of ethics for employees and principals of the Managing Owner.
In general, the Managing Owner, its principals, and all other persons associated with the Managing Owner shall observe high standards of commercial honor and just and equitable principles of trade in the conduct of their commodity futures business. All employees including anyone not on the regular payroll but filling in on a temporary basis shall be held to the highest standards of honesty and integrity. This conduct will be valid for all duties involved with the daily management and responsibilities as Managing Owner of the Trust.
Employees will conduct their daily duties in a responsible manner to ensure that all customers are treated fairly and equally. The reputation of the Managing Owner is crucial to its business, and understanding that the Managing Owner will make every effort to ensure the reputation of the Managing Owner is not tarnished in any way. Employees are urged to seek the advice of their supervisor for any questions applicable to this code relative to their individual circumstances.
| Item 11. | EXECUTIVE COMPENSATION. |
The Trust has no directors or officers. Its affairs are managed solely by the Managing Owner, which receives compensation for its services from the Trust, as follows:
Management Fees
Each Series of Units pays to the Managing Owner a monthly management fee equal to a certain percentage of the assets attributable to such Series’(including notional assets), calculated on a daily basis. The annual rate of the management fee is: 0.5% for the Balanced Series; 0.75% for the Frontier Diversified Series; 2.0% for the Frontier Masters Series, Winton Series, Currency Series, Long Only Commodity Series and Managed Futures Index Series; 2.5% for the Winton/Graham Series and Berkeley/Graham/Tiverton Series; and 3.5% for the Frontier Long/Short Commodity Series. The Managing Owner does not charge a management fee for the assets of the Frontier Dynamic Series committed to one or more Swaps which reference one or more managed futures programs that already include Trading Advisor management fees. The Managing Owner may pay all or a portion of such management fees to the Trading Advisor(s) for each Series.
99
Incentive Fees
Some Series pay to the Managing Owner an incentive fee of a certain percentage of new net trading profits generated by such Series, monthly or quarterly. Because the Frontier Diversified Series, Frontier Masters Series, Balanced Series, Winton/Graham Series, Berkeley/Graham/Tiverton Series, Currency Series and Frontier Long/Short Commodity Series may each employ multiple Trading Advisors, these Series will pay the Managing Owner a monthly incentive fee calculated on a Trading Advisor by Trading Advisor basis. It is therefore possible that in any given period these Series may pay incentive fees to the Managing Owner for one or more Trading Advisors while each of these Series as a whole experiences losses. The incentive fee is 25% for the Frontier Diversified Series, Balanced Series and 20% for the Frontier Masters Series, Winton Series, Currency Series, Winton/Graham Series, Berkeley/Graham/Tiverton Series and Frontier Long/Short Commodity Series. There is no incentive fee for the Frontier Dynamic Series, Long Only Commodity Series or the Managed Futures Index Series. The Managing Owner may pay all or a portion of such incentive fees to the Trading Advisor(s) for such Series.
Interest Income
Aggregate interest income from all sources, including assets held at clearing brokers, up to 2% (annualized) is paid to the Managing Owner by the Balanced Series (Class 1 and Class 2 only), Winton Series, Berkeley/Graham/Tiverton Series, Currency Series and Winton/Graham Series. For the Frontier Diversified Series, Frontier Dynamic Series, Frontier Long/Short Commodity Series, Frontier Masters Series, Balanced Series (Class 1a and Class 2a only), Long Only Commodity Series and Managed Futures Index Series, 20% of the total interest allocated to each Series is paid to the Managing Owner.
Other Fees
The Frontier Long/Short Commodity Series (Classes 1,2 and 3), Balanced Series, Currency Series, Berkeley/Graham/Tiverton Series, Long/Only Commodity Series, Managed Futures Index Series, Winton Series and Winton/Graham Series pays to the Managing Owner a monthly trading fee, or FCM Fee, up to 1/12th of 0.75% of such Series’ NAV, calculated daily. The Frontier Diversified Series, Frontier Dynamic Series, Frontier Long/Short Commodity Series (Classes 1a and 2a) and Frontier Masters Series pays to the Managing Owner a monthly trading fee, or FCM Fee, up to 1/12th of 2.25% and a custodial/due diligence fee of 1/12th of 0.12% of such Series’ NAV, calculated daily. Also, a monthly service fee equal to 3.0% of the NAV, calculated daily, is paid to the Managing Owner. The Managing Owner pays the service fee to Selling Agents to assist in the making of offers and sales of Units and provide customary ongoing services including advising Limited Owners. To the extent that an affiliate of the Managing Owner provides such services, it may receive service fees in proportion to the valuation of its clients’ accounts.
| Item 12. | SECURITY OWNERSHIP OF CERTAIN BENEFICIAL OWNERS AND MANAGEMENT AND RELATED STOCKHOLDER MATTERS. |
The Trust has no officers or directors. Its affairs are managed solely by the Managing Owner. Set forth in the table below is information regarding the beneficial ownership of Units of the principals of the Managing Owner as of March 6, 2012:
Equinox Fund Management, LLC*:
| | | | | | | | |
Series/Class of Units | | Units Owned | | | Percentage Ownership
of Each Series/Class | |
Frontier Diversified Series – Class 1 | | | 275 | | | | 0.04 | % |
Frontier Diversified Series – Class 2 | | | 14,301 | | | | 2.45 | % |
Frontier Long/Short Commodity Series – Class 1a | | | 117 | | | | 0.07 | % |
Frontier Long/Short Commodity Series – Class 2 | | | 3,083 | | | | 5.53 | % |
Frontier Long/Short Commodity Series – Class 2a | | | 2,222 | | | | 2.45 | % |
Frontier Masters Series – Class 1 | | | 275 | | | | 0.08 | % |
Frontier Masters Series – Class 2 | | | 5,627 | | | | 3.24 | % |
Balanced Series – Class 2 | | | 21,620 | | | | 5.42 | % |
Balanced Series – Class 2a | | | 1,237 | | | | 8.43 | % |
Currency Series – Class 2 | | | 29 | | | | 3.29 | % |
Berkeley/Graham/Tiverton Series – Class 2 | | | 70 | | | | 0.18 | % |
Winton Series – Class 2 | | | 207 | | | | 0.29 | % |
Winton/Graham Series – Class 2 | | | 428 | | | | 1.02 | % |
| * | The Managing Owner is required to maintain at least a 1% interest in the aggregate capital, profits and losses of the Trust. The Managing Owner’s interest of $6,411,746 in the aggregate capital of the Trust of $605,234,310 at March 6, 2012 is 1.06%. |
100
| Item 13. | CERTAIN RELATIONSHIPS AND RELATED TRANSACTIONS. |
The Trust has and will continue to have certain relationships with the Managing Owner and its affiliates. However, there have been no direct financial transactions between the Trust and the directors or officers of the Managing Owner. See “Item 11. Executive Compensation” and “Item 12. Security Ownership of Certain Beneficial Owners and Management.”
| Item 14. | PRINCIPAL ACCOUNTANT FEES AND SERVICES. |
The following table sets forth the fees billed to Equinox Fund Management, LLC, the Managing Owner of the Trust, for professional services provided by McGladrey & Pullen, LLP, the Trust’s independent registered public accounting firm, for the years ended December 31, 2011 and 2010. In accordance with the prospectus of the Trust, the Managing Owner has agreed to pay all costs of the Trust, and the Trust therefore bears no direct obligation to its independent registered public accounting firm.
| | | | | | | | |
FEE CATEGORY | | 2011 | | | 2010 | |
Audit Fees(1) | | $ | 368,500 | | | $ | 343,550 | |
Audit-Related Fees(2) | | $ | 0 | | | $ | 0 | |
Tax Fees(3) | | $ | 0 | | | $ | 0 | |
All Other Fees(4) | | $ | 0 | | | $ | 0 | |
TOTAL FEES | | $ | 368,500 | | | $ | 343,550 | |
| (1) | Audit Fees consist of fees for professional services rendered for the audit of the Trust’s financial statements and review of financial statements included in the Trust’s quarterly reports, as well as services normally provided by the independent accountant in connection with statutory and regulatory filings or engagements. |
| (2) | Audit-Related Fees consist of fees for assurance and related services by McGladrey & Pullen, LLP that are reasonably related to the performance of the audit or review of the Trust’s financial statements and are not reported under “Audit Fees,” above. |
| (3) | Tax Fees consist of fees for professional services rendered for tax compliance, tax advice and tax planning. |
| (4) | All Other Fees consist of any fees not otherwise reported in this table |
The Managing Owner approved all the services provided by McGladrey & Pullen, LLP to the Trust described above. The Managing Owner has determined that the payments made to McGladrey & Pullen, LLP for these services during 2011 and 2010 are compatible with maintaining that firm’s independence. The Managing Owner pre-approves all audit and allowed non-audit services of the Trust’s independent registered public accounting firm, including all engagement fees and terms.
101
Part IV
| Item 15. | EXHIBITS AND FINANCIAL STATEMENT SCHEDULES |
| | |
(a)(1) and (2) | | The response to these portions of Item 15 is submitted as a separate section of this report commencing on page F-1. |
| |
(a)(3) | | Exhibits (numbered in accordance with Item 601 of Regulation S-K). |
| |
1.1 | | Form of Selling Agent Agreement among the Registrant, Equinox Fund Management, LLC and the Selling Agents**** |
| |
1.2 | | Form of Amendment Agreement among the Registrant, Equinox Fund Management, LLC and the Selling Agents** |
| |
1.3 | | Form of Amendment Agreement among the Registrant, Equinox Fund Management, LLC and the Selling Agents*** |
| |
1.4 | | Form of Amendment Agreement among the Registrant, Equinox Fund Management, LLC and the Selling Agents*** |
| |
1.5 | | Form of Amendment Agreement among the Registrant, Equinox Fund Management, LLC and the Selling Agents**** |
| |
1.6 | | Form of Amendment Agreement among the Registrant, Equinox Fund Management, LLC and the Selling Agents**** |
| |
4.1 | | Declaration of Trust and Amended and Restated Trust Agreement of the Registrant (annexed to the Prospectus as Exhibit A)**** |
| |
4.2 | | Form of Subscription Agreement (annexed to the Prospectus as Exhibit B)**** |
| |
4.3 | | Form of Exchange Request (annexed to the Prospectus as Exhibit C)**** |
| |
4.4 | | Form of Request for Redemption (annexed to the Prospectus as Exhibit D)**** |
| |
4.5 | | Form of Request for Additional Subscription (annexed to the Prospectus as Exhibit E)**** |
| |
4.6 | | Form of Application for Transfer of Ownership / Re-registration Form (annexed to the Prospectus as Exhibit F)**** |
| |
4.7 | | Form of Privacy Notice (annexed to the Prospectus as Exhibit G)**** |
| |
10.1 | | Form of Amended and Restated Escrow Agreement among the Registrant, Equinox Fund Management, LLC, Bornhoft Group Securities Corporation and the U.S. Bank National Association, Denver Colorado*** |
| |
10.2 | | Form of Brokerage Agreement between each Trading Company and UBS Securities, LLC* |
| |
10.21 | | Form of Brokerage Agreement between each Trading Company and Banc of America Futures Incorporated* |
| |
10.22 | | Form of Brokerage Agreement between the Managing Owner, acting as agent on behalf of certain Trading Companies, and Deutsche Bank AG London** |
| |
10.23 | | Form of Brokerage Agreement between each Trading Company and Man Financial Inc. *** |
| |
10.24 | | Form of Amendment Agreement between the Managing Owner, acting as agent on behalf of certain Trading Companies, and Deutsche Bank AG London*** |
| |
10.25 | | Form of Brokerage Agreement between each Trading Company and Fimat USA, LLC**** |
| |
10.3 | | Form of Advisory Agreement among the Registrant, the Trading Company, Equinox Fund Management, LLC, and each Trading Advisor**** |
| |
10.31 | | Form of International Swaps and Derivatives Association Master Agreement, including all Schedules thereto and the Credit Support Annex thereto entered into for the Long Only Commodity Series of the Registrant*** |
| |
10.32 | | Form of License Agreement among Jefferies Financial Products, LLC, Reuters America LLC, the Registrant and Equinox Fund Management, LLC*** |
| |
10.33 | | Form of License Agreement among Jefferies Financial Products, the Registrant and Equinox Fund Management, LLC*** |
| |
10.34 | | Form of Guaranty made by Jefferies Group, Inc. in favor of Frontier Trading Company VIII, LLC*** |
| |
10.35 | | Form of International Swaps and Derivatives Association Master Agreement, including all Schedules thereto and the Credit Support Annex thereto entered into for the Currency Series of the Registrant*** |
102
| | |
10.36 | | Form of International Swaps and Derivatives Association Master Agreement, including all Schedules thereto and the Credit Support Annex thereto entered into for the Managed Futures Index Series of the Registrant*** |
| |
10.37 | | Form of International Swaps and Derivatives Association Master Agreement, including all Schedules thereto and the Credit Support Annex thereto entered into for the Balanced Series of the Registrant+ |
| |
10.4 | | Form of Cash Management Agreement between Equinox Fund Management, LLC and Merrill Lynch** |
| |
10.41 | | Form of Cash Management Agreement between Equinox Fund Management, LLC and STW Fixed Income Management Ltd.*** |
| |
10.5 | | Form of single-member limited liability company operating agreement governing each Trading Company*** |
| |
21.1 | | Subsidiaries of Registrant. (filed herewith) |
| |
23.1 | | Consent of Independent Registered Public Accounting Firm |
| |
31.1 | | Certification of Principal Executive Officer of the Managing Owner pursuant to Rules 13a-14(a) and 15d-14(a) of the Securities Exchange Act of 1934. (filed herewith) |
| |
31.2 | | Certification of Principal Executive Officer of the Managing Owner pursuant to Rules 13a-14(a) and 15d-14(a) of the Securities Exchange Act of 1934. (filed herewith) |
| |
32.1 | | Certification pursuant to 18 U.S.C. Section 1350, as enacted by Section 906 of The Sarbanes-Oxley Act of 2002. (furnished herewith) |
| |
32.2 | | Certification pursuant to 18 U.S.C. Section 1350, as enacted by Section 906 of The Sarbanes-Oxley Act of 2002. (furnished herewith) |
| |
32.3 | | Certification pursuant to 18 U.S.C. Section 1350, as enacted by Section 906 of The Sarbanes-Oxley Act of 2002. (furnished herewith) |
| |
32.4 | | Certification pursuant to 18 U.S.C. Section 1350, as enacted by Section 906 of The Sarbanes-Oxley Act of 2002. (furnished herewith) |
| |
32.5 | | Certification pursuant to 18 U.S.C. Section 1350, as enacted by Section 906 of The Sarbanes-Oxley Act of 2002. (furnished herewith) |
| |
32.6 | | Certification pursuant to 18 U.S.C. Section 1350, as enacted by Section 906 of The Sarbanes-Oxley Act of 2002. (furnished herewith) |
| |
32.7 | | Certification pursuant to 18 U.S.C. Section 1350, as enacted by Section 906 of The Sarbanes-Oxley Act of 2002. (furnished herewith) |
| |
32.8 | | Certification pursuant to 18 U.S.C. Section 1350, as enacted by Section 906 of The Sarbanes-Oxley Act of 2002. (furnished herewith) |
| |
32.9 | | Certification pursuant to 18 U.S.C. Section 1350, as enacted by Section 906 of The Sarbanes-Oxley Act of 2002. (furnished herewith) |
| |
32.10 | | Certification pursuant to 18 U.S.C. Section 1350, as enacted by Section 906 of The Sarbanes-Oxley Act of 2002. (furnished herewith) |
| |
32.11 | | Certification pursuant to 18 U.S.C. Section 1350, as enacted by Section 906 of The Sarbanes-Oxley Act of 2002. (furnished herewith) |
| |
32.12 | | Certification pursuant to 18 U.S.C. Section 1350, as enacted by Section 906 of The Sarbanes-Oxley Act of 2002. (furnished herewith) |
| |
99.1 | | Definitive Prospectus of The Frontier Fund++ |
| |
101 | | Financials in XBRL format (1) |
103
| * | Previously filed as like-numbered exhibit to the initial filing or the first, second, third or fourth pre-effective amendment or the first or second post-effective amendment to Registration Statement No. 333-108397 and incorporated by reference herein. |
| ** | Previously filed as like-numbered exhibit to the initial filing or the first pre-effective amendment or the first or second post-effective amendment to Registration Statement No. 333-119596 and incorporated by reference herein. |
| *** | Previously filed as like-numbered exhibit to the initial filing or the first pre-effective amendment or the first post-effective amendment to Registration Statement No. 333-129701 and incorporated by reference herein. |
| **** | Previously filed as like-numbered exhibit to the initial filing or the first pre-effective amendment or the first post-effective amendment to Registration Statement No. 333-140240 and incorporated by reference herein. |
| + | Previously filed as like-numbered exhibit on Form 10-Q for the period ended June 30, 2008. |
| ++ | Previously filed on April 29, 2011 pursuant to Rule 424(b)(3) of the Securities Act (File No. 333-164629). |
| ^ | Submitted electronically herewith. |
| (1) | IN ACCORDANCE WITH THE TEMPORARY HARDSHIP EXEMPTION PROVIDED BY RULE 201 OF REGULATION S-T, THE DATE BY WHICH THE INTERACTIVE DATA FILE IS REQUIRED TO BE SUBMITTED HAS BEEN EXTENDED BY SIX BUSINESS DAYS. |
104
INDEX TO THE SERIES FINANCIAL STATEMENTS
| | | | |
Report of Independent Registered Public Accounting Firm | | | F-2 | |
| |
Statements of Financial Condition as of December 31, 2011 and 2010 | | | F-3 | |
| |
Condensed Schedules of Investments as of December 31, 2011 | | | F-7 | |
| |
Condensed Schedules of Investments as of December 31, 2010 | | | F-10 | |
| |
Statements of Operations for the years ended December 31, 2011, 2010 and 2009 | | | F-13 | |
| |
Statements of Changes in Owners’ Capital for the years ended December 31, 2011, 2010 and 2009 | | | F-22 | |
| |
Statements of Cash Flows for the years ended December 31, 2011, 2010 and 2009 | | | F-23 | |
| |
Notes to Financial Statements | | | F-37 | |
| |
INDEX TO THE TRUST FINANCIAL STATEMENTS (1) | | | | |
| |
Report of Independent Registered Public Accounting Firm | | | F-62 | |
| |
Consolidated Statements of Financial Condition as of December 31, 2011 and 2010 | | | F-63 | |
| |
Consolidated Condensed Schedules of Investments as of December 31, 2011 | | | F-64 | |
| |
Consolidated Condensed Schedules of Investments as of December 31, 2010 | | | F-65 | |
| |
Consolidated Statements of Operations for the years ended December 31, 2011, 2010 and 2009 | | | F-66 | |
| |
Consolidated Statements of Changes in Members’ Equity for the years ended December 31, 2011, 2010 and 2009 | | | F-67 | |
| |
Consolidated Statements of Cash Flows for the years ended December 31, 2011, 2010 and 2009 | | | F-68 | |
| |
Notes to Consolidated Financial Statements | | | F-69 | |
| |
INDEX TO TRADING COMPANY FINANCIAL STATEMENTS (2) | | | | |
| |
Report of Independent Registered Public Accounting Firm | | | F-85 | |
| |
Statements of Financial Condition as of December 31, 2011 and 2010 | | | F-86 | |
| |
Condensed Schedules of Investments as of December 31, 2011 | | | F-88 | |
| |
Condensed Schedules of Investments as of December 31, 2010 | | | F-92 | |
| |
Statements of Operations for the years ended December 31, 2011, 2010 and 2009 | | | F-96 | |
| |
Statements of Changes in Members’ Equity for the years ended December 31, 2011, 2010 and 2009 | | | F-98 | |
| |
Statements of Cash Flows for the years ended December 31, 2011, 2010 and 2009 | | | F-100 | |
| |
Notes to Financial Statements | | | F-102 | |
| (1) | These financial statements represent the consolidated financial statements of the Series of the Trust. |
| (2) | The Trust holds a majority of the equity interests in the various Trading Companies, which are the trading vehicles established for the various Series of Units of the Trust. In the financial statements of the Trust, Trading Companies in which a Series has a majority equity interest are consolidated by such Series, and investments in Trading Companies in which a Series does not have a controlling or majority interest are accounted for under the equity method of accounting, which approximates fair value and are carried in the statement of financial condition of such Series at fair value. In addition, financial statements of each of the unconsolidated Trading Companies are included in accordance with Rule 3-09 of Regulation S-X under the Securities Act of 1933, as amended. Although not required pursuant to Rule 3-09 of Regulation S-X under the Securities Act of 1933, financial statements of each consolidated Trading Company of the Trust are also included in the interest of providing a more complete presentation. |
F-1
Report of Independent Registered Public Accounting Firm
To the Executive Committee and Unitholders
The Frontier Fund
We have audited the accompanying statements of financial condition, including the condensed schedules of investments, of the Frontier Diversified Series, Frontier Dynamic Series, Frontier Long/Short Commodity Series, Frontier Masters Series, Balanced Series, Berkeley/Graham/Tiverton Series (formerly, Campbell/Graham/Tiverton Series), Currency Series, Long Only Commodity Series, Managed Futures Index Series, Winton Series and the Winton/Graham Series of The Frontier Fund (collectively, the Series) as of December 31, 2011 and 2010, and the related statements of operations, changes in owners’ capital, and cash flows for each of the three years in the period ended December 31, 2011. These financial statements are the responsibility of the Series’ management. Our responsibility is to express an opinion on these financial statements based on our audits.
We conducted our audits in accordance with the standards of the Public Company Accounting Oversight Board (United States). Those standards require that we plan and perform the audit to obtain reasonable assurance about whether the financial statements are free of material misstatement. The Series are not required to have, nor were we engaged to perform an audit of its internal control over financial reporting. Our audits included consideration of internal control over financial reporting as a basis for designing audit procedures that are appropriate in the circumstances, but not for the purpose of expressing an opinion on the effectiveness of the Series’ internal control over financial reporting. Accordingly, we express no such opinion. An audit also includes examining, on a test basis, evidence supporting the amounts and disclosures in the financial statements, assessing the accounting principles used and significant estimates made by management, as well as evaluating the overall financial statement presentation. We believe that our audits provide a reasonable basis for our opinion.
In our opinion, the financial statements referred to above present fairly, in all material respects, the financial position of the Frontier Diversified Series, Frontier Dynamic Series, Frontier Long/Short Commodity Series, Frontier Masters Series, Balanced Series, Berkeley/Graham/Tiverton Series (formerly, Campbell/Graham/Tiverton Series), Currency Series, Long Only Commodity Series, Managed Futures Index Series, Winton Series and the Winton/Graham Series of The Frontier Fund as of December 31, 2011 and 2010, and the results of their operations and their cash flows for each of the three years in the period ended December 31, 2011, in conformity with U.S. generally accepted accounting principles.
/s/ McGladrey & Pullen, LLP
Denver, Colorado
March 30, 2012
F-2
The Series of the Frontier Fund
Statements of Financial Condition
December 31, 2011 and 2010
| | | | | | | | | | | | | | | | | | | | | | | | |
| | | Frontier Diversified | | | Frontier Dynamic | | | Frontier Long/Short | |
| | | Series | | | Series (1) | | | Commodity Series | |
| | | 12/31/2011 | | | 12/31/2010 | | | 12/31/2011 | | | 12/31/2010 | | | 12/31/2011 | | | 12/31/2010 | |
| ASSETS | | | | | | | | | | | | | | | | | | | | | | | | |
Cash and cash equivalents | | $ | 4,976,749 | | | $ | 4,647,422 | | | $ | — | | | $ | 498,048 | | | $ | 3,045,849 | | | $ | 1,114,912 | |
U.S. Treasury securities, at fair value | | | 16,557,304 | | | | 13,620,730 | | | | — | | | | 2,796,510 | | | | 9,466,240 | | | | 6,801,035 | |
Custom time deposits | | | 75,318,509 | | | | 77,115,708 | | | | — | | | | 15,832,842 | | | | 43,061,546 | | | | 38,505,033 | |
Receivable from futures commission merchants | | | — | | | | — | | | | — | | | | — | | | | 47,822,021 | | | | — | |
Swap contracts, at fair value | | | 131,004 | | | | 11,407,905 | | | | — | | | | 10,956,772 | | | | 74,89 8 | | | | — | |
Investments in unconsolidated trading companies, at fair value | | | 38,240,171 | | | | 54,940,095 | | | | — | | | | — | | | | 4,081,988 | | | | 32,964,448 | |
Prepaid service fees - Class 1 | | | 162,977 | | | | 407,844 | | | | — | | | | 6,542 | | | | 96,503 | | | | 47,889 | |
Interest receivable | | | 228,877 | | | | 185,893 | | | | — | | | | 38,166 | | | | 130,855 | | | | 92,819 | |
Receivable from related parties | | | 16,362 | | | | 90,000 | | | | — | | | | — | | | | 4,071 | | | | — | |
Other assets | | | 10,129 | | | | 60 | | | | — | | | | 12 | | | | 9,592 | | | | 212 | |
| | | | | | | | | | | | | | | | | | | | | | | | |
Total Assets | | $ | 135,642,082 | | | $ | 162,415,657 | | | $ | — | | | $ | 30,128,892 | | | $ | 107,793,563 | | | $ | 79,526,348 | |
| | | | | | | | | | | | | | | | | | | | | | | | |
| LIABILITIES & CAPITAL | | | | | | | | | | | | | | | | | | | | | | | | |
LIABILITIES | | | | | | | | | | | | | | | | | | | | | | | | |
Inter-series payables, at fair value | | $ | — | | | $ | — | | | $ | — | | | $ | 28,320,283 | | | $ | — | | | $ | — | |
Open trade deficit, at fair value | | | — | | | | — | | | | — | | | | — | | | | 25,934,678 | | | | — | |
Pending owner additions | | | 243,088 | | | | 622,918 | | | | — | | | | 70,000 | | | | 40,966 | | | | 125,967 | |
Owner redemptions payable | | | 321,138 | | | | 219,042 | | | | — | | | | 28,323 | | | | 84,705 | | | | 161,182 | |
Incentive fees payable to Managing Owner | | | 522,033 | | | | 1,453,102 | | | | — | | | | — | | | | 127,052 | | | | 1,600,703 | |
Management fees payable to Managing Owner | | | 180,232 | | | | 139,758 | | | | — | | | | — | | | | 284,677 | | | | 300,038 | |
Interest payable to Managing Owner | | | 53,915 | | | | 52,961 | | | | — | | | | 10,064 | | | | 30,614 | | | | 21,144 | |
Trading fees payable to Managing Owner | | | 269,021 | | | | 310,302 | | | | — | | | | 59,936 | | | | 83,646 | | | | 44,699 | |
Trailing service fees payable to Managing Owner | | | 76,877 | | | | 48,903 | | | | — | | | | 726 | | | | 22,920 | | | | 69,686 | |
Payables to related parties | | | — | | | | 57,770 | | | | — | | | | 6,585 | | | | — | | | | 8,528 | |
Other liabilities | | | 2,174 | | | | 14,929 | | | | — | | | | 53 | | | | — | | | | 10,961 | |
| | | | | | | | | | | | | | | | | | | | | | | | |
Total Liabilities | | | 1,668,478 | | | | 2,919,685 | | | | — | | | | 28,495,970 | | | | 26,609,258 | | | | 2,342,908 | |
| | | | | | | | | | | | | | | | | | | | | | | | |
CAPITAL | | | | | | | | | | | | | | | | | | | | | | | | |
Managing Owner Units - Class 1 | | | 27,334 | | | | 28,484 | | | | — | | | | 25,282 | | | | — | | | | — | |
Managing Owner Units - Class 1a | | | — | | | | — | | | | — | | | | — | | | | 14,271 | | | | 32,439 | |
Managing Owner Units - Class 2 | | | 1,486,740 | | | | 1,627,227 | | | | — | | | | 25,960 | | | | 499,336 | | | | 1,309,512 | |
Managing Owner Units - Class 2a | | | — | | | | — | | | | — | | | | — | | | | 282,740 | | | | 33,324 | |
Limited Owner Units - Class 1 | | | 72,397,572 | | | | 89,993,647 | | | | — | | | | 1,193,940 | | | | 4,159,047 | | | | 31,185,756 | |
Limited Owner Units - Class 1a | | | — | | | | — | | | | — | | | | — | | | | 18,877,124 | | | | 5,619,870 | |
Limited Owner Units - Class 2 | | | 60,061,958 | | | | 67,846,614 | | | | — | | | | 387,740 | | | | 8,689,426 | | | | 14,275,466 | |
Limited Owner Units - Class 2a | | | — | | | | — | | | | — | | | | — | | | | 10,628,724 | | | | 3,728,502 | |
Limited Owner Units - Class 3 | | | — | | | | — | | | | — | | | | — | | | | 27,810,058 | | | | 20,998,571 | |
| | | | | | | | | | | | | | | | | | | | | | | | |
Total Owners’ Capital | | | 133,973,604 | | | | 159,495,972 | | | | — | | | | 1,632,922 | | | | 70,960,726 | | | | 77,183,440 | |
| | | | | | | | | | | | | | | | | | | | | | | | |
Non-Controlling Interests | | | — | | | | — | | | | — | | | | — | | | | 10,223,579 | | | | — | |
| | | | | | | | | | | | | | | | | | | | | | | | |
Total Capital | | | 133,973,604 | | | | 159,495,972 | | | | — | | | | 1,632,922 | | | | 81,184,305 | | | | 77,183,440 | |
| | | | | | | | | | | | | | | | | | | | | | | | |
Total Liabilities and Capital | | $ | 135,642,082 | | | $ | 162,415,657 | | | $ | — | | | $ | 30,128,892 | | | $ | 107,793,563 | | | $ | 79,526,348 | |
| | | | | | | | | | | | | | | | | | | | | | | | |
Units Outstanding | | | | | | | | | | | | | | | | | | | | | | | | |
Class 1 | | | 728,645 | | | | 869,125 | | | | — | | | | 13,262 | | | | 30,551 | | | | 234,956 | |
Class 1a | | | N/A | | | | N/A | | | | N/A | | | | N/A | | | | 155,216 | | | | 47,917 | |
Class 2 | | | 592,037 | | | | 652,590 | | | | — | | | | 4,382 | | | | 56,731 | | | | 101,687 | |
Class 2a | | | N/A | | | | N/A | | | | N/A | | | | N/A | | | | 85,760 | | | | 31,044 | |
Class 3 | | | N/A | | | | N/A | | | | N/A | | | | N/A | | | | 171,708 | | | | 137,017 | |
Net Asset Value per Unit | | | | | | | | | | | | | | | | | | | | | | | | |
Class 1 | | $ | 99.40 | | | $ | 103.58 | | | $ | 88.05 | (1) | | $ | 91.94 | | | $ | 136.13 | | | $ | 132.73 | |
Class 1a | | | N/A | | | | N/A | | | | N/A | | | | N/A | | | $ | 121.71 | | | $ | 117.96 | |
Class 2 | | $ | 103.96 | | | $ | 106.46 | | | $ | 91.26 | (1) | | $ | 94.40 | | | $ | 161.97 | | | $ | 153.26 | |
Class 2a | | | N/A | | | | N/A | | | | N/A | | | | N/A | | | $ | 127.23 | | | $ | 121.18 | |
Class 3 | | | N/A | | | | N/A | | | | N/A | | | | N/A | | | $ | 161.96 | | | $ | 153.26 | |
| (1) | The Frontier Dynamic Series ceased trading operations on July 15, 2011 and redeemed all existing Units. Net asset value per unit represents the liquidation value. The Series remains open. |
The accompanying notes are an integral part of these financial statements.
F-3
The Series of the Frontier Fund
Statements of Financial Condition
December 31, 2011 and 2010
| | | | | | | | | | | | | | | | | | | | | | | | |
| | | Frontier Masters Series | | | Balanced Series | | | Berkeley/Graham/Tiverton Series (1) | |
| | | 12/31/2011 | | | 12/31/2010 | | | 12/31/2011 | | | 12/31/2010 | | | 12/31/2011 | | | 12/31/2010 | |
| ASSETS | | | | | | | | | | | | | | | | | | | | | | | | |
Cash and cash equivalents | | $ | 2,234,716 | | | $ | 1,207,290 | | | $ | 9,758,138 | | | $ | 5,375,950 | | | $ | 1,352,378 | | | $ | 1,341,151 | |
U.S. Treasury securities, at fair value | | | 7,232,546 | | | | 3,543,554 | | | | 29,168,216 | | | | 27,253,497 | | | | 4,347,398 | | | | 7,024,829 | |
Custom time deposits | | | 32,900,559 | | | | 20,062,341 | | | | 132,685,042 | | | | 154,299,574 | | | | 19,776,137 | | | | 39,772,074 | |
Receivable from futures commission merchants | | | 5,107,749 | | | | — | | | | 74,736,294 | | | | 85,398,794 | | | | — | | | | — | |
Open trade equity, at fair value | | | 792,372 | | | | — | | | | 13,104,541 | | | | 30,878,505 | | | | — | | | | — | |
Swap contracts, at fair value | | | 57,225 | | | | 26,242,246 | | | | 23,819,312 | | | | 49,811,462 | | | | 34,397 | | | | — | |
Investments in unconsolidated trading companies, at fair value | | | 4,717,914 | | | | 15,921,658 | | | | 18,255,809 | | | | 42,072,378 | | | | 8,234,047 | | | | 12,665,871 | |
Investment in Berkeley Quantitative Colorado Fund LLC, at fair value | | | — | | | | — | | | | — | | | | — | | | | 6,270,844 | | | | 10,157,099 | |
Inter-series receivables, at fair value | | | — | | | | — | | | | — | | | | 41,137,058 | | | | — | | | | — | |
Prepaid service fees - Class 1 | | | 50,950 | | | | 204,960 | | | | — | | | | 3 | | | | — | | | | 16 | |
Interest receivable | | | 99,978 | | | | 48,362 | | | | 403,201 | | | | 371,950 | | | | 60,095 | | | | 95,873 | |
Other assets | | | 6,162 | | | | 15 | | | | 48,273 | | | | 18,859 | | | | 7,914 | | | | 136 | |
| | | | | | | | | | | | | | | | | | | | | | | | |
Total Assets | | $ | 53,200,171 | | | $ | 67,230,426 | | | $ | 301,978,826 | | | $ | 436,618,030 | | | $ | 40,083,210 | | | $ | 71,057,049 | |
| | | | | | | | | | | | | | | | | | | | | | | | |
| LIABILITIES & CAPITAL | | | | | | | | | | | | | | | | | | | | | | | | |
LIABILITIES | | | | | | | | | | | | | | | | | | | | | | | | |
Short options written, at fair value | | $ | — | | | $ | — | | | $ | 3,326,453 | | | $ | 4,788,295 | | | $ | — | | | $ | — | |
Pending owner additions | | | 22,716 | | | | 146,000 | | | | 45,208 | | | | — | | | | 3,396 | | | | — | |
Owner redemptions payable | | | 4,996 | | | | 183,222 | | | | 84,710 | | | | 112,581 | | | | 182,552 | | | | 96,181 | |
Incentive fees payable to Managing Owner | | | — | | | | 229,686 | | | | 1,195,031 | | | | 2,688,776 | | | | — | | | | 270,557 | |
Management fees payable to Managing Owner | | | 117,541 | | | | 108,531 | | | | 241,525 | | | | 114,145 | | | | 101,400 | | | | 152,455 | |
Interest payable to Managing Owner | | | 23,408 | | | | 13,334 | | | | 397,864 | | | | 149,043 | | | | 68,021 | | | | 119,500 | |
Trading fees payable to Managing Owner | | | 105,278 | | | | 131,841 | | | | 176,398 | | | | 71,087 | | | | 25,212 | | | | 29,714 | |
Trailing service fees payable to Managing Owner | | | 41,911 | | | | 21,894 | | | | 435,380 | | | | 196,325 | | | | 87,016 | | | | 148,307 | |
Payables to related parties | | | 56 | | | | 113,911 | | | | 2,408 | | | | 67,515 | | | | 268 | | | | 10,054 | |
Other liabilities | | | 856 | | | | 6,277 | | | | 8,437 | | | | 3,129 | | | | 1,373 | | | | 953 | |
| | | | | | | | | | | | | | | | | | | | | | | | |
Total Liabilities | | | 316,762 | | | | 954,696 | | | | 5,913,414 | | | | 8,190,896 | | | | 469,238 | | | | 827,721 | |
| | | | | | | | | | | | | | | | | | | | | | | | |
CAPITAL | | | | | | | | | | | | | | | | | | | | | | | | |
Managing Owner Units - Class 1 | | | 27,569 | | | | 28,315 | | | | — | | | | — | | | | — | | | | — | |
Managing Owner Units - Class 2 | | | 589,893 | | | | 696,838 | | | | 3,351,608 | | | | 2,679,852 | | | | 7,878 | | | | 136,528 | |
Managing Owner Units - Class 2a | | | — | | | | — | | | | 158,814 | | | | 165,380 | | | | — | | | | — | |
Limited Owner Units - Class 1 | | | 34,062,567 | | | | 41,185,360 | | | | 183,785,318 | | | | 287,807,510 | | | | 35,180,631 | | | | 61,842,996 | |
Limited Owner Units - Class 1a | | | — | | | | — | | | | 2,536,559 | | | | 5,120,558 | | | | — | | | | — | |
Limited Owner Units - Class 2 | | | 18,144,968 | | | | 24,365,217 | | | | 60,020,959 | | | | 74,035,876 | | | | 4,425,463 | | | | 8,249,804 | |
Limited Owner Units - Class 2a | | | — | | | | — | | | | 2,626,016 | | | | 3,396,994 | | | | — | | | | — | |
Limited Owner Units - Class 3a | | | — | | | | — | | | | 2,952,802 | | | | 3,691,280 | | | | — | | | | — | |
| | | | | | | | | | | | | | | | | | | | | | | | |
Total Owners’ Capital | | | 52,824,997 | | | | 66,275,730 | | | | 255,432,076 | | | | 376,897,450 | | | | 39,613,972 | | | | 70,229,328 | |
| | | | | | | | | | | | | | | | | | | | | | | | |
Non-Controlling Interests | | | 58,412 | | | | — | | | | 40,633,336 | | | | 51,529,684 | | | | — | | | | — | |
| | | | | | | | | | | | | | | | | | | | | | | | |
Total Capital | | | 52,883,409 | | | | 66,275,730 | | | | 296,065,412 | | | | 428,427,134 | | | | 39,613,972 | | | | 70,229,328 | |
| | | | | | | | | | | | | | | | | | | | | | | | |
Total Liabilities and Capital | | $ | 53,200,171 | | | $ | 67,230,426 | | | $ | 301,978,826 | | | $ | 436,618,030 | | | $ | 40,083,210 | | | $ | 71,057,049 | |
| | | | | | | | | | | | | | | | | | | | | | | | |
Units Outstanding | | | | | | | | | | | | | | | | | | | | | | | | |
Class 1 | | | 340,052 | | | | 400,269 | | | | 1,476,131 | | | | 2,181,233 | | | | 386,533 | | | | 559,848 | |
Class 1a | | | N/A | | | | N/A | | | | 23,388 | | | | 44,006 | | | | N/A | | | | N/A | |
Class 2 | | | 178,710 | | | | 236,869 | | | | 408,793 | | | | 481,110 | | | | 39,641 | | | | 63,664 | |
Class 2a | | | N/A | | | | N/A | | | | 21,697 | | | | 26,653 | | | | N/A | | | | N/A | |
Class 3a | | | N/A | | | | N/A | | | | 23,005 | | | | 27,616 | | | | N/A | | | | N/A | |
Net Asset Value per Unit | | | | | | | | | | | | | | | | | | | | | | | | |
Class 1 | | $ | 100.25 | | | $ | 102.96 | | | $ | 124.50 | | | $ | 131.95 | | | $ | 91.02 | | | $ | 110.46 | |
Class 1a | | | N/A | | | | N/A | | | $ | 108.45 | | | $ | 116.36 | | | | N/A | | | | N/A | |
Class 2 | | $ | 104.83 | | | $ | 105.81 | | | $ | 155.02 | | | $ | 159.46 | | | $ | 111.84 | | | $ | 131.73 | |
Class 2a | | | N/A | | | | N/A | | | $ | 128.35 | | | $ | 133.66 | | | | N/A | | | | N/A | |
Class 3a | | | N/A | | | | N/A | | | $ | 128.36 | | | $ | 133.66 | | | | N/A | | | | N/A | |
| (1) | Formerly the Campbell/Graham/Tiverton Series. |
The accompanying notes are an integral part of these financial statements.
F-4
The Series of the Frontier Fund
Statements of Financial Condition
December 31, 2011 and 2010
| | | | | | | | | | | | | | | | | | | | | | | | |
| | | Currency Series | | | Long Only Commodity Series (2) | | | Managed Futures Index Series (2) | |
| | | 12/31/2011 | | | 12/31/2010 | | | 12/31/2011 | | | 12/31/2010 | | | 12/31/2011 | | | 12/31/2010 | |
| ASSETS | | | | | | | | | | | | | | | | | | | | | | | | |
Cash and cash equivalents | | $ | 182,875 | | | $ | 275,485 | | | $ | 1,452,927 | | | $ | 175,096 | | | $ | 1,241,857 | | | $ | 196,091 | |
U.S. Treasury securities, at fair value | | | 326,517 | | | | 2,009,673 | | | | — | | | | 485,541 | | | | — | | | | 597,700 | |
Custom time deposits | | | 1,485,313 | | | | 11,378,050 | | | | — | | | | 2,748,960 | | | | — | | | | 3,383,966 | |
Receivable from futures commission merchants | | | — | | | | 678,208 | | | | — | | | | — | | | | — | | | | — | |
Open trade equity, at fair value | | | — | | | | 28,390 | | | | — | | | | — | | | | — | | | | — | |
Swap Contracts, at fair value | | | 2,583 | | | | 5,668,768 | | | | — | | | | 790,796 | | | | — | | | | — | |
Investments in unconsolidated trading companies, at fair value | | | 2,352,121 | | | | — | | | | — | | | | — | | | | — | | | | 992,837 | |
Interest receivable | | | 4,514 | | | | 27,428 | | | | — | | | | 6,627 | | | | — | | | | 8,157 | |
Receivable from related parties | | | — | | | | — | | | | 70 | | | | — | | | | 72 | | | | 1,440 | |
Other assets | | | 497 | | | | 28 | | | | 87 | | | | 61 | | | | 183 | | | | 3 | |
| | | | | | | | | | | | | | | | | | | | | | | | |
Total Assets | | $ | 4,354,420 | | | $ | 20,066,030 | | | $ | 1,453,084 | | | $ | 4,207,081 | | | $ | 1,242,112 | | | $ | 5,180,194 | |
| | | | | | | | | | | | | | | | | | | | | | | | |
| LIABILITIES & CAPITAL | | | | | | | | | | | | | | | | | | | | | | | | |
LIABILITIES | | | | | | | | | | | | | | | | | | | | | | | | |
Short options written, at fair value | | $ | — | | | $ | 1,292 | | | $ | — | | | $ | — | | | $ | — | | | $ | — | |
Inter-series payables, at fair value | | | — | | | | 12,816,775 | | | | — | | | | — | | | | — | | | | — | |
Pending owner additions | | | 4,509 | | | | — | | | | — | | | | — | | | | — | | | | 1,440 | |
Owner redemptions payable | | | 15,694 | | | | 45,220 | | | | 1,441,899 | | | | — | | | | 1,225,363 | | | | 794 | |
Management fees payable to Managing Owner | | | — | | | | 13,860 | | | | 102 | | | | 4,634 | | | | 4,148 | | | | 10,789 | |
Interest payable to Managing Owner | | | 5,681 | | | | 24,379 | | | | 452 | | | | 1,760 | | | | 1,133 | | | | 2,212 | |
Trading fees payable to Managing Owner | | | 2,727 | | | | 8,409 | | | | 635 | | | | 1,750 | | | | 1,467 | | | | 2,154 | |
Trailing service fees payable to Managing Owner | | | 6,285 | | | | 11,273 | | | | 672 | | | | 5,599 | | | | 444 | | | | 2,338 | |
Payables to related parties | | | 52 | | | | 5,298 | | | | 9,315 | | | | 90 | | | | 9,534 | | | | — | |
Other liabilities | | | 115 | | | | 124 | | | | 9 | | | | 17 | | | | 23 | | | | 4 | |
| | | | | | | | | | | | | | | | | | | | | | | | |
Total Liabilities | | | 35,063 | | | | 12,926,630 | | | | 1,453,084 | | | | 13,850 | | | | 1,242,112 | | | | 19,731 | |
| | | | | | | | | | | | | | | | | | | | | | | | |
CAPITAL | | | | | | | | | | | | | | | | | | | | | | | | |
Managing Owner Units - Class 2 | | | 2,563 | | | | 2,791 | | | | — | | | | 51,212 | | | | — | | | | 2,375,149 | |
Limited Owner Units - Class 1 | | | 4,228,350 | | | | 6,381,882 | | | | — | | | | 3,348,953 | | | | — | | | | 1,388,452 | |
Limited Owner Units - Class 2 | | | 88,444 | | | | 754,727 | | | | — | | | | 793,066 | | | | — | | | | 1,396,862 | |
Limited Owner Units - Class 3 | | | — | | | | — | | | | — | | | | — | | | | — | | | | — | |
| | | | | | | | | | | | | | | | | | | | | | | | |
Total Owners’ Capital | | | 4,319,357 | | | | 7,139,400 | | | | — | | | | 4,193,231 | | | | — | | | | 5,160,463 | |
| | | | | | | | | | | | | | | | | | | | | | | | |
Non - Controlling Interests | | | — | | | | — | | | | — | | | | — | | | | — | | | | — | |
Total Capital | | | 4,319,357 | | | | 7,139,400 | | | | — | | | | 4,193,231 | | | | — | | | | 5,160,463 | |
| | | | | | | | | | | | | | | | | | | | | | | | |
Total Liabilities and Capital | | $ | 4,354,420 | | | $ | 20,066,030 | | | $ | 1,453,084 | | | $ | 4,207,081 | | | $ | 1,242,112 | | | $ | 5,180,194 | |
| | | | | | | | | | | | | | | | | | | | | | | | |
Units Outstanding | | | | | | | | | | | | | | | | | | | | | | | | |
Class 1 | | | 59,997 | | | | 80,694 | | | | — | | | | 35,587 | | | | — | | | | 11,770 | |
Class 2 | | | 1,039 | | | | 7,938 | | | | — | | | | 8,141 | | | | — | | | | 29,084 | |
Class 3(1) | | | N/A | | | | N/A | | | | — | | | | N/A | | | | — | | | | N/A | |
Net Asset Value per Unit | | | | | | | | | | | | | | | | | | | | | | | | |
Class 1 | | $ | 70.48 | | | $ | 79.09 | | | $ | 87.11 | | | $ | 94.11 | | | $ | 106.83 | | | $ | 117.96 | |
Class 2 | | $ | 87.61 | | | $ | 95.43 | | | $ | 97.88 | | | $ | 103.71 | | | $ | 119.76 | | | $ | 129.69 | |
Class 3 | | | N/A | | | | N/A | | | $ | 97.88 | (1) | | | N/A | | | $ | 119.76 | (1) | | | N/A | |
| (1) | The Long Only Commodity Series, Class 3 Units and the Managed Futures Index Series, Class 3 Units began trading operations on January 14, 2011. |
| (2) | The Long/Only Commodity Series and the Managed Futures Index Series ceased trading operations on December 21, 2011 and redeemed all existing Units. Net asset value per unit represents the liquidation value. Both Series remain open. |
The accompanying notes are an integral part of these financial statements.
F-5
The Series of the Frontier Fund
Statements of Financial Condition
December 31, 2011 and 2010
| | | | | | | | | | | | | | | | |
| | | Winton Series | | | Winton/Graham Series | |
| | | 12/31/2011 | | | 12/31/2010 | | | 12/31/2011 | | | 12/31/2010 | |
| ASSETS | | | | | | | | | | | | | | | | |
Cash and cash equivalents | | $ | 2,051,272 | | | $ | 1,808,624 | | | $ | 1,156,042 | | | $ | 1,352,481 | |
U.S. Treasury securities, at fair value | | | 7,821,927 | | | | 8,020,509 | | | | 3,839,855 | | | | 7,045,351 | |
Custom time deposits | | | 35,581,630 | | | | 45,409,259 | | | | 17,467,347 | | | | 39,888,265 | |
Receivable from futures commission merchants | | | — | | | | — | | | | — | | | | 11,090,076 | |
Open trade equity, at fair value | | | — | | | | — | | | | — | | | | 1,427,138 | |
Swap Contracts, at fair value | | | 61,888 | | | | — | | | | 30,381 | | | | — | |
Investments in unconsolidated trading companies, at fair value | | | 4,731,916 | | | | 6,222,907 | | | | 8,473,424 | | | | 3,383,251 | |
Interest receivable | | | 108,125 | | | | 109,462 | | | | 53,079 | | | | 96,154 | |
Other assets | | | 6,890 | | | | 117 | | | | 6,520 | | | | 111 | |
| | | | | | | | | | | | | | | | |
Total Assets | | $ | 50,363,648 | | | $ | 61,570,878 | | | $ | 31,026,648 | | | $ | 64,282,827 | |
| | | | | | | | | | | | | | | | |
| LIABILITIES & CAPITAL | | | | | | | | | | | | | | | | |
LIABILITIES | | | | | | | | | | | | | | | | |
Pending owner additions | | $ | 18,811 | | | $ | — | | | $ | 5,763 | | | $ | — | |
Owner redemptions payable | | | 10,618 | | | | 8,782 | | | | 15,451 | | | | 61,838 | |
Incentive fees payable to Managing Owner | | | — | | | | 467,341 | | | | — | | | | 623,629 | |
Management fees payable to Managing Owner | | | 90,559 | | | | 122,675 | | | | 100,311 | | | | 168,136 | |
Interest payable to Managing Owner | | | 84,494 | | | | 102,270 | | | | 52,268 | | | | 97,293 | |
Trading fees payable to Managing Owner | | | 31,302 | | | | 25,245 | | | | 19,427 | | | | 24,127 | |
Trailing service fees payable | | | 78,044 | | | | 99,085 | | | | 57,141 | | | | 103,698 | |
Payables to related parties | | | 319 | | | | 25,385 | | | | 356 | | | | 12,309 | |
Other liabilities | | | 1,377 | | | | 658 | | | | 2,244 | | | | 1,001 | |
| | | | | | | | | | | | | | | | |
Total Liabilities | | | 315,524 | | | | 851,441 | | | | 252,961 | | | | 1,092,031 | |
| | | | | | | | | | | | | | | | |
CAPITAL | | | | | | | | | | | | | | | | |
Managing Owner Units - Class 2 | | | 34,276 | | | | 230,781 | | | | 55,553 | | | | 61,691 | |
Limited Owner Units - Class 1 | | | 38,345,799 | | | | 49,350,981 | | | | 24,783,519 | | | | 45,898,246 | |
Limited Owner Units - Class 2 | | | 11,668,049 | | | | 11,137,675 | | | | 5,934,615 | | | | 11,550,501 | |
| | | | | | | | | | | | | | | | |
Total Owners’ Capital | | | 50,048,124 | | | | 60,719,437 | | | | 30,773,687 | | | | 57,510,438 | |
| | | | | | | | | | | | | | | | |
Non-Controlling Interests | | | — | | | | — | | | | — | | | | 5,680,358 | |
| | | | | | | | | | | | | | | | |
Total Capital | | | 50,048,124 | | | | 60,719,437 | | | | 30,773,687 | | | | 63,190,796 | |
| | | | | | | | | | | | | | | | |
Total Liabilities and Capital | | $ | 50,363,648 | | | $ | 61,570,878 | | | $ | 31,026,648 | | | $ | 64,282,827 | |
| | | | | | | | | | | | | | | | |
Units Outstanding | | | | | | | | | | | | | | | | |
Class 1 | | | 271,704 | | | | 365,451 | | | | 236,649 | | | | 383,032 | |
Class 2 | | | 70,575 | | | | 73,827 | | | | 46,183 | | | | 80,620 | |
Net Asset Value per Unit | | | | | | | | | | | | | | | | |
Class 1 | | $ | 141.13 | | | $ | 135.04 | | | $ | 104.73 | | | $ | 119.83 | |
Class 2 | | $ | 165.82 | | | $ | 153.99 | | | $ | 129.70 | | | $ | 144.04 | |
The accompanying notes are an integral part of these financial statements.
F-6
The Series of the Frontier Fund
Condensed Schedules of Investments
December 31, 2011
| | | | | | | | | | | | | | | | | | | | | | | | | | | | | | | | | | |
| | | | | Frontier Diversified Series | | | Frontier Dynamic Series (3) | | | Frontier Long/Short
Commodity Series | | | Frontier Masters Series | |
| Description | | Value | | | % of Total
Capital (Net
Asset Value) | | | Value | | | % of Total
Capital (Net
Asset Value) | | | Value | | | % of Total
Capital (Net
Asset Value) | | | Value | | | % of Total
Capital (Net
Asset Value) | |
LONG FUTURES CONTRACTS * | | | | | | | | | | | | | | | | | | | | | | | | | | | | | |
| | Various base metals futures contracts (U.S.) | | $ | — | | | | 0.00 | % | | $ | — | | | | 0.00 | % | | $ | (49,183 | ) | | | -.06 | % | | $ | (40,664 | ) | | | -0.08 | % |
| | Various base metals futures contracts (Europe) | | | — | | | | 0.00 | % | | | — | | | | 0.00 | % | | | (206,400 | ) | | | -0.25 | % | | | (37,959 | ) | | | -0.07 | % |
| | Various currency futures contracts (U.S.) | | | — | | | | 0.00 | % | | | — | | | | 0.00 | % | | | 179,573 | | | | 0.22 | % | | | 22,523 | | | | 0.04 | % |
| | Various currency futures contracts (Europe) | | | — | | | | 0.00 | % | | | — | | | | 0.00 | % | | | 416,924 | | | | 0.51 | % | | | 4,733 | | | | 0.01 | % |
| | Various currency futures contracts (Far East) | | | — | | | | 0.00 | % | | | — | | | | 0.00 | % | | | — | | | | 0.00 | % | | | — | | | | 0.00 | % |
| | Various energy futures contracts (U.S.) | | | — | | | | 0.00 | % | | | — | | | | 0.00 | % | | | (272,223 | ) | | | -.34 | % | | | 13,625 | | | | 0.03 | % |
| | Light Crude Oil Settling 11/1/12 (Number of Contracts: 841) | | | — | | | | 0.00 | % | | | — | | | | 0.00 | % | | | (3,555,016 | ) | | | -4.38 | % | | | — | | | | 0.00 | % |
| | Light Crude Oil Settling 1/1/13 (Number of Contracts: 841) | | | — | | | | 0.00 | % | | | — | | | | 0.00 | % | | | (3,802,753 | ) | | | -4.68 | % | | | — | | | | 0.00 | % |
| | Light Crude Oil Settling 9/1/13 (Number of Contracts: 1,002) | | | — | | | | 0.00 | % | | | — | | | | 0.00 | % | | | (4,371,122 | ) | | | -5.38 | % | | | — | | | | 0.00 | % |
| | Heating Oil Settling 9/1/12 (Number of Contracts: 393) | | | — | | | | 0.00 | % | | | — | | | | 0.00 | % | | | (1,647,299 | ) | | | -2.03 | % | | | — | | | | 0.00 | % |
| | NYM RBOB Gas Settling 5/1/12 (Number of Contracts: 238) | | | — | | | | 0.00 | % | | | — | | | | 0.00 | % | | | 892,954 | | | | 1.10 | % | | | — | | | | 0.00 | % |
| | NYM RBOB Gas Settling 6/1/12 (Number of Contracts: 330) | | | — | | | | 0.00 | % | | | — | | | | 0.00 | % | | | (836,209 | ) | | | -1.03 | % | | | — | | | | 0.00 | % |
| | Various energy futures contracts (Europe) | | | — | | | | 0.00 | % | | | — | | | | 0.00 | % | | | (26,290 | ) | | | -0.03 | % | | | 1,520 | | | | 0.00 | % |
| | ICE Brent Crude Oil Settling 12/1/13 (Number of Contracts: 1,35) | | | — | | | | 0.00 | % | | | — | | | | 0.00 | % | | | (3,069,350 | ) | | | -3.78 | % | | | — | | | | 0.00 | % |
| | Various interest rates futures contracts (U.S.) | | | — | | | | 0.00 | % | | | — | | | | 0.00 | % | | | 19,602 | | | | 0.02 | % | | | 20,708 | | | | 0.04 | % |
| | Various interest rates futures contracts (Canada) | | | — | | | | 0.00 | % | | | — | | | | 0.00 | % | | | — | | | | 0.00 | % | | | (2,284 | ) | | | 0.00 | % |
| | Various interest rates futures contracts (Europe) | | | — | | | | 0.00 | % | | | — | | | | 0.00 | % | | | — | | | | 0.00 | % | | | 229,378 | | | | 0.43 | % |
| | Various interest rates futures contracts (Far East) | | | — | | | | 0.00 | % | | | — | | | | 0.00 | % | | | — | | | | 0.00 | % | | | 2,876 | | | | 0.01 | % |
| | Various precious metals futures contracts (U.S.) | | | — | | | | 0.00 | % | | | — | | | | 0.00 | % | | | (194,462 | ) | | | -0.24 | % | | | — | | | | 0.00 | % |
| | Silver @ COMEX Settling 12/1/13 (Number of Contracts: 152) | | | — | | | | 0.00 | % | | | — | | | | 0.00 | % | | | (11,121,080 | ) | | | -13.70 | % | | | | | | | 0.00 | % |
| | Various precious metals futures contracts (Far East) | | | — | | | | 0.00 | % | | | — | | | | 0.00 | % | | | — | | | | 0.00 | % | | | — | | | | 0.00 | % |
| | Various soft futures contracts (U.S.) | | | — | | | | 0.00 | % | | | — | | | | 0.00 | % | | | (1,017,374 | ) | | | -1.25 | % | | | 31,011 | | | | 0.06 | % |
| | Coffee @ CSCE Settling 12/1/12 (Number of Contracts: 151) | | | — | | | | 0.00 | % | | | — | | | | 0.00 | % | | | (2,559,548 | ) | | | -3.15 | % | | | — | | | | 0.00 | % |
| | Corn Setttling 12/1/12 (Number of Contracts: 1,525) | | | — | | | | 0.00 | % | | | — | | | | 0.00 | % | | | (4,790,794 | ) | | | -5.90 | % | | | — | | | | 0.00 | % |
| | Various stock index futures contracts (U.S.) | | | — | | | | 0.00 | % | | | — | | | | 0.00 | % | | | 111,130 | | | | 0.14 | % | | | 6,731 | | | | 0.01 | % |
| | Various stock index futures contracts (Europe) | | | — | | | | 0.00 | % | | | — | | | | 0.00 | % | | | (4,720 | ) | | | -0.01 | % | | | 31,302 | | | | 0.06 | % |
| | Various stock index futures contracts (Far East) | | | — | | | | 0.00 | % | | | — | | | | 0.00 | % | | | — | | | | 0.00 | % | | | — | | | | 0.00 | % |
| | | | | | | | | | | | | | | | | | | | | | | | | | | | | | | | | | |
| | Total Long Futures Contracts | | $ | — | | | | 0.00 | % | | $ | — | | | | 0.00 | % | | $ | (35,903,640 | ) | | | -44.20 | % | | $ | 283,500 | | | | 0.54 | % |
| | | | | | | | | | | | | | | | | | | | | | | | | | | | | | | | | | |
OPTIONS PURCHASED * | | $ | — | | | | 0.00 | % | | $ | — | | | | 0.00 | % | | $ | — | | | | 0.00 | % | | $ | — | | | | 0.00 | % |
| | | | | | | | | | | | | | | | | | | | | | | | | | | | | | | | | | |
SHORT FUTURES CONTRACTS * | | | | | | | | | | | | | | | | | | | | | | | | | | | | | |
| | Various base metals futures contracts (U.S.) | | $ | — | | | | 0.00 | % | | $ | — | | | | 0.00 | % | | $ | 13,843 | | | | 0.02 | % | | $ | 18,428 | | | | 0.03 | % |
| | Various base metals futures contracts (Europe) | | | — | | | | 0.00 | % | | | — | | | | 0.00 | % | | | 290,936 | | | | 0.36 | % | | | 57,511 | | | | 0.11 | % |
| | Various currency futures contracts (U.S.) | | | — | | | | 0.00 | % | | | — | | | | 0.00 | % | | | (3,375 | ) | | | 0.00 | % | | | 19,290 | | | | 0.04 | % |
| | Various currency futures contracts (Europe) | | | — | | | | 0.00 | % | | | — | | | | 0.00 | % | | | (918,634 | ) | | | -1.13 | % | | | 76,986 | | | | 0.15 | % |
| | Various currency futures contracts (Far East) | | | — | | | | 0.00 | % | | | — | | | | 0.00 | % | | | — | | | | 0.00 | % | | | 3,727 | | | | 0.01 | % |
| | Various energy futures contracts (U.S.) | | | — | | | | 0.00 | % | | | — | | | | 0.00 | % | | | 1,070,542 | | | | 1.32 | % | | | — | | | | 0.00 | % |
| | Light Crude Oil Settling 12/1/12 (Number of Contracts: 218) | | | — | | | | 0.00 | % | | | — | | | | 0.00 | % | | | (1,842,322 | ) | | | -2.27 | % | | | — | | | | 0.00 | % |
| | Light Crude Oil Settling 12/1/13 (Number of Contracts: 842) | | | — | | | | 0.00 | % | | | — | | | | 0.00 | % | | | (1,910,259 | ) | | | -2.35 | % | | | — | | | | 0.00 | % |
| | Heating Oil Settling 6/1/12 (Number of Contracts: 373) | | | — | | | | 0.00 | % | | | — | | | | 0.00 | % | | | 1,591,665 | | | | 1.96 | % | | | — | | | | 0.00 | % |
| | NYM RBOB Gas Settling 4/1/12 (Number of Contracts: 2,123) | | | — | | | | 0.00 | % | | | — | | | | 0.00 | % | | | 869,669 | | | | 1.07 | % | | | — | | | | 0.00 | % |
| | Various energy futures contracts (Europe) | | | — | | | | 0.00 | % | | | — | | | | 0.00 | % | | | 573,850 | | | | 0.71 | % | | | (100 | ) | | | 0.00 | % |
| | ICE Brent Crude Oil Settling 12/1/12 (Number of Contracts: 78) | | | — | | | | 0.00 | % | | | — | | | | 0.00 | % | | | 2,835,790 | | | | 3.49 | % | | | — | | | | 0.00 | % |
| | Various energy futures contracts (Far East) | | | — | | | | 0.00 | % | | | — | | | | 0.00 | % | | | — | | | | 0.00 | % | | | (1,195 | ) | | | 0.00 | % |
| | Various interest rates futures contracts (US) | | | — | | | | 0.00 | % | | | — | | | | 0.00 | % | | | — | | | | 0.00 | % | | | (24,881 | ) | | | -0.05 | % |
| | Various interest rates futures contracts (Canada) | | | — | | | | 0.00 | % | | | — | | | | 0.00 | % | | | — | | | | 0.00 | % | | | 2,100 | | | | 0.00 | % |
| | Various interest rates futures contracts (Europe) | | | — | | | | 0.00 | % | | | — | | | | 0.00 | % | | | — | | | | 0.00 | % | | | (31 | ) | | | 0.00 | % |
| | Various interest rates futures contracts (Far East) | | | — | | | | 0.00 | % | | | — | | | | 0.00 | % | | | (75,712 | ) | | | -0.09 | % | | | (173 | ) | | | 0.00 | % |
| | Various precious metals futures contracts (U.S.) | | | — | | | | 0.00 | % | | | — | | | | 0.00 | % | | | 82,675 | | | | 0.10 | % | | | 20,200 | | | | 0.04 | % |
| | Silver @ COMEX Settling 12/1/12 (Number of Contracts: 152) | | | — | | | | 0.00 | % | | | — | | | | 0.00 | % | | | 2,879,260 | | | | 3.55 | % | | | — | | | | 0.00 | % |
| | Various soft futures contracts (U.S.) | | | — | | | | 0.00 | % | | | — | | | | 0.00 | % | | | 273,765 | | | | 0.34 | % | | | 314,855 | | | | 0.60 | % |
| | Corn Settling 7/1/12 (Number of Contracts: 1,123) | | | — | | | | 0.00 | % | | | — | | | | 0.00 | % | | | 2,867,576 | | | | 3.53 | % | | | — | | | | 0.00 | % |
| | Corn Settling 9/1/12 (Number of Contracts: 288) | | | — | | | | 0.00 | % | | | — | | | | 0.00 | % | | | 1,370,557 | | | | 1.69 | % | | | — | | | | 0.00 | % |
| | Various soft futures contracts (Far East) | | | — | | | | 0.00 | % | | | — | | | | 0.00 | % | | | — | | | | 0.00 | % | | | 1,074 | | | | 0.00 | % |
| | Various stock index futures contracts (U.S.) | | | — | | | | 0.00 | % | | | — | | | | 0.00 | % | | | (864 | ) | | | 0.00 | % | | | (3,693 | ) | | | -0.01 | % |
| | Various stock index futures contracts (Canada) | | | — | | | | 0.00 | % | | | — | | | | 0.00 | % | | | — | | | | 0.00 | % | | | — | | | | 0.00 | % |
| | Various stock index futures contracts (Europe) | | | — | | | | 0.00 | % | | | — | | | | 0.00 | % | | | — | | | | 0.00 | % | | | 18,129 | | | | 0.03 | % |
| | Various stock index futures contracts (Far East) | | | — | | | | 0.00 | % | | | — | | | | 0.00 | % | | | — | | | | 0.00 | % | | | 6,645 | | | | 0.01 | % |
| | | | | | | | | | | | | | | | | | | | | | | | | | | | | | | | | | |
| | Total Short Futures Contracts | | $ | — | | | | 0.00 | % | | $ | — | | | | 0.00 | % | | $ | 9,968,962 | | | | 12.30 | % | | $ | 508,872 | | | | 0.96 | % |
| | | | | | | | | | | | | | | | | | | | | | | | | | | | | | | | | | |
OPTIONS WRITTEN * | | $ | — | | | | 0.00 | % | | $ | — | | | | 0.00 | % | | $ | — | | | | 0.00 | % | | $ | — | | | | 0.00 | % |
| | | | | | | | | | | | | | | | | | | | | | | | | | | | | | | | | | |
CURRENCY FORWARDS * | | $ | — | | | | 0.00 | % | | $ | — | | | | 0.00 | % | | $ | — | | | | 0.00 | % | | $ | — | | | | 0.00 | % |
| | | | | | | | | | | | | | | | | | | | | | | | | | | | | | | | | | |
| | Total Open Trade Equity (Deficit) | | $ | — | | | | 0.00 | % | | $ | — | | | | 0.00 | % | | $ | (25,934,678 | ) | | | -18.22 | % | | $ | 792,372 | | | | 1.50 | % |
| | | | | | | | | | | | | | | | | | | | | | | | | | | | | | | | | | |
SWAPS (1) | | $ | 131,004 | | | | 0.10 | % | | $ | — | | | | 0.00 | % | | $ | 74,898 | | | | 0.09 | % | | $ | 57,225 | | | | 0.11 | % |
| | | | | | | | | | | | | | | | | | | | | | | | | | | | | | | | | | |
| | | | | | | |
U.S. TREASURY SECURITIES | | | | | | | | | | | | | | | | | | | | | | | | | | | | | |
| | | | | | | | |
FACE VALUE | | Fair Value | | | | | | Fair Value | | | | | | Fair Value | | | | | | Fair Value | | | | |
$36,500,000.00 | | U.S. Treasury Note 3.875% due 02/15/2013 (Cost $38,125,391) (2) | | $ | 7,976,700 | | | | 5.95 | % | | $ | — | | | | 0.00 | % | | $ | 4,560,486 | | | | 5.62 | % | | $ | 3,484,374 | | | | 6.59 | % |
$36,700,000.00 | | U.S. Treasury Note 4.000% due 02/15/2015 (Cost $38,016,039) (2) | | | 8,580,604 | | | | 6.40 | % | | | — | | | | 0.00 | % | | | 4,905,754 | | | | 6.04 | % | | | 3,748,172 | | | | 7.09 | % |
| | | | | | | | | | | | | | | | | | | | | | | | | | | | | | | | | | |
| | | | $ | 16,557,304 | | | | 12.35 | % | | $ | — | | | | 0.00 | % | | $ | 9,466,240 | | | | 11.66 | % | | $ | 7,232,546 | | | | 13.68 | % |
| | | | | | | | | | | | | | | | | | | | | | | | | | | | | | | | | | |
| | | | | | | | |
Additional Disclosure on U.S.
Treasury Securities | | Face Value | | | | | | Face Value | | | | | | Face Value | | | | | | Face Value | | | | |
| | U.S. Treasury Note 3.875% due 02/15/2013 (2) | | $ | 7,673,204 | | | | | | | $ | — | | | | | | | $ | 4,386,970 | | | | | | | $ | 3,351,802 | | | | | |
| | U.S. Treasury Note 4.000% due 02/15/2015 (2) | | | 7,715,249 | | | | | | | | — | | | | | | | | 4,411,008 | | | | | | | | 3,370,168 | | | | | |
| | | | | | | | | | | | | | | | | | | | | | | | | | | | | | | | | | |
| | | | $ | 15,388,453 | | | | | | | $ | — | | | | | | | $ | 8,797,978 | | | | | | | $ | 6,721,970 | | | | | |
| | | | | | | | | | | | | | | | | | | | | | | | | | | | | | | | | | |
| | | | | | | | | |
| | | | | Cost | | | | | | Cost | | | | | | Cost | | | | | | Cost | | | | |
| | U.S. Treasury Note 3.875% due 02/15/2013 (2) | | $ | 8,014,902 | | | | | | | $ | — | | | | | | | $ | 4,582,327 | | | | | | | $ | 3,501,062 | | | | | |
| | U.S. Treasury Note 4.000% due 02/15/2015 (2) | | | 7,991,913 | | | | | | | | — | | | | | | | | 4,569,184 | | | | | | | | 3,491,020 | | | | | |
| | | | | | | | | | | | | | | | | | | | | | | | | | | | | | | | | | |
| | | | $ | 16,006,815 | | | | | | | $ | — | | | | | | | $ | 9,151,511 | | | | | | | $ | 6,992,082 | | | | | |
| | | | | | | | | | | | | | | | | | | | | | | | | | | | | | | | | | |
| * | Except for those items disclosed, no individual futures, forwards and option on futures contract position constituted greater than 1 percent of Net Asset Value. Accordingly, the number of contracts and expiration dates are not presented. |
| (1) | See Notes to Financial Statements, Note 4. |
| (2) | Assets have been allocated to each Series based upon ownership in the cash management pool. See Note 2. |
| (3) | The Frontier Dynamic Series ceased trading operations on July 15, 2011 and redeemed all existing Units. The Series remains open. |
The accompanying notes are an integral part of these financial statements.
F-7
The Series of the Frontier Fund
Condensed Schedules of Investments
December 31, 2011
| | | | | | | | | | | | | | | | | | | | | | | | | | | | | | | | | | |
| | | | | Balanced Series | | | Berkeley/Graham/
Tiverton Series (3) | | | Currency Series | | | Long Only Commodity
Series (4) | |
Description | | Value | | | % of Total
Capital (Net
Asset Value) | | | Value | | | % of Total
Capital (Net
Asset Value) | | | Value | | | % of Total
Capital (Net
Asset Value) | | | Value | | | % of Total
Capital (Net
Asset Value) | |
LONG FUTURES CONTRACTS * | | | | | | | | | | | | | | | | | | | | | | | | | | | | | |
| | Various base metals futures contracts (U.S.) | | $ | (1,930,354 | ) | | | -0.65 | % | | $ | — | | | | 0.00 | % | | $ | — | | | | 0.00 | % | | $ | — | | | | 0.00 | % |
| | Various base metals futures contracts (Europe) | | | (3,533,012 | ) | | | -1.19 | % | | | — | | | | 0.00 | % | | | — | | | | 0.00 | % | | | — | | | | 0.00 | % |
| | Various currency futures contracts (U.S.) | | | 122,059 | | | | 0.04 | % | | | — | | | | 0.00 | % | | | — | | | | 0.00 | % | | | — | | | | 0.00 | % |
| | Various currency futures contracts (Europe) | | | 11,380 | | | | 0.00 | % | | | — | | | | 0.00 | % | | | — | | | | 0.00 | % | | | — | | | | 0.00 | % |
| | Various currency futures contracts (Far East) | | | — | | | | 0.00 | % | | | — | | | | 0.00 | % | | | — | | | | 0.00 | % | | | — | | | | 0.00 | % |
| | Various energy futures contracts (U.S.) | | | (23,315 | ) | | | -0.01 | % | | | — | | | | 0.00 | % | | | — | | | | 0.00 | % | | | — | | | | 0.00 | % |
| | Various energy futures contracts (Europe) | | | (300,490 | ) | | | -0.10 | % | | | — | | | | 0.00 | % | | | — | | | | 0.00 | % | | | — | | | | 0.00 | % |
| | Various interest rates futures contracts (U.S.) | | | 407,889 | | | | 0.14 | % | | | — | | | | 0.00 | % | | | — | | | | 0.00 | % | | | — | | | | 0.00 | % |
| | Various interest rates futures contracts (Canada) | | | 56,394 | | | | 0.02 | % | | | — | | | | 0.00 | % | | | — | | | | 0.00 | % | | | — | | | | 0.00 | % |
| | Various interest rates futures contracts (Europe) | | | 1,984,386 | | | | 0.67 | % | | | — | | | | 0.00 | % | | | — | | | | 0.00 | % | | | — | | | | 0.00 | % |
| | Various interest rates futures contracts (Far East) | | | 57,916 | | | | 0.02 | % | | | — | | | | 0.00 | % | | | — | | | | 0.00 | % | | | — | | | | 0.00 | % |
| | Various precious metals futures contracts (U.S.) | | | (152,208 | ) | | | -0.05 | % | | | — | | | | 0.00 | % | | | — | | | | 0.00 | % | | | — | | | | 0.00 | % |
| | Various soft futures contracts (U.S.) | | | 230,760 | | | | 0.08 | % | | | — | | | | 0.00 | % | | | — | | | | 0.00 | % | | | — | | | | 0.00 | % |
| | Various soft futures contracts (Europe) | | | 1,440 | | | | 0.00 | % | | | — | | | | 0.00 | % | | | — | | | | 0.00 | % | | | — | | | | 0.00 | % |
| | Various stock index futures contracts (U.S.) | | | 185,788 | | | | 0.06 | % | | | — | | | | 0.00 | % | | | — | | | | 0.00 | % | | | — | | | | 0.00 | % |
| | Various stock index futures contracts (Canada) | | | 5,579 | | | | 0.00 | % | | | — | | �� | | 0.00 | % | | | — | | | | 0.00 | % | | | — | | | | 0.00 | % |
| | Various stock index futures contracts (Europe) | | | 67,663 | | | | 0.02 | % | | | — | | | | 0.00 | % | | | — | | | | 0.00 | % | | | — | | | | 0.00 | % |
| | Various stock index futures contracts (Far East) | | | (171,692 | ) | | | -0.06 | % | | | — | | | | 0.00 | % | | | — | | | | 0.00 | % | | | — | | | | 0.00 | % |
| | | | | | | | | | | | | | | | | | | | | | | | | | | | | | | | | | |
| | Total Long Futures Contracts | | $ | (2,979,817 | ) | | | -1.01 | % | | $ | — | | | | 0.00 | % | | $ | — | | | | 0.00 | % | | $ | — | | | | 0.00 | % |
| | | | | | | | | | | | | | | | | | | | | | | | | | | | | | | | | | |
OPTIONS PURCHASED * | | $ | 11,928,779 | | | | 4.02 | % | | $ | — | | | | 0.00 | % | | $ | — | | | | 0.00 | % | | $ | — | | | | 0.00 | % |
SHORT FUTURES CONTRACTS * | | | | | | | | | | | | | | | | | | | | | | | | | | | | | |
| | Various base metals futures contracts (U.S.) | | $ | 1,630,955 | | | | 0.55 | % | | $ | — | | | | 0.00 | % | | $ | — | | | | 0.00 | % | | $ | — | | | | 0.00 | % |
| | Various base metals futures contracts (Europe) | | | 4,181,645 | | | | 1.41 | % | | | — | | | | 0.00 | % | | | — | | | | 0.00 | % | | | — | | | | 0.00 | % |
| | Various currency futures contracts (US) | | | (56,702 | ) | | | -0.02 | % | | | — | | | | 0.00 | % | | | — | | | | 0.00 | % | | | — | | | | 0.00 | % |
| | Various currency futures contracts (Europe) | | | 442,669 | | | | 0.15 | % | | | — | | | | 0.00 | % | | | — | | | | 0.00 | % | | | — | | | | 0.00 | % |
| | Various energy futures contracts (U.S.) | | | (95,263 | ) | | | -0.03 | % | | | — | | | | 0.00 | % | | | — | | | | 0.00 | % | | | — | | | | 0.00 | % |
| | Various energy futures contracts (Europe) | | | 22,315 | | | | 0.01 | % | | | — | | | | 0.00 | % | | | — | | | | 0.00 | % | | | — | | | | 0.00 | % |
| | Various interest rates futures contracts (U.S.) | | | (1,508,797 | ) | | | -0.51 | % | | | — | | | | 0.00 | % | | | — | | | | 0.00 | % | | | — | | | | 0.00 | % |
| | Various interest rates futures contracts (Canada) | | | 896 | | | | 0.00 | % | | | — | | | | 0.00 | % | | | — | | | | 0.00 | % | | | — | | | | 0.00 | % |
| | Various interest rates futures contracts (Europe) | | | (134,897 | ) | | | -0.05 | % | | | — | | | | 0.00 | % | | | — | | | | 0.00 | % | | | — | | | | 0.00 | % |
| | Various interest rates futures contracts (Far East) | | | (22,100 | ) | | | -0.01 | % | | | — | | | | 0.00 | % | | | — | | | | 0.00 | % | | | — | | | | 0.00 | % |
| | Various precious metals futures contracts (U.S.) | | | 293,052 | | | | 0.10 | % | | | — | | | | 0.00 | % | | | — | | | | 0.00 | % | | | — | | | | 0.00 | % |
| | Various soft futures contracts (U.S.) | | | (451,002 | ) | | | -0.15 | % | | | — | | | | 0.00 | % | | | — | | | | 0.00 | % | | | — | | | | 0.00 | % |
| | Various soft futures contracts (Europe) | | | 471,246 | | | | 0.16 | % | | | — | | | | 0.00 | % | | | — | | | | 0.00 | % | | | — | | | | 0.00 | % |
| | Various soft futures contracts (Far East) | | | (30,196 | ) | | | -0.01 | % | | | — | | | | 0.00 | % | | | — | | | | 0.00 | % | | | — | | | | 0.00 | % |
| | Various soft futures contracts (Canada) | | | — | | | | 0.00 | % | | | — | | | | 0.00 | % | | | — | | | | 0.00 | % | | | — | | | | 0.00 | % |
| | Various stock index futures contracts (U.S.) | | | 3,585 | | | | 0.00 | % | | | — | | | | 0.00 | % | | | — | | | | 0.00 | % | | | — | | | | 0.00 | % |
| | Various stock index futures contracts (Canada) | | | (22,258 | ) | | | -0.01 | % | | | — | | | | 0.00 | % | | | — | | | | 0.00 | % | | | — | | | | 0.00 | % |
| | Various stock index futures contracts (Europe) | | | (396,702 | ) | | | -0.13 | % | | | — | | | | 0.00 | % | | | — | | | | 0.00 | % | | | — | | | | 0.00 | % |
| | Various stock index futures contracts (Far East) | | | 110,866 | | | | 0.04 | % | | | — | | | | 0.00 | % | | | — | | | | 0.00 | % | | | — | | | | 0.00 | % |
| | | | | | | | | | | | | | | | | | | | | | | | | | | | | | | | | | |
| | Total Short Futures Contracts | | $ | 4,439,312 | | | | 1.50 | % | | $ | — | | | | 0.00 | % | | $ | — | | | | 0.00 | % | | $ | — | | | | 0.00 | % |
| | | | | | | | | | | | | | | | | | | | | | | | | | | | | | | | | | |
OPTIONS WRITTEN * | | $ | (3,326,453 | ) | | | -1.12 | % | | $ | — | | | | 0.00 | % | | $ | — | | | | 0.00 | % | | $ | — | | | | 0.00 | % |
CURRENCY FORWARDS * | | $ | (283,733 | ) | | | -.27 | % | | $ | — | | | | 0.00 | % | | $ | — | | | | 0.00 | % | | $ | — | | | | 0.00 | % |
| | | | | | | | | | | | | | | | | | | | | | | | | | | | | | | | | | |
| | Total Open Trade Equity | | $ | 9,778,088 | | | | 3.12 | % | | $ | — | | | | 0.00 | % | | $ | — | | | | 0.00 | % | | $ | — | | | | 0.00 | % |
| | | | | | | | | | | | | | | | | | | | | | | | | | | | | | | | | | |
SWAPS (1) | | $ | 230,783 | | | | 0.08 | % | | $ | 34,397 | | | | 0.09 | % | | $ | 2,583 | | | | 0.06 | % | | $ | — | | | | 0.00 | % |
| | Total Return Option Basket Swap (Termination date 11/6/12) | | | 17,706,757 | | | | 5.97 | % | | | — | | | | 0.00 | % | | | — | | | | 0.00 | % | | | — | | | | 0.00 | % |
| | Total Return Option Basket Swap (Termination date 6/30/16) | | | 5,881,772 | | | | 1.98 | % | | | — | | | | 0.00 | % | | | — | | | | 0.00 | % | | | — | | | | 0.00 | % |
| | | | | | | | | | | | | | | | | | | | | | | | | | | | | | | | | | |
| | Total Swaps | | $ | 23,819,312 | | | | 8.03 | % | | $ | 34,397 | | | | 0.09 | % | | $ | 2,583 | | | | 0.06 | % | | $ | — | | | | 0.00 | % |
| | | | | | | | | | | | | | | | | | | | | | | | | | | | | | | | | | |
Investment in Berkeley Quantitative Colorado Fund, LLC (Cost of $8,487,603) | | $ | — | | | | 0.00 | % | | $ | 6,270,844 | | | | 15.83 | % | | $ | — | | | | 0.00 | % | | $ | — | | | | 0.00 | % |
| | | | | | | | | | | | | | | | | | | | | | | | | | | | | | | | | | |
| | | | | | | |
U.S. TREASURY SECURITIES | | | | | | | | | | | | | | | | | | | | | | | | | | | | | |
| | | | | | | | |
FACE VALUE | | Fair Value | | | | | | Fair Value | | | | | | Fair Value | | | | | | Fair Value | | | | |
$36,500,000.00 | | US Treasury Note 3.875% due 02/15/2013 (Cost $38,125,391) (2) | | $ | 14,052,173 | | | | 4.74 | % | | $ | 2,094,416 | | | | 5.29 | % | | $ | 157,304 | | | | 3.64 | % | | $ | — | | | | 0.00 | % |
$36,700,000.00 | | US Treasury Note 4.000% due 02/15/2015 (Cost $38,016,039) (2) | | | 15,116,043 | | | | 5.10 | % | | | 2,252,982 | | | | 5.69 | % | | | 169,213 | | | | 3.92 | % | | | — | | | | 0.00 | % |
| | | | | | | | | | | | | | | | | | | | | | | | | | | | | | | | | | |
| | $ | 29,168,216 | | | | 9.84 | % | | $ | 4,347,398 | | | | 10.98 | % | | $ | 326,517 | | | | 7.56 | % | | $ | — | | | | 0.00 | % |
| | | | | | | | | | | | | | | | | | | | | | | | | | | | | | | | | | |
| | | | | | | | |
Additional Disclosure on U.S. Treasury
Securities | | Face Value | | | | | | Face Value | | | | | | Face Value | | | | | | Face Value | | | | |
| | US Treasury Note 3.875% due 02/15/2013 (2) | | $ | 13,517,520 | | | | | | | $ | 2,014,729 | | | | | | | $ | 151,319 | | | | | | | $ | — | | | | | |
| | US Treasury Note 4.000% due 02/15/2015 (2) | | | 13,591,588 | | | | | | | | 2,025,768 | | | | | | | | 152,148 | | | | | | | | — | | | | | |
| | | | | | | | | | | | | | | | | | | | | | | | | | | | | | | | | | |
| | $ | 27,109,108 | | | | | | | $ | 4,040,497 | | | | | | | $ | 303,467 | | | | | | | $ | — | | | | | |
| | | | | | | | | | | | | | | | | | | | | | | | | | | | | | | | | | |
| | | | | Cost | | | | | | | | Cost | | | | | | | | Cost | | | | | | | | Cost | | | | | |
| | US Treasury Note 3.875% due 02/15/2013 (2) | | $ | 14,119,472 | | | | | | | $ | 2,104,447 | | | | | | | $ | 158,057 | | | | | | | $ | — | | | | | |
| | US Treasury Note 4.000% due 02/15/2015 (2) | | | 14,078,974 | | | | | | | | 2,098,411 | | | | | | | | 157,604 | | | | | | | | — | | | | | |
| | | | | | | | | | | | | | | | | | | | | | | | | | | | | | | | | | |
| | $ | 28,198,446 | | | | | | | $ | 4,202,858 | | | | | | | $ | 315,661 | | | | | | | $ | — | | | | | |
| | | | | | | | | | | | | | | | | | | | | | | | | | | | | | | | | | |
| * | Except of those items disclosed, no individual futures, forwards and option on futures contract position constituted greater than 1 percent of Net Asset Value. Accordingly, the number of contracts and expiration dates are not presented. |
| (1) | See Notes to Financial Statements, Note 4. |
| (2) | Assets have been allocated to each Series based upon ownership in the cash management pool. See Note 2. |
| (3) | Formerly the Cambell/Graham/Tiverton Series |
| (4) | The Long Only Commodity Series ceased trading operations on December 21, 2011 and redeemed all existing Units. The Series remains open. |
The accompanying notes are an integral part of these financial statements.
F-8
The Series of the Frontier Fund
Condensed Schedules of Investments
December 31, 2011
| | | | | | | | | | | | | | | | | | | | | | | | | | |
| | | | | Managed Futures Index
Series (3) | | | Winton Series | | | Winton/Graham Series | |
Description | | | | Value | | | % of Total Capital
(Net Asset Value) | | | Value | | | % of Total Capital
(Net Asset Value) | | | Value | | | % of Total Capital
(Net Asset Value) | |
LONG FUTURES CONTRACTS * | | | | | | | | | | | | | | | | | | | | | | | | |
| | Various base metals futures contracts (U.S.) | | $ | — | | | | 0.00 | % | | $ | — | | | | 0.00 | % | | $ | — | | | | 0.00 | % |
| | Various base metals futures contracts (Europe) | | | — | | | | 0.00 | % | | | — | | | | 0.00 | % | | | — | | | | 0.00 | % |
| | Various currency futures contracts (U.S.) | | | — | | | | 0.00 | % | | | — | | | | 0.00 | % | | | — | | | | 0.00 | % |
| | Various currency futures contracts (Canada) | | | — | | | | 0.00 | % | | | — | | | | 0.00 | % | | | — | | | | 0.00 | % |
| | Various currency futures contracts (Europe) | | | — | | | | 0.00 | % | | | — | | | | 0.00 | % | | | — | | | | 0.00 | % |
| | Various currency futures contracts (Far East) | | | — | | | | 0.00 | % | | | — | | | | 0.00 | % | | | — | | | | 0.00 | % |
| | Various energy futures contracts (U.S.) | | | — | | | | 0.00 | % | | | — | | | | 0.00 | % | | | — | | | | 0.00 | % |
| | Various energy futures contracts (Europe) | | | — | | | | 0.00 | % | | | — | | | | 0.00 | % | | | — | | | | 0.00 | % |
| | Various interest rates futures contracts (U.S.) | | | — | | | | 0.00 | % | | | — | | | | 0.00 | % | | | — | | | | 0.00 | % |
| | Various interest rates futures contracts (Canada) | | | — | | | | 0.00 | % | | | — | | | | 0.00 | % | | | — | | | | 0.00 | % |
| | Various interest rates futures contracts (Europe) | | | — | | | | 0.00 | % | | | — | | | | 0.00 | % | | | — | | | | 0.00 | % |
| | Various interest rates futures contracts (Far East) | | | — | | | | 0.00 | % | | | — | | | | 0.00 | % | | | — | | | | 0.00 | % |
| | Various precious metals futures contracts (U.S.) | | | — | | | | 0.00 | % | | | — | | | | 0.00 | % | | | — | | | | 0.00 | % |
| | Various precious metals futures contracts (Europe) | | | — | | | | 0.00 | % | | | — | | | | 0.00 | % | | | — | | | | 0.00 | % |
| | Various soft futures contracts (U.S.) | | | — | | | | 0.00 | % | | | — | | | | 0.00 | % | | | — | | | | 0.00 | % |
| | Various soft futures contracts (Europe) | | | — | | | | 0.00 | % | | | — | | | | 0.00 | % | | | — | | | | 0.00 | % |
| | Various soft futures contracts (Canada) | | | — | | | | 0.00 | % | | | — | | | | 0.00 | % | | | — | | | | 0.00 | % |
| | Various stock index futures contracts (U.S.) | | | — | | | | 0.00 | % | | | — | | | | 0.00 | % | | | — | | | | 0.00 | % |
| | Various stock index futures contracts (Canada) | | | — | | | | 0.00 | % | | | — | | | | 0.00 | % | | | — | | | | 0.00 | % |
| | Various stock index futures contracts (Europe) | | | — | | | | 0.00 | % | | | — | | | | 0.00 | % | | | — | | | | 0.00 | % |
| | Various stock index futures contracts (Far East) | | | — | | | | 0.00 | % | | | — | | | | 0.00 | % | | | — | | | | 0.00 | % |
| | | | | | | | | | | | | | | | | | | | | | | | | | |
| | Total Long Futures Contracts | | $ | — | | | | 0.00 | % | | $ | — | | | | 0.00 | % | | $ | — | | | | 0.00 | % |
| | | | | | | | | | | | | | | | | | | | | | | | | | |
SHORT FUTURES CONTRACTS * | | | | | | | | | | | | | | | | | | | | | | | | |
| | Various base metals futures contracts (U.S.) | | $ | — | | | | 0.00 | % | | $ | — | | | | 0.00 | % | | $ | — | | | | 0.00 | % |
| | Various base metals futures contracts (Europe) | | | — | | | | 0.00 | % | | | — | | | | 0.00 | % | | | — | | | | 0.00 | % |
| | Various currency futures contracts (U.S.) | | | — | | | | 0.00 | % | | | — | | | | 0.00 | % | | | — | | | | 0.00 | % |
| | Various currency futures contracts (Canada) | | | — | | | | 0.00 | % | | | — | | | | 0.00 | % | | | — | | | | 0.00 | % |
| | Various base metals futures contracts (US) | | $ | — | | | | 0.00 | % | | $ | — | | | | 0.00 | % | | $ | — | | | | 0.00 | % |
| | Various base metals futures contracts (Europe) | | | — | | | | 0.00 | % | | | — | | | | 0.00 | % | | | — | | | | 0.00 | % |
| | Various currency futures contracts (US) | | | — | | | | 0.00 | % | | | — | | | | 0.00 | % | | | — | | | | 0.00 | % |
| | Various currency futures contracts (Canada) | | | — | | | | 0.00 | % | | | — | | | | 0.00 | % | | | — | | | | 0.00 | % |
| | Various currency futures contracts (Europe) | | | — | | | | 0.00 | % | | | — | | | | 0.00 | % | | | — | | | | 0.00 | % |
| | Various currency futures contracts (Far East) | | | — | | | | 0.00 | % | | | — | | | | 0.00 | % | | | — | | | | 0.00 | % |
| | Various energy futures contracts (US) | | | — | | | | 0.00 | % | | | — | | | | 0.00 | % | | | — | | | | 0.00 | % |
| | Various energy futures contracts (Europe) | | | — | | | | 0.00 | % | | | — | | | | 0.00 | % | | | — | | | | 0.00 | % |
| | Various interest rates futures contracts (US) | | | — | | | | 0.00 | % | | | — | | | | 0.00 | % | | | — | | | | 0.00 | % |
| | Various interest rates futures contracts (Canada) | | | — | | | | 0.00 | % | | | — | | | | 0.00 | % | | | — | | | | 0.00 | % |
| | Various interest rates futures contracts (Europe) | | | — | | | | 0.00 | % | | | — | | | | 0.00 | % | | | — | | | | 0.00 | % |
| | Various interest rates futures contracts (Far East) | | | — | | | | 0.00 | % | | | — | | | | 0.00 | % | | | — | | | | 0.00 | % |
| | Various precious metals futures contracts (US) | | | — | | | | 0.00 | % | | | — | | | | 0.00 | % | | | — | | | | 0.00 | % |
| | Various soft futures contracts (US) | | | — | | | | 0.00 | % | | | — | | | | 0.00 | % | | | — | | | | 0.00 | % |
| | Various soft futures contracts (Canada) | | | — | | | | 0.00 | % | | | — | | | | 0.00 | % | | | — | | | | 0.00 | % |
| | Various soft futures contracts (Europe) | | | — | | | | 0.00 | % | | | — | | | | 0.00 | % | | | — | | | | 0.00 | % |
| | Various stock index futures contracts (US) | | | — | | | | 0.00 | % | | | — | | | | 0.00 | % | | | — | | | | 0.00 | % |
| | Various stock index futures contracts (Canada) | | | — | | | | 0.00 | % | | | — | | | | 0.00 | % | | | — | | | | 0.00 | % |
| | Various stock index futures contracts (Europe) | | | — | | | | 0.00 | % | | | — | | | | 0.00 | % | | | — | | | | 0.00 | % |
| | Various stock index futures contracts (Far East) | | | — | | | | 0.00 | % | | | — | | | | 0.00 | % | | | — | | | | 0.00 | % |
| | | | | | | | | | | | | | | | | | | | | | | | | | |
| | Total Short Futures Contracts | | $ | — | | | | 0.00 | % | | $ | — | | | | 0.00 | % | | $ | — | | | | 0.00 | % |
| | | | | | | | | | | | | | | | | | | | | | | | | | |
CURRENCY FORWARDS * | | $ | — | | | | 0.00 | % | | $ | — | | | | 0.00 | % | | $ | — | | | | 0.00 | % |
| | | | | | | | | | | | | | | | | | | | | | | | | | |
| | Total Open Trade Equity | | $ | — | | | | 0.00 | % | | $ | — | | | | 0.00 | % | | $ | — | | | | 0.00 | % |
| | | | | | | | | | | | | | | | | | | | | | | | | | |
SWAPS (1) | | | | $ | — | | | | 0.00 | % | | $ | 61,888 | | | | 0.12 | % | | $ | 30,381 | | | | 0.10 | % |
| | | | | | | | | | | | | | | | | | | | | | | | | | |
U.S. TREASURY SECURITIES | | | | | | | | | | | | | | | | | | | | | | | | |
| | | | | | | |
FACE VALUE | | | | Fair Value | | | | | | Fair Value | | | | | | Fair Value | | | | |
$36,500,000.00 | | US Treasury Note 3.875% due 02/15/2013 (Cost $38,125,391) (2) | | $ | — | | | | 0.00 | % | | $ | 3,768,316 | | | | 7.53 | % | | $ | 1,849,901 | | | | 6.01 | % |
$36,700,000.00 | | US Treasury Note 4.000% due 02/15/2015 (Cost $38,016,039) (2) | | | — | | | | 0.00 | % | | | 4,053,611 | | | | 8.10 | % | | | 1,989,954 | | | | 6.47 | % |
| | | | | | | | | | | | | | | | | | | | | | | | | | |
| | | | $ | — | | | | 0.00 | % | | $ | 7,821,927 | | | | 15.63 | % | | $ | 3,839,855 | | | | 12.48 | % |
| | | | | | | | | | | | | | | | | | | | | | | | | | |
| | | | | | |
Additional Disclosure on U.S. Treasury Securities | | Face Value | | | | | | Face Value | | | | | | Face Value | | | | |
| | US Treasury Note 3.875% due 02/15/2013 (2) | | $ | — | | | | | | | $ | 3,624,941 | | | | | | | $ | 1,779,516 | | | | | |
| | US Treasury Note 4.000% due 02/15/2015 (2) | | | — | | | | | | | | 3,644,803 | | | | | | | | 1,789,267 | | | | | |
| | | | | | | | | | | | | | | | | | | | | | | | | | |
| | | | $ | — | | | | | | | $ | 7,269,744 | | | | | | | $ | 3,568,783 | | | | | |
| | | | | | | | | | | | | | | | | | | | | | | | | | |
| | | | | | | |
| | | | | Cost | | | | | | Cost | | | | | | Cost | | | | |
| | US Treasury Note 3.875% due 02/15/2013 (2) | | $ | — | | | | | | | $ | 3,786,364 | | | | | | | $ | 1,858,760 | | | | | |
| | US Treasury Note 4.000% due 02/15/2015 (2) | | | — | | | | | | | | 3,775,504 | | | | | | | | 1,853,429 | | | | | |
| | | | | | | | | | | | | | | | | | | | | | | | | | |
| | | | $ | — | | | | | | | $ | 7,561,868 | | | | | | | $ | 3,712,189 | | | | | |
| | | | | | | | | | | | | | | | | | | | | | | | | | |
| * | Except for those items disclosed, no individual futures, forwards and option on futures contract position constituted greater than 1 percent of Net Asset Value. Accordingly, the number of contracts and expiration dates are not presented. |
| (1) | See Notes to Financial Statements, Note 4. |
| (2) | Assets have been allocated to each Series based upon ownership in the cash management pool. See Note 2. |
| (3) | The Managed Futures Index Series ceased trading operations on December 21, 2011 and redeemed all existing Units. The Series remains open. |
The accompanying notes are an integral part of these financial statements.
F-9
The Series of the Frontier Fund
Condensed Schedules of Investments
December 31, 2010
| | | | | | | | | | | | | | | | | | | | | | | | | | | | | | | | | | |
| | | | | Frontier Diversified Series | | | Frontier Dynamic Series | | | Frontier Long/Short
Commodity Series | | | Frontier Masters Series | |
Description | | Value | | | % of Owners’
Capital (Net
Asset Value) | | | Value | | | % of Owners’
Capital (Net
Asset Value) | | | Value | | | % of Owners’
Capital (Net
Asset Value) | | | Value | | | % of Owners’
Capital (Net
Asset Value) | |
LONG FUTURES CONTRACTS * | | | | | | | | | | | | | | | | | | | | | | | | | | | | | |
| | Various base metals futures contracts (U.S.) | | $ | — | | | | 0.00 | % | | $ | — | | | | 0.00 | % | | $ | — | | | | 0.00 | % | | $ | — | | | | 0.00 | % |
| | Various base metals futures contracts (Europe) | | | — | | | | 0.00 | % | | | — | | | | 0.00 | % | | | — | | | | 0.00 | % | | | — | | | | 0.00 | % |
| | Various currency futures contracts (U.S.) | | | — | | | | 0.00 | % | | | — | | | | 0.00 | % | | | — | | | | 0.00 | % | | | — | | | | 0.00 | % |
| | Various currency futures contracts (Canada) | | | — | | | | 0.00 | % | | | — | | | | 0.00 | % | | | — | | | | 0.00 | % | | | — | | | | 0.00 | % |
| | Various currency futures contracts (Europe) | | | — | | | | 0.00 | % | | | — | | | | 0.00 | % | | | — | | | | 0.00 | % | | | — | | | | 0.00 | % |
| | Various currency futures contracts (Far East) | | | — | | | | 0.00 | % | | | — | | | | 0.00 | % | | | — | | | | 0.00 | % | | | — | | | | 0.00 | % |
| | Various energy futures contracts (U.S.) | | | — | | | | 0.00 | % | | | — | | | | 0.00 | % | | | — | | | | 0.00 | % | | | — | | | | 0.00 | % |
| | Various energy futures contracts (Europe) | | | — | | | | 0.00 | % | | | — | | | | 0.00 | % | | | — | | | | 0.00 | % | | | — | | | | 0.00 | % |
| | Various interest rates futures contracts (U.S.) | | | — | | | | 0.00 | % | | | — | | | | 0.00 | % | | | — | | | | 0.00 | % | | | — | | | | 0.00 | % |
| | Various interest rates futures contracts (Canada) | | | — | | | | 0.00 | % | | | — | | | | 0.00 | % | | | — | | | | 0.00 | % | | | — | | | | 0.00 | % |
| | Various interest rates futures contracts (Europe) | | | — | | | | 0.00 | % | | | — | | | | 0.00 | % | | | — | | | | 0.00 | % | | | — | | | | 0.00 | % |
| | Various interest rates futures contracts (Far East) | | | — | | | | 0.00 | % | | | — | | | | 0.00 | % | | | — | | | | 0.00 | % | | | — | | | | 0.00 | % |
| | Various precious metals futures contracts (U.S.) | | | — | | | | 0.00 | % | | | — | | | | 0.00 | % | | | — | | | | 0.00 | % | | | — | | | | 0.00 | % |
| | Various precious metals futures contracts (Europe) | | | — | | | | 0.00 | % | | | — | | | | 0.00 | % | | | — | | | | 0.00 | % | | | — | | | | 0.00 | % |
| | Various soft futures contracts (U.S.) | | | — | | | | 0.00 | % | | | — | | | | 0.00 | % | | | — | | | | 0.00 | % | | | — | | | | 0.00 | % |
| | Various soft futures contracts (Far East) | | | — | | | | 0.00 | % | | | — | | | | 0.00 | % | | | — | | | | 0.00 | % | | | — | | | | 0.00 | % |
| | Various soft futures contracts (Europe) | | | — | | | | 0.00 | % | | | — | | | | 0.00 | % | | | — | | | | 0.00 | % | | | — | | | | 0.00 | % |
| | Various soft futures contracts (Canada) | | | — | | | | 0.00 | % | | | — | | | | 0.00 | % | | | — | | | | 0.00 | % | | | — | | | | 0.00 | % |
| | Various stock index futures contracts (U.S.) | | | — | | | | 0.00 | % | | | — | | | | 0.00 | % | | | — | | | | 0.00 | % | | | — | | | | 0.00 | % |
| | Various stock index futures contracts (Canada) | | | — | | | | 0.00 | % | | | — | | | | 0.00 | % | | | — | | | | 0.00 | % | | | — | | | | 0.00 | % |
| | Various stock index futures contracts (Europe) | | | — | | | | 0.00 | % | | | — | | | | 0.00 | % | | | — | | | | 0.00 | % | | | — | | | | 0.00 | % |
| | Various stock index futures contracts (Far East) | | | — | | | | 0.00 | % | | | — | | | | 0.00 | % | | | — | | | | 0.00 | % | | | — | | | | 0.00 | % |
| | | | | | | | | | | | | | | | | | | | | | | | | | | | | | | | | | |
| | Total Long Futures Contracts | | $ | — | | | | 0.00 | % | | $ | — | | | | 0.00 | % | | $ | — | | | | 0.00 | % | | $ | — | | | | 0.00 | % |
| | | | | | | | | | | | | | | | | | | | | | | | | | | | | | | | | | |
OPTIONS PURCHASED * | | $ | — | | | | 0.00 | % | | $ | — | | | | 0.00 | % | | $ | — | | | | 0.00 | % | | $ | — | | | | 0.00 | % |
| | | | | | | | | | | | | | | | | | | | | | | | | | | | | | | | | | |
SHORT FUTURES CONTRACTS * | | | | | | | | | | | | | | | | | | | | | | | | | | | | | |
| | Various base metals futures contracts (U.S.) | | $ | — | | | | 0.00 | % | | $ | — | | | | 0.00 | % | | $ | — | | | | 0.00 | % | | $ | — | | | | 0.00 | % |
| | Various base metals futures contracts (Europe) | | | — | | | | 0.00 | % | | | — | | | | 0.00 | % | | | — | | | | 0.00 | % | | | — | | | | 0.00 | % |
| | Various currency futures contracts (U.S.) | | | — | | | | 0.00 | % | | | — | | | | 0.00 | % | | | — | | | | 0.00 | % | | | — | | | | 0.00 | % |
| | Various currency futures contracts (Canada) | | | — | | | | 0.00 | % | | | — | | | | 0.00 | % | | | — | | | | 0.00 | % | | | — | | | | 0.00 | % |
| | Various currency futures contracts (Europe) | | | — | | | | 0.00 | % | | | — | | | | 0.00 | % | | | — | | | | 0.00 | % | | | — | | | | 0.00 | % |
| | Various currency futures contracts (Far East) | | | — | | | | 0.00 | % | | | — | | | | 0.00 | % | | | — | | | | 0.00 | % | | | — | | | | 0.00 | % |
| | Various energy futures contracts (U.S.) | | | — | | | | 0.00 | % | | | — | | | | 0.00 | % | | | — | | | | 0.00 | % | | | — | | | | 0.00 | % |
| | Various energy futures contracts (Europe) | | | — | | | | 0.00 | % | | | — | | | | 0.00 | % | | | — | | | | 0.00 | % | | | — | | | | 0.00 | % |
| | Various interest rates futures contracts (U.S.) | | | — | | | | 0.00 | % | | | — | | | | 0.00 | % | | | — | | | | 0.00 | % | | | — | | | | 0.00 | % |
| | Various interest rates futures contracts (Canada) | | | — | | | | 0.00 | % | | | — | | | | 0.00 | % | | | — | | | | 0.00 | % | | | — | | | | 0.00 | % |
| | Various interest rates futures contracts (Europe) | | | — | | | | 0.00 | % | | | — | | | | 0.00 | % | | | — | | | | 0.00 | % | | | — | | | | 0.00 | % |
| | Various interest rates futures contracts (Far East) | | | — | | | | 0.00 | % | | | — | | | | 0.00 | % | | | — | | | | 0.00 | % | | | — | | | | 0.00 | % |
| | Various precious metals futures contracts (U.S.) | | | — | | | | 0.00 | % | | | — | | | | 0.00 | % | | | — | | | | 0.00 | % | | | — | | | | 0.00 | % |
| | Various soft futures contracts (U.S.) | | | — | | | | 0.00 | % | | | — | | | | 0.00 | % | | | — | | | | 0.00 | % | | | — | | | | 0.00 | % |
| | Various soft futures contracts (Europe) | | | — | | | | 0.00 | % | | | — | | | | 0.00 | % | | | — | | | | 0.00 | % | | | — | | | | 0.00 | % |
| | Various stock index futures contracts (U.S.) | | | — | | | | 0.00 | % | | | — | | | | 0.00 | % | | | — | | | | 0.00 | % | | | — | | | | 0.00 | % |
| | Various stock index futures contracts (Europe) | | | — | | | | 0.00 | % | | | — | | | | 0.00 | % | | | — | | | | 0.00 | % | | | — | | | | 0.00 | % |
| | Various stock index futures contracts (Far East) | | | — | | | | 0.00 | % | | | — | | | | 0.00 | % | | | — | | | | 0.00 | % | | | — | | | | 0.00 | % |
| | | | | | | | | | | | | | | | | | | | | | | | | | | | | | | | | | |
| | Total Short Futures Contracts | | $ | — | | | | 0.00 | % | | $ | — | | | | 0.00 | % | | $ | — | | | | 0.00 | % | | $ | — | | | | 0.00 | % |
| | | | | | | | | | | | | | | | | | | | | | | | | | | | | | | | | | |
OPTIONS WRITTEN * | | $ | — | | | | 0.00 | % | | $ | — | | | | 0.00 | % | | $ | — | | | | 0.00 | % | | $ | — | | | | 0.00 | % |
| | | | | | | | | | | | | | | | | | | | | | | | | | | | | | | | | | |
CURRENCY FORWARDS * | | $ | — | | | | 0.00 | % | | $ | — | | | | 0.00 | % | | $ | — | | | | 0.00 | % | | $ | — | | | | 0.00 | % |
| | | | | | | | | | | | | | | | | | | | | | | | | | | | | | | | | | |
| | Total Open Trade Equity | | $ | — | | | | 0.00 | % | | $ | — | | | | 0.00 | % | | $ | — | | | | 0.00 | % | | $ | — | | | | 0.00 | % |
| | | | | | | | | | | | | | | | | | | | | | | | | | | | | | | | | | |
SWAPS (1) | | | | | | | | | | | | | | | | | | | | | | | | | | | | | | | | |
| | Total Return Option Basket Swap (Termination date 6/6/14) | | $ | 11,407,905 | | | | 7.15 | % | | $ | 10,956,772 | | | | 670.99 | % | | $ | — | | | | 0.00 | % | | $ | 26,242,246 | | | | 39.60 | % |
| | | | | | | | | | | | | | | | | | | | | | | | | | | | | | | | | | |
| | | | | | | |
U.S. TREASURY SECURITIES | | | | | | | | | | | | | | | | | | | | | | | | | | | | | |
| | | | | | | | |
FACE VALUE | | Fair Value | | | | | | Fair Value | | | | | | Fair Value | | | | | | Fair Value | | | | |
$36,500,000.00 | | U.S. Treasury Note 3.875% due 02/15/2013 (Cost $38,125,391) (2) | | $ | 6,706,231 | | | | 4.20 | % | | $ | 1,376,875 | | | | 84.32 | % | | $ | 3,348,522 | | | | 4.34 | % | | $ | 1,744,686 | | | | 2.63 | % |
$36,700,000.00 | | U.S. Treasury Note 4.000% due 02/15/2015 (Cost $38,016,039) (2) | | | 6,914,499 | | | | 4.34 | % | | | 1,419,635 | | | | 86.94 | % | | | 3,452,513 | | | | 4.47 | % | | | 1,798,868 | | | | 2.71 | % |
| | | | | | | | | | | | | | | | | | | | | | | | | | | | | | | | | | |
| | | | $ | 13,620,730 | | | | 8.54 | % | | $ | 2,796,510 | | | | 171.26 | % | | $ | 6,801,035 | | | | 8.81 | % | | $ | 3,543,554 | | | | 5.34 | % |
| | | | | | | | | | | | | | | | | | | | | | | | | | | | | | | | | | |
| | | | | | | | |
Additional Disclosure on U.S.
Treasury Securities | | Face Value | | | | | | Face Value | | | | | | Face
Value | | | | | | Face Value | | | | |
| | U.S. Treasury Note 3.875% due 02/15/2013 (2) | | $ | 6,277,315 | | | | | | | $ | 1,288,813 | | | | | | | $ | 3,134,358 | | | | | | | $ | 1,633,099 | | | | | |
| | U.S. Treasury Note 4.000% due 02/15/2015 (2) | | | 6,311,712 | | | | | | | | 1,295,875 | | | | | | | | 3,151,532 | | | | | | | | 1,642,048 | | | | | |
| | | | | | | | | | | | | | | | | | | | | | | | | | | | | | | | | | |
| | | | $ | 12,589,027 | | | | | | | $ | 2,584,688 | | | | | | | $ | 6,285,890 | | | | | | | $ | 3,275,147 | | | | | |
| | | | | | | | | | | | | | | | | | | | | | | | | | | | | | | | | | |
| | | | | | | | | |
| | | | | Cost | | | | | | Cost | | | | | | Cost | | | | | | Cost | | | | |
| | U.S. Treasury Note 3.875% due 02/15/2013 (2) | | $ | 6,556,852 | | | | | | | $ | 1,346,206 | | | | | | | $ | 3,273,935 | | | | | | | $ | 1,705,823 | | | | | |
| | U.S. Treasury Note 4.000% due 02/15/2015 (2) | | | 6,538,046 | | | | | | | | 1,342,344 | | | | | | | | 3,264,544 | | | | | | | | 1,700,931 | | | | | |
| | | | | | | | | | | | | | | | | | | | | | | | | | | | | | | | | | |
| | | | $ | 13,094,898 | | | | | | | $ | 2,688,550 | | | | | | | $ | 6,538,479 | | | | | | | $ | 3,406,754 | | | | | |
| | | | | | | | | | | | | | | | | | | | | | | | | | | | | | | | | | |
| * | Except for those items disclosed, no individual futures, forwards and option on futures contract position constituted greater than 1 percent of Net Asset Value. Accordingly, the number of contracts and expiration dates are not presented. |
| (1) | See Notes to Financial Statements, Note 4. |
| (2) | Assets have been allocated to each Series based upon ownership in the cash management pool. See Note 2. |
The accompanying notes are an integral part of these financial statements.
F-10
The Series of the Frontier Fund
Condensed Schedules of Investments
December 31, 2010
| | | | | | | | | | | | | | | | | | | | | | | | | | | | | | | | | | |
| | | | | Balanced Series | | | Berkeley/Graham/
Tiverton Series (3) | | | Currency Series | | | Long Only Commodity Series | |
Description | | Value | | | % of Owners’
Capital (Net
Asset Value) | | | Value | | | % of Owners’
Capital (Net
Asset Value) | | | Value | | | % of Owners’
Capital (Net
Asset Value) | | | Value | | | % of Owners’
Capital (Net
Asset Value) | |
LONG FUTURES CONTRACTS * | | | | | | | | | | | | | | | | | | | | | | | | | | | | | | | | |
| | Various base metals futures contracts (U.S.) | | $ | 1,088,633 | | | | 0.25 | % | | $ | — | | | | 0.00 | % | | $ | — | | | | 0.00 | % | | $ | — | | | | 0.00 | % |
| | Various base metals futures contracts (Europe) | | | 8,015,226 | | | | 1.87 | % | | | — | | | | 0.00 | % | | | — | | | | 0.00 | % | | | — | | | | 0.00 | % |
| | Copper @ LME Settling 3/16/2011 (Number of Contracts: 215) | | | 6,234,313 | | | | 1.46 | % | | | — | | | | 0.00 | % | | | — | | | | 0.00 | % | | | — | | | | 0.00 | % |
| | Various currency futures contracts (U.S.) | | | 1,192,754 | | | | 0.28 | % | | | — | | | | 0.00 | % | | | — | | | | 0.00 | % | | | — | | | | 0.00 | % |
| | Various currency futures contracts (Europe) | | | 54,979 | | | | 0.01 | % | | | — | | | | 0.00 | % | | | — | | | | 0.00 | % | | | — | | | | 0.00 | % |
| | Various currency futures contracts (Far East) | | | — | | | | 0.00 | % | | | — | | | | 0.00 | % | | | — | | | | 0.00 | % | | | — | | | | 0.00 | % |
| | Various energy futures contracts (U.S.) | | | 1,008,666 | | | | 0.24 | % | | | — | | | | 0.00 | % | | | — | | | | 0.00 | % | | | — | | | | 0.00 | % |
| | Various energy futures contracts (Europe) | | | 119,345 | | | | 0.03 | % | | | — | | | | 0.00 | % | | | — | | | | 0.00 | % | | | — | | | | 0.00 | % |
| | Various interest rates futures contracts (U.S.) | | | 394,589 | | | | 0.09 | % | | | — | | | | 0.00 | % | | | — | | | | 0.00 | % | | | — | | | | 0.00 | % |
| | Various interest rates futures contracts (Canada) | | | 19,156 | | | | 0.00 | % | | | — | | | | 0.00 | % | | | — | | | | 0.00 | % | | | — | | | | 0.00 | % |
| | Various interest rates futures contracts (Europe) | | | 397,103 | | | | 0.09 | % | | | — | | | | 0.00 | % | | | — | | | | 0.00 | % | | | — | | | | 0.00 | % |
| | Various interest rates futures contracts (Far East) | | | 171,547 | | | | 0.04 | % | | | — | | | | 0.00 | % | | | — | | | | 0.00 | % | | | — | | | | 0.00 | % |
| | Various precious metals futures contracts (U.S.) | | | 1,284,530 | | | | 0.30 | % | | | — | | | | 0.00 | % | | | — | | | | 0.00 | % | | | — | | | | 0.00 | % |
| | Various soft futures contracts (U.S.) | | | 4,124,449 | | | | 0.96 | % | | | — | | | | 0.00 | % | | | — | | | | 0.00 | % | | | — | | | | 0.00 | % |
| | Various soft futures contracts (Europe) | | | 178,197 | | | | 0.04 | % | | | — | | | | 0.00 | % | | | — | | | | 0.00 | % | | | — | | | | 0.00 | % |
| | Various soft futures contracts (Far East) | | | 12,801 | | | | 0.00 | % | | | — | | | | 0.00 | % | | | — | | | | 0.00 | % | | | — | | | | 0.00 | % |
| | Various soft futures contracts (Europe) | | | | 0.00 | % | | | — | | | | 0.00 | % | | | — | | | | 0.00 | % | | | — | | | | 0.00 | % |
| | Various soft futures contracts (Canada) | | | — | | | | 0.00 | % | | | — | | | | 0.00 | % | | | — | | | | 0.00 | % | | | — | | | | 0.00 | % |
| | Various stock index futures contracts (U.S.) | | | 185,280 | | | | 0.04 | % | | | — | | | | 0.00 | % | | | — | | | | 0.00 | % | | | — | | | | 0.00 | % |
| | Various stock index futures contracts (Canada) | | | 20,301 | | | | 0.00 | % | | | — | | | | 0.00 | % | | | — | | | | 0.00 | % | | | — | | | | 0.00 | % |
| | Various stock index futures contracts (Europe) | | | (347,494 | ) | | | -0.08 | % | | | — | | | | 0.00 | % | | | — | | | | 0.00 | % | | | — | | | | 0.00 | % |
| | Various stock index futures contracts (Far East) | | | 93,974 | | | | 0.02 | % | | | — | | | | 0.00 | % | | | — | | | | 0.00 | % | | | — | | | | 0.00 | % |
| | | | | | | | | | | | | | | | | | | | | | | | | | | | | | | | | | |
| | Total Long Futures Contracts | | $ | 24,248,349 | | | | 5.65 | % | | $ | — | | | | 0.00 | % | | $ | — | | | | 0.00 | % | | $ | — | | | | 0.00 | % |
| | | | | | | | | | | | | | | | | | | | | | | | | | | | | | | | | | |
OPTIONS PURCHASED * | | $ | 24,855,339 | | | | 5.80 | % | | $ | — | | | | 0.00 | % | | $ | — | | | | 0.00 | % | | $ | — | | | | 0.00 | % |
| | Copper @ LME Settling 3/1/2011, Call @ 8,400 (Numer of Contracts: 131) | | | 4,299,158 | | | | 1.00 | % | | | — | | | | 0.00 | % | | | — | | | | 0.00 | % | | | — | | | | 0.00 | % |
| | | | | | | | | | | | | | | | | | | | | | | | | | | | | | | | | | |
| | Total Options Purchased | | $ | 29,154,497 | | | | 6.80 | % | | $ | — | | | | 0.00 | % | | $ | — | | | | 0.00 | % | | $ | — | | | | 0.00 | % |
| | | | | | | | | | | | | | | | | | | | | | | | | | | | | | | | | | |
SHORT FUTURES CONTRACTS * | | | | | | | | | | | | | | | | | | | | | | | | | | | | | | | | |
| | Various base metals futures contracts (U.S.) | | $ | (2,251,017 | ) | | | -0.53 | % | | $ | — | | | | 0.00 | % | | $ | — | | | | 0.00 | % | | $ | — | | | | 0.00 | % |
| | Copper @ Comex Settling 3/1/2011 (Number of Contracts: 265) | | | (4,448,411 | ) | | | -1.04 | % | | | — | | | | 0.00 | % | | | — | | | | 0.00 | % | | | — | | | | 0.00 | % |
| | Various base metals futures contracts (Europe) | | | (7,195,082 | ) | | | -1.68 | % | | | — | | | | 0.00 | % | | | — | | | | 0.00 | % | | | — | | | | 0.00 | % |
| | Copper @ LME Settling 3/16/2011 (Number of Contracts: 204) | | | (5,109,138 | ) | | | -1.19 | % | | | — | | | | 0.00 | % | | | — | | | | 0.00 | % | | | — | | | | 0.00 | % |
| | Various currency futures contracts (US) | | | (152,716 | ) | | | -0.04 | % | | | — | | | | 0.00 | % | | | — | | | | 0.00 | % | | | — | | | | 0.00 | % |
| | Various currency futures contracts (Canada) | | | — | | | | 0.00 | % | | | — | | | | 0.00 | % | | | — | | | | 0.00 | % | | | — | | | | 0.00 | % |
| | Various currency futures contracts (Europe) | | | 165,269 | | | | 0.04 | % | | | — | | | | 0.00 | % | | | — | | | | 0.00 | % | | | — | | | | 0.00 | % |
| | Various currency futures contracts (Far East) | | | — | | | | 0.00 | % | | | — | | | | 0.00 | % | | | — | | | | 0.00 | % | | | — | | | | 0.00 | % |
| | Various energy futures contracts (U.S.) | | | (351,689 | ) | | | -0.08 | % | | | — | | | | 0.00 | % | | | — | | | | 0.00 | % | | | — | | | | 0.00 | % |
| | Various energy futures contracts (Europe) | | | 67,860 | | | | 0.02 | % | | | — | | | | 0.00 | % | | | — | | | | 0.00 | % | | | — | | | | 0.00 | % |
| | Various interest rates futures contracts (U.S.) | | | (44,519 | ) | | | -0.01 | % | | | — | | | | 0.00 | % | | | — | | | | 0.00 | % | | | — | | | | 0.00 | % |
| | Various interest rates futures contracts (Canada) | | | — | | | | 0.00 | % | | | — | | | | 0.00 | % | | | — | | | | 0.00 | % | | | — | | | | 0.00 | % |
| | Various interest rates futures contracts (Europe) | | | (424,601 | ) | | | -0.10 | % | | | — | | | | 0.00 | % | | | — | | | | 0.00 | % | | | — | | | | 0.00 | % |
| | Various interest rates futures contracts (Far East) | | | (149,997 | ) | | | -0.04 | % | | | — | | | | 0.00 | % | | | — | | | | 0.00 | % | | | — | | | | 0.00 | % |
| | Various precious metals futures contracts (U.S.) | | | (3,226,990 | ) | | | -0.75 | % | | | — | | | | 0.00 | % | | | — | | | | 0.00 | % | | | — | | | | 0.00 | % |
| | Various precious metals futures contracts (Europe) | | | — | | | | 0.00 | % | | | — | | | | 0.00 | % | | | — | | | | 0.00 | % | | | — | | | | 0.00 | % |
| | Various soft futures contracts (U.S.) | | | (807,600 | ) | | | -0.19 | % | | | — | | | | 0.00 | % | | | — | | | | 0.00 | % | | | — | | | | 0.00 | % |
| | Various soft futures contracts (Canada) | | | — | | | | 0.00 | % | | | — | | | | 0.00 | % | | | — | | | | 0.00 | % | | | — | | | | 0.00 | % |
| | Various soft futures contracts (Europe) | | | (54,735 | ) | | | -0.01 | % | | | — | | | | 0.00 | % | | | — | | | | 0.00 | % | | | — | | | | 0.00 | % |
| | Various stock index futures contracts (U.S.) | | | 93,081 | | | | 0.02 | % | | | — | | | | 0.00 | % | | | — | | | | 0.00 | % | | | — | | | | 0.00 | % |
| | Various stock index futures contracts (Canada) | | | — | | | | 0.00 | % | | | — | | | | 0.00 | % | | | — | | | | 0.00 | % | | | — | | | | 0.00 | % |
| | Various stock index futures contracts (Europe) | | | 76,258 | | | | 0.02 | % | | | — | | | | 0.00 | % | | | — | | | | 0.00 | % | | | — | | | | 0.00 | % |
| | Various stock index futures contracts (Far East) | | | 2,893 | | | | 0.00 | % | | | — | | | | 0.00 | % | | | — | | | | 0.00 | % | | | — | | | | 0.00 | % |
| | | | | | | | | | | | | | | | | | | | | | | | | | | | | | | | | | |
| | Total Short Futures Contracts | | $ | (23,811,134 | ) | | | -5.56 | % | | $ | — | | | | 0.00 | % | | $ | — | | | | 0.00 | % | | $ | — | | | | 0.00 | % |
| | | | | | | | | | | | | | | | | | | | | | | | | | | | | | | | | | |
OPTIONS WRITTEN * | | $ | (4,788,295 | ) | | | -1.12 | % | | $ | — | | | | 0.00 | % | | $ | (1,292 | ) | | | -0.02 | % | | $ | — | | | | 0.00 | % |
| | | | | | | | | | | | | | | | | | | | | | | | | | | | | | | | | | |
CURRENCY FORWARDS * | | $ | 1,286,793 | | | | 0.30 | % | | $ | — | | | | 0.00 | % | | $ | 28,390 | | | | 0.40 | % | | $ | — | | | | 0.00 | % |
| | | | | | | | | | | | | | | | | | | | | | | | | | | | | | | | | | |
| | Total Open Trade Equity | | $ | 26,090,210 | | | | 6.07 | % | | $ | — | | | | 0.00 | % | | $ | 27,098 | | | | 0.38 | % | | $ | — | | | | 0.00 | % |
| | | | | | | | | | | | | | | | | | | | | | | | | | | | | | | | | | |
SWAPS (1) | | | | | | | | | | | | | | | | | | | | | | | | | | | | | | | | |
| | Option Basket Balanced Series (Termination date 11/6/2012) | | $ | 49,811,462 | | | | 11.63 | % | | $ | — | | | | 0.00 | % | | $ | — | | | | 0.00 | % | | $ | — | | | | 0.00 | % |
| | Option Basket Currency Series (Termination date 1/26/2013) | | | — | | | | 0.00 | % | | | — | | | | 0.00 | % | | | 5,668,768 | | | | 79.40 | % | | | — | | | | 0.00 | % |
| | Reuters/Jeffries CRB Index (Termination date 2/28/2011) | | | — | | | | 0.00 | % | | | — | | | | 0.00 | % | | | — | | | | 0.00 | % | | | 415,648 | | | | 9.91 | % |
| | Jeffries Commodity Performance Index (Termination date 2/28/2011) | | | — | | | | 0.00 | % | | | — | | | | 0.00 | % | | | — | | | | 0.00 | % | | | 375,148 | | | | 8.95 | % |
| | | | | | | | | | | | | | | | | | | | | | | | | | | | | | | | | | |
| | Total Swaps | | $ | 49,811,462 | | | | 11.63 | % | | $ | — | | | | 0.00 | % | | $ | 5,668,768 | | | | 79.40 | % | | $ | 790,796 | | | | 18.86 | % |
| | | | | | | | | | | | | | | | | | | | | | | | | | | | | | | | | | |
Investment in Berkeley Quantitative Colorado Fund, LLC (Cost of $10,000,000) | | $ | — | | | | 0.00 | % | | $ | 10,157,099 | | | | 14.46 | % | | $ | — | | | | 0.00 | % | | $ | — | | | | 0.00 | % |
| | | | | | | | | | | | | | | | | | | | | | | | | | | | | | | | | | |
| | | | | | | | |
U.S. TREASURY SECURITIES FACE VALUE | | Fair Value | | | | | | Fair Value | | | | | | Fair Value | | | | | | Fair Value | | | | |
$36,500,000.00 | | U.S. Treasury Note 3.875% due 02/15/2013 (Cost $38,125,391) (2) | | $ | 13,418,389 | | | | 3.13 | % | | $ | 3,458,708 | | | | 4.92 | % | | $ | 989,472 | | | | 13.86 | % | | $ | 239,058 | | | | 5.70 | % |
$36,700,000.00 | | U.S. Treasury Note 4.000% due 02/15/2015 (Cost $38,016,039) (2) | | | 13,835,108 | | | | 3.23 | % | | | 3,566,121 | | | | 5.08 | % | | | 1,020,201 | | | | 14.29 | % | | | 246,483 | | | | 5.88 | % |
| | | | | | | | | | | | | | | | | | | | | | | | | | | | | | | | | | |
| | | | $ | 27,253,497 | | | | 6.36 | % | | $ | 7,024,829 | | | | 10.00 | % | | $ | 2,009,673 | | | | 28.15 | % | | $ | 485,541 | | | | 11.58 | % |
| | | | | | | | | | | | | | | | | | | | | | | | | | | | | | | | | | |
| | | | | | | | |
Additional Disclosure on U.S. Treasury Securities | | Face Value | | | | | | Face Value | | | | | | Face Value | | | | | | Face Value | | | | |
| | U.S. Treasury Note 3.875% due 02/15/2013 (2) | | $ | 12,560,178 | | | | | | | $ | 3,237,497 | | | | | | | $ | 926,188 | | | | | | | $ | 223,769 | | | | | |
| | U.S. Treasury Note 4.000% due 02/15/2015 (2) | | | 12,629,001 | | | | | | | | 3,255,236 | | | | | | | | 931,263 | | | | | | | | 224,995 | | | | | |
| | | | | | | | | | | | | | | | | | | | | | | | | | | | | | | | | | |
| | | | $ | 25,189,179 | | | | | | | $ | 6,492,733 | | | | | | | $ | 1,857,451 | | | | | | | $ | 448,764 | | | | | |
| | | | | | | | | | | | | | | | | | | | | | | | | | | | | | | | | | |
| | | | | | | | | |
| | | | | Cost | | | | | | Cost | | | | | | Cost | | | | | | Cost | | | | |
| | US Treasury Note 3.875% due 02/15/2013 (2) | | $ | 13,119,498 | | | | | | | $ | 3,381,666 | | | | | | | $ | 967,432 | | | | | | | $ | 233,733 | | | | | |
| | US Treasury Note 4.000% due 02/15/2015 (2) | | | 13,081,869 | | | | | | | | 3,371,967 | | | | | | | | 964,657 | | | | | | | | 233,063 | | | | | |
| | | | | | | | | | | | | | | | | | | | | | | | | | | | | | | | | | |
| | | | $ | 26,201,367 | | | | | | | $ | 6,753,633 | | | | | | | $ | 1,932,089 | | | | | | | $ | 466,796 | | | | | |
| | | | | | | | | | | | | | | | | | | | | | | | | | | | | | | | | | |
| * | Except for those items disclosed, no individual futures, forwards and option on futures contract position constituted greater than 1 percent of Net Asset Value. Accordingly, the number of contracts and expiration dates are not presented. |
| (1) | See Notes to Financial Statements, Note 4. |
| (2) | Assets have been allocated to each Series based upon ownership in the cash management pool. See Note 2. |
| (3) | Formerly the Campbell/Graham/Tiverton Series. |
The accompanying notes are an integral part of these financial statements.
F-11
The Series of the Frontier Fund
Condensed Schedules of Investments
December 31, 2010
| | | | | | | | | | | | | | | | | | | | | | | | | | |
| | | Managed Futures Index Series | | | Winton Series | | | Winton/Graham Series | |
Description | | Value | | | % of Owners’
Capital (Net
Asset Value) | | | Value | | | % of Owners’
Capital (Net
Asset Value) | | | Value | | | % of Owners’
Capital (Net
Asset Value) | |
LONG FUTURES CONTRACTS * | | | | | | | | | | | | | | | | | | | | | | | | |
| | Various base metals futures contracts (U.S.) | | $ | — | | | | 0.00 | % | | $ | — | | | | 0.00 | % | | $ | 172,560 | | | | 0.28 | % |
| | Various base metals futures contracts (Europe) | | | — | | | | 0.00 | % | | | — | | | | 0.00 | % | | | 181,596 | | | | 0.29 | % |
| | Various currency futures contracts (U.S.) | | | — | | | | 0.00 | % | | | — | | | | 0.00 | % | | | 98,545 | | | | 0.16 | % |
| | Various currency futures contracts (Canada) | | | — | | | | 0.00 | % | | | — | | | | 0.00 | % | | | — | | | | 0.00 | % |
| | Various currency futures contracts (Europe) | | | — | | | | 0.00 | % | | | — | | | | 0.00 | % | | | 23,874 | | | | 0.04 | % |
| | Various currency futures contracts (Far East) | | | — | | | | 0.00 | % | | | — | | | | 0.00 | % | | | — | | | | 0.00 | % |
| | Various energy futures contracts (U.S.) | | | — | | | | 0.00 | % | | | — | | | | 0.00 | % | | | 89,785 | | | | 0.14 | % |
| | Various energy futures contracts (Europe) | | | — | | | | 0.00 | % | | | — | | | | 0.00 | % | | | 14,200 | | | | 0.02 | % |
| | Various interest rates futures contracts (U.S.) | | | — | | | | 0.00 | % | | | — | | | | 0.00 | % | | | 22,017 | | | | 0.04 | % |
| | Various interest rates futures contracts (Canada) | | | — | | | | 0.00 | % | | | — | | | | 0.00 | % | | | — | | | | 0.00 | % |
| | Various interest rates futures contracts (Europe) | | | — | | | | 0.00 | % | | | — | | | | 0.00 | % | | | 10,474 | | | | 0.02 | % |
| | Various interest rates futures contracts (Far East) | | | — | | | | 0.00 | % | | | — | | | | 0.00 | % | | | 17,866 | | | | 0.03 | % |
| | Various precious metals futures contracts (U.S.) | | | — | | | | 0.00 | % | | | — | | | | 0.00 | % | | | 200,060 | | | | 0.32 | % |
| | Various precious metals futures contracts (Europe) | | | — | | | | 0.00 | % | | | — | | | | 0.00 | % | | | — | | | | 0.00 | % |
| | Various soft futures contracts (Far East) | | | — | | | | 0.00 | % | | | — | | | | 0.00 | % | | | 349,196 | | | | 0.56 | % |
| | Various soft futures contracts (Europe) | | | — | | | | 0.00 | % | | | — | | | | 0.00 | % | | | 4,650 | | | | 0.01 | % |
| | Various soft futures contracts (Canada) | | | — | | | | 0.00 | % | | | — | | | | 0.00 | % | | | — | | | | 0.00 | % |
| | Various stock index futures contracts (U.S.) | | | — | | | | 0.00 | % | | | — | | | | 0.00 | % | | | (29,609 | ) | | | -0.05 | % |
| | Various stock index futures contracts (Canada) | | | — | | | | 0.00 | % | | | — | | | | 0.00 | % | | | 11,090 | | | | 0.02 | % |
| | Various stock index futures contracts (Europe) | | | — | | | | 0.00 | % | | | — | | | | 0.00 | % | | | (173,696 | ) | | | -0.28 | % |
| | Various stock index futures contracts (Far East) | | | — | | | | 0.00 | % | | | — | | | | 0.00 | % | | | (24,225 | ) | | | -0.04 | % |
| | | | | | | | | | | | | | | | | | | | | | | | | | |
| | Total Long Futures Contracts | | $ | — | | | | 0.00 | % | | $ | — | | | | 0.00 | % | | $ | 968,383 | | | | 1.56 | % |
| | | | | | | | | | | | | | | | | | | | | | | | | | |
| | | | | | |
SHORT FUTURES CONTRACTS * | | | | | | | | | | | | | | | | | | | | | | | | |
| | Various base metals futures contracts (U.S.) | | $ | — | | | | 0.00 | % | | $ | — | | | | 0.00 | % | | $ | (18,909 | ) | | | -0.03 | % |
| | Various base metals futures contracts (Europe) | | | — | | | | 0.00 | % | | | — | | | | 0.00 | % | | | (34,144 | ) | | | -0.05 | % |
| | Various currency futures contracts (U.S.) | | | — | | | | 0.00 | % | | | — | | | | 0.00 | % | | | (2,458 | ) | | | 0.00 | % |
| | Various currency futures contracts (Canada) | | | — | | | | 0.00 | % | | | — | | | | 0.00 | % | | | — | | | | 0.00 | % |
| | Various currency futures contracts (Europe) | | | — | | | | 0.00 | % | | | — | | | | 0.00 | % | | | (33,762 | ) | | | -0.05 | % |
| | Various currency futures contracts (Far East) | | | — | | | | 0.00 | % | | | — | | | | 0.00 | % | | | — | | | | 0.00 | % |
| | Various energy futures contracts (U.S.) | | | — | | | | 0.00 | % | | | — | | | | 0.00 | % | | | 2,730 | | | | 0.00 | % |
| | Various energy futures contracts (Europe) | | | — | | | | 0.00 | % | | | — | | | | 0.00 | % | | | — | | | | 0.00 | % |
| | Various interest rates futures contracts (U.S.) | | | — | | | | 0.00 | % | | | — | | | | 0.00 | % | | | (11,891 | ) | | | -0.02 | % |
| | Various interest rates futures contracts (Canada) | | | — | | | | 0.00 | % | | | — | | | | 0.00 | % | | | (4,408 | ) | | | -0.01 | % |
| | Various interest rates futures contracts (Europe) | | | — | | | | 0.00 | % | | | — | | | | 0.00 | % | | | (114,032 | ) | | | -0.18 | % |
| | Various interest rates futures contracts (Far East) | | | — | | | | 0.00 | % | | | — | | | | 0.00 | % | | | (28,536 | ) | | | -0.05 | % |
| | Various precious metals futures contracts (U.S.) | | | — | | | | 0.00 | % | | | — | | | | 0.00 | % | | | — | | | | 0.00 | % |
| | Various soft futures contracts (U.S.) | | | — | | | | 0.00 | % | | | — | | | | 0.00 | % | | | (21,733 | ) | | | -0.03 | % |
| | Various soft futures contracts (Canada) | | | — | | | | 0.00 | % | | | — | | | | 0.00 | % | | | — | | | | 0.00 | % |
| | Various soft futures contracts (Europe) | | | — | | | | 0.00 | % | | | — | | | | 0.00 | % | | | — | | | | 0.00 | % |
| | Various stock index futures contracts (U.S.) | | | — | | | | 0.00 | % | | | — | | | | 0.00 | % | | | 9,471 | | | | 0.02 | % |
| | Various stock index futures contracts (Canada) | | | — | | | | 0.00 | % | | | — | | | | 0.00 | % | | | — | | | | 0.00 | % |
| | Various stock index futures contracts (Europe) | | | — | | | | 0.00 | % | | | — | | | | 0.00 | % | | | 3,649 | | | | 0.01 | % |
| | Various stock index futures contracts (Far East) | | | — | | | | 0.00 | % | | | — | | | | 0.00 | % | | | 3,237 | | | | 0.01 | % |
| | | | | | | | | | | | | | | | | | | | | | | | | | |
| | Total Short Futures Contracts | | $ | — | | | | 0.00 | % | | $ | — | | | | 0.00 | % | | $ | (250,786 | ) | | | -0.38 | % |
| | | | | | | | | | | | | | | | | | | | | | | | | | |
| | | | | | | | | | | | | | | | | | | | | | | | | | |
CURRENCY FORWARDS * | | $ | — | | | | 0.00 | % | | $ | — | | | | 0.00 | % | | $ | 709,541 | | | | 1.13 | % |
| | | | | | | | | | | | | | | | | | | | | | | | | | |
| | Total Open Trade Equity | | $ | — | | | | 0.00 | % | | $ | — | | | | 0.00 | % | | $ | 1,427,138 | | | | 2.31 | % |
| | | | | | | | | | | | | | | | | | | | | | | | | | |
| | | | | | |
U.S. TREASURY SECURITIES | | | | | | | | | | | | | | | | | | | | | | | | |
| | | | | | |
FACE VALUE | | Fair Value | | | | | | Fair Value | | | | | | Fair Value | | | | |
$36,500,000.00 | | U.S. Treasury Note 3.875% due 02/15/2013 (Cost $38,125,391) (1) | | $ | 294,280 | | | | 5.70 | % | | $ | 3,948,936 | | | | 6.50 | % | | $ | 3,468,812 | | | | 5.53 | % |
$36,700,000.00 | | U.S. Treasury Note 4.000% due 02/15/2015 (Cost $38,016,039) (1) | | | 303,420 | | | | 5.88 | % | | | 4,071,573 | | | | 6.14 | % | | | 3,576,539 | | | | 5.70 | % |
| | | | | | | | | | | | | | | | | | | | | | | | | | |
| | | | $ | 597,700 | | | | 11.58 | % | | $ | 8,020,509 | | | | 12.64 | % | | $ | 7,045,351 | | | | 11.23 | % |
| | | | | | | | | | | | | | | | | | | | | | | | | | |
| | | | | | |
Additional Disclosure on U.S. Treasury Securities | | Face Value | | | | | | Face Value | | | | | | Face Value | | | | |
| | U.S. Treasury Note 3.875% due 02/15/2013 (1) | | $ | 275,459 | | | | | | | $ | 3,696,370 | | | | | | | $ | 3,246,954 | | | | | |
| | U.S. Treasury Note 4.000% due 02/15/2015 (1) | | | 276,968 | | | | | | | | 3,716,625 | | | | | | | | 3,264,746 | | | | | |
| | | | | | | | | | | | | | | | | | | | | | | | | | |
| | | | $ | 552,427 | | | | | | | $ | 7,412,995 | | | | | | | $ | 6,511,700 | | | | | |
| | | | | | | | | | | | | | | | | | | | | | | | | | |
| | | | | | | |
| | | | | Cost | | | | | | Cost | | | | | | Cost | | | | |
| | U.S. Treasury Note 3.875% due 02/15/2013 (1) | | $ | 287,725 | | | | | | | $ | 3,860,974 | | | | | | | $ | 3,391,545 | | | | | |
| | U.S. Treasury Note 4.000% due 02/15/2015 (1) | | | 286,900 | | | | | | | | 3,849,900 | | | | | | | | 3,381,818 | | | | | |
| | | | | | | | | | | | | | | | | | | | | | | | | | |
| | | | $ | 574,625 | | | | | | | $ | 7,710,874 | | | | | | | $ | 6,773,363 | | | | | |
| | | | | | | | | | | | | | | | | | | | | | | | | | |
| * | Except for those items disclosed, no individual futures, forwards and option on futures contract position constituted greater than 1 percent of Net Asset Value. Accordingly, the number of contracts and expiration dates are not presented. |
| (1) | Assets have been allocated to each Series based upon ownership in the cash management pool. See Note 2. |
The accompanying notes are an integral part of these financial statements.
F-12
The Series of the Frontier Fund
Statements of Operations
For the Years Ended December 31, 2011, 2010 and 2009
| | | | | | | | | | | | | | | | | | | | | | | | | | | | | | | | | | | | |
| | | Frontier Diversified
Series (2) | | | Frontier Dynamic
Series (1), (2) | | | Frontier Long/Short Commodity
Series (3) | |
| | | 12/31/2011 | | | 12/31/2010 | | | 12/31/2009 | | | 12/31/2011 | | | 12/31/2010 | | | 12/31/2009 | | | 12/31/2011 | | | 12/31/2010 | | | 12/31/2009 | |
Investment income: | | | | | | | | | | | | | | | | | | | | | | | | | | | | | | | | | | | | |
Interest - net | | $ | 2,399,088 | | | $ | 2,225,700 | | | $ | 489,238 | | | $ | 250,426 | | | $ | 454,918 | | | $ | 269,363 | | | $ | 1,371,889 | | | $ | 1,120,080 | | | $ | 1,213,141 | |
| | | | | | | | | | | | | | | | | | | | | | | | | | | | | | | | | | | | |
Total Income | | | 2,399,088 | | | | 2,225,700 | | | | 489,238 | | | | 250,426 | | | | 454,918 | | | | 269,363 | | | | 1,371,889 | | | | 1,120,080 | | | | 1,213,141 | |
| | | | | | | | | | | | | | | | | | | | | | | | | | | | | | | | | | | | |
Expenses: | | | | | | | | | | | | | | | | | | | | | | | | | | | | | | | | | | | | |
Incentive Fees | | | 4,954,751 | | | | 4,102,217 | | | | 299,318 | | | | — | | | | — | | | | — | | | | 2,887,684 | | | | 3,065,308 | | | | 2,135,357 | |
Management Fees | | | 1,988,295 | | | | 1,149,719 | | | | 189,654 | | | | — | | | | — | | | | — | | | | 3,607,413 | | | | 3,355,920 | | | | 2,923,989 | |
Service Fees - Class 1 | | | 1,797,911 | | | | 1,465,769 | | | | 179,789 | | | | 51,746 | | | | 91,089 | | | | 43,521 | | | | 824,266 | | | | 1,174,272 | | | | 1,437,570 | |
Trading Fees | | | 3,469,475 | | | | 2,734,353 | | | | 656,932 | | | | 376,388 | | | | 687,992 | | | | 391,638 | | | | 768,116 | | | | 425,521 | | | | 350,577 | |
| | | | | | | | | | | | | | | | | | | | | | | | | | | | | | | | | | | | |
Total Expenses | | | 12,210,432 | | | | 9,452,058 | | | | 1,325,693 | | | | 428,134 | | | | 779,081 | | | | 435,159 | | | | 8,087,479 | | | | 8,021,021 | | | | 6,847,493 | |
| | | | | | | | | | | | | | | | | | | | | | | | | | | | | | | | | | | | |
Investment income/(loss) - net | | | (9,811,344 | ) | | | (7,226,358 | ) | | | (836,455 | ) | | | (177,708 | ) | | | (324,163 | ) | | | (165,796 | ) | | | (6,715,590 | ) | | | (6,900,941 | ) | | | (5,634,352 | ) |
| | | | | | | | | | | | | | | | | | | | | | | | | | | | | | | | | | | | |
Realized and unrealized gain/(loss) on investments: | | | | | | | | | | | | | | | | | | | | | | | | | | | | | | | | | | | | |
Net realized gain/(loss) on futures, forwards and options | | | — | | | | 59,523 | | | | — | | | | — | | | | — | | | | — | | | | 5,096,970 | | | | (24,029,654 | ) | | | 60,288,927 | |
Net change in open trade equity/(deficit) | | | — | | | | (705,094 | ) | | | — | | | | — | | | | — | | | | — | | | | 2,754,587 | | | | 18,487,268 | | | | (28,316,249 | ) |
Net realized gain/(loss) on swap contracts | | | (5,621,987 | ) | | | — | | | | — | | | | (2,157,451 | ) | | | — | | | | — | | | | (11,411 | ) | | | — | | | | — | |
Net unrealized gain/(loss) on swap contracts | | | 1,315,339 | | | | 416,156 | | | | (1,707,778 | ) | | | 1,317,993 | | | | 929,520 | | | | (2,247,497 | ) | | | 20,529 | | | | — | | | | — | |
Net realized gain/(loss) on U.S. Treasury securities | | | — | | | | — | | | | — | | | | 128,823 | | | | — | | | | — | | | | — | | | | — | | | | — | |
Net unrealized gain/(loss) on U.S. Treasury securities | | | 23,748 | | | | 255,854 | | | | 32,581 | | | | (115,289 | ) | | | 62,532 | | | | 52,757 | | | | 24,825 | | | | 208,016 | | | | (358,065 | ) |
Trading commissions | | | — | | | | (13,918 | ) | | | — | | | | — | | | | — | | | | — | | | | (457,918 | ) | | | (444,193 | ) | | | (3,052,293 | ) |
Net change in inter-series payables | | | — | | | | (177,180 | ) | | | 37,927 | | | | 941,000 | | | | (644,168 | ) | | | 2,323,884 | | | | — | | | | — | | | | — | |
Change in fair value of investments in unconsolidated trading companies | | | 9,711,686 | | | | 18,683,902 | | | | 1,166,809 | | | | — | | | | — | | | | — | | | | 9,807,106 | | | | 21,681,676 | | | | 357,682 | |
| | | | | | | | | | | | | | | | | | | | | | | | | | | | | | | | | | | | |
Net gain/(loss) on investments | | | 5,428,786 | | | | 18,519,243 | | | | (470,461 | ) | | | 115,076 | | | | 347,884 | | | | 129,144 | | | | 17,234,688 | | | | 15,903,113 | | | | 28,920,002 | |
| | | | | | | | | | | | | | | | | | | | | | | | | | | | | | | | | | | | |
NET INCREASE/(DECREASE) IN CAPITAL RESULTING FROM OPERATIONS | | | (4,382,558 | ) | | | 11,292,885 | | | | (1,306,916 | ) | | | (62,632 | ) | | | 23,721 | | | | (36,652 | ) | | | 10,519,098 | | | | 9,002,172 | | | | 23,285,650 | |
| | | | | | | | | | | | | | | | | | | | | | | | | | | | | | | | | | | | |
Less: Operations attributable to non-controlling interests | | | — | | | | (157,005 | ) | | | — | | | | — | | | | — | | | | — | | | | 6,059,461 | | | | (2,913,121 | ) | | | 14,758,299 | |
| | | | | | | | | | | | | | | | | | | | | | | | | | | | | | | | | | | | |
NET INCREASE/(DECREASE) IN CAPITAL RESULTING FROM OPERATIONS ATTRIBUTABLE TO CONTROLLING INTERESTS | | $ | (4,382,558 | ) | | $ | 11,449,890 | | | $ | (1,306,916 | ) | | $ | (62,632 | ) | | $ | 23,721 | | | $ | (36,652 | ) | | $ | 4,459,637 | | | $ | 11,915,293 | | | $ | 8,527,351 | |
| | | | | | | | | | | | | | | | | | | | | | | | | | | | | | | | | | | | |
NET INCREASE/(DECREASE) IN CAPITAL RESULTING FROM OPERATIONS ATTRIBUTABLE TO CONTROLLING INTERESTS PER UNIT | | | | | | | | | | | | | | | | | | | | | | | | | | | | | | | | | | | | |
Class 1 | | $ | (4.18 | ) | | $ | 6.78 | | | $ | (3.20 | ) | | $ | (3.89 | ) | | $ | 0.51 | | | $ | (8.57 | ) | | $ | 3.40 | | | $ | 18.96 | | | $ | 13.38 | |
Class 1a | | | N/A | | | | N/A | | | | N/A | | | | N/A | | | | N/A | | | | N/A | | | $ | 3.75 | | | $ | 16.47 | | | $ | 1.49 | |
Class 2 | | $ | (2.50 | ) | | $ | 8.69 | | | $ | (2.23 | ) | | $ | (3.14 | ) | | $ | 2.15 | | | $ | (7.75 | ) | | $ | 8.71 | | | $ | 25.77 | | | $ | 18.21 | |
Class 2a | | | N/A | | | | N/A | | | | N/A | | | | N/A | | | | N/A | | | | N/A | | | $ | 6.05 | | | $ | 18.70 | | | $ | 2.48 | |
Class 3 | | | N/A | | | | N/A | | | | N/A | | | | N/A | | | | N/A | | | | N/A | | | $ | 8.70 | | | $ | 25.77 | | | $ | 4.79 | |
| (1) | The Frontier Dynamic Series ceased trading operations on July 15, 2011 and redeemed all existing Units. The Series remains open. |
| (2) | The Frontier Diversified Series and Frontier Dynamic Series began trading operations on June 9, 2009. |
| (3) | The Frontier Long/Short Commodity Series’ Classes 1a and 2a began trading operations on June 9, 2009. |
The accompanying notes are an integral part of these financial statements.
F-13
The Series of the Frontier Fund
Statements of Operations
For the Years Ended December 31, 2011, 2010 and 2009
| | | | | | | | | | | | | | | | | | | | | | | | | | | | | | | | | | | | |
| | | Frontier Masters Series (3) | | | Balanced Series (2) | | | Berkeley/Graham/Tiverton Series (1) | |
| | | 12/31/2011 | | | 12/31/2010 | | | 12/31/2009 | | | 12/31/2011 | | | 12/31/2010 | | | 12/31/2009 | | | 12/31/2011 | | | 12/31/2010 | | | 12/31/2009 | |
Investment income: | | | | | | | | | | | | | | | | | | | | | | | | | | | | | | | | | | | | |
Interest - net | | $ | 1,026,007 | | | $ | 941,795 | | | $ | 292,218 | | | $ | 534,877 | | | $ | 404,451 | | | $ | 901,710 | | | $ | 106,784 | | | $ | 8,268 | | | $ | 293,910 | |
| | | | | | | | | | | | | | | | | | | | | | | | | | | | | | | | | | | | |
Total Income/(loss) | | | 1,026,007 | | | | 941,795 | | | | 292,218 | | | | 534,877 | | | | 404,451 | | | | 901,710 | | | | 106,784 | | | | 8,268 | | | | 293,910 | |
| | | | | | | | | | | | | | | | | | | | | | | | | | | | | | | | | | | | |
Expenses: | | | | | | | | | | | | | | | | | | | | | | | | | | | | | | | | | | | | |
Incentive Fees | | | 805,663 | | | | 490,628 | | | | 9,073 | | | | 13,141,331 | | | | 13,893,116 | | | | 7,386,253 | | | | 29,678 | | | | 270,462 | | | | 222,963 | |
Management Fees | | | 1,439,579 | | | | 1,093,634 | | | | 336,955 | | | | 2,615,058 | | | | 2,253,874 | | | | 1,555,348 | | | | 1,240,589 | | | | 2,289,188 | | | | 2,291,126 | |
Service Fees - Class 1 | | | 809,423 | | | | 675,234 | | | | 95,272 | | | | 7,074,592 | | | | 8,595,406 | | | | 9,120,995 | | | | 1,422,634 | | | | 1,927,715 | | | | 2,148,431 | |
Trading Fees | | | 1,411,575 | | | | 1,507,560 | | | | 444,862 | | | | 1,760,639 | | | | 1,810,726 | | | | 1,937,150 | | | | 280,872 | | | | 360,892 | | | | 421,502 | |
| | | | | | | | | | | | | | | | | | | | | | | | | | | | | | | | | | | | |
Total Expenses | | | 4,466,240 | | | | 3,767,056 | | | | 886,162 | | | | 24,591,620 | | | | 26,553,122 | | | | 19,999,746 | | | | 2,973,773 | | | | 4,848,257 | | | | 5,084,022 | |
| | | | | | | | | | | | | | | | | | | | | | | | | | | | | | | | | | | | |
Investment (loss) - net | | | (3,440,233 | ) | | | (2,825,261 | ) | | | (593,944 | ) | | | (24,056,743 | ) | | | (26,148,671 | ) | | | (19,098,036 | ) | | | (2,866,989 | ) | | | (4,839,989 | ) | | | (4,790,112 | ) |
| | | | | | | | | | | | | | | | | | | | | | | | | | | | | | | | | | | | |
| | | | | | | | | | | | | | | | | | | | | | | | | | | | | | | | | | | | |
Realized and unrealized gain/(loss) on investments: | | | | | | | | | | | | | | | | | | | | | | | | | | | | | | | | | | | | |
Net realized gain/(loss) on futures, forwards and options | | | (3,513,968 | ) | | | — | | | | — | | | | 52,383,136 | | | | 27,742,406 | | | | 24,948,863 | | | | — | | | | 4,500,964 | | | | (1,617,478 | ) |
Net change in open trade equity/(deficit) | | | 792,372 | | | | — | | | | — | | | | (70,076,328 | ) | | | 17,459,669 | | | | (17,024,041 | ) | | | — | | | | 2,345,538 | | | | (760,231 | ) |
Net realized gain/(loss) on swap contracts | | | 2,061,339 | | | | — | | | | — | | | | 4,529,039 | | | | — | | | | — | | | | (6,252 | ) | | | — | | | | — | |
Net unrealized gain/(loss) on swap contracts | | | (1,607,804 | ) | | | 3,474,611 | | | | (1,864,032 | ) | | | (19,161,366 | ) | | | 8,790,928 | | | | (12,051,820 | ) | | | 2,447 | | | | — | | | | — | |
Net unrealized gain/(loss) on U.S. Treasury securities | | | 5,038 | | | | 192,745 | | | | 52,370 | | | | 16,555 | | | | 595,392 | | | | (2,354,829 | ) | | | 2,768 | | | | 144,737 | | | | (467,310 | ) |
Trading commissions | | | (68,034 | ) | | | — | | | | — | | | | (4,914,236 | ) | | | (4,075,189 | ) | | | (1,528,958 | ) | | | — | | | | (69,462 | ) | | | (99,835 | ) |
Net change in inter-series receivables | | | — | | | | — | | | | — | | | | (2,475,914 | ) | | | 2,200,706 | | | | (5,590,378 | ) | | | — | | | | — | | | | — | |
Net change in inter-series payables | | | — | | | | (829,341 | ) | | | 815,865 | | | | — | | | | — | | | | — | | | | — | | | | — | | | | — | |
Change in fair value of investments in unconsolidated trading companies | | | 4,724,104 | | | | 6,007,106 | | | | 682,798 | | | | 45,347,382 | | | | 29,620,482 | | | | 13,109,866 | | | | (4,026,248 | ) | | | 3,570,155 | | | | 2,247,382 | |
Net realized gain/(loss) on investment in Berkeley Quantitative Colorado Fund LLC | | | — | | | | — | | | | — | | | | — | | | | — | | | | — | | | | (135,775 | ) | | | — | | | | — | |
Net unrealized gain/(loss) on investment in Berkeley Quantitative Colorado Fund LLC | | | — | | | | — | | | | — | | | | — | | | | — | | | | — | | | | (2,238,083 | ) | | | 153,203 | | | | — | |
| | | | | | | | | | | | | | | | | | | | | | | | | | | | | | | | | | | | |
Net gain/(loss) on investments | | | 2,393,047 | | | | 8,845,121 | | | | (312,999 | ) | | | 5,648,268 | | | | 82,334,394 | | | | (491,297 | ) | | | (6,401,143 | ) | | | 10,645,135 | | | | (697,472 | ) |
| | | | | | | | | | | | | | | | | | | | | | | | | | | | | | | | | | | | |
NET INCREASE/(DECREASE) IN CAPITAL RESULTING FROM OPERATIONS | | | (1,047,186 | ) | | | 6,019,860 | | | | (906,943 | ) | | | (18,408,475 | ) | | | 56,185,723 | | | | (19,589,333 | ) | | | (9,268,132 | ) | | | 5,805,146 | | | | (5,487,584 | ) |
| | | | | | | | | | | | | | | | | | | | | | | | | | | | | | | | | | | | |
Less: Operations attributable to non-controlling interests | | | (27,734 | ) | | | — | | | | — | | | | (6,164,402 | ) | | | 14,493,972 | | | | (438,431 | ) | | | — | | | | 1,892,545 | | | | (1,336,526 | ) |
| | | | | | | | | | | | | | | | | | | | | | | | | | | | | | | | | | | | |
NET INCREASE/(DECREASE) IN CAPITAL RESULTING FROM OPERATIONS ATTRIBUTABLE TO CONTROLLING INTERESTS | | $ | (1,019,452 | ) | | $ | 6,019,860 | | | $ | (906,943 | ) | | $ | (12,244,073 | ) | | $ | 41,691,751 | | | $ | (19,150,902 | ) | | $ | (9,268,132 | ) | | $ | 3,912,601 | | | $ | (4,151,058 | ) |
| | | | | | | | | | | | | | | | | | | | | | | | | | | | | | | | | | | | |
NET INCREASE/(DECREASE) IN CAPITAL RESULTING FROM OPERATIONS ATTRIBUTABLE TO CONTROLLING INTERESTS PER UNIT | | | | | | | | | | | | | | | | | | | | | | | | | | | | | | | | | | | | |
Class 1 | | $ | (2.71 | ) | | $ | 8.50 | | | $ | (5.54 | ) | | $ | (7.45 | ) | | $ | 13.41 | | | $ | (6.63 | ) | | $ | (19.44 | ) | | $ | 5.81 | | | $ | (5.89 | ) |
Class 1a | | | N/A | | | | N/A | | | | N/A | | | $ | (7.91 | ) | | $ | 10.86 | | | $ | (6.59 | ) | | | N/A | | | | N/A | | | | N/A | |
Class 2 | | $ | (0.98 | ) | | $ | 10.44 | | | $ | (4.63 | ) | | $ | (4.44 | ) | | $ | 20.45 | | | $ | (3.43 | ) | | $ | (19.89 | ) | | $ | 10.63 | | | $ | (3.04 | ) |
Class 2a | | | N/A | | | | N/A | | | | N/A | | | $ | (5.31 | ) | | $ | 16.06 | | | $ | (3.70 | ) | | | N/A | | | | N/A | | | | N/A | |
Class 3a | | | N/A | | | | N/A | | | | N/A | | | $ | (5.30 | ) | | $ | 16.06 | | | $ | (4.37 | ) | | | N/A | | | | N/A | | | | N/A | |
| (1) | Formerly known as the Campbell/Graham/Tiverton Series. |
| (2) | The Balanced Series Class 3a began trading operations on June 4, 2009. |
| (3) | The Frontier Masters Series began trading operations on June 9, 2009. |
The accompanying notes are an integral part of these financial statements.
F-14
The Series of the Frontier Fund
Statements of Operations
For the Years Ended December 31, 2011, 2010 and 2009
| | | | | | | | | | | | | | | | | | | | | | | | | | | | | | | | | | | | |
| | | Currency Series | | | Long Only Commodity Series (2) | | | Managed Futures Index Series (2) | |
| | | 12/31/2011 | | | 12/31/2010 | | | 12/31/2009 | | | 12/31/2011 | | | 12/31/2010 | | | 12/31/2009 | | | 12/31/2011 | | | 12/31/2010 | | | 12/31/2009 | |
Investment income: | | | | | | | | | | | | | | | | | | | | | | | | | | | | | | | | | | | | |
Interest - net | | $ | 61,690 | | | $ | 129,943 | | | $ | 88,884 | | | $ | 60,039 | | | $ | 83,311 | | | $ | 76,629 | | | $ | 82,283 | | | $ | 51,321 | | | $ | 67,985 | |
| | | | | | | | | | | | | | | | | | | | | | | | | | | | | | | | | | | | |
Total Income | | | 61,690 | | | | 129,943 | | | | 88,884 | | | | 60,039 | | | | 83,311 | | | | 76,629 | | | | 82,283 | | | | 51,321 | | | | 67,985 | |
| | | | | | | | | | | | | | | | | | | | | | | | | | | | | | | | | | | | |
Expenses: | | | | | | | | | | | | | | | | | | | | | | | | | | | | | | | | | | | | |
Management Fees | | | 80,701 | | | | 163,333 | | | | 161,155 | | | | 37,451 | | | | 52,798 | | | | 53,403 | | | | 91,855 | | | | 120,305 | | | | 78,544 | |
Service Fees - Class 1 | | | 153,870 | | | | 216,919 | | | | 302,067 | | | | 38,421 | | | | 65,418 | | | | 68,696 | | | | 11,957 | | | | 32,965 | | | | 41,467 | |
Trading Fees | | | 60,410 | | | | 102,763 | | | | 140,572 | | | | 14,105 | | | | 20,116 | | | | 21,077 | | | | 21,395 | | | | 26,465 | | | | 19,812 | |
| | | | | | | | | | | | | | | | | | | | | | | | | | | | | | | | | | | | |
Total Expenses | | | 294,981 | | | | 483,015 | | | | 603,794 | | | | 89,977 | | | | 138,332 | | | | 143,176 | | | | 125,207 | | | | 179,735 | | | | 139,823 | |
| | | | | | | | | | | | | | | | | | | | | | | | | | | | | | | | | | | | |
Investment income/(loss) - net | | | (233,291 | ) | | | (353,072 | ) | | | (514,910 | ) | | | (29,938 | ) | | | (55,021 | ) | | | (66,547 | ) | | | (42,924 | ) | | | (128,414 | ) | | | (71,838 | ) |
| | | | | | | | | | | | | | | | | | | | | | | | | | | | | | | | | | | | |
Realized and unrealized gain/(loss) on investments: | | | | | | | | | | | | | | | | | | | | | | | | | | | | | | | | | | | | |
Net realized gain/(loss) on futures, forwards and options | | | (142,069 | ) | | | 290,954 | | | | (178,743 | ) | | | — | | | | — | | | | — | | | | — | | | | — | | | | — | |
Net change in open trade equity | | | (27,166 | ) | | | 54,015 | | | | 2,985 | | | | — | | | | — | | | | — | | | | — | | | | — | | | | — | |
Net realized gain/(loss) on swap contracts | | | (8,302,467 | ) | | | — | | | | — | | | | (50,501 | ) | | | 509,662 | | | | 883,900 | | | | (969 | ) | | | — | | | | — | |
Net unrealized gain/(loss) on swap contracts | | | 6,327,629 | | | | 675,809 | | | | (4,129,164 | ) | | | — | | | | — | | | | — | | | | — | | | | — | | | | — | |
Net realized gain/(loss) on U.S. Treasury securities | | | — | | | | — | | | | — | | | | 49,592 | | | | — | | | | — | | | | 7,179 | | | | — | | | | — | |
Net unrealized gain/(loss) on U.S. Treasury securities | | | (4,083 | ) | | | 52,062 | | | | (165,246 | ) | | | (48,272 | ) | | | 12,440 | | | | (24,171 | ) | | | (6,967 | ) | | | (4,201 | ) | | | (22,641 | ) |
Net change in inter-series payables | | | 1,534,914 | | | | (550,017 | ) | | | 2,412,702 | | | | — | | | | — | | | | — | | | | — | | | | — | | | | — | |
Net increase from payments by managing owner | | | 390,589 | | | | — | | | | — | | | | — | | | | — | | | | — | | | | — | | | | — | | | | — | |
Change in fair value of investments in unconsolidated trading companies | | | (164,993 | ) | | | — | | | | — | | | | — | | | | — | | | | — | | | | (314,596 | ) | | | 436,689 | | | | (467,800 | ) |
| | | | | | | | | | | | | | | | | | | | | | | | | | | | | | | | | | | | |
Net gain/(loss) on investments | | | (387,646 | ) | | | 522,823 | | | | (2,057,466 | ) | | | (49,181 | ) | | | 522,102 | | | | 859,729 | | | | (315,353 | ) | | | 432,488 | | | | (490,441 | ) |
| | | | | | | | | | | | | | | | | | | | | | | | | | | | | | | | | | | | |
NET INCREASE/(DECREASE) IN CAPITAL RESULTING FROM OPERATIONS | | $ | (620,937 | ) | | $ | 169,751 | | | $ | (2,572,376 | ) | | $ | (79,119 | ) | | $ | 467,081 | | | $ | 793,182 | | | $ | (358,277 | ) | | $ | 304,074 | | | $ | (562,279 | ) |
| | | | | | | | | | | | | | | | | | | | | | | | | | | | | | | | | | | | |
NET INCREASE/(DECREASE) IN CAPITAL RESULTING FROM OPERATIONS PER UNIT | | | | | | | | | | | | | | | | | | | | | | | | | | | | | | | | | | | | |
Class 1 | | $ | (8.61 | ) | | $ | 1.09 | | | $ | (18.19 | ) | | $ | (7.00 | ) | | $ | 10.52 | | | $ | 13.28 | | | $ | (11.13 | ) | | $ | 5.42 | | | $ | (19.64 | ) |
Class 2 | | $ | (7.82 | ) | | $ | 4.09 | | | $ | (17.96 | ) | | $ | (5.83 | ) | | $ | 13.41 | | | $ | 15.84 | | | $ | (9.93 | ) | | $ | 8.41 | | | $ | (18.42 | ) |
Class 3 | | | N/A | | | | N/A | | | | N/A | | | $ | (6.00 | )(1) | | | N/A | | | | N/A | | | $ | (6.97 | )(1) | | | N/A | | | | N/A | |
| (1) | Both the Long Only Commodity Series, Class 3 Units and the Managed Futures Index Series, Class 3 Units began trading operations on January 14, 2011. |
| (2) | The Long Only Commodity Series and the Managed Futures Index Series ceased trading operations on December 21, 2011 and redeemed all existing Units. |
The accompanying notes are an integral part of these financial statements.
F-15
The Series of the Frontier Fund
Statements of Operations
For the Years Ended December 31, 2011, 2010 and 2009
| | | | | | | | | | | | | | | | | | | | | | | | |
| | | Winton Series | | | Winton/Graham Series | |
| | | 12/31/2011 | | | 12/31/2010 | | | 12/1/31/2009 | | | 12/31/2011 | | | 12/31/2010 | | | 12/1/31/2009 | |
Investment income: | | | | | | | | | | | | | | | | | | | | | | | | |
Interest - net | | $ | 457,889 | | | $ | 306,338 | | | $ | 361,106 | | | $ | 217,875 | | | $ | 263,156 | | | $ | 259,485 | |
| | | | | | | | | | | | | | | | | | | | | | | | |
Total Income | | | 457,889 | | | | 306,338 | | | | 361,106 | | | | 217,875 | | | | 263,156 | | | | 259,485 | |
| | | | | | | | | | | | | | | | | | | | | | | | |
Expenses: | | | | | | | | | | | | | | | | | | | | | | | | |
Incentive Fees | | | 813,809 | | | | 534,245 | | | | (21,347 | ) | | | 298,707 | | | | 702,432 | | | | 350,180 | |
Management Fees | | | 1,225,133 | | | | 1,529,612 | | | | 1,430,660 | | | | 1,382,514 | | | | 1,959,820 | | | | 1,583,991 | |
Service Fees - Class 1 | | | 1,271,915 | | | | 1,456,391 | | | | 1,634,324 | | | | 1,023,780 | | | | 1,373,119 | | | | 1,406,083 | |
Trading Fees | | | 285,429 | | | | 291,849 | | | | 331,643 | | | | 221,789 | | | | 286,314 | | | | 285,842 | |
| | | | | | | | | | | | | | | | | | | | | | | | |
Total Expenses | | | 3,596,286 | | | | 3,812,097 | | | | 3,375,280 | | | | 2,926,790 | | | | 4,321,685 | | | | 3,626,096 | |
| | | | | | | | | | | | | | | | | | | | | | | | |
Investment (loss) - net | | | (3,138,397 | ) | | | (3,505,759 | ) | | | (3,014,174 | ) | | | (2,708,915 | ) | | | (4,058,529 | ) | | | (3,366,611 | ) |
| | | | | | | | | | | | | | | | | | | | | | | | |
Realized and unrealized gain/(loss) on investments: | | | | | | | | | | | | | | | | | | | | | | | | |
Net realized gain/(loss) on futures, forwards and options | | | — | | | | — | | | | (4,684,999 | ) | | | 798,159 | | | | 5,481,406 | | | | 5,853,780 | |
Net change in open trade equity/(deficit) | | | — | | | | — | | | | (3,608,807 | ) | | | (1,521,787 | ) | | | 616,950 | | | | 1,681,991 | |
Net realized gain/(loss) on swap contracts | | | (9,969 | ) | | | — | | | | — | | | | (5,791 | ) | | | — | | | | — | |
Net unrealized gain/(loss) on swap contracts | | | 7,291 | | | | — | | | | — | | | | (944 | ) | | | — | | | | — | |
Net unrealized gain/(loss) on U.S. Treasury securities | | | (2,017 | ) | | | 163,733 | | | | (434,210 | ) | | | (3,545 | ) | | | 159,470 | | | | (367,408 | ) |
Trading commissions | | | — | | | | — | | | | (36,658 | ) | | | (274,394 | ) | | | (613,637 | ) | | | (342,295 | ) |
Change in fair value of investments in unconsolidated trading companies | | | 5,869,725 | | | | 11,846,927 | | | | 1,026,676 | | | | (1,252,281 | ) | | | 6,322,180 | | | | (2,906,982 | ) |
| | | | | | | | | | | | | | | | | | | | | | | | |
Net gain/(loss) on investments | | | 5,865,030 | | | | 12,010,660 | | | | (7,737,998 | ) | | | (2,260,583 | ) | | | 11,966,369 | | | | 3,919,086 | |
| | | | | | | | | | | | | | | | | | | | | | | | |
NET INCREASE/(DECREASE) IN CAPITAL RESULTING FROM OPERATIONS | | | 2,726,633 | | | | 8,504,901 | | | | (10,752,172 | ) | | | (4,969,498 | ) | | | 7,907,840 | | | | 552,475 | |
| | | | | | | | | | | | | | | | | | | | | | | | |
Less: Operations attributable to non-controlling interests | | | — | | | | — | | | | (4,066,993 | ) | | | (470,719 | ) | | | 2,644,623 | | | | 3,347,600 | |
| | | | | | | | | | | | | | | | | | | | | | | | |
NET INCREASE/(DECREASE) IN CAPITAL RESULTING FROM OPERATIONS ATTRIBUTABLE TO CONTROLLING INTERESTS | | $ | 2,726,633 | | | $ | 8,504,901 | | | $ | (6,685,179 | ) | | $ | (4,498,779 | ) | | $ | 5,263,217 | | | $ | (2,795,125 | ) |
| | | | | | | | | | | | | | | | | | | | | | | | |
NET INCREASE/(DECREASE) IN CAPITAL RESULTING FROM OPERATIONS ATTRIBUTABLE TO CONTROLLING INTERESTS PER UNIT | | | | | | | | | | | | | | | | | | | | | | | | |
Class 1 | | $ | 6.09 | | | $ | 17.47 | | | $ | (12.84 | ) | | $ | (15.10 | ) | | $ | 9.77 | | | $ | (6.12 | ) |
Class 2 | | $ | 11.83 | | | $ | 23.89 | | | $ | (9.94 | ) | | $ | (14.34 | ) | | $ | 15.65 | | | $ | (3.10 | ) |
The accompanying notes are an integral part of these financial statements.
F-16
The Series of the Frontier Fund
Statements of Changes in Owners’ Capital
For the Years Ended December 31, 2011, 2010 and 2009
| | | | | | | | | | | | | | | | | | | | | | | | | | | | | | | | | | | | | | | | | | | | |
| | | Frontier Diversified Series (2) | | | Frontier Dynamic Series (2) | |
| | | Class 1 | | | Class 1 | | | Class 2 | | | Class 2 | | | Non- | | | | | | Class 1 | | | Class 1 | | | Class 2 | | | Class 2 | | | | |
| | | Managing
Owner | | | Limited
Owners | | | Managing
Owner | | | Limited
Owners | | | Controlling
Interests | | | Total | | | Managing
Owner | | | Limited
Owners | | | Managing
Owner | | | Limited
Owners | | | Total | |
Owners’ Capital, December 31, 2008 | | $ | — | | | $ | — | | | $ | — | | | $ | — | | | $ | — | | | $ | — | | | $ | — | | | $ | — | | | $ | — | | | $ | — | | | $ | — | |
| | | | | | | | | | | | | | | | | | | | | | | | | | | | | | | | | | | | | | | | | | | | |
Sale of Units | | | 27,500 | | | | 33,782,890 | | | | 547,500 | | | | 23,434,563 | | | | — | | | | 57,792,453 | | | | 27,500 | | | | 601,269 | | | | 27,500 | | | | 277,300 | | | | 933,569 | |
Redemption of Units | | | — | | | | (10,924 | ) | | | — | | | | (158,494 | ) | | | — | | | | (169,418 | ) | | | — | | | | — | | | | — | | | | — | | | | — | |
Net increase/(decrease) in Owners’ Capital resulting from operations | | | (879 | ) | | | (838,047 | ) | | | (3,710 | ) | | | (464,280 | ) | | | — | | | | (1,306,916 | ) | | | (2,358 | ) | | | (20,156 | ) | | | (2,130 | ) | | | (12,008 | ) | | | (36,652 | ) |
| | | | | | | | | | | | | | | | | | | | | | | | | | | | | | | | | | | | | | | | | | | | |
Owners’ Capital, December 31, 2009 | | | 26,621 | | | | 32,933,919 | | | | 543,790 | | | | 22,811,789 | | | | — | | | | 56,316,119 | | | | 25,142 | | | | 581,113 | | | | 25,370 | | | | 265,292 | | | | 896,917 | |
| | | | | | | | | | | | | | | | | | | | | | | | | | | | | | | | | | | | | | | | | | | | |
Sale of Units | | | — | | | | 56,557,502 | | | | 965,000 | | | | 42,502,656 | | | | — | | | | 100,025,158 | | | | — | | | | 860,542 | | | | — | | | | 133,094 | | | | 993,636 | |
Redemption of Units | | | — | | | | (5,635,008 | ) | | | — | | | | (2,660,187 | ) | | | — | | | | (8,295,195 | ) | | | — | | | | (261,947 | ) | | | — | | | | (19,405 | ) | | | (281,352 | ) |
Change in control of ownership —Trading Companies | | | — | | | | — | | | | — | | | | — | | | | 172,237 | | | | 172,237 | | | | — | | | | — | | | | — | | | | — | | | | — | |
Contributions | | | — | | | | — | | | | — | | | | — | | | | — | | | | — | | | | — | | | | — | | | | — | | | | — | | | | — | |
Distributions | | | — | | | | — | | | | — | | | | — | | | | (15,232 | ) | | | (15,232 | ) | | | — | | | | — | | | | — | | | | — | | | | — | |
Operations attributable to non-controlling interests | | | — | | | | — | | | | — | | | | — | | | | (157,005 | ) | | | (157,005 | ) | | | — | | | | — | | | | — | | | | — | | | | — | |
Net increase/(decrease) in Owners’ Capital resulting from operations | | | 1,863 | | | | 6,137,234 | | | | 118,437 | | | | 5,192,356 | | | | — | | | | 11,449,890 | | | | 140 | | | | 14,232 | | | | 590 | | | | 8,759 | | | | 23,721 | |
| | | | | | | | | | | | | | | | | | | | | | | | | | | | | | | | | | | | | | | | | | | | |
Owners’ Capital, December 31, 2010 | | | 28,484 | | | | 89,993,647 | | | | 1,627,227 | | | | 67,846,614 | | | | — | | | | 159,495,972 | | | | 25,282 | | | | 1,193,940 | | | | 25,960 | | | | 387,740 | | | | 1,632,922 | |
| | | | | | | | | | | | | | | | | | | | | | | | | | | | | | | | | | | | | | | | | | | | |
Sale of Units | | | — | | | | 26,631,502 | | | | 200,000 | | | | 17,659,192 | | | | — | | | | 44,490,694 | | | | — | | | | 165,200 | | | | — | | | | 41,500 | | | | 206,700 | |
Redemption of Units | | | — | | | | (41,207,525 | ) | | | (300,000 | ) | | | (24,122,979 | ) | | | — | | | | (65,630,504 | ) | | | (24,214 | ) | | | (1,307,577 | ) | | | (25,098 | ) | | | (420,101 | ) | | | (1,776,990 | ) |
Net increase/(decrease) in Owners’ Capital resulting from operations | | | (1,150) | | | | (3,020,052) | | | | (40,487) | | | | (1,320,869) | | | | — | | | | (4,382,558) | | | | (1,068) | | | | (51,563) | | | | (862 | ) | | | (9,139) | | | | (62,632) | |
| | | | | | | | | | | | | | | | | | | | | | | | | | | | | | | | | | | | | | | | | | | | |
Owners’ Capital, December 31, 2011 | | $ | 27,334 | | | $ | 72,397,572 | | | $ | 1,486,740 | | | $ | 60,061,958 | | | $ | — | | | $ | 133,973,604 | | | $ | — | | | $ | — | | | $ | — | | | $ | — | | | $ | — | |
| | | | | | | | | | | | | | | | | | | | | | | | | | | | | | | | | | | | | | | | | | | | |
Owners’ Capital —Units, December 31, 2008 | | | — | | | | — | | | | — | | | | — | | | | — | | | | — | | | | — | | | | — | | | | — | | | | — | | | | — | |
| | | | | | | | | | | | | | | | | | | | | | | | | | | | | | | | | | | | | | | | | | | | |
Sale of Units | | | 275 | | | | 340,324 | | | | 5,562 | | | | 234,902 | | | | — | | | | 581,063 | | | | 275 | | | | 6,356 | | | | 275 | | | | 2,876 | | | | 9,782 | |
Redemption of Units | | | — | | | | (110 | ) | | | — | | | | (1,590 | ) | | | — | | | | (1,700 | ) | | | — | | | | — | | | | — | | | | — | | | | — | |
| | | | | | | | | | | | | | | | | | | | | | | | | | | | | | | | | | | | | | | | | | | | |
Owners’ Capital —Units, December 31, 2009 | | | 275 | | | | 340,214 | | | | 5,562 | | | | 233,312 | | | | — | | | | 579,363 | | | | 275 | | | | 6,356 | | | | 275 | | | | 2,876 | | | | 9,782 | |
| | | | | | | | | | | | | | | | | | | | | | | | | | | | | | | | | | | | | | | | | | | | |
Sale of Units | | | — | | | | 583,661 | | | | 9,723 | | | | 429,811 | | | | — | | | | 1,023,195 | | | | — | | | | 9,518 | | | | — | | | | 1,443 | | | | 10,961 | |
Redemption of Units | | | — | | | | (55,025 | ) | | | — | | | | (25,818 | ) | | | — | | | | (80,843 | ) | | | — | | | | (2,887 | ) | | | — | | | | (212 | ) | | | (3,099 | ) |
| | | | | | | | | | | | | | | | | | | | | | | | | | | | | | | | | | | | | | | | | | | | |
Owners’ Capital —Units, December 31, 2010 | | | 275 | | | | 868,850 | | | | 15,285 | | | | 637,305 | | | | — | | | | 1,521,715 | | | | 275 | | | | 12,987 | | | | 275 | | | | 4,107 | | | | 17,644 | |
| | | | | | | | | | | | | | | | | | | | | | | | | | | | | | | | | | | | | | | | | | | | |
Sale of Units | | | — | | | | 256,557 | | | | 1,818 | | | | 164,652 | | | | — | | | | 423,027 | | | | — | | | | 1,791 | | | | — | | | | 436 | | | | 2,227 | |
Redemption of Units | | | — | | | | (397,037 | ) | | | (2,802 | ) | | | (224,221 | ) | | | — | | | | (624,060 | ) | | | (275 | ) | | | (14,778 | ) | | | (275 | ) | | | (4,543 | ) | | | (19,871 | ) |
| | | | | | | | | | | | | | | | | | | | | | | | | | | | | | | | | | | | | | | | | | | | |
Owners’ Capital —Units, December 31, 2011 | | | 275 | | | | 728,370 | | | | 14,301 | | | | 577,736 | | | | — | | | | 1,320,682 | | | | — | | | | — | | | | — | | | | — | | | | — | |
| | | | | | | | | | | | | | | | | | | | | | | | | | | | | | | | | | | | | | | | | | | | |
Net asset value per unit at start of operations | | | | | | $ | 100.00 | (1) | | | | | | $ | 100.00 | (1) | | | | | | | | | | | | | | $ | 100.00 | (1) | | | | | | $ | 100.00 | (1) | | | | |
Change in net asset value per unit for the year ended December 31, 2009 | | | | | | | (3.20 | ) | | | | | | | (2.23 | ) | | | | | | | | | | | | | | | (8.57 | ) | | | | | | | (7.75 | ) | | | | |
| | | | | | | | | | | | | | | | | | | | | | | | | | | | | | | | | | | | | | | | | | | | |
Net asset value per unit at December 31, 2009 | | | | | | | 96.80 | | | | | | | | 97.77 | | | | | | | | | | | | | | | | 91.43 | | | | | | | | 92.25 | | | | | |
Change in net asset value per unit for the year ended December 31, 2010 | | | | | | | 6.78 | | | | | | | | 8.69 | | | | | | | | | | | | | | | | 0.51 | | | | | | | | 2.15 | | | | | |
| | | | | | | | | | | | | | | | | | | | | | | | | | | | | | | | | | | | | | | | | | | | |
Net asset value per unit at December 31, 2010 | | | | | | | 103.58 | | | | | | | | 106.46 | | | | | | | | | | | | | | | | 91.94 | | | | | | | | 94.40 | | | | | |
Change in net asset value per unit for the year or period ended December 31, 2011 | | | | | | | (4.18 | ) | | | | | | | (2.50 | ) | | | | | | | | | | | | | | | (3.89 | ) | | | | | | | (3.14 | ) | | | | |
| | | | | | | | | | | | | | | | | | | | | | | | | | | | | | | | | | | | | | | | | | | | |
Net asset value per unit at December 31, 2011 | | | | | | $ | 99.40 | | | | | | | $ | 103.96 | | | | | | | | | | | | | | | $ | 88.05 | (3) | | | | | | $ | 91.26 | (3) | | | | |
| | | | | | | | | | | | | | | | | | | | | | | | | | | | | | | | | | | | | | | | | | | | |
| (1) | Values are for both the Managing Owner and Limited Owners. |
| (2) | The Frontier Diversified Series and Frontier Dynamic Series began trading operations on June 9, 2009. |
| (3) | The Frontier Dynamic Series ceased trading operations on July 15, 2011 and redeemed all existing Units. Net asset value per unit represents the liquidation value. The Series remains open. |
The accompanying notes are an integral part of these financial statements.
F-17
The Series of the Frontier Fund
Statements of Changes in Owners’ Capital
For the Years Ended December 31, 2011, 2010 and 2009
| | | | | | | | | | | | | | | | | | | | | | | | | | | | | | | | | | | | | | | | |
| | | Frontier Long/Short Commodity Series | |
| | | Class 1 | | | Class 2 | | | Class 3 (2) | | | Class 1a
(3) | | | Class 1a (3) | | | Class 2a
(3) | | | Class 2a (3) | | | | | | | |
| | | Limited
Owners | | | Managing
Owner | | | Limited
Owners | | | Limited
Owners | | | Managing
Owner | | | Limited
Owners | | | Managing
Owner | | | Limited
Owners | | | Non-Controlling
Interests | | | Total | |
Owners’ Capital, December 31, 2008 | | $ | 46,525,406 | | | $ | 933,708 | | | $ | 10,273,181 | | | $ | — | | | $ | — | | | $ | — | | | $ | — | | | $ | — | | | $ | 1,576,319 | | | $ | 59,308,614 | |
| | | | | | | | | | | | | | | | | | | | | | | | | | | | | | | | | | | | | | | | |
Sale of Units | | | 7,069,581 | | | | — | | | | 3,221,195 | | | | 6,746,852 | | | | 27,500 | | | | 1,052,844 | | | | 27,500 | | | | 837,250 | | | | — | | | | 18,982,722 | |
Redemption of Units | | | (14,009,386 | ) | | | — | | | | (1,557,461 | ) | | | (821,589 | ) | | | — | | | | — | | | | — | | | | — | | | | — | | | | (16,388,436 | ) |
Contributions | | | — | | | | — | | | | — | | | | — | | | | — | | | | — | | | | — | | | | — | | | | 56,470,869 | | | | 56,470,869 | |
Distributions | | | — | | | | — | | | | — | | | | — | | | | — | | | | — | | | | — | | | | — | | | | (61,271,709 | ) | | | (61,271,709 | ) |
Operations attributable to non-controlling interests | | | — | | | | — | | | | — | | | | — | | | | — | | | | — | | | | — | | | | — | | | | 14,758,299 | | | | 14,758,299 | |
Net increase (decrease) in Owners’ Capital resulting from operations attributable to controlling interests | | | 6,173,624 | | | | 155,619 | | | | 1,959,861 | | | | 214,793 | | | | 411 | | | | 11,261 | | | | 683 | | | | 11,099 | | | | — | | | | 8,527,351 | |
Owners’ Capital, December 31, 2009 | | | 45,759,225 | | | | 1,089,327 | | | | 13,896,776 | | | | 6,140,056 | | | | 27,911 | | | | 1,064,105 | | | | 28,183 | | | | 848,349 | | | | 11,533,778 | | | | 80,387,710 | |
| | | | | | | | | | | | | | | | | | | | | | | | | | | | | | | | | | | | | | | | |
Sale of Units | | | 119,434 | | | | — | | | | — | | | | 14,889,732 | | | | — | | | | 4,247,899 | | | | — | | | | 2,527,455 | | | | — | | | | 21,784,520 | |
Redemption of Units | | | (19,502,051 | ) | | | — | | | | (2,103,245 | ) | | | (3,211,460 | ) | | | — | | | | (404,900 | ) | | | — | | | | (148,649 | ) | | | — | | | | (25,370,305 | ) |
Contributions | | | — | | | | — | | | | — | | | | — | | | | — | | | | — | | | | — | | | | — | | | | (8,718,487 | ) | | | (8,718,487 | ) |
Distributions | | | — | | | | — | | | | — | | | | — | | | | — | | | | — | | | | — | | | | — | | | | 97,830 | | | | 97,830 | |
Operations attributable to non-controlling interests | | | — | | | | — | | | | — | | | | — | | | | — | | | | — | | | | — | | | | — | | | | (2,913,121 | ) | | | (2,913,121 | ) |
Net increase/(decrease) in Owners’ | | | | | | | | | | | | | | | | | | | | | | | | | | | | | | | | | | | | | | | | |
Capital resulting from operations attributable to controlling interests | | | 4,809,148 | | | | 220,185 | | | | 2,481,935 | | | | 3,180,243 | | | | 4,528 | | | | 712,766 | | | | 5,141 | | | | 501,347 | | | | — | | | | 11,915,293 | |
| | | | | | | | | | | | | | | | | | | | | | | | | | | | | | | | | | | | | | | | |
Owners’ Capital, December 31, 2010 | | | 31,185,756 | | | | 1,309,512 | | | | 14,275,466 | | | | 20,998,571 | | | | 32,439 | | | | 5,619,870 | | | | 33,324 | | | | 3,728,502 | | | | — | | | | 77,183,440 | |
Sale of Units | | | 75,898 | | | | — | | | | — | | | | 19,475,762 | | | | — | | | | 14,327,910 | | | | 260,000 | | | | 7,570,730 | | | | — | | | | 41,710,300 | |
Redemption of Units | | | (29,615,581 | ) | | | (920,000 | ) | | | (6,812,419 | ) | | | (13,879,097 | ) | | | (20,000 | ) | | | (597,869 | ) | | | — | | | | (547,685 | ) | | | — | | | | (52,392,651 | ) |
Change in control of ownership - Trading Companies | | | | | | | — | | | | — | | | | — | | | | — | | | | — | | | | — | | | | — | | | | 28,341,047 | | | | 28,341,047 | |
Contributions | | | — | | | | — | | | | — | | | | — | | | | — | | | | — | | | | — | | | | — | | | | 4,105,200 | | | | 4,105,200 | |
Distributions | | | — | | | | — | | | | — | | | | — | | | | — | | | | — | | | | — | | | | — | | | | (28,282,129 | ) | | | (28,282,129 | ) |
Operations attributable to non-controlling interests | | | — | | | | — | | | | — | | | | — | | | | — | | | | — | | | | — | | | | — | | | | 6,059,461 | | | | 6,059,461 | |
Net increase/(decrease) in Owners’ Capital resulting from operations attributable to controlling interests | | | 2,512,974 | | | | 109,824 | | | | 1,226,379 | | | | 1,214,822 | | | | 1,832 | | | | (472,787 | ) | | | (10,584 | ) | | | (122,823 | ) | | | — | | | | 4,459,637 | |
| | | | | | | | | | | | | | | | | | | | | | | | | | | | | | | | | | | | | | | | |
Owners’ Capital, December 31, 2011 | | $ | 4,159,047 | | | $ | 499,336 | | | $ | 8,689,426 | | | $ | 27,810,058 | | | $ | 14,271 | | | $ | 18,877,124 | | | $ | 282,740 | | | $ | 10,628,724 | | | $ | 10,223,579 | | | $ | 81,184,305 | |
| | | | | | | | | | | | | | | | | | | | | | | | | | | | | | | | | | | | | | | | |
Owners’ Capital - Units, December 31, 2008 | | | 463,448 | | | | 8,544 | | | | 94,008 | | | | — | | | | — | | | | — | | | | — | | | | — | | | | — | | | | 566,000 | |
| | | | | | | | | | | | | | | | | | | | | | | | | | | | | | | | | | | | | | | | |
Sale of Units | | | 67,026 | | | | — | | | | 28,148 | | | | 54,820 | | | | 275 | | | | 10,484 | | | | 275 | | | | 8,278 | | | | — | | | | 169,306 | |
Redemption of Units | | | (128,268 | ) | | | — | | | | (13,156 | ) | | | (6,658 | ) | | | — | | | | — | | | | — | | | | — | | | | — | | | | (148,082 | ) |
| | | | | | | | | | | | | | | | | | | | | | | | | | | | | | | | | | | | | | | | |
Owners’ Capital - Units, December 31, 2009 | | | 402,206 | | | | 8,544 | | | | 109,000 | | | | 48,162 | | | | 275 | | | | 10,484 | | | | 275 | | | | 8,278 | | | | — | | | | 587,224 | |
Sale of Units | | | 1,046 | | | | — | | | | — | | | | 112,406 | | | | — | | | | 40,887 | | | | — | | | | 23,967 | | | | — | | | | 178,306 | |
Redemption of Units | | | (168,296 | ) | | | — | | | | (15,857 | ) | | | (23,551 | ) | | | — | | | | (3,729 | ) | | | — | | | | (1,476 | ) | | | — | | | | (212,909 | ) |
| | | | | | | | | | | | | | | | | | | | | | | | | | | | | | | | | | | | | | | | |
Owners’ Capital - Units, December 31, 2010 | | | 234,956 | | | | 8,544 | | | | 93,143 | | | | 137,017 | | | | 275 | | | | 47,642 | | | | 275 | | | | 30,769 | | | | — | | | | 552,621 | |
Sale of Units | | | 531 | | | | — | | | | — | | | | 115,939 | | | | — | | | | 112,147 | | | | 1,947 | | | | 57,000 | | | | — | | | | 287,564 | |
Redemption of Units | | | (204,936 | ) | | | (5,461 | ) | | | (39,495 | ) | | | (81,248 | ) | | | (158 | ) | | | (4,690 | ) | | | — | | | | (4,231 | ) | | | — | | | | (340,219 | ) |
| | | | | | | | | | | | | | | | | | | | | | | | | | | | | | | | | | | | | | | | |
Owners’ Capital - Units, December 31, 2011 | | | 30,551 | | | | 3,083 | | | | 53,648 | | | | 171,708 | | | | 117 | | | | 155,099 | | | | 2,222 | | | | 83,538 | | | | — | | | | 499,966 | |
| | | | | | | | | | | | | | | | | | | | | | | | | | | | | | | | | | | | | | | | |
| | | | | | | | | | | (1) | | | | | | | | | | | | (1) | | | | | | | | (1) | | | | | | | | | |
Net asset value per unit at December 31, 2008 or start of operations | | $ | 100.39 | | | | | | | $ | 109.28 | | | $ | 122.70 | | | | | | | $ | 100.00 | | | | | | | $ | 100.00 | | | | | | | | | |
Change in net asset value per unit for the year ended December 31, 2009 | | | 13.38 | | | | | | | | 18.21 | | | | 4.79 | | | | | | | | 1.49 | | | | | | | | 2.48 | | | | | | | | | |
| | | | | | | | | | | | | | | | | | | | | | | | | | | | | | | | | | | | | | | | |
Net asset value per unit at December 31, 2009 | | | 113.77 | | | | | | | | 127.49 | | | | 127.49 | | | | | | | | 101.49 | | | | | | | | 102.48 | | | | | | | | | |
Change in net asset value per unit for the year ended December 31, 2010 | | | 18.96 | | | | | | | | 25.77 | | | | 25.77 | | | | | | | | 16.47 | | | | | | | | 18.70 | | | | | | | | | |
| | | | | | | | | | | | | | | | | | | | | | | | | | | | | | | | | | | | | | | | |
Net asset value per unit at December 31, 2010 | | | 132.73 | | | | | | | | 153.26 | | | | 153.26 | | | | | | | | 117.96 | | | | | | | | 121.18 | | | | | | | | | |
Change in net asset value per unit for the year ended December 31, 2011 | | | 3.40 | | | | | | | | 8.71 | | | | 8.70 | | | | | | | | 3.75 | | | | | | | | 6.05 | | | | | | | | | |
| | | | | | | | | | | | | | | | | | | | | | | | | | | | | | | | | | | | | | | | |
Net asset value per unit at December 31, 2011 | | $ | 136.13 | | | | | | | $ | 161.97 | | | $ | 161.96 | | | | | | | $ | 121.71 | | | | | | | $ | 127.23 | | | | | | | | | |
| | | | | | | | | | | | | | | | | | | | | | | | | | | | | | | | | | | | | | | | |
| (1) | Values are for both the Managing Owner and Limited Owners. |
| (2) | Frontier Long/Short Commodity Series Class 3 began trading operations on May 30, 2009 |
| (3) | Frontier Long/Short Commodity Series Class 1a and 2a began trading operations on June 9, 2009 |
The accompanying notes are an integral part of these financial statements.
F-18
The Series of the Frontier Fund
Statements of Changes in Owners’ Capital
For the Years Ended December 31, 2011, 2010 and 2009
| | | | | | | | | | | | | | | | | | | | | | | | | | | | | | | | | | | | | | | | | | | | | | | | | | | | | | | | | | | | | | | | |
| | | Frontier Masters Series (2) | | | Balanced Series | |
| | | Class 1 | | | Class 1 | | | Class 2 | | | Class 2 | | | Non- | | | | | | Class 1 | | | Class 1a | | | Class 2 | | | Class 2a | | | Class 3a (3) | | | Non- | | | | |
| | | Managing
Owner | | | Limited
Owners | | | Managing
Owner | | | Limited
Owners | | | Controlling
Interests | | | Total | | | Limited
Owners | | | Managing
Owner | | | Limited
Owners | | | Managing
Owner | | | Limited
Owners | | | Managing
Owner | | | Limited
Owners | | | Limited
Owners | | | Controlling
Interests | | | Total | |
Owners’ Capital, December 31, 2008 | | $ | — | | | $ | — | | | $ | — | | | $ | — | | | $ | — | | | $ | — | | | $ | 256,550,829 | | | $ | 224 | | | $ | 8,135,941 | | | $ | 3,612,130 | | | $ | 63,497,532 | | | $ | 120,378 | | | $ | 1,765,973 | | | $ | — | | | $ | 15,128,613 | | | $ | 348,811,620 | |
| | | | | | | | | | | | | | | | | | | | | | | | | | | | | | | | | | | | | | | | | | | | | | | | | | | | | | | | | | | | | | | | |
Sale of Units | | | 27,500 | | | | 15,316,642 | | | | 212,500 | | | | 8,642,384 | | | | — | | | | 24,199,026 | | | | 75,585,729 | | | | — | | | | 3,817,405 | | | | 460,000 | | | | 25,457,174 | | | | 30,000 | | | | 1,772,211 | | | | 1,241,589 | | | | — | | | | 108,364,108 | |
Redemption of Units | | | — | | | | (4,896 | ) | | | — | | | | — | | | | — | | | | (4,896 | ) | | | (29,735,827 | ) | | | (221 | ) | | | (2,204,266 | ) | | | (270,000 | ) | | | (13,352,072 | ) | | | — | | | | (282,240 | ) | | | (35,688 | ) | | | — | | | | (45,880,314 | ) |
Change in control of ownership - Trading Companies | | | — | | | | — | | | | — | | | | — | | | | — | | | | — | | | | — | | | | — | | | | — | | | | — | | | | — | | | | — | | | | — | | | | — | | | | 350,058 | | | | 350,058 | |
Contributions | | | — | | | | — | | | | — | | | | — | | | | — | | | | — | | | | — | | | | — | | | | — | | | | — | | | | — | | | | — | | | | — | | | | — | | | | 22,053,200 | | | | 22,053,200 | |
Distributions | | | — | | | | — | | | | — | | | | — | | | | — | | | | — | | | | — | | | | — | | | | — | | | | — | | | | — | | | | — | | | | — | | | | — | | | | (12,642,418 | ) | | | (12,642,418 | ) |
Operations attributable to non-controlling interests | | | — | | | | — | | | | — | | | | — | | | | — | | | | — | | | | — | | | | — | | | | — | | | | — | | | | — | | | | — | | | | — | | | | — | | | | (438,431 | ) | | | (438,431 | ) |
Net (decrease) in Owners’ | | | | | | | | | | | | | | | | | | | | | | | | | | | | | | | | | | | | | | | | | | | | | | | | | | | | | | | | | | | | | | | — | |
Capital resulting from operations attributable to controlling interests | | | (1,523 | ) | | | (614,393 | ) | | | (2,149 | ) | | | (288,878 | ) | | | — | | | | (906,943 | ) | | | (16,376,424 | ) | | | (3 | ) | | | (598,966 | ) | | | (104,950 | ) | | | (1,927,648 | ) | | | (4,861 | ) | | | (102,895 | ) | | | (35,155 | ) | | | — | | | | (19,150,902 | ) |
| | | | | | | | | | | | | | | | | | | | | | | | | | | | | | | | | | | | | | | | | | | | | | | | | | | | | | | | | | | | | | | | |
Owners’ Capital, December 31, 2009 | | | 25,977 | | | | 14,697,353 | | | | 210,351 | | | | 8,353,506 | | | | — | | | | 23,287,187 | | | | 286,024,307 | | | | — | | | | 9,150,114 | | | | 3,697,180 | | | | 73,674,986 | | | | 145,517 | | | | 3,153,049 | | | | 1,170,746 | | | | 24,451,022 | | | | 401,466,921 | |
| | | | | | | | | | | | | | | | | | | | | | | | | | | | | | | | | | | | | | | | | | | | | | | | | | | | | | | | | | | | | | | | |
Sale of Units | | | — | | | | 26,672,742 | | | | 425,000 | | | | 15,970,263 | | | | — | | | | 43,068,005 | | | | 733,684 | | | | — | | | | 25,858 | | | | — | | | | 14,425 | | | | — | | | | — | | | | 3,412,987 | | | | — | | | | 4,186,954 | |
Redemption of Units | | | — | | | | (3,606,610 | ) | | | — | | | | (2,492,712 | ) | | | — | | | | (6,099,322 | ) | | | (29,047,428 | ) | | | — | | | | (4,516,519 | ) | | | (1,310,000 | ) | | | (9,577,458 | ) | | | — | | | | (163,315 | ) | | | (1,382,434 | ) | | | — | | | | (45,997,154 | ) |
Change in control of ownership - Trading Companies | | | — | | | | — | | | | — | | | | — | | | | — | | | | — | | | | — | | | | — | | | | — | | | | — | | | | — | | | | — | | | | — | | | | — | | | | (10,641,521 | ) | | | (10,641,521 | ) |
Contributions | | | — | | | | — | | | | — | | | | — | | | | — | | | | — | | | | — | | | | — | | | | — | | | | — | | | | — | | | | — | | | | — | | | | — | | | | 47,689,690 | | | | 47,689,690 | |
Distributions | | | — | | | | — | | | | — | | | | — | | | | — | | | | — | | | | — | | | | — | | | | — | | | | — | | | | — | | | | — | | | | — | | | | — | | | | (24,463,479 | ) | | | (24,463,479 | ) |
Operations attributable to non-controlling interests | | | — | | | | — | | | | — | | | | — | | | | — | | | | — | | | | — | | | | — | | | | — | | | | — | | | | — | | | | — | | | | — | | | | — | | | | 14,493,972 | | | | 14,493,972 | |
Net increase/(decrease) in Owners’ | | | | | | | | | | | | | | | | | | | | | | | | | | | | | | | | | | | | | | | | | | | | | | | | | | | | | | | | | | | | | | | — | |
Capital resulting from operations attributable to controlling interests | | | 2,338 | | | | 3,421,875 | | | | 61,487 | | | | 2,534,160 | | | | — | | | | 6,019,860 | | | | 30,096,947 | | | | — | | | | 461,105 | | | | 292,672 | | | | 9,923,923 | | | | 19,863 | | | | 407,260 | | | | 489,981 | | | | — | | | | 41,691,751 | |
| | | | | | | | | | | | | | | | | | | | | | | | | | | | | | | | | | | | | | | | | | | | | | | | | | | | | | | | | | | | | | | | |
Owners’ Capital, December 31, 2010 | | | 28,315 | | | | 41,185,360 | | | | 696,838 | | | | 24,365,217 | | | | — | | | | 66,275,730 | | | | 287,807,510 | | | | — | | | | 5,120,558 | | | | 2,679,852 | | | | 74,035,876 | | | | 165,380 | | | | 3,396,994 | | | | 3,691,280 | | | | 51,529,684 | | | | 428,427,134 | |
| | | | | | | | | | | | | | | | | | | | | | | | | | | | | | | | | | | | | | | | | | | | | | | | | | | | | | | | | | | | | | | | |
Sale of Units | | | — | | | | 8,975,267 | | | | — | | | | 3,222,236 | | | | — | | | | 12,197,503 | | | | 680,177 | | | | — | | | | 5,618 | | | | 1,250,000 | | | | 16,575 | | | | — | | | | — | | | | 810,623 | | | | — | | | | 2,762,993 | |
Redemption of Units | | | — | | | | (15,268,645 | ) | | | (100,000 | ) | | | (9,260,139 | ) | | | — | | | | (24,628,784 | ) | | | (94,481,950 | ) | | | — | | | | (2,387,579 | ) | | | (530,000 | ) | | | (12,512,325 | ) | | | — | | | | (652,135 | ) | | | (1,420,305 | ) | | | — | | | | (111,984,294 | ) |
Change in control of ownership - Trading Companies | | | — | | | | — | | | | — | | | | — | | | | — | | | | — | | | | — | | | | — | | | | — | | | | — | | | | — | | | | — | | | | — | | | | — | | | | 17,035,844 | | | | 17,035,844 | |
Contributions | | | — | | | | — | | | | — | | | | — | | | | 115,000 | | | | 115,000 | | | | — | | | | — | | | | — | | | | — | | | | — | | | | — | | | | — | | | | — | | | | 136,058,408 | | | | 136,058,408 | |
Distributions | | | — | | | | — | | | | — | | | | — | | | | (28,854 | ) | | | (28,854 | ) | | | — | | | | — | | | | — | | | | — | | | | — | | | | — | | | | — | | | | — | | | | (157,826,198 | ) | | | (157,826,198 | ) |
Operations attributable to non-controlling interests | | | — | | | | — | | | | — | | | | | | | | (27,734 | ) | | | (27,734 | ) | | | — | | | | — | | | | — | | | | — | | | | — | | | | — | | | | — | | | | — | | | | (6,164,402 | ) | | | (6,164,402 | ) |
Net increase/(decrease) in Owners’ | | | | | | | | | | | | | | | | | | | | | | | — | | | | | | | | | | | | | | | | | | | | | | | | | | | | | | | | | | | | | | | | | |
Capital resulting from operations attributable to controlling interests | | | (746 | ) | | | (829,415 | ) | | | (6,945 | ) | | | (182,346 | ) | | | — | | | | (1,019,452 | ) | | | (10,220,419 | ) | | | — | | | | (202,038 | ) | | | (48,244 | ) | | | (1,519,167 | ) | | | (6,566 | ) | | | (118,843 | ) | | | (128,796 | ) | | | — | | | | (12,244,073 | ) |
| | | | | | | | | | | | | | | | | | | | | | | | | | | | | | | | | | | | | | | | | | | | | | | | | | | | | | | | | | | | | | | | |
Owners’ Capital, December 31, 2011 | | $ | 27,569 | | | $ | 34,062,567 | | | $ | 589,893 | | | $ | 18,144,968 | | | $ | 58,412 | | | $ | 52,883,409 | | | $ | 183,785,318 | | | $ | — | | | $ | 2,536,559 | | | $ | 3,351,608 | | | $ | 60,020,959 | | | $ | 158,814 | | | $ | 2,626,016 | | | $ | 2,952,802 | | | $ | 40,633,336 | | | $ | 296,065,412 | |
| | | | | | | | | | | | | | | | | | | | | | | | | | | | | | | | | | | | | | | | | | | | | | | | | | | | | | | | | | | | | | | | |
Owners’ Capital - Units, December 31, 2008 | | | — | | | | — | | | | — | | | | — | | | | — | | | | — | | | | 2,049,590 | | | | 2 | | | | 72,584 | | | | 25,359 | | | | 445,784 | | | | 992 | | | | 14,560 | | | | — | | | | — | | | | 2,608,871 | |
| | | | | | | | | | | | | | | | | | | | | | | | | | | | | | | | | | | | | | | | | | | | | | | | | | | | | | | | | | | | | | | | |
Sale of Units | | | 275 | | | | 155,639 | | | | 2,206 | | | | 87,587 | | | | — | | | | 245,707 | | | | 604,791 | | | | — | | | | 34,150 | | | | 3,176 | | | | 177,866 | | | | 245 | | | | 14,604 | | | | 10,253 | | | | — | | | | 845,085 | |
Redemption of Units | | | — | | | | (50 | ) | | | — | | | | | | | | — | | | | (50 | ) | | | (241,428 | ) | | | (2 | ) | | | (20,000 | ) | | | (1,939 | ) | | | (93,669 | ) | | | — | | | | (2,353 | ) | | | (298 | ) | | | — | | | | (359,689 | ) |
| | | | | | | | | | | | | | | | | | | | | | | | | | | | | | | | | | | | | | | | | | | | | | | | | | | | | | | | | | | | | | | | |
Owners’ Capital - Units, December 31, 2009 | | | 275 | | | | 155,589 | | | | 2,206 | | | | 87,587 | | | | — | | | | 245,657 | | | | 2,412,953 | | | | — | | | | 86,734 | | | | 26,596 | | | | 529,981 | | | | 1,237 | | | | 26,811 | | | | 9,955 | | | | — | | | | 3,094,267 | |
| | | | | | | | | | | | | | | | | | | | | | | | | | | | | | | | | | | | | | | | | | | | | | | | | | | | | | | | | | | | | | | | |
Sale of Units | | | — | | | | 280,625 | | | | 4,380 | | | | 167,509 | | | | — | | | | 452,514 | | | | 6,013 | | | | — | | | | 245 | | | | — | | | | 102 | | | | — | | | | — | | | | 28,815 | | | | — | | | | 35,175 | |
Redemption of Units | | | — | | | | (36,220 | ) | | | — | | | | (24,813 | ) | | | — | | | | (61,033 | ) | | | (237,733 | ) | | | — | | | | (42,973 | ) | | | (9,790 | ) | | | (65,779 | ) | | | — | | | | (1,395 | ) | | | (11,154 | ) | | | — | | | | (368,824 | ) |
| | | | | | | | | | | | | | | | | | | | | | | | | | | | | | | | | | | | | | | | | | | | | | | | | | | | | | | | | | | | | | | | |
Owners’ Capital - Units, December 31, 2010 | | | 275 | | | | 399,994 | | | | 6,586 | | | | 230,283 | | | | — | | | | 637,138 | | | | 2,181,233 | | | | — | | | | 44,006 | | | | 16,806 | | | | 464,304 | | | | 1,237 | | | | 25,416 | | | | 27,616 | | | | — | | | | 2,760,618 | |
| | | | | | | | | | | | | | | | | | | | | | | | | | | | | | | | | | | | | | | | | | | | | | | | | | | | | | | | | | | | | | | | |
Sale of Units | | | — | | | | 87,494 | | | | — | | | | 30,180 | | | | — | | | | 117,674 | | | | 5,200 | | | | — | | | | 48 | | | | 8,074 | | | | 105 | | | | — | | | | — | | | | 6,135 | | | | — | | | | 19,562 | |
Redemption of Units | | | — | | | | (147,711 | ) | | | (959 | ) | | | (87,380 | ) | | | — | | | | (236,050 | ) | | | (710,302 | ) | | | — | | | | (20,666 | ) | | | (3,260 | ) | | | (77,236 | ) | | | — | | | | (4,956 | ) | | | (10,746 | ) | | | — | | | | (827,166 | ) |
| | | | | | | | | | | | | | | | | | | | | | | | | | | | | | | | | | | | | | | | | | | | | | | | | | | | | | | | | | | | | | | | |
Owners’ Capital - Units, December 31, 2011 | | | 275 | | | | 339,777 | | | | 5,627 | | | | 173,083 | | | | — | | | | 518,762 | | | | 1,476,131 | | | | — | | | | 23,388 | | | | 21,620 | | | | 387,173 | | | | 1,237 | | | | 20,460 | | | | 23,005 | | | | — | | | | 1,953,014 | |
| | | | | | | | | | | | | | | | | | | | | | | | | | | | | | | | | | | | | | | | | | | | | | | | | | | | | | | | | | | | | | | | |
| | | | | | | (1 | ) | | | | | | | (1 | ) | | | | | | | | | | | | | | | | | | | | | | | | | | | (1 | ) | | | | | | | (1 | ) | | | | | | | | | | | | |
Net asset value per unit at December 31, 2008 or start of operations | | | | | | $ | 100.00 | | | | | | | $ | 100.00 | | | | | | | | | | | $ | 125.17 | | | | | | | $ | 112.09 | | | | | | | $ | 142.44 | | | | | | | $ | 121.30 | | | $ | 121.97 | | | | | | | | | |
Change in net asset value per unit for the year ended December 31, 2009 | | | | | | | (5.54 | ) | | | | | | | (4.63 | ) | | | | | | | | | | | (6.63 | ) | | | | | | | (6.59 | ) | | | | | | | (3.43 | ) | | | | | | | (3.70 | ) | | | (4.37 | ) | | | | | | | | |
| | | | | | | | | | | | | | | | | | | | | | | | | | | | | | | | | | | | | | | | | | | | | | | | | | | | | | | | | | | | | | | | |
Net asset value per unit at December 31, 2009 | | | | | | | 94.46 | | | | | | | | 95.37 | | | | | | | | | | | | 118.54 | | | | | | | | 105.50 | | | | | | | | 139.01 | | | | | | | | 117.60 | | | | 117.60 | | | | | | | | | |
Change in net asset value per unit for the year ended December 31, 2010 | | | | | | | 8.50 | | | | | | | | 10.44 | | | | | | | | | | | | 13.41 | | | | | | | | 10.86 | | | | | | | | 20.45 | | | | | | | | 16.06 | | | | 16.06 | | | | | | | | | |
| | | | | | | | | | | | | | | | | | | | | | | | | | | | | | | | | | | | | | | | | | | | | | | | | | | | | | | | | | | | | | | | |
Net asset value per unit at December 31, 2010 | | | | | | | 102.96 | | | | | | | | 105.81 | | | | | | | | | | | | 131.95 | | | | | | | | 116.36 | | | | | | | | 159.46 | | | | | | | | 133.66 | | | | 133.66 | | | | | | | | | |
Change in net asset value per unit for the year ended December 31, 2011 | | | | | | | (2.71 | ) | | | | | | | (0.98 | ) | | | | | | | | | | | (7.45 | ) | | | | | | | (7.91 | ) | | | | | | | (4.44 | ) | | | | | | | (5.31 | ) | | | (5.30 | ) | | | | | | | | |
| | | | | | | | | | | | | | | | | | | | | | | | | | | | | | | | | | | | | | | | | | | | | | | | | | | | | | | | | | | | | | | | |
Net asset value per unit at December 31, 2011 | | | | | | $ | 100.25 | | | | | | | $ | 104.83 | | | | | | | | | | | $ | 124.50 | | | | | | | $ | 108.45 | | | | | | | $ | 155.02 | | | | | | | $ | 128.35 | | | $ | 128.36 | | | | | | | | | |
| | | | | | | | | | | | | | | | | | | | | | | | | | | | | | | | | | | | | | | | | | | | | | | | | | | | | | | | | | | | | | | | |
| (1) | Values are for both the Managing Owner and Limited Owners. |
| (2) | The Frontier Masters Series began trading operations on June 9, 2009 |
| (3) | The Balanced Series Class 3a began trading operations on June 4, 2009 |
The accompanying notes are an integral part of these financial statements.
F-19
The Series of the Frontier Fund
Statements of Changes in Owners’ Capital
For the Years Ended December 31, 2011, 2010 and 2009
| | | | | | | | | | | | | | | | | | | | | | | | | | | | | | | | | | | | |
| | | Berkeley/Graham/Tiverton Series (2) | | | Currency Series | |
| | | Class 1 | | | Class 2 | | | | | | | | | Class 1 | | | Class 2 | | | | |
| | | Limited
Owners | | | Managing
Owner | | | Limited
Owners | | | Non-Controlling
Interests | | | Total | | | Limited
Owners | | | Managing
Owner | | | Limited
Owners | | | Total | |
Owners’ Capital, December 31, 2008 | | $ | 69,957,155 | | | $ | 302,878 | | | $ | 7,504,896 | | | $ | 2,127,880 | | | $ | 79,892,809 | | | $ | 11,900,185 | | | $ | 687,357 | | | $ | 2,259,243 | | | $ | 14,846,785 | |
| | | | | | | | | | | | | | | | | | | | | | | | | | | | | | | | | | | | |
Sale of Units | | | 10,924,243 | | | | — | | | | 4,025,676 | | | | — | | | | 14,949,919 | | | | 570,243 | | | | — | | | | 82,125 | | | | 652,368 | |
Redemption of Units | | | (7,507,650 | ) | | | (170,000 | ) | | | (1,523,780 | ) | | | — | | | | (9,201,430 | ) | | | (2,434,358 | ) | | | — | | | | (284,291 | ) | | | (2,718,649 | ) |
Change in control of ownership - Trading Companies | | | — | | | | — | | | | — | | | | (4,388,979 | ) | | | (4,388,979 | ) | | | — | | | | — | | | | — | | | | | |
Contributions | | | — | | | | — | | | | — | | | | 4,418,397 | | | | 4,418,397 | | | | — | | | | — | | | | — | | | | — | |
Distributions | | | — | | | | — | | | | — | | | | (820,772 | ) | | | (820,772 | ) | | | — | | | | — | | | | — | | | | — | |
Operations attributable to non-controlling interests | | | — | | | | — | | | | — | | | | (1,336,526 | ) | | | (1,336,526 | ) | | | — | | | | — | | | | — | | | | — | |
Net increase (decrease) in Owners’ Capital resulting from operations attributable to controlling interests | | | (3,926,382 | ) | | | (7,368 | ) | | | (217,308 | ) | | | — | | | | (4,151,058 | ) | | | (2,101,688 | ) | | | (112,973 | ) | | | (357,715 | ) | | | (2,572,376 | ) |
| | | | | | | | | | | | | | | | | | | | | | | | | | | | | | | | | | | | |
Owners’ Capital, December 31, 2009 | | | 69,447,366 | | | | 125,510 | | | | 9,789,484 | | | | — | | | | 79,362,360 | | | | 7,934,382 | | | | 574,384 | | | | 1,699,362 | | | | 10,208,128 | |
| | | | | | | | | | | | | | | | | | | | | | | | | | | | | | | | | | | | |
Sale of Units | | | 124,546 | | | | — | | | | — | | | | — | | | | 124,546 | | | | 65,957 | | | | — | | | | — | | | | 65,957 | |
Redemption of Units | | | (10,995,712 | ) | | | — | | | | (2,174,467 | ) | | | — | | | | (13,170,179 | ) | | | (1,751,140 | ) | | | (570,000 | ) | | | (983,296 | ) | | | (3,304,436 | ) |
Change in control of ownership - Trading Companies | | | — | | | | — | | | | — | | | | (14,996,045 | ) | | | (14,996,045 | ) | | | — | | | | — | | | | — | | | | — | |
Contributions | | | — | | | | — | | | | — | | | | 16,000,000 | | | | 16,000,000 | | | | — | | | | — | | | | — | | | | — | �� |
Distributions | | | — | | | | — | | | | — | | | | (2,896,500 | ) | | | (2,896,500 | ) | | | — | | | | — | | | | — | | | | — | |
Operations attributable to non-controlling interests | | | — | | | | — | | | | — | | | | 1,892,545 | | | | 1,892,545 | | | | — | | | | — | | | | — | | | | — | |
Net increase/(decrease) in Owners’ Capital resulting from operations attributable to controlling interests | | | 3,266,796 | | | | 11,018 | | | | 634,787 | | | | — | | | | 3,912,601 | | | | 132,683 | | | | (1,593 | ) | | | 38,661 | | | | 169,751 | |
| | | | | | | | | | | | | | | | | | | | | | | | | | | | | | | | | | | | |
Owners’ Capital, December 31, 2010 | | | 61,842,996 | | | | 136,528 | | | | 8,249,804 | | | | — | | | | 70,229,328 | | | | 6,381,882 | | | | 2,791 | | | | 754,727 | | | | 7,139,400 | |
| | | | | | | | | | | | | | | | | | | | | | | | | | | | | | | | | | | | |
Sale of Units | | | 73,374 | | | | — | | | | — | | | | — | | | | 73,374 | | | | 58,429 | | | | — | | | | — | | | | 58,429 | |
Redemption of Units | | | (18,343,967 | ) | | | (120,000 | ) | | | (2,956,631 | ) | | | — | | | | (21,420,598 | ) | | | (1,610,039 | ) | | | — | | | | (647,496 | ) | | | (2,257,535 | ) |
Net increase/(decrease) in Owners’ Capital resulting from operations attributable to controlling interests | | | (8,391,772 | ) | | | (8,650 | ) | | | (867,710 | ) | | | — | | | | (9,268,132 | ) | | | (601,922 | ) | | | (228 | ) | | | (18,787 | ) | | | (620,937 | ) |
| | | | | | | | | | | | | | | | | | | | | | | | | | | | | | | | | | | | |
Owners’ Capital, December 31, 2011 | | $ | 35,180,631 | | | $ | 7,878 | | | $ | 4,425,463 | | | $ | — | | | $ | 39,613,972 | | | $ | 4,228,350 | | | $ | 2,563 | | | $ | 88,444 | | | $ | 4,319,357 | |
| | | | | | | | | | | | | | | | | | | | | | | | | | | | | | | | | | | | |
Owners’ Capital - Units, December 31, 2008 | | | 632,847 | | | | 2,439 | | | | 60,454 | | | | — | | | | 695,740 | | | | 123,719 | | | | 6,289 | | | | 20,670 | | | | 150,678 | |
| | | | | | | | | | | | | | | | | | | | | | | | | | | | | | | | | | | | |
Sale of Units | | | 101,789 | | | | — | | | | 32,910 | | | | — | | | | 134,699 | | | | 6,288 | | | | — | | | | 787 | | | | 7,075 | |
Redemption of Units | | | (71,005 | ) | | | (1,403 | ) | | | (12,523 | ) | | | — | | | | (84,931 | ) | | | (28,285 | ) | | | — | | | | (2,852 | ) | | | (31,137 | ) |
| | | | | | | | | | | | | | | | | | | | | | | | | | | | | | | | | | | | |
Owners’ Capital - Units, December 31, 2009 | | | 663,631 | | | | 1,036 | | | | 80,841 | | | | — | | | | 745,508 | | | | 101,722 | | | | 6,289 | | | | 18,605 | | | | 126,616 | |
| | | | | | | | | | | | | | | | | | | | | | | | | | | | | | | | | | | | |
Sale of Units | | | 1,202 | | | | — | | | | — | | | | — | | | | 1,202 | | | | 827 | | | | — | | | | — | | | | 827 | |
Redemption of Units | | | (104,985 | ) | | | — | | | | (18,213 | ) | | | — | | | | (123,198 | ) | | | (21,855 | ) | | | (6,260 | ) | | | (10,696 | ) | | | (38,811 | ) |
| | | | | | | | | | | | | | | | | | | | | | | | | | | | | | | | | | | | |
Owners’ Capital - Units, December 31, 2010 | | | 559,848 | | | | 1,036 | | | | 62,628 | | | | — | | | | 623,512 | | | | 80,694 | | | | 29 | | | | 7,909 | | | | 88,632 | |
| | | | | | | | | | | | | | | | | | | | | | | | | | | | | | | | | | | | |
Sale of Units | | | 704 | | | | — | | | | — | | | | — | | | | 704 | | | | 789 | | | | — | | | | — | | | | 789 | |
Redemption of Units | | | (174,019 | ) | | | (966 | ) | | | (23,057 | ) | | | — | | | | (198,042 | ) | | | (21,486 | ) | | | — | | | | (6,899 | ) | | | (28,385 | ) |
| | | | | | | | | | | | | | | | | | | | | | | | | | | | | | | | | | | | |
Owners’ Capital - Units, December 31, 2011 | | | 386,533 | | | | 70 | | | | 39,571 | | | | — | | | | 426,174 | | | | 59,997 | | | | 29 | | | | 1,010 | | | | 61,036 | |
| | | | | | | | | | | | | | | | | | | | | | | | | | | | | | | | | | | | |
| | | | | | | | | | | (1 | ) | | | | | | | | | | | | | | | | | | | (1 | ) | | | | |
Net asset value per unit at December 31, 2008 | | $ | 110.54 | | | | | | | $ | 124.14 | | | | | | | | | | | $ | 96.19 | | | | | | | $ | 109.30 | | | | | |
Change in net asset value per unit for the year ended December 31, 2009 | | | (5.89 | ) | | | | | | | (3.04 | ) | | | | | | | | | | | (18.19 | ) | | | | | | | (17.96 | ) | | | | |
| | | | | | | | | | | | | | | | | | | | | | | | | | | | | | | | | | | | |
Net asset value per unit at December 31, 2009 | | | 104.65 | | | | | | | | 121.10 | | | | | | | | | | | | 78.00 | | | | | | | | 91.34 | | | | | |
Change in net asset value per unit for the year ended December 31, 2010 | | | 5.81 | | | | | | | | 10.63 | | | | | | | | | | | | 1.09 | | | | | | | | 4.09 | | | | | |
| | | | | | | | | | | | | | | | | | | | | | | | | | | | | | | | | | | | |
Net asset value per unit at December 31, 2010 | | | 110.46 | | | | | | | | 131.73 | | | | | | | | | | | | 79.09 | | | | | | | | 95.43 | | | | | |
Change in net asset value per unit for the year ended December 31, 2011 | | | (19.44 | ) | | | | | | | (19.89 | ) | | | | | | | | | | | (8.61 | ) | | | | | | | (7.82 | ) | | | | |
| | | | | | | | | | | | | | | | | | | | | | | | | | | | | | | | | | | | |
Net asset value per unit at December 31, 2011 | | $ | 91.02 | | | | | | | $ | 111.84 | | | | | | | | | | | $ | 70.48 | | | | | | | $ | 87.61 | | | | | |
| | | | | | | | | | | | | | | | | | | | | | | | | | | | | | | | | | | | |
| (1) | Values are for both the Managing Owner and Limited Owners. |
| (2) | Formerly the Campbell/Graham/Tiverton Series. |
The accompanying notes are an integral part of these financial statements.
F-20
The Series of the Frontier Fund
Statements of Changes in Owners’ Capital
For the Years Ended December 31, 2011, 2010 and 2009
| | | | | | | | | | | | | | | | | | | | | | | | | | | | | | | | | | | | | | | | |
| | | Long Only Commodity Series (3) | | | Managed Futures Index Series (3) | |
| | | Class 1 | | | Class 2 | | | Class 3 (2) | | | | | | Class 1 | | | Class 2 | | | Class 3 (2) | | | | |
| | | Limited
Owners | | | Managing
Owner | | | Limited
Owners | | | Limited
Owners | | | Total | | | Limited
Owners | | | Managing
Owner | | | Limited
Owners | | | Limited
Owners | | | Total | |
Owners’ Capital, December 31, 2008 | | $ | 3,254,226 | | | $ | 110,092 | | | $ | 678,155 | | | $ | — | | | $ | 4,042,473 | | | $ | 2,266,977 | | | $ | 77,559 | | | $ | 1,058,515 | | | $ | — | | | $ | 3,403,051 | |
| | | | | | | | | | | | | | | | | | | | | | | | | | | | | | | | | | | | | | | | |
Sale of Units | | | 409,347 | | | | — | | | | 86,800 | | | | — | | | | 496,147 | | | | 708,699 | | | | 200,000 | | | | 1,071,138 | | | | — | | | | 1,979,837 | |
Redemption of Units | | | (572,400 | ) | | | — | | | | (93,077 | ) | | | — | | | | (665,477 | ) | | | (822,446 | ) | | | — | | | | (224,954 | ) | | | — | | | | (1,047,400 | ) |
Net increase (decrease) in Owners’ Capital resulting from operations | | | 620,408 | | | | 23,421 | | | | 149,353 | | | | — | | | | 793,182 | | | | (321,795 | ) | | | (18,354 | ) | | | (222,130 | ) | | | — | | | | (562,279 | ) |
| | | | | | | | | | | | | | | | | | | | | | | | | | | | | | | | | | | | | | | | |
Owners’ Capital, December 31, 2009 | | | 3,711,581 | | | | 133,513 | | | | 821,231 | | | | — | | | | 4,666,325 | | | | 1,831,435 | | | | 259,205 | | | | 1,682,569 | | | | — | | | | 3,773,209 | |
| | | | | | | | | | | | | | | | | | | | | | | | | | | | | | | | | | | | | | | | |
Sale of Units | | | 935 | | | | — | | | | — | | | | — | | | | 935 | | | | — | | | | 2,000,000 | | | | — | | | | — | | | | 2,000,000 | |
Redemption of Units | | | (731,802 | ) | | | (80,000 | ) | | | (129,308 | ) | | | — | | | | (941,110 | ) | | | (518,756 | ) | | | — | | | | (398,064 | ) | | | — | | | | (916,820 | ) |
Net increase/(decrease) in Owners’
Capital resulting from operations | | | 368,239 | | | | (2,301 | ) | | | 101,143 | | | | — | | | | 467,081 | | | | 75,773 | | | | 115,944 | | | | 112,357 | | | | — | | |
| —
304,074 |
|
| | | | | | | | | | | | | | | | | | | | | | | | | | | | | | | | | | | | | | | | |
Owners’ Capital, December 31, 2010 | | | 3,348,953 | | | | 51,212 | | | | 793,066 | | | | — | | | | 4,193,231 | | | | 1,388,452 | | | | 2,375,149 | | | | 1,396,862 | | | | — | | | | 5,160,463 | |
| | | | | | | | | | | | | | | | | | | | | | | | | | | | | | | | | | | | | | | | |
Sale of Units | | | 1,084 | | | | — | | | | — | | | | 1,635,478 | | | | 1,636,562 | | | | — | | | | — | | | | — | | | | 375,118 | | | | 375,118 | |
Redemption of Units | | | (3,330,733 | ) | | | (48,901 | ) | | | (815,229 | ) | | | (1,555,811 | ) | | | (5,750,674 | ) | | | (1,310,251 | ) | | | (2,200,563 | ) | | | (1,306,278 | ) | | | (360,212 | ) | | | (5,177,304 | ) |
Net increase/(decrease) in Owners’
Capital resulting from operations | | | (19,304 | ) | | | (2,311 | ) | | | 22,163 | | | | (79,667 | ) | | | (79,119 | ) | | | (78,201 | ) | | | (174,586 | ) | | | (90,584 | ) | | | (14,906 | ) | | | (358,277 | ) |
| | | | | | | | | | | | | | | | | | | | | | | | | | | | | | | | | | | | | | | | |
Owners’ Capital, December 31, 2011 | | $ | — | | | $ | — | | | $ | — | | | $ | — | | | $ | — | | | $ | — | | | $ | — | | | $ | — | | | $ | — | | | $ | — | |
| | | | | | | | | | | | | | | | | | | | | | | | | | | | | | | | | | | | | | | | |
Owners’ Capital - Units, December 31, 2008 | | | 46,285 | | | | 1,479 | | | | 9,108 | | | | — | | | | 56,872 | | | | 17,151 | | | | 555 | | | | 7,577 | | | | — | | | | 25,283 | |
| | | | | | | | | | | | | | | | | | | | | | | | | | | | | | | | | | | | | | | | |
Sale of Units | | | 6,185 | | | | — | | | | 1,232 | | | | — | | | | 7,417 | | | | 5,748 | | | | 1,582 | | | | 8,084 | | | | — | | | | 15,414 | |
Redemption of Units | | | (8,065 | ) | | | — | | | | (1,245 | ) | | | — | | | | (9,310 | ) | | | (6,625 | ) | | | — | | | | (1,787 | ) | | | — | | | | (8,412 | ) |
| | | | | | | | | | | | | | | | | | | | | | | | | | | | | | | | | | | | | | | | |
Owners’ Capital - Units, December 31, 2009 | | | 44,405 | | | | 1,479 | | | | 9,095 | | | | — | | | | 54,979 | | | | 16,274 | | | | 2,137 | | | | 13,874 | | | | — | | | | 32,285 | |
| | | | | | | | | | | | | | | | | | | | | | | | | | | | | | | | | | | | | | | | |
Sale of Units | | | 12 | | | | — | | | | — | | | | — | | | | 12 | | | | — | | | | 16,177 | | | | — | | | | — | | | | 16,177 | |
Redemption of Units | | | (8,830 | ) | | | (985 | ) | | | (1,448 | ) | | | — | | | | (11,263 | ) | | | (4,504 | ) | | | — | | | | (3,104 | ) | | | — | | | | (7,608 | ) |
| | | | | | | | | | | | | | | | | | | | | | | | | | | | | | | | | | | | | | | | |
Owners’ Capital - Units, December 31, 2010 | | | 35,587 | | | | 494 | | | | 7,647 | | | | — | | | | 43,728 | | | | 11,770 | | | | 18,314 | | | | 10,770 | | | | — | | | | 40,854 | |
| | | | | | | | | | | | | | | | | | | | | | | | | | | | | | | | | | | | | | | | |
| | | | | | | | | | | | | | | | | | | | | | | | | | | | | | | | | | | — | | | | | |
Sale of Units | | | 12 | | | | — | | | | — | | | | 15,532 | | | | 15,544 | | | | — | | | | — | | | | — | | | | 2,962 | | | | 2,962 | |
Redemption of Units | | | (35,599 | ) | | | (494 | ) | | | (7,647 | ) | | | (15,532 | ) | | | (59,272 | ) | | | (11,770 | ) | | | (18,314 | ) | | | (10,770 | ) | | | (2,962 | ) | | | (43,816 | ) |
| | | | | | | | | | | | | | | | | | | | | | | | | | | | | | | | | | | | | | | | |
Owners’ Capital - Units, December 31, 2011 | | | — | | | | — | | | | — | | | | — | | | | — | | | | — | | | | — | | | | — | | | | — | | | | — | |
| | | | | | | | | | | | | | | | | | | | | | | | | | | | | | | | | | | | | | | | |
| | | | | | | | | | | (1 | ) | | | | | | | | | | | | | | | | | | | (1 | ) | | | | | | | | |
Net asset value per unit at December 31, 2008 | | $ | 70.31 | | | | | | | $ | 74.46 | | | $ | — | | | | | | | $ | 132.18 | | | | | | | $ | 139.70 | | | $ | — | | | | | |
Change in net asset value per unit for the year ended December 31, 2009 | | | 13.28 | | | | | | | | 15.84 | | | | — | | | | | | | | (19.64 | ) | | | | | | | (18.42 | ) | | | — | | | | | |
| | | | | | | | | | | | | | | | | | | | | | | | | | | | | | | | | | | | | | | | |
Net asset value per unit at December 31, 2009 | | | 83.59 | | | | | | | | 90.30 | | | | — | | | | | | | | 112.54 | | | | | | | | 121.28 | | | | — | | | | | |
Change in net asset value per unit for the year ended December 31, 2010 | | | 10.52 | | | | | | | | 13.41 | | | | — | | | | | | | | 5.42 | | | | | | | | 8.41 | | | | — | | | | | |
| | | | | | | | | | | | | | | | | | | | | | | | | | | | | | | | | | | | | | | | |
Net asset value per unit at December 31, 2010 or start of operations | | | 94.11 | | | | | | | | 103.71 | | | | 103.88 | | | | | | | | 117.96 | | | | | | | | 129.69 | | | | 126.73 | | | | | |
Change in net asset value per unit for the year or period ended December 31, 2011 | | | (7.00 | ) | | | | | | | (5.83 | ) | | | (6.00 | ) | | | | | | | (11.13 | ) | | | | | | | (9.93 | ) | | | (6.97 | ) | | | | |
| | | | | | | | | | | | | | | | | | | | | | | | | | | | | | | | | | | | | | | | |
Net asset value per unit at December 31, 2011 | | $ | 87.11 | (4) | | | | | | $ | 97.88 | (4) | | $ | 97.88 | (4) | | | | | | $ | 106.83 | (4) | | | | | | $ | 119.76 | (4) | | $ | 119.76 | (4) | | | | |
| | | | | | | | | | | | | | | | | | | | | | | | | | | | | | | | | | | | | | | | |
| (1) | Values are for both the Managing Owner and Limited Owners. |
| (2) | The Long Only Commodity Series, Class 3 Units and the Managed Futures Index Series, Class 3 units began trading operations on January 14, 2011 |
| (3) | The Long Only Commodity Series and the Managed Futures Index Series ceased trading operations on December 21, 2011 and redeemed all existing Units. Both Series remain open. |
| (4) | Net asset value per unit represents the liquidation value. |
The accompanying notes are an integral part of these financial statements.
F-21
The Series of the Frontier Fund
Statements of Changes in Owners’ Capital
For the Years Ended December 31, 2011, 2010 and 2009
| | | | | | | | | | | | | | | | | | | | | | | | | | | | | | | | | | | | | | | | | | | | |
| | | Winton Series | | | Winton/Graham Series | |
| | | Class 1 | | | Class 2 | | | Non- | | | | | | Class 1 | | | Class 2 | | | Non- | | | | |
| | | Managing
Owner | | | Limited
Owners | | | Managing
Owner | | | Limited
Owners | | | Controlling
Interests | | | Total | | | Limited
Owners | | | Managing
Owner | | | Limited
Owners | | | Controlling
Interests | | | Total | |
Owners’ Capital, December 31, 2008 | | $ | 1,304 | | | $ | 62,282,355 | | | $ | 277,935 | | | $ | 11,465,432 | | | $ | 4,688,169 | | | $ | 78,715,195 | | | $ | 35,760,835 | | | $ | 56,315 | | | $ | 14,378,079 | | | $ | — | | | $ | 50,195,229 | |
| | | | | | | | | | | | | | | | | | | | | | | | | | | | | | | | | | | | | | | | | | | | |
Sale of Units | | | — | | | | 287,976 | | | | 200,000 | | | | — | | | | — | | | | 487,976 | | | | 20,207,122 | | | | — | | | | 360,401 | | | | — | | | | 20,567,523 | |
Redemption of Units | | | (1,165 | ) | | | (8,521,271 | ) | | | — | | | | (905,208 | ) | | | — | | | | (9,427,644 | ) | | | (5,384,099 | ) | | | — | | | | (1,892,655 | ) | | | — | | | | (7,276,754 | ) |
Change in control of ownership - Trading Companies | | | — | | | | — | | | | — | | | | — | | | | (13,830,805 | ) | | | (13,830,805 | ) | | | — | | | | — | | | | — | | | | 2,258,238 | | | | 2,258,238 | |
Contributions | | | — | | | | — | | | | — | | | | — | | | | 15,598,979 | | | | 15,598,979 | | | | — | | | | — | | | | — | | | | 8,100,000 | | | | 8,100,000 | |
Distributions | | | — | | | | — | | | | — | | | | — | | | | (2,389,350 | ) | | | (2,389,350 | ) | | | — | | | | — | | | | — | | | | (7,563,092 | ) | | | (7,563,092 | ) |
Operations attributable to non-controlling interests | | | — | | | | — | | | | — | | | | — | | | | (4,066,993 | ) | | | (4,066,993 | ) | | | — | | | | — | | | | — | | | | 3,347,600 | | | | 3,347,600 | |
Net increase (decrease) in Owners’ Capital resulting from operations attributaable to controlling interests | | | (139 | ) | | | (5,850,743 | ) | | | (22,653 | ) | | | (811,644 | ) | | | — | | | | (6,685,179 | ) | | | (2,415,463 | ) | | | (1,325 | ) | | | (378,337 | ) | | | — | | | | (2,795,125 | ) |
| | | | | | | | | | | | | | | | | | | | | | | | | | | | | | | | | | | | | | | | | | | | |
Owners’ Capital, December 31, 2009 | | | — | | | | 48,198,317 | | | | 455,282 | | | | 9,748,580 | | | | — | | | | 58,402,179 | | | | 48,168,395 | | | | 54,990 | | | | 12,467,488 | | | | 6,142,746 | | | | 66,833,619 | |
| | | | | | | | | | | | | | | | | | | | | | | | | | | | | | | | | | | | | | | | | | | | |
Sale of Units | | | — | | | | 277,520 | | | | — | | | | — | | | | — | | | | 277,520 | | | | 143,516 | | | | — | | | | — | | | | — | | | | 143,516 | |
Redemption of Units | | | — | | | | (5,850,898 | ) | | | (250,000 | ) | | | (364,265 | ) | | | — | | | | (6,465,163 | ) | | | (6,276,569 | ) | | | — | | | | (2,310,599 | ) | | | — | | | | (8,587,168 | ) |
Contributions | | | — | | | | — | | | | — | | | | — | | | | — | | | | — | | | | — | | | | — | | | | — | | | | 5,800,968 | | | | 5,800,968 | |
Distributions | | | — | | | | — | | | | — | | | | — | | | | — | | | | — | | | | — | | | | — | | | | — | | | | (8,907,979 | ) | | | (8,907,979 | ) |
Operations attributable to non-controlling interests | | | — | | | | — | | | | — | | | | — | | | | — | | | | — | | | | — | | | | — | | | | — | | | | 2,644,623 | | | | 2,644,623 | |
Net increase/(decrease) in Owners’ Capital resulting from operations attributable to controlling interests | | | — | | | | 6,726,042 | | | | 25,499 | | | | 1,753,360 | | | | — | | | | 8,504,901 | | | | 3,862,904 | | | | 6,701 | | | | 1,393,612 | | | | — | | | | 5,263,217 | |
| | | | | | | | | | | | | | | | | | | | | | | | | | | | | | | | | | | | | | | | | | | | |
Owners’ Capital, December 31, 2010 | | | — | | | | 49,350,981 | | | | 230,781 | | | | 11,137,675 | | | | — | | | | 60,719,437 | | | | 45,898,246 | | | | 61,691 | | | | 11,550,501 | | | | 5,680,358 | | | | 63,190,796 | |
| | | | | | | | | | | | | | | | | | | | | | | | | | | | | | | | | | | | | | | | | | | | |
Sale of Units | | | — | | | | 256,132 | | | | — | | | | — | | | | — | | | | 256,132 | | | | 111,245 | | | | — | | | | — | | | | — | | | | 111,245 | |
Redemption of Units | | | — | | | | (13,146,425 | ) | | | (200,000 | ) | | | (307,653 | ) | | | — | | | | (13,654,078 | ) | | | (17,353,576 | ) | | | — | | | | (4,995,641 | ) | | | — | | | | (22,349,217 | ) |
Change in control of ownership - Trading Companies | | | — | | | | — | | | | — | | | | — | | | | — | | | | — | | | | — | | | | — | | | | — | | | | (5,222,639 | ) | | | (5,222,639 | ) |
Contributions | | | — | | | | — | | | | — | | | | — | | | | — | | | | — | | | | — | | | | — | | | | — | | | | 3,981,000 | | | | 3,981,000 | |
Distributions | | | — | | | | — | | | | — | | | | — | | | | — | | | | — | | | | — | | | | — | | | | — | | | | (3,968,000 | ) | | | (3,968,000 | ) |
Operations attributable to non-controlling interests | | | — | | | | — | | | | — | | | | — | | | | — | | | | — | | | | — | | | | — | | | | — | | | | (470,719 | ) | | | (470,719 | ) |
Net increase/(decrease) in Owners’ Capital resulting from operations attributable to controlling interests | | | — | | | | 1,885,111 | | | | 3,495 | | | | 838,027 | | | | — | | | | 2,726,633 | | | | (3,872,396 | ) | | | (6,138 | ) | | | (620,245 | ) | | | — | | | | (4,498,779 | ) |
| | | | | | | | | | | | | | | | | | | | | | | | | | | | | | | | | | | | | | | | | | | | |
Owners’ Capital, December 31, 2011 | | $ | — | | | $ | 38,345,799 | | | $ | 34,276 | | | $ | 11,668,049 | | | $ | — | | | $ | 50,048,124 | | | $ | 24,783,519 | | | $ | 55,553 | | | $ | 5,934,615 | | | $ | — | | | $ | 30,773,687 | |
| | | | | | | | | | | | | | | | | | | | | | | | | | | | | | | | | | | | | | | | | | | | |
Owners’ Capital - Units, December 31, 2008 | | | 10 | | | | 477,595 | | | | 1,985 | | | | 81,870 | | | | — | | | | 561,460 | | | | 307,804 | | | | 428 | | | | 109,351 | | | | — | | | | 417,583 | |
| | | | | | | | | | | | | | | | | | | | | | | | | | | | | | | | | | | | | | | | | | | | |
Sale of Units | | | — | | | | 2,363 | | | | 1,514 | | | | — | | | | — | | | | 3,877 | | | | 178,479 | | | | — | | | | 2,731 | | | | — | | | | 181,210 | |
Redemption of Units | | | (10 | ) | | | (70,007 | ) | | | — | | | | (6,940 | ) | | | — | | | | (76,957 | ) | | | (48,630 | ) | | | — | | | | (14,976 | ) | | | — | | | | (63,606 | ) |
| | | | | | | | | | | | | | | | | | | | | | | | | | | | | | | | | | | | | | | | | | | | |
Owners’ Capital - Units, December 31, 2009 | | | — | | | | 409,951 | | | | 3,499 | | | | 74,930 | | | | — | | | | 488,380 | | | | 437,653 | | | | 428 | | | | 97,106 | | | | — | | | | 535,187 | |
| | | | | | | | | | | | | | | | | | | | | | | | | | | | | | | | | | | | | | | | | | | | |
Sale of Units | | | — | | | | 2,209 | | | | — | | | | — | | | | — | | | | 2,209 | | | | 1,289 | | | | — | | | | — | | | | — | | | | 1,289 | |
Redemption of Units | | | — | | | | (46,709 | ) | | | (2,000 | ) | | | (2,602 | ) | | | — | | | | (51,311 | ) | | | (55,910 | ) | | | — | | | | (16,914 | ) | | | — | | | | (72,824 | ) |
| | | | | | | | | | | | | | | | | | | | | | | | | | | | | | | | | | | | | | | | | | | | |
Owners’ Capital - Units, December 31, 2010 | | | — | | | | 365,451 | | | | 1,499 | | | | 72,328 | | | | — | | | | 439,278 | | | | 383,032 | | | | 428 | | | | 80,192 | | | | — | | | | 463,652 | |
| | | | | | | | | | | | | | | | | | | | | | | | | | | | | | | | | | | | | | | | | | | | |
Sale of Units | | | — | | | | 1,867 | | | | — | | | | — | | | | — | | | | 1,867 | | | | 964 | | | | — | | | | — | | | | — | | | | 964 | |
Redemption of Units | | | — | | | | (95,614 | ) | | | (1,292 | ) | | | (1,960 | ) | | | — | | | | (98,866 | ) | | | (147,347 | ) | | | — | | | | (34,437 | ) | | | — | | | | (181,784 | ) |
| | | | | | | | | | | | | | | | | | | | | | | | | | | | | | | | | | | | | | | | | | | | |
Owners’ Capital - Units, December 31, 2011 | | | — | | | | 271,704 | | | | 207 | | | | 70,368 | | | | — | | | | 342,279 | | | | 236,649 | | | | 428 | | | | 45,755 | | | | — | | | | 282,832 | |
| | | | | | | | | | | | | | | | | | | | | | | | | | | | | | | | | | | | | | | | | | | | |
| | | | | | | | | | | | | | | (1 | ) | | | | | | | | | | | | | | | | | | | (1 | ) | | | | | | | | |
Net asset value per unit at December 31, 2008 | | | | | | $ | 130.41 | | | | | | | $ | 140.04 | | | | | | | | | | | $ | 116.18 | | | | | | | $ | 131.49 | | | | | | | | | |
Change in net asset value per unit for the year ended December 31, 2009 | | | | | | | (12.84 | ) | | | | | | | (9.94 | ) | | | | | | | | | | | (6.12 | ) | | | | | | | (3.10 | ) | | | | | | | | |
| | | | | | | | | | | | | | | | | | | | | | | | | | | | | | | | | | | | | | | | | | | | |
Net asset value per unit at December 31, 2009 | | | | | | | 117.57 | | | | | | | | 130.10 | | | | | | | | | | | | 110.06 | | | | | | | | 128.39 | | | | | | | | | |
Change in net asset value per unit for the year ended December 31, 2010 | | | | | | | 17.47 | | | | | | | | 23.89 | | | | | | | | | | | | 9.77 | | | | | | | | 15.65 | | | | | | | | | |
| | | | | | | | | | | | | | | | | | | | | | | | | | | | | | | | | | | | | | | | | | | | |
Net asset value per unit at December 31, 2010 | | | | | | | 135.04 | | | | | | | | 153.99 | | | | | | | | | | | | 119.83 | | | | | | | | 144.04 | | | | | | | | | |
Change in net asset value per unit for the year ended December 31, 2011 | | | | | | | 6.09 | | | | | | | | 11.83 | | | | | | | | | | | | (15.10 | ) | | | | | | | (14.34 | ) | | | | | | | | |
| | | | | | | | | | | | | | | | | | | | | | | | | | | | | | | | | | | | | | | | | | | | |
Net asset value per unit at December 31, 2011 | | | | | | $ | 141.13 | | | | | | | $ | 165.82 | | | | | | | | | | | $ | 104.73 | | | | | | | $ | 129.70 | | | | | | | | | |
| | | | | | | | | | | | | | | | | | | | | | | | | | | | | | | | | | | | | | | | | | | | |
| (1) | Values are for both the Managing Owner and Limited Owners. |
The accompanying notes are an integral part of these financial statements.
F-22
The Series of the Frontier Fund
Statements of Cash Flows
For the Years Ended December 31, 2011, 2010 and 2009
| | | | | | | | | | | | | | | | | | | | | | | | | | | | | | | | | | | | |
| | | Frontier Diversified Series | | | Frontier Dynamic Series (1) | | | Frontier Long/Short Commodity Series | |
| | | 12/31/2011 | | | 12/31/2010 | | | 12/31/2009 | | | 12/31/2011 | | | 12/31/2010 | | | 12/31/2009 | | | 12/31/2011 | | | 12/31/2010 | | | 12/31/2009 | |
Cash Flows from Operating Activities: | | | | | | | | | | | | | | | | | | | | | | | | | | | | | | | | | | | | |
Net increase/(decrease) in capital resulting from operations | | $ | (4,382,558 | ) | | $ | 11,292,885 | | | $ | (1,306,916 | ) | | $ | (62,632 | ) | | $ | 23,721 | | | $ | (36,652 | ) | | $ | 10,519,098 | | | $ | 9,002,172 | | | $ | 23,285,650 | |
Adjustments to reconcile net increase/(decrease) in capital resulting from operations to net cash provided by (used in)operating activities: | | | | | | | | | | | | | | | | | | | | | | | | | | | | | | | | | | | | |
Change in: | | | | | | | | | | | | | | | | | | | | | | | | | | | | | | | | | | | | |
Net change in open trade equity/(deficit), at fair value | | | — | | | | — | | | | — | | | | — | | | | — | | | | 18,604 | | | | 25,934,678 | | | | (518,490 | ) | | | 11,272,253 | |
Net change in ownership allocation of U.S. Treasury Securities | | | (2,912,826 | ) | | | (6,617,820 | ) | | | (6,714,475 | ) | | | 2,810,044 | | | | 5,175 | | | | (2,705,000 | ) | | | (2,640,380 | ) | | | 1,640,941 | | | | 303,949 | |
Net change in custom time deposits | | | (6,680,291 | ) | | | (35,501,972 | ) | | | (25,376,919 | ) | | | 11,120,141 | | | | (279,244 | ) | | | (8,966,996 | ) | | | (15,719,642 | ) | | | 6,227,099 | | | | (280,966 | ) |
Net change in ownership allocation of credit default swaps | | | (80,518 | ) | | | — | | | | — | | | | 7,075 | | | | — | | | | — | | | | 12,468 | | | | — | | | | — | |
Net change in ownership allocation of certificates of depsoit | | | — | | | | — | | | | — | | | | — | | | | — | | | | — | | | | — | | | | — | | | | (1,733,099 | ) |
Net realized (gain) on swap contracts | | | 5,621,987 | | | | — | | | | — | | | | 2,157,451 | | | | — | | | | — | | | | 11,411 | | | | — | | | | — | |
Net unrealized (gain)/loss on swap contracts | | | (1,315,339 | ) | | | (416,156 | ) | | | 1,707,778 | | | | (1,317,993 | ) | | | (929,519 | ) | | | 2,247,497 | | | | (20,529 | ) | | | — | | | | — | |
Net unrealized (gain)/loss on U.S. Treasury securities | | | (23,748 | ) | | | (255,854 | ) | | | (32,581 | ) | | | 115,289 | | | | (62,532 | ) | | | (52,757 | ) | | | (24,825 | ) | | | (208,016 | ) | | | 358,065 | |
Net realized (gain)/loss on U.S. Treasury securities | | | — | | | | — | | | | — | | | | (128,823 | ) | | | — | | | | — | | | | — | | | | — | | | | — | |
(Purchases) sales of: | | | | | | | | | | | | | | | | | | | | | | | | | | | | | | | | | | | | |
Sales of swap contracts | | | 7,096,699 | | | | 58,890 | | | | 21,250 | | | | 10,123,315 | | | | — | | | | — | | | | — | | | | — | | | | — | |
(Purchases) of swap contracts | | | (45,928 | ) | | | (2,500,000 | ) | | | (10,279,667 | ) | | | (13,076 | ) | | | — | | | | (12,274,750 | ) | | | (78,248 | ) | | | — | | | | — | |
Sales of custom time deposits | | | 8,477,490 | | | | — | | | | — | | | | 4,712,701 | | | | — | | | | — | | | | 11,163,129 | | | | — | | | | — | |
(Purchases) of custom time deposits | | | — | | | | (8,262,241 | ) | | | (7,974,576 | ) | | | — | | | | (2,013,641 | ) | | | (4,572,961 | ) | | | — | | | | (4,030,695 | ) | | | (10,876,124 | ) |
Sales of certificates of deposit | | | — | | | | — | | | | — | | | | — | | | | — | | | | — | | | | — | | | | — | | | | 10,913,236 | |
Increase and/or decrease in: | | | | | | | | | | | | | | | | | | | | | | | | | | | | | | | | | | | | |
Receivable from futures commission merchants | | | — | | | | — | | | | — | | | | — | | | | — | | | | — | | | | (47,822,021 | ) | | | 23,781,708 | | | | (25,290,201 | ) |
Change in control of ownership—trading companies | | | — | | | | 157,005 | | | | — | | | | — | | | | — | | | | — | | | | 28,341,047 | | | | (8,718,487 | ) | | | — | |
Contributions to trading companies | | | — | | | | — | | | | — | | | | — | | | | — | | | | — | | | | 4,105,200 | | | | 97,830 | | | | 56,470,869 | |
Distributions from trading companies | | | — | | | | — | | | | — | | | | — | | | | — | | | | — | | | | (28,282,129 | ) | | | — | | | | (61,271,709 | ) |
Investments in unconsolidated trading companies, at fair value | | | 16,699,924 | | | | (44,134,477 | ) | | | (10,805,618 | ) | | | — | | | | — | | | | — | | | | 28,882,460 | | | | (31,058,824 | ) | | | (1,905,624 | ) |
Prepaid service fees—Class 1 | | | 244,867 | | | | 16,493 | | | | (424,337 | ) | | | 6,542 | | | | (6,362 | ) | | | (180 | ) | | | (48,614 | ) | | | 12,992 | | | | 205,391 | |
Interest receivable | | | (42,984 | ) | | | (92,242 | ) | | | (93,651 | ) | | | 38,166 | | | | (146 | ) | | | (38,020 | ) | | | (38,036 | ) | | | 21,471 | | | | 2,341 | |
Receivable from related parties | | | 73,638 | | | | 189,820 | | | | (279,820 | ) | | | — | | | | 30 | | | | (30 | ) | | | (4,071 | ) | | | — | | | | 9,162 | |
Other assets | | | (10,069 | ) | | | (60 | ) | | | — | | | | 12 | | | | (12 | ) | | | — | | | | (9,380 | ) | | | (212 | ) | | | 11,333 | |
Inter-series payables/receivables, at fair value | | | — | | | | (10,962,073 | ) | | | 10,962,073 | | | | (28,320,283 | ) | | | 644,167 | | | | 27,676,116 | | | | — | | | | — | | | | — | |
Incentive fees payable to Managing Owner | | | (931,069 | ) | | | 1,320,668 | | | | 132,434 | | | | — | | | | — | | | | — | | | | (1,473,651 | ) | | | 1,322,436 | | | | 239,089 | |
Management fees payable to Managing Owner | | | 40,474 | | | | 111,533 | | | | 28,225 | | | | — | | | | — | | | | — | | | | (15,361 | ) | | | 155,692 | | | | 122,457 | |
Interest payable to Managing Owner | | | 954 | | | | 40,782 | | | | 12,179 | | | | (10,064 | ) | | | 6,016 | | | | 4,048 | | | | 9,470 | | | | 11,205 | | | | 9,610 | |
Trading fees payable to Managing Owner | | | (41,281 | ) | | | 236,534 | | | | 73,768 | | | | (59,936 | ) | | | 31,345 | | | | 28,591 | | | | 38,947 | | | | 29,219 | | | | 12,781 | |
Trailing service fees payable to Managing Owner | | | 27,974 | | | | 48,296 | | | | 607 | | | | (726 | ) | | | 726 | | | | — | | | | (46,766 | ) | | | 6,179 | | | | 58,188 | |
Payables to related parties | | | (57,770 | ) | | | 57,770 | | | | — | | | | (6,585 | ) | | | 6,585 | | | | — | | | | (8,528 | ) | | | (26,996 | ) | | | (214,285 | ) |
Other liabilities | | | (12,755 | ) | | | 10,957 | | | | 3,972 | | | | (53 | ) | | | (1,231 | ) | | | 1,284 | | | | (10,961 | ) | | | 8,000 | | | | (13,211 | ) |
| | | | | | | | | | | | | | | | | | | | | | | | | | | | | | | | | | | | |
Net cash provided by (used in) operating activities | | | 21,746,871 | | | | (95,201,262 | ) | | | (50,346,274 | ) | | | 1,170,565 | | | | (2,574,922 | ) | | | 1,328,794 | | | | 12,774,766 | | | | (2,244,776 | ) | | | 1,689,155 | |
| | | | | | | | | | | | | | | | | | | | | | | | | | | | | | | | | | | | |
Cash Flows from Financing Activities: | | | | | | | | | | | | | | | | | | | | | | | | | | | | | | | | | | | | |
Proceeds from sale of units | | | 44,490,694 | | | | 100,025,158 | | | | 57,792,453 | | | | 206,700 | | | | 993,636 | | | | 933,569 | | | | 41,710,300 | | | | 21,784,520 | | | | 18,982,722 | |
Payment for redemption of units | | | (65,630,504 | ) | | | (8,295,195 | ) | | | (169,418 | ) | | | (1,776,990 | ) | | | (281,352 | ) | | | — | | | | (52,392,651 | ) | | | (25,370,305 | ) | | | (16,388,436 | ) |
Pending owner additions | | | (379,830 | ) | | | (838,323 | ) | | | 1,461,241 | | | | (70,000 | ) | | | 70,000 | | | | — | | | | (85,001 | ) | | | 125,967 | | | | (129,636 | ) |
Owner redemptions payable | | | 102,096 | | | | 219,042 | | | �� | — | | | | (28,323 | ) | | | 28,323 | | | | — | | | | (76,477 | ) | | | 160,970 | | | | 212 | |
| | | | | | | | | | | | | | | | | | | | | | | | | | | | | | | | | | | | |
Net cash provided by (used in) financing activities | | | (21,417,544 | ) | | | 91,110,682 | | | | 59,084,276 | | | | (1,668,613 | ) | | | 810,607 | | | | 933,569 | | | | (10,843,829 | ) | | | (3,298,848 | ) | | | 2,464,862 | |
| | | | | | | | | | | | | | | | | | | | | | | | | | | | | | | | | | | | |
Net increase (decrease) in cash and cash equivalents | | | 329,327 | | | | (4,090,580 | ) | | | 8,738,002 | | | | (498,048 | ) | | | (1,764,315 | ) | | | 2,262,363 | | | | 1,930,937 | | | | (5,543,624 | ) | | | 4,154,017 | |
Cash and cash equivalents, beginning of year or period | | | 4,647,422 | | | | 8,738,002 | | | | — | | | | 498,048 | | | | 2,262,363 | | | | — | | | | 1,114,912 | | | | 6,658,536 | | | | 2,504,519 | |
| | | | | | | | | | | | | | | | | | | | | | | | | | | | | | | | | | | | |
Cash and cash equivalents, end of year or period | | $ | 4,976,749 | | | $ | 4,647,422 | | | $ | 8,738,002 | | | $ | — | | | $ | 498,048 | | | $ | 2,262,363 | | | $ | 3,045,849 | | | $ | 1,114,912 | | | $ | 6,658,536 | |
| | | | | | | | | | | | | | | | | | | | | | | | | | | | | | | | | | | | |
| (1) | The Frontier Dynamic Series ceased trading operations on July 15, 2011 and redeemed all existing Units. The Series remains open. |
The accompanying notes are an integral part of these financial statements.
F-23
The Series of the Frontier Fund
Statements of Cash Flows
For the Years Ended December 31, 2011, 2010 and 2009
| | | | | | | | | | | | | | | | | | | | | | | | | | | | | | | | | | | | |
| | | Frontier Master Series | | | Balanced Series | | | Berkeley/Graham/Tiverton Series (1) | |
| | | 12/31/2011 | | | 12/31/2010 | | | 12/31/2009 | | | 12/31/2011 | | | 12/31/2010 | | | 12/31/2009 | | | 12/31/2011 | | | 12/31/2010 | | | 12/31/2009 | |
Cash Flows from Operating Activities: | | | | | | | | | | | | | | | | | | | | | | | | | | | | | | | | | | | | |
Net increase/(decrease) in capital resulting from operations | | $ | (1,047,186 | ) | | $ | 6,019,860 | | | $ | (906,943 | ) | | $ | (18,408,475 | ) | | $ | 56,185,723 | | | $ | (19,589,333 | ) | | $ | (9,268,132 | ) | | $ | 5,805,146 | | | $ | (5,487,584 | ) |
Adjustments to reconcile net increase/(decrease) in capital resulting from operations to net cash provided by (used in)operating activities: | | | | | | | | | | | | | | | | | | | | | | | | | | | | | | | | | | | | |
Change in: | | | | | | | | | | | | | | | | | | | | | | | | | | | | | | | | | | | | |
Net change in open trade equity, at fair value | | | (792,372 | ) | | | — | | | | — | | | | 16,312,122 | | | | (15,156,564 | ) | | | 12,215,881 | | | | — | | | | — | | | | — | |
Net change in ownership allocation of U.S. Treasury Securities | | | (3,683,954 | ) | | | (506,120 | ) | | | (2,792,319 | ) | | | (1,931,274 | ) | | | 2,431,689 | | | | 7,002,882 | | | | 2,680,199 | | | | 2,633,748 | | | | 744,334 | |
Net change in custom time deposits | | | (18,343,873 | ) | | | (1,397,123 | ) | | | (8,817,861 | ) | | | (7,080,628 | ) | | | 6,455,088 | | | | 11,599,532 | | | | 6,356,295 | | | | 11,105,118 | | | | 1,922,789 | |
Net change in ownership allocation of credit default swaps | | | (44,941 | ) | | | — | | | | — | | | | 34,673 | | | | — | | | | — | | | | 33,510 | | | | — | | | | — | |
Net change in ownership allocation of certificates of deposit | | | — | | | | — | | | | — | | | | — | | | | — | | | | 5,605,836 | | | | — | | | | — | | | | (1,786,344 | ) |
Net change in ownership allocation of total return swaps | | | — | | | | — | | | | — | | | | 2,955,994 | | | | — | | | | — | | | | — | | | | — | | | | — | |
Net unrealized (gain)/loss on swap contracts | | | 1,607,804 | | | | (3,474,611 | ) | | | 1,864,032 | | | | 19,161,366 | | | | (8,790,927 | ) | | | 12,051,821 | | | | (2,447 | ) | | | — | | | | — | |
Net realized (gain)/loss on swap contracts | | | (2,061,339 | ) | | | — | | | | — | | | | (4,529,039 | ) | | | — | | | | — | | | | 6,252 | | | | — | | | | — | |
Net unrealized (gain)/loss on U.S. Treasury securities | | | (5,038 | ) | | | (192,745 | ) | | | (52,370 | ) | | | 16,555 | | | | (595,392 | ) | | | 2,354,829 | | | | (2,768 | ) | | | (144,737 | ) | | | 467,310 | |
Net realized (gain)/loss on investment in Berkeley Quantitative Colorado Fund LLC | | | — | | | | — | | | | — | | | | — | | | | — | | | | — | | | | 135,775 | | | | — | | | | — | |
Net unrealized (gain)/loss on investment in Berkeley Quantitative Colorado Fund LLC | | | — | | | | — | | | | — | | | | — | | | | — | | | | — | | | | 2,238,082 | | | | (157,099 | ) | | | — | |
(Purchases) sales of: | | | | | | | | | | | | | | | | | | | | | | | | | | | | | | | | | | | | |
Sales of swap contracts | | | 26,826,316 | | | | 7,694,189 | | | | 224,521 | | | | 27,897,084 | | | | — | | | | — | | | | — | | | | — | | | | — | |
(Purchases) of swap contracts | | | (142,819 | ) | | | (14,489,668 | ) | | | (18,060,709 | ) | | | (19,527,925 | ) | | | — | | | | — | | | | (71,712 | ) | | | — | | | | — | |
Sales of custom time deposits | | | 5,505,655 | | | | — | | | | — | | | | 28,695,160 | | | | — | | | | — | | | | 13,639,642 | | | | — | | | | — | |
(Purchases) of custom time deposits | | | — | | | | (4,603,586 | ) | | | (5,243,771 | ) | | | ��� | | | | (16,960,383 | ) | | | (27,740,904 | ) | | | — | | | | (3,849,159 | ) | | | (13,330,504 | ) |
Sales of certificates of deposit | | | — | | | | | | | | — | | | | — | | | | — | | | | 34,060,541 | | | | — | | | | — | | | | 12,854,431 | |
Sale of Berkeley Quantitative Colorado Fund LLC | | | — | | | | — | | | | — | | | | — | | | | — | | | | — | | | | 1,512,397 | | | | — | | | | — | |
Purchase of Berkeley Quantitative Colorado Fund LLC | | | — | | | | | | | | — | | | | — | | | | — | | | | — | | | | — | | | | (10,000,000 | ) | | | — | |
Increase and/or decrease in: | | | | | | | | | | | | | | | | | | | | | | | | | | | | | | | | | | | | |
Receivable from futures commission merchants | | | (5,107,749 | ) | | | — | | | | — | | | | 10,662,500 | | | | (14,237,495 | ) | | | (34,145,915 | ) | | | — | | | | — | | | | 5,110,183 | |
Change in control of ownership—trading companies | | | — | | | | — | | | | — | | | | 17,035,844 | | | | (10,641,521 | ) | | | 350,058 | | | | — | | | | (14,996,045 | ) | | | (4,388,979 | ) |
Investments in unconsolidated trading companies, at fair value | | | 11,203,744 | | | | (11,021,651 | ) | | | (4,900,007 | ) | | | 23,816,569 | | | | (26,562,849 | ) | | | (10,836,114 | ) | | | 4,431,824 | | | | 2,982,381 | | | | (1,193,609 | ) |
Contributions to trading companies | | | 115,000 | | | | — | | | | — | | | | 136,058,408 | | | | 47,689,690 | | | | 22,053,200 | | | | — | | | | 16,000,000 | | | | 4,418,397 | |
Distributions from trading companies | | | (28,854 | ) | | | — | | | | — | | | | (157,826,198 | ) | | | (24,463,479 | ) | | | (12,642,418 | ) | | | — | | | | (2,896,500 | ) | | | (820,772 | ) |
Inter-series payables/receivables, at fair value | | | — | | | | (18,184,135 | ) | | | 18,184,135 | | | | — | | | | 27,952,024 | | | | (54,409,622 | ) | | | — | | | | — | | | | — | |
Prepaid service fees—Class 1 | | | 154,010 | | | | (37,436 | ) | | | (167,524 | ) | | | 41,137,058 | | | | 487,872 | | | | 305,556 | | | | 16 | | | | 64,993 | | | | 115,630 | |
Interest receivable | | | (51,616 | ) | | | (8,877 | ) | | | (39,485 | ) | | | (31,251 | ) | | | 31,827 | | | | 100,228 | | | | 35,778 | | | | 36,182 | | | | 8,562 | |
Receivable from related parties | | | — | | | | 179,715 | | | | (179,715 | ) | | | — | | | | 296,789 | | | | (83,234 | ) | | | — | | | | 200 | | | | (200 | ) |
Other assets | | | (6,147 | ) | | | (15 | ) | | | — | | | | (29,414 | ) | | | (18,859 | ) | | | 55,234 | | | | (7,777 | ) | | | (136 | ) | | | — | |
Incentive fees payable to Managing Owner | | | (229,686 | ) | | | 229,686 | | | | — | | | | (1,493,745 | ) | | | 1,382,180 | | | | (550,987 | ) | | | (270,557 | ) | | | 270,557 | | | | (488,067 | ) |
Management fees payable to Managing Owner | | | 9,010 | | | | 78,602 | | | | 29,929 | | | | 127,380 | | | | (94,591 | ) | | | 192,338 | | | | (51,055 | ) | | | 58,444 | | | | 68,346 | |
Interest payable to Managing Owner | | | 10,074 | | | | 7,240 | | | | 6,094 | | | | 248,821 | | | | 74,328 | | | | 11,503 | | | | (51,479 | ) | | | 61,387 | | | | 41,497 | |
Trading fees payable to Managing Owner | | | (26,563 | ) | | | 90,865 | | | | 40,976 | | | | 105,311 | | | | (32,230 | ) | | | 81,998 | | | | (4,502 | ) | | | 12,630 | | | | 11,750 | |
Trailing service fees payable to Managing Owner | | | 20,017 | | | | 20,581 | | | | 1,313 | | | | 239,055 | | | | 110,726 | | | | 25,270 | | | | (61,291 | ) | | | 62,266 | | | | 62,406 | |
Payables to related parties | | | (113,855 | ) | | | 113,911 | | | | — | | | | (65,107 | ) | | | (202,485 | ) | | | 255,549 | | | | (9,786 | ) | | | (235,882 | ) | | | 218,818 | |
Other liabilities | | | (5,421 | ) | | | 4,341 | | | | 1,936 | | | | 5,308 | | | | (2,560 | ) | | | (133,953 | ) | | | 420 | | | | 473 | | | | (13,570 | ) |
| | | | | | | | | | | | | | | | | | | | | | | | | | | | | | | | | | | | |
Net cash provided by (used in) operating activities | | | 13,760,217 | | | | (39,476,977 | ) | | | (20,807,768 | ) | | | 113,586,152 | | | | 25,338,601 | | | | (51,810,224 | ) | | | 21,268,684 | | | | 6,813,967 | | | | (1,465,176 | ) |
| | | | | | | | | | | | | | | | | | | | | | | | | | | | | | | | | | | | |
Cash Flows from Financing Activities: | | | | | | | | | | | | | | | | | | | | | | | | | | | | | | | | | | | | |
Proceeds from sale of units | | | 12,197,503 | | | | 43,068,005 | | | | 24,199,026 | | | | 2,762,993 | | | | 4,186,954 | | | | 108,364,108 | | | | 73,374 | | | | 124,546 | | | | 14,949,919 | |
Payment for redemption of units | | | (24,628,784 | ) | | | (6,099,322 | ) | | | (4,896 | ) | | | (111,984,294 | ) | | | (45,997,154 | ) | | | (45,880,314 | ) | | | (21,420,598 | ) | | | (13,170,179 | ) | | | (9,201,430 | ) |
Pending owner additions | | | (123,284 | ) | | | (2,036,469 | ) | | | 2,182,469 | | | | 45,208 | | | | — | | | | (1,966,385 | ) | | | 3,396 | | | | — | | | | (136,277 | ) |
Owner redemptions payable | | | (178,226 | ) | | | 183,222 | | | | — | | | | (27,871 | ) | | | (555,035 | ) | | | 379,944 | | | | 86,371 | | | | 96,181 | | | | — | |
| | | | | | | | | | | | | | | | | | | | | | | | | | | | | | | | | | | | |
Net cash provided by (used in) financing activities | | | (12,732,791 | ) | | | 35,115,436 | | | | 26,376,599 | | | | (109,203,964 | ) | | | (42,365,235 | ) | | | 60,897,353 | | | | (21,257,457 | ) | | | (12,949,452 | ) | | | 5,612,212 | |
| | | | | | | | | | | | | | | | | | | | | | | | | | | | | | | | | | | | |
Net increase (decrease) in cash and cash equivalents | | | 1,027,426 | | | | (4,361,541 | ) | | | 5,568,831 | | | | 4,382,188 | | | | (17,026,634 | ) | | | 9,087,129 | | | | 11,227 | | | | (6,135,485 | ) | | | 4,147,036 | |
Cash and cash equivalents, beginning of year or period | | | 1,207,290 | | | | 5,568,831 | | | | — | | | | 5,375,950 | | | | 22,402,584 | | | | 13,315,455 | | | | 1,341,151 | | | | 7,476,636 | | | | 3,329,600 | |
| | | | | | | | | | | | | | | | | | | | | | | | | | | | | | | | | | | | |
Cash and cash equivalents, end of year or period | | $ | 2,234,716 | | | $ | 1,207,290 | | | $ | 5,568,831 | | | $ | 9,758,138 | | | $ | 5,375,950 | | | $ | 22,402,584 | | | $ | 1,352,378 | | | $ | 1,341,151 | | | $ | 7,476,636 | |
| | | | | | | | | | | | | | | | | | | | | | | | | | | | | | | | | | | | |
| (1) | Formerly the Campbell/Graham/Tiverton Series. |
The accompanying notes are an integral part of these financial statements.
F-24
The Series of the Frontier Fund
Statements of Cash Flows
For the Years Ended December 31, 2011, 2010 and 2009
| | | | | | | | | | | | | | | | | | | | | | | | | | | | | | | | | | | | |
| | | Currency Series | | | Long Only Commodity Series (1) | | | Managed Futures Index Series (1) | |
| | | 12/31/2011 | | | 12/31/2010 | | | 12/31/2009 | | | 12/31/2011 | | | 12/31/2010 | | | 12/31/2009 | | | 12/31/2011 | | | 12/31/2010 | | | 12/31/2009 | |
Cash Flows from Operating Activities: | | | | | | | | | | | | | | | | | | | | | | | | | | | | | | | | | | | | |
Net increase/(decrease) in capital resulting from operations | | $ | (620,937 | ) | | $ | 169,751 | | | $ | (2,572,376 | ) | | $ | (79,119 | ) | | $ | 467,081 | | | $ | 793,182 | | | $ | (358,277 | ) | | $ | 304,074 | | | $ | (562,279 | ) |
Adjustments to reconcile net increase/(decrease) in capital resulting from operations to net cash provided by (used in)operating activities: | | | | | | | | | | | | | | | | | | | | | | | | | | | | | | | | | | | | |
Change in: | | | | | | | | | | | | | | | | | | | | | | | | | | | | | | | | | | | | |
Net change in open trade equity, at fair value | | | 27,098 | | | | (7,634 | ) | | | (6,654 | ) | | | — | | | | — | | | | — | | | | — | | | | — | | | | — | |
Net change in ownership allocation of U.S. Treasury Securities | | | 1,679,073 | | | | 556,890 | | | | 832,583 | | | | 486,861 | | | | 98,238 | | | | (47,468 | ) | | | 597,912 | | | | (122,708 | ) | | | (65,671 | ) |
Net change in custom time deposits | | | 6,056,239 | | | | 2,239,528 | | | | 2,983,995 | | | | 2,113,208 | | | | 342,083 | | | | (385,575 | ) | | | 2,648,080 | | | | (906,594 | ) | | | (205,014 | ) |
Net change in ownership allocation of credit default swaps | | | 15,835 | | | | — | | | | — | | | | 323,021 | | | | — | | | | — | | | | 2,842 | | | | — | | | | — | |
Net change in ownership allocation of certificates of deposit | | | — | | | | — | | | | 121,328 | | | | — | | | | — | | | | 125,139 | | | | — | | | | | | | | (37,925 | ) |
Net unrealized (gain)/loss on swap contracts | | | (6,327,629 | ) | | | (675,809 | ) | | | 4,129,162 | | | | — | | | | — | | | | — | | | | — | | | | — | | | | — | |
Net realized (gain)/loss on swap contracts | | | 8,302,467 | | | | — | | | | — | | | | 50,501 | | | | (509,662 | ) | | | (883,900 | ) | | | 969 | | | | — | | | | — | |
Net unrealized (gain)/loss on U.S. Treasury securities | | | 4,083 | | | | (52,062 | ) | | | 165,246 | | | | 48,272 | | | | (12,440 | ) | | | 24,171 | | | | 6,967 | | | | 4,201 | | | | 22,461 | |
Net realized (gain)/loss on U.S. Treasury securities | | | — | | | | — | | | | — | | | | (49,592 | ) | | | — | | | | — | | | | (7,179 | ) | | | — | | | | — | |
Net increase from payments by managing owner | | | (390,589 | ) | | | — | | | | — | | | | — | | | | — | | | | — | | | | — | | | | — | | | | — | |
(Purchases) sales of: | | | | | | | | | | | | | | | | | | | | | | | | | | | | | | | | | | | | |
Sales of swap contracts | | | 5,043,086 | | | | — | | | | — | | | | 1,313,361 | | | | 1,498,091 | | | | 2,985,691 | | | | — | | | | — | | | | — | |
(Purchases) of swap contracts | | | (23,489 | ) | | | — | | | | — | | | | (896,087 | ) | | | (1,194,834 | ) | | | (1,849,628 | ) | | | (3,811 | ) | | | — | | | | — | |
Sales of custom time deposits | | | 3,836,498 | | | | — | | | | — | | | | 635,752 | | | | — | | | | — | | | | 735,886 | | | | — | | | | — | |
(Purchases) of custom time deposits | | | — | | | | (1,188,104 | ) | | | (3,748,697 | ) | | | — | | | | (266,848 | ) | | | (618,522 | ) | | | — | | | | (108,662 | ) | | | (715,160 | ) |
Sales of certificates of deposit | | | — | | | | — | | | | 3,503,196 | | | | — | | | | — | | | | 440,409 | | | | — | | | | — | | | | 488,020 | |
Increase and/or decrease in: | | | | | | | | | | | | | | | | | | | | | | | | | | | | | | | | | | | | |
Receivable from futures commission merchants | | | 678,208 | | | | (188,725 | ) | | | 181,444 | | | | — | | | | — | | | | — | | | | — | | | | — | | | | — | |
Investments in unconsolidated trading companies, at fair value | | | (2,352,121 | ) | | | — | | | | — | | | | — | | | | — | | | | — | | | | 992,837 | | | | (429,423 | ) | | | 110,557 | |
Prepaid service fees—Class 1 | | | — | | | | 2,852 | | | | 31,122 | | | | — | | | | 1,065 | | | | 10,370 | | | | — | | | | 3,350 | | | | 5,498 | |
Interest receivable | | | 22,914 | | | | 7,474 | | | | 11,147 | | | | 6,627 | | | | 1,303 | | | | (745 | ) | | | 8,157 | | | | (1,513 | ) | | | (926 | ) |
Receivable from related parties | | | — | | | | — | | | | 444 | | | | (70 | ) | | | — | | | | 63,133 | | | | 1,368 | | | | (1,342 | ) | | | (98 | ) |
Other assets | | | (469 | ) | | | (28 | ) | | | 12,627 | | | | (26 | ) | | | (61 | ) | | | 95 | | | | (180 | ) | | | (3 | ) | | | 1,220 | |
Inter-series payables/receivables, at fair value | | | (13,770,271 | ) | | | 550,017 | | | | (2,412,702 | ) | | | — | | | | — | | | | — | | | | — | | | | — | | | | — | |
Management fees payable to Managing Owner | | | (13,860 | ) | | | 5,323 | | | | 6,277 | | | | (4,532 | ) | | | (257 | ) | | | 724 | | | | (6,641 | ) | | | 3,684 | | | | 2,003 | |
Interest payable to Managing Owner | | | (18,698 | ) | | | 10,108 | | | | 9,563 | | | | (1,308 | ) | | | (153 | ) | | | 420 | | | | (1,079 | ) | | | 807 | | | | 87 | |
Trading fees payable to Managing Owner | | | (5,682 | ) | | | 2,839 | | | | 3,531 | | | | (1,115 | ) | | | (154 | ) | | | 239 | | | | (687 | ) | | | 518 | | | | 360 | |
Trailing service fees payable to Managing Owner | | | (4,988 | ) | | | (2,356 | ) | | | 12,394 | | | | (4,927 | ) | | | 298 | | | | 1,358 | | | | (1,894 | ) | | | 255 | | | | 486 | |
Payables to related parties | | | (5,246 | ) | | | (4,706 | ) | | | 7,477 | | | | 9,225 | | | | (62 | ) | | | 152 | | | | 9,534 | | | | (14,235 | ) | | | 13,889 | |
Other liabilities | | | (9 | ) | | | (312 | ) | | | 436 | | | | (8 | ) | | | (188 | ) | | | (84 | ) | | | 19 | | | | (177 | ) | | | 361 | |
| | | | | | | | | | | | | | | | | | | | | | | | | | | | | | | | | | | | |
Net cash provided by (used in) operating activities | | | 2,131,513 | | | | 1,425,046 | | | | 3,271,543 | | | | 3,950,044 | | | | 423,500 | | | | 659,161 | | | | 4,624,823 | | | | (1,267,768 | ) | | | (942,131 | ) |
| | | | | | | | | | | | | | | | | | | | | | | | | | | | | | | | | | | | |
Cash Flows from Financing Activities: | | | | | | | | | | | | | | | | | | | | | | | | | | | | | | | | | | | | |
Proceeds from sale of units | | | 58,429 | | | | 65,957 | | | | 652,368 | | | | 1,636,562 | | | | 935 | | | | 496,147 | | | | 375,118 | | | | 2,000,000 | | | | 1,979,837 | |
Payment for redemption of units | | | (2,257,535 | ) | | | (3,304,436 | ) | | | (2,718,649 | ) | | | (5,750,674 | ) | | | (941,110 | ) | | | (665,477 | ) | | | (5,177,304 | ) | | | (916,820 | ) | | | (1,047,400 | ) |
Pending owner additions | | | 4,509 | | | | — | | | | (10,000 | ) | | | — | | | | — | | | | — | | | | (1,440 | ) | | | 1,440 | | | | (30,000 | ) |
Redemptions payable | | | (29,526 | ) | | | 45,220 | | | | — | | | | 1,441,899 | | | | — | | | | — | | | | 1,224,569 | | | | 794 | | | | — | |
| | | | | | | | | | | | | | | | | | | | | | | | | | | | | | | | | | | | |
Net cash provided by (used in) financing activities | | | (2,224,123 | ) | | | (3,193,259 | ) | | | (2,076,281 | ) | | | (2,672,213 | ) | | | (940,175 | ) | | | (169,330 | ) | | | (3,579,057 | ) | | | 1,085,414 | | | | 902,437 | |
| | | | | | | | | | | | | | | | | | | | | | | | | | | | | | | | | | | | |
Net increase (decrease) in cash and cash equivalents | | | (92,610 | ) | | | (1,768,213 | ) | | | 1,195,262 | | | | 1,277,831 | | | | (516,675 | ) | | | 489,831 | | | | 1,045,766 | | | | (182,354 | ) | | | (39,694 | ) |
Cash and cash equivalents, beginning of year or period | | | 275,485 | | | | 2,043,698 | | | | 848,436 | | | | 175,096 | | | | 691,771 | | | | 201,940 | | | | 196,091 | | | | 378,445 | | | | 418,139 | |
| | | | | | | | | | | | | | | | | | | | | | | | | | | | | | | | | | | | |
Cash and cash equivalents, end of year or period | | $ | 182,875 | | | $ | 275,485 | | | $ | 2,043,698 | | | $ | 1,452,927 | | | $ | 175,096 | | | $ | 691,771 | | | $ | 1,241,857 | | | $ | 196,091 | | | $ | 378,445 | |
| | | | | | | | | | | | | | | | | | | | | | | | | | | | | | | | | | | | |
| (1) | The Long Only Commodity Series and Managed Futures Index Series ceased trading operations on December 21, 2011 and redeemed all existing Units. Both Series remain open. |
The accompanying notes are an integral part of these financial statements.
F-25
The Series of the Frontier Fund
Statements of Cash Flows
For the Years Ended December 31, 2011, 2010 and 2009
| | | | | | | | | | | | | | | | | | | | | | | | |
| | | Winton Series | | | Winton/Graham Series | |
| | | 12/31/2011 | | | 12/31/2010 | | | 12/31/2009 | | | 12/31/2011 | | | 12/31/2010 | | | 12/31/2009 | |
Cash Flows from Operating Activities: | | | | | | | | | | | | | | | | | | | | | | | | |
Net increase/(decrease) in capital resulting from operations | | $ | 2,726,633 | | | $ | 8,504,901 | | | $ | (10,752,172 | ) | | $ | (4,969,498 | ) | | $ | 7,907,840 | | | $ | 552,475 | |
Adjustments to reconcile net increase/(decrease) in capital resulting from operations to net cash provided by (used in) operating activities: | | | | | | | | | | | | | | | | | | | | | | | | |
Change in: | | | | | | | | | | | | | | | | | | | | | | | | |
Net change in open trade equity, at fair value | | | — | | | | — | | | | 2,158,369 | | | | 1,427,138 | | | | (616,949 | ) | | | (810,189 | ) |
Net change in ownership allocation of U.S. Treasury Securities | | | 196,565 | | | | (42,915 | ) | | | 3,663,697 | | | | 3,201,951 | | | | 478,631 | | | | 287,793 | |
Net change in custom time deposits | | | (2,508,040 | ) | | | (2,803,095 | ) | | | 4,403,764 | | | | 8,934,476 | | | | 1,250,739 | | | | (1,954,820 | ) |
Net change in ownership allocation of credit default swaps | | | 18,791 | | | | — | | | | — | | | | 26,895 | | | | — | | | | — | |
Net change in ownership allocation of certificates of deposit | | | — | | | | — | | | | (1,780,051 | ) | | | — | | | | — | | | | (391,105 | ) |
Net unrealized (gain)/loss on swap contracts | | | (7,291 | ) | | | — | | | | — | | | | 944 | | | | — | | | | — | |
Net realized (gain)/loss on swap contracts | | | 9,969 | | | | — | | | | — | | | | 5,791 | | | | — | | | | | |
Net unrealized (gain) loss on U.S. Treasury Securities, at fair value | | | 2,017 | | | | (163,733 | ) | | | 434,210 | | | | 3,545 | | | | (159,470 | ) | | | 367,408 | |
(Purchases) sale of: | | | | | | | | | | | | | | | | | | | | | | | | |
(Purchases) of swap contracts | | | (83,357 | ) | | | — | | | | — | | | | (64,011 | ) | | | — | | | | — | |
Sales of custom time deposits | | | 12,335,669 | | | | — | | | | 8,577,280 | | | | 13,486,442 | | | | — | | | | 5,320,983 | |
(Purchases) of custom time deposits | | | — | | | | (3,981,330 | ) | | | (12,043,170 | ) | | | — | | | | (4,735,352 | ) | | | (13,135,610 | ) |
Sales of certificates of deposit | | | — | | | | — | | | | 14,073,176 | | | | — | | | | — | | | | 8,666,991 | |
Increase and/or decrease in: | | | | | | | | | | | | | | | | | | | | | | | | |
Receivable from futures commission merchants | | | — | | | | — | | | | 9,653,595 | | | | 11,090,076 | | | | 1,920,174 | | | | (13,010,250 | ) |
Change in control of ownership of trading companies | | | — | | | | — | | | | (13,830,805 | ) | | | (5,222,639 | ) | | | — | | | | 2,258,238 | |
Contributions to trading companies | | | — | | | | — | | | | 15,598,979 | | | | 3,981,000 | | | | 5,800,968 | | | | 8,100,000 | |
Distributions from trading companies | | | — | | | | — | | | | (2,389,350 | ) | | | (3,968,000 | ) | | | (8,907,979 | ) | | | (7,563,092 | ) |
Investments in unconsolidated trading companies, at fair value | | | 1,490,991 | | | | 187,005 | | | | (6,409,912 | ) | | | (5,090,173 | ) | | | (125,872 | ) | | | 461,573 | |
Prepaid service fees—Class 1 | | | — | | | | — | | | | 89,142 | | | | — | | | | 105,448 | | | | 260,260 | |
Interest receivable | | | 1,337 | | | | (1,003 | ) | | | 47,584 | | | | 43,075 | | | | 6,068 | | | | 2,921 | |
Receivable from related parties | | | — | | | | — | | | | 64,844 | | | | — | | | | 470 | | | | 19,530 | |
Other assets | | | (6,773 | ) | | | (117 | ) | | | — | | | | (6,409 | ) | | | (111 | ) | | | — | |
Incentive fees payable to Managing Owner | | | (467,341 | ) | | | 467,341 | | | | — | | | | (623,629 | ) | | | 623,629 | | | | (76,168 | ) |
Management fees payable to Managing Owner | | | (32,116 | ) | | | 59,416 | | | | 45,414 | | | | (67,825 | ) | | | 88,752 | | | | 67,364 | |
Interest payable to Managing Owner | | | (17,776 | ) | | | 50,929 | | | | 39,027 | | | | (45,025 | ) | | | 43,126 | | | | 39,066 | |
Trading fees payable to Managing Owner | | | 6,057 | | | | 11,974 | | | | 8,809 | | | | (4,700 | ) | | | 12,047 | | | | 9,876 | |
Trailing service fees payable to Managing Owner | | | (21,041 | ) | | | 24,219 | | | | 57,290 | | | | (46,557 | ) | | | 50,986 | | | | 47,078 | |
Payables to related parties | | | (25,066 | ) | | | (147,171 | ) | | | 146,959 | | | | (11,953 | ) | | | 8,509 | | | | (1,324 | ) |
Other liabilities | | | 719 | | | | (132 | ) | | | (35,068 | ) | | | 1,242 | | | | 98 | | | | (7,278 | ) |
| | | | | | | | | | | | | | | | | | | | | | | | |
Net cash provided by (used in) operating activities | | | 13,619,947 | | | | 2,166,289 | | | | 11,821,611 | | | | 22,082,156 | | | | 3,751,752 | | | | (10,488,280 | ) |
| | | | | | | | | | | | | | | | | | | | | | | | |
Cash Flows from Financing Activities: | | | | | | | | | | | | | | | | | | | | | | | | |
Proceeds from sale of units | | | 256,132 | | | | 277,520 | | | | 487,976 | | | | 111,245 | | | | 143,516 | | | | 20,567,523 | |
Payment for redemption of units | | | (13,654,078 | ) | | | (6,465,163 | ) | | | (9,427,644 | ) | | | (22,349,216 | ) | | | (8,587,168 | ) | | | (7,276,754 | ) |
Pending owner additions | | | 18,811 | | | | — | | | | — | | | | 5,763 | | | | — | | | | (710,128 | ) |
Owner redemptions payable | | | 1,836 | | | | 8,782 | | | | — | | | | (46,387 | ) | | | 61,838 | | | | — | |
| | | | | | | | | | | | | | | | | | | | | | | | |
Net cash provided by (used in) financing activities | | | (13,377,299 | ) | | | (6,178,861 | ) | | | (8,939,668 | ) | | | (22,278,595 | ) | | | (8,381,814 | ) | | | 12,580,641 | |
| | | | | | | | | | | | | | | | | | | | | | | | |
Net Increase (Decrease) in cash and cash equivalents | | | 242,648 | | | | (4,012,572 | ) | | | 2,881,943 | | | | (196,439 | ) | | | (4,630,062 | ) | | | 2,092,361 | |
Cash and cash equivalents, beginning of year or period | | | 1,808,624 | | | | 5,821,196 | | | | 2,939,253 | | | | 1,352,481 | | | | 5,982,543 | | | | 3,890,182 | |
| | | | | | | | | | | | | | | | | | | | | | | | |
Cash and cash equivalents, end of year or period | | $ | 2,051,272 | | | $ | 1,808,624 | | | $ | 5,821,196 | | | $ | 1,156,042 | | | $ | 1,352,481 | | | $ | 5,982,543 | |
| | | | | | | | | | | | | | | | | | | | | | | | |
The accompanying notes are an integral part of these financial statements.
F-26
The Series of the Frontier Fund
Notes to Financial Statements
1. Organization and Purpose
The Frontier Fund, which is referred to in this report as the Trust, was formed on August 8, 2003, as a Delaware statutory trust. Please refer to the consolidated financial statements of the Trust included within this annual report. The Trust is a multi-advisor commodity pool, as described in Commodity Futures Trading Commission (the “CFTC”) Regulation § 4.10(d)(2). The Trust has authority to issue separate series, or each, a Series, of units of beneficial interest (the “Units”) pursuant to the requirements of the Delaware Statutory Trust Act, as amended (the “Trust Act”). The assets of each Series are valued and accounted for separately from the assets of other Series. The Trust is not registered as an investment company under the Investment Company Act of 1940, as amended (the “Investment Company Act”). It is managed by its Managing Owner, Equinox Fund Management, LLC.
Purchasers of Units are limited owners of the Trust (“Limited Owners”) with respect to beneficial interests of the Series’ Units purchased. The Trust Act provides that, except as otherwise provided in the amended and restated declaration of trust and trust agreement of the Trust dated as of August 8, 2003, by and among the Managing Owner, Wilmington Trust Company as trustee and the unitholders from time to time (the “Trust Agreement”), unitholders in a Delaware statutory trust will have the same limitation of liability as do stockholders of private corporations organized under the General Corporation Law of the State of Delaware. The Trust Agreement confers substantially the same limited liability, and contains the same limited exceptions thereto, as would a limited partnership agreement for a Delaware limited partnership engaged in like transactions as the Trust. In addition, pursuant to the Trust Agreement, the Managing Owner of the Trust is liable for obligations of a Series in excess of that Series’ assets. Limited Owners do not have any such liability. The Managing Owner will make contributions to the Series of the Trust necessary to maintain at least a 1% interest in the aggregate capital, profits and losses of all Series.
The Trust has been organized to pool assets of investor funds for the purpose of trading in the United States (“U.S.”) and international markets for currencies, interest rates, stock indices, agricultural and energy products, precious and base metals and other commodities. The Trust may also engage in futures contracts, forwards, option contracts and other interest in derivative instruments, including swap contracts (“Swaps”).
The Trust has eleven (11) separate and distinct Series of Units issued and outstanding: Frontier Diversified Series, Frontier Dynamic Series (closed to outside investors effective July 15, 2011 and existing outside investors were liquidated as of July 15, 2011), Frontier Long/Short Commodity Series, Frontier Masters Series, Balanced Series, Berkeley/Graham/Tiverton Series (formerly Campbell/Graham/Tiverton Series), Currency Series, Long Only Commodity Series (ceased operations as of December 21, 2011), Managed Futures Index Series (ceased operations as of December 21, 2011), Winton Series and Winton/Graham Series (each a “Series” and collectively, the “Series”). The Trust may issue additional Series of Units.
The Trust, with respect to each Series:
| | • | | engages in the speculative trading of a diversified portfolio of futures, forward (including interbank foreign currencies), options contracts and other derivative instruments (including swap contracts), and may, from time to time, engage in cash and spot transactions; |
| | • | | allocates funds to a limited liability trading company or companies (“Trading Company”). Except as otherwise described in these notes, each Trading Company has one-year renewable contracts with its own independent commodity trading advisor(s), or each, a Trading Advisor, that will manage all or a portion of such Trading Company’s assets and make the trading decisions for the assets of each Series vested in such Trading Company. Each Trading Company will segregate its assets from any other Trading Company; |
| | • | | maintains separate, distinct records for each Series, and accounts for the assets of each Series separately from the other Series; |
| | • | | calculates the Net Asset Value (“NAV”) of its Units for each Series separately from the other Series; |
| | • | | has an investment objective of increasing the value of each Series’ Units over the long term (capital appreciation), while controlling risk and volatility; further, to offer exposure to the investment programs of individual Trading Advisors and to specific instruments (currencies); |
| | • | | maintains each Series of Units in three or six sub-classes—Class 1, Class 1a, Class 2, Class 2a, Class 3, and Class 3a. Investors who have purchased Class 1 or Class 1a Units of any Series are charged a service fee of up to three percent (3.0%) annually of the NAV of each Unit purchased, for the benefit of Selling Agents selling such Class 1 or Class 1a Units. The initial service fee, which is amortized monthly at an annual rate of up to three percent (3.0%) of the average daily NAV of Class 1 or Class 1 a of such Series, is prepaid to Equinox Fund Management, LLC (the “Managing Owner”) |
F-27
by each Series, and paid to the selling agents by the Managing Owner in the month following sale; provided, however, that investors who redeem all or a portion of their Class 1 or Class 1 a Units of any Series during the first twelve (12) months following the effective date of their purchase are subject to a redemption fee of up to three percent (3.0%) of the NAV at which such investor redeemed to reimburse the Managing Owner for the then-unamortized balance of the prepaid initial service fee. With respect to Class 2 and Class 2a Units of any Series, the Managing Owner pays an ongoing service fee to Selling Agents of up to one half percent (0.5%) annually of the NAV of each Class 2 or Class 2a Unit (of which 0.25% will be charged to Limited Owners holding Class 2 Units of the Frontier Diversified Series, Frontier Dynamic Series and Frontier Masters Series or Class 2a Units of the Frontier Long/Short Commodity Series) sold until such Class 2 or Class 2a Units which are subject to the fee limitation are reclassified as Class 3 or Class 3a Units of the applicable Series. The Managing Owner may also pay Selling Agents certain additional fees and expenses for administrative and other services rendered and expenses incurred by such Selling Agents; and
| | • | | all payments made to Selling Agents who are members of the Financial Industry Regulatory Authority, Inc. (“FINRA”) and their associated persons that constitute underwriting compensation will be subject to the limitations set forth in Rule 2310(b)(4)(B)(ii) (formerly Rule 281 0(b)(4)(B)(ii)) of the Conduct Rules of FINRA (“Rule 2310”). An investor’s Class 1 Units or Class 2 Units of any Series, or Class 1a Units or Class 2a Units of the Frontier Long/Short Commodity Series or Balanced Series will be classified as Class 3 or Class 3a Units of such Series, as applicable, when the Managing Owner determines that the fee limitation set forth in Rule 2310 with respect to such Units has been reached or will be reached. No service fees are paid with respect to Class 3 or Class 3a Units. Units of any Class in a Series may be redeemed, in whole or in part, on a daily basis, at the then current NAV per Unit for such Series on the day of the week after the date the Managing Owner is in receipt of a redemption request for at least one (1) Business Day to be received by the Managing Owner prior to 4:00 PM in New York. |
The assets of any particular Series include only those funds and other assets that are paid to, held by or distributed to the Trust on account of and for the benefit of that Series. Under the “Inter-Series Limitation on Liability” expressly provided for under Section 3804(a) of the Trust Act, separate and distinct records of the cash and equivalents, although pooled for maximizing returns, is maintained in the books and records of each Series.
As of December 31, 2011, the Trust, with respect to the Frontier Diversified Series, Frontier Dynamic Series, Frontier Masters Series, Berkeley/Graham/Tiverton Series, Currency Series, Long Only Commodity Series, Managed Futures Index Series, Winton Series and Winton/Graham Series separates Units into three separate Classes—Class 1, Class 2, and Class 3. The Trust, with respect to the Balanced Series, and Frontier Long/Short Commodity Series separates Units into six separate Classes – Class 1, Class 2, Class 3, Class 1a, Class 2a and Class 3a. It is expected that between 10% and 30% of each Series’ assets normally will be invested in one or more Trading Companies to be committed as margin for trading positions, but from time to time these percentages may be substantially more or less. The remainders of each Series’ assets are maintained at the Trust level for cash management. Each of the respective Series has invested monies into pooled cash management assets which have included purchases of certificates of deposit, custom time deposits and U.S. Treasury securities. Each Series’ ownership in these investments is based on its percentage ownership in the pooled cash management assets on the reporting date.
As of December 31, 2011, Winton Series has invested a portion of its assets in a single Trading Company, and a single Trading Advisor manages 100% of the assets invested in such Trading Company. The Currency Series invests a portion of its assets in a single Trading Company, which allocates assets to one Swap. Each of the Frontier Diversified Series, Frontier Masters Series, Frontier Long/Short Commodity Series, Balanced Series, Berkeley/Graham/Tiverton Series, and Winton/Graham Series has invested a portion of its assets in several different Trading Companies and has multiple Trading Advisors that manage the assets invested in such Trading Companies.
In November 2010, the Berkeley/Graham/Tiverton Series invested a portion of its assets in Berkeley Quantitative Colorado Fund LLC, an unaffiliated company, managed by an affiliate of Berkeley Quantitative L.P. Through this investment, Berkeley Quantitative L.P. became a commodity trading advisor to the Series.
During July, 2011, Currency Series liquidated its interest in an option basket and realized a decrease in fair value greater than had previously been recorded as unrealized loss. The Managing Owner determined to make a onetime administrative adjustment by payment to the Currency Series of $390,589 to reimburse the effect of the loss on the investors in the series, exclusive of the inter-series payables’ interests, recorded in the Statements of Operations as Net increase from payments by managing owner.
2. Significant Accounting Policies
The following are the significant accounting policies of the Series of the Trust.
F-28
Basis of Presentation—The Series of the Trust follow Generally Accepted Accounting Principles (“GAAP”), as established by the Financial Accounting Standards Board (the “FASB”), to ensure consistent reporting of financial condition, schedules of investments, results of operations, changes in capital and cash flows.
Consolidation—The Series, through investing in the Trading Companies, authorize certain Trading Advisors to place trades and manage assets at pre-determined investment levels. The Trading Companies were organized by the Managing Owner for the purpose of investing in commodities interests and derivative instruments, and have no operating income or expenses, except for trading income and expenses, all of which is allocated to the Series. Trading Companies in which a Series has a controlling and majority equity interest are consolidated by such Series. Investments in Trading Companies in which a Series does not have a controlling and majority interest are accounted for under the equity method, which approximates fair value.Fair value represents the proportionate share of the Series interest in the NAV in a Trading Company. The equity interest held by Series of the Trust is shown as investments in unconsolidated trading companies in the statements of financial condition. The income or loss attributable thereto in proportion of investment level is shown in the statements of operations as equity in earnings/(loss) from unconsolidated trading companies.
The consolidated financial statements of the Balanced Series include the assets, liabilities and earnings of its majority-owned Trading Companies; Frontier Trading Company I LLC, Frontier Trading Company IX, LLC, Frontier Trading Company XIV, LLC (earnings from June 20, 2011 through December 31, 2011), Frontier Trading Company XV, LLC, Frontier Trading Company XVII, LLC (earnings from July 5, 2011 through December 31, 2011) and Frontier Trading Company XVIII, LLC (earnings from October 24, 2011 through December 31, 2011). Also included in the consolidated financial statements were the earnings of its majority owned trading company, Frontier Trading Company VI, LLC, from January 1, 2011 through March 18, 2011 and trading Company XII from July 18, 2011 through October 11, 2011.
The consolidated financial statements of the Currency Series include the earnings of its wholly owned trading company, Frontier Trading Company III, LLC through July 15, 2011.
The consolidated financial statements of the Winton/Graham Series include the earnings of its majority-owned trading company, Frontier Trading Company V, LLC through June 17, 2011.
The consolidated financial statements of the Frontier Long/Short Commodity Series include the assets, liabilities and earnings of its majority owned trading company, Frontier Trading Company VII, LLC, from September 28, 2011 through December 31, 2011.
The consolidated financial statements of the Frontier Long/Only Commodity Series include the earnings of its wholly owned trading company, Frontier Trading Company VIII, LLC through the last day of trading operations on November 10, 2011.
The consolidated financial statements of the Frontier Diversified Series include the earnings of its wholly owned trading company, Frontier Trading Company X, LLC through October 11, 2011.
The consolidated financial statements of the Frontier Masters Series include the assets, liabilities and earnings of it’s majority owned trading company, Frontier Trading Company XXI, LLC (earnings from March 1, 2011 through December 31, 2011. Also included in the consolidated financial statements were the earnings of its wholly owned trading company, Frontier Trading Company XI, LLC through March 11, 2011.
The consolidated financial statements of the Frontier Dynamic Series include the earnings of its wholly owned trading company, Frontier Trading Company XII, LLC through September 30, 2011.
Investment in Berkeley Quantitative Colorado Fund LLC—The Berkeley/Graham/Tiverton Series has an investment in the Berkeley Quantitative Colorado Fund LLC. The Berkeley Quantitative Colorado Fund LLC began operations on November 1, 2010. The Berkeley Quantitative Colorado Fund LLC is not consolidated into the financial statements of the Berkeley/Graham/Tiverton Series because the Trust has no control or transparency over the operations of the trading company. This investment is shown on the statements of financial condition with the change in fair value shown in net unrealized gain/(loss) on the Berkeley Quantitative Colorado Fund LLC.
Use of Estimates—The preparation of financial statements in conformity with GAAP may require the Managing Owner to make estimates and assumptions that affect the reported amounts of assets and liabilities and disclosure of contingent assets and liabilities at the date of the financial statements and the reported amounts of revenue and expenses during the reporting period. The valuation of swap contracts requires significant estimates as well as the valuation of certain other investments. Please refer to Note 3 for discussion of valuation methodology.
Cash and Cash Equivalents—Cash and cash equivalents include cash and overnight investments in interest-bearing demand deposits held at banks with maturities of three months or less.
F-29
Interest Income—Aggregate interest income from all sources, including assets held at Futures Commission Merchants (“FCM”), up to two percentage points of the aggregate percentage yield (annualized) is paid to the Managing Owner by the Balanced Series (Class 1 and Class 2 only), Berkeley/Graham/Tiverton Series, Currency Series, Winton Series and Winton/Graham Series. For the Frontier Diversified Series, Frontier Dynamic Series, Frontier Long/Short Commodity Series, Frontier Masters Series, Balanced Series (Class 1a, Class 2a and Class 3a only), Long Only Commodity Series and Managed Futures Index Series, 20% of the total interest allocated to each Series is paid to the Managing Owner. All interest not paid to the Managing Owner is interest income to the Series.
U.S. Treasury Securities, custom time deposits and certain demand deposits are pooled for purposes of maximizing returns on these assets to investors of all Series. Interest income from pooled cash management assets is recognized on the accrual basis and allocated daily to each Series based upon its daily proportion of ownership of the pool. Interest income from demand deposits of the Series is allocated to the respective Series in proportion to their daily NAV.
U.S. Treasury Securities—U.S. Treasury Securities are allocated to all Series of the Trust based on each Series’ percentage ownership in the pooled cash management assets as of the reporting date. They are reported at fair value as Level 1 inputs under ASC 820,Fair Value Measurements and Disclosures (“ASC 820”). The Series of the Trust values U.S. Treasury Securities at fair value and records the daily change in value in the statements of operations as net unrealized gain/(loss) on U.S. Treasury securities. Accrued interest is reported on the statements of financial condition as interest receivable.
Custom Time Deposits—Custom time deposits are structured deposit agreements with U.S. Bank National Association that earn a guaranteed fixed interest rate between 2.17% and 3.75% , mature nine months from the deposit date and are subject to automatic six-month rollovers through October 2013. Custom time deposits were purchased on September 15, 2009, October 21, 2008 and October 30, 2008. Interest is paid monthly or at least every nine months. Unscheduled withdrawals will be subject to certain penalties and other costs of up to 1.0% of the amount deposited if withdrawn within the first nine months from the deposit date. The withdrawal fee is set at 0.225% for the period from nine months to one year subsequent to the deposit date and decreases by .05% increments for each year thereafter through the maturity date. Custom time deposits are allocated to each Series based on their percentage ownership in the pooled cash management assets as of the reporting date. The Series of the Trust values the custom time deposits at face value plus accrued interest as it is considered a deposit account under paragraph 7.50 of theInvestment Company Audit Guide, and accordingly, this deposit is not subject to ASC 820.
Credit Default Swaps—The Series of the Trust invests in credit default swaps for the purpose of mitigating part of the risk of concentration of deposits with U.S. Bank National Association to other major financial institutions. See Note 4. Credit Default Swaps are allocated to each Series based on their percentage ownership in the pooled cash management assets as of the reporting date. Credit Default Swaps are reported at fair value based upon counterparty value per the valuation policy. The Series of the Trust record the daily change in fair value in the statements of operations as net unrealized gain/(loss) on swap contracts.
Receivable From Futures Commission Merchants—The Series of the Trust deposits assets with a FCM subject to CFTC regulations and various exchange and broker requirements. Margin requirements are satisfied by the deposit of cash with such FCM. The Trust earns interest income on its assets deposited with the FCM.
Investment Transactions—Futures, options on futures, forward and swap contracts are recorded on a trade date basis and realized gains or losses are recognized when contracts are settled. Unrealized gains or losses on open contracts (the difference between contract trade price and market price) are reported in the statements of financial condition as a net unrealized gain or loss, as there exists a right of offset of unrealized gains or losses in accordance with FASB ASC 210,Balance Sheet (“ASC 210”).
Any change in net unrealized gain or loss from the preceding period is reported in the statements of operations. Fair value of exchange-traded contracts is based upon exchange settlement prices. Fair value of non-exchange-traded contracts is based on third party quoted dealer values on the interbank market. For U.S. Treasury securities, interest is recognized in the period earned and the instruments are marked-to-market daily based on third party information. Custom time deposits are valued at face value plus accrued interest and the interest income is recognized in the period earned. Transaction costs are recognized as incurred and reflected separately in the statements of operations.
Foreign currency transactions—The Series’ functional currency is the U.S. dollar, however, they transact business in currencies other than the U.S. dollar. Assets and liabilities denominated in currencies other than the U.S. dollar are translated into U.S. dollars at the rates in effect at the date of the statements of financial condition. Income and expense items denominated in currencies other than the U.S. dollar are translated into U.S. dollars at the rates in effect during the period. Gains and losses resulting from the translation to U.S. dollars are reported in income. The Series do not isolate that portion of the results of operations resulting from changes in foreign exchange rates on investments from fluctuations arising from changes in market prices of securities held. Such fluctuations are included with the net realized or unrealized gain or loss from investments.
Allocation of Earnings—Each Series of the Trust maintains three or six classes of Units—Class 1, Class 2, Class 3, Class 1a, Class 2a and Class 3a). All classes have identical voting, dividend, liquidation and other rights and the same terms and conditions, except that fees charged to a Class or Series differ as described below. Revenues, expenses (other than expenses attributable to a specific class), and realized and unrealized trading gains and losses of each Series are allocated daily to Class 1, Class 1a, Class 2, Class 2a, Class 3 and Class 3a Units based on each Class’ respective owners’ capital balances.
F-30
Each Series allocates funds to an affiliated Trading Company, or Companies, of the Trust. Each Trading Company allocates all of its daily trading gains or losses to the Series in proportion to each Series’ ownership interest in the Trading Company, adjusted on a daily basis. As of December 31, 2011, the value of all open contracts and cash held at clearing brokers is similarly allocated to the Series in proportion to each Series’ funds allocated to the Trading Company, or Companies.
Inter-Series Receivables/Payables—The Balanced Series, for the purposes of diversification of investments and trading advisors through the other Series’ access to trading companies in which the Balanced Series did not have a direct interest, advanced funds to the Currency Series and the Frontier Dynamic Series. The amount of the funds advanced by the Balanced Series to each of the Currency Series and the Frontier Dynamic Series participated on apari passu basis with Class 2 Units of such investee Series. The Balanced Series and investee Series reflected the changes in values of these investments as “net change in inter-series receivables/payables” in the statements of operations. The Balanced Series was subject to the same allocations of income and fees as the Limited Owners of such Series. As a result of fees charged by the investee Series, fees were not charged by the Balanced Series on the capital allocated to advances in affiliated Series. The Managing Owner monitored such allocations so that aggregate fees of the investee Series on the Balanced Series advances did not exceed the allowable fees of the Balanced Series as provided in the Trust’s Prospectus. Interest was not credited to the Balanced Series on the capital allocated to its inter-series advances to avoid the duplication of interest charged or received. These investments were liquidated during the third quarter of 2011.
Payments by the Managing Owner—The Managing Owner may make discretionary payments to a Series related to a variety of factors, including investment losses to reimburse the effect of a loss on a portfolio investment which has been caused by a situation outside the Trust’s, or it’s affiliates’, direct control. Such payments will be made on a discretionary basis and will be disclosed in the statement of operations as a net increase from payments by managing owner. These payments are in accordance with the Trust agreement on a discretionary basis as determined by the Managing Owner.
Investments and Swaps—The Trust records investment transactions on a trade date basis and all investments are recorded at fair value in its financial statements, with changes in fair value reported as a component of realized and unrealized gains/(losses) on investments in the statements of operations. Certain Series of the Trust strategically invest a portion or all of their assets in total return Swaps, selected at the discretion of the Managing Owner. Swaps are privately negotiated contracts designed to provide investment returns linked to those produced by one or more underlying investment products or indices. In a typical Swap, two parties agree to exchange the returns (or differentials in rates of return) earned or realized on one or more particular predetermined investments or instruments. The gross returns to be exchanged or “swapped” between the parties are calculated with respect to a “notional amount” (i.e., the amount of value of the underlying asset used in computing the particular interest rate, return, or other amount to be exchanged) in a particular investment, or in a “basket” of securities. The valuation of swap contracts requires significant estimates. Swap contracts utilizing Level 2 inputs are reported at fair value based on daily reports from the swap counterparty that are corroborated against independent valuation/rate of return information published and available on a daily recurring frequency. Other Swap Contracts are reported utilizing Level 3 Inputs. Swap Contracts are reported at fair value based upon a weekly indicative value that is calculated by management using bid/ask prices from the counterparty. This fair value is corroborated by a daily range of valuations provided by a third party pricing service. The third party pricing service utilizes a Black Scholes pricing model with input adjustments factoring in volatility and liquidity of the instruments. All valuation processes are monitored by the valuation committee of the Managing Owner.
Income Taxes—The Trust applies the provisions of ASC 740Income Taxes(“ASC 740”), which provides guidance for how uncertain tax positions should be recognized, measured, presented and disclosed in the financial statements. This interpretation also provides guidance on derecognition, classification, interest and penalties, accounting in interim periods and disclosure. ASC 740 requires the evaluation of tax positions taken or expected to be taken in the course of preparing the Trust’s financial statements to determine whether the tax positions are “more-likely-than-not” of being sustained by the applicable tax authority. Tax positions with respect to tax at the Trust’s level not deemed to meet the “more-likely-than-not” threshold would be recorded as a tax benefit or expense in the current year. The Managing Owner has concluded there is no tax expense, interest or penalties to be recorded by the Trust for the years ended December 31, 2011, 2010 and 2009. The 2008 through 2011 tax years generally remain subject to examination by U.S. federal and most state tax authorities.
In the opinion of the Managing Owner, (i) the Trust is treated as a partnership for Federal income tax purposes and, assuming that at least 90% of the gross income of the Trust constitutes “qualifying income” within the meaning of Section 7704(d) of the Code, the Trust is not a publicly traded partnership treated as a corporation, and (ii) the discussion set forth in the Prospectus under the heading “Federal Income Tax Consequences” correctly summarizes the material Federal income tax consequences as of the date of the Prospectus to potential U.S. Limited Owners of the purchase, ownership and disposition of Units of the Trust.
F-31
Fees and Expenses—All management fees, incentive fees, service fees and trading fees of the Trust are paid to the Managing Owner. It is the responsibility of the Managing Owner to pay all Trading Advisor management and incentive fees, Selling Agent Service fees and all other operating expenses and continuing offering costs of the Trust.
Service Fees—The Trust maintains each Series of Units in three or six sub-classes—Class 1, Class 1a, Class 2, Class 2a, Class 3, and Class 3a. Investors who have purchased Class 1 or Class 1a Units of any Series are charged a service fee of up to three percent (3.0%) annually of the NAV of each Unit purchased, for the benefit of selling agents selling such Class 1 or Class 1a Units. The initial service fee, which is amortized monthly at an annual rate of up to three percent (3.0%) of the average daily NAV of Class 1 or Class 1a of such Series, is prepaid to the Managing Owner by each Series, and paid to the selling agents by the Managing Owner in the month following sale; provided, however, that investors who redeem all or a portion of their Class 1 or Class 1a Units of any Series during the first twelve (12) months following the effective date of their purchase are subject to a redemption fee of up to three percent (3.0%) of the NAV at which such investor redeemed to reimburse the Managing Owner for the then-unamortized balance of the prepaid initial service fee. With respect to Class 2 and Class 2a Units of any Series, the Managing Owner pays an ongoing service fee to Selling Agents of up to one half percent (0.5%) annually of the NAV of each Class 2 or Class 2a Unit (of which 0.25% will be charged to Limited Owners holding Class 2 Units of the Frontier Diversified Series, Frontier Dynamic Series and Frontier Masters Series or Class 2a Units of the Frontier Long/Short Commodity Series) sold until such Class 2 or Class 2a Units which are subject to the fee limitation are reclassified as Class 3 or Class 3a Units of the applicable Series for administrative purposes. The Managing Owner may also pay Selling Agents certain additional fees and expenses for administrative and other services rendered and expenses incurred by such Selling Agents.
These service fees are part of the offering costs of the Trust, which include registration and filing fees, legal and blue sky expenses, accounting and audit, printing, marketing support and other offering costs which are born by the Managing Owner. With respect to the service fees, the initial service fee (for the first 12 months) relating to a purchase of Class 1 and Class 1a Units by an investor is prepaid by the Managing Owner to the relevant selling agent in the month following such purchase and is reimbursed for such payment by the Series monthly in arrears in an amount based upon a corresponding percentage of NAV, calculated daily. Consequently, the Managing Owner bears the risk of the downside and enjoys the benefit of the upside potential of any difference between the amount of the initial service fee prepaid by it and the amount of the reimbursement thereof, which may result from variations in NAV over the following 12 months.
Pending Owner Additions—Funds received for new subscriptions and for additions to existing owner interests are recorded as capital additions at the NAV per unit of the second business day following receipt.
Recently Adopted Accounting Pronouncements—In January 2010, FASB issued Accounting Standards update No. 2010-06 (“ASU 2010-06”) for improving disclosure about fair value measurements. ASU 2010-06 adds new disclosure requirements about transfers into and out of Levels 1 and 2 and separate disclosures about purchases, sales, issuances and settlements in the reconciliation for fair value measurements using significant unobservable inputs (Level 3). It also clarifies existing disclosure requirements relating to the levels of disaggregation for fair value measurement and inputs and valuation techniques used to measure fair value. The amended guidance is effective for financial statements for fiscal years and interim periods beginning after December 15, 2009 except for disclosures about purchases, sales, issuances and settlements in the roll forward of activity in Level 3 fair value measurements, which are effective for fiscal years beginning after December 15, 2010 and for interim periods within those fiscal years. Adoption of ASU 2010-06 on January 1, 2011 did not have a material impact on the Trust’s statements of financial condition, results of operations and cash flows.
Recently Issued Accounting Pronouncements—In May 2011, the FASB issued ASU No. 2011-04 which provides guidance pertaining to fair value measurement that included a common definition of fair value and information to assist reporting entities to measure and disclose fair value with regards to U.S. GAAP and International Financial Reporting Standards (“IFRS”) convergence issues. This guidance becomes effective for interim and annual periods beginning on or after December 15, 2011, with early adoption prohibited. Management of the series are currently evaluating the impact that this accounting guidance may have on the Trust’s statement of financial condition, results of operations and cash flows.
In November of 2011, FASB issued new guidance that requires an entity to disclose information about offsetting and related arrangements to enable users of its financial statements to understand the effect of those arrangements on its financial position. This guidance is effective for annual and interim periods beginning on or after January, 1, 2013. An entity should provide the disclosures required by those amendments retrospectively for all comparative periods presented. Our effective date is January 1, 2013. The adoption of this guidance is not expected to have a material impact on the financial positions or results of operations.
Reclassification—Certain amounts in the 2010 financial statements have been reclassified to conform to the 2011 presentation. None of the reclassifications had an impact on the NAV or performance of any of the Series.
Subsequent Events—The Trust follows the provisions of FASB ASC 855,Subsequent Events, which establishes general standards of accounting for and disclosure of events that occur after the balance sheet date but before financial statements are issued. Refer to Note 11.
F-32
3. Fair Value Measurements
In connection with the valuation of investments the Series apply ASC 820. ASC 820 provides clarification that when a quoted price in an active market for the identical asset or liability is not available, a reporting entity is required to measure fair value using certain techniques. ASC 820 also clarifies that when estimating the fair value of an asset or liability, a reporting entity is not required to include a separate input or adjustment to other inputs relating to the existence of a restriction that prevents the transfer of an asset or liability. ASC 820 also clarifies that both a quoted price in an active market for the identical asset or liability at the measurement date and the quoted price for the identical asset or liability when traded as an asset in an active market when no adjustments to the quoted price of the asset are required are Level 1 fair value measurements.
Level 1 Inputs
Unadjusted quoted prices in active markets for identical financial assets that the reporting entity has the ability to access at the measurement date.
Level 2 Inputs
Inputs other than quoted prices included in Level 1 that are observable for the financial asset or liabilities, either directly or indirectly. These might include quoted prices for similar financial assets in active markets, quoted prices for identical or similar financial assets in markets that are not active, inputs other than quoted prices that are observable for the financial asset or inputs that are derived principally from or corroborated by market data by correlation or other means.
Level 3 Inputs
Unobservable inputs for determining the fair value of financial assets that reflect an entity’s own assumptions about the assumptions that market participants would use in pricing the financial asset.
The Series of the Trust uses the following methodologies to value instruments within its financial asset portfolio at fair value:
Trading Securities.These instruments include U.S. Treasury securities and open trade equity positions (futures contracts and currency forwards) that are actively traded on public markets with quoted pricing for corroboration. U.S. Treasury securities, futures contracts, and currency forwards are reported at fair value using Level 1 inputs. Trading securities instruments further include open trade equity positions (trading options) that are quoted prices for identical or similar assets that are not traded on active markets. Trading options are reported at fair value using Level 2 inputs.
Swap Contracts. Certain Series of the Trust strategically invest a portion or all of their assets in total return Swaps, selected at the direction of the Managing Owner. Each Series also owns a portion of the Credit Default Swaps (“CDS”) based upon ownership percentages of the cash management pool. Swaps are privately negotiated contracts designed to provide investment returns linked to those produced by one or more investment products or indices. In a typical Swap, two parties agree to exchange the returns (or differentials in rates of return) earned or realized on one or more particular predetermined investments or instruments. The gross returns to be exchanged or “swapped” between the parties are calculated with respect to a “notional amount” (i.e., the amount of value of the underlying asset used in computing the particular interest rate, return, or other amount to be exchanged) in a particular investment, or in a “basket” of securities. The valuation of swap contracts requires significant estimates. Certain Swap contracts are reported utilizing Level 2 inputs. These Swap contracts are reported at fair value based on daily reports from the swap counterparty that may be corroborated against independent valuation/rate of return information published and available on a daily recurring frequency. Swap contracts utilizing Level 2 inputs are reported at fair value based on daily reports from the swap counterparty that may be corroborated against independent valuation/rate of return information published and available on a daily recurring frequency. Other Swap contracts are reported utilizing Level 3 Inputs. Swap Contracts are reported at fair value based upon a weekly indicative value that is calculated by management using bid/ask prices from the counterparty. This fair value is corroborated by a daily range of valuations provided by a third party pricing service. The third party pricing service utilizes a Black Scholes pricing model with input adjustments factoring in volatility and liquidity of the instruments. All valuation processes are monitored by the valuation committee of the Managing Owner.
Investment in Unconsolidated Trading Companies. This investment represents the fair value of the allocation of cash, futures, forwards, options and swaps to each respective Series relative to its trading allocations from unconsolidated Trading Companies. The Series may redeem their investment in the trading companies on a daily basis at the state net asset value and therefore the inputs qualify for Level II. However, as the Series, under the same management as the Trading Companies, have access to the underlying positions of the Trading Companies, the level determination is reflected on that basis. As such, the Series report investments in unconsolidated Trading Companies at fair value using the corresponding inputs of the underlying securities of the Trading Companies which results in the Series reporting the corresponding Level determination from the inputs of the Trading Company.
Investment in the Berkeley Quantitative Colorado Fund LLC. Investment in Berkeley Quantitative Colorado Fund LLC is valued based on the daily net asset value as reported by the managing member of the Berkeley Quantitative Colorado Fund LLC. The reported net asset value represents fair value based on observable data such as ongoing redemption and/or subscription activity, which is reported as a Level 2 input.
F-33
Inter-Series Receivables and Payables. The Balanced Series, for the purposes of diversification of investments and trading advisors through the other Series’ access to Trading Companies in which the Balanced Series does not have a direct interest, advanced funds to the Currency Series and Frontier Dynamic Series. As of December 31, 2011, all inter-Series receivables and payables have been settled. Inter-Series receivables and payables were reported at fair value using Level 1 inputs.
The following tables summarize the instruments that comprise the Series’ financial asset portfolio, measured at fair value on a recurring basis as of December 31, 2011 and December 31, 2010, segregated by the level of valuation inputs within the fair value hierarchy utilized to measure fair value:
| | | | | | | | | | | | | | | | |
December 31, 2011 | | Level 1 Inputs | | | Level 2 Inputs | | | Level 3 Inputs | | | Total Fair
Value | |
Frontier Diversified Series | | | | | | | | | | | | | | | | |
Swap Contracts | | $ | — | | | $ | — | | | $ | 131,004 | | | $ | 131,004 | |
Investment in Unconsolidated Trading Companies | | | 30,885,365 | | | | 2,212,764 | | | | 5,142,042 | | | | 38,240,171 | |
U.S. Treasury Securities | | | 16,557,304 | | | | — | | | | — | | | | 16,557,304 | |
Frontier Long/Short Commodity Series | | | | | | | | | | | | | | | | |
Open Trade Deficit | | | (25,934,678 | ) | | | — | | | | — | | | | (25,934,678 | ) |
Swap Contracts | | | — | | | | — | | | | 74,898 | | | | 74,898 | |
Investment in Unconsolidated Trading Companies | | | 3,221,324 | | | | 5,428 | | | | 855,236 | | | | 4,081,988 | |
U.S. Treasury Securities | | | 9,466,240 | | | | — | | | | — | | | | 9,466,240 | |
Frontier Masters Series | | | | | | | | | | | | | | | | |
Open Trade Equity | | | 792,372 | | | | — | | | | — | | | | 792,372 | |
Swap Contracts | | | — | | | | — | | | | 57,225 | | | | 57,225 | |
Investment in Unconsolidated Trading Companies | | | 4,009,449 | | | | 708,465 | | | | — | | | | 4,717,914 | |
U.S. Treasury Securities | | | 7,232,546 | | | | — | | | | — | | | | 7,232,546 | |
Balanced Series | | | | | | | | | | | | | | | | |
Open Trade Equity | | | 1,175,762 | | | | 11,928,779 | | | | — | | | | 13,104,541 | |
Options Written | | | — | | | | (3,326,453 | ) | | | — | | | | (3,326,453 | ) |
Swap Contracts | | | — | | | | — | | | | 23,819,312 | | | | 23,819,312 | |
Investment in Unconsolidated Trading Companies | | | 18,257,754 | | | | (1,945 | ) | | | — | | | | 18,255,809 | |
U.S. Treasury Securities | | | 29,168,216 | | | | — | | | | — | | | | 29,168,216 | |
Berkeley/Graham/Tiverton Series | | | | | | | | | | | | | | | | |
Swap Contracts | | | — | | | | — | | | | 34,397 | | | | 34,397 | |
Investment in Unconsolidated Trading Companies | | | 7,219,498 | | | | 1,014,549 | | | | — | | | | 8,234,047 | |
Investment in Berkeley Quantitative Colorado Fund, LLC | | | — | | | | 6,270,844 | | | | — | | | | 6,270,844 | |
U.S. Treasury Securities | | | 4,347,398 | | | | — | | | | — | | | | 4,347,398 | |
Currency Series | | | | | | | | | | | | | | | | |
Swap Contracts | | | — | | | | — | | | | 2,583 | | | | 2,583 | |
U.S. Treasury Securities | | | 326,517 | | | | — | | | | — | | | | 326,517 | |
Investment in Unconsolidated Trading Companies | | | — | | | | — | | | | 2,352,121 | | | | 2,352,121 | |
Winton Series | | | | | | | | | | | | | | | | |
Swap Contracts | | | — | | | | — | | | | 61,888 | | | | 61,888 | |
Investment in Unconsolidated Trading Companies | | | 4,733,423 | | | | (1,507 | ) | | | — | | | | 4,731,916 | |
U.S. Treasury Securities | | | 7,821,927 | | | | — | | | | — | | | | 7,821,927 | |
Winton/Graham Series | | | | | | | | | | | | | | | | |
Swap Contracts | | | — | | | | — | | | | 30,381 | | | | 30,381 | |
Investment in Unconsolidated Trading Companies | | | 8,474,102 | | | | (678 | ) | | | — | | | | 8,473,424 | |
U.S. Treasury Securities | | | 3,839,855 | | | | — | | | | — | | | | 3,839,855 | |
F-34
| | | | | | | | | | | | | | | | |
December 31, 2010 | | Level 1 Inputs | | | Level 2 Inputs | | | Level 3 Inputs | | | Total
Fair Value | |
Frontier Diversified Series | | | | | | | | | | | | | | | | |
Swap Contracts | | $ | — | | | $ | — | | | $ | 11,407,905 | | | $ | 11,407,905 | |
Investment in Unconsolidated Trading Companies | | | 36,804,535 | | | | 5,737,148 | | | | 12,398,412 | | | | 54,940,095 | |
U.S. Treasury Securities | | | 13,620,730 | | | | — | | | | — | | | | 13,620,730 | |
Frontier Dynamic Series | | | | | | | | | | | | | | | | |
Swap Contracts | | | — | | | | — | | | | 10,956,772 | | | | 10,956,772 | |
U.S. Treasury Securities | | | 2,796,510 | | | | — | | | | — | | | | 2,796,510 | |
Inter-Series Payables | | | 28,320,283 | | | | — | | | | — | | | | 28,320,283 | |
Frontier Long/Short Commodity Series | | | | | | | | | | | | | | | | |
Investment in Unconsolidated Trading Companies | | | 31,804,854 | | | | 596,889 | | | | 562,705 | | | | 32,964,448 | |
U.S. Treasury Securities | | | 6,801,035 | | | | — | | | | — | | | | 6,801,035 | |
Frontier Masters Series | | | | | | | | | | | | | | | | |
Swap Contracts | | | — | | | | — | | | | 26,242,246 | | | | 26,242,246 | |
Investment in Unconsolidated Trading Companies | | | 13,705,024 | | | | 2,216,634 | | | | — | | | | 15,921,658 | |
U.S. Treasury Securities | | | 3,543,554 | | | | — | | | | — | | | | 3,543,554 | |
Balanced Series | | | | | | | | | | | | | | | | |
Open Trade Equity | | | 1,724,008 | | | | 29,154,497 | | | | — | | | | 30,878,505 | |
Options Written | | | — | | | | (4,788,295 | ) | | | — | | | | (4,788,295 | ) |
Swap Contracts | | | — | | | | — | | | | 49,811,462 | | | | 49,811,462 | |
Investment in Unconsolidated Trading Companies | | | 41,577,810 | | | | 494,568 | | | | — | | | | 42,072,378 | |
U.S. Treasury Securities | | | 27,253,497 | | | | — | | | | — | | | | 27,253,497 | |
Inter-Series Receivables | | | 41,137,058 | | | | — | | | | — | | | | 41,137,058 | |
Campbell/Graham/Tiverton Series | | | | | | | | | | | | | | | | |
Investment in Unconsolidated Trading Companies | | | 9,244,073 | | | | 3,421,798 | | | | — | | | | 12,665,871 | |
Investment in Berkeley Quantitative Colorado Fund, LLC | | | — | | | | 10,157,099 | | | | — | | | | 10,157,099 | |
U.S. Treasury Securities | | | 7,024,829 | | | | — | | | | — | | | | 7,024,829 | |
Currency Series | | | | | | | | | | | | | | | | |
Open Trade Equity | | | 28,390 | | | | — | | | | — | | | | 28,390 | |
Options Written | | | — | | | | (1,292 | ) | | | — | | | | (1,292 | ) |
Swap Contracts | | | — | | | | — | | | | 5,668,768 | | | | 5,668,768 | |
U.S. Treasury Securities | | | 2,009,673 | | | | — | | | | — | | | | 2,009,673 | |
Inter-Series Payables | | | 12,816,775 | | | | — | | | | — | | | | 12,816,775 | |
Long Only Commodity Series | | | | | | | | | | | | | | | | |
Swap Contracts | | | — | | | | 790,796 | | | | — | | | | 790,796 | |
U.S. Treasury Securities | | | 485,541 | | | | — | | | | — | | | | 485,541 | |
Managed Futures Index Series | | | | | | | | | | | | | | | | |
Investment in Unconsolidated Trading Companies | | | 992,837 | | | | — | | | | — | | | | 992,837 | |
U.S. Treasury Securities | | | 597,700 | | | | — | | | | — | | | | 597,700 | |
Winton Series | | | | | | | | | | | | | | | | |
Investment in Unconsolidated Trading Companies | | | 6,224,743 | | | | (1,836 | ) | | | — | | | | 6,222,907 | |
U.S. Treasury Securities | | | 8,020,509 | | | | — | | | | — | | | | 8,020,509 | |
Winton/Graham Series | | | | | | | | | | | | | | | | |
Open Trade Equity | | | 1,427,138 | | | | — | | | | — | | | | 1,427,138 | |
Investment in Unconsolidated Trading Companies | | | 3,384,249 | | | | (998 | ) | | | — | | | | 3,383,251 | |
U.S. Treasury Securities | | | 7,045,351 | | | | — | | | | — | | | | 7,045,351 | |
The changes in Level 3 assets measured at fair value on a recurring basis are summarized in the following tables. Swap contract asset gains and losses (realized/unrealized) included in earnings are classified in “realized and unrealized gain (loss) on investments – net unrealized gain/(loss) on swap contracts” on the statements of operations. Investment in unconsolidated trading company asset gains and losses (realized/unrealized) included in earnings are classified in “Change in fair value of investments in unconsolidated trading companies.” During the year ended December 31, 2011, all identified Level 3 assets are components of the Frontier Diversified Series, Frontier Long/Short Commodity Series, Frontier Masters Series, Balanced Series, Berkeley/Graham/Tiverton Series, Currency Series, Winton Series and Winton/Graham Series. The Series of the Trust assess the levels of the investments at each measurement
F-35
date, and transfers between levels are recognized on the actual date of the event or change in circumstances that caused the transfer in accordance with the Series’ accounting policy regarding the recognition of transfers between levels of the fair value hierarchy. There were no significant transfers among levels 1, 2, and 3 during the year. During the year ended December 31, 2010, all identified Level 3 assets are components of the Frontier Diversified Series, Frontier Dynamic Series, Frontier Long/Short Commodity Series, Frontier Masters Series, Balanced Series and Currency Series.
2011:
| | | | | | | | | | | | |
| Swaps: | | | | | | | | | |
| | | Frontier Diversified
Series | | | Frontier Long/Short
Commodity Series | | | Frontier Masters
Series | |
| | | For The Year Ended
December 31, 2011 | | | For The Year Ended
December 31, 2011 | | | For The Year Ended
December 31, 2011 | |
Balance of recurring Level 3 assets as of January 1, 2011 | | $ | 11,407,905 | | | $ | — | | | $ | 26,242,246 | |
Total gains or losses (realized/unrealized): | | | | | | | | | | | | |
Included in earnings-realized | | | (5,621,987 | ) | | | (11,411 | ) | | | 2,061,339 | |
Included in earnings-unrealized | | | 1,315,339 | | | | 20,529 | | | | (1,607,804 | ) |
Purchases of investments | | | 45,929 | | | | 78,248 | | | | 142,819 | |
Sales of investments | | | (7,096,699 | ) | | | — | | | | (26,826,316 | ) |
Change in ownership allocation of credit default swaps | | | 80,517 | | | | (12,468 | ) | | | 44,941 | |
Transfers in and/or out of Level 3 | | | — | | | | — | | | | — | |
| | | | | | | | | | | | |
Balance of recurring Level 3 assets as of December 31, 2011 | | $ | 131,004 | | | $ | 74,898 | | | $ | 57,225 | |
| | | | | | | | | | | | |
| | | |
| | | Balanced Series | | | Berkeley/Graham/Tiverton
Series | | | Currency Series | |
| | | For The Year Ended
December 31, 2011 | | | For The Year Ended
December 31, 2011 | | | For The Year Ended
December 31, 2011 | |
Balance of recurring Level 3 assets as of January 1, 2011 | | $ | 49,811,462 | | | $ | — | | | $ | 5,668,768 | |
Total gains or losses (realized/unrealized): | | | | | | | | | | | | |
Included in earnings-realized | | | (19,161,366 | ) | | | (6,252 | ) | | | (6,958,362 | ) |
Included in earnings-unrealized | | | 4,529,039 | | | | 2,447 | | | | 6,327,609 | |
Purchases of investments | | | 19,527,925 | | | | 71,712 | | | | 23,489 | |
Sales of investments | | | (27,897,084 | ) | | | — | | | | (5,043,086 | ) |
Change in ownership allocation of credit default swaps | | | (34,673 | ) | | | (33,510 | ) | | | (15,835 | ) |
Change in ownership allocation of total return swaps | | | (2,955,991 | ) | | | — | | | | — | |
Transfers in and/or out of Level 3 | | | — | | | | — | | | | — | |
| | | | | | | | | | | | |
Balance of recurring Level 3 assets as of December 31, 2011 | | $ | 23,819,312 | | | $ | 34,397 | | | $ | 2,583 | |
| | | | | | | | | | | | |
| | | |
| | | Winton Series | | | Winton/Graham Series | | | Frontier Dynamic
Series | |
| | | For The Year Ended
December 31, 2011 | | | For The Year Ended
December 31, 2011 | | | For The Year Ended
December 31, 2011 | |
Balance of recurring Level 3 assets as of January 1, 2011 | | $ | — | | | $ | — | | | $ | 10,956,772 | |
Total gains or losses (realized/unrealized): | | | | | | | | | | | | |
Included in earnings-realized | | | (9,969 | ) | | | (5,791 | ) | | | (2,157,451 | ) |
Included in earnings-unrealized | | | 7,291 | | | | (944 | ) | | | 1,317,993 | |
Purchases of investments | | | 83,357 | | | | 64,011 | | | | 13,076 | |
Sales of investments | | | — | | | | — | | | | (10,123,315 | ) |
Change in ownership allocation of credit default swaps | | | (18,791 | ) | | | (26,895 | ) | | | (7,075 | ) |
Change in inter-series receivable | | | — | | | | — | | | | — | |
Transfers in and/or out of Level 3 | | | — | | | | — | | | | — | |
| | | | | | | | | | | | |
Balance of recurring Level 3 assets as of December 31, 2011 | | $ | 61,888 | | | $ | 30,381 | | | $ | — | |
| | | | | | | | | | | | |
F-36
Investments in Unconsolidated Trading Companies:
| | | | | | | | | | | | |
| | | Frontier Diversified Series | | | Frontier Long/Short
Commodity Series | | | Currency Series | |
| | | For the Year Ended
December 31, 2011 | | | For the Year Ended
December 31, 2011 | | | For the Year Ended
December 31, 2011 | |
Balance of recurring Level 3 assets as of January 1, 2011 | | $ | 12,398,412 | | | $ | 562,705 | | | $ | — | |
Change in unrealized in investment of unconsolidated trading companies | | | (5,086,488 | ) | | | (753,554 | ) | | | (162,659 | ) |
Realized gain/(loss) in investment of unconsolidated trading companies | | | 1,806,063 | | | | 267,565 | | | | (2,334 | ) |
Proceeds from sales of investments of unconsolidated trading companies | | | (5,387,844 | ) | | | (798,199 | ) | | | — | |
Purchases of investments of unconsolidated trading companies | | | — | | | | — | | | | 2,500,000 | |
Change in ownership allocation | | | 1,411,899 | | | | 1,576,719 | | | | 17,114 | |
Transfers in and/or out of Level 3 | | | — | | | | — | | | | — | |
| | | | | | | | | | | | |
Balance of recurring Level 3 assets as of December 31, 2011 | | $ | 5,142,042 | | | $ | 855,236 | | | $ | 2,352,121 | |
| | | | | | | | | | | | |
| | | |
2010: | | | | | | | | | | | | |
| | | |
Swaps: | | | | | | | | | | | | |
| | | |
| | | Frontier Diversified Series | | | Frontier Dynamic Series | | | Frontier Masters Series | |
| | | For The Year Ended
December 31, 2010 | | | For The Year Ended
December 31, 2010 | | | For The Year Ended
December 31, 2010 | |
| | | |
Balance of recurring Level 3 assets as of January 1, 2010 | | $ | 8,550,639 | | | $ | 10,027,253 | | | $ | 15,972,156 | |
Total gains or losses (realized/unrealized): | | | | | | | | | | | | |
Included in earnings-realized | | | — | | | | — | | | | — | |
Included in earnings-unrealized | | | 416,156 | | | | 929,519 | | | | 3,474,611 | |
Purchases of investments | | | 2,500,000 | | | | — | | | | 14,489,668 | |
Sales of investments | | | (58,890 | ) | | | — | | | | (7,694,189 | ) |
Change in allocation of total return swaps | | | — | | | | — | | | | (6,795,479 | ) |
Transfers in and/or out of Level 3 | | | — | | | | — | | | | — | |
| | | | | | | | | | | | |
Balance of recurring Level 3 assets as of December 31, 2010 | | $ | 11,407,905 | | | $ | 10,956,772 | | | $ | 26,242,246 | |
| | | | | | | | | | | | |
| | | | | | | | |
| | | Balanced Series | | | Currency Series | |
| | | For The Year Ended
December 31, 2010 | | | For The Year Ended
December 31, 2010 | |
Balance of recurring Level 3 assets as of January 1, 2010 | | $ | 41,020,535 | | | $ | 4,992,959 | |
Total gains or losses (realized/unrealized): | | | | | | | | |
Included in earnings-realized | | | — | | | | — | |
Included in earnings-unrealized | | | 8,790,927 | | | | 675,809 | |
Purchases, sales, issuances, and settlements, net | | | — | | | | — | |
Transfers in and/or out of Level 3 | | | — | | | | — | |
| | | | | | | | |
Balance of recurring Level 3 assets as of December 31, 2010 | | $ | 49,811,462 | | | $ | 5,668,768 | |
| | | | | | | | |
| | |
Investments in Unconsolidated Trading Companies: | | | | | | | | |
| | |
| | | Frontier Diversified Series | | | Frontier Long/Short
Commodity Series | |
| | | For the Year Ended
December 31, 2010 | | | For the Year Ended
December 31, 2010 | |
Balance of recurring Level 3 assets as of January 1, 2010 | | $ | 2,540,406 | | | $ | — | |
Change in unrealized in investment of unconsolidated trading companies | | | 8,790,928 | | | | 86,455 | |
Realized gain/(loss) in investment of unconsolidated | | | | | | | | |
Change in ownership allocation | | | 1,067,077 | | | | 476,250 | |
Transfers in and/or out of Level 3 | | | — | | | | — | |
| | | | | | | | |
Balance of recurring Level 3 assets as of December 31, 2010 | | $ | 12,398,412 | | | $ | 562,705 | |
| | | | | | | | |
F-37
Investment in Berkeley Quantitative Colorado Fund LLC
On November 1, 2010, the Berkeley/Graham/Tiverton Series made an investment in a non-registered fund, the Berkeley Quantitative Colorado Fund LLC. As of December 31, 2011 and 2010, the fair value of the investment in Berkeley Quantitative Colorado Fund LLC exceeded five percent of the Berkeley/Graham/Tiverton Series owners’ capital balance.
The following table summarizes the Berkeley/Graham/Tiverton Series’ investment in Berkeley Quantitative Colorado Fund LLC as of December 31, 2011 and 2010. The management agreement of the investee fund provides for compensation to the investment manager in the form of fees in the monthly amount equal to one-twelfth of 3.0% of the notional account net asset value and 20% of the new high net trading profits earned.
2011
| | | | | | | | | | | | | | | | | | | | | | | | | | | | |
Investment | | % of Owners’
Capital | | | Fair value | | | Income (loss) | | | Mgmt Fee | | | Incentive
Fees | | | Investment
Objective | | | Redemptions
Permitted | |
Berkeley Quantitative | | | | | | | | | | | | | | | | | | | | | | | Leveraged | | | | | |
Colorado Fund LLC | | | 15.83 | % | | $ | 6,270,844 | | | $ | (2,373,858 | ) | | $ | 791,365 | | | $ | — | | | | Speculation | | | | Monthly | * |
| | | | | | | | | | | | | | | | | | | | | | | | | | | | |
2010
| | | | | | | | | | | | | | | | | | | | | | | | | | | | |
Investment | | % of Owners’
Capital | | | Fair value | | | Income (loss) | | | Mgmt Fee | | | Incentive
Fees | | | Investment
Objective | | | Redemptions
Permitted | |
Berkeley Quantitative | | | | | | | | | | | | | | | | | | | | | | | Leveraged | | | | | |
Colorado Fund LLC | | | 14.46 | % | | $ | 10,157,099 | | | $ | 153,203 | | | $ | 146,432 | | | $ | 45,345 | | | | Speculation | | | | Monthly | * |
| | | | | | | | | | | | | | | | | | | | | | | | | | | | |
Information about the investee fund’s portfolio is not available to the Series.
| * | The interest of a member in Berkeley Quantitative Colorado Fund LLC may be wholly or partially withdrawn on the last trading day of any calendar month provided the managing member has been provided written notice within five business days of such withdrawal. |
F-38
4. Swaps
In addition to authorizing Trading Advisors to manage pre-determined investment levels of futures and forward contracts, certain Series of the Trust will strategically invest a portion or all of their assets in total return Swaps, selected at the direction of the Managing Owner. Total return Swaps are privately negotiated contracts designed to provide investment returns linked to those produced by one or more investment products or indices. In a typical total return Swap, two parties agree to exchange the returns (or differentials in rates of return) earned or realized on one or more particular predetermined investments or instruments. The gross returns to be exchanged or “swapped” between the parties are calculated with respect to a “notional amount” (i.e., the amount or value of the underlying asset used in computing the particular interest rate, return, or other amount to be exchanged) in a particular investment, or in a “basket” of securities.
Each Series invests in Credit Default Swaps (“CDS”) with highly-rated counterparties as part of its portfolio. CDSs are over-the-counter investment instruments designed to mitigate counterparty risk and generally pay upon the happening of a credit default of a counterparty. The CDS are allocated to each Series based on their percentage ownership in the pooled cash management assets at U.S. Bank National Association as of the reporting date. Approximately 27% of the Trust’s U.S. Bank National Association exposure is risk-hedged in this manner with BNP Paribas through March 20, 2012, and 8% with Societe Generale through March 20, 2012.
Each Series’ investment in swaps will likely differ substantially over time due to cash flows, portfolio management decisions and market movements. The Swaps serve to diversify the investment holdings of each Series and to provide access to programs and advisors that would not be otherwise available to the Series, and are not used for hedging purposes.
The Managing Owner follows a procedure in selecting well-established financial institutions which the Managing Owner, in its sole discretion, considers to be reputable, reliable, financially responsible and well established to act as swap counterparties. The procedure includes due diligence review of documentation on all new and existing financial institution counterparties prior to initiation of the relationship, and quarterly ongoing review during the relationship, to ensure that counterparties meet the Managing Owner’s minimum credit requirements, the counterparty average rating being no less than an investment grade rating as defined by the rating agencies. As of December 31, 2011, approximately 5.0% of the Trust’s assets were deposited with over-the-counter counterparties in order to initiate and maintain Swaps.
The Series may strategically invest assets in one or more swaps linked to certain underlying investments or indices at the direction of the Managing Owner. The Trading Company in which the assets of these Series will be invested will not own any of the investments or indices referenced by any Swap entered into by these Series. In addition, neither the swap counterparty to the Trading Company of these Series nor any advisor referenced by any such Swap is a Trading Advisor to these Series.
F-39
The Series have invested in the following Swaps as of December 31, 2011:
| | | | | | | | |
| | | Frontier Diversified Series | |
| | | Credit Default Swap | | | Credit Default Swap | |
Counterparty | | | BNP Paribas | | | | Societe Generale | |
Notional Amount | | $ | 131,004 | | | $ | 0 | |
Termination Date | | | 3/20/2012 | | | | 3/20/2012 | |
Investee Returns | | | On Default | | | | On Default | |
Realized Gain/(Loss) | | $ | — | | | $ | — | |
| | | | | | | | |
Unrealized Gain/(Loss) | | $ | 46,730 | | | $ | (23,012 | ) |
| | | | | | | | |
Fair Value as of 12/31/2011 | | $ | 131,004 | | | $ | — | |
| | | | | | | | |
| | | | | | | | |
| | | Frontier Long/Short Commodity Series | |
| | | Credit Default Swap | | | Credit Default Swap | |
Counterparty | | | BNP Paribas | | | | Societe Generale | |
Notional Amount | | $ | 74,898 | | | $ | 0 | |
Termination Date | | | 3/20/2012 | | | | 3/20/2012 | |
Investee Returns | | | On Default | | | | On Default | |
Realized Gain/(Loss) | | $ | — | | | $ | — | |
| | | | | | | | |
Unrealized Gain/(Loss) | | $ | 33,374 | | | $ | (12,845 | ) |
| | | | | | | | |
Fair Value as of 12/31/2011 | | $ | 74,898 | | | $ | — | |
| | | | | | | | |
| | | | | | | | |
| | | Frontier Masters Series | |
| | | Credit Default Swap | | | Credit Default Swap | |
Counterparty | | | BNP Paribas | | | | Societe Generale | |
Notional Amount | | $ | 57,225 | | | $ | 0 | |
Termination Date | | | 3/20/2012 | | | | 3/20/2012 | |
Investee Returns | | | On Default | | | | On Default | |
Realized Gain/(Loss) | | $ | — | | | $ | — | |
| | | | | | | | |
Unrealized Gain/(Loss) | | $ | 14,031 | | | $ | (11,257 | ) |
| | | | | | | | |
Fair Value as of 12/31/2011 | | $ | 57,225 | | | $ | — | |
| | | | | | | | |
| | | | | | | | | | | | | | | | |
| | | Balanced Series | |
| | | Credit Default Swap | | | Credit Default Swap | | | Option Basket | | | Option Basket | |
Counterparty | | | BNP Paribas | | | | Societe Generale | | | | Company A | | | | DeutscheBank | |
Notional Amount | | $ | 230,783 | | | $ | 0 | | | $ | 14,129,540 | | | $ | 23,551,287 | |
Termination Date | | | 3/20/2012 | | | | 3/20/2012 | | | | 11/6/2012 | | | | 6/30/2016 | |
Investee Returns | | | On Default | | | | On Default | | | | Total Returns | | | | Total Returns | |
Realized Gain/(Loss) | | $ | — | | | $ | — | | | $ | 6,689,123 | | | $ | — | |
| | | | | | | | | | | | | | | | |
Unrealized Gain/(Loss) | | $ | 87,639 | | | $ | (41,932 | ) | | $ | (18,838,844 | ) | | $ | (368,228 | ) |
| | | | | | | | | | | | | | | | |
Fair Value as of 12/31/2011 | | $ | 230,783 | | | $ | — | | | $ | 17,706,757 | | | $ | 5,881,772 | |
| | | | | | | | | | | | | | | | |
| | | | | | | | |
| | | Berkeley/Graham/Tiverton Series (1) | |
| | | Credit Default Swap | | | Credit Default Swap | |
Counterparty | | | BNP Paribas | | | | Societe Generale | |
Notional Amount | | $ | 34,397 | | | $ | 0 | |
Termination Date | | | 3/20/2012 | | | | 3/20/2012 | |
Investee Returns | | | On Default | | | | On Default | |
Realized Gain/(Loss) | | $ | — | | | $ | — | |
| | | | | | | | |
Unrealized Gain/(Loss) | | $ | 10,346 | | | $ | (7,899 | ) |
| | | | | | | | |
Fair Value as of 12/31/2011 | | $ | 34,397 | | | $ | — | |
| | | | | | | | |
| (1) | Formerly known as the Campbell/Graham/Tiverton Series |
F-40
| | | | | | | | |
| | | Currency Series | |
| | | Credit Default Swap | | | Credit Default Swap | |
Counterparty | | | BNP Paribas | | | | Societe Generale | |
Notional Amount | | $ | 2,583 | | | $ | 0 | |
Termination Date | | | 3/20/2012 | | | | 3/20/2012 | |
Investee Returns | | | On Default | | | | On Default | |
Realized Gain/(Loss) | | $ | — | | | $ | — | |
| | | | | | | | |
Unrealized Gain/(Loss) | | $ | (2,228 | ) | | $ | (1,374 | ) |
| | | | | | | | |
Fair Value as of 12/31/2011 | | $ | 2,583 | | | $ | — | |
| | | | | | | | |
| |
| | | Winton Series | |
| | | Credit Default Swap | | | Credit Default Swap | |
Counterparty | | | BNP Paribas | | | | Societe Generale | |
Notional Amount | | $ | 61,888 | | | $ | 0 | |
Termination Date | | | 3/20/2012 | | | | 3/20/2012 | |
Investee Returns | | | On Default | | | | On Default | |
Realized Gain/(Loss) | | $ | — | | | $ | — | |
| | | | | | | | |
Unrealized Gain/(Loss) | | $ | 19,456 | | | $ | (12,165 | ) |
| | | | | | | | |
Fair Value as of 12/31/2011 | | $ | 61,888 | | | $ | — | |
| | | | | | | | |
| |
| | | Winton/Graham Series | |
| | | Credit Default Swap | | | Credit Default Swap | |
Counterparty | | | BNP Paribas | | | | Societe Generale | |
Notional Amount | | $ | 30,381 | | | $ | 0 | |
Termination Date | | | 3/20/2012 | | | | 3/20/2012 | |
Investee Returns | | | On Default | | | | On Default | |
Realized Gain/(Loss) | | $ | — | | | $ | — | |
| | | | | | | | |
Unrealized Gain/(Loss) | | $ | 6,528 | | | $ | (7,471 | ) |
| | | | | | | | |
Fair Value as of 12/31/2011 | | $ | 30,381 | | | $ | — | |
| | | | | | | | |
F-41
The Series have invested in the following Swaps as of December 31, 2010:
| | | | | | | | | | | | | | | | |
| | | Option Basket
Frontier
Diversified Series | | | Option Basket
Frontier
Dynamic Series | | | Option Basket
Frontier
Masters Series | | | Option Basket
Balanced Series | |
Series: | |
| Frontier
Diversified Series |
| |
| Frontier
Dynamic Series |
| |
| Frontier
Masters Series | ��
| | | Balanced Series | |
Counterparty | | | Company D | | | | Company E | | | | Company F | | | | Company A | |
Notional Amount | | $ | 15,569,595 | | | $ | 27,048,602 | | | $ | 26,242,246 | | | $ | 68,460,196 | |
Termination Date | | | 6/6/2014 | | | | 6/6/2014 | | | | 6/6/2014 | | | | 11/6/2012 | |
Investee Returns | | | Total Returns | | | | Total Returns | | | | Total Returns | | | | Total Returns | |
Realized Gain/(Loss) | | $ | 0 | | | $ | 0 | | | $ | 0 | | | $ | 0 | |
| | | | | | | | | | | | | | | | |
Unrealized Gain/(Loss) | | $ | 416,156 | | | $ | 929,519 | | | $ | 3,474,611 | | | $ | 8,790,927 | |
| | | | | | | | | | | | | | | | |
Fair Value as of 12/31/2010 | | $ | 11,407,905 | | | $ | 10,956,772 | | | $ | 26,242,246 | | | $ | 49,811,462 | |
| | | | | | | | | | | | | | | | |
| | | | | | | | | | | | |
| | | Option Basket
Currency Series | | | Reuters/Jefferies CRB
Index | | | Jefferies Commodity
Performance Index | |
Series: | | | Currency Series | | |
| Long/Only
Commodity Series |
| |
| Long/Only
Commodity Series |
|
Counterparty | | | Company B | | | | Company C | | | | Company C | |
Notional Amount | | $ | 11,567,063 | | | $ | 2,040,000 | | | $ | 2,040,000 | |
Termination Date | | | 1/26/2013 | | | | 2/28/2011 | | | | 2/28/2011 | |
Investee Returns | | | Total Returns | | | | Total Returns | | | | Total Returns | |
Realized Gain/(Loss) | | $ | 0 | | | $ | 190,556 | | | $ | 319,106 | |
| | | | | | | | | | | | |
Unrealized Gain/(Loss) | | $ | 675,809 | | | $ | 0 | | | $ | 0 | |
| | | | | | | | | | | | |
Fair Value as of 12/31/2010 | | $ | 5,668,768 | | | $ | 415,648 | | | $ | 375,148 | |
| | | | | | | | | | | | |
5. Investments in Unconsolidated Trading Companies
Investments in unconsolidated trading companies represent cash and open trade equity invested in the Trading Companies by each Series and cumulative trading profits or losses allocated to each Series by the Trading Companies. Trading Companies allocate trading profits or losses on the basis of the proportion of each Series’ capital allocated for trading to each respective Trading Company, which bears no relationship to the amount of cash invested by a Series in the Trading Company. The Trading Companies are valued using the equity method of accounting, which approximates fair value.
The following table summarizes the Balanced Series, Winton Series, Currency Series, Berkeley/Graham/Tiverton Series, Winton/Graham Series, Frontier Long/Short Commodity Series, Managed Futures Index Series, Frontier Diversified Series, and Frontier Masters Series investments in unconsolidated Trading Companies as of December 31, 2011 and December 31, 2010.
F-42
| | | | | | | | | | | | | | | | |
| | | As of December 31, 2011 | | | As of December 31, 2010 | |
| | | Percentage of
Series Net
Assets Invested
in Unconsolidated
Trading Companies | | | Fair Value | | | Percentage of
Series Net
Assets Invested
in Unconsolidated
Trading Companies | | | Fair Value | |
Series | | | | | | | | | | | | | | | | |
Balanced Series — | | | | | | | | | | | | | | | | |
Frontier Trading Companies II, V and VII | | | 6.17 | % | | $ | 18,255,809 | | | | 9.82 | % | | $ | 42,072,378 | |
| | | | |
Winton Series — | | | | | | | | | | | | | | | | |
Frontier Trading Company II | | | 9.45 | % | | $ | 4,731,916 | | | | 10.25 | % | | $ | 6,222,907 | |
| | | | |
Currency Series — | | | | | | | | | | | | | | | | |
Frontier Trading Company XVII | | | 54.46 | % | | $ | 2,352,121 | | | | — | | | $ | — | |
| | | | |
Berkeley/Graham/Tiverton Series — (1) | | | | | | | | | | | | | | | | |
Frontier Trading Companies V and XV | | | 20.79 | % | | $ | 8,234,047 | | | | 18.04 | % | | $ | 12,665,871 | |
| | | | |
Winton/Graham Series — | | | | | | | | | | | | | | | | |
Frontier Trading Companies II and V | | | 27.53 | % | | $ | 8,473,424 | | | | 5.35 | % | | $ | 3,383,251 | |
| | | | |
Frontier Long/Short Commodity Series — | | | | | | | | | | | | | | | | |
Frontier Trading Company I and XVIII | | | 5.03 | % | | $ | 4,081,988 | | | | 42.71 | % | | $ | 32,964,448 | |
| | | | |
Managed Futures Index Series — | | | | | | | | | | | | | | | | |
Frontier Trading Company IX | | | — | | | $ | — | | | | 19.24 | % | | $ | 992,837 | |
| | | | |
Frontier Diversified Series — | | | | | | | | | | | | | | | | |
Frontier Trading Companies I, II, V, VII, IX, XIV, XV, XVIII and XXI | | | 28.54 | % | | $ | 38,240,171 | | | | 34.45 | % | | $ | 54,940,095 | |
| | | | |
Frontier Masters Series — | | | | | | | | | | | | | | | | |
Frontier Trading Companies II, XIV and XV | | | 8.92 | % | | $ | 4,717,914 | | | | 24.02 | % | | $ | 15,921,658 | |
| (1) | Formerly known as the Campbell/Graham/Tiverton Series |
During 2010, the Balanced Series was invested in the Cantab Trading Company – Aristarchus Program, LLC, QIM Trading Company – Global Program, LLC, Tiverton Trading Company – Discretionary Program, LLC and Winton Trading Company – Diversified Program, LLC, part of such time as the majority owner. These investments were liquidated prior to December 31, 2010. Trading results for the year ended December 31, 2010 are disclosed on the statements of operations as components included in net gain/(loss) on investments.
During 2010, the Frontier Diversified Series was invested in the Beach Horizon Trading company – Horizon Program, LLC, part of such time as the majority owner. This investment was liquidated prior to December 31, 2010. Trading results for the year ended December 31, 2010 are disclosed on the statements of operations as components included in net gain/(loss) on investments.
The following table summarizes the Balanced Series, Winton Series, Currency Series, Berkeley/Graham/Tiverton Series, Winton/Graham Series, Frontier Long/Short Commodity Series, Managed Futures Index Series, Frontier Diversified Series, and Frontier Masters Series equity in earnings from unconsolidated Trading Companies as of December 31, 2011, 2010 and 2009.
F-43
| | | | | | | | | | | | | | | | | | | | | | | | | | | | | | | | | | | | | | | | | | | | | | | | |
| | | Year Ended December 31, 2011 | | | Year Ended December 31, 2010 | | | Year Ended December 31, 2009 | |
Trading Company | | Trading
Commissions | | | Realized
Gain/
(Loss) | | | Change in
Unrealized
Gain/
(Loss) | | | Net
Income
(Loss) | | | Trading
Commissions | | | Realized
Gain/
(Loss) | | | Change in
Unrealized
Gain/
(Loss) | | | Net
Income
(Loss) | | | Trading
Commissions | | | Realized
Gain/
(Loss) | | | Change in
Unrealized
Gain/
(Loss) | | | Net
Income
(Loss) | |
Balanced Series -— | | | | | | | | | | | | | | | | | | | | | | | | | | | | | | | | | | | | | | | | | | | | | | | | |
Frontier Trading Company II LLC | | $ | (43,339 | ) | | $ | 6,799,558 | | | $ | (505,785 | ) | | $ | 6,250,434 | | | $ | (60,597 | ) | | $ | 7,096,974 | | | $ | 1,629,413 | | | | 8,665,790 | | | $ | (39,049 | ) | | $ | (607,023 | ) | | $ | (398,216 | ) | | | (1,044,288 | ) |
Frontier Trading Company V LLC | | | (43,402 | ) | | | (1,265,653 | ) | | | 264,191 | | | | (1,044,864 | ) | | | — | | | | — | | | | — | | | | — | | | | — | | | | — | | | | — | | | | — | |
Frontier Trading Company VI LLC | | | — | | | | — | | | | — | | | | — | | | | (14,868 | ) | | | 965,003 | | | | 504,197 | | | | 1,454,332 | | | | — | | | | — | | | | — | | | | — | |
Frontier Trading Company VII, LLC | | | (1,127,503 | ) | | | 6,626,621 | | | | 32,869,596 | | | | 38,368,714 | | | | (2,786,670 | ) | | | 32,281,979 | | | | (11,621,678 | ) | | | 17,873,631 | | | | (2,080,917 | ) | | | 27,805,547 | | | | (11,570,476 | ) | | | 14,154,154 | |
Frontier Trading Company XIV, LLC | | | (83,595 | ) | | | 2,045,925 | | | | (189,232 | ) | | | 1,773,098 | | | | (125,524 | ) | | | (372,806 | ) | | | 2,118,611 | | | | 1,620,281 | | | | — | | | | — | | | | — | | | | — | |
Frontier Trading Company XVI, LLC | | | — | | | | — | | | | — | | | | — | | | | (3,985 | ) | | | (13,787 | ) | | | 114,194 | | | | 96,422 | | | | — | | | | — | | | | — | | | | — | |
Frontier Trading Company XIX, LLC | | | — | | | | — | | | | — | | | | — | | | | (1,753 | ) | | | (2,055 | ) | | | (86,166 | ) | | | (89,974 | ) | | | — | | | | — | | | | — | | | | — | |
| | | | | | | | | | | | | | | | | | | | | | | | | | | | | | | | | | | | | | | | | | | | | | | | |
Total | | $ | (1,297,839 | ) | | $ | 14,206,451 | | | $ | 32,438,770 | | | $ | 45,347,382 | | | $ | (2,993,397 | ) | | $ | 39,955,308 | | | $ | (7,341,429 | ) | | $ | 29,620,482 | | | $ | (2,119,966 | ) | | $ | 27,198,524 | | | $ | (11,968,692 | ) | | $ | 13,109,866 | |
| | | | | | | | | | | | | | | | | | | | | | | | | | | | | | | | | | | | | | | | | | | | | | | | |
Winton Series — | | | | | | | | | | | | | | | | | | | | | | | | | | | | | | | | | | | | | | | | | | | | | | | | |
Frontier Trading Company II LLC | | $ | (40,368 | ) | | $ | 6,690,990 | | | $ | (780,897 | ) | | $ | 5,869,725 | | | $ | (83,447 | ) | | $ | 9,623,332 | | | $ | 2,307,042 | | | $ | 11,846,927 | | | $ | (41,731 | ) | | $ | 127,741 | | | $ | 940,666 | | | $ | 1,026,676 | |
| | | | | | | | | | | | | | | | | | | | | | | | | | | | | | | | | | | | | | | | | | | | | | | | |
Currency Series — | | | | | | | | | | | | | | | | | | | | | | | | | | | | | | | | | | | | | | | | | | | | | | | | |
Frontier Trading Company XVII LLC | | $ | — | | | $ | — | | | $ | (164,993 | ) | | $ | (164,993 | ) | | $ | — | | | $ | — | | | $ | — | | | $ | — | | | $ | — | | | $ | — | | | $ | — | | | $ | — | |
| | | | | | | | | | | | | | | | | | | | | | | | | | | | | | | | | | | | | | | | | | | | | | | | |
Tiverton/Graham/Transtrend Series — (1) | | | | | | | | | | | | | | | | | | | | | | | | | | | | | | | | | | | | | | | | | | | | | | | | |
Frontier Trading Company I LLC | | $ | — | | | $ | — | | | $ | — | | | $ | — | | | $ | — | | | $ | — | | | $ | — | | | $ | — | | | $ | (54,718 | ) | | $ | 2,098,961 | | | $ | (2,458,268 | ) | | $ | (414,025 | ) |
Frontier Trading Company V LLC | | | (240,088 | ) | | | (3,589,415 | ) | | | (84,896 | ) | | | (3,914,399 | ) | | | (259,831 | ) | | | 2,255,644 | | | | 211,805 | | | | 2,207,618 | | | | (155,621 | ) | | | 2,611,025 | | | | 857,819 | | | | 3,313,223 | |
Frontier Trading Company VI LLC | | | (1,460 | ) | | | 259,429 | | | | (127,648 | ) | | | 130,321 | | | | (25,986 | ) | | | (1,123,772 | ) | | | 30,335 | | | | (1,119,423 | ) | | | (31,412 | ) | | | 35,919 | | | | (562,368 | ) | | | (557,861 | ) |
Frontier Trading Company XV, LLC | | | (71,567 | ) | | | (1,375,589 | ) | | | 1,204,986 | | | | (242,170 | ) | | | (99,106 | ) | | | 834,219 | | | | 1,746,847 | | | | 2,481,960 | | | | (13,031 | ) | | | 2,775,831 | | | | (2,856,755 | ) | | | (93,955 | ) |
| | | | | | | | | | | | | | | | | | | | | | | | | | | | | | | | | | | | | | | | | | | | | | | | |
Total | | $ | (313,115 | ) | | $ | (4,705,575 | ) | | $ | 992,442 | | | $ | (4,026,248 | ) | | $ | (384,923 | ) | | $ | 1,966,091 | | | $ | 1,988,987 | | | $ | 3,570,155 | | | $ | (254,782 | ) | | $ | 7,521,736 | | | $ | (5,019,572 | ) | | $ | 2,247,382 | |
| | | | | | | | | | | | | | | | | | | | | | | | | | | | | | | | | | | | | | | | | | | | | | | | |
Winton/Graham Series — | | | | | | | | | | | | | | | | | | | | | | | | | | | | | | | | | | | | | | | | | | | | | | | | |
Frontier Trading Company II LLC | | $ | (17,959 | ) | | $ | 3,055,428 | | | $ | (461,106 | ) | | $ | 2,576,363 | | | $ | (43,976 | ) | | $ | 5,238,242 | | | $ | 1,127,914 | | | $ | 6,322,180 | | | $ | (29,942 | ) | | $ | (1,439,961 | ) | | $ | (100,553 | ) | | $ | (1,570,456 | ) |
Frontier Trading Company V LLC | | | (140,866 | ) | | | (4,249,135 | ) | | | 561,357 | | | | (3,828,644 | ) | | | — | | | | — | | | | — | | | | — | | | | (46,668 | ) | | | (892,742 | ) | | | (397,116 | ) | | $ | (1,336,526 | ) |
| | | | | | | | | | | | | | | | | | | | | | | | | | | | | | | | | | | | | | | | | | | | | | | | |
| | $ | (158,825 | ) | | $ | (1,193,707 | ) | | $ | 100,251 | | | $ | (1,252,281 | ) | | $ | (43,976 | ) | | $ | 5,238,242 | | | $ | 1,127,914 | | | $ | 6,322,180 | | | $ | (76,610 | ) | | $ | (2,332,703 | ) | | $ | (497,669 | ) | | $ | (2,906,982 | ) |
| | | | | | | | | | | | | | | | | | | | | | | | | | | | | | | | | | | | | | | | | | | | | | | | |
Frontier Long/Short Commodity Series — | | | | | | | | | | | | | | | | | | | | | | | | | | | | | | | | | | | | | | | | | | | | | | | | |
Frontier Trading Company I LLC | | $ | (53,652 | ) | | $ | 521,524 | | | $ | (348,510 | ) | | $ | 119,362 | | | $ | (21,648 | ) | | $ | 242,186 | | | $ | 432,867 | | | $ | 653,405 | | | $ | — | | | $ | — | | | $ | — | | | $ | — | |
Frontier Trading Companies VII, LLC | | | (351,809 | ) | | | 73,665,834 | | | | (63,287,455 | ) | | | 10,026,570 | | | | (1,418,244 | ) | | | 3,385,377 | | | | 19,061,138 | | | | 21,028,271 | | | | — | | | | — | | | | — | | | | — | |
Frontier Trading Companies XIII, LLC | | | — | | | | — | | | | — | | | | — | | | | — | | | | — | | | | — | | | | — | | | | (9,702 | ) | | | 135,132 | | | | 232,252 | | | | 357,682 | |
Frontier Trading Companies XVIII, LLC | | | (6,881 | ) | | | (419,984 | ) | | | 88,039 | | | | (338,826 | ) | | | — | | | | — | | | | — | | | | — | | | | — | | | | — | | | | — | | | | — | |
| | | | | | | | | | | | | | | | | | | | | | | | | | | | | | | | | | | | | | | | | | | | | | | | |
Total | | $ | (412,342 | ) | | $ | 73,767,374 | | | $ | (63,547,926 | ) | | $ | 9,807,106 | | | $ | (1,439,892 | ) | | $ | 3,627,563 | | | $ | 19,494,005 | | | $ | 21,681,676 | | | $ | (9,702 | ) | | $ | 135,132 | | | $ | 232,252 | | | $ | 357,682 | |
| | | | | | | | | | | | | | | | | | | | | | | | | | | | | | | | | | | | | | | | | | | | | | | | |
Managed Futures Index Series — | | | | | | | | | | | | | | | | | | | | | | | | | | | | | | | | | | | | | | | | | | | | | | | | |
Frontier Trading Company IX, LLC | | $ | (10,986 | ) | | $ | (116,822 | ) | | $ | (186,788 | ) | | $ | (314,596 | ) | | $ | (22,391 | ) | | $ | 153,962 | | | $ | 305,118 | | | $ | 436,689 | | | $ | (11,181 | ) | | $ | (418,895 | ) | | $ | (37,724 | ) | | $ | (467,800 | ) |
| | | | | | | | | | | | | | | | | | | | | | | | | | | | | | | | | | | | | | | | | | | | | | | | |
Frontier Diversified Series — | | | | | | | | | | | | | | | | | | | | | | | | | | | | | | | | | | | | | | | | | | | | | | | | |
Frontier Trading Company I LLC | | $ | (1,104,816 | ) | | $ | 21,062,981 | | | $ | (26,932,976 | ) | | $ | (6,974,811 | ) | | $ | (691,807 | ) | | $ | 6,685,326 | | | $ | 1,898,999 | | | $ | 7,892,518 | | | $ | (61,046 | ) | | $ | (451,278 | ) | | $ | 829,194 | | | $ | 316,870 | |
Frontier Trading Company II LLC | | | (19,384 | ) | | | 3,076,744 | | | | (208,794 | ) | | | 2,848,566 | | | | (14,646 | ) | | | 1,838,376 | | | | 587,981 | | | | 2,411,711 | | | | (3,889 | ) | | | 220,818 | | | | (49,836 | ) | | | 167,093 | |
Frontier Trading Company V LLC | | | (47,636 | ) | | | (988,868 | ) | | | 86,947 | | | | (949,557 | ) | | | (23,040 | ) | | | 357,076 | | | | 102,969 | | | | 437,005 | | | | (2,364 | ) | | | 33,096 | | | | 3,645 | | | | 34,377 | |
Frontier Trading Company VI LLC | | | (1,069 | ) | | | 192,170 | | | | (95,556 | ) | | | 95,545 | | | | (10,342 | ) | | | 611,668 | | | | (135,057 | ) | | | 466,269 | | | | (2,433 | ) | | | 64,984 | | | | 24,700 | | | | 87,251 | |
Frontier Trading Company VII, LLC | | | (440,172 | ) | | | 1,564,889 | | | | 12,517,256 | | | | 13,641,973 | | | | (606,110 | ) | | | 10,946,282 | | | | (6,245,452 | ) | | | 4,094,720 | | | | (161,540 | ) | | | 742,948 | | | | 22,737 | | | | 604,145 | |
Frontier Trading Company IX, LLC | | | (20,834 | ) | | | (441,236 | ) | | | (165,784 | ) | | | (627,854 | ) | | | (18,356 | ) | | | 180,713 | | | | 96,846 | | | | 259,203 | | | | — | | | | — | | | | — | | | | — | |
Frontier Trading Company XIII, LLC | | | — | | | | — | | | | — | | | | — | | | | (6,553 | ) | | | (170,793 | ) | | | 532,671 | | | | 355,325 | | | | (1,111 | ) | | | 50,955 | | | | (1,487 | ) | | | 48,357 | |
Frontier Trading Company XIV, LLC | | | (163,261 | ) | | | 3,091,582 | | | | (179,388 | ) | | | 2,748,933 | | | | (67,921 | ) | | | 509,701 | | | | 442,502 | | | | 884,282 | | | | (4,279 | ) | | | 375,335 | | | | (405,630 | ) | | | (34,574 | ) |
Frontier Trading Company XV, LLC | | | (135,881 | ) | | | (3,655,745 | ) | | | 3,398,496 | | | | (393,130 | ) | | | (67,020 | ) | | | 150,833 | | | | 1,799,056 | | | | 1,882,869 | | | | (5,111 | ) | | | 1,204,823 | | | | (1,256,422 | ) | | | (56,710 | ) |
Frontier Trading Company XVIII, LLC | | | (13,242 | ) | | | (807,647 | ) | | | 170,644 | | | | (650,245 | ) | | | — | | | | — | | | | — �� | | | | — | | | | — | | | | — | | | | — | | | | — | |
Frontier Trading Company XXI, LLC | | | (674 | ) | | | (34,861 | ) | | | 7,801 | | | | (27,734 | ) | | | — | | | | — | | | | — | | | | — | | | | — | | | | — | | | | — | | | | — | |
| | | | | | | | | | | | | | | | | | | | | | | | | | | | | | | | | | | | | | | | | | | | | | | | |
Total | | $ | (1,946,969 | ) | | $ | 23,060,009 | | | $ | (11,401,354 | ) | | $ | 9,711,686 | | | $ | (1,505,795 | ) | | $ | 21,109,182 | | | $ | (919,485 | ) | | $ | 18,683,902 | | | $ | (241,773 | ) | | $ | 2,241,681 | | | $ | (833,099 | ) | | $ | 1,166,809 | |
| | | | | | | | | | | | | | | | | | | | | | | | | | | | | | | | | | | | | | | | | | | | | | | | |
Frontier Masters Series — | | | | | | | | | | | | | | | | | | | | | | | | | | | | | | | | | | | | | | | | | | | | | | | | |
Frontier Trading Company I LLC | | $ | — | | | $ | — | | | $ | — | | | $ | — | | | $ | — | | | $ | — | | | $ | — | | | $ | — | | | $ | (25,646 | ) | | $ | 267,261 | | | $ | 158,965 | | | $ | 400,580 | |
Frontier Trading Company II LLC | | | (11,513 | ) | | | 1,821,473 | | | | (233,882 | ) | | | 1,576,078 | | | | (18,791 | ) | | | 2,637,598 | | | | 314,929 | | | | 2,933,736 | | | | (5,498 | ) | | | 187,741 | | | | 125,558 | | | | 307,801 | |
Frontier Trading Company XIV, LLC | | | (162,921 | ) | | | 3,352,307 | | | | 24,021 | | | $ | 3,213,407 | | | | (116,343 | ) | | | 701,209 | | | | 989,008 | | | | 1,573,874 | | | | (7,405 | ) | | | 609,453 | | | | (566,292 | ) | | | 35,756 | |
Frontier Trading Company XV, LLC | | | (47,033 | ) | | | (1,019,827 | ) | | | 1,001,479 | | | $ | (65,381 | ) | | | (54,694 | ) | | | 326,904 | | | | 1,227,286 | | | | 1,499,496 | | | | (5,179 | ) | | | 1,192,556 | | | | (1,248,716 | ) | | | (61,339 | ) |
| | | | | | | | | | | | | | | | | | | | | | | | | | | | | | | | | | | | | | | | | | | | | | | | |
Total | | $ | (221,467 | ) | | $ | 4,153,953 | | | $ | 791,618 | | | $ | 4,724,104 | | | $ | (189,828 | ) | | $ | 3,665,711 | | | $ | 2,531,223 | | | $ | 6,007,106 | | | $ | (43,728 | ) | | $ | 2,257,011 | | | $ | (1,530,485 | ) | | $ | 682,798 | |
| | | | | | | | | | | | | | | | | | | | | | | | | | | | | | | | | | | | | | | | | | | | | | | | |
| (1) | Formerly known as the Berkeley/Graham/Tiverton Series |
F-44
6. Transactions with Affiliates
The Managing Owner contributes funds to the Series’ in order to have a 1% interest in the aggregate capital, profits and losses of all Series and in return will receive units designated as general units in the Series in which the Managing Owner invests such funds. The general units may only be purchased by the Managing Owner and may be subject to no advisory fees or management advisory fees at reduced rates. Otherwise, the general units hold the same rights as the limited units. The Managing Owner is required to maintain at least a 1% interest (“Minimum Purchase Commitment”) in the aggregate capital, profits and losses of all Series so long as it is acting as the Managing Owner of the Trust. Such contribution was made by the Managing Owner before trading commenced for the Trust and will be maintained throughout the existence of the Trust, and the Managing Owner will make such purchases as are necessary to effect this requirement. Additionally, the Managing Owner agreed with certain regulatory bodies to maintain a 1% interest specifically in the Balanced Series Class 1 a Units and Balanced Series Class 2a Units, aggregated, and each of the Long Only Commodity Series, Frontier Long/Short Commodity Series, Managed Futures Index Series, Frontier Diversified Series, Frontier Dynamic Series and Frontier Masters Series. The 1% interest in these specific Series is included in computing the Minimum Purchase Commitment in aggregate capital. In addition to the general units the Managing Owner receives in respect of its Minimum Purchase Commitment, the Managing Owner may purchase Limited Units in any Series as a Limited Owner. Principals of the Managing Owner or affiliates are allowed to own beneficial interests in the Trust, as well. All Units purchased by the Managing Owner are held for investment purposes only and not for resale. The Managing Owner may make purchases or redemptions at any time on the same terms as any Limited Owner. The Trust has and will continue to have certain relationships with the Managing Owner and its affiliates.
The Balanced Series had advanced funds to the Currency Series, Frontier Diversified Series, Frontier Dynamic Series and Frontier Masters Series for the purpose of investing in the respective Trading Company for such Series on behalf of the Balanced Series. All of these advances have been repaid as of December 31, 2011.
On July 18, 2011, the Balanced Series reduced its inter-series advance to the Dynamic Series in exchange for ownership in a total return swap contract in the amount of $27,379,284 which approximated fair value in accordance with the Series’ valuation policies at the date of transfer.
The following table summarizes the Balanced Series advances to and reductions from the Currency Series and Frontier Dynamic Series of the Trust for the years ended December 31, 2011 and 2010 as well as the Frontier Diversified Series and the Frontier Masters Series for the year ended December 31, 2010.
F-45
Balanced Series
Summary by Quarter
For the Year Ended December 31, 2011
| | | | | | | | | | | | |
| | | | | | Frontier | | | | |
| | | Currency Series | | | Dynamic Series | | | Total | |
Inter-series receivables January 1, 2011 | | $ | 12,816,775 | | | $ | 28,320,283 | | | $ | 41,137,058 | |
Additions during period | | | — | | | | — | | | | — | |
Reduction during period | | | — | | | | — | | | | — | |
Net change in inter-series receivables | | | (476,691 | ) | | | (563,946 | ) | | | (1,040,637 | ) |
| | | | | | | | | | | | |
Inter-series receivables March 31, 2011 | | $ | 12,340,084 | | | $ | 27,756,337 | | | $ | 40,096,421 | |
| | | |
Additions during period | | | — | | | | — | | | | — | |
Reduction during period | | | — | | | | — | | | | — | |
Net change in inter-series receivables | | | (46,549 | ) | | | 284,461 | | | | 237,912 | |
| | | | | | | | | | | | |
Inter-series receivables June 30, 2011 | | $ | 12,293,535 | | | $ | 28,040,798 | | | $ | 40,334,333 | |
| | | |
Additions during period | | | — | | | | — | | | | — | |
Reduction during period | | | (11,281,861 | ) | | | (27,379,283 | ) | | | (38,661,144 | ) |
Net change in inter-series receivables | | | (1,011,674 | ) | | | (661,515 | ) | | | (1,673,189 | ) |
| | | | | | | | | | | | |
Inter-series receivables September 30, 2011 | | $ | — | | | $ | — | | | $ | — | |
| | | |
Additions during period | | | — | | | | — | | | | — | |
Reduction during period | | | — | | | | — | | | | — | |
Net change in inter-series receivables | | | — | | | | — | | | | — | |
| | | | | | | | | | | | |
Inter-series receivables December 31, 2011 | | $ | — | | | $ | — | | | $ | — | |
| | | | | | | | | | | | |
F-46
Balanced Series
Summary by Quarter
For the Year Ended December 31, 2010
| | | | | | | | | | | | | | | | | | | | |
| | | Currency | | | Frontier | | | Frontier | | | Frontier | | | | |
| | | Series | | | Diversified Series | | | Dynamic Series | | | Masters Series | | | Total | |
Inter-series receivables January 1, 2010 | | $ | 12,266,758 | | | $ | 10,962,073 | | | $ | 27,676,116 | | | $ | 18,184,135 | | | $ | 69,089,082 | |
Additions during period | | | — | | | | — | | | | — | | | | — | | | | — | |
Reduction during period | | | — | | | | — | | | | — | | | | — | | | | — | |
Net change in inter-series receivables | | | 329,038 | | | | (102,443 | ) | | | (129,208 | ) | | | 125,024 | | | | 222,411 | |
| | | | | | | | | | | | | | | | | | | | |
Inter-series receivables March 31, 2010 | | $ | 12,595,796 | | | $ | 10,859,630 | | | $ | 27,546,908 | | | $ | 18,309,159 | | | $ | 69,311,493 | |
| | | | | | | | | | | | | | | | | | | — | |
Additions during period | | | — | | | | — | | | | — | | | | — | | | | — | |
Reduction during period | | | — | | | | (11,139,253 | ) | | | — | | | | — | | | | (11,139,253 | ) |
Net change in inter-series receivables | | | 177,705 | | | | 279,623 | | | | (130,449) | | | | (122,674) | | | | 204,205 | |
| | | | | | | | | | | | | | | | | | | | |
Inter-series receivables June 30, 2010 | | $ | 12,773,501 | | | $ | — | | | $ | 27,416,459 | | | $ | 18,186,485 | | | $ | 58,376,445 | |
| | | | | |
Additions during period | | | — | | | | — | | | | — | | | | — | | | | — | |
Reduction during period | | | — | | | | — | | | | — | | | | (19,013,476 | ) | | | (19,013,476 | ) |
Net change in inter-series receivables | | | 238,872 | | | | — | | | | 538,835 | | | | 826,991 | | | | 1,604,698 | |
| | | | | | | | | | | | | | | | | | | | |
Inter-series receivables September 30, 2010 | | $ | 13,012,373 | | | $ | — | | | $ | 27,955,294 | | | $ | — | | | $ | 40,967,667 | |
| | | | | |
Additions during period | | | — | | | | — | | | | — | | | | — | | | | — | |
Reduction during period | | | — | | | | — | | | | — | | | | — | | | | — | |
Net change in inter-series receivables | | | (195,598) | | | | — | | | | 364,989 | | | | — | | | | 169,391 | |
| | | | | | | | | | | | | | | | | | | | |
Inter-series receivables December 31, 2010 | | $ | 12,816,775 | | | $ | — | | | $ | 28,320,283 | | | $ | — | | | $ | 41,137,058 | |
| | | | | | | | | | | | | | | | | | | | |
Expenses
Management Fees—Each Series of Units pays to the Managing Owner a monthly management fee equal to a certain percentage of such Series’ assets attributable to such Series (including notional assets), calculated on a daily basis. The annual rate of the management fee is 0.5% for the Balanced Series, 2.0% for the Winton Series, Currency Series, Long Only Commodity Series, Frontier Long/Short Commodity Series Class 1 a and Class 2a, Managed Futures Index Series, Frontier Diversified Series, Frontier Dynamic Series and Frontier Masters Series, 2.5% for the Winton/Graham Series and Berkeley/Graham/Tiverton Series, and 3.5% for the Frontier Long/Short Commodity Series Class 1 and Class 2. The Managing Owner may pay all or a portion of such management fees to the Trading Advisor(s) for such Series.
Trading Fees—In connection with each Series’ trading activities, the Frontier Long/Short Commodity Series (Classes 1, 2 and 3), Balanced Series, Currency Series, Berkeley/Graham/Tiverton Series, Long/Only Commodity Series, Managed Futures Index Series, Winton Series and Winton/Graham Series pays to the Managing Owner a trading fee, or FCM Fee, up to 0.75% of such Series’ NAV, calculated daily. The Frontier Diversified Series, Frontier Dynamic Series, Frontier Long/Short Commodity Series (Classes 1a and 2a) and Frontier Masters Series pays to the Managing Owner a trading fee, or FCM Fee, up to 2.25% and a custodial/due diligence fee of 0.12% of such Series’ NAV, calculated daily.
Incentive Fees—Some Series pay to the Managing Owner an incentive fee of a certain percentage of new net trading profits generated by such Series, monthly or quarterly. Because the Balanced Series, Winton/Graham Series, Berkeley/Graham/Tiverton Series, Currency Series and Frontier Long/Short Commodity Series may each employ multiple Trading Advisors, these Series will pay the
Managing Owner a monthly incentive fee calculated on a Trading Advisor by Trading Advisor basis. It is therefore possible that in any given period the Balanced Series or the Frontier Long/Short Commodity Series may pay incentive fees to the Managing Owner for one or more Trading Advisors while each of these Series as a whole experiences losses. The incentive fee is 25% for the Balanced Series and the Frontier Diversified Series and 20% for the Winton Series, Currency Series, Winton/Graham Series, Berkeley/Graham/Tiverton Series, Frontier Long/Short Commodity Series, Frontier Dynamic Series and Frontier Masters Series. Each Series implements hurdle rates that vary between Series. New net trading Profits must exceed this hurdle rate in order to pay incentive fees to the Managing Owner. There is no incentive fee for the Long Only Commodity Series or the Managed Futures Index Series. The Managing Owner may pay all or a portion of such incentive fees to the Trading Advisor(s) for such Series.
F-47
Service Fees—In addition, with respect to Class 1 and Class 1a Units of each Series, as applicable, the Series pays monthly or quarterly to the Managing Owner a service fee at an annualized rate, as described in more detail above, which the Managing Owner pays to selling agents of the Trust.
The following table summarizes fees incurred to the Managing Owner for the year ended December 31, 2011.
| | | | | | | | | | | | | | | | |
Series: | | Management Fee | | | Trading Fee | | | Incentive Fee | | | Service Fee | |
Frontier Diversified Series | | $ | 1,988,295 | | | $ | 3,469,475 | | | $ | 4,954,751 | | | $ | 1,797,911 | |
Frontier Dynamic Series | | | — | | | | 376,388 | | | | — | | | | 51,746 | |
Frontier Long/Short Commodity Series | | | 3,607,413 | | | | 768,116 | | | | 2,887,684 | | | | 824,266 | |
Frontier Masters Series | | | 1,439,579 | | | | 1,411,575 | | | | 805,663 | | | | 809,423 | |
Balanced Series | | | 2,615,058 | | | | 1,760,639 | | | | 13,141,331 | | | | 7,074,592 | |
Berkeley/Graham/Tiverton Series | | | 1,240,589 | | | | 280,872 | | | | 29,678 | | | | 1,422,634 | |
Currency Series | | | 80,701 | | | | 60,410 | | | | — | | | | 153,870 | |
Long Only Commodity Series | | | 37,451 | | | | 14,105 | | | | — | | | | 38,421 | |
Managed Futures Index Series | | | 91,855 | | | | 21,395 | | | | — | | | | 11,957 | |
Winton Series | | | 1,225,133 | | | | 285,429 | | | | 813,809 | | | | 1,271,915 | |
Winton/Graham Series | | | 1,382,514 | | | | 221,789 | | | | 298,707 | | | | 1,023,780 | |
F-48
The following table summarizes fees incurred to the Managing Owner for the year ended December 31, 2010
| | | | | | | | | | | | | | | | |
Series: | | Management Fee | | | Trading Fee | | | Incentive Fee | | | Service Fee | |
Frontier Diversified Series | | $ | 1,149,719 | | | $ | 2,734,353 | | | $ | 4,102,217 | | | $ | 1,465,769 | |
Frontier Dynamic Series | | | — | | | | 687,992 | | | | — | | | | 91,089 | |
Frontier Long/Short Commodity Series | | | 3,355,920 | | | | 425,521 | | | | 3,065,308 | | | | 1,174,272 | |
Frontier Masters Series | | | 1,093,634 | | | | 1,507,560 | | | | 490,628 | | | | 675,234 | |
Balanced Series | | | 2,253,874 | | | | 1,810,726 | | | | 13,893,116 | | | | 8,595,406 | |
Berkeley/Graham/Tiverton Series | | | 2,289,188 | | | | 360,892 | | | | 270,462 | | | | 1,927,715 | |
Currency Series | | | 163,333 | | | | 102,763 | | | | — | | | | 216,919 | |
Long Only Commodity Series | | | 52,798 | | | | 20,116 | | | | — | | | | 65,418 | |
Managed Futures Index Series | | | 120,305 | | | | 26,465 | | | | — | | | | 32,965 | |
Winton Series | | | 1,529,612 | | | | 291,849 | | | | 534,245 | | | | 1,456,391 | |
Winton/Graham Series | | | 1,959,820 | | | | 286,314 | | | | 702,432 | | | | 1,373,119 | |
The following table summarizes fees incurred to the Managing Owner for the year ended December 31, 2009
| | | | | | | | | | | | | | | | |
Series: | | Management Fee | | | Trading Fee | | | Incentive Fee | | | Service Fee | |
Balanced Series | | $ | 189,654 | | | $ | 656,932 | | | $ | 299,318 | | | $ | 179,789 | |
Winton Series | | | — | | | | 391,638 | | | | — | | | | 43,521 | |
Berkeley/Graham/Tiverton Series | | | 2,923,989 | | | | 350,577 | | | | 2,135,357 | | | | 1,437,570 | |
Currency Series | | | 336,955 | | | | 444,862 | | | | 9,073 | | | | 95,272 | |
Winton/Graham Series | | | 1,555,348 | | | | 1,937,150 | | | | 7,386,253 | | | | 9,120,995 | |
Long Only Commodity Series | | | 2,291,126 | | | | 421,502 | | | | 222,963 | | | | 2,148,431 | |
Frontier Long/Short Commodity Series | | | 161,155 | | | | 140,572 | | | | — | | | | 302,067 | |
Managed Futures Index Series | | | 53,403 | | | | 21,077 | | | | — | | | | 68,696 | |
Winton Series | | | 78,544 | | | | 19,812 | | | | — | | | | 41,467 | |
Winton/Graham Series | | | 1,430,660 | | | | 331,643 | | | | (21,347 | ) | | | 1,634,324 | |
The following table summarizes fees payable to the Managing Owner as of December 31, 2011
| | | | | | | | | | | | | | | | |
Series: | | Management Fee
Payable | | | Trading Fee
Payable | | | Incentive Fee
Payable | | | Service Fee
Payable | |
Frontier Diversified Series | | $ | 180,232 | | | $ | 269,021 | | | $ | 522,033 | | | $ | 76,877 | |
Frontier Dynamic Series | | | — | | | | — | | | | — | | | | — | |
Frontier Long/Short Commodity Series | | | 284,677 | | | | 83,646 | | | | 127,052 | | | | 22,920 | |
Frontier Masters Series | | | 117,541 | | | | 105,278 | | | | — | | | | 41,911 | |
Balanced Series | | | 241,525 | | | | 176,398 | | | | 1,195,031 | | | | 435,380 | |
Berkeley/Graham/Tiverton Series | | | 101,400 | | | | 25,212 | | | | — | | | | 87,016 | |
Currency Series | | | — | | | | 2,727 | | | | — | | | | 6,285 | |
Long Only Commodity Series | | | 102 | | | | 635 | | | | — | | | | 672 | |
Managed Futures Index Series | | | 4,148 | | | | 1,467 | | | | — | | | | 444 | |
Winton Series | | | 90,559 | | | | 31,302 | | | | — | | | | 78,044 | |
Winton/Graham Series | | | 100,311 | | | | 19,427 | | | | — | | | | 57,141 | |
F-49
The following table summarizes fees payable to the Managing Owner as of December 31, 2010
| | | | | | | | | | | | | | | | |
Series: | | Management Fee
Payable | | | Trading Fee
Payable | | | Incentive Fee
Payable | | | Service Fee
Payable | |
Frontier Diversified Series | | $ | 139,758 | | | $ | 310,302 | | | $ | 1,453,102 | | | $ | 48,903 | |
Frontier Dynamic Series | | | — | | | | 59,936 | | | | — | | | | 726 | |
Frontier Long/Short Commodity Series | | | 300,038 | | | | 44,699 | | | | 1,600,703 | | | | 69,686 | |
Frontier Masters Series | | | 108,531 | | | | 131,841 | | | | 229,686 | | | | 21,894 | |
Balanced Series | | | 114,145 | | | | 71,087 | | | | 2,688,776 | | | | 196,325 | |
Berkeley/Graham/Tiverton Series | | | 152,455 | | | | 29,714 | | | | 270,557 | | | | 148,307 | |
Currency Series | | | 13,860 | | | | 8,409 | | | | — | | | | 11,273 | |
Long Only Commodity Series | | | 4,634 | | | | 1,750 | | | | — | | | | 5,599 | |
Managed Futures Index Series | | | 10,789 | | | | 2,154 | | | | — | | | | 2,338 | |
Winton Series | | | 122,675 | | | | 25,245 | | | | 467,341 | | | | 99,085 | |
Winton/Graham Series | | | 138,136 | | | | 24,127 | | | | 623,629 | | | | 103,698 | |
With respect to the service fees, the initial service fee (for the first 12 months) relating to a purchase of Units by an investor is prepaid by the Managing Owner to the relevant selling agent in the month following such purchase and is reimbursed therefore by the Series monthly in arrears in an amount based upon a corresponding percentage of NAV, calculated daily. Consequently, the Managing Owner bears the risk and enjoys the benefit of the upside potential of any difference between the amount of the initial service fee prepaid by it and the amount of the reimbursement thereof, which may result from variations in NAV over the following 12 months. For the year ended December 31, 2011, amounts received or receivable from the Managing Owner for the difference in monthly service fees from the prepaid initial service fees were $2,752 for the Frontier Dynamic Series, $77 for the Long/Only Commodity Series and $81 for the Managed Futures Index Series. For the year ended December 31, 2011, amounts paid or owed to the Managing Owner for the difference in monthly service fees from prepaid initial service fees were $34,141 for the Balanced Series, $16,508 for the Frontier Long/Short Commodity Series, $23,473 for the Frontier Diversified Series, $755 for the Currency Series, $6,607 for the Tiverton Series, $5,102 for the Winton/Graham Series, $9,011 for the Winton Series and $12,444 for the Frontier Masters Series.
For the year ended December 31, 2010, amounts received or receivable from the Managing Owner for the difference in monthly service fees from the prepaid initial service fees were $8,968 for the Balanced Series, $5,201 for the Frontier Long/Short Commodity Series and $1,592 for the Frontier Diversified Series. For the twelve months ended December 31, 2010, amounts paid or owing the Managing Owner for the difference in monthly service fees from prepaid initial service fees were $983 for the Currency Series, $439 for the Winton/Graham Series, $1,115 for the Berkeley/Graham/Tiverton Series, $13,886 for the Long Only Commodity Series, $272 for the Managed Futures Index Series, $17,149 for the Winton Series, $5,965 for the Frontier Dynamic Series, and $2,011 for the Frontier Masters Series.
Aggregate interest income from all sources, including assets held at clearing brokers, up to 2% (annualized) is paid to the Managing Owner by the Balanced Series (Class 1 and Class 2 only), Winton Series, Berkeley/Graham/Tiverton Series, Currency Series and Winton/Graham Series. For the Frontier Diversified Series, Frontier Dynamic Series, Frontier Long/Short Commodity Series, Frontier Masters Series, Balanced Series (Class 1a and Class 2a only), Long Only Commodity Series and Managed Futures Index Series 20% of the total interest allocated to each Series is paid to the Managing Owner. During the years ended December 31, 2011, 2010 and 2009, the Trust paid $9,330,127, $10,238,665 and $10,476,506, respectively, of such interest income to the Managing Owner. Such expenses are not included in the statements of operations of the Series.
The Managing Owner pays to The Bornhoft Group Corporation, an affiliate of the Trust, a monthly fee of 0.25% (annualized) of the NAV of the Trust, for services in connection with the daily valuation of each Series and Class. The amount paid under this agreement was $1,890,452, $2,027,849 and $1,746,079, respectively for the years ended December 31, 2011 2010 and 2009.
Solon Capital, LLC, an affiliate of the Trust, provides product development and marketing services. For these services, the Managing Owner paid Solon Capital, LLC, $3,402,814 $3,650,128 and $3,142,942, respectively, for the years ended December 31, 2011, 2010 and 2009.
Bornhoft Group Securities Corporation, a subsidiary of the Managing Owner, serves as wholesaler of the Trust by marketing to broker/dealer organizations. Its results are consolidated with the Managing Owner.
F-50
7. Financial Highlights
The following information presents the financial highlights of the Series for the year ended December 31, 2011. This data has been derived from the information presented in the financial statements.
| | | | | | | | | | | | | | | | | | | | | | | | | | | | | | | | | | | | |
| | | Diversified | | | Dynamic | | | Long/Short | |
| | | Class 1 | | | Class 2 | | | Class 1 | | | Class 2 | | | Class 1 | | | Class 2 | | | Class 3 | | | Class 1a | | | Class 2a | |
Per unit operating performance (1) | | | | | | | | | | | | | | | | | | | | | | | | | | | | | | | | | | | | |
Net asset value, December 31, 2010 | | $ | 103.58 | | | $ | 106.46 | | | $ | 91.94 | | | $ | 94.40 | | | $ | 132.73 | | | $ | 153.26 | | | $ | 153.26 | | | $ | 117.96 | | | $ | 121.18 | |
Net operating results: | | | | | | | | | | | | | | | | | | | | | | | | | | | | | | | | | | | | |
Interest income | | | 1.67 | | | | 1.73 | | | | 14.38 | | | | 14.84 | | | | 2.62 | | | | 3.05 | | | | 3.04 | | | | 2.30 | | | | 2.38 | |
Expenses | | | (9.50 | ) | | | (7.50 | ) | | | (25.41 | ) | | | (22.31 | ) | | | (17.66 | ) | | | (16.15 | ) | | | (16.11 | ) | | | (15.49 | ) | | | (12.62 | ) |
Net gain/(loss) on investments, net of non-controlling interests | | | 3.65 | | | | 3.27 | | | | 7.14 | | | | 4.33 | | | | 18.44 | | | | 21.81 | | | | 21.77 | | | | 16.94 | | | | 16.29 | |
| | | | | | | | | | | | | | | | | | | | | | | | | | | | | | | | | | | | |
Net income/(loss) | | | (4.18 | ) | | | (2.50 | ) | | | (3.89 | ) | | | (3.14 | ) | | | 3.40 | | | | 8.71 | | | | 8.70 | | | | 3.75 | | | | 6.05 | |
| | | | | | | | | | | | | | | | | | | | | | | | | | | | | | | | | | | | |
Net asset value, December 31, 2011 | | $ | 99.40 | | | $ | 103.96 | | | $ | 88.05 | | | $ | 91.26 | | | $ | 136.13 | | | $ | 161.97 | | | $ | 161.96 | | | $ | 121.71 | | | $ | 127.23 | |
| | | | | | | | | | | | | | | | | | | | | | | | | | | | | | | | | | | | |
Ratios to average net assets (3) | | | | | | | | | | | | | | | | | | | | | | | | | | | | | | | | | | | | |
Net investment gain/(loss) | | | 3.52 | % | | | 3.07 | % | | | 14.46 | % | | | 8.55 | % | | | 13.89 | % | | | 14.23 | % | | | 14.21 | % | | | 14.36 | % | | | 13.44 | % |
Expenses before incentive fees | | | 5.82 | % | | | 3.69 | % | | | 51.48 | % | | | 44.00 | % | | | 9.47 | % | | | 6.70 | % | | | 6.68 | % | | | 9.30 | % | | | 6.58 | % |
Expenses after incentive fees | | | 9.17 | % | | | 7.04 | % | | | 51.48 | % | | | 44.00 | % | | | 13.30 | % | | | 10.54 | % | | | 10.51 | % | | | 13.13 | % | | | 10.41 | % |
Total return before incentive fees (2) | | | -0.68 | % | | | 1.00 | % | | | -4.23 | % | | | -3.33 | % | | | 6.39 | % | | | 9.51 | % | | | 9.51 | % | | | 7.01 | % | | | 8.82 | % |
Total return after incentive fees (2) | | | -4.04 | % | | | -2.35 | % | | | -4.23 | % | | | -3.33 | % | | | 2.56 | % | | | 5.68 | % | |
| 5.68
| %
| | | 3.18 | % | | | 4.99 | % |
| | | | | | | | | | | | | | | | | | | | | | | | | | | | | | | | | | | | |
| | | Masters | | | Balanced | | | BGT | |
| | | Class 1 | | | Class 2 | | | Class 1 | | | Class 1a | | | Class 2 | | | Class 2a | | | Class 3a | | | Class 1 | | | Class 2 | |
Per unit operating performance (1) | | | | | | | | | | | | | | | | | | | | | | | | | | | | | | | | | | | | |
Net asset value, December 31, 2010 | | $ | 102.96 | | | $ | 105.81 | | | $ | 131.95 | | | $ | 116.36 | | | $ | 159.46 | | | $ | 133.66 | | | $ | 133.66 | | | $ | 110.46 | | | $ | 131.73 | |
Net operating results: | | | | | | | | | | | | | | | | | | | | | | | | | | | | | | | | | | | | |
Interest income | | | 1.75 | | | | 1.81 | | | | 0.22 | | | | 0.20 | | | | 0.27 | | | | 0.23 | | | | 0.23 | | | | 0.21 | | | | 0.25 | |
Expenses | | | (8.42 | ) | | | (6.46 | ) | | | (11.28 | ) | | | (9.90 | ) | | | (8.98 | ) | | | (7.49 | ) | | | (7.49 | ) | | | (6.10 | ) | | | (3.63 | ) |
Net gain/(loss) on investments, net of non-controlling interests | | | 3.96 | | | | 3.67 | | | | 3.61 | | | | 1.79 | | | | 4.27 | | | | 1.95 | | | | 1.96 | | | | (13.55 | ) | | | (16.51 | ) |
| | | | | | | | | | | | | | | | | | | | | | | | | | | | | | | | | | | | |
Net income/(loss) | | | (2.71 | ) | | | (0.98 | ) | | | (7.45 | ) | | | (7.91 | ) | | | (4.44 | ) | | | (5.31 | ) | | | (5.30 | ) | | | (19.44 | ) | | | (19.89 | ) |
| | | | | | | | | | | | | | | | | | | | | | | | | | | | | | | | | | | | |
Net asset value, December 31, 2011 | | $ | 100.25 | | | $ | 104.83 | | | $ | 124.50 | | | $ | 108.45 | | | $ | 155.02 | | | $ | 128.35 | | | $ | 128.36 | | | $ | 91.02 | | | $ | 111.84 | |
| | | | | | | | | | | | | | | | | | | | | | | | | | | | | | | | | | | | |
Ratios to average net assets (3) | | | | | | | | | | | | | | | | | | | | | | | | | | | | | | | | | | | | |
Net investment gain/(loss) | | | 3.84 | % | | | 3.47 | % | | | 2.74 | % | | | 1.54 | % | | | 2.68 | % | | | 1.46 | % | | | 1.47 | % | | | -12.26 | % | | | -12.53 | % |
Expenses before incentive fees | | | 6.84 | % | | | 4.77 | % | | | 4.34 | % | | | 4.30 | % | | | 1.43 | % | | | 1.40 | % | | | 1.40 | % | | | 5.47 | % | | | 2.70 | % |
Expenses after incentive fees | | | 8.18 | % | | | 6.10 | % | | | 8.55 | % | | | 8.50 | % | | | 5.63 | % | | | 5.60 | % | | | 5.61 | % | | | 5.52 | % | | | 2.76 | % |
Total return before incentive fees (2) | | | -1.29 | % | | | 0.41 | % | | | -1.44 | % | | | -2.59 | % | | | 1.42 | % | | | 0.23 | % | | | 0.24 | % | | | -17.54 | % | | | -15.04 | % |
Total return after incentive fees (2) | | | -2.63 | % | | | -0.93 | % | | | -5.65 | % | | | -6.80 | % | | | -2.78 | % | | | -3.97 | % | | | -3.97 | % | | | -17.60 | % | | | -15.10 | % |
| | | | | | | | | | | | | | | | | | | | | | | | | | | | | | | | |
| | | Currency | | | Long Only | | | MFI | |
| | | Class 1 | | | Class 2 | | | Class 1 | | | Class 2 | | | Class 3 | | | Class 1 | | | Class 2 | | | Class 3 | |
Per unit operating performance (1) | | | | | | | | | | | | | | | | | | | | | | | | | | | | | | | | |
Net asset value, December 31, 2010 | | $ | 79.09 | | | $ | 95.43 | | | $ | 94.11 | | | $ | 103.71 | | | $ | 103.88 | | | $ | 117.96 | | | $ | 129.69 | | | $ | 126.73 | |
Net operating results: | | | | | | | | | | | | | | | | | | | | | | | | | | | | | | | | |
Interest income | | | 0.84 | | | | 1.05 | | | | 1.99 | | | | 2.20 | | | | 2.11 | | | | 2.24 | | | | 2.47 | | | | 2.47 | |
Expenses | | | (4.14 | ) | | | (2.39 | ) | | | (3.56 | ) | | | (1.89 | ) | | | (1.81 | ) | | | (5.29 | ) | | | (3.40 | ) | | | (3.40 | ) |
Net gain/(loss) on investments, net of non-controlling interests | | | (5.31 | ) | | | (6.48 | ) | | | (5.43 | ) | | | (6.14 | ) | | | (6.30 | ) | | | (8.08 | ) | | | (9.00 | ) | | | (6.04 | ) |
| | | | | | | | | | | | | | | | | | | | | | | | | | | | | | | | |
Net income/(loss) | | | (8.61 | ) | | | (7.82 | ) | | | (7.00 | ) | | | (5.83 | ) | | | (6.00 | ) | | | (11.13 | ) | | | (9.93 | ) | | | (6.97 | ) |
| | | | | | | | | | | | | | | | | | | | | | | | | | | | | | | | |
Net asset value, December 31, 2011 | | $ | 70.48 | | | $ | 87.61 | | | $ | 87.11 | | | $ | 97.88 | | | $ | 97.88 | | | $ | 106.83 | | | $ | 119.76 | | | $ | 119.76 | |
| | | | | | | | | | | | | | | | | | | | | | | | | | | | | | | | |
Ratios to average net assets (3) | | | | | | | | | | | | | | | | | | | | | | | | | | | | | | | | |
Net investment gain/(loss) | | | -6.71 | % | | | -6.79 | % | | | -5.93 | % | | | -6.09 | % | | | -6.23 | % | | | -7.04 | % | | | -7.14 | % | | | -4.90 | % |
Expenses before incentive fees | | | 5.24 | % | | | 2.51 | % | | | 3.88 | % | | | 1.88 | % | | | 1.79 | % | | | 4.61 | % | | | 2.69 | % | | | 2.76 | % |
Expenses after incentive fees | | | 5.24 | % | | | 2.51 | % | | | 3.88 | % | | | 1.88 | % | | | 1.79 | % | | | 4.61 | % | | | 2.69 | % | | | 2.76 | % |
Total return before incentive fees (2) | | | -10.89 | % | | | -8.19 | % | | | -7.44 | % | | | -5.62 | % | | | -5.78 | % | | | -9.44 | % | | | -7.66 | % | | | -5.50 | % |
Total return after incentive fees (2) | | | -10.89 | % | | | -8.19 | % | | | -7.44 | % | | | -5.62 | % | | | -5.78 | % | | | -9.44 | % | | | -7.66 | % | | | -5.50 | % |
| | | | | | | | | | | | | | | | |
| | | Winton | | | Winton/Graham | |
| | | Class 1 | | | Class 2 | | | Class 1 | | | Class 2 | |
Per unit operating performance (1) | | | | | | | | | | | | | | | | |
Net asset value, December 31, 2010 | | $ | 135.04 | | | $ | 153.99 | | | $ | 119.83 | | | $ | 144.04 | |
Net operating results: | | | | | | | | | | | | | | | | |
Interest income | | | 1.17 | | | | 1.35 | | | | 0.60 | | | | 0.73 | |
Expenses | | | (10.05 | ) | | | (6.87 | ) | | | (8.68 | ) | | | (6.35 | ) |
Net gain/(loss) on investments, net of non-controlling interests | | | 14.97 | | | | 17.35 | | | | (7.02 | ) | | | (8.72 | ) |
| | | | | | | | | | | | | | | | |
Net income/(loss) | | | 6.09 | | | | 11.83 | | | | (15.10 | ) | | | (14.34 | ) |
| | | | | | | | | | | | | | | | |
Net asset value, December 31, 2011 | | $ | 141.13 | | | $ | 165.82 | | | $ | 104.73 | | | $ | 129.70 | |
| | | | | | | | | | | | | | | | |
Ratios to average net assets (3) | | | | | | | | | | | | | | | | |
Net investment gain/(loss) | | | 11.09 | % | | | 11.27 | % | | | -5.86 | % | | | -6.05 | % |
Expenses before incentive fees | | | 5.93 | % | | | 2.95 | % | | | 6.54 | % | | | 3.70 | % |
Expenses after incentive fees | | | 7.44 | % | | | 4.46 | % | | | 7.25 | % | | | 4.41 | % |
Total return before incentive fees (2) | | | 6.02 | % | | | 9.19 | % | | | -11.90 | % | | | -9.25 | % |
Total return after incentive fees (2) | | | 4.51 | % | | | 7.68 | % | | | -12.60 | % | | | -9.96 | % |
| (1) | Interest income and expenses per unit are calculated by dividing these amounts by the average number of units outstanding during the period. |
| | The net gain/(loss) on investments, net of non-controlling interests is a balancing amount necessary to reconcile the change in net asset value per unit with the other per unit information. |
| (2) | Computed using average net assets outstanding during the period. An owner’s total returns may vary from the above returns based on the timing of contributions and withdrawals. Total returns are not annualized. |
| (4) | Long Only Series Class 3 and Managed Futures Index Series Class 3 began trading operations on January 13, 2011. |
| (5) | Formerly the Cambell/Graham/Tiverton Series. |
| (6) | The Frontier Dynamic Series ceased trading operations on July 15, 2011 and redeemed all existing Units. The Series remains active. Net asset value per unit represents the liquidation value. |
| (7) | For the year ended December 31, 2011, 38.76% of the Currency Series’ Class 1 total return and 33.02% of the Currency Series’ Class 2 total return consists of a voluntary reimbursement by the managing owner for a realized investment loss. Excluding this item, total return would have been (14.12%) for Currency Series Class 1 and (6.58%) for Currency Series Class 2. Also for the year ended December 31, 2011, the inter-series payable and receivable was included in the above ratios to average net assets for the Dynamic Series and Currency Series. Excluding the inter-series payable/receivable, the net investment gain/(loss), expenses before incentive fees and expenses after incentive fees for Dyanmic Series Class 1 would have been 0.62%, 10.14% and 10.14%, respectively, and (5.36%), 2.44% and 2.44% for Dynamic Series Class 2. Excluding the inter-series payable/receivable, the net investment gain/(loss), expenses before incentive fees and expenses after incentive fees for Currency Series Class 1 would have been (7.46%), 3.91% and 3.91%, respectively, and (7.56%), 1.14% and 1.14% for Currency Series Class 2. |
| (8) | The Long Only Commodity Series and the Managed Futures Index Series ceased trading operations on December 21, 2011 and redeemed all existing Units. |
| | Net asset value per unit represents the liquidation value. |
F-51
The following information presents the financial highlights of the Series for the year ended December 31, 2010. This data has been derived from the information presented in the financial statements.
| | | | | | | | | | | | | | | | | | | | | | | | | | | | | | | | | | | | |
| | | Frontier Diversified Series | | | Frontier Dynamic Series | | | Frontier Long/Short Commodity Series | |
| | | Class 1 | | | Class 2 | | | Class 1 | | | Class 2 | | | Class 1 | | | Class 2 | | | Class 3 | | | Class 1a | | | Class 2a | |
Per unit operating performance (1) | | | | | | | | | | | | | | | | | | | | | | | | | | | | | | | | | | | | |
Net asset value, December 31, 2009 | | $ | 96.80 | | | $ | 97.77 | | | $ | 91.43 | | | $ | 92.25 | | | $ | 113.77 | | | $ | 127.49 | | | $ | 127.49 | | | $ | 101.49 | | | $ | 102.48 | |
Net operating results: | | | | | | | | | | | | | | | | | | | | | | | | | | | | | | | | | | | | |
Interest income | | | 1.90 | | | | 1.94 | | | | 29.16 | | | | 29.72 | | | | 1.86 | | | | 2.13 | | | | 2.17 | | | | 1.70 | | | | 1.74 | |
Expenses | | | (8.97 | ) | | | (6.97 | ) | | | (52.02 | ) | | | (44.95 | ) | | | (14.74 | ) | | | (13.03 | ) | | | (13.24 | ) | | | (13.47 | ) | | | (10.61 | ) |
Net gain/(loss) on investments, net of non-controlling interests | | | 13.85 | | | | 13.72 | | | | 23.37 | | | | 17.38 | | | | 31.84 | | | | 36.67 | | | | 36.84 | | | | 28.24 | | | | 27.57 | |
| | | | | | | | | | | | | | | | | | | | | | | | | | | | | | | | | | | | |
Net income/(loss) | | | 6.78 | | | | 8.69 | | | | 0.51 | | | | 2.15 | | | | 18.96 | | | | 25.77 | | | | 25.77 | | | | 16.47 | | | | 18.70 | |
| | | | | | | | | | | | | | | | | | | | | | | | | | | | | | | | | | | | |
Net asset value, December 31, 2010 | | $ | 103.58 | | | $ | 106.46 | | | $ | 91.94 | | | $ | 94.40 | | | $ | 132.73 | | | $ | 153.26 | | | $ | 153.26 | | | $ | 117.96 | | | $ | 121.18 | |
| | | | | | | | | | | | | | | | | | | | | | | | | | | | | | | | | | | | |
Ratios to average net assets | | | | | | | | | | | | | | | | | | | | | | | | | | | | | | | | | | | | |
Net investment gain/(loss) | | | -7.17 | % | | | -4.98 | % | | | -25.19 | % | | | -16.46 | % | | | -11.33 | % | | | -8.39 | % | | | -8.39 | % | | | -11.33 | % | | | -8.39 | % |
Expenses before incentive fees | | | 5.55 | % | | | 3.36 | % | | | 57.32 | % | | | 48.60 | % | | | 8.48 | % | | | 5.54 | % | | | 5.54 | % | | | 8.48 | % | | | 5.54 | % |
Expenses after incentive fees | | | 9.09 | % | | | 6.91 | % | | | 57.32 | % | | | 48.60 | % | | | 12.97 | % | | | 10.03 | % | | | 10.03 | % | | | 12.97 | % | | | 10.03 | % |
Total return before incentive fees (2) | | | 12.71 | % | | | 14.46 | % | | | 1.38 | % | | | 2.51 | % | | | 17.47 | % | | | 23.37 | % | | | 30.76 | % | | | 29.63 | % | | | 30.88 | % |
Total return after incentive fees (2) | | | 9.17 | % | | | 10.91 | % | | | 1.38 | % | | | 2.51 | % | | | 12.98 | % | | | 18.88 | % | | | 26.27 | % | | | 25.14 | % | | | 26.39 | % |
| | | |
| | | Frontier Masters Series | | | Balanced Series | | | Berkeley/Graham/Tiverton Series (3) | |
| | | Class 1 | | | Class 2 | | | Class 1 | | | Class 1a | | | Class 2 | | | Class 2a | | | Class 3a | | | Class 1 | | | Class 2 | |
Per unit operating performance (1) | | | | | | | | | | | | | | | | | | | | | | | | | | | | | | | | | | | | |
Net asset value, December 31, 2009 | | $ | 94.46 | | | $ | 95.37 | | | $ | 118.54 | | | $ | 105.50 | | | $ | 139.01 | | | $ | 117.60 | | | $ | 117.60 | | | $ | 104.65 | | | $ | 121.10 | |
Net operating results: | | | | | | | | | | | | | | | | | | | | | | | | | | | | | | | | | | | | |
Interest income | | | 1.80 | | | | 1.83 | | | | 0.13 | | | | 0.12 | | | | 0.16 | | | | 0.13 | | | | 0.14 | | | | 0.01 | | | | 0.01 | |
Expenses | | | (8.13 | ) | | | (6.01 | ) | | | (9.60 | ) | | | (8.44 | ) | | | (7.07 | ) | | | (5.97 | ) | | | (6.03 | ) | | | (7.23 | ) | | | (4.85 | ) |
Net gain/(loss) on investments, net of non-controlling interests | | | 14.83 | | | | 14.62 | | | | 22.88 | | | | 19.18 | | | | 27.36 | | | | 21.90 | | | | 21.95 | | | | 13.04 | | | | 15.47 | |
| | | | | | | | | | | | | | | | | | | | | | | | | | | | | | | | | | | | |
Net income/(loss) | | | 8.50 | | | | 10.44 | | | | 13.41 | | | | 10.86 | | | | 20.45 | | | | 16.06 | | | | 16.06 | | | | 5.81 | | | | 10.63 | |
| | | | | | | | | | | | | | | | | | | | | | | | | | | | | | | | | | | | |
Net asset value, December 31, 2010 | | $ | 102.96 | | | $ | 105.81 | | | $ | 131.95 | | | $ | 116.36 | | | $ | 159.46 | | | $ | 133.66 | | | $ | 133.66 | | | $ | 110.46 | | | $ | 131.73 | |
Ratios to average net assets | | | | | | | | | | | | | | | | | | | | | | | | | | | | | | | | | | | | |
Net investment gain/(loss) | | | -6.54 | % | | | -4.25 | % | | | -7.77 | % | | | -7.77 | % | | | -4.77 | % | | | -4.77 | % | | | -4.77 | % | | | -7.00 | % | | | -4.00 | % |
Expenses before incentive fees | | | 7.43 | % | | | 5.14 | % | | | 4.11 | % | | | 4.11 | % | | | 1.10 | % | | | 1.10 | % | | | 1.10 | % | | | 6.64 | % | | | 3.64 | % |
Expenses after incentive fees | | | 8.40 | % | | | 6.11 | % | | | 7.88 | % | | | 7.88 | % | | | 4.88 | % | | | 4.88 | % | | | 4.88 | % | | | 7.01 | % | | | 4.01 | % |
Total return before incentive fees (2) | | | 12.57 | % | | | 13.29 | % | | | 14.52 | % | | | 11.01 | % | | | 17.37 | % | | | 16.69 | % | | | 20.17 | % | | | 5.46 | % | | | 7.84 | % |
Total return after incentive fees (2) | | | 11.60 | % | | | 12.32 | % | | | 10.75 | % | | | 7.24 | % | | | 13.59 | % | | | 12.91 | % | | | 16.40 | % | | | 5.09 | % | | | 7.47 | % |
| | | | | | | | | | | | | | | | | | | | | | | | | | | | | | | | | | | | | | | | |
| | | Currency Series | | | Long Only Commodity Series | | | Managed Futures Index Series | | | Winton Series | | | Winton/Graham Series | |
| | | Class 1 | | | Class 2 | | | Class 1 | | | Class 2 | | | Class 1 | | | Class 2 | | | Class 1 | | | Class 2 | | | Class 1 | | | Class 2 | |
Per unit operating performance (1) | | | | | | | | | | | | | | | | | | | | | | | | | | | | | | | | | | | | | | | | |
Net asset value, December 31, 2009 | | $ | 78.00 | | | $ | 91.34 | | | $ | 83.59 | | | $ | 90.30 | | | $ | 112.54 | | | $ | 121.28 | | | $ | 117.57 | | | $ | 130.10 | | | $ | 110.06 | | | $ | 128.39 | |
Net operating results: | | | | | | | | | | | | | | | | | | | | | | | | | | | | | | | | | | | | | | | | |
Interest income | | | 1.28 | | | | 1.51 | | | | 1.65 | | | | 1.80 | | | | 1.09 | | | | 1.19 | | | | 0.65 | | | | 0.73 | | | | 0.51 | | | | 0.60 | |
Expenses | | | (5.01 | ) | | | (3.10 | ) | | | (3.06 | ) | | | (1.57 | ) | | | (5.38 | ) | | | (3.39 | ) | | | (8.75 | ) | | | (5.61 | ) | | | (9.02 | ) | | | (6.73 | ) |
Net gain/(loss) on investments, net of non-controlling interests | | | 4.82 | | | | 5.68 | | | | 11.94 | | | | 13.18 | | | | 9.71 | | | | 10.61 | | | | 25.57 | | | | 28.77 | | | | 18.28 | | | | 21.78 | |
| | | | | | | | | | | | | | | | | | | | | | | | | | | | | | | | | | | | | | | | |
Net income/(loss) | | | 1.09 | | | | 4.09 | | | | 10.52 | | | | 13.41 | | | | 5.42 | | | | 8.41 | | | | 17.47 | | | | 23.89 | | | | 9.77 | | | | 15.65 | |
| | | | | | | | | | | | | | | | | | | | | | | | | | | | | | | | | | | | | | | | |
Net asset value, December 31, 2010 | | $ | 79.09 | | | $ | 95.43 | | | $ | 94.11 | | | $ | 103.71 | | | $ | 117.96 | | | $ | 129.69 | | | $ | 135.04 | | | $ | 153.99 | | | $ | 119.83 | | | $ | 144.04 | |
| | | | | | | | | | | | | | | | | | | | | | | | | | | | | | | | | | | | | | | | |
Ratios to average net assets | | | | | | | | | | | | | | | | | | | | | | | | | | | | | | | | | | | | | | | | |
Net investment gain/(loss) | | | -4.68 | % | | | -1.67 | % | | | -1.75 | % | | | 0.25 | % | | | -3.79 | % | | | -1.79 | % | | | -6.47 | % | | | -3.46 | % | | | -7.65 | % | | | -4.65 | % |
Expenses before incentive fees | | | 6.27 | % | | | 3.27 | % | | | 3.78 | % | | | 1.78 | % | | | 4.75 | % | | | 2.75 | % | | | 6.08 | % | | | 3.08 | % | | | 6.89 | % | | | 3.89 | % |
Expenses after incentive fees | | | 6.27 | % | | | 3.27 | % | | | 3.78 | % | | | 1.78 | % | | | 4.75 | % | | | 2.75 | % | | | 6.98 | % | | | 3.98 | % | | | 8.11 | % | | | 5.11 | % |
Total return before incentive fees (2) | | | 1.84 | % | | | 4.10 | % | | | 11.26 | % | | | 11.96 | % | | | 4.60 | % | | | 6.20 | % | | | 14.76 | % | | | 17.66 | % | | | 9.66 | % | | | 12.92 | % |
Total return after incentive fees (2) | | | 1.84 | % | | | 4.10 | % | | | 11.26 | % | | | 11.96 | % | | | 4.60 | % | | | 6.20 | % | | | 13.86 | % | | | 16.75 | % | | | 8.44 | % | | | 11.70 | % |
| (1) | Interest income and expenses per unit are calculated by dividing these amounts by the weighted average number of units outstanding during the period. The net gain/(loss) on investments, net of non-controlling interests is a balancing amount necessary to reconcile the change in net asset value per unit with the other per unit information. |
| (2) | Computed using weighted average net assets outstanding during the period. An owner’s total returns may vary from the above returns based on the timing of contributions and withdrawals. Total returns are not annualized. |
| (3) | Formerly the Campbell/Grahama/Tiverton Series. |
F-52
The following information presents the financial highlights of the Series for the year ended December 31, 2009. This data has been derived from the information presented in the financial statements.
| | | | | | | | | | | | | | | | | | | | | | | | | | | | | | | | | | | | |
| | | Frontier Diversified Series* | | | Frontier Dynamic Series* | | | Frontier Long/Short Commodity Series** | |
| | | Class 1 | | | Class 2 | | | Class 1 | | | Class 2 | | | Class 1 | | | Class 2 | | | Class 3 | | | Class 1a | | | Class 2a | |
Per unit operating performance (1) | | | | | | | | | | | | | | | | | | | | | | | | | | | | | | | | | | | | |
Net asset value, December 31, 2008 or beginning of operations | | $ | 100.00 | | | $ | 100.00 | | | $ | 100.00 | | | $ | 100.00 | | | $ | 100.39 | | | $ | 109.28 | | | $ | 122.70 | | | $ | 100.00 | | | $ | 100.00 | |
Net operating results: | | | | | | | | | | | | | | | | | | | | | | | | | | | | | | | | | | | | |
Interest income | | | 2.41 | | | | 2.43 | | | | 72.10 | | | | 72.56 | | | | 1.93 | | | | 2.14 | | | | 2.21 | | | | 1.80 | | | | 1.81 | |
Expenses | | | (7.23 | ) | | | (5.69 | ) | | | (123.88 | ) | | | (105.50 | ) | | | (11.85 | ) | | | (9.55 | ) | | | (9.85 | ) | | | (11.05 | ) | | | (8.08 | ) |
Net gain/(loss) on investments, net of non-controlling interests | | | 1.62 | | | | 1.03 | | | | 43.21 | | | | 25.19 | | | | 23.30 | | | | 25.62 | | | | 12.43 | | | | 10.74 | | | | 8.75 | |
| | | | | | | | | | | | | | | | | | | | | | | | | | | | | | | | | | | | |
Net income/(loss) | | | (3.20 | ) | | | (2.23 | ) | | | (8.57 | ) | | | (7.75 | ) | | | 13.38 | | | | 18.21 | | | | 4.79 | | | | 1.49 | | | | 2.48 | |
| | | | | | | | | | | | | | | | | | | | | | | | | | | | | | | | | | | | |
Net asset value, December 31, 2009 | | $ | 96.80 | | | $ | 97.77 | | | $ | 91.43 | | | $ | 92.25 | | | $ | 113.77 | | | $ | 127.49 | | | $ | 127.49 | | | $ | 101.49 | | | $ | 102.48 | |
| | | | | | | | | | | | | | | | | | | | | | | | | | | | | | | | | | | | |
Ratios to average net assets | | | | | | | | | | | | | | | | | | | | | | | | | | | | | | | | | | | | |
Net investment gain/(loss) | | | -8.60 | % | | | -5.78 | % | | | -96.63 | % | | | -61.09 | % | | | -9.15 | % | | | -6.17 | % | | | -10.52 | % | | | -16.21 | % | | | -10.93 | % |
Expenses before incentive fees | | | 10.27 | % | | | 7.45 | % | | | 231.20 | % | | | 195.66 | % | | | 7.80 | % | | | 4.81 | % | | | 8.21 | % | | | 13.81 | % | | | 8.52 | % |
Expenses after incentive fees | | | 12.91 | % | | | 10.08 | % | | | 231.20 | % | | | 195.66 | % | | | 10.93 | % | | | 7.95 | % | | | 13.56 | % | | | 19.37 | % | | | 14.08 | % |
Total return before incentive fees (2) | | | -5.95 | % | | | -3.80 | % | | | -10.38 | % | | | -10.27 | % | | | 16.06 | % | | | 18.22 | % | | | 6.98 | % | | | 6.30 | % | | | 7.28 | % |
Total return after incentive fees (2) | | | -7.44 | % | | | -5.29 | % | | | -10.38 | % | | | -10.27 | % | | | 12.92 | % | | | 15.08 | % | | | 3.84 | % | | | 3.17 | % | | | 4.15 | % |
| | | | | | | | | | | | | | | | | | | | | | | | | | | | | | | | | | | | |
| | | Frontier Masters Series*** | | | Balanced Series**** | | | Berkeley/Graham/Tiverton Series (3) | |
| | | Class 1 | | | Class 2 | | | Class 1 | | | Class 1a | | | Class 2 | | | Class 2a | | | Class 3a | | | Class 1 | | | Class 2 | |
Per unit operating performance (1) | | | | | | | | | | | | | | | | | | | | | | | | | | | | | | | | | | | | |
Net asset value, December 31, 2008 or beginning of operations | | $ | 100.00 | | | $ | 100.00 | | | $ | 125.17 | | | $ | 112.09 | | | $ | 142.44 | | | $ | 121.30 | | | $ | 121.97 | | | $ | 110.54 | | | $ | 124.14 | |
Net operating results: | | | | | | | | | | | | | | | | | | | | | | | | | | | | | | | | | | | | |
Interest income | | | 3.71 | | | | 3.74 | | | | 0.28 | | | | 0.25 | | | | 0.33 | | | | 0.28 | | | | 0.28 | | | | 0.38 | | | | 0.43 | |
Expenses | | | (11.95 | ) | | | (10.12 | ) | | | (7.12 | ) | | | (6.36 | ) | | | (3.97 | ) | | | (3.37 | ) | | | (3.37 | ) | | | (6.98 | ) | | | (4.34 | ) |
Net gain/(loss) on investments, net of non-controlling interests | | | 2.70 | | | | 1.75 | | | | 0.21 | | | | (0.48 | ) | | | 0.21 | | | | (0.61 | ) | | | (1.28 | ) | | | 0.71 | | | | 0.86 | |
| | | | | | | | | | | | | | | | | | | | | | | | | | | | | | | | | | | | |
Net income/(loss) | | | (5.54 | ) | | | (4.63 | ) | | | (6.63 | ) | | | (6.59 | ) | | | (3.43 | ) | | | (3.70 | ) | | | (4.37 | ) | | | (5.89 | ) | | | (3.04 | ) |
| | | | | | | | | | | | | | | | | | | | | | | | | | | | | | | | | | | | |
Net asset value, December 31, 2009 | | $ | 94.46 | | | $ | 95.37 | | | $ | 118.54 | | | $ | 105.50 | | | $ | 139.01 | | | $ | 117.60 | | | $ | 117.60 | | | $ | 104.65 | | | $ | 121.09 | |
| | | | | | | | | | | | | | | | | | | | | | | | | | | | | | | | | | | | |
Ratios to average net assets | | | | | | | | | | | | | | | | | | | | | | | | | | | | | | | | | | | | |
Net investment gain/(loss) | | | -14.83 | % | | | -11.42 | % | | | -5.56 | % | | | -5.56 | % | | | -2.56 | % | | | -2.56 | % | | | -4.41 | % | | | -6.24 | % | | | -3.24 | % |
Expenses before incentive fees | | | 21.32 | % | | | 17.90 | % | | | 3.90 | % | | | 3.90 | % | | | 0.90 | % | | | 0.90 | % | | | 1.55 | % | | | 6.33 | % | | | 3.33 | % |
Expenses after incentive fees | | | 21.52 | % | | | 18.10 | % | | | 5.79 | % | | | 5.79 | % | | | 2.80 | % | | | 2.80 | % | | | 4.81 | % | | | 6.60 | % | | | 3.60 | % |
Total return before incentive fees (2) | | | -12.36 | % | | | -10.27 | % | | | -3.67 | % | | | -4.15 | % | | | -0.60 | % | | | -1.65 | % | | | -3.33 | % | | | -5.21 | % | | | -1.99 | % |
Total return after incentive fees (2) | | | -12.47 | % | | | -10.38 | % | | | -5.56 | % | | | -6.05 | % | | | -2.50 | % | | | -3.55 | % | | | -5.23 | % | | | -5.48 | % | | | -2.27 | % |
| | | | | | | | | | | | | | | | | | | | | | | | | | | | | | | | | | | | | | | | |
| | | Currency Series | | | Long Only Commodity Series | | | Managed Futures Index Series | | | Winton Series | | | Winton/Graham Series | |
| | | Class 1 | | | Class 2 | | | Class 1 | | | Class 2 | | | Class 1 | | | Class 2 | | | Class 1 | | | Class 2 | | | Class 1 | | | Class 2 | |
Per unit operating performance (1) | | | | | | | | | | | | | | | | | | | | | | | | | | | | | | | | | | | | | | | | |
Net asset value, December 31, 2008 or beginning of operations | | $ | 96.19 | | | $ | 109.30 | | | $ | 70.31 | | | $ | 74.46 | | | $ | 132.18 | | | $ | 139.70 | | | $ | 130.41 | | | $ | 140.04 | | | $ | 116.18 | | | $ | 131.49 | |
Net operating results: | | | | | | | | | | | | | | | | | | | | | | | | | | | | | | | | | | | | | | | | |
Interest income | | | 0.61 | | | | 0.70 | | | | 1.31 | | | | 1.41 | | | | 2.03 | | | | 2.16 | | | | 0.67 | | | | 0.73 | | | | 0.48 | | | | 0.55 | |
Expenses | | | (4.69 | ) | | | (2.38 | ) | | | (2.74 | ) | | | (1.37 | ) | | | (5.37 | ) | | | (3.12 | ) | | | (6.89 | ) | | | (3.53 | ) | | | (7.38 | ) | | | (4.68 | ) |
Net gain/(loss) on investments, net of non-controlling interests | | | (14.11 | ) | | | (16.28 | ) | | | 14.71 | | | | 15.80 | | | | (16.30 | ) | | | (17.46 | ) | | | (6.63 | ) | | | (7.15 | ) | | | 0.79 | | | | 1.03 | |
| | | | | | | | | | | | | | | | | | | | | | | | | | | | | | | | | | | | | | | | |
Net income/(loss) | | | (18.19 | ) | | | (17.96 | ) | | | 13.28 | | | | 15.84 | | | | (19.64 | ) | | | (18.42 | ) | | | (12.84 | ) | | | (9.94 | ) | | | (6.12 | ) | | | (3.10 | ) |
| | | | | | | | | | | | | | | | | | | | | | | | | | | | | | | | | | | | | | | | |
Net asset value, December 31, 2009 | | $ | 78.00 | | | $ | 91.34 | | | $ | 83.59 | | | $ | 90.30 | | | $ | 112.54 | | | $ | 121.28 | | | $ | 117.57 | | | $ | 130.09 | | | $ | 110.07 | | | $ | 128.39 | |
| | | | | | | | | | | | | | | | | | | | | | | | | | | | | | | | | | | | | | | | |
Ratios to average net assets | | | | | | | | | | | | | | | | | | | | | | | | | | | | | | | | | | | | | | | | |
Net investment gain/(loss) | | | -4.68 | % | | | -1.68 | % | | | -1.95 | % | | | 0.05 | % | | | -2.75 | % | | | -0.75 | % | | | -5.11 | % | | | -2.11 | % | | | -6.25 | % | | | -3.26 | % |
Expenses before incentive fees | | | 5.38 | % | | | 2.38 | % | | | 3.73 | % | | | 1.74 | % | | | 4.43 | % | | | 2.43 | % | | | 5.70 | % | | | 2.70 | % | | | 6.10 | % | | | 3.10 | % |
Expenses after incentive fees | | | 5.38 | % | | | 2.38 | % | | | 3.73 | % | | | 1.74 | % | | | 4.43 | % | | | 2.43 | % | | | 5.66 | % | | | 2.66 | % | | | 6.68 | % | | | 3.69 | % |
Total return before incentive fees (2) | | | -20.89 | % | | | -17.92 | % | | | 18.04 | % | | | 20.29 | % | | | -15.53 | % | | | -12.13 | % | | | -10.77 | % | | | -7.71 | % | | | -4.57 | % | | | -2.27 | % |
Total return after incentive fees (2) | | | -20.89 | % | | | -17.92 | % | | | 18.04 | % | | | 20.29 | % | | | -15.53 | % | | | -12.13 | % | | | -10.74 | % | | | -7.67 | % | | | -5.15 | % | | | -2.85 | % |
| (1) | Interest income and expenses per unit are calculated by dividing these amounts by the weighted average number of units outstanding during the period. The net gain/(loss) on investments, net of non-controlling interests is a balancing amount necessary to reconcile the change in net asset value per unit with the other per unit information. |
| (2) | Computed using weighted average net assets outstanding during the period. An owner’s total returns may vary from the above returns based on the timing of contributions and withdrawals. Total returns are not annualized. |
| (3) | Formerly the Campbell/Graham/Tiverton Series. |
| * | The Frontier Diversified Series and Frontier Dynamic Series began trading operations on June 9, 2009 |
| ** | The Frontier Long/Short Commodity Series Class 3 Units began trading on May 29, 2009 and Class 1a and 2a Units began trading on June 8, 2009 |
| *** | The Frontier Masters Series began trading operations on June 9, 2009 |
| **** | The Balanced Series Class 3a Units began trading on June 3, 2009 |
F-53
8. Derivative Instruments and Hedging Activities
The Series’ primary business is to engage in speculative trading of a diversified portfolio of futures, forwards (including interbank foreign currencies), options contracts and other derivative instruments (including swap contracts). The Series do not enter into or hold positions for hedging purposes as defined under ASC 815. The detail of the fair value of the Series’ derivatives by instrument types as of December 31, 2011 and 2010 is included in the Condensed Schedules of Investments. See Note 4 for further disclosure related to each Series’ position in swap contracts. This activity was performed by affiliated Trading Companies and does not include activity of unaffiliated trading Company investments.
The following tables summarize the monthly averages of futures contracts bought and sold for each respective Series of the Trust:
F-54
For The Year Ended December 31, 2011
| | | | | | | | |
| | | Bought | | | Sold | |
Monthly average contracts: | | | | | | | | |
Frontier Diversified Series | | | 4,400 | | | | 1,400 | |
Frontier Long/Short Commodity Series | | | 105,000 | | | | 93,100 | |
Balanced Series | | | 25,300 | | | | 34,300 | |
Berkeley/Graham/Tiverton Series | | | 5,500 | | | | 2,800 | |
Currency Series | | | 1,650 | | | | 21,400 | |
Winton/Graham | | | 16,500 | | | | 3,500 | |
For The Year Ended December 31, 2010
| | | | | | | | |
| | | Bought | | | Sold | |
Frontier Diversified Series | | | 4,000 | | | | 1,000 | |
Frontier Long/Short Commodity Series | | | 95,000 | | | | 65,000 | |
Balanced Series | | | 23,000 | | | | 24,200 | |
Berkeley/Graham/Tiverton Series | | | 5,000 | | | | 2,000 | |
Currency Series | | | 1,500 | | | | 15,000 | |
Winton/Graham | | | 15,000 | | | | 2,500 | |
F-55
The following tables summarize the trading revenues for the years ended December 31, 2011, 2010 and 2009 by contract:
Realized Trading Revenue from Futures, Forwards and Options
for the Year Ended December 31, 2011(1)
| | | | | | | | | | | | |
Type of contract | | Frontier Long/Short
Commodity Series | | | Frontier
Masters Series | | | Balanced Series | |
Metals | | $ | (19,704,072 | ) | | $ | (11,149 | ) | | $ | 5,574,604 | |
Currencies | | | (92,524 | ) | | | (1,465,976 | ) | | | 14,631,163 | |
Energies | | | 14,045,969 | | | | (1,134,274 | ) | | | (6,415,781 | ) |
Agriculturals | | | 10,091,145 | | | | (1,229,172 | ) | | | (12,366,802 | ) |
Interest rates | | | 211,370 | | | | 1,121,985 | | | | 50,568,346 | |
Stock indices | | | 545,082 | | | | (795,382 | ) | | | 391,606 | |
| | | | | | | | | | | | |
Realized trading income/(loss)(2) | | $ | 5,096,970 | | | $ | (3,513,968 | ) | | $ | 52,383,136 | |
| | | | | | | | | | | | |
| | | | | | | | |
Type of contract | | Currency Series | | | Winton/Graham
Series | |
Metals | | $ | — | | | $ | 1,144,332 | |
Currencies | | | (142,069 | ) | | | 110,745 | |
Energies | | | — | | | | 91,930 | |
Agriculturals | | | — | | | | 1,912 | |
Interest rates | | | — | | | | 391,518 | |
Stock indices | | | — | | | | (942,278 | ) |
| | | | | | | | |
Realized trading income/(loss)(2) | | $ | (142,069 | ) | | $ | 798,159 | |
| | | | | | | | |
F-56
Net Change in Open Trade Equity from Futures, Forwards and Options
for the Year Ended December 31, 2011(1)
| | | | | | | | | | | | |
Type of contract | | Frontier Long/Short
Commodity Series | | | Frontier
Masters Series | | | Balanced Series | |
Metals | | $ | 22,243,353 | | | $ | 17,541 | | | $ | (7,332,702 | ) |
Currencies | | | 64,835 | | | | 439,872 | | | | (40,725,767 | ) |
Energies | | | (11,129,918 | ) | | | 101,217 | | | | 1,141,915 | |
Agriculturals | | | (7,448,903 | ) | | | (204,311 | ) | | | (11,128,623 | ) |
Interest rates | | | (709,473 | ) | | | (893,143 | ) | | | (5,106,082 | ) |
Stock indices | | | (265,307 | ) | | | 1,331,196 | | | | (6,925,069 | ) |
| | | | | | | | | | | | |
Change in unrealized trading income/(loss)(3) | | $ | 2,754,587 | | | $ | 792,372 | | | $ | (70,076,328 | ) |
| | | | | | | | | | | | |
| | | | | | | | |
Type of contract | | Currency Series | | | Winton/Graham
Series | |
Metals | | $ | — | | | $ | (619,217 | ) |
Currencies | | | (27,166 | ) | | | (571,607 | ) |
Energies | | | — | | | | 12,279 | |
Agriculturals | | | — | | | | (371,424 | ) |
Interest rates | | | — | | | | (285,680 | ) |
Stock indices | | | — | | | | 313,862 | |
| | | | | | | | |
Change in unrealized trading income/(loss)(3) | | $ | (27,166 | ) | | $ | (1,521,787 | ) |
| | | | | | | | |
| (1) | The Frontier Diversified Series, Transtrend/Graham/Tiverton Series (formerly known as Berkeley/Graham/Tiverton Series), Currency Series, Winton/Graham Series, Frontier Long/Short Commodity Series, Managed Futures Index Series and Winton Series participate in trading activities through equity in earnings/(loss) from trading companies. The Long Only Commodity Series participates in trading activities through realized gain/(loss) on swap contracts. The Balanced Series consolidated Frontier Trading Company XIV, LLC since June 20, 2011, Frontier Trading Company XVII, LLC since September 9, 2011, and Frontier Trading Company XVIII, LLC since October 24, 2011. The Frontier Long/Short Series consolidated Frontier Trading Company VII, LLC since September 28, 2011. The Frontier Masters Series consolidated Frontier Trading Company XXI, LLC since March 1, 2011. |
| (2) | Amounts recorded in the Statements of Operations under Net realized gain(loss) on futures, forwards and options. |
| (3) | Amounts recorded in the Statements of Operations under Net change in open trade equity (deficit), at fair value. |
F-57
Realized Trading Revenue from Futures, Forwards and Options
for the Year Ended December 31, 2010(1)
| | | | | | | | | | | | |
Type of contract | | Frontier Diversified
Series | | | Frontier Long/Short
Commodity Series | | | Balanced Series | |
Metals | | $ | 906,825 | | | $ | 334,220 | | | $ | 8,897,940 | |
Currencies | | | 224,608 | | | | 619,216 | | | | 6,609,167 | |
Energies | | | (725,644 | ) | | | (32,272,414 | ) | | | (1,878,859 | ) |
Agriculturals | | | (1,060,508 | ) | | | 6,407,717 | | | | 607,231 | |
Interest rates | | | 1,444,587 | | | | (497,654 | ) | | | 10,538,167 | |
Stock indices | | | (730,345 | ) | | | 1,379,261 | | | | 2,968,760 | |
| | | | | | | | | | | | |
Realized trading income/(loss)(2) | | $ | 59,523 | | | $ | (24,029,654 | ) | | $ | 27,742,406 | |
| | | | | | | | | | | | |
| | | |
Type of contract | | Berkeley/Graham/
Tiverton Series | | | Currency Series | | | Winton/Graham
Series | |
Metals | | $ | 644,922 | | | $ | — | | | $ | 410,013 | |
Currencies | | | (2,509,333 | ) | | | 290,954 | | | | 3,469,334 | |
Energies | | | (77,310 | ) | | | — | | | | (3,365,670 | ) |
Agriculturals | | | 1,932,614 | | | | — | | | | 1,842,657 | |
Interest rates | | | 5,148,691 | | | | — | | | | 8,589,224 | |
Stock indices | | | (638,620 | ) | | | — | | | | (5,464,152 | ) |
| | | | | | | | | | | | |
Realized trading income/(loss)(2) | | $ | 4,500,964 | | | $ | 290,954 | | | $ | 5,481,406 | |
| | | | | | | | | | | | |
Net Change in Open Trade Equity from Futures, Forwards and Options
for the Year Ended December 31, 2010(1)
| | | | | | | | | | | | |
Type of contract | | Frontier Diversified
Series | | | Frontier Long/Short
Commodity Series | | | Balanced Series | |
Metals | | $ | (1,808,138 | ) | | $ | 282,667 | | | $ | 6,894,319 | |
Currencies | | | 842,676 | | | | (69,820 | ) | | | (3,152,713 | ) |
Energies | | | (4,250 | ) | | | 24,029,702 | | | | 3,465,690 | |
Agriculturals | | | (390,911 | ) | | | (5,585,339 | ) | | | 5,371,647 | |
Interest rates | | | 883,518 | | | | (201,571 | ) | | | 5,952,513 | |
Stock indices | | | (227,989 | ) | | | 31,629 | | | | (1,071,787 | ) |
| | | | | | | | | | | | |
Unrealized trading income/(loss)(3) | | $ | (705,094 | ) | | $ | 18,487,268 | | | $ | 17,459,669 | |
| | | | | | | | | | | | |
| | | |
Type of contract | | Berkeley/Graham/
Tiverton Series | | | Currency Series | | | Winton/Graham
Series | |
Metals | | $ | (2,788,785 | ) | | $ | — | | | $ | (2,364,922 | ) |
Currencies | | | 6,807,535 | | | | 54,015 | | | | 8,948,879 | |
Energies | | | (444,048 | ) | | | — | | | | (1,159,361 | ) |
Agriculturals | | | (791,698 | ) | | | — | | | | (1,491,247 | ) |
Interest rates | | | (357,453 | ) | | | — | | | | (1,541,855 | ) |
Stock indices | | | (80,013 | ) | | | — | | | | (1,774,544 | ) |
| | | | | | | | | | | | |
Unrealized trading income/(loss)(3) | | $ | 2,345,538 | | | $ | 54,015 | | | $ | 616,950 | |
| | | | | | | | | | | | |
| (1) | The Frontier Diversified Series, Frontier Masters Series, Berkeley/Graham/Tiverton Series, Managed Futures Index Series and Winton Series participate in trading activities through equity in earnings/(loss) from trading companies. The Dynamic Series and Long Only Commodity Series participates in trading activities through realized gain/(loss) on swap contracts. Frontier Long/Short Commodity Series deconsolidated Frontier Trading Company VII, LLC as of January 31, 2010. The Balanced Series deconsolidated Frontier Trading Company XIV, LLC as of January 25, 2010 and Frontier Trading Company VI, LLC as of March 19, 2010. The Berkeley/Graham/Tiverton Series consolidated Frontier Trading Company VI, LLC on March 19, 2010 and thereafter. The Frontier Diversified Series, Balanced Series and Long/Short Series participate in trading activities through equity in earnings(loss) from the aforementioned deconsolidated trading companies. |
| (2) | In the Statements of Operations under Net realized gain(loss) on futures, forwards and options. |
| (3) | In the Statements of Operations under Net change in open trade equity (deficit), at fair value. |
F-58
Realized Trading Revenue from Futures, Forwards and Options
for the Twelve Months Ended December 31, 2009(1)
| | | | | | | | | | | | |
Type of contract | | Frontier Long/Short
Commodity Series | | | Balanced Series | | | Berkeley/Graham/
Tiverton Series | |
Metals | | $ | 19,615,278 | | | $ | (5,239,299 | ) | | $ | 383,614 | |
Currencies | | | 3,599,861 | | | | 6,732,973 | | | | 1,140,115 | |
Energies | | | 20,547,042 | | | | (13,532,062 | ) | | | (660,395 | ) |
Agriculturals | | | 9,409,345 | | | | 10,327,412 | | | | (1,379,700 | ) |
Interest rates | | | 2,539,200 | | | | (25,905,939 | ) | | | (585,739 | ) |
Stock indices | | | 4,578,201 | | | | 52,565,778 | | | | (515,373 | ) |
| | | | | | | | | | | | |
Realized trading income/(loss)(2) | | $ | 60,288,927 | | | $ | 24,948,863 | | | $ | (1,617,478 | ) |
| | | | | | | | | | | | |
| | | |
Type of contract | | Currency Series | | | Winton Series | | | Winton/Graham
Series | |
Metals | | $ | — | | | $ | 1,427,741 | | | $ | 1,470,562 | |
Currencies | | | (178,743 | ) | | | (1,770,778 | ) | | | 1,214,077 | |
Energies | | | — | | | | (2,503,289 | ) | | | (2,353,206 | ) |
Agriculturals | | | — | | | | (2,116,386 | ) | | | (774,992 | ) |
Interest rates | | | — | | | | 1,325,304 | | | | (3,550,512 | ) |
Stock indices | | | — | | | | (1,047,591 | ) | | | 9,847,851 | |
| | | | | | | | | | | | |
Realized trading income/(loss)(2) | | $ | (178,743 | ) | | $ | (4,684,999 | ) | | $ | 5,853,780 | |
| | | | | | | | | | | | |
Net Change in Open Trade Equity from Futures, Forwards and Options
for the Twelve Months Ended December 31, 2009(1)
| | | | | | | | | | | | |
Type of contract | | Frontier Long/Short
Commodity Series | | | Balanced Series | | | Berkeley/Graham/
Tiverton Series | |
Metals | | $ | (15,338,074 | ) | | $ | (1,597,128 | ) | | $ | 187,751 | |
Currencies | | | (141,604 | ) | | | (25,601,772 | ) | | | (885,245 | ) |
Energies | | | 1,796,390 | | | | 1,165,825 | | | | 397,133 | |
Agriculturals | | | (15,751,965 | ) | | | 2,978,506 | | | | (74,899 | ) |
Interest rates | | | 440,666 | | | | 2,244,443 | | | | (844,133 | ) |
Stock indices | | | 678,338 | | | | 3,786,085 | | | | 459,162 | |
| | | | | | | | | | | | |
Unrealized trading income/(loss)(2) | | $ | (28,316,249 | ) | | $ | (17,024,041 | ) | | $ | (760,231 | ) |
| | | | | | | | | | | | |
| | | |
Type of contract | | Currency Series | | | Winton Series | | | Winton/Graham
Series | |
Metals | | $ | — | | | $ | (1,596,179 | ) | | $ | (647,951 | ) |
Currencies | | | 2,985 | | | | 166,923 | | | | 7,035,862 | |
Energies | | | — | | | | 860,728 | | | | (1,024,357 | ) |
Agriculturals | | | — | | | | 2,077,665 | | | | (895,567 | ) |
Interest rates | | | — | | | | (7,272,548 | ) | | | (1,762,016 | ) |
Stock indices | | | — | | | | 2,154,604 | | | | (1,023,980 | ) |
| | | | | | | | | | | | |
Unrealized trading income/(loss)(2) | | $ | 2,985 | | | $ | (3,608,807 | ) | | $ | 1,681,991 | |
| | | | | | | | | | | | |
| (1) | The Frontier Diversified Series, Frontier Masters Series and Managed Futures Index Series participate in trading activities through equity in earnings/(loss) from trading companies. The Long Only Commodity Series participates in trading activities through realized gain/(loss) on swap contracts. Berkeley/Graham/Tiverton Series deconsolidated Frontier Trading Company V LLC as of April 23, 2009, and thereafter participates in trading activities through equity in earnings/(loss) from trading companies. Winton Series deconsolidated Frontier Trading Company II LLC as of May 28, 2009, and thereafter participates in trading activities through equity in earnings/(loss) from Frontier Trading Company II LLC. |
| (2) | In the Statements of Operations under Net change in open trade equity (deficit), at fair value. |
F-59
9. Trading Activities and Related Risks
The purchase and sale of futures and options on futures contracts require margin deposits with Futures Commission Merchants (each, an “FCM”). Additional deposits may be necessary for any loss on contract value. The Commodity Exchange Act requires an FCM to segregate all customer transactions and assets from the FCM’s proprietary activities. A customer’s cash and other property (for example, U.S. Treasury bills) deposited with an FCM are considered commingled with all other customer funds subject to the FCM’s segregation requirements. In the event of an FCM’s insolvency, recovery may be limited to a pro rata share of segregated funds available. It is possible that the recovered amount could be less than the total of cash and other property deposited.
The term “off-balance sheet risk” refers to an unrecorded potential liability that, even though it does not appear on the statements of financial condition, may result in future obligation or loss in excess of the amount paid by the Series for a particular investment. Each Trading Company expects to trade in futures, options, forward and swap contracts and will therefore be a party to financial instruments with elements of off-balance sheet market and credit risk. In entering into these contracts, there exists a market risk that such contracts may be significantly influenced by market conditions, such as interest rate volatility, resulting in such contracts being less valuable. If the markets should move against all of the futures positions held by a Trading Company in respect of any Series at the same time, and if the Trading Advisor(s) of such Trading Company are unable to offset such futures interests positions, such Trading Company could lose all of its assets and the holders of Units of such Series would realize a 100% loss. The Managing Owner will seek to minimize market risk through real-time monitoring of open positions and the level of diversification of each Trading Advisor’s portfolio. It is anticipated that any Trading Advisor’s margin-to-equity ratio will typically not exceed approximately 35% although the actual ratio could be higher or lower from time to time.
In addition to market risk, trading futures, forward and swap contracts entails credit risk in that a counterparty will not be able to meet its obligations to a Trading Company. The counterparty for futures contracts traded in the United States and on most foreign exchanges is the clearinghouse associated with such exchange. In general, clearinghouses are backed by the corporate members of the
F-60
clearinghouse who are required to share any financial burden resulting from the non-performance by one of their members and, as such, should significantly reduce this credit risk. In cases where the clearinghouse is not backed by the clearing members, like some foreign exchanges, it is normally backed by a consortium of banks or other financial institutions. Some non-U.S. exchanges, in contrast to U.S. exchanges, are principals’ markets in which performance is the responsibility only of the individual counterparty with whom the Trading Company has entered into the transaction, and not of the exchange or clearing corporation. In these kinds of markets, there is risk of bankruptcy or other failure or refusal to perform by the counterparty.
In the case of forward contracts traded on the interbank market and swaps, neither is traded on exchanges. The counterparty is generally a single bank or other financial institution, rather than a group of financial institutions; thus there may be a greater counterparty credit risk. The Managing Owner expects the Trading Advisors to trade only with those counterparties which it believes to be creditworthy. All positions of each Trading Company will be valued each day on a mark-to-market basis. There can be no assurance that any clearing member, clearinghouse or other counterparty will be able to meet its obligations to any Trading Company.
The Managing Owner has established procedures to actively monitor and minimize market and credit risks. The Limited Owners bear the risk of loss only to the extent of the market value of their respective investments and, in certain specific circumstances, distributions and redemptions received.
10. Indemnifications
The Series have entered into agreements, which provide for the indemnification of futures clearing brokers, and commodity trading advisers, among others, against losses, costs, claims and liabilities arising from the performance of their individual obligations under such agreements, except for gross negligence or bad faith. The Trust has had no prior claims or payments pursuant to these agreements. The Trust’s individual maximum exposure under these arrangements is unknown, as this would involve future claims that may be made against the Trust that have not yet occurred. However, based on experience the Trust expects the risk of loss to be remote.
11. Subsequent Events
Effective as of March 1, 2012, the Berkeley/Graham/Tiverton Series of the Frontier Fund became known as the Tiverton/Graham/Transtrend Series. The TBG Institutional Series became a new Series of the Trust on January 20, 2012.
F-61
Report of Independent Registered Public Accounting Firm
To the Executive Committee and Unitholders
The Frontier Fund
We have audited the accompanying consolidated statements of financial condition, including the consolidated condensed schedules of investments, of The Frontier Fund (the Trust) as of December 31, 2011 and 2010, and the related consolidated statements of operations, changes in owners’ capital, and cash flows for each of the three years in the period ended December 31, 2011. These financial statements are the responsibility of the Trust’s management. Our responsibility is to express an opinion on these financial statements based on our audits.
We conducted our audits in accordance with the standards of the Public Company Accounting Oversight Board (United States). Those standards require that we plan and perform the audit to obtain reasonable assurance about whether the financial statements are free of material misstatement. The Trust is not required to have, nor were we engaged to perform an audit of its internal control over financial reporting. Our audits included consideration of internal control over financial reporting as a basis for designing audit procedures that are appropriate in the circumstances, but not for the purpose of expressing an opinion on the effectiveness of the Trust’s internal control over financial reporting. Accordingly, we express no such opinion. An audit also includes examining, on a test basis, evidence supporting the amounts and disclosures in the financial statements, assessing the accounting principles used and significant estimates made by management, as well as evaluating the overall financial statement presentation. We believe that our audits provide a reasonable basis for our opinion.
In our opinion, the consolidated financial statements referred to above present fairly, in all material respects, the financial position of the Frontier Fund as of December 31, 2011 and 2010, and the results of their operations and their cash flows for each of the three years in the period ended December 31, 2011, in conformity with U.S. generally accepted accounting principles.
/s/ McGladrey & Pullen, LLP
Denver, Colorado
March 30, 2012
F-62
The Frontier Fund
Consolidated Statements of Financial Condition
December 31, 2011 and 2010
| | | | | | | | |
| | | 12/31/2011 | | | 12/31/2010 | |
ASSETS | | | | | | | | |
Cash and cash equivalents | | $ | 27,452,803 | | | $ | 17,992,550 | |
U.S. Treasury securities, at fair value | | | 78,760,003 | | | | 79,198,929 | |
Custom time deposits | | | 358,276,083 | | | | 448,396,072 | |
Receivable from futures commission merchants | | | 160,366,935 | | | | 218,054,990 | |
Open trade equity, at fair value | | | — | | | | 24,082,503 | |
Swap contracts, at fair value | | | 24,211,688 | | | | 104,877,949 | |
Investments in Berkeley Quantitative Colorado Fund LLC, at fair value | | | 6,270,844 | | | | 10,157,099 | |
Prepaid service fees | | | 310,430 | | | | 667,254 | |
Interest receivable | | | 1,088,724 | | | | 1,080,891 | |
Other assets | | | 96,247 | | | | 19,614 | |
| | | | | | | | |
Total Assets | | $ | 656,833,757 | | | $ | 904,527,851 | |
| | | | | | | | |
LIABILITIES & CAPITAL | | | | | | | | |
LIABILITIES | | | | | | | | |
Open trade deficit, at fair value | | $ | 6,556,700 | | | $ | — | |
Written options, at fair value | | | 3,336,326 | | | | 5,464,104 | |
Pending owner additions | | | 384,457 | | | | 966,325 | |
Owner redemptions payable | | | 3,387,126 | | | | 917,165 | |
Incentive fees payable to Managing Owner | | | 1,844,116 | | | | 7,333,794 | |
Management fees payable to Managing Owner | | | 1,120,495 | | | | 1,135,021 | |
Interest payable to Managing Owner | | | 717,850 | | | | 593,960 | |
Trading fees payable to Managing Owner | | | 715,113 | | | | 709,264 | |
Trailing service fees payable to Managing Owner | | | 806,690 | | | | 707,834 | |
Payables to related parties | | | 1,733 | | | | 216,005 | |
Other liabilities | | | 16,608 | | | | 38,106 | |
| | | | | | | | |
Total Liabilities | | | 18,887,214 | | | | 18,081,578 | |
| | | | | | | | |
CAPITAL | | | | | | | | |
Managing Owner Units | | | 6,538,575 | | | | 9,510,765 | |
Limited Owner Units | | | 631,407,968 | | | | 876,927,046 | |
| | | | | | | | |
Total Owners’ Capital | | | 637,946,543 | | | | 886,437,811 | |
| | | | | | | | |
Non-Controlling Interests | | | — | | | | 8,462 | |
| | | | | | | | |
Total Capital | | | 637,946,543 | | | | 886,446,273 | |
| | | | | | | | |
Total Liabilities and Capital | | $ | 656,833,757 | | | $ | 904,527,851 | |
| | | | | | | | |
The accompanying notes are an integral part of these consolidated financial statements.
F-63
The Frontier Fund
Consolidated Condensed Schedule of Investments
December 31, 2011
| | | | | | | | |
| | | | | | % of Total Capital | |
Description | | Value | | | (Net Asset Value) | |
LONG FUTURES CONTRACTS * | | | | | | | | |
Various base metals futures contracts (U.S.) | | $ | (1,511,157 | ) | | | -.24 | % |
Various base metals futures contracts (Europe) | | | (4,401,353 | ) | | | -.69 | % |
Various currency futures contracts (U.S.) | | | 891,115 | | | | 0.14 | % |
Various currency futures contracts (Canada) | | | — | | | | 0.00 | % |
Various currency futures contracts (Europe) | | | 353,570 | | | | 0.06 | % |
Various currency futures contracts (Far East) | | | — | | | | 0.00 | % |
Various energy futures contracts (U.S.) | | | (13,430,017 | ) | | | -2.11 | % |
Various energy futures contracts (Europe) | | | (3,481,430 | ) | | | -0.55 | % |
Various interest rates futures contracts (U.S.) | | | 1,352,108 | | | | 0.21 | % |
Various interest rates futures contracts (Canada) | | | 78,923 | | | | 0.01 | % |
Various interest rates futures contracts (Europe) | | | 4,207,802 | | | | 0.66 | % |
Various interest rates futures contracts (Far East) | | | 666,559 | | | | 0.10 | % |
Various precious metals futures contracts (U.S.) | | | (1,105,701 | ) | | | -.17 | % |
Silver @ COMEX Settling 12/1/13 (number of Contracts: 152) | | | (11,121,080 | ) | | | -1.74 | % |
Various precious metals futures contracts (Europe) | | | — | | | | 0.00 | % |
Various soft futures contracts (U.S.) | | | (8,190,181 | ) | | | -1.28 | % |
Various soft futures contracts (Europe) | | | (3,750 | ) | | | 0.00 | % |
Various soft futures contracts (Canada) | | | — | | | | 0.00 | % |
Various stock index futures contracts (U.S.) | | | 483,160 | | | | .08 | % |
Various stock index futures contracts (Canada) | | | 5,579 | | | | 0.00 | % |
Various stock index futures contracts (Europe) | | | 252,897 | | | | 0.04 | % |
Various stock index futures contracts (Far East) | | | (187,635 | ) | | | -0.03 | % |
| | | | | | | | |
Total Long Futures Contracts | | $ | (35,140,591 | ) | | | -5.51 | % |
| | | | | | | | |
OPTIONS PURCHASED * | | $ | 11,933,138 | | | | 1.87 | % |
| | | | | | | | |
SHORT FUTURES CONTRACTS * | | | | | | | | |
Various base metals futures contracts (US) | | $ | 1,266,138 | | | | .20 | % |
Various base metals futures contracts (Europe) | | | 5,601,385 | | | | .88 | % |
Various currency futures contracts (US) | | | 70,134 | | | | 0.01 | % |
Various currency futures contracts (Canada) | | | — | | | | 0.00 | % |
Various currency futures contracts (Europe) | | | 851,771 | | | | 0.13 | % |
Various currency futures contracts (Far East) | | | 3,727 | | | | 0.00 | % |
Various energy futures contracts (US) | | | (423,746 | ) | | | -0.07 | % |
Various energy futures contracts (Europe) | | | 3,495,760 | | | | 0.55 | % |
Various energy futures contracts (Far East) | | | (1,195 | ) | | | 0.00 | % |
Various interest rates futures contracts (US) | | | (1,533,678 | ) | | | -0.24 | % |
Various interest rates futures contracts (Canada) | | | 4,052 | | | | 0.00 | % |
Various interest rates futures contracts (Europe) | | | (134,928 | ) | | | -0.02 | % |
Various interest rates futures contracts (Far East) | | | (94,959 | ) | | | -0.01 | % |
Various precious metals futures contracts (US) | | | 3,257,794 | | | | 0.51 | % |
Various soft futures contracts (US) | | | 3,561,139 | | | | 0.56 | % |
Various soft futures contracts (Europe) | | | 575,745 | | | | 0.09 | % |
Various soft futures contracts (Far East) | | | (29,121 | ) | | | 0.00 | % |
Various stock index futures contracts (US) | | | (2,153 | ) | | | 0.00 | % |
Various stock index futures contracts (Canada) | | | (27,463 | ) | | | 0.00 | % |
Various stock index futures contracts (Europe) | | | (398,770 | ) | | | -0.06 | % |
Various stock index futures contracts (Far East) | | | 137,120 | | | | 0.02 | % |
| | | | | | | | |
Total Short Futures Contracts | | $ | 16,178,752 | | | | 2.55 | % |
| | | | | | | | |
OPTIONS WRITTEN* | | $ | (3,336,326 | ) | | | -0.52 | % |
| | | | | | | | |
CURRENCY FORWARDS * | | $ | 472,001 | | | | 0.07 | % |
| | | | | | | | |
Total Open Trade Deficit | | $ | (9,893,026 | ) | | | -1.54 | % |
| | | | | | | | |
SWAPS (1) | | $ | 6,504,931 | | | | 1.02 | % |
Total Return Option Basket Swap (Termination date 11/6/12) | | | 17,706,757 | | | | 2.78 | % |
| | | | | | | | |
Total Swaps | | $ | 24,211,688 | | | | 3.80 | % |
| | | | | | | | |
Investment in Berkeley Quantitative Colorado Fund LLC (Cost of $8,487,603) | | $ | 6,270,844 | | | | 0.98 | % |
| | | | | | | | |
U.S. TREASURY SECURITIES | | | | | | | | |
| | |
FACE VALUE | | Fair Value | | | | |
$36,500,000.00 US Treasury Note 3.875% due 02/15/2013 (Cost $38,125,391) | | $ | 37,943,670 | | | | 5.95 | % |
$36,700,000.00 US Treasury Note 4.000% due 02/15/2015 (Cost $38,016,039) | | | 40,816,333 | | | | 6.40 | % |
| | | | | | | | |
| | $ | 78,760,003 | | | | 12.35 | % |
| | | | | | | | |
| * | Except for those items disclosed, no individual futures, forwards and option on futures contract position constituted greater than 1 percent of Net Asset Value. Accordingly, the number of contracts and expiration dates are not presented. |
| (1) | See Notes to Financial Statements, Note 4. |
The accompanying notes are an integral part of these consolidated financial statements.
F-64
The Frontier Fund
Consolidated Condensed Schedule of Investments
December 31, 2010
| | | | | | | | |
| | | | | | % of Net | |
Description | | Value | | | Asset Value | |
LONG FUTURES CONTRACTS* | | | | | | | | |
Various base metals futures contracts (US) | | $ | 6,478,548 | | | | 0.73 | % |
Copper @ Comex Settling 5/1/2011 (Number of Contracts: 3,001) | | | 43,349,975 | | | | 4.89 | % |
Various base metals futures contracts (Europe) | | | 19,579,755 | | | | 2.21 | % |
Various currency futures contracts (US) | | | 3,826,839 | | | | 0.43 | % |
Various currency futures contracts (Canada) | | | — | | | | 0.00 | % |
Various currency futures contracts (Europe) | | | 177,645 | | | | 0.02 | % |
Various currency futures contracts (Far East) | | | — | | | | 0.00 | % |
Various energy futures contracts (US) | | | 35,053,948 | | | | 3.95 | % |
Crude Oil, Light Settling 4/1/2011 (Number of Contracts: 3,715) | | | 13,283,070 | | | | 1.50 | % |
Crude Oil, Light Settling 12/1/2012 (Number of Contracts: 4,149) | | | 16,786,090 | | | | 1.89 | % |
Various energy futures contracts (Europe) | | | 300,758 | | | | 0.03 | % |
Various interest rates futures contracts (US) | | | 398,247 | | | | 0.04 | % |
Various interest rates futures contracts (Canada) | | | 19,156 | | | | 0.00 | % |
Various interest rates futures contracts (Europe) | | | 502,318 | | | | 0.06 | % |
Various interest rates futures contracts (Far East) | | | 189,413 | | | | 0.02 | % |
Various precious metals futures contracts (US) | | | 3,110,660 | | | | 0.35 | % |
Various precious metals futures contracts (Europe) | | | — | | | | 0.00 | % |
Various soft futures contracts (US) | | | 19,968,504 | | | | 2.25 | % |
Sugar #11 Settling 5/1/2011 (Number of Contracts: 2,735) | | | 11,302,637 | | | | 1.28 | % |
Various soft futures contracts (Europe) | | | 202,488 | | | | 0.02 | % |
Various soft futures contracts (Canada) | | | — | | | | 0.00 | % |
Various soft futures contracts (Far east) | | | 12,902 | | | | 0.00 | % |
Various stock index futures contracts (US) | | | 483,784 | | | | 0.05 | % |
Various stock index futures contracts (Canada) | | | 46,157 | | | | 0.01 | % |
Various stock index futures contracts (Europe) | | | (686,904 | ) | | | -0.08 | % |
Various stock index futures contracts (Far East) | | | 114,086 | | | | 0.01 | % |
| | | | | | | | |
Total Long Futures Contracts | | $ | 174,500,076 | | | | 19.66 | % |
| | | | | | | | |
OPTIONS PURCHASED * | | $ | 31,091,768 | | | | 3.51 | % |
| | | | | | | | |
SHORT FUTURES CONTRACTS* | | | | | | | | |
Various base metals futures contracts (US) | | $ | (7,598,915 | ) | | | -0.86 | % |
Copper @ COMEX Settling 3/1/2011 (Number of Contracts: 3,501) | | | (45,828,675 | ) | | | -5.17 | % |
Various base metals futures contracts (Europe) | | | (16,402,753 | ) | | | -1.85 | % |
Various currency futures contracts (US) | | | (184,137 | ) | | | -0.02 | % |
Various currency futures contracts (Canada) | | | — | | | | 0.00 | % |
Various currency futures contracts (Europe) | | | (136,851 | ) | | | -0.02 | % |
Various currency futures contracts (Far East) | | | — | | | | 0.00 | % |
Various energy futures contracts (US) | | | (7,683,430 | ) | | | -0.87 | % |
Crude Oil, Light Settling 2/1/2011 (Number of Contracts: 7,297) | | | (17,244,770 | ) | | | -1.95 | % |
Crude Oil, Light Settling 12/1/2011 (Number of Contracts: 4,955) | | | (28,698,600 | ) | | | -3.24 | % |
NYM RBOB Gas Settling 2/1/2011 (number of Contracts: 3,239) | | | (16,575,010 | ) | | | -1.87 | % |
Various energy futures contracts (Europe) | | | 51,020 | | | | 0.01 | % |
Various interest rates futures contracts (US) | | | (72,074 | ) | | | -0.01 | % |
Various interest rates futures contracts (Canada) | | | (10,102 | ) | | | 0.00 | % |
Various interest rates futures contracts (Europe) | | | (609,296 | ) | | | -0.07 | % |
Various interest rates futures contracts (Far East) | | | (325,573 | ) | | | -0.04 | % |
Various precious metals futures contracts (US) | | | (3,226,989 | ) | | | -0.36 | % |
Various soft futures contracts (US) | | | (5,250,542 | ) | | | -0.59 | % |
Coffee @ CSCE Settling 3/1/2011 (Number of Contracts: 1,550) | | | (13,679,100 | ) | | | -1.54 | % |
Sugar #11 Settling 3/1/2011 (Number of Contracts: 3,482) | | | (20,198,035 | ) | | | -2.28 | % |
Various soft futures contracts (Canada) | | | — | | | | 0.00 | % |
Various soft futures contracts (Europe) | | | (54,735 | ) | | | -0.01 | % |
Various stock index futures contracts (US) | | | 102,552 | | | | 0.01 | % |
Various stock index futures contracts (Canada) | | | — | | | | 0.00 | % |
Various stock index futures contracts (Europe) | | | 79,907 | | | | 0.01 | % |
Various stock index futures contracts (Far East) | | | 6,129 | | | | 0.00 | % |
| | | | | | | | |
Total Short Futures Contracts | | $ | (183,539,979 | ) | | | -20.71 | % |
| | | | | | | | |
OPTIONS WRITTEN * | | $ | (5,464,104 | ) | | | -0.62 | % |
| | | | | | | | |
CURRENCY FORWARDS * | | $ | 2,030,638 | | | | 0.23 | % |
| | | | | | | | |
Total Open Trade Equity | | $ | 18,618,399 | | | | 2.07 | % |
| | | | | | | | |
SWAPS (1) | | $ | 6,459,564 | | | | 0.73 | % |
Total Return Option Basket Swap (Terminiation date 6/6/14) | | | 11,407,905 | | | | 1.29 | % |
Total Return Option Basket Swap (Terminiation date 6/6/14) | | | 10,956,772 | | | | 1.24 | % |
Total Return Option Basket Swap (Terminiation date 6/6/14) | | | 26,242,246 | | | | 2.96 | % |
Option Basket Balanced Series (Terminiation date 11/6/12) | | | 49,811,462 | | | | 5.62 | % |
| | | | | | | | |
Total Swaps | | $ | 104,877,949 | | | | 11.84 | % |
| | | | | | | | |
Investment in Berkeley Quantitative Colorado Fund LLC (Cost of $10,000,000) | | $ | 10,157,099 | | | | 1.15 | % |
| | | | | | | | |
U.S. TREASURY SECURITIES | | | | | | | | |
| | |
FACE VALUE | | Fair Value | | | | |
$36,500,000.00 US Treasury Note 3.875% due 02/15/2013 (Cost $38,125,391) | | $ | 38,993,970 | | | | 4.40 | % |
$36,700,000.00 US Treasury Note 4.000% due 02/15/2015 (Cost $38,016,039) | | | 40,204,959 | | | | 4.54 | % |
| | | | | | | | |
| | $ | 79,198,929 | | | | 8.94 | % |
| | | | | | | | |
| * | Except as noted, no individual futures, forwards and option on futures contract position constituted greater than 1 percent of Net Asset Value. Accordingly, the number of contracts and expiration dates are not presented. |
| (1) | See Notes to Financial Statements, Note 4. |
The accompanying notes are an integral part of these consolidated financial statements.
F-65
The Frontier Fund
Consolidated Statements of Operations
For the Years Ended December 31, 2011, 2010 and 2009
| | | | | | | | | | | | |
| | | 12/31/2011 | | | 12/31/2010 | | | 12/31/2009 | |
Investment income: | | | | | | | | | | | | |
Interest—net | | $ | 6,568,847 | | | $ | 5,989,281 | | | $ | 4,313,669 | |
| | | | | | | | | | | | |
Total Income | | | 6,568,847 | | | | 5,989,281 | | | | 4,313,669 | |
| | | | | | | | | | | | |
Expenses: | | | | | | | | | | | | |
Incentive Fees | | | 22,931,623 | | | | 23,058,408 | | | | 10,381,797 | |
Management Fees | | | 13,708,588 | | | | 13,968,203 | | | | 10,604,825 | |
Service Fees—Class 1 | | | 14,480,515 | | | | 17,074,297 | | | | 16,478,215 | |
Trading Fees | | | 8,670,193 | | | | 8,254,551 | | | | 5,001,607 | |
| | | | | | | | | | | | |
Total Expenses | | | 59,790,919 | | | | 62,355,459 | | | | 42,466,444 | |
| | | | | | | | | | | | |
Investment income/(loss) - net | | | (53,222,072 | ) | | | (56,366,178 | ) | | | (38,152,775 | ) |
| | | | | | | | | | | | |
Realized and unrealized gain/(loss) on investments: | | | | | | | | | | | | |
Net realized gain/(loss) on futures, forwards and options | | | 145,646,477 | | | | 105,722,234 | | | | 85,572,188 | |
Net change in open trade equity/(deficit) | | | (86,552,220 | ) | | | 34,563,870 | | | | (45,929,274 | ) |
Net realized gain/(loss) on swap contracts | | | (9,576,420 | ) | | | 509,662 | | | | 883,900 | |
Net unrealized gain/(loss) on swap contracts | | | (11,778,886 | ) | | | 14,287,024 | | | | (22,000,291 | ) |
Net realized gain/(loss) on U.S. Treasury securities | | | 185,594 | | | | — | | | | — | |
Net unrealized gain/(loss) on U.S. Treasury securities | | | (107,239 | ) | | | 1,842,780 | | | | (4,056,172 | ) |
Trading commissions | | | (7,960,245 | ) | | | (10,194,355 | ) | | | (5,163,131 | ) |
Net increase from payments by managing owner | | | 390,589 | | | | — | | | | — | |
Change in fair value of investments in unconsolidated trading companies | | | — | | | | 361,773 | | | | — | |
Net realized gain/(loss) on investment in Berkeley Quantitative Colorado Fund LLC | | | (135,775 | ) | | | — | | | | — | |
Net unrealized gain/(loss) on investment in Berkeley Quantitative Colorado Fund LLC | | | (2,238,083 | ) | | | 153,203 | | | | — | |
| | | | | | | | | | | | |
Net gain/(loss) on investments | | | 27,873,792 | | | | 147,246,191 | | | | 9,307,220 | |
| | | | | | | | | | | | |
NET INCREASE/(DECREASE) IN CAPITAL RESULTING FROM OPERATIONS | | | (25,348,280 | ) | | | 90,880,013 | | | | (28,845,555 | ) |
| | | | | | | | | | | | |
Less: Operations attributable to non-controlling interests | | | (591 | ) | | | 1,157,873 | | | | 1,342 | |
| | | | | | | | | | | | |
NET INCREASE/(DECREASE) IN CAPITAL RESULTING FROM OPERATIONS ATTRIBUTABLE TO CONTROLLING INTERESTS | | $ | (25,347,689 | ) | | $ | 89,722,140 | | | $ | (28,846,897 | ) |
| | | | | | | | | | | | |
The accompanying notes are an integral part of these consolidated financial statements.
F-66
The Frontier Fund
Consolidated Statement of Changes in Owners’ Capital
For the Years Ended December 31, 2011, 2010 and 2009
| | | | | | | | | | | | | | | | |
| | | Managing
Owner | | | Limited Owners | | | Non-Controlling
Interests | | | Total | |
Owners’ Capital, December 31, 2008 | | $ | 6,179,880 | | | $ | 609,514,915 | | | $ | — | | | $ | 615,694,795 | |
| | | | | | | | | | | | | | | | |
Sale of Units | | | 1,815,000 | | | | 247,590,648 | | | | — | | | | 249,405,648 | |
Redemption of Units | | | (441,386 | ) | | | (92,339,032 | ) | | | — | | | | (92,780,418 | ) |
Operations attributable to non-controlling interests | | | — | | | | — | | | | 1,342 | | | | 1,342 | |
Net increase/(decrease) in Owners’ Capital resulting from operations | | | (105,241 | ) | | | (28,741,656 | ) | | | — | | | | (28,846,897 | ) |
| | | | | | | | | | | | | | | | |
Owners’ Capital, December 31, 2009 | | | 7,448,253 | | | | 736,024,875 | | | | 1,342 | | | | 743,474,470 | |
| | | | | | | | | | | | | | | | |
Sale of Units | | | 3,390,000 | | | | 169,280,747 | | | | — | | | | 172,670,747 | |
Redemption of Units | | | (2,210,000 | ) | | | (117,218,204 | ) | | | — | | | | (119,428,204 | ) |
Change in control of ownership—Trading Companies | | | — | | | | — | | | | (11,390,610 | ) | | | (11,390,610 | ) |
Contributions | | | — | | | | — | | | | 10,239,857 | | | | 10,239,857 | |
Operations attributable to non-controlling interests | | | — | | | | — | | | | 1,157,873 | | | | 1,157,873 | |
Net increase/(decrease) in Owners’ Capital resulting from operations | | | 882,512 | | | | 88,839,628 | | | | — | | | | 89,722,140 | |
| | | | | | | | | | | | | | | | |
Owners’ Capital, December 31, 2010 | | | 9,510,765 | | | | 876,927,046 | | | | 8,462 | | | | 886,446,273 | |
| | | | | | | | | | | | | | | | |
Sale of Units | | | 1,710,000 | | | | 102,169,050 | | | | — | | | | 103,879,050 | |
Redemption of Units | | | (4,488,776 | ) | | | (322,533,853 | ) | | | — | | | | (327,022,629 | ) |
Distributions | | | — | | | | — | | | | (7,871 | ) | | | (7,871 | ) |
Operations attributable to non-controlling interests | | | — | | | | — | | | | (591 | ) | | | (591 | ) |
Net increase/(decrease) in Owners’ Capital resulting from operations | | | (193,414 | ) | | | (25,154,275 | ) | | | — | | | | (25,347,689 | ) |
| | | | | | | | | | | | | | | | |
Owners’ Capital, December 31, 2011 | | $ | 6,538,575 | | | $ | 631,407,968 | | | $ | — | | | $ | 637,946,543 | |
| | | | | | | | | | | | | | | | |
The consolidated Trust is not unitized as are the individual Series of the Trust
The accompanying notes are an integral part of these consolidated financial statements.
F-67
The Frontier Fund
Consolidated Statements of Cash Flows
For the Years Ended December 31, 2011, 2010 and 2009
| | | | | | | | | | | | |
| | | 2011 | | | 2010 | | | 2009 | |
Cash Flows from Operating Activities: | | | | | | | | | | | | |
Net increase/(decrease) in capital resulting from operations | | $ | (25,348,280 | ) | | $ | 90,880,013 | | | $ | (28,845,555 | ) |
Adjustments to reconcile net increase/(decrease) in capital resulting from operations to net cash provided by (used in) operating activities: | | | | | | | | | | | | |
Change in: | | | | | | | | | | | | |
Net change in open trade equity (deficit), at fair value | | | 28,511,425 | | | | (6,846,087 | ) | | | 24,190,631 | |
Net unrealized gain/(loss) on swap contracts | | | 11,724,468 | | | | (14,287,024 | ) | | | 22,000,291 | |
Net realized gain/(loss) on swap contracts | | | 9,630,838 | | | | (509,662 | ) | | | (883,900 | ) |
Net unrealized gain/(loss) on U.S. Treasury securities, net of interest paid to Managing Owner | | | 624,520 | | | | (1,842,780 | ) | | | 4,056,172 | |
Net realized gain/(loss) on U.S. Treasuries securities | | | (185,594 | ) | | | 555,749 | | | | 475,991 | |
Net increase in payments from Managing Owner | | | (390,589 | ) | | | — | | | | — | |
Net realized gain/(loss) on investment in Berkeley Colorado Quantitative Fund LLC | | | 135,775 | | | | — | | | | — | |
Net unrealized gain/loss on investment in Berkeley Colorado Quantitative Fund LLC | | | 2,238,083 | | | | (157,099 | ) | | | — | |
(Purchases) sales of: | | | | | | | | | | | | |
Sales of swap contracts | | | 66,705,656 | | | | 9,250,733 | | | | 3,231,840 | |
(Purchases) of swap contracts | | | (7,004,112 | ) | | | (18,184,063 | ) | | | (42,465,133 | ) |
(Purchases) of U.S. Treasury securities | | | — | | | | (63,268,374 | ) | | | — | |
Sales of custom time deposits | | | 90,119,989 | | | | — | | | | — | |
(Purchases) of custom time deposits, net of interest paid to Managing Owner | | | — | | | | — | | | | (111,179,807 | ) |
Sales of certificates of deposit | | | — | | | | — | | | | 85,123,779 | |
Sales of Berkeley Colorado Quantitative Fund LLC | | | 1,512,397 | | | | — | | | | — | |
(Purchases) of Berkeley Colorado Quantitative Fund LLC | | | — | | | | (10,000,000 | ) | | | — | |
Increase and/or decrease in: | | | | | | | | | | | | |
Receivable from futures commission merchants | | | 57,688,055 | | | | (93,266,222 | ) | | | (73,735,646 | ) |
Control of ownership of trading companies | | | — | | | | (11,390,610 | ) | | | — | |
Contributions to trading companies | | | — | | | | 10,239,857 | | | | — | |
Distributions from trading companies | | | (7,871 | ) | | | — | | | | — | |
Prepaid service fees | | | 356,824 | | | | 651,267 | | | | 430,928 | |
Interest receivable | | | (7,833 | ) | | | 544 | | | | (546 | ) |
Receivable from related parties | | | — | | | | 4,915 | | | | 41,251 | |
Other assets | | | (76,633 | ) | | | (19,614 | ) | | | 80,509 | |
Incentive fees payable to Managing Owner | | | (5,489,678 | ) | | | 5,616,497 | | | | (743,699 | ) |
Management fees payable to Managing Owner | | | (14,526 | ) | | | 466,598 | | | | 563,077 | |
Interest payable to Managing Owner | | | 123,890 | | | | 305,775 | | | | 173,094 | |
Trading fees payable to Managing Owner | | | 5,849 | | | | 395,587 | | | | 272,679 | |
Trailing service fees payable to Managing Owner | | | 98,856 | | | | 322,176 | | | | 266,390 | |
Payables to related parties | | | (214,272 | ) | | | 216,005 | | | | — | |
Other liabilities | | | (21,498 | ) | | | 19,269 | | | | (195,355 | ) |
| | | | | | | | | | | | |
Net cash provided by (used in) operating activities | | | 230,715,739 | | | | (100,846,550 | ) | | | (117,332,813 | ) |
| | | | | | | | | | | | |
Cash Flows from Financing Activities: | | | | | | | | | | | | |
Proceeds from sale of capital | | | 103,879,050 | | | | 172,670,747 | | | | 249,405,648 | |
Payment for redemption of capital | | | (327,022,629 | ) | | | (119,428,204 | ) | | | (92,780,418 | ) |
Pending owner additions | | | (581,868 | ) | | | (2,677,385 | ) | | | 661,284 | |
Redemptions payable | | | 2,469,961 | | | | 249,337 | | | | 380,156 | |
| | | | | | | | | | | | |
Net cash provided by (used in) financing activities | | | (221,255,486 | ) | | | 50,814,495 | | | | 157,666,670 | |
| | | | | | | | | | | | |
Net increase (decrease) in cash and cash equivalents | | | 9,460,253 | | | | (50,032,055 | ) | | | 40,333,857 | |
| | | |
Cash and cash equivalents, beginning of year | | | 17,992,550 | | | | 68,024,605 | | | | 27,690,748 | |
| | | | | | | | | | | | |
Cash and cash equivalents, end of year | | $ | 27,452,803 | | | $ | 17,992,550 | | | $ | 68,024,605 | |
| | | | | | | | | | | | |
The accompanying notes are an integral part of these consolidated financial statements.
F-68
The Frontier Fund
Notes to Consolidated Financial Statements
1. Organization and Purpose
The Frontier Fund, which is referred to in this report as “the Trust”, was formed on August 8, 2003, as a Delaware statutory trust. The Trust is a multi-advisor commodity pool, as described in Commodity Futures Trading Commission (the “CFTC”) Regulation § 4.10(d)(2). The Trust has authority to issue separate series, or each, a Series, of units of beneficial interest (the “Units”) pursuant to the requirements of the Delaware Statutory Trust Act, as amended (the “Trust Act”). The assets of each Series are valued and accounted for separately from the assets of other Series. The Trust is not registered as an investment company under the Investment Company Act of 1940, as amended (the “Investment Company Act”). It is managed by its Managing Owner, Equinox Fund Management, LLC.
Purchasers of Units are limited owners of the Trust (“Limited Owners”) with respect to beneficial interests of the Series’ Units purchased. The Trust Act provides that, except as otherwise provided in the amended and restated declaration of trust and trust agreement of the Trust dated as of August 8, 2003, by and among the Managing Owner, Wilmington Trust Company as trustee and the unitholders from time to time (the “Trust Agreement”), unitholders in a Delaware statutory trust will have the same limitation of liability as do stockholders of private corporations organized under the General Corporation Law of the State of Delaware. The Trust Agreement confers substantially the same limited liability, and contains the same limited exceptions thereto, as would a limited partnership agreement for a Delaware limited partnership engaged in like transactions as the Trust. In addition, pursuant to the Trust Agreement, the Managing Owner of the Trust is liable for obligations of a Series in excess of that Series’ assets. Limited Owners do not have any such liability. The Managing Owner will make contributions to Series of the Trust necessary to maintain at least a 1% interest in the aggregate capital, profits and losses of all Series.
The Trust has been organized to pool assets of investor funds for the purpose of trading in the United States (“U.S.”) and international markets for currencies, interest rates, stock indices, agricultural and energy products, precious and base metals and other commodities. The Trust may also engage in futures contracts, forwards, option contracts and other interest in derivative instruments, including swap contracts (“Swaps”).
The Trust has eleven (11) separate and distinct Series of Units issued and outstanding: Frontier Diversified Series, Frontier Dynamic Series (closed to outside investors effective July 15, 2011 and existing outside investors liquidated as of July 15, 2011), Frontier Long/Short Commodity Series, Frontier Masters Series, Balanced Series, Berkeley/Graham/Tiverton Series (formerly Campbell/Graham/Tiverton Series), Currency Series, Long Only Commodity Series (ceased operations as of December 21, 2011), Managed Futures Index Series (ceased operations as of December 21, 2011), Winton Series and Winton/Graham Series (each a “Series” and collectively, the “Series”). The Trust financial statements are comprised of unitized Series which are consolidated into the Trust financial statements. However, the consolidated Trust does not issue units.
The Trust, with respect to each Series:
| | • | | engages in the speculative trading of a diversified portfolio of futures, forward (including interbank foreign currencies), options contracts and other derivative instruments (including swap contracts), and may, from time to time, engage in cash and spot transactions; |
| | • | | allocates funds to a limited liability trading company or companies (“Trading Company”). Except as otherwise described in these notes, each Trading Company has one-year renewable contracts with its own independent commodity trading advisor(s), or each, a Trading Advisor, that will manage all or a portion of such Trading Company’s assets and make the trading decisions for the assets of each Series vested in such Trading Company. Each Trading Company will segregate its assets from any other Trading Company; |
| | • | | maintains separate, distinct records for each Series, and accounts for the assets of each Series separately from the other Series; |
| | • | | calculates the Net Asset Value (“NAV”) of its Units for each Series separately from the other Series; |
| | • | | has an investment objective of increasing the value of each Series’ Units over the long term (capital appreciation), while controlling risk and volatility; further, to offer exposure to the investment programs of individual Trading Advisors and to specific instruments (currencies); |
| | • | | maintains each Series of Units in three or six sub-classes—Class 1, Class 1a, Class 2, Class 2a, Class 3, and Class 3a. Investors who have purchased Class 1 or Class 1a Units of any Series are charged a service fee of up to three percent (3.0%) annually of the NAV of each Unit purchased, for the benefit of Selling Agents selling such Class 1 or Class 1a Units. The initial service fee, which is amortized monthly at an annual rate of up to three percent (3.0%) of the average daily NAV of Class 1 or Class 1 a of such Series, is prepaid to Equinox Fund Management, LLC (the “Managing Owner”) |
F-69
| | by each Series, and paid to the selling agents by the Managing Owner in the month following sale; provided, however, that investors who redeem all or a portion of their Class 1 or Class 1 a Units of any Series during the first twelve (12) months following the effective date of their purchase are subject to a redemption fee of up to three percent (3.0%) of the NAV at which such investor redeemed to reimburse the Managing Owner for the then-unamortized balance of the prepaid initial service fee. With respect to Class 2 and Class 2a Units of any Series, the Managing Owner pays an ongoing service fee to Selling Agents of up to one half percent (0.5%) annually of the NAV of each Class 2 or Class 2a Unit (of which 0.25% will be charged to Limited Owners holding Class 2 Units of the Frontier Diversified Series, Frontier Dynamic Series and Frontier Masters Series or Class 2a Units of the Frontier Long/Short Commodity Series) sold until such Class 2 or Class 2a Units which are subject to the fee limitation are reclassified as Class 3 or Class 3a Units of the applicable Series. The Managing Owner may also pay Selling Agents certain additional fees and expenses for administrative and other services rendered and expenses incurred by such Selling Agents; and |
| | • | | all payments made to Selling Agents who are members of the Financial Industry Regulatory Authority, Inc. (“FINRA”) and their associated persons that constitute underwriting compensation will be subject to the limitations set forth in Rule 2310(b)(4)(B)(ii) (formerly Rule 281 0(b)(4)(B)(ii)) of the Conduct Rules of FINRA (“Rule 2310”). An investor’s Class 1 Units or Class 2 Units of any Series, or Class 1a Units or Class 2a Units of the Frontier Long/Short Commodity Series or Balanced Series will be classified as Class 3 or Class 3a Units of such Series, as applicable, when the Managing Owner determines that the fee limitation set forth in Rule 2310 with respect to such Units has been reached or will be reached. No service fees are paid with respect to Class 3 or Class 3a Units. Units of any Class in a Series may be redeemed, in whole or in part, on a daily basis, at the then current NAV per Unit for such Series on the day of the week after the date the Managing Owner is in receipt of a redemption request for at least one (1) Business Day to be received by the Managing Owner prior to 4:00 PM in New York. |
The assets of any particular Series include only those funds and other assets that are paid to, held by or distributed to the Trust on account of and for the benefit of that Series. Under the “Inter-Series Limitation on Liability” expressly provided for under Section 3804(a) of the Trust Act, separate and distinct records of the cash and equivalents, although pooled for maximizing returns, is maintained in the books and records of each Series.
As of December 31, 2011, the Trust, with respect to the Frontier Diversified Series, Frontier Dynamic Series, Frontier Masters Series, Berkeley/Graham/Tiverton Series, Currency Series, Long Only Commodity Series, Managed Futures Index Series, Winton Series and Winton/Graham Series separates Units into three separate Classes—Class 1, Class 2, and Class 3. The Trust, with respect to the Balanced Series, and Frontier Long/Short Commodity Series separates Units into six separate Classes – Class 1, Class 2, Class 3, Class 1a, Class 2a and Class 3a. It is expected that between 10% and 30% of each Series’ assets normally will be invested in one or more Trading Companies to be committed as margin for trading positions, but from time to time these percentages may be substantially more or less. The remainders of each Series’ assets are maintained at the Trust level for cash management. Each of the respective Series has invested monies into pooled cash management assets which have included purchases of certificates of deposit, custom time deposits and U.S. Treasury securities. Each Series’ ownership in these investments is based on its percentage ownership in the pooled cash management assets on the reporting date.
Each Series of the Trust may invest a portion of its assets in a single Trading Company or in several different Trading Companies and may have multiple Trading Advisors that manage the assets invested in such Trading Companies.
In November 2010, the Berkeley/Graham/Tiverton Series of the Trust invested a portion of its assets in Berkeley Quantitative Colorado Fund LLC, an unaffiliated company, managed by an affiliate of Berkeley Quantitative L.P. Through this investment, Berkeley Quantitative L.P. became a commodity trading advisor to the Trust.
During July, 2011, Currency Series of the Trust liquidated its interest in an option basket and realized a decrease in fair value greater than had previously been recorded as unrealized loss. The Managing Owner determined to make a onetime administrative adjustment by payment to the Currency Series of $390,589 to reimburse the effect of the loss on the investors in the series, exclusive of the inter-series payables’ interests, recorded in the Consolidated Statements of Operations as Net increase from payments by managing owner.
2. Significant Accounting Policies
The following are the significant accounting policies of the Trust.
Basis of Presentation—The Trust follows Generally Accepted Accounting Principles (“GAAP”), as established by the Financial Accounting Standards Board (the “FASB”), to ensure consistent reporting of financial condition, schedules of investments, results of operations, changes in capital and cash flows.
F-70
Consolidation— Each Series of the Trust invests in Trading Companies who authorize certain Trading Advisors to place trades and manage assets at pre-determined investment levels. The Trading Companies were organized by the Managing Owner for the purpose of investing in commodities interests and derivative instruments, and have no operating income or expenses, except for trading income and expenses, all of which is allocated to the Series. The Trading Companies and Series of the Trust which have a controlling interest are consolidated by the Trust.
Investment in Berkeley Quantitative Colorado Fund LLC - The Berkeley/Graham/Tiverton Series of the Trust has an investment in the Berkeley Quantitative Colorado Fund LLC. The Berkeley Quantitative Colorado Fund LLC began operations on November 1, 2010. The Berkeley Quantitative Colorado Fund LLC is not consolidated into the financial statements of the Trust because the Trust has no control or transparency over the operations of the fund. This investment is shown on the consolidated statements of financial condition with the change in fair value shown in net unrealized gain/(loss) on the Berkeley Quantitative Colorado Fund LLC.
Use of Estimates—The preparation of financial statements in conformity with GAAP may require the Managing Owner to make estimates and assumptions that affect the reported amounts of assets and liabilities and disclosure of contingent assets and liabilities at the date of the financial statements and the reported amounts of revenue and expenses during the reporting period. The valuation of swap contracts requires significant estimates as well as the valuation of certain other investments. Please refer to Note 3 for discussion of valuation methodology.
Cash and Cash Equivalents—Cash and cash equivalents include cash and overnight investments in interest-bearing demand deposits held at banks with maturities of three months or less.
Interest Income—Aggregate interest income from all sources, including assets held at Futures Commission Merchants (“FCM”), up to two percentage points of the aggregate percentage yield (annualized) is paid to the Managing Owner. All interest not paid to the Managing Owner is interest income to the Trust.
U.S. Treasury Securities—U.S. Treasury Securities are reported at fair value as Level 1 inputs under ASC 820,Fair Value Measurements and Disclosures (“ASC 820”). The Trust values U.S. Treasury Securities at fair value and records the daily change in value in the statements of operations as net unrealized gain/(loss) on U.S. Treasury securities. Accrued interest is reported on the consolidated statements of financial condition as interest receivable.
Custom Time Deposits—Custom time deposits are structured deposit agreements with U.S. Bank National Association that earn a guaranteed fixed interest rate between 2.17% and 3.75% , mature nine months from the deposit date and are subject to automatic six-month rollovers through October 2013. Custom time deposits were purchased on September 15, 2009, October 21, 2008 and October 30, 2008. Interest is paid monthly or at least every nine months. Unscheduled withdrawals will be subject to certain penalties and other costs of up to 1.0% of the amount deposited if withdrawn within the first nine months from the deposit date. The withdrawal fee is set at 0.225% for the period from nine months to one year subsequent to the deposit date and decreases by .05% increments for each year thereafter through the maturity date. The Trust values the custom time deposits at face value plus accrued interest as it is considered a deposit account under paragraph 7.50 of theInvestment Company Audit Guide, and accordingly, this deposit is not subject to ASC 820.
Credit Default Swaps—The Trust invests in credit default swaps for the purpose of mitigating part of the risk of concentration of deposits with U.S. Bank National Association to other major financial institutions. See Note 4. Credit Default Swaps are reported at fair value based upon daily valuations provided by a third party pricing service. The Trust records the daily change in fair value in the consolidated statements of operations as net unrealized gain/(loss) on swap contracts.
Receivable From Futures Commission Merchants—The Trust deposits assets with a FCM subject to CFTC regulations and various exchange and broker requirements. Margin requirements are satisfied by the deposit of cash with such FCM. The Trust earns interest income on its assets deposited with the FCM.
Investment Transactions—Futures, options on futures, forward and swap contracts are recorded on a trade date basis and realized gains or losses are recognized when contracts are settled. Unrealized gains or losses on open contracts (the difference between contract trade price and market price) are reported in the consolidated statements of financial condition as a net unrealized gain or loss, as there exists a right of offset of unrealized gains or losses in accordance with FASB ASC 210,Balance Sheet (“ASC 210”).
Any change in net unrealized gain or loss from the preceding period is reported in the consolidated statements of operations. Fair value of exchange-traded contracts is based upon exchange settlement prices. Fair value of non-exchange-traded contracts is based on third party quoted dealer values on the interbank market. For U.S. Treasury securities, interest is recognized in the period earned and the instruments are marked-to-market daily based on third party information. Custom time deposits are valued at face value plus accrued interest and the interest income is recognized in the period earned. Transaction costs are recognized as incurred and reflected separately in the consolidated statements of operations.
F-71
Foreign currency transactions—The Series of the Trust’s functional currency is the U.S. dollar, however, they transact business in currencies other than the U.S. dollar. Assets and liabilities denominated in currencies other than the U.S. dollar are translated into U.S. dollars at the rates in effect at the date of the statements of financial condition. Income and expense items denominated in currencies other than the U.S. dollar are translated into U.S. dollars at the rates in effect during the period. Gains and losses resulting from the translation to U.S. dollars are reported in income. The Series of the Trust do not isolate that portion of the results of operations resulting from changes in foreign exchange rates on investments from fluctuations arising from changes in market prices of securities held. Such fluctuations are included with the net realized or unrealized gain or loss from investments.
Allocation of Earnings—Each Series of the Trust maintains three or six classes of Units—Class 1, Class 2, Class 3, Class 1a, Class 2a and Class 3a). All classes have identical voting, dividend, liquidation and other rights and the same terms and conditions, except that fees charged to a Class or Series differ as described below. Revenues, expenses (other than expenses attributable to a specific class), and realized and unrealized trading gains and losses of each Series are allocated daily to Class 1, Class 1a, Class 2, Class 2a, Class 3 and Class 3a Units based on each Class’ respective owners’ capital balances.
Payments by the Managing Owner— The Managing Owner may make discretionary payments to the Trust related to a variety of factors, including investment losses to reimburse the effect of a loss on a portfolio investment which has been caused by a situation outside the Trust’s, or it’s affiliates’, direct control. Such payments will be made on a discretionary basis and will be disclosed in the consolidated statement of operations as a net increase from payments by managing owner. These payments are in accordance with the Trust agreement on a discretionary basis as determined by the Managing Owner.
Investments and Swaps—The Trust records investment transactions on a trade date basis and all investments are recorded at fair value in its financial statements, with changes in fair value reported as a component of realized and unrealized gains/(losses) on investments in the consolidated statements of operations. Certain Series of the Trust strategically invest a portion or all of their assets in total return Swaps, selected at the discretion of the Managing Owner. Swaps are privately negotiated contracts designed to provide investment returns linked to those produced by one or more underlying investment products or indices. In a typical Swap, two parties agree to exchange the returns (or differentials in rates of return) earned or realized on one or more particular predetermined investments or instruments. The gross returns to be exchanged or “swapped” between the parties are calculated with respect to a “notional amount” (i.e., the amount of value of the underlying asset used in computing the particular interest rate, return, or other amount to be exchanged) in a particular investment, or in a “basket” of securities. The valuation of swap contracts requires significant estimates. Swap contracts utilizing Level 2 inputs are reported at fair value based on daily reports from the swap counterparty that are corroborated against independent valuation/rate of return information published and available on a daily recurring frequency. Other Swap Contracts are reported utilizing Level 3 Inputs. Swap Contracts are reported at fair value based upon a weekly indicative value that is calculated by management using bid/ask prices from the counterparty. This fair value is corroborated by a daily range of valuations provided by a third party pricing service. The third party pricing service utilizes a Black Scholes pricing model with input adjustments factoring in volatility and liquidity of the instruments. All valuation processes are monitored by the valuation committee of the Managing Owner.
Income Taxes—The Trust applies the provisions of ASC 740Income Taxes(“ASC 740”), which provides guidance for how uncertain tax positions should be recognized, measured, presented and disclosed in the financial statements. This interpretation also provides guidance on derecognition, classification, interest and penalties, accounting in interim periods and disclosure. ASC 740 requires the evaluation of tax positions taken or expected to be taken in the course of preparing the Trust’s financial statements to determine whether the tax positions are “more-likely-than-not” of being sustained by the applicable tax authority. Tax positions with respect to tax at the Trust’s level not deemed to meet the “more-likely-than-not” threshold would be recorded as a tax benefit or expense in the current year. The Managing Owner has concluded there is no tax expense, interest or penalties to be recorded by the Trust for the years ended December 31, 2011, 2010 and 2009. The 2008 through 2011 tax years generally remain subject to examination by U.S. federal and most state tax authorities.
In the opinion of the Managing Owner, (i) the Trust is treated as a partnership for Federal income tax purposes and, assuming that at least 90% of the gross income of the Trust constitutes “qualifying income” within the meaning of Section 7704(d) of the Code, the Trust is not a publicly traded partnership treated as a corporation, and (ii) the discussion set forth in the Prospectus under the heading “Federal Income Tax Consequences” correctly summarizes the material Federal income tax consequences as of the date of the Prospectus to potential U.S. Limited Owners of the purchase, ownership and disposition of Units of the Trust.
Fees and Expenses—All management fees, incentive fees, service fees and trading fees of the Trust are paid to the Managing Owner. It is the responsibility of the Managing Owner to pay all Trading Advisor management and incentive fees, Selling Agent Service fees and all other operating expenses and continuing offering costs of the Trust.
F-72
Service Fees—The Trust maintains each Series of Units in three or six sub-classes—Class 1, Class 1a, Class 2, Class 2a, Class 3, and Class 3a. Investors who have purchased Class 1 or Class 1a Units of any Series are charged a service fee of up to three percent (3.0%) annually of the NAV of each Unit purchased, for the benefit of selling agents selling such Class 1 or Class 1a Units. The initial service fee, which is amortized monthly at an annual rate of up to three percent (3.0%) of the average daily NAV of Class 1 or Class 1a of such Series, is prepaid to the Managing Owner by each Series, and paid to the selling agents by the Managing Owner in the month following sale; provided, however, that investors who redeem all or a portion of their Class 1 or Class 1a Units of any Series during the first twelve (12) months following the effective date of their purchase are subject to a redemption fee of up to three percent (3.0%) of the NAV at which such investor redeemed to reimburse the Managing Owner for the then-unamortized balance of the prepaid initial service fee. With respect to Class 2 and Class 2a Units of any Series, the Managing Owner pays an ongoing service fee to Selling Agents of up to one half percent (0.5%) annually of the NAV of each Class 2 or Class 2a Unit (of which 0.25% will be charged to Limited Owners holding Class 2 Units of the Frontier Diversified Series, Frontier Dynamic Series and Frontier Masters Series or Class 2a Units of the Frontier Long/Short Commodity Series) sold until such Class 2 or Class 2a Units which are subject to the fee limitation are reclassified as Class 3 or Class 3a Units of the applicable Series for administrative purposes. The Managing Owner may also pay Selling Agents certain additional fees and expenses for administrative and other services rendered and expenses incurred by such Selling Agents.
These service fees are part of the offering costs of the Trust, which include registration and filing fees, legal and blue sky expenses, accounting and audit, printing, marketing support and other offering costs which are born by the Managing Owner. With respect to the service fees, the initial service fee (for the first 12 months) relating to a purchase of Class 1 and Class 1a Units by an investor is prepaid by the Managing Owner to the relevant selling agent in the month following such purchase and is reimbursed for such payment by the Series monthly in arrears in an amount based upon a corresponding percentage of NAV, calculated daily. Consequently, the Managing Owner bears the risk of the downside and enjoys the benefit of the upside potential of any difference between the amount of the initial service fee prepaid by it and the amount of the reimbursement thereof, which may result from variations in NAV over the following 12 months.
Pending Owner Additions—Funds received for new subscriptions and for additions to existing owner interests are recorded as capital additions at the NAV per unit of the second business day following receipt.
Recently Adopted Accounting Pronouncements—In January 2010, FASB issued Accounting Standards update No. 2010-06 (“ASU 2010-06”) for improving disclosure about fair value measurements. ASU 2010-06 adds new disclosure requirements about transfers into and out of Levels 1 and 2 and separate disclosures about purchases, sales, issuances and settlements in the reconciliation for fair value measurements using significant unobservable inputs (Level 3). It also clarifies existing disclosure requirements relating to the levels of disaggregation for fair value measurement and inputs and valuation techniques used to measure fair value. The amended guidance is effective for financial statements for fiscal years and interim periods beginning after December 15, 2009 except for disclosures about purchases, sales, issuances and settlements in the roll forward of activity in Level 3 fair value measurements, which are effective for fiscal years beginning after December 15, 2010 and for interim periods within those fiscal years. As this update is disclosure related, adoption of ASU 2010-06 on January 1, 2011 did not have a material impact on the Trust’s consolidated statements of financial condition, results of operations or cash flows.
Recently Issued Accounting Pronouncements—In May 2011, the FASB issued ASU No. 2011-04 which provides guidance pertaining to fair value measurement that included a common definition of fair value and information to assist reporting entities to measure and disclose fair value with regards to U.S. GAAP and International Financial Reporting Standards (“IFRS”) convergence issues. This guidance becomes effective for interim and annual periods beginning on or after December 15, 2011, with early adoption prohibited. We are currently evaluating the impact that this accounting guidance may have on the Trust’s consolidated statements of financial condition, results of operations or cash flows.
In November of 2011, FASB issued new guidance that requires an entity to disclose information about offsetting and related arrangements to enable users of its financial statements to understand the effect of those arrangements on its financial position. This guidance is effective for annual and interim periods beginning on or after January, 1, 2013. An entity should provide the disclosures required by those amendments retrospectively for all comparative periods presented. Our effective date is January 1, 2013. The adoption of this guidance is not expected to have a material impact on the financial positions or results of operations.
Subsequent Events—The Trust follows the provisions of FASB ASC 855,Subsequent Events, which establishes general standards of accounting for and disclosure of events that occur after the balance sheet date but before financial statements are issued. Refer to Note 10.
F-73
3. Fair Value Measurements
In connection with the valuation of investments the Trust applies ASC 820. ASC 820 provides clarification that when a quoted price in an active market for the identical asset or liability is not available, a reporting entity is required to measure fair value using certain techniques. ASC 820 also clarifies that when estimating the fair value of an asset or liability, a reporting entity is not required to include a separate input or adjustment to other inputs relating to the existence of a restriction that prevents the transfer of an asset or liability. ASC 820 also clarifies that both a quoted price in an active market for the identical asset or liability at the measurement date and the quoted price for the identical asset or liability when traded as an asset in an active market when no adjustments to the quoted price of the asset are required are Level 1 fair value measurements.
Level 1 Inputs
Unadjusted quoted prices in active markets for identical financial assets that the reporting entity has the ability to access at the measurement date.
Level 2 Inputs
Inputs other than quoted prices included in Level 1 that are observable for the financial asset or liabilities, either directly or indirectly. These might include quoted prices for similar financial assets in active markets, quoted prices for identical or similar financial assets in markets that are not active, inputs other than quoted prices that are observable for the financial asset or inputs that are derived principally from or corroborated by market data by correlation or other means.
Level 3 Inputs
Unobservable inputs for determining the fair value of financial assets that reflect an entity’s own assumptions about the assumptions that market participants would use in pricing the financial asset.
The Trust uses the following methodologies to value instruments within its financial asset portfolio at fair value:
Trading Securities.These instruments include U.S. Treasury securities and open trade equity positions (futures contracts and currency forwards) that are actively traded on public markets with quoted pricing for corroboration. U.S. Treasury securities, futures contracts, and currency forwards are reported at fair value using Level 1 inputs. Trading securities instruments further include open trade equity positions (trading options) that are quoted prices for identical or similar assets that are not traded on active markets. Trading options are reported at fair value using Level 2 inputs.
Swap Contracts. Certain Series of the Trust strategically invest a portion or all of their assets in total return Swaps, selected at the direction of the Managing Owner. Each Series also owns a portion of the Credit Default Swaps (“CDS”) based upon ownership percentages of the cash management pool. Swaps are privately negotiated contracts designed to provide investment returns linked to those produced by one or more investment products or indices. In a typical Swap, two parties agree to exchange the returns (or differentials in rates of return) earned or realized on one or more particular predetermined investments or instruments. The gross returns to be exchanged or “swapped” between the parties are calculated with respect to a “notional amount” (i.e., the amount of value of the underlying asset used in computing the particular interest rate, return, or other amount to be exchanged) in a particular investment, or in a “basket” of securities. The valuation of swap contracts requires significant estimates. Certain Swap contracts are reported utilizing Level 2 inputs. These Swap contracts are reported at fair value based on daily reports from the swap counterparty that may be corroborated against independent valuation/rate of return information published and available on a daily recurring frequency. Swap contracts utilizing Level 2 inputs are reported at fair value based on daily reports from the swap counterparty that may be corroborated against independent valuation/rate of return information published and available on a daily recurring frequency. Other Swap contracts are reported utilizing Level 3 Inputs. Swap Contracts are reported at fair value based upon a weekly indicative value that is calculated by management using bid/ask prices from the counterparty. This fair value is corroborated by a daily range of valuations provided by a third party pricing service. The third party pricing service utilizes a Black Scholes pricing model with input adjustments factoring in volatility and liquidity of the instruments. All valuation processes are monitored by the valuation committee of the Managing Owner.
Investment in the Berkeley Quantitative Colorado Fund LLC. Investment in Berkeley Quantitative Colorado Fund LLC is valued based on the daily net asset value as reported by the managing member of the Berkeley Quantitative Colorado Fund LLC. The reported net asset value represents fair value based on observable data such as ongoing redemption and/or subscription activity, which is reported as a Level 2 input.
F-74
The following table summarizes the instruments that comprise the Trust’s financial asset portfolio, by Series, measured at fair value on a recurring basis as of December 31, 2011 and December 31, 2010, segregated by the level of valuation inputs within the fair value hierarchy utilized to measure fair value:
| | | | | | | | | | | | | | | | |
December 31, 2011 | | Level 1 Inputs | | | Level 2 Inputs | | | Level 3 Inputs | | | Total
Fair Value | |
Open Trade Equity (Deficit) | | $ | (18,489,839 | ) | | $ | 11,933,138 | | | $ | — | | | $ | (6,556,701 | ) |
Swap Contracts | | | — | | | | — | | | | 24,211,688 | | | | 24,211,688 | |
U.S. Treasury Securities | | | 78,760,003 | | | | — | | | | — | | | | 78,760,003 | |
Options Written | | | — | | | | (3,336,326 | ) | | | — | | | | (3,336,326 | ) |
| | | | |
December 31, 2010 | | Level 1 Inputs | | | Level 2 Inputs | | | Level 3 Inputs | | | Total
Fair Value | |
Open Trade Equity (Deficit) | | $ | (7,009,265 | ) | | $ | 31,091,768 | | | $ | — | | | $ | 24,082,503 | |
Swap Contracts | | | — | | | | — | | | | 104,877,949 | | | | 104,877,949 | |
U.S. Treasury Securities | | | 79,198,929 | | | | — | | | | — | | | | 79,198,929 | |
Options Written | | | — | | | | (5,464,104 | ) | | | — | | | | (5,464,104 | ) |
F-75
| | | | |
| | | For The Year Ended
December 31, 2011 | |
Balance of recurring Level 3 assets as of January 1, 2011 | | $ | 104,877,949 | |
Total gains or losses (realized/unrealized): | | | | |
Included in earnings-realized | | | (9,630,838 | ) |
Included in earnings-unrealized | | | (11,724,468 | ) |
Purchases of investments | | | 7,004,112 | |
Sales of investments | | | (66,705,656 | ) |
Transfers in and/or out of Level 3 | | | — | |
Net increase in payments from Managing Owner | | | 390,589 | |
| | | | |
Balance of recurring Level 3 assets as of December 31, 2011 | | $ | 24,211,688 | |
| | | | |
| |
| | | For The Year Ended
December 31, 2010 | |
Balance of recurring Level 3 assets as of January 1, 2010 | | $ | 81,147,933 | |
Total gains or losses (realized/unrealized): | | | | |
Included in earnings-realized | | | 509,662 | |
Included in earnings-unrealized | | | 14,287,024 | |
Purchases of investments | | | 18,184,063 | |
Sales of investments | | | (9,250,733 | ) |
Transfers in and/or out of Level 3 | | | — | |
| | | | |
Balance of recurring Level 3 assets as of December 31, 2010 | | $ | 104,877,949 | |
| | | | |
The Trust assess the levels of the investments at each measurement date, and transfers between levels are recognized on the actual date of the event or change in circumstances that caused the transfer in accordance with the Trust’s accounting policy regarding the recognition of transfers between levels of the fair value hierarchy. There were no significant transfers among levels 1, 2, and 3 during the year.
F-76
4. Swaps
In addition to authorizing Trading Advisors to manage pre-determined investment levels of futures and forward contracts, certain Series of the Trust will strategically invest a portion or all of their assets in total return swaps, selected at the direction of the Managing Owner. Total return Swaps are privately negotiated contracts designed to provide investment returns linked to those produced by one or more investment products or indices. In a typical total return Swap, two parties agree to exchange the returns (or differentials in rates of return) earned or realized on one or more particular predetermined investments or instruments. The gross returns to be exchanged or “swapped” between the parties are calculated with respect to a “notional amount” (i.e., the amount or value of the underlying asset used in computing the particular interest rate, return, or other amount to be exchanged) in a particular investment, or in a “basket” of securities.
The Trust invests in Credit Default Swaps (“CDS”) with highly-rated counterparties as part of its portfolio. CDSs are over-the-counter investment instruments designed to mitigate counterparty risk and generally pay upon the happening of a credit default of a counterparty. The CDS are allocated to each Series based on their percentage ownership in the pooled cash management assets at U.S. Bank National Association as of the reporting date. Approximately 27% of the Trust’s U.S. Bank National Association exposure is risk-hedged in this manner with BNP Paribas through March 20, 2012, and 8% with Societe Generale through March 20, 2012.
The Trust’s investment in Swaps will likely differ substantially over time due to cash flows, portfolio management decisions and market movements. The Swaps serve to diversify the investment holdings of the Trust and to provide access to programs and advisors that would not be otherwise available to the Trust, and are not used for hedging purposes.
The Managing Owner follows a procedure in selecting well-established financial institutions which the Managing Owner, in its sole discretion, considers to be reputable, reliable, financially responsible and well established to act as swap counterparties. The procedure includes due diligence review of documentation on all new and existing financial institution counterparties prior to initiation of the relationship, and quarterly ongoing review during the relationship, to ensure that counterparties meet the Managing Owner’s minimum credit requirements, the counterparty average rating being no less than an investment grade rating as defined by the rating agencies. As of December 31, 2011, approximately 5.0% of the Trust’s assets were deposited with over-the-counter counterparties in order to initiate and maintain Swaps.
The Trust strategically invests assets in one or more swaps linked to certain underlying investments or indices at the direction of the Managing Owner. The Trading Company in which the assets of the Trust will be invested will not own any of the investments or indices referenced by any swap entered into by the Trust. In addition, neither the swap counterparty nor any advisor referenced by any such swap is a Trading Advisor to the Trust.
F-77
The Trust has invested in the following Swaps as of December 31, 2011:
| | | | | | | | | | | | | | | | |
| | | Credit Default Swap | | | Credit Default Swap | | | Option Basket | | | Option Basket | |
Counterparty | | | BNP Paribas | | | | Societe Generale | | | | Company A | | | | DeutscheBank | |
Notional Amount | | $ | 623,160 | | | $ | 0 | | | $ | 14,129,540 | | | $ | 23,551,287 | |
Termination Date | | | 3/20/2012 | | | | 3/20/2012 | | | | 11/6/2012 | | | | 6/30/2016 | |
Investee Returns | | | On Default | | | | On Default | | | | Total Returns | | | | Total Returns | |
Realized Gain/(Loss) | | $ | — | | | $ | — | | | $ | 6,689,123 | | | $ | — | |
| | | | | | | | | | | | | | | | |
Unrealized Gain/(Loss) | | $ | 213,160 | | | $ | (120,458 | ) | | $ | (18,838,844 | ) | | $ | (368,228 | ) |
| | | | | | | | | | | | | | | | |
Fair Value as of 12/31/2011 | | $ | 623,159 | | | $ | — | | | $ | 17,706,757 | | | $ | 5,881,772 | |
| | | | | | | | | | | | | | | | |
| |
| The Trust has invested in the following Swaps as of December 31, 2010: | | | | | |
| | | | |
| | | Option Basket | | | Option Basket | | | Option Basket | | | Option Basket | |
Counterparty | | | Company D | | | | Company E | | | | Company F | | | | Company A | |
Notional Amount | | $ | 15,569,595 | | | $ | 27,048,602 | | | $ | 26,242,246 | | | $ | 68,460,196 | |
Termination Date | | | 6/6/2014 | | | | 6/6/2014 | | | | 6/6/2014 | | | | 11/6/2012 | |
Investee Returns | | | Total Returns | | | | Total Returns | | | | Total Returns | | | | Total Returns | |
Realized Gain/(Loss) | | $ | 0 | | | $ | 0 | | | $ | 0 | | | $ | 0 | |
| | | | | | | | | | | | | | | | |
Unrealized Gain/(Loss) | | $ | 416,156 | | | $ | 929,519 | | | $ | 3,474,611 | | | $ | 8,790,927 | |
| | | | | | | | | | | | | | | | |
Fair Value as of 12/31/2010 | | $ | 11,407,905 | | | $ | 10,956,772 | | | $ | 26,242,246 | | | $ | 49,811,462 | |
| | | | | | | | | | | | | | | | |
| | | | |
| | | | | | Option Basket | | | Reuters/Jefferies
CRB Index | | | Jefferies Commodity
Performance Index | |
Counterparty | | | | | | | Company B | | | | Company C | | | | Company C | |
Notional Amount | | | | | | $ | 11,567,063 | | | $ | 2,040,000 | | | $ | 2,040,000 | |
Termination Date | | | | | | | 1/26/2013 | | | | 2/28/2011 | | | | 2/28/2011 | |
Investee Returns | | | | | | | Total Returns | | | | Total Returns | | | | Total Returns | |
Realized Gain/(Loss) | | | | | | $ | 0 | | | $ | 190,556 | | | $ | 319,106 | |
| | | | | | | | | | | | | | | | |
Unrealized Gain/(Loss) | | | | | | $ | 675,809 | | | $ | 0 | | | $ | 0 | |
| | | | | | | | | | | | | | | | |
Fair Value as of 12/31/2010 | | | | | | $ | 5,668,768 | | | $ | 415,648 | | | $ | 375,148 | |
| | | | | | | | | | | | | | | | |
F-78
5. Transactions with Affiliates
The Managing Owner contributes funds to the Trust in order to have a 1% interest in the aggregate capital, profits and losses and in return will receive units designated as general units in the Series of the Trust in which the Managing Owner invests such funds. The general units may only be purchased by the Managing Owner and may be subject to no advisory fees or management advisory fees at reduced rates. Otherwise, the general units hold the same rights as the limited units. The Managing Owner is required to maintain at least a 1% interest (“Minimum Purchase Commitment”) in the aggregate capital, profits and losses of the Trust so long as it is acting as the Managing Owner of the Trust. Such contribution was made by the Managing Owner before trading commenced for the Trust and will be maintained throughout the existence of the Trust, and the Managing Owner will make such purchases as are necessary to effect this requirement. Additionally, the Managing Owner agreed with certain regulatory bodies to maintain a 1% interest specifically in the Balanced Series Class 1 a Units and Balanced Series Class 2a Units, aggregated, and each of the Long Only Commodity Series, Frontier Long/Short Commodity Series, Managed Futures Index Series, Frontier Diversified Series, Frontier Dynamic Series and Frontier Masters Series. The 1% interest in these specific Series of the Trust is included in computing the Minimum Purchase Commitment in aggregate capital. In addition to the general units the Managing Owner receives in respect of its Minimum Purchase Commitment, the Managing Owner may purchase limited units in any Series as a Limited Owner. Principals of the Managing Owner or affiliates are allowed to own beneficial interests in the Trust, as well. All units purchased by the Managing Owner are held for investment purposes only and not for resale. The Managing Owner may make purchases or redemptions at any time on the same terms as any Limited Owner. The Trust has and will continue to have certain relationships with the Managing Owner and its affiliates.
Expenses
Management Fees—Each Series of the Trust pays to the Managing Owner a monthly management fee equal to a certain percentage of such Series’ assets attributable to such Series (including notional assets), calculated on a daily basis. The annual rate of the management fee is 0.5% for the Balanced Series, 2.0% for the Winton Series, Currency Series, Long Only Commodity Series, Frontier Long/Short Commodity Series Class 1 a and Class 2a, Managed Futures Index Series, Frontier Diversified Series, Frontier Dynamic Series and Frontier Masters Series, 2.5% for the Winton/Graham Series and Berkeley/Graham/Tiverton Series, and 3.5% for the Frontier Long/Short Commodity Series Class 1 and Class 2. The Managing Owner may pay all or a portion of such management fees to the Trading Advisor(s) for such Series.
Trading Fees—In connection with each Series’ trading activities of the Trust, the Frontier Long/Short Commodity Series (Classes 1, 2 and 3), Balanced Series, Currency Series, Berkeley/Graham/Tiverton Series, Long/Only Commodity Series, Managed Futures Index Series, Winton Series and Winton/Graham Series pays to the Managing Owner a trading fee, or FCM Fee, up to 0.75% of such Series’ NAV, calculated daily. The Frontier Diversified Series, Frontier Dynamic Series, Frontier Long/Short Commodity Series (Classes 1a and 2a) and Frontier Masters Series pays to the Managing Owner a trading fee, or FCM Fee, up to 2.25% and a custodial/due diligence fee of 0.12% of such Series’ NAV, calculated daily.
Incentive Fees—Some Series of the Trust pay to the Managing Owner an incentive fee of a certain percentage of new net trading profits generated by such Series, monthly or quarterly. Because the Balanced Series, Winton/Graham Series, Berkeley/Graham/Tiverton Series, Currency Series and Frontier Long/Short Commodity Series may each employ multiple Trading Advisors, these Series will pay the Managing Owner a monthly incentive fee calculated on a Trading Advisor by Trading Advisor basis. It is therefore possible that in any given period the Balanced Series or the Frontier Long/Short Commodity Series may pay incentive fees to the Managing Owner for one or more Trading Advisors while each of these Series as a whole experiences losses. The incentive fee is 25% for the Balanced Series and the Frontier Diversified Series and 20% for the Winton Series, Currency Series, Winton/Graham Series, Berkeley/Graham/Tiverton Series, Frontier Long/Short Commodity Series, Frontier Dynamic Series and Frontier Masters Series. There is no incentive fee for the Long Only Commodity Series or the Managed Futures Index Series. The Managing Owner may pay all or a portion of such incentive fees to the Trading Advisor(s) for such Series.
Service Fees—In addition, with respect to Class 1 and Class 1a Units of each Series of the Trust, as applicable, the Series pays monthly or quarterly to the Managing Owner a service fee at an annualized rate, as described in more detail above, which the Managing Owner pays to selling agents of the Trust.
With respect to the service fees, the initial service fee (for the first 12 months) relating to a purchase of Units by an investor is prepaid by the Managing Owner to the relevant selling agent in the month following such purchase and is reimbursed therefore by the Series monthly in arrears in an amount based upon a corresponding percentage of NAV, calculated daily. Consequently, the Managing Owner bears the risk and enjoys the benefit of the upside potential of any difference between the amount of the initial service fee prepaid by it and the amount of the reimbursement thereof, which may result from variations in NAV over the following 12 months.
F-79
For the year ended December 31, 2011, amounts received or receivable from the Managing Owner for the difference in monthly service fees from the prepaid initial service fees were $2,910. For the year ended December 31, 2011, amounts paid or owing the Managing Owner for the difference in monthly service fees from prepaid initial service fees were $108,041.
For the year ended December 31, 2010, amounts received or receivable from the Managing Owner for the difference in monthly service fees from the prepaid initial service fees were $8,968 for the Balanced Series, $5,201 for the Frontier Long/Short Commodity Series and $1,592 for the Frontier Diversified Series. For the twelve months ended December 31, 2010, amounts paid or owing the Managing Owner for the difference in monthly service fees from prepaid initial service fees were $983 for the Currency Series, $439 for the Winton/Graham Series, $1,115 for the Berkeley/Graham/Tiverton Series, $13,886 for the Long Only Commodity Series, $272 for the Managed Futures Index Series, $17,149 for the Winton Series, $5,965 for the Frontier Dynamic Series, and $2,011 for the Frontier Masters Series.
Aggregate interest income from all sources, including assets held at clearing brokers, up to 2% (annualized) is paid to the Managing Owner by the Balanced Series (Class 1 and Class 2 only), Winton Series, Berkeley/Graham/Tiverton Series, Currency Series and Winton/Graham Series. For the Frontier Diversified Series, Frontier Dynamic Series, Frontier Long/Short Commodity Series, Frontier Masters Series, Balanced Series (Class 1a and Class 2a only), Long Only Commodity Series and Managed Futures Index Series 20% of the total interest allocated to each Series is paid to the Managing Owner. During the years ended December 31, 2011, 2010 and 2009, the Trust paid $9,330,127, $10,238,665 and $10,476,506, respectively, of such interest income to the Managing Owner. Such expenses are not included in the statements of operations of the Series.
The Managing Owner pays to The Bornhoft Group Corporation, an affiliate of the Trust, a monthly fee of 0.25% (annualized) of the NAV of the Trust, for services in connection with the daily valuation of each Series and Class. The amount paid under this agreement was $1,890,452, $2,027,849 and $1,746,079, respectively for the years ended December 31, 2011 2010 and 2009.
Solon Capital, LLC, an affiliate of the Trust, provides product development and marketing services. For these services, the Managing Owner paid Solon Capital, LLC, $3,402,814 $3,650,128 and $3,142,942, respectively, for the years ended December 31, 2011, 2010 and 2009.
Bornhoft Group Securities Corporation, a subsidiary of the Managing Owner, serves as wholesaler of the Trust by marketing to broker/dealer organizations. Its results are consolidated with the Managing Owner
6. Financial Highlights
The following information presents the financial highlights of the Trust for the years ended December 31, 2011, 2010 and 2009. This data has been derived from the information presented in the financial statements.
| | | | | | | | | | | | |
| | | 2011 | | | 2010 | | | 2009 | |
Ratios to average net assets | | | | | | | | | | | | |
Net investment gain/(loss) | | | -6.98 | % | | | -6.92 | % | | | -5.61 | % |
Expenses before incentive fees | | | -4.84 | % | | | -4.82 | % | | | -4.72 | % |
Expenses after incentive fees | | | -7.84 | % | | | -7.65 | % | | | -6.25 | % |
| | | |
Total return before incentive fees | | | -0.32 | % | | | 13.84 | % | | | -2.72 | % |
Total return after incentive fees | | | -3.33 | % | | | 11.01 | % | | | -4.24 | % |
The Trust financial highlights are calculated based upon the Trust’s financial statements. The consolidated Trust does not issue units and therefore the financial highlights do not disclose any unitized data.
F-80
7. Derivative Instruments and Hedging Activities
The Trust’s primary business is to engage in speculative trading of a diversified portfolio of futures, forwards (including interbank foreign currencies), options contracts and other derivative instruments (including swap contracts). The Trust does not enter into or hold positions for hedging purposes as defined under ASC 815. The detail of the fair value of the Trust’s derivatives by instrument types as of December 31, 2011 and 2010 is included in the Consolidated Condensed Schedules of Investments. See Note 4 for further disclosure related to the Trust’s positions in swap contracts.
For the year ended December 31, 2011and 2010, the monthly average of futures contracts bought was approximately 154,390 and 143,500, respectively and sold was approximately 156,500 and 109,700, respectively. The following tables summarize the trading revenues for the years ended December 31, 2011 and 2010 approximately by contract:
Realized Trading Revenue from Futures, Forwards and Options
for the Year Ended December 31, 2011(2)
| | | | |
Type of contract | | | |
Metals | | $ | 11,612,828 | |
Currencies | | | 34,838,054 | |
Energies | | | 35,782,228 | |
Agriculturals | | | 13,881,212 | |
Interest rates | | | 28,920,221 | |
Stock indices | | | 20,611,934 | |
| | | | |
Realized trading income/(loss)(2) | | $ | 145,646,477 | |
| | | | |
Unrealized Trading Revenue from Futures, Forwards and Options
for the Year Ended December 31, 2011(1)
| | | | |
Type of contract | | | |
Metals | | $ | (9,104,684 | ) |
Currencies | | | (39,279,686 | ) |
Energies | | | 611,935 | |
Agriculturals | | | (18,764,970 | ) |
Interest rates | | | (8,749,367 | ) |
Stock indices | | | (11,265,448 | ) |
| | | | |
Unrealized trading income/(loss)(1) | | $ | (86,552,220 | ) |
| | | | |
F-81
Realized Trading Revenue from Futures, Forwards and Options
for the Year Ended December 31, 2010(2)
| | | | |
Type of contract | | | |
Metals | | $ | 14,579,597 | |
Currencies | | | 19,812,288 | |
Energies | | | 2,633,175 | |
Agriculturals | | | 46,752,288 | |
Interest rates | | | 14,743,765 | |
Stock indices | | | 7,201,121 | |
| | | | |
Realized trading income/(loss)(2) | | $ | 105,722,234 | |
| | | | |
Unrealized Trading Revenue from Futures, Forwards and Options
for the Year Ended December 31, 2010(1)
| | | | |
Type of contract | | | |
Metals | | $ | 4,546,830 | |
Currencies | | | 12,256,088 | |
Energies | | | 25,386,546 | |
Agriculturals | | | (11,784,078 | ) |
Interest rates | | | 1,744,734 | |
Stock indices | | | 2,413,750 | |
| | | | |
Unrealized trading income/(loss)(1) | | $ | 34,563,870 | |
| | | | |
Realized Trading Revenue from Futures, Forwards and Options
for the Year Ended December 31, 2009(2)
| | | | |
Type of contract | | The Frontier Fund | |
Metals | | $ | 23,231,667 | |
Currencies | | | 4,706,930 | |
Energies | | | 21,870,383 | |
Agriculturals | | | 14,079,154 | |
Interest rates | | | 3,053,132 | |
Stock indices | | | 18,630,922 | |
| | | | |
Realized trading income/(loss)(2) | | $ | 85,572,188 | |
| | | | |
Unrealized Trading Revenue from Futures, Forwards and Options
for the Year Ended December 31, 2009(1)
| | | | |
Type of contract | | The Frontier Fund | |
Metals | | $ | 18,646,859 | |
Currencies | | | (21,046,593 | ) |
Energies | | | (6,894,149 | ) |
Agriculturals | | | (21,638,396 | ) |
Interest rates | | | (2,323,143 | ) |
Stock indices | | | (12,673,852 | ) |
| | | | |
Unrealized trading income/(loss)(1) | | $ | (45,929,274 | ) |
| | | | |
| (1) | In the Consolidated Statements of Operations under net change in open trade equity (deficit), at fair value. |
| (2) | In the Consolidated Statements of Operations under Net realized gain/(loss) on futures, forwards and options. |
F-82
8. Trading Activities and Related Risks
The purchase and sale of futures and options on futures contracts require margin deposits with Futures Commission Merchants (each, an “FCM”). Additional deposits may be necessary for any loss on contract value. The Commodity Exchange Act requires an FCM to segregate all customer transactions and assets from the FCM’s proprietary activities. A customer’s cash and other property (for example, U.S. Treasury bills) deposited with an FCM are considered commingled with all other customer funds subject to the FCM’s segregation requirements. In the event of an FCM’s insolvency, recovery may be limited to a pro rata share of segregated funds available. It is possible that the recovered amount could be less than the total of cash and other property deposited.
The term “off-balance sheet risk” refers to an unrecorded potential liability that, even though it does not appear on the statements of financial condition, may result in future obligation or loss in excess of the amount paid by the Series for a particular investment. Each Trading Company expects to trade in futures, options, forward and swap contracts and will therefore be a party to financial instruments with elements of off-balance sheet market and credit risk. In entering into these contracts, there exists a market risk that such contracts may be significantly influenced by market conditions, such as interest rate volatility, resulting in such contracts being less valuable. If the markets should move against all of the futures positions held by a Trading Company in respect of any Series at the same time, and if the Trading Advisor(s) of such Trading Company are unable to offset such futures interests positions, such Trading Company could lose all of its assets and the holders of Units of such Series would realize a 100% loss. The Managing Owner will seek to minimize market risk through real-time monitoring of open positions and the level of diversification of each Trading Advisor’s portfolio. It is anticipated that any Trading Advisor’s margin-to-equity ratio will typically not exceed approximately 35% although the actual ratio could be higher or lower from time to time.
F-83
In addition to market risk, trading futures, forward and swap contracts entails credit risk in that a counterparty will not be able to meet its obligations to a Trading Company. The counterparty for futures contracts traded in the United States and on most foreign exchanges is the clearinghouse associated with such exchange. In general, clearinghouses are backed by the corporate members of the clearinghouse who are required to share any financial burden resulting from the non-performance by one of their members and, as such, should significantly reduce this credit risk. In cases where the clearinghouse is not backed by the clearing members, like some foreign exchanges, it is normally backed by a consortium of banks or other financial institutions. Some non-U.S. exchanges, in contrast to U.S. exchanges, are principals’ markets in which performance is the responsibility only of the individual counterparty with whom the Trading Company has entered into the transaction, and not of the exchange or clearing corporation. In these kinds of markets, there is risk of bankruptcy or other failure or refusal to perform by the counterparty.
In the case of forward contracts traded on the interbank market and swaps, neither is traded on exchanges. The counterparty is generally a single bank or other financial institution, rather than a group of financial institutions; thus there may be a greater counterparty credit risk. The Managing Owner expects the Trading Advisors to trade only with those counterparties which it believes to be creditworthy. All positions of each Trading Company will be valued each day on a mark-to-market basis. There can be no assurance that any clearing member, clearinghouse or other counterparty will be able to meet its obligations to any Trading Company.
The Managing Owner has established procedures to actively monitor and minimize market and credit risks. The Limited Owners bear the risk of loss only to the extent of the market value of their respective investments and, in certain specific circumstances, distributions and redemptions received.
9. Indemnifications
The Trust has entered into agreements, which provide for the indemnification of futures clearing brokers, and commodity trading advisers, among others, against losses, costs, claims and liabilities arising from the performance of their individual obligations under such agreements, except for gross negligence or bad faith. The Trust has had no prior claims or payments pursuant to these agreements. The Trust’s individual maximum exposure under these arrangements is unknown, as this would involve future claims that may be made against the Trust that have not yet occurred. However, based on experience the Trust expects the risk of loss to be remote.
10. Subsequent Events
Effective as of March 1, 2012, the Berkeley/Graham/Tiverton Series of the Trust became known as the Tiverton/Graham/Transtrend Series. The TBG Institutional Series became a new Series of the Trust on January 20, 2012.
F-84
Report of Independent Registered Public Accounting Firm
To the Frontier Fund,
as sole member of the Trading Companies
We have audited the accompanying statements of financial condition, including the condensed schedules of investments, of the Frontier Trading Company I LLC, Frontier Trading Company II LLC, Frontier Trading Company III LLC, Frontier Trading Company V LLC, Frontier Trading Company VI LLC, Frontier Trading Company VII, LLC, Frontier Trading Company VIII, LLC, Frontier Trading Company IX, LLC, Frontier Trading Company X, LLC, Frontier Trading Company XI, LLC, Frontier Trading Company XII, LLC, Frontier Trading Company XIV, LLC, Frontier Trading Company XV, LLC, Frontier Trading Company XVII, LLC, Frontier Trading Company XVIII, LLC, and Frontier Trading Company XXI, LLC (collectively, the Trading Companies) as of December 31, 2011 and 2010, and the related statements of operations, changes in members’ equity, and cash flows for each of the three years in the period ended December 31, 2011. These financial statements are the responsibility of the management of the Trading Companies. Our responsibility is to express an opinion on these financial statements based on our audits.
We conducted our audits in accordance with the standards of the Public Company Accounting Oversight Board (United States). Those standards require that we plan and perform the audit to obtain reasonable assurance about whether the financial statements are free of material misstatement. The Trading Companies are not required to have, nor were we engaged to perform an audit of its internal control over financial reporting. Our audits included consideration of internal control over financial reporting as a basis for designing audit procedures that are appropriate in the circumstances, but not for the purpose of expressing an opinion on the effectiveness of the Trading Companies’ internal control over financial reporting. Accordingly, we express no such opinion. An audit also includes examining, on a test basis, evidence supporting the amounts and disclosures in the financial statements, assessing the accounting principles used and significant estimates made by management, as well as evaluating the overall financial statement presentation. We believe that our audits provide a reasonable basis for our opinion.
In our opinion, the financial statements referred to above present fairly, in all material respects, the financial position of the Frontier Trading Company I LLC, Frontier Trading Company II LLC, Frontier Trading Company III LLC, Frontier Trading Company V LLC, Frontier Trading Company VI LLC, Frontier Trading Company VII, LLC, Frontier Trading Company VIII, LLC, Frontier Trading Company IX, LLC, Frontier Trading Company X, LLC, Frontier Trading Company XI, LLC, Frontier Trading Company XII, LLC, Frontier Trading Company XIV, LLC, Frontier Trading Company XV, LLC, Frontier Trading Company XVII, LLC, Frontier Trading Company XVIII, LLC, and Frontier Trading Company XXI, LLC as of December 31, 2011 and 2010, and the results of their operations and their cash flows for each of the three years in the period ended December 31, 2011, in conformity with U.S. generally accepted accounting principles.
/s/ McGladrey & Pullen, LLP
Denver, Colorado
March 30, 2012
F-85
The Trading Companies of the Frontier Fund
Statements of Financial Condition
December 31, 2011 and 2010
| | | | | | | | | | | | | | | | | | | | | | | | |
| | | Frontier Trading
Company I LLC | | | Frontier Trading
Company II LLC | | | Frontier Trading
Company III LLC | |
| | | 12/31/2011 | | | 12/31/2010 | | | 12/31/2011 | | | 12/31/2010 | | | 12/31/2011 | | | 12/31/2010 | |
ASSETS | | | | | | | | | | | | | | | | | | | | | | | | |
Receivable from futures commission merchants | | $ | 44,352,814 | | | $ | 51,797,165 | | | $ | 13,281,065 | | | $ | 13,321,102 | | | $ | — | | | $ | 678,454 | |
Open trade equity, at fair value | | | 295,708 | | | | 6,816,875 | | | | 4,042,808 | | | | 6,370,110 | | | | — | | | | 28,390 | |
Swap contracts, at fair value | | | 17,706,757 | | | | 49,811,462 | | | | — | | | | — | | | | — | | | | 5,668,768 | |
| | | | | | | | | | | | | | | | | | | | | | | | |
Total Assets | | $ | 62,355,279 | | | $ | 108,425,502 | | | $ | 17,323,873 | | | $ | 19,691,212 | | | $ | — | | | $ | 6,375,612 | |
| | | | | | | | | | | | | | | | | | | | | | | | |
| LIABILITIES & MEMBERS’ EQUITY | | | | | | | | | | | | | | | | | | | | | | | | |
LIABILITIES | | | | | | | | | | | | | | | | | | | | | | | | |
Payable to futures commission merchants | | $ | — | | | $ | — | | | $ | — | | | $ | — | | | $ | — | | | $ | — | |
Options written, at fair value | | | 444,255 | | | | 128,013 | | | | 9,873 | | | | 12,125 | | | | — | | | | 1,292 | |
Open trade deficit, at fair value | | | — | | | | — | | | | — | | | | — | | | | — | | | | — | |
| | | | | | | | | | | | | | | | | | | | | | | | |
Total Liabilities | | | 444,255 | | | | 128,013 | | | | 9,873 | | | | 12,125 | | | | — | | | | 1,292 | |
| | | | | | | | | | | | | | | | | | | | | | | | |
MEMBERS’ EQUITY (Net Asset Value) | | | 61,911,024 | | | | 108,297,489 | | | | 17,314,000 | | | | 19,679,087 | | | | — | | | | 6,374,320 | |
| | | | | | | | | | | | | | | | | | | | | | | | |
Total Liabilities and Members’ Equity | | $ | 62,355,279 | | | $ | 108,425,502 | | | $ | 17,323,873 | | | $ | 19,691,212 | | | $ | — | | | $ | 6,375,612 | |
| | | | | | | | | | | | | | | | | | | | | | | | |
| | | |
| | | Frontier Trading
Company V LLC | | | Frontier Trading
Company VI LLC | | | Frontier Trading
Company VII, LLC | |
| | | 12/31/2011 | | | 12/31/2010 | | | 12/31/2011 | | | 12/31/2010 | | | 12/31/2011 | | | 12/31/2010 | |
ASSETS | | | | | | | | | | | | | | | | | | | | | | | | |
Receivable from futures commission merchants | | $ | 19,418,926 | | | $ | 11,089,508 | | | $ | — | | | $ | 7,683,483 | | | $ | 47,822,021 | | | $ | 83,823,713 | |
Open trade equity, at fair value | | | 1,438,257 | | | | 1,427,138 | | | | — | | | | 593,970 | | | | — | | | | — | |
Swap contracts, at fair value | | | — | | | | — | | | | — | | | | — | | | | — | | | | — | |
| | | | | | | | | | | | | | | | | | | | | | | | |
Total Assets | | $ | 20,857,183 | | | $ | 12,516,646 | | | $ | — | | | $ | 8,277,453 | | | $ | 47,822,021 | | | $ | 83,823,713 | |
| | | | | | | | | | | | | | | | | | | | | | | | |
| LIABILITIES & MEMBERS’ EQUITY | | | | | | | | | | | | | | | | | | | | | | | | |
LIABILITIES | | | | | | | | | | | | | | | | | | | | | | | | |
Payable to futures commission merchants | | $ | — | | | $ | — | | | $ | — | | | $ | — | | | $ | — | | | $ | — | |
Open trade deficit, at fair value | | | — | | | | — | | | | — | | | | — | | | | 25,934,678 | | | | 14,945,485 | |
Options written, at fair value | | | — | | | | — | | | | — | | | | 56,300 | | | | — | | | | 662,392 | |
| | | | | | | | | | | | | | | | | | | | | | | | |
Total Liabilities | | | — | | | | — | | | | — | | | | 56,300 | | | | 25,934,678 | | | | 15,607,877 | |
| | | | | | | | | | | | | | | | | | | | | | | | |
MEMBERS’ EQUITY (Net Asset Value) | | | 20,857,183 | | | | 12,516,646 | | | | — | | | | 8,221,153 | | | | 21,887,343 | | | | 68,215,836 | |
| | | | | | | | | | | | | | | | | | | | | | | | |
Total Liabilities and Members’ Equity | | $ | 20,857,183 | | | $ | 12,516,646 | | | $ | — | | | $ | 8,277,453 | | | $ | 47,822,021 | | | $ | 83,823,713 | |
| | | | | | | | | | | | | | | | | | | | | | | | |
| | | |
| | | Frontier Trading
Company VIII, LLC | | | Frontier Trading
Company IX, LLC | | | Frontier Trading
Company X, LLC | |
| | | 12/31/2011 | | | 12/31/2010 | | | 12/31/2011 | | | 12/31/2010 | | | 12/31/2011 | | | 12/31/2010 | |
ASSETS | | | | | | | | | | | | | | | | | | | | | | | | |
Receivable from futures commission merchants | | $ | — | | | $ | — | | | $ | 4,767,402 | | | $ | 4,340,260 | | | $ | — | | | $ | — | |
Open trade equity, at fair value | | | — | | | | — | | | | 444,769 | | | | 1,531,050 | | | | — | | | | — | |
Swap contracts, at fair value | | | — | | | | 790,795 | | | | — | | | | — | | | | — | | | | 11,407,905 | |
| | | | | | | | | | | | | | | | | | | | | | | | |
Total Assets | | $ | — | | | $ | 790,795 | | | $ | 5,212,171 | | | $ | 5,871,310 | | | $ | — | | | $ | 11,407,905 | |
| | | | | | | | | | | | | | | | | | | | | | | | |
| LIABILITIES & MEMBERS’ EQUITY | | | | | | | | | | | | | | | | | | | | | | | | |
LIABILITIES | | | | | | | | | | | | | | | | | | | | | | | | |
Payable to futures commission merchants | | $ | — | | | $ | — | | | $ | — | | | $ | — | | | $ | — | | | $ | — | |
Open trade deficit, at fair value | | | — | | | | — | | | | — | | | | — | | | | — | | | | — | |
| | | | | | | | | | | | | | | | | | | | | | | | |
Total Liabilities | | | — | | | | — | | | | — | | | | — | | | | — | | | | — | |
| | | | | | | | | | | | | | | | | | | | | | | | |
MEMBERS’ EQUITY (Net Asset Value) | | | — | | | | 790,795 | | | | 5,212,171 | | | | 5,871,310 | | | | — | | | | 11,407,905 | |
| | | | | | | | | | | | | | | | | | | | | | | | |
Total Liabilities and Members’ Equity | | $ | — | | | $ | 790,795 | | | $ | 5,212,171 | | | $ | 5,871,310 | | | $ | — | | | $ | 11,407,905 | |
| | | | | | | | | | | | | | | | | | | | | | | | |
The accompanying notes are an integral part of these financial statements.
F-86
The Trading Companies of the Frontier Fund
Statements of Financial Condition
December 31, 2011 and 2010
| | | | | | | | | | | | | | | | | | | | | | | | |
| | | Frontier Trading
Company XI, LLC | | | Frontier Trading
Company XII, LLC | | | Frontier Trading
Company XIV, LLC | |
| | | 12/31/2011 | | | 12/31/2010 | | | 12/31/2011 | | | 12/31/2010 | | | 12/31/2011 | | | 12/31/2010 | |
ASSETS | | | | | | | | | | | | | | | | | | | | | | | | |
Receivable from futures commission merchants | | $ | — | | | $ | — | | | $ | — | | | $ | — | | | $ | 12,159,223 | | | $ | 23,739,656 | |
Open trade equity, at fair value | | | — | | | | — | | | | — | | | | — | | | | — | | | | 323,845 | |
Swap contracts, at fair value | | | — | | | | 26,242,246 | | | | — | | | | 10,956,756 | | | | — | | | | — | |
| | | | | | | | | | | | | | | | | | | | | | | | |
Total Assets | | $ | — | | | $ | 26,242,246 | | | $ | — | | | $ | 10,956,756 | | | $ | 12,159,223 | | | $ | 24,063,501 | |
| | | | | | | | | | | | | | | | | | | | | | | | |
| LIABILITIES & MEMBERS’ EQUITY | | | | | | | | | | | | | | | | | | | | | | | | |
LIABILITIES | | | | | | | | | | | | | | | | | | | | | | | | |
Payable to futures commission merchants | | $ | — | | | $ | — | | | $ | — | | | $ | — | | | $ | — | | | $ | — | |
Open trade deficit, at fair value | | | — | | | | — | | | | — | | | | — | | | | 238,949 | | | | — | |
CTA fees payable | | | — | | | | — | | | | — | | | | — | | | | — | | | | — | |
| | | | | | | | | | | | | | | | | | | | | | | | |
Total Liabilities | | | — | | | | — | | | | — | | | | — | | | | 238,949 | | | | — | |
| | | | | | | | | | | | | | | | | | | | | | | | |
MEMBERS’ EQUITY (Net Asset Value) | | | — | | | | 26,242,246 | | | | — | | | | 10,956,756 | | | | 11,920,274 | | | | 24,063,501 | |
| | | | | | | | | | | | | | | | | | | | | | | | |
Total Liabilities and Members’ Equity | | $ | — | | | $ | 26,242,246 | | | $ | — | | | $ | 10,956,756 | | | $ | 12,159,223 | | | $ | 24,063,501 | |
| | | | | | | | | | | | | | | | | | | | | | | | |
| | | |
| | | Frontier Trading
Company XV, LLC | | | Frontier Trading
Company XVII, LLC (1) | | | Frontier Trading
Company XVIII, LLC (1) | |
| | | 12/31/2011 | | | 12/31/2010 | | | 12/31/2011 | | | 12/31/2010 | | | 12/31/2011 | | | 12/31/2010 | |
ASSETS | | | | | | | | | | | | | | | | | | | | | | | | |
Receivable from futures commission merchants | | $ | 6,632,990 | | | $ | 21,572,442 | | | $ | — | | | $ | — | | | $ | 6,810,086 | | | $ | — | |
Open trade equity, at fair value | | | 12,006,820 | | | | 17,332,625 | | | | — | | | | — | | | | 596,193 | | | | — | |
Swap contracts, at fair value | | | — | | | | — | | | | 5,881,772 | | | | — | | | | — | | | | — | |
| | | | | | | | | | | | | | | | | | | | | | | | |
Total Assets | | $ | 18,639,810 | | | $ | 38,905,067 | | | $ | 5,881,772 | | | $ | — | | | $ | 7,406,279 | | | $ | — | |
| | | | | | | | | | | | | | | | | | | | | | | | |
| LIABILITIES & MEMBERS’ EQUITY | | | | | | | | | | | | | | | | | | | | | | | | |
LIABILITIES | | | | | | | | | | | | | | | | | | | | | | | | |
Payable to futures commission merchants | | $ | — | | | $ | — | | | $ | — | | | $ | — | | | $ | — | | | $ | — | |
Open trade deficit, at fair value | | | — | | | | — | | | | — | | | | — | | | | — | | | | — | |
Options written, at fair value | | | 2,882,198 | | | | — | | | | — | | | | — | | | | — | | | | — | |
CTA fees payable | | | — | | | | — | | | | — | | | | — | | | | — | | | | — | |
| | | | | | | | | | | | | | | | | | | | | | | | |
Total Liabilities | | | 2,882,198 | | | | — | | | | — | | | | — | | | | — | | | | — | |
| | | | | | | | | | | | | | | | | | | | | | | | |
MEMBERS’ EQUITY (Net Asset Value) | | | 15,757,612 | | | | 38,905,067 | | | | 5,881,772 | | | | — | | | | 7,406,279 | | | | — | |
| | | | | | | | | | | | | | | | | | | | | | | | |
Total Liabilities and Members’ Equity | | $ | 18,639,810 | | | $ | 38,905,067 | | | $ | 5,881,772 | | | $ | — | | | $ | 7,406,279 | | | $ | — | |
| | | | | | | | | | | | | | | | | | | | | | | | |
| | | |
| | | Frontier Trading
Company XXI, LLC (1) | | | | | | | |
| | | 12/31/2011 | | | 12/31/2010 | | | | | | | | | | | | | |
ASSETS | | | | | | | | | | | | | | | | | | | | | | | | |
Receivable from futures commission merchants | | $ | 5,107,786 | | | $ | — | | | | | | | | | | | | | | | | | |
Open trade equity, at fair value | | | 792,372 | | | | — | | | | | | | | | | | | | | | | | |
Swap contracts, at fair value | | | — | | | | — | | | | | | | | | | | | | | | | | |
| | | | | | | | | | | | | | | | | | | | | | | | |
Total Assets | | $ | 5,900,158 | | | $ | — | | | | | | | | | | | | | | | | | |
| | | | | | | | | | | | | | | | | | | | | | | | |
| LIABILITIES & MEMBERS’ EQUITY | | | | | | | | | | | | | | | | | | | | | | | | |
LIABILITIES | | | | | | | | | | | | | | | | | | | | | | | | |
Payable to futures commission merchants | | $ | — | | | $ | — | | | | | | | | | | | | | | | | | |
Open trade deficit, at fair value | | | — | | | | — | | | | | | | | | | | | | | | | | |
CTA fees payable | | | — | | | | — | | | | | | | | | | | | | | | | | |
| | | | | | | | | | | | | | | | | | | | | | | | |
Total Liabilities | | | — | | | | — | | | | | | | | | | | | | | | | | |
| | | | | | | | | | | | | | | | | | | | | | | | |
MEMBERS’ EQUITY (Net Asset Value) | | | 5,900,158 | | | | — | | | | | | | | | | | | | | | | | |
| | | | | | | | | | | | | | | | | | | | | | | | |
Total Liabilities and Members’ Equity | | $ | 5,900,158 | | | $ | — | | | | | | | | | | | | | | | | | |
| | | | | | | | | | | | | | | | | | | | | | | | |
| (1) | Trading Companies XVII, XVIII and XXI commenced trading operations in July, October and March 2011, respecitively. |
The accompanying notes are an integral part of these financial statements.
F-87
The Trading Companies of the Frontier Fund
Condensed Schedules of Investments
December 31, 2011
| | | | | | | | | | | | | | | | | | | | | | | | | | | | | | | | |
| | | Frontier Trading | | | Frontier Trading | | | Frontier Trading | | | Frontier Trading | |
| | | Company I LLC | | | Company II LLC | | | Company III LLC | | | Company V LLC | |
Description | | Value | | | % of Net
Asset Value | | | Value | | | % of Net
Asset Value | | | Value | | | % of Net
Asset Value | | | Value | | | % of Net
Asset Value | |
LONG FUTURES CONTRACTS* | | | | | | | | | | | | | | | | | | | | | | | | | | | | | | | | |
Various base metals futures contracts (US) | | $ | (108,899 | ) | | | -0.18 | % | | $ | (57,263 | ) | | | -0.33 | % | | $ | — | | | | 0.00 | % | | $ | (3,756 | ) | | | -0.02 | % |
Various base metals futures contracts (Europe) | | | (29,673 | ) | | | -0.05 | % | | | (150,823 | ) | | | -0.87 | % | | | — | | | | 0.00 | % | | | (5,863 | ) | | | -0.03 | % |
Various currency futures contracts (US) | | | 123,683 | | | | 0.20 | % | | | 550,236 | | | | 3.18 | % | | | — | | | | 0.00 | % | | | 16,724 | | | | 0.08 | % |
Various currency futures contracts (Canada) | | | — | | | | 0.00 | % | | | — | | | | 0.00 | % | | | — | | | | 0.00 | % | | | — | | | | 0.00 | % |
Various currency futures contracts (Europe) | | | 24,828 | | | | 0.04 | % | | | (79,234 | ) | | | -0.46 | % | | | — | | | | 0.00 | % | | | (233 | ) | | | 0.00 | % |
Various currency futures contracts (Far East) | | | — | | | | 0.00 | % | | | — | | | | 0.00 | % | | | — | | | | 0.00 | % | | | — | | | | 0.00 | % |
Various energy futures contracts (US) | | | 29,865 | | | | 0.05 | % | | | 111,908 | | | | 0.65 | % | | | — | | | | 0.00 | % | | | 59,215 | | | | 0.28 | % |
Various energy futures contracts (Europe) | | | (63,395 | ) | | | -0.10 | % | | | (84,305 | ) | | | -0.49 | % | | | — | | | | 0.00 | % | | | (2,515 | ) | | | -0.01 | % |
Various interest rates futures contracts (US) | | | 170,202 | | | | 0.27 | % | | | 581,827 | | | | 3.36 | % | | | — | | | | 0.00 | % | | | 322,301 | | | | 1.55 | % |
Various interest rates futures contracts (Canada) | | | 38,148 | | | | 0.06 | % | | | 15,281 | | | | 0.09 | % | | | — | | | | 0.00 | % | | | 9,531 | | | | 0.05 | % |
Various interest rates futures contracts (Europe) | | | 655,649 | | | | 1.06 | % | | | 1,509,072 | | | | 8.72 | % | | | — | | | | 0.00 | % | | | 484,795 | | | | 2.32 | % |
Various interest rates futures contracts (Far East) | | | 87,280 | | | | 0.14 | % | | | 312,983 | | | | 1.81 | % | | | — | | | | 0.00 | % | | | 292,784 | | | | 1.40 | % |
Various precious metals futures contracts (US) | | | (84,968 | ) | | | -0.14 | % | | | (759,420 | ) | | | -4.39 | % | | | — | | | | 0.00 | % | | | 390 | | | | 0.00 | % |
Various precious metals futures contracts (Europe) | | | — | | | | 0.00 | % | | | — | | | | 0.00 | % | | | — | | | | 0.00 | % | | | — | | | | 0.00 | % |
Various soft futures contracts (US) | | | 66,608 | | | | 0.11 | % | | | (84,235 | ) | | | -0.49 | % | | | — | | | | 0.00 | % | | | — | | | | 0.00 | % |
Various soft futures contracts (Europe) | | | — | | | | 0.00 | % | | | (5,190 | ) | | | -0.03 | % | | | — | | | | 0.00 | % | | | — | | | | 0.00 | % |
Various soft futures contracts (Canada) | | | — | | | | 0.00 | % | | | — | | | | 0.00 | % | | | — | | | | 0.00 | % | | | — | | | | 0.00 | % |
Various soft futures contracts (Far east) | | | — | | | | 0.00 | % | | | — | | | | 0.00 | % | | | — | | | | 0.00 | % | | | — | | | | 0.00 | % |
Various stock index futures contracts (US) | | | 76,371 | | | | 0.12 | % | | | 130,552 | | | | 0.75 | % | | | — | | | | 0.00 | % | | | 151,551 | | | | 0.73 | % |
Various stock index futures contracts (Canada) | | | — | | | | 0.00 | % | | | — | | | | 0.00 | % | | | — | | | | 0.00 | % | | | — | | | | 0.00 | % |
Various stock index futures contracts (Europe) | | | 7,360 | | | | 0.01 | % | | | 32,527 | | | | 0.19 | % | | | — | | | | 0.00 | % | | | 126,126 | | | | 0.60 | % |
Various stock index futures contracts (Far East) | | | (149,642 | ) | | | -0.24 | % | | | (3,419 | ) | | | -0.02 | % | | | — | | | | 0.00 | % | | | (12,524 | ) | | | -0.06 | % |
| | | | | | | | | | | | | | | | | | | | | | | | | | | | | | | | |
Total Long Futures Contracts | | $ | 843,417 | | | | 1.36 | % | | $ | 2,020,497 | | | | 11.67 | % | | $ | — | | | | 0.00 | % | | $ | 1,438,526 | | | | 6.90 | % |
| | | | | | | | | | | | | | | | | | | | | | | | | | | | | | | | |
OPTIONS PURCHASED * | | $ | 556,630 | | | | 0.90 | % | | $ | 4,360 | | | | 0.03 | % | | $ | — | | | | 0.00 | % | | $ | — | | | | 0.00 | % |
| | | | | | | | | | | | | | | | | | | | | | | | | | | | | | | | |
SHORT FUTURES CONTRACTS* | | | | | | | | | | | | | | | | | | | | | | | | | | | | | | | | |
Various base metals futures contracts (US) | | $ | 31,772 | | | | 0.05 | % | | $ | 69,976 | | | | 0.40 | % | | $ | — | | | | 0.00 | % | | $ | 83,553 | | | | 0.40 | % |
Various base metals futures contracts (Europe) | | | 240,822 | | | | 0.39 | % | | | 399,332 | | | | 2.31 | % | | | — | | | | 0.00 | % | | | 121,322 | | | | 0.58 | % |
Various currency futures contracts (US) | | | (66,867 | ) | | | -0.11 | % | | | 111,284 | | | | 0.64 | % | | | — | | | | 0.00 | % | | | (363 | ) | | | 0.00 | % |
Various currency futures contracts (Canada) | | | — | | | | 0.00 | % | | | — | | | | 0.00 | % | | | — | | | | 0.00 | % | | | — | | | | 0.00 | % |
Various currency futures contracts (Europe) | | | 42,568 | | | | 0.07 | % | | | (16,438 | ) | | | -0.09 | % | | | — | | | | 0.00 | % | | | (81,737 | ) | | | -0.39 | % |
Euro Settling 3/1/2012 (Number of Contracts: 355) | | | — | | | | 0.00 | % | | | 1,348,925 | | | | 7.79 | % | | | — | | | | 0.00 | % | | | — | | | | 0.00 | % |
Various currency futures contracts (Far East) | | | — | | | | 0.00 | % | | | — | | | | 0.00 | % | | | — | | | | 0.00 | % | | | — | | | | 0.00 | % |
Various energy futures contracts (US) | | | 975 | | | | 0.00 | % | | | (107,778 | ) | | | -0.62 | % | | | — | | | | 0.00 | % | | | — | | | | 0.00 | % |
Various energy futures contracts (Europe) | | | (325 | ) | | | 0.00 | % | | | 63,905 | | | | 0.37 | % | | | — | | | | 0.00 | % | | | — | | | | 0.00 | % |
Various interest rates futures contracts (US) | | | (1,508,797 | ) | | | -2.44 | % | | | — | | | | 0.00 | % | | | — | | | | 0.00 | % | | | — | | | | 0.00 | % |
Various interest rates futures contracts (Canada) | | | — | | | | 0.00 | % | | | 1,056 | | | | 0.01 | % | | | — | | | | 0.00 | % | | | — | | | | 0.00 | % |
Various interest rates futures contracts (Europe) | | | (95,043 | ) | | | -0.15 | % | | | — | | | | 0.00 | % | | | — | | | | 0.00 | % | | | — | | | | 0.00 | % |
Various interest rates futures contracts (Far East) | | | — | | | | 0.00 | % | | | 3,027 | | | | 0.02 | % | | | — | | | | 0.00 | % | | | — | | | | 0.00 | % |
Various precious metals futures contracts (US) | | | 189,502 | | | | 0.31 | % | | | 6,750 | | | | 0.04 | % | | | — | | | | 0.00 | % | | | (24,125 | ) | | | -0.12 | % |
Various soft futures contracts (US) | | | (94,690 | ) | | | -0.15 | % | | | (29,096 | ) | | | -0.17 | % | | | — | | | | 0.00 | % | | | (786,722 | ) | | | -3.77 | % |
Various soft futures contracts (Canada) | | | — | | | | 0.00 | % | | | — | | | | 0.00 | % | | | — | | | | 0.00 | % | | | — | | | | 0.00 | % |
Various soft futures contracts (Europe) | | | 450,616 | | | | 0.73 | % | | | 79,281 | | | | 0.46 | % | | | — | | | | 0.00 | % | | | 25,239 | | | | 0.12 | % |
Various soft futures contracts (Far East) | | | (30,196 | ) | | | -0.05 | % | | | — | | | | 0.00 | % | | | — | | | | 0.00 | % | | | — | | | | 0.00 | % |
Various stock index futures contracts (US) | | | 3,545 | | | | 0.01 | % | | | — | | | | 0.00 | % | | | — | | | | 0.00 | % | | | 350 | | | | 0.00 | % |
Various stock index futures contracts (Canada) | | | (22,258 | ) | | | -0.04 | % | | | — | | | | 0.00 | % | | | — | | | | 0.00 | % | | | (5,205 | ) | | | -0.02 | % |
Various stock index futures contracts (Europe) | | | (329,376 | ) | | | -0.53 | % | | | (20,197 | ) | | | -0.12 | % | | | — | | | | 0.00 | % | | | — | | | | 0.00 | % |
Various stock index futures contracts (Far East) | | | 104,144 | | | | 0.17 | % | | | 55,851 | | | | 0.32 | % | | | — | | | | 0.00 | % | | | (36,242 | ) | | | -0.17 | % |
| | | | | | | | | | | | | | | | | | | | | | | | | | | | | | | | |
Total Short Futures Contracts | | $ | (1,083,601 | ) | | | -1.75 | % | | $ | 1,965,878 | | | | 11.35 | % | | $ | — | | | | 0.00 | % | | $ | (703,930 | ) | | | -3.38 | % |
| | | | | | | | | | | | | | | | | | | | | | | | | | | | | | | | |
OPTIONS WRITTEN * | | $ | (444,255 | ) | | | -0.72 | % | | $ | (9,873 | ) | | | -0.06 | % | | $ | — | | | | 0.00 | % | | $ | — | | | | 0.00 | % |
| | | | | | | | | | | | | | | | | | | | | | | | | | | | | | | | |
CURRENCY FORWARDS * | | $ | (20,738 | ) | | | -0.03 | % | | $ | 52,073 | | | | 0.30 | % | | $ | — | | | | 0.00 | % | | $ | 703,661 | | | | 3.37 | % |
| | | | | | | | | | | | | | | | | | | | | | | | | | | | | | | | |
Total Open Trade Equity | | $ | (148,547 | ) | | | -0.24 | % | | $ | 4,032,935 | | | | 23.29 | % | | $ | — | | | | 0.00 | % | | $ | 1,438,257 | | | | 6.90 | % |
| | | | | | | | | | | | | | | | | | | | | | | | | | | | | | | | |
Total Return Option Basket Swap (Termination date 11/6/12) | | $ | 17,706,757 | | | | 28.60 | % | | $ | — | | | | 0.00 | % | | $ | — | | | | 0.00 | % | | $ | — | | | | 0.00 | % |
| | | | | | | | | | | | | | | | | | | | | | | | | | | | | | | | |
| * | Except as noted, no individual futures, forwards and option on futures contract position constituted greater than 5 percent of Net Asset Value. Accordingly, the number of contracts and expiration dates are not presented. |
| (1) | See Notes to Financial Statements, Note 4. |
The accompanying notes are an integral part of these financial statements.
F-88
The Trading Companies of the Frontier Fund
Condensed Schedules of Investments
December 31, 2011
| | | | | | | | | | | | | | | | | | | | | | | | | | | | | | | | |
| | | Frontier Trading | | | Frontier Trading | | | Frontier Trading | | | Frontier Trading | |
| | | Company VI LLC | | | Company VII, LLC | | | Company VIII, LLC | | | Company IX, LLC | |
Description | | Value | | | % of Net
Asset Value | | | Value | | | % of Net
Asset Value | | | Value | | | % of Net
Asset Value | | | Value | | | % of Net
Asset Value | |
LONG FUTURES CONTRACTS* | | | | | | | | | | | | | | | | | | | | | | | | | | | | | | | | |
Various base metals futures contracts (US) | | $ | — | | | | 0.00 | % | | $ | (49,183 | ) | | | -0.22 | % | | $ | — | | | | 0.00 | % | | $ | (78,818 | ) | | | -1.51 | % |
Various base metals futures contracts (Europe) | | | — | | | | 0.00 | % | | | (206,400 | ) | | | -0.94 | % | | | — | | | | 0.00 | % | | | (88,198 | ) | | | -1.69 | % |
Aluminum Settling 1/1/2012 (Number of Contracts: 52) | | | — | | | | 0.00 | % | | | — | | | | 0.00 | % | | | — | | | | 0.00 | % | | | (271,164 | ) | | | -5.20 | % |
Various currency futures contracts (US) | | | — | | | | 0.00 | % | | | 179,573 | | | | 0.82 | % | | | — | | | | 0.00 | % | | | — | | | | 0.00 | % |
Various currency futures contracts (Canada) | | | — | | | | 0.00 | % | | | — | | | | 0.00 | % | | | — | | | | 0.00 | % | | | — | | | | 0.00 | % |
Various currency futures contracts (Europe) | | | — | | | | 0.00 | % | | | 416,924 | | | | 1.90 | % | | | — | | | | 0.00 | % | | | — | | | | 0.00 | % |
Various currency futures contracts (Far East) | | | — | | | | 0.00 | % | | | — | | | | 0.00 | % | | | — | | | | 0.00 | % | | | — | | | | 0.00 | % |
Various energy futures contracts (US) | | | — | | | | 0.00 | % | | | (215,479 | ) | | | -0.98 | % | | | — | | | | 0.00 | % | | | (21,396 | ) | | | -0.41 | % |
Crude Oil, Light Settling 11/1/2012 (Number of Contracts: 841) | | | — | | | | 0.00 | % | | | (3,555,016 | ) | | | -16.24 | % | | | — | | | | 0.00 | % | | | — | | | | 0.00 | % |
Crude Oil, Light Settling 1/1/2013 (Number of Contracts: 841) | | | — | | | | 0.00 | % | | | (3,802,753 | ) | | | -17.37 | % | | | — | | | | 0.00 | % | | | — | | | | 0.00 | % |
Crude Oil, Light Settling 9/1/2013 (Number of Contracts: 1,002) | | | — | | | | 0.00 | % | | | (4,371,120 | ) | | | -19.97 | % | | | — | | | | 0.00 | % | | | — | | | | 0.00 | % |
Heating Oil Settling 9/1/2012 (Number of Contracts: 393) | | | — | | | | 0.00 | % | | | (1,647,299 | ) | | | -7.53 | % | | | — | | | | 0.00 | % | | | — | | | | 0.00 | % |
Various energy futures contracts (Europe) | | | — | | | | 0.00 | % | | | (26,290 | ) | | | -0.12 | % | | | — | | | | 0.00 | % | | | 1,950 | | | | 0.04 | % |
ICE Brent Crude Oil Settling 12/1/2015 (Number of Contracts: 1,359) | | | — | | | | 0.00 | % | | | (3,069,350 | ) | | | -14.02 | % | | | — | | | | 0.00 | % | | | — | | | | 0.00 | % |
Various interest rates futures contracts (US) | | | — | | | | 0.00 | % | | | 19,602 | | | | 0.09 | % | | | — | | | | 0.00 | % | | | 51,996 | | | | 1.00 | % |
Various interest rates futures contracts (Canada) | | | — | | | | 0.00 | % | | | — | | | | 0.00 | % | | | — | | | | 0.00 | % | | | — | | | | 0.00 | % |
Various interest rates futures contracts (Europe) | | | — | | | | 0.00 | % | | | — | | | | 0.00 | % | | | — | | | | 0.00 | % | | | 287,405 | | | | 5.51 | % |
Various interest rates futures contracts (Far East) | | | — | | | | 0.00 | % | | | — | | | | 0.00 | % | | | — | | | | 0.00 | % | | | (21,720 | ) | | | -0.42 | % |
Various precious metals futures contracts (US) | | | — | | | | 0.00 | % | | | (194,462 | ) | | | -0.89 | % | | | — | | | | 0.00 | % | | | — | | | | 0.00 | % |
Silver @ Comex Settling 12/1/2013 (Number of Contracts: 152) | | | — | | | | 0.00 | % | | | (11,121,080 | ) | | | -50.81 | % | | | — | | | | 0.00 | % | | | — | | | | 0.00 | % |
Various precious metals futures contracts (Europe) | | | — | | | | 0.00 | % | | | — | | | | 0.00 | % | | | — | | | | 0.00 | % | | | — | | | | 0.00 | % |
Various soft futures contracts (US) | | | — | | | | 0.00 | % | | | (1,017,375 | ) | | | -4.65 | % | | | — | | | | 0.00 | % | | | — | | | | 0.00 | % |
Corn Settling 12/1/2012 (Number of Contracts: 1,525) | | | — | | | | 0.00 | % | | | (4,790,794 | ) | | | -21.89 | % | | | — | | | | 0.00 | % | | | — | | | | 0.00 | % |
Coffee @ CSCE Settling 9/1/2012 (Number of Contracts: 176) | | | — | | | | 0.00 | % | | | (2,559,548 | ) | | | -11.69 | % | | | — | | | | 0.00 | % | | | — | | | | 0.00 | % |
Various soft futures contracts (Far East) | | | — | | | | 0.00 | % | | | — | | | | 0.00 | % | | | — | | | | 0.00 | % | | | — | | | | 0.00 | % |
Various soft futures contracts (Europe) | | | — | | | | 0.00 | % | | | — | | | | 0.00 | % | | | — | | | | 0.00 | % | | | — | | | | 0.00 | % |
Various soft futures contracts (Canada) | | | — | | | | 0.00 | % | | | — | | | | 0.00 | % | | | — | | | | 0.00 | % | | | — | | | | 0.00 | % |
Various stock index futures contracts (US) | | | — | | | | 0.00 | % | | | 111,130 | | | | 0.51 | % | | | — | | | | 0.00 | % | | | (19,844 | ) | | | -0.38 | % |
Various stock index futures contracts (Canada) | | | — | | | | 0.00 | % | | | — | | | | 0.00 | % | | | — | | | | 0.00 | % | | | — | | | | 0.00 | % |
Various stock index futures contracts (Europe) | | | — | | | | 0.00 | % | | | (4,721 | ) | | | -0.02 | % | | | — | | | | 0.00 | % | | | (6,881 | ) | | | -0.13 | % |
Various stock index futures contracts (Far East) | | | — | | | | 0.00 | % | | | — | | | | 0.00 | % | | | — | | | | 0.00 | % | | | — | | | | 0.00 | % |
| | | | | | | | | | | | | | | | | | | | | | | | | | | | | | | | |
Total Long Futures Contracts | | $ | — | | | | 0.00 | % | | $ | (35,903,641 | ) | | | -164.04 | % | | $ | — | | | | 0.00 | % | | $ | (166,670 | ) | | | -3.20 | % |
| | | | | | | | | | | | | | | | | | | | | | | | | | | | | | | | |
OPTIONS PURCHASED * | | $ | — | | | | 0.00 | % | | $ | — | | | | 0.00 | % | | $ | — | | | | 0.00 | % | | $ | — | | | | 0.00 | % |
| | | | | | | | | | | | | | | | | | | | | | | | | | | | | | | | |
SHORT FUTURES CONTRACTS* | | | | | | | | | | | | | | | | | | | | | | | | | | | | | | | | |
Various base metals futures contracts (US) | | $ | — | | | | 0.00 | % | | $ | 13,843 | | | | 0.06 | % | | $ | — | | | | 0.00 | % | | $ | 41,937 | | | | 0.80 | % |
Various base metals futures contracts (Europe) | | | — | | | | 0.00 | % | | | 290,936 | | | | 1.33 | % | | | — | | | | 0.00 | % | | | 336,000 | | | | 6.45 | % |
Various currency futures contracts (US) | | | — | | | | 0.00 | % | | | (3,375 | ) | | | -0.02 | % | | | — | | | | 0.00 | % | | | — | | | | 0.00 | % |
Various currency futures contracts (Canada) | | | — | | | | 0.00 | % | | | — | | | | 0.00 | % | | | — | | | | 0.00 | % | | | — | | | | 0.00 | % |
Various currency futures contracts (Europe) | | | — | | | | 0.00 | % | | | (918,634 | ) | | | -4.20 | % | | | — | | | | 0.00 | % | | | 7,388 | | | | 0.14 | % |
Various currency futures contracts (Far East) | | | — | | | | 0.00 | % | | | — | | | | 0.00 | % | | | — | | | | 0.00 | % | | | — | | | | 0.00 | % |
Various energy futures contracts (US) | | | — | | | | 0.00 | % | | | 1,940,210 | | | | 8.86 | % | | | — | | | | 0.00 | % | | | (8,635 | ) | | | -0.17 | % |
Crude Oil, Light Settling 12/1/2012 (Number of Contracts: 1,505) | | | — | | | | 0.00 | % | | | (1,842,322 | ) | | | -8.42 | % | | | — | | | | 0.00 | % | | | — | | | | 0.00 | % |
Crude Oil, Light Settling 12/1/2013 (Number of Contracts: 987) | | | — | | | | 0.00 | % | | | (1,910,259 | ) | | | -8.73 | % | | | — | | | | 0.00 | % | | | — | | | | 0.00 | % |
Heating Oil Settling 6/1/2012 (Number of Contracts: 373) | | | — | | | | 0.00 | % | | | 1,591,666 | | | | 7.27 | % | | | — | | | | 0.00 | % | | | — | | | | 0.00 | % |
Various energy futures contracts (Europe) | | | — | | | | 0.00 | % | | | 573,850 | | | | 2.62 | % | | | — | | | | 0.00 | % | | | (3,640 | ) | | | -0.07 | % |
ICE Brent Crude Oil Settling 12/1/2012 (Number of Contracts: 1,660) | | | — | | | | 0.00 | % | | | 2,835,790 | | | | 12.96 | % | | | — | | | | 0.00 | % | | | — | | | | 0.00 | % |
Various interest rates futures contracts (US) | | | — | | | | 0.00 | % | | | — | | | | 0.00 | % | | | — | | | | 0.00 | % | | | — | | | | 0.00 | % |
Various interest rates futures contracts (Canada) | | | — | | | | 0.00 | % | | | — | | | | 0.00 | % | | | — | | | | 0.00 | % | | | — | | | | 0.00 | % |
Various interest rates futures contracts (Europe) | | | — | | | | 0.00 | % | | | — | | | | 0.00 | % | | | — | | | | 0.00 | % | | | (5,711 | ) | | | -0.11 | % |
Various interest rates futures contracts (Far East) | | | — | | | | 0.00 | % | | | (75,712 | ) | | | -0.35 | % | | | — | | | | 0.00 | % | | | (22,100 | ) | | | -0.42 | % |
Various precious metals futures contracts (US) | | | — | | | | 0.00 | % | | | 82,675 | | | | 0.38 | % | | | — | | | | 0.00 | % | | | 65,830 | | | | 1.26 | % |
Silver @ Comex Settling 12/1/2012 (Number of Contracts: 152) | | | — | | | | 0.00 | % | | | 2,879,242 | | | | 13.15 | % | | | — | | | | 0.00 | % | | | — | | | | 0.00 | % |
Various soft futures contracts (US) | | | — | | | | 0.00 | % | | | 273,782 | | | | 1.25 | % | | | — | | | | 0.00 | % | | | (37,406 | ) | | | -0.72 | % |
Corn Settling 7/1/2012 (Number of Contracts: 1,123) | | | — | | | | 0.00 | % | | | 2,867,576 | | | | 13.10 | % | | | — | | | | 0.00 | % | | | — | | | | 0.00 | % |
Corn Settling 9/1/2012 (Number of Contracts: 288) | | | — | | | | 0.00 | % | | | 1,370,557 | | | | 6.26 | % | | | — | | | | 0.00 | % | | | — | | | | 0.00 | % |
Various soft futures contracts (Europe) | | | — | | | | 0.00 | % | | | — | | | | 0.00 | % | | | — | | | | 0.00 | % | | | — | | | | 0.00 | % |
Various stock index futures contracts (US) | | | — | | | | 0.00 | % | | | (863 | ) | | | 0.00 | % | | | — | | | | 0.00 | % | | | 40 | | | | 0.00 | % |
Various stock index futures contracts (Europe) | | | — | | | | 0.00 | % | | | — | | | | 0.00 | % | | | — | | | | 0.00 | % | | | (67,325 | ) | | | -1.29 | % |
Various stock index futures contracts (Far East) | | | — | | | | 0.00 | % | | | — | | | | 0.00 | % | | | — | | | | 0.00 | % | | | 1,930 | | | | 0.04 | % |
| | | | | | | | | | | | | | | | | | | | | | | | | | | | | | | | |
Total Short Futures Contracts | | $ | — | | | | 0.00 | % | | $ | 9,968,962 | | | | 45.55 | % | | $ | — | | | | 0.00 | % | | $ | 308,308 | | | | 5.92 | % |
| | | | | | | | | | | | | | | | | | | | | | | | | | | | | | | | |
OPTIONS WRITTEN * | | $ | — | | | | 0.00 | % | | $ | — | | | | 0.00 | % | | $ | — | | | | 0.00 | % | | $ | — | | | | 0.00 | % |
| | | | | | | | | | | | | | | | | | | | | | | | | | | | | | | | |
CURRENCY FORWARDS * | | $ | — | | | | 0.00 | % | | $ | — | | | | 0.00 | % | | $ | — | | | | 0.00 | % | | $ | 303,130 | | | | 5.82 | % |
| | | | | | | | | | | | | | | | | | | | | | | | | | | | | | | | |
Total Open Trade Equity (Deficit) | | $ | — | | | | 0.00 | % | | $ | (25,934,678 | ) | | | -118.49 | % | | $ | — | | | | 0.00 | % | | $ | 444,769 | | | | 8.53 | % |
| | | | | | | | | | | | | | | | | | | | | | | | | | | | | | | | |
SWAPS (1) | | $ | — | | | | 0.00 | % | | $ | — | | | | 0.00 | % | | $ | — | | | | 0.00 | % | | $ | — | | | | 0.00 | %�� |
| | | | | | | | | | | | | | | | | | | | | | | | | | | | | | | | |
| * | Except as noted, no individual futures, forwards and option on futures contract position constituted greater than 5 percent of Net Asset Value. Accordingly, the number of contracts and expiration dates are not presented. |
| (1) | See Notes to Financial Statements, Note 4. |
The accompanying notes are an integral part of these financial statements.
F-89
The Trading Companies of the Frontier Fund
Condensed Schedules of Investments
December 31, 2011
| | | | | | | | | | | | | | | | | | | | | | | | | | | | | | | | |
| | | Frontier Trading | | | Frontier Trading | | | Frontier Trading | | | Frontier Trading | |
| | | Company X, LLC | | | Company XI, LLC | | | Company XII, LLC | | | Company XIV, LLC | |
Description | | Value | | | % of Net
Asset Value | | | Value | | | % of Net
Asset Value | | | Value | | | % of Net
Asset Value | | | Value | | | % of Net
Asset Value | |
LONG FUTURES CONTRACTS* | | | | | | | | | | | | | | | | | | | | | | | | | | | | | | | | |
Various base metals futures contracts (US) | | $ | — | | | | 0.00 | % | | $ | — | | | | 0.00 | % | | $ | — | | | | 0.00 | % | | $ | (146,081 | ) | | | -1.23 | % |
Various base metals futures contracts (Europe) | | | — | | | | 0.00 | % | | | — | | | | 0.00 | % | | | — | | | | 0.00 | % | | | (186,593 | ) | | | -1.57 | % |
Various currency futures contracts (US) | | | — | | | | 0.00 | % | | | — | | | | 0.00 | % | | | — | | | | 0.00 | % | | | — | | | | 0.00 | % |
Various currency futures contracts (Canada) | | | — | | | | 0.00 | % | | | — | | | | 0.00 | % | | | — | | | | 0.00 | % | | | — | | | | 0.00 | % |
Various currency futures contracts (Europe) | | | — | | | | 0.00 | % | | | — | | | | 0.00 | % | | | — | | | | 0.00 | % | | | (46,338 | ) | | | -0.39 | % |
Various currency futures contracts (Far East) | | | — | | | | 0.00 | % | | | — | | | | 0.00 | % | | | — | | | | 0.00 | % | | | — | | | | 0.00 | % |
Various energy futures contracts (US) | | | — | | | | 0.00 | % | | | — | | | | 0.00 | % | | | — | | | | 0.00 | % | | | (1,023 | ) | | | -0.01 | % |
Various energy futures contracts (Europe) | | | — | | | | 0.00 | % | | | — | | | | 0.00 | % | | | — | | | | 0.00 | % | | | (159,720 | ) | | | -1.34 | % |
Various interest rates futures contracts (US) | | | — | | | | 0.00 | % | | | — | | | | 0.00 | % | | | — | | | | 0.00 | % | | | 139,346 | | | | 1.17 | % |
Various interest rates futures contracts (Canada) | | | — | | | | 0.00 | % | | | — | | | | 0.00 | % | | | — | | | | 0.00 | % | | | 43,082 | | | | 0.36 | % |
Various interest rates futures contracts (Europe) | | | — | | | | 0.00 | % | | | — | | | | 0.00 | % | | | — | | | | 0.00 | % | | | 397,412 | | | | 3.33 | % |
Various interest rates futures contracts (Far East) | | | — | | | | 0.00 | % | | | — | | | | 0.00 | % | | | — | | | | 0.00 | % | | | 26,504 | | | | 0.22 | % |
Various precious metals futures contracts (US) | | | — | | | | 0.00 | % | | | — | | | | 0.00 | % | | | — | | | | 0.00 | % | | | — | | | | 0.00 | % |
Various precious metals futures contracts (Europe) | | | — | | | | 0.00 | % | | | — | | | | 0.00 | % | | | — | | | | 0.00 | % | | | — | | | | 0.00 | % |
Various soft futures contracts (US) | | | — | | | | 0.00 | % | | | — | | | | 0.00 | % | | | — | | | | 0.00 | % | | | 218,499 | | | | 1.83 | % |
Various soft futures contracts (Far East) | | | — | | | | 0.00 | % | | | — | | | | 0.00 | % | | | — | | | | 0.00 | % | | | — | | | | 0.00 | % |
Various soft futures contracts (Europe) | | | — | | | | 0.00 | % | | | — | | | | 0.00 | % | | | — | | | | 0.00 | % | | | 1,440 | | | | 0.01 | % |
Various soft futures contracts (Canada) | | | — | | | | 0.00 | % | | | — | | | | 0.00 | % | | | — | | | | 0.00 | % | | | — | | | | 0.00 | % |
Various stock index futures contracts (US) | | | — | | | | 0.00 | % | | | — | | | | 0.00 | % | | | — | | | | 0.00 | % | | | (8,787 | ) | | | -0.07 | % |
Various stock index futures contracts (Canada) | | | — | | | | 0.00 | % | | | — | | | | 0.00 | % | | | — | | | | 0.00 | % | | | 5,579 | | | | 0.05 | % |
Various stock index futures contracts (Europe) | | | — | | | | 0.00 | % | | | — | | | | 0.00 | % | | | — | | | | 0.00 | % | | | 24,453 | | | | 0.21 | % |
Various stock index futures contracts (Far East) | | | — | | | | 0.00 | % | | | — | | | | 0.00 | % | | | — | | | | 0.00 | % | | | (22,009 | ) | | | -0.18 | % |
| | | | | | | | | | | | | | | | | | | | | | | | | | | | | | | | |
Total Long Futures Contracts | | $ | — | | | | 0.00 | % | | $ | — | | | | 0.00 | % | | $ | — | | | | 0.00 | % | | $ | 285,764 | | | | 2.40 | % |
| | | | | | | | | | | | | | | | | | | | | | | | | | | | | | | | |
OPTIONS PURCHASED * | | $ | — | | | | 0.00 | % | | $ | — | | | | 0.00 | % | | $ | — | | | | 0.00 | % | | $ | — | | | | 0.00 | % |
| | | | | | | | | | | | | | | | | | | | | | | | | | | | | | | | |
SHORT FUTURES CONTRACTS* | | | | | | | | | | | | | | | | | | | | | | | | | | | | | | | | |
Various base metals futures contracts (US) | | $ | — | | | | 0.00 | % | | $ | — | | | | 0.00 | % | | $ | — | | | | 0.00 | % | | $ | 164,351 | | | | 1.38 | % |
Various base metals futures contracts (Europe) | | | — | | | | 0.00 | % | | | — | | | | 0.00 | % | | | — | | | | 0.00 | % | | | 18,542 | | | | 0.16 | % |
Various currency futures contracts (US) | | | — | | | | 0.00 | % | | | — | | | | 0.00 | % | | | — | | | | 0.00 | % | | | — | | | | 0.00 | % |
Various currency futures contracts (Canada) | | | — | | | | 0.00 | % | | | — | | | | 0.00 | % | | | — | | | | 0.00 | % | | | — | | | | 0.00 | % |
Various currency futures contracts (Europe) | | | — | | | | 0.00 | % | | | — | | | | 0.00 | % | | | — | | | | 0.00 | % | | | (19,013 | ) | | | -0.16 | % |
Various currency futures contracts (Far East) | | | — | | | | 0.00 | % | | | — | | | | 0.00 | % | | | — | | | | 0.00 | % | | | — | | | | 0.00 | % |
Various energy futures contracts (US) | | | — | | | | 0.00 | % | | | — | | | | 0.00 | % | | | — | | | | 0.00 | % | | | (21,112 | ) | | | -0.18 | % |
Various energy futures contracts (Europe) | | | — | | | | 0.00 | % | | | — | | | | 0.00 | % | | | — | | | | 0.00 | % | | | 26,280 | | | | 0.22 | % |
Various interest rates futures contracts (US) | | | — | | | | 0.00 | % | | | — | | | | 0.00 | % | | | — | | | | 0.00 | % | | | — | | | | 0.00 | % |
Various interest rates futures contracts (Canada) | | | — | | | | 0.00 | % | | | — | | | | 0.00 | % | | | — | | | | 0.00 | % | | | 896 | | | | 0.01 | % |
Various interest rates futures contracts (Europe) | | | — | | | | 0.00 | % | | | — | | | | 0.00 | % | | | — | | | | 0.00 | % | | | (34,143 | ) | | | -0.29 | % |
Various interest rates futures contracts (Far East) | | | — | | | | 0.00 | % | | | — | | | | 0.00 | % | | | — | | | | 0.00 | % | | | — | | | | 0.00 | % |
Various precious metals futures contracts (US) | | | — | | | | 0.00 | % | | | — | | | | 0.00 | % | | | — | | | | 0.00 | % | | | 17,435 | | | | 0.15 | % |
Various soft futures contracts (US) | | | — | | | | 0.00 | % | | | — | | | | 0.00 | % | | | — | | | | 0.00 | % | | | (253,018 | ) | | | -2.12 | % |
Various soft futures contracts (Europe) | | | — | | | | 0.00 | % | | | — | | | | 0.00 | % | | | — | | | | 0.00 | % | | | 17,898 | | | | 0.15 | % |
Various stock index futures contracts (US) | | | — | | | | 0.00 | % | | | — | | | | 0.00 | % | | | — | | | | 0.00 | % | | | — | | | | 0.00 | % |
Various stock index futures contracts (Europe) | | | — | | | | 0.00 | % | | | — | | | | 0.00 | % | | | — | | | | 0.00 | % | | | — | | | | 0.00 | % |
Various stock index futures contracts (Far East) | | | — | | | | 0.00 | % | | | — | | | | 0.00 | % | | | — | | | | 0.00 | % | | | 688 | | | | 0.01 | % |
| | | | | | | | | | | | | | | | | | | | | | | | | | | | | | | | |
Total Short Futures Contracts | | $ | — | | | | 0.00 | % | | $ | — | | | | 0.00 | % | | $ | — | | | | 0.00 | % | | $ | (81,194 | ) | | | -0.68 | % |
| | | | | | | | | | | | | | | | | | | | | | | | | | | | | | | | |
OPTIONS WRITTEN * | | $ | — | | | | 0.00 | % | | $ | — | | | | 0.00 | % | | $ | — | | | | 0.00 | % | | $ | — | | | | 0.00 | % |
| | | | | | | | | | | | | | | | | | | | | | | | | | | | | | | | |
CURRENCY FORWARDS * | | $ | — | | | | 0.00 | % | | $ | — | | | | 0.00 | % | | $ | — | | | | 0.00 | % | | $ | (443,519 | ) | | | -3.72 | % |
| | | | | | | | | | | | | | | | | | | | | | | | | | | | | | | | |
Total Open Trade Equity | | $ | — | | | | 0.00 | % | | $ | — | | | | 0.00 | % | | $ | — | | | | 0.00 | % | | $ | (238,949 | ) | | | -2.00 | % |
| | | | | | | | | | | | | | | | | | | | | | | | | | | | | | | | |
SWAPS (1) | | $ | — | | | | 0.00 | % | | $ | — | | | | 0.00 | % | | $ | — | | | | 0.00 | % | | $ | — | | | | 100.00 | % |
| | | | | | | | | | | | | | | | | | | | | | | | | | | | | | | | |
| * | Except as noted, no individual futures, forwards and option on futures contract position constituted greater than 5 percent of Net Asset Value. Accordingly, the number of contracts and expiration dates are not presented. |
| (1) | See Notes to Financial Statements, Note 4. |
The accompanying notes are an integral part of these financial statements.
F-90
The Trading Companies of the Frontier Fund
Condensed Schedules of Investments
December 31, 2011
| | | | | | | | | | | | | | | | | | | | | | | | | | | | | | | | |
| | | Frontier Trading | | | Frontier Trading | | | Frontier Trading | | | Frontier Trading | |
| | | Company XV, LLC | | | Company XVII, LLC | | | Company XVIII, LLC | | | Company XXI, LLC | |
Description | | Value | | | % of Net
Asset Value | | | Value | | | % of Net
Asset Value | | | Value | | | % of Net
Asset Value | | | Value | | | % of Net
Asset Value | |
LONG FUTURES CONTRACTS* | | | | | | | | | | | | | | | | | | | | | | | | | | | | | | | | |
Various base metals futures contracts (US) | | $ | (929,394 | ) | | | -5.90 | % | | $ | — | | | | 0.00 | % | | $ | (97,100 | ) | | | -1.31 | % | | $ | (40,664 | ) | | | -0.69 | % |
Various base metals futures contracts (Europe) | | | 290,940 | | | | 1.85 | % | | | — | | | | 0.00 | % | | | (57,349 | ) | | | -0.77 | % | | | (37,959 | ) | | | -0.64 | % |
Copper @ LME Settling 1/26/2012 (Number of Contracts: 153) | | | (836,691 | ) | | | -5.31 | % | | | — | | | | 0.00 | % | | | — | | | | 0.00 | % | | | — | | | | 0.00 | % |
Copper @ LME Settling 2/15/2012 (Number of Contracts: 229) | | | (1,077,683 | )�� | | | -6.84 | % | | | — | | | | 0.00 | % | | | — | | | | 0.00 | % | | | — | | | | 0.00 | % |
Copper @ LME Settling 6/20/2012 (Number of Contracts: 48) | | | (1,743,900 | ) | | | -11.07 | % | | | — | | | | 0.00 | % | | | — | | | | 0.00 | % | | | — | | | | 0.00 | % |
Various currency futures contracts (US) | | | — | | | | 0.00 | % | | | — | | | | 0.00 | % | | | (1,624 | ) | | | -0.02 | % | | | 22,523 | | | | 0.38 | % |
Various currency futures contracts (Canada) | | | — | | | | 0.00 | % | | | — | | | | 0.00 | % | | | — | | | | 0.00 | % | | | — | | | | 0.00 | % |
Various currency futures contracts (Europe) | | | — | | | | 0.00 | % | | | — | | | | 0.00 | % | | | 32,889 | | | | 0.44 | % | | | 4,733 | | | | 0.08 | % |
Various currency futures contracts (Far East) | | | — | | | | 0.00 | % | | | — | | | | 0.00 | % | | | — | | | | 0.00 | % | | | — | | | | 0.00 | % |
Various energy futures contracts (US) | | | — | | | | 0.00 | % | | | — | | | | 0.00 | % | | | (30,762 | ) | | | -0.42 | % | | | 13,622 | | | | 0.23 | % |
Various energy futures contracts (Europe) | | | — | | | | 0.00 | % | | | — | | | | 0.00 | % | | | (79,325 | ) | | | -1.07 | % | | | 1,520 | | | | 0.03 | % |
Various interest rates futures contracts (US) | | | — | | | | 0.00 | % | | | — | | | | 0.00 | % | | | 46,346 | | | | 0.63 | % | | | 20,708 | | | | 0.35 | % |
Various interest rates futures contracts (Canada) | | | — | | | | 0.00 | % | | | — | | | | 0.00 | % | | | (24,837 | ) | | | -0.34 | % | | | (2,284 | ) | | | -0.04 | % |
Various interest rates futures contracts (Europe) | | | — | | | | 0.00 | % | | | — | | | | 0.00 | % | | | 643,920 | | | | 8.69 | % | | | 229,550 | | | | 3.89 | % |
Various interest rates futures contracts (Far East) | | | — | | | | 0.00 | % | | | — | | | | 0.00 | % | | | (34,147 | ) | | | -0.46 | % | | | 2,876 | | | | 0.05 | % |
Various precious metals futures contracts (US) | | | — | | | | 0.00 | % | | | — | | | | 0.00 | % | | | (67,240 | ) | | | -0.91 | % | | | — | | | | 0.00 | % |
Various soft futures contracts (US) | | | (2,951 | ) | | | -0.02 | % | | | — | | | | 0.00 | % | | | (51,397 | ) | | | -0.69 | % | | | 31,011 | | | | 0.53 | % |
Various soft futures contracts (Far East) | | | — | | | | 0.00 | % | | | — | | | | 0.00 | % | | | — | | | | 0.00 | % | | | — | | | | 0.00 | % |
Various soft futures contracts (Europe) | | | — | | | | 0.00 | % | | | — | | | | 0.00 | % | | | — | | | | 0.00 | % | | | — | | | | 0.00 | % |
Various soft futures contracts (Canada) | | | — | | | | 0.00 | % | | | — | | | | 0.00 | % | | | — | | | | 0.00 | % | | | — | | | | 0.00 | % |
Various stock index futures contracts (US) | | | — | | | | 0.00 | % | | | — | | | | 0.00 | % | | | 35,283 | | | | 0.48 | % | | | 6,903 | | | | 0.12 | % |
Various stock index futures contracts (Canada) | | | — | | | | 0.00 | % | �� | | — | | | | 0.00 | % | | | — | | | | 0.00 | % | | | — | | | | 0.00 | % |
Various stock index futures contracts (Europe) | | | — | | | | 0.00 | % | | | — | | | | 0.00 | % | | | 42,730 | | | | 0.58 | % | | | 31,305 | | | | 0.53 | % |
Various stock index futures contracts (Far East) | | | — | | | | 0.00 | % | | | — | | | | 0.00 | % | | | (40 | ) | | | 0.00 | % | | | — | | | | 0.00 | % |
| | | | | | | | | | | | | | | | | | | | | | | | | | | | | | | | |
Total Long Futures Contracts | | $ | (4,299,679 | ) | | | -27.29 | % | | $ | — | | | | 0.00 | % | | $ | 357,347 | | | | 4.82 | % | | $ | 283,844 | | | | 4.81 | % |
| | | | | | | | | | | | | | | | | | | | | | | | | | | | | | | | |
OPTIONS PURCHASED * | | $ | 3,069,581 | | | | 19.48 | % | | $ | — | | | | 0.00 | % | | $ | — | | | | 0.00 | % | | $ | — | | | | 0.00 | % |
Copper @ LME Setting 3/1/2012, Put @ 7,000 (Number of Contracts: 169) | | | 1,144,722 | | | | 7.26 | % | | | — | | | | 0.00 | % | | | — | | | | 0.00 | % | | | — | | | | 0.00 | % |
Copper @ LME Settling 3/1/2012, Put @ 7,300 (Numer of Contracts:167) | | | 1,548,382 | | | | 9.83 | % | | | — | | | | 0.00 | % | | | — | | | | 0.00 | % | | | — | | | | 0.00 | % |
Copper @ LME Settling 12/1/2012, Put @ 6,600 (Numer of Contracts:112) | | | 1,844,164 | | | | 11.70 | % | | | — | | | | 0.00 | % | | | — | | | | 0.00 | % | | | — | | | | 0.00 | % |
Crude Oil, Light Settling 12/1/2012, Call @9,400 (Number of Contracts: 56) | | | 814,800 | | | | 5.17 | % | | | | | | | | | | | | | | | | | | | | | | | | |
Euro Settling 3/1/2012, Put @ 1,335 (Number of Contracts: 140) | | | 948,500 | | | | 6.02 | % | | | | | | | | | | | | | | | | | | | | | | | | |
Euro Settling 3/1/2012, Put @ 1,360 (Number of Contracts: 112) | | | 1,016,400 | | | | 6.45 | % | | | — | | | | 0.00 | % | | | — | | | | 0.00 | % | | | — | | | | 0.00 | % |
S&P (Mini) Settling 3/1/2012, Put @ 1,200 (Number of Contracts: 560) | | | 985,600 | | | | 6.25 | % | | | — | | | | 0.00 | % | | | — | | | | 0.00 | % | | | — | | | | 0.00 | % |
| | | | | | | | | | | | | | | | | | | | | | | | | | | | | | | | |
Total Options Purchased | | $ | 11,372,149 | | | | 72.16 | % | | $ | — | | | | 0.00 | % | | $ | — | | | | 0.00 | % | | $ | — | | | | 0.00 | % |
| | | | | | | | | | | | | | | | | | | | | | | | | | | | | | | | |
SHORT FUTURES CONTRACTS* | | | | | | | | | | | | | | | | | | | | | | | | | | | | | | | | |
Various base metals futures contracts (US) | | $ | 840,022 | | | | 5.33 | % | | $ | — | | | | 0.00 | % | | $ | 2,256 | | | | 0.03 | % | | $ | 18,428 | | | | 0.31 | % |
Various base metals futures contracts (Europe) | | | 581,101 | | | | 3.69 | % | | | — | | | | 0.00 | % | | | (20,175 | ) | | | -0.27 | % | | | 57,512 | | | | 0.97 | % |
Copper @ LME Settling 2/15/2012 (Number of Contracts: 229) | | | 1,080,293 | | | | 6.86 | % | | | — | | | | 0.00 | % | | | — | | | | 0.00 | % | | | — | | | | 0.00 | % |
Copper @ LME Settling 6/20/2012(Number of Contracts: 48) | | | 2,495,700 | | | | 15.84 | % | | | — | | | | 0.00 | % | | | — | | | | 0.00 | % | | | — | | | | 00.0 | % |
Various currency futures contracts (US) | | | — | | | | 0.00 | % | | | — | | | | 0.00 | % | | | 10,165 | | | | 0.14 | % | | | 19,290 | | | | 0.33 | % |
Various currency futures contracts (Canada) | | | — | | | | 0.00 | % | | | — | | | | 0.00 | % | | | — | | | | 0.00 | % | | | — | | | | 0.00 | % |
Various currency futures contracts (Europe) | | | 208,124 | | | | 1.32 | % | | | — | | | | 0.00 | % | | | 203,600 | | | | 2.75 | % | | | 76,986 | | | | 1.30 | % |
Various currency futures contracts (Far East) | | | — | | | | 0.00 | % | | | — | | | | 0.00 | % | | | — | | | | 0.00 | % | | | 3,727 | | | | 0.06 | % |
Various energy futures contracts (US) | | | (66,491 | ) | | | -0.42 | % | | | — | | | | 0.00 | % | | | — | | | | 0.00 | % | | | — | | | | 0.00 | % |
Various energy futures contracts (Europe) | | | — | | | | 0.00 | % | | | — | | | | 0.00 | % | | | — | | | | 0.00 | % | | | (100 | ) | | | 0.00 | % |
Various energy futures contracts (Far East) | | | — | | | | 0.00 | % | | | — | | | | 0.00 | % | | | — | | | | 0.00 | % | | | (1,195 | ) | | | -0.02 | % |
Various interest rates futures contracts (US) | | | — | | | | 0.00 | % | | | — | | | | 0.00 | % | | | — | | | | 0.00 | % | | | (24,881 | ) | | | -0.42 | % |
Various interest rates futures contracts (Canada) | | | — | | | | 0.00 | % | | | — | | | | 0.00 | % | | | — | | | | 0.00 | % | | | 2,100 | | | | 0.04 | % |
Various interest rates futures contracts (Europe) | | | — | | | | 0.00 | % | | | — | | | | 0.00 | % | | | — | | | | 0.00 | % | | | (31 | ) | | | 0.00 | % |
Various interest rates futures contracts (Far East) | | | — | | | | 0.00 | % | | | — | | | | 0.00 | % | | | — | | | | 0.00 | % | | | (173 | ) | | | 0.00 | % |
Various precious metals futures contracts (Europe) | | | — | | | | 0.00 | % | | | — | | | | 0.00 | % | | | — | | | | 0.00 | % | | | — | | | | 0.00 | % |
Various precious metals futures contracts (US) | | | — | | | | 0.00 | % | | | — | | | | 0.00 | % | | | 20,285 | | | | 0.27 | % | | | 20,200 | | | | 0.34 | % |
Various soft futures contracts (US) | | | (81,795 | ) | | | -0.52 | % | | | — | | | | 0.00 | % | | | 15,908 | | | | 0.21 | % | | | 316,045 | | | | 5.36 | % |
Various soft futures contracts (Europe) | | | — | | | | 0.00 | % | | | — | | | | 0.00 | % | | | 2,710 | | | | 0.04 | % | | | — | | | | 0.00 | % |
Various soft futures contracts (Far East) | | | — | | | | 0.00 | % | | | — | | | | 0.00 | % | | | — | | | | 0.00 | % | | | 1,074 | | | | 0.02 | % |
Various stock index futures contracts (US) | | | — | | | | 0.00 | % | | | — | | | | 0.00 | % | | | — | | | | 0.00 | % | | | (5,226 | ) | | | -0.09 | % |
Various stock index futures contracts (Europe) | | | — | | | | 0.00 | % | | | — | | | | 0.00 | % | | | — | | | | 0.00 | % | | | 18,129 | | | | 0.31 | % |
Various stock index futures contracts (Far East) | | | — | | | | 0.00 | % | | | — | | | | 0.00 | % | | | 4,097 | | | | 0.06 | % | | | 6,644 | | | | 0.11 | % |
| | | | | | | | | | | | | | | | | | | | | | | | | | | | | | | | |
Total Short Futures Contracts | | $ | 5,056,954 | | | | 0.00 | % | | $ | — | | | | 0.00 | % | | $ | 238,846 | | | | 3.22 | % | | $ | 508,529 | | | | 8.62 | % |
| | | | | | | | | | | | | | | | | | | | | | | | | | | | | | | | |
OPTIONS WRITTEN * | | $ | (2,025,048 | ) | | | 0.00 | % | | $ | — | | | | 0.00 | % | | $ | — | | | | 0.00 | % | | $ | — | | | | 0.00 | % |
S&P Index Settling 3/1/2012, Put @ 4,100 (Numer of Contracts: 1,737) | | | (857,150 | ) | | | -5.44 | % | | | — | | | | 0.00 | % | | | — | | | | 0.00 | % | | | — | | | | 0.00 | % |
| | | | | | | | | | | | | | | | | | | | | | | | | | | | | | | | |
Total Options Written | | $ | (2,882,198 | ) | | | -18.29 | % | | $ | — | | | | 0.00 | % | | $ | — | | | | 0.00 | % | | $ | — | | | | 0.00 | % |
| | | | | | | | | | | | | | | | | | | | | | | | | | | | | | | | |
CURRENCY FORWARDS * | | $ | (122,606 | ) | | | -0.78 | % | | $ | — | | | | 0.00 | % | | $ | — | | | | 0.00 | % | | $ | — | | | | 0.00 | % |
| | | | | | | | | | | | | | | | | | | | | | | | | | | | | | | | |
Total Open Trade Equity | | $ | 9,124,622 | | | | 57.91 | % | | $ | — | | | | 0.00 | % | | $ | 596,193 | | | | 8.05 | % | | $ | 792,372 | | | | 13.43 | % |
| | | | | | | | | | | | | | | | | | | | | | | | | | | | | | | | |
SWAPS (1) | | $ | — | | | | 0.00 | % | | $ | 5,881,772 | | | | 100.00 | % | | $ | — | | | | 0.00 | % | | $ | — | | | | 0.00 | % |
| | | | | | | | | | | | | | | | | | | | | | | | | | | | | | | | |
| * | Except as noted, no individual futures, forwards and option on futures contract position constituted greater than 5 percent of Net Asset Value. Accordingly, the number of contracts and expiration dates are not presented. |
| (1) | See Notes to Financial Statements, Note 4. |
The accompanying notes are an integral part of these financial statements.
F-91
The Trading Companies of the Frontier Fund
Condensed Schedules of Investments
December 31, 2010
| | | | | | | | | | | | | | | | | | | | | | | | | | | | | | | | |
| | | Frontier Trading | | | Frontier Trading | | | Frontier Trading | | | Frontier Trading | |
| | | Company I LLC | | | Company II LLC | | | Company III LLC | | | Company V LLC | |
Description | | Value | | | % of Net
Asset Value | | | Value | | | % of Net
Asset Value | | | Value | | | % of Net
Asset Value | | | Value | | | % of Net
Asset Value | |
LONG FUTURES CONTRACTS* | | | | | | | | | | | | | | | | | | | | | | | | | | | | | | | | |
Various base metals futures contracts (US) | | $ | 555,817 | | | | 0.51 | % | | $ | 222,700 | | | | 1.13 | % | | $ | — | | | | 0.00 | % | | $ | 172,560 | | | | 1.38 | % |
Various base metals futures contracts (Europe) | | | 1,046,989 | | | | 0.97 | % | | | 1,707,490 | | | | 8.68 | % | | | — | | | | 0.00 | % | | | 181,596 | | | | 1.45 | % |
Various currency futures contracts (US) | | | 1,100,579 | | | | 1.02 | % | | | 2,296,428 | | | | 11.67 | % | | | — | | | | 0.00 | % | | | 98,545 | | | | 0.79 | % |
Various currency futures contracts (Canada) | | | — | | | | 0.00 | % | | | — | | | | 0.00 | % | | | — | | | | 0.00 | % | | | — | | | | 0.00 | % |
Various currency futures contracts (Europe) | | | 48,429 | | | | 0.04 | % | | | 32,042 | | | | 0.16 | % | | | — | | | | 0.00 | % | | | 23,874 | | | | 0.19 | % |
Various currency futures contracts (Far East) | | | — | | | | 0.00 | % | | | — | | | | 0.00 | % | | | — | | | | 0.00 | % | | | — | | | | 0.00 | % |
Various energy futures contracts (US) | | | 872,990 | | | | 0.81 | % | | | 279,399 | | | | 1.42 | % | | | — | | | | 0.00 | % | | | 89,785 | | | | 0.72 | % |
Various energy futures contracts (Europe) | | | 58,695 | | | | 0.05 | % | | | 138,670 | | | | 0.70 | % | | | — | | | | 0.00 | % | | | 14,200 | | | | 0.11 | % |
Various interest rates futures contracts (US) | | | 394,589 | | | | 0.36 | % | | | 4,447 | | | | 0.02 | % | | | — | | | | 0.00 | % | | | 22,017 | | | | 0.18 | % |
Various interest rates futures contracts (Canada) | | | 18,381 | | | | 0.02 | % | | | — | | | | 0.00 | % | | | — | | | | 0.00 | % | | | — | | | | 0.00 | % |
Various interest rates futures contracts (Europe) | | | 372,737 | | | | 0.34 | % | | | 25,928 | | | | 0.13 | % | | | — | | | | 0.00 | % | | | 10,474 | | | | 0.08 | % |
Various interest rates futures contracts (Far East) | | | 158,539 | | | | 0.15 | % | | | — | | | | 0.00 | % | | | — | | | | 0.00 | % | | | 17,866 | | | | 0.14 | % |
Various precious metals futures contracts (US) | | | 1,177,535 | | | | 1.09 | % | | | 983,795 | | | | 5.00 | % | | | — | | | | 0.00 | % | | | 200,060 | | | | 1.60 | % |
Various precious metals futures contracts (Europe) | | | — | | | | 0.00 | % | | | — | | | | 0.00 | % | | | — | | | | 0.00 | % | | | — | | | | 0.00 | % |
Various soft futures contracts (US) | | | 2,746,254 | | | | 2.54 | % | | | 2,063,151 | | | | 10.48 | % | | | — | | | | 0.00 | % | | | 349,196 | | | | 2.79 | % |
Various soft futures contracts (Europe) | | | 178,197 | | | | 0.16 | % | | | 19,642 | | | | 0.10 | % | | | — | | | | 0.00 | % | | | 4,650 | | | | 0.04 | % |
Various soft futures contracts (Canada) | | | — | | | | 0.00 | % | | | — | | | | 0.00 | % | | | — | | | | 0.00 | % | | | — | | | | 0.00 | % |
Various soft futures contracts (Far east) | | | 12,801 | | | | 0.01 | % | | | 101 | | | | 0.00 | % | | | — | | | | 0.00 | % | | | — | | | | 0.00 | % |
Various stock index futures contracts (US) | | | 167,031 | | | | 0.15 | % | | | 252,337 | | | | 1.28 | % | | | — | | | | 0.00 | % | | | (29,609 | ) | | | -0.24 | % |
Various stock index futures contracts (Canada) | | | 12,657 | | | | 0.01 | % | | | 14,766 | | | | 0.08 | % | | | — | | | | 0.00 | % | | | 11,090 | | | | 0.09 | % |
Various stock index futures contracts (Europe) | | | (345,443 | ) | | | -0.32 | % | | | (131,316 | ) | | | -0.67 | % | | | — | | | | 0.00 | % | | | (173,696 | ) | | | -1.39 | % |
Various stock index futures contracts (Far East) | | | 56,222 | | | | 0.05 | % | | | 54,237 | | | | 0.28 | % | | | — | | | | 0.00 | % | | | (24,225 | ) | | | -0.19 | % |
| | | | | | | | | | | | | | | | | | | | | | | | | | | | | | | | |
Total Long Futures Contracts | | $ | 8,632,999 | | | | 7.96 | % | | $ | 7,963,817 | | | | 40.46 | % | | $ | — | | | | 0.00 | % | | $ | 968,383 | | | | 7.74 | % |
| | | | | | | | | | | | | | | | | | | | | | | | | | | | | | | | |
OPTIONS PURCHASED * | | $ | 716,700 | | | | 0.66 | % | | $ | 6,318 | | | | 0.03 | % | | $ | — | | | | 0.00 | % | | $ | — | | | | 0.00 | % |
| | | | | | | | | | | | | | | | | | | | | | | | | | | | | | | | |
SHORT FUTURES CONTRACTS* | | | | | | | | | | | | | | | | | | | | | | | | | | | | | | | | |
Various base metals futures contracts (US) | | $ | (331,303 | ) | | | -0.31 | % | | $ | (69,311 | ) | | | -0.35 | % | | $ | — | | | | 0.00 | % | | $ | (18,909 | ) | | | -0.15 | % |
Various base metals futures contracts (Europe) | | | (733,813 | ) | | | -0.68 | % | | | (847,568 | ) | | | -4.31 | % | | | — | | | | 0.00 | % | | | (34,144 | ) | | | -0.27 | % |
Various currency futures contracts (US) | | | (122,191 | ) | | | -0.11 | % | | | (22,213 | ) | | | -0.11 | % | | | — | | | | 0.00 | % | | | (2,458 | ) | | | -0.02 | % |
Various currency futures contracts (Canada) | | | — | | | | 0.00 | % | | | — | | | | 0.00 | % | | | — | | | | 0.00 | % | | | — | | | | 0.00 | % |
Various currency futures contracts (Europe) | | | (62,039 | ) | | | -0.06 | % | | | (259,920 | ) | | | -1.32 | % | | | — | | | | 0.00 | % | | | (33,762 | ) | | | -0.27 | % |
Various currency futures contracts (Far East) | | | — | | | | 0.00 | % | | | — | | | | 0.00 | % | | | — | | | | 0.00 | % | | | — | | | | 0.00 | % |
Various energy futures contracts (US) | | | (338,619 | ) | | | -0.31 | % | | | (117,540 | ) | | | -0.60 | % | | | — | | | | 0.00 | % | | | 2,730 | | | | -0.02 | % |
Various energy futures contracts (Europe) | | | 67,860 | | | | 0.06 | % | | | (16,840 | ) | | | -0.09 | % | | | — | | | | 0.00 | % | | | — | | | | 0.00 | % |
Various interest rates futures contracts (US) | | | (81,746 | ) | | | -0.08 | % | | | (113,507 | ) | | | -0.58 | % | | | — | | | | 0.00 | % | | | (11,891 | ) | | | -0.10 | % |
Various interest rates futures contracts (Canada) | | | — | | | | 0.00 | % | | | (5,694 | ) | | | -0.03 | % | | | — | | | | 0.00 | % | | | (4,408 | ) | | | -0.04 | % |
Various interest rates futures contracts (Europe) | | | (378,077 | ) | | | -0.35 | % | | | (81,885 | ) | | | -0.42 | % | | | — | | | | 0.00 | % | | | (114,032 | ) | | | -0.91 | % |
Various interest rates futures contracts (Far East) | | | (111,437 | ) | | | -0.10 | % | | | (141,744 | ) | | | -0.72 | % | | | — | | | | 0.00 | % | | | (28,536 | ) | | | -0.23 | % |
Various precious metals futures contracts (US) | | | (544,046 | ) | | | -0.50 | % | | | — | | | | 0.00 | % | | | — | | | | 0.00 | % | | | — | | | | 0.00 | % |
Various soft futures contracts (US) | | | (484,599 | ) | | | -0.45 | % | | | — | | | | 0.00 | % | | | — | | | | 0.00 | % | | | (21,733 | ) | | | -0.17 | % |
Various soft futures contracts (Canada) | | | — | | | | 0.00 | % | | | — | | | | 0.00 | % | | | — | | | | 0.00 | % | | | — | | | | 0.00 | % |
Various soft futures contracts (Europe) | | | (54,735 | ) | | | -0.05 | % | | | — | | | | 0.00 | % | | | — | | | | 0.00 | % | | | — | | | | 0.00 | % |
Various stock index futures contracts (US) | | | 94,682 | | | | 0.09 | % | | | — | | | | 0.00 | % | | | — | | | | 0.00 | % | | | 9,471 | | | | 0.08 | % |
Various stock index futures contracts (Canada) | | | — | | | | 0.00 | % | | | — | | | | 0.00 | % | | | — | | | | 0.00 | % | | | — | | | | 0.00 | % |
Various stock index futures contracts (Europe) | | | 61,296 | | | | 0.06 | % | | | — | | | | 0.00 | % | | | — | | | | 0.00 | % | | | 3,649 | | | | 0.03 | % |
Various stock index futures contracts (Far East) | | | 2,832 | | | | 0.00 | % | | | — | | | | 0.00 | % | | | — | | | | 0.00 | % | | | 3,237 | | | | 0.03 | % |
| | | | | | | | | | | | | | | | | | | | | | | | | | | | | | | | |
Total Short Futures Contracts | | $ | (3,015,935 | ) | | | -2.79 | % | | $ | (1,676,222 | ) | | | -8.53 | % | | $ | — | | | | 0.00 | % | | $ | (250,786 | ) | | | -2.04 | % |
| | | | | | | | | | | | | | | | | | | | | | | | | | | | | | | | |
OPTIONS WRITTEN * | | $ | (128,013 | ) | | | -0.12 | % | | $ | (12,125 | ) | | | -0.06 | % | | $ | (1,292 | ) | | | -0.02 | % | | $ | — | | | | 0.00 | % |
| | | | | | | | | | | | | | | | | | | | | | | | | | | | | | | | |
CURRENCY FORWARDS * | | $ | 483,111 | | | | 0.45 | % | | $ | 76,197 | | | | 0.39 | % | | $ | 28,390 | | | | 0.45 | % | | $ | 709,541 | | | | 5.67 | % |
| | | | | | | | | | | | | | | | | | | | | | | | | | | | | | | | |
Total Open Trade Equity | | $ | 6,688,862 | | | | 6.15 | % | | $ | 6,357,985 | | | | 32.29 | % | | $ | 27,098 | | | | 0.43 | % | | $ | 1,427,138 | | | | 11.37 | % |
| | | | | | | | | | | | | | | | | | | | | | | | | | | | | | | | |
SWAPS (1) | | $ | 49,811,462 | | | | 46.00 | % | | $ | — | | | | 0.00 | % | | $ | 5,668,768 | | | | 88.93 | % | | $ | — | | | | 0.00 | % |
| | | | | | | | | | | | | | | | | | | | | | | | | | | | | | | | |
| * | Except as noted, no individual futures, forwards and option on futures contract position constituted greater than 5 percent of Net Asset Value. Accordingly, the number of contracts and expiration dates are not presented. |
| (1) | See Notes to Financial Statements, Note 4. |
The accompanying notes are an integral part of these financial statements.
F-92
The Trading Companies of the Frontier Fund
Condensed Schedules of Investments
December 31, 2010
| | | | | | | | | | | | | | | | | | | | | | | | | | | | | | | | |
| | | Frontier Trading | | | Frontier Trading | | | Frontier Trading | | | Frontier Trading | |
| | | Company VI LLC | | | Company VII, LLC | | | Company VIII, LLC | | | Company IX, LLC | |
Description | | Value | | | % of Net
Asset Value | | | Value | | | % of Net
Asset Value | | | Value | | | % of Net
Asset Value | | | Value | | | % of Net
Asset Value | |
LONG FUTURES CONTRACTS* | | | | | | | | | | | | | | | | | | | | | | | | | | | | | | | | |
Various base metals futures contracts (US) | | $ | 13,058 | | | | 0.16 | % | | $ | 750,203 | | | | 1.10 | % | | $ | — | | | | 0.00 | % | | $ | 404,374 | | | | 6.89 | % |
Copper @ Comex Settling 5/1/2011 (Number of Contracts: 3,001) | | | — | | | | 0.00 | % | | | 43,349,975 | | | | 63.55 | % | | | — | | | | 0.00 | % | | | — | | | | 0.00 | % |
Copper @ Comex Settling 7/1/2011 (Number of Contracts: 500) | | | — | | | | 0.00 | % | | | 4,043,750 | | | | 5.93 | % | | | — | | | | 0.00 | % | | | — | | | | 0.00 | % |
Various base metals futures contracts (Europe) | | | 67,497 | | | | 0.82 | % | | | 1,913,337 | | | | 2.80 | % | | | — | | | | 0.00 | % | | | 316,784 | | | | 5.40 | % |
Various currency futures contracts (US) | | | — | | | | 0.00 | % | | | 239,112 | | | | 0.35 | % | | | — | | | | 0.00 | % | | | — | | | | 0.00 | % |
Various currency futures contracts (Canada) | | | — | | | | 0.00 | % | | | — | | | | 0.00 | % | | | — | | | | 0.00 | % | | | — | | | | 0.00 | % |
Various currency futures contracts (Europe) | | | 10,225 | | | | 0.12 | % | | | — | | | | 0.00 | % | | | — | | | | 0.00 | % | | | (3,675 | ) | | | -0.06 | % |
Various currency futures contracts (Far East) | | | — | | | | 0.00 | % | | | — | | | | 0.00 | % | | | — | | | | 0.00 | % | | | — | | | | 0.00 | % |
Various energy futures contracts (US) | | | 31,319 | | | | 0.38 | % | | | 16,053,412 | | | | 23.53 | % | | | — | | | | 0.00 | % | | | 104,356 | | | | 1.78 | % |
NYM RBOB GAS Settling 4/1/2011 (Number of Contracts: 1,612) | | | — | | | | 0.00 | % | | | 4,453,298 | | | | 6.53 | % | | | — | | | | 0.00 | % | | | — | | | | 0.00 | % |
NYM RBOB GAS Settling 3/1/2011 (Number of Contracts: 1,657) | | | — | | | | 0.00 | % | | | 8,054,361 | | | | 11.81 | % | | | — | | | | 0.00 | % | | | — | | | | 0.00 | % |
Crude Oil, Light Settling 4/1/2011 (Number of Contracts: 3,715) | | | — | | | | 0.00 | % | | | 13,283,070 | | | | 19.47 | % | | | — | | | | 0.00 | % | | | — | | | | 0.00 | % |
Crude Oil, Light Settling 5/1/2011 (Number of Contracts: 2,000) | | | — | | | | 0.00 | % | | | 5,076,440 | | | | 7.44 | % | | | — | | | | 0.00 | % | | | — | | | | 0.00 | % |
Crude Oil, Light Settling 12/1/2012 (Number of Contracts: 4,149) | | | — | | | | 0.00 | % | | | 16,786,090 | | | | 24.61 | % | | | — | | | | 0.00 | % | | | — | | | | 0.00 | % |
Various energy futures contracts (Europe) | | | 10,330 | | | | 0.13 | % | | | 14,148 | | | | 0.02 | % | | | — | | | | 0.00 | % | | | 50,320 | | | | 0.86 | % |
Various interest rates futures contracts (US) | | | — | | | | 0.00 | % | | | (19,102 | ) | | | -0.03 | % | | | — | | | | 0.00 | % | | | — | | | | 0.00 | % |
Various interest rates futures contracts (Canada) | | | 775 | | | | 0.01 | % | | | — | | | | 0.00 | % | | | — | | | | 0.00 | % | | | — | | | | 0.00 | % |
Various interest rates futures contracts (Europe) | | | 7,479 | | | | 0.09 | % | | | — | | | | 0.00 | % | | | — | | | | 0.00 | % | | | 16,887 | | | | 0.29 | % |
Various interest rates futures contracts (Far East) | | | 788 | | | | 0.01 | % | | | — | | | | 0.00 | % | | | — | | | | 0.00 | % | | | 12,220 | | | | 0.21 | % |
Various precious metals futures contracts (US) | | | 53,135 | | | | 0.65 | % | | | 635,034 | | | | 0.93 | % | | | — | | | | 0.00 | % | | | 53,860 | | | | 0.92 | % |
Various precious metals futures contracts (Europe) | | | — | | | | 0.00 | % | | | — | | | | 0.00 | % | | | — | | | | 0.00 | % | | | — | | | | 0.00 | % |
Various soft futures contracts (US) | | | 94,793 | | | | 1.15 | % | | | 9,573,232 | | | | 14.03 | % | | | — | | | | 0.00 | % | | | 463,755 | | | | 7.90 | % |
Coffee @ CSCE Settling 9/1/2011 (Number of Contracts: 549) | | | — | | | | 0.00 | % | | | 3,813,713 | | | | 5.59 | % | | | — | | | | 0.00 | % | | | — | | | | 0.00 | % |
Sugar #11 Settling 5/1/2011 (Number of Contracts: 2,735) | | | — | | | | 0.00 | % | | | 11,302,637 | | | | 16.57 | % | | | — | | | | 0.00 | % | | | — | | | | 0.00 | % |
Coffee @ CSCE Settling 3/1/2011 (Number of Contracts: 31) | | | — | | | | 0.00 | % | | | — | | | | 0.00 | % | | | — | | | | 0.00 | % | | | 402,806 | | | | 6.86 | % |
Various soft futures contracts (Far East) | | | — | | | | 0.00 | % | | | — | | | | 0.00 | % | | | — | | | | 0.00 | % | | | — | | | | 0.00 | % |
Various soft futures contracts (Europe) | | | — | | | | 0.00 | % | | | — | | | | 0.00 | % | | | — | | | | 0.00 | % | | | — | | | | 0.00 | % |
Various soft futures contracts (Canada) | | | — | | | | 0.00 | % | | | — | | | | 0.00 | % | | | — | | | | 0.00 | % | | | — | | | | 0.00 | % |
Various stock index futures contracts (US) | | | 8,206 | | | | 0.10 | % | | | 55,237 | | | | 0.08 | % | | | — | | | | 0.00 | % | | | 13,284 | | | | 0.23 | % |
Various stock index futures contracts (Canada) | | | 7,645 | | | | 0.09 | % | | | — | | | | 0.00 | % | | | — | | | | 0.00 | % | | | — | | | | 0.00 | % |
Various stock index futures contracts (Europe) | | | (27,181 | ) | | | -0.33 | % | | | 27,570 | | | | 0.04 | % | | | — | | | | 0.00 | % | | | 25,130 | | | | 0.43 | % |
Various stock index futures contracts (Far East) | | | 15,909 | | | | 0.19 | % | | | (6,200 | ) | | | -0.01 | % | | | — | | | | 0.00 | % | | | 26,299 | | | | 0.45 | % |
| | | | | | | | | | | | | | | | | | | | | | | | | | | | | | | | |
Total Long Futures Contracts | | $ | 293,978 | | | | 3.57 | % | | $ | 139,399,317 | | | | 204.34 | % | | $ | — | | | | 0.00 | % | | $ | 1,886,400 | | | | 32.13 | % |
| | | | | | | | | | | | | | | | | | | | | | | | | | | | | | | | |
OPTIONS PURCHASED * | | $ | (22,321 | ) | | | -0.27 | % | | $ | 1,930,952 | | | | 2.83 | % | | $ | — | | | | 0.00 | % | | $ | — | | | | 0.00 | % |
| | | | | | | | | | | | | | | | | | | | | | | | | | | | | | | | |
SHORT FUTURES CONTRACTS* | | | | | | | | | | | | | | | | | | | | | | | | | | | | | | | | |
Various base metals futures contracts (US) | | $ | (3,738 | ) | | | -0.05 | % | | $ | (608,120 | ) | | | -0.89 | % | | $ | — | | | | 0.00 | % | | $ | (268,243 | ) | | | -4.57 | % |
Copper @ COMEX Settling 3/1/2011 (Number of Contracts: 3,501) | | | — | | | | 0.00 | % | | | (45,828,675 | ) | | | -67.18 | % | | | — | | | | 0.00 | % | | | — | | | | 0.00 | % |
Various base metals futures contracts (Europe) | | | (4,482 | ) | | | -0.05 | % | | | (1,930,122 | ) | | | -2.83 | % | | | — | | | | 0.00 | % | | | (373,617 | ) | | | -6.36 | % |
Various currency futures contracts (US) | | | — | | | | 0.00 | % | | | (6,750 | ) | | | -0.01 | % | | | — | | | | 0.00 | % | | | — | | | | 0.00 | % |
Various currency futures contracts (Canada) | | | — | | | | 0.00 | % | | | — | | | | 0.00 | % | | | — | | | | 0.00 | % | | | — | | | | 0.00 | % |
Various currency futures contracts (Europe) | | | — | | | | 0.00 | % | | | (6,675 | ) | | | -0.01 | % | | | — | | | | 0.00 | % | | | — | | | | 0.00 | % |
Various currency futures contracts (Far East) | | | — | | | | 0.00 | % | | | — | | | | 0.00 | % | | | — | | | | 0.00 | % | | | — | | | | 0.00 | % |
Various energy futures contracts (US) | | | (13,070 | ) | | | -0.16 | % | | | (7,196,572 | ) | | | -10.55 | % | | | — | | | | 0.00 | % | | | — | | | | 0.00 | % |
Crude Oil, Light Settling 2/1/2011 (Number of Contracts: 7,297) | | | — | | | | 0.00 | % | | | (17,244,770 | ) | | | -25.28 | % | | | — | | | | 0.00 | % | | | — | | | | 0.00 | % |
Crude Oil, Light Settling 12/1/2011 (Number of Contracts: 4,955) | | | — | | | | 0.00 | % | | | (28,698,600 | ) | | | -42.07 | % | | | — | | | | 0.00 | % | | | — | | | | 0.00 | % |
NYM RBOB Gas Settling 2/1/2011 (number of Contracts: 3,239) | | | — | | | | 0.00 | % | | | (16,575,010 | ) | | | -24.30 | % | | | — | | | | 0.00 | % | | | — | | | | 0.00 | % |
Various energy futures contracts (Europe) | | | — | | | | 0.00 | % | | | — | | | | 0.00 | % | | | — | | | | 0.00 | % | | | — | | | | 0.00 | % |
Various interest rates futures contracts (US) | | | (8,273 | ) | | | -0.10 | % | | | 97,843 | | | | 0.14 | % | | | — | | | | 0.00 | % | | | 45,500 | | | | 0.77 | % |
Various interest rates futures contracts (Canada) | | | — | | | | 0.00 | % | | | — | | | | 0.00 | % | | | — | | | | 0.00 | % | | | — | | | | 0.00 | % |
Various interest rates futures contracts (Europe) | | | 3,532 | | | | 0.04 | % | | | — | | | | 0.00 | % | | | — | | | | 0.00 | % | | | (50,055 | ) | | | -0.85 | % |
Various interest rates futures contracts (Far East) | | | (16,762 | ) | | | -0.20 | % | | | — | | | | 0.00 | % | | | — | | | | 0.00 | % | | | (21,799 | ) | | | -0.37 | % |
Various precious metals futures contracts (US) | | | — | | | | 0.00 | % | | | — | | | | 0.00 | % | | | — | | | | 0.00 | % | | | — | | | | 0.00 | % |
Various soft futures contracts (US) | | | (4,980 | ) | | | -0.06 | % | | | (4,401,168 | ) | | | -6.45 | % | | | — | | | | 0.00 | % | | | — | | | | 0.00 | % |
Coffee @ CSCE Settling 3/1/2011 (Number of Contracts: 1,550) | | | — | | | | 0.00 | % | | | (13,679,100 | ) | | | -20.05 | % | | | — | | | | 0.00 | % | | | — | | | | 0.00 | % |
Sugar #11 Settling 3/1/2011 (Number of Contracts: 3,482) | | | — | | | | 0.00 | % | | | (20,198,035 | ) | | | -29.61 | % | | | — | | | | 0.00 | % | | | — | | | | 0.00 | % |
Various soft futures contracts (Europe) | | | — | | | | 0.00 | % | | | — | | | | 0.00 | % | | | — | | | | 0.00 | % | | | — | | | | 0.00 | % |
Various stock index futures contracts (US) | | | — | | | | 0.00 | % | | | — | | | | 0.00 | % | | | — | | | | 0.00 | % | | | (1,601 | ) | | | -0.03 | % |
Various stock index futures contracts (Europe) | | | — | | | | 0.00 | % | | | — | | | | 0.00 | % | | | — | | | | 0.00 | % | | | 14,963 | | | | 0.25 | % |
Various stock index futures contracts (Far East) | | | 2,019 | | | | 0.02 | % | | | — | | | | 0.00 | % | | | — | | | | 0.00 | % | | | (1,959 | ) | | | -0.03 | % |
| | | | | | | | | | | | | | | | | | | | | | | | | | | | | | | | |
Total Short Futures Contracts | | $ | (45,754 | ) | | | -0.56 | % | | $ | (156,275,754 | ) | | | -229.09 | % | | $ | — | | | | 0.00 | % | | $ | (656,811 | ) | | | -11.19 | % |
| | | | | | | | | | | | | | | | | | | | | | | | | | | | | | | | |
OPTIONS WRITTEN * | | $ | (56,300 | ) | | | -0.68 | % | | $ | (662,392 | ) | | | -0.99 | % | | $ | — | | | | 0.00 | % | | $ | — | | | | 0.00 | % |
| | | | | | | | | | | | | | | | | | | | | | | | | | | | | | | | |
CURRENCY FORWARDS * | | $ | 368,067 | | | | 4.48 | % | | $ | — | | | | 0.00 | % | | $ | — | | | | 0.00 | % | | $ | 301,461 | | | | 5.13 | % |
| | | | | | | | | | | | | | | | | | | | | | | | | | | | | | | | |
Total Open Trade Equity (Deficit) | | $ | 537,670 | | | | 6.54 | % | | $ | (15,607,877 | ) | | | -22.91 | % | | $ | — | | | | 0.00 | % | | $ | 1,531,050 | | | | 32.97 | % |
| | | | | | | | | | | | | | | | | | | | | | | | | | | | | | | | |
SWAPS (1) | | $ | — | | | | 0.00 | % | | $ | — | | | | 0.00 | % | | $ | 790,795 | | | | 100.00 | % | | $ | — | | | | 0.00 | % |
| | | | | | | | | | | | | | | | | | | | | | | | | | | | | | | | |
| * | Except as noted, no individual futures, forwards and option on futures contract position constituted greater than 5 percent of Net Asset Value. Accordingly, the number of contracts and expiration dates are not presented. |
| (1) | See Notes to Financial Statements, Note 4. |
The accompanying notes are an integral part of these financial statements.
F-93
The Trading Companies of the Frontier Fund
Condensed Schedules of Investments
December 31, 2010
| | | | | | | | | | | | | | | | | | | | | | | | | | | | | | | | |
| | | Frontier Trading | | | Frontier Trading | | | Frontier Trading | | | Frontier Trading | |
| | | Company X, LLC | | | Company XI, LLC | | | Company XII, LLC | | | Company XIV, LLC | |
Description | | Value | | | % of Net
Asset Value | | | Value | | | % of Net
Asset Value | | | Value | | | % of Net
Asset Value | | | Value | | | % of Net
Asset Value | |
LONG FUTURES CONTRACTS* | | | | | | | | | | | | | | | | | | | | | | | | | | | | | | | | |
Various base metals futures contracts (US) | | $ | — | | | | 0.00 | % | | $ | — | | | | 0.00 | % | | $ | — | | | | 0.00 | % | | $ | 200,702 | | | | 0.83 | % |
Various base metals futures contracts (Europe) | | | — | | | | 0.00 | % | | | — | | | | 0.00 | % | | | — | | | | 0.00 | % | | | 1,527,816 | | | | 6.35 | % |
Various currency futures contracts (US) | | | — | | | | 0.00 | % | | | — | | | | 0.00 | % | | | — | | | | 0.00 | % | | | — | | | | 0.00 | % |
Various currency futures contracts (Canada) | | | — | | | | 0.00 | % | | | — | | | | 0.00 | % | | | — | | | | 0.00 | % | | | — | | | | 0.00 | % |
Various currency futures contracts (Europe) | | | — | | | | 0.00 | % | | | — | | | | 0.00 | % | | | — | | | | 0.00 | % | | | 66,750 | | | | 0.28 | % |
Various currency futures contracts (Far East) | | | — | | | | 0.00 | % | | | — | | | | 0.00 | % | | | — | | | | 0.00 | % | | | — | | | | 0.00 | % |
Various energy futures contracts (US) | | | — | | | | 0.00 | % | | | — | | | | 0.00 | % | | | — | | | | 0.00 | % | | | 38,587 | | | | 0.16 | % |
Various energy futures contracts (Europe) | | | — | | | | 0.00 | % | | | — | | | | 0.00 | % | | | — | | | | 0.00 | % | | | 14,395 | | | | 0.06 | % |
Various interest rates futures contracts (US) | | | — | | | | 0.00 | % | | | — | | | | 0.00 | % | | | — | | | | 0.00 | % | | | (3,703 | ) | | | -0.02 | % |
Various interest rates futures contracts (Canada) | | | — | | | | 0.00 | % | | | — | | | | 0.00 | % | | | — | | | | 0.00 | % | | | — | | | | 0.00 | % |
Various interest rates futures contracts (Europe) | | | — | | | | 0.00 | % | | | — | | | | 0.00 | % | | | — | | | | 0.00 | % | | | 68,813 | | | | 0.29 | % |
Various interest rates futures contracts (Far East) | | | — | | | | 0.00 | % | | | — | | | | 0.00 | % | | | — | | | | 0.00 | % | | | — | | | | 0.00 | % |
Various precious metals futures contracts (US) | | | — | | | | 0.00 | % | | | — | | | | 0.00 | % | | | — | | | | 0.00 | % | | | 7,240 | | | | 0.03 | % |
Various precious metals futures contracts (Europe) | | | — | | | | 0.00 | % | | | — | | | | 0.00 | % | | | — | | | | 0.00 | % | | | — | | | | 0.00 | % |
Various soft futures contracts (US) | | | — | | | | 0.00 | % | | | — | | | | 0.00 | % | | | — | | | | 0.00 | % | | | 44,753 | | | | 0.19 | % |
Various soft futures contracts (Far East) | | | — | | | | 0.00 | % | | | — | | | | 0.00 | % | | | — | | | | 0.00 | % | | | — | | | | 0.00 | % |
Various soft futures contracts (Europe) | | | — | | | | 0.00 | % | | | — | | | | 0.00 | % | | | — | | | | 0.00 | % | | | — | | | | 0.00 | % |
Various soft futures contracts (Canada) | | | — | | | | 0.00 | % | | | — | | | | 0.00 | % | | | — | | | | 0.00 | % | | | — | | | | 0.00 | % |
Various stock index futures contracts (US) | | | — | | | | 0.00 | % | | | — | | | | 0.00 | % | | | — | | | | 0.00 | % | | | 20,539 | | | | 0.09 | % |
Various stock index futures contracts (Canada) | | | — | | | | 0.00 | % | | | — | | | | 0.00 | % | | | — | | | | 0.00 | % | | | — | | | | 0.00 | % |
Various stock index futures contracts (Europe) | | | — | | | | 0.00 | % | | | — | | | | 0.00 | % | | | — | | | | 0.00 | % | | | (61,968 | ) | | | -0.27 | % |
Various stock index futures contracts (Far East) | | | — | | | | 0.00 | % | | | — | | | | 0.00 | % | | | — | | | | 0.00 | % | | | (3,701 | ) | | | -0.02 | % |
| | | | | | | | | | | | | | | | | | | | | | | | | | | | | | | | |
Total Long Futures Contracts | | $ | — | | | | 0.00 | % | | $ | — | | | | 0.00 | % | | $ | — | | | | 0.00 | % | | $ | 1,920,223 | | | | 7.97 | % |
| | | | | | | | | | | | | | | | | | | | | | | | | | | | | | | | |
OPTIONS PURCHASED * | | $ | — | | | | 0.00 | % | | $ | — | | | | 0.00 | % | | $ | — | | | | 0.00 | % | | $ | — | | | | 0.00 | % |
| | | | | | | | | | | | | | | | | | | | | | | | | | | | | | | | |
SHORT FUTURES CONTRACTS* | | | | | | | | | | | | | | | | | | | | | | | | | | | | | | | | |
Various base metals futures contracts (US) | | $ | — | | | | 0.00 | % | | $ | — | | | | 0.00 | % | | $ | — | | | | 0.00 | % | | $ | (203,148 | ) | | | -0.84 | % |
Various base metals futures contracts (Europe) | | | — | | | | 0.00 | % | | | — | | | | 0.00 | % | | | — | | | | 0.00 | % | | | (1,286,708 | ) | | | -5.35 | % |
Various currency futures contracts (US) | | | — | | | | 0.00 | % | | | — | | | | 0.00 | % | | | — | | | | 0.00 | % | | | — | | | | 0.00 | % |
Various currency futures contracts (Canada) | | | — | | | | 0.00 | % | | | — | | | | 0.00 | % | | | — | | | | 0.00 | % | | | — | | | | 0.00 | % |
Various currency futures contracts (Europe) | | | — | | | | 0.00 | % | | | — | | | | 0.00 | % | | | — | | | | 0.00 | % | | | (1,763 | ) | | | -0.01 | % |
Various currency futures contracts (Far East) | | | — | | | | 0.00 | % | | | — | | | | 0.00 | % | | | — | | | | 0.00 | % | | | — | | | | 0.00 | % |
Various energy futures contracts (US) | | | — | | | | 0.00 | % | | | — | | | | 0.00 | % | | | — | | | | 0.00 | % | | | (20,360 | ) | | | -0.08 | % |
Various energy futures contracts (Europe) | | | — | | | | 0.00 | % | | | — | | | | 0.00 | % | | | — | | | | 0.00 | % | | | — | | | | 0.00 | % |
Various interest rates futures contracts (US) | | | — | | | | 0.00 | % | | | — | | | | 0.00 | % | | | — | | | | 0.00 | % | | | — | | | | 0.00 | % |
Various interest rates futures contracts (Canada) | | | — | | | | 0.00 | % | | | — | | | | 0.00 | % | | | — | | | | 0.00 | % | | | — | | | | 0.00 | % |
Various interest rates futures contracts (Europe) | | | — | | | | 0.00 | % | | | — | | | | 0.00 | % | | | — | | | | 0.00 | % | | | 11,222 | | | | 0.05 | % |
Various interest rates futures contracts (Far East) | | | — | | | | 0.00 | % | | | — | | | | 0.00 | % | | | — | | | | 0.00 | % | | | (5,295 | ) | | | -0.02 | % |
Various precious metals futures contracts (US) | | | — | | | | 0.00 | % | | | — | | | | 0.00 | % | | | — | | | | 0.00 | % | | | — | | | | 0.00 | % |
Various soft futures contracts (US) | | | — | | | | 0.00 | % | | | — | | | | 0.00 | % | | | — | | | | 0.00 | % | | | (20,045 | ) | | | -0.08 | % |
Various soft futures contracts (Europe) | | | — | | | | 0.00 | % | | | — | | | | 0.00 | % | | | — | | | | 0.00 | % | | | — | | | | 0.00 | % |
Various stock index futures contracts (US) | | | — | | | | 0.00 | % | | | — | | | | 0.00 | % | | | — | | | | 0.00 | % | | | — | | | | 0.00 | % |
Various stock index futures contracts (Europe) | | | — | | | | 0.00 | % | | | — | | | | 0.00 | % | | | — | | | | 0.00 | % | | | — | | | | 0.00 | % |
Various stock index futures contracts (Far East) | | | — | | | | 0.00 | % | | | — | | | | 0.00 | % | | | — | | | | 0.00 | % | | | — | | | | 0.00 | % |
| | | | | | | | | | | | | | | | | | | | | | | | | | | | | | | | |
Total Short Futures Contracts | | $ | — | | | | 0.00 | % | | $ | — | | | | 0.00 | % | | $ | — | | | | 0.00 | % | | $ | (1,526,097 | ) | | | -6.33 | % |
| | | | | | | | | | | | | | | | | | | | | | | | | | | | | | | | |
OPTIONS WRITTEN * | | $ | — | | | | 0.00 | % | | $ | — | | | | 0.00 | % | | $ | — | | | | 0.00 | % | | $ | — | | | | 0.00 | % |
| | | | | | | | | | | | | | | | | | | | | | | | | | | | | | | | |
CURRENCY FORWARDS * | | $ | — | | | | 0.00 | % | | $ | — | | | | 0.00 | % | | $ | — | | | | 0.00 | % | | $ | (70,281 | ) | | | -0.29 | % |
| | | | | | | | | | | | | | | | | | | | | | | | | | | | | | | | |
Total Open Trade Equity | | $ | — | | | | 0.00 | % | | $ | — | | | | 0.00 | % | | $ | — | | | | 0.00 | % | | $ | 323,845 | | | | 1.35 | % |
| | | | | | | | | | | | | | | | | | | | | | | | | | | | | | | | |
SWAPS (1) | | $ | 11,407,905 | | | | 100.00 | % | | $ | 26,242,246 | | | | 100.00 | % | | $ | 10,956,756 | | | | 100.00 | % | | $ | — | | | | 0.00 | % |
| | | | | | | | | | | | | | | | | | | | | | | | | | | | | | | | |
| * | Except as noted, no individual futures, forwards and option on futures contract position constituted greater than 5 percent of Net Asset Value. Accordingly, the number of contracts and expiration dates are not presented. |
| (1) | See Notes to Financial Statements, Note 4. |
The accompanying notes are an integral part of these financial statements.
F-94
The Trading Companies of the Frontier Fund
Condensed Schedules of Investments
December 31, 2010
| | | | | | | | |
| | | Frontier Trading
Company XV, LLC | |
Description | | Value | | | % of Net
Asset Value | |
LONG FUTURES CONTRACTS* | | | | | | | | |
Various base metals futures contracts (US) | | $ | 115,384 | | | | 0.30 | % |
Various base metals futures contracts (Europe) | | | 6,583,934 | | | | 16.92 | % |
Copper @ LME Settling 3/16/2011 (Number of Contracts: 215) | | | 6,234,313 | | | | 16.02 | % |
Various currency futures contracts (US) | | | 92,175 | | | | 0.24 | % |
Various currency futures contracts (Europe) | | | — | | | | 0.00 | % |
Various energy futures contracts (US) | | | — | | | | 0.00 | % |
Various energy futures contracts (Europe) | | | — | | | | 0.00 | % |
Various interest rates futures contracts (US) | | | — | | | | 0.00 | % |
Various interest rates futures contracts (Europe) | | | — | | | | 0.00 | % |
Various precious metals futures contracts (US) | | | — | | | | 0.00 | % |
Various soft futures contracts (US) | | | 416,851 | | | | 1.07 | % |
Various stock index futures contracts (US) | | | (3,240 | ) | | | -0.01 | % |
Various stock index futures contracts (Europe) | | | — | | | | 0.00 | % |
Various stock index futures contracts (Far East) | | | (4,456 | ) | | | -0.01 | % |
| | | | | | | | |
Total Long Futures Contracts | | $ | 13,434,960 | | | | 34.53 | % |
| | | | | | | | |
OPTIONS PURCHASED * | | $ | 11,010,254 | | | | 28.30 | % |
Copper @ LME Settling 3/1/2011, Call @ 8,500 (Numer of Contracts: 133) | | | 4,093,906 | | | | 10.52 | % |
Copper @ LME Settling 3/1/2011, Call @ 8,400 (Numer of Contracts: 131) | | | 4,299,158 | | | | 11.05 | % |
Silver @ COMEX Settling 3/1/2011, Call @ 1,900 (Number of Contracts: 55) | | | 3,285,425 | | | | 8.44 | % |
Silver @ COMEX Settling 3/1/2011, Call @ 1,975 (Number of Contracts: 55) | | | 3,080,825 | | | | 7.92 | % |
Silver @ COMEX Settling 3/1/2011, Call @ 2,100 (Number of Contracts: 54) | | | 2,690,550 | | | | 6.92 | % |
| | | | | | | | |
Total Options Purchased | | $ | 28,460,118 | | | | 73.15 | % |
| | | | | | | | |
SHORT FUTURES CONTRACTS* | | | | | | | | |
Various base metals futures contracts (US) | | $ | (1,647,734 | ) | | | -4.24 | % |
Copper @ Comex Settling 3/1/2011 (Number of Contracts: 265) | | | (4,448,411 | ) | | | -11.43 | % |
Various base metals futures contracts (Europe) | | | (6,083,161 | ) | | | -15.64 | % |
Copper @ LME Settling 3/16/2011 (Number of Contracts: 204) | | | (5,109,138 | ) | | | -13.13 | % |
Various currency futures contracts (US) | | | (30,525 | ) | | | -0.08 | % |
Various currency futures contracts (Europe) | | | 227,308 | | | | 0.58 | % |
Various currency futures contracts (Far East) | | | — | | | | 0.00 | % |
Various energy futures contracts (US) | | | — | | | | 0.00 | % |
Various interest rates futures contracts (Europe) | | | — | | | | 0.00 | % |
Various interest rates futures contracts (Far East) | | | — | | | | 0.00 | % |
Various precious metals futures contracts (US) | | | (160,400 | ) | | | -0.41 | % |
Silver @ COMEX Settling 3/1/2011 (number of Contracts: 164) | | | (2,522,543 | ) | | | -6.48 | % |
Various soft futures contracts (US) | | | (318,020 | ) | | | -0.82 | % |
Various soft futures contracts (Europe) | | | — | | | | 0.00 | % |
Various stock index futures contracts (US) | | | — | | | | 0.00 | % |
| | | | | | | | |
Total Short Futures Contracts | | $ | (20,092,624 | ) | | | -51.65 | % |
| | | | | | | | |
OPTIONS WRITTEN * | | $ | (4,603,983 | ) | | | -11.83 | % |
| | | | | | | | |
CURRENCY FORWARDS * | | $ | 134,154 | | | | 0.34 | % |
| | | | | | | | |
Total Open Trade Equity | | $ | 17,332,625 | | | | 44.54 | % |
| | | | | | | | |
SWAPS (1) | | $ | — | | | | 0.00 | % |
| | | | | | | | |
| * | Except as noted, no individual futures, forwards and option on futures contract position constituted greater than 5 percent of Net Asset Value. Accordingly, the number of contracts and expiration dates are not presented. |
| (1) | See Notes to Financial Statements, Note 4. |
The accompanying notes are an integral part of these financial statements.
F-95
The Trading Companies of the Frontier Fund
Statements of Operations
For The Years Ended December 31, 2011, 2010 and 2009
| | | | | | | | | | | | | | | | | | | | | | | | | | | | | | | | | | | | |
| | | Frontier Trading
Company I LLC | | | Frontier Trading
Company II LLC | | | Frontier Trading
Company III LLC | |
| | | 12/31/2011 | | | 12/31/2010 | | | 12/31/2009 | | | 12/31/2011 | | | 12/31/2010 | | | 12/31/2009 | | | 12/31/2011 | | | 12/31/2010 | | | 12/31/2009 | |
Investment Income: | | | | | | | | | | | | | | | | | | | | | | | | | | | | |
Interest-net | | $ | (60,089 | ) | | $ | (43,262 | ) | | $ | (28,283 | ) | | $ | 13,749 | | | $ | 7,102 | | | $ | 11,757 | | | $ | 1,215 | | | $ | 1,636 | | | $ | 970 | |
| | | | | | | | | | | | | | | | | | | | | | | | | | | | | | | | | | | | |
Total Income | | | (60,089 | ) | | | (43,262 | ) | | | (28,283 | ) | | | 13,749 | | | | 7,102 | | | | 11,757 | | | | 1,215 | | | | 1,636 | | | | 970 | |
| | | | | | | | | | | | | | | | | | | | | | | | | | | | | | | | | | | | |
Realized and unrealized gain (loss) on investments: | | | | | | | | | | | | | | | | | | | | | | | | | | | | | | | | | | | | |
Net realized gain/(loss) on futures and currencies | | | 61,056,128 | | | | 23,493,386 | | | | 8,715,485 | | | | 21,444,191 | | | | 26,434,521 | | | | (3,723,161 | ) | | | (142,069 | ) | | | 290,954 | | | | (178,745 | ) |
Net realized gain/(loss) on swap contracts | | | 6,689,123 | | | | — | | | | — | | | | — | | | | — | | | | — | | | | (8,301,000 | ) | | | — | | | | — | |
Net change in open trade equity | | | (80,961,624 | ) | | | 5,505,198 | | | | 905,718 | | | | (2,190,461 | ) | | | 5,967,280 | | | | (1,513,729 | ) | | | (27,098 | ) | | | 54,017 | | | | 2,983 | |
Net unrealized gain/(loss) on option / swap contracts | | | (18,832,300 | ) | | | 8,790,927 | | | | (12,051,821 | ) | | | — | | | | — | | | | — | | | | 6,331,232 | | | | 675,809 | | | | (4,129,162 | ) |
Trading commissions | | | (3,722,719 | ) | | | (3,146,590 | ) | | | (1,297,644 | ) | | | (132,566 | ) | | | (221,457 | ) | | | (139,754 | ) | | | — | | | | — | | | | — | |
| | | | | | | | | | | | | | | | | | | | | | | | | | | | | | | | | | | | |
Net gain/(loss) on investments | | | (35,771,393 | ) | | | 34,642,921 | | | | (3,728,262 | ) | | | 19,121,164 | | | | 32,180,344 | | | | (5,376,644 | ) | | | (2,138,935 | ) | | | 1,020,780 | | | | (4,304,924 | ) |
| | | | | | | | | | | | | | | | | | | | | | | | | | | | | | | | | | | | |
NET INCREASE/(DECREASE) IN MEMBERS’ EQUITY RESULTING FROM OPERATIONS | | $ | (35,831,482 | ) | | $ | 34,599,659 | | | $ | (3,756,545 | ) | | $ | 19,134,913 | | | $ | 32,187,446 | | | $ | (5,364,887 | ) | | $ | (2,137,720 | ) | | $ | 1,022,416 | | | $ | (4,303,954 | ) |
| | | | | | | | | | | | | | | | | | | | | | | | | | | | | | | | | | | | |
| | | | | | | | | | | | | | | | | | | | | | | | | | | | | | | | | | | | |
| | | Frontier Trading
Company V LLC | | | Frontier Trading
Company VI LLC | | | Frontier Trading
Company VII, LLC | |
| | | 12/31/2011 | | | 12/31/2010 | | | 12/31/2009 | | | 12/31/2011 | | | 12/31/2010 | | | 12/31/2009 | | | 12/31/2011 | | | 12/31/2010 | | | 12/31/2009 | |
Investment Income: | | | | | | | | | | | | | | | | | | | | | | | | | | | | | | | | | | | | |
Interest-net | | $ | 5,304 | | | $ | 11,448 | | | $ | 5,825 | | | $ | 1,781 | | | $ | 9,062 | | | $ | 9,613 | | | $ | 68 | | | $ | 29,449 | | | $ | 3,666 | |
| | | | | | | | | | | | | | | | | | | | | | | | | | | | | | | | | | | | |
Total Income | | | 5,304 | | | | 11,448 | | | | 5,825 | | | | 1,781 | | | | 9,062 | | | | 9,613 | | | | 68 | | | | 29,449 | | | | 3,666 | |
| | | | | | | | | | | | | | | | | | | | | | | | | | | | | | | | | | | | |
Realized and unrealized gain (loss) on investments: | | | | | | | | | | | | | | | | | | | | | | | | | | | | | | | | | | | | |
Net realized gain/(loss) on futures and currencies | | | (9,654,886 | ) | | | 5,481,406 | | | | 4,236,302 | | | | 1,091,347 | | | | 3,310,465 | | | | (210,732 | ) | | | 80,287,339 | | | | 39,831,024 | | | | 60,288,927 | |
Net realized gain/(loss) on swap contracts | | | — | | | | — | | | | — | | | | — | | | | — | | | | — | | | | — | | | | — | | | | — | |
Net change in open trade equity | | | 11,205 | | | | 616,949 | | | | 921,760 | | | | (537,670 | ) | | | 1,304,905 | | | | (877,165 | ) | | | (14,886,524 | ) | | | 4,988,429 | | | | (28,316,249 | ) |
Net unrealized gain/(loss) on option / swap contracts | | | — | | | | — | | | | — | | | | — | | | | — | | | | — | | | | — | | | | — | | | | — | |
Trading commissions | | | (621,086 | ) | | | (613,637 | ) | | | (442,130 | ) | | | (6,105 | ) | | | (137,762 | ) | | | (76,084 | ) | | | (2,029,377 | ) | | | (4,896,288 | ) | | | (3,052,293 | ) |
| | | | | | | | | | | | | | | | | | | | | | | | | | | | | | | | | | | | |
Net gain/(loss) on investments | | | (10,264,767 | ) | | | 5,484,718 | | | | 4,715,932 | | | | 547,572 | | | | 4,477,608 | | | | (1,163,981 | ) | | | 63,371,439 | | | | 39,923,165 | | | | 28,920,385 | |
| | | | | | | | | | | | | | | | | | | | | | | | | | | | | | | | | | | | |
NET INCREASE/(DECREASE) IN MEMBERS’ EQUITYRESULTING FROM OPERATIONS | | $ | (10,259,463 | ) | | $ | 5,496,166 | | | $ | 4,721,757 | | | $ | 549,352 | | | $ | 4,486,670 | | | $ | (1,154,368 | ) | | $ | 63,371,507 | | | $ | 39,952,614 | | | $ | 28,924,051 | |
| | | | | | | | | | | | | | | | | | | | | | | | | | | | | | | | | | | | |
| | | |
| | | Frontier Trading
Company VIII, LLC | | | Frontier Trading
Company IX, LLC | | | Frontier Trading
Company X, LLC (1) | |
| | | 12/31/2011 | | | 12/31/2010 | | | 12/31/2009 | | | 12/31/2011 | | | 12/31/2010 | | | 12/31/2009 | | | 12/31/2011 | | | 12/31/2010 | | | 12/31/2009 | |
Investment Income: | | | | | | | | | | | | | | | | | | | | | | | | | | | | | | | | | | | | |
Interest-net | | $ | (20 | ) | | $ | (380 | ) | | $ | 853 | | | $ | 16,331 | | | $ | 16,310 | | | $ | 5,629 | | | $ | — | | | $ | — | | | $ | — | |
| | | | | | | | | | | | | | | | | | | | | | | | | | | | | | | | | | | | |
Total Income | | | (20 | ) | | | (380 | ) | | | 853 | | | | 16,331 | | | | 16,310 | | | | 5,629 | | | | — | | | | — | | | | — | |
| | | | | | | | | | | | | | | | | | | | | | | | | | | | | | | | | | | | |
Realized and unrealized gain (loss) on investments: | | | | | | | | | | | | | | | | | | | | | | | | | | | | | | | | | | | | |
Net realized gain/(loss) on futures and currencies | | | — | | | | — | | | | — | | | | (1,718,447 | ) | | | 1,015,966 | | | | (1,054,979 | ) | | | — | | | | — | | | | — | |
Net realized gain/(loss) on swap contracts | | | (49,660 | ) | | | 509,662 | | | | 883,900 | | | | — | | | | — | | | | — | | | | (5,602,827 | ) | | | — | | | | — | |
Net change in open trade equity | | | — | | | | — | | | | — | | | | (1,086,304 | ) | | | 1,492,816 | | | | (165,186 | ) | | | — | | | | — | | | | — | |
Net unrealized gain/(loss) on option / swap contracts | | | — | | | | — | | | | — | | | | — | | | | — | | | | — | | | | 1,291,619 | | | | 416,157 | | | | (1,707,778 | ) |
Trading commissions | | | — | | | | — | | | | — | | | | (90,719 | ) | | | (127,401 | ) | | | (25,833 | ) | | | — | | | | — | | | | — | |
| | | | | | | | | | | | | | | | | | | | | | | | | | | | | | | | | | | | |
Net gain/(loss) on investments | | | (49,660 | ) | | | 509,662 | | | | 883,900 | | | | (2,895,470 | ) | | | 2,381,381 | | | | (1,245,998 | ) | | | (4,311,208 | ) | | | 416,157 | | | | (1,707,778 | ) |
| | | | | | | | | | | | | | | | | | | | | | | | | | | | | | | | | | | | |
NET INCREASE/(DECREASE) IN MEMBERS’ EQUITYRESULTING FROM OPERATIONS | | $ | (49,680 | ) | | $ | 509,282 | | | $ | 884,753 | | | $ | (2,879,139 | ) | | $ | 2,397,691 | | | $ | (1,240,369 | ) | | $ | (4,311,208 | ) | | $ | 416,157 | | | $ | (1,707,778 | ) |
| | | | | | | | | | | | | | | | | | | | | | | | | | | | | | | | | | | | |
| (1) | Trading Companies X, XI, XII, XIV and XV commenced operations in June 2009. |
The accompanying notes are an integral part of these financial statements.
F-96
The Trading Companies of the Frontier Fund
Statements of Operations
For The Years Ended December 31, 2011, 2010 and 2009
| | | | | | | | | | | | | | | | | | | | | | | | | | | | | | | | | | | | |
| | | Frontier Trading
Company XI, LLC (1) | | | Frontier Trading
Company XII, LLC (1) | | | Frontier Trading
Company XIV, LLC (1) | |
| | | 12/31/2011 | | | 12/31/2010 | | | 12/31/2009 | | | 12/31/2011 | | | 12/31/2010 | | | 12/31/2009 | | | 12/31/2011 | | | 12/31/2010 | | | 12/31/2009 | |
Investment Income: | | | | | | | | | | | | | | | | | | | | | | | | | | | | | | | | | | | | |
Interest-net | | $ | — | | | $ | — | | | $ | — | | | $ | — | | | $ | — | | | $ | — | | | $ | (69,299 | ) | | $ | (20,254 | ) | | $ | (1,416 | ) |
| | | | | | | | | | | | | | | | | | | | | | | | | | | | | | | | | | | | |
Total Income | | | — | | | | — | | | | — | | | | — | | | | — | | | | — | | | | (69,299 | ) | | | (20,254 | ) | | | (1,416 | ) |
| | | | | | | | | | | | | | | | | | | | | | | | | | | | | | | | | | | | |
Realized and unrealized gain (loss) on investments: | | | | | | | | | | | | | | | | | | | | | | | | | | | | | | | | | | | | |
Net realized gain/(loss) on futures and currencies | | | — | | | | — | | | | — | | | | — | | | | — | | | | — | | | | 13,274,058 | | | | (234,782 | ) | | | 2,920,905 | |
Net realized gain/(loss) on swap contracts | | | 2,070,346 | | | | — | | | | — | | | | (4,332,249 | ) | | | — | | | | — | | | | — | | | | — | | | | — | |
Net change in open trade equity | | | — | | | | — | | | | — | | | | — | | | | — | | | | — | | | | (562,793 | ) | | | 2,822,669 | | | | (2,986,215 | ) |
Net unrealized gain/(loss) on swap contracts | | | (1,610,580 | ) | | | 3,474,611 | | | | (1,864,032 | ) | | | 1,317,993 | | | | 929,503 | | | | (2,247,497 | ) | | | — | | | | — | | | | — | |
Trading commissions | | | — | | | | — | | | | — | | | | — | | | | — | | | | — | | | | (685,193 | ) | | | (320,752 | ) | | | (33,595 | ) |
| | | | | | | | | | | | | | | | | | | | | | | | | | | | | | | | | | | | |
Net gain/(loss) on investments | | | 459,765 | | | | 3,474,611 | | | | (1,864,032 | ) | | | (3,014,256 | ) | | | 929,503 | | | | (2,247,497 | ) | | | 12,026,072 | | | | 2,267,135 | | | | (98,905 | ) |
| | | | | | | | | | | | | | | | | | | | | | | | | | | | | | | | | | | | |
NET INCREASE/(DECREASE) IN MEMBERS’ EQUITYRESULTING FROM OPERATIONS | | $ | 459,765 | | | $ | 3,474,611 | | | $ | (1,864,032 | ) | | $ | (3,014,256 | ) | | $ | 929,503 | | | $ | (2,247,497 | ) | | $ | 11,956,773 | | | $ | 2,246,881 | | | $ | (100,321 | ) |
| | | | | | | | | | | | | | | | | | | | | | | | | | | | | | | | | | | | |
| | | | | | | | | | | | | | | | | | | | | | | | | | | | | | | | | | | | |
| | | Frontier Trading
Company XV, LLC (1) | | | Frontier Trading
Company XVII, LLC (2) | | | Frontier Trading
Company XVIII, LLC (2) | |
| | | 12/31/2011 | | | 12/31/2010 | | | 12/31/2009 | | | 12/31/2011 | | | 12/31/2010 | | | 12/31/2009 | | | 12/31/2011 | | | 12/31/2010 | | | 12/31/2009 | |
Investment Income: | | | | | | | | | | | | | | | | | | | | | | | | | | | | | | | | | | | | |
Interest-net | | $ | 620 | | | $ | (4,474 | ) | | $ | (1,089 | ) | | $ | — | | | $ | — | | | $ | — | | | $ | (335 | ) | | $ | — | | | $ | — | |
| | | | | | | | | | | | | | | | | | | | | | | | | | | | | | | | | | | | |
Total Income | | | 620 | | | | (4,474 | ) | | | (1,089 | ) | | | — | | | | — | | | | — | | | | (335 | ) | | | — | | | | — | |
| | | | | | | | | | | | | | | | | | | | | | | | | | | | | | | | | | | | |
Realized and unrealized gain (loss) on investments: | | | | | | | | | | | | | | | | | | | | | | | | | | | | | | | | | | | | |
Net realized gain/(loss) on futures and currencies | | | (13,634,237 | ) | | | 3,641,985 | | | | 14,119,248 | | | | — | | | | — | | | | — | | | | (2,842,978 | ) | | | — | | | | — | |
Net realized gain/(loss) on swap contracts | | | — | | | | — | | | | — | | | | — | | | | — | | | | — | | | | — | | | | — | | | | — | |
Net change in open trade equity | | | 12,294,008 | | | | 11,935,971 | | | | (14,596,420 | ) | | | — | | | | — | | | | — | | | | 596,193 | | | | — | | | | — | |
Net unrealized gain/(loss) on swap contracts | | | — | | | | — | | | | — | | | | (368,228 | ) | | | — | | | | — | | | | — | | | | — | | | | — | |
Trading commissions | | | (557,846 | ) | | | (567,787 | ) | | | (64,559 | ) | | | — | | | | — | | | | — | | | | (46,600 | ) | | | — | | | | — | |
| | | | | | | | | | | | | | | | | | | | | | | | | | | | | | | | | | | | |
Net gain/(loss) on investments | | | (1,898,075 | ) | | | 15,010,169 | | | | (541,731 | ) | | | (368,228 | ) | | | — | | | | — | | | | (2,293,386 | ) | | | — | | | | — | |
| | | | | | | | | | | | | | | | | | | | | | | | | | | | | | | | | | | | |
NET INCREASE/(DECREASE) IN MEMBERS’ EQUITYRESULTING FROM OPERATIONS | | $ | (1,897,455 | ) | | $ | 15,005,695 | | | $ | (542,820 | ) | | $ | (368,228 | ) | | $ | — | | | $ | — | | | $ | (2,293,721 | ) | | $ | — | | | $ | — | |
| | | | | | | | | | | | | | | | | | | | | | | | | | | | | | | | | | | | |
| | | | | | | | | | | | |
| | | Frontier Trading
Company XXI, LLC (2) | |
| | | 12/31/2011 | | | 12/31/2010 | | | 12/31/2009 | |
Investment Income: | | | | | | | | | | | | |
Interest-net | | $ | (10,186 | ) | | $ | — | | | $ | — | |
| | | | | | | | | | | | |
Total Income | | | (10,186 | ) | | | — | | | | — | |
| | | | | | | | | | | | |
Realized and unrealized gain (loss) on investments: | | | | | | | | | | | | |
Net realized gain/(loss) on futures and currencies | | | (3,513,960 | ) | | | — | | | | — | |
Net realized gain/(loss) on swap contracts | | | — | | | | — | | | | — | |
Net change in open trade equity | | | 792,372 | | | | — | | | | — | |
Net unrealized gain/(loss) on swap contracts | | | — | | | | — | | | | — | |
Trading commissions | | | (68,034 | ) | | | — | | | | — | |
| | | | | | | | | | | | |
Net gain/(loss) on investments | | | (2,789,622 | ) | | | — | | | | — | |
| | | | | | | | | | | | |
NET INCREASE/(DECREASE) IN MEMBERS’ EQUITY RESULTING FROM OPERATIONS | | $ | (2,799,807 | ) | | $ | — | | | $ | — | |
| | | | | | | | | | | | |
| (1) | Trading Companies X, XI, XII, XIV and XV commenced operations in June 2009. |
| () | Trading Companies XVII, XVIII and XXI commenced operations in July, October and March 2011, respectively. |
The accompanying notes are an integral part of these financial statements.
F-97
The Trading Companies of the Frontier Fund
Statements of Changes in Members’ Equity
For the Years Ended December 31, 2011, 2010 and 2009
| | | | | | | | | | | | |
| | | Frontier Trading | | | Frontier Trading | | | Frontier Trading | |
| | | Company I LLC | | | Company II LLC | | | Company III LLC | |
Members’ Equity, December 31, 2008 | | $ | 104,857,900 | | | $ | 11,811,964 | | | $ | 9,805,858 | |
| | | | | | | | | | | | |
Capital Contributed | | | 27,700,000 | | | | 31,050,000 | | | | — | |
Capital Distributed | | | (58,037,609 | ) | | | (20,605,436 | ) | | | — | |
Net Increase in Members’ Equity Resulting From Operations | | | (3,756,545 | ) | | | (5,364,887 | ) | | | (4,303,954 | ) |
| | | | | | | | | | | | |
Members’ Equity, December 31, 2009 | | $ | 70,763,746 | | | $ | 16,891,641 | | | $ | 5,501,904 | |
| | | | | | | | | | | | |
Capital Contributed | | | 93,655,000 | | | | 15,900,000 | | | | 250,000 | |
Capital Distributed | | | (90,720,916 | ) | | | (45,300,000 | ) | | | (400,000 | ) |
Net Increase in Members’ Equity Resulting From Operations | | | 34,599,659 | | | | 32,187,446 | | | | 1,022,416 | |
| | | | | | | | | | | | |
Members’ Equity, December 31, 2010 | | $ | 108,297,489 | | | $ | 19,679,087 | | | $ | 6,374,320 | |
| | | | | | | | | | | | |
Capital Contributed | | | 167,775,000 | | | | 9,800,000 | | | | 2,064,017 | |
Capital Distributed | | | (178,329,983 | ) | | | (31,300,000 | ) | | | (6,300,618 | ) |
Net Increase in Members’ Equity Resulting From Operations | | | (35,831,482 | ) | | | 19,134,913 | | | | (2,137,719 | ) |
| | | | | | | | | | | | |
Members’ Equity, December 31, 2011 | | $ | 61,911,024 | | | $ | 17,314,000 | | | $ | — | |
| | | | | | | | | | | | |
| | | |
| | | Frontier Trading | | | Frontier Trading | | | Frontier Trading | |
| | | Company V LLC | | | Company VI LLC | | | Cmpany VII, LLC | |
Members’ Equity, December 31, 2008 | | $ | 5,110,183 | | | $ | 6,381,232 | | | $ | 9,245,270 | |
| | | | | | | | | | | | |
Capital Contributed | | | 18,100,000 | | | | 16,900,000 | | | | 71,700,000 | |
Capital Distributed | | | (14,111,460 | ) | | | (10,092,381 | ) | | | (86,606,099 | ) |
Net Increase in Members’ Equity Resulting From Operations | | | 4,721,757 | | | | (1,154,368 | ) | | | 28,924,051 | |
| | | | | | | | | | | | |
Members’ Equity, December 31, 2009 | | $ | 13,820,480 | | | $ | 12,034,483 | | | $ | 23,263,222 | |
| | | | | | | | | | | | |
Capital Contributed | | | 7,700,000 | | | | 6,200,000 | | | | 92,000,000 | |
Capital Distributed | | | (14,500,000 | ) | | | (14,500,000 | ) | | | (87,000,000 | ) |
Net Increase in Members’ Equity Resulting From Operations | | | 5,496,166 | | | | 4,486,670 | | | | 39,952,614 | |
| | | | | | | | | | | | |
Members’ Equity, December 31, 2010 | | $ | 12,516,646 | | | $ | 8,221,153 | | | $ | 68,215,836 | |
| | | | | | | | | | | | |
Capital Contributed | | | 29,400,000 | | | | — | | | | 68,341,000 | |
Capital Distributed | | | (10,800,000 | ) | | | (8,770,505 | ) | | | (178,041,000 | ) |
Net Increase in Members’ Equity Resulting From Operations | | | (10,259,463 | ) | | | 549,352 | | | | 63,371,507 | |
| | | | | | | | | | | | |
Members’ Equity, December 31, 2011 | | $ | 20,858,183 | | | $ | — | | | $ | 21,887,343 | |
| | | | | | | | | | | | |
| | | |
| | | Frontier Trading | | | Frontier Trading | | | Frontier Trading | |
| | | Company VIII, LLC | | | Company IX, LLC | | | Company X, LLC (1) | |
Members’ Equity, December 31, 2008 | | $ | 836,554 | | | $ | 1,998,134 | | | $ | — | |
| | | | | | | | | | | | |
Capital Contributed | | | 1,849,628 | | | | 900,000 | | | | 10,279,667 | |
Capital Distributed | | | (2,986,165 | ) | | | (484,146 | ) | | | (21,250 | ) |
Net Increase in Members’ Equity Resulting From Operations | | | 884,753 | | | | (1,240,369 | ) | | | (1,707,778 | ) |
| | | | | | | | | | | | |
Members’ Equity, December 31, 2009 | | $ | 584,770 | | | $ | 1,173,619 | | | $ | 8,550,639 | |
| | | | | | | | | | | | |
Capital Contributed | | | 1,194,774 | | | | 5,400,000 | | | | 2,500,000 | |
Capital Distributed | | | (1,498,031 | ) | | | (3,100,000 | ) | | | (58,891 | ) |
Net Increase in Members’ Equity Resulting From Operations | | | 509,282 | | | | 2,397,691 | | | | 416,157 | |
| | | | | | | | | | | | |
Members’ Equity, December 31, 2010 | | $ | 790,795 | | | $ | 5,871,310 | | | $ | 11,407,905 | |
| | | | | | | | | | | | |
Capital Contributed | | | 896,087 | | | | 7,532,417 | | | | — | |
Capital Distributed | | | (1,637,202 | ) | | | (5,312,417 | ) | | | (7,096,697 | ) |
Net Increase in Members’ Equity Resulting From Operations | | | (49,680 | ) | | | (2,879,139 | ) | | | (4,311,208 | ) |
| | | | | | | | | | | | |
Members’ Equity, December 31, 2011 | | $ | — | | | $ | 5,212,171 | | | $ | — | |
| | | | | | | | | | | | |
| (1) | Trading Companies X, XI, XII, XIV and XV commenced trading operations in June 2009. |
The accompanying notes are an integral part of these financial statements.
F-98
The Trading Companies of the Frontier Fund
Statements of Changes in Members’ Equity
For the Years Ended December 31, 2011, 2010 and 2009
| | | | | | | | | | | | |
| | | Frontier Trading | | | Frontier Trading | | | Frontier Trading | |
| | | Company XI, LLC (1) | | | Company XII, LLC (1) | | | Company XIV, LLC (1) | |
Members’ Equity, December 31, 2008 | | $ | — | | | $ | — | | | $ | — | |
| | | | | | | | | | | | |
Capital Contributed | | | 18,060,709 | | | | 12,500,000 | | | | 9,321,648 | |
Capital Distributed | | | (224,520 | ) | | | (225,250 | ) | | | — | |
Net Increase in Members’ Equity Resulting From Operations | | | (1,864,032 | ) | | | (2,247,497 | ) | | | (101,321 | ) |
| | | | | | | | | | | | |
Members’ Equity, December 31, 2009 | | $ | 15,972,157 | | | $ | 10,027,253 | | | $ | 9,220,327 | |
| | | | | | | | | | | | |
Capital Contributed | | | 14,489,668 | | | | — | | | | 12,600,000 | |
Capital Distributed | | | (7,694,190 | ) | | | — | | | | (3,707 | ) |
Net Increase in Members’ Equity Resulting From Operations | | | 3,474,611 | | | | 929,503 | | | | 2,246,881 | |
| | | | | | | | | | | | |
Members’ Equity, December 31, 2010 | | $ | 26,242,246 | | | $ | 10,956,756 | | | $ | 24,063,501 | |
| | | | | | | | | | | | |
Capital Contributed | | | 124,293 | | | | 10,123,315 | | | | 59,500,000 | |
Capital Distributed | | | (26,826,305 | ) | | | (18,065,815 | ) | | | (83,600,000 | ) |
Net Increase in Members’ Equity Resulting From Operations | | | 459,765 | | | | (3,014,256 | ) | | | 11,956,773 | |
| | | | | | | | | | | | |
Members’ Equity, December 31, 2011 | | $ | — | | | $ | — | | | $ | 11,920,274 | |
| | | | | | | | | | | | |
| | | |
| | | Frontier Trading | | | Frontier Trading | | | Frontier Trading | |
| | | Company XV, LLC (1) | | | Company XVII, LLC (2) | | | Company XVIII, LLC (2) | |
Members’ Equity, December 31, 2008 | | $ | — | | | $ | — | | | $ | — | |
| | | | | | | | | | | | |
Capital Contributed | | | 26,742,192 | | | | — | | | | — | |
Capital Distributed | | | (2,400,000 | ) | | | — | | | | — | |
Net Increase in Members’ Equity Resulting From Operations | | | (542,820 | ) | | | — | | | | — | |
| | | | | | | | | | | | |
Members’ Equity, December 31, 2009 | | $ | 23,799,372 | | | $ | — | | | $ | — | |
| | | | | | | | | | | | |
Capital Contributed | | | 100,000 | | | | — | | | | — | |
Capital Distributed | | | — | | | | — | | | | — | |
Net Increase in Members’ Equity Resulting From Operations | | | 15,005,695 | | | | — | | | | — | |
| | | | | | | | | | | | |
Members’ Equity, December 31, 2010 | | $ | 38,905,067 | | | $ | — | | | $ | — | |
| | | | | | | | | | | | |
Capital Contributed | | | 37,750,000 | | | | 6,250,000 | | | | 9,700,000 | |
Capital Distributed | | | (59,000,000 | ) | | | — | | | | — | |
Net Increase in Members’ Equity Resulting From Operations | | | (1,897,455 | ) | | | (368,228 | ) | | | (2,293,721 | ) |
| | | | | | | | | | | | |
Members’ Equity, December 31, 2011 | | $ | 15,757,612 | | | $ | 5,881,772 | | | $ | 7,406,279 | |
| | | | | | | | | | | | |
| | | | |
| |
| | | Frontier Trading | |
| | | Company XXI, LLC (2) | |
Members’ Equity, December 31, 2008 | | $ | — | |
| | | | |
Capital Contributed | | | — | |
Capital Distributed | | | — | |
Net Increase in Members’ Equity Resulting From Operations | | | — | |
| | | | |
Members’ Equity, December 31, 2009 | | $ | — | |
| | | | |
Capital Contributed | | | — | |
Capital Distributed | | | — | |
Net Increase in Members’ Equity Resulting From Operations | | | — | |
| | | | |
Members’ Equity, December 31, 2010 | | $ | — | |
| | | | |
Capital Contributed | | | 11,500,000 | |
Capital Distributed | | | (2,800,035 | ) |
Net Increase in Members’ Equity Resulting From Operations | | | (2,799,807 | ) |
| | | | |
Members’ Equity, December 31, 2011 | | $ | 5,900,158 | |
| | | | |
| (1) | Trading Companies X, XI, XII, XIV and XV commenced trading operations in June 2009. |
| (2) | Trading Companies XVII, XVIII and XXI commenced trading operations in July, October and March 2011, respectively. |
The accompanying notes are an integral part of these financial statements.
F-99
The Trading Companies of the Frontier Fund
Statements of Cash Flows
For the Years Ended December 31, 2011, 2010 and 2009
| | | | | | | | | | | | | | | | | | | | | | | | | | | | | | | | | | | | |
| | | Frontier Trading | | | Frontier Trading | | | Frontier Trading | |
| | | Company I LLC | | | Company II LLC | | | Company III LLC | |
| | | 2011 | | | 2010 | | | 2009 | | | 2011 | | | 2010 | | | 2009 | | | 2011 | | | 2010 | | | 2009 | |
Cash Flows from Operating Activities | | | | | | | | | | | | | | | | | | | | | | | | | | | | | | | | | | | | |
Net increase (decrease) in members’ equity resulting from operations | | $ | (35,831,482 | ) | | $ | 34,599,659 | | | $ | (3,756,545 | ) | | $ | 19,134,913 | | | $ | 32,187,446 | | | $ | (5,364,887 | ) | | $ | (2,137,720 | ) | | $ | 1,022,416 | | | $ | (4,303,954 | ) |
Adjustments to reconcile net increase (decrease) in members’ equity resulting from operations to net cash provided by (used in) operating activities: | | | | | | | | | | | | | | | | | | | | | | | | | | | | | | | | | | | | |
Decrease (increase) in receivable from futures commission merchants | | | 7,444,351 | | | | (24,146,125 | ) | | | 1,298,277 | | | | 40,037 | | | | 3,043,036 | | | | (6,710,543 | ) | | | 678,454 | | | | (188,973 | ) | | | 181,446 | |
Decrease (increase) in open trade equity, at fair value | | | 6,837,409 | | | | (4,596,691 | ) | | | 20,744,056 | | | | 2,325,050 | | | | (5,830,482 | ) | | | 1,630,866 | | | | 27,098 | | | | (7,634 | ) | | | (6,654 | ) |
Net realized (gain) loss on swap contracts | | | (6,689,123 | ) | | | — | | | | — | | | | — | | | | — | | | | — | | | | 8,301,000 | | | | — | | | | — | |
(Purchases) of swap contracts | | | — | | | | — | | | | — | | | | — | | | | — | | | | — | | | | — | | | | — | | | | — | |
Sales of swap contracts | | | 19,961,528 | | | | — | | | | — | | | | — | | | | — | | | | — | | | | 3,699,000 | | | | — | | | | — | |
Net unrealized (gain) loss on option/swap contracts | | | 18,832,300 | | | | (8,790,927 | ) | | | 12,051,821 | | | | — | | | | — | | | | — | | | | (6,331,232 | ) | | | (675,809 | ) | | | 4,129,162 | |
| | | | | | | | | | | | | | | | | | | | | | | | | | | | | | | | | | | | |
Net cash provided by (used in) operating activities | | | 10,554,983 | | | | (2,934,084 | ) | | | 30,337,609 | | | | 21,500,000 | | | | 29,400,000 | | | | (10,444,564 | ) | | | 4,236,600 | | | | 150,000 | | | | — | |
Cash Flows from Financing Activities | | | | | | | | | | | | | | | | | | | | | | | | | | | | | | | | | | | | |
Capital Contributed | | | 167,775,000 | | | | 93,655,000 | | | | 27,700,000 | | | | 9,800,000 | | | | 15,900,000 | | | | 31,050,000 | | | | 2,064,017 | | | | 250,000 | | | | — | |
Capital Distributed | | | (178,329,983 | ) | | | (90,720,916 | ) | | | (58,037,609 | ) | | | (31,300,000 | ) | | | (45,300,000 | ) | | | (20,605,436 | ) | | | (6,300,618 | ) | | | (400,000 | ) | | | — | |
| | | | | | | | | | | | | | | | | | | | | | | | | | | | | | | | | | | | |
Net cash provided by (used in) financing activities | | | (10,554,983 | ) | | | 2,934,084 | | | | (30,337,609 | ) | | | (21,500,000 | ) | | | (29,400,000 | ) | | | 10,444,564 | | | | (4,236,000 | ) | | | (150,000 | ) | | | — | |
| | | | | | | | | | | | | | | | | | | | | | | | | | | | | | | | | | | | |
Net change in cash and cash equivalents | | | — | | | | — | | | | — | | | | — | | | | — | | | | — | | | | — | | | | — | | | | — | |
Cash and cash equivalents, beginning of period | | | — | | | | — | | | | — | | | | — | | | | — | | | | — | | | | — | | | | — | | | | — | |
| | | | | | | | | | | | | | | | | | | | | | | | | | | | | | | | | | | | |
Cash and cash equivalents, end of period | | $ | — | | | $ | — | | | $ | — | | | $ | — | | | $ | — | | | $ | — | | | $ | — | | | $ | — | | | $ | — | |
| | | | | | | | | | | | | | | | | | | | | | | | | | | | | | | | | | | | |
| | | | | | | | | | | | | | | | | | | | | | | | | | | | | | | | | | | | |
| | | Frontier Trading | | | Frontier Trading | | | Frontier Trading | |
| | | Company V LLC | | | Company VI LLC | | | Company VII, LLC | |
| | | 2011 | | | 2010 | | | 2009 | | | 2011 | | | 2010 | | | 2009 | | | 2011 | | | 2010 | | | 2009 | |
Cash Flows from Operating Activities | | | | | | | | | | | | | | | | | | | | | | | | | | | | | | | | | | | | |
Net increase (decrease) in members’ equity resulting from operations | | $ | 10,259,463 | | | $ | 5,496,166 | | | $ | 4,721,757 | | | $ | 549,352 | | | $ | 4,486,670 | | | $ | (1,154,368 | ) | | $ | 63,371,507 | | | $ | 39,952,614 | | | $ | 28,924,051 | |
Adjustments to reconcile net increase (decrease) in members’ equity resulting from operations to net cash provided by (used in) operating activities: | | | | | | | | | | | | | | | | | | | | | | | | | | | | | | | | | | | | |
Decrease (increase) in receivable from futures commission merchants | | | (8,329,418 | ) | | | 1,920,783 | | | | (7,788,582 | ) | | | 7,683,483 | | | | 5,118,235 | | | | (6,530,366 | ) | | | 36,001,692 | | | | (60,042,001 | ) | | | (25,290,205 | ) |
Decrease (increase) in open trade equity, at fair value | | | (11,119 | ) | | | (616,949 | ) | | | (921,715 | ) | | | 537,670 | | | | (1,304,905 | ) | | | 877,115 | | | | 10,326,801 | | | | 15,089,387 | | | | 11,272,253 | |
Net realized (gain) loss on swap contracts | | | — | | | | — | | | | — | | | | — | | | | — | | | | — | | | | — | | | | — | | | | — | |
(Purchases) of swap contracts | | | — | | | | — | | | | — | | | | — | | | | — | | | | — | | | | — | | | | — | | | | — | |
Sales of swap contracts | | | — | | | | — | | | | — | | | | — | | | | — | | | | — | | | | — | | | | — | | | | — | |
| | | | | | | | | | | | | | | | | | | | | | | | | | | | | | | | | | | | |
Net cash provided by (used in) operating activities | | | 18,600,000 | | | | 6,800,000 | | | | (3,988,540 | ) | | | 8,770,505 | | | | 8,300,000 | | | | (6,807,619 | ) | | | 109,701,000 | | | | (5,000,000 | ) | | | 14,906,099 | |
Cash Flows from Financing Activities | | | | | | | | | | | | | | | | | | | | | | | | | | | | | | | | | | | | |
Capital Contributed | | | 29,400,000 | | | | 7,700,000 | | | | 18,100,000 | | | | — | | | | 6,200,000 | | | | 16,900,000 | | | | 68,341,000 | | | | 92,000,000 | | | | 71,700,000 | |
Capital Distributed | | | (10,800,000 | ) | | | (14,500,000 | ) | | | (14,111,460 | ) | | | (8,770,505 | ) | | | (14,500,000 | ) | | | (10,092,381 | ) | | | (178,041,000 | ) | | | (87,000,000 | ) | | | (86,606,099 | ) |
| | | | | | | | | | | | | | | | | | | | | | | | | | | | | | | | | | | | |
Net cash provided by (used in) financing activities | | | 18,600,000 | | | | (6,800,000 | ) | | | 3,988,540 | | | | (8,770,505 | ) | | | (8,300,000 | ) | | | 6,807,619 | | | | 109,700,000 | | | | 5,000,000 | | | | (14,906,099 | ) |
| | | | | | | | | | | | | | | | | | | | | | | | | | | | | | | | | | | | |
Net change in cash and cash equivalents | | | — | | | | — | | | | — | | | | — | | | | — | | | | — | | | | — | | | | — | | | | — | |
Cash and cash equivalents, beginning of period | | | — | | | | — | | | | — | | | | — | | | | — | | | | — | | | | — | | | | — | | | | — | |
| | | | | | | | | | | | | | | | | | | | | | | | | | | | | | | | | | | | |
Cash and cash equivalents, end of period | | $ | — | | | $ | — | | | $ | — | | | $ | — | | | $ | — | | | $ | — | | | $ | — | | | $ | — | | | $ | — | |
| | | | | | | | | | | | | | | | | | | | | | | | | | | | | | | | | | | | |
| | | | | | | | | | | | | | | | | | | | | | | | | | | | | | | | | | | | |
| | | Frontier Trading | | | Frontier Trading | | | Frontier Trading | |
| | | Company VIII, LLC | | | Company IX, LLC | | | Company X, LLC (1) | |
| | | 2011 | | | 2010 | | | 2009 | | | 2011 | | | 2010 | | | 2009 | | | 2011 | | | 2010 | | | 2009 | |
Cash Flows from Operating Activities | | | | | | | | | | | | | | | | | | | | | | | | | | | | | | | | | | | | |
Net increase (decrease) in members’ equity resulting from operations | | $ | (49,680 | ) | | $ | 509,282 | | | $ | 884,753 | | | $ | (2,879,139 | ) | | $ | 2,397,691 | | | $ | (1,240,369 | ) | | $ | (4,311,208 | ) | | $ | 416,157 | | | $ | (1,707,778 | ) |
Adjustments to reconcile net increase (decrease) in members’ equity resulting from operations to net cash provided by (used in) operating activities: | | | | | | | | | | | | | | | | | | | | | | | | | | | | | | | | | | | | |
Decrease (increase) in receivable from futures commission merchants | | | — | | | | — | | | | — | | | | (427,142 | ) | | | (3,204,875 | ) | | | 659,330 | | | | — | | | | — | | | | — | |
Decrease (increase) in open trade equity, at fair value | | | — | | | | — | | | | — | | | | 1,086,281 | | | | (1,492,816 | ) | | | 165,185 | | | | — | | | | — | | | | — | |
Net realized (gain) loss on swap contracts | | | 49,660 | | | | (509,662 | ) | | | (883,900 | ) | | | — | | | | — | | | | — | | | | 5,602,827 | | | | — | | | | — | |
(Purchases) of swap contracts | | | | | | | (1,194,395 | ) | | | (1,850,007 | ) | | | — | | | | — | | | | — | | | | | | | | (2,500,000 | ) | | | (10,279,667 | ) |
Sales of swap contracts | | | 741,135 | | | | 1,498,032 | | | | 2,985,691 | | | | — | | | | — | | | | — | | | | 7,096,697 | | | | 58,891 | | | | 21,250 | |
Net unrealized (gain) loss on option/swap contracts | | | — | | | | — | | | | — | | | | — | | | | — | | | | — | | | | (1,291,619 | ) | | | (416,157 | ) | | | 1,707,778 | |
| | | | | | | | | | | | | | | | | | | | | | | | | | | | | | | | | | | | |
Net cash provided by (used in) operating activities | | | 741,115 | | | | 303,257 | | | | 1,136,537 | | | | (2,220,000 | ) | | | (2,300,000 | ) | | | (415,854 | ) | | | 7,096,697 | | | | (2,441,109 | ) | | | (10,258,417 | ) |
Cash Flows from Financing Activities | | | | | | | | | | | | | | | | | | | | | | | | | | | | | | | | | | | | |
Capital Contributed | | | 896,087 | | | | 1,194,774 | | | | 1,849,628 | | | | 7,532,417 | | | | 5,400,000 | | | | 900,000 | | | | — | | | | 2,500,000 | | | | 10,279,667 | |
Capital Distributed | | | (1,637,202 | ) | | | (1,498,031 | ) | | | (2,986,165 | ) | | | (5,312,417 | ) | | | (3,100,000 | ) | | | (484,146 | ) | | | (7,096,697 | ) | | | (58,891 | ) | | | (21,250 | ) |
| | | | | | | | | | | | | | | | | | | | | | | | | | | | | | | | | | | | |
Net cash provided by (used in) financing activities | | | (741,115 | ) | | | (303,257 | ) | | | (1,136,537 | ) | | | 2,220,000 | | | | 2,300,000 | | | | 415,854 | | | | (7,096,697 | ) | | | 2,441,109 | | | | 10,258,417 | |
| | | | | | | | | | | | | | | | | | | | | | | | | | | | | | | | | | | | |
Net change in cash and cash equivalents | | | — | | | | — | | | | — | | | | — | | | | — | | | | — | | | | — | | | | — | | | | — | |
Cash and cash equivalents, beginning of period | | | — | | | | — | | | | — | | | | — | | | | — | | | | — | | | | — | | | | — | | | | — | |
| | | | | | | | | | | | | | | | | | | | | | | | | | | | | | | | | | | | |
Cash and cash equivalents, end of period | | $ | — | | | $ | — | | | $ | — | | | $ | — | | | $ | — | | | $ | — | | | $ | — | | | $ | — | | | $ | — | |
| | | | | | | | | | | | | | | | | | | | | | | | | | | | | | | | | | | | |
| (1) | Trading Companies X, XI, XII, XIV and XV commenced trading operations in June 2009. |
The accompanying notes are an integral part of these financial statements.
F-100
The Trading Companies of the Frontier Fund
Statements of Cash Flows
December 31, 2011, 2010 and 2009
| | | | | | | | | | | | | | | | | | | | | | | | | | | | | | | | | | | | |
| | | Frontier Trading
Company XI, LLC (1) | | | Frontier Trading
Company XII, LLC (1) | | | Frontier Trading
Company XIV, LLC (1) | |
| | | 2011 | | | 2010 | | | 2009 | | | 2011 | | | 2010 | | | 2009 | | | 2011 | | | 2010 | | | 2009 | |
Cash Flows from Operating Activities | | | | | | | | | | | | | | | | | | | | | | | | | | | | | | | | | | | | |
Net increase (decrease) in members’ equity resulting from operations | | $ | 459,765 | | | $ | 3,474,611 | | | $ | (1,864,032 | ) | | $ | (3,014,256 | ) | | $ | 929,503 | | | $ | (2,247,497 | ) | | $ | 11,956,773 | | | $ | 2,246,881 | | | $ | (100,321 | ) |
Adjustments to reconcile net increase (decrease) in members’ equity resulting from operations to net cash provided by (used in) operating activities: | | | | | | | | | | | | | | | | | | | | | | | | | | | | | | | | | | | | |
Decrease (increase) in receivable from futures commission merchants | | | — | | | | — | | | | — | | | | — | | | | — | | | | — | | | | 11,580,433 | | | | (12,020,504 | ) | | | (11,720,152 | ) |
Decrease (increase) in open trade equity, at fair value | | | — | | | | — | | | | — | | | | — | | | | — | | | | — | | | | 562,794 | | | | (323,845 | ) | | | — | |
Net realized (gain) loss on swap contracts | | | (2,070,346 | ) | | | — | | | | — | | | | 4,332,249 | | | | — | | | | — | | | | — | | | | — | | | | — | |
(Purchases) of swap contracts | | | | | | | (14,489,668 | ) | | | (18,060,709 | ) | | | — | | | | — | | | | (12,274,750 | ) | | | — | | | | — | | | | — | |
Sales of swap contracts | | | 26,702,011 | | | | 7,694,190 | | | | 224,520 | | | | 7,942,500 | | | | — | | | | — | | | | — | | | | — | | | | — | |
Net unrealized (gain) loss on option/swap contracts | | | 1,610,580 | | | | (3,474,611 | ) | | | 1,864,032 | | | | (1,317,993 | ) | | | (929,503 | ) | | | 2,247,497 | | | | — | | | | — | | | | — | |
Increase (decrease) in CTA fees payable | | | — | | | | — | | | | — | | | | — | | | | — | | | | — | | | | — | | | | (2,498,825 | ) | | | 2,498,825 | |
| | | | | | | | | | | | | | | | | | | | | | | | | | | | | | | | | | | | |
Net cash provided by (used in) operating activities | | | 26,702,011 | | | | (6,795,478 | ) | | | (17,836,189 | ) | | | 7,942,500 | | | | — | | | | (12,274,750 | ) | | | 24,100,000 | | | | (12,596,293 | ) | | | (9,321,648 | ) |
Cash Flows from Financing Activities | | | | | | | | | | | | | | | | | | | | | | | | | | | | | | | | | | | | |
Capital Contributed | | | 124,293 | | | | 14,489,668 | | | | 18,060,709 | | | | 10,123,315 | | | | — | | | | 12,500,000 | | | | 59,500,000 | | | | 12,600,000 | | | | 9,321,648 | |
| | | | | | | | | | | | | | | | | | | | | | | | | | | | | | | | | | | | |
Capital Distributed | | | (26,826,305 | ) | | | (7,694,190 | ) | | | (224,520 | ) | | | (18,065,815 | ) | | | — | | | | (225,250 | ) | | | (83,600,000 | ) | | | (3,707 | ) | | | — | |
| | | | | | | | | | | | | | | | | | | | | | | | | | | | | | | | | | | | |
Net cash provided by (used in) financing activities | | | (26,702,011 | ) | | | 6,795,478 | | | | 17,836,189 | | | | (7,942,500 | ) | | | — | | | | 12,274,750 | | | | (24,100,000 | ) | | | 12,596,293 | | | | 9,321,648 | |
| | | | | | | | | | | | | | | | | | | | | | | | | | | | | | | | | | | | |
Net change in cash and cash equivalents | | | — | | | | — | | | | — | | | | — | | | | — | | | | — | | | | — | | | | — | | | | — | |
Cash and cash equivalents, beginning of period | | | — | | | | — | | | | — | | | | — | | | | — | | | | — | | | | — | | | | — | | | | — | |
| | | | | | | | | | | | | | | | | | | | | | | | | | | | | | | | | | | | |
Cash and cash equivalents, end of period | | $ | — | | | $ | — | | | $ | — | | | $ | — | | | $ | — | | | $ | — | | | $ | — | | | $ | — | | | $ | — | |
| | | | | | | | | | | | | | | | | | | | | | | | | | | | | | | | | | | | |
| | | | | | | | | | | | | | | | | | | | | | | | | | | | | | | | | | | | |
| | | Frontier Trading
Company XV, LLC (1) | | | Frontier Trading
Company XVII, LLC (2) | | | Frontier Trading
Company XVIII, LLC (2) | |
| | | 2011 | | | 2010 | | | 2009 | | | 2011 | | | 2010 | | | 2009 | | | 2011 | | | 2010 | | | 2009 | |
Cash Flows from Operating Activities | | | | | | | | | | | | | | | | | | | | | | | | | | | | | | | | | | | | |
Net increase (decrease) in members’ equity resulting from operations | | $ | (1,897,455 | ) | | $ | 15,005,695 | | | $ | (542,820 | ) | | $ | (368,228 | ) | | $ | — | | | $ | — | | | $ | (2,293,721 | ) | | $ | — | | | $ | — | |
Adjustments to reconcile net increase (decrease) in members’ equity resulting from operations to net cash provided by operating activities: | | | | | | | | | | | | | | | | | | | | | | | | | | | | | | | | | | | | |
Decrease (increase) in receivable from commodities future merchant | | | 14,939,452 | | | | (9,147,153 | ) | | | (12,425,289 | ) | | | — | | | | — | | | | — | | | | (6,810,086 | ) | | | — | | | | — | |
Decrease (increase) in open trade equity | | | 8,208,003 | | | | (5,958,542 | ) | | | (11,374,083 | ) | | | — | | | | — | | | | — | | | | (596,193 | ) | | | — | | | | — | |
(Purchases) of swap contracts | | | — | | | | — | | | | — | | | | (6,250,000 | ) | | | — | | | | — | | | | — | | | | — | | | | — | |
Sales of swap contracts | | | — | | | | — | | | | — | | | | — | | | | — | | | | — | | | | — | | | | — | | | | — | |
Net unrealized (gain) loss on option/swap contracts | | | — | | | | — | | | | — | | | | 368,228 | | | | — | | | | — | | | | — | | | | — | | | | — | |
| | | | | | | | | | | | | | | | | | | | | | | | | | | | | | | | | | | | |
Net cash provided by (used in) operating activities | | | 21,250,000 | | | | (100,000 | ) | | | (24,342,192 | ) | | | (6,250,000 | ) | | | — | | | | — | | | | (9,700,000 | ) | | | — | | | | — | |
Cash Flows from Financing Activities | | | | | | | | | | | | | | | | | | | | | | | | | | | | | | | | | | | | |
Capital Contributed | | | 37,750,000 | | | | 100,000 | | | | 26,742,192 | | | | 6,250,000 | | | | — | | | | — | | | | 9,700,000 | | | | — | | | | — | |
Capital Distributed | | | (59,000,000 | ) | | | — | | | | (2,400,000 | ) | | | — | | | | — | | | | — | | | | — | | | | — | | | | — | |
| | | | | | | | | | | | | | | | | | | | | | | | | | | | | | | | | | | | |
Net cash provided by (used in) financing activities | | | (21,250,000 | ) | | | 100,000 | | | | 24,342,192 | | | | 6,250,000 | | | | — | | | | — | | | | 9,700,000 | | | | — | | | | — | |
| | | | | | | | | | | | | | | | | | | | | | | | | | | | | | | | | | | | |
Net change in cash and cash equivalents | | | — | | | | — | | | | — | | | | — | | | | — | | | | — | | | | — | | | | — | | | | — | |
Cash and cash equivalents, beginning of period | | | — | | | | — | | | | — | | | | — | | | | — | | | | — | | | | — | | | | — | | | | — | |
| | | | | | | | | | | | | | | | | | | | | | | | | | | | | | | | | | | | |
Cash and cash equivalents, end of period | | $ | — | | | $ | — | | | $ | — | | | $ | — | | | $ | — | | | $ | — | | | $ | — | | | $ | — | | | $ | — | |
| | | | | | | | | | | | | | | | | | | | | | | | | | | | | | | | | | | | |
| | | | | | | | | | | | | | | | | | | | | | | | | | | | | | | | | | | | |
| | | Frontier Trading | | | | | | | | | | | | | | | | | | | |
| | | Company XXI, LLC (2) | | | | | | | | | | | | | | | | | | | |
| | | 2011 | | | 2010 | | | 2009 | | | | | | | | | | | | | | | | | | | |
Cash Flows from Operating Activities | | | | | | | | | | | | | | | | | | | | | | | | | | | | | | | | | | | | |
Net increase (decrease) in members’ equity resulting from operations | | $ | (2,799,807 | ) | | $ | — | | | $ | — | | | | | | | | | | | | | | | | | | | | | | | | | |
Adjustments to reconcile net increase (decrease) in members’ equity resulting
from operations to net cash provided by operating activities: | | | | | | | | | | | | | | | | | | | | | | | | | | | | | | | | | | | | |
Decrease (increase) in receivable from commodities future merchant | | | (5,107,786 | ) | | | — | | | | — | | | | | | | | | | | | | | | | | | | | | | | | | |
Decrease (increase) in open trade equity | | | (792,372 | ) | | | — | | | | — | | | | | | | | | | | | | | | | | | | | | | | | | |
Net unrealized (gain) loss on option/swap contracts | | | — | | | | — | | | | — | | | | | | | | | | | | | | | | | | | | | | | | | |
| | | | | | | | | | | | | | | | | | | | | | | | | | | | | | | | | | | | |
Net cash provided by (used in) operating activities | | | (8,699,965 | ) | | | — | | | | — | | | | | | | | | | | | | | | | | | | | | | | | | |
Cash Flows from Financing Activities | | | | | | | | | | | | | | | | | | | | | | | | | | | | | | | | | | | | |
Capital Contributed | | | 11,500,000 | | | | — | | | | — | | | | | | | | | | | | | | | | | | | | | | | | | |
Capital Distributed | | | (2,800,035 | ) | | | — | | | | — | | | | | | | | | | | | | | | | | | | | | | | | | |
| | | | | | | | | | | | | | | | | | | | | | | | | | | | | | | | | | | | |
Net cash provided by (used in) financing activities | | | 8,699,965 | | | | — | | | | — | | | | | | | | | | | | | | | | | | | | | | | | | |
| | | | | | | | | | | | | | | | | | | | | | | | | | | | | | | | | | | | |
Net change in cash and cash equivalents | | | — | | | | — | | | | — | | | | | | | | | | | | | | | | | | | | | | | | | |
Cash and cash equivalents, beginning of period | | | — | | | | — | | | | — | | | | | | | | | | | | | | | | | | | | | | | | | |
| | | | | | | | | | | | | | | | | | | | | | | | | | | | | | | | | | | | |
Cash and cash equivalents, end of period | | $ | — | | | $ | — | | | $ | — | | | | | | | | | | | | | | | | | | | | | | | | | |
| | | | | | | | | | | | | | | | | | | | | | | | | | | | | | | | | | | | |
| (1) | Trading Companies X, XI, XII, XIV and XV commenced trading operations in June 2009. |
| (2) | Trading Companies XVII, XVIII and XXI commenced trading operations in July, October and March 2011, respectively. |
The accompanying notes are an integral part of these financial statements.
F-101
The Trading Companies of the Frontier Fund
Notes to Financial Statements
1. Organization and Purpose
These financial statements and related notes pertain to the following companies: Frontier Trading Company I LLC, Frontier Trading Company II LLC, Frontier Trading Company III LLC, Frontier Trading Company V LLC, Frontier Trading Company VI LLC, Frontier Trading Company VII, LLC, Frontier Trading Company VIII, LLC, Frontier Trading Company IX, LLC, Frontier Trading Company X, LLC, Frontier Trading Company XI, LLC, Frontier Trading Company XII, LLC, Frontier Trading Company XIV, LLC, Frontier Trading Company XV, LLC, Frontier Trading Company XVII, LLC, Frontier Trading Company XVIII, LLC, and Frontier Trading Company XXI, LLC (the “Trading Companies”).
The Frontier Fund (the “Trust”), was formed as a Delaware statutory trust on August 8, 2003, with separate Series of Units (the “Series”). Its term will expire on December 31, 2053 (unless terminated earlier in certain circumstances). The Trust is a multi-advisor commodity pool as described in Commodity Futures Trading Commission, or CFTC Regulation § 4.10(d)(2).
All capital of the Trading Companies is provided by the Series and there are no other investors in the Trading Companies.
Each Trading Company authorizes certain Trading Advisors to place trades and manage assets at pre-determined investment levels. The Trading Companies were organized for the purpose of investing in securities and derivative instruments, and have no operating income or expenses, except for trading income and expenses.
Trading Companies engage in the speculative trading of a diversified portfolio of futures, forward (including interbank foreign currencies) and options contracts and other derivative instruments and may, from time to time, engage in cash and spot transactions. A brief description of the Trust’s main types of investments is set forth below:
| | • | | A futures contract is a standardized contract traded on an exchange that calls for the future delivery of a specified quantity of a commodity at a specified time and place. |
| | • | | A forward contract is an individually negotiated contract between principals, not traded on an exchange, to buy or sell a specified quantity of a commodity at or before a specified date at a specified price. |
| | • | | An option on a futures contract, forward contract or a commodity gives the buyer of the option the right, but not the obligation, to buy or sell a futures contract, forward contract or a commodity, as applicable, at a specified price on or before a specified date. Options on futures contracts are standardized contracts traded on an exchange, while options on forward contracts and commodities, referred to collectively as over-the-counter options, generally are individually negotiated, principal-to-principal contracts not traded on an exchange. |
| | • | | A swap contract generally involves an exchange of a stream of payments between the contracting parties. Swap contracts generally are not uniform and not exchange-traded. |
2. Significant Accounting Policies
The following are the significant accounting policies of the Trading Companies.
Basis of Presentation—The Trading Companies follow Generally Accepted Accounting Principles (“GAAP”), as established by the Financial Accounting Standards Board (the “FASB”), to ensure consistent reporting of financial condition, schedules of investments, results of operations, changes in capital and cash flows.
Cash held at Futures Commission Merchants—the Trading Companies deposit assets with a FCM subject to CFTC Commission regulations and various exchange and FCM requirements. Margin requirements are satisfied by the deposit of cash with such FCM. The Trading Companies earn interest income on its assets deposited with the FCM.
Use of Estimates—The preparation of financial statements in conformity with GAAP may require the management of the Trading Companies to make estimates and assumptions that affect the reported amounts of assets and liabilities and disclosure of contingent assets and liabilities at the date of the financial statements and the reported amounts of revenue and expenses during the reporting period. The valuation of swap contracts requires significant estimates as well as the valuation of certain other investments. Please refer to Note 3 for discussion of valuation methodology.
Revenue recognition—Futures, options on futures, and forward contracts are recorded on a trade date basis and realized gains or losses are recognized when contracts are liquidated. Unrealized gains or losses on open contracts (the difference between contract trade price
F-102
and market price) are reported in the Statement of Operations as a Net change in open trade equity, as there exists a right of offset of unrealized gains or losses in accordance with ASC 210. Any change in net unrealized gain or loss from the preceding period is reported in the Statements of Operations. Market value of exchange-traded contracts is based upon exchange settlement prices. Market value of non-exchange-traded contracts is based on third party quoted dealer values on the interbank market.
Foreign Currency Transactions—The Trading Companies functional currency is the U.S. Dollar, however, it transacts business in currencies other than the U.S. Dollar. Assets and liabilities denominated in currencies other than the U.S. Dollar are translated into U.S. Dollars at the rates in effect at the date of the statement of financial condition. Income and expense items denominated in currencies other than the U.S. Dollar are translated into U.S. Dollars at the rates in effect during the period. Gains and losses resulting from the translation to U.S. Dollars are reported in income currently.
Investments and Swaps— The Trading Companies record investment transactions on a trade date basis and all investments are recorded at fair value in its financial statements, with changes in fair value reported as a component of realized and unrealized gains/(losses) on investments in the statements of operations. Certain Trading Companies strategically invest a portion or all of their assets in total return Swaps, selected at the direction of management. Swaps are privately negotiated contracts designed to provide investment returns linked to those produced by one or more investment products or indices. In a typical Swap, two parties agree to exchange the returns (or differentials in rates of return) earned or realized on one or more particular predetermined investments or instruments. The gross returns to be exchanged or “swapped” between the parties are calculated with respect to a “notional amount” (i.e., the amount of value of the underlying asset used in computing the particular interest rate, return, or other amount to be exchanged) in a particular investment, or in a “basket” of securities. The valuation of swap contracts require significant estimates. Swap contracts utilizing Level 2 inputs are reported at fair value based on daily reports from the swap counterparty that may be corroborated against independent valuation/rate of return information published and available on a daily recurring frequency. Other swap contracts are reported utilizing Level 3 Inputs. During the fourth quarter of 2010, these swap contracts are reported at fair value based upon daily valuations provided by a third party pricing service and corroborated by weekly counterparty settlement values. The third party pricing service utilizes a Black Scholes pricing model with input adjustments factoring in volatility and liquidity of the instruments. These swap contracts were previously reported at fair value based upon returns/values that were provided on less than a daily frequency from the swap counterparty, requiring additional internal financial modeling to develop pricing. All valuation processes are monitored by the valuation committee of management.
Income Taxes—The Trading Companies apply the provisions of ASC 740Income Taxes(“ASC 740”), which provides guidance for how uncertain tax positions should be recognized, measured, presented and disclosed in the financial statements. This interpretation also provides guidance on derecognition, classification, interest and penalties, accounting in interim periods and disclosure. ASC 740 requires the evaluation of tax positions taken or expected to be taken in the course of preparing the Trading Companies’ financial statements to determine whether the tax positions are “more-likely-than-not” of being sustained by the applicable tax authority. Tax positions with respect to tax at the Trading Company level not deemed to meet the “more-likely-than-not” threshold would be recorded as a tax benefit or expense in the current year. Management has concluded there is no tax expense, interest or penalties to be recorded by the Trading Companies for the periods ended December 31, 2011 and December 31, 2010. The 2008 through 2011 tax years generally remain subject to examination by U.S. federal and most state tax authorities.
Fees and Expenses—The Trading Companies incur no expenses other than trading commissions resulting from normal trading activity. All operating expenses such as legal, accounting, etc. are paid for, without reimbursement, by Equinox Fund Management, LLC, the managing owner of the Trust.
Recently Adopted Accounting Pronouncements—In January 2010, FASB issued Accounting Standards update No. 2010-06 (“ASU 2010-06”) for improving disclosure about fair value measurements. ASU 2010-06 adds new disclosure requirements about transfers into and out of Levels 1 and 2 and separate disclosures about purchases, sales, issuances and settlements in the reconciliation for fair value measurements using significant unobservable inputs (Level 3). It also clarifies existing disclosure requirements relating to the levels of disaggregation for fair value measurement and inputs and valuation techniques used to measure fair value. The amended guidance is effective for financial statements for fiscal years and interim periods beginning after December 15, 2009 except for disclosures about purchases, sales, issuances and settlements in the roll forward of activity in Level 3 fair value measurements, which are effective for fiscal years beginning after December 15, 2010 and for interim periods within those fiscal years. As this update is disclosure related, adoption of ASU 2010-06 on January 1, 2011 did not have a material impact on the Trading Company’s statements of financial condition, results of operations or cash flows.
Recently Issued Accounting Pronouncements—In May 2011, the FASB issued ASU No. 2011-04 which provides guidance pertaining to fair value measurement that included a common definition of fair value and information to assist reporting entities to measure and disclose fair value with regards to U.S. GAAP and International Financial Reporting Standards (“IFRS”) convergence issues. This guidance becomes effective for interim and annual periods beginning on or after December 15, 2011, with early adoption prohibited. We are currently evaluating the impact that this accounting guidance may have on the Trading Company’s statements of financial condition, results of operations or cash flows.
F-103
In November of 2011, FASB issued new guidance that requires an entity to disclose information about offsetting and related arrangements to enable users of its financial statements to understand the effect of those arrangements on its financial position. This guidance is effective for annual and interim periods beginning on or after January, 1, 2013. An entity should provide the disclosures required by those amendments retrospectively for all comparative periods presented. Our effective date is January 1, 2013. The adoption of this guidance is not expected to have a material impact on the financial positions or results of operations.
Reclassification—Certain amounts in the 2010 and 2009 financial statements have been reclassified to conform with the 2010 presentation. None of the reclasses had an impact on the NAV of the Trading Companies.
Subsequent Events—The Trading Companies follow the provisions of FASB ASC 855,Subsequent Events, which establishes general standards of accounting for and disclosure of events that occur after the balance sheet date but before financial statements are issued. Refer to Note 9.
3. Fair Value Measurements
In connection with the valuation of investments, the Trading Companies apply ASC 820. ASC 820 provides clarification that when a quoted price in an active market for the identical asset or liability is not available, a reporting entity is required to measure fair value using certain techniques. ASC 820 also clarifies that when estimating the fair value of an asset or liability, a reporting entity is not required to include a separate input or adjustment to other inputs relating to the existence of a restriction that prevents the transfer of an asset or liability. ASC 820 also clarifies that both a quoted price in an active market for the identical asset or liability at the measurement date and the quoted price for the identical asset or liability when traded as an asset or liability in an active market when no adjustments to the quoted price of the asset are required are Level 1 fair value measurements.
Level 1 Inputs
Unadjusted quoted prices in active markets for identical financial assets that the reporting entity has the ability to access at the measurement date.
Level 2 Inputs
Inputs other than quoted prices included in Level 1 that are observable for the financial asset or liabilities, either directly or indirectly. These might include quoted prices for similar financial assets in active markets, quoted prices for identical or similar financial assets in markets that are not active, inputs other than quoted prices that are observable for the financial asset or inputs that are derived principally from or corroborated by market data by correlation or other means.
Level 3 Inputs
Unobservable inputs for determining the fair value of financial assets that reflect an entity’s own assumptions about the assumptions that market participants would use in pricing the financial asset.
The Trading Companies uses the following methodologies to value instruments within its financial asset portfolio at fair value:
Trading Securities.These instruments include U.S. Treasury Securities and Open Trade Equity Positions (Futures Contracts, Currency Forwards and Options) that are actively traded on public markets with quoted pricing for corroboration. U.S. Treasury Securities, Futures Contracts, and Currency Forward are reported at fair value using Level 1 inputs. Trading Securities instruments further include Open Trade Equity that are quoted prices for identical or similar assets that are not traded on active markets. Trading Options are reported at fair value using Level 2 inputs from similar financial data in an active market.
Swap Contracts. Certain Swap Contracts are reported utilizing Level 2 inputs. These Swap Contracts are reported at fair value based on daily reports from the swap counterparty that may be corroborated against independent valuation/rate of return information published and available on a daily recurring frequency. Certain Trading Companies strategically invest a portion or all of their assets in total return Swaps, selected at the direction of management. Swaps are privately negotiated contracts designed to provide investment returns linked to those produced by one or more investment products or indices. In a typical Swap, two parties agree to exchange the returns (or differentials in rates of return) earned or realized on one or more particular predetermined investments or instruments. The gross returns to be exchanged or “swapped” between the parties are calculated with respect to a “notional amount” (i.e., the amount of value of the underlying asset used in computing the particular interest rate, return, or other amount to be exchanged) in a particular investment, or in a “basket” of securities. The valuation of swap contracts require significant estimates. Swap contracts utilizing Level 2 inputs are reported at fair value based on daily reports from the swap counterparty that may be corroborated against independent valuation/rate of return information published and available on a daily recurring frequency. Other Swap Contracts are reported utilizing Level 3 Inputs. During the fourth quarter of 2010, these Swap Contracts are reported at fair value based upon daily valuations provided by a third party pricing service and corroborated by weekly counterparty settlement values. The third party pricing service utilizes a Black Scholes pricing model with input adjustments factoring in volatility and liquidity of the instruments. These swap contracts were previously reported at fair value based upon returns/values that were provided on less than a daily frequency from the swap counterparty, requiring additional internal financial modeling to develop pricing.
F-104
The following table summarizes the instruments that comprise the Trading Companies financial asset portfolio measured at fair value on a recurring basis as of December 31, 2011 and 2010, segregated by the level of valuation inputs within the fair value hierarchy utilized to measure fair value:
| | | | | | | | | | | | | | | | |
December 31, 2011 | | Level 1 Inputs | | | Level 2 Inputs | | | Level 3 Inputs | | | Total
Fair Value | |
Frontier Trading Company I LLC | | | | | | | | | | | | | | | | |
Open Trade Equity | | $ | (260,922 | ) | | $ | 556,630 | | | $ | — | | | $ | 295,708 | |
Written Options | | | — | | | | (444,255 | ) | | | — | | | | (444,255 | ) |
Swap Contracts | | | — | | | | — | | | | 17,706,757 | | | | 17,706,757 | |
Frontier Trading Company II LLC | | | | | | | | | | | | | | | | |
Open Trade Equity | | $ | 4,038,448 | | | $ | 4,360 | | | $ | — | | | $ | 4,042,808 | |
Written Options | | | — | | | | (9,873 | ) | | | — | | | | (9,873 | ) |
Frontier Trading Company V LLC | | | | | | | | | | | | | | | | |
Open Trade Equity | | $ | 1,438,257 | | | $ | — | | | $ | — | | | $ | 1,438,257 | |
Frontier Trading Company VII, LLC | | | | | | | | | | | | | | | | |
Open Trade Equity | | $ | (25,934,678 | ) | | $ | — | | | $ | — | | | $ | (25,934,677 | ) |
Frontier Trading Company IX, LLC | | | | | | | | | | | | | | | | |
Open Trade Equity | | $ | 444,769 | | | $ | — | | | $ | — | | | $ | 444,769 | |
Frontier Trading Company XIV, LLC | | | | | | | | | | | | | | | | |
Open Trade Equity | | $ | (238,948 | ) | | $ | — | | | $ | — | | | $ | (238,948 | ) |
Frontier Trading Company XV, LLC | | | | | | | | | | | | | | | | |
Open Trade Equity | | $ | 634,671 | | | $ | 11,372,149 | | | $ | — | | | $ | 12,006,820 | |
Written Options | | | — | | | | (2,882,198 | ) | | | — | | | | (2,882,198 | ) |
Frontier Trading Company XVII, LLC | | | | | | | | | | | | | | | | |
Swap Contracts | | $ | — | | | $ | — | | | $ | 5,881,772 | | | $ | 5,881,772 | |
Frontier Trading Company XVIII, LLC | | | | | | | | | | | | | | | | |
Open Trade Equity | | $ | 596,193 | | | $ | — | | | $ | — | | | $ | 596,193 | |
Frontier Trading Company XXI, LLC | | | | | | | | | | | | | | | | |
Open Trade Equity | | $ | 792,372 | | | $ | — | | | $ | — | | | $ | 792,372 | |
F-105
| | | | | | | | | | | | | | | | |
December 31, 2010 | | Level 1 Inputs | | | Level 2 Inputs | | | Level 3 Inputs | | | Total
Fair Value | |
Frontier Trading Company I LLC | | | | | | | | | | | | | | | | |
Open Trade Equity | | $ | 6,100,175 | | | $ | 716,700 | | | $ | — | | | $ | 6,816,875 | |
Written Options | | | — | | | | (128,013 | ) | | | — | | | | (128,013 | ) |
Swap Contracts | | | — | | | | — | | | | 49,811,462 | | | | 49,811,462 | |
Frontier Trading Company II LLC | | | | | | | | | | | | | | | | |
Open Trade Equity | | | 6,363,791 | | | | 6,319 | | | | — | | | | 6,370,110 | |
Written Options | | | — | | | | (12,125 | ) | | | — | | | | (12,125 | ) |
Frontier Trading Company III LLC | | | | | | | | | | | | | | | | |
Open Trade Equity | | | 28,390 | | | | — | | | | — | | | | 28,390 | |
Written Options | | | — | | | | (1,292 | ) | | | — | | | | (1,292 | ) |
Swap Contracts | | | — | | | | — | | | | 5,668,768 | | | | 5,668,768 | |
Frontier Trading Company V LLC | | | | | | | | | | | | | | | | |
Open Trade Equity | | | 1,427,138 | | | | | | | | | | | | 1,427,138 | |
Frontier Trading Company VI LLC | | | | | | | | | | | | | | | | |
Open Trade Equity | | | 616,291 | | | | (22,321 | ) | | | — | | | | 593,970 | |
Written Options | | | — | | | | (56,300 | ) | | | — | | | | (56,300 | ) |
Frontier Trading Company VII, LLC | | | | | | | | | | | | | | | | |
Open Trade Equity | | | (16,876,380 | ) | | | 1,930,895 | | | | — | | | | (14,945,485 | ) |
Written Options | | | — | | | | (662,392 | ) | | | — | | | | (662,392 | ) |
Frontier Trading Company VIII, LLC | | | | | | | | | | | | | | | | |
Swap Contracts | | | — | | | | — | | | | 790,795 | | | | 790,795 | |
Frontier Trading Company IX, LLC | | | | | | | | | | | | | | | | |
Open Trade Equity | | | 1,531,050 | | | | — | | | | — | | | | 1,531,050 | |
Frontier Trading Company X, LLC | | | | | | | | | | | | | | | | |
Swap Contracts | | | — | | | | — | | | | 11,407,905 | | | | 11,407,905 | |
Frontier Trading Company XI, LLC | | | | | | | | | | | | | | | | |
Swap Contracts | | | — | | | | — | | | | 26,242,246 | | | | 26,242,246 | |
Frontier Trading Company XII, LLC | | | | | | | | | | | | | | | | |
Swap Contracts | | | — | | | | — | | | | 10,956,756 | | | | 10,956,756 | |
Frontier Trading Company XIII, LLC | | | | | | | | | | | | | | | | |
Open Trade Equity | | | — | | | | — | | | | — | | | | — | |
Frontier Trading Company XIV, LLC | | | | | | | | | | | | | | | | |
Open Trade Equity | | | 323,845 | | | | — | | | | — | | | | 323,845 | |
Frontier Trading Company XV, LLC | | | | | | | | | | | | | | | | |
Open Trade Equity | | | (6,523,511 | ) | | | 28,460,119 | | | | — | | | | 21,936,608 | |
Written Options | | | — | | | | (4,603,983 | ) | | | — | | | | (4,603,983 | ) |
F-106
The changes in Level 3 assets measured at fair value on a recurring basis are summarized in the following tables. Swap Contract asset gains and losses (realized/unrealized) included in earnings are classified in “net realized and unrealized gain/(loss) on investments—net realized and unrealized gain/(loss) on swap contracts” on the statements of operations. During the year ended December 31, 2011 and 2010, all identified level three assets are components of the Frontier Trading Company I, Frontier Trading Company III, Frontier Trading Company VIII, Frontier Trading Company X, Frontier Trading Company XI and Frontier Trading Company XII.
2011:
| | | | | | | | |
Swap Contracts | | Frontier Trading Company I LLC
For The Year Ending
December 31, 2011 | | | Frontier Trading Company XVII, LLC
For The Year Ending
December 31, 2011 | |
Balance of recurring Level 3 assets as of January 1, 2011 | | $ | 49,811,462 | | | $ | — | |
Total gains or losses (realized/unrealized): | | | | | | | | |
Included in earnings-realized | | | 6,689,123 | | | | 36,540 | |
Included in earnings-unrealized | | | (18,631,737 | ) | | | (404,768 | ) |
Purchases, sales, issuances, and settlements, net | | | (20,162,091 | ) | | | 6,250,000 | |
Transfers in and/or out of Level 3 | | | — | | | | — | |
| | | | | | | | |
Balance of recurring Level 3 assets as of December 31, 2011 | | $ | 17,706,757 | | | $ | 5,881,772 | |
| | | | | | | | |
2010:
| | | | | | | | | | | | |
Swap Contracts | | Frontier Trading Company I LLC
For The Year Ending
December 31, 2010 | | | Frontier Trading Company III LLC
For The Year Ending
December 31, 2010 | | | Frontier Trading Company VIII, LLC
For The Year Ending
December 31, 2010 | |
Balance of recurring Level 3 assets as of January 1, 2010 | | $ | 41,020,535 | | | $ | 4,992,959 | | | $ | 584,770 | |
Total gains or losses (realized/unrealized): | | | | | | | | | | | | |
Included in earnings-realized | | | — | | | | — | | | | 509,662 | |
Included in earnings-unrealized | | | 292,551 | | | | 729,826 | | | | — | |
Purchases, sales, issuances, and settlements, net | | | 8,498,376 | | | | (54,017 | ) | | | (303,637 | ) |
Transfers in and/or out of Level 3 | | | — | | | | — | | | | — | |
| | | | | | | | | | | | |
Balance of recurring Level 3 assets as of December 31, 2010 | | $ | 49,811,462 | | | $ | 5,668,768 | | | $ | 790,795 | |
| | | | | | | | | | | | |
| | | | | | | | | | | | |
Swap Contracts | | Frontier Trading Company X, LLC
For The Year Ending
December 31, 2010 | | | Frontier Trading Company XI, LLC
For The Year Ending
December 31, 2010 | | | Frontier Trading Company XII, LLC
For The Year Ending
December 31, 2010 | |
Balance of recurring Level 3 assets as of January 1, 2010 | | $ | 8,550,639 | | | $ | 15,972,157 | | | $ | 10,027,253 | |
Total gains or losses (realized/unrealized): | | | | | | | | | | | | |
Included in earnings-realized | | | — | | | | — | | | | — | |
Included in earnings-unrealized | | | 416,157 | | | | 3,474,611 | | | | 929,503 | |
Included in other comprehensive income | | | — | | | | — | | | | — | |
Purchases, sales, issuances, and settlements, net | | | 2,441,109 | | | | 6,795,478 | | | | — | |
Transfers in and/or out of Level 3 | | | — | | | | — | | | | — | |
| | | | | | | | | | | | |
Balance of recurring Level 3 assets as of December 31, 2010 | | $ | 11,407,905 | | | $ | 26,242,246 | | | $ | 10,956,756 | |
| | | | | | | | | | | | |
The Trading Companies assess the levels of the investments at each measurement date, and transfers between levels are recognized on the actual date of the event or change in circumstances that caused the transfer in accordance with the Trading Company’s accounting policy regarding the recognition of transfers between levels of the fair value hierarchy. There were no significant transfers among levels 1, 2, and 3 during the year.
F-107
4. Swaps
In addition to authorizing Trading Advisors to manage pre-determined investment levels of futures and forward contracts, certain Trading Companies of the Trust will strategically invest a portion or all of their assets in total return swaps, selected at the direction of management. Swaps are privately negotiated contracts designed to provide investment returns linked to those produced by one or more investment products or indices. In a typical swap, two parties agree to exchange the returns (or differentials in rates of return) earned or realized on one or more particular predetermined investments or instruments. The gross returns to be exchanged or “swapped” between the parties are calculated with respect to a “notional amount” (i.e., the amount or value of the underlying asset used in computing the particular interest rate, return, or other amount to be exchanged) in a particular investment, or in a “basket” of securities.
Each Trading Companies’ investment in swaps will likely differ substantially over time due to cash flows, portfolio management decisions and market movements. The Swaps serve to diversify the investment holdings of each Trading Company and to provide access to programs and advisors that would not be otherwise available to the Trading Companies, and are not used for hedging purposes.
Management follows a procedure in selecting well-established financial institutions which management, in its sole discretion, considers to be reputable, reliable, financially responsible and well established, to act as swap counterparties. The procedure includes due diligence review of documentation on all new and existing financial institution counterparties prior to initiation of relationship, and quarterly ongoing review during the relationship, to ensure that counterparties meet the managements’ minimum credit requirements, the counterparty average rating being no less than an investment grade rating as defined by the rating agencies.
The Trading Companies strategically invest assets in one or more swaps linked to certain underlying investments or indices, at the direction of management. The Trading Companies will not own any of the investments or indices referenced by any swap. In addition, the swap counterparty to the Trading Company is not a Trading Advisor to these Trading Companies.
F-108
The Trading Companies have invested in the following Swaps as of December 31, 2011.
| | | | | | | | |
| | | Option Basket
Frontier Trading
Company I, LLC | | | Option Basket
Frontier Trading
Company XVII, LLC | |
Counterparty | | | Company A | | | | Company B | |
Notional Amount | | $ | 14,129,540 | | | $ | 23,551,287 | |
Termination Date | | | 11/6/2012 | | | | 6/6/2014 | |
Investee Returns | | | Total Returns | | | | Total Returns | |
Realized Gain/(Loss) | | $ | 6,689,123 | | | $ | — | |
| | | | | | | | |
Unrealized Gain/(Loss) | | $ | (18,832,300 | ) | | $ | (368,228 | ) |
| | | | | | | | |
Fair Value as of 12/31/2011 | | $ | 17,706,757 | | | $ | 5,881,772 | |
| | | | | | | | |
F-109
The Trading Companies have invested in the following Swaps as of December 31, 2010.
| | | | | | | | | | | | | | | | |
| | | Option Basket
Frontier Trading
Company X, LLC | | | Option Basket
Frontier Trading
Company XII, LLC | | | Option Basket
Frontier Trading
Company XI, LLC | | | Option Basket
Frontier Trading
Company I LLC | |
Counterparty | | | Company D | | | | Company E | | | | Company F | | | | Company A | |
Notional Amount | | $ | 15,569,595 | | | $ | 27,048,602 | | | $ | 26,242,246 | | | $ | 68,460,196 | |
Termination Date | | | 6/6/2014 | | | | 6/6/2014 | | | | 6/6/2014 | | | | 11/6/2012 | |
Investee Returns | | | Total Returns | | | | Total Returns | | | | Total Returns | | | | Total Returns | |
Realized Gain/(Loss) | | $ | 0 | | | $ | 0 | | | $ | 0 | | | $ | 0 | |
| | | | | | | | | | | | | | | | |
Unrealized Gain/(Loss) | | $ | 416,156 | | | $ | 929,503 | | | $ | 3,474,611 | | | $ | 8,790,927 | |
| | | | | | | | | | | | | | | | |
Fair Value as of 12/31/2010 | | $ | 11,407,905 | | | $ | 10,956,756 | | | $ | 26,242,246 | | | $ | 49,811,462 | |
| | | | | | | | | | | | | | | | |
| | | | | | | | | | | | |
| | | Option Basket
Frontier Trading
Company III, LLC | | | Reuters/Jefferies
CRB Index
Frontier Trading
Company
VIII, LLC | | | Jefferies Commodity
Performance Index
Frontier Trading
Company VIII, LLC | |
Counterparty | | | Company B | | | | Company C | | | | Company C | |
Notional Amount | | $ | 11,567,063 | | | $ | 2,040,000 | | | $ | 2,040,000 | |
Termination Date | | | 7/26/2013 | | | | 2/28/2011 | | | | 2/28/2011 | |
Investee Returns | | | Total Returns | | | | Total Returns | | | | Total Returns | |
Realized Gain/(Loss) | | $ | 0 | | | $ | 190,556 | | | $ | 319,106 | |
| | | | | | | | | | | | |
Unrealized Gain/(Loss) | | $ | 675,809 | | | $ | 0 | | | $ | 0 | |
| | | | | | | | | | | | |
Fair Value as of 12/31/2010 | | $ | 5,668,768 | | | $ | 415,648 | | | $ | 375,148 | |
| | | | | | | | | | | | |
F-110
5. Financial Highlights
The following information presents the financial highlights of the Trading Companies for the years ended December 31, 2011, 2010 and 2009.
| | | | | | | | | | | | | | | | | | | | | | | | | | | | | | | | | | | | |
| | | Frontier Trading | | | Frontier Trading | | | Frontier Trading | |
| | | Company I LLC (2) | | | Company II LLC (2) | | | Company III LLC (2) | |
| | | 12/31/2011 | | | 12/31/2010 | | | 12/31/2009 | | | 12/31/2011 | | | 12/31/2010 | | | 12/31/2009 | | | 12/31/2011 | | | 12/31/2010 | | | 12/31/2009 | |
Net Investment Gain | | | -0.07 | % | | | -0.02 | % | | | -0.03 | % | | | 0.07 | % | | | 0.04 | % | | | 0.10 | % | | | 0.04 | % | | | 0.02 | % | | | 0.01 | % |
Total Return | | | -43.09 | % | | | 30.19 | % | | | -6.36 | % | | | 78.95 | % | | | 239.96 | % | | | -73.23 | % | | | -31.25 | % | | | 18.00 | % | | | -43.89 | % |
| | | | | | | | | | | | | | | | | | | | | | | | | | | | | | | | | | | | |
| | | Frontier Trading | | | Frontier Trading | | | Frontier Trading | |
| | | Company V LLC (2) | | | Company VI LLC (2) | | | Company VII, LLC (2) | |
| | | 12/31/2011 | | | 12/31/2010 | | | 12/31/2009 | | | 12/31/2011 | | | 12/31/2010 | | | 12/31/2009 | | | 12/31/2011 | | | 12/31/2010 | | | 12/31/2009 | |
Net Investment Gain | | | 0.04 | % | | | 0.08 | % | | | 0.06 | % | | | 0.14 | % | | | 1.00 | % | | | 0.14 | % | | | 0.00 | % | | | 0.02 | % | | | -0.02 | % |
Total Return | | | -81.56 | % | | | 19.76 | % | | | 24.08 | % | | | 12.56 | % | | | 35.91 | % | | | -16.71 | % | | | 183.54 | % | | | 131.49 | % | | | 408.19 | % |
| | | | | | | | | | | | | | | | | | | | | | | | | | | | | | | | | | | | |
| | | Frontier Trading | | | Frontier Trading | | | Frontier Trading | |
| | | Company VIII, LLC (2) | | | Company IX, LLC (2) | | | Company X, LLC (1), (2) | |
| | | 12/31/2011 | | | 12/31/2010 | | | 12/31/2009 | | | 12/31/2011 | | | 12/31/2010 | | | 12/31/2009 | | | 12/31/2011 | | | 12/31/2010 | | | 12/31/2009 | |
Net Investment Gain | | | -0.01 | % | | | 0.19 | % | | | 0.15 | % | | | 0.28 | % | | | 0.19 | % | | | 0.35 | % | | | 0.00 | % | | | 0.00 | % | | | 0.00 | % |
Total Return | | | -89.74 | % | | | 95.01 | % | | | 327.66 | % | | | -63.08 | % | | | 12.60 | % | | | -58.00 | % | | | -46.12 | % | | | 2.43 | % | | | -33.17 | % |
| | | | | | | | | | | | | | | | | | | | | | | | | | | | | | | | | | | | |
| | | Frontier Trading | | | Frontier Trading | | | Frontier Trading | |
| | | Company XI, LLC (1), (2) | | | Company XII, LLC (1), (2) | | | Company XIV, LLC (1), (2) | |
| | | 12/31/2011 | | | 12/31/2010 | | | 12/31/2009 | | | 12/31/2011 | | | 12/31/2010 | | | 12/31/2009 | | | 12/31/2011 | | | 12/31/2010 | | | 12/31/2009 | |
Net Investment Gain | | | 0.00 | % | | | 0.00 | % | | | 0.00 | % | | | 0.00 | % | | | 0.00 | % | | | 0.00 | % | | | -0.32 | % | | | -0.14 | % | | | -0.08 | % |
Total Return | | | 1.75 | % | | | 12.93 | % | | | -24.56 | % | | | -27.51 | % | | | 9.27 | % | | | -31.23 | % | | | 8.85 | % | | | -15.32 | % | | | -6.50 | % |
| | | | | | | | | | | | | | | | | | | | | | | | | | | | | | | | | | | | |
| | | Frontier Trading | | | Frontier Trading | | | Frontier Trading | |
| | | Company XV, LLC (1), (2) | | | Company XVII, LLC (2) (3) | | | Company XVIII, LLC (2) (3) | |
| | | 12/31/2011 | | | 12/31/2010 | | | 12/31/2009 | | | 12/31/2011 | | | 12/31/2010 | | | 12/31/2009 | | | 12/31/2011 | | | 12/31/2010 | | | 12/31/2009 | |
Net Investment Gain | | | 0.00 | % | | | -0.01 | % | | | -0.03 | % | | | 0.00 | % | | | n/a | | | | n/a | | | | -0.02 | % | | | n/a | | | | n/a | |
Total Return | | | 33.21 | % | | | 62.82 | % | | | -13.34 | % | | | -5.89 | % | | | n/a | | | | n/a | | | | -32.58 | % | | | n/a | | | | n/a | |
| | | | | | | | | | | | |
| | | Frontier Trading | |
| | | Company XXI, LLC (2) (3) | |
| | | 12/31/2011 | | | 12/31/2010 | | | 12/31/2009 | |
Net Investment Gain | | | -0.23 | % | | | n/a | | | | n/a | |
Total Return | | | -42.12 | % | | | n/a | | | | n/a | |
| (1) | Trading Companies X, XI, XII, XIV and XV commenced trading operations in June 2009. |
| (2) | Ratio of net investment gain to average members’ equity, annualized. Net investment gain is “Interest-net”, only, as there are no expenses included with the Trading Companies. |
| (3) | Trading Companies XVII, XVIII and XXI commenced trading operations in July, October and March 2011, respectively. |
6. Derivative Instruments and Hedging Activities
The Trading Companies’ primary business is to engage in speculative trading of a diversified portfolio of futures, forwards (including interbank foreign currencies), options contracts and other derivative instruments (including swap contracts). The Trading Companies do not enter into or hold positions for hedging purposes as defined under ASC 815. The detail of the fair value of the Trading Companies’ derivatives by instrument types as of December 31, 2011 and 2010 is included in the Condensed Schedules of Investments. See Note 4 for further disclosure related to the Trading Companies’ positions in swap contracts.
F-111
The following tables summarize the monthly averages of futures contracts bought and sold for each respective Series of the Trust:
For The Year Ended December 31, 2011
| | | | | | | | |
| Monthly average contracts: | | Bought | | | Sold | |
Frontier Trading Company I LLC | | | 23,080 | | | | 27,586 | |
Frontier Trading Company II LLC | | | 11,812 | | | | 13,315 | |
Frontier Trading Company III LLC | | | 990 | | | | 12,840 | |
Frontier Trading Company V LLC | | | 13,735 | | | | 10,528 | |
Frontier Trading Company VII, LLC | | | 64,453 | | | | 60,410 | |
Frontier Trading Company IX, LLC | | | 18,510 | | | | 23,611 | |
Frontier Trading Company XIV, LLC | | | 15,486 | | | | 19,780 | |
Frontier Trading Company XV, LLC | | | 15,452 | | | | 19,220 | |
Frontier Trading Company XVIII, LLC | | | 31,110 | | | | 33,620 | |
Frontier Trading Company XXI, LLC | | | 44 | | | | 14 | |
For The Year Ended December 31, 2010
| | | | | | | | |
| Monthly average contracts: | | Bought | | | Sold | |
Frontier Trading Company I LLC | | | 21,823 | | | | 22,763 | |
Frontier Trading Company II LLC | | | 10,303 | | | | 8,108 | |
Frontier Trading Company III LLC | | | 1,500 | | | | 15,000 | |
Frontier Trading Company V LLC | | | 10,548 | | | | 2,270 | |
Frontier Trading Company VI LLC | | | 14,702 | | | | 13,976 | |
Frontier Trading Company VII, LLC | | | 58,233 | | | | 43,465 | |
Frontier Trading Company IX, LLC | | | 11,958 | | | | 12,582 | |
Frontier Trading Company XIV, LLC | | | 15,969 | | | | 16,405 | |
Frontier Trading Company XV, LLC | | | 15,937 | | | | 15,859 | |
F-112
The following tables summarize the trading revenues for the years ended December 31, 2011, 2010 and 2009, approximately by sector:
Realized Trading Revenue from Futures, Forwards and Options
for the Year Ended December 31, 2011(2)
| | | | | | | | | | | | | | | | |
Type of contract | | Frontier Trading
Company I LLC | | | Frontier Trading
Company II LLC | | | Frontier Trading
Company III LLC | | | Frontier Trading
Company V LLC | |
Metals | | $ | (2,270,390 | ) | | $ | 4,435,105 | | | $ | — | | | $ | 1,183,539 | |
Currencies | | | 44,028,692 | | | | 4,867,863 | | | | (142,069 | ) | | | (3,657,845 | ) |
Energies | | | (1,736,606 | ) | | | 5,462,294 | | | | — | | | | (1,816,066 | ) |
Agriculturals | | | (7,153,482 | ) | | | 2,782,578 | | | | — | | | | (649,094 | ) |
Interest rates | | | 24,250,819 | | | | 3,347,851 | | | | — | | | | 267,832 | |
Stock indices | | | 3,937,098 | | | | 548,500 | | | | — | | | | (4,983,252 | ) |
| | | | | | | | | | | | | | | | |
Realized trading income/(loss)(2) | | $ | 61,056,131 | | | $ | 21,444,191 | | | $ | (142,069 | ) | | $ | (9,654,886 | ) |
| | | | | | | | | | | | | | | | |
| | | | |
Type of contract | | Frontier Trading
Company VI LLC | | | Frontier Trading
Company VII, LLC | | | Frontier Trading
Company IX, LLC | | | Frontier Trading
Company XIV, LLC | |
Metals | | $ | 179,921 | | | $ | 18,975,003 | | | $ | (233,668 | ) | | $ | (821,080 | ) |
Currencies | | | (66,738 | ) | | | 711,906 | | | | (2,437,287 | ) | | | (5,562,322 | ) |
Energies | | | 315,168 | | | | 37,449,900 | | | | (594,882 | ) | | | 518,390 | |
Agriculturals | | | 370,166 | | | | 20,969,699 | | | | 497,822 | | | | (2,100,179 | ) |
Interest rates | | | (88,900 | ) | | | 1,473,698 | | | | 2,174,958 | | | | (2,565,463 | ) |
Stock indices | | | 412,236 | | | | 707,133 | | | | (1,125,390 | ) | | | 23,804,712 | |
| | | | | | | | | | | | | | | | |
Realized trading income/(loss)(2) | | $ | 1,121,853 | | | $ | 80,287,339 | | | $ | (1,718,447 | ) | | $ | 13,274,058 | |
| | | | | | | | | | | | | | | | |
| | | | |
Type of contract | | Frontier Trading
Company XV, LLC | | | Frontier Trading
Company XVIII, LLC (3) | | | Frontier Trading
Company XXI, LLC (4) | | | | |
Metals | | $ | (9,001,350 | ) | | $ | (823,103 | ) | | $ | (11,149 | ) | |
Currencies | | | (1,344,598 | ) | | | (93,572 | ) | | | (1,465,976 | ) | |
Energies | | | (2,254,523 | ) | | | (396,663 | ) | | | (1,134,274 | ) | |
Agriculturals | | | 1,418,651 | | | | (1,025,777 | ) | | | (1,229,172 | ) | |
Interest rates | | | (1,014,199 | ) | | | (48,360 | ) | | | 1,121,985 | | |
Stock indices | | | (1,438,218 | ) | | | (455,503 | ) | | | (795,382 | ) | |
| | | | | | | | | | | | | |
Realized trading income/(loss)(2) | | $ | (13,634,237 | ) | | $ | (2,842,978 | ) | | $ | (3,513,968 | ) | |
| | | | | | | | | | | | | | | | |
Unrealized Trading Revenue from Futures, Forwards and Options
for the Year Ended December 31, 2011(1)
| | | | | | | | | | | | | | | | |
| | | Frontier Trading | | | Frontier Trading | | | Frontier Trading | | | Frontier Trading | |
Type of contract | | Company I LLC | | | Company II LLC | | | Company III LLC | | | Company V LLC | |
Metals | | $ | (10,273,731 | ) | | $ | (4,201,484 | ) | | $ | — | | | $ | (233,946 | ) |
Currencies | | | (44,048,926 | ) | | | 2,882,661 | | | | (27,098 | ) | | | 77,124 | |
Energies | | | (2,185,091 | ) | | | (1,208,319 | ) | | | — | | | | 302,829 | |
Agriculturals | | | (4,320,827 | ) | | | (2,048,480 | ) | | | — | | | | (1,325,915 | ) |
Interest rates | | | (7,491,321 | ) | | | 1,330,714 | | | | — | | | | 723,544 | |
Stock indices | | | (12,787,873 | ) | | | 1,054,447 | | | | — | | | | 467,568 | |
| | | | | | | | | | | | | | | | |
Unrealized trading income/(loss)(1) | | $ | (81,107,769 | ) | | $ | (2,190,461 | ) | | $ | (27,098 | ) | | $ | 11,204 | |
| | | | | | | | | | | | | | | | |
| | | | |
Type of contract | | Frontier Trading
Company VI LLC | | | Frontier Trading
Company VII, LLC | | | Frontier Trading
Company IX, LLC | | | Frontier Trading
Company XIV, LLC | |
Metals | | $ | (40,954 | ) | | $ | (11,439,472 | ) | | $ | (512,090 | ) | | $ | (1,373,977 | ) |
Currencies | | | (539,672 | ) | | | (35,834 | ) | | | 419,982 | | | | (684,637 | ) |
Energies | | | (28,579 | ) | | | 4,399,950 | | | | (186,397 | ) | | | 586,823 | |
Agriculturals | | | (69,240 | ) | | | (7,454,852 | ) | | | (958,808 | ) | | | 588,490 | |
Interest rates | | | 2,236 | | | | (642,498 | ) | | | 298,931 | | | | 683,742 | |
Stock indices | | | 138,539 | | | | 286,181 | | | | (147,899 | ) | | | (363,234 | ) |
| | | | | | | | | | | | | | | | |
Unrealized trading income/(loss)(1) | | $ | (537,670 | ) | | $ | (14,886,525 | ) | | $ | (1,086,281 | ) | | $ | (562,793 | ) |
| | | | | | | | | | | | | | | | |
| | | | |
| | | Frontier Trading | | | Frontier Trading | | | Frontier Trading | | | | |
Type of contract | | Company XV, LLC | | | Company XVIII, LLC (3) | | | Company XXI, LLC (4) | | |
Metals | | $ | 19,006,684 | | | $ | (53,255 | ) | | $ | 17,541 | | |
Currencies | | | 2,020,971 | | | | 63,271 | | | | 439,872 | | |
Energies | | | (1,101,151 | ) | | | (69,347 | ) | | | 101,217 | | |
Agriculturals | | | (2,927,624 | ) | | | (43,403 | ) | | | (204,311 | ) | |
Interest rates | | | (3,413,034 | ) | | | 651,462 | | | | (893,143 | ) | |
Stock indices | | | (1,291,838 | ) | | | 47,465 | | | | 1,331,196 | | |
| | | | | | | | | | | | | |
Unrealized trading income/(loss)(1) | | $ | 12,294,008 | | | $ | 596,193 | | | $ | 792,372 | | |
| | | | | | | | | | | | | | | | |
| (1) | In the Statements of Operations under net change in open trade equity (deficit), at fair value. |
| (2) | In the Statements of Operations under Net realized gain/(loss) on futures, forwards and options. |
| (3) | Frontier Trading Company XVIII, LLC commenced operations in October 2011. |
| (4) | Frontier Trading Company XXI, LLC commenced operations in March 2011. |
F-113
Realized Trading Revenue from Futures, Forwards and Options
for the Year Ended December 31, 2010(2)
| | | | | | | | | | | | | | | | |
Type of contract | | Frontier Trading
Company I LLC | | | Frontier Trading
Company II LLC | | | Frontier Trading
Company III LLC | | | Frontier Trading
Company V LLC | |
Metals | | $ | 7,072,534 | | | $ | 5,503,516 | | | $ | — | | | $ | 410,013 | |
Currencies | | | 7,774,727 | | | | 3,798,329 | | | | 290,954 | | | | 3,469,334 | |
Energies | | | (130,447 | ) | | | 3,319,469 | | | | — | | | | (3,365,670 | ) |
Agriculturals | | | 4,354,478 | | | | 4,770,663 | | | | — | | | | 1,842,657 | |
Interest rates | | | (547,946 | ) | | | 4,405,255 | | | | — | | | | 8,589,224 | |
Stock indices | | | 4,970,040 | | | | 4,637,289 | | | | — | | | | (5,464,152 | ) |
| | | | | | | | | | | | | | | | |
Realized trading income/(loss)(2) | | $ | 23,493,386 | | | $ | 26,434,521 | | | $ | 290,954 | | | $ | 5,481,406 | |
| | | | | | | | | | | | | | | | |
| | | | | | | | | | | | | | | | |
| | | | |
Type of contract | | Frontier Trading
Company VI LLC | | | Frontier Trading
Company VII, LLC | | | Frontier Trading
Company IX, LLC | | | Frontier Trading
Company XIV, LLC | |
Metals | | $ | 1,279,208 | | | $ | 3,435,419 | | | $ | 425,278 | | | $ | 509,045 | |
Currencies | | | (215,576 | ) | | | 603,604 | | | | (61,362 | ) | | | (504,367 | ) |
Energies | | | 160,430 | | | | 3,185,822 | | | | 134,906 | | | | (543,552 | ) |
Agriculturals | | | 908,815 | | | | 30,624,139 | | | | 1,056,061 | | | | 266,192 | |
Interest rates | | | 10,419 | | | | 701,354 | | | | (857,722 | ) | | | (653,108 | ) |
Stock indices | | | 1,167,169 | | | | 1,280,686 | | | | 318,805 | | | | 691,008 | |
| | | | | | | | | | | | | | | | |
Realized trading income/(loss)(2) | | $ | 3,310,465 | | | $ | 39,831,024 | | | $ | 1,015,966 | | | $ | (234,782 | ) |
| | | | | | | | | | | | | | | | |
| | | | |
| |
Type of contract | | Frontier Trading
Company XV, LLC | |
Metals | | $ | (4,305,416 | ) |
Currencies | | | 4,156,645 | |
Energies | | | (127,783 | ) |
Agriculturals | | | 1,471,974 | |
Interest rates | | | 2,846,289 | |
Stock indices | | | (399,724 | ) |
| | | | |
Realized trading income/(loss)(2) | | $ | 3,641,985 | |
| | | | |
Unrealized Trading Revenue from Futures, Forwards and Options
for the Year Ended December 31, 2010(1)
| | | | | | | | | | | | | | | | |
| | | Frontier Trading | | | Frontier Trading | | | Frontier Trading | | | Frontier Trading | |
Type of contract | | Company I LLC | | | Company II LLC | | | Company III LLC | | | Company V LLC | |
Metals | | $ | 301,912 | | | $ | 744,333 | | | $ | — | | | $ | (2,364,922 | ) |
Currencies | | | 2,424,817 | | | | 645,472 | | | | 54,015 | | | | 8,948,879 | |
Energies | | | 3,386,563 | | | | 889,357 | | | | — | | | | (1,159,361 | ) |
Agriculturals | | | 3,412,782 | | | | 2,641,055 | | | | — | | | | (1,491,247 | ) |
Interest rates | | | 3,103,488 | | | | (706,213 | ) | | | — | | | | (1,541,855 | ) |
Stock indices | | | 1,374,012 | | | | 1,753,276 | | | | — | | | | (1,774,544 | ) |
| | | | | | | | | | | | | | | | |
Unrealized trading income/(loss)(1) | | $ | 14,003,574 | | | $ | 5,967,280 | | | $ | 54,015 | | | $ | 616,950 | |
| | | | | | | | | | | | | | | | |
| | | | | | | | | | | | | | | | |
Type of contract | | Frontier Trading
Company VI LLC | | | Frontier Trading
Company VII, LLC | | | Frontier Trading
Company IX, LLC | | | Frontier Trading
Company XIV, LLC | |
Metals | | $ | 5,210 | | | $ | 256,571 | | | $ | (148,416 | ) | | $ | 59,801 | |
Currencies | | | (736,347 | ) | | | (225,639 | ) | | | 1,693,130 | | | | (39,060 | ) |
Energies | | | 757,738 | | | | 27,567,517 | | | | 73,155 | | | | 204,825 | |
Agriculturals | | | 478,475 | | | | (22,437,145 | ) | | | 323,105 | | | | 1,956,523 | |
Interest rates | | | 148,180 | | | | (2,612 | ) | | | (334,538 | ) | | | (564,098 | ) |
Stock indices | | | 651,649 | | | | (170,263 | ) | | | (113,620 | ) | | | 1,204,678 | |
| | | | | | | | | | | | | | | | |
Unrealized trading income/(loss)(1) | | $ | 1,304,905 | | | $ | 4,988,429 | | | $ | 1,492,816 | | | $ | 2,822,669 | |
| | | | | | | | | | | | | | | | |
| | | | |
Type of contract | | Frontier Trading
Company XV, LLC | |
Metals | | $ | 6,826,650 | |
Currencies | | | 2,548,379 | |
Energies | | | — | |
Agriculturals | | | 392,571 | |
Interest rates | | | 2,077,645 | |
Stock indices | | | 90,726 | |
| | | | |
Unrealized trading income/(loss)(1) | | $ | 11,935,971 | |
| | | | |
| (1) | In the Statements of Operations under net change in open trade equity (deficit), at fair value. |
| (2) | In the Statements of Operations under Net realized gain/(loss) on futures, forwards and options. |
F-114
Realized Trading Revenue from Futures, Forwards and Options
for the Year Ended December 31, 2009(2)
| | | | | | | | | | | | | | | | |
Type of contract | | Frontier Trading
Company I LLC | | | Frontier Trading
Company II LLC | | | Frontier Trading
Company III LLC | | | Frontier Trading
Company V LLC | |
Metals | | $ | 3,475,246 | | | $ | 1,588,047 | | | $ | — | | | $ | 1,200,986 | |
Currencies | | | 3,170,040 | | | | (1,610,472 | ) | | | (178,743 | ) | | | 944,497 | |
Energies | | | 286,142 | | | | (2,342,983 | ) | | | — | | | | (2,622,786 | ) |
Agriculturals | | | 62,398 | | | | (1,956,080 | ) | | | — | | | | (1,044,572 | ) |
Interest rates | | | (741,506 | ) | | | 1,485,612 | | | | — | | | | (3,820,092 | ) |
Stock indices | | | 2,463,165 | | | | (887,285 | ) | | | — | | | | 9,578,269 | |
| | | | | | | | | | | | | | | | |
Realized trading income/(loss)(2) | | $ | 8,715,485 | | | $ | (3,723,161 | ) | | $ | (178,743 | ) | | $ | 4,236,302 | |
| | | | | | | | | | | | | | | | |
| | | | |
Type of contract | | Frontier Trading
Company VI LLC | | | Frontier Trading
Company VII, LLC | | | Frontier Trading
Company IX, LLC | | | Frontier Trading
Company XIII, LLC | |
Metals | | $ | 3,441,595 | | | $ | 19,615,278 | | | $ | (88,155 | ) | | $ | 3,142,777 | |
Currencies | | | (169,551 | ) | | | 3,599,861 | | | | (192,123 | ) | | | (443,885 | ) |
Energies | | | (1,689,573 | ) | | | 20,547,042 | | | | 162,890 | | | | (1,017,693 | ) |
Agriculturals | | | (517,887 | ) | | | 9,409,345 | | | | (311,339 | ) | | | (1,719,906 | ) |
Interest rates | | | 78,737 | | | | 2,539,200 | | | | (47,574 | ) | | | 1,167,187 | |
Stock indices | | | (1,354,053 | ) | | | 4,578,201 | | | | (578,678 | ) | | | (669,543 | ) |
| | | | | | | | | | | | | | | | |
Realized trading income/(loss)(2) | | $ | (210,732 | ) | | $ | 60,288,927 | | | $ | (1,054,979 | ) | | $ | 458,937 | |
| | | | | | | | | | | | | | | | |
| | | |
Type of contract | | Frontier Trading
Company XIV, LLC | | | Frontier Trading
Company XV, LLC | | | | |
Metals | | $ | (2,942,602 | ) | | $ | (6,201,505 | ) | |
Currencies | | | (1,728,629 | ) | | | 1,315,935 | | |
Energies | | | 4,484,267 | | | | 4,063,077 | | |
Agriculturals | | | (2,238,895 | ) | | | 12,396,090 | | |
Interest rates | | | 2,574,598 | | | | (183,030 | ) | |
Stock indices | | | 2,772,166 | | | | 2,728,681 | | |
| | | | | | | | | |
Realized trading income/(loss)(2) | | $ | 2,920,905 | | | $ | 14,119,248 | | |
| | | | | | | | | |
Unrealized Trading Revenue from Futures, Forwards and Options
for the Year Ended December 31, 2009(1)
| | | | | | | | | | | | | | | | |
Type of contract | | Frontier Trading
Company I LLC | | | Frontier Trading
Company II LLC | | | Frontier Trading
Company III LLC | | | Frontier Trading
Company V LLC | |
Metals | | $ | 1,800,573 | | | $ | 1,956,286 | | | $ | — | | | $ | 648,562 | |
Currencies | | | (555,213 | ) | | | (1,242,233 | ) | | | 2,985 | | | | 392,073 | |
Energies | | | 2,526,944 | | | | (1,974,744 | ) | | | — | | | | (3,175,210 | ) |
Agriculturals | | | 1,886,477 | | | | (1,587,841 | ) | | | — | | | | (1,596,996 | ) |
Interest rates | | | 252,323 | | | | 1,853,851 | | | | — | | | | (4,372,516 | ) |
Stock indices | | | (5,006,125 | ) | | | (519,048 | ) | | | — | | | | 9,025,847 | |
| | | | | | | | | | | | | | | | |
Unrealized trading income/(loss)(1) | | $ | 904,979 | | | $ | (1,513,729 | ) | | $ | 2,985 | | | $ | 921,760 | |
| | | | | | | | | | | | | | | | |
| | | | |
Type of contract | | Frontier Trading
Company VI LLC | | | Frontier Trading
Company VII, LLC | | | Frontier Trading
Company IX, LLC | | | Frontier Trading
Company XIII, LLC | |
Metals | | $ | 551,242 | | | $ | (15,338,074 | ) | | $ | (361,205 | ) | | $ | 1,058,999 | |
Currencies | | | (956,054 | ) | | | (141,604 | ) | | | (148,544 | ) | | | 33,463 | |
Energies | | | 4,730 | | | | 1,796,390 | | | | (187,104 | ) | | | 304,177 | |
Agriculturals | | | (889,051 | ) | | | (15,751,965 | ) | | | (129,226 | ) | | | (720,468 | ) |
Interest rates | | | 3,115,915 | | | | 440,666 | | | | 712,669 | | | | (481,812 | ) |
Stock indices | | | (2,703,947 | ) | | | 678,338 | | | | (51,776 | ) | | | 500,869 | |
| | | | | | | | | | | | | | | | |
Unrealized trading income/(loss)(1) | | $ | (877,165 | ) | | $ | (28,316,249 | ) | | $ | (165,186 | ) | | $ | 695,228 | |
| | | | | | | | | | | | | | | | |
| | | |
Type of contract | | Frontier Trading
Company XIV, LLC | | | Frontier Trading
Company XV, LLC | | | | |
Metals | | $ | 2,005,875 | | | $ | 26,324,601 | | |
Currencies | | | 237,027 | | | | (3,668,493 | ) | |
Energies | | | (3,960,994 | ) | | | (2,228,338 | ) | |
Agriculturals | | | 2,757,764 | | | | (5,607,090 | ) | |
Interest rates | | | (4,088,349 | ) | | | 244,110 | | |
Stock indices | | | 62,462 | | | | (468,370 | ) | |
| | | | | | | | | |
Unrealized trading income/(loss)(1) | | $ | (2,986,215 | ) | | $ | 14,596,420 | | |
| | | | | | | | | |
| (1) | In the Statements of Operations under net change in open trade equity (deficit), at fair value |
| (2) | In the Statements of Operations under Net realized gain/(loss) on futures, forwards and options. |
F-115
7. Trading Activities and Related Risks
The purchase and sale of futures and options on futures contracts require margin deposits with Futures Commodities Merchants (each, an “FCM”). Additional deposits may be necessary for any loss on contract value. The Commodity Exchange Act requires an FCM to segregate all customer transactions and assets from the FCM’s proprietary activities. A customer’s cash and other property (for example, U.S. Treasury bills) deposited with an FCM are considered commingled with all other customer funds subject to the FCM’s segregation requirements. In the event of an FCM’s insolvency, recovery may be limited to a pro rata share of segregated funds available. It is possible that the recovered amount could be less than the total of cash and other property deposited.
The term “off-balance sheet risk” refers to an unrecorded potential liability that, even though it does not appear on the Statement of Financial Condition, may result in future obligation or loss in excess of the amount paid by the Series for a particular investment. Each Trading Company expects to trade in futures, options, forward and swap contracts and will therefore be a party to financial instruments with elements of off-balance sheet market and credit risk. In entering into these contracts, there exists a market risk that such contracts may be significantly influenced by market conditions, such as interest rate volatility, resulting in such contracts being less valuable. If the markets should move against all of the futures positions held by a Trading Company in respect of any Series at the same time, and if the Trading Advisor(s) of such Trading Company are unable to offset such futures interests positions, such Trading Company could lose all of its assets and the holders of Units of such Series would realize a 100% loss. Management will seek to minimize market risk through real-time monitoring of open positions and the level of diversification of each Trading Advisor’s portfolio. It is anticipated that any Trading Advisor’s margin-to-equity ratio will typically not exceed approximately 35% although the actual ratio could be higher or lower from time to time.
In addition to market risk, trading futures, forward and swap contracts entails credit risk in that a counterparty will not be able to meet its obligations to a Trading Company. The counterparty for futures contracts traded in the United States and on most foreign exchanges is the clearinghouse associated with such exchange. In general, clearinghouses are backed by the corporate members of the clearinghouse who are required to share any financial burden resulting from the non-performance by one of their members and, as such, should significantly reduce this credit risk. In cases where the clearinghouse is not backed by the clearing members, like some foreign exchanges, it is normally backed by a consortium of banks or other financial institutions. Some non-U.S. exchanges, in contrast to U.S. exchanges, are principals’ markets in which performance is the responsibility only of the individual counterparty with whom the Trading Company has entered into the transaction, and not of the exchange or clearing corporation. In these kinds of markets, there is risk of bankruptcy or other failure or refusal to perform by the counterparty.
In the case of forward contracts traded on the interbank market and swaps, neither is traded on exchanges. The counterparty is generally a single bank or other financial institution, rather than a group of financial institutions; thus there may be a greater counterparty credit risk. Management expects the Trading Advisors to trade only with those counterparties which it believes to be creditworthy. All positions of each Trading Company will be valued each day on a mark-to-market basis. There can be no assurance that any clearing member, clearinghouse or other counterparty will be able to meet its obligations to any Trading Company.
F-116
Management has established procedures to actively monitor and minimize market and credit risks. Investors in units of the Frontier Fund Series bear the risk of loss only to the extent of the market value of their respective investments and, in certain specific circumstances, distributions and redemptions received.
8. Indemnifications
The Trading Companies have entered into agreements, which provide for the indemnification of futures clearing brokers, currency trading companies, and commodity trading advisers, among others, against losses, costs, claims and liabilities arising from the performance of their individual obligations under such agreements, except for gross negligence or bad faith. The Trading Companies have had no prior claims or payments pursuant to these agreements. The Trading Companies’ individual maximum exposure under these arrangements is unknown, as this would involve future claims that may be made against the Trading Companies that have not yet occurred. However, based on experience the Trading Companies expect the risk of loss to be remote.
9. Subsequent Events
The Trading Companies evaluated subsequent events through the date of the financial statements were available to be issued and not identify any events or transactions that would require recognition or disclosure.
F-117
SIGNATURES
Pursuant to the requirements of the Securities Exchange Act of 1934, the registrant has duly caused this report to be signed on its behalf by the undersigned thereunto duly authorized.
| | | | | | | | |
| | | | The Frontier Fund |
| | | | (Registrant) |
| | | |
| Date: March 30, 2012 | | | | By: | | /S/ ROBERT J. ENCK |
| | | | | | | | Robert J. Enck |
| | | | | | | | President and Chief Executive Officer of Equinox Fund Management, LLC, the Managing Owner of The Frontier Fund |
Pursuant to the requirements of the Securities Exchange Act of 1934, this report has been signed below by the following persons on behalf of the registrant and in the capacities and on the dates indicated.
Equinox Fund Management, LLC
| | | | | | |
| BY: | | /s/ | | Robert J. Enck | | March 30, 2012 |
| | | | Robert J. Enck, Chairman and Member of the Executive Committee of The Frontier Fund | | |
| | | | President and Chief Executive Officer of Equinox Fund Management, LLC, the Managing Owner of The Frontier Fund | | |
| | | | | | |
| | /s/ | | Brent Bales | | March 30, 2012 |
| | | | Brent Bales, Principal Financial Officer and Principal Accounting Officer of Equinox Fund Management, LLC, the Managing Owner of The Frontier Fund | | |
| | | | | | |
| | /s/ | | Richard E. Bornhoft | | March 30, 2012 |
| | | | Richard E. Bornhoft, Member of the Executive Committee of The Frontier Fund | | |
| | | | Chief Investment Officer of Equinox Fund Management, LLC, the Managing Owner of The Frontier Fund | | |
| | | | | | |
| | /s/ | | David P. DeMuth | | March 30, 2012 |
| | | | David P. DeMuth, Member of the Executive Committee of The Frontier Fund | | |
E-1
SIGNATURES
Pursuant to the requirements of the Securities Exchange Act of 1934, the registrant has duly caused this report to be signed on its behalf by the undersigned thereunto duly authorized.
| | | | | | | | |
| | | | Balanced Series, |
| | | | a Series of The Frontier Fund (Registrant) |
| | | |
| Date: March 30, 2012 | | | | By: | | /S/ ROBERT J. ENCK |
| | | | | | | | Robert J. Enck |
| | | | | | | | President and Chief Executive Officer of Equinox Fund Management, LLC, the Managing Owner of The Frontier Fund |
Pursuant to the requirements of the Securities Exchange Act of 1934, this report has been signed below by the following persons on behalf of the registrant and in the capacities and on the dates indicated.
Equinox Fund Management, LLC
| | | | | | |
| BY: | | /s/ | | Robert J. Enck | | March 30, 2012 |
| | | | Robert J. Enck, Chairman and Member of the Executive Committee of The Frontier Fund | | |
| | | | President and Chief Executive Officer of Equinox Fund Management, LLC, the Managing Owner of The Frontier Fund | | |
| | | | | | |
| | /s/ | | Brent Bales | | March 30, 2012 |
| | | | Brent Bales, Principal Financial Officer and Principal Accounting Officer of Equinox Fund Management, LLC, the Managing Owner of The Frontier Fund | | |
| | | | | | |
| | /s/ | | Richard E. Bornhoft | | March 30, 2012 |
| | | | Richard E. Bornhoft, Member of the Executive Committee of The Frontier Fund | | |
| | | | Chief Investment Officer of Equinox Fund Management, LLC, the Managing Owner of The Frontier Fund | | |
| | | | | | |
| | /s/ | | David P. DeMuth | | March 30, 2012 |
| | | | David P. DeMuth, Member of the Executive Committee of The Frontier Fund | | |
E-2
Pursuant to the requirements of the Securities Exchange Act of 1934, this report has been signed below by the following persons on behalf of the registrant and in the capacities and on the dates indicated.
Equinox Fund Management, LLC
| | | | | | | | |
| | | | Winton/Graham Series, |
| | | | a Series of The Frontier Fund (Registrant) |
| | | |
| Date: March 30, 2012 | | | | By: | | /S/ ROBERT J. ENCK |
| | | | | | | | Robert J. Enck |
| | | | | | | | President and Chief Executive Officer of Equinox Fund Management, LLC, the Managing Owner of The Frontier Fund |
Pursuant to the requirements of the Securities Exchange Act of 1934, this report has been signed below by the following persons on behalf of the registrant and in the capacities and on the dates indicated.
Equinox Fund Management, LLC
| | | | | | |
| BY: | | /s/ | | Robert J. Enck | | March 30, 2012 |
| | | | Robert J. Enck, Chairman and Member of the Executive Committee of The Frontier Fund | | |
| | | | President and Chief Executive Officer of Equinox Fund Management, LLC, the Managing Owner of The Frontier Fund | | |
| | | | | | |
| | /s/ | | Brent Bales | | March 30, 2012 |
| | | | Brent Bales, Principal Financial Officer and Principal Accounting Officer of Equinox Fund Management, LLC, the Managing Owner of The Frontier Fund | | |
| | | | | | |
| | /s/ | | Richard E. Bornhoft | | March 30, 2012 |
| | | | Richard E. Bornhoft, Member of the Executive Committee of The Frontier Fund | | |
| | | | Chief Investment Officer of Equinox Fund Management, LLC, the Managing Owner of The Frontier Fund | | |
| | | | | | |
| | /s/ | | David P. DeMuth | | March 30, 2012 |
| | | | David P. DeMuth, Member of the Executive Committee of The Frontier Fund | | |
E-3
SIGNATURES
Pursuant to the requirements of the Securities Exchange Act of 1934, the registrant has duly caused this report to be signed on its behalf by the undersigned thereunto duly authorized.
| | | | | | | | |
| | | | Winton Series, |
| | | | a Series of The Frontier Fund (Registrant) |
| | | |
| Date: March 30, 2012 | | | | By: | | /S/ ROBERT J. ENCK |
| | | | | | | | Robert J. Enck |
| | | | | | | | President and Chief Executive Officer of Equinox Fund Management, LLC, the Managing Owner of The Frontier Fund |
Pursuant to the requirements of the Securities Exchange Act of 1934, this report has been signed below by the following persons on behalf of the registrant and in the capacities and on the dates indicated.
Equinox Fund Management, LLC
| | | | | | |
| BY: | | /s/ | | Robert J. Enck | | March 30, 2012 |
| | | | Robert J. Enck, Chairman and Member of the Executive Committee of The Frontier Fund | | |
| | | | President and Chief Executive Officer of Equinox Fund Management, LLC, the Managing Owner of The Frontier Fund | | |
| | | | | | |
| | /s/ | | Brent Bales | | March 30, 2012 |
| | | | Brent Bales, Principal Financial Officer and Principal Accounting Officer of Equinox Fund Management, LLC, the Managing Owner of The Frontier Fund | | |
| | | | | | |
| | /s/ | | Richard E. Bornhoft | | March 30, 2012 |
| | | | Richard E. Bornhoft, Member of the Executive Committee of The Frontier Fund | | |
| | | | Chief Investment Officer of Equinox Fund Management, LLC, the Managing Owner of The Frontier Fund | | |
| | | | | | |
| | /s/ | | David P. DeMuth | | March 30, 2012 |
| | | | David P. DeMuth, Member of the Executive Committee of The Frontier Fund | | |
E-4
Pursuant to the requirements of the Securities Exchange Act of 1934, this report has been signed below by the following persons on behalf of the registrant and in the capacities and on the dates indicated.
Equinox Fund Management, LLC
| | | | | | |
| BY: | | /s/ | | Robert J. Enck | | March 30, 2012 |
| | | | Robert J. Enck, Chairman and Member of the Executive Committee of The Frontier Fund | | |
| | | | President and Chief Executive Officer of Equinox Fund Management, LLC, the Managing Owner of The Frontier Fund | | |
| | | | | | |
| | /s/ | | Brent Bales | | March 30, 2012 |
| | | | Brent Bales, Principal Financial Officer and Principal Accounting Officer of Equinox Fund Management, LLC, the Managing Owner of The Frontier Fund | | |
| | | | | | |
| | /s/ | | Richard E. Bornhoft | | March 30, 2012 |
| | | | Richard E. Bornhoft, Member of the Executive Committee of The Frontier Fund | | |
| | | | Chief Investment Officer of Equinox Fund Management, LLC, the Managing Owner of The Frontier Fund | | |
| | | | | | |
| | /s/ | | David P. DeMuth | | March 30, 2012 |
| | | | David P. DeMuth, Member of the Executive Committee of The Frontier Fund | | |
E-5
SIGNATURES
Pursuant to the requirements of the Securities Exchange Act of 1934, the registrant has duly caused this report to be signed on its behalf by the undersigned thereunto duly authorized.
| | | | | | | | |
| | | | Tiverton/Graham/Transtrend Series, |
| | | | a Series of The Frontier Fund (Registrant) |
| | | |
| Date: March 30, 2012 | | | | By: | | /S/ ROBERT J. ENCK |
| | | | | | | | Robert J. Enck |
| | | | | | | | President and Chief Executive Officer of Equinox Fund Management, LLC, the Managing Owner of The Frontier Fund |
Pursuant to the requirements of the Securities Exchange Act of 1934, this report has been signed below by the following persons on behalf of the registrant and in the capacities and on the dates indicated.
Equinox Fund Management, LLC
| | | | | | |
| BY: | | /s/ | | Robert J. Enck | | March 30, 2012 |
| | | | Robert J. Enck, Chairman and Member of the Executive Committee of The Frontier Fund | | |
| | | | President and Chief Executive Officer of Equinox Fund Management, LLC, the Managing Owner of The Frontier Fund | | |
| | | | | | |
| | /s/ | | Brent Bales | | March 30, 2012 |
| | | | Brent Bales, Principal Financial Officer and Principal Accounting Officer of Equinox Fund Management, LLC, the Managing Owner of The Frontier Fund | | |
| | | | | | |
| | /s/ | | Richard E. Bornhoft | | March 30, 2012 |
| | | | Richard E. Bornhoft, Member of the Executive Committee of The Frontier Fund | | |
| | | | Chief Investment Officer of Equinox Fund Management, LLC, the Managing Owner of The Frontier Fund | | |
| | | | | | |
| | /s/ | | David P. DeMuth | | March 30, 2012 |
| | | | David P. DeMuth, Member of the Executive Committee of The Frontier Fund | | |
E-6
SIGNATURES
Pursuant to the requirements of the Securities Exchange Act of 1934, the registrant has duly caused this report to be signed on its behalf by the undersigned thereunto duly authorized.
| | | | | | | | |
| | | | Currency Series, |
| | | | a Series of The Frontier Fund (Registrant) |
| | | |
| Date: March 30, 2012 | | | | By: | | /S/ ROBERT J. ENCK |
| | | | | | | | Robert J. Enck |
| | | | | | | | President and Chief Executive Officer of Equinox Fund Management, LLC, the Managing Owner of The Frontier Fund |
Pursuant to the requirements of the Securities Exchange Act of 1934, this report has been signed below by the following persons on behalf of the registrant and in the capacities and on the dates indicated.
Equinox Fund Management, LLC
| | | | | | |
| BY: | | /s/ | | Robert J. Enck | | March 30, 2012 |
| | | | Robert J. Enck, Chairman and Member of the Executive Committee of The Frontier Fund | | |
| | | | President and Chief Executive Officer of Equinox Fund Management, LLC, the Managing Owner of The Frontier Fund | | |
| | | | | | |
| | /s/ | | Brent Bales | | March 30, 2012 |
| | | | Brent Bales, Principal Financial Officer and Principal Accounting Officer of Equinox Fund Management, LLC, the Managing Owner of The Frontier Fund | | |
| | | | | | |
| | /s/ | | Richard E. Bornhoft | | March 30, 2012 |
| | | | Richard E. Bornhoft, Member of the Executive Committee of The Frontier Fund | | |
| | | | Chief Investment Officer of Equinox Fund Management, LLC, the Managing Owner of The Frontier Fund | | |
| | | | | | |
| | /s/ | | David P. DeMuth | | March 30, 2012 |
| | | | David P. DeMuth, Member of the Executive Committee of The Frontier Fund | | |
E-7
SIGNATURES
Pursuant to the requirements of the Securities Exchange Act of 1934, the registrant has duly caused this report to be signed on its behalf by the undersigned thereunto duly authorized.
| | | | | | | | |
| | | | Long Only Commodity Series, |
| | | | a Series of The Frontier Fund (Registrant) |
| | | |
| Date: March 30, 2012 | | | | By: | | /S/ ROBERT J. ENCK |
| | | | | | | | Robert J. Enck |
| | | | | | | | President and Chief Executive Officer of Equinox Fund Management, LLC, the Managing Owner of The Frontier Fund |
Pursuant to the requirements of the Securities Exchange Act of 1934, this report has been signed below by the following persons on behalf of the registrant and in the capacities and on the dates indicated.
Equinox Fund Management, LLC
| | | | | | |
| BY: | | /s/ | | Robert J. Enck | | March 30, 2012 |
| | | | Robert J. Enck, Chairman and Member of the Executive Committee of The Frontier Fund | | |
| | | | President and Chief Executive Officer of Equinox Fund Management, LLC, the Managing Owner of The Frontier Fund | | |
| | | | | | |
| | /s/ | | Brent Bales | | March 30, 2012 |
| | | | Brent Bales, Principal Financial Officer and Principal Accounting Officer of Equinox Fund Management, LLC, the Managing Owner of The Frontier Fund | | |
| | | | | | |
| | /s/ | | Richard E. Bornhoft | | March 30, 2012 |
| | | | Richard E. Bornhoft, Member of the Executive Committee of The Frontier Fund | | |
| | | | Chief Investment Officer of Equinox Fund Management, LLC, the Managing Owner of The Frontier Fund | | |
| | | | | | |
| | /s/ | | David P. DeMuth | | March 30, 2012 |
| | | | David P. DeMuth, Member of the Executive Committee of The Frontier Fund | | |
E-8
SIGNATURES
Pursuant to the requirements of the Securities Exchange Act of 1934, the registrant has duly caused this report to be signed on its behalf by the undersigned thereunto duly authorized.
| | | | | | | | |
| | | | Frontier Long/Short Commodity Series, |
| | | | a Series of The Frontier Fund (Registrant) |
| | | |
| Date: March 30, 2012 | | | | By: | | /S/ ROBERT J. ENCK |
| | | | | | | | Robert J. Enck |
| | | | | | | | President and Chief Executive Officer of Equinox Fund Management, LLC, the Managing Owner of The Frontier Fund |
Pursuant to the requirements of the Securities Exchange Act of 1934, this report has been signed below by the following persons on behalf of the registrant and in the capacities and on the dates indicated.
Equinox Fund Management, LLC
| | | | | | |
| BY: | | /s/ | | Robert J. Enck | | March 30, 2012 |
| | | | Robert J. Enck, Chairman and Member of the Executive Committee of The Frontier Fund | | |
| | | | President and Chief Executive Officer of Equinox Fund Management, LLC, the Managing Owner of The Frontier Fund | | |
| | | | | | |
| | /s/ | | Brent Bales | | March 30, 2012 |
| | | | Brent Bales, Principal Financial Officer and Principal Accounting Officer of Equinox Fund Management, LLC, the Managing Owner of The Frontier Fund | | |
| | | | | | |
| | /s/ | | Richard E. Bornhoft | | March 30, 2012 |
| | | | Richard E. Bornhoft, Member of the Executive Committee of The Frontier Fund | | |
| | | | Chief Investment Officer of Equinox Fund Management, LLC, the Managing Owner of The Frontier Fund | | |
| | | | | | |
| | /s/ | | David P. DeMuth | | March 30, 2012 |
| | | | David P. DeMuth, Member of the Executive Committee of The Frontier Fund | | |
E-9
SIGNATURES
Pursuant to the requirements of the Securities Exchange Act of 1934, the registrant has duly caused this report to be signed on its behalf by the undersigned thereunto duly authorized.
| | | | | | | | |
| | | | Managed Futures Index Series, |
| | | | a Series of The Frontier Fund (Registrant) |
| | | |
| Date: March 30, 2012 | | | | By: | | /S/ ROBERT J. ENCK |
| | | | | | | | Robert J. Enck |
| | | | | | | | President and Chief Executive Officer of Equinox Fund Management, LLC, the Managing Owner of The Frontier Fund |
Pursuant to the requirements of the Securities Exchange Act of 1934, this report has been signed below by the following persons on behalf of the registrant and in the capacities and on the dates indicated.
Equinox Fund Management, LLC
| | | | | | |
| BY: | | /s/ | | Robert J. Enck | | March 30, 2012 |
| | | | Robert J. Enck, Chairman and Member of the Executive Committee of The Frontier Fund | | |
| | | | President and Chief Executive Officer of Equinox Fund Management, LLC, the Managing Owner of The Frontier Fund | | |
| | | | | | |
| | /s/ | | Brent Bales | | March 30, 2012 |
| | | | Brent Bales, Principal Financial Officer and Principal Accounting Officer of Equinox Fund Management, LLC, the Managing Owner of The Frontier Fund | | |
| | | | | | |
| | /s/ | | Richard E. Bornhoft | | March 30, 2012 |
| | | | Richard E. Bornhoft, Member of the Executive Committee of The Frontier Fund | | |
| | | | Chief Investment Officer of Equinox Fund Management, LLC, the Managing Owner of The Frontier Fund | | |
| | | | | | |
| | /s/ | | David P. DeMuth | | March 30, 2012 |
| | | | David P. DeMuth, Member of the Executive Committee of The Frontier Fund | | |
E-10
SIGNATURES
Pursuant to the requirements of the Securities Exchange Act of 1934, the registrant has duly caused this report to be signed on its behalf by the undersigned thereunto duly authorized.
| | | | | | | | |
| | | | Frontier Diversified Series, |
| | | | a Series of The Frontier Fund (Registrant) |
| | | |
| Date: March 30, 2012 | | | | By: | | /S/ ROBERT J. ENCK |
| | | | | | | | Robert J. Enck |
| | | | | | | | President and Chief Executive Officer of Equinox Fund Management, LLC, the Managing Owner of The Frontier Fund |
Pursuant to the requirements of the Securities Exchange Act of 1934, this report has been signed below by the following persons on behalf of the registrant and in the capacities and on the dates indicated.
Equinox Fund Management, LLC
| | | | | | |
| BY: | | /s/ | | Robert J. Enck | | March 30, 2012 |
| | | | Robert J. Enck, Chairman and Member of the Executive Committee of The Frontier Fund | | |
| | | | President and Chief Executive Officer of Equinox Fund Management, LLC, the Managing Owner of The Frontier Fund | | |
| | | | | | |
| | /s/ | | Brent Bales | | March 30, 2012 |
| | | | Brent Bales, Principal Financial Officer and Principal Accounting Officer of Equinox Fund Management, LLC, the Managing Owner of The Frontier Fund | | |
| | | | | | |
| | /s/ | | Richard E. Bornhoft | | March 30, 2012 |
| | | | Richard E. Bornhoft, Member of the Executive Committee of The Frontier Fund | | |
| | | | Chief Investment Officer of Equinox Fund Management, LLC, the Managing Owner of The Frontier Fund | | |
| | | | | | |
| | /s/ | | David P. DeMuth | | March 30, 2012 |
| | | | David P. DeMuth, Member of the Executive Committee of The Frontier Fund | | |
E-11
SIGNATURES
Pursuant to the requirements of the Securities Exchange Act of 1934, the registrant has duly caused this report to be signed on its behalf by the undersigned thereunto duly authorized.
| | | | | | | | |
| | | | Frontier Dynamic Series, |
| | | | a Series of The Frontier Fund (Registrant) |
| | | |
| Date: March 30, 2012 | | | | By: | | /S/ ROBERT J. ENCK |
| | | | | | | | Robert J. Enck |
| | | | | | | | President and Chief Executive Officer of Equinox Fund Management, LLC, the Managing Owner of The Frontier Fund |
Pursuant to the requirements of the Securities Exchange Act of 1934, this report has been signed below by the following persons on behalf of the registrant and in the capacities and on the dates indicated.
Equinox Fund Management, LLC
| | | | | | |
| BY: | | /s/ | | Robert J. Enck | | March 30, 2012 |
| | | | Robert J. Enck, Chairman and Member of the Executive Committee of The Frontier Fund | | |
| | | | President and Chief Executive Officer of Equinox Fund Management, LLC, the Managing Owner of The Frontier Fund | | |
| | | | | | |
| | /s/ | | Brent Bales | | March 30, 2012 |
| | | | Brent Bales, Principal Financial Officer and Principal Accounting Officer of Equinox Fund Management, LLC, the Managing Owner of The Frontier Fund | | |
| | | | | | |
| | /s/ | | Richard E. Bornhoft | | March 30, 2012 |
| | | | Richard E. Bornhoft, Member of the Executive Committee of The Frontier Fund | | |
| | | | Chief Investment Officer of Equinox Fund Management, LLC, the Managing Owner of The Frontier Fund | | |
| | | | | | |
| | /s/ | | David P. DeMuth | | March 30, 2012 |
| | | | David P. DeMuth, Member of the Executive Committee of The Frontier Fund | | |
E-12
SIGNATURES
Pursuant to the requirements of the Securities Exchange Act of 1934, the registrant has duly caused this report to be signed on its behalf by the undersigned thereunto duly authorized.
| | | | | | | | |
| | | | Frontier Masters Series, |
| | | | a Series of The Frontier Fund (Registrant) |
| | | |
| Date: March 30, 2012 | | | | By: | | /S/ ROBERT J. ENCK |
| | | | | | | | Robert J. Enck |
| | | | | | | | President and Chief Executive Officer of Equinox Fund Management, LLC, the Managing Owner of The Frontier Fund |
Pursuant to the requirements of the Securities Exchange Act of 1934, this report has been signed below by the following persons on behalf of the registrant and in the capacities and on the dates indicated.
Equinox Fund Management, LLC
| | | | | | |
| BY: | | /s/ | | Robert J. Enck | | March 30, 2012 |
| | | | Robert J. Enck, Chairman and Member of the Executive Committee of The Frontier Fund | | |
| | | | President and Chief Executive Officer of Equinox Fund Management, LLC, the Managing Owner of The Frontier Fund | | |
| | | | | | |
| | /s/ | | Brent Bales | | March 30, 2012 |
| | | | Brent Bales, Principal Financial Officer and Principal Accounting Officer of Equinox Fund Management, LLC, the Managing Owner of The Frontier Fund | | |
| | | | | | |
| | /s/ | | Richard E. Bornhoft | | March 30, 2012 |
| | | | Richard E. Bornhoft, Member of the Executive Committee of The Frontier Fund | | |
| | | | Chief Investment Officer of Equinox Fund Management, LLC, the Managing Owner of The Frontier Fund | | |
| | | | | | |
| | /s/ | | David P. DeMuth | | March 30, 2012 |
| | | | David P. DeMuth, Member of the Executive Committee of The Frontier Fund | | |
E-13