Prospectus Supplement (to Prospectus dated April 30, 2014) | Filed pursuant to Rule 424(b)(3) Registration Statement No. 333-185695 |
EQUINOX FRONTIER FUNDS
(a Delaware statutory trust)
PROSPECTUS SUPPLEMENT
TO
PROSPECTUSAND DISCLOSURE DOCUMENT
DATED APRIL 30, 2014
The following information amends the disclosure in the Prospectus and Disclosure Document dated as of April 30, 2014, as supplemented from time to time (the “Prospectus”). If any statement in this supplement conflicts with a statement in the Prospectus, the statement in this supplement controls. Capitalized terms not defined herein will have the meaning ascribed to such term in the Prospectus.
Equinox Fund Management, LLC
Managing Owner
DATED NOVEMBER 30, 2014
EQUINOX FRONTIER FUNDS
EQUINOX FRONTIER DIVERSIFIED FUND; EQUINOX FRONTIER LONG/SHORT COMMODITY FUND; EQUINOX FRONTIER MASTERS FUND
Supplement dated November 30, 2014 to the Prospectus and Disclosure Document dated as of April 30, 2014
The fourth paragraph under the heading “SUMMARY—The Units” is hereby deleted in its entirety and replaced with the following:
The percentage return (and associated dollar amount) that your investment must earn in the indicated series, after taking into account estimated interest income, in order to break-even after one year is as follows (please see the “Break-Even Analysis” on page 16): Equinox Frontier Diversified Fund: Class 1 – 5.55% ($55.53); Class 2 – 3.23% ($32.35); Class 3 – 2.90% ($29.04); Equinox Frontier Masters Fund: Class 1 – 6.19% ($61.87); Class 2 – 4.00% ($40.00); Class 3 – 3.69% ($36.87); and Equinox Frontier Long/Short Commodity Fund: Class 1a – 7.64% ($76.39); Class 2a – 5.45% ($54.50); Class 3a – 5.14% ($51.37).
The chart under the heading “SUMMARY—Fees and Expenses” is hereby deleted in its entirety and replaced with the following:
Series | Initial Service Fee(1) | Ongoing Service Fee(2) | Management Fee(3) | Incentive Fee (4) | Brokerage Commission (5) | Interest Expense (6) | Due Diligence (7) | |||||||||||||||||||||
| % | % | % | % | % | % | % | ||||||||||||||||||||||
Frontier | ||||||||||||||||||||||||||||
Diversified | ||||||||||||||||||||||||||||
Class 1 | 2 | 2 | 0.75 | 25 | 2.75 | 0.54 | 0.12 | |||||||||||||||||||||
Class 2 | 0 | 0.25 | 0.75 | 25 | 2.75 | 0.54 | 0.12 | |||||||||||||||||||||
Class 3(8) | 0 | 0 | 0.75 | 25 | 2.75 | 0.54 | 0.12 | |||||||||||||||||||||
Frontier | ||||||||||||||||||||||||||||
Masters | ||||||||||||||||||||||||||||
Class 1 | 2 | 2 | 2 | 20 | 2.33 | 0.54 | 0.12 | |||||||||||||||||||||
Class 2 | 0 | 0.25 | 2 | 20 | 2.33 | 0.54 | 0.12 | |||||||||||||||||||||
Class 3(8) | �� | 0 | 0 | 2 | 20 | 2.33 | 0.54 | 0.12 | ||||||||||||||||||||
Frontier | ||||||||||||||||||||||||||||
Long/Short Commodity | ||||||||||||||||||||||||||||
Class 1a | 2 | 2 | 2 | 20 | 2.29 | 0.54 | 0.12 | |||||||||||||||||||||
Class 2a | 0 | 0.25 | 2 | 20 | 2.29 | 0.54 | 0.12 | |||||||||||||||||||||
Class 3a(8) | 0 | 0 | 2 | 20 | 2.29 | 0.54 | 0.12 | |||||||||||||||||||||
- 2 -
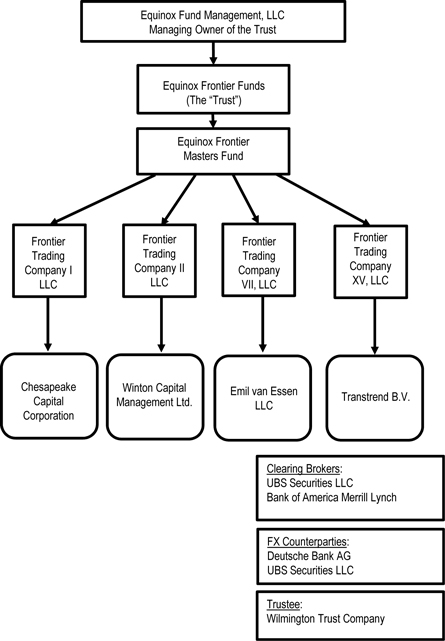
The organizational chart under the heading “SUMMARY—Organizational Charts—Equinox Frontier Masters Fund” is hereby deleted in its entirety and replaced with the following:
Equinox Frontier Masters Fund
- 3 -
The section entitled “BREAK-EVEN ANALYSIS” is hereby deleted in its entirety and replaced with the following:
BREAK-EVEN ANALYSIS
Following are tables that set forth the fees and expenses that you would incur on an investment of $1,000 in each class of each series of the trust and the amount that your investment must earn, after taking into account estimated interest income, in order to break-even after one year. The fees and expenses applicable to each series are described above. The footnotes below are an integral part of the Break-Even Analysis. The numbers appearing in the table below have been rounded for ease of analysis.
EQUINOX FRONTIER DIVERSIFIED FUND
| Class 1 | Class 2 | Class 3(8) | ||||||||||||||||||||||
| $ | % | $ | % | $ | % | |||||||||||||||||||
Management Fee(1) | 21.52 | 2.15 | 21.52 | 2.15 | 21.52 | 2.15 | ||||||||||||||||||
Service Fee(2) | 20.00 | 2.00 | 2.50 | 0.25 | 0.00 | 0.00 | ||||||||||||||||||
Brokerage Commissions and Investment and Trading Fees and Expenses(3, 9) | 27.53 | 2.75 | 27.53 | 2.75 | 27.53 | 2.75 | ||||||||||||||||||
Incentive Fee(4) | 6.88 | 0.69 | 1.20 | 0.12 | 0.39 | 0.04 | ||||||||||||||||||
Less Interest income (5, 9) | -21.60 | -2.16 | -21.60 | -2.16 | -21.60 | -2.16 | ||||||||||||||||||
Due Diligence and Custodial Fees and Expenses(6, 9) | 1.20 | 0.12 | 1.20 | 0.12 | 1.20 | 0.12 | ||||||||||||||||||
Redemption Fee(7) | 0.00 | 0.00 | 0.00 | 0.00 | 0.00 | 0.00 | ||||||||||||||||||
Trading profit the series must earn for you to recoup your investment after one year | 55.53 | 5.55 | 32.35 | 3.23 | 29.04 | 2.90 | ||||||||||||||||||
EQUINOX FRONTIER MASTERS FUND
| Class 1 | Class 2 | Class 3(8) | ||||||||||||||||||||||
| $ | % | $ | % | $ | % | |||||||||||||||||||
Management Fee(1) | 33.68 | 3.37 | 33.68 | 3.37 | 33.68 | 3.37 | ||||||||||||||||||
Service Fee(2) | 20.00 | 2.00 | 2.50 | 0.25 | 0.00 | 0.00 | ||||||||||||||||||
Brokerage Commissions and Investment and Trading Fees and Expenses(3, 9) | 23.30 | 2.33 | 23.30 | 2.33 | 23.30 | 2.33 | ||||||||||||||||||
Incentive Fee(4) | 5.30 | 0.53 | 0.93 | 0.09 | 0.30 | 0.03 | ||||||||||||||||||
Less Interest income (5, 9) | -21.60 | -2.16 | -21.60 | -2.16 | -21.60 | -2.16 | ||||||||||||||||||
Due Diligence and Custodial Fees and Expenses(6, 9) | 1.20 | 0.12 | 1.20 | 0.12 | 1.20 | 0.12 | ||||||||||||||||||
Redemption Fee(7) | 0.00 | 0.00 | 0.00 | 0.00 | 0.00 | 0.00 | ||||||||||||||||||
Trading profit the series must earn for you to recoup your investment after one year | 61.87 | 6.19 | 40.00 | 4.00 | 36.87 | 3.69 | ||||||||||||||||||
EQUINOX FRONTIER LONG/SHORT COMMODITY FUND
| Class 1a | Class 2a | Class 3a(8) | ||||||||||||||||||||||
| $ | % | $ | % | $ | % | |||||||||||||||||||
Management Fee(1) | 48.54 | 4.85 | 48.54 | 4.85 | 48.54 | 4.85 | ||||||||||||||||||
Service Fee(2) | 20.00 | 2.00 | 2.50 | 0.25 | 0.00 | 0.00 | ||||||||||||||||||
Brokerage Commissions and Investment and Trading Fees and Expenses(3, 9) | 22.93 | 2.29 | 22.93 | 2.29 | 22.93 | 2.29 | ||||||||||||||||||
Incentive Fee(4) | 5.32 | 0.53 | 0.93 | 0.09 | 0.30 | 0.03 | ||||||||||||||||||
Less Interest income (5, 9) | -21.60 | -2.16 | -21.60 | -2.16 | -21.60 | -2.16 | ||||||||||||||||||
Due Diligence and Custodial Fees and Expenses(6, 9) | 1.20 | 0.12 | 1.20 | 0.12 | 1.20 | 0.12 | ||||||||||||||||||
Redemption Fee(7) | 0.00 | 0.00 | 0.00 | 0.00 | 0.00 | 0.00 | ||||||||||||||||||
Trading profit the series must earn for you to recoup your investment after one year | 76.39 | 7.64 | 54.50 | 5.45 | 51.37 | 5.14 | ||||||||||||||||||
- 4 -
| (1) | The percentage figures indicated above reflect the estimated percentage of net asset value of the relevant series payable to the managing owner (or otherwise charged to the series indirectly through a swap or other derivative instruments) in respect of the management fee based upon the Relevant Rate of such management fee for such series and the estimated level of nominal assets for such series calculated as the average level of nominal assets allocated to CTAs (excluding any allocation in respect of QFIT) for such series at the end of each of the previous 12 months. The “Relevant Rate” of the management fee for each series is equal to the weighted average of (i) the management fee rate charged to the series by the managing owner as set forth herein on page 10 under “Fees and Expenses” and (ii) the weighted average management fee embedded in any swaps or other derivative instruments owned by such series. The Relevant Rate of the management fee for each series is 0.76% of nominal assets in respect of Equinox Frontier Diversified Fund, 2.00% of nominal assets in respect of Equinox Frontier Masters Fund and 1.99% of nominal assets in respect of Equinox Frontier Long/Short Commodity Fund. The estimated level of nominal assets allocated to CTAs (excluding any allocation in respect of QFIT) for each series is 258% of net asset value in respect of Equinox Frontier Diversified Fund, 160% of net asset value in respect of Equinox Frontier Masters Fund and 236% of net asset value in respect of Equinox Frontier Long/Short Commodity Fund. |
The percentage figure indicated above also includes an estimated portion of the management fees that are charged in respect of QFIT based upon the reduced management fee rate of 0.25% per annum and an estimated allocation to QFIT calculated based upon the average level of nominal assets allocated to QFIT for such series at the end of each month since the managing owner began to allocate to QFIT in order to hedge its cash management investments in November 2013. The estimated level of nominal assets allocated to QFIT for each series is 64.64% of net asset value in respect of Equinox Frontier Diversified Fund, 55.47% of net asset value in respect of Equinox Frontier Masters Fund and 68.80% of net asset value in respect of Equinox Frontier Long/Short Commodity Fund. For further detail about management fees payable to the managing owner see footnote 3 under “Fees and Expenses.”
| (2) | See footnotes 1 and 2 under “Fees and Expenses.” |
| (3) | See footnote 5 under “Fees and Expenses.” |
| (4) | The figures above are calculated based upon the weighted average of (i) the incentive fee rate charged to the series by the managing owner as set forth herein on page 10 under “Fees and Expenses” and (ii) the weighted average incentive fee embedded in any swaps or other derivative instruments owned by such series. The resulting incentive fee rate utilized for each series is 24.51% of new trading profits in respect of Equinox Frontier Diversified Fund, 20.0% of new trading profits in respect of Equinox Frontier Masters Fund and 20.05% of new trading profits in respect of Equinox Frontier Long/Short Commodity Fund. A portion of the 2% initial service fee and ongoing service fee is not deductible on the incentive fee calculation with respect to certain trading advisors, thereby requiring class 1 to achieve trading profits in an amount that, after being reduced by a corresponding incentive fee, offsets such nondeductible portion. Otherwise, incentive fees are paid to trading advisors only on new trading profits earned by the trading advisor. |
| (5) | See footnote 6 under “Fees and Expenses.” |
| (6) | See footnote 7 under “Fees and Expenses.” |
| (7) | Investors who redeem all or a portion of their class 1 or 1a units during the first 12 months following the effective date of their purchase will be subject to a redemption fee of up to 2.0% of the purchase price of any units redeemed to reimburse the managing owner for the then-unamortized balance of the prepaid initial service fee relating to such units. There are no redemption fees associated with the class 2, 2a, 3 or 3a units. At the end of 12 months, no redemption fee will apply. |
| (8) | Class 3 is not being offered to investors pursuant to this prospectus.See footnote 8 under “Fees and Expenses.” |
| (9) | These fees and expenses may not be paid directly by the series; rather may be an element of the pricing of swap and derivative instruments. Such fees and expenses are estimated based on our historical experience. |
- 5 -
The chart under the heading“FEES AND EXPENSES—Summary Table of Fees and Expenses” is hereby deleted in its entirety and replaced with the following:
Series | Initial Service Fee(1) | Ongoing Service Fee(2) | Management Fee(3) | Incentive Fee(4) | Brokerage Commission (5) | Interest Expense (6) | Due Diligence (7) | |||||||||||||||||||||
| % | % | % | % | % | % | % | ||||||||||||||||||||||
Diversified | ||||||||||||||||||||||||||||
Class 1 | 2 | 2 | 0.75 | 25 | 2.75 | 0.54 | 0.12 | |||||||||||||||||||||
Class 2 | 0 | 0.25 | 0.75 | 25 | 2.75 | 0.54 | 0.12 | |||||||||||||||||||||
Class 3(8) | 0 | 0 | 0.75 | 25 | 2.75 | 0.54 | 0.12 | |||||||||||||||||||||
Masters | ||||||||||||||||||||||||||||
Class 1 | 2 | 2 | 2 | 20 | 2.33 | 0.54 | 0.12 | |||||||||||||||||||||
Class 2 | 0 | 0.25 | 2 | 20 | 2.33 | 0.54 | 0.12 | |||||||||||||||||||||
Class 3(8) | 0 | 0 | 2 | 20 | 2.33 | 0.54 | 0.12 | |||||||||||||||||||||
Long/Short Commodity | ||||||||||||||||||||||||||||
Class 1a | 2 | 2 | 2 | 20 | 2.29 | 0.54 | 0.12 | |||||||||||||||||||||
Class 2a | 0 | 0.25 | 2 | 20 | 2.29 | 0.54 | 0.12 | |||||||||||||||||||||
Class 3a (8) | 0 | 0 | 2 | 20 | 2.29 | 0.54 | 0.12 | |||||||||||||||||||||
- 6 -
New Trading Advisors for Equinox Frontier Masters Fund
Effective November 26, 2014, the Equinox Frontier Masters Fund added Emil van Essen LLC as a major commodity trading advisor.
The current major commodity trading advisors and/or reference programs for the Equinox Frontier Masters Fund are:
| • | Chesapeake Capital Corporation; |
| • | Emil van Essen LLC; |
| • | Transtrend B.V.; and |
| • | Winton Capital Management Ltd. |
As of November 30, 2014, the allocation of the assets of the Equinox Frontier Masters Fund between the trading advisors was as follows (however, the actual allocation among trading advisors for the Equinox Frontier Masters Fund will vary based on the relative trading performance of the trading advisors and/or reference programs, and the managing owner may otherwise vary such percentages from time to time in its sole discretion):
Advisor | Allocation as of November 30, 2014 (expressed as a percentage of aggregate notional exposure to commodity trading programs) | |||
Chesapeake Capital Corporation | 26.1 | % | ||
Emil van Essen LLC | 17.1 | % | ||
Transtrend B.V. | 26.1 | % | ||
Winton Capital Management Ltd. | 30.7 | % | ||
The managing owner anticipates that up to 40% of the assets of the Equinox Frontier Masters Fund may be allocated to each of the major commodity trading advisors of Equinox Frontier Masters Fund at any time.
Information about Emil van Essen, LLC
Background
Emil van Essen, LLC (EvE) is a 12 person Chicago-based CTA that specializes in real alpha commodity strategies with the goal of low to negative correlation with other CTA and commodity funds. EvE launched its flagship Spread Trading Program (STP) in 2006 during the rapid growth of commodity funds. The Multi-Strategy Program (MSP) is an approximate 50/50 combination of the Spread Trading Program (STP) and the Long-Short Commodity Program (LSCP). STP seeks non-correlated alpha through the spread and relative value trading of exchange-listed futures and options that are primarily commodity contracts. Quantitative research and significant discretion are used in trade selection. The LSCP is a short to medium-term systematic program with a discretionary overlay that trades outright positions on 13 exchange-listed commodity futures contracts. The program uses multiple trend models on both outright and calendar spread data and analyzes historical spread levels to generate daily trade signals. Trade signal generation is fully systematic, however, the PM will at times exercise discretion regarding where in the term structure the trade signal will be executed and to overweight or underweight positions based on inter-commodity relationships. The program has a deleveraging component that will systematically reduce position sizes at the portfolio level after periods of rapid gains. The MSP is designed to generate returns that have a low to negative correlation to most CTA and commodity programs. Emil van Essen LLC became registered as a commodity trading advisor and NFA member in August of 2008, and as a commodity pool operator in March of 2011.
Principals
Emil van Essen
Emil van Essen has been the CIO & CEO of Emil van Essen LLC since its registration in August 2008. Mr. van Essen focuses his time on the strategic direction of the firm, research, and trading. Mr. van Essen has extensive
- 7 -
experience in the futures industry in both Canada and the U.S. Emil studied honors mathematics at the University of Waterloo in Waterloo, Ontario from 1983 to 1986. He holds a Series 3 license. Emil has been a member of Mensa, has won awards for achievement in mathematics, and has authored two books on systematic futures trading. Emil has been listed as a principal of Emil van Essen LLC since July of 2008, and registered as an associated person and an NFA associate member of Emil van Essen LLC since August of 2008.
Dennis Callahan
Mr. Callahan has served as the Chief Compliance Officer of Emil Van Essen LLC from December 2012 to present. From March 2011 through December 2012, Mr. Callahan was Director of Trading for Emil van Essen LLC. From December 2001 through March 2011, Dennis worked for Vankar Trading Corp, an introducing broker registered with the CFTC and an entity of which Emil was a principal. Dennis was registered as an associated person with Vankar Trading from January 2002 through March 2011. While registered with Vankar he served in the capacity of Director of Trading. Dennis has a BS in Finance from Western Michigan University. Mr. Callahan has been registered as an NFA associate member and an associated person of Emil van Essen LLC since December of 2010, and listed as a principal of Emil van Essen LLC since March of 2013. Mr. Callahan’s principal listing was pending from December 2012 until March 2013.
Russ Rausch
Russ Rausch began working for Emil van Essen LLC in July 2011 and was registered as the Chief Operating Officer of Emil van Essen LLC in March 2012. Prior to joining Emil van Essen, Raush was the executive vice president, global buy-side sales, managing director New York for Trading Technologies International (TT), a trading software and platform company, from May 1998 through July 2011. Rausch was responsible for managing TT’s New York sales office and their global sales effort to buy-side firms. Rausch first joined TT in May 1998 and has held several senior-level positions, including Chief Financial Officer and Executive Vice President Global Support and Chief Information Officer. Rausch received his B.S. in accounting from Kansas State University. He is a CPA and a member of the American Institute of Certified Public Accountants. Mr. Rausch has been registered as an NFA associate member and an associated person of Emil van Essen LLC since December of 2011, and listed as a principal of Emil van Essen LLC since March of 2012.
John Farley
John Farley joined Emil van Essen, LLC in June 2012. John serves as the Portfolio Manager for the Option Volatility Program at EVE LLC. John has over 16 years of derivative trading experience across a wide range of commodity and equity markets with a specialization in options trading. From May 2009 to May 2012, he established and managed the proprietary energy derivative division of Atlantic Trading USA, a proprietary trading firm with trading across all financial markets, equities, futures, interest rates, Forex, etc. From July 2008 through May 2009, he was an Option Portfolio Manager while at First New York Securities, a proprietary trading firm with trading across all financial markets, equities, futures, interest rates, Forex, etc. From May 2006 through June 2008, John managed a $30 million energy and $50 million equity hedge book at DellaCamera Capital, a multi-strategy hedge fund. From June 1995 to April 2006, John was a proprietary option market maker on the Philadelphia Stock Exchange currency and equity floors, the Chicago Board Options Exchange equity option floor, and the New York Mercantile Exchange. The Philadelphia Stock Exchange is an exchange for options on equity, Forex and interest rates, owned by NASDAQ OMX. The Chicago Board Options Exchange is the largest U.S. equity options exchange. The New York Mercantile Exchange is a commodity futures exchange owned and operated by CME Group of Chicago. John has a BA in Mathematics from Cornell University. Mr. Farley has been registered as an NFA associate member and an associated person of Emil van Essen LLC since December 2012 and has been listed as a principal of Emil van Essen LLC since June 2014.
Emil van Essen LLC and its Principals may, from time to time, trade futures, forwards, and options contracts and securities for their own proprietary accounts. Such trades may or may not be in accordance with the Emil van Essen LLC trading program described below. The trading records of those accounts are available for inspection on Emil van Essen LLC’s premises upon reasonable prior notice and during normal business hours, subject to reasonable assurances of confidentiality.
Emil van Essen LLC and its Principals do not have a beneficial or ownership interest in the Trust or any of the Series.
- 8 -
Trading Approach
The Multi-Strategy Program (MSP) is an approximate 50/50 combination of the Spread Trading Program (STP) and the Long-Short Commodity Program (LSCP). STP seeks non-correlated alpha through the spread and relative value trading of exchange-listed futures and options that are primarily commodity contracts. Quantitative research and significant discretion are used in trade selection. The LSCP is a short to medium-term systematic program with a discretionary overlay that trades outright positions on 13 exchange-listed commodity futures contracts. The program uses multiple trend models on both outright and calendar spread data and analyzes historical spread levels to generate daily trade signals. Trade signal generation is fully systematic, however, the PM will at times exercise discretion regarding where in the term structure the trade signal will be executed and to overweight or underweight positions based on inter-commodity relationships. The program has a deleveraging component that will systematically reduce position sizes at the portfolio level after periods of rapid gains. The MSP is designed to generate returns that have a low to negative correlation to most CTA and commodity programs. The Emil van Essen Spread Trading Program is traded at 2x leverage for the series.
Legal Actions
There have been no material administrative, civil or criminal proceedings against Emil van Essen, LLC or any of its principals, which are pending, are on appeal or have concluded at any time during the last five years.
- 9 -
Past Performance of Emil van Essen, LLC
The Capsule Performance Table which follows presents the performance results of the Emil van Essen Multi-Strategy Program for the period covered by the table.PAST PERFORMANCE IS NOT NECESSARILY INDICATIVE OF FUTURE RESULTS.
Emil van Essen Multi-Strategy Program
Pro-forma fees of 2% management and 20% incentive fee included in performance calculations.
| Month | 2014 | |
January | — | |
February | — | |
March | — | |
April | — | |
May | -3.58% | |
June | 0.24% | |
July | 2.87% | |
August | -0.12% | |
September | -2.53% | |
October | 0.18% | |
November | 1.23% | |
December | 2.00% | |
Year | 0.13% (8 months) |
Name of CTA: | Emil van Essen, LLC | |
Name of program: | Emil van Essen Multi-Strategy Program | |
Inception of trading by CTA: | August 2008 | |
Inception of trading in program: | May 2014 | |
Worst monthly drawdown: | -3.58% (May 2014) | |
Worst peak-to-valley drawdown: | -3.58% (May 2014) | |
Total Assets in the Program: | $39.5 million (August 31, 2014) | |
Total Assets Under Management of the CTA: | $131 million (August 31, 2014) |
| * | Draw-down means losses experienced by the trading program over a specified period. |
| ** | Worst peak-to-valley draw-down means the greatest cumulative percentage decline in month-end net asset value due to losses sustained by the trading program during any period in which the initial month-end net asset value is not equaled or exceeded by a subsequent month-end net asset value. |
- 10 -