Filed pursuant to Rule 424(b)(3)
Registration Statement No. 333-185695
EQUINOX FRONTIER FUNDS
(a Delaware statutory trust)
PROSPECTUS SUPPLEMENT
TO
PROSPECTUSAND DISCLOSURE DOCUMENT
DATED APRIL 30, 2015
The following information amends the disclosure in the Prospectus and Disclosure Document dated as of April 30, 2015, as supplemented from time to time (the “Prospectus”). If any statement in this supplement conflicts with a statement in the Prospectus, the statement in this supplement controls. Capitalized terms not defined herein will have the meaning ascribed to such term in the Prospectus.
Equinox Fund Management, LLC
Managing Owner
DATED SEPTEMBER 22, 2015
EQUINOX FRONTIER FUNDS
EQUINOX FRONTIER DIVERSIFIED FUND; EQUINOX FRONTIER LONG/SHORT COMMODITY
FUND; EQUINOX FRONTIER MASTERS FUND
Supplement dated September 22, 2015 to the Prospectus and Disclosure Document dated as of April 30, 2015
The fourth paragraph under the heading “SUMMARY—The Units” is hereby deleted in its entirety and replaced with the following:
The percentage return (and associated dollar amount) that your investment must earn in the indicated series, after taking into account estimated interest income, in order to break-even after one year is as follows (please see the “Break-Even Analysis” on page 17): Equinox Frontier Diversified Fund: Class 1 – 6.29% ($62.86); Class 2 – 3.99% ($39.86); Class 3 – 3.66% ($36.58); Equinox Frontier Masters Fund: Class 1 – 6.91% ($69.06); Class 2 – 4.72% ($47.19); Class 3 – 4.41% ($44.06); and Equinox Frontier Long/Short Commodity Fund: Class 1a – 7.22% ($72.18); Class 2a – 5.00% ($50.05); Class 3a – 4.69% ($46.88).
The chart under the heading “SUMMARY—Fees and Expenses” is hereby deleted in its entirety and replaced with the following:
Series | Initial Service Fee(1) | Ongoing Service Fee(2) | Management Fee(3) | Incentive Fee (4) | Brokerage Commission (5) | Interest Expense (6) | Due Diligence (7) | |||||||||||||||||||||
| % | % | % | % | % | % | % | ||||||||||||||||||||||
Frontier | ||||||||||||||||||||||||||||
Diversified | ||||||||||||||||||||||||||||
Class 1 | 2 | 2 | 0.75 | 25 | 2.58 | 0.41 | 0.12 | |||||||||||||||||||||
Class 2 | 0 | 0.25 | 0.75 | 25 | 2.58 | 0.41 | 0.12 | |||||||||||||||||||||
Class 3(8) | 0 | 0 | 0.75 | 25 | 2.58 | 0.41 | 0.12 | |||||||||||||||||||||
Frontier | ||||||||||||||||||||||||||||
Masters | ||||||||||||||||||||||||||||
Class 1 | 2 | 2 | 2 | 20 | 2.40 | 0.41 | 0.12 | |||||||||||||||||||||
Class 2 | 0 | 0.25 | 2 | 20 | 2.40 | 0.41 | 0.12 | |||||||||||||||||||||
Class 3(8) | 0 | 0 | 2 | 20 | 2.40 | 0.41 | 0.12 | |||||||||||||||||||||
Frontier | ||||||||||||||||||||||||||||
Long/Short Commodity | ||||||||||||||||||||||||||||
Class 1a | 2 | 2 | 2 | 20 | 2.55 | 0.41 | 0.12 | |||||||||||||||||||||
Class 2a | 0 | 0.25 | 2 | 20 | 2.55 | 0.41 | 0.12 | |||||||||||||||||||||
Class 3a(8) | 0 | 0 | 2 | 20 | 2.55 | 0.41 | 0.12 | |||||||||||||||||||||
- 2 -
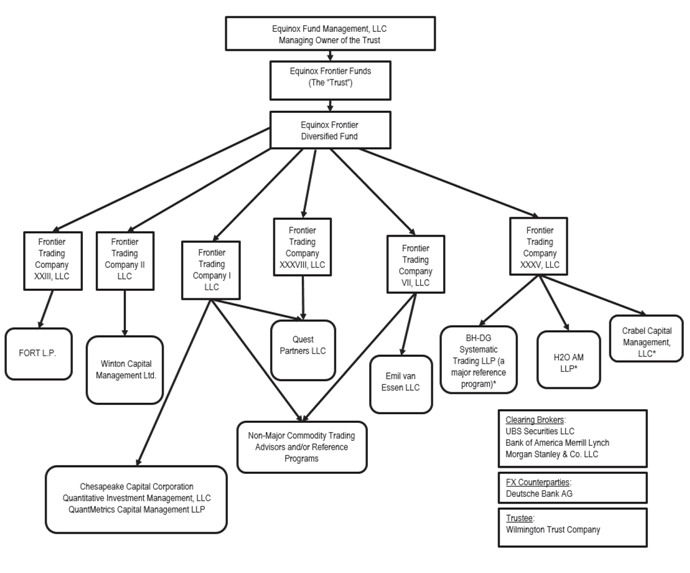
The organizational chart under the heading “SUMMARY—Organizational Charts—Equinox Frontier Diversified Fund” is hereby deleted in its entirety and replaced with the following:
Equinox Frontier Diversified Fund
- 3 -
The organizational chart under the heading “SUMMARY—Organizational Charts—Equinox Frontier Long/Short Commodity Fund” is hereby deleted in its entirety and replaced with the following:
Equinox Frontier Long/Short Commodity Fund
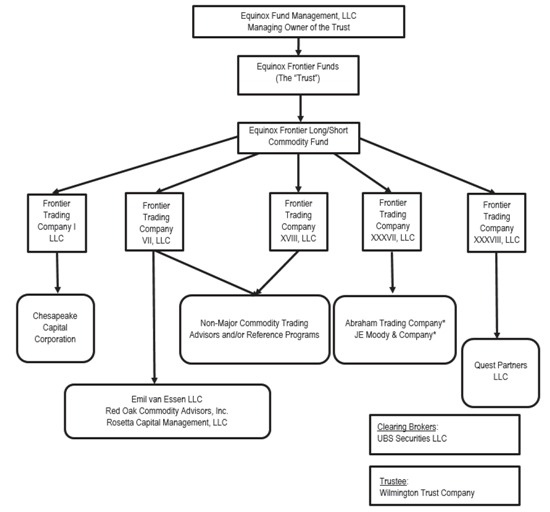
| * | CTA is accessed by an over-the-counter total return swap. |
- 4 -
The section entitled “BREAK-EVEN ANALYSIS” is hereby deleted in its entirety and replaced with the following:
BREAK-EVEN ANALYSIS
Following are tables that set forth the fees and expenses that you would incur on an investment of $1,000 in each class of each series of the trust and the amount that your investment must earn, after taking into account estimated interest income, in order to break-even after one year. The fees and expenses applicable to each series are described above. The footnotes below are an integral part of the Break-Even Analysis. The numbers appearing in the table below have been rounded for ease of analysis.
EQUINOX FRONTIER DIVERSIFIED FUND
| Class 1 | Class 2 | Class 3(8) | ||||||||||||||||||||||
| $ | % | $ | % | $ | % | |||||||||||||||||||
Management Fee(1) | 25.51 | 2.55 | 25.51 | 2.55 | 25.51 | 2.55 | ||||||||||||||||||
Service Fee(2) | 20.00 | 2.00 | 2.50 | 0.25 | 0.00 | 0.00 | ||||||||||||||||||
Brokerage Commissions and Investment and Trading Fees and Expenses(3, 9) | 25.81 | 2.58 | 25.81 | 2.58 | 25.81 | 2.58 | ||||||||||||||||||
Incentive Fee(4) | 6.66 | 0.67 | 1.16 | 0.12 | 0.38 | 0.04 | ||||||||||||||||||
Less Interest income (5, 9) | -16.32 | -1.63 | -16.32 | -1.63 | -16.32 | -1.63 | ||||||||||||||||||
Due Diligence and Custodial Fees and Expenses(6, 9) | 1.20 | 0.12 | 1.20 | 0.12 | 1.20 | 0.12 | ||||||||||||||||||
Redemption Fee(7) | 0.00 | 0.00 | 0.00 | 0.00 | 0.00 | 0.00 | ||||||||||||||||||
Trading profit the series must earn for you to recoup your investment after one year | 62.86 | 6.29 | 39.86 | 3.99 | 36.58 | 3.66 | ||||||||||||||||||
EQUINOX FRONTIER MASTERS FUND
| Class 1 | Class 2 | Class 3(8) | ||||||||||||||||||||||
| $ | % | $ | % | $ | % | |||||||||||||||||||
Management Fee(1) | 34.87 | 3.49 | 34.87 | 3.49 | 34.87 | 3.49 | ||||||||||||||||||
Service Fee(2) | 20.00 | 2.00 | 2.50 | 0.25 | 0.00 | 0.00 | ||||||||||||||||||
Brokerage Commissions and Investment and Trading Fees and Expenses(3, 9) | 24.01 | 2.40 | 24.01 | 2.40 | 24.01 | 2.40 | ||||||||||||||||||
Incentive Fee(4) | 5.30 | 0.53 | 0.93 | 0.09 | 0.30 | 0.03 | ||||||||||||||||||
Less Interest income (5, 9) | -16.32 | -1.63 | -16.32 | -1.63 | -16.32 | -1.63 | ||||||||||||||||||
Due Diligence and Custodial Fees and Expenses(6, 9) | 1.20 | 0.12 | 1.20 | 0.12 | 1.20 | 0.12 | ||||||||||||||||||
Redemption Fee(7) | 0.00 | 0.00 | 0.00 | 0.00 | 0.00 | 0.00 | ||||||||||||||||||
Trading profit the series must earn for you to recoup your investment after one year | 69.06 | 6.91 | 47.19 | 4.72 | 44.06 | 4.41 | ||||||||||||||||||
EQUINOX FRONTIER LONG/SHORT COMMODITY FUND
| Class 1a | Class 2a | Class 3a(8) | ||||||||||||||||||||||
| $ | % | $ | % | $ | % | |||||||||||||||||||
Management Fee(1) | 37.93 | 3.79 | 37.93 | 3.79 | 37.93 | 3.79 | ||||||||||||||||||
Service Fee(2) | 20.00 | 2.00 | 2.50 | 0.25 | 0.00 | 0.00 | ||||||||||||||||||
Brokerage Commissions and Investment and Trading Fees and Expenses(3, 9) | 25.52 | 2.55 | 25.52 | 2.55 | 25.52 | 2.55 | ||||||||||||||||||
Incentive Fee(4) | 5.61 | 0.56 | 0.98 | 0.10 | 0.32 | 0.03 | ||||||||||||||||||
Less Interest income (5, 9) | -18.08 | -1.81 | -18.08 | -1.81 | -18.08 | -1.81 | ||||||||||||||||||
Due Diligence and Custodial Fees and Expenses(6, 9) | 1.20 | 0.12 | 1.20 | 0.12 | 1.20 | 0.12 | ||||||||||||||||||
Redemption Fee(7) | 0.00 | 0.00 | 0.00 | 0.00 | 0.00 | 0.00 | ||||||||||||||||||
Trading profit the series must earn for you to recoup your investment after one year | 72.18 | 7.22 | 50.05 | 5.00 | 46.88 | 4.69 | ||||||||||||||||||
- 5 -
| (1) | The percentage figures indicated above reflect the estimated percentage of net asset value of the relevant series payable to the managing owner (or otherwise charged to the series indirectly through a swap or other derivative instruments) in respect of the management fee based upon the Relevant Rate of such management fee for such series and the estimated level of nominal assets for such series calculated as the average level of nominal assets allocated to CTAs (excluding any allocation in respect of QFIT) for such series at the end of each of the previous 12 months. The “Relevant Rate” of the management fee for each series is equal to the weighted average of (i) the management fee rate charged to the series by the managing owner as set forth herein on page 10 under the heading “Summary—Fees and Expenses” and (ii) the weighted average management fee embedded in any swaps or other derivative instruments owned by such series. The Relevant Rate of the management fee for each series is 0.80% of nominal assets in respect of Equinox Frontier Diversified Fund, 2.00% of nominal assets in respect of Equinox Frontier Masters Fund and 1.91% of nominal assets in respect of Equinox Frontier Long/Short Commodity Fund. The estimated level of nominal assets allocated to CTAs (excluding any allocation in respect of QFIT) for each series is 301% of net asset value in respect of Equinox Frontier Diversified Fund, 167% of net asset value in respect of Equinox Frontier Masters Fund and 193% of net asset value in respect of Equinox Frontier Long/Short Commodity Fund. |
The percentage figure indicated above also includes an estimated portion of the management fees that are charged in respect of QFIT based upon the reduced management fee rate of 0.25% per annum and an estimated allocation to QFIT calculated based upon the average level of nominal assets allocated to QFIT for such series at the end of each month since the managing owner began to allocate to QFIT in order to hedge its cash management investments in November 2013. The estimated level of nominal assets allocated to QFIT for each series is 57.88% of net asset value in respect of Equinox Frontier Diversified Fund, 56.20% of net asset value in respect of Equinox Frontier Masters Fund and 47.65% of net asset value in respect of Equinox Frontier Long/Short Commodity Fund. For further detail about management fees payable to the managing owner see footnote 3 on page 10 under the heading “Summary—Fees and Expenses” and on page 72 under the heading “Fees and Expenses.”
| (2) | See footnotes 1 and 2 on page 10 under the heading “Summary—Fees and Expenses” and on page 72 under the heading “Fees and Expenses.” |
| (3) | See footnote 5 on page 11 under the heading “Summary—Fees and Expenses” and on page 73 under the heading “Fees and Expenses.” |
| (4) | The figures above are calculated based upon the weighted average of (i) the incentive fee rate charged to the series by the managing owner as set forth herein on page 10 under “Summary—Fees and Expenses” and (ii) the weighted average incentive fee embedded in any swaps or other derivative instruments owned by such series. The resulting incentive fee rate utilized for each series is 24.51% of new trading profits in respect of Equinox Frontier Diversified Fund, 20.0% of new trading profits in respect of Equinox Frontier Masters Fund and 20.94% of new trading profits in respect of Equinox Frontier Long/Short Commodity Fund. A portion of the 2% initial service fee and ongoing service fee is not deductible on the incentive fee calculation with respect to certain trading advisors, thereby requiring class 1 to achieve trading profits in an amount that, after being reduced by a corresponding incentive fee, offsets such nondeductible portion. Otherwise, incentive fees are paid to trading advisors only on new trading profits earned by the trading advisor. |
| (5) | See footnote 6 on page 11 under the heading “Summary—Fees and Expenses” and on page 73 under the heading “Fees and Expenses.” |
| (6) | See footnote 7 on page 11 under the heading “Summary—Fees and Expenses” and on page 73 under the heading “Fees and Expenses.” |
| (7) | Investors who redeem all or a portion of their class 1 or 1a units during the first 12 months following the effective date of their purchase will be subject to a redemption fee of up to 2.0% of the purchase price of any units redeemed to reimburse the managing owner for the then-unamortized balance of the prepaid initial service fee relating to such units. There are no redemption fees associated with the class 2, 2a, 3 or 3a units. At the end of 12 months, no redemption fee will apply. |
| (8) | Class 3 and Class 3a are not being offered to investors pursuant to this prospectus.See footnote 8 on page 11 under the heading “Summary—Fees and Expenses” and on page 73 under the heading “Fees and Expenses.” |
| (9) | These fees and expenses may not be paid directly by the series; rather may be an element of the pricing of swap and derivative instruments. Such fees and expenses are estimated based on our historical experience. |
- 6 -
The chart under the heading “FEES AND EXPENSES—Summary Table of Fees and Expenses” is hereby deleted in its entirety and replaced with the following:
Series | Initial Service Fee(1) | Ongoing Service Fee(2) | Management Fee(3) | Incentive Fee(4) | Brokerage Commission (5) | Interest Expense (6) | Due Diligence (7) | |||||||||||||||||||||
| % | % | % | % | % | % | % | ||||||||||||||||||||||
Diversified | ||||||||||||||||||||||||||||
Class 1 | 2 | 2 | 0.75 | 25 | 2.58 | 0.41 | 0.12 | |||||||||||||||||||||
Class 2 | 0 | 0.25 | 0.75 | 25 | 2.58 | 0.41 | 0.12 | |||||||||||||||||||||
Class 3(8) | 0 | 0 | 0.75 | 25 | 2.58 | 0.41 | 0.12 | |||||||||||||||||||||
Masters | ||||||||||||||||||||||||||||
Class 1 | 2 | 2 | 2 | 20 | 2.40 | 0.41 | 0.12 | |||||||||||||||||||||
Class 2 | 0 | 0.25 | 2 | 20 | 2.40 | 0.41 | 0.12 | |||||||||||||||||||||
Class 3(8) | 0 | 0 | 2 | 20 | 2.40 | 0.41 | 0.12 | |||||||||||||||||||||
Long/Short Commodity | ||||||||||||||||||||||||||||
Class 1a | 2 | 2 | 2 | 20 | 2.55 | 0.41 | 0.12 | |||||||||||||||||||||
Class 2a | 0 | 0.25 | 2 | 20 | 2.55 | 0.41 | 0.12 | |||||||||||||||||||||
Class 3a (8) | 0 | 0 | 2 | 20 | 2.55 | 0.41 | 0.12 | |||||||||||||||||||||
New Trading Advisor for Equinox Frontier Long/Short Commodity Fund
Effective September 1, 2015, the Equinox Frontier Long/Short Commodity Fund added Chesapeake Capital Corporation as a major commodity trading advisor.
The current major commodity trading advisors and/or reference programs for the Equinox Frontier Long/Short Commodity Fund are:
| • | Abraham Trading Company; |
| • | Chesapeake Capital Corporation; |
| • | Emil van Essen LLC; |
| • | JE Moody & Company; |
| • | Red Oak Commodity Advisors, Inc.; and |
| • | Rosetta Capital Management, LLC. |
As of September 1, 2015, the allocation of the assets of the Equinox Frontier Long/Short Commodity Fund between the trading advisors was as follows (however, the actual allocation among trading advisors for the Equinox Frontier Long/Short Commodity Fund will vary based on the relative trading performance of the trading advisors and/or reference programs, and the managing owner may otherwise vary such percentages from time to time in its sole discretion):
Advisor | Allocation as of September 1, 2015 (expressed as a percentage of aggregate notional exposure to commodity trading programs) | |||
Abraham Trading Company | 0 | % | ||
Chesapeake Capital Corporation | 15.0 | % | ||
Emil van Essen LLC | 19.2 | % | ||
JE Moody & Company | 14.0 | % | ||
Red Oak Commodity Advisors, Inc. | 24.8 | % | ||
Rosetta Capital Management, LLC | 21.2 | % | ||
- 7 -
The managing owner anticipates that between 10% and 30% of the assets of the Equinox Frontier Long/Short Commodity Fund may be allocated to each of the major commodity trading advisors of Equinox Frontier Long/Short Commodity Fund at any time.
Information about Chesapeake Capital Corporation
Background
Chesapeake Capital Corporation (“Chesapeake”) was incorporated under the laws of the Commonwealth of Virginia in February 1988 for the purpose of offering advisory and investment portfolio management services to both retail and institutional investors in trading futures interest contracts. On August 19, 1991, Chesapeake was merged into Chesapeake Capital Corporation, an Illinois corporation formed on August 13, 1991. References herein to “Chesapeake” refer to the Virginia Corporation prior to August 19, 1991, and the Illinois Corporation on and after August 19, 1991. Chesapeake has been registered as a commodity trading advisor (“CTA”) and as a commodity pool operator (“CPO”) with the Commodity Trading Futures Commission (“CFTC”) since June 20, 1988, and May 8, 1991, respectively, and has also been a member of the National Futures Association (“NFA”) since June 20, 1988. Chesapeake was listed as a principal of Chesapeake SP Partners LLC (“SP Partners”), a CPO located in Richmond, Virginia, from January 14, 2011 until July 9, 2011. Neither Chesapeake’s registration with the CFTC nor its membership in the NFA should be taken as an indication that any such agency or regulatory body has recommended or approved Chesapeake. Chesapeake’s principal place of business is located at 1721 Summit Ave., Richmond, Virginia 23230. All business records will be kept at Chesapeake’s principal place of business.
Principals
Chesapeake’s Principals are Chesapeake Holding Company, R. Jerry Parker, Jr., Michael L. Ivie, Anilchandra G. Ladde, and Michael Striano.
Chesapeake Holding Company
Chesapeake Holding Company is a Virginia corporation that owns all of the issued and outstanding shares of stock of Chesapeake Capital Corporation. Chesapeake Holding Company has been listed as a principal of Chesapeake Capital Corporation since January 2004.
Jerry Parker
Jerry Parker is the Chairman of the Board of Directors and the Chief Executive Officer of Chesapeake Capital and Chesapeake Holding Company. Mr. Parker has overseen Chesapeake since its inception. Mr. Parker has been registered as an associated person and listed as a Principal of Chesapeake since June 1988 and registered as a swap associated person since November 2014. Mr. Parker commenced his trading career in November 1983 as a member of the Richard Dennis “Turtle” trading program. Mr. Parker received a Bachelor of Science degree in Commerce, with an emphasis in Accounting, from the University of Virginia in January 1980.
Michael L. Ivie
Michael L. Ivie is the Director of Research of Chesapeake. Mr. Ivie joined Chesapeake in June 1991. Mr. Ivie has been registered as an associated person of Chesapeake since May 21, 1999 and listed as a principal of Chesapeake since May 12, 2008. Mr. Ivie received a Bachelor of Science degree in Mathematics from Louisiana State University in 1989.
Anilchandra G. Ladde
Anilchandra G. Ladde is the Chief Operating Officer and Director of Trading of Chesapeake. Mr. Ladde joined Chesapeake in April 1993. Mr. Ladde has been registered as an associated person of Chesapeake since November 3, 1994 and listed as a principal of Chesapeake since May 13, 2008. Mr. Ladde received his Bachelor of Science degree in Mathematics from the University of Texas at Arlington in 1990 and an M.B.A. in Finance from The George Washington University in 1992.
- 8 -
Michael Striano
Michael Striano is the Senior Vice President of Operations of Chesapeake. Mr. Striano’s duties include general management and overseeing daily operations in compliance, administration and accounting. Mr. Striano joined Chesapeake in August 2005. Mr. Striano has been registered as an associated person of Chesapeake since August 12, 2005 and listed as a principal of Chesapeake since May 2, 2014. Mr. Striano received his Bachelor of Science degree in Finance from Siena College in 1992.
Chesapeake and its Principals may, from time to time, trade futures, forwards, and options contracts and securities for their own proprietary accounts. Such trades may or may not be in accordance with the Chesapeake trading program described below. The trading records of those accounts are available for inspection on Chesapeake’s premises upon reasonable prior notice and during normal business hours, subject to reasonable assurances of confidentiality.
Chesapeake and its Principals do not have a beneficial or ownership interest in the Trust or any of the Series.
Legal Actions
There have never been any material administrative, civil or criminal actions (whether pending, on appeal or concluded) against Chesapeake or its Principals.
Trading Approach
Chesapeake seeks to achieve capital appreciation primarily through trading on a highly leveraged basis commodity futures contracts, options on futures contracts and commodities, spot and forward currency contracts and other derivative contracts traded in U.S. and non-U.S. markets (such contracts being hereinafter referred to collectively as “Futures Interest Contracts”). Futures Interest Contracts traded by Chesapeake may include, but are not limited to, contracts on agricultural products, precious and industrial metals, currencies, financial instruments, and stock, financial and economic indices.
Chesapeake initially traded the Diversified 2XL Program on behalf of the Fund. Since August 19, 2013, Chesapeake has traded the Diversified Program on behalf of the Fund.
A general description of Chesapeake’s trading approach immediately follows, with a more specific explanation of the Diversified Program and the markets traded following the general description. Since Chesapeake’s trading strategies and programs are proprietary and confidential, the discussion below is of a general nature and it is not intended to be exhaustive.
In general, Chesapeake analyzes markets, including price action, market volatility, open interest and volume (“technical analysis”) as a means of predicting market opportunity and discovering any repeating patterns in past historical prices. Chesapeake generally employs a computerized analysis of a large number of interrelated statistical and mathematical formulas and techniques — based on an extensive proprietary and confidential database of prices, volatility, volume, open interest and various other market statistics — to search for patterns in data and to develop, use and monitor trading strategies. Chesapeake places primary emphasis on technical analysis in assessing market opportunities.
Chesapeake’s trading decisions are based on a combination of its systems, its market timing techniques, its trading discretion, judgment and experience and on market opportunities. Chesapeake’s trading methodology is both systematic and strategic. Trading decisions require the exercise of strategic judgment by Chesapeake in evaluating its technical trading methods, in their possible modification from time to time, and in their implementation.
Chesapeake is free to use its discretion whether to follow any trading signals or parameters generated by its technical trading strategies and the Chesapeake Trading Programs. The decision not to trade certain markets or not to make certain trades indicated by Chesapeake’s systems can materially affect performance. Under no circumstances is Chesapeake compelled to follow any of the trading indications generated by the Chesapeake Trading Programs.
- 9 -
Chesapeake has the right to employ any form or method of technical analysis that it deems appropriate in trading the Chesapeake Trading Programs. By way of example, the technical trading strategies and programs utilized by Chesapeake may be revised from time to time by Chesapeake as a result of ongoing research and development, which seeks to devise new trading strategies and programs as well as test its current technical strategies and programs; provided that Chesapeake will notify clients of any material revisions or changes in its trading strategies and/or systems.
Exchanges on which transactions will take place in trading the Diversified Program may include, but are not limited to, all exchanges in the United States, as well as non-U.S. exchanges which include but are not limited to the Dubai Mercantile Exchange (DME), the EUREX, the Euronext Amsterdam (EUROAEX), the Euronext Brussels (EUROBRU), the EURONEXT Liffe (LIFFE), the Euronext Paris (EUROPAR), the Hong Kong Exchanges & Clearing Limited (HKEX), the ICE Futures Europe and the ICE Futures Canada (ICE), the Korea Exchange (KRX), the Borsa Italiana (IDEM), the London Metal Exchange (LME), the Montreal Exchange (MX), the MEFF AIAF SENAF Holding de Mercados S.A. (MEFF), the NASDAQ OMX (OMX), the Osaka Securities Exchange Co., Ltd. (OSE), the South African Futures Exchange (SAFEX), the Singapore Exchange Derivatives Trading Ltd. (SGX-DT), the Sydney Futures Exchange (SFE), the Thailand Futures Exchange (TFEX), the Tokyo Commodity Exchange (TOCOM), the Tokyo Financial Exchange Inc. (TFX), the Tokyo Grain Exchange (TGE), and the Tokyo Stock Exchange (TSE). In addition, Chesapeake continually monitors numerous markets, both U.S. and non-U.S., and initiates trades at any point it determines that a market is sufficiently liquid and tradable using the methods employed by Chesapeake.
- 10 -
Past Performance of Diversified 2XL Program
Chesapeake initially traded the Diversified 2XL Program on behalf of the Fund. Since August 19, 2013, Chesapeake has traded the Diversified Program on behalf of the Fund. Therefore, the rate of return for August 2013 reflects the change in trading program described hereto. Beginning September 2013, the monthly rate of return reflects the performance of Chesapeake’s Diversified Program on behalf of the Fund.
Chesapeake Diversified 2XL Program (through August 18, 2013)
Chesapeake Diversified Program (beginning August 19, 2013)
Monthly Rates of Return | 2015 (%) | 2014 (%) | 2013 (%) | 2012 (%) | 2011 (%) | 2010 (%) | ||||||||||||||||||
January | 3.21 | 7.08 | 9.45 | -2.77 | 2.50 | -9.01 | ||||||||||||||||||
February | 0.02 | 2.63 | -2.05 | -3.10 | 9.29 | 4.63 | ||||||||||||||||||
March | 3.30 | -1.50 | 3.80 | 1.83 | 2.02 | 6.99 | ||||||||||||||||||
April | -8.03 | 1.23 | 2.45 | 3.85 | 7.82 | 6.58 | ||||||||||||||||||
May | 3.22 | 1.83 | -1.48 | -5.52 | -14.90 | -25.28 | ||||||||||||||||||
June | -4.70 | 3.95 | 0.10 | -4.49 | -11.39 | -5.18 | ||||||||||||||||||
July | 9.36 | -1.40 | 5.31 | 9.44 | 6.32 | -2.53 | ||||||||||||||||||
August | -6.16 | 6.36 | -6.68 | * | -1.58 | -0.56 | 5.22 | |||||||||||||||||
September | 3.70 | 1.07 | -7.57 | -21.65 | 12.01 | |||||||||||||||||||
October | 2.45 | 4.55 | -8.10 | -1.93 | 15.47 | |||||||||||||||||||
November | 6.96 | 10.36 | 0.27 | 9.96 | -9.94 | |||||||||||||||||||
December | 6.02 | 5.29 | -5.10 | 2.36 | 23.71 | |||||||||||||||||||
Compound Rate of Return |
| 3.21 (8 months | ) | 27.16 | 35.67 | -21.73 | -15.05 | 13.68 | ||||||||||||||||
| * | The rate of return for August 2013 reflects the change in trading program described above. |
PAST PERFORMANCE IS NOT NECESSARILY INDICATIVE OF FUTURE RESULTS.
| Name of CTA: | Chesapeake Capital Corporation | |
| Name of program: | Diversified 2XL Program until August 18, 2013; Diversified Program on and after August 19, 2013 | |
| Inception of trading by CTA: | February 1988 | |
| Inception of trading in Fund: | March 2006 | |
| Worst monthly drawdown*: | -25.28% (May 2010) | |
Worst peak-to-valley drawdown**: Totals Assets in the Fund: | -46.02% (May 2011 – December 2012) $25,000,000 | |
| Total Assets Under Management of the CTA: | $119,000,000 |
| * | Draw-down means losses experienced by the trading program over a specified period. |
| ** | Worst peak-to-valley draw-down means the greatest cumulative percentage decline in month-end net asset value due to losses sustained by the trading program during any period in which the initial month-end net asset value is not equaled or exceeded by a subsequent month-end net asset value. |
- 11 -