UNITED STATES
SECURITIES AND EXCHANGE COMMISSION
WASHINGTON, DC 20549
FORM 10-K
☒ ANNUAL REPORT PURSUANT TO SECTION 13 OR 15(d) OF THE SECURITIES EXCHANGE ACT OF 1934
For the fiscal year ended December 31, 2022
or
☐ TRANSITION REPORT PURSUANT TO SECTION 13 OR 15(d) OF THE SECURITIES EXCHANGE ACT OF 1934
For the transition period from to
Commission File Number 000-51274
FRONTIER FUNDS
FRONTIER DIVERSIFIED FUND;
FRONTIER LONG/SHORT COMMODITY FUND;
FRONTIER MASTERS FUND;
FRONTIER BALANCED FUND;
FRONTIER SELECT FUND;
FRONTIER GLOBAL FUND;
FRONTIER HERITAGE FUND
(Exact Name of Registrant as specified in Its Charter)
| Delaware | | 36-6815533 |
(State or Other Jurisdiction of
Incorporation or Organization) | | (IRS Employer
Identification No.) |
c/o Frontier Fund Management, LLC
25568 Genesee Trail Road
Golden, Colorado 80401 |
| (Address of Principal Executive Offices) |
Registrant’s Telephone Number, Including Area Code: (303) 454-5500
Securities registered pursuant to Section 12(b) of the Act:
| Title of each class | | Trading Symbol(s) | | Name of each exchange on which registered |
| N/A | | N/A | | N/A |
Securities registered pursuant to Section 12(g) of the Act:
Title of Each Class
Frontier Diversified Fund Class 2 and Class 3 Units;
Frontier Long/Short Commodity Fund Class 2, Class 3, Class 2a and Class 3a Units;
Frontier Masters Fund Class 2 and Class 3 Units;
Frontier Balanced Fund Class 1, Class 1AP, Class 2, Class 2a and Class 3a Units;
Frontier Select Fund Class 1, Class 1AP, and Class 2 Units;
Frontier Global Fund Class 1 and Class 2 Units;
Frontier Heritage Fund Class 1, Class 1AP, and Class 2 Units
Indicate by check mark if the registrant is a well-known seasoned issuer, as defined in Rule 405 of the Securities Act. Yes ☐ No ☒
Indicate by check mark if the registrant is not required to file reports pursuant to Section 13 or Section 15(d) of the Act. Yes ☐ No ☒
Indicate by check mark whether the registrant: (1) has filed all reports required to be filed by Section 13 or 15(d) of the Securities Exchange Act of 1934 during the preceding 12 months (or for such shorter period that the registrant was required to file such reports), and (2) has been subject to such filing requirements for the past 90 days. Yes ☒ No ☐
Indicate by check mark whether the registrant has submitted electronically every Interactive Data File required to be submitted pursuant to Rule 405 of Regulation S-T (§232.405 of this chapter) during the preceding 12 months (or for such shorter period that the registrant was required to submit such files). Yes ☒ No ☐
Indicate by check mark whether the registrant is a large accelerated filer, an accelerated filer, a non-accelerated filer, a smaller reporting company, or an emerging growth company. See the definitions of “large accelerated filer,” “accelerated filer,” “smaller reporting company,” and “emerging growth company” in Rule 12b-2 of the Exchange Act.
| Large Accelerated Filer | ☐ | | Accelerated Filer | ☐ |
| Non–Accelerated Filer | ☒ | | Smaller Reporting Company | ☐ |
| | | | Emerging Growth Company | ☐ |
If an emerging growth company, indicate by check mark if the registrant has elected not to use the extended transition period for complying with any new or revised financial accounting standards provided pursuant to Section 13(a) of the Exchange Act. ☐
Indicate by check mark whether the registrant has filed a report on and attestation to its management’s assessment of the effectiveness of its internal control over financial reporting under Section 404(b) of the Sarbanes-Oxley Act (15 U.S.C. 7262(b)) by the registered public accounting firm that prepared or issued its audit report. ☐
If securities are registered pursuant to Section 12(b) of the Act, indicate by check mark whether the financial statements of the registrant included in the filing reflect the correction of an error to previously issued financial statements. ☐
Indicate by check mark whether any of those error corrections are restatements that required a recovery analysis of incentive-based compensation received by any of the registrant’s executive officers during the relevant recovery period pursuant to § 240.10D-1(b). ☐
Indicate by check mark whether the registrant is a shell company (as defined in Rule 12b-2 of the Act). Yes ☐ No ☒
The Frontier Funds’ units of beneficial interest are not traded on any market and, accordingly, do not have an aggregate market value. Units outstanding as of December 31, 2022 were: 31,309 for the Frontier Diversified Fund, 7,670 for the Frontier Masters Fund, 13,407 for the Frontier Long/Short Commodity Fund, 85,297 for the Frontier Balanced Fund, 20,625 for the Frontier Select Fund, 14,982 for the Frontier Global Fund and 19,345 for the Frontier Heritage Fund.
Documents Incorporated by Reference
Portions of the Prospectus filed by the registrant on February 11, 2019 pursuant to rule 424(b)(3) of the Securities Act (File No. 333-210313) are incorporated by reference into Part I and Part II of this report.
Special Note About Forward-Looking Statements
THIS ANNUAL REPORT CONTAINS STATEMENTS WHICH CONSTITUTE FORWARD-LOOKING STATEMENTS WITHIN THE MEANING OF THE PRIVATE SECURITIES LITIGATION REFORM ACT OF 1995 AND OTHER FEDERAL SECURITIES LAWS. THESE FORWARD-LOOKING STATEMENTS REFLECT THE MANAGING OWNER’S CURRENT EXPECTATIONS ABOUT THE FUTURE RESULTS, PERFORMANCE, PROSPECTS AND OPPORTUNITIES OF THE TRUST. THE MANAGING OWNER HAS TRIED TO IDENTIFY THESE FORWARD-LOOKING STATEMENTS BY USING WORDS SUCH AS “MAY,” “WILL,” “EXPECT,” “ANTICIPATE,” “BELIEVE,” “INTEND,” “SHOULD,” “ESTIMATE” OR THE NEGATIVE OF THOSE TERMS OR SIMILAR EXPRESSIONS. THESE FORWARD-LOOKING STATEMENTS ARE BASED ON INFORMATION CURRENTLY AVAILABLE TO THE MANAGING OWNER AND ARE SUBJECT TO SEVERAL RISKS, UNCERTAINTIES AND OTHER FACTORS, BOTH KNOWN, SUCH AS THOSE DESCRIBED IN THE “RISK FACTORS” SECTION UNDER ITEM 1A AND ELSEWHERE IN THIS REPORT AND UNKNOWN, THAT COULD CAUSE THE TRUST’S ACTUAL RESULTS, PERFORMANCE, PROSPECTS OR OPPORTUNITIES TO DIFFER MATERIALLY FROM THOSE EXPRESSED IN, OR IMPLIED BY, THESE FORWARD-LOOKING STATEMENTS.
YOU SHOULD NOT PLACE UNDUE RELIANCE ON ANY FORWARD-LOOKING STATEMENTS. EXCEPT AS EXPRESSLY REQUIRED BY THE FEDERAL SECURITIES LAWS, THE MANAGING OWNER UNDERTAKES NO OBLIGATION TO PUBLICLY UPDATE OR REVISE ANY FORWARD-LOOKING STATEMENTS OR THE RISKS, UNCERTAINTIES OR OTHER FACTORS DESCRIBED HEREIN, AS A RESULT OF NEW INFORMATION, FUTURE EVENTS OR CHANGED CIRCUMSTANCES OR FOR ANY OTHER REASON AFTER THE DATE OF THIS REPORT.
UNLESS EXPRESSLY STATED OTHERWISE, ALL INFORMATION IN THIS REPORT IS AS OF DECEMBER 31, 2022, AND THE MANAGING OWNER UNDERTAKES NO OBLIGATION TO UPDATE THIS INFORMATION.
Table of Contents
Summary of Risk Factors
An investment in the Units of each Series is subject to a number of risks of which you should be aware before making an investment decision. The following summary should not be considered an exhaustive summary of the material risks facing the Trust, and it should be read in conjunction with the “Risk Factors” section and the other information contained in this Form 10-K.
Structural Risks
| ● | The Trust, the Trading Companies and the Galaxy Plus entities are not registered investment companies. |
| ● | Certain restrictions on redemption and transfer of the Units apply, redemptions may be temporarily suspended, and a substantial number of redemption requests in a short period may result in losses. |
| ● | Unitholders have limited rights, including not being able to review any Series’ holdings on a daily basis, cannot prevent the Trust from taking actions which could cause losses, and will not be aware of changes to trading programs or investments into, or divestments from, any Galaxy Plus entities. |
| ● | The Managing Owner may allocate nominal assets in respect of a Series in excess of its Net Asset Value, and it may adjust the leverage employed by a Trading Advisor in its sole discretion. |
| ● | Each Series may be charged substantial fees and expenses regardless of profitability, including indirect fees and expenses associated with derivative instruments. |
| ● | The failure by one or more of a Series’ counterparties could result in a substantial loss of such Series’ assets. |
| ● | There are certain risks associated with investments in series LLCs (such as certain of the Trading Companies and the Galaxy Plus entities), and certain conflicts of interest exist in the structure and operation of the Trust. |
| ● | The Managing Owner is leanly staffed and relies heavily on its key personnel to manage the Trust’s trading activities, and the loss of such personnel could adversely affect the Trust. Unitholders do not have privity of contract with service providers to the Trust or any Series, including the Trading Advisors. |
Risks Relating to Trading and the Markets
| ● | The Trading Advisors may trade in futures, options, and swaps, each of which carry distinct risks. |
| ● | The trading on behalf of each Series will be margined, which means that sharp declines in prices could lead to large losses. |
| ● | Trading on unregulated or foreign exchanges involves risks that trading on regulated or U.S. exchanges does not, such as lack of investor protection regulation, possible government intervention, relatively new markets and exchange-rate exposure. |
| ● | The Trading Advisors’ positions may be concentrated from time to time, which may render each Series susceptible to larger losses than if the positions were more diversified. |
| ● | Turnover in each Series’ portfolio may be high which could result in higher brokerage commissions and transaction fees and expenses. |
| ● | There are certain risks associated with the Trust’s investment in U.S. government debt securities, including market risk, interest rate risk and credit risk. |
| ● | Investments in reference programs through a swap or other derivative instrument may not always replicate exactly the performance of the relevant CTA trading program(s). |
Risks Relating to the Trading Advisors
| ● | There are disadvantages to making trading decisions based on technical analysis and fundamental analysis. |
| ● | Increased competition from other systematic traders could reduce the Trading Advisors’ profitability. |
| ● | The incentive fees could be an incentive to the Trading Advisors to make riskier investments. |
| ��� | The risk management approaches of one or all of the Trading Advisors may not be fully effective, and a Series may incur losses. |
| ● | Increases in assets under management of any of the Trading Advisors could lead to diminished returns. |
| ● | Each Series relies on its Trading Advisor(s) for success, and if a Trading Advisor’s trading is unsuccessful, the Series may incur losses. |
| ● | The Managing Owner’s allocation of the Trust’s assets among Trading Advisors may result in less than optimal performance by the Trust. |
| ● | Each Trading Advisor advises other clients and may achieve more favorable results for its other accounts. |
| ● | The Managing Owner places significant reliance on the Trading Advisors and their key personnel; the loss of such personnel could adversely affect a Series. |
| ● | The success of each Series depends on the ability of the personnel of its Trading Advisor(s) to accurately implement their trading systems, and any failure to do so could subject a Series to losses. |
| ● | Stop-loss orders may not prevent large losses. |
Risks Relating to the Galaxy Plus Platform
| ● | The success of each Series depends on the performance of the Galaxy Plus entities in which each Series invests. |
| ● | The Galaxy Plus Platform is recently established and has a limited operating history and the Galaxy Plus entities have limited or no operating history or track record. |
| ● | A Series may incur losses related to other investors’ large redemptions from, or investments into, a Galaxy Plus entity. |
| ● | The Galaxy Plus Platform operates independently from each Series, the Trust and the Managing Owner, and the Managing Owner will have no control over, or involvement in, the operation and administration of the commodity pools. |
| | ● | The Galaxy Plus Platform and New Hyde Park Alts, LLC (“New Hyde Park”) may limit the ability of a Series to invest in, or divest from, a Galaxy Plus entity. New Hyde Park is the Galaxy Plus Platform sponsor and operator. |
| ● | Cessation of, or changes to, the operation of the Galaxy Plus Platform could adversely impact the performance of a Series. |
| ● | Investment in Galaxy Plus entities presents operational, administrative risk to each Series. |
| ● | The use of multiple Trading Advisors may result in offsetting or opposing trading positions and may also require one Trading Advisor to fund the margin requirements of another Trading Advisor. |
| ● | The Trading Advisors’ trading programs bear some similarities and, therefore, may lessen the benefits to the Series which have multiple Trading Advisors. |
Operating Risks
| ● | The Managing Owner may allocate notional assets in respect of a Series that are in excess of the net asset value of such Series. |
| ● | Differing levels of fees received may create an incentive for the Managing Owner to favor certain Series over others. |
| ● | The Managing Owner may terminate, replace and/or add Trading Advisors in its sole discretion which may disrupt trading, adversely affecting the net asset value of a Series. |
Taxation and Benefits Risks
| ● | You may have tax liability attributable to your investment in a series even if you have received no distributions and redeemed no units, and even if the series generated an economic loss, you may be subject to tax on gains that the Trust never realizes, and you will likely recognize short-term capital gain. |
| ● | Partnership treatment is not assured, and if the Trust or any Series is not treated as a Partnership, you could suffer adverse tax consequences. |
| ● | The IRS could challenge allocations of recognized gains to Unitholders who redeem. |
| ● | The IRS could take the position that deductions for certain Trust expenses are subject to various limitations. |
| ● | The investment of Benefit Plan Investors may be limited and/or subject to mandatory redemption in certain circumstances. |
| ● | Foreign investors may face exchange rate risk and local tax consequences. |
Regulatory Risks
| ● | Regulation of the commodity interest markets is extensive and constantly changing; future regulatory developments are impossible to predict, but may significantly and adversely affect the Trust. |
| ● | The Series, the Trading Companies or Galaxy Plus entities are subject to speculative position limits. |
| ● | CFTC registrations could be terminated which could adversely affect the Trust or a Series. |
Part I
Overview
Frontier Funds, which is referred to in this report as “the Trust”, was formed on August 8, 2003, as a Delaware statutory trust. The Trust is a multi-advisor commodity pool, as described in Commodity Futures Trading Commission (the “CFTC”) Regulation § 4.10(d)(2). The Trust has authority to issue separate series, or each, a Series, of units of beneficial interest (the “Units”) pursuant to the requirements of the Delaware Statutory Trust Act, as amended (the “Trust Act”). The assets of each Series are valued and accounted for separately from the assets of other Series. The Trust is not registered as an investment company under the Investment Company Act of 1940, as amended (the “Investment Company Act”). The Trust is managed by Frontier Fund Management, LLC (the “Managing Owner”).
Purchasers of Units are limited owners of the Trust (“Limited Owners”) with respect to beneficial interests of the Series’ Units purchased. The Trust Act provides that, except as otherwise provided in the second amended and restated declaration of trust and trust agreement dated December 9, 2013, as further amended, by and among the Managing Owner, Wilmington Trust Company as trustee and the unitholders, as amended from time to time (the “Trust Agreement”), unitholders in a Delaware statutory trust will have the same limitation of liability as do stockholders of private corporations organized under the General Corporation Law of the State of Delaware. The Trust Agreement confers substantially the same limited liability, and contains the same limited exceptions thereto, as would a limited partnership agreement for a Delaware limited partnership engaged in like transactions as the Trust. In addition, pursuant to the Trust Agreement, the Managing Owner of the Trust is liable for obligations of a Series in excess of that Series’ assets. Limited Owners do not have any such liability. The Managing Owner will make contributions to Series of the Trust necessary to maintain at least a 1% interest in the aggregate capital, profits and losses of the combined Series of the Trust.
The Trust has been organized to pool investor funds to trading in the United States (“U.S.”) and international markets for currencies, interest rates, stock indices, agricultural and energy products, precious and base metals and other commodities. The Trust may also engage in futures contracts, forwards, option contracts and derivative instruments, including swap contracts.
The Trust has seven (7) separate and distinct series of Units issued and outstanding: Frontier Diversified Fund, Frontier Masters Fund, Frontier Long/Short Commodity Fund, Frontier Balanced Fund, Frontier Select Fund, Frontier Global Fund, and Frontier Heritage Fund, (each a “Series” and collectively, the “Series”). The Trust financial statements are comprised of unitized Series which are consolidated into the Trust financial statements. However, the consolidated Trust does not issue units.
The Trust, with respect to each Series:
| ● | engages in the speculative trading of a diversified portfolio of futures, forwards (including interbank foreign currencies), options contracts and other derivative instruments (including swap contracts), and may, from time to time, engage in cash and spot transactions; |
| ● | allocates funds to a limited liability trading company or companies affiliated with the Managing Owner (“Trading Company” or “Trading Companies”) or to an unaffiliated series limited liability company (“Galaxy Plus entities” or “Galaxy Plus entity”), each of which has one-year renewable contracts with its own independent trading advisor(s) (each a “Trading Advisor”) that will manage all or a portion of the applicable Trading Company’s or Galaxy Plus entity’s assets, and make the trading decisions for the assets of each Series vested in such Trading Company or Galaxy Plus entity. The assets of each Trading Company and Galaxy Plus entity will be segregated from the assets of the other Trading Companies and Galaxy Plus entities. |
| ● | maintains separate, distinct records for each Series, and accounts for the assets of each Series separately from the other Series; |
| ● | calculates the Net Asset Value (“NAV”) of its Units for each Series separately from the other Series; |
| ● | has an investment objective of increasing the value of each Series’ Units over the long term (capital appreciation), while managing risk and volatility; further, to offer exposure to the investment programs of individual Trading Advisors and to specific instruments; |
| | ● | maintains each Series of Units in three to seven sub-classes—Class 1, Class 1AP, Class 1a, Class 2, Class 2a, Class 3, and Class 3a. Investors who have purchased Class 1a Units of Frontier Diversified Fund or Frontier Masters Fund or Class 1 Units of Frontier Long/Short Commodity Fund are charged a service fee of up to two percent (2.0%) annually of the NAV (or the purchase price, in case of the initial service fee) of each Unit purchased, for the benefit of selling agents selling such Class 1 or Class 1a Units. The initial service fee, which is amortized monthly at an annual rate of up to two percent (2.0%) of the average daily NAV of Class 1 or Class 1a of such Series, is prepaid to the Managing Owner by each Series, and paid to the selling agents by the Managing Owner in the month following sale; provided, however, that investors who redeem all or a portion of their Class 1 or Class 1a Units of any Series during the first twelve (12) months following the effective date of their purchase are subject to a redemption fee of up to two percent (2.0%) of the purchase price at which such investor redeemed to reimburse the Managing Owner for the then-unamortized balance of the prepaid initial service fee. Investors who have purchased Class 1 or Class 1a Units of Frontier Balanced Fund, Frontier Heritage Fund, Frontier Select Fund, and Frontier Global Fund are charged a service fee of up to three percent (3.0%) annually of the NAV (of the purchase price, in case of the initial service fee) of each Unit purchased, for the benefit of selling agents selling such Class 1 or Class 1a Units. The initial service fee, which is amortized monthly at an annual rate of up to three percent (3.0%) of the average daily NAV of Class 1 or Class 1a of such Series, is prepaid to the Managing Owner by each Series, and paid to the selling agents by the Managing Owner in the month following sale; provided, however, that investors who redeem all or a portion of their Class 1 and Class 1a Units of any Series during the first twelve (12) months following the effective date of their purchase are subject to a redemption fee of up to two percent (2.0%) of the purchase price at which such investor redeemed to reimburse the Managing Owner for the then-unamortized balance of the prepaid initial service fee. With respect to Class 2 and Class 2a Units of any Series, the Managing Owner pays an ongoing service fee to selling agents of up to one half percent (0.5%) annually of the NAV of each Class 2 or Class 2a Unit (of which 0.25% will be charged to Limited Owners holding Class 2 Units of the Frontier Diversified Fund, and Frontier Masters Fund or Class 2a Units of the Frontier Long/Short Commodity Fund sold) until such Class 2 or Class 2a Units which are subject to the fee limitation are reclassified as Class 3 or Class 3a Units of the applicable Series. Class 1AP was created as a sub-class of Class 1 and it has been presented separately because the fees applicable to it are different from those applicable to Class 1. Currently the service fee is not charged to Class 1AP investors. The Managing Owner may also pay selling agents certain additional fees and expenses for administrative and other services rendered and expenses incurred by such selling agents; and |
| | ● | all payments made to selling agents who are members of the Financial Industry Regulatory Authority, Inc. (“FINRA”) and their associated persons that constitute underwriting compensation will be subject to the limitations set forth in Rule 2310(b)(4)(B)(ii) (formerly Rule 2810(b)(4)(B)(ii)) of the Conduct Rules of FINRA (“Rule 2310”). An investor’s Class 1 Units or Class 2 Units of any Series, or Class 1a Units or Class 2a Units of the Frontier Long/Short Commodity Fund or Frontier Balanced Fund will be classified as Class 3 or Class 3a Units of such Series, as applicable, when the Managing Owner determines that the fee limitation with respect to such Units has been reached or will be reached. The service fee limit applicable to each unit sold is reached upon the earlier of when (i) the aggregate initial and ongoing service fees received by the selling agent with respect to such unit equals 9% of the purchase price of such unit or (ii) the aggregate underwriting compensation (determined in accordance with FINRA Rule 2310) paid in respect of such unit totals 10% of the purchase price of such unit. No service fees are paid with respect to Class 3 or Class 3a Units. Units of any Class in a Series may be redeemed, in whole or in part, on a daily basis, at the then current NAV per Unit for such Series on the day of the week after the date the Managing Owner is in receipt of a redemption request for at least one (1) business day to be received by the Managing Owner prior to 4:00 PM in New York. |
The assets of any particular Series include only those funds and other assets that are paid to, held by or distributed to the Trust on account of and for the benefit of that Series. Under the “Inter-Series Limitation on Liability” expressly provided for under Section 3804(a) of the Trust Act, separate and distinct records of the cash and equivalents, although pooled for maximizing returns, is maintained in the books and records of each Series.
As of December 31, 2022, the Trust, with respect to the Frontier Diversified Fund and Frontier Masters Fund, separates Units into two separate Classes—Class 2, and Class 3. The Trust, with respect to the Frontier Select Fund and Frontier Heritage Fund separates Units into a maximum of three separate Classes—Class 1, Class 2 and Class 1AP. The Trust with respect to the Frontier Global Fund separates Units into a maximum of two separate Classes—Class 1 and Class 2. The Trust, with respect to the Frontier Balanced Fund separates Units into a maximum of five separate Classes—Class 1, Class 1AP, Class 2, Class 2a and Class 3a. The Trust, with respect to the Frontier Long/Short Commodity Fund separates Units into a maximum of four separate Classes—Class 2a, Class 2, Class 3a and Class 3. For those Series that invest in Galaxy Plus entities, approximately 75-95% of those Series assets are used to support the margin requirements of the Master Funds. The remaining assets of the Series are split between investments in Trading Companies and a pooled cash management account that invests primarily in U.S. Treasury securities. For those Series that do not invest in Galaxy Plus entities, their assets are split between investments in Trading Companies and investments in the pooled cash management account.
As of December 31, 2022, Frontier Global Fund has invested a portion of its assets in a single Trading Company, and a single Trading Advisor manages 100% of the assets invested in such Trading Company. Each of the remaining Series has invested a portion of its assets in several different Trading Companies or Galaxy Plus entities and one or more Trading Advisors may manage the assets invested in such Trading Companies or Galaxy Plus entities.
Trading Advisors are responsible for the trading decisions of the respective Trading Companies or Galaxy Plus entities for which they trade. It is expected that between 75% and 95% of each Series’ assets normally will be invested in one or more Trading Companies or Galaxy Plus entities to be committed as margin for trading positions but from time to time these percentages may be substantially more or less. The remainder of each Series’ assets is maintained at the Trust level for cash management. Each of the respective Series has invested monies into pooled cash management assets which have included purchases of U.S. Treasury securities. Each Series’ ownership in these investments is based on its percentage ownership in the pooled cash management assets on the reporting date.
The Trading Advisors were selected based upon the Managing Owner’s evaluation of each Trading Advisor’s past performance, trading portfolios and strategies, as well as how each Trading Advisor’s performance, portfolio and strategies complement and differ from those of the other Trading Advisors.
The Managing Owner is a Delaware Limited Liability Company formed in November 2016. The Managing Owner has delegated its commodity pool operator responsibilities to Wakefield Advisors LLC pursuant to the Commodity Pool Operator Delegation Agreement between the Managing Owner and Wakefield Advisors LLC, which has been registered with the CFTC as a commodity pool operator since January 7, 2013 and has been a member of the NFA since that date. The Managing Owner remains jointly and severally liable with Wakefield Advisors LLC for violations of the Commodity Exchange Act of 1936, as amended (the “CEA”), and Commodity Futures Trading Commission regulations thereunder (“CPO Regulations”). However, Wakefield Advisors LLC will indemnify the Managing Owner from and against any and all loss, liability, damage, penalty, fine, cost, and expense (including attorneys’, accountants’, experts’, and other professionals’ fees and expenses incurred in investigation or defense of any and all demands, claims, actions, suits, or arbitrations) actually and reasonably incurred by the Managing Owner, based upon, arising out of or from, or in any way in connection with, any act, activity, conduct, performance, omission, or non-performance by the Wakefield Advisors LLC of any of its functions as a commodity pool operator (“CPO”) or which violates the CEA or CPO Regulations in connection with its functions as CPO.
The Managing Owner’s main business office is located at 25568 Genesee Trail Road, Golden, Colorado 80401, telephone (303) 454-5500. A description of the Managing Owner’s responsibilities to the Trust is contained in a Prospectus filed February 11, 2019, with the SEC pursuant to Rule 424(b)(3) of the Securities Act of 1933, as amended (File No. 333-210313), which is referred to herein as the “Prospectus,” under the section captioned “The Managing Owner,” and such description is incorporated herein by reference from the Prospectus.
Regulation
Under the CEA, commodity exchanges and commodity futures trading are subject to regulation by the CFTC. The NFA, a registered futures association under the CEA, is the only non-exchange self-regulatory organization for commodity industry professionals. The CFTC has delegated responsibility to the NFA for the registration of commodity trading advisors, “commodity pool operators,” “futures commission merchants,” “introducing brokers” and their respective “associated persons” and “floor brokers.” The CEA requires “commodity pool operators,” such as the Managing Owner, “commodity trading advisors,” and commodity brokers or “futures commission merchants,” such as the Trust’s commodity brokers, to be registered and to comply with various reporting and recordkeeping requirements. The Managing Owner and the Trust’s commodity brokers are members of the NFA. The CFTC may suspend a commodity pool operator’s or a commodity trading advisor’s registration if it finds that its trading practices tend to disrupt orderly market conditions, or as the result of violations of the CEA or rules and regulations promulgated thereunder. In the event that the Managing Owner’s registration as a commodity pool operator were terminated or suspended, the Managing Owner would be unable to continue to manage the business of the Trust. Should the Managing Owner’s registration be suspended, termination of the Trust may result.
In addition to such registration requirements, the CFTC and certain commodity exchanges have established limits on the maximum net long and net short positions that any person, including the Trust, may hold or control in particular commodities. Most exchanges also limit the maximum changes in futures contract prices that may occur during a single trading day. The Trust also trades in dealer markets for forward and swap contracts, which are not regulated by the CFTC. Federal and state banking authorities also do not regulate forward trading or forward dealers. In addition, the Trust trades on foreign commodity exchanges, which are not subject to regulation by any U.S. government agency.
Operations
A description of the business of the Trust, including trading approaches for each Series of Units, rights and obligations of the limited owners, compensation arrangements and fees and expenses is contained in the Prospectus, under the sections captioned “Risk Disclosure Statement,” “Summary,” “Risk Factors,” “Frontier Funds Trust,” “The Offering,” “Trading Limitations, Policies and swaps,” “The Trustee,” “The Managing Owner,” “Actual and Potential Conflicts of Interest,” “Fees and Expenses” and the appendix attached to the Prospectus for each Series of Units, and such description is incorporated herein by reference from the Prospectus.
The Trading Companies and Galaxy Plus entities for each Series of Units engage in the speculative trading of a diversified portfolio of futures, forwards (including interbank foreign currencies), options contracts and other derivative instruments (including swaps) and may, from time to time, engage in cash and spot transactions. A brief description of the Trust’s main types of investments is set forth below:
| ● | A futures contract is a standardized contract traded on an exchange that calls for the future delivery of a specified quantity of a commodity at a specified time and place. |
| ● | A forward contract is an individually negotiated contract between principals, not traded on an exchange, to buy or sell a specified quantity of a commodity at or before a specified date at a specified price. |
| ● | An option on a futures contract, forward contract or a commodity gives the buyer of the option the right, but not the obligation, to buy or sell a futures contract, forward contract or a commodity, as applicable, at a specified price on or before a specified date. Options on futures contracts are standardized contracts traded on an exchange, while options on forward contracts and commodities, referred to collectively in this prospectus as over-the-counter options, generally are individually negotiated, principal-to-principal contracts not traded on an exchange. |
| ● | A swap contract generally involves an exchange of a stream of payments between the contracting parties. Swap contracts generally are not uniform and not exchange-traded. |
Certain of the Trading Companies and Galaxy Plus entities have entered into contractual arrangements with independent commodity trading advisors that will manage all or a portion of such Trading Company’s and Galaxy Plus entity’s assets and make the trading decisions with respect to the assets of such Trading Company or Galaxy Plus entity.
Selection and Replacement of Trading Advisors
The Managing Owner is responsible for the selection, retention and termination of the Trading Advisors and reference programs on behalf of each Series. The actual allocation among Trading Advisors for each Series will vary based upon the relative trading performance of the Trading Advisors and/or reference programs, and the Managing Owner may otherwise vary such percentages from time to time in its sole discretion. The Managing Owner will adjust its allocations and rebalance the portfolio of any Series among Trading Advisors to maintain weightings that it believes will most likely achieve capital growth within the investment guidelines of the relevant Series.
The Managing Owner utilizes certain quantitative and qualitative analysis in connection with the identification, evaluation and selection of the Trading Advisors. The Managing Owner’s proprietary and commercial analytical software programs and comprehensive Trading Advisor database provide the quantitative basis for the Trading Advisor selection, portfolio implementation process, and ongoing risk management, monitoring, and review.
The Managing Owner’s research department is continually refining ways to assimilate vast amounts of Trading Advisor performance data and due-diligence information. The proprietary and commercial database of alternative investment programs is always increasing. Research team members regularly interact with Trading Advisors throughout the due diligence and monitoring process. Only those programs that have met strict quantitative and qualitative review are considered as potential managers of client assets. Following is a summary of the quantitative and qualitative analysis:
Quantitative Analysis
The Managing Owner’s analytical software system applies a variety of statistical measures towards the evaluation of current and historical advisor performance data. Statistical measures include but are not limited to: (1) risk/reward analysis, (2) time window analysis, (3) risk analysis, (4) correlation analysis, (5) statistical overlays and (6) performance cycle analysis.
Qualitative Analysis
Although quantitative analysis statistically identifies the top performing Trading Advisors, qualitative analysis plays a major role in the Trading Advisor evaluation and final selection process. Each Trading Advisor in the Managing Owner’s top docile universe initially undergoes extensive qualitative review by the Managing Owner’s research department, as well as continual monitoring. This analysis generally includes but is not limited to: (1) preliminary information and due diligence, (2) background review, (3) due diligence questionnaires and (4) written review and periodic updates. This information allows a thorough review of each Trading Advisor’s trading philosophy, trading systems and corporate structure.
Multi-Manager Approach
A multi-manager approach to portfolio management provides diversification of Trading Advisors and access to broader global markets. Portfolios comprised of multiple trading advisors can provide diversification across trading methodologies, trading time horizons, and markets traded, resulting in more consistent performance returns and overall lower volatility.
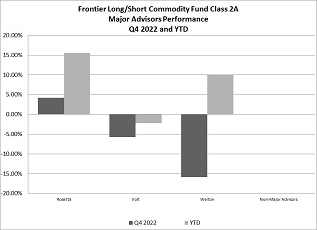
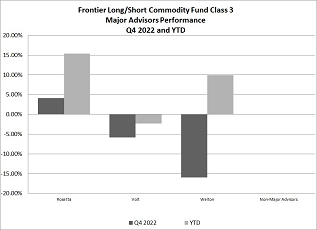
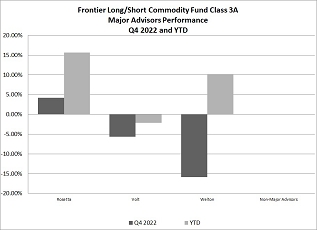
As of December 31, 2022, the trading system of each of the major Trading Advisors and the means by which the Series access those Trading Advisors were as follows:
| Major Commodity Trading Advisor | | Trading System Style | | Accessed Through |
| | | | | |
| Aspect Capital Limited | | Systematic | | Galaxy Plus |
| Fort, L.P. | | Systematic | | Galaxy Plus |
| Quantica Capital AG | | Systematic | | Galaxy Plus |
| Quantitative Investment Management, LLC | | Systematic | | Galaxy Plus |
| Quest Partners LLC | | Systematic | | Galaxy Plus |
| Rosetta Capital Management, LLC | | Discretionary | | Galaxy Plus |
| Volt Capital Management AB | | Systematic | | Galaxy Plus |
| Welton Investment Partners LLC | | Systematic | | Galaxy Plus |
| Wimmer Horizon, LLP | | Systematic | | Trading Company |
Wimmer Horizon LLP, accessed through Frontier Trading Company I, was rebranded as Horizon3 Investment Management LLP effective January 20, 2023. The trading strategy remains the same.
As of December 31, 2022, the allocation of the assets of each applicable Series of the Trust among the Trading Advisors was as follows:
Allocation as of December 31, 2022 (expressed as a percentage of aggregate notional exposure to commodity trading programs)
| Advisor | | Frontier
Diversified
Fund | | | Frontier
Long/Short
Commodity
Fund | | | Frontier
Masters
Fund | | | Frontier
Balanced
Fund | | | Frontier
Select Fund | | | Frontier
Global Fund | | | Frontier
Heritage
Fund | |
| Aspect Capital Limited | | | 32 | % | | | - | | | | 51 | % | | | 22 | % | | | - | | | | 100 | % | | | 86 | % |
| Fort, L.P. | | | 6 | % | | | - | | | | - | | | | 2 | % | | | - | | | | - | | | | - | |
| Quantica Capital AG | | | 9 | % | | | - | | | | 29 | % | | | 15 | % | | | 50 | % | | | - | | | | - | |
| Quantitative Investment Management, LLC | | | 21 | % | | | - | | | | - | | | | 23 | % | | | - | | | | - | | | | - | |
| Quest Partners LLC | | | 21 | % | | | - | | | | - | | | | 15 | % | | | - | | | | - | | | | - | |
| Rosetta Capital Management, LLC | | | - | | | | 52 | % | | | - | | | | - | | | | - | | | | - | | | | - | |
| Volt Diversified Alpha Fund | | | - | | | | 24 | % | | | - | | | | - | | | | - | | | | - | | | | - | |
| Welton Investment Partners LLC | | | 11 | % | | | 24 | % | | | 20 | % | | | 12 | % | | | 50 | % | | | - | | | | 14 | % |
| Wimmer Horizon | | | - | | | | - | | | | - | | | | 11 | % | | | - | | | | - | | | | - | |
A description of the trading strategies of the major commodity trading advisors, including general trading focus and registration as a commodity pool operator and/or an investment adviser, and a description of the advisory agreements with the commodity trading advisors is contained in the Prospectus, under the section captioned “Summary of Agreements—Advisory Agreements” and the appendix attached to the Prospectus for each Series of Units, containing a description of each major commodity trading advisor and its trading program, and such description is incorporated herein by reference from the Prospectus.
Employees
The Trust has no employees. The Trust is managed solely by the Managing Owner in its capacity as the managing owner of the Trust pursuant to the Trust Agreement.
Available Information
The Trust files quarterly, annual and current reports, and all amendments to these reports, with the Securities and Exchange Commission (“SEC”). The Trust and the Series do not maintain an internet website for their filings; however, the SEC maintains an internet site that contains reports, proxy and information statements, and other information regarding issuers that file electronically with the SEC. The Trust’s SEC filings are available to the public from the EDGAR database on the SEC’s website at http://www.sec.gov. The Trust’s CIK number is 0001261379. The Trust will provide electronic or paper copies of its filings to its investors free of charge upon request.
Any forward-looking statements herein are based on expectations of the Managing Owner at this time. Whether or not actual results and developments will conform to the Managing Owner’s expectations and predictions, however, is subject to a number of risks and uncertainties, including the special considerations discussed in the Series’ prospectuses, general economic, market and business conditions, changes in laws or regulations or other actions made by governmental authorities or regulatory bodies, and other world economic and political developments. The Series and the Managing Owner undertake no duty to update or revise any forward-looking statements, whether as a result of new information, future events or otherwise.
The Trust is a venture in a high-risk business. An investment in the Units of each Series is very speculative. You should make an investment in one or more of the Series only after consulting with independent, qualified sources of investment and tax advice and only if your financial condition will permit you to bear the risk of a total loss of your investment. You should consider an investment in the Units only as a long-term investment. Moreover, to evaluate the risks of this investment properly, you must familiarize yourself with the relevant terms and concepts relating to commodities trading and the regulation of commodities trading, which are discussed in the Prospectus in the Statement of Additional Information below, in the section captioned “The Futures Markets,” which is incorporated herein by reference.
You should carefully consider all the information we have included or incorporated by reference in this Form 10-K and our subsequent periodic filings with the SEC. In particular, you should carefully consider the risk factors described below and read the risks and uncertainties as set forth in the “Management’s Discussion and Analysis of Financial Condition and Results of Operations” Section of this Form 10-K. Any of the following risks and uncertainties could materially adversely affect the Trust, its trading activities, operating results, financial condition and NAV and therefore could negatively impact the value of your investment. The information contained herein does not constitute investment, legal or tax advice. You should not invest in the Units unless you can afford to lose all of your investment.
All trading and investment activities take place at the Trading Company level or through a Series’ investment in one or more Galaxy Plus entities Platform, and since the Trust invests substantially all of the assets of each Series in one or more Trading Companies and/or Galaxy Plus entities, each of the risks applicable to the Trading Companies and/or Galaxy Plus entities flows through to the Series.
Structural Risks
Neither the Trust nor any of the Trading Companies nor any of the Galaxy Plus entities is a registered investment company.
Neither the Trust nor any of the Trading Companies nor any of the Galaxy Plus entities is an investment company subject to the Investment Company Act. Accordingly, Unitholders do not have the protections afforded by that statute. For example, the Investment Company Act requires investment companies to have a majority of disinterested directors and regulates the relationship between the investment company and its investment adviser.
Certain restrictions on redemption and transfer of the Units apply.
Unitholders generally may redeem Units daily on one business day notice, but certain restrictions on redemption and transfer will apply. For example, if a Unitholder invests in class 1 or 1a Units and redeem all or a portion of such Units on or before the end of the 12 full months following the purchase of such Units, a Unitholder will be charged a redemption fee of up to a percentage of the purchase price of any such Units being redeemed. Also, transfers of Units are permitted only with the prior written consent of the Managing Owner and provided that conditions specified in the trust agreement are satisfied. There is no secondary market for the Units and none is expected to develop.
Redemptions may be temporarily suspended.
The Managing Owner may temporarily suspend redemptions for some or all of the Series for up to 30 days if the effect of any redemption, either alone or in conjunction with other redemptions, would be to impair the Trust’s ability to operate in pursuit of its objectives (for example, if the Managing Owner believes a redemption, if allowed, would materially advantage one investor over another investor). The Managing Owner anticipates suspending redemptions only under extreme circumstances, such as a natural disaster, force majeure, act of war, terrorism or other event which results in the closure of financial markets. During any suspension of redemptions, a redeeming limited owner invested in a Series for which redemptions were suspended would remain subject to market risk with respect to such Series.
An unanticipated number of redemption requests over a short period of time could result in losses.
Substantial redemptions of Units could require a Series to liquidate investments more rapidly than otherwise desirable in order to raise the necessary cash to fund the redemptions, which could result in losses. Illiquidity in the markets could make it difficult to liquidate positions on favorable terms, which could result in additional losses. It may also be difficult for the Series to achieve a market position appropriately reflecting a smaller equity base.
Reserves for contingent liabilities may be established upon redemption, and the Trust may withhold a portion of a Unitholder’s redemption amount.
When a Unitholder redeems its Units, the Trust may find it necessary to set up a reserve for undetermined or contingent liabilities and withhold a certain portion of a Unitholder’s redemption amount. This could occur, for example, if (i) some of the positions of the Series in which a Unitholder is invested were illiquid, (ii) there are any assets which cannot be properly valued on the redemption date, or (iii) there is any pending transaction or claim by or against the Trust involving, or which may affect, a Unitholder’s capital account or a Unitholder’s obligations.
Unitholders have limited rights and cannot prevent the Trust from taking actions which could cause losses.
Unitholders exercise no control over the Trust’s day-to-day business. Therefore, the Trust will take certain actions and enter into certain transactions or agreements without the Unitholders’ approval. For example, the Trust may retain a trading advisor for a Series in which a Unitholder is invested, and such trading advisor may ultimately incur losses for the Series. As a limited owner, a Unitholder will have no ability to influence the hiring, retention or firing of such trading advisor. However, certain actions, such as termination or dissolution of a Series, may only be taken upon the affirmative vote of Unitholders holding Units representing at least a majority (over 50%) of the net asset value of the Series (excluding Units owned by the Managing Owner and its affiliates).
Unitholders will not be able to review any Series’ holdings on a daily basis and may suffer unanticipated losses.
The trading advisors make trading decisions on behalf of the assets of each Series. While the trading advisors receive daily trade confirmations from the clearing brokers of each transaction entered into on behalf of each Series for which they manage the trading, each Series’ trading results are only reported to investors monthly in summary fashion. Accordingly, an investment in the Units does not offer investors the same transparency that a personal trading account offers. As a result, you may suffer unanticipated losses.
Unitholders will not be aware of changes to trading programs or investments into, or divestments from, any Galaxy Plus entities.
Because of the proprietary nature of each trading advisor’s trading programs, you generally will not be advised if adjustments are made to a trading program or to allocations made to one or more Galaxy Plus entities in order to accommodate additional assets under management or for any other reason.
The Trust could terminate before a Unitholder achieves its investment objective, causing potential loss of its investment or upsetting its investment portfolio.
Unforeseen circumstances, including substantial losses or withdrawal of the Trust’s Managing Owner, could cause the Trust to terminate before its stated termination date of December 31, 2053. The Trust’s termination would cause the liquidation and potential loss of your investment and could upset the overall maturity and timing of your investment portfolio.
The Managing Owner may allocate nominal assets in respect of a Series that are in excess of the Net Asset Value of such Series.
At any given time, the nominal assets of a Series may exceed the net asset value of such Series depending on the amount of notional equity that is being utilized, including through investments in the Galaxy Plus entities. The Managing Owner expects that the nominal assets of each Series will generally be maintained at a level in excess of the net asset value of such Series and such excess may be substantial to the extent the Managing Owner deems necessary to achieve the desired level of volatility. The Managing Owner also expects each of the trading advisors to the Galaxy Plus entities to maintain nominal assets at a level in excess of the net asset value of such Galaxy Plus entity. To the extent that nominal assets of a Series or Galaxy Plus entity are in excess of net asset value, investors should understand that the applicable Series or Galaxy Plus entity will experience greater volatility as measured by net asset value than it would if the nominal assets were maintained at a level equal to net asset value. In such case, any losses to the Series or Galaxy Plus entity will be greater as measured by a percentage of net asset value, as compared to the percentage loss incurred in respect of nominal assets. Consequently, the allocation of nominal assets in excess of a Series’ or Galaxy Plus entity’s net asset value will magnify exposure to the swings in market prices of futures, forwards, options or other assets held by a Trading Company, Galaxy Plus entity or referenced by a swap or other derivative instrument and result in increased volatility, and potentially greater losses. You may lose all or substantially all of your investment in a Series.
The Managing Owner may adjust the leverage employed by a Trading Advisor through a Trading Company to maintain the target rate of volatility.
In its sole discretion, the Managing Owner may modify the allocations between the trading advisors used by a particular Series at any time, including adding new trading advisors or terminating current trading advisor relationships, and the Managing Owner may also increase or decrease the amount of leverage employed by a specific trading advisor by allocating notional funds to a particular trading advisor in accordance with the Managing Owner’s proprietary management program. The Managing Owner may increase or decrease the notional equity allocated to one or more individual trading advisors over time in order to adjust the annual volatility for a Series within the target volatility range disclosed for such Series.
To the extent that the Managing Owner increases the leverage employed by a particular trading advisor to maintain the target volatility of a Series, either by increasing the actual funds which are traded by the trading advisor at a leverage of greater than 1x or by allocating notional amounts to one or more trading advisors, the specific risks associated with the relevant trading advisors will be greater for the affected Series. As the notional equity under management of a specific trading advisor increases, the diversification benefits attributable to a multi-advisor pool will be decreased to an extent, since the trading advisor will manage a greater percentage of the notional exposure of the Series. Since the Managing Owner may change the applicable leverage used by a particular trading advisor at any time, the diversification of risks between the trading advisors is variable.
Each Series may be charged substantial fees and expenses regardless of profitability.
Each Series is charged brokerage charges, over-the-counter (“OTC”) dealer spreads and related transaction fees and expenses, and management fees in all cases regardless of whether any Series’ activities are profitable. In addition, the Managing Owner charges each Series an incentive fee based on a percentage of the new trading profits generated by each trading advisor for such Series or the profits generated by such Series’ investment in Galaxy Plus entities. Such incentive fee is reduced by an amount equal to any performance fees paid by the Galaxy Plus entity to its trading advisors, and to the extent any related incentive fee is paid by the Series to a trading advisor, the Managing Owner will pay all or a portion of its incentive fee to the Series. As a result of the fact that incentive fees are calculated separately for each trading advisor and Galaxy Plus entity to which the Series has allocated assets and each Series allocates assets to multiple trading advisors and/or Galaxy Plus entities, it is possible that substantial incentive fees may be paid out of the net assets of a Series during periods in which such Series has no net new trading profits or in which such Series actually loses money. In addition, each Series must earn new trading profits and interest income sufficient to cover these fees and expenses in order for it to be profitable.
Investors should note that the management fee payable to the Managing Owner is based on nominal assets rather than net asset value. Therefore, the management fee will be greater as a percentage of a Series’ net asset value to the extent that the nominal assets of such Series exceed its net asset value. The Managing Owner expects that the nominal assets of each Series will generally be maintained at a level in excess of the net asset value of such Series and such excess may be substantial to the extent the Managing Owner deems necessary to achieve the desired level of volatility. In addition, basing the management fee on nominal assets may result in the Managing Owner receiving a higher management fee than if it was based on net asset value. This method of calculating the management fee payable to the Managing Owner may differ from how other commodity pools that are similar to the Trust calculate their management fees.
There are certain risks associated with investments in Trading Companies and Galaxy Plus entities.
Certain of the trading companies and Galaxy Plus entities may be organized as series limited liability companies. This means that, under the Delaware Limited Liability Company Act, the assets of one series are not available to pay the liabilities of another series or the trading company as a whole. This statute has not been tested in a court of law in the United States. In the event series limited liability is not enforceable, a segregated series could be obligated to pay the liabilities of another series or the trading company. In addition, each of the Trust’s Series is subject to, and invests a portion of its assets in Galaxy Plus entities that are subject to, risks related to the operation and administration of the Galaxy Plus Managed Account Platform (“Galaxy Plus Platform”) by officers and employees of New Hyde Park.
Each Series invests in trading companies that, although they are organized as series limited liability companies, allocate assets to more than one commodity trading advisor without the establishment of separate series with segregated liabilities. For these trading companies, losses incurred by one commodity trading advisor may negatively impact the trading company as a whole, as the assets allocated to a different commodity trading advisor may be made available to pay the liabilities of the commodity trading advisor that has incurred the loss. Since each of the Frontier Diversified Fund, the Frontier Masters Fund and the Frontier Long/Short Commodity Fund currently invests in such trading companies, this could indirectly cause the assets of one Series to be used to pay the liabilities of another Series. For trading companies that allocate assets to more than one commodity trading advisor, a series may be allowed to allocate a portion of its assets to a particular commodity trading advisor accessed by the trading company, rather than to the trading company as a whole.
Conflicts of interest exist in the structure and operation of the Trust.
A number of actual and potential conflicts of interest exist in the operation of the Trust’s business. The Managing Owner, the trading advisors, the independent administrator, the independent transfer agent, the clearing brokers, the Trustee and their respective principals are all engaged in other investment activities and are not required to devote substantially all of their time to the Trust’s business.
Each Series may incur higher fees and expenses upon renewing existing or entering into new contractual relationships.
The clearing agreements between the clearing brokers and the trading companies generally are terminable by the clearing brokers once the clearing broker has given the trading company the required notice. Upon termination of a clearing agreement, the Managing Owner may be required to renegotiate that agreement or make other arrangements for obtaining clearing. The services of the clearing brokers may not be available, or even if available, these services may not be available on the terms as favorable as those contained in the expired or terminated clearing agreements.
Each Series may be subject to indirect fees and expenses associated with investments in swaps or other derivative instruments.
A portion of each Series’ assets may be used to enter into principal-to-principal OTC derivative contracts, including swaps, which are individually negotiated by the parties and priced by the counterparty and may include fees and expenses that are accounted for in the pricing under the applicable contract. Such indirect embedded expenses may not be identifiable or enumerated explicitly in confirms or other transaction documentation. Each Series may pay a fee to a counterparty in respect of any swap or derivative instruments of up to 0.50% of the notional amount of such swap or derivative instrument. Any management fee or incentive fees embedded in a swap or other derivative instrument may be greater or less than the management fee or incentive fees that would otherwise be charged to the Series by the Managing Owner. During the periods covered in this report, none of the Series owned a derivative instrument or swap.
The failure or bankruptcy of one of its futures clearing brokers, central clearing brokers, banks, counterparties or other custodians could result in a substantial loss of one or more Series’ assets.
The Trust is subject to the risk of insolvency of an exchange, clearinghouse, central clearing broker, commodity broker, and counterparties with whom the trading companies trade. Trust assets could be lost or impounded in such an insolvency during lengthy bankruptcy proceedings. Were a substantial portion of the Trust’s capital tied up in a bankruptcy, the Managing Owner might suspend or limit trading, perhaps causing a Series to miss significant profit opportunities. The Trust is subject to the risk of the inability or refusal to perform on the part of the counterparties with whom contracts are traded. In the event that the clearing brokers are unable to perform their obligations, the Trust’s assets are at risk and investors may only recover a pro rata share of their investment, or nothing at all.
Exchange-traded futures and futures-styled option contracts are marked to market on a daily basis, with variations in value credited or charged to the Trust’s account on a daily basis. The clearing brokers, as futures commission merchants for the Trust’s exchange-traded contracts, are required, pursuant to CFTC regulations, to segregate from their own assets, and for the sole benefit of its commodity customers, all funds held by such clients with respect to exchange-traded futures and futures-styled options contracts, including an amount equal to the net unrealized gain on all open futures and futures-styled options contracts. Similar requirements apply with respect to funds held in connection with cleared swap contracts. Bankruptcy law applicable to all U.S. futures brokers requires that, in the event of the bankruptcy of such a broker, all property held by the broker, including certain property specifically traceable to the Trust, will be returned, transferred, or distributed to the broker’s customers only to the extent of each customer’s pro rata share of the assets held by such futures broker. The Managing Owner will attempt to limit the Trust’s deposits and transactions to well-capitalized institutions in an effort to mitigate such risks, but there can be no assurance that even a well-capitalized, major institution will not become bankrupt.
In the event of a shortfall in segregated customer funds held by the futures commission merchant, the Series’ assets on account with the futures commission merchant may be at risk in the event of the futures commission merchant’s bankruptcy or insolvency, and in such event, the Series may only recover a portion of the available customer funds. If no property is available for distribution, the Series would not recover any of its assets. With respect to a Series’ OTC uncleared swaps, prior to the implementation of the provisions of the Dodd-Frank Wall Street Reform and Consumer Protection Act, as amended (the “Dodd-Frank Act”), there was no requirement to segregate funds held with respect to such contracts. There is now a requirement to segregate funds held as variation margin posted by a party engaging in uncleared swaps with a swap dealer or major swap participant; moreover, a party engaging in uncleared swaps with a swap dealer or major swap participant can ask that the initial margin posted by such party be held with an independent third-party custodian. Generally, the party requesting segregation will pay the costs of such custodial arrangement. There may also be costs and delays involved in negotiating the custodial arrangement and related contractual terms.
With respect to transactions a Series enters into that are not traded on an exchange, there are no daily settlements of variations in value and there is no requirement to segregate funds held with respect to such accounts. Thus, the funds that a Series invests in such transactions may not have the same protections as funds used as margin or to guarantee exchange-traded futures and options contracts. If the counterparty becomes insolvent and a Series has a claim for amounts deposited or profits earned on transactions with the counterparty, the Series’ claim may not receive a priority. Without a priority, the Trust is a general creditor and its claim will be paid, along with the claims of other general creditors, from any monies still available after priority claims are paid. Even funds of the Trust that the counterparty keeps separate from its own operating funds may not be safe from the claims of other general and priority creditors. There are no limitations on the amount of allocated assets a portfolio manager can trade on foreign exchanges or in forward contracts.
A Unitholder may not be able to establish a basis for liability against a Trading Advisor, a clearing broker or a swap counterparty.
Each trading advisor, clearing broker, and swap counterparty acts only as a trading advisor, clearing broker or swap counterparty, respectively, to the applicable Series and/or trading company. These parties do not act as trading advisors, clearing brokers, or swap counterparties to you. Therefore, you have no contractual privity with the trading advisors, the clearing brokers, or any swap counterparty. Due to this lack of contractual privity, you may not be able to establish a basis for liability against a trading advisor, clearing broker, or swap counterparty.
The Managing Owner is leanly staffed and relies heavily on its key personnel to manage the Trust’s trading activities. The loss of such personnel could adversely affect the Trust.
In managing and directing the day-to-day activities and affairs of the Trust, the Managing Owner relies heavily on its principals. The Managing Owner is leanly staffed, although there are back-up personnel for every key function. If any of the Managing Owner’s key persons were to leave or be unable to carry out his or her present responsibilities, it may have an adverse effect on the management of the Trust.
Risks Relating to Trading and the Markets
Futures interests trading is speculative and volatile.
The rapid fluctuations in the market prices of futures, forwards, and options make an investment in any of the Series volatile. Volatility is caused by, among other things: changes in supply and demand relationships; weather; agriculture, trade, fiscal, monetary and exchange control programs; domestic and foreign political and economic events and policies; and changes in interest rates. The Trading Advisors’ technical trading methods may not take account of these factors except as they may be reflected in the technical input data analyzed by the Trading Advisors. In addition, governments from time to time intervene, directly and by regulation, in certain markets, often with the intent to influence prices directly. The effects of governmental intervention may be particularly significant at certain times in the financial instrument and currency markets, and this intervention may cause these markets to move rapidly.
Each Series’ performance will be volatile, and a Series could lose all or substantially all of its assets. The multi-advisor feature of each Series, except for Frontier Global Fund, along with its investments in Galaxy Plus entities, may reduce the return volatility relative of the performance of single-advisor investment funds.
Options trading can be more volatile and expensive than futures trading.
Options are derivatives that give the purchaser the option to buy (call) or sell (put) an underlying asset from or to a counterparty at a specified price (the strike price) on or before an expiration date. Certain trading advisors may purchase or write (i.e., sell) put and call options on an underlying reference it is otherwise permitted to invest in. By investing in options, the series are exposed to the risk that it may be required to buy or sell the underlying reference at a disadvantageous price on or before the expiration date. If a series sells a put option, the series may be required to buy the underlying reference at a strike price that is above market price, resulting in a loss. If a series sells a call option, the series may be required to sell the underlying reference at a strike price that is below market price, resulting in a loss. If a series sells a call option that is not covered (it does not own the underlying reference), the series’ losses are potentially unlimited. Options may involve economic leverage, which could result in greater volatility in price movement. Options may be traded on a securities exchange or in the over-the-counter market. At or prior to maturity of an options contract, a series may enter into an offsetting contract and may incur a loss to the extent there has been adverse movement in options prices. Options can increase a series’ risk exposure to underlying references and their attendant risks such as credit risk, market risk, foreign currency risk and interest rate risk, while also exposing the Fund to correlation risk, counterparty risk, hedging risk, leverage risk, liquidity risk, pricing risk and volatility risk.
Certain Trading Advisors may trade options on futures. Although successful options trading requires many of the same skills as successful futures trading, the risks involved are somewhat different. Successful options trading requires a trader to accurately assess near-term market volatility, because that volatility is immediately reflected in the price of outstanding options. Correct assessment of market volatility can therefore be of much greater significance in trading options than it is in many long-term futures strategies. If market volatility is incorrectly predicted, the use of options can be extremely expensive.
Trading Swaps Creates Distinctive Risks.
The series may trade in certain swaps. Unlike futures and options on futures contracts, most swap contracts currently are not traded on or cleared by an exchange or clearinghouse. The CFTC currently requires only a limited class of swap contracts (certain interest rate and credit default swaps) to be cleared and executed on an exchange or other organized trading platform. In accordance with the Dodd-Frank Act, the CFTC will determine in the future which other classes of swap contracts will be required to be cleared and executed on an exchange or other organized trading platform. Until such time as these transactions are cleared, the series will be subject to a greater risk of counterparty default on its swaps. Because swaps do not generally involve the delivery of underlying assets or principal, the amount payable upon default and early termination is usually calculated by reference to the current market value of the contract. Swap dealers and major swap participants require the series to deposit initial margin and variation margin as collateral to support such series’ obligation under the swap agreement but may not themselves provide collateral for the benefit of any series. If the counterparty to such a swap defaults, the series would be a general unsecured creditor for any termination amounts owed by the counterparty to the series as well as for any collateral deposits in excess of the amounts owed by the series to the counterparty, which would result in losses to the series.
There are no limitations on daily price movements in swaps. Speculative position limits are not currently applicable to swaps, but in the future, may be applicable for swaps on certain commodities. In addition, participants in the swap markets are not required to make continuous markets in the swaps they trade and determining a market value for calculation of termination amounts can lead to uncertain results.
Trading of swaps has been and will continue to be subject to substantial change under the Dodd-Frank Act and related regulatory action. Under the Dodd-Frank Act, many commodity swaps will be required to be cleared through central clearing parties and executed on exchanges or other organized trading platforms. Security-based swaps will be subject to similar requirements. Additional regulatory requirements will apply to all swaps, whether subject to mandatory clearing or not. These include margin, collateral and capital requirements, reporting obligations, speculative position limits for certain swaps, and other regulatory requirements. Swaps which are not offered for clearing by a clearinghouse will continue to be traded bi-laterally. Such bi-lateral transactions will remain subject to many of the risks discussed in the preceding paragraphs.
Swap counterparties may hold collateral in U.S. or non-U.S. depositories. Non-U.S. depositories are not subject to U.S. regulation. The series’ assets held in these depositories are subject to the risk that events could occur which would hinder or prevent the availability of these funds for distribution to customers, including the series. Such events may include actions by the government of the jurisdiction in which the depository is located including expropriation, taxation, moratoria and political or diplomatic events.
The trading on behalf of each Series will be margined, which means that sharp declines in prices could lead to large losses.
Because the amount of margin funds necessary to be deposited with a futures clearing broker to enter into a futures, forward contract or option position is typically about 2% to 10% of the total value of the contract, each Trading Advisor may take positions on behalf of a Series with face values equal to several times such Series’ NAV. These low margin requirements provide a large amount of leverage. As a result of margining, even a small movement in the price of a contract can cause major losses. Any purchase or sale of a futures or forward contract or option position may result in losses that substantially exceed the amount invested. If severe short-term price declines occur, such declines could force the liquidation of open positions with large losses. Margin is normally monitored through the margin-to-equity ratio employed by each Trading Advisor. Under normal circumstances, the Trading Advisors will vary between a 10% to 30% margin-to-equity ratio. In addition, OTC transactions present risks in addition to those associated with exchange-traded contracts, as discussed immediately below.
The unregulated nature of uncleared trades in the OTC markets creates counterparty risks that do not exist in futures trading on exchanges or in cleared swaps.
Unlike futures contracts and cleared swaps, uncleared trades, such as forward contracts, some swaps and some OTC “spot” contracts, are entered into between private parties off an exchange or other trading platform and are not subject to clearing. As a result, the performance of those contracts is not guaranteed by an exchange or its clearinghouse and the Series is at risk with respect to the ability of the counterparty to perform on the contract, including the creditworthiness of the counterparty. Trading of foreign exchange spot contracts of foreign exchange forwards and foreign exchange swaps (as such terms are defined in the Dodd-Frank Act), and of uncleared swaps is not regulated or is subject to limited regulation; therefore, there are limited or no specific standards or regulatory supervision of trade pricing and other trading activities that occur in those markets.
Foreign currency and spot contracts historically were not regulated when traded between certain “eligible contract participants” and are subject to credit risk.
Each Series may trade forward contracts in foreign currencies and may engage in spot commodity transactions (transactions in physical commodities). These contracts, unlike futures contracts and options on futures, historically were not regulated by the CFTC when traded between certain “eligible contract participants,” as defined in the CEA. On July 21, 2010, the President signed into law major financial services reform legislation in the form of the Dodd-Frank Act. The Dodd-Frank Act includes foreign currency forwards and foreign currency swaps (as such terms are defined in the Dodd-Frank Act) in the definition of “swap.” The CFTC has been granted authority to regulate all swaps but grants the U.S. Treasury Department the discretion to exempt foreign currency forwards and foreign currency swaps from all aspects of the Dodd-Frank Act other than reporting, recordkeeping and business conduct rules for swap dealers and major swap participants. In November 2012, Treasury determined that those transactions can be carved out of the swap category, and they are subject only to the noted categories of the Dodd-Frank Act requirements. Therefore, the Series will not receive the full benefit of CFTC regulation for certain of their foreign currency trading activities.
The percentage of each Series’ positions that are expected to constitute foreign currency forwards and foreign currency swaps can vary substantially from month to month.
Trading on foreign exchanges presents greater risks to the Series than trading on U.S. exchanges.
Each Series trades on exchanges located outside the United States. Trading on U.S. exchanges is subject to CFTC regulation and oversight, including, for example, minimum capital requirements for commodity brokers, segregation of customer funds, regulation of trading practices on the exchanges, prohibitions against trading ahead of customer orders, prohibitions against filling orders off exchanges, prescribed risk disclosure statements, testing and licensing of industry sales personnel and other industry professionals, and recordkeeping requirements, and other requirements and restrictions for the purpose of preventing price manipulation and other disruptions to market integrity, avoiding systemic risk, preventing fraud and promoting innovation, competition and financial integrity of transactions. Trading on foreign exchanges is not regulated by the CFTC or any other U.S. governmental agency or instrumentality and may be subject to regulations that are different from those to which U.S. exchange trading is subject, provide less protection to investors than trading on U.S. exchanges, and may be less vigorously enforced than regulations in the U.S. The CFTC has no power to compel the enforcement of the rules of a foreign exchange or applicable foreign laws. Therefore, the Series will not receive any benefit of U.S. government regulation for these trading activities.
Trading on foreign exchanges involves some risks that trading on U.S. exchanges does not, such as:
Lack of Investor Protection Regulation
The rights of the Series in the event of the insolvency or bankruptcy of a non-U.S. market or broker are likely to differ from rights that the Series would have in the United States and these rights may be more limited than in the case of failures of U.S. markets or brokers.
Possible Governmental Intervention
Generally, foreign brokers are not subject to the jurisdiction of the CFTC or any other U.S. regulator. In addition, the Series’ assets held outside of the United States to margin transactions on foreign exchanges are held in accordance with the client assets protection regime and the insolvency laws of the applicable jurisdiction. A foreign government might halt trading in a market and/or take possession of the Series’ assets maintained in its country in which case the assets may never be recovered. The Managing Owner and the Series might have little or no notice that such events were happening. In such circumstances, the Managing Owner may not be able to obtain the Series’ assets.
Relatively New Markets
Some foreign exchanges on which the Series trade may be in developmental stages so that prior price histories may not be indicative of current price patterns.
Exchange-Rate Exposure
The Series are valued in U.S. dollars. Contracts on foreign exchanges are usually traded in the local currency. The Series’ assets held in connection with contracts priced and settled in a foreign currency may be held in a foreign depository in accounts denominated in a foreign currency. Changes in the value of the local currency relative to the U.S. dollar could cause losses to the Series even if the contract traded is profitable.
Assets held in accounts at U.S. banks may not be fully insured.
The assets of each Trading Company or Galaxy Plus entity that are deposited with commodity brokers or their affiliates may be placed in deposit accounts at U.S. banks. The Federal Deposit Insurance Corporation (“FDIC”) generally insures all deposit accounts of any one accountholder held at any one insured U.S. bank for up to $250,000 in the aggregate. If the funds in an account can be traced back to multiple individual co-owners, then each co-owner may be separately entitled to up to $250,000 in coverage. This $250,000 maximum amount of deposit insurance coverage was made permanent by the Dodd-Frank Act. Uninsured depositors also may receive funds in the event of a receivership of the bank holding the deposit accounts, but uninsured depositors have a lower priority in respect of payment than insured depositors or certain other creditors, and frequently there are insufficient funds in a receivership estate to pay off uninsured depositors fully or at all. If the FDIC were to become receiver of an insured U.S. bank holding deposit accounts that were established by a commodity broker or one of its affiliates, then it is uncertain whether the commodity broker, the affiliate involved, the Trading Company or Galaxy Plus entity, the Series involved, or the investor would be able to reclaim cash in the deposit accounts in the full amount.
Exchanges of futures for physicals may adversely affect performance.
Certain Trading Advisors may engage in exchanges of futures for physicals for client accounts. An exchange of futures for physicals is a transaction permitted under the rules of many futures exchanges in which two parties holding futures positions may close out their positions without making an open, competitive trade on the exchange. Generally, the holder of a short futures position buys the physical commodity, while the holder of a long futures position sells the physical commodity. The prices at which such transactions are executed are negotiated between the parties. If a Trading Advisor engaging in exchanges of futures for physicals were prevented from such trading as a result of regulatory changes, the performance of client accounts of such Trading Advisor could be adversely affected.
Cash flow needs may cause positions to be closed which may cause substantial losses.
Certain Trading Advisors may trade options on futures. Futures contract gains and losses are marked-to-market daily for purposes of determining margin requirements. Option positions generally are not marked-to-market daily, although short option positions will require additional margin if the market moves against the position. Due to these differences in margin treatment between futures and options, there may be periods in which positions on both sides must be closed down prematurely due to short term cash flow needs. If this occurs during an adverse move in a spread or straddle relationship, then a substantial loss could occur.
Your investment could be illiquid.
A Trading Advisor may not always be able to liquidate its commodity interest positions at the desired time or price. It is difficult to execute a trade at a specific price when there is a relatively small volume of buy and sell orders in a market. A market disruption, such as a foreign government taking political actions that disrupt the market in its currency or in a major export, can also make it difficult to liquidate a position. Alternatively, limits imposed by futures exchanges or other regulatory organizations, such as speculative position limits and daily price fluctuation limits, may contribute to a lack of liquidity with respect to some commodity interests. There is no secondary market for the Units, and none is expected to develop.
The Trading Advisors’ trading is subject to execution risks.
Although each Series generally will purchase and sell actively traded contracts, orders may not be executed at or near the desired price, particularly in thinly traded markets, in markets that lack trading liquidity, or because of applicable “daily price fluctuation limits,” “speculative position limits” or market disruptions. If market illiquidity or disruptions occur, major losses could result.
An investment in Units may not diversify an overall portfolio.
Historically, managed futures have performed in a manner largely independent from the general equity and debt markets. If, however, a Series does not perform in a non-correlated manner with respect to the general financial markets or does not perform successfully, you will obtain little or no diversification benefits by investing in the Units. An investment in any Series of the Trust could increase, rather than reduce your overall portfolio losses during periods when the Trust and the equity and debt markets decline in value. There is no way of predicting whether the Trust will lose more or less than stocks and bonds in declining markets. You should therefore not consider the Units to be a hedge against losses in your core stock and bond portfolios. Past performance is not indicative of future results.
Markets or positions may be correlated and may expose a Series to significant risk of loss.
Different markets traded or individual positions held by a Series of Units may be highly correlated to one another at times. Accordingly, a significant change in one such market or position may affect other such markets or positions. The Trading Advisors cannot always predict correlation. Correlation may expose such Series of Units both to significant risk of loss and significant potential for profit.
The Trading Advisors’ positions may be concentrated from time to time, which may render each Series susceptible to larger losses than if the positions were more diversified.
One or more of the Trading Advisors may from time to time cause a Series to hold a few, relatively large positions in relation to its assets. Consequently, a loss in any such position could result in a proportionately greater loss to such Series than if the Series’ assets had been spread among a wider number of instruments.
Turnover in each Series’ portfolio may be high which could result in higher brokerage commissions and transaction fees and expenses.
Each Trading Advisor will make certain trading decisions on the basis of short-term market considerations. The portfolio turnover rate may be substantial at times, either due to such decisions or to market conditions, and this could result in one or more Series incurring substantial brokerage commissions and other transaction fees and expenses.
There are certain risks associated with the Trust’s investment in U.S. government debt securities.
With respect to the portion of the Trust’s assets apportioned for cash management, the Trust may invest in U.S. government securities which include any security issued or guaranteed as to principal or interest by the United States, or by a person controlled by or supervised by and acting as an instrumentality of the government of the United States pursuant to authority granted by Congress of the United States or any certificate of deposit for any of the foregoing, including U.S. Treasury bonds, U.S. Treasury bills and issues of agencies of the U.S. government (such as Ginnie Mae, Fannie Mae, or Freddie Mac). U.S. government securities are subject to market risk, interest rate risk and credit risk. Securities, such as those issued or guaranteed by Ginnie Mae or the U.S. Treasury, that are backed by the full faith and credit of the United States are guaranteed only as to the timely payment of interest and principal when held to maturity and the market prices for such securities will fluctuate. Notwithstanding that these securities are backed by the full faith and credit of the United States, circumstances could arise that would prevent the payment of interest or principal. This would result in losses to the Trust. Securities issued or guaranteed by U.S. government-related organizations, such as Fannie Mae and Freddie Mac, are not backed by the full faith and credit of the U.S. government and no assurance can be given that the U.S. government would provide financial support. Therefore, U.S. government-related organizations may not have the funds to meet their payment obligations in the future.
The Trust’s investment in U.S. government debt securities will be subject to interest rate risk.
The Trust’s cash management pool includes investments in U.S. government debt securities that change in value based on changes in interest rates. If rates increase, the value of these investments generally declines. On the other hand, if rates fall, the value of these investments generally increases. U.S. government securities with greater interest rate sensitivity and longer maturities tend to produce higher yields but are subject to greater fluctuations in value. Usually, the changes in the value of fixed income securities will not affect cash income generated but may affect the value of your investment. Given the current low interest rate environment, the risk associated with rising rates is heightened.
Investments in reference programs through a swap or other derivative instrument may not always replicate exact exactly the performance of the relevant CTA trading program(s).
From time to time, certain Series may invest in reference programs through total return swaps. Such swaps reference an index comprised of shares in segregated investment portfolios directed by CTAs selected by the Managing Owner. It is possible that the underlying index in respect of any swap owned by a Series may not fully replicate the performance of the relevant CTA programs in respect of other accounts traded by such CTAs. Further, the calculation of the underlying index for such swaps may include a deduction for a fee payable to the swap counterparty. Each of these deductions will mean that the return of such investment will be less than would be the case if no fees were deducted. During the periods covered by this report, no Series was invested in any derivative instruments including swaps.
Our investments and operations are subject to the risk of a potential public health crisis.
A public health crisis, pandemic, epidemic or outbreak of a contagious disease, such as the recent global outbreak of a disease caused by a novel and highly contagious form of coronavirus (COVID-19), could have an adverse impact on global, national and local economies, which in turn could negatively impact the Series. An outbreak such as COVID-19, and the reactions to such an outbreak, are expected to adversely affect the performance of the U.S. and global economies, including due to market volatility, market and business uncertainty and closures, supply chain and travel interruptions, the need for employees to work at external locations and extensive medical absences among the workforce. Disruptions to commercial activity relating to the imposition of quarantines, stay-at-home orders or travel restrictions (or more generally, a failure of containment efforts) may adversely impact the Series’ investments. In addition, such restrictions may significantly impair the ability of the Trading Advisors’ personnel to travel in connection with potential or existing investments of the Series, which could negatively impact the ability of such Trading Advisors to effectively identify, monitor, operate and dispose of investments.
Risks Relating to the Trading Advisors
There are disadvantages to making trading decisions based on technical analysis.
Many of the Trading Advisors, except certain Trading Advisors trading for the Frontier Long/Short Commodity Fund may base their trading decisions on trading strategies that use mathematical analyses of technical factors relating to past market performance rather than fundamental analysis. The buy and sell signals generated by a technical, trend-following trading strategy are derived from a study of actual daily, weekly and monthly price fluctuations, volume variations and changes in open interest in the markets. The profitability of any technical, trend-following trading strategy depends upon the occurrence in the future of significant, sustained price moves in some of the markets traded.
A danger for trend-following traders is whip-saw markets, that is, markets in which a potential price trend may start to develop but reverses before an actual trend is realized. A pattern of false starts may generate repeated entry and exit signals in technical systems, resulting in unprofitable transactions. In the past, there have been prolonged periods without sustained price moves. Presumably these periods will continue to occur. Periods without sustained price moves may produce substantial losses for trend-following trading strategies. Further, any factor that may lessen the prospect of these types of moves in the future, such as increased governmental control of, or participation in, the relevant markets, may reduce the prospect that any trend- following trading strategy will be profitable in the future.
There are disadvantages to making trading decisions based on fundamental analysis.
Certain Trading Advisors will base their decisions on trading strategies which utilize in whole or in part fundamental analysis of underlying market forces. Fundamental analysis attempts to examine factors external to the trading market which affect the supply and demand for a particular commodity interest in order to predict future prices. Such analysis may not result in profitable trading because certain Trading Advisors may not have knowledge of all factors affecting supply and demand or may incorrectly interpret the information they do have. Furthermore, prices may often be affected by unrelated or unexpected factors and fundamental analysis may not enable the Trading Advisor to determine whether its previous decisions were incorrect in sufficient time to avoid substantial losses. In addition, fundamental analysis assumes that commodity markets are inefficient—i.e., that commodity prices do not always reflect all available information—which some market analysts dispute.
Discretionary decision-making may result in missed opportunities or losses.
Because each of the Trading Advisors’ strategies involves some discretionary aspects in addition to analysis of technical factors, certain Trading Advisors may occasionally use discretion in investing the assets of a Series. For example, the Trading Advisors often use discretion in selecting contracts and markets to be followed. In exercising such discretion, such Trading Advisor may take positions opposite to those recommended by the Trading Advisor’s trading system or signals. Discretionary decision making may also result in a Trading Advisor’s failing to capitalize on certain price trends or making unprofitable trades in a situation where another trader relying solely on a systematic approach might not have done so. Furthermore, such use of discretion may not enable the Series to avoid losses, and in fact, such use of discretion may cause the Series to forego profits which it may have otherwise earned had such discretion not been used.
Increased competition from other systematic traders could reduce the Trading Advisors’ profitability.
There has been a dramatic increase over the past 15 to 25 years in the amount of assets managed pursuant to trading systems like those that some of the Trading Advisors may employ. This means increased trading competition among a larger number of market participants for transactions at favorable prices, which could operate to the detriment of some or all Series by preventing the Trading Advisors from effecting transactions at the desired prices. It may become more difficult for the Trading Advisors to implement their trading strategies if other commodity trading advisors using technical systems are attempting to initiate or liquidate commodity interest positions at the same time as the Trading Advisors. The more competition there is for the same positions, the more costly and harder they will be to acquire.
The incentive fees could be an incentive to the Trading Advisors to make riskier investments.
The Managing Owner pays each Trading Advisor incentive fees based on the trading profits earned by it for the applicable Series, including unrealized appreciation on open positions. Accordingly, it is possible that the Managing Owner will pay an incentive fee on trading profits that do not become realized. Also, because the Trading Advisors are compensated based on the trading profits earned, each of the Trading Advisors has a financial incentive to make investments that are riskier than might be made if a Series’ assets were managed by a Trading Advisor that did not receive performance-based compensation.
The risk management approaches of one or all of the Trading Advisors may not be fully effective, and a Series may incur losses.
The mechanisms employed by each Trading Advisor to monitor and manage the risks associated with its trading activities on behalf of the Series for which it trades may not succeed in mitigating all identified risks. Even if a Trading Advisor’s risk management approaches are fully effective, it cannot anticipate all risks that it may face. If one or more of the Trading Advisors fails to identify and adequately monitor and manage all of the risks associated with its trading activities, the Series for which it trades may suffer losses.
Increases in assets under management of any of the Trading Advisors could lead to diminished returns.
We believe that none of the Trading Advisors intend to limit the amount of additional equity that it may manage, and each will continue to seek major new accounts. However, the rates of returns achieved by a Trading Advisor often diminish as the assets under its management increase. This can occur for many reasons, including the inability of the Trading Advisor to execute larger position sizes at desired prices and because of the need to adjust the Trading Advisor’s trading program to avoid exceeding speculative position limits.
These limits are established by the CFTC and the exchanges on the number of speculative futures and options contracts in a commodity that one trader may own or control. Furthermore, if the Trading Advisors for a Series, including through a Galaxy Plus entity, cannot manage any additional allocations from the Trust, the Managing Owner may add additional Trading Advisors for such Series who may have less experience or less favorable performance than the existing Trading Advisors.
Each Series relies on its Trading Advisor(s) for success, and if a Trading Advisor’s trading is unsuccessful, the Series may incur losses.
The Trading Advisor(s) for each Series will make the commodity trading decisions for that Series. Therefore, the success of each Series depends on the judgment and ability of the Trading Advisors. A Trading Advisor’s trading for any Series may not prove successful under all or any market conditions. If a Trading Advisor’s trading is unsuccessful, the applicable Series may incur losses. Similarly, the success of each Series that invests in swaps largely depends on the judgment and ability of the Trading Advisors whose trading programs are referenced by swaps in which such Series invests.
There are disadvantages associated with terminating or replacing Trading Advisors, Trading Programs, or Reference Trading Programs
A Trading Advisor generally is required to recoup previous trading losses in its trading program or a reference trading program, as applicable, before it can earn performance-based compensation. However, the Managing Owner and/or the commodity pool operator may elect to replace a Trading Advisor, or any trading program or reference trading program, that has a “loss carryforward.” In that case, the trust would lose the “free ride” of any potential recoupment of the prior losses of such Trading Advisor, trading program or reference trading program. In addition, the new Trading Advisor, trading program or reference trading program, or an existing Trading Advisor in respect of a new trading program or reference program, would earn performance-based compensation on the first dollars of investment profits.
It is also possible that (i) the advisory agreement with any Trading Advisor, once it expires, will not be renewed on the same terms as the current advisory agreement for that Trading Advisor, (ii) if assets of any Series allocated to a particular Trading Advisor, trading program or reference trading program are reallocated to a new or different Trading Advisor, trading program or reference trading program, the new or different Trading Advisor, with respect to its applicable trading program or reference trading program, will not manage the assets on terms as favorable to the Series as those previously negotiated, (iii) the addition of a new Trading Advisor, trading program or reference trading program and/or the removal of one of the current Trading Advisors, trading programs or reference trading programs may cause disruptions in trading as assets are reallocated, or (iv) the services of a replacement Trading Advisor, in respect of a trading program, reference program or otherwise, may not be available. There is severe competition for the services of qualified Trading Advisors, and the Managing Owner may not be able to retain replacement or additional Trading Advisors on acceptable terms. The effect of the replacement of, or the reallocation of assets away from, a Trading Advisor, trading program or reference trading program therefore could be significant.
The Managing Owner’s allocation of the Trust’s assets among Trading Advisors may result in less than optimal performance by the Trust.
The Managing Owner may reallocate assets among the Trading Advisors in a Series upon termination of a Trading Advisor or retention of a new Trading Advisor, including through divestments out of, or investments into, Galaxy Plus entities, or at the commencement of any month. Consequently, the net assets for such Series may be allocated among the Trading Advisors in a different manner than the currently anticipated allocations. The Managing Owner’s allocation of assets of any such Series may adversely affect the profitability of the trading of such Series. For example, a Trading Advisor for a Series may experience a high rate of return but may be managing only a small percentage of the net assets of such Series. In this case, the Trading Advisor’s performance could have a minimal effect on the NAV of such Series.
Each Trading Advisor advises other clients and may achieve more favorable results for its other accounts.
Each of the Trading Advisors currently manages other trading accounts, and each will remain free to manage additional accounts, including its own accounts, in the future. A Trading Advisor may vary the trading strategies applicable to the Series for which it trades from those used for its other managed accounts, or its other managed accounts may impose a different cost structure than that of the Series for which it trades. Consequently, the results any Trading Advisor achieves for the Series for which it trades may not be similar to those achieved for other accounts managed by the Trading Advisor or its affiliates at the same time. Moreover, it is possible that those other accounts managed by the Trading Advisor or its affiliates may compete with the Series for which it trades for the same or similar positions in the commodity interest markets and that those other accounts may make trades at better prices than the Series for which it trades.
A Trading Advisor may also have a financial incentive to favor other accounts because the compensation received from those other accounts exceeds, or may in the future exceed, the compensation that it receives from managing the account of the Series for which it trades. Because records with respect to other accounts are not accessible to investors in the Units, investors will not be able to determine if any Trading Advisor is favoring other accounts.
The Managing Owner places significant reliance on the Trading Advisors and their key personnel; the loss of such personnel could adversely affect a Series.
The Managing Owner relies on the Trading Advisors to achieve trading gains for each Series, entrusting each of them with the responsibility for, and discretion over, the investment of their allocated portions of the Trust’s assets. The Trading Advisors, in turn, are dependent on the services of a limited number of persons to develop and refine their trading approaches and strategies and execute the trading transactions. The loss of the services of any Trading Advisor’s principals or key employees, or the failure of those principals or key employees to function effectively as a team, may have an adverse effect on that Trading Advisor’s ability to manage its trading activities successfully or may cause the Trading Advisor to cease operations entirely. This, in turn, could negatively impact one or more Series’ performance. Each of the Trading Advisors is wholly- (or majority-) owned and controlled, directly or indirectly, by single individuals who have major roles in developing, refining and implementing the Trading Advisor’s trading strategies and operating its business. The death, incapacity or other prolonged unavailability of such individuals likely would greatly hinder these Trading Advisors’ operations, and could result in their ceasing operations entirely, which could adversely affect the value of your investment.
The success of each Series depends on the ability of the personnel of its Trading Advisor(s) to accurately implement their trading systems, and any failure to do so could subject a Series to losses.
The Trading Advisors’ computerized trading systems rely on the Trading Advisors’ personnel to accurately process the systems’ outputs and execute the transactions called for by the systems. In addition, each Trading Advisor relies on its staff to properly operate and maintain the computer and communications systems upon which its trading systems rely. Execution and operation of each Trading Advisor’s systems is therefore subject to human errors. Any failure, inaccuracy or delay in implementing any of the Trading Advisors’ systems and executing transactions could impair the Trading Advisor’s ability to identify profit opportunities and benefit from them. It could also result in decisions to undertake transactions based on inaccurate or incomplete information. This could cause substantial losses.
Stop-loss orders may not prevent large losses.
Certain of the Trading Advisors may use stop-loss orders. Such stop-loss orders may not effectively prevent substantial losses, and depending on market factors at the time, may not be able to be executed at such stop-loss levels. No risk control technique can assure that large losses will be avoided.
Risks Relating to the Galaxy Plus Platform
The success of each Series depends on the performance of the Galaxy Plus entities in which each Series invests.
The assets of each Series are substantially invested in Galaxy Plus entities, and accordingly, each Series’ performance depends substantially upon the performance of each such Galaxy Plus entity. Factors that may significantly affect a Galaxy Plus entity’s performance include the investment strategies selected for it by New Hyde Park and/or such Galaxy Plus entity’s trading advisor in their sole discretion, the Galaxy Plus entity’s adherence to the selected strategies, the effectiveness of such strategies and the specific trading activities of the Galaxy Plus entity’s trading advisor, including the trading advisor’s selection of financial instruments. Each Galaxy Plus entity is advised by an independent trading advisor. As a result, many of the risks outlined above with respect to the Trading advisors of each Series will also apply to the trading advisors of each Galaxy Plus entity.
The Galaxy Plus Platform is recently established and has a limited operating history and the Galaxy Plus entities have limited or no operating history or track record.
The Galaxy Plus Platform was formed in April 2015 and has a limited history of operations. The commodity pools offered on the platform are recently established with a limited operating history or, in some cases, newly established with no operating history. There is a limited performance history, or in some cases, no performance history, to serve as a factor in evaluating an investment in the commodity pools on the Galaxy Plus Platform.
A Series may be one of multiple investors in each Galaxy Plus entity.
The Galaxy Plus Platform allows multiple investors to subscribe for interests in its commodity pools. Investors other than a Series could cause a commodity pool to take, or omit to take, actions that may adversely affect the performance of, or value of a Series’ investments in, a commodity pool.
A Series may incur losses related to other investors’ large redemptions from, or investments into, a Galaxy Plus entity.
A commodity pool may experience relatively large redemptions or investments related to actions of other investors in the commodity pool. In the event of such redemptions or investments, a Trading Advisor to the commodity pool could be required to sell futures, options or other investments or to invest cash at a time when it is not advantageous to do so, harming the performance of a Series.
The Galaxy Plus Platform operates independently from each Series, the Trust and the Managing Owner.
The commodity pools on the Galaxy Plus Platform operate independently from each Series, the Trust and the Managing Owner. The Managing Owner will have no control over, or involvement in, the operation and administration of the commodity pools. New Hyde Park, as the sponsor of the commodity pools, may make operational and administrative decisions that could adversely affect the performance of the commodity pool and the value of a Series’ investment in the commodity pool.
The Galaxy Plus Platform and New Hyde Park may limit the ability of a Series to invest in, or divest from, a Galaxy Plus entity.
The Galaxy Plus Platform and/or its Sponsor will have the ability to restrict investments into, or divestments from, any of the commodity pools on the Galaxy Plus Platform. The success of each Series depends upon the ability to select Trading Advisors in the Galaxy Plus Platform through investments into, or divestments from, one or more commodity pools. If investments into or out of a commodity pool are limited or restricted by the Galaxy Plus Platform and/or its Sponsor, New Hyde Park, the performance of a Series may be adversely affected.
Cessation of, or changes to, the operation of the Galaxy Plus Platform could adversely impact the performance of a Series.
Unlike the Trading Companies managed by the Managing Owner, the on-going business operations of the Galaxy Plus Platform are administered by New Hyde Park. If New Hyde Park ceases operating, or effects administrative or other changes to, the Galaxy Plus Platform, a Series may no longer be able to access one or more Trading Advisors available through commodity pools on the Galaxy Plus Platform. The inability to gain exposure to Trading Advisors through the Galaxy Plus Platform may materially affect the performance of a Series.
Investment in Galaxy Plus entities presents operational, administrative risk to each Series.
Each Series is subject to certain risks related to the operation and administration of the Galaxy Plus Platform by New Hyde Park as a result of its investment in one or more commodity pools on the Galaxy Plus Platform. The investment of each Series in a commodity pool may be adversely affected due to possible human error or fraud on the part of an employee or agent of New Hyde Park, prohibited trading activity by a commodity pool’s Trading Advisors due to a lack of internal controls or failed trading systems, New Hyde Park’s noncompliance with applicable laws, rules and regulations and external events such as service provider failure, hardware or software failure or acts of god.
The reliance on technology by the Managing Owner, Trading Advisors, Sponsor Clearing brokers, and Swap Counterparties may lead to loss of data and economic losses.
In addition, as the use of technology increases, each Series may be more susceptible to operational risks through breaches in cyber security. A breach in cyber security refers to both intentional and unintentional events that may cause the Series to lose proprietary information or operational capacity or suffer data corruption. As a result, each Series may incur regulatory penalties, reputational damage, additional compliance costs associated with corrective measures, and/or financial loss. In addition, cyber security breaches of the Series’ third-party service providers or issuers in which the Series invest may also subject the Series to many of the same risks associated with direct cyber security breaches.
The use of multiple Trading Advisors may result in offsetting or opposing trading positions and may also require one Trading Advisor to fund the margin requirements of another Trading Advisor.
The use of multiple Trading Advisors for the Frontier Diversified Fund, Frontier Masters Fund, Frontier Balanced Fund, Frontier Heritage Fund, Frontier Select Fund, and Frontier Long/Short Commodity Fund may result in developments or positions that adversely affect the respective Series’ NAV. For example, because the Trading Advisors trading for the Frontier Diversified Fund, Frontier Masters Fund, Frontier Balanced Fund, Frontier Heritage Fund, Frontier Select Fund, and Frontier Long/Short Commodity Fund will be acting independently, such Series could buy and sell the same futures contract, thereby incurring additional expenses but with no net change in its holdings. The Trading Advisors also may compete, from time to time, for the same trades or other transactions, increasing the cost to such Series of making trades or transactions or causing some of them to be foregone altogether. Even though the margin requirements resulting from each Trading Advisor’s trading for any such Series ordinarily will be met from that Trading Advisor’s allocated net assets of such Series, a Trading Advisor for the Frontier Diversified Fund, Frontier Masters Fund, Frontier Balanced Fund, Frontier Heritage Fund, Frontier Select Fund, or Frontier Long/Short Commodity Fund may incur losses of such magnitude that such Series is unable to meet margin calls from the allocated net assets of that Trading Advisor. If losses of such magnitude were to occur, the clearing brokers for the Trading Company(ies) or Galaxy Plus entity(ies) in which such Series invests its assets may require liquidations and contributions from the allocated net assets of another Trading Advisor for such Series.
The Trading Advisors’ trading programs bear some similarities and, therefore, may lessen the benefits to the Frontier Balanced Fund, Frontier Heritage Fund, Frontier Select Fund, Frontier Long/Short Commodity Fund, Frontier Diversified Fund Frontier Masters Fund and Frontier Global Fund of having multiple Trading Advisors.
Each Trading Advisor has, over time, developed and modified the program it will use in trading. Nevertheless, the Trading Advisors’ trading programs have some similarities. These similarities may, in fact, mitigate the positive effect of having multiple Trading Advisors for the Frontier Diversified Fund, Frontier Masters Fund, Frontier Balanced Fund, Frontier Heritage Fund, Frontier Select Fund Frontier Long/Short Commodity Fund and Frontier Global Fund. For example, in periods where one Trading Advisor experiences a draw-down, it is possible that these similarities will cause the other Trading Advisors to also experience a draw-down.
Operating Risks
Past performance is not necessarily indicative of future performance.
The Managing Owner has selected each Trading Advisor to manage the assets of each Series because each Trading Advisor performed well through the date of its selection. You must consider, however, the uncertain significance of past performance, and you should not rely to a substantial degree on the Trading Advisors’ or the Managing Owner’s records to date for predictive purposes. You should not assume that any Trading Advisor’s future trading decisions will create profit, avoid substantial losses or result in performance for the Series comparable to that Trading Advisor’s or to the Managing Owner’s past performance. In fact, as a significant amount of academic study has shown, futures funds more frequently than not under-perform the past performance records included in their prospectuses. The Managing Owner believes that the past performance of the Trading Advisors may be of interest to prospective investors but encourages you to look at such information as an example of the respective objectives of the Managing Owner and each Trading Advisor rather than as any indication that the investment objectives of any Series will be achieved.
Because you and other investors will acquire, exchange, and redeem Units at different times, you may experience a loss on your Units even though the Series in which you have invested as a whole is profitable and even though other investors in that Series experience a profit. The past performance of any Series may not be representative of each investor’s investment experience in it.
Likewise, you and other investors will invest in different Series managed by different Trading Advisors. Each Series’ assets are valued and accounted for separately from every other Series. Consequently, the past performance of one Series has no bearing on the past performance of another Series. You cannot, for example, consider the Frontier Balanced Fund’s past performance in deciding whether to invest in any other Series.
The Managing Owner may allocate notional assets in respect of a Series that are in excess of the NAV of such Series.
At any given time, the notional assets, which are the total amount of assets of a Series allocated to Trading Advisors and/or reference programs, including (i) actual funds deposited in accounts directed by the Trading Advisors or deposited as margin in respect of swaps or other derivative instruments referencing a reference program plus (ii) any notional equity allocated to the Trading Advisors and any reference programs, of a Series may exceed the NAV of such Series depending on the amount of notional equity that is being utilized. The Managing Owner expects that the notional assets of each Series will generally be maintained at a level in excess of the NAV of such Series and such excess may be substantial to the extent the Managing Owner deems necessary to achieve the desired level of volatility. To the extent that notional assets of a Series are in excess of NAV, investors should understand that the applicable Series will experience greater volatility as measured by NAV than it would if the notional assets were maintained at a level equal to NAV. In such case, any losses to the Series will be greater as measured by a percentage of NAV, as compared to the percentage loss incurred in respect of notional assets. Consequently, the allocation of notional assets in excess of a Series’ NAV will magnify exposure to the swings in market prices of futures, forwards, options or other assets held by a Trading Company or Galaxy Plus entity or referenced by a swap or other derivative instrument and result in increased volatility, and potentially greater losses. You may lose all or substantially all of your investment in a Series.
Differing levels of fees received may create an incentive for the Managing Owner to favor certain Series over others.
The Managing Owner charges the various Series differing levels of fees. This may create an incentive for the Managing Owner to favor certain Series over other Series in, among other things, the amount of time and effort spent managing any given Series and the selection of Trading Advisors for a given Series.
The Managing Owner may terminate, replace and/or add Trading Advisors in its sole discretion which may disrupt trading, adversely affecting the Net Asset Value of a Series.
The Managing Owner may terminate, substitute or retain Trading Advisors on behalf of each Series in its sole discretion. The addition of a new Trading Advisor and/or the removal of one of the current Trading Advisors may cause disruptions in trading as assets are reallocated and new Trading Advisors transition over, which may have an adverse effect on the NAV of the affected Series.
Taxation and Benefits Risks
You are strongly urged to consult your own tax advisor and counsel about the possible tax consequences to you of an investment in the Trust. Tax consequences may differ for different investors, and you could be affected by changes in the tax laws.
You may have tax liability attributable to your investment in a Series even if you have received no distributions and redeemed no Units, and even if the Series generated an economic loss.
If a Series has profit for a taxable year (as determined for federal income tax purposes), the profit will be includible in your taxable income, whether or not cash or other property is actually distributed to you by the Series. The Managing Owner does not intend to make any distributions from any Series. Accordingly, your liability for federal income taxes as well as other taxes on your allocable share of a Series’ profits will exceed the amount of distributions to you, if any, for a taxable year. As such, you must be prepared to satisfy any tax liability from redemptions of Units or other sources. In addition, a Series may have capital losses from trading activities that cannot be deducted against the Series’ interest income, so that you may be subject to pay taxes on interest income even if the Series generates a net economic loss for a taxable year.
You may be subject to tax on gains that the Trust never realizes.
Because a substantial portion of the Trust’s open positions are “marked-to-market” at the end of each taxable year, all or a portion of your tax liability for each taxable year may be based on unrealized gains that the Trust may never actually realize.
Partnership treatment is not assured, and if the Trust or any Series is not treated as a Partnership, you could suffer adverse tax consequences.
It is expected that each of the Trust’s Series will be treated as a separate partnership for federal income tax purposes and, assuming that at least 90% of the gross income of the Trust and each Series each taxable year has always constituted and will continue to constitute “qualifying income” within the meaning of Section 7704(d) of the Internal Revenue Code of 1986 ( the “Code”), neither the Trust nor any Series will be a publicly traded partnership treated as a corporation. The Managing Owner believes that it is likely, but not certain, that the Trust, and each Series, will meet this income test. The Trust has not requested, and does not intend to request, a ruling from the Internal Revenue Service (the “IRS”), concerning its tax treatment or the tax treatment of any Series.
If the Trust, or any Series, were to be treated as a corporation for federal income tax purposes: the net income of the Trust, or the Series, would be subject to tax at corporate income tax rates, thereby substantially reducing its distributable cash; you would not be allowed to deduct losses of the Trust, or a Series; and distributions to you, other than liquidating distributions, would constitute dividends to the extent of the current or accumulated earnings and profits of the Trust, or a Series, and would be taxable as such.
There is the possibility of a tax audit which could result in additional taxes to you.
The Trust’s tax returns may be audited by a taxing authority, and such an audit could result in adjustments to the Trust’s returns. If an audit results in an adjustment, you may be compelled to file amended returns and to pay additional taxes plus interest and penalties.
You will likely recognize short-term capital gain.
Profits on futures contracts traded in regulated U.S. and some foreign exchanges, foreign currency contracts traded in the interbank market, and U.S. and some foreign exchange-traded options on commodities treated as Section 1256 contracts under the Code are generally treated as short-term capital gain to the extent of 40% of gains with respect to section 1256 contracts. Special rules apply in the case of mixed straddles (generally, offsetting positions where some, but not all, of the positions are marked-to-market). These special rules could have the effect of limiting the amount of gain treated as long-term capital gain.
The IRS could challenge allocations of recognized gains to Unitholders who redeem.
The trust agreement provides that recognized gains may be specially allocated for tax purposes to redeeming limited owners. If the IRS were to successfully challenge such allocations, each remaining limited owner’s share of recognized gains would be increased.
The IRS could take the position that deductions for certain Trust expenses are subject to various limitations.
Non-corporate taxpayers are subject to certain limitations for deductions for “investment advisory expenses” for federal income tax and alternative minimum tax purposes. The IRS could argue that certain expenses of the Trust are investment advisory expenses.
The investment of Benefit Plan Investors may be limited and/or Subject to Mandatory Redemption if any or all of the Series (or Class of any Series) are deemed to hold plan assets or if the Trading Advisors have fiduciary relationships with certain investing Benefit Plan Investors and Benefit Plan Investors are required to consider their fiduciary responsibilities in making an investment decision.
Special considerations apply to investments in the Trust by individual retirement accounts, pension, profit-sharing, stock bonus, Keogh, welfare benefit and other employee benefit plans whether or not subject to the Employee Retirement Income Security Act of 1974 (“ERISA”) or Section 4975 of the Code, each a Plan, a Plan that is subject to Part 4 of Subtitle B of Title I of ERISA or Section 4975 of the Code, or an ERISA Plan, and any entity whose underlying assets include plan assets by reason of a Plan’s investment in such entity is referred to as a “Benefit Plan Investor.” While the assets of the Trust or any Series (and Class of any Series) are intended not to constitute plan assets with respect to any Benefit Plan Investors, the United States Department of Labor, or the DOL, IRS or a court could disagree. If the DOL, IRS or a court were to find that the assets of some or all of the Series (or Class of any Series) are the assets of Benefit Plan Investors, the Managing Owner and the Trading Advisors to such Series (or Class) may be fiduciaries and certain transactions in or by the Trust could be prohibited. For example, if the Trust were deemed to hold “plan assets,” within the meaning of 29 C.F.R. § 2510.3-101, the Trading Advisors may have to refrain from directing certain transactions that are currently contemplated. Furthermore, whether or not the Trust is deemed to hold plan assets, if a Benefit Plan Investor has certain pre-existing relationships with the Managing Owner, one or more Trading Advisors, the selling agents or a Clearing Broker, investment in a Series may be limited or prohibited. In the event that, for any reason, the assets of any Series (or Class of any Series) might be deemed to be “plan assets,” and if any transactions would or might constitute prohibited transactions under ERISA or the Code and an exemption for such transaction or transactions is not available or cannot be obtained (or the Managing Owner determines not to seek such exemption), the Managing Owner reserves the right, upon notice to, but without the consent of any limited owner, to mandatorily redeem Units held by any limited owner that is a Benefit Plan Investor. Furthermore, whether or not a Series (or Class of any Series) are plan assets, Benefit Plan Investors should consider their fiduciary responsibilities before making a decision to invest in a Series (or Class of any Series) and Plan investors who are not subject to ERISA may be subject to similar responsibilities under state, local, or non-U.S. law.
Foreign investors may face exchange rate risk and local tax consequences.
Foreign investors should note that the Units are denominated in U.S. dollars and that changes in the rates of exchange between currencies may cause the value of their investment to decrease.
Regulatory Risks
Regulation of the commodity interest markets is extensive and constantly changing; future regulatory developments are impossible to predict, but may significantly and adversely affect the Trust.
The futures, options on futures and security futures markets are subject to comprehensive statutes, regulations and margin requirements. With respect to traditional futures exchanges, the CFTC and the exchanges are authorized to take extraordinary actions in the event of a market emergency, including, for example, the retroactive implementation of speculative position limits or higher margin requirements, the establishment of daily limits and the suspension of trading. The regulation of commodity interest transactions in the United States is a rapidly changing area of law and is subject to ongoing modification by governmental and judicial action. In addition, various national governments have expressed concern regarding the disruptive effects of speculative trading in the currency markets and the need to regulate the derivatives markets in general. The effect of any future regulatory change is impossible to predict, but could be substantial and adverse.
The Series, the Trading Companies or Galaxy Plus entities are subject to speculative position limits.
The U.S. futures exchanges have established speculative position limits (referred to as “position limits”) on the maximum net long or net short position which any person or group of persons may hold or control in particular futures and options on futures. Most exchanges also limit the amount of fluctuation in commodity futures contract prices on a single trading day. Therefore, a Trading Advisor may have to modify its trading instructions or reduce the size of its positions in one or more futures or options contracts in order to avoid exceeding such position limits, which could adversely affect the profitability of the Trading Companies or Galaxy Plus entities. The futures exchange may amend or adjust these position limits or the interpretation of how such limits are applied and adversely affect the profitability of the Trading Companies or Galaxy Plus entities. In addition, in October 2011, the CFTC adopted rules governing position limits on futures (and options on futures) on a number of agricultural, energy and metals commodities, as well as on swaps that perform a significant price discovery function with respect to those futures and options. In September 2012, the CFTC’s rules were vacated by the United States District Court for the District of Columbia and remanded to the CFTC for further consideration. The CFTC initially proposed revised position limits rules late in 2013 and re-proposed further revised position limits rules late in 2016 with respect to speculative positions in 25 core physical commodity futures contracts and their “economically equivalent” futures, options, and swaps. The comment period for the rules closed in February 2017. The date for the CFTC’s final rules is unknown. It is possible that these rules may take effect in some form. If so, these rules could have an adverse effect on the Trading Companies’ or Galaxy Plus entities’ trading.
CFTC registrations could be terminated which could adversely affect the Trust or a Series.
If the CEA registrations or NFA memberships of the Managing Owner or the registered Trading Advisors were no longer effective, these entities would not be able to act for the Trust, which could adversely affect the Trust or such Series.
The foregoing risk factors are not a complete explanation of all the risks involved in purchasing interests in a fund that invests in the highly speculative, highly leveraged trading of futures, forwards and options. You should read this entire Form 10-K and the Prospectus before determining to subscribe for Units.
The Trust does not own or use any physical properties in the conduct of its business. Its assets currently consist of cash items, Treasury Notes, and, through each Trading Company or Galaxy entity, U.S. and international futures and forward contracts and other interests in derivative instruments, including options contracts on futures forwards and swap contracts. The Managing Owner’s main office is located at 25568 Genesee Trail Road, Golden, Colorado 80401.
| Item 3. | LEGAL PROCEEDINGS. |
There are no material legal proceedings to which the Trust or any of its affiliates is a party or of which any of their assets are the subject.
| Item 4. | MINE SAFETY DISCLOSURES |
Not applicable.
Part II
| Item 5. | MARKET FOR REGISTRANT’S COMMON EQUITY, RELATED STOCKHOLDER MATTERS AND ISSUER PURCHASES OF EQUITY SECURITIES. |
No Units in any Series are publicly traded. The Units in each Series may be redeemed, in whole or in part, on a daily basis, subject to a notice requirement as set forth in the Prospectus. Except as otherwise set forth in the Prospectus, Units will be redeemed at a redemption price equal to 100% of the NAV per Unit of the applicable Series, calculated as of the point described in the Prospectus. The redemption of Units has no impact on the value of Units that remain outstanding. The Managing Owner may temporarily suspend redemptions under limited circumstances described in the Prospectus. The right to obtain redemption of Units of a Series is contingent upon such Series’ having property sufficient to discharge its liabilities on the date of redemption.
Further, if a Limited Owner redeems all or a portion of its Class 1 and 1a Units of any Series on or before the end of twelve full months following the effective date of the purchase of the Units being redeemed, such Limited Owner is charged a redemption fee of up to 2.0% of the NAV at which the Units are redeemed. The redemption fee charged will depend on, among other things, the particular Series of Units being redeemed. The Trust Agreement also contains restrictions on the transfer or assignment of the Units.
The Managing Owner has the sole discretion in determining what distributions, if any, the Trust will make to the Limited Owners. The Trust has not affected distributions on the Units in any Series as of the date hereof and the Managing Owner does not intend to affect any distributions in the foreseeable future.
The proceeds of offerings are deposited in the bank and brokerage accounts of the Trust, the Trading Companies and the Galaxy Plus entities for the purpose of engaging in trading activities in accordance with the Trust’s trading policies and its Trading Advisors’ respective trading strategies.
The following table shows the number of Limited Owners and the number of Units outstanding in each Class of each Series as of December 31, 2022:
| | | Number of Limited Owners | | | Number of Units Outstanding | |
| Frontier Diversified Fund (Class 2) | | | 17 | | | | 4163 | |
| Frontier Diversified Fund (Class 3) | | | 103 | | | | 27146 | |
| Frontier Long/Short Commodity Fund (Class 2) | | | 6 | | | | 262 | |
| Frontier Long/Short Commodity Fund (Class 2a) | | | 8 | | | | 1251 | |
| Frontier Long/Short Commodity Fund (Class 3) | | | 64 | | | | 8677 | |
| Frontier Long/Short Commodity Fund (Class 3a) | | | 36 | | | | 3217 | |
| Frontier Masters Fund (Class 2) | | | 12 | | | | 1925 | |
| Frontier Masters Fund (Class 3) | | | 39 | | | | 5745 | |
| Frontier Balanced Fund (Class 1) | | | 434 | | | | 71936 | |
| Frontier Balanced Fund (Class 1AP) | | | 3 | | | | 587 | |
| Frontier Balanced Fund (Class 2) | | | 45 | | | | 9318 | |
| Frontier Balanced Fund (Class 2a) | | | 0 | | | | 290 | |
| Frontier Balanced Fund (Class 3a) | | | 19 | | | | 3166 | |
| Frontier Select Fund (Class 1) | | | 165 | | | | 19894 | |
| Frontier Select Fund (Class 1AP) | | | 1 | | | | 115 | |
| Frontier Select Fund (Class 2) | | | 8 | | | | 616 | |
| Frontier Global Fund (Class 1) | | | 99 | | | | 14514 | |
| Frontier Global Fund (Class 2) | | | 3 | | | | 468 | |
| Frontier Heritage Fund (Class 1) | | | 108 | | | | 18366 | |
| Frontier Heritage Fund (Class 1AP) | | | 1 | | | | 64 | |
| Frontier Heritage Fund (Class 2) | | | 7 | | | | 915 | |
No Units are authorized for issuance by the Trust under equity compensation plans. During the year ended December 31, 2022, no unregistered Units were sold by the Trust. In addition, the Trust did not repurchase any Units under a formal repurchase plan. All Unit redemptions during the year ended December 31, 2022 were in the ordinary course of business. There have not been any purchases of units by the trust or any affiliated purchasers during the year ended December 31, 2022.
| Item 7. | MANAGEMENT’S DISCUSSION AND ANALYSIS OF FINANCIAL CONDITION AND RESULTS OF OPERATIONS. |
Overview
The Trust is a Delaware statutory trust formed on August 8, 2003. The Trust is a multi-advisor commodity pool, as described in CFTC Regulation § 4.10(d)(2). The Trust is authorized to issue multiple Series of Units, pursuant to the requirements of the Trust Act. The assets of each Series are held and accounted for in separate and distinct records separately from the assets of other Series. The Trust is managed by the Managing Owner, and its term will expire on December 31, 2053 (unless terminated earlier in certain circumstances).
The Trust, with respect to each Series of Units, engages in the speculative trading of a diversified portfolio of futures, forward (including interbank foreign currencies) and options contracts and other derivative instruments (including swaps). The Trust allocates funds to affiliated Trading Companies and Galaxy Plus entities, each of which has one-year renewable contracts with its own independent Trading Advisor(s) that will manage all or a portion of the applicable Trading Company’s or Galaxy Plus entity’s assets, and make the trading decisions for the assets of each Series vested in such Trading Company or Galaxy Plus entity. The assets of each Trading Company and Galaxy Plus entity will be segregated from the assets of each other Trading Company and Galaxy Plus entity. The Trust has an investment objective of increasing the value of the Units over the long term (capital appreciation), while controlling risk and volatility; further, to offer exposure to the investment programs of individual Trading Advisors and to specific instruments (currencies). For additional overview of the Trust’s structure and business activities, see Item 1 “BUSINESS.” For a discussion of fees paid by the Trust, see Item 11 “EXECUTIVE COMPENSATION.”
Critical Accounting Policies and Estimates
The preparation of financial statements in conformity with accounting principles generally accepted in the United States (“GAAP”) requires the Managing Owner to adopt accounting policies and make estimates and assumptions that affect amounts reported in the Trust’s financial statements. The Trust’s most significant accounting policy, described below, includes the valuation of its futures and forward contracts, options contracts, swap contracts, U.S. Treasury securities and investments in unconsolidated Trading Companies and Galaxy Plus entities. The majority of these investments are exchange traded contracts valued upon exchange settlement prices or non-exchange traded contracts and obligations with valuation based on third-party quoted dealer values on the Interbank market.
The Trust’s other significant accounting policies are described in detail in Note 2 of the financial statements.
Investment Transactions and Valuation
The Managing Owner has evaluated the nature and type of transactions processed and estimates that it makes in preparing the Trust’s financial statements and related disclosures and has adopted Accounting Standard Codification (“ASC”) 820, Fair Value Measurements and Disclosure, and implemented the framework for measuring fair value for assets and liabilities.
The Trust utilizes valuation techniques that are consistent with the market approach per the requirement of ASC 820 for the valuation of futures (exchange traded) contracts, forward (non-exchange traded) contracts, option contracts, swap contracts and other non-cash assets. The market approach uses prices and other relevant information generated by market transactions involving identical or comparable assets or liabilities. The Trust applies the valuation techniques in a consistent manner for each asset or liability. The Trust records all investments at fair value in its Statements of Financial Condition, with changes in fair value reported as a component of net gain/(loss) on investments in the Statements of Operations.
Inputs to valuation techniques refer to the assumptions that market participants would use in pricing the assets or liabilities. Inputs may be observable, meaning those that reflect the assumptions market participants would use in pricing the financial asset or liability based on market data obtained from independent sources, or unobservable, meaning those that reflect the reporting entity’s own assumptions about the assumptions market participants would use in pricing the financial asset or liability based on the best information available in the circumstances.
In addition, the Trust monitors counterparty credit risk and incorporates any identified risk factors when assigning input levels to underlying financial assets or liabilities. In that regard ASC 820 establishes a fair value hierarchy for valuation inputs that gives the highest priority to quoted prices in active markets for identical financial assets and the lowest priority to unobservable inputs. A full disclosure of the fair value hierarchy is presented in Note 3 of the financial statements—Fair Value Measurements.
Liquidity and Capital Resources
The Trust will raise additional capital only through the sale of Units offered pursuant to the continuing offering and does not intend to raise any capital through borrowing. Due to the nature of the Trust’s business, it makes no capital expenditures and has no capital assets that are not operating capital or assets.
The Managing Owner is responsible for the payment of all of the ordinary expenses associated with the organization of the Trust and the offering of each Series of Units, except for the initial and ongoing service fee, if any, and no Series will be required to reimburse these expenses. As a result, 100% of each Series’ offering proceeds are initially available for that Series’ trading activities.
A portion of each Trading Company’s assets is used as margin to maintain that Trading Company’s forward currency contract positions, and another portion is deposited in cash in segregated accounts in the name of each Trading Company maintained for each Trading Company at the clearing brokers in accordance with CFTC segregation requirements. At December 31, 2022, cash deposited at the clearing brokers was $320,241 for the Trust. The clearing brokers are expected to credit each Trading Company with approximately 80%-100% of the interest earned on its average net assets on deposit with the clearing brokers each month. Currently, with the Federal Funds target rate at 4.25 to 4.50%, this amount is estimated to be 4.25%. In an attempt to increase interest income earned, the Managing Owner also may invest the non-margin assets in U.S. government securities which include any security issued or guaranteed as to principal or interest by the U.S., or by a person controlled by or supervised by and acting as an instrumentality of the government of the U.S. pursuant to authority granted by Congress or any certificate of deposit for any of the foregoing, including U.S. treasury bonds, U.S. treasury bills and issues of agencies of the U.S. government, and certain cash items such as money market funds and time deposits. Aggregate interest income from all sources, including US. treasury Securities assets net of premiums and cash held at clearing brokers, of up to 2% (annualized) is paid to the Managing Owner by the Frontier Balanced Fund (Class 1 and Class 2 only), Frontier Long/Short Commodity Fund (Class 2 and Class 3), Frontier Global Fund, Frontier Select Fund and Frontier Heritage Fund. For the Frontier Diversified Fund, Frontier Long/Short Commodity Fund (Class 2a and Class 3a), Frontier Masters Fund and Frontier Balanced Fund (Class 1AP, Class 2a and Class 3a), 100% of the interest is retained by the respective Series. The amount reflected in the financial statements for the Trust and Series are disclosed on a net basis. Due to some classes not exceeding the 2% paid to the Managing Owner, amounts earned by those classes may be zero.
Approximately 75% to 95% of the Trust’s assets are expected to be committed as required margin for futures contracts and forwards and options trading and held by the respective broker, although the amount committed may vary significantly. Such assets are maintained in the form of cash or U.S. treasury bills in segregated accounts with the futures broker pursuant to the CEA and regulations there under. The remaining approximately 5% to 25% of the Trust’s assets will normally be invested in cash equivalents and short-term investments, such as money market funds and time deposits and held by the clearing broker, the over-the-counter counterparties and by U.S. federally chartered banks. As of December 31, 2022, total cash and cash equivalents held at banking institutions were $46,604 for the Frontier Diversified Fund, $38,703 for the Frontier Long/Short Commodity Fund, $18,560 for the Frontier Masters Fund, $221,344 for the Frontier Balanced Fund, $33,183 for the Frontier Select Fund, $26,333 for the Frontier Global Fund, and $45,466 for the Frontier Heritage Fund.
As a commodity pool, the Trust has large cash positions. Such cash positions are used to pay margin for the trading of futures, forwards and options, and also to pay redemptions. Generally, the Trust has not been forced to liquidate positions to fund redemptions. As of December 31, 2022, the redemptions payable were $12,788 for the Frontier Long/Short Commodity Fund, $35,051 for the Frontier Balanced Fund and $19,922 for the Frontier Masters Fund. During the year ended December 31, 2022, the Trust was able to pay all redemptions on a timely basis.
Off-Balance Sheet Risk
The term “off-balance sheet risk” refers to an unrecorded potential liability that, even though it does not appear on the balance sheet, may result in future obligation or loss. Each Trading Company trades in futures, forward and swap contracts and is therefore a party to financial instruments with elements of off-balance sheet market and credit risk. In entering into these contracts there exists a market risk that such contracts may be significantly influenced by market conditions, such as interest rate volatility, resulting in such contracts being less valuable. If the markets should move against all of the futures interests positions held by a Trading Company in respect of any Series at the same time, and if the Trading Advisor(s) of such Trading Company are unable to offset such futures interests positions, such Trading Company could lose all of its assets and the holders of Units of such Series would realize a 100% loss. The Managing Owner seeks to minimize market risk through real-time monitoring of open positions and the level of diversification of each Trading Advisor’s portfolio. It is anticipated that any Trading Advisor’s margin-to-equity ratio will typically not exceed approximately 35% although the actual ratio could be higher or lower from time to time.
In addition to market risk, trading futures forward and swap contracts entails credit risk which is the risk that a counterparty will not be able to meet its obligations to a Trading Company. The counterparty for futures contracts traded in the U.S. and on most foreign exchanges is the clearinghouse associated with such exchange. In general, clearinghouses are backed by the corporate members of the clearinghouse who are required to share any financial burden resulting from the non-performance by one of their members and, as such, should significantly reduce this credit risk. In cases where the clearinghouse is not backed by the clearing members, like some foreign exchanges, it is normally backed by a consortium of banks or other financial institutions. Some non-U.S. exchanges, in contrast to U.S. exchanges are principals’ markets in which performance is the responsibility only of the individual counterparty with whom the Trading Company has entered into the transaction and not of the exchange or clearing corporation. In these kinds of markets, there is risk of bankruptcy or other failure or refusal to perform by the counterparty.
In the case of forward contracts traded on the interbank market and swaps, neither is traded on an exchange. The counterparty is generally a single bank or other financial institution, rather than a group of financial institutions; thus, there may be a greater counterparty credit risk. The Managing Owner expects the Trading Advisors to trade only with those counterparties which it believes to be creditworthy. All positions of each Trading Company are valued each day on a mark-to-market basis. There can be no assurance that any clearing member, clearinghouse or other counterparty will be able to meet its obligations to any Trading Company.
The Trust has entered into agreements, which provide for the indemnification of futures clearing brokers, currency trading companies, and commodity trading advisers, among others, against losses, costs, claims and liabilities arising from the performance of their individual obligations under such agreements, except for gross negligence, bad faith or willful misconduct. The Trust has had no prior claims or payments pursuant to these agreements. The Trust’s individual maximum exposure under these arrangements is unknown, as this would involve future claims that may be made against the Trust that have not yet occurred. However, based on experience the Trust expects the risk of loss to be remote.
Disclosure of Contractual Obligations
The business of the Trust is the speculative trading of commodity interests. The majority of the Trust’s futures and forward positions, which may be categorized as “purchase obligations” under Item 303 of Regulation S-K, are short-term. That is, they are held for less than one year. Because the Trust does not enter into other long-term debt obligations, capital lease obligations, operating lease obligations or other long-term liabilities that would otherwise be reflected on the Trust’s Statement of Financial Condition, a table of contractual obligations has not been presented.
Results of Operations for the Twelve Months Ended December 31, 2022
Series Returns and Other Information
The returns for each Series and Class of Units for the twelve months ended December 31, 2022, and related information, are discussed below. The activities of the Trust on a combined consolidated basis are explained through the activity of each underlying Series. Please refer to the discussion of the Series activities in relation to the Trust on a combined consolidated basis.
Each Series had exposure to commodity interest positions within one or more sectors during fiscal 2022. The performance of each Series was impacted over the course of the year by, among other things, the relative performance of the relevant sector or sectors and the commodities within those sectors, the changing allocations among, and the specific positions taken by, the Series’ Trading Advisors in, the relevant sector(s) and commodities, and the timing of entries and exits. For each of the Series, a sector attribution chart has been included at the end of the relevant discussion. Each chart depicts the performance of the relevant Series’ positions within each of the relevant sectors (determined by the Managing Owner using monthly gross return and NAV figures, with various adjustments to net out a proportional allocation of the fees and expenses chargeable to the Series) during the fourth quarter (except as otherwise noted) and for the full calendar year. Charts depicting the performance of the various Series’ positions within each of the relevant sectors during the prior three quarters were included in the Trust’s quarterly reports on Form 10-Q previously filed.
Frontier Diversified Fund
2022
The Frontier Diversified Fund – Class 2 NAV gained 8.30% for the twelve months ended December 31, 2022 net of fees and expenses; the Frontier Diversified Fund – Class 3 NAV gained 8.57% for the twelve months ended December 31, 2022 net of fees and expenses.
For the twelve months ended December 31, 2022 the Frontier Diversified Fund recorded total expenses of $114,673, net investment loss of $108,392, and net realized/unrealized gain on investments of $432,659, resulting in a net increase in owners’ capital from operations of $324,267. For Class 2, the NAV per Unit increased from $88.98 at December 31, 2021, to $96.37 as of December 31, 2022. For Class 3, the NAV per Unit increased from $83.56 at December 31, 2021, to $90.72 as of December 31, 2022. Total Class 2 subscriptions and redemptions for the period were $0 and $15,125, respectively. Total Class 3 subscriptions and redemptions for the period were $0 and $478,310, respectively. Ending capital at December 31, 2022, was $401,179 for Class 2 and $2,462,793 for Class 3.
For the twelve months ended December 31, 2022, Frontier Diversified Fund did not own a swap investment.
The Frontier Diversified Fund may have both long and short exposure to the Interest Rates, Currencies, Stock Indices, Energies, Metals and Commodities sectors.
Sector & Major Advisor Attribution for the Frontier Diversified Fund
One of the six sectors traded in the Frontier Diversified Fund was profitable in Q4 2022. Agriculturals were positive while Currencies, Energies, Interest Rates, Metals and Stock Indices were negative for the quarter.
Currencies, Energies and Interest Rates were positive year-to-date (“YTD”) while Agriculturals, Metals and Stock Indices were negative YTD.
In terms of major CTA performance, QIM finished positive for the quarter. Aspect, Fort, Quantica, Quest and Welton finished negative for the quarter. Aspect, Quantica, QIM, Quest and Welton were positive YTD while Fort was negative YTD
Frontier Masters Fund
2022
The Frontier Masters Fund – Class 2 NAV gained 34.87% for the twelve months ended December 31, 2022, net of fees and expenses, the Frontier Masters Fund – Class 3 NAV gained 35.22% for the twelve months ended December 31, 2022, net of fees and expenses.
For the twelve months ended December 31, 2022 the Frontier Masters Fund recorded total expenses of $57,142, net investment loss of $54,327, and net realized/unrealized gain on investments of $286,396, resulting in a net increase in owners’ capital from operations of $232,069. For Class 2, the NAV per Unit increased from $70.17 at December 31, 2021, to $94.64 as of December 31, 2022. For Class 3, the NAV per Unit increased from $66.15 at December 31, 2021 to $89.45 as of December 31, 2022. Total Class 2 subscriptions and redemptions for the period were $0 and $69,840, respectively. Total Class 3 subscriptions and redemptions for the period were $0 and $173,783, respectively. Ending capital at December 31, 2022, was $182,202 for Class 2 and $513,918 for Class 3.
For the twelve months ended December 31, 2022, Frontier Masters Fund did not own a swap investment.
The Frontier Masters Fund may have both long and short exposure to the Interest Rates, Currencies, Stock Indices, Energies, Metals, Hybrids and Commodities sectors.
Sector & Major Advisor Attribution for the Frontier Masters Fund
None of the six sectors traded in the Frontier Masters Fund were profitable in Q4 2022. Agriculturals, Currencies, Energies, Interest Rates, Metals and Stock Indices were negative for the quarter. There were no positive sectors for the quarter.
Currencies, Energies and Interest Rates were positive YTD while Agriculturals, Metals and Stock Indices were negative YTD.
In terms of major CTA performance, there were no CTAs that finished positive for the quarter while Aspect, Quantica and Welton were negative for the quarter. In terms of YTD performance, Aspect, Quantica and Welton were positive while no CTAs were negative YTD.
Frontier Long/Short Commodity Fund
2022
The Frontier Long/Short Commodity Fund – Class 2 NAV gained 21.87% for the twelve months ended December 31, 2022, net of fees and expenses; the Frontier Long/Short Commodity Fund – Class 3 NAV gained 21.87% for the twelve months ended December 31, 2022, net of fees and expenses; the Frontier Long/Short Commodity Fund – Class 2a NAV gained 22.43% for the twelve months ended December 31, 2022, net of fees and expenses; the Frontier Long/Short Commodity Fund – Class 3a NAV gained 22.74% for the twelve months ended December 31, 2022, net of fees and expenses.
For the twelve months ended December 31, 2022, the Frontier Long/Short Commodity Fund recorded total expenses of $42,222, net investment loss of $38,795, and net realized/unrealized gain on investments of $307,206, resulting in a net increase in owners’ capital from operations of $268,411. For Class 2, the NAV per Unit increased from $89.97 at December 31, 2021, to $109.65 as of December 31, 2022. For Class 3, the NAV per Unit increased from $94.38 at December 31, 2021, to $115.03 as of December 31, 2022. For Class 2a, the NAV per Unit increased from $58.75 at December 31, 2021, to $71.93 as of December 31, 2022. For Class 3a, the NAV per Unit increased from $62.16 at December 31, 2021, to $76.29 as of December 31, 2022. Total Class 2 subscriptions and redemptions for the period were $0 and $2,000, respectively. Total Class 3 subscriptions and redemptions for the period were $0 and $120,894, respectively. Total Class 2a subscriptions and redemptions for the period were $0 and $12,788, respectively. Total Class 3a subscriptions and redemptions for the period were $0 and $10,780, respectively. Ending capital at December 31, 2022, was $28,713 for Class 2, $998,095 for Class 3, $90,017 for Class 2a and $245,448 for Class 3a.
For the twelve months ended December 31, 2022, Frontier Long/Short Commodity Fund did not own a swap investment.
The Frontier Long/Short Commodity Fund may have both long and short exposure to the Interest Rates, Currencies, Stock Indices, Energies, Metals and Commodities sectors, although the majority of the exposure will typically be in the Energies, Metals and Commodities sectors.
Sector & Major Advisor Attribution for the Frontier Long/Short Commodity Fund
All of the seven sectors traded in the Frontier Long/Short Commodity Fund were negative in Q4 2022. Energies, Base Metals, Grains, Meats, Precious Metals, Softs and Financials finished negative for the quarter. There were no positive sectors for the quarter.
Base Metals, Energies, Financials, Grains, Meats, Precious Metals and Softs were positive YTD. There were no negative sectors YTD.
In terms of major CTA performance, Rosetta finished positive for the quarter while Volt and Welton were negative for the quarter.
In terms of YTD performance, Rosetta and Welton were positive YTD while Volt was negative YTD.
Frontier Balanced Fund
2022
The Frontier Balanced Fund – Class 1 NAV gained 19.75% for the twelve months ended December 31, 2022, net of fees and expenses; The Frontier Balanced Fund – Class 1AP NAV gained 23.39% for the twelve months ended December 31, 2022, net of fees and expenses; the Frontier Balanced Fund – Class 2 NAV gained 23.39% for the twelve months ended December 31, 2022, net of fees and expenses; the Frontier Balanced Fund – Class 2a NAV gained 23.55% for the twelve months ended December 31, 2022, net of fees and expenses; the Frontier Balanced Fund – Class 3a NAV gained 23.54% for the twelve months ended December 31, 2022, net of fees and expenses.
For the twelve months ended December 31, 2022, the Frontier Balanced Fund recorded total expenses of $976,966, net investment loss of $976,966, and net realized/unrealized gain on investments of $3,151,174, resulting in a net increase in owners’ capital from operations of $2,174,208. For Class 1, the NAV per Unit increased from $82.82 at December 31, 2021, to $99.17 as of December 31, 2022. For Class 1AP, the NAV per Unit increased from $103.38 at December 31, 2021, to $127.56 as of December 31, 2022. For Class 2, the NAV per Unit increased from $139.40 at December 31, 2021, to $172.01 as of December 31, 2022. For Class 2a, the NAV per Unit increased from $120.98 at December 31, 2021, to $149.47 as of December 31, 2022. For Class 3a, the NAV per Unit increased from $120.57 at December 31, 2021, to $148.96 as of December 31, 2022. Total Class 1 subscriptions and redemptions for the period were $0 and $2,018,252, respectively. Total Class 1AP subscriptions and redemptions for period were $0 and $7,580, respectively. Total Class 2 subscriptions and redemptions for the period were $0 and $302,031, respectively. Total Class 2a subscriptions and redemptions for the period were $0 and $28,650, respectively. Total Class 3a subscriptions and redemptions for the period were $0 and $0, respectively. Ending capital at December 31, 2022, was $7,134,145 for Class 1, $74,869 for Class 1 AP, $1,602,786 for Class 2, $43,282 for Class 2a, and $471,646 for Class 3a.
For the twelve months ended December 31, 2022, Frontier Balanced Fund did not own a swap investment.
The Frontier Balanced Fund may have both long and short exposure to the Interest Rates, Currencies, Stock Indices, Energies, Metals and Commodities sectors.
Sector & Major Advisor Attribution for the Frontier Balanced Fund
None of the six sectors traded in the Frontier Balanced Fund were profitable in Q4 2022. Agriculturals, Currencies, Energies, Interest Rates, Metals and Stock Indices were negative for the quarter. There were no positive sectors for the quarter.
Currencies, Energies and Interest Rates were positive YTD while Agriculturals, Metals and Stock Indices were negative YTD.
In terms of major CTA performance, QIM finished positive for the quarter. Aspect, Fort, Quantica, QIM, Welton and Wimmer Horizon finished negative for the quarter. Aspect, Quantica, QIM Welton and Wimmer Horizon were positive YTD while Fort was negative YTD.
Frontier Select Fund
2022
The Frontier Select Fund – Class 1 NAV gained 12.37% for the twelve months ended December 31, 2022, net of fees and expenses; The Frontier Select Fund Frontier Select Fund – Class 1AP NAV gained 15.78% for the twelve months ended December 31, 2022, net of fees and expenses; the Frontier Select Fund – Class 2 NAV gained 15.79% for the twelve months ended December 31, 2022, net of fees and expenses.
For the twelve months ended December 31, 2022, the Frontier Select Fund recorded total expenses of $113,333, net investment loss of $113,333, and net realized/unrealized gain on investments of $309,094, resulting in a net increase in owners’ capital from operations of $195,761. For Class 1, the NAV per Unit increased from $63.39 at December 31, 2021, to $71.23 as of December 31, 2022. For Class 1AP, the NAV per Unit increased from $79.21 at December 31, 2021, to $91.71 as of December 31, 2022. For Class 2, the NAV per Unit increased from $105.10 at December 31, 2021, to $121.70 as of December 31, 2022. Total Class 1 subscriptions and redemptions for the period were $0 and $100,095, respectively. Total Class 1AP subscriptions and redemptions for the period were $0 and $1,330, respectively. Total Class 2 subscriptions and redemptions for the period were $0 and $7,600, respectively. Ending capital, at December 31, 2022, was $1,417,113 for Class 1, $10,554 for Class 1AP, and $74,939 for Class 2.
For the twelve months ended December 31, 2022, Frontier Select Fund did not own a swap investment.
The Frontier Select Fund may have both long and short exposure to the Interest Rates, Currencies, Stock Indices, Energies, Metals, Hybrids and Commodities sectors.
Sector & Major Advisor Attribution for the Frontier Select Fund
None of the six sectors traded in the Frontier Select Fund were profitable in Q4 2022. Agriculturals, Currencies, Energies, Interest Rates, Metals and Stock Indices were negative for the quarter. There were no positive sectors for the quarter.
Currencies, Energies, Interest Rates and Metals were positive YTD while Agriculturals and Stock Indices were negative YTD.
In terms of major CTA performance, no CTA finished positive for the quarter while Quantica and Welton finished the quarter negative. Quantica and Welton were positive for the year while no CTAs finished the year negative.
Frontier Global Fund
2022
The Frontier Global Fund– Class 1 NAV gained 69.28% for the twelve months ended December 31, 2022, net of fees and expenses; the Frontier Global Fund– Class 2 NAV gained 74.44% for the twelve months ended December 31, 2022, net of fees and expenses.
For the twelve months ended December 31, 2022, the Frontier Global Fund recorded total expenses of $232,383, net investment loss of $232,383, and net realized/unrealized gain on investments of $1,642,945, resulting in a net increase in owners’ capital from operations of $1,410,562. For Class 1, the NAV per Unit increased from $109.45 at December 31, 2021 to $185.27 as of December 31, 2022. For Class 2, the NAV per Unit increased from $170.40 at December 31, 2021, to $297.25 as of December 31, 2022. Total Class 1 subscriptions and redemptions for the period were $0 and $540,252, respectively. Total Class 2 subscriptions and redemptions for the period were $0 and $153,448, respectively. Ending capital, at December 31, 2022, was $2,689,125 for Class 1, and $139,078 for Class 2.
For the twelve months ended December 31, 2022, Frontier Global Fund did not own a swap investment.
The Frontier Global Fund may have both long and short exposure to the Interest Rates, Currencies, Stock Indices, Energies, Metals and Commodities sectors.
Sector Attribution for the Frontier Global Fund
Three of the six sectors traded in the Frontier Global Fund were profitable in Q4 2022. Metals, Currencies and Stock Indices were positive while Energies, Agriculturals and Interest Rates were negative for the quarter.
Metals, Energies, Agriculturals and Stock Indices were positive YTD while Currencies and Interest Rates were negative YTD.
Frontier Heritage Fund
2022
The Frontier Heritage Fund – Class 1 NAV gained 49.03% for the twelve months ended December 31, 2022, net of fees and expenses; The Frontier Heritage Fund – Class 1AP NAV gained 53.59% for the twelve months ended December 31, 2022, net of fees and expenses; the Frontier Heritage Fund – Class 2 NAV gained 53.58% for the twelve months ended December 31, 2022, net of fees and expenses.
For the twelve months ended December 31, 2022, the Frontier Heritage Fund recorded total expenses of $232,736, net investment loss of $232,736, and net realized/unrealized gain on investments of $1,376,459, resulting in a net increase in owners’ capital from operations of $1,143,723. For Class 1, the NAV per Unit increased from $103.43 at December 31, 2021, to $154.14 as of December 31, 2022. For Class 1AP, the NAV per Unit increased from $129.19 at December 31, 2021, to $198.42 as of December 31, 2022. For Class 2, the NAV per Unit increased from $172.91 at December 31, 2021, to $265.55 as of December 31, 2022. Total Class 1 subscriptions and redemptions for the period were $0 and $316,598, respectively. Total Class 1AP subscriptions and redemptions for the period were $0 and $0, respectively. Total Class 2 subscriptions and redemptions for the period were $0 and $63,076, respectively. Ending capital, at December 31, 2022, was $2,830,832, for Class 1, $12,657 for Class 1AP, and $242,868 for Class 2.
For the twelve months ended December 31, 2022, Frontier Heritage Fund did not own a swap investment.
The Frontier Heritage Fund may have both long and short exposure to the Interest Rates, Currencies, Stock Indices, Energies, Metals and Commodities sectors.
Sector & Major Advisor Attribution for the Frontier Heritage Fund
None of the six sectors traded in the Frontier Heritage Fund were profitable in Q4 2022. Agriculturals, Currencies, Energies, Interest Rates, Metals and Stock Indices were negative for the quarter. There were no positive sectors for the quarter.
Currencies, Energies and Interest Rates were positive YTD while Agriculturals, Metals and Stock Indices were negative YTD.
In terms of major CTA performance, no CTAs finished positive for the quarter, while John Locke and Welton finished the quarter negative. Welton was positive for the year while John Locke finished negative.
Results of Operations for the Twelve Months Ended December 31, 2021
Series Returns and Other Information
The returns for each Series and Class of Units for the twelve months ended December 31, 2021, and related information, are discussed below. The activities of the Trust on a consolidated basis are explained through the activity of the underlying Series. Please refer to the discussion of the Series activities in relation to the Trust on a consolidated basis.
Each Series had exposure to commodity interest positions within one or more sectors during fiscal 2021. The performance of each Series was impacted over the course of the year by, among other things, the relative performance of the relevant sector or sectors and the commodities within those sectors, the changing allocations among, and the specific positions taken by, the Series’ Trading Advisors in, the relevant sector(s) and commodities, and the timing of entries and exits. For each of the Series, a sector attribution chart has been included at the end of the relevant discussion. Each chart depicts the performance of the relevant Series’ positions within each of the relevant sectors (determined by the Managing Owner using monthly gross return and NAV figures, with various adjustments to net out a proportional allocation of the fees and expenses chargeable to the Series) during the fourth quarter (except as otherwise noted) and for the full calendar year. Charts depicting the performance of the various Series’ positions within each of the relevant sectors during the prior three quarters were included in the Trust’s quarterly reports on Form 10-Q previously filed.
Frontier Diversified Fund
2021
The Frontier Diversified Fund – Class 1 NAV gained 5.06% for the twelve months ended December 31, 2021, net of fees and expenses; the Frontier Diversified Fund – Class 2 NAV gained 0.03% for the twelve months ended December 31, 2021 net of fees and expenses; the Frontier Diversified Fund – Class 3 NAV gained 0.28% for the twelve months ended December 31, 2021 net of fees and expenses. For the twelve months ended December 31, 2021 the Frontier Diversified Fund recorded total expenses of $131,851, net investment loss of $127,301, and net realized/unrealized gain on investments of $196,459, resulting in a net increase in owners’ capital from operations of $69,158. The NAV per Unit, Class 1, decreased from $72.68 at December 31, 2020, to $0 as of December 31, 2021. Class 1 was closed July 21, 2021. The NAV per Unit, Class 2, increased from $88.95 at December 31, 2020, to $88.98 as of December 31, 2021. The NAV per Unit, Class 3, increased from $83.33 at December 31, 2020, to $83.56 as of December 31, 2021. Total Class 1 subscriptions and redemptions for the period were $0 and $161,099, respectively. Total Class 2 subscriptions and redemptions for the period were $6,000 and $91,628, respectively. Total Class 3 subscriptions and redemptions for the period were $0 and $972,262, respectively. Ending capital at December 31, 2021, was $0 for Class 1, $381,517 for Class 2 and $2,651,623 for Class 3.
For the twelve months ended December 31, 2021, Frontier Diversified Fund did not own a swap investment.
The Frontier Diversified Fund may have both long and short exposure to the Interest Rates, Currencies, Stock Indices, Energies, Metals and Commodities sectors.
Sector & Major Advisor Attribution for the Frontier Diversified Fund
Two of the six sectors traded in the Frontier Diversified Fund were profitable in Q4 2021. Currencies and Stock Indices were positive while Metals, Energies, Agriculturals and Interest Rates were negative for the quarter.
Energies, Agriculturals and Stock Indices were positive YTD while Metals, Currencies, and Interest Rates were negative YTD.
In terms of major CTA performance, one of the six major CTAs in the Frontier Diversified Fund were profitable in Q4 2021. Fort finished positive for the quarter. Aspect, John Locke, QIM, Quest and Welton finished negative for the quarter. In terms of YTD performance Aspect and Welton were positive YTD while Fort, John Locke, QIM and Quest were negative YTD.
Frontier Masters Fund
2021
The Frontier Masters Fund – Class 1 NAV gained 4.59% for the twelve months ended December 31, 2021, net of fees and expenses, the Frontier Masters Fund – Class 2 NAV gained 3.89% for the twelve months ended December 31, 2021, net of fees and expenses, the Frontier Masters Fund – Class 3 NAV gained 4.14% for the twelve months ended December 31, 2021, net of fees and expenses.
For the twelve months ended December 31, 2021 the Frontier Masters Fund recorded total expenses of $54,617, net investment loss of $51,476, and net realized/unrealized gain on investments of $99,083, resulting in a net increase in owners’ capital from operations of $47,607. The NAV per Unit, Class 1, decreased from $55.18 at December 31, 2020, to $0 as of December 31, 2021. Class 1 was closed on April 1, 2021. The NAV per Unit, Class 2, increased from $67.54 at December 31, 2020, to $70.17 as of December 31, 2021. The NAV per Unit, Class 3 increased from $63.52 at December 31, 2020 to $66.15 as of December 31, 2021. Total Class 1 subscriptions and redemptions for the period were $0 and $0, respectively. Class 1 had $10,187 of inter-class transfers out. Total Class 2 subscriptions and redemptions for the period were $1,000 and $78,335, respectively. Total Class 3 subscriptions and redemptions for the period were $0 and $256,125, respectively. Class 3 had $10,187 of inter-class transfers in. Ending capital at December 31, 2021, was $0 for Class 1, $198,399 for Class 2 and $509,275 for Class 3.
For the twelve months ended December 31, 2021, Frontier Masters Fund did not own a swap investment.
The Frontier Masters Fund may have both long and short exposure to the Interest Rates, Currencies, Stock Indices, Energies, Metals, Hybrids and Commodities sectors.
Sector & Major Advisor Attribution for the Frontier Masters Fund
Two of the six sectors traded in the Frontier Masters Fund were profitable in Q4 2021. Currencies and Stock Indices were positive while Metals, Energies, Agriculturals and Interest Rates were negative for the quarter.
Energies, Agriculturals and Stock Indices were positive YTD while Metals, Currencies, and Interest Rates were negative YTD.
In terms of major CTA performance, there were no CTAs that finished positive for the quarter while Aspect, John Locke and Welton were negative during the quarter. In terms of YTD performance, Aspect and Welton were positive while John Locke was negative YTD.
Frontier Long/Short Commodity Fund
2021
The Frontier Long/Short Commodity Fund – Class 2 NAV gained 4.63% for the twelve months ended December 31, 2021, net of fees and expenses; the Frontier Long/Short Commodity Fund – Class 3 NAV gained 4.63% for the twelve months ended December 31, 2021, net of fees and expenses; the Frontier Long/Short Commodity Fund – Class 2a NAV gained 6.25% for the twelve months ended December 31, 2021, net of fees and expenses; the Frontier Long/Short Commodity Fund – Class 3a NAV gained 6.49% for the twelve months ended December 31, 2021, net of fees and expenses.
For the twelve months ended December 31, 2021, the Frontier Long/Short Commodity Fund recorded total expenses of $39,570, net investment loss of $35,848, and net realized/unrealized gain on investments of $110,120, resulting in a net increase in owners’ capital from operations of $74,272. The NAV per Unit, Class 2, increased from $85.99 at December 31, 2020, to $89.97 as of December 31, 2021. The NAV per Unit, Class 3, increased from $90.21 at December 31, 2020, to $94.38 as of December 31, 2021.The NAV per Unit, Class 2a, increased from $55.29 at December 31, 2020, to $58.75 as of December 31, 2021. The NAV per Unit, Class 3a, increased from $58.37 at December 31, 2020, to $62.16 as of December 31, 2021. Total Class 2 subscriptions and redemptions for the period were $0 and $11,508, respectively. Total Class 3 subscriptions and redemptions for the period were $0 and $106,533, respectively. Total Class 2a subscriptions and redemptions for the period were $0 and $6,263, respectively. Total Class 3a subscriptions and redemptions for the period were $0 and $22,947, respectively. Ending capital at December 31, 2021, was $25,166 for Class 2, $923,058 for Class 3, $83,858 for Class 2a and $208,242 for Class 3a.
For the twelve months ended December 31, 2021, Frontier Long/Short Commodity Fund did not own a swap investment.
The Frontier Long/Short Commodity Fund may have both long and short exposure to the Interest Rates, Currencies, Stock Indices, Energies, Metals and Commodities sectors, although the majority of the exposure will typically be in the Energies, Metals and Commodities sectors.
Sector & Major Advisor Attribution for the Frontier Long/Short Commodity Fund
All of the seven sectors traded in the Frontier Long/Short Commodity Fund were negative in Q4 2021. Energies, Base Metals, Grains, Meats, Precious Metals, Softs and Financials finished negative for the quarter. There were no positive sectors for the quarter.
Energies, Base Metals, Grains, Meats, Precious Metals and Softs were positive YTD. Financials were negative YTD.
In terms of major CTA performance, no CTAs finished positive for the quarter while Rosetta, Volt and Welton were negative for the quarter.
In terms of YTD performance, Welton was positive YTD while Rosetta and Volt were negative YTD.
Frontier Balanced Fund
2021
The Frontier Balanced Fund – Class 1 NAV gained 3.61% for the twelve months ended December 31, 2021, net of fees and expenses; The Frontier Balanced Fund – Class 1AP NAV gained 6.79% for the twelve months ended December 31, 2021, net of fees and expenses; the Frontier Balanced Fund – Class 2 NAV gained 6.79% for the twelve months ended December 31, 2021, net of fees and expenses; the Frontier Balanced Fund – Class 2a NAV gained 6.87% for the twelve months ended December 31, 2021, net of fees and expenses; the Frontier Balanced Fund – Class 3a NAV gained 6.88% for the twelve months ended December 31, 2021, net of fees and expenses.
For the twelve months ended December 31, 2021, the Frontier Balanced Fund recorded total expenses of $876,257, net investment loss of $875,992, and net realized/unrealized gain on investments of $1,439,973, resulting in a net increase in owners’ capital from operations of $563,981. The NAV per Unit, Class 1, increased from $79.93 at December 31, 2020, to $82.82 as of December 31, 2021. The NAV per Unit, Class 1AP, increased from $96.81 at December 31, 2020, to $103.38 as of December 31, 2021. The NAV per Unit, Class 2, increased from $130.54 at December 31, 2020, to $139.40 as of December 31, 2021. For Class 2a, the NAV per Unit increased from $113.20 at December 31, 2020, to $120.98 as of December 31, 2021. For Class 3a, the NAV per Unit increased from $112.81 at December 31, 2020, to $120.57 as of December 31, 2021. Total Class 1 subscriptions and redemptions for the period were $0 and $2,341,345, respectively. Total Class 1AP subscriptions and redemptions for the period were $0 and $51,153, respectively. Total Class 2 subscriptions and redemptions for the period were $0 and $552,032, respectively. Total Class 2a subscriptions and redemptions for the period were $0 and $57,662, respectively. Total Class 3a subscriptions and redemptions for the period were $0 and $163,035, respectively. Ending capital at December 31, 2021, was $7,471,841 for Class 1, $66,027 for Class 1 AP, $1,533,078 for Class 2, $56,328 for Class 2a, and $381,759 for Class 3a.
For the twelve months ended December 31, 2021, Frontier Balanced Fund did not own a swap investment.
The Frontier Balanced Fund may have both long and short exposure to the Interest Rates, Currencies, Stock Indices, Energies, Metals and Commodities sectors.
Sector & Major Advisor Attribution for the Frontier Balanced Fund
Two of the six sectors traded in the Frontier Balanced Fund were profitable in Q4 2021. Currencies and Stock Indices were positive while Metals, Energies, Agriculturals and Interest Rates were negative for the quarter.
Energies, Agriculturals and Stock Indices were positive YTD while Metals, Currencies, and Interest Rates were negative YTD.
In terms of major CTA performance, Fort and Wimmer Horizon finished positive for the quarter. Aspect, John Locke, QIM and Welton finished negative for the quarter. Aspect, Welton and Wimmer Horizon were positive YTD while Fort, John Locke and QIM were negative YTD.
Frontier Select Fund
2021
The Frontier Select Fund – Class 1 NAV gained 8.27% for the twelve months ended December 31, 2021, net of fees and expenses; The Frontier Select Fund Frontier Select Fund – Class 1AP NAV gained 11.58% for the twelve months ended December 31, 2021, net of fees and expenses; the Frontier Select Fund – Class 2 NAV gained 11.57% for the twelve months ended December 31, 2021, net of fees and expenses.
For the twelve months ended December 31, 2021, the Frontier Select Fund recorded total expenses of $93,353, net investment loss of $93,353, and net realized/unrealized gain on investments of $243,162, resulting in a net increase in owners’ capital from operations of $149,809. The NAV per Unit, Class 1, increased from $58.55 at December 31, 2020, to $63.39 as of December 31, 2021. The NAV per Unit, Class 1AP, increased from $70.99 at December 31, 2020, to $79.21 as of December 31, 2021. The NAV per Unit, Class 2, increased from $94.20 at December 31, 2020, to $105.10 as of December 31, 2021. Total Class 1 subscriptions and redemptions for the period were $0 and $381,729, respectively. Total Class 1AP subscriptions and redemptions for the period were $0 and $656, respectively. Total Class 2 subscriptions and redemptions for the period were $0 and $4,682, respectively. Ending capital, at December 31, 2021, was $1,334,518 for Class 1, $10,259 for Class 1AP, and $71,093 for Class 2.
For the twelve months ended December 31, 2021, Frontier Select Fund did not own a swap investment.
The Frontier Select Fund may have both long and short exposure to the Interest Rates, Currencies, Stock Indices, Energies, Metals, Hybrids and Commodities sectors.
Sector & Major Advisor Attribution for the Frontier Select Fund
Two of the six sectors traded in the Frontier Select Fund were profitable in Q4 2021. Currencies and Stock Indices were positive while Metals, Energies, Agriculturals and Interest Rates were negative for the quarter.
Energies, Agriculturals and Stock Indices were positive YTD while Metals, Currencies, and Interest Rates were negative YTD.
In terms of major CTA performance, no CTAs finished positive for the quarter, while Aspect and Welton finished the quarter negative. Welton was positive for the year while Aspect finished negative.
Frontier Global Fund
2021
The Frontier Global Fund– Class 1 NAV lost 1.31% for the twelve months ended December 31, 2021, net of fees and expenses; the Frontier Global Fund– Class 2 NAV gained 1.70% for the twelve months ended December 31, 2021, net of fees and expenses.
For the twelve months ended December 31, 2021, the Frontier Global Fund recorded total expenses of $216,695, net investment loss of $216,695, and net realized/unrealized gain on investments of $206,960, resulting in a net decrease in owners’ capital from operations of $9,735. The NAV per Unit, Class 1, decreased from $110.90 at December 31, 2020 to $109.45 as of December 31, 2021. The NAV per Unit, Class 2, increased from $167.56 at December 31, 2020, to $170.40 as of December 31, 2021. Total Class 1 subscriptions and redemptions for the period were $0 and $802,573, respectively. Total Class 2 subscriptions and redemptions for the period were $0 and $7,000, respectively. Ending capital, at December 31, 2021, was $1,926,328 for Class 1 and $185,013 for Class 2.
The Frontier Global Fund may have both long and short exposure to the Interest Rates, Currencies, Stock Indices, Energies, Metals and Commodities sectors.
For the twelve months ended December 31, 2021, Frontier Global Fund did not own a swap investment.
Sector Attribution for the Frontier Global Fund
Three of the six sectors traded in the Frontier Global Fund were profitable in Q4 2021. Metals, Currencies and Stock Indices were positive while Energies, Agriculturals and Interest Rates were negative for the quarter.
Metals, Energies, Agriculturals and Stock Indices were positive YTD while Currencies and Interest Rates were negative YTD.
Frontier Heritage Fund
2021
The Frontier Heritage Fund – Class 1 NAV gained 7.62% for the twelve months ended December 31, 2021, net of fees and expenses; The Frontier Heritage Fund – Class 1AP NAV gained 10.89% for the twelve months ended December 31, 2021, net of fees and expenses; the Frontier Heritage Fund – Class 2 NAV gained 10.90% for the twelve months ended December 31, 2021, net of fees and expenses. For the twelve months ended December 31, 2021, the Frontier Heritage Fund recorded total expenses of $170,031, net investment loss of $170,031, and net realized/unrealized gain on investments of $365,497, resulting in a net increase in owners’ capital from operations of $195,466. The NAV per Unit, Class 1, increased from $96.10 at December 31, 2020, to $103.43 as of December 31, 2021. The NAV per Unit, Class 1AP, increased from $116.50 at December 31, 2020, to $129.19 as of December 31, 2021. The NAV per Unit, Class 2, increased from $155.92 at December 31, 2020, to $172.91 as of December 31, 2021. Total Class 1 subscriptions and redemptions for the period were $0 and $217,618, respectively. Total Class 1AP subscriptions and redemptions for the period were $0 and $1,101, respectively. Total Class 2 subscriptions and redemptions for the period were $0 and $39,721, respectively. Ending capital, at December 31, 2021, was $2,119,250, for Class 1, $8,242 for Class 1AP, and $194,816 for Class 2.
For the twelve months ended December 31, 2021, Frontier Heritage Fund did not own a swap investment.
The Frontier Heritage Fund may have both long and short exposure to the Interest Rates, Currencies, Stock Indices, Energies, Metals and Commodities sectors.
Sector & Major Advisor Attribution for the Frontier Heritage Fund
One of the six sectors traded in the Frontier Heritage Fund was profitable in Q4 2021. Stock Indices were positive while Metals, Currencies, Agriculturals, Energies and Interest Rates were negative for the quarter.
Metals, Energies, Agriculturals and Stock Indices were positive YTD while Currencies and Interest Rates were negative YTD.
In terms of major CTA performance, no CTA’s finished positive for the quarter, while Aspect and Welton finished the quarter negative. Welton was positive for the year while Aspect finished negative.
Results of Operations for the Twelve Months Ended December 31, 2020
The returns for each Series and Class of Units for the twelve months ended December 31, 2020 can be found in our annual report on Form 10-K for the fiscal year ended December 31, 2021, located within Part II, Item 7. “Management’s Discussion and Analysis of Financial Condition and Results of Operations”.
| Item 7A. | QUANTITATIVE AND QUALITATIVE DISCLOSURES ABOUT MARKET RISK. |
The Trust is a speculative commodity pool. The market sensitive instruments, which are held by the Trading Companies or Galaxy Plus entities in which the Series are invested, are acquired for speculative trading purposes, and all or a substantial amount of the Series’ assets are subject to the risk of trading loss. Unlike an operating company, the risk of market sensitive instruments is integral, not incidental, to the Series’ main line of business.
Market movements result in frequent changes in the fair market value of each Trading Company’s open positions and, consequently, in each Series of the Trust’s earnings and cash flow. The Trading Companies’ and Galaxy Plus entities’ and consequently the Series’ market risk is influenced by a wide variety of factors, including the level and volatility of exchange rates, interest rates, equity price levels, the market value of financial instruments and contracts, the diversification effects among the open positions and the liquidity of the markets in which trades are made.
Each Trading Company and Galaxy Plus entity rapidly acquires and liquidates both long and short positions in a wide range of different markets. Consequently, it is not possible to predict how a particular future market scenario will affect performance, and the past performance for any Series is not necessarily indicative of the future results of such Series.
Additional risk of trading loss from investment in an unaffiliated Trading Company may result from the Managing Owner’s inability to directly control or stop trading in the event of exercise of certain withdrawal provisions in the investment agreement.
The Trading Companies and Galaxy Plus entities, and consequently the Series’ primary market risk exposures as well as the strategies used and to be used by the Trading Advisors for managing such exposures are subject to numerous uncertainties, contingencies and risks, any one of which could cause the actual results of the Trust’s and the Managing Owner’s risk controls to differ materially from the objectives of such strategies. Government interventions, defaults and expropriations, illiquid markets, the emergence of dominant fundamental factors, political upheavals, changes in historical price relationships, an influx of new market participants, increased regulation and many other factors could result in material losses as well as in material changes to the risk exposures and the risk management strategies of the Trading Companies and Galaxy Plus entities and consequently the Trust. There can be no assurance that the Trading Companies’ and Galaxy Plus entities’ current market exposure and/or risk management strategies will not change materially or that any such strategies will be effective in either the short- or long-term. Investors must be prepared to lose all or substantially all of their investment in a Series.
Quantitative Market Risk
The Series’ approximate risk exposure in the various market sectors traded by its Trading Advisors is quantified below in terms of value at risk. Due to the Series’ mark-to-market accounting, any loss in the fair value of the Series’ (through the Trading Companies and Galaxy Plus entities) open positions is directly reflected in the Series’ earnings, realized or unrealized gain/loss.
Exchange maintenance margin requirements have been used by the Trust as the measure of its value at risk. Maintenance margin requirements are set by exchanges to equal or exceed the maximum losses reasonably expected to be incurred in the fair value of any given contract in 95% to 99% of any one-day interval. The maintenance margin levels are established by brokers, dealers and exchanges using historical price studies as well as an assessment of current market volatility and economic fundamentals to provide a probabilistic estimate of the maximum expected near-term one-day price fluctuation. Maintenance margin has been used rather than the more generally available initial margin, because initial margin includes a credit risk component that is not relevant to value at risk.
In the case of market sensitive instruments that are not exchange-traded, including currencies and some energy products and metals, the margin requirements for the equivalent futures positions have been used as value at risk. In those cases in which a futures-equivalent margin is not available, dealers’ margins have been used.
In the case of contracts denominated in foreign currencies, the value at risk figures include foreign currency margin amounts converted into U.S. dollars with an incremental adjustment to reflect the exchange rate risk inherent to the Series, which is valued in U.S. dollars, in expressing value at risk in a functional currency other than U.S. dollars.
In quantifying each Series’ value at risk, 100% positive correlation in the different positions held in each market risk category has been assumed. Consequently, the margin requirements applicable to the open contracts have simply been aggregated to determine each trading category’s aggregate value at risk. The diversification effects resulting from the fact that the Series’ positions held through the Trading Companies and Galaxy Plus entities are rarely, if ever, 100% positively correlated have not been reflected.
Value at Risk by Market Sectors
The following tables present the trading value at risk associated with each Series’ exposure to open positions (as held by the Trading Companies) by market sector as of December 31, 2022 and 2021. All open position trading risk exposures of the Series have been included in calculating the figures set forth below.
DOMESTIC EXPOSURE
Frontier Balanced Fund:
| | | December 31, 2022 | | | | December 31, 2021 | |
| | | VALUE | | | % OF TOTAL | | | | VALUE | | | % OF TOTAL | |
| | | AT RISK | | | CAPITALIZATION | | | | AT RISK | | | CAPITALIZATION | |
| MARKET SECTOR | | | | | | | | | | | | | |
| Interest Rates | | $ | 50 | | | | 0.00 | % | | | $ | 7,906 | | | | 0.08 | % |
| Currencies | | | 321,385 | | | | 3.45 | % | | | | 817,788 | | | | 8.60 | % |
| Stock Indices | | | - | | | | 0.00 | % | | | | 269 | | | | 0.00 | % |
| Metals | | | 897 | | | | 0.01 | % | | | | 107,346 | | | | 1.13 | % |
| Agriculturals/Softs | | | 1,590 | | | | 0.02 | % | | | | 313,239 | | | | 3.29 | % |
| Energy | | | - | | | | 0.00 | % | | | | 10,826 | | | | 0.11 | % |
| Total: | | $ | 323,922 | | | | 3.48 | % | | | $ | 1,257,374 | | | | 13.22 | % |
Value at Risk: Foreign Markets
The following table presents the portion of trading value at risk associated with each Series’ exposure to open positions (as held by the Trading Companies) by market sector as of December 31, 2022 and 2021, on foreign markets. All open position trading risk exposures of the Series have been included in calculating the figures set forth below.
FOREIGN EXPOSURE
Frontier Balanced Fund:
| | | December 31, 2022 | | | | December 31, 2021 | |
| | | VALUE | | | % OF TOTAL | | | | VALUE | | | % OF TOTAL | |
| | | AT RISK | | | CAPITALIZATION | | | | AT RISK | | | CAPITALIZATION | |
| MARKET SECTOR | | | | | | | | | | | | | |
| Interest Rates | | $ | - | | | | 0.00 | % | | | $ | 1,514,134 | | | | 15.92 | % |
| Currencies | | | 122 | | | | 0.00 | % | | | | 22,104 | | | | 0.23 | % |
| Stock Indices | | | 106 | | | | 0.00 | % | | | | 20,897 | | | | 0.22 | % |
| Agriculturals/Softs | | | 227 | | | | 0.00 | % | | | | 107,740 | | | | 1.13 | % |
| Total: | | $ | 455 | | | | 0.00 | % | | | $ | 1,664,875 | | | | 17.50 | % |
Material Limitations on Value at Risk as an Assessment of Market Risk
The face value of the market sector instruments held on behalf of the Series is typically many times the applicable maintenance margin requirement, which generally ranges between approximately 1% and 10% of contract face value, as well as many times the capitalization of the Series. The magnitude of each Series’ open positions creates a risk of ruin not typically found in most other investment vehicles. Because of the size of their positions, certain market conditions, although unusual, but historically recurring from time to time, could cause a Series to incur severe losses over a short period of time. The value at risk table above, as well as the past performance of the Series, gives no indication of this risk of severe losses.
Non-Trading Risk
The Series have non-trading market risk on their foreign cash balances not needed for margin. However, these balances, as well as the market risk they represent, are immaterial. The Series also have non-trading market risk as a result of investing a portion of their available assets in U.S. government securities which include any security issued or guaranteed as to principal or interest by the U.S., or by a person controlled by or supervised by and acting as an instrumentality of the government of the U.S. pursuant to authority granted by Congress of the U.S. or any certificate of deposit for any of the foregoing, including U.S. treasury bonds, U.S. treasury bills and issues of agencies of the U.S. government, and certain cash items such as money market funds, certificates of deposit (under three months) and time deposits. The market risk represented by these investments is also immaterial.
Qualitative Market Risk
The following are the primary trading risk exposures of the Series of the Trust as of December 31, 2022, by market sector.
Interest Rates
Interest rate risk is one of the principal market exposures of each Series. Interest rate movements directly affect the price of interest rate futures positions held and indirectly the value of a Trading Company’s stock index and currency positions. Interest rate movements in one country as well as relative interest rate movements between countries materially impact profitability. The primary interest rate exposure is to interest rate fluctuations in the U.S. and the other G-7 countries. However, the Trading Companies and Galaxy Plus entities also may take futures positions on the government debt of smaller nations. The Managing Owner anticipates that G-7 interest rates will remain the primary market exposure of each Trading Company and Galaxy Plus entities and accordingly of each Series for the foreseeable future. The changes in interest rates which are expected to have the most effect on the Series are changes in long-term, as opposed to short-term rates. Most of the speculative positions to be held by the Trading Companies and Galaxy Plus entities will be in medium- to long-term instruments. Consequently, even a material change in short term rates is expected to have little effect on the Series if the medium- to long-term rates remain steady. Aggregate interest income from all sources, including assets held at clearing brokers, of up to 2% (annualized) is paid to the Managing Owner by the Frontier Balanced Fund (Class 1 and Class 2 only), Frontier Global Fund, Frontier Select Fund and Frontier Heritage Fund. For the Frontier Diversified Fund, Frontier Long/Short Commodity Fund (Class 1a, Class 2a, Class 3a only), Frontier Masters Fund and Frontier Balanced Fund (Class 1AP, Class 2a and Class 3a), 20% of the total interest allocated to each Series was paid to the Managing Owner from January 1, 2017 through April 28, 2017; thereafter 100% of the interest is retained by the respective Series.
Currencies
Exchange rate risk is a significant market exposure of each Series of the Trust in general. For each Series of the Trust in general, currency exposure is to exchange rate fluctuations, primarily fluctuations that disrupt the historical pricing relationships between different currencies and currency pairs. These fluctuations are influenced by interest rate changes as well as political and general economic conditions. The Trading Advisors on behalf of a Series trade in a large number of currencies, including cross-rates, which are positions between two currencies other than the U.S. dollar. The Managing Owner does not anticipate that the risk profile of the Series’ currency sector will change significantly in the future.
Stock Indices
For each Series, its primary equity exposure is equity price risk in the G-7 countries as well as other smaller jurisdictions. Each Series of the Trust is primarily exposed to the risk of adverse price trends or static markets in the major U.S., European and Japanese indices.
Metals
For each Series, its metals market exposure is fluctuations in the price of both precious metals, including gold and silver, as well as base metals including aluminum, copper, nickel and zinc. Some metals, such as gold, are used as surrogate stores of value, in place of hard currency, and thus have currency or interest rate risk associated with them relative to their price in a specific currency. Other metals, such as silver, platinum, copper and steel, have substantial industrial applications, and may be subject to forces affecting industrial production and demand.
Agriculturals/Softs
Each Series may also invest in raw commodities and may thus have exposure to agricultural price movements, which are often directly affected by severe or unexpected weather conditions or by political events in countries that comprise significant sources of commodity supply.
Energy
For each Series its primary energy market exposure is in oil, gas and other energy product price movements, often resulting from political developments and ongoing conflicts in the Middle East. Oil and gas prices can be volatile and substantial profits and losses have been and are expected to continue to be experienced in this market.
Other Trading Risks
As a result of leverage, small changes in the price of a Trading Company’s positions may result in substantial losses for a Series. Futures, forwards and options are typically traded on margin. This means that a small amount of capital can be used to invest in contracts of much greater total value. The resulting leverage means that a relatively small change in the market price of a contract can produce a substantial loss. Like other leveraged investments, any purchase or sale of a contract may result in losses in excess of the amount invested in that contract. The Trading Companies and Galaxy Plus entities may lose more than their initial margin deposits on a trade.
The Trading Companies’ and Galaxy Plus entities’ trading is subject to execution risks. Market conditions may make it impossible for the Trading Advisors to execute a buy or sell order at the desired price, or to close out an open position. Daily price fluctuation limits are established by the exchanges and approved by the CFTC. When the market price of a contract reaches its daily price fluctuation limit, no trades can be executed at prices outside the limit. The holder of a contract may therefore be locked into an adverse price movement for several days or more and lose considerably more than the initial margin put up to establish the position. Thinly traded or illiquid markets also can make it difficult or impossible to execute trades. The Trading Advisor’s positions are subject to speculative limits. The CFTC and domestic exchanges have established speculative position limits on the maximum futures position which any person, or group of persons acting in concert, may hold or control in particular futures contracts or options on futures contracts traded on U.S. commodity exchanges. Under current regulations, other accounts of the Trading Advisors are combined with the positions held by them on behalf of the applicable Trading Company and Galaxy Plus entity for position limit purposes. This trading could preclude additional trading in these commodities by the Trading Advisors for the accounts of the Series.
Systematic strategies do not consider fundamental types of data and do not have the benefit of discretionary decision making. The assets of the Series are allocated to Trading Advisors that rely on technical, systematic strategies that do not take into account factors external to the market itself (although certain of these strategies may have minor discretionary elements incorporated into their systematic strategy). The widespread use of technical trading systems frequently results in numerous Trading Advisors attempting to execute similar trades at or about the same time, altering trading patterns and affecting market liquidity. Furthermore, the profit potential of trend-following systems may be diminished by the changing character of the markets, which may make historical price data (on which technical programs are based) only marginally relevant to future market patterns. Systematic strategies are developed on the basis of a statistical analysis of market prices. Consequently, any factor external to the market itself that dominates prices that a discretionary decision maker may take into account may cause major losses for a systematic strategy. For example, a pending political or economic event may be very likely to cause a major price movement, but a systematic strategy may continue to maintain positions indicated by its trading method that might incur major losses if the event proved to be adverse.
However, because certain of the Trading Advisors’ strategies involve some discretionary aspects in addition to their technical factors, certain of the Trading Advisors may occasionally use discretion in investing the assets of a Trading Company. For example, the Trading Advisors often use discretion in selecting contracts and markets to be followed. In exercising such discretion, such Trading Advisor may take positions opposite to those recommended by the Trading Advisor’s trading system or signals. Discretionary decision making may also result in a Trading Advisor failing to capitalize on certain price trends or making unprofitable trades in a situation where another trader relying solely on a systematic approach might not have done so. Furthermore, such use of discretion may not enable the relevant Series of the Trust to avoid losses, and in fact, such use of discretion may cause such Series to forego profits which it may have otherwise earned had such discretion not been used.
Qualitative Disclosures Regarding Means of Managing Risk Exposure
The means by which the Managing Owner attempts to manage the risk of the Trust’s open positions is essentially the same in all market categories traded. The Managing Owner applies risk management policies to trading which generally are designed to limit the total exposure of assets under management. In addition, the Managing Owner follows diversification guidelines which are often formulated in terms of the balanced volatility between markets and correlated groups.
Cyber Risks and Security
The Trust’s business requires it to use and store investor, employee and business partner personally identifiable information (“PII”). This may include, among other information, names, addresses, phone numbers, email addresses, contact preferences, tax identification numbers and payment account information.
The Trust requires usernames and passwords in order to access its information technology systems. The Trust also uses encryption and authentication technologies designed to secure the transmission and storage of data and prevent access to Trust data or accounts. These security measures are subject to third-party security breaches, employee error, malfeasance, faulty password management, or other irregularities. To help protect investors and the Trust, the Trust monitors accounts and systems for unusual activity and may freeze accounts under suspicious circumstances.
The Trust devotes significant resources to network security, data encryption and other security measures to protect its systems and data, but these security measures cannot provide absolute security. To the extent the Trust was to experience a breach of its systems and was unable to protect sensitive data, such a breach could materially damage business partner and investor relationships. Moreover, if a computer security breach affects the Trust’s systems or results in the unauthorized release of PII, the Trust’s reputation and brand could be materially damaged and the Trust could be exposed to a risk of loss or litigation and possible liability. While the Trust maintains insurance coverage that, subject to policy terms and conditions and subject to a significant self-insured retention, is designed to address certain aspects of cyber risks, such insurance coverage may be insufficient to cover all losses or all types of claims that may arise in the continually evolving area of cyber risk.
Qualitative Disclosures Regarding Means of Managing Risk Exposure
The means by which the Managing Owner attempts to manage the risk of the Trust’s open positions is essentially the same in all market categories traded. The Managing Owner applies risk management policies to trading which generally are designed to limit the total exposure of assets under management. In addition, the Managing Owner follows diversification guidelines which are often formulated in terms of the balanced volatility between markets and correlated groups.
| Item 8. | FINANCIAL STATEMENTS AND SUPPLEMENTARY DATA. |
Financial statements meeting the requirements of Regulation S-X appear beginning on page F-1 of this report. The supplementary financial information specified by Item 302 of Regulation S-K is included in this report under the heading “Selected Financial Data” above.
| Item 9. | CHANGES IN AND DISAGREEMENTS WITH ACCOUNTANTS ON ACCOUNTING AND FINANCIAL DISCLOSURE. |
None.
| Item 9A. | CONTROLS AND PROCEDURES |
Evaluation of Disclosure Controls and Procedures
Under the supervision and with the participation of the management of the Managing Owner, including its Chairman and Chief Financial Officer, the Trust evaluated the effectiveness of the design and operation of the disclosure controls and procedures (as defined in Rule 13a-15(e) under the Securities Exchange Act of 1934, as amended (the “Exchange Act”)), for the Trust and each Series as of December 31, 2022 (the “Evaluation Date”). Any control system, no matter how well designed and operated, can only provide reasonable (not absolute) assurance that its objectives will be met. Furthermore, no evaluation of controls can provide absolute assurance that all control issues and instances of fraud, if any, have been detected.
Based upon its evaluation, the management of the Managing Owner concluded that, as of the Evaluation Date, the disclosure controls and procedures for the Trust and each Series were effective to provide reasonable assurance that they are timely alerted to the material information relating to the Trust and each Series required to be included in the Trust’s periodic SEC filing.
Report on Management’s Assessment of Internal Control over Financial Reporting
The management of the Managing Owner is responsible for establishing and maintaining adequate internal control over financial reporting by the Trust.
The Managing Owner’s internal control over financial reporting is a process designed to provide reasonable assurance regarding the reliability of financial reporting and the preparation of financial statements for external purposes in accordance with accounting principles generally accepted in the United States.
The internal control over financial reporting for the Trust and each Series includes those policies and procedures that (i) pertain to the maintenance of records that, in reasonable detail, accurately and fairly reflect the transactions and dispositions of assets; (ii) provide reasonable assurance that transactions are recorded as necessary to permit preparation of financial statements in accordance with accounting principles generally accepted in the United States, and that receipts and expenditures are being made only in accordance with authorizations of the management of the Managing Owner; and (iii) provide reasonable assurance regarding prevention or timely detection of unauthorized acquisition, use or disposition of assets that could have a material effect on the financial statements of the Trust or any Series.
Because of its inherent limitations, internal control over financial reporting may not prevent or detect misstatements on a timely basis. All internal control systems, no matter how well designed, have inherent limitations, including the possibility of human error and the circumvention of overriding controls. Accordingly, even effective internal control over financial reporting can provide only reasonable assurance with respect to financial statement preparation. Also, projections of any evaluation of effectiveness to future periods are subject to the risk that controls may become inadequate because of changes in conditions, or that the degree of compliance with the policies or procedures may deteriorate.
Management assessed the effectiveness of the internal control over financial reporting for the Trust and each Series as of December 31, 2022, based on the framework set forth by the Committee of Sponsoring Organizations of the Treadway Commission (COSO) in its 2013 report entitled Internal Control-Integrated Framework.
Based on that assessment, the Trust’s Chief Executive Officer and Chief Financial Officer concluded that the Trust maintained effective internal control over financial reporting as of December 31, 2022.
This annual report does not include an attestation report of the Trust’s independent registered public accounting firm regarding internal control over financial reporting. Management’s report was not subject to attestation by the Trust’s independent registered public accounting firm pursuant to the rules of the SEC that permit the Trust to provide only management’s report in this annual report.
Scope of Exhibit 31 Certifications
The certifications of the Chairman and Chief Financial Officer, and the President and Chief Executive Officer, of the Managing Owner as of December 31, 2022 and as of April 6, 2023 (the date of this filing) are included as Exhibits 31.1 and 31.2, respectively, to this Form 10-K, and apply not only to the Trust as a whole but also to each Series individually.
| Item 9B. | OTHER INFORMATION. |
None.
| Item 9C. | DISCLOSURE REGARDING FOREIGN JURISDICTIONS THAT PREVENT INSPECTIONS |
Not applicable.
Part III
| Item 10. | DIRECTORS, EXECUTIVE OFFICERS AND CORPORATE GOVERNANCE. |
The Trust has no directors or executive officers and also does not have any employees. Frontier Fund Management LLC serves as the Managing Owner. The Managing Owner was incorporated in Delaware in November 2016. The Managing Owner has delegated its commodity pool operator responsibilities to Wakefield Advisors LLC pursuant to the Commodity Pool Operator Delegation Agreement between the Managing Owner and Wakefield Advisors LLC, which has been registered with the CFTC as a commodity pool operator since January 7, 2013 and has been a member of the NFA since that date. Under the Commodity Pool Operator Delegation Agreement, Wakefield does not receive any fees or remuneration from the Managing Owner in connection with the performance of its obligations thereunder. The Commodity Pool Operator Delegation Agreement is effective until terminated by either the Managing Owner or Wakefield, or until Wakefield is no longer registered as a CPO (unless excluded or exempt from CPO registration under the CEA). The Managing Owner remains jointly and severally liable with Wakefield Advisors LLC for violations of the CEA and CPO Regulations. However, Wakefield Advisors LLC will indemnify the Managing Owner from and against any and all loss, liability, damage, penalty, fine, cost, and expense (including attorneys’, accountants’, experts’, and other professionals’ fees and expenses incurred in investigation or defense of any and all demands, claims, actions, suits, or arbitrations) actually and reasonably incurred by the Managing Owner, based upon, arising out of or from, or in any way in connection with, any act, activity, conduct, performance, omission, or non-performance by the Wakefield Advisors LLC of any of its functions as CPO or which violates the CEA or CPO Regulations in connection with its functions as CPO.
Principals of the Managing Owner and Wakefield
The current officers and directors of the Managing Owner and Wakefield are as follows:
Patrick J. Kane (Age 55)
Chairman and Director, Wakefield Advisors, LLC
Chairman and Chief Financial Officer, Frontier Fund Management LLC
Patrick Kane has served as Chairman of Wakefield since co-founding the firm in January 2012. The firm serves as Investment Advisor to the Wakefield family of mutual funds sponsored and launched on the Wakefield Alternative Series Trust platform which is registered under the Investment Company Act of 1940, as amended, and organized as a Delaware statutory trust. Prior to co-founding the adviser, Mr. Kane was the head of alternative investments at Oppenheimer Asset Management until June 2011, overseeing approximately $3 billion in hedge funds and private equity investments. Mr. Kane joined Oppenheimer in 2001 as a senior member of the fund of hedge funds team. Mr. Kane has worked in the alternative investments industry since 1989. Prior to joining Oppenheimer in 2001, Mr. Kane worked for Dunbar Capital Management, a boutique fund of funds manager. Mr. Kane previously worked for Brandywine Asset Management, an alternative investment firm in Thornton, PA. At Brandywine, he was the Director of Trading, responsible for all trading on the managed futures and statistical arbitrage market-neutral equity hedge funds. Before that, he worked for Tricon Investments, an energy focused hedge fund, based in Somerset, NJ. Mr. Kane is also a member of the investment subcommittee that serves the University of Scranton endowment. Mr. Kane holds a Bachelor of Science in Accounting from the University of Scranton.
Patrick F. Hart III (Age 64)
Chief Executive Officer, President and Director, Wakefield Advisors, LLC
Chief Executive Officer, Frontier Fund Management LLC
Patrick F. Hart III co-founded and is President and Chief Executive Officer of Wakefield where he has been registered as a principal and associated person since December 2012 and January 2013, respectively. He also serves as the firm’s Chief Compliance Officer. Mr. Hart has been involved in the alternative investment industry for over thirty years, having specialized in the design, implementation and management of structured hedge fund and managed futures products for private and institutional clients worldwide. Mr. Hart is also the Chief Executive Officer and President of Three Palms, LLC (est. June 2003). Further, he is founder, Chief Executive Officer and Managing Partner of Hart Financial Group, LLC, a registered commodity pool operator, where he has been registered as an associated person and listed as a principal since August 1998.
Previous affiliations of Mr. Hart include PyxisGFS, which he co-founded in October 2010. Pyxis provided administration, accounting and reporting services to alternative investment managers and funds. Northfield Trading, LP where he was listed as a principal and registered as an associated person of the trading advisor from March 2007 to December 2014. From June 2009 through October 2013 Mr. Hart was listed as a principal, and from July 2009 through October 2013 he was registered as an associated person, with the trading advisory firm Strategic Capital Management, LLC. At the same firm’s affiliated commodity pool operator, Strategic Fund Management, he was listed as a principal from July 2009 through May 2013 and registered as an associated person from August 2009 through May 2013. Mr. Hart was also listed as a principal of the commodity trading advisor, Seven Trust Global Advisors, LLC, from January 2007 to March 2011 and registered as an associated person from April 2007 through March 2011. At the same firm’s affiliated commodity pool operator, CTP Fund Management, LLC, he was listed as a principal from January 2008 to June 2011 and registered as an associated person from April 2008 through June 2011.
Mr. Hart served nine years on the Introducing Broker Advisory Committee of the National Futures Association, or NFA. Additionally, he has served periodically on the NFA Arbitration and Nominating Committees since 1988. Mr. Hart has been a frequent guest speaker at international conferences and symposiums on the topic of alternative investment strategies. Moreover, Mr. Hart has contributed to numerous articles in leading investment publications and is a contributing author to the “Handbook of Managed Futures—Performance, Evaluation and Analysis” (McGraw-Hill 1997). Mr. Hart received a B.S. in Economics from Colorado State University in 1983. Mr. Hart is registered with Foreside Fund Services, LLC which is not affiliated with Wakefield or its affiliates. He holds FINRA Series 7, 63, and the CFTC/NFA Series 3 registrations.
Michael B. Egan II (Age 55)
Executive Vice-President, Wakefield Advisors, LLC
Secretary, Frontier Fund Management LLC
Michael B. Egan II has served as Executive Vice President of Wakefield since its founding in 2012. Mr. Egan brings more than 30 years of alternative investment experience with a focus on commodity trading advisor research and multi-advisor portfolio construction. As a member of Wakefield’s portfolio management team, Mr. Egan is involved in day-to-day portfolio and risk management for all of Wakefield’s funds’ offerings as well as the development and structuring of new products. In addition, Mr. Egan has also served as Research Director of Three Palms, LLC since its founding in June 2003. He also serves as President of Hart Financial Group, LLC, a registered Commodity Pool Operator, where he has been registered as a principal since April 2015 and associated person since May 2006. Mr. Egan was also registered as an associated person of the Commodity Trading Advisor Seven Trust Global Advisors, LLC from July 2008 through March 2011. From January 1991 through April 2009, Mr. Egan was the Director of Research for Hart Asset Management Group, Inc. (formerly Hart-Bornhoft Group, Inc.), a registered Commodity Pool Operator and Commodity Trading Advisor and was listed as a principal from December 1998 through April 2009. Mr. Egan received a Bachelor of Science Degree in Finance from Colorado State University in 1990 and he is licensed with the NFA and CFTC and holds a Series 3 certification.
Executive Committee of the Managing Owner
Patrick Kane—Mr. Kane’s biography appears above under the caption “Item 10. Directors, Executive Officers and Corporate Governance—Principals of the Managing Owner.”
Patrick Hart—Mr. Hart’s biography appears above under the caption “Item 10. Directors, Executive Officers and Corporate Governance—Principals of the Managing Owner.”
Michael Egan—Mr. Egan’s biography appears above under the caption “Item 10. Directors, Executive Officers and Corporate Governance—Principals of the Managing Owner.”
Section 16(a) Beneficial Ownership Reporting Compliance
Section 16 of the Exchange Act requires an issuer’s directors and certain executive officers and certain other beneficial owners of the issuer’s equity securities to periodically file notices of changes in their beneficial ownership with the SEC. The Trust does not have any directors or officers. However, the officers of the Managing Owner, as well as the Managing Owner itself, file such notices regarding their beneficial ownership in the Trust, if any.
Audit Committee Financial Expert
The Trust does not have a board of directors but instead is operated and managed by the Managing Owner. The Executive Committee of the Managing Owner has created an audit committee of the Trust consisting of all of the Executive Committee’s members. The Executive Committee of the Managing Owner, in its capacity as the audit committee for the Trust, has determined that Patrick J. Kane, the Chairman of the Managing Owner, qualifies as an “audit committee financial expert” in accordance with the applicable rules and regulations of the SEC. Mr. Kane is not independent of management.
Code of Ethics
The Trust has not adopted a code of ethics because it does not have any officers or employees. The Managing Owner has adopted a code of ethics for employees and principals of the Managing Owner.
In general, the Managing Owner, its principals, and all other persons associated with the Managing Owner shall observe high standards of commercial honor and just and equitable principles of trade in the conduct of their commodity futures business. All employees including anyone not on the regular payroll but filling in on a temporary basis shall be held to the highest standards of honesty and integrity. This conduct will be valid for all duties involved with the daily management and responsibilities as Managing Owner of the Trust.
Employees will conduct their daily duties in a responsible manner to ensure that all customers are treated fairly and equally. The reputation of the Managing Owner is crucial to its business and understanding that the Managing Owner will make every effort to ensure the reputation of the Managing Owner is not tarnished in any way. Employees are urged to seek the advice of their supervisor for any questions applicable to this code relative to their individual circumstances.
| Item 11. | EXECUTIVE COMPENSATION. |
The Trust has no directors or officers. Its affairs are managed solely by the Managing Owner, which receives compensation for its services from the Trust, as follows:
Management Fees
Each Series of Units pays to the Managing Owner a monthly management fee equal to a percentage of the notional assets of such Series allocated to Trading Companies, calculated on a daily basis. The percentage basis of the fees varies and are in line with the amounts being disclosed below. In addition, the Managing Owner receives a monthly management equal to a certain percentage of the assets in the Galaxy Plus entities attributable to such Series’ (including notional assets), calculated on a monthly basis. The management fees attributable to Galaxy Plus entities are included in unrealized gain/(loss) on private investment companies on the Consolidated Statements of Operations. The total amount of assets of a Series allocated to Trading Advisors and/or reference programs, including (i) actual funds deposited in accounts directed by the Trading Advisors or deposited as margin in respect of swaps or other derivative instruments referencing a reference program plus (ii) any notional equity allocated to the Trading Advisors and any reference programs, is referred to herein as the “notional assets” of the Series. The annual rate of the management fee is: 0.5% for the Frontier Balanced Fund Class 1 and Class 2, 0.5% for the Frontier Balanced Fund Class 1AP, Class 2a and Class 3a, 2.0% for the Frontier Global Fund, Frontier Long/Short Commodity Fund Class 1a, Class 2a and Class 3a and Frontier Masters Fund, 0.75% for Frontier Diversified Fund, 2.5% for the Frontier Heritage Fund and Frontier Select Fund, and 3.5% for the Frontier Long/Short Commodity Fund Class 2 and Class 3. The Managing Owner may pay all or a portion of such management fees to the Trading Advisor(s) and/or waive (up to the percentage specified) any such management fee to the extent any related management fee is paid by a trading company or estimated management fee is embedded in a swap or other derivative instrument. Any management fee embedded in a swap or other derivative instrument may be greater or less than the management fee that would otherwise be charged to the Series by the Managing Owner. During the periods covered by this report, no Series was invested in a swap.
The management fee as a percentage of the applicable Series’ notional assets will be greater than the percentage of the applicable Series’ net asset value to the extent that the notional assets of the Series exceeds its net asset value. The Managing Owner expects that the notional assets of each Series will generally be maintained at a level in excess of the net asset value of such Series and such excess may be substantial to the extent the Managing Owner deems necessary to achieve the desired level of volatility.
Trading Fees
In connection with each Series’ trading activities the Frontier Balanced Fund, Frontier Select Fund, Frontier Global Fund and Frontier Heritage Fund pays to the Managing Owner an FCM Fee of up to 2.25% per annum of notional assets allocated to the trading advisors, including through investments in commodity pools available on the Galaxy Plus Platform, and any reference programs of the applicable Series. The Frontier Diversified Fund, Frontier Long/Short Commodity Fund and Frontier Masters Fund pays to the Managing Owner an FCM Fee of up to 2.25% of notional assets allocated to the trading advisors, including through investments in commodity pools available on the Galaxy Plus Platform, and a custodial/due diligence fee of 0.12% of such Series’ NAV, calculated daily.
Incentive Fees
Some Series pay to the Managing Owner an incentive fee of a certain percentage of new net trading profits generated in the Trading Companies by such Series, monthly or quarterly. In addition, the Managing Owner receives a quarterly incentive fee of a certain percentage of new net trading profits generated in the Galaxy Plus entities that have been allocated to the Series. The incentive fees attributable to Galaxy Plus entities are included in unrealized gain/(loss) on private investment companies on the Consolidated Statements of Operations. Because the Frontier Balanced Fund, Frontier Diversified Fund, Frontier Masters Fund, Frontier Heritage Fund, Frontier Select Fund, and Frontier Long/Short Commodity Fund may each employ multiple Trading Advisors, these Series will pay the Managing Owner a monthly incentive fee calculated on a Trading Advisor by Trading Advisor basis. It is therefore possible that in any given period the Series may pay incentive fees to the Managing Owner for one or more Trading Advisors while each of these Series as a whole experiences losses. The incentive fee is 25% for the Frontier Balanced Fund and the Frontier Diversified Fund and 20% for the Frontier Global Fund, Frontier Heritage Fund, Frontier Select Fund, Frontier Long/Short Commodity Fund and Frontier Masters Fund. The Managing Owner may pay all or a portion of such incentive fees to the Trading Advisor(s) for such Series.
Interest Income
Aggregate interest income from all sources, including U.S. Treasury Securities assets net of premiums and cash held at clearing brokers, of up to the first 2% (annualized) of average net assets less any fair market value related to swaps is paid to the Managing Owner by the Frontier Balanced Fund (Class 1 and Class 2), Frontier Long/Short Commodity Fund (Class 2 and Class 3), Frontier Global Fund, Frontier Select Fund, and Frontier Heritage Fund. For the Frontier Diversified Fund, Frontier Long/Short Commodity Fund (Class 1a, Class 2a and Class 3a), Frontier Masters Fund and Frontier Balanced Fund (Class 1AP, Class 2a and Class 3a), thereafter 100% of the interest is retained by the respective Series.
Other Fees
In addition, with respect to Class 1 and Class 1a Units of each Series of the Trust, as applicable, the Series pays monthly or quarterly to the Managing Owner a service fee of up to 3% and 2% annually, for the closed Series and open Series, respectively, which the Managing Owner pays to selling agents of the Trust.
| Item 12. | SECURITY OWNERSHIP OF CERTAIN BENEFICIAL OWNERS AND MANAGEMENT AND RELATED STOCKHOLDER MATTERS. |
The Trust has no officers or directors. Its affairs are managed solely by the Managing Owner. Set forth in the table below is information regarding the beneficial ownership of Units of the principals of the Managing Owner as of December 31, 2022:
| | | Units
Owned | | | Percentage
Ownership of
Each Class | |
| Frontier Balanced Fund - Class 2 | | | 310 | | | | 3.32 | % |
| Frontier Balanced Fund - Class 2A | | | 290 | | | | 100.00 | % |
| Frontier Heritage Fund - Class 2 | | | 117 | | | | 12.81 | % |
| Frontier Long/Short Commodity Fund - Class 2 | | | 28 | | | | 10.67 | % |
| Frontier Select Fund - Class 2 | | | 125 | | | | 20.23 | % |
| Frontier Global Fund - Class 2 | | | 97 | | | | 20.72 | % |
| Frontier Diversified Fund - Class 2 | | | 88 | | | | 2.12 | % |
| Frontier Diversified Fund - Class 3 | | | 225 | | | | 0.83 | % |
| Frontier Long/Short Commodity Fund - Class 2A | | | 130 | | | | 10.37 | % |
| Frontier Long/Short Commodity Fund - Class 3A | | | 18 | | | | 0.56 | % |
| Frontier Masters Fund - Class 2 | | | 54 | | | | 2.80 | % |
| Frontier Masters Fund - Class 3 | | | 25 | | | | 0.43 | % |
| * | The Managing Owner is required to maintain at least a 1% interest in the aggregate capital as well as in certain series, profits and losses of the Trust. The Managing Owner’s interest of $221,670 in the aggregate capital of the Trust of $21,666,259 at December 31, 2022 is 1.02%. |
| Item 13. | CERTAIN RELATIONSHIPS AND RELATED TRANSACTIONS. |
The Trust has and will continue to have certain relationships with the Managing Owner and its affiliates. However, there have been no direct financial transactions between the Trust and the directors or officers of the Managing Owner. See “Item 11. Executive Compensation” and “Item 12. Security Ownership of Certain Beneficial Owners and Management.”
| Item 14. | PRINCIPAL ACCOUNTANT FEES AND SERVICES. |
The following table sets forth the fees billed to Frontier Fund Management LLC, the Managing Owner of the Trust, for professional services provided by Spicer Jeffries LLP, the Trust’s independent registered public accounting firm, for the years ended December 31, 2022 and 2021. In accordance with the prospectus of the Trust, the Managing Owner has agreed to pay all costs of the Trust, and the Trust therefore bears no direct obligation to its independent registered public accounting firm.
| FEE CATEGORY | | 2022 | | | 2021 | |
| Audit Fees(1) | | $ | 105,000 | | | $ | 105,000 | |
| Audit-Related Fees(2) | | $ | - | | | $ | - | |
| Tax Fees(3) | | $ | 15,000 | | | $ | 15,000 | |
| All Other Fees(4) | | $ | - | | | $ | - | |
| TOTAL FEES | | $ | 120,000 | | | $ | 120,000 | |
| (1 ) | Audit Fees consist of fees for professional services rendered for the audit of the Trust’s financial statements and review of financial statements included in the Trust’s quarterly reports, as well as services normally provided by the independent accountant in connection with statutory and regulatory filings or engagements. |
| (2) | Audit-Related Fees consist of fees for assurance and related services by Spicer Jeffries LLP that are reasonably related to the performance of the audit or review of the Trust’s financial statements and are not reported under “Audit Fees,” above. |
| (3) | Tax Fees consist of fees for professional services rendered for tax compliance, tax advice and tax planning. |
| (4) | All Other Fees consist of any fees not otherwise reported in this table |
The Managing Owner approved all the services provided by Spicer Jeffries LLP to the Trust described above. The Managing Owner has determined that the payments made to Spicer Jeffries LLP for these services during 2022 and 2021 are compatible with maintaining that firm’s independence. The Managing Owner pre-approves all audit and allowed non-audit services of the Trust’s independent registered public accounting firm, including all engagement fees and terms.
Part IV
| Item 15. | EXHIBITS AND FINANCIAL STATEMENT SCHEDULES. |
| (a)(1) and (2) | | The response to these portions of Item 15 is submitted as a separate section of this report commencing on page F-1. |
| | | |
| (a)(3) | | Exhibits (numbered in accordance with Item 601 of Regulation S-K). |
| | | |
| 1.1 | | Form of selling agent Agreement among the Registrant, Frontier Fund Management, LLC and the selling agents**** |
| | | |
| 1.2 | | Form of Amendment Agreement among the Registrant, Frontier Fund Management, LLC and the selling agents** |
| | | |
| 1.3 | | Form of Amendment Agreement among the Registrant, Frontier Fund Management, LLC and the selling agents*** |
| | | |
| 1.4 | | Form of Amendment Agreement among the Registrant, Frontier Fund Management, LLC and the selling agents*** |
| | | |
| 1.5 | | Form of Amendment Agreement among the Registrant, Frontier Fund Management, LLC and the selling agents**** |
| | | |
| 1.6 | | Form of Amendment Agreement among the Registrant, Frontier Fund Management, LLC and the selling agents**** |
| | | |
| 4.1 | | Restated Declaration of Trust and Second Amended and Restated Trust and Trust Agreement of the Registrant +++ |
| | | |
| 4.11 | | First Amendment to Second Amended and Restated Trust and Trust Agreement of the Registrant++++ |
| | | |
| 4.2 | | Form of Subscription Agreement (annexed to the Prospectus as Exhibit B)**** |
| | | |
| 4.3 | | Form of Exchange Request (annexed to the Prospectus as Exhibit C)**** |
| | | |
| 4.4 | | Form of Request for Redemption (annexed to the Prospectus as Exhibit D)**** |
| | | |
| 4.5 | | Form of Request for Additional Subscription (annexed to the Prospectus as Exhibit E)**** |
| | | |
| 4.6 | | Form of Application for Transfer of Ownership / Re-registration Form (annexed to the Prospectus as Exhibit F)**** |
| | | |
| 4.7 | | Form of Privacy Notice (annexed to the Prospectus as Exhibit G)**** |
| | | |
| 4.8 | | Description of Registrant’s Securities #### |
| | | |
| 10.21 | | Form of Brokerage Agreement between each Trading Company and Banc of America Futures Incorporated* |
| | | |
| 10.22 | | Form of Brokerage Agreement between the Managing Owner, acting as agent on behalf of certain Trading Companies, and Deutsche Bank AG London** |
| | | |
| 10.23 | | Form of Brokerage Agreement between each Trading Company and Man Financial Inc. *** |
| | | |
| 10.24 | | Form of Amendment Agreement between the Managing Owner, acting as agent on behalf of certain Trading Companies, and Deutsche Bank AG London*** |
| | | |
| 10.3 | | Form of Advisory Agreement among the Registrant, the Trading Company, Frontier Fund Management LLC, and each Trading Advisor**** |
| | | |
| 10.32 | | Form of License Agreement among Jefferies Financial Products, LLC, Reuters America LLC, the Registrant and Frontier Fund Management LLC*** |
| | | |
| 10.33 | | Form of License Agreement among Jefferies Financial Products, the Registrant and Frontier Fund Management LLC*** |
| | | |
| 10.34 | | Form of Guaranty made by Jefferies Group, Inc. in favor of Frontier Trading Company VIII, LLC*** |
| | | |
| 10.35 | | Form of International Swaps and Derivatives Association Master Agreement, including all Schedules thereto and the Credit Support Annex thereto entered into for the Currency Series of the Registrant*** |
| | | |
| 10.37 | | Form of International Swaps and Derivatives Association Master Agreement, including all Schedules thereto and the Credit Support Annex thereto entered into for the Frontier Balanced Fund of the Registrant+ |
| | | |
| 10.4 | | Form of Cash Management Agreement between Frontier Fund Management LLC and Merrill Lynch** |
| 10.41 | | Form of Cash Management Agreement between Frontier Fund Management LLC and STW Fixed Income Management Ltd.*** |
| | | |
| 10.5 | | Form of single-member limited liability company operating agreement governing each Trading Company*** |
| | | |
| 10.6 | | Form of Platform Agreement among Galaxy Plus Fund LLC, Gemini Alternative Funds, LLC and the Trust# |
| | | |
| 10.7 | | Form of Fund Services Agreement between the Trust and Gemini Fund Services, LLC## |
| | | |
| 10.8 | | Form of Administrative Services Agreement between Gemini Hedge Fund Services, LLC and the Managing Owner### |
| | | |
| 21.1 | | Subsidiaries of Registrant. (filed herewith) |
| | | |
| 31.1 | | Certification of Principal Executive Officer of the Managing Owner pursuant to Rules 13a-14(a) and 15d-14(a) of the Securities Exchange Act of 1934. (filed herewith) |
| | | |
| 31.2 | | Certification of Principal Financial Officer of the Managing Owner pursuant to Rules 13a-14(a) and 15d-14(a) of the Securities Exchange Act of 1934. (filed herewith) |
| | | |
| 32.1 | | Certification pursuant to 18 U.S.C. Section 1350, as enacted by Section 906 of The Sarbanes-Oxley Act of 2002. (furnished herewith) |
| | | |
| 32.2 | | Certification pursuant to 18 U.S.C. Section 1350, as enacted by Section 906 of The Sarbanes-Oxley Act of 2002. (furnished herewith) |
| | | |
| 32.3 | | Certification pursuant to 18 U.S.C. Section 1350, as enacted by Section 906 of The Sarbanes-Oxley Act of 2002. (furnished herewith) |
| | | |
| 32.4 | | Certification pursuant to 18 U.S.C. Section 1350, as enacted by Section 906 of The Sarbanes-Oxley Act of 2002. (furnished herewith) |
| | | |
| 32.5 | | Certification pursuant to 18 U.S.C. Section 1350, as enacted by Section 906 of The Sarbanes-Oxley Act of 2002. (furnished herewith) |
| | | |
| 32.6 | | Certification pursuant to 18 U.S.C. Section 1350, as enacted by Section 906 of The Sarbanes-Oxley Act of 2002. (furnished herewith) |
| | | |
| 32.7 | | Certification pursuant to 18 U.S.C. Section 1350, as enacted by Section 906 of The Sarbanes-Oxley Act of 2002. (furnished herewith) |
| | | |
| 32.8 | | Certification pursuant to 18 U.S.C. Section 1350, as enacted by Section 906 of The Sarbanes-Oxley Act of 2002. (furnished herewith) |
| | | |
| 99.1 | | Prospectus of Frontier Funds ++ |
| | | |
| 101.INS^ | | XBRL Instance Document |
| | | |
| 101.SCH^ | | XBRL Taxonomy Extension Schema |
| | | |
| 101.CAL^ | | XBRL Taxonomy Extension Calculation Linkbase |
| | | |
| 101.DEF^ | | XBRL Taxonomy Extension Definition Linkbase |
| | | |
| 101.LAB^ | | XBRL Taxonomy Extension Label Linkbase |
| | | |
| 101.PRE^ | | XBRL Taxonomy Extension Presentation Linkbase |
| | | |
| 104 | | Cover Page Interactive Data File (formatted as Inline XBRL and contained in Exhibit 101). |
| * | Previously filed as like-numbered exhibit to the initial filing or the first, second, third or fourth pre-effective amendment or the first or second post-effective amendment to Registration Statement No. 333-108397 and incorporated by reference herein. |
| ** | Previously filed as like-numbered exhibit to the initial filing or the first pre-effective amendment or the first or second post-effective amendment to Registration Statement No. 333-119596 and incorporated by reference herein. |
| | |
| *** | Previously filed as like-numbered exhibit to the initial filing or the first pre-effective amendment or the first post-effective amendment to Registration Statement No. 333-129701 and incorporated by reference herein. |
| | |
| **** | Previously filed as like-numbered exhibit to the initial filing or the first pre-effective amendment or the first post-effective amendment to Registration Statement No. 333-140240 and incorporated by reference herein. |
| | |
| + | Previously filed as like-numbered exhibit on Form 10-Q for the period ended June 30, 2008. |
| | |
| ++ | Previously filed on February 11, 2019 pursuant to Rule 424(b)(3) of the Securities Act (File No. 333-210313). |
| | |
| +++ | Previously filed as Exhibit 3.2 on Form 8-K, filed on December 11, 2013. |
| | |
| ++++ | Previously filed as Exhibit 4.1 on Form 8-K, filed on March 10, 2017. |
| | |
| # | Previously filed as Exhibit 10.1 on Form 8-K, filed on October 19, 2016. |
| | |
| ## | Previously filed as Exhibit 10.2 on Form 8-K, filed on October 19, 2016. |
| | |
| ### | Previously filed as Exhibit 10.3 on Form 8-K, filed on October 19, 2016. |
| | |
| #### | Previously filed as Exhibit 4.8 on Form 10-K for the period ended December 31, 2019, filed on March 30, 2020. |
| | |
| ^ | Submitted electronically herewith. |
INDEX TO THE SERIES FINANCIAL STATEMENTS
INDEX TO THE TRUST FINANCIAL STATEMENTS (1)
INDEX TO TRADING COMPANY FINANCIAL STATEMENTS (2)
INDEX TO GALAXY PLUS FUND FINANCIAL STATEMENTS (3)
| (1) | These financial statements represent the combined consolidated financial statements of the Series of the Trust. |
| (2) | The Trust holds a majority of the equity interests in the various Trading Companies, which are the trading vehicles established for the various Series of Units of the Trust. In the combined consolidated financial statements of the Trust, Trading Companies in which a Series has a majority equity interest are consolidated by such Series, and investments in Trading Companies in which a Series does not have a controlling or majority interest are accounted for under the equity method of accounting, which approximates fair value and are carried in the consolidated statement of financial condition of such Series at fair value. In addition, financial statements of each of the unconsolidated Trading Companies are included in accordance with Rule 3-09 of Regulation S-X under the Securities Act of 1933, as amended. Inclusion of these financial statements may or may not be required pursuant to Rule 3-09 of Regulation S-X under the Securities Act of 1933, financial statements of each Trading Company consolidated by a Series of the Trust are also included in the interest of providing a more complete presentation. |
| (3) | Financial statements of each of the Galaxy Plus entities are included in accordance with Rule 3-09 of Regulation S-X under the Securities Act of 1933, as amended. Inclusion of these financial statements may or may not be required pursuant to Rule 3-09 of Regulation S-X under the Securities Act of 1933, financial statements of the Galaxy Plus entities are also included in the interest of providing a more complete presentation. |
REPORT OF INDEPENDENT REGISTERED PUBLIC ACCOUNTING FIRM
To the Unitholders and the Executive Committee of Frontier Funds
Opinions on the Financial Statements
We have audited the accompanying consolidated statements of financial condition of Frontier Diversified Fund, Frontier Long/Short Commodity Fund, Frontier Masters Fund, Frontier Balanced Fund, Frontier Select Fund, Frontier Global Fund, and Frontier Heritage Fund (collectively the “Series”) as of December 31, 2022 and 2021, including the consolidated schedules of investments, as of December 31, 2022 and 2021, and the related consolidated statements of operations, changes in owners’ capital and cash flows for the years ended December 31, 2021, 2020 and 2020, and the related notes (collectively referred to as the “financial statements”). In our opinion, the financial statements referred to above present fairly, in all material respects, the financial position of the Series as of December 31, 2022 and 2021, and the results of its operations and its cash flows for the years ended December 31, 2022, 2021 and 2020, in conformity with accounting principles generally accepted in the United States of America.
Basis for Opinion
These financial statements are the responsibility of the Series’ management. Our responsibility is to express an opinion on the Series’ financial statements based on our audits. We are a public accounting firm registered with the Public Company Accounting Oversight Board (United States) (PCAOB) and are required to be independent with respect to the Series in accordance with the U.S. federal securities laws and the applicable rules and regulations of the Securities and Exchange Commission and the PCAOB.
We conducted our audits in accordance with the standards of the PCAOB. Those standards require that we plan and perform the audits to obtain reasonable assurance about whether the financial statements are free of material misstatement, whether due to error or fraud. The Series is not required to have, nor were we engaged to perform, an audit of its internal control over financial reporting. As part of our audits, we are required to obtain an understanding of internal control over financial reporting, but not for the purpose of expressing an opinion on the effectiveness of the Series’ internal control over financial reporting. Accordingly, we express no such opinion.
Our audits of the financial statements included performing procedures to assess the risks of material misstatement of the financial statements, whether due to error or fraud, and performing procedures that respond to those risks. Such procedures included examining, on a test basis, evidence regarding the amounts and disclosures in the financial statements. Our audits also included evaluating the accounting principles used and significant estimates made by management, as well as evaluating the overall presentation of the financial statements. We believe that our audits provide a reasonable basis for our opinion.
Critical Audit Matters
Critical audit matters are matters arising from the current period audit of the financial statements that were communicated or required to be communicated to the audit committee and that: (1) relate to accounts or disclosures that are material to the financial statements and (2) involved our especially challenging, subjective, or complex judgments. We determined that there are no critical audit matters.
/s/ Spicer Jeffries LLP
We have served as auditor of the Frontier Funds Trust since 2019.
Denver, Colorado
April 3, 2023
The Series of Frontier Funds
Consolidated Statements of Financial Condition
December 31, 2022 and December 31, 2021
| | | Frontier | | | Frontier | | | Frontier | |
| | | Diversified
Fund | | | Masters
Fund | | | Long/Short
Commodity Fund | |
| | | 12/31/2022 | | | 12/31/2021 | | | 12/31/2022 | | | 12/31/2021 | | | 12/31/2022 | | | 12/31/2021 | |
| ASSETS | | | | | | | | | | | | | | | | | | |
| Cash and cash equivalents | | $ | 46,604 | | | $ | 165,491 | | | $ | 18,560 | | | $ | 76,703 | | | $ | 38,703 | | | $ | 40,528 | |
| U.S. Treasury securities, at fair value | | | 42,198 | | | | 33,274 | | | | 16,805 | | | | 15,422 | | | | 35,044 | | | | 8,148 | |
| Investments in private investment companies, at fair value | | | 2,779,566 | | | | 2,838,658 | | | | 705,739 | | | | 638,376 | | | | 1,281,982 | | | | 1,209,022 | |
| Investments in unconsolidated trading companies, at fair value | | | 28,671 | | | | 30,788 | | | | 11,418 | | | | 14,270 | | | | 23,810 | | | | 7,541 | |
| Interest receivable | | | 1,051 | | | | 717 | | | | 419 | | | | 332 | | | | 873 | | | | 176 | |
| | | | | | | | | | | | | | | | | | | | | | | | | |
| Total Assets | | $ | 2,898,090 | | | $ | 3,068,928 | | | $ | 752,941 | | | $ | 745,103 | | | $ | 1,380,412 | | | $ | 1,265,415 | |
| | | | | | | | | | | | | | | | | | | | | | | | | |
| LIABILITIES & CAPITAL | | | | | | | | | | | | | | | | | | | | | | | | |
| | | | | | | | | | | | | | | | | | | | | | | | | |
| LIABILITIES | | | | | | | | | | | | | | | | | | | | | | | | |
| Interest payable to Managing Owner | | $ | - | | | $ | - | | | $ | - | | | $ | - | | | $ | 53 | | | $ | 32 | |
| Redemptions payable | | | - | | | | - | | | | 19,922 | | | | - | | | | 12,788 | | | | 20,299 | |
| Service fees payable to Managing Owner | | | 85 | | | | 83 | | | | 43 | | | | 43 | | | | 21 | | | | 19 | |
| Trading fees payable to Managing Owner | | | 9,653 | | | | 9,217 | | | | 4,443 | | | | 3,882 | | | | 3,447 | | | | 3,407 | |
| Subscriptions in advance for service fee rebates | | | 22,650 | | | | 22,650 | | | | 31,725 | | | | 31,725 | | | | 393 | | | | 393 | |
| Other liabilities | | | 1,730 | | | | 3,838 | | | | 688 | | | | 1,779 | | | | 1,437 | | | | 941 | |
| | | | | | | | | | | | | | | | | | | | | | | | | |
| Total Liabilities | | | 34,118 | | | | 35,788 | | | | 56,821 | | | | 37,429 | | | | 18,139 | | | | 25,091 | |
| | | | | | | | | | | | | | | | | | | | | | | | | |
| CAPITAL | | | | | | | | | | | | | | | | | | | | | | | | |
| Managing Owner - Class 2 | | | 8,523 | | | | 7,870 | | | | 5,100 | | | | 3,781 | | | | 3,065 | | | | 4,121 | |
| Managing Owner - Class 2a | | | - | | | | - | | | | - | | | | - | | | | 9,328 | | | | 7,619 | |
| Managing Owner - Class 3 | | | 20,433 | | | | 22,677 | | | | 2,214 | | | | 3,933 | | | | - | | | | - | |
| Managing Owner - Class 3a | | | - | | | | - | | | | - | | | | - | | | | 1,369 | | | | 1,116 | |
| Limited Owner - Class 2 | | | 392,656 | | | | 373,647 | | | | 177,102 | | | | 194,618 | | | | 25,648 | | | | 21,045 | |
| Limited Owner - Class 2a | | | - | | | | - | | | | - | | | | - | | | | 80,689 | | | | 76,239 | |
| Limited Owner - Class 3 | | | 2,442,360 | | | | 2,628,946 | | | | 511,704 | | | | 505,342 | | | | 998,095 | | | | 923,058 | |
| Limited Owner - Class 3a | | | - | | | | - | | | | - | | | | - | | | | 244,079 | | | | 207,126 | |
| | | | | | | | | | | | | | | | | | | | | | | | | |
| Total Owners’ Capital | | | 2,863,972 | | | | 3,033,140 | | | | 696,120 | | | | 707,674 | | | | 1,362,273 | | | | 1,240,324 | |
| | | | | | | | | | | | | | | | | | | | | | | | | |
| Non-Controlling Interests | | | - | | | | - | | | | - | | | | - | | | | - | | | | - | |
| | | | | | | | | | | | | | | | | | | | | | | | | |
| Total Capital | | | 2,863,972 | | | | 3,033,140 | | | | 696,120 | | | | 707,674 | | | | 1,362,273 | | | | 1,240,324 | |
| | | | | | | | | | | | | | | | | | | | | | | | | |
| Total Liabilities and Capital | | $ | 2,898,090 | | | $ | 3,068,928 | | | $ | 752,941 | | | $ | 745,103 | | | $ | 1,380,412 | | | $ | 1,265,415 | |
| | | | | | | | | | | | | | | | | | | | | | | | | |
| Units Outstanding | | | | | | | | | | | | | | | | | | | | | | | | |
| Class 2 | | | 4,163 | | | | 4,288 | | | | 1,925 | | | | 2,828 | | | | 262 | | | | 280 | |
| Class 2a | | | N/A | | | | N/A | | | | N/A | | | | N/A | | | | 1,251 | | | | 1,428 | |
| Class 3 | | | 27,146 | | | | 31,733 | | | | 5,745 | | | | 7,699 | | | | 8,677 | | | | 9,780 | |
| Class 3a | | | N/A | | | | N/A | | | | N/A | | | | N/A | | | | 3,217 | | | | 3,351 | |
| | | | | | | | | | | | | | | | | | | | | | | | | |
| Net Asset Value per Unit | | | | | | | | | | | | | | | | | | | | | | | | |
| Class 2 | | $ | 96.37 | | | $ | 88.98 | | | $ | 94.64 | | | $ | 70.17 | | | $ | 109.65 | | | $ | 89.97 | |
| Class 2a | | | N/A | | | | N/A | | | | N/A | | | | N/A | | | $ | 71.93 | | | $ | 58.75 | |
| Class 3 | | $ | 90.72 | | | $ | 83.56 | | | $ | 89.45 | | | $ | 66.15 | | | $ | 115.03 | | | $ | 94.38 | |
| Class 3a | | | N/A | | | | N/A | | | | N/A | | | | N/A | | | $ | 76.29 | | | $ | 62.16 | |
The accompanying notes are an integral part of these consolidated financial statements.
The Series of Frontier Funds
Consolidated Statements of Financial Condition
December 31, 2022 and December 31, 2021
| | | Frontier
Balanced Fund | | | Frontier
Select Fund | |
| | | 12/31/2022 | | | 12/31/2021 | | | 12/31/2022 | | | 12/31/2021 | |
| ASSETS | | | | | | | | | | | | |
| Cash and cash equivalents | | $ | 221,344 | | | $ | 188,010 | | | $ | 33,183 | | | $ | 51,140 | |
| U.S. Treasury securities, at fair value | | | 200,417 | | | | 37,801 | | | | 30,046 | | | | 10,282 | |
| Open trade equity, at fair value | | | 1,670 | | | | 14,836 | | | | - | | | | - | |
| Receivable from futures commission merchants | | | 320,241 | | | | 818,362 | | | | - | | | | - | |
| Investments in private investment companies, at fair value | | | 8,944,014 | | | | 8,928,481 | | | | 1,449,919 | | | | 1,374,376 | |
| Investments in unconsolidated trading companies, at fair value | | | 136,169 | | | | 34,977 | | | | 20,414 | | | | 9,514 | |
| Interest receivable | | | 4,991 | | | | 815 | | | | 748 | | | | 222 | |
| | | | | | | | | | | | | | | | | |
| Total Assets | | $ | 9,828,846 | | | $ | 10,023,282 | | | $ | 1,534,310 | | | $ | 1,445,534 | |
| | | | | | | | | | | | | | | | | |
| LIABILITIES & CAPITAL | | | | | | | | | | | | | | | | |
| | | | | | | | | | | | | | | | | |
| LIABILITIES | | | | | | | | | | | | | | | | |
| Redemptions payable | | $ | 35,051 | | | $ | 20,382 | | | $ | - | | | $ | - | |
| Incentive fees payable to Managing Owner | | | 692 | | | | 54,702 | | | | - | | | | - | |
| Management fees payable to Managing Owner | | | 1,573 | | | | 1,431 | | | | - | | | | - | |
| Interest payable to Managing Owner | | | 2,306 | | | | 957 | | | | 342 | | | | 196 | |
| Service fees payable to Managing Owner | | | 16,784 | | | | 18,314 | | | | 3,630 | | | | 3,524 | |
| Trading fees payable to Managing Owner | | | 36,946 | | | | 32,970 | | | | 4,454 | | | | 3,682 | |
| Risk analysis fees payable | | | 10,442 | | | | 10,380 | | | | - | | | | - | |
| Subscriptions in advance for service fee rebates | | | 391,457 | | | | 369,341 | | | | 22,046 | | | | 21,076 | |
| Other liabilities | | | 6,867 | | | | 5,772 | | | | 1,232 | | | | 1,186 | |
| | | | | | | | | | | | | | | | | |
| Total Liabilities | | | 502,118 | | | | 514,249 | | | | 31,704 | | | | 29,664 | |
| | | | | | | | | | | | | | | | | |
| CAPITAL | | | | | | | | | | | | | | | | |
| Managing Owner - Class 2 | | | 53,242 | | | | 43,148 | | | | 15,168 | | | | 14,981 | |
| Managing Owner - Class 2a | | | 43,282 | | | | 56,328 | | | | - | | | | - | |
| Limited Owner - Class 1 | | | 7,134,145 | | | | 7,471,841 | | | | 1,417,113 | | | | 1,334,518 | |
| Limited Owner - Class 1AP | | | 74,869 | | | | 66,027 | | | | 10,554 | | | | 10,259 | |
| Limited Owner - Class 2 | | | 1,549,544 | | | | 1,489,930 | | | | 59,771 | | | | 56,112 | |
| Limited Owner - Class 3a | | | 471,646 | | | | 381,759 | | | | - | | | | - | |
| | | | | | | | | | | | | | | | | |
| Total Owners’ Capital | | | 9,326,728 | | | | 9,509,033 | | | | 1,502,606 | | | | 1,415,870 | |
| | | | | | | | | | | | | | | | | |
| Non-Controlling Interests | | | - | | | | - | | | | - | | | | - | |
| | | | | | | | | | | | | | | | | |
| Total Capital | | | 9,326,728 | | | | 9,509,033 | | | | 1,502,606 | | | | 1,415,870 | |
| | | | | | | | | | | | | | | | | |
| Total Liabilities and Capital | | $ | 9,828,846 | | | $ | 10,023,282 | | | $ | 1,534,310 | | | $ | 1,445,534 | |
| | | | | | | | | | | | | | | | | |
| Units Outstanding | | | | | | | | | | | | | | | | |
| Class 1 | | | 71,936 | | | | 90,219 | | | | 19,894 | | | | 21,051 | |
| Class 1AP | | | 587 | | | | 639 | | | | 115 | | | | 129 | |
| Class 2 | | | 9,318 | | | | 10,998 | | | | 616 | | | | 677 | |
| Class 2a | | | 290 | | | | 466 | | | | N/A | | | | N/A | |
| Class 3a | | | 3,166 | | | | 3,166 | | | | N/A | | | | N/A | |
| | | | | | | | | | | | | | | | | |
| Net Asset Value per Unit | | | | | | | | | | | | | | | | |
| Class 1 | | $ | 99.17 | | | $ | 82.82 | | | $ | 71.23 | | | $ | 63.39 | |
| Class 1AP | | $ | 127.56 | | | $ | 103.38 | | | $ | 91.71 | | | $ | 79.21 | |
| Class 2 | | $ | 172.01 | | | $ | 139.40 | | | $ | 121.70 | | | $ | 105.10 | |
| Class 2a | | $ | 149.47 | | | $ | 120.98 | | | | N/A | | | | N/A | |
| Class 3a | | $ | 148.96 | | | $ | 120.57 | | | | N/A | | | | N/A | |
The accompanying notes are an integral part of these consolidated financial statements.
The Series of Frontier Funds
Consolidated Statements of Financial Condition
December 31, 2022 and December 31, 2021
| | | Frontier
Global Fund | | | Frontier
Heritage Fund | |
| | | 12/31/2022 | | | 12/31/2021 | | | 12/31/2022 | | | 12/31/2021 | |
| ASSETS | | | | | | | | | | | | |
| Cash and cash equivalents | | $ | 26,333 | | | $ | 128,021 | | | $ | 45,466 | | | $ | 48,839 | |
| U.S. Treasury securities, at fair value | | | 23,843 | | | | 25,740 | | | | 41,167 | | | | 9,820 | |
| Investments in private investment companies, at fair value | | | 2,943,814 | | | | 2,137,382 | | | | 3,070,641 | | | | 2,338,774 | |
| Investments in unconsolidated trading companies, at fair value | | | 16,200 | | | | 23,818 | | | | 27,970 | | | | 9,087 | |
| Interest receivable | | | 594 | | | | 555 | | | | 1,025 | | | | 212 | |
| | | | | | | | | | | | | | | | | |
| Total Assets | | $ | 3,010,784 | | | $ | 2,315,516 | | | $ | 3,186,269 | | | $ | 2,406,732 | |
| | | | | | | | | | | | | | | | | |
| LIABILITIES & CAPITAL | | | | | | | | | | | | | | | | |
| | | | | | | | | | | | | | | | | |
| LIABILITIES | | | | | | | | | | | | | | | | |
| Redemptions payable | | $ | - | | | $ | 27,561 | | | $ | - | | | $ | - | |
| Interest payable to Managing Owner | | | 302 | | | | 312 | | | | 447 | | | | 217 | |
| Service fees payable to Managing Owner | | | 6,437 | | | | 4,986 | | | | 6,432 | | | | 4,950 | |
| Trading fees payable to Managing Owner | | | 12,480 | | | | 9,533 | | | | 11,679 | | | | 8,307 | |
| Subscriptions in advance for service fee rebates | | | 162,385 | | | | 158,810 | | | | 79,667 | | | | 69,814 | |
| Other liabilities | | | 977 | | | | 2,973 | | | | 1,687 | | | | 1,136 | |
| | | | | | | | | | | | | | | | | |
| Total Liabilities | | | 182,581 | | | | 204,175 | | | | 99,912 | | | | 84,424 | |
| | | | | | | | | | | | | | | | | |
| CAPITAL | | | | | | | | | | | | | | | | |
| Managing Owner - Class 2 | | | 28,821 | | | | 25,029 | | | | 31,125 | | | | 23,919 | |
| Limited Owner - Class 1 | | | 2,689,125 | | | | 1,926,328 | | | | 2,830,832 | | | | 2,119,250 | |
| Limited Owner - Class 1AP | | | - | | | | - | | | | 12,657 | | | | 8,242 | |
| Limited Owner - Class 2 | | | 110,257 | | | | 159,984 | | | | 211,743 | | | | 170,897 | |
| | | | | | | | | | | | | | | | | |
| Total Owners’ Capital | | | 2,828,203 | | | | 2,111,341 | | | | 3,086,357 | | | | 2,322,308 | |
| | | | | | | | | | | | | | | | | |
| Non-Controlling Interests | | | - | | | | - | | | | - | | | | - | |
| | | | | | | | | | | | | | | | | |
| Total Capital | | | 2,828,203 | | | | 2,111,341 | | | | 3,086,357 | | | | 2,322,308 | |
| | | | | | | | | | | | | | | | | |
| Total Liabilities and Capital | | $ | 3,010,784 | | | $ | 2,315,516 | | | $ | 3,186,269 | | | $ | 2,406,732 | |
| | | | | | | | | | | | | | | | | |
| Units Outstanding | | | | | | | | | | | | | | | | |
| Class 1 | | | 14,514 | | | | 17,600 | | | | 18,366 | | | | 20,491 | |
| Class 1AP | | | - | | | | - | | | | 64 | | | | 64 | |
| Class 2 | | | 468 | | | | 1,086 | | | | 915 | | | | 1,127 | |
| | | | | | | | | | | | | | | | | |
| Net Asset Value per Unit | | | | | | | | | | | | | | | | |
| Class 1 | | $ | 185.27 | | | $ | 109.45 | | | $ | 154.14 | | | $ | 103.43 | |
| Class 1AP | | | N/A | | | | N/A | | | $ | 198.42 | | | $ | 129.19 | |
| Class 2 | | $ | 297.25 | | | $ | 170.40 | | | $ | 265.55 | | | $ | 172.91 | |
The accompanying notes are an integral part of these consolidated financial statements.
The Series of Frontier Funds
Consolidated Condensed Schedules of Investments
December 31, 2022
| | | | | | | | | Frontier | |
| | | Frontier
Diversified Fund | | | Frontier
Masters Fund | | | Long/Short
Commodity Fund | |
| | | Fair | | | % of Total Capital | | | Fair | | | % of Total Capital | | | Fair | | | % of Total Capital | |
| Description | | Value | | | (Net Asset Value) | | | Value | | | (Net Asset Value) | | | Value | | | (Net Asset Value) | |
| PRIVATE INVESTMENT COMPANIES (2) | | | | | | | | | | | | | | | | | | |
| Galaxy Plus Fund - Fort Contrarian Feeder Fund (510) LLC | | $ | 211,143 | | | | 7.37 | % | | $ | - | | | | 0.00 | % | | $ | - | | | | 0.00 | % |
| Galaxy Plus Fund - QIM Feeder Fund (526) LLC | | | 453,405 | | | | 15.83 | % | | | - | | | | 0.00 | % | | | - | | | | 0.00 | % |
| Galaxy Plus Fund - Quantica Managed Futures Feeder Fund (507) LLC | | | 212,180 | | | | 7.41 | % | | | 164,320 | | | | 23.60 | % | | | - | | | | 0.00 | % |
| Galaxy Plus Fund - Quest Feeder Fund (517) LLC | | | 667,783 | | | | 23.32 | % | | | - | | | | 0.00 | % | | | - | | | | 0.00 | % |
| Galaxy Plus Fund - Aspect Feeder Fund (532) LLC | | | 754,702 | | | | 26.35 | % | | | 313,172 | | | | 44.99 | % | | | - | | | | 0.00 | % |
| Galaxy Plus Fund - Welton GDP Feeder Fund (538) LLC | | | 480,353 | | | | 16.77 | % | | | 228,247 | | | | 32.79 | % | | | 455,615 | | | | 33.45 | % |
| Galaxy Plus Fund – Volt Diversified Alpha Feeder Fund (550) LLC) | | | - | | | | 0.00 | % | | | - | | | | 0.00 | % | | | 252,472 | | | | 18.53 | % |
| Galaxy Plus Fund - LRR Feeder Fund (522) LLC | | | - | | | | 0.00 | % | | | - | | | | 0.00 | % | | | 573,895 | | | | 42.13 | % |
| Total Private Investment Companies | | $ | 2,779,566 | | | | 97.05 | % | | $ | 705,739 | | | | 101.38 | % | | $ | 1,281,982 | | | | 94.11 | % |
| | | | | | | | | | | | | | | | | | | | | | | | | |
| INVESTMENT IN UNCONSOLIDATED TRADING COMPANIES (2) | | | | | | | | | | | | | | | | | | | | | | | | |
| Frontier Trading Company XXXVIII, LLC | | $ | 28,671 | | | | 1.00 | % | | $ | 11,418 | | | | 1.64 | % | | $ | 23,810 | | | | 1.75 | % |
| Total Investment in Unconsolidated Trading Companies | | $ | 28,671 | | | | 1.00 | % | | $ | 11,418 | | | | 1.64 | % | | $ | 23,810 | | | | 1.75 | % |
| | | | | | | | | | | | | | | | | | | | | | | | | |
| U.S. TREASURY SECURITIES (1) | | | | | | | | | | | | | | | | | | | | | | | | |
| | | Fair Value | | | | | | | Fair Value | | | | | | | Fair Value | | | | | |
| US Treasury Note 6.875% due 08/15/2025 | | $ | 42,198 | | | | 1.47 | % | | $ | 16,805 | | | | 2.41 | % | | $ | 35,044 | | | | 2.57 | % |
| | | | | | | | | | | | | | | | | | | | | | | | | |
| | | $ | 7,189,274 | | | | | | | $ | 6,346,891 | | | | | | | $ | (1,294,652 | ) | | | | |
| | | | | | | | | | | | | | | | | | | | | | | | | |
| Additional Disclosure on U.S. Treasury Securities | | Face Value | | | | | | | Face Value | | | | | | | Face Value | | | | | |
| US Treasury Note 6.875% due 08/15/2025 (1) | | $ | 39,704 | | | | | | | $ | 15,812 | | | | | | | $ | 32,973 | | | | | |
| | | $ | 5,007,998 | | | | | | | $ | 4,421,200 | | | | | | | | SOI! | | | | | |
| | | | | | | | | | | | | | | | | | | | | | | | | |
| Additional Disclosure on U.S. Treasury Securities | | Cost | | | | | | | Cost | | | | | | | Cost | | | | | |
| US Treasury Note 6.875% due 08/15/2025 (1) | | $ | 42,270 | | | | | | | $ | 16,834 | | | | | | | $ | 35,105 | | | | | |
| (1) | See Note 2 to the Consolidated Financial Statements. |
| (2) | See Note 5 to the Consolidated Financial Statements. |
The accompanying notes are an integral part of these consolidated financial statements.
The Series of Frontier Funds
Consolidated Condensed Schedules of Investments
December 31, 2022
| | | Frontier | | | Frontier | |
| | | Balanced Fund | | | Select Fund | |
| | | Fair | | | % of Total Capital | | | Fair | | | % of Total Capital | |
| Description | | Value | | | (Net Asset Value) | | | Value | | | (Net Asset Value) | |
| LONG FUTURES CONTRACTS* | | | | | | | | | | | | |
| Various agriculture futures contracts (U.S.) | | $ | 1,590 | | | | 0.02 | % | | $ | - | | | | 0.00 | % |
| Various base metals futures contracts (U.S.) | | | 897 | | | | 0.01 | % | | | - | | | | 0.00 | % |
| Various currency futures contracts (U.S.) | | | (230 | ) | | | 0.00 | % | | | - | | | | 0.00 | % |
| Total Long Futures Contracts | | $ | 2,257 | | | | 0.03 | % | | $ | - | | | | 0.00 | % |
| | | | | | | | | | | | | | | | | |
| SHORT FUTURES CONTRACTS* | | | | | | | | | | | | | | | | |
| Various agriculture futures contracts (Europe) | | $ | (227 | ) | | | 0.00 | % | | $ | - | | | | 0.00 | % |
| Various currency futures contracts (Europe) | | | 67 | | | | 0.00 | % | | | - | | | | 0.00 | % |
| Various currency futures contracts (Far East) | | | (55 | ) | | | 0.00 | % | | | - | | | | 0.00 | % |
| Various currency futures contracts (U.S.) | | | (216 | ) | | | 0.00 | % | | | - | | | | 0.00 | % |
| Various interest rates futures contracts (U.S.) | | | (50 | ) | | | 0.00 | % | | | - | | | | 0.00 | % |
| Various stock index futures contracts (Far East) | | | (106 | ) | | | 0.00 | % | | | - | | | | 0.00 | % |
| Total Short Futures Contracts | | $ | (587 | ) | | | 0.00 | % | | $ | - | | | | 0.00 | % |
| Total Open Trade Equity (Deficit) | | $ | 1,670 | | | | 0.03 | % | | $ | - | | | | 0.00 | % |
| | | | | | | | | | | | | | | | | |
| PRIVATE INVESTMENT COMPANIES (2) | | | | | | | | | | | | | | | | |
| Galaxy Plus Fund - Fort Contrarian Feeder Fund (510) LLC | | $ | 352,115 | | | | 3.78 | % | | $ | - | | | | 0.00 | % |
| Galaxy Plus Fund - QIM Feeder Fund (526) LLC | | | 1,803,881 | | | | 19.34 | % | | | - | | | | 0.00 | % |
| Galaxy Plus Fund - Quantica Managed Futures Feeder Fund (507) LLC | | | 1,285,974 | | | | 13.79 | % | | | 492,107 | | | | 32.75 | % |
| Galaxy Plus Fund - Quest Feeder Fund (517) LLC | | | 1,747,568 | | | | 18.74 | % | | | - | | | | 0.00 | % |
| Galaxy Plus Fund - Aspect Feeder Fund (532) LLC | | | 1,900,887 | | | | 20.38 | % | | | - | | | | 0.00 | % |
| Galaxy Plus Fund - Welton GDP Feeder Fund (538) LLC | | | 1,853,589 | | | | 19.87 | % | | | 957,812 | | | | 63.74 | % |
| Total Private Investment Companies | | $ | 8,944,014 | | | | 95.90 | % | | $ | 1,449,919 | | | | 96.49 | % |
| | | | | | | | | | | | | | | | | |
| INVESTMENT IN UNCONSOLIDATED TRADING COMPANIES (2) | | | | | | | | | | | | | | | | |
| Frontier Trading Company XXXVIII, LLC | | $ | 136,169 | | | | 1.46 | % | | $ | 20,414 | | | | 1.36 | % |
| Total Investment in Unconsolidated Trading Companies | | $ | 136,169 | | | | 1.46 | % | | $ | 20,414 | | | | 1.36 | % |
| | | | | | | | | | | | | | | | | |
| U.S. TREASURY SECURITIES (1) | | | | | | | | | | | | | | | | |
| | | Fair Value | | | | | | | Fair Value | | | | | |
| | | | | | | | | | | | | | | | | |
| US Treasury Note 6.875% due 08/15/2025 | | $ | 200,417 | | | | 2.15 | % | | $ | 30,046 | | | | 2.00 | % |
| | | | | | | | | | | | | | | | | |
| | | $ | 24,786,908 | | | | | | | $ | 3,723,152 | | | | | |
| | | | | | | | | | | | | | | | | |
| Additional Disclosure on U.S. Treasury Securities | | Face Value | | | | | | | Face Value | | | | | |
| | | | | | | | | | | | | | | | | |
| US Treasury Note 6.875% due 08/15/2025 (1) | | $ | 188,573 | | | | | | | $ | 28,270 | | | | | |
| | | | | | | | | | | | | | | | | |
| | | $ | 17,266,387 | | | | | | | $ | 2,593,522 | | | | | |
| | | | | | | | | | | | | | | | | |
| Additional Disclosure on U.S. Treasury Securities | | Cost | | | | | | | Cost | | | | | |
| | | | | | | | | | | | | | | | | |
| US Treasury Note 6.875% due 08/15/2025 (1) | | $ | 200,764 | | | | | | | $ | 30,098 | | | | | |
| * | Except for those items disclosed, no individual futures, or forwards position constituted greater than 1 percent of Net Asset Value. Accordingly, the number of contracts and expiration dates are not presented. |
| (1) | See Note 2 to the Consolidated Financial Statements. |
| (2) | See Note 5 to the Consolidated Financial Statements. |
The accompanying notes are an integral part of these consolidated financial statements.
The Series of Frontier Funds
Consolidated Condensed Schedules of Investments
December 31, 2022
| | | Frontier Global | | | Frontier | |
| | | Fund | | | Heritage Fund | |
| | | Fair | | | % of Total Capital | | | Fair | | | % of Total Capital | |
| Description | | Value | | | (Net Asset Value) | | | Value | | | (Net Asset Value) | |
| PRIVATE INVESTMENT COMPANIES (2) | | | | | | | | | | | | |
| Galaxy Plus Fund - Aspect Feeder Fund (532) LLC | | $ | 2,943,814 | | | | 104.09 | % | | $ | 2,363,685 | | | | 76.58 | % |
| Galaxy Plus Fund - Welton GDP Feeder Fund (538) LLC | | | - | | | | - | | | | 706,956 | | | | 22.91 | % |
| Total Private Investment Companies | | $ | 2,943,814 | | | | 104.09 | % | | $ | 3,070,641 | | | | 99.49 | % |
| | | | | | | | | | | | | | | | | |
| INVESTMENT IN UNCONSOLIDATED TRADING COMPANIES (2) | | | | | | | | | | | | | | | | |
| Frontier Trading Company XXXVIII, LLC | | $ | 16,200 | | | | 0.57 | % | | $ | 27,970 | | | | 0.91 | % |
| Total Investment in Unconsolidated Trading Companies | | $ | 16,200 | | | | 0.57 | % | | $ | 27,970 | | | | 0.91 | % |
| | | | | | | | | | | | | | | | | |
| U.S. TREASURY SECURITIES (1) | | | | | | | | | | | | | | | | |
| | | Fair Value | | | | | | | Fair Value | | | | | |
| | | | | | | | | | | | | | | | | |
| US Treasury Note 6.875% due 08/15/2025 | | $ | 23,843 | | | | 0.84 | % | | $ | 41,167 | | | | 1.33 | % |
| | | | | | | | | | | | | | | | | |
| Additional Disclosure on U.S. Treasury Securities | | Face Value | | | | | | | Face Value | | | | | |
| | | | | | | | | | | | | | | | | |
| US Treasury Note 6.875% due 08/15/2025 (1) | | $ | 22,434 | | | | | | | $ | 38,734 | | | | | |
| | | | | | | | | | | | | | | | | |
| Additional Disclosure on U.S. Treasury Securities | | Cost | | | | | | | Cost | | | | | |
| | | | | | | | | | | | | | | | | |
| US Treasury Note 6.875% due 08/15/2025 (1) | | $ | 23,885 | | | | | | | $ | 41,238 | | | | | |
Except for those items disclosed, no individual futures, or forwards position constituted greater than 1 percent of Net Asset Value. Accordingly, the number of contracts and expiration dates are not presented.
| (1) | See Note 2 to the Consolidated Financial Statements. |
| (2) | See Note 5 to the Consolidated Financial Statements. |
The accompanying notes are an integral part of these consolidated financial statements.
The Series of Frontier Funds
Consolidated Condensed Schedules of Investments
December 31, 2021
| | | Frontier | | | Frontier | | | Frontier | |
| | | Diversified Fund | | | Masters Fund | | | Long/Short Commodity Fund | |
| | | Fair | | | % of Total Capital | | | Fair | | | % of Total Capital | | | Fair | | | % of Total Capital | |
| Description | | Value | | | (Net Asset Value) | | | Value | | | (Net Asset Value) | | | Value | | | (Net Asset Value) | |
| PRIVATE INVESTMENT COMPANIES (2) | | | | | | | | | | | | | | | | | | |
| Galaxy Plus Fund - Fort Contrarian Feeder Fund (510) LLC | | $ | 875,796 | | | | 28.87 | % | | $ | - | | | | 0.00 | % | | $ | - | | | | 0.00 | % |
| Galaxy Plus Fund - QIM Feeder Fund (526) LLC | | | 185,705 | | | | 6.12 | % | | | - | | | | 0.00 | % | | | - | | | | 0.00 | % |
| Galaxy Plus Fund - Quest Feeder Fund (517) LLC | | | 453,710 | | | | 14.96 | % | | | - | | | | 0.00 | % | | | - | | | | 0.00 | % |
| Galaxy Plus Fund - Aspect Feeder Fund (532) LLC | | | 663,002 | | | | 21.86 | % | | | 279,895 | | | | 39.55 | % | | | - | | | | 0.00 | % |
| Galaxy Plus Fund - Welton GDP Feeder Fund (538) LLC | | | 386,996 | | | | 12.76 | % | | | 193,269 | | | | 27.31 | % | | | 482,639 | | | | 38.91 | % |
| Galaxy Plus Fund - JL Cyril Systematic Feeder Fund (547) LLC) | | | 273,449 | | | | 9.02 | % | | | 165,212 | | | | 23.35 | % | | | - | | | | 0.00 | % |
| Galaxy Plus Fund - Volt Diversified Alpha Feeder Fund (550) LLC) | | | - | | | | 0.00 | % | | | - | | | | 0.00 | % | | | 252,149 | | | | 20.33 | % |
| Galaxy Plus Fund - LRR Feeder Fund (522) LLC | | | - | | | | 0.00 | % | | | - | | | | 0.00 | % | | | 474,234 | | | | 38.23 | % |
| Total Private Investment Companies | | $ | 2,838,658 | | | | 93.59 | % | | $ | 638,376 | | | | 90.21 | % | | $ | 1,209,022 | | | | 97.47 | % |
| | | | | | | | | | | | | | | | | | | | | | | | | |
| INVESTMENT IN UNCONSOLIDATED TRADING COMPANIES (2) | | | | | | | | | | | | | | | | | | | | | | | | |
| Frontier Trading Company XXXVIII, LLC | | $ | 30,788 | | | | 1.02 | % | | $ | 14,270 | | | | 2.02 | % | | $ | 7,541 | | | | 0.61 | % |
| Total Investment in Unconsolidated Trading Companies | | $ | 30,788 | | | | 1.02 | % | | $ | 14,270 | | | | 2.02 | % | | $ | 7,541 | | | | 0.61 | % |
| | | | | | | | | | | | | | | | | | | | | | | | | |
| U.S. TREASURY SECURITIES (1) | | | | | | | | | | | | | | | | | | | | | | | | |
| | | Fair Value | | | | | | | Fair Value | | | | | | | Fair Value | | | | | |
| US Treasury Note 6.875% due 08/15/2025 | | $ | 33,274 | | | | 1.10 | % | | $ | 15,422 | | | | 2.18 | % | | $ | 8,148 | | | | 0.66 | % |
| | | | | | | | | | | | | | | | | | | | | | | | | |
| Additional Disclosure on U.S. Treasury Securities | | Face Value | | | | | | | Face Value | | | | | | | Face Value | | | | | |
| US Treasury Note 6.875% due 08/15/2025 (1) | | $ | 27,592 | | | | | | | $ | 12,789 | | | | | | | $ | 6,757 | | | | | |
| | | | | | | | | | | | | | | | | | | | | | | | | |
| Additional Disclosure on U.S. Treasury Securities | | Cost | | | | | | | Cost | | | | | | | Cost | | | | | |
| US Treasury Note 6.875% due 08/15/2025 (1) | | $ | 33,709 | | | | | | | $ | 15,624 | | | | | | | $ | 8,255 | | | | | |
| (1) | See Note 2 to the Consolidated Financial Statements. |
| (2) | See Note 5 to the Consolidated Financial Statements. |
The accompanying notes are an integral part of these consolidated financial statements.
The Series of Frontier Funds
Consolidated Condensed Schedules of Investments
December 31, 2021
| | | Frontier | | | Frontier | |
| | | Balanced Fund | | | Select Fund | |
| | | | | | % of Total Capital | | | | | | % of Total Capital | |
| Description | | Fair
Value | | | (Net Asset Value) | | | Fair
Value | | | (Net Asset Value) | |
| LONG FUTURES CONTRACTS* | | | | | | | | | | | | |
| Various agriculture futures contracts (Far East) | | $ | 10,141 | | | | 0.11 | % | | $ | - | | | | 0.00 | % |
| Various agriculture futures contracts (Europe) | | | (21,640 | ) | | | -0.23 | % | | | - | | | | 0.00 | % |
| Various agriculture futures contracts (U.S.) | | | 51,912 | | | | 0.55 | % | | | - | | | | 0.00 | % |
| Various base metals futures contracts (U.S.) | | | 20,031 | | | | 0.21 | % | | | - | | | | 0.00 | % |
| Various currency futures contracts (Europe) | | | 1,994 | | | | 0.02 | % | | | - | | | | 0.00 | % |
| Various currency futures contracts (Far East) | | | 819 | | | | 0.01 | % | | | - | | | | 0.00 | % |
| Various currency futures contracts (Latin America) | | | 6,710 | | | | 0.07 | % | | | - | | | | 0.00 | % |
| Various currency futures contracts (U.S.) | | | (9,800 | ) | | | -0.10 | % | | | - | | | | 0.00 | % |
| Various energy futures contracts (U.S.) | | | 34 | | | | 0.00 | % | | | - | | | | 0.00 | % |
| Various interest rates futures contracts (Europe) | | | (718,038 | ) | | | -7.55 | % | | | - | | | | 0.00 | % |
| Various interest rates futures contracts (Far East) | | | (10,418 | ) | | | -0.11 | % | | | - | | | | 0.00 | % |
| Various interest rates futures contracts (U.S.) | | | (7,281 | ) | | | -0.08 | % | | | - | | | | 0.00 | % |
| Various precious metal futures contracts (U.S.) | | | 19,168 | | | | 0.20 | % | | | - | | | | 0.00 | % |
| Various soft futures contracts (U.S.) | | | 138,674 | | | | 1.46 | % | | | - | | | | 0.00 | % |
| Various stock index futures contracts (Europe) | | | 1,508 | | | | 0.02 | % | | | - | | | | 0.00 | % |
| Various stock index futures contracts (Far East) | | | 1,542 | | | | 0.02 | % | | | - | | | | 0.00 | % |
| Various stock index futures contracts (Oceanic) | | | 1,236 | | | | 0.01 | % | | | - | | | | 0.00 | % |
| Various stock index futures contracts (Canada) | | | 1,853 | | | | 0.02 | % | | | - | | | | 0.00 | % |
| Total Long Futures Contracts | | $ | (511,556 | ) | | | -5.37 | % | | $ | - | | | | 0.00 | % |
| | | | | | | | | | | | | | | | | |
| SHORT FUTURES CONTRACTS* | | | | | | | | | | | | | | | | |
| Various agriculture futures contracts (Far East) | | $ | (27,804 | ) | | | -0.29 | % | | $ | - | | | | 0.00 | % |
| Various agriculture futures contracts (Europe) | | | 20,105 | | | | 0.21 | % | | | - | | | | 0.00 | % |
| Various agriculture futures contracts (U.S.) | | | (11,749 | ) | | | -0.12 | % | | | - | | | | 0.00 | % |
| Various base metals futures contracts (U.S.) | | | (29,574 | ) | | | -0.31 | % | | | - | | | | 0.00 | % |
| Various currency futures contracts (Europe) | | | (18,181 | ) | | | -0.19 | % | | | - | | | | 0.00 | % |
| Various currency futures contracts (Far East) | | | (1,110 | ) | | | -0.01 | % | | | - | | | | 0.00 | % |
| Various currency futures contracts (Latin America) | | | (21,340 | ) | | | -0.22 | % | | | - | | | | 0.00 | % |
| Various currency futures contracts (U.S.) | | | 6,288 | | | | 0.07 | % | | | - | | | | 0.00 | % |
| Various energy futures contracts (U.S.) | | | (10,792 | ) | | | -0.11 | % | | | - | | | | 0.00 | % |
| Various interest rates futures contracts (Europe) | | | 785,677 | | | | 8.26 | % | | | - | | | | 0.00 | % |
| Various interest rates futures contracts (U.S.) | | | (625 | ) | | | -0.01 | % | | | - | | | | 0.00 | % |
| Various precious metal futures contracts (U.S.) | | | (38,573 | ) | | | -0.41 | % | | | - | | | | 0.00 | % |
| Various soft futures contracts (U.S.) | | | (110,902 | ) | | | -1.17 | % | | | - | | | | 0.00 | % |
| Various stock index futures contracts (Canada) | | | (5,194 | ) | | | -0.05 | % | | | - | | | | 0.00 | % |
| Various stock index futures contracts (Europe) | | | (5,157 | ) | | | -0.05 | % | | | - | | | | 0.00 | % |
| Various stock index futures contracts (Far East) | | | (2,191 | ) | | | -0.02 | % | | | - | | | | 0.00 | % |
| Various stock index futures contracts (Oceanic) | | | (2,217 | ) | | | -0.02 | % | | | - | | | | 0.00 | % |
| Various stock index futures contracts (U.S.) | | | (269 | ) | | | 0.00 | % | | | - | | | | 0.00 | % |
| Total Short Futures Contracts | | $ | 526,392 | | | | 5.56 | % | | $ | - | | | | 0.00 | % |
| Total Open Trade Equity (Deficit) | | $ | 14,836 | | | | 0.19 | % | | $ | - | | | | 0.00 | % |
| | | | | | | | | | | | | | | | | |
| PRIVATE INVESTMENT COMPANIES (2) | | | | | | | | | | | | | | | | |
| Galaxy Plus Fund - Fort Contrarian Feeder Fund (510) LLC | | $ | 1,890,115 | | | | 19.88 | % | | $ | - | | | | 0.00 | % |
| Galaxy Plus Fund - QIM Feeder Fund (526) LLC | | | 820,002 | | | | 8.62 | % | | | - | | | | 0.00 | % |
| Galaxy Plus Fund - Quest Feeder Fund (517) LLC | | | 1,134,963 | | | | 11.94 | % | | | - | | | | 0.00 | % |
| Galaxy Plus Fund - Aspect Feeder Fund (532) LLC | | | 1,658,225 | | | | 17.44 | % | | | - | | | | 0.00 | % |
| Galaxy Plus Fund - Welton GDP Feeder Fund (538) LLC | | | 2,032,209 | | | | 21.37 | % | | | 796,855 | | | | 56.28 | % |
| Galaxy Plus Fund – JL Cyril Systematic Feeder Fund (547) LLC) | | | 1,392,967 | | | | 14.65 | % | | | 577,521 | | | | 40.79 | % |
| Total Private Investment Companies | | $ | 8,928,481 | | | | 93.90 | % | | $ | 1,374,376 | | | | 97.07 | % |
| | | | | | | | | | | | | | | | | |
| INVESTMENT IN UNCONSOLIDATED TRADING COMPANIES (2) | | | | | | | | | | | | | | | | |
| Frontier Trading Company XXXVIII, LLC | | $ | 34,977 | | | | 0.37 | % | | $ | 9,514 | | | | 0.67 | % |
| Total Investment in Unconsolidated Trading Companies | | $ | 34,977 | | | | 0.37 | % | | $ | 9,514 | | | | 0.67 | % |
| | | | | | | | | | | | | | | | | |
| U.S. TREASURY SECURITIES (1) | | | | | | | | | | | | | | | | |
| | | Fair Value | | | | | | | Fair Value | | | | | |
| | | | | | | | | | | | | | | | | |
| US Treasury Note 6.875% due 08/15/2025 | | $ | 37,801 | | | | 0.40 | % | | $ | 10,282 | | | | 0.73 | % |
| | | | | | | | | | | | | | | | | |
| Additional Disclosure on U.S. Treasury Securities | | Face Value | | | | | | | Face Value | | | | | |
| | | | | | | | | | | | | | | | | |
| US Treasury Note 6.875% due 08/15/2025 (1) | | $ | 31,347 | | | | | | | $ | 8,527 | | | | | |
| | | | | | | | | | | | | | | | | |
| Additional Disclosure on U.S. Treasury Securities | | Cost | | | | | | | Cost | | | | | |
| | | | | | | | | | | | | | | | | |
| US Treasury Note 6.875% due 08/15/2025 (1) | | $ | 38,296 | | | | | | | $ | 10,417 | | | | | |
| * | Except for those items disclosed, no individual futures, or forwards position constituted greater than 1 percent of Net Asset Value. Accordingly, the number of contracts and expiration dates are not presented. |
| (1) | See Note 2 to the Consolidated Financial Statements. |
| (2) | See Note 5 to the Consolidated Financial Statements. |
The accompanying notes are an integral part of these consolidated financial statements.
The Series of Frontier Funds
Consolidated Condensed Schedules of Investments
December 31, 2021
| | | Frontier Global | | | Frontier | |
| | | Fund | | | Heritage Fund | |
| | | Fair | | | % of Total Capital | | | Fair | | | % of Total Capital | |
| Description | | Value | | | (Net Asset Value) | | | Value | | | (Net Asset Value) | |
| PRIVATE INVESTMENT COMPANIES (2) | | | | | | | | | | | | |
| Galaxy Plus Fund - Aspect Feeder Fund (532) LLC | | $ | 2,137,382 | | | | 101.23 | % | | $ | 1,614,360 | | | | 69.52 | % |
| Galaxy Plus Fund - Welton GDP Feeder Fund (538) LLC | | | - | | | | - | | | | 724,414 | | | | 31.19 | % |
| Total Private Investment Companies | | $ | 2,137,382 | | | | 101.23 | % | | $ | 2,338,774 | | | | 100.71 | % |
| | | | | | | | | | | | | | | | | |
| INVESTMENT IN UNCONSOLIDATED TRADING COMPANIES (2) | | | | | | | | | | | | | | | | |
| Frontier Trading Company XXXVIII, LLC | | $ | 23,818 | | | | 1.13 | % | | $ | 9,087 | | | | 0.39 | % |
| Total Investment in Unconsolidated Trading Companies | | $ | 23,818 | | | | 1.13 | % | | $ | 9,087 | | | | 0.39 | % |
| | | | | | | | | | | | | | | | | |
| U.S. TREASURY SECURITIES (1) | | | | | | | | | | | | | | | | |
| | | Fair Value | | | | | | | Fair Value | | | | | |
| | | | | | | | | | | | | | | | | |
| US Treasury Note 6.875% due 08/15/2025 | | $ | 25,740 | | | | 1.22 | % | | $ | 9,820 | | | | 0.42 | % |
| | | | | | | | | | | | | | | | | |
| Additional Disclosure on U.S. Treasury Securities | | Face Value | | | | | | | Face Value | | | | | |
| | | | | | | | | | | | | | | | | |
| US Treasury Note 6.875% due 08/15/2025 (1) | | $ | 21,345 | | | | | | | $ | 8,143 | | | | | |
| | | | | | | | | | | | | | | | | |
| Additional Disclosure on U.S. Treasury Securities | | Cost | | | | | | | Cost | | | | | |
| | | | | | | | | | | | | | | | | |
| US Treasury Note 6.875% due 08/15/2025 (1) | | $ | 26,077 | | | | | | | $ | 9,948 | | | | | |
| * | Except for those items disclosed, no individual futures, or forwards contract position constituted greater than 1 percent of Net Asset Value. Accordingly, the number of contracts and expiration dates are not presented. |
| (1) | See Note 2 to the Consolidated Financial Statements. |
| (2) | See Note 5 to the Consolidated Financial Statements. |
The accompanying notes are an integral part of these consolidated financial statements.
The Series of Frontier Funds
Consolidated Statements of Operations
For the Years Ended December 31, 2022, 2021, 2020
| | | Frontier
Diversified Fund | | | Frontier
Masters Fund | | | Frontier
Long/Short Commodity Fund | |
| | | | | | | | | | |
| | | 12/31/2022 | | | 12/31/2021 | | | 12/31/2020 | | | 12/31/2022 | | | 12/31/2021 | | | 12/31/2020 | | | 12/31/2022 | | | 12/31/2021 | | | 12/31/2020 | |
| Investment income: | | | | | | | | | | | | | | | | | | | | | | | | | | | |
| Interest - net | | $ | 6,281 | | | $ | 4,550 | | | $ | 441 | | | $ | 2,815 | | | $ | 3,141 | | | $ | 2,476 | | | $ | 3,427 | | | $ | 3,722 | | | $ | 4,010 | |
| | | | | | | | | | | | | | | | | | | | | | | | | | | | | | | | | | | | | |
| Total Income | | | 6,281 | | | | 4,550 | | | | 441 | | | | 2,815 | | | | 3,141 | | | | 2,476 | | | | 3,427 | | | | 3,722 | | | | 4,010 | |
| | | | | | | | | | | | | | | | | | | | | | | | | | | | | | | | | | | | | |
| Expenses: | | | | | | | | | | | | | | | | | | | | | | | | | | | | | | | | | | | | |
| Incentive Fees (rebate) | | | (13,788 | ) | | | - | | | | - | | | | - | | | | - | | | | - | | | | - | | | | - | | | | - | |
| Service Fees - Class 1 | | | 1,128 | | | | 2,118 | | | | 14,246 | | | | 563 | | | | 628 | | | | 1,786 | | | | 270 | | | | 228 | | | | 381 | |
| Due Diligence Fees | | | 4,073 | | | | 4,304 | | | | 8,636 | | | | 1,004 | | | | 1,032 | | | | 1,971 | | | | 450 | | | | 381 | | | | 363 | |
| Trading Fees | | | 123,260 | | | | 125,429 | | | | 251,203 | | | | 55,575 | | | | 52,957 | | | | 101,300 | | | | 41,502 | | | | 38,961 | | | | 32,628 | |
| | | | | | | | | | | | | | | | | | | | | | | | | | | | | | | | | | | | | |
| Total Expenses | | | 114,673 | | | | 131,851 | | | | 274,085 | | | | 57,142 | | | | 54,617 | | | | 105,057 | | | | 42,222 | | | | 39,570 | | | | 33,372 | |
| | | | | | | | | | | | | | | | | | | | | | | | | | | | | | | | | | | | | |
| Investment (loss) - net | | | (108,392 | ) | | | (127,301 | ) | | | (273,644 | ) | | | (54,327 | ) | | | (51,476 | ) | | | (102,581 | ) | | | (38,795 | ) | | | (35,848 | ) | | | (29,362 | ) |
| | | | | | | | | | | | | | | | | | | | | | | | | | | | | | | | | | | | | |
| Realized and unrealized gain/(loss) on investments: | | | | | | | | | | | | | | | | | | | | | | | | | | | | | | | | | | | | |
| Net unrealized gain/(loss) on private investment companies | | | 168,307 | | | | 98,954 | | | | 946,785 | | | | 192,089 | | | | 64,947 | | | | 393,123 | | | | 243,664 | | | | 53,498 | | | | 283,384 | |
| Net realized gain/(loss) on private investment companies | | | 251,470 | | | | 98,105 | | | | (1,549,052 | ) | | | 89,888 | | | | 24,753 | | | | (754,772 | ) | | | 56,892 | | | | 47,148 | | | | (405,836 | ) |
| Net realized gain/(loss) on swap contracts | | | - | | | | - | | | | (446,306 | ) | | | - | | | | - | | | | - | | | | - | | | | - | | | | 188,100 | |
| Net unrealized gain/(loss) on swap contracts | | | - | | | | - | | | | (1,537,399 | ) | | | - | | | | - | | | | - | | | | - | | | | - | | | | 44,277 | |
| Net realized gain/(loss) on U.S. Treasury securities | | | (7,623 | ) | | | (4,809 | ) | | | (14,579 | ) | | | (3,779 | ) | | | (3,365 | ) | | | 8,759 | | | | (5,686 | ) | | | (5,738 | ) | | | 737 | |
| Net unrealized gain/(loss) on U.S. Treasury securities | | | (2,303 | ) | | | (832 | ) | | | 23,758 | | | | (89 | ) | | | 227 | | | | (4,357 | ) | | | (653 | ) | | | 1,187 | | | | (1,009 | ) |
| Change in fair value of investments in unconsolidated trading companies | | | 22,808 | | | | 5,041 | | | | 11,127 | | | | 8,287 | | | | 12,521 | | | | (3,287 | ) | | | 12,989 | | | | 14,025 | | | | (11,314 | ) |
| | | | | | | | | | | | | | | | | | | | | | | | | | | | | | | | | | | | | |
| Net gain/(loss) on investments | | | 432,659 | | | | 196,459 | | | | (2,565,666 | ) | | | 286,396 | | | | 99,083 | | | | (360,534 | ) | | | 307,206 | | | | 110,120 | | | | 98,339 | |
| | | | | | | | | | | | | | | | | | | | | | | | | | | | | | | | | | | | | |
| NET INCREASE/(DECREASE) IN CAPITAL RESULTING FROM OPERATIONS | | | 324,267 | | | | 69,158 | | | | (2,839,310 | ) | | | 232,069 | | | | 47,607 | | | | (463,115 | ) | | | 268,411 | | | | 74,272 | | | | 68,977 | |
| | | | | | | | | | | | | | | | | | | | | | | | | | | | | | | | | | | | | |
| Less: Operations attributable to non-controlling interests | | | - | | | | - | | | | - | | | | - | | | | - | | | | - | | | | - | | | | - | | | | - | |
| | | | | | | | | | | | | | | | | | | | | | | | | | | | | | | | | | | | | |
| NET INCREASE/(DECREASE) IN CAPITAL RESULTING FROM OPERATIONS ATTRIBUTABLE TO CONTROLLING INTERESTS | | $ | 324,267 | | | $ | 69,158 | | | $ | (2,839,310 | ) | | $ | 232,069 | | | $ | 47,607 | | | $ | (463,115 | ) | | $ | 268,411 | | | $ | 74,272 | | | $ | 68,977 | |
| | | | | | | | | | | | | | | | | | | | | | | | | | | | | | | | | | | | | |
| NET INCREASE/(DECREASE) IN CAPITAL RESULTING FROM OPERATIONS ATTRIBUTABLE TO CONTROLLING INTERESTS PER UNIT | | | | | | | | | | | | | | | | | | | | | | | | | | | | | | | | | | | | |
| Class 1 | | | N/A | | | $ | (72.68 | ) | | $ | (28.42 | ) | | | N/A | | | $ | (55.18 | ) | | $ | (17.10 | ) | | | N/A | | | | N/A | | | | N/A | |
| Class 1a | | | N/A | | | | N/A | | | | N/A | | | | N/A | | | | N/A | | | | N/A | | | | N/A | | | | N/A | | | $ | (44.20 | ) |
| Class 2 | | $ | 7.39 | | | $ | 0.03 | | | $ | (32.63 | ) | | $ | 24.47 | | | $ | 2.63 | | | $ | (19.64 | ) | | $ | 19.68 | | | $ | 3.98 | | | $ | 4.39 | |
| Class 2a | | | N/A | | | | N/A | | | | N/A | | | | N/A | | | | N/A | | | | N/A | | | $ | 13.18 | | | $ | 3.46 | | | $ | 2.74 | |
| Class 3 | | $ | 7.16 | | | $ | 0.23 | | | $ | (30.28 | ) | | $ | 23.30 | | | $ | 2.63 | | | $ | (18.26 | ) | | $ | 20.65 | | | $ | 4.17 | | | $ | 4.57 | |
| Class 3a | | | N/A | | | | N/A | | | | N/A | | | | N/A | | | | N/A | | | | N/A | | | $ | 14.13 | | | $ | 3.79 | | | $ | 3.06 | |
The accompanying notes are an integral part of these consolidated financial statements.
The Series of the Frontier Funds
Consolidated Statements of Operations
For the Years Ended December 31, 2022, 2021, 2020
| | | Frontier Balanced Fund | | | Frontier Select Fund | |
| | | 12/31/2022 | | | 12/31/2021 | | | 12/31/2020 | | | 12/31/2022 | | | 12/31/2021 | | | 12/31/2020 | |
| Investment income: | | | | | | | | | | | | | | | | | | |
| Interest - net | | $ | - | | | $ | 265 | | | $ | 6,461 | | | $ | - | | | $ | - | | | $ | - | |
| | | | | | | | | | | | | | | | | | | | | | | | | |
| Total Income/(loss) | | | - | | | | 265 | | | | 6,461 | | | | - | | | | - | | | | - | |
| | | | | | | | | | | | | | | | | | | | | | | | | |
| Expenses: | | | | | | | | | | | | | | | | | | | | | | | | |
| Incentive Fees (rebate) | | | 213,064 | | | | 158,775 | | | | - | | | | - | | | | - | | | | - | |
| Interest - net | | | 1,626 | | | | - | | | | - | | | | - | | | | - | | | | - | |
| Management Fees | | | 18,115 | | | | 18,441 | | | | 19,600 | | | | - | | | | - | | | | - | |
| Service Fees - Class 1 | | | 263,174 | | | | 258,209 | | | | 351,503 | | | | 53,197 | | | | 46,410 | | | | 62,144 | |
| Risk analysis Fees | | | 5,434 | | | | 5,532 | | | | 5,880 | | | | - | | | | - | | | | - | |
| Trading Fees | | | 475,553 | | | | 435,300 | | | | 580,978 | | | | 60,136 | | | | 46,943 | | | | 53,759 | |
| | | | | | | | | | | | | | | | | | | | | | | | | |
| Total Expenses | | | 976,966 | | | | 876,257 | | | | 957,961 | | | | 113,333 | | | | 93,353 | | | | 115,903 | |
| | | | | | | | | | | | | | | | | | | | | | | | | |
| Investment (loss) - net | | | (976,966 | ) | | | (875,992 | ) | | | (951,500 | ) | | | (113,333 | ) | | | (93,353 | ) | | | (115,903 | ) |
| | | | | | | | | | | | | | | | | | | | | | | | | |
| Realized and unrealized gain/(loss) on investments: | | | | | | | | | | | | | | | | | | | | | | | | |
| Net realized gain/(loss) on futures, forwards and options | | | 807,627 | | | | 872,699 | | | | 598,263 | | | | - | | | | - | | | | - | |
| Net unrealized gain/(loss) on private investment companies | | | 1,673,486 | | | | 171,769 | | | | 619,705 | | | | 345,213 | | | | 3,095 | | | | 66,982 | |
| Net realized gain/(loss) on private investment companies | | | 666,011 | | | | 542,771 | | | | (1,593,919 | ) | | | (42,378 | ) | | | 233,656 | | | | (240,757 | ) |
| Net change in open trade equity/(deficit) | | | (13,166 | ) | | | (89,306 | ) | | | 30,465 | | | | - | | | | - | | | | - | |
| Net realized gain/(loss) on swap contracts | | | - | | | | - | | | | (2,448,166 | ) | | | - | | | | - | | | | (91,989 | ) |
| Net unrealized gain/(loss) on swap contracts | | | - | | | | - | | | | (3,088,917 | ) | | | - | | | | - | | | | - | |
| Net realized gain/(loss) on U.S. Treasury securities | | | (27,240 | ) | | | (11,502 | ) | | | 25,729 | | | | (4,946 | ) | | | (3,778 | ) | | | 3,696 | |
| Net unrealized gain/(loss) on U.S. Treasury securities | | | 8,388 | | | | 1,499 | | | | (5,410 | ) | | | (454 | ) | | | 852 | | | | (2,628 | ) |
| Trading commissions | | | (8,536 | ) | | | (15,423 | ) | | | (21,148 | ) | | | - | | | | - | | | | - | |
| Change in fair value of investments in unconsolidated trading companies | | | 44,604 | | | | (32,534 | ) | | | (31,150 | ) | | | 11,659 | | | | 9,337 | | | | 82,965 | |
| | | | | | | | | | | | | | | | | | | | | | | | | |
| Net gain/(loss) on investments | | | 3,151,174 | | | | 1,439,973 | | | | (5,914,548 | ) | | | 309,094 | | | | 243,162 | | | | (181,731 | ) |
| | | | | | | | | | | | | | | | | | | | | | | | | |
| NET INCREASE/(DECREASE) IN CAPITAL RESULTING FROM OPERATIONS | | | 2,174,208 | | | | 563,981 | | | | (6,866,048 | ) | | | 195,761 | | | | 149,809 | | | | (297,634 | ) |
| | | | | | | | | | | | | | | | | | | | | | | | | |
| Less: Operations attributable to non-controlling interests | | | - | | | | - | | | | - | | | | - | | | | - | | | | - | |
| | | | | | | | | | | | | | | | | | | | | | | | | |
| NET INCREASE/(DECREASE) IN CAPITAL RESULTING FROM OPERATIONS ATTRIBUTABLE TO CONTROLLING INTERESTS | | $ | 2,174,208 | | | $ | 563,981 | | | $ | (6,866,048 | ) | | $ | 195,761 | | | $ | 149,809 | | | $ | (297,634 | ) |
| | | | | | | | | | | | | | | | | | | | | | | | | |
| NET INCREASE/(DECREASE) IN CAPITAL RESULTING FROM OPERATIONS ATTRIBUTABLE TO CONTROLLING INTERESTS PER UNIT | | | | | | | | | | | | | | | | | | | | | | | | |
| Class 1 | | $ | 16.35 | | | $ | 2.89 | | | $ | (37.30 | ) | | $ | 7.84 | | | $ | 4.84 | | | $ | (8.01 | ) |
| Class 1AP | | $ | 24.18 | | | $ | 6.57 | | | $ | (41.00 | ) | | $ | 12.50 | | | $ | 8.22 | | | $ | (7.52 | ) |
| Class 2 | | $ | 32.61 | | | $ | 8.86 | | | $ | (55.28 | ) | | $ | 16.60 | | | $ | 10.90 | | | $ | (9.74 | ) |
| Class 2a | | $ | 28.49 | | | $ | 7.78 | | | $ | (47.84 | ) | | | N/A | | | | N/A | | | | N/A | |
| Class 3a | | $ | 28.39 | | | $ | 7.76 | | | $ | (47.69 | ) | | | N/A | | | | N/A | | | | N/A | |
The accompanying notes are an integral part of these consolidated financial statements.
The Series of the Frontier Funds
Consolidated Statements of Operations
For the Years Ended December 31, 2022, 2021, 2020
| | | Frontier Global Fund | | | Frontier Heritage Fund | |
| | | 12/31/2022 | | | 12/31/2021 | | | 12/31/2020 | | | 12/31/2022 | | | 12/31/2021 | | | 12/31/2020 | |
| Investment income: | | | | | | | | | | | | | | | | | | |
| Interest - net | | $ | - | | | $ | - | | | $ | - | | | $ | - | | | $ | - | | | $ | - | |
| | | | | | | | | | | | | | | | | | | | | | | | | |
| Total Income | | | - | | | | - | | | | - | | | | - | | | | - | | | | - | |
| | | | | | | | | | | | | | | | | | | | | | | | | |
| Expenses: | | | | | | | | | | | | | | | | | | | | | | | | |
| Service Fees - Class 1 | | | 84,304 | | | | 76,678 | | | | 100,858 | | | | 92,170 | | | | 68,400 | | | | 66,761 | |
| Trading Fees | | | 148,079 | | | | 140,017 | | | | 186,591 | | | | 140,566 | | | | 101,631 | | | | 104,941 | |
| | | | | | | | | | | | | | | | | | | | | | | | | |
| Total Expenses | | | 232,383 | | | | 216,695 | | | | 287,449 | | | | 232,736 | | | | 170,031 | | | | 171,702 | |
| | | | | | | | | | | | | | | | | | | | | | | | | |
| Investment (loss) - net | | | (232,383 | ) | | | (216,695 | ) | | | (287,449 | ) | | | (232,736 | ) | | | (170,031 | ) | | | (171,702 | ) |
| | | | | | | | | | | | | | | | | | | | | | | | | |
| Realized and unrealized gain/(loss) on investments: | | | | | | | | | | | | | | | | | | | | | | | | |
| Net unrealized gain/(loss) on private investment companies | | | 962,203 | | | | (97,778 | ) | | | (751,136 | ) | | | 906,091 | | | | 197,905 | | | | 227,342 | |
| Net realized gain/(loss) on private investment companies | | | 671,439 | | | | 292,612 | | | | 455,079 | | | | 461,959 | | | | 156,731 | | | | (83,882 | ) |
| Net realized gain/(loss) on swap contracts | | | - | | | | - | | | | - | | | | - | | | | - | | | | (97,745 | ) |
| Net unrealized gain/(loss) on swap contracts | | | - | | | | - | | | | - | | | | - | | | | - | | | | 197,829 | |
| Net realized gain/(loss) on U.S. Treasury securities | | | (6,920 | ) | | | (2,415 | ) | | | 11,678 | | | | (6,217 | ) | | | (3,385 | ) | | | 900 | |
| Net unrealized gain/(loss) on U.S. Treasury securities | | | (1,779 | ) | | | (2,520 | ) | | | (7,981 | ) | | | (1,944 | ) | | | (1,279 | ) | | | 1,057 | |
| Change in fair value of investments in unconsolidated trading companies | | | 18,002 | | | | 17,061 | | | | (4,495 | ) | | | 16,570 | | | | 15,525 | | | | (16,350 | ) |
| | | | | | | | | | | | | | | | | | | | | | | | | |
| Net gain/(loss) on investments | | | 1,642,945 | | | | 206,960 | | | | (296,855 | ) | | | 1,376,459 | | | | 365,497 | | | | 229,151 | |
| | | | | | | | | | | | | | | | | | | | | | | | | |
| NET INCREASE/(DECREASE) IN CAPITAL RESULTING FROM OPERATIONS | | | 1,410,562 | | | | (9,735 | ) | | | (584,304 | ) | | | 1,143,723 | | | | 195,466 | | | | 57,449 | |
| | | | | | | | | | | | | | | | | | | | | | | | | |
| Less: Operations attributable to non-controlling interests | | | - | | | | - | | | | - | | | | - | | | | - | | | | 95,915 | |
| | | | | | | | | | | | | | | | | | | | | | | | | |
| NET INCREASE/(DECREASE) IN CAPITAL RESULTING FROM OPERATIONS ATTRIBUTABLE TO CONTROLLING INTERESTS | | $ | 1,410,562 | | | $ | (9,735 | ) | | $ | (584,304 | ) | | $ | 1,143,723 | | | $ | 195,466 | | | $ | (38,466 | ) |
| | | | | | | | | | | | | | | | | | | | | | | | | |
| NET INCREASE/(DECREASE) IN CAPITAL RESULTING FROM OPERATIONS ATTRIBUTABLE TO CONTROLLING INTERESTS PER UNIT | | | | | | | | | | | | | | | | | | | | | | | | |
| Class 1 | | $ | 75.82 | | | $ | (1.45 | ) | | $ | (20.62 | ) | | $ | 50.71 | | | $ | 7.33 | | | $ | (1.44 | ) |
| Class 1AP | | | N/A | | | | N/A | | | $ | (154.43 | ) | | $ | 69.23 | | | $ | 12.69 | | | $ | 2.35 | |
| Class 2 | | $ | 126.85 | | | $ | 2.84 | | | $ | (25.26 | ) | | $ | 92.64 | | | $ | 16.99 | | | $ | 2.32 | |
The accompanying notes are an integral part of these consolidated financial statements.
The Series of Frontier Funds
Consolidated Statements of Changes in Owners’ Capital
For the Years Ended December 31, 2022, 2021, 2020
| | | Frontier Diversified Fund | | | Frontier Masters Fund | |
| | | Class 1 | | | Class 2 | | | Class 2 | | | Class 3 | | | Class 3 | | | Non- | | | | | | Class 1 | | | Class 2 | | | Class 2 | | | Class 3 | | | Class 3 | | | Non- | | | | |
| | | Limited Owners | | | Managing Owner | | | Limited Owners | | | Managing Owner | | | Limited Owners | | | Controlling
Interests | | | Total | | | Limited Owners | | | Managing Owner | | | Limited Owners | | | Managing Owner | | | Limited Owners | | | Controlling
Interests | | | Total | |
| | | | | | | | | | | | | | | | | | | | | | | | | | | | | | | | | | | | | | | | | | | |
| Owners’ Capital, December 31, 2019 | | $ | 1,303,195 | | | $ | 3,023 | | | $ | 5,597,828 | | | $ | 115,933 | | | $ | 4,979,641 | | | $ | - | | | $ | 11,999,620 | | | $ | 12,794 | | | $ | 13,043 | | | $ | 837,765 | | | $ | 9,228 | | | $ | 1,365,209 | | | $ | - | | | $ | 2,238,039 | |
| | | | | | | | | | | | | | | | | | | | | | | | | | | | | | | | | | | | | | | | | | | | | | | | | | | | | | | | | |
| Sale of Units | | | - | | | | - | | | | - | | | | - | | | | - | | | | - | | | | - | | | | - | | | | - | | | | - | | | | - | | | | - | | | | - | | | | - | |
| Redemption of Units | | | - | | | | - | | | | (3,958,812 | ) | | | (30,900 | ) | | | (987,627 | ) | | | - | | | | (4,977,339 | ) | | | - | | | | (4,200 | ) | | | (379,078 | ) | | | - | | | | (398,119 | ) | | | - | | | | (781,397 | ) |
| Transfer of Units In(Out) | | | (987,405 | ) | | | - | | | | - | | | | - | | | | 987,405 | | | | - | | | | - | | | | - | | | | - | | | | - | | | | - | | | | - | | | | - | | | | - | |
| Net increase/(decrease) in Owners’ Capital resulting from operations attributable to controlling interests | | | (161,530 | ) | | | (811 | ) | | | (1,175,004 | ) | | | (30,628 | ) | | | (1,471,337 | ) | | | - | | | | (2,839,310 | ) | | | (3,054 | ) | | | (2,578 | ) | | | (201,014 | ) | | | (2,061 | ) | | | (254,408 | ) | | | - | | | | (463,115 | ) |
| | | | | | | | | | | | | | | | | | | | | | | | | | | | | | | | | | | | | | | | | | | | | | | | | | | | | | | | | |
| Owners’ Capital, December 31, 2020 | | $ | 154,260 | | | $ | 2,212 | | | $ | 464,012 | | | $ | 54,405 | | | $ | 3,508,082 | | | $ | - | | | $ | 4,182,971 | | | $ | 9,740 | | | $ | 6,265 | | | $ | 257,673 | | | $ | 7,167 | | | $ | 712,682 | | | $ | - | | | $ | 993,527 | |
| | | | | | | | | | | | | | | | | | | | | | | | | | | | | | | | | | | | | | | | | | | | | | | | | | | | | | | | | |
| Sale of Units | | | - | | | | 6,000 | | | | - | | | | - | | | | - | | | | - | | | | 6,000 | | | | - | | | | 1,000 | | | | - | | | | - | | | | - | | | | - | | | | 1,000 | |
| Redemption of Units | | | (161,099 | ) | | | - | | | | (91,628 | ) | | | (32,300 | ) | | | (939,962 | ) | | | - | | | | (1,224,989 | ) | | | - | | | | (3,500 | ) | | | (74,835 | ) | | | (3,500 | ) | | | (252,625 | ) | | | - | | | | (334,460 | ) |
| Transfer of Units In(Out) | | | - | | | | - | | | | - | | | | - | | | | - | | | | - | | | | - | | | | (10,187 | ) | | | - | | | | - | | | | - | | | | 10,187 | | | | - | | | | | |
| Net increase/(decrease) in Owners’ Capital resulting from operations attributable to controlling interests | | | 6,839 | | | | (342 | ) | | | 1,263 | | | | 572 | | | | 60,826 | | | | - | | | | 69,158 | | | | 447 | | | | 16 | | | | 11,780 | | | | 266 | | | | 35,098 | | | | - | | | | 47,607 | |
| | | | | | | | | | | | | | | | | | | | | | | | | | | | | | | | | | | | | | | | | | | | | | | | | | | | | | | | | |
| Owners’ Capital, December 31, 2021 | | $ | - | | | $ | 7,870 | | | $ | 373,647 | | | $ | 22,677 | | | $ | 2,628,946 | | | $ | - | | | $ | 3,033,140 | | | $ | - | | | $ | 3,781 | | | $ | 194,618 | | | $ | 3,933 | | | $ | 505,342 | | | $ | - | | | $ | 707,674 | |
| | | | | | | | | | | | | | | | | | | | | | | | | | | | | | | | | | | | | | | | | | | | | | | | | | | | | | | | | |
| Sale of Units | | | - | | | | - | | | | - | | | | - | | | | - | | | | - | | | | - | | | | - | | | | - | | | | - | | | | - | | | | - | | | | - | | | | - | |
| Redemption of Units | | | - | | | | - | | | | (15,125 | ) | | | (4,800 | ) | | | (473,510 | ) | | | - | | | | (493,435 | ) | | | - | | | | - | | | | (69,840 | ) | | | (3,150 | ) | | | (170,633 | ) | | | - | | | | (243,623 | ) |
| Transfer of Units In(Out) | | | - | | | | - | | | | - | | | | - | | | | - | | | | - | | | | - | | | | - | | | | - | | | | - | | | | - | | | | - | | | | - | | | | | |
| Net increase/(decrease) in Owners’ Capital resulting from operations attributable to controlling interests | | | - | | | | 653 | | | | 34,134 | | | | 2,556 | | | | 286,924 | | | | - | | | | 324,267 | | | | - | | | | 1,319 | | | | 52,324 | | | | 1,431 | | | | 176,995 | | | | - | | | | 232,069 | |
| | | | | | | | | | | | | | | | | | | | | | | | | | | | | | | | | | | | | | | | | | | | | | | | | | | | | | | | | |
| Owners’ Capital, December 31, 2022 | | $ | - | | | $ | 8,523 | | | $ | 392,656 | | | $ | 20,433 | | | $ | 2,442,360 | | | $ | - | | | $ | 2,863,972 | | | $ | - | | | $ | 5,100 | | | $ | 177,102 | | | $ | 2,214 | | | $ | 511,704 | | | $ | - | | | $ | 696,120 | |
| | | | | | | | | | | | | | | | | | | | | | | | | | | | | | | | | | | | | | | | | | | | | | | | | | | | | | | | | |
| Owners’ Capital - Units, December 31, 2019 | | | 12,890 | | | | 25 | | | | 46,042 | | | | 1,020 | | | | 43,832 | | | | | | | | | | | | 177 | | | | 149 | | | | 9,610 | | | | 113 | | | | 16,693 | | | | | | | | | |
| Sale of Units (including transfers) | | | - | | | | - | | | | - | | | | - | | | | - | | | | | | | | | | | | - | | | | - | | | | - | | | | - | | | | - | | | | | | | | | |
| Redemption of Units (including transfers) | | | (10,768 | ) | | | - | | | | (40,825 | ) | | | (367 | ) | | | (1,732 | ) | | | | | | | | | | | - | | | | (56 | ) | | | (5,794 | ) | | | - | | | | (5,473 | ) | | | | | | | | |
| Owners’ Capital - Units, December 31, 2020 | | | 2,122 | | | | 25 | | | | 5,217 | | | | 653 | | | | 42,100 | | | | | | | | | | | | 177 | | | | 93 | | | | 3,816 | | | | 113 | | | | 11,220 | | | | | | | | | |
| | | | | | | | | | | | | | | | | | | | | | | | | | | | | | | | | | | | | | | | | | | | | | | | | | | | | | | | | |
| Sale of Units (including transfers) | | | - | | | | 64 | | | | - | | | | - | | | | - | | | | | | | | | | | | - | | | | 13 | | | | - | | | | - | | | | - | | | | | | | | | |
| Redemption of Units (including transfers) | | | (2,122 | ) | | | - | | | | (1,018 | ) | | | (382 | ) | | | (10,638 | ) | | | | | | | | | | | (177 | ) | | | (53 | ) | | | (1,041 | ) | | | (53 | ) | | | (3,581 | ) | | | | | | | | |
| Owners’ Capital - Units, December 31, 2021 | | | - | | | | 89 | | | | 4,199 | | | | 271 | | | | 31,462 | | | | | | | | | | | | - | | | | 53 | | | | 2,775 | | | | 60 | | | | 7,639 | | | | | | | | | |
| | | | | | | | | | | | | | | | | | | | | | | | | | | | | | | | | | | | | | | | | | | | | | | | | | | | | | | | | |
| Sale of Units (including transfers) | | | - | | | | - | | | | - | | | | - | | | | - | | | | | | | | | | | | - | | | | - | | | | - | | | | - | | | | - | | | | | | | | | |
| Redemption of Units (including transfers) | | | - | | | | - | | | | (125 | ) | | | (46 | ) | | | (4,541 | ) | | | | | | | | | | | - | | | | - | | | | (903 | ) | | | (35 | ) | | | (1,919 | ) | | | | | | | | |
| Owners’ Capital - Units, December 31, 2022 | | | - | | | | 89 | | | | 4,074 | | | | 225 | | | | 26,921 | | | | | | | | | | | | - | | | | 53 | | | | 1,872 | | | | 25 | | | | 5,720 | | | | | | | | | |
| | | | | | | | | | | | | | | | | | | | | | | | | | | | | | | | | | | | | | | | | | | | | | | | | | | | | | | | | |
| Net asset value per unit at December 31, 2019 | | $ | 101.10 | | | | | | | $ | 121.58 | | | | | | | $ | 113.61 | | | | | | | | | | | $ | 72.28 | | | | | | | $ | 87.18 | | | | | | | $ | 81.78 | | | | | | | | | |
| | | | | | | | | | | | | | | | | | | | | | | | | | | | | | | | | | | | | | | | | | | | | | | | | | | | | | | | | |
| Change in net asset value per unit for the year ended December 31, 2020 | | | (28.42 | ) | | | | | | | (32.63 | ) | | | | | | | (30.28 | ) | | | | | | | | | | | (17.10 | ) | | | | | | | (19.64 | ) | | | | | | | (18.26 | ) | | | | | | | | |
| | | | | | | | | | | | | | | | | | | | | | | | | | | | | | | | | | | | | | | | | | | | | | | | | | | | | | | | | |
| Net asset value per unit at December 31, 2020 | | $ | 72.68 | | | | | | | $ | 88.95 | | | | | | | $ | 83.33 | | | | | | | | | | | $ | 55.18 | | | | | | | $ | 67.54 | | | | | | | $ | 63.52 | | | | | | | | | |
| | | | | | | | | | | | | | | | | | | | | | | | | | | | | | | | | | | | | | | | | | | | | | | | | | | | | | | | | |
| Change in net asset value per unit for the year ended December 31, 2021 | | | (72.68 | ) | | | | | | | 0.03 | | | | | | | | 0.23 | | | | | | | | | | | | (55.18 | ) | | | | | | | 2.63 | | | | | | | | 2.63 | | | | | | | | | |
| | | | | | | | | | | | | | | | | | | | | | | | | | | | | | | | | | | | | | | | | | | | | | | | | | | | | | | | | |
| Net asset value per unit at December 31, 2021 | | $ | - | | | | | | | $ | 88.98 | | | | | | | $ | 83.56 | | | | | | | | | | | $ | - | | | | | | | $ | 70.17 | | | | | | | $ | 66.15 | | | | | | | | | |
| | | | | | | | | | | | | | | | | | | | | | | | | | | | | | | | | | | | | | | | | | | | | | | | | | | | | | | | | |
| Change in net asset value per unit for the year ended December 31, 2022 | | $ | - | | | | | | | $ | 7.39 | | | | | | | $ | 7.16 | | | | | | | | | | | $ | - | | | | | | | $ | 24.47 | | | | | | | $ | 23.30 | | | | | | | | | |
| | | | | | | | | | | | | | | | | | | | | | | | | | | | | | | | | | | | | | | | | | | | | | | | | | | | | | | | | |
| Net asset value per unit at December 31, 2022 (1) | | $ | - | | | | | | | $ | 96.37 | | | | | | | $ | 90.72 | | | | | | | | | | | $ | - | | | | | | | $ | 94.64 | | | | | | | $ | 89.45 | | | | | | | | | |
| (1) | Values are for both the Managing Owner and Limited Owners. |
The accompanying notes are an integral part of these consolidated financial statements.
The Series of Frontier Funds
Consolidated Statements of Changes in Owners’ Capital
For the Years Ended December 31, 2022, 2021, 2020
| | | Frontier Long/Short Commodity Fund | |
| | | Class 2 | | | Class 3 | | | Class 1a | | | Class 2a | | | Class 3a | | | Non- | | | | |
| | | Managing
Owner | | | Limited Owners | | | Limited Owners | | | Limited Owners | | | Managing Owner | | | Limited Owners | | | Managing Owner | | | Limited Owners | | | Controlling Interests | | | Total | |
| | | | | | | | | | | | | | | | | | | | | | | | | | | | | | | |
| Owners’ Capital, December 31, 2019 | | $ | 4,530 | | | $ | 36,515 | | | $ | 991,828 | | | $ | 11,447 | | | $ | 7,861 | | | $ | 73,965 | | | $ | 993 | | | $ | 207,151 | | | $ | - | | | $ | 1,334,290 | |
| | | | | | | | | | | | | | | | | | | | | | | | | | | | | | | | | | | | | | | | | |
| Redemption of Units | | | (800 | ) | | | (7,667 | ) | | | (66,892 | ) | | | - | | | | - | | | | (1,193 | ) | | | - | | | | (13,411 | ) | | | - | | | | (89,964 | ) |
| Transfer of Units In(Out) | | | - | | | | - | | | | - | | | | (11,267 | ) | | | - | | | | - | | | | - | | | | 11,267 | | | | - | | | | - | |
| Net increase/(decrease) in Owners’ Capital resulting from operations attributable to controlling interests | | | 209 | | | | 1,486 | | | | 51,835 | | | | (180 | ) | | | 413 | | | | 3,811 | | | | 55 | | | | 11,347 | | | | - | | | | 68,977 | |
| Owners’ Capital, December 31, 2020 | | $ | 3,939 | | | $ | 30,334 | | | $ | 976,771 | | | $ | - | | | $ | 8,274 | | | $ | 76,583 | | | $ | 1,048 | | | $ | 216,354 | | | $ | - | | | $ | 1,313,303 | |
| | | | | | | | | | | | | | | | | | | | | | | | | | | | | | | | | | | | | | | | | |
| Sale of Units | | | - | | | | - | | | | - | | | | - | | | | - | | | | - | | | | - | | | | - | | | | - | | | | - | |
| Redemption of Units | | | - | | | | (11,508 | ) | | | (106,533 | ) | | | - | | | | (1,300 | ) | | | (4,963 | ) | | | - | | | | (22,947 | ) | | | - | | | | (147,251 | ) |
| Transfer of Units In(Out) | | | - | | | | - | | | | - | | | | - | | | | - | | | | - | | | | - | | | | - | | | | - | | | | - | |
| Net increase/(decrease) in Owners’ Capital resulting from operations attributable to controlling interests | | | 182 | | | | 2,219 | | | | 52,820 | | | | - | | | | 645 | | | | 4,619 | | | | 68 | | | | 13,719 | | | | - | | | | 74,272 | |
| | | | | | | | | | | | | | | | | | | | | | | | | | | | | | | | | | | | | | | | | |
| Owners’ Capital, December 31, 2021 | | $ | 4,121 | | | $ | 21,045 | | | $ | 923,058 | | | $ | - | | | $ | 7,619 | | | $ | 76,239 | | | $ | 1,116 | | | $ | 207,126 | | | $ | - | | | $ | 1,240,324 | |
| | | | | | | | | | | | | | | | | | | | | | | | | | | | | | | | | | | | | | | | | |
| Sale of Units | | | - | | | | - | | | | - | | | | - | | | | - | | | | - | | | | - | | | | - | | | | - | | | | - | |
| Redemption of Units | | | (2,000 | ) | | | - | | | | (120,894 | ) | | | - | | | | - | | | | (12,788 | ) | | | - | | | | (10,780 | ) | | | - | | | | (146,462 | ) |
| Transfer of Units In(Out) | | | - | | | | - | | | | - | | | | - | | | | - | | | | - | | | | - | | | | - | | | | - | | | | - | |
| Net increase/(decrease) in Owners’ Capital resulting from operations attributable to controlling interests | | | 944 | | | | 4,603 | | | | 195,931 | | | | - | | | | 1,709 | | | | 17,238 | | | | 253 | | | | 47,733 | | | | - | | | | 268,411 | |
| Owners’ Capital, December 31, 2022 | | $ | 3,065 | | | $ | 25,648 | | | $ | 998,095 | | | $ | - | | | $ | 9,328 | | | $ | 80,689 | | | $ | 1,369 | | | $ | 244,079 | | | $ | - | | | $ | 1,362,273 | |
| | | | | | | | | | | | | | | | | | | | | | | | | | | | | | | | | | | | | | | | | |
| Owners’ Capital - Units, December 31, 2019 | | | 56 | | | | 447 | | | | 11,581 | | | | 259 | | | | 149 | | | | 1,409 | | | | 18 | | | | 3,745 | | | | | | | | | |
| Sale of Units (including transfers) | | | - | | | | - | | | | - | | | | - | | | | - | | | | - | | | | - | | | | - | | | | | | | | | |
| Redemption of Units (including transfers) | | | (10 | ) | | | (94 | ) | | | (753 | ) | | | (259 | ) | | | - | | | | (23 | ) | | | - | | | | (38 | ) | | | | | | | | |
| Owners’ Capital - Units, December 31, 2020 | | | 46 | | | | 353 | | | | 10,828 | | | | - | | | | 149 | | | | 1,386 | | | | 18 | | | | 3,707 | | | | | | | | | |
| Sale of Units (including transfers) | | | - | | | | - | | | | - | | | | - | | | | - | | | | - | | | | - | | | | - | | | | | | | | | |
Redemption of Units (including transfers) | | | - | | | | (119 | ) | | | (1,048 | ) | | | - | | | | (20 | ) | | | (87 | ) | | | - | | | | (374 | ) | | | | | | | | |
| Owners’ Capital - Units, December 31, 2021 | | | 46 | | | | 234 | | | | 9,780 | | | | - | | | | 129 | | | | 1,299 | | | | 18 | | | | 3,333 | | | | | | | | | |
| | | | | | | | | | | | | | | | | | | | | | | | | | | | | | | | | | | | | | | | | |
| Sale of Units (including transfers) | | | - | | | | - | | | | - | | | | - | | | | - | | | | - | | | | - | | | | - | | | | | | | | | |
| Redemption of Units (including transfers) | | | (18 | ) | | | - | | | | (1,103 | ) | | | - | | | | - | | | | (177 | ) | | | - | | | | (133 | ) | | | | | | | | |
| Owners’ Capital - Units, December 31, 2022 | | | 28 | | | | 234 | | | | 8,677 | | | | - | | | | 129 | | | | 1,122 | | | | 18 | | | | 3,199 | | | | | | | | | |
| | | | | | | | | | | | | | | | | | | | | | | | | | | | | | | | | | | | | | | | | |
| | | | | | | | | | | | | | | | | | | | | | | | | | | | | | | | | | | | | | | | | |
| Net asset value per unit at December 31, 2019 | | | | | | $ | 81.60 | | | $ | 85.64 | | | $ | 44.20 | | | | | | | $ | 52.55 | | | | | | | $ | 55.31 | | | | | | | | | |
| | | | | | | | | | | | | | | | | | | | | | | | | | | | | | | | | | | | | | | | | |
| Change in net asset value per unit for the year ended December 31, 2020 | | | | | | | 4.39 | | | | 4.57 | | | | (44.20 | ) | | | | | | | 2.74 | | | | | | | | 3.06 | | | | | | | | | |
| Net asset value per unit at December 31, 2020 | | | | | | $ | 85.99 | | | $ | 90.21 | | | $ | - | | | | | | | $ | 55.29 | | | | | | | $ | 58.37 | | | | | | | | | |
| Change in net asset value per unit for the year ended December 31, 2021 | | | | | | | 3.98 | | | | 4.17 | | | | - | | | | | | | | 3.46 | | | | | | | | 3.79 | | | | | | | | | |
| | | | | | | | | | | | | | | | | | | | | | | | | | | | | | | | | | | | | | | | | |
| Net asset value per unit at December 31, 2021 | | | | | | $ | 89.97 | | | $ | 94.38 | | | $ | - | | | | | | | $ | 58.75 | | | | | | | $ | 62.16 | | | | | | | | | |
| | | | | | | | | | | | | | | | | | | | | | | | | | | | | | | | | | | | | | | | | |
| Change in net asset value per unit for the year ended December 31, 2022 | | | | | | $ | 19.68 | | | $ | 20.65 | | | $ | - | | | | | | | $ | 13.18 | | | | | | | $ | 14.13 | | | | | | | | | |
| | | | | | | | | | | | | | | | | | | | | | | | | | | | | | | | | | | | | | | | | |
| Net asset value per unit at December 31, 2022 (1) | | | | | | $ | 109.65 | | | $ | 115.03 | | | $ | - | | | | | | | $ | 71.93 | | | | | | | $ | 76.29 | | | | | | | | | |
| (1) | Values are for both the Managing Owner and Limited Owners. |
The accompanying notes are an integral part of these consolidated financial statements.
The Series of Frontier Funds
Consolidated Statements of Changes in Owners’ Capital
For the Years Ended December 31, 2022, 2021, 2020
| | | Frontier Balanced Fund | |
| | | Class 1 | | | Class 1AP | | | Class 2 | | | Class 2a | | | Class 3a | | | Non- | | | | |
| | | Limited Owners | | | Limited Owners | | | Managing Owner | | | Limited Owners | | | Managing Owner | | | Limited Owners | | | Limited Owners | | | Controlling Interests | | | Total | |
| Owners’ Capital, December 31, 2019 | | $ | 17,797,600 | | | $ | 238,544 | | | $ | 73,748 | | | $ | 3,288,105 | | | $ | 151,133 | | | $ | 44,048 | | | $ | 900,583 | | | $ | - | | | $ | 22,493,761 | |
| | | | | | | | | | | | | | | | | | | | | | | | | | | | | | | | | | | | | |
| Redemption of Units (including transfers) | | | (2,911,348 | ) | | | (54,192 | ) | | | - | | | | (400,453 | ) | | | (29,800 | ) | | | - | | | | (121,641 | ) | | | - | | | | (3,517,434 | ) |
| Net increase/(decrease) in Owners’ Capital resulting from operations attributable to controlling interests | | | (5,455,720 | ) | | | (76,299 | ) | | | (21,938 | ) | | | (981,293 | ) | | | (45,917 | ) | | | (13,087 | ) | | | (271,794 | ) | | | - | | | | (6,866,048 | ) |
| | | | | | | | | | | | | | | | | | | | | | | | | | | | | | | | | | | | | |
| Owners’ Capital, December 31, 2020 | | $ | 9,430,532 | | | $ | 108,053 | | | $ | 51,810 | | | $ | 1,906,359 | | | $ | 75,416 | | | $ | 30,961 | | | $ | 507,148 | | | $ | - | | | $ | 12,110,279 | |
| | | | | | | | | | | | | | | | | | | | | | | | | | | | | | | | | | | | | |
| Redemption of Units (including transfers) | | | (2,341,345 | ) | | | (51,153 | ) | | | (12,500 | ) | | | (539,532 | ) | | | (23,500 | ) | | | (34,162 | ) | | | (163,035 | ) | | | - | | | | (3,165,227 | ) |
| Net increase/(decrease) in Owners’ Capital resulting from operations attributable to controlling interests | | | 382,654 | | | | 9,127 | | | | 3,838 | | | | 123,103 | | | | 4,412 | | | | 3,201 | | | | 37,646 | | | | - | | | | 563,981 | |
| | | | | | | | | | | | | | | | | | | | | | | | | | | | | | | | | | | | | |
| Owners’ Capital, December 31, 2021 | | $ | 7,471,841 | | | $ | 66,027 | | | $ | 43,148 | | | $ | 1,489,930 | | | $ | 56,328 | | | $ | - | | | $ | 381,759 | | | $ | - | | | $ | 9,509,033 | |
| | | | | | | | | | | | | | | | | | | | | | | | | | | | | | | | | | | | | |
| Redemption of Units | | | (2,018,252 | ) | | | (7,580 | ) | | | - | | | | (302,031 | ) | | | (28,650 | ) | | | - | | | | - | | | | - | | | | (2,356,513 | ) |
| Net increase/(decrease) in Owners’ Capital resulting from operations attributable to controlling interests | | | 1,680,556 | | | | 16,422 | | | | 10,094 | | | | 361,645 | | | | 15,604 | | | | - | | | | 89,887 | | | | - | | | | 2,174,208 | |
| | | | | | | | | | | | | | | | | | | | | | | | | | | | | | | | | | | | | |
| Owners’ Capital, December 31, 2022 | | $ | 7,134,145 | | | $ | 74,869 | | | $ | 53,242 | | | $ | 1,549,544 | | | $ | 43,282 | | | $ | - | | | $ | 471,646 | | | $ | - | | | $ | 9,326,728 | |
| | | | | | | | | | | | | | | | | | | | | | | | | | | | | | | | | | | | | |
| Owners’ Capital - Units, December 31, 2019 | | | 151,814 | | | | 1,731 | | | | 397 | | | | 17,695 | | | | 938 | | | | 274 | | | | 5,611 | | | | | | | | | |
| Redemption of Units (including transfers) | | | (33,823 | ) | | | (615 | ) | | | - | | | | (3,092 | ) | | | (272 | ) | | | - | | | | (1,116 | ) | | | | | | | | |
| | | | | | | | | | | | | | | | | | | | | | | | | | | | | | | | | | | | | |
| Owners’ Capital - Units, December 31, 2020 | | | 117,991 | | | | 1,116 | | | | 397 | | | | 14,603 | | | | 666 | | | | 274 | | | | 4,495 | | | | | | | | | |
| Redemption of Units (including transfers) | | | (27,772 | ) | | | (477 | ) | | | (87 | ) | | | (3,915 | ) | | | (200 | ) | | | (274 | ) | | | (1,329 | ) | | | | | | | | |
| | | | | | | | | | | | | | | | | | | | | | | | | | | | | | | | | | | | | |
| Owners’ Capital - Units, December 31, 2021 | | | 90,219 | | | | 639 | | | | 310 | | | | 10,688 | | | | 466 | | | | - | | | | 3,166 | | | | | | | | | |
| Sale of Units (including transfers) | | | - | | | | - | | | | - | | | | - | | | | - | | | | - | | | | - | | | | | | | | | |
| Redemption of Units (including transfers) | | | (18,283 | ) | | | (52 | ) | | | - | | | | (1,680 | ) | | | (176 | ) | | | - | | | | - | | | | | | | | | |
| Owners’ Capital - Units, December 31, 2022 | | | 71,936 | | | | 587 | | | | 310 | | | | 9,008 | | | | 290 | | | | - | | | | 3,166 | | | | | | | | | |
| | | | | | | | | | | | | | | | | | | | | | | | | | | | | | | | | | | | | |
| Net asset value per unit at December 31, 2019 | | $ | 117.23 | | | $ | 137.81 | | | | | | | $ | 185.82 | | | | | | | $ | 161.04 | | | $ | 160.50 | | | | | | | | | |
| Change in net asset value per unit for the year ended December 31, 2020 | | | (37.30 | ) | | | (41.00 | ) | | | | | | | (55.28 | ) | | | | | | | (47.84 | ) | | | (47.69 | ) | | | | | | | | |
| | | | | | | | | | | | | | | | | | | | | | | | | | | | | | | | | | | | | |
| Net asset value per unit at December 31, 2020 | | $ | 79.93 | | | $ | 96.81 | | | | | | | $ | 130.54 | | | | | | | $ | 113.20 | | | $ | 112.81 | | | | | | | | | |
| Change in net asset value per unit for the year ended December 31, 2021 | | | 2.89 | | | | 6.57 | | | | | | | | 8.86 | | | | | | | | 7.78 | | | | 7.76 | | | | | | | | | |
| | | | | | | | | | | | | | | | | | | | | | | | | | | | | | | | | | | | | |
| Net asset value per unit at December 31, 2021 | | $ | 82.82 | | | $ | 103.38 | | | | | | | $ | 139.40 | | | | | | | $ | 120.98 | | | $ | 120.57 | | | | | | | | | |
| Change in net asset value per unit for the year ended December 31, 2022 | | $ | 16.35 | | | $ | 24.18 | | | | | | | $ | 32.61 | | | | | | | $ | 28.49 | | | $ | 28.39 | | | | | | | | | |
| Net asset value per unit at December 31, 2022 (1) | | $ | 99.17 | | | $ | 127.56 | | | | | | | $ | 172.01 | | | | | | | $ | 149.47 | | | $ | 148.96 | | | | | | | | | |
| (1) | Values are for both the Managing Owner and Limited Owners. |
The accompanying notes are an integral part of these consolidated financial statements.
The Series of Frontier Funds
Consolidated Statements of Changes in Owners’ Capital
For the Years Ended December 31, 2022, 2021, 2020
| | | Frontier Select Fund | | | Frontier Global Fund | | | Frontier Heritage Fund | |
| | | Class 1 | | | Class 1AP | | | Class 2 | | | Non- | | | | | | Class 1 | | | Class 1AP | | | Class 2 | | | Non- | | | | | | Class 1 | | | Class 1AP | | | Class 2 | | | Non- | | | | |
| | | Limited Owners | | | Limited Owners | | | Managing Owner | | | Limited Owners | | | Controlling Interests | | | Total | | | Limited Owners | | | Limited Owners | | | Managing Owner | | | Limited Owners | | | Controlling Interests | | | Total | | | Limited Owners | | | Limited Owners | | | Managing Owner | | | Limited Owners | | | Controlling Interests | | | Total | |
| | | | | | | | | | | | | | | | | | | | | | | | | | | | | | | | | | | | | | | | | | | | | | | | | | | | | | | |
| | | | | | | | | | | | | | | | | | | | | | | | | | | | | | | | | | | | | | | | | | | | | | | | | | | | | | | |
| Owners’ Capital, December 31, 2019 | | $ | 2,715,051 | | | $ | 10,834 | | | $ | 29,831 | | | $ | 60,910 | | | $ | - | | | $ | 2,816,626 | | | $ | 4,471,980 | | | $ | 33,047 | | | $ | 50,058 | | | $ | 293,159 | | | $ | - | | | $ | 4,848,244 | | | $ | 2,295,623 | | | $ | 8,333 | | | $ | 28,593 | | | $ | 493,464 | | | $ | 479,024 | | | $ | 3,305,037 | |
| | | | | | | | | | | | | | | | | | | | | | | | | | | | | | | | | | | | | | | | | | | | | | | | | | | | | | | | | | | | | | | | | | | | | | | | | |
| Sale of Units | | | - | | | | - | | | | - | | | | - | | | | - | | | | - | | | | - | | | | - | | | | - | | | | - | | | | - | | | | - | | | | - | | | | - | | | | - | | | | - | | | | - | | | | - | |
| Payment made by Related Party | | | - | | | | - | | | | - | | | | - | | | | - | | | | - | | | | - | | | | - | | | | - | | | | - | | | | - | | | | - | | | | - | | | | - | | | | - | | | | - | | | | - | | | | - | |
| Redemption of Units | | | (850,467 | ) | | | - | | | | (10,200 | ) | | | (5,197 | ) | | | - | | | | (865,864 | ) | | | (1,174,215 | ) | | | (25,277 | ) | | | (14,300 | ) | | | (119,499 | ) | | | - | | | | (1,333,291 | ) | | | (94,455 | ) | | | - | | | | (4,700 | ) | | | (303,112 | ) | | | - | | | | (402,266 | ) |
| Change in control of ownership - Trading Companies | | | - | | | | - | | | | - | | | | - | | | | - | | | | - | | | | - | | | | - | | | | - | | | | - | | | | - | | | | - | | | | - | | | | - | | | | - | | | | - | | | | - | | | | - | |
| Operations attributable to non-controlling interests | | | - | | | | - | | | | - | | | | - | | | | - | | | | - | | | | - | | | | - | | | | - | | | | - | | | | - | | | | - | | | | - | | | | - | | | | - | | | | - | | | | - | | | | - | |
| Transfer of Units In(Out) | | | - | | | | - | | | | - | | | | - | | | | - | | | | - | | | | - | | | | - | | | | - | | | | - | | | | - | | | | - | | | | - | | | | - | | | | - | | | | - | | | | - | | | | - | |
| Net increase/(decrease) in Owners’ Capital resulting from operations attributable to controlling interests | | | (289,256 | ) | | | (1,013 | ) | | | (2,421 | ) | | | (4,944 | ) | | | - | | | | (297,634 | ) | | | (555,793 | ) | | | (7,770 | ) | | | (4,392 | ) | | | (16,349 | ) | | | - | | | | (584,304 | ) | | | (32,016 | ) | | | 127 | | | | 212 | | | | (6,787 | ) | | | (479,024 | ) | | | (517,489 | ) |
| | | | | | | | | | | | | | | | | | | | | | | | | | | | | | | | | | | | | | | | | | | | | | | | | | | | | | | | | | | | | | | | | | | | | | | | | |
| Owners’ Capital, December 31, 2020 | | $ | 1,575,328 | | | $ | 9,821 | | | $ | 17,210 | | | $ | 50,769 | | | $ | - | | | $ | 1,653,128 | | | $ | 2,741,972 | | | $ | - | | | $ | 31,366 | | | $ | 157,311 | | | $ | - | | | $ | 2,930,649 | | | $ | 2,169,152 | | | $ | 8,460 | | | $ | 24,105 | | | $ | 183,565 | | | $ | - | | | $ | 2,385,282 | |
| | | | | | | | | | | | | | | | | | | | | | | | | | | | | | | | | | | | | | | | | | | | | | | | | | | | | | | | | | | | | | | | | | | | | | | | | |
| Payment made by Related Party | | | - | | | | - | | | | - | | | | - | | | | - | | | | - | | | | - | | | | - | | | | - | | | | - | | | | - | | | | - | | | | - | | | | - | | | | - | | | | - | | | | - | | | | - | |
| Redemption of Units | | | (381,729 | ) | | | (656 | ) | | | (4,200 | ) | | | (482 | ) | | | - | | | | (387,067 | ) | | | (802,573 | ) | | | - | | | | (7,000 | ) | | | - | | | | - | | | | (809,573 | ) | | | (217,618 | ) | | | (1,101 | ) | | | (3,000 | ) | | | (36,721 | ) | | | - | | | | (258,440 | ) |
| Operations attributable to non-controlling interests | | | - | | | | - | | | | - | | | | - | | | | - | | | | - | | | | - | | | | - | | | | - | | | | - | | | | - | | | | - | | | | - | | | | - | | | | - | | | | - | | | | - | | | | - | |
| Transfer of Units In(Out) | | | - | | | | - | | | | - | | | | - | | | | - | | | | - | | | | - | | | | - | | | | - | | | | - | | | | - | | | | - | | | | - | | | | - | | | | - | | | | - | | | | - | | | | - | |
| Net increase/(decrease) in Owners’ Capital resulting from operations attributable to controlling interests | | | 140,919 | | | | 1,094 | | | | 1,971 | | | | 5,825 | | | | - | | | | 149,809 | | | | (13,071 | ) | | | - | | | | 663 | | | | 2,673 | | | | - | | | | (9,735 | ) | | | 167,716 | | | | 883 | | | | 2,814 | | | | 24,053 | | | | - | | | | 195,466 | |
| | | | | | | | | | | | | | | | | | | | | | | | | | | | | | | | | | | | | | | | | | | | | | | | | | | | | | | | | | | | | | | | | | | | | | | | | |
| Owners’ Capital, December 31, 2021 | | $ | 1,334,518 | | | $ | 10,259 | | | $ | 14,981 | | | $ | 56,112 | | | $ | - | | | $ | 1,415,870 | | | $ | 1,926,328 | | | $ | - | | | $ | 25,029 | | | $ | 159,984 | | | $ | - | | | $ | 2,111,341 | | | $ | 2,119,250 | | | $ | 8,242 | | | $ | 23,919 | | | $ | 170,897 | | | $ | - | | | $ | 2,322,308 | |
| | | | | | | | | | | | | | | | | | | | | | | | | | | | | | | | | | | | | | | | | | | | | | | | | | | | | | | | | | | | | | | | | | | | | | | | | |
| Sale of Units | | | - | | | | - | | | | - | | | | - | | | | - | | | | - | | | | - | | | | - | | | | - | | | | - | | | | - | | | | - | | | | - | | | | - | | | | - | | | | - | | | | - | | | | - | |
| Redemption of Units | | | (100,095 | ) | | | (1,330 | ) | | | (2,400 | ) | | | (5,200 | ) | | | - | | | | (109,025 | ) | | | (540,252 | ) | | | - | | | | (12,500 | ) | | | (140,948 | ) | | | - | | | | (693,700 | ) | | | (316,598 | ) | | | - | | | | (5,800 | ) | | | (57,276 | ) | | | - | | | | (379,674 | ) |
| Transfer of Units In(Out) | | | - | | | | - | | | | - | | | | | | | | - | | | | - | | | | - | | | | - | | | | - | | | | - | | | | - | | | | - | | | | - | | | | - | | | | - | | | | - | | | | - | | | | - | |
| Net increase/(decrease) in Owners’ Capital resulting from operations attributable to controlling interests | | | 182,690 | | | | 1,625 | | | | 2,587 | | | | 8,859 | | | | - | | | | 195,761 | | | | 1,303,049 | | | | - | | | | 16,292 | | | | 91,221 | | | | - | | | | 1,410,562 | | | | 1,028,180 | | | | 4,415 | | | | 13,006 | | | | 98,122 | | | | - | | | | 1,143,723 | |
| | | | | | | | | | | | | | | | | | | | | | | | | | | | | | | | | | | | | | | | | | | | | | | | | | | | | | | | | | | | | | | | | | | | | | | | | |
| Owners’ Capital, December 31, 2022 | | $ | 1,417,113 | | | $ | 10,554 | | | $ | 15,168 | | | $ | 59,771 | | | $ | - | | | $ | 1,502,606 | | | $ | 2,689,125 | | | $ | - | | | $ | 28,821 | | | $ | 110,257 | | | $ | - | | | $ | 2,828,203 | | | $ | 2,830,832 | | | $ | 12,657 | | | $ | 31,125 | | | $ | 211,743 | | | $ | - | | | $ | 3,086,357 | |
| | | | | | | | | | | | | | | | | | | | | | | | | | | | | | | | | | | | | | | | | | | | | | | | | | | | | | | | | | | | | | | | | | | | | | | | | |
| Owners’ Capital - Units, December 31, 2019 | | | 40,793 | | | | 138 | | | | 288 | | | | 585 | | | | | | | | | | | | 34,003 | | | | 214 | | | | 260 | | | | 1,520 | | | | | | | | | | | | 23,536 | | | | 73 | | | | 186 | | | | 3,213 | | | | | | | | | |
| | | | | | | | | | | | | | | | | | | | | | | | | | | | | | | | | | | | | | | | | | | | | | | | | | | | | | | | | | | | | | | | | | | | | | | | | |
| Sale of Units (including transfers) | | | - | | | | - | | | | - | | | | - | | | | | | | | | | | | - | | | | - | | | | - | | | | - | | | | | | | | | | | | - | | | | - | | | | - | | | | - | | | | | | | | | |
| Redemption of Units (including transfers) | | | (13,887 | ) | | | - | | | | (105 | ) | | | (46 | ) | | | | | | | | | | | (9,279 | ) | | | (214 | ) | | | (73 | ) | | | (581 | ) | | | | | | | | | | | (964 | ) | | | - | | | | (31 | ) | | | (2,036 | ) | | | | | | | | |
| | | | | | | | | | | | | | | | | | | | | | | | | | | | | | | | | | | | | | | | | | | | | | | | | | | | | | | | | | | | | | | | | | | | | | | | | |
| Owners’ Capital - Units, December 31, 2020 | | | 26,906 | | | | 138 | | | | 183 | | | | 539 | | | | | | | | | | | | 24,724 | | | | - | | | | 187 | | | | 939 | | | | | | | | | | | | 22,572 | | | | 73 | | | | 155 | | | | 1,177 | | | | | | | | | |
| | | | | | | | | | | | | | | | | | | | | | | | | | | | | | | | | | | | | | | | | | | | | | | | | | | | | | | | | | | | | | | | | | | | | | | | | |
| Sale of Units (including transfers) | | | | | | | | | | | | | | | | | | | | | | | | | | | | | | | | | | | | | | | | | | | | | | | | | | | | | | | | | | | | | | | | | | | | | | | | |
| Redemption of Units (including transfers) | | | (5,855 | ) | | | (9 | ) | | | (41 | ) | | | (4 | ) | | | | | | | | | | | (7,124 | ) | | | - | | | | (40 | ) | | | - | | | | | | | | | | | | (2,081 | ) | | | (9 | ) | | | (16 | ) | | | (189 | ) | | | | | | | | |
| | | | | | | | | | | | | | | | | | | | | | | | | | | | | | | | | | | | | | | | | | | | | | | | | | | | | | | | | | | | | | | | | | | | | | | | | |
| Owners’ Capital - Units, December 31, 2021 | | | 21,051 | | | | 129 | | | | 142 | | | | 535 | | | | | | | | | | | | 17,600 | | | | - | | | | 147 | | | | 939 | | | | | | | | | | | | 20,491 | | | | 64 | | | | 139 | | | | 988 | | | | | | | | | |
| | | | | | | | | | | | | | | | | | | | | | | | | | | | | | | | | | | | | | | | | | | | | | | | | | | | | | | | | | | | | | | | | | | | | | | | | |
| Sale of Units (including transfers) | | | - | | | | - | | | | - | | | | - | | | | | | | | | | | | | | | | | | | | | | | | | | | | | | | | | | | | | | | | | | | | | | | | | | | | | | | | | |
| | | | | | | | | | | | | | | | | | | | | | | | | | | | - | | | | - | | | | - | | | | - | | | | | | | | | | | | - | | | | - | | | | - | | | | - | | | | | | | | | |
| Redemption of Units (including transfers) | | | (1,157 | ) | | | (14 | ) | | | (18 | ) | | | (43 | ) | | | | | | | | | | | (3,086 | ) | | | - | | | | (50 | ) | | | (568 | ) | | | | | | | | | | | (2,125 | ) | | | - | | | | (21 | ) | | | (191 | ) | | | | | | | | |
| | | | | | | | | | | | | | | | | | | | | | | | | | | | | | | | | | | | | | | | | | | | | | | | | | | | | | | | | | | | | | | | | | | | | | | | | |
| Owners’ Capital - Units, December 31, 2022 | | | 19,894 | | | | 115 | | | | 124 | | | | 492 | | | | | | | | | | | | 14,514 | | | | - | | | | 97 | | | | 371 | | | | | | | | | | | | 18,366 | | | | 64 | | | | 118 | | | | 797 | | | | | | | | | |
| | | | | | | | | | | | | | | | | | | | | | | | | | | | | | | | | | | | | | | | | | | | | | | | | | | | | | | | | | | | | | | | | | | | | | | | | |
| Net asset value per unit at December 31, 2019 | | $ | 66.56 | | | $ | 78.51 | | | | | | | $ | 103.94 | | | | | | | | | | | $ | 131.52 | | | $ | 154.43 | | | | | | | $ | 192.82 | | | | | | | | | | | $ | 97.54 | | | $ | 114.15 | | | | | | | $ | 153.59 | | | | | | | | | |
| | | | | | | | | | | | | | | | | | | | | | | | | | | | | | | | | | | | | | | | | | | | | | | | | | | | | | | | | | | | | | | | | | | | | | | | | |
| Change in net asset value per unit for the year ended December 31, 2020 | | | (8.01 | ) | | | (7.52 | ) | | | | | | | (9.74 | ) | | | | | | | | | | | (20.62 | ) | | | (154.43 | ) | | | | | | | (25.26 | ) | | | | | | | | | | | (1.44 | ) | | | 2.35 | | | | | | | | 2.32 | | | | | | | | | |
| | | | | | | | | | | | | | | | | | | | | | | | | | | | | | | | | | | | | | | | | | | | | | | | | | | | | | | | | | | | | | | | | | | | | | | | | |
| Net asset value per unit at December 31, 2020 | | $ | 58.55 | | | $ | 70.99 | | | | | | | $ | 94.20 | | | | | | | | | | | $ | 110.90 | | | $ | - | | | | | | | $ | 167.56 | | | | | | | | | | | | 96.10 | | | | 116.50 | | | | | | | | 155.92 | | | | | | | | | |
| | | | | | | | | | | | | | | | | | | | | | | | | | | | | | | | | | | | | | | | | | | | | | | | | | | | | | | | | | | | | | | | | | | | | | | | | |
| Change in net asset value per unit for the year ended December 31, 2021 | | | 4.84 | | | | 8.22 | | | | | | | | 10.90 | | | | | | | | | | | | (1.45 | ) | | | - | | | | | | | | 2.84 | | | | | | | | | | | | 7.33 | | | | 12.69 | | | | | | | | 16.99 | | | | | | | | | |
| | | | | | | | | | | | | | | | | | | | | | | | | | | | | | | | | | | | | | | | | | | | | | | | | | | | | | | | | | | | | | | | | | | | | | | | | |
| Net asset value per unit at December 31, 2021 | | $ | 63.39 | | | $ | 79.21 | | | | | | | $ | 105.10 | | | | | | | | | | | $ | 109.45 | | | $ | - | | | | | | | $ | 170.40 | | | | | | | | | | | $ | 103.43 | | | $ | 129.19 | | | | | | | $ | 172.91 | | | | | | | | | |
| | | | | | | | | | | | | | | | | | | | | | | | | | | | | | | | | | | | | | | | | | | | | | | | | | | | | | | | | | | | | | | | | | | | | | | | | |
| Change in net asset value per unit for the year ended December 31, 2022 | | $ | 7.84 | | | $ | 12.50 | | | | | | | $ | 16.60 | | | | | | | | | | | $ | 75.82 | | | $ | - | | | | | | | $ | 126.85 | | | | | | | | | | | $ | 50.71 | | | $ | 69.23 | | | | | | | $ | 92.64 | | | | | | | | | |
| | | | | | | | | | | | | | | | | | | | | | | | | | | | | | | | | | | | | | | | | | | | | | | | | | | | | | | | | | | | | | | | | | | | | | | | | |
| Net asset value per unit at December 31, 2022 (1) | | $ | 71.23 | | | $ | 91.71 | | | | | | | $ | 121.70 | | | | | | | | | | | $ | 185.27 | | | $ | - | | | | | | | $ | 297.25 | | | | | | | | | | | $ | 154.14 | | | $ | 198.42 | | | | | | | $ | 265.55 | | | | | | | | | |
| (1) | Values are for both the Managing Owner and Limited Owners. |
The accompanying notes are an integral part of these consolidated financial statements.
The Series of Frontier Funds
Consolidated Statements of Cash Flows
For the Years Ended December 31, 2022, 2021, 2020
| | | Frontier Diversified Fund | | | Frontier Masters Fund | | | Frontier Long/Short Commodity Fund | |
| | | 12/31/2022 | | | 12/31/2021 | | | 12/31/2020 | | | 12/31/2022 | | | 12/31/2021 | | | 12/31/2020 | | | 12/31/2022 | | | 12/31/2021 | | | 12/31/2020 | |
| Cash Flows from Operating Activities: | | | | | | | | | | | | | | | | | | | | | | | | | | | |
| Net increase/(decrease) in capital resulting from operations | | $ | 324,267 | | | $ | 69,158 | | | $ | (2,839,310 | ) | | $ | 232,069 | | | $ | 47,607 | | | $ | (463,115 | ) | | $ | 268,411 | | | $ | 74,272 | | | $ | 68,977 | |
| Adjustments to reconcile net increase/(decrease) in capital resulting from operations to net cash provided by (used in) | | | | | | | | | | | | | | | | | | | | | | | | | | | | | | | | | | | | |
| operating activities: | | | | | | | | | | | | | | | | | | | | | | | | | | | | | | | | | | | | |
| Change in: | | | | | | | | | | | | | | | | | | | | | | | | | | | | | | | | | | | | |
| Net change in ownership allocation of U.S. Treasury securities | | | 400,338 | | | | 897,176 | | | | 3,801,487 | | | | 26,239 | | | | (135,864 | ) | | | 346,666 | | | | (43,649 | ) | | | (139,882 | ) | | | (1,347,014 | ) |
| Net unrealized (gain)/loss on swap contracts | | | - | | | | - | | | | 1,537,399 | | | | - | | | | - | | | | - | | | | - | | | | - | | | | (44,277 | ) |
| Net unrealized (gain)/loss on U.S. Treasury securities | | | 2,303 | | | | 832 | | | | (23,758 | ) | | | 89 | | | | (227 | ) | | | 4,357 | | | | 653 | | | | (1,187 | ) | | | 1,009 | |
| Net realized (gain)/loss on U.S. Treasuries securities | | | 7,623 | | | | 4,809 | | | | 14,579 | | | | 3,779 | | | | 3,365 | | | | (8,759 | ) | | | 5,686 | | | | 5,738 | | | | (737 | ) |
| Net unrealized (gain)/loss on private investment companies | | | (168,307 | ) | | | (98,954 | ) | | | (946,785 | ) | | | (192,089 | ) | | | (64,947 | ) | | | (393,123 | ) | | | (243,664 | ) | | | (53,498 | ) | | | (283,384 | ) |
| Net realized (gain)/loss on private investment companies | | | (251,470 | ) | | | (98,105 | ) | | | 1,549,052 | | | | (89,888 | ) | | | (24,753 | ) | | | 754,772 | | | | (56,892 | ) | | | (47,148 | ) | | | 405,836 | |
| (Purchases) sales of: | | | | | | | | | | | | | | | | | | | | | | | | | | | | | | | | | | | | |
| Sales of swap contracts | | | - | | | | 4,870,025 | | | | 4,870,025 | | | | - | | | | - | | | | - | | | | - | | | | 594,898 | | | | 594,898 | |
| (Purchases) of swap contracts | | | - | | | | (4,469,147 | ) | | | (4,469,147 | ) | | | - | | | | - | | | | - | | | | - | | | | (115,000 | ) | | | (115,000 | ) |
| Sales of U.S. Treasury securities | | | 180,769 | | | | 552,562 | | | | (1,888,716 | ) | | | 107,457 | | | | 291,260 | | | | 530,370 | | | | 181,323 | | | | 763,556 | | | | 2,003,499 | |
| (Purchases) of U.S. Treasury securities | | | (606,238 | ) | | | (1,065,811 | ) | | | (2,231,818 | ) | | | (141,762 | ) | | | (153,851 | ) | | | (852,963 | ) | | | (174,336 | ) | | | (185,359 | ) | | | (1,054,832 | ) |
| U.S. Treasury interest and premium paid/amortized | | | 6,281 | | | | 4,550 | | | | 441 | | | | 2,815 | | | | 3,141 | | | | 2,476 | | | | 3,427 | | | | 3,722 | | | | 4,010 | |
| (Purchases) of Private Investment Companies | | | (974,066 | ) | | | (6,219,401 | ) | | | (2,163,542 | ) | | | (472,671 | ) | | | (1,535,116 | ) | | | (1,178,274 | ) | | | (173,106 | ) | | | (703,517 | ) | | | (206,942 | ) |
| Reduction of collateral in Swap contracts | | | - | | | | (400,878 | ) | | | 4,446,306 | | | | - | | | | - | | | | - | | | | - | | | | (479,898 | ) | | | (73,100 | ) |
| Sale of Private Investment Companies | | | 1,452,935 | | | | 7,222,405 | | | | 7,222,405 | | | | 687,285 | | | | 2,001,031 | | | | 2,001,031 | | | | 400,702 | | | | 333,194 | | | | 333,194 | |
| Increase and/or decrease in: | | | | | | | | | | | | | | | | | | | | | | | | | | | | | | | | | | | | |
| Investments in unconsolidated trading companies, at fair value | | | 2,117 | | | | (14,119 | ) | | | 7,481 | | | | 2,852 | | | | (13,363 | ) | | | 10,098 | | | | (16,269 | ) | | | 10,195 | | | | (3,025 | ) |
| Interest receivable | | | (334 | ) | | | 7,817 | | | | (6,507 | ) | | | (87 | ) | | | 132 | | | | 460 | | | | (697 | ) | | | 8,904 | | | | (7,784 | ) |
| Receivable from related parties | | | - | | | | 4,892 | | | | 6,561 | | | | - | | | | 266 | | | | (266 | ) | | | - | | | | 5,205 | | | | (5,205 | ) |
| Other assets | | | - | | | | - | | | | 5,700 | | | | - | | | | - | | | | - | | | | - | | | | - | | | | - | |
| Redemptions receivable from private investment companies | | | - | | | | 31,886 | | | | 140,020 | | | | - | | | | 24,837 | | | | (24,837 | ) | | | - | | | | 1,251 | | | | (1,251 | ) |
| Interest payable to Managing Owner | | | - | | | | - | | | | - | | | | - | | | | - | | | | - | | | | 21 | | | | (55 | ) | | | 87 | |
| Trading fees payable to Managing Owner | | | 436 | | | | (3,359 | ) | | | (23,301 | ) | | | 561 | | | | (1,578 | ) | | | (6,213 | ) | | | 40 | | | | 1,126 | | | | (1,187 | ) |
| Service fees payable to Managing Owner | | | 2 | | | | (302 | ) | | | (3,007 | ) | | | - | | | | (27 | ) | | | (134 | ) | | | 2 | | | | 1 | | | | 18 | |
| Advance on unrealized Swap Appreciation | | | - | | | | - | | | | - | | | | - | | | | - | | | | - | | | | - | | | | - | | | | (115,000 | ) |
| Subscriptions in advance for service fee rebates | | | - | | | | - | | | | 119 | | | | - | | | | - | | | | 184 | | | | - | | | | - | | | | 173 | |
| Other liabilities | | | (2,108 | ) | | | 728 | | | | 3,110 | | | | (1,091 | ) | | | 1,608 | | | | (328 | ) | | | 496 | | | | (2,367 | ) | | | 2,641 | |
| Net cash provided by (used in) operating activities | | | 374,548 | | | | 1,296,764 | | | | 9,008,794 | | | | 165,558 | | | | 443,521 | | | | 722,402 | | | | 152,148 | | | | 74,151 | | | | 155,604 | |
| | | | | | | | | | | | | | | | | | | | | | | | | | | | | | | | | | | | | |
| Cash Flows from Financing Activities: | | | | | | | | | | | | | | | | | | | | | | | | | | | | | | | | | | | | |
| Proceeds from sale of units | | | - | | | | 6,000 | | | | - | | | | - | | | | 1,000 | | | | - | | | | - | | | | - | | | | - | |
| Payment for redemption of units | | | (493,435 | ) | | | (1,224,988 | ) | | | (4,977,342 | ) | | | (243,623 | ) | | | (334,461 | ) | | | (781,398 | ) | | | (146,462 | ) | | | (147,249 | ) | | | (89,964 | ) |
| Advance on unrealized Swap Appreciation | | | - | | | | - | | | | (4,000,000 | ) | | | - | | | | - | | | | - | | | | - | | | | - | | | | - | |
| Change in owner redemptions payable | | | - | | | | - | | | | - | | | | 19,922 | | | | (38,128 | ) | | | 38,128 | | | | (7,511 | ) | | | 20,299 | | | | (6,585 | ) |
| | | | | | | | | | | | | | | | | | | | | | | | | | | | | | | | | | | | | |
| Net cash provided by (used in) financing activities | | | (493,435 | ) | | | (1,218,988 | ) | | | (8,977,342 | ) | | | (223,701 | ) | | | (371,589 | ) | | | (743,270 | ) | | | (153,973 | ) | | | (126,950 | ) | | | (96,549 | ) |
| | | | | | | | | | | | | | | | | | | | | | | | | | | | | | | | | | | | | |
| Net increase (decrease) in cash and cash equivalents | | | (118,887 | ) | | | 77,776 | | | | 31,452 | | | | (58,143 | ) | | | 71,932 | | | | (20,868 | ) | | | (1,825 | ) | | | (52,799 | ) | | | 59,055 | |
| | | | | | | | | | | | | | | | | | | | | | | | | | | | | | | | | | | | | |
| Cash and cash equivalents, beginning of year | | | 165,491 | | | | 87,715 | | | | 56,263 | | | | 76,703 | | | | 4,771 | | | | 25,639 | | | | 40,528 | | | | 93,327 | | | | 34,272 | |
| Cash and cash equivalents, end of year | | $ | 46,604 | | | $ | 165,491 | | | $ | 87,715 | | | $ | 18,560 | | | $ | 76,703 | | | $ | 4,771 | | | $ | 38,703 | | | $ | 40,528 | | | $ | 93,327 | |
The accompanying notes are an integral part of these consolidated financial statements.
The Series of Frontier Funds
Consolidated Statements of Cash Flows
For the Years Ended December 31, 2022, 2021, 2020
| | | Frontier Balanced Fund | | | Frontier Select Fund | |
| | | 12/31/2022 | | | 12/31/2021 | | | 12/31/2020 | | | 12/31/2022 | | | 12/31/2021 | | | 12/31/2020 | |
| Cash Flows from Operating Activities: | | | | | | | | | | | | | | | | | | |
| Net increase/(decrease) in capital resulting from operations | | $ | 2,174,208 | | | $ | 563,981 | | | $ | (6,866,048 | ) | | $ | 195,761 | | | $ | 149,809 | | | $ | (297,634 | ) |
| Adjustments to reconcile net increase/(decrease) in capital resulting from operations to net cash provided by (used in) operating activities: | | | | | | | | | | | | | | | | | | | | | | | | |
| Change in: | | | | | | | | | | | | | | | | | | | | | | | | |
| Net change in open trade equity, at fair value | | | 13,166 | | | | 85,604 | | | | 5,744 | | | | - | | | | - | | | | - | |
| Net change in ownership allocation of U.S. Treasury securities | | | (428,684 | ) | | | 465,487 | | | | (220,865 | ) | | | 7,778 | | | | (235,383 | ) | | | (826,946 | ) |
| Net unrealized (gain)/loss on swap contracts | | | - | | | | - | | | | 3,088,917 | | | | - | | | | - | | | | - | |
| Net realized (gain)/loss on swap contracts | | | - | | | | - | | | | 2,448,166 | | | | - | | | | - | | | | - | |
| Net unrealized (gain)/loss on U.S. Treasury securities | | | (8,388 | ) | | | (1,499 | ) | | | 5,410 | | | | 454 | | | | (852 | ) | | | 2,628 | |
| Net realized (gain)/loss on U.S. Treasury securities | | | 27,240 | | | | 11,502 | | | | (25,729 | ) | | | 4,946 | | | | 3,778 | | | | (3,696 | ) |
| Net unrealized (gain)/loss on private investment companies | | | (1,673,486 | ) | | | (171,769 | ) | | | (619,705 | ) | | | (345,213 | ) | | | (3,095 | ) | | | (66,982 | ) |
| Net realized (gain)/loss on private investment companies | | | (666,011 | ) | | | (542,771 | ) | | | 1,593,919 | | | | 42,378 | | | | (233,656 | ) | | | 240,757 | |
| (Purchases) sales of: | | | | | | | | | | | | | | | | | | | | | | | | |
| Sales of swap contracts | | | - | | | | - | | | | 7,586,366 | | | | - | | | | - | | | | - | |
| (Purchases) of swap contracts | | | - | | | | - | | | | (7,355,251 | ) | | | - | | | | - | | | | - | |
| Sales of U.S. Treasury securities | | | 853,454 | | | | 1,827,896 | | | | 3,915,124 | | | | 131,330 | | | | 377,421 | | | | 2,403,975 | |
| (Purchases) of U.S. Treasury securities | | | (606,238 | ) | | | (1,065,811 | ) | | | (4,746,242 | ) | | | (164,272 | ) | | | (155,247 | ) | | | (1,467,357 | ) |
| U.S. Treasury interest and premium paid/amortized | | | - | | | | 265 | | | | 6,461 | | | | - | | | | - | | | | - | |
| (Purchases) of Private Investment Companies | | | (2,530,199 | ) | | | (4,841,423 | ) | | | (4,848,308 | ) | | | (854,667 | ) | | | (2,007,482 | ) | | | (2,136,722 | ) |
| Sale of Private Investment Companies | | | 4,854,163 | | | | 7,155,734 | | | | 7,155,734 | | | | 1,081,959 | | | | 2,508,522 | | | | 2,508,522 | |
| Reduction of collateral in Swap contracts | | | - | | | | - | | | | 6,176,555 | | | | - | | | | - | | | | - | |
| Increase and/or decrease in: | | | | | | | | | | | | | | | | | | | | | | | | |
| Receivable from futures commission merchants | | | 498,121 | | | | (584,389 | ) | | | 2,292,269 | | | | - | | | | - | | | | - | |
| Investments in unconsolidated trading companies, at fair value | | | (101,192 | ) | | | 14,778 | | | | 1,112 | | | | (10,900 | ) | | | (9,514 | ) | | | 505,355 | |
| Interest receivable | | | (4,176 | ) | | | 24,656 | | | | (21,201 | ) | | | (526 | ) | | | (222 | ) | | | 2,268 | |
| Receivable from related parties | | | - | | | | 14,602 | | | | (14,602 | ) | | | - | | | | - | | | | - | |
| Redemptions receivable from private investment companies | | | - | | | | 55,473 | | | | 324,638 | | | | - | | | | 67,876 | | | | (67,876 | ) |
| Incentive fees payable to Managing Owner | | | (54,010 | ) | | | 54,702 | | | | - | | | | - | | | | - | | | | - | |
| Management fees payable to Managing Owner | | | 142 | | | | (7,423 | ) | | | 59 | | | | - | | | | - | | | | - | |
| Interest payable to Managing Owner | | | 1,349 | | | | (419 | ) | | | 1,271 | | | | 146 | | | | 17 | | | | 179 | |
| Trading fees payable to Managing Owner | | | 3,976 | | | | (4,924 | ) | | | (32,285 | ) | | | 772 | | | | (251 | ) | | | (2,067 | ) |
| Service fees payable to Managing Owner | | | (1,530 | ) | | | (3,067 | ) | | | (20,254 | ) | | | 106 | | | | (185 | ) | | | (3,197 | ) |
| Risk analysis fees payable | | | 62 | | | | 867 | | | | 1,048 | | | | - | | | | - | | | | - | |
| Payables to related parties | | | - | | | | - | | | | - | | | | - | | | | (26,129 | ) | | | 26,129 | |
| Subscriptions in advance for service fee rebates | | | 22,116 | | | | 22,486 | | | | 27,157 | | | | 970 | | | | 1,613 | | | | 2,568 | |
| Other liabilities | | | 1,095 | | | | (3,486 | ) | | | 6,886 | | | | 46 | | | | 1,186 | | | | (8,509 | ) |
| | | | | | | | | | | | | | | | | | | | | | | | | |
| Net cash provided by (used in) operating activities | | | 2,375,178 | | | | 3,071,052 | | | | 9,866,346 | | | | 91,068 | | | | 438,206 | | | | 811,395 | |
| | | | | | | | | | | | | | | | | | | | | | | | | |
| Cash Flows from Financing Activities: | | | | | | | | | | | | | | | | | | | | | | | | |
| Payment for redemption of units | | | (2,356,513 | ) | | | (3,165,227 | ) | | | (3,517,435 | ) | | | (109,025 | ) | | | (387,066 | ) | | | (865,865 | ) |
| Advance on unrealized Swap Appreciation | | | - | | | | - | | | | (6,176,555 | ) | | | - | | | | - | | | | - | |
| Change in owner redemptions payable | | | 14,669 | | | | 20,382 | | | | (39,059 | ) | | | - | | | | - | | | | (6,875 | ) |
| | | | | | | | | | | | | | | | | | | | | | | | | |
| Net cash provided by (used in) financing activities | | | (2,341,844 | ) | | | (3,144,845 | ) | | | (9,733,049 | ) | | | (109,025 | ) | | | (387,066 | ) | | | (872,740 | ) |
| | | | | | | | | | | | | | | | | | | | | | | | | |
| Net increase (decrease) in cash and cash equivalents | | | 33,334 | | | | (73,793 | ) | | | 143,297 | | | | (17,957 | ) | | | 51,140 | | | | (61,345 | ) |
| | | | | | | | | | | | | | | | | | | | | | | | | |
| Cash and cash equivalents, beginning of year | | | 188,010 | | | | 261,803 | | | | 118,506 | | | | 51,140 | | | | - | | | | 61,345 | |
| Cash and cash equivalents, end of year | | $ | 221,344 | | | $ | 188,010 | | | $ | 261,803 | | | $ | 33,183 | | | $ | 51,140 | | | $ | - | |
The accompanying notes are an integral part of these consolidated financial statements.
The Series of Frontier Funds
Consolidated Statements of Cash Flows
For the Years Ended December 31, 2022, 2021, 2020
| | | Frontier Global Fund | | | Frontier Heritage Fund | |
| | | 12/31/2022 | | | 12/31/2021 | | | 12/31/2020 | | | 12/31/2022 | | | 12/31/2021 | | | 12/31/2020 | |
| Cash Flows from Operating Activities: | | | | | | | | | | | | | | | | | | |
| Net increase/(decrease) in capital resulting from operations | | $ | 1,410,562 | | | $ | (9,735 | ) | | $ | (584,304 | ) | | $ | 1,143,723 | | | $ | 195,466 | | | $ | (38,465 | ) |
| Adjustments to reconcile net increase/(decrease) in capital resulting from operations to net cash provided by (used in) operating activities: | | | | | | | | | | | | | | | | | | | | | | | | |
| Change in: | | | | | | | | | | | | | | | | | | | | | | | | |
| Net change in ownership allocation of U.S. Treasury securities | | | 168,882 | | | | (101,461 | ) | | | (223,579 | ) | | | 149,201 | | | | (40,786 | ) | | | (1,547,348 | ) |
| Net unrealized (gain)/loss on swap contracts | | | - | | | | - | | | | - | | | | - | | | | - | | | | (197,829 | ) |
| Net realized (gain)/loss on swap contracts | | | - | | | | - | | | | - | | | | - | | | | - | | | | 97,745 | |
| Net unrealized (gain)/loss on U.S. Treasury securities | | | 1,779 | | | | 2,520 | | | | 7,981 | | | | 1,944 | | | | 1,279 | | | | (1,057 | ) |
| Net realized (gain)/loss on U.S. Treasuries securities | | | 6,920 | | | | 2,415 | | | | (11,678 | ) | | | 6,217 | | | | 3,385 | | | | (900 | ) |
| Net unrealized (gain)/loss on private investment companies | | | (962,203 | ) | | | 97,778 | | | | 751,136 | | | | (906,091 | ) | | | (197,905 | ) | | | (227,342 | ) |
| Net realized (gain)/loss on private investment companies | | | (671,439 | ) | | | (292,612 | ) | | | (455,079 | ) | | | (461,959 | ) | | | (156,731 | ) | | | 83,882 | |
| (Purchases) sale of: | | | | | | | | | | | | | | | | | | | | | | | | |
| Sales of U.S. Treasury Securities | | | 134,003 | | | | 375,978 | | | | 877,516 | | | | 114,081 | | | | 337,555 | | | | 2,493,564 | |
| (Purchases) of U.S. Treasury securities | | | (309,686 | ) | | | (277,451 | ) | | | (629,240 | ) | | | (302,790 | ) | | | (237,408 | ) | | | (940,190 | ) |
| U.S. Treasury interest and premium paid/amortized | | | - | | | | - | | | | - | | | | - | | | | - | | | | - | |
| Sales of swap contracts | | | - | | | | - | | | | - | | | | - | | | | 1,491,966 | | | | 1,491,966 | |
| (Purchases) of swap contracts | | | - | | | | - | | | | - | | | | - | | | | (978,809 | ) | | | (978,809 | ) |
| (Purchases) of Private Investment Companies | | | (741,782 | ) | | | (1,088,812 | ) | | | (556,666 | ) | | | (531,551 | ) | | | (820,627 | ) | | | (1,168,275 | ) |
| Sale of Private Investment Companies | | | 1,568,992 | | | | 2,214,920 | | | | 2,214,920 | | | | 1,167,734 | | | | 1,203,951 | | | | 1,203,951 | |
| Reduction of collateral in Swap contracts | | | - | | | | - | | | | | | | | - | | | | (513,156 | ) | | | 2,474,936 | |
| Increase and/or decrease in: | | | | | | | | | | | | | | | | | | | | | | | | |
| Investments in unconsolidated trading companies, at fair value | | | 7,618 | | | | (22,735 | ) | | | 10,735 | | | | (18,883 | ) | | | (6,207 | ) | | | 16,011 | |
| Interest receivable | | | (39 | ) | | | (1 | ) | | | 438 | | | | (813 | ) | | | 1,263 | | | | 111 | |
| Advance on unrealized Swap Appreciation | | | - | | | | - | | | | - | | | | - | | | | - | | | | (1,900,000.00 | ) |
| Receivable from related parties | | | - | | | | 319 | | | | (319 | ) | | | - | | | | 845 | | | | (845.00 | ) |
| Management fees payable to Managing Owner | | | - | | | | - | | | | - | | | | - | | | | - | | | | - | |
| Interest payable to Managing Owner | | | (10 | ) | | | (14 | ) | | | 270 | | | | 230 | | | | 78 | | | | (27 | ) |
| Trading fees payable to Managing Owner | | | 2,947 | | | | (2,316 | ) | | | (10,691 | ) | | | 3,372 | | | | 602 | | | | (3,465 | ) |
| Service fees payable to Managing Owner | | | 1,451 | | | | (1,362 | ) | | | (4,915 | ) | | | 1,482 | | | | 156 | | | | (568 | ) |
| Subscriptions in advance for service fee rebates | | | 3,575 | | | | 4,139 | | | | 4,646 | | | | 9,853 | | | | 6,609 | | | | 6,073 | |
| Other liabilities | | | (1,996 | ) | | | 2,768 | | | | (8,338 | ) | | | 551 | | | | 596 | | | | (948 | ) |
| | | | | | | | | | | | | | | | | | | | | | | | | |
| Net cash provided by (used in) operating activities | | | 619,573 | | | | 904,338 | | | | 1,382,833 | | | | 376,301 | | | | 292,122 | | | | 862,171 | |
| | | | | | | | | | | | | | | | | | | | | | | | | |
| Cash Flows from Financing Activities: | | | | | | | | | | | | | | | | | | | | | | | | |
| Payment for redemption of units | | | (693,700 | ) | | | (809,572 | ) | | | (1,333,292 | ) | | | (379,674 | ) | | | (258,439 | ) | | | (402,266 | ) |
| Change in non-controlling interest | | | - | | | | - | | | | - | | | | - | | | | - | | | | (479,025 | ) |
| Change in owner redemptions payable | | | (27,561 | ) | | | 27,561 | | | | (71,379 | ) | | | - | | | | - | | | | (9,735 | ) |
| | | | | | | | | | | | | | | | | | | | | | | | | |
| Net cash provided by (used in) financing activities | | | (721,261 | ) | | | (782,011 | ) | | | (1,404,671 | ) | | | (379,674 | ) | | | (258,439 | ) | | | (891,026 | ) |
| | | | | | | | | | | | | | | | | | | | | | | | | |
| Net increase (decrease) in cash and cash equivalents | | | (101,688 | ) | | | 122,327 | | | | (21,838 | ) | | | (3,373 | ) | | | 33,683 | | | | (28,855 | ) |
| | | | | | | | | | | | | | | | | | | | | | | | | |
| Cash and cash equivalents, beginning of year | | | 128,021 | | | | 5,694 | | | | 27,532 | | | | 48,839 | | | | 15,156 | | | | 44,011 | |
| Cash and cash equivalents, end of year | | $ | 26,333 | | | $ | 128,021 | | | $ | 5,694 | | | $ | 45,466 | | | $ | 48,839 | | | $ | 15,156 | |
The accompanying notes are an integral part of these consolidated financial statements.
Notes to Financial Statements
1. Organization and Purpose
Frontier Funds, which is referred to in this report as the “Trust”, was formed on August 8, 2003, as a Delaware statutory trust. Please refer to the combined consolidated financial statements of the Trust included within this periodic report. The Trust is a multi-advisor commodity pool, as described in Commodity Futures Trading Commission (the “CFTC”) Regulation § 4.10(d)(2). The Trust has authority to issue separate series, or each, a Series, of units of beneficial interest (the “Units”) pursuant to the requirements of the Delaware Statutory Trust Act, as amended (the “Trust Act”). The assets of each Series are valued and accounted for separately from the assets of other Series. The Trust is not registered as an investment company under the Investment Company Act of 1940, as amended (the “Investment Company Act”). It is managed by Frontier Fund Management LLC (the “Managing Owner”).
Purchasers of Units are limited owners of the Trust (“Limited Owners”) with respect to beneficial interests of the Series’ Units purchased. The Trust Act provides that, except as otherwise provided in the second amended and restated declaration of trust and trust agreement dated December 9, 2013, as further amended, by and among the Managing Owner, Wilmington Trust Company as trustee and the unitholders, as may be amended from time to time (“Trust Agreement”), unitholders of the Trust will have the same limitation of liability as do stockholders of private corporations organized under the General Corporation Law of the State of Delaware. The Trust Agreement confers substantially the same limited liability, and contains the same limited exceptions thereto, as would a limited partnership agreement for a Delaware limited partnership engaged in like transactions as the Trust. In addition, pursuant to the Trust Agreement, the Managing Owner of the Trust is liable for obligations of a Series in excess of that Series’ assets. Limited Owners do not have any such liability. The Managing Owner will make contributions to the Series of the Trust necessary to maintain at least a 1% interest in the aggregate capital, profits and losses of the combined Series’ of the Trust.
The Trust has been organized to pool investor funds for the purpose of trading in the United States (“U.S.”) and international markets for currencies, interest rates, stock indices, agricultural and energy products, precious and base metals and other commodities. The Trust may also engage in futures contracts, forwards, option contracts and derivative instruments, including swap contracts.
The Trust has seven (7) separate and distinct Series of Units issued and outstanding: Frontier Diversified Fund, Frontier Masters Fund, Frontier Long/Short Commodity Fund, Frontier Balanced Fund, Frontier Select Fund, Frontier Global Fund, and Frontier Heritage Fund, (each a “Series” and collectively, the “Series”). The Trust, with respect to the Series, may issue additional Series of Units.
The Trust, with respect to each Series:
| | ● | engages in the speculative trading of a diversified portfolio of futures, forwards (including interbank foreign currencies), options contracts and other derivative instruments (including swap contracts), and may, from time to time, engage in cash and spot transactions; |
| | ● | allocates funds to a limited liability trading company or companies (“Trading Company” or “Trading Companies”) or to an unaffiliated series limited liability company (“Galaxy Plus entities” or “Galaxy Plus entity”). Except as otherwise described in these notes, each Trading Company and Galaxy Plus entity has one-year renewable contracts with its own independent commodity trading advisor(s), or each, a Trading Advisor, that will manage all or a portion of such Trading Company’s and Galaxy Plus assets and make the trading decisions for the assets of each Series invested in such Trading Company and Galaxy Plus entity. Each Trading Company and Galaxy Plus entity will segregate its assets from any other Trading Company and Galaxy Plus entity; |
| | ● | maintains separate, distinct records for each Series, and accounts for the assets of each Series separately from the other Series; |
| | ● | calculates the Net Asset Value (“NAV”) of its Units for each Series separately from the other Series; |
| | ● | has an investment objective of increasing the value of each Series’ Units over the long term (capital appreciation), while managing risk and volatility; further, to offer exposure to the investment programs of individual Trading Advisors and to specific instruments; |
| | ● | maintains each Series of Units in three to seven sub-classes—Class 1, Class 1AP, Class 1a, Class 2, Class 2a, Class 3, and Class 3a. Investors who have purchased Class 1 or Class 1a Units of Frontier Diversified Fund, Frontier Masters Fund, and Frontier Long/Short Commodity Fund are charged a service fee of up to two percent (2.0%) annually of the NAV (of the purchase price, in case of the initial service fee) of each Unit purchased, for the benefit of selling agents selling such Class 1 or Class 1a Units. The initial service fee, which is amortized monthly at an annual rate of up to two percent (2.0%) of the average daily NAV of Class 1 or Class 1a of such Series, is prepaid to the Managing Owner by each Series, and paid to the selling agents by the Managing Owner in the month following sale; provided, however, that investors who redeem all or a portion of their Class 1 or Class 1a Units of any Series during the first twelve (12) months following the effective date of their purchase are subject to a redemption fee of up to two percent (2.0%) of the purchase price at which such investor redeemed to reimburse the Managing Owner for the then-unamortized balance of the prepaid initial service fee. Investors who have purchased Class 1 or Class 1a Units of Frontier Balanced Fund, Frontier Heritage Fund, Frontier Select Fund, and Frontier Global Fund are charged a service fee of up to three percent (3.0%) annually of the NAV (of the purchase price, in case of the initial service fee) of each Unit purchased, for the benefit of selling agents selling such Class 1 or Class 1a Units. The initial service fee, which is amortized monthly at an annual rate of up to three percent (3.0%) of the average daily NAV of Class 1 or Class 1a of such Series, is prepaid to the Managing Owner by each Series, and paid to the selling agents by the Managing Owner in the month following sale. With respect to Class 2 and Class 2a Units of any Series, the Managing Owner pays an ongoing service fee to selling agents of up to one half percent (0.5%) annually of the NAV of each Class 2 or Class 2a Unit (of which 0.25% will be charged to Limited Owners holding Class 2 Units of the Frontier Diversified Fund, and Frontier Masters Fund or Class 2a Units of the Frontier Long/Short Commodity Fund sold) until such Class 2 or Class 2a Units which are subject to the fee limitation are reclassified as Class 3 or Class 3a Units of the applicable Series. Class 1AP was created as a sub-class of Class 1 and it has been presented separately because the fees applicable to it are different from those applicable to Class 1. Currently the service fee is not charged to Class 1AP investors. The Managing Owner may also pay selling agents certain additional fees and expenses for administrative and other services rendered and expenses incurred by such Selling agents; and |
| | ● | all payments made to selling agents who are members of the Financial Industry Regulatory Authority, Inc. (“FINRA”) and their associated persons that constitute underwriting compensation will be subject to the limitations set forth in Rule 2310(b)(4)(B)(ii) (formerly Rule 2810(b)(4)(B)(ii)) of the Conduct Rules of FINRA (“Rule 2310”). An investor’s Class 1 Units or Class 2 Units of any Series, or Class 2a Units of the Frontier Long/Short Commodity Fund or Frontier Balanced Fund will be classified as Class 3 or Class 3a Units of such Series, as applicable, when the Managing Owner determines that the fee limitation set forth in Rule 2310 with respect to such Units has been reached or will be reached. The service fee limit applicable to each unit sold is reached upon the earlier of when (i) the aggregate initial and ongoing service fees received by the selling agent with respect to such unit equals 9% of the purchase price of such unit or (ii) the aggregate underwriting compensation (determined in accordance with FINRA Rule 2310) paid in respect of such unit totals 10% of the purchase price of such unit. No service fees are paid with respect to Class 3 or Class 3a Units. Units of any Class in a Series may be redeemed, in whole or in part, on a daily basis, at the then current NAV per Unit for such Series on the day of the week after the date the Managing Owner is in receipt of a redemption request for at least one (1) business day to be received by the Managing Owner prior to 4:00 PM in New York. |
The assets of any particular Series include only those funds and other assets that are paid to, held by or distributed to the Trust, with respect to the Series, on account of and for the benefit of that Series. Under the “Inter-Series Limitation on Liability” expressly provided for under Section 3804(a) of the Trust Act, separate and distinct records of the cash and equivalents, although pooled for maximizing returns, are maintained in the books and records of each Series.
As of December 31, 2022, the Trust, with respect to the Frontier Diversified Fund and Frontier Masters Fund, separates Units into two separate Classes—Class 2, and Class 3. The Trust, with respect to the Frontier Select Fund and Frontier Heritage Fund separates Units into three separate Classes—Class 1, Class 2 and Class 1AP. The Trust, with respect to the Frontier Global Fund, separates Units into two separate Classes—Class 1 and Class 2. The Trust, with respect to the Frontier Balanced Fund, separates Units into five separate Classes—Class 1, Class 1AP, Class 2, Class 2a and Class 3a. The Trust, with respect to the Frontier Long/Short Commodity Fund, separates Units into four separate Classes—Class 2, Class 2a, Class 3 and Class 3a.
Between April 15, 2016 and May 10, 2017, a portion of the interests in Frontier Trading Company I, LLC and all of the interests in Frontier Trading Company VII, LLC, Frontier Trading Company XV, LLC, and Frontier Trading Company XXIII LLC held by Frontier Diversified Fund, Frontier Masters Fund, Frontier Select Fund, Frontier Balanced Fund and Frontier Long/Short Commodity Fund were exchanged for equivalent interests in the Galaxy Plus Managed Account Platform (“Galaxy Plus Platform”) which is an unaffiliated, third-party managed account platform. The assets of Frontier Trading Company I, LLC, which included exposure to Quantmetrics Capital Management LLP’s Multi-Strategy Program, Quantitative Investment Management, LLC’s Quantitative Global Program, Quest Partners LLC’s Quest Tracker Index Program, Chesapeake Capital Management, LLC’s Diversified Program, and Doherty Advisors LLC’s Relative Value Moderate Program, the assets of Frontier Trading Company VII, LLC, which included exposure to Emil van Essen LLC’s Multi-Strategy Program, Red Oak Commodity Advisors, Inc.’s Fundamental Diversified Program, Rosetta Capital Management, LLC’s Rosetta Trading Program, and Landmark Trading Company’s Landmark Program, the assets of Frontier Trading Company XV, LLC, which included exposure to Transtrend B.V.’s TT Enhanced Risk (USD) Program, and the assets of Frontier Trading Company XXIII, LLC which included exposure to Fort L.P.’s Global Contrarian Program have been transferred to individual Delaware limited liability companies (“Master Funds”) in Galaxy Plus. Each Master Fund is sponsored and operated by New Hyde Park Alts, LLC (“New Hyde Park”). New Hyde Park has contracted with the Trading Advisors to manage the portfolios of the Master Funds pursuant to the advisors’ respective program. For those Series that invest in Galaxy Plus, approximately 75-95% of those Series assets are used to support the margin requirements of the Master Funds. The remaining assets of the Series are split between investments in Trading Companies and a pooled cash management account that invests primarily in U.S. Treasury securities. All the funds are invested in Galaxy Plus entities.
Each of the Series has invested a portion of its assets in several different Trading Companies or Galaxy Plus entities and one or more Trading Advisors may manage the assets invested in such Trading Companies or Galaxy Plus entities.
The Trust has entered into agreements, which provide for the indemnification of futures clearing brokers, currency trading companies, and commodity trading advisers, among others, against losses, costs, claims and liabilities arising from the performance of their individual obligations under such agreements, except for gross negligence, bad faith or willful misconduct.
2. Significant Accounting Policies
The following are the significant accounting policies of the Series of the Trust.
Basis of Presentation—The Series of the Trust follow U.S. Generally Accepted Accounting Principles (“GAAP”), as established by the Financial Accounting Standards Board (the “FASB”), to ensure consistent reporting of financial condition, condensed schedules of investments, results of operations, changes in capital and cash flows. The Trust is an investment company following accounting and reporting guidance in Accounting Standards Codification (“ASC”) 946.
Consolidation— The Series, through investing in the Trading Companies and Galaxy Plus, authorize certain Trading Advisors to place trades and manage assets at pre- determined investment levels. The Trading Companies were organized by the Managing Owner for the purpose of investing in commodities interests and derivative instruments, and have no operating income or expenses, except for trading income and expenses and a risk analysis fee (for closed Series only), all of which is allocated to the Series if consolidated by a Series. Galaxy Plus is a series of Delaware limited liability companies, sponsored by New Hyde Park, that create exposure to a variety of third party professional managed futures and foreign exchange advisors. Galaxy Plus is available to qualified high-net-worth individuals and institutional investors. Trading Companies in which a Series has a controlling and majority interest as calculated on that Series’ pro-rata net asset value in the Trading Company are consolidated by such Series. Investments in Trading Companies in which a Series does not have a controlling and majority interest and all interests in Galaxy Plus entities are accounted for using net asset value as the practical expedient, which approximates fair value. Fair value represents the proportionate share of the Series’ interest in the NAV in a Trading Company or Galaxy Plus entity. The equity interest held by Series of the Trust is shown as investments in unconsolidated Trading Companies or investments in private investment companies in the consolidated statements of financial condition. The income or loss attributable thereto in proportion of investment level is shown in the consolidated statements of operations as change in fair value of investments in unconsolidated Trading Companies or net unrealized gain/(loss) on private investment companies.
Galaxy Plus entities are co-mingled investment vehicles. In addition to the Series, there are other non-affiliated investors in Galaxy Plus. Subscriptions and redemptions by these non-affiliated investors will have a direct impact on the Series ownership percentage in Galaxy Plus. It is expected that ownership percentage will fluctuate (sometimes significantly) on a week-by-week basis which could also result in frequent changes in the consolidating Series. Such fluctuations make consolidating the financial statements of the Galaxy Plus entities both impractical and misleading. Non-consolidation of these Galaxy Plus entities presents a more useful financial statement for the readers. As such, management has decided that presenting Galaxy Plus entities on a non-consolidated basis as investments in other investments companies (a “fund of funds” approach) is appropriate and preferable to the users of these financial statements. Refer to Note 5 for additional disclosures related to these private investment companies.
As of December 31, 2022, and 2021, the consolidated statements of financial condition of Frontier Balanced Fund included the assets and liabilities of its wholly owned interests in Frontier Trading Company I, LLC.
For the year ended December 31, 2022, 2021 and 2020 the consolidated statements of operations of Frontier Balanced Fund included the earnings of its wholly owned interest in Frontier Trading Company I, LLC and for the year ended December 31, 2020, for its wholly owned interest in Frontier Trading Company XXXIV, LLC.
For the year ended December 31, 2020, the consolidated statements of operations of Frontier Long/Short Commodity Fund included the earnings of its wholly owned Trading Company listed above.
For the years ended December 31, 2020 the consolidated statements of operations of Frontier Diversified Fund included the earnings of its wholly owned Trading Company listed above.
As of and for the year ended December 31, 2020, the consolidated statement of operations of Frontier Heritage Fund included the earnings of its majority owned Trading Company, Frontier Trading Company XXXIX, LLC.
For the year ended December 31, 2022, 2021 and 2020, the consolidated statements of operations of Frontier Select Fund included the earnings of its majority owned Trading Company.
Each of the Series has invested in Frontier Trading Company XXXVIII, LLC on the same basis as its ownership in the cash pool. Frontier Trading Company XXXVIII, LLC’s assets, liabilities and earnings are allocated to all of the Series of the Trust based on their proportionate share of the cash pool. Each Series investment in the Frontier Trading Company XXXVIII, LLC is listed under Investments in unconsolidated trading companies, at fair value on the Consolidated Statements of Financial Condition.
Use of Estimates—The preparation of consolidated financial statements in conformity with GAAP may require the Managing Owner to make estimates and assumptions that affect the reported amounts of assets and liabilities and disclosure of contingent assets and liabilities at the date of the consolidated financial statements and the reported amounts of revenue and expenses during the reporting period. The valuation of swap contracts requires significant estimates as well as the valuation of certain other investments. Please refer to Note 3 for discussion of valuation methodology. Actual results could differ from these estimates, and such differences could be material.
Cash and Cash Equivalents—Cash and cash equivalents include cash and overnight investments in interest-bearing demand deposits held at banks with original maturities of three months or less. This cash is not restricted.
Interest Income— U.S. Treasury Securities are pooled for purposes of maximizing returns on these assets to investors of all Series. Interest income from pooled cash management assets is recognized on the accrual basis and allocated daily to each Series based upon its daily proportion of ownership of the pool. Aggregate interest income from all sources, including U.S. Treasuries and assets held at a futures commission merchant (“FCM”), of up to two percentage points of the aggregate percentage yield (annualized) of net asset value less any fair market value related to swaps, is paid to the Managing Owner by the Frontier Balanced Fund (Class 1, and Class 2 only), Frontier Long/Short Commodity Fund (Class 2 and Class 3), Frontier Select Fund, Frontier Global Fund and Frontier Heritage Fund. For the Frontier Diversified Fund, Frontier Long/Short Commodity Fund (Class 1a, Class 2a and Class 3a), Frontier Masters Fund and Frontier Balanced Fund (Class 1AP, Class 2a and Class 3a), 100% of the interest is retained by the respective Series. All interest not paid to the Managing Owner is interest income to the Series and shown net on the consolidated statement of operations. The amount reflected in the consolidated financial statements of the Series are disclosed on a net basis. Due to some classes not exceeding the 2% paid to the Managing Owner, amounts earned by those Series may be zero.
U.S. Treasury Securities—U.S. Treasury Securities are allocated to all Series of the Trust based on each Series’ percentage ownership in the pooled cash management assets as of the reporting date. They are reported at fair value as Level 1 inputs under ASC 820, Fair Value Measurements and Disclosures (“ASC 820”). The Series of the Trust valued U.S. Treasury Securities at fair value and recorded the daily change in value in the consolidated statements of operations as net unrealized gain/(loss) on U.S. Treasury securities. Accrued interest is reported on the consolidated statements of financial condition as interest receivable.
Receivable from Futures Commission Merchants—The Series of the Trust deposit assets with a FCM subject to CFTC regulations and various exchange and broker requirements. Margin requirements are satisfied by the deposit of cash with such FCM. The Trust, with respect to the Series, earns interest income on its assets deposited with the FCM. A portion of the receivable is restricted cash required to meet maintenance margin requirements. Cash with the clearing broker as of December 31, 2022 and 2021 included restricted cash for margin requirements of $320,939 and $801,701 respectively, for the Frontier Balanced Fund.
Investment Transactions—Futures, options on futures, forward and swap contracts are recorded on a trade date basis and realized gains or losses are recognized when contracts are settled. Unrealized gains or losses on open contracts (the difference between contract trade price and market price) are reported in the consolidated statements of financial condition as open trade equity (deficit) for futures and forwards as there exists a right of offset of unrealized gains or losses in accordance with ASC 210, Balance Sheet (“ASC 210”) and Accounting Standards Update (ASU) 2013-01, Balance Sheet (Topic 210).
Any change in net unrealized gain or loss from the preceding period is reported in the consolidated statements of operations. Fair value of exchange-traded contracts is based upon exchange settlement prices. Fair value of non-exchange-traded contracts is based on third party quoted dealer values on the interbank market. For U.S. Treasury securities, interest is recognized in the period earned and the instruments are marked-to-market daily based on third party information. Transaction costs are recognized as incurred and reflected separately in the consolidated statements of operations.
Purchase and Sales of Private Investment Companies – The Series are able to subscribe into and redeem from the Galaxy Plus entities on a weekly basis. The value of the private investment companies is determined by New Hyde Park and reported on a daily basis. The change in the difference between the total purchase cost and the fair value calculated by New Hyde Park is recorded as net unrealized gain/(loss) on private investment companies on the consolidated statements of operations.
Foreign Currency Transactions—The Series’ functional currency is the U.S. dollar; however, they transact business in currencies other than the U.S. dollar. The Series do not isolate that portion of the results of operations resulting from changes in foreign exchange rates on investments from fluctuations arising from changes in market prices of securities held. Such fluctuations are included with the net realized or unrealized gain or loss from investments.
Allocation of Earnings—Each Series of the Trust may maintain three to seven subclasses of Units—Class 1, Class 2, Class 3, Class 1a, Class 2a, Class 3a, and Class 1AP. All classes have identical voting, dividend, liquidation and other rights and the same terms and conditions, except that fees charged to a Class or Series differ as described below. Revenues, expenses (other than expenses attributable to a specific class), and realized and unrealized trading gains and losses of each Series are allocated daily to Class 1, Class 1a, Class 2, Class 2a, Class 3, Class 3a and Class 1AP Units based on each Class’s respective owners’ capital balances as applicable to the classes maintained by the Series.
Each Series allocates funds to an affiliated Trading Company, or Companies, of the Trust or unaffiliated Galaxy Plus entity. Each Trading Company allocates all of its daily trading gains or losses to the Series in proportion to each Series’ ownership trading level interest in the Trading Company, adjusted on a daily basis (except for Trading Advisors and other investments such as swaps that are directly allocated to a specific Series). Likewise, trading gains and losses earned and incurred by the Series through their investments in Galaxy Plus entities are allocated to those Series on a daily basis. The allocation of gains and losses in Galaxy Plus entities are based on each Series pro-rata shares of the trading level of that entity which is updated at the beginning of each month or more frequently if there is a subscription or redemption activity in the entity. The value of all open contracts and cash held at clearing brokers is similarly allocated to the Series in proportion to each Series’ funds allocated to the Trading Companies or Galaxy Plus entities.
Investments and Swaps—The Trust, with respect to the Series, records investment transactions on a trade date basis and at fair value, with changes in fair value reported as a component of realized and unrealized gains/(losses) on investments in the consolidated statements of operations. Investments in private investment companies are valued utilizing the net asset values as a practical expedient. Certain Series of the Trust strategically invest a portion or all of their assets in total return swaps, selected at the discretion of the Managing Owner. Swaps are privately negotiated contracts designed to provide investment returns linked to those produced by one or more underlying investment products or indices. In a typical swap, two parties agree to exchange the returns (or differentials in rates of return) earned or realized on one or more particular predetermined investments or instruments. The gross returns to be exchanged or “swapped” between the parties are calculated with respect to a “notional amount” (i.e., the amount of value of the underlying asset used in computing the particular interest rate, return, or other amount to be exchanged) in a particular investment, or in a “basket” of securities. The valuation of swap contracts requires significant estimates. Swap contracts are reported at fair value based upon daily reports from the counterparty. The Managing Owner reviews and approves current day pricing of the commodity trading advisor (“CTA”) positions, as received from the counterparty which includes intra-day volatility and volume and daily index performance, that is used to determine a daily fair value NAV for the swap contracts.
Income Taxes—The Trust, with respect to the Series, applies the provisions of ASC 740 Income Taxes (“ASC 740”), which provides guidance for how uncertain tax positions should be recognized, measured, presented and disclosed in the consolidated financial statements. This interpretation also provides guidance on derecognition, classification, interest and penalties, accounting in interim periods and disclosure. ASC 740 requires the evaluation of tax positions taken or expected to be taken in the course of preparing the Trust, with respect to the Series’, consolidated financial statements to determine whether the tax positions are “more-likely-than-not” of being sustained by the applicable tax authority. Tax positions with respect to tax at the Trust’s level not deemed to meet the “more-likely-than-not” threshold would be recorded as a tax benefit or expense in the current year.
The 2019 through 2022 tax years generally remain subject to examination by U.S. federal and most state tax authorities.
In the opinion of the Managing Owner, (i) the Trust, with respect to the Series, is treated as a partnership for federal income tax purposes and, assuming that at least 90% of the gross income of the Trust constitutes “qualifying income” within the meaning of Section 7704(d) of the Code, (ii) the Trust is not a publicly traded partnership treated as a corporation, and (iii) the discussion set forth in the Prospectus under the heading “U.S. Federal Income Tax Consequences” correctly summarizes the material federal income tax consequences as of the date of the Prospectus to potential U.S. Limited Owners of the purchase, ownership and disposition of Units of the Trust.
Fees and Expenses—All management fees, incentive fees, service fees, risk analysis fees (for closed Series only) and trading fees of the Trust, with respect to the Series, are paid to the Managing Owner. It is the responsibility of the Managing Owner to pay all Trading Advisor management and incentive fees, selling agent service fees and all other operating expenses and continuing offering costs of the Trust, with respect to the Series. Only management fees and incentive fees related to assets allocated through Trading Companies are included in expense on the consolidated statements of operations. The Series are all charged management and incentive fees on the asset allocated through the Galaxy Plus entities. Those fees are included in unrealized gain/(loss) on private investment companies on the consolidated statements of operations. The Series are also charged management and incentive fees on assets allocated to swaps. Such fees are embedded in the fair value of the swap and are included in net unrealized gain (loss) on swap contracts on the consolidated statements of operations.
Incentive Fee (rebate)—The Managing Owner is allowed to share in the incentive fees earned by the Commodity Trading Advisors up to 10% of New Net Profits (as defined in the prospectus). If the Managing Owner’s share of the incentive fee exceeds 10% of new net profits during the period for a particular series, then the Managing Owner is obligated to return any amount in excess to the Series. The returned amounts are recorded as Incentive Fee (Rebate) on the consolidated statements of operations.
Service Fees—The Trust may maintain each Series of Units in three to seven sub-classes—Class 1, Class 1AP, Class 1a, Class 2, Class 2a, Class 3, and Class 3a. Investors who have purchased Class 1 or Class 1a Units of Frontier Diversified Fund, Frontier Masters Fund, and Frontier Long/Short Commodity Fund are charged a service fee of up to two percent (2.0%) annually of the NAV (of the purchase price, in case of the initial service fee) of each Unit purchased, for the benefit of selling agents selling such Class 1 or Class 1a Units. The initial service fee, which is amortized monthly at an annual rate of up to two percent (2.0%) of the average daily NAV of Class 1 or Class 1a of such Series, is prepaid to the Managing Owner by each Series, and paid to the selling agents by the Managing Owner in the month following sale; provided, however, that investors who redeem all or a portion of their Class 1 and Class 1a Units of any Series during the first twelve (12) months following the effective date of their purchase are subject to a redemption fee of up to two percent (2.0%) of the purchase price at which such investor redeemed to reimburse the Managing Owner for the then-unamortized balance of the prepaid initial service fee. Investors who have purchased Class 1 or Class 1a Units of Frontier Balanced Fund, Frontier Heritage Fund, Frontier Select Fund, and Frontier Global Fund are charged a service fee of up to three percent (3.0%) annually of the NAV (of the purchase price, in case of the initial service fee) of each Unit purchased, for the benefit of selling agents selling such Class 1 or Class 1a Units. The initial service fee, which is amortized monthly at an annual rate of up to three percent (3.0%) of the average daily NAV of Class 1 or Class 1a of such Series, is prepaid to the Managing Owner by each Series, and paid to the selling agents by the Managing Owner in the month following sale; provided, however, that investors who redeem all or a portion of their Class 1 and Class 1a Units of any Series during the first twelve (12) months following the effective date of their purchase are subject to a redemption fee of up to three percent (3.0%) of the purchase price at which such investor redeemed to reimburse the Managing Owner for the then-unamortized balance of the prepaid initial service fee. With respect to Class 2 and Class 2a Units of any Series, the Managing Owner pays an ongoing service fee to selling agents of up to one half percent (0.5%) annually of the NAV of each Class 2 or Class 2a Unit (of which 0.25% will be charged to Limited Owners holding Class 2 Units of the Frontier Diversified Fund and Frontier Masters Fund or Class 2a Units of the Frontier Long/Short Commodity Fund sold) until such Class 2 or Class 2a Units which are subject to the fee limitation are reclassified as Class 3 or Class 3a Units of the applicable Series for administrative purposes. Currently the service fee is not charged to Class 1AP investors. The Managing Owner may also pay selling agents certain additional fees and expenses for administrative and other services rendered and expenses incurred by such selling agents.
Each Series is charged service fees as outlined above. In some cases, amounts paid to selling agents might be less than the amount charged to the Series. When this occurs, the service fee is rebated back to the investor in the form of additional units. During 2022, 2021 and 2020, the Series were not allowed to issue additional units. The Managing Owner has determined that the purchase of additional units of the relevant Series will commence in 2023 when the Series are allowed to sell shares again. As such, the Managing Owner has calculated the amounts for additional units of the relevant series which will be purchased and classified such amounts as subscriptions in advance for service fee rebates of $22,650, $393, $31,725, $391,457, $22,046, $162,385 and $79,667 for the Frontier Diversified, Long/Short Commodity, Masters, Balanced, Select, Global and Heritage Funds, respectively, as of December 31, 2022.
These service fees are part of the offering costs of the Trust, with respect to the Series, which include registration and filing fees, legal and blue sky expenses, accounting and audit, printing, marketing support and other offering costs which are borne by the Managing Owner. With respect to the service fees, the initial service fee (for the first 12 months) relating to a purchase of Class 1 and Class 1a Units by an investor is prepaid by the Managing Owner to the relevant selling agent in the month following such purchase and is reimbursed for such payment by the Series monthly in arrears in an amount based upon a corresponding percentage of NAV, calculated daily. Consequently, the Managing Owner bears the risk of the downside and enjoys the benefit of the upside potential of any difference between the amount of the initial service fee prepaid by it and the amount of the reimbursement thereof, which may result from variations in NAV over the following 12 months.
Pending Owner Additions—Funds received for new subscriptions and for additions to existing owner interests are recorded as capital additions at the NAV per unit of the second business day following receipt.
Owner redemptions payable—Funds payable for existing owner redemption requests are recorded as capital subtractions at the NAV per unit on the second business day following receipt or request.
Recently Adopted Accounting Pronouncements— In August 2018, FASB issued ASU 2018-13, Fair Value Measurement (Topic 820): Disclosure Framework—Changes to the Disclosure Requirements for Fair Value Measurement (“ASU 2018-13”). The primary focus of ASU 2018-13 is to improve the effectiveness of the disclosure requirements for fair value measurements. The changes affect all companies that are required to include fair value measurement disclosures. In general, the amendments in ASU 2018-13 are effective for all entities for fiscal years and interim periods within those fiscal years, beginning after December 15, 2019. An entity is permitted to early adopt the removed or modified disclosures upon the issuance of ASU 2018-13 and may delay adoption of the additional disclosures, which are required for public companies only, until their effective date. Management has evaluated the impacts of ASU 2018-13 and ensured that the consolidated financial statements are compliant.
Subsequent Events—Each Series follows the provisions of ASC 855, Subsequent Events, which establishes general standards of accounting for and disclosure of events that occur after the balance sheet date and up through the date the consolidated financial statements are issued. Refer to Note 11.
3. Fair Value Measurements
In connection with the valuation of investments the Series apply ASC 820. ASC 820 provides clarification that when a quoted price in an active market for the identical asset or liability is not available, a reporting entity is required to measure fair value using certain techniques. ASC 820 also clarifies that when estimating the fair value of an asset or liability, a reporting entity is not required to include a separate input or adjustment to other inputs relating to the existence of a restriction that prevents the transfer of an asset or liability. ASC 820 also clarifies that both a quoted price in an active market for the identical asset or liability at the measurement date and the quoted price for the identical asset or liability when traded as an asset in an active market when no adjustments to the quoted price of the asset are required are Level 1 fair value measurements.
Level 1 Inputs
Unadjusted quoted prices in active markets for identical financial assets that the reporting entity has the ability to access at the measurement date.
Level 2 Inputs
Inputs other than quoted prices included in Level 1 that are observable for the financial assets or liabilities, either directly or indirectly. These might include quoted prices for similar financial assets in active markets, quoted prices for identical or similar financial assets in markets that are not active, inputs other than quoted prices that are observable for the financial assets or inputs that are derived principally from or corroborated by market data by correlation or other means.
Level 3 Inputs
Unobservable inputs for determining the fair value of financial assets that reflect an entity’s own assumptions about the assumptions that market participants would use in pricing the financial asset.
The Trust, with respect to the Series, uses the following methodologies to value instruments within its financial asset portfolio at fair value:
Trading Securities. These instruments include U.S. Treasury securities and open trade equity positions (futures contracts) that are actively traded on public markets with quoted pricing for corroboration. U.S. Treasury securities and futures contracts are reported at fair value using Level 1 inputs. Trading securities instruments further include open trade equity positions (trading options and currency forwards) that are quoted prices for identical or similar assets that are not traded on active markets. Trading options and currency forwards are reported at fair value using Level 2 inputs.
Swap Contracts. Certain Series of the Trust strategically invest a portion or all of their assets in total return swaps, selected at the direction of the Managing Owner. Swaps are privately negotiated contracts designed to provide investment returns linked to those produced by one or more investment products or indices. In a typical swap, two parties agree to exchange the returns (or differentials in rates of return) earned or realized on one or more particular predetermined investments or instruments. The gross returns to be exchanged or “swapped” between parties are calculated with respect to a “notional amount” (i.e., the amount of value of the underlying asset used in computing the particular interest rate, return, or other amount to be exchanged) in a particular investment, or in a “basket” of securities.
Swap contracts are reported at fair value upon daily reports from the counterparty. In addition, a third party takes the inputs from the counterparty, makes certain adjustments, and runs it through their pricing model to come up with their daily price. The fair value measurements of the swap contracts are valued using unadjusted inputs that were not internally developed. The Managing Owner reviews and compares approves current day pricing of the CTA positions, as received from the counterparty which includes intra-day volatility and volume and daily index performance, as well as from the third party. Differences in prices exceeding 5% are investigated. Unexplainable differences are escalated to the Managing Owner’s Valuation Committee for evaluation and resolution. Swap contracts are reported at fair value using Level 3 inputs.
Investments in Private Investment Companies. Investments in private investment companies are valued utilizing the net asset values provided by the underlying private investment companies as a practical expedient. Each Series applies the practical expedient to its investments in private investment companies on an investment-by-investment basis, and consistently with the Series’ entire position in a particular investment, unless it is probable that the Series will sell a portion of an investment at an amount different from the net asset value of the investment. Investments in Private Investment Companies are excluded from the leveling table below.
Investment in Unconsolidated Trading Companies. This investment represents the fair value of the allocation of cash, futures, forwards, options and swaps to each respective Series relative to its trading allocations from unconsolidated Trading Companies. A Series may redeem its investment in any of the Trading Companies on a daily basis at the Trading Company’s stated net asset value. Each of the Series, all of which are under the same management as the Trading Companies, has access to the underlying positions of the Trading Companies.
The following table summarizes investment in each Series measured at fair value on a recurring basis as of December 31, 2022 and December 31, 2021 segregated by the level of valuation inputs within the fair value hierarchy utilized to measure fair value.
| December 31, 2022 | | Practical
Expedient
(NAV) | | | Level 1
Inputs | | | Level 2
Inputs | | | Level 3
Inputs | | | Total
Fair Value | |
| | | | | | | | | | | | | | | | |
| Frontier Diversified Fund | | | | | | | | | | | | | | | |
| Investment in Unconsolidated Trading Companies | | $ | 28,671 | | | $ | - | | | $ | - | | | $ | - | | | $ | 28,671 | |
| U.S. Treasury Securities | | | - | | | | 42,198 | | | | - | | | | - | | | | 42,198 | |
| Frontier Masters Fund | | | | | | | | | | | | | | | | | | | | |
| Investment in Unconsolidated Trading Companies | | | 11,418 | | | | - | | | | - | | | | - | | | | 11,418 | |
| U.S. Treasury Securities | | | - | | | | 16,805 | | | | - | | | | - | | | | 16,805 | |
| Frontier Long/Short Commodity Fund | | | | | | | | | | | | | | | | | | | | |
| Investment in Unconsolidated Trading Companies | | | 23,810 | | | | - | | | | - | | | | - | | | | 23,810 | |
| U.S. Treasury Securities | | | - | | | | 35,044 | | | | - | | | | - | | | | 35,044 | |
| Frontier Balanced Fund | | | | | | | | | | | | | | | | | | | | |
| Investment in Unconsolidated Trading Companies | | | 136,169 | | | | - | | | | - | | | | - | | | | 136,169 | |
| Open Trade Equity (Deficit) | | | - | | | | 1,670 | | | | - | | | | - | | | | 1,670 | |
| U.S. Treasury Securities | | | - | | | | 200,417 | | | | - | | | | - | | | | 200,417 | |
| Frontier Select Fund | | | | | | | | | | | | | | | | | | | | |
| Investment in Unconsolidated Trading Companies | | | 20,414 | | | | - | | | | - | | | | - | | | | 20,414 | |
| U.S. Treasury Securities | | | - | | | | 30,046 | | | | - | | | | - | | | | 30,046 | |
| Frontier Global Fund | | | | | | | | | | | | | | | | | | | | |
| Investment in Unconsolidated Trading Companies | | | 16,200 | | | | - | | | | - | | | | - | | | | 16,200 | |
| U.S. Treasury Securities | | | - | | | | 23,843 | | | | - | | | | - | | | | 23,843 | |
| Frontier Heritage Fund | | | | | | | | | | | | | | | | | | | | |
| Investment in Unconsolidated Trading Companies | | | 27,970 | | | | - | | | | - | | | | - | | | | 27,970 | |
| U.S. Treasury Securities | | | - | | | | 41,167 | | | | - | | | | - | | | | 41,167 | |
| December 31, 2021 | | Practical
Expedient(NAV) | | | Level 1
Inputs | | | Level 2
Inputs | | | Level 3
Inputs | | | Total
Fair Value | |
| | | | | | | | | | | | | | | | |
| Frontier Diversified Fund | | | | | | | | | | | | | | | |
| Investment in Unconsolidated Trading Companies | | $ | 30,788 | | | $ | - | | | $ | - | | | $ | - | | | $ | 30,788 | |
| U.S. Treasury Securities | | | - | | | | 33,274 | | | | - | | | | - | | | | 33,274 | |
| Frontier Masters Fund | | | | | | | | | | | | | | | | | | | | |
| Investment in Unconsolidated Trading Companies | | | 14,270 | | | | - | | | | - | | | | - | | | | 14,270 | |
| U.S. Treasury Securities | | | - | | | | 15,422 | | | | - | | | | - | | | | 15,422 | |
| Frontier Long/Short Commodity Fund | | | | | | | | | | | | | | | | | | | | |
| Investment in Unconsolidated Trading Companies | | | 7,541 | | | | - | | | | - | | | | - | | | | 7,541 | |
| U.S. Treasury Securities | | | - | | | | 8,148 | | | | - | | | | - | | | | 8,148 | |
| Frontier Balanced Fund | | | | | | | | | | | | | | | | | | | | |
| Investment in Unconsolidated Trading Companies | | | 34,977 | | | | - | | | | - | | | | - | | | | 34,977 | |
| Open Trade Equity (Deficit) | | | - | | | | 14,836 | | | | - | | | | - | | | | 14,836 | |
| U.S. Treasury Securities | | | - | | | | 37,801 | | | | - | | | | - | | | | 37,801 | |
| Frontier Select Fund | | | | | | | | | | | | | | | | | | | | |
| Investment in Unconsolidated Trading Companies | | | 9,514 | | | | - | | | | - | | | | - | | | | 9,514 | |
| U.S. Treasury Securities | | | - | | | | 10,282 | | | | - | | | | - | | | | 10,282 | |
| Frontier Global Fund | | | | | | | | | | | | | | | | | | | | |
| Investment in Unconsolidated Trading Companies | | | 23,818 | | | | - | | | | - | | | | - | | | | 23,818 | |
| U.S. Treasury Securities | | | - | | | | 25,740 | | | | - | | | | - | | | | 25,740 | |
| Frontier Heritage Fund | | | | | | | | | | | | | | | | | | | | |
| Investment in Unconsolidated Trading Companies | | | 9,087 | | | | - | | | | - | | | | - | | | | 9,087 | |
| U.S. Treasury Securities | | | - | | | | 9,820 | | | | - | | | | - | | | | 9,820 | |
4. Swap Contracts
In addition to authorizing Trading Advisors to manage pre-determined investment levels of futures, option on futures and forward contracts, certain Series of the Trust will strategically invest a portion or all of their assets in total return swaps, selected at the direction of the Managing Owner. Total return swaps are privately negotiated contracts designed to provide investment returns linked to those produced by one or more investment products or indices. In a typical total return swap, two parties agree to exchange the returns (or differentials in rates of return) earned or realized on one or more particular predetermined investments or instruments. The gross returns to be exchanged or “swapped” between the parties are calculated with respect to a “notional amount” (i.e., the amount or value of the underlying asset used in computing the particular interest rate, return, or other amount to be exchanged) in a particular investment, or in a “basket” of securities.
Each Series’ investment in swaps will likely differ substantially over time due to cash flows, portfolio management decisions and market movements. The swaps serve to diversify the investment holdings of each Series and to provide access to programs and advisors that would not be otherwise available to the Series, and are not used for hedging purposes.
The Managing Owner follows a procedure in selecting well-established financial institutions which the Managing Owner, in its sole discretion, considers to be reputable, reliable, financially responsible and well established to act as swap counterparties. The procedure includes due diligence review of documentation on all new and existing financial institution counterparties prior to initiation of the relationship, and quarterly ongoing review during the relationship, to ensure that counterparties meet the Managing Owner’s minimum credit requirements, the counterparty average rating being no less than an investment grade rating as defined by the rating agencies. As of December 31, 2022, none of the Trust’s assets were deposited with over-the-counter counterparties in order to initiate and maintain swaps and is recorded as collateral within the swap fair value within the Statements of Financial Condition. The cash held with the counterparty is not restricted.
The Series may strategically invest assets in one or more swaps linked to certain underlying investments or indices at the direction of the Managing Owner. The Trading Company in which the assets of these Series will be invested will not own any of the investments or indices referenced by any swap entered into by these Series. In addition, neither the swap counterparty to the Trading Company of these Series nor any advisor referenced by any such swap is a Trading Advisor to these Series.
To help to reduce counterparty risk on the Series, the Managing Owner has the right to reduce the Series’ exposure and remove cash from the Series’ total return swaps with Deutsche Bank AG. This cash holding shall be in excess of $250,000 and may not exceed 40% of the index exposure in total. Index exposure is defined as the total notional amount plus any profit. The Series are charged interest on this cash holding and any amount removed will be offset against the final settlement value of the swap. All swap investments were liquidated in the year 2020.
5. Investments in Unconsolidated Trading Companies and Private Investment Companies
Investments in unconsolidated Trading Companies and private investment companies represent cash and open trade equity invested in the Trading and private investment companies and cumulative trading profits or losses allocated to each Series by the Trading Companies and private investment companies. Trading Companies and private investment companies allocate trading profits or losses on the basis of the proportion of each Series’ capital allocated for trading to each respective Trading Company, which bears no relationship to the amount of cash invested by a Series in the Trading Company and private investment companies. The Trading Companies are valued using the equity method of accounting, which approximates fair value. Investments in private investment companies are valued using the NAV provided by the underlying private investment.
The Galaxy Plus entities are made up of feeder funds in which the Trust invests and master trading entities into which the feeder funds invest. No investment held by the Galaxy Plus master trading entity is greater than 5% of the Trust’s total capital.
The following table summarizes each of the Series’ investments in unconsolidated Trading Companies as of December 31, 2022 and 2021:
| | | As of December 31, 2022 | | | As of December 31, 2021 | |
| | | Percentage of | | | | | | Percentage of | | | | |
| | | Series Total | | | | | | Series Total | | | | |
| | | Capital Invested in | | | | | | Capital Invested in | | | | |
| | | Unconsolidated Trading Companies | | | Fair Value | | | Unconsolidated Trading Companies | | | Fair Value | |
| Series | | | | | | | | | | | | |
| | | | | | | | | | | | | |
| Frontier Diversified Series — | | | | | | | | | | | | | | | | |
| Frontier Trading Company XXXVIII | | | 1.00 | % | | $ | 28,671 | | | | 1.02 | % | | $ | 30,788 | |
| Frontier Masters Fund — | | | | | | | | | | | | | | | | |
| Frontier Trading Company XXXVIII | | | 1.64 | % | | $ | 11,418 | | | | 2.02 | % | | $ | 14,270 | |
| Frontier Long/Short Commodity Fund — | | | | | | | | | | | | | | | | |
| Frontier Trading Company XXXVIII | | | 1.75 | % | | $ | 23,810 | | | | 0.61 | % | | $ | 7,541 | |
| Frontier Balanced Fund — | | | | | | | | | | | | | | | | |
| Frontier Trading Company XXXVIII | | | 1.46 | % | | $ | 136,169 | | | | 0.37 | % | | $ | 34,977 | |
| Frontier Select Fund — | | | | | | | | | | | | | | | | |
| Frontier Trading Companies XXXVIII | | | 1.36 | % | | $ | 20,414 | | | | 0.67 | % | | $ | 9,514 | |
| Frontier Global Fund — | | | | | | | | | | | | | | | | |
| Frontier Trading Company XXXVIII | | | 0.57 | % | | $ | 16,200 | | | | 1.13 | % | | $ | 23,818 | |
| Frontier Heritage Fund — | | | | | | | | | | | | | | | | |
| Frontier Trading Company XXXVIII | | | 0.91 | % | | $ | 27,970 | | | | 0.39 | % | | $ | 9,087 | |
The Series investments in private investment companies have certain redemption and liquidity restrictions which are described in the following table:
| | | Redemptions | | Redemptions | | Liquidity |
| | | Notice Period | | Permitted | | Restrictions |
| Frontier Diversified Fund | | | | | | |
| Multi-Strategy | | | | | | |
| Galaxy Plus Fund - Quantica Managed Futures Feeder Fund (507) LLC | | 24 hours | | Daily | | None |
| Galaxy Plus Fund - Welton GDP Feeder Fund (538) LLC | | 24 hours | | Daily | | None |
| Trend Following | | | | | | |
| Galaxy Plus Fund - Aspect Feeder Fund (532) LLC | | 24 hours | | Daily | | None |
| Galaxy Plus Fund - Fort Contrarian Feeder Fund (510) LLC | | 24 hours | | Daily | | None |
| Galaxy Plus Fund - QIM Feeder Fund (526) LLC | | 24 hours | | Daily | | None |
| Galaxy Plus Fund - Quest Feeder Fund (517) LLC | | 24 hours | | Daily | | None |
| | | | | | | |
| Frontier Masters Fund | | | | | | |
| Trend Following | | | | | | |
| Galaxy Plus Fund - Aspect Feeder Fund (532) LLC | | 24 hours | | Daily | | None |
| Multi-Strategy | | | | | | |
| Galaxy Plus Fund - Quantica Managed Futures Feeder Fund (507) LLC | | 24 hours | | Daily | | None |
| Galaxy Plus Fund - Welton GDP Feeder Fund (538) LLC | | 24 hours | | Daily | | None |
| | | | | | | |
| Frontier Long/Short Commodity Fund | | | | | | |
| Multi-Strategy | | | | | | |
| Galaxy Plus Fund - LRR Feeder Fund (522) LLC | | 24 hours | | Daily | | None |
| Galaxy Plus Fund - Volt Diversified Alpha Feeder Fund (550) LLC | | 24 hours | | Daily | | None |
| Galaxy Plus Fund - Welton GDP Feeder Fund (538) LLC | | 24 hours | | Daily | | None |
| | | | | | | |
| Frontier Balanced Fund | | | | | | |
| Multi-Strategy | | | | | | |
| Galaxy Plus Fund - Quantica Managed Futures Feeder Fund (507) LLC | | 24 hours | | Daily | | None |
| Galaxy Plus Fund - Welton GDP Feeder Fund (538) LLC | | 24 hours | | Daily | | None |
| Trend Following | | | | | | |
| Galaxy Plus Fund - Aspect Feeder Fund (532) LLC | | 24 hours | | Daily | | None |
| Galaxy Plus Fund - Fort Contrarian Feeder Fund (510) LLC | | 24 hours | | Daily | | None |
| Galaxy Plus Fund - QIM Feeder Fund (526) LLC | | 24 hours | | Daily | | None |
| Galaxy Plus Fund - Quest Feeder Fund (517) LLC | | 24 hours | | Daily | | None |
| | | | | | | |
| Frontier Select Fund | | | | | | |
| Multi-Strategy | | | | | | |
| Galaxy Plus Fund - Quantica Managed Futures Feeder Fund (507) LLC | | 24 hours | | Daily | | None |
| Galaxy Plus Fund - Welton GDP Feeder Fund (538) LLC | | 24 hours | | Daily | | None |
| | | | | | | |
| Frontier Global Fund | | | | | | |
| Trend Following | | | | | | |
| Galaxy Plus Fund - Aspect Feeder Fund (532) LLC | | 24 hours | | Daily | | None |
| | | | | | | |
| Frontier Heritage Fund | | | | | | |
| Multi-Strategy | | | | | | |
| Galaxy Plus Fund - Welton GDP Feeder Fund (538) LLC | | 24 hours | | Daily | | None |
| Trend Following | | | | | | |
| Galaxy Plus Fund - Aspect Feeder Fund (532) LLC | | 24 hours | | Daily | | None |
6. Transactions with Affiliates
The Managing Owner contributes funds to the Trust, with respect to the Series, in order to have a 1% interest (“Minimum Purchase Commitment”) in the aggregate capital, profits and losses of all Series and in return will receive units designated as general units in the Series in which the Managing Owner invests such funds. The general units may only be purchased by the Managing Owner and may be subject to no management fees or management fees at reduced rates. Otherwise, the general units hold the same rights as the limited units. The Managing Owner will make contributions to the Series of the Trust necessary to maintain at least a 1% interest in the aggregate capital, profits and losses of the combined Series of the Trust. Such contribution was made by the Managing Owner before trading commenced for the Trust and will be maintained throughout the existence of the Trust, and the Managing Owner will make such purchases as are necessary to effect this requirement. Additionally, the Managing Owner agreed with certain regulatory bodies to maintain a 1% interest specifically in the Frontier Balanced Fund Class 1AP and 2a Units, aggregated, and each of the Frontier Long/Short Commodity Fund, Frontier Diversified Fund and Frontier Masters Fund. The 1% interest in these specific Series is included in computing the Minimum Purchase Commitment in aggregate capital. In addition to the general units the Managing Owner receives in respect of its Minimum Purchase Commitment, the Managing Owner may purchase limited units in any Series as a Limited Owner. Principals of the Managing Owner or affiliates are allowed to own beneficial interests in the Trust, with respect to the Series, as well. All Units purchased by the Managing Owner are held for investment purposes only and not for resale. The Managing Owner may make purchases or redemptions at any time on the same terms as any Limited Owner. The Trust has and will continue to have certain relationships with the Managing Owner and its affiliates.
Expenses
Management Fees— Each Series of Units pays to the Managing Owner a monthly management fee equal to a percentage of the notional assets of such Series allocated to Trading Companies, calculated on a daily basis. The percentage basis of the fees varies and are in line with the amounts being disclosed below. In addition, the Managing Owner receives a monthly management fee equal to a certain percentage of the assets in the Galaxy Plus entities attributable to such Series’ (including notional assets), calculated on a monthly basis. The management fees attributable to Galaxy Plus entities are included in unrealized gain/(loss) on private investment companies on the consolidated statements of operations. The total amount of assets of a Series allocated to Trading Advisors and/or reference programs, including (i) actual funds deposited in accounts directed by the Trading Advisors or deposited as margin in respect of swaps or other derivative instruments referencing a reference program plus (ii) any notional equity allocated to the Trading Advisors and any reference programs, is referred to herein as the “notional assets” of the Series. The annual rate of the management fee is: 0.5% for the Frontier Balanced Fund Class 1 and Class 2, 0.5% for the Frontier Balanced Fund Class 1AP, Class 2a and Class 3a, 2.0% for the Frontier Global Fund, Frontier Long/Short Commodity Fund Class 1a, Class 2a, and Class 3a and Frontier Masters Fund, 0.75% for Frontier Diversified Fund, 2.5% for the Frontier Heritage Fund and Frontier Select Fund, and 3.5% for the Frontier Long/Short Commodity Fund Class 2 and Class 3. The Managing Owner may pay all or a portion of such management fees to the Trading Advisor(s) and/or waive (up to the percentage specified) any such management fee to the extent any related management fee is paid by a trading company or estimated management fee is embedded in a swap or other derivative instrument. Any management fee embedded in a swap or other derivative instrument may be greater or less than the management fee that would otherwise be charged to the Series by the Managing Owner.
The management fee as a percentage of the applicable Series’ notional assets will be greater than the percentage of the applicable Series’ net asset value to the extent that the notional assets of the Series exceeds its net asset value. The Managing Owner expects that the notional assets of each Series will generally be maintained at a level in excess of the net asset value of such Series and such excess may be substantial to the extent the Managing Owner deems necessary to achieve the desired level of volatility.
Trading Fees— In connection with each Series’ trading activities the Frontier Balanced Fund, Frontier Select Fund, Frontier Global Fund and Frontier Heritage Fund pays to the Managing Owner an FCM Fee of up to 2.25% per annum of notional assets allocated to the trading advisors, including through investments in commodity pools available on the Galaxy Plus Platform, and any reference programs of the applicable Series. The Frontier Diversified Fund, Frontier Long/Short Commodity Fund and Frontier Masters Fund pays to the Managing Owner an FCM Fee of up to 2.25% of notional assets allocated to the trading advisors, including through investments in commodity pools available on the Galaxy Plus Platform, and a custodial/due diligence fee of 0.12% of such Series’ NAV, calculated daily.
Incentive Fees— Some Series pay to the Managing Owner an incentive fee of a certain percentage of new net trading profits generated in the Trading Companies by such Series, monthly or quarterly. In addition, the Managing Owner receives a quarterly incentive fee of a certain percentage of new net trading profits generated in the Galaxy Plus entities that have been allocated to the Series. The incentive fees attributable to Galaxy Plus entities are included in unrealized gain/(loss) on private investment companies on the consolidated statements of operations. Because the Frontier Diversified Fund, Frontier Masters Fund, Frontier Balanced Fund, Frontier Heritage Fund, Frontier Select Fund, and Frontier Long/Short Commodity Fund may each employ multiple Trading Advisors, these Series will pay the Managing Owner a monthly incentive fee calculated on a Trading Advisor by Trading Advisor basis. It is therefore possible that in any given period the Series may pay incentive fees to the Managing Owner for one or more Trading Advisors while each of these Series as a whole experiences losses. The incentive fee is 25% for the Frontier Balanced Fund and the Frontier Diversified Fund and 20% for the Frontier Global Fund, Frontier Heritage Fund, Frontier Select Fund, Frontier Long/Short Commodity Fund and Frontier Masters Fund. The Managing Owner may pay all or a portion of such incentive fees to the Trading Advisor(s) for such Series.
Service Fees— Investors who have purchased Class 1 or Class 1a Units of Frontier Diversified Fund, Frontier Masters Fund, and Frontier Long/Short Commodity Fund are charged a service fee of up to two percent (2.0%) annually of the NAV (of the purchase price, in case of the initial service fee) of each Unit purchased, for the benefit of selling agents selling such Class 1 or Class 1a Units. The initial service fee, which is amortized monthly at an annual rate of up to two percent (2.0%) of the average daily NAV of Class 1 or Class 1a of such Series, is prepaid to the Managing Owner by each Series, and paid to the selling agents by the Managing Owner in the month following sale; provided, however, that investors who redeem all or a portion of their Class 1 and Class 1a Units of any Series during the first twelve (12) months following the effective date of their purchase are subject to a redemption fee of up to two percent (2.0%) of the purchase price at which such investor redeemed to reimburse the Managing Owner for the then-unamortized balance of the prepaid initial service fee. Investors who have purchased Class 1 or Class 1a Units of Frontier Balanced Fund, Frontier Heritage Fund, Frontier Select Fund, and Frontier Global Fund are charged a service fee of up to three percent (3.0%) annually of the NAV (of the purchase price, in case of the initial service fee) of each Unit purchased, for the benefit of selling agents selling such Class 1 or Class 1a Units. The initial service fee, which is amortized monthly at an annual rate of up to three percent (3.0%) of the average daily NAV of Class 1 or Class 1a of such Series, is prepaid to the Managing Owner by each Series, and paid to the selling agents by the Managing Owner in the month following sale; provided, however, that investors who redeem all or a portion of their Class 1 and Class 1a Units of any Series during the first twelve (12) months following the effective date of their purchase are subject to a redemption fee of up to three percent (3.0%) of the purchase price at which such investor redeemed to reimburse the Managing Owner for the then-unamortized balance of the prepaid initial service fee. With respect to Class 2 and Class 2a Units of any Series, the Managing Owner pays an ongoing service fee to selling agents of up to one half percent (0.5%) annually of the NAV of each Class 2 or Class 2a Unit (of which 0.25% will be charged to Limited Owners holding Class 2 Units of the Frontier Diversified Fund and Frontier Masters Fund or Class 2a Units of the Frontier Long/Short Commodity Fund sold) until such Class 2 or Class 2a Units which are subject to the fee limitation are reclassified as Class 3 or Class 3a Units of the applicable Series for administrative purposes. Currently the service fee is not charged to Class 1AP investors. The Managing Owner may also pay selling agents certain additional fees and expenses for administrative and other services rendered and expenses incurred by such selling agents.
The Managing Owner has determined that the purchase of additional units of the relevant series will commence in 2023. As such, the Managing Owner has calculated the amounts for additional units of the relevant series which will be purchased and classified such amounts as Subscriptions in advance for service fee rebates of $22,650, $393, $31,725, $391,457, $22,046, $162,385 and $79,667 for the Frontier Diversified, Long/Short Commodity, Masters, Balanced, Select, Global and Heritage Funds, respectively, as of December 31, 2022.
The following table summarizes fees earned by the Managing Owner for the years ended December 31, 2022, 2021 and 2020.
| For the Year Ended December 31, 2022 | | Incentive
(Rebate)
Fees | | | Management
Fee | | | Service
Fee | | | Trading
Fee | |
| | | | | | | | | | | | | |
| Frontier Diversified Fund | | $ | (13,788 | ) | | $ | - | | | $ | 1,128 | | | $ | 123,260 | |
| Frontier Masters Fund | | | - | | | | - | | | | 563 | | | | 55,575 | |
| Frontier Long/Short Commodity Fund | | | - | | | | - | | | | 270 | | | | 41,502 | |
| Frontier Balanced Fund | | | 213,064 | | | | 18,115 | | | | 263,174 | | | | 475,553 | |
| Frontier Select Fund | | | - | | | | - | | | | 53,197 | | | | 60,136 | |
| Frontier Global Fund | | | - | | | | - | | | | 84,304 | | | | 148,079 | |
| Frontier Heritage Fund | | | - | | | | - | | | | 92,170 | | | | 140,566 | |
| For the Year Ended December 31, 2021 | | Incentive
(Rebate)
Fees | | | Management
Fee | | | Service
Fee | | | Trading
Fee | |
| | | | | | | | | | | | | |
| Frontier Diversified Fund | | $ | - | | | $ | - | | | $ | 2,118 | | | $ | 125,429 | |
| Frontier Masters Fund | | | - | | | | - | | | | 628 | | | | 52,957 | |
| Frontier Long/Short Commodity Fund | | | - | | | | - | | | | 228 | | | | 38,961 | |
| Frontier Balanced Fund | | | 158,775 | | | | 18,441 | | | | 258,209 | | | | 435,300 | |
| Frontier Select Fund | | | - | | | | - | | | | 46,410 | | | | 46,943 | |
| Frontier Global Fund | | | - | | | | - | | | | 76,678 | | | | 140,017 | |
| Frontier Heritage Fund | | | - | | | | - | | | | 68,400 | | | | 101,631 | |
| For the Year Ended December 31, 2020 | | Incentive
(Rebate)
Fees | | | Management
Fee | | | Service
Fee | | | Trading
Fee | |
| | | | | | | | | | | | | |
| Frontier Diversified Fund | | $ | - | | | $ | - | | | $ | 14,246 | | | $ | 251,203 | |
| Frontier Masters Fund | | | - | | | | - | | | | 1,786 | | | | 101,300 | |
| Frontier Long/Short Commodity Fund | | | - | | | | - | | | | 381 | | | | 32,628 | |
| Frontier Balanced Fund | | | - | | | | 19,600 | | | | 351,503 | | | | 580,978 | |
| Frontier Select Fund | | | - | | | | - | | | | 62,144 | | | | 53,759 | |
| Frontier Global Fund | | | - | | | | - | | | | 100,858 | | | | 186,591 | |
| Frontier Heritage Fund | | | - | | | | - | | | | 66,761 | | | | 104,941 | |
The following table summarizes fees payable to the Managing Owner as of December 31, 2022 and 2021.
| As of December 31, 2022 | | Incentive
Fees | | | Management
Fees | | | Interest
Fees | | | Service
Fees | | | Trading
Fees | |
| | | | | | | | | | | | | | | | |
| Frontier Diversified Fund | | $ | - | | | $ | - | | | $ | - | | | $ | 85 | | | $ | 9,653 | |
| Frontier Masters Fund | | | - | | | | - | | | | - | | | | 43 | | | | 4,443 | |
| Frontier Long/Short Commodity Fund | | | - | | | | - | | | | 53 | | | | 21 | | | | 3,447 | |
| Frontier Balanced Fund | | | 692 | | | | 1,573 | | | | 2,306 | | | | 16,784 | | | | 36,946 | |
| Frontier Select Fund | | | - | | | | - | | | | 342 | | | | 3,630 | | | | 4,454 | |
| Frontier Global Fund | | | - | | | | - | | | | 302 | | | | 6,437 | | | | 12,480 | |
| Frontier Heritage Fund | | | - | | | | - | | | | 447 | | | | 6,432 | | | | 11,679 | |
| As of December 31, 2021 | | Incentive Fees | | | Management
Fees | | | Interest
Fees | | | Service
Fees | | | Trading
Fees | |
| | | | | | | | | | | | | | | | |
| Frontier Diversified Fund | | $ | - | | | $ | - | | | $ | - | | | $ | 83 | | | $ | 9,217 | |
| Frontier Masters Fund | | | - | | | | - | | | | - | | | | 43 | | | | 3,882 | |
| Frontier Long/Short Commodity Fund | | | - | | | | - | | | | 32 | | | | 19 | | | | 3,407 | |
| Frontier Balanced Fund | | | 54,702 | | | | 1,431 | | | | 957 | | | | 18,314 | | | | 32,970 | |
| Frontier Select Fund | | | - | | | | - | | | | 196 | | | | 3,524 | | | | 3,682 | |
| Frontier Global Fund | | | - | | | | - | | | | 312 | | | | 4,986 | | | | 9,533 | |
| Frontier Heritage Fund | | | - | | | | - | | | | 217 | | | | 4,950 | | | | 8,307 | |
With respect to the service fees, the initial service fee (for the first 12 months) relating to a purchase of Units by an investor is prepaid by the Managing Owner to the relevant selling agent in the month following such purchase and is reimbursed therefore by the Series monthly in arrears in an amount based upon a corresponding percentage of NAV, calculated daily. Consequently, the Managing Owner bears the risk and the benefit of the upside potential of any difference between the amount of the initial service fee prepaid by it and the amount of the reimbursement thereof, which may result from variations in NAV over the following 12 months.
Aggregate interest income from all sources, including U.S. Treasury Securities assets net of premiums and cash held at clearing brokers, of up to the first 2% (annualized) of average net assets less any fair market value related to swaps is paid to the Managing Owner by the Frontier Balanced Fund (Class 1 and Class 2), Frontier Long/Short Commodity Fund (Class 2 and Class 3), Frontier Global Fund, Frontier Select Fund, and Frontier Heritage Fund. For the Frontier Diversified Fund, Frontier Long/Short Commodity Fund (Class 1a, Class 2a and Class 3a), Frontier Masters Fund, and Frontier Balanced Fund (Class 1AP, Class 2a and Class 3a), 100% of the interest is retained by the respective Series.
Frontier Masters Fund Class 1 was closed as of April 1, 2021 and Frontier Diversified Fund Class 1 was closed as of July 21, 2021. All swaps were sold as of December 31, 2020.
The following table outlines the interest paid by each Series to the Managing Owner and its ratio to average net assets for the years ended December 31, 2022, 2021 and 2020:
| | | 2022 | | | 2021 | | | 2020 | | | 2022 | | | 2021 | | | 2020 | |
| | | Gross Amount
Paid to the
Managing Owner | | | Gross Amount
Paid to the
Managing Owner | | | Gross Amount
Paid to the
Managing
Owner | | | Ratio to
Average
Net Assets | | | Ratio to
Average
Net Assets | | | Ratio to
Average
Net Assets | |
| | | | | | | | | | | | | | | | | | | |
| Frontier Diversified Fund Class 1 | | $ | - | | | $ | - | | | $ | 128,397 | | | | 0.00 | % | | | 0.00 | % | | | 33.62 | % |
| Frontier Diversified Fund Class 2 | | | - | | | | - | | | | 791,849 | | | | 0.00 | % | | | 0.00 | % | | | 29.93 | % |
| Frontier Diversified Fund Class 3 | | | - | | | | - | | | | 617,154 | | | | 0.00 | % | | | 0.00 | % | | | 14.78 | % |
| Frontier Masters Fund Class 1 | | | - | | | | - | | | | 219 | | | | 0.00 | % | | | 0.00 | % | | | 2.00 | % |
| Frontier Masters Fund Class 2 | | | - | | | | - | | | | 1,567 | | | | 0.00 | % | | | 0.00 | % | | | 0.25 | % |
| Frontier Long/Short Commodity Fund Class 2 | | | 17 | | | | 22 | | | | 27 | | | | 0.06 | % | | | 0.06 | % | | | 0.07 | % |
| Frontier Long/Short Commodity Fund Class 3 | | | 585 | | | | 659 | | | | 703 | | | | 0.05 | % | | | 0.06 | % | | | 0.07 | % |
| Frontier Balanced Fund Class 1 | | | 13,088 | | | | 8,660 | | | | 7,387 | | | | 0.15 | % | | | 0.10 | % | | | 0.06 | % |
| Frontier Balanced Fund Class 1AP | | | 128 | | | | 108 | | | | 103 | | | | 0.15 | % | | | 0.11 | % | | | 0.06 | % |
| Frontier Balanced Fund Class 2 | | | 2,970 | | | | 1,749 | | | | 1,484 | | | | 0.15 | % | | | 0.10 | % | | | 0.06 | % |
| Frontier Balanced Fund Class 2a | | | 17 | | | | 16 | | | | 17 | | | | 0.03 | % | | | 0.02 | % | | | 0.01 | % |
| Frontier Balanced Fund Class 3a | | | 156 | | | | 103 | | | | 80 | | | | 0.03 | % | | | 0.02 | % | | | 0.01 | % |
| Frontier Select Fund Class 1 | | | 3,556 | | | | 2,876 | | | | 4,514 | | | | 0.20 | % | | | 0.19 | % | | | 0.22 | % |
| Frontier Select Fund Class 1AP | | | 29 | | | | 20 | | | | 24 | | | | 0.20 | % | | | 0.19 | % | | | 0.24 | % |
| Frontier Select Fund Class 2 | | | 185 | | | | 138 | | | | 173 | | | | 0.20 | % | | | 0.18 | % | | | 0.23 | % |
| Frontier Global Fund Class 1 | | | 5,232 | | | | 3,665 | | | | 3,110 | | | | 0.19 | % | | | 0.14 | % | | | 0.09 | % |
| Frontier Global Fund Class 1AP | | | - | | | | - | | | | 28 | | | | 0.00 | % | | | 0.00 | % | | | 0.10 | % |
| Frontier Global Fund Class 2 | | | 293 | | | | 281 | | | | 238 | | | | 0.18 | % | | | 0.14 | % | | | 0.09 | % |
| Frontier Heritage Fund Class 1 | | | 5,196 | | | | 3,669 | | | | 5,141 | | | | 0.17 | % | | | 0.16 | % | | | 0.23 | % |
| Frontier Heritage Fund Class 1AP | | | 22 | | | | 14 | | | | 20 | | | | 0.17 | % | | | 0.16 | % | | | 0.24 | % |
| Frontier Heritage Fund Class 2 | | | 451 | | | | 373 | | | | 847 | | | | 0.17 | % | | | 0.16 | % | | | 0.20 | % |
| | | | | | | | | | | | | | | | | | | | | | | | | |
| Total | | $ | 31,925 | | | $ | 22,353 | | | $ | 1,563,082 | | | | | | | | | | | | | |
7. Financial Highlights
The following information presents the financial highlights of the Series for the years ended December 31, 2022, 2021 and 2020. This data has been derived from the information presented in the consolidated financial statements.
For the year ended December 31, 2022
| | | Frontier Diversified Fund | | | Frontier Masters Fund | | | Frontier Long/Short
Commodity Fund | |
| | | Class 2 | | | Class 3 | | | Class 2 | | | Class 3 | | | Class 2 | | | Class 2a | | | Class 3 | | | Class 3a | |
| Per unit operating performance (1) | | | | | | | | | | | | | | | | | | | | | | | | | | | | | | | | |
| Net asset value, December 31, 2021 | | $ | 88.98 | | | $ | 83.56 | | | $ | 70.17 | | | $ | 66.15 | | | $ | 89.97 | | | $ | 58.75 | | | $ | 94.38 | | | $ | 62.16 | |
| Net operating results: | | | | | | | | | | | | | | | | | | | | | | | | | | | | | | | | |
| Interest income | | | 0.20 | | | | 0.19 | | | | 0.35 | | | | 0.33 | | | | 0.27 | | | | 0.17 | | | | 0.28 | | | | 0.19 | |
| Expenses | | | (3.59 | ) | | | (3.37 | ) | | | (6.98 | ) | | | (6.55 | ) | | | (3.27 | ) | | | (2.14 | ) | | | (3.42 | ) | | | (2.27 | ) |
| Net gain/(loss) on investments, net of non-controlling interests | | | 10.78 | | | | 10.34 | | | | 31.10 | | | | 29.52 | | | | 22.68 | | | | 15.15 | | | | 23.79 | | | | 16.21 | |
| Net income/(loss) | | | 7.39 | | | | 7.16 | | | | 24.47 | | | | 23.30 | | | | 19.68 | | | | 13.18 | | | | 20.65 | | | | 14.13 | |
| Net asset value, December 31, 2022 | | $ | 96.37 | | | $ | 90.72 | | | $ | 94.64 | | | $ | 89.45 | | | $ | 109.65 | | | $ | 71.93 | | | $ | 115.03 | | | $ | 76.29 | |
| | | | | | | | | | | | | | | | | | | | | | | | | | | | | | | | | |
| Ratios to average net assets | | | | | | | | | | | | | | | | | | | | | | | | | | | | | | | | |
| Net investment income/(loss) | | | -3.17 | % | | | -3.17 | % | | | -6.45 | % | | | -6.45 | % | | | -2.60 | % | | | -2.60 | % | | | -2.60 | % | | | -2.60 | % |
| Expenses before incentive fees (rebate) (3)(4) | | | 3.76 | % | | | 3.76 | % | | | 6.78 | % | | | 6.78 | % | | | 2.83 | % | | | 2.83 | % | | | 2.83 | % | | | 2.83 | % |
| Expenses after incentive fees (rebate) (3)(4) | | | 3.35 | % | | | 3.35 | % | | | 6.78 | % | | | 6.78 | % | | | 2.83 | % | | | 2.83 | % | | | 2.83 | % | | | 2.83 | % |
| Total return before incentive fees (rebate) (2) | | | 7.90 | % | | | 8.17 | % | | | 34.87 | % | | | 35.22 | % | | | 21.87 | % | | | 22.43 | % | | | 21.87 | % | | | 22.74 | % |
| Total return after incentive fees (rebate) (2) | | | 8.30 | % | | | 8.57 | % | | | 34.87 | % | | | 35.22 | % | | | 21.87 | % | | | 22.43 | % | | | 21.87 | % | | | 22.74 | % |
| | | | | | | | | | | | | | | | | | | | | | | | | | | | | | | | | |
| Incentive fee (rebate) per share | | | (0.44 | ) | | | (0.41 | ) | | | - | | | | - | | | | - | | | | - | | | | - | | | | - | |
| Incentive Fee (rebate) to ANA | | | -0.41 | % | | | -0.41 | % | | | 0.00 | % | | | 0.00 | % | | | 0.00 | % | | | 0.00 | % | | | 0.00 | % | | | 0.00 | % |
| | | Frontier Balanced Fund | | | Frontier Select Fund | |
| | | Class 1 | | | Class 1AP | | | Class 2 | | | Class 2a | | | Class 3a | | | Class 1 | | | Class 1AP | | | Class 2 | |
| Per unit operating performance (1) | | | | | | | | | | | | | | | | | | | | | | | | |
| Net asset value, December 31, 2021 | | $ | 82.82 | | | $ | 103.38 | | | $ | 139.40 | | | $ | 120.98 | | | $ | 120.57 | | | $ | 63.39 | | | $ | 79.21 | | | $ | 105.10 | |
| Net operating results: | | | | | | | | | | | | | | | | | | | | | | | | | | | | | | | | |
| Interest income (expense) | | | (0.02 | ) | | | (0.02 | ) | | | (0.03 | ) | | | (0.02 | ) | | | (0.02 | ) | | | 0.00 | | | | 0.00 | | | | 0.00 | |
| Expenses | | | (10.14 | ) | | | (8.70 | ) | | | (11.74 | ) | | | (10.13 | ) | | | (10.17 | ) | | | (5.39 | ) | | | (3.54 | ) | | | (4.67 | ) |
| Net gain/(loss) on investments, net of non-controlling interests | | | 26.51 | | | | 32.90 | | | | 44.38 | | | | 38.64 | | | | 38.58 | | | | 13.23 | | | | 16.04 | | | | 21.27 | |
| Net income/(loss) | | | 16.35 | | | | 24.18 | | | | 32.61 | | | | 28.49 | | | | 28.39 | | | | 7.84 | | | | 12.50 | | | | 16.60 | |
| Net asset value, December 31, 2022 | | $ | 99.17 | | | $ | 127.56 | | | $ | 172.01 | | | $ | 149.47 | | | $ | 148.96 | | | $ | 71.23 | | | $ | 91.71 | | | $ | 121.70 | |
| | | | | | | | | | | | | | | | | | | | | | | | | | | | | | | | | |
| Ratios to average net assets | | | | | | | | | | | | | | | | | | | | | | | | | | | | | | | | |
| Net investment income/(loss) | | | -9.43 | % | | | -6.37 | % | | | -6.37 | % | | | -6.37 | % | | | -6.37 | % | | | -6.21 | % | | | -3.21 | % | | | -3.21 | % |
| Expenses before incentive fees (3)(4) | | | 7.51 | % | | | 4.46 | % | | | 4.46 | % | | | 4.46 | % | | | 4.46 | % | | | 6.21 | % | | | 3.21 | % | | | 3.21 | % |
| Expenses after incentive fees (3)(4) | | | 9.42 | % | | | 6.36 | % | | | 6.36 | % | | | 6.36 | % | | | 6.36 | % | | | 6.21 | % | | | 3.21 | % | | | 3.21 | % |
| Total return before incentive fees (2) | | | 21.65 | % | | | 25.29 | % | | | 25.30 | % | | | 25.45 | % | | | 25.45 | % | | | 12.37 | % | | | 15.78 | % | | | 15.79 | % |
| Total return after incentive fees (2) | | | 19.75 | % | | | 23.39 | % | | | 23.39 | % | | | 23.55 | % | | | 23.54 | % | | | 12.37 | % | | | 15.78 | % | | | 15.79 | % |
| | | | | | | | | | | | | | | | | | | | | | | | | | | | | | | | | |
| Incentive fee per share | | | 2.05 | | | | 2.60 | | | | 3.51 | | | | 3.03 | | | | 3.04 | | | | - | | | | - | | | | - | |
| Incentive Fee to ANA | | | 1.90 | % | | | 1.90 | % | | | 1.90 | % | | | 1.90 | % | | | 1.90 | % | | | 0.00 | % | | | 0.00 | % | | | 0.00 | % |
| | | Frontier Global Fund | | | Frontier Heritage Fund | |
| | | Class 1 | | | Class 2 | | | Class 1 | | | Class 1AP | | | Class 2 | |
| Per unit operating performance (1) | | | | | | | | | | | | | | | |
| Net asset value, December 31, 2021 | | $ | 109.45 | | | $ | 170.40 | | | $ | 103.43 | | | $ | 129.19 | | | $ | 172.91 | |
| Net operating results: | | | | | | | | | | | | | | | | | | | | |
| Interest income | | | 0.00 | | | | 0.00 | | | | 0.00 | | | | 0.00 | | | | 0.00 | |
| Expenses | | | (14.39 | ) | | | (13.45 | ) | | | (11.60 | ) | | | (8.62 | ) | | | (11.40 | ) |
| Net gain/(loss) on investments, net of non-controlling interests | | | 90.21 | | | | 140.30 | | | | 62.31 | | | | 77.85 | | | | 104.04 | |
| Net income/(loss) | | | 75.82 | | | | 126.85 | | | | 50.71 | | | | 69.23 | | | | 92.64 | |
| Net asset value, December 31, 2022 | | $ | 185.27 | | | $ | 297.25 | | | $ | 154.14 | | | $ | 198.42 | | | $ | 265.55 | |
| | | | | | | | | | | | | | | | | | | | | |
| Ratios to average net assets | | | | | | | | | | | | | | | | | | | | |
| Net investment income/(loss) | | | -8.01 | % | | | -5.00 | % | | | -7.21 | % | | | -4.20 | % | | | -4.20 | % |
| Expenses before incentive fees (3)(4) | | | 8.01 | % | | | 5.00 | % | | | 7.21 | % | | | 4.20 | % | | | 4.20 | % |
| Expenses after incentive fees (3)(4) | | | 8.01 | % | | | 5.00 | % | | | 7.21 | % | | | 4.20 | % | | | 4.20 | % |
| Total return before incentive fees (2) | | | 69.28 | % | | | 74.44 | % | | | 49.03 | % | | | 53.59 | % | | | 53.58 | % |
| Total return after incentive fees (2) | | | 69.28 | % | | | 74.44 | % | | | 49.03 | % | | | 53.59 | % | | | 53.58 | % |
| | | | | | | | | | | | | | | | | | | | | |
| Incentive fee per share | | | - | | | | - | | | | - | | | | - | | | | - | |
| Incentive Fee to ANA | | | 0.00 | % | | | 0.00 | % | | | 0.00 | % | | | 0.00 | % | | | 0.00 | % |
| (1) | Interest income and expenses per unit are calculated by dividing these amounts by the average number of units outstanding during the period. The net gain/(loss) on investments, net of non-controlling interests is a balancing amount necessary to reconcile the change in net asset value per unit with the other per unit information. |
| (2) | Impact of incentive fee computed using average net assets, otherwise computed using average units outstanding during the period prior to the effects of any non-controlling transactions. An owner’s total returns may vary from the above returns based on the timing of contributions and withdrawals. Total returns are not annualized. |
| (3) | Expense ratios do not reflect interest allocated to the Managing Owner as such expenses are not included in the consolidated statements of operations of the Series, see footnote 6. |
| (4) | Expense ratios do not include management and incentive fees at the Galaxy Plus entities. The ratios would have been higher had those expenses been included. The impact of those fees is included in the total return. |
For the year ended December 31, 2021
| | | Frontier Diversified Fund | | | Frontier Masters Fund | | | Frontier Long/Short
Commodity Fund | |
| | | Class 1 | | | Class 2 | | | Class 3 | | | Class 1 | | | Class 2 | | | Class 3 | | | Class 2 | | | Class 2a | | | Class 3 | | | Class 3a | |
| Per unit operating performance (1) | | | | | | | | | | | | | | | | | | | | | | | | | | | | | | |
| Net asset value, December 31, 2020 | | $ | 72.68 | | | $ | 88.95 | | | $ | 83.33 | | | $ | 55.18 | | | $ | 67.54 | | | $ | 63.52 | | | $ | 85.99 | | | $ | 55.29 | | | $ | 90.21 | | | $ | 58.37 | |
| Net operating results: | | | | | | | | | | | | | | | | | | | | | | | | | | | | | | | | | | | | | | | | |
| Interest income | | | 0.09 | | | | 0.11 | | | | 0.11 | | | | 0.19 | | | | 0.27 | | | | 0.25 | | | | 0.27 | | | | 0.17 | | | | 0.27 | | | | 0.17 | |
| Expenses | | | (4.32 | ) | | | (3.28 | ) | | | (3.17 | ) | | | (6.89 | ) | | | (4.56 | ) | | | (4.28 | ) | | | (2.88 | ) | | | (1.74 | ) | | | (2.85 | ) | | | (1.84 | ) |
| Net gain/(loss) on investments, net of non-controlling interests | | | (68.45 | )* | | | 3.19 | | | | 3.28 | | | | (48.48 | )* | | | 6.92 | | | | 6.66 | | | | 6.59 | | | | 5.04 | | | | 6.75 | | | | 5.45 | |
| Net income/(loss) | | | (72.68 | )* | | | 0.03 | | | | 0.23 | | | | (55.18 | )* | | | 2.63 | | | | 2.63 | | | | 3.98 | | | | 3.46 | | | | 4.17 | | | | 3.79 | |
| Net asset value, December 31, 2021 | | $ | - | * | | $ | 88.98 | | | $ | 83.56 | | | $ | - | * | | $ | 70.17 | | | $ | 66.15 | | | $ | 89.97 | | | $ | 58.75 | | | $ | 94.38 | | | $ | 62.16 | |
| | | | | | | | | | | | | | | | | | | | | | | | | | | | | | | | | | | | �� | | | | | |
| Ratios to average net assets | | | | | | | | | | | | | | | | | | | | | | | | | | | | | | | | | | | | | | | | |
| Net investment income/(loss) | | | -10.83 | % | | | -6.54 | % | | | -6.54 | % | | | -24.03 | % | | | -11.12 | % | | | -11.12 | % | | | -5.16 | % | | | -5.16 | % | | | -5.16 | % | | | -5.16 | % |
| Expenses before incentive fees (3)(4) | | | 11.07 | % | | | 6.78 | % | | | 6.78 | % | | | 24.71 | % | | | 11.81 | % | | | 11.81 | % | | | 5.70 | % | | | 5.70 | % | | | 5.70 | % | | | 5.70 | % |
| Expenses after incentive fees (3)(4) | | | 11.07 | % | | | 6.78 | % | | | 6.78 | % | | | 24.71 | % | | | 11.81 | % | | | 11.81 | % | | | 5.70 | % | | | 5.70 | % | | | 5.70 | % | | | 5.70 | % |
| Total return before incentive fees (2) | | | 5.06 | %* | | | 0.03 | % | | | 0.28 | % | | | 4.59 | %* | | | 3.89 | % | | | 4.14 | % | | | 4.63 | % | | | 6.25 | % | | | 4.63 | % | | | 6.49 | % |
| Total return after incentive fees (2) | | | 5.06 | %* | | | 0.03 | % | | | 0.28 | % | | | 4.59 | %* | | | 3.89 | % | | | 4.14 | % | | | 4.63 | % | | | 6.25 | % | | | 4.63 | % | | | 6.49 | % |
| | | | | | | | | | | | | | | | | | | | | | | | | | | | | | | | | | | | | | | | | |
| Incentive fee per share | | | - | | | | - | | | | - | | | | - | | | | - | | | | - | | | | - | | | | - | | | | - | | | | - | |
| Incentive Fee to ANA | | | 0.00 | % | | | 0.00 | % | | | 0.00 | % | | | 0.00 | % | | | 0.00 | % | | | 0.00 | % | | | 0.00 | % | | | 0.00 | % | | | 0.00 | % | | | 0.00 | % |
| | | Frontier Balanced Fund | | | Frontier Select Fund | |
| | | Class 1 | | | Class 1AP | | | Class 2 | | | Class 2a | | | Class 3a | | | Class 1 | | | Class 1AP | | | Class 2 | |
| Per unit operating performance (1) | | | | | | | | | | | | | | | | | | | | | | | | |
| Net asset value, December 31, 2020 | | $ | 79.93 | | | $ | 96.81 | | | $ | 130.54 | | | $ | 113.20 | | | $ | 112.81 | | | $ | 58.55 | | | $ | 70.99 | | | $ | 94.20 | |
| Net operating results: | | | | | | | | | | | | | | | | | | | | | | | | | | | | | | | | |
| Interest income | | | 0.00 | | | | 0.00 | | | | 0.00 | | | | 0.00 | | | | 0.00 | | | | 0.00 | | | | 0.00 | | | | 0.00 | |
| Expenses | | | (7.39 | ) | | | (6.40 | ) | | | (7.92 | ) | | | (7.83 | ) | | | (6.75 | ) | | | (3.87 | ) | | | (2.22 | ) | | | (2.95 | ) |
| Net gain/(loss) on investments, net of non-controlling interests | | | 10.28 | | | | 12.97 | | | | 16.78 | | | | 15.61 | | | | 14.51 | | | | 8.71 | | | | 10.44 | | | | 13.86 | |
| Net income/(loss) | | | 2.89 | | | | 6.57 | | | | 8.86 | | | | 7.78 | | | | 7.76 | | | | 4.84 | | | | 8.22 | | | | 10.90 | |
| Net asset value, December 31, 2021 | | $ | 82.82 | | | $ | 103.38 | | | $ | 139.40 | | | $ | 120.98 | | | $ | 120.57 | | | $ | 63.39 | | | $ | 79.21 | | | $ | 105.10 | |
| | | | | | | | | | | | | | | | | | | | | | | | | | | | | | | | | |
| Ratios to average net assets | | | | | | | | | | | | | | | | | | | | | | | | | | | | | | | | |
| Net investment income/(loss) | | | -15.38 | % | | | -9.53 | % | | | -9.53 | % | | | -9.53 | % | | | -9.53 | % | | | -11.80 | % | | | -5.79 | % | | | -5.79 | % |
| Expenses before incentive fees (3)(4) | | | 13.99 | % | | | 8.14 | % | | | 8.14 | % | | | 8.14 | % | | | 8.14 | % | | | 11.80 | % | | | 5.79 | % | | | 5.79 | % |
| Expenses after incentive fees (3)(4) | | | 15.38 | % | | | 9.53 | % | | | 9.53 | % | | | 9.53 | % | | | 9.53 | % | | | 11.80 | % | | | 5.79 | % | | | 5.79 | % |
| Total return before incentive fees (2) | | | 5.01 | % | | | 8.18 | % | | | 8.18 | % | | | 8.27 | % | | | 8.27 | % | | | 8.27 | % | | | 11.58 | % | | | 11.57 | % |
| Total return after incentive fees (2) | | | 3.61 | % | | | 6.79 | % | | | 6.79 | % | | | 6.87 | % | | | 6.88 | % | | | 8.27 | % | | | 11.58 | % | | | 11.57 | % |
| | | | | | | | | | | | | | | | | | | | | | | | | | | | | | �� | | | |
| Incentive fee per share | | | 1.24 | | | | 1.64 | | | | 2.03 | | | | 2.01 | | | | 1.74 | | | | - | | | | - | | | | - | |
| Incentive Fee to ANA | | | 1.39 | % | | | 1.39 | % | | | 1.39 | % | | | 1.39 | % | | | 1.39 | % | | | 0.00 | % | | | 0.00 | % | | | 0.00 | % |
| | | Frontier Global Fund | | | Frontier Heritage Fund | |
| | | Class 1 | | | Class 2 | | | Class 1 | | | Class 1AP | | | Class 2 | |
| Per unit operating performance (1) | | | | | | | | | | | | | | | |
| Net asset value, December 31, 2020 | | $ | 110.90 | | | $ | 167.56 | | | $ | 96.10 | | | $ | 116.50 | | | $ | 155.92 | |
| Net operating results: | | | | | | | | | | | | | | | | | | | | |
| Interest income | | | 0.00 | | | | 0.00 | | | | 0.00 | | | | 0.00 | | | | 0.00 | |
| Expenses | | | (9.45 | ) | | | (8.67 | ) | | | (7.58 | ) | | | (5.34 | ) | | | (7.16 | ) |
| Net gain/(loss) on investments, net of non-controlling interests | | | 8.00 | | | | 11.51 | | | | 14.91 | | | | 18.03 | | | | 24.16 | |
| Net income/(loss) | | | (1.45 | ) | | | 2.84 | | | | 7.33 | | | | 12.69 | | | | 16.99 | |
| Net asset value, December 31, 2021 | | $ | 109.45 | | | $ | 170.40 | | | $ | 103.43 | | | $ | 129.19 | | | $ | 172.91 | |
| | | | | | | | | | | | | | | | | | | | | |
| Ratios to average net assets | | | | | | | | | | | | | | | | | | | | |
| Net investment income/(loss) | | | -15.46 | % | | | -9.73 | % | | | -14.26 | % | | | -8.18 | % | | | -8.18 | % |
| Expenses before incentive fees (3)(4) | | | 15.46 | % | | | 9.73 | % | | | 14.26 | % | | | 8.18 | % | | | 8.18 | % |
| Expenses after incentive fees (3)(4) | | | 15.46 | % | | | 9.73 | % | | | 14.26 | % | | | 8.18 | % | | | 8.18 | % |
| Total return before incentive fees (2) | | | -1.31 | % | | | 1.70 | % | | | 7.62 | % | | | 10.89 | % | | | 10.90 | % |
| Total return after incentive fees (2) | | | -1.31 | % | | | 1.70 | % | | | 7.62 | % | | | 10.89 | % | | | 10.90 | % |
| | | | | | | | | | | | | | | | | | | | | |
| Incentive fee per share | | | - | | | | - | | | | - | | | | - | | | | - | |
| Incentive Fee to ANA | | | 0.00 | % | | | 0.00 | % | | | 0.00 | % | | | 0.00 | % | | | 0.00 | % |
| (1) | Interest income and expenses per unit are calculated by dividing these amounts by the average number of units outstanding during the period. The net gain/(loss) on investments, net of non-controlling interests is a balancing amount necessary to reconcile the change in net asset value per unit with the other per unit information. |
| (2) | Impact of incentive fee computed using average net assets, otherwise computed using average units outstanding during the period prior to the effects of any non-controlling transactions. An owner’s total returns may vary from the above returns based on the timing of contributions and withdrawals. Total returns are not annualized. |
| (3) | Expense ratios do not reflect interest allocated to the Managing Owner as such expenses are not included in the consolidated statements of operations of the Series, see footnote 6. |
| (4) | Expense ratios do not include management and incentive fees at the Galaxy Plus entities. The ratios would have been higher had those expenses been included. The impact of those fees is included in the total return. |
| * | Class 1 of Frontier Masters Fund was closed as of April 1, 2021 and Frontier Diversified Fund Class 1 was closed as of July 21, 2021. |
For the year ended December 31, 2020
| | | Frontier Diversified Fund | | | Frontier Masters Fund | | | Frontier Long/Short Commodity Fund | |
| | | Class 1 | | | Class 2 | | | Class 3 | | | Class 1 | | | Class 2 | | | Class 3 | | | Class 1a | | | Class 2 | | | Class 2a | | | Class 3 | | | Class 3a | |
| Per unit operating performance (1) | | | | | | | | | | | | | | | | | | | | | | | | | | | | | | | | | |
| Net asset value, December 31, 2019 | | $ | 101.10 | | | $ | 121.58 | | | $ | 113.61 | | | $ | 72.28 | | | $ | 87.18 | | | $ | 81.78 | | | $ | 44.20 | | | $ | 81.60 | | | $ | 52.55 | | | $ | 85.64 | | | $ | 55.31 | |
| Net operating results: | | | | | | | | | | | | | | | | | | | | | | | | | | | | | | | | | | | | | | | | | | | | |
| Interest income | | | 0.01 | | | | 0.01 | | | | 0.01 | | | | 0.09 | | | | 0.12 | | | | 0.11 | | | | 0.14 | | | | 0.25 | | | | 0.16 | | | | 0.27 | | | | 0.17 | |
| Expenses | | | (6.39 | ) | | | (3.65 | ) | | | (3.23 | ) | | | (14.02 | ) | | | (4.83 | ) | | | (4.51 | ) | | | (3.09 | ) | | | (2.09 | ) | | | (1.34 | ) | | | (2.19 | ) | | | (1.41 | ) |
| Net gain/(loss) on investments, net of non-controlling interests | | | (22.03 | ) | | | (28.98 | ) | | | (27.06 | ) | | | (3.17 | ) | | | (14.93 | ) | | | (13.86 | ) | | | (41.24 | )* | | | 6.22 | | | | 3.91 | | | | 6.49 | | | | 4.30 | |
| Net income/(loss) | | | (28.42 | ) | | | (32.63 | ) | | | (30.28 | ) | | | (17.10 | ) | | | (19.64 | ) | | | (18.27 | ) | | | (44.20 | )* | | | 4.39 | | | | 2.74 | | | | 4.56 | | | | 3.05 | |
| Net asset value, December 31, 2020 | | $ | 72.68 | | | $ | 88.95 | | | $ | 83.33 | | | $ | 55.18 | | | $ | 67.54 | | | $ | 63.52 | | | $ | - | * | | $ | 85.99 | | | $ | 55.29 | | | $ | 90.21 | | | $ | 58.37 | |
| | | | | | | | | | | | | | | | | | | | | | | | | | | | | | | | | | | | | | | | | | | | | |
| Ratios to average net assets | | | | | | | | | | | | | | | | | | | | | | | | | | | | | | | | | | | | | | | | | | | | |
| Net investment income/(loss) | | | -7.33 | % | | | -3.60 | % | | | -3.60 | % | | | -22.42 | % | | | -6.13 | % | | | -6.13 | % | | | -6.61 | % | | | -2.21 | % | | | -2.21 | % | | | -2.21 | % | | | -2.21 | % |
| Expenses before incentive fees (3)(4) | | | 7.34 | % | | | 3.61 | % | | | 3.61 | % | | | 22.57 | % | | | 6.28 | % | | | 6.28 | % | | | 6.91 | % | | | 2.51 | % | | | 2.51 | % | | | 2.51 | % | | | 2.51 | % |
| Expenses after incentive fees (3)(4) | | | 7.34 | % | | | 3.61 | % | | | 3.61 | % | | | 22.57 | % | | | 6.28 | % | | | 6.28 | % | | | 6.91 | % | | | 2.51 | % | | | 2.51 | % | | | 2.51 | % | | | 2.51 | % |
| Total return before incentive fees (2) | | | -28.11 | % | | | -26.84 | % | | | -26.65 | % | | | -23.66 | % | | | -22.53 | % | | | -22.33 | % | | | -1.63 | %* | | | 5.38 | % | | | 5.20 | % | | | 5.33 | % | | | 5.52 | % |
| Total return after incentive fees (2) | | | -28.11 | % | | | -26.84 | % | | | -26.65 | % | | | -23.66 | % | | | -22.53 | % | | | -22.33 | % | | | -1.63 | %* | | | 5.38 | % | | | 5.20 | % | | | 5.33 | % | | | 5.52 | % |
| | | | | | | | | | | | | | | | | | | | | | | | | | | | | | | | | | | | | | | | | | | | | |
| Incentive fee per share | | | - | | | | - | | | | - | | | | - | | | | - | | | | - | | | | - | | | | - | | | | - | | | | - | | | | - | |
| Incentive Fee to ANA | | | 0.00 | % | | | 0.00 | % | | | 0.00 | % | | | 0.00 | % | | | 0.00 | % | | | 0.00 | % | | | 0.00 | % | | | 0.00 | % | | | 0.00 | % | | | 0.00 | % | | | 0.00 | % |
| | | Frontier Balanced Fund | | Frontier Select Fund | |
| | | Class 1 | | | Class 1AP | | | Class 2 | | | Class 2a | | | Class 3a | | | Class 1 | | | Class 1AP | | | Class 2 | |
| Per unit operating performance (1) | | | | | | | | | | | | | | | | | | | | | | | | |
| Net asset value, December 31, 2019 | | $ | 117.23 | | | $ | 137.81 | | | $ | 185.82 | | | $ | 161.04 | | | $ | 160.50 | | | $ | 66.56 | | | $ | 78.51 | | | $ | 103.94 | |
| Net operating results: | | | | | | | | | | | | | | | | | | | | | | | | | | | | | | | | |
| Interest income | | | 0.04 | | | | 0.04 | | | | 0.06 | | | | 0.05 | | | | 0.05 | | | | 0.00 | | | | 0.00 | | | | 0.00 | |
| Expenses | | | (6.16 | ) | | | (4.17 | ) | | | (5.64 | ) | | | (4.92 | ) | | | (4.87 | ) | | | (3.40 | ) | | | (1.82 | ) | | | (2.42 | ) |
| Net gain/(loss) on investments, net of non-controlling interests | | | (31.19 | ) | | | (36.87 | ) | | | (49.70 | ) | | | (42.97 | ) | | | (42.87 | ) | | | (4.60 | ) | | | (5.70 | ) | | | (7.32 | ) |
| Net income/(loss) | | | (37.31 | ) | | | (41.00 | ) | | | (55.28 | ) | | | (47.84 | ) | | | (47.69 | ) | | | (8.01 | ) | | | (7.52 | ) | | | (9.74 | ) |
| Net asset value, December 31, 2020 | | $ | 79.93 | | | $ | 96.81 | | | $ | 130.54 | | | $ | 113.20 | | | $ | 112.81 | | | $ | 58.55 | | | $ | 70.99 | | | $ | 94.20 | |
| | | | | | | | | | | | | | | | | | | | | | | | | | | | | | | | | |
| Ratios to average net assets | | | | | | | | | | | | | | | | | | | | | | | | | | | | | | | | |
| Net investment income/(loss) | | | -6.98 | % | | | -3.99 | % | | | -3.99 | % | | | -3.99 | % | | | -3.99 | % | | | -5.49 | % | | | -2.49 | % | | | -2.49 | % |
| Expenses before incentive fees (3)(4) | | | 7.03 | % | | | 4.03 | % | | | 4.03 | % | | | 4.03 | % | | | 4.03 | % | | | 5.49 | % | | | 2.49 | % | | | 2.49 | % |
| Expenses after incentive fees (3)(4) | | | 7.03 | % | | | 4.03 | % | | | 4.03 | % | | | 4.03 | % | | | 4.03 | % | | | 5.49 | % | | | 2.49 | % | | | 2.49 | % |
| Total return before incentive fees (2) | | | -31.82 | % | | | -29.75 | % | | | -29.75 | % | | | -29.71 | % | | | -29.71 | % | | | -12.03 | % | | | -9.58 | % | | | -9.37 | % |
| Total return after incentive fees (2) | | | -31.82 | % | | | -29.75 | % | | | -29.75 | % | | | -29.71 | % | | | -29.71 | % | | | -12.03 | % | | | -9.58 | % | | | -9.37 | % |
| | | | | | | | | | | | | | | | | | | | | | | | | | | | | | | | | |
| Incentive fee per share | | | - | | | | - | | | | - | | | | - | | | | - | | | | - | | | | - | | | | - | |
| Incentive Fee to ANA | | | 0.00 | % | | | 0.00 | % | | | 0.00 | % | | | 0.00 | % | | | 0.00 | % | | | 0.00 | % | | | 0.00 | % | | | 0.00 | % |
| | | Frontier Global Fund | | | Frontier Heritage Fund | |
| | | Class 1 | | | Class 1AP | | | Class 2 | | | Class 1 | | | Class 1AP | | | Class 2 | |
| Per unit operating performance (1) | | | | | | | | | | | | | | | | | | |
| Net asset value, December 31, 2019 | | $ | 131.52 | | | $ | 154.43 | | | $ | 192.82 | | | $ | 97.54 | | | $ | 114.15 | | | $ | 153.59 | |
| Net operating results: | | | | | | | | | | | | | | | | | | | | | | | | |
| Interest income | | | 0.00 | | | | 0.00 | | | | 0.00 | | | | 0.00 | | | | 0.00 | | | | 0.00 | |
| Expenses | | | (9.95 | ) | | | (7.59 | ) | | | (9.47 | ) | | | (6.76 | ) | | | (4.58 | ) | | | (6.26 | ) |
| Net gain/(loss) on investments, net of non-controlling interests | | | (10.67 | ) | | | (146.84 | )* | | | (15.79 | ) | | | 5.33 | | | | 6.93 | | | | 8.58 | |
| Net income/(loss) | | | (20.62 | ) | | | (154.43 | )* | | | (25.26 | ) | | | (1.44 | ) | | | 2.35 | | | | 2.32 | |
| Net asset value, December 31, 2020 | | $ | 110.90 | | | $ | - | * | | $ | 167.56 | | | $ | 96.10 | | | $ | 116.50 | | | $ | 155.92 | |
| | | | | | | | | | | | | | | | | | | | | | | | | |
| Ratios to average net assets | | | | | | | | | | | | | | | | | | | | | | | | |
| Net investment income/(loss) | | | -8.11 | % | | | -5.12 | % | | | -5.12 | % | | | -6.93 | % | | | -3.93 | % | | | -3.93 | % |
| Expenses before incentive fees (3)(4) | | | 8.11 | % | | | 5.12 | % | | | 5.12 | % | | | 6.93 | % | | | 3.93 | % | | | 3.93 | % |
| Expenses after incentive fees (3)(4) | | | 8.11 | % | | | 5.12 | % | | | 5.12 | % | | | 6.93 | % | | | 3.93 | % | | | 3.93 | % |
| Total return before incentive fees (2) | | | -15.68 | % | | | -23.34 | %* | | | -13.10 | % | | | -1.47 | % | | | 2.06 | % | | | 1.51 | % |
| Total return after incentive fees (2) | | | -15.68 | % | | | -23.34 | %* | | | -13.10 | % | | | -1.47 | % | | | 2.06 | % | | | 1.51 | % |
| (1) | Interest income and expenses per unit are calculated by dividing these amounts by the average number of units outstanding during the period. The net gain/(loss) on investments, net of non-controlling interests is a balancing amount necessary to reconcile the change in net asset value per unit with the other per unit information. |
| (2) | Impact of incentive fee computed using average net assets, otherwise computed using average units outstanding during the period prior to the effects of any non-controlling transactions. An owner’s total returns may vary from the above returns based on the timing of contributions and withdrawals. Total returns are not annualized. |
| (3) | Expense ratios do not reflect interest allocated to the Managing Owner as such expenses are not included in the consolidated statements of operations of the Series, see footnote 6. |
| (4) | Expense ratios do not include management and incentive fees at the Galaxy Plus entities. The ratios would have been higher had those expenses been included. The impact of those fees is included in the total return. |
| * | Frontier Long/Short Commodity Fund Class 1A was closed as of September 30, 2020 and Frontier Global Class 1AP was closed as of November 18, 2020. |
8. Derivative Instruments and Hedging Activities
The Series’ primary business is to engage in speculative trading of a diversified portfolio of futures, forwards (including interbank foreign currencies), options contracts and other derivative instruments (including swap contracts). The Series do not enter into or hold positions for hedging purposes as defined under ASC 815, Derivatives and Hedging (“ASC 815”). The detail of the fair value of the Series’ derivatives by instrument types as of December 31, 2022 and 2021 is included in the consolidated condensed schedules of investments. See Note 4 for further disclosure related to each Series’ position in swap contracts.
The following tables summarize the monthly averages of futures contracts bought and sold for each respective Series of the Trust:
For the Year Ended December 31, 2022
Monthly average contracts:
| | | Bought | | | Sold | |
| Frontier Balanced Fund | | | 296 | | | | 295 | |
For the Year Ended December 31, 2021
Monthly average contracts:
| | | Bought | | | Sold | |
| Frontier Balanced Fund | | | 652 | | | | 654 | |
For the Year Ended December 31, 2020
Monthly average contracts:
| | | Bought | | | Sold | |
| Frontier Balanced Fund | | | 613 | | | | 612 | |
The following tables summarize the consolidated trading revenues for the years ended December 31, 2022, 2021 and 2020 by sector:
Realized Trading Revenue from Futures, Forwards and Options
for the Year Ended December 31, 2022
| Type of contract | | Frontier Balanced Fund | |
| | | | |
| Agriculturals | | $ | (385,424 | ) |
| Currencies | | | 683,628 | |
| Energies | | | 94,910 | |
| Interest rates | | | 230,542 | |
| Metals | | | (115,239 | ) |
| Stock indices | | | 299,210 | |
| Realized trading income/(loss)(1) | | $ | 807,627 | |
Realized Trading Revenue from Futures, Forwards and Options
for the Year Ended December 31, 2021
| Type of contract | | Frontier Balanced Fund | |
| | | | |
| Agriculturals | | $ | 191,851 | |
| Currencies | | | 96,075 | |
| Energies | | | 148,710 | |
| Interest rates | | | 108,590 | |
| Metals | | | 123,350 | |
| Stock indices | | | 204,123 | |
| Realized trading income/(loss)(1) | | $ | 872,699 | |
Realized Trading Revenue from Futures, Forwards and Options
for the Year Ended December 31, 2020
| Type of contract | | Frontier Balanced Fund | |
| | | | |
| Agriculturals | | $ | 147,013 | |
| Currencies | | | 90,903 | |
| Energies | | | 118,920 | |
| Interest rates | | | 59,037 | |
| Metals | | | 217,301 | |
| Stock indices | | | (34,911 | ) |
| Realized trading income/(loss)(1) | | $ | 598,263 | |
| (1) | Amounts recorded in the consolidated statements of operations under net realized gain(loss) on futures forwards and options. |
Net Change in Open Trade Equity from Futures, Forwards and Options
for the Year Ended December 31, 2022
| Type of contract | | Frontier Balanced Fund | |
| | | | |
| Agriculturals | | $ | 187,295 | |
| Currencies | | | (252,215 | ) |
| Energies | | | 47,945 | |
| Interest rates | | | (108,413 | ) |
| Metals | | | 98,894 | |
| Stock indices | | | 13,327 | |
| Change in unrealized trading income/(loss)(1) | | $ | (13,166 | ) |
Net Change in Open Trade Equity from Futures, Forwards and Options
for the Year Ended December 31, 2021
| Type of contract | | Frontier Balanced Fund | |
| | | | |
| Agriculturals | | $ | (13,842 | ) |
| Currencies | | | 11,977 | |
| Energies | | | (14,160 | ) |
| Interest rates | | | (37,684 | ) |
| Metals | | | (28,136 | ) |
| Stock indices | | | (7,461 | ) |
| Change in unrealized trading income/(loss)(1) | | $ | (89,306 | ) |
Net Change in Open Trade Equity from Futures, Forwards and Options
for the Year Ended December 31, 2020
| Type of contract | | Frontier Balanced Fund | |
| | | | |
| Agriculturals | | $ | 27,115 | |
| Currencies | | | 14,158 | |
| Energies | | | (25,335 | ) |
| Interest rates | | | 4,660 | |
| Metals | | | (1,619 | ) |
| Stock indices | | | 11,486 | |
| Change in unrealized trading income/(loss)(1) | | $ | 30,465 | |
| (1) | Amounts recorded in the consolidated statements of operations under net change in open trade equity/(deficit) |
Certain financial instruments and derivative instruments are eligible for offset in the consolidated statements of financial condition under GAAP. The Series’ open trade equity/(deficit), options written, and receivables from futures commissions merchants (each, an “FCM”) are subject to master netting arrangements and collateral arrangements and meet the GAAP guidance to qualify for offset. A master netting arrangement with a counterparty creates a right of offset for amounts due to and from that same counterparty that is enforceable in the event of a default or bankruptcy. The Series’ policy is to recognize amounts subject to master netting arrangements on a net basis on the consolidated statements of financial condition.
The following tables present gross and net information about the Series’ assets and liabilities subject to master netting arrangements as disclosed on the consolidated statements of financial condition as of December 31, 2022 and 2021.
As of December 31, 2022
| | | Gross Amounts of
recognized
Derivative
Assets/Liabilities | | | Gross Amounts
offset in the
Consolidated
Statements of Financial Condition | | | Net Amounts
Presented in the
Consolidated
Statements of
Financial Condition | |
| Frontier Balanced Fund | | | | | | | | | |
| Open Trade Equity/(Deficit) | | $ | 3,438 | | | $ | (1,768 | ) | | $ | 1,670 | |
As of December 31, 2021
| | | Gross Amounts of
recognized
Derivative
Assets/Liabilities | | | Gross Amounts
offset in the
Consolidated
Statements of Financial Condition | | | Net Amounts
Presented in the
Consolidated
Statements of
Financial Condition | |
| Frontier Balanced Fund | | | | | | | | | | | | |
| Open Trade Equity/(Deficit) | | $ | 2,118,427 | | | $ | (2,103,591 | ) | | $ | 14,836 | |
9. Trading Activities and Related Risks
The purchase and sale of futures and options on futures contracts require margin deposits with FCMs. Additional deposits may be necessary for any loss on contract value. The CEA requires an FCM to segregate all customer transactions and assets from the FCM’s proprietary activities. A customer’s cash and other property (for example, U.S. treasury bills) deposited with an FCM are considered commingled with all other customer funds subject to the FCM’s segregation requirements. In the event of an FCM’s insolvency, recovery may be limited to a pro rata share of segregated funds available. It is possible that the recovered amount could be less than the total of cash and other property deposited.
The term “off-balance sheet risk” refers to an unrecorded potential liability that, even though it does not appear on the consolidated statements of financial condition, may result in future obligation or loss in excess of the amount paid by the Series for a particular investment. Each Trading Company expects to trade in futures, options, forward and swap contracts and will therefore be a party to financial instruments with elements of off-balance sheet market and credit risk. In entering into these contracts, there exists a market risk that such contracts may be significantly influenced by market conditions, such as interest rate volatility, resulting in such contracts being less valuable. If the markets should move against all of the futures positions held by a Trading Company in respect of any Series at the same time, and if the Trading Advisor(s) of such Trading Company are unable to offset such futures interests positions, such Trading Company could lose all of its assets and the holders of Units of such Series would realize a 100% loss. The Managing Owner will seek to minimize market risk through real-time monitoring of open positions and the level of diversification of each Trading Advisor’s portfolio. It is anticipated that any Trading Advisor’s margin-to-equity ratio will typically not exceed approximately 35% although the actual ratio could be higher or lower from time to time.
In addition to market risk, trading futures, forward and swap contracts entails credit risk that a counterparty will not be able to meet its obligations to a Trading Company. The counterparty for futures contracts traded in the United States and on most foreign exchanges is the clearinghouse associated with such exchange. In general, clearinghouses are backed by the corporate members of the clearinghouse who are required to share any financial burden resulting from the non-performance by one of their members and, as such, should significantly reduce this credit risk. In cases where the clearinghouse is not backed by the clearing members, like some foreign exchanges, it is normally backed by a consortium of banks or other financial institutions. Some non-U.S. exchanges, in contrast to U.S. exchanges, are principals’ markets in which performance is the responsibility only of the individual counterparty with whom the Trading Company has entered into the transaction, and not of the exchange or clearing corporation. In these kinds of markets, there is risk of bankruptcy or other failure or refusal to perform by the counterparty.
In the case of forward contracts traded on the interbank market and swaps, neither is traded on exchanges. The counterparty is generally a single bank or other financial institution, rather than a group of financial institutions; thus there may be a greater counterparty credit risk. The Managing Owner expects the Trading Advisors to trade only with those counterparties which it believes to be creditworthy. All positions of each Trading Company will be valued each day on a mark-to-market basis. There can be no assurance that any clearing member, clearing house or other counterparty will be able to meet its obligations to any Trading Company.
The Managing Owner has established procedures to actively monitor and minimize market and credit risks. The Limited Owners bear the risk of loss only to the extent of the market value of their respective investments and, in certain specific circumstances, distributions and redemptions received.
10. Indemnifications and Guarantees noted in Management Discussion and Analysis
The Trust has entered into agreements, which provide for the indemnification of futures clearing brokers, and commodity trading advisers, among others, against losses, costs, claims and liabilities arising from the performance of their individual obligations under such agreements, except for gross negligence, bad faith or willful misconduct. The Trust has had no prior claims or payments pursuant to these agreements. The Trust’s individual maximum exposure under these arrangements is unknown, as this would involve future claims that may be made against the Trust that have not yet occurred. However, based on experience the Trust expects the risk of loss to be remote. Maximum exposure is unfulfilled obligations of the Series up to the amount of equity at risk with the custodian of the referenced Series as allocated from the Trading Company. The Series have not recorded any liability for the indemnifications in the accompanying consolidated financial statements as it expects any possibility of losses to be remote.
11. Subsequent Events
The Managing Owner evaluates events that occur after the balance sheet date but before and up until consolidated financial statements are available to be issued. The Managing Owner has assessed the subsequent events through the date that the consolidated financial statements were issued and has determined that, except as set forth below, there were no subsequent events requiring adjustment to or disclosure in the consolidated financial statements.
From January 1, 2023 through April 3, 2023, Frontier Balanced Fund, Frontier Diversified Fund, Frontier Heritage Fund, Frontier Long/Short Commodity Fund, Frontier Masters Fund, Frontier Select Fund and Frontier Global Fund paid $476, 407, $500, $80,874, $47,300, $22,298, $30,660 and $29,522, respectively, in redemptions.
REPORT OF INDEPENDENT REGISTERED PUBLIC ACCOUNTING FIRM
To the Executive Committee of Frontier Funds
Opinions on the Financial Statements
We have audited the accompanying combined consolidated statement of financial condition, including the combined consolidated condensed schedule of investments, of the Frontier Funds (the “Trust”) as of December 31, 2022 and 2021, and the related combined consolidated statements of operations, changes in owners’ capital and cash flows for the years ended December 31, 2022, 2021, and 2020, and the related notes to the combined consolidated financial statements (collectively referred to as the “financial statements”). In our opinion, the financial statements referred to above present fairly, in all material respects, the financial position of the Trust as of December 31, 2022 and 2021, and the results of its operations and its cash flows for the years ended December 31, 2022, 2021, and 2020, in conformity with accounting principles generally accepted in the United States of America.
Basis for Opinion
These financial statements are the responsibility of the Trust’s management. Our responsibility is to express an opinion on the Trust’s financial statements based on our audit. We are a public accounting firm registered with the Public Company Accounting Oversight Board (United States) (PCAOB) and are required to be independent with respect to the Trust in accordance with the U.S. federal securities laws and the applicable rules and regulations of the Securities and Exchange Commission and the PCAOB.
We conducted our audit in accordance with the standards of the PCAOB. Those standards require that we plan and perform the audit to obtain reasonable assurance about whether the financial statements are free of material misstatement, whether due to error or fraud. The Trust is not required to have, nor were we engaged to perform, an audit of its internal control over financial reporting. As part of our audit, we are required to obtain an understanding of internal control over financial reporting, but not for the purpose of expressing an opinion on the effectiveness of the Trust’s internal control over financial reporting. Accordingly, we express no such opinion.
Our audit of the financial statements included performing procedures to assess the risks of material misstatement of the financial statements, whether due to error or fraud, and performing procedures that respond to those risks. Such procedures included examining, on a test basis, evidence regarding the amounts and disclosures in the financial statements. Our audit also included evaluating the accounting principles used and significant estimates made by management, as well as evaluating the overall presentation of the financial statements. We believe that our audit provide a reasonable basis for our opinion.
Critical Audit Matters
Critical audit matters are matters arising from the current period audit of the financial statements that were communicated or required to be communicated to the audit committee and that: (1) relate to accounts or disclosures that are material to the financial statements and (2) involved our especially challenging, subjective, or complex judgments. We determined that there are no critical audit matters.
/s/ Spicer Jeffries LLP
We have served as auditor of the Frontier Funds Trust since 2019.
Denver, Colorado
April 3, 2023
Frontier Funds
Combined Consolidated Statements of Financial Condition
December 31, 2022 and December 31, 2021
| | | December 31,
2022 | | | December 31,
2021 | |
| ASSETS | | | | | | |
| | | | | | | |
| Cash and cash equivalents | | $ | 430,193 | | | $ | 698,732 | |
| U.S. Treasury securities, at fair value | | | 389,520 | | | | 140,487 | |
| Receivable from futures commission merchants | | | 320,241 | | | | 818,362 | |
| Open trade equity, at fair value | | | 1,670 | | | | 14,836 | |
| Investments in private investment companies, at fair value | | | 21,440,327 | | | | 19,595,064 | |
| Interest receivable | | | 9,701 | | | | 3,029 | |
| | | | | | | | | |
| Total Assets | | $ | 22,591,652 | | | $ | 21,270,510 | |
| | | | | | | | | |
| LIABILITIES & CAPITAL | | | | | | | | |
| | | | | | | | | |
| LIABILITIES | | | | | | | | |
| Redemptions payable | | $ | 67,761 | | | $ | 68,242 | |
| Incentive fees payable to Managing Owner | | | 692 | | | | 54,702 | |
| Management fees payable to Managing Owner | | | 1,573 | | | | 1,431 | |
| Interest payable to Managing Owner | | | 3,450 | | | | 1,714 | |
| Trading fees payable to Managing Owner | | | 83,102 | | | | 70,998 | |
| Service fees payable to Managing Owner | | | 33,432 | | | | 31,919 | |
| Risk analysis fees payable | | | 10,442 | | | | 10,380 | |
| Subscriptions in advance for service fee rebates | | | 710,323 | | | | 673,809 | |
| Other liabilities | | | 14,618 | | | | 17,625 | |
| | | | | | | | | |
| Total Liabilities | | | 925,393 | | | | 930,820 | |
| | | | | | | | | |
| OWNERS CAPITAL | | | | | | | | |
| Managing Owner Units | | | 221,670 | | | | 214,522 | |
| Limited Owner Units | | | 21,444,589 | | | | 20,125,168 | |
| | | | | | | | | |
| Total Owners Capital | | | 21,666,259 | | | | 20,339,690 | |
| | | | | | | | | |
| | | | | | | | | |
| Total Liabilities and Owners Capital | | $ | 22,591,652 | | | $ | 21,270,510 | |
The accompanying notes are an integral part of these combined consolidated financial statements.
Frontier Funds
Combined Consolidated Condensed Schedule of Investments
December 31, 2022
| Description | | Fair
Value | | | % of Total Capital
(Net Asset Value) | |
| LONG FUTURES CONTRACTS * | | | | | | |
| Various agriculture futures contracts (U.S.) | | $ | 1,590 | | | | 0.01 | % |
| Various base metals futures contracts (U.S.) | | | 897 | | | | 0.00 | % |
| Various currency futures contracts (U.S.) | | | (230 | ) | | | 0.00 | % |
| Total Long Futures Contracts | | $ | 2,257 | | | | 0.01 | % |
| | | | | | | | | |
| SHORT FUTURES CONTRACTS * | | | | | | | | |
| Various agriculture futures contracts (Europe) | | $ | (227 | ) | | | 0.00 | % |
| Various currency futures contracts (Europe) | | | 67 | | | | 0.00 | % |
| Various currency futures contracts (Far East) | | | (55 | ) | | | 0.00 | % |
| Various currency futures contracts (U.S.) | | | (216 | ) | | | 0.00 | % |
| Various interest rates futures contracts (U.S.) | | | (50 | ) | | | 0.00 | % |
| Various stock index futures contracts (Far East) | | | (106 | ) | | | 0.00 | % |
| Total Short Futures Contracts | | $ | (587 | ) | | | 0.00 | % |
| Total Open Trade Equity (Deficit) | | $ | 1,670 | | | | 0.01 | % |
| | | | | | | | | |
| PRIVATE INVESTMENT COMPANIES (1) | | | | | | | | |
| Galaxy Plus Fund - Fort Contrarian Feeder Fund (510) LLC | | $ | 563,258 | | | | 2.60 | % |
| Galaxy Plus Fund - QIM Feeder Fund (526) LLC | | | 2,257,286 | | | | 10.42 | % |
| Galaxy Plus Fund - Quantica Managed Futures Feeder Fund (507) LLC | | | 2,154,581 | | | | 9.94 | % |
| Galaxy Plus Fund - Quest Fit Feeder Fund (535) LLC | | | 264,652 | | | | 1.22 | % |
| Galaxy Plus Fund - Quest Feeder Fund (517) LLC | | | 2,415,351 | | | | 11.15 | % |
| Galaxy Plus Fund - Aspect Feeder Fund (532) LLC | | | 8,276,260 | | | | 38.20 | % |
| Galaxy Plus Fund - Welton GDP Feeder Fund (538) LLC | | | 4,682,572 | | | | 21.61 | % |
| Galaxy Plus Fund – JL Cyril Systematic Feeder Fund (547) LLC) | | | 0 | | | | 0.00 | % |
| Galaxy Plus Fund – Volt Diversified Alpha Feeder Fund (550) LLC) | | | 252,472 | | | | 1.17 | % |
| Galaxy Plus Fund - LRR Feeder Fund (522) LLC | | | 573,895 | | | | 2.65 | % |
| Total Private Investment Companies | | $ | 21,440,324 | | | | 98.96 | % |
| | | | | | | | | |
| U.S. TREASURY SECURITIES | | | | | | | | |
| US Treasury Note 6.875% due 08/15/2025 | | | 389,520 | | | | 1.80 | % |
| Total U.S. Treasury Securities | | $ | 389,520 | | | | 1.80 | % |
| * | Except for those items disclosed, no individual futures, forwards and option on futures contract position constituted greater than 1 percent of Net Asset Value. Accordingly, the number of contracts and expiration dates are not presented. |
| (1) | See Notes to Combined Consolidated Financial Statements, Note 5. |
The accompanying notes are an integral part of these combined consolidated financial statements.
Frontier Funds
Combined Consolidated Condensed Schedule of Investments
December 31, 2021
| Description | | Fair
Value | | | % of Total Capital
(Net Asset Value) | |
| LONG FUTURES CONTRACTS * | | | | | | |
| Various agriculture futures contracts (Far East) | | $ | 10,141 | | | | 0.05 | % |
| Various agriculture futures contracts (Europe) | | | (21,640 | ) | | | -0.11 | % |
| Various agriculture futures contracts (U.S.) | | | 51,912 | | | | 0.26 | % |
| Various base metals futures contracts (U.S.) | | | 20,031 | | | | 0.10 | % |
| Various currency futures contracts (Europe) | | | 1,994 | | | | 0.01 | % |
| Various currency futures contracts (Far East) | | | 819 | | | | 0.00 | % |
| Various currency futures contracts (Latin America) | | | 6,710 | | | | 0.03 | % |
| Various currency futures contracts (U.S.) | | | (9,800 | ) | | | -0.05 | % |
| Various energy futures contracts (U.S.) | | | 34 | | | | 0.00 | % |
| Various interest rates futures contracts (Europe) | | | (718,038 | ) | | | -3.53 | % |
| Various interest rates futures contracts (Far East) | | | (10,418 | ) | | | -0.05 | % |
| Various interest rates futures contracts (U.S.) | | | (7,281 | ) | | | -0.04 | % |
| Various precious metal futures contracts (U.S.) | | | 19,168 | | | | 0.09 | % |
| Various soft futures contracts (U.S.) | | | 138,674 | | | | 0.68 | % |
| Various stock index futures contracts (Europe) | | | 1,508 | | | | 0.01 | % |
| Various stock index futures contracts (Far East) | | | 1,541 | | | | 0.01 | % |
| Various stock index futures contracts (Oceanic) | | | 1,236 | | | | 0.01 | % |
| Various stock index futures contracts (Canada) | | | 1,853 | | | | 0.01 | % |
| Total Long Futures Contracts | | $ | (511,556 | ) | | | -2.52 | % |
| | | | | | | | | |
| SHORT FUTURES CONTRACTS * | | | | | | | | |
| Various agriculture futures contracts (Far East) | | $ | (27,804 | ) | | | -0.14 | % |
| Various agriculture futures contracts (Europe) | | | 20,105 | | | | 0.10 | % |
| Various agriculture futures contracts (U.S.) | | | (11,749 | ) | | | -0.06 | % |
| Various base metals futures contracts (U.S.) | | | (29,574 | ) | | | -0.15 | % |
| Various currency futures contracts (Europe) | | | (18,181 | ) | | | -0.09 | % |
| Various currency futures contracts (Far East) | | | (1,110 | ) | | | -0.01 | % |
| Various currency futures contracts (Latin America) | | | (21,340 | ) | | | -0.10 | % |
| Various currency futures contracts (U.S.) | | | 6,288 | | | | 0.03 | % |
| Various energy futures contracts (U.S.) | | | (10,792 | ) | | | -0.05 | % |
| Various interest rates futures contracts (Europe) | | | 785,677 | | | | 3.86 | % |
| Various interest rates futures contracts (U.S.) | | | (625 | ) | | | 0.00 | % |
| Various precious metal futures contracts (U.S.) | | | (38,573 | ) | | | -0.19 | % |
| Various soft futures contracts (U.S.) | | | (110,902 | ) | | | -0.55 | % |
| Various stock index futures contracts (Canada) | | | (5,194 | ) | | | -0.03 | % |
| Various stock index futures contracts (Europe) | | | (5,157 | ) | | | -0.03 | % |
| Various stock index futures contracts (Far East) | | | (2,191 | ) | | | -0.01 | % |
| Various stock index futures contracts (Oceanic) | | | (2,217 | ) | | | -0.01 | % |
| Various stock index futures contracts (U.S.) | | | (269 | ) | | | 0.00 | % |
| Total Short Futures Contracts | | $ | 526,392 | | | | 2.57 | % |
| Total Open Trade Equity (Deficit) | | $ | 14,836 | | | | 0.05 | % |
| | | | | | | | | |
| PRIVATE INVESTMENT COMPANIES (1) | | | | | | | | |
| Galaxy Plus Fund - Fort Contrarian Feeder Fund (510) LLC | | $ | 2,765,907 | | | | 13.60 | % |
| Galaxy Plus Fund - QIM Feeder Fund (526) LLC | | | 1,005,707 | | | | 4.94 | % |
| Galaxy Plus Fund - Quest Fit Feeder Fund (535) LLC | | | 129,995 | | | | 0.64 | % |
| Galaxy Plus Fund - Quest Feeder Fund (517) LLC | | | 1,588,673 | | | | 7.81 | % |
| Galaxy Plus Fund - Aspect Feeder Fund (532) LLC | | | 6,352,869 | | | | 31.23 | % |
| Galaxy Plus Fund - Welton GDP Feeder Fund (538) LLC | | | 4,616,381 | | | | 22.70 | % |
| Galaxy Plus Fund – JL Cyril Systematic Feeder Fund (547) LLC) | | | 2,409,149 | | | | 11.84 | % |
| Galaxy Plus Fund – Volt Diversified Alpha Feeder Fund (550) LLC) | | | 252,149 | | | | 1.24 | % |
| Galaxy Plus Fund - LRR Feeder Fund (522) LLC | | | 474,234 | | | | 2.33 | % |
| Total Private Investment Companies | | $ | 19,595,064 | | | | 96.33 | % |
| U.S. TREASURY SECURITIES | | | | | | | | |
| | | | | | | | | |
| US Treasury Note 6.875% due 08/15/2025 | | | 140,487 | | | | 0.69 | % |
| Total U.S. Treasury Securities | | $ | 140,487 | | | | 0.69 | % |
| * | Except for those items disclosed, no individual futures, forwards and option on futures contract position constituted greater than 1 percent of Net Asset Value. Accordingly, the number of contracts and expiration dates are not presented. |
| (1) | See Notes to Combined Consolidated Financial Statements, Note 5. |
The accompanying notes are an integral part of these combined consolidated financial statements.
Frontier Funds
Combined Consolidated Statements of Operations
For the Years Ended December 31, 2022, 2021, and 2020
| | | 2022 | | | 2021 | | | 2020 | |
| Investment income: | | | | | | | | | |
| Interest - net | | $ | 10,897 | | | $ | 11,678 | | | $ | 13,388 | |
| | | | | | | | | | | | | |
| Total Income | | | 10,897 | | | | 11,678 | | | | 13,388 | |
| | | | | | | | | | | | | |
| Expenses: | | | | | | | | | | | | |
| Incentive Fees (rebate) | | | 199,276 | | | | 158,775 | | | | - | |
| Management Fees | | | 18,115 | | | | 18,441 | | | | 19,600 | |
| Risk analysis Fees | | | 5,434 | | | | 5,532 | | | | 5,880 | |
| Service Fees - Class 1 | | | 494,806 | | | | 452,671 | | | | 597,679 | |
| Due Diligence Fees | | | 5,527 | | | | 5,717 | | | | 10,970 | |
| Trading Fees | | | 1,044,671 | | | | 941,238 | | | | 1,311,400 | |
| Total Expenses | | | 1,767,829 | | | | 1,582,374 | | | | 1,945,529 | |
| | | | | | | | | | | | | |
| Investment income/(loss) - net | | | (1,756,932 | ) | | | (1,570,696 | ) | | | (1,932,141 | ) |
| | | | | | | | | | | | | |
| Realized and unrealized gain/(loss) on investments: | | | | | | | | | | | | |
| Net realized gain/(loss) on futures, forwards and options | | | 807,627 | | | | 872,699 | | | | 598,263 | |
| Net unrealized gain/(loss) on private investment companies | | | 4,643,860 | | | | 511,420 | | | | 1,738,708 | |
| Net realized gain/(loss) on private investment companies | | | 2,137,393 | | | | 1,417,718 | | | | (4,194,080 | ) |
| Net change in open trade equity/(deficit) | | | (13,166 | ) | | | (89,306 | ) | | | 30,465 | |
| Net realized gain/(loss) on swap contracts | | | - | | | | - | | | | (2,896,106 | ) |
| Net unrealized gain/(loss) on swap contracts | | | - | | | | - | | | | (4,384,210 | ) |
| Net realized gain/(loss) on U.S. Treasury securities | | | (62,411 | ) | | | (34,992 | ) | | | 36,920 | |
| Net unrealized gain/(loss) on U.S. Treasury securities | | | 1,166 | | | | (866 | ) | | | 3,430 | |
| Trading commissions | | | (8,536 | ) | | | (15,423 | ) | | | (21,148 | ) |
| | | | | | | | | | | | | |
| Net gain/(loss) on investments | | | 7,505,933 | | | | 2,661,250 | | | | (9,087,758 | ) |
| | | | | | | | | | | | | |
| NET INCREASE/(DECREASE) IN OWNERS’ CAPITAL | | | | | | | | | | | | |
| RESULTING FROM OPERATIONS | | $ | 5,749,001 | | | $ | 1,090,554 | | | $ | (11,019,899 | ) |
The accompanying notes are an integral part of these combined consolidated financial statements.
Frontier Funds
Combined Consolidated Statements of Changes in Owners’ Capital
for the Year Ended December 31, 2022
| | | Managing Owner | | | Limited Owners | | | Total | |
| Owners’ Capital, December 31, 2019 | | $ | 487,974 | | | $ | 48,068,619 | | | $ | 48,556,593 | |
| | | | | | | | | | | | | |
| Sale of Units (including transfers) | | | - | | | | - | | | | - | |
| Redemption of Units (including transfers) | | | (94,900 | ) | | | (11,872,655 | ) | | | (11,967,555 | ) |
| Payment made by Related Party | | | - | | | | - | | | | - | |
| Payment made by Managing Owner | | | - | | | | - | | | | - | |
| Net increase/(decrease) in Owners’ | | | | | | | | | | | | |
| Capital resulting from operations | | | (109,857 | ) | | | (10,910,042 | ) | | | (11,019,899 | ) |
| | | | | | | | . | | | | | |
| Owners’ Capital, December 31, 2020 | | $ | 283,217 | | | $ | 25,285,922 | | | $ | 25,569,139 | |
| | | | | | | | | | | | | |
| Sale of Units (including transfers) | | | 7,000 | | | | - | | | | 7,000 | |
| Redemption of Units (including transfers) | | | (90,800 | ) | | | (6,236,203 | ) | | | (6,327,003 | ) |
| Payment made by Related Party | | | - | | | | - | | | | - | |
| Payment made by Managing Owner | | | - | | | | - | | | | - | |
| Net increase/(decrease) in Owners’ | | | | | | | | | | | | |
| Capital resulting from operations | | | 15,105 | | | | 1,075,449 | | | | 1,090,554 | |
| | | | | | | | | | | | | |
| Owners’ Capital, December 31, 2021 | | $ | 214,522 | | | $ | 20,125,168 | | | $ | 20,339,690 | |
| | | | | | | | | | | | | |
| Sale of Units (including transfers) | | | - | | | | - | | | | - | |
| Redemption of Units (including transfers) | | | (59,300 | ) | | | (4,363,132 | ) | | | (4,422,432 | ) |
| Payment made by Related Party | | | - | | | | - | | | | - | |
| Payment made by Managing Owner | | | - | | | | - | | | | - | |
| Net increase/(decrease) in Owners’ | | | 66,448 | | | | 5,682,553 | | | | 5,749,001 | |
| Capital resulting from operations | | | | | | | | | | | | |
| | | | | | | | | | | | | |
| Owners’ Capital, December 31, 2022 | | $ | 221,670 | | | $ | 21,444,589 | | | $ | 21,666,259 | |
The accompanying notes are an integral part of these combined consolidated financial statements.
Frontier Funds
Combined Consolidated Statements of Cash Flows
For the Years Ended December 31, 2022, 2021, and 2020
| | | 2022 | | | 2021 | | | 2020 | |
| Cash Flows from Operating Activities: | | | | | | | | | |
| Net increase/(decrease) in capital resulting from operations | | $ | 5,749,001 | | | $ | 1,090,554 | | | $ | (11,019,899 | ) |
| Adjustments to reconcile net increase/(decrease) in capital resulting from operations to net cash provided by (used in) operating activities: | | | | | | | | | | | | |
| Change in: | | | | | | | | | | | | |
| Net change in open trade equity | | | 13,166 | | | | 85,604 | | | | (30,465 | ) |
| Net change in ownership allocation of U.S. Treasury Securities | | | (15,849 | ) | | | (16,260 | ) | | | - | |
| Net unrealized (gain)/loss on swap contracts | | | - | | | | - | | | | 4,384,210 | |
| Net realized (gain)/loss on swap contracts | | | - | | | | - | | | | 2,896,106 | |
| Net unrealized (gain)/loss on private investment companies | | | (4,643,860 | ) | | | (511,420 | ) | | | (1,717,767 | ) |
| Net realized (gain)/loss on private investment companies | | | (2,137,393 | ) | | | (1,417,718 | ) | | | 4,173,139 | |
| Net unrealized (gain)/loss on U.S. Treasury securities | | | (1,166 | ) | | | 866 | | | | (3,430 | ) |
| Net realized (gain)/loss on U.S. Treasuries securities | | | 62,411 | | | | 34,992 | | | | (36,920 | ) |
| (Purchases) sales of: | | | | | | | | | | | | |
| Sales of swap contracts | | | - | | | | - | | | | 14,543,253 | |
| (Purchases) of Swap Contracts | | | - | | | | - | | | | (12,918,208 | ) |
| Reduction of collateral in Swap contracts | | | - | | | | - | | | | 12,674,504 | |
| (Purchases) of U.S. Treasury securities | | | (3,152,834 | ) | | | (2,415,391 | ) | | | (11,894,038 | ) |
| Sales of U.S. Treasury securities | | | 2,847,509 | | | | 4,526,234 | | | | 10,335,331 | |
| (Purchases) of Private Investment Companies | | | (17,491,552 | ) | | | (6,734,082 | ) | | | (12,258,403 | ) |
| Sales of Private Investment Companies | | | 22,427,541 | | | | 12,157,468 | | | | 22,639,756 | |
| U.S. Treasury interest and premium paid/amortized | | | 10,897 | | | | 11,678 | | | | 13,388 | |
| Increase and/or decrease in: | | | | | | | | | | | | |
| Receivable from futures commission merchants | | | 498,121 | | | | (584,389 | ) | | | 2,292,269 | |
| Advance on unrealized Swap Appreciation | | | - | | | | - | | | | (12,191,555 | ) |
| Interest receivable | | | (6,672 | ) | | | 42,550 | | | | (32,215 | ) |
| Receivable from related parties | | | - | | | | - | | | | (14,676 | ) |
| Other assets | | | - | | | | - | | | | 5,700 | |
| Redemptions receivable from private investment companies | | | - | | | | 181,323 | | | | 370,694 | |
| Incentive fees payable to Managing Owner | | | (54,010 | ) | | | 54,702 | | | | - | |
| Management fees payable to Managing Owner, net of change in receivable | | | 142 | | | | (7,423 | ) | | | 59 | |
| Interest payable to Managing Owner | | | 1,736 | | | | (393 | ) | | | 1,780 | |
| Trading fees payable to Managing Owner | | | 12,104 | | | | (10,700 | ) | | | (79,209 | ) |
| Service fees payable to Managing Owner | | | 1,513 | | | | (4,786 | ) | | | (32,057 | ) |
| Risk analysis fees payable | | | 62 | | | | 867 | | | | 1,048 | |
| Payables to related parties | | | - | | | | - | | | | 26,129 | |
| Subscriptions in advance for service fee rebates | | | 36,514 | | | | 34,847 | | | | 40,920 | |
| Other liabilities | | | (3,007 | ) | | | 1,033 | | | | (5,486 | ) |
| | | | | | | | | | | | | |
| Net cash provided by operating activities | | | 4,154,374 | | | | 6,520,156 | | | | 12,163,958 | |
| Cash Flows from Financing Activities: | | | | | | | | | | | | |
| | | | | | | | | | | | | |
| Proceeds from sale of capital | | | - | | | | 7,000 | | | | - | |
| Payment for redemption of capital | | | (4,422,432 | ) | | | (6,327,004 | ) | | | (11,967,555 | ) |
| Redemptions payable | | | (481 | ) | | | 30,114 | | | | (95,505 | ) |
| | | | | | | | | | | | | |
| Net cash used in financing activities | | | (4,422,913 | ) | | | (6,289,890 | ) | | | (12,063,060 | ) |
| | | | | | | | | | | | | |
| Net increase (decrease) in cash and cash equivalents | | | (268,539 | ) | | | 230,266 | | | | 100,898 | |
| | | | | | | | | | | | | |
| Cash and cash equivalents, beginning of year | | | 698,732 | | | | 468,466 | | | | 367,568 | |
| Cash and cash equivalents, end of year | | $ | 430,193 | | | $ | 698,732 | | | $ | 468,466 | |
The accompanying notes are an integral part of these combined consolidated financial statements.
Frontier Funds
Notes to Combined Consolidated Financial Statements
1. Organization and Purpose
Frontier Funds, which is referred to in this report as the “Trust”, was formed on August 8, 2003, as a Delaware statutory trust and is set to expire on December 31, 2053. The Trust is a multi-advisor commodity pool, as described in CFTC Regulation § 4.10(d)(2). The Trust has authority to issue separate Series of Units pursuant to the requirements of the Trust Act. The assets of each Series are valued and accounted for separately from the assets of other Series. The Trust is not registered as an investment company under the Investment Company Act. It is managed by the Managing Owner.
Purchasers of Units are Limited Owners of the Trust with respect to beneficial interests of the Series’ Units purchased. The Trust Act provides that, except as otherwise provided in the second amended and restated declaration of trust and trust agreement dated December 9, 2013, as further amended, by and among the Managing Owner, Wilmington Trust Company as trustee and the unitholders, as amended from time to time (the “Trust Agreement”), unitholders of the Trust will have the same limitation of liability as do stockholders of private corporations organized under the General Corporation Law of the State of Delaware. The Trust Agreement confers substantially the same limited liability, and contains the same limited exceptions thereto, as would a limited partnership agreement for a Delaware limited partnership engaged in like transactions as the Trust. In addition, pursuant to the Trust Agreement, the Managing Owner of the Trust is liable for obligations of a Series in excess of that Series’ assets. Limited Owners do not have any such liability. The Managing Owner will make contributions to the Series of the Trust necessary to maintain at least a 1% interest in the aggregate capital, profits and losses of all Series.
The Trust has been organized to pool investor funds for the purpose of trading in the U.S. and international markets for currencies, interest rates, stock indices, agricultural and energy products, precious and base metals and other commodities. The Trust may also engage in futures contracts, forwards, option contracts and derivative instruments, including swap contracts.
The Trust has seven (7) separate and distinct Series of Units issued and outstanding: Frontier Diversified Fund, Frontier Masters Fund, Frontier Long/Short Commodity Fund, Frontier Balanced Fund, Frontier Select Fund, Frontier Global Fund, and Frontier Heritage Fund. The Trust’s combined consolidated financial statements are comprised of each unitized Series’ consolidated financial statements being combined to present all Series in aggregate. However, the combined consolidated Trust does not issue units.
The Trust, with respect to each Series:
| ● | engages in the speculative trading of a diversified portfolio of futures, forwards (including interbank foreign currencies), options contracts and other derivative instruments (including swap contracts), and may, from time to time, engage in cash and spot transactions. |
| ● | allocates funds to a limited liability trading company or companies (“Trading Company” or “Trading Companies”) and Galaxy Plus entities (“Galaxy Plus”). Except as otherwise described in these notes, each Trading Company and Galaxy Plus entity has one-year renewable contracts with its own independent commodity trading advisor(s), or each, a Trading Advisor, that will manage all or a portion of such Trading Company’s and Galaxy Plus assets and make the trading decisions for the assets of each Series invested in such Trading Company and Galaxy Plus entity. Each Trading Company and Galaxy Plus entity will segregate its assets from any other Trading Company and Galaxy Plus entity. |
| ● | maintains separate, distinct records for each Series, and accounts for the assets of each Series separately from the other Series. |
| ● | calculates the Net Asset Value (“NAV”) of its Units for each Series separately from the other Series. |
| ● | has an investment objective of increasing the value of each Series’ Units over the long term (capital appreciation), while managing risk and volatility; further, to offer exposure to the investment programs of individual Trading Advisors and to specific instruments. |
| ● | maintains each Series of Units in three to seven sub-classes—Class 1, Class 1AP, Class 1a, Class 2, Class 2a, Class 3, and Class 3a. Investors who have purchased Class 1 or Class 1a Units of Frontier Diversified Fund, Frontier Masters Fund, and Frontier Long/Short Commodity Fund are charged a service fee of up to two percent (2.0%) annually of the NAV (of the purchase price, in case of the initial service fee) of each Unit purchased, for the benefit of selling agents selling such Class 1 or Class 1a Units. The initial service fee, which is amortized monthly at an annual rate of up to two percent (2.0%) of the average daily NAV of Class 1 or Class 1a of such Series, is prepaid to the Managing Owner by each Series, and paid to the selling agents by the Managing Owner in the month following sale; provided, however, that investors who redeem all or a portion of their Class 1 or Class 1a Units of any Series during the first twelve(12) months following the effective date of their purchase are subject to a redemption fee of up to two percent (2.0%) of the purchase price at which such investor redeemed to reimburse the Managing Owner for the then-unamortized balance of the prepaid initial service fee. Investors who have purchased Class 1 or Class 1a Units of Frontier Balanced Fund, Frontier Heritage Fund, Frontier Select Fund, and Frontier Global Fund are charged a service fee of up to three percent (3.0%) annually of the NAV (of the purchase price, in case of the initial service fee) of each Unit purchased, for the benefit of selling agents selling such Class 1 or Class 1a Units. The initial service fee, which is amortized monthly at an annual rate of up to three percent (3.0%) of the average daily NAV of Class 1 or Class 1a of such Series, is prepaid to the Managing Owner by each Series, and paid to the selling agents by the Managing Owner in the month following sale. With respect to Class 2 and Class 2a Units of any Series, the Managing Owner pays an ongoing service fee to selling agents of up to one half percent (0.5%) annually of the NAV of each Class 2 or Class 2a Unit (of which 0.25% will be charged to Limited Owners holding Class 2 Units of the Frontier Diversified Fund, and Frontier Masters Fund or Class 2a Units of the Frontier Long/Short Commodity Fund sold) until such Class 2 or Class 2a Units which are subject to the fee limitation are reclassified as Class 3 or Class 3a Units of the applicable Series. Class 1AP was created as a sub-class of Class 1 and it has been presented separately because the fees applicable to it are different from those applicable to Class 1. Currently the service fee is not charged to Class 1AP investors. The Managing Owner may also pay selling agents certain additional fees and expenses for administrative and other services rendered and expenses incurred by such selling agents; and |
| ● | all payments made to selling agents who are members of the Financial Industry Regulatory Authority, Inc. (“FINRA”) and their associated persons that constitute underwriting compensation will be subject to the limitations set forth in Rule 2310(b)(4)(B)(ii) (formerly Rule 2810(b)(4)(B)(ii)) of the Conduct Rules of FINRA (“Rule 2310”). An investor’s Class 1 Units or Class 2 Units of any Series, or Class 1a Units or Class 2a Units of the Frontier Long/Short Commodity Fund or Frontier Balanced Fund will be classified as Class 3 or Class 3a Units of such Series, as applicable, when the Managing Owner determines that the fee limitation set forth in Rule 2310 with respect to such Units has been reached or will be reached. The service fee limit applicable to each unit sold is reached upon the earlier of when (i) the aggregate initial and ongoing service fees received by the selling agent with respect to such unit equals 9% of the purchase price of such unit or (ii) the aggregate underwriting compensation (determined in accordance with FINRA Rule 2310) paid in respect of such unit totals 10% of the purchase price of such unit. No service fees are paid with respect to Class 3 or Class 3a Units. Units of any Class in a Series may be redeemed, in whole or in part, on a daily basis, at the then current NAV per Unit for such Series on the day of the week after the date the Managing Owner is in receipt of a redemption request for at least one (1) business day to be received by the Managing Owner prior to 4:00 PM in New York. |
Frontier Masters Fund Class 1 was closed as of April 1, 2021 and Frontier Diversified Fund Class 1 was closed as of July 21, 2021.
The assets of any particular Series include only those funds and other assets that are paid to, held by or distributed to the Trust on account of and for the benefit of that Series. Under the “Inter-Series Limitation on Liability” expressly provided for under Section 3804(a) of the Trust Act, separate and distinct records of the cash and equivalents, although pooled for maximizing returns, are maintained in the books and records of each Series.
As of December 31, 2022, the Trust, with respect to the Frontier Diversified Fund and Frontier Masters Fund, separates Units into two separate Classes—Class 2, and Class 3. The Trust, with respect to the Frontier Select Fund and Frontier Heritage Fund separates Units into three separate Classes—Class 1, Class 2 and Class 1AP. The Trust, with respect to the Frontier Global Fund, separates Units into two separate Classes—Class 1 and Class 2. The Trust, with respect to the Frontier Balanced Fund, separates Units into five separate Classes—Class 1, Class 1AP, Class 2, Class 2a and Class 3a. The Trust, with respect to the Frontier Long/Short Commodity Fund, separates Units into four separate Classes—Class 2, Class 2a, Class 3 and Class 3a.
Between April 15, 2016 and May 10, 2017, a portion of the interests in Frontier Trading Company I, LLC and all of the interests in Frontier Trading Company VII, LLC, Frontier Trading Company XV, LLC, and Frontier Trading Company XXIII LLC held by Frontier Diversified Fund, Frontier Masters Fund, Frontier Select Fund, Frontier Balanced Fund and Frontier Long/Short Commodity Fund were exchanged for equivalent interests in the Galaxy Plus Managed Account Platform (“Galaxy Plus”) which is an unaffiliated, third-party managed account platform. The assets of Frontier Trading Company I, LLC, which included exposure to Quantmetrics Capital Management LLP’s Multi-Strategy Program, Quantitative Investment Management, LLC’s Quantitative Global Program, Quest Partners LLC’s Quest Tracker Index Program, Chesapeake Capital Management, LLC’s Diversified Program, and Doherty Advisors LLC’s Relative Value Moderate Program, the assets of Frontier Trading Company VII, LLC, which included exposure to Emil van Essen LLC’s Multi-Strategy Program, Red Oak Commodity Advisors, Inc.’s Fundamental Diversified Program, Rosetta Capital Management, LLC’s Rosetta Trading Program, and Landmark Trading Company’s Landmark Program, the assets of Frontier Trading Company XV, LLC, which included exposure to Transtrend B.V.’s TT Enhanced Risk (USD) Program, and the assets of Frontier Trading Company XXIII, LLC which included exposure to Fort L.P.’s Global Contrarian Program have been transferred to individual Delaware limited liability companies (“Master Funds”) in Galaxy Plus. Each Master Fund is sponsored and operated by New Hyde Park. New Hyde Park has contracted with the Trading Advisors to manage the portfolios of the Master Funds pursuant to the advisors’ respective program. For those Series that invest in Galaxy Plus, approximately 30-70% of those Series assets are used to support the margin requirements of the Master Funds. The remaining assets of the Series are split between investments in Trading Companies and a pooled cash management account that invests primarily in U.S. Treasury securities. For those Series that do not invest in Galaxy Plus, their assets are split between investments in Trading Companies and investments in the pooled cash management account.
Each of the Series has invested a portion of its assets in several different Trading Companies or Galaxy Plus entities and one or more Trading Advisors may manage the assets invested in such Trading Companies or Galaxy Plus entities.
The Trust has entered into agreements, which provide for the indemnification of futures clearing brokers, currency trading companies, and commodity trading advisers, among others, against losses, costs, claims and liabilities arising from the performance of their individual obligations under such agreements, except for gross negligence, bad faith or willful misconduct.
2. Significant Accounting Policies
The following are the significant accounting policies of the Trust.
Basis of Presentation—The Trust follows GAAP, as established by the Financial Accounting Standards Board (the “FASB”), to ensure consistent reporting of financial condition, condensed schedules of investments, results of operations, changes in capital and cash flows. The Trust is an investment company following accounting and reporting guidance in Accounting Standards Codification (“ASC”) 946.
Consolidation— The Series, through investing in the Trading Companies and Galaxy Plus, authorize certain Trading Advisors to place trades and manage assets at pre- determined investment levels. The Trading Companies were organized by the Managing Owner for the purpose of investing in commodities interests and derivative instruments, and have no operating income or expenses, except for trading income and expenses and a risk analysis fee (for closed Series only), all of which is allocated to the Series, if consolidated by a Series. Galaxy Plus is a series of Delaware limited liability companies, sponsored by New Hyde Park, that create exposure to a variety of third party professional managed futures and foreign exchange advisors. Galaxy Plus is available to qualified high-net-worth individuals and institutional investors. Investment interests in Galaxy Plus entities are accounted for using net asset value as the practical expedient, which approximates fair value. Fair value represents the proportionate share of the Trust’s interest in the NAV in the Galaxy Plus entities. The equity interest held by Trust is shown as investments in private investment companies in the combined consolidated statements of financial condition.
The income or loss attributable thereto in proportion to of the investment level of the private investment companies is shown in the combined consolidated statements of operations as net unrealized gain/(loss) on private investment companies. The consolidated financial statements of the Series and Trading Companies are combined to form the combined consolidated financial statements of the Trust. All intercompany transactions have been eliminated in combination.
Galaxy Plus entities are co-mingled investment vehicles. In addition to the Trust, there are other non-affiliated investors in Galaxy Plus. Subscriptions and redemptions by these non-affiliated investors will have a direct impact on the Trust ownership percentage in Galaxy Plus. It is expected that ownership percentage will fluctuate (sometimes significantly) on a week by week basis which could also result in frequent changes in the consolidating Series. Such fluctuations make consolidating the financial statements of the Galaxy Plus entities both impractical and misleading. Non-consolidation of these Galaxy Plus entities presents a more useful financial statement for the readers. As such, management has decided that presenting Galaxy Plus entities on a non-consolidated basis as investments in other investments companies (a “fund of funds” approach) is appropriate and preferable to the users of these financial statements. Refer to Note 5 for additional disclosures related to these private investment companies.
Use of Estimates—The preparation of combined consolidated financial statements in conformity with GAAP may require the Managing Owner to make estimates and assumptions that affect the reported amounts of assets and liabilities and disclosure of contingent assets and liabilities at the date of the financial statements and the reported amounts of revenue and expenses during the reporting period. The valuation of swap contracts requires significant estimates as well as the valuation of certain other investments. Please refer to Note 3 for discussion of valuation methodology. Actual results could differ from these estimates and such differences could be material.
Cash and Cash Equivalents—Cash and cash equivalents include cash and overnight investments in interest-bearing demand deposits held at banks with original maturities of three months or less. This cash is not restricted.
Interest Income—U.S. Treasury Securities are pooled for purposes of maximizing returns on these assets to investors of all Series. Interest income from pooled cash management assets is recognized on the accrual basis and allocated daily to each Series based upon its daily proportion of ownership of the pool. Aggregate interest income from all sources, including U.S. Treasury securities and assets held at an FCM of up to two percentage points of the aggregate percentage yield (annualized) of net asset value less any fair market value related to swaps, is paid to the Managing Owner by the Frontier Balanced Fund (Class 1, and Class 2 only), Frontier Long/Short Commodity Fund (Class 2 and Class 3), Frontier Select Fund, Frontier Global Fund and Frontier Heritage Fund. For the Frontier Diversified Fund, Frontier Long/Short Commodity Fund (Class 1a, Class 2a and Class 3a), Frontier Masters Fund and Frontier Balanced Fund (Class 1AP, Class 2a and Class 3a), 100% of the interest is retained by the respective Series. All interest not paid to the Managing Owner is interest income to the Series, and shown net on the combined consolidated statements of operations.
U.S. Treasury Securities—U.S. Treasury Securities are reported at fair value as Level 1 inputs under ASC 820, Fair Value Measurements and Disclosures (“ASC 820”). The Trust values U.S. Treasury Securities at fair value and records the daily change in value in the consolidated statements of operations as net unrealized gain/(loss) on U.S. Treasury securities. Accrued interest is reported on the combined consolidated statements of financial condition as interest receivable.
Receivable from Futures Commission Merchants—The Trust deposits assets with an FCM subject to CFTC regulations and various exchange and broker requirements. Margin requirements are satisfied by the deposit of cash with such FCM. The Trust earns interest income on its assets deposited with the FCM. A portion of the receivable is restricted cash required to meet maintenance margin requirements. Cash with the clearing broker as of December 31, 2022 and December 31, 2021 included restricted cash for margin requirements of $320,241 and $801,701 for the Frontier Balanced Fund.
Investment Transactions—Futures, options on futures, forward and swap contracts are recorded on a trade date basis and realized gains or losses are recognized when contracts are settled. Unrealized gains or losses on open contracts (the difference between contract trade price and market price) are reported in the combined consolidated statements of financial condition as a net unrealized gain or loss, as there exists a right of offset of unrealized gains or losses in accordance with FASB ASC 210, Balance Sheet (“ASC 210”) and Accounting Standards Update (ASU) 2013-01, Balance Sheet (Topic 210).
Any change in net unrealized gain or loss from the preceding period is reported in the combined consolidated statements of operations. Fair value of exchange-traded contracts is based upon exchange settlement prices. Fair value of non-exchange-traded contracts is based on third party quoted dealer values on the interbank market. For U.S. Treasury securities, interest was recognized in the period earned and the instruments were marked-to-market daily based on third party information. Transaction costs are recognized as incurred and reflected separately in the combined consolidated statements of operations.
Purchase and Sales of Private Investment Companies – The Trust is able to subscribe into and redeem from the Galaxy Plus entities on a weekly basis. The value of the private investment companies is determined by New Hyde Park and reported on a daily basis. The change in value is calculated as the difference between the total purchase cost and the fair value calculated by New Hyde Park and is recorded as net unrealized gain/(loss) on private investment companies on the combined consolidated statements of operations.
Foreign Currency Transactions—The Series of the Trust’s functional currency is the U.S. dollar; however, they transact business in currencies other than the U.S. dollar. The Series of the Trust do not isolate that portion of the results of operations resulting from changes in foreign exchange rates on investments from fluctuations arising from changes in market prices of securities held. Such fluctuations are included with the net realized or unrealized gain or loss from investments.
Allocation of Earnings—Each Series of the Trust may maintain three to seven classes of Units—Class 1, Class 2, Class 3, Class 1a, Class 2a Class 3a and Class 1AP. All classes have identical voting, dividend, liquidation and other rights and the same terms and conditions, except that fees charged to a Class or Series differ as described below. Revenues, expenses (other than expenses attributable to a specific class), and realized and unrealized trading gains and losses of each Series are allocated daily to Class 1, Class 1a, Class 2, Class 2a, Class 3, Class 3a and Class 1AP Units based on each Class’s respective owners’ capital balances as applicable to the classes maintained by the Series.
Each Series allocates funds to an affiliated Trading Company, or Companies, of the Trust, or unaffiliated Galaxy Plus entity. Each Trading Company allocates all of its daily trading gains or losses to the Series in proportion to each Series’ ownership trading level interest in the Trading Company, adjusted on a daily basis (except for Trading Advisors and other investments such as swaps that are directly allocated to a specific series). Likewise, trading gains and losses earned and incurred by the Series through their investments in Galaxy Plus entities are allocated to those Series on a daily basis. The allocation of gains and losses in Galaxy Plus entities are based on each Series pro-rata shares of the trading level of that entity which is updated at the beginning of each month or more frequently if there is a subscription or redemption activity in the entity. The value of all open contracts and cash held at clearing brokers is similarly allocated to the Series in proportion to each Series’ funds allocated to the Trading Companies or Galaxy Plus entities.
Investments and Swaps—The Trust records investment transactions on a trade date basis and all investments are recorded at fair value, with changes in fair value reported as a component of realized and unrealized gains/(losses) on investments in the combined consolidated statements of operations. Investments in private investment companies are valued utilizing the net asset values as a practical expedient. Certain Series of the Trust strategically invest a portion or all of their assets in total return swaps, selected at the discretion of the Managing Owner. Swaps are privately negotiated contracts designed to provide investment returns linked to those produced by one or more underlying investment products or indices. In a typical swap, two parties agree to exchange the returns (or differentials in rates of return) earned or realized on one or more particular predetermined investments or instruments. The gross returns to be exchanged or “swapped” between the parties are calculated with respect to a “notional amount” (i.e., the amount of value of the underlying asset used in computing the particular interest rate, return, or other amount to be exchanged) in a particular investment, or in a “basket” of securities. The valuation of swap contracts requires significant estimates. Swap contracts are reported at fair value based upon daily reports from the counterparty. The Managing Owner reviews and approves current day pricing of the CTA positions, as received from the counterparty which includes intra-day volatility and volume and daily index performance, that is used to determine a daily fair value NAV for the swap contracts.
Income Taxes—The Trust applies the provisions of ASC 740 Income Taxes (“ASC 740”), which provides guidance for how uncertain tax positions should be recognized, measured, presented and disclosed in the combined consolidated financial statements. This interpretation also provides guidance on derecognition, classification, interest and penalties, accounting in interim periods and disclosure. ASC 740 requires the evaluation of tax positions taken or expected to be taken in the course of preparing the Trust’s financial statements to determine whether the tax positions are “more-likely-than-not” of being sustained by the applicable tax authority. Tax positions with respect to tax at the Trust’s level not deemed to meet the “more-likely-than-not” threshold would be recorded as a tax benefit or expense in the current year. The Managing Owner has concluded there is no tax expense, interest or penalties to be recorded by the Trust for the year ended December 31, 2022.
The 2019 through 2022 tax years generally remain subject to examination by U.S. federal and most state tax authorities.
In the opinion of the Managing Owner, (i) the Trust is treated as a partnership for Federal income tax purposes and, assuming that at least 90% of the gross income of the Trust constitutes “qualifying income” within the meaning of Section 7704(d) of the Code, (ii) the Trust is not a publicly traded partnership treated as a corporation, and (iii) the discussion set forth in the Prospectus under the heading “U.S. Federal Income Tax Consequences” correctly summarizes the material Federal income tax consequences as of the date of the Prospectus to potential U.S. Limited Owners of the purchase, ownership and disposition of Series Units of the Trust.
Fees and Expenses—All management fees, incentive fees, service fees, risk analysis fees (for closed Series only) and trading fees of the Trust are paid to the Managing Owner. It is the responsibility of the Managing Owner to pay all Trading Advisor management and incentive fees, selling agent service fees and all other operating expenses and continuing offering costs of the Trust. Only management fees and incentive fees related to assets allocated through Trading Companies are included in expense on the combined consolidated statements of operations. The Series are all charged management and incentive fees on the asset allocated through the Galaxy Plus entities. Those fees are included in unrealized gain/(loss) on private investment companies on the combined consolidated statements of operations. The Series are also charged management and incentive fees on assets allocated to swaps. Such fees are embedded in the fair value of the swap and are included in net unrealized gain (loss) on swap contracts on the combined consolidated statements of operations.
Incentive Fee (rebate)—The Managing Owner is allowed to share in the incentive fees earned by the Commodity Trading Advisors up to 10% of New Net Profits (as defined in the prospectus). If the Managing Owner’s share of the incentive fee exceeds 10% of new net profits during the period, then the Managing Owner is obligated to return any amount in excess. The returned amounts are recorded as Incentive Fee (Rebate) on the combined consolidated statements of operations.
Service Fees—The Trust may maintain each Series of Units in three to seven sub-classes—Class 1, Class 1AP, Class 1a, Class 2, Class 2a, Class 3, and Class 3a. Investors who have purchased Class 1 or Class 1a Units of Frontier Diversified Fund, Frontier Masters Fund, and Frontier Long/Short Commodity Fund are charged a service fee of up to two percent (2.0%) annually of the NAV (of the purchase price, in case of the initial service fee) of each Unit purchased, for the benefit of selling agents selling such Class 1 or Class 1a Units. The initial service fee, which is amortized monthly at an annual rate of up to two percent (2.0%) of the average daily NAV of Class 1 or Class 1a of such Series, is prepaid to the Managing Owner by each Series, and paid to the selling agents by the Managing Owner in the month following sale; provided, however, that investors who redeem all or a portion of their Class 1 and Class 1a Units of any Series during the first twelve (12) months following the effective date of their purchase are subject to a redemption fee of up to two percent (2.0%) of the purchase price at which such investor redeemed to reimburse the Managing Owner for the then-unamortized balance of the prepaid initial service fee. Investors who have purchased Class 1 or Class 1a Units of Frontier Balanced Fund, Frontier Heritage Fund, Frontier Select Fund, and Frontier Global Fund are charged a service fee of up to three percent (3.0%) annually of the NAV (of the purchase price, in case of the initial service fee) of each Unit purchased, for the benefit of selling agents selling such Class 1 or Class 1a Units. The initial service fee, which is amortized monthly at an annual rate of up to three percent (3.0%) of the average daily NAV of Class 1 or Class 1a of such Series, is prepaid to the Managing Owner by each Series, and paid to the selling agents by the Managing Owner in the month following sale; provided, however, that investors who redeem all or a portion of their Class 1 and Class 1a Units of any Series during the first twelve (12) months following the effective date of their purchase are subject to a redemption fee of up to three percent (3.0%) of the purchase price at which such investor redeemed to reimburse the Managing Owner for the then-unamortized balance of the prepaid initial service fee. With respect to Class 2 and Class 2a Units of any Series, the Managing Owner pays an ongoing service fee to selling agents of up to one half percent (0.5%) annually of the NAV of each Class 2 or Class 2a Unit (of which 0.25% will be charged to Limited Owners holding Class 2 Units of the Frontier Diversified Fund and Frontier Masters Fund or Class 2a Units of the Frontier Long/Short Commodity Fund sold) until such Class 2 or Class 2a Units which are subject to the fee limitation are reclassified as Class 3 or Class 3a Units of the applicable Series for administrative purposes. Currently the service fee is not charged to Class 1AP investors. The Managing Owner may also pay selling agents certain additional fees and expenses for administrative and other services rendered and expenses incurred by such selling agents.
Each Series is charged service fees as outlined above. In some cases, amounts paid to selling agents might be less than the amount charged to the Series. When this occurs, the service fee is rebated back to the investor in the form of additional units. During 2022, 2021 and 2020, the Series were not allowed to issue additional units. The Managing Owner has determined that the purchase of additional units of the relevant Series will commence in 2021 when the Series are allowed to sell shares again. As such, the Managing Owner has calculated the amounts for additional units of the relevant series which will be purchased and classified such amounts as Subscriptions in advance for service fee rebates of $710,323 and $673,809 as of December 31, 2022 and December 31, 2021, respectively.
These service fees are part of the offering costs of the Trust, which include registration and filing fees, legal and blue sky expenses, accounting and audit, printing, marketing support and other offering costs which are borne by the Managing Owner. With respect to the service fees, the initial service fee (for the first 12 months) relating to a purchase of Class 1 and Class 1a Units by an investor is prepaid by the Managing Owner to the relevant selling agent in the month following such purchase and is reimbursed for such payment by the Series monthly in arrears in an amount based upon a corresponding percentage of NAV, calculated daily. Consequently, the Managing Owner bears the risk of the downside and enjoys the benefit of the upside potential of any difference between the amount of the initial service fee prepaid by it and the amount of the reimbursement thereof, which may result from variations in NAV over the following 12 months.
Pending Owner Additions—Funds received for new subscriptions and for additions to existing owner interests are recorded as capital additions at the NAV per unit of the second business day following receipt.
Owner redemptions payable—Funds payable for existing owner redemption requests are recorded as capital subtractions at the NAV per unit on the second business day following receipt or request.
Recently Adopted Accounting Pronouncements—In August 2018, FASB issued ASU 2018-13, Fair Value Measurement (Topic 820): Disclosure Framework—Changes to the Disclosure Requirements for Fair Value Measurement (“ASU 2018-13”). The primary focus of ASU 2018-13 is to improve the effectiveness of the disclosure requirements for fair value measurements. The changes affect all companies that are required to include fair value measurement disclosures. In general, the amendments in ASU 2018-13 are effective for all entities for fiscal years and interim periods within those fiscal years, beginning after December 15, 2019. An entity is permitted to early adopt the removed or modified disclosures upon the issuance of ASU 2018-13 and may delay adoption of the additional disclosures, which are required for public companies only, until their effective date. Management has evaluated the impacts of ASU 2018-13 and ensured that the combined consolidated financial statements are compliant.
Subsequent Events—The Trust follows the provisions of ASC 855, Subsequent Events, which establishes general standards of accounting for and disclosure of events that occur after the balance sheet date and up through the date the financial statements are issued. Refer to Note 11.
3. Fair Value Measurements
In connection with the valuation of investments the Trust applies ASC 820, Fair Value Measurement (“ASC 820”). ASC 820 provides clarification that when a quoted price in an active market for the identical asset or liability is not available, a reporting entity is required to measure fair value using certain techniques. ASC 820 also clarifies that when estimating the fair value of an asset or liability, a reporting entity is not required to include a separate input or adjustment to other inputs relating to the existence of a restriction that prevents the transfer of an asset or liability. ASC 820 also clarifies that both a quoted price in an active market for the identical asset or liability at the measurement date and the quoted price for the identical asset or liability when traded as an asset in an active market when no adjustments to the quoted price of the asset are required are Level 1 fair value measurements.
Level 1 Inputs
Unadjusted quoted prices in active markets for identical financial assets that the reporting entity has the ability to access at the measurement date.
Level 2 Inputs
Inputs other than quoted prices included in Level 1 that are observable for the financial assets or liabilities, either directly or indirectly. These might include quoted prices for similar financial assets in active markets, quoted prices for identical or similar financial assets in markets that are not active, inputs other than quoted prices that are observable for the financial assets or inputs that are derived principally from or corroborated by market data by correlation or other means.
Level 3 Inputs
Unobservable inputs for determining the fair value of financial assets that reflect an entity’s own assumptions about the assumptions that market participants would use in pricing the financial asset.
The Trust uses the following methodologies to value instruments within its financial asset portfolio at fair value:
Trading Securities. These instruments include U.S. Treasury securities and open trade equity positions (futures contracts) that are actively traded on public markets with quoted pricing for corroboration. U.S. Treasury securities and futures contracts are reported at fair value using Level 1 inputs. Trading securities instruments further include open trade equity positions (trading options and currency forwards) that are quoted prices for identical or similar assets that are not traded on active markets. Trading options and currency forwards are reported at fair value using Level 2 inputs.
Swap Contracts. Certain Series of the Trust strategically invest a portion or all of their assets in total return swaps, selected at the direction of the Managing Owner. Swaps are privately negotiated contracts designed to provide investment returns linked to those produced by one or more investment products or indices. In a typical swap, two parties agree to exchange the returns (or differentials in rates of return) earned or realized on one or more particular predetermined investments or instruments. The gross returns to be exchanged or “swapped” between parties are calculated with respect to a “notional amount” (i.e., the amount of value of the underlying asset used in computing the particular interest rate, return, or other amount to be exchanged) in a particular investment, or in a “basket” of securities.
Swap contracts are reported at fair value upon daily reports from the counterparty. In addition, a third party takes the inputs from the counterparty, makes certain adjustments, and runs it through their pricing model to come up with their daily price. The fair value measurements of the swap contracts are valued using unadjusted inputs that were not internally developed. The Managing Owner reviews and compares approved current day pricing of the CTA positions, as received from the counterparty which includes intra-day volatility and volume and daily index performance, as well as from the third party. Differences in prices exceeding 5% are investigated. Unexplainable differences are escalated to the Managing Owner’s Valuation Committee for evaluation and resolution. The Swap Contracts are reported at fair value using Level 3 inputs. All swap investments were liquidated in 2020.
Investments in Private Investment Companies. Investments in private investment companies are valued utilizing the net asset values provided by the underlying private investment companies as a practical expedient. Each Series applies the practical expedient to its investments in private investment companies on an investment-by-investment basis, and consistently with the Series’ entire position in a particular investment, unless it is probable that the Series will sell a portion of an investment at an amount different from the net asset value of the investment. The private investment companies are excluded from the fair value hierarchy table below.
The following table summarizes the instruments that comprise the Trust’s combined consolidated financial asset portfolio, in aggregate, measured at fair value on a recurring basis as of December 31, 2022 and 2021, segregated by the level of valuation inputs within the fair value hierarchy utilized to measure fair value:
| December 31, 2022 | | Level 1 Inputs | | | Level 2 Inputs | | | Level 3 Inputs | | | Fair Value | |
| Open Trade Equity (Deficit) | | $ | 1,670 | | | $ | - | | | $ | - | | | $ | 1,670 | |
| U.S. Treasury Securities | | | 389,520 | | | | - | | | | - | | | | 389,520 | |
| December 31, 2021 | | Level 1 Inputs | | | Level 2 Inputs | | | Level 3 Inputs | | | Fair Value | |
| Open Trade Equity (Deficit) | | $ | 14,836 | | | $ | - | | | $ | - | | | $ | 14,836 | |
| U.S. Treasury Securities | | | 140,487 | | | | - | | | | - | | | | 140,487 | |
4. Swap Contracts
In addition to authorizing Trading Advisors to manage pre-determined investment levels of futures and forward contracts, certain Series of the Trust will strategically invest a portion or all of their assets in total return swaps, selected at the direction of the Managing Owner. Total return swaps are privately negotiated contracts designed to provide investment returns linked to those produced by one or more investment products or indices. In a typical total return swap, two parties agree to exchange the returns (or differentials in rates of return) earned or realized on one or more particular predetermined investments or instruments. The gross returns to be exchanged or “swapped” between the parties are calculated with respect to a “notional amount” (i.e., the amount or value of the underlying asset used in computing the particular interest rate, return, or other amount to be exchanged) in a particular investment, or in a “basket” of securities.
The Trust’s investment in swaps will likely differ substantially over time due to cash flows, portfolio management decisions and market movements. The swaps serve to diversify the investment holdings of the Trust and to provide access to programs and advisors that would not be otherwise available to the Trust and are not used for hedging purposes.
The Managing Owner follows a procedure in selecting well-established financial institutions which the Managing Owner, in its sole discretion, considers to be reputable, reliable, financially responsible and well established to act as swap counterparties. The procedure includes due diligence review of documentation on all new and existing financial institution counterparties prior to initiation of the relationship, and quarterly ongoing review during the relationship, to ensure that counterparties meet the Managing Owner’s minimum credit requirements, the counterparty average rating being no less than an investment grade rating as defined by the rating agencies. As of December 31, 2020, All swaps were sold so that no Trust’s assets were deposited with over-the-counter counterparties.
The Trust strategically invests assets in one or more swaps linked to certain underlying investments or indices at the direction of the Managing Owner. The Trading Company in which the assets of the Trust will be invested will not own any of the investments or indices referenced by any swap entered into by the Trust. In addition, neither the swap counterparty nor any advisor referenced by any such swap is a Trading Advisor to the Trust.
To help to reduce counterparty risk on the Series, the Managing Owner has the right to reduce the Series’ exposure and remove cash from the Series’ total return swaps with Deutsche Bank AG. This cash holding shall be in excess of $250,000 and may not exceed 40% of the Index exposure in total. Index exposure is defined as the total notional amount plus any profit. The Series are charged interest on this cash holding and any amount removed will be offset against the final settlement value of the swap. The Frontier Select Fund (through its investment in an unconsolidated trading company) and Frontier Heritage Fund Brevan Howard swap investments were liquidated on May 30, 2020 and Frontier Balanced Fund, Frontier Long/Short Commodity Fund, Frontier Diversified Fund TRS swap investments were liquidated on December 21, 2020.
5. Investments in Private Investment Companies
Investments in private investment companies represent cash and open trade equity invested in the private investment companies as well as the cumulative trading profits or losses allocated to the Trust by the private investment companies. private investment companies allocate trading profits or losses on the basis of the proportion of the Trust’s capital allocated for trading to each respective private investment company, which bears no relationship to the amount of cash invested by the Trust in the private investment companies. Investments in private investment companies are valued using the NAV provided by the underlying private investment.
The Galaxy Plus entities are made up of feeder funds in which the Trust invests and master trading entities into which the feeder funds invest. No investment held by the Galaxy Plus master trading entity is greater than 5% of the Trust’s total capital.
The Trust’s investments in private investment companies have certain redemption and liquidity restrictions which are described in the following table:
| | | Redemptions | | Redemptions | | Liquidity |
| | | Notice Period | | Permitted | | Restrictions |
| Frontier Funds | | | | | | |
| Multi-Strategy | | | | | | |
| Galaxy Plus Fund - LRR Feeder Fund (522) LLC | | 24 hours | | Daily | | None |
| Galaxy Plus Fund - Quantica Managed Futures Feeder Fund (507) LLC | | 24 hours | | Daily | | None |
| Galaxy Plus Fund - Volt Diversified Alpha Feeder Fund (550) LLC | | 24 hours | | Daily | | None |
| Galaxy Plus Fund - Welton GDP Feeder Fund (538) LLC | | 24 hours | | Daily | | None |
| Trend Following | | | | | | |
| Galaxy Plus Fund - Aspect Feeder Fund (532) LLC | | 24 hours | | Daily | | None |
| Galaxy Plus Fund - Fort Contrarian Feeder Fund (510) LLC | | 24 hours | | Daily | | None |
| Galaxy Plus Fund - QIM Feeder Fund (526) LLC | | 24 hours | | Daily | | None |
| Galaxy Plus Fund - Quest Feeder Fund (517) LLC | | 24 hours | | Daily | | None |
6. Transactions with Affiliates
The Managing Owner contributes funds to the Trust in order to have a 1% interest in the aggregate capital, profits and losses and in return will receive units designated as general units in the Series of the Trust in which the Managing Owner invests such funds. The general units may only be purchased by the Managing Owner and may be subject to no advisory fees or management advisory fees at reduced rates. Otherwise, the general units hold the same rights as the limited units. The Managing Owner is required to maintain at least a 1% interest (“Minimum Purchase Commitment”) in the aggregate capital, profits and losses of the Trust so long as it is acting as the Managing Owner of the Trust. Such contribution was made by the Managing Owner before trading commenced for the Trust and will be maintained throughout the existence of the Trust, and the Managing Owner will make such purchases as are necessary to effect this requirement. Additionally, the Managing Owner agreed with certain regulatory bodies to maintain a 1% interest specifically in the Frontier Balanced Fund Class 1AP Units and Frontier Balanced Fund Class 2a Units, aggregated, and each of the Frontier Long/Short Commodity Fund, Frontier Diversified Fund, and Frontier Masters Fund. The 1% interest in these specific Series of the Trust is included in computing the Minimum Purchase Commitment in aggregate capital. In addition to the general units the Managing Owner receives in respect of its Minimum Purchase Commitment, the Managing Owner may purchase limited units in any Series as a Limited Owner. Principals of the Managing Owner or affiliates are allowed to own beneficial interests in the Trust, as well. All units purchased by the Managing Owner are held for investment purposes only and not for resale.
The Managing Owner may make purchases or redemptions at any time on the same terms as any Limited Owner. The Trust has and will continue to have certain relationships with the Managing Owner and its affiliates.
Expenses
Management Fees— Each Series of Units pays to the Managing Owner a monthly management fee equal to a percentage of the notional assets of such Series allocated to Trading Companies, calculated on a daily basis. The percentage basis of the fees varies and are in line with the amounts being disclosed below. In addition, the Managing Owner receives a monthly management equal to a certain percentage of the assets in the Galaxy Plus entities attributable to such Series’ (including notional assets), calculated on a monthly basis. The management fees attributable to Galaxy Plus entities are included in unrealized gain/(loss) on private investment companies on the combined consolidated statements of operations. The total amount of assets of a Series allocated to Trading Advisors and/or reference programs, including (i) actual funds deposited in accounts directed by the Trading Advisors or deposited as margin in respect of swaps or other derivative instruments referencing a reference program plus (ii) any notional equity allocated to the Trading Advisors and any reference programs, is referred to herein as the “notional assets” of the Series. The annual rate of the management fee is: 0.5% for the Frontier Balanced Fund Class 1 and Class 2, 1.0% for the Frontier Balanced Fund Class 1AP, Class 2a and Class 3a, 2.0% for the Frontier Global Fund, Frontier Long/Short Commodity Fund Class 1a, Class 2a and Class 3a and Frontier Masters Fund, 0.75% for Frontier Diversified Fund, 2.5% for the Frontier Heritage Fund and Frontier Select Fund, and 3.5% for the Frontier Long/Short Commodity Fund Class 2 and Class 3. The Managing Owner may pay all or a portion of such management fees to the Trading Advisor(s) and/or waive (up to the percentage specified) any such management fee to the extent any related management fee is paid by a trading company or estimated management fee is embedded in a swap or other derivative instrument. Any management fee embedded in a swap or other derivative instrument may be greater or less than the management fee that would otherwise be charged to the Series by the Managing Owner.
The management fee as a percentage of the applicable Series’ notional assets will be greater than the percentage of the applicable Series’ net asset value to the extent that the notional assets of the Series exceeds its net asset value. The Managing Owner expects that the notional assets of each Series will generally be maintained at a level in excess of the net asset value of such Series and such excess may be substantial to the extent the Managing Owner deems necessary to achieve the desired level of volatility.
Trading Fees— In connection with each Series’ trading activities the Frontier Balanced Fund, Frontier Select Fund, Frontier Global Fund (formerly Frontier Winton Fund) and Frontier Heritage Fund pays to the Managing Owner an FCM Fee of up to 2.25% per annum of notional assets allocated to the trading advisors, including through investments in commodity pools available on the Galaxy Plus Platform, and any reference programs of the applicable Series. The Frontier Diversified Fund, Frontier Long/Short Commodity Fund and Frontier Masters Fund pays to the Managing Owner an FCM Fee of up to 2.25% of notional assets allocated to the trading advisors, including through investments in commodity pools available on the Galaxy Plus Platform, and a custodial/due diligence fee of 0.12% of such Series’ NAV, calculated daily.
Incentive Fees Some Series pay to the Managing Owner an incentive fee of a certain percentage of new net trading profits generated in the Trading Companies by such Series, monthly or quarterly. In addition, the Managing Owner receives a quarterly incentive fee of a certain percentage of new net trading profits generated in the Galaxy Plus entities that have been allocated to the Series. The incentive fees attributable to Galaxy Plus entities are included in unrealized gain/(loss) on private investment companies on the combined consolidated statements of operations. Because the Frontier Balanced Fund, Frontier Diversified Fund, Frontier Masters Fund, Frontier Heritage Fund, Frontier Select Fund, and Frontier Long/Short Commodity Fund may each employ multiple Trading Advisors, these Series will pay the Managing Owner a monthly incentive fee calculated on a Trading Advisor by Trading Advisor basis. It is therefore possible that in any given period the Series may pay incentive fees to the Managing Owner for one or more Trading Advisors while each of these Series as a whole experiences losses. The incentive fee is 25% for the Frontier Balanced Fund and the Frontier Diversified Fund and 20% for the Frontier Global Fund, Frontier Heritage Fund, Frontier Select Fund, Frontier Long/Short Commodity Fund and Frontier Masters Fund. The Managing Owner may pay all or a portion of such incentive fees to the Trading Advisor(s) for such Series.
Service Fees—In addition, with respect to Class 1 and Class 1a Units of each Series of the Trust, as applicable, the Series pays monthly or quarterly to the Managing Owner a service fee of up to 3% and 2% annually, for the closed Series and open Series, respectively, which the Managing Owner pays to selling agents of the Trust. With respect to Class 2 Units of each Series of the Trust, as applicable, the Series pays monthly or quarterly to the Managing Owner a service fee of up to 0.25% annually, for the closed Series and open Series, respectively, which the Managing Owner pays to selling agents of the Trust.
As of December 31, 2022, the Trust had a payable to the Managing Owner in the amounts of $692, $1,573, $3,450, $83,102 and $33,432 for incentive fees, management fees, interest, trading fees, and service fees, respectively.
As of December 31, 2021, the Trust had a payable to the Managing Owner in the amounts of $54,702, $1,431, $1,714, $70,998 and $31,919 for incentive fees, management fees, interest, trading fees, and service fees, respectively.
As of December 31, 2020, the Trust had a payable to the Managing Owner in the amounts of $0, $8,854, $2,107, $81,698 and $36,705 for incentive fees, management fees, interest, trading fees, and service fees, respectively.
For the year ended December 31, 2022, the Managing Owner earned $199,276, $18,115, $494,806 and $1,044,671 for incentive fees (rebate), management fees, service fees, and trading fees, respectively.
For the year ended December 31, 2021, the Managing Owner earned $158,775, $18,441, $452,671 and $941,238 for incentive fees, management fees, service fees, and trading fees, respectively.
For the year ended December 31, 2020, the Managing Owner earned $0, $19,600, $597,679 and $1,311,400 for incentive fees, management fees, service fees, and trading fees, respectively.
With respect to the service fees, the initial service fee (for the first 12 months) relating to a purchase of Units by an investor is prepaid by the Managing Owner to the relevant selling agent in the month following such purchase and is reimbursed therefore by the Series monthly in arrears in an amount based upon a corresponding percentage of NAV, calculated daily. Consequently, the Managing Owner bears the risk and enjoys the benefit of the upside potential of any difference between the amount of the initial service fee prepaid by it and the amount of the reimbursement thereof, which may result from variations in NAV over the following 12 months.
Aggregate interest income from all sources, including U.S. Treasury Securities assets net of premiums and cash held at clearing brokers, of up to the first 2% (annualized) is paid to the Managing Owner by the Frontier Balanced Fund (Class 1 and Class 2 only), Frontier Long/Short Commodity Fund (Class 2 and Class 3), Frontier Global Fund, Frontier Select Fund, and Frontier Heritage Fund. For the Frontier Diversified Fund, Frontier Long/Short Commodity Fund (Class 1a, Class 2a and Class 3a), Frontier Masters Fund, and Frontier Balanced Fund (Class 1AP, Class 2a and Class 3a), 100% of the interest is retained by the respective Series. During the years ended December 31, 2022, 2021 and 2020, the Trust paid $31,925, $22,353, and $1,563,082, respectively, of such interest income to the Managing Owner. Such amounts are not included in the combined consolidated statements of operations of the Trust. All other interest income is recorded by the Trust on the combined consolidated statements of operations.
Frontier Masters Fund Class 1 was closed as of April 1, 2021, and Frontier Diversified Fund Class 1 was closed as of July 21, 2021.
7. Financial Highlights
The following information presents the financial highlights of the Trust for the years ended December 31, 2022, 2021 ,2020 and 2019 This data has been derived from the information presented in the combined consolidated financial statements.
| | | 2022 | | | 2021 | | | 2020 | | | 2019 | |
| Ratios to average net assets (1) | | | | | | | | | | | | |
| Net investment income/(loss) (1) | | | -7.17 | % | | | -6.69 | % | | | -5.71 | % | | | -5.54 | % |
| Expenses before incentive fees (rebate) (3) | | | -6.40 | % | | | -6.06 | % | | | -5.75 | % | | | -5.71 | % |
| Expenses after incentive fees (rebate) (3) | | | -7.21 | % | | | -6.74 | % | | | -5.75 | % | | | -5.71 | % |
| | | | | | | | | | | | | | | | | |
| Total return before incentive fees (rebate) (2) | | | 24.27 | % | | | 5.32 | % | | | -32.58 | % | | | -1.89 | % |
| Total return after incentive fees (rebate) (2) | | | 23.46 | % | | | 4.65 | % | | | -32.58 | % | | | -1.89 | % |
| (1) | Annualized with the exception of incentive fees. |
| (2) | Total returns are not annualized. |
| (3) | Expense ratios do not reflect interest allocated to the Managing Owner as such expenses are not included in the Combined Consolidated Statements of Operations of the Trust. See footnote 6. |
The Trust financial highlights are calculated based upon the Trust’s combined consolidated financial statements. The combined consolidated Trust does not issue units and therefore the financial highlights do not disclose any unitized data.
8. Derivative Instruments and Hedging Activities
The Trust’s primary business is to engage in speculative trading of a diversified portfolio of futures, forwards (including interbank foreign currencies), options contracts and other derivative instruments (including swap contracts). The Trust does not enter into or hold positions for hedging purposes as defined under ASC 815. The detail of the fair value of the Trust’s derivatives by instrument types as of December 31, 2022 and 2021 is included in the combined consolidated condensed schedules of investments. See Note 4 for further disclosure related to the Trust’s positions in swap contracts. There are embedded management fees in transacting these swaps ranging from 1% to 1.5% based on fair value of swaps and the embedded incentive fees ranging from 15% to 25% based on net new trading profits on swaps.
For the years ended December 31, 2022, 2021, and 2020, the monthly average of futures, forwards and options contracts bought was approximately 296, 652, and 613 respectively and the monthly average of futures, forwards, and options contracts sold was approximately 295, 654, and 612, respectively.
The following tables summarize the Trust’s combined consolidated trading revenues for the years ended December 31, 2022, 2021, and 2020 by contract type:
| Realized Trading Revenue from Futures, Forwards and Options |
| for the Year Ended December 31, 2022 |
| Type of contract | | | |
| | | | |
| Agriculturals | | $ | (385,424 | ) |
| Currencies | | | 683,628 | |
| Energies | | | 94,910 | |
| Interest rates | | | 230,542 | |
| Metals | | | (115,239 | ) |
| Stock indices | | | 299,210 | |
| Realized trading income/(loss)(1) | | $ | 807,627 | |
| (1) | Amounts recorded in the combined consolidated statements of operations under net realized gain(loss) on futures forwards and options. |
| Realized Trading Revenue from Futures, Forwards and Options |
| for the Year Ended December 31, 2021 |
| Type of contract | | | |
| | | | |
| Agriculturals | | $ | 191,851 | |
| Currencies | | | 96,075 | |
| Energies | | | 148,710 | |
| Interest rates | | | 108,590 | |
| Metals | | | 123,350 | |
| Stock indices | | | 204,123 | |
| Realized trading income/(loss)(1) | | $ | 872,699 | |
| (1) | Amounts recorded in the combined consolidated statements of operations under net realized gain(loss) on futures forwards and options. |
| Realized Trading Revenue from Futures, Forwards and Options |
| for the Year Ended December 31, 2020 |
| Type of contract | | | |
| | | | |
| Agriculturals | | $ | 147,013 | |
| Currencies | | | 90,903 | |
| Energies | | | 118,920 | |
| Interest rates | | | 59,037 | |
| Metals | | | 217,301 | |
| Stock indices | | | (34,911 | ) |
| Realized trading income/(loss)(1) | | $ | 598,263 | |
| (1) | Amounts recorded in the combined consolidated statements of operations under net realized gain(loss) on futures forwards and options. |
| Net Change in Open Trade Equity from Futures, Forwards and Options |
| for the Year Ended December 31, 2022 |
| Type of contract | | | |
| | | | |
| Agriculturals | | $ | 187,295 | |
| Currencies | | | (252,215 | ) |
| Energies | | | 47,945 | |
| Interest rates | | | (108,413 | ) |
| Metals | | | 98,894 | |
| Stock indices | | | 13,327 | |
| Change in unrealized trading income/(loss)(1) | | $ | (13,166 | ) |
| (1) | Amounts recorded in the combined consolidated statements of operations under net change in open trade equity/(deficit). |
| Net Change in Open Trade Equity from Futures, Forwards and Options |
| for the Year Ended December 31, 2021 |
| Type of contract | | | |
| | | | |
| Agriculturals | | $ | (13,842 | ) |
| Currencies | | | 11,977 | |
| Energies | | | (14,160 | ) |
| Interest rates | | | (37,684 | ) |
| Metals | | | (28,136 | ) |
| Stock indices | | | (7,461 | ) |
| Change in unrealized trading income/(loss)(1) | | $ | (89,306 | ) |
| (1) | Amounts recorded in the combined consolidated statements of operations under net change in open trade equity/(deficit). |
| Net Change in Open Trade Equity from Futures, Forwards and Options |
| for the Year Ended December 31, 2020 |
| Type of contract | | | |
| | | | |
| Metals | | $ | 27,115 | |
| Currencies | | | 14,158 | |
| Energies | | | (25,335 | ) |
| Interest rates | | | 4,660 | |
| Agriculturals | | | (1,619 | ) |
| Stock indices | | | 11,486 | |
| Change in unrealized trading income/(loss)(1) | | $ | 30,465 | |
| (1) | Amounts recorded in the combined consolidated statements of operations under net change in open trade equity/(deficit). |
Certain financial instruments and derivative instruments are eligible for offset in the combined consolidated statements of financial condition under GAAP. The Trust’s open trade equity/(deficit), options written, and receivables from futures commission merchants (each, an “FCM”) are subject to master netting arrangements and collateral arrangements and meet the GAAP guidance to qualify for offset. A master netting arrangement with a counterparty creates a right of offset for amounts due to and from that same counterparty that is enforceable in the event of a default or bankruptcy. The Trust’s policy is to recognize amounts subject to master netting arrangements on a net basis on the combined consolidated statements of financial condition.
The following tables present gross and net information about the Trust’s assets and liabilities subject the master netting arrangements as disclosed on the combined consolidated statements of financial condition as of December 31, 2022 and 2021:
As of December 31, 2022
| | | Gross Amounts of
recognized
Derivative
Assets | | | Gross Amounts
offset in the
Combined
Consolidated
Statements of
Financial
Condition | | | Net Amounts
Presented in the
Combined
Consolidated
Statements of
Financial
Condition | |
| | | | | | | | | | |
| Open Trade Equity/(Deficit) | | $ | 3,438 | | | $ | (1,768 | ) | | $ | 1,670 | |
As of December 31, 2021
| | | Gross Amounts of
recognized
Derivative
Assets | | | Gross Amounts
offset in the
Combined
Consolidated
Statements of
Financial
Condition | | | Net Amounts
Presented in the
Combined
Consolidated
Statements of
Financial
Condition | |
| | | | | | | | | | |
| Open Trade Equity/(Deficit) | | $ | 2,118,427 | | | $ | (2,103,591 | ) | | $ | 14,836 | |
9. Trading Activities and Related Risks
The purchase and sale of futures and options on futures contracts require margin deposits with FCMs. Additional deposits may be necessary for any loss on contract value. The CEA requires an FCM to segregate all customer transactions and assets from the FCM’s proprietary activities. A customer’s cash and other property (for example, U.S. treasury bills) deposited with an FCM are considered commingled with all other customer funds subject to the FCM’s segregation requirements. In the event of an FCM’s insolvency, recovery may be limited to a pro rata share of segregated funds available. It is possible that the recovered amount could be less than the total of cash and other property deposited.
The term “off-balance sheet risk” refers to an unrecorded potential liability that, even though it does not appear on the combined consolidated statements of financial condition, may result in future obligation or loss in excess of the amount paid by the Series for a particular investment. Each Trading Company and Galaxy Plus entity expects to trade in futures, options, forward and swap contracts and will therefore be a party to financial instruments with elements of off-balance sheet market and credit risk. In entering into these contracts, there exists a market risk that such contracts may be significantly influenced by market conditions, such as interest rate volatility, resulting in such contracts being less valuable. If the markets should move against all of the futures positions held by a Trading Company or Galaxy Plus entity in respect of any Series at the same time, and if the Trading Advisor(s) of such Trading Company or Galaxy Plus entity are unable to offset such futures interests positions, such Trading Company or Galaxy Plus entity could lose all of its assets and the holders of Units of such Series would realize a 100% loss. The Managing Owner will seek to minimize market risk through real-time monitoring of open positions and the level of diversification of each Trading Advisor’s portfolio. It is anticipated that any Trading Advisor’s margin- to-equity ratio will typically not exceed approximately 35% although the actual ratio could be higher or lower from time to time.
In addition to market risk, trading futures, forward and swap contracts entails credit risk that a counterparty will not be able to meet its obligations to a Trading Company or Galaxy Plus entity. The counterparty for futures contracts traded in the United States and on most foreign exchanges is the clearinghouse associated with such exchange. In general, clearinghouses are backed by the corporate members of the clearinghouse who are required to share any financial burden resulting from the non-performance by one of their members and, as such, should significantly reduce this credit risk. In cases where the clearinghouse is not backed by the clearing members, like some foreign exchanges, it is normally backed by a consortium of banks or other financial institutions. Some non-U.S. exchanges, in contrast to U.S. exchanges, are principals’ markets in which performance is the responsibility only of the individual counterparty with whom the Trading Company has entered into the transaction, and not of the exchange or clearing corporation. In these kinds of markets, there is risk of bankruptcy or other failure or refusal to perform by the counterparty.
In the case of forward contracts traded on the interbank market and swaps, neither is traded on exchanges. The counterparty is generally a single bank or other financial institution, rather than a group of financial institutions; thus there may be a greater counterparty credit risk. The Managing Owner expects the Trading Advisors to trade only with those counterparties which it believes to be creditworthy. All positions of each Trading Company will be valued each day on a mark-to-market basis. There can be no assurance that any clearing member, clearinghouse or other counterparty will be able to meet its obligations to any Trading Company.
The Managing Owner has established procedures to actively monitor and minimize market and credit risks. The Limited Owners bear the risk of loss only to the extent of the market value of their respective investments and, in certain specific circumstances, distributions and redemptions received.
10. Indemnifications and Guarantees
The Trust has entered into agreements, which provide for the indemnification of futures clearing brokers, and commodity trading advisers, among others, against losses, costs, claims and liabilities arising from the performance of their individual obligations under such agreements, except for gross negligence, bad faith or willful misconduct. The Trust has had no prior claims or payments pursuant to these agreements. The Trust’s individual maximum exposure under these arrangements is unknown, as this would involve future claims that may be made against the Trust that have not yet occurred. However, based on experience the Trust expects the risk of loss to be remote. Maximum exposure is unfulfilled obligations of the Trust up to the amount of equity at risk Morgan Stanley & Co. LLC. The Trust has not recorded any liability for the guarantees in the accompanying financial statements as it expects any possibility of losses to be remote. The Trust has not recorded any liability for the indemnifications in the accompanying combined consolidated financial statements as it expects any possibility of losses to be remote.
11. Subsequent Events
The Managing Owner evaluates events that occur after the balance sheet date but before and up until financial statements are available to be issued. The Managing Owner has assessed the subsequent events through the date that the combined consolidated financial statements were issued and has determined that, except as set forth below, there were no subsequent events requiring adjustment to or disclosure in the combined consolidated financial statements.
From January 1, 2023 through April 3, 2023, the Trust paid $687,561 in redemptions.
INDEPENDENT AUDITORS’ REPORT
To the Executive Committee of Frontier Funds
Opinion
We have audited the accompanying financial statements of Frontier Trading Company I, LLC and Frontier Trading Company XXXVIII, LLC (collectively, the “Trading Companies”), which comprise the statements of financial condition, including the condensed schedules of investments, as of December 31, 2022 and 2021, the related statements of operations, changes in members’ equity and cash flows for the years ended December 31, 2022, 2021, and 2020, and the related notes to the financial statements.
In our opinion, the accompanying financial statements present fairly, in all material respects, the financial position of the Trading Companies as of December 31, 2022 and 2021, and the results of their operations and their cash flows for the years ended December 31, 2022, 2021, and 2020, in accordance with accounting principles generally accepted in the United States of America.
Basis for Opinion
We conducted our audits in accordance with auditing standards generally accepted in the United States of America (GAAS). Our responsibilities under those standards are further described in the Auditors’ Responsibilities for the Audit of the Financial Statements section of our report. We are required to be independent of the Trading Companies and to meet our other ethical responsibilities, in accordance with the relevant ethical requirements relating to our audit. We believe that the audit evidence we have obtained is sufficient and appropriate to provide a basis for our audit opinion.
Responsibilities of Management for the Financial Statements
Management is responsible for the preparation and fair presentation of the financial statements in accordance with accounting principles generally accepted in the United States of America, and for the design, implementation, and maintenance of internal control relevant to the preparation and fair presentation of financial statements that are free from material misstatement, whether due to fraud or error.
In preparing the financial statements, management is required to evaluate whether there are conditions or events, considered in the aggregate, that raise substantial doubt about the Trading Companiesw’ ability to continue as a going concern within one year after the date that the financial statements are issued or available to be issued.
Auditors’ Responsibilities for the Audit of the Financial Statements
Our objectives are to obtain reasonable assurance about whether the financial statements as a whole are free from material misstatement, whether due to fraud or error, and to issue an auditors’ report that includes our opinion. Reasonable assurance is a high level of assurance but is not absolute assurance and therefore is not a guarantee that an audit conducted in accordance with GAAS will always detect a material misstatement when it exists. The risk of not detecting a material misstatement resulting from fraud is higher than for one resulting from error, as fraud may involve collusion, forgery, intentional omissions, misrepresentations, or the override of internal control. Misstatements are considered material if there is a substantial likelihood that, individually or in the aggregate, they would influence the judgment made by a reasonable user based on the financial statements.
In performing an audit in accordance with GAAS, we:
| ● | Exercise professional judgment and maintain professional skepticism throughout the audit. |
| | | |
| ● | Identify and assess the risks of material misstatement of the financial statements, whether due to fraud or error, and design and perform audit procedures responsive to those risks. Such procedures include examining, on a test basis, evidence regarding the amounts and disclosures in the financial statements. |
| | | |
| ● | Obtain an understanding of internal control relevant to the audit in order to design audit procedures that are appropriate in the circumstances, but not for the purpose of expressing an opinion on the effectiveness of the Trading Companies’ internal control. Accordingly, no such opinion is expressed. |
| | | |
| ● | Evaluate the appropriateness of accounting policies used and the reasonableness of significant accounting estimates made by management, as well as evaluate the overall presentation of the financial statements. |
| | | |
| ● | Conclude whether, in our judgment, there are conditions or events, considered in the aggregate, that raise substantial doubt about the Trading Companies’ ability to continue as a going concern for a reasonable period of time. |
We are required to communicate with those charged with governance regarding, among other matters, the planned scope and timing of the audit, significant audit findings, and certain internal control—related matters that we identified during the audit.
/s/ Spicer Jeffries LLP
Denver, Colorado
April 3, 2023
The Trading Companies of the Frontier Fund
Statements of Financial Condition
December 31, 2022 and 2021
| | | Frontier Trading | |
| | | Company I, LLC | |
| | | 12/31/2022 | | | 12/31/2021 | |
| | | | | | | |
| ASSETS | | | | | | |
| | | | | | | |
| Receivable from futures commission merchants | | $ | 320,241 | | | $ | 818,362 | |
| Open trade equity, at fair value | | | 1,670 | | | | 14,836 | |
| Total Assets | | $ | 321,911 | | | $ | 833,198 | |
| | | | | | | | | |
| LIABILITIES & MEMBERS’ EQUITY | | | | | | | | |
| | | | | | | | | |
| LIABILITIES | | | | | | | | |
| Risk analysis fee payable | | $ | 10,442 | | | $ | 10,380 | |
| Total Liabilities | | | 10,442 | | | | 10,380 | |
| MEMBERS’ EQUITY (Net Asset Value) | | | 311,469 | | | | 822,818 | |
| Total Liabilities and Members’ Equity | | $ | 321,911 | | | $ | 833,198 | |
| | | Frontier Trading | | | Frontier Trading | | | Frontier Trading | |
| | | Company XXXIV LLC | | | Company XXXV LLC | | | Company XXXVII LLC | |
| | | 12/31/2022 | | | 12/31/2021 | | | 12/31/2022 | | | 12/31/2021 | | | 12/31/2022 | | | 12/31/2021 | |
| | | | | | | | | | | | | | | | | | | |
| ASSETS | | | | | | | | | | | | | | | | | | |
| | | | | | | | | | | | | | | | | | | |
| Swap contracts, at fair value | | $ | - | | | $ | - | | | $ | - | | | $ | ��- | | | $ | - | | | $ | - | |
| Interest receivable | | | - | | | | - | | | | - | | | | - | | | | - | | | | - | |
| Total Assets | | $ | - | | | $ | - | | | $ | - | | | $ | - | | | $ | - | | | $ | - | |
| | | | | | | | | | | | | | | | | | | | | | | | | |
| LIABILITIES & MEMBERS’ EQUITY | | | | | | | | | | | | | | | | | | | | | | | | |
| | | | | | | | | | | | | | | | | | | | | | | | | |
| LIABILITIES | | | | | | | | | | | | | | | | | | | | | | | | |
| Advance on unrealized swap appreciations | | $ | - | | | $ | - | | | $ | - | | | $ | - | | | $ | - | | | $ | - | |
| Interest payable | | | - | | | | - | | | | - | | | | - | | | | - | | | | - | |
| Options written, at fair value | | | - | | | | - | | | | - | | | | - | | | | - | | | | - | |
| | | | | | | | | | | | - | | | | - | | | | - | | | | - | |
| Open trade deficit, at fair value | | $ | - | | | $ | - | | | | - | | | $ | - | | | | - | | | | - | |
| Total Liabilities | | | - | | | | - | | | | - | | | | - | | | | - | | | | - | |
| MEMBERS’ EQUITY (Net Asset Value) | | | - | | | | - | | | | - | | | | - | | | | - | | | | - | |
| Total Liabilities and Members’ Equity | | $ | - | | | $ | - | | | $ | - | | | $ | - | | | $ | - | | | $ | - | |
| | | Frontier Trading | | | Frontier Trading | |
| | | Company XXXVIII LLC | | | Company XXXIX LLC | |
| | | 12/31/2022 | | | 12/31/2021 | | | 12/31/2022 | | | 12/31/2021 | |
| | | | | | | | | | | | | |
| ASSETS | | | | | | | | | | | | |
| | | | | | | | | | | | | |
| Investments in private investment companies, at fair value | | $ | 264,652 | | | $ | 129,995 | | | $ | - | | | $ | - | |
| Swap contracts, at fair value | | | - | | | | - | | | | - | | | | - | |
| Total Assets | | $ | 264,652 | | | $ | 129,995 | | | $ | - | | | $ | - | |
| | | | | | | | | | | | | | | | | |
| LIABILITIES & MEMBERS’ EQUITY | | | | | | | | | | | | | | | | |
| | | | | | | | | | | | | | | | | |
| LIABILITIES | | | | | | | | | | | | | | | | |
| Advance on unrealized swap appreciations | | $ | - | | | $ | - | | | $ | - | | | $ | - | |
| Total Liabilities | | | - | | | | - | | | | - | | | | - | |
| MEMBERS’ EQUITY (Net Asset Value) | | | 264,652 | | | | 129,995 | | | | - | | | | - | |
| Total Liabilities and Members’ Equity | | $ | 264,652 | | | $ | 129,995 | | | $ | - | | | $ | - | |
The accompanying notes are an integral part of these financial statements.
The Trading Companies of the Frontier Funds
Condensed Schedules of Investments
December 31, 2022
| | | Frontier Trading | | | Frontier Trading | |
| | | Company I LLC | | | Company XXXVIII LLC | |
| | | | | | % of Total Capital | | | | | | % of Total Capital | |
| Description | | Value | | | (Net Asset Value) | | | Value | | | (Net Asset Value) | |
| LONG FUTURES CONTRACTS * | | | | | | | | | | | | |
| Various agriculture futures contracts (U.S.) | | $ | 1,590 | | | | 0.51 | % | | | - | | | | 0.00 | % |
| Various base metals futures contracts (U.S.) | | | 897 | | | | 0.29 | % | | | - | | | | 0.00 | % |
| Various currency futures contracts (U.S.) | | | (230 | ) | | | -1.19 | % | | | - | | | | 0.00 | % |
| Total Long Futures Contracts | | $ | 2,257 | | | | -0.39 | % | | $ | - | | | | 0.00 | % |
| SHORT FUTURES CONTRACTS * | | | | | | | | | | | | | | | | |
| Various agriculture futures contracts (Europe) | | $ | (227 | ) | | | -0.07 | % | | | - | | | | 0.00 | % |
| Various currency futures contracts (Europe) | | | 67 | | | | 0.02 | % | | | - | | | | 0.00 | % |
| Various currency futures contracts (Far East) | | | (55 | ) | | | -0.02 | % | | | - | | | | 0.00 | % |
| Various currency futures contracts (U.S.) | | | (216 | ) | | | -0.07 | % | | | - | | | | 0.00 | % |
| Various interest rates futures contracts (U.S.) | | | (50 | ) | | | -0.02 | % | | | - | | | | 0.00 | % |
| Various stock index futures contracts (Far East) | | | (106 | ) | | | -0.03 | % | | | - | | | | 0.00 | % |
| Total Short Futures Contracts | | $ | (587 | ) | | | -0.19 | % | | $ | - | | | | 0.00 | % |
| Total Open Trade Equity (Deficit) | | $ | 1,670 | | | | -0.58 | % | | $ | - | | | | 0.00 | % |
| PRIVATE INVESTMENT COMPANIES | | | | | | | | | | | | | | | | |
| Galaxy Plus Fund - Quest Fit Feeder Fund (535) LLC | | $ | - | | | | 0.00 | % | | | 264,652 | | | | 100.00 | % |
| Total Private Investment Companies | | $ | - | | | | 0.00 | % | | $ | 264,652 | | | | 100.00 | % |
The Trading Companies of the Frontier Funds
Condensed Schedules of Investments
December 31, 2021
| | | Frontier Trading | | | Frontier Trading | |
| | | Company I LLC | | | Company XXXVIII LLC | |
| | | | | | % of Total
Capital | | | | | | % of Total
Capital | |
| Description | | Value | | | (Net Asset
Value) | | | Value | | | (Net Asset
Value) | |
| LONG FUTURES CONTRACTS * | | | | | | | | | | | | |
| Various agriculture futures contracts (Far East) | | $ | 10,141 | | | | 1.23 | % | | $ | - | | | | 0.00 | % |
| Various agriculture futures contracts (Europe) | | | (21,640 | ) | | | -2.63 | % | | | - | | | | 0.00 | % |
| Various agriculture futures contracts (U.S.) | | | 51,912 | | | | 6.31 | % | | | - | | | | 0.00 | % |
| Various base metals futures contracts (U.S.) | | | 20,031 | | | | 2.43 | % | | | - | | | | 0.00 | % |
| Various currency futures contracts (Europe) | | | 1,994 | | | | 0.24 | % | | | - | | | | 0.00 | % |
| Various currency futures contracts (Far East) | | | 819 | | | | 0.10 | % | | | - | | | | 0.00 | % |
| Various currency futures contracts (Latin America) | | | 6,710 | | | | 0.82 | % | | | - | | | | 0.00 | % |
| Various currency futures contracts (U.S.) | | | (9,800 | ) | | | -1.19 | % | | | - | | | | 0.00 | % |
| Various energy futures contracts (U.S.) | | | 34 | | | | 0.00 | % | | | - | | | | 0.00 | % |
| Various interest rates futures contracts (Europe) | | | (718,038 | ) | | | -87.27 | % | | | - | | | | 0.00 | % |
| Various interest rates futures contracts (Far East) | | | (10,418 | ) | | | -1.27 | % | | | - | | | | 0.00 | % |
| Various interest rates futures contracts (U.S.) | | | (7,281 | ) | | | -0.88 | % | | | - | | | | 0.00 | % |
| Various precious metal futures contracts (U.S.) | | | 19,168 | | | | 2.33 | % | | | - | | | | 0.00 | % |
| Various soft futures contracts (U.S.) | | | 138,674 | | | | 16.85 | % | | | - | | | | 0.00 | % |
| Various stock index futures contracts (Europe) | | | 1,508 | | | | 0.18 | % | | | - | | | | 0.00 | % |
| Various stock index futures contracts (Far East) | | | 1,541 | | | | 0.19 | % | | | - | | | | 0.00 | % |
| Various stock index futures contracts (Oceanic) | | | 1,236 | | | | 0.15 | % | | | - | | | | 0.00 | % |
| Various stock index futures contracts (Canada) | | | 1,853 | | | | 0.23 | % | | | - | | | | 0.00 | % |
| Total Long Futures Contracts | | $ | (511,556 | ) | | | -62.17 | % | | $ | - | | | | 0.00 | % |
| SHORT FUTURES CONTRACTS * | | | | | | | | | | | | | | | | |
| Various agriculture futures contracts (Far East) | | $ | (27,804 | ) | | | -3.38 | % | | $ | - | | | | 0.00 | % |
| Various agriculture futures contracts (Europe) | | | 20,105 | | | | 2.44 | % | | | - | | | | 0.00 | % |
| Various agriculture futures contracts (U.S.) | | | (11,749 | ) | | | -1.43 | % | | | - | | | | 0.00 | % |
| Various base metals futures contracts (U.S.) | | | (29,574 | ) | | | -3.59 | % | | | - | | | | 0.00 | % |
| Various currency futures contracts (Europe) | | | (18,181 | ) | | | -2.21 | % | | | - | | | | 0.00 | % |
| Various currency futures contracts (Far East) | | | (1,110 | ) | | | -0.13 | % | | | - | | | | 0.00 | % |
| Various currency futures contracts (Latin America) | | | (21,340 | ) | | | -2.59 | % | | | - | | | | 0.00 | % |
| Various currency futures contracts (U.S.) | | | 6,288 | | | | 0.76 | % | | | - | | | | 0.00 | % |
| Various energy futures contracts (U.S.) | | | (10,792 | ) | | | -1.31 | % | | | - | | | | 0.00 | % |
| Various interest rates futures contracts (Europe) | | | 785,677 | | | | 95.49 | % | | | - | | | | 0.00 | % |
| Various interest rates futures contracts (U.S.) | | | (625 | ) | | | -0.08 | % | | | - | | | | 0.00 | % |
| Various precious metal futures contracts (U.S.) | | | (38,573 | ) | | | -4.69 | % | | | - | | | | 0.00 | % |
| Various soft futures contracts (U.S.) | | | (110,902 | ) | | | -13.48 | % | | | - | | | | 0.00 | % |
| Various stock index futures contracts (Canada) | | | (5,194 | ) | | | -0.63 | % | | | - | | | | 0.00 | % |
| Various stock index futures contracts (Europe) | | | (5,157 | ) | | | -0.63 | % | | | - | | | | 0.00 | % |
| Various stock index futures contracts (Far East) | | | (2,191 | ) | | | -0.27 | % | | | - | | | | 0.00 | % |
| Various stock index futures contracts (Oceanic) | | | (2,217 | ) | | | -0.27 | % | | | - | | | | 0.00 | % |
| Various stock index futures contracts (U.S.) | | | (269 | ) | | | -0.03 | % | | | - | | | | 0.00 | % |
| Total Short Futures Contracts | | $ | 526,392 | | | | 63.97 | % | | $ | - | | | | 0.00 | % |
| Total Open Trade Equity (Deficit) | | $ | 14,836 | | | | 1.80 | % | | $ | - | | | | 0.00 | % |
| PRIVATE INVESTMENT COMPANIES | | | | | | | | | | | | | | | | |
| Galaxy Plus Fund - Quest Fit Feeder Fund (535) LLC | | $ | - | | | | 0.00 | % | | | 129,995 | | | | 100.00 | % |
| Total Private Investment Companies | | $ | - | | | | 0.00 | % | | $ | 129,995 | | | | 100.00 | % |
The accompanying notes are an integral part of these financial statements.
The Trading Companies of the Frontier Fund
Statements of Operations
For The Years Ended December 31, 2022, 2021 and 2020
| | | Frontier Trading | |
| | | Company I, LLC | |
| | | 12/31/2022 | | | 12/31/2021 | | | 12/31/2020 | |
| Investment Income: | | | | | | | | | |
| Interest-net | | $ | (2,319 | ) | | $ | (213 | ) | | $ | 6,075 | |
| | | | | | | | | | | | | |
| Total Income | | | (2,319 | ) | | | (213 | ) | | | 6,075 | |
| | | | | | | | | | | | | |
| Realized and unrealized gain (loss) on investments: | | | | | | | | | | | | |
| Net realized gain/(loss) on futures, forwards, and options | | | 807,627 | | | | 872,698 | | | | 598,263 | |
| Net change in open trade equity | | | (13,166 | ) | | | (89,306 | ) | | | 30,465 | |
| Risk analysis fees | | | (5,434 | ) | | | (5,532 | ) | | | (5,880 | ) |
| Trading commissions | | | (13,009 | ) | | | (15,423 | ) | | | (21,149 | ) |
| | | | | | | | | | | | | |
| Net gain/(loss) on investments | | | 776,018 | | | | 762,437 | | | | 601,699 | |
| | | | | | | | | | | | | |
| NET INCREASE/(DECREASE) IN MEMBERS’ EQUITY RESULTING FROM OPERATIONS | | $ | 773,699 | | | $ | 762,224 | | | $ | 607,774 | |
| | | Frontier Trading | | | Frontier Trading | |
| | | Company XXXIV, LLC | | | Company XXXV, LLC | |
| | | 12/31/2022 | | | 12/31/2021 | | | 12/31/2020 | | | 12/31/2022 | | | 12/31/2021 | | | 12/31/2020 | |
| Investment Income: | | | | | | | | | | | | | | | | | | |
| Interest-net | | $ | - | | | $ | - | | | $ | - | | | $ | - | | | $ | - | | | $ | - | |
| | | | | | | | | | | | | | | | | | | | | | | | | |
| Total Income | | | - | | | | - | | | | - | | | | - | | | | - | | | | - | |
| | | | | | | | | | | | | | | | | | | | | | | | | |
| Realized and unrealized gain (loss) on investments: | | | | | | | | | | | | | | | | | | | | | | | | |
| Net realized gain/(loss) on swap contracts | | | - | | | | - | | | | (2,448,166 | ) | | | - | | | | - | | | | (446,306 | ) |
| Net unrealized gain/(loss) on option / swap contracts | | | - | | | | - | | | | (3,088,917 | ) | | | - | | | | - | | | | (1,537,399 | ) |
| | | | | | | | | | | | | | | | | | | | | | | | | |
| Net gain/(loss) on investments | | | - | | | | - | | | | (5,537,083 | ) | | | - | | | | - | | | | (1,983,705 | ) |
| | | | | | | | | | | | | | | | | | | | | | | | | |
| NET INCREASE/(DECREASE) IN MEMBERS’ EQUITY RESULTING FROM OPERATIONS | | $ | - | | | $ | - | | | $ | (5,537,083 | ) | | $ | - | | | $ | - | | | $ | (1,983,705 | ) |
| | | Frontier Trading | | | Frontier Trading | | | Frontier Trading | |
| | | Company XXXVII, LLC | | | Company XXXVIII, LLC | | | Company XXXIX, LLC | |
| | | 12/31/2022 | | | 12/31/2021 | | | 12/31/2020 | | | 12/31/2022 | | | 12/31/2021 | | | 12/31/2020 | | | 12/31/2022 | | | 12/31/2021 | | | 12/31/2020 | |
| Investment Income: | | | | | | | | | | | | | | | | | | | | | | | | | | | |
| Interest-net | | $ | - | | | $ | - | | | $ | - | | | $ | - | | | $ | - | | | $ | - | | | $ | - | | | $ | - | | | $ | - | |
| | | | | | | | | | | | | | | | | | | | | | | | | | | | | | | | | | | | | |
| Total Income | | | - | | | | - | | | | - | | | | - | | | | - | | | | - | | | | - | | | | - | | | | - | |
| | | | | | | | | | | | | | | | | | | | | | | | | | | | | | | | | | | | | |
| Realized and unrealized gain (loss) on investments: | | | | | | | | | | | | | | | | | | | | | | | | | | | | | | | | | | | | |
| Net realized gain/(loss) on option / swap contracts | | | - | | | | - | | | | 188,100 | | | | - | | | | - | | | | - | | | | - | | | | - | | | | (189,734 | ) |
| Net unrealized gain/(loss) on option / swap contracts | | | - | | | | - | | | | 44,277 | | | | - | | | | - | | | | - | | | | - | | | | - | | | | 197,829 | |
| Net unrealized gain/(loss) on private investment companies | | | - | | | | - | | | | - | | | | 134,657 | | | | 40,965 | | | | (68,745 | ) | | | - | | | | - | | | | - | |
| Net realized gain/(loss) on private investment companies | | | - | | | | - | | | | - | | | | - | | | | - | | | | - | | | | - | | | | - | | | | - | |
| | | | | | | | | | | | | | | | | | | | | | | | | | | | | | | | | | | | | |
| Net gain/(loss) on investments | | | - | | | | - | | | | 232,377 | | | | 134,657 | | | | 40,965 | | | | (68,745 | ) | | | - | | | | - | | | | 8,095 | |
| | | | | | | | | | | | | | | | | | | | | | | | | | | | | | | | | | | | | |
| NET INCREASE/(DECREASE) IN MEMBERS’ EQUITY RESULTING FROM OPERATIONS | | $ | - | | | $ | - | | | $ | 232,377 | | | $ | 134,657 | | | $ | 40,965 | | | $ | (68,745 | ) | | $ | - | | | $ | - | | | $ | 8,095 | |
The accompanying notes are an integral part of these financial statements.
The Trading Companies of the Frontier Fund
Statements of Changes in Members’ Equity
For the Years Ended December 31, 2022, 2021, 2020
| | | Frontier Trading | |
| | | Company I LLC | |
| Members’ Equity, December 31, 2019 | | | 2,633,758 | |
| | | | | |
| Capital Contributed | | | 1,250,215 | |
| Capital Distributed | | | (4,166,847 | ) |
| Net Increase (decrease) in Members’ Equity Resulting From Operations | | | 607,774 | |
| | | | | |
| Members’ Equity, December 31, 2020 | | $ | 324,900 | |
| | | | | |
| Capital Contributed | | | 825,630 | |
| Capital Distributed | | | (1,089,936 | ) |
| Net Increase (decrease) in Members’ Equity Resulting From Operations | | | 762,224 | |
| | | | | |
| Members’ Equity, December 31, 2021 | | $ | 822,818 | |
| | | | | |
| Capital Contributed | | | 450,000 | |
| Capital Distributed | | | (1,735,048 | ) |
| Net Increase (decrease) in Members’ Equity Resulting From Operations | | | 773,699 | |
| | | | | |
| Members’ Equity, December 31, 2022 | | $ | 311,469 | |
| | | Frontier Trading | | | Frontier Trading | |
| | | Company
XXXIV, LLC | | | Company
XXXV, LLC | |
| Members’ Equity, December 31, 2019 | | | 5,768,199 | | | | 2,384,583 | |
| | | | | | | | | |
| Capital Contributed | | | 1,178,695 | | | | 269,147 | |
| Capital Distributed | | | (1,409,811 | ) | | | (670,025 | ) |
| Net Increase (decrease) in Members’ Equity Resulting From Operations | | | (5,537,083 | ) | | | (1,983,705 | ) |
| | | | | | | | | |
| Members’ Equity, December 31, 2020 | | $ | - | | | $ | - | |
| | | | | | | | | |
| Capital Contributed | | | - | | | | - | |
| Capital Distributed | | | - | | | | - | |
| Net Increase (decrease) in Members’ Equity Resulting From Operations | | | - | | | | - | |
| | | | | | | | | |
| Members’ Equity, December 31, 2021 | | $ | - | | | $ | - | |
| | | | | | | | | |
| Capital Contributed | | | - | | | | - | |
| Capital Distributed | | | - | | | | - | |
| Net Increase (decrease) in Members’ Equity Resulting From Operations | | | - | | | | - | |
| | | | | | | | | |
| Members’ Equity, December 31, 2022 | | $ | - | | | $ | - | |
| | | Frontier
Trading | | | Frontier
Trading | | | Frontier
Trading | |
| | | Company
XXXVII,
LLC | | | Company
XXXVIII,
LLC | | | Company
XXXIX,
LLC | |
| Members’ Equity, December 31, 2019 | | | 247,521 | | | | 157,775 | | | | 988,009 | |
| | | | | | | | | | | | | |
| Capital Contributed | | | - | | | | - | | | | - | |
| Capital Distributed | | | (479,898 | ) | | | - | | | | (996,104 | ) |
| Net Increase (decrease) in Members’ Equity Resulting From Operations | | | 232,377 | | | | (68,745 | ) | | | 8,095 | |
| | | | | | | | | | | | | |
| Members’ Equity, December 31, 2020 | | $ | - | | | $ | 89,030 | | | $ | - | |
| | | | | | | | | | | | | |
| Capital Contributed | | | - | | | | - | | | | - | |
| Capital Distributed | | | - | | | | - | | | | - | |
| Net Increase (decrease) in Members’ Equity Resulting From Operations | | | - | | | | 40,965 | | | | - | |
| | | | | | | | | | | | | |
| Members’ Equity, December 31, 2021 | | $ | - | | | $ | 129,995 | | | $ | - | |
| | | | | | | | | | | | | |
| Capital Contributed | | | - | | | | - | | | | - | |
| Capital Distributed | | | - | | | | - | | | | - | |
| Net Increase (decrease) in Members’ Equity Resulting From Operations | | | - | | | | 134,657 | | | | - | |
| | | | | | | | | | | | | |
| Members’ Equity, December 31, 2022 | | $ | - | | | $ | 264,652 | | | $ | - | |
The accompanying notes are an integral part of these financial statements.
The Trading Companies of the Frontier Fund
Statements of Cash Flows
For the Years Ended December 31, 2022, 2021 and 2020
| | | Frontier Trading | |
| | | Company I, LLC | |
| | | 2022 | | | 2021 | | | 2020 | |
| | | | | | | | | | |
| Cash Flows from Operating Activities | | | | | | | | | |
| Net increase (decrease) in members’ equity resulting from operations | | $ | 773,699 | | | $ | 762,224 | | | $ | 607,774 | |
| Adjustments to reconcile net increase (decrease) in members’ equity resulting from operations to net cash provided by (used in) operating activities: | | | | | | | | | | | | |
| Decrease (increase) in receivable from futures commission merchants | | | 498,121 | | | | (584,389 | ) | | | 2,292,065 | |
| Decrease (increase) in open trade equity (deficit), at fair value | | | 13,166 | | | | 85,604 | | | | 15,744 | |
| (Decrease) increase in risk analysis fee payable | | | 62 | | | | 867 | | | | 1,048 | |
| Net cash provided by (used in) operating activities | | | 1,285,048 | | | | 264,306 | | | | 2,916,631 | |
| | | | | | | | | | | | | |
| Cash Flows from Financing Activities | | | | | | | | | | | | |
| Capital Contributed | | | 450,000 | | | | 825,630 | | | | 1,250,215 | |
| Capital Distributed | | | (1,735,048 | ) | | | (1,089,936 | ) | | | (4,166,846 | ) |
| | | | | | | | | | | | | |
| Net cash provided by (used in) financing activities | | | (1,285,048 | ) | | | (264,306 | ) | | | (2,916,631 | ) |
| | | | | | | | | | | | | |
| Net change in cash and cash equivalents | | | - | | | | - | | | | - | |
| Cash and cash equivalents, beginning of year | | $ | - | | | $ | - | | | $ | - | |
| Cash and cash equivalents, end of year | | $ | - | | | $ | - | | | $ | - | |
| | | Frontier Trading | | | Frontier Trading | |
| | | Company XXXIV, LLC | | | Company XXXV, LLC | |
| | | 2022 | | | 2021 | | | 2020 | | | 2022 | | | 2021 | | | 2020 | |
| | | | | | | | | | | | | | | | | | | |
| Cash Flows from Operating Activities | | | | | | | | | | | | | | | | | | |
| Net increase (decrease) in members’ equity resulting from operations | | $ | - | | | $ | - | | | $ | (5,537,083 | ) | | $ | - | | | $ | - | | | $ | (1,983,705 | ) |
| Adjustments to reconcile net increase (decrease) in members’ equity resulting from operations to net cash provided by (used in) operating activities: | | | | | | | | | | | | | | | | | | | | | | | | |
| Net unrealized (gain) loss on swap contracts | | | - | | | | - | | | | 3,088,917 | | | | - | | | | - | | | | 1,537,399 | |
| (Decrease) increase in swap collateral | | | - | | | | - | | | | 2,679,282 | | | | - | | | | - | | | | 847,184 | |
| Net cash provided by (used in) operating activities | | | - | | | | - | | | | 231,116 | | | | - | | | | - | | | | 400,878 | |
| | | | | | | | | | | | | | | | | | | | | | | | | |
| Cash Flows from Financing Activities | | | | | | | | | | | | | | | | | | | | | | | | |
| Capital Contributed | | | - | | | | - | | | | 1,178,695 | | | | - | | | | - | | | | 269,147 | |
| Capital Distributed | | | - | | | | - | | | | (1,409,811 | ) | | | - | | | | - | | | | (670,025 | ) |
| | | | | | | | | | | | | | | | | | | | | | | | | |
| Net cash provided by (used in) financing activities | | | - | | | | - | | | | (231,116 | ) | | | - | | | | - | | | | (400,878 | ) |
| | | | | | | | | | | | | | | | | | | | | | | | | |
| Net change in cash and cash equivalents | | | - | | | | - | | | | - | | | | - | | | | - | | | | - | |
| Cash and cash equivalents, beginning of year | | $ | - | | | $ | - | | | $ | - | | | $ | - | | | $ | - | | | $ | - | |
| Cash and cash equivalents, end of year | | $ | - | | | $ | - | | | $ | - | | | $ | - | | | $ | - | | | $ | - | |
| | | Frontier Trading | | | Frontier Trading | | | Frontier Trading | |
| | | Company XXXVII, LLC | | | Company XXXVIII, LLC | | | Company XXXIX, LLC | |
| | | 2022 | | | 2021 | | | 2020 | | | 2022 | | | 2021 | | | 2020 | | | 2022 | | | 2021 | | | 2020 | |
| | | | | | | | | | | | | | | | | | | | | | | | | | | | |
| | | | | | | | | | | | | | | | | | | | | | | | | | | | |
| Cash Flows from Operating Activities | | | | | | | | | | | | | | | | | | | | | | | | | | | |
| Net increase (decrease) in members’ equity resulting from operations | | $ | - | | | $ | - | | | $ | 232,377 | | | $ | 134,657 | | | $ | 40,965 | | | $ | (68,745 | ) | | $ | - | | | $ | - | | | $ | 8,095 | |
| Adjustments to reconcile net increase (decrease) in members’ equity resulting from operations to net cash provided by (used in) operating activities: | | | | | | | | | | | | | | | | | | | | | | | | | | | | | | | | | | | | |
| (Decrease) increase in swap collateral | | | - | | | | - | | | | 291,798 | | | | - | | | | - | | | | - | | | | - | | | | - | | | | 1,185,838 | |
| Net unrealized (gain) loss on swap contracts | | | - | | | | - | | | | (44,277 | ) | | | - | | | | - | | | | - | | | | - | | | | - | | | | (197,829 | ) |
| Net unrealized (gain) loss in Investments in private investment companies | | | - | | | | - | | | | - | | | | (134,657 | ) | | | (40,965 | ) | | | 68,745 | | | | - | | | | - | | | | - | |
| Net cash provided by (used in) operating activities | | | - | | | | - | | | | 479,898 | | | | - | | | | - | | | | - | | | | - | | | | - | | | | 996,104 | |
| | | | | | | | | | | | | | | | | | | | | | | | | | | | | | | | | | | | | |
| Cash Flows from Financing Activities | | | | | | | | | | | | | | | | | | | | | | | | | | | | | | | | | | | | |
| Capital Distributed | | | - | | | | - | | | | (479,898 | ) | | | - | | | | - | | | | - | | | | - | | | | - | | | | (996,104 | ) |
| | | | | | | | | | | | | | | | | | | | | | | | | | | | | | | | | | | | | |
| Net cash provided by (used in) financing activities | | | - | | | | - | | | | (479,898 | ) | | | - | | | | - | | | | - | | | | - | | | | - | | | | (996,104 | ) |
| | | | | | | | | | | | | | | | | | | | | | | | | | | | | | | | | | | | | |
| Net change in cash and cash equivalents | | | - | | | | - | | | | - | | | | - | | | | - | | | | - | | | | - | | | | - | | | | - | |
| Cash and cash equivalents, beginning of year | | $ | - | | | $ | - | | | $ | - | | | $ | - | | | $ | - | | | $ | - | | | $ | - | | | $ | - | | | $ | - | |
| Cash and cash equivalents, end of year | | $ | - | | | $ | - | | | $ | - | | | $ | - | | | $ | - | | | $ | - | | | $ | - | | | $ | - | | | $ | - | |
The accompanying notes are an integral part of these financial statements.
The Trading Companies of the Frontier Funds
Notes to Financial Statements
1. Organization and Purpose
These financial statements and related notes pertain to the following companies: Frontier Trading Company I LLC, Frontier Trading Company II LLC, Frontier Trading Company XXIX, Frontier Trading Company XXXIV, LLC, Frontier Trading Company XXXV LLC, Frontier Trading Company XXXVII, LLC, Frontier Trading Company XXXVIII, LLC, and Frontier Trading Company XXXIX, LLC (the “Trading Companies”).
Frontier Funds (the “Trust”) was formed as a Delaware statutory trust on August 8, 2003, with separate Series of Units (the “Series”). Its term will expire on December 31, 2053 (unless terminated earlier in certain circumstances). The Trust is a multi-advisor commodity pool as described in Commodity Futures Trading Commission, or CFTC Regulation § 4.10(d)(2).
All capital of the Trading Companies is provided by the Series and there are no other investors in the Trading Companies.
Each Trading Company authorizes certain Trading Advisors to place trades and manage assets at pre-determined investment levels. The Trading Companies were organized for the purpose of investing in securities and derivative instruments, and have no operating income or expenses, except for trading income and expenses and a risk analysis fee (for closed Series only).
Trading Companies engage in the speculative trading of a diversified portfolio of futures, forwards (including interbank foreign currencies) and options contracts and other derivative instruments (including swap contracts) and may, from time to time, engage in cash and spot transactions. A brief description of the Trading Company’s main types of investments is set forth below:
| | ● | A futures contract is a standardized contract traded on an exchange that calls for the future delivery of a specified quantity of a commodity at a specified time and place. Exposure to futures contracts is done directly by the trading companies or indirectly through an investment in a private investment company that trades futures. |
| | ● | A forward contract is an individually negotiated contract between principals, not traded on an exchange, to buy or sell a specified quantity of a commodity at or before a specified date at a specified price. |
| | ● | An option on a futures contract, forward contract or a commodity gives the buyer of the option the right, but not the obligation, to buy or sell a futures contract, forward contract or a commodity, as applicable, at a specified price on or before a specified date. Options on futures contracts are standardized contracts traded on an exchange, while options on forward contracts and commodities, referred to collectively as over-the-counter options, generally are individually negotiated, principal-to-principal contracts not traded on an exchange. |
| | ● | A swap contract generally involves an exchange of a stream of payments between the contracting parties. Swap contracts generally are not uniform and not exchange-traded. |
The Trust has entered into agreements, which provide for the indemnification of futures clearing brokers, currency trading companies, and commodity trading advisers, among others, against losses, costs, claims and liabilities arising from the performance of their individual obligations under such agreements, except for gross negligence, bad faith or willful misconduct.
2. Significant Accounting Policies
The following are the significant accounting policies of the Trading Companies.
Basis of Presentation—The Trading Companies follow Generally Accepted Accounting Principles (“GAAP”), as established by the Financial Accounting Standards Board (the “FASB”), to ensure consistent reporting of financial condition, condensed schedules of investments, results of operations, changes in capital and cash flows. The Trading Companies are investment companies and follow ASC 946.
Receivable from Futures Commission Merchants—The Trading Companies deposit assets with an FCM subject to CFTC regulations and various exchange and broker requirements. Margin requirements are satisfied by the deposit of cash with such FCM. The Trading Companies earn interest income on its assets deposited with the FCM. A portion of the receivable is restricted cash required to meet maintenance margin requirements. Cash with the clearing broker as of December 31, 2022 and December 31, 2021 included restricted cash for margin requirements of $320,241 and $818,362 for the Frontier Trading Company I LLC.
Use of Estimates—The preparation of financial statements in conformity with GAAP may require the management of the Trading Companies to make estimates and assumptions that affect the reported amounts of assets and liabilities and disclosure of contingent assets and liabilities at the date of the financial statements and the reported amounts of revenue and expenses during the reporting period. The valuation of swap contracts requires significant estimates as well as the valuation of certain other investments. Please refer to Note 3 for discussion of valuation methodology. Actual results could differ from these estimates, and such differences could be material.
Investment Transactions—Futures, options on futures, and forward contracts are recorded on a trade date basis and realized gains or losses are recognized when contracts are settled. Unrealized gains or losses on open contracts (the difference between contract trade price and market price) are reported in the Statement of Operations as a Net change in open trade equity, as there exists a right of offset of unrealized gains or losses in accordance with ASC 210. Any change in net unrealized gain or loss from the preceding period is reported in the Statements of Operations. Fair value of exchange-traded contracts is based upon exchange settlement prices. Fair value of non- exchange-traded contracts is based on third party quoted dealer values on the interbank market.
Foreign Currency Transactions— The Trading Company’s functional currency is the U.S. dollar; however, they transact business in currencies other than the U.S. dollar. The Series do not isolate that portion of the results of operations resulting from changes in foreign exchange rates on investments from fluctuations arising from changes in market prices of securities held. Such fluctuations are included with the net realized or unrealized gain or loss from investments.
Purchase and Sales of Private Investment Companies – Trading Companies are able to subscribe into and redeem from the Galaxy Plus entities on a weekly basis. The value of the private investment companies is determined by the Sponsor and reported on a daily basis. The change in value is calculated as the difference between the total purchase proceeds and the fair value calculated by the Sponsor and is recorded as net unrealized gain/(loss) on private investment companies on the statements of operations.
Investments and Swaps— The Trading Companies record investment transactions on a trade date basis and all investments are recorded at fair value, with changes in fair value reported as a component of realized and unrealized gains/(losses) on investments in the statements of operations. Investments in private investment companies are valued utilizing the net asset values as a practical expedient. The Trading Companies strategically invest a portion or all of their assets in total return swaps, selected at the discretion of management. Swaps are privately negotiated contracts designed to provide investment returns linked to those produced by one or more underlying investment products or indices. In a typical swap, two parties agree to exchange the returns (or differentials in rates of return) earned or realized on one or more particular predetermined investment or instrument. The gross returns to be exchanged or “swapped” between the parties are calculated with respect to a “notional amount” (i.e., the amount of value of the underlying asset used in computing the particular interest rate, return, or other amount to be exchanged) in a particular investment, or in a “basket” of securities. The valuation of swap contracts requires significant estimates. Swap contracts are reported utilizing Level 3 Inputs. The significant unobservable inputs used in the fair value measurement of the Trust’s swap contracts are asset liquidity, debt valuation, credit risk, volatility, market risk, distributions, dividends, risk premiums, and other risk management tools. Significant increases (decreases) in any of those inputs in isolation would result in a significantly lower (higher) fair value measurement. Swap Contracts are reported at fair value based upon a weekly indicative value that is calculated by management using bid/ask prices from the counterparty. All valuation processes are monitored by the valuation committee.
Income Taxes—The Trading Companies apply the provisions of ASC 740 Income Taxes (“ASC 740”), which provides guidance for how uncertain tax positions should be recognized, measured, presented and disclosed in the financial statements. This interpretation also provides guidance on derecognition, classification, interest and penalties, accounting in interim periods and disclosure. ASC 740 requires the evaluation of tax positions taken or expected to be taken in the course of preparing the Trading Companies’ financial statements to determine whether the tax positions are “more-likely-than-not” of being sustained by the applicable tax authority. Tax positions with respect to tax at the Trading Company level not deemed to meet the “more-likely-than-not” threshold would be recorded as a tax benefit or expense in the current year. Management has concluded there is no tax expense, interest or penalties to be recorded by the Trading Companies. The 2019 through 2022 tax years generally remain subject to examination by U.S. federal and most state tax authorities.
Fees and Expenses—The Trading Companies incur no expenses other than trading commissions resulting from normal trading activity. All operating expenses such as legal, accounting, etc. are paid for, without reimbursement, by Frontier Fund Management LLC, the Managing Owner of the Trust.
Recently Adopted Accounting Pronouncement—
In August 2018, FASB issued ASU 2018-13, Fair Value Measurement (Topic 820): Disclosure Framework—Changes to the Disclosure Requirements for Fair Value Measurement (“ASU 2018-13”). The primary focus of ASU 2018-13 is to improve the effectiveness of the disclosure requirements for fair value measurements. The changes affect all companies that are required to include fair value measurement disclosures. In general, the amendments in ASU 2018-13 are effective for all entities for fiscal years and interim periods within those fiscal years, beginning after December 15, 2019. An entity is permitted to early adopt the removed or modified disclosures upon the issuance of ASU 2018-13 and may delay adoption of the additional disclosures, which are required for public companies only, until their effective date.
Management is currently evaluating the impacts ASU 2018-13 will have on the financial statements
Subsequent Events—The Trading Companies follow the provisions of FASB ASC 855, Subsequent Events, which establishes general standards of accounting for and disclosure of events that occur after the balance sheet date and up through the date the financial statements are issued. Refer to Note 9.
3. Fair Value Measurements
In connection with the valuation of investments, the Trading Companies apply ASC 820. ASC 820 provides clarification that when a quoted price in an active market for the identical asset or liability is not available, a reporting entity is required to measure fair value using certain techniques. ASC 820 also clarifies that when estimating the fair value of an asset or liability, a reporting entity is not required to include a separate input or adjustment to other inputs relating to the existence of a restriction that prevents the transfer of an asset or liability. ASC 820 also clarifies that both a quoted price in an active market for the identical asset or liability at the measurement date and the quoted price for the identical asset or liability when traded as an asset or liability in an active market when no adjustments to the quoted price of the asset are required are Level 1 fair value measurements.
Level 1 Inputs
Unadjusted quoted prices in active markets for identical financial assets that the reporting entity has the ability to access at the measurement date.
Level 2 Inputs
Inputs other than quoted prices included in Level 1 that are observable for the financial assets or liabilities, either directly or indirectly. These might include quoted prices for similar financial assets in active markets, quoted prices for identical or similar financial assets in markets that are not active, inputs other than quoted prices that are observable for the financial assets or inputs that are derived principally from or corroborated by market data by correlation or other means.
Level 3 Inputs
Unobservable inputs for determining the fair value of financial assets that reflect an entity’s own assumptions about the assumptions that market participants would use in pricing the financial asset.
The Trading Companies uses the following methodologies to value instruments within its financial asset portfolio at fair value:
Trading Securities. These instruments include open trade equity positions (futures contracts) that are actively traded on public markets with quoted pricing for corroboration. Futures contracts are reported at fair value using Level 1 inputs. Trading securities instruments further include open trade equity positions (trading options and currency forwards) that are quoted prices for identical or similar assets that are not traded on active markets. Trading options and currencies are reported at fair value using Level 2 inputs.
Swap Contracts. Certain Series of the Trust strategically invest a portion or all of their assets in total return swaps, selected at the direction of the Managing Owner. Swaps are privately negotiated contracts designed to provide investment returns linked to those produced by one or more investment products or indices. In a typical swap, two parties agree to exchange the returns (or differentials in rates of return) earned or realized on one or more particular predetermined investments or instruments. The gross returns to be exchanged or “swapped” between parties are calculated with respect to a “notional amount” (i.e., the amount of value of the underlying asset used in computing the particular interest rate, return, or other amount to be exchanged) in a particular investment, or in a “basket” of securities.
Swap contracts are reported at fair value upon daily reports from the counterparty. In addition, a third party takes the inputs from the counterparty, makes certain adjustments, and runs it through their pricing model to come up with their daily price. The fair value measurements of the swap contracts are valued using unadjusted inputs that were not internally developed. The Managing Owner reviews and compares approved current day pricing of the CTA positions, as received from the counterparty which includes intra-day volatility and volume and daily index performance, as well as from the third party. Differences in prices exceeding 5% are investigated. Unexplainable differences are escalated to the Managing Owner’s Valuation Committee for evaluation and resolution. The Swap Contracts are reported at fair value using Level 3 inputs.
Investments in Private Investment Companies. Investments in private investment companies are valued utilizing the net asset values provided by the underlying private investment companies as a practical expedient. Each Series applies the practical expedient to its investments in private investment companies on an investment-by-investment basis, and consistently with the Series’ entire position in a particular investment, unless it is probable that the Series will sell a portion of an investment at an amount different from the net asset value of the investment. The Private Investment Companies are reported at fair value using Level 2 inputs. The Frontier Select Fund (through its investment in an unconsolidated trading company) and Frontier Heritage Fund Brevan Howard swap investments were liquidated on May 30, 2020 and Frontier Balanced Fund, Frontier Long/Short Commodity Fund, Frontier Diversified Fund TRS swap investment were liquidated on December 21, 2020.
The following table summarizes the instruments that comprise the Trading Companies financial asset portfolio measured at fair value on a recurring basis as of December 31, 2022 and 2021, segregated by the level of valuation inputs within the fair value hierarchy utilized to measure fair value:
| December 31, 2022 | | Pratical
Expedient | | | Level 1
Inputs | | | Level 2
Inputs | | | Level 3
Inputs | | | Total
Fair Value | |
| | | | | | | | | | | | | | | | |
| Frontier Trading Company I LLC | | | | | | | | | | | | | | | |
| Open Trade Equity (Deficit) | | $ | - | | | $ | 1,670 | | | $ | - | | | $ | - | | | $ | 1,670 | |
| Frontier Trading Company XXXVIII, LLC | | | | | | | | | | | | | | | | | | | | |
| Private Investment Companies | | | 264,652 | | | | - | | | | - | | | | - | | | | 264,652 | |
| December 31, 2021 | | Pratical
Expedient | | | Level 1
Inputs | | | Level 2
Inputs | | | Level 3
Inputs | | | Total
Fair Value | |
| | | | | | | | | | | | | | | | |
| Frontier Trading Company I LLC | | | | | | | | | | | | | | | |
| Open Trade Equity (Deficit) | | $ | - | | | $ | 14,836 | | | $ | - | | | $ | - | | | $ | 14,836 | |
| Frontier Trading Company XXXVIII, LLC | | | | | | | | | | | | | | | | | | | | |
| Private Investment Companies | | | 129,995 | | | | - | | | | - | | | | - | | | | 129,995 | |
The Trading Companies assess the levels of the investments at each measurement date, and transfers between levels are recognized on the actual date of the event or change in circumstances that caused the transfer in accordance with the Trading Company’s accounting policy regarding the recognition of transfers between levels of the fair value hierarchy. During the years ended December 31, 2022, 2021 and 2020, the Trading Companies did not transfer any assets between Level 1, Level 2 or Level 3.
4. Swap Contracts
In addition to authorizing Trading Advisors to manage pre-determined investment levels of futures and forward contracts, certain Trading Companies of the Trust will strategically invest a portion or all of their assets in total return swaps, selected at the direction of management. Swaps are privately negotiated contracts designed to provide investment returns linked to those produced by one or more investment products or indices. In a typical swap, two parties agree to exchange the returns (or differentials in rates of return) earned or realized on one or more particular predetermined investments or instruments. The gross returns to be exchanged or “swapped” between the parties are calculated with respect to a “notional amount” (i.e., the amount or value of the underlying asset used in computing the particular interest rate, return, or other amount to be exchanged) in a particular investment, or in a “basket” of securities.
Each Trading Company’s investment in swaps will likely differ substantially over time due to cash flows, portfolio management decisions and market movements. The swaps serve to diversify the investment holdings of each Trading Company and to provide access to programs and advisors that would not be otherwise available to the Trading Company and are not used for hedging purposes.
Management follows a procedure in selecting well-established financial institutions which management, in its sole discretion, considers to be reputable, reliable, financially responsible and well established, to act as swap counterparties. The procedure includes due diligence review of documentation on all new and existing financial institution counterparties prior to initiation of relationship, and quarterly ongoing review during the relationship, to ensure that counterparties meet the managements’ minimum credit requirements, the counterparty average rating being no less than an investment grade rating as defined by the rating agencies.
The Trading Companies strategically invest assets in one or more swaps linked to certain underlying investments or indices, at the direction of management. The Trading Companies will not own any of the investments or indices referenced by any swap. In addition, the swap counterparty to the Trading Company is not a Trading Advisor to these Trading Companies.
To help to reduce counterparty risk on the Trading Companies, the Managing Owner has the right to reduce the Trading Companies’ exposure and remove cash from the Trading Companies’ total return swaps with Deutsche Bank AG. The Series are charged interest on this cash holding and any amount removed will be offset against the final settlement value of the swap. The Frontier Trading Company XXXIX, LLC ceased trading operations on May 30, 2020. The Frontier Trading Company XXXIV LLC, Frontier Trading Company XXXV LLC and Frontier Trading Company XXXVII LLC ceased trading operations on December 21, 2020. Embedded in the swap fair value is management and incentive fees being paid to Trading Advisors.
5. Financial Highlights
The following information presents the financial highlights of the Trading Companies for the years ended December 31, 2022, 2021, and 2020.
| | | Frontier Trading | | | Frontier Trading | | | Frontier Trading | |
| | | Company I LLC | | | Company XXXIV, LLC | | | Company XXXV, LLC | |
| | | 12/31/2022 | | | 12/31/2021 | | | 12/31/2020 | | | 12/31/2022 | | | 12/31/2021 | | | 12/31/2020 | | | 12/31/2022 | | | 12/31/2021 | | | 12/31/2020 | |
| | | | | | | | | | | | | | | | | | | | | | | | | | | | |
| Net Investment Gain | | | -0.39 | % | | | -0.04 | % | | | 0.88 | % | | | 0.00 | % | | | 0.00 | % | | | 0.00 | % | | | 0.00 | % | | | 0.00 | % | | | 0.00 | % |
| | | | | | | | | | | | | | | | | | | | | | | | | | | | | | | | | | | | | |
| Total Return | | | 360.75 | % | | | 306.85 | % | | | 114.13 | % | | | 0.00 | % | | | 0.00 | % | | | -0.61 | % | | | 0.00 | % | | | 0.00 | % | | | 19.32 | % |
| | | Frontier Trading | | | Frontier Trading | | | Frontier Trading | |
| | | Company XXXVII, LLC | | | Company XXXVIII, LLC | | | Company XXXIX, LLC | |
| | | 12/31/2022 | | | 12/31/2021 | | | 12/31/2020 | | | 12/31/2022 | | | 12/31/2021 | | | 12/31/2020 | | | 12/31/2022 | | | 12/31/2021 | | | 12/31/2020 | |
| | | | | | | | | | | | | | | | | | | | | | | | | | | | |
| Net Investment Gain | | | 0.00 | % | | | 0.00 | % | | | 0.00 | % | | | 0.00 | % | | | 0.00 | % | | | 0.00 | % | | | 0.00 | % | | | 0.00 | % | | | 0.00 | % |
| | | | | | | | | | | | | | | | | | | | | | | | | | | | | | | | | | | | | |
| Total Return | | | 0.00 | % | | | 0.00 | % | | | -497.38 | % | | | 103.59 | % | | | 46.01 | % | | | 191.44 | % | | | 0.00 | % | | | 0.00 | % | | | -1871.86 | % |
| (1) | Trading Company XXXIX, LLC ceased trading operations May 30,2020 |
| | |
| (2) | Trading Company XXXVII, LLC ceased trading operations December 21, 2020 |
| | |
| (3) | Trading Company XXXV, LLC ceased trading operations December 21, 2020 |
| | |
| (4) | Trading Company XXXIV, LLC ceased trading operations December 21, 2020 |
6. Investments in Private Investment Companies
Investments in private investment companies represent cash and open trade equity invested in the private investment companies as well as the cumulative trading profits or losses allocated to the Trust by the private investment companies. Private investment companies allocate trading profits or losses on the basis of the proportion of the Trading Company’s capital allocated for trading to the private investment company, which bears no relationship to the amount of cash invested by the Trading Company in the private investment companies. Investments in private investment companies are valued using the NAV provided by the underlying private investment.
As of December 31, 2022, Frontier Trading Company XXXVIII, LLC’s investment into Galaxy Plus Fund – Quest FIT Feeder Fund (535) LLC had a fair value of $264,652. For the year ended December 31, 2022, Galaxy Plus Fund – Quest FIT Feeder Fund (535) LLC incurred $0 in trading commissions and had $141,820 and $16,539 in realized and unrealized trading gains, respectively, for a net gain of $134,657. Galaxy Plus Fund – Quest FIT Feeder Fund (535) LLC allows for daily redemptions upon 24 hours written notice. There are no liquidity restrictions.
7. Derivative Instruments and Hedging Activities
The Trading Companies’ primary business is to engage in speculative trading of a diversified portfolio of futures, forwards (including interbank foreign currencies), options contracts and other derivative instruments (including swap contracts). The Trading Companies do not enter into or hold positions for hedging purposes as defined under ASC 815. The detail of the fair value of the Trading Companies’ derivatives by instrument types as of December 31, 2022 and 2021 is included in the Condensed Schedules of Investments. See Note 4 for further disclosure related to the Trading Companies’ positions in swap. The following tables summarize the monthly averages of futures contracts bought and sold for each respective Trading Company:
For the Year Ended December 31, 2022
Monthly average contracts:
| | | Bought | | | Sold | |
| | | | | | | |
| Frontier Trading Company I LLC | | | 296 | | | | 295 | |
For the Year Ended December 31, 2021
Monthly average contracts:
| | | Bought | | | Sold | |
| | | | | | | |
| Frontier Trading Company I LLC | | | 652 | | | | 654 | |
For the Year Ended December 31, 2020
Monthly average contracts:
| | | Bought | | | Sold | |
| | | | | | | | | |
| Frontier Trading Company I LLC | | | 613 | | | | 612 | |
The following tables summarize the trading revenues for the years ended December 31, 2022, 2021, and 2020, approximately by sector:
Realized Trading Revenue from Futures, Forwards and Options for the Year Ended December 31, 2022.
| | | Frontier Trading | |
| | | Company I LLC | |
| Type of contract | | | |
| Agriculturals | | $ | (385,424 | ) |
| Currencies | | | 683,628 | |
| Energies | | | 94,910 | |
| Interest rates | | | 230,542 | |
| Metals | | | (115,239 | ) |
| Stock indices | | | 299,210 | |
| Realized trading income/(loss)(1) | | $ | 807,627 | |
Realized Trading Revenue from Futures, Forwards and Options for the Year Ended December 31, 2021.
| | | Frontier Trading | |
| | | Company I LLC | |
| Type of contract | | | |
| Agriculturals | | $ | 191,851 | |
| Currencies | | | 96,075 | |
| Energies | | | 148,710 | |
| Interest rates | | | 108,590 | |
| Metals | | | 123,350 | |
| Stock indices | | | 204,122 | |
| Realized trading income/(loss)(1) | | $ | 872,698 | |
Realized Trading Revenue from Futures, Forwards and Options for the Year Ended December 31, 2020
| | | Frontier Trading | |
| | | Company I LLC | |
| Type of contract | | | |
| Metals | | $ | 147,013 | |
| Currencies | | | 90,903 | |
| Energies | | | 118,920 | |
| Agriculturals | | | 59,037 | |
| Interest rates | | | 217,301 | |
| Stock indices | | | (34,911 | ) |
| Realized trading income/(loss)(1) | | $ | 598,263 | |
| (1) | Amounts recorded in the Statements of Operations under Net realized gain(loss) on futures forwards and options. |
Net Change in Open Trade Equity from Futures, Forwards and Options for the Year Ended December 31, 2022
| | | Frontier Trading | |
| Type of contract | | Company I LLC | |
| Metals | | $ | 98,894 | |
| Currencies | | | (252,215 | ) |
| Energies | | | 47,945 | |
| Agriculturals | | | 187,295 | |
| Interest rates | | | (108,413 | ) |
| Stock indices | | | 13,328 | |
| Change in unrealized trading income/(loss)(1) | | $ | (13,166 | ) |
Net Change in Open Trade Equity from Futures, Forwards and Options for the Year Ended December 31, 2021
| | | Frontier Trading | |
| Type of contract | | Company I LLC | |
| Metals | | $ | (28,136 | ) |
| Currencies | | | 11,977 | |
| Energies | | | (14,160 | ) |
| Agriculturals | | | (13,842 | ) |
| Interest rates | | | (37,684 | ) |
| Stock indices | | | (7,461 | ) |
| Change in unrealized trading income/(loss)(1) | | $ | (89,306 | ) |
Net Change in Open Trade Equity from Futures, Forwards and Options for the Year Ended December 31, 2020
| | | Frontier Trading | |
| Type of contract | | Company I LLC | |
| Metals | | $ | (1,619 | ) |
| Currencies | | | 14,159 | |
| Energies | | | (25,335 | ) |
| Agriculturals | | | 27,115 | |
| Interest rates | | | 4,660 | |
| Stock indices | | | 11,486 | |
| Change in unrealized trading income/(loss)(1) | | $ | 30,466 | |
Certain financial instruments and derivative instruments are eligible for offset in the statements of financial condition under GAAP. The Series’ open trade equity/(deficit), options written, and receivables from futures commissions merchants (each, an “FCM”) are subject to master netting arrangements and collateral arrangements and meet the U.S. GAAP guidance to qualify for offset. A master netting arrangement with a counterparty creates a right of offset for amounts due to and from that same counterparty that is enforceable in the event of a default or bankruptcy. The Series’ policy is to recognize amounts subject to master netting arrangements on a net basis on the statements of financial condition.
The following tables present gross and net information about the Series’ assets and liabilities subject to master netting arrangements as disclosed on the statements of financial condition as of December 31, 2022 and December 31, 2021.
As of December 31, 2022
| Frontier Trading Company I, LLC | | Gross Amounts of recognized Assets | | | Gross Amounts of recognized Liabilities | | | Net Amounts of Assets and Liabilities Presented in the Statements of Financial Condition | |
| | | | | | | | | | |
| Open Trade Equity/(Deficit) | | $ | 5,695 | | | $ | (4,025 | ) | | $ | 1,670 | |
As of December 31, 2021
| Frontier Trading Company I, LLC | | Gross Amounts of recognized Assets | | | Gross Amounts of recognized Liabilities | | | Net Amounts of Assets and Liabilities Presented in the Statements of Financial Condition | |
| | | | | | | | | | |
| Open Trade Equity/(Deficit) | | $ | 2,118,427 | | | $ | (2,103,591 | ) | | $ | 14,836 | |
8. Trading Activities and Related Risks
The purchase and sale of futures and options on futures contracts require margin deposits with futures commission merchants (each, an “FCM”). Additional deposits may be necessary for any loss on contract value. The CEA requires an FCM to segregate all customer transactions and assets from the FCM’s proprietary activities. A customer’s cash and other property (for example, U.S. Treasury bills) deposited with an FCM are considered commingled with all other customer funds subject to the FCM’s segregation requirements. In the event of an FCM’s insolvency, recovery may be limited to a pro rata share of segregated funds available. It is possible that the recovered amount could be less than the total of cash and other property deposited.
The term “off-balance sheet risk” refers to an unrecorded potential liability that, even though it does not appear on the Statement of Financial Condition, may result in future obligation or loss in excess of the amount paid by the trading Companies for a particular investment. Each Trading Company expects to trade in futures, options, forward and swap contracts and will therefore be a party to financial instruments with elements of off-balance sheet market and credit risk. In entering into these contracts, there exists a market risk that such contracts may be significantly influenced by market conditions, such as interest rate volatility, resulting in such contracts being less valuable. If the markets should move against all of the futures positions held by a Trading Company at the same time, and if the Trading Advisor(s) of such Trading Company are unable to offset such futures interests positions, such Trading Company could lose all of its assets. Management will seek to minimize market risk through real-time monitoring of open positions and the level of diversification of each Trading Advisor’s portfolio. It is anticipated that any Trading Advisor’s margin-to- equity ratio will typically not exceed approximately 35% although the actual ratio could be higher or lower from time to time.
In addition to market risk, trading futures, forward and swap contracts entails credit risk in that a counterparty will not be able to meet its obligations to a Trading Company. The counterparty for futures contracts traded in the United States and on most foreign exchanges is the clearinghouse associated with such exchange. In general, clearinghouses are backed by the corporate members of the clearinghouse who are required to share any financial burden resulting from the non-performance by one of their members and, as such, should significantly reduce this credit risk. In cases where the clearinghouse is not backed by the clearing members, like some foreign exchanges, it is normally backed by a consortium of banks or other financial institutions. Some non-U.S. exchanges, in contrast to U.S. exchanges, are principals’ markets in which performance is the responsibility only of the individual counterparty with whom the Trading Company has entered into the transaction, and not of the exchange or clearing corporation. In these kinds of markets, there is risk of bankruptcy or other failure or refusal to perform by the counterparty.
In the case of forward contracts traded on the interbank market and swaps, neither is traded on exchanges. The counterparty is generally a single bank or other financial institution, rather than a group of financial institutions; thus, there may be a greater counterparty credit risk. Management expects the Trading Advisors to trade only with those counterparties which it believes to be creditworthy. All positions of each Trading Company will be valued each day on a mark-to-market basis. There can be no assurance that any clearing member, clearinghouse or other counterparty will be able to meet its obligations to any Trading Company.
Management has established procedures to actively monitor and minimize market and credit risks. Investors in units of the Frontier Funds bear the risk of loss only to the extent of the market value of their respective investments and, in certain specific circumstances, distributions and redemptions received.
9. Indemnifications
The Trading Companies have entered into agreements, which provide for the indemnification of futures clearing brokers, currency trading companies, and commodity trading advisers, among others, against losses, costs, claims and liabilities arising from the performance of their individual obligations under such agreements, except for gross negligence or bad faith. The Trading Companies have had no prior claims or payments pursuant to these agreements. The Trading Companies’ individual maximum exposure under these arrangements is unknown, as this would involve future claims that may be made against the Trading Companies that have not yet occurred. However, based on experience the Trading Companies expect the risk of loss to be remote.
10. Subsequent Events
Management evaluated subsequent events till the date of issuance of this report and noted that there were none that required disclosure.
Galaxy Plus Fund LLC
(A Delaware Series Limited Liability Company)
The attached annual report is filed under exemption pursuant to Section 4.7 of the regulations under the Commodity Exchange Act.
Financial Report
December 31, 2022
Contents
Independent Auditor’s Report
Managing Member
Galaxy Plus Fund LLC
Opinion
We have audited the financial statements of Galaxy Plus Fund - Quantica Managed Futures Feeder Fund (507) LLC, Galaxy Plus Fund - FORT Contrarian Feeder Fund (510) LLC, Galaxy Plus Fund - Quest Feeder Fund (517) LLC, Galaxy Plus Fund - LRR Feeder Fund (522) LLC, Galaxy Plus Fund - QIM Feeder Fund (526) LLC, Galaxy Plus Fund - Aspect Feeder Fund (532) LLC, Galaxy Plus Fund - Welton GDP Feeder Fund (538) LLC and Galaxy Plus Fund - Volt Diversified Alpha Feeder Fund (550) LLC (collectively, the Funds), which comprise the statements of financial condition as of December 31, 2022, the related statements of operations and changes in members’ equity for the year then ended, and the related notes to the financial statements (collectively, the financial statements).
In our opinion, the accompanying financial statements present fairly, in all material respects, the financial position of the Funds as of December 31, 2022, and the results of their operations and changes in members’ equity for the year then ended in accordance with accounting principles generally accepted in the United States of America.
Basis for Opinion
We conducted our audits in accordance with auditing standards generally accepted in the United States of America (GAAS). Our responsibilities under those standards are further described in the Auditor’s Responsibilities for the Audits of the Financial Statements section of our report. We are required to be independent of the Funds and to meet our other ethical responsibilities, in accordance with the relevant ethical requirements relating to our audits. We believe that the audit evidence we have obtained is sufficient and appropriate to provide a basis for our audit opinion.
Responsibilities of Management for the Financial Statements
Management is responsible for the preparation and fair presentation of the financial statements in accordance with accounting principles generally accepted in the United States of America, and for the design, implementation and maintenance of internal control relevant to the preparation and fair presentation of financial statements that are free from material misstatement, whether due to fraud or error.
In preparing the financial statements, management is required to evaluate whether there are conditions or events, considered in the aggregate, that raise substantial doubt about the Funds’ ability to continue as a going concern within one year after the date that the financial statements are issued or available to be issued.
Auditor’s Responsibilities for the Audits of the Financial Statements
Our objectives are to obtain reasonable assurance about whether the financial statements as a whole are free from material misstatement, whether due to fraud or error, and to issue an auditor’s report that includes our opinion. Reasonable assurance is a high level of assurance but is not absolute assurance and therefore is not a guarantee that an audit conducted in accordance with GAAS will always detect a material misstatement when it exists. The risk of not detecting a material misstatement resulting from fraud is higher than for one resulting from error, as fraud may involve collusion, forgery, intentional omissions, misrepresentations, or the override of internal control. Misstatements are considered material if there is a substantial likelihood that, individually or in the aggregate, they would influence the judgment made by a reasonable user based on the financial statements.
In performing an audit in accordance with GAAS, we:
| ● | Exercise professional judgment and maintain professional skepticism throughout the audit. |
| ● | Identify and assess the risks of material misstatement of the financial statements, whether due to fraud or error, and design and perform audit procedures responsive to those risks. Such procedures include examining, on a test basis, evidence regarding the amounts and disclosures in the financial statements. |
| ● | Obtain an understanding of internal control relevant to the audit in order to design audit procedures that are appropriate in the circumstances, but not for the purpose of expressing an opinion on the effectiveness of the Funds’ internal control. Accordingly, no such opinion is expressed. |
| ● | Evaluate the appropriateness of accounting policies used and the reasonableness of significant accounting estimates made by management, as well as evaluate the overall presentation of the financial statements. |
| ● | Conclude whether, in our judgment, there are conditions or events, considered in the aggregate, that raise substantial doubt about the Funds’ ability to continue as a going concern for a reasonable period of time. |
We are required to communicate with those charged with governance regarding, among other matters, the planned scope and timing of the audits, significant audit findings, and certain internal control–related matters that we identified during the audits.
/s/ RSM US LLP
Denver, Colorado
March 30, 2023
Galaxy Plus Fund LLC
(A Delaware Series Limited Liability Company)
Statements of Financial Condition
December 31, 2022
(Expressed in U.S. Dollars)
| | | Galaxy Plus | | | Galaxy Plus | | | Galaxy Plus | | | Galaxy Plus | | | Galaxy Plus | | | Galaxy Plus | | | Galaxy Plus | | | Galaxy Plus | |
| | | Fund LLC - | | | Fund LLC - | | | Fund LLC - | | | Fund LLC - | | | Fund LLC - | | | Fund LLC - | | | Fund LLC - | | | Fund LLC - | |
| | | 507 Series | | | 510 Series | | | 517 Series | | | 522 Series | | | 526 Series | | | 532 Series | | | 538 Series | | | 550 Series | |
| | | | | | | | | | | | | | | | | | | | | | | | | |
| Assets | | | | | | | | | | | | | | | | | | | | | | | | |
| | | | | | | | | | | | | | | | | | | | | | | | | |
| Investment in Master Fund - at fair value | | $ | 2,405,697 | | | $ | 592,995 | | | $ | 2,421,025 | | | $ | 592,443 | | | $ | 2,264,697 | | | $ | 8,349,284 | | | $ | 4,734,863 | | | $ | 283,349 | |
| Receivable from Master Fund | | | - | | | | - | | | | - | | | | - | | | | - | | | | - | | | | - | | | | 74,789 | |
| Cash | | | 77,004 | | | | 74,144 | | | | 30,746 | | | | 31,451 | | | | 477,016 | | | | 91,059 | | | | 378,875 | | | | 1,849 | |
| Other assets | | | 462 | | | | 614 | | | | - | | | | 6,223 | | | | - | | | | - | | | | - | | | | - | |
| | | | | | | | | | | | | | | | | | | | | | | | | | | | | | | | | |
| Total assets | | $ | 2,483,163 | | | $ | 667,753 | | | $ | 2,451,771 | | | $ | 630,117 | | | $ | 2,741,713 | | | $ | 8,440,343 | | | $ | 5,113,738 | | | $ | 359,987 | |
| | | | | | | | | | | | | | | | | | | | | | | | | | | | | | | | | |
| Liabilities and members’ equity | | | | | | | | | | | | | | | | | | | | | | | | | | | | | | | | |
| | | | | | | | | | | | | | | | | | | | | | | | | | | | | | | | | |
| Payable to Master Fund | | $ | 75,672 | | | $ | 76,418 | | | $ | 32,025 | | | $ | 39,631 | | | $ | 445,277 | | | $ | 69,749 | | | $ | 379,088 | | | $ | - | |
| Subscriptions received in advance | | | - | | | | - | | | | - | | | | - | | | | 7,122 | | | | - | | | | - | | | | - | |
| Accrued management fees | | | 12,238 | | | | 1,116 | | | | 5,543 | | | | 5,836 | | | | 4,546 | | | | 44,992 | | | | 9,167 | | | | 3,045 | |
| Accrued incentive fees | | | 2,003 | | | | - | | | | 111 | | | | 10,305 | | | | 26,290 | | | | 25,432 | | | | 5,475 | | | | - | |
| Accrued sponsor fees | | | - | | | | - | | | | 907 | | | | - | | | | 1,239 | | | | 4,265 | | | | 1,229 | | | | 435 | |
| | | | | | | | | | | | | | | | | | | | | | | | | | | | | | | | | |
| Total liabilities | | | 89,913 | | | | 77,534 | | | | 38,586 | | | | 55,772 | | | | 484,474 | | | | 144,438 | | | | 394,959 | | | | 3,480 | |
| | | | | | | | | | | | | | | | | | | | | | | | | | | | | | | | | |
| Members’ equity | | | 2,393,250 | | | | 590,219 | | | | 2,413,185 | | | | 574,345 | | | | 2,257,239 | | | | 8,295,905 | | | | 4,718,779 | | | | 356,507 | |
| | | | | | | | | | | | | | | | | | | | | | | | | | | | | | | | | |
| Total liabilities and members’ equity | | $ | 2,483,163 | | | $ | 667,753 | | | $ | 2,451,771 | | | $ | 630,117 | | | $ | 2,741,713 | | | $ | 8,440,343 | | | $ | 5,113,738 | | | $ | 359,987 | |
See notes to financial statements.
Galaxy Plus Fund LLC
(A Delaware Series Limited Liability Company)
Statements of Operations
For the year ended December 31, 2022
(Expressed in U.S. Dollars)
| | | Galaxy Plus | | | Galaxy Plus | | | Galaxy Plus | | | Galaxy Plus | | | Galaxy Plus | | | Galaxy Plus | | | Galaxy Plus | | | Galaxy Plus | |
| | | Fund LLC - | | | Fund LLC - | | | Fund LLC - | | | Fund LLC - | | | Fund LLC - | | | Fund LLC - | | | Fund LLC - | | | Fund LLC - | |
| | | 507 Series | | | 510 Series | | | 517 Series | | | 522 Series | | | 526 Series | | | 532 Series | | | 538 Series | | | 550 Series | |
| | | | | | | | | | | | | | | | | | | | | | | | | |
| Net investment income (loss) allocated from Master Fund: | | | | | | | | | | | | | | | | | | | | | | | | |
| Interest income | | $ | 15,943 | | | $ | 3,737 | | | $ | 22,980 | | | $ | 1,008 | | | $ | 16,894 | | | $ | 128,567 | | | $ | 12,527 | | | $ | 763 | |
| Interest expense | | | (41 | ) | | | (8,041 | ) | | | (2,769 | ) | | | (13 | ) | | | (336 | ) | | | (19,724 | ) | | | (2,707 | ) | | | - | |
| Other expenses | | | (398 | ) | | | (586 | ) | | | (1,328 | ) | | | (1,914 | ) | | | (1,365 | ) | | | (1,431 | ) | | | (1,561 | ) | | | (3,809 | ) |
| | | | | | | | | | | | | | | | | | | | | | | | | | | | | | | | | |
| Net investment income (loss) allocated from Master Fund | | | 15,504 | | | | (4,890 | ) | | | 18,883 | | | | (919 | ) | | | 15,193 | | | | 107,412 | | | | 8,259 | | | | (3,046 | ) |
| | | | | | | | | | | | | | | | | | | | | | | | | | | | | | | | | |
| Fund expenses: | | | | | | | | | | | | | | | | | | | | | | | | | | | | | | | | |
| Operating expenses | | | 743 | | | | 592 | | | | 3,280 | | | | 1,773 | | | | 1,800 | | | | 2,242 | | | | 1,745 | | | | 4,472 | |
| Professional fees | | | 15,362 | | | | 17,888 | | | | 18,132 | | | | 17,888 | | | | 17,888 | | | | 17,888 | | | | 17,888 | | | | 17,888 | |
| Management fees | | | 128,299 | | | | 23,317 | | | | 42,561 | | | | 60,750 | | | | 44,436 | | | | 577,808 | | | | 185,830 | | | | 43,394 | |
| Incentive fees | | | 492,281 | | | | - | | | | 438,856 | | | | 12,057 | | | | 103,070 | | | | 1,686,555 | | | | 958,238 | | | | 21,863 | |
| Sponsor fees | | | 24,090 | | | | 5,672 | | | | 11,215 | | | | 2,917 | | | | 12,153 | | | | 53,350 | | | | 18,263 | | | | 4,864 | |
| | | | | | | | | | | | | | | | | | | | | | | | | | | | | | | | | |
| Total fund expenses | | | 660,775 | | | | 47,469 | | | | 514,044 | | | | 95,385 | | | | 179,347 | | | | 2,337,843 | | | | 1,181,964 | | | | 92,481 | |
| | | | | | | | | | | | | | | | | | | | | | | | | | | | | | | | | |
| Total net investment loss | | | (645,271 | ) | | | (52,359 | ) | | | (495,161 | ) | | | (96,304 | ) | | | (164,154 | ) | | | (2,230,431 | ) | | | (1,173,705 | ) | | | (95,527 | ) |
| | | | | | | | | | | | | | | | | | | | | | | | | | | | | | | | | |
| Realized and unrealized gain (loss) on investments and foreign currency transactions allocated from Master Fund: | | | | | | | | | | | | | | | | | | | | | | | | | | | | | | | | |
| Net realized gain (loss) from investments and foreign currency transactions | | | 970,889 | | | | (2,351,388 | ) | | | 1,487,808 | | | | 181,878 | | | | 1,134,270 | | | | 6,926,413 | | | | 2,337,497 | | | | (237,339 | ) |
| Net change in unrealized appreciation (depreciation) on investments | | | 323,856 | | | | 179,292 | | | | 174,666 | | | | 83,204 | | | | (146,845 | ) | | | 189,496 | | | | (83,800 | ) | | | 37,434 | |
| Net realized and unrealized gain (loss) on investments and foreign currency transactions allocated from investment in Master Fund | | | 1,294,745 | | | | (2,172,096 | ) | | | 1,662,474 | | | | 265,082 | | | | 987,425 | | | | 7,115,909 | | | | 2,253,697 | | | | (199,905 | ) |
| | | | | | | | | | | | | | | | | | | | | | | | | | | | | | | | | |
| Net increase (decrease) in members’ equity resulting from operations | | $ | 649,474 | | | $ | (2,224,455 | ) | | $ | 1,167,313 | | | $ | 168,778 | | | $ | 823,271 | | | $ | 4,885,478 | | | $ | 1,079,992 | | | $ | (295,432 | ) |
See notes to financial statements.
Galaxy Plus Fund LLC
(A Delaware Series Limited Liability Company)
Statements of Changes in Members’ Equity
For the year ended December 31, 2022
(Expressed in U.S. Dollars)
| | | Galaxy Plus | | | Galaxy Plus | | | Galaxy Plus | | | Galaxy Plus | | | Galaxy Plus | | | Galaxy Plus | | | Galaxy Plus | | | Galaxy Plus | |
| | | Fund LLC - | | | Fund LLC - | | | Fund LLC - | | | Fund LLC - | | | Fund LLC - | | | Fund LLC - | | | Fund LLC - | | | Fund LLC - | |
| | | 507 Series | | | 510 Series | | | 517 Series | | | 522 Series | | | 526 Series | | | 532 Series | | | 538 Series | | | 550 Series | |
| Increase (decrease) in members’ equity from operations: | | | | | | | | | | | | | | | | | | | | | | | | | | | | | | | | |
| Total net investment loss | | $ | (645,271 | ) | | $ | (52,359 | ) | | $ | (495,161 | ) | | $ | (96,304 | ) | | $ | (164,154 | ) | | $ | (2,230,431 | ) | | $ | (1,173,705 | ) | | $ | (95,527 | ) |
| Net realized gain (loss) from investments and foreign currency transactions | | | 970,889 | | | | (2,351,388 | ) | | | 1,487,808 | | | | 181,878 | | | | 1,134,270 | | | | 6,926,413 | | | | 2,337,497 | | | | (237,339 | ) |
| Net change in unrealized appreciation (depreciation) on investments | | | 323,856 | | | | 179,292 | | | | 174,666 | | | | 83,204 | | | | (146,845 | ) | | | 189,496 | | | | (83,800 | ) | | | 37,434 | |
| | | | | | | | | | | | | | | | | | | | | | | | | | | | | | | | | |
| Net increase (decrease) in members’ equity from operations | | | 649,474 | | | | (2,224,455 | ) | | | 1,167,313 | | | | 168,778 | | | | 823,271 | | | | 4,885,478 | | | | 1,079,992 | | | | (295,432 | ) |
| | | | | | | | | | | | | | | | | | | | | | | | | | | | | | | | | |
| Increase (decrease) in members’ equity from capital transactions: | | | | | | | | | | | | | | | | | | | | | | | | | | | | | | | | |
| Proceeds from issuance of capital | | | 2,739,819 | | | | 376,763 | | | | 161,686 | | | | 52,142 | | | | 632,767 | | | | 1,485,429 | | | | 942,722 | | | | 29,215 | |
| Payments for redemption of capital | | | (2,168,621 | ) | | | (1,121,335 | ) | | | (504,786 | ) | | | (120,303 | ) | | | (1,166,670 | ) | | | (4,428,156 | ) | | | (1,912,410 | ) | | | (1,556,983 | ) |
| | | | | | | | | | | | | | | | | | | | | | | | | | | | | | | | | |
| Net increase (decrease) in members’ equity from capital transactions | | | 571,198 | | | | (744,572 | ) | | | (343,100 | ) | | | (68,161 | ) | | | (533,903 | ) | | | (2,942,727 | ) | | | (969,688 | ) | | | (1,527,768 | ) |
| | | | | | | | | | | | | | | | | | | | | | | | | | | | | | | | | |
| Total net increase (decrease) in members’ equity | | | 1,220,672 | | | | (2,969,027 | ) | | | 824,213 | | | | 100,617 | | | | 289,368 | | | | 1,942,751 | | | | 110,304 | | | | (1,823,200 | ) |
| | | | | | | | | | | | | | | | | | | | | | | | | | | | | | | | | |
| Members’ equity, beginning of the year | | | 1,172,578 | | | | 3,559,246 | | | | 1,588,972 | | | | 473,728 | | | | 1,967,871 | | | | 6,353,154 | | | | 4,608,475 | | | | 2,179,707 | |
| | | | | | | | | | | | | | | | | | | | | | | | | | | | | | | | | |
| Members’ equity, end of the year | | $ | 2,393,250 | | | $ | 590,219 | | | $ | 2,413,185 | | | $ | 574,345 | | | $ | 2,257,239 | | | $ | 8,295,905 | | | $ | 4,718,779 | | | $ | 356,507 | |
See notes to financial statements.
Galaxy Plus Fund LLC
(A Delaware Series Limited Liability Company)
Notes to Financial Statements
Note 1. Organization and Structure
Galaxy Plus Fund LLC (the “Onshore Platform”) was formed in Delaware as a series limited liability company on April 14, 2014. The Onshore Platform is part of the Galaxy Plus Managed Account Platform (the “Platform”). Both are sponsored by New Hyde Park Alternatives Funds, LLC (the “Sponsor” or “NHPAF”) as a means of making available to qualified high net-worth individuals and institutional investors (including fund of hedge funds) (“Investors”) a variety of third-party professional managed futures and foreign exchange advisors (“Advisors”) in an investment environment which facilitates access to multiple Advisors without having to negotiate individually with any Advisor, meet their account minimums, or establish futures and forward dealing accounts.
Each of the Onshore Platform’s respective series (each a “Fund”, collectively the “Funds”) invest in a separately formed Delaware limited liability company (each a “Master Fund”, collectively the “Master Funds”). Unless specified otherwise, each Master Fund is managed by a different Advisor. Collectively, the Advisors implement a wide range of trading strategies, trade entirely independently from each other and are not affiliated with the Sponsor.
The structure of the Platform permits the Funds to offer Investors a choice of trading leverage levels as well as the ability to adjust such levels in response to changes in Advisor performance, general market conditions and the Investor’s own portfolio objectives. Each Investor’s selected trading leverage is managed by the Sponsor by allocating the Investor’s subscription proceeds between the Funds’ bank accounts and the corresponding Master Funds.
Galaxy Plus Fund SPC (the “Offshore Platform”) is part of the Platform and is sponsored by NHPAF primarily for non-U.S. Investors. The Offshore Platform operates in substantially the same manner as the Onshore Platform and also invests in the same Master Funds.
NHPAF was formed in October 2013 and its principal office is located in Wheaton, Illinois. NHPAF is registered with the U.S. Commodity Futures Trading Commission (CFTC) as a commodity pool operator and commodity trading advisor, and is a member of the National Futures Association (NFA).
The Platform has appointed the Sponsor, under the terms of the Limited Liability Company Agreement (the “LLC Agreement”) as the managing member of the Onshore Platform. In such capacity, the Sponsor has the authority, to manage, with wide discretionary powers, the business and affairs of the Onshore Platform including the authority to select the administrator for the Onshore Platform. The LLC Agreement will continue to remain in force until terminated by either the Sponsor or the Platform upon not less than sixty (60) days’ prior written notice. In certain circumstances (for example, the insolvency of either party or in the event all trading for the Platform by the Advisors are suspended), the LLC Agreement may be immediately terminated by either party. Capitalized terms throughout these notes are defined in the LLC Agreement.
In accordance with Delaware law, the assets held in each Fund shall be applied and held solely for the benefit of the members in such Fund and no member of another Fund shall have any claim or right to any asset allocated to another Fund. The assets of each Fund shall be applied solely to satisfy only that respective Fund’s liabilities.
If an asset is not attributable to any particular Fund, the Sponsor shall have the discretion to determine the basis upon which such asset shall be allocated among the Funds and the Sponsor shall have the absolute discretion to vary such allocation. If the assets not attributable to any Fund give rise to any net profits, the Sponsor may, in its absolute discretion, allocate the net profits to any Fund.
Galaxy Plus Fund LLC
(A Delaware Series Limited Liability Company)
Notes to Financial Statements
During 2022, the Onshore Platform consisted, in part, of the Funds described below. The Funds listed, herein, contain Class EF interest. That interest was created specifically for a strategic investor (see Note 3). The Funds are considered significant subsidiaries of that strategic investor under the SEC’s Regulation S-X 3-09.
The financial statements for each of the Master Funds referenced below are attached to this report and should be read in conjunction with each Fund’s financial statements.
Galaxy Plus Fund – Quantica Managed Futures Feeder Fund (507) LLC (“507”) – On its inception date, April 20, 2015, 507 invested its assets in Galaxy Plus Fund – Quantica Managed Futures Master Fund (507) LLC, a Delaware limited liability company. As of December 31, 2022, 507 owned 91.21% of its Master Fund.
Galaxy Plus Fund – FORT Contrarian Feeder Fund (510) LLC (“510”) – On its inception date, August 6, 2015, 510 invested its assets in Galaxy Plus Fund – FORT Contrarian Master Fund (510) LLC, a Delaware limited liability company. As of December 31, 2022, 510 owned 100% of its Master Fund.
Galaxy Plus Fund – Quest Feeder Fund (517) LLC (“517”) – On its inception date, June 29, 2016, 517 invested its assets in Galaxy Plus Fund – Quest Master Fund (517) LLC, a Delaware limited liability company. As of December 31, 2022, 517 owned 100% of its Master Fund.
Galaxy Plus Fund – LRR Feeder Fund (522) LLC (“522”) – On its inception date, April 28, 2016, 522 invested its assets in Galaxy Plus Fund – LRR Master Fund (522) LLC, a Delaware limited liability company. As of December 31, 2022, 522 owned 100% of its Master Fund.
Galaxy Plus Fund – QIM Feeder Fund (526) LLC (“526”) – On its inception date, June 22, 2016, 526 invested its assets in Galaxy Plus Fund – QIM Master Fund (526) LLC, a Delaware limited liability company. As of December 31, 2022, 526 owned 100% of its Master Fund.
Galaxy Plus Fund – Aspect Feeder Fund (532) LLC (“532”) – On its inception date, December 16, 2016, 532 invested its assets in Galaxy Plus Fund – Aspect Master Fund (532) LLC, a Delaware limited liability company. As of December 31, 2022, 532 owned 100% of its Master Fund.
Galaxy Plus Fund – Welton GDP Feeder Fund (538) LLC (“538”) – On its inception date, March 28, 2017, 538 invested its assets in Galaxy Plus Fund – Welton GDP Master Fund (538) LLC, a Delaware limited liability company. As of December 31, 2022, 538 owned 100% of its Master Fund.
Galaxy Plus Fund – Volt Diversified Alpha Feeder Fund (550) LLC (“550”) – On its inception date, September 9, 2020, 550 invested its assets in Galaxy Plus Fund – Volt Diversified Alpha Master Fund (550) LLC, a Delaware limited liability company. As of December 31, 2022, 550 owned 100% of its Master Fund.
Galaxy Plus Fund LLC
(A Delaware Series Limited Liability Company)
Notes to Financial Statements
Note 2. Summary of Significant Accounting Policies
The following is a summary of significant accounting policies consistently followed in the preparation of the Onshore Platform’s financial statements.
Principles of accounting: The accompanying financial statements are expressed in United States dollars (USD) and have been prepared in accordance with accounting principles generally accepted in the United States of America (U.S. GAAP), as established by the Financial Accounting Standards Board (FASB), to ensure consistent reporting of financial condition and results of operations. The Funds are investment companies and follow the accounting and reporting guidance in FASB Accounting Standards Codification Topic 946.
Investments: Each Fund invests its assets in its respective Master Fund.
Investment in Master Fund: Each Fund’s investment in its respective Master Fund is carried at fair value and represents the Fund’s pro-rata interest in the net assets of the Master Fund as of the close of business on the relevant valuation date. The assets of each Master Fund are carried at fair value. At each valuation date, each Master Fund’s income, expenses, net realized gain/(loss) and net increase/(decrease) in unrealized appreciation/(depreciation) are allocated to the respective Fund, based on the Fund’s pro rata interest in the net assets of the Master Fund, and recorded in the respective Fund’s Statement of Operations. The financial statements of the Master Funds are attached to this report and should be read in conjunction with the Onshore Platform’s financial statements.
Cash: The Funds maintain deposits with financial institutions in amounts that at times maybe in excess of federally insured limits. The amount of cash held at the financial institutions is determined by the Investors choice of trading leverage levels respective to the maximum trading level of the Funds, as determined by the Sponsor. The Funds do not believe they are exposed to any significant credit risk.
Subscriptions received in advance: Subscriptions received in advance are subscriptions proceeds received for the purchase of capital effective subsequent to period end.
Redemptions payable: Redemptions payable are redemption proceeds payable for the sale of capital effective prior to period end.
Receivable/payable from/to Master Fund: Generally, receivables and payables from/to Master Fund are a result of timing differences of cash movements related to capital activity at the Master Fund level.
Use of estimates: The preparation of financial statements in accordance with U.S. GAAP requires management to make estimates and assumptions that affect the reported amounts of assets and liabilities and disclosure of contingent assets and liabilities at the date of the financial statements and the reported amounts of income and expenses during the reporting period. Actual results could differ from those estimates.
Interest income/expense: Interest income and expense is recognized on an accrual basis and includes the Master Fund’s interest income/expense from its broker that is allocated on a pro rata basis to the respective Fund percentage in the Master Funds on the first day.
Dividend income/expense: Dividend income and expense is recognized on an accrual basis and includes the Master Fund’s dividend income/expense from its broker that is allocated on a pro rata basis to the respective the respective Fund based on it’s ownership percentage in the respective Master Fund on the first day of each accounting period.
Galaxy Plus Fund LLC
(A Delaware Series Limited Liability Company)
Notes to Financial Statements
Allocation of income and gains and losses: Profits and losses for each accounting period are generally allocated, at the discretion of the Sponsor, pro-rata to the members based on their respective ownership percentage on the first day of the accounting period.
Income taxes: The Onshore Platform evaluates tax positions taken or expected to be taken to determine whether the tax positions are “more-likely-than-not” of being sustained by the applicable tax authority. For tax positions meeting the “more-likely-than-not” threshold, the tax amount recognized in the financial statements is reduced by the largest benefit that had a greater than fifty percent likelihood of being realized upon ultimate settlement with the relevant taxing authority. The Funds have determined that there is no tax liability resulting from uncertain income tax positions taken or expect to be taken with respect to all open tax years. No income tax returns are currently under examination. The Funds’ U.S. Federal tax returns remain open for the current and prior three years.
The Funds are treated as partnerships for U.S. Federal income tax purposes and, as such, are generally not subject to U.S. Federal, state or local income taxes. The members of the Funds are liable for their share of all U.S. Federal, state, and local taxes, if any imposed on the net investment income and realized gains of the Funds.
Indemnifications and litigations: The Sponsor and its affiliates are indemnified against certain liabilities arising out of the performance of their duties for the Onshore Platform. In addition, in the normal course of business, the Onshore Platform enters into contracts with vendors and others that provide for general indemnifications. The Funds’ maximum exposure under these arrangements is unknown as this would involve future claims that may be made against the Onshore Platform. However, the Onshore Platform expects the risk of loss to be remote. From time to time, in the normal course of business, the Funds may be threatened with, or named as defendants in, lawsuits, arbitrations, and administrative claims. Any such claims that are decided against the Funds could harm the Funds’ business. The Funds are also subject to periodic regulatory audits and inspections which could result in fines or other disciplinary actions. Unfavorable outcomes in such matters may result in a material impact on the Funds’ financial position or results from operations. As of December 31, 2022, the Sponsor was not aware of any matters that would have a material impact on the Funds’ financial statements.
Statement of Cash Flows: The Onshore Platform has elected not to provide Statements of Cash Flows as permitted by U.S. GAAP as all of the following conditions have been met:
| ● | During the year/period, substantially all of the Funds’ investments were carried at fair value and classified as Level 1 or Level 2 or were measured using the practical expedient measurements in accordance with FASB ASC 820; |
| ● | The Funds had little or no debt during the year/period; |
| ● | The Onshore Platform financial statements include Statements of Changes in Members’ Equity. |
Subscriptions and redemptions: Subscriptions and redemptions can typically be made on a weekly basis as of the first day (Monday) of each week; (or, if such day is not a business day, the first business day thereafter) (each, a Subscription Date or a Redemption Date). The Onshore Platform may accept subscriptions or redemptions more frequently than the first day of each week, depending upon the size of the requested subscription or redemption amount, with the approval of the Sponsor.
Note 3. Classes of Interest and Series
Four different classes of Interests (“Interests”) are currently offered by each Fund: Class A, Class B, Class C and Class EF Interests. Each Class is generally subject to different fees. Investors are eligible to receive Class A, Class B or Class C Interests depending on their aggregate Trading Level, as discussed in Note 5, on the Platform.
Galaxy Plus Fund LLC
(A Delaware Series Limited Liability Company)
Notes to Financial Statements
Class A Interests are available to (i) Investors who make capital contributions with an assigned Trading Level of $25,000,000 or more, as aggregated across all Funds in which capital contributions are invested, (ii) other collective investment vehicles or commodity pools sponsored by the Sponsor or its affiliates, and (iii) such other Investors as the Sponsor may determine. Class A Interests are subject to a Sponsor Fee and Sales Commissions and other fees allocable to Class A Interests as disclosed in the LLC Agreement.
Class B Interests are available to (i) Investors who make capital contributions with an assigned Trading Level between $5,000,000 and $24,999,999, as aggregated across all Funds in which capital contributions are invested, and (ii) such other Investors as the Sponsor may determine. Class B Interests are subject to a Sponsor Fee and Sales Commissions and other fees allocable to Class B Interests as disclosed in the LLC Agreement.
Class C Interests are available to Investors who make capital contributions with an assigned Trading Level of less than $5,000,000, as aggregated across all Funds in which capital contributions are invested. Class C Interests are subject to a Sponsor Fee and Sales Commissions and other fees allocable to Class C Interests as disclosed in the LLC Agreement.
Class EF Interests are reserved for a strategic investor and not available to other investors without consent from the Sponsor. There is no stated minimum Trading Level for Class EF Interest. Class EF Interests are subject to a Sponsor Fee and other fees allocable to Class EF Interests as disclosed in the LLC Agreement.
Once an Investor becomes eligible for Class B Interests, any Class C Interests held by such investor will be automatically converted into Class B Interests. Once an Investor becomes eligible for Class A Interests, any Class B Interests held by such Investor will be automatically converted into Class A Interests. Similarly, if an investor’s aggregate Trading Level falls below the minimum for Class A or Class B, such interests will be converted to Class B or Class C, as appropriate. All such conversions will occur at the first trading day after such minimum is breached.
An Investor of Class A, B, or C Interests, which invests more than once in a Fund, will receive a separate series with respect to each investment. Incentive Fees are calculated separately with respect to each such series. Series at or above their respective High Water Marks at the end of an Incentive Fee Calculation Period are subject to consolidation (i.e., “roll-up”) at the discretion of the Sponsor.
The Sponsor may from time to time offer additional classes or subclasses of Interest having different rights and privileges (including but not limited to different fees, funding factors, investment minimums and/or liquidity terms) from those described herein. The issuance of such additional class or sub-class of Interest will not require Investor’s approval; provided, that the terms of any such additional class or sub-class of Interest do not materially adversely affect the Investors in the applicable Fund as a whole. Such additional class or sub-class of Interest may or may not be generally available to other Investors.
Galaxy Plus Fund LLC
(A Delaware Series Limited Liability Company)
Notes to Financial Statements
The amount of capital activity by each class of Interest for each Fund for the year/period ended December 31, 2022, is as follows:
| | | Galaxy Plus Fund LLC -507 | | | Galaxy Plus Fund LLC -507 | | | Galaxy Plus Fund LLC -507 | | | Galaxy Plus Fund LLC -510 | | | Galaxy Plus Fund LLC -510 | | | Galaxy Plus Fund LLC -510 | |
| | | Series | | | Series | | | Series | | | Series | | | Series | | | Series | |
| | | Class A | | | Class C | | | Class EF | | | Class A | | | Class C | | | Class EF | |
| | | | | | | | | | | | | | | | | | | |
| Subscriptions | | $ | - | | | $ | 209,742 | | | $ | 2,530,077 | | | $ | - | | | $ | 33,335 | | | $ | 343,428 | |
| Redemptions | | | (1,053,687 | ) | | | (134,742 | ) | | | (980,192 | ) | | | (710,604 | ) | | | - | | | | (410,731 | ) |
| | | | | | | | | | | | | | | | | | | | | | | | | |
| Total increase (decrease) | | $ | (1,053,687 | ) | | $ | 75,000 | | | $ | 1,549,885 | | | $ | (710,604 | ) | | $ | 33,335 | | | $ | (67,303 | ) |
| | | Galaxy Plus Fund LLC -517 | | | Galaxy Plus Fund LLC -522 | | | Galaxy Plus Fund LLC -526 | | | Galaxy Plus Fund LLC -526 | | | Galaxy Plus Fund LLC -532 | | | Galaxy Plus Fund LLC -532 | |
| | | Series | | | Series | | | Series | | | Series | | | Series | | | Series | |
| | | Class EF | | | Class EF | | | Class A | | | Class EF | | | Class C | | | Class EF | |
| | | | | | | | | | | | | | | | | | | |
| Subscriptions | | $ | 161,686 | | | $ | 52,142 | | | $ | - | | | $ | 632,767 | | | $ | 25,000 | | | $ | 1,460,429 | |
| Redemptions | | | (504,786 | ) | | | (120,303 | ) | | | (961,551 | ) | | | (205,119 | ) | | | - | | | | (4,428,156 | ) |
| | | | | | | | | | | | | | | | | | | | | | | | | |
| Total increase (decrease) | | $ | (343,100 | ) | | $ | (68,161 | ) | | $ | (961,551 | ) | | $ | 427,648 | | | $ | 25,000 | | | $ | (2,967,727 | ) |
| | | Galaxy Plus Fund LLC -538 | | | Galaxy Plus Fund LLC -538 | | | Galaxy Plus Fund LLC -550 | | | Galaxy Plus Fund LLC -550 | |
| | | Series | | | Series | | | Series | | | Series | |
| | | Class C | | | Class EF | | | Class C | | | Class EF | |
| | | | | | | | | | | | | |
| Subscriptions | | $ | 50,000 | | | $ | 892,722 | | | $ | - | | | $ | 29,215 | |
| Redemptions | | | - | | | | (1,912,410 | ) | | | (1,490,370 | ) | | | (66,613 | ) |
| | | | - | | | | | | | | | | | | | |
| Total increase (decrease) | | $ | 50,000 | | | $ | (1,019,688 | ) | | $ | (1,490,370 | ) | | $ | (37,398 | ) |
Transfers into and out of a Fund relating to movement from one class of Share to another, change in beneficial ownership, and consolidation to an older series may occur from time to time. Roll-ups are considered transfers for financial reporting purposes. Since the amount of transfers into and out of each Fund offset, such transfers are not shown in the Funds’ Statements of Changes in Members’ Equity. For the year/period ended December 31, 2022, there were no transfers.
Galaxy Plus Fund LLC
(A Delaware Series Limited Liability Company)
Notes to Financial Statements
Note 4. Management, Incentive, Sponsor and Other Fees
Each Fund class will pay its respective Advisor, or in the case of Class EF, the managing owner of the member, both asset based (management fee) and performance based (incentive fee) compensation as outlined in the Supplement. In addition, each Fund class will pay the Sponsor asset based (sponsor fee) compensation and, if applicable, a selling agent will receive from each Fund class an asset based fee (sales commission). All asset based fees are calculated on the same uniform fee base which is the beginning of the period Trading Level (as defined in the Supplement and discussed in Note 5) plus periodic trading profits and losses for the Fund. Investors can be charged different management and incentive fees at the discretion of the Sponsor.
Management Fee: Each Advisor earns a management fee (the “Management Fee”) which is calculated and accrued monthly (prorated for partial periods) and payable in arrears as of the last business day of each month. The rate at which the Management Fee is calculated is specific to each Fund and typically ranges from 0% to 3.50% per annum. Each Advisor may enter into fee sharing arrangements with the Sponsor, pursuant to which the Sponsor will receive a portion of the Management Fee to be paid to such advisor. In addition, the Sponsor can enter into agreements with Selling Agents in which the Selling Agent will receive a portion of the Management Fee on assets they introduce to the Funds. The amounts due to the Selling Agents and Sponsor are included in the Management Fee charged to the Funds. During the year ended December 31, 2022, Management Fees paid to Selling Agents and the Sponsor are as follows:
| | | Galaxy Plus | | | Galaxy Plus | | | Galaxy Plus | | | Galaxy Plus | | | Galaxy Plus | |
| | | Fund LLC - | | | Fund LLC - | | | Fund LLC - | | | Fund LLC - | | | Fund LLC - | |
| | | 507 Series | | | 510 Series | | | 532 Series | | | 538 Series | | | 550 Series | |
| Selling Agent | | $ | 4,831 | | | $ | - | | | $ | - | | | $ | - | | | $ | 535 | |
| Sponsor | | | 70 | | | | 147 | | | | 14 | | | | 139 | | | | 2,089 | |
Incentive Fee: As of the end of each calendar quarter, each Fund will pay an incentive fee (the “Incentive Fee”) to the Advisor equal to the percentage (the “Incentive Fee Rate”) of the New Net Profit (defined below) attributable to each series of Interest in such Fund. The Incentive Fee Rate is specific to each Fund and typically ranges from 20% to 30%.
Any Incentive Fee, if accrued, will also be made in respect of Interests withdrawn, at the time of such withdrawal, as if the withdrawal date were the end of a calendar quarter.
“New Net Profit” means, with respect to each series of Interest, the amount by which the Net Asset Value of such series of Interest as of the date of determination exceeds the High Water Mark (defined below) then attributable to such series of Interest.
Net Asset Value, for purposes of calculating the Incentive Fee, is calculated prior to reduction for the Incentive Fee being calculated. Net Asset Value is calculated after deduction for the Management Fee (regardless of whether such Management Fee is paid to an Advisor or to the Sponsor), but prior to deduction for the Sponsor Fee, Sales Commissions, and/or Operating Expenses.
“High Water Mark” means, with respect to each series of Interest, the greater of: (i) the aggregate Capital Contributions made to such series of Interest; and (ii) the Net Asset Value of such series of Interest as of the end of the most recent Incentive Fee Calculation Period as of which an Incentive Fee was made from such series of Interest (after deduction for the Incentive Fee then made). The High Water Mark with respect to a series of Interest is reduced proportionately when any withdrawal is made from such series of Interest — i.e., the High Water Mark immediately prior to any such withdrawal is multiplied by the fraction of the numerator of which is the Net Asset Value of such series of Interest immediately after such withdrawal and the denominator of which is such Net Asset Value immediately prior to such withdrawal (Net Asset Value in each case being calculated prior to reduction for any Incentive Fee).
As the Incentive Fee is calculated separately with respect to each investment made by an Investor, an Investor which invests more than once in a Fund is at risk of being subject to Incentive Fees in respect of capital contributions made at different times even though the overall value of such Investor’s investment in such Fund has declined.
Galaxy Plus Fund LLC
(A Delaware Series Limited Liability Company)
Notes to Financial Statements
The Trading Advisors may enter into side agreements with various investors changing the management/ incentive fees charged to those investors. Each Advisor may enter into fee sharing agreements with the Sponsor, pursuant to which the Sponsor will receive a portion of the Incentive Fee to be paid to such advisor. The amounts due to the Sponsor are included in the Incentive Fee charged to the Funds. Pursuant to a fee sharing agreement between the Sponsor and the Advisor of 550, the Sponsor of 550 earned $3,905 of the Incentive Fees during the year ended December 31, 2022.
The Sponsor, on behalf of the managing owner of the Class EF members, has entered into separate fee arrangements with the Trading Advisors which results in the managing owner retaining a portion of both the management and incentive fees charged to the Class EF members. During the year ended December 31, 2022, the amount of management fees and incentive fees retained by the managing owner of Class EF members are as follows:
| | | Galaxy Plus Fund LLC - 507
Series | | | Galaxy Plus Fund LLC -510
Series | | | Galaxy Plus Fund LLC - 517
Series | | | Galaxy Plus Fund LLC - 522
Series | |
| Management fee | | $ | 80,311 | | | $ | 3,057 | | | $ | 42,561 | | | $ | 31,669 | |
| Incentive fee | | | 126,760 | | | | - | | | | 264,405 | | | | 12,057 | |
| | | Galaxy Plus Fund LLC - 526
Series | | | Galaxy Plus Fund LLC - 532
Series | | | Galaxy Plus Fund LLC - 538
Series | | | Galaxy Plus Fund LLC - 550
Series | |
| Management Fee | | $ | 24,246 | | | $ | 436,296 | | | $ | 13,261 | | | $ | 31,877 | |
| Incentive Fee | | | 53,962 | | | | 777,102 | | | | - | | | | 2,373 | |
The amount of management fees and incentive fees due to the managing owner of the class EF members as of December 31, 2022 are as follows:
| | | Galaxy Plus Fund LLC - 507
Series | | | Galaxy Plus Fund LLC - 510
Series | | | Galaxy Plus Fund LLC - 517
Series | | | Galaxy Plus Fund LLC - 522
Series | |
| Accrued management fee | | $ | 5,728 | | | $ | 130 | | | $ | 3,442 | | | $ | 3,036 | |
| Accrued incentive fee | | | 134 | | | | - | | | | - | | | | 10,305 | |
| | | Galaxy Plus Fund LLC - 526
Series | | | Galaxy Plus Fund LLC - 532
Series | | | Galaxy Plus Fund LLC - 538
Series | | | Galaxy Plus Fund LLC - 550
Series | |
| Accrued management fee | | $ | 2,487 | | | $ | 36,019 | | | $ | 909 | | | $ | 2,237 | |
| Accrued incentive fee | | | - | | | | - | | | | - | | | | - | |
Sponsor Fee: The Sponsor will receive from each Interest a monthly sponsor fee (the “Sponsor Fee”) calculated as a percentage (the “Sponsor Fee Rate”) applicable to each Class of Interests. The Sponsor Fee is calculated and accrued monthly and payable in arrears as of the last business day of each month. The Sponsor Fee is pro rated for partial periods. The annual Sponsor Fee Rate is 0.25% for Class A Interests, 0.50% for Class B Interests, 0.80% for Class C Interests, 0.15% for Class EF Interests.
Sales Commission: Class A, B and C Interests are subject to monthly ongoing sales commissions (“Sales Commissions”) equal to a percentage (the “Sales Commission Rate”) applicable to each Class of Interest. Sales Commissions are calculated and accrued monthly and payable in arrears as of the last business day of each month. Sales Commissions are pro-rated for partial periods. Sales Commissions are specific to an Investor and are agreed upon between the Investor and Selling Agent prior to making a contribution to the Onshore Platform. The Sales Commission Rate generally ranges between 0%-2% per annum. With the exception of 507 and 550, no sales commissions were charged during the year ended December 31, 2022. Sales commissions are included in the Sponsor Fee totals on the Statements of Operations.
Galaxy Plus Fund LLC
(A Delaware Series Limited Liability Company)
Notes to Financial Statements
Professional Fees and Operating Expenses: The Sponsor will be responsible for paying all ongoing operating costs of each Fund and the Onshore Platform as the expenses are incurred, including, but not limited to, any administrative, transfer, exchange and withdrawal processing costs, legal, compliance, regulatory, reporting, filing, escrow, accounting and printing fees and expenses, and any other operating or administrative expenses related to accounting, research, due diligence or reporting. However, the Master Fund will be responsible for paying all of its execution and clearing brokerage commissions, Fund set-up and organization expenses (which can be capped at the discretion of the Sponsor); bank wire fees; fees related to the audit and tax preparation; and extraordinary expenses such as litigation and indemnification.
The allocation of the audit and tax fees is based on the number of trading managers that trade on behalf of each respective Fund. The audit and tax preparation fees are recorded as a component of professional fees in the Statements of Operations, and are recorded in the year when the related services are performed.
Note 5. Notional Funding
The ability to customize notional funding in the various Funds is a special feature of the Onshore Platform. The Sponsor determines each Fund’s Maximum Funding Factor (i.e., the maximum ratio of Trading Level to actual capital invested in such Fund) and may increase or reduce such Maximum Funding Factor at any time. In establishing a Fund’s Maximum Funding Factor, the Sponsor generally considers the Advisor’s maximum 5 day drawdown and its typical margin-to-equity ratio and sets the Maximum Funding Factor to protect against any failure to meet margin calls.
The leverage used by a Master Fund (i.e., the ratio of the Trading Level of such Master Fund to the notional amount of the futures, options, and forward contracts held by such Master Fund) will fluctuate on an ongoing basis. The Advisors will adjust such leverage in response to market conditions and will not maintain any set relationship between the Trading Level of a Master Fund and the notional amount of the futures, options, and forward positions held for such Master Fund. The notional amount of the futures, options, and forward contracts held by a Master Fund is likely to exceed the Trading Level of such Master Fund by a factor of 10 or more.
Investors customize their notional funding of their investment in a Fund by choosing an Effective Funding Factor (which must be no greater than the Maximum Funding Factor). The Effective Funding Factor so chosen is implemented by the applicable Fund by keeping a portion of the capital at the Fund’s bank account or, as the Fund matures, by keeping a certain percentage of an Investor’s investment in the Fund’s bank account rather than allocating such capital to the corresponding Master Fund. All capital allocated by a Fund to its corresponding Master Fund is traded at the Maximum Funding Factor for such Fund.
Due to market appreciation/depreciation and other factors, an Investor’s Trading Level to actual capital contributed by such Investor will diverge — potentially materially — from such Investor’s selected Effective Funding Factor. As a result, the Sponsor will from time to time rebalance allocations between the corresponding Master Fund and the Fund’s bank account in an attempt to reflect the desired Effective Funding Factor. Such rebalancing is not done pursuant to any predefined parameters but is done at the Sponsor’s discretion.
Note 6. Financial Instruments with off-balance sheet risk and concentration of credit risk
At December 31, 2022, none of the Funds have direct commitments to buy or sell financial instruments, including derivative instruments. Each Fund does have indirect buy and sell commitments that arise through the positions held by the Master Fund in which each respective Fund invests. However, as an investor in a Master Fund, each Fund’s risk at December 31, 2022, is limited to the fair value of its investment in the Master Fund.
Galaxy Plus Fund LLC
(A Delaware Series Limited Liability Company)
Notes to Financial Statements
Note 7. Financial highlights
Financial highlights for each Fund and its respective Class(es) for the year ended December 31, 2022 are presented in the table below. The information has been derived from information presented in the financial statements.
| | | Galaxy Plus Fund LLC -
507 Series | | | Galaxy Plus Fund LLC -
507 Series | | | Galaxy Plus Fund LLC -
510 Series | | | Galaxy Plus Fund LLC -
510 Series | | | Galaxy Plus Fund LLC -
517 Series | |
| | | Class C | | | Class EF | | | Class C | | | Class EF | | | Class EF | |
| | | | | | | | | | | | | | | | |
| Total return before incentive fee | | | 43.71 | % | | | 42.97 | % | | | -15.58 | % | | | -81.65 | % | | | 99.11 | % |
| Incentive fee | | | -11.59 | % | | | -22.32 | % | | | 0.00 | % | | | 0.00 | % | | | -28.38 | % |
| Total return after incentive fee (A) | | | 32.12 | % | | | 20.65 | % | | | -15.58 | % | | | -81.65 | % | | | 70.73 | % |
| | | | | | | | | | | | | | | | | | | | | |
| Ratios to average members’ equity (B) (D): | | | | | | | | | | | | | | | | | | | | |
| Expenses excluding incentive fee | | | 7.64 | % | | | 5.56 | % | | | 12.58 | % | | | 4.97 | % | | | 3.15 | % |
| Incentive fee | | | 8.01 | % | | | 17.53 | % | | | 0.00 | % | | | 0.00 | % | | | 17.42 | % |
| Total expenses and incentive fee | | | 15.65 | % | | | 23.09 | % | | | 12.58 | % | | | 4.97 | % | | | 20.57 | % |
| | | | | | | | | | | | | | | | | | | | | |
| Net investment loss (C) | | | -15.19 | % | | | -22.54 | % | | | -12.39 | % | | | -4.62 | % | | | -19.66 | % |
| | | Galaxy Plus Fund LLC -
522 Series | | | Galaxy Plus Fund LLC -
526 Series | | | Galaxy Plus Fund LLC -
532 Series | | | Galaxy Plus Fund LLC -
532 Series | | | Galaxy Plus Fund LLC -
538 Series | |
| | | Class EF | | | Class EF | | | Class C | | | Class EF | | | Class C | |
| | | | | | | | | | | | | | | | |
| Total return before incentive fee | | | 44.94 | % | | | 87.50 | % | | | -15.22 | % | | | 117.63 | % | | | -27.07 | % |
| Incentive fee | | | -3.00 | % | | | -9.35 | % | | | 0.00 | % | | | -31.07 | % | | | 0.00 | % |
| Total return after incentive fee (A) | | | 41.94 | % | | | 78.15 | % | | | -15.22 | % | | | 86.56 | % | | | -27.07 | % |
| | | | | | | | | | | | | | | | | | | | | |
| Ratios to average members’ equity (B) (D): | | | | | | | | | | | | | | | | | | | | |
| Expenses excluding incentive fee | | | 17.31 | % | | | 3.78 | % | | | 5.33 | % | | | 7.69 | % | | | 5.67 | % |
| Incentive fee | | | 2.45 | % | | | 5.00 | % | | | 0.00 | % | | | 19.30 | % | | | 0.00 | % |
| Total expenses and incentive fee | | | 19.76 | % | | | 8.78 | % | | | 5.33 | % | | | 26.99 | % | | | 5.67 | % |
| | | | | | | | | | | | | | | | | | | | | |
| Net investment loss (C) | | | -19.55 | % | | | -7.97 | % | | | -8.17 | % | | | -25.52 | % | | | -8.12 | % |
Galaxy Plus Fund LLC
(A Delaware Series Limited Liability Company)
Notes to Financial Statements
| | | Galaxy Plus Fund LLC -
538 Series | | | Galaxy Plus Fund LLC -
550 Series | | | Galaxy Plus Fund LLC -
550 Series | |
| | | Class EF | | | Class C | | | Class EF | |
| | | | | | | | | | |
| Total return before incentive fee | | | 45.26 | % | | | -8.74 | % | | | 18.34 | % |
| Incentive fee | | | -23.95 | % | | | -2.35 | % | | | -7.80 | % |
| Total return after incentive fee (A) | | | 21.31 | % | | | -11.09 | % | | | 10.54 | % |
| | | | | | | | | | | | | |
| Ratios to average members’ equity (B) (D): | | | | | | | | | | | | |
| Expenses excluding incentive fee | | | 3.85 | % | | | 5.65 | % | | | 18.85 | % |
| Incentive fee | | | 16.19 | % | | | 0.90 | % | | | 6.31 | % |
| Total expenses and incentive fee | | | 20.04 | % | | | 6.55 | % | | | 25.16 | % |
| | | | | | | | | | | | | |
| Net investment loss (C) | | | -19.82 | % | | | -6.27 | % | | | -25.19 | % |
| (A) | Total return is based on the change in average members’ equity during the period of a theoretical investment made at the inception of the Fund. Total return is not annualized for Funds or classes that have been in operations for less than a year/period as of December 31, 2022. |
| (B) | The total expense and net investment income (loss) ratios are computed based upon weighted-average members’ equity as a whole for the year/period ended December 31, 2022. |
| (C) | The net investment income (loss) ratio excludes net realized and unrealized gains (losses) on investments. |
| (D) | Ratios have been annualized, excluding non-recurring expenses and incentive fees, for Funds and classes that have been in operations for less than a year/period as of December 31, 2022. Refer to note 1 for commencement dates of each Fund. |
Financial highlights are calculated for each permanent, non-managing class of interest. An individual member’s return and ratios may vary based on different incentive and/or management fee arrangements, and the timing of capital interest transactions.
Note 8. Subsequent events
In accordance with FASB ASC 855, Subsequent Events, the Sponsor has evaluated all subsequent events requiring recognition and disclosure in the Funds’ financial statements through March 30, 2023, the date the financial statements were available for issuance. The Sponsor has determined that there are no material events that would require recognition or disclosure in the Funds’ financial statements through this date.
Galaxy Plus Fund LLC
(A Delaware Series Limited Liability Company)
Oath and Affirmation of the Commodity Pool Operator
To the best of the knowledge and belief of the undersigned, the information contained in the annual report as of and for the year/period ended December 31, 2022, is accurate and complete.
David Young, President
New Hyde Park Alternative Funds, LLC — Sponsor
Galaxy Plus Fund LLC
Galaxy Plus Fund – Quantica Managed Futures Master Fund (507) LLC
(A Delaware Limited Liability Company)
The attached annual report is filed under exemption pursuant to Section 4.7 of the regulations under the Commodity Exchange Act.
Financial Report
December 31, 2022
Contents
Independent Auditor’s Report
Managing Member
Galaxy Plus Fund LLC
Opinion
We have audited the financial statements of Galaxy Plus Fund — Quantica Managed Futures Master Fund (507) LLC (the Fund), which comprise the statement of financial condition, including the condensed schedule of investments, as of December 31, 2022, the related statements of operations and changes in members’ equity for the year then ended, and the related notes to the financial statements.
In our opinion, the accompanying financial statements present fairly, in all material respects, the financial position of the Fund as of December 31, 2022, and the results of its operations and changes in members’ equity for the year then ended in accordance with accounting principles generally accepted in the United States of America.
Basis for Opinion
We conducted our audit in accordance with auditing standards generally accepted in the United States of America (GAAS). Our responsibilities under those standards are further described in the Auditor’s Responsibilities for the Audit of the Financial Statements section of our report. We are required to be independent of the Fund and to meet our other ethical responsibilities, in accordance with the relevant ethical requirements relating to our audit. We believe that the audit evidence we have obtained is sufficient and appropriate to provide a basis for our audit opinion.
Responsibilities of Management for the Financial Statements
Management is responsible for the preparation and fair presentation of the financial statements in accordance with accounting principles generally accepted in the United States of America, and for the design, implementation and maintenance of internal control relevant to the preparation and fair presentation of financial statements that are free from material misstatement, whether due to fraud or error.
In preparing the financial statements, management is required to evaluate whether there are conditions or events, considered in the aggregate, that raise substantial doubt about the Fund’s ability to continue as a going concern within one year after the date that the financial statements are issued or available to be issued.
Auditor’s Responsibilities for the Audit of the Financial Statements
Our objectives are to obtain reasonable assurance about whether the financial statements as a whole are free from material misstatement, whether due to fraud or error, and to issue an auditor’s report that includes our opinion. Reasonable assurance is a high level of assurance but is not absolute assurance and therefore is not a guarantee that an audit conducted in accordance with GAAS will always detect a material misstatement when it exists. The risk of not detecting a material misstatement resulting from fraud is higher than for one resulting from error, as fraud may involve collusion, forgery, intentional omissions, misrepresentations, or the override of internal control. Misstatements are considered material if there is a substantial likelihood that, individually or in the aggregate, they would influence the judgment made by a reasonable user based on the financial statements.
In performing an audit in accordance with GAAS, we:
| ● | Exercise professional judgment and maintain professional skepticism throughout the audit. |
| ● | Identify and assess the risks of material misstatement of the financial statements, whether due to fraud or error, and design and perform audit procedures responsive to those risks. Such procedures include examining, on a test basis, evidence regarding the amounts and disclosures in the financial statements. |
| ● | Obtain an understanding of internal control relevant to the audit in order to design audit procedures that are appropriate in the circumstances, but not for the purpose of expressing an opinion on the effectiveness of the Fund’s internal control. Accordingly, no such opinion is expressed. |
| ● | Evaluate the appropriateness of accounting policies used and the reasonableness of significant accounting estimates made by management, as well as evaluate the overall presentation of the financial statements. |
| ● | Conclude whether, in our judgment, there are conditions or events, considered in the aggregate, that raise substantial doubt about the Fund’s ability to continue as a going concern for a reasonable period of time. |
We are required to communicate with those charged with governance regarding, among other matters, the planned scope and timing of the audit, significant audit findings, and certain internal control–related matters that we identified during the audit.
/s/ RSM US LLP
Denver, Colorado
March 30, 2023
Galaxy Plus Fund - Quantica Managed Futures Master Fund (507) LLC
(A Delaware Limited Liability Company)
Statement of Financial Condition
December 31, 2022
(Expressed in U.S. Dollars)
| Assets | | | |
| | | | |
| Equity in commodity trading accounts at clearing brokers: | | | | |
| Cash | | $ | 983,419 | |
| Restricted cash - margin balance | | | 1,239,304 | |
Investments in futures contracts, at fair value
(represents unrealized appreciation on open derivative contracts, net) | | | 235,403 | |
| Receivable from Offshore Feeder Fund | | | 103,681 | |
| Receivable from Onshore Feeder Fund | | | 75,672 | |
| | | | | |
| Total assets | | $ | 2,637,479 | |
| | | | | |
| Liabilities and Members’ Equity | | | | |
| | | | | |
| Total liabilities | | $ | - | |
| | | | | |
| Members’ equity | | | 2,637,479 | |
| | | | | |
| Total liabilities and members’ equity | | $ | 2,637,479 | |
See notes to financial statements.
Galaxy Plus Fund - Quantica Managed Futures Master Fund (507) LLC
(A Delaware Limited Liability Company)
Condensed Schedule of Investments
December 31, 2022
(Expressed in U.S. Dollars)
| | | Number of | | | | | Percent of | |
| | | Contracts/
Units | | Fair Value | | | Members’ Equity | |
| Long positions: | | | | | | | | |
| Derivative contracts: | | | | | | | | |
| Domestic (United States): | | | | | | | | |
| Futures contracts: | | | | | | | | |
| Agriculture | | 85 | | $ | 77,924 | | | | 2.95 | % |
| Currency | | 73 | | | 13,767 | | | | 0.52 | |
| Index | | 6 | | | (5,749 | ) | | | (0.22 | ) |
| Metals | | 17 | | | 54,465 | | | | 2.07 | |
| Foreign: | | | | | | | | | | |
| Futures contracts: | | | | | | | | | | |
| Energy | | 5 | | | (43,779 | ) | | | (1.66 | ) |
| Index | | 26 | | | (61,403 | ) | | | (2.33 | ) |
| Interest | | 32 | | | (51,773 | ) | | | (1.96 | ) |
| Metals | | 21 | | | (117,686 | ) | | | (4.46 | ) |
| | | | | | | | | | | |
| Total long positions | | | | | (134,234 | ) | | | (5.09 | ) |
| | | | | | | | | | | |
| Short positions: | | | | | | | | | | |
| Derivative contracts: | | | | | | | | | | |
| Domestic (United States): | | | | | | | | | | |
| Futures contracts: | | | | | | | | | | |
| Agriculture | | 3 | | | (7,616 | ) | | | (0.29 | ) |
| Currency | | 21 | | | 2,949 | | | | 0.11 | |
| Energy | | 2 | | | 1,736 | | | | 0.07 | |
| Index | | 18 | | | 21,749 | | | | 0.82 | |
| Interest | | 30 | | | 9,759 | | | | 0.37 | |
| Foreign: | | | | | | | | | | |
| Futures contracts: | | | | | | | | | | |
| Agriculture | | 10 | | | 673 | | | | 0.03 | |
| Index | | 5 | | | (2,411 | ) | | | (0.09 | ) |
| Interest 1 | | 107 | | | 191,746 | | | | 7.27 | |
| Metals 1 | | 2 | | | 151,052 | | | | 5.73 | |
| | | | | | | | | | | |
| Total short positions | | | | | 369,637 | | | | 14.02 | |
| | | | | | | | | | | |
| Investments in futures contracts, at fair value | | | | $ | 235,403 | | | | 8.93 | % |
| 1 | No individual position is greater than 5% of members’ equity. |
See notes to financial statements.
Galaxy Plus Fund - Quantica Managed Futures Master Fund (507) LLC
(A Delaware Limited Liability Company)
Statement of Operations
For the year ended December 31, 2022
(Expressed in U.S. Dollars)
| Investment Income: | | | |
| Interest income | | $ | 17,345 | |
| | | | | |
| Total investment income | | | 17,345 | |
| | | | | |
| Expenses: | | | | |
| Interest expenses | | | 44 | |
| Other expenses | | | 430 | |
| | | | | |
| Total expenses | | | 474 | |
| | | | | |
| Net investment income | | | 16,871 | |
| | | | | |
| Realized and unrealized gain (loss) on investments and foreign currency transactions: | | | | |
| Net realized gain from: | | | | |
| Derivative contracts1 | | | 1,024,131 | |
| Foreign currency transactions | | | 7,920 | |
| | | | 1,032,051 | |
| | | | | |
| Net increase in unrealized appreciation on: | | | | |
| Derivative contracts | | | 358,282 | |
| | | | 358,282 | |
| | | | | |
| Net realized and unrealized gain on investments and foreign currency transactions | | | 1,390,333 | |
| | | | | |
| Net increase in members’ equity resulting from operations | | $ | 1,407,204 | |
See notes to financial statements.
Galaxy Plus Fund - Quantica Managed Futures Master Fund (507) LLC
(A Delaware Limited Liability Company)
Statement of Changes in Members’ Equity
For the year ended December 31, 2022
(Expressed in U.S. Dollars)
| Changes in members’ equity from operations: | | | |
| Net investment income | | $ | 16,871 | |
| Net realized gain from derivative contracts and foreign currency transactions | | | 1,032,051 | |
| Net increase in unrealized appreciation on derivative contracts | | | 358,282 | |
| | | | | |
| Net increase in members’ equity resulting from operations | | | 1,407,204 | |
| | | | | |
| Changes in members’ equity from capital transactions: | | | | |
| Proceeds from issuance of capital | | | 1,423,131 | |
| Payments for redemptions of capital | | | (1,546,760 | ) |
| | | | | |
| Net decrease in members’ equity resulting from capital transactions | | | (123,629 | ) |
| | | | | |
| Total increase | | | 1,283,575 | |
| | | | | |
| Members’ equity, beginning of year | | | 1,353,904 | |
| | | | | |
| Members’ equity, end of year | | $ | 2,637,479 | |
See notes to financial statements.
Galaxy Plus Fund – Quantica Managed Futures Master Fund (507) LLC
(A Delaware Limited Liability Company)
Notes to Financial Statements
Note 1. Organization and Structure
Galaxy Plus Fund – Quantica Managed Futures Master Fund (507) LLC (the “Master Fund”) was formed in Delaware as a limited liability company on September 3, 2014 and commenced operations on April 20, 2015. The Master Fund was created to serve as the trading entity managed by Quantica Capital AG (the “Trading Advisor”) pursuant to its Managed Futures Program (the “Program”). The Program is a systematic investment strategy that aims to detect and take advantage of trend-following market inefficiencies in a diversified, liquid investment universe which includes multiple futures instruments.
The Master Fund and other separately formed Delaware limited liability companies (“Other Master Funds”), are investment vehicles available under the Galaxy Plus Managed Account Platform (the “Platform”). The Master Fund and the Platform are sponsored by New Hyde Park Alternative Funds, LLC (the “Sponsor” or “NHPAF”) as a means of making available, to qualified high net-worth individuals and institutional investors (including funds of hedge funds) (“Investors”), a variety of third-party professional managed futures and foreign exchange advisors (“Advisors”). The Trading Advisor is not affiliated with the Sponsor.
NHPAF was formed in October 2013 and its principal office is located in Wheaton, Illinois. NHPAF is registered with the U.S. Commodity Futures Trading Commission (CFTC) as a commodity pool operator and commodity trading advisor, and is a member of the National Futures Association (NFA).
Galaxy Plus Fund LLC, a Delaware Series Limited Liability Company (the “Onshore Platform”), and Galaxy Plus Fund SPC, a Cayman Islands Segregated Portfolio Company (the “Offshore Platform”) serve as the feeder funds for the Platform and invest substantially all of the assets of the respective segregated portfolios (each a “Fund”) in the Master Fund or Other Master funds. Galaxy Plus Fund – Quantica Managed Futures Feeder Fund (507) (“LLC507”), a separated series of the Onshore Platform and Galaxy Plus Fund – Quantica Managed Futures Offshore Feeder Fund (507) Segregated Portfolio (“SPC507”), a segregated portfolio of the Offshore Platform, each invest in the Master Fund.
LLC507 and SPC507 are collectively hereafter referred to as the “Feeder Funds”.
Subscriptions and redemptions into the Feeder Funds and the corresponding transactions with the Master Fund are governed by the Onshore Platform’s and the Offshore Platform’s respective Confidential Offering Memorandums.
The Platform has appointed the Sponsor, under the terms of the Limited Liability Company Agreement (the “LLC Agreement”) as the managing member of the Master Fund. In such capacity, the Sponsor has the authority, to manage, with wide discretionary powers, the business and affairs of the Master Fund including the authority to select the administrator for the Master Fund. The LLC Agreement will continue to remain in force until terminated by either the Sponsor or the Platform upon not less than sixty (60) days’ prior written notice. In certain circumstances (for example, the insolvency of either party or in the event all trading for the Platform by the Advisors are suspended), the LLC Agreement may be immediately terminated by either party.
Galaxy Plus Fund – Quantica Managed Futures Master Fund (507) LLC
(A Delaware Limited Liability Company)
Notes to Financial Statements
The Master Fund and the Sponsor have entered into a tri-party contract (the “Trading Agreement”) with the Trading Advisor pursuant to which the Master Fund’s trading accounts are managed, subject to rights of termination, by the Trading Advisor in accordance with the Program. The Trading Advisor may alter its Program (including its trading systems and methods and including the addition and/or deletion of any financial interests or contracts traded in the Master Fund’s trading accounts), provided that the Trading Advisor provide prior notice to the Master Fund and the Sponsor of any material change to the Trading Advisor’s Program. From time to time, the Trading Advisor (or its affiliates) may manage additional accounts, and these accounts will increase the level of competition for the same trades desired for the Master Fund, including the priorities of order entry. There is no specific limit as to the number of accounts the Trading Advisors (or their affiliates) may manage. In addition, the positions of all of the accounts owned or controlled by the Trading Advisor (or its affiliates) are aggregated for the purposes of applying speculative position limits. The management, incentive and sponsor fees are paid directly by the Feeder Funds, and for this reason are not recorded as expenses of the Master Fund.
Note 2. Summary of Significant Accounting Policies
The following is a summary of significant accounting policies consistently followed in the preparation of the Master Fund’s financial statements.
Principles of accounting: The accompanying financial statements are expressed in United States dollars (USD) and have been prepared in accordance with Generally Accepted Accounting Principles (GAAP), as established by the Financial Accounting Standards Board (FASB), to ensure consistent reporting of financial condition and results of operations. The Master Fund is an investment company and follows the accounting and reporting guidance in FASB Account Standards Codification Topic 946.
Cash and restricted cash: Cash held in the commodity trading accounts at clearing broker consists of either cash maintained in the custody of the broker, a portion of which is required margin for open positions, or amounts due to/from the broker for margin or unsettled trades. The Master Fund may also hold cash in a non-interest bearing USD commercial bank account. The Master Fund holds various currencies at the clearing broker, of which $1,755,945 is held in USD and a balance of $466,778 in foreign currencies as of December 31, 2022, and are recorded in cash and restricted cash – margin balance on the Statement of Financial Condition. The non-U.S. currencies fluctuate in value on a daily basis relative to the USD. A portion of this cash is restricted cash required to meet maintenance margin requirements. Cash with the clearing broker as of December 31, 2022 included restricted cash for margin requirements of $1,239,304. This cash becomes unrestricted when the underlying positions to which it is applicable are liquidated. Cash with the clearing broker as of December 31, 2022 included amounts due to the broker for unsettled trades of $0.
Offsetting of amounts related to certain contracts: When the requirements are met, the Master Fund offsets certain fair value amounts recognized for net derivative positions executed with the same counterparty under the same master netting arrangement (see Note 5).
Galaxy Plus Fund – Quantica Managed Futures Master Fund (507) LLC
(A Delaware Limited Liability Company)
Notes to Financial Statements
Valuation and Revenue Recognition: Depending on the Program and investments traded, the Master Fund follows the following valuation and revenue recognition policies. All investments are recorded at their estimated fair value, as described in Note 3.
Futures and options on futures contracts: The Master Fund may enter into futures and options on futures contracts. Upon entering into a futures contract, the Master Fund agrees to receive or deliver a fixed quantity of an underlying instrument or commodity for an agreed-upon price, while an option contract provides the option purchaser with the right, but not the obligation, to buy or sell a security or financial instrument at a predetermined exercise price during a defined period. Futures and options on futures contracts are recorded on the trade date. The difference between the original contract amount and the fair value of futures contracts purchased or sold is reflected as unrealized appreciation/(depreciation) on open contracts. Options on futures contracts are reflected in investments at fair value. The difference between the premiums paid or received on open options on futures contracts and fair value of such options is recorded as unrealized appreciation/(depreciation) on open contracts. The fair value of futures and options on futures contracts is based upon daily exchange settlement prices. The realized gain or loss is determined on the settlement of intraday trades first and then by the FIFO method.
Foreign currency transactions: The Master Fund’s financial statements are denominated in USD. However, foreign currency forward contracts, non-U.S. futures contracts, and non-U.S. options on futures contracts are denominated in currencies other than USD. Assets and liabilities and transactions denominated in currencies other than the USD are translated into USD at the rates in effect either at the close of business on the last business day of the reporting period or on the date of such transactions, respectively. Such fluctuations are included with the unrealized appreciation (depreciation) on open derivative contracts, net. Net realized foreign exchange gain or loss arises from the sales of foreign currencies and currency gains or losses realized between trade and settlement dates. Net unrealized foreign exchange gain and loss arises from changes in the fair value of margin collateral assets and liabilities resulting from changes in exchange rates.
Trading costs: Trading costs generally consist of brokerage commissions, brokerage fees, clearing fees, exchange and regulatory fees, transaction and NFA fees. Fees vary by type of contract for each purchase and sale or sale and purchase (round turn) of futures, options on futures, and forward contracts. Commissions are paid on each individual purchase and sale transaction. These costs are recognized as expenses for futures and options on futures transactions and are included in net realized gain/loss from derivative contracts on the Statement of Operations.
Interest income/expense: Interest income and expense is recognized on an accrual basis.
Allocation of income and gains and losses: Profits and losses for each monthly accounting period, or shorter period if there are mid-month subscriptions and/or redemptions, are allocated pro-rata to the Feeder Funds based on their respective ownership percentage on the first day of each period throughout the year.
Income taxes: The Master Fund will not be subject to United States federal income taxation other than certain withholding taxes. The Master Fund evaluates tax positions taken or expected to be taken to determine whether the tax positions are more-likely-than-not of being sustained by the applicable tax authority. For tax positions meeting the more-likely-than-not threshold, the tax amount recognized in the financial statements is reduced by the largest benefit that has a greater than fifty percent likelihood of being realized upon ultimate settlement with the relevant taxing authority. The Master Fund has determined that there is no tax liability resulting from uncertain income tax positions taken or expected to be taken with respect to all open tax years. The Master Fund’s U.S. Federal tax returns for the years ended December 31, 2019 through 2022, remain open. The Master Fund recognizes interest and penalties, if any, related to unrecognized tax benefits as income tax expense in the Statement of Operations. During the year, the Master Fund did not accrue any interest or penalties.
Galaxy Plus Fund – Quantica Managed Futures Master Fund (507) LLC
(A Delaware Limited Liability Company)
Notes to Financial Statements
Use of estimates: The preparation of financial statements in accordance with GAAP requires management to make estimates and assumptions that affect the reported amounts of assets and liabilities and disclosure of contingent assets and liabilities at the date of the financial statements and the reported amounts of income and expenses during the reporting period. Actual results could differ from those estimates.
Indemnifications: The Sponsor and its affiliates are indemnified against certain liabilities arising out of the performance of their duties for the Master Fund. In addition, in the normal course of business, the Master Fund enters into contracts with vendors and others that provide for general indemnifications. The Master Fund’s maximum exposure under these arrangements is unknown as this would involve future claims that may be made against the Master Fund. However, the Master Fund expects the risk of loss to be remote.
Statement of Cash Flows: The Master Fund has elected not to provide a Statement of Cash Flows as permitted by GAAP as all of the following conditions have been met:
| ● | During the year, substantially all of the Master Fund’s investments were carried at fair value and classified as Level 1 or Level 2 measurements in accordance with FASB ASC 820; |
| ● | The Master Fund had little or no debt during the year; |
| ● | The Master Fund’s financial statements include a Statement of Changes in Members’ Equity. |
Subscriptions and redemptions: Subscriptions and redemptions can typically be made on a weekly basis as of the first day (Monday) of each week; (or, if such day is not a business day, the first business day thereafter) (each, a Subscription Date or a Redemption Date). The Master Fund may accept subscriptions or redemptions more frequently than the first day of each week, depending upon the size of the requested subscription or redemption amount, with the approval of the Sponsor.
Galaxy Plus Fund – Quantica Managed Futures Master Fund (507) LLC
(A Delaware Limited Liability Company)
Notes to Financial Statements
Note 3 Fair Value Measurements
The Master Fund’s investments are stated at fair value in accordance with FASB ASC 820, Fair Value Measurements and Disclosures (ASC 820). ASC 820 defines fair value, establishes a framework for measuring fair value and expands disclosures about fair value measurements. ASC 820 also emphasizes that fair value is a market-based measurement, not an entity-specific measurement, and sets out a fair value hierarchy with the highest priority being quoted prices in active market. Under ASC 820, fair value measurements are disclosed by level within that hierarchy, as follows:
Level 1 — Values for investments classified as Level 1 are based on unadjusted quoted prices for identical investments in an active market. Since valuations are based on quoted prices that are readily accessible at the measurement date, valuation of these investments does not entail a significant degree of judgment.
Level 2 — Values for investments classified as Level 2 are based on quoted prices for similar investments in an active or non-active markets for which all significant inputs are observable either directly or indirectly. Level 2 inputs may also include discounts related to restrictions on the investments.
Level 3 — Values for investments categorized as Level 3 are based on prices or valuation techniques that require inputs that are both significant to the fair value and unobservable, including valuations by the Sponsor in the absence of readily ascertainable fair values.
A description of the valuation methodologies applied to the Master Fund’s major categories of assets and liabilities measured at fair value on a recurring basis follows. Inputs that are used in determining fair value of an investment may include price information, credit data, volatility statistics, and other factors. These inputs can be either observable or unobservable. All of the inputs for the Master Fund were observable as of December 31, 2022. The availability of observable inputs can vary between investments and is affected by various factors such as type of investment and the volume and level of activity for that investment or similar investments in the marketplace.
Exchange-traded derivative contracts that are actively traded are valued based on daily quoted settlement prices from the respective exchange and are categorized in Level 1 of the fair value hierarchy. Exchange-traded derivative contracts not actively traded and over-the-counter (OTC) derivative contracts can include futures contracts, option on futures contracts, forward contracts and option contracts whose values are based on an underlying such as interest rates, foreign currencies, credit standing of reference entities, equities or commodities. Such derivative contracts are valued using observable market data, including currency spot rates or quoted prices of the related underlying obtained from the applicable exchange or market. OTC derivative contracts are valued using the above described pricing methodology and are categorized as Level 2 within the fair value hierarchy.
The Master Fund assesses the levels of the investments at each measurement date, and transfers between levels are recognized on the actual date of the event or change in circumstances that caused the transfer in accordance with the Master Fund’s accounting policy regarding the recognition of transfers between levels of the fair value hierarchy. There were no transfers among levels 1, 2, and 3 during the year ended December 31, 2022.
The inputs or methodologies used for valuing investments are not necessarily indicative of the risk associated with investing in those instruments.
Galaxy Plus Fund – Quantica Managed Futures Master Fund (507) LLC
(A Delaware Limited Liability Company)
Notes to Financial Statements
The following tables present the classification of derivatives, by type, into the fair value hierarchy levels as of December 31, 2022. Presentation is gross – as an asset if in a gain position and a liability if in a loss position.
| | | | | | Fair Value Measurements at Reporting Date Using | |
| | | | | | Quoted Prices | | | Significant Other | | | Significant | |
| | | | | | in Active | | | Observable | | | Unobservable | |
| | | | | | Markets | | | Inputs | | | Inputs | |
| Description | | Fair Value | | | (Level 1) | | | (Level 2) | | | (Level 3) | |
| Assets: | | | | | | | | | | | | |
| Derivative contracts: | | | | | | | | | | | | |
| Futures contracts: | | | | | | | | | | | | |
| Agriculture | | $ | 81,554 | | | $ | 81,554 | | | $ | - | | | $ | - | |
| Currency | | | 40,085 | | | | 40,085 | | | | - | | | | - | |
| Energy | | | 1,736 | | | | 1,736 | | | | - | | | | - | |
| Index | | | 25,768 | | | | 25,768 | | | | - | | | | - | |
| Interest | | | 203,837 | | | | 203,837 | | | | - | | | | - | |
| Metals | | | 94,762 | | | | 94,762 | | | | - | | | | - | |
| Total investment assets at fair value | | | 447,742 | | | | 447,742 | | | | - | | | | - | |
| | | | | | | | | | | | | | | | | |
| Liabilities: | | | | | | | | | | | | | | | | |
| Derivative contracts: | | | | | | | | | | | | | | | | |
| Futures contracts: | | | | | | | | | | | | | | | | |
| Agriculture | | | (10,573 | ) | | $ | (10,573 | ) | | | - | | | | - | |
| Currency | | | (23,369 | ) | | | (23,369 | ) | | | - | | | | - | |
| Energy | | | (43,779 | ) | | | (43,779 | ) | | | - | | | | - | |
| Index | | | (73,582 | ) | | | (73,582 | ) | | | - | | | | - | |
| Interest | | | (54,105 | ) | | | (54,105 | ) | | | - | | | | - | |
| Metals | | | (6,931 | ) | | | (6,931 | ) | | | - | | | | - | |
| Total investment liabilities at fair value | | | (212,339 | ) | | | (212,339 | ) | | | - | | | | - | |
| | | | | | | | | | | | | | | | | |
| Total net investments at fair value | | $ | 235,403 | | | $ | 235,403 | | | $ | - | | | $ | - | |
Note 4. Derivative Financial Instruments
Derivative financial instruments speculatively traded by the Master Fund can include U.S. and foreign futures, options on futures contracts, and forward currency contracts (collectively, derivatives) whose values are based upon an underlying asset, indices, or reference rates, and generally represent future commitments to exchange cash flows, or to purchase or sell other financial instruments at specified future dates. A derivative contract may be traded on an exchange or OTC. Exchange-traded derivatives are standardized and include futures and options on futures contracts. OTC derivative contracts are negotiated between contracting parties and include forward currency contracts and certain options. Derivatives are subject to various risks similar to those related to the underlying financial instruments including market and credit risks.
Market risk is the potential for changes in the value of derivatives due to market changes, including interest and foreign exchange rate movements and fluctuations in commodity and security prices. Market risk is directly impacted by the volatility and liquidity in the markets in which the related underlying assets are traded. The market risk of the Master Fund is managed by the underlying Trading Advisors according to each respective Program. The Master Fund is exposed to a market risk equal to the notional contract value of the derivatives contracts purchased and unlimited liability on such contracts sold short.
Galaxy Plus Fund – Quantica Managed Futures Master Fund (507) LLC
(A Delaware Limited Liability Company)
Notes to Financial Statements
Credit risk is the possibility that a loss may occur due to the failure of a counterparty to perform according to the terms of a contract. Credit risk due to exchange traded derivative financial instruments is significantly reduced by the regulatory requirements of the individual exchanges on which the instruments are traded. At any point in time, the credit risk for OTC derivatives is limited to the net unrealized gain for each counterparty for which a netting agreement exists, if any. In a similar fashion, liabilities represent net amounts owed to counterparties. The credit risk exposure for the Master Fund’s outstanding OTC derivatives was $0 at December 31, 2022.
Market and geopolitical risk relate to the increasing interconnectivity between global economies and financial markets increases the likelihood that events or conditions in one region or financial market may adversely impact issuers in a different country, region, or financial market. Securities in the Master Fund may underperform due to inflation (or expectations for inflation), interest rates, global demand for particular products or resources, natural disasters, pandemics, epidemics, terrorism, regulatory events and governmental or quasi-governmental actions. The occurrence of global events similar to those in recent years, such as terrorist attacks around the world, natural disasters, social and political discord or debt crises and downgrades, among others, may result in market volatility and may have long term effects on both the U.S. and global financial markets. It is difficult to predict when similar events affecting the U.S. or global financial markets may occur, the effects that such events may have and the duration of those effects. Any such event(s) could have a significant adverse impact on the value and risk profile of the Master Fund. The current novel coronavirus (COVID-19) global pandemic and the aggressive responses taken by many governments, including closing borders, restricting international and domestic travel, and the imposition of prolonged quarantines or similar restrictions, as well as the forced or voluntary closure of, or operational changes to, many retail and other businesses, has had negative impacts, and in many cases severe negative impacts, on markets worldwide. It is not known how long such impacts, or any future impacts of other significant events described above, will or would last, but there could be a prolonged period of global economic slowdown, which may impact your investment.
Purchase and sale of futures contracts requires margin deposits with the broker. Additional deposits may be necessary for any loss on contract value. The U.S. Commodity Exchange Act requires a broker to segregate all customer transactions and assets from such broker’s proprietary activities. A customer’s cash and other property (for example, U.S. Treasury bills) deposited with a broker are considered commingled with all other customer funds subject to the broker’s segregation requirements. In the event of a broker’s insolvency, recovery may be limited to a pro rata share of segregated funds available. It is possible that the recovered amount could be less than total cash and other property deposited.
Galaxy Plus Fund – Quantica Managed Futures Master Fund (507) LLC
(A Delaware Limited Liability Company)
Notes to Financial Statements
The Master Fund has a substantial portion of its assets on deposit with counterparties. In the event of a counterparty’s insolvency, recovery of the Master Fund’s assets on deposit may be limited to account insurance or other protection afforded such deposits.
The notional value represents amounts related to the Master Fund’s stock exchange indices, commodities, interest rate and foreign currencies upon which the fair value of the futures contracts held by the Master Fund are based. Notional values do not represent the current fair value of, and are not necessarily indicative of the future cash flows of the Master Fund’s futures contracts. Further, the underlying price changes in relation to variables specified by the notional values affects the fair value of these derivative financial instruments. Theoretically, the Master Fund’s exposure is equal to the notional value of contracts purchased and unlimited on such contracts sold short. As of December 31, 2022, the Master Fund had open futures contracts with the following notional values by sector:
 Description Description | | Quantity | | | Notional Value | | | Description | | Quantity | | | 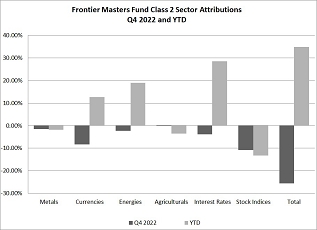 Notional Value Notional Value | |
| Long: | | | | | | | | Short: | | | | | | |
| Agriculture | | | 85 | | | $ | 3,417,597 | | | Agriculture | | | 13 | | | $ | (358,797) | |
| Currency | | | 73 | | | | 2,261,540 | | | Currency | | | 21 | | | | (1,696,373) | |
| Energy | | | 5 | | | | 449,407 | | | Energy | | | 2 | | | | (78,620) | |
| Index | | | 32 | | | | 1,769,397 | | | Index | | | 23 | | | | (1,940,835) | |
| Interest | | | 32 | | | | 13,963,322 | | | Interest | | | 137 | | | | (27,712,257) | |
| Metals | | | 38 | | | | 2,296,523 | | | Metals | | | 2 | | | | (58,988) | |
During the year ended December 31, 2022, the Master Fund participated in 3,359 futures contract transactions.
Below is a summary of net trading gains and (losses) by investment type and industry:
| | | Net Trading Gain (Loss)* | |
| Futures contracts: | | | | |
| Agriculture | | $ | (199,737 | ) |
| Currency | | | 490,084 | |
| Energy | | | 505,854 | |
| Index | | | (314,379 | ) |
| Interest | | | 1,071,715 | |
| Metals | | | (153,760 | ) |
| | | | | |
| Total futures contracts | | | 1,399,777 | |
| | | | | |
| Trading costs | | | (17,364 | ) |
| | | | | |
| Total net trading gain (loss) | | $ | 1,382,413 | |
| * | Includes both realized gain of $1,024,131 and unrealized appreciation of $358,282 and is located in net realized and unrealized gain (loss) on investments on the Statement of Operations. Amounts exclude foreign currency transactions. |
Galaxy Plus Fund – Quantica Managed Futures Master Fund (507) LLC
(A Delaware Limited Liability Company)
Notes to Financial Statements
Note 5. Balance Sheet Offsetting
The Master Fund is required to disclose the impact of offsetting assets and liabilities presented in the Statement of Financial Condition to enable users of the financial statements to evaluate the effect or potential effect of netting arrangements on its financial position for recognized assets and liabilities. These recognized assets and liabilities include financial instruments and derivative instruments that are either subject to an enforceable master netting arrangement or similar agreement or meet the following right of set-off criteria: each of the two parties owes the other determinable amounts, the Master Fund has the right to set-off the amounts owed with the amounts owed by the other party, the Master Fund intends to set off, and the Master Fund’s right of set-off is enforceable by law.
The Master Fund is subject to enforceable master netting agreements with certain counterparties. These agreements govern the terms of certain transactions, and reduce the counterparty risk associated with relevant transactions by specifying offsetting mechanisms and collateral posting arrangements at prearranged exposure levels. Since different types of transactions have different mechanics and are sometimes traded out of different legal entities of a particular counterparty organization, each type of transaction may be covered by a different master netting arrangement, possibly resulting in the need for multiple agreements with a single counterparty. Master netting agreements may not be specific to each different asset type; in such instances, they would allow the Master Fund to close out and net its total exposure to a specified counterparty in the events of default or early termination with respect to any and all the transactions governed under a single agreement with the counterparty.
The following tables summarize the Master Fund’s netting arrangements:
| | | | | | | | | Net Amount of | |
| | | Gross Amounts | | | Offset in the | | | Assets (Liabilities) | |
| | | of Recognized | | | Statement of | | | in the Statement of | |
| Description | | Assets (Liabilities) | | | Financial Condition | | | Financial Condition | |
| | | | | | | | | | |
| Futures contracts | | $ | 447,742 | | | $ | (212,339 | ) | | $ | 235,403 | |
| Total | | $ | 447,742 | | | $ | (212,339 | ) | | $ | 235,403 | |
| | | Net Amount in | | | Cash Collateral | | | Net Amount | |
| | | the Statement of | | | Received by | | | in the Statement of | |
| | | Financial Condition | | | Counterparty | | | Financial Condition | |
| | | | | | | | | | |
| Counterparty A | | $ | 235,403 | | | $ | 1,239,304 | | | $ | 1,474,707 | |
| Total | | $ | 235,403 | | | $ | 1,239,304 | | | $ | 1,474,707 | |
Galaxy Plus Fund – Quantica Managed Futures Master Fund (507) LLC
(A Delaware Limited Liability Company)
Notes to Financial Statements
Note 6. Related Parties
As of December 31, 2022, the Master Fund had $103,681 receivable from the Offshore Feeder Fund and $75,672 receivable from the Onshore Feeder Fund, as reflected in the Statement of Financial Condition. Generally, receivables and payables from/to Feeder Funds are a result of timing differences of cash movements related to capital activity at the Feeder Fund level.
Note 7. Financial Highlights
Financial highlights of the Master Fund for the year ended December 31, 2022 are presented in the table below. The information has been derived from information presented in the financial statements.
| Total return (A) | | | 47.76 | % |
| | | | | |
| Ratios to average members’ equity (B): | | | | |
| Net investment income (C) | | | 0.52 | % |
| Total expenses | | | 0.01 | % |
| (A) | Total return is based on the change in average members’ equity during the period of a theoretical investment made at the inception of the Master Fund. |
| (B) | The total expense and net investment income ratios are computed based upon weighted-average members’ equity as a whole for the year ended December 31, 2022. |
| (C) | The net investment income ratio excludes net realized and unrealized gains (losses) on investments. |
Financial highlights are calculated for each member class taken as a whole. An individual member’s return and ratios may vary based on the timing of capital transactions. The total return and the net investment income ratio would have been lower, and total expense ratio would have been higher if the management, incentive fees, and sponsor fees, had been charged to the Master Fund instead of the Feeder Funds.
Note 8. Subsequent Events
In accordance with FASB ASC 855, Subsequent Events, the Sponsor has evaluated all subsequent events requiring recognition and disclosure in the Master Fund’s financial statements through March 30, 2023, the date the financial statements were available for issuance. The Sponsor has determined that there are no material events that would require recognition or disclosure in the Master Fund’s financial statements through this date.
Galaxy Plus Fund – Quantica Managed Futures Master Fund (507) LLC
(A Delaware Limited Liability Company)
Oath and Affirmation of the Commodity Pool Operator
To the best of the knowledge and belief of the undersigned, the information contained in the annual report as of and for the year ended December 31, 2022, is accurate and complete.
| /s/ David Young | |
| David Young, President | |
| New Hyde Park Alternative Funds, LLC — Sponsor |
| Galaxy Plus Fund – Quantica Managed Futures Master Fund (507) LLC |
Galaxy Plus Fund – FORT Contrarian Master Fund (510) LLC
(A Delaware Limited Liability Company)
The attached annual report is filed under exemption pursuant to Section 4.7 of the regulations under the Commodity Exchange Act.
Financial Report
December 31, 2022
Contents
Independent Auditor’s Report
Managing Member
Galaxy Plus Fund LLC
Opinion
We have audited the financial statements of Galaxy Plus Fund — FORT Contrarian Master Fund (510) LLC (the Fund), which comprise the statement of financial condition, including the condensed schedule of investments, as of December 31, 2022, the related statements of operations and changes in member’s equity for the year then ended, and the related notes to the financial statements.
In our opinion, the accompanying financial statements present fairly, in all material respects, the financial position of the Fund as of December 31, 2022, and the results of its operations and changes in member’s equity for the year then ended in accordance with accounting principles generally accepted in the United States of America.
Basis for Opinion
We conducted our audit in accordance with auditing standards generally accepted in the United States of America (GAAS). Our responsibilities under those standards are further described in the Auditor’s Responsibilities for the Audit of the Financial Statements section of our report. We are required to be independent of the Fund and to meet our other ethical responsibilities, in accordance with the relevant ethical requirements relating to our audit. We believe that the audit evidence we have obtained is sufficient and appropriate to provide a basis for our audit opinion.
Responsibilities of Management for the Financial Statements
Management is responsible for the preparation and fair presentation of the financial statements in accordance with accounting principles generally accepted in the United States of America, and for the design, implementation and maintenance of internal control relevant to the preparation and fair presentation of financial statements that are free from material misstatement, whether due to fraud or error.
In preparing the financial statements, management is required to evaluate whether there are conditions or events, considered in the aggregate, that raise substantial doubt about the Fund’s ability to continue as a going concern within one year after the date that the financial statements are issued or available to be issued.
Auditor’s Responsibilities for the Audit of the Financial Statements
Our objectives are to obtain reasonable assurance about whether the financial statements as a whole are free from material misstatement, whether due to fraud or error, and to issue an auditor’s report that includes our opinion. Reasonable assurance is a high level of assurance but is not absolute assurance and therefore is not a guarantee that an audit conducted in accordance with GAAS will always detect a material misstatement when it exists. The risk of not detecting a material misstatement resulting from fraud is higher than for one resulting from error, as fraud may involve collusion, forgery, intentional omissions, misrepresentations, or the override of internal control. Misstatements are considered material if there is a substantial likelihood that, individually or in the aggregate, they would influence the judgment made by a reasonable user based on the financial statements.
In performing an audit in accordance with GAAS, we:
| ● | Exercise professional judgment and maintain professional skepticism throughout the audit. |
| ● | Identify and assess the risks of material misstatement of the financial statements, whether due to fraud or error, and design and perform audit procedures responsive to those risks. Such procedures include examining, on a test basis, evidence regarding the amounts and disclosures in the financial statements. |
| ● | Obtain an understanding of internal control relevant to the audit in order to design audit procedures that are appropriate in the circumstances, but not for the purpose of expressing an opinion on the effectiveness of the Fund’s internal control. Accordingly, no such opinion is expressed. |
| ● | Evaluate the appropriateness of accounting policies used and the reasonableness of significant accounting estimates made by management, as well as evaluate the overall presentation of the financial statements. |
| ● | Conclude whether, in our judgment, there are conditions or events, considered in the aggregate, that raise substantial doubt about the Fund’s ability to continue as a going concern for a reasonable period of time. |
We are required to communicate with those charged with governance regarding, among other matters, the planned scope and timing of the audit, significant audit findings, and certain internal control–related matters that we identified during the audit.
/s/ RSM US LLP
Denver, Colorado
March 30, 2023
Galaxy Plus Fund – Fort Contrarian Master Fund (510) LLC
(A Delaware Limited Liability Company)
Statement of Financial Condition
December 31, 2022
(Expressed in U.S. Dollars)
| Assets | | | |
| | | | |
| Equity in commodity trading accounts at clearing brokers: | | | |
| Cash | | $ | 254,402 | |
| Restricted cash - margin balance | | | 232,475 | |
Investments in futures contracts, at fair value
(represents unrealized appreciation on open derivative contracts, net) | | | 29,700 | |
| Receivable from Onshore Feeder Fund | | | 76,418 | |
| Total assets | | $ | 592,995 | |
| Liabilities and Member’s Equity | | | | |
| | | | | |
| Total liabilities | | $ | - | |
| Member’s equity | | | 592,995 | |
| Total liabilities and member’s equity | | $ | 592,995 | |
See notes to financial statements.
Galaxy Plus Fund – Fort Contrarian Master Fund (510) LLC
(A Delaware Limited Liability Company)
Condensed Schedule of Investments
December 31, 2022
(Expressed in U.S. Dollars)
| | | Number of | | | | | | Percent of | |
| | | Contracts/
Units | | | Fair Value | | | Member’s Equity | |
| Long Positions: | | | | | | | | | |
| Derivative contracts: | | | | | | | | | |
| Domestic (United States): | | | | | | | | | �� |
| Futures contracts: | | | | | | | | | |
| Agriculture | | 1 | | | $ | 2,320 | | | | 0.39 | % |
| Energy | | 2 | | | | 5,140 | | | | 0.87 | |
| Index | | 6 | | | | (3,490 | ) | | | (0.59 | ) |
| Interest | | 1 | | | | (9,656 | ) | | | (1.63 | ) |
| Foreign: | | | | | | | | | | | |
| Futures contracts: | | | | | | | | | | | |
| Energy | | 1 | | | | 2,420 | | | | 0.41 | |
| Index | | 5 | | | | (2,332 | ) | | | (0.39 | ) |
| Interest | | 4 | | | | (14,196 | ) | | | (2.39 | ) |
| | | | | | | | | | | | |
| Total long positions | | | | | | (19,794 | ) | | | (3.33 | ) |
| | | | | | | | | | | | |
| Short positions: | | | | | | | | | | | |
| Derivative contracts: | | | | | | | | | | | |
| Domestic (United States): | | | | | | | | | | | |
| Futures contracts: | | | | | | | | | | | |
| Agriculture | | 1 | | | | (888 | ) | | | (0.15 | ) |
| Currency | | 6 | | | | (3,506 | ) | | | (0.59 | ) |
| Index | | 6 | | | | (337 | ) | | | (0.06 | ) |
| Interest | | 12 | | | | 19,789 | | | | 3.34 | |
| Foreign: | | | | | | | | | | | |
| Futures contracts: | | | | | | | | | | | |
| Index | | 1 | | | | (288 | ) | | | (0.05 | ) |
| Interest 1 | | 33 | | | | 34,724 | | | | 5.86 | |
| | | | | | | | | | | | |
| Total short positions | | | | | | 49,494 | | | | 8.35 | |
| | | | | | | | | | | | |
| Investments in futures contracts, at fair value | | | | | $ | 29,700 | | | | 5.02 | % |
| 1 | No individual position is greater than 5% of members’ equity. |
See notes to financial statements.
Galaxy Plus Fund – Fort Contrarian Master Fund (510) LLC
(A Delaware Limited Liability Company)
Schedule of Operations
For the year ended December 31, 2022
(Expressed in U.S. Dollars)
| Investment Income: | | | |
| Interest income | | $ | 3,737 | |
| | | | | |
| Total investment income | | | 3,737 | |
| | | | | |
| Expenses: | | | | |
| Interest expenses | | | 8,041 | |
| Other expenses | | | 586 | |
| | | | | |
| Total expenses | | | 8,627 | |
| | | | | |
| Net investment loss | | | (4,890 | ) |
| | | | | |
| Realized and unrealized gain (loss) on investments and foreign currency transactions: | | | | |
| Net realized (gain) loss from: | | | | |
| Derivative contracts1 | | | (2,352,516 | ) |
| Foreign currency transactions | | | 1,128 | |
| | | | (2,351,388 | ) |
| Net increase in unrealized appreciation on: | | | | |
| Derivative contracts | | | 179,292 | |
| | | | 179,292 | |
| Net realized and unrealized loss on investments and foreign currency transactions | | | (2,172,096 | ) |
| | | | | |
| Net decrease in member’s equity resulting from operations | | $ | (2,176,986 | ) |
See notes to financial statements.
Galaxy Plus Fund – Fort Contrarian Master Fund (510) LLC
(A Delaware Limited Liability Company)
Schedule of Changes in Members’ Equity
For the year ended December 31, 2022
(Expressed in U.S. Dollars)
| Changes in member’s equity from operations: | | | |
| Net investment loss | | $ | (4,890 | ) |
| Net realized loss from derivative contracts and foreign currency transactions | | | (2,351,388 | ) |
| Net increase in unrealized appreciation on derivative contracts | | | 179,292 | |
| | | | | |
| Net decrease in member’s equity resulting from operations | | | (2,176,986 | ) |
| | | | | |
| Changes in member’s equity from capital transactions: | | | | |
| Proceeds from issuance of capital | | | 334,232 | |
| Payments for redemptions of capital | | | (614,815 | ) |
| | | | | |
| Net decrease in member’s equity resulting from capital transactions | | | (280,583 | ) |
| | | | | |
| Total decrease | | | (2,457,569 | ) |
| | | | | |
| Member’s equity, beginning of year | | | 3,050,564 | |
| | | | | |
| Member’s equity, end of year | | $ | 592,995 | |
See notes to financial statements.
Galaxy Plus Fund – FORT Contrarian Master Fund (510) LLC
(A Delaware Limited Liability Company)
Notes to Financial Statements
Note 1. Organization and Structure
Galaxy Plus Fund – FORT Contrarian Master Fund (510) LLC (the “Master Fund”) was formed in Delaware as a limited liability company on June 5, 2015. The Master Fund was created to serve as the trading entity managed by Fort L.P. (the “Trading Advisor”) pursuant to its Global Contrarian program (the “Program”). The Program is a systematic, trend-anticipating trading program that seeks to capitalize on medium to long-term trends.
The Master Fund and other separately formed Delaware limited liability companies (“Other Master Funds”), are investment vehicles available under the Galaxy Plus Managed Account Platform (the “Platform”). The Master Fund and the Platform are sponsored by New Hyde Park Alternative Funds, LLC (the “Sponsor” or “NHPAF”) as a means of making available, to qualified high net-worth individuals and institutional investors (including funds of hedge funds) (“Investors”), a variety of third-party professional managed futures and foreign exchange advisors (“Advisors”). The Trading Advisor is not affiliated with the Sponsor.
NHPAF was formed in October 2013 and its principal office is located in Wheaton, Illinois. NHPAF is registered with the U.S. Commodity Futures Trading Commission (CFTC) as a commodity pool operator and commodity trading advisor, and is a member of the National Futures Association (NFA).
Galaxy Plus Fund LLC, a Delaware Series Limited Liability Company (the “Onshore Platform”), and Galaxy Plus Fund SPC, a Cayman Islands Segregated Portfolio Company (the “Offshore Platform”) serve as the feeder funds for the Platform and invest substantially all of the assets of the respective segregated portfolios (each a “Fund”) in the Master Fund or Other Master funds. Galaxy Plus Fund – FORT Contrarian Feeder Fund (510) LLC (“LLC510”), a separated series of the Onshore Platform and Galaxy Plus Fund – Fort Contrarian Offshore Feeder Fund (510) Segregated Portfolio (“SPC510”), a segregated portfolio of the Offshore Platform, can each invest in the Master Fund. As of December 31, 2022, SPC510 had not yet commenced operations and LLC510 is the sole member.
LLC510 and SPC510 are collectively hereafter referred to as the “Feeder Funds”.
Subscriptions and redemptions into the Feeder Funds and the corresponding transactions with the Master Fund are governed by the Onshore Platform’s and the Offshore Platform’s respective Confidential Offering Memorandums.
The Platform has appointed the Sponsor, under the terms of the Limited Liability Company Agreement (the “LLC Agreement”) as the managing member of the Master Fund. In such capacity, the Sponsor has the authority, to manage, with wide discretionary powers, the business and affairs of the Master Fund including the authority to select the administrator for the Master Fund. The LLC Agreement will continue to remain in force until terminated by either the Sponsor or the Platform upon not less than sixty (60) days’ prior written notice. In certain circumstances (for example, the insolvency of either party or in the event all trading for the Platform by the Advisors are suspended), the LLC Agreement may be immediately terminated by either party.
Galaxy Plus Fund – FORT Contrarian Master Fund (510) LLC
(A Delaware Limited Liability Company)
Notes to Financial Statements
The Master Fund and the Sponsor have entered into a tri-party contract (the “Trading Agreement”) with the Trading Advisor pursuant to which the Master Fund’s trading accounts are managed, subject to rights of termination, by the Trading Advisor in accordance with the Program. The Trading Advisor may alter its Program (including its trading systems and methods and including the addition and/or deletion of any financial interests or contracts traded in the Master Fund’s trading accounts), provided that the Trading Advisor provide prior notice to the Master Fund and the Sponsor of any material change to the Trading Advisor’s Program. From time to time, the Trading Advisor (or its affiliates) may manage additional accounts, and these accounts will increase the level of competition for the same trades desired for the Master Fund, including the priorities of order entry. There is no specific limit as to the number of accounts the Trading Advisors (or their affiliates) may manage. In addition, the positions of all of the accounts owned or controlled by the Trading Advisor (or its affiliates) are aggregated for the purposes of applying speculative position limits. The management, incentive, and sponsor fees are paid directly by the Feeder Funds, and for this reason are not recorded as expenses of the Master Fund.
Note 2. Summary of Significant Accounting Policies
The following is a summary of significant accounting policies consistently followed in the preparation of the Master Fund’s financial statements.
Principles of accounting: The accompanying financial statements are expressed in United States dollars (USD) and have been prepared in accordance with Generally Accepted Accounting Principles (GAAP), as established by the Financial Accounting Standards Board (FASB), to ensure consistent reporting of financial condition and results of operations. The Master Fund is an investment company and follows the accounting and reporting guidance in FASB Account Standards Codification Topic 946.
Cash and restricted cash: Cash held in the commodity trading accounts at clearing broker consists of either cash maintained in the custody of the broker, a portion of which is required margin for open positions, or amounts due to/from the broker for margin or unsettled trades. The Master Fund may also hold cash in a non-interest bearing USD commercial bank account. The Master Fund holds various currencies at the clearing broker, of which $507,856 is held in USD and a balance payable of $(20,979) in foreign currencies as of December 31, 2022, and are recorded in cash and restricted cash – margin balance on the Statement of Financial Condition. The non-U.S. currencies fluctuate in value on a daily basis relative to the USD. A portion of this cash is restricted cash required to meet maintenance margin requirements. Cash with the clearing broker as of December 31, 2022 included restricted cash for margin requirements of $232,475. This cash becomes unrestricted when the underlying positions to which it is applicable are liquidated. Cash with the clearing broker as of December 31, 2022 included amounts due to the broker for unsettled trades of $0.
Offsetting of amounts related to certain contracts: When the requirements are met, the Master Fund offsets certain fair value amounts recognized for net derivative positions executed with the same counterparty under the same master netting arrangement (See Note 5).
Galaxy Plus Fund – FORT Contrarian Master Fund (510) LLC
(A Delaware Limited Liability Company)
Notes to Financial Statements
Valuation and Revenue Recognition: Depending on the Program and Investments traded, the Master Fund follows the following valuation and revenue recognition policies. All investments are recorded at their estimated fair value, as described in Note 3.
Futures and options on futures contracts: The Master Fund may enter into futures and options on futures contracts. Upon entering into a futures contract, the Master Fund agrees to receive or deliver a fixed quantity of an underlying instrument or commodity for an agreed-upon price, while an option contract provides the option purchaser with the right, but not the obligation, to buy or sell a security or financial instrument at a predetermined exercise price during a defined period. Futures and options on futures contracts are recorded on the trade date. The difference between the original contract amount and the fair value of futures contracts purchased or sold is reflected as unrealized appreciation (depreciation) on open contracts. Options on futures contracts are reflected in investments at fair value. The difference between the premiums paid or received on open options on futures contracts and fair value of such options is recorded as unrealized appreciation/(depreciation) on open contracts. The fair value of futures and options on futures contracts is based upon daily exchange settlement prices. The realized gain or loss is determined on the settlement of intraday trades first and then by the FIFO method.
Foreign currency transactions: The Master Fund’s financial statements are denominated in USD. However, foreign currency forward contracts, non-U.S. futures contracts, and non-U.S. options on futures contracts are denominated in currencies other than USD. Assets and liabilities and transactions denominated in currencies other than the USD are translated into USD at the rates in effect either at the close of business on the last business day of the reporting period or on the date of such transactions, respectively. Such fluctuations are included with the unrealized appreciation (depreciation) on open derivative contracts, net. Net realized foreign exchange gain or loss arises from the sales of foreign currencies and currency gains or losses realized between trade and settlement dates. Net unrealized foreign exchange gain and loss arises from changes in the fair value of margin collateral assets and liabilities resulting from changes in exchange rates.
Trading costs: Trading costs generally consist of brokerage commissions, brokerage fees, clearing fees, exchange and regulatory fees, transaction and NFA fees. Fees vary by type of contract for each purchase and sale or sale and purchase (round turn) of futures, options on futures, and forward contracts. Commissions are paid on each individual purchase and sale transaction. These costs are recognized as expenses for futures and options on futures transactions and are included in net realized gain/loss from derivative contracts on the Statement of Operations.
Interest income/expense: Interest income and expense is recognized on an accrual basis.
Allocation of income and gains and losses: Profits and losses for each monthly accounting period, or shorter period if there are mid-month subscriptions and/or redemptions, are allocated pro-rata to the Feeder Funds based on their respective ownership percentage on the first day of each period throughout the year.
Galaxy Plus Fund – FORT Contrarian Master Fund (510) LLC
(A Delaware Limited Liability Company)
Notes to Financial Statements
Income taxes: The Master Fund will not be subject to United States federal income taxation other than certain withholding taxes. The Master Fund evaluates tax positions taken or expected to be taken to determine whether the tax positions are more-likely-than-not of being sustained by the applicable tax authority. For tax positions meeting the more-likely-than-not threshold, the tax amount recognized in the financial statements is reduced by the largest benefit that has a greater than fifty percent likelihood of being realized upon ultimate settlement with the relevant taxing authority. The Master Fund has determined that there is no tax liability resulting from uncertain income tax positions taken or expected to be taken with respect to all open tax years. The Master Fund’s U.S. Federal tax returns for the years ended December 31, 2019 through 2022 remain open. The Master Fund recognizes interest and penalties, if any, related to unrecognized tax benefits as income tax expense in the Statement of Operations. During the year, the Master Fund did not accrue any interest or penalties.
Use of estimates: The preparation of financial statements in accordance with GAAP requires management to make estimates and assumptions that affect the reported amounts of assets and liabilities and disclosure of contingent assets and liabilities at the date of the financial statements and the reported amounts of income and expenses during the reporting period. Actual results could differ from those estimates.
Indemnifications: The Sponsor and its affiliates are indemnified against certain liabilities arising out of the performance of their duties for The Master Fund. In addition, in the normal course of business, the Master Fund enters into contracts with vendors and others that provide for general indemnifications. The Master Fund’s maximum exposure under these arrangements is unknown as this would involve future claims that may be made against the Master Fund. However, the Master Fund expects the risk of loss to be remote.
Statement of Cash Flows: The Master Fund has elected not to provide a Statement of Cash Flows as permitted by GAAP as all of the following conditions have been met:
| ● | During the year, substantially all of the Master Fund’s investments were carried at fair value and classified as Level 1 or Level 2 measurements in accordance with FASB ASC 820; |
| ● | The Master Fund had little or no debt during the year; |
| ● | The Master Fund’s financial statements include a Statement of Changes in Member’s Equity. |
Subscriptions and redemptions: Subscriptions and redemptions can typically be made on a weekly basis as of the first day (Monday) of each week; (or, if such day is not a business day, the first business day thereafter) (each, a Subscription Date or a Redemption Date). The Master Fund may accept subscriptions or redemptions more frequently than the first day of each week, depending upon the size of the requested subscription or redemption amount, with the approval of the Sponsor.
Galaxy Plus Fund – FORT Contrarian Master Fund (510) LLC
(A Delaware Limited Liability Company)
Notes to Financial Statements
Note 3. Fair Value Measurements
The Master Fund’s investments are stated at fair value in accordance with FASB ASC 820, Fair Value Measurements and Disclosures (ASC 820). ASC 820 defines fair value, establishes a framework for measuring fair value and expands disclosures about fair value measurements. ASC 820 also emphasizes that fair value is a market-based measurement, not an entity-specific measurement, and sets out a fair value hierarchy with the highest priority being quoted prices in active market. Under ASC 820, fair value measurements are disclosed by level within that hierarchy, as follows:
Level 1 — Values for investments classified as Level 1 are based on unadjusted quoted prices for identical investments in an active market. Since valuations are based on quoted prices that are readily accessible at the measurement date, valuation of these investments does not entail a significant degree of judgment.
Level 2 — Values for investments classified as Level 2 are based on quoted prices for similar investments in an active or non-active markets for which all significant inputs are observable either directly or indirectly. Level 2 inputs may also include discounts related to restrictions on the investments.
Level 3 — Values for investments categorized as Level 3 are based on prices or valuation techniques that require inputs that are both significant to the fair value and unobservable, including valuations by the Sponsor in the absence of readily ascertainable fair values.
A description of the valuation methodologies applied to the Master Fund’s major categories of assets and liabilities measured at fair value on a recurring basis follows. Inputs that are used in determining fair value of an investment may include price information, credit data, volatility statistics, and other factors. These inputs can be either observable or unobservable. All of the inputs for the Master Fund were observable as of December 31, 2022. The availability of observable inputs can vary between investments and is affected by various factors such as type of investment and the volume and level of activity for that investment or similar investments in the marketplace.
Exchange-traded derivative contracts that are actively traded are valued based on daily quoted settlement prices from the respective exchange and are categorized in Level 1 of the fair value hierarchy. Exchange-traded derivative contracts not actively traded and over-the-counter (OTC) derivative contracts can include futures contracts, option on futures contracts, forward contracts and option contracts whose values are based on an underlying such as interest rates, foreign currencies, credit standing of reference entities, equities or commodities. Such derivative contracts are valued using observable market data, including currency spot rates or quoted prices of the related underlying obtained from the applicable exchange or market. OTC derivative contracts are valued using the above described pricing methodology and are categorized as Level 2 within the fair value hierarchy.
The Master Fund assesses the levels of the investments at each measurement date, and transfers between levels are recognized on the actual date of the event or change in circumstances that caused the transfer in accordance with the Master Fund’s accounting policy regarding the recognition of transfers between levels of the fair value hierarchy. There were no transfers among levels 1, 2, and 3 during the year ended December 31, 2022.
The inputs or methodologies used for valuing investments are not necessarily indicative of the risk associated with investing in those instruments.
Galaxy Plus Fund – FORT Contrarian Master Fund (510) LLC
(A Delaware Limited Liability Company)
Notes to Financial Statements
The following tables present the classification of derivatives, by type, into the fair value hierarchy levels as of December 31, 2022. Presentation is gross – as an asset if in a gain position and a liability if in a loss position.
| | | | | | Fair Value Measurements at Reporting Date Using | |
| | | | | | Quoted Prices | | | Significant Other | | | Significant | |
| | | | | | in Active | | | Observable | | | Unobservable | |
| | | | | | Markets | | | Inputs | | | Inputs | |
| Description | | Fair Value | | | (Level 1) | | | (Level 2) | | | (Level 3) | |
| Assets: | | | | | | | | | | | | |
| Derivative contracts: | | | | | | | | | | | | |
| Futures contracts: | | | | | | | | | | | | |
| Agriculture | | $ | 2,320 | | | $ | 2,320 | | | $ | - | | | $ | - | |
| Currency | | | 2,196 | | | | 2,196 | | | | - | | | | - | |
| Energy | | | 7,560 | | | | 7,560 | | | | - | | | | - | |
| Index | | | 1,491 | | | | 1,491 | | | | - | | | | - | |
| Interest | | | 54,656 | | | | 54,656 | | | | - | | | | - | |
| | | | | | | | | | | | | | | | | |
| Total investment assets at fair value | | | 68,223 | | | | 68,223 | | | | - | | | | - | |
| | | | | | | | | | | | | | | | | |
| Liabilities: | | | | | | | | | | | | | | | | |
| Derivative contracts: | | | | | | | | | | | | | | | | |
| Futures contracts: | | | | | | | | | | | | | | | | |
| Agriculture | | | (888 | ) | | | (888 | ) | | | - | | | | - | |
| Currency | | | (5,702 | ) | | | (5,702 | ) | | | - | | | | - | |
| Index | | | (7,938 | ) | | | (7,938 | ) | | | - | | | | - | |
| Interest | | | (23,995 | ) | | | (23,995 | ) | | | - | | | | - | |
| | | | | | | | | | | | | | | | | |
| Total investment liabilities at fair value | | | (38,523 | ) | | | (38,523 | ) | | | - | | | | - | |
| | | | | | | | | | | | | | | | | |
| Total net investments at fair value | | $ | 29,700 | | | $ | 29,700 | | | $ | - | | | $ | - | |
Galaxy Plus Fund – FORT Contrarian Master Fund (510) LLC
(A Delaware Limited Liability Company)
Notes to Financial Statements
Note 4. Derivative Financial Instruments
Derivative financial instruments speculatively traded by the Master Fund can include U.S. and foreign futures, options on futures contracts, and forward currency contracts (collectively, derivatives) whose values are based upon an underlying asset, indices, or reference rates, and generally represent future commitments to exchange cash flows, or to purchase or sell other financial instruments at specified future dates. A derivative contract may be traded on an exchange or OTC. Exchange-traded derivatives are standardized and include futures and options on futures contracts. OTC derivative contracts are negotiated between contracting parties and include forward currency contracts and certain options. Derivatives are subject to various risks similar to those related to the underlying financial instruments including market and credit risks.
Market risk is the potential for changes in the value of derivatives due to market changes, including interest and foreign exchange rate movements and fluctuations in commodity and security prices. Market risk is directly impacted by the volatility and liquidity in the markets in which the related underlying assets are traded. The market risk of the Master Fund is managed by the underlying Trading Advisors according to each respective Program. The Master Fund is exposed to a market risk equal to the notional contract value of the derivatives contracts purchased and unlimited liability on such contracts sold short.
Credit risk is the possibility that a loss may occur due to the failure of a counterparty to perform according to the terms of a contract. Credit risk due to exchange traded derivative financial instruments is significantly reduced by the regulatory requirements of the individual exchanges on which the instruments are traded. At any point in time, the credit risk for OTC derivatives is limited to the net unrealized gain for each counterparty for which a netting agreement exists, if any. In a similar fashion, liabilities represent net amounts owed to counterparties. The credit risk exposure for the Master Fund’s outstanding OTC derivatives was $0 at December 31, 2022.
Market and geopolitical risk relate to the increasing interconnectivity between global economies and financial markets increases the likelihood that events or conditions in one region or financial market may adversely impact issuers in a different country, region, or financial market. Securities in the Master Fund may underperform due to inflation (or expectations for inflation), interest rates, global demand for particular products or resources, natural disasters, pandemics, epidemics, terrorism, regulatory events and governmental or quasi-governmental actions. The occurrence of global events similar to those in recent years, such as terrorist attacks around the world, natural disasters, social and political discord or debt crises and downgrades, among others, may result in market volatility and may have long term effects on both the U.S. and global financial markets. It is difficult to predict when similar events affecting the U.S. or global financial markets may occur, the effects that such events may have and the duration of those effects. Any such event(s) could have a significant adverse impact on the value and risk profile of the Master Fund. The current novel coronavirus (COVID-19) global pandemic and the aggressive responses taken by many governments, including closing borders, restricting international and domestic travel, and the imposition of prolonged quarantines or similar restrictions, as well as the forced or voluntary closure of, or operational changes to, many retail and other businesses, has had negative impacts, and in many cases severe negative impacts, on markets worldwide. It is not known how long such impacts, or any future impacts of other significant events described above, will or would last, but there could be a prolonged period of global economic slowdown, which may impact your investment.
Purchase and sale of futures contracts requires margin deposits with the broker. Additional deposits may be necessary for any loss on contract value. The U.S. Commodity Exchange Act requires a broker to segregate all customer transactions and assets from such broker’s proprietary activities. A customer’s cash and other property (for example, U.S. Treasury bills) deposited with a broker are considered commingled with all other customer funds subject to the broker’s segregation requirements. In the event of a broker’s insolvency, recovery may be limited to a pro rata share of segregated funds available. It is possible that the recovered amount could be less than total cash and other property deposited.
Galaxy Plus Fund – FORT Contrarian Master Fund (510) LLC
(A Delaware Limited Liability Company)
Notes to Financial Statements
The Master Fund has a substantial portion of its assets on deposit with counterparties. In the event of a counterparty’s insolvency, recovery of the Master Fund’s assets on deposit may be limited to account insurance or other protection afforded such deposits.
The notional value represents amounts related to the Master Fund’s stock exchange indices, commodities, interest rate and foreign currencies upon which the fair value of the futures contracts held by the Master Fund are based. Notional values do not represent the current fair value of, and are not necessarily indicative of the future cash flows of the Master Fund’s futures contracts. Further, the underlying price changes in relation to variables specified by the notional values affects the fair value of these derivative financial instruments. Theoretically, the Master Fund’s exposure is equal to the notional value of contracts purchased and unlimited on such contracts sold short.
As of December 31, 2022, the Master Fund had open futures contracts with the following notional values by sector:
| Description | | Quantity | | Notional Value | | | Description | | Quantity | | Notional Value | |
| Long: | | | | | | | Short: | | | | | |
| Agriculture | | 1 | | $ | 47,100 | | | Agriculture | | 1 | | $ | (33,925 | ) |
| Energy | | 3 | | | 256,770 | | | Currency | | 6 | | | (544,830 | ) |
| Index | | 11 | | | 1,356,975 | | | Index | | 7 | | | (1,451,383 | ) |
| Interest | | 5 | | | 907,998 | | | Interest | | 45 | | | (7,727,611 | ) |
During the year ended December 31, 2022, the Master Fund participated in 4,502 futures contract transactions.
Below is a summary of net trading gains and (losses) by investment type and industry:
| | | Net Trading Gain (Loss)* | |
| Futures contracts: | | �� | |
| Agriculture | | $ | 20,972 | |
| Currency | | | 15,369 | |
| Energy | | | 281,486 | |
| Index | | | (1,408,084 | ) |
| Interest | | | (1,059,940 | ) |
| Metals | | | (9,517 | ) |
| | | | | |
| Total futures contracts | | | (2,159,714 | ) |
| | | | | |
| Trading costs | | | (13,510 | ) |
| | | | | |
| Total net trading gain (loss) | | $ | (2,173,224 | ) |
| * | Includes both realized loss of $(2,352,516) and unrealized appreciation of $179,292 and is located in net realized and unrealized gain (loss) on investments and foreign currency transactions on the Statement of Operations. Amounts exclude foreign currency transactions. |
Galaxy Plus Fund – FORT Contrarian Master Fund (510) LLC
(A Delaware Limited Liability Company)
Notes to Financial Statements
Note 5. Balance Sheet Offsetting
The Master Fund is required to disclose the impact of offsetting assets and liabilities presented in the Statement of Financial Condition to enable users of the financial statements to evaluate the effect or potential effect of netting arrangements on its financial position for recognized assets and liabilities. These recognized assets and liabilities include financial instruments and derivative instruments that are either subject to an enforceable master netting arrangement or similar agreement or meet the following right of set-off criteria: each of the two parties owes the other determinable amounts, the Master Fund has the right to set-off the amounts owed with the amounts owed by the other party, the Master Fund intends to set off, and the Master Fund’s right of set-off is enforceable by law.
The Master Fund is subject to enforceable master netting agreements with certain counterparties. These agreements govern the terms of certain transactions, and reduce the counterparty risk associated with relevant transactions by specifying offsetting mechanisms and collateral posting arrangements at prearranged exposure levels. Since different types of transactions have different mechanics and are sometimes traded out of different legal entities of a particular counterparty organization, each type of transaction may be covered by a different master netting arrangement, possibly resulting in the need for multiple agreements with a single counterparty. Master netting agreements may not be specific to each different asset type; in such instances, they would allow the Master Fund to close out and net its total exposure to a specified counterparty in the events of default or early termination with respect to any and all the transactions governed under a single agreement with the counterparty.
The following tables summarize the Master Fund’s netting arrangements:
| | | Gross Amounts
of Recognized | | | Offset in the
Statement of | | | Net Amount of
Assets (Liabilities)
in the Statement of | |
| Description | | Assets (Liabilities) | | | Financial Condition | | | Financial Condition | |
| Futures contracts | | $ | 68,223 | | | $ | (38,523 | ) | | $ | 29,700 | |
| Total | | $ | 68,223 | | | $ | (38,523 | ) | | $ | 29,700 | |
| | | Net Amount in
the Statement of | | | Cash Collateral | | | Net Amount in the Statement of | |
| | | Financial Condition | | | Received by
Counterparty | | | Financial Condition | |
| Counterparty A | | $ | 29,700 | | | $ | 232,475 | | | $ | 262,175 | |
| Total | | $ | 29,700 | | | $ | 232,475 | | | $ | 262,175 | |
Galaxy Plus Fund – FORT Contrarian Master Fund (510) LLC
(A Delaware Limited Liability Company)
Notes to Financial Statements
Note 6. Related Parties
As of December 31, 2022, the Master Fund had $76,418 receivable from the Feeder Fund, as reflected in the Statement of Financial Condition. Generally, receivables and payables from/to Feeder Fund are a result of timing differences of cash movements related to capital activity at the Feeder Fund level.
Note 7. Financial Highlights
Financial highlights of the Master Fund for the year ended December 31, 2022 are presented in the table below. The information has been derived from information presented in the financial statements.
| Total return (A) | | | (80.84 | )% |
| Ratios to average member’s equity (B): | | | | |
| Net investment loss (C) | | | (0.45 | )% |
| Total expenses | | | 0.79 | % |
| (A) | Total return is based on the change in average member’s equity during the period of a theoretical investment made at the inception of the Master Fund. |
| (B) | The total expense and net investment loss ratios are computed based upon weighted-average member’s equity as a whole for the year ended December 31, 2022. |
| (C) | The net investment loss ratio excludes net realized and unrealized gains (losses) on investments. |
Financial highlights are calculated for each member class taken as a whole. An individual member’s return and ratios may vary based on the timing of capital transactions. The negative total return would have been lower and the net investment loss and total expense ratios would have been higher if the management, incentive fees, and sponsor fees, had been charged to the Master Fund instead of the Feeder Fund.
Note 8. Subsequent Events
In accordance with FASB ASC 855, Subsequent Events, the Sponsor has evaluated all subsequent events requiring recognition and disclosure in the Master Fund’s financial statements through March 30, 2023, the date the financial statements were available for issuance. The Sponsor has determined that there are no material events that would require recognition or disclosure in the Master Fund’s financial statements through this date.
Galaxy Plus Fund – FORT Contrarian Master Fund (510) LLC
(A Delaware Limited Liability Company)
Oath and Affirmation of the Commodity Pool Operator
To the best of the knowledge and belief of the undersigned, the information contained in the annual report as of, and for the year ended December 31, 2022 is accurate and complete.
| /s/ David Young | |
| David Young, President | |
New Hyde Park Alternative Funds, LLC — Sponsor
Galaxy Plus Fund – FORT Contrarian Master Fund (510) LLC
Galaxy Plus Fund – Quest Master Fund (517) LLC
(A Delaware Limited Liability Company)
The attached annual report is filed under exemption pursuant to Section 4.7 of the regulations under the Commodity Exchange Act.
Financial Report
December 31, 2022
Contents
Independent Auditor’s Report
Managing Member
Galaxy Plus Fund LLC
Opinion
We have audited the financial statements of Galaxy Plus Fund — Quest Master Fund (517) LLC (the Fund), which comprise the statement of financial condition, including the condensed schedule of investments, as of December 31, 2022, the related statements of operations and changes in member’s equity for the year then ended, and the related notes to the financial statements.
In our opinion, the accompanying financial statements present fairly, in all material respects, the financial position of the Fund as of December 31, 2022, and the results of its operations and changes in member’s equity for the year then ended in accordance with accounting principles generally accepted in the United States of America.
Basis for Opinion
We conducted our audit in accordance with auditing standards generally accepted in the United States of America (GAAS). Our responsibilities under those standards are further described in the Auditor’s Responsibilities for the Audit of the Financial Statements section of our report. We are required to be independent of the Fund and to meet our other ethical responsibilities, in accordance with the relevant ethical requirements relating to our audit. We believe that the audit evidence we have obtained is sufficient and appropriate to provide a basis for our audit opinion.
Responsibilities of Management for the Financial Statements
Management is responsible for the preparation and fair presentation of the financial statements in accordance with accounting principles generally accepted in the United States of America, and for the design, implementation and maintenance of internal control relevant to the preparation and fair presentation of financial statements that are free from material misstatement, whether due to fraud or error.
In preparing the financial statements, management is required to evaluate whether there are conditions or events, considered in the aggregate, that raise substantial doubt about the Fund’s ability to continue as a going concern within one year after the date that the financial statements are issued or available to be issued.
Auditor’s Responsibilities for the Audit of the Financial Statements
Our objectives are to obtain reasonable assurance about whether the financial statements as a whole are free from material misstatement, whether due to fraud or error, and to issue an auditor’s report that includes our opinion. Reasonable assurance is a high level of assurance but is not absolute assurance and therefore is not a guarantee that an audit conducted in accordance with GAAS will always detect a material misstatement when it exists. The risk of not detecting a material misstatement resulting from fraud is higher than for one resulting from error, as fraud may involve collusion, forgery, intentional omissions, misrepresentations, or the override of internal control. Misstatements are considered material if there is a substantial likelihood that, individually or in the aggregate, they would influence the judgment made by a reasonable user based on the financial statements.
In performing an audit in accordance with GAAS, we:
| ● | Exercise professional judgment and maintain professional skepticism throughout the audit. |
| ● | Identify and assess the risks of material misstatement of the financial statements, whether due to fraud or error, and design and perform audit procedures responsive to those risks. Such procedures include examining, on a test basis, evidence regarding the amounts and disclosures in the financial statements. |
| ● | Obtain an understanding of internal control relevant to the audit in order to design audit procedures that are appropriate in the circumstances, but not for the purpose of expressing an opinion on the effectiveness of the Fund’s internal control. Accordingly, no such opinion is expressed. |
| ● | Evaluate the appropriateness of accounting policies used and the reasonableness of significant accounting estimates made by management, as well as evaluate the overall presentation of the financial statements. |
| ● | Conclude whether, in our judgment, there are conditions or events, considered in the aggregate, that raise substantial doubt about the Fund’s ability to continue as a going concern for a reasonable period of time. |
We are required to communicate with those charged with governance regarding, among other matters, the planned scope and timing of the audit, significant audit findings, and certain internal control–related matters that we identified during the audit.
/s/ RSM US LLP
Denver, Colorado
March 30, 2023
Galaxy Plus Fund - Quest Master Fund (517) LLC
(A Delaware Limited Liability Company)
Statement of Financial Condition
December 31, 2022
(Expressed in U.S. Dollars)
| Assets | | | |
| | | | |
| Equity in commodity trading accounts at clearing brokers: | | | |
| Cash | | $ | 993,218 | |
| Restricted cash - margin balance | | | 1,206,540 | |
Investments in futures contracts, at fair value
(represents unrealized appreciation on open derivative contracts, net) | | | 189,242 | |
| Receivable from Onshore Feeder Fund | | | 32,025 | |
| | | | | |
| Total assets | | $ | 2,421,025 | |
| | | | | |
| Liabilities and Member’s Equity | | | | |
| | | | | |
| Total liabilities | | $ | - | |
| | | | | |
| Member’s equity | | | 2,421,025 | |
| | | | | |
| Total liabilities and member’s equity | | $ | 2,421,025 | |
See notes to financial statements.
Galaxy Plus Fund - Quest Master Fund (517) LLC
(A Delaware Limited Liability Company)
Condensed Schedule of Investments
December 31, 2022
(Expressed in U.S. Dollars)
| | | Number of | | | | | | Percent of | |
| | | Contracts/
Units | | | Fair Value | | | Member’s
Equity | |
| Long positions: | | | | | | | | | |
| Derivative contracts: | | | | | | | | | |
| Domestic (United States): | | | | | | | | | |
| Futures contracts: | | | | | | | | | |
| Agriculture | | 38 | | | $ | 29,843 | | | | 1.23 | % |
| Currency | | 32 | | | | 4,321 | | | | 0.18 | |
| Energy | | 1 | | | | 5,019 | | | | 0.21 | |
| Metals | | 4 | | | | 15,248 | | | | 0.63 | |
| Foreign: | | | | | | | | | | | |
| Futures contracts: | | | | | | | | | | | |
| Index | | 8 | | | | (11,668 | ) | | | (0.48 | ) |
| | | | | | | | | | | | |
| Total long positions | | | | | | 42,763 | | | | 1.77 | |
| | | | | | | | | | | | |
| Short positions: | | | | | | | | | | | |
| Derivative contracts: | | | | | | | | | | | |
| Domestic (United States): | | | | | | | | | | | |
| Futures contracts: | | | | | | | | | | | |
| Agriculture | | 3 | | | | (1,463 | ) | | | (0.06 | ) |
| Currency | | 12 | | | | (6,316 | ) | | | (0.26 | ) |
| Energy | | 5 | | | | (4,590 | ) | | | (0.19 | ) |
| Index | | 7 | | | | 12,662 | | | | 0.52 | |
| Interest | | 36 | | | | 7,672 | | | | 0.32 | |
| Foreign: | | | | | | | | | | | |
| Futures contracts: | | | | | | | | | | | |
| Index | | 5 | | | | 3,965 | | | | 0.16 | |
| Interest 1 | | 50 | | | | 134,549 | | | | 5.56 | |
| | | | | | | | | | | | |
| Total short positions | | | | | | 146,479 | | | | 6.05 | |
| | | | | | | | | | | | |
| Investments in futures contracts, at fair value | | | | | $ | 189,242 | | | | 7.82 | % |
| 1 | No individual position is greater than 5% of members’ equity. |
See notes to financial statements.
Galaxy Plus Fund - Quest Master Fund (517) LLC
(A Delaware Limited Liability Company)
Statements of Operations
For the year ended December 31, 2022
(Expressed in U.S. Dollars)
| Investment Income: | | | |
| Interest income | | $ | 22,980 | |
| | | | | |
| Total investment income | | | 22,980 | |
| | | | | |
| Expenses: | | | | |
| Interest expenses | | | 2,769 | |
| Other expenses | | | 1,328 | |
| | | | | |
| Total expenses | | | 4,097 | |
| | | | | |
| Net investment income | | | 18,883 | |
| | | | | |
| Realized and unrealized gain (loss) on investments and foreign currency transactions: | | | | |
| Net realized gain from: | | | | |
| Derivative contracts1 | | | 1,484,361 | |
| Foreign currency transactions | | | 3,447 | |
| | | | 1,487,808 | |
| | | | | |
| Net increase (decrease) in unrealized appreciation on: | | | | |
| Derivative contracts | | | 174,666 | |
| | | | 174,666 | |
| | | | | |
| Net realized and unrealized gain on investments and foreign currency transactions | | | 1,662,474 | |
| | | | | |
| Net increase in member’s equity resulting from operations | | $ | 1,681,357 | |
| 1 | Including trading costs. |
See notes to financial statements.
Galaxy Plus Fund - Quest Master Fund (517) LLC
(A Delaware Limited Liability Company)
Statements of Changes in Members’ Equity
For the year ended December 31, 2022
(Expressed in U.S. Dollars)
| Changes in member’s equity from operations: | | | |
| Net investment income | | $ | 18,883 | |
| Net realized gain from derivative contracts and foreign currency transactions | | | 1,487,808 | |
| Net increase (decrease) in unrealized appreciation on derivative contracts | | | 174,666 | |
| | | | | |
| Net increase in member’s equity resulting from operations | | | 1,681,357 | |
| | | | | |
| Changes in member’s equity from capital transactions: | | | | |
| Proceeds from issuance of capital | | | 85,846 | |
| Payments for redemptions of capital | | | (939,363 | ) |
| | | | | |
| Net decrease in member’s equity resulting from capital transactions | | | (853,517 | ) |
| | | | | |
| Total increase | | | 827,840 | |
| | | | | |
| Member’s equity, beginning of year | | | 1,593,185 | |
| | | | | |
| Member’s equity, end of year | | $ | 2,421,025 | |
See notes to financial statements.
Galaxy Plus Fund – Quest Master Fund (517) LLC
(A Delaware Limited Liability Company)
Notes to Financial Statements
Note 1. Organization and Structure
Galaxy Plus Fund – Quest Master Fund (517) LLC (the “Master Fund”) was formed in Delaware as a limited liability company on January 12, 2016 and commenced operation on June 29, 2016. The Master Fund was created to serve as the trading entity managed by Quest Partner, L.L.C. (the “Trading Advisor”) pursuant to its Quest Tracker Index “QTI” (the “Program”). The Program is a systematic program that seeks to replicate the performance generated by the broad class of managed futures trading strategies of trend following.
The Master Fund and other separately formed Delaware limited liability companies (“Other Master Funds”), are investment vehicles available under the Galaxy Plus Managed Account Platform (the “Platform”). The Master Fund and the Platform are sponsored by New Hyde Park Alternative Funds, LLC (the “Sponsor” or “NHPAF”) as a means of making available, to qualified high net-worth individuals and institutional investors (including fund of hedge funds) (“Investors”), a variety of third-party professional managed futures and foreign exchange advisors (“Advisors”). The Trading Advisor is not affiliated with the Sponsor.
NHPAF was formed in October 2013 and its principal office is located in Wheaton, Illinois. NHPAF is registered with the U.S. Commodity Futures Trading Commission (CFTC) as a commodity pool operator and commodity trading advisor, and is a member of the National Futures Association (NFA).
Galaxy Plus Fund LLC, a Delaware Series Limited Liability Company (the “Onshore Platform”), and Galaxy Plus Fund SPC, a Cayman Islands Segregated Portfolio Company (the “Offshore Platform”) serve as the feeder funds for the Platform and invest substantially all of the assets of the respective segregated portfolios (each a “Fund”) in the Master Fund or other Master Funds. Galaxy Plus Fund – Quest Feeder Fund (517) (“LLC517”), a separated series of the Onshore Platform and Galaxy Plus Fund – Quest Offshore Feeder Fund (517) Segregated Portfolio (“SPC517”), a segregated portfolio of the Offshore Platform, can each invest in the Master Fund. As of December 31, 2022, SPC517 had not yet commenced operations and LLC517 is the sole member.
LLC517 and SPC517 are collectively hereafter referred to as the “Feeder Funds”.
Subscriptions and redemptions into the Feeder Funds and the corresponding transactions with the Master Fund are governed by the Onshore Platform’s and the Offshore Platform’s respective Confidential Offering Memorandums.
The Platform has appointed the Sponsor, under the terms of the Limited Liability Company Agreement (the “LLC Agreement”) as the managing member of the Master Fund. In such capacity, the Sponsor has the authority, to manage, with wide discretionary powers, the business and affairs of the Master Fund including the authority to select the administrator for the Master Fund. The LLC Agreement will continue to remain in force until terminated by either the Sponsor or the Platform upon not less than sixty (60) days’ prior written notice. In certain circumstances (for example, the insolvency of either party or in the event all trading for the Platform by the Advisors are suspended), the LLC Agreement may be immediately terminated by either party.
The Master Fund and the Sponsor have entered into a tri-party contract (the “Trading Agreement”) with the Trading Advisor pursuant to which the Master Fund’s trading accounts are managed, subject to rights of termination, by the Trading Advisor in accordance with the Program. The Trading Advisor may alter its Program (including its trading systems and methods and including the addition and/or deletion of any financial interests or contracts traded in the Master Fund’s trading accounts), provided that the Trading Advisor provide prior notice to the Master Fund and the Sponsor of any material change to the Trading Advisor’s Program. From time to time, the Trading Advisor (or its affiliates) may manage additional accounts, and these accounts will increase the level of competition for the same trades desired for the Master Fund, including the priorities of order entry. There is no specific limit as to the number of accounts the Trading Advisors (or their affiliates) may manage. In addition, the positions of all of the accounts owned or controlled by the Trading Advisor (or its affiliates) are aggregated for the purposes of applying speculative position limits. The management, incentive, and sponsor fees are paid directly by the Feeder Funds, and for this reason are not recorded as expenses of the Master Fund.
Galaxy Plus Fund – Quest Master Fund (517) LLC
(A Delaware Limited Liability Company)
Notes to Financial Statements
Note 2. Summary of Significant Accounting Policies
The following is a summary of significant accounting policies consistently followed in the preparation of the Master Fund’s financial statements.
Principles of accounting: The accompanying financial statements are expressed in United States dollars (USD) and have been prepared in accordance with Generally Accepted Accounting Principles (GAAP), as established by the Financial Accounting Standards Board (FASB), to ensure consistent reporting of financial condition and results of operations. The Master Fund is an investment company and follows the accounting and reporting guidance in FASB Account Standards Codification Topic 946.
Cash and restricted cash: Cash held in the commodity trading accounts at clearing broker consists of either cash maintained in the custody of the broker, a portion of which is required margin for open positions, or amounts due to/from the broker for margin or unsettled trades. The Master Fund may also hold cash in a non-interest bearing USD commercial bank account. The Master Fund holds various currencies at the clearing broker, of which $2,203,167 is held in USD and a payable balance of $(3,409) in foreign currencies as of December 31, 2022, and are recorded in cash and restricted cash – margin balance on the Statement of Financial Condition. The non-U.S. currencies fluctuate in value on a daily basis relative to the USD. A portion of this cash is restricted cash required to meet maintenance margin requirements. Cash with the clearing broker as of December 31, 2022 included restricted cash for margin requirements of $1,206,540. This cash becomes unrestricted when the underlying positions to which it is applicable are liquidated. Cash with the clearing broker as of December 31, 2022 included amounts due to the broker for unsettled trades of $0.
Offsetting of amounts related to certain contracts: When the requirements are met, the Master Fund offsets certain fair value amounts recognized for net derivative positions executed with the same counterparty under the same master netting arrangement (see Note 5).
Valuation and Revenue Recognition: Depending on the Program and Investments traded, the Master Fund follows the following valuation and revenue recognition policies. All investments are recorded at their estimated fair value, as described in Note 3.
Futures and options on futures contracts: The Master Fund may enter into futures and options on futures contracts. Upon entering into a futures contract, the Master Fund agrees to receive or deliver a fixed quantity of an underlying instrument or commodity for an agreed-upon price, while an option contract provides the option purchaser with the right, but not the obligation, to buy or sell a security or financial instrument at a predetermined exercise price during a defined period. Futures and options on futures contracts are recorded on the trade date. The difference between the original contract amount and the fair value of futures contracts purchased or sold is reflected as unrealized appreciation/(depreciation) on open contracts. Options on futures contracts are reflected in investments at fair value. The difference between the premiums paid or received on open options on futures contracts and fair value of such options is recorded as unrealized appreciation/(depreciation) on open contracts. The fair value of futures and options on futures contracts is based upon daily exchange settlement prices. The realized gain or loss is determined on the settlement of intraday trades first and then by the FIFO method.
Foreign currency transactions: The Master Fund’s financial statements are denominated in USD. However, foreign currency forward contracts, non-U.S. futures contracts, and non-U.S. options on futures contracts are denominated in currencies other than USD. Assets and liabilities and transactions denominated in currencies other than the USD are translated into USD at the rates in effect either at the close of business on the last business day of the reporting period or on the date of such transactions, respectively. Such fluctuations are included with the unrealized appreciation (depreciation) on open derivative contracts, net. Net realized foreign exchange gain or loss arises from the sales of foreign currencies and currency gains or losses realized between trade and settlement dates. Net unrealized foreign exchange gain and loss arises from changes in the fair value of margin collateral assets and liabilities resulting from changes in exchange rates.
Trading costs: Trading costs generally consist of brokerage commissions, brokerage fees, clearing fees, exchange and regulatory fees, transaction and NFA fees. Fees vary by type of contract for each purchase and sale or sale and purchase (round turn) of futures, options on futures, and forward contracts. Commissions are paid on each individual purchase and sale transaction. These costs are recognized as expenses for futures and options on futures transactions and are included in net realized gain/loss from derivative contracts on the Statement of Operations.
Interest income/expense: Interest income and expense is recognized on an accrual basis.
Allocation of income and gains and losses: Profits and losses for each monthly accounting period, or shorter period if there are mid-month subscriptions and/or redemptions, are allocated pro-rata to the Feeder Funds based on their respective ownership percentage on the first day of each period throughout the year.
Galaxy Plus Fund – Quest Master Fund (517) LLC
(A Delaware Limited Liability Company)
Notes to Financial Statements
Income taxes: The Master Fund will not be subject to United States federal income taxation other than certain withholding taxes. The Master Fund evaluates tax positions taken or expected to be taken to determine whether the tax positions are more-likely-than-not of being sustained by the applicable tax authority. For tax positions meeting the more-likely-than-not threshold, the tax amount recognized in the financial statements is reduced by the largest benefit that has a greater than fifty percent likelihood of being realized upon ultimate settlement with the relevant taxing authority. The Master Fund has determined that there is no tax liability resulting from uncertain income tax positions taken or expected to be taken with respect to all open tax years. The Master Fund’s U.S. Federal tax returns for the years ended December 31, 2019 through 2022, remain open. The Master Fund recognizes interest and penalties, if any, related to unrecognized tax benefits as income tax expense in the Statement of Operations. During the year, the Master Fund did not accrue any interest or penalties.
Use of estimates: The preparation of financial statements in accordance with GAAP requires management to make estimates and assumptions that affect the reported amounts of assets and liabilities and disclosure of contingent assets and liabilities at the date of the financial statements and the reported amounts of income and expenses during the reporting period. Actual results could differ from those estimates.
Indemnifications: The Sponsor and its affiliates are indemnified against certain liabilities arising out of the performance of their duties for The Master Fund. In addition, in the normal course of business, the Master Fund enters into contracts with vendors and others that provide for general indemnifications. The Master Fund’s maximum exposure under these arrangements is unknown as this would involve future claims that may be made against the Master Fund. However, the Master Fund expects the risk of loss to be remote.
Statement of Cash Flows: The Master Fund has elected not to provide a Statement of Cash Flows as permitted by GAAP as all of the following conditions have been met:
| ● | During the year, substantially all of the Master Fund’s investments were carried at fair value and classified as Level 1 or Level 2 measurements in accordance with FASB ASC 820; |
| ● | The Master Fund had little or no debt during the year; |
| ● | The Master Fund’s financial statements include a Statement of Changes in Member’s Equity. |
Subscriptions and redemptions: Subscriptions and redemptions can typically be made on a weekly basis as of the first day (Monday) of each week; (or, if such day is not a business day, the first business day thereafter) (each, a Subscription Date or a Redemption Date). The Master Fund may accept subscriptions or redemptions more frequently than the first day of each week, depending upon the size of the requested subscription or redemption amount, with the approval of the Sponsor.
Note 3. Fair Value Measurements
The Master Fund’s investments are stated at fair value in accordance with FASB ASC 820, Fair Value Measurements and Disclosures (ASC 820). ASC 820 defines fair value, establishes a framework for measuring fair value and expands disclosures about fair value measurements. ASC 820 also emphasizes that fair value is a market-based measurement, not an entity-specific measurement, and sets out a fair value hierarchy with the highest priority being quoted prices in active market. Under ASC 820, fair value measurements are disclosed by level within that hierarchy, as follows:
Level 1 — Values for investments classified as Level 1 are based on unadjusted quoted prices for identical investments in an active market. Since valuations are based on quoted prices that are readily accessible at the measurement date, valuation of these investments does not entail a significant degree of judgment.
Level 2 — Values for investments classified as Level 2 are based on quoted prices for similar investments in an active or non-active markets for which all significant inputs are observable either directly or indirectly. Level 2 inputs may also include discounts related to restrictions on the investments.
Level 3 — Values for investments categorized as Level 3 are based on prices or valuation techniques that require inputs that are both significant to the fair value and unobservable, including valuations by the Sponsor in the absence of readily ascertainable fair values.
Galaxy Plus Fund – Quest Master Fund (517) LLC
(A Delaware Limited Liability Company)
Notes to Financial Statements
A description of the valuation methodologies applied to the Master Fund’s major categories of assets and liabilities measured at fair value on a recurring basis follows. Inputs that are used in determining fair value of an investment may include price information, credit data, volatility statistics, and other factors. These inputs can be either observable or unobservable. All of the inputs for the Master Fund were observable as of December 31, 2022. The availability of observable inputs can vary between investments and is affected by various factors such as type of investment and the volume and level of activity for that investment or similar investments in the marketplace.
Exchange-traded derivative contracts that are actively traded are valued based on daily quoted settlement prices from the respective exchange and are categorized in Level 1 of the fair value hierarchy. Exchange-traded derivative contracts not actively traded and over-the-counter (OTC) derivative contracts can include futures contracts, option on futures contracts, forward contracts and option contracts whose values are based on an underlying such as interest rates, foreign currencies, credit standing of reference entities, equities or commodities. Such derivative contracts are valued using observable market data, including currency spot rates or quoted prices of the related underlying obtained from the applicable exchange or market. OTC derivative contracts are valued using the above described pricing methodology and are categorized as Level 2 within the fair value hierarchy.
The Master Fund assesses the levels of the investments at each measurement date, and transfers between levels are recognized on the actual date of the event or change in circumstances that caused the transfer in accordance with the Master Fund’s accounting policy regarding the recognition of transfers between levels of the fair value hierarchy. There were no transfers among levels 1, 2, and 3 during the year ended December 31, 2022.
The inputs or methodologies used for valuing investments are not necessarily indicative of the risk associated with investing in those instruments.
Galaxy Plus Fund – Quest Master Fund (517) LLC
(A Delaware Limited Liability Company)
Notes to Financial Statements
The following tables present the classification of derivatives, by type, into the fair value hierarchy levels as of December 31, 2022. Presentation is gross – as an asset if in a gain position and a liability if in a loss position.
| | | | | | Fair Value Measurements at Reporting Date Using | |
| | | | | | Quoted Prices | | | Significant Other | | | Significant | |
| | | | | | in Active | | | Observable | | | Unobservable | |
| | | | | | Markets | | | Inputs | | | Inputs | |
| Description | | Fair Value | | | (Level 1) | | | (Level 2) | | | (Level 3) | |
| Assets: | | | | | | | | | | | | |
| Derivative contracts: | | | | | | | | | | | | |
| Futures contracts: | | | | | | | | | | | | |
| Agriculture | | $ | 30,823 | | | $ | 30,823 | | | $ | - | | | $ | - | |
| Currency | | | 16,412 | | | | 16,412 | | | | - | | | | - | |
| Energy | | | 18,849 | | | | 18,849 | | | | - | | | | - | |
| Index | | | 17,731 | | | | 17,731 | | | | - | | | | - | |
| Interest | | | 142,787 | | | | 142,787 | | | | - | | | | - | |
| Metals | | | 15,248 | | | | 15,248 | | | | - | | | | - | |
| Total investment assets at fair value | | | 241,850 | | | | 241,850 | | | | - | | | | - | |
| | | | | | | | | | | | | | | | | |
| Liabilities: | | | | | | | | | | | | | | | | |
| Derivative contracts: | | | | | | | | | | | | | | | | |
| Futures contracts: | | | | | | | | | | | | | | | | |
| Agriculture | | | (2,443 | ) | | | (2,443 | ) | | | - | | | | - | |
| Currency | | | (18,407 | ) | | | (18,407 | ) | | | - | | | | - | |
| Energy | | | (18,420 | ) | | | (18,420 | ) | | | - | | | | - | |
| Index | | | (12,772 | ) | | | (12,772 | ) | | | - | | | | - | |
| Interest | | | (566 | ) | | | (566 | ) | | | - | | | | - | |
| Total investment liabilities at fair value | | | (52,608 | ) | | | (52,608 | ) | | | - | | | | - | |
| | | | | | | | | | | | | | | | | |
| Total net investments at fair value | | $ | 189,242 | | | $ | 189,242 | | | $ | - | | | $ | - | |
Galaxy Plus Fund – Quest Master Fund (517) LLC
(A Delaware Limited Liability Company)
Notes to Financial Statements
Note 4. Derivative Financial Instruments
Derivative financial instruments speculatively traded by the Master Fund can include U.S. and foreign futures, options on futures contracts, and forward currency contracts (collectively, derivatives) whose values are based upon an underlying asset, indices, or reference rates, and generally represent future commitments to exchange cash flows, or to purchase or sell other financial instruments at specified future dates. A derivative contract may be traded on an exchange or OTC. Exchange-traded derivatives are standardized and include futures and options on futures contracts. OTC derivative contracts are negotiated between contracting parties and include forward currency contracts and certain options. Derivatives are subject to various risks similar to those related to the underlying financial instruments including market and credit risks.
Market risk is the potential for changes in the value of derivatives due to market changes, including interest and foreign exchange rate movements and fluctuations in commodity and security prices. Market risk is directly impacted by the volatility and liquidity in the markets in which the related underlying assets are traded. The market risk of the Master Fund is managed by the underlying Trading Advisors according to each respective Program. The Master Fund is exposed to a market risk equal to the notional contract value of the derivatives contracts purchased and unlimited liability on such contracts sold short.
Credit risk is the possibility that a loss may occur due to the failure of a counterparty to perform according to the terms of a contract. Credit risk due to exchange traded derivative financial instruments is significantly reduced by the regulatory requirements of the individual exchanges on which the instruments are traded. At any point in time, the credit risk for OTC derivatives is limited to the net unrealized gain for each counterparty for which a netting agreement exists, if any. In a similar fashion, liabilities represent net amounts owed to counterparties. The credit risk exposure for the Master Fund’s outstanding OTC derivatives was $0 at December 31, 2022.
Market and geopolitical risk relate to the increasing interconnectivity between global economies and financial markets increases the likelihood that events or conditions in one region or financial market may adversely impact issuers in a different country, region, or financial market. Securities in the Master Fund may underperform due to inflation (or expectations for inflation), interest rates, global demand for particular products or resources, natural disasters, pandemics, epidemics, terrorism, regulatory events and governmental or quasi-governmental actions. The occurrence of global events similar to those in recent years, such as terrorist attacks around the world, natural disasters, social and political discord or debt crises and downgrades, among others, may result in market volatility and may have long term effects on both the U.S. and global financial markets. It is difficult to predict when similar events affecting the U.S. or global financial markets may occur, the effects that such events may have and the duration of those effects. Any such event(s) could have a significant adverse impact on the value and risk profile of the Master Fund. The current novel coronavirus (COVID-19) global pandemic and the aggressive responses taken by many governments, including closing borders, restricting international and domestic travel, and the imposition of prolonged quarantines or similar restrictions, as well as the forced or voluntary closure of, or operational changes to, many retail and other businesses, has had negative impacts, and in many cases severe negative impacts, on markets worldwide. It is not known how long such impacts, or any future impacts of other significant events described above, will or would last, but there could be a prolonged period of global economic slowdown, which may impact your investment.
Purchase and sale of futures contracts requires margin deposits with the broker. Additional deposits may be necessary for any loss on contract value. The U.S. Commodity Exchange Act requires a broker to segregate all customer transactions and assets from such broker’s proprietary activities. A customer’s cash and other property (for example, U.S. Treasury bills) deposited with a broker are considered commingled with all other customer funds subject to the broker’s segregation requirements. In the event of a broker’s insolvency, recovery may be limited to a pro rata share of segregated funds available. It is possible that the recovered amount could be less than total cash and other property deposited.
Galaxy Plus Fund – Quest Master Fund (517) LLC
(A Delaware Limited Liability Company)
Notes to Financial Statements
The Master Fund has a substantial portion of its assets on deposit with counterparties. In the event of a counterparty’s insolvency, recovery of the Master Fund’s assets on deposit may be limited to account insurance or other protection afforded such deposits.
The notional value represents amounts related to the Master Fund’s stock exchange indices, commodities, interest rate and foreign currencies upon which the fair value of the futures contracts held by the Master Fund are based. Notional values do not represent the current fair value of, and are not necessarily indicative of the future cash flows of the Master Fund’s futures contracts. Further, the underlying price changes in relation to variables specified by the notional values affects the fair value of these derivative financial instruments. Theoretically, the Master Fund’s exposure is equal to the notional value of contracts purchased and unlimited on such contracts sold short. As of December 31, 2022, the Master Fund had open futures contracts with the following notional values by sector:
| Description | | Quantity | | | Notional Value | | | Description | | | Quantity | | | Notional Value | |
| Long: | | | | | | | | Short: | | | | | | | |
| Agriculture | | 38 | | | $ | 1,564,684 | | | | Agriculture | | | 3 | | | $ | (118,800 | ) |
| Currency | | 32 | | | | 2,124,886 | | | | Currency | | | 12 | | | | (941,910 | ) |
| Energy | | 1 | | | | 104,089 | | | | Energy | | | 5 | | | | (330,280 | ) |
| Index | | 8 | | | | 578,287 | | | | Index | | | 12 | | | | (1,874,887 | ) |
| Metals | | 4 | | | | 389,808 | | | | Interest | | | 86 | | | | (18,670,441 | ) |
During the year ended December 31, 2022, the Master Fund participated in 4,566 futures contract transactions.
Below is a summary of net trading gains and (losses) by investment type and industry:
| | | Net Trading Gain (Loss)* | |
| Futures contracts: | | | |
| Agriculture | | $ | 267,838 | |
| Currency | | | 333,854 | |
| Energy | | | 244,607 | |
| Index | | | (241,005 | ) |
| Interest | | | 1,126,954 | |
| Metals | | | (59,850 | ) |
| | | | | |
| Total futures contracts | | | 1,672,398 | |
| | | | | |
| Trading costs | | | (13,371 | ) |
| | | | | |
| Total net trading gain (loss) | | $ | 1,659,027 | |
| * | Includes both realized gain of $1,484,361 and unrealized appreciation of $174,666 and is located in net realized and unrealized gain (loss) on investments on the Statement of Operations. Amounts exclude foreign currency transactions. |
Galaxy Plus Fund – Quest Master Fund (517) LLC
(A Delaware Limited Liability Company)
Notes to Financial Statements
Note 5. Balance Sheet Offsetting
The Master Fund is required to disclose the impact of offsetting assets and liabilities presented in the Statement of Financial Condition to enable users of the financial statements to evaluate the effect or potential effect of netting arrangements on its financial position for recognized assets and liabilities. These recognized assets and liabilities include financial instruments and derivative instruments that are either subject to an enforceable master netting arrangement or similar agreement or meet the following right of set-off criteria: each of the two parties owes the other determinable amounts, the Master Fund has the right to set-off the amounts owed with the amounts owed by the other party, the Master Fund intends to set off, and the Master Fund’s right of set-off is enforceable at law.
The Master Fund is subject to enforceable master netting agreements with certain counterparties. These agreements govern the terms of certain transactions, and reduce the counterparty risk associated with relevant transactions by specifying offsetting mechanisms and collateral posting arrangements at prearranged exposure levels. Since different types of transactions have different mechanics and are sometimes traded out of different legal entities of a particular counterparty organization, each type of transaction may be covered by a different master netting arrangement, possibly resulting in the need for multiple agreements with a single counterparty. Master netting agreements may not be specific to each different asset type; in such instances, they would allow the Master Fund to close out and net its total exposure to a specified counterparty in the events of default or early termination with respect to any and all the transactions governed under a single agreement with the counterparty.
The following tables summarize the Master Fund’s netting arrangements:
| Description | | Gross
Amounts of
Recognized
Assets
(Liabilities) | | | Offset
in the
Statement
of Financial
Condition | | | Net Amount
of Assets
(Liabilities)
in the
Statement of
Financial
Condition | |
| | | | | | | | | | |
| Futures contracts | | $ | 241,850 | | | $ | (52,608 | ) | | $ | 189,242 | |
| Total | | $ | 241,850 | | | $ | (52,608 | ) | | $ | 189,242 | |
| | | Net Amount
in the
Statement
of Financial
Condition | | | Cash
Collateral
Received by
Counterparty | | | Net Amount
in the
Statement
of Financial
Condition | |
| | | | | | | | | | |
| Counterparty A | | $ | 189,242 | | | $ | 1,206,540 | | | $ | 1,395,782 | |
| Total | | $ | 189,242 | | | $ | 1,206,540 | | | $ | 1,395,782 | |
Galaxy Plus Fund – Quest Master Fund (517) LLC
(A Delaware Limited Liability Company)
Notes to Financial Statements
Note 6. Related Parties
As of December 31, 2022, the Master Fund had $32,025 receivable from the Feeder Fund, as reflected in the Statement of Financial Condition. Generally, receivables and payables from/to Feeder Fund are a result of timing differences of cash movements related to capital activity at the Feeder Fund level.
Note 7. Financial Highlights
Financial highlights of the Master Fund for the year ended December 31, 2022 are presented in the table below. The information has been derived from information presented in the financial statements.
| Total return (A) | | | 105.56 | % |
| | | | | |
| Ratios to average member’s equity (B): | | | | |
| Net investment income (C) | | | 0.73 | % |
| Total expenses | | | 0.16 | % |
| (A) | Total return is based on the change in average member’s equity during the period of a theoretical investment made at the inception of the Master Fund. |
| (B) | The total expense and net investment income ratios are computed based upon weighted-average member’s equity as a whole for the year ended December 31, 2022. |
| (C) | The net investment income ratio excludes net realized and unrealized gains (losses) on investments. |
Financial highlights are calculated for each member class taken as a whole. An individual member’s return and ratios may vary based on the timing of capital transactions. The total return and the net investment income ratio would have been lower and total expense ratio would have been higher if the management and incentive fees, as well as the sponsor fees, had been charged to the Master Fund instead of the Feeder Fund.
Note 8. Subsequent Events
In accordance with FASB ASC 855, Subsequent Events, the Sponsor has evaluated all subsequent events requiring recognition and disclosure in the Master Fund’s financial statements through March 30, 2023, the date the financial statements were available for issuance. The Sponsor has determined that there are no material events that would require recognition or disclosure in the Master Fund’s financial statements through this date.
Galaxy Plus Fund – Quest Master Fund (517) LLC
(A Delaware Limited Liability Company)
Oath and Affirmation of the Commodity Pool Operator
To the best of the knowledge and belief of the undersigned, the information contained in the annual report as of and for the year ended December 31, 2022, is accurate and complete.
| /s/ David Young | |
| David Young, President | |
| New Hyde Park Alternative Funds, LLC — Sponsor |
| |
| Galaxy Plus Fund – Quest Master Fund (517) LLC |
Galaxy Plus Fund – LRR
Master Fund (522) LLC
(A Delaware Limited Liability Company)
The attached annual report is filed under exemption pursuant to Section 4.7 of the regulations under the Commodity Exchange Act.
Financial Report
December 31, 2022
Contents
Independent Auditor’s Report
Managing Member
Galaxy Plus Fund LLC
Opinion
We have audited the financial statements of Galaxy Plus Fund — LRR Master Fund (522) LLC (the Fund), which comprise the statement of financial condition, including the condensed schedule of investments, as of December 31, 2022, the related statements of operations and changes in member’s equity for the year then ended, and the related notes to the financial statements.
In our opinion, the accompanying financial statements present fairly, in all material respects, the financial position of the Fund as of December 31, 2022, and the results of its operations and changes in member’s equity for the year then ended in accordance with accounting principles generally accepted in the United States of America.
Basis for Opinion
We conducted our audit in accordance with auditing standards generally accepted in the United States of America (GAAS). Our responsibilities under those standards are further described in the Auditor’s Responsibilities for the Audit of the Financial Statements section of our report. We are required to be independent of the Fund and to meet our other ethical responsibilities, in accordance with the relevant ethical requirements relating to our audit. We believe that the audit evidence we have obtained is sufficient and appropriate to provide a basis for our audit opinion.
Responsibilities of Management for the Financial Statements
Management is responsible for the preparation and fair presentation of the financial statements in accordance with accounting principles generally accepted in the United States of America, and for the design, implementation and maintenance of internal control relevant to the preparation and fair presentation of financial statements that are free from material misstatement, whether due to fraud or error.
In preparing the financial statements, management is required to evaluate whether there are conditions or events, considered in the aggregate, that raise substantial doubt about the Fund’s ability to continue as a going concern within one year after the date that the financial statements are issued or available to be issued.
Auditor’s Responsibilities for the Audit of the Financial Statements
Our objectives are to obtain reasonable assurance about whether the financial statements as a whole are free from material misstatement, whether due to fraud or error, and to issue an auditor’s report that includes our opinion. Reasonable assurance is a high level of assurance but is not absolute assurance and therefore is not a guarantee that an audit conducted in accordance with GAAS will always detect a material misstatement when it exists. The risk of not detecting a material misstatement resulting from fraud is higher than for one resulting from error, as fraud may involve collusion, forgery, intentional omissions, misrepresentations, or the override of internal control. Misstatements are considered material if there is a substantial likelihood that, individually or in the aggregate, they would influence the judgment made by a reasonable user based on the financial statements.
In performing an audit in accordance with GAAS, we:
| ● | Exercise professional judgment and maintain professional skepticism throughout the audit. |
| ● | Identify and assess the risks of material misstatement of the financial statements, whether due to fraud or error, and design and perform audit procedures responsive to those risks. Such procedures include examining, on a test basis, evidence regarding the amounts and disclosures in the financial statements. |
| ● | Obtain an understanding of internal control relevant to the audit in order to design audit procedures that are appropriate in the circumstances, but not for the purpose of expressing an opinion on the effectiveness of the Fund’s internal control. Accordingly, no such opinion is expressed. |
| ● | Evaluate the appropriateness of accounting policies used and the reasonableness of significant accounting estimates made by management, as well as evaluate the overall presentation of the financial statements. |
| ● | Conclude whether, in our judgment, there are conditions or events, considered in the aggregate, that raise substantial doubt about the Fund’s ability to continue as a going concern for a reasonable period of time. |
We are required to communicate with those charged with governance regarding, among other matters, the planned scope and timing of the audit, significant audit findings, and certain internal control–related matters that we identified during the audit.
/s/ RSM US LLP
Denver, Colorado
March 30, 2023
| Galaxy Plus Fund - LRR Master Fund (522) LLC |
| (A Delaware Limited Liability Company) |
| |
| Statement of Financial Condition |
| December 31, 2022 |
| (Expressed in U.S. Dollars) |
| Assets | | | |
| | | | |
| Equity in commodity trading accounts at clearing brokers: | | | |
| Cash | | $ | 384,445 | |
| Restricted cash - margin balance | | | 104,115 | |
Investments in futures contracts, at fair value
(represents unrealized appreciation on open derivative contracts, net) | | | 64,252 | |
| Receivable from Onshore Feeder Fund | | | 39,631 | |
| | | | | |
| Total assets | | $ | 592,443 | |
| | | | | |
| Liabilities and Member’s Equity | | | | |
| | | | | |
| Total liabilities | | $ | - | |
| | | | | |
| Member’s equity | | | 592,443 | |
| | | | | |
| Total liabilities and member’s equity | | $ | 592,443 | |
See notes to financial statements.
Galaxy Plus Fund - LRR Master Fund (522) LLC
(A Delaware Limited Liability Company)
Schedule of Investments
December 31, 2022
(Expressed in U.S. Dollars)
| | | Number of
Contracts/
Units | | | Fair Value | | | Percent of
Member’s
Equity | |
| Long positions: | | | | | | | | | |
| Derivative contracts: | | | | | | | | | |
| Domestic (United States): | | | | | | | | | |
| Futures contracts: | | | | | | | | | |
| Agriculture | | | | | | | | | |
| Corn- Maturity July 2023 | | 25 | | | $ | 32,812 | | | | 5.54 | % |
| Live Cattle- Maturity February 2023 | | 24 | | | | 31,440 | | | | 5.31 | |
| | | | | | | | | | | | |
| Total long positions | | | | | | 64,252 | | | | 10.85 | |
| | | | | | | | | | | | |
| Investments in futures contracts, at fair value | | | | | $ | 64,252 | | | | 10.85 | % |
See notes to financial statements.
Galaxy Plus Fund - LRR Master Fund (522) LLC
(A Delaware Limited Liability Company)
Statements of Operations
For the year ended December 31, 2022
(Expressed in U.S. Dollars)
| Investment Income: | | | |
| Interest income | | $ | 1,008 | |
| | | | | |
| Total investment income | | | 1,008 | |
| | | | | |
| Expenses: | | | | |
| Interest expense | | | 13 | |
| Other expenses | | | 1,914 | |
| | | | | |
| Total expenses | | | 1,927 | |
| | | | | |
| Net investment loss | | | (919 | ) |
| | | | | |
| Realized and unrealized gain (loss) on investments: | | | | |
| Net realized gain from: | | | | |
| Derivative contracts1 | | | 181,878 | |
| | | | 181,878 | |
| | | | | |
| Net increase in unrealized appreciation on: | | | | |
| Derivative contracts | | | 83,204 | |
| | | | 83,204 | |
| | | | | |
| Net realized and unrealized gain on investments | | | 265,082 | |
| | | | | |
| Net increase in member’s equity resulting from operations | | $ | 264,163 | |
See notes to financial statements.
| Galaxy Plus Fund - LRR Master Fund (522) LLC |
| (A Delaware Limited Liability Company) |
| |
| Statements of Changes in Members’ Equity |
| For the year ended December 31, 2022 |
| (Expressed in U.S. Dollars) |
| Changes in member’s equity from operations: | | | |
| Net investment loss | | $ | (919 | ) |
| Net realized gain from derivative contracts | | | 181,878 | |
| Net increase in unrealized appreciation on derivative contracts | | | 83,204 | |
| | | | | |
| Net increase in member’s equity resulting from operations | | | 264,163 | |
| | | | | |
| Changes in member’s equity from capital transactions: | | | | |
| Proceeds from issuance of capital | | | 23,650 | |
| Payments for redemptions of capital | | | (173,781 | ) |
| | | | | |
| Net decrease in member’s equity resulting from capital transactions | | | (150,131 | ) |
| | | | | |
| Total increase | | | 114,032 | |
| | | | | |
| Member’s equity, beginning of year | | | 478,411 | |
| | | | | |
| Member’s equity, end of year | | $ | 592,443 | |
See notes to financial statements.
Galaxy Plus Fund - LRR Master Fund (522) LLC
(A Delaware Limited Liability Company)
Notes to Financial Statements
Note 1. Organization and Structure
Galaxy Plus Fund - LRR Master Fund (522) LLC (the “Master Fund”) was formed in Delaware as a limited liability company on January 26, 2016 and commenced operation on April 28, 2016. The Master Fund is a multi- advisor managed futures fund that allocates and reallocates its capital to different trading advisors implementing various trading programs. Rosetta Capital Management LLC (“Rosetta”), (the “Trading Advisor”) runs a technical program. As of and during the year ended December 31, 2022, Rosetta was the sole trading advisor of LRR.
The Master Fund and other separately formed Delaware limited liability companies (“Other Master Funds”), are investment vehicles available under the Galaxy Plus Managed Account Platform (the “Platform”). The Master Fund and the Platform are sponsored by New Hyde Park Alternative Funds, LLC (the “Sponsor” or “NHPAF”) as a means of making available, to qualified high net-worth individuals and institutional investors (including fund of hedge funds) (“Investors”), a variety of third-party professional managed futures and foreign exchange advisors (“Advisors”). The Trading Advisor is not affiliated with the Sponsor.
NHPAF was formed in October 2013 and its principal office is located in Wheaton, Illinois. NHPAF is registered with the U.S. Commodity Futures Trading Commission (CFTC) as a commodity pool operator and commodity trading advisor, and is a member of the National Futures Association (NFA).
Galaxy Plus Fund LLC, a Delaware Series Limited Liability Company (the “Onshore Platform”), and Galaxy Plus Fund SPC, a Cayman Islands Segregated Portfolio Company (the “Offshore Platform”) serve as the feeder funds for the Platform and invest substantially all of the assets of the respective segregated portfolios (each a “Fund”) in the Master Fund or other Master Funds. Galaxy Plus Fund - LRR Feeder Fund (522) (“LLC522”), a separated series of the Onshore Platform and Galaxy Plus Fund- LRR Offshore Feeder Fund (522) Segregated Portfolio (“SPC522”), a segregated portfolio of the Offshore Platform, can each invest in the Master Fund. As of December 31, 2022, SPC522 had not yet commenced operations and LLC522 is the sole member.
LLC522 and SPC522 are collectively hereafter referred to as the “Feeder Funds”.
Subscriptions and redemptions into the Feeder Funds and the corresponding transactions with the Master Fund are governed by the Onshore Platform’s and the Offshore Platform’s respective Confidential Offering Memorandums.
The Platform has appointed the Sponsor, under the terms of the Limited Liability Company Agreement (the “LLC Agreement”) as the managing member of the Master Fund. In such capacity, the Sponsor has the authority, to manage, with wide discretionary powers, the business and affairs of the Master Fund including the authority to select the administrator for the Master Fund. The LLC Agreement will continue to remain in force until terminated by either the Sponsor or the Platform upon not less than sixty (60) days’ prior written notice. In certain circumstances (for example, the insolvency of either party or in the event all trading for the Platform by the Advisors are suspended), the LLC Agreement may be immediately terminated by either party.
Galaxy Plus Fund - LRR Master Fund (522) LLC
(A Delaware Limited Liability Company)
Notes to Financial Statements
The Master Fund and the Sponsor have entered into a tri-party contract (the “Trading Agreement”) with the Trading Advisor pursuant to which the Master Fund’s trading accounts are managed, subject to rights of termination, by the Trading Advisor in accordance with the Program. The Trading Advisor may alter its Program (including its trading systems and methods and including the addition and/or deletion of any financial interests or contracts traded in the Master Fund’s trading accounts), provided that the Trading Advisor provide prior notice to the Master Fund and the Sponsor of any material change to the Trading Advisor’s Program. From time to time, the Trading Advisor (or its affiliates) may manage additional accounts, and these accounts will increase the level of competition for the same trades desired for the Master Fund, including the priorities of order entry. There is no specific limit as to the number of accounts the Trading Advisors (or their affiliates) may manage. In addition, the positions of all of the accounts owned or controlled by the Trading Advisor (or its affiliates) are aggregated for the purposes of applying speculative position limits. The management, incentive, and sponsor fees are paid directly by the Feeder Funds, and for this reason are not recorded as expenses of the Master Fund.
Note 2. Summary of Significant Accounting Policies
The following is a summary of significant accounting policies consistently followed in the preparation of the Master Fund’s financial statements.
Principles of accounting: The accompanying financial statements are expressed in United States dollars (USD) and have been prepared in accordance with Generally Accepted Accounting Principles (GAAP), as established by the Financial Accounting Standards Board (FASB), to ensure consistent reporting of financial condition and results of operations. The Master Fund is an investment company and follows the accounting and reporting guidance in FASB Account Standards Codification Topic 946.
Cash and restricted cash: Cash held in the commodity trading accounts at clearing broker consists of either cash maintained in the custody of the broker, a portion of which is required margin for open positions, or amounts due to/from the broker for margin or unsettled trades. The Master Fund may also hold cash in a non-interest bearing USD commercial bank account. The Master Fund holds various currencies at the clearing broker, of which $ 488,560 is held in USD and $0 in foreign currencies as of December 31, 2022, and are recorded in cash and restricted cash – margin balance on the Statement of Financial Condition. The non-U.S. currencies fluctuate in value on a daily basis relative to the USD. A portion of this cash is restricted cash required to meet maintenance margin requirements. Cash with the clearing broker as of December 31, 2022 included restricted cash for margin requirements of $ 104,115. This cash becomes unrestricted when the underlying positions to which it is applicable are liquidated. Cash with the clearing broker as of December 31, 2022 included amounts due to the broker for unsettled trades of $0.
Offsetting of amounts related to certain contracts: When the requirements are met, the Master Fund offsets certain fair value amounts recognized for net derivative positions executed with the same counterparty under the same master netting arrangement (see Note 5).
Galaxy Plus Fund - LRR Master Fund (522) LLC
(A Delaware Limited Liability Company)
Notes to Financial Statements
Valuation and Revenue Recognition: Depending on the Program and Investments traded, the Master Fund follows the following valuation and revenue recognition policies. All investments are recorded at their estimated fair value, as described in Note 3.
Futures and options on futures contracts: The Master Fund may enter into futures and options on futures contracts. Upon entering into a futures contract, the Master Fund agrees to receive or deliver a fixed quantity of an underlying instrument or commodity for an agreed-upon price, while an option contract provides the option purchaser with the right, but not the obligation, to buy or sell a security or financial instrument at a predetermined exercise price during a defined period. Futures and options on futures contracts are recorded on the trade date. The difference between the original contract amount and the fair value of futures contracts purchased or sold is reflected as unrealized appreciation/(depreciation) on open contracts. Options on futures contracts are reflected in investments at fair value. The difference between the premiums paid or received on open options on futures contracts and fair value of such options is recorded as unrealized appreciation/(depreciation) on open contracts. The fair value of futures and options on futures contracts is based upon daily exchange settlement prices. The realized gain or loss is determined on the settlement of intraday trades first and then by the FIFO method.
Trading costs: Trading costs generally consist of brokerage commissions, brokerage fees, clearing fees, exchange and regulatory fees, transaction and NFA fees. Fees vary by type of contract for each purchase and sale or sale and purchase (round turn) of futures, options on futures, and forward contracts. Commissions are paid on each individual purchase and sale transaction. These costs are recognized as expenses for futures and options on futures transactions and are included in net realized gain/loss from derivative contracts on the Statement of Operations.
Interest income/expense: Interest income and expense is recognized on an accrual basis.
Allocation of income and gains and losses: Profits and losses for each monthly accounting period, or shorter period if there are mid-month subscriptions and/or redemptions, are allocated pro-rata to the Feeder Funds based on their respective ownership percentage on the first day of each period throughout the year.
Income taxes: The Master Fund will not be subject to United States federal income taxation other than certain withholding taxes. The Master Fund evaluates tax positions taken or expected to be taken to determine whether the tax positions are more-likely-than-not of being sustained by the applicable tax authority. For tax positions meeting the more-likely-than-not threshold, the tax amount recognized in the financial statements is reduced by the largest benefit that has a greater than fifty percent likelihood of being realized upon ultimate settlement with the relevant taxing authority. The Master Fund has determined that there is no tax liability resulting from uncertain income tax positions taken or expected to be taken with respect to all open tax years. The Master Fund’s U.S. Federal tax returns for the years ended December 31, 2019 through 2022, remain open. The Master Fund recognizes interest and penalties, if any, related to unrecognized tax benefits as income tax expense in the Statement of Operations. During the year, the Master Fund did not accrue any interest or penalties.
Use of estimates: The preparation of financial statements in accordance with GAAP requires management to make estimates and assumptions that affect the reported amounts of assets and liabilities and disclosure of contingent assets and liabilities at the date of the financial statements and the reported amounts of income and expenses during the reporting period. Actual results could differ from those estimates.
Galaxy Plus Fund - LRR Master Fund (522) LLC
(A Delaware Limited Liability Company)
Notes to Financial Statements
Indemnifications: The Sponsor and its affiliates are indemnified against certain liabilities arising out of the performance of their duties for The Master Fund. In addition, in the normal course of business, the Master Fund enters into contracts with vendors and others that provide for general indemnifications. The Master Fund’s maximum exposure under these arrangements is unknown as this would involve future claims that may be made against the Master Fund. However, the Master Fund expects the risk of loss to be remote.
Statement of Cash Flows: The Master Fund has elected not to provide a Statement of Cash Flows as permitted by GAAP as all of the following conditions have been met:
| ● | During the year, substantially all of the Master Fund’s investments were carried at fair value and classified as Level 1 or Level 2 measurements in accordance with FASB ASC 820; |
| ● | The Master Fund had little or no debt during the year; |
| ● | The Master Fund’s financial statements include a Statement of Changes in Member’s Equity. |
Subscriptions and redemptions: Subscriptions and redemptions can typically be made on a weekly basis as of the first day (Monday) of each week; (or, if such day is not a business day, the first business day thereafter) (each, a Subscription Date or a Redemption Date). The Master Fund may accept subscriptions or redemptions more frequently than the first day of each week, depending upon the size of the requested subscription or redemption amount, with the approval of the Sponsor.
Note 3. Fair Value Measurements
The Master Fund’s investments are stated at fair value in accordance with FASB ASC 820, Fair Value Measurements and Disclosures (ASC 820). ASC 820 defines fair value, establishes a framework for measuring fair value and expands disclosures about fair value measurements. ASC 820 also emphasizes that fair value is a market-based measurement, not an entity-specific measurement, and sets out a fair value hierarchy with the highest priority being quoted prices in active market. Under ASC 820, fair value measurements are disclosed by level within that hierarchy, as follows:
Level 1 — Values for investments classified as Level 1 are based on unadjusted quoted prices for identical investments in an active market. Since valuations are based on quoted prices that are readily accessible at the measurement date, valuation of these investments does not entail a significant degree of judgment.
Level 2 — Values for investments classified as Level 2 are based on quoted prices for similar investments in an active or non-active markets for which all significant inputs are observable either directly or indirectly. Level 2 inputs may also include discounts related to restrictions on the investments.
Level 3 — Values for investments categorized as Level 3 are based on prices or valuation techniques that require inputs that are both significant to the fair value and unobservable, including valuations by the Sponsor in the absence of readily ascertainable fair values.
A description of the valuation methodologies applied to the Master Fund’s major categories of assets and liabilities measured at fair value on a recurring basis follows. Inputs that are used in determining fair value of an investment may include price information, credit data, volatility statistics, and other factors. These inputs can be either observable or unobservable. All of the inputs for the Master Fund were observable as of December 31, 2022. The availability of observable inputs can vary between investments and is affected by various factors such as type of investment and the volume and level of activity for that investment or similar investments in the marketplace.
Galaxy Plus Fund - LRR Master Fund (522) LLC
(A Delaware Limited Liability Company)
Notes to Financial Statements
Exchange-traded derivative contracts that are actively traded are valued based on daily quoted settlement prices from the respective exchange and are categorized in Level 1 of the fair value hierarchy. Exchange-traded derivative contracts not actively traded and over-the-counter (OTC) derivative contracts can include futures contracts, option on futures contracts, forward contracts and option contracts whose values are based on an underlying such as interest rates, foreign currencies, credit standing of reference entities, equities or commodities. Such derivative contracts are valued using observable market data, including currency spot rates or quoted prices of the related underlying obtained from the applicable exchange or market. OTC derivative contracts are valued using the above described pricing methodology and are categorized as Level 2 within the fair value hierarchy.
The Master Fund assesses the levels of the investments at each measurement date, and transfers between levels are recognized on the actual date of the event or change in circumstances that caused the transfer in accordance with the Master Fund’s accounting policy regarding the recognition of transfers between levels of the fair value hierarchy. There were no transfers among levels 1, 2, and 3 during the year ended December 31, 2022.
The inputs or methodologies used for valuing investments are not necessarily indicative of the risk associated with investing in those instruments.
The following tables present the classification of derivatives, by type, into the fair value hierarchy levels as of December 31, 2022. Presentation is gross – as an asset if in a gain position and a liability if in a loss position.
| | | | | | Fair Value Measurements at Reporting Date Using | |
| | | | | | Quoted Prices | | | Significant Other | | | Significant | |
| | | | | | in Active | | | Observable | | | Unobservable | |
| | | | | | Markets | | | Inputs | | | Inputs | |
| Description | | Fair Value | | | (Level 1) | | | (Level 2) | | | (Level 3) | |
| Assets: | | | | | | | | | | | | |
| Derivative contracts: | | | | | | | | | | | | |
| Futures contracts: | | | | | | | | | | | | |
| Agriculture | | $ | 64,252 | | | $ | 64,252 | | | $ | - | | | $ | - | |
| | | | | | | | | | | | | | | | | |
| Total investment assets at fair value | | | 64,252 | | | | 64,252 | | | | - | | | | - | |
| | | | | | | | | | | | | | | | | |
| Total investment liabilities at fair value | | | - | | | | - | | | | - | | | | - | |
| | | | | | | | | | | | | | | | | |
| Total net investments at fair value | | $ | 64,252 | | | $ | 64,252 | | | $ | - | | | $ | - | |
Galaxy Plus Fund - LRR Master Fund (522) LLC
(A Delaware Limited Liability Company)
Notes to Financial Statements
Note 4. Derivative Financial Instruments
Derivative financial instruments speculatively traded by the Master Fund can include U.S. and foreign futures, options on futures contracts, and forward currency contracts (collectively, derivatives) whose values are based upon an underlying asset, indices, or reference rates, and generally represent future commitments to exchange cash flows, or to purchase or sell other financial instruments at specified future dates. A derivative contract may be traded on an exchange or OTC. Exchange-traded derivatives are standardized and include futures and options on futures contracts. OTC derivative contracts are negotiated between contracting parties and include forward currency contracts and certain options. Derivatives are subject to various risks similar to those related to the underlying financial instruments including market and credit risks.
Market risk is the potential for changes in the value of derivatives due to market changes, including interest and foreign exchange rate movements and fluctuations in commodity and security prices. Market risk is directly impacted by the volatility and liquidity in the markets in which the related underlying assets are traded. The market risk of the Master Fund is managed by the underlying Trading Advisors according to each respective Program. The Master Fund is exposed to a market risk equal to the notional contract value of the derivatives contracts purchased and unlimited liability on such contracts sold short.
Credit risk is the possibility that a loss may occur due to the failure of a counterparty to perform according to the terms of a contract. Credit risk due to exchange traded derivative financial instruments is significantly reduced by the regulatory requirements of the individual exchanges on which the instruments are traded. At any point in time, the credit risk for OTC derivatives is limited to the net unrealized gain for each counterparty for which a netting agreement exists, if any. In a similar fashion, liabilities represent net amounts owed to counterparties. The credit risk exposure for the Master Fund’s outstanding OTC derivatives was $0 at December 31, 2022.
Market and geopolitical risk relate to the increasing interconnectivity between global economies and financial markets increases the likelihood that events or conditions in one region or financial market may adversely impact issuers in a different country, region, or financial market. Securities in the Master Fund may underperform due to inflation (or expectations for inflation), interest rates, global demand for particular products or resources, natural disasters, pandemics, epidemics, terrorism, regulatory events and governmental or quasi-governmental actions. The occurrence of global events similar to those in recent years, such as terrorist attacks around the world, natural disasters, social and political discord or debt crises and downgrades, among others, may result in market volatility and may have long term effects on both the U.S. and global financial markets. It is difficult to predict when similar events affecting the U.S. or global financial markets may occur, the effects that such events may have and the duration of those effects. Any such event(s) could have a significant adverse impact on the value and risk profile of the Master Fund. The current novel coronavirus (COVID-19) global pandemic and the aggressive responses taken by many governments, including closing borders, restricting international and domestic travel, and the imposition of prolonged quarantines or similar restrictions, as well as the forced or voluntary closure of, or operational changes to, many retail and other businesses, has had negative impacts, and in many cases severe negative impacts, on markets worldwide. It is not known how long such impacts, or any future impacts of other significant events described above, will or would last, but there could be a prolonged period of global economic slowdown, which may impact your investment.
Purchase and sale of futures contracts requires margin deposits with the broker. Additional deposits may be necessary for any loss on contract value. The U.S. Commodity Exchange Act requires a broker to segregate all customer transactions and assets from such broker’s proprietary activities. A customer’s cash and other property (for example, U.S. Treasury bills) deposited with a broker are considered commingled with all other customer funds subject to the broker’s segregation requirements. In the event of a broker’s insolvency, recovery may be limited to a pro rata share of segregated funds available. It is possible that the recovered amount could be less than total cash and other property deposited.
Galaxy Plus Fund - LRR Master Fund (522) LLC
(A Delaware Limited Liability Company)
Notes to Financial Statements
The Master Fund has a substantial portion of its assets on deposit with counterparties. In the event of a counterparty’s insolvency, recovery of the Master Fund’s assets on deposit may be limited to account insurance or other protection afforded such deposits.
The notional value represents amounts related to the Master Fund’s stock exchange indices, commodities, interest rate and foreign currencies upon which the fair value of the futures contracts held by the Master Fund are based. Notional values do not represent the current fair value of, and are not necessarily indicative of the future cash flows of the Master Fund’s futures and options contracts. Further, the underlying price changes in relation to variables specified by the notional values affects the fair value of these derivative financial instruments. Theoretically, the Master Fund’s exposure is equal to the notional value of contracts purchased and unlimited on such contracts sold short. As of December 31, 2022, the Master Fund had open futures contracts with the following notional values by sector:
| Description | | Quantity | | Notional
Value | | | Description | | | Quantity | | | Notional
Value | |
| Long: | | | | | | | | | Short: | | | | | | | | | |
| Agriculture | | 49 | | $ | 2,355,528 | | | | - | | | | - | | | $ | - | |
During the year ended December 31, 2022, the Master Fund participated in 32 futures contract, and 8 options on futures contract transactions.
Below is a summary of net trading gains and (losses) by investment type and industry:
| | | Net Trading
Gain (Loss)* | |
| Options on futures contracts: | | | | |
| Agriculture | | $ | 48,275 | |
| | | | | |
| Total options on futures contracts | | | 48,275 | |
| | | | | |
| Futures contracts: | | | | |
| Agriculture | | | 219,157 | |
| | | | | |
| Total futures contracts | | | 219,157 | |
| | | | | |
| Trading costs | | | (2,350 | ) |
| | | | | |
| Total net trading gain (loss) | | $ | 265,082 | |
| * | Includes both realized gain of $181,878 and unrealized appreciation of $83,204 and is located in net realized and unrealized gain (loss) on investments on the Statement of Operations. |
Galaxy Plus Fund - LRR Master Fund (522) LLC
(A Delaware Limited Liability Company)
Notes to Financial Statements
Note 5. Balance Sheet Offsetting
The Master Fund is required to disclose the impact of offsetting assets and liabilities presented in the Statement of Financial Condition to enable users of the financial statements to evaluate the effect or potential effect of netting arrangements on its financial position for recognized assets and liabilities. These recognized assets and liabilities include financial instruments and derivative instruments that are either subject to an enforceable master netting arrangement or similar agreement or meet the following right of set-off criteria: each of the two parties owes the other determinable amounts, the Master Fund has the right to set-off the amounts owed with the amounts owed by the other party, the Master Fund intends to set off, and the Master Fund’s right of set-off is enforceable by law.
The Master Fund is subject to enforceable master netting agreements with certain counterparties. These agreements govern the terms of certain transactions, and reduce the counterparty risk associated with relevant transactions by specifying offsetting mechanisms and collateral posting arrangements at prearranged exposure levels. Since different types of transactions have different mechanics and are sometimes traded out of different legal entities of a particular counterparty organization, each type of transaction may be covered by a different master netting arrangement, possibly resulting in the need for multiple agreements with a single counterparty. Master netting agreements may not be specific to each different asset type; in such instances, they would allow the Master Fund to close out and net its total exposure to a specified counterparty in the events of default or early termination with respect to any and all the transactions governed under a single agreement with the counterparty.
The following tables summarize the Master Fund’s netting arrangements:
| Description | | Gross
Amounts
of Recognized
Assets
(Liabilities) | | | Offset
in the
Statement of
Financial
Condition | | | Net Amount of
Assets
(Liabilities)
in the
Statement of
Financial
Condition | |
| | | | | | | | | | |
| Futures contracts | | $ | 64,252 | | | $ | - | | | $ | 64,252 | |
| Total | | $ | 64,252 | | | $ | - | | | $ | 64,252 | |
| | | Net Amount
in the
Statement of
Financial
Condition | | | Cash
Collateral
Received by
Counterparty | | | Net Amount
in the
Statement of
Financial
Condition | |
| | | | | | | | | | |
| Counterparty A | | $ | 64,252 | | | $ | 104,115 | | | $ | 168,367 | |
| Total | | $ | 64,252 | | | $ | 104,115 | | | $ | 168,367 | |
Galaxy Plus Fund - LRR Master Fund (522) LLC
(A Delaware Limited Liability Company)
Notes to Financial Statements
Note 6. Related Parties
As of December 31, 2022 the Master Fund had $39,631 receivable from the Feeder Fund, as reflected in the Statement of Financial Condition. Generally, receivables and payables from/to Feeder Fund are a result of timing differences of cash movements related to capital activity at the Feeder Fund level.
Note 7. Financial Highlights
Financial highlights of the Master Fund for the year ended December 31, 2022 are presented in the table below. The information has been derived from information presented in the financial statements.
| Total return (A) | | | 71.43 | % |
| | | | | |
| Ratios to average member’s equity (B): | | | | |
| Net investment loss (C) | | | (0.18 | )% |
| Total expenses | | | 0.39 | % |
| (A) | Total return is based on the change in average member’s equity during the period of a theoretical investment made at the inception of the Master Fund. |
| (B) | The total expense and net investment loss ratios are computed based upon weighted-average member’s equity as a whole for the year ended December 31, 2022. |
| (C) | The net investment loss ratio excludes net realized and unrealized gains (losses) on investments. |
Financial highlights are calculated for each member class taken as a whole. An individual member’s return and ratios may vary based on the timing of capital transactions. The total return would have been lower and the net investment loss and total expense ratios would have been higher if the management, incentive fees, and sponsor fee had been charged to the Master Fund instead of the Feeder Fund.
Note 8. Subsequent Events
In accordance with FASB ASC 855, Subsequent Events, the Sponsor has evaluated all subsequent events requiring recognition and disclosure in the Master Fund’s financial statements through March 30, 2023, the date the financial statements were available for issuance. The Sponsor has determined that there are no material events that would require recognition or disclosure in the Master Fund’s financial statements through this date.
Galaxy Plus Fund - LRR Master Fund (522) LLC
(A Delaware Limited Liability Company)
Oath and Affirmation of the Commodity Pool Operator
To the best of the knowledge and belief of the undersigned, the information contained in the annual report as of and for the year ended December 31, 2022, is accurate and complete.
| /s/ David Young | |
| David Young, President | |
| New Hyde Park Alternative Funds, LLC — Sponsor | |
| | |
| Galaxy Plus Fund – LRR Master Fund (522) LLC | |
Galaxy Plus Fund – QIM Master Fund (526) LLC
(A Delaware Limited Liability Company)
The attached annual report is filed under exemption pursuant to Section 4.7 of the regulations under the Commodity Exchange Act.
Financial Report
December 31, 2022
Contents
Independent Auditor’s Report
Managing Member
Galaxy Plus Fund LLC
Opinion
We have audited the financial statements of Galaxy Plus Fund — QIM Master Fund (526) LLC (the Fund), which comprise the statement of financial condition, including the condensed schedule of investments, as of December 31, 2022, the related statements of operations and changes in member’s equity for the year then ended, and the related notes to the financial statements.
In our opinion, the accompanying financial statements present fairly, in all material respects, the financial position of the Fund as of December 31, 2022, and the results of its operations and changes in member’s equity for the year then ended in accordance with accounting principles generally accepted in the United States of America.
Basis for Opinion
We conducted our audit in accordance with auditing standards generally accepted in the United States of America (GAAS). Our responsibilities under those standards are further described in the Auditor’s Responsibilities for the Audit of the Financial Statements section of our report. We are required to be independent of the Fund and to meet our other ethical responsibilities, in accordance with the relevant ethical requirements relating to our audit. We believe that the audit evidence we have obtained is sufficient and appropriate to provide a basis for our audit opinion.
Responsibilities of Management for the Financial Statements
Management is responsible for the preparation and fair presentation of the financial statements in accordance with accounting principles generally accepted in the United States of America, and for the design, implementation and maintenance of internal control relevant to the preparation and fair presentation of financial statements that are free from material misstatement, whether due to fraud or error.
In preparing the financial statements, management is required to evaluate whether there are conditions or events, considered in the aggregate, that raise substantial doubt about the Fund’s ability to continue as a going concern within one year after the date that the financial statements are issued or available to be issued.
Auditor’s Responsibilities for the Audit of the Financial Statements
Our objectives are to obtain reasonable assurance about whether the financial statements as a whole are free from material misstatement, whether due to fraud or error, and to issue an auditor’s report that includes our opinion. Reasonable assurance is a high level of assurance but is not absolute assurance and therefore is not a guarantee that an audit conducted in accordance with GAAS will always detect a material misstatement when it exists. The risk of not detecting a material misstatement resulting from fraud is higher than for one resulting from error, as fraud may involve collusion, forgery, intentional omissions, misrepresentations, or the override of internal control. Misstatements are considered material if there is a substantial likelihood that, individually or in the aggregate, they would influence the judgment made by a reasonable user based on the financial statements.
In performing an audit in accordance with GAAS, we:
| ● | Exercise professional judgment and maintain professional skepticism throughout the audit. |
| ● | Identify and assess the risks of material misstatement of the financial statements, whether due to fraud or error, and design and perform audit procedures responsive to those risks. Such procedures include examining, on a test basis, evidence regarding the amounts and disclosures in the financial statements. |
| ● | Obtain an understanding of internal control relevant to the audit in order to design audit procedures that are appropriate in the circumstances, but not for the purpose of expressing an opinion on the effectiveness of the Fund’s internal control. Accordingly, no such opinion is expressed. |
| ● | Evaluate the appropriateness of accounting policies used and the reasonableness of significant accounting estimates made by management, as well as evaluate the overall presentation of the financial statements. |
| ● | Conclude whether, in our judgment, there are conditions or events, considered in the aggregate, that raise substantial doubt about the Fund’s ability to continue as a going concern for a reasonable period of time. |
We are required to communicate with those charged with governance regarding, among other matters, the planned scope and timing of the audit, significant audit findings, and certain internal control–related matters that we identified during the audit.
/s/ RSM US LLP
Denver, Colorado
March 30, 2023
Galaxy Plus Fund – QIM Master Fund (526) LLC
(A Delaware Limited Liability Company)
Statement of Financial Condition
December 31, 2022
(Expressed in U.S. Dollars)
| Assets | | | |
| | | | |
| Equity in commodity trading accounts at clearing brokers: | | | |
| Cash | | $ | 799,227 | |
| Restricted cash - margin balance | | | 1,208,726 | |
| Receivable from Onshore Feeder Fund | | | 445,277 | |
| | | | | |
| Total assets | | $ | 2,453,230 | |
| | | | | |
| Liabilities and Member’s Equity | | | | |
| | | | | |
| Liabilities | | | | |
| Deficit in commodity trading accounts at clearing brokers: | | | | |
| Investments in futures contracts, at fair value | | | | |
| (represents unrealized depreciation on open derivative contracts, net) | | $ | 188,533 | |
| | | | | |
| Total liabilities | | | 188,533 | |
| | | | | |
| Member’s equity | | | 2,264,697 | |
| | | | | |
| Total liabilities and member’s equity | | $ | 2,453,230 | |
See notes to financial statements.
Galaxy Plus Fund – QIM Master Fund (526) LLC
(A Delaware Limited Liability Company)
Condensed Schedule of Investments
December 31, 2022
(Expressed in U.S. Dollars)
| | | Number of | | | | | | Percent of | |
| | | Contracts/
Units | | | Fair Value | | | Member’s
Equity | |
| Long positions: | | | | | | | | | |
| Derivative contracts: | | | | | | | | | |
| Domestic (United States): | | | | | | | | | |
| Futures contracts: | | | | | | | | | |
| Currency | | 15 | | | $ | 2,015 | | | | 0.09 | % |
| Energy | | 2 | | | | 2,079 | | | | 0.09 | |
| Index | | 18 | | | | 1,336 | | | | 0.06 | |
| Interest | | 12 | | | | (22,242 | ) | | | (0.98 | ) |
| Foreign: | | | | | | | | | | | |
| Futures contracts: | | | | | | | | | | | |
| Energy | | 1 | | | | 2,510 | | | | 0.11 | |
| Index | | 77 | | | | (45,714 | ) | | | (2.02 | ) |
| Interest | | 11 | | | | (77,993 | ) | | | (3.44 | ) |
| | | | | | | | | | | | |
| Total long positions | | | | | | (138,009 | ) | | | (6.09 | ) |
| | | | | | | | | | | | |
| Short positions: | | | | | | | | | | | |
| Derivative contracts: | | | | | | | | | | | |
| Domestic (United States): | | | | | | | | | | | |
| Futures contracts: | | | | | | | | | | | |
| Currency | | 25 | | | | (23,238 | ) | | | (1.03 | ) |
| Index | | 1 | | | | 300 | | | | 0.01 | |
| Metals | | 26 | | | | (33,150 | ) | | | (1.45 | ) |
| Foreign: | | | | | | | | | | | |
| Futures contracts: | | | | | | | | | | | |
| Index | | 53 | | | | 4,115 | | | | 0.18 | |
| Interest | | 1 | | | | 1,449 | | | | 0.06 | |
| | | | | | | | | | | | |
| Total short positions | | | | | | (50,524 | ) | | | (2.23 | ) |
| | | | | | | | | | | | |
| Investments in futures contracts, at fair value | | | | | $ | (188,533 | ) | | | (8.32 | )% |
See notes to financial statements.
Galaxy Plus Fund – QIM Master Fund (526) LLC
(A Delaware Limited Liability Company)
Statement of Operations
For the year ended December 31, 2022
(Expressed in U.S. Dollars)
| Investment income: | | | |
| Interest income | | $ | 16,894 | |
| | | | | |
| Total investment income | | | 16,894 | |
| | | | | |
| Expenses: | | | | |
| Interest expense | | | 336 | |
| Other expense | | | 1,365 | |
| | | | | |
| Total expenses | | | 1,701 | |
| | | | | |
| Net investment income | | | 15,193 | |
| | | | | |
| Realized and unrealized gain (loss) on investments and foreign currency transactions: | | | | |
| Net realized gain (loss) from: | | | | |
| Derivative contracts1 | | | 1,146,953 | |
| Foreign currency transactions | | | (12,683 | ) |
| | | | 1,134,270 | |
| | | | | |
| Net (increase) in unrealized depreciation on: | | | | |
| Derivative contracts | | | (146,845 | ) |
| | | | (146,845 | ) |
| | | | | |
| Net realized and unrealized gain (loss) on investments and foreign currency transactions | | | 987,425 | |
| | | | | |
| Net increase in member’s equity resulting from operations | | $ | 1,002,618 | |
| 1 | Including trading costs. |
See notes to financial statements.
Galaxy Plus Fund – QIM Master Fund (526) LLC
(A Delaware Limited Liability Company)
Statement of Changes in Members’ Equity
For the year ended December 31, 2022
(Expressed in U.S. Dollars)
| Changes in member’s equity from operations: | | | |
| Net investment income | | $ | 15,193 | |
| Net realized gain (loss) from derivative contracts and foreign currency transactions | | | 1,134,270 | |
| Net (increase) in unrealized depreciation on derivative contracts | | | (146,845 | ) |
| | | | | |
| Net increase in member’s equity resulting from operations | | | 1,002,618 | |
| | | | | |
| Changes in member’s equity from capital transactions: | | | | |
| Proceeds from issuance of capital | | | 481,728 | |
| Payments for redemptions of capital | | | (917,231 | ) |
| | | | | |
| Net decrease in member’s equity resulting from capital transactions | | | (435,503 | ) |
| | | | | |
| Total increase | | | 567,115 | |
| | | | | |
| Member’s equity, beginning of year | | | 1,697,582 | |
| | | | | |
| Member’s equity, end of year | | $ | 2,264,697 | |
See notes to financial statements.
Galaxy Plus Fund – QIM Master Fund (526) LLC
(A Delaware Limited Liability Company)
Notes to Financial Statements
Note 1. Organization and Structure
Galaxy Plus Fund – QIM Master Fund (526) LLC (the “Master Fund”) was formed in Delaware as a limited liability company on April 19, 2016 and commenced operation on June 22, 2016. The Master Fund was created to serve as the trading entity managed by Quantitative Investment Management, L.L.C. (the “Trading Advisor”) pursuant to its Global Program (the “Program”). The Program is a short to medium-term trading strategy designed to capitalize on market inefficiencies across a wide array of futures markets.
The Master Fund and other separately formed Delaware limited liability companies (“Other Master Funds”), are investment vehicles available under the Galaxy Plus Managed Account Platform (the “Platform”). The Master Fund and the Platform are sponsored by New Hyde Park Alternative Funds, LLC (the “Sponsor” or “NHPAF”) as a means of making available, to qualified high net-worth individuals and institutional investors (including fund of hedge funds) (“Investors”), a variety of third-party professional managed futures and foreign exchange advisors (“Advisors”). The Trading Advisor is not affiliated with the Sponsor.
NHPAF was formed in October 2013 and its principal office is located in Wheaton, Illinois. NHPAF is registered with the U.S. Commodity Futures Trading Commission (CFTC) as a commodity pool operator and commodity trading advisor, and is a member of the National Futures Association (NFA).
Galaxy Plus Fund LLC, a Delaware Series Limited Liability Company (the “Onshore Platform”), and Galaxy Plus Fund SPC, a Cayman Islands Segregated Portfolio Company (the “Offshore Platform”) serve as the feeder funds for the Platform and invest substantially all of the assets of the respective segregated portfolios (each a “Fund”) in the Master Fund or other Master Funds. Galaxy Plus Fund – QIM Feeder Fund (526) (“LLC526”), a separated series of the Onshore Platform and Galaxy Plus Fund – QIM Offshore Feeder Fund (526) Segregated Portfolio (“SPC526”), a segregated portfolio of the Offshore Platform, can each invest in the Master Fund. As of December 31, 2022, SPC526 had not yet commenced operations and LLC526 is the sole member.
LLC526 and SPC526 are collectively hereafter referred to as the “Feeder Funds”.
Subscriptions and redemptions into the Feeder Funds and the corresponding transactions with the Master Fund are governed by the Onshore Platform’s and the Offshore Platform’s respective Confidential Offering Memorandums.
The Platform has appointed the Sponsor, under the terms of the Limited Liability Company Agreement (the “LLC Agreement”) as the managing member of the Master Fund. In such capacity, the Sponsor has the authority, to manage, with wide discretionary powers, the business and affairs of the Master Fund including the authority to select the administrator for the Master Fund. The LLC Agreement will continue to remain in force until terminated by either the Sponsor or the Platform upon not less than sixty (60) days’ prior written notice. In certain circumstances (for example, the insolvency of either party or in the event all trading for the Platform by the Advisors are suspended), the LLC Agreement may be immediately terminated by either party.
Galaxy Plus Fund – QIM Master Fund (526) LLC
(A Delaware Limited Liability Company)
Notes to Financial Statements
The Master Fund and the Sponsor have entered into a tri-party contract (the “Trading Agreement”) with the Trading Advisor pursuant to which the Master Fund’s trading accounts are managed, subject to rights of termination, by the Trading Advisor in accordance with the Program. The Trading Advisor may alter its Program (including its trading systems and methods and including the addition and/or deletion of any financial interests or contracts traded in the Master Fund’s trading accounts), provided that the Trading Advisor provide prior notice to the Master Fund and the Sponsor of any material change to the Trading Advisor’s Program. From time to time, the Trading Advisor (or its affiliates) may manage additional accounts, and these accounts will increase the level of competition for the same trades desired for the Master Fund, including the priorities of order entry. There is no specific limit as to the number of accounts the Trading Advisors (or their affiliates) may manage. In addition, the positions of all of the accounts owned or controlled by the Trading Advisor (or its affiliates) are aggregated for the purposes of applying speculative position limits. The management, incentive, and sponsor fees are paid directly by the Feeder Funds, and for this reason are not recorded as expenses of the Master Fund.
Note 2. Summary of Significant Accounting Policies
The following is a summary of significant accounting policies consistently followed in the preparation of the Master Fund’s financial statements.
Principles of accounting: The accompanying financial statements are expressed in United States dollars (USD) and have been prepared in accordance with Generally Accepted Accounting Principles (GAAP), as established by the Financial Accounting Standards Board (FASB), to ensure consistent reporting of financial condition and results of operations. The Master Fund is an investment company and follows the accounting and reporting guidance in FASB Account Standards Codification Topic 946.
Cash and restricted cash: Cash held in the commodity trading accounts at clearing broker consists of either cash maintained in the custody of the broker, a portion of which is required margin for open positions, or amounts due to/from the broker for margin or unsettled trades. The Master Fund may also hold cash in a non-interest bearing USD commercial bank account. The Master Fund holds various currencies at the clearing broker, of which $1,951,058 is held in USD and $56,895 in foreign currencies as of December 31, 2022, and are recorded in cash and restricted cash – margin balance on the Statement of Financial Condition. The non-U.S. currencies fluctuate in value on a daily basis relative to the USD. A portion of this cash is restricted cash required to meet maintenance margin requirements. Cash with the clearing broker as of December 31, 2022 included restricted cash for margin requirements of $1,208,726. This cash becomes unrestricted when the underlying positions to which it is applicable are liquidated. Cash with the clearing broker as of December 31, 2022 included amounts due to the broker for unsettled trades of $0.
Offsetting of amounts related to certain contracts: When the requirements are met, the Master Fund offsets certain fair value amounts recognized for net derivative positions executed with the same counterparty under the same master netting arrangement (see Note 5).
Galaxy Plus Fund – QIM Master Fund (526) LLC
(A Delaware Limited Liability Company)
Notes to Financial Statements
Valuation and Revenue Recognition: Depending on the Program and Investments traded, the Master Fund follows the following valuation and revenue recognition policies. All investments are recorded at their estimated fair value, as described in Note 3.
Futures and options on futures contracts: The Master Fund may enter into futures and options on futures contracts. Upon entering into a futures contract, the Master Fund agrees to receive or deliver a fixed quantity of an underlying instrument or commodity for an agreed-upon price, while an option contract provides the option purchaser with the right, but not the obligation, to buy or sell a security or financial instrument at a predetermined exercise price during a defined period. Futures and options on futures contracts are recorded on the trade date. The difference between the original contract amount and the fair value of futures contracts purchased or sold is reflected as unrealized appreciation/(depreciation) on open contracts. Options on futures contracts are reflected in investments at fair value. The difference between the premiums paid or received on open options on futures contracts and fair value of such options is recorded as unrealized appreciation/(depreciation) on open contracts. The fair value of futures and options on futures contracts is based upon daily exchange settlement prices. The realized gain or loss is determined on the settlement of intraday trades first and then by the FIFO method.
Foreign currency transactions: The Master Fund’s financial statements are denominated in USD. However, foreign currency forward contracts, non-U.S. futures contracts, and non-U.S. options on futures contracts are denominated in currencies other than USD. Assets and liabilities and transactions denominated in currencies other than the USD are translated into USD at the rates in effect either at the close of business on the last business day of the reporting period or on the date of such transactions, respectively. Such fluctuations are included with the unrealized appreciation (depreciation) on open derivative contracts, net. Net realized foreign exchange gain or loss arises from the sales of foreign currencies and currency gains or losses realized between trade and settlement dates. Net unrealized foreign exchange gain and loss arises from changes in the fair value of margin collateral assets and liabilities resulting from changes in exchange rates.
Trading costs: Trading costs generally consist of brokerage commissions, brokerage fees, clearing fees, exchange and regulatory fees, transaction and NFA fees. Fees vary by type of contract for each purchase and sale or sale and purchase (round turn) of futures, options on futures, and forward contracts. Commissions are paid on each individual purchase and sale transaction. These costs are recognized as expenses for futures and options on futures transactions and are included in net realized gain/loss from derivative contracts on the Statement of Operations.
Interest income/expense: Interest income and expense is recognized on an accrual basis.
Allocation of income and gains and losses: Profits and losses for each monthly accounting period, or shorter period if there are mid-month subscriptions and/or redemptions, are allocated pro-rata to the Feeder Funds based on their respective ownership percentage on the first day of each period throughout the year.
Income taxes: The Master Fund will not be subject to United States federal income taxation other than certain withholding taxes. The Master Fund evaluates tax positions taken or expected to be taken to determine whether the tax positions are more-likely-than-not of being sustained by the applicable tax authority. For tax positions meeting the more-likely-than-not threshold, the tax amount recognized in the financial statements is reduced by the largest benefit that has a greater than fifty percent likelihood of being realized upon ultimate settlement with the relevant taxing authority. The Master Fund has determined that there is no tax liability resulting from uncertain income tax positions taken or expected to be taken with respect to all open tax years. The Master Fund’s U.S. Federal tax returns for the years ended December 31, 2019 through 2022, remain open. The Master Fund recognizes interest and penalties, if any, related to unrecognized tax benefits as income tax expense in the Statement of Operations. During the year, the Master Fund did not accrue any interest or penalties.
Galaxy Plus Fund – QIM Master Fund (526) LLC
(A Delaware Limited Liability Company)
Notes to Financial Statements
Use of estimates: The preparation of financial statements in accordance with GAAP requires management to make estimates and assumptions that affect the reported amounts of assets and liabilities and disclosure of contingent assets and liabilities at the date of the financial statements and the reported amounts of income and expenses during the reporting period. Actual results could differ from those estimates.
Indemnifications: The Sponsor and its affiliates are indemnified against certain liabilities arising out of the performance of their duties for The Master Fund. In addition, in the normal course of business, the Master Fund enters into contracts with vendors and others that provide for general indemnifications. The Master Fund’s maximum exposure under these arrangements is unknown as this would involve future claims that may be made against the Master Fund. However, the Master Fund expects the risk of loss to be remote.
Statement of cash flows: The Master Fund has elected not to provide a statement of cash flows as permitted by GAAP as all of the following conditions have been met:
| ● | During the year, substantially all of the Master Fund’s investments were carried at fair value and classified as Level 1 or Level 2 measurements in accordance with FASB ASC 820; |
| ● | The Master Fund had little or no debt during the year; |
| ● | The Master Fund’s financial statements include a Statement of Changes in Member’s Equity. |
Subscriptions and redemptions: Subscriptions and redemptions can typically be made on a weekly basis as of the first day (Monday) of each week; (or, if such day is not a business day, the first business day thereafter) (each, a Subscription Date or a Redemption Date). The Master Fund may accept subscriptions or redemptions more frequently than the first day of each week, depending upon the size of the requested subscription or redemption amount, with the approval of the Sponsor.
Note 3. Fair Value Measurements
The Master Fund’s investments are stated at fair value in accordance with FASB ASC 820, Fair Value Measurements and Disclosures (ASC 820). ASC 820 defines fair value, establishes a framework for measuring fair value and expands disclosures about fair value measurements. ASC 820 also emphasizes that fair value is a market-based measurement, not an entity-specific measurement, and sets out a fair value hierarchy with the highest priority being quoted prices in active market. Under ASC 820, fair value measurements are disclosed by level within that hierarchy, as follows:
Level 1 — Values for investments classified as Level 1 are based on unadjusted quoted prices for identical investments in an active market. Since valuations are based on quoted prices that are readily accessible at the measurement date, valuation of these investments does not entail a significant degree of judgment.
Level 2 — Values for investments classified as Level 2 are based on quoted prices for similar investments in an active or non-active markets for which all significant inputs are observable either directly or indirectly. Level 2 inputs may also include discounts related to restrictions on the investments.
Level 3 — Values for investments categorized as Level 3 are based on prices or valuation techniques that require inputs that are both significant to the fair value and unobservable, including valuations by the Sponsor in the absence of readily ascertainable fair values.
A description of the valuation methodologies applied to the Master Fund’s major categories of assets and liabilities measured at fair value on a recurring basis follows. Inputs that are used in determining fair value of an investment may include price information, credit data, volatility statistics, and other factors. These inputs can be either observable or unobservable. All of the inputs for the Master Fund were observable as of December 31, 2022. The availability of observable inputs can vary between investments and is affected by various factors such as type of investment and the volume and level of activity for that investment or similar investments in the marketplace.
Galaxy Plus Fund – QIM Master Fund (526) LLC
(A Delaware Limited Liability Company)
Notes to Financial Statements
Exchange-traded derivative contracts that are actively traded are valued based on daily quoted settlement prices from the respective exchange and are categorized in Level 1 of the fair value hierarchy. Exchange-traded derivative contracts not actively traded and over-the-counter (OTC) derivative contracts can include futures contracts, option on futures contracts, forward contracts and option contracts whose values are based on an underlying such as interest rates, foreign currencies, credit standing of reference entities, equities or commodities. Such derivative contracts are valued using observable market data, including currency spot rates or quoted prices of the related underlying obtained from the applicable exchange or market. OTC derivative contracts are valued using the above described pricing methodology and are categorized as Level 2 within the fair value hierarchy.
The Master Fund assesses the levels of the investments at each measurement date, and transfers between levels are recognized on the actual date of the event or change in circumstances that caused the transfer in accordance with the Master Fund’s accounting policy regarding the recognition of transfers between levels of the fair value hierarchy. There were no transfers among levels 1, 2, and 3 during the year ended December 31, 2022.
The inputs or methodologies used for valuing investments are not necessarily indicative of the risk associated with investing in those instruments.
| | | | | | Fair Value Measurements at Reporting Date Using | |
| | | | | | Quoted Prices | | | Significant Other | | | Significant | |
| | | | | | in Active | | | Observable | | | Unobservable | |
| | | | | | Markets | | | Inputs | | | Inputs | |
| Description | | Fair Value | | | (Level 1) | | | (Level 2) | | | (Level 3) | |
| Assets: | | | | | | | | | | | | |
| Derivative contracts: | | | | | | | | | | | | |
| Futures contracts: | | | | | | | | | | | | |
| Currency | | $ | 2,015 | | | $ | 2,015 | | | $ | - | | | $ | - | |
| Energy | | | 4,887 | | | | 4,887 | | | | - | | | | - | |
| Index | | | 21,993 | | | | 21,993 | | | | - | | | | - | |
| Interest | | | 1,449 | | | | 1,449 | | | | - | | | | - | |
| Metals | | | 5,636 | | | | 5,636 | | | | - | | | | - | |
| | | | | | | | | | | | | | | | |
| Total investment assets at fair value | | | 35,980 | | | | 35,980 | | | | - | | | | - | |
| | | | | | | | | | | | | | | | | |
| Liabilities: | | | | | | | | | | | | | | | | |
| Derivative contracts: | | | | | | | | | | | | | | | | |
| Futures contracts: | | | | | | | | | | | | | | | | |
| Currency | | | (23,238 | ) | | | (23,238 | ) | | | - | | | | - | |
| Energy | | | (298 | ) | | | (298 | ) | | | - | | | | - | |
| Index | | | (61,956 | ) | | | (61,956 | ) | | | - | | | | - | |
| Interest | | | (100,235 | ) | | | (100,235 | ) | | | - | | | | - | |
| Metals | | | (38,786 | ) | | | (38,786 | ) | | | - | | | | - | |
| | | | | | | | | | | | | | | | |
| Total investment liabilities at fair value | | | (224,513 | ) | | | (224,513 | ) | | | - | | | | - | |
| | | | | | | | | | | | | | | | |
| Total net investments at fair value | | $ | (188,533 | ) | | $ | (188,533 | ) | | $ | - | | | $ | - | |
Galaxy Plus Fund – QIM Master Fund (526) LLC
(A Delaware Limited Liability Company)
Notes to Financial Statements
Note 4. Derivative Financial Instruments
Derivative financial instruments speculatively traded by the Master Fund can include U.S. and foreign futures, options on futures contracts, and forward currency contracts (collectively, derivatives) whose values are based upon an underlying asset, indices, or reference rates, and generally represent future commitments to exchange cash flows, or to purchase or sell other financial instruments at specified future dates. A derivative contract may be traded on an exchange or OTC. Exchange-traded derivatives are standardized and include futures and options on futures contracts. OTC derivative contracts are negotiated between contracting parties and include forward currency contracts and certain options. Derivatives are subject to various risks similar to those related to the underlying financial instruments including market and credit risks.
Market risk is the potential for changes in the value of derivatives due to market changes, including interest and foreign exchange rate movements and fluctuations in commodity and security prices. Market risk is directly impacted by the volatility and liquidity in the markets in which the related underlying assets are traded. The market risk of the Master Fund is managed by the underlying Trading Advisors according to each respective Program. The Master Fund is exposed to a market risk equal to the notional contract value of the derivatives contracts purchased and unlimited liability on such contracts sold short.
Credit risk is the possibility that a loss may occur due to the failure of a counterparty to perform according to the terms of a contract. Credit risk due to exchange traded derivative financial instruments is significantly reduced by the regulatory requirements of the individual exchanges on which the instruments are traded. At any point in time, the credit risk for OTC derivatives is limited to the net unrealized gain for each counterparty for which a netting agreement exists, if any. In a similar fashion, liabilities represent net amounts owed to counterparties. The credit risk exposure for the Master Fund’s outstanding OTC derivatives was $0 at December 31, 2022.
Market and geopolitical risk relate to the increasing interconnectivity between global economies and financial markets increases the likelihood that events or conditions in one region or financial market may adversely impact issuers in a different country, region, or financial market. Securities in the Master Fund may underperform due to inflation (or expectations for inflation), interest rates, global demand for particular products or resources, natural disasters, pandemics, epidemics, terrorism, regulatory events and governmental or quasi-governmental actions. The occurrence of global events similar to those in recent years, such as terrorist attacks around the world, natural disasters, social and political discord or debt crises and downgrades, among others, may result in market volatility and may have long term effects on both the U.S. and global financial markets. It is difficult to predict when similar events affecting the U.S. or global financial markets may occur, the effects that such events may have and the duration of those effects. Any such event(s) could have a significant adverse impact on the value and risk profile of the Master Fund. The current novel coronavirus (COVID-19) global pandemic and the aggressive responses taken by many governments, including closing borders, restricting international and domestic travel, and the imposition of prolonged quarantines or similar restrictions, as well as the forced or voluntary closure of, or operational changes to, many retail and other businesses, has had negative impacts, and in many cases severe negative impacts, on markets worldwide. It is not known how long such impacts, or any future impacts of other significant events described above, will or would last, but there could be a prolonged period of global economic slowdown, which may impact your investment.
Purchase and sale of futures contracts requires margin deposits with the broker. Additional deposits may be necessary for any loss on contract value. The U.S. Commodity Exchange Act requires a broker to segregate all customer transactions and assets from such broker’s proprietary activities. A customer’s cash and other property (for example, U.S. Treasury bills) deposited with a broker are considered commingled with all other customer funds subject to the broker’s segregation requirements. In the event of a broker’s insolvency, recovery may be limited to a pro rata share of segregated funds available. It is possible that the recovered amount could be less than total cash and other property deposited.
Galaxy Plus Fund – QIM Master Fund (526) LLC
(A Delaware Limited Liability Company)
Notes to Financial Statements
The Master Fund has a substantial portion of its assets on deposit with counterparties. In the event of a counterparty’s insolvency, recovery of the Master Fund’s assets on deposit may be limited to account insurance or other protection afforded such deposits.
The notional value represents amounts related to the Master Fund’s stock exchange indices, commodities, interest rate and foreign currencies upon which the fair value of the futures contracts held by the Master Fund are based. Notional values do not represent the current fair value of, and are not necessarily indicative of the future cash flows of the Master Fund’s futures contracts. Further, the underlying price changes in relation to variables specified by the notional values affects the fair value of these derivative financial instruments. Theoretically, the Master Fund’s exposure is equal to the notional value of contracts purchased and unlimited on such contracts sold short. As of December 31, 2022, the Master Fund had open futures contracts with the following notional values by sector:
| Description | | Quantity | | | Notional Value | | | Description | | Quantity | | | Notional Value | |
| Long: | | | | | | | | Short: | | | | | | |
| Currency | | 15 | | | $ | 1,125,635 | | | Currency | | 25 | | | $ | (2,865,488 | ) |
| Energy | | 3 | | | | 210,920 | | | Index | | 54 | | | | (1,553,204 | ) |
| Index | | 95 | | | | 8,655,057 | | | Interest | | 1 | | | | (1,109,239 | ) |
| Interest | | 23 | | | | 2,815,372 | | | Metals | | 26 | | | | (3,375,185 | ) |
During the year ended December 31, 2022, the Master Fund participated in 8,447 futures contract transactions.
Below is a summary of net trading gains and (losses) by investment type and industry:
| | | Net Trading
Gain (Loss)* | |
| Futures contracts: | | | |
| Currency | | $ | 552,671 | |
| Energy | | | (14,993 | ) |
| Index | | | 945,588 | |
| Interest | | | (283,053 | ) |
| Metals | | | (154,652 | ) |
| Total futures contracts | | | 1,045,561 | |
| | | | | |
| Trading costs | | | (45,453 | ) |
| | | | | |
| Total net trading gain (loss) | | $ | 1,000,108 | |
| * | Includes both realized gain of $1,146,953 and unrealized depreciation of $(146,845) and is located in net realized and unrealized gain (loss) on investments on the Statement of Operations. Amounts exclude foreign currency transactions. |
Galaxy Plus Fund – QIM Master Fund (526) LLC
(A Delaware Limited Liability Company)
Notes to Financial Statements
Note 5. Balance Sheet Offsetting
The Master Fund is required to disclose the impact of offsetting assets and liabilities presented in the Statement of Financial Condition to enable users of the financial statements to evaluate the effect or potential effect of netting arrangements on its financial position for recognized assets and liabilities. These recognized assets and liabilities include financial instruments and derivative instruments that are either subject to an enforceable master netting arrangement or similar agreement or meet the following right of set-off criteria: each of the two parties owes the other determinable amounts, the Master Fund has the right to set-off the amounts owed with the amounts owed by the other party, the Master Fund intends to set off, and the Master Fund’s right of set-off is enforceable by law.
The Master Fund is subject to enforceable master netting agreements with certain counterparties. These agreements govern the terms of certain transactions, and reduce the counterparty risk associated with relevant transactions by specifying offsetting mechanisms and collateral posting arrangements at prearranged exposure levels. Since different types of transactions have different mechanics and are sometimes traded out of different legal entities of a particular counterparty organization, each type of transaction may be covered by a different master netting arrangement, possibly resulting in the need for multiple agreements with a single counterparty. Master netting agreements may not be specific to each different asset type; in such instances, they would allow the Master Fund to close out and net its total exposure to a specified counterparty in the events of default or early termination with respect to any and all the transactions governed under a single agreement with the counterparty.
The following tables summarize the Master Fund’s netting arrangements:
| Description | | Gross
Amounts of
Recognized
Assets
(Liabilities) | | | Offset
in the
Statement of
Financial
Condition | | | Net Amount of
Assets
(Liabilities) in
the Statement
of Financial
Condition | |
| | | | | | | | | | |
| Futures | | $ | (224,513 | ) | | $ | 35,980 | | | $ | (188,533 | ) |
| Total | | $ | (224,513 | ) | | $ | 35,980 | | | $ | (188,533 | ) |
| | | Net Amount
in the
Statement
of Financial
Condition | | | Cash
Collateral
Received by
Counterparty | | | Net Amount
in the
Statement
of Financial
Condition | |
| | | | | | | | | | |
| Counterparty A | | $ | (188,533 | ) | | $ | 1,208,726 | | | $ | 1,020,193 | |
| Total | | $ | (188,533 | ) | | $ | 1,208,726 | | | $ | 1,020,193 | |
Galaxy Plus Fund – QIM Master Fund (526) LLC
(A Delaware Limited Liability Company)
Notes to Financial Statements
Note 6. Related Parties
As of December 31, 2022 the Master Fund had $445,277 receivable from the Feeder Fund, as reflected in the Statement of Financial Condition. Generally, receivables and payables from/to Feeder Fund are a result of timing differences of cash movements related to capital activity at the Feeder Fund level.
Note 7. Financial Highlights
Financial highlights of the Master Fund for the year ended December 31, 2022 are presented in the table below. The information has been derived from information presented in the financial statements.
| Total return (A) | | | 93.76 | % |
| | | | | |
| Ratios to average member’s equity (B): | | | | |
| Net investment income (C) | | | 0.73 | % |
| Total expenses | | | 0.08 | % |
| (A) | Total return is based on the change in average member’s equity during the period of theoretical investment made at the inception of the Master Fund. |
| | |
| (B) | The total expense and net investment income ratios are computed based on weighted-average member’s equity as a whole for the year ended December 31, 2022. |
| | |
| (C) | The net investment income ratio excludes realized and unrealized gains (losses) on investments. |
Financial highlights are calculated for each member class taken as a whole. An individual member’s return and ratios may vary based on the timing of capital transactions. The total return and net investment income ratio would have been lower and total expense ratio would have been higher if the management, incentive fees, and sponsor fee, had been charged to the Master Fund instead of the Feeder Fund.
Note 8. Subsequent Events
In accordance with FASB ASC 855, Subsequent Events, the Sponsor has evaluated all subsequent events requiring recognition and disclosure in the Master Fund’s financial statements through March 30, 2023, the date the financial statements were available for issuance. The Sponsor has determined that there are no material events that would require recognition or disclosure in the Master Fund’s financial statements through this date.
Galaxy Plus Fund – QIM Master Fund (526) LLC
(A Delaware Limited Liability Company)
Oath and Affirmation of the Commodity Pool Operator
To the best of the knowledge and belief of the undersigned, the information contained in the annual report as of and for the year ended December 31, 2022, is accurate and complete.
| /s/ David Young | |
| David Young, President | |
| New Hyde Park Alternative Funds, LLC — Sponsor | |
Galaxy Plus Fund – QIM Master Fund (526) LLC
Galaxy Plus Fund – Aspect Master Fund (532) LLC
(A Delaware Limited Liability Company)
The attached annual report is filed under exemption pursuant to Section 4.7 of the regulations under the Commodity Exchange Act.
Financial Report
December 31, 2022
Contents
Independent Auditor’s Report
Managing Member
Galaxy Plus Fund LLC
Opinion
We have audited the financial statements of Galaxy Plus Fund — Aspect Master Fund (532) LLC (the Fund), which comprise the statement of financial condition, including the condensed schedule of investments, as of December 31, 2022, the related statements of operations and changes in member’s equity for the year then ended, and the related notes to the financial statements.
In our opinion, the accompanying financial statements present fairly, in all material respects, the financial position of the Fund as of December 31, 2022, and the results of its operations and changes in member’s equity for the year then ended in accordance with accounting principles generally accepted in the United States of America.
Basis for Opinion
We conducted our audit in accordance with auditing standards generally accepted in the United States of America (GAAS). Our responsibilities under those standards are further described in the Auditor’s Responsibilities for the Audit of the Financial Statements section of our report. We are required to be independent of the Fund and to meet our other ethical responsibilities, in accordance with the relevant ethical requirements relating to our audit. We believe that the audit evidence we have obtained is sufficient and appropriate to provide a basis for our audit opinion.
Responsibilities of Management for the Financial Statements
Management is responsible for the preparation and fair presentation of the financial statements in accordance with accounting principles generally accepted in the United States of America, and for the design, implementation and maintenance of internal control relevant to the preparation and fair presentation of financial statements that are free from material misstatement, whether due to fraud or error.
In preparing the financial statements, management is required to evaluate whether there are conditions or events, considered in the aggregate, that raise substantial doubt about the Fund’s ability to continue as a going concern within one year after the date that the financial statements are issued or available to be issued.
Auditor’s Responsibilities for the Audit of the Financial Statements
Our objectives are to obtain reasonable assurance about whether the financial statements as a whole are free from material misstatement, whether due to fraud or error, and to issue an auditor’s report that includes our opinion. Reasonable assurance is a high level of assurance but is not absolute assurance and therefore is not a guarantee that an audit conducted in accordance with GAAS will always detect a material misstatement when it exists. The risk of not detecting a material misstatement resulting from fraud is higher than for one resulting from error, as fraud may involve collusion, forgery, intentional omissions, misrepresentations, or the override of internal control. Misstatements are considered material if there is a substantial likelihood that, individually or in the aggregate, they would influence the judgment made by a reasonable user based on the financial statements.
In performing an audit in accordance with GAAS, we:
| ● | Exercise professional judgment and maintain professional skepticism throughout the audit. |
| ● | Identify and assess the risks of material misstatement of the financial statements, whether due to fraud or error, and design and perform audit procedures responsive to those risks. Such procedures include examining, on a test basis, evidence regarding the amounts and disclosures in the financial statements. |
| ● | Obtain an understanding of internal control relevant to the audit in order to design audit procedures that are appropriate in the circumstances, but not for the purpose of expressing an opinion on the effectiveness of the Fund’s internal control. Accordingly, no such opinion is expressed. |
| ● | Evaluate the appropriateness of accounting policies used and the reasonableness of significant accounting estimates made by management, as well as evaluate the overall presentation of the financial statements. |
| ● | Conclude whether, in our judgment, there are conditions or events, considered in the aggregate, that raise substantial doubt about the Fund’s ability to continue as a going concern for a reasonable period of time. |
We are required to communicate with those charged with governance regarding, among other matters, the planned scope and timing of the audit, significant audit findings, and certain internal control–related matters that we identified during the audit.
/s/ RSM US LLP
Denver, Colorado
March 30, 2023
Galaxy Plus Fund – Aspect Master Fund (532) LLC
(A Delaware Limited Liability Company)
Statement of Financial Condition
December 31, 2022
(Expressed in U.S. Dollars)
| Assets | | | |
| | | | |
| Equity in commodity trading accounts at clearing brokers: | | | |
| Cash | | $ | 4,982,606 | |
| Restricted cash - margin balance | | | 2,942,466 | |
Investments in futures contracts, at fair value
(represents unrealized appreciation on open derivative contracts, net) | | | 354,463 | |
| Receivable from Onshore Feeder Fund | | | 69,749 | |
| | | | | |
| Total assets | | $ | 8,349,284 | |
| Liabilities and Member’s Equity | | | | |
| | | | | |
| Total liabilities | | | - | |
| Member’s equity | | | 8,349,284 | |
| | | | | |
| Total liabilities and member’s equity | | $ | 8,349,284 | |
See notes to financial statements.
Galaxy Plus Fund – Aspect Master Fund (532) LLC
(A Delaware Limited Liability Company)
Condensed Schedule of Investments
December 31, 2022
(Expressed in U.S. Dollars)
| | | Number of | | | | | | Percent of | |
| | | Contracts/
Units | | | Fair Value | | | Member’s Equity | |
| Long positions: | | | | | | | | | |
| Derivative contracts: | | | | | | | | | |
| Domestic (United States): | | | | | | | | | |
| Futures contracts: | | | | | | | | | |
| Agriculture | | 34 | | | $ | 10,575 | | | | 0.12 | % |
| Currency | | 127 | | | | 55,729 | | | | 0.67 | |
| Energy | | 1 | | | | 8,980 | | | | 0.11 | |
| Metals | | 2 | | | | 2,825 | | | | 0.03 | |
| Foreign: | | | | | | | | | | | |
| Futures contracts: | | | | | | | | | | | |
| Agriculture | | 8 | | | | 4,005 | | | | 0.05 | |
| Energy | | 1 | | | | 875 | | | | 0.01 | |
| Index | | 38 | | | | (17,445 | ) | | | (0.21 | ) |
| Metals | | 7 | | | | (3,638 | ) | | | (0.04 | ) |
| | | | | | | | | | | | |
| Total long positions | | | | | | 61,906 | | | | 0.74 | |
| | | | | | | | | | | | |
| Short positions: | | | | | | | | | | | |
| Derivative contracts: | | | | | | | | | | | |
| Domestic (United States): | | | | | | | | | | | |
| Futures contracts: | | | | | | | | | | | |
| Agriculture | | 13 | | | | 6,752 | | | | 0.08 | |
| Currency | | 90 | | | | (84,435 | ) | | | (1.01 | ) |
| Energy | | 4 | | | | 1,680 | | | | 0.02 | |
| Index | | 8 | | | | 15,596 | | | | 0.19 | |
| Interest | | 71 | | | | 32,101 | | | | 0.38 | |
| Metals | | 4 | | | | (15,918 | ) | | | (0.19 | ) |
| Foreign: | | | | | | | | | | | |
| Futures contracts: | | | | | | | | | | | |
| Agriculture | | 3 | | | | (1,563 | ) | | | (0.02 | ) |
| Index | | 29 | | | | (5,286 | ) | | | (0.06 | ) |
| Interest | | 220 | | | | 358,620 | | | | 4.30 | |
| Metals | | 11 | | | | (14,990 | ) | | | (0.18 | ) |
| | | | | | | | | | | | |
| Total short positions | | | | | | 292,557 | | | | 3.51 | |
| | | | | | | | | | | | |
| Investments in futures contracts, at fair value | | | | | $ | 354,463 | | | | 4.25 | % |
See notes to financial statements.
Galaxy Plus Fund – Aspect Master Fund (532) LLC
(A Delaware Limited Liability Company)
Statement of Operations
For the year ended December 31, 2022
(Expressed in U.S. Dollars)
| Investment Income: | | | |
| Interest income | | $ | 128,567 | |
| | | | | |
| Total investment income | | | 128,567 | |
| | | | | |
| Expenses: | | | | |
| Interest expense | | | 19,724 | |
| Other expense | | | 1,431 | |
| | | | | |
| Total expenses | | | 21,155 | |
| | | | | |
| Net investment income | | | 107,412 | |
| | | | | |
| Realized and unrealized gain on investments and foreign currency transactions: | | | | |
| | | | | |
| Net realized gain from: | | | | |
| Derivative contracts1 | | | 6,908,985 | |
| Foreign currency transactions | | | 17,428 | |
| | | | 6,926,413 | |
| Net increase in unrealized appreciation on: | | | | |
| Derivative contracts | | | 189,496 | |
| | | | 189,496 | |
| Net realized and unrealized gain on investments and foreign currency transactions | | | 7,115,909 | |
| | | | | |
| Net increase in member’s equity resulting from operations | | $ | 7,223,321 | |
| l | Including trading costs. |
See notes to financial statements.
Galaxy Plus Fund – Aspect Master Fund (532) LLC
(A Delaware Limited Liability Company)
Statement of Changes in Members’ Equity
For the year ended December 31, 2022
(Expressed in U.S. Dollars)
| Changes in member’s equity from operations: | | | |
| Net investment income | | $ | 107,412 | |
| Net realized gain from derivative contracts and foreign currency transactions | | | 6,926,413 | |
| Net increase in unrealized appreciation on derivative contracts | | | 189,496 | |
| | | | | |
| Net increase in member’s equity resulting from operations | | | 7,223,321 | |
| | | | | |
| Changes in member’s equity from capital transactions: | | | | |
| Proceeds from issuance of capital | | | 697,601 | |
| Payments for redemptions of capital | | | (5,944,947 | ) |
| | | | | |
| Net decrease in member’s equity resulting from capital transactions | | | (5,247,346 | ) |
| | | | | |
| Total increase | | | 1,975,975 | |
| | | | | |
| Member’s equity, beginning of year | | | 6,373,309 | |
| | | | | |
| Member’s equity, end of year | | $ | 8,349,284 | |
See notes to financial statements.
Galaxy Plus Fund – Aspect Master Fund (532) LLC
(A Delaware Limited Liability Company)
Notes to Financial Statements
Note 1. Organization and Structure
Galaxy Plus Fund – Aspect Master Fund (532) LLC (the “Master Fund”) was formed in Delaware as a limited liability company on April 20, 2016 and commenced operations on December 16, 2016. The Master Fund was created to serve as the trading entity managed by Aspect Capital Limited, L.L.C. (the “Trading Advisor”) pursuant to its Aspect Core Diversified Program (the “Program”). The Program applies a proprietary and systematic quantitative investment approach to generate profit from trends in both rising and falling markets.
The Master Fund and other separately formed Delaware limited liability companies (“Other Master Funds”), are investment vehicles available under the Galaxy Plus Managed Account Platform (the “Platform”). The Master Fund and the Platform are sponsored by New Hyde Park Alternative Funds, LLC (the “Sponsor” or “NHPAF”) as a means of making available, to qualified high net-worth individuals and institutional investors (including fund of hedge funds) (“Investors”), a variety of third-party professional managed futures and foreign exchange advisors (“Advisors”). The Trading Advisor is not affiliated with the Sponsor.
NHPAF was formed in October 2013 and its principal office is located in Wheaton, Illinois. NHPAF is registered with the U.S. Commodity Futures Trading Commission (CFTC) as a commodity pool operator and commodity trading advisor, and is a member of the National Futures Association (NFA).
Galaxy Plus Fund LLC, a Delaware Series Limited Liability Company (the “Onshore Platform”), and Galaxy Plus Fund SPC, a Cayman Islands Segregated Portfolio Company (the “Offshore Platform”) serve as the feeder funds for the Platform and invest substantially all of the assets of the respective segregated portfolios (each a “Fund”) in the Master Fund or other Master Funds. Galaxy Plus Fund – Aspect Feeder Fund (532) (“LLC532”), a separated series of the Onshore Platform and Galaxy Plus Fund – Aspect Offshore Feeder Fund (532) Segregated Portfolio (“SPC532”), a segregated portfolio of the Offshore Platform, can each invest in the Master Fund. As of December 31, 2022, SPC532 had not commenced operations and LLC532 is the sole member.
LLC532 and SPC532 are collectively hereafter referred to as the “Feeder Funds”.
Subscriptions and redemptions into the Feeder Funds and the corresponding transactions with the Master Fund are governed by the Onshore Platform’s and the Offshore Platform’s respective Confidential Offering Memorandums.
The Platform has appointed the Sponsor, under the terms of the Limited Liability Company Agreement (the “LLC Agreement”) as the managing member of the Master Fund. In such capacity, the Sponsor has the authority, to manage, with wide discretionary powers, the business and affairs of the Master Fund including the authority to select the administrator for the Master Fund. The LLC Agreement will continue to remain in force until terminated by either the Sponsor or the Platform upon not less than sixty (60) days’ prior written notice. In certain circumstances (for example, the insolvency of either party or in the event all trading for the Platform by the Advisors are suspended), the LLC Agreement may be immediately terminated by either party.
Galaxy Plus Fund – Aspect Master Fund (532) LLC
(A Delaware Limited Liability Company)
Notes to Financial Statements
The Master Fund and the Sponsor have entered into a tri-party contract (the “Trading Agreement”) with the Trading Advisor pursuant to which the Master Fund’s trading accounts are managed, subject to rights of termination, by the Trading Advisor in accordance with the Program. The Trading Advisor may alter its Program (including its trading systems and methods and including the addition and/or deletion of any financial interests or contracts traded in the Master Fund’s trading accounts), provided that the Trading Advisor provide prior notice to the Master Fund and the Sponsor of any material change to the Trading Advisor’s Program. From time to time, the Trading Advisor (or its affiliates) may manage additional accounts, and these accounts will increase the level of competition for the same trades desired for the Master Fund, including the priorities of order entry. There is no specific limit as to the number of accounts the Trading Advisors (or their affiliates) may manage. In addition, the positions of all of the accounts owned or controlled by the Trading Advisor (or its affiliates) are aggregated for the purposes of applying speculative position limits. The management, incentive, and sponsor fees are paid directly by the Feeder Funds, and for this reason are not recorded as expenses of the Master Fund.
Note 2. Summary of Significant Accounting Policies
The following is a summary of significant accounting policies consistently followed in the preparation of the Master Fund’s financial statements.
Principles of accounting: The accompanying financial statements are expressed in United States dollars (USD) and have been prepared in accordance with Generally Accepted Accounting Principles (GAAP), as established by the Financial Accounting Standards Board (FASB), to ensure consistent reporting of financial condition and results of operations. The Master Fund is an investment company and follows the accounting and reporting guidance in FASB Account Standards Codification Topic 946.
Cash and restricted cash: Cash held in the commodity trading accounts at clearing broker consists of either cash maintained in the custody of the broker, a portion of which is required margin for open positions, or amounts due to/from the broker for margin or unsettled trades. The Master Fund may also hold cash in a non-interest bearing USD commercial bank account. The Master Fund holds various currencies at the clearing broker, of which $7,914,546 is held in USD and a balance of $10,526 in foreign currencies as of December 31, 2022, and are recorded in cash and restricted cash – margin balance on the Statement of Financial Condition. The non-U.S. currencies fluctuate in value on a daily basis relative to the USD. A portion of this cash is restricted cash required to meet maintenance margin requirements. Cash with the clearing broker as of December 31, 2022 included restricted cash for margin requirements of $2,942,466. This cash becomes unrestricted when the underlying positions to which it is applicable are liquidated. Cash with the clearing broker as of December 31, 2022 included amounts due to the broker for unsettled trades of $0.
Offsetting of amounts related to certain contracts: When the requirements are met, the Master Fund offsets certain fair value amounts recognized for net derivative positions executed with the same counterparty under the same master netting arrangement (see Note 5).
Galaxy Plus Fund – Aspect Master Fund (532) LLC
(A Delaware Limited Liability Company)
Notes to Financial Statements
Valuation and Revenue Recognition: Depending on the Program and Investments traded, the Master Fund follows the following valuation and revenue recognition policies. All investments are recorded at their estimated fair value, as described in Note 3.
Futures and options on futures contracts: The Master Fund may enter into futures and options on futures contracts. Upon entering into a futures contract, the Master Fund agrees to receive or deliver a fixed quantity of an underlying instrument or commodity for an agreed-upon price, while an option contract provides the option purchaser with the right, but not the obligation, to buy or sell a security or financial instrument at a predetermined exercise price during a defined period. Futures and options on futures contracts are recorded on the trade date. The difference between the original contract amount and the fair value of futures contracts purchased or sold is reflected as unrealized appreciation/(depreciation) on open contracts. Options on futures contracts are reflected in investments at fair value. The difference between the premiums paid or received on open options on futures contracts and fair value of such options is recorded as unrealized appreciation/(depreciation) on open contracts. The fair value of futures and options on futures contracts is based upon daily exchange settlement prices. The realized gain or loss is determined on the settlement of intraday trades first and then by the FIFO method.
Foreign currency transactions: The Master Fund’s financial statements are denominated in USD. However, foreign currency forward contracts, non-U.S. futures contracts, and non-U.S. options on futures contracts are denominated in currencies other than USD. Assets and liabilities and transactions denominated in currencies other than the USD are translated into USD at the rates in effect either at the close of business on the last business day of the reporting period or on the date of such transactions, respectively. Such fluctuations are included with the unrealized appreciation (depreciation) on open derivative contracts, net. Net realized foreign exchange gain or loss arises from the sales of foreign currencies and currency gains or losses realized between trade and settlement dates. Net unrealized foreign exchange gain and loss arises from changes in the fair value of margin collateral assets and liabilities resulting from changes in exchange rates.
Trading costs: Trading costs generally consist of brokerage commissions, brokerage fees, clearing fees, exchange and regulatory fees, transaction and NFA fees. Fees vary by type of contract for each purchase and sale or sale and purchase (round turn) of futures, options on futures, and forward contracts. Commissions are paid on each individual purchase and sale transaction. These costs are recognized as expenses for futures and options on futures transactions, and are included in net realized gain/loss from derivative contracts on the Statement of Operations.
Interest income/expense: Interest income and expense is recognized on an accrual basis.
Allocation of income and gains and losses: Profits and losses for each monthly accounting period, or shorter period if there are mid-month subscriptions and/or redemptions, are allocated pro-rata to the Feeder Funds based on their respective ownership percentage on the first day of each period throughout the year.
Income taxes: The Master Fund will not be subject to United States federal income taxation other than certain withholding taxes. The Master Fund evaluates tax positions taken or expected to be taken to determine whether the tax positions are more-likely-than-not of being sustained by the applicable tax authority. For tax positions meeting the more-likely-than-not threshold, the tax amount recognized in the financial statements is reduced by the largest benefit that has a greater than fifty percent likelihood of being realized upon ultimate settlement with the relevant taxing authority. The Master Fund has determined that there is no tax liability resulting from uncertain income tax positions taken or expected to be taken with respect to all open tax years. The Master Fund’s U.S. Federal tax returns for the years ended December 31, 2019, through 2022, remain open. The Master Fund recognizes interest and penalties, if any, related to unrecognized tax benefits as income tax expense in the Statement of Operations. During the year, the Master Fund did not accrue any interest or penalties.
Galaxy Plus Fund – Aspect Master Fund (532) LLC
(A Delaware Limited Liability Company)
Notes to Financial Statements
Use of estimates: The preparation of financial statements in accordance with GAAP requires management to make estimates and assumptions that affect the reported amounts of assets and liabilities and disclosure of contingent assets and liabilities at the date of the financial statements and the reported amounts of income and expenses during the reporting period. Actual results could differ from those estimates.
Indemnifications: The Sponsor and its affiliates are indemnified against certain liabilities arising out of the performance of their duties for the Master Fund. In addition, in the normal course of business, the Master Fund enters into contracts with vendors and others that provide for general indemnifications. The Master Fund’s maximum exposure under these arrangements is unknown as this would involve future claims that may be made against the Master Fund. However, the Master Fund expects the risk of loss to be remote.
Statement of cash flows: The Master Fund has elected not to provide a statement of cash flows as permitted by GAAP as all of the following conditions have been met:
| ● | During the year, substantially all of the Master Fund’s investments were carried at fair value and classified as Level 1 or Level 2 measurements in accordance with FASB ASC 820; |
| ● | The Master Fund had little or no debt during the year; |
| ● | The Master Fund’s financial statements include a Statement of Changes in Member’s Equity. |
Subscriptions and redemptions: Subscriptions and redemptions can typically be made on a weekly basis as of the first day (Monday) of each week; (or, if such day is not a business day, the first business day thereafter) (each, a Subscription Date or a Redemption Date). The Master Fund may accept subscriptions or redemptions more frequently than the first day of each week, depending upon the size of the requested subscription or redemption amount, with the approval of the Sponsor.
Note 3. Fair Value Measurements
The Master Fund’s investments are stated at fair value in accordance with FASB ASC 820, Fair Value Measurements and Disclosures (ASC 820). ASC 820 defines fair value, establishes a framework for measuring fair value and expands disclosures about fair value measurements. ASC 820 also emphasizes that fair value is a market-based measurement, not an entity-specific measurement, and sets out a fair value hierarchy with the highest priority being quoted prices in active market. Under ASC 820, fair value measurements are disclosed by level within that hierarchy, as follows:
Level 1 — Values for investments classified as Level 1 are based on unadjusted quoted prices for identical investments in an active market. Since valuations are based on quoted prices that are readily accessible at the measurement date, valuation of these investments does not entail a significant degree of judgment.
Level 2 — Values for investments classified as Level 2 are based on quoted prices for similar investments in an active or non-active markets for which all significant inputs are observable either directly or indirectly. Level 2 inputs may also include discounts related to restrictions on the investments.
Level 3 — Values for investments categorized as Level 3 are based on prices or valuation techniques that require inputs that are both significant to the fair value and unobservable, including valuations by the Sponsor in the absence of readily ascertainable fair values.
A description of the valuation methodologies applied to the Master Fund’s major categories of assets and liabilities measured at fair value on a recurring basis follows. Inputs that are used in determining fair value of an investment may include price information, credit data, volatility statistics, and other factors. These inputs can be either observable or unobservable. All of the inputs for the Master Fund were observable as of December 31, 2022. The availability of observable inputs can vary between investments and is affected by various factors such as type of investment and the volume and level of activity for that investment or similar investments in the marketplace.
Exchange-traded derivative contracts that are actively traded are valued based on daily quoted settlement prices from the respective exchange and are categorized in Level 1 of the fair value hierarchy. Exchange-traded derivative contracts not actively traded and over-the-counter (OTC) derivative contracts can include futures contracts, option on futures contracts, forward contracts and option contracts whose values are based on an underlying such as interest rates, foreign currencies, credit standing of reference entities, equities or commodities. Such derivative contracts are valued using observable market data, including currency spot rates or quoted prices of the related underlying obtained from the applicable exchange or market. OTC derivative contracts are valued using the above described pricing methodology and are categorized as Level 2 within the fair value hierarchy.
The Master Fund assesses the levels of the investments at each measurement date, and transfers between levels are recognized on the actual date of the event or change in circumstances that caused the transfer in accordance with the Master Fund’s accounting policy regarding the recognition of transfers between levels of the fair value hierarchy. There were no transfers among levels 1, 2, and 3 during the year ended December 31, 2022.
The inputs or methodologies used for valuing investments are not necessarily indicative of the risk associated with investing in those instruments.
Galaxy Plus Fund – Aspect Master Fund (532) LLC
(A Delaware Limited Liability Company)
Notes to Financial Statements
The following tables present the classification of derivatives, by type, into the fair value hierarchy levels as of December 31, 2022. Presentation is gross – as an asset if in a gain position and a liability if in a loss position.
| | | | | | Fair Value Measurements at Reporting Date Using | |
| | | | | | Quoted Prices | | | Significant Other | | | Significant | |
| | | | | | in Active | | | Observable | | | Unobservable | |
| | | | | | Markets | | | Inputs | | | Inputs | |
| Description | | Fair Value | | | (Level 1) | | | (Level 2) | | | (Level 3) | |
| Assets: | | | | | | | | | | | | |
| Derivative contracts: | | | | | | | | | | | | |
| Futures contracts: | | | | | | | | | | | | |
| Agriculture | | $ | 36,500 | | | $ | 36,500 | | | $ | - | | | $ | - | |
| Currency | | | 62,583 | | | | 62,583 | | | | - | | | | - | |
| Energy | | | 18,075 | | | | 18,075 | | | | - | | | | - | |
| Index | | | 16,807 | | | | 16,807 | | | | - | | | | - | |
| Interest | | | 395,262 | | | | 395,262 | | | | - | | | | - | |
| Metals | | | 13,073 | | | | 13,073 | | | | - | | | | - | |
| | | | | | | | | | | | | | | | | |
| Total investment assets at fair value | | | 542,300 | | | | 542,300 | | | | - | | | | - | |
| | | | | | | | | | | | | | | | | |
| Liabilities: | | | | | | | | | | | | | | | | |
| Derivative contracts: | | | | | | | | | | | | | | | | |
| Futures contracts: | | | | | | | | | | | | | | | | |
| Agriculture | | | (16,731 | ) | | | (16,731 | ) | | | - | | | | - | |
| Currency | | | (91,289 | ) | | | (91,289 | ) | | | | | | | | |
| Energy | | | (6,540 | ) | | | (6,540 | ) | | | | | | | | |
| Index | | | (23,942 | ) | | | (23,942 | ) | | | | | | | | |
| Interest | | | (4,541 | ) | | | (4,541 | ) | | | - | | | | - | |
| Metals | | | (44,794 | ) | | | (44,794 | ) | | | - | | | | - | |
| | | | | | | | | | | | | | | | | |
| Total investment liabilities at fair value | | | (187,837 | ) | | | (187,837 | ) | | | - | | | | - | |
| | | | | | | | | | | | | | | | | |
| Total net investments at fair value | | $ | 354,463 | | | $ | 354,463 | | | $ | - | | | $ | - | |
Galaxy Plus Fund – Aspect Master Fund (532) LLC
(A Delaware Limited Liability Company)
Notes to Financial Statements
Note 4. Derivative Financial Instruments
Derivative financial instruments speculatively traded by the Master Fund can include U.S. and foreign futures, options on futures contracts and forward currency contracts (collectively, derivatives) whose values are based upon an underlying asset, indices, or reference rates, and generally represent future commitments to exchange cash flows, or to purchase or sell other financial instruments at specified future dates. A derivative contract may be traded on an exchange or OTC. Exchange-traded derivatives are standardized and include futures and options on futures contracts. OTC derivative contracts are negotiated between contracting parties and include forward currency contracts and certain options. Derivatives are subject to various risks similar to those related to the underlying financial instruments including market and credit risks.
Market risk is the potential for changes in the value of derivatives due to market changes, including interest and foreign exchange rate movements and fluctuations in commodity and security prices. Market risk is directly impacted by the volatility and liquidity in the markets in which the related underlying assets are traded. The market risk of the Master Fund is managed by the underlying Trading Advisors according to each respective Program. The Master Fund is exposed to a market risk equal to the notional contract value of the derivatives contracts purchased and unlimited liability on such contracts sold short.
Credit risk is the possibility that a loss may occur due to the failure of a counterparty to perform according to the terms of a contract. Credit risk due to exchange traded derivative financial instruments is significantly reduced by the regulatory requirements of the individual exchanges on which the instruments are traded. At any point in time, the credit risk for OTC derivatives is limited to the net unrealized gain for each counterparty for which a netting agreement exists, if any. In a similar fashion, liabilities represent net amounts owed to counterparties. The credit risk exposure for the Master Fund’s outstanding OTC derivatives was $0 at December 31, 2022.
Market and geopolitical risk relate to the increasing interconnectivity between global economies and financial markets increases the likelihood that events or conditions in one region or financial market may adversely impact issuers in a different country, region, or financial market. Securities in the Master Fund may underperform due to inflation (or expectations for inflation), interest rates, global demand for particular products or resources, natural disasters, pandemics, epidemics, terrorism, regulatory events and governmental or quasi-governmental actions. The occurrence of global events similar to those in recent years, such as terrorist attacks around the world, natural disasters, social and political discord or debt crises and downgrades, among others, may result in market volatility and may have long term effects on both the U.S. and global financial markets. It is difficult to predict when similar events affecting the U.S. or global financial markets may occur, the effects that such events may have and the duration of those effects. Any such event(s) could have a significant adverse impact on the value and risk profile of the Master Fund. The current novel coronavirus (COVID-19) global pandemic and the aggressive responses taken by many governments, including closing borders, restricting international and domestic travel, and the imposition of prolonged quarantines or similar restrictions, as well as the forced or voluntary closure of, or operational changes to, many retail and other businesses, has had negative impacts, and in many cases severe negative impacts, on markets worldwide. It is not known how long such impacts, or any future impacts of other significant events described above, will or would last, but there could be a prolonged period of global economic slowdown, which may impact your investment.
Purchase and sale of futures contracts requires margin deposits with the broker. Additional deposits may be necessary for any loss on contract value. The U.S. Commodity Exchange Act requires a broker to segregate all customer transactions and assets from such broker’s proprietary activities. A customer’s cash and other property (for example, U.S. Treasury bills) deposited with a broker are considered commingled with all other customer funds subject to the broker’s segregation requirements. In the event of a broker’s insolvency, recovery may be limited to a pro rata share of segregated funds available. It is possible that the recovered amount could be less than total cash and other property deposited.
The Master Fund has a substantial portion of its assets on deposit with counterparties. In the event of a counterparty’s insolvency, recovery of the Master Fund’s assets on deposit may be limited to account insurance or other protection afforded such deposits.
Galaxy Plus Fund – Aspect Master Fund (532) LLC
(A Delaware Limited Liability Company)
Notes to Financial Statements
The notional value represents amounts related to the Master Fund’s stock exchange indices, commodities, interest rate and foreign currencies upon which the fair value of the futures contracts held by the Master Fund are based. Notional values do not represent the current fair value of, and are not necessarily indicative of the future cash flows of the Master Fund’s futures contracts. Further, the underlying price changes in relation to variables specified by the notional values affects the fair value of these derivative financial instruments. Theoretically, the Master Fund’s exposure is equal to the notional value of contracts purchased and unlimited on such contracts sold short. As of December 31, 2022, the Master Fund had open futures contracts with the following notional values by sector:
| Description | | Quantity | | Notional
Value | | | Description | | Quantity | | Notional
Value | |
| Long: | | | | | | | Short: | | | | | |
| Agriculture | | 42 | | $ | 1,469,057 | | | Agriculture | | 16 | | $ | (749,471 | ) |
| Currency | | 127 | | | 5,396,670 | | | Currency | | 90 | | | (7,004,708 | ) |
| Energy | | 2 | | | 228,990 | | | Energy | | 4 | | | (210,800 | ) |
| Index | | 38 | | | 1,084,702 | | | Index | | 37 | | | (1,580,252 | ) |
| Metals | | 9 | | | 768,196 | | | Interest | | 291 | | | (51,607,612 | ) |
| | | | | | | | | Metals | | 15 | | | (1,464,659 | ) |
During the year ended December 31, 2022, the Master Fund participated in 13,669 futures contract transactions.
| | | Net Trading Gain (Loss)* | |
| | | | |
| Futures contracts: | | | |
| Agriculture | | $ | (311,033 | ) |
| Currency | | | 1,349,365 | |
| Energy | | | 2,316,068 | |
| Index | | | (577,383 | ) |
| Interest | | | 4,680,978 | |
| Metals | | | (334,018 | ) |
| | | | | |
| Total futures contracts | | | 7,123,977 | |
| | | | | |
| Trading costs | | | (25,496 | ) |
| | | | | |
| Total net trading gain (loss) | | $ | 7,098,481 | |
| * | Includes both realized gain of $6,908,985 and unrealized appreciation of $189,496 and is located in net realized and unrealized gain on investments on the Statement of Operations. Amounts exclude foreign currency transactions. |
Galaxy Plus Fund – Aspect Master Fund (532) LLC
(A Delaware Limited Liability Company)
Notes to Financial Statements
Note 5. Balance Sheet Offsetting
The Master Fund is required to disclose the impact of offsetting assets and liabilities presented in the Statement of Financial condition to enable users of the financial statements to evaluate the effect or potential effect of netting arrangements on its financial position for recognized assets and liabilities. These recognized assets and liabilities include financial instruments and derivative instruments that are either subject to an enforceable master netting arrangement or similar agreement or meet the following right of set-off criteria: each of the two parties owes the other determinable amounts, the Master Fund has the right to set-off the amounts owed with the amounts owed by the other party, the Master Fund intends to set off, and the Master Fund’s right of set-off is enforceable by law.
The Master Fund is subject to enforceable master netting agreements with certain counterparties. These agreements govern the terms of certain transactions, and reduce the counterparty risk associated with relevant transactions by specifying offsetting mechanisms and collateral posting arrangements at prearranged exposure levels. Since different types of transactions have different mechanics and are sometimes traded out of different legal entities of a particular counterparty organization, each type of transaction may be covered by a different master netting arrangement, possibly resulting in the need for multiple agreements with a single counterparty. Master netting agreements may not be specific to each different asset type; in such instances, they would allow the Master Fund to close out and net its total exposure to a specified counterparty in the events of default or early termination with respect to any and all the transactions governed under a single agreement with the counterparty.
The following tables summarize the Master Fund’s netting arrangements:
| Description | | Gross
Amounts
of Recognized
Assets
(Liabilities) | | | Offset in the
Statement of
Financial
Condition | | | Net Amount
of Assets
(Liabilities)
in the
Statement of
Financial
Condition | |
| Futures contracts | | $ | 542,300 | | | $ | (187,837 | ) | | $ | 354,463 | |
| Total | | $ | 542,300 | | | $ | (187,837 | ) | | $ | 354,463 | |
| | | Net amount
in the
Statement of
Financial
Condition | | | Cash
Collateral
Received by
Counterparty | | | Net Amount
in the
Statement of
Financial
Condition | |
| Counterparty A | | $ | 354,463 | | | $ | 2,942,466 | | | $ | 3,296,929 | |
| Total | | $ | 354,463 | | | $ | 2,942,466 | | | $ | 3,296,929 | |
Galaxy Plus Fund – Aspect Master Fund (532) LLC
(A Delaware Limited Liability Company)
Notes to Financial Statements
Note 6. Related Parties
As of December 31, 2022, the Master Fund had $69,749 receivable from the Feeder Fund, as reflected in the Statement of Financial Condition. Generally, receivables and payables from/to the Feeder Fund are a result of timing differences of cash movements related to capital activity at the Feeder Fund level.
Note 7. Financial Highlights
Financial highlights of the Master Fund for the year ended December 31, 2022, are presented in the table below. The information has been derived from information presented in the financial statements.
| Total return (A) | | | 139.27 | % |
| | | | | |
| Ratios to average member’s equity (B): | | | | |
| Net investment income (C) | | | 1.19 | % |
| Total expenses | | | 0.23 | % |
| (A) | Total return is based on the change in average member’s equity during the period of theoretical investment made at the inception of the Master Fund. |
| | |
| (B) | The total expense and net investment income ratios are computed based upon weighted-average member’s equity as a whole for the year ended December 31, 2022. |
| | |
| (C) | The net investment income ratio excludes net realized and unrealized gain on investments and foreign currency transactions. |
Financial highlights are calculated for each member class taken as a whole. An individual member’s return and ratios may vary based on the timing of capital transactions. The total return and net investment income would have been lower, and total expense ratios would have been higher if the management and incentive fees, as well as the sponsor fees, had been charged to the Master Fund instead of the Feeder Fund.
Note 8. Subsequent Events
In accordance with FASB ASC 855, Subsequent Events, the Sponsor has evaluated all subsequent events requiring recognition and disclosure in the Master Fund’s financial statements through March 30, 2023, the date the financial statements were available for issuance. The Sponsor has determined that there are no material events that would require recognition or disclosure in the Master Fund’s financial statements through this date.
Galaxy Plus Fund – Aspect Master Fund (532) LLC
(A Delaware Limited Liability Company)
Oath and Affirmation of the Commodity Pool Operator
To the best of the knowledge and belief of the undersigned, the information contained in the annual report as of and for the year ended December 31, 2022, is accurate and complete.
| /s/ David Young | |
| David Young, President | |
New Hyde Park Alternative Funds, LLC — Sponsor
Galaxy Plus Fund – Aspect Master Fund (532) LLC
Galaxy Plus Fund – Welton GDP Master Fund (538) LLC
(A Delaware Limited Liability Company)
The attached annual report is filed under exemption pursuant to Section 4.7 of the regulations under the Commodity Exchange Act.
Financial Report
December 31, 2022
Contents
Independent Auditor’s Report
Managing Member
Galaxy Plus Fund LLC
Opinion
We have audited the financial statements of Galaxy Plus Fund — Welton GDP Master Fund (538) LLC (the Fund), which comprise the statement of financial condition, including the condensed schedule of investments, as of December 31, 2022, the related statements of operations and changes in member’s equity for the year then ended, and the related notes to the financial statements.
In our opinion, the accompanying financial statements present fairly, in all material respects, the financial position of the Fund as of December 31, 2022, and the results of its operations and changes in member’s equity for the year then ended in accordance with accounting principles generally accepted in the United States of America.
Basis for Opinion
We conducted our audit in accordance with auditing standards generally accepted in the United States of America (GAAS). Our responsibilities under those standards are further described in the Auditor’s Responsibilities for the Audit of the Financial Statements section of our report. We are required to be independent of the Fund and to meet our other ethical responsibilities, in accordance with the relevant ethical requirements relating to our audit. We believe that the audit evidence we have obtained is sufficient and appropriate to provide a basis for our audit opinion.
Responsibilities of Management for the Financial Statements
Management is responsible for the preparation and fair presentation of the financial statements in accordance with accounting principles generally accepted in the United States of America, and for the design, implementation and maintenance of internal control relevant to the preparation and fair presentation of financial statements that are free from material misstatement, whether due to fraud or error.
In preparing the financial statements, management is required to evaluate whether there are conditions or events, considered in the aggregate, that raise substantial doubt about the Fund’s ability to continue as a going concern within one year after the date that the financial statements are issued or available to be issued.
Auditor’s Responsibilities for the Audit of the Financial Statements
Our objectives are to obtain reasonable assurance about whether the financial statements as a whole are free from material misstatement, whether due to fraud or error, and to issue an auditor’s report that includes our opinion. Reasonable assurance is a high level of assurance but is not absolute assurance and therefore is not a guarantee that an audit conducted in accordance with GAAS will always detect a material misstatement when it exists. The risk of not detecting a material misstatement resulting from fraud is higher than for one resulting from error, as fraud may involve collusion, forgery, intentional omissions, misrepresentations, or the override of internal control. Misstatements are considered material if there is a substantial likelihood that, individually or in the aggregate, they would influence the judgment made by a reasonable user based on the financial statements.
In performing an audit in accordance with GAAS, we:
| ● | Exercise professional judgment and maintain professional skepticism throughout the audit. |
| ● | Identify and assess the risks of material misstatement of the financial statements, whether due to fraud or error, and design and perform audit procedures responsive to those risks. Such procedures include examining, on a test basis, evidence regarding the amounts and disclosures in the financial statements. |
| ● | Obtain an understanding of internal control relevant to the audit in order to design audit procedures that are appropriate in the circumstances, but not for the purpose of expressing an opinion on the effectiveness of the Fund’s internal control. Accordingly, no such opinion is expressed. |
| ● | Evaluate the appropriateness of accounting policies used and the reasonableness of significant accounting estimates made by management, as well as evaluate the overall presentation of the financial statements. |
| ● | Conclude whether, in our judgment, there are conditions or events, considered in the aggregate, that raise substantial doubt about the Fund’s ability to continue as a going concern for a reasonable period of time. |
We are required to communicate with those charged with governance regarding, among other matters, the planned scope and timing of the audit, significant audit findings, and certain internal control–related matters that we identified during the audit.
/s/ RSM US LLP
Denver, Colorado
March 30, 2023
Galaxy Plus Fund – Welton GDP Master Fund (538) LLC
(A Delaware Limited Liability Company)
Statement of Financial Condition
December 31, 2022
(Expressed in U.S. Dollars)
| Assets | | | |
| | | | |
| Equity in commodity trading accounts at clearing brokers: | | | | |
| Cash | | $ | 2,815,007 | |
| Restricted cash - margin balance | | | 1,583,784 | |
| Receivable from Onshore Feeder Fund | | | 379,088 | |
| | | | | |
| Total assets | | $ | 4,777,879 | |
| | | | | |
| Liabilities and Member’s Equity | | | | |
| | | | | |
| Liabilities | | | | |
| Deficit in commodity trading accounts at clearing brokers: | | | | |
| Investments in futures contracts, at fair value (represents unrealized depreciation on open derivative contracts, net) | | $ | 43,016 | |
| | | | | |
| Total liabilities | | | 43,016 | |
| | | | | |
| Member’s equity | | | 4,734,863 | |
| | | | | |
| Total liabilities and member’s equity | | $ | 4,777,879 | |
See notes to financial statements.
Galaxy Plus Fund – Welton GDP Master Fund (538) LLC
(A Delaware Limited Liability Company)
Condensed Schedule of Investments
December 31, 2022
(Expressed in U.S. Dollars)
| | | Number of | | | | | Percent of | |
| | | Contracts/
Units | | Fair Value | | | Member’s Equity | |
| Long positions: | | | | | | | | |
| Derivative contracts: | | | | | | | | |
| Domestic (United States): | | | | | | | | |
| Futures contracts: | | | | | | | | |
| Agriculture | | 80 | | $ | 72,069 | | | | 1.54 | % |
| Currency | | 38 | | | (10,351 | ) | | | (0.22 | ) |
| Energy | | 5 | | | 13,811 | | | | 0.29 | |
| Index | | 2 | | | (750 | ) | | | (0.02 | ) |
| Interest | | 12 | | | (10,797 | ) | | | (0.23 | ) |
| Metals | | 3 | | | (467 | ) | | | (0.01 | ) |
| Foreign: | | | | | | | | | | |
| Futures contracts: | | | | | | | | | | |
| Energy | | 3 | | | (5,607 | ) | | | (0.12 | ) |
| Index | | 57 | | | (86,508 | ) | | | (1.83 | ) |
| Interest | | 57 | | | (56,729 | ) | | | (1.20 | ) |
| Metals | | 32 | | | 32,278 | | | | 0.68 | |
| | | | | | | | | | | |
| Total long positions | | | | $ | (53,051 | ) | | | (1.12 | ) |
| | | | | | | | | | | |
| Short positions: | | | | | | | | | | |
| Derivative contracts: | | | | | | | | | | |
| Domestic (United States): | | | | | | | | | | |
| Futures contracts: | | | | | | | | | | |
| Agriculture | | 45 | | $ | (30,620 | ) | | | (0.65 | ) |
| Currency | | 16 | | | (8,880 | ) | | | (0.19 | ) |
| Energy | | 13 | | | (43,209 | ) | | | (0.91 | ) |
| Index | | 11 | | | (15,360 | ) | | | (0.32 | ) |
| Interest | | 21 | | | 22,989 | | | | 0.49 | |
| Foreign: | | | | | | | | | | |
| Futures contracts: | | | | | | | | | | |
| Energy | | 4 | | | (16,320 | ) | | | (0.34 | ) |
| Index | | 36 | | | 40,072 | | | | 0.85 | |
| Interest | | 30 | | | 68,556 | | | | 1.43 | |
| Metals | | 25 | | | (7,193 | ) | | | (0.15 | ) |
| | | | | | | | | | | |
| Total short positions | | | | | 10,035 | | | | 0.21 | |
| | | | | | | | | | | |
| Total investments in futures contracts, at fair value | | | | $ | (43,016 | ) | | | (0.91 | )% |
See notes to financial statements.
Galaxy Plus Fund – Welton GDP Master Fund (538) LLC
(A Delaware Limited Liability Company)
Statement of Operations
For the year ended December 31, 2022
(Expressed in U.S. Dollars)
| Investment Income: | | | |
| Interest income | | $ | 12,527 | |
| | | | | |
| Total investment income | | | 12,527 | |
| | | | | |
| Expenses: | | | | |
| Interest expense | | | 2,707 | |
| Other expenses | | | 1,561 | |
| | | | | |
| Total expenses | | | 4,268 | |
| | | | | |
| Net investment income | | | 8,259 | |
| | | | | |
| Realized and unrealized gain (loss) on investments and foreign currency transactions: | | | | |
| Net realized gain (loss) from: | | | | |
| Derivative contracts1 | | | 2,351,866 | |
| Foreign currency transactions | | | (14,369 | ) |
| | | | 2,337,497 | |
| | | | | |
| Net (increase) in unrealized depreciation on: | | | | |
| Derivative contracts | | | (83,800 | ) |
| | | | (83,800 | ) |
| | | | | |
| Net realized and unrealized gain on investments and foreign currency transactions | | | 2,253,697 | |
| | | | | |
| Net increase in member’s equity resulting from operations | | $ | 2,261,956 | |
| 1 | Including trading costs. |
See notes to financial statements.
Galaxy Plus Fund – Welton GDP Master Fund (538) LLC
(A Delaware Limited Liability Company)
Statement of Changes in Members’ Equity
For the year ended December 31, 2022
(Expressed in U.S. Dollars)
| Changes in member’s equity from operations: | | | |
| Net investment income | | $ | 8,259 | |
| Net realized gain (loss) from derivative contracts and foreign currency transactions | | | 2,337,497 | |
| Net (increase) in unrealized depreciation on derivative contracts | | | (83,800 | ) |
| | | | | |
| Net increase in member’s equity resulting from operations | | | 2,261,956 | |
| | | | | |
| Changes in member’s equity from capital transactions: | | | | |
| Proceeds from issuance of capital | | | 468,685 | |
| Payments for redemptions of capital | | | (2,612,455 | ) |
| | | | | |
| Net decrease in member’s equity resulting from capital transactions | | | (2,143,770 | ) |
| | | | | |
| Total increase | | | 118,186 | |
| | | | | |
| Member’s equity, beginning of year | | | 4,616,677 | |
| | | | | |
| Member’s equity, end of year | | $ | 4,734,863 | |
See notes to financial statements.
Galaxy Plus Fund – Welton GDP Master Fund (538) LLC
(A Delaware Limited Liability Company)
Notes to Financial Statements
Note 1. Organization and Structure
Galaxy Plus Fund – Welton GDP Master Fund (538) LLC (the “Master Fund”) was formed in Delaware as a limited liability company on January 27, 2017, and commenced operation on March 28, 2017. The Master Fund was created to serve as the trading entity managed by Welton Investment Partners, L.L.C. (the “Trading Advisor”) pursuant to its Global Directional Portfolio (the “Program”). The Program is designed to provide investors with non-correlated returns and long-term capital appreciation through the global futures and FX Markets.
The Master Fund and other separately formed Delaware limited liability companies (“Other Master Funds”), are investment vehicles available under the Galaxy Plus Managed Account Platform (the “Platform”). The Master Fund and the Platform are sponsored by New Hyde Park Alternative Funds, LLC (the “Sponsor” or “NHPAF”) as a means of making available, to qualified high net-worth individuals and institutional investors (including fund of hedge funds) (“Investors”), a variety of third-party professional managed futures and foreign exchange advisors (“Advisors”). The Trading Advisor is not affiliated with the Sponsor.
NHPAF was formed in October 2013 and its principal office is located in Wheaton, Illinois. NHPAF is registered with the U.S. Commodity Futures Trading Commission (CFTC) as a commodity pool operator and commodity trading advisor, and is a member of the National Futures Association (NFA).
Galaxy Plus Fund LLC, a Delaware Series Limited Liability Company (the “Onshore Platform”), and Galaxy Plus Fund SPC, a Cayman Islands Segregated Portfolio Company (the “Offshore Platform”) serve as the feeder funds for the Platform and invest substantially all of the assets of the respective segregated portfolios (each a “Fund”) in the Master Fund or other Master Funds. Galaxy Plus Fund – Welton GDP Feeder Fund (538W) (“LLC538W”), a separated series of the Onshore Platform and Galaxy Plus Fund – Welton GDP Offshore Feeder Fund (538W) Segregated Portfolio (“SPC538W”), a segregated portfolio of the Offshore Platform, can each invest in the Master Fund. As of December 31, 2022, SPC538W had not yet commenced operations and LLC538W is the sole member.
LLC538W and SPC538W are collectively hereafter referred to as the “Feeder Funds”.
Subscriptions and redemptions into the Feeder Funds and the corresponding transactions with the Master Fund are governed by the Onshore Platform’s and the Offshore Platform’s respective Confidential Offering Memorandums.
The Platform has appointed the Sponsor, under the terms of the Limited Liability Company Agreement (the “LLC Agreement”) as the managing member of the Master Fund. In such capacity, the Sponsor has the authority, to manage, with wide discretionary powers, the business and affairs of the Master Fund including the authority to select the administrator for the Master Fund. The LLC Agreement will continue to remain in force until terminated by either the Sponsor or the Platform upon not less than sixty (60) days’ prior written notice. In certain circumstances (for example, the insolvency of either party or in the event all trading for the Platform by the Advisors are suspended), the LLC Agreement may be immediately terminated by either party.
Galaxy Plus Fund – Welton GDP Master Fund (538) LLC
(A Delaware Limited Liability Company)
Notes to Financial Statements
The Master Fund and the Sponsor have entered into a tri-party contract (the “Trading Agreement”) with the Trading Advisor pursuant to which the Master Fund’s trading accounts are managed, subject to rights of termination, by the Trading Advisor in accordance with the Program. The Trading Advisor may alter its Program (including its trading systems and methods and including the addition and/or deletion of any financial interests or contracts traded in the Master Fund’s trading accounts), provided that the Trading Advisor provide prior notice to the Master Fund and the Sponsor of any material change to the Trading Advisor’s Program. From time to time, the Trading Advisor (or its affiliates) may manage additional accounts, and these accounts will increase the level of competition for the same trades desired for the Master Fund, including the priorities of order entry. There is no specific limit as to the number of accounts the Trading Advisors (or their affiliates) may manage. In addition, the positions of all of the accounts owned or controlled by the Trading Advisor (or its affiliates) are aggregated for the purposes of applying speculative position limits. The management, incentive, and sponsor fees are paid directly by the Feeder Funds, and for this reason are not recorded as expenses of the Master Fund.
Note 2. Summary of Significant Accounting Policies
The following is a summary of significant accounting policies consistently followed in the preparation of the Master Fund’s financial statements.
Principles of accounting: The accompanying financial statements are expressed in United States dollars (USD) and have been prepared in accordance with Generally Accepted Accounting Principles (GAAP), as established by the Financial Accounting Standards Board (FASB), to ensure consistent reporting of financial condition and results of operations. The Master Fund is an investment company and follows the accounting and reporting guidance in FASB Account Standards Codification Topic 946.
Cash and restricted cash: Cash held in the commodity trading accounts at clearing broker consists of either cash maintained in the custody of the broker, a portion of which is required margin for open positions, or amounts due to/from the broker for margin or unsettled trades. The Master Fund may also hold cash in a non-interest bearing USD commercial bank account. The Master Fund holds various currencies at the clearing broker, of which $4,399,976 is held in USD and a payable balance of $(1,185) in foreign currencies as of December 31, 2022, and are recorded in cash and restricted cash – margin balance on the Statement of Financial Condition. The non-U.S. currencies fluctuate in value on a daily basis relative to the USD. A portion of this cash is restricted cash required to meet maintenance margin requirements. Cash with the clearing broker as of December 31, 2022, included restricted cash for margin requirements of $1,583,784. This cash becomes unrestricted when the underlying positions to which it is applicable are liquidated. Cash with the clearing broker as of December 31, 2022 included amounts due to the broker for unsettled trades of $0.
Offsetting of amounts related to certain contracts: When the requirements are met, the Master Fund offsets certain fair value amounts recognized for net derivative positions executed with the same counterparty under the same master netting arrangement (see Note 5).
Galaxy Plus Fund – Welton GDP Master Fund (538) LLC
(A Delaware Limited Liability Company)
Notes to Financial Statements
Valuation and Revenue Recognition: Depending on the Program and Investments traded, The Master Fund follows the following valuation and revenue recognition policies. All investments are recorded at their estimated fair value, as described in Note 3.
Futures and options on futures contracts: The Master Fund may enter into futures and options on futures contracts. Upon entering into a futures contract, The Master Fund agrees to receive or deliver a fixed quantity of an underlying instrument or commodity for an agreed-upon price, while an option contract provides the option purchaser with the right, but not the obligation, to buy or sell a security or financial instrument at a predetermined exercise price during a defined period. Futures and options on futures contracts are recorded on the trade date. The difference between the original contract amount and the fair value of futures contracts purchased or sold is reflected as unrealized appreciation/(depreciation) on open contracts. Options on futures contracts are reflected in investments at fair value. The difference between the premiums paid or received on open options on futures contracts and fair value of such options is recorded as unrealized appreciation/(depreciation) on open contracts. The fair value of futures and options on futures contracts is based upon daily exchange settlement prices. The realized gain or loss is determined on the settlement of intraday trades first and then by the FIFO method.
Foreign currency transactions: The Master Fund’s financial statements are denominated in USD. However, foreign currency forward contracts, non-U.S. futures contracts, and non-U.S. options on futures contracts are denominated in currencies other than USD. Assets and liabilities and transactions denominated in currencies other than the USD are translated into USD at the rates in effect either at the close of business on the last business day of the reporting period or on the date of such transactions, respectively. Such fluctuations are included with the unrealized appreciation (depreciation) on open derivative contracts, net. Net realized foreign exchange gain or loss arises from the sales of foreign currencies and currency gains or losses realized between trade and settlement dates. Net unrealized foreign exchange gain and loss arises from changes in the fair value of margin collateral assets and liabilities resulting from changes in exchange rates.
Trading costs: Trading costs generally consist of brokerage commissions, brokerage fees, clearing fees, exchange and regulatory fees, transaction and NFA fees. Fees vary by type of contract for each purchase and sale or sale and purchase (round turn) of futures, options on futures, and forward contracts. Commissions are paid on each individual purchase and sale transaction. These costs are recognized as expenses for futures and options on futures transactions and are included in net realized gain/loss from derivative contracts on the Statement of Operations.
Interest income/expense: Interest income and expense is recognized on an accrual basis.
Allocation of income and gains and losses: Profits and losses for each monthly accounting period, or shorter period if there are mid-month subscriptions and/or redemptions, are allocated pro-rata to the Feeder Funds based on their respective ownership percentage on the first day of each period throughout the year.
Income taxes: The Master Fund will not be subject to United States federal income taxation other than certain withholding taxes. The Master Fund evaluates tax positions taken or expected to be taken to determine whether the tax positions are more-likely-than-not of being sustained by the applicable tax authority. For tax positions meeting the more-likely-than-not threshold, the tax amount recognized in the financial statements is reduced by the largest benefit that has a greater than fifty percent likelihood of being realized upon ultimate settlement with the relevant taxing authority. The Master Fund has determined that there is no tax liability resulting from uncertain income tax positions taken or expected to be taken with respect to all open tax years. The Master Fund’s U.S. Federal tax returns for the years ended December 31, 2019 through 2022, remain open. The Master Fund recognizes interest and penalties, if any, related to unrecognized tax benefits as income tax expense in the Statement of Operations. During the year, the Master Fund did not accrue any interest or penalties.
Galaxy Plus Fund – Welton GDP Master Fund (538) LLC
(A Delaware Limited Liability Company)
Notes to Financial Statements
Use of estimates: The preparation of financial statements in accordance with GAAP requires management to make estimates and assumptions that affect the reported amounts of assets and liabilities and disclosure of contingent assets and liabilities at the date of the financial statements and the reported amounts of income and expenses during the reporting period. Actual results could differ from those estimates.
Indemnifications: The Sponsor and its affiliates are indemnified against certain liabilities arising out of the performance of their duties for The Master Fund. In addition, in the normal course of business, the Master Fund enters into contracts with vendors and others that provide for general indemnifications. The Master Fund’s maximum exposure under these arrangements is unknown as this would involve future claims that may be made against the Master Fund. However, the Master Fund expects the risk of loss to be remote.
Statement of cash flows: The Master Fund has elected not to provide a statement of cash flows as permitted by GAAP as all of the following conditions have been met:
| ● | During the year, substantially all of the Master Fund’s investments were carried at fair value and classified as Level 1 or Level 2 measurements in accordance with FASB ASC 820; |
| ● | The Master Fund had little or no debt during the year; |
| ● | The Master Fund’s financial statements include a Statement of Changes in Member’s Equity. |
Subscriptions and redemptions: Subscriptions and redemptions can typically be made on a weekly basis as of the first day (Monday) of each week; (or, if such day is not a business day, the first business day thereafter) (each, a Subscription Date or a Redemption Date). The Master Fund may accept subscriptions or redemptions more frequently than the first day of each week, depending upon the size of the requested subscription or redemption amount, with the approval of the Sponsor.
Note 3. Fair Value Measurements
The Master Fund’s investments are stated at fair value in accordance with FASB ASC 820, Fair Value Measurements and Disclosures (ASC 820). ASC 820 defines fair value, establishes a framework for measuring fair value and expands disclosures about fair value measurements. ASC 820 also emphasizes that fair value is a market-based measurement, not an entity-specific measurement, and sets out a fair value hierarchy with the highest priority being quoted prices in active market. Under ASC 820, fair value measurements are disclosed by level within that hierarchy, as follows:
Level 1 — Values for investments classified as Level 1 are based on unadjusted quoted prices for identical investments in an active market. Since valuations are based on quoted prices that are readily accessible at the measurement date, valuation of these investments does not entail a significant degree of judgment.
Level 2 — Values for investments classified as Level 2 are based on quoted prices for similar investments in an active or non-active markets for which all significant inputs are observable either directly or indirectly. Level 2 inputs may also include discounts related to restrictions on the investments.
Level 3 — Values for investments categorized as Level 3 are based on prices or valuation techniques that require inputs that are both significant to the fair value and unobservable, including valuations by the Sponsor in the absence of readily ascertainable fair values.
Galaxy Plus Fund – Welton GDP Master Fund (538) LLC
(A Delaware Limited Liability Company)
Notes to Financial Statements
A description of the valuation methodologies applied to the Master Fund’s major categories of assets and liabilities measured at fair value on a recurring basis follows. Inputs that are used in determining fair value of an investment may include price information, credit data, volatility statistics, and other factors. These inputs can be either observable or unobservable. All of the inputs for the Master Fund were observable as of December 31, 2022. The availability of observable inputs can vary between investments and is affected by various factors such as type of investment and the volume and level of activity for that investment or similar investments in the marketplace.
Exchange-traded derivative contracts that are actively traded are valued based on daily quoted settlement prices from the respective exchange and are categorized in Level 1 of the fair value hierarchy. Exchange-traded derivative contracts not actively traded and over-the-counter (OTC) derivative contracts can include futures contracts, option on futures contracts, forward contracts, and option contracts whose values are based on an underlying such as interest rates, foreign currencies, credit standing of reference entities, equities or commodities. Such derivative contracts are valued using observable market data, including currency spot rates or quoted prices of the related underlying obtained from the applicable exchange or market. OTC derivative contracts are valued using the above described pricing methodology and are categorized as Level 2 within the fair value hierarchy.
The Master Fund assesses the levels of the investments at each measurement date, and transfers between levels are recognized on the actual date of the event or change in circumstances that caused the transfer in accordance with the Master Fund’s accounting policy regarding the recognition of transfers between levels of the fair value hierarchy. There were no transfers among levels 1, 2, and 3 during the year ended December 31, 2022.
The inputs or methodologies used for valuing investments are not necessarily indicative of the risk associated with investing in those instruments.
Galaxy Plus Fund – Welton GDP Master Fund (538) LLC
(A Delaware Limited Liability Company)
Notes to Financial Statements
The following tables present the classification of derivatives, by type, into the fair value hierarchy levels as of December 31, 2022. Presentation is gross – as an asset if in a gain position and a liability if in a loss position.
| | | | | | Fair Value Measurements at Reporting Date Using | |
| | | | | | Quoted Prices | | | Significant Other | | | Significant | |
| | | | | | in Active | | | Observable | | | Unobservable | |
| | | | | | Markets | | | Inputs | | | Inputs | |
| Description | | Fair Value | | | (Level 1) | | | (Level 2) | | | (Level 3) | |
| Assets: | | | | | | | | | | | | |
| Derivative contracts: | | | | | | | | | | | | |
| Futures contracts: | | | | | | | | | | | | | | | | |
| Agriculture | | $ | 74,615 | | | $ | 74,615 | | | $ | - | | | $ | - | |
| Currency | | | 13,089 | | | | 13,089 | | | | - | | | | - | |
| Energy | | | 29,921 | | | | 29,921 | | | | - | | | | - | |
| Index | | | 54,756 | | | | 54,756 | | | | - | | | | - | |
| Interest | | | 91,545 | | | | 91,545 | | | | - | | | | - | |
| Metals | | | 106,658 | | | | 106,658 | | | | - | | | | - | |
| | | | | | | | | | | | | | | | | |
| Total investment assets at fair value | | | 370,584 | | | | 370,584 | | | | - | | | | - | |
| | | | | | | | | | | | | | | | | |
| Liabilities: | | | | | | | | | | | | | | | | |
| Derivative contracts: | | | | | | | | | | | | | | | | |
| Futures contracts: | | | | | | | | | | | | | | | | |
| Agriculture | | | (33,166 | ) | | | (33,166 | ) | | | - | | | | - | |
| Currency | | | (32,320 | ) | | | (32,320 | ) | | | - | | | | - | |
| Energy | | | (81,246 | ) | | | (81,246 | ) | | | - | | | | - | |
| Index | | | (117,302 | ) | | | (117,302 | ) | | | - | | | | - | |
| Interest | | | (67,526 | ) | | | (67,526 | ) | | | - | | | | - | |
| Metals | | | (82,040 | ) | | | (82,040 | ) | | | - | | | | - | |
| | | | | | | | | | | | | | | | | |
| Total investment liabilities at fair value | | | (413,600 | ) | | | (413,600 | ) | | | - | | | | - | |
| | | | | | | | | | | | | | | | | |
| Total net investments at fair value | | $ | (43,016 | ) | | $ | (43,016 | ) | | $ | - | | | $ | - | |
Galaxy Plus Fund – Welton GDP Master Fund (538) LLC
(A Delaware Limited Liability Company)
Notes to Financial Statements
Note 4. Derivative Financial Instruments
Derivative financial instruments speculatively traded by the Master Fund can include U.S. and foreign futures, options on futures contracts, and forward currency contracts (collectively, derivatives) whose values are based upon an underlying asset, indices, or reference rates, and generally represent future commitments to exchange cash flows, or to purchase or sell other financial instruments at specified future dates. A derivative contract may be traded on an exchange or OTC. Exchange-traded derivatives are standardized and include futures and options on futures contracts. OTC derivative contracts are negotiated between contracting parties and include forward currency contracts and certain options. Derivatives are subject to various risks similar to those related to the underlying financial instruments including market and credit risks.
Market risk is the potential for changes in the value of derivatives due to market changes, including interest and foreign exchange rate movements and fluctuations in commodity and security prices. Market risk is directly impacted by the volatility and liquidity in the markets in which the related underlying assets are traded. The market risk of the Master Fund is managed by the underlying Trading Advisors according to each respective Program. The Master Fund is exposed to a market risk equal to the notional contract value of the derivatives contracts purchased and unlimited liability on such contracts sold short.
Credit risk is the possibility that a loss may occur due to the failure of a counterparty to perform according to the terms of a contract. Credit risk due to exchange traded derivative financial instruments is significantly reduced by the regulatory requirements of the individual exchanges on which the instruments are traded. At any point in time, the credit risk for OTC derivatives is limited to the net unrealized gain for each counterparty for which a netting agreement exists, if any. In a similar fashion, liabilities represent net amounts owed to counterparties. The credit risk exposure for the Master Fund’s outstanding OTC derivatives was $0 at December 31, 2022.
Market and geopolitical risk relate to the increasing interconnectivity between global economies and financial markets increases the likelihood that events or conditions in one region or financial market may adversely impact issuers in a different country, region, or financial market. Securities in the Master Fund may underperform due to inflation (or expectations for inflation), interest rates, global demand for particular products or resources, natural disasters, pandemics, epidemics, terrorism, regulatory events and governmental or quasi-governmental actions. The occurrence of global events similar to those in recent years, such as terrorist attacks around the world, natural disasters, social and political discord or debt crises and downgrades, among others, may result in market volatility and may have long term effects on both the U.S. and global financial markets. It is difficult to predict when similar events affecting the U.S. or global financial markets may occur, the effects that such events may have and the duration of those effects. Any such event(s) could have a significant adverse impact on the value and risk profile of the Master Fund. The current novel coronavirus (COVID-19) global pandemic and the aggressive responses taken by many governments, including closing borders, restricting international and domestic travel, and the imposition of prolonged quarantines or similar restrictions, as well as the forced or voluntary closure of, or operational changes to, many retail and other businesses, has had negative impacts, and in many cases severe negative impacts, on markets worldwide. It is not known how long such impacts, or any future impacts of other significant events described above, will or would last, but there could be a prolonged period of global economic slowdown, which may impact your investment.
Purchase and sale of futures contracts requires margin deposits with the broker. Additional deposits may be necessary for any loss on contract value. The U.S. Commodity Exchange Act requires a broker to segregate all customer transactions and assets from such broker’s proprietary activities. A customer’s cash and other property (for example, U.S. Treasury bills) deposited with a broker are considered commingled with all other customer funds subject to the broker’s segregation requirements. In the event of a broker’s insolvency, recovery may be limited to a pro rata share of segregated funds available. It is possible that the recovered amount could be less than total cash and other property deposited.
Galaxy Plus Fund – Welton GDP Master Fund (538) LLC
(A Delaware Limited Liability Company)
Notes to Financial Statements
The Master Fund has a substantial portion of its assets on deposit with counterparties. In the event of a counterparty’s insolvency, recovery of The Master Fund’s assets on deposit may be limited to account insurance or other protection afforded such deposits.
The notional value represents amounts related to the Master Fund’s stock exchange indices, commodities, interest rate and foreign currencies upon which the fair value of the futures contracts held by the Master Fund are based. Notional values do not represent the current fair value of, and are not necessarily indicative of the future cash flows of the Master Fund’s futures and forward contracts. Further, the underlying price changes in relation to variables specified by the notional values affects the fair value of these derivative financial instruments. Theoretically, the Master Fund’s exposure is equal to the notional value of contracts purchased and unlimited on such contracts sold short. As of December 31, 2022, the Master Fund had open futures contracts with the following notional values by sector:
| Description | | Quantity | | Notional Value | | | Description | | Quantity | | Notional Value | |
| Long: | | | | | | | Short: | | | | | |
| Agriculture | | 80 | | $ | 2,960,297 | | | Agriculture | | 45 | | $ | (1,760,300 | ) |
| Currency | | 38 | | | 2,357,252 | | | Currency | | 16 | | | (1,228,170 | ) |
| Energy | | 8 | | | 784,079 | | | Energy | | 17 | | | (1,178,059 | ) |
| Index | | 59 | | | 4,809,586 | | | Index | | 47 | | | (5,521,607 | ) |
| Interest | | 69 | | | 19,727,225 | | | Interest | | 51 | | | (8,889,133 | ) |
| Metals | | 35 | | | 3,478,671 | | | Metals | | 25 | | | (2,048,978 | ) |
During the year ended December 31, 2022, the Master Fund participated in 20,645 futures contract transactions.
Below is a summary of net trading gains and (losses) by investment type and industry:
| | | Net Trading Gain (Loss)* | |
| Futures contracts: | | | |
| Agriculture | | $ | (411,954 | ) |
| Currency | | | 2,017,867 | |
| Energy | | | 681,792 | |
| Index | | | (508,351 | ) |
| Interest | | | 229,449 | |
| Metals | | | 368,923 | |
| Total futures contracts | | | 2,377,726 | |
| | | | | |
| Trading costs | | | (109,660 | ) |
| | | | | |
| Total net trading gain (loss) | | $ | 2,268,066 | |
| * | Includes both realized gain of $2,351,866 and unrealized depreciation of $(83,800) and is located in net realized and unrealized gain (loss) on investments on the Statement of Operations. Amounts exclude foreign currency transactions. |
Galaxy Plus Fund – Welton GDP Master Fund (538) LLC
(A Delaware Limited Liability Company)
Notes to Financial Statements
Note 5. Balance Sheet Offsetting
The Master Fund is required to disclose the impact of offsetting assets and liabilities presented in the Statement of Financial Condition to enable users of the financial statements to evaluate the effect or potential effect of netting arrangements on its financial position for recognized assets and liabilities. These recognized assets and liabilities include financial instruments and derivative instruments that are either subject to an enforceable master netting arrangement or similar agreement or meet the following right of set-off criteria: each of the two parties owes the other determinable amounts, the Master Fund has the right to set-off the amounts owed with the amounts owed by the other party, the Master Fund intends to set off, and the Master Fund’s right of set-off is enforceable by law.
The Master Fund is subject to enforceable master netting agreements with certain counterparties. These agreements govern the terms of certain transactions, and reduce the counterparty risk associated with relevant transactions by specifying offsetting mechanisms and collateral posting arrangements at prearranged exposure levels. Since different types of transactions have different mechanics and are sometimes traded out of different legal entities of a particular counterparty organization, each type of transaction may be covered by a different master netting arrangement, possibly resulting in the need for multiple agreements with a single counterparty. Master netting agreements may not be specific to each different asset type; in such instances, they would allow the Master Fund to close out and net its total exposure to a specified counterparty in the events of default or early termination with respect to any and all the transactions governed under a single agreement with the counterparty.
The following tables summarize the Master Fund’s netting arrangements:
| Description | | Gross
Amounts of
Recognized
Assets
(Liabilities) | | | Offset in the
Statement of
Financial
Condition | | | Net Amount of
Assets
(Liabilities)
in the
Statement of
Financial
Condition | |
| | | | | | | | | | |
| Futures contracts | | $ | (413,600 | ) | | $ | 370,584 | | | $ | (43,016 | ) |
| Total | | $ | (413,600 | ) | | $ | 370,584 | | | $ | (43,016 | ) |
| | | Net Amount
in the
Statement of
Financial
Condition | | | Cash
Collateral
Received by
Counterparty | | | Net Amount
in the
Statement of
Financial
Condition | |
| | | | | | | | | | |
| Counterparty A | | $ | (43,016 | ) | | $ | 1,583,784 | | | $ | 1,540,768 | |
| Total | | $ | (43,016 | ) | | $ | 1,583,784 | | | $ | 1,540,768 | |
Galaxy Plus Fund – Welton GDP Master Fund (538) LLC
(A Delaware Limited Liability Company)
Notes to Financial Statements
Note 6. Related Parties
As of December 31, 2022, the Master Fund had $379,088 receivable from the Feeder Fund, as reflected in the Statement of Financial Condition. Generally, receivables and payables from/to Feeder Fund are a result of timing differences of cash movements related to capital activity at the Feeder Fund level.
Note 7. Financial Highlights
Financial highlights of the Master Fund for the year ended December 31, 2022 are presented in the table below. The information has been derived from information presented in the financial statements.
| Total return (A) | | | 45.61 | % |
| | | | | |
| Ratios to average member’s equity (B): | | | | |
| Net investment income (C) | | | 0.14 | % |
| Total expenses | | | 0.07 | % |
| (A) | Total return is based on the change in average member’s equity during the period of a theoretical investment made at the inception of the Master Fund. |
| (B) | The total expense and net investment income ratios are computed based upon weighted-average member’s equity as a whole for the year ended December 31, 2022. |
| (C) | The net investment income ratio excludes net realized and unrealized gains (losses) on investments. |
Financial highlights are calculated for each member class taken as a whole. An individual member’s return and ratios may vary based on the timing of capital transactions. The total return and net investment income ratio would have been lower and total expense ratio would have been higher if the management, incentive fees, and sponsor fees, had been charged to the Master Fund instead of the Feeder Fund.
Note 8. Subsequent Events
In accordance with FASB ASC 855, Subsequent Events, the Sponsor has evaluated all subsequent events requiring recognition and disclosure in the Master Fund’s financial statements through March 30, 2023, the date the financial statements were available for issuance. The Sponsor has determined that there are no material events that would require recognition or disclosure in the Master Fund’s financial statements through this date.
Galaxy Plus Fund – Welton GDP Master Fund (538) LLC
(A Delaware Limited Liability Company)
Oath and Affirmation of the Commodity Pool Operator
To the best of the knowledge and belief of the undersigned, the information contained in the annual report as of and for the year ended December 31, 2022 is accurate and complete.
David Young, President
New Hyde Park Alternative Funds, LLC — Sponsor
Galaxy Plus Fund – Welton GDP Master Fund (538) LLC
Galaxy Plus Fund – Volt Diversified Alpha Master Fund (550) LLC
(A Delaware Limited Liability Company)
The attached annual report is filed under exemption pursuant to Section 4.7 of the regulations under the Commodity Exchange Act.
Financial Report
December 31, 2022
Contents
Independent Auditor’s Report
Managing Member
Galaxy Plus Fund LLC
Opinion
We have audited the financial statements of Galaxy Plus Fund — Volt Diversified Alpha Master Fund (550) LLC (the Fund), which comprise the statement of financial condition, including the condensed schedule of investments, as of December 31, 2022, the related statements of operations and changes in member’s equity for the year then ended, and the related notes to the financial statements.
In our opinion, the accompanying financial statements present fairly, in all material respects, the financial position of the Fund as of December 31, 2022, and the results of its operations and changes in member’s equity for the year then ended in accordance with accounting principles generally accepted in the United States of America.
Basis for Opinion
We conducted our audit in accordance with auditing standards generally accepted in the United States of America (GAAS). Our responsibilities under those standards are further described in the Auditor’s Responsibilities for the Audit of the Financial Statements section of our report. We are required to be independent of the Fund and to meet our other ethical responsibilities, in accordance with the relevant ethical requirements relating to our audit. We believe that the audit evidence we have obtained is sufficient and appropriate to provide a basis for our audit opinion.
Responsibilities of Management for the Financial Statements
Management is responsible for the preparation and fair presentation of the financial statements in accordance with accounting principles generally accepted in the United States of America, and for the design, implementation and maintenance of internal control relevant to the preparation and fair presentation of financial statements that are free from material misstatement, whether due to fraud or error.
In preparing the financial statements, management is required to evaluate whether there are conditions or events, considered in the aggregate, that raise substantial doubt about the Fund’s ability to continue as a going concern within one year after the date that the financial statements are issued or available to be issued.
Auditor’s Responsibilities for the Audit of the Financial Statements
Our objectives are to obtain reasonable assurance about whether the financial statements as a whole are free from material misstatement, whether due to fraud or error, and to issue an auditor’s report that includes our opinion. Reasonable assurance is a high level of assurance but is not absolute assurance and therefore is not a guarantee that an audit conducted in accordance with GAAS will always detect a material misstatement when it exists. The risk of not detecting a material misstatement resulting from fraud is higher than for one resulting from error, as fraud may involve collusion, forgery, intentional omissions, misrepresentations, or the override of internal control. Misstatements are considered material if there is a substantial likelihood that, individually or in the aggregate, they would influence the judgment made by a reasonable user based on the financial statements.
In performing an audit in accordance with GAAS, we:
| ● | Exercise professional judgment and maintain professional skepticism throughout the audit. |
| ● | Identify and assess the risks of material misstatement of the financial statements, whether due to fraud or error, and design and perform audit procedures responsive to those risks. Such procedures include examining, on a test basis, evidence regarding the amounts and disclosures in the financial statements. |
| ● | Obtain an understanding of internal control relevant to the audit in order to design audit procedures that are appropriate in the circumstances, but not for the purpose of expressing an opinion on the effectiveness of the Fund’s internal control. Accordingly, no such opinion is expressed. |
| ● | Evaluate the appropriateness of accounting policies used and the reasonableness of significant accounting estimates made by management, as well as evaluate the overall presentation of the financial statements. |
| ● | Conclude whether, in our judgment, there are conditions or events, considered in the aggregate, that raise substantial doubt about the Fund’s ability to continue as a going concern for a reasonable period of time. |
We are required to communicate with those charged with governance regarding, among other matters, the planned scope and timing of the audit, significant audit findings, and certain internal control–related matters that we identified during the audit.
/s/ RSM US LLP
Denver, Colorado
March 30, 2023
Galaxy Plus Fund - Volt Diversified Alpha Master Fund (550) LLC
(A Delaware Limited Liability Company)
Statement of Financial Condition
December 31, 2022
(Expressed in U.S. Dollars)
| Assets | | | |
| | | | |
| Equity in commodity trading accounts at clearing brokers: | | | |
| Cash | | $ | 256,858 | |
| Restricted cash - margin balance | | | 92,906 | |
Investments in futures contracts, at fair value
(represents unrealized appreciation on open derivative contracts, net) | | | 8,374 | |
| | | | | |
| Total assets | | $ | 358,138 | |
| | | | | |
| Liabilities and Member’s Equity | | | | |
| | | | | |
| Liabilities | | | | |
| Payable to Onshore Feeder Fund | | $ | 74,789 | |
| | | | | |
| Total liabilities | | | 74,789 | |
| | | | | |
| Member’s equity | | | 283,349 | |
| | | | | |
| Total liabilities and member’s equity | | $ | 358,138 | |
See notes to financial statements.
Galaxy Plus Fund - Volt Diversified Alpha Master Fund (550) LLC
(A Delaware Limited Liability Company)
Condensed Schedule of Investments
December 31, 2022
(Expressed in U.S. Dollars)
| | | Number of
Contracts/
Units | | | Fair Value | | | Percent of
Member’s
Equity | |
| Long positions: | | | | | | | | | |
| Derivative contracts: | | | | | | | | | |
| Domestic (United States): | | | | | | | | | |
| Futures contracts: | | | | | | | | | |
| Agriculture | | | 12 | | | $ | 6,358 | | | | 2.24 | % |
| Currency | | | 8 | | | | 1,569 | | | | 0.55 | |
| Interest | | | 1 | | | | (1,328 | ) | | | (0.47 | ) |
| Metals | | | 1 | | | | 115 | | | | 0.04 | |
| Foreign: | | | | | | | | | | | | |
| Futures contracts: | | | | | | | | | | | | |
| Agriculture | | | 1 | | | | (660 | ) | | | (0.23 | ) |
| Interest | | | 1 | | | | (1,565 | ) | | | (0.55 | ) |
| | | | | | | | | | | | | |
| Total long positions | | | | | | | 4,489 | | | | 1.58 | |
| | | | | | | | | | | | | |
| Short positions: | | | | | | | | | | | | |
| Derivative contracts: | | | | | | | | | | | | |
| Domestic (United States): | | | | | | | | | | | | |
| Futures contracts: | | | | | | | | | | | | |
| Agriculture | | | 5 | | | | 7 | | | | 0.00 | |
| Currency | | | 1 | | | | 1,116 | | | | 0.40 | |
| Foreign: | | | | | | | | | | | | |
| Futures contracts: | | | | | | | | | | | | |
| Interest | | | 2 | | | | 2,762 | | | | 0.97 | |
| | | | | | | | | | | | | |
| Total short positions | | | | | | | 3,885 | | | | 1.37 | |
| | | | | | | | | | | | | |
| Investments in futures contracts, at fair value | | | | | | $ | 8,374 | | | | 2.95 | % |
See notes to financial statements.
Galaxy Plus Fund - Volt Diversified Alpha Master Fund (550) LLC
(A Delaware Limited Liability Company)
Statement of Operations
For the year ended December 31, 2022
(Expressed in U.S. Dollars)
| Investment Income: | | | |
| Interest income | | $ | 763 | |
| | | | | |
| Total investment income | | | 763 | |
| | | | | |
| Expenses: | | | | |
| Other expenses | | | 3,809 | |
| | | | | |
| Total expenses | | | 3,809 | |
| | | | | |
| Net investment loss | | | (3,046 | ) |
| | | | | |
| Realized and unrealized gain (loss) on investments and foreign currency transactions: | | | | |
| Net realized gain (loss) from: | | | | |
| Derivative contracts1 | | | (238,314 | ) |
| Foreign currency transactions | | | 975 | |
| | | | (237,339 | ) |
| | | | | |
| Net increase in unrealized appreciation on: | | | | |
| Derivative contracts | | | 37,434 | |
| | | | 37,434 | |
| | | | | |
| Net realized and unrealized loss on investments and foreign currency transactions | | | (199,905 | ) |
| | | | | |
| Net decrease in member’s equity resulting from operations | | $ | (202,951 | ) |
| 1 | Including trading costs. |
See notes to financial statements.
Galaxy Plus Fund - Volt Diversified Alpha Master Fund (550) LLC
(A Delaware Limited Liability Company)
Statement of Changes in Members’ Equity
For the year ended December 31, 2022
(Expressed in U.S. Dollars)
| Changes in member’s equity from operations: | | | |
| Net investment loss | | $ | (3,046 | ) |
| Net realized loss from derivative contracts and foreign currency transactions | | | (237,339 | ) |
| Net increase in unrealized appreciation on on derivative contracts | | | 37,434 | |
| | | | | |
| Net decrease in member’s equity resulting from operations | | | (202,951 | ) |
| | | | | |
| Changes in member’s equity from capital transactions: | | | | |
| Payments for redemptions of capital | | | (1,626,290 | ) |
| | | | | |
| Net decrease in member’s equity resulting from capital transactions | | | (1,626,290 | ) |
| | | | | |
| Total decrease | | | (1,829,241 | ) |
| | | | | |
| Member’s equity, beginning of year | | | 2,112,590 | |
| | | | | |
| Member’s equity, end of year | | $ | 283,349 | |
See notes to financial statements.
Galaxy Plus Fund – Volt Diversified Alpha Master Fund (550) LLC
(A Delaware Limited Liability Company)
Notes to Financial Statements
Note 1. Organization and Structure
Galaxy Plus Fund – Volt Diversified Alpha Master Fund (550) LLC (the “Master Fund”) was formed in Delaware as a limited liability company on September 9, 2020 and commenced operations on November 11, 2020. The Master Fund was created to serve as the trading entity managed by Volt Capital Management AB (the “Trading Advisor”) pursuant to its Volt Program (the “Program”). The Program is a diversified, systematic approach that uses machine learning on a portfolio of diversified, liquid financial and commodities futures contracts.
The Master Fund and other separately formed Delaware limited liability companies (“Other Master Funds”), are investment vehicles available under the Galaxy Plus Managed Account Platform (the “Platform”). The Master Fund and the Platform are sponsored by New Hyde Park Alternative Funds, LLC (the “Sponsor” or “NHPAF”) as a means of making available, to qualified high net-worth individuals and institutional investors (including fund of hedge funds) (“Investors”), a variety of third-party professional managed futures and foreign exchange advisors (“Advisors”). The Trading Advisor is not affiliated with the Sponsor.
NHPAF was formed in October 2013 and its principal office is located in Wheaton, Illinois. NHPAF is registered with the U.S. Commodity Futures Trading Commission (CFTC) as a commodity pool operator and commodity trading advisor, and is a member of the National Futures Association (NFA).
Galaxy Plus Fund LLC, a Delaware Series Limited Liability Company (the “Onshore Platform”), and Galaxy Plus Fund SPC, a Cayman Islands Segregated Portfolio Company (the “Offshore Platform”) serve as the feeder funds for the Platform and invest substantially all of the assets of the respective segregated portfolios (each a “Fund”) in the Master Fund or other Master Funds. Galaxy Plus Fund – Volt Diversified Alpha Feeder Fund (550) (“LLC550”), a separated series of the Onshore Platform and Galaxy Plus Fund – Volt Diversified Alpha Offshore Feeder Fund (550) Segregated Portfolio (“SPC550”), a segregated portfolio of the Offshore Platform, can each invest in the Master Fund. As of December 31, 2022, SPC550 had not commenced operations and LLC550 is the sole member.
LLC550 and SPC550 are collectively hereafter referred to as the “Feeder Funds”.
Subscriptions and redemptions into the Feeder Funds and the corresponding transactions with the Master Fund are governed by the Onshore Platform’s and the Offshore Platform’s respective Confidential Offering Memorandums.
The Platform has appointed the Sponsor, under the terms of the Limited Liability Company Agreement (the “LLC Agreement”) as the managing member of the Master Fund. In such capacity, the Sponsor has the authority, to manage, with wide discretionary powers, the business and affairs of the Master Fund including the authority to select the administrator for the Master Fund. The LLC Agreement will continue to remain in force until terminated by either the Sponsor or the Platform upon not less than sixty (60) days’ prior written notice. In certain circumstances (for example, the insolvency of either party or in the event all trading for the Platform by the Advisors are suspended), the LLC Agreement may be immediately terminated by either party.
Galaxy Plus Fund – Volt Diversified Alpha Master Fund (550) LLC
(A Delaware Limited Liability Company)
Notes to Financial Statements
The Master Fund and the Sponsor have entered into a tri-party contract (the “Trading Agreement”) with the Trading Advisor pursuant to which the Master Fund’s trading accounts are managed, subject to rights of termination, by the Trading Advisor in accordance with the Program. The Trading Advisor may alter its Program (including its trading systems and methods and including the addition and/or deletion of any financial interests or contracts traded in the Master Fund’s trading accounts), provided that the Trading Advisor provide prior notice to the Master Fund and the Sponsor of any material change to the Trading Advisor’s Program. From time to time, the Trading Advisor (or its affiliates) may manage additional accounts, and these accounts will increase the level of competition for the same trades desired for the Master Fund, including the priorities of order entry. There is no specific limit as to the number of accounts the Trading Advisors (or their affiliates) may manage. In addition, the positions of all of the accounts owned or controlled by the Trading Advisor (or its affiliates) are aggregated for the purposes of applying speculative position limits. The management, incentive, and sponsor fees are paid directly by the Feeder Funds, and for this reason are not recorded as expenses of the Master Fund.
Note 2. Summary of Significant Accounting Policies
The following is a summary of significant accounting policies consistently followed in the preparation of the Master Fund’s financial statements.
Principles of accounting: The accompanying financial statements are expressed in United States dollars (USD) and have been prepared in accordance with Generally Accepted Accounting Principles (GAAP), as established by the Financial Accounting Standards Board (FASB), to ensure consistent reporting of financial condition and results of operations. The Master Fund is an investment company and follows the accounting and reporting guidance in FASB Account Standards Codification Topic 946.
Cash and restricted cash: Cash held in the commodity trading accounts at clearing broker consists of either cash maintained in the custody of the broker, a portion of which is required margin for open positions, or amounts due to/from the broker for margin or unsettled trades. The Master Fund may also hold cash in a non-interest bearing USD commercial bank account. The Master Fund holds various currencies at the clearing broker, of which $349,764 is held in USD and $0 in foreign currencies as of December 31, 2022, and are recorded in cash and restricted cash – margin balance on the Statement of Financial Condition. The non-U.S. currencies fluctuate in value on a daily basis relative to the USD. A portion of this cash is restricted cash required to meet maintenance margin requirements. Cash with the clearing broker as of December 31, 2022 included restricted cash for margin requirements of $92,906. This cash becomes unrestricted when the underlying positions to which it is applicable are liquidated. Cash with the clearing broker as of December 31, 2022 included amounts due to the broker for unsettled trades of $0.
Offsetting of amounts related to certain contracts: When the requirements are met, the Master Fund offsets certain fair value amounts recognized for net derivative positions executed with the same counterparty under the same master netting arrangement (see Note 5).
Galaxy Plus Fund – Volt Diversified Alpha Master Fund (550) LLC
(A Delaware Limited Liability Company)
Notes to Financial Statements
Valuation and Revenue Recognition: Depending on the Program and Investments traded, the Master Fund follows the following valuation and revenue recognition policies. All investments are recorded at their estimated fair value, as described in Note 3.
Futures and options on futures contracts: The Master Fund may enter into futures and options on futures contracts. Upon entering into a futures contract, the Master Fund agrees to receive or deliver a fixed quantity of an underlying instrument or commodity for an agreed-upon price, while an option contract provides the option purchaser with the right, but not the obligation, to buy or sell a security or financial instrument at a predetermined exercise price during a defined period. Futures and options on futures contracts are recorded on the trade date. The difference between the original contract amount and the fair value of futures contracts purchased or sold is reflected as unrealized appreciation/(depreciation) on open contracts. Options on futures contracts are reflected in investments at fair value. The difference between the premiums paid or received on open options on futures contracts and fair value of such options is recorded as unrealized appreciation/(depreciation) on open contracts. The fair value of futures and options on futures contracts is based upon daily exchange settlement prices. The realized gain or loss is determined on the settlement of intraday trades first and then by the FIFO method.
Foreign currency transactions: The Master Fund’s financial statements are denominated in USD. However, foreign currency forward contracts, non-U.S. futures contracts, and non-U.S. options on futures contracts are denominated in currencies other than USD. Assets and liabilities and transactions denominated in currencies other than the USD are translated into USD at the rates in effect either at the close of business on the last business day of the reporting period or on the date of such transactions, respectively. Such fluctuations are included with the unrealized appreciation (depreciation) on open derivative contracts, net. Net realized foreign exchange gain or loss arises from the sales of foreign currencies and currency gains or losses realized between trade and settlement dates. Net unrealized foreign exchange gain and loss arises from changes in the fair value of margin collateral assets and liabilities resulting from changes in exchange rates.
Trading costs: Trading costs generally consist of brokerage commissions, brokerage fees, clearing fees, exchange and regulatory fees, transaction and NFA fees. Fees vary by type of contract for each purchase and sale or sale and purchase (round turn) of futures, options on futures, and forward contracts. Commissions are paid on each individual purchase and sale transaction. These costs are recognized as expenses for futures and options on futures transactions, and are included in net realized gain/loss from derivative contracts on the Statement of Operations.
Interest income/expense: Interest income and expense is recognized on an accrual basis.
Allocation of income and gains and losses: Profits and losses for each monthly accounting period, or shorter period if there are mid-month subscriptions and/or redemptions, are allocated pro-rata to the Feeder Funds based on their respective ownership percentage on the first day of each period throughout the year.
Income taxes: The Master Fund will not be subject to United States federal income taxation other than certain withholding taxes. The Master Fund evaluates tax positions taken or expected to be taken to determine whether the tax positions are more-likely-than-not of being sustained by the applicable tax authority. For tax positions meeting the more-likely-than-not threshold, the tax amount recognized in the financial statements is reduced by the largest benefit that has a greater than fifty percent likelihood of being realized upon ultimate settlement with the relevant taxing authority. The Master Fund has determined that there is no tax liability resulting from uncertain income tax positions taken or expected to be taken with respect to all open tax years. The Master Fund’s U.S. Federal tax returns for the years ended December 31, 2020 through 2022, remain open. The Master Fund recognizes interest and penalties, if any, related to unrecognized tax benefits as income tax expense in the Statement of Operations. During the year, the Master Fund did not accrue any interest or penalties.
Galaxy Plus Fund – Volt Diversified Alpha Master Fund (550) LLC
(A Delaware Limited Liability Company)
Notes to Financial Statements
Use of estimates: The preparation of financial statements in accordance with GAAP requires management to make estimates and assumptions that affect the reported amounts of assets and liabilities and disclosure of contingent assets and liabilities at the date of the financial statements and the reported amounts of income and expenses during the reporting period. Actual results could differ from those estimates.
Indemnifications: The Sponsor and its affiliates are indemnified against certain liabilities arising out of the performance of their duties for The Master Fund. In addition, in the normal course of business, the Master Fund enters into contracts with vendors and others that provide for general indemnifications. The Master Fund’s maximum exposure under these arrangements is unknown as this would involve future claims that may be made against the Master Fund. However, the Master Fund expects the risk of loss to be remote.
Statement of Cash Flows: The Master Fund has elected not to provide a Statement of Cash Flows as permitted by GAAP as all of the following conditions have been met:
| ● | During the year, substantially all of the Master Fund’s investments were carried at fair value and classified as Level 1 or Level 2 measurements in accordance with FASB ASC 820; |
| ● | The Master Fund had little or no debt during the year; |
| ● | The Master Fund’s financial statements include a Statement of Changes in Member’s Equity. |
Subscriptions and redemptions: Subscriptions and redemptions can typically be made on a weekly basis as of the first day (Monday) of each week; (or, if such day is not a business day, the first business day thereafter) (each, a Subscription Date or a Redemption Date). The Master Fund may accept subscriptions or redemptions more frequently than the first day of each week, depending upon the size of the requested subscription or redemption amount, with the approval of the Sponsor.
Note 3. Fair Value Measurements
The Master Fund’s investments are stated at fair value in accordance with FASB ASC 820, Fair Value Measurements and Disclosures (ASC 820). ASC 820 defines fair value, establishes a framework for measuring fair value and expands disclosures about fair value measurements. ASC 820 also emphasizes that fair value is a market-based measurement, not an entity-specific measurement, and sets out a fair value hierarchy with the highest priority being quoted prices in active market. Under ASC 820, fair value measurements are disclosed by level within that hierarchy, as follows:
Level 1 — Values for investments classified as Level 1 are based on unadjusted quoted prices for identical investments in an active market. Since valuations are based on quoted prices that are readily accessible at the measurement date, valuation of these investments does not entail a significant degree of judgment.
Level 2 — Values for investments classified as Level 2 are based on quoted prices for similar investments in an active or non-active markets for which all significant inputs are observable either directly or indirectly. Level 2 inputs may also include discounts related to restrictions on the investments.
Level 3 — Values for investments categorized as Level 3 are based on prices or valuation techniques that require inputs that are both significant to the fair value and unobservable, including valuations by the Sponsor in the absence of readily ascertainable fair values.
A description of the valuation methodologies applied to the Master Fund’s major categories of assets and liabilities measured at fair value on a recurring basis follows. Inputs that are used in determining fair value of an investment may include price information, credit data, volatility statistics, and other factors. These inputs can be either observable or unobservable. All of the inputs for the Master Fund were observable as of December 31, 2022. The availability of observable inputs can vary between investments and is affected by various factors such as type of investment and the volume and level of activity for that investment or similar investments in the marketplace.
Galaxy Plus Fund – Volt Diversified Alpha Master Fund (550) LLC
(A Delaware Limited Liability Company)
Notes to Financial Statements
Exchange-traded derivative contracts that are actively traded are valued based on daily quoted settlement prices from the respective exchange and are categorized in Level 1 of the fair value hierarchy. Exchange-traded derivative contracts not actively traded and over-the-counter (OTC) derivative contracts can include futures contracts, option on futures contracts, forward contracts and option contracts whose values are based on an underlying such as interest rates, foreign currencies, credit standing of reference entities, equities or commodities. Such derivative contracts are valued using observable market data, including currency spot rates or quoted prices of the related underlying obtained from the applicable exchange or market. OTC derivative contracts are valued using the above described pricing methodology and are categorized as Level 2 within the fair value hierarchy.
The Master Fund assesses the levels of the investments at each measurement date, and transfers between levels are recognized on the actual date of the event or change in circumstances that caused the transfer in accordance with the Master Fund’s accounting policy regarding the recognition of transfers between levels of the fair value hierarchy. There were no transfers among levels 1, 2, and 3 during the year ended December 31, 2022.
The inputs or methodologies used for valuing investments are not necessarily indicative of the risk associated with investing in those instruments.
The following tables present the classification of derivatives, by type, into the fair value hierarchy levels as of December 31, 2022. Presentation is gross – as an asset if in a gain position and a liability if in a loss position.
| | | | | | Fair Value Measurements at Reporting Date Using | |
| | | | | | Quoted Prices | | | Significant Other | | | Significant | |
| | | | | | in Active | | | Observable | | | Unobservable | |
| | | | | | Markets | | | Inputs | | | Inputs | |
| Description | | Fair Value | | | (Level 1) | | | (Level 2) | | | (Level 3) | |
| Assets: | | | | | | | | | | | | |
| Derivative contracts: | | | | | | | | | | | | |
| Futures contracts: | | | | | | | | | | | | |
| Agriculture | | $ | 8,332 | | | $ | 8,332 | | | $ | - | | | $ | - | |
| Currency | | | 5,060 | | | | 5,060 | | | | - | | | | - | |
| Interest | | | 2,763 | | | | 2,763 | | | | - | | | | - | |
| Metals | | | 115 | | | | 115 | | | | - | | | | - | |
| | | | | | | | | | | | | | | | | |
| Total investment assets at fair value | | | 16,270 | | | | 16,270 | | | | - | | | | - | |
| | | | | | | | | | | | | | | | | |
| Liabilities: | | | | | | | | | | | | | | | | |
| Derivative contracts: | | | | | | | | | | | | | | | | |
| Futures contracts: | | | | | | | | | | | | | | | | |
| Agriculture | | | (2,627 | ) | | | (2,627 | ) | | | - | | | | - | |
| Currency | | | (2,375 | ) | | | (2,375 | ) | | | - | | | | - | |
| Interest | | | (2,894 | ) | | | (2,894 | ) | | | - | | | | - | |
| | | | | | | | | | | | | | | | | |
| Total investment liabilities at fair value | | | (7,896 | ) | | | (7,896 | ) | | | - | | | | - | |
| | | | | | | | | | | | | | | | | |
| Total net investments at fair value | | $ | 8,374 | | | $ | 8,374 | | | $ | - | | | $ | - | |
Galaxy Plus Fund – Volt Diversified Alpha Master Fund (550) LLC
(A Delaware Limited Liability Company)
Notes to Financial Statements
Note 4. Derivative Financial Instruments
Derivative financial instruments speculatively traded by the Master Fund can include U.S. and foreign futures, options on futures contracts and forward currency contracts (collectively, derivatives) whose values are based upon an underlying asset, indices, or reference rates, and generally represent future commitments to exchange cash flows, or to purchase or sell other financial instruments at specified future dates. A derivative contract may be traded on an exchange or OTC. Exchange-traded derivatives are standardized and include futures and options on futures contracts. OTC derivative contracts are negotiated between contracting parties and include forward currency contracts and certain options. Derivatives are subject to various risks similar to those related to the underlying financial instruments including market and credit risks.
Market risk is the potential for changes in the value of derivatives due to market changes, including interest and foreign exchange rate movements and fluctuations in commodity and security prices. Market risk is directly impacted by the volatility and liquidity in the markets in which the related underlying assets are traded. The market risk of the Master Fund is managed by the underlying Trading Advisors according to each respective Program. The Master Fund is exposed to a market risk equal to the notional contract value of the derivatives contracts purchased and unlimited liability on such contracts sold short.
Credit risk is the possibility that a loss may occur due to the failure of a counterparty to perform according to the terms of a contract. Credit risk due to exchange traded derivative financial instruments is significantly reduced by the regulatory requirements of the individual exchanges on which the instruments are traded. At any point in time, the credit risk for OTC derivatives is limited to the net unrealized gain for each counterparty for which a netting agreement exists, if any. In a similar fashion, liabilities represent net amounts owed to counterparties. The credit risk exposure for the Master Fund’s outstanding OTC derivatives was $0 at December 31, 2022.
Market and geopolitical risk relate to the increasing interconnectivity between global economies and financial markets increases the likelihood that events or conditions in one region or financial market may adversely impact issuers in a different country, region, or financial market. Securities in the Master Fund may underperform due to inflation (or expectations for inflation), interest rates, global demand for particular products or resources, natural disasters, pandemics, epidemics, terrorism, regulatory events and governmental or quasi-governmental actions. The occurrence of global events similar to those in recent years, such as terrorist attacks around the world, natural disasters, social and political discord or debt crises and downgrades, among others, may result in market volatility and may have long term effects on both the U.S. and global financial markets. It is difficult to predict when similar events affecting the U.S. or global financial markets may occur, the effects that such events may have and the duration of those effects. Any such event(s) could have a significant adverse impact on the value and risk profile of the Master Fund. The current novel coronavirus (COVID-19) global pandemic and the aggressive responses taken by many governments, including closing borders, restricting international and domestic travel, and the imposition of prolonged quarantines or similar restrictions, as well as the forced or voluntary closure of, or operational changes to, many retail and other businesses, has had negative impacts, and in many cases severe negative impacts, on markets worldwide. It is not known how long such impacts, or any future impacts of other significant events described above, will or would last, but there could be a prolonged period of global economic slowdown, which may impact your investment.
Purchase and sale of futures contracts requires margin deposits with the broker. Additional deposits may be necessary for any loss on contract value. The U.S. Commodity Exchange Act requires a broker to segregate all customer transactions and assets from such broker’s proprietary activities. A customer’s cash and other property (for example, U.S. Treasury bills) deposited with a broker are considered commingled with all other customer funds subject to the broker’s segregation requirements. In the event of a broker’s insolvency, recovery may be limited to a pro rata share of segregated funds available. It is possible that the recovered amount could be less than total cash and other property deposited.
Galaxy Plus Fund – Volt Diversified Alpha Master Fund (550) LLC
(A Delaware Limited Liability Company)
Notes to Financial Statements
The Master Fund has a substantial portion of its assets on deposit with counterparties. In the event of a counterparty’s insolvency, recovery of the Master Fund’s assets on deposit may be limited to account insurance or other protection afforded such deposits.
The notional value represents amounts related to the Master Fund’s stock exchange indices, commodities, interest rate and foreign currencies upon which the fair value of the futures contracts held by the Master Fund are based. Notional values do not represent the current fair value of, and are not necessarily indicative of the future cash flows of the Master Fund’s futures contracts. Further, the underlying price changes in relation to variables specified by the notional values affects the fair value of these derivative financial instruments. Theoretically, the Master Fund’s exposure is equal to the notional value of contracts purchased and unlimited on such contracts sold short.
As of December 31, 2022, the Master Fund had open futures contracts with the following notional values by sector:
| Description | | Quantity | | Notional Value | | | Description | | Quantity | | 
Notional Value | |
| Long: | | | | | | | Short: | | | | | |
| Agriculture | | 13 | | $ | 597,594 | | | Agriculture | | 5 | | $ | (357,350 | ) |
| Currency | | 8 | | | 645,220 | | | Currency | | 1 | | | (103,269 | ) |
| Interest | | 2 | | | 191,122 | | | Interest | | 2 | | | (284,577 | ) |
| Metals | | 1 | | | 54,145 | | | | | | | | | |
During the year ended December 31, 2022, the Master Fund participated in 4,327 futures contract transactions.
Below is a summary of net trading gains and (losses) by investment type and industry:
| | | Net Trading Gain (Loss)* | |
| Futures contracts: | | | |
| Agriculture | | $ | (74,540 | ) |
| Currency | | | (70,178 | ) |
| Energy | | | 77,828 | |
| Index | | | 13,967 | |
| Interest | | | 19,568 | |
| Metals | | | (156,688 | ) |
| Total futures contracts | | | (190,043 | ) |
| | | | | |
| Trading costs | | | (10,837 | ) |
| | | | | |
| Total net trading gain (loss) | | $ | (200,880 | ) |
| * | Includes both realized loss of $(238,314) and unrealized appreciation of $37,434 and is located in net realized and unrealized gain (loss) on investments on the Statement of Operations. Amounts exclude foreign currency transactions. |
Galaxy Plus Fund – Volt Diversified Alpha Master Fund (550) LLC
(A Delaware Limited Liability Company)
Notes to Financial Statements
Note 5. Balance Sheet Offsetting
The Master Fund is required to disclose the impact of offsetting assets and liabilities presented in the Statement of Financial Condition to enable users of the financial statements to evaluate the effect or potential effect of netting arrangements on its financial position for recognized assets and liabilities. These recognized assets and liabilities include financial instruments and derivative instruments that are either subject to an enforceable master netting arrangement or similar agreement or meet the following right of set-off criteria: each of the two parties owes the other determinable amounts, the Master Fund has the right to set-off the amounts owed with the amounts owed by the other party, the Master Fund intends to set off, and the Master Fund’s right of set-off is enforceable by law.
The Master Fund is subject to enforceable master netting agreements with certain counterparties. These agreements govern the terms of certain transactions, and reduce the counterparty risk associated with relevant transactions by specifying offsetting mechanisms and collateral posting arrangements at prearranged exposure levels. Since different types of transactions have different mechanics and are sometimes traded out of different legal entities of a particular counterparty organization, each type of transaction may be covered by a different master netting arrangement, possibly resulting in the need for multiple agreements with a single counterparty. Master netting agreements may not be specific to each different asset type; in such instances, they would allow the Master Fund to close out and net its total exposure to a specified counterparty in the events of default or early termination with respect to any and all the transactions governed under a single agreement with the counterparty.
The following tables summarize the Master Fund’s netting arrangements:
| Description | | Gross
Amounts of
Recognized
Assets
(Liabilities) | | | Offset
in the
Statement of
Financial
Condition | | | Net Amount
of Assets
(Liabilities)
in the
Statement of
Financial
Condition | |
| | | | | | | | | | |
| Futures contracts | | $ | 16,270 | | | $ | (7,896 | ) | | $ | 8,374 | |
| Total | | $ | 16,270 | | | $ | (7,896 | ) | | $ | 8,374 | |
| | | Net amount
in the
statement of
Financial
Condition | | | Cash
Collateral
Received by
Counterparty | | | Net amount
in the
Statement of
Financial
Condition | |
| | | | | | | | | | |
| Counterparty A | | $ | 8,374 | | | $ | 92,906 | | | $ | 101,280 | |
| Total | | $ | 8,374 | | | $ | 92,906 | | | $ | 101,280 | |
Galaxy Plus Fund – Volt Diversified Alpha Master Fund (550) LLC
(A Delaware Limited Liability Company)
Notes to Financial Statements
Note 6. Related Parties
As of December 31, 2022 the Master Fund had $74,789 payable to the Feeder Fund, as reflected in the Statement of Financial Condition. Generally, receivables and payables from/to Feeder Fund are a result of timing differences of cash movements related to capital activity at the Feeder Fund level.
Note 7. Financial Highlights
Financial highlights of the Master Fund for the year ended December 31, 2022 are presented in the table below. The information has been derived from information presented in the financial statements.
| Total return (A) | | | 40.53 | % |
| | | | | |
| Ratios to average member’s equity (B): | | | | |
| Net investment loss (C) | | | (0.56 | )% |
| Total expenses | | | 0.71 | % |
| (A) | Total return is based on the change in average member’s equity during the period of a theoretical investment made at the inception of the Master Fund. |
| (B) | The total expense and net investment loss ratios are computed based upon weighted-average member’s equity as a whole for the year ended December 31, 2022. |
| (C) | The net investment loss ratio excludes net realized and unrealized gains (losses) on investments. |
Financial highlights are calculated for each member class taken as a whole. An individual member’s return and ratios may vary based on the timing of capital transactions. The total return would have been lower, and the net investment loss and total expense ratios would have been higher if the management, incentive fees, and sponsor fees, had been charged to the Master Fund instead of the Feeder Fund.
Note 8. Subsequent Events
In accordance with FASB ASC 855, Subsequent Events, the Sponsor has evaluated all subsequent events requiring recognition and disclosure in the Master Fund’s financial statements through March 30, 2023, the date the financial statements were available for issuance. The Sponsor has determined that there are no material events that would require recognition or disclosure in the Master Fund’s financial statements through this date.
Galaxy Plus Fund – Volt Diversified Alpha Master Fund (550) LLC
(A Delaware Limited Liability Company)
Oath and Affirmation of the Commodity Pool Operator
To the best of the knowledge and belief of the undersigned, the information contained in the annual report as of and for the year ended December 31, 2022, is accurate and complete.
| /s/ David Young | |
| David Young, President | |
| New Hyde Park Alternative Funds, LLC — Sponsor |
| |
| Galaxy Plus Fund – Volt Diversified Alpha Master Fund (550) LLC |
SIGNATURES
Pursuant to the requirements of the Securities Exchange Act of 1934, the registrant has duly caused this report to be signed on its behalf by the undersigned thereunto duly authorized.
| | Frontier Funds |
| | (Registrant) |
| | | |
| Date: April 6, 2023 | By: | /s/ Patrick J. Kane |
| | | Patrick J. Kane |
| | | Chairman and Chief Financial Officer of
Frontier Fund Management LLC, the Managing Owner of Frontier Funds |
| | | |
| Date: April 6, 2023 | By: | /s/ Patrick F. Hart |
| | | Patrick F. Hart |
| | | President and Chief Executive Officer of
Frontier Fund Management LLC, the Managing Owner of Frontier Funds |
SIGNATURES
Pursuant to the requirements of the Securities Exchange Act of 1934, as amended, the registrant has duly caused this report to be signed on its behalf by the undersigned thereunto duly authorized.
| | Frontier Balanced Fund, |
| | a Series of Frontier Funds |
| | (Registrant) |
| | | |
| Date: April 6, 2023 | By: | /s/ Patrick J. Kane |
| | | Patrick J. Kane |
| | | Chairman and Chief Financial Officer of
Frontier Fund Management LLC, the Managing Owner of Frontier Funds |
| | | |
| Date: April 6, 2023 | By: | /s/ Patrick F. Hart |
| | | Patrick F. Hart |
| | | President and Chief Executive Officer of
Frontier Fund Management LLC, the Managing Owner of Frontier Funds |
SIGNATURES
Pursuant to the requirements of the Securities Exchange Act of 1934, as amended, the registrant has duly caused this report to be signed on its behalf by the undersigned thereunto duly authorized.
| | Frontier Heritage Fund, |
| | a Series of Frontier Funds |
| | (Registrant) |
| | | |
| Date: April 6, 2023 | By: | /s/ Patrick J. Kane |
| | | Patrick J. Kane |
| | | Chairman and Chief Financial Officer of
Frontier Fund Management LLC, the Managing Owner of Frontier Funds |
| | | |
| Date: April 6, 2023 | By: | /s/ Patrick F. Hart |
| | | Patrick F. Hart |
| | | President and Chief Executive Officer of
Frontier Fund Management LLC, the Managing Owner of Frontier Funds |
SIGNATURES
Pursuant to the requirements of the Securities Exchange Act of 1934, as amended, the registrant has duly caused this report to be signed on its behalf by the undersigned thereunto duly authorized.
| | Frontier Global Fund, |
| | a Series of Frontier Funds |
| | (Registrant) |
| | | |
| Date: April 6, 2023 | By: | /s/ Patrick J. Kane |
| | | Patrick J. Kane |
| | | Chairman and Chief Financial Officer of
Frontier Fund Management LLC, the Managing Owner of Frontier Funds |
| | | |
| Date: April 6, 2023 | By: | /s/ Patrick F. Hart |
| | | Patrick F. Hart |
| | | President and Chief Executive Officer of
Frontier Fund Management LLC, the Managing Owner of Frontier Funds |
SIGNATURES
Pursuant to the requirements of the Securities Exchange Act of 1934, as amended, the registrant has duly caused this report to be signed on its behalf by the undersigned thereunto duly authorized.
| | Frontier Select Fund, |
| | a Series of Frontier Funds (Registrant) |
| | | |
| Date: April 6, 2023 | By: | /s/ Patrick J. Kane |
| | | Patrick J. Kane |
| | | Chairman and Chief Financial Officer of
Frontier Fund Management LLC, the Managing Owner of Frontier Funds |
| | | |
| Date: April 6, 2023 | By: | /s/ Patrick F. Hart |
| | | Patrick F. Hart |
| | | President and Chief Executive Officer of
Frontier Fund Management LLC, the Managing Owner of Frontier Funds |
SIGNATURES
Pursuant to the requirements of the Securities Exchange Act of 1934, as amended, the registrant has duly caused this report to be signed on its behalf by the undersigned thereunto duly authorized.
| | Frontier Long Short Commodity Fund, |
| | a Series of Frontier Funds (Registrant) |
| | | |
| Date: April 6, 2023 | By: | /s/ Patrick J. Kane |
| | | Patrick J. Kane |
| | | Chairman and Chief Financial Officer of
Frontier Fund Management LLC, the Managing Owner of Frontier Funds |
| | | |
| Date: April 6, 2023 | By: | /s/ Patrick F. Hart |
| | | Patrick F. Hart |
| | | President and Chief Executive Officer of
Frontier Fund Management LLC, the Managing Owner of Frontier Funds |
SIGNATURES
Pursuant to the requirements of the Securities Exchange Act of 1934, as amended, the registrant has duly caused this report to be signed on its behalf by the undersigned thereunto duly authorized.
| | Frontier Diversified Fund, |
| | a Series of Frontier Funds (Registrant) |
| | | |
| Date: April 6, 2023 | By: | /s/ Patrick J. Kane |
| | | Patrick J. Kane |
| | | Chairman and Chief Financial Officer of
Frontier Fund Management LLC, the Managing Owner of Frontier Funds |
| | | |
| Date: April 6, 2023 | By: | /s/ Patrick F. Hart |
| | | Patrick F. Hart |
| | | President and Chief Executive Officer of
Frontier Fund Management LLC, the Managing Owner of Frontier Funds |
SIGNATURES
Pursuant to the requirements of the Securities Exchange Act of 1934, as amended, the registrant has duly caused this report to be signed on its behalf by the undersigned thereunto duly authorized.
| | Frontier Masters Fund, |
| | a Series of Frontier Funds (Registrant) |
| | | |
| Date: April 6, 2023 | By: | /s/ Patrick J. Kane |
| | | Patrick J. Kane |
| | | Chairman and Chief Financial Officer of
Frontier Fund Management LLC, the Managing Owner of Frontier Funds |
| | | |
| Date: April 6, 2023 | By: | /s/ Patrick F. Hart |
| | | Patrick F. Hart |
| | | President and Chief Executive Officer of
Frontier Fund Management LLC, the Managing Owner of Frontier Funds |
86
0001261379 frfd:FrontierMastersFundMember frfd:SeriesOfFrontierFundsMember frfd:GalaxyPlusFundFourMember frfd:PrivateInvestmentCompaniesMember 2022-12-31 0001261379 frfd:FrontierSelectFundMember frfd:TheSeriesOfTheFrontierFundsMember frfd:ClassTwoMember frfd:LimitedOwnersMember 2019-12-31 iso4217:USD xbrli:shares