UNITED STATES
SECURITIES AND EXCHANGE COMMISSION
WASHINGTON, D.C. 20549
FORM 10-12G
(Amendment No. 10 )
(GENERAL FORM FOR REGISTRATION OF SECURITIES)
PURSUANT TO SECTION 12(b) OR 12(g) OF THE SECURITIES EXCHANGE ACT OF 1934
EFT BIOTECH HOLDINGS, INC.
(Exact name of registrant as specified in its charter)
Commission File No. 000-53730
| Nevada | 20-1211204 |
| (State or other Jurisdiction of | (I.R.S. Employer |
| Incorporation or Organization) | Identification No.) |
| 17800 Castleton St., Suite 300 | |
| City of Industry, CA | 91748 |
| (Address of Principal Executive Offices) | (Zip Code) |
Registrant's Telephone Number: (626) 581 - 3335
With Copies to:
Hart & Trinen
1624 Washington St.
Denver, CO 80203
Telephone: (303) 839-0061
Securities registered under Section 12(b) of the Act:
| Title of each class | Name of each exchange on which | |
| To be registered | Each class is to be registered | |
| N/A | N/A |
Securities registered under Section 12 (g) of the Act:
Common Stock, par value $0.00001 per share
(Title of Class)
Indicate by check mark whether the registrant is a large accelerated filer, an accelerated filer, a non-accelerated filer, or a smaller reporting company. See the definitions of “large accelerated filer,” “accelerated filer,” "non-accelerated filer" and “smaller reporting company” in Rule 12b-2 of the Exchange Act. (Check one):
| Large accelerated filer | o | Accelerated filer | o |
| Non-accelerated filer | o | Smaller reporting company | x |
TABLE OF CONTENTS
| Item: | Page Number: | |||
| Item 1. | Business | 3 | ||
| Item 1A. | Risk Factors | 13 | ||
| Item 2. | Financial Information | 22 | ||
| Management’s Discussion and Analysis of Financial Condition and Results of Operation | 22 | |||
| Item 3. | Properties | 33 | ||
| Item 4. | Security Ownership of Certain Beneficial Owners and Management | 34 | ||
| Item 5. | Directors and Executive Officers | 35 | ||
| Item 6. | Executive Compensation | 37 | ||
| Item 7. | Certain Relationships and Related Transactions, and Director Independence | 40 | ||
| Item 8. | Legal Proceedings | 41 | ||
| Item 9. | Market Price of and Dividends on the Registrant’s Common Equity and Related Stockholder Matters | 41 | ||
| Item 10. | Recent Sales of Unregistered Securities | 43 | ||
| Item 11. | Description of Registrant’s Securities to be Registered | 46 | ||
| Item 12. | Indemnification of Directors and Officers | 46 | ||
| Item 13. | Financial Statements and Supplementary Data | F-1 | ||
| Item 14. | Changes in and Disagreements with Accountants on Accounting and Financial Disclosure | 47 | ||
| Item 15. | Financial Statements and Exhibits | 47 | ||
| Signatures | 49 |
2
FORWARD LOOKING STATEMENTS
All statements other than statements of historical fact included in this Form 10 regarding the prospects of our industry or our prospects, plans, financial position or business strategy, may constitute forward-looking statements. In addition, forward-looking statements generally can be identified by the use of forward-looking words such as “may,” “will,” “expect,” “intend,” “estimate,” “foresee,” “project,” “anticipate,” “believe,” “plans,” “forecasts,” “continue” or “could” or the negatives of these terms or variations of them or similar terms. Furthermore, such forward-looking statements may be included in various filings that we make with the SEC or press releases or oral statements made by or with the approval of one of our authorized executive officers. Although we believe that the expectations reflected in these forward-looking statements are reasonable, we cannot assure you that these expectations will prove to be correct. These forward-looking statements are subject to certain known and unknown risks and uncertainties, as well as assumptions that could cause actual results to differ materially from those reflected in these forward-looking statements. Readers are cautioned not to place undue reliance on any forward-looking statements contained herein, which reflect management’s opinions only as of the date hereof. Except as required by law, we undertake no obligation to revise or publicly release the results of any revision to any forward-looking statements. You are advised, however, to consult any additional disclosures we make in our reports to the SEC. All subsequent written and oral forward-looking statements attributable to us or persons acting on our behalf are expressly qualified in their entirety by the cautionary statements contained in this Form 10.
Item 1. Business.
General
The Registrant together with its subsidiaries is an e-Business company designed around the concept of “Business-to-Customer,” meaning products are sold directly to individuals, rather than the traditional “Business to Business” model where products are sold to distributors who then sell to individuals, using the World Wide Web through our website, www.eftb.us. The contents of our website are not incorporated by reference herein. The Registrant is a holding company and conducts its business through its operating subsidiaries. See “Organizational History” below. The information in this registration statement concerning the Registrant’s business and operations pertains to the operating subsidiaries. Terms such as the “Company,” “EFT,” “we,” “us,” “our” and similar phrases pertain to the activities of the operating subsidiaries unless otherwise noted.
We offer 25 different nutritional products, some of which are oral sprays; 18 different personal care products; an environmentally protective automotive product, an environmentally friendly house cleaner and flip top portable drinking container which contains a filter to remove impurities from the water. See “Products” below for a more detailed description of our products.
We market and sell our products through an internet platform which consists of us selling our products directly to customers through our website. Once a customer purchases our products he or she becomes an “Affiliate” by being recommended by another Affiliate. Currently, most of our Affiliates are located in China and Hong Kong.
To become an Affiliate, a customer must make a minimum purchase of $300 plus $30 for shipping and handling fees. After that point, the new Affiliate is not required to make any additional purchases. Our Affiliates only purchase because they want to. Affiliates are not required to pay membership fees, buy products, resell products, recruit others, attend meetings or report to us. Free educational classes are offered to our Affiliates where they can learn more about our products and how to use them. Affiliate rewards are issued in the form of a reward card. Rewards are credited in U.S. Dollars and can be withdrawn in local currency at automated teller machines (ATM’s) in the country of the Affiliate. By using this method, we eliminate cumbersome accounting chores such as issuing checks and reconciling bank statements. This method helps us to keep our accounting staff smaller than it would be if we used a check payment method, thereby saving operating expenses.
3
The Company generally does not have a return policy. The Company does, however, provide a warranty for its products. If a customer receives defective products, we will send replacement products. Historically, the company warranty provisions have not been material. The specific warranty terms and conditions vary depending upon the product sold, but generally include replacement over a period of six months.
Customers who originally enrolled in the Affiliate program (the “EFT Program”) shared this program with friends and relatives in China. From this, our Chinese business grew. Customers can join the EFT program only by being recommended by another Affiliate and by making a purchase through our website. To purchase products, customers order on- line and send payment for the order to an off-shore account. Currently, the Company has no sales activities in the United States. EFT International Ltd. (“EFT International”) an off-shore subsidiary will verify receipt of payment and notify the appropriate distribution center to ship the products. The Affiliate then receives the products for personal use.
As of September 30, 2009, we had approximately 980,000 Affiliates enrolled in the EFT Program. When a customer joins the EFT Program, the customer is given a membership ID number.
EFT Commission Plan:
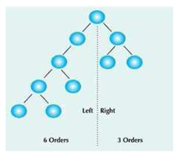
We also have a commission plan. The Company's commission plan is calculated on every nine new orders that are placed under an Affiliate’s identification number. When an Affiliate places an order, he/she is required to provide us with identification number of the Affiliate which referred him/her to us. Each Affiliate is recognized to have both a right and left sales side. The Company’s compensation plan whereby Affiliates are placed into two groups, one on the left side and one on the right side of the originating Affiliate is commonly known as a “Binary Plan.” Binary compensation plans originated in the 1990’s to the network marketing industry. As well as the simplicity of the design that the binary compensation structure offers, there are a number of advantages that make it attractive to all network marketers.
A binary plan, as the name suggests, is based around the number 2, which represents the maximum number of frontline Affiliates that the initial Affiliates can have. Any additional Affiliates must then be placed under one of the frontline Affiliates. This creates a very supportive environment for new Affiliates as the easiest way for Affiliates to earn a commission is by assisting the new Affiliates to build their network. This team approach makes the binary plan very attractive as there is a lot of support (both initial and ongoing) as all Affiliates work towards achieving a common goal. The binary plan benefits the Company because it encourages Affiliates to recruit other Affiliates and to help their weaker downline Affiliates to build their network (i.e., promoting teamwork) to achieve a better volume balance and a more consistent and higher commission check. Another benefit of a binary plan is that it allows a company to sell its products directly to the consumer by choosing to use a word of mouth approach (e.g., networking) instead of advertising through traditional streams (e.g., media).
The Company's binary compensation plan is calculated on every "nine" new orders that are placed under an Affiliate’s ID number for the purpose of selling the Company's products. Each Affiliate is recognized to have both a right and left sales side. The commissions that each Affiliate earns are calculated on the accumulation of nine new orders placed on these two sides with a minimum of three orders placed on one side in order to generate the commission. Commissions are paid on a weekly basis and are calculated on total new sales generated each week.
4
Full payment is required in U.S. Dollars prior to shipment of the products purchased. At period end, we recognize cash received where orders have not been shipped as a liability. We report unshipped orders as a liability under unearned revenues. Revenue is recognized at the date of shipment to customers when a formal arrangement exists, the price is fixed or determinable, the delivery is completed, no other significant obligations of the Company exist and collectibility is reasonably assured. Payments received before all of the relevant criteria for revenue recognition are satisfied are recorded as unearned revenue. Cash consideration given by the Company to its Affiliates is considered to be a reduction of the selling prices of the Company's products, thus, is recorded as a reduction of revenue. Customers may return defective merchandise for an exchange.
EFT does not own any manufacturing facilities. Our products are manufactured by third party vendors, and are packaged under the EFT brand. EFT packages clearly state the country of manufacture which currently is the United States in most cases. We do not have any long-term supply contracts or agreements with any merchants to produce or market our products at this time. We order our products directly from vendors, on an “as-needed” or “expected need” basis.
The Registrant’s Common Stock is currently trading on the OTC Pink Sheets under the ticker symbol “EFTB.”As of the fiscal quarter ended September 30, 2009, there were 75,983,205 shares of Common Stock outstanding (23,583,205 were held by non-Affiliates and the remaining 52,400,000 were held by Affiliates).
Organizational History
EFT BioTech Holdings, Inc., (formerly HumWare Media Corporation, GRG, Inc., Ghiglieri Corporation, Karat Productions, Inc.) was incorporated in the state of Nevada on March 19, 1992 (“EFT Holdings”). HumWare’s stock had been trading on the Pink Sheets and as a result EFT Holdings is a public company trading on the Pink Sheets.
On November 7, 2007, HumWare Media Corporation changed its name to EFT BioTech Holdings, Inc. and effected a reverse stock split of 20,000 shares of common stock for 1 share of common stock, which resulted in a decrease in the total amount of common shares then issued and outstanding.
On November 18, 2007, EFT Holdings issued an aggregate of 53,300,000 shares of its Common Stock in connection with a share exchange with EFT BioTech, Inc. (“EFT BioTech”), a Nevada corporation formed on September 18, 2007, pursuant to which EFT Holdings acquired 100% of the issued and outstanding shares of EFT BioTech in consideration for such 53,300,000 shares, representing 70.15% of EFT Holdings capital stock on a fully-diluted basis. See Item 4, “Security Ownership of Certain Beneficial Owners and Management” herein for a description of the current holders of such 53,300,000 common shares.
Upon the consummation of the merger, EFT BioTech became a wholly-owned subsidiary of EFT Holdings. The Registrant is a holding company and conducts its business through the operations of the subsidiaries of EFT Limited, a British Virgin Islands corporation (“EFT Limited”). EFT Limited has four wholly-owned subsidiaries: EFT (HK), Ltd., Top Capital International Limited, EFT, Ltd. and EFT International Ltd.
Excalibur International Marine Corporation
Due to the recent changes in policy between Mainland China and Taiwan, an opportunity was recognized to take advantage of direct sailings for cargo and passengers through the Taiwan Strait. EFT identified Excalibur International Marina Corporation (“Excalibur”), a shipping company located in Taiwan, as a viable entity to participate with in this business opportunity. In order to expedite the purchase of a new vessel, EFT’s Board of Directors approved a non-interest bearing, unsecured loan to facilitate this purchase.
5
On July 28, 2008, the Registrant loaned $19,193,000 to Excalibur. The purpose of this loan was to provide Excalibur funds to purchase a vessel ($17,628,283) and working capital ($1,564,717). This loan was still outstanding with balance of $1,564,717 as of September 30, 2009. At the time of the transaction, Excalibur was not a related party nor did any of the Company or any of its officers or directors have any relationship with Excalibur or any of its officers and directors.
On September 23, 2008, the Registrant signed a loan agreement with Excalibur to lend $2,000,000 at an interest rate of 3.75% per month with a term of no more than 60 days. At the end of the 60 days term, the term of the loan was extended for six months. On December 25, 2008, the Company extended this loan to May 25, 2009. On May 25, 2009, the Company extended this loan to Excalibur for another six months and decreased the interest rate to 12.5% per annum. On November 25, 2009 the Company extended this loan for another six months and decreased the interest rate to 8% per annum. The loan was used to fund operations.
On October 20, 2008, EFT Investment Co., Ltd. was formed as a wholly-owned subsidiary of EFT BioTech Holdings, Inc. EFT Investment Co., Ltd was formed in Taiwan. On October 25, 2008, EFT Investment Co., Ltd. completed the acquisition of 58,567,750 shares of common stock of Excalibur; representing approximately 49% shares of issued and outstanding shares of Excalibur, for an aggregate purchase price of USD $19,193,000. Prior to the acquisition of Excalibur, Excalibur was not a related person under Item 404 of Regulation S-K.
On November 24, 2008, the Registrant signed an additional loan agreement with Excalibur, a then related party, pursuant to which the Registrant loaned Excalibur $500,000 at the interest rate of 3.75% per month with a term of 30 days with an extension of six months. On December 25, 2008, the Company extended the loan to May 25, 2009. On May 25, 2009, the Company extended this loan for another six months and decreased the interest rate to 12.5% per annum. On November 25, 2009 the Company extended this loan for another six months and decreased the interest rate to 8% per annum. The loan was used to fund operations.
On May 13, 2009, the Company signed another loan agreement denominated in U.S. dollars with Excalibur to lend Excalibur $600,000 at interest rate of 12.5% per annum with a maturity date of November 13, 2009. On November 13, 2009 the Company extended this loan for another six months and decreased the interest rate to 8% per annum. The loan was used to fund operations.
On June 28, 2009, Excalibur completed its inaugural passenger voyage across the Taiwan Strait.
Below is our corporate chart:
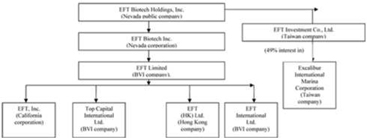
EFT Limited (BVI) has four wholly-owned subsidiaries: EFT, Inc., a California company formed on January 1, 2003, Top Capital International, Ltd. (BVI), a BVI company formed on May 22, 2002, EFT (HK), Ltd., a Hong Kong (“HK”) company formed on November 1, 2006 and EFT International Ltd. (BVI), a BVI company formed on April 20, 2005, which it acquired all on November 14, 2007. EFT International Ltd. is the operating company that generates substantially all of the company’s net income. As EFT Limited (BVI) and the four companies being acquired were under the common control, this acquisition also represents a reorganization of entities under common control.
6
Products
Nutritional Products:
Our nutritional products are non-pharmaceutical nutritional products. They are ingestible through oral liquids, oral sprays, tablets and tea. Our oral sprays are delivered through very fine mist sprayed directly into the mouth. Our containers used to deliver our nutritional products are small, compact and easy to carry.
Our products are all natural, made from pure ingredients, and are designed to address specific goals of the user such as strengthening the immune system, assisting in weight loss, helping to overcome a sore throat and fighting off colds. Each product has been formulated to address specific need, symptom and condition. We make no claims as to the products curing any medical condition, or preventing any medical ailment. Our products have not been tested and/or approved by the FDA, as with all non-prescription products.
We currently offer 25 different nutritional products for various purposes:
| 1. | Zeolite Plus: |
An oral liquid designed to detoxify the body, support immune system strength and normalize pH in the body.
| 2. | 2006 Celprotect I: |
Ingestible tablets designed to eliminate toxins and viruses (e.g., cold sores) and promote energy.
| 3. | 2007 Celprotect II Bullet Points: |
An oral liquid designed to stimulate cellular metabolism, neutralize toxins, assist in avoiding food poisoning, balance cell life and boost energy.
| 4. | 2006 – 2007 Celprotect I: |
A kit containing 2006 Celprotect I and 2006 - 2007 Celprotect II.
| 5. | CardioSupport: |
An oral spray designed to promote heart health.
| 6. | Colloidal Silver: |
An oral liquid designed to combat bacterial, fungal and viral infections.
| 7. | Colostrum: |
An oral spray designed to promote anti-aging, weight loss and immune system support.
| 8. | Deer Antler Velvet Plus: |
An oral spray designed to promote white blood cell count and to help the body handle stress and promote recovery from the effects of injury and fatigue.
| 9. | Essential 90+: |
An oral spray designed to promote overall health.
| 10. | GlucoBalance: |
An oral spray designed to maintain proper levels of blood sugar for good health.
7
| 11. | Liver Support: |
An oral spray designed to cleanse the liver and rebuild damaged tissue.
| 12. | Memory Plus b: |
An oral spray designed to overcome the natural processes associated with aging and enhance healthy cognitive ability.
| 13. | MSM (Methylsulfonymethane): |
An oral spray designed to rebuild connective tissue and joints.
| 14. | Perform Plus: |
An oral spray designed to promote endurance, performance and increased libido.
| 15. | Re-Live Again: |
An oral spray designed to increase the release of Human Growth Hormone within the body to increase energy and endurance.
| 16. | ReishiPlus: |
An oral spray designed to help lower blood pressure and decrease elevated cholesterol and triglyceride levels and support the immune system.
| 17. | Rooibos Tea: |
A popular South African tea believed to promote anti-aging and immune system health.
| 18. | Slim’n Easy: |
An oral spray designed to promote and sustain weight loss.
| 19. | Slumber Plus: |
An oral spray designed to aid sleep.
| 20. | Spray-EEZE: |
An oral spray designed to alleviate colds and sore throats.
| 21. | Super Hydro-Oxy: |
An oral liquid designed to revitalize and detoxify the human body.
| 22. | Super Re-Vitalizer: |
An oral spray designed to promote overall health.
8
| 23. | Super Silica: |
An oral liquid designed to support bones, arteries, connective tissue, healthy hair, skin and nails.
| 24. | Super Cal: |
An oral spray designed to promote bone health.
| 25. | Vision Plus: |
An oral spray designed to nourish the eyes.
Personal Care Products:
We currently offer the following 18 different Personal Care products;
| 1. | Bust Cream: An herbal cream containing natural ingredients for the purpose of stimulating the development of the breast tissue and tightening and firming of the breast. | |
2. | Daily Eye Treatment: A soothing and hydrating eye cream for the purpose of reducing puffiness, fine lines and the effects of stress and fatigue. | |
3. | Lip gloss: A long lasting moisturizing lipstick. | |
4. | Pressed Mineral Powder: A multi-functional face power containing zinc, Vitamins A and E and green tea extract. |
5. | Fountain of Youth: A daily skin care regimen including a synergistic blend of 10 oriental herbs for the purpose of skin brightening, cleaning, and anti-wrinkle effects. |
6. | Gold Cream: A topical cream containing colloidal gold for the purpose of relieving pain associated with arthritis, stiff and swollen joints, sprains, strains, muscle spasms, bursitis and tendonitis. |
7. | Instant Whitening Cream: A cream for the purpose of brightening overall complexion, lightening age spots, liver spots and sun damaged skin. |
8. | Lifting Masque: A 20 minute masque for the purpose of reducing the visible signs of aging while lifting, tightening, and refining the pores of the skin. | |
9. | Perfume set: A floral fragrance perfume. |
9
10. | Nia 3 Plus 1 Lash & Line: Mascara and eyeliner package containing two items in each tube: dark brown mascara and navy blue mascara in one tube and black mascara and black eyeliner in the other tube. |
11. | Nia Concealer: A light colored concealer for the purpose of providing coverage for any skin imperfection as in darkness around the eyes, blemishes and to even out skin tones. |
12. | Nia Eye Color: A palette of four color-coordinated eye shadows: Pearl grey, Soft pink, Cranberry and Charcoal. |
13. | Nia Face and Body Powder: A jar containing face and body powder and a powder puff. |
| 14. | Nia Lip Magic: A lip gloss. Colors include Celebration Red with Pink shimmer and Plum Raisin with Peach shimmer. |
15. | Progesterone Cream: A non-pharmaceutical cream containing natural ingredients for menopausal and postmenopausal women. |
16. | Rooibos Tea Cream: A skin cream containing Alpha-Hydroxy acids, antioxidant, Vitamin B, Vitamin C and Vitamin E , Zinc, Potassium, Calcium, Copper and DHEA. |
17. | The Collection: A makeup kit containing Face Primer, Silk Whipped Foundation, Wet/Dry Powder, Eye Shadow, Black Eye Pencil, Pressed Shimmer Powder, Shimmer Blush, Long Lasting Lipstick, Lip Gloss Palate, Cream Lipstick, and Coordinating Lip Pencils. |
18. | Travel Kits. An Anti-Aging Skin Care Travel Kit containing products designed for balancing skin tone, increasing hydration, diminishing lines and wrinkles and restoring resiliency. |
Automotive Additive Products:
We currently offer the following one automotive product:
| 1. | Fast Team Plus: A fuel additive that acts as a lubricant and cleaning compound and has been found to significantly improve gas mileage and performance and reduce smog in all gasoline powered engines. |
Environmentally Friendly Home Cleaning Product:
| 1. | Natural Clean: A 100% biodegradable multi-purpose cleaning solution that aids in the clean-up and removal of a number of different stains and spills including grease, tar, crayons, pet stains, soap film, blood, ink and make-up. Natural Clean is non-toxic, non-caustic, non-pollutant, non-flammable and non-rusting and can be used for cleaning kitchens, baths and cars as well being used as an insect repellant when applied on skin or clothing. |
10
Other:
Flip-Top Portable Filter: A 24-ounce drinking container in a portable tote and featuring a filtration system.
Distribution of Our Products
Our products are sold exclusively on the Internet. Customer orders are filled using the following general process:
| · | To purchase products, customers order on- line and send payment for the order to an off-shore account. EFT International will verify receipt of payment and notify the appropriate distribution center to ship the products. Currently, orders are filled primarily through our subsidiary EFT (HK) Ltd., located in Hong Kong and we do not have any sales in the United States. We are currently in the process of establishing operations in other locations around the world, specifically Europe, Thailand, Vietnam and South America, from which products may also be shipped if we determine there is sufficient demand. |
| · | Once orders are placed on-line, EFT International will notify EFT (HK) Ltd. that payment was received. EFT (HK) Ltd. will notify IFC (defined below) how much of any particular type of product will be needed. In most cases, products ordered are shipped directly from our third party vendor to the distribution center in Hong Kong. In some cases, however, products are shipped to California rather than directly to the distribution center in Hong Kong. As a result some inventory may be maintained in California but only for a short period of time, generally not to exceed three months. Any products received in California are subsequently shipped to Hong Kong for distribution. Vendors are paid for their products by EFT International. |
The product formulations, delivery systems (spray), packages, packaging design and labels are proprietary to EFT. There are several manufacturers who produce these formulated products owned by EFT. We do not own any manufacturing facilities.
It would be difficult and prohibitively expensive for a competitor to duplicate the process without a ready market to sell hundreds of thousands of products into, therefore, we do not copyright or patent our products. To date, we have not encountered any competitor who has products similar to ours. Additionally, we are not fully dependent upon any one manufacturer supplier for 100% of any single product.
Significant Vendors
The vendors that supply the Company’s formulated products are currently located in the United States. None of our vendors account for a significant portion of our business and can be replaced. In December of 2008, we contracted with Industry Fulfillment Co., Inc. (“IFC”), a California corporation, to provide quality control on products ordered from vendors beginning in January 2009. IFC tracks the quantity and progress on delivery of these orders. In the future products may be purchased from vendors located outside the United States. There are no commitments or manufacturing agreements with any of our current vendors. We order products on an “as needed” or an “expected need” basis.
Sources and Availability of Raw Materials
Raw materials used in the manufacture of our products by third parties are readily available to the manufacturers of our products. We are not a party to any agreement for the purchase or delivery of such raw materials.
11
Significant Customers and Dependence on One or More Customers
None of our customers or Affiliates account for a significant portion of our business. We do not currently depend on any one or more customers or Affiliates for the purchase of our products.
Competition
The nutritional supplement and cosmetic e-business markets have and continue to become increasingly competitive and are rapidly evolving. In addition, the internet on-line commerce market is rapidly evolving and intensely competitive. Barriers to entry are minimal and current and new competitors can launch new websites at a relatively low cost. Continued advancement in technology and increasing access to that technology is paving the way for growth in the internet consumer industry. We believe that we are well-positioned within the Asian consumer market with our current marketing plan of supplying American merchandise brands to Asian consumers and that our exposure to both the Asian and American cultures gives us a competitive advantage. We also face competition for consumers from retailers, duty-free retailers, specialty stores, department stores and specialty and general merchandise catalogs, many of which have greater financial and marketing resources than we have.
Government Regulation
Currently, government approval is not necessary for the sale of any of our products and our Affiliate marketing activities are not subject to governmental regulation in the countries in which we operate. However, if existing laws change we may be required to conduct clinical trials to demonstrate the safety and efficacy of these products in order to continue to market and sell them.
Personal Identifiable Information
The collection of data and processing of transactions through our systems require us to receive and store a large volume of personally identifiable data. We are subject to various consumer protection laws relating to the collection, use, retention, security and transfer of personally identifiable information about our users, especially for financial information. In many states, there is currently great uncertainty whether or how existing laws governing issues such as property ownership, sales and other taxes, apply to the Internet and commercial online services. New laws in this area have been passed by several jurisdictions, and other jurisdictions are considering imposing additional restrictions. The interpretation and application of these laws are in a state of flux. These laws may be interpreted and applied inconsistently from country to country and our current data protection policies and practices may not be consistent with those interpretations and applications. Complying with these varying requirements could cause us to incur substantial costs or require us to change our business practices in a manner adverse to our business. Any failure, or perceived failure, by us to comply with any regulatory requirements or orders or other federal, state or international privacy or consumer protection-related laws and regulations could result in proceedings or actions against us by governmental entities or others, subject us to significant penalties and negative publicity and adversely affect us. In addition, we are subject to the possibility of security breaches, which themselves may result in a violation of these laws.
Seasonality
Our business is not seasonal in nature.
Intellectual Property
We do not currently hold any patents or trademarks, nor are we a party to any licenses, franchises, concessions, royalty agreements or labor contracts except as disclosed herein. The Company uses the “EFT” name, a trademark owned by EFT Assets Limited and licensed by EFT Assets Limited to the Company. EFT Limited is required to pay an annual royalty fee equal to a percentage of the Company’s gross sales for the previous fiscal year. The percentage is 5% for the first $30 million in gross sales, 4% for the $10 million in gross sales in excess of $30 million, 3% for the $10 million in gross sales in excess of $40 million and up to $50 million; 2% for the $10 million in gross sales in excess of $50 million and up to $60 million; and 1% for the $10 million in gross sales in excess of $60 million.
12
Research and Development Activities
We have not and do not engage in any research and development activities nor do we contemplate spending any time on such activities in the foreseeable future. On an as- needed basis, we may outsource research and development of a new product.
Environmental Laws
Our products are biodegradable and are not impacted by federal, state or local environmental laws.
Employees
As of the date of this Registration Statement, we have 5 full-time employees at the executive offices of the Registrant in the City of Industry, California and the remaining 9 at our Kowloon, Hong Kong office. The number of employees was reduced in the City of Industry office because EFT, Inc. is no longer a fulfillment or procurement center, and in the Kowloon office as a result of decreased sales generally. We adjust the number of employees from time to time as necessary to meet the needs of the Company.
None of our employees are represented by a collective bargaining agreement. There are no pending labor-related legal actions against us filed with any state or federal agency. We believe our employee relations are good.
Available Information
We filed the original Form 10 with the SEC on December 10, 2008 and the Registration Statement is effective by operation of law as of February 9, 2009. Since the effectiveness date of the Form 10, we have been required to file annual, quarter and other required reports and forms with the SEC under the Securities Exchange Act of 1934, as amended. This Form 10, as amended, and our other reports and other information may be inspected and copied at the public reference facilities maintained by the SEC at 100 F Street, N.E., Washington, D.C. 20549. The public may obtain information on the operation of the Public Reference Room by calling the SEC at 1-800-SEC-0330. In addition, the SEC maintains an Internet website that contains reports, proxy and information statements and other information regarding registrants that file electronically. The address of the website is http://www.sec.gov.
ITEM 1A. RISK FACTORS
Risk Factors
Investing in our securities involves risk. You should carefully consider all of the information contained in or incorporated by reference into this report and, in particular, the risks described below before investing in our securities. If any of the following risks actually occur, our business, financial condition or results of operations could be materially harmed and you may lose part or all of your investment.
Risks Related to Our Business
Current economic conditions may adversely affect our industry, business and results of operations and could cause the market value of our common stock to decline.
The global economy is currently undergoing a period of unprecedented volatility, and the future economic environment may continue to be less favorable than that of recent years. This has led, and could further lead, to reduced consumer spending in the foreseeable future, and may include consumer spending on nutritional and beauty products and other discretionary items. In addition, reduced consumer spending may drive us and our competitors to decrease prices. These conditions may adversely affect our industry, business and results of operations and may cause the market value of our common stock to decline.
13
FINRA might not approve of Buckman, Buckman & Reid, Inc.’s application to act as a market maker for our common stock on the OTC Bulletin Board.
After we have been informed by the SEC that they no longer have any further comments regarding our Form 10, Buckman, Buckman & Reid, Inc., will file an application with FINRA for authorization to act as a market maker of our common stock on the OTC Bulletin Board. Buckman, Buckman & Reid, Inc. served as the placement agent of our Units in the Regulation S Offering which commenced in January of, 2008 and expired on October 25, 2008. No assurance can be made that their application will be approved by FINRA. If their application is not approved, we will remain quoted on the OTC Pink Sheets which could make our common stock less attractive for potential investments and our company less attractive for any deals. This could decrease the value of our common stock.
We regularly maintain cash balances at a commercial bank in excess of the Federal Deposit Insurance Corporation insurance limit of $250,000.
We regularly maintain cash balances at a commercial bank in excess of the Federal Deposit Insurance Corporation (FDIC) insurance limit of $250,000. If the financial position and/or liquidity of the bank were to become impaired, our financial position and the results of our operations could be negatively affected to the extent of account balances held at the financial institution in excess of the federally insured limit.
The extent of our sourcing and manufacturing may adversely affect our business, financial condition and results of operations.
All of our products are currently manufactured in the United States and a majority of them are sold to customers in Hong Kong and China. As a result of the magnitude of this sourcing and shipping, our respective businesses are subject to the following risks:
| · | political and economic instability in foreign countries, including heightened terrorism and other security concerns, which could subject imported or exported goods to additional or more frequent inspections, leading to delays in deliveries or impoundment of goods, or to an increase in transportation costs of raw materials or finished product; | |
| · | the imposition of regulations and quotas relating to exports and imports, including quotas imposed by bilateral agreements between the United States from where we source our products and foreign countries, including China; | |
| · | the imposition of duties, taxes and other charges on exports and imports; | |
| · | significant fluctuation of the value of the U.S. dollar against the Hong Kong Dollar, Chinese Yuan and other foreign currencies; | |
| · | restrictions on the transfer of funds to or from foreign countries; and | |
| · | violations by foreign contractors of labor and wage standards and resulting adverse publicity. |
We operate on very tight delivery schedules and, if there are delays and expected delivery dates cannot be met, it could negatively affect our profitability.
If there is a delay in the delivery of goods and delivery schedules cannot be met, then our Affiliates and retail customers may cancel orders with us which would impact our gross profits and therefore, our profitability. We may also incur extra costs to meet delivery dates, which would also reduce our company’s profitability.
14
We face intense competition and any failure to timely implement our business plan could diminish or suspend our development and possibly cease our operations.
From time to time in the Business to Consumer (B2C) e-commerce business environment, competitors, typically catalog and other online retailers, will attempt to secure contracts with various merchandise brands to offer merchandise to their consumers. We also face competition for consumers from retailers, duty-free retailers, specialty stores, department stores and specialty and general merchandise catalogs, many of which have greater financial and marketing resources than we have. The internet online commerce market is rapidly evolving and intensely competitive. Barriers to entry are minimal and current and new competitors can launch new websites at a relatively low cost. Many competitors in this area have greater financial, technical and marketing resources than our Company. Continued advancement in technology and increasing access to that technology is paving the way for growth in the internet consumer industry. In addition, the nutritional supplement and cosmetic e-business markets have and continue to become increasingly competitive and are rapidly evolving. We believe that we are well-positioned within the Asian consumer market with our current marketing plan of supplying American merchandise brands to Asian consumers and that our exposure to both the Asian and American cultures gives us a competitive advantage but there can be no assurance that we will maintain our competitive edge or that we will continue to provide only American- made merchandise.
Consumers concerns about purchasing items through the Internet as well as external or internal infrastructure system failures could negatively impact our e-commerce sales or cause us to incur additional costs.
The e-commerce business is vulnerable to consumer privacy concerns relating to purchasing items over the Internet, security breaches, and failures of Internet infrastructure and communications systems. If consumer confidence in making purchases over the Internet declines as a result of privacy or other concerns, e-commerce net sales could decline. We may be required to incur increased costs to address or remedy any system failures or security breaches.
We are subject to laws governing our customers’ personal identifiable information. The processing, storage and use of personal data could give rise to liabilities as a result of governmental regulation, conflicting legal requirements or differing views of personal privacy rights.
The collection of data and processing of transactions through our systems require us to receive and store a large volume of personally identifiable data. We are subject to various consumer protection laws relating to the collection, use, retention, security and transfer of personally identifiable information about our users, especially for financial information. In many states, there is currently great uncertainty whether or how existing laws governing issues such as property ownership, sales and other taxes, apply to the Internet and commercial online services. The interpretation and application of these laws are in a state of flux. These laws may be interpreted and applied inconsistently from country to country and our current data protection policies and practices may not be consistent with those interpretations and applications. . We might become exposed to potential liabilities with respect to the data that we collect, manage and processes, and may incur legal costs if our information security policies and procedures are not effective or if we are required to defend our respective methods of collection, processing and storage of personal data. Complying with these varying requirements could cause us to incur substantial costs or require us to change our business practices in a manner adverse to our business. Any failure, or perceived failure, by us to comply with any regulatory requirements or orders or other federal, state or international privacy or consumer protection-related laws and regulations could result in proceedings or actions against us by governmental entities or others, subject us to significant penalties and negative publicity and adversely affect us. In addition, we are subject to the possibility of security breaches, which themselves may result in a violation of these laws. Future investigations, lawsuits or adverse publicity relating to our methods of handling personal data could adversely affect our business, financial condition and results of operations due to the costs and negative market reaction relating to such developments.
15
Our business depends on the ability to source merchandise in a timely and cost-effective manner.
Our business depends on being able to find qualified vendors and access products in a timely and efficient manner. All of the vendors must comply with applicable laws. Political or financial instability, changes in U.S. and foreign laws and regulations affecting the importation and taxation of goods, including duties, tariffs and quotas, or changes in the enforcement of those laws and regulations, as well as currency exchange rates, transport capacity and costs and other factors relating to foreign trade and the inability to access suitable merchandise on acceptable terms could adversely impact our results of operations.
We face significant inventory risks.
We are exposed to significant inventory risks that may adversely affect our operating results as a result of new product launches, rapid changes in product cycles, changes in consumer tastes with respect to our products and other factors. We must accurately predict these trends and avoid overstocking or under-stocking products. All of our products are supplied by third parties which we order generally on an “as- needed” basis. However, based on ordering trends we do stock certain items that we believe will be in demand so that they are available for immediate shipping. In recent months we have mitigated decreases in sales by lowering our levels of inventory to preserve cash on hand. Demand for products, however, can change significantly between the time inventory is ordered and the date of sale. In addition, when we begin selling a new product, it may be difficult to establish vendor relationships, determine appropriate product selection, and accurately forecast product demand. The acquisition of certain types of inventory, or inventory from certain sources, may require significant lead-time and prepayment, and such inventory may not be returnable. Although we have significantly reduced inventory levels and primarily order products on an as needed basis, any one of the inventory risk factors set forth above may adversely affect our operating results.
We depend on third parties to manufacture all of the products we sell, and we don’t have any contracts with any of the manufacturers of our products. If we are unable to maintain these manufacturing relationships or enter into additional or different arrangements, we may fail to meet customer demand and our net sales and profitability may suffer as a result.
All of our products are manufactured by third parties. We don’t have any contracts with any of the manufacturers of our products. The fact that we do not have contracts with our third-party manufacturers means that they could cease manufacturing these products for us at any time and for any reason. In addition, our third-party manufacturers are not restricted from manufacturing our competitors' products. Our inability to secure adequate and timely supplies of merchandise would harm inventory levels, net sales and gross profit, and ultimately our results of operations.
Our manufacturers may increase the cost of the products we purchase from them.
If our manufacturers increase their costs, our margins would suffer unless we were able to pass along these increased costs to our customers. We may not be able to develop relationships with new vendors and manufacturers at the same prices or at all, and even if we do establish such relationships, such new vendors and manufacturers might not allocate sufficient capacity to us to meet our requirements. Furthermore, if we increase our product orders significantly from the amounts we have historically ordered from our manufacturers, our manufacturers might be unable to meet this increased demand.
Our third-party manufacturers may not continue to produce products that are consistent with our standards or applicable regulatory requirements, which could harm our brand, cause customer dissatisfaction and require us to find alternative suppliers of our products.
Our third-party manufacturers may not maintain adequate controls with respect to product specifications and quality and may not continue to produce products that are consistent with our quality standards. If we are forced to rely on products of inferior quality, then our customer satisfaction and brand reputation would likely suffer, which would lead to reduced net sales. In addition, we may be required to find new third-party manufacturers to supply our products. There can be no assurance that we would be successful in finding third-party manufacturers that make products meeting our standards of quality.
16
Future increases in the price of gasoline may cut into our margins and if we are unable to pass those costs to our customers, our profit margins will decrease.
We pay for the shipment of goods from our vendors. The recent worldwide prices of gas have significantly and rapidly fluctuated in the recent past. Increased fuel prices increase our costs of sales which decrease our profit margins. Future and sustained increases in the price of gasoline will decrease our profit margins to the extent we are unable to foresee them and pass on any increased costs to our customers.
We are subject to the risks of doing business abroad.
Some of our products originate from abroad (e.g., our teas originate from South Africa) and most of our Affiliates are currently located in China and Hong Kong. As such, we are subject to the usual risks of doing business abroad, including currency fluctuations, political or labor instability and potential import restrictions, duties and tariffs. We do not maintain insurance for the potential lost profits due to such disruptions. Political or economic instability in the China or Hong Kong or elsewhere could cause substantial disruption in our business. This could materially adversely affect our financial condition and results of operations. Heightened terrorism security concerns could subject exported goods to additional, more frequent or more thorough inspections. This could delay deliveries or increase costs, which could adversely impact our results of operations. In addition, since we negotiate our purchase orders with customers in United States dollars, the value of the United States dollar against local currencies could impact our cost in dollars of production from these manufacturers. We are not currently engaged in any hedging activities to protect against these currency risks. If there is downward pressure on the value of the dollar, our customers’ purchase prices for our products could increase. We may not be able to offset an increase in production costs with a price increase to our customers.
Fluctuations in the price, availability and quality of materials used in our products could have a material adverse effect on our cost of goods sold and our ability to meet our customers’ demands.
Fluctuations in the price, availability and quality of the materials used in the manufacture of our products by third parties could have a material adverse effect on the cost of such products to us or our ability to meet our customers’ demands. We may not be able to pass on all or any portion of higher material prices to our customers.
The regulatory status of our products could change, and we may be required to conduct clinical trials to establish efficacy and safety or cease to market these products.
The Food and Drug Administration, or FDA, does not have a pre-market approval system for our products. However, the FDA may in the future determine to regulate our products or the ingredients included in our products as drugs or biologics. If certain of our products are deemed to be drugs or biologics we would be required to conduct clinical trials to demonstrate the safety and efficacy of these products in order to continue to market and sell them. In such event, we may not have sufficient resources to conduct any required clinical trials, and we may not be able to establish sufficient efficacy or safety data to resume the sale of these products. Any inquiries by the FDA or any foreign regulatory authorities into the regulatory status of our products and any related interruption in the marketing and sale of these products could severely damage our brand reputation and image in the marketplace, as well as our relationships with customers, which would harm our business, prospects, financial condition and results of operations.
The failure to upgrade information technology systems as necessary could have an adverse effect on our operations.
Some of our information technology systems, are primarily utilized to manage information necessary to price and ship products and to generate reports. If we are unable to effectively implement these systems and update them where necessary, this could have a material adverse effect on its business, financial condition and results of operations.
17
We are highly dependent on our current management.
Our success is significantly dependent upon our management team. Our success is particularly dependent upon Mr. Jack Qin, our Chairman and CEO, and Mr. George Curry, Chief Marketing Officer. The loss of any of them could have an adverse effect on us. If we were to lose the services of our officers and directors, we may experience difficulties in effectively implementing our business plan.
Dragon Win beneficially owns 52,099,000 shares of common stock thereby controlling 68.57% of our issued and outstanding common stock as of the date of this Registration Statement.
As of the date of this registration statement, Dragon Win Management, Ltd., a British Virgin Islands company (“Dragon Win”) owns 52,099,000 shares of our common stock, thereby representing approximately 68.57% of our issued and outstanding common stock. The board of directors of Dragon Win has voting and dispositive control of the Registrant’s common stock held by Dragon Win. Due to the fact that Dragon Win owns a majority of our issued and outstanding common stock, the board of directors of Dragon Win can thus approve or reject all matters on which the Registrant needs approval by not less than a majority of stockholders, including mergers, acquisitions, sales of assets, amending the Registrant’s Certificate of Incorporation, electing the Registrant’s Board of Directors, and appointing the Registrant’s officers. This might make the Company less attractive for strategic partners or tender offers which consequently might artificially suppress the value of the Registrant’s common stock.
Our Preferred Stock may be used to avoid a change in control of the Registrant.
Our Certificate of Incorporation authorizes the issuance of 25,000,000 shares of preferred stock with designations, rights and preferences determined from time to time by the Board of Directors. As of the date of this Form 10, there are no shares of preferred stock outstanding. However, the Board of Directors is empowered, without stockholder approval, to issue preferred stock with dividend, liquidation, conversion, voting or other rights that could be used to avoid a change of control of the Registrant and which could suppress the value of our common stock.
We may not be able to manage our growth effectively.
We must continually implement and improve our products and/or services, operations, operating procedures and quality controls on a timely basis, as well as expand, train, motivate and manage our work force in order to accommodate anticipated growth and compete effectively in our market segment. Successful implementation of our strategy also requires that we establish and manage a competent, dedicated work force and employ additional key employees in corporate management, product design, client service and sales. We can give no assurance that our personnel, systems, procedures and controls will be adequate to support our existing and future operations. If we fail to implement and improve these operations, there could be a material, adverse effect on our business, operating results and financial condition.
Our business is concentrated in Hong Kong and China, making our operations sensitive to economic fluctuations.
All of our offered products are marketed outside of the U.S., mostly in Hong Kong and China. Should we be unable to further diversify our markets, we may be subject to economic fluctuations within Hong Kong and China. If our business does not succeed, an investor could lose all or part of his investment.
18
If we do not meet our expansion strategy, we may not achieve our anticipated results.
Our business strategy is designed to expand the sales of our products and services internationally. Our ability to implement our plans will depend primarily on the ability to attract new customers. To implement this strategy the Registrant in March of 2009 retained the services of Aero Strategic Advisory, a division of Aero Financial, a global consulting and financial services firm, Based in Las Vegas, Nevada. The contract with Aero Strategic Advisory was terminated on July 31, 2009. On August 1, 2009, the Registrant has hired Ed Carter, an independent strategic advisor, a former employee of Aero Strategic Advisory, who has assisted the Registrant in a number of capacities, including corporate communications, handling of investor inquires, dissemination of news, business development and other services. We can give you no assurance that any of our expansion plans will be successful or that we will be able to establish additional favorable relationships for the marketing and sales of products and services. If we are unable to expand our business, our business operations could be adversely affected.
A dispute concerning the infringement or misappropriation of our proprietary rights or the proprietary rights of others could be time consuming and costly, and an unfavorable outcome could harm our business.
We may be exposed to future litigation by third parties based on claims that our programs infringe the intellectual property rights of others. If we become involved in litigation, it could consume a substantial portion of our managerial and financial resources, regardless of whether we win or lose. We may not be able to afford the costs of litigation. Any legal action against us or our collaborators could lead to:
| · | payment of damages, potentially treble damages, if we are found to have willfully infringed a party’s patent rights; |
| · | injunctive or other equitable relief that may effectively block our ability to further develop, commercialize and sell products; or |
| · | we or our collaborators having to enter into license arrangements that may not be available on commercially acceptable terms, if at all. |
As a result, we could be prevented from commercializing current or future products.
We have agreed to indemnify our officers and directors to fullest extent permitted under Nevada law.
Our Certificate of Incorporation contains a provision eliminating the personal liability of officers and directors to the extent allowed under the law of the State of Nevada. Under such provision, stockholder(s) may only prosecute an action against an officer and/or a director if the stockholder(s) can show acts or omissions which involve intentional misconduct, fraud or a knowing violation of law or the unlawful payment of distributions.
We may make acquisitions and strategic investments, which will involve numerous risks. We may not be able to address these risks without substantial expense, delay or other operational or financial problems.
Although we have a limited history of making acquisitions or strategic investments, we may acquire or make investments in related businesses or products in the future. Acquisitions or investments involve various risks, such as:
| · | higher than expected acquisition and integration costs; |
| · | the difficulty of integrating the operations and personnel of the acquired business; |
| · | the potential disruption of our ongoing business, including the diversion of management time and attention; |
19
| · | the possible inability to obtain the desired financial and strategic benefits from the acquisition or investment; | |
| · | assumption of unanticipated liabilities; | |
| · | incurrence of substantial debt or dilutive issuances of securities to pay for acquisitions; | |
| · | impairment in relationships with key suppliers and personnel of any acquired businesses due to changes in management and ownership; | |
| · | the loss of key employees of an acquired business; and | |
| · | the possibility of our entering markets in which we have limited prior experience. |
Future acquisitions and investments could also result in substantial cash expenditures, potentially dilutive issuance of our equity securities, our incurring of additional debt and contingent liabilities, and amortization expenses related to other assets that could adversely affect our business, operating results and financial condition.
We are subject to SEC regulations relating to low-priced penny-stocks.
Our Common Stock is currently traded on the OTC Pink Sheets under the ticker symbol “EFTB” As of the fiscal quarter ended September 30, 2009, there were 75,983,205 shares of Common Stock outstanding (23,583,205 were held by non-affiliates and the remaining 52,400,000 were held by affiliates). Our common stock has recently been trading under $5.00 per share. The Securities and Exchange Commission has adopted regulations concerning low-priced (or “penny”) stocks. The regulations generally define “penny stock” to be any equity security that has a market price less than $5.00 per share, subject to certain exceptions. Due to the fact that our stock is trading under $5.00, our stock is currently classified as a penny stock.
The penny stock regulations require that broker-dealers, who recommend penny stocks to persons other than institutional accredited investors make a special suitability determination for the purchaser, receive the purchaser’s written agreement to the transaction prior to the sale and provide the purchaser with risk disclosure documents that identify risks associated with investing in penny stocks. Furthermore, the broker-dealer must obtain a signed and dated acknowledgment from the purchaser demonstrating that the purchaser has actually received the required risk disclosure document before effecting a transaction in penny stock. These requirements have historically resulted in reducing the level of trading activity in securities that become subject to the penny stock rules.
The additional burdens imposed upon broker-dealers by these penny stock requirements may discourage broker-dealers from effecting transactions in our common stock, which could severely limit the market liquidity of our common stock and our shareholders’ ability to sell our common stock in the secondary market.
Penny stocks may trade infrequently, which means that it may be difficult to sell penny stock shares once you own them. Because it may be difficult to find quotations for certain penny stocks, they may be impossible to accurately price. Investors in penny stocks and in the common stock of the Registrant should be prepared for the possibility that they may lose their whole investment.
20
Our stock price has been thinly traded but may become highly volatile in the future.
Our common stock trades on the OTC Pink Sheets and there has historically been a very low volume of transactions. However, the market price of our common stock may become highly volatile and be subject to wide fluctuations in response to factors such as the following, some of which are beyond our control:
| • | Quarterly variations in our operating results; | |
| • | Operating results that vary from the expectations of securities analysts and investors; | |
| • | Changes in expectations as to our future financial performance, including financial estimates by securities analysts and investors; | |
| • | Reaction to our earnings releases and conference calls, or presentations by executives at investor and industry conferences; | |
| • | Changes in our capital structure; | |
| • | Changes in market valuations of other internet or online service companies; | |
| • | Announcements of innovations or new services by us or our competitors; | |
| • | Announcements by us or our competitors of significant contracts, acquisitions, strategic partnerships, joint ventures or capital commitments; | |
| • | Lack of success in the expansion of our business operations; | |
| • | Announcements by third parties of significant claims or proceedings against us or adverse developments in pending proceedings; | |
| • | Additions or departures of key personnel; | |
| • | Rumors or public speculation about any of the above factors; and | |
| • | Market and volume fluctuations in the stock markets in general. |
These market fluctuations may also materially and adversely affect the market price of our Common Stock.
21
ITEM 2. FINANCIAL INFORMATION.
MANAGEMENT’S DISCUSSION AND ANALYSIS
OF FINANCIAL CONDITION AND RESULTS OF OPERATIONS.
You should read the following discussion together with "Selected Historical Financial Data" and our consolidated financial statements and the related notes included elsewhere in this Registration Statement on Form 10. This discussion contains forward-looking statements, which involve risks and uncertainties. Our actual results may differ materially from those we currently anticipate as a result of many factors, including the factors we describe under "Risk Factors” and elsewhere in this Registration Statement.
Forward Looking Statements
Some of the information in this section contains forward-looking statements that involve substantial risks and uncertainties. You can identify these statements by forward-looking words such as "may," "will," "expect," "anticipate," "believe," "estimate" and "continue," or similar words. You should read statements that contain these words carefully because they:
| · | discuss our future expectations; |
| · | contain projections of our future results of operations or of our financial condition; and |
| · | state other "forward-looking" information. |
We believe it is important to communicate our expectations. However, there may be events in the future that we are not able to accurately predict or over which we have no control. Our actual results and the timing of certain events could differ materially from those anticipated in these forward-looking statements as a result of certain factors, including those set forth under "Risk Factors," "Business" and elsewhere in this Registration Statement. See "Risk Factors."
Unless stated otherwise, the words “we,” “us,” “our,” “the Company” or “EFT BioTech” in this Registration Statement collectively refers to the EFT BioTech Holdings, Inc. and its subsidiaries.
Industry Trends
We believe that the Business to Customer business is robust and that consumers have become more confident in ordering products, like ours, over the internet. However, the nutritional supplement and cosmetic e-business markets have and continue to become increasingly competitive and are rapidly evolving. Barriers to entry are minimal and current and new competitors can launch new websites at a relatively low cost. Many competitors in this area have greater financial, technical and marketing resources than our Company. Continued advancement in technology and increasing access to that technology is paving the way for growth in direct marketing. We also face competition for consumers from retailers, duty-free retailers, specialty stores, department stores and specialty and general merchandise catalogs, many of which have greater financial and marketing resources than we have. Notwithstanding the foregoing, we believe that we are well-positioned within the Asian consumer market with our current plan of supplying American merchandise brands to consumers and that our exposure to both the Asian and American cultures gives us a competitive advantage. There can be no assurance that we will maintain our competitive edge or that we will continue to provide only American- made merchandise.
However, the global economy is currently undergoing a period of unprecedented volatility, and the future economic environment may continue to be less favorable than that of recent years. This has led, and could further lead, to reduced consumer spending in the foreseeable future, and this may include spending on nutritional and beauty products and other discretionary items, like our products. In addition, reduced consumer spending may drive us and our competitors to decrease prices. These conditions may adversely affect our revenues and profits.
22
Our long term plan is to use funds from the private placement and revenues earned for investments and acquisitions to allow us to grow our existing business operations and to enter into additional territories. To date, we have not located any acquisition targets nor do we have any commitments for capital expenditures, other than Excalibur. We believe that due to the current global economic recession, there might be material opportunities for us to acquire smaller companies at discount prices. There can be no assurances however that we will be successful in doing so. Our expansion will rely to a great degree on global economic conditions and perceived future changes. Until such time, we intend to retain our cash reserves to fund our operations.
RESULTS OF OPERATIONS
The Three Months Ended September 30, 2009 Compared to the Three Months Ended September 30, 2008
Revenues. Our Revenues increased to $5,125,444 for the three months ended September 30, 2009 from $4,668,808 for the three months ended September 30, 2008 because the Company raised its unit sales price in July 2008 from $250 to $300 and the worldwide recession. The price increase only took effect for the last two months in the quarter ended September 30, 2008 compared to the full three months ended September 30, 2009. This increase in the initial cost might have contributed to a decrease in sales as customers believe that such an increase is prohibitively expensive. Our products are discretionary items and in light of the worldwide recession, consumers have generally been decreasing their purchases of discretionary items.
Costs of Goods Sold. Costs of Goods Sold decreased to $1,365,484 for the three months ended September 30, 2009 from $1,678,941 for the three months ended September 30, 2008. Costs of Goods Sold consist of merchandise purchases from vendors and decreased because of decreased sales in quantities.
Shipping Charges. Shipping Charges decreased to $995,490 for the three months ended September 30, 2009 from $1,329,240 for the three months ended September 30, 2008 due to decreased sales in quantities.
Shipping Costs. Shipping Costs decreased to $286,468 for the three months ended September 30, 2009 from $728,537 for the three months ended September 30, 2008. Shipping Costs consist of freight charges to our Hong Kong facility and decreased because of decreased sales in quantities.
Gross Profits. Gross Profits increased to $4,468,982 for the three months ended September 30, 2009 from $3,590,570 for the three months ended September 30, 2008. Our gross profit percentage for the three months ended September 30, 2009 was 73% compared to 60% for the three months ended September 30, 2008. Gross profits increased due to the Company raising its unit sales prices in July 2008. The price increase only took effect for the last two months in the quarter ended September 30, 2008 compared to the full three months ended September 30, 2009.
Selling, General and Administrative Expenses. Selling, General and Administrative Expenses increased to $2,253,548 for the three months ended September 30, 2009 from $1,083,343 for the three months ended September 30, 2008. Selling, General and Administrative Expenses consist of advertising of $6,841 and corporate administrative expenses of $1,319,044, and increasing consultant fees to ZR Public Relation Company, Ltd. of $327,663 and royalty fees accrued for trademark of $600,000 at September 30, 2009.
Interest Income. Interest Income decreased to $134,462 for the three months ended September 30, 2009 from $355,744 for the three months ended September 30, 2008. Interest Income decreased due to cash balance decrease and interest rate decline at September 30, 2009.
Foreign Exchange Loss. Foreign Exchange loss increased to $5,038 for the three months ended September 30, 2009 compared to a gain of $854 for the three months ended September 30, 2008. Foreign Exchange loss increased because of fluctuation on foreign exchange rates.
Other Income (Net). Other Income (Net) increased to $43,711 for the three months ended September 30, 2009 from loss of $3,774 for the three months ended September 30, 2008. Other Income (Net) consists of fees received for educational training classes and increased due to additional classes held.
23
The Six Months Ended September 30, 2009 Compared to the Six Months Ended September 30, 2008
Revenues. Our Revenues decreased to $9,114,760 for the six months ended September 30, 2009 from $9,420,326 for the six months ended September 30, 2008 because of decreased sales because of the Company raised its unit sales price in July 2008 from $250 to $300 and the worldwide recession. The price increase only took effect for the last two months in the six months ended September 30, 2008 compared to the full six months ended September 30, 2009. This increase in the initial cost might have contributed to a decrease in sales as customers believe that such an increase is prohibitively expensive. Our products are discretionary items and in light of the worldwide recession, consumers have generally been decreasing their purchases of discretionary items.
Costs of Goods Sold. Costs of Goods Sold decreased to $2,325,932 for the six months ended September 30, 2009 from $3,311,782 for the six months ended September 30, 2008. Costs of Goods Sold consist of merchandise purchases from vendors and decreased because of decreased sales.
Shipping Charges. Shipping Charges decreased to $2,049,570 for the six months ended September 30, 2009 from $2,829,110 for the six months ended September 30, 2008 due to decreased sales.
Shipping Costs. Shipping Costs decreased to $588,368 for the six months ended September 30, 2009 from $1,465,441 for the six months ended September 30, 2008. Shipping Costs consist of freight charges to our Hong Kong facility and decreased because of decreased sales.
Gross Profits. Gross Profits increased to $8,250,030 for the six months ended September 30, 2009 from $7,472,213 for the six months ended September 30, 2008. Our gross profit percentage for the six months ended September 30, 2009 was 74% compared to 61% for the six months ended September 30, 2008. Gross profits and gross profit percentage increased due to the Company raising its unit sales prices in July 2008. The price increase only took effect for the last two months for six months ended September 30, 2008 compared to the full six months ended September 30, 2009.
Selling, General and Administrative Expenses. Selling, General and Administrative Expenses increased to $4,559,866 for the six months ended September 30, 2009 from $2,329,916 for the six months ended September 30, 2008. Selling, General and Administrative Expenses consist of advertising of $21,987 and corporate administrative expenses of $3,367,316, and increasing consultant fees to ZR Public Relation Company, Ltd. of $570,563 and royalty fees accrued for trademark of $600,000 at September 30, 2009.
Interest Income. Interest Income decreased to $299,394 for the six months ended September 30, 2009 from $772,120 for the six months ended September 30, 2008. Interest Income decreased due to cash balance decrease and interest rate decline at September 30, 2009.
Foreign Exchange Loss. Foreign Exchange loss increased to $4,152 for the six months ended September 30, 2009 from a gain of $355 for the six months ended September 30, 2008. Foreign Exchange loss increased because of fluctuation on foreign exchange rates.
Other Income (Net). Other Income (Net) increased to $72,943 for the six months ended September 30, 2009 from loss of $140 for the six months ended September 30, 2008. Other Income (Net) consists of fees received for educational training classes and increased due to additional classes held.
LIQUIDITY AND CAPITAL RESOURCES
As reflected in the accompanying consolidated financial statements, at September 30, 2009, the Company had $36,597,902 cash on hand and a stockholders’ equity of $58,040,429. To date, we have funded our operations primarily from sales to our Affiliates and through private equity financings. While we believe in the viability of our strategy to improve sales volume and in our ability to raise additional funds, there can be no assurances to that effect.
24
At September 30, 2009, we had $68,723,140 in total assets, compared to $68,666,322 at March 31, 2009. This was primarily due to the decrease of prepaid expenses. Our inventories also decreased to $3,454,589 at September 30, 2009 from $3,908,629 at March 31, 2009 due to sales decrease. Our decrease in investments was due to an equity investment in Excalibur to $14,536,757 at September 30, 2009 from $17,129,314 at March 31, 2009, and related party Notes Receivable of $6,811,717 at September 30, 2009 compared to $5,961,717 at March 31, 2009 was due to loans made to Excalibur and Yeuh-Chi Liu. At September 30, 2009, we had $694,023 in invested mutual funds, $4,771,924 in invested bonds and our prepaid expenses were $977,981.
At September 30, 2009, our Total Liabilities consisted of $10,682,711compared to $12,276,962 at March 31, 2009. Liabilities consist of Accounts Payable; Other Liabilities; Unearned Revenue; Deposits from Investors; and Income Tax Payable. Accounts payable decreased to $1,232,721 at September 30, 2009 from $3,610,195 at March 31, 2009 primarily due to due to payment of trademark royalty expenses for last fiscal year. Other liabilities consist of commissions (Affiliate rewards) payable, payroll liabilities and other liabilities, and increased to $8,385,605 at September 30, 2009 from $6,675,552 at March 31, 2009 because of increased commissions payable and payroll payable. Unearned revenue consists of customer deposits for unshipped products, and decreased to $1,064,385 at September 30, 2009 from $1,991,215 at March 31, 2009 due to increased deliveries in-transit.
Our products are sensitive to business and personal discretionary spending levels and tend to decline or grow more slowly during economic downturns, including downturns in any of our major markets. The current worldwide recession is expected to adversely affect our sales and liquidity for the foreseeable future. Although we have mitigated decreases in sales by lowering our levels of inventory to preserve cash on hand, we do not know when the recession will subside and when consumer spending will increase from its current depressed levels. Even if consumer spending increases, we are not sure when consumer spending will increase for our products which will affect our liquidity. We believe we have enough capital to fund our operations during the next 12 months.
The Fiscal Year Ended March 31, 2009 Compared to the Fiscal Year Ended March 31, 2008
Assets. At March 31, 2009, we had $68,666,322 in total assets, compared to $57,427,420 at March 31 2008. This was primarily due to an increase in cash and cash equivalents to $38,181,837 at March 31, 2009 from $15,165,620 at March 31, 2008 following our Regulation S Private Placement. Our inventories also increased to $3,908,629 at March 31, 2009 from $2,619,429 at March 31, 2008 due to anticipated sales increases. At March 31, 2009, our restricted cash decreased to $0 from $37,845,432 at March 31, 2008 because release of cash restriction. Restricted cash consisted of $37 million of funds received during March of 2008 from investors for the Regulation S Private Placement Offering and held in escrow until closing.
Liabilities. At March 31, 2009, our Total Liabilities were $12,276,962, compared to $55,687,992 at March 31, 2008. Liabilities consist of Accounts Payable; Other Liabilities; Unearned Revenue; Deposits from Investors; and Income Tax Payable. Accounts payable increased to $3,610,195 at March 31, 2009 from $804,041 at March 31, 2008 primarily due to increases in freight expenses incurred from decreased sales. Other liabilities consist of commissions (Affiliate rewards) payable, payroll liabilities and other liabilities, and decreased to $6,675,552 at March 31, 2009 from $12,787,714 at March 31, 2008 because of decreased commissions (Affiliate rewards) payable and payroll payable. Unearned revenue consists of customer deposits for unshipped products, and decreased to 1,991,215 at March 31, 2009 from $3,945,805 at March 31, 2008 due to decreased orders. Deposits from investors decreased to $0 at March 31, 2009 from $37,845,432 at March 31, 2008 due to our Regulation S Private Placement Offering was completed in year 2008. Income tax payable decreased to $0 at March 31, 2009 from $305,000 at March 31, 2008 due to recognition of a tax calculation method according to the treasury regulations.
Stockholders’ Equity (Deficit). Our Stockholders’ Equity (Deficit) increased to $56,389,360 at March 31, 2009 from $1,739,428 at March 31, 2008. This increase was primarily due to an increase in Additional Paid in Capital to $52,854,891 at March 31, 2009 from $6,552 at March 31, 2008 and in Retained Earnings to $4,023,992 at March 31, 2009 from $1,895,330 at March 31, 2008.
25
Revenues. Our Revenues decreased to $12,846,809 for the fiscal year ended March 31, 2009 from $30,249,302 for the fiscal year ended March 31, 2008 because of decreased sales. The decrease in sales from the fiscal year ended March 31, 2008 to 2009 was due to the worldwide recession and to several natural disasters in China during 2008. Also, in July 2008, we increased our initial cost to our customers in order for them to become Affiliates from $250 to $300. This increase in the initial cost might have contributed to a decrease in sales as customers believe that such an increase is prohibitively expensive. Our products are discretionary items and in light of the worldwide recession, consumers have generally been decreasing their purchases of discretionary items. Also, in the 1st quarter of, 2008, we discontinued two (2) of our environmental home care products and, in 4 th quarter of 2008, we have added four (4) nutritional products. Consumers might have decreased their purchases of our products due to the change in the mix of products we offer.
Shipping Charges. Shipping Charges decreased to $5,657,625 for the fiscal year ended March 31, 2009 from $10,110,360 for the fiscal year ended March 31, 2008 due to decreased sales.
Costs of Goods Sold. Costs of Goods Sold decreased to $5,780,447 for the fiscal year ended March 31, 2009 $11,423,852 for the fiscal year March 31, 2008. Costs of Goods Sold consist of merchandise purchases from vendors and decreased because of decreased sales volume. On the contrary, Costs of Goods Sold percentage (Total Costs of Goods Sold divided by Total sales) increased from approximately 39% to 43% for the fiscal year ended March 31, 2008 and March 31, 2009 respectively due to the Company had given out free products to promote its business.
Shipping Costs. Shipping Costs of Goods Sold decreased to $2,204,502 for the fiscal year ended March 31, 2009 from $4,467,140 for the fiscal year March 31, 2008 due to decreased sales.
Gross Profits. Gross Profits decreased to $10,519,486 for the fiscal year ended March 31, 2009 from $24,468,670 for the fiscal year ended March 31, 2008. Our gross profit margin for the fiscal year ended March 31, 2009 decreased to 57% from 61% for the fiscal year ended March 31, 2008. Gross Profits and gross profit margins decreased because of decreased sales in year 2009. Also, during the year 2009, we held many promotions by giving out free products to boost our sales. As a result, our cost of goods sold was correspondingly higher in year 2009.
Selling, General and Administrative Expenses. Selling, General and Administrative Expenses increased to $8,929,162 for the fiscal year ended March 31, 2009 from $3,693,369 for the fiscal year ended March 31, 2008, General and Administrative Expenses consist of advertising and corporate administrative expenses, and increased because of professional fees incurred in connection with our Regulation S Private Placement Offering and royalty fees accrued for trademark at the year end.
Interest Income. Interest Income increased to $1,246,433 for the fiscal year ended March 31, 2009 from $275,538 for the fiscal year ended March 31, 2008. Interest Income consists of bank deposit interest, interest income from the outstanding loans and increased because of cash balance increases due to our Regulation S Private Placement Offering.
Foreign Exchange Loss. Foreign Exchange Gain increased to $723,357 for the fiscal year ended March 31, 2009 from $(4,248) for the fiscal year ended March 31, 2008. Foreign Exchange Gain increased because of gains on foreign exchange rates.
Other Income (Net). Other Income (Net) increased to $634,635 for the fiscal year ended March 31, 2009 from $54,904 for the fiscal year ended March 31, 2008. Other Income (Net) consists of fees received for educational training classes and increased due to additional classes held.
LIQUIDITY AND CAPITAL RESOURCES
As reflected in the accompanying consolidated financial statements, at March 31, 2009, the Company had $38,181,837 cash on hand and a stockholders’ equity of $56,389,360. To date, we have funded our operations primarily from sales to our Affiliates and through private equity financings. While we believe in the viability of our strategy to improve sales volume and in our ability to raise additional funds, there can be no assurances to that effect.
26
At March 31, 2009, we had $68,666,322 in total assets, compared to $57,427,420 at March 31, 2008. This was primarily due to our Regulation S Private Placement and outstanding loans. Our inventories also increased to $3,908,629 at March 31, 2009 from $2,619,429 at March 31, 2008 due to anticipated sales increase. Our increase in investments was due to an equity investment in Excalibur of $17,129,314 at March 31, 2009 from $0 at March 31, 2008, and related party Notes Receivable of $5,961,717 at March 31, 2009 compared to $0 at March 31, 2008 was due to loans made to Excalibur and Yeuh-Chi Liu. At March 31, 2009 we had $508,746 invested in mutual funds, compared to $835,965 at March 31, 2008. Our prepaid expenses increased to $2,551,298 at March 31, 2009 from $793,760 at March 31, 2008.
Our products are sensitive to business and personal discretionary spending levels and tend to decline or grow more slowly during economic downturns, including downturns in any of our major markets. The current worldwide recession is expected to adversely affect our sales and liquidity for the foreseeable future. Although we have mitigated decreases in sales by lowering our levels of inventory to preserve cash on hand, we do not know when the recession will subside and when consumer spending will increase from its current depressed levels. Even if consumer spending increases, we are not sure when consumer spending will increase for our products which will affect our liquidity. We believe we have enough capital to fund our operations during the next 12 months.
Our Revenues decreased to $12,846,809 for the fiscal year ended March 31, 2009 from $30,249,302 for the fiscal year ended March 31, 2008 due to decreased sales. The decrease in revenue from the fiscal year ended March 31, 2008 to 2009 was due to the worldwide recession and to several natural disasters in China during 2008. Also, in July 2008, we increased our initial cost to our customers in order for them to become Affiliates from $250 to $300. This increase in the initial cost might have contributed to a decrease in sales as customers believe that such an increase is prohibitively expensive for their budgets. Our products are discretionary items and in light of the worldwide recession, consumers have been decreasing their purchases of discretionary items. Also, in the 1st quarter of, 2008, we discontinued two (2) of our environmental home care products and, in 4 th quarter of 2008, we have added four (4) nutritional products. Consumers might have decreased their purchases of our products due to the change in the mix of products we offer.
Accounts Payable increased to $3,610,195 at March 31, 2009 from $804,041 at March 31, 2008 to due to the trademark royalty fee accrued at the year end. Other Liabilities consist of commissions (Affiliate rewards) payable, payroll liabilities and other liabilities, and decreased to $6,657,552 at March 31, 2009 from $12,787,714 at March 31, 2008 because of decreases in commissions (Affiliate rewards) payable as a result of decreases in sales. Unearned Revenues consist of customer deposits for unshipped products, and decreased to $1,991,215 at March 31, 2009 from $3,945,805 at March 31, 2008 because of decreased sales. Deposits from Investors consist of net proceeds from our Regulation S Private Placement Offering of Units, and decreased to $0 at March 31, 2009 from $37,845,432 at March 31, 2008 because of the expiration of the Regulation S Offering. Income Tax Payables consist of Federal Tax Provision, and decreased to $0 at March 31, 2009 from $305,000 at March 31, 2008 because of recognition of a tax calculation method according to the treasury regulation.
Our stockholders’ equity increased to $56,389,360 at March 31, 2009 from $1,739,428 at March 31, 2008. This increase was primarily due to an increase in retained earnings to $4,023,992 at March 31, 2009 from $1,895,330 at March 31, 2008 and proceeds from our Regulation S Private Placement of $51,149,412 at December 31, 2008.
In January of 2008, we commenced a private placement of Units exclusively to non-U.S. residents at a purchase price of $3.80 per Unit under the exemption from the registration requirements of the Securities Act of 1933, as amended, afforded the Registrant under Regulation S thereunder due to the fact that offers and sales were only made to non U.S. residents. The offering was conducted on a best-efforts basis. The original offering was for up to 10,000,000 Units but was oversubscribed and increased to 14,890,040 Units pursuant to the terms of the Private Placement Memorandum.
Each Unit consisted of one share of Common Stock and one Redeemable Common Stock Purchase Warrant (a “Warrant”). Each Warrant is exercisable to purchase one share of Common Stock at $3.80 per share until the second anniversary date of the date of issuance. The Warrants are redeemable by the Registrant, on a pro rata basis, at a purchase price of $0.0001 per share within 30 days from the tenth (10th) consecutive trading day that the Registrant’s common stock trades on the OTCBB or any public securities market within the U.S. at a closing sales price, or the average of the closing bid and asked price, of at least $11.
27
Moneys received from investors were held in an escrow account by Buckman, Buckman & Reid, Inc., the placement agent, pending the payment of attorneys’ fees and placement agent fees and considered “restricted cash.” The cash was released from escrow once such payments were made and following each of five closings: three in July of 2008, one in August of 2008 and one in October of 2008. The cash was then available for lending or operating purposes. The related Units were issued following each closing. Until such release from escrow, “restricted cash” was accounted for as an asset and a liability. Following the release from escrow and until the completion of the offering in October 2008, proceeds received from the offering were considered “deposits from investors” and accounted for as a liability in accordance with GAAP. The private placement ended on October 25, 2008 and the Registrant sold an aggregate of 14,890,040 Units for net proceeds of $51,149,412 consisting of a total of 14,890,040 shares of Common Stock and 14,890,040 Warrants. As of the date hereof, none of the warrants have been exercised or redeemed.
Industry Trends
We believe that the Business to Customer business is robust and that consumers have become more confident in ordering products, like ours, over the internet. However, the nutritional supplement and cosmetic e-business markets have and continue to become increasingly competitive and are rapidly evolving. Barriers to entry are minimal and current and new competitors can launch new websites at a relatively low cost. Many competitors in this area have greater financial, technical and marketing resources than our Company. Continued advancement in technology and increasing access to that technology is paving the way for growth in direct marketing. We also face competition for consumers from retailers, duty-free retailers, specialty stores, department stores and specialty and general merchandise catalogs, many of which have greater financial and marketing resources than we have. Notwithstanding the foregoing, we believe that we are well-positioned within the Asian consumer market with our current plan of supplying American merchandise brands to consumers and that our exposure to both the Asian and American cultures gives us a competitive advantage. There can be no assurance that we will maintain our competitive edge or that we will continue to provide only American made merchandise.
However, the global economy is currently undergoing a period of unprecedented volatility, and the future economic environment may continue to be less favorable than that of recent years. This has led, and could further lead, to reduced consumer spending in the foreseeable future, and this may include spending on nutritional and beauty products and other discretionary items, like our products. In addition, reduced consumer spending may drive us and our competitors to decrease prices. These conditions may adversely affect our revenues and profits.
Our long-term plan is to use funds from the private placement and revenues earned for investments and acquisitions to allow us to grow our existing business operations and to enter into additional territories. To date, we have not located any acquisition targets nor do we have any commitments for capital expenditures, other than Excalibur. We believe that due to the current global economic recession, there might be material opportunities for us to acquire smaller companies at discount prices. There can be no assurances however that we will be successful in doing so. Our expansion will rely to a great degree on global economic conditions and perceived future changes. Until such time, we intend to retain our cash reserves to fund our operations.
28
TABULAR DISCLOSURE OF CONTRACTUAL OBLIGATIONS
| Payments due by period | ||||||||||||||||||||
| Total | Less than 1 year | 1-3 years | 3-5 years | More Than 5 years | ||||||||||||||||
| Long-Term Debt Obligations | - | - | - | - | ||||||||||||||||
| Capital Lease Obligations | - | - | - | - | ||||||||||||||||
| Operating Lease Obligations (1) | $ | 1,135,010 | $ | 413,875 | $ | 721,135 | - | - | ||||||||||||
| Purchase Obligations | - | - | - | - | ||||||||||||||||
| Other Long-Term Liabilities Reflected on the Registrant's Balance Sheet under GAAP | - | - | - | - | ||||||||||||||||
| Total | $ | 1,135,010 | $ | 413,875 | $ | 721,135 | - | - | ||||||||||||
| (1) | Operating Lease |
The Company leases office space in the US under an operating lease agreement. The lease provides for monthly lease payments approximating $10,063 and expires on July 31, 2009. Future minimum lease payments under the operating leases as of March 31, 2009 approximate the following:
| Year Ending March 31, | ||||
| 2010, four months | $ | 40,250 | ||
The Company rents office space for its sales division in Hong Kong. The lease provides for free lease in the first two years and a monthly lease payments approximating $50,000 USD starting the beginning of the third year and expires on March 31, 2012. Expensing the 5-year total rent evenly over the life of the lease, the future minimum lease payments under the operating lease are as follows:
| Year Ending March 31, | ||||
| 2010 | $ | 360,000 | ||
| 2011 | $ | 360,000 | ||
| 2012 | $ | 360,000 | ||
The Company rents storage space to for its sales division in Hong Kong. The lease provides for monthly lease payments approximating $1,135 USD starting on May 8, 2008 and expires on May 7, 2010. Future minimum lease payments under the operating leases as of March 31, 2009 approximate the following:
| Year Ending March 31, | ||||
| 2010 | $ | 13,625 | ||
| 2011 | $ | 1,135 | ||
Rent expenses for the year ended March 31, 2009 and March 31, 2008 were approximately $494,487 and $487,896, respectively.
Excalibur International Marine Corporation
Due to the recent changes in policy between Mainland China and Taiwan, an opportunity was recognized to take advantage of direct sailings for cargo and passengers through the Taiwan Strait. EFT identified Excalibur International Marina Corporation (“Excalibur”), a shipping company located in Taiwan, as a viable entity to participate with in this business opportunity. In order to expedite the purchase of a new vessel, EFT’s Board of Directors approved a non-interest bearing, unsecured loan to facilitate this purchase. On July 28, 2008, the Registrant loaned $19,193,000 to Excalibur. This loan was still outstanding with balance of $1,564,717 as of September 30, 2009. At the time of the transaction, Excalibur was not a related party nor did any of the Company or any of its officers or directors have any relationship with Excalibur or any of its officers and directors.
29
On September 23, 2008, the Registrant signed a loan agreement with Excalibur to lend $2,000,000 at an interest rate of 3.75% per month with a term of no more than 60 days. At the end of the 60 days term, the term of the loan was extended for six months. On December 25, 2008, the Company extended this loan to May 25, 2009. On May 25, 2009, the Company extended this loan to Excalibur for another six months and decreased the interest rate to 12.5% per annum. On November 25, 2009 the Company extended this loan for another six months and decreased the interest rate to 8% per annum.
On October 20, 2008, EFT Investment Co., Ltd. was formed as a wholly-owned subsidiary of EFT BioTech Holdings, Inc. EFT Investment Co., Ltd was formed in Taiwan. On October 25, 2008, EFT Investment Co., Ltd. completed the acquisition of 58,567,750 shares of common stock of Excalibur; representing approximately 49% shares of issued and outstanding shares of Excalibur, for an aggregate purchase price of USD $19,193,000. Prior to the acquisition of Excalibur, Excalibur was not a related person under Item 404 of Regulation S-K.
On November 24, 2008, the Registrant signed an additional loan agreement with Excalibur, a then related party, pursuant to which the Registrant loaned Excalibur $500,000 at the interest rate of 3.75% per month with a term of 30 days with an extension of six months. On December 25, 2008, the Company extended the loan to May 25, 2009. On May 25, 2009, the Company extended this loan for another six months and decreased the interest rate to 12.5% per annum. On November 25, 2009 the Company extended this loan for another six months and decreased the interest rate to 8% per annum.
On May 13, 2009, the Company signed another loan agreement denominated in U.S. dollars with Excalibur to lend Excalibur $600,000 at interest rate of 12.5% per annum with a maturity date of November 13, 2009. On November 13, 2009 the Company extended this loan for another six months and decreased the interest rate to 8% per annum.
Note Receivable – Related party
The Board of Directors approved two non-interest bearing unsecured demand loans in the amount of U.S. $330,000 and $1,567,000 respectively on July 14, 2008 and July 25, 2008 to Yeuh-Chi Liu, a vendor and a member of the board of directors of Excalibur. As of the date hereof the full principal amount remains outstanding.
Off-Balance Sheet Arrangements
The Registrant does not have any off-balance sheet arrangements that have or are reasonably likely to have a current or future effect on the Registrant’s financial condition, changes in financial condition, revenues or expenses, results of operations, liquidity, capital expenditures or capital resources that is material to investors.
Quantitative and Qualitative Disclosures about Market Risk
For our fiscal year ended March 31, 2009, 100% of our total sales consisted of sales outside of the United States, with less than 0% of total sales denominated in currencies other than the United States dollar. In addition, from time to time we execute intercompany loans with our foreign subsidiaries that are denominated in foreign currencies.
We are exposed to foreign currency risks that arise from normal business operations. These risks include the translation of local currency balances of our Company and foreign subsidiaries, intercompany loans with foreign subsidiaries and transactions denominated in foreign currencies. It is our policy not to enter into derivative financial instruments for speculative purposes. We do not hedge our exposure to the translation of reported results of our foreign subsidiaries from local currency to United States dollars. A 10% adverse change in the underlying foreign currency exchange rates would not be significant to our financial condition or results of operations.
Critical Accounting Policies
The Registrant’s financial statements are based on the selection and application of significant accounting policies, which require management to make significant estimates and assumptions. The Registrant believes that the following are some of the more critical judgment areas in the application of the Registrant’s accounting policies that currently affect the Registrant’s financial condition and results of operations.
30
Cash & Cash Equivalents
Cash and cash equivalents include cash on hand and cash in time deposits, and certificates. The Company maintains its accounts in various banks and several which exceed the federally insured limit.
Inventories
Inventories are valued at the lower of cost or market. Product cost includes completed merchandise and is accounted for using the first-in, first-out basis. The Company has two warehouses, one in City of Industry, CA and the other one in Kowloon, HK. On a quarterly basis, the Company reviews inventory levels in each country for estimated obsolescence or unmarketable items, as compared to future demand requirements and the shelf life of the various products. Based on this review, the Company records inventory write-downs when costs exceed expected net realizable value. Historically, the Company estimates of the obsolete or unmarketable items have been insignificant.
SFAS No. 151, “Inventory Costs,” (“SFAS 151”) which clarifies that abnormal amount of idle facility expense, freight, handling costs, and wasted material (spoilage) should be recognized as period charges, rather than as an inventory value. This standard also requires the allocation of fixed production overheads to inventory based on the normal capacity of the production facilities. The Registrant’s existing accounting policy for inventory valuation is generally consistent with this guidance, and therefore, the adoption of SFAS 151 did not have a significant impact on The Registrant’s 2008 and 2009 financial results.
Notes Receivables from Related Parties
Notes receivable consists of receivables from the Registrant’s loans to Excalibur, Taiwan, and Yeuh-Chi Liu, related parties. As of March 31, 2009, outstanding loans to Excalibur totaled $ 4.06 million and to Yeuh-Chi Liu $1.89 million. The Registrant periodically reviews notes receivables for reliability and collectability, and recent account activities. If the Registrant’s estimates regarding collectability are inaccurate or an unforeseen matter is to occur, the Registrant may be exposed to a write-off or bad debts. As of March 31, 2009, the Registrant does not have an allowance for bad debts.
Investment
The Registrant accounts for equity investments in entities in which it exercises significant influence but does not own a majority equity interest in or have control using the equity method. The Registrant evaluates its equity investments for impairment whenever events and changes in business circumstances indicate the carrying amount of the equity investment may not be fully recoverable. On October 25, 2008, the Registrant, through its wholly-owned subsidiary, EFT Investment Co. Ltd., invested $19,193,000 in Excalibur International Marine Corporation for 49% of its ownership. The Registrant recorded this investment using the equity method because of its significant influence over the entity.
Unearned Revenues
Unearned Revenues consist of cash amounts received in advance for goods and services to be delivered at a future date. The Registrant records the cash from customers as a liability until the products are delivered.
Revenue
The Registrant receives payment by cash only for orders from customers or Affiliates. Cash consideration given by the Registrant to its sales Affiliates is considered to be a reduction of the selling prices of the Company’s products, thus, is recorded as a reduction of revenue. Sales revenue are recorded when the merchandise delivery is completed.
31
Foreign Currency Translation
The Company’s functional currency is the U.S. dollar and its operation in Hong Kong uses Hong Kong dollar (HKD) as its functional currency. An entity’s functional currency is the currency of the primary economic environment in which the entity operates. Management must use judgment in determining an entity’s functional currency, assessing economic factors including cash flow, sales price, sales market, expense, financing and inter-company transactions and arrangements. Impact from exchange rate changes related to transactions denominated in currencies other than the functional currency is recorded as a gain and loss in the statements of operations, while impact from exchange rate changes related to translating a foreign entity’s financial statements from the functional currency to its reporting currency, the U.S. dollar, is disclosed and accumulated in a separate component under the equity section of the balance sheets. Different judgments or assumptions resulting in a change of functional currency may materially impact the Registrant’s financial position and results of operations.
Income Taxes
The Registrant uses the asset and liability method of accounting for income taxes. Under this method, income tax expense is recognized for the amount of taxes payable or refundable for the current year. In addition, deferred tax assets and liabilities are recognized for the expected future tax consequences of temporary differences between the financial reporting and tax bases of assets and liabilities and for operating losses and tax credit carry-forwards. Management must make assumptions, judgments and estimates to determine the current provision for income taxes and the deferred tax assets and liabilities and any valuation allowance to be recorded against a deferred tax asset. Management’s judgments, assumptions and estimates relative to the current provision for income tax take into account current tax laws, management’s interpretation of current tax laws and possible outcomes of current and future audits conducted by foreign and domestic tax authorities. Changes in tax law or management’s interpretation of tax laws and the resolution of current and future tax audits could significantly impact the amounts provided for income taxes in the financial statements. Management’s assumptions, judgments and estimates relative to the value of a deferred tax asset take into account predictions of the amount and category of future taxable income, such as income from operations. Actual operating results and the underlying amount and category of income in future years could render management’s current assumptions, judgments and estimates of recoverable net deferred taxes inaccurate. Any of the assumptions, judgments and estimates mentioned above could cause our actual income tax obligations to differ from the estimates, thus materially impact the financial position and results of operations.
RECENT ACCOUNTING PRONOUNCEMENTS
The FASB issued SFAS No. 168, The FASB Accounting Standards Codification and the Hierarchy of Generally Accepted Accounting Principles, on June 29, 2009 and, in doing so, authorized the Codification as the sole source for authoritative U.S. GAAP. SFAS No. 168 will be effective for financial statements issued for reporting periods that end after September 15, 2009. Once it's effective, it will supersede all accounting standards in U.S. GAAP, aside from those issued by the SEC. SFAS No. 168 replaces SFAS No. 162 to establish a new hierarchy of GAAP sources for non-governmental entities under the FASB Accounting Standards Codification. The Company will evaluate the impact of SFAS No. 168 upon its effectiveness.
SFAS No. 167 amends FASB Interpretation (FIN) No. 46(R), Consolidation of Variable Interest Entities, by altering how a company determines when an entity that is insufficiently capitalized or not controlled through voting should be consolidated, the FASB said. A company has to determine whether it should provide consolidated reporting of an entity based upon the entity's purpose and design and the parent company's ability to direct the entity's actions.
The standards will be effective at the start of the first fiscal year beginning after November 15, 2009, which will mean January 2010 for companies that are on calendar years. The guidance will have to be applied for 1st quarter filings. The Company will comply with the disclosure requirements of this statement when and if it acquires a variable interest entity, upon its effectiveness.
32
FAS No. 166 revises SFAS No. 140, Accounting for Transfers and Servicing of Financial Assets and Extinguishments of Liabilities, and will require entities to provide more information about sales of securitized financial assets and similar transactions, particularly if the seller retains some risk to the assets, the FASB said. The statement eliminates the concept of a qualifying special-purpose entity, changes the requirements for the derecognition of financial assets, and calls upon sellers of the assets to make additional disclosures about them. The Company does not believe implementation of FAS No. 166 will have a material impact on its financial statements.
On May 28, 2009 the FASB announced the issuance of SFAS 165, Subsequent Events. SFAS 165 should not result in significant changes in the subsequent events that an entity reports. Rather, SFAS 165 introduces the concept of financial statements being available to be issued. Financial statements are considered available to be issued when they are complete in a form and format that complies with generally accepted accounting principles (GAAP) and all approvals necessary for issuance have been obtained. The Company believes that SFAS No. 165 will have an effect on its financial statements and will comply upon effectiveness
ITEM 3. PROPERTIES.
The principal executive office of our operating company, EFT Limited, consists of 6,500 square feet located at Langham Office Tower, 8 Argyle Street, Suite 3706, Kowloon, Hong Kong SAR which is leased from a third party pursuant to a five year lease commencing on March 31, 2007. The lease expires on June 30, 2012 . Pursuant to the lease, there is no rent for the first two years. Commencing on the third year of the lease, the monthly rent is $50,000 USD starting the beginning of the third year and we expense the 5-year total rent evenly over the life of the lease. There is no affiliation between any of our officers and directors with the landlord for these premises.
We also lease a 3,367 square foot office in the City of Industry in California. The lease expires on February 15, 2013. Pursuant to the lease, the monthly rent for the three year is $9,090, $9,454 and $9,832 respectively. There is no affiliation between any of our officers and directors with the landlord for these premises.
We also lease a number of small offices (generally 3,000 square feet or less) to support our sales, service center and auction product divisions. These offices, which are located in Chain, Hong Kong, Vietnam and Thailand, are leased for terms of two years or less. Se Note 13 to our September 30, 2009 financial statements included as part of this registration statement for information concerning the amounts we are required to pay pursuant to these leases.
We believe our properties are sufficient for our current operations.
33
ITEM 4. SECURITY OWNERSHIP OF CERTAIN BENEFICIAL OWNERS AND MANAGEMENT.
SECURITY OWNERSHIP OF CERTAIN BENEFICIAL OWNERS AND MANAGEMENT
The following table sets forth information regarding the beneficial ownership of outstanding Common Stock as of May 20, 2010 by (i) each of our directors and executive officers, (ii) all directors and executive officers as a group, and (iii) each owner of more than 5% of our Common Stock (5% owners). Except as set forth in the footnotes to this table, the business address of each director and executive officer listed is c/o EFT BioTech Holdings, Inc., 17800 Castleton St., Suite 300, City of Industry, CA 91789.
| Name of Beneficial Owners | Number of Shares Beneficially Owned | Percent of Shares Outstanding | ||||||
| (1) | (2) | |||||||
| Jack Jie Qin | 1,000 | * | ||||||
| George W. Curry | 300,000 | * | ||||||
| Jerry B. Lewin | 0 | — | ||||||
| Visman Chow | 0 | — | ||||||
| Norman Ko | 0 | — | ||||||
Dragon Win Management, Ltd. (3) Palm Grove Houses, P.O. Box 438 Road Town, Tortola British Virgin Islands | 52,099,000 | 68.57 | % | |||||
| Officers and Directors as a group (5 persons) | 301,000 | * | ||||||
* Represents less than 1%.
| (1) | As used herein, the term beneficial ownership with respect to a security is defined by Rule 13d-3 under the Securities Exchange Act of 1934, as amended, as consisting of sole or shared voting power (including the power to vote or direct the vote) and/or sole or shared investment power (including the power to dispose or direct the disposition of) with respect to the security through any contract, arrangement, understanding, relationship or otherwise, including a right to acquire such power(s) during the next 60 days. Unless otherwise noted, beneficial ownership consists of sole ownership, voting and investment rights. |
| (2) | Based on 75,983,205 shares of common stock issued and outstanding as of the fiscal quarter ended September 30, 2009. |
34
| (3) | On or around November, 2007, the owner of Top Capital International Limited, EFT International Limited, and EFT (HK) Limited (collectively, the “Offshore Operating Entities”), reached an agreement in principle with the Registrant to transfer, sell and assign, with exception of certain assets, the entire business operations of these Offshore Operating Entities to EFT Limited, in exchange for shares of common stock of the Registrant following the share exchange between the Registrant and EFT BioTech, the parent of EFT Limited. In consideration for the ownership transfer of the Offshore Operating Entities, 52,099,000 shares of common stock were issued to Dragon Win Management Limited, a British Virgin Islands company. The board of directors of Dragon Win has voting and dispositive control of the Registrant’s common stock held by Dragon Win. Ning-Sheng Cai and Xiao-Bao Hu are currently the two directors of Dragon Win. |
ITEM 5. DIRECTORS AND EXECUTIVE OFFICERS
Set forth below is information regarding the current directors and executive officers of EFT BioTech Holdings, Inc. as of May 20, 2010 . The directors are elected annually by stockholders. The executive officers serve at the pleasure of the board of directors.
| Name: | Age: | Title: | Director Since: | ||||
| Jack Jie Qin | 49 | President, Chief Executive Officer and Chairman (Principal Financial Officer) | November 2007 | ||||
| George W. Curry | 64 | Chief Marketing Officer and Director | November 2007 | ||||
| Jerry B. Lewin | 54 | Director | August 5, 2009 | ||||
| Visman Chow | 54 | Director | August 5, 2009 | ||||
| Norman Ko | 45 | Director | August 5, 2009 |
Biographies
Jack Jie Qin
Mr. Qin has been serving as our President, Chief Executive Officer and Chairman of the Board of Directors since November 2007. Mr. Qin was appointed as our Principal Financial Officer on May 18, 2010. Since January 2004, Mr. Qin has been serving as the President of EFT BioTech, Inc. From July 1998 to December 2002, Mr. Qin serviced as the President of eFastTeam International, Inc. located in Los Angeles, California. From June 1992 to December 1997, he served as the President of LA Import & Export Company located in Los Angeles, California. In May 1991, Mr. Qin earned an MBA from Emporia State University located in Kansas. In May 1982, Mr. Qin graduated from Jiangxi Engineering Institute located in Nanchang, China with a major in Mechanic Engineering.
35
George W. Curry
Mr. Curry has been serving as our Chief Marketing Officer and as a Director since November 2007. From 1996 to October 2007, Mr. Curry served as a sales representative of Mayor Pharmaceutical Labs, Inc. where he marketed products directly to the public and recruited and trained additional sales people. He also served as a motivational speaker at company training seminars throughout the U.S. From 1992 to 1995, Mr. Curry owned Continental Limited, an import export business focused on the clothing industry. In 1968, Mr. Curry earned a Bachelor in Business Administration (BBA) from the University of North Texas with a major in Marketing.
Jerry B. Lewin
During the past five years, Mr. Lewin has been serving as the Senior Vice President of Field Operations North America for Hyatt Hotel Corporation. Mr. Lewin is responsible for, and oversees the operation of 23 Hyatt Hotels throughout the East Coast and Canada including the Flag Ship Hotel, Grand Hyatt New York in Mid-Town Manhattan. Mr. Lewin also serves on several boards and foundations including the New York City Hotel Association and the New York Law Enforcement Foundation.
Visman Chow
Since 1993, Mr. Chow has been serving as the Chief Lending Officer and board member at Universal Bank. From 1979 to 1983, Mr. Chow was with Union Bank where he managed a commercial real estate portfolio of approximately $50 million. Mr. Chow then went on to become President of Unieast Financial Corporation prior to his current position.
Norman Ko
Since 2007, Mr. Ko has been a partner with Smith Mandel and Associates, LLP. He provides audit and assurance services to private clients in various industry groups along with SEC audit preparation and tax planning. Mr. Ko also has experience in areas including due diligence, mergers and acquisition and business reorganizations.
Mr. Lewis, Mr. Chow and Mr. Ko are independent directors as that term is defined in Section 803.A of the NYSE Amex Company Guide.
On February 1, 2010, Sharon Tang resigned from her position as the Chief Financial Officer of the EFT BioTech Holdings, Inc., a Nevada corporation (the “Company”).
Angy C. Chin became our Principal Financial Officer on February 15, 2010. Ms. Chin resigned this position on May 18, 2010 and was replaced by Jack Jie Qin.
Legal/Disciplinary History
None of our executive officers or directors has been the subject of:
| 1. | A conviction in a criminal proceeding or named as a defendant in a pending criminal proceeding (excluding traffic violations and other minor offenses); |
| 2. | The entry of an order, judgment or decree, not subsequently reversed, suspended or vacated, by a court of competent jurisdiction that permanently or temporarily enjoined, barred, suspended or otherwise limited such person’s involvement in any type of business, securities, commodities, or banking activities; |
| 3. | A finding or judgment by a court of competent jurisdiction (in a civil action), the Securities and Exchange Commission, the Commodity Futures Trading Commission, or a state securities regulator of a violation of federal or state securities or commodities law, which finding or judgment has not been reversed, suspended, or vacated; or |
| 4. | The entry of an order by a self-regulatory organization that permanently or temporarily barred, suspended or otherwise limited such party’s involvement in any type of business or securities activities. |
Family/Certain Relationships
There are no family relationships among or between any of the Registrant’s officers and directors.
36
Employment Agreements
We currently do not have any employment agreements with any officer or director.
Ms. Sharon Tang served as our Chief Financial Officer pursuant to an Employment Agreement, dated May 1, 2008. The employment agreement commenced on June 1, 2008 and expired on February 1, 2010. Ms. Tang’s compensation was $120,000 per year payable in equal monthly installments with 10% annual increases for each subsequent year.
COMPLIANCE WITH SECTION 16(a) OF THE SECURITIES EXCHANGE ACT OF 1934
Section 16(a) of the Exchange Act requires the Registrant’s directors and officers, and persons who beneficially own more than 10% of a registered class of the Registrant’s equity securities, to file reports of beneficial ownership and changes in beneficial ownership of the Registrant’s securities with the SEC on Forms 3, 4 and 5. Officers, directors and greater than 10% stockholders are required by SEC regulation to furnish the Registrant with copies of all Section 16(a) forms they file.
Jack Jie Qin, our President, CEO and Chairman; Sharon Tang, our former Chief Financial Officer; and George Curry, our Chief Marketing Officer, have not filed Forms 3, 4 and 5 to date. They intend to file them in the near future. Our 5% stockholders have not filed a Form 3 to date.
ITEM 6. EXECUTIVE COMPENSATION
Compensation Discussion and Analysis
The goal of our named executive officers’ compensation levels is the same as our goal for operating the Company – to create long-term value for our stockholders. Toward this goal, we establish compensation levels based on our named executive officers’ relevant experience and leadership experience and skills. We also consider the named executive officers’ ability and likelihood of contributing to our Company’s growth and success. We also take into account comparable salary ranges at similar companies in order to attract and retain our named executive officers.
We do not have a formula or benchmark or necessarily react to short-term changes in business performance when reviewing our named executive officers’ salaries. We consider their past contributions to the Company, ability to work cohesively with our management team and our expectations regarding their future performance. Executive officers have an active role in our determination of their compensation levels and we consider such executive officers’ opinions and expectations.
To date, we have not adopted a stock option plan or other incentive plan. We intend to adopt a plan in the future to further align our management’s interest with our stockholders’ interest.
Other than our employment with Ms. Sharon Tang, our Chief Financial Officer, we do not have any employment agreements with our executive officers. Ms. Tang’s employment agreement does not contain a change in control or severance provisions. Our executive officers serve at the will of the Board which enables the Company to terminate their employment at their discretion. This is consistent with the Company’s performance-based employment and compensation philosophy.
The table below summarizes the compensation we have paid our Named Executive Officers in the last two fiscal years.
37
SUMMARY COMPENSATION TABLE
Name and Principal Position | Fiscal Year Ended March 31, | Salary | Bonus | Stock Awards | Option Awards | Non-Equity Plan Comp | Non-Equity Incentive Comp | Non-Qualified Comp Earnings | Other Comp | Total | ||||||||||||||||||||||||||||
| Jack Jie Qin (President, CEO and Chairman) | 2009 | $ | 300,000 | (1) | $ | 0 | $ | 1 | (2) | $ | 0 | $ | 0 | $ | 0 | $ | 0 | $ | 0 | $ | 300,001 | |||||||||||||||||
| (Principal Executive Officer) | 2008 | $ | 300,000 | (1) | $ | 0 | $ | 1 | (2) | $ | 0 | $ | 0 | $ | 0 | $ | 0 | $ | 0 | $ | 300,001 | |||||||||||||||||
Sharon Tang (Chief Financial Officer) | 2009 | $ | 120,000 | $ | 0 | $ | 0 | $ | 0 | $ | 0 | $ | 0 | $ | 0 | $ | 0 | $ | 120,000 | |||||||||||||||||||
| (Principal Financial and Accounting Officer)(3) | 2008 | $ | 120,000 | $ | 0 | $ | 0 | $ | 0 | $ | 0 | $ | 0 | $ | 0 | $ | 0 | $ | 120,000 | |||||||||||||||||||
Dr. Joseph B Williams (Former Chief Administrative | 2009 | $ | 0 | $ | 0 | $ | 0 | $ | 0 | $ | 0 | $ | 0 | $ | 0 | $ | 0 | $ | 0 | |||||||||||||||||||
| Officer, Secretary and Director (4,8) | 2008 | $ | 100,000 | $ | 0 | $ | 300 | (5) | $ | 0 | $ | 0 | $ | 0 | $ | 0 | $ | 0 | $ | 100,300 | ||||||||||||||||||
George Curry (Chief Marketing | 2009 | $ | 120,000 | $ | 0 | $ | () | $ | 0 | $ | 0 | $ | 0 | $ | 0 | $ | 0 | $ | 120,000 | |||||||||||||||||||
Officer, Secretary and Director) (9) | 2008 | $ | 0 | $ | 0 | $ | 300 | (5) | $ | 0 | $ | 0 | $ | 0 | $ | 0 | $ | 0 | $ | 300 | ||||||||||||||||||
Jun Qin Liu (Former | 2009 | $ | 0 | $ | 0 | $ | 0 | $ | 0 | $ | 0 | $ | 0 | $ | 0 | $ | 0 | $ | 0 | |||||||||||||||||||
| Operations Manager and Director)(6) | 2008 | $ | 120,000 | $ | 0 | $ | 300 | (5) | $ | 0 | $ | 0 | $ | 0 | $ | 0 | $ | 0 | $ | 120,300 | ||||||||||||||||||
| Tony So | 2009 | $ | 0 | $ | 0 | $ | 0 | $ | 0 | $ | 0 | $ | 0 | $ | 0 | $ | 0 | $ | ||||||||||||||||||||
(Former Treasurer) (7)(8) | 2008 | $ | 100,000 | $ | 0 | $ | 300 | (5) | $ | 0 | $ | 0 | $ | 0 | $ | 0 | $ | 0 | $ | 100,000 | ||||||||||||||||||
Notes:
| (1) | Accrued compensation | |
| (2) | 1,000 shares at $0.0018 per share. Share price is based on estimate fair market price on the grant date on November 2008. |
| (3) | Ms. Tang commenced serving as the Company’s Chief Financial Officer on June 1, 2008. On February 1, 2010, Sharon Tang resigned from her position as the Chief Financial Officer of the EFT BioTech Holdings, Inc., a Nevada corporation (the “Company”). |
| (4) | Dr. Williams served as our Chief Administrative Officer and Secretary from June 2008 to February 6, 2009 and as a Director from November 2007 to February 6, 2009. On February 6, 2009, Dr. Wiiliams resigned from his position as the Chief Administrative Officer and Secretary. Dr. Williams served as our Chief Financial Officer (Principal Financial Officer) from February 2008 to June 2008. Before his employment with the Registrant, Mr. Williams served as a consultant for the Registrant for seven months in the fiscal year ended March 31, 2008. |
| (5) | 300,000 shares at $0.0001 per share. Share price is based on estimated fair market price on the grant date in November 2008. | |
| (6) | Ms. Liu resigned as the Registrant’s Operations Manager and a Director effective December 2, 2008. | |
| (7) | Tony So resigned from the Registrant in September 2008. | |
| (8) | From June 1, 2007 to December 31, 2007, we retained Dr. Williams and Mr. So as consultants at an annual salary of $120,000 each. As of January 1, 2008, Dr. Williams and Mr. So became officers of the Registrant at a monthly salary of $10,000 each. Mr. So resigned in September of 2008 and Dr. Williams resigned in February of 2009. | |
| (9) | Ms. George Curry served as our Director from November 2007 to December 31, 2008. Since April 1, 2009, Mr. George Curry has served as our Chief Marketing Officer, Secretary, and Director. |
38
Board Committees
The Company has a standing Audit Committee and a Compensation Committee. Norman Ko is the Chairperson of both committees. Jack Qin and George Curry are the other two members sitting on the Audit Committee and the Compensation Committee. Jerry B. Corwin, Visman Chow and Norman Ko are deemed to be independent.
Financial Expert
Our Board of Directors has designated Mr. Norman Ko as a “financial expert” as that term is defined in Item 407 of the Sarbanes Oxley Act of 2002.
Director Compensation
Directors are reimbursed for their out-of-pocket expenses incurred in connection with attending board meetings. In the fiscal year ended March 31, 2009, the Registrant reimbursed the directors an aggregate of $0 for such expenses.
Code of Ethics
We currently have a Code of Ethics for our directors and principal executive officers.
Code of Business Conduct
The Company has adopted a Code of Business Conduct which is followed in connection with all Related Party Transactions (as defined below) with Related Persons (as defined in Rule 404 of Regulation S-K). For these purposes, a “Related Person Transaction” is a financial transaction, arrangement or relationship, or any series of similar transactions, between the Company and an entity in which any Related Person will have a direct or indirect material interest, other than:
1. Transactions available to all employees generally.
2. Transactions involving less than $25,000 annually ($6,250 quarterly) when aggregated with all similar transactions.
This includes any transactions requiring disclosure under item 404 of Regulation S-K under the Securities and Exchange Act of 1934, as amended.
Approval Procedures:
| 1. | A proposed Related Person Transaction shall be brought before the Board of Directors. The Board must be informed of (a) the Related Person’s relationship or interest, including all conflicts of interest that may exist or otherwise arise on account of the Related Person Transaction, and (b) the material facts of the proposed Related Person Transaction. |
| 2. | The Board shall determine whether to approve a Related Person Transaction after considering the following factors, as deemed relevant by the Board: |
• Whether the transaction is on terms comparable to those that could be obtained in arms-length dealing with an unrelated third party;
• Whether there are business reasons to enter into the Related Person Transaction;
• Whether the Related Person Transaction could impair the independence of a director, if applicable;
• Whether the Related Person Transaction would present an improper conflict of interest, taking into account the size of the transaction, the overall financial position of the executive officer, Director or Director Nominee, the direct or indirect nature of the interest of the executive officer, Director or Director Nominee in the transaction, the ongoing nature of any proposed relationships or any other factors the Board deems relevant.
39
| 3. | The Board will approve such transactions to be entered into by the Company, including the ratification of such transactions if applicable. At subsequent meetings, management shall update the Board as to any material changes to those proposed transactions. |
| 4. | The Board shall also periodically review and assess ongoing relationships with Related Persons to assure compliance with the Board guidelines and directives and to ensure that such Related Person Transaction remains fair to the Company. |
| 5. | Any member of the Board who has an interest in the transaction under consideration will abstain from voting, but may participate in the discussion if invited to do so by the Chair of the Board. |
| 6. | These procedures generally should be used to approve Related Person Transactions in advance of the transaction being entered into. On occasion, however, it may be advisable to commence a Related Person Transaction before the Board has evaluated it, or a transaction may commence before it is discovered there is a Related Person. Accordingly, in such instances, notwithstanding the above, management should consult with the Chair of the Board to determine the appropriate course of action, which may include subsequent ratification by the Board. |
Disclosure:
Related Person Transactions are to be disclosed in the Company’s applicable filings as required by the Securities Act of 1933 and the Securities Exchange Act of 1934 and related rules. Any material Related Person Transaction shall be disclosed to the full Board of Directors.
Options
To date the Registrant has not issued any options to its executive officer, directors or employees.
ITEM 7. CERTAIN RELATIONSHIPS AND RELATED TRANSACTIONS, AND DIRECTOR INDEPENDENCE
The Registrant’s Code of Business Conducts states that the Registrant shall not, directly or indirectly, including through any subsidiary, make or maintain any new extension of credit or arrange for the extension of credit in the form of a personal loan to or for any director or executive officer (or equivalent thereof) of the Registrant. This prohibition includes corporate guarantees but excludes loans under the Registrant’s 401(k) plan, if any, reimbursable travel and similar expenses incurred while performing executive responsibilities, reimbursable relocation expenses, use of company vehicles for business purposes, and credit and charge cards used only in connection with business and limited ancillary personal purposes (e.g., personal items included in hotel room charges) settled within a reasonable time period (e.g., monthly).
Our Board of Directors review and vote on all proposed transactions involving a related person, including our officers and directors and any affiliates thereof or their respective family members, if any. The interested director, if any, does not vote on any such matter(s). In its determination, the Board deliberates whether the proposed transaction is in the best interests of the Registrant and its stockholders and whether the proposed transaction is as fair and equitable as it would be with non-related party on an “arm’s length basis.”
Loan to Excalibur Marine Exploration
As disclosed in this Form 10, the Company has loaned amounts to Excalibur, a related party. On October 25, 2008, EFT Investment Co., Ltd. completed the acquisition of 58,567,750 shares of common stock of Excalibur, representing approximately 49% shares of issued and outstanding shares of Excalibur, for an aggregate purchase price of USD $19,193,000. Prior to the acquisition of Excalibur, the Company did not have any relationship with Excalibur nor was it deemed to be a related party.
40
Note Receivable
On July 14, 2008, the Company entered into a loan agreement and issued a promissory note to Yeuh-Chi Liu, a vendor and a former director of the Company’s Board of Directors, for the principal amount of $330,000. The loan is non-interesting bearing and was payable upon demand. On July 15, 2009, the loan agreement was amended to change the term of the loan to December 15, 2009. As of the date hereof, the principal amount has been paid back in full.
On July 25, 2008, the Company entered into a loan agreement and issued a promissory note to Yeuh-Chi Liu, a vendor and a director of the Company’s Board of Directors, for the principal amount of $1,567,000. The loan is non-interesting bearing and was payable upon demand. The loan is secured by Yeuh-Chi Liu’s 3.97% ownership interest of Excalibur Marine Company.
The Board of Directors approved two non-interest bearing, unsecured demand loans in the amount of U.S. $330,000 and $1,567,000 on July 14, 2008 and July 25, 2008, respectively, to Yeuh-Chi Liu who is a vendor and director on the board of Excalibur.
Director Independence
Majority of our directors are deemed to be independent.
ITEM 8. LEGAL PROCEEDINGS
We are not a party to nor are any of our properties the subject of any material pending legal proceedings. We have not been threatened with nor have any knowledge of any potential claims or legal actions that would have a material adverse impact on our financial position, operations or potential performance. There are no material proceedings to which any director, officer or affiliate of the Registrant or any of its subsidiaries, any owner of record or beneficially of more than five percent of any class of voting securities of the Registrant, or any associate of any such director, officer, affiliate of the Registrant, or security holder is a party adverse to the Registrant or has a material interest adverse to the Registrant.
ITEM 9. MARKET PRICE OF AND DIVIDENDS ON THE REGISTRANT’S COMMON EQUITY AND RELATED STOCKHOLDER MATTERS
Our Common Stock
As of the date of this Registration Statement, our common stock is listed for trading on the Pink OTC Markets Inc. (the “Pink Sheets”) under the ticker symbol “EFTB.” As of the fiscal quarter ended September 30, 2009, there were 75,983,205 shares of Common Stock outstanding (23,583,205 were held by non-affiliates and the remaining 52,400,000 were held by affiliates). Our common stock has recently been trading under $5.00 per share. Stocks traded on the Pink Sheets are usually thinly traded, highly volatile, and not followed by analysts. Investors in our common stock may experience a loss or liquidity problem with their share holdings.
After we have been informed by the SEC that they no longer have any further comments regarding this Form 10, Buckman, Buckman & Reid, Inc., will apply to file an application with FINRA for authorization to act as a market maker of our common stock on the OTC Bulletin Board. Buckman, Buckman & Reid, Inc. served as the placement agent of our Units in the Regulation S Offering which commenced in January of, 2008 and expired on October 25, 2008.
The holders of the Registrant’s common stock are entitled to one vote per share. The common stock holders do not have preemptive rights to purchase, subscribe for, or otherwise acquire any shares of common stock.
The ability of individual stockholders to trade their shares in a particular state may be subject to various rules and regulations of that state. A number of states require that an Registrant's securities be registered in their state or appropriately exempted from registration before the securities are permitted to trade in that state. Presently, the Registrant has no plans to register its securities in any particular state.
41
The Securities and Exchange Commission has adopted regulations concerning low-priced (or “penny”) stocks. The regulations generally define “penny stock” to be any equity security that has a market price less than $5.00 per share, subject to certain exceptions. Due to the fact that our stock is trading under $5.00, our stock is currently classified as a penny stock.
The penny stock regulations require that broker-dealers, who recommend penny stocks to persons other than institutional accredited investors make a special suitability determination for the purchaser, receive the purchaser’s written agreement to the transaction prior to the sale and provide the purchaser with risk disclosure documents that identify risks associated with investing in penny stocks. Furthermore, the broker-dealer must obtain a signed and dated acknowledgment from the purchaser demonstrating that the purchaser has actually received the required risk disclosure document before effecting a transaction in penny stock. These requirements have historically resulted in reducing the level of trading activity in securities that become subject to the penny stock rules.
The additional burdens imposed upon broker-dealers by these penny stock requirements may discourage broker-dealers from effecting transactions in our common stock, which could severely limit the market liquidity of our common stock and our shareholders’ ability to sell our common stock in the secondary market.
Penny stocks may trade infrequently, which means that it may be difficult to sell penny stock shares once you own them. Because it may be difficult to find quotations for certain penny stocks, they may be impossible to accurately price. Investors in penny stocks should be prepared for the possibility that they may lose their whole investment.
The Registrant’s fiscal year end is March 31st. The range of high and low bid information for our common stock on the Pink Sheets for each quarterly period within the two most recent fiscal years is set forth below. Such quotations reflect inter-dealer prices, without retail mark-up, mark-down or commission and may not necessarily represent actual transactions. There was no active trading market for our common stock during the period reflected below:
| Fiscal Period | Low Bid Price | High Bid Price | ||||||
| 2009 | ||||||||
| 2nd Quarter Ended September 30, 2009 | $ | 3.01 | $ | 5.675 | ||||
| 1st Quarter Ended June 30, 2009 | $ | 3.50 | $ | 3.75 | ||||
| 2008 | ||||||||
| 4th Quarter Ended March 31, 2009 | $ | 2.75 | $ | 2.75 | ||||
| 3rd Quarter Ended December 31, 2008 | $ | 3.70 | $ | 3.80 | ||||
| 2nd Quarter Ended September 30, 2008 | $ | 3.90 | $ | 3.95 | ||||
| 1st Quarter Ended June 30, 2008 | $ | 5.25 | $ | 5.25 | ||||
| 2007 | ||||||||
| 4th Quarter Ended March 31, 2008 | $ | 5.30 | $ | 5.45 | ||||
| 3rd Quarter Ended December 31, 2007 | $ | 4.15 | $ | 4.50 | ||||
| 2nd Quarter Ended September 30, 2007 | N/A | N/A | ||||||
| 1st Quarter Ended June 30, 2007 | N/A | N/A | ||||||
Dividend Policy
For the fiscal year ended March 31, 2009 and 2008, approximately $0 and $18.5 million, respectively, in dividends were paid to the Company’s stockholders.
42
We currently intend to retain all future earnings for use in the operation and expansion of our business and do not anticipate paying any cash dividends on common stock in the foreseeable future. Any future dividends will be at the discretion of the board of directors, after taking into account various factors, including among others, operations, current and anticipated cash needs and expansion plans, the income tax laws then in effect, the requirements of Nevada law, and any restrictions that may be imposed by our future credit arrangements.
Record Holders
As of February 26 2010, there were 29,821 record holders of our common stock.
Transfer Agent
Our transfer agent
Standard Registrar and Transfer Company, Inc.
12528 South 1840 East
Draper, UT 84020
Phone: (801) 571-8844
Fax: (801) 571-2551
Email: investors@amsrcorp.com
ITEM 10. RECENT SALES OF UNREGISTERED SECURITIES
On November 18, 2007, the Registrant issued an aggregate of 53,300,000 shares of its common stock in connection with a share exchange with EFT BioTech, Inc. (“EFT BioTech”), a Nevada corporation formed on September 18, 2007, pursuant to which EFT Holdings acquired 100% of the issued and outstanding shares of EFT BioTech in consideration for 53,300,000 shares of the Registrant’s Common Stock, representing 70.15% of the Registrant’s capital stock on a fully-diluted basis on the recapitalization date. The Registrant issued the shares pursuant to the exemptions from the registration requirements of the Securities Act of 1933, as amended, afforded the Registrant under Section 4(2) promulgated thereunder due to the fact that such issuances did not involve a public offering of securities.
Below is a list of the investors who received shares of EFT BioTech Holdings, Inc. in the share exchange:
| Stockholder: | No. of EFT BioTech Holdings, Inc. Shares Received in Share Exchange: | |||
| Dragon Win Management Limited, a BVI company (1) | 52,099,000 | |||
| George Curry (2) | 300,000 | |||
| Jun Qin Liu (3) | 300,000 | |||
| Jack Jie Qin (4) | 1,000 | |||
| Tony So (5) | 300,000 | |||
| Joseph B. Williams (6) | 300,000 | |||
| Total | 53,300,000 | |||
| (1) | See Item 4, “Security Ownership of Certain Beneficial Owners and Management” herein. | |
| (2) | Chief Marketing Officer of the Registrant. | |
| (3) | Former Operations Manager and Director of the Registrant. | |
| (4) | President, Chief Executive Officer and Chairman of the Registrant. |
43
| (5) | Former Treasurer of the Registrant. | |
| (6) | Former Chief Administrative Officer, Secretary and Director of the Registrant. |
In November 2007, the Registrant sold an aggregate of 7,550,000 shares of the Registrant for $0.0018 per share. The Registrant issued these shares pursuant to the exemptions from the registration requirements of the Securities Act of 1933, as amended, afforded the Registrant under Section 4(2) promulgated thereunder due to the fact that such issuances did not involve a public offering of securities.
Below is a table which set forth the stock issuances of 7,550,000 shares of common stock to the following accredited investors:
| Holder: | Number of Shares: | Consideration: | ||||||
Greenstone Holdings, Inc.(1) 40 Wall Street, 11th Floor New York, NY 10005 | 4,000,000 | $ | 7,200.00 | |||||
Pierstone Group, LLC 40 Park Avenue, #19B New York, NY 10016 | 1,000,000 | $ | 1,800.00 | |||||
Brown Door, Inc. 4 Tall Oaks Court Farmingdale, NJ 07727 | 1,000,000 | $ | 1,800.00 | |||||
| Robert McGuire | 312,000 | $ | 561.60 | |||||
| Ming Jie Huo | 337,000 | $ | 606.60 | |||||
Single Digit, LLC 321 Libourel Road South Plainfield, NJ 07727 | 551,000 | $ | 991.80 | |||||
| John Heumoeller | 350,000 | $ | 630.00 | |||||
| Total | 7,550,000 | $ | 13,590.00 | |||||
| (1) | Wallace Gaikas and Peter Lau have voting and dispositive control of Greenstone Holdings, Inc. |
The Registrant used the proceeds of this sale for working capital purposes.
Regulation S Private Offering
In January of 2008, we commenced a private placement of Units exclusively to non-U.S. residents at a purchase price of $3.80 per Unit under the exemption from the registration requirements of the Securities Act of 1933, as amended, afforded the Registrant under Regulation S thereunder due to the fact that offers and sales were only made to non U.S. residents. The offering was conducted on a best-efforts basis and the placement agent was Buckman, Buckman & Reid, Inc., a registered broker/dealer (“Buckman”). The original offering was for up to 10,000,000 Units but was oversubscribed and increased by Buckman pursuant to the terms of the related Private Placement Memorandum.
Each Unit consisted of one share of Common Stock and one Redeemable Common Stock Purchase Warrant (the “Warrant”). Each Warrant is exercisable to purchase one share of Common Stock at $3.80 per share until the second anniversary date of the date of issuance. The Warrants are redeemable by the Registrant, on a pro rata basis, at a purchase price of $0.0001 per share within 30 days from the tenth (10th) consecutive trading day that the closing sales price for the Registrant’s common stock, or the average of the closing bid and asked price, on the OTCBB or any public securities market within the U.S., is at least $11.
44
Moneys received from investors were held in an escrow account by Buckman, pending the payment of attorneys’ fees and placement agent fees and considered “restricted cash.” The cash was released from escrow once such payments were made and following each of five closings: three payments in the amount of US$30 million, approximately, were received in July of 2008, one payment in the amount of US$12 million, approximately, was received in August of 2008 and last payment in the amount of US$9 million, approximately, was received in October of 2008. The cash was then available for lending or operating purposes. The related Units were issued following each closing. The private placement ended on October 25, 2008 and the Registrant sold an aggregate of 14,890,040 Units for net proceeds of $51,149,412 consisting of a total of 14,890,040 shares of Common Stock and 14,890,040 Warrants. As of the date hereof, none of the warrants have been exercised or redeemed.
The table below sets forth management’s used and currently planned allocation of the net proceeds of the offering.
| Proceeds from Sale of Units | ||||||||
| Category: | Amount (USD$): | Percentage of Net Proceeds: | ||||||
| Acquisition of 49% interest of Excalibur (1) | $ | 19,193,000 | 38 | % | ||||
| Loan to Excalibur International Marine Corporation (1) | 2,500,000 | 4 | % | |||||
| Loan to Yeuh-Chi Liu (2) | 1,567,000 | 3 | % | |||||
| Marketing Development (3) | 20,000,000 | 39 | % | |||||
| Business Development (3)(4) | 7,889,412 | 16 | % | |||||
| TOTAL | $ | 51,149,412 | 100 | % | ||||
| (1) | On October 25, 2008, EFT Investment Co., Ltd. completed the acquisition of 58,567,750 shares of common stock of Excalibur; representing approximately 49% shares of issued and outstanding shares of Excalibur, for an aggregate purchase price of USD $19,193,000. See Item 2, “Financial Information - Excalibur International Marine Corporation..” |
| (2) | See Item 7, “Certain Relationships and Related Transactions, and Director Independence” herein. |
| (3) | Currently planned. This amount includes the loan of $19,193,000 loan made to Excalibur in July of 2008 and repaid in November of 2008. See Item 2, “Financial Information - Excalibur International Marine Corporation..” Currently, this allocation of these net proceeds of the private placement represents our best estimate based upon our present plans and certain assumptions regarding general economic and industry conditions and our future revenues and expenditures. We reserve the right to reallocate these proceeds within the above-mentioned categories or to other purposes if management believes it is in our best interests. |
| (4) | We anticipate using up to 16% of the net proceeds the private placement for investments and acquisitions to allow us to grow our existing business operations and to enter into additional territories. To date, we have not located any acquisition targets nor do we have any commitments for capital expenditures, other than Excalibur. We believe that due to the current global economic recession, there might be material opportunities for us to acquire smaller companies at discount prices. There can be no assurances that we will be successful in doing so. Our expansion will rely to a great degree on global economic conditions and perceived future changes. Until such time, we intend to retain our cash reserves to fund our operations. |
Other Issuances
On April 8, 2008, the Registrant issued 66,667 shares of common stock to John Heumoeller, an accredited investor, upon the conversion of 75 shares of preferred stock. The Registrant has issued these securities pursuant to the exemptions from the registration requirements of the Securities Act of 1933, as amended, afforded the Registrant under Section 4(2) promulgated thereunder due to the fact that such issuances did not involve a public offering of securities.
From time to time, the Registrant has issued 172,448 shares of common stock to individuals who are accredited investors in consideration for services rendered. The Registrant has issued these securities pursuant to the exemptions from the registration requirements of the Securities Act of 1933, as amended, afforded the Registrant under Section 4(2) promulgated thereunder due to the fact that such issuances did not involve a public offering of securities.
45
ITEM 11. DESCRIPTION OF REGISTRANT’S SECURITIES TO BE REGISTERED
The following description of certain matters relating to our securities does not purport to be complete and is subject in all respects to applicable Nevada law and to the provisions of our certificate of incorporation (“Certificate of Incorporation”) and By-laws (the “By-Laws”).
Common Stock
The Registrant is authorized to issue 4,975,000,000 shares of Common Stock, $0.00001 par value. As of the fiscal quarter ended September 30, 2009, there were 75,983,205 shares of Common Stock outstanding (23,583,205 were held by non-affiliates and the remaining 52,400,000 were held by affiliates).
Each share of the Registrant’s Common Stock is entitled to one vote at all meetings of our stockholders. The Registrant’s stockholders are not permitted to cumulate votes in the election of directors. All shares of the Registrant’s Common Stock are equal to each other with respect to liquidation rights and dividend rights. There are no preemptive rights to purchase any additional shares of the Registrant’s Common Stock. In the event of the Registrant’s liquidation, dissolution or winding up, holders of its Common Stock will be entitled to receive, on a pro rata basis, all of our assets remaining after satisfaction of all liabilities and preferences of outstanding preferred stock, if any. Neither the Certificate of Incorporation nor the By-Laws of the Registrant contain any provisions which limit or restrict the ability of another person to take over our company.
Preferred Stock
The Registrant is also authorized to issue 25,000,000 shares of preferred stock, $0.001 par value, none of which are outstanding.
The Board of Directors is empowered, without stockholder approval, to issue preferred stock with dividend, liquidation, conversion, voting or other rights which could adversely affect the voting power or other rights of the holders of the Registrant’s Common Stock.
ITEM 12. INDEMNIFICATION OF DIRECTORS AND OFFICERS
The Registrant’s Certificate of Incorporation provides that it is required to indemnify an officer, director, or former officer or director, to the full extent permitted by Section 78.7502 of the Nevada Revised Statutes 2005, provided that the person acted in good faith and in a manner reasonably believed to be in and not opposed to the best interests of the company. The Registrant has been advised that, in the opinion of the SEC, indemnification for liabilities arising under the Securities Act is against public policy as expressed in the Securities Act, and is, therefore, unenforceable. In the event that a claim for indemnification against such liabilities is asserted by one of our directors, officers, or controlling persons in connection with the securities being registered, we will, unless in the opinion of our legal counsel, submit the question of whether such indemnification is against public policy to a court of appropriate jurisdiction.
46
ITEM 13. FINANCIAL STATEMENTS AND SUPPLEMENTARY DATA
EFT BIOTECH HOLDINGS, INC.
CONSOLIDATED FINANCIAL STATEMENTS
INDEX TO CONSOLIDATED FINANCIAL STATEMENTS
| Page(s) | |||
| Auditor’s Report | F-2 | ||
| Audited Consolidated Financial Statements | |||
| Consolidated Balance Sheets | F-3 | ||
| Consolidated Statements of Operations and Other Comprehensive Income | F-4 | ||
| Consolidated Statements of Changes in Stockholders’ Equity | F-5 | ||
| Consolidated Statements of Cash Flows | F-6 | ||
| Notes to Consolidated Financial Statements | F-7 |
F-1
 | |||
Douglas W. Child, CPA Marty D. Van Wagoner, CPA J. Russ Bradshaw, CPA William R. Denney, CPA Russell E. Anderson, CPA Scott L. Farnes 1284 W. Flint Meadow Dr. #D Kaysville, Utah 84037 Telephone 801.927.1337 Facsimile 801.927.1344 5296 S. Commerce Dr. #300 Salt Lake City, Utah 84107 Telephone 801.281.4700 Facsimile 801.281.4701 Suite A, 5/F Max Share Centre 373 King’s Road North Point, Hong Kong Telephone 852.21.555.333 Facsimile 852.21.165.222 www.cpaone.net | Report of Independent Registered Public Accounting Firm To the Board of Directors and Audit Committee EFT Biotech Holdings, Inc. City of Industry, California We have audited the consolidated balance sheets of EFT Biotech Holdings, Inc. (the Company) as of March 31, 2009 and 2008, and the related consolidated statements of operations and other comprehensive income, stockholders’ equity and cash flows for the years then ended. These consolidated financial statements are the responsibility of the Company’s management. Our responsibility is to express an opinion on these consolidated financial statements based on our audits. We conducted our audits in accordance with the standards of the Public Company Accounting Oversight Board (United States). Those standards require that we plan and perform the audits to obtain reasonable assurance about whether the consolidated financial statements are free of material misstatement. The company is not required to have, nor were we engaged to perform, an audit of its internal control over financial reporting. Our audit included consideration of internal control over financial reporting as a basis for designing audit procedures that are appropriate in the circumstances, but not for the purpose of expressing an opinion on the effectiveness of the company’s internal control over financial reporting. Accordingly, we express no such opinion. An audit also includes examining, on a test basis, evidence supporting the amounts and disclosures in the consolidated financial statements, assessing the accounting principles used and significant estimates made by management, as well as evaluating the overall consolidated financial statement presentation. We believe that our audits provide a reasonable basis for our opinion. In our opinion, the consolidated financial statements referred to above present fairly, in all material respects, the consolidated financial position of EFT Biotech Holdings, Inc. as of March 31, 2009 and 2008, and the consolidated results of its operations and its cash flows for the years ended, in conformity with accounting principles generally accepted in the United States of America. /s/ Child, Van Wagoner & Bradshaw, PLLC Child, Van Wagoner & Bradshaw, PLLC Salt Lake City, Utah July 15, 2009 | ||
F-2
EFT BIOTECH HOLDINGS, INC.
Consolidated Balance Sheets
| As of March 31, | ||||||||
| 2009 | 2008 - Restated | |||||||
| ASSETS | ||||||||
| Current assets | ||||||||
| Cash and cash equivalents | $ | 38,181,837 | $ | 15,165,620 | ||||
| Inventories | 3,908,629 | 2,619,429 | ||||||
| Available for sale securities | 508,746 | 835,965 | ||||||
| Prepaid expenses | 2,551,298 | 793,760 | ||||||
| Short-term note receivables – related party | 4,064,717 | - | ||||||
| Total current assets | 49,215,227 | 19,414,774 | ||||||
| Property and equipment, net | 360,156 | 140,106 | ||||||
| Other receivables | 33,504 | - | ||||||
| Investments | 17,129,314 | - | ||||||
| Restricted cash | - | 37,845,432 | ||||||
| Loan to related party | 1,897,000 | - | ||||||
| Security deposit | 31,121 | 27,108 | ||||||
| Total assets | $ | 68,666,322 | $ | 57,427,420 | ||||
| LIABILITIES AND STOCKHOLDERS' EQUITY (DEFICIT) | ||||||||
| Current liabilities | ||||||||
| Accounts payable and accrued expenses | $ | 3,610,195 | $ | 804,041 | ||||
| Other liabilities | 6,675,552 | 12,787,714 | ||||||
| Unearned revenues | 1,991,215 | 3,945,805 | ||||||
| Deposits from investors | - | 37,845,432 | ||||||
| Income tax payable | - | 305,000 | ||||||
| Total current liabilities | 12,276,962 | 55,687,992 | ||||||
| Stockholders' equity | ||||||||
| Preferred stock, $.001 par value, 25,000,000 shares authorized, | ||||||||
| none issued and outstanding | - | - | ||||||
| Common stock, $0.00001 par value, 4,975,000,000 authorized, | ||||||||
| 75,983,205 and 61,022,414 shares issued and outstanding | ||||||||
| at March 31, 2009 and 2008 | 760 | 610 | ||||||
| Additional paid in capital | 52,854,891 | 6,552 | ||||||
| Retained earnings | 4,023,992 | 1,895,330 | ||||||
| Accumulated other comprehensive loss | (490,283 | ) | (163,064 | ) | ||||
| Total stockholders' equity | 56,389,360 | 1,739,428 | ||||||
| Total liabilities and stockholders' equity | $ | 68,666,322 | $ | 57,427,420 | ||||
The accompanying notes are an integral part of these consolidated financial statements.
F-3
EFT BIOTECH HOLDINGS, INC.
Consolidated Statements of Operations and Other Comprehensive Income
| Year Ended | ||||||||
| March 31, 2009 | March 31, 2008 - Restated | |||||||
| Sales revenues, net | $ | 12,846,809 | $ | 30,249,302 | ||||
| Shipping charge | 5,657,625 | 10,110,360 | ||||||
| 18,504,434 | 40,359,662 | |||||||
| Cost of goods sold | 5,780,447 | 11,423,852 | ||||||
| Shipping cost | 2,204,502 | 4,467,140 | ||||||
| 7,984,949 | 15,890,992 | |||||||
| Gross profit | 10,519,485 | 24,468,670 | ||||||
| Selling, general and administrative expenses | 8,929,162 | 3,693,369 | ||||||
| Net operating income | 1,590,323 | 20,775,301 | ||||||
| Other income (expense) | ||||||||
| Interest income | 1,246,433 | 275,538 | ||||||
| Subsidiary loss on equity method investment | (2,063,686 | ) | - | |||||
| Foreign exchange income | 723,357 | (4,248 | ) | |||||
| Other income, net | 634,635 | 54,904 | ||||||
| Total other income | 540,739 | 326,194 | ||||||
| Net income before income taxes | 2,131,062 | 21,101,495 | ||||||
| Income taxes | 2,400 | 305,800 | ||||||
| Net income | $ | 2,128,662 | $ | 20,795,695 | ||||
| Unrealized loss on available for sale securities | (327,219 | ) | (163,064 | ) | ||||
| Comprehensive income | $ | 1,801,443 | $ | 20,632,631 | ||||
| Net income per common share | ||||||||
| Basic and diluted | $ | 0.03 | $ | 0.37 | ||||
| Weighted average common shares outstanding | ||||||||
| Basic and diluted | 66,637,448 | 55,350,545 | ||||||
The accompanying notes are an integral part of these consolidated financial statements.
F-4
EFT BIOTECH HOLDINGS, INC.
Consolidated Statements of Changes in Stockholders’ Equity
| Accumulated | ||||||||||||||||||||||||
| Additional | Other | Total | ||||||||||||||||||||||
Common Stock | Paid-in | Retained | Comprehensive | Stockholders' | ||||||||||||||||||||
Shares | Amount | Capital | Earnings | Income (Loss) | Equity | |||||||||||||||||||
| BALANCE, ,MARCH 31, 2007 | 52,099,000 | $ | 521 | $ | 4,479 | $ | (374,188 | ) | $ | - | $ | (369,188 | ) | |||||||||||
| Issuance of common stock for services | 1,201,000 | 12 | 2,150 | - | - | 2,162 | ||||||||||||||||||
| Shares effectively issued to former shareholders as part of the recapitalization | 7,722,414 | 77 | (77 | ) | - | - | - | |||||||||||||||||
| Net income | - | - | - | 20,795,695 | - | 20,795,695 | ||||||||||||||||||
| Dividend paid | - | - | - | (18,526,177 | ) | - | (18,526,177 | ) | ||||||||||||||||
| Unrealized loss on available for sale securities | - | - | - | - | (163,064 | ) | (163,064 | ) | ||||||||||||||||
| BALANCE, MARCH 31, 2008 - restated | 61,022,414 | 610 | 6,552 | 1,895,330 | (163,064 | ) | 1,739,428 | |||||||||||||||||
| Shares effectively issued to former shareholders as part of the recapitalization | 66,667 | 1 | (1 | ) | - | - | - | |||||||||||||||||
| Shares issued for service | 4,084 | - | 16,731 | - | - | 16,731 | ||||||||||||||||||
| Shares issued pursuant to private placement offering-common stock, net of operating costs | 14,890,040 | 149 | 43,919,414 | - | 43,919,563 | |||||||||||||||||||
| Fair value of warrants issued with common stock | 8,912,195 | 8,912,195 | ||||||||||||||||||||||
| Net income | 2,128,662 | 2,128,662 | ||||||||||||||||||||||
| Unrealized loss on available for sale securities | - | - | - | - | (327,219 | ) | (327,219 | ) | ||||||||||||||||
| BALANCE, MARCH 31, 2009 | 75,983,205 | $ | 760 | $ | 52,854,891 | $ | 4,023,992 | $ | (490,283 | ) | $ | 56,389,360 | ||||||||||||
The accompanying notes are an integral part of these consolidated financial statements.
F-5
EFT BIOTECH HOLDINGS, INC.
Consolidated Statements of Cash Flows
| Year Ended | ||||||||
| March 31, 2009 | March 31, 2008 | |||||||
| Cash flows from operating activities: | ||||||||
| Net income | $ | 2,128,662 | $ | 20,795,695 | ||||
| Adjustments to reconcile net income to net cash | ||||||||
| provided by (used in) operating activities: | ||||||||
| Depreciation and amortization | 51,514 | 38,340 | ||||||
| Subsidiary loss on equity method investment | 2,063,686 | - | ||||||
| Warranty liability | (33,924 | ) | 36,912 | |||||
| Stock based compensation | 16,731 | 2,162 | ||||||
| Changes in operating assets and liabilities: | ||||||||
| Inventories | (1,289,200 | ) | (833,670 | ) | ||||
| Prepaid expenses and other current assets | (1,761,551 | ) | (411,560 | ) | ||||
| Accounts payable and accrued liabilities | 2,806,154 | 497,625 | ||||||
| Other liabilities | (6,078,238 | ) | 12,372,996 | |||||
| Unearned revenues | (1,954,590 | ) | 1,434,470 | |||||
| Income tax payable | (305,000 | ) | 305,000 | |||||
| Net cash provided by operating activities | (4,355,756 | ) | 34,237,970 | |||||
| Cash flows from investing activities: | ||||||||
| Additions to fixed assets | (305,068 | ) | (101,706 | ) | ||||
| Note receivables – related party | (5,961,717 | ) | - | |||||
| Investment | (19,193,000 | ) | - | |||||
| Purchase of available for sale securities | - | (999,029 | ) | |||||
| Net cash (used in) investing activities | (25,459,785 | ) | (1,100,735 | ) | ||||
| Cash flows from financing activities: | ||||||||
| Restricted cash | - | (37,845,432 | ) | |||||
| Proceeds from investor deposits | - | 37,845,432 | ||||||
| Proceeds from issuance of stock and warrants | 52,831,758 | - | ||||||
| Payment of dividends | - | (18,526,177 | ) | |||||
| Net cash provided by (used in) financing activities | 52,831,758 | (18,526,177 | ) | |||||
| Net increase (decrease) in cash | 23,016,217 | 14,611,058 | ||||||
| Cash, beginning of period | 15,165,620 | 554,562 | ||||||
| Cash, end of period | $ | 38,181,837 | $ | 15,165,620 | ||||
| Supplemental disclosures of cash flow information: | ||||||||
| Interest paid in cash | $ | - | $ | - | ||||
| Income taxes paid in cash | $ | 2,400 | $ | 800 | ||||
| Non-cash investing and financing activities: | ||||||||
| Unrealized loss on available for sale securities | $ | 327,219 | $ | 163,064 | ||||
| Fixed assets sold with receivable | $ | 33,504 | $ | - | ||||
| Release of cash from restriction | $ | 37,845,432 | $ | - | ||||
The accompanying notes are an integral part of these consolidated financial statements.
F-6
Note 1 - ORGANIZATION
EFT Biotech Holdings, Inc. (“EFT Holdings” or “the Company”), formerly HumWare Media Corporation, GRG, Inc., Ghiglieri Corporation, Karat Productions, Inc., was incorporated in the State of Nevada on March 19, 1992.
On November 18, 2007, the Company issued an aggregate of 53,300,000 shares of its common stock in connection with a share exchange with the stockholders of EFT BioTech, Inc. (“EFT BioTech”), a Nevada Corporation formed on September 18, 2007 (the “Transaction”), pursuant to which EFT BioTech became a wholly-owned subsidiary of the Company. The 53,300,000 common shares issued included 52,099,000 to pre-capitalization shareholders and 1,201,000 to four directors and officers of EFT BioTech, and represented approximately 87.34% of the Company’s common stock outstanding after the Transaction. Consequently, the stockholders of EFT BioTech, Inc. own a majority of the Company's common stock immediately following the Transaction, therefore, the Transaction is being accounted for as a "reverse acquisition", and EFT BioTech is deemed to be the accounting acquirer in the reverse acquisition. As EFT Holdings was a non-operating public shell corporation that acquired an operating company, this Transaction is treated as a capital transaction where the acquiring corporation issued stock for the net monetary assets of the shell corporation, accompanied by a recapitalization. The accounting is similar in form to a reverse acquisition, except that goodwill or other intangibles are not recorded. All references to EFT BioTech common stock have been restated to reflect the equivalent numbers of EFT Holdings common shares.
At its formation on September 18, 2007, EFT BioTech acquired EFT Limited, a British Virgin Islands company (“BVI”) formed on August 22, 2007, pursuant to which EFT Limited (BVI) became a wholly-owned subsidiary of EFT BioTech. Since both EFT BioTech and EFT Limited (BVI) were under common control, this acquisition represents a reorganization of entities under common control.
EFT Limited (BVI) has four wholly-owned subsidiaries: EFT, Inc., a California company formed on January 1, 2003, Top Capital International, Ltd. (BVI), a BVI company formed on May 22, 2002, EFT (HK), Ltd., a Hong Kong (“HK”) company formed on November 1, 2006 and EFT International Ltd. (BVI), a BVI company formed on April 20, 2005, which it acquired all on November 14, 2007. EFT International Ltd. is the operating company that generates substantially all of the company’s net income. As EFT Limited (BVI) and the four companies being acquired were under common control, this acquisition also represents a reorganization of entities under common control.
These reorganizations of entities under common control resulted in changes in the legal organization of these predecessors to EFT BioTech but did not result in changes in the reporting entity.
On October 20, 2008, EFT Investment Co., Ltd., a Taiwan company, was formed as a wholly-owned subsidiary of EFT Biotech Holding, Inc.
The Company, through its subsidiaries, is engaged in the E-Business designed around the concept of Business-to-customer using the World Wide Web as its “storefront” and business platform to market, sell and distribute 46 American brand products consisting of 25 nutritional products, 18 personal care products, 1 automotive fuel additives, 1 home product and a portable drinking container.
Note 2 - SUMMARY OF SIGNIFICANT ACCOUNTING POLICIES
1. Basis of Presentation
The accompanying consolidated financial statements have been prepared in conformity with accounting principles generally accepted in the United States of America.
Principles of Consolidation
The consolidated financial statements include the accounts of the Company and its wholly-owned subsidiaries. All inter-company accounts and transactions have been eliminated in consolidation.
F-7
Foreign Currency
The Company’s reporting currency is the U.S. dollar. The Company’s operation in Hong Kong uses Hong Kong dollar (HKD) as its functional currency. The financial statements of the subsidiary are translated into U.S. Dollars (USD) in accordance with Statement of Financial Accounting Standards (SFAS) No. 52, Foreign Currency Translation. According to the Statement, all assets and liabilities were translated at the year end current exchange rate, stockholders equity items are translated at the historical rates and income statement items are translated at the average exchange rate for the year. The resulting translation adjustments are reported under other comprehensive income in accordance with SFAS No. 130, Reporting Comprehensive Income as a Component of Stockholders Equity. Foreign exchange transaction gains and losses are reflected in the income statement. During the years 2009 and 2008 there have been immaterial currency fluctuations between HKD and USD.
Use of Estimates
The preparation of financial statements in conformity with generally accepted accounting principles requires management to make estimates and assumptions that affect the reported amounts of assets and liabilities and disclosure of contingent assets and liabilities at the date of the financial statements and the reported amounts of revenues and expenses during the reporting period. Actual results could differ from those estimates.
Cash and Cash Equivalents
Cash and cash equivalents include cash on hand and cash in time deposits, certificates of deposit and all highly liquid debt instruments with original maturities of three months or less. The Company maintains its accounts in banks, several of which exceed the federally insured limit. In aggregate, approximately $35.5 million were above the federally insured limit. Management believes the Company is not exposed to any significant credit risk on those accounts.
Available for sale securities
The Company’s investments in publicly traded equity securities are classified as available-for-sale and are reported at fair value (based on quoted prices and market prices) using the specific identification method. Unrealized gains and losses, net of taxes, are reported as a component of stockholders’ equity. Realized gains and losses on investments are included in investment and other income, net when realized. Any impairment loss to reduce an investment’s carrying amount to its fair market value is recognized in income when a decline in the fair market value of an individual security below its cost or carrying value is determined to be other than temporary.
Inventories
Inventories are valued at the lower of cost (determined on a first-in, first-out basis) or market. The Management compares the cost of inventories with the market value and allowance is made for writing down the inventories to market value, if lower. Inventory consists of high tech nutritional, cosmetic, automotive maintenance and environmentally safe products.
Property and equipment
Property and equipment are stated at cost less accumulated depreciation. Expenditures for maintenance and repairs are charged to earnings as incurred; additions, renewals and betterments are capitalized. When property and equipment are retired or otherwise disposed of, the related cost and accumulated depreciation are removed from the respective accounts, and any gain or loss is included in operations. Depreciation of property and equipment is provided using the straight-line method for substantially all assets with estimated lives of:
| Machinery & equipment | 3 years |
| Computers & office equipment | 3 years |
| Automobile | 5 years |
F-8
For the years ended March 31, 2009 and 2008, depreciation expenses were $51,514 and $38,340, respectively.
Long-Lived Assets
Effective January 1, 2002, the Company adopted Statement of Financial Accounting Standards No. 144, Accounting for the Impairment or Disposal of Long-Lived Assets (SFAS 144), which addresses financial accounting and reporting for the impairment or disposal of long-lived assets and supersedes SFAS No. 121, Accounting for the Impairment of Long-Lived Assets and for Long-Lived Assets to be Disposed Of, and the accounting and reporting provisions of APB Opinion No. 30, Reporting the Results of Operations for a Disposal of a Segment of a Business. The Company periodically evaluates the carrying value of long-lived assets to be held and used in accordance with SFAS 144. SFAS 144 requires impairment losses to be recorded on long-lived assets used in operations when indicators of impairment are present and the undiscounted cash flows estimated to be generated by those assets are less than the asset’s carrying amounts. In that event, a loss is recognized based on the amount by which the carrying amount exceeds the fair market value of the long-lived assets. Loss on long-lived assets to be disposed of is determined in a similar manner, except that fair market values are reduced for the cost of disposal. Based on its review, the Company believes that, as of March 31, 2009 there were no significant impairments of its long-lived assets.
Fair Value of Financial Instruments
Statement of Financial Accounting Standards No. 107, “Disclosures about Fair Value of Financial Instruments”, requires that the Company discloses estimated fair values of financial instruments. The carrying amounts reported in the statements of financial position for current assets and current liabilities qualifying as financial instruments are a reasonable estimate of fair value due to the short-term maturity of these instruments.
Fair Value Measurements
Effective April 1, 2008, the Company adopted Financial Accounting Standards Board (“FASB”) Statement of Financial Accounting Standards (“SFAS”) No. 157, “ Fair Value Measurements ”, which defines fair value, establishes guidelines for measuring fair value and expands disclosures regarding fair value measurements. SFAS No. 157 does not require any new fair value measurements, but rather eliminates inconsistencies in guidance found in various other accounting pronouncements. The adoption of SFAS No. 157 did not have a material effect on the Company’s financial condition or operating results.
Refer to Note 4, “Fair Value Measurements” for additional information on the adoption of SFAS No. 157.
Stock-Based Compensation
In December 2004, the FASB issued FASB Statement No. 123R ("SFAS 123R"), "Share-Based Payment, an Amendment of FASB Statement No. 123". SFAS 123R requires companies to recognize in the statement of operations the grant date fair value of stock options and other equity-based compensation issued to employees. The Company adopted SFAS 123R on April 1, 2006.
Stocks issued to officers or employees
On November 18, 2007 in conjunction with the reverse acquisition, the Company granted its officers an aggregate 1,201,000 shares of fully vested stock with no future requisite service requirement. The share compensation cost is measured at grant date, based on estimated fair value of the award which is $0.0018 per share.
The amount of compensation was included as a period compensation expense. For the years ended March 31, 2009 and 2008, the stock-based compensation for shares awarded were to employees was $0 and $2,162, respectively.
During the years 2009 and 2008, the Company has not issued any stock options or warrants to employees nor are there any outstanding warrants or options during the year ended March 31, 2008, therefore pro forma disclosures are not required.
F-9
Stock issued for service
The company accounts for equity instruments issued in exchange for the receipts of goods or service from other than employees in accordance with SFAS No.123 (R) and the conclusions reached by the Emerging Issues Task Force (“EITF”) in Issue No. 96-18. Costs are measured at the estimated fair market value of the consideration received or the estimated fair value of the equity instruments issued, whichever is more reliably measurable. The value of equity instruments issued for consideration other than employee services is determined on the earliest of performance commitment or completion of performance by the provider of goods or service as defined by EITF 96-18.
During November 2008, we issued 4,084 shares of common stock in exchange of service we received.
For the years ended March 31, 2009 and 2008, the stock-based compensation for shares issued to non-employees was $16,731 and $0, respectively.
Revenue Recognition
The Company’s revenue recognition policy is in accordance with the requirements of Staff Accounting Bulletin (“SAB”) No. 104, Revenue Recognition, (“SAB 104”), EITF 01-09, Accounting for Consideration Given by a Vendor to a Customer (Including a Reseller of the Vendor’s Products) (“EITF 01-09”) and other applicable revenue recognition guidance and interpretations. Sales revenue is recognized at the date of shipment to customers when a formal arrangement exists, the price is fixed or determinable, the delivery is completed, no other significant obligations of the Company exist and collectibility is reasonably assured. Payments received before all of the relevant criteria for revenue recognition are satisfied are recorded as unearned revenue. Cash consideration given by the Company to its sales affiliates is considered to be a reduction of the selling prices of the Company's products, thus, is recorded as a reduction of revenue.
Warranty
The Company generally does not provide customers with right of return except for defective products which is within six month warranty period from date of sales. Historically, the company warranty provisions have not been material. The specific warranty terms and conditions vary depending upon the product sold, but generally include replacement over a period of six months. Factors that affect the Company’s warranty liability include the number of products currently under warranty, historical and anticipated rates of warranty claims on those products, and cost per claim to satisfy the warranty obligation. The anticipated rate of warranty claims is the primary factor impacting the estimated warranty obligation. Warranty claims are relatively predictable based on our historical experience. Warranty reserves are included in other liabilities and the provision for warranty accruals is included in cost of goods sold in the consolidated statement of Operations and Other Comprehensive Income. Management reviews the adequacy of warranty reserves each reporting period based on historical experience and management's estimate of the costs to remediate the claims and adjusts the provisions accordingly.
Currently, the Company estimates its warranty expense as follows:
| Products sold for | |
| 0-2 months | 2% of cost |
| 3-4 months | 1.5% of cost |
| 5-6 months | 1% of cost |
F-10
The Company records warranty liabilities at the time of sale for the estimated costs that may be incurred under its limited warranty. The specific warranty terms and conditions vary depending upon the product sold, but generally include replacement over a period of six months. Factors that affect the Company’s warranty liability include the number of products currently under warranty, historical and anticipated rates of warranty claims on those products, and cost per claim to satisfy the warranty obligation. The anticipated rate of warranty claims is the primary factor impacting the estimated warranty obligation. The other factors are less significant due to the fact that the warranty period is only six months and replacement is generally already in stock or available at a pre-determined price. Warranty claims are relatively predictable based on historical experience of failure rates. If actual results differ from the estimates, the Company revises its estimated warranty liability.
Currently, the Company estimates its warranty expense as follows:
| Products sold for | |
| 0-2 months | 2% of cost |
| 3-4 months | 1.5% of cost |
| 5-6 months | 1% of cost |
Shipping Costs
The Company’s shipping costs are included in cost of sales in the accompanying Consolidated Statements of Operations and Other Comprehensive Income for all periods presented.
Unearned Revenues
Unearned Revenues consist of cash amounts received in advance for goods and services to be shipped at a future date. The Registrant records the cash from customers as a liability until the products are shipped.
2. Advertising
Advertising expenses consist primarily of costs of promotion for corporate image and product marketing and costs of direct advertising. The Company expenses all advertising costs as incurred. For the years ended March 31, 2009 and 2008, advertising expenses were $89,283 and $1,540, respectively.
Consultant Fee
On January 1, 2009, EFT International Ltd, a wholly-owned subsidiary of EFT BioTech Holdings, Inc., entered a contract with ZR Public Relation Consultant Ltd. (the Consultant), which provides public relation consulting services in Asia. In consideration of the services rendered by the Consultant, EFT International Ltd agrees to pay 5% of total commission payout for each fiscal year. For the year ended March 31, 2009, consultant expense for EFT International Ltd was $1,771,944.
Income Taxes
The Company utilizes SFAS No. 109, Accounting for Income Taxes, which requires the recognition of deferred tax assets and liabilities for the expected future tax consequences of events that have been included in the financial statements or tax returns. Under this method, deferred income taxes are recognized for the tax consequences in future years of differences between the tax bases of assets and liabilities and their financial reporting amounts at each period end based on enacted tax laws and statutory tax rates applicable to the periods in which the differences are expected to affect taxable income. Valuation allowances are established, when necessary, to reduce deferred tax assets to the amount expected to be realized.
The Company adopted the provisions of FASB Interpretation No. 48, Accounting for Uncertainty in Income Taxes (“FIN 48”), on April 1, 2007 The Interpretation addresses the determination of whether tax benefits claimed or expected to be claimed on a tax return should be recorded in the financial statements. Under FIN 48, we may recognize the tax benefit from an uncertain tax position only if it is more likely than not that the tax position will be sustained on examination by the taxing authorities, based on the technical merits of the position. The tax benefits recognized in the financial statements from such a position should be measured based on the largest benefit that has a greater than fifty percent likelihood of being realized upon ultimate settlement. FIN 48 also provides guidance on derecognition, classification, interest and penalties on income taxes, accounting in interim periods and requires increased disclosures.
F-11
Net Earnings per Share
Basic net earnings per common share of stock is calculated by dividing net income available to common stockholders by the weighted-average of common shares outstanding during each period.
Diluted net income per common share is calculated by dividing adjusted net income by the weighted-average of common shares outstanding, including the effect of other dilutive securities. The Company’s potentially dilutive securities consist of in-the-money outstanding warrants to purchase the Company’s common stock. Diluted net income per common share does not give effect to dilutive securities as their effect would be anti-dilutive.
The treasury stock method is used to measure the dilutive impact of stock options and warrants. Under this method, options and warrants are assumed to be exercised at the beginning of the period (or at the time of issuance, if later), and as if funds obtained thereby were used to purchase common stock at the average market price during the period. For the year ended March 31, 2009 and 2008, stock warrants of 14,890,000 and zero shares have no effect on the diluted calculation because they are not in-the-money.
For the Years ended March 31, | ||||||||
| 2009 | 2008 | |||||||
| Historical Numerator: | ||||||||
| Net Income | $ | 2,128,662 | $ | 20,795,695 | ||||
| Denominator: | ||||||||
| Weighted-average shares used for basic net income per share | 66,637,448 | 55,350,545 | ||||||
| Effect of common stock equivalents | - | - | ||||||
| Weighted-average shares used for diluted net income per share | 66,637,448 | 55,350,545 | ||||||
| Basic and diluted net income per share | $ | 0.03 | $ | 0.37 | ||||
| Diluted net income per share | $ | 0.03 | $ | 0.37 | ||||
Comprehensive income
Comprehensive income is defined as the change in equity of a company during a period from transactions and other events and circumstances excluding transactions resulting from investments from owners and distributions to owners. For the Company, comprehensive income for the periods presented is comprised of net income and unrealized loss on marketable securities classified as available-for-sale.
Concentration of Credit Risk
Financial instruments that potentially subject the Company to concentrations of credit risk are cash, accounts receivable and other receivables arising from its normal business activities. The Company places its cash in what it believes to be credit-worthy financial institutions, but several of its bank accounts exceed the federally insured limit. The Company’s accounts receivable is constantly at a marginal to zero dollar ($0) level and its revenues are derived from orders place by consumers located anywhere in the world over the Company’s designated internet portal. The Company maintains a zero dollar ($0) allowance for doubtful accounts and authorizes credits based upon its historical “sound and quality” after sales customer services provided to affiliates and customers. Historically, such customer services have been maintained in accordance with the management expectations. The Company routinely assesses the credits authorized to its customers and, based upon factors surrounding the credit risk, establishes an allowance, if required, for uncollectible accounts and, as a consequence, believes that its accounts receivable credit risk exposure beyond such allowance is limited.
F-12
Segment Reporting
Statement of Financial Accounting Standards No. 131 (SFAS 131), “Disclosure about Segments of an Enterprise and Related Information” requires use of the management approach model for segment reporting. The management approach model is based on the way a company's management organizes segments within the company for making operating decisions and assessing performance. Reportable segments are based on products and services, geography, legal structure, management structure, or any other manner in which management disaggregates a company. Since management does not disaggregate Company data, the Company has determined that only one segment exists. Accordingly, no segment reporting is provided. The Company’s maintains 5 product categories; nutritional products, personal care products, automotive fuel additives, home products and portable drinking containers. The Company’s current “in-house” information systems do not have the ability to compile revenues from external customers for each product category.
Recent accounting pronouncements
The FASB issued SFAS No. 168, The FASB Accounting Standards Codification and the Hierarchy of Generally Accepted Accounting Principles, on June 29, 2009 and, in doing so, authorized the Codification as the sole source for authoritative U.S. GAAP. SFAS No. 168 will be effective for financial statements issued for reporting periods that end after September 15, 2009. Once it's effective, it will supersede all accounting standards in U.S. GAAP, aside from those issued by the SEC. SFAS No. 168 replaces SFAS No. 162 to establish a new hierarchy of GAAP sources for non-governmental entities under the FASB Accounting Standards Codification. The Company will evaluate the impact of SFAS No. 168 upon its effectiveness.
SFAS No. 167 amends FASB Interpretation (FIN) No. 46(R), Consolidation of Variable Interest Entities, by altering how a company determines when an entity that is insufficiently capitalized or not controlled through voting should be consolidated, the FASB said. A company has to determine whether it should provide consolidated reporting of an entity based upon the entity's purpose and design and the parent company's ability to direct the entity's actions.
The standards will be effective at the start of the first fiscal year beginning after November 15, 2009, which will mean January 2010 for companies that are on calendar years. The guidance will have to be applied for first-quarter filings. The Company will comply with the disclosure requirements of this statement when and if it acquires a variable interest entity, upon its effectiveness.
FAS No. 166 revises SFAS No. 140, Accounting for Transfers and Servicing of Financial Assets and Extinguishments of Liabilities, and will require entities to provide more information about sales of securitized financial assets and similar transactions, particularly if the seller retains some risk to the assets, the FASB said. The statement eliminates the concept of a qualifying special-purpose entity, changes the requirements for the derecognition of financial assets, and calls upon sellers of the assets to make additional disclosures about them. The Company does not believe implementation of FAS No. 166 will have a material impact on its financial statements.
F-13
On May 28, 2009 the FASB announced the issuance of SFAS 165, Subsequent Events. SFAS 165 should not result in significant changes in the subsequent events that an entity reports. Rather, SFAS 165 introduces the concept of financial statements being available to be issued. Financial statements are considered available to be issued when they are complete in a form and format that complies with generally accepted accounting principles (GAAP) and all approvals necessary for issuance have been obtained. The Company believes that SFAS No. 165 will have an effect on its financial statements and will comply upon effectiveness.
Note 3 - FINANCIAL INSTRUMENTS
The following table summarizes unrealized gains and losses related to the Company’s investments in marketable securities designated as available-for-sale. The fair value of available for sale securities has been estimated based on quoted market prices, which the Company currently believes are indicative of fair value. The Company’s available for sale securities are mainly on equity securities mutual funds.
| March 31, 2009 | March 31, 2008 | |||||||||||||||||||||||
| Fair Value | Cost | Unrealized (Loss) | Fair Value | Cost | Unrealized (Loss) | |||||||||||||||||||
| Available for sale securities | $ | 508,746 | $ | 999,029 | $ | (490,283 | ) | $ | 835,965 | $ | 999,029 | $ | (163,064 | ) | ||||||||||
| Total | $ | 508,746 | $ | 999,029 | $ | (490,283 | ) | $ | 835,965 | $ | 999,029 | $ | (163,064 | ) | ||||||||||
Note 4 - FAIR VALUE MEASUREMENTS
On April 1, 2008, the Company adopted the effective portions of SFAS 157. In February 2008 the FASB issued FSP FAS 157-2, “Effective Date of FASB Statement No. 157”, which provides a one year deferral of the effective date of SFAS No. 157 for all nonfinancial assets and nonfinancial liabilities, except those that are recognized or disclosed at fair value in the financial statements on a recurring basis (at least annually). Therefore, the Company adopted the provisions of SFAS 157 with respect to only financial assets and liabilities.
SFAS 157 defines fair value, establishes a framework for measuring fair value and enhances disclosure requirements for fair value measurements. This statement does not require any new fair value measurements. SFAS 157 defines fair value as the price that would be received to sell an asset or paid to transfer a liability in an orderly transaction between market participants at the measurement date. As such, fair value is a market-based measurement that should be determined based on assumptions that market participants would use in pricing an asset or a liability. As a basis for considering such assumptions, SFAS 157 establishes a three-tier value hierarchy, which prioritizes the inputs used in the valuation methodologies in measuring fair value:
Level 1—Observable inputs that reflect quoted prices (unadjusted) for identical assets or liabilities in active markets.
Level 2—Include other inputs that are directly or indirectly observable in the marketplace.
Level 3—Unobservable inputs which are supported by little or no market activity.
The fair value hierarchy also requires an entity to maximize the use of observable inputs and minimize the use of unobservable inputs when measuring fair value.
In accordance with SFAS 157, the Company measures its available for sale securities at fair value. The available for sale securities are classified within Level 1. This is because the available for sale securities are valued using quoted market prices.
Assets and liabilities measured at fair value are summarized below.
F-14
| December 31, 2008 | ||||||||||||||||
| Level 1 | ||||||||||||||||
| Quoted Prices | Level 2 | |||||||||||||||
| in Active | Significant | Level 3 | ||||||||||||||
| Markets for | Other | Significant | ||||||||||||||
| Identical | Observable | Unobservable | ||||||||||||||
| Assets | Inputs | Inputs | Total | |||||||||||||
| Available for sale securities | $ | 508,746 | $ | - | $ | - | $ | 508,746 | ||||||||
| Total assets measured at fair value | $ | 508,746 | $ | - | $ | - | $ | 508,746 | ||||||||
Note 5 - NOTE RECEIVABLES, RELATED PARTY
Short-Term
On June 30, 2008, the Company signed a loan agreement denominated in U.S. dollars with Excalibur International Marine Corporation (“Excalibur”) to lend $19,193,000 at no interest with a term of five month. On November 14, 2008, the Company has received $17,628,283 from Excalibur. At the end of the five month term, the term of the loan was extended for another nine months. This loan still has an outstanding balance of $1,564,717 at year end of March 31, 2009.
On September 23, 2008, the Company signed a loan agreement denominated in U.S. dollars with Excalibur International Marine Corporation (“Excalibur”) to lend $2,000,000 at interest rate of 3.75% per month with a term of no more than 60 days. At the end of the 60-day term, the term of the loan was extended for six months. On May 25, 2009, the Company extended this loan to Excalibur for another six months and lowered the interest rate to 12.5% per annum.
On November 24, 2008, the Company signed another loan agreement denominated in U.S. dollars with Excalibur to lend $500,000 at interest rate of 3.75% per month with a term of no more than 30 days. At the end of the 30-day term, the term of the loan was extended for six months. On May 25, 2009, the Company extended this loan to Excalibur for another six months and lowered the interest rate to 12.5% per annum.
Long-Term
The Board of Directors approved two non-interest bearing unsecured demand loans in the amount of U.S. $330,000 and $1,567,000 respectively on July 14, 2008 and July 25, 2008 to Yeuh-Chi Liu, a vendor and a member of the board of directors of Excalibur. The loan amount of $1,567,000 is collateralized with 3.97% ownership of Excalibur International Marine Corp. As of the date hereof the full principal amount remains outstanding.
Note 6 – OTHER RECEIVABLE
EFT USA, Inc. (EFT), a wholly-owned subsidiary of EFT BioTech Holdings, Inc., sold certain business properties, including computers and an auto to Industrial Fulfillment Co. (IFC) in the amount of $33,504, its net book value as other receivable, pursuant to an asset purchase agreement. The sale of the assets under this agreement constitutes a complete transfer of all of its rights, title and interest with respect to the assets.
Note 7 – PROPERTY AND EQUIPMENT
Property and equipment consist of the following:
| March 31, | ||||||||
| 2009 | 2008 | |||||||
| Automobile | $ | 154,724 | $ | 176,384 | ||||
| Furniture and fixture | 12,278 | - | ||||||
| Computer equipment | 26,373 | 22,068 | ||||||
| Machinery and equipment | 6,405 | 15,959 | ||||||
| Leasehold improvement | 262,679 | - | ||||||
| 462,459 | 214,411 | |||||||
| Less: Accumulated depreciation | (102,303 | ) | (74,305 | ) | ||||
| $ | 360,156 | $ | 140,106 | |||||
F-15
Note 8 – INVESTMENT
On October 25, 2008, the Company through its wholly-owned subsidiary, EFT Investment Co. Ltd, a Taiwan company formed on October 20 2008, completed the acquisition of 48.81% of equity interest of Excalibur for approximately $19,193,000. The equity method has been used for this investment. The Company’s investment in Excalibur was $17,129,314 due to Excalibur has $4,222,808 net loss for year ended 2008.
Investment consists of:
| March 31, | March 31, | |||||||
| 2009 | 2008 | |||||||
| 48.81% equity interest (a) | $ | 17,129,314 | $ | - | ||||
| $ | 17,129,314 | - | ||||||
(a) On October 20, 2008, EFT Investment Co., Ltd. was formed as a wholly-owned subsidiary of EFT BioTech Holdings, Inc. EFT Investment Co., Ltd was formed in Taiwan. On October 25, 2008, EFT Investment Co., Ltd. completed the acquisition of 58,567,750 shares of common stock of Excalibur; representing approximately 49% shares of issued and outstanding shares of Excalibur, for an aggregate purchase price of USD $19,193,000. Prior to the acquisition of Excalibur, Excalibur was not a related person under Item 404 of regulation S-K. The equity method has been used for this investment for the year ended March 31, 2009.
The following table shows the summary of income statement for Excalibur International Corp. for the year ended March 31, 2009:
Excalibur International Marine Corp
| Year Ended March 31, | ||||||||
| 2009 | 2008 | |||||||
| Exchange rate | 33 | - | ||||||
| Revenue | $ | 10,775 | $ | - | ||||
| Gross profit | $ | (239,403 | ) | $ | - | |||
| Income from continuing operations | $ | (4,222,808 | ) | $ | - | |||
| Net income | $ | (4,222,808 | ) | $ | - | |||
| EFT 48.81% investment loss | $ | (2,063,686 | ) | $ | - | |||
The following table provides the summary of balance sheet information for Excalibur International Marine Corp. as of March 31, 2009 and March 31, 2008:
F-16
| Excalibur International Marine Corp |
| March 31, 2009 | March 31, 2008 | |||||||||||||||
| NT$ | USD | NT$ | USD | |||||||||||||
| Total assets | 1,289,432,107 | 39,073,700 | - | - | ||||||||||||
| Total liabilities | 204,417,971 | 6,194,484 | - | - | ||||||||||||
| Net assets | 1,085,014,136 | 32,879,216 | - | - | ||||||||||||
| EFT 48.81% ownership | 529,595,400 | 16,048,345 | - | - | ||||||||||||
| Ending balance of investment account | 17,129,314 | - | ||||||||||||||
| Difference/Premium | (1,080,969 | ) | - | |||||||||||||
The premium of $1,080,969 was mainly the excess we paid to purchase of the 48.81% of ownership in Excalibur as of March 31, 2009.
The following is the shareholder’s list of Excalibur International Marine Corp as of March 31, 2009:
Excalibur International Marine Corp. Shareholders’ List
| Shareholders’ Name | # of shares | % | |||||||
| 1 | EFT Investment Co. Ltd | 58,567,750 | 48.81 | % | |||||
| 2 | Lu, TsoChun | 10,000,000 | 8.33 | % | |||||
| 3 | Chiao, Jen-Ho | 8,200,000 | 6.83 | % | |||||
| 5 | Lin, Ming-i | 5,170,000 | 4.31 | % | |||||
| 4 | Ms. Ku | 5,000,000 | 4.17 | % | |||||
| 6 | Yeuh-Chi Liu | 4,766,000 | 3.97 | % | |||||
| 7 | Steve Hsiao | 4,639,250 | 3.87 | % | |||||
| 8 | Wen Investment | 4,000,000 | 3.33 | % | |||||
| Others (*) | 19,657,000 | 16.38 | % | ||||||
| Total | 120,000,000 | 100 | % | ||||||
*: 56 individuals, none exceeds 2.5% interest in Excalibur International Marine Corp.
Note 9 – OTHER LIABILITIES
Other liabilities consist of the following:
| March 31, | ||||||||
| 2009 | 2008 | |||||||
| Commission payable | $ | 5,977,969 | $ | 12,028,644 | ||||
| Payroll liabilities | 645,900 | 671,409 | ||||||
| Warranty liability | 51,683 | 85,608 | ||||||
| Other | - | 2,053 | ||||||
| $ | 6,675,552 | $ | 12,787,714 | |||||
Note 10 – STOCKHOLDERS’ EQUITY
Common stock
As of March 31, 2009, the Company has 4,975,000,000 shares of common stock authorized and 75,983,205 shares issued and outstanding at par value $0.00001 per share.
F-17
For the year ended March 31, 2009, the Company issued 14,960,791 shares of Common Stock including 14,890,040 shares issued upon the completion of a private placement of its common stock to non-resident aliens at a purchase price of $3.80 per unit, for a unit consisting of one share of common stock and one common stock redeemable purchase warrant.
Warrants
Each warrant underlying the unit offered in the private placement is immediately exercisable in whole or in part and from time to time, to purchase one share of common stock at $3.80 per share until the second anniversary date of the date of issuance.
The Company shall have the right, not the obligation to redeem the outstanding warrants, on a pro rata basis, at a purchase price of $0.00001 per warrant within thirty (30) days from the tenth (10 th ) consecutive trading day that the closing sales price, or the average of the closing bid and asked price in the event that the Company’s common stock trades on the OTC or any public securities market within the U.S., is at least Eleven Dollars ($11.00) per share.
As the only settlement option for the warrants is physical settlement, in which the party designated in the contract as the buyer delivers the full stated amount of cash to the seller, and the seller delivers the full stated number of shares to the buyer, the Company accounted for the warrants as permanent equity and recorded it in additional paid in capital.
Dividend
For the years ended March 31, 2009 and 2008, approximately $0 and $18.5 million dividends were paid to the stockholders of EFT BioTech before the merger.
Deposits from investors and restricted cash
In March 2008, The Company received $37,845,432 deposits related to a future private placement of its common stock to non-resident aliens at a purchase price of $3.80 per unit, for a unit consisting of one share of common stock and one common stock purchase warrant. The deposits are held in an escrow account and are refundable anytime before stock subscription agreement is executed. As of March 31, 2008 we had not executed any of the stock subscription agreement.
Note 11 - INCOME TAXES
The Company was incorporated in the United States of America (“US”) and has operations in three tax jurisdictions - the United States of America, the Hong Kong Special Administrative Region (“HK SAR”) and the BVI. The Company generated substantially all of its net income from its BVI operations for the years ended March 31, 2009 and 2008 which are not subject to any tax provision according to BVI tax law. The Company’s HK SAR subsidiaries had no taxable income in the respective periods. The deferred tax assets for the Company’s US operations and HK SAR subsidiaries were immaterial at March 31, 2009 and 2008.
The income tax expenses consist of the following:
| Years Ended March 31, | ||||||||
| 2009 | 2008 | |||||||
| Current: | ||||||||
| Domestic | $ | 2,400 | $ | 305,800 | ||||
| Foreign | - | - | ||||||
| Deferred | - | - | ||||||
| Income tax expenses | $ | 2,400 | $ | 305,800 | ||||
F-18
A reconciliation of income taxes, with the amount computed by applying the statutory federal income tax rate (37% for the years ended March 31, 2009 and 2008) to income before income taxes for the years ended March 31, 2009 and 2008, is as follows:
| Years Ended March 31, | ||||||||
| 2009 | 2008 | |||||||
| Income tax at U.S. statutory rate | $ | 788,493 | $ | 7,807,553 | ||||
| State tax | 2,400 | 800 | ||||||
| Indefinitely invested earnings of foreign subsidiaries | (819,633 | ) | (7,516,351 | ) | ||||
| Nondeductible expenses | 31,140 | 13,798 | ||||||
| $ | 2,400 | $ | 305,800 | |||||
| Effective tax rate | 0 | % | 1 | % | ||||
The Company’s effective tax rate decreased for the year ended March 31, 2009, compared to the same period of 2008, due to, after the re-capitalization, a higher proportion of its operating profits is subject to income tax.
Uncertain Tax Positions
As a result of the implementation of Interpretation 48 on April 1, 2007, the Company recognized no material adjustments to liabilities or stockholders’ equity. Interest associated with unrecognized tax benefits are classified as income tax and penalties are classified in selling, general and administrative expenses in the statements of operations. The adoption of FIN 48 did not have a material impact on the Company’s financial statements.
For the years ended March 31, 2009 and 2008, the Company had no unrecognized tax benefits and related interest and penalties expenses. Currently, the Company is not subject to examination by major tax jurisdictions.
Note 12 - WARRANTY LIABILITY
The Company records warranty liabilities at the time of sale for the estimated costs that may be incurred under its limited warranty. Changes in warranty liability for standard warranties which are included in current liabilities on the Company’s Consolidated Balance Sheets are presented in the following tables:
| Years Ended | ||||||||
| March 31, | ||||||||
| 2009 | 2008 | |||||||
| Warranty liability at beginning of year | $ | 85,608 | $ | 48,696 | ||||
| Costs accrued | (33,924 | ) | 36,912 | |||||
| Service obligations honored | - | - | ||||||
| Warranty liability at end of year | $ | 51,684 | $ | 85,608 | ||||
| Current portion | $ | 51,684 | $ | 85,608 | ||||
| Non-current portion | - | - | ||||||
| Warranty liability at end of year | $ | 51,684 | $ | 85,608 | ||||
Note 13 - COMMITMENT
Operating Lease
The Company leases office space in the US under an operating lease agreement. The lease provides for monthly lease payments approximating $10,063 and expires on July 31, 2009. Future minimum lease payments under the operating leases as of March 31, 2009 approximate the following:
F-19
| Year Ending March 31, | ||||
| 2010, four months | $ | 40,250 | ||
The Company rents office space for its sales division in Hong Kong. The lease provides for free lease in the first two years and a monthly lease payments approximating $50,000 USD starting the beginning of the third year and expires on March 31, 2012. Expensing the 5-year total rent evenly over the life of the lease, the future minimum lease payments under the operating lease are as follows:
| Year Ending March 31, | ||||
| 2010 | $ | 360,000 | ||
| 2011 | 360,000 | |||
| 2012 | 360,000 | |||
The Company rents storage space for its sales division in Hong Kong. The lease provides for monthly lease payments approximating $1,135 USD starting on May 8, 2008 and expires on May 7, 2010. Future minimum lease payments under the operating leases as of March 31, 2009 approximate the following:
| Year Ending March 31, | ||||
| 2010 | $ | 13,625 | ||
| 2011 | 1,135 | |||
Rent expenses for the year ended March 31, 2009 and March 31, 2008 were approximately $494,487 and $487,896, respectively.
Note 14 - RESTATEMENT
Subsequent to the issuance of the consolidated financial statements for the years ended March 31, 2008 and 2007, the Company determined that certain errors existed in the Consolidated Balance Sheets, Consolidated Statements of Operations and Comprehensive Income and Consolidated Statements of Changes in Stockholders’ Equity with respect to the correct par value and amount of shares issued during the respective periods. The changes to the previously discussed consolidated financial statements had no impact on the Company’s net income.
F-20
EFT BIOTECH HOLDINGS, INC.
Consolidated Balance Sheets
| As of March 31, | ||||||||
| 2008 | 2008 | |||||||
| restated | original | |||||||
| ASSETS | ||||||||
| Current assets | ||||||||
| Cash and cash equivalents | $ | 15,165,620 | $ | 15,165,620 | ||||
| Inventories | 2,619,429 | 2,619,429 | ||||||
| Available for sale securities | 835,965 | 835,965 | ||||||
| Prepaid expenses | 793,760 | 793,760 | ||||||
| Total current assets | 19,414,774 | 19,414,774 | ||||||
| Property, plant and equipment, net | 140,106 | 140,106 | ||||||
| Restricted cash | 37,845,432 | 37,845,432 | ||||||
| Security deposit | 27,108 | 27,108 | ||||||
| Total assets | $ | 57,427,420 | $ | 57,427,420 | ||||
| LIABILITIES AND STOCKHOLDERS' EQUITY | ||||||||
| Current liabilities | ||||||||
| Accounts payable and accrued expenses | $ | 804,041 | $ | 804,041 | ||||
| Other liabilities | 12,787,714 | 12,787,714 | ||||||
| Unearned revenues | 3,945,805 | 3,945,805 | ||||||
| Deposits from investors | 37,845,432 | 37,845,432 | ||||||
| Income tax payable | 305,000 | 305,000 | ||||||
| Total current liabilities | 55,687,992 | 55,687,992 | ||||||
| Stockholders' equity (deficit) | ||||||||
| Preferred stock, $0.001 par value, 25,000,000 shares authorized, | ||||||||
| none issued and outstanding | - | - | ||||||
| Common stock, $0.00001 par value, 4,975,000 authorized, | ||||||||
| 61,022,414 and 52,099,000 shares issued and outstanding | ||||||||
| at March 31, 2008 and 2007 | 610 | 6,102 | ||||||
| Additional paid in capital | 6,552 | 1,060 | ||||||
| Retained earnings (deficit) | 1,895,330 | 1,895,330 | ||||||
| Accumulated other comprehensive loss | (163,064 | ) | (163,064 | ) | ||||
| Total stockholders' equity | 1,739,428 | 1,739,428 | ||||||
| Total liabilities and stockholders' equity | $ | 57,427,420 | $ | 57,427,420 | ||||
F-21
EFT BIOTECH HOLDINGS, INC.
Consolidated Statements of Operations and Other Comprehensive Income
| Year Ended | ||||||||
| March 31, 2008 | March 31, 2008 | |||||||
| restated | original | |||||||
| Sales revenues, net | $ | 30,249,302 | $ | 30,249,302 | ||||
| Shipping charge | 10,110,360 | 10,110,360 | ||||||
| 40,359,662 | 40,359,662 | |||||||
| Cost of goods sold | 11,423,852 | 11,423,852 | ||||||
| Shipping costs | 4,467,140 | 4,467,140 | ||||||
| 15,890,992 | 15,890,992 | |||||||
| Gross profit | 24,468,670 | 24,468,670 | ||||||
| Selling, general and administrative expenses | 3,693,369 | 3,693,369 | ||||||
| Net operating income | 20,775,301 | 20,775,301 | ||||||
| Other income (expense) | ||||||||
| Interest income | 275,538 | 275,538 | ||||||
| Foreign exchange loss | (4,248 | ) | (4,248 | ) | ||||
| Other expense, net | 54,904 | 54,904 | ||||||
| Total other income | 326,194 | 326,194 | ||||||
| Net income before income taxes | 21,101,495 | 21,101,495 | ||||||
| Income taxes | 305,800 | 305,800 | ||||||
| Net income | $ | 20,795,695 | $ | 20,795,695 | ||||
| Unrealized loss on available for sale securitities | (163,064 | ) | (163,064 | ) | ||||
| Comprehensive income | $ | 20,632,631 | $ | 20,632,631 | ||||
| Net income per common shares | ||||||||
| Basic and diluted | $ | 0.37 | $ | 0.34 | ||||
| Weighted average common shares outstanding | ||||||||
| Basic and diluted | 55,350,545 | 60,277,531 | ||||||
F-22
EFT BIOTECH HOLDINGS, INC.
Consolidated Statements of Changes in Stockholders' Equity (Deficit)
| Accumulated | Accumulated | |||||||||||||||||||||||||||||||||||||||||||||||
| Additional | Additional | Other | Other | Total | Total | |||||||||||||||||||||||||||||||||||||||||||
| Paid-in | Paid-in | Retained | Retained | Comprehensive | Comprehensive | Stockholders' | Stockholders' | |||||||||||||||||||||||||||||||||||||||||
Shares | Shares | Amount | Amount | Capital | Capital | Earnings | Earnings | Income (loss) | Income (loss) | Equity (Deficit) | Equity (Deficit) | |||||||||||||||||||||||||||||||||||||
| restated | original | restated | original | restated | original | restated | original | restated | original | restated | original | |||||||||||||||||||||||||||||||||||||
BALANCE, APRIL 1, 2006 | 52,099,000 | 59,821,414 | $ | 521 | $ | 5,982 | $ | 4,479 | $ | (982 | ) | $ | 1,563 | $ | 1,563 | $ | - | $ | - | $ | 6,563 | $ | 6,563 | |||||||||||||||||||||||||
| Net income | - | - | - | - | - | - | 10,063,293 | 10,063,293 | - | - | 10,063,293 | 10,063,293 | ||||||||||||||||||||||||||||||||||||
| Dividend paid | - | - | - | - | - | - | (10,439,044 | ) | (10,439,044 | ) | - | - | (10,439,044 | ) | (10,439,044 | ) | ||||||||||||||||||||||||||||||||
| BALANCE, MARCH 31, 2007 | 52,099,000 | 59,821,414 | 521 | 5,982 | 4,479 | (982 | ) | (374,188 | ) | (374,188 | ) | - | - | (369,188 | ) | (369,188 | ) | |||||||||||||||||||||||||||||||
| Issuance of common stock for services | 1,201,000 | 1,201,000 | 12 | 120 | 2,150 | 2,042 | - | - | - | - | 2,162 | 2,162 | ||||||||||||||||||||||||||||||||||||
| Shares effectively issued to former sharholders as part of the recapitalization | 7,722,414 | - | 77 | - | (77 | ) | - | - | - | - | - | - | - | |||||||||||||||||||||||||||||||||||
| Net income | - | - | - | - | - | - | 20,795,695 | 20,795,695 | - | - | 20,795,695 | 20,795,695 | ||||||||||||||||||||||||||||||||||||
| Dividend paid | - | - | - | - | - | - | (18,526,177 | ) | (18,526,177 | ) | - | - | (18,526,177 | ) | (18,526,177 | ) | ||||||||||||||||||||||||||||||||
| Unrealized loss on available for sale securities | - | - | - | - | - | - | - | - | (163,064 | ) | (163,064 | ) | (163,064 | ) | (163,064 | ) | ||||||||||||||||||||||||||||||||
| BALANCE, MARCH 31, 2008 | 61,022,414 | 61,022,414 | $ | 610 | $ | 6,102 | $ | 6,552 | $ | 1,060 | $ | 1,895,330 | $ | 1,895,330 | $ | (163,064 | ) | $ | (163,064 | ) | $ | 1,739,428 | $ | 1,739,428 | ||||||||||||||||||||||||
F-23
INDEX TO CONSOLIDATED FINANCIAL STATEMENTS
| Page(s) | |
| Consolidated Financial Statements | |
| Consolidated Balance Sheets - unaudited | F-25 |
| Consolidated Statements of Operations and Other Comprehensive Income - unaudited | F-26 |
| Consolidated Statements of Cash Flows - unaudited | F-27 |
| Notes to unaudited Consolidated Financial Statements | F-28 |
F-24
EFT BIOTECH HOLDINGS, INC.
Consolidated Balance Sheets
| September 30, 2009 | March 31, 2009 | |||||||
| (unaudited) | ||||||||
| ASSETS | ||||||||
| Current assets | ||||||||
| Cash and cash equivalents | $ | 36,597,902 | $ | 38,181,837 | ||||
| Inventories | 3,454,589 | 3,908,629 | ||||||
| Available for sale securities | 694,023 | 508,746 | ||||||
| Prepaid expenses | 977,981 | 2,551,298 | ||||||
| Short-term note receivables – related party | 4,914,717 | 4,064,717 | ||||||
| Total current assets | 46,639,212 | 49,215,227 | ||||||
| Property and equipment, net | 471,174 | 360,156 | ||||||
| Other receivables | 96,368 | 33,504 | ||||||
| Investments | 14,536,757 | 17,129,314 | ||||||
| Investments in bonds | 4,771,924 | - | ||||||
| Loan to related party | 1,897,000 | 1,897,000 | ||||||
| Security deposit | 310,705 | 31,121 | ||||||
| Total assets | $ | 68,723,140 | $ | 68,666,322 | ||||
| LIABILITIES AND STOCKHOLDERS' EQUITY (DEFICIT) | ||||||||
| Current liabilities | ||||||||
| Accounts payable and accrued expenses | $ | 1,232,721 | $ | 3,610,195 | ||||
| Other liabilities | 8,385,605 | 6,675,552 | ||||||
| Unearned revenues | 1,064,385 | 1,991,215 | ||||||
| Income tax payable | - | - | ||||||
| Total current liabilities | 10,682,711 | 12,276,962 | ||||||
| Stockholders' equity | ||||||||
| Preferred stock, $.001 par value, 25,000,000 shares authorized, | ||||||||
| none issued and outstanding | - | - | ||||||
| Common stock, $0.00001 par value, 4,975,000,000 authorized, | ||||||||
| 75,983,205 and 75,983,205 shares issued and outstanding | ||||||||
| at September 30, 2009 and March 31, 2009, respectively | 760 | 760 | ||||||
| Additional paid in capital | 52,854,891 | 52,854,891 | ||||||
| Retained earnings | 5,489,784 | 4,023,992 | ||||||
| Accumulated other comprehensive loss | (305,006 | ) | (490,283 | ) | ||||
| Total stockholders' equity | 58,040,429 | 56,389,360 | ||||||
| Total liabilities and stockholders' equity | $ | 68,723,140 | $ | 68,666,322 | ||||
The accompanying notes are an integral part of these unaudited consolidated financial statements.
F-25
EFT BIOTECH HOLDINGS, INC.
Consolidated Statements of Operations and Other Comprehensive Income (Unaudited)
| Three Months Ended | Six Months Ended | |||||||||||||||
| September 30, 2009 | September 30, 2008 | September 30, 2009 | September 30, 2008 | |||||||||||||
| Sales revenues, net | $ | 5,125,444 | $ | 4,668,808 | $ | 9,114,760 | $ | 9,420,326 | ||||||||
| Shipping charge | 995,490 | 1,329,240 | 2,049,570 | 2,829,110 | ||||||||||||
| 6,120,934 | 5,998,048 | 11,164,330 | 12,249,436 | |||||||||||||
| Cost of goods sold | 1,365,484 | 1,678,941 | 2,325,932 | 3,311,782 | ||||||||||||
| Shipping cost | 286,468 | 728,537 | 588,368 | 1,465,441 | ||||||||||||
| 1,651,952 | 2,407,478 | 2,914,300 | 4,777,223 | |||||||||||||
| Gross profit | 4,468,982 | 3,590,570 | 8,250,030 | 7,472,213 | ||||||||||||
| Selling, general and administrative expenses | 2,253,548 | 1,083,343 | 4,559,866 | 2,329,916 | ||||||||||||
| Net operating income | 2,215,434 | 2,507,227 | 3,690,164 | 5,142,297 | ||||||||||||
| Other income (expense) | ||||||||||||||||
| Interest income | 134,462 | 355,744 | 299,394 | 772,120 | ||||||||||||
| Investment income | - | 7,088 | - | 7,088 | ||||||||||||
| Investment loss - 48.81% Excalibur | - | (1,080,969 | ) | |||||||||||||
| Subsidiary loss on equity method investment | (514,854 | ) | - | (1,511,588 | ) | - | ||||||||||
| Foreign exchange gain (loss) | (5,038 | ) | 854 | (4,152 | ) | 355 | ||||||||||
| Other, net | 43,711 | (3,774 | ) | 72,943 | (140 | ) | ||||||||||
| Total other income | (341,719 | ) | 359,912 | (2,224,372 | ) | 779,423 | ||||||||||
| Net income before income taxes | 1,873,715 | 2,867,139 | 1,465,792 | 5,921,720 | ||||||||||||
| Provision for Income taxes | - | 94,800 | - | 184,800 | ||||||||||||
| Net income | $ | 1,873,715 | $ | 2,772,339 | $ | 1,465,792 | $ | 5,736,920 | ||||||||
| Unrealized gain (loss) on investments | 75,129 | (11,605 | ) | 185,277 | (121,091 | ) | ||||||||||
| Comprehensive income | $ | 1,948,844 | $ | 2,760,734 | $ | 1,651,069 | $ | 5,615,829 | ||||||||
| Net income per common share | ||||||||||||||||
| Basic and diluted | $ | 0.02 | $ | 0.05 | $ | 0.02 | $ | 0.09 | ||||||||
| Weighted average common shares outstanding basic and diluted | 75,983,205 | 61,083,953 | 75,983,205 | 61,083,953 | ||||||||||||
The accompanying notes are an integral part of these unaudited consolidated financial statements.
F-26
EFT BIOTECH HOLDINGS, INC.
Consolidated Statements of Cash Flows (unaudited)
| Six Months Ended | ||||||||
| September 30, 2009 | September 30, 2008 | |||||||
| Cash flows from operating activities: | ||||||||
| Net income | $ | 1,465,792 | $ | 5,736,920 | ||||
| Adjustments to reconcile net income to net cash | ||||||||
| provided by (used in) operating activities: | ||||||||
| Depreciation and amortization | 33,197 | 24,117 | ||||||
| Investment loss | 1,080,969 | - | ||||||
| Subsidiary loss on equity method investment | 1,511,588 | - | ||||||
| Warranty liability | (11,655 | ) | (42,696 | ) | ||||
| Stock based compensation | - | 120 | ||||||
| Changes in operating assets and liabilities: | ||||||||
| Inventories | 454,040 | (2,620,264 | ) | |||||
| Prepaid expenses and other current assets | 1,293,733 | 531,521 | ||||||
| Other receivables | (62,864 | ) | - | |||||
| Accounts payable and accrued liabilities | (2,377,474 | ) | (213,954 | ) | ||||
| Other liabilities | 1,721,708 | (9,151,696 | ) | |||||
| Unearned revenues | (926,830 | ) | (3,747,070 | ) | ||||
| Income tax payable | - | 184,000 | ||||||
| Net cash provided by (used in) operating activities | 4,182,204 | (9,299,002 | ) | |||||
| Cash flows from investing activities: | ||||||||
| Additions to fixed assets | (144,215 | ) | (57,787 | ) | ||||
| Note receivables – related party | (850,000 | ) | (22,760,000 | ) | ||||
| Purchase of bonds | (4,771,924 | ) | - | |||||
| Net cash (used in) investing activities | (5,766,139 | ) | (22,817,787 | ) | ||||
| Cash flows from financing activities: | ||||||||
| Restricted cash | - | 37,845,432 | ||||||
| Proceeds from issuance of stock and warrants | - | 14,434,296 | ||||||
| Net cash provided by (used in) financing activities | - | 52,279,728 | ||||||
| Net increase (decrease) in cash | (1,583,935 | ) | 20,162,939 | |||||
| Cash, beginning of period | 38,181,837 | 15,165,620 | ||||||
| Cash, end of period | $ | 36,597,902 | $ | 35,328,559 | ||||
| Supplemental disclosures of cash flow information: | ||||||||
| Interest paid in cash | $ | - | $ | - | ||||
| Income taxes paid in cash | $ | - | $ | 800 | ||||
| Non-cash investing and financing activities: | ||||||||
| Unrealized loss on available for sale securities | $ | 185,277 | $ | 121,091 | ||||
| Fixed assets sold with receivable | $ | 33,504 | $ | - | ||||
The accompanying notes are an integral part of these unaudited consolidated financial statements.
F-27
EFT BIOTECH HOLDINGS, INC.
NOTES TO UNAUDITED CONSOLIDATED FINANCIAL STATEMENTS
Note 1 - ORGANIZATION
EFT Biotech Holdings, Inc. (“EFT Holdings” or “the Company”), formerly HumWare Media Corporation, GRG, Inc., Ghiglieri Corporation, Karat Productions, Inc., was incorporated in the State of Nevada on March 19, 1992.
On November 18, 2007, the Company issued an aggregate of 53,300,000 shares of its common stock in connection with a share exchange with the stockholders of EFT BioTech, Inc. (“EFT BioTech”), a Nevada Corporation formed on September 18, 2007 (the “Transaction”), pursuant to which EFT BioTech became a wholly-owned subsidiary of the Company. The 53,300,000 common shares issued included 52,099,000 to pre-capitalization shareholders and 1,201,000 to four directors and officers of EFT BioTech, and represented approximately 87.34% of the Company’s common stock outstanding after the Transaction. Consequently, the stockholders of EFT BioTech, Inc. own a majority of the Company's common stock immediately following the Transaction, therefore, the Transaction is being accounted for as a "reverse acquisition", and EFT BioTech is deemed to be the accounting acquirer in the reverse acquisition. As EFT Holdings was a non-operating public shell corporation that acquired an operating company, this Transaction is treated as a capital transaction where the acquiring corporation issued stock for the net monetary assets of the shell corporation, accompanied by a recapitalization. The accounting is similar in form to a reverse acquisition, except that goodwill or other intangibles are not recorded. All references to EFT BioTech common stock have been restated to reflect the equivalent numbers of EFT Holdings common shares.
At its formation on September 18, 2007, EFT BioTech acquired EFT Limited, a British Virgin Islands company (“BVI”) formed on August 22, 2007, pursuant to which EFT Limited (BVI) became a wholly-owned subsidiary of EFT BioTech. Since both EFT BioTech and EFT Limited (BVI) were under common control, this acquisition represents a reorganization of entities under common control.
EFT Limited (BVI) has four wholly-owned subsidiaries: EFT, Inc., a California company formed on January 1, 2003, Top Capital International, Ltd. (BVI), a BVI company formed on May 22, 2002, EFT (HK), Ltd., a Hong Kong (“HK”) company formed on November 1, 2006 and EFT International Ltd. (BVI), a BVI company formed on April 20, 2005, which it acquired all on November 14, 2007. As EFT Limited (BVI) and the four companies being acquired were under common control, this acquisition also represents a reorganization of entities under common control.
These reorganizations of entities under common control resulted in changes in the legal organization of these predecessors to EFT BioTech but did not result in changes in the reporting entity.
On October 20, 2008, EFT Investment Co., Ltd., a Taiwan company, was formed as a wholly-owned subsidiary of EFT Biotech Holding, Inc.
The Company, through its subsidiaries, is engaged in the E-Business designed around the concept of Business-to-customer using the World Wide Web as its “storefront” and business platform to market, sell and distribute 49 American brand products consisting of 26 nutritional products, 20 personal care products, 1 automotive fuel additives, 1 home product and a portable drinking container.
Note 2 - SUMMARY OF SIGNIFICANT ACCOUNTING POLICIES
1. Basis of Presentation
The accompanying unaudited condensed consolidated financial statements have been prepared in conformity with accounting principles generally accepted in the United States of America for interim financial information and with the instructions for Form 10-Q and Article 210.8-03 of Regulation S-X. Accordingly, they do not include all of the information and footnotes required by generally accepted accounting principles for complete financial statements. In the opinion of management, all adjustments considered necessary for a fair presentation have been included. All such adjustments are of a normal recurring nature. Operating results for the six month period ended September 30, 2009, are not necessarily indicative of the results that may be expected for the fiscal year ending March 31, 2010. For further information refer to the consolidated financial statements and footnotes thereto included in the Company’s Annual Report on Form 10-K for the year ended March 31, 2009.
Principles of Consolidation
The consolidated financial statements include the accounts of the Company and its wholly-owned subsidiaries. All inter-company accounts and transactions have been eliminated in consolidation.
Foreign Currency
The Company’s reporting currency is the U.S. dollar. The Company’s operation in Hong Kong uses Hong Kong dollar (HKD) as its functional currency. The financial statements of the subsidiary are translated into U.S. Dollars (USD) in accordance with Accounting Standards Codification or “ASC” Topic 830, Foreign Currency Translation. According to the Statement, all assets and liabilities were translated at the year end current exchange rate, stockholders equity items are translated at the historical rates and income statement items are translated at the average exchange rate for the periodyear. The resulting translation adjustments are reported under other comprehensive income in accordance with ASC Topic 220, Reporting Comprehensive Income as a Component of Stockholders Equity. Foreign exchange transaction gains and losses are reflected in the income statement. During the years 2009 and 2008 there have been immaterial currency fluctuations between HKD and USD.
Use of Estimates
The preparation of financial statements in conformity with generally accepted accounting principles requires management to make estimates and assumptions that affect the reported amounts of assets and liabilities and disclosure of contingent assets and liabilities at the date of the financial statements and the reported amounts of revenues and expenses during the reporting period. Actual results could differ from those estimates.
Cash and Cash Equivalents
Cash and cash equivalents include cash on hand and cash in time deposits, certificates of deposit and all highly liquid debt instruments with original maturities of three months or less. The Company maintains its accounts in banks, several of which exceed the federally insured limit. In aggregate, approximately $31.8 million were above the federally insured limit. Management believes the Company is not exposed to any significant credit risk on those accounts.
F-28
Available for sale securities
The Company’s investments in publicly traded equity securities are classified as available-for-sale and are reported at fair value (based on quoted prices and market prices) using the specific identification method. Unrealized gains and losses, net of taxes, are reported as a component of stockholders’ equity. Realized gains and losses on investments are included in investment and other income, net when realized. Any impairment loss to reduce an investment’s carrying amount to its fair market value is recognized in income when a decline in the fair market value of an individual security below its cost or carrying value is determined to be other than temporary.
Inventories
Inventories are valued at the lower of cost (determined on a first-in, first-out basis) or market. The Management compares the cost of inventories with the market value and allowance is made for writing down the inventories to market value, if lower. Inventory consists of high tech nutritional, cosmetic, automotive maintenance and environmentally safe products.
Property and equipment
Property and equipment are stated at cost less accumulated depreciation. Expenditures for maintenance and repairs are charged to earnings as incurred; additions, renewals and betterments are capitalized. When property and equipment are retired or otherwise disposed of, the related cost and accumulated depreciation are removed from the respective accounts, and any gain or loss is included in operations. Depreciation of property and equipment is provided using the straight-line method for substantially all assets with estimated lives of:
| Machinery & equipment | 3 years |
| Computers & office equipment | 3 years |
| Automobile | 5 years |
For the Six Months ended September 30, 2009 and 2008, depreciation expenses were $33,197 and $24,117, respectively.
Long-Lived Assets
Effective January 1, 2002, the Company adopted Accounting Standards Codification(ASC) Topic 360, Accounting for the Impairment or Disposal of Long-Lived Assets (ASC Topic 360), which addresses financial accounting and reporting for the impairment or disposal of long-lived assets and supersedes SFAS No. 121, Accounting for the Impairment of Long-Lived Assets and for Long-Lived Assets to be Disposed Of, and the accounting and reporting provisions of ASC Topic 225, Reporting the Results of Operations for a Disposal of a Segment of a Business. The Company periodically evaluates the carrying value of long-lived assets to be held and used in accordance with ASC Topic 360. ASC Topic 360 requires impairment losses to be recorded on long-lived assets used in operations when indicators of impairment are present and the undiscounted cash flows estimated to be generated by those assets are less than the asset’s carrying amounts. In that event, a loss is recognized based on the amount by which the carrying amount exceeds the fair market value of the long-lived assets. Loss on long-lived assets to be disposed of is determined in a similar manner, except that fair market values are reduced for the cost of disposal. Based on its review, the Company believes that, as of September 30, 2009 there were no significant impairments of its long-lived assets.
Fair Value of Financial Instruments
Accounting Standard Codification Topic 825, “Disclosures about Fair Value of Financial Instruments”, requires that the Company discloses estimated fair values of financial instruments. The carrying amounts reported in the statements of financial position for current assets and current liabilities qualifying as financial instruments are a reasonable estimate of fair value due to the short-term maturity of these instruments.
Fair Value Measurements
Effective April 1, 2008, the Company adopted Accounting Standards Codification or “ASC” Topic 820, “ Fair Value Measurements ”, which defines fair value, establishes guidelines for measuring fair value and expands disclosures regarding fair value measurements. ASC Topic 820 does not require any new fair value measurements, but rather eliminates inconsistencies in guidance found in various other accounting pronouncements. The adoption of ASC Topic 820 did not have a material effect on the Company’s financial condition or operating results.
Refer to Note 4, “Fair Value Measurements” for additional information on the adoption of ASC Topic 820.
Stock-Based Compensation
Accounting Standards Codification Topic 718 requires companies to recognize in the statement of operations the grant date fair value of stock options and other equity-based compensation issued to employees. The Company adopted ASC Topic 718 on April 1, 2006.
Stocks issued to officers or employees
On November 18, 2007 in conjunction with the reverse acquisition, the Company granted its officers an aggregate 1,201,000 shares of fully vested stock with no future requisite service requirement. The share compensation cost is measured at grant date, based on estimated fair value of the award which is $0.0018 per share.
The amount of compensation was included as a period compensation expense. For the Six Months ended September 30, 2009 and 2008, the stock-based compensation for shares awarded were to employees was $0 and $120, respectively.
During the years 2009 and 2008, the Company has not issued any stock options or warrants to employees nor is there any outstanding warrants or options during the Six Months ended September 30, 2009, therefore pro forma disclosures are not required.
F-29
Stock issued for service
The company accounts for equity instruments issued in exchange for the receipts of goods or service from other than employees in accordance with Accounting Standards Codification or “ASC” Topic 718 and the conclusions reached by ASC Topic 505. Costs are measured at the estimated fair market value of the consideration received or the estimated fair value of the equity instruments issued, whichever is more reliably measurable. The value of equity instruments issued for consideration other than employee services is determined on the earliest of performance commitment or completion of performance by the provider of goods or service as defined by ASC Topic 505.
During November 2008, we issued 4,084 shares of common stock in exchange of service we received. For the Six Months ended September 30, 2009 and 2008, the stock-based compensation for shares issued to non-employees was $0 and $120, respectively.
Revenue Recognition
The Company’s revenue recognition policy is in accordance with the requirements of Staff Accounting Bulletin (“SAB”) No. 104, Revenue Recognition, (“SAB 104”), Accounting Standards Codification or “ASC” Topic 605, Accounting for Consideration Given by a Vendor to a Customer (Including a Reseller of the Vendor’s Products) (ASC Topic 605) and other applicable revenue recognition guidance and interpretations. Sales revenue is recognized at the date of shipment to customers when a formal arrangement exists, the price is fixed or determinable, the delivery is completed, no other significant obligations of the Company exist and collectibility is reasonably assured. Payments received before all of the relevant criteria for revenue recognition are satisfied are recorded as unearned revenue. Cash consideration given by the Company to its sales affiliates is considered to be a reduction of the selling prices of the Company's products, thus, is recorded as a reduction of revenue.
EFT has developed its own reverse auction program, a proprietary software program, for the purposes of increasing revenues by attracting new members to join EFT’s affiliate program. In a reverse auction the objective is to bid the price of a product down within a predetermined time frame unlike an ordinary auction (also known as a forward auction) where bidders bid the price up and the highest bidder wins the right to buy the product at the conclusion of bidding. The reverse auction program was beta-tested and introduced to all affiliates in June 2009.
The Company recognizes revenues for the reverse auction according to SAB Topic 13A.1, revenue generally is realized or realizable and earned when all of the following four criteria are met: 1. Persuasive evidence of an arrangement exists, All the bidders acknowledge that they have read and understand the Terms and Conditions with the Company before they can participate in the reverse auction program. 2. Delivery has occurred or services have been rendered, The Company only recognizes revenue when bidder placed 300 bids on any auction product and these placed bids are non-refundable according to the Terms and Conditions of the reverse auction program. 3. The seller's price to the buyer is fixed or determinable, Every bid has a fixed price of $1 which has been stated in the Terms and Conditions. 4. Collectibility is reasonably assured. The bidders must purchase bids in advance before entering the reverse auction program. The bids being purchased are non-refundable according to the Terms and Conditions of the reverse auction program. The reverse auction program generated $945,400 sales revenue as of September 30, 2009.
Warranty
The Company generally does not provide customers with right of return except for defective products which is within six month warranty period from date of sales. Historically, the company warranty provisions have not been material. The specific warranty terms and conditions vary depending upon the product sold, but generally include replacement over a period of six months. Factors that affect the Company’s warranty liability include the number of products currently under warranty, historical and anticipated rates of warranty claims on those products, and cost per claim to satisfy the warranty obligation. The anticipated rate of warranty claims is the primary factor impacting the estimated warranty obligation. Warranty claims are relatively predictable based on our historical experience. Warranty reserves are included in other liabilities and the provision for warranty accruals is included in cost of goods sold in the consolidated statement of Operations and Other Comprehensive Income. Management reviews the adequacy of warranty reserves each reporting period based on historical experience and management's estimate of the costs to remediate the claims and adjusts the provisions accordingly.
Currently, the Company estimates its warranty expense as follows:
| Products sold for | |
| 0-2 months | 2% of cost |
| 3-4 months | 1.5% of cost |
| 5-6 months | 1% of cost |
The Company records warranty liabilities at the time of sale for the estimated costs that may be incurred under its limited warranty. The specific warranty terms and conditions vary depending upon the product sold, but generally include replacement over a period of six months. Factors that affect the Company’s warranty liability include the number of products currently under warranty, historical and anticipated rates of warranty claims on those products, and cost per claim to satisfy the warranty obligation. The anticipated rate of warranty claims is the primary factor impacting the estimated warranty obligation. The other factors are less significant due to the fact that the warranty period is only six months and replacement is generally already in stock or available at a pre-determined price. Warranty claims are relatively predictable based on historical experience of failure rates. If actual results differ from the estimates, the Company revises its estimated warranty liability.
Shipping Costs
The Company’s shipping costs are included in cost of sales in the accompanying Consolidated Statements of Operations and Other Comprehensive Income for all periods presented.
Unearned Revenues
Unearned Revenues consist of cash amounts received in advance for goods and services to be shipped at a future date. The Registrant records the cash from customers as a liability until the products are shipped.
Advertising
Advertising expenses consist primarily of costs of promotion for corporate image and product marketing and costs of direct advertising. The Company expenses all advertising costs as incurred. For the Six Months ended September 30, 2009 and 2008, advertising expenses were $21,987 and $85,871, respectively.
Consultant Fee
On January 1, 2009, EFT International Ltd, a wholly-owned subsidiary of EFT BioTech Holdings, Inc., entered a contract with ZR Public Relation Consultant Ltd. (the Consultant), which provides public relation consulting services in Asia. In consideration of the services rendered by the Consultant, EFT International Ltd agrees to pay 5% of total commission payout for each fiscal year. For the six months ended September 30, 2009, consultant expense for EFT International Ltd was $570,562.
F-30
Income Taxes
The Company utilizes Accounting Standards Codification or “ASC” Topic 740, Accounting for Income Taxes, which requires the recognition of deferred tax assets and liabilities for the expected future tax consequences of events that have been included in the financial statements or tax returns. Under this method, deferred income taxes are recognized for the tax consequences in future years of differences between the tax bases of assets and liabilities and their financial reporting amounts at each period end based on enacted tax laws and statutory tax rates applicable to the periods in which the differences are expected to affect taxable income. Valuation allowances are established, when necessary, to reduce deferred tax assets to the amount expected to be realized.
The Company adopted the provisions of Accounting Standards Codification or “ASC” Topic 740, Accounting for Uncertainty in Income Taxes (“ASC Topic 740”), on April 1, 2007 The Interpretation addresses the determination of whether tax benefits claimed or expected to be claimed on a tax return should be recorded in the financial statements. Under ASC Topic 740, we may recognize the tax benefit from an uncertain tax position only if it is more likely than not that the tax position will be sustained on examination by the taxing authorities, based on the technical merits of the position. The tax benefits recognized in the financial statements from such a position should be measured based on the largest benefit that has a greater than fifty percent likelihood of being realized upon ultimate settlement. ASC Topic 740 also provides guidance on derecognition, classification, interest and penalties on income taxes, accounting in interim periods and requires increased disclosures.
Earnings Per Share
Basic net income per share is computed on the basis of the weighted average number of common shares outstanding during the period.
Diluted net income per share is computed on the basis of the weighted average number of common shares and common share equivalents outstanding. Dilutive securities having an anti-dilutive effect on diluted net income per share are excluded from the calculation.
Dilution is computed by applying the treasury stock method. Under this method, options and warrants are assumed to be exercised at the beginning of the period (or at the time of issuance, if later), and as if funds obtained thereby were used to purchase common stock at the average market price during the period.
The following table shows the weighted-average number of potentially dilutive shares excluded from the diluted net income per share calculation for the three and six months ended September 30, 2009 and 2008:
| For the three | For the three | For the six | For the six | |||||||||||||
| months ended | months ended | months ended | months ended | |||||||||||||
| September 30, 2009 | September 30, 2008 | September 30, 2009 | September 30, 2008 | |||||||||||||
| Weighted average | ||||||||||||||||
| warrants outstanding | 14,890,040 | - | 14,890,040 | - | ||||||||||||
| Total | 14,890,040 | - | 14,890,040 | - | ||||||||||||
| For the Three Months Ended | For the Six Months Ended | |||||||||||||||
| September 30, | September 30, | |||||||||||||||
| 2009 | 2008 | 2009 | 2008 | |||||||||||||
| Historical Numerator: | ||||||||||||||||
| Net Income | $ | 1,873,715 | $ | 2,772,339 | $ | 1,465,792 | $ | 5,736,920 | ||||||||
| Denominator: | ||||||||||||||||
| Weighted-average shares used for basic net income per share | 75,983,205 | 61,083,953 | 75,983,205 | 61,083,953 | ||||||||||||
| Effect of common stock equivalents | - | - | - | - | ||||||||||||
| Weighted-average shares used for diluted net (loss) per share | 75,983,205 | 61,083,953 | 75,983,205 | 61,083,953 | ||||||||||||
| Basic and diluted net income per share | $ | 0.02 | $ | 0.05 | $ | 0.02 | $ | 0.09 | ||||||||
| Diluted net income per share | $ | 0.02 | $ | 0.05 | $ | 0.02 | $ | 0.09 | ||||||||
F-31
Comprehensive income
Comprehensive income is defined as the change in equity of a company during a period from transactions and other events and circumstances excluding transactions resulting from investments from owners and distributions to owners. For the Company, comprehensive income for the periods presented is comprised of net income and unrealized loss on marketable securities classified as available-for-sale.
Concentration of Credit Risk
Financial instruments that potentially subject the Company to concentrations of credit risk are cash, accounts receivable and other receivables arising from its normal business activities. The Company places its cash in what it believes to be credit-worthy financial institutions, but several of its bank accounts exceed the federally insured limit. The Company’s accounts receivable is constantly at a marginal to zero dollar ($0) level and its revenues are derived from orders place by consumers located anywhere in the world over the Company’s designated internet portal. The Company maintains a zero dollar ($0) allowance for doubtful accounts and authorizes credits based upon its historical “sound and quality” after sales customer services provided to affiliates and customers. Historically, such customer services have been maintained in accordance with the management expectations. The Company routinely assesses the credits authorized to its customers and, based upon factors surrounding the credit risk, establishes an allowance, if required, for uncollectible accounts and, as a consequence, believes that its accounts receivable credit risk exposure beyond such allowance is limited.
Segment Reporting
Accounting Standards Codification or “ASC” Topic 280, “Disclosure about Segments of an Enterprise and Related Information” requires use of the management approach model for segment reporting. The management approach model is based on the way a company's management organizes segments within the company for making operating decisions and assessing performance. Reportable segments are based on products and services, geography, legal structure, management structure, or any other manner in which management disaggregates a company. Since management does not disaggregate Company data, the Company has determined that only one segment exists. Accordingly, no segment reporting is provided.
Recent accounting pronouncements
In June 2009 the FASB established the Accounting Standards Codification ("Codification" or "ASC") as the source of authoritative accounting principles recognized by the FASB to be applied by nongovernmental entities in the preparation of financial statements in accordance with generally accepted accounting principles in the United States ("GAAP"). Rules and interpretive releases of the Securities and Exchange Commission ("SEC") issued under authority of federal securities laws are also sources of GAAP for SEC registrants. Existing GAAP was not intended to be changed as a result of the Codification, and accordingly the change did not impact our financial statements. The ASC does change the way the guidance is organized and presented.
Statement of Financial Accounting Standards ("SFAS") SFAS No. 165 (ASC Topic 855), "Subsequent Events", SFAS No. 166 (ASC Topic 810), "Accounting for Transfers of Financial Assets-an Amendment of FASB Statement No. 140", SFAS No. 167 (ASC Topic 810), "Amendments to FASB Interpretation No. 46(R)", and ASC Topic 105.
Accounting Standards Codification or “ASC” Topic 820, which amends Fair Value Measurements and Disclosures - Overall, ASC Topic 605, Multiple-Deliverable Revenue Arrangements, ASC Topic 985, Certain Revenue Arrangements that include Software Elements, and various other ASU's No. 2009-2 through ASU No. 2009-15 which contain technical corrections to existing guidance or affect guidance to specialized industries or entities were recently issued. These updates have no current
applicability to the Company or their effect on the financial statements would not have been significant.
Note 3 - FINANCIAL INSTRUMENTS
The following table summarizes unrealized gains and losses related to the Company’s investments in marketable securities designated as available-for-sale. The fair value of available for sale securities has been estimated based on quoted market prices, which the Company currently believes are indicative of fair value. The Company’s available for sale securities are mainly on equity securities mutual funds.
| September 30, 2009 | September 30, 2008 | |||||||||||||||||||||||
| Fair Value | Cost | Unrealized (Loss) | Fair Value | Cost | Unrealized (Loss) | |||||||||||||||||||
| Available for sale securities | $ | 694,023 | $ | 999,029 | $ | (305,006 | ) | $ | 714,874 | $ | 999,029 | $ | (284,155 | ) | ||||||||||
| Total | $ | 694,023 | $ | 999,029 | $ | (305,006 | ) | $ | 714,874 | $ | 999,029 | $ | (284,155 | ) | ||||||||||
Note 4 - FAIR VALUE MEASUREMENTS
On April 1, 2008, the Company adopted the effective portions of Accounting Standards Codification or “ASC” Topic 820. In February 2008 the FASB issued ASC Topic 820, “Effective Date of ASC Topic 820”, which provides a one year deferral of the effective date of ASC Topic 820 for all nonfinancial assets and nonfinancial liabilities, except those that are recognized or disclosed at fair value in the financial statements on a recurring basis (at least annually). Therefore, the Company adopted the provisions of ASC Topic 820 with respect to only financial assets and liabilities.
Accounting Standards Codification or “ASC” Topic 820 defines fair value, establishes a framework for measuring fair value and enhances disclosure requirements for fair value measurements. This statement does not require any new fair value measurements. ASC Topic 820 defines fair value as the price that would be received to sell an asset or paid to transfer a liability in an orderly transaction between market participants at the measurement date. As such, fair value is a market-based measurement that should be determined based on assumptions that market participants would use in pricing an asset or a liability. As a basis for considering such assumptions, ASC Topic 820 establishes a three-tier value hierarchy, which prioritizes the inputs used in the valuation methodologies in measuring fair value:
F-32
Level 1—Observable inputs that reflect quoted prices (unadjusted) for identical assets or liabilities in active markets.
Level 2—Include other inputs that are directly or indirectly observable in the marketplace.
Level 3—Unobservable inputs which are supported by little or no market activity.
The fair value hierarchy also requires an entity to maximize the use of observable inputs and minimize the use of unobservable inputs when measuring fair value.
In accordance with ASC Topic 820, the Company measures its available for sale securities at fair value. The available for sale securities are classified within Level 1. This is because the available for sale securities are valued using quoted market prices.
Assets and liabilities measured at fair value are summarized below.
| September 30, 2009 | ||||||||||||||||
| Level 1 | ||||||||||||||||
| Quoted Prices | Level 2 | |||||||||||||||
| in Active | Significant | Level 3 | ||||||||||||||
| Markets for | Other | Significant | ||||||||||||||
| Identical | Observable | Unobservable | ||||||||||||||
| Assets | Inputs | Inputs | Total | |||||||||||||
| Available for sale securities | $ | 694,023 | $ | - | $ | - | $ | 694,023 | ||||||||
| Total assets measured at fair value | $ | 694,023 | $ | - | $ | - | $ | 694,023 | ||||||||
Note 5 - NOTE RECEIVABLES, RELATED PARTY
Short-Term
On June 30, 2008, the Company signed a loan agreement denominated in U.S. dollars with Excalibur International Marine Corporation (“Excalibur”) to lend $19,193,000 at no interest with a term of five month. On November 14, 2008, the Company has received $17,628,283 from Excalibur. At the end of the five month term, the term of the loan was extended for another nine months. This loan still has an outstanding balance of $1,564,717 at quarter end of September 30, 2009.
On September 23, 2008, the Company signed a loan agreement denominated in U.S. dollars with Excalibur International Marine Corporation (“Excalibur”) to lend $2,000,000 at interest rate of 3.75% per month with a term of no more than 60 days. At the end of the 60-day term, the term of the loan was extended for six months. On May 25, 2009, the Company extended this loan to Excalibur for another six months and lowered the interest rate to 12.5% per annum.
On November 24, 2008, the Company signed another loan agreement denominated in U.S. dollars with Excalibur to lend $500,000 at interest rate of 3.75% per month with a term of no more than 30 days. At the end of the 30-day term, the term of the loan was extended for six months. On May 25, 2009, the Company extended this loan to Excalibur for another six months and lowered the interest rate to 12.5% per annum.
On May 13, 2009, the Company signed another loan agreement denominated in U.S. dollars with Excalibur to lend $600,000 at interest rate of 12.5% per annum with a term of six months.
On August 17, 2009, the Company signed another loan agreement denominated in U.S. dollars with Excalibur to lend $250,000 at interest rate of 12.5% per annum with a term of six months.
Long-Term
The Board of Directors approved two non-interest bearing unsecured demand loans in the amount of U.S. $330,000 and $1,567,000 respectively on July 11 and July 25 to Yeuh-Chi Liu, a vendor and a member of the board of directors of Excalibur. The loan amount of $1,567,000 is collateralized with 3.97% ownership of Excalibur International Marine Corp. As of the date hereof the full principal amount remains outstanding.
Note 6 – OTHER RECEIVABLE
EFT USA, Inc. (EFT), a wholly-owned subsidiary of EFT BioTech Holdings, Inc., sold certain business properties, including computers and an auto to Industrial Fulfillment Co. (IFC) in the amount of $33,504, its net book value as other receivable, pursuant to an asset purchase agreement. The sale of the assets under this agreement constitutes a complete transfer of all of its rights, title and interest with respect to the assets.
Note 7 – PROPERTY AND EQUIPMENT
Property and equipment consist of the following:
| September 30, 2009 | March 31, 2009 | |||||||
| Automobile | $ | 154,724 | $ | 154,724 | ||||
| Furniture and fixture | 60,868 | 12,278 | ||||||
| Computer equipment | 52,594 | 26,373 | ||||||
| Machinery and equipment | 41,611 | 6,405 | ||||||
| Leasehold improvement | 296,878 | 262,679 | ||||||
| 606,675 | 462,459 | |||||||
| Less: Accumulated depreciation | (135,501 | ) | (102,303 | ) | ||||
| $ | 471,174 | $ | 360,156 | |||||
F-33
Note 8 – INVESTMENT
On October 25, 2008, the Company through its wholly-owned subsidiary, EFT Investment Co. Ltd, a Taiwan company formed on October 20 2008, completed the acquisition of 48.81% of equity interest of Excalibur for approximately $19,193,000. The equity method has been used for this investment. The Company’s investment in Excalibur was $14,536,757 due to Excalibur has $2,592,557 net loss for the six months and writes off for the premium the Company paid when it purchased the investment.
Investment consists of:
| September 30, | March 31, | |||||||
| 2009 | 2009 | |||||||
| 48.81% equity interest (a) | $ | $14,536,757 | $ | 17,129,314 | ||||
| $ | $14,536,757 | $ | 17,129,314 | |||||
(a) On October 20, 2008, EFT Investment Co., Ltd. was formed as a wholly-owned subsidiary of EFT BioTech Holdings, Inc. EFT Investment Co., Ltd was formed in Taiwan. On October 25, 2008, EFT Investment Co., Ltd. completed the acquisition of 58,567,750 shares of common stock of Excalibur; representing approximately 49% shares of issued and outstanding shares of Excalibur, for an aggregate purchase price of USD $19,193,000. Prior to the acquisition of Excalibur, Excalibur was not a related person under Item 404 of regulation S-K. The equity method has been used for this investment for the six months ended September 30, 2009.
The following table shows the summary of income statement for Excalibur International Corp. for the three and six months ended September 30, 2009 and 2008:
Excalibur International Marine Corp
| Three Months Ended September 30, | Six Months Ended September 30, | |||||||||||||||
| 2009 | 2008 | 2009 | 2008 | |||||||||||||
| Exchange rate | 33 | - | 33 | - | ||||||||||||
| Revenue | $ | 62,598 | $ | - | $ | 66,002 | $ | - | ||||||||
| Gross profit (loss) | $ | (1,117,410 | ) | $ | - | $ | (3,248,239 | ) | $ | - | ||||||
| Loss from continuing operations | $ | (1,054,812 | ) | $ | - | $ | (3,182,237 | ) | $ | - | ||||||
| Net loss | $ | (1,054,812 | ) | $ | - | $ | (3,182,237 | ) | $ | - | ||||||
| EFT 48.81% share of loss | $ | (514,854 | ) | $ | - | $ | (1,553,250 | ) | $ | - | ||||||
| Exchange rate fluctuation difference | $ | - | $ | - | $ | 41,662 | $ | - | ||||||||
| Subsidiary loss on equity method investment | $ | (514,854 | ) | $ | - | $ | (1,511,588 | ) | $ | - | ||||||
The following table provides the summary of balance sheet information for Excalibur International Marine Corp. as of September 30, 2009 and March 31, 2009:
F-34
Excalibur International Marine Corp
| September 30, 2009 | March 31, 2009 | ||||||||||||
| NT$ | USD | NT$ | USD | ||||||||||
| Total assets | 1,265,120,282 | 38,336,978 | 1,289,432,107 | 39,073,700 | |||||||||
| Total liabilities | 285,120,048 | 8,640,001 | 204,417,971 | 6,194,484 | |||||||||
| Net assets | 980,000,234 | 29,696,977 | 1,085,014,136 | 32,879,216 | |||||||||
| EFT 48.81% ownership | 478,338,115 | 14,495,095 | 529,595,400 | 16,048,345 | |||||||||
| Ending balance of investment account | 14,536,757 | 17,129,314 | |||||||||||
| Difference/Premium | 41,662 | (1,080,969 | ) | ||||||||||
The difference of $41,662 was due to the exchange rate fluctuations between the periods. The exchange rate fluctuation of $41,662 was not included in investment loss for the six months ended September 30, 2009.
The Company elected to perform an assessment of the carrying value of the equity method investment of Excalibur International as of June 30, 2009. As of June 30, 2009, the Company determined the estimated fair value of its reporting unit using a discounted cash flow model and compared the value to the carrying value of its reporting unit. This assessment indicated that the Company's carrying value in its investment was impaired.
The discount rate, sales growth, profitability assumptions and perpetual growth rate are the material assumptions utilized in the discounted cash flow model used to estimate the fair value of its reporting unit. According to the Company’s valuation, using the discounted cash flow method, the $1,080,969 better reflect a more conservative value to our impairment loss.
According to Accounting Standards Codification or “ASC” Topic 323, the current fair value of the equity method investment was less than its carrying amount with indicated a loss in value per the Company’s discounted cash flow model. The Company reports this loss as investment loss on the Statement of Operations and Other Comprehensive Income. The Company’s share of earnings or losses of the investment are shown as a subsidiary loss on equity method investment per ASC Topic 323.
The following is the shareholder’s list of Excalibur International Marine Corp as of September 30, 2009:
Excalibur International Marine Corp. Shareholders’ List
| Shareholders’ Name | # of shares | % | ||||||||
| 1 | EFT Investment Co. Ltd | 58,567,750 | 48.81 | % | ||||||
| 2 | Lu, TsoChun | 10,000,000 | 8.33 | % | ||||||
| 3 | Chiao, Jen-Ho | 8,200,000 | 6.83 | % | ||||||
| 5 | Lin, Ming-i | 5,170,000 | 4.31 | % | ||||||
| 4 | Ms. Ku | 5,000,000 | 4.17 | % | ||||||
| 6 | Yeuh-Chi Liu | 4,766,000 | 3.97 | % | ||||||
| 7 | Steve Hsiao | 4,639,250 | 3.87 | % | ||||||
| 8 | Wen Investment | 4,000,000 | 3.33 | % | ||||||
| Others (*) | 19,657,000 | 16.38 | % | |||||||
| Total | 120,000,000 | 100 | % | |||||||
56 individuals, none exceeds 2.5% interest in Excalibur International Marine Corp.
Note 9 – OTHER LIABILITIES
Other liabilities consist of the following:
| September 30, 2009 | March 31, 2009 | |||||||
| Commission payable | $ | 7,549,676 | $ | 5,977,969 | ||||
| Payroll liabilities | 795,900 | 645,900 | ||||||
| Warranty liability | 40,029 | 51,683 | ||||||
| Other | - | - | ||||||
| $ | 8,385,605 | $ | 6,675,552 | |||||
Note 10 – STOCKHOLDERS’ EQUITY
Common stock
As of September 30, 2009 the Company has 4,975,000,000 shares of common stock authorized and 75,983,205 shares issued and outstanding at par value $0.00001 per share.
F-35
The Company did not issue any shares of Common Stock for the six months ended September 30, 2009.
Warrants
Each warrant underlying the unit offered in the private placement is immediately exercisable in whole or in part and from time to time, to purchase one share of common stock at $3.80 per share until the second anniversary date of the date of issuance.
The Company shall have the right, not the obligation to redeem the outstanding warrants, on a pro rata basis, at a purchase price of $0.00001 per warrant within thirty (30) days from the tenth (10 th ) consecutive trading day that the closing sales price, or the average of the closing bid and asked price in the event that the Company’s common stock trades on the OTC or any public securities market within the U.S., is at least Eleven Dollars ($11.00) per share.
As the only settlement option for the warrants is physical settlement, in which the party designated in the contract as the buyer delivers the full stated amount of cash to the seller, and the seller delivers the full stated number of shares to the buyer, the Company accounted for the warrants as permanent equity and recorded it in additional paid in capital.
Dividend
For the six months ended September 30, 2009 and 2008, approximately $0 and $0 million dividends were paid to the stockholders of EFT BioTech.
Deposits from investors and restricted cash
As of June 30, 2008, the Company received $55,078,730 deposits related to a future private placement of its common stock to non-resident aliens at a purchase price of $3.80 per unit, for a unit consisting of one share of common stock and one common stock purchase warrant. The deposits are held in an escrow account and are refundable anytime before stock subscription agreement is executed. As of September 30, 2009 we had not executed any of the stock subscription agreement.
Note 11 - INCOME TAXES
The Company was incorporated in the United States of America (“US”) and has operations in three tax jurisdictions - the United States of America, the Hong Kong Special Administrative Region (“HK SAR”) and the BVI. The Company generated substantially all of its net income from its BVI operations for the six months ended September 30, 2009 and 2008 which are not subject to any tax provision according to BVI tax law. The Company’s HK SAR subsidiaries had no taxable income in the respective periods. The deferred tax assets for the Company’s US operations and HK SAR subsidiaries were immaterial at September 30, 2009 and 2008.
The income tax expenses consist of the following:
| Six Months Ended September 30, | ||||||||
| 2009 | 2008 | |||||||
| Current: | ||||||||
| Domestic | $ | - | $ | 184,800 | ||||
| Foreign | - | - | ||||||
| Deferred | - | - | ||||||
| Income tax expenses | $ | - | $ | 184,800 | ||||
A reconciliation of income taxes, with the amount computed by applying the statutory federal income tax rate (37% for the six months ended September 30, 2009 and 2008) to income before income taxes for the six months ended September 30, 2009 and 2008, is as follows:
| Six Months Ended September 30, | ||||||||
| 2009 | 2008 | |||||||
| Income tax at U.S. statutory rate | $ | 545,026 | $ | 1,715,862 | ||||
| State tax | - | 800 | ||||||
| Indefinitely invested earnings of foreign subsidiaries | (550,320 | ) | (1,540,991 | ) | ||||
| Nondeductible expenses | 5,294 | 9,129 | ||||||
| $ | 0 | $ | 184,800 | |||||
| Effective tax rate | 0 | % | 3 | % | ||||
The Company’s effective tax rate decreased for the six months ended September 30, 2009, compared to the same period of 2008, due to, after the re-capitalization, a higher proportion of its operating profits is not subject to income tax.
Uncertain Tax Positions
As a result of the implementation of Accounting Standards Codification or “ASC” Topic 740 on April 1, 2007, the Company recognized no material adjustments to liabilities or stockholders’ equity. Interest associated with unrecognized tax benefits are classified as income tax and penalties are classified in selling, general and administrative expenses in the statements of operations. The adoption of ASC Topic 740 did not have a material impact on the Company’s financial statements.
F-36
For the six months ended September 30, 2009 and 2008, the Company had no unrecognized tax benefits and related interest and penalties expenses. Currently, the Company is not subject to examination by major tax jurisdictions.
Note 12 - WARRANTY LIABILITY
The Company records warranty liabilities at the time of sale for the estimated costs that may be incurred under its limited warranty. Changes in warranty liability for standard warranties which are included in current liabilities on the Company’s Consolidated Balance Sheets are presented in the following tables:
| September 30, 2009 | March 31, 2009 | |||||||
| Warranty liability at March 31 | $ | 51,684 | $ | 85,608 | ||||
| Costs accrued | (11,655 | ) | (33,924 | ) | ||||
| Service obligations honored | - | - | ||||||
| Warranty liability at September 30 | $ | 40,029 | $ | 51,684 | ||||
| Current portion | $ | 40,029 | $ | 51,684 | ||||
| Non-current portion | - | - | ||||||
| Warranty liability at end of period | $ | 40,029 | $ | 51,684 | ||||
Note 13 - COMMITMENT
Operating Lease
The Company rents office space for its sales division in Hong Kong. The lease provides for free lease in the first two years and a monthly lease payments approximating $50,000 USD starting the beginning of the third year and expiring on June 30, 2012. Expensing the 5-year total rent evenly over the life of the lease, the future minimum lease payments under the operating lease are as follows:
| Year Ending March 31, | ||||
| 2010 | $ | 180,000 | ||
| 2011 | 360,000 | |||
| 2012 | 360,000 | |||
The Company rents storage space for its sales division in Hong Kong. The lease provides for monthly lease payments approximating $1,135 USD starting on May 8, 2008 and expiring on May 7, 2010. Future minimum lease payments under the operating leases as of September 30, 2009 approximate the following:
| Year Ending March 31, | ||||
| 2010 | $ | 6,810 | ||
| 2011 | 1,135 | |||
The Company rents office space for its service center in Korea. The lease provides for monthly lease payments approximating $9,330 USD starting on June 25, 2009 and expires on June 24, 2011. Future minimum lease payments under the operating leases as of September 30, 2009 approximate the following:
| Year Ending March 31, | ||||
| 2010 | $ | 55,980 | ||
| 2011 | 111,960 | |||
| 2012 | 27,990 | |||
The Company rents storage space for its service center in Korea. The lease provides for monthly lease payments approximating $1,134 USD starting on June 25, 2009 and expires on June 24, 2011. Future minimum lease payments under the operating leases as of September 30, 2009 approximate the following:
| Year Ending March 31, | ||||
| 2010 | $ | 6,804 | ||
| 2011 | 13,608 | |||
| 2012 | 3,402 | |||
The Company rents office space for its service center in Vietnam. The lease provides for monthly lease payments approximating $2,420 USD starting on May 9, 2009 and expires on May 9, 2011. Future minimum lease payments under the operating leases as of September 30, 2009 approximate the following:
F-37
| Year Ending March 31, | ||||
| 2010 | $ | 14,520 | ||
| 2011 | 29,040 | |||
| 2012 | 2,420 | |||
The Company rents office space for its service center in Vietnam SaiKong. The lease provides for monthly lease payments approximating $1,400 USD starting on August 8, 2009 and expires on August 8, 2011. Future minimum lease payments under the operating leases as of September 30, 2009 approximate the following:
| Year Ending March 31, | ||||
| 2010 | $ | 8,400 | ||
| 2011 | 16,800 | |||
| 2012 | 5,600 | |||
The Company rents office space for its service center in Thailand. The lease provides for monthly lease payments approximating $1,860 USD starting on April 20, 2009 and expires on February 28, 2010. Future minimum lease payments under the operating leases as of September 30, 2009 approximate the following:
| Year Ending March 31, | ||||
| 2010 | $ | 9,300 | ||
The Company rents office space for its service center as Thailand Center. The lease provides for monthly lease payments approximating $564 USD starting on April 1, 2009 and expires on February 28, 2010. Future minimum lease payments under the operating leases as of September 30, 2009 approximate the following:
| Year Ending March 31, | ||||
| 2010 | $ | 2,820 | ||
The Company rents office space for its auction product purchase center in China. The lease provides for monthly lease payments approximating $732 USD starting on June 1, 2009 and expires on May 30, 2010. Future minimum lease payments under the operating leases as of September 30, 2009 approximate the following:
| Year Ending March 31, | ||||
| 2010 | $ | 4,392 | ||
| 2011 | 1,464 | |||
The Company rents another office space for its auction product purchase center in China. The lease provides for monthly lease payments approximating $264 USD starting on July 15, 2009 and expires on July 14, 2010. Future minimum lease payments under the operating leases as of September 30, 2009 approximate the following:
| Year Ending March 31, | ||||
| 2010 | $ | 1,584 | ||
| 2011 | 1,056 | |||
Rent expenses for the six months ended September 30, 2009 and September 30, 2008 were approximately $253,226 and $244,305, respectively.
14. Subsequent Events
The Company has evaluated subsequent events from the balance sheet date through November 16, 2009 with the date being the date that the financial statements are issued or are available to be issued.
F-38
ITEM 14. CHANGES IN AND DISAGREEMENTS WITH ACCOUNTANTS ON ACCOUNTING AND FINANCIAL DISCLOSURE
We dismissed Weinberg & Company, P.A. (“Weinberg”) as our independent accountants on May 4, 2008. We had engaged Weinberg to audit our financial statements for the year ended March 31, 2008. On May 4, 2008, we engaged Child, Van Wagoner & Bradshaw, PLLC (“CVB”) as our independent accountants to audit our financial statements for the fiscal year ended March 31, 2008 and the subsequent fiscal years ending March 31st and d to review our unaudited reports for the interim periods. The change in accountants was approved by our board of directors on May 4, 2008. We do not have an audit committee due to the size of our board of directors.
For the period of their engagement, there were no disagreements with Weinberg on any matters of accounting principles or practices, financial statement disclosure, or auditing scope or procedure which, if not resolved to Weinberg satisfaction, would have caused Weinberg to make reference to the subject matter in connection with its reports; and there were no reportable events as defined in Item 304(a)(1)(iv) of Regulation S-K. During the period of the Company’s engagement of Weinberg, Weinberg did not issue any reports on the Company’s audited financial statements.
Prior to its engagement, neither the Company nor anyone on its behalf has consulted CVB, regarding (i) either: the application of accounting principles to a specific completed or contemplated transaction, or the type of audit opinion that might be rendered on the Company’s financial statements; as such, no written or oral advice was provided, and none was an important factor considered by the Company in reaching a decision as to the accounting, auditing or financial reporting issues; or (ii) any matter that was a subject of a disagreement or reportable event, as there were none.
We provided Weinberg with a copy of this disclosure on April 17, 2009, requesting Weinberg to furnish us with a letter addressed to the Securities and Exchange Commission stating whether it agrees with the statements made by us, and, if not, stating the respects in which it does not agree. A copy of the letter furnished by Weinberg in response to that request is filed as Exhibit 16.1 to Amendment No. 2 to the Company’s Form 10 filed with the SEC on April 21, 2009.
ITEM 15. FINANCIAL STATEMENTS AND EXHIBITS
(a) Financial Statements filed as part of this Registration Statement:
The Registrant’s audited financial statements for the years ended March 31, 2009 and 2008 and the notes thereto and the unaudited financial statements for the three and six months ended September 30, 2009 and 2008 and notes thereto are included in Item 13 of this Registration Statement on Form 10 and are incorporated by reference herein.
(b) Exhibits:
| Exhibit No.: | Description: | |
| 3.1(1) | Articles of Incorporation of GRG, Inc. (now EFT BioTech Holdings, Inc.). | |
| 3.1.1(1) | Articles of Merger filed December 28, 2004 between HumWare Media Corporation, World Wide Golf Web, Inc. and GRG, Inc. | |
| 3.1.2(1) | Certificate of Amendment, effective November 7, 2007, to the Articles of Incorporation of HumWare Media Corporation | |
| 3.2(3) | By-laws | |
| 4.1(1) | Form of Common Stock Certificate | |
| 4.2(1) | Form of Warrant to purchase one share of Common Stock for a purchase price of $3.80 per share until the second anniversary date of the date of issuance | |
| 10.1(3) | Share Exchange Agreement, dated as of the 1st day of November, 2007, by and among EFT BioTech Holdings, Inc. (formerly HumWare Media Corporation), a Nevada corporation; certain EFT Shareholders and EFT BioTech Corporation, a Nevada corporation | |
| 10.2(2) | Subscription Agreement for Units in connection with the Registrant’s Regulation S Private Placement | |
| 10.3(3) | Employment Agreement, dated May 10, 2008, between EFT BioTech Holdings, Inc. and Sharon Tang |
47
| 10.4(5) | $500,000 Loan Agreement, dated November 24, 2008, between the EFT Biotech Holdings, Inc. (as the Lender), EFT Investment Co., LTD., and Excalibur International Marine Corporation (as the Borrower) | |
| 10.5(5) | First Extension of $500,000 Loan, dated December 25, 2008 | |
| 10.6(5) | Second Extension of $500,000 Loan, dated May 25, 2009 | |
| 10.7(6) | $2,000,000 Loan Agreement, dated September 23, 2008, between the EFT Biotech Holdings, Inc. (as the Lender), EFT Investment Co., LTD., and Excalibur International Marine Corporation (as the Borrower). | |
| 10.8(5) | First Extension of $2,000,000 Loan, dated November 25, 2008 | |
| 10.9(5) | Second Extension of $2,000,000 Loan, dated May 25, 2009 | |
| 10.10(6) | $600,000 Loan Agreement, dated May 13, 2009, between the EFT Biotech Holdings, Inc. (as the Lender), EFT Investment Co., LTD., and Excalibur International Marine Corporation (as the Borrower). | |
| 10.11(6) | Addendum to $600,000 Loan Agreement, dated May 13, 2009, between the EFT Biotech Holdings, Inc. (as the Lender), EFT Investment Co., LTD., and Excalibur International Marine Corporation (as the Borrower). | |
| 10.12(7) | $330,000 Loan Agreement, dated July 14, 2008, between EFT BioTech Holdings, Inc. (Lender) and Yeuh-Chi Liu (Borrower) | |
| 10.13(7) | Addendum to $330,000 Loan Agreement, dated July 15, 2008, between BioTech Holdings, Inc. and Yeuh-Chi Liu | |
| 10.14(7) | $1,567,000 Loan Agreement, dated July 25, 2008, between BioTech Holdings, Inc. (Lender) and Yeuh-Chi Liu (Borrower) | |
| 10.15(8) | Subscription Agreement with Excalibur International Marine Corporation. | |
| 10.16(8) | Extension of $2,000,000 loan with Excalibur International Marine Corporation. | |
| 10.17(8) | Extension of $600,000 loan with Excalibur International Marine Corporation. | |
| 10.18(8) | Extension of $500,000 loan with Excalibur International Marine Corporation. | |
| 14.1(3) | Code of Ethics | |
| 14.2(6) | Amended Code of Business Conduct | |
| 16.1(4) | Letter of Weinberg & Company P.A., dated April 21, 2009 |
Notes:
| (1) | Filed as an exhibit to Form 10 (File No.: 001-34222) filed with the SEC on December 10, 2008 and incorporated by reference herein. |
| (2) | Filed as an exhibit to Form 10-Q for the quarter ended December 31, 2008 (File No.: 001-34222) filed with the SEC on February 13, 2009 and incorporated by reference herein. |
| (3) | Filed as an Exhibit to Amendment No. 1 to Form 10 (File No.: 001-34222) filed with the SEC on April 13, 2009 and incorporated by reference herein. |
| (4) | Filed as an Exhibit to Amendment No. 2 to Form 10 (File No.: 001-34222) filed with the SEC on April 21, 2009 and incorporated by reference herein. |
| (5) | Filed as an Exhibit to Form 10-K (File No.: 001-34222) filed with the SEC on July 17, 2009 and incorporated by reference herein. |
| (6) | Filed as an Exhibit to Amendment No. 4 to Form 10 (File No.: 001-34222) filed with the SEC on September 3, 2009 and incorporated by reference herein. |
| (7) | Filed as an Exhibit to Amendment No. 5 to Form 10 (File No.: 001-34222) filed with the SEC on October 29, 2009 and incorporated by reference herein. |
| (8) | Filed with this Amendment No. 9 |
48
SIGNATURES
Pursuant to the requirements of Section 12 of the Securities and Exchange Act of 1934, the Registrant has duly caused this registration statement to be signed on its behalf by the undersigned, thereunto duly authorized.
| EFT BIOTECH HOLDINGS, INC. | ||
| Date: May 20, 2010 | By: | /s/ Jack Jie Qin |
| Name: Jack Jie Qin | ||
| Title: President, Chief Executive Officer and Chairman | ||
| (Principal Executive Officer) | ||
49