Exhibit 99.1
Q4 2022 INVESTOR PRESENTATION |
2 SEVEN HILLS REALTY TRUST This presentation contains statements that constitute forward-looking statements within the meaning of the Private Securities Litigation Reform Act of 1995 and other securities laws. Whenever Seven Hills Realty Trust, or SEVN, uses words such as “believe”, “expect”, “anticipate”, “intend”, “plan”, “estimate”, “will”, “may” and negatives or derivatives of these or similar expressions, SEVN is making forward-looking statements. These forward-looking statements are based upon SEVN’s present intent, beliefs or expectations, but forward-looking statements are not guaranteed to occur and may not occur. Actual results may differ materially from those contained in or implied by SEVN’s forward-looking statements. Forward-looking statements involve known and unknown risks, uncertainties and other factors, some of which are beyond SEVN’s control. The information contained in SEVN's filings with the Securities and Exchange Commission, or the SEC, including under the heading “Risk Factors” in SEVN’s Annual Report on Form 10-K for the year ended December 31, 2022, and its other periodic reports, or incorporated therein, identifies other important factors that could cause SEVN’s actual results to differ materially from those stated in or implied by SEVN’s forward-looking statements. SEVN’s filings with the SEC are available on the SEC’s website at www.sec.gov. These factors should not be construed as exhaustive and should be read in conjunction with the other cautionary statements that are included in this presentation and in the filings. SEVN assumes no obligation to update or supplement forward‐looking statements that become untrue because of subsequent events or circumstances, except as required by law. SEVN's manager, Tremont Realty Capital LLC, or Tremont, is registered with the SEC as an investment adviser. Tremont is owned by The RMR Group (Nasdaq: RMR). Notes Regarding Certain Information in this Presentation This presentation contains industry and statistical data that SEVN obtained from various second party sources. Nothing in the data used or derived from second party sources should be construed as investment advice. Some data and other information presented are also based on SEVN’s good faith estimates and beliefs derived from its review of internal surveys and independent sources and its experience. SEVN believes that these external sources, estimates and beliefs are reliable and reasonable, but it has not independently verified them. Although SEVN is not aware of any misstatements regarding the data presented herein, these estimates and beliefs involve inherent risks and uncertainties and are based on assumptions that are subject to change. Unless otherwise noted, all data presented are as of or for the three months ended December 31, 2022. Non-GAAP Financial Measures This presentation contains non-GAAP financial measures including Distributable Earnings, Distributable Earnings per common share, Adjusted Distributable Earnings, Adjusted Distributable Earnings per common share and Adjusted Book Value per common share. Please refer to Non-GAAP Financial Measures and Certain Definitions in the Appendix for terms used throughout this presentation. WARNING REGARDING FORWARD-LOOKING STATEMENTS |
3 SEVEN HILLS REALTY TRUST BUSINESS AT A GLANCE Seven Hills Realty Trust is a real estate investment trust that originates and invests in floating rate first mortgage loans secured by middle market and transitional commercial real estate, or CRE. 3 1.7x Debt to Book Equity 0.5x Price to Book Value Per Share $682M Total Debt Capacity 68% Weighted Average Loan to Value 100% Loans Current on Debt Service $728M Total Loan Commitments 27 Floating-Rate First Mortgage Loans SEVN Nasdaq Listed |
4 SEVEN HILLS REALTY TRUST BUSINESS STRATEGY FOCUSED ON DRIVING GROWTH Attractively positioned to enhance shareholder value as SEVN further executes its business plan and demonstrates the strength of its portfolio to the investment community. Key Priorities • Identify investments that meet our disciplined underwriting criteria and targeted returns. • Originate investments in accretive loan opportunities. • Increase dividends as Distributable Earnings grow. • Communicate progress through enhanced marketing and investor engagement. 3 2 1 4 Retail Acquisition Financing Brandywine, MD 4 |
5 SEVEN HILLS REALTY TRUST • All loans current on debt service. • Diversified across geographies, sponsors and property types. • Emphasis on strong credit, visible cash flow and moderate LTV. High Quality Portfolio • Strong earnings growth tailwind in the current rising interest rate environment as 100% of investment portfolio is floating rate loans. • Attractive deep value stock with opportunity to enhance valuation as Distributable Earnings continue to grow. Strong Upside Potential • CRE investors continue to see strength in the fundamentals of the U.S. CRE markets despite rising interest rates and macroeconomic uncertainty. • Alternative lenders continue to gain market share by providing bespoke solutions for middle market and transitional CRE transactions. Attractive Market Opportunity • Proven investment professionals averaging over 20 years experience in real estate lending with deep relationships across the CRE space. • Differentiated client-focused mortgage origination process. • Strong shareholder alignment with ~12% ownership of SEVN equity. Managed by Tremont Realty Capital LLC • More than $37 billion in assets under management with approximately 600 real estate professionals in over 30 offices across the U.S. • The RMR Group’s expertise in procuring and managing real estate provides unrivaled insight into market conditions and loan collateral. Integrated with RMR Real Estate Platform COMPELLING INVESTMENT OPPORTUNITY Senior secured, diversified loan portfolio supported by an established CRE lender and nationwide real estate platform with extensive investment management expertise. 5 |
6 SEVEN HILLS REALTY TRUST LOAN PORTFOLIO OVERVIEW Portfolio Statistics Number of Loans 27 Average Loan Commitment $27M Total Loan Commitments $728M Principal Balance $679M Weighted Average Coupon Rate 8.07% Weighted Average All In Yield 8.57% Weighted Average LTV 68% Weighted Average Floor 0.62% Loans with Active Floors 2 0% Weighted Average Maximum Maturity 3.3 years Weighted Average Risk Rating 2.9 Property Type1 Geographic Diversity1 Loan to Value1 Risk Rating Distribution1 Office 38% Multifamily 29% Industrial 17% Retail 16% East 16% South 25% West 22% Midwest 37% 6 Well diversified portfolio of 100% floating rate loans with strong credit metrics. 15% 13% 29% 36% 7% 30%-60% 61%-65% 66%-70% 71%-75% 76%-80% 20% 65% 14% 1. Based on principal balance of loans held for investment as of December 31, 2022. 2. Represents percentage of principal balance of loans held for investment as of December 31, 2022. Lower Risk (1) Average Risk (2) Acceptable Risk (3) Higher Risk (4) Impaired/ Loss Likely (5) 1% ---% |
7 SEVEN HILLS REALTY TRUST $15 million - $75 million 80% >$75 million 20% ATTRACTIVE MARKET OPPORTUNITY Demand for CRE debt capital in the underserved middle market is expected to remain strong as alternative lenders like SEVN increase their presence in the marketplace. • ~80% of CRE asset sales transactions occur between $15 million and $75 million. • Demand for alternative sources of CRE debt capital is growing, particularly in the middle market. • Focus on underserved middle market presents opportunity to generate attractive risk adjusted returns. Alternative Lender Market Share2 CRE Asset Sales Transactions > $15 Million1 2017 - 2022 1. Source: Real Capital Analytics; data obtained February 2023. Includes all properties sold in transactions greater than $15 million from 2017 to 2022 in the following property types: Office, Industrial, Retail, Hotel, Apartment and Senior Housing & Care. 2. Source: Real Capital Analytics as of September 2022. 7% 10% 10% 8% 12% 16% 2017 2018 2019 2020 2021 2022 H1 “Strong interest from both borrowers and lenders is likely to continue to drive increases in commercial and multifamily mortgage debt in 2022.” – Mortgage Bankers Association “Middle Market” “Upper Market” |
8 SEVEN HILLS REALTY TRUST MANAGED BY TREMONT REALTY CAPITAL LLC Impressive track record with deep experience originating and actively managing middle market and transitional CRE loans. • ~$6 billion of loan originations completed since inception in 2000. • Team of professionals with an average of over 20 years experience in the CRE finance sector. • Seasoned underwriting, asset management and origination resources support continued growth. • Fully integrated platform provides a competitive advantage versus outsourced models. • Strong shareholder alignment with 12% equity ownership of SEVN. Fully Integrated Platform Origination Diligence Financing Asset Management Reporting Investor Relations Compliance Marketing Established Manager |
9 SEVEN HILLS REALTY TRUST STRONG ORIGINATION PIPELINE Term Sheets Issued 41 Loans $1.5 billion 10 Loans $299 million 7 Loans $228 million Full Year 2022 Production Statistics Tremont employs a rigorous screening process with multidisciplinary review to select the most compelling loan opportunities. • Screened loans with an average size of approximately $36 million. • Converted 17% of term sheets issued into closed loans. • Closed approximately 1.5% of the total value of loans screened. 456 Loans $17 billion Loans Screened Applications Closed 9 |
10 SEVEN HILLS REALTY TRUST LOAN PRODUCTION Tremont closed more than $220 million of new loans in 2022, increasing total committed capital to $728 million. $55.5 $77.0 $128.4 $157.3 $91.2 $51.6 $38.4 $22.0 $10.0 $11.8 $11.1 $7.4 $4.6 $8.9 $8.6 $2.4 $65.5 $88.8 $139.5 $164.7 $95.8 $60.5 $47.0 $24.4 Q1 2021 Q2 2021 Q3 2021 Q4 2021 Q1 2022 Q2 2022 Q3 2022 Q4 2022 Loan Originations by Quarter1 (Dollars in millions) Total Commitments Unfunded Commitments Principal Balance Loan Count 1. Includes loans originated by TRMT and acquired by SEVN on September 30, 2021, as a result of the Merger. 2 3 6 6 3 2 1 1 |
11 SEVEN HILLS REALTY TRUST Loan Fontana, CA Passaic, NJ Las Vegas, NV Type First Mortgage Loan First Mortgage Loan First Mortgage Loan Size $24.4 million $47.0 million $29.0 million Term Two-year initial term; Two one-year extension options Three-year initial term; Two one-year extension options Three-year initial term; Two one-year extension options LTV 72% 69% 60% Collateral Industrial Industrial Multifamily Loan Purpose Acquisition Acquisition Acquisition Investment Date November 2022 September 2022 June 2022 RECENT LOAN ORIGINATIONS |
12 SEVEN HILLS REALTY TRUST FOURTH QUARTER FINANCIAL PERFORMANCE • Delivered solid earnings growth supported by the positive impact of rising interest rates. • Increased Adjusted Distributable Earnings per common share by 37% on a sequential quarter basis. • Grew interest income from investments by more than 100% compared to Q4 2021. • Ended the quarter with $71 million of cash on hand. Delivered meaningful earnings growth supported by the positive impact of rising interest. Adjusted Distributable Earnings Per Common Share Q4 2022 Highlights 1 $0.24 $0.21 $0.37 $0.24 $0.27 $0.37 Q3 2021 Q4 2021 Q1 2022 Q2 2022 Q3 2022 Q4 2022 1. Q1 2022 Adjusted Distributable Earnings per common share included $0.16 of prepayment income. |
13 SEVEN HILLS REALTY TRUST 13 Dividends Per Common Share $0.15 $0.15 $0.25 $0.25 $0.25 $0.25 $0.35 Aug 2021 Sep 2021 Feb 2022 May 2022 Aug 2022 Nov 2022 Feb 2023 1 DIVIDEND GROWTH Dividend increases supported by strength of loan portfolio and the favorable impact of rising interest rates. 1. Paid fourth quarter dividend of $0.15 per common share in September 2021 in anticipation of the Merger closing. |
14 SEVEN HILLS REALTY TRUST FOURTH QUARTER PORTFOLIO ACTIVITY SEVN closed one new loan and realized two loan repayments during Q4 2022. $705.5 $705.5 $727.5 $678.6 $678.6 $22.0 $4.8 $53.7 $57.7 $49.0 Q3 2022 Portfolio Originations Fundings Repayments Q4 2022 Portfolio $763.1 $727.6 Total Commitments Unfunded Commitments Principal Balance Q4 2022 Portfolio Activity (Dollars in millions) 14 |
15 SEVEN HILLS REALTY TRUST FOURTH QUARTER CAPITALIZATION Equity Secured 37% Financing Facilities 63% $474 $208 Q4 2022 Advanced Unused Capacity Capital Structure Secured Financing Facilities (Dollars in millions) Strong relationships with Secured Financing Facilities continue to support SEVN’s capacity to invest in additional loan opportunities. Recent Highlights • Closed a repurchase facility with Wells Fargo in March 2022. • Upsized non mark to market facility with BMO in April 2022. • Available liquidity to fund ~$255 million of future loan originations and advances. • Target leverage of 2.5x as available capital continues to be deployed. $682 |
16 SEVEN HILLS REALTY TRUST INTEREST RATE SENSITIVITY Annualized Impact to Net Interest Income Per Share1 As of December 31, 2022 Strong earnings growth tailwind in the current rising interest rate environment as 100% of investment portfolio is floating rate loans. • Expect earnings to continue to benefit from higher interest rate levels and additional interest rate increases that may occur. • None of our loans have active interest rate floors. • No interest rate floors on advances under our Secured Financing Facilities. 1. The above table illustrates the incremental impact on our annual income from investments, net, due to hypothetical increases in LIBOR and SOFR, taking into consideration our borrowers’ interest rate floors as of December 31, 2022. The results in the table above are based on our loan portfolio and debt outstanding at December 31, 2022. Any changes to the mix of our investments or debt outstanding could impact the interest rate sensitivity analysis. This illustration is not meant to forecast future results. 16 $-0.07 $-0.03 $0.00 $0.04 $0.07 $0.11 $0.14 $0.18 ($0.10) ($0.05) $0.00 $0.05 $0.10 $0.15 $0.20 -50 bps -25 bps 0 bps +25 bps +50 bps +75 bps +100 bps+125 bps Interest Rate Changes |
17 SEVEN HILLS REALTY TRUST RMR’s Operations Include: National Multi-Sector Investment Platform INDUSTRIAL GOVERNMENT MEDICAL OFFICE LIFE SCIENCE OFFICE SENIOR LIVING HOTELS RETAIL RMR Managed Companies Over 38,000 Employees Nearly 2,100 Properties Over $16 Billion in Annual Revenues Over $37 Billion in AUM Approximately 600 CRE Professionals More than 30 Offices Throughout the U.S. Financial Services Real Estate Services Business Services Accounting Acquisitions/ Dispositions Administration Capital Markets Asset Management Human Resources Compliance/Audit Construction/ Development Information Technology Finance/Planning Engineering Investor Relations Treasury Leasing Marketing Tax Property Management Legal/ Risk Management VERITCALLY INTEGRATED NATIONAL REAL ESTATE INVESTING PLATFORM The RMR Group 17 |
APPENDIX |
19 SEVEN HILLS REALTY TRUST TARGET INVESTMENTS Selective origination strategy focused on providing borrowers flexible capital solutions for middle market CRE properties nationwide. Loan Size Principal balances typically $15 million to $75 million. Collateral First lien mortgages on middle market transitional assets. Property Type Multifamily, Industrial, Office, Retail and other commercial property types. Geography Primary and secondary markets nationwide. Loan to Value Stabilized LTV ratios generally 75% or less. Interest Rates SOFR plus market competitive margin. Term 2 - 5 years including extension options. Amortization Interest only. Recourse Non-recourse to sponsors. 19 |
20 SEVEN HILLS REALTY TRUST KEY UNDERWRITING CRITERIA Primary investment objective of balancing capital preservation with the generation of attractive risk adjusted returns. SPONSORSHIP Meaningful “skin” in the game History of performance High character Well capitalized COLLATERAL First mortgage secured by cash flowing properties Properties in liquid markets with institutional investor base Quality properties in strong locations LTV supported by third party appraisal BUSINESS PLAN Fully capitalized at closing Achievable over 3 to 5-year horizon Actionable plans not reliant on market rent growth or cap rate compression EXIT STRATEGY Evaluate both a primary and secondary source of repayment Refinance exit achievable based on current CMBS sizing and pricing standards Loan basis vis-à-vis downside scenario and path to repayment 20 |
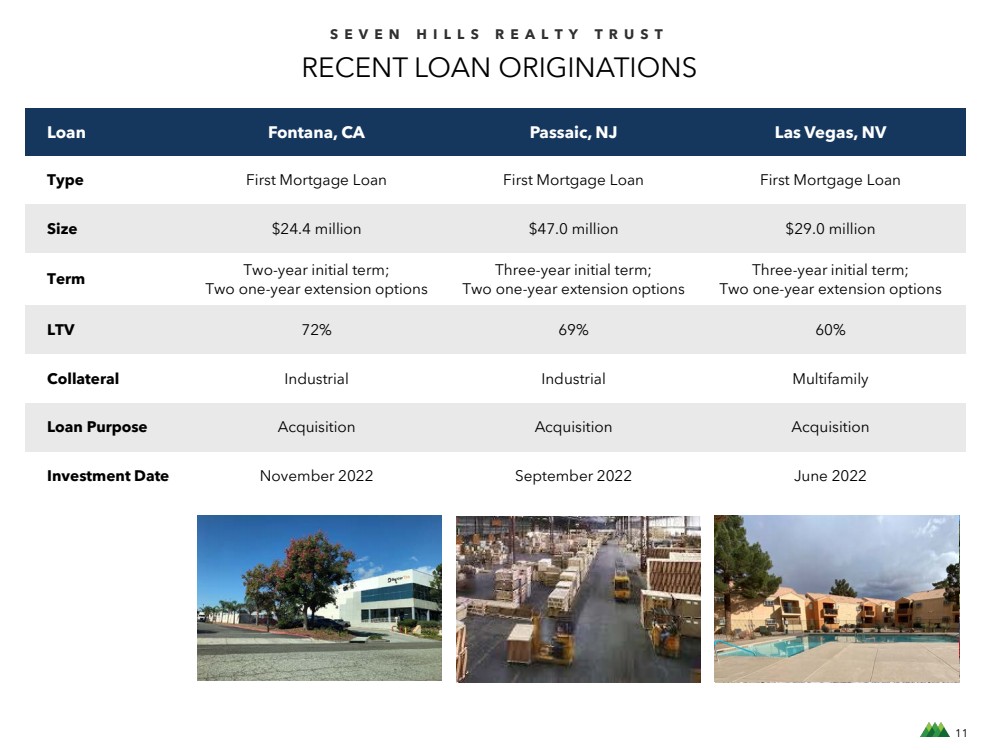
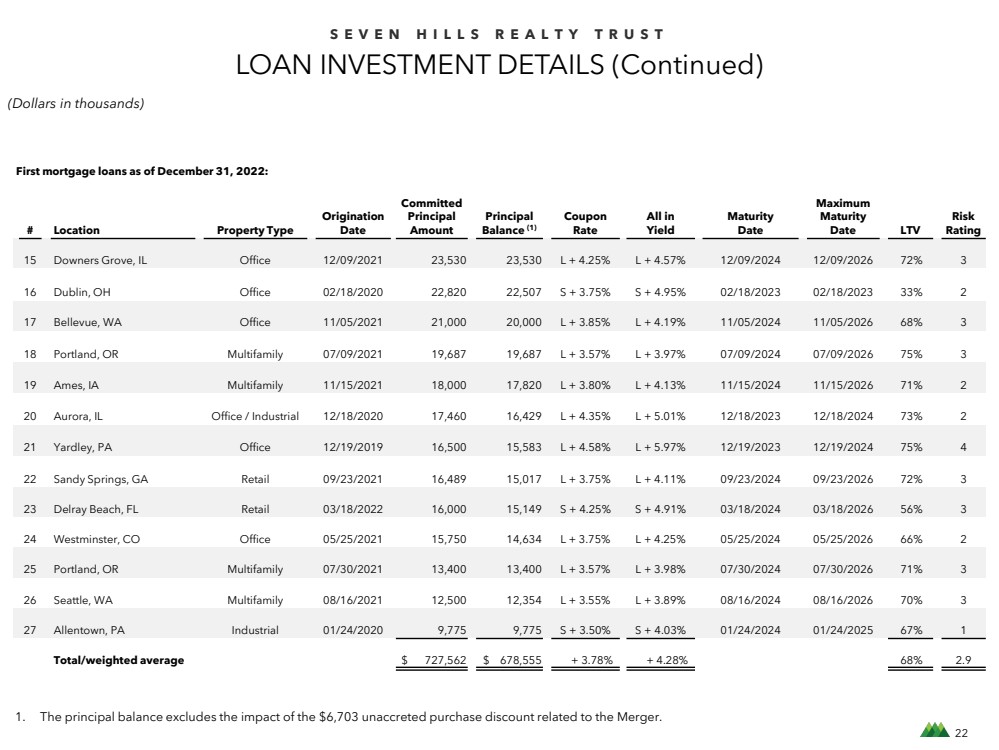
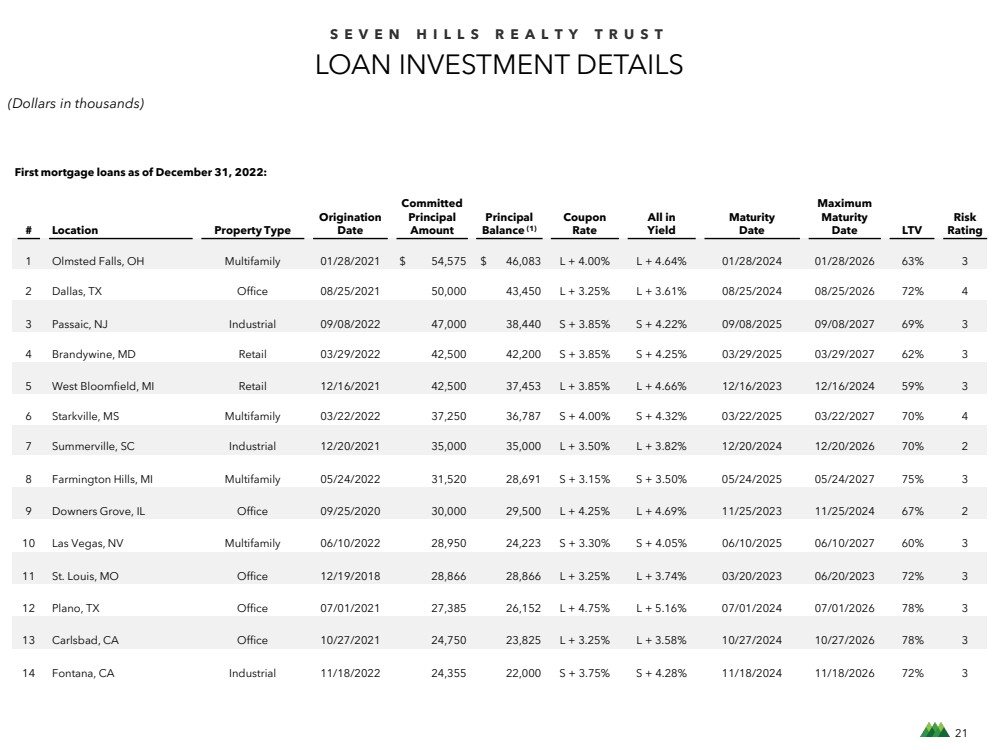
21 SEVEN HILLS REALTY TRUST LOAN INVESTMENT DETAILS (1) (Dollars in thousands) First mortgage loans as of December 31, 2022: # Location Property Type Origination Date Committed Principal Amount Principal Balance (1) Coupon Rate All in Yield Maturity Date Maximum Maturity Date LTV Risk Rating 1 Olmsted Falls, OH Multifamily 01/28/2021 $ 54,575 $ 46,083 L + 4.00% L + 4.64% 01/28/2024 01/28/2026 63% 3 2 Dallas, TX Office 08/25/2021 50,000 43,450 L + 3.25% L + 3.61% 08/25/2024 08/25/2026 72% 4 3 Passaic, NJ Industrial 09/08/2022 47,000 38,440 S + 3.85% S + 4.22% 09/08/2025 09/08/2027 69% 3 4 Brandywine, MD Retail 03/29/2022 42,500 42,200 S + 3.85% S + 4.25% 03/29/2025 03/29/2027 62% 3 5 West Bloomfield, MI Retail 12/16/2021 42,500 37,453 L + 3.85% L + 4.66% 12/16/2023 12/16/2024 59% 3 6 Starkville, MS Multifamily 03/22/2022 37,250 36,787 S + 4.00% S + 4.32% 03/22/2025 03/22/2027 70% 4 7 Summerville, SC Industrial 12/20/2021 35,000 35,000 L + 3.50% L + 3.82% 12/20/2024 12/20/2026 70% 2 8 Farmington Hills, MI Multifamily 05/24/2022 31,520 28,691 S + 3.15% S + 3.50% 05/24/2025 05/24/2027 75% 3 9 Downers Grove, IL Office 09/25/2020 30,000 29,500 L + 4.25% L + 4.69% 11/25/2023 11/25/2024 67% 2 10 Las Vegas, NV Multifamily 06/10/2022 28,950 24,223 S + 3.30% S + 4.05% 06/10/2025 06/10/2027 60% 3 11 St. Louis, MO Office 12/19/2018 28,866 28,866 L + 3.25% L + 3.74% 03/20/2023 06/20/2023 72% 3 12 Plano, TX Office 07/01/2021 27,385 26,152 L + 4.75% L + 5.16% 07/01/2024 07/01/2026 78% 3 13 Carlsbad, CA Office 10/27/2021 24,750 23,825 L + 3.25% L + 3.58% 10/27/2024 10/27/2026 78% 3 14 Fontana, CA Industrial 11/18/2022 24,355 22,000 S + 3.75% S + 4.28% 11/18/2024 11/18/2026 72% 3 |
22 SEVEN HILLS REALTY TRUST LOAN INVESTMENT DETAILS (Continued) (Dollars in thousands) (1) 1. The principal balance excludes the impact of the $6,703 unaccreted purchase discount related to the Merger. First mortgage loans as of December 31, 2022: # Location Property Type Origination Date Committed Principal Amount Principal Balance (1) Coupon Rate All in Yield Maturity Date Maximum Maturity Date LTV Risk Rating 15 Downers Grove, IL Office 12/09/2021 23,530 23,530 L + 4.25% L + 4.57% 12/09/2024 12/09/2026 72% 3 16 Dublin, OH Office 02/18/2020 22,820 22,507 S + 3.75% S + 4.95% 02/18/2023 02/18/2023 33% 2 17 Bellevue, WA Office 11/05/2021 21,000 20,000 L + 3.85% L + 4.19% 11/05/2024 11/05/2026 68% 3 18 Portland, OR Multifamily 07/09/2021 19,687 19,687 L + 3.57% L + 3.97% 07/09/2024 07/09/2026 75% 3 19 Ames, IA Multifamily 11/15/2021 18,000 17,820 L + 3.80% L + 4.13% 11/15/2024 11/15/2026 71% 2 20 Aurora, IL Office / Industrial 12/18/2020 17,460 16,429 L + 4.35% L + 5.01% 12/18/2023 12/18/2024 73% 2 21 Yardley, PA Office 12/19/2019 16,500 15,583 L + 4.58% L + 5.97% 12/19/2023 12/19/2024 75% 4 22 Sandy Springs, GA Retail 09/23/2021 16,489 15,017 L + 3.75% L + 4.11% 09/23/2024 09/23/2026 72% 3 23 Delray Beach, FL Retail 03/18/2022 16,000 15,149 S + 4.25% S + 4.91% 03/18/2024 03/18/2026 56% 3 24 Westminster, CO Office 05/25/2021 15,750 14,634 L + 3.75% L + 4.25% 05/25/2024 05/25/2026 66% 2 25 Portland, OR Multifamily 07/30/2021 13,400 13,400 L + 3.57% L + 3.98% 07/30/2024 07/30/2026 71% 3 26 Seattle, WA Multifamily 08/16/2021 12,500 12,354 L + 3.55% L + 3.89% 08/16/2024 08/16/2026 70% 3 27 Allentown, PA Industrial 01/24/2020 9,775 9,775 S + 3.50% S + 4.03% 01/24/2024 01/24/2025 67% 1 Total/weighted average $ 727,562 $ 678,555 + 3.78% + 4.28% 68% 2.9 |
23 SEVEN HILLS REALTY TRUST RECONCILIATION OF NET INCOME TO DISTRIBUTABLE EARNINGS AND ADJUSTED DISTRIBUTABLE EARNINGS 1. Exit fees collected for loans acquired in the Merger represent fees collected upon repayment of loans for which no income relating to those exit fees has previously been recognized in Distributable Earnings. In accordance with GAAP, exit fees payable with respect to loans acquired in the Merger were accreted as a component of the purchase discount and were excluded from Distributable Earnings as a non-cash item. Accordingly, these exit fees have been recognized in Distributable Earnings upon collection. 2. Other transaction related costs include expenses related to the Merger. 3. Income tax expense for the three months and year ended December 31, 2021 represents the portion of income tax expense incurred on realized gains on the disposition of our securities portfolio in connection with SEVN's conversion from a registered investment company to a mortgage REIT in January 2021. Three Months Ended December 31, Year Ended December 31, 2022 2021 2022 2021 Reconciliation of net income to Distributable Earnings and Adjusted Distributable Earnings: Net income $ 6,760 $ 20,656 $ 27,640 $ 24,650 Non-cash equity compensation expense 129 446 1,018 627 Non-cash accretion of purchase discount (1,522) (18,932) (10,689) (18,932) Exit fees collected on loans acquired in Merger (1) — — 104 — Distributable Earnings 5,367 2,170 18,073 6,345 Other transaction related costs (2) — 589 37 589 Income tax expense (3) — 282 — 282 Adjusted Distributable Earnings $ 5,367 $ 3,041 $ 18,110 $ 7,216 Weighted average common shares outstanding - basic 14,579 14,506 14,540 11,304 Weighted average common shares outstanding - diluted 14,579 14,507 14,540 11,304 Net income per common share - basic and diluted $ 0.46 $ 1.42 $ 1.89 $ 2.18 Distributable Earnings per common share - basic and diluted $ 0.37 $ 0.15 $ 1.24 $ 0.56 Adjusted Distributable Earnings per common share - basic and diluted $ 0.37 $ 0.21 $ 1.25 $ 0.64 |
24 SEVEN HILLS REALTY TRUST NON-GAAP FINANCIAL MEASURES AND CERTAIN DEFINITIONS Non-GAAP Financial Measures: We present Distributable Earnings, Distributable Earnings per common share, Adjusted Distributable Earnings, Adjusted Distributable Earnings per common share and Adjusted Book Value per common share, which are considered “non-GAAP financial measures” within the meaning of the applicable SEC rules. These non-GAAP financial measures do not represent net income, net income per common share or cash generated from operating activities and should not be considered as alternatives to net income or net income per common share determined in accordance with GAAP or as an indication of our cash flows from operations determined in accordance with GAAP, a measure of our liquidity or operating performance or an indication of funds available for our cash needs. In addition, our methodologies for calculating these non-GAAP financial measures may differ from the methodologies employed by other companies to calculate the same or similar supplemental performance measures; therefore, our reported Distributable Earnings, Distributable Earnings per common share, Adjusted Distributable Earnings, and Adjusted Distributable Earnings per common share may not be comparable to distributable earnings, distributable earnings per common share, adjusted distributable earnings and adjusted distributable earnings per common share, as reported by other companies. We believe that Adjusted Book Value per common share is a meaningful measure of our capital adequacy because it excludes the unaccreted purchase discount resulting from the excess of the fair value of the loans TRMT then held for investment and that we acquired as a result of the Merger over the consideration we paid in the Merger. Adjusted Book Value per common share does not represent book value per common share or alternative measures determined in accordance with GAAP. Our methodology for calculating Adjusted Book Value per common share may differ from the methodologies employed by other companies to calculate the same or similar supplemental capital adequacy measures; therefore, our Adjusted Book Value per common share may not be comparable to the adjusted book value per common share reported by other companies. In order to maintain our qualification for taxation as a REIT, we are generally required to distribute substantially all of our taxable income, subject to certain adjustments, to our shareholders. We believe that one of the factors that investors consider important in deciding whether to buy or sell securities of a REIT is its distribution rate. Over time, Distributable Earnings, Distributable Earnings per common share, Adjusted Distributable Earnings and Adjusted Distributable Earnings per common share may be useful indicators of distributions to our shareholders and are measures that are considered by our Board of Trustees when determining the amount of distributions. We believe that Distributable Earnings, Distributable Earnings per common share, Adjusted Distributable Earnings and Adjusted Distributable Earnings per common share provide meaningful information to consider in addition to net income, net income per common share and cash flows from operating activities determined in accordance with GAAP. These measures help us to evaluate our performance excluding the effects of certain transactions, the variability of any management incentive fees that may be paid or payable and GAAP adjustments that we believe are not necessarily indicative of our current loan portfolio and operations. In addition, Distributable Earnings is used in determining the amount of base management and management incentive fees payable by us to Tremont under our management agreement. Distributable Earnings: We calculate Distributable Earnings and Distributable Earnings per common share as net income and net income per common share, respectively, computed in accordance with GAAP, including realized losses not otherwise included in net income determined in accordance with GAAP, and excluding: (a) the management incentive fees earned by Tremont, if any; (b) depreciation and amortization, if any; (c) non-cash equity compensation expense; (d) unrealized gains, losses and other similar non-cash items that are included in net income for the period of the calculation (regardless of whether such items are included in or deducted from net income or in other comprehensive income under GAAP), if any; and (e) one-time events pursuant to changes in GAAP and certain non-cash items, if any. Distributable Earnings are reduced for realized losses on loan investments when amounts are deemed uncollectable. Adjusted Distributable Earnings: We define Adjusted Distributable Earnings and Adjusted Distributable Earnings per common share as Distributable Earnings and Distributable Earnings per common share, respectively, excluding the effects of certain non-recurring transactions. Adjusted Book Value: Adjusted Book Value per common share is a non-GAAP measure that excludes the impact of the unaccreted purchase discount resulting from the excess of the fair value of the loans TRMT then held for investment which we acquired as a result of the Merger over the consideration we paid. |
25 SEVEN HILLS REALTY TRUST NON-GAAP FINANCIAL MEASURES AND CERTAIN DEFINITIONS All In Yield: All In Yield represents the yield on a loan, including amortization of deferred fees over the initial term of the loan and excluding any purchase discount accretion. BMO: BMO refers to BMO Harris Bank N.A. CMBS: CMBS refers to commercial mortgage-backed securities. LIBOR: LIBOR refers to the London Interbank Offered Rate. LTV: Loan to value ratio, or LTV, represents the initial loan amount divided by the underwritten in-place value of the underlying collateral at closing. GAAP: GAAP means U.S. generally accepted accounting principles. Maximum Maturity: Maximum Maturity assumes all borrower loan extension options have been exercised, which options are subject to the borrower meeting certain conditions. Merger: On September 30, 2021, TRMT merged with and into us. We refer to this transaction as the merger. Secured Financing Facilities: Collectively, we refer to our master repurchase facilities and our non mark to market loan facility as our Secured Financing Facilities. SOFR: SOFR refers to the Secured Overnight Financing Rate. TRMT: TRMT refers to Tremont Mortgage Trust. Wells Fargo: Wells Fargo refers to Wells Fargo, National Association. |
TWO NEWTON PLACE | 255 WASHINGTON STREET, SUITE 300 | NEWTON, MASSACHUSETTS 02458 SEVNREIT.COM |