
1 THIRD QUARTER 2022 Supplemental Operating and Financial Data ALL AMOUNTS IN THIS REPORT ARE UNAUDITED. Exhibit 99.2

2 Supplemental Q3 2022 2 Table of Contents CORPORATE INFORMATION Company Profile ...................................................................................................................................................................... 3 Investor Information and Research Coverage ................................................................................................................... 4 Company Highlights ............................................................................................................................................................... 5 PORTFOLIO OVERVIEW Third Quarter 2022 Highlights .............................................................................................................................................. 6 Loan Portfolio Summary ......................................................................................................................................................... 7 Portfolio Growth and Diversification ................................................................................................................................... 8 Portfolio Credit Quality .......................................................................................................................................................... 9 Capital Structure Overview .................................................................................................................................................... 10 Interest Rate Sensitivity ........................................................................................................................................................... 11 APPENDIX Loan Investment Details ......................................................................................................................................................... 13 Purchase Discount Details ..................................................................................................................................................... 15 Condensed Consolidated Balance Sheets ......................................................................................................................... 16 Condensed Consolidated Statements of Operations ...................................................................................................... 17 Reconciliation of Net Income to Distributable Earnings and Adjusted Distributable Earnings ............................... 18 WARNING CONCERNING FORWARD-LOOKING STATEMENTS ................................................................................................ 19 NON-GAAP FINANCIAL MEASURES AND CERTAIN DEFINITIONS Non-GAAP Financial Measures ............................................................................................................................................. 20 Other Measures and Definitions .......................................................................................................................................... 21 Please refer to Non-GAAP Financial Measures and Other Measures and Definitions for terms used throughout this document.

3 Supplemental Q3 2022 3 Management: Our manager, Tremont Realty Capital LLC, or Tremont, is registered with the Securities and Exchange Commission, or SEC, as an investment adviser. Tremont is owned by The RMR Group (Nasdaq: RMR). RMR is an alternative asset management company that is focused on CRE and related businesses. RMR primarily provides management services to publicly traded real estate companies, privately held real estate funds and real estate related operating businesses. As of September 30, 2022, RMR had over $37 billion of real estate assets under management and the combined RMR managed companies had approximately $12 billion of annual revenues, 2,100 properties and over 38,000 employees. We believe Tremont’s relationship with RMR provides us with a depth of market knowledge that may allow us to identify high quality investment opportunities and to evaluate them more thoroughly than many of our competitors, including other commercial mortgage REITs. We also believe RMR’s broad platform provides us with access to RMR’s extensive network of real estate owners, operators, intermediaries, sponsors, financial institutions and other real estate related professionals and businesses with which RMR has historical relationships. We also believe that Tremont provides us with significant experience and expertise in investing in middle market and transitional CRE. The Company: Seven Hills Realty Trust, or SEVN, we, our or us, is a real estate investment trust, or REIT, that focuses on originating and investing in floating rate first mortgage loans secured by middle market and transitional commercial real estate, or CRE. We define middle market CRE as commercial properties that have values up to $100.0 million and transitional CRE as commercial properties subject to redevelopment or repositioning activities that are expected to increase the value of the properties. Corporate Headquarters: Two Newton Place 255 Washington Street, Suite 300 Newton, MA 02458-1634 (617) 332-9530 Stock Exchange Listing: Nasdaq Trading Symbol: Common Shares: SEVN Key Data (as of and for the three months ended September 30, 2022): (dollars in thousands) Income from investments, net $ 7,799 Net income $ 5,176 Adjusted Distributable Earnings $ 3,943 Loans held for investment, net $ 695,154 Total assets $ 775,199 Company Profile RETURN TO TABLE OF CONTENTSCORPORATE INFORMATION

4 Supplemental Q3 2022 4 Investor Information and Research Coverage Board of Trustees Equity Research Coverage Barbara D. Gilmore Phyllis M. Hollis William A. Lamkin JMP Securities Independent Trustee Independent Trustee Independent Trustee Chris Muller, CFA (212) 906-3559 Joseph L. Morea Jeffrey P. Somers cmuller@jmpsecurities.com Lead Independent Trustee Independent Trustee Matthew P. Jordan Adam D. Portnoy Jones Trading Institutional Services, LLC Managing Trustee Chair of the Board & Managing Trustee Jason M. Stewart (646) 465-9932 Executive Officers jstewart@jonestrading.com Thomas J. Lorenzini Tiffany R. Sy President Chief Financial Officer and Treasurer Contact Information Investor Relations Inquiries SEVN is followed by the analysts listed above. Please note that any opinions, estimates or forecasts regarding SEVN’s performance made by these analysts do not represent opinions, estimates or forecasts of SEVN or its management. SEVN does not by its reference above imply its endorsement of or concurrence with any information, conclusions or recommendations provided by any of these analysts. Seven Hills Realty Trust Financial, investor and media inquiries should be directed to: Two Newton Place Kevin Barry, Director, Investor Relations 255 Washington Street, Suite 300 at (617) 332-9530 or ir@sevnreit.com (617) 796-8253 ir@sevnreit.com www.sevnreit.com CORPORATE INFORMATION RETURN TO TABLE OF CONTENTS
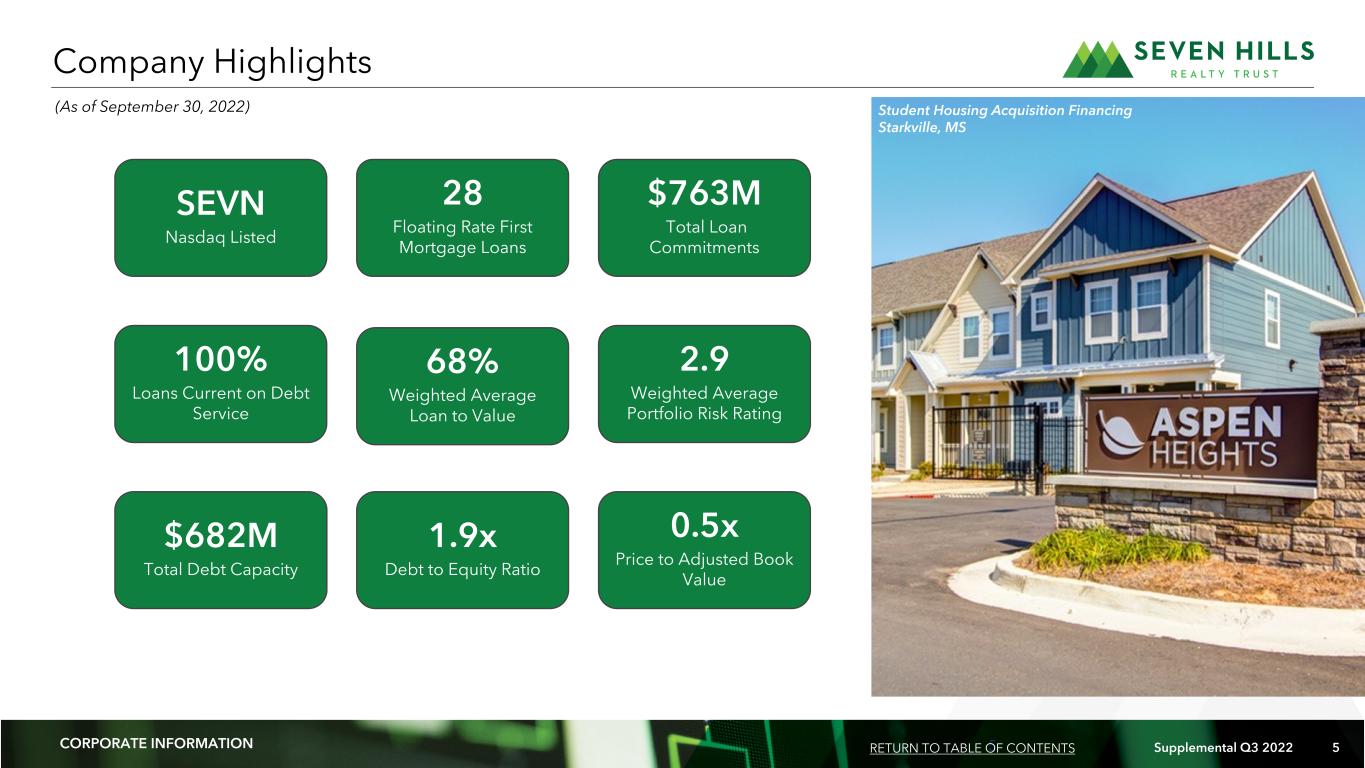
5 Supplemental Q3 2022 5 Company Highlights CORPORATE INFORMATION 28 Floating Rate First Mortgage Loans SEVN Nasdaq Listed $763M Total Loan Commitments 100% Loans Current on Debt Service $682M Total Debt Capacity 68% Weighted Average Loan to Value 1.9x Debt to Equity Ratio 2.9 Weighted Average Portfolio Risk Rating 0.5x Price to Adjusted Book Value RETURN TO TABLE OF CONTENTS Student Housing Acquisition Financing Starkville, MS (As of September 30, 2022)
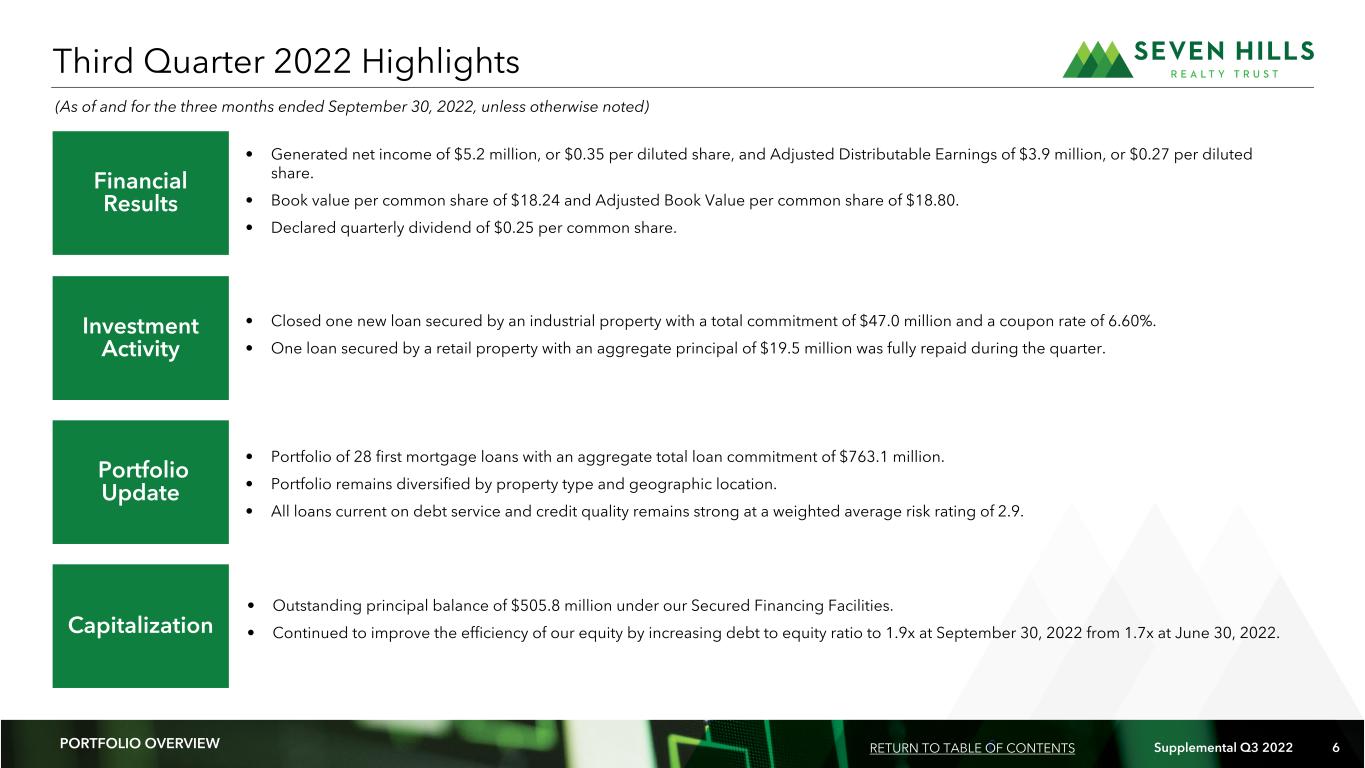
6 Supplemental Q3 2022 6 Financial Results Investment Activity Portfolio Update Capitalization • Generated net income of $5.2 million, or $0.35 per diluted share, and Adjusted Distributable Earnings of $3.9 million, or $0.27 per diluted share. • Book value per common share of $18.24 and Adjusted Book Value per common share of $18.80. • Declared quarterly dividend of $0.25 per common share. • Portfolio of 28 first mortgage loans with an aggregate total loan commitment of $763.1 million. • Portfolio remains diversified by property type and geographic location. • All loans current on debt service and credit quality remains strong at a weighted average risk rating of 2.9. • Closed one new loan secured by an industrial property with a total commitment of $47.0 million and a coupon rate of 6.60%. • One loan secured by a retail property with an aggregate principal of $19.5 million was fully repaid during the quarter. • Outstanding principal balance of $505.8 million under our Secured Financing Facilities. • Continued to improve the efficiency of our equity by increasing debt to equity ratio to 1.9x at September 30, 2022 from 1.7x at June 30, 2022. Third Quarter 2022 Highlights PORTFOLIO OVERVIEW RETURN TO TABLE OF CONTENTS (As of and for the three months ended September 30, 2022, unless otherwise noted)

7 Supplemental Q3 2022 7 $682.3 $682.3 $720.7 $705.5 $705.5 $38.4 $4.3 $19.5$52.7 $57.7 Q2 2022 Portfolio Originations Fundings Repayments Q3 2022 Portfolio Third Quarter 2022 Portfolio Activity (dollars in millions) Total Loan Commitments Unfunded Commitments (dollars in thousands) Third Quarter Originations Total Portfolio As of September 30, 2022 Number of loans 1 28 Average loan commitment $47,000 $27,253 Total loan commitments $47,000 $763,076 Unfunded loan commitments $8,560 $57,712 Principal balance $38,440 $705,460 Weighted average coupon rate 6.60% 6.59% Weighted average All In Yield 6.97% 7.10% Weighted average Maximum Maturity 5.0 3.5 Weighted average LTV 69% 68% Weighted average floor 0.25% 0.55% Loans with active floors 0% 0% Weighted average risk rating 3.0 2.9 Principal Balance Loan Portfolio Summary $763.1 PORTFOLIO OVERVIEW RETURN TO TABLE OF CONTENTS $734.9

8 Supplemental Q3 2022 8 Retail East: 15% South: 24% West: 26% Midwest: 35% Office: 39% Multifamily: 28% Retail: 19% Industrial: 14% Geographic Region (2) Property Type (2) (dollars in millions) Portfolio Growth and Diversification (1) Includes loans originated by Tremont Mortgage Trust, or TRMT, and acquired by SEVN on September 30, 2021, as a result of the merger with TRMT, or the Merger. (2) Based on principal balance of loans held for investment as of September 30, 2022. $55.5 $77.0 $128.4 $157.3 $91.2 $51.6 $38.4 $10.0 $11.8 $11.1 $7.4 $4.6 $8.9 $8.6 $65.5 $88.8 $139.5 $164.7 $95.8 $60.5 $47.0 Q1 2021 Q2 2021 Q3 2021 Q4 2021 Q1 2022 Q2 2022 Q3 2022 Total Loan Commitments Unfunded Commitments Principal Balance Loan Originations by Quarter (1) PORTFOLIO OVERVIEW Loan Count 6 6 3 2 RETURN TO TABLE OF CONTENTS 32 1
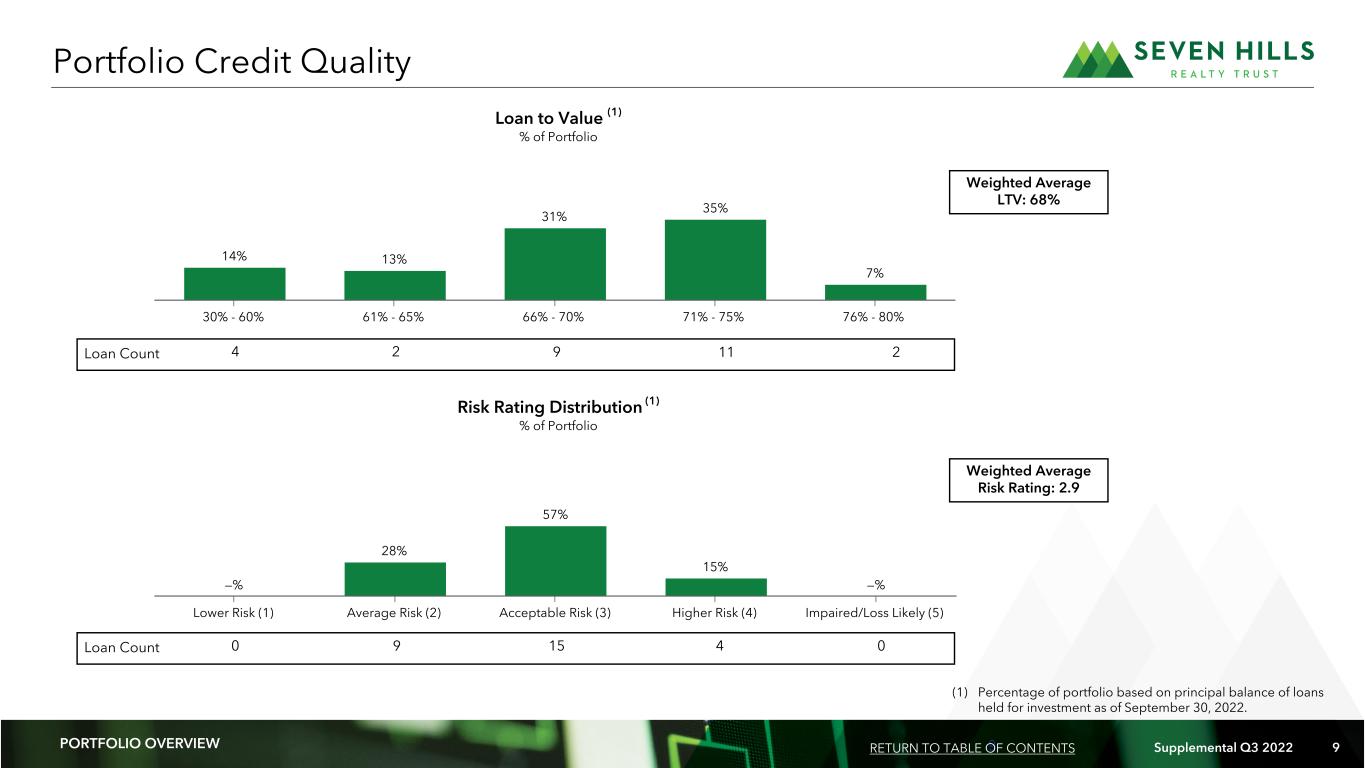
9 Supplemental Q3 2022 9 Loan Count 14% 13% 31% 35% 7% 30% - 60% 61% - 65% 66% - 70% 71% - 75% 76% - 80% Loan to Value (1) % of Portfolio Portfolio Credit Quality Loan Count 4 2 9 11 2 0 9 15 4 0 —% 28% 57% 15% —% Lower Risk (1) Average Risk (2) Acceptable Risk (3) Higher Risk (4) Impaired/Loss Likely (5) Risk Rating Distribution (1) % of Portfolio Weighted Average LTV: 68% Weighted Average Risk Rating: 2.9 (1) Percentage of portfolio based on principal balance of loans held for investment as of September 30, 2022. PORTFOLIO OVERVIEW RETURN TO TABLE OF CONTENTS

10 Supplemental Q3 2022 10 CA PI TA L ST RU CT UR E OV ER VI EW Secured Financing Facilities Maximum Facility Size Principal Balance Unused Capacity Weighted Average Advance Rate Weighted Average Coupon Rate Weighted Average Remaining Maturity (1) (dollars in thousands) Master Repurchase Facilities $ 532,000 $ 394,726 $ 137,274 74.0% 4.94% 1.5 Asset Specific Financing 150,000 111,105 38,895 74.8% 4.73% 2.5 Total $ 682,000 $ 505,831 $ 176,169 74.2% 4.89% 1.7 Capital Structure Detail (1) The weighted average remaining maturity of our Master Repurchase Facilities is determined using the earlier of the underlying loan maturity date and the respective repurchase agreement maturity date. The weighted average remaining maturity of Asset Specific Financing is determined using the underlying loan investment maturity date. (2) Adjusted Book Value per common share excludes the impact of the unaccreted purchase discount resulting from the excess fair value over the purchase price of the loans held for investment acquired in the Merger. The purchase discount of $36.4 million was allocated to each acquired loan held for investment and is accreted into income over the remaining term of the respective loan held for investment. As of September 30, 2022, the unaccreted purchase discount was $8.2 million. Secured Financing Facilities, 65% Equity, 35% Capital Structure Overview Capital Structure Composition RETURN TO TABLE OF CONTENTS PORTFOLIO OVERVIEW RETURN TO TABLE OF CONTENTS (As of September 30, 2022) Reconciliation of Book Value per Common Share to Adjusted Book Value per Common Share (amounts in thousands, except per share data) Shareholders’ equity $ 268,409 Total outstanding common shares 14,714 Book value per common share 18.24 Unaccreted purchase discount per common share 0.56 Adjusted Book Value per common share (2) $ 18.80
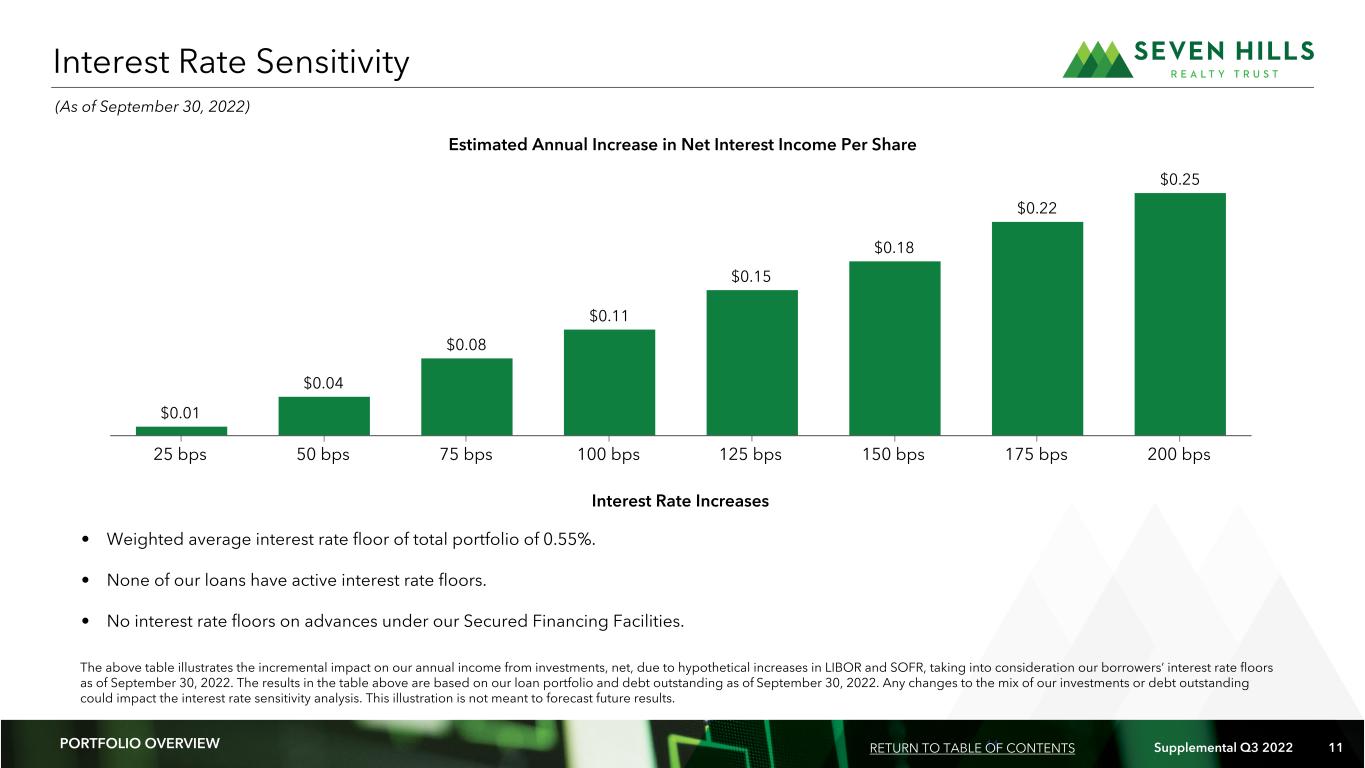
11 Supplemental Q3 2022 11 The above table illustrates the incremental impact on our annual income from investments, net, due to hypothetical increases in LIBOR and SOFR, taking into consideration our borrowers’ interest rate floors as of September 30, 2022. The results in the table above are based on our loan portfolio and debt outstanding as of September 30, 2022. Any changes to the mix of our investments or debt outstanding could impact the interest rate sensitivity analysis. This illustration is not meant to forecast future results. Interest Rate Increases $0.01 $0.04 $0.08 $0.11 $0.15 $0.18 $0.22 $0.25 25 bps 50 bps 75 bps 100 bps 125 bps 150 bps 175 bps 200 bps Interest Rate Sensitivity Estimated Annual Increase in Net Interest Income Per Share PORTFOLIO OVERVIEW RETURN TO TABLE OF CONTENTS • Weighted average interest rate floor of total portfolio of 0.55%. • None of our loans have active interest rate floors. • No interest rate floors on advances under our Secured Financing Facilities. (As of September 30, 2022)
12 Supplemental Q3 2022 12APPENDIX Appendix
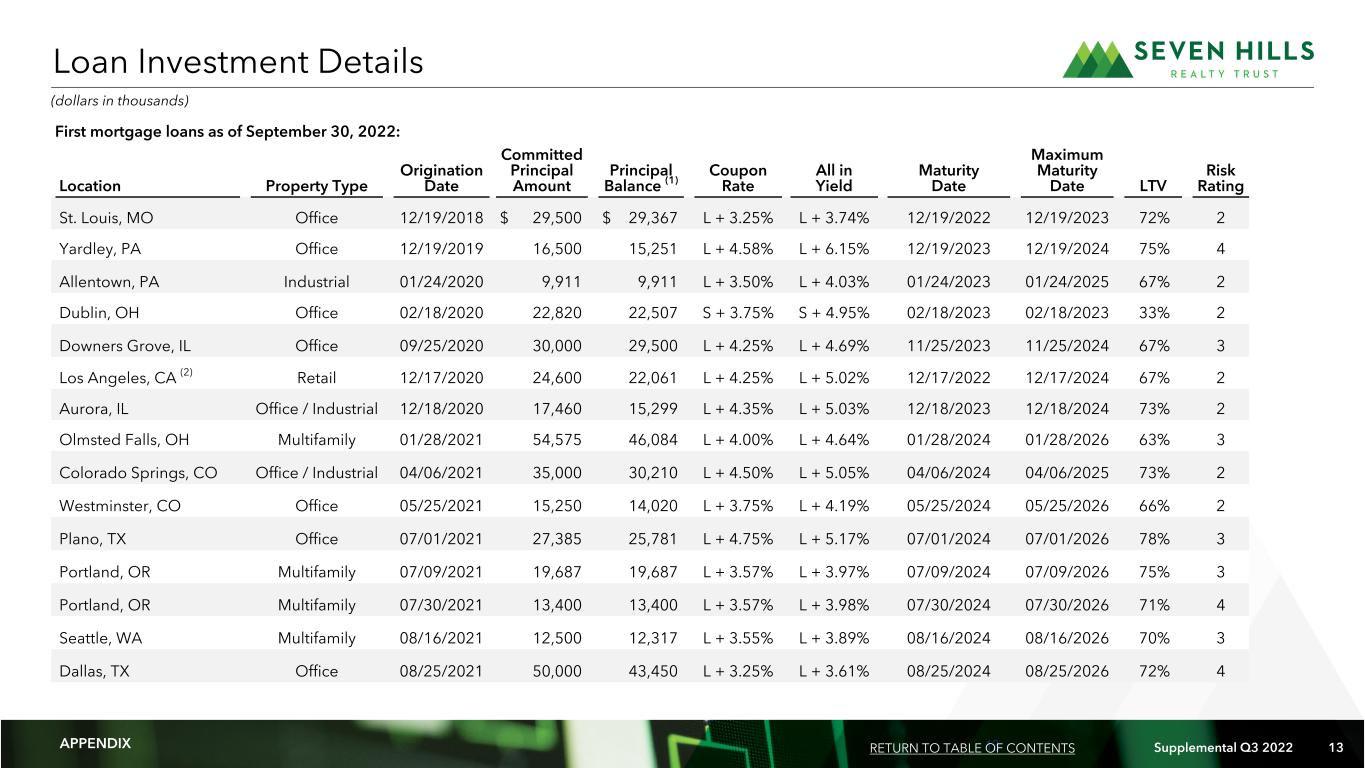
13 Supplemental Q3 2022 13 First mortgage loans as of September 30, 2022: Location Property Type Origination Date Committed Principal Amount Principal Balance (1) Coupon Rate All in Yield Maturity Date Maximum Maturity Date LTV Risk Rating St. Louis, MO Office 12/19/2018 $ 29,500 $ 29,367 L + 3.25% L + 3.74% 12/19/2022 12/19/2023 72% 2 Yardley, PA Office 12/19/2019 16,500 15,251 L + 4.58% L + 6.15% 12/19/2023 12/19/2024 75% 4 Allentown, PA Industrial 01/24/2020 9,911 9,911 L + 3.50% L + 4.03% 01/24/2023 01/24/2025 67% 2 Dublin, OH Office 02/18/2020 22,820 22,507 S + 3.75% S + 4.95% 02/18/2023 02/18/2023 33% 2 Downers Grove, IL Office 09/25/2020 30,000 29,500 L + 4.25% L + 4.69% 11/25/2023 11/25/2024 67% 3 Los Angeles, CA (2) Retail 12/17/2020 24,600 22,061 L + 4.25% L + 5.02% 12/17/2022 12/17/2024 67% 2 Aurora, IL Office / Industrial 12/18/2020 17,460 15,299 L + 4.35% L + 5.03% 12/18/2023 12/18/2024 73% 2 Olmsted Falls, OH Multifamily 01/28/2021 54,575 46,084 L + 4.00% L + 4.64% 01/28/2024 01/28/2026 63% 3 Colorado Springs, CO Office / Industrial 04/06/2021 35,000 30,210 L + 4.50% L + 5.05% 04/06/2024 04/06/2025 73% 2 Westminster, CO Office 05/25/2021 15,250 14,020 L + 3.75% L + 4.19% 05/25/2024 05/25/2026 66% 2 Plano, TX Office 07/01/2021 27,385 25,781 L + 4.75% L + 5.17% 07/01/2024 07/01/2026 78% 3 Portland, OR Multifamily 07/09/2021 19,687 19,687 L + 3.57% L + 3.97% 07/09/2024 07/09/2026 75% 3 Portland, OR Multifamily 07/30/2021 13,400 13,400 L + 3.57% L + 3.98% 07/30/2024 07/30/2026 71% 4 Seattle, WA Multifamily 08/16/2021 12,500 12,317 L + 3.55% L + 3.89% 08/16/2024 08/16/2026 70% 3 Dallas, TX Office 08/25/2021 50,000 43,450 L + 3.25% L + 3.61% 08/25/2024 08/25/2026 72% 4 Loan Investment Details (dollars in thousands) APPENDIX RETURN TO TABLE OF CONTENTS (dollars in thousands)
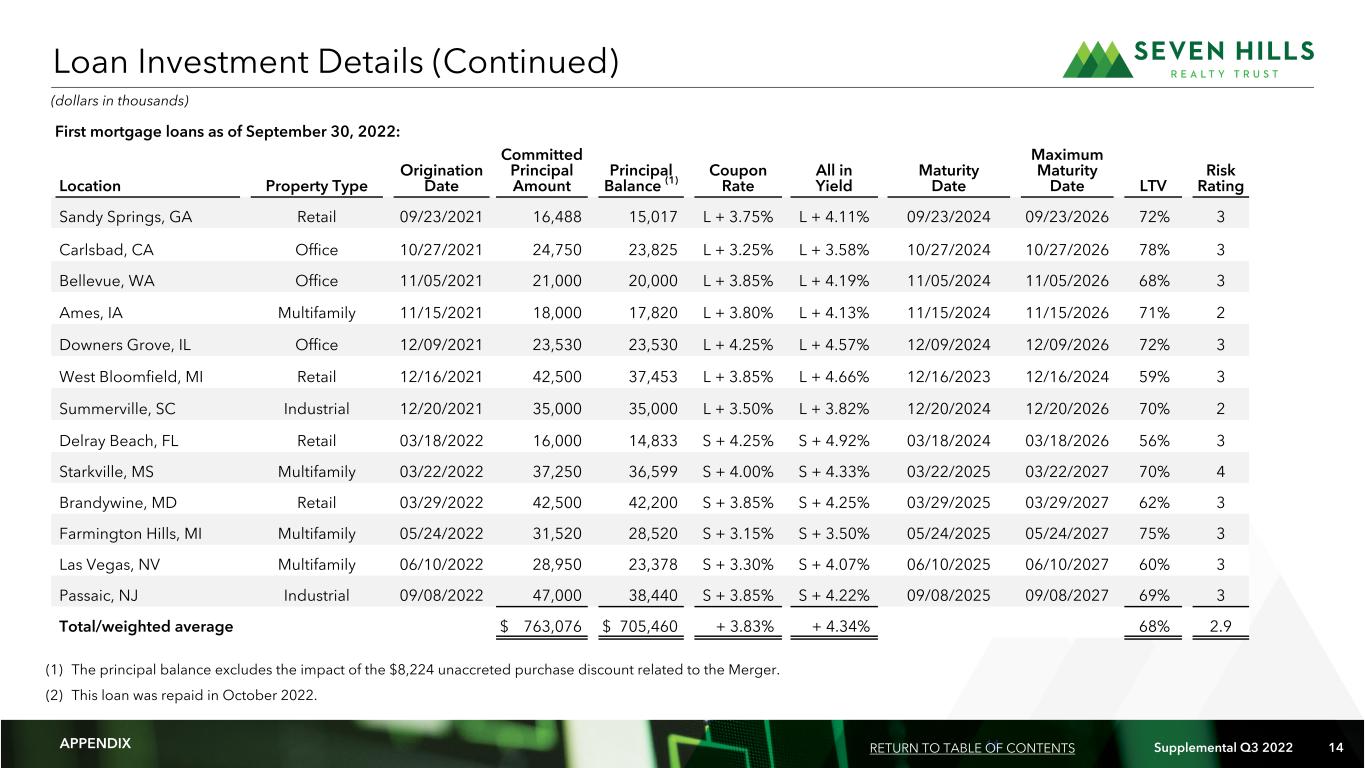
14 Supplemental Q3 2022 14 First mortgage loans as of September 30, 2022: Location Property Type Origination Date Committed Principal Amount Principal Balance (1) Coupon Rate All in Yield Maturity Date Maximum Maturity Date LTV Risk Rating Sandy Springs, GA Retail 09/23/2021 16,488 15,017 L + 3.75% L + 4.11% 09/23/2024 09/23/2026 72% 3 Carlsbad, CA Office 10/27/2021 24,750 23,825 L + 3.25% L + 3.58% 10/27/2024 10/27/2026 78% 3 Bellevue, WA Office 11/05/2021 21,000 20,000 L + 3.85% L + 4.19% 11/05/2024 11/05/2026 68% 3 Ames, IA Multifamily 11/15/2021 18,000 17,820 L + 3.80% L + 4.13% 11/15/2024 11/15/2026 71% 2 Downers Grove, IL Office 12/09/2021 23,530 23,530 L + 4.25% L + 4.57% 12/09/2024 12/09/2026 72% 3 West Bloomfield, MI Retail 12/16/2021 42,500 37,453 L + 3.85% L + 4.66% 12/16/2023 12/16/2024 59% 3 Summerville, SC Industrial 12/20/2021 35,000 35,000 L + 3.50% L + 3.82% 12/20/2024 12/20/2026 70% 2 Delray Beach, FL Retail 03/18/2022 16,000 14,833 S + 4.25% S + 4.92% 03/18/2024 03/18/2026 56% 3 Starkville, MS Multifamily 03/22/2022 37,250 36,599 S + 4.00% S + 4.33% 03/22/2025 03/22/2027 70% 4 Brandywine, MD Retail 03/29/2022 42,500 42,200 S + 3.85% S + 4.25% 03/29/2025 03/29/2027 62% 3 Farmington Hills, MI Multifamily 05/24/2022 31,520 28,520 S + 3.15% S + 3.50% 05/24/2025 05/24/2027 75% 3 Las Vegas, NV Multifamily 06/10/2022 28,950 23,378 S + 3.30% S + 4.07% 06/10/2025 06/10/2027 60% 3 Passaic, NJ Industrial 09/08/2022 47,000 38,440 S + 3.85% S + 4.22% 09/08/2025 09/08/2027 69% 3 Total/weighted average $ 763,076 $ 705,460 + 3.83% + 4.34% 68% 2.9 Loan Investment Details (Continued) (dollars in thousands) APPENDIX RETURN TO TABLE OF CONTENTS (1) The principal balance excludes the impact of the $8,224 unaccreted purchase discount related to the Merger. (2) This loan was repaid in October 2022.

15 Supplemental Q3 2022 15 (1) The estimate of purchase discount accretion is based on information as of September 30, 2022 and is subject to change as a result of early repayments or modifications of loans accounted for as extinguishments. Purchase Discount Details (dollars in millions) The fair value of the loans acquired in the Merger exceeded the purchase price of the loans. In accordance with U.S. generally accepted accounting principles, or GAAP, a purchase discount is recorded for the difference between the fair value and purchase price of the loans acquired. The purchase discount is accreted into income over the remaining terms of the acquired loans. Purchase Discount Fair value of TRMT loans acquired in the Merger $ 205.6 Less: Purchase price of TRMT loans acquired in the Merger 169.2 Purchase discount as of September 30, 2021 36.4 Less: Accumulated accretion of purchase discount as of September 30, 2022 (28.2) Remaining purchase discount to be accreted as of September 30, 2022 $ 8.2 Estimate of Purchase Discount Accretion $18.9 $5.9 $1.6 $1.6 $1.5 $4.4 $2.3 Q4 2021 (Actual) Q1 2022 (Actual) Q2 2022 (Actual) Q3 2022 (Actual) Q4 2022 2023 2024 (1) APPENDIX RETURN TO TABLE OF CONTENTS

16 Supplemental Q3 2022 16 Financial Summary September 30, 2022 December 31, 2021 ASSETS Cash and cash equivalents $ 76,371 $ 26,197 Restricted cash 66 98 Loans held for investment, net 695,154 570,780 Prepaid expenses and other assets 3,608 2,918 Total assets $ 775,199 $ 599,993 LIABILITIES AND SHAREHOLDERS' EQUITY Accounts payable, accrued liabilities and deposits $ 1,508 $ 1,561 Secured financing facilities, net 503,514 339,627 Due to related persons 1,768 1,111 Total liabilities 506,790 342,299 Commitments and contingencies Shareholders' equity: Common shares of beneficial interest, $0.001 par value, 25,000,000 shares authorized; 14,713,623 and 14,597,079 shares issued and outstanding, respectively 15 15 Additional paid in capital 238,417 237,624 Cumulative net income 45,530 24,650 Cumulative distributions (15,553) (4,595) Total shareholders' equity 268,409 257,694 Total liabilities and shareholders' equity $ 775,199 $ 599,993 Condensed Consolidated Balance Sheets (dollars in thousands, except per share data) APPENDIX RETURN TO TABLE OF CONTENTS

17 Supplemental Q3 2022 17 Condensed Consolidated Statements of Operations Three Months Ended September 30, Nine Months Ended September 30, 2022 2021 2022 2021 INCOME FROM INVESTMENTS: Interest income from investments $ 11,650 $ 4,510 $ 30,098 $ 9,566 Purchase discount accretion 1,596 — 9,167 — Less: interest and related expenses (5,447) (488) (10,191) (680) Income from investments, net 7,799 4,022 29,074 8,886 OTHER EXPENSES: Base management fees 1,064 731 3,190 2,167 General and administrative expenses 1,016 433 3,340 1,739 Reimbursement of shared services expenses 520 349 1,520 950 Other transaction related costs — — 37 — Total other expenses 2,600 1,513 8,087 4,856 Income before income taxes 5,199 2,509 20,987 4,030 Income tax expense (23) (25) (107) (36) Net income $ 5,176 $ 2,484 $ 20,880 $ 3,994 Weighted average common shares outstanding - basic 14,551 10,263 14,526 10,225 Weighted average common shares outstanding - diluted 14,551 10,264 14,526 10,225 Net income per common share - basic and diluted $ 0.35 $ 0.24 $ 1.43 $ 0.39 (amounts in thousands, except per share data) APPENDIX RETURN TO TABLE OF CONTENTS
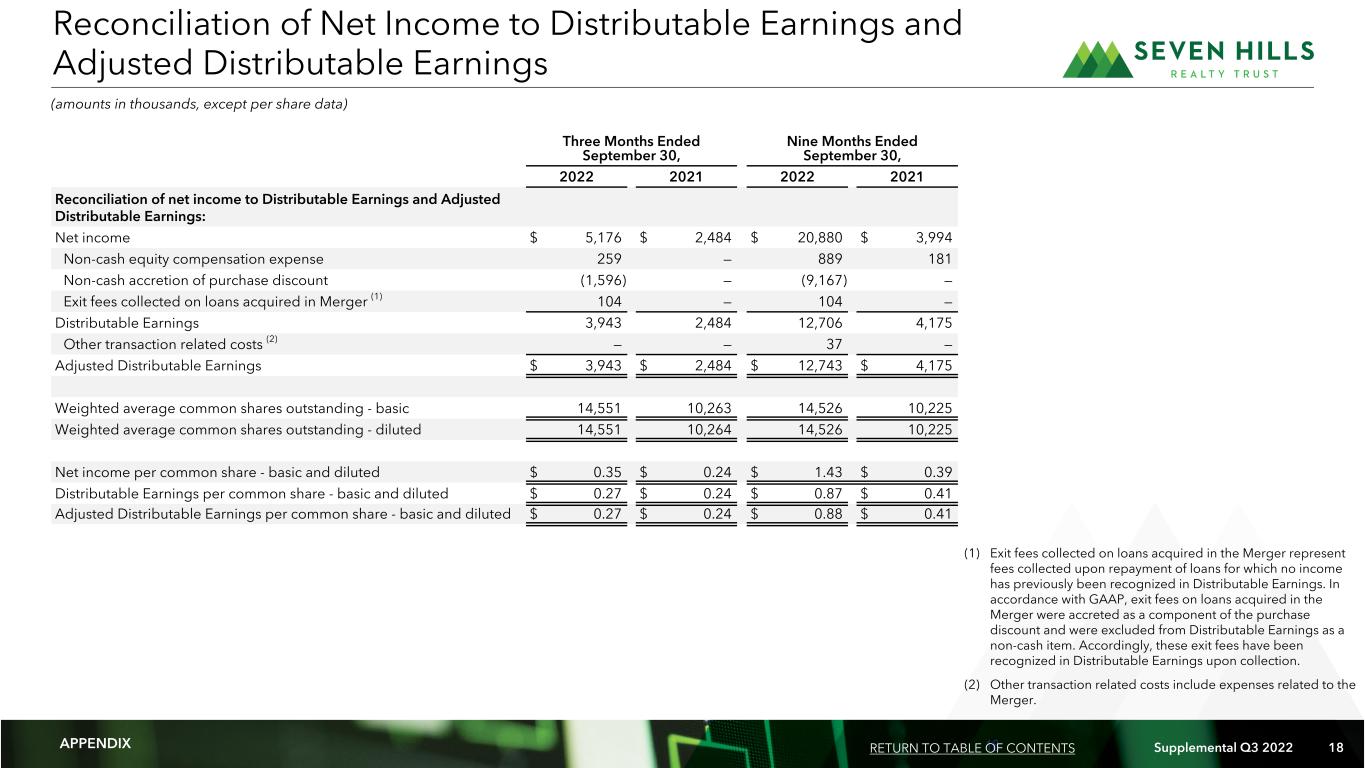
18 Supplemental Q3 2022 18 Three Months Ended September 30, Nine Months Ended September 30, 2022 2021 2022 2021 Reconciliation of net income to Distributable Earnings and Adjusted Distributable Earnings: Net income $ 5,176 $ 2,484 $ 20,880 $ 3,994 Non-cash equity compensation expense 259 — 889 181 Non-cash accretion of purchase discount (1,596) — (9,167) — Exit fees collected on loans acquired in Merger (1) 104 — 104 — Distributable Earnings 3,943 2,484 12,706 4,175 Other transaction related costs (2) — — 37 — Adjusted Distributable Earnings $ 3,943 $ 2,484 $ 12,743 $ 4,175 Weighted average common shares outstanding - basic 14,551 10,263 14,526 10,225 Weighted average common shares outstanding - diluted 14,551 10,264 14,526 10,225 Net income per common share - basic and diluted $ 0.35 $ 0.24 $ 1.43 $ 0.39 Distributable Earnings per common share - basic and diluted $ 0.27 $ 0.24 $ 0.87 $ 0.41 Adjusted Distributable Earnings per common share - basic and diluted $ 0.27 $ 0.24 $ 0.88 $ 0.41 Reconciliation of Net Income to Distributable Earnings and Adjusted Distributable Earnings (amounts in thousands, except per share data) APPENDIX RETURN TO TABLE OF CONTENTS (1) Exit fees collected on loans acquired in the Merger represent fees collected upon repayment of loans for which no income has previously been recognized in Distributable Earnings. In accordance with GAAP, exit fees on loans acquired in the Merger were accreted as a component of the purchase discount and were excluded from Distributable Earnings as a non-cash item. Accordingly, these exit fees have been recognized in Distributable Earnings upon collection. (2) Other transaction related costs include expenses related to the Merger.
19 Supplemental Q3 2022 19 This supplemental operating and financial data may contain forward-looking statements within the meaning of the Private Securities Litigation Reform Act of 1995 and other securities laws. Also, whenever we use words such as “believe”, “expect”, “anticipate”, “intend”, “plan”, “estimate”, “will”, “may” and negatives or derivatives of these or similar expressions, we are making forward-looking statements. These forward-looking statements are based upon our present intent, beliefs or expectations, but forward-looking statements are not guaranteed to occur and may not occur. Actual results may differ materially from those contained in or implied by our forward-looking statements. Forward-looking statements involve known and unknown risks, uncertainties and other factors, some of which are beyond our control. The information contained in our filings with the SEC, including under “Risk Factors” in our periodic reports, or incorporated therein, identifies important factors that could cause our actual results to differ materially from those stated in or implied by our forward-looking statements. Our filings with the SEC are available on the SEC's website at www.sec.gov. You should not place undue reliance upon forward-looking statements. Except as required by law, we do not intend to update or change any forward-looking statements as a result of new information, future events or otherwise. Warning Concerning Forward-Looking Statements WARNING CONCERNING FORWARD-LOOKING STATEMENTS RETURN TO TABLE OF CONTENTS

20 Supplemental Q3 2022 20 ON -G AA P FI NA NC IA L ME AS UR ES A ND C ER TA IN D EF IN IT IO NS We present Distributable Earnings, Distributable Earnings per common share, Adjusted Distributable Earnings, Adjusted Distributable Earnings per common share and Adjusted Book Value per common share, which are considered “non-GAAP financial measures” within the meaning of the applicable SEC rules. These non-GAAP financial measures do not represent net income, net income per common share or cash generated from operating activities and should not be considered as an alternative to net income or net income per common share determined in accordance with GAAP or as an indication of our cash flows from operations determined in accordance with GAAP, a measure of our liquidity or operating performance or an indication of funds available for our cash needs. In addition, our methodologies for calculating these non- GAAP financial measures may differ from the methodologies employed by other companies to calculate the same or similar supplemental performance measures; therefore, our reported Distributable Earnings, Distributable Earnings per common share, Adjusted Distributable Earnings, and Adjusted Distributable Earnings per common share may not be comparable to distributable earnings, distributable earnings per common share, adjusted distributable earnings and adjusted distributable earnings per common share, as reported by other companies. We believe that Adjusted Book Value per common share is a meaningful measure of our capital adequacy because it excludes the unaccreted purchase discount resulting from the excess of the fair value of the loans TRMT then held for investment and that we acquired as a result of the Merger over the consideration we paid in the Merger. Adjusted Book Value per common share does not represent book value per common share or alternative measures determined in accordance with GAAP. Our methodology for calculating Adjusted Book Value per common share may differ from the methodologies employed by other companies to calculate the same or similar supplemental capital adequacy measures; therefore, our Adjusted Book Value per common share may not be comparable to the adjusted book value per common share reported by other companies. In order to maintain our qualification for taxation as a REIT, we are generally required to distribute substantially all of our taxable income, subject to certain adjustments, to our shareholders. We believe that one of the factors that investors consider important in deciding whether to buy or sell securities of a REIT is its distribution rate. Over time, Distributable Earnings, Distributable Earnings per common share, Adjusted Distributable Earnings and Adjusted Distributable Earnings per common share may be useful indicators of distributions to our shareholders and are measures that are considered by our Board of Trustees when determining the amount of distributions. We believe that Distributable Earnings, Distributable Earnings per common share, Adjusted Distributable Earnings and Adjusted Distributable Earnings per common share provide meaningful information to consider in addition to net income, net income per common share and cash flows from operating activities determined in accordance with GAAP. These measures help us to evaluate our performance excluding the effects of certain transactions, the variability of any management incentive fees that may be paid or payable and GAAP adjustments that we believe are not necessarily indicative of our current loan portfolio and operations. In addition, Distributable Earnings is used in determining the amount of base management and management incentive fees payable by us to Tremont under our management agreement. Distributable Earnings: We calculate Distributable Earnings and Distributable Earnings per common share as net income and net income per common share, respectively, computed in accordance with GAAP, including realized losses not otherwise included in net income determined in accordance with GAAP, and excluding: (a) the management incentive fees earned by our Manager, if any; (b) depreciation and amortization, if any; (c) non-cash equity compensation expense; (d) unrealized gains, losses and other similar non-cash items that are included in net income for the period of the calculation (regardless of whether such items are included in or deducted from net income or in other comprehensive income under GAAP), if any; and (e) one-time events pursuant to changes in GAAP and certain non-cash items, if any. Distributable Earnings are reduced for realized losses on loan investments when amounts are deemed uncollectable. Adjusted Distributable Earnings: We define Adjusted Distributable Earnings and Adjusted Distributable Earnings per common share as Distributable Earnings and Distributable Earnings per common share, respectively, excluding the effects of certain non-recurring transactions. Adjusted Book Value: Adjusted Book Value per common share is a non-GAAP measure that excludes the impact of the unaccreted purchase discount resulting from the excess of the fair value of the loans TRMT then held for investment which we acquired as a result of the merger with TRMT on September 30, 2021 over the consideration we paid in the merger. Non-GAAP Financial Measures NON-GAAP FINANCIAL MEASURES AND CERTAIN DEFINITIONS RETURN TO TABLE OF CONTENTS
21 Supplemental Q3 2022 21 ON -G AA P FI NA NC IA L ME AS UR ES A ND C ER TA IN D EF IN IT IO NS All In Yield: All In Yield represents the yield on a loan, including amortization of deferred fees over the initial term of the loan and excluding any purchase discount accretion. Asset Specific Financing: Amounts advanced under the facility loan agreement and security agreement with BMO Harris Bank N.A. are pursuant to separate facility loan agreements that we refer to as Asset Specific Financing. LIBOR: LIBOR refers to the London Interbank Offered Rate. LTV: Loan to value ratio, or LTV, represents the initial loan amount divided by the underwritten in-place value of the underlying collateral at closing. Master Repurchase Facilities: Collectively, we refer to the master repurchase facilities with UBS AG, Citibank, N.A. and Wells Fargo, National Association as our Master Repurchase Facilities. Maximum Maturity: Maximum Maturity assumes all borrower loan extension options have been exercised, which options are subject to the borrower meeting certain conditions. Secured Financing Facilities: Collectively, we refer to the Master Repurchase Facilities and our Asset Specific Financing as our Secured Financing Facilities. SOFR: SOFR is defined as the Secured Overnight Financing Rate. Other Measures and Definitions NON-GAAP FINANCIAL MEASURES AND CERTAIN DEFINITIONS RETURN TO TABLE OF CONTENTS


