UNITED STATES
SECURITIES AND EXCHANGE COMMISSION
Washington, D.C. 20549
FORM 10-K
ANNUAL REPORT PURSUANT TO SECTION 13 OR 15(d) OF THE
SECURITIES EXCHANGE ACT OF 1934
For the fiscal year ended December 31, 2008
Commission File Number 001-34251
MEAD JOHNSON NUTRITION COMPANY
(Exact name of registrant as specified in its charter)
| | |
| Delaware | | 80-0318351 |
(State or other jurisdiction of
incorporation or organization) | | (IRS Employer
Identification No.) |
2400 West Lloyd Expressway
Evansville, Indiana 47721-0001
(Address of principal executive offices)
Registrant’s telephone number: (812) 429-5000
Securities registered pursuant to Section 12(b) of the Act:
| | |
Title of each class | | Name of each exchange on which registered |
| Common Stock, $0.01 Par Value | | New York Stock Exchange |
Securities registered pursuant to Section 12(g) of the Act: None
Indicate by check mark if the registrant is a well-known seasoned issuer, as defined in Rule 405 of the Securities Act. Yes ¨ No x
Indicate by check mark if the registrant is not required to file reports pursuant to Section 13 or Section 15(d) of the Act. Yes ¨ No x
Indicate by check mark whether the registrant (1) has filed all reports required to be filed by Section 13 or 15(d) of the Securities Exchange Act of 1934 during the preceding 12 months (or for such shorter period that the registrant was required to file such reports), and (2) has been subject to such filing requirements for the past 90 days. Yes ¨ No x
Indicate by check mark if disclosure of delinquent filers pursuant to Item 405 of Regulation S-K is not contained herein, and will not be contained, to the best of the registrant’s knowledge, in definitive proxy or information statements incorporated by reference in Part III of this Form 10-K or any amendment to this Form 10-K. x
Indicate by check mark whether the registrant is a large accelerated filer, an accelerated filer, a non-accelerated filer or a smaller reporting company. See definitions of “accelerated filer”, “large accelerated filer” and “smaller reporting company” in Rule 12b-2 of the Exchange Act.
Large accelerated filer ¨ Accelerated filer ¨ Non-accelerated filer x Smaller reporting company ¨
Indicate by check mark if the registrant is a shell company (as defined in Rule 12b-2 of the Exchange Act). Yes ¨ No x
The registrant completed the initial public offering of its Class A common stock on February 17, 2009. Accordingly, there was no public market for the registrant’s common stock as of June 30, 2008, the last business day of the registrant’s most recently completed second fiscal quarter. At March 16, 2009, there were 76,844,571 shares of Class A common stock outstanding and 127,655,429 shares of Class B common stock outstanding.
DOCUMENTS INCORPORATED BY REFERENCE: NONE
TABLE OF CONTENTS
i
PART I
Our Company
Mead Johnson Nutrition Company is a global leader in pediatric nutrition with approximately $2.9 billion in net sales for the year ended December 31, 2008. We are committed to creating trusted nutritional brands and products that help improve the health and development of infants and children around the world and provide them with the best start in life. Our Enfa family of brands, includingEnfamil®infant formula, is the world’s leading brand franchise in pediatric nutrition, based on retail sales. Our comprehensive product portfolio addresses a broad range of nutritional needs for infants, children and expectant and nursing mothers. We have more than 100 years of innovation experience during which we have developed or improved many breakthrough or industry-defining products across each of our product categories. Our singular focus on pediatric nutrition and our implementation of a business model that integrates nutritional science with health care and consumer marketing expertise differentiate us from many of our competitors.
We market our portfolio of more than 70 products to mothers, health care professionals and retailers in more than 50 countries in Asia, North America, Latin America and Europe. Our two reportable segments are Asia/Latin America and North America/Europe, which comprised 52.6% and 47.4%, respectively, of our net sales for the year ended December 31, 2008. See “Item 8. Financial Statements—Note 16. Segment Information.” For the year ended December 31, 2008, 61.5% of our net sales were generated in countries outside of the United States.
We believe mothers and health care professionals associate the Mead Johnson name and the Enfa family of brands with quality, science-based pediatric nutrition products. We believe the strength of our brands allows us to create and maintain consumer loyalty across our product portfolio and stages of pediatric development.
The two principal product categories in which we operate are infant formula and children’s nutrition, which represented 67.0% and 29.7% of our net sales for the year ended December 31, 2008, respectively.
Our History
Mead Johnson was founded in 1905, and we introducedDextri-Maltose®, our first infant formula product, in 1911. Over the next several decades, we built upon our leadership in science-based nutrition, introducing many innovative infant feeding products while expanding into vitamins, pharmaceutical products and nutrition. During the course of our history, we have expanded our operations into geographies outside of the United States, including Europe, Asia and Latin America. Throughout our history, our deeply-held commitment to support breastfeeding and our commitment to improve the health and development of infants and children around the world have been hallmarks of our organization. In 1967, we became a wholly owned subsidiary of Bristol-Myers Squibb Company (with its subsidiaries, BMS).
In February 2009, we consummated an initial public offering of 34.5 million shares of our Class A common stock. BMS beneficially owns 127,655,429 shares of our Class B common stock (representing 100% of the outstanding shares of Class B common stock) and 42,344,571 shares of our Class A common stock (or approximately 55.1% of the outstanding shares of Class A common stock). Each share of Class B common stock has 10 votes per share and each share of Class A common stock has one vote per share. The shares of Class B common stock are convertible into shares of Class A common stock on a one-for-one basis. As a result, BMS’s share ownership represents 83.1% of our outstanding stock, with 97.5% of the combined voting power of our capital stock. Due to its level of ownership, BMS has the ability to exercise substantial control and influence over our management and affairs.
1
Our Brands
The Mead Johnson name has been associated with science-based nutritional products for more than 100 years. In addition to the Mead Johnson name, our products are marketed around the world under brands that we have developed through our global sales and marketing efforts.
Enfa Family of Brands
The Enfa family of brands includes several of the world’s leading infant formula and children’s nutrition brands. We have positioned the Enfa family of brands as providing unique, clinically supported health and developmental benefits. The Enfa family of brands features products that include DHA and ARA, which support brain, visual and nervous system development. Our Enfa family of brands, includingEnfamil® infant formula, which accounted for 61.0 % of our net sales for the year ended December 31, 2008, is the world’s leading brand franchise in pediatric nutrition, based on retail sales.
Building upon the strength of our brand equity, we have extended the Enfa family of brands into the fast-growing children’s nutrition category. We believe we have enhanced consumer retention by creating links between age groups and leveraging brand loyalty. Additionally, the use of the Enfa prefix in our prenatal nutrition products (such asEnfaMama A+®) reinforces the scientific basis, quality and innovation that these products hold in common with our core pediatric nutrition line.
We consistently promote the brand through our global sales and marketing operations. Our studies show mothers and health care professionals often associate the Enfa family of brands with science, superior nutrition, quality and good value. Mothers often describe the Enfa family of brands as science-based, sophisticated, trustworthy, reliable and comforting. Additionally, health care professionals frequently comment on our professional and innovative approach to nutrition science.
Complementary Brands
In addition to the Enfa family of brands, we market several other powerful brands on a local, regional or global basis. These brands complement the Enfa family of brands portfolio and are designed to meet the nutritional needs of broad consumer populations (such as ChocoMilk® andCal-C-Tose®) or the specific nutritional needs of infants under the supervision of health care professionals (such asNutramigen®).
Stages of Development
Generally, there are five stages of pediatric development and we produce different products for each of these stages. The stages of development are illustrated below:
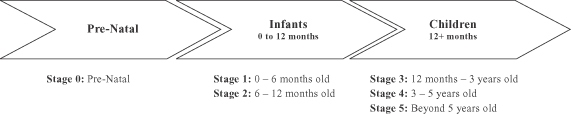
In the United States, our business is focused on the infant formula category (Stages 1 and 2). However, outside of the United States, we market both infant formula products (Stages 1 and 2) and children’s nutrition products designed for the changing nutritional needs of growing toddlers and children (Stages 3, 4 and 5). This allows us to take advantage of brand loyalty developed in Stages 1 and 2 to retain consumers as their children grow older.
2
Our Products
Our pediatric nutrition products are grouped by category of feeding: (1) infant formula products, (2) children’s nutrition products and (3) other products. Infant formula, children’s nutrition and other product sales comprised approximately 67.0%, 29.7% and 3.3% of our net sales for the year ended December 31, 2008 respectively.
Infant Formula
General
Our infant formula products include formulas for routine feeding and mild intolerance as well as specialty formula products, including formulas for severe intolerance, formulas for premature and low birth weight infants and medical nutrition products. The table below illustrates our key infant formula brands and products:
| | | | |
ROUTINE INFANT FORMULA | | ROUTINE FORMULA FOR
COMMON FEEDING PROBLEMS | | SPECIALTY FORMULAS |
Stage 1 • Enfamil LIPIL® • Enfalac A+® • Enfamil Premium® Stage 2 • Enfamil NEXT STEP LIPIL® • Enfapro A+® • Enfapro Premium® | | Many available in stages 1 and 2 • Enfamil Gentlease®: for gas/fussiness • Enfamil ProSobee®: soy formula • Enfamil LactoFree®: for lactoseintolerance • Enfamil A.R.®: for anti-regurgitation • Enfamil®HA: for infants with milk protein allergy | | Many available in stages 1 and 2 • Nutramigen LIPIL®: for severe protein sensitivity • Nutramigen AA®: for multiple food allergies • Pregestimil®: for fat malabsorption • Enfamil Premature®: for premature infants |
Routine Infant Formula
We design routine infant formula as a breast milk substitute for healthy, full-term infants without special nutritional needs both for use as the infant’s sole source of nutrition and as a supplement to breastfeeding. We endeavor to bring routine infant formula closer to breast milk. We also provide products within our routine formula line for healthy full-term infants who experience common feeding problems with symptoms such as mild spit-up, fussiness or gas.
Each product is referred to as a “formula”, as it is formulated for the specific nutritional needs of an infant of a given age. Generally, routine infant formula has the following four main components: (1) protein from cow’s milk that is processed to have a profile similar to human milk, (2) a blend of vegetable fats (including DHA/ARA) to replace bovine milk fat in order to better resemble the composition of human milk, (3) a carbohydrate, generally lactose from cow’s milk and (4) a vitamin and mineral “micronutrient” pre-mix that is blended into the product to meet the specific needs of the infant at a given age. Patterned after breast milk, which changes composition to meet the infant’s changing nutritional needs, we produce two stages of infant formula. Stage 1 formula is consumed by newborn infants up to six months of age, and Stage 2 formula is generally consumed by infants aged from six to twelve months. Our most prominent product form around the world is milk-based powder, but we also produce several infant formulas in ready-to-use and concentrated liquid form for sale in the United States and Canada.
We market the same product under different names in different regions, based on regional marketing strategies and regional brand recognition. For example, our premium Stage 1 infant formula containing DHA and ARA is sold under the brandsEnfamil LIPIL® in the United States,Enfamil Premium® in Latin America andEnfamil A+®/Enfalac A+® in Asia and Europe. We market all of our routine infant formulas for mild intolerance such asGentlease andProsobee® under the Enfa family of brands name. In parts of Asia, Latin America and Europe, we use the nameEnfapro for our Stage 2 products.
3
Routine infant formula products comprised 86.1%, 86.1% and 86.0% of our infant formula net sales for the years ended December 31, 2008, 2007 and 2006, respectively.
Specialty Formulas
Our specialty formulas include: (1) formulas for severe intolerance, (2) formulas for premature and low birth weight infants and (3) medical nutrition products. Specialty infant formula products comprised 13.9%, 13.9% and 14.0% of our infant formula net sales for the years ended December 31, 2008, 2007 and 2006, respectively.
Formulas for Severe Intolerance
We design formulas for severe intolerance to be used on the specific recommendation and under the supervision of a doctor. We specially formulate these products for use by infants displaying symptoms of certain conditions or diagnosed with special medical needs.
Nutramigen® infant formula was the first infant formula to include protein hydrolysate in the United States. This ingredient is easier for infants with severe intolerance to digest because its protein is extensively hydrolyzed (or broken down into peptides, a process that would otherwise be performed in the infant’s stomach). We designedNutramigen® infant formula for use by infants with severe milk protein allergies.Nutramigen®with LGG infant formula is a variant ofNutramigen® we market in Europe. LGG is a probiotic ingredient that has been associated with reduced incidence of infant atopic dermatitis, a non-contagious skin disease characterized by chronic inflammation of the skin, resulting from an allergy to cow’s milk.Nutramigen AA® infant formula is an amino acid formula we formulated with fully broken-down proteins which can be consumed without the need for digestion of the protein. We have designed this product for infants who experience a severe allergy to cow’s milk or multiple other food allergies.Pregestimil® infant formula is a variation of theNutramigen® formulation designed mainly for fat malabsorption. It contains medium chain triglycerides oil instead of fat.
Formulas for Premature and Low Birth Weight Infants
We also design products for premature and low birth weight infants to meet these infants’ unique needs under the supervision of a doctor, most often in the hospital. Typically, such infants need extra assistance obtaining the requisite nutrition. They require a higher density of nutrients and calories because they cannot take in enough volume of breast milk or routine infant formula. We designedEnfamil® Human Milk Fortifier product as a supplement to a mother’s breast milk that improves nutritional density.EnfaCare® infant formula, another of our products, is a hypercaloric formula available at retail for premature babies when they are able to go home. In addition,Enfamil Premature® is an infant formula used primarily in the hospital.
Medical Nutrition
We also produce medical foods, or foods for special medical purposes, for nutritional management of individuals with rare, inborn errors of metabolism such as maple syrup urine disease (Mead Johnson BCAD®) and phenylketonuria (Mead Johnson Phenyl-Free®). Category 1 products are intended for infants and young children from zero to three years of age and Category 2 products are suitable for children and adults. We produce approximately 20 formulas targeted at specific disorders for use under the direct and continuous supervision of a physician. We market these medical nutrition products under the Mead Johnson brand name.
Children’s Nutrition Products
Children’s nutrition products are designed to provide children with enhanced nutrition. Our children’s nutrition business is present primarily in Asia, Latin America and Europe. We separate our children’s nutrition
4
products into two categories: (1) Enfa branded children’s nutrition products and (2) other children’s nutrition products. The table below illustrates our key children’s nutrition products:
| | |
ENFA BRANDED CHILDREN’S NUTRITION PRODUCTS | | OTHER CHILDREN’S NUTRITION PRODUCTS |
Stage 3 • Enfagrow A+® • Enfagrow Premium® Stage 4 • Enfakid A+® Stage 5 • EnfaSchool A+® | | Many available in stages 3, 4 and 5 • Sustagen KID®: nutritious powdered milk for picky eaters • Lactum®: nutritious powdered milk for picky eaters • ChocoMilk®: nutritious milk modifier • Cal-C-Tose®: nutritious milk modifier |
Enfa Branded Children’s Nutrition Products
Outside of the United States, we market children’s nutrition products under the Enfa family of brands. We design these products to meet the changing nutrition needs of children at different stages of development. We offer products at Stages 3, 4 and 5 that are designed for children’s nutritional needs at one to three years of age, three to five years of age and beyond five years of age, respectively. These products are not breast milk substitutes and are not designed for use as the sole source of nutrition but instead are designed to be a part of a child’s appropriate diet. Our use of the Enfa prefix allows for a consistent equity across Stages 3 and 4, with products such asEnfagrow®offered at Stage 3 andEnfakid®offered at Stage 4. Enfa branded children’s nutrition products comprised 56.1%, 53.4% and 53.4% of our children’s nutrition products sales for the years ended December 31, 2008, 2007 and 2006, respectively.
Other Products
We also produce a range of other products, including pre-natal and post-natal nutritional supplements for expectant and nursing mothers, includingExpecta LIPIL®, EnfaMama A+®andEnfamil Poly-Vi-Sol®.Our products for expectant or nursing women contain vitamin supplements that provide the developing fetus or breastfed infant with an increased supply of DHA for brain, visual and nervous system development. These products also supplement the mother’s diet by providing either DHA or ARA with increased proteins, as well as 24 vitamins and minerals. Our pediatric vitamin products, such asEnfamil Poly-Vi-Sol®,provide a range of benefits for infants, including multivitamins and iron supplements. These products comprised 3.3%, 3.4% and 4.3% of our net sales for the years ended December 31, 2008, 2007 and 2006, respectively.
The Special Supplemental Nutrition Program for Women, Infants and Children (“WIC”)
The WIC program is a U.S. Department of Agriculture (“USDA”) program created to provide nutritious foods, nutrition education and referrals to health care professionals and other social services to those considered to be at nutritional risk, including low-income pregnant, postpartum and breastfeeding women and infants and children up to age five. It is estimated that approximately 51% of all infants born in the United States during the 12-month period ending December 31, 2008 benefited from the WIC program. The USDA program is administered individually by each state.
Participation in the WIC program is an important part of our U.S. business based on the volume of infant formula sold under the program. Our financial results reflect net WIC sales, after taking into account the rebates we paid to the state WIC agencies, which represented approximately 12% of our U.S. net sales in 2008.
WIC Eligibility and Participation
The WIC program is available in all 50 U.S. states, 34 Indian Tribal Organizations, American Samoa, District of Columbia, Guam, Commonwealth Islands of the Northern Marianas, Puerto Rico and the U.S. Virgin Islands. To be eligible to participate in WIC, one must: (1) be a pregnant or postpartum woman or a child less than five years of
5
age, (2) be at “nutrition risk”, as determined by a health care professional and (3) meet certain income requirements. Under the WIC eligibility guidelines, families who are at or below 185% of U.S. poverty level may participate (with some adjunct eligibility for families qualifying for other federal aid programs).
Process
Most state WIC programs provide vouchers that participants use at authorized food stores to obtain the products covered by the program, including infant formula. Each state WIC agency is responsible for authorizing stores to accept WIC vouchers. Nearly 49,000 stores currently are authorized to accept WIC vouchers.
State WIC agencies enter into contracts with manufacturers, pursuant to which the state agency provides mothers with vouchers for a single manufacturer’s brand of infant formula and, in return, the manufacturer gives the state agency a rebate for each can of infant formula purchased by WIC participants. The manufacturer’s brand of infant formula provided by WIC varies from state to state depending on which manufacturer received the particular state’s exclusive contract.
Retailers purchase infant formula directly from the manufacturer, paying the manufacturer’s published wholesale price. Mothers redeem the vouchers received from the WIC agency for infant formula at authorized retailers. The retailer is then reimbursed the full retail price by the WIC agency for redeemed vouchers. On a monthly basis, each state WIC agency invoices the contracted manufacturer for an amount equal to the number of cans of infant formula redeemed by the agency and paid to retailers during the month multiplied by the agreed rebate per can.
Contracts
The bid solicitation process is determined by each state’s procurement laws, but the process is relatively standardized across the WIC program. Some states form groups and hold their bid processes jointly while other states solicit bids individually. Some states split bids between separate contracts for milk- and soy-based formulas. During the bid process, each manufacturer submits a sealed bid. The manufacturer with the lowest net price, calculated as the manufacturer’s published wholesale price less the manufacturer’s rebate bid, is awarded the contract. No other factors are considered. WIC contracts are generally three years in duration with some contracts providing for extensions. Specific contract provisions can vary significantly from state to state.
Our WIC Participation
Manufacturers that choose to compete for WIC contracts must have a widely distributed infant formula brand in order to meet the requirements of the contract bidding process. As of December 31, 2008, we hold the contracts that supply approximately 41% of WIC births. A large number of WIC contracts matured in 2006 and 2007, which resulted in significant turnover in contract holdings, but a less significant change in the overall percentage of WIC births covered by each respective WIC contract holder.
6
As of December 31, 2008, we hold the exclusive WIC contract for the following states and territories:
| | |
State | | Date of Expiration(1) |
New York(2) | | June 30, 2009 |
Arkansas | | September 30, 2009 |
Indiana | | September 30, 2009 |
Mississippi | | September 30, 2009 |
Missouri | | September 30, 2009 |
Nebraska | | September 30, 2009 |
New Mexico | | September 30, 2009 |
North Carolina | | September 30, 2009 |
South Dakota | | September 30, 2009 |
Colorado | | December 31, 2009 |
California | | July 31, 2010 |
Louisiana | | September 30, 2010 |
Illinois | | January 31, 2011 |
Michigan | | November 1, 2011 |
Puerto Rico | | September 30, 2012 |
(1) | Many contracts include one or two year extension provisions. |
(2) | The New York WIC contract is split into milk and soy products. We hold the exclusive WIC contract for milk products only. |
Sales and Marketing
We conduct regional marketing in North America, Europe, Asia and Latin America within a global strategic framework focused on both mothers and health care professionals in compliance with our policy with respect to the International Code of Marketing of Breast-milk Substitutes (“International Code”). See “—Regulatory—Global Policy and Guidance—WHO”. We employ approximately 1,350 individuals worldwide as part of our health care professional sales force and approximately 550 individuals worldwide as part of our retail sales force. Our marketing activities vary from region to region depending on our market position, consumer trends and the regulatory environment. Our marketing teams seek to anticipate market and consumer trends, and attempt to capture deep consumer insight to determine strategy for brand positioning and communication, product innovation and demand-generation programs. The marketing teams work with advertising agencies to create strong marketing campaigns for health care professionals, retail sales organizations and consumers.
Health Care Professionals
Our health care professional sales force educates health care professionals about the benefits of our infant formula products in each of the countries where we market our infant formula products. Primary marketing efforts for infant formula products are directed toward securing the recommendation of the Enfa family of brands by physicians or other health care professionals. We focus on neonatal intensive care units, physicians and other health care professionals, hospital group purchasing organizations and other integrated buying organizations. We believe we have an industry-leading health care professional sales force.
Our health care professional sales force receives continuous training about our products and on customer service skills. We support health care professionals by organizing continuing medical education programs, symposia and other educational interfaces with health care professionals.
Retail Sales Organization
Our retail sales force markets our products to each of the retail channels where our products are purchased by consumers, including mass merchandisers, club stores, grocery stores, drug stores and, to a limited extent,
7
convenience stores. The size, role and purpose of our retail sales organization varies significantly from country to country depending on our market position, the consolidation of the retail trade, consumer trends and the regulatory environment. In North America, Latin America and Asia, we focus on all retail channels, while in Europe we focus only on pharmacies, with a specialized product line. In most countries, we have entered into logistics partnerships with distributors and wholesalers.
Consumers
As their children grow older, mothers play an increasing role in brand selection. We participate in a variety of marketing activities intended for mothers of older children, including print and television advertising, direct mail, online/internet and promotional programs. Our marketing is evidence-based and emphasizes our superior nutritional science. Our direct marketing efforts focus upon the targeted direct-mail and coupon distribution programs designed to reach consumers at key decision points starting from the pre-natal period. Direct mail includes educational materials as well as discount coupons.
In the United Statesour Enfamil Family Beginnings® program provides new or prospective mothers with many resources to help them with their newborns, including free samples, instant redeemable checks and nutritional and developmental information post-birth. The program also includes post-natal magazines used to better inform mothers on nutritional and developmental topics and an e-mail initiative that periodically provides pertinent updates to program participants. The marketing materials at each of these stages are designed to develop interest in our products with respect to mothers’ current and future needs in order to create brand loyalty. The program is focused primarily on non-WIC mothers.
Global Supply Chain
We manage sourcing, manufacturing and distribution through our fully-integrated global supply chain. We operate in-house production facilities at seven different locations around the world and additionally utilize third-party manufacturers for a portion of our requirements. We use our in-house production facilities for the manufacture of products distributed throughout Europe and Latin America. We utilize a third-party manufacturer in addition to in-house facilities for products distributed throughout North America. Our in-house production facilities and third-party manufacturers provide certain material for finishing products in China, the Philippines and Thailand for distribution throughout Asia. In addition, our liquid manufacturing facility at Evansville, Indiana, manufactures and packages liquid products that are distributed worldwide and also manufactures adult nutritional products for a third party. We believe our global manufacturing facilities and third-party supply chain will continue to meet our worldwide demand.
Locations
Our in-house manufacturing and finishing facilities are located in the United States, Mexico, the Netherlands, China, the Philippines and Thailand. See “Item 2. Properties” for a description of our global manufacturing facilities.
As the production process advances, regional or sub-regional teams support the global team, overseeing manufacturing activities such as the finishing of our products. Our four regional quality departments perform regional and manufacturing site quality control and assurance. These departments focus on regulatory requirements, food safety, continuous quality improvement, third-party compliance and ingredient supplier manufacturing operations.
Suppliers
We generally enter into long-term supplier agreements. We have over 30 suppliers, through which we source approximately 80% of our materials. Through these suppliers, we obtain key raw materials (such as dairy, agricultural oil and agricultural products) and primary packaging materials (such as cans). Our suppliers also provide us with minor raw materials and secondary packaging materials (such as cardboard and shipping cases).
8
We procure key raw materials and primary packaging materials on a global basis. Certain raw materials, while managed and contracted on a global basis, are subject to regional and local variations in price under the terms of the supply agreement. For example, milk prices vary at the local level around the world partly due to government pricing regulation. Dairy products, consisting primarily of milk powders, non-fat dry milk, lactose and whey protein concentrates, accounted for approximately 43.0% of our global expenditures for materials in 2008.
Distribution
We manage our distribution networks locally with regional oversight. We generally enter into distribution agreements with third-party logistics providers and distributors and maintain a small staff at the local or regional level to track performance and implement initiatives.
Customers
Our products are sold principally to wholesale and retail customers, both nationally and internationally. One of our customers, Wal-Mart Stores, Inc. (including sales to Sam’s Club), accounted for approximately 13.0%, 15.2%, and 15.8% of our gross sales for the years ended December 31, 2008, 2007 and 2006, respectively.
Competition
We compete in two primary categories, infant formula and children’s nutrition. The competitive landscape in each category is similar around the world, as the majority of the large global players are active in these categories. Our main global competitors for sales of infant formula and children’s nutrition products are Nestlé S.A., Abbott Laboratories, Groupe Danone and Wyeth. Wyeth does not compete with us in the United States. We also compete against significant local competitors in Asia and Europe.
Many other companies, including manufacturers of private label, store and economy brand products, manufacture and sell one or more products that are similar to those marketed by us. We believe sources of competitive advantage include product quality and efficacy, brand identity, image and associated value, broad distribution capabilities and consumer satisfaction. Significant expenditures for advertising, promotion and marketing are generally required to achieve acceptance of products among consumers and health care professionals.
Research and Development
During the past six years, we have nearly doubled our research and development expenditures and the number of individuals within our research and development department. We have three main research and development facilities. Our research and development organization consists of approximately 300 people many of whom have extensive industry experience and advanced educational backgrounds.
With respect to infant formula, we organize our research and development on a global scale because these science-based products address nutritional needs that are broadly common around the world. With respect to children’s nutritional products, we organize our research and development on a more regional basis to incorporate geographic-specific consumer behaviors and preferences.
We are in the process of implementing a global formulation management system to support our innovative portfolio management and product development process. We expect this system will provide significant benefits throughout the product development and manufacturing process. In addition, we are making a significant investment in a pilot plant that will allow us to accelerate product development.
We also have strong external development relationships that complement our internal research and development capabilities. We manage our research and development activities in collaboration with leading scientists and institutes around the world and we have an active portfolio of projects involving commercial
9
technology suppliers. We believe this approach allows us to be at the forefront of scientific and technological developments relevant for pediatric nutrition. Research and development expense was $72.8 million, $67.2 million and $62.0 million in 2008, 2007 and 2006, respectively.
Intellectual Property
Patents
We own or license approximately 22 active U.S. and 120 non-U.S. patents and have 43 U.S. and 311 non-U.S. patent applications pending as of December 31, 2008.
Trademarks
We file and maintain our trademarks in those countries in which we have, or desire to have, a business presence. We hold an extensive portfolio of trademarks across our key geographies. We maintain more than 5,000 trademark registrations and applications in more than 140 countries worldwide.
Regulatory
We are subject to the laws and regulations in each country in which we market our products. We have proven processes, systems and resources in place to manage the current regulatory requirements and to participate proactively in the shaping of future regional, country and global policy, guidance and regulations.
United States Food and Drug Administration
The main regulatory body in the United States is the U.S. FDA. The U.S. FDA’s Center for Food Safety and Applied Nutrition is responsible for the regulation of infant formula. The Office of Nutritional Products, Labeling, and Dietary Supplements (“ONPLDS”) has program responsibility for infant formula while the Office of Food Additive Safety (“OFAS”) has program responsibility for food ingredients and packaging. The ONPLDS evaluates whether the infant formula manufacturer has met the requirements under the Federal Food, Drug and Cosmetic Act (“FFDCA”) and consults with the OFAS regarding the safety of ingredients in infant formula and of packaging materials for infant formula.
All manufacturers of pediatric nutrition products must begin with safe food ingredients, which are either generally recognized as safe or approved as food additives. The specific requirements for infant formula are governed by the Infant Formula Act of 1980, as amended (“Formula Act”). The purpose of the Formula Act is to ensure the safety and nutrition of infant formulas, including minimum, and in some cases, maximum levels of specified nutrients.
Once an infant formula product is formulated, the manufacturer must provide regulatory agencies assurance of the nutritional quality of that particular formulation before marketing the infant formula. The U.S. FDA has established requirements for certain labeling, nutrient content, manufacturers quality control procedures (to assure the nutrient content of infant formulas), as well as company records and reports. A manufacturer must notify the U.S. FDA 90 days before the first processing of any infant formula that differs fundamentally in processing or in composition from any previous formulation produced by the manufacturer. The U.S. FDA currently is finalizing incremental good manufacturing practices, quality control procedures, quality factors, notification requirements, and reports and records, for the production of infant formulas.
In addition, as part of its responsibility to implement the provisions of the FFDCA, the U.S. FDA continuously monitors infant formula products. The FFDCA requires infant formula manufacturers to test product composition during production and shelf-life, to keep records on production, testing and distribution of each batch of infant formula and to use good manufacturing practices and quality control procedures. In addition,
10
the FFDCA requires infant formula manufacturers to maintain records of all complaints, some of which are reviewed to reveal the possible existence of a hazard to health. The U.S. FDA conducts yearly inspections of all facilities that manufacture infant formula. The U.S. FDA also inspects new facilities during early production runs. As part of the inspection, the U.S. FDA collects and analyzes samples of infant formula.
Outside of the United States
Country-specific regulatory laws have provisions that include requirements for certain labeling, nutrient content and manufacturers quality control procedures (to assure the nutrient content of infant formulas), as well as company records and reports. With the exception of the European Union, most other countries’ regulatory agencies have not promulgated specific requirements for the testing of new and reformulated infant formulas. Other countries will generally refer to the U.S. FDA, European Union or the WHO in establishing standards and regulations for infant formulas.
Global Policy and Guidance
WHO
The WHO is the directing and coordinating authority for health within the United Nations system. It is responsible for providing leadership on global health matters, shaping the health research agenda, setting norms and standards, articulating evidence-based policy options, providing technical support to countries and monitoring and assessing health trends.
Many Member States of the WHO adopted the International Code 26 years ago with the aim to protect, promote and support appropriate infant and young child feeding practices. Countries have taken variable action to enact legislation based on the guidance of the International Code. In 1983, we believe we were the first U.S. infant formula manufacturer to adopt the International Code in developing countries and develop a specific set of marketing guidelines. While the International Code is not international law, it is our policy to comply with all applicable regulations and International Code guidance in developing countries. In developed countries such as the United States and Canada, we comply with those countries’ laws and regulations.
CODEX
The CODEX is the publication of internationally recognized standards, codes of practice, guidelines and other recommendations relating to infant formula and food production. These texts are developed and maintained by the CODEX Commission, a body that was established in 1963 by the WHO. In 2007, new comprehensive and more restrictive infant formula standards were published by CODEX. It is usual practice for countries in Central America, Latin America, Africa and Asia to incorporate CODEX standards directly into national law. We maintain material compliance with all country law and with new CODEX standards where national regulatory requirements have not yet been enacted.
Environmental, Health, and Safety
Our facilities and operations are subject to various environmental, health, and safety laws and regulations in each of the jurisdictions in which we operate. Among other things, these requirements regulate the emission or discharge of materials into the environment, the use, management, treatment, storage and disposal of solid and hazardous substances and wastes, the control of combustible dust, the reduction of noise emissions and fire and explosion risks, the cleanup of contamination and the prevention of workplace exposures and injuries. Pollution controls and various permits and programs are required for many of our operations. Each of our global manufacturing facilities undergoes periodic internal audits relating to environmental, health, and safety requirements and we incur operating and capital costs to improve our facilities or maintain compliance with applicable requirements on an ongoing basis. If we violate or become subject to liabilities under environmental,
11
health, and safety laws and regulations, including requirements under the permits and programs required for our operations, we could incur, among other things, substantial costs (including civil or criminal fines or penalties or clean-up costs), third-party claims for property damage or personal injury, or requirements to install additional pollution control or safety equipment.
From time to time, we may be responsible under various state, Federal and foreign laws, including the U.S. Comprehensive Environmental Response, Compensation, and Liability Act (“CERCLA”), for certain costs of investigating and/or remediating contamination at our current or former sites and/or at waste disposal or reprocessing facilities operated by third parties. Liability under CERCLA and analogous state or foreign laws may be imposed without regard to knowledge, fault or ownership at the time of the disposal or release. Most of our facilities have a history of industrial operations, and contaminants have been detected at some of our facilities. We also have been named as a “potentially responsible party”, or are involved in investigation and remediation, at three third-party disposal sites. As of December 31, 2008, management believes that those future site costs that were probable and reasonably estimable, as well as any related accruals, are not material to us.
We are also occasionally a party to environmental proceedings and other matters. For example, the U.S. Environmental Protection Agency (“EPA”) investigates industrial and commercial facilities throughout the United States that use refrigeration equipment containing ozone-depleting substances (“ODS”) and is responsible for enforcing compliance with regulations governing the prevention, service and repair of leaks (“ODS requirements”). In 2004, the EPA sent Mead Johnson a request for information regarding compliance with ODS requirements at our facility in Evansville, Indiana. We responded to the request in June 2004, and, as a result, identified potential violations at the Evansville facility. In addition, BMS performed a voluntary corporate-wide audit at all of its facilities, including the Mead Johnson facilities, in the United States that use ODS-containing refrigeration equipment. The audit report that BMS submitted to the EPA in November 2004 identified potential violations of ODS requirements at several facilities, including two potential administrative violations of ODS requirements at our Zeeland, Michigan facility. In July 2008, BMS (acting on behalf of BMS and Mead Johnson) and EPA entered into a proposed consent decree, which requires BMS to retire or retrofit by July 2009 certain industrial refrigeration equipment at five facilities, including Evansville, Indiana. Under the proposed consent decree, BMS is also required to pay $127,000 in civil penalties, a de minimis portion of which is attributable to Mead Johnson and will be paid by BMS. Mead Johnson believes that it does not have any material obligations remaining under the proposed consent decree. It is possible that we may have additional obligations, or additional costs may be imposed on us, if the proposed consent decree does not become final or is otherwise modified before being finalized by the court.
We are not aware of any pending litigation or significant financial obligations or liabilities arising from current or former operations or properties that are likely to have a material adverse impact on our business, financial position or results of operations. Liabilities or obligations, which could require us to make significant expenditures, could arise in the future, however, as the result of, among other things, changes in, or new interpretations of, existing laws, regulations or enforcement policies, claims relating to on- or off-site contamination, or the imposition of unanticipated investigation or cleanup obligations.
Insurance
Our business involves an inherent risk of product liability and any claims of this type could have an adverse impact on us. We will take what we believe are appropriate precautions, primarily self-insurance combined with product liability insurance coverage, to provide adequate coverage for possible product liability claims. Though our insurance coverage and cash flows have been adequate to provide for liability claims in the past, product liability claims could exceed our insurance coverage limits and cash flows, and insurance may not be available on commercially reasonable terms or at all. We evaluate our insurance requirements on an ongoing basis to ensure we maintain adequate levels of coverage.
12
Employees
As of December 31, 2008, we employed approximately 5,300 people worldwide. Our manufacturing workforces at Zeeland, Michigan; Evansville, Indiana; Guangzhou, China and Chonburi, Thailand are not unionized. The manufacturing workforce at Delicias, Mexico is unionized and covered by a collective bargaining agreement which becomes subject to salary and benefits review on March 31, 2009, and to total contract review on March 31, 2010. The manufacturing workforce and the non-supervised sales force at Makati, Philippines are unionized and covered by a collective bargaining agreement, which expires on December 31, 2010. In addition, several of our workforces in Europe have works council representation. We believe our employee relations are satisfactory.
Available Information
The company’s internet web site address iswww.meadjohnson.com. On its web site, the company makes available, free of charge, its annual, quarterly and current reports, including amendments to such reports, as soon as reasonably practicable after the company electronically files such material with, or furnishes such material to, the SEC. Stockholders and other interested parties may request email notification of the posting of these documents through the Investors section of our web site.
13
In addition to the other information in this Annual Report, any of the factors described below could significantly and negatively affect the company’s business, prospects, financial condition or operating results, which could cause the trading price of the company’s Class A common stock to decline.
Risks Related to Our Business
Our success depends on sustaining the strength of our brands, particularly our Enfa family of brands.
The Enfa family of brands accounted for 61.0% of our net sales for the year ended December 31, 2008. The willingness of consumers to purchase our products depends upon our ability to offer attractive brand value propositions. This in turn depends in part on consumers attributing a higher value to our products than to alternatives. If the difference in the value attributed to our products as compared to those of our competitors narrows, or if there is a perception of such a narrowing, consumers may choose not to buy our products. If we fail to promote and maintain the brand equity of our products across each of our markets, then consumer perception of our products’ nutritional quality may be diminished and our business could be materially adversely affected. Our ability to maintain or improve our brand value propositions will impact whether these circumstances will result in decreased market share and profitability.
We may experience liabilities or negative effects on our reputation as a result of real or perceived quality issues, including product recalls, injuries or other claims.
Whether real or perceived, contamination, spoilage or other adulteration, product misbranding or product tampering could require us to recall products. From time to time we have experienced recalls of our products. While such recalls have not been material to our business on a global level in the past, we cannot assure you that such material product recalls will not occur in the future. We may also be subject to liability if our products or operations violate or are alleged to violate applicable laws or regulations or in the event our products cause, or are alleged to cause, injury, illness or death.
Powder milk products are not sterile. A substantial portion of our products must be prepared and maintained according to label instruction to retain their flavor and nutritional value and avoid contamination or deterioration. Depending on the specific type of product, a risk of contamination or deterioration may exist at each stage of the production cycle, including the purchase and delivery of raw food materials, the processing and packaging of food products and upon use and handling by health care professionals, hospital personnel and consumers. In the event that certain of our products are found, or are alleged, to have suffered contamination or deterioration, whether or not such products were under our control, our brand reputation and business could be materially adversely affected.
Whether real or perceived, reports or allegations of inadequate product quality control with respect to other manufacturers of pediatric nutrition products also could adversely impact sales of our products. For example, although the U.S. FDA currently permits the use of bisphenol-A (“BPA”) in food packaging materials, including polycarbonate baby bottles and some of our infant formula packaging, recent public reports and allegations regarding the potential health hazards of BPA, and several lawsuits against baby bottle manufacturers and infant formula manufacturers (including us) related to BPA content, could contribute to a perceived safety risk about our products and adversely impact sales or otherwise disrupt our business. Further, the U.S. FDA or other regulatory authorities could prohibit the use of BPA in the future. In addition, in November 2008 and December 2008, the U.S. FDA released test results that identified extremely low trace levels of melamine and cyanuric acid in infant formula produced by U.S. manufacturers. The U.S. FDA has found no melamine in our products and only a trace amount of cyanuric acid, which the U.S. FDA believes does not raise public health concerns, was found in a sampling of our products. Chinese authorities found significant levels of melamine in Chinese dairy used in certain infant formula products of other manufacturers, which led to the deaths of several infants in September 2008. We do not use dairy
14
or protein-containing raw ingredients from China at any of our manufacturing sites and we have not been adversely impacted by these events in China thus far. Events such as these may create a perception of contamination risk among consumers with respect to all products in our industry.
In addition, we advertise our products and could be the target of claims relating to false or deceptive advertising under foreign laws and U.S. Federal and state laws, including the consumer protection statutes of some states. A significant product liability or other legal claim or judgment against us or a widespread product recall may negatively impact our profitability. Even if a product liability or consumer fraud claim is unsuccessful or is not merited or fully pursued, the negative publicity surrounding such assertions regarding our products or processes could materially adversely affect our reputation and brand image and therefore our business.
We are subject to numerous governmental regulations, and it can be costly to comply with these regulations. Changes in governmental regulations could harm our business.
As a producer of pediatric nutrition products, our activities are subject to extensive regulation by governmental authorities and international organizations, including rules and regulations with respect to the environment, employee health and safety, hygiene, quality control and tax laws. It can be costly to comply with these regulations and to develop compliant product processes. Our activities may also be subject to all kinds of barriers or sanctions imposed by countries or international organizations limiting international trade and increasingly dictating the specific content of our products and, with regard to the protection of consumer health and safety, limiting information and advertising about the health benefits of products that we market. In addition, regulatory changes or decisions that restrict the marketing, promotion and availability of our products, continued access to health care professionals, the ability to include genetically modified organisms in our products, as well as the manufacture and labeling of our products, could materially adversely affect our business. For example, regulations in the Philippines require governmental review of all advertisements for products intended for children under the age of two. In addition, certain activists, along with governmental and quasi-governmental entities, such as the United Nations Childrens’ Fund (“UNICEF”), have advocated against the marketing and sale of pediatric nutrition products. These efforts could result in increased regulatory restrictions on our activities in the future. Our activities could be materially adversely affected by any significant changes in such regulations or their enforcement. Our ability to anticipate and comply with evolving global standards requires significant investment in monitoring the global regulatory environment and we may be unable to comply with changes in regulation restricting our ability to continue to operate our business or manufacture, market or sell our products.
Commodity price increases will increase our operating costs and may reduce our profitability.
Commodity prices impact our business directly through the cost of raw materials used to make our products (such as skim milk powder, lactose and whey protein concentrate), the cost of inputs used to manufacture and ship our products (such as crude oil and energy) and the amount we pay to produce or purchase packaging for our products (such as cans, pouches, cardboard and plastic). Commodities such as these are susceptible to price volatility caused by conditions outside of our control, including fluctuations in commodities markets, currency fluctuations and changes in governmental agricultural programs. Our dairy costs have increased significantly over the past two years. If, as a result of consumer sensitivity to pricing or otherwise, we are unable to increase our prices to offset the increased cost of commodities, we may experience lower profitability and we may be unable to maintain historical levels of productivity.
Our business is particularly vulnerable to commodity price increases in Asia, the fastest growing region in the pediatric nutrition industry. Commodity price increases in Asia could reduce our sales and limit our ability to pursue our growth strategy in that region. We employ various purchasing and pricing contract techniques in an effort to minimize commodity price volatility. Generally, these techniques include setting fixed terms with suppliers such as incorporating clauses setting forth unit pricing that is based on an average commodity price over a corresponding period of time. If we fail to manage our commodity price exposure adequately, our business may be materially adversely affected.
15
Our profitability may suffer as a result of competition in our markets.
The pediatric nutrition industry is intensely competitive. Our primary competitors, including Nestlé S.A., Abbott Laboratories, Groupe Danone and Wyeth, all have substantial financial, marketing and other resources. We compete against large global companies, as well as regional and local companies, in each of the regions in which we operate. In most product categories, we compete not only with other widely advertised branded products, but also with private label, store and economy brand products that are generally sold at lower prices. Competition in our product categories is based on the following factors:
| | • | | brand recognition and loyalty; |
| | • | | effectiveness of marketing, promotional activity and the ability to identify and satisfy consumer preferences; |
| | • | | distribution and availability of products. |
From time to time, in order to protect our existing market share or capture increased market share, we may need to improve our brand recognition and product value proposition, and increase our spending on marketing, advertising and new product innovation. The success of marketing, advertising and new product innovation is subject to risks, including uncertainties about trade and consumer acceptance. We may also need to reduce prices for some of our products in order to respond to competitive and customer pressures and to maintain our market share. Competitive and customer pressures may restrict our ability to increase prices, including in response to commodity and other cost increases. Our business will suffer if profit margins decrease, either as a result of a reduction in prices or an increase in costs with an inability to increase prices proportionally.
Economic downturns, such as the current downturn, could cause consumers to shift their purchases from our higher-priced premium products to lower-priced products, including private label or store brands, which could materially adversely affect our business.
The willingness of consumers to purchase premium brand pediatric nutrition products depends in part on local economic conditions. In periods of economic uncertainty, consumers tend to shift their purchases from our higher-priced premium products to lower-priced products, including private label and store brand products. We believe private label and store brand product manufacturers gained market share in the United States over the past 12 months.
Turmoil in the financial markets could adversely affect our liquidity, cash flow and financial flexibility, as well as the demand for our products.
Recent turmoil in the financial markets has adversely affected economic activity and credit markets in the United States and other regions of the world in which we do business. This could have an adverse impact on our customers, distributors, suppliers, counterparties to certain financial instruments, financial service providers and other service providers. We believe that, based on our expected operating cash flows and relationship with BMS, the current lack of liquidity in the credit markets will not have a material impact on our liquidity, cash flow, or financial flexibility.
Our operations face significant foreign currency exchange rate exposure that could materially negatively impact our operating results.
We hold assets, incur liabilities, earn revenue and pay expenses in a variety of currencies other than the U.S. dollar, primarily the Chinese renminbi, the Mexican peso, the Philippine peso, the Hong Kong dollar and the
16
Euro. Because our financial statements are presented in U.S. dollars, we must translate our assets, liabilities, revenue and expenses into U.S. dollars at the then-applicable exchange rates. Consequently, increases in the value of the U.S. dollar versus these other currencies may negatively affect the value of these items in our financial statements, even if their value has not changed in their original currency. While we intend to mitigate some of this risk with hedging and other activities, our business will nevertheless remain subject to substantial foreign exchange risk from foreign currency translation exposures that we will not be able to manage through effective hedging or the use of other financial instrument approaches.
The international nature of our business subjects us to additional business risks that could cause our revenue and profitability to decline.
We operate our business and market our products internationally in more than 50 countries. For the year ended December 31, 2008 and year ended December 31, 2007, 61.5% and 56.2%, respectively, of our net sales were generated in countries outside of the United States. The risks associated with our operations outside of the United States include:
| | • | | multiple regulatory requirements that are subject to change and that could restrict our ability to manufacture, market or sell our products; |
| | • | | inflation, recession, fluctuations in foreign currency exchange and interest rates and discriminatory fiscal policies; |
| | • | | adverse tax consequences from the repatriation of cash; |
| | • | | trade protection measures, including increased duties and taxes, and import or export licensing requirements; |
| | • | | government health promotional programs intended to discourage the use of our products; |
| | • | | differing local product preferences and product requirements; |
| | • | | difficulty in establishing, staffing and managing operations; |
| | • | | differing labor regulations; |
| | • | | potentially negative consequences from changes in or interpretations of tax laws; |
| | • | | political and economic instability; |
| | • | | enforcement of remedies in various jurisdictions; |
| | • | | changes in foreign medical reimbursement policies and programs; and |
| | • | | diminished protection of intellectual property in some countries. |
These and other risks could have a material adverse effect on our business.
Our international operations are subject to political and economic risks of developing countries, and special risks associated with doing business in corrupt environments.
We operate our business and market our products internationally in more than 50 countries, and we are focusing on increasing our sales and in some cases establishing new production facilities in regions, including Asia, Latin America, India and the Middle East, which are less developed, have less stability in legal systems and financial markets, and are generally recognized as potentially more corrupt business environments than the United States, and therefore present greater political, economic and operational risks. We have in place policies, procedures and certain ongoing training of employees with regard to business ethics and many key legal requirements, such as applicable anti-corruption laws, including the U.S. Foreign Corrupt Practices Act
17
(“FCPA”), which make it illegal for us to give anything of value to foreign officials in order to obtain or retain any business or other advantages; however, there can be no assurance that our employees will adhere to our code of business ethics or any other of our policies, applicable anti-corruption laws, including the FCPA, or other legal requirements. If we fail to enforce our policies and procedures properly or maintain adequate record-keeping and internal accounting practices to accurately record our transactions, we may be subject to regulatory sanctions. If we believe or have reason to believe that our employees have or may have violated applicable anti-corruption laws, including the FCPA, or other laws or regulations, we are required to investigate or have outside counsel investigate the relevant facts and circumstances, and if violations are found or suspected could face civil and criminal penalties, and significant costs for investigations, litigation, fees, settlements and judgments, which in turn could have a material adverse effect on our business.
Sales of our products are subject to changing consumer preferences, and our success depends upon our ability to predict, identify and interpret changes in consumer preferences and develop and offer new products rapidly enough to meet those changes.
Our success depends on our ability to predict, identify and interpret the tastes, dietary habits and nutritional needs of consumers and to offer products that appeal to those preferences. If we do not succeed in offering products that consumers want to buy, our sales and market share will decrease, resulting in reduced profitability. If we are unable to predict accurately which shifts in consumer preferences will be long lasting, or to introduce new and improved products to satisfy those preferences, our sales will decline. In addition, given the variety of cultures and backgrounds of consumers in our global consumer base, we must offer a sufficient array of products to satisfy the broad spectrum of consumer preferences. As such, we must be successful in developing innovative products across our product categories.
The consolidation of our retail customers may put pressures on our profitability.
Our retail customers, such as mass merchandisers, club stores, grocery stores, drug stores and convenience stores, have consolidated in recent years and consolidation is expected to continue throughout the United States, Europe and other major markets. This consolidation has produced large, sophisticated customers with increased buying power which are more capable of operating with reduced inventories, resisting price increases and demanding lower pricing, increased promotional programs and specifically tailored products. These customers also may use shelf space currently used for our products for their private label or store brand products. Meeting demands from these customers may adversely affect our margins and, if we fail to effectively respond to these demands, our sales could decline, each of which could materially adversely affect our profitability.
We rely on third parties to provide us with materials and services in connection with the manufacturing and distribution of our products.
Unaffiliated third-party suppliers provide us with materials necessary for commercial production of our products, including certain key raw materials (such as dairy, agricultural oil and agricultural products) and primary packaging materials (such as cans). In particular, Martek Biosciences Corporation (Martek) provides us with most of the supply of DHA and ARA that we use in our products. We may be unable to manufacture our products in a timely manner, or at all, if any of our third-party suppliers, including Martek, should cease or interrupt production or otherwise fail to supply us or if the supply agreements are suspended, terminated or otherwise expire without renewal. If these suppliers are not able to supply us with the quantities of materials we need or if these suppliers are not able to provide services in the required time period, this could have a material adverse effect on our business. We also utilize third parties in several countries throughout the world to distribute our products. If any of our third-party distributors fail to distribute our products in a timely manner, or at all, or if our distribution agreements are suspended, terminated or otherwise expire without renewal, our profitability could be materially adversely affected.
18
The manufacture of many of our products is a highly exacting and complex process, and if we or one of our suppliers should encounter problems manufacturing products, our business could suffer.
The manufacture of many of our products is a highly exacting and complex process, in part due to strict regulatory requirements. Problems may arise during the manufacturing process for a variety of reasons, including equipment malfunction, failure to follow specific protocols and procedures, problems with raw materials, maintenance of our manufacturing environment, natural disasters, various contagious diseases and process safety issues. If problems arise during the production of a batch of product, that batch of product may have to be discarded. This could, among other things, lead to increased costs, lost revenue, damage to customer relations, time and expenses being spent investigating the cause and, depending on the cause, similar losses with respect to other batches or products. If problems are not discovered before the affected product is released to the market, recall and product liability costs as well as reputational damage may also be incurred. To the extent that we or one of our suppliers experience significant manufacturing problems, this could have a material adverse effect on our business.
We may experience difficulties and delays inherent in the manufacturing and selling of our products.
We may experience difficulties and delays inherent in the manufacturing and selling of our products, such as: (1) seizure or recalls of products or forced closings of manufacturing plants; (2) the failure to obtain, the imposition of limitations on the use of, or loss of, patent, trademark or other intellectual property rights; (3) our failure, or the failure of any of our vendors or suppliers, to comply with current good manufacturing practices and other applicable regulations and quality assurance guidelines that could lead to temporary manufacturing shutdowns, product shortages and delays in product manufacturing; (4) construction delays related to the construction of new facilities or the expansion of existing facilities, including those intended to support future demand for our products; (5) other manufacturing or distribution problems, including changes in manufacturing production sites and limits to manufacturing capability due to regulatory requirements, changes in types of products produced or physical limitations that could impact continuous supply; (6) availability of raw materials; and (7) restrictions associated with the transportation of goods in and out of foreign countries.
If we fail to increase our production and manufacturing capacity, we will be unable to continue to grow and our ability to produce new products, expand within our existing markets and enter into new markets will be limited.
Global growth and demand for our products has increased the utilization of our production and manufacturing facilities, including manufacturing capacity provided by third-party manufacturers and packaging capacity with respect to our products. If we are unable to successfully expand our production and manufacturing capacity, we will be unable to continue our growth and expand within our existing markets or enter into additional geographic markets or new product categories. In addition, failure to successfully expand our production and manufacturing capacity will limit our ability to introduce and distribute new products, including our existing pipeline of innovations and product improvements, or otherwise take advantage of opportunities in new and existing markets. Further, increasing our production and manufacturing facilities requires significant investment and build times. Delays in increasing capacity could also limit our ability to continue our growth and materially adversely affect our business.
Disruption of our global supply chain could materially adversely affect our business.
Our ability to manufacture, distribute and sell products is critical to our success. Damage or disruption to raw material supplies or our manufacturing or distribution capabilities due to weather, natural disaster, fire, terrorism, strikes, various contagious diseases or other reasons could impair our ability to manufacture or sell our products. Failure to take adequate steps to mitigate the likelihood or potential impact of such events, or to effectively manage such events if they occur, particularly when a product is sourced from a single location, could materially adversely affect our business.
19
Changes in WIC, or our participation in it, could materially adversely affect our business.
Participation in the WIC program is an important part of our U.S. business based on the volume of infant formula sold under the program. As of December 31, 2008, we hold the contracts that supply approximately 41% of WIC births. As a result, our business strategy includes bidding for new WIC contracts and maintaining current WIC relationships. Our failure to win bids for new contracts pursuant to the WIC program or our inability to maintain current WIC relationships could have a material adverse effect on our business. In addition, any changes to how the WIC program is administered and any changes to the eligibility requirements and/or overall participation in the WIC program could also have a material adverse effect on our business.
Our business could be harmed by a failure of our information technology, administrative or outsourcing systems.
We rely on our information technology, administrative and outsourcing systems to effectively manage our business data, communications, supply chain, order entry and fulfillment and other business processes. The failure of our information technology, administrative or outsourcing systems to perform as we anticipate could disrupt our business and result in transaction errors, processing inefficiencies and the loss of sales and customers, causing our business to suffer. In addition, our information technology, administrative and outsourcing systems may be vulnerable to damage or interruption from circumstances beyond our control, including fire, natural disasters, systems failures, security breaches and viruses. Any such damage or interruption could have a material adverse effect on our business and prevent us from paying our suppliers or employees, receiving payments from our customers or performing other information technology, administrative or outsourcing services on a timely basis.
We may face difficulties as we expand our operations into countries in which we have no prior operating experience or as we expand our operations into new product categories.
We intend to continue to expand our global footprint in order to enter into new markets. This may involve expanding into countries other than those in which we currently operate. It may involve expanding into less developed countries, which may have less political, social or economic stability and less developed infrastructure and legal systems. We also intend to expand our product portfolio by adding new product categories. As we expand our business into new countries or product categories we may encounter regulatory, personnel, technological and other difficulties that increase our expenses or delay our ability to start up our operations or become profitable in such countries or product categories. This may affect our relationships with customers, suppliers and regulators and could have a material adverse effect on our business.
Resources devoted to research and development may not yield new products that achieve commercial success.
Our ability to develop new pediatric nutrition products depends on, among other factors, our ability to understand the composition and variation of breast milk. Analyzing breast milk requires significant investment in research and development and testing of new ingredients and new production processes. We devote significant resources to investment in research and development in order gain a deep understanding of the composite ingredients of breast milk. The research and development process is expensive, prolonged and entails considerable uncertainty. Development of a new product, from discovery through testing and registration to initial product launch, typically takes between five and seven years. Each of these periods varies considerably from product to product and country to country. Because of the complexities and uncertainties associated with research and development, products that we are currently developing may not complete the development process or obtain the regulatory approvals required for us to market such products successfully. The development of new products may take longer and cost more to develop and may be less successful than we currently anticipate as a result of:
| | • | | products that may appear promising in development but fail to reach market within the expected or optimal time frame, or fail to ever reach market, for any number of reasons, including efficacy and the difficulty or excessive cost to manufacture; |
20
| | • | | failure to enter into or successfully implement optimal alliances where appropriate for the discovery and commercialization of products, or otherwise to maintain a consistent scope and variety of promising late-stage pipeline products; or |
| | • | | failure of one or more of our products to achieve or maintain commercial viability. |
We cannot assure you that any of our products currently in our development pipeline will be commercially successful.
We could incur substantial costs to comply with environmental, health, and safety laws and regulations and to address violations of or liabilities under these requirements.
Our facilities and operations are subject to various environmental, health, and safety laws and regulations in each of the jurisdictions in which we operate. Among other things, these requirements regulate the emission or discharge of materials into the environment, the use, management, treatment, storage and disposal of solid and hazardous substances and wastes, the control of combustible dust, the reduction of noise emissions and fire and explosion risks, the cleanup of contamination and the prevention of workplace exposures and injuries. Pollution controls and various permits and programs are required for many of our operations. We could incur or be subject to, among other things, substantial costs (including civil or criminal fines or penalties or clean-up costs), third party damage claims, requirements to install additional pollution control or safety control equipment and/or permit revocations in the event of violations by us of environmental, health, and safely requirements applicable to our facilities and operations or our failure to obtain, develop or comply with required environmental permits or programs. In addition, most of our facilities have a history of industrial operations, and contaminants have been detected at some of our facilities. We also have been named as a potentially responsible party with respect to three Superfund or state sites. We can be held responsible, in some cases without regard to knowledge, fault, or ownership at the time of the release, for the costs of investigating or remediating contamination of any real property we or our predecessors ever owned, operated, or used as a waste disposal site. In addition, we can be required to compensate public authorities or private owners for damages to natural resources or other real property, or to restore those properties, in the event of off-site migration of contamination. Changes in, or new interpretations of, existing laws, regulations or enforcement policies, could also cause us to incur additional or unexpected costs to achieve or maintain compliance. The assertion of claims relating to on- or off-site contamination, the discovery of previously unknown environmental liabilities or the imposition of unanticipated investigation or cleanup obligations, could result in potentially significant expenditures to address contamination or resolve claims or liabilities. Such costs and expenditures could have a material adverse effect on our business, financial condition or results of operations.
We may not be able to adequately protect our intellectual property rights.
Given the importance of brand recognition to our business, we have invested considerable effort in seeking trademark protection for our core brands, including the Enfa family of brands. However, we cannot be certain that the steps we have taken will be sufficient to protect our intellectual property rights in our brands adequately or that third parties will not infringe upon or misappropriate any such rights. Our trademark registrations and applications can potentially be challenged and cancelled or narrowed. Moreover, some of the countries in which we operate offer less protection for, and may subject these rights to higher risks, than is the case in Europe or North America. In addition, it is costly to litigate in order to protect any of our intellectual property rights. If we are unable to prevent third parties from infringing or misappropriating these rights in our core products or brands, including our Enfa family of brands, our future financial condition and our ability to develop our business could be materially adversely affected.
Other companies have from time to time taken, and may in the future take, actions that we believe violate our intellectual property rights and we may decide to enforce (and in some cases are currently enforcing) those rights against such actions. Uncertainties inherent in such litigation make the outcome and associated costs difficult to predict. If unsuccessful, the legal actions could result in the invalidation of some of our intellectual property rights, which could materially adversely affect our business.
21
We rely on a combination of security measures, confidentiality policies, contractual arrangements and trade secret laws to protect our proprietary formulae and other valuable trade secrets. We also rely on patent, copyright and trademark laws to further protect our intellectual property rights. We cannot, however, be certain that the steps we take will prevent the development and marketing of similar, competing products and services by third parties. Our existing patents and any future patents that we obtain may not be sufficiently broad to protect us against third parties with similar products or to provide us with a competitive advantage. Moreover, our patents can potentially be challenged and narrowed or invalidated. Trade secrets are difficult to protect, and despite our efforts may become known to competitors or independently discovered. The confidentiality agreements we rely on with our employees, customers, contractors and others may be breached, and we may not have adequate remedies for such breach. Failure to adequately protect our valuable intellectual property from being infringed or misappropriated could materially adversely affect our business.
We may be required to defend ourselves against intellectual property claims from third parties, which could harm our business.
Regardless of merit, there are third-party patents that may cover our products. Third parties may obtain patents in the future and claim that use of our technologies infringes upon these patents. If a third party asserts that our products or services are infringing upon its intellectual property, these claims could cause us to incur significant expenses and, if successfully asserted against us, could require that we pay substantial damages and/or prevent us from selling our products. Even if we were to prevail against such claims, any litigation regarding intellectual property could be costly and time-consuming and could divert the attention of our management and key personnel from our business operations. Furthermore, as a result of an intellectual property challenge, we may find it necessary to enter into royalty licenses or other costly agreements, and we may not be able to obtain such agreements at all or on terms acceptable to us.
Increases in costs of pension benefits and current and post-retirement medical and other employee health and welfare benefits may reduce our profitability.
With approximately 5,300 employees, our profitability is substantially affected by costs of retirement benefits and current and post-retirement medical and other employee health and welfare benefits. These costs can vary substantially as a result of changes in health care costs, volatility in investment returns on plan assets and changes in discount rates used to calculate related liabilities. These factors may put upward pressure on the cost of providing pensions and medical benefits. We can provide no assurance that we will succeed in limiting future cost increases, and upward pressure would reduce our profitability.
Labor disputes may cause work stoppages, strikes and disruptions.
The workforce at our manufacturing facility in Delicias, Mexico is unionized and covered by a collective bargaining agreement, which becomes subject to salary and benefits review on March 31, 2009, and to total contract review on March 31, 2010. The manufacturing workforce and non-supervised sales force in Makati, Philippines are unionized and covered by a collective bargaining agreement, which expires on December 31, 2010. In addition, several of our workforces in Europe have works council representation. As a result, any labor disputes, including work stoppages, strikes and disruptions, could have a material adverse impact on our business.
Our success depends on attracting and retaining qualified personnel in a competitive environment.
Our business strategy and future success depends, in part, on our ability to attract, hire and retain highly-skilled managerial, professional service, sales, development, marketing, finance, accounting, administrative, information technology, science, research and infrastructure-related personnel in a competitive environment, who are critical to our business functions. The market for highly-skilled employees is competitive in the labor markets in which we operate. Our business could be materially adversely affected if we are unable to retain key employees or recruit
22
qualified personnel in a timely fashion, or if we are required to incur unexpected increases in compensation costs to retain key employees or meet our hiring goals. If we are not able to retain and attract the personnel that we require, or we are not able to do so on a cost-effective basis, it could be more difficult for us to sell and develop our products and services and execute our business strategy.
We derive a significant percentage of our revenues from one customer. The loss of this customer could materially adversely affect our financial performance.
Our products are sold principally to the wholesale and retail trade, both nationally and internationally, and revenues from one customer, Wal-Mart Stores, Inc. (including sales to Sam’s Club, Wal-Mart), accounted for approximately 13.0% of our gross sales for the year ended December 31, 2008. If this customer ceases doing business with us or if we encounter any difficulties in our relationship with Wal-Mart, our business could be materially adversely affected.
An adverse change in favorable demographic and economic trends as well as a change in scientific opinion regarding our products in any of our largest markets could materially adversely affect our business and reduce our profitability.
Our growth plan relies on favorable demographic and economic trends in various markets, including: (1) rising incomes in emerging markets, (2) increasing number of working mothers and (3) increasing consumer spending on health care worldwide. If these demographic trends change in an adverse way, our business could be materially adversely affected. In addition, an adverse change in scientific opinion regarding our products, such as the health benefits of DHA and ARA, could materially adversely affect our business.
We have substantial debt, which could materially adversely affect our business and our ability to meet our obligations.
We had total indebtedness of $2,000 million as of December 31, 2008. See “Item 8. Financial Statements—Note 3, Related Parties” and “Item 13. Certain Relationships and Related Transactions, and Director Independence.”
This amount of debt could have important consequences to us and our investors, including:
| | • | | requiring a substantial portion of our cash flow from operations to make interest and principal payments on this debt; |
| | • | | requiring us to repay the full amount of our debt upon a change of control event; |
| | • | | making it more difficult to satisfy debt service and other obligations; |
| | • | | increasing our vulnerability to general adverse economic and industry conditions; |
| | • | | reducing the cash flow available to fund capital expenditures and other corporate purposes and to grow our business; |
| | • | | limiting our flexibility in planning for, or reacting to, changes in our business and industry; |
| | • | | placing us at a competitive disadvantage to our competitors that may not be as leveraged with debt as we are; |
| | • | | limiting our ability to borrow additional funds as needed or take advantage of business opportunities as they arise; and |
| | • | | pay cash dividends or repurchase common stock. |
To the extent we become more leveraged, the risks described above could increase. In addition, our actual cash requirements in the future may be greater than expected. Our cash flow from operations may not be sufficient to repay at maturity all of the outstanding debt as it becomes due, and we may not be able to borrow money, sell assets or otherwise raise funds on acceptable terms, or at all, to refinance our debt.
23
We intend to evaluate acquisitions, joint ventures and other strategic initiatives, any of which could distract our management or otherwise have a negative effect on our revenues, costs and stock price.
Our future success may depend on opportunities to buy or obtain rights to other businesses or technologies that could complement, enhance or expand our current business or products or that might otherwise offer us growth opportunities. In particular, we intend to evaluate potential mergers, acquisitions, joint venture investments, strategic initiatives, alliances, vertical integration opportunities and divestitures. If we attempt to engage in these transactions, we expose ourselves to various inherent risks, including:
| | • | | accurately assessing the value, future growth potential, strengths, weaknesses, contingent and other liabilities and potential profitability of acquisition candidates; |
| | • | | the potential loss of key personnel of an acquired or combined business; |
| | • | | our ability to achieve projected economic and operating synergies; |
| | • | | difficulties successfully integrating, operating, maintaining and managing newly-acquired operations or employees; |
| | • | | difficulties maintaining uniform standards, controls, procedures and policies; |
| | • | | unanticipated changes in business and economic conditions affecting an acquired business; |
| | • | | the possibility we could incur impairment charges if an acquired business performs below expectations; and |
| | • | | the diversion of our management’s attention from our existing business to integrate the operations and personnel of the acquired or combined business or implement the strategic initiative. |
If any of the foregoing risks materializes, our results of operations and the results of the proposed transactions would likely differ from our, and market expectations, and our stock price could, accordingly, decline. In addition, we may not be able to complete desirable transactions, for reasons including a failure to secure financing, as a result of our separation agreement or other agreements with third parties. See “Item 13. Certain Relationships and Related Transactions, and Director Independence” for a description of the restrictions arising under the separation agreement.
We depend on cash flows generated by our subsidiaries, and a failure to receive distributions from our subsidiaries may result in our inability to meet our financial obligations, or to pay dividends.
We are a holding company with no material assets other than the equity interests of our subsidiaries. Our subsidiaries conduct substantially all of our operations and own substantially all of our assets. Consequently, our cash flow and our ability to meet our obligations and pay dividends to our stockholders depends upon the cash flow of our subsidiaries and the payment of funds by our subsidiaries to us in the form of dividends, tax sharing payments or otherwise. There are a number of other factors that could affect our ability to pay dividends, including the following:
| | • | | lack of availability of cash to pay dividends due to changes in our operating cash flow, capital expenditure requirements, working capital requirements and other cash needs; |
| | • | | unexpected or increased operating or other expenses or changes in the timing thereof; |
| | • | | restrictions under Delaware law or other applicable law on the amount of dividends that we may pay; |
| | • | | a decision by our board of directors to modify or revoke its policy to pay dividends; and |
| | • | | the other risks described in this “Risk Factors” section |
Each of our subsidiaries is a distinct legal entity and its ability to make any payments will depend on its earnings, the terms of its indebtedness, tax considerations and legal restrictions. While no restrictions currently
24
exist, under certain circumstances, legal and contractual restrictions may limit our ability to obtain cash from our subsidiaries and our subsidiaries may not be able to, or be permitted to, make distributions to us in the future. In the event that we do not receive distributions from our subsidiaries, we may be unable to meet our financial obligations.
Risks Related to Our Relationship with BMS
We may not realize the potential benefits from our separation from BMS.
We may not realize the benefits that we anticipate from our separation from BMS. These benefits include the following:
| | • | | allowing our management to focus its efforts on our business and strategic priorities; |
| | • | | enabling us to allocate our capital more efficiently; |
| | • | | providing us with direct access to the debt and equity capital markets; |
| | • | | improving our ability to pursue acquisitions through the use of shares of our common stock as consideration; |
| | • | | enhancing our market recognition with investors; and |
| | • | | increasing our ability to attract and retain employees by providing equity compensation tied to our business. |
We may not achieve the anticipated benefits from our separation for a variety of reasons. For example, the process of separating our business from BMS and operating as an independent public company may distract our management from focusing on our business and strategic priorities. In addition, although we will have direct access to the debt and equity capital markets following the separation, we may not be able to issue debt or equity on terms acceptable to us or at all. The availability of shares of our common stock for use as consideration for acquisitions also will not ensure that we will be able to successfully pursue acquisitions or that the acquisitions will be successful. Moreover, even with equity compensation tied to our business we may not be able to attract and retain employees as desired. We also may not fully realize the anticipated benefits from our separation if any of the matters identified as risks in this “Risk Factors” section were to occur. If we do not realize the anticipated benefits from our separation for any reason, our business may be materially adversely affected.
BMS controls the direction of our business, and the concentrated ownership of our common stock and certain governance arrangements will prevent you and other stockholders from influencing significant decisions.
BMS owns 55.1% of the outstanding shares of our Class A common stock, and 100% of our outstanding Class B common stock, giving BMS 83.1% of the shares of our outstanding common stock and 97.5% of the combined voting power of our outstanding common stock. As long as BMS owns a majority of our voting power, BMS will be able to control any corporate action that requires a stockholder vote irrespective of the vote of, and without prior notice to, any other stockholder. As a result, BMS will have the ability to control significant corporate activities, including:
| | • | | the election of our board of directors and, through our board of directors, decision-making with respect to our business direction and policies, including the appointment and removal of our officers; |
| | • | | acquisitions or dispositions of businesses or assets, mergers or other business combinations; |
| | • | | payment of dividends; and |
| | • | | the number of shares available for issuance under our equity incentive plans for our prospective and existing employees. |
25
In addition, we do not have a formal mechanism by which our independent directors must approve any future transactions with BMS.
This voting control and influence may discourage transactions involving a change of control of our company, including transactions in which a holder of our Class A common stock might otherwise receive a premium for such shares. Furthermore, after the expiration of the 180-day lock-up period, BMS generally has the right at any time to spin-off or split-off our common stock that it owns or to sell a controlling interest in us to a third party, in either case without stockholder approval and without providing for a purchase of the other outstanding shares.
Even if the ownership interest of BMS is reduced to less than a majority of our outstanding shares of our common stock, so long as BMS retains a significant portion of our voting power, BMS will have the ability to substantially influence these significant corporate activities.
The transitional services that BMS provides to us may not be sufficient to meet our needs, and we may have difficulty finding replacement services or be required to pay increased costs to replace these services after our transitional services agreement with BMS expires.
Historically BMS has provided us with significant corporate and shared services related to corporate functions such as executive oversight, risk management, information technology, accounting, audit, legal, investor relations, human resources, tax, treasury, procurement, pensions and post retirement, stock based compensation and other services. Following our separation from BMS, BMS continues to provide many of these services on a transitional basis for a fee. The terms of these services and amounts to be paid by us to BMS are provided in the transitional services agreement described in “Item 13. Certain Relationships and Related Transactions, and Director Independence.” While these services are being provided to us by BMS, our operational flexibility to modify or implement changes with respect to such services or the amounts we pay for them will be limited. After the expiration of the transitional services agreement, we may not be able to replace these services or enter into appropriate third-party agreements on terms and conditions, including cost, comparable to those that we will receive from BMS under the transitional services agreement. Although we intend to replace portions of the services currently provided by BMS, we may encounter difficulties replacing certain services or be unable to negotiate pricing or other terms as favorable as those we currently have in effect. In addition, we have historically received informal support from BMS, which may not be addressed in the transitional services agreement that we have entered into with BMS. We expect that the level of this informal support will diminish following the separation as we become a stand-alone company.
In Argentina, Brazil, China and Mexico, due to regulatory and other concerns, not all of the assets or shares related to our business in those jurisdictions were transferred to us prior to or concurrently with our initial public offering. We intend to make these transfers, but we cannot offer any assurance that such transfers will ultimately occur or not be delayed for an extended period of time. See Item 13. Certain Relationships and Related Transactions, and Director Independence.”
As a stand-alone public company, we no longer have access to the resources of BMS, and we may experience increased costs resulting from decreased purchasing power.
We have benefited from BMS’s financial strength and numerous significant business relationships and have been able to take advantage of BMS’s size and purchasing power in procuring goods, services and technology. We have drawn on these resources in developing our own contacts and relationships. Following our separation from BMS, we are no longer able to rely on BMS’s resources and contacts. As a stand-alone public company, we may be unable to obtain goods, services and technology at prices and on terms as favorable as those that we obtained prior to our separation from BMS and, as a result, our profitability could be materially adversely affected.
26
We may not be able to favorably resolve disputes that arise between BMS and us with respect to our past and ongoing relationships.
Disputes may arise between BMS and us in a number of areas relating to our past and ongoing relationships, including:
| | • | | labor, tax, employee benefit, indemnification and other matters arising from our separation from BMS; |
| | • | | employee retention and recruiting; |
| | • | | business combinations involving us; |
| | • | | sales or dispositions by BMS of all or any portion of its ownership interest in us; and |
| | • | | the nature, quality and pricing of services BMS has agreed to provide us. |
We may not be able to resolve any potential conflicts, and even if we do, the resolution may be less favorable to us than if we were dealing with an unaffiliated party. The agreements that we will enter into with BMS may be amended upon agreement between the parties. While we are controlled by BMS, we may not have the leverage to negotiate amendments to these agreements, if required, on terms as favorable to us as those we would negotiate with an unaffiliated third party.
Some of our directors are executive officers of BMS. In addition, some of our directors and executive officers own common stock of BMS, and options or other instruments, the value of which is related to the value of stock of BMS, which could cause conflicts of interests that result in our not acting on opportunities on which we would otherwise act.
Six of our directors have been designated to our board of directors by BMS and are current executive officers of BMS. These directors and a number of our officers own a substantial amount of BMS common stock, and options or other instruments, the value of which is related to the value of common stock of BMS. The direct and indirect interests of our directors and officers in common stock of BMS and the presence of executive officers of BMS on our board of directors could create, or appear to create, conflicts of interest with respect to matters involving both us and BMS that could have different implications for BMS than they do for us. As a result, we may be precluded from pursuing certain opportunities on which we would otherwise act, including growth opportunities.
We are a “controlled company” within the meaning of the New York Stock Exchange (“NYSE”) rules, and, as a result, will rely on exemptions from certain corporate governance requirements that provide protection to stockholders of other companies.
Because BMS owns more than 50% of the total voting power of our common shares, we are a “controlled company” under the NYSE corporate governance standards. As a controlled company, certain exemptions under the NYSE standards free us from the obligation to comply with certain NYSE corporate governance requirements, including the requirements:
| | • | | that a majority of our board of directors consists of “independent directors”, as defined under the rules of the NYSE; |
| | • | | that we have a corporate governance and nominating committee that is composed entirely of independent directors with a written charter addressing the committee’s purpose and responsibilities; |
| | • | | that we have a compensation committee that is composed entirely of independent directors with a written charter addressing the committee’s purpose and responsibilities; and |
| | • | | for an annual performance evaluation of the nominating and governance committee and compensation committee. |
27
Accordingly, for so long as we are a “controlled company”, our stockholders will not have the same protections afforded to stockholders of companies that are subject to all of the NYSE corporate governance requirements.
Risks Related to Owning Our Common Stock
Future sales, or the perception of future sales, of our common stock may depress the price of our Class A common stock.
The market price of our Class A common stock could decline significantly as a result of sales of a large number of shares of our common stock in the market, including shares which might be offered for sale by BMS. The perception that these sales might occur could depress the market price. These sales, or the possibility that these sales may occur, also might make it more difficult for us to sell equity securities in the future at a time and at a price that we deem appropriate.
Our costs will increase significantly as a result of operating as a public company, and our management will be required to devote substantial time to complying with public company regulations.
We have historically operated our business as a division of a public company. As a stand-alone public company, we will incur additional legal, accounting, compliance and other expenses that we have not incurred historically.
Failure to achieve and maintain effective internal controls in accordance with Section 404 of Sarbanes-Oxley could have a material adverse effect on our business and stock price.
As a public company, we will be required to document and test our internal control procedures to satisfy the requirements of Section 404 of Sarbanes-Oxley, which will require annual management assessments of the effectiveness of our internal control over financial reporting and a report by our independent registered public accounting firm that addresses the effectiveness of internal control over financial reporting. During the course of our testing, we may identify deficiencies that we may not be able to remediate in time to meet our deadline for compliance with Section 404. Testing and maintaining internal control can divert our management’s attention from other matters that are important to the operation of our business. We also expect these regulations to increase our legal and financial compliance costs and make some activities more difficult, time consuming and costly. We may not be able to conclude on an ongoing basis that we have effective internal control over financial reporting in accordance with Section 404, or our independent registered public accounting firm may not be able or willing to issue an unqualified report on the effectiveness of our internal control over financial reporting. If we conclude that our internal control over financial reporting is not effective, we cannot be certain as to the timing of completion of our evaluation, testing and remediation actions or their effect on our operations because there is presently no precedent available by which to measure compliance adequacy. If either we are unable to conclude that we have effective internal control over financial reporting or our independent auditors are unable to provide us with an unqualified report as required by Section 404, then investors could lose confidence in our reported financial information, which could have a negative effect on the trading price of our stock.
Anti-takeover provisions in our charter documents could discourage, delay or prevent a change of control of our company and may result in an entrenchment of management and diminish the value of our Class A common stock.
Several provisions of our amended and restated certificate of incorporation and amended and restated by-laws could make it difficult for our stockholders to change the composition of our board of directors, preventing them from changing the composition of management. In addition, the same provisions may discourage, delay or prevent a merger or acquisition that our stockholders may consider favorable.
28
These provisions include:
| | • | | a dual-class common stock structure that gives BMS and its affiliates control over all matters requiring stockholder approval, including the election of directors and significant corporate transactions, such as a merger or other sale of our company or its assets; |
| | • | | authorizing our board of directors to issue “blank check” preferred shares without stockholder approval; |
| | • | | prohibiting cumulative voting in the election of directors; |
| | • | | limiting the persons who may call special meetings of stockholders; and |
| | • | | establishing advance notice requirements for nominations for election to our board of directors or for proposing matters that can be acted on by stockholders at stockholder meetings. |
These anti-takeover provisions could substantially impede the ability of our Class A common stockholders to benefit from a change of control and, as a result, could materially adversely affect the market price of our Class A common stock and our stockholders’ ability to realize any potential change-in-control premium.
| Item 1B. | UNRESOLVED STAFF COMMENTS. |
None.
Our corporate headquarters are located in Evansville, Indiana, where we own office, operations and laboratory buildings comprising approximately 700,000 square feet. We also own or operate seven manufacturing facilities located in the following cities: Chonburi, Thailand; Delicias, Chihuahua, Mexico; Evansville, Indiana; Guangzhou, China; Makati, Philippines; Nijmegen, Netherlands; and Zeeland, Michigan. For additional information related to our seven manufacturing facilities around the world, see “Item 1. Global Supply Chain.” We lease the vast majority of our other properties worldwide, including our Delicias, Chihuahua, Mexico manufacturing facility. In the fall of 2008, we entered into a manufacturing arrangement that gives us access to 57,400 square foot of manufacturing space in Tatura, Australia.
Our in-house powder manufacturing facilities are located in the United States, Mexico, the Netherlands, China, the Philippines and Thailand.
The following table illustrates our global manufacturing locations, the approximate square footage of the facilities and the reportable segment served by such locations:
| | | | |
Location | | Square Feet | | Business
Segment Served |
Chonburi, Thailand | | 125,000 | | Asia/Latin America |
Delicias, Chihuahua, Mexico* | | 173,000 | | Asia/Latin America |
Evansville, Indiana, United States | | 280,000 | | All segments |
Guangzhou, China** | | 100,000 | | Asia/Latin America |
Makati, Philippines | | 96,000 | | Asia/Latin America |
Nijmegen, Netherlands | | 102,000 | | All segments |
Zeeland, Michigan, United States | | 512,000 | | All segments |
| * | The Delicias, Chihuahua, Mexico facility is leased from BMS. |
| ** | See “Item 13. Certain Relationship and Related Transactions, and Director Independence” for a description of the MJN China Services Agreement. |
29
| Item 3. | LEGAL PROCEEDINGS. |
In the ordinary course of our business, we are subject to periodic lawsuits, investigations and claims, including, but not limited to, product liability claims, contractual disputes, premises claims and employment and environmental, health and safety matters. Although we cannot predict with certainty the ultimate resolution of lawsuits, investigations and claims asserted against us, we do not believe any currently pending legal proceeding to which we are a party will have a material adverse effect on our business, prospects, financial condition, cash flows and results of operations.
| Item 4. | SUBMISSION OF MATTERS TO A VOTE OF SECURITY HOLDERS. |
No matters were submitted to a vote of security holders during the fourth quarter of the year ended December 31, 2008.
30
| Item 5. | MARKET FOR REGISTRANT’S COMMON STOCK, RELATED STOCKHOLDER MATTERS, AND ISSUER PURCHASES OF EQUITY SECURITIES. |
Shares of our Class A common stock are traded on the NYSE (symbol MJN). Our shares have only been publicly traded since February 11, 2009; as a result, we have not set forth quarterly information with respect to the high and low prices for our common stock and the dividends declared on our common stock for the two most recent fiscal years. As of March 16, 2009, there were 6,598 stockholders of record of our Class A common stock. The number of record holders is based upon the actual number of holders registered on the books of the company at such date and does not include holders of shares in “street names” or persons, partnerships, associations, corporations or other entities identified in security position listings maintained by depositories. BMS possesses approximately 97.5% of the voting power of our outstanding stock. See “Item 1. Business.”
We did not purchase any of our equity securities, nor did we sell any securities pursuant to any unregistered offering, during the period covered by this report.
In February 2009, we completed our initial public offering of Class A common stock pursuant to a Registration Statement on Form S-1, as amended (Reg. No. 333-156298) that was declared effective on February 10, 2009. Under the registration statement, we registered the offering and sale of an aggregate of 34,500,000 shares of our Class A common stock. All of the 34,500,000 shares of Class A common stock registered under the registration statement, which included 4,500,000 shares of our Class A common stock covered by an over-allotment option granted to the underwriters, were sold at a price to the public of $24.00 per share. Citigroup Global Markets Inc., Morgan Stanley & Co. Incorporated, Banc of America Securities LLC, Credit Suisse Securities (USA) LLC and J.P. Morgan Securities Inc. acted as joint book running managers of the offering and as representatives of the underwriters. The offering commenced on February 10, 2009 and closed on February 17, 2009. The closing of the over-allotment portion of the offering also occurred on February 17, 2009. As a result of the initial public offering, we raised a total of $828.0 million in gross proceeds, and approximately $782.3 million in net proceeds after deducting underwriting discounts and commissions of $41.4 million and estimated offering expenses of $4.3 million. We used the entire amount of the net proceeds from the offering to (i) repay in full approximately $597 million of the foreign intercompany notes payable to subsidiaries of BMS, and (ii) satisfy payables and other obligations owing to one or more subsidiaries of BMS that would have otherwise been forgiven or reduced in full.
We intend to pay quarterly cash dividends on our Class A common stock and Class B common stock at an initial rate of $0.20 per share. We intend to pay the first dividend in July 2009, which will include the dividend for the second quarter and an amount on a pro-rated basis for the remainder of the first fiscal quarter of 2009 following our initial public offering and, thereafter, to pay dividends on a quarterly basis. The declaration and payment of dividends to holders of our Class A common stock and Class B common stock will be at the discretion of our board of directors and will depend on many factors, including our financial condition, earnings, legal requirements, restrictions in our debt agreements and other factors our board of directors deems relevant.
31
| Item 6. | SELECTED FINANCIAL DATA. |
| | | | | | | | | | | | | | | | | |
| (in millions, except per share data) | | 2008 | | | 2007 | | 2006 | | 2005 | | 2004 | |
Net Sales | | $ | 2,882.4 | | | $ | 2,576.4 | | $ | 2,345.1 | | $ | 2,201.8 | | $ | 1,997.2 | |
Earnings before Interest, Income Taxes and Minority Interest | | | 695.7 | | | | 663.2 | | | 634.8 | | | 618.4 | | | 849.9 | (1) |
Interest Expense | | | (43.3 | ) | | | — | | | — | | | — | | | — | |
Net Earnings | | | 393.9 | | | | 422.5 | | | 398.2 | | | 389.8 | | | 519.2 | |
| | | | | |
Basic and Diluted Earnings per Share(2) | | $ | 2.32 | | | $ | 2.49 | | $ | 2.34 | | $ | 2.29 | | $ | 3.05 | |
Weighted Average Shares Outstanding(2) | | | 170.0 | | | | 170.0 | | | 170.0 | | | 170.0 | | | 170.0 | |
| | | | | |
Depreciation and Amortization | | $ | 52.1 | | | $ | 51.0 | | $ | 49.5 | | $ | 53.8 | | $ | 57.4 | |
Capital Expenditures | | | 81.1 | | | | 78.4 | | | 68.9 | | | 56.4 | | | 59.9 | |
| | | | | |
Total Assets | | $ | 1,361.4 | | | $ | 1,301.9 | | $ | 1,204.3 | | $ | 1,123.5 | | $ | 1,103.3 | |
Debt | | | 2,000.0 | | | | — | | | — | | | — | | | — | |
Minority Interest and Divisional Equity (Deficit) | | | (1,395.5 | ) | | | 637.8 | | | 592.4 | | | 464.8 | | | 451.1 | |
(1) | Includes $325.3 million pre-tax gain on sale of Adult Nutrition Business. |
(2) | On February 17, 2009, we completed the offering of 34.5 million shares of Class A common stock in an initial public offering (“IPO”). Prior to that date, we had 170 million shares of Class A and Class B common stock outstanding, all of which were owned by BMS. The weighted average number of common shares outstanding for the periods presented is calculated using the common stock outstanding prior to the IPO. |
32
| Item 7. | MANAGEMENT’S DISCUSSION AND ANALYSIS OF FINANCIAL CONDITION AND RESULTS OF OPERATIONS. |
This management’s discussion and analysis of financial condition and results of operations contains forward-looking statements that involve risks and uncertainties. See “Item 1a. Risk Factors” for a discussion of the uncertainties, risks and assumptions associated with those statements. You should read the following discussion in conjunction with our audited financial statements and the notes to our audited financial statements. Our results may differ materially from those discussed in the forward-looking statements as a result of various factors, including but not limited to those in “Risk Factors”.
Overview of Our Business
We are a global leader in pediatric nutrition with approximately $2.9 billion in net sales for the year ended December 31, 2008. We are committed to creating trusted nutritional brands and products that help improve the health and development of infants and children around the world and provide them with the best start in life. Our Enfa family of brands, includingEnfamil®infant formula, is the world’s leading brand franchise in pediatric nutrition, based on retail sales. Our comprehensive product portfolio addresses a broad range of nutritional needs for infants, children and expectant and nursing mothers. We have over 100 years of innovation experience during which we have developed or improved many breakthrough or industry-defining products across each of our product categories. We operate in four geographic regions: North America, Europe, Asia and Latin America. Due to similarities in the economics, products offered, production process, customer base and regulatory environment, these operating regions have been aggregated into two reportable segments: North America/Europe and Asia/Latin America.
During 2008, our sales increased 11.9%, led by the Asia/Latin America segment where net sales increased by 23.8% compared with 2007. The Asia/Latin America segment now represents more than 50% of our global net sales and is characterized by broad based growth, a balanced portfolio of infant and children’s products and increasing investments in advertising and promotion. Our North America/Europe segment net sales increased by 1.1% over 2007, with an increase in Europe offset by a decline in the United States. 2008 performance in the United States has been affected by growth in private label products, due in part to the weakening economy, and the impact of WIC contract changes on our business. The global business experienced increases in dairy and other commodity costs in 2007 and 2008. Pricing actions have been implemented to compensate, although gross margin has declined as a percentage of sales. Earnings Before Interest, Income Taxes and Minority Interest in our two reportable operating segments grew by $88.7 million in 2008 driven by strong sales growth. Net earnings, however, were down $28.6 million in 2008 due to initial public offering costs and interest expense.
Factors Affecting Our Results of Operations
Our operating results are primarily affected by the following factors:
Industry Growth
According to Euromonitor, the global pediatric nutrition industry has grown at a CAGR of approximately 11% from 2003 to 2008. We believe several trends have supported and will continue to support this growth, including the following:
| | • | | favorable demographics; |
| | • | | increased consumer awareness of the importance of health and wellness; |
| | • | | enhanced nutritional insight; |
| | • | | consumer willingness to pay for premium and enhanced nutrition products. |
33
Perceptions of Product Quality and Safety
We believe pediatric nutrition producers with a reputation for quality and safety should be able to command higher average selling prices and thereby generate higher gross margins than competitors who do not possess the same reputation. A decrease in the quality and safety of any particular product, whether real or perceived, could
trigger wider negative perception of the decrease in the quality and safety of all producers, thereby affecting the industry generally. We believe our past growth has benefited from our brand recognition and from real and perceived safety and quality of our pediatric nutrition products. However, if a future market crisis involving any of our products should occur, especially if management fails to respond to such crisis in a timely and effective manner, our brand recognition and reputation could be severely damaged, which could adversely affect our results of operations. For example, melamine was found in Chinese dairy used in certain infant formula products of other manufacturers, which led to the deaths of several infants in September 2008. We do not use dairy or protein-containing raw ingredients from China at any of our manufacturing sites and we have not been adversely impacted by these events in China thus far. Events such as these, however, may create a perception of contamination risk among consumers with respect to all products in our industry.
Competition and Brand Recognition
The pediatric nutrition industry is intensely competitive. Our principal competitors, including Néstle S.A., Abbott Laboratories, Groupe Danone and Wyeth, all have substantial financial, marketing and other resources. In addition, we face significant competition from domestic producers and private label, store and economy brand manufacturers. In recent years, there has been growing demand, particularly in Asia, for premium pediatric nutrition products due to increasing consumer awareness of brand image and nutritional value of the products offered by leading producers.
Our success depends on sustaining the strength of our brands, particularly our Enfa family of brands. If we fail to promote and maintain the brand equity of our products, particularly our Enfa family of brands, across each of our markets, then consumer perception of its superior nutritional benefits may be diminished. If the difference in the value attributed to our products as compared to those of our competitors narrows, consumers may choose not to buy our products. In periods of economic uncertainty, these trends may be more pronounced.
Raw Material Supply and Prices
The per unit costs of producing our pediatric nutrition products are subject to the supply and price volatility of dairy and other raw materials, which are affected by global factors. For example, dairy prices are affected by factors such as geographic location, the impact of weather on dairy production, fluctuation in product availability, competition and inflation. Dairy costs are the largest component of our costs of products sold and our dairy costs have increased significantly over the past two years.
Increases in the price of dairy would negatively impact our gross margins if we are not able to offset such increases through increases in our selling price, change in product mix or cost reduction/productivity enhancement efforts. The prices of these materials may continue to rise due to a general increase in commodities prices, especially for agricultural products. This would in turn affect the unit costs of products sold for our pediatric nutrition products.
Foreign Exchange Movements
We market our portfolio of products in more than 50 countries in North America, Europe, Asia and Latin America. Due to the international aspect of our business, our net sales and expenses are influenced by foreign exchange movements. This impact is reflected across our results of operations discussed below.
34
Our Growth Strategies
We intend to grow our business profitably and enhance shareholder value by executing against the following strategic initiatives:
| | • | | Building on our leadership position in our core businesses; |
| | • | | Continuing our leadership in product innovation; |
| | • | | Expanding into selected high-growth geographic markets and adjacent product categories; and |
| | • | | Continuously improving upon our manufacturing and global supply chain excellence. |
Build on Our Leadership Position in Our Core Businesses
We intend to grow our business in our core countries and product categories by building loyal usage of our brands, introducing innovative product that differentiate us in the marketplace and leveraging our expertise in marketing to consumers and health care professionals. In addition, we will continue to implement best practices and insights using our balance of local, regional and global capabilities to execute the most effective programs in all markets. We have a successful business model based on acquiring new consumers and retaining them. We also intend to invest in order to attract, retain and train talented employees who are committed to improving the health of the world’s infants and children and who have world class capabilities in key business disciplines including marketing, sales, product development, supply chain and finance.
Continued Leadership in Innovation
Innovation is fundamental to our long-term growth and profitability. From 2003 to 2008, we have increased our investment in research and development (“R&D”) by 100% and established world-class professional capabilities in our R&D headquarters and regional labs. Our R&D teams drive the integration of nutritional science with marketing across all phases of the product development process. We believe we have a strong innovation pipeline that is focused on improving the health and development of infants and children, with a particular focus on brain development, allergy and tolerance issues, immunity, healthy growth and improved product experience. Investments in leading systems and processes will be used to reduce cycle times for projects in our pipeline, and we are planning to achieve a systematic flow of innovations. We believe our global R&D capabilities, the strength of our brands and our ability to convert advances in nutritional science into marketable product innovations will continue to allow us to successfully develop new products and improve existing products across each of our product categories.
Expansion into Selected High-Growth Geographic Markets and Adjacent Product Categories
Emerging markets in Asia, Eastern Europe and the Middle East are projected to experience continued growth. We have established replicable business models and developed a deep understanding of business drivers in our core markets that we believe will lead to success in selected new high-growth markets. We believe our global supply chain infrastructure, along with the strength of our business model and demand-creation capabilities, strategically positions us for further expansion into certain high-growth regions in which we currently have a more limited presence. In addition, there is a global trend of mothers seeking increased nutritional reassurance, and mothers and health care professionals alike associate the Mead Johnson name and the Enfa family of brands with the highest quality nutrition. We believe there are opportunities to extend our strong brand equities into select adjacent product categories through organic development, partnerships and acquisitions.
Continuously Improve Upon Our Manufacturing and Global Supply Chain Excellence
We seek to continuously improve the management and operation of our business by increasing efficiency in our operations at all stages of production, from sourcing of raw materials to manufacturing and distribution in local geographies. We maintained higher operating margins than those of our primary competitors in 2008, and we plan to continue to achieve incremental cost savings through broad-based organizational involvement.
35
Components of Our Net Sales and Expenses
Net Sales
Our net sales are primarily derived from powdered milk formulated for infants and children sold to retailers and distributors. Net sales are driven by a combination of factors that include, but are not limited to: (1) the overall number of infants and children in the geographic and demographic markets in which we operate, (2) the innovation and competitiveness of our product offering, (3) governmental regulations and economic dynamics in our markets and (4) increased consumer awareness of the importance of health and wellness and enhanced nutritional insight. Our net sales include various adjustments including, gross-to-net sales adjustments for WIC rebates, cash discounts and sales returns.
Our financial results include net sales of rebated WIC products which represented approximately 12% of total U.S. and Puerto Rico net sales for the year ended December 31, 2008. The WIC program is a U.S. Department of Agriculture program created to provide nutritious foods, nutrition education and referrals to health care professionals and other social services to those considered to be at nutritional risk, including low-income pregnant, postpartum and breastfeeding women and infants and children up to age five. It is estimated that approximately 51% of all infants born in the United States and Puerto Rico during the 12-month period ending December 31, 2008 benefited from the WIC program. Participation in the WIC program is an important part of our U.S. business based on the volume of infant formula sold under the program. Sales to WIC participants are primarily transacted through the retail network at full retail price. Rebates to the state WIC agencies are payable based on the number of eligible retail purchases by WIC participants, vouchers issued and the terms of the WIC contracts.
Expenses
Our expenses are made up of the following components:
| | • | | Costs of products sold consist primarily of costs of materials that we use in the manufacture of our products. Historically, the cost of materials has represented a majority of our total costs of products sold. Our materials costs are influenced by inflation and fluctuations in global commodity prices, principally dairy, agricultural oils and tinplate. Plant conversion costs including labor and overhead make up most of the remainder of costs of products sold. |
| | • | | Marketing, selling and administrative expenses consist primarily of employee compensation and benefits, corporate and shared service allocations, occupancy, third-party selling, marketing and market research services. These expenses also include distribution expenses, which are primarily comprised of warehousing and freight costs. Marketing, selling and administrative expenses are driven by business strategy and inflation. |
| | • | | Advertising and product promotion expenses consist primarily of expenses related to media, samples, medical education and direct-to-consumer programs. Advertising and product promotion expenses are driven by marketing strategy and inflation. |
| | • | | Research and development expenses consist primarily of employee compensation and benefits, clinical studies and product development costs. Research and development expenses are driven by business strategy and the level of innovation and support for our products. |
| | • | | Other expenses, net, consist primarily of income or loss from a third-party manufacturing contract that is non-core to our pediatric nutrition business, gains and losses from the disposal of property, plant and equipment, the impact of certain foreign exchange gains and losses and other miscellaneous expenses. |
BMS currently provides us with significant corporate and shared services functions. Our historical financial statements for all periods in this report reflect an allocation of these costs primarily within marketing, selling and administrative expenses. These allocations include costs related to corporate and shared services functions such as executive oversight, risk management, information technology, accounting, audit, legal, investor relations, human resources, tax, treasury, procurement, pensions and post retirement, stock based compensation and other services.
36
Results of Operations
Year Ended December 31, 2008 Compared to Year Ended December 31, 2007
Below is a summary of comparative results of operations and a more detailed discussion of results for the years ended December 31, 2008 and 2007:
| | | | | | | | | | | | | | | | | |
| | | Year Ended December 31, | |
| | | | | | | | | | | | % of Net Sales | |
| (Dollars in millions) | | 2008 | | | 2007 | | | % Change | | | 2008 | | | 2007 | |
Net Sales | | $ | 2,882.4 | | | $ | 2,576.4 | | | 11.9 | % | | — | | | — | |
Expenses | | | 2,186.7 | | | | 1,913.2 | | | 14.3 | % | | 75.9 | % | | 74.3 | % |
Earnings before Interest, Income Taxes and Minority Interest | | | 695.7 | | | | 663.2 | | | 4.9 | % | | 24.1 | % | | 25.7 | % |
Interest Expense | | | (43.3 | ) | | | — | | | — | | | 1.5 | % | | — | |
Provision for Income Taxes | | | (251.4 | ) | | | (233.6 | ) | | 7.6 | % | | 8.7 | % | | 9.1 | % |
Effective Tax Rate | | | 38.5 | % | | | 35.2 | % | | | | | | | | | |
Minority Interest Expense—net of tax | | | (7.1 | ) | | | (7.1 | ) | | 0.0 | % | | 0.2 | % | | 0.3 | % |
| | | | | | | | | | | | | | | | | |
Net Earnings | | $ | 393.9 | | | $ | 422.5 | | | (6.8 | %) | | 13.7 | % | | 16.4 | % |
| | | | | | | | | | | | | | | | | |
Net Sales
Net sales for the year ended December 31, 2008 increased $306.0 million, or 11.9%, to $2,882.4 million compared to the year ended December 31, 2007. The percentage change in sales was driven by price increase of 8.5% and volume growth of 1.5%, and included a 1.9% positive foreign exchange impact. Net sales increased throughout Asia, Latin America and Europe offset by a slight decline in the United States. Net sales increased in all product categories, driven by pricing increases in response to increased dairy costs, the impact of increased advertising and promotion, regional expansion within key Asian markets, most notably China, and product innovation. Innovations launched in the period include the addition of prebiotics and an increase in the level of DHA in several of our products in Asia. Additionally, in North America, we launchedNutramigen AA®, an amino-acid based infant formula for infants with severe food allergies. The decline in the U.S. business was attributable to growth in private label products, due in part to the weakening economy, and the impact of WIC contract changes on our business.
We operate in two reportable segments: Asia/Latin America and North America/Europe. Our net sales based on those segments are shown in the table below:
| | | | | | | | | | | | |
| | | Year Ended December 31, | |
| (Dollars in millions) | | 2008 | | 2007 | | % Change | | | % Change Due to
Foreign Exchange | |
Asia/Latin America | | $ | 1,516.9 | | $ | 1,225.2 | | 23.8 | % | | 3.2 | % |
North America/Europe | | | 1,365.5 | | | 1,351.2 | | 1.1 | % | | 0.8 | % |
| | | | | | | | | | | | |
Net Sales | | $ | 2,882.4 | | $ | 2,576.4 | | 11.9 | % | | 1.9 | % |
| | | | | | | | | | | | |
Our Asia/Latin America segment represented 52.6% of net sales and our North America/Europe segment represented 47.4% of net sales for the year ended December 31, 2008. Asia/Latin America sales increased $291.7 million, or 23.8%, including a positive 3.2% foreign currency exchange impact, to $1,516.9 million in 2008. Growth in Asia/Latin America was broad-based across all major markets driven by pricing increases and strong volume growth in China and Hong Kong. The net sales growth is underpinned by higher advertising and promotion supporting new product launches including the addition of prebiotics and the increase in the level of DHA in some children’s nutrition products in Asia. In addition, we experienced a temporary increase in demand for our products in China due to the withdrawal of certain infant formula products of other manufacturers due to the presence of melamine in certain dairy materials sourced in-country. We do not use dairy or protein-containing raw ingredients from China in our products.
37
For the year ended December 31, 2008, North America/Europe sales increased $14.3 million, or 1.1%, including a positive 0.8% foreign currency exchange impact, to $1,365.5 million compared to the year ended December 31, 2007. This increase was due primarily to pricing increases offset by U.S. volume losses attributable to growth in private label products, due in part to the weakening economy, and the impact of WIC contract changes on our business.
We have three product categories: (1) infant formula, (2) children’s nutrition and (3) other. Our net sales based on those product categories are shown in the table below:
| | | | | | | | | | | | |
| | | Year Ended December 31, | |
| (Dollars in millions) | | 2008 | | 2007 | | % Change | | | % Change Due to
Foreign Exchange | |
Infant Formula | | $ | 1,931.6 | | $ | 1,788.1 | | 8.0 | % | | 1.5 | % |
Children’s Nutrition | | | 855.9 | | | 696.5 | | 22.9 | % | | 3.0 | % |
Other | | | 94.9 | | | 91.8 | | 3.4 | % | | 2.5 | % |
| | | | | | | | | | | | |
Net Sales | | $ | 2,882.4 | | $ | 2,576.4 | | 11.9 | % | | 1.9 | % |
| | | | | | | | | | | | |
Net sales for the period increased in each of our product categories. For the year ended December 31, 2008, infant formula sales increased $143.5 million, or 8.0%, including a positive 1.5% foreign currency exchange impact, to $1,931.6 million compared to 2007. Growth in the sales of infant formula, which is sold in all regions, reflects a mix of the higher growth in the Asia/Latin America segment and the lower growth in the North America/Europe segment. Children’s nutrition products, sold primarily in the Asia/Latin America segment, increased $159.4 million, or 22.9%, including a positive 3.0% foreign currency exchange impact, to $855.9 million in 2008, in line with the broad-based growth across our key Asia and Latin America markets.
We recognize revenue net of various sales adjustments to arrive at net sales as reported on the statements of earnings. These adjustments are referred to as gross-to-net sales adjustments. The reconciliation of our gross sales to net sales was as follows:
| | | | | | | | | | | |
| | | Year Ended December 31, | |
| (Dollars in millions) | | 2008 | | | 2007 | | | % Change | |
Gross Sales | | $ | 3,974.2 | | | $ | 3,717.2 | | | 6.9 | % |
Gross-to-Net Sales Adjustments | | | | | | | | | | | |
WIC Rebates | | | (796.0 | ) | | | (847.8 | ) | | (6.1 | %) |
Sales Discounts | | | (87.9 | ) | | | (66.3 | ) | | 32.6 | % |
Returns | | | (64.7 | ) | | | (67.6 | ) | | (4.3 | %) |
Cash Discounts | | | (46.9 | ) | | | (48.0 | ) | | (2.3 | %) |
Prime Vendor Charge-Backs | | | (42.2 | ) | | | (47.5 | ) | | (11.2 | %) |
Other Adjustments | | | (54.1 | ) | | | (63.6 | ) | | (14.9 | %) |
| | | | | | | | | | | |
Total Gross-to-Net Sales Adjustments | | | (1,091.8 | ) | | | (1,140.8 | ) | | (4.3 | %) |
| | | | | | | | | | | |
Total Net Sales | | $ | 2,882.4 | | | $ | 2,576.4 | | | 11.9 | % |
| | | | | | | | | | | |
For the year ended December 31, 2008, our gross sales increased $257.0 million, or 6.9 %, to $3,974.2 million compared to the year ended December 31, 2007. Gross-to-net sales adjustments during the same period declined $49.0 million, or 4.3%, to $1,091.8 million. The decline was generated by changes in WIC rebates in North America due to the loss of the Western States Contracting Alliance, Texas, Minnesota and Iowa WIC contracts to other infant formula manufacturers during the fourth quarter of 2007, partially offset by the gain of California and Louisiana WIC contracts during the second half of 2007, as well as the gain of Illinois and Colorado WIC contracts during the first quarter of 2008. Sales discounts increased $21.6 million during the same period primarily in key Asia markets due to revenue growth and a change in retail sales mix to key customers with higher discounts. Other adjustments include coupons, contract discounts and various rebates. The decrease in other adjustments was driven primarily by a decline in consumer coupons.
38
Expenses
| | | | | | | | | | | | | | | |
| | | Year Ended December 31, | |
| | | | | | | | | | % of Net Sales | |
| (Dollars in millions) | | 2008 | | 2007 | | % Change | | | 2008 | | | 2007 | |
Expenses: | | | | | | | | | | | | | | | |
Costs of Products Sold | | $ | 1,079.8 | | $ | 948.7 | | 13.8 | % | | 37.5 | % | | 36.8 | % |
Marketing, Selling and Administrative | | | 651.7 | | | 575.2 | | 13.3 | % | | 22.6 | % | | 22.3 | % |
Advertising and Product Promotion | | | 369.3 | | | 318.5 | | 15.9 | % | | 12.8 | % | | 12.4 | % |
Research and Development | | | 72.8 | | | 67.2 | | 8.3 | % | | 2.5 | % | | 2.6 | % |
Other Expenses—net | | | 13.1 | | | 3.6 | | — | | | 0.5 | % | | 0.1 | % |
| | | | | | | | | | | | | | | |
Total Expenses | | $ | 2,186.7 | | $ | 1,913.2 | | 14.3 | % | | 75.9 | % | | 74.3 | % |
| | | | | | | | | | | | | | | |
Costs of Products Sold
For the year ended December 31, 2008, costs of products sold increased $131.1 million, or 13.8%, to $1,079.8 million compared to the year ended December 31, 2007. This increase was driven primarily by global material price increases. In 2007, the market volatility in material prices was mitigated partially through the contractual pricing agreements we entered into during 2006 and prior periods. However, many of these contracts expired in late 2007, resulting in an increase in our costs of products sold in 2008. Additionally, the costs of products sold increase was driven by sales volume growth and an unfavorable foreign exchange impact due to the weakening of the U.S. dollar versus foreign currencies. Furthermore, the cost increase as a percentage of sales was also driven by product mix changes as lower margin children’s nutrition products experienced more rapid volume gains than higher margin infant formulas.
Marketing, Selling and Administrative Expenses
For the year ended December 31, 2008, marketing, selling and administrative expenses increased $76.5 million, or 13.3%, to $651.7 million compared to the year ended December 31, 2007. The majority of this increase was due to $41.8 million of non-recurring costs related to our initial public offering and $19.3 million of higher corporate and shared service expense allocations. The marketing, selling and administrative expense increase was also driven by additional marketing efforts in Asia, including sales force expansion in China, and global salary and benefits increases due to inflation. Unfavorable foreign exchange impacts due to the weakening of the U.S. dollar also drove an increase in expense. Partially offsetting these increases was the absence of a $17.6 million bad debt expense in the first half of 2007 related to a distributor’s insolvency in Asia.
Advertising and Product Promotion Expenses
For the year ended December 31, 2008, advertising and product promotion expenses increased $50.8 million, or 15.9%, to $369.3 million compared to the year ended December 31, 2007. This increase was driven in large part by a strategic decision to increase various demand-generating activities in key Asian markets, investment in promotional programs in Mexico and by an unfavorable foreign exchange impact due to the weakening of the U.S. dollar versus foreign currencies.
Research and Development Expenses
For the year ended December 31, 2008, research and development expenses increased $5.6 million, or 8.3%, to $72.8 million compared to the year ended December 31, 2007. This increase was driven mainly by increased investment in clinical and discovery trials, salary and benefits inflation and an unfavorable foreign exchange impact due to the weakening of the U.S. dollar versus foreign currencies.
39
Other Expense—net
For the year ended December 31, 2008, other expense—net increased $9.5 million, to $13.1 million compared to the year ended December 31, 2007. The increase was driven by the losses in 2008 on our supply agreement for our former Adult Nutrition business, which was divested in 2004, and a non-recurring gain on the 2007 divestiture of Cafcit, a pediatric pharmaceutical product.
Earnings before Interest, Income Taxes and Minority Interest
Our Earnings Before Interest, Income Taxes and Minority Interest (“EBITMI”) are from our two reportable segments, North America/Europe and Asia/Latin America, reduced by Corporate and Other costs. Corporate and Other costs consist of unallocated general and administrative activities and associated expenses, including in part, executive, legal, finance, information technology, human resources, research and development, global marketing and global supply chain costs.
| | | | | | | | | | | |
| | | Year Ended December 31, | |
| (Dollars in millions) | | 2008 | | | 2007 | | | % Change | |
Total Earnings before Interest, Income Taxes and Minority Interest | | $ | 695.7 | | | $ | 663.2 | | | 4.9 | % |
Asia/Latin America | | | 462.9 | | | | 363.9 | | | 27.2 | % |
North America/Europe | | | 467.3 | | | | 477.6 | | | (2.2 | %) |
Corporate and Other | | | (234.5 | ) | | | (178.3 | ) | | 31.5 | % |
For the year ended December 31, 2008, Asia/Latin America EBITMI increased $99.0 million, or 27.2%, to $462.9 million. This increase was primarily driven by growth in sales and the absence of $17.6 million bad debt expense in 2007 related to a distributor’s insolvency, partly offset by increases in material costs. During the same period, North America/Europe EBITMI decreased $10.3 million, or 2.2%, to $467.3 million compared to the year ended December 31, 2007, driven by sales declines in the United States and increases in material costs. During the same period, Corporate and Other costs increased $56.2 million, or 31.5%, to $234.5 million. This was principally due to $44.8 million in expenses related to our initial public offering and an increase in corporate and shared service expense allocations from $90.1 million for the year ended December 31, 2007, to $112.1 million for the year ended December 31, 2008.
Income Taxes
The effective tax rate for the year ended December 31, 2008 increased from 35.2% to 38.5%, compared to the year ended December 31, 2007. The increase in the effective tax rate was driven primarily by the capitalization in 2008 of certain initial public offering expenses for tax purposes, the benefit of certain basis differences reflected in the 2007 effective tax rate and changes in the mix of earnings by jurisdiction.
Interest Expense
Interest expense represents interest incurred on the $2,000.0 million note payable issued in August 2008. See “Item 8. Financial Statements—Note 3. Related Parties and Note 21. Subsequent Events.”
Minority Interest Expense
Minority interest expenses net of taxes consist almost entirely of an 11% minority interest in our joint venture in China.
Net Earnings
For the foregoing reasons, for the year ended December 31, 2008, net earnings decreased $28.6 million, or 6.8%, to $393.9 million compared to the year ended December 31, 2007.
40
Year Ended December 31, 2007 Compared to Year Ended December 31, 2006
Below is a summary of comparative results of operations and a more detailed discussion of results for the years ended December 31, 2007 and 2006:
| | | | | | | | | | | | | | | | | |
| | | Year Ended December 31, | |
| | | | | | | | | | | | % of Net Sales | |
| (Dollars in millions) | | 2007 | | | 2006 | | | % Change | | | 2007 | | | 2006 | |
Net Sales | | $ | 2,576.4 | | | $ | 2,345.1 | | | 9.9 | % | | — | | | — | |
Expenses | | | 1,913.2 | | | | 1,710.3 | | | 11.9 | % | | 74.3 | % | | 72.9 | % |
Earnings before Interest, Income Taxes and Minority Interest | | | 663.2 | | | | 634.8 | | | 4.5 | % | | 25.7 | % | | 27.1 | % |
Provision for Income Taxes | | | (233.6 | ) | | | (230.1 | ) | | 1.5 | % | | 9.1 | % | | 9.8 | % |
Effective Tax Rate | | | 35.2 | % | | | 36.2 | % | | | | | | | | | |
Minority Interest Expense—net of tax | | | (7.1 | ) | | | (6.5 | ) | | 9.2 | % | | 0.3 | % | | 0.3 | % |
| | | | | | | | | | | | | | | | | |
Net Earnings | | $ | 422.5 | | | $ | 398.2 | | | 6.1 | % | | 16.4 | % | | 17.0 | % |
| | | | | | | | | | | | | | | | | |
Net Sales
For the year ended December 31, 2007, global net sales increased $231.3 million to $2,576.4 million compared to the year ended December 31, 2006. The percentage change in sales was driven by price of 3.4% and volume growth of 3.2%, and included a 3.3% positive foreign exchange impact. The business grew in all regions and all product categories, with strong broad-based growth across our key Asia markets.
Net sales based on our segments are shown in the table below:
| | | | | | | | | | | | |
| | | Year Ended December 31, | |
| (Dollars in millions) | | 2007 | | 2006 | | % Change | | | % Change Due to
Foreign Exchange | |
Asia/Latin America | | $ | 1,225.2 | | $ | 1,054.6 | | 16.2 | % | | 5.7 | % |
North America/Europe | | | 1,351.2 | | | 1,290.5 | | 4.7 | % | | 1.3 | % |
| | | | | | | | | | | | |
Net Sales | | $ | 2,576.4 | | $ | 2,345.1 | | 9.9 | % | | 3.3 | % |
| | | | | | | | | | | | |
Our Asia/Latin America segment represented 47.6% of net sales and our North America/Europe segment represented 52.4% of net sales for the year ended December 31, 2007. Asia/Latin America sales increased $170.6 million, or 16.2%, including a favorable 5.7% foreign currency exchange impact, to $1,225.2 million. Growth was broad-based with the top Asian markets all showing double digit increases in net sales. During the same period, North America/Europe net sales increased $60.7 million, or 4.7%, including a positive 1.3% foreign currency exchange impact, to $1,351.2 million in 2007 compared to 2006. Sales growth was driven in the United States by a third quarter price increase and additional WIC sales from the new California contract, which was offset partially by the Texas and the Western States Contracting Alliance contract losses and by the loss of regulatory exclusivity for Cafcit, a pediatric pharmaceutical product since divested.
Net sales based on our product categories are shown in the table below:
| | | | | | | | | | | | |
| | | Year Ended December 31, | |
| (Dollars in millions) | | 2007 | | 2006 | | % Change | | | % Change Due to
Foreign Exchange | |
Infant Formula | | $ | 1,788.1 | | $ | 1,634.8 | | 9.4 | % | | 2.4 | % |
Children’s Nutrition | | | 696.5 | | | 603.8 | | 15.4 | % | | 5.6 | % |
Other | | | 91.8 | | | 106.5 | | (13.8 | )% | | 3.7 | % |
| | | | | | | | | | | | |
Net Sales | | $ | 2,576.4 | | $ | 2,345.1 | | 9.9 | % | | 3.3 | % |
| | | | | | | | | | | | |
41
Net sales for the period increased in the infant formula and children’s nutrition product categories. For the year ended December 31, 2007, the infant formula business increased $153.3 million, or 9.4%, including a favorable 2.4% foreign currency impact, to $1,788.1 million compared to the year ended December 31, 2006. We maintained a strong position in infant formula products sold in the United States, with 5.0% growth in net sales. Children’s nutrition products, which are almost entirely sold in the Asia/Latin America segment, increased $92.7 million, or 15.4%, including a favorable 5.6% foreign currency exchange impact, to $696.5 million during the same period, primarily due to broad-based growth across our key Asian markets. The decrease in other sales was due mainly to a $17 million decline in net sales of Cafcit, a pediatric pharmaceutical product, due to the loss of regulatory exclusivity in the fourth quarter of 2006 and its divestment in the fourth quarter of 2007.
The reconciliation of our gross sales to net sales was as follows:
| | | | | | | | | | | |
| | | Year Ended December 31, | |
| (Dollars in millions) | | 2007 | | | 2006 | | | % Change | |
Gross Sales | | $ | 3,717.2 | | | $ | 3,480.1 | | | 6.8 | % |
Gross-to-Net Sales Adjustments | | | | | | | | | | | |
WIC Rebates | | | (847.8 | ) | | | (871.9 | ) | | (2.8 | )% |
Sales Discounts | | | (66.3 | ) | | | (55.0 | ) | | 20.5 | % |
Returns | | | (67.6 | ) | | | (65.2 | ) | | 3.7 | % |
Cash Discounts | | | (48.0 | ) | | | (47.9 | ) | | 0.2 | % |
Prime Vendor Charge-Backs | | | (47.5 | ) | | | (46.7 | ) | | 1.7 | % |
Other Adjustments | | | (63.6 | ) | | | (48.3 | ) | | 31.7 | % |
| | | | | | | | | | | |
Total Gross-to-Net Sales Adjustments | | | (1,140.8 | ) | | | (1,135.0 | ) | | 0.5 | % |
| | | | | | | | | | | |
Total Net Sales | | $ | 2,576.4 | | | $ | 2,345.1 | | | 9.9 | % |
| | | | | | | | | | | |
For the year ended December 31, 2007, our gross sales increased $237.1 million, or 6.8%, to $3,717.2 million compared to the year ended December 31, 2006. Gross-to-net sales adjustments during the same period increased $5.8 million, or 0.5%, to $1,140.8 million. This decline was largely the result of changes in WIC rebates in North America due to the loss of Georgia and the New England and Tribal Organization WIC contracts to other infant formula manufacturers in the fourth quarter of 2006, as well as the Western States Contracting Alliance, Texas, Minnesota and Iowa WIC contracts during the fourth quarter of 2007. These declines were partially offset by the addition of the Michigan WIC contract during the fourth quarter of 2006, as well as California and Louisiana WIC contracts during the second half of 2007. In addition, sales discounts increased $6.5 million during the same period in key Asian markets due to a change in retail sales mix resulting in increased gross sales to key customers with higher discounts and a $5.1 million increase from a distributor model change. Other adjustments include coupons, contract discounts and various rebates. The increase in other adjustments was driven primarily by an increase in consumer coupons.
Expenses
| | | | | | | | | | | | | | | |
| | | Year Ended December 31, | |
| | | | | | | | | | % of Net Sales | |
| (Dollars in millions) | | 2007 | | 2006 | | % Change | | | 2007 | | | 2006 | |
Expenses: | | | | | | | | | | | | | | | |
Costs of Products Sold | | $ | 948.7 | | $ | 850.4 | | 11.6 | % | | 36.8 | % | | 36.3 | % |
Marketing, Selling and Administrative | | | 575.2 | | | 504.3 | | 14.1 | % | | 22.3 | % | | 21.5 | % |
Advertising and Product Promotion | | | 318.5 | | | 290.6 | | 9.6 | % | | 12.4 | % | | 12.4 | % |
Research and Development | | | 67.2 | | | 62.0 | | 8.4 | % | | 2.6 | % | | 2.6 | % |
Other Expenses—net | | | 3.6 | | | 3.0 | | 20.0 | % | | 0.1 | % | | 0.1 | % |
| | | | | | | | | | | | | | | |
Total Expenses | | $ | 1,913.2 | | $ | 1,710.3 | | 11.9 | % | | 74.3 | % | | 72.9 | % |
| | | | | | | | | | | | | | | |
42
Costs of Products Sold
For the year ended December 31, 2007, costs of products sold increased $98.3 million, or 11.6%, to $948.7 million compared to the year ended December 31, 2006. The increase was driven by sales volume growth, dairy price increases and an unfavorable foreign exchange impact due to the weakening of the U.S. dollar versus foreign currencies. Furthermore, the cost increase as a percentage of sales was driven by product mix changes as children’s nutrition products carry a higher cost of products sold on a percentage of sales basis as compared to infant formula.
Marketing, Selling and Administrative Expenses
For the year ended December 31, 2007, marketing, selling and administrative expenses increased $70.9 million, or 14.1%, to $575.2 million compared to the year ended December 31, 2006. This increase was driven by a $17.6 million bad debt expense related to a distributor insolvency, increased corporate and shared service expense allocations of $11.7 million from BMS, unfavorable foreign exchange due to the weakening of the U.S. dollar versus foreign currencies and global salary and benefits inflationary increases. The increase in corporate allocations included costs related to information management and corporate insurance.
Advertising and Product Promotion Expenses
For the year ended December 31, 2007, advertising and product promotion expenses increased $27.9 million, or 9.6%, to $318.5 million compared to the year ended December 31, 2006. This increase was driven by strategic decisions regarding investment to support sales growth.
Research and Development Expenses
For the year ended December 31, 2007, research and development expenses increased $5.2 million, or 8.4%, to $67.2 million compared to the year ended December 31, 2006. The rate of increase reflected the full-year staffing impact of the regional development centers in Asia and Latin America.
Earnings before Interest, Income Taxes and Minority Interest
| | | | | | | | | | | |
| | | Year Ended December 31, | |
| (Dollars in millions) | | 2007 | | | 2006 | | | % Change | |
Total Earnings before Interest, Income Taxes and Minority Interest | | $ | 663.2 | | | $ | 634.8 | | | 4.5 | % |
Asia/Latin America | | | 363.9 | | | | 335.9 | | | 8.3 | % |
North America/Europe | | | 477.6 | | | | 460.3 | | | 3.8 | % |
Corporate and Other | | | (178.3 | ) | | | (161.4 | ) | | 10.5 | % |
For the year ended December 31, 2007, Asia/Latin America EBITMI increased $28.0 million, or 8.3%, to $363.9 million compared to the year ended December 31, 2006. The increase in EBITMI for the Asia/Latin America segment was primarily driven by a 16.2% increase in net sales during the same period, partially offset by a bad debt expense of $17.6 million related to a distributor’s insolvency. For the same period, North America/Europe EBITMI increased $17.3 million, or 3.8%, to $477.6 million compared to the prior year. The increase in EBITMI for North America/Europe was primarily driven by a 4.7% increase in net sales during the same period. For the same period, Corporate and Other costs increased $16.9 million, or 10.5%, to $178.3 million compared to the year ended December 31, 2006. This was due to an increase in corporate insurance and information management expenses allocated from BMS.
Income Taxes
The effective tax rate for the year ended December 31, 2007 decreased to 35.2% from 36.2%, compared to the year ended December 31, 2006. This reduction in the effective tax rate was driven primarily by the benefit of certain basis differences. For the year ended December 31, 2007, our provision for income taxes increased $3.5 million, or 1.5%, to $233.6 million compared to the year ended December 31, 2006, due to higher pre-tax earnings.
43
Net Earnings
For the foregoing reasons, for the year ended December 31, 2007, net earnings increased $24.3 million, or 6.1%, to $422.5 million compared to the year ended December 31, 2006.
Financial Position, Liquidity and Capital Resources
Overview
Our primary sources of liquidity are cash from operations and available borrowings under our $410.0 million revolving credit facility. Cash flows from operating activities represent the inflow of cash from our customers and the outflow of our cash for inventory purchases, operating expenses and taxes. Cash flows used in investing activities primarily represent capital expenditure for equipment, buildings and computer software. Cash flows used in financing activities historically have represented the transfer of cash to BMS.
As an operating division, we have not reported cash or cash equivalents on our balance sheet for the periods presented. Historically, BMS has managed the treasury relationships for receiving and disbursing cash to cover all cash flow activity from operations and investing activities. In the future, we believe that cash from operations will be sufficient to support our working capital needs, pay our operating expenses, satisfy debt obligations, fund capital expenditures and make dividend payments. In addition, we will have $410.0 million available to us under our revolving credit facility.
| | | | | | | | | | | | |
| | | Year Ended December 31, | |
| (Dollars in millions) | | 2008 | | | 2007 | | | 2006 | |
Cash flow provided by/(used in): | | | | | | | | | | | | |
Operating Activities | | $ | 477.3 | | | $ | 472.1 | | | $ | 351.8 | |
Investing Activities | | | (79.4 | ) | | | (74.2 | ) | | | (63.0 | ) |
Financing Activities | | | (397.9 | ) | | | (397.9 | ) | | | (288.8 | ) |
| | | | | | | | | | | | |
Net change in Cash and Cash Equivalents | | $ | — | | | $ | — | | | $ | — | |
| | | | | | | | | | | | |
Year Ended December 31, 2008 Compared to Year Ended December 31, 2007
Net cash provided by operating activities increased $5.2 million to $477.3 million for the year ended December 31, 2008 compared to the year ended December 31, 2007. This increase was due to a reduction in working capital in 2008 as compared to an increase in 2007, offset by a decline in net earnings of $28.6 million which was driven by initial public offering expenses and interest costs. The favorable change in working capital is due to increases in accounts payable and accrued expenses. Net cash used in investing activities increased $5.2 million to $79.4 million for the same period, due to an increase in capital expenditures and a decrease in the proceeds from the sale of equipment and a trademark.
Year Ended December 31, 2007 Compared to Year Ended December 31, 2006
Net cash provided by operating activities increased $120.3 million to $472.1 million for the year ended December 31, 2007 compared to the year ended December 31, 2006. This increase was driven by a $24.3 million increase in net earnings and an increase of $68.8 million due to a reduced build in working capital in 2007 as compared to 2006. The favorable working capital change is due to changes in accounts payable and accrued expenses primarily due to increased commodity costs and salary and benefit accruals. Net cash used in investing activities increased $11.2 million to $74.2 million for the same period, primarily related to quality and capacity investments at our production facilities and an increase in capitalized software to support formulation management and web based sales capabilities.
Capital Expenditures
Our capital expenditures increased $2.7 million to $81.1 million for the year ending December 31, 2008 compared to the year ended December 31, 2007, which is consistent with historical growth rates. We expect our
44
capital expenditures to increase significantly in 2009 to support manufacturing and research and development capabilities as well as global software and hardware purchases. Capital expenditures in 2009 will include the expansion of our Research and Development Technology Center.
Debt
On August 26, 2008, we declared and issued a dividend in the form of a note in an amount of $2,000.0 million bearing an annual interest rate of 6.1% to BMS. On February 17, 2009, we restructured this note into three senior unsecured notes of $744.2 million, $500.0 million and $500.0 million, respectively. The first note, in the amount of $744.2 million, matures in February 2014 and bears interest at a floating rate per annum equal to LIBOR plus 3.0%, payable quarterly. Starting June 1, 2010 and continuing through December 31, 2013, we will make quarterly principal payments of $18.8 million. The second note, in the amount of $500.0 million, matures in February 2016 and bears interest at a fixed rate per annum equal to 6.43%, payable semiannually. This note is not subject to amortization payments. The third note, in the amount of $500.0 million matures in February 2019 and bears interest at a fixed rate per annum equal to 6.91%, payable semiannually. This note is not subject to amortization payments.
In addition, we and BMS agreed that our opening cash balance at the date of the initial public offering of our stock would be $250.0 million to meet our operating requirements. The resulting debt on our balance sheet at the time of the offering was $1,750.0 million, excluding our capital lease obligations and including $5.8 million of debt in our international subsidiaries. We believe that cash flows from operations and available borrowings under our $410.0 million revolving credit facility will be sufficient to service our debt. See “Item 13. Certain Relationships and Related Transactions, and Director Independence” for further discussion.
Revolving Credit Facility Agreement
On February 17, 2009, we entered into a three-year syndicated revolving credit facility agreement (“Credit Facility”). The Credit Facility is unsecured and repayable on maturity in February 2012, subject to annual extensions if sufficient lenders agree. The maximum amount of outstanding borrowings and letters of credit permitted at any one time under the facility agreement is $410.0 million, which amount may be increased from time to time up to $500.0 million at our request, subject to customary conditions contained in the Credit Facility. The proceeds of the Credit Facility are to be used for working capital and other general corporate purposes.
Borrowings under the Credit Facility will bear interest either at (a) LIBOR for specified interest periods plus a margin determined with reference to our consolidated leverage ratio, or (b) a floating rate based upon JPMorgan Chase Bank’s prime rate, the Federal Funds rate or LIBOR plus, in each case, a margin determined with reference to our consolidated leverage ratio. The margin on the borrowings can range from 1.125% to 2.65% over the applicable base.
Our subsidiaries may become borrowers under the Credit Facility.
The Credit Facility contains customary covenants, including covenants applicable to us limiting liens, substantial asset sales and mergers. Most of these restrictions are subject to certain minimum thresholds and exceptions. The Credit Facility also contains the following financial covenants:
| | • | | We are required to maintain a ratio of (a) consolidated total debt to (b) consolidated Earnings Before Interest, Income Taxes, Depreciation and Amortization (“EBITDA”) of not greater than 3.25 to 1.0. Compliance with this covenant is tested on the last day of each fiscal quarter and as a condition precedent to each credit extension under the Credit Facility |
| | • | | We are required to maintain a ratio of (i) consolidated EBITDA to (ii) consolidated interest expense of at least 3.00 to 1.00. Compliance with this covenant is tested on the last day of each fiscal quarter for the preceding four consecutive fiscal quarters |
45
In addition, the Credit Facility has customary events of default, including (subject to certain materiality thresholds and grace periods) payment default, failure to comply with covenants, material inaccuracy of representation or warranty, bankruptcy or insolvency proceedings, change of control, ERISA matters and cross-default to other debt agreements.
2009 Operational Changes
The results of operations during 2009 will reflect several adjustments related to our separation from BMS, as described below.
| | • | | Operating model changes |
| | • | | Delays in establishing new operating subsidiaries |
| | • | | Increases in stand-alone public company costs |
| | • | | Separation costs associated with the initial public offering |
In addition to these items that impact 2009 results of operations, there will be several adjustments to the balance sheet related to our separation from BMS. These include the recognition of a pension liability, inclusion of cash balances and restructuring of related party debt and divisional equity. See “Item 8. Financial Statements-Note 21. Subsequent Events.”
Operating Model Changes
In Europe, we will transition from using BMS to distribute our products to a third-party distributor model. This will have the effect of reducing our net sales by the amount of the distributors’ margin and lowering costs for distribution-related expenses that historically have been recorded in our marketing, selling and administrative expenses. Had this model been in effect during 2008, we estimate that sales and EBITMI would have been reduced by approximately $8.0 million and $5.0 million, respectively.
In Mexico, we will operate our business through a newly formed operating subsidiary. Had this model been in effect during 2008, we estimate that employee profit sharing within the MJN operating subsidiary would have increased expenses by approximately $3.0 million. Furthermore, a BMS subsidiary will lease to our Mexico operating subsidiary all of the property, plant and equipment at our manufacturing facility in Delicias under a 20-year lease that will be treated as a capital lease. This will result in an increase in “Interest Expense” and “Other Liabilities” related to the lease payments.
Delays in Establishing New Operating Subsidiaries
In Brazil, our ability to operate a new stand-alone subsidiary will be delayed for a period of time due to certain statutory and regulatory requirements for permits and applications. Until we are able to operate as a stand-alone entity in Brazil, BMS will distribute and record sales for our products. We will conduct marketing activities and record service revenue equal to our marketing costs plus a markup. Had this model been in effect during 2008, we estimate that our sales would have been reduced by approximately $28.0 million with a minimal impact to EBITMI.
Stand-alone Public Company Costs
MJN results historically have included corporate and shared service cost allocations from BMS. As a stand-alone company, we will build these capabilities through a combination of transition services agreements and transferred and incremental costs. We will incur additional costs for financial reporting and compliance, corporate governance, treasury and investor relations activities. We estimate that our general and administrative expenses will increase in 2009 by approximately $30.0 million to $36.0 million, including service charges by BMS and expenses for services not included in the transition service agreements.
46
Separation Costs
We have incurred in 2008 and expect to incur in 2009, separation costs in connection with the initial public offering, including costs related to legal, accounting, systems implementation and consulting services. Our 2008 results include separation costs of $44.8 million, and we expect these costs to be approximately $29.0 million to $35.0 million in 2009.
Interest Expense
On August 26, 2008, we issued a $2,000.0 million intercompany note to BMS and incurred interest expense of $43.3 million in 2008. In 2009, we will incur a full year of interest expense on the restructured notes. See “Item 8. Financial Statements-Note 3. Related Parties and Note 21. Subsequent Events.”
Contractual Obligations and Commitments
As of December 31, 2008, our significant contractual obligations and other commitments were as follows:
| | | | | | | | | | | | | | | | | | | | | |
| | | Payments due by December 31, |
| (Dollars in millions) | | 2009 | | 2010 | | 2011 | | 2012 | | 2013 | | Thereafter | | Total |
Operating Lease Obligations | | $ | 14.6 | | $ | 7.7 | | $ | 6.1 | | $ | 5.5 | | $ | 5.4 | | $ | 25.8 | | $ | 65.1 |
Capital Lease Obligations | | | 0.2 | | | 0.2 | | | 0.2 | | | 0.2 | | | 0.2 | | | 0.4 | | | 1.4 |
Purchase Obligations | | | 29.2 | | | 25.5 | | | 23.1 | | | 12.5 | | | 6.9 | | | 52.2 | | | 149.4 |
Related Party Debt* | | | 2,043.3 | | | — | | | — | | | — | | | — | | | — | | | 2,043.3 |
| | | | | | | | | | | | | | | | | | | | | |
Total | | $ | 2,087.3 | | $ | 33.4 | | $ | 29.4 | | $ | 18.2 | | $ | 12.5 | | $ | 78.4 | | $ | 2,259.2 |
| | | | | | | | | | | | | | | | | | | | | |
| * | Amount represents the $2,000.0 million note payable to BMS and related interest. This note is classified as noncurrent on our balance sheet as it was amended and restructured on February 17, 2009, into three notes, which are payable in more than one year, and a portion of which was forgiven. See “Item 8. Financial Statements-Note 21. Subsequent Events.” |
Our operating lease obligations are generally related to real estate leases for manufacturing assets or offices and vehicle leases. Capital lease obligations relate to assets utilized for interplant transportation of materials and finished goods. Purchase obligations are generally for unconditional commitments related to the purchase of materials used in manufacturing and for promotional services. The table above does not include $17.9 million in uncertain tax positions due to the uncertainty related to the timing of the reversal of those positions.
See “Item 8. Financial Statements-Note 21. Subsequent Events” for discussion of various agreements entered into subsequent to December 31, 2008.
Off-Balance Sheet Arrangements
We do not currently use off-balance sheet derivative financial instruments to hedge or partially hedge interest rate exposure nor do we currently maintain any other off-balance sheet arrangements for the purpose of credit enhancement, hedging transactions or other financial or investment purposes.
Critical Accounting Policies
In presenting our financial statements in conformity with U.S. GAAP, we are required to make estimates and assumptions that affect the reported amounts of assets, liabilities, revenues, costs and expenses and related disclosures.
Some of the estimates and assumptions that we are required to make relate to matters that are inherently uncertain as they pertain to future events. We base these estimates and assumptions on historical experience or on
47
various other factors that we believe to be reasonable and appropriate under the circumstances. On an ongoing basis, we reconsider and evaluate our estimates and assumptions. Actual results may differ significantly from these estimates. Future results may differ from our estimates under different assumptions or conditions.
We believe that the critical accounting policies listed below involve our more significant judgments, assumptions and estimates and, therefore, could have the greatest potential impact on our financial statements.
For further information on our critical and other significant accounting policies, see “Item 8. Financial Statements.”
Basis of Presentation
Our financial statements have been derived from the consolidated financial statements and accounting records of BMS, principally from statements and records representing the Mead Johnson Nutrition business. The statements of earnings also include corporate and shared service expense allocations for certain corporate functions historically provided to us by BMS, including general corporate expenses such as executive oversight, risk management, information technology, accounting, audit, legal, investor relations, human resources, tax and other services. These allocations were based on specific identification or the percentage of our revenues and headcount to the respective total BMS revenues and headcount. These allocations are reflected in the statements of earnings, primarily within marketing, selling and administrative, and totaled $112.1 million, $90.1 million, and $80.7 million for the years ended December 31, 2008, 2007 and 2006, respectively. Allocation costs in prior years have been revised from previously disclosed amounts. The disclosure now excludes information management costs dedicated to MJN and includes stock based compensation and pension costs. This change in disclosure had no impact on amounts presented in the financial statements. We consider these allocations to be a reasonable reflection of the utilization of services provided. The allocations may not, however, reflect the expense we would have incurred as a stand-alone company. Actual costs that may have been incurred if we had been a stand-alone company in 2008, 2007 and 2006 would depend on a number of factors, including our chosen organizational structure, what functions were outsourced or performed by our employees and strategic decisions made in areas such as information technology systems and infrastructure.
BMS has not allocated debt or external debt interest cost to us because none of the debt recorded by BMS is directly related to our business, which is self-funding.
Revenue Recognition
We recognize revenue in accordance with Staff Accounting Bulletin (“SAB”) No. 101,Revenue Recognition in Financial Statements, as amended by SAB No. 104,Revenue Recognition, when substantially all the risks and rewards of ownership have transferred to the customer. Revenue is recognized on the date of receipt by the purchaser. Revenues are reduced at the time of recognition to reflect expected returns that are estimated based on historical experience and business trends. Additionally, provisions are made at the time of revenue recognition for discounts, WIC rebates and estimated sales allowances based on historical experience, updated for changes in facts and circumstances, as appropriate. Such provisions are recorded as a reduction of revenue. We offer sales incentives to customers and consumers through various programs consisting primarily of customer pricing allowances, merchandising funds and consumer coupons. The cost of these programs is recognized as incurred and recorded as a reduction of revenue.
WIC rebate accruals were $194.7 million and $197.6 million at December 31, 2008, and 2007, respectively, which are included in accrued rebates and returns. We participate on a competitive bidding basis in nutrition programs sponsored by states, tribal governments, the Commonwealth of Puerto Rico, and U.S. territories for WIC. Under these programs, we reimburse these entities for the difference between our wholesaler list price and the contract price on eligible products. We account for WIC contract rebates by establishing an accrual in an amount equal to our estimate of WIC rebate claims attributable to a sale. We determine our estimate of the WIC
48
rebate accrual primarily based on historical experience regarding WIC rebates and current contract prices under the WIC programs. We consider levels of inventory in the distribution channel, new WIC contracts, terminated WIC contracts, changes in existing WIC contracts and WIC participation, and adjust the accrual quarterly to reflect actual expense. Rebates under the WIC program reduced revenues by $796.0 million, $847.8 million, and $871.9 million in the years ended December 31, 2008, 2007 and 2006, respectively.
Sales return accruals were $29.3 million and $30.7 million at December 31, 2008 and 2007, respectively, which are included in accrued rebates and returns. We account for sales returns in accordance with the Statement of Financial Accounting Standards (“SFAS”) No. 48,Revenue Recognition When Right of Return Exists, by establishing an accrual in an amount equal to our estimate of sales recorded for which the related products are expected to be returned. We determine our estimate of the sales return accrual primarily based on historical experience regarding sales returns, but also consider other factors that could impact sales returns. Returns reduced sales by $64.7 million, $67.6 million and $65.2 million for the years ended December 31, 2008, 2007 and 2006, respectively.
Income Taxes
During the periods presented, we did not file separate tax returns, as we were included in the tax grouping of other BMS entities within the respective entity’s tax jurisdiction. The income tax provision included in the financial statements was calculated using the separate return basis, as if we were a separate stand-alone taxpayer.
The provision for income taxes has been determined using the asset and liability approach of accounting for income taxes. Under this approach, deferred taxes represent the future tax consequences expected to occur when the reported amounts of assets and liabilities are recovered or paid. The provision for income taxes represents income taxes paid or payable for the current year plus the change in deferred taxes during the year. Deferred taxes result from differences between the financial and tax basis of our assets and liabilities. Deferred tax assets and liabilities are measured using the currently enacted tax rates that apply to taxable income in effect for the years in which those tax attributes are expected to be recovered or paid, and are adjusted for changes in tax rates and tax laws when changes are enacted.
Valuation allowances are recorded to reduce deferred tax assets when it is more likely than not that a tax benefit will not be realized. The assessment of whether or not a valuation allowance is required often requires significant judgment including the long-range forecast of future taxable income and the evaluation of tax planning initiatives. Adjustments to the deferred tax valuation allowances are made to earnings in the period when such assessments are made.
With the exception of Mead Johnson-dedicated entities, we do not maintain taxes payable to or from BMS and are deemed to settle the annual current tax balances immediately with the tax paying legal entities in their respective jurisdictions. These settlements are reflected as changes in divisional equity.
We adopted the Financial Accounting Standards Board (“FASB”) Interpretation Number (“FIN”) No. 48,Accounting for Uncertainty in Income Taxes—an interpretation of FASB Statement No. 109 on January 1, 2007. As a result of the adoption of this accounting pronouncement, we derecognized $4.8 million of previously recognized tax benefits, which were accounted for as a decrease to the opening balance of divisional equity.
Impairment of Long-Lived Assets
We periodically evaluate whether current facts or circumstances indicate that the carrying value of our depreciable assets to be held and used may not be recoverable. If such circumstances are determined to exist, an estimate of undiscounted future cash flows produced by the long-lived asset, or the appropriate grouping of assets, is compared to the carrying value to determine whether impairment exists. If an asset is determined to be impaired, the loss is measured based on the difference between the asset’s fair value and its carrying value. An
49
estimate of the asset’s fair value is based on quoted market prices in active markets, if available. If quoted market prices are not available, the estimate of fair value is based on various valuation techniques, including a discounted value of estimated future cash flows. We report an asset to be disposed of at the lower of its carrying value or its estimated net realizable value. Asset impairment or accelerated depreciation resulting from an assessment in accordance with SFAS No. 144,Accounting for the Impairment or Disposal of Long-Lived Assets, is recorded as costs of products sold.
Goodwill and Other Intangible Assets
Goodwill is tested for impairment using a two-step process on an annual basis or when current facts or circumstances indicate that a potential impairment may exist. The first step is to identify a potential impairment, and the second step measures the amount of the impairment loss, if any. Goodwill is deemed to be impaired if the carrying amount of a reporting unit’s goodwill exceeds its estimated fair value. We complete our annual goodwill impairment assessment during the first quarter and monitor for any potential impairment in the remaining quarters, neither of which indicated an impairment of goodwill in 2008, 2007 or 2006.
Other intangible assets, consisting of a trademark and computer software, are amortized on a straight-line basis over their useful lives, ranging from 3 to 7.5 years. All other intangible assets are evaluated for impairment as described in “Impairment of Long-Lived Assets” above.
Contingencies
In the normal course of business, we are subject to loss contingencies, such as legal proceedings and claims arising out of our business, that cover a wide range of matters, including, among others, government investigations, product and/or environmental, health, and safety liabilities, and tax matters. In accordance with SFAS No. 5,Accounting for Contingencies, we record accruals for such loss contingencies when it is probable that a liability will be incurred and the amount of loss can be reasonably estimated. We, in accordance with SFAS No. 5, do not recognize gain contingencies until realized. For a discussion of contingencies, see “Item 8. Financial Statements.”
Recent Accounting Pronouncements
Effective January 1, 2008, we adopted SFAS No. 157,Fair Value Measurements,for financial assets and liabilities and any other assets and liabilities carried at fair value. This pronouncement defines fair value, establishes a framework for measuring fair value and expands disclosures about fair value measurements. On November 14, 2007, the FASB agreed to a one-year deferral for the implementation of SFAS No. 157 for other non-financial assets and liabilities. Our adoption of SFAS No. 157 did not have a material effect on our financial statements for financial assets and liabilities and any other assets and liabilities carried at fair value. We are currently in the process of evaluating the impact of adopting this pronouncement for other non-financial assets or liabilities.
In December 2007, the FASB issued SFAS No. 160,Noncontrolling Interests in Consolidated Financial Statements, an amendment of ARB No. 51.SFAS No. 160 establishes accounting and reporting standards that require the ownership interests in subsidiaries held by parties other than the parent be clearly identified, labeled and presented in the consolidated statement of financial position within equity, but separate from the parent’s equity. This FASB also requires the amount of consolidated net income attributable to the parent and to the noncontrolling interest be clearly identified and presented on the face of the consolidated statement of income. Changes in a parent’s ownership interest while the parent retains its controlling financial interest in its subsidiary must be accounted for consistently, and when a subsidiary is deconsolidated, any retained noncontrolling equity investment in the former subsidiary must be initially measured at fair value. This FASB statement also requires
50
entities provide sufficient disclosures that clearly identify and distinguish between the interests of the parent and the interests of the noncontrolling owners. This FASB is effective for fiscal years beginning on or after December 15, 2008. The adoption of SFAS No. 160 will not have a material impact on our financial statements.
In March 2008, the FASB issued SFAS No. 161,Disclosures about Derivative Instruments and Hedging Activities, as an amendment to SFAS No. 133,Accounting for Derivative Instruments and Hedging Activities. SFAS No. 161 requires that objectives for using derivative instruments be disclosed in terms of underlying risk and accounting designation. The fair value of derivative instruments and their gains and losses will need to be presented in tabular format in order to present a more complete picture of the effects of using derivative instruments. SFAS No. 161 is effective for financial statements issued for fiscal years beginning after November 15, 2008. The adoption of SFAS No. 161 will not have a material impact on our financial statements.
For additional discussion of recent accounting pronouncements, see “Item 8. Financial Statements.”
| Item 7A. | QUANTITATIVE AND QUALITATIVE DISCLOSURES ABOUT MARKET RISK. |
Inflation
The impact of inflation has affected, and will continue to affect, our operations significantly. Our materials costs are influenced by inflation and fluctuations in global commodity prices, principally dairy, agricultural oils and tinplate. In addition, costs for construction, taxes, repairs, maintenance, insurance and media are all subject to inflationary pressures.
Foreign Exchange Risk
We are exposed to market risk due to changes in currency exchange rates. Our primary net foreign currency translation exposures are the Chinese renminbi, the Mexican peso, the Philippine peso, the Hong Kong dollar and the Euro. Historically, we have used derivative financial instruments indirectly through participation in the centralized hedging functions of BMS, which are designed primarily to minimize exposure to foreign currency risk. In the future, we expect to use derivative financial instruments consistent with past use. We do not hold or issue derivative financial instruments for speculative purposes.
We use foreign currency contracts to hedge anticipated transactions on certain foreign currencies and designate these derivative instruments as foreign currency cash flow hedges when appropriate. If the derivative is designated as a cash flow hedge, the change in the fair value of the derivative is initially recorded in other comprehensive income and then recognized in our statement of earnings when the corresponding hedged item impacts our earnings. The foreign currency derivatives resulted in losses of $0.9 million, $2.6 million, and $5.1 million in the years ended December 31, 2008, 2007 and 2006, respectively. The impact of hedge ineffectiveness on our earnings was not material.
We plan to enter into hedging and other foreign exchange management arrangements to reduce the risk of foreign currency exchange rate fluctuations to the extent that cost-effective derivative financial instruments or other non-derivative financial instrument approaches are available. Derivative financial instruments will not be used for speculative purposes. The intent of gains and losses on hedging transactions is to offset the respective gains and losses on the underlying exposures being hedged. While we intend to mitigate some of this risk with hedging and other activities, our business will nevertheless remain subject to substantial foreign exchange risk from foreign currency translation exposures that we will not be able to manage through effective hedging or the use of other financial instruments.
51
Commodity Risk
We purchase certain products in the normal course of business, including dairy and agricultural oils, the costs of which are affected by global commodity changes. Therefore, we are exposed to some price volatility related to market conditions outside of our control.
We employ various purchasing and pricing contract techniques in an effort to minimize volatility. Generally these techniques include setting fixed prices with suppliers, such as unit pricing that is based on an average of commodity prices over a contractually defined period of time. We do not generally make use of financial instruments to hedge commodity prices, partly because of these contract pricing techniques.
52
| Item 8. | FINANCIAL STATEMENTS AND SUPPLEMENTARY DATA. |
INDEX TO FINANCIAL STATEMENTS
| | |
REPORT OF INDEPENDENT REGISTERED PUBLIC ACCOUNTING FIRM | | 54 |
| |
Audited Financial Statements of Mead Johnson Nutrition, a division of Bristol-Myers Squibb Company: | | |
| |
Statements of Earnings for the Years Ended December 31, 2008, 2007, and 2006 | | 55 |
| |
Statements of Comprehensive Income and Changes in Divisional Equity (Deficit) for the Years Ended December 31, 2008, 2007, and 2006 | | 56 |
| |
Balance Sheets as of December 31, 2008 and 2007 | | 57 |
| |
Statements of Cash Flows for the Years Ended December 31, 2008, 2007, and 2006 | | 58 |
| |
Notes to Financial Statements | | 59 |
| |
Schedule II—Valuation and Qualifying Accounts | | 85 |
53
REPORT OF INDEPENDENT REGISTERED PUBLIC ACCOUNTING FIRM
To the Board of Directors and Stockholders of
Mead Johnson Nutrition Company
Evansville, Indiana
We have audited the accompanying balance sheets of Mead Johnson Nutrition, a division of Bristol-Myers Squibb Company (the “Division”), as of December 31, 2008 and 2007, and the related statements of earnings, comprehensive income and changes in divisional equity (deficit), and cash flows for each of the three years in the period ended December 31, 2008. Our audits also included the financial statement schedule listed in the Index at Item 8. These financial statements and financial statement schedule are the responsibility of the Division’s management. Our responsibility is to express an opinion on the financial statements and such financial statement schedule based on our audits.
We conducted our audits in accordance with the standards of the Public Company Accounting Oversight Board (United States). Those standards require that we plan and perform the audit to obtain reasonable assurance about whether the financial statements are free of material misstatement. The Division is not required to have, nor were we engaged to perform, an audit of its internal control over financial reporting. Our audits included consideration of internal control over financial reporting as a basis for designing audit procedures that are appropriate in the circumstances, but not for the purpose of expressing an opinion on the effectiveness of the Division’s internal control over financial reporting. Accordingly, we express no such opinion.An audit also includes examining, on a test basis, evidence supporting the amounts and disclosures in the financial statements, assessing the accounting principles used and significant estimates made by management, as well as evaluating the overall financial statement presentation. We believe that our audits provide a reasonable basis for our opinion.
In our opinion, such financial statements present fairly, in all material respects, the financial position of Mead Johnson Nutrition and subsidiaries as of December 31, 2008 and 2007, and the results of their operations and their cash flows for each of the three years in the period ended December 31, 2008, in conformity with accounting principles generally accepted in the United States of America. Also, in our opinion, such financial statement schedule, when considered in relation to the basic financial statements taken as a whole, presents fairly, in all material respects, the information set forth therein.
As discussed in Note 2 to the financial statements, the financial statements include allocations of expenses from Bristol-Myers Squibb Company. These allocations may not be reflective of the actual level of costs or debt which would have been incurred had the Division operated as a separate entity apart from Bristol-Myers Squibb Company.
As discussed in Notes 2 and 6 to the financial statements, Bristol-Myers Squibb Company adopted Financial Accounting Standards Board Interpretation No. 48,Accounting for Uncertainty in Income Taxes—an interpretation of FASB Statement No. 109, effective January 1, 2007.
/s/ DELOITTE & TOUCHE LLP
Parsippany, New Jersey
March 27, 2009
54
AUDITED FINANCIAL STATEMENTS OF MEAD JOHNSON NUTRITION, A DIVISION OF
BRISTOL-MYERS SQUIBB COMPANY
MEAD JOHNSON NUTRITION
STATEMENTS OF EARNINGS
YEARS ENDED DECEMBER 31, 2008, 2007, AND 2006
(Dollars and Shares in millions, except Per Share Data)
| | | | | | | | | | | | |
| | | December 31, | |
| | | 2008 | | | 2007 | | | 2006 | |
NET SALES | | $ | 2,882.4 | | | $ | 2,576.4 | | | $ | 2,345.1 | |
| | | | | | | | | | | | |
EXPENSES: | | | | | | | | | | | | |
Costs of Products Sold | | | 1,079.8 | | | | 948.7 | | | | 850.4 | |
Marketing, Selling, and Administrative | | | 651.7 | | | | 575.2 | | | | 504.3 | |
Advertising and Product Promotion | | | 369.3 | | | | 318.5 | | | | 290.6 | |
Research and Development | | | 72.8 | | | | 67.2 | | | | 62.0 | |
Other Expenses—net | | | 13.1 | | | | 3.6 | | | | 3.0 | |
| | | | | | | | | | | | |
Total Expenses | | | 2,186.7 | | | | 1,913.2 | | | | 1,710.3 | |
| | | | | | | | | | | | |
EARNINGS BEFORE INTEREST, INCOME TAXES AND MINORITY INTEREST | | | 695.7 | | | | 663.2 | | | | 634.8 | |
| | | |
INTEREST EXPENSE | | | (43.3 | ) | | | — | | | | — | |
| | | | | | | | | | | | |
EARNINGS BEFORE INCOME TAXES AND MINORITY INTEREST | | | 652.4 | | | | 663.2 | | | | 634.8 | |
| | | |
PROVISION FOR INCOME TAXES | | | (251.4 | ) | | | (233.6 | ) | | | (230.1 | ) |
| | | |
MINORITY INTEREST EXPENSE—net of tax | | | (7.1 | ) | | | (7.1 | ) | | | (6.5 | ) |
| | | | | | | | | | | | |
NET EARNINGS | | $ | 393.9 | | | $ | 422.5 | | | $ | 398.2 | |
| | | | | | | | | | | | |
BASIC AND DILUTED NET EARNINGS PER SHARE | | $ | 2.32 | | | $ | 2.49 | | | $ | 2.34 | |
| | | | | | | | | | | | |
Weighted Average Shares Outstanding | | | 170.0 | | | | 170.0 | | | | 170.0 | |
The accompanying notes are an integral part of these financial statements.
55
MEAD JOHNSON NUTRITION
STATEMENTS OF COMPREHENSIVE INCOME AND CHANGES IN DIVISIONAL EQUITY (DEFICIT)
YEARS ENDED DECEMBER 31, 2008, 2007, AND 2006
(Dollars in millions)
| | | | | | | | | | | | | | | | |
| | | Total
Divisional
Equity (Deficit) | | | Parent
Company
Investment | | | Accumulated
Other
Comprehensive
Income (Loss) | | | Comprehensive
Income | |
BALANCE—January 1, 2006 | | $ | 458.2 | | | $ | 467.2 | | | $ | (9.0 | ) | | | | |
| | | | |
Comprehensive Income: | | | | | | | | | | | | | | | | |
Net Earnings | | | 398.2 | | | | 398.2 | | | | | | | $ | 398.2 | |
Currency Translation—net of tax liability of $3.0 | | | 12.1 | | | | | | | | 12.1 | | | | 12.1 | |
| | | | | | | | | | | | | | | | |
Total Comprehensive Income | | | | | | | | | | | | | | $ | 410.3 | |
| | | | | | | | | | | | | | | | |
Net Transfers to Parent | | | (282.7 | ) | | | (282.7 | ) | | | — | | | | | |
| | | | | | | | | | | | | | | | |
BALANCE—December 31, 2006 | | | 585.8 | | | | 582.7 | | | | 3.1 | | | | | |
| | | | | | | | | | | | | | | | |
Comprehensive Income: | | | | | | | | | | | | | | | | |
Cumulative Effect of Adoption of FIN No. 48 | | | (4.8 | ) | | | (4.8 | ) | | | | | | | | |
Net Earnings | | | 422.5 | | | | 422.5 | | | | | | | $ | 422.5 | |
Currency Translation—net of tax liability of $9.4 | | | 18.3 | | | | | | | | 18.3 | | | | 18.3 | |
| | | | | | | | | | | | | | | | |
Total Comprehensive Income | | | | | | | | | | | | | | $ | 440.8 | |
| | | | | | | | | | | | | | | | |
Net Transfers to Parent | | | (391.0 | ) | | | (391.0 | ) | | | — | | | | | |
| | | | | | | | | | | | | | | | |
BALANCE—December 31, 2007 | | | 630.8 | | | | 609.4 | | | | 21.4 | | | | | |
| | | | | | | | | | | | | | | | |
Comprehensive Income: | | | | | | | | | | | | | | | | |
Net Earnings | | | 393.9 | | | | 393.9 | | | | | | | $ | 393.9 | |
Currency Translation—net of tax benefit of $6.5 | | | (42.1 | ) | | | | | | | (42.1 | ) | | | (42.1 | ) |
Unrealized Gain (Loss) on Derivatives—net of tax liability of $1.9 | | | 5.2 | | | | | | | | 5.2 | | | | 5.2 | |
| | | | | | | | | | | | | | | | |
Total Comprehensive Income | | | | | | | | | | | | | | $ | 357.0 | |
| | | | | | | | | | | | | | | | |
Related Party Debt | | | (2,000.0 | ) | | | (2,000.0 | ) | | | | | | | | |
Net Transfers to Parent | | | (388.7 | ) | | | (388.7 | ) | | | — | | | | | |
| | | | | | | | | | | | | | | | |
BALANCE—December 31, 2008 | | $ | (1,400.9 | ) | | $ | (1,385.4 | ) | | $ | (15.5 | ) | | | | |
| | | | | | | | | | | | | | | | |
The accompanying notes are an integral part of these financial statements.
56
MEAD JOHNSON NUTRITION
BALANCE SHEETS
DECEMBER 31, 2008 AND 2007
(Dollars in millions)
| | | | | | | |
| | | December 31, |
| | | 2008 | | | 2007 |
ASSETS | | | | | | | |
| | |
CURRENT ASSETS: | | | | | | | |
Receivables—net of allowances of $7.0 and $29.9, respectively | | $ | 262.7 | | | $ | 283.0 |
Inventories | | | 354.3 | | | | 301.2 |
Deferred Income Taxes—net of valuation allowance | | | 70.9 | | | | 66.8 |
Foreign Income Taxes Receivable | | | 4.5 | | | | 3.6 |
Prepaid Expenses and Other Assets | | | 24.7 | | | | 32.9 |
| | | | | | | |
Total Current Assets | | | 717.1 | | | | 687.5 |
| | |
Property, Plant, and Equipment—net | | | 453.6 | | | | 439.7 |
Goodwill | | | 117.5 | | | | 117.5 |
Other Intangible Assets—net | | | 39.2 | | | | 32.5 |
Deferred Income Taxes—net of valuation allowance | | | 2.0 | | | | 3.2 |
Other Assets | | | 32.0 | | | | 21.5 |
| | | | | | | |
TOTAL | | $ | 1,361.4 | | | $ | 1,301.9 |
| | | | | | | |
LIABILITIES AND DIVISIONAL EQUITY (DEFICIT) | | | | | | | |
| | |
CURRENT LIABILITIES: | | | | | | | |
Accounts Payable | | $ | 198.5 | | | $ | 166.5 |
Accrued Expenses | | | 172.3 | | | | 118.3 |
Accrued Rebates and Returns | | | 250.6 | | | | 259.3 |
Deferred Income—current | | | 18.1 | | | | 10.9 |
Deferred Income Taxes—current | | | 0.1 | | | | 0.1 |
U.S. and Foreign Income Taxes Payable | | | 13.2 | | | | 7.6 |
| | | | | | | |
Total Current Liabilities | | | 652.8 | | | | 562.7 |
| | |
Related Party Debt | | | 2,000.0 | | | | — |
Deferred Income—noncurrent | | | 6.4 | | | | 11.8 |
Deferred Income Taxes—noncurrent | | | 78.6 | | | | 73.6 |
Other Liabilities | | | 19.1 | | | | 16.0 |
| | | | | | | |
Total Liabilities | | | 2,756.9 | | | | 664.1 |
| | |
MINORITY INTEREST | | | 5.4 | | | | 7.0 |
| | |
COMMITMENTS AND CONTINGENCIES | | | | | | | |
| | |
DIVISIONAL EQUITY (DEFICIT) | | | (1,400.9 | ) | | | 630.8 |
| | | | | | | |
TOTAL | | $ | 1,361.4 | | | $ | 1,301.9 |
| | | | | | | |
The accompanying notes are an integral part of these financial statements.
57
MEAD JOHNSON NUTRITION
STATEMENTS OF CASH FLOWS
YEARS ENDED DECEMBER 31, 2008, 2007, AND 2006
(Dollars in millions)
| | | | | | | | | | | | |
| | | December 31, | |
| | | 2008 | | | 2007 | | | 2006 | |
CASH FLOWS FROM OPERATING ACTIVITIES: | | | | | | | | | | | | |
Net Earnings | | $ | 393.9 | | | $ | 422.5 | | | $ | 398.2 | |
Adjustments to Reconcile Net Earnings to Net Cash Provided by Operating Activities: | | | | | | | | | | | | |
Depreciation | | | 44.1 | | | | 40.9 | | | | 37.9 | |
Amortization | | | 8.0 | | | | 10.1 | | | | 11.6 | |
Provision for Losses on Accounts Receivable | | | 0.6 | | | | 22.3 | | | | 2.4 | |
Deferred Income Taxes | | | 6.0 | | | | 4.6 | | | | 5.4 | |
Stock-Based Compensation Expense | | | 9.2 | | | | 6.9 | | | | 6.1 | |
Gain on Sale of Trademark | | | — | | | | (2.9 | ) | | | — | |
Impairment Charges and Asset Write-Offs | | | — | | | | — | | | | 15.6 | |
(Gain)/Loss on Disposal of Property, Plant, and Equipment | | | (0.1 | ) | | | 0.1 | | | | 0.3 | |
Minority Interest Expense | | | 7.1 | | | | 7.1 | | | | 6.5 | |
Distribution to Minority Interests | | | (11.7 | ) | | | (6.6 | ) | | | (6.6 | ) |
Change in Operating Assets and Liabilities: | | | | | | | | | | | | |
Receivables | | | (0.9 | ) | | | (15.9 | ) | | | (23.3 | ) |
Inventories | | | (79.9 | ) | | | (29.6 | ) | | | (36.0 | ) |
Prepaid Expenses and Other Assets | | | — | | | | (10.4 | ) | | | (3.8 | ) |
Accounts Payable, Accrued Expenses, and Deferred Income | | | 103.0 | | | | 46.5 | | | | (22.3 | ) |
Accrued Rebates and Returns | | | (5.9 | ) | | | (27.6 | ) | | | (25.9 | ) |
U.S. and Foreign Income Taxes Payable | | | 4.4 | | | | (7.9 | ) | | | (11.9 | ) |
Other Liabilities | | | (0.5 | ) | | | 12.0 | | | | (2.4 | ) |
| | | | | | | | | | | | |
Net Cash Provided by Operating Activities | | | 477.3 | | | | 472.1 | | | | 351.8 | |
| | | | | | | | | | | | |
CASH FLOWS FROM INVESTING ACTIVITIES: | | | | | | | | | | | | |
Additions to Property, Plant, and Equipment and Capitalized Software | | | (81.1 | ) | | | (78.4 | ) | | | (68.9 | ) |
Proceeds from Sale of Equipment and Trademark | | | 1.7 | | | | 4.2 | | | | 5.9 | |
| | | | | | | | | | | | |
Net Cash Used in Investing Activities | | | (79.4 | ) | | | (74.2 | ) | | | (63.0 | ) |
| | | | | | | | | | | | |
CASH FLOWS FROM FINANCING ACTIVITIES—Net Transfers to Parent, excluding non-cash items | | | (397.9 | ) | | | (397.9 | ) | | | (288.8 | ) |
| | | | | | | | | | | | |
NET (DECREASE) INCREASE IN CASH AND CASH EQUIVALENTS | | | — | | | | — | | | | — | |
| | | |
CASH AND CASH EQUIVALENTS: | | | | | | | | | | | | |
Beginning of Year | | | — | | | | — | | | | — | |
| | | | | | | | | | | | |
End of Year | | $ | — | | | $ | — | | | $ | — | |
| | | | | | | | | | | | |
SUPPLEMENTAL DISCLOSURES OF CASH FLOW INFORMATION: | | | | | | | | | | | | |
Noncash Financing Activities—Related Party Debt | | $ | 2,000.0 | | | $ | — | | | $ | — | |
| | | | | | | | | | | | |
The accompanying notes are an integral part of these financial statements.
58
MEAD JOHNSON NUTRITION
NOTES TO FINANCIAL STATEMENTS
AS OF DECEMBER 31, 2008 AND 2007 AND FOR THE YEARS ENDED
DECEMBER 31, 2008, 2007, AND 2006
(Dollars in millions, except Per Share Data)
Mead Johnson Nutrition (previously referred to as “Mead Johnson Nutritionals” or “Division”, now referred to as “MJN” or the “Company”) manufactures, distributes and sells infant formulas and other nutritional products, and operates as a division of Bristol-Myers Squibb Company (“BMS”). All references to BMS refer to Bristol-Myers Squibb Company, our parent company, and its consolidated subsidiaries. MJN has a broad product portfolio, which extends across routine and specialty infant formulas, children’s milks and milk modifiers, pediatric vitamins, dietary supplements for pregnant and breastfeeding mothers, and products for metabolic disorders. These products are generally sold by wholesalers and retailers and are promoted to health care professionals, and, where permitted by regulation or policy, directly to consumers.
On February 17, 2009, Mead Johnson Nutrition Company (“MJNC”) completed its initial public offering (“IPO”). This entity now holds all the business of MJN. See Note 21—“Subsequent Events” for more discussion.
Basis of Presentation—The financial statements present the results of operations, financial position, and cash flows of Mead Johnson Nutrition and its majority-owned-and-controlled subsidiaries. All inter-divisional transactions have been eliminated.
These financial statements of MJN have been prepared in accordance with accounting principles generally accepted in the United States of America (“U.S. GAAP”). All amounts are in millions of dollars with the exception of per share data, unless otherwise stated.
The financial statements of MJN have been derived from the consolidated financial statements and accounting records of BMS, principally from statements and records representing the Mead Johnson Nutrition business. These statements of earnings also include corporate and shared service expense allocations for certain corporate functions historically provided to MJN by BMS, including general expenses related to corporate functions such as executive oversight, risk management, information technology, accounting, audit, legal, investor relations, human resources, tax and other services. These allocations are based on specific identification or the percentage of MJN’s revenues and headcount to the respective total BMS revenues and headcount. These allocations reflected in the statements of earnings, primarily within marketing, selling and administrative, totaled $112.1, $90.1, and $80.7 for 2008, 2007, and 2006, respectively. Allocation costs in prior years have been revised from previously disclosed amounts. The disclosure now excludes information management costs dedicated to MJN and includes stock based compensation and pension costs. This change in disclosure had no impact on amounts presented in the financial statements. MJN considers these allocations to be a reasonable reflection of the utilization of services provided. The allocations may not, however, reflect the expense MJN would have incurred as a stand-alone company. Actual costs that may have been incurred if MJN had been a stand-alone company in 2008, 2007, and 2006 would depend on a number of factors, including MJN’s chosen organizational structure, what functions were outsourced or performed by MJN’s employees and strategic decisions made in areas such as information technology systems and infrastructure.
BMS has not allocated a portion of its third-party debt interest cost to MJN. Debt is not being allocated as none of the third-party debt recorded by BMS is directly related to the MJN business, which is self-funding. BMS debt is used solely for BMS corporate purposes. On August 26, 2008, Mead Johnson & Company (“MJC”), a wholly owned subsidiary of MJN, declared and issued a dividend in the form of a 10-year intercompany note to
59
BMS in the amount of $2,000.0, which was recorded as a reduction of divisional equity. See Note 3—“Related Parties.” On February 17, 2009, as part of the IPO, this related party note was amended and restructured into three separate notes totaling $1,744.2 as discussed in Note 21—“Subsequent Events.”
Use of Estimates—The preparation of financial statements in conformity with U.S. GAAP requires the use of estimates and assumptions that affect the reported amounts of assets and liabilities and disclosure of contingent assets and contingent liabilities at the date of the financial statements and the reported amounts of revenues and expenses during the reporting period. The most significant assumptions are employed in estimates used in determining values of sales rebate and return accruals, BMS allocations, income tax assets, income tax liabilities, and income tax expense as well as in estimates used in applying the revenue recognition policy and accounting for stock-based compensation costs and retirement and postretirement benefits (including the actuarial assumptions). Actual results may or may not differ from estimated results.
Revenue Recognition—MJN recognizes revenue in accordance with Staff Accounting Bulletin (“SAB”) No. 101, Revenue Recognition in Financial Statements, as amended by SAB No. 104, Revenue Recognition, when substantially all the risks and rewards of ownership have transferred to the customer. Revenue is recognized on the date of receipt by the purchaser. Revenues are reduced at the time of recognition to reflect expected returns that are estimated based on historical experience and business trends. Additionally, provisions are made at the time of revenue recognition for discounts, Women, Infants and Children (“WIC”) rebates and estimated sales allowances based on historical experience, updated for changes in facts and circumstances, as appropriate. Such provisions are recorded as a reduction of revenue. The Company offers sales incentives to customers and consumers through various programs consisting primarily of customer pricing allowances, merchandising funds and consumer coupons. The cost of these programs is recognized as incurred and recorded as a reduction of revenue.
WIC rebate accruals were $194.7 and $197.6 at December 31, 2008 and 2007, respectively, which are included in accrued rebates and returns. MJN participates on a competitive bidding basis in nutrition programs sponsored by states, tribal governments, the Commonwealth of Puerto Rico, and U.S. territories for WIC. Under these programs, MJN reimburses these entities for the difference between wholesaler list price and the contract price on eligible products. The Company accounts for WIC rebates by establishing an accrual in an amount equal to the Company’s estimate of WIC rebate claims attributable to a sale. MJN determines its estimate of the WIC rebate accrual primarily based on historical experience regarding WIC rebates and current contract prices under the WIC programs. The Company considers levels of inventory in the distribution channel, new WIC contracts, terminated WIC contracts, changes in existing WIC contracts and WIC participation, and adjusts the accrual periodically throughout the year to reflect actual expense. Rebates under the WIC program reduced revenues by $796.0, $847.8, and $871.9 in the years ended December 31, 2008, 2007, and 2006, respectively.
Sales return accruals were $29.3 and $30.7 at December 31, 2008 and 2007, respectively, which are included in accrued rebates and returns. The Company accounts for sales returns in accordance with the Statement of Financial Accounting Standards (“SFAS”) No. 48,Revenue Recognition When Right of Return Exists, by establishing an accrual in an amount equal to its estimate of sales recorded for which the related products are expected to be returned. The Company determines its estimate of the sales return accrual primarily based on historical experience regarding sales returns, but also considers other factors that could impact sales returns
Income Taxes—During the periods presented, MJN did not file separate tax returns, as the Company was included in the tax grouping of other BMS entities within the respective entity’s tax jurisdiction. The income tax provision included in these financial statements was calculated based on a separate return-methodology, as if MJN’s operations were separate taxpayers in the respective jurisdictions.
The provision for income taxes has been determined using the asset and liability approach of accounting for income taxes. Under this approach, deferred taxes represent the future tax consequences expected to occur when the reported amounts of assets and liabilities are recovered or paid. The provision for income taxes represents
60
income taxes paid or payable for the current year plus the change in deferred taxes during the year. Deferred taxes result from differences between the financial and tax bases of the Company’s assets and liabilities. Deferred tax assets and liabilities are measured using the currently enacted tax rates that apply to taxable income in effect for the years in which those tax attributes are expected to be recovered or paid, and are adjusted for changes in tax rates and tax laws when changes are enacted.
Valuation allowances are recorded to reduce deferred tax assets when it is more likely than not that a tax benefit will not be realized. The assessment of whether or not a valuation allowance is required often requires significant judgment including the long-range forecast of future taxable income and the evaluation of tax planning initiatives. Adjustments to the deferred tax valuation allowances are made to earnings in the period when such assessments are made.
With the exception of MJN-dedicated entities, the Company does not maintain taxes payable to/from BMS as it is deemed to settle the annual current tax balances immediately with the tax paying legal entities in the respective jurisdictions. These settlements are reflected as changes in divisional equity.
The Company adopted Financial Accounting Standards Board (“FASB”) Interpretation Number (“FIN”) No. 48,Accounting for Uncertainty in Income Taxes—an interpretation of FASB Statement No. 109, on January 1, 2007. As a result of the adoption of this accounting pronouncement, the Company derecognized $4.8 of previously recognized tax benefits, which was accounted for as a decrease to divisional equity.
Cash and Cash Equivalents—Cash and cash equivalents have been excluded from the financial statements. Historically, cash deposits from the Company have been transferred to BMS, and BMS has funded the Company’s disbursement accounts as required.
Inventory Valuation—Inventories are stated at average cost, not in excess of market.
Capital Assets and Depreciation—Expenditures for additions and improvements are capitalized at cost. Depreciation is generally computed on a straight-line method based on the estimated useful lives of the related assets. The estimated useful lives of the major classes of depreciable assets are 50 years for buildings and 3 to 40 years for machinery, equipment, and fixtures. Maintenance and repair costs are expensed as incurred.
Impairment of Long-Lived Assets—The Company periodically evaluates whether current facts or circumstances indicate that the carrying value of its depreciable assets to be held and used may not be recoverable. If such circumstances are determined to exist, an estimate of undiscounted future cash flows produced by the long-lived asset, or the appropriate grouping of assets, is compared to the carrying value to determine whether impairment exists. If an asset is determined to be impaired, the loss is measured based on the difference between the asset’s fair value and its carrying value. An estimate of the asset’s fair value is based on quoted market prices in active markets, if available. If quoted market prices are not available, the estimate of fair value is based on various valuation techniques, including a discounted value of estimated future cash flows. The Company reports an asset to be disposed of at the lower of its carrying value or its estimated net realizable value. Asset impairment or accelerated depreciation resulting from an assessment in accordance with SFAS No. 144,Accounting for the Impairment or Disposal of Long-Lived Assets.
Capitalized Software—Certain costs to obtain internal use software for significant systems projects are capitalized and amortized over the estimated useful life of the software, which ranges from 3 to 5 years. Costs to obtain software for projects that are not significant are expensed as incurred.
Goodwill—Goodwill is tested for impairment using a two-step process on an annual basis or when current facts or circumstances indicate that a potential impairment may exist. The first step is to identify a potential impairment, and the second step measures the amount of the impairment loss, if any. Goodwill is deemed to be impaired if the carrying amount of a reporting unit’s goodwill exceeds its estimated fair value. The Company
61
completes its annual goodwill impairment assessment during the first quarter and monitors for any potential impairment in the remaining quarters, neither of which indicated an impairment of goodwill in 2008, 2007 or 2006.
Contingencies—In the normal course of business, the Company is subject to loss contingencies, such as legal proceedings and claims arising out of its business, that cover a wide range of matters, including, among others, government investigations, shareholder lawsuits, product and/or environmental, health, and safety liabilities, and tax matters. In accordance with SFAS No. 5, Accounting for Contingencies, the Company records accruals for such loss contingencies when it is probable that a liability will be incurred and the amount of loss can be reasonably estimated. The Company, in accordance with SFAS No. 5, does not recognize gain contingencies until realized. For a discussion of contingencies, see Note 6 on “Income Taxes” and Note 20 on “Legal Proceedings and Contingencies.”
Derivative Financial Instruments—The Company uses derivative financial instruments through its participation in the centralized hedging functions of BMS, which are designed primarily to minimize exposure to foreign currency risk. BMS does not hold or issue derivative financial instruments for speculative purposes.
MJN is exposed to market risk due to changes in currency exchange rates. The primary net foreign currency translation exposures are the Chinese renminbi, the Mexican peso, the Philippine peso, the Hong Kong dollar and the Euro. Historically, MJN has used derivative financial instruments indirectly through participation in the centralized hedging functions of BMS, which are designed primarily to minimize exposure to foreign currency risk. MJN does not hold or issue derivative financial instruments for speculative purposes.
Foreign currency contracts are used to hedge anticipated transactions on certain foreign currencies and MJN designates these derivative instruments as foreign currency cash flow hedges when appropriate. If the derivative is designated as a cash flow hedge, the change in the fair value of the derivative is initially recorded in other comprehensive income and then recognized in our statement of earnings when the corresponding hedged item impacts our earnings. The foreign currency derivatives resulted in losses of $0.9, $2.6, and $5.1 in the years ended December 31, 2008, 2007 and 2006, respectively. These amounts are reflected in the statements of earnings in either costs of products sold or other expenses—net. The impact of hedge ineffectiveness on our earnings was not material.
Shipping and Handling Costs—The Company typically does not charge customers for shipping and handling costs. Shipping and handling costs, including warehousing expenses, were $82.9, $76.2, and $73.9 in the years ended December 31, 2008, 2007, and 2006, respectively, and are included as marketing, selling and administrative expenses in the statements of earnings.
Advertising Costs—Advertising costs are expensed as incurred. Advertising expenses were $115.3, $92.9, and $81.8 in the years ended December 31, 2008, 2007, and 2006, respectively.
Research and Development—Research and development costs are expensed as incurred. The Company from time to time will enter into agreements with third parties, which gives the Company rights to ingredients owned by these parties or claims resulting from studies, the rights to which are owned by such third parties. As a result of these agreements, the Company may be obligated to make payments to these third parties in connection with research and development contingent upon the achievement of certain pre-determined criteria. For milestones achieved prior to regulatory approval of the product, such payments are expensed as research and development. The Company has made no milestone payments in connection with regulatory approvals, including non-U.S. regulatory approvals and additional indications.
Earnings Per Share—For periods prior to the Company’s IPO, the weighted average number of shares outstanding is calculated using the 170,000,000 shares of Class A and Class B common stock outstanding. The same number of shares has been used to calculate basic earnings per share and diluted earnings per share for the periods prior to the IPO and no MJN stock options nor restricted stock were outstanding prior to the IPO.
62
Foreign Currency Translation—The statements of earnings of the Company’s foreign subsidiaries are translated into U.S. dollars using average exchange rates for the period. The net assets of the Company’s foreign subsidiaries are translated into U.S. dollars using exchange rates as of the balance sheet date. The U.S. dollar effects that arise from translating the net assets of these subsidiaries at changing rates are recorded in the foreign currency translation adjustment account, which is included in accumulated other comprehensive income (loss).
Recently Issued Accounting Standards—Effective January 1, 2008, the Company adopted Emerging Issues Task Force (“EITF”) Issue No. 07-3, Accounting for Nonrefundable Advance Payments for Goods or Services Received for Use in Future Research and Development Activities. Nonrefundable advance payments for goods or services that will be used or rendered for future research and development activities should be deferred and capitalized. Such amounts should be recognized as an expense as the related goods are delivered or the services are performed, or when the goods or services are no longer expected to be provided. The Company’s adoption of EITF No. 07-3 did not have a material effect on the Company’s financial statements.
In December 2007, the FASB issued SFAS No. 141(R),Business Combinations, which replaces SFAS No. 141,Business Combinations, and requires recognition of assets acquired, liabilities assumed, and any non-controlling interest in the acquiree at the acquisition date, measured at their fair values as of that date. In a business combination achieved in stages, this statement requires recognition of identifiable assets and liabilities, as well as the non-controlling interest in the acquiree, at the full amounts of their fair values. This statement also requires the fair value of acquired in-process research and development to be recorded as indefinite lived intangibles, contingent consideration to be recorded on the acquisition date, and restructuring and acquisition-related deal costs to be expensed as incurred. In addition, any excess of the fair value of net assets acquired over purchase price and any subsequent changes in estimated contingencies are to be recorded in earnings. This statement applies to business combinations occurring in 2009.
Effective January 1, 2008, the Company adopted FASB SFAS No. 157, Fair Value Measurements, for financial assets and liabilities and any other assets and liabilities carried at fair value. This pronouncement defines fair value, establishes a framework for measuring fair value and expands disclosures about fair value measurements. On November 14, 2007, the FASB agreed to a one-year deferral for the implementation of SFAS No. 157 for other non-financial assets and liabilities. The Company’s adoption of SFAS No. 157 did not have a material effect on the Company’s financial statements for financial assets and liabilities and any other assets and liabilities carried at fair value. The Company is currently in the process of evaluating the impact of adopting this pronouncement for the other non-financial assets or liabilities.
Effective January 1, 2008, the Company adopted FASB SFAS No. 159, The Fair Value Option for Financial Assets and Financial Liabilities, including an amendment of FASB Statement No. 115, Accounting for Certain Investments in Debt and Equity Securities, which permits an entity to measure certain financial assets and financial liabilities at fair value. The objective of SFAS No. 159 is to improve financial reporting by allowing entities to mitigate volatility in reported earnings caused by the measurement of related assets and liabilities using different attributes, without having to apply complex hedge accounting provisions. Under SFAS No. 159, entities that elect the fair value option (by instrument) will report unrealized gains and losses in earnings at each subsequent reporting date. The fair value option election is irrevocable, unless a new election date occurs. SFAS No. 159 establishes presentation and disclosure requirements to help financial statement users understand the effect of the entity’s election on its earnings, but does not eliminate disclosure requirements of other accounting standards. Assets and liabilities that are measured at fair value must be displayed on the face of the balance sheet. The Company chose not to elect the fair value option for its financial assets and liabilities existing at January 1, 2008, and did not elect the fair value option on financial assets and liabilities transacted during 2008. Therefore, the adoption of SFAS No. 159 had no impact on the Company’s financial statements.
In December 2007, the FASB issued SFAS No. 160, Noncontrolling Interests in Consolidated Financial Statements,an amendment of ARB No. 51. SFAS No. 160 establishes accounting and reporting standards that require the ownership interests in subsidiaries held by parties other than the parent be clearly identified, labelled
63
and presented in the consolidated statement of financial position within equity, but separate from the parent’s equity. This FASB also requires the amount of consolidated net income attributable to the parent and to the noncontrolling interest be clearly identified and presented on the face of the consolidated statement of income. Changes in a parent’s ownership interest while the parent retains its controlling financial interest in its subsidiary must be accounted for consistently, and when a subsidiary is deconsolidated, any retained noncontrolling equity investment in the former subsidiary must be initially measured at fair value. This FASB also requires entities provide sufficient disclosures that clearly identify and distinguish between the interests of the parent and the interests of the noncontrolling owners. This FASB is effective for fiscal years beginning on or after December 15, 2008. The adoption of SFAS No. 160 is not expected to have a material impact on the Company’s financial statements.
In March 2008, the FASB issued SFAS No. 161, Disclosures about Derivative Instruments and Hedging Activities, as an amendment to SFAS No. 133, Accounting for Derivative Instruments and Hedging Activities. SFAS No. 161 requires that objectives for using derivative instruments be disclosed in terms of underlying risk and accounting designation. The fair value of derivative instruments and their gains and losses will need to be presented in tabular format in order to present a more complete picture of the effects of using derivative instruments. SFAS No. 161 is effective for financial statements issued for fiscal years beginning after November 15, 2008. The Company will provide enhanced disclosures as required upon effective date of this pronouncement.
In July 2006, the FASB issued FIN No. 48, which, in the case of the Company, was effective as of January 1, 2007. FIN No. 48 clarifies the accounting for uncertainty in income taxes recognized in an enterprise’s financial statements in accordance with SFAS No. 109, Accounting for Income Taxes. FIN No. 48 requires that all tax positions be evaluated using a recognition threshold and measurement attribute for the financial statement recognition and measurement of a tax position taken or expected to be taken in a tax return. Differences between tax positions taken in a tax return and amounts recognized in the financial statements are recorded as adjustments to income taxes payable or receivable, or adjustments to deferred taxes, or both. FIN No. 48 also requires expanded disclosure at the end of each annual reporting period, including a tabular reconciliation of unrecognized tax benefits. The Company adopted FIN No. 48 on January 1, 2007. As a result of the adoption of this accounting pronouncement, the Company derecognized $4.8 of previously recognized tax benefits, which was accounted for as a decrease to divisional equity. In May 2007, the FASB issued FASB Staff Position (“FSP”) FIN No. 48-1,Definition of Settlement in FASB Interpretation No. 48, which is effective retroactively to January 1, 2007. FSP FIN No. 48-1 provides guidance on how to determine whether a tax position is effectively settled for the purpose of recognizing previously unrecognized tax benefits. The adoption of FSP FIN No. 48-1 did not have any effect on the Company’s financial statements.
These financial statements include transactions with affiliated companies. MJN entered into transactions with BMS and its subsidiaries for the sale of inventory, services provided to and received from BMS pharmaceutical divisions in various markets worldwide, as well as corporate services provided by BMS for the financial statement periods presented. Product transfers from BMS to MJN were made at various transfer prices.
The Company had no sales to related parties in 2008, 2007, or 2006. Purchases from BMS and its subsidiaries amounted to $27.0, $23.2, and $17.8 for the years ended December 31, 2008, 2007, and 2006, respectively, and relate to goods and services. Additionally, MJN allocated charges of $19.6, $21.6, and $17.9 for the years ended December 31, 2008, 2007, and 2006, respectively, to BMS in various markets worldwide, and was allocated charges of $20.2, $18.4, and $10.8 for the years ended December 31, 2008, 2007, and 2006, respectively from BMS. The charges were for services that included occupancy, distribution, promotion, sales force and other administration. Charges were allocated either to MJN from BMS or from MJN to BMS, depending on the location and if the MJN company was the host business in that location. Occupancy costs were allocated based on square meters occupied; the other charges were generally based on headcount or level of
64
activity. Management considers these market allocations to be a reasonable reflection of the utilization of services provided.
The statements of earnings, primarily within marketing, selling and administrative, include allocated corporate and shared services expense allocations from BMS totaling $112.1, $90.1, and $80.7 for the years ended December 31, 2008, 2007, and 2006, respectively. These costs are primarily related to BMS’s corporate administrative services to the Company, and are generally allocated based on either the ratio of MJN’s annual net sales or headcount to BMS’s comparable consolidated net sales or headcount. Allocation costs in prior years have been revised from previously disclosed amounts. The disclosure now excludes information management costs dedicated to MJN and includes stock based compensation and pension costs. This change in disclosure had no impact on amounts presented in the financial statements. Management believes that this allocation method is reasonable. Corporate expenses allocated include accounting, treasury, finance, tax, human resources, legal, and certain other administrative services. Management considers such allocations have been made on a reasonable basis, but may not, however, reflect the expense MJN would have incurred as a stand-alone company. Actual costs which may have been incurred if MJN had been a stand-alone company in 2008, 2007, and 2006 would depend on a number of factors, including how the Company chose to organize itself, what, if any, functions were outsourced or performed by MJN employees and strategic decisions made in areas such as information technology systems and infrastructure.
On August 26, 2008, MJC declared and issued a dividend in the form of a 10-year intercompany note to BMS in the amount of $2,000.0, which was recorded as a reduction of divisional equity. The outstanding principal of the note bears interest at an annual rate of 6.1% and interest payments must be settled no less than annually. Both the outstanding principal and accrued interest were due on demand for payment to BMS, and could have been prepaid by the Company at any time without premium or penalty. Interest expense for the year ended December 31, 2008 was $43.3.
On February 17, 2009, at the time of the MJN’s IPO, this related party note was amended and restructured into three separate notes totaling $1,744.2 as discussed in Note 21—“Subsequent Events.” Since these notes are now payable in more than one year, the $2,000.0 note is classified as noncurrent on the balance sheet as of December 31, 2008.
BMS uses a centralized approach to cash management and financing its operations. During the periods covered by these financial statements, cash deposits were remitted to BMS on a regular basis and are reflected within divisional equity in the financial statements. Similarly, MJN’s cash disbursements were funded through BMS’s cash accounts. As a result, none of BMS’s cash, cash equivalents or liabilities pertaining to book overdrafts have been allocated to MJN in the financial statements.
On February 10, 2009, immediately prior to the completion of the IPO, the separation of MJN’s business from BMS (“Separation”) was finalized. Prior to the IPO, MJN had 170,000,000 shares of Class A and Class B common stock outstanding, all of which were owned by BMS. This amount was used to calculate the weighted average number of common shares outstanding for the periods presented.
The following table presents the calculation of basic and diluted earnings per share:
| | | | | | | | | |
| | | Year Ended December 31, |
Amounts in millions, except Per Share Data | | 2008 | | 2007 | | 2006 |
Net Earnings | | $ | 393.9 | | $ | 422.5 | | $ | 398.2 |
Weighted Average Shares Outstanding | | | 170.0 | | | 170.0 | | | 170.0 |
| | | | | | | | | |
Net Earnings per Share—Basic and Diluted | | $ | 2.32 | | $ | 2.49 | | $ | 2.34 |
| | | | | | | | | |
65
The components of other expenses—net were:
| | | | | | | | | | | |
| | | Year Ended December 31, | |
| | | 2008 | | 2007 | | | 2006 | |
Loss from Third-Party Contract Manufacturing | | $ | 6.0 | | $ | 0.9 | | | $ | 1.8 | |
Foreign Exchange Transaction Losses | | | 1.8 | | | 4.3 | | | | 4.8 | |
Other—net | | | 5.3 | | | (1.6 | ) | | | (3.6 | ) |
| | | | | | | | | | | |
Other Expenses—net | | $ | 13.1 | | $ | 3.6 | | | $ | 3.0 | |
| | | | | | | | | | | |
Foreign exchange transaction losses include the effect of hedges allocated to the Company. Other—net includes certain other litigation matters and (gains) and losses on disposal of property, plant, and equipment.
During the periods presented, MJN did not file separate tax returns, as it was included in the tax grouping of other BMS entities within the respective entity’s tax jurisdiction. The income tax provision included in these financial statements was calculated using the separate return basis, as if MJN was a separate stand-alone taxpayer. With the exception of MJN-dedicated entities, the Company did not maintain taxes payable to or from BMS as it is deemed to settle the annual current tax balances immediately with the tax paying legal entities in their respective jurisdictions. These settlements are reflected as changes in divisional equity.
The components of earnings before minority interest and income taxes were:
| | | | | | | | | |
| | | Year Ended December 31, |
| | | 2008 | | 2007 | | 2006 |
U.S. | | $ | 154.7 | | $ | 306.8 | | $ | 289.2 |
Non-U.S. | | | 497.7 | | | 356.4 | | | 345.6 |
| | | | | | | | | |
| | $ | 652.4 | | $ | 663.2 | | $ | 634.8 |
| | | | | | | | | |
The above amounts are categorized based on the location of the taxing authorities.
The provision/(benefit) for income taxes attributable to operations consisted of:
| | | | | | | | | | | |
| | | Year Ended December 31, | |
| | | 2008 | | 2007 | | | 2006 | |
Current: | | | | | | | | | | | |
U.S. Federal | | $ | 102.6 | | $ | 106.2 | | | $ | 111.7 | |
U.S. States | | | 18.1 | | | 19.1 | | | | 22.6 | |
Non-U.S. | | | 124.7 | | | 103.7 | | | | 90.4 | |
| | | | | | | | | | | |
| | | 245.4 | | | 229.0 | | | | 224.7 | |
| | | | | | | | | | | |
Deferred: | | | | | | | | | | | |
U.S. Federal | | | 1.2 | | | 7.7 | | | | 2.2 | |
U.S. States | | | — | | | 1.4 | | | | (0.4 | ) |
Non-U.S. | | | 4.8 | | | (4.5 | ) | | | 3.6 | |
| | | | | | | | | | | |
| | | 6.0 | | | 4.6 | | | | 5.4 | |
| | | | | | | | | | | |
| | $ | 251.4 | | $ | 233.6 | | | $ | 230.1 | |
| | | | | | | | | | | |
66
Effective Tax Rate—MJN’s provision for income taxes in the years ended December 31, 2008, 2007, and 2006 was different from the amount computed by applying the statutory U.S. Federal income tax rate to earnings before income taxes and minority interest, as a result of the following:
| | | | | | | | | | | | | | | | | | | | | |
| | | 2008 | | | 2007 | | | 2006 | |
U.S. Statutory Rate | | $ | 228.3 | | | 35.0 | % | | $ | 232.1 | | | 35.0 | % | | $ | 222.2 | | | 35.0 | % |
State and Local Taxes | | | 10.8 | | | 1.7 | | | | 13.3 | | | 2.0 | | | | 14.4 | | | 2.2 | |
Foreign Income Taxed at Different Rates | | | (23.3 | ) | | (3.6 | ) | | | (20.6 | ) | | (3.1 | ) | | | (14.2 | ) | | (2.2 | ) |
Repatriation of Foreign Income | | | 37.4 | | | 5.7 | | | | 24.5 | | | 3.7 | | | | 20.7 | | | 3.3 | |
Tax Holidays | | | (4.5 | ) | | (0.7 | ) | | | (3.5 | ) | | (0.5 | ) | | | (5.0 | ) | | (0.8 | ) |
Disallowed IPO Expenses | | | 8.8 | | | 1.4 | | | | — | | | — | | | | — | | | — | |
U.S. Manufacturing Deduction | | | (3.7 | ) | | (0.6 | ) | | | (4.5 | ) | | (0.7 | ) | | | (2.9 | ) | | (0.5 | ) |
Other | | | (2.4 | ) | | (0.4 | ) | | | (7.7 | ) | | (1.2 | ) | | | (5.1 | ) | | (0.8 | ) |
| | | | | | | | | | | | | | | | | | | | | |
Total Provision / Effective Tax Rate | | $ | 251.4 | | | 38.5 | % | | $ | 233.6 | | | 35.2 | % | | $ | 230.1 | | | 36.2 | % |
| | | | | | | | | | | | | | | | | | | | | |
The effective tax rate for the year ended December 31, 2008, increased from 35.2% to 38.5% compared to the year ended December 31, 2007. The increase in the effective tax rate was driven primarily by the capitalization in 2008 of certain initial public offering expenses for tax purposes, the benefit of certain basis differences reflected in the 2007 effective tax rate and changes in the mix of earnings by jurisdiction.
The Company has negotiated a tax holiday under which certain profits in the Netherlands are exempt from taxation through the year ending December 31, 2009.
Deferred Taxes and Valuation Allowance—The components of current and noncurrent deferred income tax assets (liabilities) were:
| | | | | | | | |
| | | December 31, | |
| | | 2008 | | | 2007 | |
Accrued Rebates and Returns | | $ | 38.2 | | | $ | 36.4 | |
Inter-Company Profit and Other Inventory Items | | | 18.1 | | | | 10.5 | |
Accruals | | | 13.7 | | | | 14.6 | |
Net Operating Loss Carryforwards | | | 16.8 | | | | 18.3 | |
Pension and Other Post-Employment Benefits | | | 7.9 | | | | 7.2 | |
Deferred Income | | | 2.9 | | | | 4.2 | |
Stock Options | | | 8.1 | | | | 5.0 | |
Allowance for Bad Debts | | | 0.2 | | | | 7.2 | |
Others—net | | | 3.2 | | | | 2.7 | |
| | | | | | | | |
Total Deferred Tax Assets | | | 109.1 | | | | 106.1 | |
| | | | | | | | |
Depreciation/Amortization | | | (49.3 | ) | | | (43.4 | ) |
Outside Basis | | | (49.0 | ) | | | (48.2 | ) |
| | | | | | | | |
Total Deferred Tax Liabilities | | | (98.3 | ) | | | (91.6 | ) |
| | | | | | | | |
Valuation Allowance | | | (16.6 | ) | | | (18.2 | ) |
| | | | | | | | |
Deferred Tax Assets (Liabilities)—net | | $ | (5.8 | ) | | $ | (3.7 | ) |
| | | | | | | | |
Recognized as: | | | | | | | | |
Deferred Income Taxes—current | | $ | 70.8 | | | $ | 66.7 | |
Deferred Income Taxes—noncurrent | | | (76.6 | ) | | | (70.4 | ) |
| | | | | | | | |
Total | | $ | (5.8 | ) | | $ | (3.7 | ) |
| | | | | | | | |
As of December 31, 2008, the Company had foreign net operating loss (“NOL”) carryforwards of $64.0. The majority of these NOL carryforwards will expire through 2012. The valuation allowance increased (decreased) by
67
$(1.6), $8.0, and $5.9 in the years ended December 31, 2008, 2007 and 2006, respectively. The valuation allowance relates to foreign NOLs that are not expected to be realized because they are based upon a hypothetical stand alone carve out structure that will not exist after restructuring for an IPO.
Income taxes paid were $227.8, $228.0, and $236.4 in the years ended December 31, 2008, 2007, and 2006, respectively.
The MJN operations do not maintain any cash or cash equivalents; rather, all earnings are immediately distributed to BMS. Accordingly, there are no unremitted earnings in foreign subsidiaries for which there might be a future tax consequence upon repatriation. However, cumulative translation adjustments on foreign subsidiaries with a functional currency other than U.S. Dollar resulted in deferred tax liabilities of $16.6 and $23.1 at December 31, 2008 and 2007, respectively. Further basis differences arose due to the qualification of repatriated earnings as return of capital for tax purposes, resulting in deferred tax liabilities of $33.1 and $27.9 at December 31, 2008 and 2007, respectively.
The Company adopted the provisions of FIN No. 48 on January 1, 2007, resulting in the derecognition of $4.8 of previously recognized tax benefits which was accounted for as a decrease to the opening balance of divisional equity. A reconciliation of the Company’s changes in uncertain tax positions from January 1, 2007 to December 31, 2007 and January 1, 2008 to December 31, 2008 is as follows:
| | | | | | | | | | | | | | | | | | | | | | | | |
Description | | Unrecognized
Federal,
State, and
Foreign Tax
Benefits | | | Interest | | | Penalties | | | Unrecognized
Income Tax
Benefits,
including
Interest and
Penalties | | | Deferred
Income
Tax
Benefits | | | Unrecognized
Income Tax
Benefits,
including
Interest and
Penalties, Net
of Deferred
Tax Benefits | |
Total Uncertain Tax Positions that, if Recognized, Would Impact the Effective Tax Rate as of January 1, 2007 | | $ | 3.2 | | | $ | 1.3 | | | $ | 2.6 | | | $ | 7.1 | | | $ | (2.8 | ) | | $ | 4.3 | |
Gross Additions to Tax Positions Related to Current Year | | | 1.4 | | | | — | | | | — | | | | 1.4 | | | | (0.4 | ) | | | 1.0 | |
| | | | | | |
Gross Reductions to Tax Positions Related to Current Year | | | — | | | | — | | | | — | | | | — | | | | — | | | | — | |
| | | | | | |
Gross Additions to Tax Positions Related to Prior Year | | | — | | | | 1.3 | | | | 0.4 | | | | 1.7 | | | | (0.3 | ) | | | 1.4 | |
| | | | | | |
Gross Reductions to Tax Positions Related to Prior Year | | | (0.5 | ) | | | (0.4 | ) | | | (0.1 | ) | | | (1.0 | ) | | | 0.2 | | | | (0.8 | ) |
| | | | | | |
Settlements | | | 6.2 | | | | 1.4 | | | | — | | | | 7.6 | | | | (0.4 | ) | | | 7.2 | |
| | | | | | |
Cumulative Translation Adjustment | | | — | | | | — | | | | 0.1 | | | | 0.1 | | | | — | | | | 0.1 | |
| | | | | | | | | | | | | | | | | | | | | | | | |
Total Uncertain Tax Positions that, if Recognized, Would Impact the Effective Tax Rate as of December 31, 2007 | | $ | 10.3 | | | $ | 3.6 | | | $ | 3.0 | | | $ | 16.9 | | | $ | (3.7 | ) | | $ | 13.2 | |
| | | | | | | | | | | | | | | | | | | | | | | | |
68
| | | | | | | | | | | | | | | | | | | | | | | |
Description | | Unrecognized
Federal,
State, and
Foreign Tax
Benefits | | Interest | | | Penalties | | | Unrecognized
Income Tax
Benefits,
including
Interest and
Penalties | | | Deferred
Income
Tax
Benefits | | | Unrecognized
Income Tax
Benefits,
including
Interest and
Penalties, Net
of Deferred
Tax Benefits | |
Total Uncertain Tax Positions that, if Recognized, Would Impact the Effective Tax Rate as of January 1, 2008 | | $ | 10.3 | | $ | 3.6 | | | $ | 3.0 | | | $ | 16.9 | | | $ | (3.7 | ) | | $ | 13.2 | |
Gross Additions to Tax Positions Related to Current Year | | | 1.4 | | | — | | | | 0.4 | | | | 1.8 | | | | (0.4 | ) | | | 1.4 | |
| | | | | | |
Gross Reductions to Tax Positions Related to Current Year | | | — | | | — | | | | — | | | | — | | | | — | | | | — | |
| | | | | | |
Gross Additions to Tax Positions Related to Prior Year | | | — | | | 1.2 | | | | 0.1 | | | | 1.3 | | | | (0.4 | ) | | | 0.9 | |
| | | | | | |
Gross Reductions to Tax Positions Related to Prior Year | | | — | | | (1.1 | ) | | | (0.4 | ) | | | (1.5 | ) | | | — | | | | (1.5 | ) |
| | | | | | |
Settlements | | | — | | | — | | | | (0.4 | ) | | | (0.4 | ) | | | — | | | | (0.4 | ) |
| | | | | | |
Cumulative Translation Adjustment | | | — | | | (0.1 | ) | | | (0.1 | ) | | | (0.2 | ) | | | — | | | | (0.2 | ) |
| | | | | | | | | | | | | | | | | | | | | | | |
Total Uncertain Tax Positions that, if Recognized, Would Impact the Effective Tax Rate as of December 31, 2008 | | $ | 11.7 | | $ | 3.6 | | | $ | 2.6 | | | $ | 17.9 | | | $ | (4.5 | ) | | $ | 13.4 | |
| | | | | | | | | | | | | | | | | | | | | | | |
The uncertain tax benefits as of December 31, 2008 are recorded against the Company’s deferred tax assets to the extent the uncertainty directly related to that asset; otherwise they are recorded as either current or noncurrent income tax payable. As of December 31, 2008 and 2007, approximately $17.6 and $14.3, respectively, of noncurrent income tax payable was included in other liabilities on the balance sheet.
As of December 31, 2008, the Company had no uncertain tax positions for which the ultimate deductibility is highly certain but for which there is uncertainty as to the timing of such deductibility.
The amounts of unrecognized tax benefits that, if recognized, would impact the effective tax rate were $11.7 and $10.3 as of December 31, 2008 and 2007, respectively.
The Company classifies interest and penalties related to unrecognized tax benefits as income tax expense. These amounts are reflected separately on the reconciliation above.
The Company, under the assumption of a separate taxpayer, is considered under examination by a number of tax authorities, including all of the major tax jurisdictions listed in the table below, which have unrecognized tax benefits for issues such as transfer pricing, certain tax credits and the deductibility of certain expenses. The Company estimates that it is reasonably possible that the balance of unrecognized tax benefits as of December 31, 2008 will decrease approximately $0.3 in the next twelve months as a result of the anticipated effective settlement of certain tax audits for the jurisdictions listed below. Such settlements may involve the payment of additional taxes, the adjustment of certain deferred taxes and/or the recognition of tax benefits. The Company also anticipates that it is reasonably possible that new issues will be raised by tax authorities who may require increases to the balance of unrecognized tax benefits; however, an estimate of such increases cannot be made. The Company believes that it has adequately provided for all open tax years by tax jurisdiction under FIN No. 48.
The Company under the assumption of a separate tax return preparer files income tax returns in the U.S. Federal jurisdiction and various state and foreign jurisdictions. With few exceptions, the Company is assumed to be
69
subject to U.S. Federal, state and local, and non-U.S. income tax examinations by tax authorities. The following is a summary of major tax jurisdictions for which tax authorities may assert additional taxes against the Company based upon tax years currently under audit and subsequent years that will likely be audited. After the IPO, the management of these and other tax audits relating to tax years prior to the tax year in which the IPO took place, together with the liability for tax, interest and penalties, if any, rests with BMS.
| | |
U.S. | | 2004 to 2008 |
Canada | | 2001 to 2008 |
China | | 2004 to 2008 |
Mexico | | 2003 to 2008 |
Malaysia | | 2006 to 2008 |
Netherlands | | 2003 to 2008 |
Philippines | | 2005 to 2008 |
Spain | | 2003 to 2008 |
Taiwan | | 2002 to 2008 |
As discussed in “—Note 2, Accounting Policies,” MJN adopted SFAS No. 157, as amended by FSP 157-2, on January 1, 2008. Consistent with the deferral in FSP 157-2, the Company has not applied SFAS No. 157 to nonfinancial assets and liabilities that are recorded on a nonrecurring basis. Such assets and liabilities include those measured at fair value in goodwill impairment testing, asset retirement obligations initially measured at fair value, and nonfinancial long-lived asset impairment assessments as well as those initially measured at fair value in a business combination.
When determining fair value, SFAS No. 157 requires an entity to maximize the use of observable inputs and minimize the use of unobservable inputs. SFAS No. 157 establishes a valuation hierarchy for prioritizing the inputs and the hierarchy places greater emphasis on the use of observable market inputs and less emphasis on unobservable inputs. The three levels of the hierarchy are as follows:
Level One—Values based on unadjusted quoted prices in active markets for identical assets and liabilities.
Level Two—Values based on quoted market prices for similar assets and liabilities in active markets, quoted prices in inactive markets for identical assets and liabilities, and inputs other than quoted market prices that are observable for the asset or liability but corroborated by market data.
Level Three—Values based on inputs that cannot be corroborated by observable market data and reflect the use of significant management judgment. Valuation techniques could include the use of discounted cash flow models and similar techniques. The Company does not currently have any instruments with fair value determined using level three inputs.
MJN has various financial instruments that must be measured under the new fair value standard including certain derivatives instruments. We currently do not have non-financial assets and non-financial liabilities that are required to be measured at fair value on a recurring basis.
MJN utilizes the market approach for valuing financial instruments. According to SFAS No. 157, the market approach “utilizes prices and information generated by market transactions involving identical or similar assets and liabilities.” In instances in which the inputs used to measure fair value fall into different levels of the fair value hierarchy, the fair value measurement has been determined based on the lowest level input that is significant to the fair value measurement in its entirety. Our assessment of the significance of a particular input to the fair value measurement requires judgment and may affect the classification of fair value assets and liabilities within the fair value hierarchy. MJN’s financial assets and liabilities are measured using inputs from level two of the fair value hierarchy.
70
As of December 31, 2008, the Company had the following financial assets and (liabilities) measured at fair value on a recurring basis:
| | | | | | | | |
| | | Total | | | Level 2 | |
Foreign Currency—net | | $ | 9.8 | | | $ | 9.8 | |
Natural Gas | | | (2.1 | ) | | | (2.1 | ) |
MJN’s derivative assets and liabilities are foreign exchange derivatives and natural gas contracts, respectively. Foreign exchange derivatives are valued using quoted forward foreign exchange prices at the reporting date. Natural gas forward contracts are valued using NYMEX futures prices for natural gas at the reporting date.
The major categories of receivables were as follows:
| | | | | | | | |
| | | December 31, | |
| | | 2008 | | | 2007 | |
Trade Receivables | | $ | 249.1 | | | $ | 288.3 | |
Miscellaneous Receivables | | | 20.6 | | | | 24.6 | |
Less Allowances | | | (7.0 | ) | | | (29.9 | ) |
| | | | | | | | |
Receivables—net | | $ | 262.7 | | | $ | 283.0 | |
| | | | | | | | |
Miscellaneous receivables include receivables in connection with the Company’s third-party supply agreement. During the year ended December 31, 2007, the Company terminated its distribution agreement with a Philippines distributor, which had become financially insolvent. A provision of $17.6 was recorded to reserve the net receivable balance. During the year ended December 31, 2008, this receivable, along with the related reserve, was written off.
The major categories of inventories were as follows:
| | | | | | |
| | | December 31, |
| | | 2008 | | 2007 |
Finished Goods | | $ | 191.3 | | $ | 143.3 |
Work in Process | | | 28.0 | | | 26.6 |
Raw and Packaging Materials | | | 135.0 | | | 131.3 |
| | | | | | |
Inventories | | $ | 354.3 | | $ | 301.2 |
| | | | | | |
| 10. | PROPERTY, PLANT, AND EQUIPMENT |
The major categories of property, plant, and equipment were as follows:
| | | | | | | | |
| | | December 31, | |
| | | 2008 | | | 2007 | |
Land | | $ | 4.4 | | | $ | 4.7 | |
Buildings | | | 382.5 | | | | 364.1 | |
Machinery, Equipment, and Fixtures | | | 504.2 | | | | 493.4 | |
Construction in Progress | | | 67.9 | | | | 58.2 | |
Accumulated Depreciation | | | (505.4 | ) | | | (480.7 | ) |
| | | | | | | | |
Property, Plant, and Equipment—net | | $ | 453.6 | | | $ | 439.7 | |
| | | | | | | | |
71
Depreciation expense was $44.1, $40.9, and $37.9 for the years ended December 31, 2008, 2007, and 2006, respectively, and is primarily included in costs of products sold. Accrued capital expenditures were $22.3, $17.9 and $15.4 at December 31, 2008, 2007, and 2006, respectively. The Company’s liability for asset retirement obligations amounted to $1.3 and $1.2 at December 31, 2008 and 2007, respectively.
The carrying amount of goodwill was $117.5 at December 31, 2008 and 2007. Of the total carrying amount of goodwill, $115.8 is related to the Asia /Latin America segment and $1.7 is related to the North America/Europe segment at December 31, 2008 and 2007.
| 12. | OTHER INTANGIBLE ASSETS |
Computer software comprises the entire balance as follows:
| | | | | | | | |
| | | December 31, | |
| | | 2008 | | | 2007 | |
Computer Software | | $ | 77.3 | | | $ | 62.5 | |
Less Accumulated Amortization | | | (38.1 | ) | | | (30.0 | ) |
| | | | | | | | |
Total Other Intangible Assets—net | | $ | 39.2 | | | $ | 32.5 | |
| | | | | | | | |
Amortization expense for other intangible assets was $8.0, $10.1, and $11.6 for the years ended December 31, 2008, 2007, and 2006, respectively. Expected amortization expense related to the current net carrying amount of computer software is as follows:
| | | |
Years Ending December 31, | | |
2009 | | $ | 9.0 |
2010 | | | 7.9 |
2011 | | | 8.0 |
2012 | | | 6.9 |
2013 | | | 5.4 |
Later years | | | 2.0 |
| 13. | DIVISIONAL EQUITY (DEFICIT) |
For 2008, MJN operated as a division of BMS. Accordingly, certain operating, financing, and investing activities of MJN are funded through interdivisional transactions with BMS and other operating divisions and subsidiaries. The accompanying balance sheets reflect these amounts in divisional equity (deficit).
| 14. | EMPLOYEE STOCK BENEFIT PLANS |
BMS sponsors the following employee stock plans in which certain employees of MJN participate. Expense recognized for the stock-based compensation plans resulted in an increase of divisional equity (deficit).
Employee Stock Plans—On May 1, 2007, BMS stockholders approved the BMS 2007 Stock Award and Incentive Plan (the “BMS 2007 Plan”). The BMS 2007 Plan replaced the BMS 2002 Stock Incentive Plan (the “BMS 2002 Plan”) that expired on May 31, 2007. The BMS 2007 Plan provides for 42 million new shares of common stock reserved for delivery to participants, plus shares remaining available for new grants under the 2002 Plan and shares recaptured from outstanding awards under the 2002 Plan. Only the number of shares actually delivered to participants in connection with an award after all restrictions have lapsed will be counted against the number of shares reserved. Shares tendered in a prior year to pay the purchase price of options and the number of shares previously utilized to satisfy withholding tax obligations upon exercise continue to be available and reserved.
72
Under the BMS 2007 Plan and the BMS 2002 Plan, executive officers and key employees of MJN may be granted options to purchase BMS’s common stock at no less than 100% of the market price on the date the option is granted. Options generally become exercisable in installments of 25% per year on each of the first through the fourth anniversaries of the grant date and have a maximum term of 10 years. Generally, BMS issues shares for the stock option exercises from treasury stock. Additionally, the plans provide for the granting of stock appreciation rights whereby the grantee may surrender exercisable rights and receive common stock and/or cash measured by the excess of the market price of the common stock over the option exercise price.
The BMS 2007 Plan and the BMS 2002 Plan provide for the granting of common stock to key employees, subject to restrictions as to continuous employment. Restrictions generally expire over a four-year period from date of grant. Compensation expense is recognized over the restricted period. During the first quarter of 2007, BMS began granting restricted stock units instead of restricted stock. A stock unit is a right to receive stock at the end of the specified vesting period. A stock unit has no voting rights.
The BMS 2007 Plan and the BMS 2002 Plan also incorporate long-term performance awards which are delivered in the form of a target number of performance shares and have a three-year cycle. For 2008 to 2010 and 2007 to 2009, the awards have annual goals set at the beginning of each performance period and are based 50% on earnings per share and 50% on sales. Maximum performance will result in a maximum payout of 165% for the 2008 to 2010 award and 220% for the 2007 to 2009 award. In addition, a one-time special performance award was granted for the 2008 to 2010 performance period. This special performance award has annual goals, set at the beginning of each performance period, based 50% on pre-tax operating margin and 50% on operating cash flow. Maximum performance will result in a maximum payout of 165%. The goals for the 2005 through 2007 and the 2006 through 2008 awards are set for the three year period and are based 50% on cumulative earnings per share and 50% on cumulative sales, with the ultimate payout modified by BMS’s total stockholder return versus the 11 companies in its proxy peer group. Maximum performance for all three measures will result in a maximum payout of 253% of target. If threshold targets are not met for the performance period, no payment will be made under the plan.
Under the Team Share Stock Option Plan, which terminated on January 3, 2005, full-time MJN employees, excluding key executives, were granted options to purchase BMS’s common stock at the market price on the date the options were granted. Individual grants generally became exercisable evenly on the third, fourth and fifth anniversary of the grant date and have a maximum term of 10 years.
The results of operations for MJN for the years ended December 31, 2008, 2007 and 2006 reflect the impact of SFAS No. 123(R),Share-Based Payment, which includes the impact of expensing stock options. BMS and MJN have elected the alternative method as provided in FSP No. 123(R)-3,Transition Election Related To Accounting For The Tax Effects of Share-Based Payment Awards, in determining BMS’s pool of excess tax benefits. The following table summarizes MJN’s stock-based compensation expense related to employee stock options, restricted stock and long-term performance awards for the years ended December 31, 2008, 2007 and 2006:
| | | | | | | | | | | | |
| | | Year Ended December 31, | |
| | | 2008 | | | 2007 | | | 2006 | |
Costs of Products Sold | | $ | 0.9 | | | $ | 0.7 | | | $ | 0.7 | |
Marketing, Selling, and Administrative | | | 7.4 | | | | 5.5 | | | | 4.8 | |
Research and Development | | | 0.9 | | | | 0.7 | | | | 0.6 | |
| | | | | | | | | | | | |
Total Stock-Based Compensation Expense | | | 9.2 | | | | 6.9 | | | | 6.1 | |
| | | |
Deferred Tax Benefit | | | (3.2 | ) | | | (2.2 | ) | | | (1.9 | ) |
| | | | | | | | | | | | |
Stock-Based Compensation—net of tax | | $ | 6.0 | | | $ | 4.7 | | | $ | 4.2 | |
| | | | | | | | | | | | |
There were no costs related to stock-based compensation that were capitalized during all periods.
73
Share option activity for the Company’s employees under all BMS plans as of December 31, 2008 and changes during the year then ended follows:
| | | | | | | | | | | |
Shares in thousands | | Shares | | | Weighted-
Average
Exercise Price
of Shares | | Average
Remaining
Contractual
Term
(in years) | | Aggregate
Intrinsic
Value
(dollars in
millions) |
Outstanding—January 1, 2008 | | 9,146 | | | $ | 39.07 | | | | | |
| | | | |
Granted | | 1,178 | | | | 21.99 | | | | | |
| | | | |
Exercised | | 0 | | | | 21.58 | | | | | |
| | | | |
Lapsed or Transferred | | (2,007 | ) | | | 44.99 | | | | | |
| | | | | | | | | | | |
Balance—December 31, 2008 | | 8,317 | | | $ | 35.16 | | 4.80 | | $ | 1.72 |
| | | | |
Vested and Expected to Vest at December 31, 2008 | | 8,200 | | | $ | 35.31 | | 4.76 | | $ | 1.64 |
| | | | |
Exercisable at December 31, 2008 | | 6,101 | | | $ | 38.95 | | 3.57 | | $ | 0.22 |
Transferred shares are shares attributable to employees that transferred to or from other BMS divisions.
The weighted-average grant-date fair value of options granted under BMS plans to employees of the Company during the years ended December 31, 2008, 2007, and 2006 was $4.74 per share, $5.89 per share, and $4.39 per share, respectively. The total intrinsic value of options exercised by the Company’s employees for the years ended December 31, 2008, 2007, and 2006 was $0.0, $2.6, and $2.2, respectively. As of December 31, 2008, there was $6.8 of total unrecognized compensation cost related to non-vested BMS stock options granted to the Company’s employees. The cost is expected to be recognized over a weighted-average period of 2.57 years.
Stock Option Valuation—The fair value of employee stock options granted in 2008 were estimated on the date of the grant and prior to January 1, 2007, were estimated using a weighted-average estimated per option value granted, using the Black-Scholes option pricing model with the following assumptions:
| | | | | | | | | |
| | | December 31, | |
| | | 2008 | | | 2007 | | | 2006 | |
Expected volatility | | 31.1 | % | | 28.9 | % | | 26.7 | % |
Risk-free interest rate | | 3.3 | % | | 4.7 | % | | 4.6 | % |
Dividend yield | | 4.3 | % | | 4.5 | % | | 4.8 | % |
Expected life | | 6.7 yrs | | | 6.2 yrs | | | 6.3 yrs | |
The expected volatility assumption required in the Black-Scholes model was calculated using a 10-year historical volatility of the BMS stock price and weighting it equally against the derived implied volatility. The selection of the blended historical and implied volatility approach was based on BMS’s assessment that this calculation of expected volatility is more representative of future stock price trends than using only historical volatility.
The risk-free interest rate assumption is based upon the U.S. Treasury yield curve in effect at the time of grant. The dividend yield assumption is based on BMS’s history and expectation of dividend payouts.
The expected life of employee stock options represents the weighted-average period the stock options are expected to remain outstanding and is a derived output of the lattice-binomial model. The expected life of employee stock options is impacted by all of the underlying assumptions and calibration of BMS’s model. The lattice-binomial model assumes that MJN employees exercise behavior is a function of the option’s remaining vested life and the extent to which the option is in-the-money. The lattice-binomial model estimates the probability of exercise as a function of these two variables based on the entire history of exercises and cancellations on all past option grants made to MJN employees.
74
Stock-based compensation expense is based on awards ultimately expected to vest. Forfeitures were estimated based on historical experience at the time of grant and revised in subsequent periods if actual forfeitures differ from those estimates.
Restricted Stock—The fair value of nonvested shares of BMS’s common stock granted to MJN employees is determined based on the average trading price of BMS’s common stock on the grant date.
A summary of restricted share activity related to MJN employees follows:
| | | | | | |
Shares in Thousands | | Number of Shares | | | Weighted-Average
Grant-Date
Fair Value |
Nonvested Shares at January 1, 2008 | | 451 | | | $ | 25.70 |
Granted | | 424 | | | | 21.91 |
Vested | | (166 | ) | | | 25.45 |
Forfeited or Transferred | | (63 | ) | | | 23.91 |
| | | | | | |
Nonvested Shares at December 31, 2008 | | 646 | | | $ | 23.46 |
| | | | | | |
Transferred shares are shares attributable to employees that transferred to or from other BMS divisions.
As of December 31, 2008, the total unrecognized compensation cost related to BMS nonvested restricted stock and BMS restricted stock units granted to Company employees is $11.5. The cost is expected to be recognized over a weighted-average period of 2.77 years. The total fair value of BMS shares and BMS share units granted to Company employees that vested during the years ended December 31, 2008, 2007, and 2006 was $4.2, $1.6, and $0.3, respectively. The weighted average grant date fair value of restricted stock awards/units granted to Company employees during the years ended December 31, 2008, 2007, and 2006 was $21.91, $26.92, and $23.31, respectively.
Long-Term Performance Awards—Since the adoption of SFAS No. 123(R), the fair value of the 2006 through 2008 performance award was estimated on the date of grant using a Monte Carlo simulation model due to a market condition. The Monte Carlo simulation model utilizes multiple input variables that determine the probability of satisfying each market condition stipulated in the award grant and calculates the fair market value for the long-term performance awards. For the 2008 to 2010 and 2007 to 2009 performance awards, because these awards do not contain a market condition, the fair value was based on the closing trading price of BMS’s common stock on the grant date.
The valuation model for the 2006 through 2008 award used the following assumptions:
| | | | | | | | |
| Grant Year | | Grant Date | | Weighted-Average
Expected Volatility | | Expected Dividend
Yield | | Risk Free
Interest Rate |
| 2006 | | 3/7/2006 | | 20.4% | | 4.9% | | 4.4% |
Weighted-average expected volatility is based on the three year historical volatility levels on BMS’s common stock. Expected dividend yield is based on BMS’s historical dividend payments. Risk free interest rate reflects the yield on five year zero coupon U.S. Treasury bonds, based on the performance shares’ contractual term. The fair value of the performance awards is amortized over the performance period of the award.
At December 31, 2008, there were 61,932 shares outstanding and total unrecognized compensation cost was $0.9 related to awards granted to MJN employees under the BMS performance share plan, which is expected to be recognized over a weighted-average period of 1.73 years.
Accuracy of Fair Value Estimates—MJN’s determination of fair value of stock-based payment awards on the date of grant using an option-pricing model is affected by BMS’s stock price as well as assumptions
75
regarding a number of highly complex and subjective variables. These variables include, but are not limited to BMS’s expected stock price volatility over the term of the awards, and actual and projected MJN employee stock option exercise behaviors. Option-pricing models were developed for use in estimating the value of traded options that have no vesting or hedging restrictions and are fully transferable. Because MJN’s employee stock options have certain characteristics that are significantly different from traded options, and because changes in the subjective assumptions can materially affect the estimated value, in management’s opinion, the existing valuation models may not provide an accurate measure of the fair value of MJN’s employee stock options. Although the fair value of employee stock options is determined in accordance with SFAS No. 123(R) and Staff Accounting Bulletin (“SAB”) No. 107,Share-Based Payment, using an option-pricing model, that value may not be indicative of the fair value observed in a willing buyer/willing seller market transaction.
| 15. | FINANCIAL INSTRUMENTS AND RISK CONCENTRATION |
The Company’s financial instruments consist primarily of accounts receivable, accounts payable and derivative financial instruments.
Concentrations of credit risk with respect to accounts receivable are limited due to the large number of customers in the Company’s business customer base and their dispersion across different geographic areas. The Company maintains an allowance for losses based upon the expected collectability of accounts receivable.
The Company is exposed to market risk due to changes in currency exchange rates. The Company had exposures to net foreign currency denominated assets and liabilities of $407.7 and $379.3 at December 31, 2008 and 2007, respectively, primarily in Mexico, Europe, Thailand, Philippines and China. The Company’s primary net foreign currency translation exposures are the Chinese renminbi, the Mexican peso, the Philippine peso, the Hong Kong dollar and the Euro.
MJN utilizes foreign currency contracts to hedge anticipated transactions, primarily intercompany transactions. These instruments are managed on a centralized basis to efficiently net exposures and thus take advantage of any natural offsets. Derivative financial instruments are not used for speculative purposes. BMS designates these instruments as foreign currency cash flow hedges when appropriate. The effects of the hedges, including any discontinued or ineffective portion of the hedges, allocated to the Company in the statements of earnings based on divisional costs of products sold at standard cost were losses of $0.9, $2.6, and $5.1 for the years ended December 31, 2008, 2007, and 2006, respectively.
Foreign currency forward contract assets of $10.1 and liabilities of $0.3 were allocated to the Company’s balance sheet at December 31, 2008, as these were executed specifically for the Company. The unrealized gains, net of tax, of $6.6 related to these contracts were recorded in Other Comprehensive Income. There were no foreign currency forward contracts allocated to the Company’s balance sheet at December 31, 2007 as none were specifically executed for the Company.
SFAS No. 133 requires periodic assessments of hedge effectiveness. These assessments determine whether derivatives designated as qualifying hedges continue to be highly effective in offsetting changes in the cash flows of hedged items. The amount of hedge ineffectiveness gain (loss) was $0.5 for the year ended December 31, 2008, and $0.0 for the two years ended December 31, 2007 and 2006. In addition, SFAS No. 133 requires that BMS or the Company discontinue cash flow hedge accounting if the forecasted transaction is not expected to occur on the original forecasted date or 60 days thereafter. For the years ended December 31, 2008, 2007 and 2006 the impact of discontinued hedges was gains (losses) of $0.8, $(0.4), and $0.5, respectively.
MJN utilizes natural gas forward contracts to hedge anticipated purchases of natural gas. These instruments are managed on a centralized basis. BMS designates these instruments as cash flow hedges when appropriate. The effects of the natural gas hedges allocated to the Company in the statements of earnings based on divisional natural gas usage was gains (losses) of $(0.8), $1.9, and $0 in 2008, 2007, and 2006, respectively. In addition,
76
natural gas forward contract liabilities of $2.1 were allocated to the Company’s balance sheet at December 31, 2008, as these were executed specifically for the Company. The unrealized losses, net of tax, of $(1.4) related to these contracts were recorded in Other Comprehensive Income. There were no natural gas forward contracts allocated to the Company’s balance sheet at December 31, 2007 as none were specifically executed for the Company.
MJN operates in four geographic operating segments: North America, Latin America, Asia and Europe. This operating segmentation is how the chief operating decision maker regularly assesses information for decision making purposes, including allocation of resources. Due to similarities in the economics, products offered, production process, customer base, and regulatory environment, these operating segments have been aggregated into two reportable segments: North America/Europe and Asia/Latin America.
Corporate and Other costs consist of unallocated general and administrative activities and associated expenses, including in part, executive, legal, finance, information technology, human resources, research and development, global marketing costs, global supply chain and certain facility costs. Corporate and Other assets primarily consist of a global production facility.
The Company’s products are sold principally to the wholesale and retail trade, both nationally and internationally. One customer (including its related entities) accounted for 13%, 15% and 16% of the Company’s gross sales for the years ended December 31, 2008, 2007, and 2006, respectively.
| | | | | | | | | | | | | | | | |
| | | Net Sales | | Earnings Before
Interest,
Income Taxes and
Minority Interest | | | Year-End
Assets | | Capital
Expenditures | | Depreciation
and
Amortization
Expense |
Year Ended December 31, 2008 | | | | | | | | | | | | | | | | |
| | | | | |
North America/Europe | | $ | 1,365.5 | | $ | 467.3 | | | $ | 559.6 | | $ | 33.5 | | $ | 34.1 |
Asia/Latin America | | | 1,516.9 | | | 462.9 | | | | 608.0 | | | 26.8 | | | 14.1 |
| | | | | | | | | | | | | | | | |
Total Operating Segments | | | 2,882.4 | | | 930.2 | | | | 1,167.6 | | | 60.3 | | | 48.2 |
| | | | | |
Corporate and Other | | | — | | | (234.5 | ) | | | 193.8 | | | 20.8 | | | 3.9 |
| | | | | |
Total | | $ | 2,882.4 | | $ | 695.7 | | | $ | 1,361.4 | | $ | 81.1 | | $ | 52.1 |
| | | | | |
Year Ended December 31, 2007 | | | | | | | | | | | | | | | | |
| | | | | |
North America/Europe | | $ | 1,351.2 | | $ | 477.6 | | | $ | 550.7 | | $ | 32.8 | | $ | 33.8 |
Asia/Latin America | | | 1,225.2 | | | 363.9 | | | | 577.7 | | | 25.2 | | | 13.9 |
| | | | | | | | | | | | | | | | |
Total Operating Segments | | | 2,576.4 | | | 841.5 | | | | 1,128.4 | | | 58.0 | | | 47.7 |
| | | | | |
Corporate and Other | | | — | | | (178.3 | ) | | | 173.5 | | | 20.4 | | | 3.3 |
| | | | | |
Total | | $ | 2,576.4 | | $ | 663.2 | | | $ | 1,301.9 | | $ | 78.4 | | $ | 51.0 |
| | | | | |
Year Ended December 31, 2006 | | | | | | | | | | | | | | | | |
| | | | | |
North America/Europe | | $ | 1,290.5 | | $ | 460.3 | | | | | | $ | 29.7 | | $ | 34.9 |
Asia/Latin America | | | 1,054.6 | | | 335.9 | | | | | | | 26.8 | | | 11.1 |
| | | | | | | | | | | | | | | | |
Total Operating Segments | | | 2,345.1 | | | 796.2 | | | | | | | 56.5 | | | 46.0 |
| | | | | |
Corporate and Other | | | — | | | (161.4 | ) | | | | | | 12.4 | | | 3.5 |
| | | | | |
Total | | $ | 2,345.1 | | $ | 634.8 | | | | | | $ | 68.9 | | $ | 49.5 |
| | | | | | | | | | | | |
Net Sales | | Infant
Formula | | Children’s
Nutrition | | Other | | Total |
Year ended December 31, 2008 | | $ | 1,931.6 | | $ | 855.9 | | $ | 94.9 | | $ | 2,882.4 |
| | | | |
Year ended December 31, 2007 | | $ | 1,788.1 | | $ | 696.5 | | $ | 91.8 | | $ | 2,576.4 |
| | | | |
Year ended December 31, 2006 | | $ | 1,634.8 | | $ | 603.8 | | $ | 106.5 | | $ | 2,345.1 |
77
| | | | | | | | | | | | | | | |
Geographic | | United
States | | China | | Mexico | | Other | | Total |
Year Ended December 31, 2008 | | | | | | | | | | | | | | | |
Net Sales | | $ | 1,108.4 | | $ | 322.0 | | $ | 285.4 | | $ | 1,166.6 | | $ | 2,882.4 |
Long-Lived Assets | | | 312.5 | | | 30.4 | | | 152.2 | | | 147.2 | | | 642.3 |
| | | | | |
Year Ended December 31, 2007 | | | | | | | | | | | | | | | |
Net Sales | | $ | 1,128.3 | | $ | 209.0 | | $ | 264.2 | | $ | 974.9 | | $ | 2,576.4 |
Long-Lived Assets | | | 312.2 | | | 27.4 | | | 148.5 | | | 123.1 | | | 611.2 |
| | | | | |
Year Ended December 31, 2006 | | | | | | | | | | | | | | | |
Net Sales | | $ | 1,092.8 | | $ | 185.0 | | $ | 254.3 | | $ | 813.0 | | $ | 2,345.1 |
Minimum rental commitments under all non-cancelable operating leases, primarily real estate and motor vehicles, in effect at December 31, 2008, are:
| | | |
Years Ending December 31, | | |
2009 | | $ | 14.6 |
2010 | | | 7.7 |
2011 | | | 6.1 |
2012 | | | 5.5 |
2013 | | | 5.4 |
Later Years | | | 25.8 |
Total Minimum Payments | | $ | 65.1 |
Operating lease rental expenses were $11.5, $9.8, and $10.3 in the years ended December 31, 2008, 2007, and 2006, respectively. At December 31, 2008 and 2007, MJN had capital lease obligations outstanding in the amount of $1.4 and $1.6, respectively.
The Company has unconditional purchase obligations in five supply agreements, two promotional or marketing services agreements and one non-clinical grant agreement, with future commitments in excess of $2.5 per agreement. The minimum purchase commitments or penalties in effect at December 31, 2008, are:
| | | |
Years Ending December 31, | | |
2009 | | $ | 29.2 |
2010 | | | 25.5 |
2011 | | | 23.1 |
2012 | | | 12.5 |
2013 | | | 6.9 |
Later Years | | | 52.2 |
| | | |
Total minimum payments | | $ | 149.4 |
| | | |
Four supply agreements for packaging and raw materials expire in 2010, 2011, 2012, and 2018; one supply agreement for landfill gas expires in 2029; the promotional or marketing services agreements expire in 2010 and 2011; and, the non-clinical grant agreement expires in 2013.
78
Pensions—A majority of employees of MJN were participants in various defined benefit pension plans as well as postretirement plans administered and sponsored by BMS. Benefits under the pension plans are based primarily on years of service and employees’ compensation. The other postretirement plans provide associates with health care and life insurance benefits upon retirement. Pension entitlements are funded by contributions by BMS to a separately administered pension fund.
These financial statements reflect the plans on a multi-employer basis in accordance with SFAS No. 87,Employers’ Accounting for Pensions,as amended by SFAS No. 158,Employers’ Accounting for Defined Benefit Pension and Other Postretirement Plans. The adoption of SFAS No. 158 does not have an impact on the pension and postretirement plans for MJN as they are accounted for under a multi-employer plan. MJN has specifically identified the pension expense attributable to MJN participants for the pension plans in the Philippines, Indonesia and the Netherlands. For the pension plans in the U.S., Canada, Taiwan and Mexico, costs associated with the pension plans have been allocated to MJN on the basis of pensionable wages. The SFAS No. 87 expense for MJN employees participating in the above mentioned pension plans was $19.4, $21.1, and $25.0 for the years ended December 31, 2008, 2007, and 2006, respectively.
MJN offers defined contribution plans to eligible employees in the U.S. whereby employees contribute a portion of their compensation, which is partially matched by MJN. The Company matches 75% of these contributions up to 6% of the employee’s base pay. Once the contributions have been paid, MJN has no further payment obligations. The contributions to the U.S. 401(k) plan totaled $5.5, $5.0, and $4.6 for the years ended December 31, 2008, 2007, and 2006, respectively, which are recognized as expense as incurred.
Other Post Retirement Plans—The Company also provides comprehensive medical and group life benefits for substantially all U.S. retirees who elect to participate in its comprehensive medical and group life plans. The medical plan is contributory. Contributions are adjusted periodically and vary by date of retirement. The life insurance plan is non-contributory. Plan assets consist principally of equity and fixed-income securities. Similar plans exist for employees in certain countries outside of the U.S. These financial statements reflect the plans on a multi-employer basis in accordance with SFAS No. 106,Employers’ Accounting for Postretirement Benefits Other Than Pensions. As such, BMS allocated costs associated with the medical and life plans to MJN based upon a ratio of participant headcount. The amount of SFAS No. 106 expense allocated to MJN from BMS for MJN employees participating in the U.S. and Canadian BMS medical and life plans was $2.0, $1.6, and $1.8 for the years ended December 31, 2008, 2007, and 2006, respectively.
MJN offers medical continuation and income replacement benefits to employees on long-term disability in the U.S. and Canada. These financial statements reflect the plans on a multi-employer basis in accordance with SFAS No. 112,Employers’ Accounting for Postemployment Benefits. For the Long Term Disability (“LTD”) medical continuation benefits in the U.S., BMS allocated costs associated with the LTD medical continuation benefits to MJN based upon a ratio of the Postemployment Benefit Obligation. For the LTD income replacement benefits in the U.S., BMS allocated expense based on an allocation rate times base salary. The allocation rate represents the percentage required to recoup the full income replacement liability. The amount of SFAS No. 112 expense allocated to MJN from BMS for MJN employees participating in the U.S. BMS LTD medical continuation and income replacement plans was $1.1, $0.6, and $1.4 for the years ended December 31, 2008, 2007, and 2006, respectively.
| 20. | LEGAL PROCEEDINGS AND CONTINGENCIES |
In the ordinary course of business, MJN is subject to periodic lawsuits, investigations and claims, including, but not limited to, product liability claims, commercial disputes, premises claims and employment and environmental, health, and safety matters. Although MJN cannot predict with certainty the ultimate resolution of lawsuits, investigations and claims asserted against the Company, MJN does not believe any currently pending legal proceeding to which MJN is a party will have a material adverse effect on the Company’s business, prospects, financial condition, cash flows and results of operations.
79
The Company’s facilities and operations are subject to various environmental, health, and safety laws and regulations in each of the jurisdictions in which MJN operates. Among other things, these requirements regulate the emission or discharge of materials into the environment, the use, management, treatment, storage and disposal of solid and hazardous substances and wastes, the control of combustible dust, the reduction of noise emissions and fire and explosion risks, the cleanup of contamination and the prevention of workplace exposures and injuries. Pollution controls and various permits and programs are required for many of the Company’s operations. Each of MJN’s global manufacturing facilities undergoes periodic internal audits relating to environmental, health, and safety requirements and the Company incurs operating and capital costs to improve the Company’s facilities or maintain compliance with applicable requirements on an ongoing basis.
From time to time, the Company may be responsible under various state, Federal and foreign laws, including the U.S. Comprehensive Environmental Response, Compensation, and Liability Act (CERCLA), for certain costs of investigating and/or remediating contamination at the Company’s current or former sites, and/or at waste disposal or reprocessing facilities operated by third parties. Liability under CERCLA and analogous state or foreign laws may be imposed without regard to knowledge, fault, or ownership at the time of the disposal or release. Most of the Company’s facilities have a history of industrial operations, and contaminants have been detected at some of the Company’s facilities. The Company also has been named as a “potentially responsible party”, or is involved in investigation and remediation, at three third-party disposal sites. As of December 31, 2008, management believes that those future site costs which were probable and reasonably estimable, as well as any related accruals, are not material.
We are also occasionally a party to environmental proceedings and other matters. For example, the U.S. Environmental Protection Agency (“EPA”) investigates industrial and commercial facilities throughout the United States that use refrigeration equipment containing ozone-depleting substances (“ODS”) and is responsible for enforcing compliance with regulations governing the prevention, service and repair of leaks (“ODS requirements”). In 2004, the EPA sent Mead Johnson a request for information regarding compliance with ODS requirements at our facility in Evansville, Indiana. We responded to the request in June 2004, and, as a result, identified potential violations at the Evansville facility. In addition, BMS performed a voluntary corporate-wide audit at all of its facilities, including the Mead Johnson facilities, in the United States that use ODS-containing refrigeration equipment. The audit report that BMS submitted to the EPA in November 2004 identified potential violations of ODS requirements at several facilities, including two potential administrative violations of ODS requirements at our Zeeland, Michigan facility. In July 2008, BMS (acting on behalf of BMS and Mead Johnson) and EPA entered into a proposed consent decree, which requires BMS to retire or retrofit by July 2009 certain industrial refrigeration equipment at five facilities, including Evansville, Indiana. Under the proposed consent decree, BMS is also required to pay $0.1 in civil penalties, a de minimis portion of which is attributable to Mead Johnson and will be paid by BMS. Mead Johnson believes that it does not have any material obligations remaining under the proposed consent decree. It is possible that we may have additional obligations, or additional costs may be imposed on us, if the proposed consent decree does not become final or is otherwise modified before being finalized by the court.
The Company is not aware of any pending litigation or significant financial obligations or liabilities arising from current or former operations or properties that are likely to have a material adverse impact on the Company’s business, financial position or results of operations. Liabilities or obligations, which could require the Company to make significant expenditures, could arise in the future, however, as the result of, among other things, changes in, or new interpretations of, existing laws, regulations or enforcement policies, claims relating to on- or off-site contamination, or the imposition of unanticipated investigation or cleanup obligations.
Separation Activities and Related Agreements
Initial Public Offering—On February 17, 2009, Mead Johnson Nutrition Company (“MJNC”) completed the IPO of 34,500,000 shares of Class A common stock at a price of $24.00 per share. The net proceeds from the IPO, after deducting underwriting discounts, commissions and estimating offering expenses, were $782.3.
80
All of the net proceeds of the IPO were paid to BMS and were used to (i) repay in full approximately $597.0 of the foreign intercompany notes payable to subsidiaries of BMS and (ii) satisfy payables and other obligations owing to one or more subsidiaries of BMS that would have been otherwise forgiven or reduced in full.
Immediately following the IPO, including the exercise of the underwriters’ over-allotment option, there were 76,844,571 outstanding shares of Class A stock and 127,655,429 outstanding shares of Class B stock. The holders of Class A common stock and Class B common stock generally have identical rights, except that holders of Class A common stock are entitled to one vote per share while holders of Class B common stock are entitled to ten votes per share on all matters voted upon by stockholders (including the election and removal of directors) and do not have cumulative voting rights. Of the outstanding Class A and Class B common stock, BMS beneficially owned 42,344,571 shares of Class A common stock and all of the Class B common stock, or 83.1% of the total outstanding shares of Class A and Class B common stock (representing 97.5% of the combined voting power of the Company’s common stock), and 34,500,000 shares of Class A common stock, or 16.9% of the total outstanding shares of Class A and Class B common stock, have been distributed to the public.
Notes Payable—On August 26, 2008, MJC, now a wholly owned subsidiary of MJNC, issued a $2,000.0 intercompany note to BMS. On February 17, 2009, this related party note payable was amended and restructured into three separate notes described below:
| | • | | $744.2 aggregate principal amount note due 2014 (the “2014 Note”); |
| | • | | $500.0 aggregate principal amount note due 2016 (the “2016 Note”); and |
| | • | | $500.0 aggregate principal amount note due 2019 (the “2019 Note” and, together with the 2014 Note and the 2016 Note, the “Notes”). |
The 2014 Note will mature on the fifth anniversary of its issuance. The 2014 Note bears interest at a rate of LIBOR plus 3.0% per annum, payable in cash in quarterly installments. The 2014 Note is subject to the following amortization schedule:
| | • | | No amortization in 2009; |
| | • | | Annual amortization of $75.0 payable in cash in quarterly installments in 2010-2014; and |
| | • | | The remaining principal amount payable in cash on the maturity date. |
The 2016 Note will mature on the seventh anniversary of its issuance. The 2016 Note bears interest at a fixed rate per annum equal to 6.43%, payable in cash in semi-annual installments. The 2016 Note is not subject to amortization.
The 2019 Note will mature on the tenth anniversary of its issuance. The 2019 Note bears interest at a fixed rate per annum equal to 6.91%, payable in cash in semi-annual installments. The 2019 Note is not subject to amortization.
The Notes are senior unsecured obligations of MJC and rank equally in right of payment with each other and with all existing and future senior unsecured indebtedness of MJC. The Notes effectively rank junior to any secured indebtedness of MJC. In addition, the Notes will be structurally subordinated to all liabilities of the subsidiaries of MJC, including trade payables.
The Notes may be prepaid at any time, in whole or in part, without premium or penalty. Each Note will be mandatorily prepayable in cash upon a change of control, in an amount equal to 100% of the then outstanding principal amount plus accrued and unpaid interest.
BMS will not be permitted to transfer the Notes to other persons, other than its affiliates.
Separation Activities—
| | • | | BMS formed MJN Restructuring Holdco, Inc. (“MJNR”) in August 2008. |
81
| | • | | Also in August 2008, through a series of steps, Mead Johnson & Company, which directly or indirectly holds substantially all of the U.S. assets, became a wholly owned subsidiary of MJNR. |
| | • | | During the fourth quarter of 2008, new entities were formed as direct and indirect subsidiaries of MJNR in numerous non U.S. jurisdictions through which we intend to conduct our business in those jurisdictions in the future. |
| | • | | On December 17, 2008, BMS formed MJNC as an indirect wholly owned subsidiary. MJNC and MJNR had the same direct parent company, which was another wholly owned subsidiary of BMS. |
| | • | | On January 31, 2009, BMS transferred to MJNR the non-U.S. businesses of MJN through a sale of shares, sale of assets and contributions of stock with some exceptions as described below. The consideration for these transfers was in the form of cash, which was contributed or otherwise provided by BMS, and the issuance by MJNR’s subsidiaries of foreign intercompany notes to BMS subsidiaries related to the purchase of assets or shares in Indonesia, Malaysia, the Netherlands and the Philippines. |
| | • | | The terms of these foreign intercompany notes were substantially similar, except that the principal amount of each note varied by jurisdiction. The aggregate principal amount of the foreign intercompany notes was approximately $597.0 and the rate of interest per annum on each note was equal to LIBOR plus 0.75%. These foreign intercompany notes were repaid in full on February 17, 2009 with the net proceeds to the IPO. |
| | • | | On February 10, 2009, MJNR merged with and into MJNC, with MJNC remaining as the surviving entity. Therefore, MJNC now holds all of the businesses acquired by MJNR. |
Transitional Services Provided by BMS—On January 31, 2009, MJNR and MJNC entered into a Transitional Services Agreement with BMS whereby BMS agreed to provide MJNR with various corporate support services (the “BMS Services”) and MJNC agreed to provide BMS with certain services (the “MJN Services”). The Transitional Services Agreement became operative on January 31, 2009 and the BMS Services and the MJN Services will continue for a specified initial term, which will vary with the types of services to be provided, unless earlier terminated or extended according to the terms of the transitional services agreement. MJNC pays BMS mutually agreed-upon fees for the BMS Services and BMS pays MJNC mutually agreed-upon fees for the MJN Services. By term, the annual cost to MJNC is $19.3 for up to eighteen months, $66.4 for eighteen months up to three years, and $2.9 for greater than three years. The annual net cost to BMS is $23.6, the majority of which is up to eighteen months.
Mexico Capital Lease—On January 31, 2009, Mead Johnson Nutricionales de Mexico, S. De R.L. de C.V., a subsidiary of MJNC, entered into an agreement with BMS to lease all of the property, plant and equipment assets at the manufacturing facility in Delicias, Mexico for 20 years. This facility is included in the financial statements of the Company for all periods prior to the separation. The lease qualifies as a capital lease, and MJN will continue to carry the plant, property and equipment in the financial statements. The Company will also record a lease liability of $41.5, representing the present value of the minimum lease payments set forth by the lease agreement, and will amortize this liability over the lease term.
China Services Agreement—On February 10, 2009, MJNC entered into a services agreement (the “MJN China Services Agreement”) with BMS pursuant to which BMS has agreed to cause MJN China to operate in a manner that is consistent with the instructions and directions of MJNC. In return, MJNC will provide all necessary support and access to assets and resources, including intellectual property, for BMS to cause MJN China to operate in a manner consistent with MJNC’s instructions and directions. This support will include management oversight, supply chain management and general stewardship of MJN China’s business. The agreement provides so that MJNC will be entitled to the cash flow, benefit and risk of MJN China’s operations and business, and will continue to consolidate MJN China as a variable interest entity under FIN No. 46 (revised December 2003),Consolidation of Variable Interest Entities.
82
Tax Matters Agreement—Effective February 10, 2009, MJNR entered into a tax matters agreement to allocate the responsibility of BMS and its subsidiaries, on the one hand, and MJNC and its subsidiaries, on the other hand, for the payment of taxes resulting from filing (i) tax returns on a combined, consolidated or unitary basis and (ii) single entity tax returns for entities that have both Mead Johnson and non-Mead Johnson operations.
Pursuant to this tax matters agreement, BMS will prepare returns for MJNC for all periods during which MJNC or any of its subsidiaries are included in a combined, consolidated or unitary group with BMS or any of its subsidiaries for federal, state, local or foreign tax purposes, as if MJNC itself were filing as a consolidated, combined or unitary group. BMS will also prepare returns for MJNC for all periods during which a single entity tax return is filed for an entity that has both Mead Johnson and non-Mead Johnson operations. MJNC will make payments to BMS and BMS will make payments to MJNC with respect to such returns, as if such returns were actually required to be filed under the laws of the applicable taxing jurisdiction and BMS were the relevant taxing authority of such jurisdiction. If and when MJNC and its subsidiaries cease to be included in BMS’s consolidated tax returns, BMS will compensate MJNC for tax attributes for which MJNC was not previously compensated and that BMS used, and MJNC will reimburse BMS for tax attributes for which MJNC was previously compensated but that BMS never used.
Employee Matters Agreement—On January 31, 2009, MJNR entered into an employee matters agreement with BMS. The employee matters agreement governs BMS’s, MJNC’s and the parties’ respective subsidiaries’ and affiliates’ rights, responsibilities and obligations after this offering with respect to:
| | • | | employees and former employees (and their respective dependents and beneficiaries) who are or were associated with BMS, MJNC or the parties’ respective subsidiaries or affiliates; |
| | • | | the allocation of assets and liabilities as it relates to certain employee benefit, pension, welfare, compensation, employment, severance and termination-related matters; and |
| | • | | other human resources, employment and employee benefits matters. |
Defined Benefit, Supplemental Retirement and Indemnity Plans—The employee matters agreement provides for the transfer from the BMS qualified defined benefit pension plan in the United States to a Mead Johnson qualified defined benefit pension plan in the U.S., with assets and liabilities allocable to the participants transferring to MJNC based on assumptions set forth in the employee matters agreement. Outside of the United States, BMS transferred to MJNC defined benefit plans pension assets and liabilities allocable to the employees transferring to MJNC in certain countries as described in the employee matters agreement. MJNC assumed liabilities allocable to employees transferring to MJNC under certain pension, supplemental retirement and termination indemnity plans. The net obligation to be transferred is estimated to be between $40.0 and $50.0.
Defined Contribution Plans—The employee matters agreement provides for the transfer from the U.S. BMS qualified defined contribution plan to a U.S. Mead Johnson qualified defined contribution plan, with assets and liabilities allocable to the participants transferring to the U.S. Mead Johnson qualified defined contribution plan. Outside of the United States, BMS will transfer to MJNC’s defined contribution plans assets allocable to the employees transferring to MJNC in certain countries as described in the employee matters agreement. MJNC also assumed supplemental benefit plan liabilities allocable to employees transferring to MJNC as set forth in the employee matters agreement. In addition, MJNC has formed certain new retirement plans.
MJN 2009 Stock Award and Incentive Plan—In December 2008, the MJNC Board approved the MJN 2009 Stock Award and Incentive Plan (“MJN 2009 Plan”). The MJN 2009 Plan provides for the grant of options to purchase MJNC Class A common stock intended to qualify as incentive stock options (“ISOs”), non-statutory stock options, stock appreciation rights (“SARs”), restricted stock, stock units, stock granted as a bonus or in lieu of another award, dividend equivalents, other stock-based awards and performance awards. Executive officers and other employees of MJNC or one of its subsidiaries or affiliates, and non-employee directors and others who provide substantial services to us, are eligible to be granted awards under the MJN 2009 Plan. Under the MJN 2009 Plan, 25 million shares of MJNC have been reserved for delivery to participants.
83
2009 Founder’s Awards—On February 11, 2009, MJNC granted approximately 350,000 restricted stock units as “founder’s awards” to approximately 140 of MJN’s employees, including each of MJNC’s Named Executive Officers. These founder’s awards will vest in equal installments on each of the third, fourth and fifth anniversaries of the date of grant. The value of these founder’s awards was tied to each employee’s grade level.
Additional Intercompany Note—On January 31, 2009, Mead Johnson Venezuela S.C.A., a wholly owned indirect subsidiary of MJNC issued a note in the local currency equivalent of $5.8 aggregate principal amount payable to Bristol-Myers Squibb de Venezuela S.C.A., a wholly owned subsidiary of BMS. This note will (i) mature in 2014, (ii) require no amortization payments, (iii) be prepayable at MJNC’s option and (iv) bear interest at a fixed rate of approximately 24% per annum.
Credit Revolver—On February 17, 2009, MJNC entered into a three-year syndicated revolving credit facility agreement. The credit facility is unsecured and provides for borrowings and letters of credit up to $410.0.
Long-Term Supply Agreement
MJN entered into a long-term supply agreement on January 16, 2009, and effective as of January 1, 2010. The agreement is a ten year contract, with an exit clause after five years, and contains a minimum volume purchase commitment of $55.1 for infant formula base product for the initial five-year period, beginning 2010.
| 22. | SELECTED QUARTERLY FINANCIAL DATA (UNAUDITED) |
| | | | | | | | | | | | | | | |
Dollars in Millions, Except Per Share Data | | First
Quarter | | Second
Quarter | | Third
Quarter | | Fourth
Quarter | | Year |
2008: | | | | | | | | | | | | | | | |
Net Sales | | $ | 703.3 | | $ | 728.6 | | $ | 742.8 | | $ | 707.7 | | $ | 2,882.4 |
Gross Margin | | | 451.5 | | | 456.3 | | | 454.9 | | | 439.9 | | | 1,802.6 |
Net Earnings | | | 130.6 | | | 114.2 | | | 102.7 | | | 46.4 | | | 393.9 |
Basic and Diluted Earnings per Share: | | | | | | | | | | | | | | | |
Net Earnings per Share | | $ | 0.77 | | $ | 0.67 | | $ | 0.61 | | $ | 0.27 | | $ | 2.32 |
| | | | | |
2007: | | | | | | | | | | | | | | | |
Net Sales | | $ | 609.1 | | $ | 621.1 | | $ | 677.0 | | $ | 669.2 | | $ | 2,576.4 |
Gross Margin | | | 392.5 | | | 393.5 | | | 427.4 | | | 414.3 | | | 1,627.7 |
Net Earnings | | | 110.2 | | | 94.3 | | | 115.5 | | | 102.5 | | | 422.5 |
Basic and Diluted Earnings per Share: | | | | | | | | | | | | | | | |
Net Earnings per Share | | $ | 0.65 | | $ | 0.56 | | $ | 0.68 | | $ | 0.60 | | $ | 2.49 |
84
SCHEDULE II
MEAD JOHNSON NUTRITION, A DIVISION OF BRISTOL-MYERS SQUIBB COMPANY
MEAD JOHNSON NUTRITION
VALUATION AND QUALIFYING ACCOUNTS
| | | | | | | | | | | | | | | | | |
Description | | Balance at
beginning
of period | | Provisions
for bad
debts | | Bad
debts
written
off | | | Other | | | Balance
at end of
period |
| Dollars in millions | | | | | | | | | | | | |
Allowances for Doubtful Accounts | | | | | | | | | | | | | | | | | |
For the year ended December 31, 2008 | | $ | 29.9 | | $ | 0.6 | | $ | (19.5 | ) | | $ | (4.0 | ) | | $ | 7.0 |
For the year ended December 31, 2007(1) | | | 8.2 | | | 22.3 | | | (1.3 | ) | | | 0.7 | | | | 29.9 |
For the year ended December 31, 2006 | | | 12.0 | | | 2.4 | | | (6.7 | ) | | | 0.5 | | | | 8.2 |
(1) | During the year ended December 31, 2007, the Company terminated its distribution agreement with a Philippines distributor, which had become financially insolvent. A provision of $17.6 was recorded to reserve the net receivable balance. During the year ended December 31, 2008, this receivable, along with the related reserve, was written off. |
| | | | | | | | | | | | | |
Description | | Balance at
beginning
of period | | Provision for
valuation
allowance | | Release of
valuation
allowance/
other | | | Balance
at end of
period |
| Dollars in millions | | | | | | | | | |
Valuation Allowance on Deferred Tax Assets | | | | | | | | | | | | | |
For the year ended December 31, 2008 | | $ | 18.2 | | $ | 1.3 | | $ | (2.9 | ) | | $ | 16.6 |
For the year ended December 31, 2007 | | | 10.2 | | | 8.1 | | | (0.1 | ) | | | 18.2 |
For the year ended December 31, 2006 | | | 4.3 | | | 5.9 | | | — | | | | 10.2 |
85
| Item 9. | CHANGES IN AND DISAGREEMENTS WITH ACCOUNTANTS ON ACCOUNTING AND FINANCIAL DISCLOSURE |
None.
| Item 9A. | CONTROLS AND PROCEDURES |
Conclusion Regarding the Effectiveness of Disclosure Controls and Procedures
Under the supervision and with the participation of our management, including the Chief Executive Officer and the Chief Financial Officer of the company (its principal executive officer and principal financial officer, respectively), we have evaluated our disclosure controls and procedures (as defined in Securities Exchange Act Rule 13a -15(e)) as of December 31, 2008. Based upon that evaluation, the Chief Executive Officer and Chief Financial Officer have concluded that our disclosure controls and procedures were effective.
Management’s Report on Internal Control Over Financial Reporting
This Annual Report does not include a report of management’s assessment regarding internal control over financial reporting or an attestation report of the company’s registered public accounting firm due to a transition period established by the rules of the SEC for newly public companies.
Changes in Internal Control Over Financial Reporting
There has been no change in the company’s internal control over financial reporting during the fourth quarter ended December 31, 2008, that has materially affected, or is reasonably likely to materially affect, the company’s internal control over financial reporting.
| Item 9B. | OTHER INFORMATION |
The MJN Board has approved the following benefit plans pursuant to which certain of our key employees, including certain Named Executive Officers, now participate. These plans are intended to mimic benefits that were provided by BMS prior to our initial public offering under similar plans. Below is a brief description of the material terms of each of these plans:
MJN Benefit Equalization Plan—Retirement Plan
The Mead Johnson & Company Benefit Equalization Plan—Retirement Plan (MJN BEP-RP) is a supplemental defined benefit pension plan that provides retirement income for certain of our employees in excess of the benefits payable under the Mead Johnson & Company Retirement Plan (MJN Retirement Plan), which is a tax-qualified defined benefit pension plan. Effective as of February 9, 2009, Mead Johnson assumed the obligations to pay, under the MJN BEP-RP, all benefits accrued under the BMS Benefit Equalization Plan—Retirement Plan with respect to all of our regular full-time employees who were active participants in the BMS Benefit Equalization Plan—Retirement Plan as of February 8, 2009. Eligible participants in the MJN Retirement Plan accrue benefits under the MJN BEP-RP going forward.
The MJN Retirement Plan is a partially frozen plan and limits the extent to which additional years of service and compensation increases from Mead Johnson will be recognized for purposes of determining benefits under the MJN Retirement Plan. Specifically, service after February 9, 2009 will not be recognized for purposes of determining benefit accruals under the MJN Retirement Plan, but such service will be recognized for purposes of (i) vesting in unvested benefits, (ii) eligibility for early retirement and (iii) “Rule of 70” benefits. Furthermore, compensation increases after February 9, 2014 will not be taken into account in determining a participant’s benefits under the MJN Retirement Plan. These limits also apply to benefits pursuant to the MJN BEP-RP.
The benefit under the MJN BEP-RP is calculated using the same formula as the MJN Retirement Plan, which is based on the employee’s final average compensation and years of service, but without the limits on
86
compensation and benefits imposed under Section 401(a)(17) and Section 415(b) of the Code and, for purposes of calculating final average compensation, by using the cash award earned by a participant for the relevant calendar year under our annual performance incentive plan, regardless of when such award is actually paid. The MJN BEP-RP also has the same vesting provisions as the MJN Retirement Plan. The pension benefit under the MJN BEP-RP is paid as a cash lump sum or, if an election is made at least 12 months prior to retirement, the lump sum may be credited to the MJN Benefit Equalization Plan—Retirement Savings Plan or paid in installments.
The MJN BEP-RP is unfunded, with payments made from the general assets of Mead Johnson. The MJN BEP-RP can be terminated by the MJN Board at any time, subject to the restrictions imposed by Section 409A of the Code, and can also be amended at any time so long as such amendment does not eliminate or reduce previously accrued benefits.
MJN Benefit Equalization Plan—Retirement Savings Plan
The Mead Johnson & Company Benefit Equalization Plan—Retirement Savings Plan (MJN BEP-RSP) is a non-qualified deferred compensation plan that allows certain of our employees to defer a portion of their base salary and to receive matching contributions from Mead Johnson in excess of contributions allowed under the Mead Johnson & Company Retirement Savings Plan (MJN Savings Plan), which is a tax qualified defined contribution plan. Employees who participate in the Mead Johnson performance incentive plan or whose pay or benefits exceed the IRS qualified plan limits are eligible for the MJN BEP-RSP. Effective as of February 9, 2009, Mead Johnson assumed the obligations to pay, under the MJN BEP-RSP, all benefits accrued under the BMS Benefit Equalization Plan—Savings Plan with respect to all of our employees who were active participants in the BMS Benefit Equalization Plan—Savings Plan as of February 8, 2009. Eligible participants in the MJN Savings Plan accrue benefits under the MJN BEP-RSP going forward.
Contributions to the MJN BEP-RSP begin once the employee’s total base salary paid for the year exceeds the limit under Section 401(a)(17) of the Code or total contributions to the MJN Savings Plan exceed the limits under Section 415(c) of the Code. The contribution limits and matching contribution amounts are the same as under the MJN Savings Plan except that, as described above, such amounts are not limited by the Sections 401(a)(17) and 415(c) of the Code. The vesting provisions are the same as under the MJN Savings Plan. Investment alternatives are the same as those offered under the MJN Savings Plan, except that the MJN BEP-RSP does not permit investment in a Mead Johnson company stock fund. The employee’s full balance under the MJN BEP-RSP is paid following termination of employment, or, if an election is made at least 12 months prior to termination, the payments may be deferred until a later date, no sooner than five years following the termination date.
The MJN BEP-RSP is unfunded, with payments made from the general assets of Mead Johnson. The MJN BEP-RSP can be terminated by the MJN Board at any time, subject to the restrictions imposed by Section 409A of the Code, and can also be amended at any time so long as such amendment does not eliminate or reduce previously vested amounts.
MJN Key International Pension Plan
The Mead Johnson Key International Pension Plan (MJN KIPP) is a supplemental defined benefit pension plan that provides retirement income for certain of our employees who are or were on international assignment outside their home countries. Effective as of February 1, 2009, Mead Johnson assumed the obligations to pay, under the MJN KIPP, all benefits accrued under the Bristol-Myers Squibb Key International Pension Plan (BMS KIPP) with respect to key employees of Mead Johnson who were active participants in the BMS KIPP as of January 31, 2009. The MJN KIPP is a continuation and successor plan to the BMS KIPP with respect to all such benefits accrued prior to February 1, 2009 by such employees, and no new participants will be admitted to the MJN KIPP after February 1, 2009. The MJN KIPP is a partially frozen plan and accordingly, a participant’s years of service with Mead Johnson and future compensation increases will only increase benefit accruals under the MJN KIPP for limited purposes, as described below.
87
The benefit under the MJN KIPP is calculated based on the employee’s Final Average Salary (as described below) and years of service. The key plan provisions are as follows:
| | • | | The monthly retirement benefit equals: |
| | • | | 1.75% x Final Average Salary x years of service with BMS credited under the BMS KIPP (but without regard to any service with Mead Johnson beginning on February 1, 2009), minus, |
| | • | | The monthly Social Security benefits amounts attributable to employer contributions, minus, |
| | • | | Certain other employer benefits payable to the participant, minus, |
| | • | | The actuarial equivalent of any severance payments payable to the participant that exceed the severance benefits that would be paid to the participant under Mead Johnson’s U.S. severance plan. |
| | • | | Final Average Salary equals the employee’s average annual compensation in the five consecutive years out of the last ten in which such employee’s compensation was the highest. Compensation equals the base salary rate, plus bonuses paid during the year. However, under the MJN KIPP, Final Average Salary will not take into account any compensation increases occurring after February 1, 2014. |
| | • | | Normal retirement age is 65. Employees are eligible for early retirement at age 55 with 10 or more combined years of service with BMS and Mead Johnson. |
| | • | | Employees eligible for early retirement may receive their pension without any reduction at age 60. The pension is reduced by 4% for each year that the retirement age precedes age 60. |
| | • | | Employees with at least 10 combined years of service with BMS and Mead Johnson who are involuntarily terminated and eligible for severance and whose age plus combined years of service with BMS and Mead Johnson equals or exceeds 70 are entitled to begin collecting their pension benefits upon such termination, subject to execution of a general release and certain reductions in benefits based on age. |
| | • | | Employees are 100% vested after attaining five combined years of service with BMS and Mead Johnson. |
| | • | | The pension is payable as a monthly life annuity, with or without survivor benefits, or a lump sum. |
The MJN KIPP also contains a replication program, which replicates as closely as legally and administratively practicable the retirement benefits that a participant would have been entitled to receive under his or her home country plans had he or she continued to be eligible to participate in such plans while employed. In addition, the MJN KIPP contains a supplemental program, which applies Final Average Salary increases through February 1, 2014, for purposes of determining the benefits of participants in certain foreign defined benefit plans that have been frozen.
The MJN KIPP is unfunded, with payments made from the general assets of Mead Johnson. No amendment to the plan will be effective unless it is for the exclusive benefit of the participants and their designated joint pensioners, and no such amendment may directly or indirectly deprive either of any benefits accrued prior to such amendment. The MJN Board may terminate the MJN KIPP, in whole or in part, for any reason and at any time.
The foregoing descriptions of these plans are summaries of their material terms, do not purport to be complete and are qualified in their entirety by reference to the full text of each of the plans filed as Exhibits 10.31, 10.32 and 10.33 to this report.
88
PART III
| Item 10. | DIRECTORS, EXECUTIVE OFFICERS AND CORPORATE GOVERNANCE |
Executive Officers and Directors
Set forth below is information concerning our executive officers and directors as of March 16, 2009.
| | | | |
Name | | Age | | Position(s) |
Stephen W. Golsby | | 54 | | President, Chief Executive Officer and Director |
Peter G. Leemputte | | 51 | | Senior Vice President and Chief Financial Officer |
Charles M. Urbain | | 54 | | President, Asia and Europe |
Peter Kasper Jakobsen | | 46 | | President, Americas |
Christiaan Augustijns | | 54 | | Senior Vice President and Chief Marketing Officer |
Dirk Hondmann | | 43 | | Senior Vice President, Global Research and Development |
James J. Jobe | | 49 | | Senior Vice President, Global Supply Chain |
William P’Pool | | 43 | | Senior Vice President, General Counsel and Secretary |
Lynn H. Clark | | 51 | | Senior Vice President, Human Resources |
Stanley D. Burhans | | 43 | | Vice President and Controller |
James M. Cornelius | | 65 | | Chairman of the Board of Directors |
Lamberto Andreotti | | 58 | | Vice Chairman of the Board of Directors |
Steven M. Altschuler, M.D | | 55 | | Director |
Howard B. Bernick | | 56 | | Director |
John E. Celentano | | 48 | | Director |
Jean-Marc Huet | | 39 | | Director |
Sandra Leung | | 48 | | Director |
Peter G. Ratcliffe | | 61 | | Director |
Elliott Sigal, M.D., Ph.D. | | 57 | | Director |
Robert S. Singer | | 57 | | Director |
Backgrounds of Executive Officers and Directors of Mead Johnson Nutrition Company
Set forth below is information concerning our current executive officers and directors identified above. Our executive officers were appointed in January 2009 to serve in their current roles. Each executive officer is appointed for such term as may be prescribed by the board of directors and until a successor has been chosen and qualified or until such officer’s death, resignation or removal. All of our directors (other than Steven M. Altschuler, M.D and Elliott Sigal, M.D., Ph.D.) were elected in January 2009. Our directors will serve until the next annual stockholders meeting or until their successors are elected.
Stephen W. Golsby. Mr. Golsby, our President, Chief Executive Officer and one of our directors, has been continuously employed by Mead Johnson since October 1997 in various capacities. Before assuming his current role, Mr. Golsby had served as President of Mead Johnson since January 2004. He served as President, International of Mead Johnson from 2001 until 2003. Mr. Golsby serves on the Advisory Board of the University of Evansville Business School.
Peter G. Leemputte. Mr. Leemputte, our Senior Vice President and Chief Financial Officer since September 2008, served as Senior Vice President and Chief Financial Officer of Brunswick Corporation, a manufacturer of recreation and leisure-time products, from August 2003 to September 2008. Mr. Leemputte is a director of Beazer Homes USA, Inc. and serves on the Advisory Board of the Washington University (St. Louis) School of Engineering.
Charles M. Urbain. Mr. Urbain, our President, Asia and Europe, has served as Senior Vice President, North America, Latin America and Europe of Mead Johnson since June 2008 and has been continuously employed by
89
Mead Johnson since January 1996 in various capacities. Mr. Urbain served as Senior Vice President, North America and Europe from June 2007 to June 2008. From January 2004 to June 2007, Mr. Urbain served as Senior Vice President, International of Mead Johnson and from January 2001 to January 2004, he served as Senior Vice President, Latin America, Canada and Europe of Mead Johnson.
Peter Kasper Jakobsen. Mr. Jakobsen, our President, Americas, has served as Senior Vice President, Asia Pacific of Mead Johnson since October 2006 and has been continuously employed by Mead Johnson since March 1998 in various capacities. From February 2004 to October 2006, Mr. Jakobsen served as Vice President, South Asia of Mead Johnson and from June 2001 to June 2004 he served as General Manager, Philippines of Mead Johnson.
Christiaan Augustijns.Mr. Augustijns, our Senior Vice President and Chief Marketing Officer since September 2008, worked for the Coca-Cola Company, a global leader in the beverage industry, for 11 years before assuming his current position. At Coca-Cola, Mr. Augustijns served as Director of Coca-Cola Europe from January 2008 to August 2008 and from September 2003 to January 2008 he served as Executive Vice President of Coca-Cola Japan.
Lynn H. Clark.Ms. Clark, our Senior Vice President, Human Resources, had been continuously employed by BMS since March 2001 in various capacities. Ms. Clark served as Vice President, Human Resources, Health Care Group of BMS from September 2005 to September 2008. From June 2004 to September 2005, Ms. Clark served as Vice President, Human Resources, Americas of BMS and from September 2002 to June 2004, she served as Vice President, Human Resources, ConvaTec, a division of BMS.
Dirk Hondmann. Mr. Hondmann, our Senior Vice President, Global Research and Development, a position he has held with Mead Johnson since joining Mead Johnson in October 2005. From October 2002 to October 2005, Mr. Hondmann served as Vice President, Research and Development of Slimfast, an affiliate of the Unilever Group, an international manufacturer of food, home care, and personal care products. Mr. Hondmann serves as a member of the Board of Trustees of Evansville Day School.
James J. Jobe.Mr. Jobe, our Senior Vice President, Global Supply Chain, a position he has held with Mead Johnson since November 2005, has been continuously employed by Mead Johnson since 1988. From May 2003 to November 2005, Mr. Jobe served as Senior Director, North America Supply Chain of Mead Johnson.
William P’Pool.Mr. P’Pool, our Senior Vice President, General Counsel and Secretary, had been continuously employed by BMS since June 2004. Before assuming his current position, Mr. P’Pool served as Vice President and Senior Counsel for Mead Johnson from May 2005 to December 2008 and from June 2004 to May 2005, he served as Counsel for Mead Johnson. From May 2001 to June 2004, Mr. P’Pool served as Senior Counsel and Director, Legal Services of Yum! Brands, Inc., a large operator and franchiser of restaurant companies.
Stanley D. Burhans. Mr. Burhans, our Vice President and Controller, has been continuously employed by Mead Johnson or BMS since 1992 in various capacities. Before assuming his current position, Mr. Burhans served as Vice President, Finance of Mead Johnson since February 2006. From July 2005 to February 2006, Mr. Burhans served as Senior Director, International Finance of Mead Johnson and from June 2003 to July 2005, he served as Senior Director, U.S. Finance of Mead Johnson.
James M. Cornelius. Mr. Cornelius, our Chairman of the board of directors, is currently the Chairman of the board of directors and Chief Executive Officer of BMS and he has served in such a role since February 2008. Mr. Cornelius served as the Chief Executive Officer, including serving as Interim Chief Executive Officer, of BMS since September 2006 when he ended his retirement. Mr. Cornelius served as the Interim Chief Executive Officer and Chairman of the board of directors for Guidant Corporation from November 2005 to April 2006 when it was acquired by Boston Scientific Corporation, at which point Mr. Cornelius retired. He served as Guidant’s Non-Executive Chairman of the board of directors from August 2000 until November 2005. Mr. Cornelius is a director and chairman of the audit committee of The DIRECTV Group and he is also a director and chairman of the compensation committee and member of the audit committee of Given Imaging Ltd.
90
Lamberto Andreotti.Mr. Andreotti, our Vice Chairman of the board of directors, is currently President and Chief Operating Officer of BMS, serving in that role since March 2009. From March 2008 to March 2009, he served as Executive Vice President and Chief Operating Officer of BMS. From September 2005 to March 2008, Mr. Andreotti served as Executive Vice President, Worldwide Pharmaceuticals of BMS and from November 2002 to September 2005, Mr. Andreotti served as Senior Vice President and President International, Worldwide Medicines Group of BMS.
Dr. Steven M. Altschuler.Dr. Altschuler, one of our directors, was appointed as a director on March 10, 2009. Dr. Altschuler is currently the President and Chief Executive Officer of The Children’s Hospital of Philadelphia, a position he has held since April 2000. Dr. Altschuler serves on the board of directors of the Children’s Miracle Network.
Howard B. Bernick. Mr. Bernick, one of our directors, is currently the President of Bernick Holdings Inc., a private investment company, and has served in such a role since November 2006. From November 1994 to November 2006, Mr. Bernick served as President and Chief Executive Officer of Alberto-Culver Company, a branded consumer products and beauty supply distribution company.
John E. Celentano.Mr. Celentano, one of our directors, is currently President, Emerging Markets and Asia-Pacific of BMS, serving in that role since March 2009. From March 2008 to March 2009, Mr. Celentano served as Senior Vice President, Strategy and Productivity Transformation of BMS. From December 2005 to March 2008, Mr. Celentano served as President, Health Care Group of BMS and from January 2002 to December 2005, Mr. Celentano served as President, Latin America and Canada, Worldwide Medicines Group, a division of BMS.
Jean-Marc Huet.Mr. Huet, one of our directors, is currently Executive Vice President and Chief Financial Officer of BMS and he has served in such a role since March 2009. From March 2008 to March 2009, Mr. Huet served as Senior Vice President and Chief Financial Officer of BMS. Mr. Huet served as Chief Financial Officer of Royal Numico N.V., a specialist baby food and clinical nutrition company from March 2003 to November 2007, when Royal Numico was acquired by the food manufacturer, Group Danone. Following this acquisition until taking on his current role, Mr. Huet took the time to select his next opportunity. Prior to joining Royal Numico N.V., he was an Executive Director of Investment Banking Services at Goldman Sachs International, a full-service global investment banking and securities firm.
Sandra Leung. Ms. Leung, one of our directors, is currently Senior Vice President and General Counsel of BMS and she has served in such a role since February 2007. From September 2006 to February 2007, Ms. Leung served as Vice President, Corporate Secretary and Acting General Counsel of BMS and from June 2002 to September 2006, she served as Vice President and Corporate Secretary of BMS.
Peter G. Ratcliffe. From April 2003 until his retirement in June 2007, Mr. Ratcliffe, one of our directors, served as Chief Executive Officer of the P&O Princess International division of Carnival Corporation and PLC, a global cruise company. From January 2000 to April 2003, he served as Chief Executive Officer of Carnival PLC, a global cruise company. Mr. Ratcliffe is a director of Carnival Corporation and PLC and a director of Carnival PLC. He is also a director of BBA Aviation PLC.
Dr. Elliott Sigal. Dr. Sigal, one of our directors, was appointed as a director on March 10, 2009. Dr. Sigal is currently Executive Vice President, Chief Scientific Officer and President, Research and Development for BMS, a position he has held since October 2004. Between January 2004 and October 2004, Dr. Sigal served as Senior Vice President, Global Clinical and Pharmaceutical Development.
Robert S. Singer. Mr. Singer, one of our directors, currently serves as Chief Executive Officer of Barilla Holding S.p.A, a major Italian food company, and he has served in such a role since January 2006. From May 2004 to September 2005, Mr. Singer served as President and Chief Operating Officer of Abercrombie & Fitch Co., an American clothing retailer. Between October 2005 and December 2005, he took the time to select his next opportunity. Prior to joining Abercrombie, Mr. Singer served as Chief Financial Officer of Gucci Group NV, a leading luxury goods company, from September 1995 to April 2004. Mr. Singer is a director and the chairman of the compensation committee of Benetton S.p.A.
91
Involvement in Certain Legal Proceedings
Mr. Leemputte, our Senior Vice President and Chief Financial Officer, currently serves as a director of Beazer Homes and as the chairman of its audit committee. Beazer Homes was the subject of an SEC investigation to determine whether it had violated any federal securities laws. Beazer Homes settled the investigation on September 24, 2008, with no charges brought against it. Beazer Homes is also the subject of pending investigations by the U.S. Department of Justice and other state and federal agencies. Mr. Leemputte is a named defendant in a pending derivative shareholder lawsuit, which also names Beazer Homes as a nominal defendant and alleges that the defendants violated state and federal laws, including violations of the Exchange Act, breached their fiduciary duties to Beazer Homes’ shareholders and committed abuse of control, waste of corporate assets and unjust enrichment, also arising from the same alleged actions that led to the SEC investigation.
Composition of our Board of Directors
Our business and affairs are managed under the direction of our board of directors. Currently seven of our directors are either employed by Mead Johnson or its parent company, BMS, and therefore, they are not considered independent under the NYSE rules. Four of our directors (Dr. Steven M. Altschuler, Howard B. Bernick, Peter G. Ratcliffe, and Robert S. Singer) are independent, as defined by the applicable rules of the NYSE. The directors have discretion to increase or decrease the size of the board of directors.
We are a “controlled company” as set forth in the corporate governance rules of the NYSE. Accordingly, we do not have, and are not required to have, a majority of “independent directors” on our board of directors nor do we have, nor are we required to have, a compensation committee and a nominating and corporate governance committee composed entirely of “independent directors” as defined under the rules of the NYSE. The “controlled company” exception does not modify the independence requirements for the audit committee, and we have an audit committee made up of three independent directors.
Communication with our Board of Directors
Stockholders and other interested parties wishing to contact one or more of our directors, including the non-management directors as a group, may do so by sending a letter to [Name of Director(s)], c/o Corporate Secretary, 2400 West Lloyd Expressway, Evansville, Indiana 47721-0001. Any such correspondence will be forwarded to the appropriate director or directors for review.
Committees of the Board of Directors
Our board of directors has established an audit committee, a compensation committee and a nominating and corporate governance committee. The members of each committee have been appointed by the board of directors and will serve until their successor is elected and qualified, unless they are earlier removed or resign.
Audit Committee
We have an audit committee that consists of three directors who are not affiliated with either us or BMS. The committee is responsible for, among other things:
| | • | | overseeing management’s maintenance of the reliability and integrity of our accounting policies and financial reporting and our disclosure practices; |
| | • | | overseeing management’s establishment and maintenance of processes to assure that an adequate system of internal control is functioning; |
| | • | | overseeing management’s establishment and maintenance of processes to assure our compliance with all applicable laws, regulations and corporate policies; |
92
| | • | | reviewing our annual and quarterly financial statements prior to their filing and prior to the release of earnings; and |
| | • | | reviewing the performance of the independent accountants and making recommendations to the board of directors regarding the appointment or termination of the independent accountants and considering and approving any non-audit services proposed to be performed by the independent accountants. |
Howard B. Bernick, Peter G. Ratcliffe and Robert S. Singer serve on our audit committee, with Robert S. Singer serving as the chair of the audit committee. The audit committee has the power to investigate any matter brought to its attention within the scope of its duties and to retain counsel for this purpose where appropriate. Each of the directors serving on the audit committee is an “audit committee financial expert” within the meaning of the rules of the SEC.
Compensation Committee
We have a compensation committee that has responsibility for, among other things:
| | • | | reviewing our compensation practices and policies, including equity benefit plans and incentive compensation; |
| | • | | reviewing key employee compensation policies; |
| | • | | monitoring performance and compensation of our employee-directors, officers and other key employees; and |
| | • | | preparing recommendations and periodic reports to the board of directors concerning these matters. |
Lamberto Andreotti, Howard B. Bernick, John E. Celentano, James M. Cornelius and Jean-Marc Huet serve on the compensation committee, with Howard B. Bernick serving as the chair of the compensation committee.
Nominating and Corporate Governance Committee
We have a nominating and corporate governance committee that has responsibility for, among other things:
| | • | | making recommendations as to the size, composition, structure, operations, performance and effectiveness of the board of directors; |
| | • | | establishing criteria and qualifications for membership on the board of directors and its committees; |
| | • | | assessing and recommending to the board of directors strong and capable candidates qualified to serve on the board of directors and its committees; |
| | • | | developing and recommending to the board of directors a set of corporate governance principles; and |
| | • | | considering and recommending to the board of directors other actions relating to corporate governance. |
Lamberto Andreotti, John E. Celentano, James M. Cornelius, Sandra Leung, Peter G. Ratcliffe and Robert S. Singer serve on the nominating and corporate governance committee, with Peter G. Ratcliffe serving as the chair of the nominating and corporate governance committee.
Code of Ethics
Information relating to corporate governance at Mead Johnson, including our Standards of Business Conduct and Ethics, Code of Ethics for Senior Financial Officers, Code of Business Conduct and Ethics for Directors (collectively, the Codes), Corporate Governance Guidelines, and information concerning our Executive Officers, Board of Directors, including Board Committees and Committee charters, and transactions in Mead Johnson securities by Directors and executive officers, is available on our web site, www.meadjohnson.com, under the “Investors” caption and in print to any stockholder upon request. Any waivers to the Codes that may be granted to directors or executive officers and any material amendments to the Code of Business Conduct and Ethics for Directors and Code of Ethics for Senior Financial Officers will be posted promptly on our web site.
93
| Item 11. | EXECUTIVE COMPENSATION |
Compensation Discussion and Analysis
Our executive officers whose compensation is discussed in this Compensation Discussion and Analysis (“CD&A”), and who we refer to as our Named Executive Officers for purposes of this Annual Report, are:
| | • | | Stephen W. Golsby—our President and Chief Executive Officer, who served as our President during 2008. |
| | • | | Peter G. Leemputte—our Senior Vice President and Chief Financial Officer. |
| | • | | Charles M. Urbain—our President, Asia and Europe, who served as our Senior Vice President, North America, Latin America and Europe during 2008. |
| | • | | Peter Kasper Jakobsen—our President, Americas, who served as our Senior Vice President, Asia Pacific during 2008. |
| | • | | Dirk H. Hondmann—our Senior Vice President, Global Research and Development. |
Prior to our initial public offering, we were wholly owned by BMS, and so BMS has been primarily responsible for determining our historical compensation strategy. The Compensation and Management Development Committee (“BMS Compensation Committee”) of BMS’s board of directors (“BMS Board”) approved the 2008 compensation arrangements for Mr. Golsby and the new compensation arrangements for Mr. Leemputte when he was hired in September 2008, while the BMS Salary and Bonus Committee (“BMS S&B Committee”) and the BMS executives involved with the BMS Compensation Planning Process, described below, approved the 2008 compensation arrangements for Messrs. Jakobsen, Urbain and Hondmann. As it related to our Named Executive Officers prior to our initial public offering, the BMS S&B Committee was comprised of BMS’s Chief Executive Officer, its Senior Vice President of Human Resources and its Executive Vice President and Chief Operating Officer of Worldwide Pharmaceuticals. Since the information presented in the compensation tables of this Annual Report relates to our 2008 fiscal year, this CD&A describes the compensation programs and decisions of BMS, the BMS Compensation Committee, the BMS S&B Committee and the results of the BMS Compensation Planning Process that are material to understanding the information shown in the tables. Unless otherwise indicated below, the compensation philosophy, strategy and decisions that were applicable to us and our Named Executive Officers for 2008 were substantially consistent with the compensation philosophy, strategy and decisions that were generally applicable to BMS for 2008.
In connection with our initial public offering, our board of directors (“MJN Board”) formed its own compensation committee (“MJN Compensation Committee”), which is now responsible for determining our executive compensation strategy. For descriptions of the MJN Compensation Committee, see “—Committees of the Board of Directors—Compensation Committee” above and “—MJN Compensation Committee” below.
Introduction
This CD&A aims to explain how BMS’s compensation program is designed and how it operated with respect to our Named Executive Officers prior to our initial public offering. This CD&A first describes BMS’s executive compensation philosophy and how BMS designed its compensation program as it relates to our Named Executive Officers, with a discussion focusing on the main components of its compensation program. We then detail the process for, and analyze the determinations made prior to our initial public offering with respect to, the 2008 compensation of our Named Executive Officers. Subsequently, we discuss individual arrangements with our Named Executive Officers and other benefits that are provided to them. We then describe several of BMS’s key corporate governance policies covering executive compensation. Finally, we discuss how our compensation program is currently structured and describe certain compensation-related actions taken by the MJN board of directors and MJN Compensation Committee.
94
Impact of New Strategy on 2008 Compensation Program
In connection with BMS’s strategy to transform into a next-generation biopharmaceutical company, BMS implemented several changes to its 2008 compensation program, including:
| | • | | The use of a cash flow measure for determining annual incentives; |
| | • | | A special one-time performance share award for all BMS executives (including each of our Named Executive Officers, other than Mr. Leemputte), which is tied to three-year productivity transformation goals; and |
| | • | | The elimination of the following corporate perquisites for BMS employees: personal air travel, company car, financial counseling, tax preparation and tickets to sporting and cultural events. |
Executive Compensation Philosophy
BMS’s executive compensation philosophy is based on two core elements: (1) to pay for performance and (2) to provide a competitive compensation package. Each of these elements is described below.
Pay for Performance
BMS structures its compensation program to align the interests of its senior executives with the interests of BMS’s stockholders. BMS believes that an employee’s compensation should be tied directly to helping BMS achieve its mission and deliver value to its stockholders. Therefore, a significant part of each executive’s pay depends on his or her individual performance measured against financial and operational objectives as well as meeting key behavioral standards. BMS also believes that a significant amount of compensation should be at risk. A substantial portion of an executive’s compensation, therefore, is in the form of equity awards that tie the executive’s compensation directly to creating stockholder value and achieving financial and operational results.
Competitive Pay
BMS believes that a competitive compensation program is an important tool to help attract and retain talented employees capable of leading its business in the highly complex and competitive business environment in which BMS operates. BMS aims to pay its executives at approximately the median level of pay of BMS’s peer group when targeted levels of performance are achieved. By providing compensation that is competitive with BMS’s peer companies, BMS reduces the risk that its executives can be recruited away.
BMS’s compensation program is also designed with the following principles in mind:
| | • | | To pay employees equitably relative to one another based on the work they do, the capabilities and experience they possess and the performance they demonstrate; |
| | • | | To promote a non-discriminatory work environment that enables BMS to leverage the diversity of thought that comes with a diverse workforce; |
| | • | | To motivate executives to deliver high performance; and |
| | • | | To continue to focus on good corporate governance practices by implementing compensation best practices and corporate policies, several of which are described in greater detail under “—Corporate Governance Policies Covering Executive Compensation”. |
Compensation Program Design
This section will explain how BMS has determined the design of the 2008 executive compensation program as it relates to our Named Executive Officers.
95
Role of the BMS Compensation Committee
The BMS Compensation Committee is generally responsible for determining the executive compensation strategy and philosophy for the entire BMS organization. Furthermore, the BMS Compensation Committee reviews and approves individual compensation packages for the most senior executives of BMS. Prior to our initial public offering, Mr. Golsby was the head of a major division within BMS, and therefore, BMS considered him one of its most senior executives. Accordingly, the BMS Compensation Committee was responsible for approving his individual compensation for 2008. In addition, the BMS Compensation Committee reviewed and approved the initial compensation arrangements for Mr. Leemputte, as well as his sign-on equity awards, because of the acceleration provisions contained in the vesting schedule relating to those awards, as described under “—Special Compensation Arrangements with Mr. Leemputte”. In the case of compensation for individuals below the most senior level, the BMS Compensation Committee delegated certain authority to members of BMS management to make determinations in accordance with guidelines established by the BMS Compensation Committee. In some cases, compensation below the most senior level was determined by the BMS S&B Committee. In other cases, such compensation was determined by a process described below, which we refer to for purposes of this CD&A as the “BMS Compensation Planning Process”. Also, the BMS Compensation Committee reviewed and approved 2008 annual incentive award payouts to each of our Named Executive Officers, as described under “—Annual Incentive Awards” below.
Interaction between BMS Executive Officers and the BMS Compensation Committee
BMS management plays a significant role in BMS’s executive compensation program. BMS’s Chief Executive Officer and Chief Financial Officer are involved in setting the business goals that are used as the performance goals for the annual and long-term incentive programs, subject to BMS Compensation Committee approval. In this respect, BMS’s Senior Vice President of Human Resources works closely with the BMS Compensation Committee, its compensation consultant and BMS senior management to (i) ensure that the BMS Compensation Committee is provided with the appropriate information to make its decisions, (ii) propose recommendations for BMS Compensation Committee consideration and (iii) communicate those decisions to BMS senior management for implementation.
Role of the BMS S&B Committee and the BMS Compensation Planning Process
The primary role of the BMS S&B Committee is to make determinations regarding compensation for executives below the most senior level in the event of hiring, promotion or transfer to another division within BMS. The BMS S&B Committee is generally not responsible for the regular compensation planning process for these executives. Instead, regular compensation planning (including regular annual base salary merit increases and annual equity award grants) for executives below the most senior level (as well as for BMS’s non-executive employees) occurs through the BMS Compensation Planning Process. The BMS Compensation Planning Process is a process pursuant to which managers review the compensation of their direct reports and make recommendations regarding changes to their compensation, such as annual base salary merit increases. Members of the BMS management team at successively higher grade levels then review those recommendations until the Chief Executive Officer of BMS ultimately conducts his own review. In most cases, BMS’s Chief Executive Officer reviews compensation recommendations on an aggregate basis, but he also reviews the individual compensation of a select group of executives. The 2008 compensation for each of our Named Executive Officers (except for Mr. Leemputte, who was a new hire in 2008) was determined through the BMS Compensation Planning Process in a manner that is typical of the process that BMS uses to determine compensation for other executives of similar levels. However, as noted above, Mr. Leemputte’s initial compensation arrangements were reviewed and approved by the BMS Compensation Committee. Also, following the completion of the 2008 BMS Compensation Planning Process cycle, the BMS Compensation Committee reviewed and approved 2008 annual incentive award payouts to each of our Named Executive Officers, described under “—Annual Incentive Awards” below.
96
Role of the BMS Compensation Consultants
The BMS Compensation Committee has retained Mercer Incorporated (“Mercer”) as its compensation consultant since October of 2002. Mercer reports directly to the BMS Compensation Committee and the BMS Compensation Committee directly oversees the fees paid for services provided to the BMS Compensation Committee. The BMS Compensation Committee instructs Mercer to give advice to the BMS Compensation Committee independent of management and to provide such advice for the benefit of BMS and its stockholders. Mercer assisted the BMS Compensation Committee by providing the following services in 2008:
| | • | | Participated in the design and development of BMS’s executive compensation program; |
| | • | | Provided competitive benchmarking and market data analysis; |
| | • | | Provided recommendations for the compensation of the most senior executives of BMS, including Mr. Golsby; |
| | • | | Provided an annual review of BMS’s change-in-control benefits, including analyzing these benefits against BMS’s peer companies and best practices; |
| | • | | Reviewed and advised on all materials provided to the BMS Compensation Committee for discussion and approval; and |
| | • | | Attended all of the BMS Compensation Committee’s regular meetings in 2008. |
BMS management also engaged Frederic W. Cook & Co. to assist in designing our post-offering compensation program, as described in more detail below under “—Our Post-Offering Compensation Program”. In addition, because Mr. Leemputte was hired with the expectation that he would serve as our Chief Financial Officer following our initial public offering, Frederic W. Cook & Co. provided input regarding the initial compensation arrangements for Mr. Leemputte at the time of hire.
BMS Peer Group Analysis
BMS’s executive compensation program seeks to provide total compensation, when targeted levels of performance are achieved, at the median of the pay levels provided by a designated peer group of U.S. companies. Specifically, BMS targets the competitive pay median on two levels: (1) total cash compensation (base salary plus annual target bonus) and (2) total direct compensation (total cash compensation plus the value of long-term incentives). BMS uses competitive median pay levels to maintain its compensation program guidelines on an annual basis (i.e., its salary structure, the leveling of its positions, its annual target bonus levels and its long-term incentive award guidelines). BMS also uses competitive pay levels to help in determining individual pay decisions (i.e., base salary levels, the size of salary adjustments and the size of long-term incentive awards). Paying at the competitive median when targeted levels of performance are achieved allows BMS to attract and retain the talent it needs to run its business while also enabling it to maintain a competitive cost base with respect to compensation expense.
For 2008, BMS’s peer group consisted of the following companies:
| | |
| Abbott Laboratories | | Merck & Co., Inc. |
| Amgen Inc. | | Pfizer Inc. |
| Eli Lilly and Company | | Schering-Plough Corporation |
| Johnson & Johnson | | Wyeth |
BMS believes this peer group is appropriate given the unique nature of the pharmaceutical/biotechnology industry. We note that the companies in BMS’s peer group vary in size, but BMS does not believe that company size should be a primary factor in determining BMS’s peer group. Instead, BMS believes emphasis should be placed on whether a company competes directly with BMS for unique pharmaceutical/biotechnology talent. The companies in BMS’s peer group represent BMS’s primary competitors for executive talent and operate in a
97
similarly-complex regulatory and research-driven environment. BMS monitors the composition of its peer group regularly and will make changes when appropriate. BMS believes it is critical to pay at a competitive level relative to this peer group in order to attract and retain the talent BMS needs; therefore, for 2008, BMS targeted compensation for its executives, including our Named Executive Officers, at the median of its peer group.
Prior to our initial public offering, BMS’s management conducted an annual review of the compensation for Messrs. Golsby, Urbain, Jakobsen and Hondmann using compensation data and analysis provided by the BMS Global Compensation department. Since our initial public offering, the compensation arrangements for our Named Executive Officers have been determined by the MJN Compensation Committee, as described under “—MJN Compensation Committee”.
Determining the Individual Compensation of Our Named Executive Officers for 2008
BMS’s executive compensation program, as it related to our Named Executive Officers, is designed to provide value to the executive based on the extent to which (i) individual performance, (ii) BMS performance versus annual budgeted financial targets, (iii) longer-term financial performance and (iv) total return to BMS stockholders (stock price appreciation plus dividends) meet, exceed or fall short of expectations. BMS believes this approach, with its emphasis on long-term compensation, serves to focus the efforts of its executives on the attainment of sustained long-term growth and profitability for the benefit of BMS and its long-term stockholders. All elements of executive compensation are reviewed both separately and in the aggregate to ensure that the amount and type of compensation is within appropriate competitive parameters and the program design encourages the creation of long-term stockholder value.
| | |
When determining the individual award levels for base salary merit increases, annual incentive awards, stock option awards and restricted stock unit awards for our Named Executive Officers prior to our initial public offering, the BMS executives involved with the BMS Compensation Planning Process gave equal weight to performance measured against financial and operational objectives that are linked to BMS’s business strategy and total stockholder return (“Results”) and an executive’s demonstration of the values and behaviors defined in the BMS Pledge and Core BMS Behaviors (Behaviors). The Pledge can be found in the About Us section of the BMS website (www.bms.com). | | 2008 Core BMS Behaviors Leads Strategically Drives Performance Innovates Embraces Teamwork Communicates Directly Develops and Energizes People |
BMS Performance Management System
The BMS Performance Management System involves an annual review and assessment of all executives, including, for 2008, our Named Executive Officers, to measure individual performance over the course of the previous year against preset financial and operational performance goals. The system assists in ensuring that each executive’s compensation is tied to the financial and operational performance of BMS, to BMS’s stockholder return and to the executive’s demonstration of the Core BMS Behaviors and the values embodied in the BMS Pledge.
The annual review and assessment under the BMS Performance Management System is generally conducted in the first quarter of the year following the relevant performance year. The annual review and assessment process under the BMS Performance Management System took place in the first quarter of 2008 in order to determine 2008 base salary merit increases and 2008 stock option and restricted stock unit awards for our Named Executive Officers (other than Mr. Leemputte), as described under “—Base Salaries”, “—Stock Option Awards” and “—Restricted Stock Unit Awards”. Payout levels pursuant to the 2008 annual incentive awards, as described under “—Annual Incentive Awards” below, were reviewed and approved by the BMS Compensation Committee in February 2009 and are reflected in the tables below. The process for assessing the performance of each of our Named Executive Officers under the BMS Performance Management System for 2008 is described below:
| | • | | Stephen W. Golsby: For 2008, BMS’s Executive Vice President and Chief Operating Officer of Worldwide Pharmaceuticals, who was Mr. Golsby’s first-level manager during 2008, conducted the |
98
| | assessment of Mr. Golsby under the BMS Performance Management System and made recommendations concerning his compensation to BMS’s Chief Executive Officer. BMS’s Chief Executive Officer reviewed these recommendations and then made recommendations to the BMS Compensation Committee regarding Mr. Golsby’s compensation. Due to Mr. Golsby’s role prior to our initial public offering as the head of a major division within BMS, the BMS Compensation Committee approved Mr. Golsby’s compensation for 2008. |
| | • | | Peter G. Leemputte:Mr. Golsby, who is Mr. Leemputte’s first-level manager, conducted the 2008 assessment of Mr. Leemputte under the BMS Performance Management System and made recommendations concerning his compensation to BMS’s Executive Vice President and Chief Operating Officer for Worldwide Pharmaceuticals. BMS’s Chief Executive Officer also reviewed and approved these recommendations on an individual basis. |
| | • | | Charles M. Urbain: For 2008, individual decisions with respect to the assessments under the BMS Performance Management System and the compensation of Mr. Urbain were made by the BMS S&B Committee and through the BMS Compensation Planning Process. Pursuant to the BMS Compensation Planning Process, Mr. Golsby, who is Mr. Urbain’s first-level manager, reviewed the 2008 compensation of Mr. Urbain, and BMS’s Executive Vice President and Chief Operating Officer of Worldwide Pharmaceuticals approved it. In addition, due to his job level during 2008, BMS’s Chief Executive Officer reviewed and approved Mr. Urbain’s compensation on an individual basis. |
| | • | | Peter Kasper Jakobsen: The process for 2008 with respect to Mr. Jakobsen was substantially similar to the process for Mr. Urbain. |
| | • | | Dirk H. Hondmann:The process for 2008 with respect to Mr. Hondmann was substantially similar to the process for Mr. Jakobsen, except that BMS’s Chief Executive Officer did not review Mr. Hondmann’s compensation on an individual basis. |
Listed below are the key performance results against the 2008 performance objectives for each of our Named Executive Officers. The BMS executives involved in the BMS Compensation Planning Process used these results as the basis for making individual compensation decisions for 2008, as detailed below.
Stephen W. Golsby
| | • | | Played an instrumental role in Mead Johnson’s growth and achievement of 100% of global net sales target and 101% of pretax earnings target. |
| | • | | Strategically managed the development of strong product innovation pipeline with key products being readied for launch in 2009. Achieved key productivity targets that funded business growth and innovation. |
| | • | | Demonstrated outstanding strategic leadership abilities, effectively managing the complexity of a global business in dynamic environments. |
| | • | | Energized the Mead Johnson management team as the company prepared for the separation from BMS and our initial public offering. Recruited and selected an experienced management team with the necessary mix of global and public company experience to lead us following our initial public offering. |
Peter G. Leemputte
| | • | | Contributed to Mead Johnson’s growth and achievement of 100% of global net sales target and 101% of pretax earnings target. |
| | • | | Played critical role in planning for the separation of Mead Johnson from BMS, our initial public offering and in the development of Mead Johnson’s 2009 operating plan. |
99
| | • | | Played a crucial role in retaining high performing talent through his transition to the role of Chief Financial Officer and quickly recruited experienced and diverse financial executives for new Mead Johnson roles. |
| | • | | Demonstrated strong business acumen and financial leadership and actively shared public company experience in order to prepare the leadership team for our initial public offering and public company status. |
Charles M. Urbain
| | • | | Played an instrumental role in Mead Johnson’s growth and achievement of 95% of North America, Latin America and Europe combined net sales target and 93% of North America, Latin America and Europe combined regional pretax earnings target. |
| | • | | Contributed broadly to Mead Johnson’s overall strategy and developed several key initiatives that reshaped our business strategy for the United States in a challenging economy that should yield positive results in 2009. |
| | • | | Made significant and important contributions to our initial public offering preparation with internal and external constituents. |
| | • | | Successfully leveraged broad global experiences at the Mead Johnson Management Committee level. |
Peter Kasper Jakobsen
| | • | | Played an instrumental role in Mead Johnson’s growth and achievement of 112% Asia Pacific regional net sales target and 128% of Asia Pacific regional pretax earnings target. |
| | • | | Was crucial to the success of both our business launch in India and the sales force expansion and realignment of our business strategy for China, which resulted in strong sales growth. |
| | • | | Developed our talent pipeline in general management and regional marketing, and recruited experienced management talent in key leadership roles. |
| | • | | Successfully managed through the melamine crisis in China and ensured both an ethical and an effective commercial strategy and execution plan. |
Dirk H. Hondmann
| | • | | Played a leadership role in building innovation pipeline strength and in ensuring that significant projects progressed, including product launches planned for 2009. |
| | • | | Displayed strong collaborative abilities and business acumen across a broad range of issues while actively engaging his management team, and proactively contributing to solving cross-function challenges. |
| | • | | Strengthened our talent pipeline, provided developmental opportunities for key talent and continued to raise performance standards against significant program milestones. |
| | • | | Developed a plan and secured approval for a new global technology center in Evansville to accelerate the effective commercialization of new processes and products. |
Principal Components of the 2008 Compensation Program for our Named Executive Officers
The main components of the 2008 executive compensation program for our Named Executive Officers were:
100
| | • | | Long-Term Performance Awards |
The following chart shows the 2008 target compensation mix, on an aggregate basis, for the main components of the compensation of our Named Executive Officers, based on targeted compensation for each of our Named Executive Officers:
This target mix supports the core elements of BMS’s executive compensation philosophy by emphasizing long-term incentives while providing competitive short-term components. The 2008 mix reflects the mix of compensation components for the respective divisional levels of our Named Executive Officers within BMS. In the paragraphs that follow, we explain how each of these components is set and describe certain changes BMS made to these components in 2008. BMS implemented the changes noted to provide for the continued alignment of BMS’s compensation program with the core elements of its compensation philosophy. In addition, the following paragraphs describe the specific pay decisions that were made in 2008 with respect to the Named Executive Officers.
Base Salaries
Base salaries are a tool used both to keep BMS competitive and help BMS retain talent. The base salaries of BMS executives are set based primarily upon the pay levels of comparable positions within BMS’s peer group and the unique qualifications and experience of the individual executives. Merit increases for these executives are determined based upon both the performance of an individual and the size of BMS’s merit increase budget in a given year. The BMS Compensation Committee reviews results of surveys that forecast what other companies’ salary increase budgets will be. The BMS Compensation Committee typically sets the annual salary increase budgets based upon the median of such forecasts. Salary adjustments are also typically granted when executives assume significant increases in responsibility.
Messrs. Golsby and Urbain received merit increases in April 2008 and Messrs. Jakobsen and Hondmann received merit increases in July 2008 based on their individual performance of Results and Behaviors, as described under “—Determining the Individual Compensation of Our Named Executive Officers for 2008”, and their relative market position. These increases ranged from 4% to 5% and were within the guidelines established for all employees based upon competitive benchmarking. Mr. Leemputte was not eligible for a merit increase during 2008 because he was hired in September 2008.
101
In addition, the BMS S&B Committee granted base salary increases to Messrs. Urbain and Jakobsen, effective January 1, 2009. In the case of Mr. Urbain, this increase was granted in connection with his promotion to the position of President, Asia and Europe, and in the case of Mr. Jakobsen, this increase was granted in connection with his promotion to the position of President, Americas.
Annual Incentive Awards
Annual incentive awards under BMS’s Performance Incentive Plan are designed to reward the executives for achieving short-term financial and operational goals and to reward their individual performance, consistent with the BMS pay for performance philosophy. An executive’s annual incentive award opportunity is a percentage of his/her base salary as determined by the individual’s job level.
For 2008, the adjusted annual incentive target award for each of our Named Executive Officers under BMS’s Performance Incentive Plan was determined based 50% on BMS’s performance measured against pre-established net operating cash flow goals (a measure expressed as an absolute dollar amount that was used for the first time in 2008 and that includes net income, working capital, capital expenditures, capitalized software, depreciation and amortization, taxes and other miscellaneous components) and 50% on BMS’s performance measured against target non-U.S. GAAP diluted earnings per share (a measure that was used in 2007). For 2008, BMS eliminated division-specific financial goals used for prior years (i.e., divisional pre-tax earnings and sales goals) and replaced them with BMS cash flow goals in order to create more seamless teamwork across BMS. This change served to align all BMS bonus participants worldwide with the interests of BMS stockholders as well as drive cross-divisional cooperation to maximize corporate-level financial performance. The 2008 net operating cash flow goal was $3.333 billion and the target non-U.S. GAAP diluted earnings per share was $1.54. Both of these targets reflect adjustments made in June 2008 in accordance with the terms of BMS’s Performance Incentive Plan to reflect discontinued operations. BMS’s actual performance against the non-U.S. GAAP diluted earnings per share goal was $1.74, or 113.0% of target, and BMS’s actual performance against the net operating cash flow target was $3.852 billion, or 115.6% of target.
BMS’s performance measured against these goals was used to determine each participant’s adjusted target annual incentive award opportunity for 2008. The actual amount of each participant’s bonus was based 100% on individual performance relating to Results and Behaviors, as described under “—Determining the Individual Compensation of Our Named Executive Officers for 2008”, and was paid at a level ranging from 100-110% of each participant’s adjusted target bonus. In past years, at least half of each participant’s bonus was tied to the achievement of corporate or divisional objectives. Tying 100% of bonus earnings to individual performance for 2008 gave BMS more leverage to raise the level of personal accountability within the organization.
On February 19, 2009, the BMS Compensation Committee met and approved 2008 annual incentive award payouts under the BMS Performance Incentive Plan. Actual annual incentives paid to our Named Executive Officers under the BMS Performance Incentive Plan for 2008 were as follows:
| | | | | | | | | |
Name | | Target
Annual Incentive | | Actual
Annual Incentive | | % of
Target | |
Mr. Golsby | | $ | 337,206 | | $ | 593,483 | | 176 | % |
Mr. Leemputte | | $ | 82,499 | | $ | 131,998 | | 160 | % |
Mr. Urbain | | $ | 152,790 | | $ | 244,464 | | 160 | % |
Mr. Jakobsen | | $ | 101,955 | | $ | 179,441 | | 176 | % |
Mr. Hondmann | | $ | 107,988 | | $ | 172,781 | | 160 | % |
102
These actual payout amounts shown above are also reported in the Non-Equity Incentive Plan Compensation column of the Summary Compensation Table below.
Long-Term Incentive Awards
Long-term incentives are designed to tie executive interests to the interests of BMS stockholders. The ultimate value of long-term awards is driven by stock price, which provides a direct link to the creation of stockholder value. In addition, the BMS long-term incentive program is designed to reward individual performance. During 2008, BMS offered three long-term award vehicles, each of which serves a different purpose.
| | • | | Long-Term Performance Awards to reward the achievement of internal financial goals; |
| | • | | Stock Option Awards to reward the creation of incremental stockholder value; and |
| | • | | Restricted Stock Unit Awards to help BMS retain key talent. |
The following graph shows the 2008 target mix of the long-term incentives for each of our Named Executive Officers:
BMS typically makes annual grants of long-term performance awards, stock option awards and restricted stock unit awards on the first Tuesday in March to coincide with meetings of the BMS Compensation Committee and the full BMS Board. BMS believes that consistent timing of equity award grants is a good corporate governance practice that reduces the risk in selecting a grant date with a preferential stock price. Mr. Leemputte received grants of stock option and restricted stock unit awards on October 1, 2008, which was the first business day of the month following his date of hire, consistent with BMS’s practice of granting equity-based awards to new hires, as described under “—Equity Grant Policy”.
All of the long-term incentive awards granted by BMS and held by our Named Executive Officers have remained outstanding following our initial public offering, and BMS continues to treat each of our Named Executives Officers as an employee of BMS for purposes of continued vesting pursuant to these awards.
103
As the chart below details, approximately 66.7% of the target long-term incentives mix for our Named Executive Officers for 2008 only became payable based on the achievement of performance criteria, including the performance of BMS common stock:
The following is an explanation of the three categories of the BMS long-term incentive awards that relate to our Named Executive Officers for 2008:
Long-Term Performance Awards
This type of award, which is denominated in the form of a target number of performance shares, is based on three-year performance cycles. The target number of performance shares in an executive’s award is tied to his or her grade level. The higher an executive’s grade level, the larger the target award because executives in successively higher grade levels have correspondingly greater levels of responsibility. The following paragraphs describe each grant of long-term performance awards held by our Named Executive Officers that was outstanding during 2008.
2006-2008 Award: BMS granted a long-term performance award in 2006 which covered the three-year performance period 2006-2008. BMS granted each of Messrs. Golsby, Urbain and Hondmann a 2006-2008 award. Mr. Jakobsen was not eligible to receive this award. Mr. Leemputte did not receive a 2006-2008 award because he was not employed by BMS at the time of grant. Each award was based 50% on cumulative non-U.S. GAAP diluted earnings per share and 50% on cumulative net sales over the performance period and was subject to a total stockholder return multiplier. During this period the non-U.S. GAAP diluted earnings per share target was $3.92 and the cumulative net sales target was $59.049 billion. BMS believes that these targeted levels of performance were challenging but achievable and reflected anticipated business conditions and changes to BMS’s drug portfolio over the performance period. Minimum performance of 92% of target on either the earnings per share or sales portion of the award was necessary for a threshold payout of 45% for that portion of the award. Maximum performance of 110% of target would have resulted in a payout of 220% for that portion of the award. Additionally, the final payout could have been adjusted by up to plus or minus 15% based on total stockholder return versus BMS’s peer group.
Below are the achievement levels for the 2006-2008 performance cycle as they relate to Messrs. Golsby, Urbain and Hondmann:
| | | | | | | | | | | | |
| | | Target | | Actual | | Achievement | | | Payout | |
Earnings Per Share | | | $ 3.92 | | | $ 4.31 | | 109.9 | % | | 219.2 | % |
Net Sales | | $ | 59.049 billion | | $ | 58.488 billion | | 99.0 | % | | 95.2 | % |
Combined | | | | | | | | | | | 173.0 | %* |
| * | Reflects a 10% increase based on BMS’s achievement of total stockholder return for this period. |
104
2007-2009 Award: In 2007, the long-term performance award design for the 2007-2009 performance period (and for subsequent periods, as deemed appropriate by the BMS Compensation Committee) was modified such that the BMS Compensation Committee will approve annual earnings per share and sales targets at the beginning of each of the three years of the cycle, with final payout made at the end of the three-year performance period. Under the prior program design, three-year cumulative earnings per share and sales targets were set at the beginning of the three-year performance period. BMS determined that the change made for the 2007-2009 performance period provides for a better link between performance and payout because it eliminates the need to project performance beyond one year. This closer line of sight will help to avoid situations where unforeseen events lead to performance targets that are either overstated or understated and do not appropriately support BMS’s pay for performance philosophy. BMS also eliminated a feature used in previous years in which payouts were adjusted based upon its three-year total stockholder return versus that of its competitors because, under Section 162(m) of the Internal Revenue Code of 1986, as amended (Code), BMS is not permitted to combine a three-year total stockholder return measure with financial goals that are set annually. Given that long-term performance awards are denominated and paid in shares, however, a strong link to stockholder return remains.
BMS granted each of our Named Executive Officers a 2007-2009 award, other than Mr. Leemputte, who was not employed by BMS at the time of grant. This award is based 50% on non-U.S. GAAP diluted earnings per share and 50% on net sales. In March 2007, the BMS Compensation Committee approved 2007 earnings per share and sales targets under the 2007-2009 award. The 2007 non-U.S. GAAP diluted earnings per share target was $1.25 and the 2007 net sales target was $19.262 billion. In January 2008, the BMS Compensation Committee approved the 2008 earnings per share and sales targets under the 2007-2009 award. The 2008 non-U.S. GAAP diluted earnings per share target was $1.54 and the 2008 net sales target was $19.627 billion. Both of these targets reflect adjustments made in June 2008 in accordance with the terms of BMS’s equity incentive plan to reflect discontinued operations. The final one-third of the award will be tied to 2009 annual targets. Upon completion of the three-year cycle, award earnings on each one-third of the award will be tallied and a payout will be made. An achievement of 92% on a given performance measure will yield a payout of 45% of target for that portion of the award. Achievement below 92% will yield no payout. Achievement levels of 110% or higher will yield a maximum payout of 220% for that portion of the award.
Below are the achievement levels for the first and second years of the 2007-2009 performance cycle as they relate to our Named Executive Officers:
| | | | | | | | | | | | |
2007 | | Target | | Actual | | Achievement | | | Payout | |
Earnings Per Share | | | $ 1.25 | | | $ 1.48 | | 118.4 | % | | 220.0 | % |
Net Sales | | $ | 19.262 billion | | $ | 19.977 billion | | 103.7 | % | | 127.1 | % |
Combined | | | | | | | | | | | 173.6 | % |
| | | | |
2008 | | Target | | Actual | | Achievement | | | Payout | |
Earnings Per Share | | | $ 1.54 | | | $ 1.74 | | 113.0 | % | | 220.0 | % |
Net Sales | | $ | 19.627 billion | | $ | 20.597 billion | | 104.9 | % | | 144.1 | % |
Combined | | | | | | | | | | | 182.1 | % |
The first-year payout under the 2007-2009 award was 173.6%, a payout factor which applies to one-third of the target award only. The second-year payout under the 2007-2009 award was 182.1%, which also applies to one-third of the target award only. The payouts on these portions of the award are fixed, but will not be paid until the completion of the three-year cycle. The final one-third of the award will be tied to 2009 annual targets. Upon completion of the three-year cycle, award earnings on each third of the award will be tallied and a payout will be made.
2008-2010 Award: In 2008, the long-term performance award design for the 2008-2010 performance period was similar to the long-term performance award design for the 2007-2009 performance period described above, except that the award payout schedule differs from the 2007-2009 performance period awards. BMS granted each of our Named Executive Officers a 2008-2010 award (based on a fixed number of shares, rather than a dollar
105
amount), other than Mr. Leemputte, who was not employed by BMS at the time of grant. Each such award is based 50% on non-U.S. GAAP diluted earnings per share and 50% on net sales. The 2008 non-U.S. GAAP diluted earnings per share target was $1.54 and the 2008 net sales target was $19.627 billion. Both of these targets reflect an adjustment made in June 2008 in accordance with the terms of BMS’s equity incentive plan to reflect discontinued operations due to BMS’s divestiture of a business unit. Under the awards granted for the 2008-2010 performance period, an achievement of 80% on a given performance measure will yield a payout of 40% of target for that portion of the award, achievement below 80% will yield no payout and achievement levels of 115% or higher will yield a maximum payout of 165% for that portion of the award.
Below are the achievement levels for the first year of the 2008-2010 performance cycle as they relate to our Named Executive Officers:
| | | | | | | | | | | | |
2008 | | Target | | Actual | | Achievement | | | Payout | |
Earnings Per Share | | | $ 1.54 | | | $ 1.74 | | 113.0 | % | | 155.0 | % |
Net Sales | | $ | 19.627 billion | | $ | 20.597 billion | | 104.9 | % | | 110.8 | % |
Combined | | | | | | | | | | | 132.9 | % |
The first-year payout under the 2008-2010 award was 132.9%, a payout factor which applies to one-third of the target award only. The payout on this portion of the award is fixed, but will not be paid until the completion of the three-year cycle. In year two of the performance cycle, another one-third of the target award will be tied to 2009 annual targets, and the final one-third of the award will be tied to 2010 annual targets. Upon completion of the three-year cycle, award earnings on each third of the award will be tallied and a payout will be made.
Special 2008-2010 Award: To drive continued cost reductions and productivity improvements over the next three years, BMS granted a special, one-time long-term performance award to all BMS executives worldwide including each of our Named Executive Officers, other than Mr. Leemputte, in 2008. The payout of this award is tied to the extent that net operating cash flow and pretax profit margin goals, which will be approved annually by the BMS Compensation Committee, are achieved over the 2008-2010 performance period. The 2008 net operating cash flow target was $3.333 billion and the 2008 pretax profit margin target was 18.8%. Both of these targets reflect adjustments made in June 2008 in accordance with the terms of BMS’s equity incentive plan to reflect discontinued operations. BMS’s actual performance against the pretax profit margin goal was 20.7%, or 110.1% of target. BMS’s actual performance against the net operating cash flow target was $3.852 billion, or 115.6% of target. Approximately 100 of the top executives of BMS including, prior to our initial public offering, each of our Named Executive Officers, other than Mr. Leemputte, are normally eligible for long-term performance awards on an annual basis. For this group, the special award was granted by BMS in addition to a regular 2008-2010 long-term performance award and was granted in the same amount as the regular award (based on a fixed number of shares, rather than a dollar amount). These awards have the same payout schedule as the regular 2008-2010 long-term performance awards described above.
Below are the achievement levels for the first year of the special 2008-2010 performance cycle as they relate to our Named Executive Officers:
| | | | | | | | | | | | | | |
2008 | | Target | | | Actual | | | Achievement | | | Payout | |
Earnings Per Share | | $ | 3.333 billion | | | $ | 3.852 billion | | | 115.6 | % | | 165.0 | % |
Net Sales | | | 18.8 | % | | | 20.7 | % | | 110.1 | % | | 139.0 | % |
Combined | | | | | | | | | | | | | 152.1 | % |
The first-year payout under the Special 2008-2010 award was 152.1%, a payout factor which applies to one-third of the target award only. The payout on this portion of the award is fixed, but will not be paid until the completion of the three-year cycle. In year two of the performance cycle, another one-third of the target award will be tied to 2009 annual targets, and the final one-third of the award will be tied to 2010 annual targets. Upon completion of the three-year cycle, award earnings on each third of the award will be tallied and a payout will be made.
106
Mr. Leemputte was hired in September 2008 and has not received a grant of BMS long-term performance awards.
Stock Option Awards
BMS grants stock options to executives as an incentive to create long-term stockholder value. The size of the annual award an executive receives is tied to a combination of grade level and individual performance. Within each grade level, for 2008, BMS established a fixed-value guideline award (based on a fixed dollar amount). In prior years, BMS used a fixed-share guideline (based on a fixed number of shares). BMS shifted to fixed-value awards to deliver a targeted amount of value to employees at the grant date regardless of changes in stock price and option valuation assumptions over time. On an individual level, the executive may receive more than or less than the award guideline, or potentially no award at all, based upon the executive’s performance versus pre-established performance standards (a process which is described under “—BMS Performance Management System”). Each stock option’s exercise price per share is equal to the fair market value per share of BMS common stock on the date of grant. These options vest 25% per year over four years following the date of grant, except that Mr. Leemputte’s initial stock option award contains special accelerated vesting provisions, which are described under “—Special Compensation Arrangements with Mr. Leemputte”.
Restricted Stock Unit Awards
BMS grants service-based restricted stock unit awards to assist BMS in retaining key talent. The size of the annual award an executive receives is determined in the same manner as that described above for stock option awards. Annual grants of restricted stock units vest 25% per year over four years following the date of grant, except that Mr. Leemputte’s initial restricted stock unit award contains special accelerated vesting provisions, which are described under “—Special Compensation Arrangements with Mr. Leemputte”.
To further enhance the link between executive pay and BMS’s performance against its business strategy, BMS determined the size of the stock option awards and restricted stock unit awards for 2008 for each of our Named Executive Officers, other than Mr. Leemputte, in large part based on the assessment of the executive’s measured performance against objectives that drive the BMS business strategy and demonstration of behaviors consistent with the BMS Pledge and the Core BMS Behaviors under the BMS Performance Management System. BMS guidelines, which are established based on competitive benchmarking, provide that employees can receive between 0% and 150% of their targeted award based on individual performance.
In March 2008, our Named Executive Officers, other than Mr. Leemputte, received stock option grants and restricted stock unit awards ranging from 105% to 115% of the established guidelines.
Individual Compensation Arrangements
BMS has entered into retention agreements with Messrs. Golsby, Urbain, Jakobsen and Hondmann. In addition, Mr. Leemputte’s and Mr. Hondmann’s offer letters provide for certain compensation and benefits. These individual arrangements are described in this section.
Retention Agreements
BMS has entered into retention agreements with certain executives, including each of our Named Executive Officers, other than Mr. Leemputte. These agreements enable management to evaluate and support a range of potential transactions (such as our initial public offering) that might be beneficial to stockholders of BMS. Additionally, the agreements provide for continuity of management in the event of such a transaction. The agreements provide for a special performance bonus equal to up to each applicable Named Executive Officer’s target annual BMS bonus as of the closing of the transaction (except that for Mr. Golsby, the special performance bonus will range from an amount equal to one times his target annual BMS bonus up to $1.6 million, as
107
determined by the BMS Compensation Committee in its discretion) in the event such a transaction is consummated, as well as a pro rata bonus at the executive’s target level under BMS’s annual bonus plan in the event the executive’s employment is transferred along with Mead Johnson’s business. The special performance bonus is payable in two installments. The first installment was paid within 30 days following completion of our initial public offering. The second installment is payable within 30 days of the six-month anniversary of completion of our initial public offering, subject to the Named Executive Officer’s continued employment on the payment date. However, the second installment will also be paid upon an involuntary termination of employment prior to such six-month anniversary. Pursuant to these agreements, Mr. Golsby received a cash bonus of $500,000, Messrs. Urbain and Jakobsen each received a cash bonus of $85,000 and Mr. Hondmann received a cash bonus of $55,311, each as the first installment of the special performance bonus. The second installment will be in the same amount as the first for each of our Named Executive Officers.
The retention agreements also provide for enhanced severance benefits in the event the executive’s employment is terminated for reasons other than cause within 12 months following completion of our initial public offering. If such a termination of employment had occurred during 2008 prior to the effectiveness of the amendments to the retention agreements described below, the executive would have been entitled to receive the greater of 18 months (for Mr. Golsby) or one year (for Messrs. Urbain, Jakobsen and Hondmann) of base pay or the severance benefits under the applicable BMS severance plan.
The retention agreements became effective in November 2007 and initially covered transactions that occur through April 20, 2009. The BMS Compensation Committee reviewed the benefits provided under the agreements to ensure they met its needs. Based on recommendations from Frederic W. Cook & Co., as described under “—Our Post-Offering Compensation Program”, for 2008, the BMS Compensation Committee decided to amend the retention agreements to (i) include initial public offerings of more than 10% of Mead Johnson as a covered transaction (which occurred in connection with our initial public offering), (ii) extend the period during which a covered transaction could occur to December 31, 2009, (iii) increase the severance protection period to 18 months following consummation of the transaction and (iv) increase the severance benefits to the greater of two years (for Mr. Golsby) or 18 months (for Messrs. Urbain, Jakobsen and Hondmann) of base pay or the severance benefits under the applicable BMS severance plan. Also, the amendment provided that the change-in-control agreements with Messrs. Golsby and Urbain will continue to apply with respect to a change in control of BMS following our initial public offering, and that Messrs. Jakobsen and Hondmann would continue to be entitled to participate in BMS’s Change in Control Separation Benefits Plan, as described under “—Change-in-Control Arrangements” and “—Mead Johnson Program Distinctions from the BMS Program—Change-in-Control Arrangements” below. The BMS Compensation Committee will continue to conduct reviews on an annual basis to ensure the retention agreements and the change-in-control agreements conform to applicable BMS policies and competitive practices. The value of these benefits for our Named Executive Officers, other than Mr. Leemputte, determined as if employment terminated on December 31, 2008, is provided below in the Post-Termination Benefits section.
Special Compensation Arrangements with Mr. Leemputte
In connection with hiring Mr. Leemputte to become our Chief Financial Officer, BMS provided him with an offer letter that entitles him to certain compensation and benefits. This included a $300,000 cash sign-on bonus, $200,000 in sign-on BMS stock option awards and $800,000 in sign-on BMS restricted stock unit awards. The BMS Compensation Committee determined these amounts to be appropriate to compensate Mr. Leemputte for the equity-based awards he forfeited when he left his prior employer and to provide him with an incentive to join Mead Johnson. These stock option and restricted stock unit awards were granted on October 1, 2008 in connection with commencing employment. These stock option and restricted stock unit awards vest 25% per year over four years and provide for immediate vesting upon an involuntary termination of Mr. Leemputte’s employment for reasons other than cause. Mr. Leemputte is also eligible to participate in the Mead Johnson bonus plan (with a target bonus of 85% of base salary) and to receive a Mead Johnson 2009 annual performance share award (targeted at $700,000), a Mead Johnson 2009 annual stock option award (targeted at $700,000) and a
108
Mead Johnson founder’s award of restricted stock units (targeted at $700,000) under our stock award and incentive plan. The founder’s award was granted to Mr. Leemputte on February 11, 2009, as described under “—Founder’s Awards” below.
In accordance with his offer letter, if Mr. Leemputte is terminated without cause or terminates his employment for good reason, he is entitled to the greater of 18 months base salary or the severance he would have been entitled to under the Bristol-Myers Squibb Company Severance Plan. Further, if BMS divests Mead Johnson and Mr. Leemputte is involuntarily terminated without cause within 18 months thereafter, BMS will pay Mr. Leemputte the same severance amount described above. If Mr. Leemputte is terminated more than 18 months following the divestiture by BMS, severance benefits (if any) will be paid by the successor company.
Other Elements of 2008 Compensation
In addition to the components set forth above, BMS senior executives, including each of our Named Executive Officers, were entitled to participate in the following programs in 2008:
| | • | | Post-Employment Benefits |
| | • | | Qualified and Non-Qualified Retirement Plans |
| | • | | Qualified and Non-Qualified Savings Plans |
| | • | | Non-Qualified Annual Incentive Deferral Plan |
| | • | | Change-in-Control Arrangements |
| | • | | General Employee Benefits |
Post-Employment Benefits
BMS offers certain plans which provide compensation and benefits to employees, including our Named Executive Officers, if their employment is terminated. These plans are periodically reviewed by the BMS Compensation Committee to ensure that they are consistent with competitive practice. The plans offered are common within BMS’s peer group and enhance its ability to attract and retain key talent.
Qualified and Non-Qualified Retirement Plans: During 2008, each of our Named Executive Officers, other than Mr. Jakobsen, participated in BMS’s defined benefit plans for U.S. employees, which provide income for employees following retirement. The BMS Retirement Income Plan is a tax-qualified plan, as defined under Internal Revenue Service (IRS) regulations, and the BMS Benefit Equalization Plan—Retirement Plan is a non-qualified plan that provides pension benefits above those allowed under the contribution limits for tax-qualified plans. All U.S. employees of BMS who are not participants in a pension plan through a collective bargaining agreement are eligible for the qualified plan if they work at least 1,000 hours per year, and employees who participate in the BMS Performance Incentive Plan or whose pay or benefits exceeds the IRS qualified plan limits are eligible for the non-qualified plan. Mr. Jakobsen was a U.S. expatriate prior to January 1, 2009, and during his expatriate assignment, he participated in the BMS Key International Pension Plan. This plan provides defined benefit retirement benefits to employees of BMS categorized as U.S. expatriates. The Summary Compensation Table reflects the increase in 2008 in the actuarial value of these benefits. Accrued benefits for each of our Named Executive Officers, determined as of December 31, 2008, are provided in the Pension Benefits Table. Mr. Jakobsen became eligible to participate in the U.S. retirement plans on January 1, 2009 as part of BMS’s inpatriate package.
Qualified and Non-Qualified Savings Plans: During 2008, each of our Named Executive Officers, other than Messrs. Jakobsen and Leemputte, participated in BMS’s savings plans for U.S. employees, which allow employees to defer a portion of their base salary and to receive matching contributions from BMS to supplement
109
their income in retirement. The BMS Savings and Investment Program is a tax-qualified 401(k) plan, as defined under IRS regulations, and the BMS Benefit Equalization Plan–Savings Plan is a non-qualified deferred compensation plan that allows employees to defer a portion of their base salary and to receive matching contributions from BMS in excess of the contributions allowed under the BMS Savings and Investment Program. The savings plans are designed to allow employees to accumulate savings for retirement on a tax-advantaged basis. All U.S. employees of BMS are eligible to participate in the qualified plan, and employees who participate in the qualified plan who participate in the BMS Performance Incentive Plan or whose pay or benefits exceeds the IRS qualified plan limits are eligible for the non-qualified plan. The Summary Compensation Table reflects BMS contributions to these plans during 2008. The Non-Qualified Deferred Compensation Table provides more detail on the BMS Benefits Equalization Plan—Savings Plan. Mr. Jakobsen became eligible to participate in the savings plans on January 1, 2009 as part of BMS’s inpatriate package.
Non-Qualified Annual Incentive Deferral Plan: BMS maintains a non-qualified deferred compensation program which is available to all executives of BMS, including our Named Executive Officers. The program provides a benefit to eligible employees by allowing them to defer taxes on earned compensation. This is a common program within BMS’s competitive peer group. Under the program, executives are permitted to defer up to 100% of their annual cash incentive awards into a choice of two funds: (1) a BMS common stock unit fund and (2) a U.S. Treasury Bill fund. BMS does not pay above-market interest rates on these investments. Upon retirement or termination of employment, the employee is eligible to receive the deferred amounts based on a previously-selected payout schedule. The BMS Compensation Committee may approve accelerated distributions in the event of an unforeseeable emergency. In 2008, our Named Executive Officers did not defer their annual incentive award payments. The Non-Qualified Deferred Compensation Table provides more detail on this program for these executives who participated in the plan in previous years.
Severance Plan: The Bristol-Myers Squibb Senior Executive Severance Plan provides a competitive level of severance protection for certain senior executives to help BMS attract and retain key talent necessary to run BMS. This plan covers 15 BMS executives, including Mr. Golsby. Severance benefits for Messrs. Leemputte, Urbain, Jakobsen and Hondmann are covered by the broad-based Bristol-Myers Squibb Company Severance Plan and calculated based on years of service. Mr. Leemputte’s offer letter also contains special severance benefits, as described under “—Special Compensation Arrangements with Mr. Leemputte”. The retention agreements with Messrs. Golsby, Urbain, Jakobsen and Hondmann also contain special severance benefits, as described under “—Retention Agreements”. The value of the severance benefits for our Named Executive Officers, determined as if employment terminated on December 31, 2008, is shown below in the Post-Termination Benefits section.
Change-in-Control Arrangements: BMS has entered into change-in-control agreements with certain executives including, as of December 31, 2008, Messrs. Golsby, Leemputte and Urbain. These agreements enable management to evaluate and support potential transactions that might be beneficial to stockholders even though the result would be a change in control of BMS. Additionally, the agreements provide for continuity of management in the event of a change in control. BMS’s agreements require a “double-trigger” before any payments are made to an executive. This means that payments are only made in the event of a change in control and subsequent involuntary termination or termination for good reason of the executive within three years after a change in control.
Consistent with competitive practice, if payments made to a covered executive are subject to the excise tax applicable to excess parachute payments pursuant to the Code, BMS will gross up the compensation to fully offset the excise tax. However, if the payment does not exceed the excise tax threshold by more than 10%, BMS will reduce the payment so that no portion of the payment is subject to excise tax and no gross-up will be made. Based on a review conducted by Mercer, BMS believes that this is a best practice relating to change-in-control arrangements.
The change-in-control agreements become effective on January 1 of each year and remain in effect through December 31 of that year. These agreements are automatically extended, beginning on each January 1, unless
110
either BMS or the executive gives prior notice of termination of the agreement or a change in control shall have occurred prior to January 1 of such year. If a change in control occurs during the term of the agreement, the agreement will continue in effect for a period of not less than 36 months beyond the month in which the change in control occurred. The change-in-control agreements that were in effect for 2008 with Messrs. Golsby, Leemputte and Urbain expired on December 31, 2008 and, effective January 1, 2009, they were replaced by change-in-control agreements with substantially similar terms that have been updated to address the requirements of Section 409A of the Code (Section 409A).
The BMS Compensation Committee reviews the benefits provided under the agreements on an annual basis to ensure they meet BMS’s needs and, with Mercer’s assistance, ensure that the benefits are within competitive parameters. The BMS Compensation Committee will continue to conduct such reviews on an annual basis to ensure the agreements conform to applicable BMS policies and competitive practices.
As of December 31, 2008, Messrs. Jakobsen and Hondmann were covered by the broad-based Bristol-Myers Squibb Company Change-in-Control Separation Benefits Plan. This plan provides enhanced severance benefits in the event of a “double-trigger” termination of employment for reasons other than for cause or due to a good reason resignation within three years following a change in control. On January 1, 2009, Mr. Jakobsen became eligible to receive a change-in-control agreement similar to the agreements with Messrs. Leemputte and Urbain and ceased participation in the Bristol-Myers Squibb Company Change-in-Control Separation Benefits Plan.
The value of these benefits for each of our Named Executive Officers, determined as if employment terminated on December 31, 2008, is provided in the Post-Termination Benefits section below. The change-in-control arrangements between BMS and our Named Executive Officers will remain in effect for so long as BMS continues to hold a majority ownership position in Mead Johnson.
Limited Perquisites
During 2008, each of our Named Executive Officers was entitled to receive an annual physical examination, subject to a dollar limit. In addition, Mr. Golsby received two annual home leave trips to Thailand and related tax gross-ups, as well as furniture storage in Thailand. Since our initial public offering, Mr. Golsby is no longer entitled to such perquisites. As a U.S. expatriate during 2008, Mr. Jakobsen was entitled to receive certain personal benefits pursuant to BMS’s expatriate policy, including housing, subject to a dollar limit, a car for foreign locations, where appropriate, and tax preparation services.
Effective January 1, 2008, BMS eliminated the following perquisites provided to its senior executives, including Messrs. Golsby and Urbain: a company car, financial counseling and tax preparation for the 2008 calendar year and later. On January 1, 2008, Messrs. Golsby and Urbain received base salary increases averaging 3% to partially offset the elimination of these perquisites.
As of January 1, 2009, Mr. Urbain became a U.S. expatriate and participates in BMS’s expatriate program. As of January 1, 2009, Mr. Jakobsen was no longer a U.S. expatriate. Instead, Mr. Jakobsen became a U.S. local employee, but he is entitled to continue to receive certain transitional benefits pursuant to BMS’s inpatriate package.
General Employee Benefits
BMS maintains medical and dental insurance, accidental death insurance and disability insurance for all of its employees. Prior to our initial public offering, our Named Executive Officers were eligible to participate in these programs. In addition, they were covered by BMS’s vacation, leave of absence and similar policies.
Tax Implications of Executive Compensation Program
During 2008, none of the compensation paid to our Named Executive Officers was subject to the limitations on the deductibility of compensation in excess of $1 million under Section 162(m) of the Code. This is because our Named Executive Officers were not among the executives of BMS that are subject to Section 162(m) of the Code.
111
Corporate Governance Policies Covering Executive Compensation
Share Ownership and Retention Guidelines
In order to preserve the link between the interests of BMS senior executives and those of stockholders, BMS executives are expected to use the BMS shares acquired upon the exercise of their BMS stock options, after satisfying the cost of exercise and taxes, to establish and maintain a significant level of direct ownership in BMS. This same expectation applies to shares acquired upon the vesting of BMS restricted stock units. BMS continues to maintain longstanding share ownership expectations for BMS’s senior executives. BMS’s guidelines require that each of Messrs. Golsby, Leemputte and Urbain hold BMS shares with a value of three times his base salary. Messrs. Golsby, Leemputte and Urbain may sell up to 50% of their shares until the share ownership guideline is met, after which they are permitted to sell any additional shares they receive. Messrs. Golsby, Leemputte and Urbain were in compliance with BMS’s share ownership and retention guidelines during 2008.
During 2008, Messrs. Jakobsen and Hondmann were not subject to share ownership and retention guidelines with respect to BMS shares. However, effective January 1, 2009, Mr. Jakobsen became subject to these guidelines.
The BMS share ownership guidelines remain applicable to each of our Named Executive Officers, other than Mr. Hondmann, for a period of six months following our initial public offering, after which they will not be required to retain their BMS shares. Immediately following our initial public offering, each of our Named Executive Officers became subject to Mead Johnson’s share ownership and retention guidelines, as described under “—MJN Corporate Governance Polices Covering Executive Compensation”.
Recoupment of Compensation
BMS maintains clawback provisions relating to BMS stock options, restricted stock units and long-term performance awards. Under these clawback provisions, executives that violate non-competition or non-solicitation agreements, or otherwise act in a manner detrimental to BMS’s interests, forfeit any outstanding awards as of the date such violation is discovered and have to return any gains realized in the twelve months prior to the violation. These provisions serve to protect our intellectual property and human capital and those of BMS, and help ensure that executives act in the best interest of BMS and its stockholders.
In 2005, the BMS Board adopted a policy wherein the BMS Board will seek reimbursement of annual incentives paid to an executive if such executive engages in misconduct that caused or partially caused a restatement of financial results. In such an event, BMS will seek to claw back the executive’s entire annual incentive for the relevant period, plus a reasonable rate of interest. This policy may be viewed on BMS’s website atwww.bms.com.
Equity Grant Policy
The BMS Compensation Committee approved a policy covering BMS equity grants to all employees.
Approval of Awards
| | • | | Awards granted to the Chief Executive Officer of BMS must be approved by the full BMS Board. |
| | • | | The BMS Compensation Committee must approve awards to all other employees, including our Named Executive Officers. |
Grant Effective Date
Annual Awards
| | • | | For regularly-scheduled annual awards, the grant effective date is the date in March on which the BMS Compensation Committee and full BMS Board meet. |
112
All Other Awards
| | • | | For awards granted to current employees at any other time during the year, the grant effective date is the first business day of the month following the approval date, except that if the approval date falls on the first business day of a given month, the grant effective date is the approval date. |
| | • | | For awards granted to new hires, the grant effective date is the first business day of the month following the employee’s hire date, except that if the employee’s hire date falls on the first business day of a given month, the grant effective date is the employee’s hire date. |
In no case whatsoever will the grant effective date precede the approval date of a given award.
Grant Price
| | • | | The grant price of any and all awards is the fair market value (FMV) of BMS’s common stock as of the grant effective date. |
| | • | | The FMV is defined under the stockholder-approved stock incentive plan pursuant to which the award is granted. Under the plan currently in effect, the 2007 Stock Award and Incentive Plan, FMV equals the closing price on the date of grant. |
Policy Against Repricing Stock Options
BMS has always maintained a consistent policy against repricing of BMS stock options. BMS believes this is a critical element in maintaining the integrity of the equity compensation program and ensuring alignment of senior executives’ interests with the interests of stockholders. The BMS Board has adopted a formal policy prohibiting the repricing of BMS stock options. This policy may be viewed on BMS’s website atwww.bms.com.
Policy Regarding Stockholder Approval of Severance
The BMS Board has approved a policy requiring stockholder approval of any future agreements that provide for cash severance payments in excess of 2.99 times the sum of an executive’s base salary plus annual incentive. “Cash severance payments” exclude accrued incentive payments, the value of equity acceleration, benefits continuation or the increase in retirement benefits triggered by severance provisions or tax gross-up payments. This policy may be viewed on BMS’s website atwww.bms.com.
Our Post-Offering Compensation Program
The following section describes the compensation program that we have implemented following our initial public offering. BMS engaged Frederic W. Cook & Co. prior to our initial public offering to assist in designing our post-offering compensation program, and the MJN Compensation Committee expects to identify its own compensation consultant for purposes of advising on its compensation planning decisions, but has not yet done so.
MJN Compensation Committee
The MJN Compensation Committee, which was appointed by the MJN Board, determines the design of our executive compensation program. The MJN Compensation Committee will annually review and evaluate our executive compensation program to ensure that the program is aligned with our compensation philosophy.
113
Peer Group Analysis
Frederic W. Cook & Co. identified the following peer group of companies that BMS used for competitive benchmarking of the compensation program for Mead Johnson. Our peer group consists of the following companies:
| | |
| Alberto-Culver Company | | Herbalife Ltd. |
| Allergan, Inc. | | The Hershey Company |
| Campbell Soup Company | | H.J. Heinz Company |
| Church & Dwight Co., Inc. | | The J.M. Smucker Company |
| The Clorox Company | | Kellogg Company |
| Del Monte Foods Company | | McCormick & Company, Incorporated |
| Energizer Holdings, Inc. | | Tupperware Brands Corporation |
| The Estée Lauder Companies Inc. | | |
We believe this peer group is appropriate given the unique nature of the consumer packaged goods industry. We note that the companies in our peer group were chosen for a variety of reasons, including because they are comparable in size to us in terms of sales volume and our market capitalization.
Board Approval of Certain Compensation Arrangements
On December 5, 2008, the MJN Board met to review and approve Mead Johnson’s global plan structure and plan design, including certain compensation plans and arrangements for Mead Johnson employees that generally became effective following our initial public offering. The plans included the 2009 Stock Award and Incentive Plan and the 2009 Senior Executive Performance Incentive Plan. The MJN Board also approved guidelines for granting founder’s awards based on an employee’s grade level as described below in “—Mead Johnson Program Distinctions from the BMS Program”. In addition, the MJN Board approved the general plan design for the retirement, savings and health and welfare benefit plans that are generally applicable to employees of Mead Johnson.
Founder’s Awards
Prior to our initial public offering, the MJN Board approved founder’s awards of Mead Johnson restricted stock units, subject to completion of the offering. On February 11, 2009, we granted an aggregate of 321,917 restricted stock units as founder’s awards to approximately 140 of our employees, including each of our Named Executive Officers. Mr. Golsby received a founder’s award of 62,500 restricted stock units, Mr. Leemputte received a founder’s award of 29,167 restricted stock units, Messrs. Urbain and Jakobsen each received a founder’s award of 16,667 restricted stock units and Mr. Hondmann received a founder’s award of 9,375 restricted stock units. The founder’s awards will vest in equal installments on each of the third, fourth and fifth anniversaries of the date of grant. The value of the founder’s awards was tied to each employee’s grade level.
Individual Post-Offering Compensation Arrangements
Prior to our initial public offering, the BMS Compensation Committee approved, with input from Frederic W. Cook & Co., a compensation package for Mr. Golsby that became effective upon the consummation of our initial public offering. The compensation package includes an annual base salary of $900,000, a target annual incentive award opportunity equal to 115% of his base salary and annual long-term incentive awards with a target value of $3 million. Mr. Golsby’s total direct compensation (total cash compensation plus the value of long-term incentives) is targeted at between the 25th percentile and the median of our peer group of companies, as described above under “—Peer Group Analysis”, which was recommended by Frederic W. Cook & Co. as an appropriately competitive level given that Mr. Golsby is a new Chief Executive Officer. The BMS Compensation Committee determined that Mr. Golsby’s long-term incentive awards will be comprised of an equal value of performance shares, which are expected to be similar to those described under “—Long-Term Performance Awards” above, and stock options, on the terms described below under “—Mead Johnson Program Distinctions from the BMS Program”. In addition, the BMS Compensation
114
Committee approved a grant to Mr. Golsby of a founder’s award of restricted stock units with a value targeted at $1.5 million on the effective date of our initial public offering, on the terms described below under “—Mead Johnson Program Distinctions from the BMS Program”.
On February 18, 2009 the MJN Compensation Committee approved a compensation package for each of Messrs. Urbain and Jakobsen that has applied since that date. The compensation package includes, for each individual, an annual base salary of $500,000, a target annual incentive award opportunity equal to 70% base salary and annual long-term incentive awards with a target value of $800,000. Consistent with BMS compensation practices, we anticipate that Messrs. Urbain and Jakobsen’s long-term incentive awards will also be comprised of an equal value of performance shares, which are expected to be similar to those described under “—Long-Term Performance Awards” above, and stock options, on the terms described below under “—Mead Johnson Program Distinctions from the BMS Program”.
For a description of Mr. Leemputte’s compensation arrangements, as set forth in his offer letter, see “—Special Compensation Arrangements with Mr. Leemputte” above.
Mead Johnson Program Distinctions from the BMS Program
While we are still in the process of determining specific details of our compensation program, except as noted below, we currently expect that our compensation program will generally be similar to BMS’s compensation program. We anticipate that our compensation program will differ from BMS’s compensation program in the following respects:
| | • | | Individual Award Levels: Rather than having two separate ratings for Behaviors and Results to determine individual award levels, as described under “—Determining the Individual Compensation of our Named Executive Officers for 2008”, there will be a single rating that will be based primarily on Results. |
| | • | | Stock Option Awards: We will grant annual stock option awards with respect to our common stock to our Named Executive Officers and other senior executives under our 2009 Stock Award and Incentive Plan as an incentive to create long-term stockholder value. These awards will include performance-based exercise thresholds. To satisfy the exercise threshold, our common stock will need to close at a price at least 15% above the option exercise price for at least seven consecutive trading days. Although the options will vest according to a normal vesting schedule (25% per year over four years), an executive will not be able to exercise the options unless and until the exercise threshold is satisfied. Therefore, the executive will not realize any value related to these options until our stock price appreciates at least 15%. This threshold strengthens the link between the value realized by the executive and the creation of value for the stockholders. |
| | • | | Restricted Stock Unit Awards: We do not intend to grant service-based restricted stock unit awards on an annual basis because we desire to have all long-term incentive compensation programs be performance-based. However, we granted restricted stock units as “founder’s awards”, as described under “—Founder’s Awards” above, and we will grant additional restricted stock unit awards, when needed, to hire or retain employees. |
| | • | | Change-in-Control Arrangements: We have not adopted a change in control severance plan and we have not entered into any individual change-in-control arrangements with respect to a change in control of Mead Johnson, but as long as BMS continues to hold a majority ownership position in Mead Johnson, BMS will continue to offer coverage under the Bristol-Myers Squibb Company Change-in-Control Separation Benefits Plan to employees of Mead Johnson and the individual change-in-control arrangements between BMS and each of our Named Executive Officers, as applicable, will remain in effect. |
| | • | | Assignment Arrangements: Mr. Urbain has entered into a letter agreement regarding his employment assignment to Thailand that will entitle him to participate in BMS’s expatriate program, and Mr. Jakobsen has entered into a letter agreement regarding his employment assignment to the United States that will entitle him to participate in BMS’s inpatriate program. |
115
Corporate Governance Policies Covering Executive Compensation
The BMS share ownership guidelines will remain applicable to each of our Named Executive Officers, other than Mr. Hondmann, for a period of six months following the offering, after which they will not be required to retain their BMS shares. We have adopted similar share ownership guidelines with respect to Mead Johnson shares. Our guidelines require that Mr. Golsby hold Mead Johnson shares with a value of five times his base salary and that all remaining senior executives, including each of our Named Executive Officers, hold Mead Johnson shares with a value of three times their base salary, before they can sell any net shares following the exercise of options or the vesting of restricted stock units. Once these share ownership guidelines are attained, the executive must retain 75% of all net shares acquired following any subsequent option exercises or vesting of restricted stock units for a period of one year. We are currently considering whether to adopt other governance policies similar to those applicable to BMS.
Compensation Committee Report
The MJN Compensation Committee has reviewed and discussed with management the Compensation Discussion and Analysis on pages 94 to 116 of this Annual Report required under Item 402(b) of Regulation S-K. Based on its review and discussions with management, the MJN Compensation Committee recommended to the full MJN Board that the Compensation Discussion and Analysis be included in this Annual Report.
Compensation Committee
Howard B. Bernick, Chair
Dr. Steven M. Altschuler
Lamberto Andreotti
John E. Celentano
James M. Cornelius
Jean-Marc Huet
Compensation Committee Interlocks and Insider Participation
None of our executive officers serves, or in the past year has served, as a member of the board of directors or compensation committee of any entity that has one or more executive officers who serve on our board of directors or compensation committee.
116
Summary Compensation Table
The following tables and notes present the compensation during fiscal year 2008 provided to Stephen W. Golsby, President and Chief Executive Officer of Mead Johnson, Peter G. Leemputte, Senior Vice President and Chief Financial Officer of Mead Johnson, Charles M. Urbain, President, Asia and Europe of Mead Johnson, Peter Kasper Jakobsen, President, Americas of Mead Johnson and Dirk H. Hondmann, Senior Vice President, Global Research and Development of Mead Johnson.
Summary Compensation Table
2008 Fiscal Year
| | | | | | | | | | | | | | | | | | | | | | | | | | |
Name and
Principal Position(1) | | Year | | Salary(2)
($) | | Bonus
($) | | Stock
Awards(3)
($) | | Option
Awards(4)
($) | | Non-Equity
Incentive Plan
Compensation(5)
($) | | Change in
Pension
Value and
Non-Qualified
Deferred
Compensation
Earnings(6)
($) | | All Other
Compensation(7)
($) | | Total
($) |
Stephen W. Golsby President and Chief Executive Officer, Mead Johnson | | 2008 | | $ | 561,871 | | $ | 0 | | $ | 1,060,375 | | $ | 568,674 | | $ | 593,483 | | $ | 492,008 | | $ | 81,928 | | $ | 3,358,339 |
| | | | | | | | | |
Peter G. Leemputte Senior Vice President and Chief Financial Officer, Mead Johnson | | 2008 | | $ | 148,077 | | $ | 300,000 | | $ | 50,342 | | $ | 11,981 | | $ | 131,998 | | $ | 61,606 | | $ | 0 | | $ | 704,004 |
| | | | | | | | | |
Charles M. Urbain President, Asia and Europe, Mead Johnson | | 2008 | | $ | 381,866 | | $ | 0 | | $ | 502,945 | | $ | 186,084 | | $ | 244,464 | | $ | 362,764 | | $ | 17,327 | | $ | 1,695,450 |
| | | | | | | | | |
Peter Kasper Jakobsen President, Americas, Mead Johnson | | 2008 | | $ | 291,256 | | $ | 0 | | $ | 241,661 | | $ | 57,703 | | $ | 179,441 | | $ | 110,130 | | $ | 310,018 | | $ | 1,190,209 |
| | | | | | | | | |
Dirk H. Hondmann Senior Vice President, Global Research and Development, Mead Johnson | | 2008 | | $ | 308,460 | | $ | 0 | | $ | 382,433 | | $ | 69,813 | | $ | 172,781 | | $ | 52,894 | | $ | 13,881 | | $ | 1,000,262 |
(1) | Reflects position as of January 1, 2009. Messrs. Golsby, Urbain and Jakobsen served in different positions during 2008 as described above in the CD&A. |
(2) | Reflects actual salary earned. Mr. Leemputte’s salary was paid from September 22, 2008, the date he assumed the position of Senior Vice President and Chief Financial Officer, through year-end. |
(3) | Represents expense recognized by BMS in 2008 under FAS 123R (without regard to estimated forfeitures) for BMS restricted stock, restricted stock units and long-term performance awards (which are denominated as performance shares). Restricted stock granted prior to 2007 is valued based on the average of the high and low prices on the grant date. Restricted stock units granted in 2007 and thereafter are valued based on the BMS closing price on the grant date. BMS pays dividends on unvested restricted stock and restricted stock units. The value of the right to receive dividends is included in the valuation of the restricted stock and restricted stock units. Long-term performance awards granted prior to 2007 are valued based on the average of the high and low prices on the grant date. The 2006-2008 award is valued using a Monte Carlo model, which results in a fair value of 88% of the average of the high and low prices on the grant date. The 2007-2009 and 2008-2010 awards are valued based on the BMS closing price on the grant date. The value of the awards will be amortized over the performance period of the award and adjusted for projected performance. |
117
(4) | Represents expense recognized by BMS in 2008 under FAS 123R (without regard to estimated forfeitures) for BMS stock options. The table below contains the assumptions used to value the awards included in the 2008 expense, which reflects the unamortized portion of the then outstanding stock option awards. |
| | | | | | | | | | | | | | | | | |
Expense
Year | | Grant
Date | | Expected
Term
(years) | | Volatility
(%) | | | Risk-
Free
Rate
(%) | | | Dividend
Yield
(%) | | | Black-
Scholes
Ratio | | Award Recipient |
2008 | | 3/2/04 | | 7 | | 30.0 | % | | 3.5 | % | | 4.4 | % | | 0.2117 | | Mr. Golsby, Mr. Urbain,
Mr. Jakobsen |
2008 | | 3/1/05 | | 7 | | 29.4 | % | | 4.4 | % | | 4.6 | % | | 0.2166 | | Mr. Golsby, Mr. Urbain,
Mr. Jakobsen |
2008 | | 10/3/05 | | 7 | | 28.3 | % | | 4.4 | % | | 4.8 | % | | 0.2038 | | Mr. Hondmann |
2008 | | 3/7/06 | | 6 | | 26.3 | % | | 4.6 | % | | 4.8 | % | | 0.1874 | | Mr. Golsby, Mr. Urbain,
Mr. Jakobsen,
Mr. Hondmann |
2008 | | 12/1/06 | | 6 | | 28.1 | % | | 4.7 | % | | 4.7 | % | | 0.2815 | | Mr. Golsby |
2008 | | 3/6/07 | | 6 | | 29.0 | % | | 4.7 | % | | 4.5 | % | | 0.2177 | | Mr. Golsby, Mr. Urbain,
Mr. Jakobsen,
Mr. Hondmann |
2008 | | 3/4/08 | | 7 | | 31.0 | % | | 3.2 | % | | 4.3 | % | | 0.2167 | | Mr. Golsby, Mr. Urbain,
Mr. Jakobsen, Mr. Hondmann |
2008 | | 10/1/08 | | 7 | | 31.5 | % | | 3.2 | % | | 5.1 | % | | 0.1960 | | Mr. Leemputte |
(5) | Represents the annual cash incentive award for 2008 earned under the BMS Performance Incentive Plan. Payments were made on March 13, 2009. |
(6) | Reflects an increase in estimated value of accrued benefits during the year. BMS does not pay above-market interest rates on deferred compensation. For Mr. Urbain, reflects the change in the United Kingdom Bristol-Myers Pension Plan benefits based on a conversion from British pounds to U.S. dollars as of the year-end exchange ratio. |
(7) | Includes value of perquisites and BMS contributions to the BMS qualified and Benefits Equalization Plan savings plans. Details of the components in this column are provided in a separate table below. |
All Other Compensation Detail
2008 Fiscal Year
| | | | | | | | | | | | | | | | | | |
Name | | Year | | Car(1)
($) | | Tax
Preparation(2)
($) | | Total
Perquisites
and Other
($) | | | BMS
Contributions to
Savings Plans
($) | | Total All Other
Compensation
($) |
Stephen W. Golsby | | 2008 | | $ | 0 | | $ | 2,000 | | $ | 56,643 | (3)(4) | | $ | 25,284 | | $ | 81,928 |
Peter G. Leemputte | | 2008 | | $ | 0 | | $ | 0 | | $ | 0 | | | $ | 0 | | $ | 0 |
Charles M. Urbain | | 2008 | | $ | 0 | | $ | 0 | | $ | 143 | (3) | | $ | 17,184 | | $ | 17,327 |
Peter Kasper Jakobsen | | 2008 | | $ | 26,855 | | $ | 0 | | $ | 310,018 | (5) | | $ | 0 | | $ | 310,018 |
Dirk H. Hondmann | | 2008 | | $ | 0 | | $ | 0 | | $ | 0 | | | $ | 13,881 | | $ | 13,881 |
(1) | Reflects the value of a company car and a driver for personal travel while in Asia. |
(2) | Reflects bills paid for tax preparation services. |
(3) | Includes the cost of physical exams reimbursed by BMS and/or laboratory tests performed by BMS medical staff. These benefits were available to all executives of BMS. |
(4) | Includes the cost of two home leave trips to Thailand ($30,345) and related tax gross-ups ($19,907) as well as the cost of furniture storage in Thailand ($4,363). |
(5) | Includes the following benefits related to Mr. Jakobsen’s U.S. expatriate status: allowance for the cost of living differential between the United States and Thailand ($4,986); hardship allowance ($29,126); housing allowance ($69,273); education allowance for children’s schooling ($2,872); Thai taxes paid on Mr. Jakobsen’s behalf ($175,608); visa and work permit fees ($404); and club dues ($894). |
118
Grants of Plan-Based Awards
2008 Fiscal Year
| | | | | | | | | | | | | | | | | | | | | | | | | | | | | | |
Name | | Grant
Date(1) | | Approval
Date(1) | | Estimated Future Payouts
Under Non-Equity Incentive
Plan Awards(2) | | Estimated Future Payouts
Under Equity Incentive
Plan Awards | | | All
Other
Stock
Awards:
# of
Shares of
Stock or
Units(6) | | All
Other
Option
Awards:
# of
Securities
Under-
lying
Options(7) | | Exercise
or Base
Price of
Option
Awards
($/Share)(8) | | Grant
Date Fair
Value of
Stock
and
Option
Awards(9)
($) |
| | | | Threshold
($) | | Target
($) | | Maximum
($) | | Threshold
(#) | | Target
(#) | | Maximum
(#) | | | | | |
Stephen W. Golsby | | | | | | $ | 134,882 | | $ | 337,206 | | $ | 872,521 | | | | | | | | | | | | | | | | | |
| | 3/25/08 | | 1/22/08 | | | | | | | | | | | 731 | | 3,250 | | 7,150 | (3) | | | | | | | | | $ | 154,440 |
| | 3/19/08 | | 1/22/08 | | | | | | | | | | | 650 | | 3,250 | | 5,363 | (4) | | | | | | | | | $ | 115,079 |
| | 3/19/08 | | 1/22/08 | | | | | | | | | | | 650 | | 3,250 | | 5,363 | (5) | | | | | | | | | $ | 115,079 |
| | 3/4/08 | | | | | | | | | | | | | | | | | | | | 12,154 | | | | | | | $ | 269,090 |
| | 3/4/08 | | | | | | | | | | | | | | | | | | | | | | 55,463 | | $ | 22.14 | | $ | 266,095 |
| | | | | | | | | | | | |
Peter G. Leemputte | | | | | | $ | 33,000 | | $ | 82,499 | | $ | 213,466 | | | | | | | | | | | | | | | | | |
| | 10/1/08 | | 9/2/08 | | | | | | | | | | | | | | | | | | 38,480 | | | | | | | $ | 799,999 |
| | 10/1/08 | | 9/2/08 | | | | | | | | | | | | | | | | | | | | 46,722 | | $ | 20.79 | | $ | 190,394 |
| | | | | | | | | | | | |
Charles M. Urbain | | | | | | $ | 61,116 | | $ | 152,790 | | $ | 395,344 | | | | | | | | | | | | | | | | | |
| | 3/25/08 | | 1/22/08 | | | | | | | | | | | 368 | | 1,637 | | 3,601 | (3) | | | | | | | | | $ | 77,790 |
| | 3/19/08 | | 1/22/08 | | | | | | | | | | | 327 | | 1,636 | | 2,699 | (4) | | | | | | | | | $ | 57,929 |
| | 3/19/08 | | 1/22/08 | | | | | | | | | | | 327 | | 1,636 | | 2,699 | (5) | | | | | | | | | $ | 57,929 |
| | 3/4/08 | | | | | | | | | | | | | | | | | | | | 5,588 | | | | | | | $ | 123,718 |
| | 3/4/08 | | | | | | | | | | | | | | | | | | | | | | 25,509 | | $ | 22.14 | | $ | 122,384 |
| | | | | | | | | | | | |
Peter Kasper Jakobsen | | | | | | $ | 40,782 | | $ | 101,955 | | $ | 263,809 | | | | | | | | | | | | | | | | | |
| | 3/25/08 | | 1/22/08 | | | | | | | | | | | 256 | | 1,137 | | 2,501 | (3) | | | | | | | | | $ | 54,030 |
| | 3/19/08 | | 1/22/08 | | | | | | | | | | | 227 | | 1,136 | | 1,874 | (4) | | | | | | | | | $ | 40,225 |
| | 3/19/08 | | 1/22/08 | | | | | | | | | | | 227 | | 1,136 | | 1,874 | (5) | | | | | | | | | $ | 40,225 |
| | 3/4/08 | | | | | | | | | | | | | | | | | | | | 3,881 | | | | | | | $ | 85,925 |
| | 3/4/08 | | | | | | | | | | | | | | | | | | | | | | 17,681 | | $ | 22.14 | | $ | 84,828 |
| | | | | | | | | | | | |
Dirk H. Hondmann | | | | | | $ | 43,195 | | $ | 107,988 | | $ | 279,419 | | | | | | | | | | | | | | | | | |
| | 3/25/08 | | 1/22/08 | | | | | | | | | | | 256 | | 1,137 | | 2,501 | (3) | | | | | | | | | $ | 54,030 |
| | 3/19/08 | | 1/22/08 | | | | | | | | | | | 227 | | 1,136 | | 1,874 | (4) | | | | | | | | | $ | 40,225 |
| | 3/19/08 | | 1/22/08 | | | | | | | | | | | 227 | | 1,136 | | 1,874 | (5) | | | | | | | | | $ | 40,225 |
| | 3/4/08 | | | | | | | | | | | | | | | | | | | | 4,250 | | | | | | | $ | 94,095 |
| | 3/4/08 | | | | | | | | | | | | | | | | | | | | | | 19,365 | | $ | 22.14 | | $ | 92,907 |
(1) | The grant date for annual BMS stock option and restricted stock unit awards is the date the BMS Compensation Committee approved the awards. The grant date for off-cycle BMS stock option and restricted stock unit awards is the first business day of the month following approval of the awards. The grant date for the BMS long-term performance awards is the date the awards were communicated to award recipients; the approval date is the date the BMS Compensation Committee approved the awards. |
(2) | Target payouts under the BMS Performance Incentive Plan are based on a targeted percentage of base salary earned during the year. The BMS Compensation Committee reviews financial and individual objectives in determining the actual bonus as reported in the Summary Compensation Table. “Maximum” represents the maximum level of performance for which payouts are authorized under BMS’s 2008 annual incentive program. “Threshold” represents the minimum level of performance for which payouts are authorized under BMS’s 2008 annual incentive program. Maximum and threshold percentages were the same for all participants in the BMS Performance Incentive Plan. |
(3) | Reflects the second tranche of the BMS 2007-2009 long-term performance award program. Performance targets under the BMS 2007-2009 long-term performance award program are set on an annual basis over a three-year period at the beginning of each performance year and are based one-half on sales and one-half on earnings per share. At the end of each year, performance is assessed versus the target sales and earnings per share to determine how many shares are earned. An actual payout will be made at the end of the three-year period. For each yearly tranche, threshold performance on both measures will result in a payout of 45% of target; performance below threshold on either measure but not both measures will result in a payout of 22.5% of target, which is the threshold amount shown above; maximum performance will result in a payout of 220% of target; performance above the maximum level will result in the maximum payout. |
(4) | Reflects the first tranche of the BMS 2008-2010 regular long-term performance award program. Performance targets under the BMS 2008-2010 regular long-term performance award program are set on an annual basis over a three-year period at the beginning of each performance year and are based one-half on sales and one-half on earnings per share. At the end of each year, performance is assessed versus the target sales and earnings per share to determine how many shares are earned. An actual payout will be made at the end of the three-year period. For each yearly tranche, threshold performance on both measures will result in a payout of 40% of target; performance below threshold on either measure but not both measures will result in a payout of 20% of target, which is the threshold amount shown above; maximum performance will result in a payout of 165% of target; performance above the maximum level will result in the maximum payout. |
119
(5) | Reflects the first tranche of the BMS 2008-2010 special long-term performance award program. Performance targets under the BMS 2008-2010 special long-term performance award program are set on an annual basis over a three-year period at the beginning of each performance year and are based one-half on operating cash flow and one-half on pre-tax profit margin. At the end of each year, performance is assessed versus the target pre-tax profit margin and operating cash flow to determine how many shares are earned. An actual payout will be made at the end of the three-year period. For each yearly tranche, threshold performance on both measures will result in a payout of 40% of target; performance below threshold on either measure but not both measures will result in a payout of 20% of target, which is the threshold amount shown above; maximum performance will result in a payout of 165% of target; performance above the maximum level will result in the maximum payout. |
(6) | BMS restricted stock unit awards vest in equal installments over 4 years. For Mr. Leemputte, notwithstanding the normal vesting schedule, this restricted stock unit award will vest fully upon an involuntary termination of Mr. Leemputte’s employment for reasons other than cause. |
(7) | BMS stock option awards vest in equal installments over 4 years. For Mr. Leemputte, notwithstanding the normal vesting schedule, this stock option will vest fully upon an involuntary termination of Mr. Leemputte’s employment for reasons other than cause. |
(8) | The exercise price equals the closing price of our common stock on the date of grant. |
(9) | Fair value of awards under the BMS long-term performance award program is based on the maximum number of shares earnable and the grant-date closing price of $21.46 on 3/19/2008 for the first tranche of the 2008-2010 awards and $21.60 on 3/25/2008 for the second tranche of the 2007-2009 award. Fair value of BMS stock options is based on the number of underlying shares, the exercise price, and Black-Scholes ratios of 0.2167 for the 3/4/2008 grant and 0.1960 for the 10/1/2008 grant. Fair value of BMS restricted stock units is based on the number of units and the grant-date closing price of $22.14 on 3/4/2008 and $20.79 on 10/1/2008. Specific valuation assumptions relating to BMS stock options are provided in footnote 4 to the Summary Compensation Table. |
120
Outstanding Equity Awards At Fiscal Year-End
2008 Fiscal Year
| | | | | | | | | | | | | | | | | | | | |
| | | Option Awards | | Stock Awards |
| | | Number of Securities
Underlying Unexercised
Options (#) | | | Option
Exercise
Price
($) | | Option
Expiration
Date | | Number of
Shares or
Units of
Stock
That
Have Not
Vested(2)
(#) | | | Market
Value of
Shares or
Units of
Stock That
Have Not
Vested(3)
($) | | Equity
Incentive Plan
Awards:
Number of
Unearned
Shares,
Units or
Rights That
Have Not
Vested (#) | | Equity
Incentive Plan
Awards:
Market or
Payout
Value of
Unearned
Shares,
Units or
Rights That
Have Not
Vested(3)
($) |
Name | | Exercisable | | Unexercisable(1) | | | | | | | |
Stephen W. Golsby | | 25,660 | | 0 | (4) | | $ | 62.95 | | 1/3/09 | | 6,667 | (7) | | $ | 155,008 | | | | |
| | 2,524 | | 0 | (6) | | $ | 61.09 | | 1/2/10 | | 2,256 | (7) | | $ | 52,452 | | | | |
| | 26,817 | | 0 | (4) | | $ | 42.64 | | 3/6/10 | | 4,741 | (7) | | $ | 110,228 | | | | |
| | 14,789 | | 14,789 | (4)(14) | | $ | 59.78 | | 3/5/11 | | 4,428 | (8) | | $ | 102,951 | | | | |
| | 32,000 | | 0 | (4) | | $ | 48.08 | | 3/4/12 | | 10,000 | (9) | | $ | 232,500 | | | | |
| | 36,500 | | 0 | (4) | | $ | 23.14 | | 3/3/13 | | 8,410 | (8) | | $ | 195,533 | | | | |
| | 40,600 | | 0 | (4) | | $ | 28.11 | | 3/1/14 | | 12,154 | (8) | | $ | 282,581 | | | | |
| | 32,000 | | 10,667 | (4) | | $ | 25.45 | | 2/28/15 | | 5,642 | (10) | | $ | 131,177 | | | | |
| | 18,572 | | 18,573 | (4) | | $ | 22.73 | | 3/6/16 | | 5,918 | (11) | | $ | 137,594 | | | | |
| | 0 | | 100,000 | (5)(15) | | $ | 24.74 | | 11/30/16 | | 4,319 | (12) | | $ | 100,417 | | | | |
| | 11,215 | | 33,647 | (4) | | $ | 27.01 | | 3/5/17 | | 4,943 | (13) | | $ | 114,925 | | | | |
| | 0 | | 55,463 | (4) | | $ | 22.14 | | 3/3/18 | | | | | | | | | | |
Total | | 240,667 | | 233,139 | | | | | | | | | | | | | | | | |
| | | | | | | | |
Peter G. Leemputte | | 0 | | 46,722 | (4)(16) | | $ | 20.79 | | 9/30/18 | | 38,480 | (8)(16) | | $ | 894,660 | | | | |
| | | | | | | | |
Charles M. Urbain | | 26,817 | | 0 | (4) | | $ | 62.95 | | 1/3/09 | | 1,289 | (7) | | $ | 29,969 | | | | |
| | 2,524 | | 0 | (6) | | $ | 61.09 | | 1/2/10 | | 2,256 | (7) | | $ | 52,452 | | | | |
| | 19,718 | | 0 | (4) | | $ | 42.64 | | 3/6/10 | | 1,950 | (8) | | $ | 45,338 | | | | |
| | 9,859 | | 9,859 | (4)(14) | | $ | 59.78 | | 3/5/11 | | 3,867 | (8) | | $ | 89,908 | | | | |
| | 27,000 | | 0 | (4) | | $ | 48.08 | | 3/4/12 | | 5,588 | (8) | | $ | 129,921 | | | | |
| | 6,719 | | 0 | (4) | | $ | 23.14 | | 3/3/13 | | 2,840 | (10) | | $ | 66,030 | | | | |
| | 23,200 | | 0 | (4) | | $ | 28.11 | | 3/1/14 | | 2,981 | (11) | | $ | 69,308 | | | | |
| | 15,225 | | 5,075 | (4) | | $ | 25.45 | | 2/28/15 | | 2,174 | (12) | | $ | 50,546 | | | | |
| | 4,025 | | 8,050 | (4) | | $ | 22.73 | | 3/6/16 | | 2,488 | (13) | | $ | 57,846 | | | | |
| | 5,158 | | 15,475 | (4) | | $ | 27.01 | | 3/5/17 | | | | | | | | | | |
| | 0 | | 25,509 | (4) | | $ | 22.14 | | 3/3/18 | | | | | | | | | | |
Total | | 140,245 | | 63,968 | | | | | | | | | | | | | | | | |
| | | | | | | | |
Peter Kasper Jakobsen | | 4,732 | | 0 | (4) | | $ | 61.72 | | 3/1/09 | | 434 | (7) | | $ | 10,091 | | | | |
| | 9,465 | | 0 | (4) | | $ | 68.76 | | 11/30/09 | | 1,070 | (7) | | $ | 24,878 | | | | |
| | 1,262 | | 0 | (6) | | $ | 61.09 | | 1/2/10 | | 1,265 | (8) | | $ | 29,411 | | | | |
| | 11,831 | | 0 | (4) | | $ | 42.64 | | 3/6/10 | | 2,814 | (8) | | $ | 65,426 | | | | |
| | 4,732 | | 4,733 | (4)(14) | | $ | 59.78 | | 3/5/11 | | 3,881 | (8) | | $ | 90,233 | | | | |
| | 11,000 | | 0 | (4) | | $ | 48.08 | | 3/4/12 | | 1,972 | (10) | | $ | 45,849 | | | | |
| | 15,955 | | 0 | (4) | | $ | 23.14 | | 3/3/13 | | 2,070 | (11) | | $ | 48,128 | | | | |
| | 11,700 | | 0 | (4) | | $ | 28.11 | | 3/1/14 | | 1,510 | (12) | | $ | 35,108 | | | | |
| | 10,828 | | 3,610 | (4) | | $ | 25.45 | | 2/28/15 | | 1,728 | (13) | | $ | 40,176 | | | | |
| | 5,280 | | 5,280 | (4) | | $ | 22.73 | | 3/6/16 | | | | | | | | | | |
| | 3,745 | | 11,237 | (4) | | $ | 27.01 | | 3/5/17 | | | | | | | | | | |
| | 0 | | 17,681 | (4) | | $ | 22.14 | | 3/3/18 | | | | | | | | | | |
Total | | 90,530 | | 42,541 | | | | | | | | | | | | | | | | |
| | | | | | | | |
Dirk H. Hondmann | | 15,000 | | 7,500 | (4) | | $ | 24.02 | | 10/2/15 | | 6,667 | (7) | | $ | 155,008 | | | | |
| | 2,800 | | 5,600 | (4) | | $ | 22.73 | | 3/6/16 | | 1,350 | (8) | | $ | 31,388 | | | | |
| | 3,575 | | 10,726 | (4) | | $ | 27.01 | | 3/5/17 | | 2,686 | (8) | | $ | 62,450 | | | | |
| | 0 | | 19,365 | (4) | | $ | 22.14 | | 3/3/18 | | 4,250 | (8) | | $ | 98,813 | | | | |
| | | | | | | | | | | | 1,972 | (10) | | $ | 45,849 | | | | |
| | | | | | | | | | | | 2,070 | (11) | | $ | 48,128 | | | | |
| | | | | | | | | | | | 1,510 | (12) | | $ | 35,108 | | | | |
| | | | | | | | | | | | 1,728 | (13) | | $ | 40,176 | | | | |
Total | | 21,375 | | 43,191 | | | | | | | | | | | | | | | | |
121
(1) | Represents unexercisable (unvested) BMS stock options as of 12/31/2008. A portion of the BMS annual stock option grant in 2001 was subject to an exercise threshold described in footnote 14, below. These options appear in this column even if service- based vesting conditions have been met. These stock option awards become exercisable in the ninth year of the award even if the threshold is not met. |
(2) | Represents unvested BMS restricted stock/restricted stock units as of 12/31/2008, as well as long-term performance awards for which performance goals have been achieved as of 12/31/2008 but that remain subject to continued service requirements. |
(3) | Values based on BMS closing stock price on 12/31/2008 of $23.25. |
(4) | These BMS stock option awards granted on 1/4/1999, 3/2/1999, 12/1/1999, 3/7/2000, 3/6/2001, 3/5/2002, 3/4/2003, 3/2/2004, 3/1/2005, 10/3/2005, 3/7/2006, 3/6/2007, 3/4/2008 and 10/1/2008 vest in equal annual installments of 25% over 4 years following the date of grant. |
(5) | This BMS stock option award granted to Mr. Golsby on 12/1/2006 vests in three equal installments at the end of years 3, 4 and 5 following the date of grant. |
(6) | This award was granted in lieu of a portion of the annual incentive for 2000. The award vested 100% one year from the date of grant. |
(7) | BMS restricted stock granted on 2/2/2004, 3/2/2004, 3/1/2005 and 10/3/2005 vests in three equal installments at the end of years 3, 4 and 5 following the grant date. |
(8) | BMS restricted stock granted on 3/7/2006 and BMS restricted stock units granted on 3/6/2007, 3/4/2008 and 10/1/2008 vest 25% per year over four years following the grant dates. |
(9) | This BMS restricted stock unit award granted to Mr. Golsby becomes fully vested at the end of year 5 following the grant date. |
(10) | Reflects the first tranche of the BMS 2007-2009 award at actual performance. |
(11) | Reflects the second tranche of the BMS 2007-2009 award at actual performance. |
(12) | Reflects the first tranche of the BMS 2008-2010 regular award at actual performance. |
(13) | Reflects the first tranche of the BMS 2008-2010 special award at actual performance. |
(14) | 50% of award is subject to a 30% price appreciation threshold. These BMS stock options are not exercisable until the threshold is met and maintained for at least 15 consecutive trading days. As of December 31, 2008, the relevant price appreciation threshold had not been met. |
(15) | 100% of award is subject to a 15% price appreciation threshold. These BMS stock options are not exercisable until the threshold is met and maintained for at least seven consecutive trading days. As of December 31, 2008, the relevant price appreciation threshold had been met. |
(16) | These BMS stock option and restricted stock unit awards granted on 10/1/2008 provide for immediate vesting upon an involuntary termination of Mr. Leemputte’s employment for reasons other than cause. |
Option Exercises and Stock Vesting 2008 Fiscal Year
| | | | | | | | | | | |
Name | | Options(1) | | Stock Awards | |
| | Number of Shares
Acquired on
Exercise (#) | | Value Realized
On Exercise
($) | | Number of Shares
Acquired on
Vesting (#) | | Value Realized
On Vesting
($) | |
Stephen W. Golsby | | 0 | | $ | 0 | | 18,977 | | $ | 432,846 | (2) |
| | | | | | | 13,321 | | $ | 309,713 | (3) |
| | | | |
Peter G. Leemputte | | 0 | | $ | 0 | | 0 | | $ | 0 | (2) |
| | | | | | | 0 | | $ | 0 | (3) |
| | | | |
Charles M. Urbain | | 0 | | $ | 0 | | 11,680 | | $ | 246,820 | (2) |
| | | | | | | 6,747 | | $ | 156,868 | (3) |
| | | | |
Peter Kasper Jakobsen | | 0 | | $ | 0 | | 3,871 | | $ | 84,927 | (2) |
| | | | | | | 0 | | $ | 0 | (3) |
| | | | |
Dirk H. Hondmann | | 0 | | $ | 0 | | 10,903 | | $ | 224,746 | (2) |
| | | | | | | 4,671 | | $ | 108,601 | (3) |
(1) | Reflects shares acquired on BMS stock option exercises. None of the executives exercised option awards in 2008. |
(2) | Reflects BMS restricted shares that vested during 2008. Value realized is based on BMS closing price on vesting date. |
(3) | Reflects BMS 2006-2008 long-term performance award payout based on BMS’s closing stock price on 12/31/2008 of $23.25. The award vested as of 12/31/2008. |
Pension Benefits in 2008 Fiscal Year
Retirement Plan
The BMS Retirement Income Plan is a defined benefit pension plan that provides income for employees after retirement. The BMS Retirement Income Plan is a tax-qualified plan, as defined under Section 401(a) of the
122
Code. The benefit is calculated based on the employee’s final average compensation and years of service. All U.S. employees of BMS who are not participants in a pension plan through a collective bargaining agreement are eligible for the BMS Retirement Income Plan if they work at least 1,000 hours per year. Employees who participate in the BMS Performance Incentive Plan or whose pay or benefits exceed the IRS qualified plan limits are eligible for the BMS Benefit Equalization Plan—Retirement Plan. The key plan provisions of the BMS Retirement Income Plan are as follows:
| | • | | The retirement benefit equals: |
| | • | | 2% x Final Average Compensation x Years of Service, up to 40, minus |
| | • | | 1/70th of the Primary Social Security Benefit x Years of Service, up to 40. |
| | • | | Final Average Compensation equals the average of the five consecutive years out of the last ten in which the employee’s compensation was the highest. Compensation equals the base salary rate, plus bonuses paid during the year. Compensation is subject to the limits defined under Section 401(a) (17) of the Code. |
| | • | | Normal retirement age is 65. Employees are eligible for early retirement at age 55 with 10 or more years of service. |
| | • | | Employees eligible for early retirement may receive their pension without any reduction at age 60. The pension is reduced by 4% for each year that the retirement age precedes age 60. |
| | • | | Employees are 100% vested after attaining five years of service. |
| | • | | The pension is payable as a monthly life annuity, with or without survivor benefits, or a lump sum. |
The BMS Benefit Equalization Plan—Retirement Plan is a non-qualified deferred compensation plan that provides income for employees after retirement in excess of the benefits payable under the qualified BMS Retirement Income Plan. The benefit is calculated using the same formula as the BMS Retirement Income Plan, but without the limits on compensation and benefits imposed under Section 401(a) (17) and Section 415(b) of the Code. The provisions are the same as those above for the BMS Retirement Income Plan, except for the following:
| | • | | Compensation is not subject to the limits under Section 401(a) (17) of the Code. |
| | • | | Compensation includes the higher of bonus earned or paid during the year. |
| | • | | The pension is paid as a cash lump sum or, if an election is made at least 12 months prior to retirement, the lump sum may be credited to the BMS Benefit Equalization Plan—Savings Plan. |
Key International Pension Plan
The BMS Key International Pension Plan is a non-qualified plan. International employees of BMS categorized as U.S. expatriates paid from U.S. expatriate payroll who work at least 1,000 hours per year, nominated for participation by management and approved by the BMS Key International Pension Plan administrator are eligible to participate in the BMS Key International Pension Plan. The plan provides income for these employees after retirement.
The benefit is calculated based on the employee’s final average compensation and years of service. The key plan provisions are as follows:
| | • | | The retirement benefit equals: |
| | • | | 1.75% x Final Average Compensation x Years of Service, up to 40, minus, |
| | • | | 1/70th of the Primary Social Security Benefit x Years of Service, up to 40, only when applicable. |
123
| | • | | Final Average Compensation equals the average compensation in the five consecutive years out of the last ten in which the employee’s compensation was the highest. Compensation equals the base salary rate, plus bonuses paid during the year. |
| | • | | Normal retirement age is 65. Employees are eligible for early retirement at age 55 with 10 or more years of service. |
| | • | | Employees eligible for early retirement may receive their pension without any reduction at age 60. The pension is reduced by 4% for each year that the retirement age precedes age 60. |
| | • | | Employees are 100% vested after attaining five years of service. |
| | • | | The pension is payable as a monthly life annuity, with or without survivor benefits, or a lump sum. |
United Kingdom Bristol-Myers Squibb Company Pension Plan
The United Kingdom Bristol-Myers Pension Plan was a voluntary pension plan that covered BMS employees in the United Kingdom. Since January 1, 1992, the plan has been replaced by the United Kingdom Bristol-Myers Squibb Company Pension Plan with accrued prior plan benefits preserved. The plan was approved by the United Kingdom Inland Revenue Service. The plan was not contracted out from the United Kingdom government pension program, meaning that the benefits were additional to the government pension entitlements. Full-time employees were eligible to participate in the plan. The plan provides income for members after retirement as follows:
| | • | | 2% x Pensionable Salary up to the National Insurance Upper Earnings Limit x years and months of plan membership plus 1.67% of Pensionable Salary above the National Insurance Upper Earnings Limit x Years and months of plan membership, minus The State Pension Deduction. |
| | • | | Average Pensionable Salary equals the average salary in the highest three consecutive years of the last ten years before the employee retires or leaves the company. Pensionable Salary is the base annual salary in effect on April 1. |
| | • | | Normal retirement age is 65. Employees are eligible for early retirement at age 55. Employees who were members of the plan prior to June 1989 are eligible to retire at age 50. |
| | • | | Employees eligible for early retirement may receive their pension without any reduction at age 60. The pension is reduced by 3.6% for each year that the retirement age is between ages 55 and 60 and 6% for each year that the retirement age is between ages 55 and 50. |
| | • | | The pension is payable as a monthly life annuity with an option for partial payment in a cash lump sum. 50% of the pension benefit would continue to the spouse upon death of the retiree. |
| | • | | Contributions to the plan were 1% of Pensionable Salary up to the National Insurance Upper Earnings Limit plus 6% of Pensionable Salary above the National Insurance Upper Earnings Limit. |
| | • | | Employees were eligible to make Additional Voluntary Contributions to the plan. The contributions are held in a separate account for the employee and are paid at retirement. |
124
Present Value of Accumulated Pension Benefits
2008 Fiscal Year
| | | | | | | |
Name | | Plan Name | | # of Years of
Credited Service (#) | | Present Value of
Accumulated Benefits(1) ($) |
Stephen W. Golsby(2) | | BMS Retirement Income Plan | | 4.9 | | $ | 166,093 |
| | BMS Benefits Equalization Plan | | 4.9 | | $ | 588,360 |
| | BMS Key International Pension Plan | | 6.5 | | $ | 876,445 |
| | | |
Peter G. Leemputte | | BMS Retirement Income Plan | | 0.6 | | $ | 19,257 |
| | BMS Benefits Equalization Plan | | 0.6 | | $ | 42,349 |
| | | |
Charles M. Urbain(3) | | BMS Retirement Income Plan | | 19.5 | | $ | 680,771 |
| | BMS Benefits Equalization Plan | | 19.5 | | $ | 1,094,830 |
| | BMS United Kingdom Pension Plan | | 2.4 | | $ | 52,757 |
| | | |
Peter Kasper Jakobsen(4) | | BMS Key International Pension Plan | | 10.8 | | $ | 331,268 |
| | | |
Dirk H. Hondmann | | BMS Retirement Income Plan | | 3.6 | | $ | 69,334 |
| | BMS Benefits Equalization Plan | | 3.6 | | $ | 64,921 |
(1) | Reflects the present value of the accumulated pension benefits as of December 31, 2008. The present value of accumulated benefits has been calculated based on the following assumptions which were used in BMS’s December 31, 2008 disclosure in BMS’s Annual Report on Form 10-K for the BMS Retirement Income Plan, the BMS Benefits Equalization Plan and the BMS Key International Pension Plan: |
| | • | | 65% lump sum utilization for the BMS Retirement Income Plan/BMS Key International Pension Plan and 100% lump sum utilization for the BMS Benefits Equalization Plan. |
| | • | | 6.5% discount rate for annuities and 5.75% discount rate for lump sums. |
| | • | | the RP 2000 mortality table projected to 2016 for annuities. |
| | • | | the 2009 lump sum mortality table under Section 417(e)(3) of the Code (combined annuitant and nonannuitant RP 2000 mortality table with projections blended 50% male/50% female) for lump sums. |
These assumptions are the same as those disclosed in BMS’s Annual Report on Form 10-K in conformity with U.S. GAAP. The actual benefit received will vary based on a number of factors including final pay, years of service and interest rates at the time of retirement. No pension payments were made to any Named Executive Officer under these plans in 2008.
(2) | Mr. Golsby was a U.S. expatriate from October 1997 until January 2004, and, therefore, was eligible to participate in the BMS Key International Pension Plan. |
(3) | Mr. Urbain was a participant in the United Kingdom Bristol-Myers Pension Plan from February 1987 to July 1989, before he relocated to the United States. The value was converted from British pound to U.S. dollar as of the year-end exchange ratio. |
(4) | As a U.S. expatriate, Mr. Jakobsen is not eligible to participate in the BMS Retirement Income and BMS Benefit Equalization Plans. Instead, he is eligible to participate in the BMS Key International Pension Plan. |
Non-Qualified Deferred Compensation Plan
The BMS Benefit Equalization Plan—Savings Plan is a non-qualified deferred compensation plan that allows employees to defer a portion of their base salary and to receive BMS matching contributions in excess of contributions allowed under the BMS Savings and Investment Program. The BMS Savings and Investment Program is a tax-qualified plan, as defined under Section 401(a) and Section 401(k) of the Code. Employees who participate in the BMS Performance Incentive Plan or whose pay or benefits exceed the IRS qualified plan limits are eligible for the BMS Benefit Equalization Plan—Savings Plan. The key provisions of the BMS Benefit Equalization Plan—Savings Plan are as follows:
| | • | | Contributions to the BMS Benefit Equalization Plan—Savings Plan begin once the employee’s total base salary paid for the year exceeds the limit under Section 401(a) (17) of the Code, or total contributions to the BMS Savings and Investment Program exceed the limits under Section 415(c) of the Code. |
125
| | • | | Employees may defer up to 20% of their base salary. |
| | • | | BMS matching contribution equals 75% of the employee’s contribution, up to 6% of base salary. |
| | • | | The plan is not funded. Benefits are paid from the general assets of BMS. |
| | • | | Employees may allocate their contributions among 13 different investment options. |
| | • | | The employee’s full balance under the BMS Benefit Equalization Plan—Savings Plan is paid following termination of employment, or, if an election is made at least 12 months prior to termination, the payments may be deferred until a later date, no sooner than five years following the termination date. |
Non-Qualified Deferred Compensation
2008 Fiscal Year
| | | | | | | | | | | | | | | | |
Name | | Executive
Contributions
in Last FY
($) | | Registrant
Contributions
in Last FY
($) | | Aggregate
Earnings
in Last FY(2)
($) | | | Aggregate
Withdrawals/
Distributions
($) | | Aggregate
Balance at
Last FYE(5)
($) |
Stephen W. Golsby(1) | | $ | 33,187 | | $ | 14,934 | | $ | 7,588 | | | $ | 0 | | $ | 230,979 |
Peter G. Leemputte(3) | | $ | 0 | | $ | 0 | | $ | 0 | | | $ | 0 | | $ | 0 |
Charles M. Urbain(1) | | $ | 15,187 | | $ | 6,834 | | $ | (20,273 | ) | | $ | 0 | | $ | 148,303 |
Peter Kasper Jakobsen(4) | | $ | 0 | | $ | 0 | | $ | 0 | | | $ | 0 | | $ | 0 |
Dirk H. Hondmann(1) | | $ | 4,708 | | $ | 3,531 | | $ | (3,739 | ) | | $ | 0 | | $ | 18,242 |
(1) | Reflects BMS non-qualified savings and investment program. Executive contributions are included in the Salary column and registrant contributions are included in the All Other Compensation column of the Summary Compensation Table. |
(2) | BMS does not pay above-market interest rates on non-qualified deferred compensation. |
(3) | Mr. Leemputte did not participate in the BMS non-qualified savings and investment program. |
(4) | As a U.S. expatriate, Mr. Jakobsen was not eligible to participate in the BMS non-qualified savings and investment program in 2008. |
(5) | Portions of the amounts shown in this column have been included in 2008 compensation reflected in the Salary and All Other Compensation columns of the Summary Compensation Table, as follows: |
| | | | | | | | | |
| | | 2008 |
Name | | Salary
($) | | All Other Compensation
($) | | Total
($) |
Stephen W. Golsby | | $ | 33,187 | | $ | 14,934 | | $ | 48,121 |
Peter G. Leemputte | | $ | 0 | | $ | 0 | | $ | 0 |
Charles M. Urbain | | $ | 15,187 | | $ | 6,834 | | $ | 22,021 |
Peter Kasper Jakobsen | | $ | 0 | | $ | 0 | | $ | 0 |
Dirk H. Hondmann | | $ | 4,708 | | $ | 3,531 | | $ | 8,238 |
Other portions of the aggregate balances in this column reflect amounts from 2007 and earlier years.
126
Post-Termination Benefits
The following table illustrates the potential payments and benefits under BMS’s plans and programs to our Named Executive Officers upon a termination of employment assuming an effective termination date of December 31, 2008. To the extent payments and benefits are generally available to salaried employees on a non-discriminatory basis, they are excluded from the table.
Termination of Employment Obligations (Excluding Vested Benefits)
2008 Fiscal Year
| | | | | | | | | | | | | | | | | | | | | | | | | | | | | | | | | | | | |
Name | | Cash
Severance
(1)($) | | Special
Bonus
(2)($) | | Non-
Equity
Annual
Incentive
(3)($) | | In the
Money
Value
of
Options
(4)($) | | Restricted
Stock
Awards
(5)($) | | Long-
Term
Perfor-
mance
Plan
(6)($) | | Retire-
ment
(7)($) | | Savings
Plan
Balances
(8)($) | | Health,
Perquisites
and
Other
Benefits
(9)($) | | Retiree
Medical
(10)($) | | Total
($) | | Gross-Up
on Excise
Taxes
(11)($) |
Involuntary Termination Not for Cause |
Stephen W. Golsby | | $ | 851,696 | | $ | 0 | | $ | 593,483 | | $ | 9,658 | | $ | 414,734 | | $ | 215,342 | | $ | 0 | | $ | 0 | | $ | 302,161 | | $ | 0 | | $ | 2,387,072 | | $ | 0 |
Peter G. Leemputte | | $ | 825,000 | | $ | 0 | | $ | 131,998 | | $ | 0 | | $ | 0 | | $ | 0 | | $ | 0 | | $ | 0 | | $ | 22,090 | | $ | 0 | | $ | 979,088 | | $ | 0 |
Charles M. Urbain(12) | | $ | 415,350 | | $ | 0 | | $ | 244,464 | | $ | 0 | | $ | 0 | | $ | 0 | | $ | 0 | | $ | 0 | | $ | 21,432 | | $ | 0 | | $ | 681,246 | | $ | 0 |
Peter Kasper Jakobsen | | $ | 179,921 | | $ | 0 | | $ | 179,441 | | $ | 2,746 | | $ | 48,569 | | $ | 75,284 | | $ | 0 | | $ | 0 | | $ | 38,038 | | $ | 0 | | $ | 523,998 | | $ | 0 |
Dirk H. Hondmann | | $ | 316,063 | | $ | 0 | | $ | 172,781 | | $ | 2,912 | | $ | 48,569 | | $ | 75,284 | | $ | 0 | | $ | 0 | | $ | 19,733 | | $ | 0 | | $ | 635,342 | | $ | 0 |
|
Involuntary Termination Not for Cause Following Our Initial Public Offering |
Stephen W. Golsby | | $ | 1,135,594 | | $ | 1,600,000 | | $ | 593,483 | | $ | 9,658 | | $ | 414,734 | | $ | 215,342 | | $ | 0 | | $ | 0 | | $ | 22,161 | | $ | 0 | | $ | 3,990,971 | | $ | 0 |
Peter G. Leemputte | | $ | 825,000 | | $ | 0 | | $ | 131,998 | | $ | 0 | | $ | 0 | | $ | 0 | | $ | 0 | | $ | 0 | | $ | 22,090 | | $ | 0 | | $ | 979,088 | | $ | 0 |
Charles M. Urbain(12) | | $ | 578,523 | | $ | 154,273 | | $ | 244,464 | | $ | 0 | | $ | 0 | | $ | 0 | | $ | 0 | | $ | 0 | | $ | 21,432 | | $ | 0 | | $ | 998,692 | | $ | 0 |
Peter Kasper Jakobsen | | $ | 445,518 | | $ | 103,954 | | $ | 179,441 | | $ | 2,746 | | $ | 48,569 | | $ | 75,284 | | $ | 0 | | $ | 0 | | $ | 46,740 | | $ | 0 | | $ | 902,252 | | $ | 0 |
Dirk H. Hondmann | | $ | 474,095 | | $ | 110,622 | | $ | 172,781 | | $ | 2,912 | | $ | 48,569 | | $ | 75,284 | | $ | 0 | | $ | 0 | | $ | 21,154 | | $ | 0 | | $ | 905,416 | | $ | 0 |
|
Qualifying Termination Within 3 Years Following a Change in Control |
Stephen W. Golsby | | $ | 2,716,341 | | $ | 0 | | $ | 593,483 | | $ | 71,222 | | $ | 1,131,252 | | $ | 484,112 | | $ | 1,768,817 | | $ | 0 | | $ | 347,180 | | $ | 55,238 | | $ | 7,167,644 | | $ | 1,994,805 |
Peter G. Leemputte | | $ | 797,500 | | $ | 0 | | $ | 131,998 | | $ | 114,936 | | $ | 894,660 | | $ | 0 | | $ | 291,426 | | $ | 0 | | $ | 20,669 | | $ | 62,022 | | $ | 2,313,211 | | $ | 0 |
Charles M. Urbain(13) | | $ | 539,955 | | $ | 0 | | $ | 244,464 | | $ | 28,315 | | $ | 257,959 | | $ | 0 | | $ | 1,129,610 | | $ | 0 | | $ | 20,012 | | $ | 5,277 | | $ | 2,225,591 | | $ | 0 |
Peter Kasper Jakobsen | | $ | 297,012 | | $ | 0 | | $ | 179,441 | | $ | 22,372 | | $ | 220,038 | | $ | 169,260 | | $ | 0 | | $ | 0 | | $ | 38,038 | | $ | 0 | | $ | 926,161 | | $ | 0 |
Dirk H. Hondmann | | $ | 316,063 | | $ | 0 | | $ | 172,781 | | $ | 24,407 | | $ | 347,657 | | $ | 169,260 | | $ | 0 | | $ | 11,703 | | $ | 19,733 | | $ | 0 | | $ | 1,061,605 | | $ | 0 |
(1) | Involuntary termination represents severance equal to 1.5 times base salary for Messrs. Golsby and Leemputte, 56 weeks of base salary for Mr. Urbain, 31.5 weeks of base salary for Mr. Jakobsen, and 1 year of base salary for Mr. Hondmann. Involuntary termination following our initial public offering represents severance equal to 2 times base salary for Mr. Golsby and 1.5 times base salary for all other Named Executive Officers. Change in control represents severance equal to 2.99 times base salary plus target bonus for Mr. Golsby, 1 times base salary plus target bonus for Messrs. Urbain and Leemputte and 1 times base salary for Messrs. Jakobsen and Hondmann. |
(2) | Reflects special performance bonus with respect to our initial public offering. For Mr. Golsby, it may range from an amount equal to Mr. Golsby’s regular target bonus in effect as of 12/31/2008 to a maximum amount equal to $1,600,000. For Messrs. Urbain, Jakobsen and Hondmann, it represents an amount equal to their target bonus in effect as of 12/31/2008. |
(3) | Reflects annual BMS Performance Incentive Plan awards for 2008. |
(4) | Intrinsic values as of 12/31/2008 based on the BMS closing stock price of $23.25 on 12/31/2008. For involuntary termination scenarios, represents unvested awards held at least one year. For change in control, represents all unvested awards. |
(5) | Values as of 12/31/2008 based on the BMS closing stock price of $23.25 on 12/31/2008. For involuntary termination scenarios, represents pro-rata portion of awards held at least one year. For change in control, represents all unvested shares. |
(6) | Reflects values as of 12/31/2008 based on the BMS closing stock price of $23.25 on 12/31/2008. For involuntary termination scenarios, the amounts represent actual payouts of the first tranche of the regular and special BMS 2008-2010 awards. For change in control, the amounts represent actual payouts of the first and second tranches of the BMS 2007-2009 award and actual payouts of the first tranche of the regular and special BMS 2008-2010 awards. |
(7) | Change in control values include a special early retirement subsidy and additional years of credited service and age for Messrs. Golsby, Leemputte and Urbain. |
(8) | Reflects vesting of unvested portion of employer matching contributions upon change in control as of 12/31/2008. |
(9) | For involuntary termination scenarios, reflects health care continuation through the severance period. For change in control, represents continuation of health and life insurance benefits for three years for Mr. Golsby, one year for Messrs. Leemputte and Urbain and through the severance period for Messrs. Jakobsen and Hondmann. With respect to Mr. Golsby, involuntary termination not for cause and change in control scenarios also reflect certain relocation benefits, including (i) coverage for expenses relating to the sale of his home and the related tax gross-up (determined assuming the house was brought into BMS inventory), (ii) reimbursement for up to 10% of the purchase price of his home if its selling price is less than its purchase price, based upon three independent appraisals, and the related tax gross-up (assumed to be the maximum amount reimbursable of $80,000), (iii) reimbursement for the cost of return economy class airfare to Thailand for him and his family and (iv) reimbursement for reasonable costs associated with the shipment of his household goods. With respect to Mr. Jakobsen, involuntary termination and change in control scenarios also reflect certain relocation benefits, including economy class airfare for Mr. Jakobsen’s return trip and those of his accompanying dependents and reasonable costs for shipment of household goods back to New Zealand, if Mr. Jakobsen returns to New Zealand within 6 months following involuntary termination. |
127
(10) | Change in control values reflect cost to BMS for providing retiree medical benefits. They include additional years of credited service and age for Messrs. Golsby, Leemputte and Urbain. |
(11) | Reflects the gross-up under the change-in-control agreements for Messrs. Golsby, Leemputte and Urbain. The reimbursement amount for the excise tax on the excess parachute payment (i.e., the amount subject to the excise tax) is grossed up to account for the effect of federal and state income taxes and the excise tax. The amounts include Federal income tax of 35%, excise tax of 20% and relevant state taxes. The amounts do not reflect employment taxes or amounts attributable to the loss of itemized deductions. |
(12) | Mr. Urbain is retirement-eligible under BMS’s stock plans and therefore is entitled to a pro-rata portion of BMS restricted stock held for one year from the grant date, accelerated vesting of BMS options held for one year from the grant date and a pro-rata BMS long-term performance award payment based on months worked at the actual payout level for awards held for one year from the grant date. |
(13) | Mr. Urbain is retirement-eligible under BMS’s stock plans and therefore change in control value reflects: |
| | • | | Options—The value of the 2008 BMS stock option award which will not have been held for one year from the grant date. |
| | • | | Restricted Stock—The difference between a pro-rata portion of BMS restricted stock held for one year from the grant date and all unvested restricted stock including shares held less than one year. |
The following is a description of payments and benefits available under different termination scenarios:
Voluntary Termination
BMS does not offer any payments or benefits to salaried employees, including our Named Executive Officers, upon a voluntary termination other than those that are vested at the time of termination and those payments and benefits payable upon a constructive termination or resignation for good reason, which are described below.
Retirement and Death
The following benefits are generally available to all salaried employees, including our Named Executive Officers:
Annual Incentive: Employees are eligible for a pro-rata award based on the number of months worked in the performance period. In the case of a retirement on or after September 15th of the plan year, employees are eligible for the full award.
Stock Options:Employees are eligible for accelerated vesting of BMS stock options held at least one year from the grant date and have the full term to exercise. For retirement, exercise thresholds as described in the CD&A and Outstanding Equity Awards Table, where applicable, remain in effect. Upon death, exercise thresholds lapse.
Restricted Stock/Restricted Stock Units: Employees are eligible for a pro-rata portion of BMS restricted stock/restricted stock unit awards held at least one year from the grant date.
Long-Term Performance Awards:Employees are eligible for a pro-rata portion of BMS long-term performance awards held at least one year from the grant date.
Defined Benefit Pension Plans/Key International Pension Plan:Employees are eligible for benefits accrued under the BMS Retirement Income Plan, BMS Key International Pension Plan, BMS United Kingdom Pension Plan and the BMS Benefit Equalization Plan—Retirement Plan.
Savings Plans: Employees are eligible for benefits accumulated under the BMS Savings and Investment Program and the BMS Benefit Equalization Plan—Savings Plan.
Post-Retirement Medical and Life Insurance: Employees with ten years of service are eligible for post-retirement medical and life insurance benefits.
128
Involuntary Termination Not for Cause
The following benefits are generally available to all salaried employees, including our Named Executive Officers:
Annual Incentive: Employees are eligible for a pro-rata award based on the number of months worked in the performance period if the termination occurs on or after September 30th of the plan year. If an employee is eligible to retire, the employee is eligible for a pro-rata award based on the number of months worked in the performance period. In the case of a retirement on or after September 15th of the plan year, employees are eligible for the full award.
Stock Options: Upon signing a general release, an employee is eligible for accelerated vesting of BMS stock options held at least one year from the grant date and has three months to exercise. If an employee is eligible to retire or the employee’s age plus years of service equal or exceed 70 and the employee has at least 10 years of service, the employee will have the full term to exercise. Exercise thresholds as described in the Outstanding Equity Awards Table, where applicable, remain in effect.
Restricted Stock/Restricted Stock Units: Upon signing a general release, employees are eligible for a pro-rata portion of BMS restricted stock/restricted stock unit awards held at least one year from the grant date.
Long-Term Performance Awards: BMS awards granted in 2007 and earlier are forfeited; however, if the employee is eligible to retire or the employee’s age plus years of service equal or exceed 70 and the employee has at least 10 years of service, the employee will be eligible for a pro-rata portion of any awards held at least one year from the grant date. For BMS awards granted in 2008 or later, the employee will be eligible for a pro-rata portion of any awards held at least one year from the grant date.
Defined Benefit Pension Plans/Key International Pension Plan:Employees are eligible for benefits accrued under the BMS Retirement Income Plan, BMS Key International Pension Plan, BMS United Kingdom Pension Plan and the BMS Benefit Equalization Plan—Retirement Plan. Except under the BMS United Kingdom Pension Plan, if the employee’s age plus years of service equal or exceed 70 and the employee has at least 10 years of service, the employee is not eligible for early retirement, and the employee signs a general release, the retirement benefits are payable immediately following termination of employment with the enhanced adjustment factors that are applicable to employees eligible for early retirement.
Savings Plans:Employees are eligible for benefits accumulated under the BMS Savings and Investment Program and the BMS Benefit Equalization Plan—Savings Plan.
Post-Retirement Medical Insurance: If the employee’s age plus years of service equal or exceed 70 and the employee has at least 10 years of service, the employee is not eligible for early retirement, and the employee signs a general release, the employee is eligible for continued medical coverage without BMS subsidy until age 55, and is eligible for the post-retirement medical benefits starting at age 55.
Cash Severance:Our Named Executive Officers are eligible to receive severance payments and benefits if their employment is terminated for any of the following reasons:
| | • | | Involuntary termination not for “cause”; |
| | • | | The executive’s monthly base salary is materially reduced; |
| | • | | The executive’s grade level is reduced (or in the case of Mr. Golsby, his grade level is materially reduced, which results in a material diminution of his authority, duties or responsibilities); or |
| | • | | The location of the executive’s job or office is changed, so that it will be based at a location which is more than 50 miles farther (determined in accordance with BMS’s relocation policy) from his primary residence than his work location immediately prior to the proposed change in his job or office. |
129
A terminated executive who signs a general release will be eligible for the following:
| | • | | Severance payments in the amount of 1.5 times base salary for Messrs. Golsby and Leemputte, 56 weeks of base salary for Mr. Urbain, 31.5 weeks of base salary for Mr. Jakobsen and 1 year of base salary for Mr. Hondmann; |
| | • | | Continuation of medical, dental and life insurance benefits; and |
Involuntary Termination Not for Cause Under Mead Johnson Disposition
As described in the CD&A, BMS has entered into retention agreements with certain Mead Johnson executives including Messrs. Golsby, Urbain, Jakobsen and Hondmann. If BMS proceeds with the sale, spin off, divestiture or other disposition of Mead Johnson, such as our initial public offering, Messrs. Golsby, Urbain, Jakobsen and Hondmann will be offered the following enhanced incentives in addition to the benefits available under a regular involuntary termination:
| | • | | Special performance bonus. For Messrs. Urbain, Jakobsen and Hondmann, this represents an amount equal to their regular target bonus in effect as of December 31, 2008. For Mr. Golsby, the payment may range from an amount equal to Mr. Golsby’s regular target bonus in effect as of December 31, 2008 up to a maximum amount equal to $1,600,000. Fifty percent of the bonuses have been paid to our Named Executive Officers and the remaining fifty percent will be paid to our Named Executive Officers six months following our initial public offering, without regard to whether their employment terminates (See “—Retention Agreements”). |
| | • | | Payout of annual bonus on a pro-rata basis at target. |
| | • | | Severance payments, which represent 2 times base salary for Mr. Golsby and 1.5 times base salary for the other Named Executive Officers (in lieu of the severance described under “—Involuntary Termination Not for Cause”). |
Change in Control
As disclosed in the CD&A, BMS has entered into change-in-control agreements with certain senior executives, including Messrs. Golsby, Leemputte and Urbain. The current agreements will expire on December 31, 2009, and may be extended with revisions, as appropriate, beginning on January 1, 2010 in one-year increments unless either BMS or the executive gives prior notice of termination of the agreement or a change in control or potential change in control shall have occurred during the term of the agreement.
To trigger benefits, there must be both a change in control or potential change in control of BMS and either (i) a subsequent involuntary termination without cause by the employer or (ii) a good reason termination by the employee. Good reason includes a reduction in job responsibilities or changes in pay and benefits as well as relocation beyond 50 miles. The executive has 120 days to assert a claim for payments under this provision, and BMS has until the date of termination to correct such circumstances. This protection extends for three years following a change in control.
“Change in Control” means the occurrence of any one of the following events after the effective date of the agreement:
| | (i) | Any Person (as defined in Section 13(d) (3) of the Exchange Act) shall have become the direct or indirect beneficial owner of thirty percent (30%) or more of the then outstanding common shares of BMS; |
| | (ii) | The consummation of a merger or consolidation of BMS with any other corporation other than (A) a merger or consolidation which would result in the voting securities of BMS outstanding immediately |
130
| | prior thereto continuing to represent at least fifty one percent (51%) of the combined voting power of the voting securities of BMS or the surviving entity outstanding immediately after such merger or consolidation, or (B) a merger or consolidation effected to implement a recapitalization of BMS in which no Person acquires more than fifty percent (50%) of the combined voting power of BMS’s then outstanding securities; |
| | (iii) | The date the stockholders of BMS approve a plan of complete liquidation of BMS or an agreement for the sale or disposition by BMS of all or substantially all BMS’s assets; or |
| | (iv) | The date there shall have been a change in the composition of the BMS Board within a two-year period such that a majority of the BMS Board does not consist of directors who were serving at the beginning of such period together with directors whose initial nomination for election by BMS’s stockholders or, if earlier, initial appointment to the BMS Board, was approved by the vote of two-thirds of the directors then still in office who were in office at the beginning of the two-year period together with the directors who were previously so approved. |
A “Potential Change in Control” will be deemed to occur if, during the term of the agreement:
| | (i) | BMS enters into a written agreement, the consummation of which would result in a Change in Control; |
| | (ii) | BMS or any person publicly announces an intention to take or to consider taking actions which, if consummated, would constitute a Change in Control; |
| | (iii) | Any person who is or becomes a beneficial owner of securities of BMS representing 10% (or in some cases, 15%) or more of the combined voting power of BMS’s outstanding securities thereafter increases such person’s beneficial ownership of such securities by 5% or more; or |
| | (iv) | The BMS Board adopts a resolution to the effect that a Potential Change in Control has occurred. |
A terminated executive who signs an agreement not to compete with BMS for a period of one year will receive the following benefits:
| | • | | A cash payment equal to 2.99 years of base salary plus target bonus for Mr. Golsby and one year of base salary plus target bonus for Messrs. Leemputte and Urbain. (If the amount of time between the termination date and normal retirement is less than 2.99 years for Mr. Golsby and less than one year for Messrs. Leemputte and Urbain, the payment multiple is equal to such lesser amount of time.) |
| | • | | Payout of outstanding awards under the BMS long-term performance award program on a pro-rata basis at target including any award held less than one year. |
| | • | | Payout of annual bonus on a pro-rata basis at target. |
| | • | | Vesting of unvested BMS stock options, including options held less than one year. Waiver of exercise thresholds placed on awards, where applicable. |
| | • | | Vesting of BMS restricted stock/restricted stock units, including shares/units held less than one year. |
| | • | | A payment to account for an additional three years (for Mr. Golsby) or one year (for Messrs. Leemputte and Urbain) of service and age for pension purposes. |
| | • | | Application of the early retirement subsidy under the BMS Retirement Income Plan for executives who are terminated prior to age 55 as if the executive were 55 with at least ten years of service. |
| | • | | Eligibility for retiree medical benefits based on three years of additional age and service for Mr. Golsby and one additional year for Messrs. Leemputte and Urbain. |
| | • | | Continuation of benefits for three years for Mr. Golsby and for one year for Messrs. Leemputte and Urbain. |
| | • | | Vesting of unvested employer matching contributions in BMS’s Savings and Investment Program. |
131
| | • | | Gross-up of excise tax on payments deemed to be excess parachute payments that exceed 10% of the total payment which could be made without triggering the golden parachute excise taxes under Sections 280G and 4999 of the Code. |
| | • | | Reasonable outplacement services. |
| | • | | Payment of any legal fees incurred to enforce the agreement. |
Also as disclosed in the CD&A, Messrs. Jakobsen and Hondmann are participants in the Bristol-Myers Squibb Company Change-in-Control Separation Benefits Plan. To trigger benefits under this plan, there must be both a change in control of BMS and either (i) a subsequent involuntary termination without cause by the employer or (ii) a good reason termination. A good reason termination would include reductions in base salary, annual bonus, benefits and perquisites as well as relocation beyond 50 miles. The executive has 60 days to assert a claim for payments under this provision. This protection extends for three years following a change in control.
“Change in Control” is defined similarly to the definition contained in the change-in-control agreements described above.
Messrs. Jakobsen and Hondmann will receive the following benefits upon termination if they execute a valid release of claims:
| | • | | a cash payment equal to 12 months of base salary; or |
| | • | | the greatest of cash severance payable under (i) the applicable severance plan of the acquirer, (ii) the applicable BMS severance plan that was in effect on September 12, 2006 or (iii) the applicable BMS severance plan that was in effect on the date of the change in control. |
| | • | | Payout of annual bonus on a pro-rata basis at target. |
| | • | | Continuation of life, medical and dental benefits on a subsidized basis to the extent provided under BMS’s applicable severance plan. |
| | • | | Vesting of unvested BMS stock options, including options held less than one year. Waiver of exercise thresholds placed on awards, where applicable. |
| | • | | Vesting of BMS restricted stock/restricted stock units, including shares/units held less than one year. |
| | • | | Payout of outstanding awards under the BMS long-term performance award program on a pro-rata basis at the greater of target or projection including any award held less than one year. |
| | • | | Vesting of unvested accrued benefits under the BMS Key International Pension Plan. |
Director Compensation
When we were formed in December 2008, our initial board of directors was comprised of James M. Cornelius, Lamberto Andreotti, Stephen W. Golsby, Jean-Marc Huet, John E. Celentano and Sandra Leung, all of whom were full-time employees of either BMS or Mead Johnson. None of these initial directors received any additional compensation for service as a director of Mead Johnson.
We intend to provide competitive compensation to our non-employee directors that will enable us to attract and retain high quality directors, provide them with compensation at a level that is consistent with our compensation objectives and encourage their ownership of our stock to further align their interests with those of our stockholders. Our directors who are full-time employees of Mead Johnson or BMS will receive no additional compensation for service as a director of Mead Johnson.
In January 2009, our board of directors reviewed market data and other analysis prepared by Frederic W. Cook & Co. and determined that it was appropriate to target non-employee director compensation between the
132
25th percentile and the median of compensation for our peer group of companies, which are listed above under “—Our Post-Offering Compensation Program—Peer Group Analysis”. Based on that review, our board of directors adopted an initial non-employee director compensation program which includes the following:
| | • | | An annual cash retainer of $55,000, payable to each non-employee director. |
| | • | | Annual cash retainers of $20,000, $15,000 and $10,000, payable to the chairs of our audit committee, compensation committee and nominating and corporate governance committee, respectively. |
| | • | | Annual cash retainers of $10,000, $7,500 and $5,000, payable to each non-employee director who is a member of our audit committee, compensation committee and nominating and corporate governance committee, respectively (in each case, other than the chair of the relevant committee). |
| | • | | An annual grant of Mead Johnson equity-based awards having a grant date fair market value of $80,000, to be granted to each non-employee director. Upon the consummation of our initial public offering, each individual then serving as a non-employee director received, in lieu of an annual grant for 2009, a founder’s award of 3,334 Mead Johnson restricted stock units having a grant date fair market value of approximately $80,000. The terms of the founder’s awards provide that the restricted stock units will fully vest on the first anniversary of the grant date. It is anticipated that in future years, equity grants to our non-employee directors will be made on the date of the annual meeting of our stockholders. Grants will be made pursuant to the 2009 Stock Award and Incentive Plan. |
Our non-employee directors will not receive any fees for attendance at board of directors or committee meetings.
Our non-employee directors are subject to ownership guidelines regarding shares of our common stock. Our guidelines require that each of our non-employee directors hold shares with a value equal to four times his or her annual cash retainer of $55,000, for a total of $220,000. These shares are to be acquired through the retention of the annual stock awards as well as any other acquisition of stock. Our non-employee directors may not sell any of their stock until the director has achieved the ownership threshold, after which the director is free to sell any shares acquired following vesting. If one of our non-employee directors departs from the MJN Board, the director must retain shares with a value equal to four times his or her annual cash retainer for a six-month period following the director’s date of departure.
Securities Authorized For Issuance Under Equity Compensation Plans
The table below sets forth information with regard to securities authorized for issuance under our equity compensation plans as of December 31, 2008. As of December 31, 2008, we had one equity compensation plan (the “2009 Stock Award and Incentive Plan”), which was approved by BMS, then our sole stockholder, but under which no awards had been granted as of that date.
| | | | | | | |
Plan Category | | Number of
Securities to be
Issued Upon
Exercise of
Outstanding
Options, Warrants
and Rights | | Weighted-Average
Exercise Price of
Outstanding
Options, Warrants
and Rights | | Number of
Securities
Remaining Available
for Future Issuance
Under Equity
Compensation Plans
(Excluding
Securities Reflected
in First Column) | |
Equity Compensation Plans Approved by Security Holders | | 0 | | — | | 25,000,000 | (1) |
Equity Compensation Plans Not Approved by Security Holders | | 0 | | — | | 0 | |
| | | | | | | |
Total | | 0 | | — | | 25,000,000 | |
(1) | Types of awards issuable under the 2009 Stock Award and Incentive Plan include: options, stock appreciation rights, restricted stock, restricted stock units, stock granted as a bonus or in lieu of another award, dividend equivalents, other stock-based awards, or performance awards. |
133
| Item 12. | SECURITY OWNERSHIP OF CERTAIN BENEFICIAL OWNERS AND MANAGEMENT AND RELATED STOCKHOLDER MATTERS |
The following table sets forth information as of March 16, 2009, as to the beneficial ownership of shares of each class of our common stock and the common stock of Bristol-Myers Squibb Company, in each case, by:
| | • | | each of our Named Executive Officers; |
| | • | | each of our directors; and |
| | • | | all of our executive officers and directors as a group. |
The number of shares beneficially owned by each shareholder is determined under the SEC’s rules and generally includes voting or investment power over shares. Under SEC rules, shares are beneficially owned when an individual has voting and/or investment power over the shares or could obtain voting and/or investment power over the shares within 60 days. Voting power includes the power to direct the voting of the shares and investment power includes the power to direct the disposition of the shares. Unless otherwise noted, shares listed below are owned directly or indirectly with sole voting and investment power. None of our directors and executive offices, individually or as a group, beneficially owns greater than 1% of the outstanding shares of our common stock or the common stock of Bristol-Myers Squibb Company.
| | | | | |
Name of Beneficial Owner | | Number of
Class A Shares | | Bristol-Myers Squibb Company’s
Common Stock(1) | |
Stephen W. Golsby | | — | | 344,461 | (2) |
Peter G. Leemputte | | 15,000 | | — | |
Charles M. Urbain | | — | | 180,496 | (3) |
Peter Kasper Jakobsen | | — | | 112,511 | (4) |
Dirk H. Hondmann | | — | | 45,018 | (5) |
James M. Cornelius | | 10,000 | | 632,877 | (6) |
Lamberto Andreotti | | 6,000 | | 888,445 | (7) |
Dr. Steven M. Altschuler | | — | | — | |
Howard B. Bernick | | 12,500 | | — | |
John E. Celentano | | 1,000 | | 295,805 | (8) |
Jean-Marc Huet | | 10,000 | | 72,650 | (9) |
Sandra Leung | | 1,500 | | 176,329 | (10) |
Peter G. Ratcliffe | | — | | — | |
Robert S. Singer | | 10,000 | | — | |
Dr. Elliott Sigal | | 5,000 | | 738,415 | (11) |
All directors and executive officers as a group (20 persons) | | 73,100 | | 3,789,286 | (12) |
(1) | Includes vested and unvested restricted stock, shares credited to the accounts of the executive officers under the Bristol-Myers Squibb Company Savings and Investment Program, stock options that are currently exercisable or exercisable within 60 days, restricted stock units that vest within 60 days and deferred share units. Deferred share units have no voting rights. |
(2) | Includes 274,840 shares underlying stock options that are currently exercisable or exercisable within 60 days. |
(3) | Includes 143,922 shares underlying stock options that are currently exercisable or exercisable within 60 days. |
(4) | Includes 104,947 shares underlying stock options that are currently exercisable or exercisable within 60 days. |
(5) | Includes 32,591 shares underlying stock options that are currently exercisable or exercisable within 60 days. |
134
(6) | Includes 364,375 shares underlying stock options that are currently exercisable or exercisable within 60 days and4,658 deferred share units. |
(7) | Includes 665,442 shares underlying stock options that are currently exercisable or exercisable within 60 days. |
(8) | Includes 230,132 shares underlying stock options that are currently exercisable or exercisable within 60 days. |
(9) | Includes 72,650 shares underlying stock options that are currently exercisable or exercisable within 60 days. |
(10) | Includes 157,204 shares underlying stock options that are currently exercisable or exercisable within 60 days. |
(11) | Includes 551,965 shares underlying stock options that are currently exercisable or exercisable within 60 days and20,167 deferred share units. |
(12) | Includes2,869,378 shares underlying stock options that are currently exercisable or exercisable within 60 days and24,825 deferred share units. |
At March 16, 2009, Bristol-Myers Squibb Company beneficially owned 42,344,571 shares of Class A common stock, representing 55.1% of the outstanding Class A common stock, and 127,655,429 shares of Class B common stock, representing 100% of the outstanding Class B common stock. Other than Bristol-Myers Squibb Company, there are no persons or groups known to us to be beneficial owners of more than 5% of the outstanding Class A common stock. The address for Bristol-Myers Squibb is 345 Park Avenue, New York, N.Y. 10154.
| Item 13. | CERTAIN RELATIONSHIPS AND RELATED TRANSACTIONS, AND DIRECTOR INDEPENDENCE |
Relationship with BMS
BMS owns 55.1% of the outstanding shares of our Class A common stock, and 100% of our outstanding Class B common stock, giving it 83.1% of the shares of our outstanding common stock and 97.5% of the combined voting power of our outstanding common stock. BMS is not subject to any contractual obligation to retain its controlling interest in us, except that BMS has agreed, subject to certain exceptions, not to sell or otherwise dispose of any of our shares of common stock for a period of 180 days after the date of our initial public offering without the prior written consent of the representatives of the underwriters of the offering.
We have entered into agreements with BMS to clarify our relationship with BMS while it is our controlling stockholder. As our controlling stockholder, BMS will exercise significant influence over our business policies and affairs, including the composition of our board of directors and any action requiring the approval of our stockholders. We do not have a formal mechanism by which our independent directors must approve any future transactions with BMS or any related persons. We intend to consider adopting a policy which would address related party transactions. See “Risk Factors—Risks Related to Our Relationship with BMS”.
Pre-Initial Public Offering Transactions
Prior to our initial public offering, we were a wholly owned subsidiary of BMS and all of our outstanding shares of common stock were owned by BMS. Following our separation and upon completion of our initial public offering, we became a stand-alone public company.
In connection with the separation, we and BMS entered into an agreement that provided for the separation of our business from BMS. In addition, we and BMS entered into a transitional services agreement governing the provision of various services on a transitional basis by BMS to us as well as by us to BMS and several ancillary agreements in connection with the separation.
The following are the principal steps in connection with the separation of our business from BMS:
| | • | | BMS formed MJN Restructuring Holdco, Inc. (MJN Restructuring) on August 22, 2008. |
135
| | • | | On August 27, 2008, through a series of steps, Mead Johnson & Company, which directly or indirectly holds substantially all of our U.S. assets, became a wholly owned subsidiary of MJN Restructuring. |
| | • | | During the fourth quarter of 2008, new entities were formed as direct and indirect subsidiaries of MJN Restructuring in numerous non-U.S. jurisdictions through which we intend to conduct our business in those jurisdictions in the future. |
| | • | | On December 17, 2008, BMS formed our company as an indirect wholly owned subsidiary. We and MJN Restructuring had the same direct parent company, which was another wholly owned subsidiary of BMS. |
| | • | | On January 31, 2009, we completed the transfers of our non-U.S. businesses from BMS to MJN Restructuring through a sale of shares, sale of assets and contributions of stock with some exceptions. The consideration for these transfers was in the form of cash, which was contributed or otherwise provided by BMS, and the issuance by subsidiaries of MJN Restructuring of foreign intercompany notes (the “foreign intercompany notes”) to BMS subsidiaries related to the purchase of assets and shares in Indonesia, Malaysia, the Netherlands and the Philippines. |
| | • | | The terms of each of these foreign intercompany notes were substantially similar, except that the principal amount of each note varied by jurisdiction. The aggregate principal amount of the foreign intercompany notes was approximately $597 million and the rate of interest per annum on each note was equal to LIBOR plus 0.75%. The foreign intercompany notes were repaid in full on the date the initial public offering was completed, with the net proceeds from the offering, and thus the foreign intercompany notes are no longer outstanding. |
| | • | | On February 10, 2009, MJN Restructuring merged with and into our company, with our company remaining the surviving entity. Therefore, we hold, all of the businesses acquired by MJN Restructuring. |
Post-Initial Public Offering Transactions
We have paid for, or otherwise received rights to, the assets and shares related to our business in Argentina, Brazil, China, Vietnam and India, but the assets and shares have not yet been transferred to us by BMS. In Mexico, all of our assets have been transferred (with our manufacturing facility and related assets in Mexico transferred to us by way of a capital lease). We and BMS are implementing alternative arrangements to complete the transfer of assets in these jurisdictions.
Specifically:
| | • | | in Argentina, we expect to complete the business transfers within one year of our initial public offering and we will market our products while BMS will distribute our products in this jurisdiction during the transitional period; |
| | • | | in Brazil, we expect to complete the business transfer within 24 months after our initial public offering and we will market our products while BMS will distribute our products in this jurisdiction during the transitional period; |
| | • | | in Vietnam, we expect to complete the business transfer within 3 months after our initial public offering, and in India we expect to complete the transfer within 9 to 12 months of our initial public offering, in each case with BMS distributing our products in the interim; and |
| | • | | in China, we have entered into a services agreement with BMS that will result in the continued operation of our China business for our benefit. |
In addition, while we have historically used BMS’s pharmaceutical operations to distribute our products in Europe, following our initial public offering, we intend to distribute our products in Europe through third-party distributors with BMS acting as our initial distributor in most countries.
136
China
Our business in China is currently managed and operated by Mead Johnson Nutritionals (China) Ltd. (MJN China), 89% of which is currently held indirectly by BMS and 11% of which is held by two Chinese companies not affiliated with BMS or MJN.
BMS and MJN have entered into a services agreement (MJN China Services Agreement) pursuant to which BMS has agreed to cause MJN China to operate in a manner that is consistent with the instructions and directions of MJN. In return, MJN will provide all necessary support and access to assets and resources, including intellectual property, for BMS to cause MJN China to operate in a manner consistent with MJN’s instructions and directions. This support will include management oversight, supply chain management and general stewardship of MJN China’s business.
The MJN China Services Agreement has been designed so that MJN will be entitled to the cash flows, benefit and risk of MJN China’s operations and business. To the extent MJN China has positive cash balances and is able to distribute such amounts to its foreign parent under applicable law, BMS will be obligated to make a payment to us equal to this amount. To the extent MJN decides to have cash contributed to MJN China, we will be obligated to make a payment to BMS equal to this amount.
BMS has the right (Put Right), exercisable at any time, to require MJN to purchase all of the shares of MJN China indirectly held by BMS in exchange for the MJN China Consideration (as defined below). MJN has the right (Call Right) to require BMS to cause all of the shares of MJN China indirectly held by BMS to be sold to MJN in exchange for the MJN China Consideration, which right will be exercisable at any time after the earliest of: (1) BMS and its subsidiaries ceasing to own or control 50% or more of the voting interests of MJN, including as a result of an acquisition of 50% or more of the voting interests of BMS by any one entity, (2) the occurrence of a BMS insolvency event and (3) 10 years after the effective date of the MJN China Services Agreement. “MJN China Consideration” is defined in substance as the termination of the MJN China Services Agreement and the related obligations to make the payments described above, the result of which is that no net cash payments will be made between BMS and MJN.
BMS has agreed not to transfer to a non-BMS entity any shares of MJN China it owns directly or indirectly prior to the exercise of the Put Right or the Call Right. The MJN China Services Agreement will terminate upon the earlier of: (1) BMS and MJN mutually agreeing to terminate the agreement, and (2) upon completion of the transfer of the MJN China shares following the exercise of the Put Right or the Call Right.
We will consolidate MJN China as a variable interest entity in accordance with FIN 46(R), as a result of the terms of the MJN China Services Agreement even for periods prior to any exercise of the Put Right or the Call Right.
Brazil, Argentina and India
Our principal assets in Brazil, Argentina and India have not yet been transferred to us due to regulatory limitations. BMS will distribute and record sales of our products until our entities are established in these markets. In Brazil and Argentina, we will market our products while BMS will distribute them. We expect to generate revenues during this transitional period through a marketing and servicing fee paid to us by BMS. In India, BMS will both market and distribute our products. After obtaining the necessary regulatory permits, our principal assets in Brazil, subject to a working capital adjustment, and Argentina will be transferred to us, and we intend to operate our business directly through our subsidiaries in Brazil and Argentina. We expect the transitional period to be up to 24 months in Brazil, 7 to 9 months in Argentina and 9 to 12 months in India.
Mexico
We are operating our business in Mexico through a newly-formed operating subsidiary. A subsidiary of BMS leases to our Mexican operating subsidiary all of the property, plant and equipment assets at our
137
manufacturing facility in Delicias, Mexico under a 20-year lease that will be treated as a capital lease for U.S. GAAP purposes. We have consolidated all of these leased assets on our balance sheet historically, and we will continue to consolidate such assets on our balance sheet. We intend to acquire all of the leased assets at some future date; however, no contractual arrangement is currently in place to effect such a transfer.
Europe
In the past, we have used BMS’s pharmaceutical operations to distribute our products in Europe at cost. As a result of our separation from BMS, we now operate our business in Europe pursuant to a third-party distributor model. We expect to generate sales by selling products to our third-party distributors. The use of third-party distributors will reduce our net sales by the amount of the distributors’ margin, partially offset by a reduction in our historical distribution-related expenses, which will be borne by the third-party distributor. BMS will initially act as our distributor in most of our local European markets and will be paid a third-party distributor margin rather than having us incur expenses at cost as was the historical practice. Over time we intend to replace BMS with independent third parties who will continue to act as our distributors.
Malaysia and the Philippines
We intend to operate our business in Malaysia and the Philippines through our existing Malaysia and Philippines subsidiaries. In addition, we intend to operate the BMS pharmaceutical business for a transitional period of approximately one year. As a result, for a period of time following our initial public offering, our financial results will include our sale of BMS pharma products in Malaysia and the Philippines, but we believe that those results will be immaterial to our financial statements as a whole.
Separation Agreement
We and BMS have entered into a separation agreement, which governs the transfer of assets and assumption of liabilities and sets forth the agreements between BMS and us regarding the principal corporate transactions required to effect our separation from BMS, our initial public offering, and other agreements governing the relationship between BMS and us.
The Separation.To effect the separation, BMS has, or has caused its subsidiaries, to, transfer or agree to transfer, the assets of the contributed business to us as described in this Annual Report. We assumed, or agreed to assume, and agreed to perform and fulfill the liabilities of the contributed business in accordance with their respective terms. Except as expressly set forth in the separation agreement or in any other ancillary agreement, neither we nor BMS make any representation or warranty as to:
| | • | | the assets, businesses or liabilities transferred or assumed as part of our separation from BMS; |
| | • | | any consents or approvals required in connection with the transfers; |
| | • | | the value or freedom from any liens of any assets transferred; |
| | • | | the absence of any defenses or freedom from counterclaim with respect to any claim of any party; or |
| | • | | the legal sufficiency of any assignment, document or instrument delivered to convey title to any asset transferred. |
Except as expressly set forth in any ancillary agreement, all assets were transferred on an “as is”, “where is” basis, and the respective transferees agreed to bear the economic and legal risks that any conveyance was insufficient to vest in the transferee good and marketable title, free and clear of any lien and that any necessary consents or approvals are not obtained or that requirements of laws or judgments are not complied with.
Releases and Indemnification.The separation agreement provides for a full and complete release and discharge of all liabilities between BMS and us, and our respective subsidiaries, except as expressly set forth in
138
the separation agreement. The liabilities released or discharged include liabilities arising under any contractual agreements or from any acts, events or conditions existing or alleged to exist on or before the completion of our initial public offering (other than tax liabilities, which are addressed by the tax matters agreement described under “—Tax Matters Agreement”).
We also agreed to indemnify, hold harmless and defend BMS, each of its affiliates and each of their respective directors, officers, members, managers and employees, from and against all liabilities relating to, arising out of or resulting from:
| | • | | our failure or the failure of any of our affiliates or any other person or entity to pay, perform or otherwise promptly discharge any liabilities associated with the contributed business, or any contracts associated with the contributed business, in accordance with their respective terms; |
| | • | | the contributed business, liabilities or contracts; |
| | • | | any material breach by us or any of our affiliates of the separation agreement or any of the ancillary agreements (that does not contain its own indemnification provisions); and |
| | • | | any untrue statement or alleged untrue statement of a material fact or omission or alleged omission to state a material fact required to be stated in the registration statement or prospectus relating to our initial public offering or necessary to make the statements in the registration statement or the prospectus relating to our initial public offering not misleading, with respect to all information contained in or incorporated by reference in such registration statement or prospectus or any other document we filed with the SEC or otherwise used in connection with the initial public offering, except for any statement or omission made in reliance on and in conformity with written information supplied to us by BMS for use in our initial public offering. |
BMS agreed to indemnify, hold harmless and defend us, each of our affiliates and each of our respective directors, officers, members, managers and employees from and against all liabilities relating to, arising out of or resulting from:
| | • | | the failure of BMS or any affiliate of BMS or any other person or entity to pay, perform or otherwise promptly discharge any liabilities of BMS or its affiliates other than liabilities associated with the contributed business; |
| | • | | the BMS business or any liability of BMS or its affiliates other than liabilities associated with our separation from BMS; and |
| | • | | any material breach by BMS or any of its affiliates of the separation agreement or any of the ancillary agreements (that does not contain its own indemnification provisions). |
The separation agreement also specifies procedures with respect to claims subject to indemnification and related matters.
Transitional Services Agreement
Historically BMS has provided significant corporate and shared services functions to us. Our historical financial statements in this Annual Report reflect an allocation of these costs primarily within marketing, selling and administrative expenses. These allocations include costs related to corporate and shared services functions such as executive oversight, risk management, information technology, accounting, audit, legal, investor relations, human resources, tax, treasury, procurement and other services.
We and BMS have entered into a transitional services agreement whereby BMS has agreed to provide us with various corporate support services (“BMS Services”) following our initial public offering, including: accounting; credit and collection; cash application; information technology; tax; treasury; human resources; compliance; environmental, health and safety; legal; procurement; audit; research & development; insurance; customs clearance; supply chain management; facilities services; and other general support services.
139
BMS also may provide us with additional services that we and BMS may identify from time to time in the future. We will provide BMS with certain services under the transitional services agreement (“MJN Services”) including accounting, credit and collection, order entry, information technology, tax, human resources, customs clearance, supply chain management, facilities administration and other general support services. Both we and BMS may engage third parties to provide services covered by the transitional services agreement. The BMS Services and the MJN Services will continue for a specified initial term, which will vary with the types of services to be provided, unless earlier terminated or extended according to the terms of the transitional services agreement.
The transitional services agreement provides that the performance of a service according to the agreement, whether by us or BMS, will not subject the provider of such service to any liability whatsoever except as directly caused by the gross negligence or willful misconduct of the service provider. Liability for gross negligence or willful misconduct is limited to the lesser of the price paid for the particular service or the cost of the service’s recipient performing the service itself or hiring a third party to perform the service. Under the transitional services agreement, the service provider of each service is indemnified by the recipient against all third-party claims relating to provision of services or the recipient’s material breach of a third-party agreement, except where the claim is directly caused by the service provider’s gross negligence or willful misconduct. BMS is the service provider and we are the recipient of the majority of the services to be provided under the transitional services agreement.
We will pay BMS mutually agreed-upon fees for the BMS Services and BMS will pay us mutually agreed-upon fees for the MJN Services. The cost of the transitional services agreement in aggregate will be consistent with general and administrative expenses that BMS has historically allocated or incurred with respect to the BMS Services and the MJN Services.
The terms of the transitional services agreement, including the fees charged for the BMS Services and the MJN Services, are substantially similar to those that would be agreed to by parties bargaining at arm’s length for similar services. We believe the payments we will make to BMS and BMS will make to us are reasonable. However, these payments are not necessarily indicative of, and it is not practical for us to estimate, the level of expenses we might incur in procuring these BMS Services from alternative sources.
Tax Matters Agreement
We and certain of our eligible corporate subsidiaries are included in the affiliated group of corporations that file a consolidated return for U.S. federal income tax purposes, of which BMS is the common parent corporation, and in certain cases, we or one or more of our subsidiaries may (at BMS’s discretion) be included in a combined, consolidated or unitary group with BMS or one or more of its subsidiaries for certain state, local and foreign tax purposes. We have entered into a tax matters agreement to allocate the responsibility of BMS and its subsidiaries, on the one hand, and us and our subsidiaries, on the other hand, for the payment of taxes resulting from filing (i) tax returns on a combined, consolidated or unitary basis and (ii) single entity tax returns for entities that have both Mead Johnson and non-Mead Johnson operations.
Pursuant to this tax matters agreement, BMS will prepare returns for us for all periods during which we or any of our subsidiaries are included in a combined, consolidated or unitary group with BMS or any of its subsidiaries for Federal, state, local or foreign tax purposes, as if we were filing ourselves as a consolidated, combined or unitary group. BMS will also prepare returns for us for all periods during which a single entity tax return is filed for an entity that has both Mead Johnson and non-Mead Johnson operations. We will make payments to BMS and BMS will make payments to us with respect to such returns, as if such returns were actually required to be filed under the laws of the applicable taxing jurisdiction and BMS were the relevant taxing authority of such jurisdiction. If and when we and our subsidiaries cease to be included in BMS’s consolidated tax returns, BMS will compensate us for tax attributes for which we were not previously compensated and that BMS used, and we will reimburse BMS for tax attributes for which we were previously compensated but that BMS never used.
140
Registration Rights Agreement
We have entered into a registration rights agreement with BMS pursuant to which we have granted BMS and its affiliates certain registration rights with respect to our Class A common stock owned by them.
Demand Registration Rights. The registration rights agreement provides that we can be required to effect up to three registrations of Class A common stock upon the request of BMS. Pursuant to the lock-up arrangements, BMS and its affiliates have agreed not to exercise those rights during the lock-up period without the prior written consent of the representatives, on behalf of the underwriters.
We are required to pay the registration expenses in connection with each demand registration. We may decline to honor any of these demand registrations if the size of the offering does not reach a defined threshold or if we have effected a registration within the preceding six months. If we furnish to the stockholder requesting a demand registration a board resolution stating that in the good faith judgment of the board it would be significantly disadvantageous to us for a registration statement to be filed or maintained effective, we are entitled to withdraw (or decline to file) such registration statement for a period not to exceed 180 days. In addition, we are not required to file a registration statement under the registration rights agreement prior to the date that is six months after consummation of our initial public offering.
Piggyback Registration Rights.In addition to our obligations with respect to demand registrations, if we propose to register any of our securities, other than a registration (1) on Form S-8 or Form S-4, (2) relating to equity securities in connection with employee benefit plans, (3) in connection with an acquisition by us of another entity or (4) pursuant to a demand registration, we will give each stockholder party to the registration rights agreement the right to participate in such registration. Expenses relating to these registrations are required to be paid by us. If a majority of the joint-lead bookrunning underwriters in a piggyback registration advise us that the number of securities offered to the public needs to be reduced, first priority for inclusion in the piggyback registration will be given to us and then to BMS and pro rata to the other piggybacking holders.
Holdback Agreements. If any registration of Class A common stock is in connection with an underwritten public offering, each holder of unregistered Class A common stock party to the registration rights agreement will agree not to effect any public sale or distribution of any Class A common stock during the seven days prior to and during the 90-day period beginning on, the effective date of such registration statement and will also agree to enter into a customary lock-up with the underwriters of such offering (not to exceed six months from the date of consummation of such offering). We will enter into a similar agreement, except that we will be permitted to affect a sale or distribution of Class A common stock in connection with a merger or consolidation, in connection with certain acquisitions and in connection with employee stock ownership or other similar benefit plans.
Employee Matters Agreement
We have entered into an employee matters agreement with BMS. The employee matters agreement governs BMS’s, our and the parties’ respective subsidiaries’ and affiliates’ rights, responsibilities and obligations after our initial public offering with respect to:
| | • | | employees and former employees (and their respective dependents and beneficiaries) who are or were associated with BMS, us or the parties’ respective subsidiaries or affiliates; |
| | • | | the allocation of assets and liabilities as it relates to certain employee benefit, pension, welfare, compensation, employment, severance and termination-related matters; and |
| | • | | other human resources, employment and employee benefits matters. |
Intercompany Notes
On February 17, 2009, MJ&C issued a Floating Rate Note Due 2014 (2014 Note) to E.R. Squibb & Sons, L.L.C. (“E.R. Squibb”) in the principal amount of $744,246,256. E.R. Squibb is a wholly owned subsidiary of
141
BMS. We have guaranteed the obligations of MJ&C under the 2014 Note. The 2014 Note matures in February 2014 and bears interest at a floating rate per annum equal to the LIBOR plus 3.00%, payable quarterly. Starting on June 1, 2010 and continuing through December 31, 2013, MJ&C will make quarterly principal payments of $18,750,000 on the 2014 Note. The affirmative and negative covenants and events of default in the 2014 Note are substantially similar to those contained in our revolving credit facility.
On February 17, 2009, MJ&C issued a Fixed Rate Note Due 2016 (2016 Note) to E.R. Squibb in the principal amount of $500,000,000. We have guaranteed the obligations of MJ&C under the 2016 Note. The 2016 Note matures in February 2016 and bears interest at a fixed rate per annum equal to 6.43%, payable semiannually. The 2016 Note is not subject to amortization payments. The 2016 Note contains covenants that are applicable to the company and its subsidiaries, including restrictions on liens, sale and leaseback transactions, substantial asset transfers and mergers. Most of these restrictions are subject to certain minimum thresholds and exceptions. The 2016 Note does not contain any financial covenants. The 2016 Note has customary events of default, including (subject to certain materiality thresholds and grace periods) payment default, failure to comply with covenants, bankruptcy or insolvency proceedings and change of control.
On February 17, 2009, MJ&C issued a Fixed Rate Note Due 2019 (2019 Note) to E.R. Squibb in the principal amount of $500,000,000. We have guaranteed the obligations of MJ&C under the 2019 Note. The 2019 Note matures in February 2019 and bears interest at a fixed rate per annum equal to 6.91%, payable semiannually. The 2019 Note is not subject to amortization payments. The affirmative and negative covenants and events of default in the 2019 Note are substantially similar to those contained in the 2016 Note.
The 2014 Note, 2016 Note and 2019 Note collectively evidence indebtedness that previously was outstanding under a $2,000,000,000 intercompany note issued by the company on August 26, 2008.
Item 14. PRINCIPAL ACCOUNTING FEES AND SERVICES
The following table presents aggregate fees for professional audit services rendered by Deloitte & Touche LLP (“D&T”) for the years ended December 31, 2007 and 2008 for the audits of our annual financial statements, and fees billed for other services rendered by D&T during those periods.
| | | | | | |
| | | 2007 | | 2008 |
Audit | | $ | 1,350,000 | | $ | 2,029,000 |
Audit Related | | | — | | | 421,000 |
| | | | | | |
Total | | $ | 1,350,000 | | $ | 2,450,000 |
Auditfees for 2007 and 2008 were for professional services rendered for the audits of our financial statements, including accounting consultation, and reviews of quarterly financial statements.
Audit Relatedfees for 2008 were for services associated with our initial public offering, which closed on February 17, 2009.
D&T did not provide any other services to us in 2007 or 2008.
Pre-Approval Policy for Services Provided by our Independent Registered Public Accounting Firm
The Audit Committee has established a policy to pre-approve all audit and permissible non-audit services provided by our independent registered public accounting firm consistent with applicable SEC rules. Our independent registered public accounting firm is generally prohibited from performing any management consulting projects, or from providing tax consulting services relating to transactions or proposals in which the sole purpose may be tax avoidance or for which the tax treatment may not be supported by the Internal Revenue Code. Prior to the engagement of our independent registered public accounting firm for the next year’s audit,
142
management submits an aggregate of services expected to be rendered during that year for each of the four categories of services described above to the Audit Committee for approval. Prior to engagement, the Audit Committee pre-approves these services by category of service. The fees are budgeted by category of service and the Audit Committee receives periodic reports from management and our independent registered public accounting firm on actual fees versus the budget by category of service. During the year, circumstances may arise when it may become necessary to engage our independent registered public accounting firm for additional services not contemplated in the pre-approval. In those instances, the Audit Committee requires specific pre-approval before engaging our independent registered public accounting firm.
The Audit Committee may delegate pre-approval authority to its Chair. The Chair is required to report, for informational purposes, any pre-approval decisions to the Audit Committee at its next regularly scheduled meeting.
143
PART IV
| Item 15. | EXHIBITS AND FINANCIAL STATEMENT SCHEDULES |
The financial statements and schedule filed as part of this Annual Report are listed in the accompanying Index to Financial Statements and Financial Statement Schedule on page 53. The exhibits filed as a part of this Annual Report are listed in the accompanying Exhibit Index on page 147.
144
SIGNATURES
Pursuant to the requirements of Section 13 or 15(d) of the Securities Exchange Act of 1934, the registrant has duly caused this report to be signed on its behalf by the undersigned, thereunto duly authorized.
| | | | | | | | |
| | | | MEAD JOHNSON NUTRITION COMPANY |
| | | |
| Date: March 27, 2009 | | | | By: | | /s/ Stanley D. Burhans |
| | | | | | | | Stanley D. Burhans |
| | | | | | | | Vice President and Controller |
Pursuant to the requirements of the Securities Exchange Act of 1934, this report has been signed below by the following persons on behalf of the registrant and in the capacities and on the date indicated.
| | | | | | | | |
| Date: March 27, 2009 | | | | By: | | /s/ Stephen W. Golsby |
| | | | | | | | Stephen W. Golsby |
| | | | | | | | President and Chief Executive Officer |
| | | | | | | | (Principal Executive Officer) |
| | | |
| Date: March 27, 2009 | | | | By: | | /s/ Peter G. Leemputte |
| | | | | | | | Peter G. Leemputte |
| | | | | | | | Senior Vice President and Chief Financial Officer |
| | | | | | | | (Principal Financial Officer) |
| | | |
| Date: March 27, 2009 | | | | By: | | /s/ Stanley D. Burhans |
| | | | | | | | Stanley D. Burhans |
| | | | | | | | Vice President and Controller |
| | | | | | | | (Principal Accounting Officer) |
| | | |
| Date: March 27, 2009 | | | | By: | | /s/ James M. Cornelius |
| | | | | | | | James M. Cornelius |
| | | | | | | | Director |
| | | |
| Date: March 27, 2009 | | | | By: | | /s/ Lamberto Andreotti |
| | | | | | | | Lamberto Andreotti |
| | | | | | | | Director |
| | | |
| Date: March 27, 2009 | | | | By: | | /s/ Steven M. Altschuler, M.D. |
| | | | | | | | Steven M. Altschuler, M.D. |
| | | | | | | | Director |
| | | |
| Date: March 27, 2009 | | | | By: | | /s/ Howard B. Bernick |
| | | | | | | | Howard B. Bernick |
| | | | | | | | Director |
| | | |
| Date: March 27, 2009 | | | | By: | | /s/ John E. Celentano |
| | | | | | | | John E. Celentano |
| | | | | | | | Director |
| | | |
| Date: March 27, 2009 | | | | By: | | /s/ Jean-Marc Huet |
| | | | | | | | Jean-Marc Huet |
| | | | | | | | Director |
| | | |
| Date: March 27, 2009 | | | | By: | | /s/ Sandra Leung |
| | | | | | | | Sandra Leung |
| | | | | | | | Director |
145
| | | | | | | | |
| | | |
| Date: March 27, 2009 | | | | By: | | /s/ Peter G. Ratcliffe |
| | | | | | | | Peter G. Ratcliffe |
| | | | | | | | Director |
| | | |
| Date: March 27, 2009 | | | | By: | | /s/ Elliott Sigal, MD., Ph.D. |
| | | | | | | | Elliott Sigal, M.D., Ph.D. |
| | | | | | | | Director |
| | | |
| Date: March 27, 2009 | | | | By: | | /s/ Robert S. Singer |
| | | | | | | | Robert S. Singer |
| | | | | | | | Director |
146
EXHIBIT INDEX
| | |
Exhibit Number | | Description |
3 | | Certificate of Incorporation and Bylaws |
| |
3.1 | | Amended and Restated Certificate of Incorporation of Mead Johnson Nutrition Company |
| |
3.2 | | Amended and Restated By-laws of Mead Johnson Nutrition Company |
| |
4 | | Instruments defining the rights of the security holders |
| |
4.1 | | Specimen Common Stock certificate (incorporated by reference to Exhibit 4.1 of Amendment No. 1 to Form S-1 (Registration No. 333-156298) filed on January 14, 2009) |
| |
10 | | Material Contracts |
| |
10.1 | | Separation Agreement by and between Bristol-Myers Squibb Company and Mead Johnson Nutrition Company |
| |
10.2 | | Employee Matters Agreement between Bristol-Myers Squibb Company and Mead Johnson Nutrition Company |
| |
10.3 | | Transitional Services Agreement between Bristol-Myers Squibb Company and Mead Johnson Nutrition Company |
| |
10.4 | | Registration Rights Agreement between Mead Johnson Nutrition Company and Bristol-Myers Squibb Company |
| |
10.5 | | Tax Matters Agreement between Bristol-Myers Squibb Company and Mead Johnson Nutrition Company |
| |
10.6 | | China Services Agreement between Bristol-Myers Squibb Company and Mead Johnson Nutrition Company, dated February 10, 2009 (incorporated by reference to Exhibit 10.26 of Amendment No. 1 to Form S-1 (Registration No. 333-156298) filed on February 12, 2009) |
| |
10.7 | | Floating Rate Note of Mead Johnson & Company due 2014 (incorporated by reference to Exhibit 10.2 of Form 8-K, filed on February 20, 2009) |
| |
10.8 | | 6.43% Note of Mead Johnson & Company due 2016 (incorporated by reference to Exhibit 10.3 of Form 8-K, filed on February 20, 2009) |
| |
10.9 | | 6.91% Note of Mead Johnson & Company due 2019 (incorporated by reference to Exhibit 10.4 of Form 8-K, filed on February 20, 2009) |
| |
10.10 | | Three Year Revolving Credit Facility Agreement, dated February 17, 2009 (incorporated by reference to Exhibit 10.1 of Form 8-K, filed on February 20, 2009) |
| |
10.11† | | Supply Agreement by and between Mead Johnson & Company and Martek Biosciences Corporation, dated as of January 1, 2006 (incorporated by reference to Exhibit 10.18 of Form S-1 (Registration No. 333-156298) filed on December 19, 2008) |
| |
10.12* | | Retention Agreement between Bristol-Myers Squibb Company and Stephen W. Golsby, dated as of November 12, 2007, and as amended August 5, 2008 (incorporated by reference to Exhibit 10.1 of Form S-1 (Registration No. 333-156298) filed on December 19, 2008) |
| |
10.13* | | Retention Agreement between Bristol-Myers Squibb Company and Charles M. Urbain, dated as of November 7, 2007, and as amended August 11, 2008 (incorporated by reference to Exhibit 10.2 of Form S-1 (Registration No. 333-156298) filed on December 19, 2008) |
| |
10.14* | | Retention Agreement between Bristol-Myers Squibb Company and Peter Kasper Jakobsen, dated as of November 5, 2007, and as amended August 11, 2008 (incorporated by reference to Exhibit 10.3 of Form S-1 (Registration No. 333-156298) filed on December 19, 2008) |
147
| | |
Exhibit Number | | Description |
10.15* | | Amended and Restated Change-in-Control Agreement between Bristol-Myers Squibb Company and Stephen W. Golsby, effective as of January 1, 2009 |
| |
10.16* | | Form of Amended and Restated Change-in-Control Agreement between Bristol-Myers Squibb Company and Peter G. Leemputte, Charles M. Urbain and Peter Kasper Jakobsen, effective as of January 1, 2009 (incorporated by reference to Exhibit 10.5 of Amendment No. 1 to Form S-1 (Registration No. 333-156298) filed on January 14, 2009) |
| |
10.17* | | Assignment Agreement between Bristol-Myers Squibb Company and Charles Urbain, dated September 12, 2008 (incorporated by reference to Exhibit 10.6 of Amendment No. 1 to Form S-1 (Registration No. 333-156298) filed on January 14, 2009) |
| |
10.18* | | Assignment Agreement between Bristol-Myers Squibb Company and Peter Kasper Jakobsen, dated November 20, 2008 (incorporated by reference to Exhibit 10.7 of Amendment No. 1 to Form S-1 (Registration No. 333-156298) filed on January 14, 2009) |
| |
10.19* | | Bristol-Myers Squibb Company Change in Control Separation Benefits Plan, as amended effective September 12, 2008 (incorporated by reference to Exhibit 10.8 of Form S-1 (Registration No. 333-156298) filed on December 19, 2008) |
| |
10.20* | | Offer Letter to Stephen Golsby, dated December 19, 2003 (incorporated by reference to Exhibit 10.9 of Form S-1 (Registration No. 333-156298) filed on December 19, 2008) |
| |
10.21* | | Offer Letter to Peter Kasper Jakobsen, dated February 13, 2004 (incorporated by reference to Exhibit 10.10 of Form S-1 (Registration No. 333-156298) filed on December 19, 2008) |
| |
10.22* | | Offer Letter to Peter G. Leemputte, dated September 2, 2008 (incorporated by reference to Exhibit 10.11 of Form S-1 (Registration No. 333-156298) filed on December 19, 2008) |
| |
10.23* | | Offer Letter to Dirk H. Hondmann, dated June 22, 2005 (incorporated by reference to Exhibit 10.25 of Amendment No. 2 to Form S-1 (Registration No. 333-156298) filed on January 28, 2009) |
| |
10.24* | | Bristol-Myers Squibb Company 2007 Stock Award and Incentive Plan, as amended and restated, effective as of June 10, 2008 (incorporated by reference to Exhibit 10.14 of Form S-1 (Registration No. 333-156298) filed on December 19, 2008) |
| |
10.25* | | Bristol-Myers Squibb Company 2002 Stock Incentive Plan, as amended and restated, effective June 10, 2008 (incorporated by reference to Exhibit 10.15 of Form S-1 (Registration No. 333-156298) filed on December 19, 2008) |
| |
10.26* | | Bristol-Myers Squibb Company TeamShare Stock Option Plan, as amended and restated, effective September 10, 2002 (incorporated by reference to Exhibit 10.16 of Form S-1 (Registration No. 333-156298) filed on December 19, 2008) |
| |
10.27* | | Bristol-Myers Squibb Company 1997 Stock Incentive Plan, effective as of May 6, 1997 as amended and restated, effective July 16, 2002 (incorporated by reference to Exhibit 10.17 of Form S-1 (Registration No. 333-156298) filed on December 19, 2008) |
| |
10.28* | | Mead Johnson Nutrition Company 2009 Stock Award and Incentive Plan |
| |
10.29* | | Mead Johnson Nutrition Company 2009 Senior Executive Performance Incentive Plan |
| |
10.30* | | Retention Agreement between Bristol-Myers Squibb Company and Dirk H. Hondmann, dated as of October 30, 2007, and as amended August 11, 2008 (incorporated by reference to Exhibit 10.24 of Amendment No. 1 to Form S-1 (Registration No. 333-156298) filed on January 14, 2009) |
| |
10.31* | | Mead Johnson & Company Benefit Equalization Plan-Retirement Plan |
| |
10.32* | | Mead Johnson & Company Benefit Equalization Plan-Retirement Savings Plan |
148
| | |
Exhibit Number | | Description |
10.33* | | Mead Johnson & Company Key International Pension Plan |
| |
10.34* | | Form of Nonqualified Stock Option Agreement |
| |
10.35* | | Form of Performance Shares Agreement |
| |
10.36* | | Form of Director Restricted Stock Units Agreement |
| |
10.37* | | Form of Employee Restricted Stock Units Agreement |
| |
21 | | Subsidiaries of the Registrant |
| |
21.1 | | Subsidiaries of the Registrant |
| |
31 | | Rule 13a-15(e) and 15(d)-15(e) Certification |
| |
31.1 | | Certification of the Chief Executive Officer |
| |
31.2 | | Certification of the Chief Financial Officer |
| |
32 | | Section 1350 Certifications pursuant to 18 U.S.C. Section 1350, as adopted pursuant to Section 906 of the Sarbanes-Oxley Act of 2002 |
| |
32.1 | | Certification of the Chief Executive Officer |
| |
32.2 | | Certification of the Chief Financial Officer |
| † | Confidential treatment has been granted for certain portions which are omitted in the copy of the exhibit electronically filed with the SEC. The omitted information has been filed separately with the SEC pursuant to our application for confidential treatment. |
| * | Compensatory plan or arrangement |
149