Exhibit 99.1

Nimble Storage, Inc. Q1FY15 Shareholder Letter
Financial Highlights
| — | Revenue of $46.5 million was up 110% from prior year Q1 |
| — | Non-GAAP gross margin of 66.2% vs. 61.8% in prior year Q1 |
| — | Non-GAAP operating margin was negative 22% compared to negative 36% in prior year Q1 |
| — | Non-GAAP loss per share of $0.14 per share compared to a non-GAAP loss per share of $0.14 in prior year Q1; based on 70.3 million weighted average basic shares outstanding during Q1 |
Nimble was founded on the belief that we could transform storage architectures by leveraging two key external disruptions: flash and cloud connectivity. We translated our belief into a platform built on two fundamental innovations – our CASL file system software and our InfoSight cloud-based management software. CASL has been designed from the ground up and is unmatched in its ability to leverage the complementary characteristics of flash and disk and bring compelling value across a very broad range of workloads to enterprises and cloud service providers. InfoSight leverages deep data analytics and the rich telemetry capabilities of our platform to proactively monitor the health, capacity and performance of our customer-deployed systems and provide real-time operational insights to our customers and us.
Our overall strategy remains focused on five broad themes:
| 1. | Technology innovation that delivers the most efficient flash platform in the industry |
| 2. | Go-to-market execution to drive rapid customer acquisition across mid-market customers, large enterprises and cloud service providers, and steadily increasing international contribution |
| 3. | Driving strong repeat bookings through our product differentiation, high-quality support experience and cloud-based management |
| 4. | Market positioning as the broadest flash platform targeting mainstream applications and leveraging tight integration with key partners for converged infrastructure solutions |
| 5. | Attracting and retaining the industry’s best talent pool |
Financially, our strategy remains to invest for rapid growth while simultaneously growing revenue faster than our investments, thereby delivering steadily improving operating leverage and better operating margins on a year-over-year basis, on the path to achieving our target business model.
Our execution during Q1FY15 continues to validate our founding beliefs, and the magnitude of the growth opportunity ahead of us as we leverage our technology leadership in flash storage solutions.
| NIMBLE STORAGE Q1FY15 SHAREHOLDER LETTER | 1 |
Product Momentum
Our product value proposition continues to resonate strongly in the market, with continued momentum against competitors. Key reasons why customers choose us continue to be:
| — | Efficiency in delivering better performance/$ and capacity/$ |
| — | Scale-to-fit architecture that allows us to span a wide spectrum of workloads ranging from those that need all-flash performance to those that need the cost profile of disk systems |
| — | Integrated protection that protects application data much better than traditional approaches to data protection |
| — | InfoSight cloud-based management that radically simplifies day-to-day operations |
We are focused on three key product initiatives to further enhance our differentiation and increase our ability to serve larger enterprises and cloud service providers during FY15:
| 1. | General availability of our scale-out software. |
| 2. | Roll-out of a new high-end platform during Q2FY15. |
| 3. | Release of our fiber channel capability by the end of FY15. |
| During Q1, we rolled out our scale-out functionality broadly, with over 1200 customer systems already deployed with the scale-out release. As of May, the scale-out release is generally available. The customer reaction to scale-out has been very positive as it complements our scale-up and scale-deep functionality, allowing customers to scale non-disruptively from a small footprint to extremely large environments. During Q1, other beta features that were introduced as part of the InfoSight platform also became generally available to all our customers. Specifically, customers appreciate the ability to drill deeper and quickly diagnose the root cause of performance bottlenecks without on-premise |
Case Example: Investment Management Firm
An investment management firm that uses data analytics and algorithmic trading, selected us after considering EMC VMAX and high-end NetApp FAS systems. The primary application used SQL databases, while the environment also included Exchange, VMware and Citrix. Key drivers of why we won included:
— Performance that met or exceeded all the benchmarks at costs much lower than those of the high-end VMAX system — Field measured “Five 9s” availability of our systems — Ability to deploy replication for disaster recovery within the substantially lower capital spend
Scale-out clustering is a key next step that allows this customer to scale performance by pooling the resources of multiple Nimble arrays. |
software. Also, channel partners appreciate the ability to view their customers’ assets upon delegated authority. We are also very excited about a new high-end platform that went into beta at the end of Q1 and is due to be launched and become generally available during Q2. This platform will offer the performance of flash-only arrays, while improving $/performance and retaining our leadership on $/GB. At the other extreme, we can also deliver petabyte-scale capacities cost effectively and compete even more successfully against the mainstream storage arrays of the incumbents. We have over 20 customers already in beta with our high-end platform. Additionally, we have developed software enhancements aimed at addressing the needs of larger enterprises and cloud service providers.
| NIMBLE STORAGE Q1FY15 SHAREHOLDER LETTER | 2 |
We are excited about the potential of our high-end platform in penetrating large enterprises and cloud service providers and addressing demanding applications within mid-sized enterprises. The potential of the platform will be further expanded when we release support for fiber channel environments, and we remain on track to deliver that capability by year end.
Go-to-Market Execution
Q1FY15 was another strong quarter for new end customer acquisition as we added over 450 new end customers to our installed base, driven significantly by continued channel leverage. Our emphasis within the US channel has been on deeper engagement and enablement of channel partners. Internationally, we are focused on channel recruitment. Metrics that point to the success of our strategy include: |
Case Example: Fortune 50 Telecommunications Company
One of the world’s largest telecom providers analyzes critical network security events by processing billions of events per day using HP Vertica.
Their environment used individual compute nodes with local storage to handle IO and capacity needs, resulting in the scalability challenge of having to continually add nodes as capacity and IO requirements increased. Storage management was also a challenge with respect to centralized provisioning and data protection.
Replacing the local storage with Nimble allowed the customer to: | |||||||
— |
Reduce the number of Vertica nodes since our scale-to-fit architecture allows for simplicity in scaling performance and capacity independently | |||||||
— | Centralize data protection through snapshots and replication | |||||||
— | Simplify management dramatically | |||||||
This customer is now evaluating our high-end platform for their Splunk environment – an extremely large, performance intensive and business critical environment.
| ||||||||
— | In ~40% of the new end customer acquisitions during the quarter, the channel partner contribution to the success of the sales cycle was deemed to have been 75% or greater. This is a record compared to any previous quarter. | 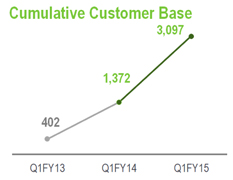 | ||||
— | The number of individual channel partner account executives who closed deals during the quarter was also a record, having more than doubled from the prior year. | |||||
— | The cumulative number of partner engineers that have been trained and accredited as of the end of the quarter was also a record, having increased by 199% from a year ago. | |||||
A second growth dimension on which we performed well during the quarter relates to international expansion. International accounted for 19% of total bookings in Q1, up from 12% in the same quarter of the prior year. Across EMEA and APJ, we now have teams in 13 countries, and distribution arrangements in 21 countries. With ~300 channel partners in these regions, our channel-centric model continues to be a key driver of growth. During Q1, we signed a distribution agreement with Ingram Micro to further recruit and enable channel
| NIMBLE STORAGE Q1FY15 SHAREHOLDER LETTER | 3 |
partners across Europe to sell our flash storage solutions. In addition, Ingram Micro will focus on offering our SmartStack converged infrastructure solutions to joint Nimble Storage and Cisco channel partners. We signed
a similar distribution agreement in Q1 with the Westcon Group with a focus on Southeast Asia. The relationship we announced last quarter with Toshiba Corporation in Japan is off to a quick start as well.
A third dimension of growth is diversifying our customer base to serve large enterprises and cloud service providers.
Our installed base of large enterprises (defined as the 5000 largest companies by revenue globally) grew at 118% compared to the same quarter of the previous year, and includes three Fortune 10 companies and several Fortune 500 companies. The value proposition that we deliver to these large enterprises is even more compelling given their need for greater performance, significantly larger scale and business continuity. |
Case Example: Fortune 500 Engineering & Construction Company
This customer first engaged us because of a need to improve performance for their Autonomy eDiscovery and Oracle Data Warehouse applications, and because their backups took too long with backup windows of ~10 hours.
They conducted an extensive proof of concept against EMC who was the incumbent vendor, and selected Nimble based on some key benefits that they saw: | |||||||
— |
Application performance was up by 130% | |||||||
| — | Snapshot-based backup and replication for DR has allowed them to eliminate tape and eliminate traditional backup windows | |||||||
| — | Data reduction allowed them to store 2.3 times more data per TB of useable capacity, thus substantially lowering capital costs | |||||||
| — | They are saving $3,500 per month in power, cooling and space | |||||||
Having deployed ~150TB across 4 systems in two data centers, they are now looking to expand the foot-print, deploy scale-out clustering, and migrate their virtual server environment to Nimble.
| ||||||||
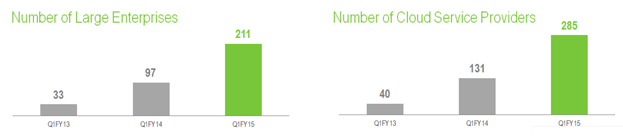
As our end-customers evaluate cloud-based infrastructure as a complement to their on-premise infrastructure, we are focused on serving cloud service providers that use our flash storage platform as an underlying building block for their service offerings. Our installed base has grown rapidly to 285 cloud service providers, more than double of what it was a year ago. Even as we have grown our installed customer base of cloud service providers, their propensity for repeat purchases is driving aggressive growth for us. In Q1FY15, repeat bookings accounted for ~60% of the total bookings by cloud service providers, significantly higher than the average repeat bookings across our customer base. |
Land and Expand Example: Global Forbes 2000 Energy Giant
This global energy leader first engaged us after a VDI deployment using their incumbent storage ran into scalability challenges. They rolled out a 3000 seat VDI deployment due to the compelling value of our solution: | |||||||
— |
72% lower cost per IO | |||||||
| — | Lower cost per GB through 37% data reduction, and use of low cost HDDs | |||||||
| — | Time to recover virtual PCs lowered by 50% | |||||||
Since the initial deployment nearly 18 months ago, this global energy leader has rapidly expanded their use of Nimble Storage’s flash storage platform: | ||||||||
— |
An exchange deployment across two data centers supporting 11,500 users | |||||||
| — | Storage for their ESX farm comprising 600 VMs and ~200TB of data | |||||||
Within 18 months, our deployment is now at 10 systems and 600TB of capacity.
| ||||||||
| NIMBLE STORAGE Q1FY15 SHAREHOLDER LETTER | 4 |
| Our fourth dimension of growth is our land and expand business model. Repeat bookings from existing customers account for ~40% of our total bookings. A core, deeply held belief that we have operated on since our inception is that making every customer a reference customer is of paramount importance, particularly in an industry in which customers are justifiably paranoid about risking their data assets. This belief drove us to complement our product investments with investments in InfoSight for cloud-based management and in ensuring that our platforms are highly resilient. That investment, in turn, is driving a steady pattern of repeat | 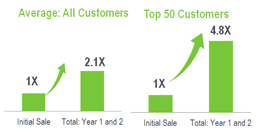 |
purchases by existing customers as they migrate additional workloads on to our platform after initial deployment. Across our entire base of customers, at the end of year 2, the average customer would more than have doubled
their initial spend with us. The top 50 customers would have spent an incremental 4X their initial investment during the same 2-year period.
A key factor that is enabling us to acquire new customers, recruit and enable channel partners and address a wide variety of workloads is the momentum that we are seeing with our alliance partners, including Cisco, VMware, Microsoft, Oracle, Citrix, CommVault and Veeam among others. We are seeing strong interest in our SmartStack solutions, pre-validated |
H.F. Lenz replaces IBM with SmartStack Converged Infrastructure
H.F. Lenz, a consulting engineering firm with a specialty in data center engineering & design, selected Nimble SmartStack converged infrastructure over incumbent IBM XIV storage and servers for business critical applications such as SQL, SharePoint, Exchange, Forefront Security and CAD/CAM services. Challenged with identifying funding for the cost to buy, maintain and manage the products, they selected Nimble for the following main reasons: | |||||||
— |
Performance and reliability that met or exceeded current high-end IBM XIV systems at a fraction of the cost | |||||||
| — | Our robust and efficient replication, snapshot and cloning features | |||||||
| — | Our and Cisco’s fully tested SmartStack reference architecture | |||||||
converged infrastructure solutions. As an illustration, the number of SmartStack deployments in Q1FY15 more than quadrupled compared to Q1FY14.
Q1FY15 Financial Results
As a reminder, all results presented in this letter are on a non-GAAP basis except for revenue and the balance sheet. Non-GAAP results exclude the impact of stock-based compensation.
Q1 FY15 was a very strong financial quarter for us. We achieved record revenue of $46.5 million that was approximately 8% above the mid-point of our guidance of $42 million to $44 million. Our gross margin was very strong at 66.2%, and remains best of breed in the storage industry. Our operating loss was ($10.1 million), better than our projected operating loss of ($11-12 million), due to higher than expected revenue. As a result, Q1 non-GAAP EPS was a loss of ($0.14) per share compared to our guidance of ($0.16) to ($0.17) loss per share.
| NIMBLE STORAGE Q1FY15 SHAREHOLDER LETTER | 5 |
We also maintained our focus on operational excellence and working capital management as was reflected in our cash conversion cycle of four days, with positive cash flow from operations for a second quarter in a row.
Q1 revenue was a record high of $46.5 million, more than doubling from $22.1million in Q1 of last year. We continued our rapid pace of end customer acquisition during the quarter, ending with a total of 3,097 end customers, an increase of 126% from Q1 of last year. The land and expand aspect of our business model continued to reflect the importance of new customer acquisition as well as customers’ increasing adoption of our platform. We also continued to see the impact of larger deal sizes as the number of deals closed with a value of over $100K more than doubled over the last 12 month period compared to the corresponding period last year. | 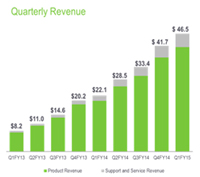 |
Product revenue for Q1 was $41.2 million, representing 89% of total revenue and an increase of 106% from Q1 of the prior year. Support and service revenue for Q1, which includes our maintenance entitlement and InfoSight service, was $5.3 million, representing 11% of total revenue and an increase of 156% from Q1 of the prior year. International product revenue continued to show strong growth with an increase of 28% sequentially from Q4 of last year, and an increase of approximately 200% from Q1 of the prior year.
Gross margin was strong at 66.2% in Q1, up by 4.4 percentage points from 61.8% last year. Our overall gross margin decreased by 1 percentage point from Q4, mainly due to the impact of lower support and service margin during the quarter. Our long-term target for overall gross margin remains 63% to 65%, even though we expect to be at the high end of this range in the near term.
Product gross margin in Q1 was 69.0%, up by 3.2 percentage points from 65.8% last year. The majority of the improvement in product gross margin from prior year was due to operational leverage and efficiencies in our supply chain infrastructure as well as improving manufacturing yield and quality from our partnership with Flextronics. We expect our long-term target product gross margin to be approximately 66%-67%, as we continue to execute our go to market investments and international expansion plans. | 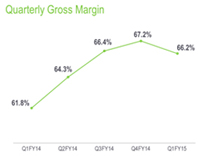 |
| Support and service gross margin in Q1 was 44.8%, up by 22 percentage points from 22.8% last year and 6.2 percentage points lower than the record 51.0% we reported in Q4. During the quarter, we continued to make investments to support the rapid growth in our installed base of customers as well as our growing international deployments. At the end of Q1, we had over 70 | 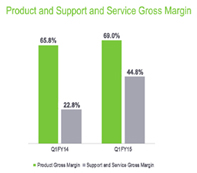 |
| NIMBLE STORAGE Q1FY15 SHAREHOLDER LETTER | 6 |
active service depots with greater than 30% of these outside of North America. Our customer loyalty metrics also remained very strong with over 99.5% of our installed base of customers presently covered by an active support and service contract. As we recognize the deferred revenue from our support and service agreements over their average 3-year life, we expect our support and service gross margins to grow towards the long-term target of approximately 60%.
Q1 total non-GAAP operating expenses were $40.9 million or 88% of revenue compared to Q1 last year operating expenses of $21.7 million or 98% of revenue. We saw an improvement in operating leverage by 10 percentage points even as we increased overall headcount by 260 during the last four quarters to end with 668 employees at the end of Q1.
— | Research and development (R&D) spending in Q1 was $11.8 million or 25% of revenue compared to last year when spending was $6.0 million or 27% of revenue. Our R&D roadmap remains as rich as it has ever been as we continue to expand the capabilities of our broad platform. Our long term target for R&D spending is 11% to 13% of revenue. | |||
— | Sales and marketing (S&M) spending was $24.3 million or 52% of revenue compared to Q1 last year spending of $13.7 million or 62% of revenue. Our level of engagement with our channel partners continued to increase as they brought over 1,700 qualified opportunities to us during Q1 alone. As we continue to experience leverage in our sales and marketing model, we expect our long term target for S&M spending to be 28% to 31% of revenue. | 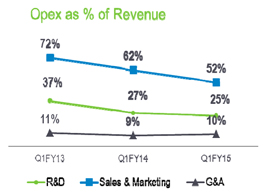 | ||
— | General and administrative (G&A) spending was $4.9 million or 10% of revenue compared to Q1 last year spending of $2.1 million or 9% of revenue. Our G&A expenses in the current quarter included approximately $0.6M in litigation related legal expenses. We expect over time to achieve our long-term target of G&A spending at 5% to 6% of revenue. | |||
Our Q1 non-GAAP operating loss was ($10.1 million), better than our guidance for an operating loss of ($11 – 12 million). As a result of higher gross margin, and better operating expense leverage, our Q1 non-GAAP operating margin improved to negative 22% compared to negative 36% in Q1 last year, a 14 percentage point improvement. Our leverage with respect to adjusted EBITDA was even better with negative 17% in Q1 compared to negative 34% in Q1 of last year, a 17 percentage point improvement. As previously disclosed, while operating margin may fluctuate on a quarterly basis, we currently expect to continue to deliver sequential improvement in operating margin every fiscal year. Based on current projections, we estimate that by the end of our next fiscal year (FY16), we will achieve break even on a non-GAAP basis.
| NIMBLE STORAGE Q1FY15 SHAREHOLDER LETTER | 7 |
During Q1, we reported approximately $200K of foreign exchange gains, and $150K of income tax expenses, mainly on our international entities. As a result of operating losses and accumulated net operating losses, or NOLs, we do not expect to incur income tax expenses in the US in the near term.
Q1 non-GAAP EPS was a loss of ($0.14) per share on approximately 70.3 million weighted average basic shares outstanding compared to a loss of ($0.14) per share in Q1 last year. This was better than our guidance for a loss of ($0.16 – 0.17) per share.
Balance Sheet
We ended Q1 with cash and cash equivalents of $204.3M, a reduction of $4.2M in the quarter. We continued our strong focus on working capital management and operational excellence, achieving a cash conversion cycle of four days, well below our target of 20 days. Days sales outstanding (DSO) was 35 days compared to 32 days in Q4, days sales in inventory (DSI) was 36 days compared to 38 days in Q4 and days payable outstanding (DPO) was 67 days compared to 70 days in Q4.
Our Q1 cash flow from operations was $0.5M, positive for a second consecutive quarter. Capex spend was $3.7M, resulting in negative free cash flow (FCF) of $3.3M for the quarter. This represented an improvement compared to | 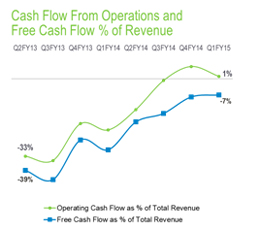 | |
negative FCF of $6.8M in Q1 last year and was consistent with negative FCF of $3.3M in Q4 of last year. Our FCF margin in Q1 was negative 7% vs. negative 31% in Q1 last year. We expect our FCF margins to break even ahead of our operating income margin since we bill for the full value of support and service upfront even as we recognize revenue over the contractual period. For the full year FY15, we expect our total capex spend to be approximately 10% of revenue, roughly in line with our prior fiscal year.
We ended Q1 with total deferred revenue of $42.1 million, an increase of $8.6 million or 26% from the Q4 balance of $33.5 million, and an increase of $27.2 million or 183% from $14.9 million in Q1 last year. Our deferred revenue consists primarily of payments received for support and service agreements which have an average life of approximately three years.
Q2FY15 Financial Outlook
As we look ahead to Q2 and the rest of FY15, we are excited about the progress we are making in our go-to-market and product development efforts.
Our Q2 FY15 financial guidance is as follows:
| — | Revenue of $49 - $51 million; the midpoint of this range reflects 75% growth compared to the prior year period |
| NIMBLE STORAGE Q1FY15 SHAREHOLDER LETTER | 8 |
| — | Operating Loss of ($11 – 12 million); the midpoint of this range represents negative 23% operating margin compared to negative 30% in the prior year period |
| — | Non-GAAP loss of ($0.16 – 0.17) per share |
| — | Weighted average basic shares outstanding of approximately 70.8M |
Our financial objectives remain (1) driving strong revenue growth and increasing our market share (2) maintaining industry leading gross margins and (3) steadily progressing towards our long term target financial model of 16%-20% operating margin by delivering sequential improvement in operating margin every year. Our target for operating margin break-even is by the end of FY16, with FCF break even achieved ahead of that timeline.
We believe that we have built the industry’s most advanced flash storage platform and that we have the opportunity to lead our industry as it transitions towards flash optimized storage solutions. Our execution during Q1FY15 is a step towards that goal. We want to thank our partners and customers once again for embracing us, our investors for their confidence in us, and our employees for their dedication and flawless execution.
|
| |||
| Suresh Vasudevan, CEO | Anup Singh, CFO |


| NIMBLE STORAGE Q1FY15 SHAREHOLDER LETTER | 9 |
Conference Call Information:
As previously announced, Nimble Storage will host a live question & answer conference call and webcast today at 5:00 p.m. ET (2:00 p.m. PT) to discuss its financial results for the first quarter 2015.
To access the conference call, dial 877-941-2068, using conference code 4681069. Callers outside the U.S. and Canada should dial 480-629-9712, using conference code 4681069. A replay of the conference call will be available through June 5, 2014. To access the replay, please dial 800-406-7325 and enter pass code 4681069. Callers outside the U.S. and Canada should dial 303-590-3030 and enter pass code 4681069.
The live webcast will be accessible on Nimble Storage’s investor relations website at http://investors.nimblestorage.com/ and will be archived and available on this site for 45 days.
Non-GAAP Financial Measures
To provide investors with additional information regarding our financial results, Nimble Storage has disclosed in this release non-GAAP financial measures that are not calculated in accordance with generally accepted accounting principles in the United States, or GAAP. The Company provides non-GAAP gross margin, non-GAAP operating margin, non-GAAP net loss, non-GAAP net loss per share, free cash flow and adjusted EBITDA. In computing many of these non-GAAP financial measures, the Company excludes the effects of stock-based compensation, which is a recurring expense for the Company. The Company has provided a reconciliation below of non-GAAP financial measures to the most directly comparable GAAP financial measures.
The Company discloses these non-GAAP financial measures because they are key measures used by the Company’s management and board of directors to understand and evaluate operating performance and trends, to prepare and approve the annual budget and to develop short-term and long-term operational and compensation plans. In particular, the exclusion of certain expenses in calculating non-GAAP financial measures can provide a useful measure for period-to-period comparisons of the Company’s business. Accordingly, the Company believes that these non-GAAP financial measures provide useful information to investors and others in understanding and evaluating the Company’s operating results in the same manner as the Company’s management and board of directors.
Non-GAAP financial measures have limitations as analytical tools and, as such, should not be considered in isolation or as substitutes for analysis of the Company’s results as reported under GAAP. Some of these limitations are:
| ¡ | Non-GAAP financial measures do not consider the potentially dilutive impact of equity-based compensation, which is an ongoing expense for the Company; and |
| ¡ | Other companies, including companies in our industry, may calculate non-GAAP financial measures differently, which reduces their usefulness as comparative measures. |
| NIMBLE STORAGE Q1FY15 SHAREHOLDER LETTER | 10 |
Nimble Storage, Inc.
Reconciliation of GAAP to Non-GAAP Financial Measures
(In thousands, except per share amounts)
(Unaudited)
| Three Months Ended April 30, | ||||||||
| 2014 | 2013 | |||||||
GAAP gross margin | $ | 30,212 | $ | 13,581 | ||||
Stock-based compensation | 624 | 83 | ||||||
|
|
|
| |||||
Non-GAAP gross margin | $ | 30,836 | $ | 13,664 | ||||
|
|
|
| |||||
GAAP operating margin | $ | (19,644) | $ | (9,198) | ||||
Stock-based compensation | 9,557 | 1,155 | ||||||
|
|
|
| |||||
Non-GAAP operating margin | $ | (10,087) | $ | (8,043) | ||||
|
|
|
| |||||
GAAP net loss | $ | (19,595) | $ | (9,371) | ||||
Stock-based compensation | 9,557 | 1,155 | ||||||
|
|
|
| |||||
Non-GAAP net loss | $ | (10,038) | $ | (8,216) | ||||
|
|
|
| |||||
Interest income (expense), net | 4 | (6) | ||||||
Provision for income taxes | 156 | 46 | ||||||
Depreciation | 1,758 | 617 | ||||||
|
|
|
| |||||
Adjusted EBITDA | $ | (8,120) | $ | (7,559) | ||||
|
|
|
| |||||
GAAP net loss per share, basic and diluted | $ | (0.28) | $ | (0.47) | ||||
Stock-based compensation | 0.14 | 0.06 | ||||||
Impact of difference in number of GAAP and non-GAAP shares | - | 0.27 | ||||||
|
|
|
| |||||
Non-GAAP net loss per share | $ | (0.14) | $ | (0.14) | ||||
|
|
|
| |||||
Shares used to compute GAAP net loss per share attributable to common stockholders, basic and diluted | 70,319 | 19,805 | ||||||
Weighted average effect of the assumed conversion of convertible preferred stock from the date of issuance | - | 38,868 | ||||||
|
|
|
| |||||
Shares used to compute Non-GAAP net loss per share | 70,319 | 58,673 | ||||||
|
|
|
| |||||
| NIMBLE STORAGE Q1FY15 SHAREHOLDER LETTER | 11 |
Forward-Looking Statements
This press release contains “forward-looking” statements that are based on our management’s beliefs and assumptions and on information currently available to management. We intend for such forward-looking statements to be covered by the safe harbor provisions for forward-looking statements contained in the U.S. Private Securities Litigation Reform Act of 1995. Forward-looking statements include all statements other than statements of historical fact contained in this letter, including information concerning our future financial results, timing of product releases or enhancements, business plans and objectives, potential growth opportunities, competitive position, industry environment and potential market opportunities.
Forward-looking statements are subject to known and unknown risks, uncertainties, assumptions and other factors including, but not limited to, those related to our future financial performance which is inherently uncertain, unforeseen delays in product development or introduction, uncertainty around market acceptance of our solutions, our ability to increase sales of our solutions, our ability to attract and retain customers and to selling additional solutions to our existing customers, our ability to develop new solutions and bring them to market in a timely manner, pricing pressure (as a result of competition or otherwise), our ability to maintain, protect and enhance our brand and intellectual property, the effectiveness of our channel partners and our ability to continue to expand our business and manage our growth. Moreover, we operate in very competitive and rapidly changing environments, and new risks may emerge from time to time. It is not possible for our management to predict all risks, nor can we assess the impact of all factors on our business or the extent to which any factor, or combination of factors, may cause actual results to differ materially from those contained in any forward-looking statements we may make. Further information on these and other factors that could affect our financial results are included in our filings with the Securities and Exchange Commission, and may cause our actual results, performance or achievements to differ materially and adversely from those anticipated or implied by our forward-looking statements.
You should not rely upon forward-looking statements as predictions of future events. Although our management believes that the expectations reflected in our forward-looking statements are reasonable, we cannot guarantee that the future results, levels of activity, performance or events and circumstances described in the forward-looking statements will be achieved or occur. Moreover, neither we, nor any other person, assume responsibility for the accuracy and completeness of the forward-looking statements. We undertake no obligation to publicly update any forward-looking statements for any reason after the date of this presentation to conform these statements to actual results or to changes in our expectations, except as required by law.
Any unreleased services, features or functions referenced in this document, Nimble Storage’s website or other press releases or public statements that are not currently available are subject to change at Nimble Storage’s discretion and may not be delivered as planned or at all. Customers who purchase Nimble Storage’s products and services should make their purchase decisions based upon services, features and functions that are currently available.
| NIMBLE STORAGE Q1FY15 SHAREHOLDER LETTER | 12 |
Nimble Storage, the Nimble Storage logo, CASL, InfoSight, SmartStack, and NimbleConnect are trademarks or registered trademarks of Nimble Storage. Other trade names or words used in this document are the properties of their respective owners.
Press Contact:
Kristalle Cooks
650-346-7810
kristalle@nimblestorage.com
Investor Relations Contact:
Edelita Tichepco
408-514-3379
IR@nimblestorage.com
| NIMBLE STORAGE Q1FY15 SHAREHOLDER LETTER | 13 |