Exhibit 99.1

Nimble Storage, Inc. Q2FY15 Shareholder Letter
Executive Summary
Our founding thesis was that traditional enterprise storage architectures will be upended by flash-optimized architectures and that cloud-based management will upend traditional approaches to storage management. We have translated this thesis into an industry-leading platform that positions us well to emerge as the market leader through this industry transformation.
Q2FY15 was an inflection point for Nimble. During Q2, our Adaptive Flash platform launch underscored the breadth and comprehensive nature of our approach to leveraging flash, particularly when contrasted against more narrowly focused tiered hybrid storage offerings or all-flash offerings. Our positioning resonated very well with industry analysts and thought leaders, drove substantially higher customer activity than ever before in our history, and drove deeper engagement with large enterprises and cloud service providers. Within a short period of its launch, our new high-end system drove the largest deal ever for us.
Someexecution highlightsfrom the quarter include:
| | • | | A record pace of new customer acquisition |
| | • | | A record pace of deals over $100K from large enterprises and cloud service providers |
| | • | | Scale-out release now deployed on a substantial part of our installed base of systems |
| | • | | A record pace of SmartStack converged infrastructure deployments |
| | • | | Recognition as a “Top Workplace” by the Bay Area News Group for the second year in a row |
Keyfinancial highlightsfor the quarter are as follows:
| | • | | Revenue of $53.8 million was up 89% from prior year Q2 |
| | • | | Non-GAAP gross margin of 67.4% vs. 64.3% in prior year Q2 |
| | • | | Non-GAAP operating margin was negative 20% compared to negative 30% in prior year Q2 |
| | • | | Non-GAAP net loss per share of $0.15 per share compared to a non-GAAP net loss per share of $0.15 in prior year Q2; based on 71.4 million weighted average basic shares outstanding during Q2 |
Driving Revenue Growth
Our strategy for driving growth remains focused on four broad themes:
| | |
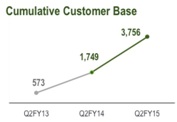 | | • New customer acquisition. Q2 was a record quarter in terms of new customer acquisitions, as we added 663 new customers to our installed base, which now stands at over 3,750 customers. |
| | Our channel partners remain key contributors in terms of driving new customer acquisition, and our focus on building deeper relationships with and enabling our partners to be self-sufficient is paying off. The number of unique partner account executives that closed deals almost doubled from a year ago and increased ~24% compared to last quarter. Deals where our channel partner contribution was deemed to have been 75% or greater also doubled compared to a year ago. |
| | |
| NIMBLE STORAGE Q2FY15 SHAREHOLDER LETTER | | 1 |
An additional factor that drove the strong pace of new customer acquisition during Q2 was the impact of the launch of our Adaptive Flash platform, which translated into strong demand generation as well.
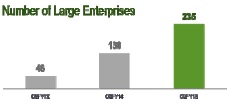
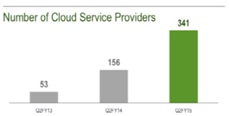
| | • | | Expanding into Global 5000 enterprises and cloud service providers (CSPs). We continue to make strong progress on penetrating large enterprises (defined as the 5,000 largest companies by revenue globally) and CSPs. |
| | | | |
| | Becoming a Standard at a Fortune 1000 Financial Institution A leading financial institution that has petabytes of EMC storage first selected us for VDI about 18 months ago. Based on the success of that project, this customer has since deployed Nimble for server consolidation, customer facing web applications and their test and development environment. The initial footprint of 4 systems for VDI has now grown into 40 systems for multiple applications. | | |
| | One key benefit that the customer saw was that 6 racks of legacy storage had been replaced by two racks of Nimble, thereby lowering capital costs as well as power, cooling and rack-space costs. Additionally, the simplicity that accompanied the Nimble deployment has lowered the customer’s administrative burden significantly. As a next step, they plan to increase their Nimble footprint in their QA environment, and plan to evaluate our upcoming Fibre Channel SAN functionality. | | |
| | | | |
Our installed base of large enterprises grew by 81% compared to the same quarter of the previous year, to a total of 235 large enterprises. Within our installed base, we now have 7 of the top 50, 13 of the top 100 and 53 of the Global 500 as customers. Our installed base of CSPs (SaaS as well as IaaS companies) grew even faster - by 119% compared to the same quarter of the previous year to a total of 341 CSPs. | | Powering Cloud Services at a Global Managed Services Firm A global systems integration and managed services firm with deep expertise in Microsoft technologies first evaluated us in response to a requirement to provide hosted Exchange services for their Fortune 50 Telecom client. They selected us over the incumbent storage solution because our footprint was 10 times smaller resulting in capital costs that were 3-4 times lower, and we saved the client substantially on power, cooling and other operating costs. We were also able to accommodate hundreds of snapshot-based backups in addition to hosting the production Exchange data. Since that initial evaluation, we have now been powering cloud services at this global managed services firm and are now deployed as: • Their cloud services platform in the US, Europe and Japan • The infrastructure underpinning hosted services for many F500 clients What started as a vendor relationship has evolved into a partnership where our sales force is now proactively partnering and recommending the managed services firm to customers evaluating cloud services. | | |
The introduction of our new high-end controller and our All-Flash Shelf has further enhanced our competitive differentiation and economic advantage in large-scale deployments. During Q2, we saw a very healthy increase in bookings from larger transactions. The number of deals valued at over $100K during the last 12 months grew at 86% over the prior twelve-month period. | | |
| | • | | International expansion. International bookings accounted for 17% of total bookings in Q2, up 25% on a sequential basis and up 121% from Q2 of last year. Across EMEA and APJ, we now have teams in 19 countries and distribution arrangements in 26 additional countries. With ~400 channel partners across EMEA and APJ, we are aggressively building our channel partner base as a key foundation for driving continued growth. |
| | |
| NIMBLE STORAGE Q2FY15 SHAREHOLDER LETTER | | 2 |
| | |
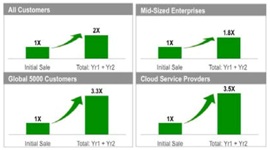
| | • Land and expand model. Consistent with our historical experience, our customers continue to migrate additional workloads onto our platforms, thus driving repeat bookings. The strong value proposition of our products as well as the quality of the support experience that we deliver through InfoSight is driving this propensity. Across our entire customer base, a customer on average more than doubles their initial spend over a 2-year time frame after the initial purchase. When we look at our Global 5000 customers and our cloud service provider customers, the propensity for repeat bookings is even higher. Global 5000 customers increase their spend by 3.3X and cloud service providers increase their spend by 3.5X over a 2-year time-frame after the initial purchase. |
Extending Our Product Differentiation and Technology Leadership
Our Adaptive Flash platform, comprising the CASL file system and InfoSight cloud based management, continues to deliver a compelling value proposition to our customers. Our solutions provide our customers:
| | | | |
• Substantially lower cost of capacity and cost of performance, whether we are compared with traditional disk arrays, hybrid flash and disk arrays, or all-flash arrays • Vastly greater flexibility in being configured for performance or capacity, and non-disruptive scalability • Better application data protection • Radically simpler manageability and supportability | | Airclic deploys our high-end system for large-scale Oracle databases Airclic is a SaaS provider that provides mobile supply chain management solutions. Airclic went through an extensive evaluation of Nimble as a solution for their critical applications, including several high-end Oracle databases. The evaluation led to their selection of Nimble as their storage infrastructure for the following main reasons: • They saw significant savings from compression which lowered their cost of deploying storage • Performance for their database environments improved by three times • Based on snapshots, they were able to bring their recovery point objective to 7 minutes – a dramatic improvement! | | |
| | |
| | |
| | |
Our key product initiatives for FY15 are to (i) deploy scale-out clustering (ii) roll out new platforms and associated Nimble OS 2.1 and (iii) deploy Fibre Channel to our customer base.
| | • | | Scale-out clustering continues to see strong adoption within our customer base, with a substantial part of our entire installed base of systems now running versions of software that are scale-out enabled. Based on actual field measured availability across thousands of systems using InfoSight, we are already at 99.999% availability with our scale-out enabled systems. Considering the significant architectural challenge that scale-out poses for any storage vendor, the rapid adoption and field-measured reliability of our scale-out enabled systems is a significant differentiator. |
| | • | | New platforms and Nimble OS 2.1 released during Q2. During Q2, we introduced the CS700, our high-end controller, and our All-Flash Shelf. The CS700 allows us to deliver write IO performance that matches or exceeds that of all flash arrays, while the All-Flash Shelf allows us to configure our systems to deliver read IO performance that matches flash-only |
| | |
| NIMBLE STORAGE Q2FY15 SHAREHOLDER LETTER | | 3 |
| | arrays. At the same time, our systems can be configured to also compete in Petabyte scale deployments against traditional modular storage systems. During the quarter, our high-end platform drove the largest deal in our history. |
| | | | |
In early August, we completed the new platform rollout by replacing our entry-level CS200 and mid-range CS400 controllers with CS300 and CS500 controllers, respectively. The new controllers leverage the platform enhancements that were part of the CS700 to also deliver 50% better price-performance relative to the previous generation platforms, thus further strengthening our economic advantage. | | Milliman leverages CS700 as a consolidation platform Milliman, a global leader in actuarial and consulting services, first evaluated us for their pension database environment, and selected us when we delivered 4-6 times higher performance at a lower cost than their prior platform. In addition to performance efficiency, two key benefits drove the expanded footprint: • Superior data protection using snapshots and replication • Ability to centrally manage distributed deployments using InfoSight The most recent deployment entailed deploying our high-end CS700 system along with our All-Flash Shelf as part of the pension database environment. The superior scalability and performance of the solution has allowed Milliman to consolidate their storage needs. | | |
Several software features that are part of the NOS 2.1 release accompanied the new platform introductions. These software features further strengthen our appeal to enterprises and cloud service providers, and include key functionality such as the following:
| | • | | Triple parity RAID which protects data even against triple disk failures – critical as denser drives become more mainstream |
| | • | | Multi-tenancy features, including VLAN tagging and role-based access control |
| | • | | Non-disruptive volume migration within a scale-out cluster |
| | • | | Richer vCenter plugin for VM-integrated storage management |
| | • | | Deeper CommVault integration to facilitate replication of CommVault managed snapshots |
| | • | | Several other enhancements |
| | • | | On track for Fibre Channel release. All of the new platforms were designed to support Fibre Channel functionality that remains on track for delivery by the end of Q4. |
In addition to innovations within our platform, a key investment area for us is in building solutions in conjunction with our alliance partners. Our converged infrastructure solution, SmartStack, continues to see strong momentum with 40% growth over Q1. During Q2, we became a Splunk technology partner and two Fortune 1000 companies selected us as the storage platform for their Splunk deployment during Q2.
We are excited at the pace with which we are able to build on our platform foundation – we are introducing new functionality, new products and new solutions at a rapid clip, all while still ensuring that we maintain the track record for stability and availability required for enterprise storage deployments.
Establishing and Building Our Brand
A key highlight of Q2 was the success of our Adaptive Flash platform launch, not just in driving demand as reflected in the pace of new customer acquisition, but also in terms of driving mindshare within our customer base and among industry analysts and independent thought leaders. During the quarter, we had a record number of press articles, analyst coverage, social engagement on platforms such as LinkedIn and Twitter, YouTube content subscribers and website traffic – all metrics that we track to assess marketing-led demand generation and brand followership
| | |
| NIMBLE STORAGE Q2FY15 SHAREHOLDER LETTER | | 4 |
Perhaps the most gratifying highlight of the quarter was that we were recognized for the second year in a row as a “Top Workplace” in the Bay Area News Group ranking, and were placed among the top 10 companies from among hundreds of mid-sized organizations. This is a reflection on our employees and on our collective commitment to assemble an industry leading talent pool at Nimble.
Q2FY15 Financial Results
As a reminder, all results presented in this letter are on a non-GAAP basis except for revenue and the balance sheet. Non-GAAP results exclude the impact of stock-based compensation.
| | |
Q2 FY15 was another very strong financial quarter for us. We achieved record revenue of $53.8 million that was approximately 8% above the midpoint of our guidance of $49 million to $51 million. Our gross margin was also a record high at 67.4%, and remains best of breed in the storage industry. Our operating loss was ($10.7 million), better than our projected operating loss of ($11-12 million), due to higher than expected revenue and gross margins. As a result, Q2 non-GAAP EPS was a loss of ($0.15) per share compared to our financial guidance of ($0.16) to ($0.17) loss per share. During Q2, our cash balance increased by $1.5 million and we maintained our cash conversion cycle of four days. Over the last 12 months, our total cash burn, excluding net proceeds from our IPO, was $6.4 million, approximately $1.6 million per quarter. | | 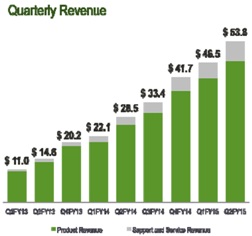 |
Q2 revenue was a record high of $53.8 million, an increase of 89% from $28.5 million in Q2 of last year. We added a record 663 new end customers during the quarter. During the last four quarters, we added a total of over 2,000 new end customers as we continued to increase our market share.
Our existing installed base of customers also continued to be a strong growth driver. We also recorded 444 deals greater than $100K over the last 12-month period, an increase of 86% compared to the corresponding period last year.
Product revenue for Q2 was $47.1 million, representing 88% of total revenue and an increase of 83% from Q2 of the prior year. Support and service revenue for Q2, which includes our maintenance entitlement and InfoSight service, was $6.6 million, representing 12% of total revenue and an increase of 141% from Q2 of the prior year. Our international business contributed 15% of total revenue during Q2 and was approximately double that of Q2 last year.
| | |
| Gross margin was very strong at 67.4% in Q2, up by 3.1 percentage points from 64.3% last year. Our gross margin improvement from prior year was driven by increases in both product and support and service margins. Our gross margin increased by 1.2 percentage points from Q1, mainly due to the impact of increased support and service margin during the quarter. Our long-term target for overall gross margin remains 63% to 65%, even though we expect to be at the high end of this range in the near term. | | 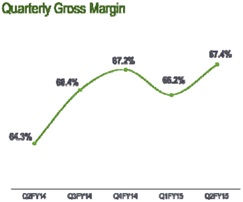 |
| | |
| NIMBLE STORAGE Q2FY15 SHAREHOLDER LETTER | | 5 |
Product gross margin in Q2 was 69.4%, up by 2.2 percentage points from 67.2% last year, and 0.4 percentage points higher than Q1. The majority of the improvement in product gross margin from prior year was due to continuing operational leverage and efficiencies in our supply chain infrastructure. We expect our long-term target product gross margin to be approximately 66%-67% as we continue to expand our market share in a highly competitive environment.
| | |
| Support and service gross margin in Q2 was 52.9%, up by 15.6 percentage points from 37.3% last year and 8.1 percentage points higher than the 44.8% we reported in Q1. The improvements in support and service gross margin from prior year and from prior quarter were driven by increased revenue from our larger base of customers and from increased leverage from our support organization even as we continue to make investments to build out a scalable infrastructure. At the end of Q2, we had over 90 active service depots with greater than 35% of these outside of North America. Our customer loyalty metrics remained very strong with over 99.5% of our installed base of customers presently covered by an active support and service contract. As we recognize the deferred revenue from our support and service agreements over their average 3-year life, we expect our support and service gross margin to grow towards the long-term target of greater than 60%. | | 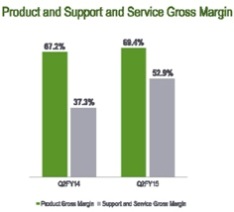 |
Q2 total non-GAAP operating expenses were $47.0 million or 87% of revenue compared to Q2 last year operating expenses of $26.9 million or 94% of revenue. We saw an improvement in operating leverage by 7 percentage points even as we increased overall headcount by 271 or 58% during the last four quarters to end with 735 employees at the end of Q2.
| | |
• Research and development (R&D) spending in Q2 was $13.7 million or 26% of total revenue compared to last year when spending was $7.5 million or 26% of total revenue. Leverage in R&D was flat compared to prior year as we continue to invest in our rich product roadmap. In particular, our R&D investments continue to enable increased penetration in the large enterprises and cloud service providers segments of our markets. Our long term target for R&D spending is 11% to 13% of total revenue. • Sales and marketing (S&M) spending was $28.0 million or 52% of revenue compared to Q2 last year spending of $16.6 million or 58% of total revenue. Our operating leverage in S&M improved by 6 percentage points vs. prior year as we continued to experience increased leverage from our channel partners. We expect our long term target for S&M spending to be 28% to 31% of revenue. | | 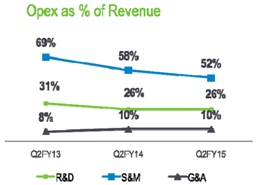 |
| | • | | General and administrative (G&A) spending was $5.3 million or 10% of revenue compared to Q2 last year spending of $2.7 million or 10% of revenue. Leverage in G&A was flat compared with prior year due to increased costs of operating as a public company and higher real estate expenses. Our G&A expenses in Q2 also included approximately $0.4 million in net litigation related legal expenses. As we benefit from economies of scale, we expect over time to achieve our long-term target of G&A spending at 5% to 6% of total revenue. |
| | |
| NIMBLE STORAGE Q2FY15 SHAREHOLDER LETTER | | 6 |
Our Q2 non-GAAP operating loss was ($10.7 million), better than our guidance for an operating loss of ($11 – 12 million). As a result of higher gross margin (3 percentage point improvement), and better operating expense leverage (7 percentage point improvement), our Q2 non-GAAP operating margin improved to negative 20% compared to negative 30% in Q2 last year, a 10 percentage point improvement. Our leverage with respect to adjusted EBITDA was even better with negative 16% in Q2 compared to negative 28% in Q2 of last year, a 12 percentage point improvement. As we previously discussed, while operating margin and adjusted EBITDA may fluctuate on a quarterly basis, we currently expect to continue to deliver sequential improvement in these metrics every fiscal year. We remain on track to achieve break-even on a non-GAAP basis around the end of our next fiscal year (FY16).
Q2 non-GAAP EPS was a loss of ($0.15) per share on approximately 71.4 million weighted average basic shares outstanding compared to a loss of ($0.15) per share in Q2 last year. This was better than our guidance for a loss of ($0.16 – 0.17) per share.
Balance Sheet
We ended Q2 with cash and cash equivalents of $205.8M, an increase of $1.5M in the quarter. We achieved a cash conversion cycle of four days, flat compared to Q1, and well ahead of our target of 20 days. Days sales outstanding (DSO) was 41 days compared to 37 days in Q2 last year, days sales in inventory (DSI) was 43 days compared to 50 days in Q2 last year, and days payable outstanding (DPO) was 80 days compared to 63 days in Q2 last year.
| | |
| Our Q2 cash flow from operations was $2.8 million, positive for a third consecutive quarter. Capex spend was $4.2 million, resulting in negative free cash flow (FCF) of $1.3 million for the quarter. This represented an improvement compared to negative FCF of $5.3 million in Q2 last year. Our FCF margin in Q2 was negative 2% vs. negative 19% in Q2 last year. We expect our FCF margins to break even ahead of our operating margin since we bill for the full value of support and service upfront even as we recognize revenue over the contractual period. For the full year FY15, we expect our total capex spend to be approximately 10% of total revenue, as we conduct the leasehold improvements in our new North Carolina facilities during the second half of this year. This is roughly in line with our prior fiscal year capex spend as a percentage of revenue. | | 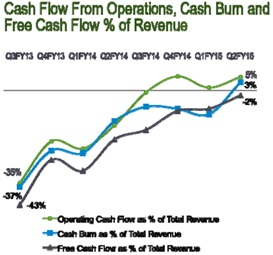 |
We ended Q2 with total deferred revenue of $50.5 million, an increase of $8.4 million or 20% from the Q1 balance of $42.1 million, and an increase of $30.5 million or 153% from $19.9 million in Q2 last year. Our deferred revenue consists primarily of payments received for support and service agreements, which have an average life of approximately three years.
| | |
| NIMBLE STORAGE Q2FY15 SHAREHOLDER LETTER | | 7 |
Q3FY15 Financial Outlook
Looking ahead to Q3 and beyond, we are very pleased with the progress we are making towards achieving our long-term financial and strategic objectives.
Our Q3 FY15 financial guidance is as follows:
| | • | | Revenue of $56 - $58 million; the midpoint of this range reflects 71% growth compared to the prior year period |
| | • | | Non-GAAP operating loss of ($11 – 12 million); the midpoint of this range represents negative 20% operating margin compared to negative 24% in the prior year period |
| | • | | Non-GAAP net loss of ($0.16 – 0.17) per share |
| | • | | Weighted average basic shares outstanding of approximately 73 million |
Our financial objectives remain (1) driving strong revenue growth and increasing our market share (2) maintaining industry leading gross margins and (3) steadily progressing towards our long term target financial model of 16%-20% operating margin by delivering sequential improvement in operating margin every year. We remain on track to achieve our goal of operating margin break-even by the end of FY16, with FCF break even achieved ahead of that timeline.
We want to thank our partners and customers once again for embracing us, our investors for their confidence in us, and our employees for their dedication and flawless execution.
| | |

| |  |
| |
| Suresh Vasudevan, CEO | | Anup Singh, CFO |
| | |
| NIMBLE STORAGE Q2FY15 SHAREHOLDER LETTER | | 8 |
Conference Call Information:
As previously announced, Nimble Storage will host a live question & answer conference call and webcast today at 5:00 p.m. ET (2:00 p.m. PT) to discuss its financial results for the fiscal second quarter 2015.
To access the conference call, dial (888) 855-5487 in the U.S. or (719) 325-2104 from international locations. In addition, a live audio webcast of the conference call will be available on the Nimble Storage Investor Relations website at http://investors.nimblestorage.com.
A replay of the conference call will be available for 45 days. To access the replay, please dial 888-203-1112 and enter pass code 5883072. Callers outside the U.S. and Canada should dial 719-457-0820 and enter pass code 5883072.
Non-GAAP Financial Measures
To provide investors with additional information regarding our financial results, Nimble Storage has disclosed in this release non-GAAP financial measures that are not calculated in accordance with generally accepted accounting principles in the United States, or GAAP. The Company provides non-GAAP gross margin, non-GAAP operating margin, non-GAAP net loss, non-GAAP net loss per share, free cash flow and adjusted EBITDA. In computing many of these non-GAAP financial measures, the Company excludes the effects of stock-based compensation, which is a recurring expense for the Company. The Company has provided reconciliation below of non-GAAP financial measures to the most directly comparable GAAP financial measures.
The Company discloses these non-GAAP financial measures because they are key measures used by the Company’s management and board of directors to understand and evaluate operating performance and trends, to prepare and approve the annual budget and to develop short-term and long-term operational and compensation plans. In particular, the exclusion of certain expenses in calculating non-GAAP financial measures can provide a useful measure for period-to-period comparisons of the Company’s business. Accordingly, the Company believes that these non-GAAP financial measures provide useful information to investors and others in understanding and evaluating the Company’s operating results in the same manner as the Company’s management and board of directors.
Non-GAAP financial measures have limitations as analytical tools and, as such, should not be considered in isolation or as substitutes for analysis of the Company’s results as reported under GAAP. Some of these limitations are:
| | • | | Non-GAAP financial measures do not consider the potentially dilutive impact of equity-based compensation, which is an ongoing expense for the Company; and |
| | • | | Other companies, including companies in our industry, may calculate non-GAAP financial measures differently, which reduces their usefulness as comparative measures. |
| | |
| NIMBLE STORAGE Q2FY15 SHAREHOLDER LETTER | | 9 |
Nimble Storage, Inc.
Reconciliation of GAAP to Non-GAAP Financial Measures
(In thousands, except per share amounts)
(Unaudited)
| | | | | | | | | | | | | | | | |
| | | Three Months Ended
July 31, | | | Six Months Ended
July 31, | |
| | | 2014 | | | 2013 | | | 2014 | | | 2013 | |
GAAP gross margin | | $ | 35,245 | | | $ | 18,180 | | | $ | 65,457 | | | $ | 31,761 | |
Stock-based compensation | | | 967 | | | | 126 | | | | 1,591 | | | | 209 | |
| | | | | | | | | | | | | | | | |
Non-GAAP gross margin | | $ | 36,212 | | | $ | 18,306 | | | $ | 67,048 | | | $ | 31,970 | |
| | | | | | | | | | | | | | | | |
GAAP operating margin | | $ | (25,912 | ) | | $ | (10,187 | ) | | $ | (45,556 | ) | | $ | (19,385 | ) |
Stock-based compensation | | | 15,169 | | | | 1,627 | | | | 24,726 | | | | 2,782 | |
| | | | | | | | | | | | | | | | |
Non-GAAP operating margin | | $ | (10,743 | ) | | $ | (8,560 | ) | | $ | (20,830 | ) | | $ | (16,603 | ) |
| | | | | | | | | | | | | | | | |
GAAP net loss | | $ | (26,117 | ) | | $ | (10,463 | ) | | $ | (45,712 | ) | | $ | (19,834 | ) |
Stock-based compensation | | | 15,169 | | | | 1,627 | | | | 24,726 | | | | 2,782 | |
| | | | | | | | | | | | | | | | |
Non-GAAP net loss | | $ | (10,948 | ) | | $ | (8,836 | ) | | $ | (20,986 | ) | | $ | (17,052 | ) |
| | | | | | | | | | | | | | | | |
Interest income, net | | | (22 | ) | | | (16 | ) | | | (18 | ) | | | (22 | ) |
Provision for income taxes | | | 162 | | | | 130 | | | | 318 | | | | 176 | |
Depreciation | | | 2,070 | | | | 891 | | | | 3,828 | | | | 1,508 | |
| | | | | | | | | | | | | | | | |
Adjusted EBITDA | | $ | (8,738 | ) | | $ | (7,831 | ) | | $ | (16,858 | ) | | $ | (15,390 | ) |
| | | | | | | | | | | | | | | | |
GAAP net loss per share, basic and diluted | | $ | (0.37 | ) | | $ | (0.51 | ) | | $ | (0.65 | ) | | $ | (0.98 | ) |
Stock-based compensation | | | 0.21 | | | | 0.08 | | | | 0.35 | | | | 0.14 | |
Impact of difference in number of GAAP and non-GAAP shares | | | 0.01 | | | | 0.28 | | | | — | | | | 0.55 | |
| | | | | | | | | | | | | | | | |
Non-GAAP net loss per share | | $ | (0.15 | ) | | $ | (0.15 | ) | | $ | (0.30 | ) | | $ | (0.29 | ) |
| | | | | | | | | | | | | | | | |
Shares used to compute GAAP net loss per share attributable to common stockholders, basic and diluted | | | 71,381 | | | | 20,525 | | | | 70,854 | | | | 20,172 | |
Weighted average effect of the assumed conversion of convertible preferred stock from the date of issuance | | | — | | | | 38,868 | | | | — | | | | 38,868 | |
| | | | | | | | | | | | | | | | |
Shares used to compute Non-GAAP net loss per share | | | 71,381 | | | | 59,393 | | | | 70,854 | | | | 59,040 | |
| | | | | | | | | | | | | | | | |
Forward-Looking Statements
This press release contains “forward-looking” statements that are based on our management’s beliefs and assumptions and on information currently available to management. We intend for such forward-looking statements to be covered by the safe harbor provisions for forward-looking statements contained in the U.S. Private Securities Litigation Reform Act of 1995. Forward-looking statements include all statements other than statements of historical fact contained in this letter, including information concerning our future financial results, timing of product releases or enhancements, business plans and objectives, potential growth opportunities, competitive position, industry environment and potential market opportunities.
Forward-looking statements are subject to known and unknown risks, uncertainties, assumptions and other factors including, but not limited to, those related to our future financial performance which is inherently uncertain, unforeseen delays in product development or introduction, uncertainty around market acceptance of our solutions, our ability to increase sales of our solutions, our ability to attract and retain customers and to selling additional solutions to our existing customers, our ability to develop new solutions and bring them to market in a timely manner, pricing pressure (as a result of competition or otherwise), our ability to maintain, protect and enhance our brand and intellectual property, the effectiveness of our channel partners and our ability to continue to expand our business and manage our growth. Moreover, we operate in very competitive
| | |
| NIMBLE STORAGE Q2FY15 SHAREHOLDER LETTER | | 10 |
and rapidly changing environments, and new risks may emerge from time to time. It is not possible for our management to predict all risks, nor can we assess the impact of all factors on our business or the extent to which any factor, or combination of factors, may cause actual results to differ materially from those contained in any forward-looking statements we may make. Further information on these and other factors that could affect our financial results are included in our filings with the Securities and Exchange Commission, and may cause our actual results, performance or achievements to differ materially and adversely from those anticipated or implied by our forward-looking statements.
You should not rely upon forward-looking statements as predictions of future events. Although our management believes that the expectations reflected in our forward-looking statements are reasonable, we cannot guarantee that the future results, levels of activity, performance or events and circumstances described in the forward-looking statements will be achieved or occur. Moreover, neither we, nor any other person, assume responsibility for the accuracy and completeness of the forward-looking statements. We undertake no obligation to publicly update any forward-looking statements for any reason after the date of this presentation to conform these statements to actual results or to changes in our expectations, except as required by law.
Any unreleased services, features or functions referenced in this document, Nimble Storage’s website or other press releases or public statements that are not currently available are subject to change at Nimble Storage’s discretion and may not be delivered as planned or at all. Customers who purchase Nimble Storage’s products and services should make their purchase decisions based upon services, features and functions that are currently available.
“Customer” or “Customers” referenced above are Nimble Storage’s end customers. It is Nimble Storage’s practice to identify an end-customer from our channel partners prior to shipment and before any support and services are provided. Products are typically shipped directly to the end-customers of our channel partners. Assuming all other revenue recognition criteria have been met, Nimble Storage generally recognizes product revenue on sales upon shipment, as title and risk of loss are transferred at that time. Nimble Storage recognizes revenue from support and service contracts over the contractual service period.
Nimble Storage, the Nimble Storage logo, CASL, InfoSight, SmartStack, and NimbleConnect are trademarks or registered trademarks of Nimble Storage. Other trade names or words used in this document are the properties of their respective owners.
Press Contact:
Kristalle Cooks
408-314-3313
kristalle@nimblestorage.com
Investor Relations Contact:
Edelita Tichepco
408-514-3379
IR@nimblestorage.com
| | |
| NIMBLE STORAGE Q2FY15 SHAREHOLDER LETTER | | 11 |