Exhibit 99.1

Nimble Storage, Inc. Q4FY15 Shareholder Letter
Executive Summary
We were founded on the belief that our adaptive flash platform is disruptive to incumbent vendors and that their legacy architectures will no longer be viable. We also believe that our platform is also superior and broader than those of other emerging companies in our industry, which tend to address specific niches within the broader storage landscape. During FY15, our pace of innovation has further extended our technology lead over our competitors and positioned us well as a leading contender in the minds of customers and channel partners that are looking for better alternatives to the multi-billion dollar legacy storage vendors.
More and more enterprises and cloud service providers are reaching an inflection point at which they are concluding that the economic benefits of a modern, flash-optimized platform justify the perceived risks of moving away from long-standing incumbent vendor relationships. We think that the revenue decline that we are seeing among all of the leading legacy vendors is driven in large part by a shift toward more cost-effective modern architectures resulting in a reduction in storage spend – a trend that is likely to continue for the next several quarters. We see this as the beginning of a secular share shift that presents a massive growth opportunity for us, and an opportunity to emerge as a long-term leader in storage.
We executed very well against that growth opportunity in Q4FY15:
| | • | | We added 660 new customers in Q4 and over 2,300 new customers in FY15 to end with an installed base of 4,979 customers – a pace of customer acquisition that is several times faster than other emerging companies in our industry. |
| | • | | Fibre Channel accounted for more than 10% of our bookings in Q4FY15, a rapid pace of adoption given that Fibre Channel has been available for only one quarter. We ended FY15 with 83 customers deploying Fibre Channel—over 70% are new customers to Nimble. |
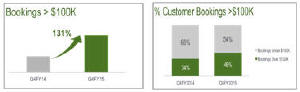
| | • | | Record share of bookings from deals over $100K and deals over $250K in Q4FY15, which further increased ASPs from record levels in Q3FY15. |
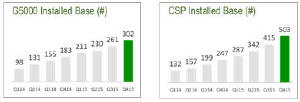
| | • | | Record number of new G5000 (Global 5000) enterprises and CSPs (Cloud Service Providers), and record share of bookingsfrom these two segments compared to any previous quarter. |
| | • | | Continued momentum in SmartStack converged infrastructure deployments with a threefold increase in the number of SmartStack customers in FY15 over FY14. |
| | • | | Market leadership recognition as we were named Storage Vendor of the Year by CRNin the UK and were placed for the second consecutive year as aVisionary on the Gartner Magic Quadrantfor General Purpose Storage Arrays. |
| | • | | Strong financial performance during Q4FY15as revenue of $68.3M increased 64% from a year ago, non-GAAP gross margin was strong at 67.2%, operating leverage improved substantially with operating margin at negative 12%, and non-GAAP EPS at a loss of $0.13 was ahead of guidance. We generated positive cash flow during the quarter; our cash balance increased by $3.4M during Q4FY15, and our free cash flow turned positive in Q4FY15 for the first time in our history. |
Adaptive Flash Platform: The broadest approach to leveraging flash in the enterprise
Our Adaptive Flash Platform is based on two foundational innovations – our CASL file system software and our InfoSight cloud-based management software. We are able to address the broadest range of workloads, ranging from extremely demanding, performance-intensive workloads to Petabyte-scale capacity-intensive workloads.
We are proud of the pace of innovation that we delivered during FY15, which has further extended our differentiation relative to legacy competitors and emerging companies and enhanced our appeal within enterprises of all sizes and within cloud service providers.
We advanced our Adaptive Flash Platform significantly during FY15:
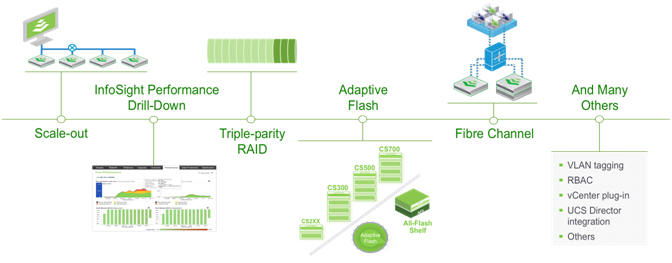
| | • | | Scale-out clustering became generally available in Q1, enabling us to scale-up or scale-deep or scale-out – all without disrupting applications. Our ability to scale is unmatched in our industry. |
| | • | | In Q2, we introduced our high-end CS700 platform and an All-Flash Shelf. As a result of these two products, we have successfully competed in dozens of engagements where we were selected against all-flash arrays by delivering the same or better performance at a lower cost. |
| | • | | During Q2, we also delivered functionality within InfoSight for deep performance drill-downs allowing our adaptive flash storage arrays to be dynamically tuned as their workloads change. |
| | • | | During Q3, we introduced triple parity RAID without any performance penalty – a key competitive differentiator that allows us to deploy ever-denser disk drives to lower the cost of capacity. |
| | • | | During Q3, we refreshed our entire platform portfolio that resulted in improving price-performance by 50% – further enhancing our competitive differentiation. |
| | • | | At the end of Q3, we introduced Fibre Channel earlier than anticipated because of our product stability and strong positive customer feedback during the Beta program. |
| | • | | Throughout the year, there were several additional software enhancements such as multi-tenancy features, vCenter integration, OpenStack integration and Cisco UCS Director integration among many others. |
During Q4FY15, our Fibre Channel product experienced strong customer uptake and accounted for more than 10% of our bookings – a remarkable pace given that this was the first full quarter of availability. We already have 83 customers deploying Fibre Channel as of the end of FY15. These customers span a broad mix of industries and a broad spectrum of workloads. Competitively, Fibre Channel is already having an impact as we realized a measurable increase in win rates as a result of having Fibre Channel as an option across our portfolio, including dozens of wins against all-flash arrays. The early evidence from Fibre Channel also validates our belief that Fibre Channel would drive a measurable increase in deal sizes. Overall, we are very pleased with the pace at which Fibre Channel is impacting our market opportunity and extending our competitive position.
TREND selects Nimble FC SAN for databases and virtualization
TREND, headquartered in King of Prussia, PA, is a Multiple Listing Service (MLS) organization serving 28,000 real estate agents and brokers.
The engagement with Nimble was prompted by TREND’s need to deploy a new application infrastructure for its distributed user base. TREND completed a beta test with Nimble’s CS700 with Fibre Channel.
The results compelled TREND to select and deploy Nimble for their product, test and development databases and for their virtual infrastructure.
| | • | | Price-Performance: “Nimble delivered excellent performance…we achieved over 100,000 IOPs on the array. Nimble is enabling us to meet our IOPs and performance requirements at a much better price point” | |
| | • | | Simplicity: “The configuration of the Nimble array was simple. In addition to the initial setup, upgrades are non-disruptive. Nimble has made an array where nearly all the overhead for a SAN administrator has been relieved” | |
| | • | | Rack space: Nimble is 1/8th of the rack space of the competitive system | |
During Q4, we also introduced Per-VM monitoring as a key capability within InfoSight,and we are currently in Beta at over 40 customer sites. This functionality extends our InfoSight monitoring capability into VMware host environments and allows us to identify individual VMs that might be experiencing poor performance and disrupting other workloads and diagnose the root causes of the performance problem. Despite still being in Beta, this capability was a significant factor in winning a major multi-location storage deployment at a Fortune 500 company.
Strong Market Traction for SmartStack, our Converged Infrastructure Solution
| | |
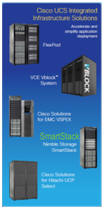 | | Converged infrastructure is emerging as a “higher level” building block as customers look to expedite and simplify the manner in which they deploy and manage infrastructure for their business-enabling applications. Our strategy to address this key requirement is to build pre-validated SmartStack solutions through our deep partnerships with Cisco and leading ISVs such as Citrix, Microsoft, Oracle and VMware. We realized rapid momentum for SmartStack throughout FY15. We now have 8 unique SmartStack reference architectures in place. Our most recent |
| SmartStack reference architecture was delivered in Q4FY15, showcasing the deployment of Oracle’s JD Edwards software on SmartStack. This solution resulted in Cisco and Nimble being voted as the top platinum sponsors at the JD Edwards Summit. During Q4, we also announced the availability of our integration with Cisco UCS Director that allows administrators to manage Nimble Storage workflows from within UCS Director. |
Our momentum with SmartStack has strengthened our ability to recruit larger system integrators and resellers and foster stronger relationships with our channel partners. The ultimate measure of the success is the accelerating pace at which customers have adopted SmartStack. Joint SmartStack customers increased threefold between FY14 and FY15 – much faster than our overall customer adoption.
Portland-based company selects Nimble over All-Flash Arrays
A company based in Portland was actively evaluating flash storage solutions to replace their legacy storage arrays. Their primary requirements were to address performance bottlenecks, lower the cost of managing multiple copies of databases, and simplify the management of their infrastructure.
After completing an extensive benchmarking exercise against the flagship array from a leading all flash array vendor, the Company selected Nimble to realize the following benefits:
| | • | | Nimble performance was comparable to the all flash array, and delivered over 20GB of throughput and high, random IOPs with sub-millisecond latency | |
| | • | | Nimble delivered five times the usable capacity at a lower cost, enabling the consolidation of applications and workloads on a single platform. Nimble scale-to-fit architecture was a key factor for future scaling | |
| | • | | Nimble InfoSight cloud-based management software enables individual VM monitoring to identify, isolate and address “potential noisy neighbor” challenges | |
| | • | | The Nimble SmartStack solution, including integration with UCS Director, was aligned to their future plans to implement Cisco UCS as their primary server platform | |
| | • | | The customer plans to shrink their footprint from 3 racks to 6U of Nimble arrays | |
Driving Revenue Growth By Building A Large, Diverse and Delighted Customer Base
Our strategy for growth remains focused on four main themes: (i) rapidly acquiring new customers; (ii) growing the contribution from Global 5000 (G5000) enterprises and Cloud Service Providers (CSPs) as a share of overall bookings; (iii) growing international bookings as a share of overall bookings; and (iv) ensuring customer success that translates into a pattern of repeat deployments.
| | |
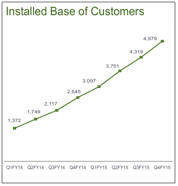 | | Q4FY15 saw a rapid pace of new customer acquisition, as we added 660 new customers to our installed base, which brings our total installed base to 4,979 customers globally. We have added more customers in the last 6 months than the entire installed base of even the largest emerging storage companies. Our channel partners have been a key enabler. The number of unique reseller sales representatives that sold our product in Q4 reached an all-time peak. The number of accredited reseller engineers at the end of Q4 has more than doubled from a year ago. Further, a key strategic initiative has been to enable channel partners to become more self-sufficient in closing deals. During Q4, 38% of all of our new customer acquisitions had channel partners driving 75% or more of the sales engagement with minimal direct involvement from Nimble sales teams. |
During Q3, our new deal ASPs achieved record levels with a double-digit increase from the previous quarter, and Q4 saw a continuation of that momentum towards even higher deal ASPs. During Q4, our new customer deal ASPs as well as our blended deal ASPs hit all-time highs, increasing further from Q3 levels. This was driven by the highest ever contribution to bookings from deals over $100K and from a sizeable increase in the number of deals and contribution of deals over $250K.
SingleHop standardizes on Nimble as the storage platform for IaaS
SingleHop, located in Chicago, IL, provides on-demand hosted private clouds and managed hosting to 5,500 customers in over 124 countries.
They were looking for an alternative to their legacy storage vendor to address three key challenges:
| | • | | Their legacy storage solution was difficult to manage and scale | |
| | • | | The complexity of their existing storage systems made issues difficult to diagnose—response time to root-cause and address critical issues often ran into multiple days – unacceptable for service providers with thousands of end-customers | |
| | • | | End-users performance SLAs were hard to architect with the existing tiered storage architecture | |
SingleHop successfully deployed Nimble as their primary storage platform and have since realized a 10X reduction in their data center footprint, significant increases in performance, and a dramatic reduction in the amount of time spent on managing storage.
University Hospital selects Nimble for VDI for 4500 users
A leading university hospital in Switzerland decided to virtualize 4,500 user desktops to provide location independent access and geographical redundancy.
They completed an extensive evaluation process comparing Nimble with the latest flash-based array from the incumbent vendor. They selected Nimble for the following reasons:
| | • | | Nimble arrays delivered the IOPs required for VDI at a substantially lower cost | |
| | • | | The footprint was a third of the competitive solution, resulting in substantial, space and power efficiencies | |
| | • | | Reduced complexity made it much simpler for the storage team to manage and maintain their storage environment | |
| | • | | Proactive monitoring leveraging InfoSight was a substantial benefit with no equivalent competitive offering | |
During Q4FY15, we added new G5000 enterprises and CSPs at a record pace, and the contribution to bookings from these two segments achieved another all-time high. We added 41 new G5000 customers to our installed base during the quarter, and our installed base now includes dozens of Global 500 companies as well. G5000 bookings during Q4 more than doubled year over year. Large enterprises are increasingly evaluating and selecting flash-optimized solutions as they realize that economic benefits outweigh the risks of moving away from entrenched, incumbent vendors. We also benefited from the availability of our Fibre Channel product, which has significantly enhanced our ability to compete in the G5000 enterprise segment. Our CSP segment grew even faster in terms of customer count and in terms of year-over-year bookings growth. We now have several large CSPs that use our platform as a foundational building block to manage more than a Petabyte of storage and serve hundreds to thousands of end customers.
International contribution was strong during Q4FY15 at 21% of bookings and more than double the bookings from Q4FY14. We now have presence in 20 countries and distribution capabilities in 10 additional countries.
Ourland and expand model continues to thrive as our customers typically spend more than double their initial deployment within two years, driving a healthy pattern of repeat bookings. While the product value proposition continues to play a strong role in initial and repeat bookings, our customers’ support experience is a key enabler of our “land and expand” strategy. While many of our competitors now claim some level of telemetry, InfoSight remains significantly more advanced because of the richness of the data we collect, the frequency with which we monitor our customers’ environment, the depth of analysis that we perform against the telemetry and the extent to which InfoSight is ingrained within our development organization. Customer satisfaction survey results continue to highlight our industry leading support as a significant source of competitive advantage.
Financial Performance
Q4FY15 and FY15 Financial Results
As a reminder, all results presented in this letter are on a non-GAAP basis except for revenue and the balance sheet. Non-GAAP results exclude the impact of stock-based compensation.
Q4FY15 Highlights
| | • | | Revenue of $68.3 million increased 64% from $41.7 million in Q4FY14 |
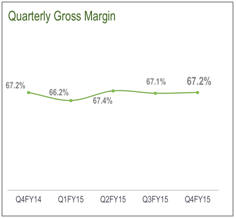
| | • | | Non-GAAP Gross Margin was 67.2% consistent with Q4FY14 |
| | • | | Non-GAAP Operating Margin improved to negative 12% compared to negative 21% in Q4FY14 |
| | • | | Non-GAAP EPS was a loss of $0.13 per share compared to a loss of $0.14 per share in Q4FY14 |
| | • | | Foreign exchange loss was $1.1 million, which had a $0.01 per share negative impact on basic and diluted loss per share |
| | • | | Cash Flow from Operations was positive $8.6 million compared to positive $2.2 million in Q4FY14 |
| | • | | Free Cash Flow was positive $0.6 million, a milestone for us, compared to negative $3.3 million in Q4FY14 |
| | • | | Total Cash increased by $3.4 million compared to a cash burn of $3.0 million in Q4FY14 |
FY 2015 Highlights
| | • | | Revenue of $227.7 million was up 81% from $125.7 million in FY14 |
| | • | | Non-GAAP Gross Margin was 67.0%, an improvement of 1.6 percentage points from 65.4% in FY14 |
| | • | | Non-GAAP Operating Margin was negative 17% compared to negative 27% in FY14 |
| | • | | Non-GAAP EPS was a loss of $0.58 per share compared to a loss of $0.56 per share in FY14 |
| | • | | Foreign exchange loss was $2.1 million, which had a $0.03 per share negative impact on basic and diluted loss per share |
| | • | | Cash Flow from Operations was positive $5.4 million compared to negative $6.7 million in FY14 |
| | • | | Free Cash Flow was negative $15.4 million compared to negative $20.4 million in FY14 |
| | • | | Total Cash remained flat at $208.4 million compared to a cash burn of $13.6 million (excluding IPO proceeds) in FY14 |
Q4FY15 Financial Results
Q4 FY15 was another strong financial quarter for us. We achieved revenue of $68.3 million, above our guidance of $65 million to $67 million. Q4 revenue grew 64% from prior year. We estimate that at constant Q3 foreign exchange rates, our Q4 revenue would have been approximately $0.8 million higher. Our gross margin remained industry leading at 67.2% and above our long-term financial model of 63% to 65%. Our operating loss was $8.5 million, better than our projected operating loss of $9.5 million to $10.5 million, due to higher than expected revenue and gross margin. Adjusted EBITDA for the quarter was negative $6.8 million. During Q4, due to the continued appreciation of the USD against most major currencies, we reported a loss on foreign exchange of $1.1 million in non-operating expenses, which had a $0.01 per share impact on basic and diluted net loss per share. Q4 non-GAAP EPS was a loss of $0.13 per share, better than our financial guidance of $0.14 to $0.15 loss per share.
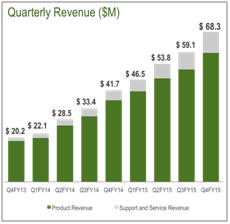
Product revenue for Q4 was $58.6 million, representing 86% of total revenue and an increase of 58% from Q4 of the prior year. Support and service revenue for Q4, which includes our maintenance entitlement and InfoSight service, was $9.6 million, representing 14% of total revenue and an increase of 111% from Q4 of the prior year. Our international business contributed 20% of total revenue during Q4 and grew by 102% from Q4 of the prior year. We ended Q4 with total deferred revenue of $74.4 million, an increase of $40.9 million or 122% from Q4 last year. Our deferred revenue consists primarily of payments received for support and service agreements, which have an average life of approximately three years.
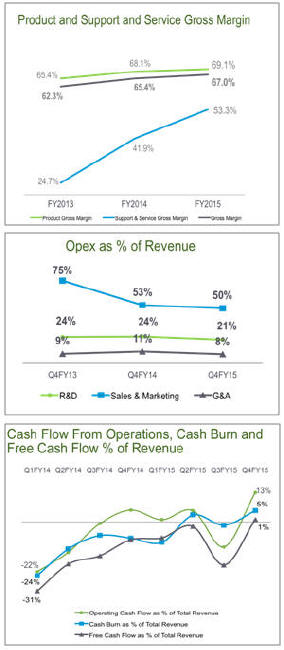
Gross margin was 67.2% in Q4, consistent with Q4FY14. Product gross margin in Q4 was 69.1%, compared to 69.2% in Q4FY14. Our industry leading product gross margin continues to reflect the efficiencies of our Adaptive Flash platform.
Support and service gross margin in Q4 was 56%, up by 5 percentage points from 51% in Q4 last year. The improvement in support and service gross margin from prior year was driven by increased revenue from our larger base of customers and economies of scale from our support organization, enabled by the automation capabilities of InfoSight.
Q4 total operating expenses were $54.4 million or 80% of revenue compared to Q4 last year operating expenses of $36.8 million or 88% of revenue. We saw an improvement in overall operating expense leverage by 8 percentage points which was spread across all of our functional areas.
| | • | | Research and development (R&D) spending in Q4 was $14.6 million or 21% of revenue compared to Q4 last year when spending was $10.2 million or 24% of total revenue. Our long-term target for R&D spending is 11% to 13% of total revenue. |
| | • | | Sales and marketing (S&M) spending was $34.1 million or 50% of revenue compared to Q4 last year spending of $22.1 million or 53% of revenue. Our long-term target for S&M spending is 28% to 31% of total revenue. |
| | • | | General and administrative (G&A) spending was $5.6 million or 8% of revenue compared to Q4 last year spending of $4.5 million or 11% of revenue. Our long-term target for G&A spending is 5% to 6% of total revenue. |
Our Q4 operating loss was $8.5 million, better than our guidance for an operating loss of $9.5 million to $10.5 million. Q4 operating margin improved to negative 12% compared to negative 21% in Q4 last year, a 9 percentage point improvement. Our Adjusted EBITDA was negative $6.8 million or negative 10% of revenue in Q4 compared to negative 17% in Q4 of last year, a 7 percentage point improvement. Excluding the F/X loss of $1.1 million, our Adjusted EBITDA loss would have been $5.7 million or negative 8% of revenue.
Q4 non-GAAP EPS was a loss of $0.13 per share on approximately 74.5 million weighted average basic and diluted shares outstanding compared to a loss of $0.14 per share in Q4 last year. This was better than our guidance for a loss of $0.14 to $0.15 per share. Foreign exchange loss of $1.1 million had a $0.01 per share negative impact on basic and diluted loss per share.
We ended Q4 with cash and cash equivalents of $208.4 million. During Q4, our cash balance increased by $3.4 million compared to a reduction of $3.0 million in Q4 of last year.
In Q4, we achieved a cash conversion cycle of 2 days, consistent with the past several quarters, and well ahead of our target of 20 days. Days sales outstanding (DSO) were 39 days, inside of our target range of 35 to 45 days. Days sales in inventory (DSI) were 46 days, slightly above our target range of 35 to 45 days as we increased our service inventory to support our fast growing installed base of customers.
Our Q4 cash flow from operations (CFFO) was positive $8.6 million or 13% of revenue, compared to positive $2.2 million or 5% of revenue in Q4FY14. In Q4, Free Cash Flow (FCF) was $0.6 million, positive for the first time in our history. FCF was negative $3.3 million in Q4 of last year.
Capex spend during Q4 was $8.0 million, mainly due to leasehold improvements to support our growing headcount and R&D lab investments.
FY15 Financial Results
FY15 was a year of very strong financial execution. We achieved revenue of $227.7 million, an increase of 81% from FY14. Product revenue was $198.1 million, representing 87% of total revenue and an increase of 76% from prior year. Support and service revenue was $29.5 million, representing 13% of total revenue and an increase of 129% from prior year. Our international business contributed 18% of total revenue during FY15 and grew by 125% from prior year.
We saw a strengthening in margins across the board during FY15 as a result of economies of scale and the efficiencies of our Adaptive Flash platform. Gross Margin increased by 1.6 percentage points to 67.0% from 65.4%. Our Product Margin increased by 1 percentage point to 69.1% from 68.1%. Support and Service Margin increased by 11.4 percentage points to 53.3% from 41.9%. Total operating expenses were 84% of revenue compared to 92% in FY14, an improvement of 8 percentage points. Our Operating Margin in FY15 was negative 17% compared to negative 27% in FY14, an improvement of 10 percentage points. Adjusted EBITDA was negative 14% compared to negative 23% in FY14, an improvement of 9 percentage points.
Our total cash balance remained flat during the year at $208.4 million, compared to cash burn of $13.6 million (excluding IPO proceeds) in FY14. As our operating performance improved, CFFO increased by $12.1 million, from negative $6.7 million in FY14 to positive $5.4 million in FY15. CFFO margin was positive 2% in FY15 compared to negative 5% in FY14. Capex spending during FY15 was 9% of revenue compared to 11% in FY14. FCF margin improved to negative 7% in FY15 from negative 16% in FY14.
Q1FY16 Financial Outlook
As we enter our new fiscal year, FY16, we are very pleased with our execution and progress towards achieving our long-term financial and strategic objectives. As a reminder, Q1 is our seasonally slowest quarter and one in which the large companies in our industry typically see double digit sequential declines in revenue from Q4. Our guidance takes into account the seasonality effect of Q1, and is as follows:
| | • | | Total revenue of $68 million to $70 million |
| | • | | Non-GAAP operating loss of $9.0 million to $10.0 million |
| | • | | Non-GAAP net loss of $0.13 to $0.14 per share |
| | • | | Weighted average basic shares outstanding of approximately 76 million |
Our financial objectives remain (1) driving strong revenue growth and increasing our market share (2) maintaining strong gross margins and (3) steadily progressing towards our long term target financial model of 16%-20% operating margin by delivering sequential improvement in operating margin every year.
We remain on track to achieve our goal of non-GAAP P&L break-even by the end of FY16. As a result of investments we are making to continue our strong growth and market share gains, our progression towards break even in Q4 will be non-linear. We expect our Q2 operating loss to be generally similar to Q1, an improvement in Q3, followed by break even in Q4. As we demonstrated in Q4FY15, we achieved FCF breakeven and maintained a flat cash balance during FY15. We expect that we will not incur cash burn after Q1 and that after Q1; our total cash balance should increase on a sustainable basis going forward.
We want to thank our partners and customers once again for embracing us, our investors for their confidence in us, and our employees for their dedication and flawless execution.
| | | | |
 | | | |  |
| Suresh Vasudevan, CEO | | | | Anup Singh, CFO |
Conference Call Information:
As previously announced, Nimble Storage will host a live question & answer conference call and webcast today at 5:00 p.m. ET (2:00 p.m. PT) to discuss its financial results for the fiscal fourth quarter and fiscal year 2015. Interested parties may access the call by dialing (888) 471-3841 in the U.S. or (719) 325-2186 from international locations. In addition, a live audio webcast of the conference call will be available on the Nimble Storage Investor Relations website athttp://investors.nimblestorage.com. The live webcast will be archived and available on this site for 45 days.
A replay of the conference call will be available for 45 days. To access the replay, please dial 888-203-1112 and enter pass code 2620521. Callers outside the U.S. and Canada should dial 719-457-0820 and enter pass code 2620521.
Non-GAAP Financial Measures
To provide investors with additional information regarding our financial results, Nimble Storage has disclosed in this release non-GAAP financial measures that are not calculated in accordance with generally accepted accounting principles in the United States, or GAAP. The Company provides non-GAAP gross margin, non-GAAP operating margin, non-GAAP net loss, non-GAAP net loss per basic and diluted share, free cash flow and adjusted EBITDA. In computing many of these non-GAAP financial measures, the Company excludes the effects of stock-based compensation, which is a recurring expense for the Company. The Company has provided reconciliation below of non-GAAP financial measures to the most directly comparable GAAP financial measures.
The Company discloses these non-GAAP financial measures because they are key measures used by the Company’s management and board of directors to understand and evaluate operating performance and trends, to prepare and approve the annual budget and to develop short-term and long-term operational and compensation plans. In particular, the exclusion of certain expenses in calculating non-GAAP financial measures can provide a useful measure for period-to-period comparisons of the Company’s business. Accordingly, the Company believes that these non-GAAP financial measures provide useful information to investors and others in understanding and evaluating the Company’s operating results in the same manner as the Company’s management and board of directors.
Non-GAAP financial measures have limitations as analytical tools and, as such, should not be considered in isolation or as substitutes for analysis of the Company’s results as reported under GAAP. Some of these limitations are:
| | ¡ | Non-GAAP financial measures do not consider the potentially dilutive impact of equity-based compensation, which is an ongoing expense for the Company; and |
| | ¡ | Other companies, including companies in our industry, may calculate non-GAAP financial measures differently, which reduces their usefulness as comparative measures. |
Nimble Storage, Inc.
Reconciliation of GAAP to Non-GAAP Financial Measures
(In thousands, except per share amounts)
(Unaudited)
| | | | | | | | | | | | | | | | |
| | | Three Months Ended
January 31, | | | Year Ended
January 31, | |
| | | 2015 | | | 2014 | | | 2015 | | | 2014 | |
GAAP gross margin | | $ | 44,831 | | | $ | 27,739 | | | $ | 148,720 | | | $ | 81,522 | |
Stock-based compensation | | | 1,062 | | | | 312 | | | | 3,888 | | | | 700 | |
| | | | | | | | | | | | | | | | |
Non-GAAP gross margin | | $ | 45,893 | | | $ | 28,051 | | | $ | 152,608 | | | $ | 82,222 | |
| | | | | | | | | | | | | | | | |
GAAP operating margin | | $ | (23,393 | ) | | $ | (12,813 | ) | | $ | (96,077 | ) | | $ | (42,569 | ) |
Stock-based compensation | | | 14,935 | | | | 4,102 | | | | 57,067 | | | | 9,149 | |
| | | | | | | | | | | | | | | | |
Non-GAAP operating margin | | $ | (8,458 | ) | | $ | (8,711 | ) | | $ | (39,010 | ) | | $ | (33,420 | ) |
| | | | | | | | | | | | | | | | |
GAAP net loss | | $ | (24,745 | ) | | $ | (13,153 | ) | | $ | (98,846 | ) | | $ | (43,123 | ) |
Stock-based compensation | | | 14,935 | | | | 4,102 | | | | 57,067 | | | | 9,149 | |
| | | | | | | | | | | | | | | | |
Non-GAAP net loss | | $ | (9,810 | ) | | $ | (9,051 | ) | | $ | (41,779 | ) | | $ | (33,974 | ) |
| | | | | | | | | | | | | | | | |
Interest expense (income), net | | | (50 | ) | | | 6 | | | | (139 | ) | | | (21 | ) |
Provision for income taxes | | | 300 | | | | 173 | | | | 837 | | | | 425 | |
Depreciation | | | 2,712 | | | | 1,729 | | | | 8,753 | | | | 4,177 | |
| | | | | | | | | | | | | | | | |
Adjusted EBITDA | | $ | (6,848 | ) | | $ | (7,143 | ) | | $ | (32,328 | ) | | $ | (29,393 | ) |
| | | | | | | | | | | | | | | | |
GAAP net loss per share, basic and diluted | | $ | (0.33 | ) | | $ | (0.29 | ) | | $ | (1.37 | ) | | $ | (1.61 | ) |
Stock-based compensation | | | 0.20 | | | | 0.09 | | | | 0.79 | | | | 0.34 | |
Impact of difference in number of GAAP and non-GAAP shares | | | — | | | | 0.06 | | | | — | | | | 0.71 | |
| | | | | | | | | | | | | | | | |
Non-GAAP net loss per share | | $ | (0.13 | ) | | $ | (0.14 | ) | | $ | (0.58 | ) | | $ | (0.56 | ) |
| | | | | | | | | | | | | | | | |
Shares used to compute GAAP net loss per share attributable to common stockholders, basic and diluted | | | 74,517 | | | | 45,278 | | | | 72,304 | | | | 26,772 | |
Weighted average effect of the assumed conversion of convertible preferred stock from the date of issuance | | | — | | | | 19,856 | | | | — | | | | 34,076 | |
| | | | | | | | | | | | | | | | |
Shares used to compute Non-GAAP net loss per share | | | 74,517 | | | | 65,134 | | | | 72,304 | | | | 60,848 | |
| | | | | | | | | | | | | | | | |
Forward-Looking Statements
This press release contains “forward-looking” statements that are based on our management’s beliefs and assumptions and on information currently available to management. We intend for such forward-looking statements to be covered by the safe harbor provisions for forward-looking statements contained in the U.S. Private Securities Litigation Reform Act of 1995. Forward-looking statements include all statements other than statements of historical fact contained in this letter, including information concerning our future financial results, timing of product releases or enhancements, business plans and objectives, potential growth opportunities, competitive position, industry trends and environment and potential market opportunities.
Forward-looking statements are subject to known and unknown risks, uncertainties, assumptions and other factors including, but not limited to, those related to our future financial performance which is inherently uncertain, unforeseen delays in product development or introduction, uncertainty around market acceptance of our solutions, our ability to increase sales of our solutions, our ability to attract and retain customers and to selling additional solutions to our existing customers, our ability to develop new solutions and bring them to market in a timely manner, pricing pressure (as a result of competition or otherwise), introduction of new technologies and products by other companies, our ability to maintain, protect and enhance our brand and intellectual property, the effectiveness of our channel partners and sales team, our ability to recruit new or keep our existing key talent, global economic conditions and fluctuations in foreign currency rates and our ability to continue to expand our business and manage our growth. Moreover, we operate in very competitive and rapidly changing environments, and new risks may emerge from time to time. It is not possible for our management to predict all risks, nor can we assess the impact of all factors on our business or the extent to which any factor, or combination of factors, may cause actual results to differ materially from those contained in any forward-looking statements we may make. Further information on these and other factors that could affect our financial results are included in our filings with the Securities and Exchange Commission, and may cause our actual results, performance or achievements to differ materially and adversely from those anticipated or implied by our forward-looking statements.
You should not rely upon forward-looking statements as predictions of future events. Although our management believes that the expectations reflected in our forward-looking statements are reasonable, we cannot guarantee that the future results, levels of activity, performance or events and circumstances described in the forward-looking statements will be achieved or occur. Moreover, neither we, nor any other person, assume responsibility for the accuracy and completeness of the forward-looking statements. We undertake no obligation to publicly update any forward-looking statements for any reason after the date of this presentation to conform these statements to actual results or to changes in our expectations, except as required by law.
Any unreleased services, features or functions referenced in this document, Nimble Storage’s website or other press releases or public statements that are not currently available are subject to change at Nimble Storage’s discretion and may not be delivered as planned or at all. Customers who purchase Nimble Storage’s products and services should make their purchase decisions based upon services, features and functions that are currently available.
“Customer” or “Customers” referenced above are Nimble Storage’s end customers. It is Nimble Storage’s practice to identify an end-customer from our channel partners prior to shipment and before any support and services are provided. Products are typically shipped directly to the end-customers of our channel partners. Assuming all other revenue recognition criteria have been met, Nimble Storage generally recognizes product revenue on sales upon shipment, as title and risk of loss are transferred at that time. Nimble Storage recognizes revenue from support and service contracts over the contractual service period.
Nimble Storage, the Nimble Storage logo, CASL, InfoSight, SmartStack, and NimbleConnect are trademarks or registered trademarks of Nimble Storage. Other trade names or words used in this document are the properties of their respective owners.
Press Contact:
Kristalle Cooks
408-314-3313
kristalle@nimblestorage.com
Investor Relations Contact:
Edelita Tichepco
408-514-3379
IR@nimblestorage.com