Exhibit 99.2
Nimble Storage Inc. Q1FY17 Shareholder Letter
Executive Summary
We began FY17 by significantly expanding our technology platform with the introduction of ourPredictive Flash Platform in Q1FY17. Organizations rely on applications to accelerate core business processes and to drive digital transformation and these applications in turn expect fast, uninterrupted access to data. Infrastructure constraints that create an app-data gap negatively impact business outcomes.Our Predictive Flash Platform leverages flash and cloud-based predictive analytics to eliminate the app-data gap and deliver data velocity.The Nimble Storage Predictive Flash Platform is comprised of three key components:
| | • | | Unified Flash Fabric, powered by the Nimble Operating System (“Nimble OS”). Nimble OS enables fast, scalable and always-on data infrastructure at a total cost of ownership that we believe is unmatched in the industry. The Unified Flash Fabric, powered by the Nimble OS, combines industry-leading All-Flash and Adaptive Flash arrays into a single architecture that accelerates applications while also lowering the total cost of storage ownership. |
| | • | | InfoSight cloud-based predictive analytics. We believe InfoSight is unmatched in enabling pain-free operations and cross-stack visibility by monitoring our customers’ infrastructure from the cloud and using predictive analytics to predict and prevent the vast majority of infrastructure disruptions that can negatively impact applications. |
| | • | | Timeless Storage. Timeless Storage ensures investment protection to customers through our unwavering commitment to customer success, our guarantee to customers that protects against product obsolescence or forklift upgrades, and the choice we offer customers of paying for storage based on actual usage by leveraging our Storage on Demand solution. |
We believe the differentiation and breadth of our Predictive Flash Platform create an opportunity for us to emerge as a leading next-generation storage provider. Large incumbent storage vendors have experienced consistent revenue declines over the last two years since we believe their legacy architectures are no longer competitive. At the same time, only a very few storage startups have reached critical mass in terms of customer base or revenues, as we believe that they lack the breadth of functionality to displace the large incumbent vendors. Consequently, we believe that the storage industry will consolidate to just a few large systems vendors and next generation storage vendors; resulting in an opportunity for us to leverage the competitive advantage we derive from our Predictive Flash Platform.
We executed well against this opportunity during Q1FY17.
| | • | | Strong momentum in the very first quarter of launch of our All Flash Arrays (AFAs). During the very first quarter of announcing our AFAs, we saw strong customer and channel partner interest and validation of our product differentiation in numerous competitive engagements. We added 55 AFA customers, including 25 “new to Nimble” customers, with deal sizes substantially above our overall averages. AFA bookings accounted for 12% of our total array bookings (excluding orders for add-ons and support renewals). Underscoring our differentiation, 64% of our AFA customers leveraged our Unified Flash Fabric. |
| | • | | Steady progress in driving faster Enterprise growth. Bookings from our enterprise segment grew at 43% over Q1FY16 and accounted for 20% of our total bookings, up from 17% during Q1FY16. |
| | • | | Faster growth from Cloud Service Providers (CSP). Our strong value proposition for CSPs drove bookings growth of 56% over Q1FY16, as bookings from CSPs accounted for 19% of total bookings, up from 15% during Q1FY16. |
| | • | | Larger deployments. We are driving larger deals, including the largest deal in our history during Q1, as deals over $100K accounted for 44%, and deals over $250K accounted for an all-time high of 20% of total bookings. AFAs and Fibre Channel are both driving larger deployments. Fibre Channel accounted for 34% of Fibre Channel + iSCSI bookings during Q1FY17, up from 26% in Q4FY16. |
| | • | | Large and thriving customer community of over 8,100 customers. Our installed base now stands at 8,160 customers as we added 580 new customers during Q1FY17. Our large installed base and our maniacal focus on customer satisfaction, as reflected in our inaugural Net Promoter Score of 85, continues to drive strong growth with Q1 repeat bookings accounting for 55% of total bookings. |
| | • | | Wepartnered with Veeam on a joint data protection solutionthat leverages our Unified Flash Fabric and enhances Nimble’s snapshot and replication to provide customers additional flexibility in data recovery. |
| | • | | Financial performance ahead of guidance. Our revenue during Q1FY17 was $86.4 million relative to guidance of $83-86 million. Our non-GAAP operating loss was $19.7 million, and our non-GAAP EPS was a loss of $0.24 per share, better than our guidance for a non-GAAP operating loss of $20 million to $22 million, and non-GAAP EPS loss of $0.25 to $0.27 per share. |
Highly Differentiated Predictive Flash Platform Drives Strong AFA Momentum
The Nimble OS leverages the CASL flash-optimized file system with a ground-up design that has resulted in an All Flash Array that, we believe, delivers a substantially better value proposition than other all flash arrays in the market.
| | • | | Unmatched performance and capacity scaling delivered by combining scale-out and scale-up,with performance of up to 1.2M IOPS and capacity of up to 8PB+ of effective capacity. We believe this is substantially above the leading all flash arrays in the market. |
| | • | | Non-stop availabilitywith unique innovations such as Triple+ Parity RAID and measured availability of 99.9997%. |
| | | | |
• Simplified management that accelerates all applications at their price/performance sweetspot and optimizes cost of capacity through a Unified Flash Fabricthatunifies All Flash and Adaptive Flash Arrays into a single managed entity with common data services. Allows for transparent application mobility between All Flash and Adaptive Flash arrays, with All Flash Arrays for performance-demanding production workloads and cost-optimized Adaptive Flash Arrays for test & development, backup, DR and archives. • Up to 33-66% lower TCO than leading all flash arrays, driven by memory efficient, lower-cost controllers, use of low-cost high density 3D-NAND, comprehensive inline data reduction, and backup and DR to cost-optimized secondary storage. Numerous customer engagements and competitive bake-offs during Q1 validated the differentiation of our All Flash Arrays in the market. Of the 55 AFA customer wins during the quarter, we experienced the following successes: • A Fortune 100 technology firmselected our AFA over a leading provider for a large-scale software development and test environment based on extensive performance testing. • A Fortune 1000 financial institutionthat had already deployed the market leading all flash array selected Nimble Storage, deploying multiple all flash arrays for a high performance virtual environment as part of a Unified Flash Fabric deployment. • A nationally ranked law firmselected our AFA over a leading all flash array vendor after a performance bake-off for their high-performance Relativity database, and they deployed our Adaptive Arrays for a broad range of other workloads as part of a Unified Flash deployment. | | | | Hutchinson Clinic Leverages the Nimble Unified Flash Fabric to simplify operations Hutchinson Clinic is one of the largest medical clinics in Kansas. With more than 90 physicians and 650 healthcare professionals, it provides comprehensive medical and surgical care across all of the major specialties of medicine, including oncology, radiology, and emergency services. The IT group manages 30+ enterprise applications for the clinic, including electronic health records (EHR) and centralized billing. The IBM and NetApp storage infrastructure supporting the IT infrastructure was “consistently underperforming.” Now, the Nimble Unified Flash Fabric delivers the speed, capacity and up-time required to meet the rigorous demands of the Clinic. The Nimble Predictive All Flash and Adaptive Flash arrays share the responsibility for production, disaster recovery and back-ups. With Nimble, the benefits include: • Ultra-low latency delivering near-instantaneous access to patient information • Simplified infrastructure management, eliminating “IT management anxiety” • Greater visibility into storage and server environment with InfoSight • Time to focus IT Staff on higher-value projects • Ability to easily migrate applications/workloads in between arrays • Simple, solid DR strategy including low cost replication |
| | | | |
| | | | Rent-A-Center utilizes the Nimble Storage Unified Flash Fabric to increase data warehouse speed and throughput Rent-A-Center has over 2,700+ stores in the US, Canada and Mexico that offer name-brand furniture, electronics, appliances and computers through flexible rental to purchase agreements. As its business continues to grow, internal business owners are demanding faster and easier access to business critical data. Since its legacy storage infrastructure was unable to keep up, it needed a new solution. By using Nimble All Flash and Adaptive Flash arrays as the foundation for its Oracle data warehouse, the IT organization has achieved business and technical benefits including: • Execution on complex multi-query requests that were impossible before the Nimble Storage deployment • Ability to evaluate and modify web and email promotional data in near real-time • Building an Oracle based decision engine leveraged by executives at all levels • Delivering valuable customer insight enabling up-to-the-minute decisions • Consistent end-user access to mission critical data • 20x reduction in data back-up times |
| | • | | A major architectural and engineering firmselected us over a market leader for their ERP and VDI environment, driven by the TCO advantage of our AFAs. |
During Q1FY17, we also saw strong interest among our channel partners, who see us as offering the broadest platform that is designed to address every application in the enterprise, thereby providing customers with an alternative to legacy incumbents across both hybrid arrays and all flash arrays.
Growth in bookings from large enterprises and cloud service providers
We are making steady progress in driving a larger share of our bookings from large global enterprises. During Q1FY17, bookings from large global enterprises grew 43% compared to Q1FY16 and accounted for 20% of our bookings. During the quarter, we also had a multi-million dollar deployment at a large enterprise, spanning over 200 remote sites and its main data center.
| | | | |
Our cloud service provider bookings grew even faster at 56% compared to Q1FY16, contributing 19% of total bookings during Q1FY17. Our CSP customers during the quarter included global system integrators, leading IaaS companies and SaaS companies. Our ability to deliver a compelling TCO, high availability and pain-free operations are key drivers of our success with cloud service providers. Building a thriving, global customer community of extremely satisfied customers We now have an installed base of 8,160 customers – up 48% from a year ago. Our channel partners continue to be a key contributor to new customer acquisition, as channel partners initiated 48% of the opportunities during the quarter. The large installed base provides us with a strong foundation for growth given the high level of customer satisfaction, as evidenced by our Net Promoter Score of 85. InfoSight is a key driver of this customer satisfaction since we deliver 99.9997% availability, predict over 90% of the cases before a customer calls us, and dramatically simplify day-to-day operations. This has in turn caused our customers to be strong advocates for Nimble Storage – recommending us to other prospects as well as driving repeat bookings. During Q1FY17, repeat bookings from our installed base contributed 55% of our total bookings. With the addition of All Flash Arrays and Fibre Channel to our product portfolio, we are steadily achieving larger deployments within our installed base of customers. Our average AFA deals and Fibre Channel deals are substantially larger than our average deals. Consequently, during Q1FY17, bookings from deals over $100K contributed to 44% of total bookings, and deals over $250K contributed to 20% of total bookings. | | | | Retailer deploys Nimble Adaptive Flash arrays in 200+ locations A rapidly growing retail chain with hundreds of locations in North America chose Nimble and Cisco SmartStack integrated infrastructure for a massive IT refresh. Operating on razor-thin margins and facing competition from traditional retailers and online challengers, the retailer was challenged with lowering data center costs while increasing performance to satisfy internal and external customer demand. After reviewing various storage partners recommended by Cisco, SmartStack stood out based on the Nimble Predictive Flash Platform’s ability to provide guaranteed performance, simplicity, and the highest levels of reliability. The retailer’s new virtualized infrastructure, which includes Nimble Adaptive Flash arrays and Cisco UCS integrated infrastructure, supports point of sale, inventory management, logistics, payroll, scheduling, security and back officeoperations for more than 200 store locations. The IT organization selected the platform they felt was the best platform to provide unmatched performance and resiliency. InfoSight will provide the retailer with predictive analytics to prevent and predict issues across the infrastructure stack. |
| | | | |
| | | | City of Pueblo, CO selects Predictive All Flash array to power critical applications The City of Pueblo has deployed the Nimble AF5000 All Flash array to accelerate IT operations across the city. Over 120 applications spanning city-wide departments that include the City’s primary financial system, the police and fire departments’ 911 call dispatch, and record management systems, will all benefit from the new platform. The City of Pueblo encountered data access and delivery issues with its legacy storage infrastructure, which was negatively impacting application performance and response times. In an effort to shorten the gap between a request for data and the delivery, the IT team researched 11 storage vendors with offerings encompassing hybrid and all flash storage systems. The City deployed a Nimble Predictive All Flash array to address its primary storage requirements. In addition to the speed of the Nimble Storage array, the City was attracted to InfoSight which provides visibility of their entire IT infrastructure enabling them to quickly identify and address latency hotspots whether they occur in the storage, compute or networking layers of the IT stack. |
Building a strong alliance ecosystem
Our SmartStack solution continues to grow rapidly as customers seek to simplify and accelerate infrastructure deployment. FlexPod and vBlock are based on legacy storage and present substantial displacement opportunities for us. During Q1FY17, SmartStack accounted for approximately 14% of our new customer acquisitions.
During Q1FY17, we continued to build out our alliance ecosystem with several partner solutions, including a major Veeam-Nimble data protection solution that leverages our Unified Flash Fabric with cost-optimized secondary storage.
We continue to be recognized by our ecosystem partners as a top technology partner. For two consecutive years Nimble has been awarded a 5-star rating in CRN’s Partner Program Guide.
Financial Performance
As a reminder, all results presented in this letter are on a non-GAAP basis except for revenue and balance sheet items. Non-GAAP results exclude only the impact of stock-based compensation versus GAAP results. An explanation of non-GAAP measures and a reconciliation of non-GAAP to GAAP results are provided below.
Q1FY17 Financial Results
During Q1 we delivered solid financial results as we executed against our financial and operational plans. We achieved revenue of $86.4 million, above the top end of our guidance range of $83.0 million to $86.0 million. We had an operating loss of $19.7 million, and our non-GAAP EPS was a loss of $0.24 per share, better than our guidance for an operating loss of $20.0 million to $22.0 million, and non-GAAP EPS loss of $0.25 to $0.27 per share.
| | | | |
| Total revenue for Q1FY17 increased 21% from $71.3 million in Q1FY16 and decreased sequentially by 4% from Q4FY16 due to typical Q1 seasonality. Product revenue for Q1FY17 was $68.4 million, representing 79% of total revenue and an increase of 14% from Q1FY16. Q1FY17 support and service revenue, which includes our maintenance and InfoSight cloud-based predictive analytics service, was $18.0 million, representing 21% of total revenue and an increase of 63% from Q1FY16. | | | | 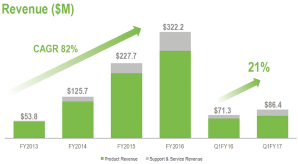 |
Our international business contributed 20% of total revenue during Q1FY17, up from 19% in Q1 a year ago. Total revenue from international grew by 29% from Q1FY16 and by 32% at constant exchange rates. Revenue from our EMEA operations increased by 27% and revenue from APJ increased by 32% from a year ago.
At the end of Q1FY17, our total deferred revenue was $120.2 million, an increase of $34 million or 39% from Q1FY16. Our deferred revenue consists primarily of payments received for support and service agreements including InfoSight, which have an average term of approximately three years.
| | | | |
Gross margin was 65.7% in Q1FY17, a decrease of 70 bps from Q4FY16 and a decrease of 1.9 percentage points from Q1FY16. Product gross margin in Q1FY17 was 66.1%, 60 bps lower than Q4FY16 as a result of seasonally lower volumes. Support and service gross margin in Q1FY17 was 64.4%, 80 bps lower than Q4FY16 as we continue to invest in our global support infrastructure. Our overall gross margin was in line with our expectations for the quarter and remains above our long-term target model of 63% to 65%. Q1FY17 total operating expenses were $76.5 million or 89% of revenue, an increase of $7.3 million from Q4FY16. Expenses were in line with our expectations for the quarter. Sales and marketing spend totaled $49.8 million in Q1FY17 and increased by $5 million from Q4FY16. As | | | | 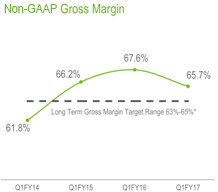
|
previously discussed, we continue to make investments in sales and marketing to increase our market share. We are also investing in R&D to drive innovation and to capitalize on our differentiated Predictive Flash Platform. We expect to add approximately a similar number of employees to our team in FY17 as we did during FY16.
| | | | |
Our Q1FY17 operating loss was $19.7 million, better than our guidance of $20 million to $22 million for the quarter due to higher than expected revenue. Q1FY17 operating margin was negative 23% compared to negative 11% in Q1FY16 and negative 10% in Q4FY16. As we outlined during our earnings call last quarter, for FY17 we expect our operating margin to be between the levels we achieved during FY15 and FY16. This implies an annual range for FY17 operating margin of negative 17% to negative 11%. Q1FY17 non-GAAP EPS was a loss of $0.24 per share on approximately 83.2 million weighted average basic and diluted shares outstanding compared to a loss of $0.10 per share in Q1FY16. This was better than our expectations for a loss of $0.25 to $0.27 per share. | | | | 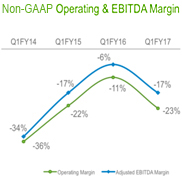 |
We ended Q1FY17 with cash and cash equivalents of $203.0 million, a decrease of $8.2 million during the quarter. This was in line with our plan for Q1. Cash Flow from Operations (CFFO) during Q1FY17 was negative $8.3 million which was flat compared to negative $8.3 million in Q1FY16. Free Cash Flow (FCF) during Q1FY17 was negative $15.1 million due to capex spending of $6.8 million during the quarter, compared to negative $16.4 million in Q1FY16. As discussed during our last earnings call, we expect our cash balance at the end of FY17 to be in the range of $185.0 million to $190.0 million. |
| In Q1FY17, we achieved a cash conversion cycle of 19 days. We ended Q1FY17 with accounts receivables of $46.9 million, a decrease of $3.5 million from Q4FY16. Days sales outstanding (DSO) were 48 days (calculated on billings), an increase of 4 days from Q4FY16 due to less linearity of billings during the quarter. We ended Q1FY17 with inventory of $15.5 million, a decrease of $0.5 million from Q4FY16. Days sales in inventory (DSI) were 48 days, similar to the 47 days in Q4FY16. | | | | 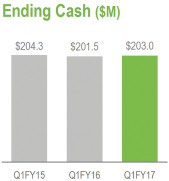 |
Q2FY17 Financial Outlook
Looking ahead to Q2, our goal is to continue to successfully execute against the plan we outlined at the beginning of the fiscal year. Our guidance for Q2 is as follows:
| | • | | Total revenue of $93.0 million to $96.0 million |
| | • | | Non-GAAP operating loss of $16.0 million to $18.0 million |
| | • | | Non-GAAP net loss of $0.19 to $0.21 per share, based on weighted average basic shares outstanding of approximately 85.0 million |
We thank our partners and customers once again for embracing us, our investors for their confidence in us, and our employees for their dedication and continued execution.
| | | | |
 | | | |  |
| Suresh Vasudevan, CEO | | | | Anup Singh, CFO |
Conference Call Information:
As previously announced, Nimble Storage will host a live question & answer conference call and webcast today at 5:00 p.m. ET (2:00 p.m. PT) to discuss its financial results for the fiscal first quarter 2017. Interested parties may access the call by dialing (877) 604-9673 in the U.S. or (719) 325-4773 from international locations. In addition, a live audio webcast of the conference call will be available on the Nimble Storage Investor Relations website athttp://investors.nimblestorage.com. The live webcast will be archived and available on this site for 45 days.
Non-GAAP Financial Measures
To provide investors with additional information regarding our financial results, Nimble Storage has disclosed in this release non-GAAP financial measures that are not calculated in accordance with generally accepted accounting principles in the United States, or GAAP. The Company provides non-GAAP gross margin, non-GAAP product margin, non-GAAP service and support margin, non-GAAP operating margin, non-GAAP net loss, non-GAAP net loss per basic and diluted share, free cash flow and adjusted EBITDA. In computing many of these non-GAAP financial measures, the Company excludes the effects of stock-based compensation, which is a recurring non-cash expense for the Company. The Company has provided reconciliation below of non-GAAP financial measures to the most directly comparable GAAP financial measures. A reconciliation of the Q2FY17 forward outlook for non-GAAP operating loss or non-GAAP net loss per basic and diluted share is not available without unreasonable efforts as the quantification of stock-based compensation expense requires additional inputs such as number of shares granted and market price, that are not ascertainable.
The Company discloses these non-GAAP financial measures because they are key measures used by the Company’s management and board of directors to understand and evaluate operating performance and trends, to prepare and approve the annual budget and to develop short-term and long-term operational and compensation plans. In particular, the exclusion of certain expenses in calculating non-GAAP financial measures can provide a useful measure for period-to-period comparisons of the Company’s business. Accordingly, the Company believes that these non-GAAP financial measures provide useful information to investors and others in understanding and evaluating the Company’s operating results in the same manner as the Company’s management and board of directors.
Non-GAAP financial measures have limitations as analytical tools and, as such, should not be considered in isolation or as substitutes for analysis of the Company’s results as reported under GAAP. Some of these limitations are:
| | • | | Non-GAAP financial measures do not consider the potentially dilutive impact of equity-based compensation, which is an ongoing expense for the Company; and |
| | • | | Other companies, including companies in our industry, may calculate non-GAAP financial measures differently, which reduces their usefulness as comparative measures. |
Nimble Storage, Inc.
Reconciliation of GAAP to Non-GAAP Financial Measures
(In thousands, except per share amounts)
(Unaudited)
| | | | | | | | |
| | | Three Months Ended
April 30, | |
| | | 2016 | | | 2015 | |
GAAP gross margin | | $ | 54,819 | | | $ | 46,495 | |
Stock-based compensation | | | 2,000 | | | | 1,702 | |
| | | | | | | | |
Non-GAAP gross margin | | $ | 56,819 | | | $ | 48,197 | |
| | | | | | | | |
GAAP operating margin | | $ | (42,214 | ) | | $ | (28,918 | ) |
Stock-based compensation | | | 22,547 | | | | 20,985 | |
| | | | | | | | |
Non-GAAP operating margin | | $ | (19,667 | ) | | $ | (7,933 | ) |
| | | | | | | | |
GAAP net loss | | $ | (42,682 | ) | | $ | (28,986 | ) |
Stock-based compensation | | | 22,547 | | | | 20,985 | |
| | | | | | | | |
Non-GAAP net loss | | $ | (20,135 | ) | | $ | (8,001 | ) |
| | | | | | | | |
Interest income, net | | | (73 | ) | | | (68 | ) |
Provision for income taxes | | | 317 | | | | 212 | |
Depreciation | | | 5,141 | | | | 3,312 | |
| | | | | | | | |
Adjusted EBITDA | | $ | (14,750 | ) | | $ | (4,545 | ) |
| | | | | | | | |
GAAP net loss per share, basic and diluted | | $ | (0.51 | ) | | $ | (0.38 | ) |
Stock-based compensation | | | 0.27 | | | | 0.28 | |
| | | | | | | | |
Non-GAAP net loss per share | | $ | (0.24 | ) | | $ | (0.10 | ) |
| | | | | | | | |
Shares used to compute GAAP net loss per share, basic and diluted | | | 83,154 | | | | 76,506 | |
| | | | | | | | |
Shares used to compute Non-GAAP net loss per share | | | 83,154 | | | | 76,506 | |
| | | | | | | | |
GAAP net cash provided by operating activities | | $ | (8,298 | ) | | $ | (8,307 | ) |
Purchase of property and equipment | | | (6,776 | ) | | | (8,057 | ) |
| | | | | | | | |
Non-GAAP free cash flow | | $ | (15,074 | ) | | $ | (16,364 | ) |
| | | | | | | | |
Forward-Looking Statements
This shareholder letter contains “forward-looking” statements that are based on our management’s beliefs and assumptions and on information currently available to management. We intend for such forward-looking statements to be covered by the safe harbor provisions for forward-looking statements contained in the U.S. Private Securities Litigation Reform Act of 1995. Forward-looking statements include all statements other than statements of historical fact contained in this letter, including our current beliefs and expectations concerning our future financial results, product releases, product performance and benefits, business plans, strategy and objectives, potential growth drivers and opportunities, competitive position, industry trends and environment and potential market opportunities.
Forward-looking statements are subject to known and unknown risks, uncertainties, assumptions and other factors including, but not limited to, those related to our future financial performance, which is inherently uncertain, unforeseen delays in product development or introduction, uncertainty around market acceptance of our solutions, including recently introduced products, our ability to increase sales of our solutions, our ability to attract and retain customers and to selling additional solutions to our existing customers, our ability to develop new solutions and bring
them to market in a timely manner, pricing pressure (as a result of competition or otherwise), introduction of new technologies and products by other companies, changes in technologies, which could render our solutions less competitive, changes in the storage industry, our ability to maintain, protect and enhance our brand and intellectual property, the effectiveness of our channel partners and sales team, our ability to recruit new or keep our existing key talent, global economic conditions, fluctuations in foreign currency rates, and our ability to continue to expand our business and manage our growth. Moreover, we operate in very competitive and rapidly changing environments, and new risks may emerge from time to time. It is not possible for our management to predict all risks, nor can we assess the impact of all factors on our business or the extent to which any factor, or combination of factors, may cause actual results to differ materially from those contained in any forward-looking statements we may make. Further information on these and other factors that could affect our financial results are included in our Annual Report on Form 10-K and Quarterly Reports on Form 10-Q filed with the Securities and Exchange Commission, and may cause our actual results, performance or achievements to differ materially and adversely from those anticipated or implied by our forward-looking statements.
You should not rely upon forward-looking statements as predictions of future events. Although our management believes that the expectations reflected in our forward-looking statements are reasonable, we cannot guarantee that the future results, levels of activity, performance or events and circumstances described in the forward-looking statements will be achieved or occur. Moreover, neither the Company, nor any other person, assumes responsibility for the accuracy and completeness of the forward-looking statements. We undertake no obligation to publicly update any forward-looking statements for any reason after the date of this presentation to conform these statements to actual results or to changes in our expectations, except as required by law.
Any unreleased services, features or functions whether referenced in this document, Nimble Storage’s website or other press releases or public statements that are not currently available are subject to change at Nimble Storage’s discretion and may not be delivered as planned or at all. Customers who purchase Nimble Storage’s products and services should make their purchase decisions based upon services, features and functions that are currently available.
“Customer” or “Customers” referenced above are Nimble Storage’s end-customers. It is Nimble Storage’s practice to identify an end-customer from our channel partners prior to shipment and before any support and services are provided. Products are typically shipped directly to the end-customers of our channel partners. Assuming all other revenue recognition criteria have been met, Nimble Storage generally recognizes product revenue on sales upon shipment, as title and risk of loss are transferred at that time. Nimble Storage recognizes revenue from support and service contracts over the contractual service period.
Nimble Storage, the Nimble Storage logo, CASL, InfoSight, SmartStack, Timeless Storage, Data Velocity Delivered, Unified Flash Fabric and NimbleConnect are trademarks or registered trademarks of Nimble Storage, Inc. Other trade names or words used in this document are the properties of their respective owners.
Press Contact:
Kristalle Cooks
408-514-3313
kristalle@nimblestorage.com
Investor Relations Contact:
Edelita Tichepco
408-514-3379
IR@nimblestorage.com