Exhibit 99.2
Nimble Storage Inc. Q2FY17 Shareholder Letter
Executive Summary
Organizations rely on applications to accelerate core business processes and to drive digital transformation, and these applications in turn expect fast, uninterrupted access to data from the underlying infrastructure. Infrastructure constraints that create an app-data gap negatively impact business outcomes.
Our Predictive Flash platform leverages flash and cloud-based predictive analytics and aims to eliminate the app-data gap. Our platform combines All Flash arrays and Adaptive Flash arrays into a single architecture that accelerates every application while simultaneously lowering the cost of storage ownership. However, fast flash alone is inadequate since the majority of application disruptions stem from complexity of the infrastructure stack that powers applications. By leveraging cloud-based predictive analytics to monitor our customer-deployed infrastructure, our Predictive Flash platform delivers unmatched operational simplicity, infrastructure availability and cross-stack visibility.
Our market opportunity derives from the disruption underway within the storage industry. As customers look to shift their IT investments towards business transforming applications they are simultaneously looking to radically simplify their IT infrastructure and minimize costs. Given these customer priorities, we believe that complex storage solutions from legacy vendors are no longer competitive, creating a significant share shift opportunity. At the same time, we believe that younger storage companies and startups do not have the breadth of functionality of our Predictive Flash platform. Consequently,we believe that we have the opportunity to emerge as a leading next generation infrastructure provider.
We executed well against this opportunity during Q2FY17.
| | • | | Continued strong All Flash momentum.All Flash array product bookings accounted for 17% of total product bookings in Q2FY17, up from 9% in Q1FY17(All Flash array bookings were 23% oftotal array bookings in Q2FY17 compared with 12% in Q1FY17). During Q2FY17, our first full quarter of having All Flash arrays in our portfolio, we added 133 AFA customers, including 79 “new to Nimble” customers, with deal sizes substantially above our overall averages. |
| | • | | Continued rapid growth from Cloud Service Providers (CSP), as bookings from CSPs grew 69% over Q2FY16, accounting for 19% of total bookings. Within CSPs, larger CSPs grew at an even faster pace. |
| | • | | Steady progress in driving faster Enterprise growth. Bookings from Enterprise customers (Global 5000 customers) grew 37% over Q2FY16 as we continue to steadily grow our base of Global 5000 enterprises. |
| | • | | Large and thriving customer community of over 8,850 customers. We added approximately 700 new customers during Q2FY17 and our installed base now stands at over 8,850 customers. |
| | • | | Significantly enhanced All Flash and Adaptive Flash product portfolio. In early August, we began shipping a full-featured, aggressively–priced entry level All Flash array, the AF1000. We also began shipping a new family of Adaptive Flash arrays with up to double the performance and up to 40% lower cost of capacity. |
| | • | | We continue to garner industry recognitionwinning the Most Innovative Flash Memory Customer Implementation Award at the Flash Memory Summit, and Network Products Guide IT World awards for our AF9000 All Flash array and InfoSight. |
| | • | | Financial performance ahead of guidance. Our revenue during Q2FY17 was $97.1 million relative to our guidance of $93 to $96 million. Our Q2FY17 GAAP operating loss was $39.3 million and our GAAP EPS was a loss of $0.47 per share. Our non-GAAP operating loss was $15.5 million, and our non-GAAP EPS was a loss of $0.19 per share, relative to our guidance for a non-GAAP operating loss of $16 million to $18 million, and non-GAAP EPS loss of $0.19 to $0.21 per share. |
As we began this year, we had three main execution priorities. Our first priority was to invest in building a strong pipeline. Our second priority was to drive faster growth in strategic segments – namely, large Enterprises and Cloud Service Providers. Our third and perhaps most important priority was to drive rapid traction in the all-flash array market. By executing on these priorities, we believed that we could increase our growth rates as we exited FY17, and we could also get back to demonstrating year-over-year improvements in operating leverage. While we are only halfway through the year, we are pleased with our execution against the plan thus far.
Continued Strong All Flash Momentum
Q2FY17 was our first full quarter since we introduced our All Flash arrays, and we saw strong momentum in terms of customer adoption, channel partner adoption and competitive win rates against the leading all-flash array vendors.
During the quarter, we had hundreds of head-to-head competitive engagements against the leading all-flash array vendors and our value proposition resonated extremely well, resulting in strong win rates. Specifically, customers that compared us to competitors consistently experienced:
| | • | | Better performance and scalability. We were able to deliver better performance and demonstrate far better scalability through a combination of being able to scale-up, scale-deep and scale-out. |
| | • | | Lower cost of capacity. Our effective capacity per TB of raw capacity is industry leading, through a combination of industry leading data reduction, and the ability to extract higher useable capacity per TB of raw flash capacity. When coupled with more cost-effective controllers that require less memory per TB of flash capacity, we believe that our cost of capacity is industry leading. |
| | • | | Measured availability of 99.9997%. Nimble OS has a demonstrated availability of 99.9997%, as measured across an installed base of thousands of customer deployments. |
| | • | | Dramatically simpler operations. The inherent simplicity of our All Flash arrays, combined with InfoSight’s ability to predict and prevent issues, provide cross-stack visibility and cloud-based monitoring is unmatched in simplifying infrastructure management for our customers. |
| | | | | | |
• Cost-optimized secondary storage. By leveraging cost-optimized Adaptive Flash arrays for test and development, backup, data recovery (DR) and archives, we further lower the total cost of the deployment relative to competitors. As a result of the strong value proposition, we saw strong customer momentum during the quarter with 133 AFA customers, 79 of whom were “new to Nimble” customers. These customers spanned a broad range of verticals and a broad range of workloads. Underscoring the differentiation of our Unified Flash Fabric, the majority of our All Flash customers also leveraged our Adaptive Flash arrays for their less performance intensive applications and for their secondary storage use cases. Bookings from All Flash arrays during Q2FY17 increased as a percentage of total product bookings from 9% in Q1FY17 to 17% in Q2FY17. All Flash deals were almost double the size of our typical Adaptive Flash deals, helping to drive higher overall average selling prices (ASPs). During Q2FY17, we trained hundreds of channel partners and received strong | | | | | | Grant Street Group Adds Nimble All Flash Arrays and Increases Performance and Capacity Grant Street Group (GSG) develops, hosts, and administers customized software applications for government entities and financial institutions. Using the software as a service (SaaS) model, GSG provides its clients with access to the latest technologies from any location with Internet access — saving them time, money, and staff resources. GSG needed to implement a cost-efficient storage infrastructure without compromising performance. With Nimble CS-Series Adaptive Flash and AF-Series All Flash arrays, GSG is experiencing faster application response times at a lower total cost of ownership compared to its legacy infrastructure. The Nimble deduplication features enable GSG to receive 50 percent more storage, with over 3x data reduction savings. GSG depends heavily on InfoSight to monitor capacity trends and VMVision to identify noisy neighbors. |
| | | | | | |
| | | | | | Castlight Health chooses Nimble Unified Flash Fabric Castlight Health, Inc. (NYSE:CSLT), a leading health benefits platform provider, made a strategic decision to build and manage a private SaaS cloud to deliver its platform to customers. Castlight had deployed Nimble Adaptive Flash arrays to support its data centers and disaster recovery site. Castlight decided to support its data warehouse with all-flash storage arrays and ran proof-of-concepts with different arrays, including the Nimble All Flash array. Today, Castlight is leveraging the Nimble Predictive Flash platform, Adaptive Flash and All Flash arrays across its entire infrastructure to support superior healthcare. Benefits include sub 1ms latency access to data and efficient back-up and replication. |
positive feedback on the strength of our product differentiation as well feedback that having Adaptive Flash arrays and All Flash arrays in the portfolio allows our channel partners to offer a comprehensive alternative to legacy storage vendor deployments.
Growth in bookings from enterprise customers and cloud service providers
Bookings from Enterprise customers grew 37% compared to Q2FY16. We continue to grow our base of Global 5000 customers with over 10% of the G5000 as current customers, while also continuing to expand our footprint once we acquire a G5000 account. The addition of All Flash arrays to our portfolio has been a key enabler to expanding our footprint further within our G5000 installed base.
During Q2FY17, our Cloud Service Provider (CSP) bookings grew even more rapidly at 69% over Q2FY16, and accounted for 19% of total bookings. Bookings growth from larger CSPs within our overall CSP base grew even faster. A key driver of our growth is that we have become a defacto storage standard within hundreds of CSPs, benefiting from the growth that SaaS and IaaS companies are experiencing.
Building a thriving, global customer community
We now have an installed base of over 8,850 customers – up 43% from a year ago, as we added approximately 700 new customers during the quarter.
Our channel partners continue to be a key contributor to new customer acquisition, as channel partners accounted for 48% of total bookings during the quarter, up from 45% in the previous quarter and 44% in Q2FY16. As the industry continues to consolidate, the depth of our engagement with large channel partners that have traditionally partnered closely with large legacy storage vendors continues to increase.
We are achieving steadily larger deployments within our customer base. During Q2FY17, our average new customer ASP rose 4% over Q1FY17 and 6% over Q2FY16. Bookings from deals over $250K were higher by 60% over Q2FY16.
The large installed base combined with the high level of customer satisfaction, as evidenced by our Net Promoter Score of 85 and actual measured availability of 99.9997%, drives strong repeat bookings. During Q2FY17, repeat bookings from our installed base contributed 50% of our total bookings. During Q2FY17, we crossed $1 billion in cumulative purchases of products and services by customers around the world.
| | | | |
Expanding breadth and competitive differentiation of Predictive Flash arrays Our Predictive Flash platform is comprised of three key elements: • Unified Flash Fabric, powered by the Nimble OS, which combines All Flash arrays and Adaptive Flash arrays into a single architecture, allows customers unmatched flexibility in their ability to leverage flash for every application – primary production applications as well as for secondary storage needs. • InfoSight monitors our customers’ infrastructure from the cloud and uses predictive analytics to predict and prevent the vast majority of infrastructure disruptions that can negatively impact applications. InfoSight delivers an unmatched level of operational simplicity, high availability and cross-stack visibility. | | | | Saunderson House Invests in Nimble Storage Unified Flash Fabric Saunderson House Limited (SHL) provides complete financial planning and investment service to over 1,900 high net-worth individuals, charities, trusts and other institutional clients. Fast and simplified access to data is at the core of its ability to make strategic decisions for its clients. SHL initially purchased Nimble Adaptive Flash arrays in 2012 to support a VMware VDI initiative. The performance of the arrays vastly exceeded expectations encouraging the IT team to quickly transfer the rest of its workloads onto Nimble arrays. With the recent purchase of a Nimble All Flash array, SHL can cluster and manage multiple arrays as a single entity in a Unified Flash Fabric. SHL consolidated workloads from two Nimble Adaptive Flash arrays onto a Nimble AF5000 All Flash array. With its primary data on the Nimble All Flash array, the firm is leveraging their Adaptive Flash arrays to support their expansion in a second data center by scaling-out their existing Nimble Arrays to support its disaster recovery strategy, development, user acceptance testing and support functions. Using Nimble Storage Arrays delivers flexibility, ease of updates, and comprehensive information provided by InfoSight. The non-disruptive scalability enables Saunderson House to support its systems for many more years, providing a platform to exceed customer expectations for years to come. |
| | • | | Timeless Storage provides investment protection to customers through our unwavering commitment to customer success, protection against product obsolescence or forklift upgrades, and the flexibility of paying for storage based on actual usage by leveraging our Storage on Demand solution. |
In early August 2016, we significantly expanded the breadth and differentiation of our Predictive Flash arrays by shipping a new entry level All Flash array, the AF1000, and a new generation of Adaptive Flash arrays.
The new entry-level All Flash array, the AF1000brings the benefits of consistent, sub-millisecond latency to a broader customer base and to a broader range of workloads. With an MSRP of $40K, the AF1000 addresses the needs of organizations that want all-flash at a lower entry point. Further, customers can leverage the unmatched ability of the Nimble OS to non-disruptively scale controllers, scale capacity and scale-out across multiple systems to start with the AF1000 and scale non-disruptively to 8PB of effective capacity and 1.2M+ IOPS, further expanding our “land and expand” strategy.
Our new family of Adaptive Flash arrays, comprising the CS1000, CS3000, CS5000 and CS7000, delivers dramatic improvements in performance and cost of capacity. The new family of Adaptive Flash arrays delivers up to twice the performance of the previous generation with the CS7000 scaling to 230K+ IOPS. They also lower the cost of capacity by up to 40% and scale up to a capacity of 2.4PB of effective capacity. Adaptive Flash arrays continue to be deployed in a wide range of primary applications that need a combination of high performance as well as low cost of capacity. Additionally, when primary applications are deployed on All Flash arrays, our Unified Flash Fabric facilitates deploying lower cost Adaptive Flash arrays for test and development, backup, DR and archival.
The breadth of our portfolio combined with the rich data services within the Nimble OS and the unmatched operational simplicity that InfoSight provides continue to provide a compelling value proposition to our customers, and strong competitive differentiation relative to other storage vendors in the industry.
Building a leadership position through strong alliances and industry recognition
As customers look to alternatives to legacy storage vendors, they are looking for next generation vendors with superior technology, but with proven solutions and validated reference architectures. To that end, we continue to work closely with alliance partners to strengthen our solutions portfolio, and accomplished the following during Q2FY17:
| | • | | OurSmartStack solution presents a compelling alternative to FlexPod and vBlock, and continues to grow rapidly. During Q2FY17, our SmartStack installed base crossed 1000 customers. We now have 11 reference architectures in conjunction with Cisco, and our SmartStack solution was expanded during Q2FY17 to include our recently introduced All Flash arrays. |
| | • | | TheMirantis Unlocked validation for the Nimble Cinder Driver provides easy-to-deploy, scalable and highly available storage options for customers using OpenStack infrastructure. |
| | • | | We obtained SAP HANA® Certification for our Predictive All Flash arrays,which is a key enabler to customers that want to deploy All Flash arrays for the SAP HANA platform. |
| | • | | Nimble Storage AF-Series All Flash arrays and CS-Series Adaptive Flash arrays are nowfully compatible with the newest version of Citrix XenDesktop 7.9, for persistent and non-persistent XenDesktop VDI workloads. |
We continue to garner industry recognition for our innovation and industry impact. We won the Most Innovative Flash Memory Customer Implementation award at the Flash Memory Summit for Hutchinson Clinic’s deployment of a Unified Flash Fabric solution with InfoSight predictive analytics. We were awarded Network Products Guide IT World awards for the AF9000 All Flash array, the CS700 Adaptive Flash array and InfoSight. Three Nimble Storage employees were acknowledged by CRN, a top news source for solution providers and the IT channel, for their accomplishments and leadership in channel sales and marketing.
Financial Performance
As a reminder, non-GAAP results presented in this letter exclude only the impact of stock-based compensation versus GAAP results. An explanation of non-GAAP measures and a reconciliation of non-GAAP to GAAP results are provided below.
Q2FY17 Financial Results Overview
During Q2FY17 we delivered another solid financial quarter exceeding the guidance we provided at the beginning of the quarter. We achieved revenue of $97.1 million, exceeding our guidance of $93.0 million to $96.0 million.
Our GAAP operating loss was $39.3 million for Q2FY17. Our non-GAAP operating loss was $15.5 million, better than our guidance for a non-GAAP operating loss of $16.0 million to $18.0 million.
Our GAAP EPS for Q2FY17 was a loss of $0.47 per share. Our non-GAAP EPS for Q2FY17 was a loss of $0.19 per share, at the lower end of our guidance range for non-GAAP EPS loss of $0.19 to $0.21 per share.
Revenue
Total revenue for Q2FY17 was $97.1 million, an increase of 21% from Q2FY16 and 12% sequentially from Q1FY17.
Product revenue for Q2FY17 was $77.6 million, representing 80% of total revenue. Product revenue increased 16% from Q2FY16 and grew sequentially by 13% from Q1FY17.
| | | | |
Q2FY17 support and service revenue, which includes our maintenance and InfoSight cloud-based predictive analytics service, was $19.5 million, representing 20% of total revenue, an increase of 46% from Q2FY16 and an increase of 8% from Q1FY17. Our international business contributed 23% of total revenue during Q2FY17, up from 20% in Q2FY16. Total revenue from international grew by 43% from Q2FY16 and by 49% at constant exchange rates. Revenue from our EMEA operations increased by 29% and revenue from APJ increased by 67% from Q2FY16. | | | | .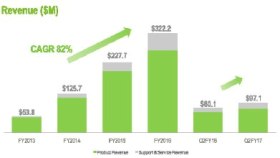 |
At the end of Q2FY17, our total deferred revenue was $127.1 million, an increase of $29.2 million or 30% from Q2FY16. Our deferred revenue consists primarily of payments received for support and service agreements including InfoSight, which have an average term of approximately three years.
Gross Margin
GAAP gross margin was 64.6% in Q2FY17 compared to 63.4% in Q1FY17 and 65.3% in Q2FY16.
Non-GAAP gross margin was 67.0% in Q2FY17, an increase of 130 bps from Q1FY17 and a decrease of 80 bps from Q2FY16. In Q2FY17, our non-GAAP gross margin was at its highest level in the preceding 4 quarters.
| | | | |
Product Gross Margin • GAAP product gross margin in Q2FY17 was 66.7%, 150 bps higher than Q1FY17. Non-GAAP product gross margin in Q2FY17 was 67.7%, 160 bps higher than Q1FY17. Sequentially, the improvement in product gross margins, on a GAAP and non-GAAP basis, were driven by better product mix, pricing and cost leverage. • GAAP product gross margin in Q2FY17 was 170 bps lower than Q2FY16 and non-GAAP product gross margin was 160 bps lower than Q2FY16 mainly due to pricing and product mix. | | | | 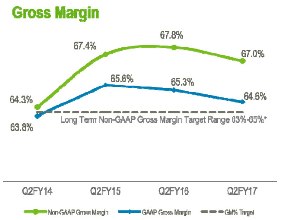 |
Support and Service Gross Margin
| | • | | GAAP support and service gross margin in Q2FY17 was 56.1%, slightly lower by 60 bps compared to Q1FY17, and 5.8 percentage points higher than Q2FY16. |
| | • | | Non-GAAP support and service gross margin in Q2FY17 was 64.2%, slightly lower by 20 bps compared to Q1FY17, and 4.1 percentage points higher than Q2FY16. |
| | • | | The year-over-year improvement in both GAAP and non-GAAP support and service gross margin was due to improved support operations leverage from a year ago. |
Our overall non-GAAP gross margin remains above our long-term target model range of 63% to 65%, and we expect to continue to operate slightly above the high end of this range in the near term.
Operating Expenses
GAAP operating expenses in Q2FY17 were $102.1 million, an increase of $5.0 million or 5% from Q1FY17. GAAP operating expenses as a percentage of sales improved by 7% to 105% of revenue compared to Q1FY17.
Q2FY17 total non-GAAP operating expenses were $80.5 million, an increase of $4.0 million or 5% from Q1FY17. Non-GAAP operating expenses as a percentage of sales improved by 6% to 83% of revenue compared to Q1FY17.
| | • | | GAAP sales and marketing spend totaled $61.7 million in Q2FY17 and increased by $1.2 million from Q1FY17. Non-GAAP sales and marketing spend totaled $52.0 million in Q2FY17 and increased by $2.1 million from Q1FY17. Sequentially, the increase in both GAAP and non-GAAP sales and marketing expenses were driven in part by higher revenue and investments to increase market share. |
| | • | | GAAP R&D expenses were $29.6 million and increased by $3.4 million during Q2FY17 and non-GAAP R&D expenses were $21.8 million and increased by $1.8 million during Q2FY17. R&D expenses increased sequentially on a GAAP and non-GAAP basis as we continued to drive innovation and delivered on significant enhancements to our All Flash and Adaptive Flash product portfolio. |
| | • | | During the first half of FY17, we added over 100 employees to the Company and ended Q2FY17 with over 1,200 employees on board. |
Operating Income and EPS
GAAP operating loss was $39.3 million for Q2FY17, compared to a loss of $29.5 million in Q2FY16.
| | | | |
Non-GAAP operating loss in Q2FY17 was $15.5 million, better than our guidance for a non-GAAP operating loss of $16.0 million to $18.0 million for the quarter due to higher than expected revenue. GAAP operating margin in Q2FY17 was negative 40% compared to negative 49% in Q1FY17 and negative 37% in Q2FY16. Non-GAAP operating margin in Q2FY17 was negative 16% compared to negative 23% in Q1FY17 and negative 9% in Q2FY16. GAAP EPS for Q2Y17 was a loss of $0.47 per share, compared to a loss of $0.51 per share in Q1FY17 and a loss of $0.38 per share in Q2FY16. Non-GAAP EPS in Q2FY17 was a loss of $0.19 per share on approximately 84.5 million weighted average basic and diluted shares outstanding compared to a loss of $0.24 per share in Q1FY17, and a loss of $0.10 per share in Q2FY16. This was at the lower end of our guidance range for a loss of $0.19 to $0.21 per share. | | | | 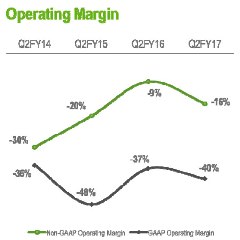 |
Balance Sheet
We ended Q2FY17 with cash and cash equivalents of $194.2 million, a decrease of $8.8 million during the quarter. Cash Flow from Operations during Q2FY17 was negative $4.1 million compared to negative $8.3 million in Q1FY17 and positive $14.9 million in Q2FY16. Free Cash Flow during Q2FY17 was negative $9.1 million compared to negative $15.1 million in Q1FY17 and positive $9.0 million in Q2FY16.
| | | | |
| In Q2FY17, we achieved a cash conversion cycle of 11 days, better than the 19 days we experienced in Q1FY17 and the 13 days we experienced in Q2FY16. We ended Q2FY17 with accounts receivables of $49.1 million, an increase of $2.2 million from Q1FY17. Days sales outstanding were 42 days (calculated on billings), a reduction of 6 days from Q1FY17 due to better collections and linearity of billings during the quarter. We ended Q2FY17 with inventory of $18.1 million, an increase of $2.6 million from Q1FY17 mainly due to customer evaluation inventory increasing by $1.2 million. Days sales in inventory were 48 days, flat to Q1FY17. | | | | 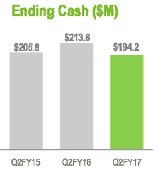 |
Q3FY17 Financial Outlook
These metrics are provided on a non-GAAP basis, except for revenue and share count.
Looking ahead to Q3FY17, our priority remains achieving the financial goals we outlined at the beginning of the fiscal year. These were (a) increasing our revenue growth rate in the second half of FY17 and (b) making investments to increase our market share while achieving an annual non-GAAP operating margin in the range of negative 11% to negative 17% for the full year FY17. We believe that we remain on track to achieve both of these goals.
Our guidance for Q3FY17 is as follows:
| | • | | Total revenue of $100.0 million to $103.0 million. At the mid-point, this translates into revenue growth of 26% from a year ago. |
| | • | | Non-GAAP operating loss of $14.0 million to $16.0 million. At the mid-point, this translates into non-GAAP operating margin of negative 15%. We believe that for the full year FY17 our range remains negative 11% to negative 17%. |
| | • | | Non-GAAP net loss of $0.17 to $0.19 per share, based on weighted average basic shares outstanding of approximately 86.0 million. |
We thank our partners and customers once again for embracing us, our investors for their confidence in us, and our employees for their dedication and continued execution.
| | | | |
 | | | |  |
| Suresh Vasudevan, CEO | | | | Anup Singh, CFO |
Conference Call Information:
As previously announced, Nimble Storage will host a live question & answer conference call and webcast today at 5:00 p.m. ET (2:00 p.m. PT) to discuss its financial results for the fiscal second quarter 2017. Interested parties may access the call by dialing (888) 347-5685 in the U.S. or (719) 325-2314 from international locations. In addition, a live audio webcast of the conference call will be available on the Nimble Storage Investor Relations website athttp://investors.nimblestorage.com. The live webcast will be archived and available on this site for 45 days.
Non-GAAP Financial Measures
To provide investors with additional information regarding our financial results, Nimble Storage has disclosed in this release non-GAAP financial measures that are not calculated in accordance with generally accepted accounting principles in the United States, or GAAP. The Company provides non-GAAP gross margin, non-GAAP product margin, non-GAAP service and support margin, non-GAAP operating margin, non-GAAP net loss, non-GAAP net loss per basic and diluted share and free cash flow. In computing many of these non-GAAP financial measures, the Company excludes the effects of stock-based compensation, which is a recurring non-cash expense for the Company. The Company has provided reconciliation below of non-GAAP financial measures to the most directly comparable GAAP financial measures. A reconciliation of the Q3FY17 forward outlook for non-GAAP operating loss and non-GAAP net loss per basic and diluted share is not available without unreasonable efforts as the quantification of stock-based compensation expense requires additional inputs such as number of shares granted and market price, that are not ascertainable.
The Company discloses these non-GAAP financial measures because they are key measures used by the Company’s management and board of directors to understand and evaluate operating performance and trends, to prepare and approve the annual budget and to develop short-term and long-term operational and compensation plans. In particular, the exclusion of certain expenses in calculating non-GAAP financial measures can provide a useful measure for period-to-period comparisons of the Company’s business. Accordingly, the Company believes that these non-GAAP financial measures provide useful information to investors and others in understanding and evaluating the Company’s operating results in the same manner as the Company’s management and board of directors.
Non-GAAP financial measures have limitations as analytical tools and, as such, should not be considered in isolation or as substitutes for analysis of the Company’s results as reported under GAAP. Some of these limitations are:
| | • | | Non-GAAP financial measures do not consider the potentially dilutive impact of equity-based compensation, which is an ongoing expense for the Company; and |
| | • | | Other companies, including companies in our industry, may calculate non-GAAP financial measures differently, which reduces their usefulness as comparative measures. |
Nimble Storage, Inc.
Reconciliation of GAAP to Non-GAAP Financial Measures
(In thousands, except percentages and per share amounts)
(Unaudited)
| | | | | | | | | | | | | | | | | | | | |
| | | Three Months Ended | |
| | | July 31, 2016 | | | April 30, 2016 | | | July 31, 2015 | | | July 31, 2014 | | | July 31, 2013 | |
Revenue | | $ | 97,111 | | | $ | 86,417 | | | $ | 80,109 | | | $ | 53,761 | | | $ | 28,478 | |
GAAP gross margin | | $ | 62,743 | | | $ | 54,819 | | | $ | 52,345 | | | $ | 35,245 | | | $ | 18,180 | |
Stock-based compensation | | | 2,296 | | | | 2,000 | | | | 1,964 | | | | 967 | | | | 126 | |
| | | | | | | | | | | | | | | | | | | | |
Non-GAAP gross margin | | $ | 65,039 | | | $ | 56,819 | | | $ | 54,309 | | | $ | 36,212 | | | $ | 18,306 | |
| | | | | | | | | | | | | | | | | | | | |
GAAP gross margin % | | | 64.6 | % | | | 63.4 | % | | | 65.3 | % | | | 65.6 | % | | | 63.8 | % |
Stock-based compensation % | | | 2.4 | % | | | 2.3 | % | | | 2.5 | % | | | 1.8 | % | | | 0.5 | % |
| | | | | | | | | | | | | | | | | | | | |
Non-GAAP gross margin % | | | 67.0 | % | | | 65.7 | % | | | 67.8 | % | | | 67.4 | % | | | 64.3 | % |
| | | | | | | | | | | | | | | | | | | | |
Product revenue | | $ | 77,615 | | | $ | 68,385 | | | $ | 66,752 | | | | | | | | | |
GAAP product gross margin | | $ | 51,800 | | | $ | 44,594 | | | $ | 45,625 | | | | | | | | | |
Stock-based compensation | | | 728 | | | | 615 | | | | 660 | | | | | | | | | |
| | | | | | | | | | | | | | | | | | | | |
Non-GAAP product gross margin | | $ | 52,528 | | | $ | 45,209 | | | $ | 46,285 | | | | | | | | | |
| | | | | | | | | | | | | | | | | | | | |
GAAP product gross margin % | | | 66.7 | % | | | 65.2 | % | | | 68.4 | % | | | | | | | | |
Stock-based compensation % | | | 1.0 | % | | | 0.9 | % | | | 0.9 | % | | | | | | | | |
| | | | | | | | | | | | | | | | | | | | |
Non-GAAP product gross margin % | | | 67.7 | % | | | 66.1 | % | | | 69.3 | % | | | | | | | | |
| | | | | | | | | | | | | | | | | | | | |
Support and service revenue | | $ | 19,496 | | | $ | 18,032 | | | $ | 13,357 | | | | | | | | | |
GAAP support and service gross margin | | $ | 10,943 | | | $ | 10,225 | | | $ | 6,720 | | | | | | | | | |
Stock-based compensation | | | 1,568 | | | | 1,385 | | | | 1,304 | | | | | | | | | |
| | | | | | | | | | | | | | | | | | | | |
Non-GAAP support and service gross margin | | $ | 12,511 | | | $ | 11,610 | | | $ | 8,024 | | | | | | | | | |
| | | | | | | | | | | | | | | | | | | | |
GAAP support and service gross margin % | | | 56.1 | % | | | 56.7 | % | | | 50.3 | % | | | | | | | | |
Stock-based compensation % | | | 8.1 | % | | | 7.7 | % | | | 9.8 | % | | | | | | | | |
| | | | | | | | | | | | | | | | | | | | |
Non-GAAP support and service gross margin % | | | 64.2 | % | | | 64.4 | % | | | 60.1 | % | | | | | | | | |
| | | | | | | | | | | | | | | | | | | | |
GAAP operating expenses | | $ | 102,063 | | | $ | 97,033 | | | $ | 81,848 | | | | | | | | | |
Stock-based compensation | | | 21,567 | | | | 20,547 | | | | 20,357 | | | | | | | | | |
| | | | | | | | | | | | | | | | | | | | |
Non-GAAP operating expenses | | $ | 80,496 | | | $ | 76,486 | | | $ | 61,491 | | | | | | | | | |
| | | | | | | | | | | | | | | | | | | | |
GAAP operating expenses as a percentage of revenue | | | 105 | % | | | 112 | % | | | 102 | % | | | | | | | | |
Stock-based compensation as a percentage of revenue | | | 22 | % | | | 23 | % | | | 25 | % | | | | | | | | |
| | | | | | | | | | | | | | | | | | | | |
Non-GAAP operating expenses as a percentage of revenue | | | 83 | % | | | 89 | % | | | 77 | % | | | | | | | | |
| | | | | | | | | | | | | | | | | | | | |
GAAP sales and marketing | | $ | 61,678 | | | $ | 60,444 | | | $ | 47,860 | | | | | | | | | |
Stock-based compensation | | | 9,727 | | | | 10,613 | | | | 9,389 | | | | | | | | | |
| | | | | | | | | | | | | | | | | | | | |
Non-GAAP sales and marketing | | $ | 51,951 | | | $ | 49,831 | | | $ | 38,471 | | | | | | | | | |
| | | | | | | | | | | | | | | | | | | | |
GAAP research and development | | $ | 29,593 | | | $ | 26,147 | | | $ | 24,539 | | | | | | | | | |
Stock-based compensation | | | 7,773 | | | | 6,146 | | | | 6,638 | | | | | | | | | |
| | | | | | | | | | | | | | | | | | | | |
Non-GAAP research and development | | $ | 21,820 | | | $ | 20,001 | | | $ | 17,901 | | | | | | | | | |
| | | | | | | | | | | | | | | | | | | | |
GAAP operating margin | | $ | (39,320 | ) | | $ | (42,214 | ) | | $ | (29,503 | ) | | $ | (25,912 | ) | | $ | (10,187 | ) |
Stock-based compensation | | | 23,863 | | | | 22,547 | | | | 22,321 | | | | 15,169 | | | | 1,627 | |
| | | | | | | | | | | | | | | | | | | | |
Non-GAAP operating margin | | $ | (15,457 | ) | | $ | (19,667 | ) | | $ | (7,182 | ) | | $ | (10,743 | ) | | $ | (8,560 | ) |
| | | | | | | | | | | | | | | | | | | | |
GAAP operating margin % | | | -40 | % | | | -49 | % | | | -37 | % | | | -48 | % | | | -36 | % |
Stock-based compensation % | | | 24 | % | | | 26 | % | | | 28 | % | | | 28 | % | | | 6 | % |
| | | | | | | | | | | | | | | | | | | | |
Non-GAAP operating margin % | | | -16 | % | | | -23 | % | | | -9 | % | | | -20 | % | | | -30 | % |
| | | | | | | | | | | | | | | | | | | | |
GAAP net loss | | $ | (39,950 | ) | | $ | (42,682 | ) | | $ | (30,109 | ) | | | | | | | | |
Stock-based compensation | | | 23,863 | | | | 22,547 | | | | 22,321 | | | | | | | | | |
| | | | | | | | | | | | | | | | | | | | |
Non-GAAP net loss | | $ | (16,087 | ) | | $ | (20,135 | ) | | $ | (7,788 | ) | | | | | | | | |
| | | | | | | | | | | | | | | | | | | | |
Interest income, net | | | (47 | ) | | | | | | | (61 | ) | | | | | | | | |
Provision for income taxes | | | 338 | | | | | | | | 288 | | | | | | | | | |
Depreciation and amortization | | | 5,437 | | | | | | | | 3,626 | | | | | | | | | |
| | | | | | | | | | | | | | | | | | | | |
Adjusted EBITDA | | $ | (10,359 | ) | | | | | | $ | (3,935 | ) | | | | | | | | |
| | | | | | | | | | | | | | | | | | | | |
GAAP net loss per share, basic and diluted | | $ | (0.47 | ) | | $ | (0.51 | ) | | $ | (0.38 | ) | | | | | | | | |
Stock-based compensation | | | 0.28 | | | | 0.27 | | | | 0.28 | | | | | | | | | |
| | | | | | | | | | | | | | | | | | | | |
Non-GAAP net loss per share | | $ | (0.19 | ) | | $ | (0.24 | ) | | $ | (0.10 | ) | | | | | | | | |
| | | | | | | | | | | | | | | | | | | | |
Shares used to compute GAAP and Non-GAAP net loss per share | | | 84,482 | | | | 83,154 | | | | 78,228 | | | | | | | | | |
GAAP net cash provided by (used in) operating activities | | $ | (4,069 | ) | | | | | | $ | 14,876 | | | | | | | | | |
Purchase of property and equipment | | | (5,002 | ) | | | | | | | (5,901 | ) | | | | | | | | |
| | | | | | | | | | | | | | | | | | | | |
Non-GAAP free cash flow | | $ | (9,071 | ) | | | | | | $ | 8,975 | | | | | | | | | |
| | | | | | | | | | | | | | | | | | | | |
Forward-Looking Statements
This shareholder letter contains “forward-looking” statements that are based on our management’s beliefs and assumptions and on information currently available to management. We intend for such forward-looking statements to be covered by the safe harbor provisions for forward-looking statements contained in the U.S. Private Securities Litigation Reform Act of 1995. Forward-looking statements include all statements other than statements of historical fact contained in this letter, including our current beliefs and expectations concerning our future financial results, product releases, product performance and benefits, business plans, strategy and objectives, potential growth drivers and opportunities, competitive position, industry trends and environment and potential market opportunities.
Forward-looking statements are subject to known and unknown risks, uncertainties, assumptions and other factors including, but not limited to, those related to our future financial performance, which is inherently uncertain, unforeseen delays in product development or introduction, uncertainty around market acceptance of our solutions, including recently introduced products, our ability to increase sales of our solutions, our ability to attract and retain customers and to sell additional solutions to our existing customers and continue to add new customers, our ability to develop new solutions and bring them to market in a timely manner, pricing pressure (as a result of competition or otherwise), introduction of new technologies and products by other companies, changes in technologies, which could render our solutions less competitive, changes in the storage industry, our ability to maintain, protect and enhance our brand and intellectual property, the effectiveness of our channel partners and sales team, our ability to convert leads into sales, our ability to recruit new or keep our existing key talent, global economic conditions, fluctuations in foreign currency rates, and our ability to continue to expand our business and manage our growth. Moreover, we operate in very competitive and rapidly changing environments, and new risks may emerge from time to time. It is not possible for our management to predict all risks, nor can we assess the impact of all factors on our business or the extent to which any factor, or combination of factors, may cause actual results to differ materially from those contained in any forward-looking statements we may make. Further information on these and other factors that could affect our financial results are included in our Annual Report on Form 10-K and Quarterly Reports on Form 10-Q filed with the Securities and Exchange Commission, and may cause our actual results, performance or achievements to differ materially and adversely from those anticipated or implied by our forward-looking statements.
You should not rely upon forward-looking statements as predictions of future events. Although our management believes that the expectations reflected in our forward-looking statements are reasonable, we cannot guarantee that the future results, levels of activity, performance or events and circumstances described in the forward-looking statements will be achieved or occur. Moreover, neither the Company, nor any other person, assumes responsibility for the accuracy and completeness of the forward-looking statements. We undertake no obligation to publicly update any forward-looking statements for any reason after the date of this presentation to conform these statements to actual results or to changes in our expectations, except as required by law.
Any unreleased services, features or functions whether referenced in this document, Nimble Storage’s website or other press releases or public statements that are not currently available are subject to change at Nimble Storage’s discretion and may not be delivered as planned or at all. Customers who purchase Nimble Storage’s products and services should make their purchase decisions based upon services, features and functions that are currently available.
“Customer” or “Customers” referenced above are Nimble Storage’s end-customers. It is Nimble Storage’s practice to identify an end-customer from our channel partners prior to shipment and before any support and services are provided. Products are typically shipped directly to the end-customers of our channel partners. Assuming all other revenue recognition criteria have been met, Nimble Storage generally recognizes product revenue on sales upon shipment, as title and risk of loss are transferred at that time. Nimble Storage recognizes revenue from support and service contracts over the contractual service period.
Nimble Storage, the Nimble Storage logo, CASL, InfoSight, SmartStack, Timeless Storage, Data Velocity Delivered, Unified Flash Fabric and NimbleConnect are trademarks or registered trademarks of Nimble Storage, Inc. Other trade names or words used in this document are the properties of their respective owners.
Press Contact:
Kristalle Cooks
408-514-3313
kristalle@nimblestorage.com
Investor Relations Contact:
Edelita Tichepco
408-514-3379
IR@nimblestorage.com