
KBS Strategic Opportunity REIT Valuation and Portfolio Update December 10, 2015 Exhibit 99.3
Forward-Looking Statements The information contained herein should be read in conjunction with, and is qualified by, the information in the KBS Strategic Opportunity REIT, Inc. (“KBS Strategic Opportunity REIT”) Annual Report on Form 10-K for the year ended December 31, 2014, filed with the Securities and Commission Exchange (the “SEC”) on March 9, 2015 (the “Annual Report”), and in KBS Strategic Opportunity REIT’s Quarterly Report on Form 10-Q for the period ended September 30, 2015, filed with the SEC on November 12, 2015, including the “Risk Factors” contained therein. For a full description of the limitations, methodologies and assumptions used to value KBS Strategic Opportunity REIT’s assets and liabilities in connection with the calculation of KBS Strategic Opportunity REIT’s estimated value per share, see KBS Strategic Opportunity REIT’s Current Report on Form 8-K, filed with the SEC on December 10, 2015. Forward-Looking Statements Certain statements contained herein may be deemed to be forward-looking statements within the meaning of the Federal Private Securities Litigation Reform Act of 1995. KBS Strategic Opportunity REIT intends that such forward-looking statements be subject to the safe harbors created by Section 27A of the Securities Act of 1933, as amended, and Section 21E of the Securities Exchange Act of 1934, as amended. These statements include statements regarding the intent, belief or current expectations of KBS Strategic Opportunity REIT and members of its management team, as well as the assumptions on which such statements are based, and generally are identified by the use of words such as “may,” “will,” “seeks,” “anticipates,” “believes,” “estimates,” “expects,” “plans,” “intends,” “should” or similar expressions. Further, forward-looking statements speak only as of the date they are made, and KBS Strategic Opportunity REIT undertakes no obligation to update or revise forward-looking statements to reflect changed assumptions, the occurrence of unanticipated events or changes to future operating results over time, unless required by law. Actual results may differ materially from those contemplated by such forward-looking statements. The valuation methodology for KBS Strategic Opportunity REIT’s real estate investments assumes that its properties realize the projected cash flows and exit cap rates and that investors would be willing to invest in such properties at cap rates equal to the cap rates used in the valuation. Though the appraisals and valuation estimates used in calculating the estimated value per share are Duff & Phelps and Landauer Services’ best estimates as September 30, 2015, and/or KBS Strategic Opportunity REIT’s and KBS Capital Advisors LLC’s (“the Advisor”) best estimates as of December 8, 2015, KBS Strategic Opportunity REIT can give no assurance that these estimated values will be realized by KBS Strategic Opportunity REIT. These statements also depend on factors such as future economic, competitive and market conditions, KBS Strategic Opportunity REIT’s ability to maintain occupancy levels and rental rates at its properties, and other risks identified in Part I, Item IA of KBS Strategic Opportunity REIT’s Annual Report on form 10-K for the year ended December 31, 2014, and its subsequent quarterly reports. Actual events may cause the value and returns on KBS Strategic Opportunity REIT’s investments to be less than that used for purposes of KBS Strategic Opportunity REIT’s estimated value per share. 2

Total Acquisitions1: $1,093,248,000 Total Current Portfolio2: $1,018,196,000 21 Equity Assets 1 Debt Asset December 2015 Estimated Value of Portfolio3: $1,356,127,000 SOR Equity Raised4: $561,749,000 Portfolio Leverage5: 43% Percent Leased as of 9/30/156: 87% Occupancy at Acquisition6: 68% 1 Represents acquisition price (excluding closing costs) of real estate and loans acquired since inception (including investments which have been disposed), adjusted for KBS Strategic Opportunity REIT’s share of consolidated and unconsolidated joint ventures. This total is $1,219,214,000 including our partners’ shares of consolidated and unconsolidated joint ventures. Subsequent to acquisition, KBS Strategic Opportunity REIT foreclosed on or otherwise received title to the properties securing five of its original debt investments, all of which were non-performing loans at the time of acquisition. 2 Represents acquisition price (excluding closing costs) of real estate and loans in portfolio as of September 30, 2015, adjusted for KBS Strategic Opportunity REIT’s share of consolidated and unconsolidated joint ventures. This total is $1,141,504,000 including our partners’ shares of conso lidated and unconsolidated joint ventures. 3 Value as of September 30, 2015, and is the net total of real estate, investments in unconsolidated JVs, real estate loan receivable and minority interest as shown on page 6. 4 Represents gross offering proceeds from the sale of common stock in the primary portion of KBS Strategic Opportunity REIT’s initial public offering. 5 As of September 30, 2015, KBS Strategic Opportunity REIT’s consolidated borrowings were approximately 43% of the appraised va lue of consolidated properties. 6 For consolidated properties in the portfolio as of September 30, 2015. Portfolio Overview 3
Estimated value per share2 calculated using information as of September 30, 2015 • Net asset value; no enterprise (portfolio) premium or discount applied • Considered potential participation fee that would be due to the advisor in a hypothetical liquidation if the required shareholder return thresholds are met. • KBS Strategic Opportunity REIT followed the IPA Valuation Guidelines, which included independent third-party appraisals for all but one of its consolidated properties, which was valued at contractual sales price less actual disposition costs and fees because it was sold subsequent to September 30, 2015, and one of its two unconsolidated joint venture investments in real estate properties. Duff & Phelps and Landauer Services, LLC were engaged to provide appraisals of the estimated market values of real estate assets. Duff & Phelps provided appraisals of all investments in consolidated real estate properties (excluding undeveloped land) and 110 William Street, and Landauer provided appraisals of all investments in undeveloped land (excluding a parcel of land sold subsequent to September 30, 2015). The appraisals were performed in accordance with the Code of Professional Ethics and Standards of Profession Practice set forth by the Appraisal Institute and the Uniform Standards of Professional Appraisal Practice (USPAP). Non-controlling interest liability due to our joint venture partners calculated by assuming a hypothetical liquidation of the underlying real estate properties at their current appraised values and the payoff of any related debt at its fair value, based on the profit participation thresholds contained in the joint venture agreements. 1For more information, see KBS Strategic Opportunity REIT’s Current Report on Form 8-K filed with the SEC on December 10, 2015. 2The estimated value of the REIT’s assets less the estimated value of the REIT’s liabilities, divided by the number of shares outstanding, all as of September 30, 2015. Valuation1 4

1Based on data as of September 30, 2015 2 Based on data as of September 30, 2014. 3Includes cash and cash equivalents, restricted cash, rents and other receivables, deposits and prepaid expenses as applicable. 4Includes accounts payable, accrued liabilities, security deposits, contingent liabilities and prepaid rent. Valuation1 Estimated Value of Portfolio 5 As of December 20151 As of December 20142 Assets: $1.500 Billion $1.401 Billion Real Estate (i) $1.295 Billion (86%) $1.244 Billion (89%) Investments in Unconsolidated JVs (i) $140.4 Million (9%) $104.3 Million (7%) Real Estate Loan Receivable (i) $27.9 Million (2%) $27.9 Million (2%) Other Assets3 $37.0 Million (3%) $25.1 Million (2%) Liabilities: $601.2 Million $550.0 Million Mortgage and Other Debt $554.2 Million $524.1 Million Advisor Incentive Fee Potential Liability $19.5 Million $10.5 Million Other Liabilities4 $27.5 Million $20.4 Million Minority Interest in Consolidated JVs (i) $107.1 Million $113.5 Million Net Equity at Estimated Value $792.0 Million $733.0 Million Estimated Value of Portfolio (before debt) sum of (i) $1.356 Billion
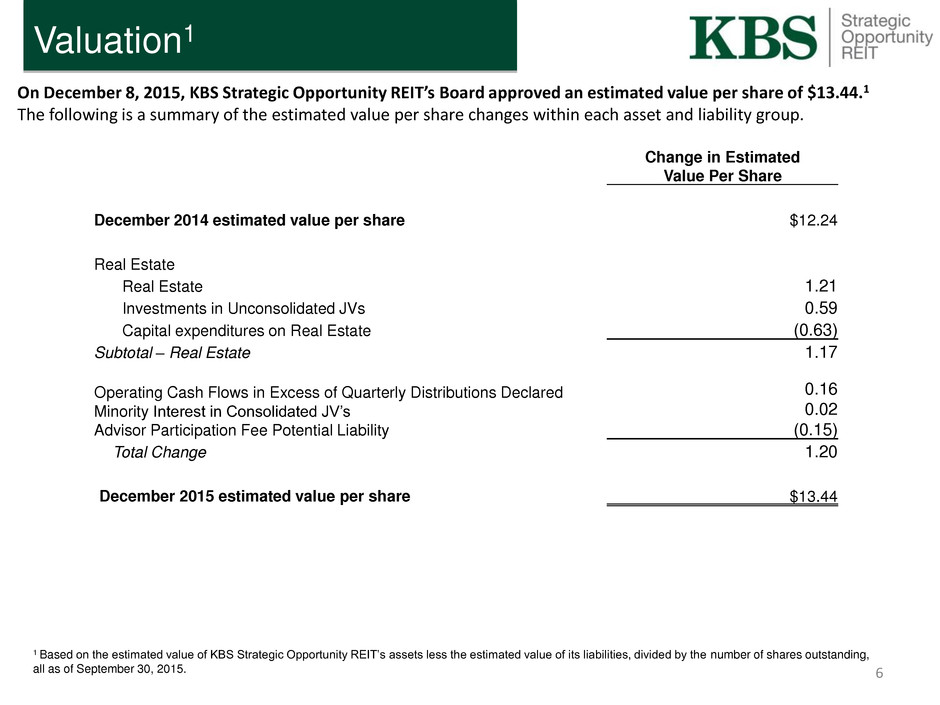
Valuation1 On December 8, 2015, KBS Strategic Opportunity REIT’s Board approved an estimated value per share of $13.44.1 The following is a summary of the estimated value per share changes within each asset and liability group. 6 1 Based on the estimated value of KBS Strategic Opportunity REIT’s assets less the estimated value of its liabilities, divided by the number of shares outstanding, all as of September 30, 2015. Change in Estimated Value Per Share December 2014 estimated value per share $12.24 Real Estate Real Estate 1.21 Investments in Unconsolidated JVs 0.59 Capital expenditures on Real Estate (0.63) Subtotal – Real Estate 1.17 Operating Cash Flows in Excess of Quarterly Distributions Declared Minority Interest in Consolidated JV’s Advisor Participation Fee Potential Liability 0.16 0.02 (0.15) Total Change 1.20 December 2015 estimated value per share $13.44
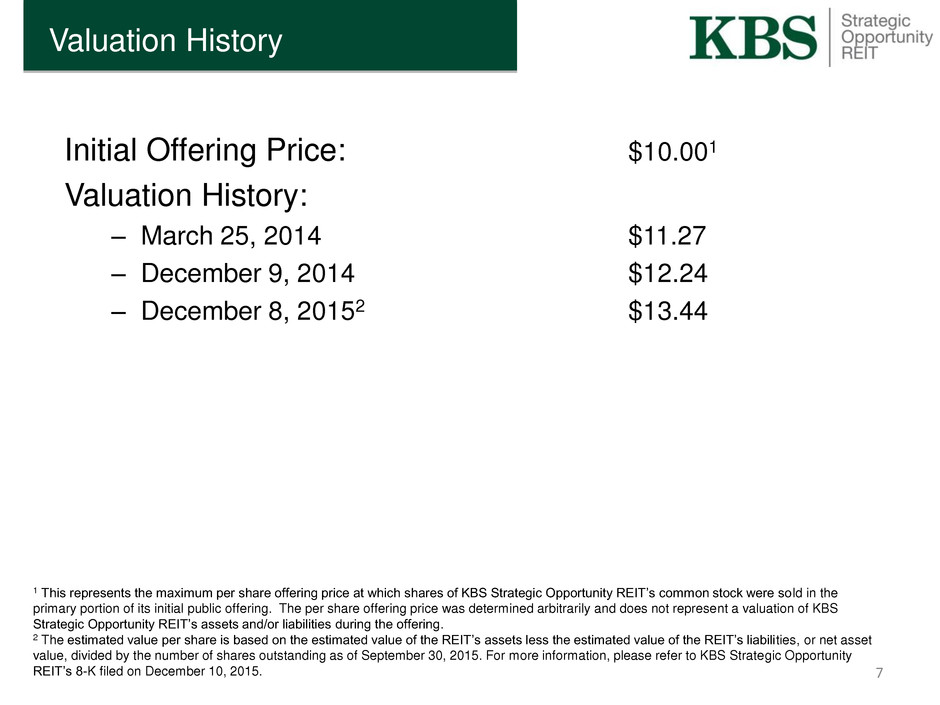
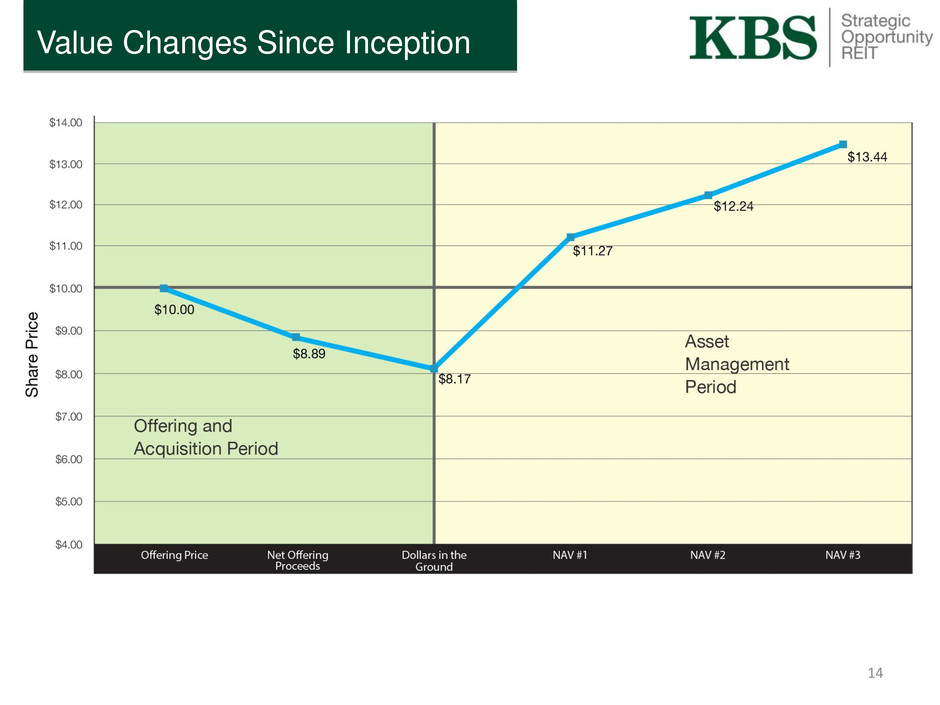
Valuation History 1 This represents the maximum per share offering price at which shares of KBS Strategic Opportunity REIT’s common stock were sold in the primary portion of its initial public offering. The per share offering price was determined arbitrarily and does not represent a valuation of KBS Strategic Opportunity REIT’s assets and/or liabilities during the offering. 2 The estimated value per share is based on the estimated value of the REIT’s assets less the estimated value of the REIT’s liabilities, or net asset value, divided by the number of shares outstanding as of September 30, 2015. For more information, please refer to KBS Strategic Opportunity REIT’s 8-K filed on December 10, 2015. Initial Offering Price: $10.001 Valuation History: – March 25, 2014 $11.27 – December 9, 2014 $12.24 – December 8, 20152 $13.44 7

1 Cost basis equals acquisition price (net of closing credits and excluding closing costs) plus capital expenditures as of September 30, 2015 for investments made and still in the portfolio as of that date. Real estate acquired through consolidated and unconsolidated joint ventures reflects KBS Strategic Opportunity REIT’s share. 2 Includes real estate and loans in portfolio as of September 30, 2015, including KBS Strategic Opportunity REIT’s share of consolidated and unconsolidated joint ventures 3 Includes gross proceeds of primary offering, excluding proceeds from the dividend reinvestment plan. Portfolio Overview Acquisition History Cost Basis and Fundraising 8
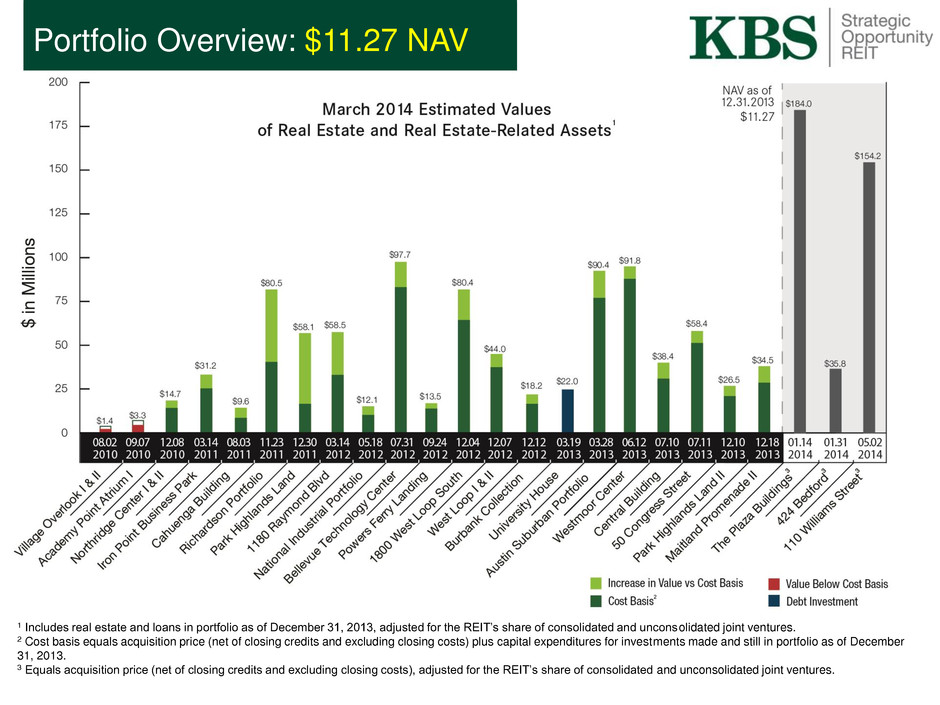
1 Includes real estate and loans in portfolio as of December 31, 2013, adjusted for the REIT’s share of consolidated and unconsolidated joint ventures. 2 Cost basis equals acquisition price (net of closing credits and excluding closing costs) plus capital expenditures for investments made and still in portfolio as of December 31, 2013. 3 Equals acquisition price (net of closing credits and excluding closing costs), adjusted for the REIT’s share of consolidated and unconsolidated joint ventures. Portfolio Overview: $11.27 NAV
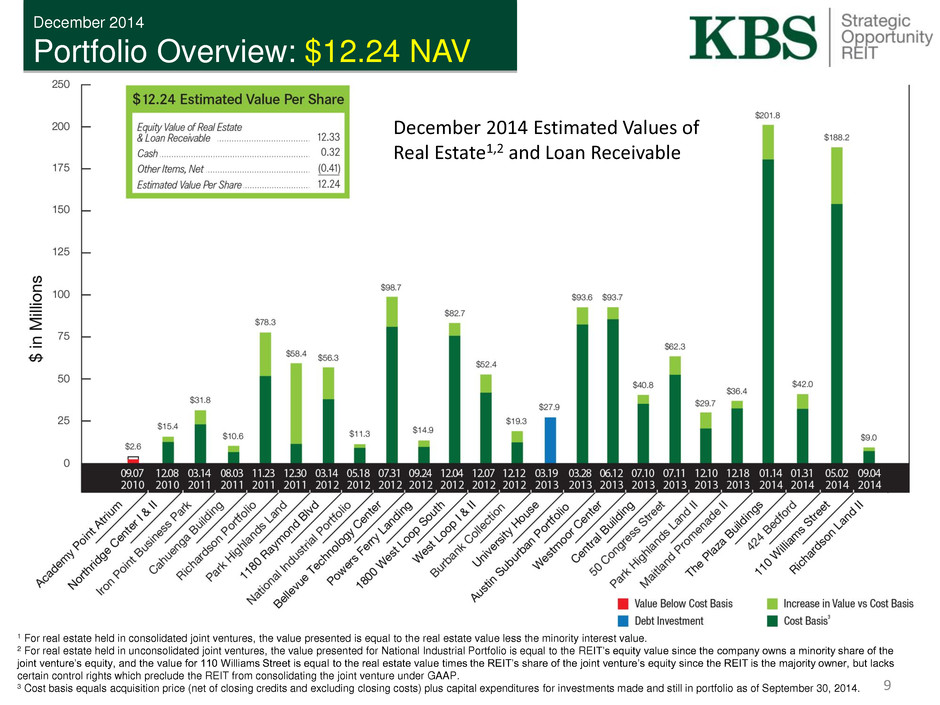
December 2014 Portfolio Overview: $12.24 NAV 1 For real estate held in consolidated joint ventures, the value presented is equal to the real estate value less the minority interest value. 2 For real estate held in unconsolidated joint ventures, the value presented for National Industrial Portfolio is equal to the REIT’s equity value since the company owns a minority share of the joint venture’s equity, and the value for 110 Williams Street is equal to the real estate value times the REIT’s share of the joint venture’s equity since the REIT is the majority owner, but lacks certain control rights which preclude the REIT from consolidating the joint venture under GAAP. 3 Cost basis equals acquisition price (net of closing credits and excluding closing costs) plus capital expenditures for investments made and still in portfolio as of September 30, 2014. December 2014 Estimated Values of Real Estate1,2 and Loan Receivable 9
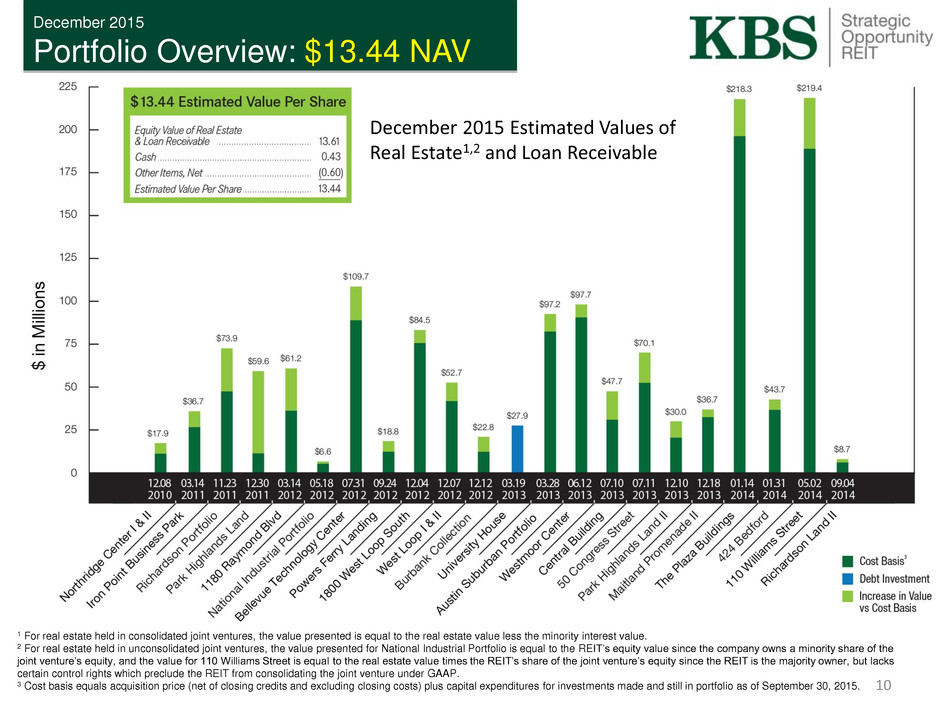
1 For real estate held in consolidated joint ventures, the value presented is equal to the real estate value less the minority interest value. 2 For real estate held in unconsolidated joint ventures, the value presented for National Industrial Portfolio is equal to the REIT’s equity value since the company owns a minority share of the joint venture’s equity, and the value for 110 Williams Street is equal to the real estate value times the REIT’s share of the joint venture’s equity since the REIT is the majority owner, but lacks certain control rights which preclude the REIT from consolidating the joint venture under GAAP. 3 Cost basis equals acquisition price (net of closing credits and excluding closing costs) plus capital expenditures for investments made and still in portfolio as of September 30, 2015. December 2015 Portfolio Overview: $13.44 NAV December 2015 Estimated Values of Real Estate1,2 and Loan Receivable 10
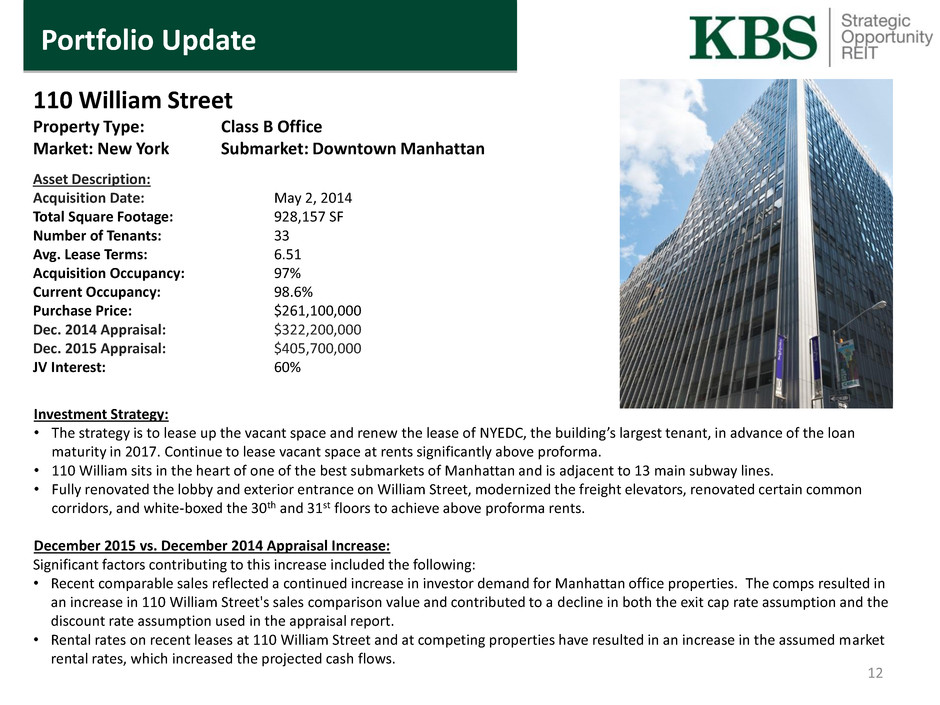
110 William Street Property Type: Class B Office Market: New York Submarket: Downtown Manhattan Asset Description: Acquisition Date: May 2, 2014 Total Square Footage: 928,157 SF Number of Tenants: 33 Avg. Lease Terms: 6.51 Acquisition Occupancy: 97% Current Occupancy: 98.6% Purchase Price: $261,100,000 Dec. 2014 Appraisal: $322,200,000 Dec. 2015 Appraisal: $405,700,000 JV Interest: 60% Investment Strategy: • The strategy is to lease up the vacant space and renew the lease of NYEDC, the building’s largest tenant, in advance of the loan maturity in 2017. Continue to lease vacant space at rents significantly above proforma. • 110 William sits in the heart of one of the best submarkets of Manhattan and is adjacent to 13 main subway lines. • Fully renovated the lobby and exterior entrance on William Street, modernized the freight elevators, renovated certain common corridors, and white-boxed the 30th and 31st floors to achieve above proforma rents. December 2015 vs. December 2014 Appraisal Increase: Significant factors contributing to this increase included the following: • Recent comparable sales reflected a continued increase in investor demand for Manhattan office properties. The comps resulted in an increase in 110 William Street's sales comparison value and contributed to a decline in both the exit cap rate assumption and the discount rate assumption used in the appraisal report. • Rental rates on recent leases at 110 William Street and at competing properties have resulted in an increase in the assumed market rental rates, which increased the projected cash flows. Portfolio Update 12
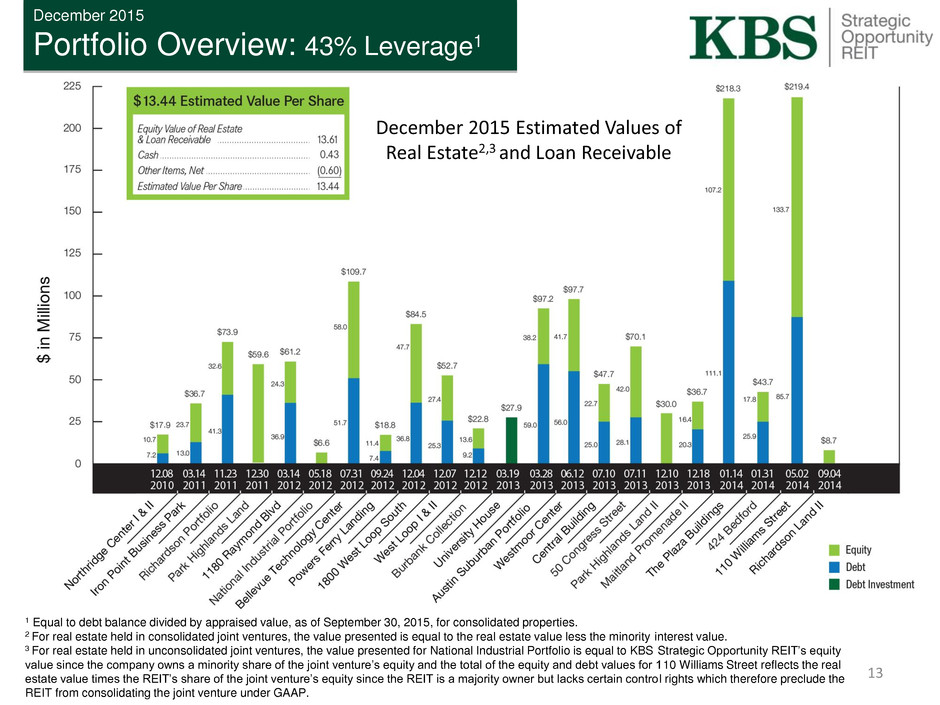
December 2015 Portfolio Overview: 43% Leverage1 13 1 Equal to debt balance divided by appraised value, as of September 30, 2015, for consolidated properties. 2 For real estate held in consolidated joint ventures, the value presented is equal to the real estate value less the minority interest value. 3 For real estate held in unconsolidated joint ventures, the value presented for National Industrial Portfolio is equal to KBS Strategic Opportunity REIT’s equity value since the company owns a minority share of the joint venture’s equity and the total of the equity and debt values for 110 Williams Street reflects the real estate value times the REIT’s share of the joint venture’s equity since the REIT is a majority owner but lacks certain contro l rights which therefore preclude the REIT from consolidating the joint venture under GAAP. December 2015 Estimated Values of Real Estate2,3 and Loan Receivable
Value Changes Since Inception 14
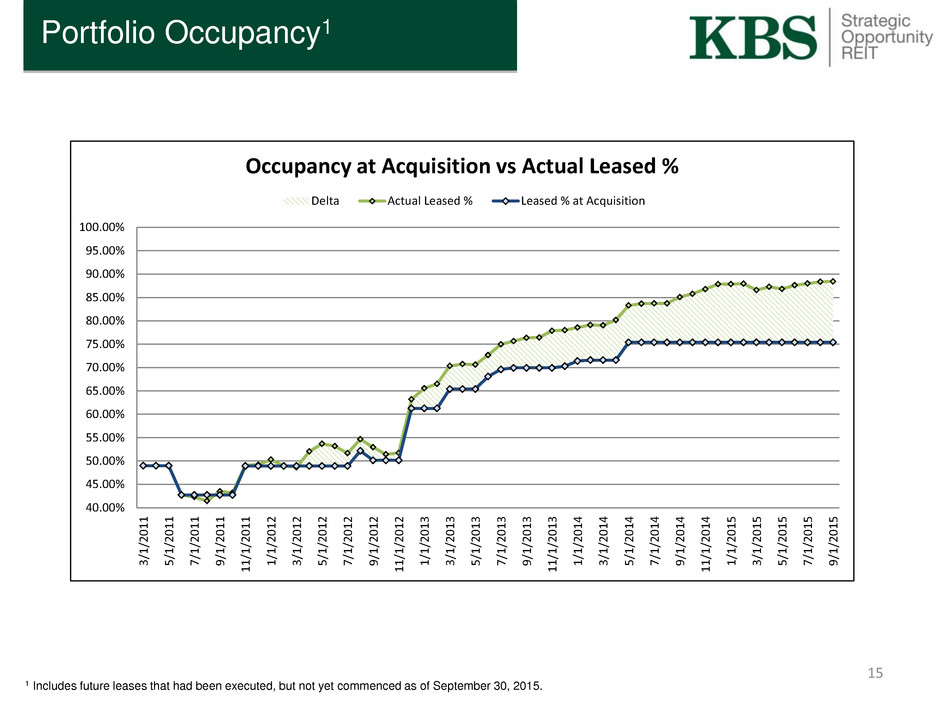
15 Portfolio Occupancy1 1 Includes future leases that had been executed, but not yet commenced as of September 30, 2015. 40.00% 45.00% 50.00% 55.00% 60.00% 65.00% 70.00% 75.00% 80.00% 85.00% 90.00% 95.00% 100.00% 3/ 1 /20 1 1 5/ 1 /20 1 1 7/ 1 /20 1 1 9/ 1 /20 1 1 1 1 /1/2 0 1 1 1/ 1 /20 1 2 3/ 1 /20 1 2 5/ 1 /20 1 2 7/ 1 /20 1 2 9/ 1 /20 1 2 1 1 /1/2 0 1 2 1/ 1 /20 1 3 3/ 1 /20 1 3 5/ 1 /20 1 3 7/ 1 /20 1 3 9/ 1 /20 1 3 1 1 /1/2 0 1 3 1/ 1 /20 1 4 3/ 1 /20 1 4 5/ 1 /20 1 4 7/ 1 /20 1 4 9/ 1 /20 1 4 1 1 /1/2 0 1 4 1/ 1 /20 1 5 3/ 1 /20 1 5 5/ 1 /20 1 5 7/ 1 /20 1 5 9/ 1 /20 1 5 Occupancy at Acquisition vs Actual Leased % Delta Actual Leased % Leased % at Acquisition
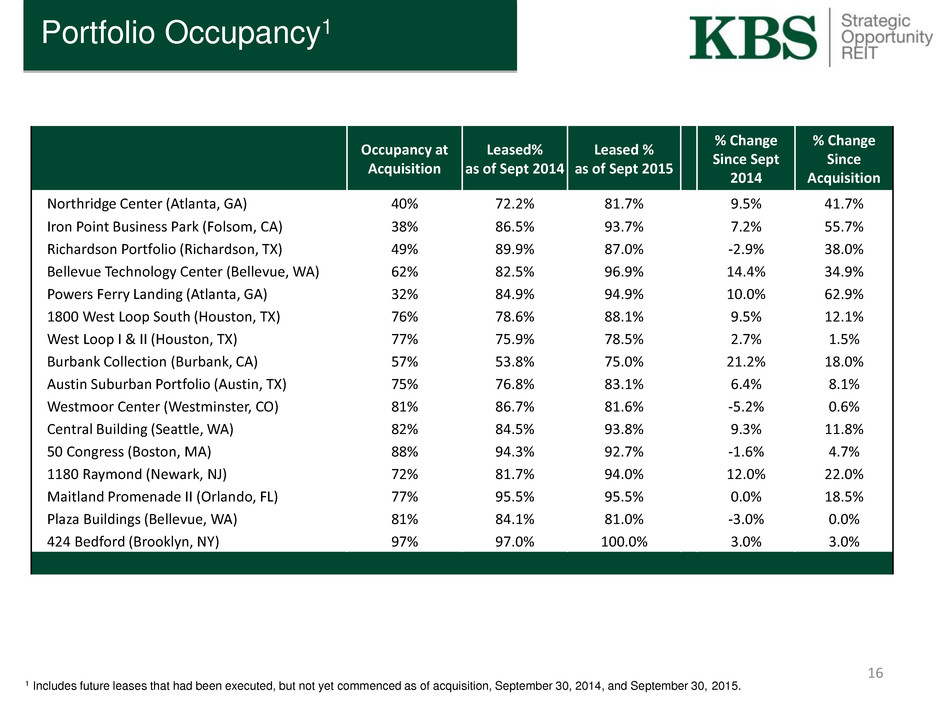
16 Portfolio Occupancy1 Occupancy at Acquisition Leased% as of Sept 2014 Leased % as of Sept 2015 % Change Since Sept 2014 % Change Since Acquisition Northridge Center (Atlanta, GA) 40% 72.2% 81.7% 9.5% 41.7% Iron Point Business Park (Folsom, CA) 38% 86.5% 93.7% 7.2% 55.7% Richardson Portfolio (Richardson, TX) 49% 89.9% 87.0% -2.9% 38.0% Bellevue Technology Center (Bellevue, WA) 62% 82.5% 96.9% 14.4% 34.9% Powers Ferry Landing (Atlanta, GA) 32% 84.9% 94.9% 10.0% 62.9% 1800 West Loop South (Houston, TX) 76% 78.6% 88.1% 9.5% 12.1% West Loop I & II (Houston, TX) 77% 75.9% 78.5% 2.7% 1.5% Burbank Collection (Burbank, CA) 57% 53.8% 75.0% 21.2% 18.0% Austin Suburban Portfolio (Austin, TX) 75% 76.8% 83.1% 6.4% 8.1% Westmoor Center (Westminster, CO) 81% 86.7% 81.6% -5.2% 0.6% Central Building (Seattle, WA) 82% 84.5% 93.8% 9.3% 11.8% 50 Congress (Boston, MA) 88% 94.3% 92.7% -1.6% 4.7% 1180 Raymond (Newark, NJ) 72% 81.7% 94.0% 12.0% 22.0% Maitland Promenade II (Orlando, FL) 77% 95.5% 95.5% 0.0% 18.5% Plaza Buildings (Bellevue, WA) 81% 84.1% 81.0% -3.0% 0.0% 424 Bedford (Brooklyn, NY) 97% 97.0% 100.0% 3.0% 3.0% 1 Includes future leases that had been executed, but not yet commenced as of acquisition, September 30, 2014, and September 30, 2015.

Portfolio MFFO Growth 17 (1) Represents the cumulative acquisition price of investments in the portfolio as of the date presented, as adjusted for KBS Strategic Opportunity REIT’s share of consolidated and unconsolidated joint ventures. (2) See slide 15 for a reconciliation of Adjusted MFFO GAAP net income (loss). $2,870 $4,139 $5,581 $4,710 $6,499 $7,524 $6,692 $0 $1,000 $2,000 $3,000 $4,000 $5,000 $6,000 $7,000 $8,000 $0 $200,000 $400,000 $600,000 $800,000 $1,000,000 $1,200,000 Q1 2014 Q2 2014 Q3 2014 Q4 2014 Q1 2015 Q2 2015 Q3 2015 A DJU ST ED M FF O ( $000 'S ) A C Q UI SI TI O N P R IC E ($000 'S ) Adjusted MFFO Growth Acquisition Price (1) Adjusted MFFO (2)
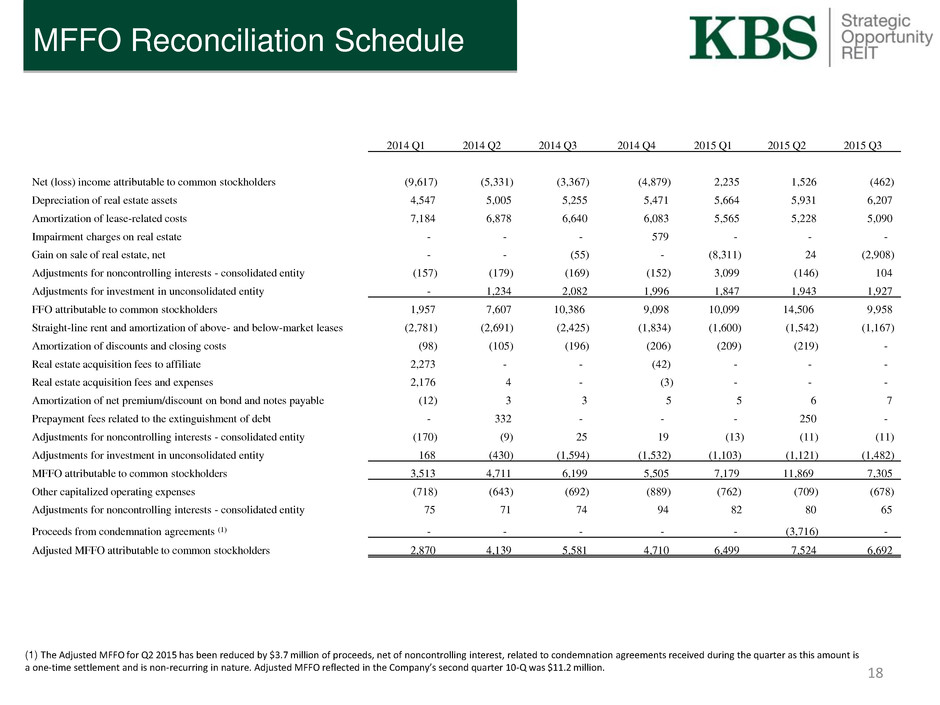
MFFO Reconciliation Schedule 18 (1) The Adjusted MFFO for Q2 2015 has been reduced by $3.7 million of proceeds, net of noncontrolling interest, related to condemnation agreements received during the quarter as this amount is a one-time settlement and is non-recurring in nature. Adjusted MFFO reflected in the Company’s second quarter 10-Q was $11.2 million. 2014 Q1 2014 Q2 2014 Q3 2014 Q4 2015 Q1 2015 Q2 2015 Q3 Net (loss) income attributable to common stockholders (9,617) (5,331) (3,367) (4,879) 2,235 1,526 (462) Depreciation of real estate assets 4,547 5,005 5,255 5,471 5,664 5,931 6,207 Amortization of lease-related costs 7,184 6,878 6,640 6,083 5,565 5,228 5,090 Impairment charges on real estate - - - 579 - - - Gain on sale of real estate, net - - (55) - (8,311) 24 (2,908) Adjustments for noncontrolling interests - consolidated entity (157) (179) (169) (152) 3,099 (146) 104 Adjustments for investment in unconsolidated entity - 1,234 2,082 1,996 1,847 1,943 1,927 FFO attributable to common stockholders 1,957 7,607 10,386 9,098 10,099 14,506 9,958 Straight-line rent and amortization of above- and below-market leases (2,781) (2,691) (2,425) (1,834) (1,600) (1,542) (1,167) Amortization of discounts and closing costs (98) (105) (196) (206) (209) (219) - Real estate acquisition fees to affiliate 2,273 - - (42) - - - Real estate acquisition fees and expenses 2,176 4 - (3) - - - Amortization of net premium/discount on bond and notes payable (12) 3 3 5 5 6 7 Prepayment fees related to the extinguishment of debt - 332 - - - 250 - Adjustments for noncontrolling interests - consolidated entity (170) (9) 25 19 (13) (11) (11) Adjustments for investment in unconsolidated entity 168 (430) (1,594) (1,532) (1,103) (1,121) (1,482) MFFO attributable to common stockholders 3,513 4,711 6,199 5,505 7,179 11,869 7,305 Other capitalized operating expenses (718) (643) (692) (889) (762) (709) (678) Adjustments for noncontrolling interests - consolidated entity 75 71 74 94 82 80 65 Proceeds from condemnation agreements (1) - - - - - (3,716) - Adjusted MFFO attributable to common stockholders 2,870 4,139 5,581 4,710 6,499 7,524 6,692

Distribution History1 Record Date Payment Date Amount/Share Reason 12/23/2011 12/28/2011 $0.30 Estimated increase in portfolio value, as supported by completed broker opinions of value (BOVs) 2/14/2012 2/17/2012 $0.02309337 Gain on the sale of 1 Roseville building 4/16/2012 4/30/2012 $0.025 Gain from paying off loan at a discount, disposition of Roseville land and estimated increased value in the portfolio 7/20/2012 7/31/2012 $0.35190663 Estimated increase in portfolio value, as supported by a second round of completed BOVs 3/22/2013 4/4/2013 $0.06153498 Gain from the unsolicited sale of one building in the Richardson Portfolio 11/13/2013 12/5/2013 $0.38 100% of forecasted taxable income for 2013, including gains from the sales of 2 Powers Ferry buildings, the remaining 4 Roseville buildings, and the payoff of Ponte Palmero mortgage loan 3/31/2014 4/15/2014 $0.04931507 Based on Board’s determination of available cash flow; 2.0% Annualized 6/16/2014 6/23/2014 $0.056096 Based on Board’s determination of available cash flow; 2.25% Annualized 9/15/2014 9/24/2014 $0.069315 Based on Board’s determination of available cash flow; 2.75% Annualized 12/15/2014 12/29/2014 $0.088219 Based on Board’s determination of available cash flow; 3.5% Annualized 3/20/2015 3/26/2015 $0.09246575 Based on Board’s determination of available cash flow; 3.75% Annualized 6/18/2015 6/25/2015 $0.09349315 Based on Board’s determination of available cash flow; 3.75% Annualized 9/21/2015 9/28/2015 $0.09452055 Based on Board’s determination of available cash flow; 3.75% Annualized 12/15/2015 12/22/2015 $0.09452055 Based on Board’s determination of available cash flow; 3.75% Annualized Total $1.7794801 1 Based on all distributions declared, but not yet paid as of December 8, 2015. 19

Stockholder Performance KBS Strategic Opportunity REIT is providing this estimated value per share to assist broker dealers that participated in its initial public offering in meeting their customer account statement reporting obligations. As with any valuation methodology, the methodologies used are based upon a number of estimates and assumptions that may not be accurate or complete. Different parties with different assumptions and estimates could derive a different estimated value per share. KBS Strategic Opportunity REIT can give no assurance that: a stockholder would be able to resell his or her shares at this estimated value per share; a stockholder would ultimately realize distributions per share equal to KBS Strategic Opportunity REIT's estimated value per share upon liquidation or sale of KBS Strategic Opportunity REIT; KBS Strategic Opportunity REIT's shares of common stock would trade at the estimated value per share on a national securities exchange; an independent third-party appraiser or other third-party valuation firm would agree with KBS Strategic Opportunity REIT's estimated value per share; or the methodology used to estimate KBS Strategic Opportunity REIT's value per share would be acceptable to FINRA or for compliance with ERISA reporting requirements. Further, the estimated value per share as of December 8, 2015 is based on the estimated value of KBS Strategic Opportunity REIT's assets less the estimated value of KBS Strategic Opportunity REIT's liabilities, or net asset value, divided by the number of shares outstanding as of September 30, 2015. All of KBS Strategic Opportunity REIT's assets and liabilities were valued as of September 30, 2015. 20
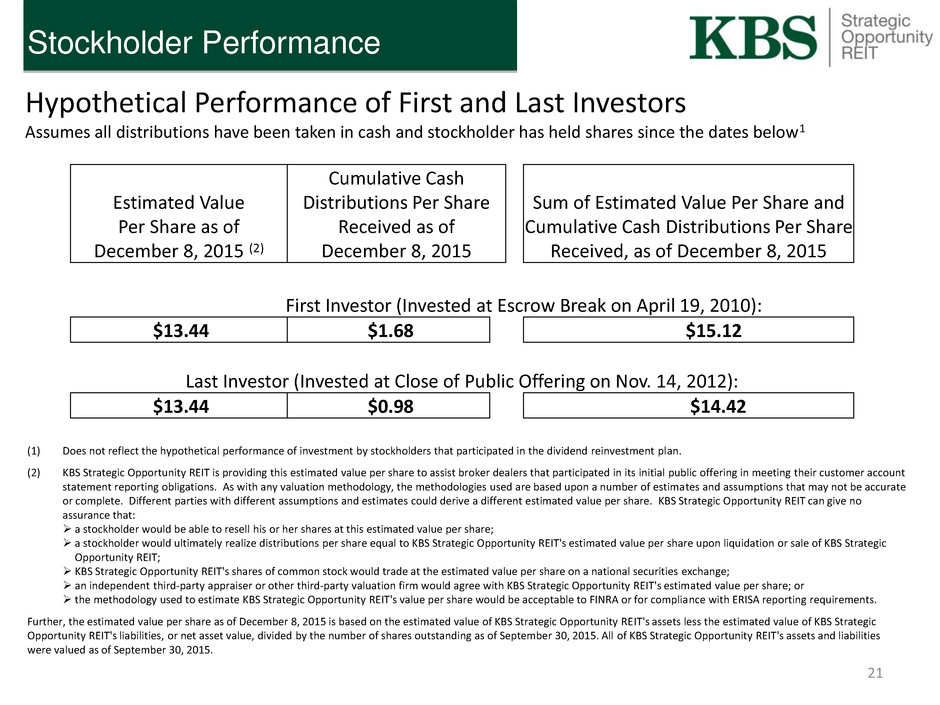
Stockholder Performance Hypothetical Performance of First and Last Investors Assumes all distributions have been taken in cash and stockholder has held shares since the dates below1 (1) Does not reflect the hypothetical performance of investment by stockholders that participated in the dividend reinvestment plan. (2) KBS Strategic Opportunity REIT is providing this estimated value per share to assist broker dealers that participated in its initial public offering in meeting their customer account statement reporting obligations. As with any valuation methodology, the methodologies used are based upon a number of estimates and assumptions that may not be accurate or complete. Different parties with different assumptions and estimates could derive a different estimated value per share. KBS Strategic Opportunity REIT can give no assurance that: a stockholder would be able to resell his or her shares at this estimated value per share; a stockholder would ultimately realize distributions per share equal to KBS Strategic Opportunity REIT's estimated value per share upon liquidation or sale of KBS Strategic Opportunity REIT; KBS Strategic Opportunity REIT's shares of common stock would trade at the estimated value per share on a national securities exchange; an independent third-party appraiser or other third-party valuation firm would agree with KBS Strategic Opportunity REIT's estimated value per share; or the methodology used to estimate KBS Strategic Opportunity REIT's value per share would be acceptable to FINRA or for compliance with ERISA reporting requirements. Further, the estimated value per share as of December 8, 2015 is based on the estimated value of KBS Strategic Opportunity REIT's assets less the estimated value of KBS Strategic Opportunity REIT's liabilities, or net asset value, divided by the number of shares outstanding as of September 30, 2015. All of KBS Strategic Opportunity REIT's assets and liabilities were valued as of September 30, 2015. Estimated Value Per Share as of December 8, 2015 (2) Cumulative Cash Distributions Per Share Received as of December 8, 2015 Sum of Estimated Value Per Share and Cumulative Cash Distributions Per Share Received, as of December 8, 2015 First Investor (Invested at Escrow Break on April 19, 2010): $13.44 $1.68 $15.12 Last Investor (Invested at Close of Public Offering on Nov. 14, 2012): $13.44 $0.98 $14.42 21
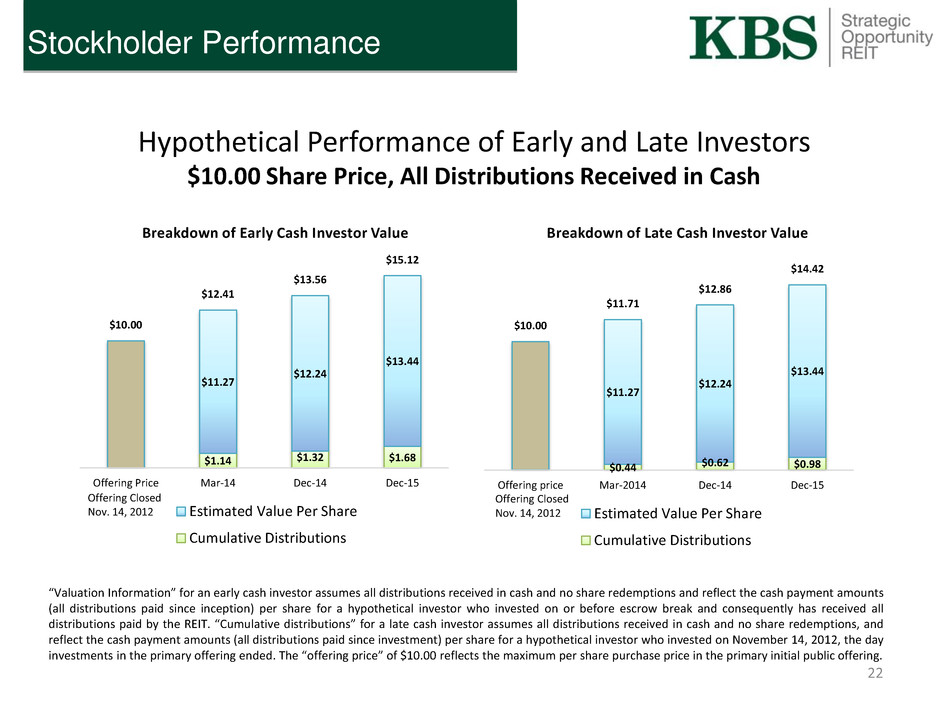
Stockholder Performance Hypothetical Performance of Early and Late Investors $10.00 Share Price, All Distributions Received in Cash “Valuation Information” for an early cash investor assumes all distributions received in cash and no share redemptions and reflect the cash payment amounts (all distributions paid since inception) per share for a hypothetical investor who invested on or before escrow break and consequently has received all distributions paid by the REIT. “Cumulative distributions” for a late cash investor assumes all distributions received in cash and no share redemptions, and reflect the cash payment amounts (all distributions paid since investment) per share for a hypothetical investor who invested on November 14, 2012, the day investments in the primary offering ended. The “offering price” of $10.00 reflects the maximum per share purchase price in the primary initial public offering. $0.44 $0.62 $0.98 $11.27 $12.24 $13.44 $10.00 $11.71 $12.86 $14.42 Offering price Mar-2014 Dec-14 Dec-15 Breakdown of Late Cash Investor Value Estimated Value Per Share Cumulative Distributions $1.14 $1.32 $1.68 $11.27 $12.24 $13.44 $10.00 $12.41 $13.56 $15.12 Offering Price Mar-14 Dec-14 Dec-15 Breakdown of Early Cash Investor Value Estimated Value Per Share Cumulative Distributions 22 Offering Closed Nov. 14, 2012 Offering Closed Nov. 14, 2012
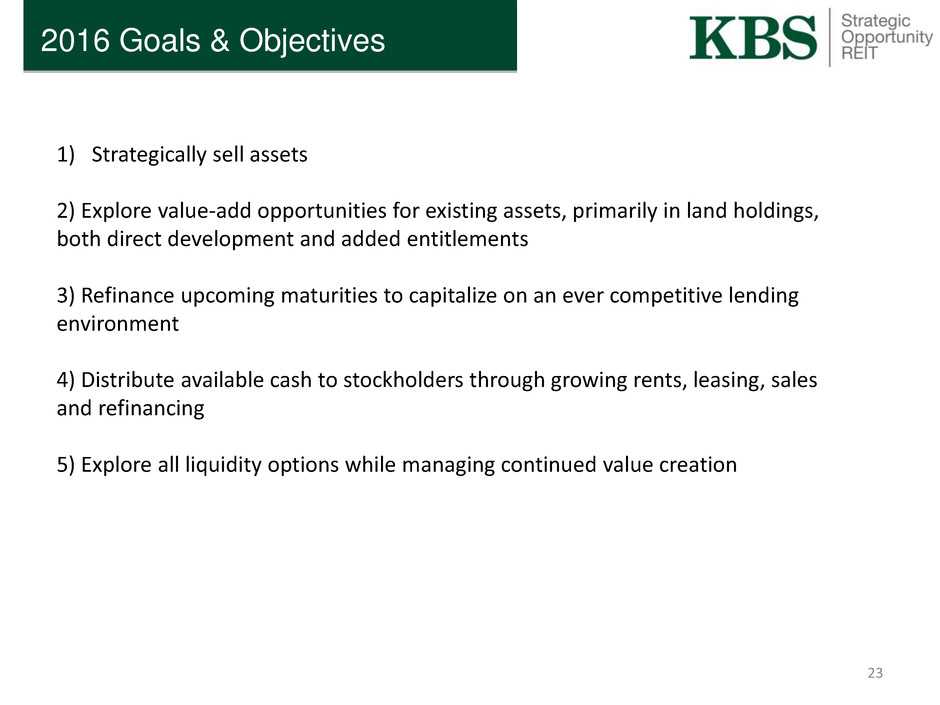
2016 Goals & Objectives 1) Strategically sell assets 2) Explore value-add opportunities for existing assets, primarily in land holdings, both direct development and added entitlements 3) Refinance upcoming maturities to capitalize on an ever competitive lending environment 4) Distribute available cash to stockholders through growing rents, leasing, sales and refinancing 5) Explore all liquidity options while managing continued value creation 23
Shareholder Communication Statements will reflect new estimated value per share of $13.44 beginning with December 2015 statements. Shareholder letter will be included with December statements mailed in early January 2016. Estimated value per share visible through DST will be updated to show new estimated value. Expected next NAV date: December 2016 24

For more information, please contact your financial advisor or KBS Capital Markets Group at (866) 527-4264. KBS Capital Markets Group Member FINRA & SIPC 800 Newport Center Drive, Suite 700 Newport Beach, CA 92660 www.kbs-cmg.com Thank you! 25


