UNITED STATES
SECURITIES AND EXCHANGE COMMISSION
Washington, D.C. 20549
FORM N-CSR
CERTIFIED SHAREHOLDER REPORT OF REGISTERED MANAGEMENT
INVESTMENT COMPANIES
Investment Company Act File Number 811-22263
Exchange Traded Concepts Trust
(Exact name of registrant as specified in charter)
10900 Hefner Pointe Drive
Suite 400
Oklahoma City, OK 73120
(Address of principal executive offices) (Zip code)
J. Garrett Stevens
Exchange Traded Concepts Trust
10900 Hefner Pointe Drive
Suite 400
Oklahoma City, OK 73120
(Name and address of agent for service)
Copy to:
Chapman and Cutler LLP
320 South Canal Street
Chicago, IL 60606
Registrant’s telephone number, including area code: 1-405-778-8377
Date of fiscal year end: April 30, 2024
Date of reporting period: April 30, 2024
| Item 1. | Reports to Stockholders. |
| (a) | A copy of the report transmitted to stockholders pursuant to Rule 30e-1 under the Investment Company Act of 1940, as amended (the “Act”) (17 CFR § 270.30e-1) is attached hereto. |
EXCHANGE TRADED CONCEPTS TRUST
ROBO Global® Healthcare Technology and Innovation ETF
ROBO Global® Robotics and Automation Index ETF
ROBO Global® Artificial Intelligence ETF
Annual Report
April 30, 2024
ROBO Global®
Healthcare Technology and Innovation ETF
Robotics and Automation Index ETF
Artificial Intelligence ETF
Table of Contents
The Funds file their complete schedule of investments with the U.S. Securities and Exchange Commission (the “Commission”) for the first and third quarters of each fiscal year as an exhibit to each Fund’s report on Form N-PORT within sixty days after the end of the period. Each Fund’s Form N-PORT reports are available on the Commission’s website at https://www.sec.gov.
Exchange Traded Concepts, LLC’s proxy voting policies and procedures are attached to each Fund’s Statement of Additional Information (the “SAI”). The SAI, as well as information relating to how each Fund voted proxies relating to each Fund’s securities during the most recent 12-month period ended June 30, is available without charge, upon request, by calling (855)-456-7626 and on the Commission’s website at https://www.sec.gov.
ROBO Global®
Healthcare Technology and Innovation ETF
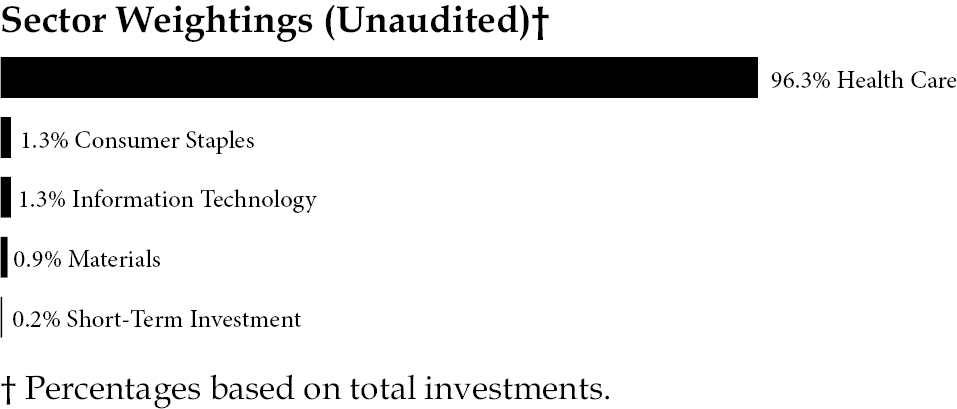
Management Discussion of Fund Performance (Unaudited)
Dear Shareholders,
On behalf of the entire team, we want to express our appreciation for the confidence you have placed in the ROBO Global® Healthcare Technology and Innovation ETF (“HTEC” or the “Fund”). The information presented in this report relates to the operations of HTEC for the fiscal year ended April 30, 2024.
The Fund seeks to track the total return performance, before fees and expenses, of the ROBO Global® Healthcare Technology and Innovation Index (the “Index”). The Index is designed to measure the performance of companies that have a portion of their business and revenue derived from the field of healthcare technology as described below and the potential to grow within this space through innovation and/or market adoption of their products and services. The Index provides investors with unique, global exposure to companies leading the healthcare technology revolution across diagnostics, robotics, genomics, precision and regenerative medicine, lab automation, instruments, data analytics and telehealth.
Despite a challenging year for the global healthcare ecosystem, with downward valuation pressure and underperformance of the healthcare sector relative to the broader market post-Covid, the Process Automation and Genomics subsectors demonstrated positive performance. However, the Medical Instruments, Precision Medicine, Diagnostics, and Telehealth subsectors were the biggest laggards and led to an overall decline for the Fund. Although 2023 saw lower-than-expected full year revenue and earnings, both are currently projected to re-accelerate in 2024.
The Fund returned negative performance during the fiscal year ended April 30, 2024. The market price for HTEC decreased 13.31% and the net asset value decreased 13.26% while the MSCI ACWI Index, a broad market index, increased 17.46% over the same period. The Fund’s Index returned -12.68%.
The Fund commenced operations on June 24, 2019, and had 2,275,001 outstanding shares as of April 30, 2024.
Thank you for your investment in HTEC.
Sincerely,
J. Garrett Stevens
Chief Executive Officer
Exchange Traded Concepts, LLC, Adviser to the Fund
1
ROBO Global®
Healthcare Technology and Innovation ETF
Management Discussion of Fund Performance (Unaudited) (Continued)
About the Index: The Fund tracks the Index, which is designed to measure the performance of companies that have a portion of their business and revenue derived from the field of healthcare technology, and the potential to grow within this space through innovation and market adoption of such companies’ products and services. The Index consists of securities of both U.S. and foreign issuers, including securities of issuers located in emerging market countries.
The Fund is designed to track, before fees and expenses, the price and yield performance of the Index. This is a rule-based index which employs specific investment criteria focused on companies that derive a portion of revenues and profits from robotics-related and/or automation-related products and/or services.
The S&P 500® Index is a market-value weighted index consisting of 500 stocks chosen for market size, liquidity, and industry group representation, with each stock’s weight in the S&P 500® Index proportionate to its market value. The MSCI ACWI Index (All Country World Index) is a free float-adjusted market capitalization weighted index that is designed to measure the equity market performance of developed and emerging markets.
This material represents an assessment of the market environment at a specific point in time and is not intended to be a forecast of future events, or a guarantee of future results. This information should not be relied upon by the reader as research or investment advice.
Growth of a $10,000 Investment
(at Net Asset Value)
| | AVERAGE ANNUAL TOTAL RETURN
FOR THE YEAR ENDED APRIL 30, 2024 |
| | | 1 Year | | Annualized Inception to Date* |
| | | Net Asset Value | | Market Price | | Net Asset Value | | Market Price |
ROBO Global® Healthcare Technology and Innovation ETF | | -13.26% | | -13.31% | | 1.61% | | 1.57% |
ROBO Global® Healthcare Technology and Innovation Index | | -12.68% | | -12.68% | | 2.29% | | 2.29% |
S&P 500® Index | | 22.66% | | 22.66% | | 13.53% | | 13.53% |
MSCI ACWI Index | | 17.46% | | 17.46% | | 9.71% | | 9.71% |
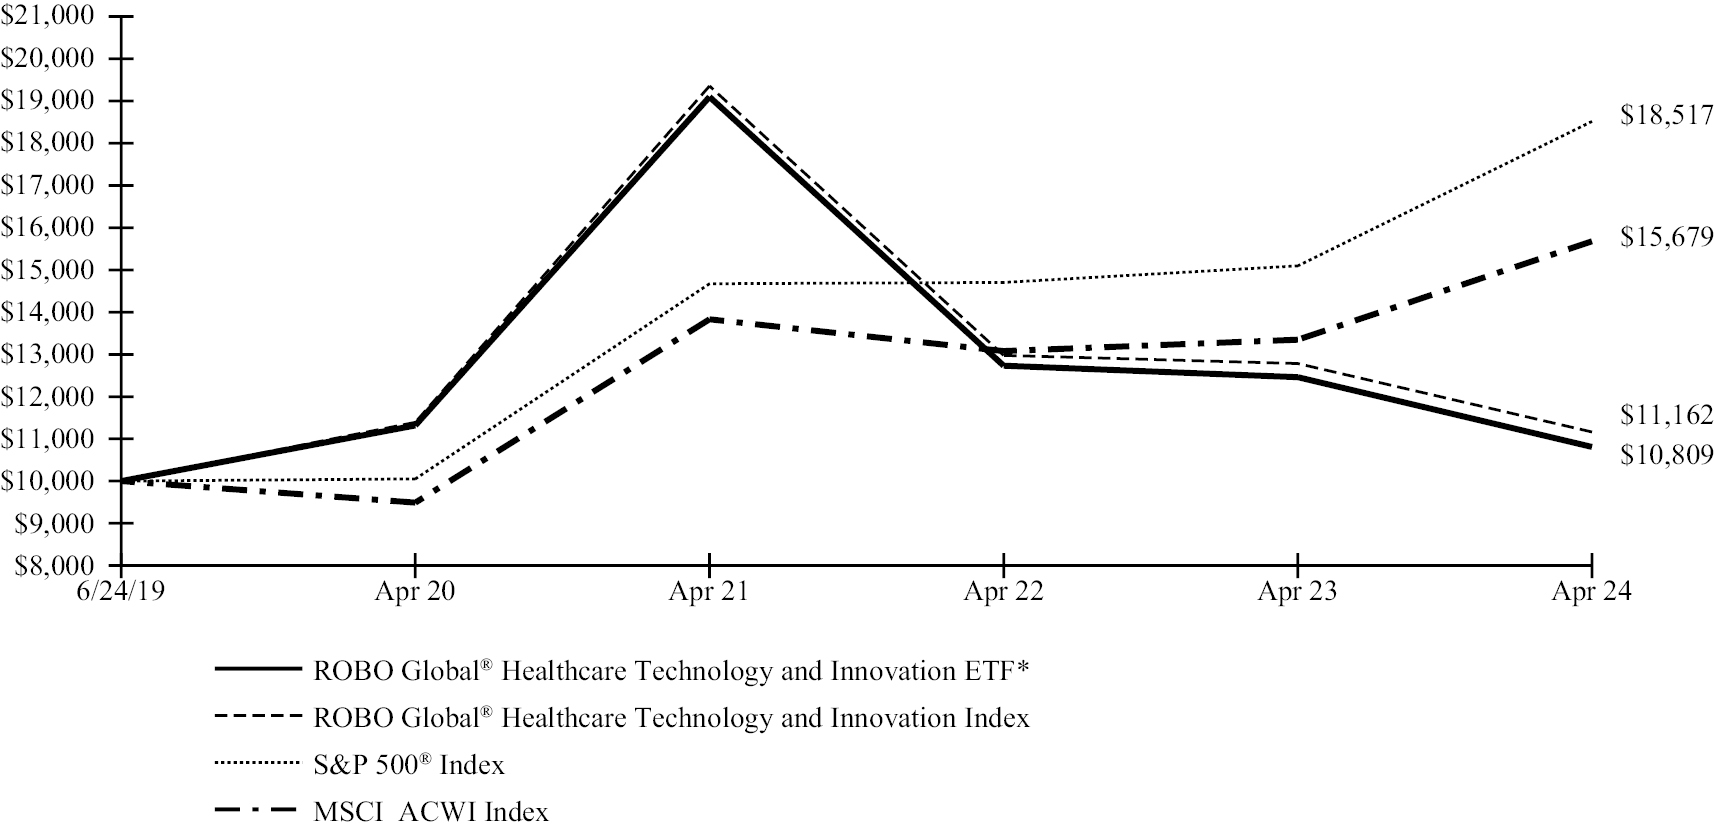
*Fund commenced operations on June 24, 2019.
2
ROBO Global®
Healthcare Technology and Innovation ETF
Management Discussion of Fund Performance (Unaudited) (Concluded)
The performance data quoted herein represents past performance and the return and value of an investment in the Fund will fluctuate so that shares, when redeemed or sold in the market, may be worth more or less than their original cost. Past performance is no guarantee of future performance and should not be considered as a representation of the future results of the Fund. The Fund’s performance assumes the reinvestment of all dividends and all capital gains. Index returns assume reinvestment of dividends and, unlike the Fund’s returns, do not reflect any fees or expenses. If such fees and expenses were included in the Index returns, the performance would have been lower. Please note that one cannot invest directly in an unmanaged index.
Investors should consider the investment objectives, risks, charges and expenses of the Fund carefully before investing. A prospectus, containing this and other information, is available at www.roboglobaletfs.com. Investors should read the prospectus carefully before investing. There are risks associated with investing, including possible loss of principal.
Current performance may be lower or higher than the performance data shown above.
Performance data current to the most recent month-end is available at www.roboglobaletfs.com.
There are no assurances that the Fund will meet its stated objective.
The Fund’s holdings and allocations are subject to change and should not be considered recommendations to buy individual securities.
Returns shown do not reflect the deduction of taxes that a shareholder would pay on Fund distributions or the redemption of Fund shares.
3
ROBO Global®
Robotics and Automation Index ETF
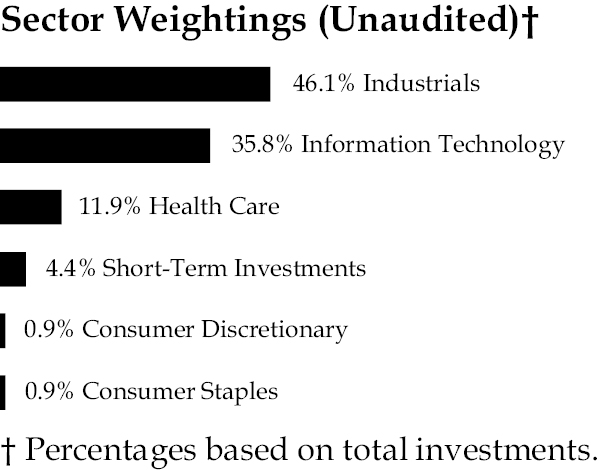
Management Discussion of Fund Performance (Unaudited)
Dear Shareholders,
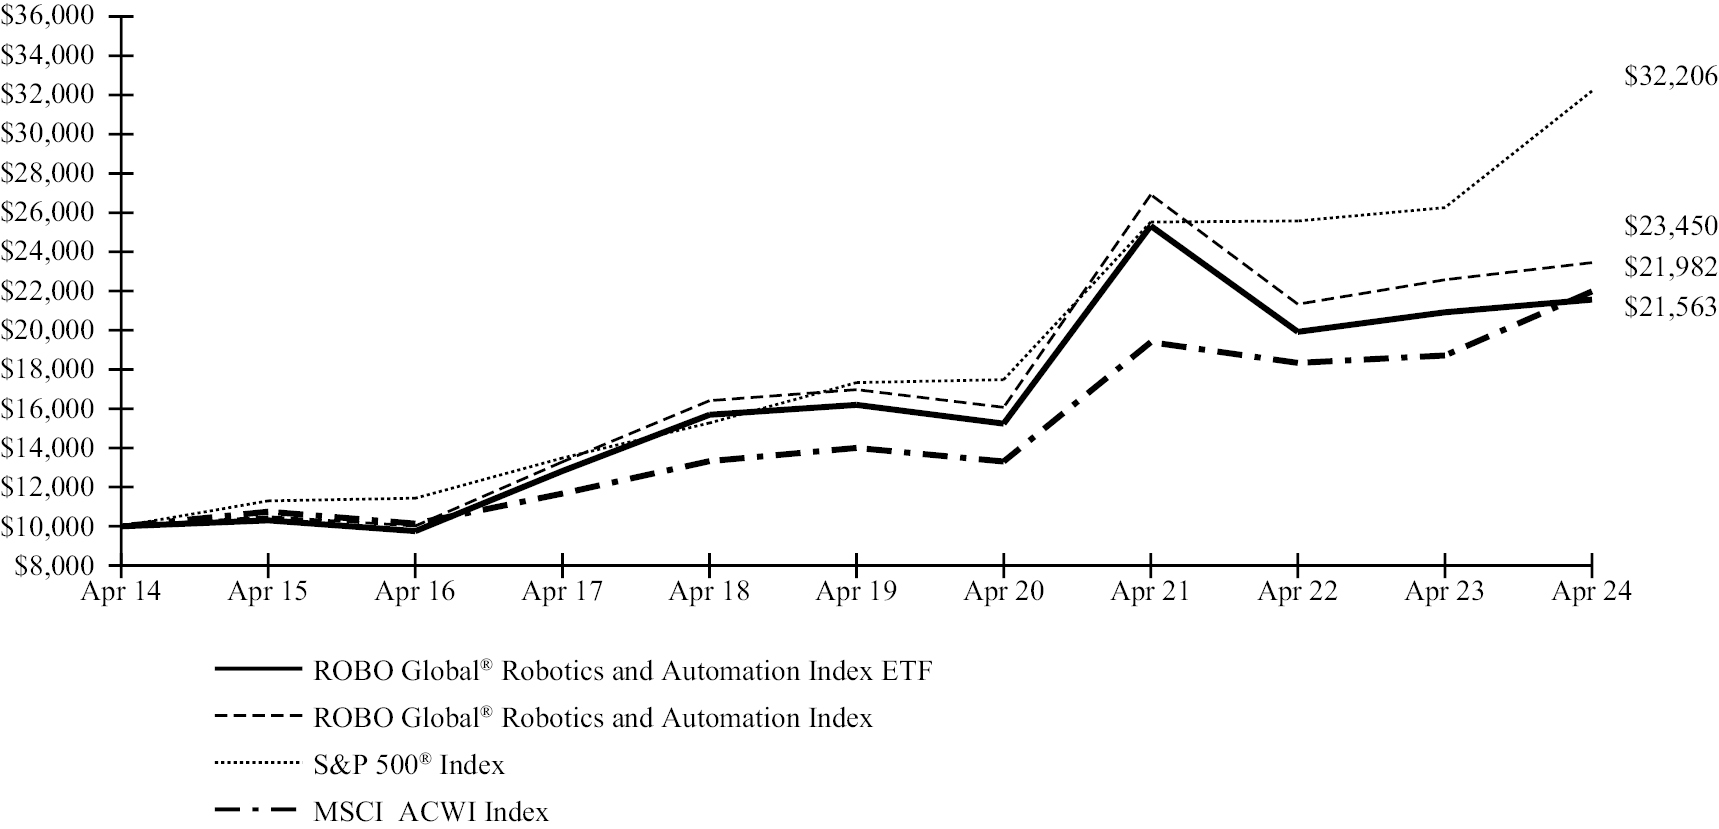
On behalf of the entire team, we want to express our appreciation for the confidence you have placed in the ROBO Global® Robotics and Automation Index ETF (“ROBO” or the “Fund”). The information presented in this report relates to the operations of ROBO for the fiscal year ended April 30, 2024.
The Fund seeks to track the total return performance, before fees and expenses, of the ROBO Global® Robotics and Automation Index (the “Index”). The Index is designed to measure the performance of robotics-related and/or automation-related companies. The Index provides investors with a comprehensive, transparent, and diversified benchmark that represents the global value chain of robotics, automation, and enabling technologies.
The Fund trailed global equities, which were bolstered by mega-cap outperformance. The robotics and automation space faced challenges due to slower-than-expected reshoring initiatives, strikes, and a stagnating Chinese economy, resulting in a cyclical decline in revenue and earnings. However, this decline appears to be bottoming out, with a recovery to growth expected in the second half of 2024. Despite the overall underperformance, the Fund experienced double-digit growth in Business Process Automation, Computing & AI, Integration, and Logistics Automation. Conversely, Actuation, Healthcare, and 3D printing sectors saw declines.
The Fund had positive performance during the fiscal year ended April 30, 2024. The market price for ROBO increased 2.04% and the net asset value increased 3.09%, while the MSCI ACWI Index, a broad market index, increased 17.46% over the same period. The Fund’s Index increased 3.87%.
The Fund commenced operations on October 21, 2013, and had 22,700,000 outstanding shares as of April 30, 2024.
Thank you for your investment in ROBO.
Sincerely,
J. Garrett Stevens
Chief Executive Officer
Exchange Traded Concepts, LLC, Adviser to the Fund
4
ROBO Global®
Robotics and Automation Index ETF
Management Discussion of Fund Performance (Unaudited) (Continued)
About the Index: The Fund tracks the Index, which is designed to measure the performance of robotics-related and/or automation-related companies. The Index consists of securities of both U.S. and foreign issuers, including securities of issuers located in emerging market countries.
The Fund is designed to track, before fees and expenses, the price and yield performance of the Index. This is a rule-based index which employs specific investment criteria focused on companies that derive a portion of revenues and profits from robotics-related and/or automation-related products and/or services.
The S&P 500® Index is a market-value weighted index consisting of 500 stocks chosen for market size, liquidity, and industry group representation, with each stock’s weight in the S&P 500® Index proportionate to its market value. The MSCI ACWI Index (All Country World Index) is a free float-adjusted market capitalization weighted index that is designed to measure the equity market performance of developed and emerging markets.
This material represents an assessment of the market environment at a specific point in time and is not intended to be a forecast of future events, or a guarantee of future results. This information should not be relied upon by the reader as research or investment advice.
Growth of a $10,000 Investment
(at Net Asset Value)
| | AVERAGE ANNUAL TOTAL RETURN
FOR THE YEAR ENDED APRIL 30, 2024 |
| | | 1 Year | | 5 Year | | 10 Year |
| | | Net Asset Value | | Market Price | | Net Asset Value | | Market Price | | Net Asset Value | | Market Price |
ROBO Global® Robotics & Automation Index ETF | | 3.09% | | 2.04% | | 5.89% | | 5.71% | | 7.99% | | 7.86% |
ROBO Global® Robotics & Automation Index | | 3.87% | | 3.87% | | 6.68% | | 6.68% | | 8.90% | | 8.90% |
S&P 500® Index | | 22.66% | | 22.66% | | 13.19% | | 13.19% | | 12.41% | | 12.41% |
MSCI ACWI Index | | 17.46% | | 17.46% | | 9.44% | | 9.44% | | 8.19% | | 8.19% |
5
ROBO Global®
Robotics and Automation Index ETF
Management Discussion of Fund Performance (Unaudited) (Concluded)
The performance data quoted herein represents past performance and the return and value of an investment in the Fund will fluctuate so that shares, when redeemed or sold in the market, may be worth more or less than their original cost. Past performance is no guarantee of future performance and should not be considered as a representation of the future results of the Fund. The Fund’s performance assumes the reinvestment of all dividends and all capital gains. Index returns assume reinvestment of dividends and, unlike the Fund’s returns, do not reflect any fees or expenses. If such fees and expenses were included in the Index returns, the performance would have been lower. Please note that one cannot invest directly in an unmanaged index.
Investors should consider the investment objectives, risks, charges and expenses of the Fund carefully before investing. A prospectus, containing this and other information, is available at www.roboglobaletfs.com. Investors should read the prospectus carefully before investing. There are risks associated with investing, including possible loss of principal.
Current performance may be lower or higher than the performance data shown above.
Performance data current to the most recent month-end is available at www.roboglobaletfs.com.
There are no assurances that the Fund will meet its stated objective.
The Fund’s holdings and allocations are subject to change and should not be considered recommendations to buy individual securities.
Returns shown do not reflect the deduction of taxes that a shareholder would pay on Fund distributions or the redemption of Fund shares.
6
ROBO Global®
Artificial Intelligence ETF
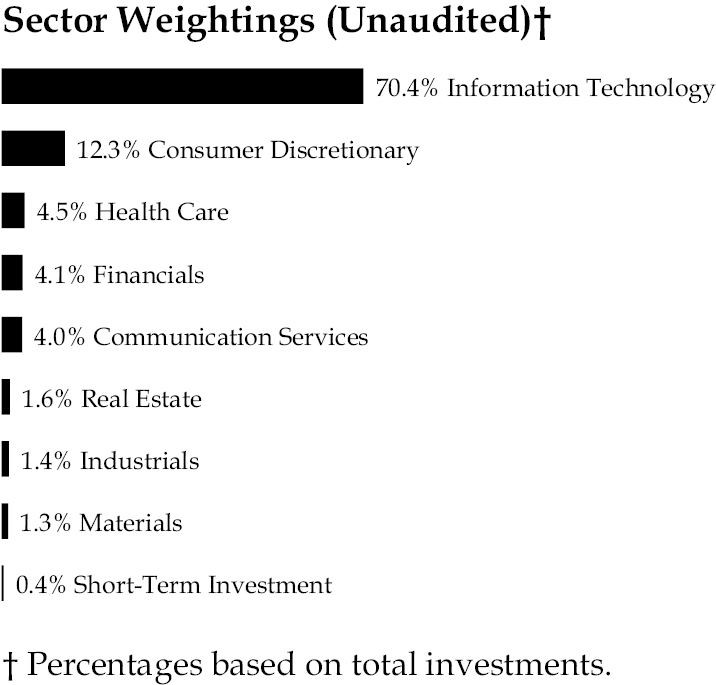
Management Discussion of Fund Performance (Unaudited)
Dear Shareholders,
On behalf of the entire team, we want to express our appreciation for the confidence you have placed in the ROBO Global® Artificial Intelligence ETF (“THNQ” or the “Fund”). The information presented in this report relates to the operations of THNQ for the fiscal year ended April 30, 2024.
The Fund seeks to track the total return performance, before fees and expenses, of the ROBO Global® Artificial Intelligence Index (the “Index”). The Index is designed to measure the performance of publicly-traded companies that have a significant portion of their revenue derived from the field of artificial intelligence (AI) and the potential to grow within this space through innovation and/or market adoption of their products and services. The Index provides investors with unique, global exposure to companies leading the healthcare technology revolution across diagnostics, robotics, genomics, precision and regenerative medicine, lab automation, instruments, data analytics and telehealth.
The AI ecosystem experienced robust demand and growth across various subsectors, making it one of the fastest-growing areas in the market. This growth extends beyond large cap technology companies, which constitute a smaller portion of the Fund’s strategy compared to its peers. The Fund benefited from strong performance in Semiconductors, Networking & Security, Business Process, and Big Data/Analytics. However, smaller subsectors like Factory Automation and Healthcare saw declines. Despite the growth, valuations across the broader AI-enabling ecosystem remain close to long-term averages and are not indicative of a bubble.
The Fund had positive performance during the fiscal year ended April 30, 2024. The market price for THNQ increased 37.56% and the net asset value increased 37.90%, while the MSCI ACWI Index, a broad market index, increased 17.46% over the same period. The Fund’s Index returned 38.19%.
The Fund commenced operations on May 8, 2020, and had 4,150,000 outstanding shares as of April 30, 2024.
Thank you for your investment in THNQ.
Sincerely,
J. Garrett Stevens
Chief Executive Officer
Exchange Traded Concepts, LLC, Adviser to the Fund
7
ROBO Global®
Artificial Intelligence ETF
Management Discussion of Fund Performance (Unaudited) (Continued)
About the Index: The Fund tracks the Index, which is designed to measure the performance of Artificial Intelligence-related companies. The Index consists of securities of both U.S. and foreign issuers, including securities of issuers located in emerging market countries.
The Fund is designed to track, before fees and expenses, the price and yield performance of the Index. This is a rule-based index which employs specific investment criteria focused on companies that derive a portion of revenues and profits from robotics-related and/or automation-related products and/or services.
The S&P 500® Index is a market-value weighted index consisting of 500 stocks chosen for market size, liquidity, and industry group representation, with each stock’s weight in the S&P 500® Index proportionate to its market value. The MSCI ACWI Index (All Country World Index) is a free float-adjusted market capitalization weighted index that is designed to measure the equity market performance of developed and emerging markets.
This material represents an assessment of the market environment at a specific point in time and is not intended to be a forecast of future events, or a guarantee of future results. This information should not be relied upon by the reader as research or investment advice.
Growth of a $10,000 Investment
(at Net Asset Value)
| | AVERAGE ANNUAL TOTAL RETURN
FOR THE YEAR ENDED APRIL 30, 2024 |
| | | 1 Year | | Annualized Inception to Date* |
| | | Net Asset Value | | Market Price | | Net Asset Value | | Market Price |
ROBO Global® Artificial Intelligence ETF | | 37.90% | | 37.56% | | 13.77% | | 13.75% |
ROBO Global® Artificial Intelligence Index | | 38.19% | | 38.19% | | 14.17% | | 14.17% |
S&P 500® Index | | 22.66% | | 22.66% | | 16.39% | | 16.39% |
MSCI ACWI Index | | 17.46% | | 17.46% | | 13.36% | | 13.36% |
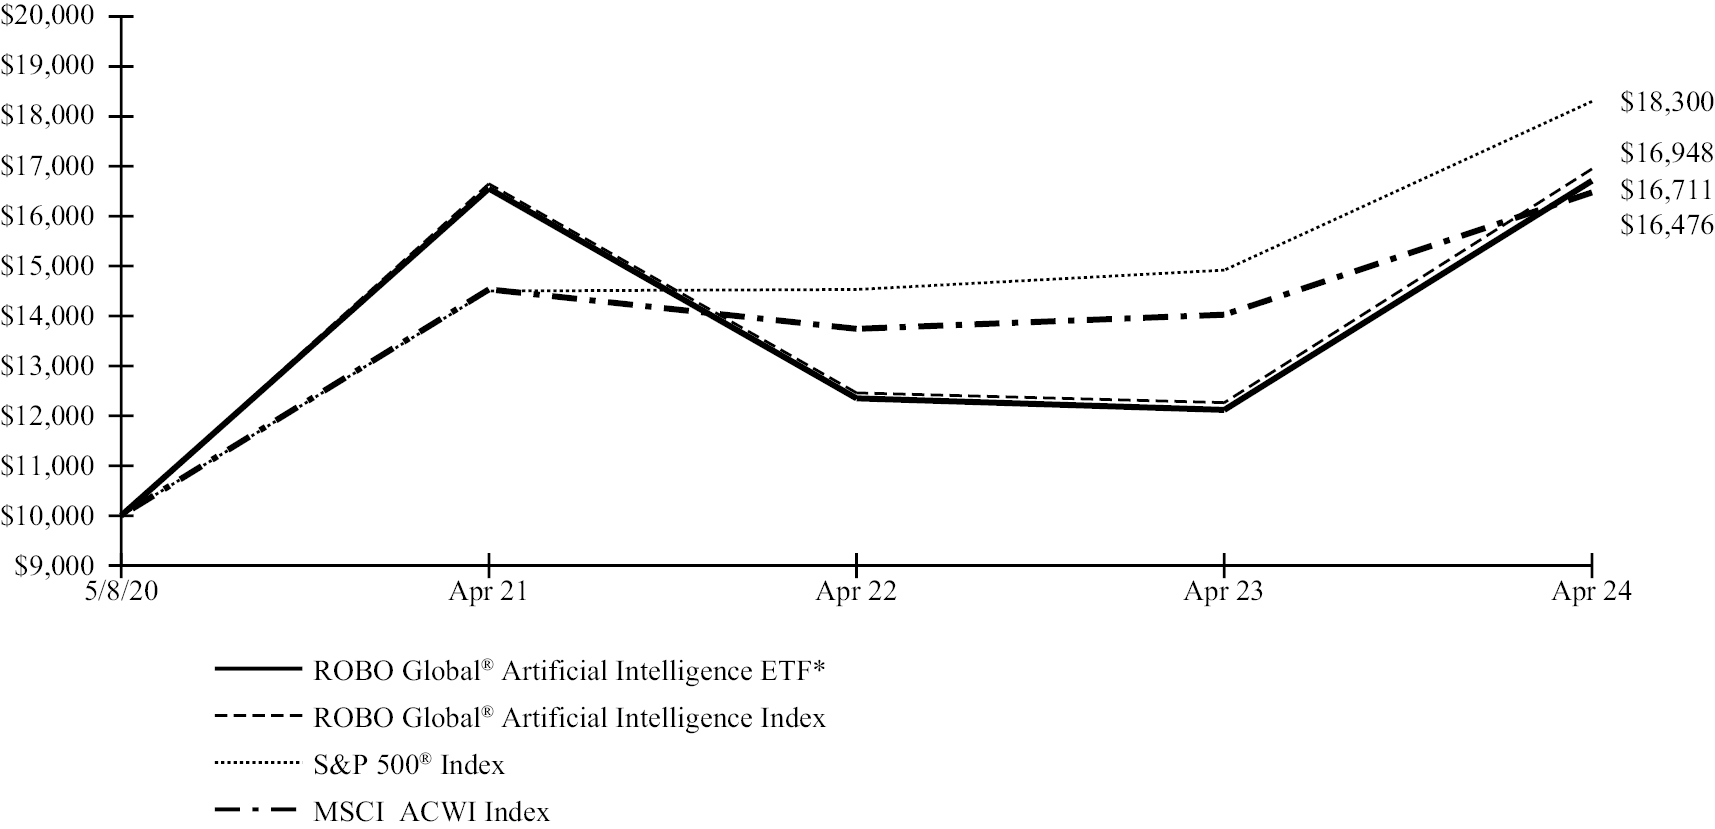
*Fund commenced operations on May 8, 2020.
8
ROBO Global®
Artificial Intelligence ETF
Management Discussion of Fund Performance (Unaudited) (Concluded)
The performance data quoted herein represents past performance and the return and value of an investment in the Fund will fluctuate so that shares, when redeemed or sold in the market, may be worth more or less than their original cost. Past performance is no guarantee of future performance and should not be considered as a representation of the future results of the Fund. The Fund’s performance assumes the reinvestment of all dividends and all capital gains. Index returns assume reinvestment of dividends and, unlike the Fund’s returns, do not reflect any fees or expenses. If such fees and expenses were included in the Index returns, the performance would have been lower. Please note that one cannot invest directly in an unmanaged index.
Investors should consider the investment objectives, risks, charges and expenses of the Fund carefully before investing. A prospectus, containing this and other information, is available at www.roboglobaletfs.com. Investors should read the prospectus carefully before investing. There are risks associated with investing, including possible loss of principal.
Current performance may be lower or higher than the performance data shown above.
Performance data current to the most recent month-end is available at www.roboglobaletfs.com.
There are no assurances that the Fund will meet its stated objective.
The Fund’s holdings and allocations are subject to change and should not be considered recommendations to buy individual securities.
Returns shown do not reflect the deduction of taxes that a shareholder would pay on Fund distributions or the redemption of Fund shares.
9
ROBO Global®
Healthcare Technology and Innovation ETF
Schedule of Investments
April 30, 2024
Description | | Shares | | Fair Value |
COMMON STOCK — 99.7% | | | | | |
China — 1.3% | | | | | |
Consumer Staples — 1.3% | | | | | |
JD Health International* | | 228,450 | | $ | 793,026 |
| | | | | | |
Germany — 1.6% | | | | | |
Health Care — 1.6% | | | | | |
Siemens Healthineers | | 17,560 | | | 978,236 |
| | | | | | |
Italy — 1.9% | | | | | |
Health Care — 1.9% | | | | | |
DiaSorin | | 11,149 | | | 1,131,792 |
| | | | | | |
Japan — 0.9% | | | | | |
Health Care — 0.9% | | | | | |
Terumo | | 33,000 | | | 564,837 |
| | | | | | |
Luxembourg — 1.7% | | | | | |
Health Care — 1.7% | | | | | |
Eurofins Scientific | | 16,102 | | | 991,708 |
| | | | | | |
Netherlands — 2.3% | | | | | |
Health Care — 2.3% | | | | | |
Koninklijke Philips* | | 51,822 | | | 1,399,127 |
| | | | | | |
Switzerland — 4.3% | | | | | |
Health Care — 4.3% | | | | | |
CRISPR Therapeutics* | | 11,979 | | | 634,767 |
Lonza Group | | 1,896 | | | 1,055,137 |
Tecan Group | | 2,537 | | | 904,540 |
| | | | | | 2,594,444 |
| | | | | | |
United Kingdom — 1.2% | | | | | |
Health Care — 1.2% | | | | | |
Smith & Nephew PLC | | 58,487 | | | 716,962 |
| | | | | | |
United States — 84.5% | | | | | |
Health Care — 82.3% | | | | | |
Abbott Laboratories | | 7,881 | | | 835,150 |
Agilent Technologies | | 6,968 | | | 954,895 |
Align Technology* | | 3,021 | | | 853,070 |
Description | | Shares | | Fair Value |
United States — continued | | | | | |
Health Care — continued | | | | | |
Alnylam Pharmaceuticals* | | 3,735 | | $ | 537,653 |
Arrowhead Pharmaceuticals* | | 29,069 | | | 657,541 |
Artivion* | | 50,348 | | | 987,828 |
Axogen* | | 106,644 | | | 683,588 |
Azenta* | | 16,939 | | | 888,620 |
Baxter International | | 16,610 | | | 670,546 |
Becton Dickinson | | 3,512 | | | 823,915 |
BioMarin Pharmaceutical* | | 9,027 | | | 729,021 |
Bio-Rad Laboratories, Cl A* | | 3,002 | | | 809,790 |
Boston Scientific* | | 16,558 | | | 1,190,023 |
Bristol-Myers Squibb | | 15,905 | | | 698,866 |
CareDx* | | 72,141 | | | 559,814 |
Catalent* | | 18,439 | | | 1,029,818 |
Charles River Laboratories International* | | 4,312 | | | 987,448 |
CONMED | | 8,912 | | | 605,838 |
Danaher | | 4,344 | | | 1,071,317 |
DexCom* | | 7,585 | | | 966,253 |
Edwards Lifesciences* | | 11,571 | | | 979,717 |
Exact Sciences* | | 14,576 | | | 865,086 |
Fulgent Genetics* | | 45,130 | | | 918,396 |
GE HealthCare Technologies | | 9,590 | | | 731,142 |
Globus Medical, Cl A* | | 12,143 | | | 604,600 |
Guardant Health* | | 55,288 | | | 995,184 |
Health Catalyst* | | 74,257 | | | 461,879 |
Hologic* | | 12,461 | | | 944,170 |
Illumina* | | 7,789 | | | 958,436 |
Incyte* | | 16,603 | | | 864,186 |
Integra LifeSciences Holdings* | | 29,776 | | | 868,566 |
Intuitive Surgical* | | 2,865 | | | 1,061,826 |
IQVIA Holdings* | | 4,132 | | | 957,674 |
iRhythm Technologies* | | 8,892 | | | 974,385 |
Masimo* | | 6,129 | | | 823,799 |
Medpace Holdings* | | 2,200 | | | 854,370 |
Moderna* | | 11,513 | | | 1,269,998 |
Natera* | | 12,751 | | | 1,184,313 |
Novocure* | | 58,930 | | | 721,303 |
Omnicell* | | 38,491 | | | 1,031,944 |
Penumbra* | | 4,624 | | | 908,477 |
Privia Health Group* | | 33,966 | | | 624,974 |
QIAGEN | | 26,238 | | | 1,110,655 |
QuidelOrtho* | | 19,906 | | | 807,188 |
Regeneron Pharmaceuticals* | | 1,067 | | | 950,334 |
Revvity | | 10,217 | | | 1,046,936 |
The accompanying notes are an integral part of the financial statements.
10
ROBO Global®
Healthcare Technology and Innovation ETF
Schedule of Investments
April 30, 2024 (Concluded)
Description | | Shares | | Fair Value |
United States — continued | | | | | |
Health Care — continued | | | | | |
Roche Holding | | 3,267 | | $ | 785,804 |
STAAR Surgical* | | 32,856 | | | 1,510,061 |
Stryker | | 3,228 | | | 1,086,222 |
Teladoc Health* | | 41,801 | | | 532,963 |
Thermo Fisher Scientific | | 1,978 | | | 1,124,928 |
Twist Bioscience* | | 22,279 | | | 695,773 |
United Therapeutics* | | 3,293 | | | 771,649 |
Veeva Systems, Cl A* | | 3,774 | | | 749,365 |
Veracyte* | | 36,338 | | | 711,135 |
Vertex Pharmaceuticals* | | 2,634 | | | 1,034,662 |
| | | | | | 49,063,094 |
| | | | | | |
Information Technology — 1.3% | | | | | |
Novanta* | | 4,845 | | | 758,243 |
| | | | | | |
Materials — 0.9% | | | | | |
Ginkgo Bioworks Holdings* | | 623,036 | | | 555,187 |
| | | | | | 50,376,524 |
| | | | | | |
Total Common Stock | | | | | |
(Cost $78,663,775) | | | | | 59,546,656 |
| | | | | | |
SHORT-TERM INVESTMENT — 0.2% | | | | | |
Invesco Government & Agency Portfolio, Institutional Class, 5.23%(A) | | 103,708 | | | 103,708 |
| | | | | | |
Total Short-Term Investment | | | | | |
(Cost $103,708) | | | | | 103,708 |
| | | | | | |
Total Investments — 99.9% | | | | | |
(Cost $78,767,483) | | | | $ | 59,650,364 |
As of April 30, 2024, all of the Fund’s investments were considered Level 1 of the fair value hierarchy, in accordance with the authoritative guidance on fair value measurements and disclosure under U.S. Generally Accepted Accounting Principles.
The accompanying notes are an integral part of the financial statements.
11
ROBO Global®
Robotics and Automation Index ETF
Schedule of Investments
April 30, 2024
Description | | Shares | | Fair Value |
COMMON STOCK — 99.9% | | | | | |
Canada — 1.4% | | | | | |
Industrials — 1.4% | | | | | |
ATS* | | 517,956 | | $ | 17,074,810 |
| | | | | | |
China — 2.6% | | | | | |
Industrials — 2.6% | | | | | |
Airtac International Group | | 536,983 | | | 19,129,669 |
Estun Automation, Cl A | | 2,024,100 | | | 4,514,150 |
Han’s Laser Technology Industry Group, Cl A | | 1,878,400 | | | 5,470,615 |
Shenzhen Inovance Technology, Cl A | | 446,047 | | | 3,664,958 |
| | | | | | 32,779,392 |
| | | | | | |
Finland — 1.5% | | | | | |
Industrials — 1.5% | | | | | |
Cargotec, Cl B | | 230,560 | | | 18,243,042 |
| | | | | | |
France — 1.2% | | | | | |
Information Technology — 1.2% | | | | | |
Dassault Systemes | | 390,953 | | | 15,479,603 |
| | | | | | |
Germany — 7.8% | | | | | |
Industrials — 6.6% | | | | | |
Duerr | | 709,278 | | | 18,277,429 |
GEA Group | | 478,106 | | | 19,375,146 |
KION Group | | 236,908 | | | 10,988,815 |
Krones(A) | | 155,915 | | | 20,605,727 |
Siemens | | 67,974 | | | 12,784,691 |
| | | | | | 82,031,808 |
| | | | | | |
Information Technology — 1.2% | | | | | |
Jenoptik | | 570,967 | | | 15,409,265 |
| | | | | | 97,441,073 |
| | | | | | |
Japan — 21.3% | | | | | |
Industrials — 16.3% | | | | | |
Daifuku(A) | | 881,500 | | | 18,272,507 |
Daihen | | 247,700 | | | 15,205,300 |
Description | | Shares | | Fair Value |
Japan — continued | | | | | |
Industrials— continued | | | | | |
FANUC | | 756,600 | | $ | 22,246,295 |
Fuji Machine Manufacturing(A) | | 1,112,300 | | | 18,787,490 |
Harmonic Drive Systems(A) | | 613,500 | | | 15,594,319 |
Mitsubishi Electric | | 972,800 | | | 17,142,150 |
Nabtesco(A) | | 958,100 | | | 15,951,590 |
Shibaura Machine(A) | | 423,500 | | | 9,540,288 |
SMC | | 32,100 | | | 17,036,774 |
THK | | 736,800 | | | 16,209,460 |
Toyota Industries | | 170,100 | | | 16,246,325 |
Yaskawa Electric | | 469,500 | | | 19,631,494 |
| | | | | | 201,863,992 |
Information Technology — 5.0% | | | | | |
Keyence | | 42,100 | | | 18,807,422 |
Omron | | 467,000 | | | 16,203,222 |
Optex Group | | 719,600 | | | 8,491,705 |
Yokogawa Electric | | 823,100 | | | 18,364,338 |
| | | | | | 61,866,687 |
| | | | | | 263,730,679 |
| | | | | | |
Norway — 1.4% | | | | | |
Industrials — 1.4% | | | | | |
AutoStore Holdings(A)* | | 11,858,951 | | | 17,133,885 |
| | | | | | |
South Korea — 1.2% | | | | | |
Information Technology — 1.2% | | | | | |
Koh Young Technology | | 1,286,101 | | | 15,214,349 |
| | | | | | |
Sweden — 2.6% | | | | | |
Health Care — 1.1% | | | | | |
Elekta, Cl B(A) | | 1,847,918 | | | 13,334,223 |
| | | | | | |
Information Technology — 1.5% | | | | | |
Hexagon, Cl B(A) | | 1,761,359 | | | 18,735,472 |
| | | | | | 32,069,695 |
| | | | | | |
Switzerland — 4.7% | | | | | |
Health Care — 1.4% | | | | | |
Tecan Group | | 47,318 | | | 16,870,726 |
| | | | | | |
Industrials — 3.3% | | | | | |
ABB | | 378,018 | | | 18,502,130 |
Kardex Holding | | 86,200 | | | 22,932,781 |
| | | | | | 41,434,911 |
| | | | | | 58,305,637 |
| | | | | | |
Taiwan — 4.8% | | | | | |
Industrials — 1.5% | | | | | |
Hiwin Technologies | | 2,628,283 | | | 18,685,815 |
The accompanying notes are an integral part of the financial statements.
12
ROBO Global®
Robotics and Automation Index ETF
Schedule of Investments
April 30, 2024 (Concluded)
Description | | Shares | | Fair Value |
Taiwan — continued | | | | | |
Information Technology — 3.3% | | | | | |
Advantech | | 1,384,264 | | $ | 16,154,423 |
Delta Electronics | | 1,463,665 | | | 14,406,506 |
Global Unichip | | 243,286 | | | 10,235,914 |
| | | | | | 40,796,843 |
| | | | | | 59,482,658 |
| | | | | | |
United Kingdom — 2.2% | | | | | |
Consumer Staples — 0.9% | | | | | |
Ocado Group(A)* | | 2,572,360 | | | 11,373,231 |
| | | | | | |
Information Technology — 1.3% | | | | | |
Renishaw | | 324,993 | | | 16,887,932 |
| | | | | | 28,261,163 |
| | | | | | |
United States — 47.2% | | | | | |
Consumer Discretionary — 1.0% | | | | | |
Aptiv* | | 171,879 | | | 12,203,409 |
| | | | | | |
Health Care — 9.9% | | | | | |
Azenta* | | 345,329 | | | 18,115,959 |
Globus Medical, Cl A* | | 253,915 | | | 12,642,428 |
Illumina* | | 145,915 | | | 17,954,841 |
Intuitive Surgical* | | 59,924 | | | 22,209,033 |
iRhythm Technologies* | | 161,200 | | | 17,664,296 |
Omnicell* | | 727,937 | | | 19,515,991 |
QIAGEN | | 384,030 | | | 16,255,990 |
| | | | | | 124,358,538 |
| | | | | | |
Industrials — 13.6% | | | | | |
3D Systems* | | 3,154,132 | | | 10,566,342 |
Deere | | 43,101 | | | 16,870,162 |
Emerson Electric | | 182,958 | | | 19,719,213 |
GXO Logistics* | | 264,434 | | | 13,131,792 |
Joby Aviation(A)* | | 2,374,902 | | | 11,993,255 |
John Bean Technologies | | 185,047 | | | 16,485,837 |
Nordson | | 72,120 | | | 18,620,663 |
Rockwell Automation | | 78,769 | | | 21,343,248 |
Schneider Electric | | 57,652 | | | 13,259,781 |
Stratasys* | | 1,438,751 | | | 13,984,660 |
Symbotic, Cl A(A)* | | 380,039 | | | 14,658,104 |
| | | | | | 170,633,057 |
| | | | | | |
Information Technology — 22.7% | | | | | |
Ambarella* | | 348,211 | | | 16,007,260 |
Autodesk* | | 56,733 | | | 12,075,619 |
Cadence Design Systems* | | 53,688 | | | 14,798,023 |
Cognex | | 427,893 | | | 17,774,675 |
IPG Photonics* | | 247,425 | | | 20,778,752 |
Description | | Shares | | Fair Value |
United States — continued | | | | | |
Information Technology — continued | | | | | |
Manhattan Associates* | | 69,643 | | $ | 14,350,637 |
Microchip Technology | | 164,388 | | | 15,120,408 |
Novanta* | | 125,127 | | | 19,582,375 |
NVIDIA | | 22,468 | | | 19,412,801 |
PTC* | | 90,790 | | | 16,109,778 |
QUALCOMM | | 95,013 | | | 15,757,906 |
Samsara, Cl A* | | 510,934 | | | 17,846,925 |
ServiceNow* | | 28,057 | | | 19,452,760 |
Teradyne | | 203,745 | | | 23,699,618 |
Trimble Navigation* | | 248,506 | | | 14,927,755 |
Zebra Technologies, Cl A* | | 77,362 | | | 24,334,991 |
| | | | | | 282,030,283 |
| | | | | | 589,225,287 |
| | | | | | |
Total Common Stock | | | | | |
(Cost $1,173,942,324) | | | | | 1,244,441,273 |
| | | | | | |
SHORT-TERM INVESTMENT — 4.6% | | | | | |
Dreyfus Institutional Preferred Government Plus Money Market Fund, Institutional Shares, 5.27%(B)(C) | | 57,387,637 | | | 57,387,637 |
| | | | | | |
Total Short-Term Investment | | | | | |
(Cost $57,387,637) | | | | | 57,387,637 |
| | | | | | |
Total Investments – 104.5% | | | | | |
(Cost $1,231,329,961) | | | | $ | 1,301,828,910 |
As of April 30, 2024, all of the Fund’s investments were considered Level 1 of the fair value hierarchy, in accordance with the authoritative guidance on fair value measurements and disclosure under U.S. Generally Accepted Accounting Principles.
The accompanying notes are an integral part of the financial statements.
13
ROBO Global®
Artificial Intelligence ETF
Schedule of Investments
April 30, 2024
Description | | Shares | | Fair Value |
COMMON STOCK — 99.6% | | | | | |
Brazil — 1.5% | | | | | |
Consumer Discretionary — 1.5% | | | | | |
MercadoLibre* | | 1,818 | | $ | 2,651,917 |
| | | | | | |
Canada — 1.8% | | | | | |
Information Technology — 1.8% | | | | | |
Shopify, Cl A* | | 43,386 | | | 3,045,697 |
| | | | | | |
China — 4.0% | | | | | |
Consumer Discretionary — 4.0% | | | | | |
Alibaba Group Holding ADR | | 50,239 | | | 3,760,389 |
JD.com ADR | | 109,285 | | | 3,157,244 |
| | | | | | 6,917,633 |
| | | | | | |
France — 1.4% | | | | | |
Information Technology — 1.4% | | | | | |
Dassault Systemes | | 63,438 | | | 2,511,798 |
| | | | | | |
Germany — 1.5% | | | | | |
Information Technology — 1.5% | | | | | |
Infineon Technologies | | 72,886 | | | 2,549,993 |
| | | | | | |
Israel — 2.8% | | | | | |
Information Technology — 2.8% | | | | | |
JFrog* | | 70,986 | | | 2,830,922 |
Nice ADR* | | 9,416 | | | 2,104,570 |
| | | | | | 4,935,492 |
| | | | | | |
Netherlands — 1.9% | | | | | |
Information Technology — 1.9% | | | | | |
ASML Holding, Cl G | | 3,779 | | | 3,297,064 |
Description | | Shares | | Fair Value |
Taiwan — 5.0% | | | | | |
Information Technology — 5.0% | | | | | |
Global Unichip | | 69,057 | | $ | 2,905,475 |
MediaTek | | 82,892 | | | 2,525,301 |
Taiwan Semiconductor Manufacturing | | 132,939 | | | 3,225,288 |
| | | | | | 8,656,064 |
| | | | | | |
United Kingdom — 2.5% | | | | | |
Information Technology — 2.5% | | | | | |
Darktrace* | | 569,239 | | | 4,293,723 |
| | | | | | |
United States — 77.2% | | | | | |
Communication Services — 3.9% | | | | | |
Alphabet, Cl A | | 27,023 | | | 4,398,804 |
Spotify Technology* | | 8,720 | | | 2,445,437 |
| | | | | | 6,844,241 |
| | | | | | |
Consumer Discretionary — 6.8% | | | | | |
Amazon.com* | | 19,123 | | | 3,346,525 |
Booking Holdings | | 764 | | | 2,637,351 |
Etsy* | | 43,936 | | | 3,017,085 |
Tesla* | | 15,554 | | | 2,850,737 |
| | | | | | 11,851,698 |
| | | | | | |
Financials — 4.1% | | | | | |
Block, Cl A* | | 31,717 | | | 2,315,341 |
Fiserv* | | 14,731 | | | 2,248,982 |
Lemonade* | | 151,075 | | | 2,603,022 |
| | | | | | 7,167,345 |
| | | | | | |
Health Care — 4.5% | | | | | |
Illumina* | | 22,134 | | | 2,723,589 |
Veeva Systems, Cl A* | | 14,967 | | | 2,971,848 |
Veracyte* | | 110,058 | | | 2,153,835 |
| | | | | | 7,849,272 |
| | | | | | |
Industrials — 1.4% | | | | | |
Verisk Analytics, Cl A | | 11,102 | | | 2,419,792 |
| | | | | | |
Information Technology — 53.6% | | | | | |
Accenture PLC, Cl A | | 6,821 | | | 2,052,507 |
Adobe* | | 4,250 | | | 1,967,028 |
Advanced Micro Devices* | | 20,180 | | | 3,196,108 |
Ambarella* | | 69,313 | | | 3,186,319 |
Analog Devices | | 20,411 | | | 4,094,651 |
Arista Networks* | | 12,433 | | | 3,189,810 |
Autodesk* | | 14,321 | | | 3,048,225 |
C3.ai, Cl A* | | 74,822 | | | 1,685,740 |
Cloudflare, Cl A* | | 40,077 | | | 3,502,730 |
The accompanying notes are an integral part of the financial statements.
14
ROBO Global®
Artificial Intelligence ETF
Schedule of Investments
April 30, 2024 (Concluded)
Description | | Shares | | Fair Value |
United States — continued | | | | | |
Information Technology— continued | | | | | |
Cognex | | 87,708 | | $ | 3,643,390 |
Crowdstrike Holdings, Cl A* | | 11,645 | | | 3,406,628 |
Datadog, Cl A* | | 23,551 | | | 2,955,651 |
Fair Isaac* | | 2,563 | | | 2,904,725 |
HubSpot* | | 5,305 | | | 3,208,835 |
International Business Machines | | 16,522 | | | 2,745,956 |
Intuit | | 3,577 | | | 2,237,843 |
Lam Research | | 3,599 | | | 3,218,982 |
Microsoft | | 10,250 | | | 3,990,633 |
MongoDB, Cl A* | | 7,215 | | | 2,634,774 |
NVIDIA | | 5,177 | | | 4,473,031 |
Palo Alto Networks* | | 13,806 | | | 4,016,026 |
Pure Storage, Cl A* | | 66,214 | | | 3,337,186 |
QUALCOMM | | 19,065 | | | 3,161,930 |
Rapid7* | | 65,431 | | | 2,931,309 |
Salesforce | | 9,543 | | | 2,566,494 |
Samsara, Cl A* | | 109,582 | | | 3,827,699 |
ServiceNow* | | 4,845 | | | 3,359,184 |
Snowflake, Cl A* | | 16,881 | | | 2,619,931 |
Teradyne | | 27,762 | | | 3,229,276 |
Varonis Systems, Cl B* | | 57,513 | | | 2,516,194 |
| | | | | | 92,908,795 |
| | | | | | |
Materials — 1.3% | | | | | |
Ginkgo Bioworks Holdings* | | 2,542,982 | | | 2,266,051 |
| | | | | | |
Real Estate — 1.6% | | | | | |
CoStar Group* | | 29,923 | | | 2,738,852 |
| | | | | | 134,046,046 |
| | | | | | |
Total Common Stock | | | | | |
(Cost $160,236,645) | | | | | 172,905,427 |
| | | | | | |
SHORT-TERM INVESTMENT — 0.4% | | | | | |
Invesco Government & Agency Portfolio, Institutional Class, 5.23%(A) | | 699,072 | | | 699,072 |
| | | | | | |
Total Short-Term Investment | | | | | |
(Cost $699,072) | | | | | 699,072 |
| | | | | | |
Total Investments — 100.0% | | | | | |
(Cost $160,935,717) | | | | $ | 173,604,499 |
As of April 30, 2024, all of the Fund’s investments were considered Level 1 of the fair value hierarchy, in accordance with the authoritative guidance on fair value measurements and disclosure under U.S. Generally Accepted Accounting Principles.
The accompanying notes are an integral part of the financial statements.
15
ROBO Global®
Statements of Assets and Liabilities
April 30, 2024
| | ROBO Global®
Healthcare
Technology and
Innovation ETF | | ROBO Global®
Robotics and
Automation
Index ETF | | ROBO Global®
Artificial
Intelligence ETF |
Assets: | | | | | | | | | | | |
Investments, at Cost | | $ | 78,767,483 | | | $ | 1,231,329,961 | | | $ | 160,935,717 |
Investments at Fair Value * | | $ | 59,650,364 | | | $ | 1,301,828,910 | | | $ | 173,604,499 |
Reclaims Receivable | | | 53,502 | | | | 2,173,926 | | | | 5,072 |
Dividends Receivable | | | 30,171 | | | | 2,106,823 | | | | 15,499 |
Receivable for Investment Securities Sold | | | — | | | | 2,593,009 | | | | — |
Securities Lending Income Receivable | | | — | | | | 18,670 | | | | — |
Total Assets | | | 59,734,037 | | | | 1,308,721,338 | | | | 173,625,070 |
| | | | | | | | | | | | |
Liabilities: | | | | | | | | | | | |
Payable Upon Return on Securities Loaned | | | — | | | | 57,387,637 | | | | — |
Payable for Capital Shares Redeemed | | | — | | | | 2,744,461 | | | | — |
Payable to Custodian – Overdraft | | | — | | | | 1,619,019 | | | | — |
Advisory Fees Payable | | | 34,140 | | | | 992,536 | | | | 97,463 |
Total Liabilities | | | 34,140 | | | | 62,743,653 | | | | 97,463 |
| | | | | | | | | | | | |
Net Assets | | $ | 59,699,897 | | | $ | 1,245,977,685 | | | $ | 173,527,607 |
| | | | | | | | | | | | |
Net Assets Consist of: | | | | | | | | | | | |
Paid-in Capital | | $ | 162,350,122 | | | $ | 1,542,618,858 | | | $ | 173,509,166 |
Total Distributable Earnings (Accumulated Losses) | | | (102,650,225 | ) | | | (296,641,173 | ) | | | 18,441 |
Net Assets | | $ | 59,699,897 | | | $ | 1,245,977,685 | | | $ | 173,527,607 |
| | | | | | | | | | | | |
Outstanding Shares of Beneficial Interest (unlimited authorization – no par value) | | | 2,275,001 | | | | 22,700,000 | | | | 4,150,000 |
Net Asset Value, Offering and Redemption Price Per Share | | $ | 26.24 | | | $ | 54.89 | | | $ | 41.81 |
* Includes Value of Securities on Loan | | $ | — | | | $ | 89,431,134 | | | | — |
The accompanying notes are an integral part of the financial statements.
16
ROBO Global®
Statements of Operations
For the Year Ended April 30, 2024
| | ROBO Global®
Healthcare
Technology and
Innovation ETF | | ROBO Global®
Robotics and
Automation
Index ETF | | ROBO Global®
Artificial
Intelligence ETF |
Investment Income: | | | | | | | | | | | | |
Dividend Income | | $ | 383,285 | | | $ | 13,732,042 | | | $ | 541,852 | |
Income from Securities Lending, Net | | | — | | | | 1,551,309 | | | | — | |
Less: Foreign Taxes Withheld | | | (22,107 | ) | | | (1,357,074 | ) | | | (35,276 | ) |
Total Investment Income | | | 361,178 | | | | 13,926,277 | | | | 506,576 | |
| | | | | | | | | | | | | |
Expenses: | | | | | | | | | | | | |
Advisory Fees | | | 598,576 | | | | 12,867,233 | | | | 747,642 | |
Total Expenses | | | 598,576 | | | | 12,867,233 | | | | 747,642 | |
| | | | | | | | | | | | | |
Less: | | | | | | | | | | | | |
Waiver of Advisory Fees | | | (89,677 | ) | | | — | | | | (69,739 | ) |
Net Expenses | | | 508,899 | | | | 12,867,233 | | | | 677,903 | |
Net Investment Income (Loss) | | | (147,721 | ) | | | 1,059,044 | | | | (171,327 | ) |
| | | | | | | | | | | | | |
Net Realized Gain (Loss) on: | | | | | | | | | | | | |
Investments(1) | | | (23,281,222 | ) | | | (6,830,603 | ) | | | 5,068,631 | |
Foreign Currency Transactions | | | (4,614 | ) | | | (408,444 | ) | | | (16,591 | ) |
Net Realized Gain (Loss) | | | (23,285,836 | ) | | | (7,239,047 | ) | | | 5,052,040 | |
| | | | | | | | | | | | | |
Net Change in Unrealized Appreciation (Depreciation) on: | | | | | | | | | | | | |
Investments | | | 11,052,757 | | | | 43,921,079 | | | | 16,796,615 | |
Foreign Currency Translations | | | (2,085 | ) | | | (70,878 | ) | | | (62 | ) |
Net Unrealized Appreciation (Depreciation) | | | 11,050,672 | | | | 43,850,201 | | | | 16,796,553 | |
Net Realized and Unrealized Gain (Loss) | | | (12,235,164 | ) | | | 36,611,154 | | | | 21,848,593 | |
Net Increase (Decrease) in Net Assets Resulting from Operations | | $ | (12,382,885 | ) | | $ | 37,670,198 | | | $ | 21,677,266 | |
The accompanying notes are an integral part of the financial statements.
17
ROBO Global®
Statements of Changes in Net Assets
| | ROBO Global® Healthcare
Technology and Innovation ETF | | ROBO Global® Robotics and
Automation Index ETF |
| | | Year Ended
April 30, 2024 | | Year Ended
April 30, 2023 | | Year Ended
April 30, 2024 | | Year Ended
April 30, 2023 |
Operations: | | | | | | | | | | | | | | | | |
Net Investment Income (Loss) | | $ | (147,721 | ) | | $ | (395,444 | ) | | $ | 1,059,044 | | | $ | 785,492 | |
Net Realized Gain (Loss)(1) | | | (23,285,836 | ) | | | (39,315,994 | ) | | | (7,239,047 | ) | | | (60,974,299 | ) |
Net Change in Unrealized Appreciation (Depreciation) | | | 11,050,672 | | | | 36,019,304 | | | | 43,850,201 | | | | 109,510,266 | |
Net Increase (Decrease) in Net Assets Resulting from Operations | | | (12,382,885 | ) | | | (3,692,134 | ) | | | 37,670,198 | | | | 49,321,459 | |
Distributions: | | | — | | | | — | | | | (684,846 | ) | | | — | |
| | | | | | | | | | | | | | | | | |
Capital Share Transactions: | | | | | | | | | | | | | | | | |
Issued | | | — | | | | 11,962,884 | | | | 112,374,880 | | | | 87,610,761 | |
Redeemed | | | (26,217,033 | ) | | | (39,804,429 | ) | | | (241,682,762 | ) | | | (188,745,861 | ) |
Increase (Decrease) in Net Assets from Capital Share Transactions | | | (26,217,033 | ) | | | (27,841,545 | ) | | | (129,307,882 | ) | | | (101,135,100 | ) |
Total Increase (Decrease) in Net Assets | | | (38,599,918 | ) | | | (31,533,679 | ) | | | (92,322,530 | ) | | | (51,813,641 | ) |
| | | | | | | | | | | | | | | | | |
Net Assets: | | | | | | | | | | | | | | | | |
Beginning of Year | | | 98,299,815 | | | | 129,833,494 | | | | 1,338,300,215 | | | | 1,390,113,856 | |
End of Year | | $ | 59,699,897 | | | $ | 98,299,815 | | | $ | 1,245,977,685 | | | $ | 1,338,300,215 | |
| | | | | | | | | | | | | | | | | |
Share Transactions: | | | | | | | | | | | | | | | | |
Issued | | | — | | | | 400,000 | | | | 2,000,000 | | | | 1,675,000 | |
Redeemed | | | (975,000 | ) | | | (1,350,000 | ) | | | (4,425,000 | ) | | | (3,950,000 | ) |
Net Increase (Decrease) in Shares Outstanding from Share Transactions | | | (975,000) | | | | (950,000) | | | | (2,425,000) | | | | (2,275,000) | |
The accompanying notes are an integral part of the financial statements.
18
ROBO Global®
Statements of Changes in Net Assets
| | ROBO Global® Artificial
Intelligence ETF |
| | | Year Ended
April 30, 2024 | | Year Ended
April 30, 2023 |
Operations: | | | | | | | | |
Net Investment Income (Loss) | | $ | (171,327 | ) | | $ | (43,218 | ) |
Net Realized Gain (Loss)(1) | | | 5,052,040 | | | | (7,175,050 | ) |
Net Change in Unrealized Appreciation (Depreciation) | | | 16,796,553 | | | | 6,232,746 | |
Net Increase (Decrease) in Net Assets Resulting from Operations | | | 21,677,266 | | | | (985,522 | ) |
| | | | | | | | | |
Capital Share Transactions: | | | | | | | | |
Issued | | | 155,540,574 | | | | 3,089,368 | |
Redeemed | | | (28,705,175 | ) | | | (6,441,946 | ) |
Increase (Decrease) in Net Assets from Capital Share Transactions | | | 126,835,399 | | | | (3,352,578 | ) |
Total Increase (Decrease) in Net Assets | | | 148,512,665 | | | | (4,338,100 | ) |
| | | | | | | | | |
Net Assets: | | | | | | | | |
Beginning of Year | | | 25,014,942 | | | | 29,353,042 | |
End of Year | | $ | 173,527,607 | | | $ | 25,014,942 | |
| | | | | | | | | |
Share Transactions: | | | | | | | | |
Issued | | | 4,025,000 | | | | 100,000 | |
Redeemed | | | (700,000 | ) | | | (225,000 | ) |
Net Increase (Decrease) in Shares Outstanding from Share Transactions | | | 3,325,000 | | | | (125,000 | ) |
The accompanying notes are an integral part of the financial statements.
19
ROBO Global®
Healthcare Technology and Innovation ETF
Financial Highlights
Selected Per Share Data & Ratios
For a Share Outstanding Throughout the Year/Period
| | Years Ended April 30, | | Period Ended
April 30, 2020† |
| | | 2024 | | 2023 | | 2022 | | 2021 | |
Net Asset Value, beginning of year/period | | $ | 30.25 | | | $ | 30.91 | | | $ | 46.39 | | | $ | 27.49 | | | $ | 24.29 | |
Investment Activities | | | | | | | | | | | | | | | | | | | | |
Net investment income (loss)* | | | (0.05 | ) | | | (0.11 | ) | | | (0.18 | ) | | | (0.15 | ) | | | (0.07 | ) |
Net realized and unrealized gain (loss) | | | (3.96 | ) | | | (0.55 | ) | | | (15.28 | ) | | | 19.05 | | | | 3.27 | |
Total from investment activities | | | (4.01 | ) | | | (0.66 | ) | | | (15.46 | ) | | | 18.90 | | | | 3.20 | |
Distributions to shareholders from: | | | | | | | | | | | | | | | | | | | | |
Net realized capital gains | | | — | | | | — | | | | (0.02 | ) | | | — | | | | — | |
Total distributions | | | — | | | | — | | | | (0.02 | ) | | | — | | | | — | |
Net Asset Value, end of year/period | | $ | 26.24 | | | $ | 30.25 | | | $ | 30.91 | | | $ | 46.39 | | | $ | 27.49 | |
Net Asset Value, Total Return (%)(1) | | | (13.26 | ) | | | (2.14 | ) | | | (33.33 | ) | | | 68.75 | | | | 13.17 | |
Ratios to Average Net Assets | | | | | | | | | | | | | | | | | | | | |
Expenses (%) | | | 0.68 | | | | 0.68 | | | | 0.68 | | | | 0.68 | | | | 0.68 | (2) |
Expenses excluding waivers (%) | | | 0.80 | | | | 0.80 | | | | 0.80 | | | | 0.80 | | | | 0.80 | (2) |
Net investment income (loss) (%) | | | (0.20 | ) | | | (0.36 | ) | | | (0.42 | ) | | | (0.36 | ) | | | (0.32 | )(2) |
Supplemental Data | | | | | | | | | | | | | | | | | | | | |
Net Assets end of year/period (000) | | $ | 59,700 | | | $ | 98,300 | | | $ | 129,833 | | | $ | 218,013 | | | $ | 13,747 | |
Portfolio turnover(%)(3) | | | 39 | | | | 39 | | | | 38 | | | | 28 | | | | 20 | |
The accompanying notes are an integral part of the financial statements.
20
ROBO Global®
Robotics and Automation Index ETF
Financial Highlights
Selected Per Share Data & Ratios
For a Share Outstanding Throughout the Year
| | Years Ended April 30, |
| | | 2024 | | 2023 | | 2022 | | 2021 | | 2020 |
Net Asset Value, beginning of year | | $ | 53.27 | | | $ | 50.73 | | $ | 64.61 | | | $ | 38.95 | | | $ | 41.55 | |
Investment Activities | | | | | | | | | | | | | | | | | | | |
Net investment income (loss)* | | | 0.04 | | | | 0.03 | | | (0.09 | ) | | | 0.10 | | | | 0.09 | |
Net realized and unrealized gain (loss) | | | 1.61 | | | | 2.51 | | | (13.67 | ) | | | 25.68 | | | | (2.53 | ) |
Total from investment activities | | | 1.65 | | | | 2.54 | | | (13.76 | ) | | | 25.78 | | | | (2.44 | ) |
Distributions to shareholders from: | | | | | | | | | | | | | | | | | | | |
Net investment income | | | (0.03 | ) | | | — | | | (0.12 | ) | | | (0.12 | ) | | | (0.16 | ) |
Total distributions | | | (0.03 | ) | | | — | | | (0.12 | ) | | | (0.12 | ) | | | (0.16 | ) |
Net Asset Value, end of year | | $ | 54.89 | | | $ | 53.27 | | $ | 50.73 | | | $ | 64.61 | | | $ | 38.95 | |
Net Asset Value, Total Return (%)(1) | | | 3.09 | | | | 5.01 | | | (21.35 | ) | | | 66.21 | | | | (5.91 | ) |
Ratios to Average Net Assets | | | | | | | | | | | | | | | | | | | |
Expenses (%) | | | 0.95 | | | | 0.95 | | | 0.95 | | | | 0.95 | | | | 0.95 | |
Net investment income (loss) (%) | | | 0.08 | | | | 0.06 | | | (0.14 | ) | | | 0.19 | | | | 0.22 | |
Supplemental Data | | | | | | | | | | | | | | | | | | | |
Net Assets end of year (000) | | $ | 1,245,978 | | | $ | 1,338,300 | | $ | 1,390,114 | | | $ | 1,886,545 | | | $ | 1,063,451 | |
Portfolio turnover(%)(2) | | | 26 | | | | 24 | | | 26 | | | | 29 | | | | 25 | |
The accompanying notes are an integral part of the financial statements.
21
ROBO Global®
Artificial Intelligence ETF
Financial Highlights
Selected Per Share Data & Ratios
For a Share Outstanding Throughout the Year/Period
| | Years Ended April 30, | | Period Ended
April 30, 2021† |
| | | 2024 | | 2023 | | 2022 | |
Net Asset Value, beginning of year/period | | $ | 30.32 | | | $ | 30.90 | | | $ | 41.42 | | | $ | 25.02 | |
Investment Activities | | | | | | | | | | | | | | | | |
Net investment income (loss)* | | | (0.07 | ) | | | (0.05 | ) | | | (0.06 | ) | | | (0.16 | ) |
Net realized and unrealized gain (loss) | | | 11.56 | | | | (0.53 | ) | | | (10.46 | ) | | | 16.56 | |
Total from investment activities | | | 11.49 | | | | (0.58 | ) | | | (10.52 | ) | | | 16.40 | |
Net Asset Value, end of year/period | | $ | 41.81 | | | $ | 30.32 | | | $ | 30.90 | | | $ | 41.42 | |
Net Asset Value, Total Return (%)(1) | | | 37.90 | | | | (1.88 | ) | | | (25.40 | ) | | | 65.55 | |
Ratios to Average Net Assets | | | | | | | | | | | | | | | | |
Expenses (%) | | | 0.68 | | | | 0.68 | | | | 0.68 | | | | 0.68 | (2) |
Expenses excluding waivers (%) | | | 0.75 | | | | 0.75 | | | | 0.75 | | | | 0.75 | (2) |
Net investment income (loss) (%) | | | (0.17 | ) | | | (0.18 | ) | | | (0.15 | ) | | | (0.42 | )(2) |
Supplemental Data | | | | | | | | | | | | | | | | |
Net Assets end of year/period (000) | | $ | 173,528 | | | $ | 25,015 | | | $ | 29,353 | | | $ | 37,281 | |
Portfolio turnover(%)(3) | | | 29 | | | | 37 | | | | 30 | | | | 30 | |
The accompanying notes are an integral part of the financial statements.
22
ROBO Global®
Notes to Financial Statements
April 30, 2024
1. ORGANIZATION
Exchange Traded Concepts Trust (the “Trust”) is a Delaware statutory trust formed on July 17, 2009. The Trust is registered with the Commission under the Investment Company Act of 1940 (the “1940 Act”) as an open-end management investment company with multiple investment portfolios. The financial statements herein are those of the ROBO Global® Healthcare Technology and Innovation ETF, the ROBO Global® Robotics and Automation Index ETF, and the ROBO Global® Artificial Intelligence ETF (each a “Fund”, and together the “Funds”). The ROBO Global® Healthcare Technology and Innovation ETF seeks to provide investment results that, before fees and expenses, correspond generally to the price and yield performance of the ROBO Global® Healthcare Technology and Innovation Index. The ROBO Global® Robotics and Automation Index ETF seeks to provide investment results that, before fees and expenses, correspond generally to the price and yield performance of the ROBO Global® Robotics and Automation Index. The ROBO Global® Artificial Intelligence ETF seeks to provide investment results that, before fees and expenses, correspond generally to the price and yield performance of the ROBO Global® Artificial Intelligence Index. Exchange Traded Concepts, LLC (the “Adviser”), an Oklahoma limited liability company, serves as the investment adviser for each Fund. Each Fund is classified as “diversified” under the 1940 Act, except for ROBO Global® Artificial Intelligence ETF which is classified as “non-diversified” (see “Non-Diversification Risk” under Note 7). The ROBO Global® Healthcare Technology and Innovation ETF commenced operations on June 24, 2019, the ROBO Global® Robotics & Automation Index ETF commenced operations on October 21, 2013 and the ROBO Global® Artificial Intelligence ETF commenced operations on May 8, 2020.
Shares of the Funds are listed and traded on the NYSE Arca, Inc. (the “Exchange”). Market prices for shares of a Fund may be different from their net asset value (“NAV”). The Funds issue and redeem shares on a continuous basis to certain institutional investors (typically market makers or other broker-dealers) at NAV only in large blocks of shares called “Creation Units.” Creation Units are available for purchase and redemption on each business day and are offered and redeemed on an in-kind basis, together with a specified cash amount, or for an all cash amount. Once created, shares trade in a secondary market at market prices that change throughout the day in share amounts less than a Creation Unit.
2. SIGNIFICANT ACCOUNTING POLICIES
The following significant accounting policies, which are consistently followed in the preparation of the financial statements of the Trust, are in conformity with accounting principles generally accepted in the United States of America (“U.S. GAAP”) for investment companies. The accompanying financial statements have been prepared in accordance with U.S. GAAP on the accrual basis of accounting. Management has reviewed Financial Accounting Standards Board (“FASB”) Accounting Standards Codification (“ASC”) Topic 946, Financial Services — Investment Companies (“ASC 946”), and concluded that the Funds meet the criteria of an “investment company,” and therefore, the Funds prepare their financial statements in accordance with investment company accounting as outlined in ASC 946.
Use of Estimates and Indemnifications — Each Fund is an investment company in conformity with U.S. GAAP. Therefore, the Funds follow the accounting and reporting guidelines for investment companies. The preparation of financial statements in conformity with U.S. GAAP requires management to make estimates and assumptions that affect the reported amounts of assets and liabilities and disclosure of contingent assets and liabilities at the date of the financial statements and the reported amounts of increases and decreases in net assets from operations during the reporting period. Actual results could differ from those estimates.
In the normal course of business, the Trust, on behalf of the Funds, enters into contracts that contain a variety of representations which provide general indemnifications. Each Fund’s maximum exposure under these arrangements cannot be known; however, the Funds expect any risk of loss to be remote.
23
ROBO Global®
Notes to Financial Statements
April 30, 2024 (Continued)
2. SIGNIFICANT ACCOUNTING POLICIES (Continued)
Security Valuation — The Funds record their investments at fair value. Securities listed on a securities exchange, market or automated quotation system for which quotations are readily available (except for securities traded on the NASDAQ Stock Market (“NASDAQ”)), including securities traded over the counter, are valued at the last quoted sale price on the primary exchange or market (foreign or domestic) on which they are traded (or at approximately 4:00 pm Eastern Time if a security’s primary exchange is normally open at that time), or, if there is no such reported sale, at the most recent quoted bid price for long positions and at the most recent quoted ask price for short positions. For securities traded on NASDAQ, the NASDAQ Official Closing Price will be used. If available, debt securities are priced based upon valuations provided by independent, third-party pricing agents. Such values generally reflect the last reported sales price if the security is actively traded.
The third-party pricing agents may also value debt securities at an evaluated bid price by employing methodologies that utilize actual market transactions, broker-supplied valuations, or other methodologies designed to identify the fair value for such securities. Debt obligations with remaining maturities of sixty days or less when acquired will be valued at their market value. If a market value is not available from a pricing vendor or from an independent broker, the security shall be fair valued according to the Trust’s fair value procedures. Prices for most securities held in the Funds are provided daily by recognized independent pricing agents. If a security price cannot be obtained from an independent, third-party pricing agent, the Funds seek to obtain a bid price from at least one independent broker.
Rule 2a-5 under the 1940 Act, establishes requirements to determine fair value in good faith for purposes of the 1940 Act. The rule permits fund boards to designate a fund’s investment adviser to perform fair-value determinations, subject to board oversight and certain other conditions. The rule also defines when market quotations are “readily available” for purposes of the 1940 Act and requires a fund to fair value a portfolio investment when a market quotation is not readily available.
Pursuant to the requirements of Rule 2a-5, the Trust’s Board of Trustees (the “Board”) (i) has designated the Adviser as the Board’s valuation designee to perform fair-value determinations for a Fund through the Adviser’s Valuation Committee and (ii) approved the Adviser’s Valuation Procedures.
Some of the more common reasons that may necessitate that a security be valued using fair value procedures include: the security’s trading has been halted or suspended; the security has been de-listed from a national exchange; the security’s primary trading market is temporarily closed at a time, when under normal conditions, it would be open; the security has not been traded for an extended period of time; the security’s primary pricing source is not able or willing to provide a price; or trading of the security is subject to local government-imposed restrictions. In addition, a Fund may fair value its securities if an event that may materially affect the value of the Fund’s securities that traded outside of the United States (a ‘‘Significant Event’’) has occurred between the time of the security’s last close and the time that the Fund calculates its net asset value. A Significant Event may relate to a single issuer or to an entire market sector. Events that may be Significant Events include, but are not limited to, government actions, natural disasters, armed conflict, acts of terrorism and significant market fluctuations. If the Adviser becomes aware of a Significant Event that has occurred with respect to a security or group of securities after the closing of the exchange or market on which the security or securities principally trade, but before the time at which the Fund calculates its net asset value, it may request that a Committee meeting be called. When a security is valued in accordance with the fair value procedures, the Committee will determine the value after taking into consideration relevant information reasonably available to the Committee.
In accordance with the authoritative guidance on fair value measurements and disclosure under U.S. GAAP, the Funds disclose fair value of its investments in a hierarchy that prioritizes the inputs to valuation techniques used to measure the fair value. The objective of a fair value measurement is to determine the price that would be received to sell an asset or paid to transfer a liability in an orderly transaction between market participants at the measurement
24
ROBO Global®
Notes to Financial Statements
April 30, 2024 (Continued)
2. SIGNIFICANT ACCOUNTING POLICIES (Continued)
date (an exit price). Accordingly, the fair value hierarchy gives the highest priority to quoted prices (unadjusted) in active markets for identical assets or liabilities (Level 1) and the lowest priority to unobservable inputs (Level 3). The three levels of the fair value hierarchy are described below:
| • | Level 1 – Unadjusted quoted prices in active markets for identical, unrestricted assets or liabilities that the Funds have the ability to access at the measurement date; |
• | Level 2 – Quoted prices which are not active, or inputs that are observable (either directly or indirectly) for substantially the full term of the asset or liability; and |
• | Level 3 – Prices, inputs or exotic modeling techniques which are both significant to the fair value measurement and unobservable (supported by little or no market activity). |
The valuation techniques used by the Funds to measure fair value during the year ended April 30, 2024 maximized the use of observable inputs and minimized the use of unobservable inputs. Investments are classified within the level of the lowest significant input considered in determining fair value.
Federal Income Taxes — It is each Fund’s intention to qualify as a regulated investment company for Federal income tax purposes by complying with the appropriate provisions of Subchapter M of the Internal Revenue Code of 1986, as amended. Accordingly, no provisions for Federal income taxes have been made in the financial statements.
The Funds’ policy is to classify interest and penalties associated with underpayment of federal and state income taxes, if any, as income tax expense on their Statements of Operations. As of April 30, 2024, the Funds did not have any interest or penalties associated with the underpayment of any income taxes. Current tax years remain open and subject to examination by tax jurisdictions. The Funds have reviewed all major jurisdictions and concluded that there is no impact on the Funds’ net assets and no tax liability resulting from unrecognized tax benefits relating to uncertain income tax positions taken or expected to be taken on its tax returns.
Foreign Taxes — The Funds may be subject to taxes imposed by countries in which it invests. Such taxes are generally based on either income or gains earned or repatriated. The Funds accrue and apply such taxes to net investment income, net realized gains and net unrealized gains as income and/or capital gains earned.
Security Transactions and Investment Income — Security transactions are accounted for on trade date. Costs used in determining realized gains and losses on the sale of investment securities are based on specific identification. Dividend income is recorded on the ex-dividend date. Interest income is recognized on the accrual basis. Withholding taxes and reclaims on foreign dividends, if any, have been provided for in accordance with the Funds’ understanding of the applicable country’s tax rules and rates.
Repurchase Agreements — Securities pledged as collateral for repurchase agreements are held by the Funds’ custodian bank until the repurchase date of the repurchase agreement. The Funds may also invest in tri-party repurchase agreements. Securities held as collateral for tri-party repurchase agreements are maintained by the broker’s custodian bank in a segregated account until the repurchase date of the repurchase agreement. Provisions of the repurchase agreements and the Funds’ policies require that the market value of the collateral, including accrued interest thereon, is sufficient in the event of default by the counterparty. If the counterparty defaults and the value of the collateral declines, or if the counterparty enters into an insolvency proceeding, realization of the collateral by the Funds may be delayed or limited.
Foreign Currency Translation — The books and records of the Funds are maintained in U.S. dollars. Investment securities and other assets and liabilities denominated in a foreign currency are translated into U.S. dollars on the date of valuation. Purchases and sales of investment securities, income and expenses are translated into U.S. dollars at the relevant rates of exchange prevailing on the respective dates of such transactions. The Funds do not isolate that portion of realized or unrealized gains and losses resulting from changes in the foreign exchange rate from
25
ROBO Global®
Notes to Financial Statements
April 30, 2024 (Continued)
2. SIGNIFICANT ACCOUNTING POLICIES (Continued)
fluctuations arising from changes in the market prices of the securities. These gains and losses are included in net realized and unrealized gains and losses on investments on the Statements of Operations. Net realized and unrealized gains and losses on foreign currency transactions represent net foreign exchange gains or losses from foreign currency exchange contracts, disposition of foreign currencies, currency gains or losses realized between trade and settlement dates on securities transactions and the difference between the amount of the investment income and foreign withholding taxes recorded on the Funds’ books and the U.S. dollar equivalent amounts actually received or paid. The Funds may be subject to foreign taxes related to foreign income received, capital gain on the sale of securities and certain foreign currency transactions (a portion of which may be reclaimable). All foreign taxes are recorded in accordance with the applicable regulations and rates that exist in the foreign jurisdictions in which the Funds invest.
Cash and Cash Equivalents — Idle cash may be swept into various overnight demand deposits and is classified as Cash and Cash equivalents on the Statements of Assets and Liabilities. The Funds maintain cash in bank deposit accounts which, at times, may exceed United States federally insured limits. Amounts swept overnight are available on the next business day.
Dividends and Distributions to Shareholders — Each Fund pays out dividends from its net investment income and distributes its net capital gains, if any, to investors at least annually. All distributions are recorded on ex-dividend date.
Creation Units — The Funds issue and redeem shares at NAV and only in Creation Units, or multiples thereof. Purchasers of Creation Units (“Authorized Participants”) at NAV must pay a standard creation transaction fee of $550, $1,000 and $550 per transaction, regardless of the number of Creation Units created in a given transaction for ROBO Global® Healthcare Technology and Innovation ETF, ROBO Global® Robotics and Automation Index ETF and ROBO Global® Artificial Intelligence ETF, respectively. An Authorized Participant who holds Creation Units and wishes to redeem at NAV would also pay a standard minimum redemption transaction fee of $550, $1,000 and $550 per transaction to the custodian on the date of such redemption, regardless of the number of Creation Units redeemed in a given transaction for ROBO Global® Healthcare Technology and Innovation ETF, ROBO Global® Robotics and Automation Index ETF and ROBO Global® Artificial Intelligence ETF, respectively. The Funds may charge, either in lieu of or in addition to the fixed creation transaction fee, a variable fee for creations and redemptions in order to cover certain non-standard brokerage, tax, foreign exchange, execution, market impact and other costs and expenses related to the execution of trades resulting from such transactions. In all cases, such fees will be limited in accordance with the requirements of the Commission applicable to management investment companies offering redeemable securities.
The Adviser may retain all or a portion of the transaction fee to the extent the Adviser bears the expenses that otherwise would be borne by the Trust in connection with the purchase or redemption of a Creation Unit, which the transaction fee is designed to cover.
Except when aggregated in Creation Units, shares are not redeemable securities of the Funds. Shares of the Funds may only be purchased or redeemed by certain Authorized Participants. An Authorized Participant is either (i) a broker-dealer or other participant in the clearing process through the Continuous Net Settlement System of the National Securities Clearing Corporation or (ii) a Depository Trust Company (“DTC”) participant and, in each case, must have executed an Authorized Participant Agreement with the Funds’ distributor. Most retail investors will not qualify as Authorized Participants or have the resources to buy and sell whole Creation Units. Therefore, they will be unable to purchase or redeem the shares directly from the Funds. Rather, most retail investors will purchase and sell shares in the secondary market with the assistance of a broker and will be subject to customary brokerage commissions or fees.
To the extent contemplated by an Authorized Participant Agreement, in the event an Authorized Participant has submitted a redemption request in proper form but is unable to transfer all or part of the shares comprising a Creation Unit to be redeemed to SEI Investments Distribution Co. (the “Distributor”), on behalf of a Fund, by the
26
ROBO Global®
Notes to Financial Statements
April 30, 2024 (Continued)
2. SIGNIFICANT ACCOUNTING POLICIES (Continued)
time as set forth in the Authorized Participant Agreement, the Distributor may nonetheless accept the redemption request in reliance on the undertaking by the Authorized Participant to deliver the missing shares as soon as possible, which undertaking shall be secured by the Authorized Participant’s delivery and maintenance of collateral equal to a percentage of the value of the missing shares as specified in the Authorized Participant Agreement. An Authorized Participant Agreement may permit a Fund to use such collateral to purchase the missing shares, and could subject an Authorized Participant to liability for any shortfall between the cost of a Fund acquiring such shares and the value of the collateral. Amounts are disclosed as Segregated Cash Balance from Authorized Participants for Deposit Securities and Collateral Payable upon Return of Deposit Securities on the Statements of Assets and Liabilities, when applicable.
3. SERVICE PROVIDERS
Investment Advisory and Administrative Services
The Adviser is an Oklahoma limited liability company located at 10900 Hefner Pointe Drive, Suite 400, Oklahoma City, Oklahoma 73120, its principal place of business, and 295 Madison Avenue, New York, New York 10017. The Adviser serves as the investment adviser to each Fund pursuant to an investment advisory agreement with the Trust (the “Advisory Agreement”). Under the Advisory Agreement, the Adviser provides investment advisory services to the Funds and is responsible for the day-to-day management of the Funds, including, among other things, implementing changes to each Fund’s portfolio in connection with any rebalancing or reconstitution of an Index, trading portfolio securities on behalf of each Fund, and selecting broker-dealers to execute purchase and sale transactions, subject to the oversight of the Board. For the services it provides to the Funds, the Adviser receives a fee, which is calculated daily and paid monthly, at an annual rate based on the average daily net assets of each Fund as follows:
ROBO Global® Healthcare Technology and Innovation ETF | | 0.80 | %(1) | | |
ROBO Global® Robotics and Automation Index ETF | | 0.95 | %(2) | | |
ROBO Global® Artificial Intelligence ETF | | 0.75 | %(3) | | |
ETC Platform Services, LLC (“ETC Platform Services”), a direct wholly-owned subsidiary of the Adviser, administers each Fund’s business affairs and provides office facilities and equipment, certain clerical, bookkeeping and administrative services, paying agent services under the Funds’ unitary fee arrangement (as described below), and its officers and employees to serve as officers or Trustees of the Trust. ETC Platform Services also arranges for transfer agency, custody, fund administration and accounting, and other non-distribution related services necessary for the Funds to operate. For the services it provides to the Funds, ETC Platform Services is paid a fee calculated daily and paid monthly based on a percentage of each Fund’s average daily net assets.
Under the Advisory Agreement, the Adviser has agreed to pay all expenses incurred by the Funds (including the fee charged by ETC Platform Services) except for the advisory fee, interest, taxes, brokerage commissions and other expenses incurred in placing orders for the purchase and sale of securities and other investment instruments, acquired fund fees and expenses, accrued deferred tax liability, extraordinary expenses, and distribution fees and expenses paid by the Funds under any distribution plan adopted pursuant to Rule 12b-1 under the 1940 Act (“Excluded Expenses”).
ROBO Global Index, LLC is the sponsor of each Fund’s Index and each Fund (the “Sponsor”). In connection with an arrangement between the Adviser, and the Sponsor, the Sponsor has agreed to assume the obligation of the Adviser to pay all expenses of the Funds (except Excluded Expenses) and, to the extent applicable, pay the Adviser
27
ROBO Global®
Notes to Financial Statements
April 30, 2024 (Continued)
3. SERVICE PROVIDERS (Continued)
a minimum fee. For its services, the Sponsor is entitled to a fee from the Adviser, which is calculated daily and paid monthly, based on a percentage of the average daily net assets of each Fund. The sponsor does not make any investment decisions, provide investment advice, or otherwise act in the capacity of an investment advisor to the Fund.
A Trustee and certain officers of the Trust are affiliated with the Adviser and receive no compensation from the Trust for serving as officers and/or Trustee.
Distribution Arrangement
The Distributor serves as the underwriter and distributor of each Fund’s shares pursuant to a distribution agreement (the “Distribution Agreement”). Under the Distribution Agreement, the Distributor, as agent, receives orders to purchase shares in Creation Units and transmits such orders to the Fund’s custodian and transfer agent. The Distributor has no obligation to sell any specific quantity of a Fund’s shares. The Distributor bears the following costs and expenses relating to the distribution of shares: (i) the expenses of maintaining its registration or qualification as a dealer or broker under federal or state laws; (ii) filing fees; and (iii) all other expenses incurred in connection with the distribution services, that are not reimbursed by the Adviser, as contemplated in the Distribution Agreement. The Distributor does not maintain any secondary market in any Fund’s shares.
The Funds have adopted a Distribution and Service Plan (the “Plan”) pursuant to Rule 12b-1 under the 1940 Act. In accordance with the Plan, the Funds are authorized to pay an amount up to 0.25% of its average daily net assets each year for certain distribution-related activities. For the year ended April 30, 2024, no fees were charged by the Distributor under the Plan and the Plan will only be implemented with approval of the Board.
Administrator, Custodian and Transfer Agent
SEI Investments Global Funds Services serves as the Funds’ administrator pursuant to an administration agreement. The Bank of New York Mellon serves as the Funds’ custodian and transfer agent pursuant to a custodian agreement and transfer agency services agreement. The Adviser of the Funds pays these fees.
An officer of the Trust is affiliated with the administrator and receives no compensation from the Trust for serving as an officer.
4. INVESTMENT TRANSACTIONS
For the year ended April 30, 2024, the purchases and sales of investments in securities, excluding in-kind transactions, long-term U.S. Government and short-term securities were:
| | Purchases | | Sales and
Maturities | | |
ROBO Global® Healthcare Technology and Innovation ETF | | $ | 29,282,178 | | $ | 29,615,700 | |
ROBO Global® Robotics and Automation Index ETF | | | 354,837,469 | | | 362,993,148 | |
ROBO Global® Artificial Intelligence ETF | | | 35,654,773 | | | 28,299,804 | |
For the year ended April 30, 2024, there were no purchases or sales of long-term U.S. Government securities by any of the funds
For the year ended April 30, 2024, the in-kind transactions associated with creations and redemptions were:
| | Purchases | | Sales | | Realized
Gain(Loss) | | |
ROBO Global® Healthcare Technology and Innovation ETF | | $ | — | | $ | 25,969,685 | | $ | 1,269,715 | |
ROBO Global® Robotics and Automation Index ETF | | | 96,592,178 | | | 216,647,259 | | | 69,972,544 | |
ROBO Global® Artificial Intelligence ETF | | | 145,840,484 | | | 27,129,400 | | | 9,108,337 | |
28
ROBO Global®
Notes to Financial Statements
April 30, 2024 (Continued)
5. TAX INFORMATION
The amount and character of income and capital gain distributions to be paid, if any, are determined in accordance with Federal income tax regulations, which may differ from U.S. GAAP. As a result, net investment income (loss) and net realized gain (loss) on investment transactions for a reporting period may differ significantly from distributions during such period. These book/tax differences may be temporary or permanent. To the extent these differences are permanent in nature; they are charged or credited to paid-in capital or total distributable earnings as appropriate, in the period that the differences arise.
Accordingly, the following permanent differences primarily attributable to net operating losses and redemptions in-kind have been reclassified within the components of net assets for the year ended April 30, 2024:
| | Paid-in
Capital | | Distributable
Earnings
(Accumulated
Losses) | | |
ROBO Global® Healthcare Technology and Innovation ETF | | $ | 388,774 | | $ | (388,774 | ) | |
ROBO Global® Robotics and Automation Index ETF | | | 68,147,457 | | | (68,147,457 | ) | |
ROBO Global® Artificial Intelligence ETF | | | 8,611,645 | | | (8,611,645 | ) | |
During the year ended April 30, 2024, realized gains, which are not taxable to the Funds and are not distributable to shareholders have been reclassified from distributable earnings to paid-in-capital.
These reclassifications have no impact on net assets or net asset value per share.
The tax character of dividends and distributions paid during the years ended April 30, 2024 and April 30, 2023 were as follows:
| | Ordinary
Income | | Long-Term
Capital Gain | | Totals | | |
ROBO Global® Healthcare Technology and Innovation ETF | | | | | | | | | | |
2024 | | $ | — | | $ | — | | $ | — | |
2023 | | | — | | | — | | | — | |
| | | | | | | | | | | |
ROBO Global® Robotics and Automation Index ETF | | | | | | | | | | |
2024 | | $ | 684,846 | | $ | — | | $ | 684,846 | |
2023 | | | — | | | — | | | — | |
| | | | | | | | | | | |
ROBO Global® Artificial Intelligence ETF | | | | | | | | | | |
2024 | | $ | — | | $ | — | | $ | — | |
2023 | | | — | | | — | | | — | |
As of April 30, 2024, the components of Distributable Earnings (Accumulated Losses) on a tax basis were as follows:
| | ROBO Global®
Healthcare
Technology and
Innovation ETF | | ROBO Global®
Robotics and
Automation
Index ETF | | ROBO Global®
Artificial
Intelligence ETF | | |
Undistributed Ordinary Income | | $ | — | | | $ | 5,665,464 | | | $ | — | | |
Post-October Losses | | | (8,297,874 | ) | | | (45,073,677 | ) | | | (1,247,824 | ) | |
Capital Loss Carryforwards | | | (72,092,753 | ) | | | (291,398,601 | ) | | | (8,659,197 | ) | |
Deferred Late-Year Losses | | | (61,934 | ) | | | — | | | | (93,347 | ) | |
Unrealized Appreciation (Depreciation) | | | (22,197,668 | ) | | | 34,165,647 | | | | 10,018,810 | | |
Other Temporary Differences | | | 4 | | | | (6 | ) | | | (1 | ) | |
Total Distributable Earnings (Accumulated Losses) | | $ | (102,650,225 | ) | | $ | (296,641,173 | ) | | $ | 18,441 | | |
29
ROBO Global®
Notes to Financial Statements
April 30, 2024 (Continued)
5. TAX INFORMATION (Continued)
The Funds may elect for any taxable year to treat any portion of any qualified late year loss as arising on the first day of the next taxable year.
Post-October capital losses represent capital losses realized on investment transactions from November 1, 2023 through April 30, 2024, that, in accordance with Federal income tax regulations, the Funds may elect to defer and treat as having arisen in the following fiscal year.
The Funds are permitted to utilize capital losses that are carried forward and will retain their character as either short-term or long-term capital losses. As of April 30, 2024, the Funds have the following capital loss carryforwards to offset capital gains for an unlimited period:
| | Non-Expiring
Short-Term | | Non-Expiring
Long-Term | | Total
Capital Loss
Carryforwards | | |
ROBO Global® Healthcare Technology and Innovation ETF | | $ | 24,291,412 | | $ | 47,801,341 | | $ | 72,092,753 | |
ROBO Global® Robotics and Automation Index ETF | | | 83,383,300 | | | 208,015,301 | | | 291,398,601 | |
ROBO Global® Artificial Intelligence ETF | | | 2,129,346 | | | 6,529,851 | | | 8,659,197 | |
For the taxable year ended April 30, 2024, the Funds did not utilize any capital loss carryforwards.
For Federal income tax purposes, the cost of securities owned at April 30, 2024, and the net realized gains or losses on securities sold for the period, were different from amounts reported for financial reporting purposes primarily due to wash sales which cannot be used for Federal income tax purposes in the current period and have been deferred for use in future years, as well as investments in passive foreign investment companies. The Federal tax cost and aggregate gross unrealized appreciation and depreciation on investments and foreign currency transactions held by the Funds at April 30, 2024, were as follows:
| | Federal Tax
Cost | | Aggregated
Gross
Unrealized
Appreciation | | Aggregated
Gross
Unrealized
Depreciation | | Net Unrealized
Appreciation
(Depreciation) |
ROBO Global® Healthcare Technology and Innovation ETF | | $ | 81,847,243 | | $ | 4,395,443 | | $ | (26,593,111 | ) | | $ | (22,197,668 | ) |
ROBO Global® Robotics and Automation Index ETF | | | 1,267,557,210 | | | 209,276,731 | | | (175,111,084 | ) | | | 34,165,647 | |
ROBO Global® Artificial Intelligence ETF | | | 163,585,600 | | | 16,489,798 | | | (6,470,988 | ) | | | 10,018,810 | |
6. SECURITIES LENDING
Each Fund has entered into a Securities Lending Agreement with the Bank of New York Mellon (the “Lending Agent”) to lend portfolio securities to brokers, dealers and other financial organizations that meet capital and other credit requirements or other criteria established by the Trust’s Board. These loans, if and when made, may not exceed 33 1/3% of the total asset value of a Fund (including the loan collateral). The Funds will not lend portfolio securities to the Adviser or its affiliates unless permissible under the 1940 Act and the rules and regulations thereunder. Loans of portfolio securities will be fully collateralized by cash, letters of credit or U.S. government securities, and the collateral will be maintained in an amount equal to at least 102% of the value of domestic equity securities and American Depositary Receipts and 105% of the value of foreign equity securities (other than ADRs). However, due to market fluctuations during the day, the value of securities loaned on a particular day may, during the course of the day, exceed the value of collateral. On each business day, the amount of collateral is adjusted based on the prior day’s market fluctuations and the current day’s lending activity. Income from lending activity is determined by the amount of interest earned on collateral, less any amounts payable to the borrowers of the securities and the lending agent. Lending securities involves certain risks, including the risk that the Funds may be delayed or restricted from recovering the loaned securities or disposing of the collateral for the loan, which could give rise to
30
ROBO Global®
Notes to Financial Statements
April 30, 2024 (Continued)
6. SECURITIES LENDING (Continued)
loss because at adverse market actions expenses and/or delays in connection with the disposition of the underlying securities. Any gain or loss in the market price of the securities loaned and income from lending activity by a Fund that might occur during the term of the loan would be for the account of the Fund.
Securities pledged as collateral for repurchase agreements are held by BNY and are designated as being held on the Funds’ behalf under a book-entry system. The Funds monitor the adequacy of the collateral on a daily basis and can require the seller to provide additional collateral in the event the market value of the securities pledged falls below the carrying value of the repurchase agreement, including accrued interest. It is the Funds’ policy to only enter into repurchase agreements with banks and other financial institutions which are deemed by the Adviser to be creditworthy. The Funds bear the risk of loss in the event that the other party to a repurchase agreement defaults on its obligations and the Fund is prevented from exercising its rights to dispose of the underlying securities received as collateral and the risk of a possible decline in the value of the underlying securities during the period. For financial statement purposes, the Funds record the securities lending collateral (included in repurchase agreements, at value or restricted cash) as an asset and the obligation to return securities lending collateral as a liability on the Statements of Assets and Liabilities.
Cash collateral received in connection with securities lending is invested in short-term investments and/or repurchase agreements by the lending agent. The Funds do not have effective control of the non-cash collateral and therefore it is not disclosed in the Fund’s Schedules of Investments.
Securities lending transactions are entered into by the Funds under the Securities Lending Agreement, which permits a Fund, under certain circumstances such as an event of default, to offset amounts payable by the Fund to the same counterparty against amounts receivable from the counterparty to create a net payment due to or from the Fund.
The following is a summary of securities lending agreements held by the Funds, with cash collateral of overnight maturities and non-cash collateral, which would be subject to offset as of April 30, 2024:
| | Gross Amount of
Recognized
Assets (Value of
Securities on
Loan) | | Value of Cash
Collateral
Received(1) | | Value of
Non-Cash
Collateral
Received(1) | | Net Amount |
ROBO Global® Robotics and Automation Index ETF | | $ | 89,431,134 | | $ | 57,387,637 | | $ | 32,043,497 | | $ | — |
The value of loaned securities and related collateral outstanding at April 30, 2024 are shown in the Schedule of Investments. The value of the collateral held may be temporarily less than that required under the lending contract. As of April 30, 2024, the cash collateral was invested in a Short-Term Investment (Dreyfus Institutional Preferred Government Plus Money Market Fund) and the non-cash collateral consisted of Government Securities (U.S. Treasury Bills, Notes, Bonds and U.S. Treasury Inflation Indexed Bonds) with the following maturities:
Remaining Contractual Maturity of the Agreements, as of April 30, 2024
| | Overnight and
Continuous | | <30 Days | | Between
30 & 90 Days | | >90 Days | | Total |
ROBO Global® Robotics and Automation Index ETF | | | | | | | | | | | | | | | |
Short-Term Investment | | $ | 57,387,637 | | $ | — | | $ | — | | $ | — | | $ | 57,387,637 |
U.S. Government Securities | | | — | | | — | | | — | | | 38,944,106 | | | 38,944,106 |
Total | | $ | 57,387,637 | | $ | — | | $ | — | | $ | 38,944,106 | | $ | 96,331,743 |
31
ROBO Global®
Notes to Financial Statements
April 30, 2024 (Continued)
7. PRINCIPAL RISKS OF INVESTING IN THE FUNDS
As with all exchange traded funds (“ETFs”), each shareholder of a Fund is subject to the risk that his or her investment could lose money. The Funds are subject to the principal risks noted below, any of which may adversely affect a Fund’s NAV, trading price, yield, total return and ability to meet its investment objective. Risk information is applicable to each Fund unless otherwise noted. Additional principal risks are disclosed in the Funds’ prospectus. Please refer to the Funds’ prospectus for a complete description of the principal risks of investing in a Fund.
Currency Exchange Rate Risk: To the extent each Fund invests in securities denominated in non-U.S. currencies, changes in currency exchange rates and the relative value of non-U.S. currencies will affect the value of the Funds’ investment and the value of your shares. Because the Funds’ net asset value (“NAV”) is determined in U.S. dollars, the Fund’s NAV could decline if the currency of the non-U.S. market in which each Fund invests depreciates against the U.S. dollar, even if the value of the Funds’ holdings, measured in the foreign currency, increases. Currency exchange rates can be very volatile and can change quickly and unpredictably. As a result, a Fund’s investment may change quickly and without warning and a Fund may lose money.
Foreign Securities Risk: Investments in non-U.S. securities involve certain risks that may not be present with investments in U.S. securities. For example, investments in non-U.S. securities may be subject to risk of loss due to foreign currency fluctuations or to expropriation, nationalization or adverse political or economic developments. Foreign securities may have relatively low market liquidity and decreased publicly available information about issuers. Investments in non-U.S. securities also may be subject to withholding or other taxes and may be subject to additional trading, settlement, custodial, and operational risks. Non-U.S. issuers may also be subject to inconsistent and potentially less stringent accounting, auditing, financial reporting and investor protection standards than U.S. issuers. These and other factors can make investments in each Fund more volatile and potentially less liquid than other types of investments. In addition, where all or a portion of the Funds’ portfolio holdings trade in markets that are closed when the Funds’ market is open, there may be valuation differences that could lead to differences between the Funds’ market price and the value of the Funds’ portfolio holdings.
Geographic Investment Risk: To the extent each Fund invests a significant portion of its assets in the securities of companies of a single country or region, it is more likely to be impacted by events or conditions affecting that country or region.
Healthcare Technology Companies Risk: (ROBO Global® Healthcare Technology and Innovation ETF only) The Fund invests primarily in the equity securities of Medical Technology Companies and, as such, is particularly sensitive to risks to those types of companies. These risks include, but are not limited to, small or limited markets for such securities, changes in business cycles, world economic growth, technological progress, rapid obsolescence, and government regulation. Healthcare Technology Companies may have limited product lines, markets, financial resources or personnel. Securities of Healthcare Technology Companies, especially smaller, start-up companies, tend to be more volatile than securities of companies that do not rely heavily on technology. Rapid change to technologies that affect a company’s products could have a material adverse effect on such company’s operating results. Healthcare Technology Companies also rely heavily on a combination of patents, copyrights, trademarks and trade secret laws to establish and protect their proprietary rights in their products and technologies. There can be no assurance that the steps taken by these companies to protect their proprietary rights will be adequate to prevent the misappropriation of their technology or that competitors will not independently develop technologies that are substantially equivalent or superior to such companies’ technology. Healthcare Technology Companies typically engage in significant amounts of spending on research and development, and there is no guarantee that the products or services produced by these companies will be successful.
Market Risk: The market price of an investment could decline, sometimes rapidly or unpredictably, due to general market conditions that are not specifically related to a particular company, such as real or perceived adverse economic or political conditions throughout the world, changes in the general outlook for corporate earnings, changes in interest or currency rates, or adverse investor sentiment generally. The market value of an investment also may decline because of factors that affect a particular industry or industries such as labor shortages, increased
32
ROBO Global®
Notes to Financial Statements
April 30, 2024 (Continued)
7. PRINCIPAL RISKS OF INVESTING IN THE FUNDS (Continued)
production costs, and competitive conditions. Local, regional, or global events such as war, acts of terrorism, the spread of infectious illness or other public health issues, recessions, or other events could have a significant impact on the market generally and on specific investments. For example, in recent years, the COVID-19 pandemic, the large expansion of government deficits and debt as a result of government actions to mitigate the effects of the pandemic, Russia’s invasion of Ukraine, and the rise of inflation have resulted in extreme volatility in the global economy and in global financial markets. Economies and financial markets throughout the world are becoming increasingly interconnected. As a result, whether or not the Fund invests in securities of issuers located in or with significant exposure to countries experiencing economic and financial difficulties, the value and liquidity of the Fund’s investments may be negatively affected.
Non-Diversification Risk: (ROBO Global® Artificial Intelligence ETF only) The Fund is non-diversified under the 1940 Act, meaning that, as compared to a diversified fund, it can invest a greater percentage of its assets in securities issued by or representing a small number of issuers. As a result, the performance of these issuers can have a substantial impact on each Fund’s performance.
Sector Focus Risk: Each Fund may invest a significant portion of its assets in one or more sectors and thus will be more susceptible to the risks affecting those sectors. While each Fund’s sector exposure is expected to vary over time based on the composition of the Index, each Fund anticipates that it may be subject to some or all of the risks described below. The list below is not a comprehensive list of the sectors to which each Fund may have exposure over time and should not be relied on as such.
Health Care Sector Risk: (ROBO Global® Healthcare Technology and Innovation ETF only) Companies in the health care sector are subject to extensive government regulation and their profitability can be significantly affected by restrictions on government reimbursement for medical expenses, rising costs of medical products and services, pricing pressure (including price discounting), limited product lines and an increased emphasis on the delivery of healthcare through outpatient services. Companies in the health care sector are heavily dependent on obtaining and defending patents, which may be time consuming and costly, and the expiration of patents may also adversely affect the profitability of these companies. Health care companies are also subject to extensive litigation based on product liability and similar claims. In addition, their products can become obsolete due to industry innovation, changes in technologies or other market developments. Many new products in the health care sector require significant research and development and may be subject to regulatory approvals, all of which may be time consuming and costly with no guarantee that any product will come to market.
Industrials Sector Risk: (ROBO Global® Robotics and Automation Index ETF only) Stock prices for industrials companies are affected by supply and demand both for their specific product or service and for industrials sector products in general. Government regulation, world events, exchange rates and economic conditions, technological developments and liabilities for environmental damage and general civil liabilities will likewise affect the performance of these companies.
Information Technology Sector Risk: (ROBO Global® Robotics and Automation Index ETF and ROBO Global® Artificial Intelligence ETF only) The Fund is subject to the risk that market or economic factors impacting information technology companies and companies that rely heavily on technology advances could have a major effect on the value of the Fund’s investments. The value of stocks of information technology companies and companies that rely heavily on technology is particularly vulnerable to rapid changes in technology product cycles, rapid product obsolescence, government regulation and competition, both domestically and internationally, including competition from foreign competitors with lower production costs.
33
ROBO Global®
Notes to Financial Statements
April 30, 2024 (Concluded)
8. OTHER
At April 30, 2024, the records of the Trust reflected that 100% of the Funds’ total shares outstanding were held by four Authorized Participants, in the form of Creation Units. However, the individual shares comprising such Creation Units are listed and traded on the Exchange and have been purchased and sold by persons other than Authorized Participants.
9. RECENT MARKET EVENTS
Local, regional, or global events such as war, acts of terrorism, the spread of infectious illness or other public health issues, recessions, or other events could have a significant impact on the market generally and on specific securities. Periods of market volatility may occur in response to such events and other economic, political, and global macro factors.
Governments and central banks, including the Federal Reserve in the United States, took extraordinary and unprecedented actions to support local and global economies and the financial markets in response to the COVID-19 pandemic, including by keeping interest rates at historically low levels for an extended period. The Federal Reserve concluded its market support activities in 2022 and began to raise interest rates in an effort to fight inflation. The Federal Reserve may determine to raise interest rates further. This and other government intervention into the economy and financial markets to address the pandemic, inflation, or other significant events in the future may not work as intended, particularly if the efforts are perceived by investors as being unlikely to achieve the desired results.
10. SUBSEQUENT EVENTS
The Funds have evaluated the need for additional disclosures and/or adjustments resulting from subsequent events through the date the financial statements were issued. Based on this evaluation, no additional disclosures and/or adjustments were required to the financial statements.
34
ROBO Global®
Report of Independent Registered Public Accounting Firm
To the Shareholders of ROBO Global® Healthcare Technology and Innovation ETF, ROBO Global® Robotics and Automation Index ETF, and ROBO Global® Artificial Intelligence ETF and Board of Trustees of Exchange Traded Concepts Trust
Opinion on the Financial Statements
We have audited the accompanying statements of assets and liabilities, including the schedules of investments, of Exchange Traded Concepts Trust comprising the funds listed below (the “Funds”), as of April 30, 2024, the related statements of operations, the statements of changes in net assets, the related notes, and the financial highlights for each of the periods indicated below (collectively referred to as the “financial statements”). In our opinion, the financial statements present fairly, in all material respects, the financial position of each of the Funds as of April 30, 2024, the results of their operations, the changes in net assets, and the financial highlights for each of the periods indicated below in conformity with accounting principles generally accepted in the United States of America.
Fund Name | Statements of
Operations | Statements of
Changes in Net
Assets | Financial
Highlights |
ROBO Global®
Healthcare Technology and Innovation ETF | For the year ended April 30, 2024 | For the years ended April 30, 2024, and 2023 | For the years ended April 30, 2024, 2023, 2022, 2021, and for the period from June 24, 2019 (commencement of operations) through April 30, 2020 |
ROBO Global®
Robotics and Automation Index ETF | For the year ended April 30, 2024 | For the years ended April 30, 2024, and 2023 | For the years ended April 30, 2024, 2023, 2022, 2021, and 2020 |
ROBO Global®
Artificial Intelligence ETF | For the year ended April 30, 2024 | For the years ended April 30, 2024, and 2023 | For the years ended April 30, 2024, 2023, 2022, and for the period from May 8, 2020 (commencement of operations) through April 30, 2021 |
Basis for Opinion
These financial statements are the responsibility of the Funds’ management. Our responsibility is to express an opinion on the Funds’ financial statements based on our audits. We are a public accounting firm registered with the Public Company Accounting Oversight Board (United States) (“PCAOB”) and are required to be independent with respect to the Funds in accordance with the U.S. federal securities laws and the applicable rules and regulations of the Securities and Exchange Commission and the PCAOB.
We conducted our audits in accordance with the standards of the PCAOB. Those standards require that we plan and perform the audit to obtain reasonable assurance about whether the financial statements are free of material misstatement whether due to error or fraud.
Our audits included performing procedures to assess the risks of material misstatement of the financial statements, whether due to error or fraud, and performing procedures that respond to those risks. Such procedures included examining, on a test basis, evidence regarding the amounts and disclosures in the financial statements. Our procedures included confirmation of securities owned as of April 30, 2024, by correspondence with the custodian and brokers; when replies were not received from brokers, we performed other auditing procedures. Our audits also included evaluating the accounting principles used and significant estimates made by management, as well as evaluating the overall presentation of the financial statements. We believe that our audits provide a reasonable basis for our opinion.
We have served as the auditor of one or more investment companies advised by Exchange Traded Concepts, LLC since 2012.

COHEN & COMPANY, LTD.
Cleveland, Ohio
June 25, 2024
35
ROBO Global®
Trustees and Officers of the Trust
(Unaudited)
Set forth below is information about the Trustees of the Trust. The address of each Trustee of the Trust is c/o Exchange Traded Concepts Trust, 10900 Hefner Pointe Drive, Suite 400, Oklahoma City, Oklahoma 73120. The Fund’s SAI includes additional information about the Trustee and Officers. The SAI may be obtained without charge by calling 855-456-7626.
Name and
Year of Birth | Position(s) Held
with Trust | Term of Office
and Length of
Time Served(1) | Principal
Occupation(s)
During the
Past 5 Years | Number of
Portfolios
in Fund
Complex
Overseen By
Trustee(2) | Other
Directorships
Held by Trustee
During Past 5 Years |
Interested Trustee(3) | | | | | |
J. Garrett Stevens
(1979) | Trustee and President | Trustee since 2009; President since 2011 | Investment Adviser/Vice President, T.S. Phillips Investments, Inc. (since 2000); Chief Executive Officer, Exchange Traded Concepts, LLC (since 2009); President, Exchange Traded Concepts Trust (since 2011); President, Exchange Listed Funds Trust (since 2012). | 32 | None. |
Independent Trustees | | | | | |
Timothy Jacoby
(1952) | Trustee | Since 2014 | Retired: Partner at Deloitte & Touche LLP (2000-2014). | 32 | Independent Trustee, Bridge Builder Trust (15 portfolios) (since 2022); Independent Trustee, Edward Jones Money Market Fund (since 2017); Audit Committee Chair, Perth Mint Physical Gold ETF (2018 to 2020). |
Linda Petrone
(1962) | Trustee | Since 2019 | Founding Partner, Sage Search Advisors (since 2012). | 32 | None. |
Stuart Strauss
(1953) | Trustee | Since 2021 | Partner, Dechert LLP (2009 to 2020). | 32 | None. |
Mark Zurack
(1957) | Trustee | Since 2011 | Professor, Columbia Business School (since 2002). | 22 | Independent Trustee, AQR Funds (36 portfolios) (since 2014); Independent Trustee, Exchange Listed Funds Trust (2019). |
36
ROBO Global®
Trustees and Officers of the Trust
(Unaudited) (Concluded)
Set forth below is information about each of the persons currently serving as officers of the Trust. The address of J. Garrett Stevens, Richard Malinowski, Andrew Serowik, Christopher Roleke, Matthew Fleischer and Heather Nichols is c/o Exchange Traded Concepts Trust, 10900 Hefner Pointe Drive, Suite 400, Oklahoma City, Oklahoma 73120; and the address of John Bourgeois is SEI Investments Company, One Freedom Valley Drive, Oaks, Pennsylvania 19456.
Name and
Year of Birth | Position(s)
Held with Trust | Term of Office and
Length of Time
Served(1) | Principal Occupation(s)
During Past 5 Years |
Officers | | | |
J. Garrett Stevens
(1979) | Trustee and President | Trustee since 2009; President since 2011 | Investment Adviser/Vice President, T.S. Phillips Investments, Inc. (since 2000); Chief Executive Officer, Exchange Traded Concepts, LLC (since 2009); President, Exchange Listed Funds Trust (since 2012). |
Richard Malinowski
(1983) | Vice President and Secretary | Since 2022 | General Counsel, Exchange Traded Concepts, LLC (since 2022); Senior Vice President and Senior Managing Counsel, Ultimus Fund Solutions LLC, (2020 to 2022); Senior Vice President, Ultimus Fund Solutions LLC (2017 to 2020). |
Andrew Serowik
(1976) | Vice President | Since 2024 | Portfolio Manager, Exchange Traded Concepts, LLC (since 2018). |
Christopher Roleke
(1972) | Treasurer | Since 2022 | Controller, Exchange Traded Concepts, LLC (since 2022); Managing Director/Fund Principal Financial Officer, Foreside Management Services, LLC (2011 to 2022). |
John Bourgeois
(1973) | Assistant Treasurer | Since 2024 | Director, Fund Accounting, SEI Investments Global Funds Services (since 2024); Manager, Investment Manager Services, SEI Investments Global Funds Services (2001 to 2024). |
Matthew Fleischer
(1983) | Chief Compliance Officer | Since 2021 | Chief Compliance Officer, Exchange Traded Concepts Trust (since 2021); Chief Compliance Officer, Exchange Listed Funds Trust (since 2021); Vice President, Compliance, Goldman Sachs Asset Management Funds (2017 to 2021). |
Heather Nichols
(1983) | Assistant Secretary | Since 2023 | Counsel, Exchange Traded Concepts, LLC (since 2023); Principal, HND Compliance and Regulatory Services, LLC (2015 to 2023). |
37
ROBO Global®
Disclosure of Fund Expenses
(Unaudited)
All ETFs have operating expenses. As a shareholder of a Fund you incur an advisory fee. In addition to the advisory fee, a shareholder may pay brokerage expenses, taxes, interest, litigation expenses and other extraordinary expenses (including acquired fund fees and expenses), if any. It is important for you to understand the impact of these ongoing costs on your investment returns. Shareholders may incur brokerage commissions on their purchases and sales of Fund shares, which are not reflected in these examples.
The following examples use the annualized expense ratio and are intended to help you understand the ongoing costs (in dollars) of investing in a Fund and to compare these costs with those of other funds. The examples are based on an investment of $1,000 made at the beginning of the period shown and held for the entire period (November 1, 2023 to April 30, 2024) (unless otherwise noted below). The table below illustrates the Fund’s cost in two ways:
Actual Fund Return. This section helps you to estimate the actual expenses after fee waivers that your Fund incurred over the period. The “Expenses Paid During Period” column shows the actual dollar expense cost incurred by a $1,000 investment in the Fund, and the “Ending Account Value” number is derived from deducting that expense cost from the Fund’s gross investment return.
You can use this information, together with the actual amount you invested in a Fund, to estimate the expenses you paid over that period. Simply divide your actual account value by $1,000 to arrive at a ratio (for example, an $8,600 account value divided by $1,000 = 8.6), then multiply that ratio by the number shown for your Fund under “Expenses Paid During Period.”
Hypothetical 5% Return. This section helps you compare your Fund’s costs with those of other funds. It assumes that the Fund had an annual 5% return before expenses during the year, but that the expense ratio (Column 3) for the period is unchanged. This example is useful in making comparisons because the Commission requires all funds to make this 5% calculation. You can assess your Fund’s comparative cost by comparing the hypothetical result for your Fund in the “Expenses Paid During Period” column with those that appear in the same charts in the shareholder reports for other funds.
NOTE: Because the return is set at 5% for comparison purposes — NOT your Fund’s actual return — the account values shown may not apply to your specific investment.
| | Beginning
Account
Value
11/1/2023 | | Ending
Account
Value
04/30/2024 | | Annualized
Expense
Ratios | | Expenses
Paid
During
Period(1) |
ROBO Global® Healthcare Technology and Innovation ETF | | | | | | | | | | | |
Actual Fund Return | | $ | 1,000.00 | | $ | 1,168.30 | | 0.68% | | $ | 3.67 |
Hypothetical 5% Return | | $ | 1,000.00 | | $ | 1,021.48 | | 0.68% | | $ | 3.42 |
ROBO Global® Robotics and Automation Index ETF | | | | | | | | | | | |
Actual Fund Return | | $ | 1,000.00 | | $ | 1,195.40 | | 0.95% | | $ | 5.19 |
Hypothetical 5% Return | | $ | 1,000.00 | | $ | 1,020.14 | | 0.95% | | $ | 4.77 |
ROBO Global® Artificial Intelligence ETF | | | | | | | | | | | |
Actual Fund Return | | $ | 1,000.00 | | $ | 1,282.50 | | 0.68% | | $ | 3.86 |
Hypothetical 5% Return | | $ | 1,000.00 | | $ | 1,021.48 | | 0.68% | | $ | 3.42 |
38
ROBO Global®
Review of Liquidity Risk Management Program
(Unaudited)
Pursuant to Rule 22e-4 under the Investment Company Act of 1940, the Trust, on behalf of the series of the Trust covered by this shareholder report (the “Funds”), has adopted a liquidity risk management program to govern the Trust’s approach to managing liquidity risk. Rule 22e-4 seeks to promote effective liquidity risk management, thereby reducing the risk that a Fund will be unable to meet its redemption obligations and mitigating dilution of the interests of its shareholders. The Trust’s liquidity risk management program (the “Program”), which adopts the liquidity risk management policies and procedures of Exchange Traded Concepts, LLC, the Trust’s investment adviser (the “Adviser”), is tailored to reflect the Funds’ particular risks, but not to eliminate all adverse impacts of liquidity risk, which would be incompatible with the nature of the Funds.
The Adviser, which is the administrator of the Program, has formed a Liquidity Risk Working Group (“LRWG”) consisting of certain individuals from the Adviser’s portfolio management, capital markets and compliance teams. The LRWG is responsible for conducting an initial assessment of the liquidity risk of the Funds and managing the liquidity risk of the Funds on an ongoing basis. Meetings of the LRWG are held no less than monthly.
At the March 2024 meeting of the Board of Trustees of the Trust, the Trustees received a report pertaining to the operation, adequacy, and effectiveness of implementation of the Program for the period ended December 31, 2023. The report concluded that the Program is adequately designed to assess and manage the Funds’ liquidity risk and has been effectively implemented. The report reflected that no material changes have been made to the Program since its implementation.
There can be no assurance that the Program will achieve its objectives in the future. Please refer to each Fund’s prospectus for more information regarding a Fund’s exposure to liquidity risk and other principal risks to which an investment in the Fund may be subject.
39
ROBO Global®
Notice to Shareholders
(Unaudited)
For shareholders that do not have an April 30, 2024 tax year end, this notice is for informational purposes only. For shareholders with an April 30, 2024 tax year end, please consult your tax advisor as to the pertinence of this notice.
For the fiscal year ended April 30, 2024, the Fund are designating the following items with regard to distributions paid during the year.
| | Long Term
Capital Gain
Distributions | | Ordinary
Income
Distributions | | Total
Distributions | | Qualifying
For
Corporate
Dividend
Receivable
Deduction(1) | | Qualifying
Dividend
Income(2) | | U.S.
Government
Interest(3) | | Interest
Related
Dividends(4) | | Short-Term
Capital Gain
Dividends(5) | | Qualifying
Business
Income(6) | | FTC* |
ROBO Global® Healthcare Technology and Innovation ETF | | 0.00% | | 0.00% | | 0.00% | | 0.00% | | 0.00% | | 0.00% | | 0.00% | | 0.00% | | 0.00% | | 0.00% |
ROBO Global® Robotics and Automation Index ETF | | 0.00% | | 100.00% | | 100.00% | | 28.91% | | 100.00% | | 0.00% | | 0.00% | | 0.00% | | 0.00% | | 66.41% |
ROBO Global® Artificial Intelligence ETF | | 0.00% | | 0.00% | | 0.00% | | 0.00% | | 0.00% | | 0.00% | | 0.00% | | 0.00% | | 0.00% | | 0.00% |
40
ROBO Global®
Supplemental Information
(Unaudited)
NAV is the price per share at which a fund issues and redeems shares. It is calculated in accordance with the standard formula for valuing fund shares. The “Market Price” of a fund generally is determined using the midpoint between the highest bid and the lowest offer on the stock exchange on which the shares of the fund are listed for trading, as of the time that the fund’s NAV is calculated. A fund’s Market Price may be at, above or below its NAV. The NAV of a fund will fluctuate with changes in the market value of the fund’s holdings. The NAV of a fund may also be impacted by the accrual of deferred taxes. The Market Price of a fund will fluctuate in accordance with changes in its NAV, as well as market supply and demand.
Premiums or discounts are the differences (expressed as a percentage) between the NAV and Market Price of a fund on a given day, generally at the time NAV is calculated. A premium is the amount that a fund is trading above the reported NAV, expressed as a percentage of the NAV. A discount is the amount that a fund is trading below the reported NAV, expressed as a percentage of the NAV.
Further information regarding premiums and discounts is available on the Funds’ website at www.roboglobaletfs.com.
41
10900 Hefner Pointe Drive, Suite 400
Oklahoma City, OK 73120
Investment Adviser:
Exchange Traded Concepts, LLC
10900 Hefner Pointe Drive, Suite 400
Oklahoma City, OK 73120
Distributor:
SEI Investments Distribution Co.
One Freedom Valley Drive
Oaks, PA 19456
Administrator:
SEI Investments Global Funds Services
One Freedom Valley Drive
Oaks, PA 19456
Legal Counsel:
Chapman and Cutler LLP
320 South Canal Street
Chicago, IL 60606
Independent Registered Public Accounting Firm:
Cohen & Company, Ltd.
1350 Euclid Avenue
Suite 800
Cleveland, OH 44115
This information must be preceded or accompanied by a current prospectus for the Funds.
ROB-AR-001-1100
The Registrant has adopted a code of ethics that applies to the Registrant's principal executive officer, principal financial officer, controller or principal accounting officer or any person who performs a similar function.
| Item 3. | Audit Committee Financial Expert. |
(a) (1) The Registrant’s Board of Trustees has determined that the Registrant has an audit committee financial expert serving on the audit committee.
(a) (2) The audit committee financial expert Timothy Jacoby is an independent trustee as defined in Form N-CSR Item 3 (a) (2).
| Item 4. | Principal Accountant Fees and Services. |
Fees billed by Cohen & Company, Ltd (Cohen) related to the Registrant.
Cohen billed the Registrant aggregate fees for services rendered to the Registrant for the last two fiscal years as follows:
| | 2024 | 2023 |
| | | All fees and
services to
the Trust
that were
pre-
approved | All fees and
services to
service
affiliates
that were
pre-
approved | All other
fees and
services to
service
affiliates
that did not
require pre-
approval | All fees and
services to
the Trust
that were
pre-
approved | All fees and
services to
service
affiliates
that were
pre-
approved | All other
fees and
services to
service
affiliates
that did not
require pre-
approval |
| (a) | Audit Fees | $77,775 | N/A | N/A | $77,775 | N/A | N/A |
| | | | | | | | |
| (b) | Audit-Related Fees | N/A | N/A | N/A | N/A | N/A | N/A |
| | | | | | | | |
| (c) | Tax Fees | $17,500 | N/A | N/A | $17,500 | N/A | N/A |
| | | | | | | | |
| (d) | All Other Fees | N/A | N/A | N/A | N/A | N/A | N/A |
(e)(1) The Trust’s Audit Committee has adopted, and the Board of Trustees has ratified, an Audit and Non-Audit Services Pre-Approval Policy (the “Policy”), which sets forth the procedures and the conditions pursuant to which services proposed to be performed by the independent auditor of the Trust may be pre-approved.
(e)(2) Percentage of fees billed applicable to non-audit services pursuant to waiver of pre-approval requirement were as follows:
| | 2024 | 2023 |
| Audit-Related Fees | 0% | 0% |
| | | |
| Tax Fees | 0% | 0% |
| | | |
| All Other Fees | 0% | 0% |
| | | |
| (g) | The aggregate non-audit fees and services billed by Cohen for the fiscal years 2024 and 2023 were $17,500 and $17,500, respectively. |
| (i) | Not applicable. The Registrant has not retained, for the preparation of the audit report on the financial statements included in the Form N-CSR, a registered public accounting firm that has a branch or office that is located in a foreign jurisdiction and that the Public Company Accounting Oversight Board (the “PCAOB”) has determined that the PCAOB is unable to inspect or investigate completely because of a position taken by an authority in the foreign jurisdiction. |
| (j) | Not applicable. The Registrant is not a “foreign issuer,” as defined in 17 CFR 240.3b-4. |
| Item 5. | Audit Committee of Listed Registrants. |
The Registrant has a separately-designated standing Audit Committee, which is composed of the Registrant's Independent Trustees: Timothy Jacoby, Stuart Strauss, Linda Petrone and Mark Zurack.
Schedule of Investments is included as part of the Report to Shareholders filed under Item 1 of this form.
| Item 7. | Disclosure of Proxy Voting Policies and Procedures for Closed-End Management Investment Companies. |
Not applicable to open-end management investment companies.
| Item 8. | Portfolio Managers of Closed-End Management Investment Companies. |
Not applicable to open-end management investment companies.
| Item 9. | Purchases of Equity Securities by Closed-End Management Company and Affiliated Purchasers. |
Not applicable to open-end management investment companies.
| Item 10. | Submission of Matters to a Vote of Security Holders. |
There have been no changes to the procedures by which shareholders may recommend nominees to the Registrant’s Board of Trustees during the period covered by this report.
| Item 11. | Controls and Procedures. |
(a) The Registrant’s principal executive and principal financial officers, or persons performing similar functions, have concluded that the Registrant’s disclosure controls and procedures (as defined in Rule 30a-3(c) under the Act (17 CFR 270.30a-3(c))) as of a date within 90 days of the filing date of the report, are effective based on the evaluation of these controls and procedures required by Rule 30a-3(b) under the Act (17 CFR 270.30a-3(b)) and Rules 13a-15(b) or 15d-15(b) under the Exchange Act (17 CFR 240.13a-15(b) or 240.15d-15(b)).
(b) There has been no change in the Registrant’s internal control over financial reporting (as defined in Rule 30a-3(d) under the Act (17 CFR 270.30a-3(d)) that occurred during the period covered by this report that has materially affected, or is reasonably likely to materially affect, the Registrant’s internal control over financial reporting.
| Item 12. | Disclosure of Securities Lending Activities for the Closed-End Management Investment Companies. |
Not applicable to open-end management investment companies.
| Item 18. | Recovery of Erroneously Awarded Compensation. |
(a) Not Applicable.
(b) Not Applicable.
(a)(1) Code of Ethics attached hereto.
(a)(2) Not applicable.
(a)(3) A separate certification for the principal executive officer and the principal financial officer of the Registrant as required by Rule 30a-2(a) under the Investment Company Act of 1940 Act, as amended (17 CFR 270.30a-2(a)), are filed herewith.
(b) Officer certifications as required by Rule 30a-2(b) under the Investment Company Act of 1940, as amended (17 CFR 270.30a-2(b)) also accompany this filing as exhibits.
SIGNATURES
Pursuant to the requirements of the Securities Exchange Act of 1934 and the Investment Company Act of 1940, the Registrant has duly caused this report to be signed on its behalf by the undersigned, thereunto duly authorized.
| | | Exchange Traded Concepts Trust |
| | | |
| | By | /s/ J. Garrett Stevens |
| | | J. Garrett Stevens,
Principal Executive Officer |
Date: July 1, 2024
Pursuant to the requirements of the Securities Exchange Act of 1934 and the Investment Company Act of 1940, this report has been signed below by the following persons on behalf of the Registrant and in the capacities and on the dates indicated.
| | By | /s/ J. Garrett Stevens |
| | | J. Garrett Stevens,
Principal Executive Officer |
Date: July 1, 2024
| | By | /s/ Christopher W. Roleke |
| | | Christopher W. Roleke,
Principal Financial Officer |
Date: July 1, 2024