Ballard Power Systems Inc.
Notice of Annual Meeting,
Management Proxy Circular and
2010 Annual Report
TABLE OF CONTENTS
| 2010 ANNUAL REPORT | ||
| LETTER FROM IAN A. BOURNE CHAIR OF THE BOARD | 1 | |
| LETTER FROM JOHN W. SHERIDAN PRESIDENT AND CHIEF EXECUTIVE OFFICER | 2 | |
| BALLARD EMPLOYEE AWARDS OF EXCELLENCE FOR 2010 | 6 | |
| NOTICE OF ANNUAL MEETING | 7 | |
| MANAGEMENT PROXY CIRCULAR | 8 | |
| DEFINED TERMS | 8 | |
| MATTERS TO BE VOTED UPON | 8 | |
| ELECTION OF DIRECTORS | 9 | |
| APPOINTMENT OF AUDITORS | 12 | |
| ADVISORY VOTE ON APPROACH TO EXECUTIVE COMPENSATION | 12 | |
| VOTING | 13 | |
| Solicitation of Proxies | 13 | |
| How to Vote | 13 | |
| Execution and Revocation of Proxies | 13 | |
| Voting of Shares and Exercise of Discretion by Proxies | 14 | |
| Voting Shares and Principal Shareholders | 14 | |
| Interest of Certain Persons or Companies in Matters to be Acted Upon | 14 | |
| BOARD AND COMMITTEES | 15 | |
| Board Composition and Nomination Process | 15 | |
| Majority Voting Policy | 15 | |
| Board Meetings | 15 | |
| Committees of the Board | 15 | |
| Audit Committee | 16 | |
| Management Development, Nominating & Compensation Committee | 16 | |
| Corporate Governance Committee | 16 | |
| CORPORATE GOVERNANCE | 16 | |
| EXECUTIVE COMPENSATION | 17 | |
| Compensation Discussion and Analysis | 17 | |
| Objectives of Our Executive Compensation Program | 17 | |
| Philosophy and Objectives | 18 | |
| How Executive Compensation is Determined | 18 | |
| Executive Pay Mix and the Emphasis on "At Risk" Pay | 18 | |
| The Use of Benchmarking | 18 | |
| Current Executive Compensation Elements | 19 | |
| Annual Salary | 19 | |
| Annual Bonus for Executive Officers | 20 | |
| Long Term Incentives | 21 | |
| Chief Executive Officer Compensation | 23 | |
| Termination and Change of Control Benefits | 24 | |
| Perquisites | 24 | |
| Retirement Benefits | 25 | |
| Total Executive Officer Compensation | 25 | |
| Minimum Share Ownership Guidelines | 25 | |
| Performance Graph | 26 | |
| Executive Compensation Tables | 27 | |
| Incentive Plan Awards | 30 | |
| Pension Plan Benefits | 32 | |
| Termination and Change of Control Benefits | 32 | |
| Employment Contracts | 32 | |
| Equity-Based Compensation Plans | 33 | |
| DIRECTOR COMPENSATION | 35 | |
| Incentive Plan Awards | 37 | |
| EQUITY BASED COMPENSATION PLANS | 38 | |
| SECURITIES AUTHORIZED FOR ISSUANCE UNDER EQUITY COMPENSATION PLANS | 38 | |
| INTEREST OF INFORMED PERSONS IN MATERIAL TRANSACTIONS | 38 | |
| INDEBTEDNESS OF DIRECTORS AND EXECUTIVE OFFICERS | 39 | |
| DIRECTORS’ AND OFFICERS’ LIABILITY INSURANCE | 39 | |
| ADDITIONAL INFORMATION | 39 | |
| PROPOSALS | 39 | |
| APPROVAL BY BOARD | 40 |
i
| APPENDIX "A" DESCRIPTION OF OPTION PLAN | A-1 | |
| APPENDIX "B" DESCRIPTION OF SDP | B-1 | |
| FINANCIAL INFORMATION | F-1 | |
| MANAGEMENT’S DISCUSSION AND ANALYSIS | F-1 | |
| CONSOLIDATED FINANCIAL STATEMENTS | F-2 | |
| Corporate Information | F-3 |
This document contains forward-looking statements, including: revenue estimates; market growth projections; cash operating costs; gross margins; adjusted EBIDTA; and product cost reductions. These forward-looking statements reflect Ballard’s current expectations as contemplated under section 27A of the Securities Act of 1933, as amended, and Section 21E of the Securities Exchange Act of 1934, as amended. Any such forward-looking statements are based on Ballard’s assumptions relating to its financial forecasts and expectations regarding its product development efforts, manufacturing capacity, and market demand.
These statements involve risks and uncertainties that may cause Ballard's actual results to be materially different, including general economic and regulatory changes, detrimental reliance on third parties, successfully achieving our business plans and achieving and sustaining profitability. For a detailed discussion of these and other risk factors that could affect Ballard's future performance, please refer to Ballard's most recent Annual Information Form. Readers should not place undue reliance on Ballard's forward-looking statements and Ballard assumes no obligation to update or release any revisions to these forward-looking statements, other than as required under applicable legislation.
ii

Letter from IAN A. BOURNE
Chair of the Board
Chair of the Board
Fellow Shareholders:
Ballard on a Positive Trajectory
The past three years have been key to re-setting Ballard’s course and ensuring an “up and to the right” trajectory for revenue growth and overall financial results. As John Sheridan discusses in his President and CEO Letter, 2010 was a turning point along the Company’s path to profitability – particularly with respect to sales and product shipment momentum across the Company’s target markets. We are now seeing the early stage of what promises to be an exciting next chapter for Ballard fuel cell products.
During the past three years Management has, with the full support of your Board of Directors, successfully closed a number of key transactions that have raised over C$100 million in cash – the last of these transactions was the sale-leaseback agreement for the head office building site in Burnaby, completed in early-2010. Collectively, these transactions have established a strong liquidity position that will facilitate execution of Ballard’s multi-market growth strategy.
Committed People …. Building Momentum
Your Board of Directors congratulates Management, under John’s leadership, for the strong corporate results in 2010 – this is a testament to the good judgment and sound business practices of Ballard’s Management team. The Board, comprised of a seasoned group of business leaders with a variety of complementary skill sets, has naturally gained a deeper understanding of the fuel cell sector over time – as a result, I believe we are contributing measurably to the planning effort for Ballard’s future and to prudent governance of the business.
The employees of Ballard Power Systems certainly deserve recognition for their hard work, spirit of innovation and passionate desire to make a real difference for the environment. I encourage you to look at the “Employee Awards of Excellence for 2010” in the following pages, which acknowledge the outstanding contributions made by our people.
Finally, I would like to thank shareholders for your commitment and support of Ballard. The Company is focused on consistent execution of its business strategy, and the early results are offering a glimpse to a promising future.
"Ian A. Bourne"
Ian A. Bourne
Chair of the Board of Directors
1

Letter from JOHN W. SHERIDAN
President and Chief Executive Officer
President and Chief Executive Officer
2010 – A Turning Point for Our Company
2010 was a turning point for Ballard. With our corporate transformation completed – after 3 years of re-positioning and foundation building – we posted significant progress in growth and profitability in 2010.
This transformation began in 2007, with the shift away from high-cost, long-term automotive fuel cell technology development. At that time, Ballard embarked on a new vision: to leverage our technology and intellectual property, to become a global leader in clean energy, fuel cell products in commercial markets. We committed to this fundamental change in strategic direction to enable Ballard’s movement towards profitability – after decades of high cash burn and large losses. And, as part of this transformation, we re-set our cost base to enable near-term profitability and we built a solid liquidity position.
This commercial market focus has been all about replacing legacy diesel engines, diesel generators and lead-acid batteries, with cost-effective zero-emission fuel cell solutions. To maximize revenue potential and to minimize risk, we have pursued a multi-market growth strategy, addressing opportunities in:
- Backup power;
- Distributed generation;
- Buses; and
- Material handling.
Our strong revenue growth in 2010 is clear evidence of our progress in penetrating these markets, and is also an early barometer of the future potential. Customers, suppliers and industry experts are now recognizing this potential. As an example, Deloitte – a global business consulting service – recently issued its 2011 technology predictions, which includes the striking headline “Hydrogen comes out of hiding: the alternative alternative energy source”. “Deloitte predicts that hydrogen will enjoy tremendous success in 2011” precisely in the application areas that Ballard is focusing on. And, Deloitte goes on to say that “HFCs (hydrogen fuel cells) … could easily create a billion-dollar market by 2015.”
2010 Operating Results – “Putting Fuel Cells to Work”
In 2010, we drove significant improvement in our top-line revenue, which grew 39% to $65 million on fuel cell product shipment growth of 104%. This growth in revenue met the guidance we had provided to the investment community.
Gross margin improved significantly in the 4th quarter, and was up 3 points for the full year, to 16% — moving towards our longer term target of 30-35%.
2
In addition, we improved cash flow from operations by 30%, excluding the impacts of Dantherm Power and foreign exchange, ending the year at $(29.3) million. We also drove an improvement in Adjusted EBITDA of 33%, moving Ballard closer to overall profitability.
Finally, we ended the year with substantial cash reserves of $74.4 million, which puts the company on a strong financial footing for continued execution of our multi-market growth strategy.
Looking back on our ‘growth story’ for 2010, I am very pleased to report solid achievements that helped build momentum throughout the year –
- We secured orders for a number of fuel cell modules to be used in transit buses - including 3 additional buses for Transport for London in the U.K., 2 for SunLine Transit Agency in Palm Springs, CA and 4 that will be utilized in various locations under a U.S. FTA program. In addition, we secured an order from Tuttotrasporti in December for 3 modules that will be integrated into buses in Brazil, the world’s largest transit bus market.
- A 1-megawatt CLEARgenTM distributed generation system was delivered to FirstEnergy Generation Corp. in Ohio.
- A CLEARgenTM system was sold to K2 Pure Solutions, which will utilize by-product hydrogen from its bleach plant in California as fuel.
- 1.25-megawatts of fuel cell stacks were sold to Real Time Engineering for creation of a utility-scale distributed power generator in Singapore.
- We extended our supply agreement with Plug Power through 2014 under a mutually exclusive arrangement for the North American material handling market and Plug Power announced commercial orders with such customers as Coca-Cola, BMW, FedEx, Sysco and United Natural Foods.
- Ballard launched FuelWorksTM, a center of excellence for the advancement of fuel processing technology that will be important in the development of backup / supplemental power markets, together with founding partners University of Maryland and the U.S. Department of Defense.
- In February of 2011 we announced a conditional award of up to C$7 million from Sustainable Development Technology Canada to fund activities that will contribute to product cost reduction for the FCgen®-1300 fuel cell product platform, which powers the CLEARgen™ distributed generation system.
Unfortunately, despite this momentum and solid overall operating performance, our share price declined over the year – about 21% on NASDAQ and about 25% on the TSX. While Ballard’s share price outperformed our fuel cell company comparators, this share price performance is not acceptable. However, we remain convinced that we are on the right path to grow shareholder value, with a commitment to continue to build growth momentum on the ‘top line’ and drive the company to profitability, on the bottom line, after decades of losses. And progress on these fundamental goals was clearly evident in 2010.
Looking Forward – “Smarter Solutions for a Clean Energy Future”
We will continue aggressively driving forward on growth and profitability fronts in 2011.
In terms of growth, we expect revenue to be up in 2011, in excess of 30%, through our multi-market fuel cell product strategy:
- We expect the strongest growth to be in the bus and backup power markets;
- We will continue to work closely with Plug Power, to drive continued growth in the material handling market; and
- We expect to forge key progress with major customers, continuing to create a solid foundation in the fuel cell distributed generation market.
3
In terms of progressing to profitability, we expect an improvement in Adjusted EBITDA in 2011 in excess of 40%, through:
- Strong growth, with a shift to higher margin products;
- Further reductions in product costs;
- Improvements in gross margin toward a 30-35% target; and
- Maintenance of the operating cost base at the current run-rate.
Behind these numbers are enthusiastic Ballard employees who are committed to playing an important role in the clean energy sector. We are all working hard to deliver smarter solutions for a clean energy future, and remain focused on:
- Maintaining our leadership position in the fuel cell sector;
- Expanding our channels into global markets for target applications;
- Continuing to build equity in Ballard’s brand; and
- Becoming a profitable, sustainable business.
I look forward to reporting our progress as we move through 2011. Thank you for your continued support of Ballard.
"John Sheridan"
John Sheridan
President & CEO
Ballard Power Systems
President & CEO
Ballard Power Systems
4
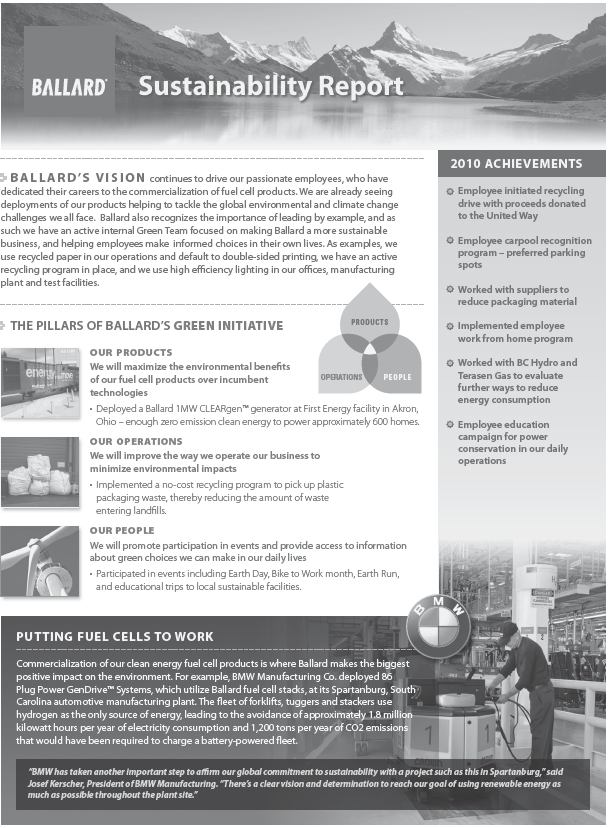
Sustainability Report
5
Ballard Employee Awards of Excellence for 2010

6
BALLARD POWER SYSTEMS INC.
9000 Glenlyon Parkway
Burnaby, British Columbia, Canada V5J 5J8
Burnaby, British Columbia, Canada V5J 5J8
NOTICE OF ANNUAL MEETING
TO OUR SHAREHOLDERS:
Our 2011 Annual Meeting (the "Meeting") will be held at 9000 Glenlyon Parkway, Burnaby, British Columbia, on Tuesday, May 31, 2011 at 1:00 p.m. (Pacific Daylight Time) for the following purposes:
| 1. | To receive our audited financial statements for the financial year ended December 31, 2010 and the report of our auditors thereon; | ||
| 2. | To elect our directors for the ensuing year; | ||
| 3. | To appoint our auditors for the ensuing year and to authorize our Audit Committee to fix the remuneration of the auditors; and | ||
| 4. | To consider and, if thought appropriate, to approve a resolution, on an advisory basis, accepting the Corporation’s approach to executive compensation. | ||
In addition, shareholders will be asked to consider any amendment to or variation of a matter identified in this Notice and to transact such other business as may properly come before the Meeting or any adjournment thereof.
A detailed description of the matters to be dealt with at the Meeting, our 2010 Annual Report, our consolidated financial statements for the year ended December 31, 2010 and the report of our auditors thereon, and our 2010 Management’s Discussion and Analysis, are included with this Notice.
If you are unable to attend the Meeting in person and wish to ensure that your shares will be voted at the Meeting, you must complete, date and execute the enclosed form of proxy and deliver it in accordance with the instructions set out in the form of proxy and in the Management Proxy Circular accompanying this Notice, so that it is received by Computershare Investor Services Inc. no later than 1:00 p.m. (Pacific Daylight Time) on Friday, May 27, 2011.
If you plan to attend the Meeting you must follow the instructions set out in the form of proxy and in the Management Proxy Circular to ensure that your shares will be voted at the Meeting.
DATED at Burnaby, British Columbia, April 15, 2011.
| BY ORDER OF THE BOARD |
| "Kerry Hillier" |
| Kerry Hillier |
| Corporate Secretary |
| Ballard Power Systems |
7
MANAGEMENT PROXY CIRCULAR
dated as of April 15, 2011
dated as of April 15, 2011
DEFINED TERMS
In this Management Proxy Circular:
"Ballard", "Corporation", "we", "us" and "our" refer to Ballard Power Systems Inc.
"Beneficial Shareholders" means holders of our Shares that do not hold our Shares in their own name, but instead, whose Shares are held on the Record Date by a bank, trust company, securities broker or other nominee.
"Board" means the board of directors of Ballard.
"C$" refers to Canadian currency.
"DSU" means deferred share unit.
"$" or "dollars" refer to United States currency unless specifically stated otherwise.
"Meeting" means the 2011 annual meeting of our Registered Shareholders and includes any adjournment thereof, unless otherwise indicated.
"NASDAQ" means the NASDAQ Global Market.
“Option Plan” means the Corporation’s consolidated share option plan, the principal terms of which are set out in Appendix "A".
"Record Date" means 5:00 p.m. Pacific Daylight Time on April 15, 2011.
"Registered Shareholders" means registered holders of our Shares on the Record Date.
"RSU" means restricted share unit.
“SDP” means the Corporation’s consolidated share distribution plan, the principal terms of which are set out in Appendix "B".
“SEC” means the U.S. Securities and Exchange Commission
"Shares" means common shares without par value in the capital of Ballard.
"TSX" means the Toronto Stock Exchange.
"US$" refers to United States currency.
MATTERS TO BE VOTED UPON
Registered Shareholders or their duly appointed proxyholders will be voting on:
- the election of directors to our Board;
- the re-appointment of our auditors and authorization for our Audit Committee to fix the remuneration of the auditors; and
- on an advisory basis, the Corporation’s approach to executive compensation.
As of the date of this Management Proxy Circular, we know of no amendment, variation or other matter that may come before the Meeting other than the matters referred to in the Notice of Annual Meeting. If any other matter is properly brought before the Meeting, it is the intention of the persons named in the enclosed proxy to vote the proxy on that matter in accordance with their best judgment.
With respect to resolutions to be voted on at the Meeting, a simple majority of the votes (greater than 50%) cast in favour by Registered Shareholders, by proxy or in person, will constitute approval.
8
ELECTION OF DIRECTORS
At the Meeting you will be asked to elect eight directors. All of our eight nominees are currently members of the Board. Each elected director will hold office until the end of our next annual shareholders’ meeting (or if no director is then elected, until a successor is elected) unless the director resigns or is otherwise removed from office earlier. If any nominee for election as a director advises us that he or she is unable to serve as a director, the persons named in the enclosed proxy will vote to elect a substitute director at their discretion.
The following information pertains to our nominees for election as directors at the Meeting, as of April 15, 2011. The number of Shares shown as being held by each nominee constitute the number beneficially owned, or controlled or directed, directly or indirectly, by that nominee and such information has been provided to us by that nominee.
Ian A. Bourne Age: 63 Alberta, Canada Director since: 2003 Independent | Mr. Bourne’s principal occupation is corporate director, and he has been the Chair of the Board of Ballard since February 2006. Mr. Bourne was also our lead director from October 2005 to February 2006. Previously, Mr. Bourne was the Executive Vice President and the Chief Financial Officer of TransAlta Corporation (electricity generation and marketing) from January 1998 to December 2006 and from January 1998 to December 2005, respectively. He has completed the Directors Education Program of the Institute of Corporate Directors and has received his ICD.D designation. | ||||
| Board and Committee Membership | Attendance | Board Memberships | |||
| Board (Chair) Audit Corporate Governance Management Development, Nominating & Compensation | 5 5 4 4 | 100% 100% 100% 100% | Current: SNC-Lavalin Group; Canadian Public Accountability Board; Wajax Corporation (formerly Wajax Income Fund); Canada Pension Plan Investment Board; Canadian Oil Sands Limited; The Calgary Foundation Previous: TransAlta Power LP; TransAlta CoGen LP; Glenbow Museum; Calgary Philharmonic Orchestra | ||
| Securities Held(1) | |||||
| Year | Shares | DSUs | Total of Shares and DSUs | Total Value of Shares and DSUs (C$)(2) | |
| 2011 | 26,824 | 77,706 | 104,530 | $211,151 | |
| 2010 | 26,824 | 77,706 | 104,530 | $266,552 | |
Edwin J. Kilroy Age: 51 Ontario, Canada Director since: 2002 Independent | Mr. Kilroy’s principal occupation is corporate director. Previously, Mr. Kilroy was the Chief Executive Officer of Symcor Inc. (business process outsourcing services), from January 2005 to November 2010. Prior to that, Mr. Kilroy was the Chief Executive Officer of IBM Canada Ltd. (information technology) from April 2001 to January 2005. | ||||
| Board and Committee Membership | Attendance | Board Memberships | |||
Board Audit (Chair) Management Development, Nominating & Compensation | 5 5 3 | 100% 100% 100%(3) | Current: not applicable Previous: Symcor Inc.; The Conference Board of Canada | ||
| Securities Held(1) | |||||
| Year | Shares | DSUs | Total of Shares and DSUs | Total Value of Shares and DSUs (C$)(2) | |
| 2011 | 2,752 | 42,844 | 45,596 | $92,104 | |
| 2010 | 2,752(4) | 42,844 | 45,596 | $116,270 | |
9
Dr. Chong Sup (C.S.) Park Age: 63 California, U.S.A. Director since: 2007 Independent | Dr. Park’s principal occupation is corporate director. Previously, Dr. Park was the Chief Executive Officer and Chairman of the Board of Maxtor Corporation (storage solutions and hard disk drives) from November 2004 to May 2006. Dr. Park was also the Managing Director, Investment Partner and Senior Advisor of H&Q Asia Pacific (private equity investment) from November 2002 to September 2004. | ||||
| Board and Committee Membership | Attendance | Board Memberships | |||
Board Corporate Governance Management Development, Nominating & Compensation | 5 4 4 | 100% 100% 100% | Current: Brooks Automation, Inc.; Seagate Technology; Computer Sciences Corp.; Sand Force Inc.; American Leadership Forum (Silicon Valley); Silicon Valley Community Foundation Previous: Smart Modular Technologies, Inc. | ||
| Securities Held(1) | |||||
| Year | Shares | DSUs | Total of Shares and DSUs | Total Value of Shares and DSUs (C$)(2) | |
| 2011 | 17,091 | 0 | 17,091 | $34,524 | |
| 2010 | 17,091 | 0 | 17,091 | $43,582 | |
John W. Sheridan Age: 56 B.C., Canada Director since: 2001 Non-Independent | Mr. Sheridan is President and Chief Executive Officer of Ballard, a position he has held since February 2006. Mr. Sheridan was also Chair of our Board from June 2004 to February 2006. | ||||
| Board and Committee Membership | Attendance | Board Memberships | |||
| Board | 5 | 100% | Current: AFCC Automotive Fuel Cell Cooperation Corp.; Dantherm Power; Premier’s Technology Council; Canadian Hydrogen Fuel Cells Association Previous: Aliant Inc.; Bell Canada, Bell Actimedia, Bell Distribution, Bell Express Vu, Bell Mobility, Bell West, Bell Sygma UK Ltd; Encom Cable TV & Telecommunications, plc; Manitoba Telecom Services Inc.; MTS Communications Inc.; Photowatt Technologies; Sun Media Corp. Ltd.; NewPage Corporation; BC Hydrogen Highway | ||
| Securities Held(1) | |||||
| Year | Shares | DSUs | Total of Shares and DSUs | Total Value of Shares and DSUs (C$)(2) | |
| 2011 | 269,913 | 57,943 | 327,856 | $662,269 | |
| 2010 | 261,710 | 57,943 | 319,653 | $815,115 | |
David J. Smith Age: 76 B.C., Canada Director since: 2006 Independent | Mr. Smith is a part-time Commissioner of the British Columbia Securities Commission (provincial securities regulator), a position he has held since July 2006. Mr. Smith was counsel with Lawson Lundell LLP (law firm) from May 2005 until April 2006, and prior to that, he was a partner at Lawson Lundell LLP and predecessor firms practicing corporate, commercial and securities law. He has completed the Directors Education Program of the Institute of Corporate Directors and has received his ICD.D designation. | ||||
| Board and Committee Membership | Attendance | Board Memberships | |||
Board Corporate Governance (Chair) | 5 4 | 100% 100% | Previous: Member of Executive Committee, British Columbia Chapter, Institute of Corporate Directors | ||
| Securities Held(1) | |||||
| Year | Shares | DSUs | Total of Shares and DSUs | Total Value of Shares and DSUs (C$)(2) | |
| 2011 | 8,411 | 14,841 | 23,252 | $46,969 | |
| 2010 | 7,911 | 14,841 | 22,752 | $58,018 | |
10
David B. Sutcliffe Age: 51 B.C., Canada Director since: 2005 Independent | Mr. Sutcliffe’s principal occupation is corporate director. Previously, Mr. Sutcliffe was the Chief Executive Officer of Sierra Wireless, Inc. (electrical and electronic industrial products) from May 1995 to October 2005. From May 2001 to April 2005, he was also the Chair of the Board of Sierra Wireless, Inc. He has completed the Directors Education Program of the Institute of Corporate Directors and has received his ICD.D designation. | ||||
| Board and Committee Membership | Attendance | Board Memberships | |||
Board Management Development, Nominating & Compensation (Chair) | 5 4 | 100% 100% | Current: Sierra Wireless, Inc. Previous: BC Technology Social Venture Partners; E-Comm 911 | ||
| Securities Held(1) | |||||
| Year | Shares | DSUs | Total of Shares and DSUs | Total Value of Shares and DSUs (C$) (2) | |
| 2011 | 3,600 | 25,528 | 29,128 | $58,839 | |
| 2010 | 3,600 | 25,528 | 29,128 | $74,276 | |
 Mark A. Suwyn Age: 68 Florida, U.S.A. Director since: 2003 Independent | Mr. Suwyn’s principal occupation is corporate director. Previously, Mr. Suwyn was Executive Chairman of the Board of NewPage Corporation (coated papers) from March 2009 to June 2010; Acting Chief Executive Officer and Chairman of the Board from March 2009 to January 2010; and Chief Executive Officer and Chairman of the Board, positions he held from April 2006 and May 2005, respectively. Mr. Suwyn was the President of MARSUW LLC (consulting) from November 2004 to April 2005. He was the Chief Executive Officer and Chairman of the Board of Louisiana-Pacific Corporation (building products) from January 1996 to October 2004. | ||||
| Board and Committee Membership | Attendance | Board Memberships | |||
| Board Audit | 5 5 | 100% 100% | Current: BlueLinx Corporation Previous: NewPage Corporation; Hope College Board of Trustees; Louisiana Pacific Corporation; International Paper Company; Junior Achievement Inc.; Junior Achievement International; Kelly Cabinets; The Nature Conservancy of Oregon; United Rentals Inc. | ||
| Securities Held(1) | |||||
| Year | Shares | DSUs | Total of Shares and DSUs | Total Value of Shares and DSUs (C$) (2) | |
| 2011 | 7,237 | 35,019 | 42,256 | $85,357 | |
| 2010 | 7,237 | 35,019 | 42,256 | $107,753 | |
 Douglas W.G. Whitehead Age: 64 B.C., Canada Director since: 1998 Independent | Mr. Whitehead is the Chairman of Finning International Inc. (heavy equipment reseller). Previously, Mr. Whitehead was the President and Chief Executive Officer of Finning International Inc. from 1999 to May 2008. | ||||
| Board and Committee Membership | Attendance | Board Memberships | |||
| Board Audit | 5 5 | 100% 100% | Current: International Forest Products Inc.; INMET Mining Corporation; Belkorp Industries Inc.; Finning International Inc.; Vancouver General Hospital/University of British Columbia Hospital Foundation | ||
| Securities Held(1) | |||||
| Year | Shares | DSUs | Total of Shares and DSUs | Total Value of Shares and DSUs (C$) (2) | |
| 2011 | 5,383 | 36,916 | 42,299 | $85,444 | |
| 2010 | 4,383 | 36,916 | 41,299 | $105,312 | |
| (1) | As of April 13, 2010 and April 15, 2011, respectively. | |
| (2) | Based on a C$2.02 and C$2.55 closing Share price on the TSX as of April 15, 2011 and April 13, 2010, respectively. | |
11
| (3) | Mr. Kilroy was appointed to the Management Development, Nominating & Compensation Committee on June 1, 2010 and attended all meetings scheduled from that time. | |
| (4) | Mr. Kilroy’s shareholdings were reported as 2,424 shares in 2010 due to error, which has been corrected. Mr. Kilroy’s actual shareholdings have not increased since that time. | |
APPOINTMENT OF AUDITORS
Our Audit Committee has recommended that KPMG LLP, Chartered Accountants, of 777 Dunsmuir Street, Vancouver, British Columbia, be nominated at the Meeting for re-appointment as our external auditors. Our Audit Committee will fix the remuneration of our external auditors if authorized to do so by shareholders at the Meeting. It is expected that representatives of KPMG LLP will be present at the Meeting. KPMG LLP were appointed as our external auditors in 1999. Total fees paid to KPMG in 2010 and 2009 are set forth in the table below. We comply with the requirement regarding the rotation of our audit engagement partner every five years. The current audit engagement partner at KPMG LLP may continue in his role until the end of 2016.
The following table shows the fees we incurred with KPMG LLP in 2010 and 2009:
| Type of Audit Fees | 2010 | 2009 | ||
| (C$) | (C$) | |||
| Audit Fees | $353,302 | $340,089 | ||
| Audit-Related Fees(1) | Nil | $9,587 | ||
| Tax Fees(2) | $19,265 | $6,115 | ||
| All Other Fees | Nil | Nil | ||
| (1) | The Audit-Related Fees for 2009 relate primarily to accounting advice for International Financial Reporting Standards. | |
| (2) | The Tax Fees for 2010 and 2009 related to tax advisory services. | |
For a more detailed description of the Audit Committee or to see the Audit Committee’s mandate, a copy of which is posted on our website, see the section entitled "Board Committees – Audit Committee" in our Annual Information Form dated March 9, 2011, which section is incorporated by reference into this Management Proxy Circular.
ADVISORY VOTE ON APPROACH TO EXECUTIVE COMPENSATION
The adoption of advisory votes on executive compensation, commonly known as “say-on-pay”, is a recent and still evolving corporate governance practice in Canada and elsewhere. The Corporate Governance Committee has monitored developments and trends relating to say-on-pay and reviewed the guidelines provided by various advisory bodies on this subject, including in particular the Canadian Coalition for Good Governance’s Model Shareholder Engagement and “Say on Pay” Policy for Boards of Directors.
The Corporate Governance Committee also noted that, in the United States, the SEC has established say-on-pay advisory shareholder vote requirements. The Corporation’s shares are traded on NASDAQ and it is a reporting company with the SEC. However, Ballard is a “foreign private issuer” with the SEC and accordingly these requirements do not apply to it.
In Canada, the Ontario Securities Commission has commenced a study of a number of “shareholder democracy issues” including say-on-pay. There is a possibility that say-on-pay shareholder voting requirements may be mandated in Canada and the Corporate Governance Committee will continue to monitor the situation.
In light of these developments, the Corporate Governance Committee recommended to the Board that Ballard shareholders be provided the opportunity, on an advisory basis, to vote at the Meeting in respect of the Corporation’s approach to executive compensation. The Corporate Governance Committee also recommended that adoption of a formal say-on-pay policy by the Board should be deferred until Canadian regulatory requirements applicable to the Corporation are known.
12
Accordingly, the shareholders of the Corporation are being given the opportunity to vote at this Meeting, on an advisory and non-binding basis, “FOR” or “AGAINST” the Corporation’s approach to executive compensation through the following resolution:
“RESOLVED, on an advisory basis and not to diminish the role and responsibilities of the Board of Directors of the Corporation, that the shareholders accept the approach to executive compensation disclosed in the Corporation’s management information circular delivered in advance of the Corporation’s 2011 annual meeting of shareholders.”
The Board believes that shareholders should be well informed as to, and fully understand, the objectives, philosophy and principles that it has used to make executive compensation decisions. For information regarding Ballard’s approach to executive compensation, shareholders should review the section entitled "Compensation – Compensation Discussion and Analysis" appearing below in this Management Information Circular.
The Board recommends that shareholders vote “FOR” the foregoing resolution. The representatives of management named in the enclosed form of proxy, if named as proxyholders, intend to vote for the resolution, unless the shareholder has specified in the form of proxy that his or her shares are to be voted against the resolution.
Approval of the above resolution will require an affirmative vote of a majority of the votes cast on the matter at the Meeting. As the vote on this resolution is advisory, the results will not be binding on the Board or the Management Development, Nominating & Compensation Committee ("MDNCC"). However, the Board and the MDNCC will take the results of the advisory vote into account, as appropriate, as part of their ongoing review of executive compensation philosophy, policies and programs.
VOTING
SOLICITATION OF PROXIES
This Management Proxy Circular is furnished in connection with the solicitation of proxies by our management in connection with the Meeting to be held on Tuesday, May 31, 2011 at 1:00 p.m. Pacific Daylight Time in Vancouver, British Columbia, Canada, or the date and place of any adjournment thereof. We are soliciting proxies primarily by mail, but our directors, officers and employees may solicit proxies personally, by telephone, by facsimile transmission or by other means of electronic communication. The cost of the solicitation will be borne by us. The approximate date on which this Management Proxy Circular and the related materials are first being sent to Registered Shareholders is May 6, 2011.
HOW TO VOTE
Only Registered Shareholders or their duly appointed proxyholders are permitted to vote at the Meeting. Beneficial Shareholders are not permitted to vote at the Meeting as only proxies from Registered Shareholders can be recognized and voted at the Meeting. You may vote as follows:
Registered Shareholders: If you are a Registered Shareholder you may vote by attending the Meeting in person, or if you do not plan to attend the Meeting, by completing the proxy and delivering it according to the instructions contained in the form of proxy and this Management Proxy Circular.
Beneficial Shareholders: If you are a Beneficial Shareholder you may only vote by carefully following the instructions on the voting instruction form or proxy form provided to you by your stockbroker or financial intermediary. If you do not follow the special procedures described by your stockbroker or financial intermediary, you will not be entitled to vote.
EXECUTION AND REVOCATION OF PROXIES
A Registered Shareholder or the Registered Shareholder’s attorney authorized in writing or, where the Registered Shareholder is a company, a duly authorized officer or attorney of that company, must execute
13
the proxy. In order to be effective, completed proxies must be deposited at the office of the registrar and transfer agent for the Shares, being Computershare Investor Services Inc. ("Computershare"), Proxy Dept., 100 University Avenue, 9th Floor, Toronto Ontario, M5J 2Y1 (Fax: within North America: 1-866-249-7775; outside North America: 1-416-263-9524), not less than 48 hours (excluding Saturdays and holidays) before the time of the Meeting. The individuals named as proxyholders in the accompanying form of proxy are directors and officers of Ballard. A Registered Shareholder desiring to appoint a person or company (who need not be a shareholder) to represent him or her at the Meeting, other than the persons or companies named in the enclosed proxy, may do so by inserting the name of such other person or company in the blank space provided in the proxy.
A proxy may be revoked by written notice executed by the Registered Shareholder or by his or her attorney authorized in writing or, where the Registered Shareholder is a company, by a duly authorized officer or attorney of that company, and delivered to:
- Computershare, at the address or fax number set out above, at any time up to and including the last business day preceding the day of the Meeting at which the proxy is to be used;
- the registered office of the Corporation at any time up to and including the last business day preceding the day of the Meeting at which the proxy is to be used; or
- the chair of the Meeting on the day of the Meeting and before any vote in respect of which the proxy is to be used is taken.
A proxy may also be revoked in any other manner provided by law. Any revocation of a proxy will not affect a matter on which a vote is taken before such revocation.
VOTING OF SHARES AND EXERCISE OF DISCRETION BY PROXIES
If you complete and deposit your proxy properly, then the proxyholder named in the accompanying form of proxy will vote or withhold from voting the Shares represented by the proxy in accordance with your instructions. If you do not specify a choice on any given matter to be voted upon, your Shares will be voted in favour of such matter. The proxy grants the proxyholder the discretion to vote on amendments to or variations of matters identified in the Notice of Annual Meeting and with respect to other matters that may properly come before the Meeting.
VOTING SHARES AND PRINCIPAL SHAREHOLDERS
As of the Record Date of April 15, 2011 we had 84,345,192 Shares issued and outstanding, each carrying the right to one vote. On a show of hands, every individual who is present as a Registered Shareholder or as a representative of one or more corporate Registered Shareholders, or who is holding a proxy on behalf of a Registered Shareholder who is not present at the Meeting, will have one vote, and on a poll, every Registered Shareholder present in person or represented by proxy and every person who is a representative of one or more corporate Registered Shareholders, will have one vote for each Share recorded in the Registered Shareholder’s name on the register of shareholders, which is available for inspection during normal business hours at Computershare and will be available at the Meeting.
As of the Record Date, to the knowledge of our directors and executive officers, no person beneficially owns, controls or directs, directly or indirectly, Shares carrying more than 10% of the voting rights attached to all issued and outstanding Shares carrying the right to vote in all circumstances.
INTEREST OF CERTAIN PERSONS OR COMPANIES IN MATTERS TO BE ACTED UPON
No one who has been a director or executive officer of ours at any time since January 1, 2010, or any of his or her associates or affiliates, has any material interest, direct or indirect, by way of beneficial ownership of Shares or otherwise, in any matter to be acted on at the Meeting other than the election of directors.
14
BOARD AND COMMITTEES
BOARD COMPOSITION AND NOMINATION PROCESS
Our Management Development, Nominating & Compensation Committee ("MDNCC") conducts an annual process under which an assessment is made of the skills, expertise and competencies of the directors and is compared to our needs and the needs of the Board. This process culminates in a recommendation to the Board of individual nominee directors for election at our annual shareholders’ meeting.
Directors are elected yearly at our annual shareholders’ meeting and serve on the Board until the following annual shareholders’ meeting, at which time they either stand for re-election or leave the Board. If no meeting is held, each director serves until his or her successor is elected or appointed, unless the director resigns earlier. The Board has established director resignation guidelines, which set out the circumstances under which a director would be compelled to submit a resignation or be asked to resign.
MAJORITY VOTING POLICY
The Board has adopted a policy which requires that any nominee for director who receives a greater number of votes "withheld" than "for" his or her election shall tender his or her resignation to the Board following our annual shareholders’ meeting, to take effect immediately upon acceptance by the Board. Upon receipt of such conditional resignation, the Corporate Governance Committee will consider the matter and, as soon as possible, make a recommendation to the full Board regarding whether or not such resignation should be accepted. After considering the recommendation of the Corporate Governance Committee, the Board will decide whether or not to accept the tendered resignation and will, not later than 90 days after the annual shareholders’ meeting, issue a press release which either confirms that it has accepted the resignation or provides an explanation for why it has refused to accept the resignation. The director tendering his or her resignation will not participate in any meeting of the Board or the Corporate Governance Committee at which the resignation is considered. Subject to any restrictions or requirements contained in applicable corporate law or Ballard’s constating documents, the Board may: (a) leave a resulting vacancy unfilled until the next annual shareholders’ meeting; (b) appoint a replacement director whom the Board considers merits the confidence of the shareholders; or (c) call a special meeting of shareholders to elect a replacement director who may be a person nominated by management. The policy does not apply in respect of any contested shareholders’ meeting, which is any meeting of shareholders where the number of nominees for director is greater than the number of directors to be elected.
BOARD MEETINGS
The Board meets on a regularly scheduled basis and directors are kept informed of our operations at meetings of the Board and its committees, and through reports by and discussions with management. In 2010, in-camera sessions were held after each regularly scheduled Board meeting. The in-camera sessions consisted of all of the independent directors without the presence of management. The Chair of the Board chairs the in-camera session. In 2010, there were 5 regularly scheduled meetings of the Board. In addition, communications between the directors and management occur apart from regularly scheduled Board and committee meetings. The Board has set a minimum meeting attendance guideline of 70%. Non-compliance with this guideline by a director is one of the factors considered in his or her individual performance evaluation at the end of the year.
COMMITTEES OF THE BOARD
The Board has established three standing committees: (1) the Audit Committee; (2) the MDNCC; and (3) the Corporate Governance Committee. Each committee has been delegated certain responsibilities, performs certain advisory functions and either makes certain decisions or makes recommendations to the Board. Each committee chair reports on the activities of the committee to the Board following each committee meeting. None of the members of these committees are current or former officers or employees of ours, or any of our subsidiaries.
15
In July 2009, in support of the Corporation's cost reduction initiatives, the Board decided to reduce the size of the standing committees. This was accomplished by providing that committee chairs no longer maintain membership on multiple committees. In order to maintain an adequate quorum on the Corporate Governance Committee following the departure of Mr. Kilroy from that Committee, Dr. Park joined the Committee at that time.
Following Dr. Sinclair’s resignation in June 2010, the Board determined that another director should replace her on the Management Development, Nominating & Compensation Committee in order to maintain adequate quorum. Given Mr. Kilroy’s previous experience serving on this committee, the Board approved his appointment as an exception to the requirement that committee chairs no longer maintain membership on multiple committees.
The information below sets out the members of each of our standing committees and indicates the number of meetings that each committee held in 2010. After the Meeting, we will reconstitute all of the committees to reflect the newly elected Board.
Audit Committee
The Audit Committee met 6 times during the financial year ended December 31, 2010. The members in 2010 were Ian A. Bourne, Edwin J. Kilroy (Chair), Mark A. Suwyn and Douglas W.G. Whitehead. All of the members of the Audit Committee are independent of our management in accordance with the applicable Canadian and United States securities laws and exchange requirements.
For a more detailed description of the Audit Committee or to see the Audit Committee’s mandate, a copy of which is posted on our website, see the section entitled "Board Committees – Audit Committee" in our Annual Information Form dated March 9, 2011, which section is incorporated by reference into this Management Proxy Circular.
Management Development, Nominating & Compensation Committee
The MDNCC met 4 times during the financial year ended December 31, 2010. The members in 2010 were Ian A. Bourne, Edwin J. Kilroy, Dr. C.S. Park and David B. Sutcliffe (Chair). All of the members of the MDNCC are independent of our management in accordance with the applicable Canadian and United States securities laws and exchange requirements.
For a more detailed description of the MDNCC or to see the MDNCC’s mandate, a copy of which is posted on our website, see the section entitled "Board Committees – Management Development, Nominating & Compensation Committee" in our Annual Information Form dated March 9, 2011, which section is incorporated by reference into this Management Proxy Circular.
Corporate Governance Committee
The Corporate Governance Committee met 4 times during the financial year ended December 31, 2010. The members in 2010 were Ian A. Bourne, Dr. C.S. Park and David J. Smith (Chair). All of the members of the Corporate Governance Committee are independent of our management in accordance with the applicable Canadian and United States securities laws and exchange requirements.
For a more detailed description of the Corporate Governance Committee or to see the Corporate Governance Committee’s mandate, a copy of which is posted on our website, see the section entitled "Board Committees – Corporate Governance Committee" in our Annual Information Form dated March 9, 2011, which section is incorporated by reference into this Management Proxy Circular.
CORPORATE GOVERNANCE
Our Board and senior management consider good corporate governance to be central to our effective and efficient operation. We monitor corporate governance initiatives as they develop and benchmark industry practices to ensure that we are in compliance with corporate governance rules.
16
Our corporate governance practices are reflected in our Corporate Governance Guidelines, which provide for director qualification standards, director responsibilities, the form and amount of director compensation, director orientation and continuing education, management succession planning and performance evaluation of the Board. A copy of the Corporate Governance Guidelines can be found on our website. We have also reviewed our internal control and disclosure procedures, and are satisfied that they are sufficient to enable our Chief Executive Officer and Chief Financial Officer to certify our interim and annual reports filed with Canadian securities regulatory authorities, and to certify our annual reports filed with or submitted to the SEC.
In addition, we have set up a process for shareholders to communicate to the Board, the details of which can be found on our website. A summary of shareholder feedback is provided to the Board through a semi-annual report.
For a more detailed description of our corporate governance policies and practices, see the section entitled "Corporate Governance" in our Annual Information Form dated March 9, 2011, which section is incorporated by reference into this Management Proxy Circular.
EXECUTIVE COMPENSATION
COMPENSATION DISCUSSION AND ANALYSIS
This section of this Management Proxy Circular contains a discussion of the elements of compensation earned by our "Named Executive Officers", who are listed in the Summary Compensation Table below: John W. Sheridan (President and Chief Executive Officer), Bruce Cousins(1) (former Vice President and Chief Financial Officer), Tony Guglielmin(2) (Vice President and Chief Financial Officer), Christopher J. Guzy (Vice President and Chief Technical Officer), Michael Goldstein (Vice President and Chief Commercial Officer) and William Foulds (Vice President and President, Ballard Material Products).
Objectives of Our Executive Compensation Program
The structure of our executive compensation program is designed to compensate and reward executives appropriately for driving superior performance. For our Named Executive Officers, a significant portion of their total direct compensation is "at risk" and tied closely to the success of the Corporation’s short and long-term objectives. "At risk" means that the executive will not realize value unless specified goals, many of which are directly tied to the Corporation’s performance, are achieved or the price at which our common shares are traded on the TSX or NASDAQ appreciates. In 2010, these performance goals, and resulting compensation awards, were largely focused on the Corporation’s key business drivers including growing revenue and building the long term order book, EBITDA(3) performance, reducing costs, customer deliveries and the delivery of key strategic business enablers to position the Corporation for long term success. This compensation philosophy puts a strong emphasis on pay for performance, and uses equity awards as a significant component in order to correlate the long-term growth of shareholder value with management’s most significant compensation opportunities. The strategic goals of the Corporation are reflected in the incentive-based executive compensation programs so that executives’ interests are aligned with shareholders interests.
| (1) | Mr. Cousins resigned as Chief Financial Officer on June 14, 2010.and provided transition support to Mr. Guglielmin until June 30, 2010 when he departed the company. | |
| (2) | Mr. Guglielmin was appointed Vice President and Chief Financial Officer on June 14, 2010. | |
| (3) | For a discussion of EBITDA and Adjusted EBITDA , please refer to Ballard’s Management’s Discussion & Analysis. | |
17
Philosophy and Objectives
Our philosophy and objectives regarding compensation are to:
| (a) | attract and retain experienced, qualified, capable executive officers by paying salaries which are competitive in the markets in which we compete for executive talent; | ||
| (b) | motivate short and long-term performance by directly linking annual bonuses to performance; and | ||
| (c) | link our executive officers' interests with those of our shareholders by providing our executive officers with equity-based compensation, requiring them to comply with minimum share ownership guidelines and build a sustained ownership position. | ||
How Executive Compensation is Determined
The MDNCC is charged, on behalf of our Board, with reviewing and approving executive officers’ benefit policies and compensation plans, including our annual bonus plan and our long-term equity-based compensation plans. As part of its mandate, the committee approves and recommends to the Board the appointment of our executive officers. The committee also reviews and approves the amount and form of their compensation, their development and succession plans, and any significant organizational or management changes. The committee retains independent compensation consultants for professional advice and as a source of competitive market information. In 2010, the committee directly retained Towers Watson (formerly Towers Perrin), on an as-needed basis, to provide independent advice related to Ballard executive compensation items. The committee also seeks the advice and recommendations of our President and Chief Executive Officer with respect to the compensation of our other executive officers. The President and Chief Executive Officer does not participate in the portions of the committee discussions that relate directly to his personal compensation.
Executive Pay Mix and the Emphasis on "At Risk" Pay
We place emphasis on performance by having a significant proportion of our executive officers’ total annual compensation linked to corporate and individual performance. For 2010, an average of 63% of the annual compensation earned by each of our Named Executive Officers came from "at risk", variable, performance-related compensation containing inherent market performance risk, where annual compensation includes base salary, annual bonus and equity-based long-term incentives (including share options and RSUs).
The Use of Benchmarking
Our overall compensation objective is to pay executives on average at the 50th percentile of the comparator group for full achievement of performance goals. Over-achievement or under-achievement will result in being over or under the average.
In late 2008, the MDNCC, working with Towers Watson, updated the comparator companies contained within the Corporation’s compensation comparator group to better reflect the Corporation’s business size and market focus following the divestment of the automotive business in January 2008. A new list of comparator companies was reviewed and accepted by the committee, which selected the group of comparators ensuring a suitable mix of Canadian and United States companies exhibiting a growth oriented mix of revenues, employee base, asset base, market capitalization and market focus. This comparator group comprises the primary source of compensation data for review of the Corporation’s market competitiveness. The committee reviews the composition of the comparator company list on an annual basis.
The committee compares each executive officer’s annual salary, target annual incentive bonus and long-term incentive compensation value, both separately and in the aggregate, to amounts paid for similar positions at comparator group companies. As noted above, the committee’s practice is to target annual total
18
direct compensation for each executive at approximately the 50th percentile among the comparator group companies.
The Corporation’s current comparator group is:
| Canadian Companies(4) | United States Companies | |
| Gennum Corporation | American Superconductor Corp. | |
| MacDonald Dettwiler and Associates Ltd. | Clean Energy Fuels Corp. | |
| QLT Inc. | Comverge Inc. | |
| Sierra Wireless Inc. | Energy Conversion Devices Inc. | |
| Westport Innovations Inc. | Evergreen Solar Inc. | |
| FuelCell Energy Inc. | ||
| Maxwell Technologies Inc. | ||
| PMC-Sierra Inc. | ||
| Plug Power Inc. | ||
| Power Integrations Inc. |
Current Executive Compensation Elements
Our compensation program for our executive officers has three primary components:
| (a) | annual salary; | ||
| (b) | annual incentives (bonus); and | ||
| (c) | equity-based long-term incentives comprised of awards that may be issued under our Option Plan or under the Market Purchase RSU Plan(5). | ||
Annual Salary
The MDNCC approves the annual salary of our executive officers. Salary guidelines and salary adjustments for our executive officers are considered with reference to:
| (a) | comparative market assessments performed by external compensation consultants; | ||
| (b) | the experience and qualifications of each executive officer; | ||
| (c) | the individual performance of each executive officer; and | ||
| (d) | the roles and responsibilities of each executive officer. | ||
The Corporation chooses to pay this element of compensation, because the Corporation’s view is that a competitive base salary is a necessary element for attracting and retaining qualified and experienced executive talent.
The Corporation’s decisions about this element of compensation and its annual level impacts decisions about the level of target annual incentive an executive might receive, but only in the sense that the incentive bonus target is set as a percentage of annual salary.
In 2010, there were no annual salary increases for the Named Executive Officers (with the exception of Mr. Foulds, who received an increase to $230,000 as a result of his elevation to a job level consistent with the other Senior Executives). However, in 2010 base salary levels for Named Executive Officers (with the
| (4) | Xantrex Technology was removed from the Canadian comparator group in 2009 following its acquisition by Schneider Electric. | |
| (5) | For a detailed description of our equity-based compensation plans, see “Equity Based Compensation Plans” and Appendix "A" and "B" of this Management Proxy Circular. | |
19
previously noted exception of Mr. Foulds) were restored to previous levels, following an action in 2009, where the full-time Named Executive Officers voluntarily accepted a temporary 10% reduction in base salary, consistent with the Corporation's overall cost reduction efforts and austerity measures.
Annual Bonus for Executive Officers
The MDNCC reviews and approves the annual bonus for each executive officer based on the recommendations of our President and Chief Executive Officer in accordance with the factors described in the foregoing section. Ballard had historically paid the annual bonus in Shares or in DSUs. Starting in 2010, the Corporation commenced the payment of annual bonuses for our Named Executive Officers in cash. This change was consistent with the overall move away from the use of treasury shares for compensation purposes and the changes approved by shareholders in 2009 related to the consolidation and funding of the Corporation's share and option based plans.
The annual target bonus for executive officers (excluding the President and Chief Executive Officer) was set at 70% of base salary in 2010. This bonus target had been reduced in 2008 to 70% from 75% in 2007 (this reduction followed a similar reduction in the target bonus level of 5% from 2006 levels to better align annual incentive levels to market levels relative to the Corporation’s comparator group). Each executive officer’s actual 2010 bonus was based on a combination of his individual performance and our corporate performance relative to goals, as discussed below under the section entitled "Methodology for Determining Annual Incentives".
The Corporation maintains an annual bonus program in order to motivate short and long-term performance by directly linking annual bonuses to the performance and progress of the Corporation.
The Corporation’s decisions about this element of compensation do not directly affect decisions about any other element of the Corporation’s compensation program.
For a full discussion of annual incentive compensation for our President and Chief Executive Officer, see the section entitled "Chief Executive Officer Compensation". The section below entitled "Methodology for Determining Annual Incentives" applies equally to the President and Chief Executive Officer as it does to the other executives.
Methodology for Determining Annual Incentives
The actual annual bonus for each executive officer is determined by the MDNCC on the basis of the following formula:
annual base salary x target bonus percentage x individual performance multiplier x corporate multiplier
The corporate multiplier is determined by the MDNCC and approved by the Board with reference to achievement against the corporate goals set out in a Corporate Performance Scorecard approved by the MDNCC and the Board prior to the commencement of the year. Each corporate performance goal on the scorecard is assigned a relative weighting in terms of importance to annual performance and growth of the Corporation, as well as a range of targeted outcomes, such that below a certain performance level the contribution of that goal to the overall corporate multiplier is zero. For 2010, the Corporate Performance Scorecard reflected a balance of Quantitative annual goals focussed on delivery of the 2010 operating plan (60% of the scorecard) and Qualitative goals focussed on key strategic outcomes during 2010 to position the Corporation for longer term success (40% of the scorecard). The Quantitative portion of the scorecard had 3 financial elements (Revenue from fuel cell products, Revenue from supporting business segments and EBITDA performance) and 3 operational elements (Cost of Goods Sold target improvements, on-time delivery of customer orders and building an order book for 2011). The Qualitative portion of the scorecard had 4 elements (successful execution of the sales/lease back agreement for the Burnaby location, demonstrating an EBITDA inflection point toward corporate profitability in Q4 2010, booking a major Distributed Generation sale in hydrogen by-product or wind application, and establishing key strategic systems and fuel processing capabilities for supplemental power).
20
Goals related to Revenue from the supporting business segments, Cost of Goods Sold target improvements and order book build for 2011 targets were all exceeded and received between 100% to 150% scoring in the overall corporate multiplier.
Targets related to on-time delivery of manufacturing orders, the sales leaseback transaction, DG sale in by-product hydrogen and strategic systems and fuel processing capability in supplemental power were all met, and received 100% scoring, while the EBITDA inflection point target was partially met and received a 50% score in the overall corporate multiplier.
While significant progress was made in 2010 in overall revenue growth and EBITDA performance, aggressive stretch targets related to Revenue from fuel cell products and EBITDA were not met and received 0% scoring in the overall corporate multiplier.
The overall corporate multiplier for 2010, as reviewed and agreed to by the MDNCC and the Board, based on achievement relative to these corporate goals, was 90%.
Given the nature of the corporate performance multiplier, for any particular year the corporate performance multiplier is not determined until our annual financial statements for that particular financial year are complete. However, notwithstanding that the corporate performance multiplier is not determined, and the annual bonus based thereon is not paid until the end of the first quarter following each particular financial year, in our summary compensation table we report the annual bonus for each particular financial year as if it had been determined and paid in the particular financial year.
A discussion of the annual base salary, target bonus percentage and corporate multiplier components of this annual incentive formula for each executive officer is set out above. The individual performance multiplier is determined with reference to achievement against the individual goals set for each executive officer, with an individual performance multiplier greater than 100% being awarded for superior performance against these goals, and an individual performance multiplier of less than 100% being awarded for substandard performance against these goals. Individual goals are set for individual executive officers by the Chief Executive Officer and are based on agreed-upon objective/identifiable measures relative to their respective functional accountabilities, which are aligned to the corporate performance goals. Our Named Executive Officers’ individual performance multipliers for 2010 ranged from 90% to 140%.
Mr. Guglielmin was appointed Chief Financial Officer on June 14, 2010. Although only a partial year, Mr. Guglielmin has met his overall performance goals for his CFO role, related to financial operations, administration, investor relations and information technology since the date of his appointment.
Mr. Guzy’s primary responsibilities for 2010, in his role of Vice President and Chief Technology Officer, were in research programs, product development and project implementation. Mr. Guzy met his goals in his fundamental accountabilities for product cost reduction goals, key technology development programs and the establishment of FuelWorks--the Fuel Processing Solutions Center of Excellence at the University of Maryland.
Mr. Goldstein continued key programs in 2010 to build stronger organizational capabilities in sales and marketing through the recruitment of external talent, sales training, improving the funnel management processes, etc. He also played a key leadership role in heightening the business focus on distributed generation business opportunities.
Mr. Foulds had a strong performance year in 2010. Under his leadership the Ballard Material Products division exceeded its goals, producing strong revenue growth and positive bottom line results.
Mr. Cousins resigned effective June 30, 2010 and did not receive an annual bonus for 2010, nor did he receive any severance payment.
Long Term Incentives
We provide our executive officers with equity-based long-term incentives through the Option Plan, Market Purchase RSU Plan and the SDP. These plans are designed to reinforce the connection between executive officer remuneration and our performance by motivating and rewarding participants for improving our long-term financial strength and enhancing shareholder value, and also providing retention value to
21
executives. With respect to equity-based long-term compensation awards for our executive officers, individual performance and future contribution expectations are taken into account in determining the award. In 2010, the President and Chief Executive Officer recommended to the MDNCC a value amount in dollars for each Named Executive Officer which considered the previous comparator company study by Towers Perrin (now Towers Watson), which was approved for each executive: see the amounts set out under “Share-Based Awards” and “Option-Based Awards” in our Summary Compensation Table. 50% of this value amount was then converted to RSUs at the then current market price by dividing the dollar value by the closing share price on either the TSX or NASDAQ on the award date. 50% of this value amount was converted to options by dividing the dollar value by the Black-Scholes value of a Ballard option on the award date. These options were then priced at the closing share price on the day prior to the award date.
A new hire Long Term Incentive award consisting of both options and RSUs was given to Mr. Guglielmin upon his appointment as executive to the Corporation on June 14, 2010.
This element of compensation and the Corporation’s decisions about this element fit into the Corporation’s overall compensation objectives in that they link our shareholders’ interests with those of our executive officers by providing our executive officers with equity-based compensation, and requiring them to comply with minimum share ownership guidelines.
The Corporation’s decisions about this element of compensation do not affect decisions about any other element of the Corporation’s compensation.
Share Options
Share options are granted annually in respect of approximately 50% of the long-term incentive compensation to be provided to an executive. As a result, previous grants of Share options are not generally taken into account when making new grants. The actual number of Share options granted is determined by dividing the dollar value of the portion of the long-term incentive to be satisfied though an option grant by the Black-Scholes value of a Ballard option on the award date.
Under our Option Plan:
| (a) | the exercise price of each option is determined by the Board, but must not be less than the closing price per Share on the TSX on the last trading day before the date the option is granted; and | ||
| (b) | each option may be exercised by the holder in respect of up to one-third of the Shares subject to the option on or after the first, second and third anniversary of the effective date of the option on a cumulative basis. | ||
Share options are typically granted for a term of seven years.
Restricted Share Units
Employees and executive officers are eligible to receive new RSU awards under the Market Purchase RSU Plan, which provides for vesting over periods of up to three years and awards may be subject to certain performance criteria, as determined by the Board upon the recommendation of the MDNCC. Redemption of these RSUs is satisfied with Shares bought under the Market Purchase RSU Plan.
The amount of the long-term incentive that is awarded to each executive officer is typically determined in the first quarter of each financial year, in conjunction with the determination of that executive officer’s annual bonus for the prior financial year. Since the long-term incentive is tied to future (as opposed to past) corporate performance, in our summary compensation table we report the grant of the long-term incentive in the "Share-Based Awards" column and the "Option-Based Awards" column for the particular year in which they were actually granted. The year-end values of unexercised or unvested Share options and RSUs, and the vesting during the year of Share options and RSUs are reported in the tables under the heading "Incentive Plan Awards".
New Issuances
On March 11, 2010, 254,587 RSUs were issued to the Named Executive Officers, including the President and Chief Executive Officer (this amount of RSUs does not include 50,000 units which were issued
22
to Mr. Cousins, but subsequently expired upon his departure). For all our executive officers who received an award on that date, the RSU awards included a performance criteria achievement goal of a minimum corporate multiplier of 75% in each of the 3 years of the award. With redemption of each 1/3 of the award subject to a minimum corporate performance of 75% in 2010, 2011 and 2012. Failure to meet this minimum corporate performance threshold in any one year results in that year’s award portion expiring and not being redeemed (see the section above entitled "Methodology for Determining Annual Incentives" for a description of the determination of the corporate multiplier).
Mr. Guglielmin received a grant of RSUs as part of his new hire award. These RSU awards were subject to time vesting only over 3 years. He received 75,676 RSUs on June 14, 2010.
Redemptions
On February 22 2010, 23,055 RSUs reached the end of their restriction period and after statutory withholdings, 13,167 RSUs were redeemed into Shares, representing one-third of the 2007 annual RSU long-term incentive award granted to Mr. Sheridan, Mr. Guzy and Mr. Foulds on February 22, 2007. These RSUs were redeemed into Shares following the Board’s previous confirmation that the performance criteria (>75% achievement of the corporate multiplier in 2007) was met.
On February 22 2010, 33,191 RSUs reached the end of their restriction period and after statutory withholdings, 18,993 RSUs were redeemed into Shares, representing one-third of the 2008 annual RSU long-term incentive award granted to Mr. Sheridan on May 12, 2008 and to Mr. Guzy and Mr. Foulds on February 21, 2008. These RSUs were redeemed into Shares following the Board’s confirmation that the performance criteria (>75% achievement of the corporate multiplier in 2008) was met. The remaining one-third of the RSU award will be issued to each executive officer in 2011, provided they remain employed by the Corporation on the respective redemption dates.
On May 4, 2010, 19,943 RSUs reached the end of their restriction period and after statutory withholdings, 11,228 RSUs were redeemed into Shares for Mr. Goldstein. This award was the first 1/3 of his new hire award, granted on May 5, 2009 and subject to time vesting only.
On April 30, 2010, 19,047 RSUs reached the end of their restriction period and after statutory withholdings, 10,724 RSUs were redeemed into Shares for Mr. Cousins. This award was the first 1/3 of his new hire award, granted on April 30, 2009 and subject to time vesting only. The remaining 2/3’s of this award was cancelled upon his departure, and no further RSUs were redeemed for shares to Mr. Cousins.
Chief Executive Officer Compensation
Mr. Sheridan was appointed President and CEO by the Board on February 22, 2006. When appointed, his base salary at that time was fixed at $530,000 Cdn per year. The CEO base salary has been frozen since that time, other than a 10% voluntary temporary reduction during the 2nd half of 2009. This base salary reduction from August until year end 2009, was volunteered as an austerity measure in support of cost reduction initiatives that were being implemented across the Corporation. In January 2010, Mr. Sheridan’s base salary returned to its original level of $530,000 Cdn per year.
Mr. Sheridan is entitled to receive an RRSP contribution (US$11,060 (6) in 2010). Due to changes in the corporate RRSP program in 2010 this benefit was reduced by 50% relative to 2009, and is now subject to an equivalent matching contribution from Mr. Sheridan. Mr. Sheridan is also entitled to receive company paid insurance premiums (US$1,826 (7) in 2010).
Mr. Sheridan’s target bonus for 2010, as detailed below was equal to 90% of his annual base salary. This level of target bonus has been reduced from 100% in 2007. Mr. Sheridan’s bonus for 2010 was determined by the MDNCC on the basis of corporate financial and operational performance reflected in the
____________________
| (6) | RRSP contribution was paid in Canadian dollars (C$11,000) and was converted into United States dollars for the purpose of the disclosure above using the Bank of Canada noon rate of exchange on December 31, 2010. | |
| (7) | Insurance premiums were paid in Canadian dollars (C$1,816) and were converted into United States dollars for the purpose of the disclosure above using the Bank of Canada noon rate of exchange on December 31, 2010. |
23
Corporate Performance Scorecard rating, plus performance relative to the CEO’s individual goals for 2010, as approved by the Board.
The MDNCC assessed Mr. Sheridan's financial and operational performance as being strong overall, as evidenced by strong operating results:
- Revenue: $65m (39% growth versus 2009)
- Adjusted EBITDA: - $26m (33% improvement versus 2009)
- Cash Flow from Operations: -$29.3m (30% improvement, excluding foreign exchange adjustments and Dantherm Power)
- Product Shipments: 3,014 Units (104% growth versus 2009)
- Gross Margin: 16% (3 point improvement versus 2009)
- Yearend Cash Reserves: $74.4m
In addition, the MDNCC recognized strong achievements relative to Mr. Sheridan’s individual goals, as approved by the Board of Directors, including the development of an effective operating model with Dantherm Power, effective strategic planning to position the Company to move to the ‘next level’ of growth and profitability, and the re-energization of the organization after the downsizing & cost-cutting in 2009.
These individual goals were purposely not weighted in advance so that the Board could retain the flexibility to assess the overall individual performance of Mr. Sheridan after reviewing all aspects of performance for the full year, without the constraint of a pre-set weighting on any particular goal.
After assessing the above achievements relative to the goals, the Board approved an individual performance multiplier of 125%. Applying this individual multiplier and the corporate multiplier of 90% (determined in accordance with the corporate multiplier methodology set forth in the section entitled "Methodology for Determining Annual Incentives"), to Mr. Sheridan’s target bonus for 2010 of 90% of base salary, resulted in a bonus payment to Mr. Sheridan of US$539,539(8) for the fiscal year ended December 31, 2010.
The total value of Mr. Sheridan's compensation in 2010 was US$1,612,180.
On March 11, 2010, the Board approved the recommendation by the MDNCC and Mr. Sheridan was granted a long-term incentive award, equivalent at the time of grant to a total value of US$502,894; with US$251,852 converted to options in respect of 185,185 Shares (at an exercise price of CDN$2.40 per Share) and a RSU award of US$251,042 (104,167 RSUs at a price of CDN$2.40 per Share). These awards formed Mr. Sheridan’s 2010 long-term incentive package, and the overall value and equity mix was approved by the MDNCC and the Board following consultations with Towers Watson. Consistent with other Named Executive Officers, the RSU award has performance criteria and time vesting as described above in the Restricted Share Units – New Issuances section, and the share options were granted with a 7-year term, with one-third of the options vesting at the end of each of the first three years.
Termination and Change of Control Benefits
For a description of the termination and change of control benefits under Ballard's employee contracts and equity compensation plans for the President & CEO and other Named Executive Officers, see the section entitled "Termination and Change of Control Benefits" below.
Perquisites
In addition to cash and equity compensation, the Corporation provides Named Executive Officers with certain personal benefits, consistent with similar benefits coverage within the comparator group. These
____________________
| (8) | Mr. Sheridan’s bonus was paid in Canadian dollars (C$536,625) and was converted into United States dollars for the purpose of this disclosure using the Bank of Canada noon rate of exchange on December 31, 2010. |
24
benefits include a car allowance, medical benefits program, long and short-term disability coverage, life insurance, an annual medical and a financial planning allowance.
Retirement Benefits
In 2010, each Canadian Named Executive Officer received an RRSP contribution from the Corporation, equal to 50% of the maximum amount allowable under the Income Tax Act (Canada), based on the Named Executive Officer making an equivalent personal matching contribution. In 2010, this amount was US$11,060(9), pro-rated for Mr. Cousins and Mr. Guglielmin based on the portion of the full year they were employed by the Corporation. In 2010, the Corporation made changes to its overall RRSP program. Starting on January 1, 2010, each executive is required to make a matching contribution to receive an RRSP benefit. As a result of these changes, the maximum benefit each executive can receive is up to 50% of the maximum amount allowable under the Income Tax Act (Canada), based on the executive making an equal matching contribution. This is both a reduction of 50% in value of the total benefit relative to the program prior to 2010, and also requires a matching contribution from the executive.
In the United States, Mr. Foulds participated in a similar 401k matching program. Based on personal contributions from Mr. Foulds, the Corporation will make matching contributions up to a value of 10% of his base salary, subject to annual personal and catch-up contribution limits.
None of the Named Executive Officers currently participates in a Corporation-sponsored Defined Benefits Plan, Defined Contribution Plan, or Supplemental Executive Retirement Plan, nor do they receive contributions to any such plan on their behalf from the Corporation. Mr. Foulds retains a frozen retirement benefit under a previously active Defined Benefits Plan.
Total Executive Officer Compensation
The total value of the compensation of the Chief Executive Officer together with all of the other Named Executive Officers (as defined below in the section entitled "Executive Compensation") was US$5,268,702(10).
Minimum Share Ownership Guidelines
We established executive officer minimum share ownership guidelines in 2003, which obligate each executive officer to own a minimum number of our Shares. Those guidelines were modified by our Board in December 2007 to increase the minimum share ownership requirements for our executive officers.
For current executive officers other than the President and Chief Executive Officer, a new minimum share ownership guideline(11) was established requiring the executive officers to acquire a number of Shares, equal to the lesser of:
| (a) | the number of Shares with a fair market value equal to the executive officer’s annual base salary; or | ||
| (b) | 35,300 Shares(12). | ||
In 2006, the policy for the President and Chief Executive Officer was reviewed and the equity ownership requirement for the President and Chief Executive Officer was increased such that the minimum share ownership guideline is equal to the lesser of:
____________________
| (9) | RRSP contributions were paid in Canadian dollars (C$11,000) and were converted into United States dollars for the purpose of the disclosure above using the Bank of Canada noon rate of exchange on December 31, 2010. | |
| (10) | The majority of compensation was paid in Canadian dollars and the aggregate amount paid was converted into United States dollars for the purpose of the disclosure above using the Bank of Canada noon rate of exchange on December 31, 2010. | |
| (11) | For executive officers other than the President and Chief Executive Officer who were employed as at December 2007, the time for acquiring the new minimum share ownership level has been extended by three years for a total of eight years. For executive officers hired after December, 2007, the minimum number of Shares must be acquired over a five-year period. For the President and Chief Executive Officer, the share acquisition period is five years from the date of hire. | |
| (12) | For executives hired after December 2007 the minimum value is determined by the number of Shares equal to one times the executive’s base salary divided by the closing share price of the Corporation’s Shares on the TSX on the trading day of the date of hire. | |
25
| (a) | the number of Shares that have a fair market value of three times the President and Chief Executive Officer’s base salary; or | ||
| (b) | 181,903 Shares. | ||
For the purposes of this section, the "fair market value" is defined as the closing price of our Shares as listed on the TSX on the date of review of the guideline. All executive officers have met or are on track to achieve the applicable guidelines.
PERFORMANCE GRAPH
The following graph compares the total cumulative return to a shareholder who invested $100 in our Shares on December 31, 2005, assuming reinvestment of dividends, with the total cumulative return of $100 on the NASDAQ Composite Index for the last five years.
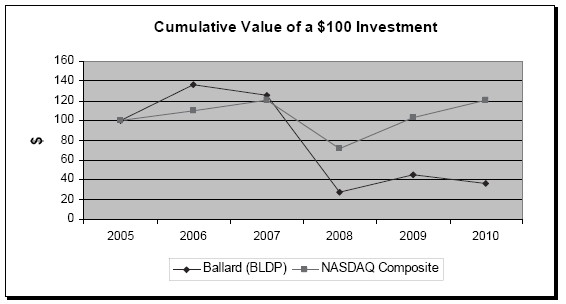
| 2005 (Dec 31) | 2006 (Dec 31) | 2007 (Dec 31) | 2008 (Dec 31) | 2009 (Dec 31) | 2010 (Dec 31) | |||||||
| ($) | ($) | ($) | ($) | ($) | ($) | |||||||
| Ballard | 100 | 136 | 126 | 27 | 45 | 36 | ||||||
| NASDAQ | 100 | 110 | 120 | 72 | 103 | 120 | ||||||
| Composite | ||||||||||||
| Index |
The trend shown by this graph does not reflect the trend in the Corporation’s compensation to its Named Executive Officers.
26
EXECUTIVE COMPENSATION TABLES
The following table summarizes the compensation paid for the fiscal years ended on December 31, 2008, December 31, 2009 and December 31, 2010 to our Named Executive Officers. The 2008 and 2009 compensation figures have been restated using the same foreign exchange rate as the 2010 figures to provide a meaningful year-on-year comparison.
| Summary Compensation Table | |||||||
| Long-Tern Incentives | |||||||
| Share-Based | Option-Based | All Other | Total | ||||
| Name and Principal | Salary(3) | Bonus(4) | Awards(5) | Awards(6) | Compensation(7) | Compensation | |
| Position | Year | (US$) | (US$) | (US$) | (US$) | (US$) | (US$) |
| John W. Sheridan(1) | 2010 | 532,878 | 539,539 | 251,042 | 251,852 | 36,869 | 1,612,180 |
| President and Chief Executive | 2009 | 512,438 | 355,856 | 193,875 | 122,334 | 44,853 | 1,229,356 |
| Officer | 2008 | 532,878 | 684,854 | 1,758,393 (8) | 251,237 | 48,311 | 3,275,673 |
| Tony Guglielmin(2) | 2010 | 170,785 | 97,425 | 140,757 | 178,500 | 15,276 | 602,743 |
| Vice President and Chief | 2009 | 0 | 0 | 0 | 0 | 0 | 0 |
| Financial Officer | 2008 | 0 | 0 | 0 | 0 | 0 | 0 |
| Bruce Cousins(2) | 2010 | 154,561 | 0 | 120,500 | 120,888 | 66,441 | 462,390 |
| Former Vice President and | 2009 | 217,751 | 112,744 | 140,571 | 217,000 | 60,365 | 748,431 |
| Chief Financial Officer | 2008 | 0 | 0 | 0 | 0 | 0 | 0 |
| William Foulds | 2010 | 225,479 | 253,792 | 120,000 | 120,000 | 141,845 | 861,116 |
| Vice President and President, | 2009 | 189,231 | 78,413 | 69,300 | 44,010 | 132,189 | 513,143 |
| Ballard Material Products | 2008 | 202,093 | 66,867 | 80,000 | 80,000 | 138,013 | 566,973 |
| Christopher J. Guzy | 2010 | 311,683 | 196,361 | 120,500 | 120,888 | 49,768 | 799,200 |
| Chief Technical Officer | 2009 | 299,728 | 92,508 | 93,060 | 58,720 | 43,122 | 587,138 |
| 2008 | 311,683 | 289,305 | 120,709 | 120,425 | 60,562 | 902,684 | |
| Michael Goldstein | 2010 | 382,063 | 216,630 | 120,500 | 120,888 | 90,992 | 931,073 |
| Vice President and Chief | 2009 | 244,939 | 122,846 | 140,598 | 222,250 | 204,606 | 935,239 |
| Commercial Officer | 2008 | 0 | 0 | 0 | 0 | 0 | 0 |
| (1) | Mr. Sheridan is also a director, but receives no compensation for his service as a director. | |
| (2) | Mr. Cousins resigned effective June 30, 2010, at which time any unvested outstanding options and RSUs were cancelled. Mr. Guglielmin was appointed Vice President & Chief Financial Officer effective June 14, 2010. | |
| (3) | Salary of each of the Named Executive Officers was paid in Canadian dollars with the exception of Mr. Foulds, who was paid in United States dollars. The Canadian dollar amounts for 2010 were C$530,000, C$169,863, C$153,726, C$310,000 and C$380,000 for Messrs. Sheridan, Guglielmin, Cousins, Guzy and Goldstein, respectively. The Canadian dollar amounts for 2009 were C$509,671, C$216,575, C$298,110 and C$243,616 for Messrs. Sheridan, Cousins, Guzy and Goldstein, respectively. Note that each full-time Named Executive Officer voluntarily accepted a temporary 10% base salary cut starting in August 2009. The Canadian dollar amounts for 2008 were C$530,000 and C$310,000 for Messrs. Sheridan and Guzy, respectively. The Canadian dollar amounts were converted into United States dollars for the purpose of the table above using the Bank of Canada noon rate of exchange on December 31, 2010. | |
| (4) | The bonus of each of the Named Executive Officers was paid in Canadian dollars with the exception of Mr. Foulds, who was paid in United States dollars. The Canadian dollar amounts for 2010 were C$536,625, C$96,899, C$0, C$195,300 and C$215,460, for Messrs. Sheridan, Guglielmin, Cousins, Guzy and Goldstein, respectively. The Canadian dollar amounts for 2009 were C$353,934, C$112,135, C$92,008 and C$122,183 for Messrs. Sheridan, Cousins, Guzy and Goldstein, respectively. The Canadian dollar amounts for 2008 were C$681,156 and C$287,743 for Messrs. Sheridan and Guzy, respectively. The Canadian dollar amounts were converted into United States dollars for the purpose of the table above using the Bank of Canada noon rate of exchange on December 31, 2010. | |
| (5) | Represents the total fair market value of RSUs issued to each Named Executive Officer during the 2008, 2009 and 2010 fiscal years. This amount is based on the grant date fair market value of the award, which equals the closing price of the Shares on the TSX and NASDAQ on the date of issuance of the award. Fair value is determined in accordance with Section 3870 of the CICA Handbook (accounting fair value) is recorded as compensation expense in the statement of operations over vesting periods of one to three years. There is no difference in Canadian dollars between the grant date fair market value of the award and the accounting fair value. The Canadian dollar amounts were converted into United States dollars for the purpose of the table above using the Bank of Canada noon rate of exchange on December 31, 2010. | |
| As noted above, a dollar value is approved for the long term incentive awarded to each executive and 50% of this amount is awarded in the form of RSUs with the remaining 50% being awarded in the form of Share options in 2010. In 2009, 55% of this amount was awarded in the form of RSUs with the remaining 45% being awarded in the form of Share options. In 2008, 50% of this amount was awarded in the form of RSUs with the remaining 50% being awarded in the form of Share options. The number of RSUs awarded is equal to the dollar amount of the award | ||
27
| divided by the fair market value of the Shares at the time of issuance (based on the closing price of the Shares on the TSX and NASDAQ on the date of issuance). The number of RSUs issued to each Named Executive Officer in respect of the fiscal years ended December 31, 2008, December 31, 2009 and December 31, 2010 is as follows: |
| Fair Market Value | ||||
| Named Executive | RSUs | of a Share | Total | |
| Officer | Year | (#) | (US$)(A) | (US$) |
| John W. Sheridan | 2010 | 104,167 | 2.41 | 251,042 |
| 2009 | 137,500 | 1.41 | 193,875 | |
| 2008 | 419,664 | 4.19 | 1,758,393 | |
| Tony Guglielmin | 2010 | 75,676 | 1.86 | 140,757 |
| 2009 | 0 | 0 | 0 | |
| 2008 | 0 | 0 | 0 | |
| Bruce Cousins | 2010 | 50,000 | 2.41 | 120,500 |
| 2009 | 57,143 | 2.46 | 140,571 | |
| 2008 | 0 | 0 | 0 | |
| William Foulds | 2010 | 50,420 | 2.38 | 120,000 |
| 2009 | 60,261 | 1.15 | 69,300 | |
| 2008 | 16,000 | 5.00 | 80,000 | |
| Christopher J. Guzy | 2010 | 50,000 | 2.41 | 120,500 |
| 2009 | 66,000 | 1.41 | 93,060 | |
| 2008 | 23,622 | 5.11 | 120,709 | |
| Michael Goldstein | 2010 | 50,000 | 2.41 | 120,500 |
| 2009 | 59,829 | 2.35 | 140,598 | |
| 2008 | 0 | 0 | 0 |
| ____________________ | ||
| (A) | The fair market value of a Share has been calculated using the Canadian dollar closing price of the Shares underlying the RSUs on the TSX on the date of issuance with the exception of RSUs issued to Mr. Foulds, which have been calculated using the United States dollar closing price of the Shares underlying the RSUs on the NASDAQ on the date of issuance. The Canadian dollar amounts were converted to United States dollars for the purpose of this disclosure using the Bank of Canada noon rate of exchange on December 31, 2010. | |
| (6) | Represents the total of the fair market value of options to purchase our Shares issued under the Option Plan granted to each Named Executive Officer during each fiscal year. This amount is based on the grant date fair market value of the award determined using the Black-Scholes valuation model using the following key assumptions: expected life of 5 years, expected volatility of 65% and risk free interest rate of 3% for 2010; expected life of 5 years, expected volatility of 60% and risk free interest rate of 2% for 2009; and expected life of 7 years, expected volatility of 44% and risk free interest rate of 3% for 2008. Accounting fair value is recorded as compensation expense in the statement of operations over the vesting period. There is no difference in Canadian dollars between the grant date fair market value of the award determined using the Black-Scholes valuation model and accounting fair value determined in accordance with s.3870 of the CICA Handbook (accounting fair value). The Canadian dollar amounts were converted into United States dollars for the purpose of the table above using the Bank of Canada noon rate of exchange on December 31, 2010. | |
| As noted above, a dollar value is approved for the long term incentive awarded to each executive and 50% of this amount is awarded in the form of RSUs with the remaining 50% being awarded in the form of Share options. In 2009, 55% of this amount was awarded in the form of RSUs with the remaining 45% being awarded in the form of Share options. In 2008, 50% of this amount was awarded in the form of RSUs with the remaining 50% being awarded in the form of Share options. The number of Share options awarded is equal to the dollar amount of the award divided by the fair market value of the Shares at the time of issuance (based on the closing trading price of the Shares on the TSX on the day prior to issuance). The number of Share options issued to each Named Executive Officer in respect of the fiscal years ended December 31, 2008, December 31, 2009 and December 31, 2010 is as follows: | ||
| Option-Based Awards | ||||
| Black-Scholes Value of Shares | ||||
| Shares Under | Underlying Options on Date of | |||
| Named Executive | Options | Grant | Fair Market Value | |
| Officer | Year | (#) | (US$/Share)(A) | (US$) |
| John W. Sheridan | 2010 | 185,185 | 1.36 | 251,852 |
| 2009 | 177,295 | 0.69 | 122,334 | |
| 2008 | 123,762 | 2.03 | 251,237 | |
| Tony Guglielmin | 2010 | 175,000 | 1.02 | 178,500 |
| 2009 | 0 | 0 | 0 | |
| 2008 | 0 | 0 | 0 | |
| Bruce Cousins | 2010 | 88,888 | 1.36 | 120,888 |
| 2009 | 175,000 | 1.24 | 217,000 | |
| 2008 | 0 | 0 | 0 | |
28
| William Foulds | 2010 | 93,750 | 1.28 | 120,000 |
| 2009 | 81,500 | 0.54 | 44,010 | |
| 2008 | 28,469 | 2.81 | 80,000 | |
| Christopher J. Guzy | 2010 | 88,888 | 1.36 | 120,888 |
| 2009 | 85,101 | 0.69 | 58,720 | |
| 2008 | 42,553 | 2.83 | 120,425 | |
| Michael Goldstein | 2010 | 88,888 | 1.36 | 120,888 |
| 2009 | 175,000 | 1.27 | 222,250 | |
| 2008 | 0 | 0 | 0 |
| ____________________ | ||
| (A) | The fair market value of a Share has been calculated using the Canadian dollar closing price of the Shares underlying the options on the TSX on the date of issuance. The Canadian dollar amounts were converted into United States dollars for the purpose of this disclosure using the Bank of Canada noon rate of exchange on December 31, 2010. | |
| (7) | All Other Compensation was actually paid in Canadian dollars with the exception of Other Compensation for Mr. Foulds, which was paid in United States dollars. The Canadian dollar amounts for 2010 were C$36,669, C$15,194, C$66,083, C$49,499 and C$90,500 for Messrs. Sheridan, Guglielmin, Cousins, Guzy and Goldstein, respectively. The Canadian dollar amounts for 2009 were C$44,610, C$60,038, C$42,890 and C$203,501 for Messrs. Sheridan, Cousins, Guzy and Goldstein, respectively. The Canadian dollar amounts for 2008 were C$48,051 and C$60,235 for Messrs. Sheridan and Guzy, respectively. The Canadian dollar amounts were converted into United States dollars for the purpose of the table above using the Bank of Canada noon rate of exchange on December 31, 2010. | |
| The value of the items included in this amount was based on the aggregate incremental cash cost to the Corporation. All Other Compensation, including the type and amount of each perquisite, the value of which exceeds 25% of the total value of perquisites reported for a Named Executive Officer, includes: | ||
| All Other Compensation | |||||
| Retirement Benefits | |||||
| (RRSP / 401k / | |||||
| Named Executive | Defined Benefits) | Insurance Premiums | Other(B) | Total | |
| Officer | Year | (US$)(A) | (US$)(A) | (US$) | (US$) |
| John W. Sheridan | 2010 | 11,060 | 1,826 | 23,983 | 36,869 |
| 2009 | 21,114 | 2,032 | 21,707 | 44,853 | |
| 2008 | 20,109 | 1,914 | 26,288 | 48,311 | |
| Tony Guglielmin | 2010 | 6,075 | 462 | 8,739 | 15,276 |
| 2009 | 0 | 0 | 0 | 0 | |
| 2008 | 0 | 0 | 0 | 0 | |
| Bruce Cousins | 2010 | 5,530 | 702 | 60,209 | 66,441 |
| 2009 | 15,836 | 717 | 43,812 | 60,365 | |
| 2008 | 0 | 0 | 0 | 0 | |
| William Foulds | 2010 | 112,606 | 1,152 | 28,087 | 141,845 |
| 2009 | 108,086 | 1,008 | 23,095 | 132,189 | |
| 2008 | 114,509 | 1,008 | 22,496 | 138,013 | |
| Christopher J. Guzy | 2010 | 11,060 | 893 | 37,815 | 49,768 |
| 2009 | 21,114 | 861 | 21,147 | 43,122 | |
| 2008 | 20,109 | 812 | 39,641 | 60,562 | |
| Michael Goldstein | 2010 | 11,060 | 893 | 79,039 | 90,992 |
| 2009 | 14,252 | 574 | 189,780 | 204,606 | |
| 2008 | 0 | 0 | 0 | 0 | |
| ____________________ | ||
| (A) | The amounts in this table were paid in Canadian dollars and have been converted into United States dollars using the Bank of Canada noon rate of exchange on December 31, 2010. The Canadian dollar amounts of the RRSP Contribution paid in 2010 in respect of each of the Named Executive Officers was C$11,000, pro-rated for Mr. Cousins and Mr. Guglielmin based on the portion of the full year they were employed by the Corporation. The Canadian dollar amounts of the RRSP Contribution paid in 2009 in respect of each of the Named Executive Officers was C$21,000, pro-rated for Mr. Cousins and Mr. Goldstein based on the portion of the full year they were employed by the Corporation. The Canadian dollar amounts of the RRSP Contribution paid in 2008 in respect of each of the Named Executive Officers was C$20,000. The amounts for Mr. Foulds include defined benefit pension plan benefits of US$90,606, US$105,248 and US$105,209 for 2010, 2009 and 2008, respectively. | |
| The Canadian dollar amounts of insurance premiums paid in 2010 were C$1,816, C$460, C$698, C$888 and C$888 for Messrs. Sheridan, Guglielmin, Cousins, Guzy and Goldstein, respectively. The Canadian dollar amounts of insurance premiums paid in 2009 were C$2,021, C$713, C$857 and C$571 for Messrs. Sheridan, Cousins, Guzy and Goldstein, respectively. The Canadian dollar amounts of insurance premiums paid in 2008 were C$1,904 and C$808 for Messrs. Sheridan and Guzy, respectively. The Canadian dollar amounts of "other" compensation paid in 2010 were C$23,853, | ||
29
| C$8,692, C$59,884, C$37,611 and C$78,612 for Messrs. Sheridan, Guglielmin, Cousins, Guzy and Goldstein, respectively. The Canadian dollar amounts of "other" compensation paid in 2009 were C$21,589, C$43,575, C$21,033 and C$188,755 for Messrs. Sheridan, Cousins, Guzy and Goldstein, respectively. The Canadian dollar amounts of "other" compensation paid in 2008 were C$26,147 and C$39,427 for Messrs. Sheridan and Guzy, respectively. | ||||
| (B) | Includes automobile allowances, temporary living and travel allowances, financial planning services and medical and health benefits. Mr. Goldstein’s amount in 2009 includes a one-time signing bonus of C$150,000. | |||
| (8) | In addition to the grant of 59,952 RSUs awarded to Mr. Sheridan in accordance with the Corporation’s usual practices for annual long-term incentives awards, the Board approved a recommendation by the MDNCC to award Mr. Sheridan a special, one-time three-year RSU award designed to retain and provide incentive to Mr. Sheridan through mid-2011. This three-year award, issued on May 12, 2008 had an award value at grant of US$1,507,194 (359,712 RSUs at a price of US$4.19 per share) with a three-year cliff vesting provision that requires Mr. Sheridan to continue to be employed by Ballard until that date in order to receive the full award. The special RSU award was based on a Canadian dollar amount (C$1.5 million) which has been converted into United States dollars using the Bank of Canada noon rate of exchange on December 31, 2010. | |||
INCENTIVE PLAN AWARDS
The following table sets forth all option-based and share-based awards granted to our Named Executive Officers that are outstanding as of December 31, 2010.
Outstanding Share-Based Awards and Option-Based Awards
(as of December 31, 2010)
| Option-Based Awards | Share-Based Awards | |||||||||||
| Number of | Value of | |||||||||||
| Securities | Unexercised | |||||||||||
| Underlying | Option | In-The- | Number of RSUs | Market or Payout | ||||||||
| Unexercised | Exercise | Option | Money | That Have Not | Value of RSUs That | |||||||
| Named Executive | Options | Price(1) | Expiration | Options(2) | Vested | Have Not Vested(3) | ||||||
| Officer | (#) | (US$) | Date | (US$) | (#) | (US$) | ||||||
| John W. Sheridan | 6,000 | 88.98 | May 17, 2011 | 0 | 575,531 | 867,983 | ||||||
| 2,500 | 44.04 | Nov. 30, 2011 | 0 | |||||||||
| 6,000 | 38.96 | May 16, 2012 | 0 | |||||||||
| 76,713 | 7.84 | Feb. 23, 2014 | 0 | |||||||||
| 123,762(4) | 4.19 | May 13, 2015 | 0 | |||||||||
| 177,295(5) | 1.35 | Mar. 5, 2016 | 9,507 | |||||||||
| 175,000 | 7.22 | Mar. 8, 2016 | 0 | |||||||||
| 185,185(6) | 2.41 | Mar. 12, 2017 | 0 | |||||||||
| Tony Guglielmin | 175,000(6) | 1.81 | Jun. 14, 2017 | 0 | 75,676 | 114,130 | ||||||
| William Foulds | 7,500 | 66.36 | Jun. 18, 2011 | 0 | 95,928 | 143,893 | ||||||
| 10,000 | 44.04 | Nov. 30, 2011 | 0 | |||||||||
| 20,000 | 24.91 | May 16, 2012 | 0 | |||||||||
| 8,750 | 10.00 | Mar. 28, 2013 | 0 | |||||||||
| 16,169 | 6.65 | Feb. 23, 2014 | 0 | |||||||||
| 10,000 | 10.41 | Mar. 5, 2014 | 0 | |||||||||
| 28,469(7) | 5.00 | Feb. 22, 2015 | 0 | |||||||||
| 20,000 | 6.20 | Mar. 2, 2015 | 0 | |||||||||
| 25,000 | 6.10 | Feb. 24, 2016 | 0 | |||||||||
| 76,500(8) | 1.01 | Mar. 5, 2016 | 10,861 | |||||||||
| 93,750(6) | 2.38 | Mar. 12, 2017 | 0 | |||||||||
| Christopher J. Guzy | 22,484 | 7.84 | Feb. 23, 2014 | 0 | 101,874 | 153,641 | ||||||
| 40,000 | 7.99 | Feb. 1, 2015 | 0 | |||||||||
| 42,553(9) | 5.11 | Feb. 22, 2015 | 0 | |||||||||
| 35,000 | 7.61 | Mar. 2, 2015 | 0 | |||||||||
| 85,101(10) | 1.35 | Mar. 5, 2016 | 4,563 | |||||||||
| 60,000 | 7.22 | Mar. 8, 2016 | 0 | |||||||||
| 88,888(6) | 2.41 | Mar. 12, 2017 | 0 | |||||||||
| Michael Goldstein | 175,000(11) | 2.35 | May 5, 2016 | 0 | 89,886 | 135,561 | ||||||
| 88,888(6) | 2.41 | Mar. 12, 2017 | 0 | |||||||||
| (1) | All figures are in United States dollars. Where options are exercisable in Canadian dollars, the exercise price has been converted to United States dollars using the Bank of Canada noon rate of exchange on December 31, 2010. | |
| (2) | This amount is based on the difference between the closing price of the Shares underlying the options on the TSX and NASDAQ as at December 31, 2010, and the exercise price of the option converted to United States dollars using the Bank of Canada noon rate of exchange on December | |
30
| 31, 2010. Where the difference is a negative number the value is deemed to be 0. The Canadian dollar amounts were C$9,456 and C$4,539 for Messrs. Sheridan and Guzy, respectively. | ||
| (3) | This amount is calculated by multiplying the number of RSUs that have not vested by the closing price of the Shares underlying the RSUs on the TSX as at December 31, 2010. It has then been converted to United States dollars for the purpose of this disclosure using the Bank of Canada noon rate of exchange on December 31, 2010. The Canadian dollar amounts were C$863,296, C$113,514, C$152,812,and C$134,829, for Messrs. Sheridan, Guglielmin, Guzy and Goldstein, respectively. | |
| Such amounts may not represent the actual value of the RSUs which ultimately vest, as the value of the Shares underlying the RSUs may be of greater or lesser value and/or the exchange rate may be higher or lower on vesting. However, given that it would be not be feasible for the Corporation to estimate, with any certainty, the market value of its Shares or the exchange rate on vesting, the Corporation has used the market value and exchange rate at the end of the most recently completed financial year for the purpose of calculating the amount disclosed. | ||
| (4) | Comprising 82,508 vested and 41,254 unvested options. | |
| (5) | Comprising 59,098 vested and 118,197 unvested options. | |
| (6) | Unvested options. | |
| (7) | Comprising 18,979 vested and 9,490 unvested options. | |
| (8) | Comprising 22,166 vested and 54,334 unvested options. | |
| (9) | Comprising 28,368 vested and 14,185 unvested options. | |
| (10) | Comprising 28,367 vested and 56,734 unvested options. | |
| (11) | Comprising 58,333 vested and 116,667 unvested options. | |
The following table sets forth the value of the incentive plan awards vested or earned during the year ended December 31, 2010 by our Named Executive Officers.
Incentive Plan Awards – Value Vested or Earned During the Year
(2010)
(2010)
| Option-Based Awards – | Non-equity incentive plan | |||
| Value Vested During the | Share-Based Awards – Value | compensation – Value earned | ||
| Year(1) | Vested During the Year(2) | during the year | ||
| Named Executive Officer | (US$) | (US$) | (US$) | |
| John W. Sheridan | 62,984 | 85,166 | 0 | |
| Tony Guglielmin | 0 | 0 | 0 | |
| Bruce Cousins | 7,624 | 46,152 | 0 | |
| William Foulds | 35,859 | 20,190 | 0 | |
| Christopher J. Guzy | 30,232 | 29,828 | 0 | |
| Michael Goldstein | 0 | 47,121 | 0 |
| (1) | This value was determined by calculating the difference between the market price of the underlying Shares on the vesting date and the exercise price of the options on the vesting date. It has then been converted to United States dollars for the purpose of this disclosure using the Bank of Canada noon rate of exchange on December 31, 2010. Where the difference is a negative number the value is deemed to be 0. The Canadian dollar amounts were C$62,644, C$0, C$7,583, C$30,069 and C$0 for Messrs. Sheridan, Guglielmin, Cousins, Guzy and Goldstein, respectively. | |
| (2) | This value was determined by calculating the dollar value realized by multiplying the number of Shares by the market value of the underlying Shares on the vesting date. It has then been converted to United States dollars for the purpose of this disclosure using the Bank of Canada noon rate of exchange on December 31, 2010. The Canadian dollar amounts were C$84,706, C$0, C$45,903, C$29,666 and C$46,866 for Messrs. Sheridan, Guglielmin, Cousins, Guzy and Goldstein, respectively. | |
The number of options vesting to Named Executive Officers under the Option Plan during the most recently completed financial year is 334,681, of which 5,000 were exercised by Mr. Foulds during 2010.
As noted in the Outstanding Share-Based Awards and Option-Based Awards table, as at December 31, 2010, there were 938,895 RSUs awarded to Named Executive Officers that were still unvested. The performance criteria for each of these RSUs has been met and they are set to vest (subject to the terms of the Market Purchase RSU Plan) as follows:
31
| Named Executive Officer | Number of RSUs That Have Not Vested | Vesting Date | ||
| John W. Sheridan | 19,985 | February 20, 2011 | ||
| 45,834 | March 3, 2011 | |||
| 34,722 | March 11, 2011 | |||
| 359,712 | May 11, 2011 | |||
| 45,833 | March 3, 2012 | |||
| 34,722 | March 11, 2012 | |||
| 34,723 | March 10, 2013 | |||
| Tony Guglielmin | 25,225 | June 14, 2011 | ||
| 25,225 | June 14, 2012 | |||
| 25,226 | June 14, 2013 | |||
| Bruce Cousins(1) | 0 | N/A | ||
| William Foulds | 5,333 | February 20, 2011 | ||
| 20,087 | March 3, 2011 | |||
| 16,807 | March 11, 2011 | |||
| 20,088 | March 3, 2012 | |||
| 16,807 | March 11, 2012 | |||
| 16,806 | March 10, 2013 | |||
| Christopher J. Guzy | 7,874 | February 20, 2011 | ||
| 22,000 | March 3, 2011 | |||
| 16,667 | March 11, 2011 | |||
| 22,000 | March 3, 2012 | |||
| 16,667 | March 11, 2012 | |||
| 16,666 | March 10, 2013 | |||
| Michael Goldstein | 16,667 | March 11, 2011 | ||
| 19,943 | May 4, 2011 | |||
| 16,667 | March 11, 2012 | |||
| 19,943 | May 4, 2012 | |||
| 16,666 | March 10, 2013 | |||
| (1) | Mr. Cousin’s unvested RSUs lapsed on June 30, 2010, the effective date of his resignation from Ballard. |
PENSION PLAN BENEFITS
None of the Named Executive Officers participate in a Corporation-sponsored Defined Benefits Plan or Defined Contribution Plan, nor do they receive contributions to any such plan on their behalf from the Corporation. Mr. Foulds retains a frozen retirement benefit under a previously active Defined Benefits Plan.
TERMINATION AND CHANGE OF CONTROL BENEFITS
Employment Contracts
Ballard employs a standard-form executive employment agreement which all of our Named Executive Officers have executed. These agreements have indefinite terms, provide for payments to be made on termination and otherwise include standard industry terms and conditions, including intellectual property, confidentiality, and non-competition and non-solicitation provisions in favour of Ballard.
The annual salary paid(13) to each of our Named Executive Officers under their employment agreements for 2010 was as follows: Mr. Sheridan received US$532,878, Mr. Guglielmin received US$170,785, Mr. Cousins received US$154,561, Dr. Guzy received US$311,683, Mr. Goldstein received US$382,063 and Mr. Foulds received US$225,479.
____________________
____________________
| (13) | All figures are in United States dollars. However, as the majority of compensation is paid in Canadian dollars, the amounts paid were converted into United States dollars using the Bank of Canada noon rate of exchange on December 31, 2010. |
32
Pursuant to these employment agreements, we can terminate a Named Executive Officer’s employment immediately, without any required period of notice or payment in lieu thereof, for just cause, upon the death of the executive, or if the executive does not renew any required work permits. In every other circumstance, other than one following a change of control, we are required to provide notice of 12 months plus one month for every year of employment completed with us, to a maximum of 24 months, or payment in lieu of such notice, consisting of the salary, bonus and other benefits that would have been earned during such notice period.
All of the employment contracts for the Named Executive Officers include a "double-trigger" in relation to a change of control – if the executive’s employment is terminated (including a constructive dismissal) within 2 years following the date of a change of control, the executive is entitled to a payment equivalent to payment in lieu of a 24 month notice period. For these purposes, a "change of control" under the employment agreements is defined as occurring when:
| (a) | a person or persons acting in concert acquires at least one-half of Ballard’s shares; | ||
| (b) | the persons who comprise the Board of Ballard do not consist of a majority of persons who were previously directors of Ballard, or who were recommended to the shareholders for election to the Board by a majority of the Directors; | ||
| (c) | there is a disposition of all or substantially all of Ballard’s assets to an entity in which Ballard does not have a majority interest; or | ||
| (d) | Ballard is involved in any business combination that results in Ballard’s shareholders owning less than one-half of the voting shares of the combined entity. | ||
Equity-Based Compensation Plans
The Option Plan provides that, if a participant ceases to be an employee of Ballard or its subsidiaries, he or she will have up to 90 days, in the event of termination other than for just cause, or 30 days, in the event of voluntary resignation, in which to exercise his or her vested options (in each case subject to extension if the option would otherwise expire during, or within 9 business days after the end of, a blackout period). In the event of termination other than for just cause, the CEO has the discretion to extend the exercise period to up to one year after the optionee ceases to work for Ballard and to accelerate the vesting of unvested options that would have otherwise vested during that period in the next year (in effect, enabling the continuance of the options during a notice period).
All Ballard RSUs awarded under either the SDP or the Market Purchase RSU Plan expire (no longer be capable of being converted into Shares) on the last day on which the participant works for Ballard or any of its subsidiaries.
DSUs will be redeemed for Shares under the SDP by no later than December 31 of the first calendar year commencing after the holder’s employment with Ballard and its subsidiaries is terminated, except in the case of US holders, whose DSUs will be redeemed for Shares approximately 6 months after termination of employment.
The Option Plan provides for the acceleration of vesting of options upon a change of control, which is defined as:
| (a) | a person making a take-over bid that could result in that person or persons acting in concert acquiring at least two-thirds of Ballard’s shares and in respect of which the Board approves the acceleration of options; | ||
| (b) | any person or persons acting in concert acquiring at least two-thirds of the outstanding Shares; | ||
| (c) | there is a disposition of all or substantially all of Ballard’s assets to an entity in which Ballard does not have a majority interest; | ||
| (d) | Ballard joins in any business combination that results in Ballard’s shareholders owning one-third or less of the voting shares of the combined entity and Ballard is | ||
33
| privatized (or the parties to the business combination have publicly expressed an intention to privatize Ballard); or | |||
| (e) | any other transaction, a consequence of which is to privatize Ballard is approved by Ballard securityholders or, if such approval is not required, is approved by Ballard. | ||
If an accelerated vesting event occurs, any outstanding option may be exercised at any time before the 60th day after such event.
Under the SDP and the Market Purchase RSU Plan, the occurrence of any of the accelerated vesting events described above triggers (subject to Board approval in the case of a take-over bid) the termination of the restriction period applicable to RSUs such that holders will become immediately entitled to receive Shares in respect of their RSUs (subject to satisfaction of any performance criteria or other conditions specified in the award).
The following table shows, for each Named Executive Officer, the amount such person would have been entitled to receive on the termination of his employment, without just cause, on December 31, 2010, the amount such person would have been entitled to if a change of control occurred on December 31, 2010 and the amount such person would have been entitled to receive on the termination of his employment, without just cause, on December 31, 2010 if that termination occurred following a change in control:
| Triggering Event | |||
| Termination of Employment | |||
| Named Executive Officer | Termination of Employment(2) | Change of Control(3) | following Change of Control |
| (US$)(1) | (US$)(1) | (US$)(1) | |
| John W. Sheridan | |||
| Severance | $1,349,956 | $0 | $2,024,935 |
| Other benefits | $69,133 | $0 | $128,835 |
| Accelerated vesting | $0 | $896,505 | $0 |
| Total | $1,419,089 | $896,505 | $2,153,770 |
| Tony Guglielmin | |||
| Severance | $529,861 | $0 | $1,059,723 |
| Other benefits | $35,242 | $0 | $95,619 |
| Accelerated vesting | $0 | $114,130 | $0 |
| Total | $565,103 | $114,130 | $1,155,341 |
| William Foulds | |||
| Severance | $391,000 | $0 | $782,000 |
| Other benefits | $65,639 | $0 | $156,278 |
| Accelerated vesting | $0 | $181,377 | $0 |
| Total | $456,639 | $181,377 | $938,278 |
| Christopher J. Guzy | |||
| Severance | $750,637 | $0 | $1,059,723 |
| Other benefits | $91,826 | $0 | $154,772 |
| Accelerated vesting | $0 | $167,331 | $0 |
| Total | $842,462 | $167,331 | $1,214,494 |
| Michael Goldstein | |||
| Severance | $703,633 | $0 | $1,299,015 |
| Other benefits | $114,960 | $0 | $237,370 |
| Accelerated vesting | $0 | $135,561 | $0 |
| Total | $818,593 | $135,561 | $1,536,384 |
34
____________________
| (1) | All values are in United States dollars. However, as the majority of payments are payable in Canadian dollars (with the exception of Mr. Foulds), the amounts disclosed above were converted into United States dollars using the Bank of Canada noon rate of exchange on December 31, 2010. | |
| (2) | Based on accrued service to December 31, 2010. | |
| (3) | All options and RSUs vest immediately upon a change of control. Value shown equals, in the case of RSUs, the price of the underlying Shares on December 31, 2010 multiplied by the number of RSUs, and in the case of options, for Mr. Sheridan, Mr Foulds and Dr. Guzy, where the exercise price of the relevant options exceeded the market price of the underlying Shares on December 31, 2009, for the grant they received in March 2009, the value calculates the differential in share price between the December 31, 2010 close price and the original strike price, multiplied by the number of options awarded. For Messrs. Guglielmin and Goldstein no value is attributable to options. | |
DIRECTOR COMPENSATION
Our Corporate Governance Committee has the responsibility for determining compensation for our Directors. The committee has determined that the principal method of compensating Directors should be through an annual retainer and meeting fees. The retainer has historically been paid in DSUs or Shares, at the election of the individual directors, but with the current shift in focus on limiting shareholder dilution, it is expected that the greater proportion of director retainers will be paid in cash. Directors have not been issued any stock options or similar equity-based compensation in the last 5 years, and there is no current intention to do so in the future.
The objective of the committee is to ensure that the annual retainer and meeting fees paid to Directors is commensurate with the high quality of candidates Ballard has enjoyed in the past and expects in the future. As a result, the committee seeks to provide compensation for directors at approximately the 50% mark for the comparator group of North American companies. The committee retains independent compensation consultants for professional advice and as a source of competitive market information. In 2008, the committee retained Towers Perrin (now Towers Watson) to provide independent compensation analysis and advice related to director compensation. Based on Towers Perrin’s report in November 2008, the compensation provided to directors is slightly lower than the 50% mark. In 2009, in support of the Corporation's cost reduction initiatives, on the recommendation of the Committee, the Board decided to reduce the retainer fees for both the Chair and other Board members. To further reduce expenses, Committee sizes were reduced, such that Committee Chairs no longer sit on multiple Committees. The Board Chair also voluntarily decided to forego meeting fees for board meetings, effectively making his annual retainer an 'all-in' fee.
Dr. Sinclair did not stand for re-election at the 2010 AGM and her compensation therefore reflects approximately 6 months service during 2010.
The Board sets annual effectiveness goals and tracks performance against those goals.
In 2010, compensation was earned by the directors as follows(1):
| Name | Fees Earned (US$)(2) | |
| Ian A. Bourne | 138,749 | |
| Edwin J. Kilroy | 74,276 | |
| Dr. C.S. Park | 62,400 | |
| Dr. Geraldine B. Sinclair | 18,014 | |
| David J. Smith | 59,923 | |
| David B. Sutcliffe | 64,950 | |
| Mark A. Suwyn | 59,800 | |
| Douglas W.G. Whitehead | 60,124 |
| (1) | All figures are in United States dollars. However, the compensation paid to directors (other than Dr. C.S. Park and Mr. Suwyn) was actually paid in Canadian dollars. The Canadian dollar amounts were C$138,000, C$73,875, C$17,917, C$59,600, C$64,600 and C$59,800 for Mr. Bourne, Mr. Kilroy, Ms. Sinclair, Mr. Smith, Mr. Sutcliffe and Mr. Whitehead, respectively. The Canadian dollar amounts were converted into United States dollars for the purpose of the table above using the Bank of Canada noon rate of exchange on December 31, 2010. | |
| (2) | Represents the aggregate retainers and attendance fees paid: | |
35
| Compensation | ||||||||
| Board and Committee | ||||||||
| Board Retainer | Committee Retainer | Attendance Fees | Total Compensation | |||||
| Director | (US$) | (US$) | (US$) | (US$) | ||||
| Ian A. Bourne | 138,749 | N/A | N/A | 138,749 | ||||
| Edwin J. Kilroy | 40,217 | 13,950 | 20,109 | 74,276 | ||||
| Dr. C.S. Park | 40,000 | 3,000 | 19,400 | 62,400 | ||||
| Dr. Geraldine B. Sinclair | 16,757 | 1,257 | N/A | 18,014 | ||||
| David J. Smith | 40,217 | 5,027 | 14,679 | 59,923 | ||||
| David B. Sutcliffe | 40,217 | 10,054 | 14,679 | 64,950 | ||||
| Mark A. Suwyn | 40,000 | 3,000 | 16,800 | 59,800 | ||||
| Douglas W.G. Whitehead | 40,217 | 3,016 | 16,891 | 60,124 | ||||
All figures are in United States dollars. However, the compensation paid to directors (other than Dr. C.S. Park and Mr. Suwyn) was actually paid in Canadian dollars. The Canadian dollar amounts in respect of Board Retainer were C$138,000 for Mr. Bourne; C$40,000 for each of Mr. Kilroy, Mr. Smith, Mr. Sutcliffe and Mr. Whitehead; and C$16,667 for Ms. Sinclair. The Canadian dollar amounts in respect of Committee Retainer were C$13,875, C$1,250, C$5,000, C$10,000, and C$3,000 for Mr. Kilroy, Ms. Sinclair, Mr. Smith, Mr. Sutcliffe and Mr. Whitehead, respectively. The Canadian dollar amounts in respect of Board and Committee Attendance Fees were C$20,000, C$14,600, C$14,600 and C$16,800 for Mr. Kilroy, Mr. Smith, Mr. Sutcliffe and Mr. Whitehead, respectively. The Canadian dollar amounts were converted into United States dollars for the purpose of the table above using the Bank of Canada noon rate of exchange on December 31, 2010.
We remunerate directors who are not executive officers for services to the Board, committee participation and special assignments. The following table describes the compensation of independent directors in 2010(1):
| C$(1) | |
| Annual Retainer (Non-Executive Chair of the Board) | $138,000 |
| Annual Retainer (Director) | $40,000 |
| Annual Retainer (Committee Chairs) | |
| - Audit Committee | $13,000 |
| - Management Development, Nominating & Compensation Committee | $10,000 |
| - Corporate Governance Committee | $5,000 |
| Annual Retainer for Committee Members | |
| - Audit Committee | $3,000 |
| - All other Committees | $1,500 |
| Committee Meeting Attendance Fee (per meeting) | |
| - Committee Chair | $1,400 |
| - Committee Member | $1,300 |
| Board Meeting Attendance Fee (per meeting) | $1,500 |
| (1) | The majority of compensation is paid in Canadian dollars. However, Dr. Park’s and Mr. Suwyn’s compensation was payable in United States dollars and they received the following amounts: |
| Annual Retainer (Director) | US$40,000 |
| Annual Retainer for Committee Members | |
| - Audit Committee | US$3,000 |
| - All other Committees | US$1,500 |
| Committee Meeting Attendance Fee (per meeting) | |
| - Committee Chair | US$1,400 |
| - Committee Member | US$1,300 |
| Board Meeting Attendance Fee (per meeting) | US$1,500 |
36
At the discretion of the Chair, a meeting fee may be paid to independent directors for meetings that the director is requested or required to attend that are not official meetings of the Board or committees.
Directors are also reimbursed for travel and other reasonable expenses incurred in connection with fulfilling their duties. If a meeting or group of meetings is held on a continent other than the continent on which an independent director is resident, that director will receive an additional fee of U.S.$2,250 (or C$2,250 in the case of a non-United States resident), in recognition of the additional time required to travel to and from the meeting or meetings.
Historically, we have satisfied our Chair’s annual retainer by utilizing up to 1/3 cash and the remainder in equity-based compensation, and our Directors’ annual retainers by utilizing 100% in equity-based compensation. In 2003, we ceased the practice of annual grants of share options to our independent Directors. Starting in 2009, cash compensation for all elements of the Directors compensation became the norm. The Corporation does not plan in the near future to issue further DSUs to Directors as compensation.
Previously, Directors were entitled to elect to participate in the deferred share unit section for directors (the "DSU Plan for Directors") in the SDP. Under this plan, each independent outside director was able to elect annually the proportion (0% to 100%) of his or her annual retainer that he or she wished to receive in DSUs. Each DSU was convertible into one Share. The number of DSUs to be credited to a Director was determined on the relevant date by dividing the amount of the eligible remuneration to be deferred into DSUs by the fair market value per Share, being a price not less than the closing sale price at which the Shares are traded on the TSX (in respect of a DSU issued or to be issued to a person who is resident in any country other than the U.S.) or NASDAQ (in respect of a DSU issued or to be issued to a person who is resident in the U.S.) on the trading day before the relevant date. For the Directors, DSUs were credited to an account maintained for each eligible person by Ballard at the time specified by the Board (historically, DSUs were granted in equal instalments over the course of a year, at the end of each quarter). However, a DSU is not redeemed until the Director leaves the Board, and its value on redemption will be based on the value of our Shares at that time. The SDP or any successor plans will be used to satisfy the redemption of DSUs issued pursuant to the DSU Plan for Directors.
INCENTIVE PLAN AWARDS
The following table sets forth all option-based and share-based awards granted to our non-executive directors that are outstanding as of December 31, 2010.
Outstanding Share-Based Awards and Option-Based Awards
(as of December 31, 2010)
(as of December 31, 2010)
| Option-Based Awards | ||||
| Number of Securities | Value of Unexercised | |||
| Underlying | In-The-Money | |||
| Unexercised Options | Option Exercise Price(1) | Options(2) | ||
| Name | (#) | (US$) | Option Expiration Date | (US$) |
| Ian A. Bourne | 0 | – | – | – |
| Edwin J. Kilroy | 6,000 | 38.96 | May 16, 2012 | 0 |
| Dr. C.S. Park | 0 | – | – | – |
| David J. Smith | 0 | – | – | – |
| David B. Sutcliffe | 0 | – | – | – |
| Mark A. Suwyn | 0 | – | – | – |
| Douglas W.G. Whitehead | 6,000 | 88.98 | May 17, 2011 | 0 |
| 2,500 | 44.04 | Nov. 30, 2011 | 0 | |
| 6,000 | 38.96 | May 16, 2012 | 0 | |
| (1) | All figures are in United States dollars. Where options are exercisable in Canadian dollars, the exercise price has been converted to United States dollars using the Bank of Canada noon rate of exchange on December 31, 2010. | |
| (2) | This amount is based on the difference between the closing price of the Shares underlying the options on the TSX as at December 31, 2010, and the exercise price of the option converted to United States dollars using the Bank of Canada noon rate of exchange on December 31, 2010. Where the difference is a negative number the value is deemed to be 0. | |
37
No incentive plan awards vested for, or were earned by, our Directors during the year ended December 31, 2010.
EQUITY BASED COMPENSATION PLANS
In 2009, the Corporation adopted two equity-based compensation plans approved by our shareholders at the 2009 Annual Meeting to supersede and replace the prior nine equity compensation plans as follows:
| (f) | a consolidated share option plan (the "Option Plan") to supersede and replace four prior option plans; and | ||
| (g) | a consolidated share distribution plan (the "SDP") to supersede and replace five prior SDPs. | ||
Set out in Appendix "A" is a discussion of the principal terms of the Option Plan. Set out in Appendix "B" is a discussion of the principal terms of the SDP.
The Corporation also adopted a plan, administered by an independent trustee, for the purchase of Ballard Shares on the open market for the redemption of RSU awards (the "Market Purchase RSU Plan"). The independent trustee makes these open market purchases through the facilities of the TSX, and holds the purchased Shares in escrow until the restriction period is complete and any performance criteria have been satisfied. This plan is consistent with the overall move away from the historical practice of using treasury shares for this purpose.
SECURITIES AUTHORIZED FOR ISSUANCE UNDER EQUITY COMPENSATION PLANS
The following table sets out, as of December 31, 2010, the number of securities we are authorized to issue under our equity-based compensation plans and the relevant exercise prices at which such securities may be issued.
| Number of Securities Remaining | |||
| Number of Securities to be | Weighted-Average Exercise | Available for Future Issuance | |
| Issued Upon Exercise of | Price of Outstanding | Under Equity Compensation | |
| Outstanding Options, | Options, Warrants and | Plans excluding securities | |
| Warrants and Rights (#) | Rights (US$) | reflected in column (a) | |
| Plan Category | (a) | (b) | (c) |
| Equity-based compensation plans | 7,460,457 (1) | 9.71 | 954,390 |
| approved by security holders | |||
| Equity-based compensation plans | Nil | N/A | N/A |
| not approved by security holders | |||
| Total | 7,460,457 | 9.71 | 954,390 |
| (1) | Shares issuable under the DSU Plan for Directors and the DSU Plan for Executive Officers (together, the "DSU Plans") will be satisfied with Shares reserved under the SDP or any successor plan. |
For a detailed description of our equity-based compensation plans, see Appendix "A" and "B" of this Management Proxy Circular.
INTEREST OF INFORMED PERSONS IN MATERIAL TRANSACTIONS
To the best of our knowledge, no informed person, proposed director or person who has been a director or executive officer of the Corporation (or any associate of affiliate of such persons) had any interest in any material transactions during the past year or has any interest in any material transaction to be considered at the Meeting, except as disclosed in this Management Proxy Circular.
38
INDEBTEDNESS OF DIRECTORS AND EXECUTIVE OFFICERS
In compliance with Sarbanes-Oxley, we do not make or arrange personal loans to directors or executive officers. As of April 15, 2011, our current or former directors, officers and employees have no outstanding indebtedness to the Corporation, its subsidiaries or to any other entity and which is guaranteed by the Corporation or its subsidiaries.
DIRECTORS’ AND OFFICERS’ LIABILITY INSURANCE
We purchase and maintain insurance for the benefit of our directors and officers for losses arising from claims against them for certain actual or alleged wrongful acts they may undertake while performing their director or officer function. The total annual premium in respect of our directors’ and officers’ liability insurance program was approximately US$257,750 for 2010 and US$276,000 for 2009. The aggregate maximum coverage provided by the policy for all claims, for both directors and officers, in any single policy year is US$30 million. In addition to the payment of the premiums, we are accountable for the payment of the policy deductible of US$0 to US$200,000 per claim. We have also agreed to indemnify each of our directors and officers against all expenses, liability and loss, reasonably incurred or suffered, arising from the performance of his or her duties as an officer or director of Ballard.
ADDITIONAL INFORMATION
Additional information relating to us is included in the following public filings, which are incorporated by reference (the "Incorporated Documents") into, and form an integral part of, this Management Proxy Circular:
- Annual Information Form dated March 9, 2011;
- Audited Annual Financial Statements for the year ended December 31, 2010 together with the auditors’ report thereon; and
- Management's Discussion and Analysis for the year ended December 31, 2010.
Copies of the Incorporated Documents and all our other public filings providing additional information relating to us may be obtained at www.sedar.com or www.sec.gov, or upon request and without further charge from either our Corporate Secretary, at 9000 Glenlyon Parkway, Burnaby, British Columbia, Canada V5J 5J8, or by calling our Investor Relations Department at (604) 454-0900.
PROPOSALS
Any shareholder who intends to present a proposal at our 2012 annual shareholders’ meeting must send the proposal to our Corporate Secretary at 9000 Glenlyon Parkway, Burnaby, British Columbia, Canada V5J 5J8. In order for the proposal to be included in the proxy materials we send to shareholders for that meeting, the proposal:
- must be received by us no later than January 14, 2012; and
- must comply with the requirements of section 137 of the Canada Business Corporations Act.
We are not obligated to include any shareholder proposal in our proxy materials for the 2012 annual shareholders’ meeting if the proposal is received after the January 14, 2012 deadline.
39
APPROVAL BY BOARD
Our Board has approved the contents and the sending of this Management Proxy Circular to the shareholders of the Corporation.
BY ORDER OF THE BOARD
"Kerry Hillier"
Kerry Hillier
Corporate Secretary
Ballard Power Systems
Corporate Secretary
Ballard Power Systems
Dated: April 15, 2011
40
APPENDIX "A"
DESCRIPTION OF OPTION PLAN
All directors, officers and employees of Ballard and its subsidiaries are eligible to participate in the Option Plan. Former Ballard employees who were transferred to AFCC Automotive Fuel Cell Cooperation Corp. ("AFCC") on January 31, 2008 (the "Transferred Employees") are also permitted to participate in the Option Plan for so long as they remain employees of AFCC. New Ballard options may not be granted to Transferred Employees under either the Option Plan or the prior option plans.
As at April 15, 2011, the total number of Shares issued and reserved and authorized for issue under the Option Plan was 7,749,519 Shares, representing 9.2% of the issued and outstanding Shares as of April 15, 2011.
The number of options granted under the Option Plan may adjust if any share reorganization, stock dividend or corporate reorganization occurs.
The Option Plan limits insider participation such that the number of Shares issued to insiders, within any one-year period, and issuable to insiders, at any time, under the plan and any other Ballard equity-based compensation arrangements, cannot exceed 10% of Ballard’s issued and outstanding Shares.
In any year, a non-executive Director’s participation in all Ballard equity-based compensation arrangements is limited to that number of shares (or that number of securities in respect of underlying shares) having a value of not more than C$100,000 on the date of grant, excluding any securities issued in respect of the non-executive Director’s annual retainer.
Apart from the limits on Shares issued or issuable to insiders and to non-executive Directors, described above, the Option Plan does not restrict the number of Shares that can be issued to any one person or to Directors.
The exercise price of a Ballard option will be determined by the Board and is to be no less than the closing price per Share on the TSX on the last trading day before the date the option is granted.
Ballard options may have a term of up to 10 years from the date of grant, and unless otherwise determined by the Board, will vest in equal amounts on the first, second and third anniversaries of the date of grant.
If an "accelerated vesting event" occurs, any outstanding option may be exercised at any time before the 60th day after such event. An accelerated vesting event occurs when: (a) a person makes a take-over bid that could result in that person or persons acting in concert acquiring at least two-thirds of Shares; (b) any person or persons acting in concert acquire at least two-thirds of Shares; (c) there is a disposition of all or substantially all of Ballard’s assets; (d) Ballard joins in any business combination that results in Ballard’s shareholders owning one-third or less of the voting shares of the combined entity and Ballard is privatized (or the parties to the business combination have publicly expressed an intention to privatize Ballard); or (e) any other transaction is approved, a consequence of which is to privatize Ballard.
The Option Plan also contains a "double trigger" in the event of a take-over. Accordingly, vesting will only be accelerated if the Board approves the acceleration. In such circumstances, the Board will also have the ability to make such changes as it considers fair and appropriate, including accelerating vesting, otherwise modifying the terms of options to assist the holder to tender into the take-over bid or terminating options which have not been exercised prior to the successful completion of the accelerated vesting event.
Under the Option Plan each option will expire (or no longer be capable of being exercised) on the earlier of:
| (a) | the expiration date as determined by the Board, which date will not be more than 10 years from the date of grant; and | ||||
| (b) | if the optionee is a director, officer or employee, the optionee ceases to hold such position, except that, an option will be capable of exercise, if the optionee ceases to be a director, officer or employee: | ||||
| (i) | because of his or her death, for one year after the optionee dies; | ||||
A-1
| (ii) | because of his or her retirement, for three years after the optionee retires (or, if the optionee dies after retirement, one year after his or her death, if earlier); | ||
| (iii) | as a result of voluntary resignation, for 30 days after the last day on which the optionee ceases to be a director, or the officer or employee ceases to work for Ballard; or | ||
| (iv) | other than as a result of voluntary resignation (in the case of a director) or termination other than for just cause (in the case of an officer or employee), for 90 days after the last day on which the optionee ceases to be a director, or the officer or employee ceases to work for Ballard (although in these circumstances, the Chief Executive Officer has discretion to extend the exercise period to up to one year after the optionee ceases to work for Ballard). | ||
In the event that the optionee dies, all previously unvested options vest and, in the circumstances described in (b)(iv) above, the Chief Executive Officer has discretion to accelerate the vesting of unvested options that would have otherwise vested in the next year. In the other circumstances described above, an option is only capable of being exercised in respect of options that were vested at the time the optionee ceased to be a director or ceased to work for Ballard.
In the event that an optionee becomes "totally disabled" (as defined in the Option Plan), his or her options will continue to vest and be exercisable as they would have had the optionee continued to be a director, officer or employee of Ballard.
If an option would otherwise expire or cease to be exercisable during a blackout period or within nine business days after the end of a blackout period (that is, a period during which employees and/or directors cannot trade in securities of the Corporation because they may be in possession of insider information), the expiry date of the option is extended to the date which is 10 business days after the end of the blackout period.
The Board is entitled to make, at any time, and from time to time, and without obtaining shareholder approval, any of the following amendments
| (a) | amendments to the definitions and other amendments of a clerical nature; | ||||||
| (b) | amendments to any provisions relating to the granting or exercise of options, including but not limited to provisions relating to the term, termination, amount and payment of the subscription price, vesting period, expiry or adjustment of options, provided that, without shareholder approval, such amendment does not entail: | ||||||
| (i) | a change in the number or percentage of Shares reserved for issuance under the plan; | ||||||
| (ii) | a reduction in the exercise price of an option or the cancellation and reissuance of options; | ||||||
| (iii) | an extension of the expiry date of an outstanding option; | ||||||
| (iv) | an increase to the maximum number of Shares that may be: | ||||||
| (A) | issued to insiders within a one-year period; or | ||||||
| (B) | issuable to insiders at any time, | ||||||
| under all of Ballard’s equity-based compensation arrangements, which could exceed 10% of the issued and outstanding Shares at that time; | |||||||
| (v) | an increase in the maximum number of securities that can be granted to directors (other than directors who are also officers) under all of Ballard’s equity-based compensation arrangements, which could exceed such number of securities in respect of which the underlying Shares have a Fair Market | ||||||
A-2
| Value (as defined in the plan) on the date of grant of such securities of C$100,000; | |||||
| (vi) | permitting options to be transferable or assignable other than for normal course estate settlement purposes; or | ||||
| (vii) | a change to the amendment provisions of the plan; | ||||
| (c) | the addition or amendment of terms relating to the provision of financial assistance to optionees or resulting in optionees receiving any Ballard securities, including pursuant to a cashless exercise feature; | ||||
| (d) | any amendment in respect of the persons eligible to participate in the plan, provided that, without shareholder approval, such amendment does not permit non-employee directors to re-gain participation rights under the plan at the discretion of the Board if their eligibility to participate had previously been removed or increase limits previously imposed on non-employee director participation; | ||||
| (e) | such amendments as are necessary for the purpose of complying with any changes in any relevant law, rule, regulation, regulatory requirement or requirement of any applicable stock exchange or regulatory authority; or | ||||
| (f) | amendments to correct or rectify any ambiguity, defective provision, error or omission in the plan or in any agreement to purchase options. | ||||
Options are not assignable except as permitted by applicable regulatory authorities in connection with a transfer to an optionee’s registered retirement savings plan or registered retirement income fund or to the personal representative of an optionee who has died.
A-3
APPENDIX "B"
DESCRIPTION OF SDP
DESCRIPTION OF SDP
The SDP is a single plan divided into the following three principal sections:
| (a) | A deferred share unit section for senior executives (the "DSU Plan for Executive Officers"). Under the SDP, DSUs are granted at the election of each executive officer of Ballard who is eligible (as determined by the Board) in partial or full payment of his or her annual bonus, which otherwise is paid in Shares. | ||
| (b) | A deferred share unit section for directors (the "DSU Plan for Directors"). Under the DSU Plan for Directors, each independent outside director elects annually the proportion (0% to 100%) of his or her annual retainer that he or she wishes to receive in DSUs. | ||
Under the SDP, DSUs are credited to an account maintained for each eligible person by Ballard. Each DSU is convertible into one Share. The number of DSUs to be credited to an eligible person is determined on the relevant date by dividing the amount of the eligible remuneration to be deferred into DSUs by the fair market value per Share, being a price not less than the closing sale price at which the Shares are traded on the TSX (in respect of a DSU issued or to be issued to a person who is resident in any country other than the U.S.) or NASDAQ (in respect of a DSU issued or to be issued to a person who is resident in the U.S.) on the trading day before the relevant date. In the case of the executive officers, the relevant date is set by the Board but if such date occurs during a trading blackout, the number of DSUs will be determined on the first trading day after the day on which the blackout is lifted. For directors, DSUs are credited at the time specified by the Board (currently DSUs are granted in equal instalments over the course of a year, at the end of each quarter).
On any date on which a dividend is paid on the Shares, an eligible person's account will be credited with the number of DSUs calculated by: (i) multiplying the amount of the dividend per Share by the aggregate number of DSUs that were credited to that account as of the record date for payment of the dividend; and (ii) dividing the amount obtained in (i) by the fair market value (determined as set out above) of Shares on the date on which the dividend is paid.
A departing director or executive officer may receive Shares in respect of the DSUs credited to that person's account (at the ratio of one Share per DSU, subject to the deduction of any applicable withholding tax in the case of an eligible person who is a United States citizen or resident for the purpose of United States tax). A DSU, however, cannot be redeemed until such time as the director leaves the Board or the executive officer ceases to work for Ballard, and its value on redemption will be based on the value of Shares at that time. All DSUs vest immediately as they are issued in respect of remuneration that would have otherwise been paid in Shares or cash. DSUs do not expire. Except in the case of death, DSUs can only be assigned with consent.
| (c) | A restricted share unit section (the "RSU Plan"). All employees (excluding non-executive directors) are eligible to participate in the RSU Plan. |
The vesting of RSUs issued under the SDP occurs up to three years from the date of issuance, subject to the achievement of any performance criteria which may be set by the Board and to earlier vesting upon the occurrence of any accelerated vesting event (as defined in the SDP). Each RSU is convertible into one Share, which will be issued under the SDP.
A "double trigger" is included in the event of a take-over. Accordingly, in the event of a take-over the accelerated vesting of an RSU (technically, the shortening of the restriction period) will only occur if the Board so determines. In such circumstances, the Board will also have the ability to make such changes as it considers fair and appropriate in the
B-1
circumstances, including the date on which the restriction period ends or otherwise modifying the terms of RSUs to assist the holder to tender into the take-over bid.
In addition, the Board has the discretion to deem performance criteria or other conditions to have been met on the occurrence of an accelerated vesting event.
If any performance criteria or other conditions specified in an award of RSUs is not met on or before the last day of the restriction period applicable to the relevant grant (usually three years less one day from the date of grant), the RSUs will expire and the participant will no longer be entitled to receive any Shares upon conversion of those RSUs.
All RSUs awarded to a participant under the SDP will also expire on the last day on which the participant works for Ballard or any of its subsidiaries (or, in the case of a Transferred Employee, AFCC or its subsidiaries) except that, in the event of the participant's death or total disability, the performance criteria and conditions specified in the participant's award of RSUs will, unless otherwise specified in the award, be deemed satisfied and the RSUs will be converted into Shares.
RSUs awarded to Transferred Employees prior to their transfer to AFCC will vest according to the terms of the award, subject to performance criteria or other conditions specified in the award and for so long as they remain employees of AFCC. New RSUs may not be granted to Transferred Employees under either the prior RSU Plan or the RSU Plan.
RSUs cannot be assigned other than by will or the laws of descent and distribution.
Under the SDP, the Board can elect to satisfy the conversion of RSUs through Ballard Shares purchased on the open market.
As of April 15, 2011, the total number of Shares issued and reserved and authorized for issue under the SDP was 606,949 Shares, representing 0.7% of the issued and outstanding Shares as of April 15, 2011.
The SDP limits insider participation such that the number of Shares issued to insiders, within any one-year period, and issuable to insiders, at any time, under the plan and any other Ballard equity-based compensation arrangements, cannot exceed 10% of Ballard’s issued and outstanding Shares.
Under the SDP, in any year, a non-executive Director’s participation in all Ballard equity-based compensation arrangements is limited to that number of shares (or that number of securities in respect of underlying shares) having a value of not more than C$100,000 on the date of grant, excluding any securities issued in respect of the non-executive Director’s annual retainer.
The SDP does not limit the number of DSUs that can be issued to executive officers.
The SDP does not limit the number of RSUs that can be issued to any one participant.
Apart from the limits on Shares issued or issuable to insiders and non-executive Directors described above, the SDP does not restrict the number of Shares that can be issued to any one person, to executive officers or to Directors.
The SDP permits the Board, without obtaining shareholder approval, to amend any provision of the SDP and/or any RSU and/or DSU governed by it (whether outstanding or otherwise) (subject to any stock exchange or regulatory requirement at the time of any such amendment) including, without limitation, any of the following amendments:
| (a) | amendments to the definitions and other amendments of a clerical nature; | ||||
| (b) | amendments to any provisions relating to the issuance of Shares, granting or conversion of DSUs or RSUs, including but not limited to provisions relating to the term, termination, and number of DSUs or RSUs to be awarded, provided that, without shareholder approval, such amendment does not entail: | ||||
| (i) | a change in the number or percentage of Shares reserved for issuance under the plan; | ||||
B-2
| (ii) | a reduction of the issue price of the Shares issued under the plan or the cancellation and reissue of Shares; | ||||||
| (iii) | a reduction to the fair market value used to calculate the number of DSUs to be awarded; | ||||||
| (iv) | an extension of time for redemption of a DSU or an extension beyond the original restriction period of a RSU; | ||||||
| (v) | an increase to the maximum number of Shares that may be: | ||||||
| (A) | issued to insiders within a one-year period; or | ||||||
| (B) | issuable to insiders at any time, under all of Ballard’s equity-based compensation arrangements, which could exceed 10% of the issued and outstanding Shares at that time; | ||||||
| (vi) | an increase in the maximum number of securities that can be granted to directors (other than directors who are also officers) under all of Ballard’s equity-based compensation arrangements, which could exceed such number of securities in respect of which the underlying Shares have a Fair Market Value (as defined in the plan) on the date of grant of such securities of C$100,000; | ||||||
| (vii) | permitting DSUs or RSUs to be transferable or assignable other than for normal course estate settlement purposes; or | ||||||
| (viii) | a change to the amendment provisions of the plan; | ||||||
| (c) | any amendment in respect of the persons eligible to participate in the plan (or any part of it), provided that, without shareholder approval, such amendment does not permit non-employee directors to: | ||||||
| (i) | participate as holders of RSUs at the discretion of the Board; | ||||||
| (ii) | re-gain participation rights under any section of the plan at the discretion of the Board if their eligibility (as a class) to participate had previously been removed; or | ||||||
| (iii) | increase limits previously imposed on non-employee director participation; | ||||||
| (d) | such amendments as are necessary for the purpose of complying with any changes in any relevant law, rule, regulation, regulatory requirement or requirement of any applicable stock exchange or regulatory authority; or | ||||||
| (e) | amendments to correct or rectify any ambiguity, defective provision, error or omission in the plan or in any option agreement, notice to redeem DSUs or RSU agreement. | ||||||
B-3
Financial Information
MANAGEMENT’S DISCUSSION AND ANALYSIS
Consolidated Financial Statements
F-1
MANAGEMENT’S DISCUSSION AND ANALYSIS
This discussion and analysis of the consolidated results of Ballard Power Systems Inc. (“Ballard”, “the Company”, “we”, “us” or “our”) dated March 8, 2011 should be read in conjunction with the audited consolidated financial statements and accompanying notes for the year ended December 31, 2010. The results reported herein have been prepared in accordance with Canadian generally accepted accounting principles (“GAAP”) and are presented in U.S. dollars unless otherwise stated. The effect of significant differences between Canadian and U.S. GAAP has been disclosed in note 23 to the Consolidated Financial Statements for the year ended December 31, 2010.
Additional information relating to the Company, including our Annual Information Form, are filed with Canadian (www.sedar.com) and U.S. securities regulatory authorities (www.sec.gov) and are also available on our website at www.ballard.com.
BUSINESS OVERVIEW
At Ballard, we are building a clean energy growth company. We are recognized as a world leader in proton exchange membrane (“PEM”) fuel cell development and commercialization. Our principal business is the design, development, manufacture, sale and service of fuel cell products for a variety of applications, focusing on motive power (material handling and buses) and stationary power (backup power and distributed generation) markets.
A fuel cell is an environmentally clean electrochemical device that combines hydrogen fuel with oxygen (from the air) to produce electricity. The hydrogen fuel can be obtained from natural gas, kerosene, methanol or other hydrocarbon fuels, or from water through electrolysis. As long as fuel is supplied, the fuel cell produces electricity efficiently and continuously without combustion, with water and heat as the main by-products when hydrogen is used as the fuel source. Ballard® fuel cell products feature high fuel efficiency, low operating temperature, low noise and vibration, compact size, quick response to changes in electrical demand, modular design and environmental cleanliness.
Over the past three years, we have continued to focus on our core fuel cell business and on markets with near-term commercial prospects.
We completed our exit from the automotive business by selling our automotive fuel cell research and development assets to AFCC Automotive Fuel Cell Cooperation Corp. (“AFCC”) on January 31, 2008 (the “AFCC Transaction”). The purpose of the AFCC Transaction was to decrease our investment in automotive fuel cell research and development due to its high cost, uncertainties surrounding government mandates relating to adoption and deployment of automotive fuel cell powered vehicles, the lengthening timeline to automotive fuel cell commercialization, and the negative impacts of these factors on our production volumes and revenues. The AFCC Transaction allowed us to focus our efforts on the development and commercialization of fuel cells for non-automotive applications and buses. In addition, we have continued involvement with automotive products and services for Daimler AG (“Daimler”) and AFCC on a contract basis under which we are paid on a profitable basis. Under the terms of the AFCC Transaction, we retained a 19.9% interest in AFCC, which is subject to a Share Purchase Agreement under which Ford,
1
either at our option or Ford’s election, could purchase our interest in AFCC at any time on or after January 31, 2013 for $65 million plus interest accruing at LIBOR from January 31, 2008.
In May 2009, we decided to discontinue operations in EBARA Ballard Corporation (“EBARA BALLARD”), our joint venture with Ebara Corporation (“Ebara”), as it became evident that the timeframe to commercialization for the residential cogeneration market in Japan was longer than anticipated, and due to an increasing investment requirement for continued system development work. On our decision to discontinue operations in 2009, we recorded a non-cash gain of $10.8 million (see note 12 to our consolidated financial statements). EBARA BALLARD was formally dissolved in October 2009.
Following the completion of these strategic dispositions, we have focused on bolstering our cash reserves and liquidity to strengthen our capability to execute on our clean energy growth priorities without the need for public market financing.
In December 2008, we executed a transaction to extract value from our tax attributes through a restructuring agreement (“Arrangement”) with Superior Plus Income Fund ("Superior Plus") resulting in a non-dilutive financing for net cash proceeds of approximately $33 million (see note 3 to our consolidated financial statements).
In December 2009, we completed an agreement with a financial institution to monetize our rights under the above noted Share Purchase Agreement with Ford for $37.0 million and a contingent payment of $7.5 million, resulting in a net gain on sale of assets of $34.3 million in 2009. The contingent payment of $7.5 million was subsequently monetized and extinguished in July 2010 for $5.0 million, resulting in an additional net gain on sale of assets of $4.8 million in 2010 (see note 9 to our consolidated financial statements).
In March 2010, we completed a sale and leaseback agreement with Madison Pacific Properties Inc. (“Madison”) to further bolster our cash reserves. On the closing of this transaction on March 9, 2010, we sold our head office building in Burnaby, British Columbia in return for gross cash proceeds of $20.4 million (Canadian $20.8 million). We then leased this property back from Madison for an initial 15-year term plus two renewal options. On the closing of this transaction, we recorded a deferred gain of $9.5 million which will be recognized to income on a straight-line basis over the term of the 15-year lease. Due to the long term nature of the lease, the leaseback of the building qualifies as a capital lease. As a result, we have recorded assets under capital lease of $12.2 million, and a corresponding obligation under capital lease, representing the net present value of the minimum lease payments at the inception of the lease (see note 4 to the consolidated financial statements).
On January 18, 2010, we acquired a controlling interest (the “Acquisition”) in Denmark-based Dantherm Power A/S (“Dantherm Power”), partnering with co-investors Dantherm A/S and Danfoss Ventures A/S. In exchange for an initial investment of 15.0 million Danish Kroner, or approximately $2.9 million, we obtained a 45% interest in Dantherm Power including the right to nominate a majority of the members of the Board of Directors. Through our ability to elect a majority of the members of the Dantherm Power board, who have the power to determine the strategic operating, investing and financing policies of Dantherm Power, we held
2
effective control over Dantherm Power as of the date of the initial investment. As a result, all assets, liabilities and results of operations of Dantherm Power are consolidated and have been included in our Consolidated Financial Statements for the year ended December 31, 2010. Non-Ballard ownership interests in Dantherm Power are shown as non-controlling interests. On August 31, 2010 we, together with the minority shareholders Dantherm A/S and Danfoss Ventures A/S completed the second tranche of our agreed upon investment in Dantherm Power. In accordance with the terms of the initial acquisition agreement, of the total second tranche investment of 20.0 million Danish Kroner, we made our required investment of 15.0 million Danish Kroner, or approximately $2.6 million, and in return received an additional 7% interest in Dantherm Power, resulting in our now holding a 52% total equity interest. Dantherm Power is focused on the development and production of commercially viable fuel cell-based backup power systems for use in IT and telecom network base stations. Dantherm Power’s results are reported in our core Fuel Cell Products segment (see note 2 to the consolidated financial statements).
We are focused on building a clean energy fuel cell solutions company. We provide our customers the positive economic and environmental benefits unique to fuel cell power. We plan to build value for our shareholders by developing, manufacturing, selling and servicing industry-leading fuel cell products to meet the needs of our customers in select target markets. We are focused on our core competencies of PEM fuel cell design, development, manufacture, sales and service. We are based in Canada, with head office, research and development, testing and manufacturing facilities in Burnaby, British Columbia. In addition, we have sales, research and development and manufacturing facilities in Lowell, Massachusetts and Hobro, Denmark. We report our results in the following reporting units:
1. Fuel Cell Products (core segment): fuel cell products and services for motive power (material handling and bus markets) and stationary power (backup power and distributed generation markets) applications;
2. Contract Automotive (supporting segment): contract technical and manufacturing services provided primarily for Daimler, Ford and AFCC.
3. Material Products (supporting segment): carbon fiber products primarily for automotive transmissions and gas diffusion layers (“GDLs”) for fuel cells.
SELECTED ANNUAL FINANCIAL INFORMATION
| Years ended December 31 (Expressed in thousands of U.S. dollars, except per share amounts) | ||||||||||
| 2010 | 2009 | 2008 | ||||||||
| Product and service revenues | $ | 65,019 | $ | 46,722 | $ | 52,726 | ||||
| Engineering development revenue | - | - | 6,854 | |||||||
| Revenues | $ | 65,019 | $ | 46,722 | $ | 59,580 | ||||
| Net income (loss) attributable to Ballard | $ | (34,936 | ) | $ | (3,258 | ) | $ | 31,456 | ||
| Net income (loss) per share attributable to Ballard | $ | (0.42 | ) | $ | (0.04 | ) | $ | 0.37 | ||
| Adjusted EBITDA (1) | $ | (25,988 | ) | $ | (38,977 | ) | $ | (35,753 | ) | |
| Cash, cash equivalents and short-term investments | $ | 74,445 | $ | 82,231 | $ | 85,399 | ||||
| Total assets | $ | 189,788 | $ | 195,348 | $ | 208,443 | ||||
| 1 | Adjusted EBITDA is a non-GAAP measure. We use certain Non-GAAP measures to assist in assessing our financial performance. Non-GAAP measures do not have any standardized meaning prescribed by GAAP and are therefore unlikely to be comparable to similar measures presented by other companies. See reconciliation to GAAP in the Supplemental Non-GAAP Measures section. |
3
RESULTS OF OPERATIONS – Fourth Quarter of 2010
Revenue and gross margin
| (Expressed in thousands of U.S. dollars) | Three months ended December 31, | |||||||||||
| 2010 | 2009 | $ Change | % Change | |||||||||
| Fuel Cell Products | $ | 13,336 | $ | 7,687 | $ | 5,649 | 73% | |||||
| Contract Automotive | 3,401 | 4,485 | (1,084 | ) | (24% | ) | ||||||
| Material Products | 4,346 | 4,344 | 2 | -% | ||||||||
| Revenues | 21,083 | 16,516 | 4,567 | 28% | ||||||||
| Cost of goods sold | 15,975 | 14,159 | 1,816 | 13% | ||||||||
| Gross Margin | $ | 5,108 | $ | 2,357 | $ | 2,751 | n/a | |||||
| Gross Margin % | 24% | 14% | n/a | n/a | ||||||||
Our revenues for the fourth quarter of 2010 increased 28%, or $4.6 million, to $21.1 million, compared to $16.5 million for the fourth quarter of 2009. Increases in our Fuel Cell Products segment of $5.6 million combined with steady results in our Material Products segment more than offset declines in our Contract Automotive segment of $1.1 million.
In our core Fuel Cell Products business segment, fourth quarter of 2010 revenues improved 73%, or $5.6 million, to $13.3 million compared to the fourth quarter of 2009 as sales increased in all of our markets. Fuel cell bus market revenues increased as a result of new shipments to the Transport for London fuel cell bus program and increased shipments to Daimler AG whereas material handling market revenues improved due to increased shipments to support Plug Power Inc.’s GenDrive™ systems. In our backup power market, revenues increased due to higher shipments and increased work performed on engineering service projects, combined with the acquisition, and subsequent consolidation, of Dantherm Power’s operating results.
Declines in our Contract Automotive segment of $1.1 million resulted from lower shipments of FCvelocity®-1100 fuel cell products for Daimler AG’s Hyway 2/3 programs. Material Products segment revenues were consistent quarter over quarter as increased volumes of fuel cell GDL shipments were offset by lower carbon friction material product revenues.
Gross margins increased to $5.1 million, or 24% of revenues, for the fourth quarter of 2010, compared to $2.4 million, or 14% of revenues, for the fourth quarter of 2009. The increase in gross margin is primarily as a result of increased shipments of higher margin fuel cell bus units combined with improved mix of our backup power products and improved warranty performance on our material handling and fuel cell bus products.
4
Cash Operating Costs
| (Expressed in thousands of U.S. dollars) | Three months ended December 31, | ||||||||||||||||||||||
| 2010 | |||||||||||||||||||||||
| 2010 | Dantherm | Ballard $ | Ballard % | Total $ | Total % | ||||||||||||||||||
| Ballard | Power | 2010 | 2009 | Change | Change | Change | Change | ||||||||||||||||
| Research and | |||||||||||||||||||||||
| Product | |||||||||||||||||||||||
| Development | $ | 4,738 | $ | (399 | ) | $ | 4,339 | $ | 5,495 | $ | (757 | ) | (14% | ) | $ | (1,156 | ) | (21% | ) | ||||
| General and | |||||||||||||||||||||||
| Administration | 3,511 | 380 | 3,891 | 2,803 | $ | 708 | 25% | 1,088 | 39% | ||||||||||||||
| Sales and | |||||||||||||||||||||||
| Marketing | 1,822 | 735 | 2,557 | 1,914 | $ | (92 | ) | (1% | ) | 643 | 34% | ||||||||||||
| Operating | |||||||||||||||||||||||
| costs | 10,071 | 716 | 10,787 | 10,212 | $ | (141 | ) | (1% | ) | 575 | 6% | ||||||||||||
| Less: Stock- | |||||||||||||||||||||||
| based | |||||||||||||||||||||||
| compensation | (1,182 | ) | - | (1,182 | ) | (860 | ) | $ | (322 | ) | (37% | ) | (322 | ) | (37% | ) | |||||||
| Cash | |||||||||||||||||||||||
| Operating | |||||||||||||||||||||||
| Costs | $ | 8,889 | $ | 716 | $ | 9,605 | $ | 9,352 | $ | (463 | ) | (5% | ) | $ | 253 | 3% | |||||||
| 1 | Cash Operating Costs is a non-GAAP measure. We use certain Non-GAAP measures to assist in assessing our financial performance. Non-GAAP measures do not have any standardized meaning prescribed by GAAP and are therefore unlikely to be comparable to similar measures presented by other companies. See reconciliation to GAAP in the Supplemental Non-GAAP Measures section. |
Cash Operating Costs (see Supplemental Non-GAAP Measures) for the fourth quarter of 2010 were $9.6 million, an increase of $0.3 million, or 3%, compared to the fourth quarter of 2009. Excluding Dantherm Power, Cash Operating Costs declined $0.5 million, or 5%, to $8.9 million. The 5% reduction in the fourth quarter of 2010 was primarily as a result of the narrowing of our research efforts, the aggressive pursuit of government funding for our programs, and the redirection of engineering resources to revenue bearing engineering service projects. Government research funding is reflected as a cost offset to research and product development expenses. These expense reductions were partially offset by a provision for allowance for doubtful accounts of $0.6 million included in general and administrative expense, and by the negative effects of a 5% stronger Canadian dollar relative to the U.S. dollar on our Canadian operating cost base.
Adjusted EBITDA
| (Expressed in thousands of U.S. dollars) | Three months ended December 31, | ||||||||||
| Adjusted EBITDA | 2010 | 2009 | $ Change | % Change | |||||||
| Adjusted EBITDA | $ | (3,126 | ) | $ | (6,443 | ) | $ | 3,317 | 51% | ||
| Adjusted EBITDA attributable to controlling | |||||||||||
| interest in Dantherm Power | $ | (229 | ) | $ | - | $ | (229 | ) | n/a | ||
| Adjusted EBITDA attributable to Ballard Power | |||||||||||
| Systems Inc., excluding Dantherm Power | $ | (2,897 | ) | $ | (6,443 | ) | $ | 3,546 | 55% | ||
| 1 | Adjusted EBITDA is a non-GAAP measure. We use certain Non-GAAP measures to assist in assessing our financial performance. Non-GAAP measures do not have any standardized meaning prescribed by GAAP and are therefore unlikely to be comparable to similar measures presented by other companies. See reconciliation to GAAP in the Supplemental Non-GAAP Measures section. |
Adjusted EBITDA (see Supplemental Non-GAAP Measures) for the fourth quarter of 2010 improved 51%, or $3.3 million, to ($3.1) million, compared to ($6.4) million in the fourth quarter of 2009. Adjusted EBITDA, excluding the impact related to our controlling ownership interest in Dantherm Power of ($0.2) million, improved 55%, or $3.5 million, to ($2.9) million.
The $3.3 million, or 51%, improvement in Adjusted EBITDA in the fourth quarter of 2010 was driven by gross margin improvements of $2.8 million as a result of the 28% increase in revenues, combined with the overall increase in gross margin as a percentage of revenues from 14% to 24%. The gross margin improvement was
5
partially offset by higher Cash Operating Costs of $0.3 million, or 3%, due primarily to the acquisition of Dantherm Power.
Net income (loss)
| (Expressed in thousands of U.S. dollars) | Three months ended December 31, | |||||||||||
| Net income (loss) | 2010 | 2009 | $ Change | % Change | ||||||||
| Net income (loss) attributable to Ballard Power | ||||||||||||
| Systems Inc. | $ | (8,430 | ) | $ | 25,634 | $ | (34,064 | ) | (133% | ) | ||
| Net loss attributable to controlling interest in | ||||||||||||
| Dantherm Power | (325 | ) | - | (325 | ) | n/a | ||||||
| Net income (loss) attributable to Ballard Power | ||||||||||||
| Systems Inc., excluding Dantherm Power | $ | (8,105 | ) | $ | 25,634 | $ | (33,739 | ) | (132% | ) | ||
Net loss attributable to Ballard for the fourth quarter of 2010 was ($8.4) million, or ($0.10) per share, compared to net income of $25.6 million, or $0.31 per share, in the fourth quarter of 2009. Net income in the fourth quarter of 2009 was significantly impacted by the positive effect of a gain on sale of assets of $34.3 million resulting from the initial monetization of the Share Purchase Agreement with Ford whereas net loss in the fourth quarter of 2010 includes the negative impact of our controlling interest in Dantherm Power of $0.3 million.
Cash provided by operating activities
| (Expressed in thousands of U.S. dollars) | Three months ended December 31, | ||||||||||
| Cash provided by operating activities | 2010 | 2009 | $ Change | % Change | |||||||
| Cash provided by operating activities | $ | 1,995 | $ | 1,578 | 417 | 26% | |||||
| Cash provided by operating activities | |||||||||||
| attributable to Dantherm Power | $ | 123 | $ | - | 123 | n/a | |||||
| Cash provided by operating activities, | |||||||||||
| excluding Dantherm Power | $ | 1,872 | $ | 1,578 | $ | 294 | 19% | ||||
Cash provided by operating activities in the fourth quarter of 2010 increased by $0.4 million to $2.0 million, compared to $1.6 million in the fourth quarter of 2009. Cash provided by operating activities, excluding the impact of Dantherm Power of $0.1 million, improved by $0.3 million to $1.9 million.
The improved cash flow from operating activities in the fourth quarter of 2010 of $0.3 million, excluding the results of Dantherm Power, was driven by lower cash operating losses of $0.8 million partially offset by lower working capital improvements of $0.5 million.
The cash provided by operating activities of Dantherm Power of $0.1 million in the fourth quarter of 2010 has improved from ($1.6) million used in the third quarter of 2010, ($2.0) million used in the second quarter of 2010 and ($2.8) million used in the first quarter of 2010. In order to reduce potential future funding requirements, Dantherm Power initiated cost reduction efforts in the third quarter of 2010 including a 25% workforce reduction (8 positions).
6
RESULTS OF OPERATIONS – 2010
Revenue and gross margin
| (Expressed in thousands of U.S. dollars) | Years ended December 31, | ||||||||||
| 2010 | 2009 | $ Change | % Change | ||||||||
| Fuel Cell Products | $ | 32,784 | $ | 24,142 | $ | 8,642 | 36% | ||||
| Contract Automotive | 11,271 | 9,170 | 2,101 | 23% | |||||||
| Material Products | 20,964 | 13,410 | 7,554 | 56% | |||||||
| Revenues | 65,019 | 46,722 | 18,297 | 39% | |||||||
| Cost of goods sold | 54,808 | 40,795 | 14,013 | 34% | |||||||
| Gross Margin | $ | 10,211 | $ | 5,927 | $ | 4,284 | n/a | ||||
| Gross Margin % | 16% | 13% | n/a | n/a | |||||||
Our revenues for the year ended December 31, 2010 increased 39% (meeting our guidance target for growth in excess of 35%), or $18.3 million, to $65.0 million, compared to $46.7 million for 2009. Increases in our Fuel Cell Products segment of $8.6 million combined with increases in our Contract Automotive segment of $2.1 million and increases in our Material Products segment of $7.6 million.
In our core Fuel Cell Products business segment, 2010 revenues increased 36%, or $8.6 million, to $32.8 million compared to 2009. Significantly higher material handling revenues as a result of increased shipments to support Plug Power Inc.’s GenDrive™ systems and increased shipments of hydrogen-based units in our backup power market drove the increase. Fuel cell bus market revenues improved slightly in 2010 as new shipments to Daimler AG, Transport for London, Sunline Transit Agency and Advanced Public Transportation System bv and others were in excess of our 2009 shipments for the B.C. Transit 2010 Olympic ($6.0 million) and Transport of London fuel cell bus programs. Revenues in 2010 were also positively impacted by the consolidation of Dantherm Power’s operating results which contributed $2.5 million of revenue.
The following table provides a summary of our fuel cell stack shipments:
| Three months ended December 31, | Year ended December 31, | |||||||||||
| 2010 | 2009 | % Change | 2010 | 2009 | % Change | |||||||
| Material handling | 345 | 102 | 238% | 1,100 | 182 | 504% | ||||||
| Backup power | 706 | 409 | 73% | 1,716 | 1,225 | 40% | ||||||
| Other | 68 | 40 | 70% | 198 | 69 | 187% | ||||||
| Fuel Cell Stack | ||||||||||||
| Shipments | 1,119 | 551 | 103% | 3,014 | 1,476 | 104% | ||||||
In our supporting Contract Automotive and Material Products business segments, 2010 revenues increased 43%, or $9.7 million, to $32.2 million compared to 2009. Improvements in our Contract Automotive segment of $2.1 million, or 23%, resulted from increased contract manufacturing of FCvelocity®-1100 fuel cell products for Daimler AG’s Hyway 2/3 programs partially offset by lower automotive testing and engineering services provided to AFCC. Improvements in our Material Products segment of $7.6 million, or 56%, represents increased volumes of carbon friction material products related to the recovery in the U.S. automotive sector in 2010 combined with increased shipments of fuel cell GDL products.
7
Gross margins increased to $10.2 million, or 16% of revenues, for 2010 compared to $5.9 million, or 13% of revenues, for 2009. The increase in gross margin is primarily a result of increased shipments of carbon fiber products and light-duty automotive products combined with improved margins on our backup power products and improved warranty performance on our material handling and fuel cell bus products. Gross margins in 2009 were also negatively impacted by more aggressive product pricing on our back-up power products in order to encourage market adoption.
Cash Operating Costs
| (Expressed in thousands of U.S. dollars) | Year ended December 31, | ||||||||||||||||||||||
| 2010 | |||||||||||||||||||||||
| 2010 | Dantherm | Ballard $ | Ballard % | Total $ | Total % | ||||||||||||||||||
| Ballard | Power | 2010 | 2009 | Change | Change | Change | Change | ||||||||||||||||
| Research and | |||||||||||||||||||||||
| Product | |||||||||||||||||||||||
| Development | $ | 20,228 | $ | 3,584 | $ | 23,812 | $ | 26,628 | $ | (6,400 | ) | (24% | ) | $ | (2,816 | ) | (11% | ) | |||||
| General and | |||||||||||||||||||||||
| Administration | 11,572 | 1,743 | 13,315 | 10,801 | $ | 771 | 7% | 2,514 | 23% | ||||||||||||||
| Sales and | |||||||||||||||||||||||
| Marketing | 7,482 | 1,379 | 8,861 | 7,203 | $ | 279 | 4% | 1,658 | 23% | ||||||||||||||
| Operating | |||||||||||||||||||||||
| costs | 39,282 | 6,706 | 45,988 | 44,632 | $ | (5,350 | ) | (12% | ) | 1,356 | 3% | ||||||||||||
| Less: Stock- | |||||||||||||||||||||||
| based | |||||||||||||||||||||||
| compensation | (4,057 | ) | - | (4,057 | ) | (3,033 | ) | $ | (1,024 | ) | (34% | ) | (1,024 | ) | (34% | ) | |||||||
| Cash | |||||||||||||||||||||||
| Operating | |||||||||||||||||||||||
| Costs | $ | 35,225 | $ | 6,706 | $ | 41,931 | $ | 41,599 | $ | (6,374 | ) | (15% | ) | $ | 332 | 1% | |||||||
| 1 | Cash Operating Costs is a non-GAAP measure. We use certain Non-GAAP measures to assist in assessing our financial performance. Non-GAAP measures do not have any standardized meaning prescribed by GAAP and are therefore unlikely to be comparable to similar measures presented by other companies. See reconciliation to GAAP in the Supplemental Non-GAAP Measures section. |
Cash Operating Costs (see Supplemental Non-GAAP Measures) for 2010 were $41.9 million, an increase of $0.3 million, or 1%, compared to 2009. Excluding Dantherm Power’s Cash Operating Costs of $6.7 million, Cash Operating Costs declined $6.4 million, or 15%, to $35.2 million. This 15% reduction is due primarily to a 7% workforce reduction initiated in March 2009 and a 20% workforce reduction initiated in August 2009 combined with the narrowing of our research efforts and the aggressive pursuit of government funding for our programs. Government research funding is reflected as a cost offset to research and product development expenses. These expense reductions in 2010 were partially offset by a provision for allowance for doubtful accounts of $0.7 million included in general and administrative expense, increased investment in sales and marketing capacity in support of commercial efforts, and by the negative effects of a 10% stronger Canadian dollar relative to the U.S. dollar on our Canadian operating cost base.
Adjusted EBITDA
| (Expressed in thousands of U.S. dollars) | Year ended December 31, | ||||||||||
| EBITDA and Adjusted EBITDA | 2010 | 2009 | $ Change | % Change | |||||||
| Adjusted EBITDA | $ | (25,988 | ) | $ | (38,977 | ) | $ | 12,989 | 33% | ||
| Adjusted EBITDA attributable to controlling | |||||||||||
| interest in Dantherm Power | $ | (2,637 | ) | $ | - | $ | (2,637 | ) | n/a | ||
| Adjusted EBITDA attributable to Ballard Power | |||||||||||
| Systems Inc., excluding Dantherm Power | $ | (23,351 | ) | $ | (38,977 | ) | $ | 15,626 | 40% | ||
| 1 | Adjusted EBITDA is a non-GAAP measure. We use certain Non-GAAP measures to assist in assessing our financial performance. Non-GAAP measures do not have any standardized meaning prescribed by GAAP and are therefore unlikely to be comparable to similar measures presented by other companies. See reconciliation to GAAP in the Supplemental Non-GAAP Measures section. |
Adjusted EBITDA (see Supplemental Non-GAAP Measures) for 2010 improved 33%,
8
or $13.0 million, to ($26.0) million, compared to ($39.0) million in 2009. Adjusted EBITDA, excluding the impact related to our controlling ownership interest in Dantherm Power of ($2.6) million, improved 40%, or $15.6 million, to ($23.4) million.
The $13.0 million, or 33%, improvement in Adjusted EBITDA in the 2010 was assisted by gross margin improvements of $4.3 million as a result of the 39% increase in revenues, combined with the overall increase in gross margin as a percentage of revenues from 13% to 16%. Cash Operating Costs were held steady in 2010 as the benefits of a 7% workforce reduction initiated in March 2009 and a 20% workforce reduction initiated in August 2009 were offset by the acquisition and consolidation of Dantherm Power’s Cash Operating Costs of $6.7 million and the negative impacts of a 10% stronger Canadian dollar relative to the U.S. dollar on our Canadian operating cost base. Adjusted EBITDA for 2009 also includes restructuring and related expenses of $6.2 million relating to the above noted workforce reductions.
Net loss
| (Expressed in thousands of U.S. dollars) | Year ended December 31, | |||||||||||
| Net loss | 2010 | 2009 | $ Change | % Change | ||||||||
| Net loss attributable to Ballard Power Systems | ||||||||||||
| Inc. | $ | (34,936 | ) | $ | (3,258 | ) | $ | (31,678 | ) | (972% | ) | |
| Net loss attributable to controlling interest in | ||||||||||||
| Dantherm Power | (3,411 | ) | - | $ | (3,411 | ) | n/a | |||||
| Net loss attributable to Ballard Power Systems | ||||||||||||
| Inc., excluding Dantherm Power | $ | (31,525 | ) | $ | (3,258 | ) | $ | (28,267 | ) | (868% | ) | |
Net loss attributable to Ballard for the year ended December 31, 2010 was ($34.9) million, or ($0.42) per share, compared to ($3.3) million, or ($0.04) per share, in 2009.
Net loss in 2009 was significantly impacted by the positive effect of a gain on sale of assets of $34.3 million resulting from the initial monetization of the Share Purchase Agreement with Ford and a non-cash gain of $10.8 million related to our decision to discontinue operations in EBARA BALLARD in May 2009. Net loss in 2010 includes the negative impact of our controlling interest in Dantherm Power of $3.4 million and the positive impact of a gain on sale of assets of $4.8 million related to the stub period monetization of the Share Purchase Agreement with Ford.
Cash used in operating activities
| (Expressed in thousands of U.S. dollars) | Year ended December 31, | |||||||||||
| Cash used in operating activities | 2010 | 2009 | $ Change | % Change | ||||||||
| Cash used in operating activities | $ | (29,312 | ) | $ | (26,962 | ) | (2,350 | ) | (9% | ) | ||
| Cash used in operating activities attributable to | ||||||||||||
| Dantherm Power | $ | (6,192 | ) | $ | - | (6,192 | ) | n/a | ||||
| Cash used in operating activities, excluding | ||||||||||||
| Dantherm Power | $ | (23,120 | ) | $ | (26,962 | ) | $ | 3,842 | 14% | |||
Cash used in operating activities in the year ended December 31, 2010 increased by ($2.4) million to ($29.3) million, compared to ($27.0) million for 2009. On a
9
comparable year-over-year basis, excluding the negative impact of Dantherm Power of ($6.2) million and the negative impacts of a 10% stronger Canadian dollar relative to the U.S. dollar on our Canadian operating cost base of approximately ($4.0) million, cash flow from operations would have been ($19.1) million, an improvement of approximately 30% over 2009, meeting guidance.
The reduced cash used in operating activities in 2010 of $3.8 million, excluding the results of Dantherm Power, was driven by lower cash operating losses of $9.3 million as a result of lower operating expenses and higher gross margins, partially offset by lower working capital improvements of $5.4 million in 2010 as compared to 2009.
The cash used in operating activities of Dantherm Power of ($6.2) million in 2010 was driven by costs of development work on the new 5kW direct hydrogen backup system. In order to reduce potential future funding requirements, Dantherm Power initiated cost reduction efforts in the third quarter of 2010 including a 25% workforce reduction (8 positions).
| RESULTS OF OPERATIONS (Additional details) - 2010 | |||||||||||||||||||||||
| (Expressed in thousands of U.S. dollars) | Year ended December 31, | ||||||||||||||||||||||
| 2010 | |||||||||||||||||||||||
| 2010 | Dantherm | Total | Total | Ballard $ | Ballard % | Total $ | Total % | ||||||||||||||||
| Ballard | Power | 2010 | 2009 | Change | Change | Change | Change | ||||||||||||||||
| Research and | |||||||||||||||||||||||
| Product | |||||||||||||||||||||||
| Development | $ | 20,228 | $ | 3,584 | $ | 23,812 | $ | 26,628 | $ | (6,400 | ) | (24% | ) | $ | (2,816 | ) | (11% | ) | |||||
| General and | |||||||||||||||||||||||
| Administration | 11,572 | 1,743 | 13,315 | 10,801 | $ | 771 | 7% | 2,514 | 23% | ||||||||||||||
| Sales and | |||||||||||||||||||||||
| Marketing | 7,482 | 1,379 | 8,861 | 7,203 | $ | 279 | 4% | 1,658 | 23% | ||||||||||||||
| Operating | |||||||||||||||||||||||
| costs | 39,282 | 6,706 | 45,988 | 44,632 | $ | (5,350 | ) | (12% | ) | 1,356 | 3% | ||||||||||||
| Restructuring | |||||||||||||||||||||||
| and related | |||||||||||||||||||||||
| Costs | 55 | 230 | 285 | 6,229 | $ | (6,174 | ) | (99% | ) | (5,944 | ) | (95% | ) | ||||||||||
| Acquisition | |||||||||||||||||||||||
| Charges | 243 | - | 243 | 529 | $ | (286 | ) | (54% | ) | (286 | ) | (54% | ) | ||||||||||
| Depreciation | |||||||||||||||||||||||
| and | |||||||||||||||||||||||
| Amortization | 5,759 | 695 | 6,454 | 6,580 | $ | (821 | ) | (12% | ) | (126 | ) | (2% | ) | ||||||||||
| Operating | |||||||||||||||||||||||
| expenses | $ | 45,339 | $ | 7,631 | $ | 52,970 | $ | 57,970 | $ | (12,631 | ) | (22% | ) | $ | (5,000 | ) | (9% | ) | |||||
Research and product development expenses for 2010 were $23.8 million, a decrease of $2.8 million, or 11%, compared to 2009. Excluding Dantherm Power’s expenses of $3.6 million, research and product development expense declined $6.4 million, or 24%. This reduction is due primarily to a 7% workforce reduction initiated in March 2009 and a 20% workforce reduction initiated in August 2009 combined with the narrowing of our research efforts and the aggressive pursuit of government funding for our programs. Government research funding is reflected as a cost offset to research and product development expenses. Expense reductions in 2010 were partially offset by the negative effects of a 10% stronger Canadian dollar relative to the U.S. dollar.
General and administrative expenses for 2010 were $13.3 million, an increase of $2.5 million, or 23%, compared to 2009. Excluding Dantherm Power’s expenses of $1.7 million, general and administrative expense increased $0.8 million, or 7%. Reductions due to the above noted workforce reductions initiated in 2009 were offset by a provision for allowance for doubtful accounts of $0.7 million, an adjustment in 2010 to reduce non-cash share compensation expense awarded in 2009 of $0.4
10
million, the negative effects of a 10% stronger Canadian dollar relative to the U.S. dollar, and increased accounting advisory fees as a result of our upcoming convergence to IFRS.
Sales and marketing expenses for 2010 were $8.9 million, an increase of $1.7 million, or 23% compared to 2009. Excluding Dantherm Power’s expenses of $1.4 million, sales and marketing expense increased $0.3 million, or 4%. This increase is due primarily to the negative effects of a 10% stronger Canadian dollar, relative to the U.S. dollar.
Restructuring and related expenses for 2010 were $0.3 million and relate to a 25% workforce reduction initiated at Dantherm Power in August 2010. Restructuring and related expenses for 2009 were $6.2 million and relate to the 20% workforce reduction initiated in August 2009 and the 7% workforce reduction initiated in March 2009.
Acquisition charges for 2010 and 2009 were $0.2 million and $0.5 million, respectively, and relate to costs incurred for the acquisition of Dantherm Power.
Depreciation and amortization expense was $6.5 million for 2010, an increase of $0.1 million, or 2%, compared to 2009. Depreciation and amortization expense in 2010 was impacted by a fourth quarter of 2010 acceleration of depreciation expense of $2.3 million for equipment that was considered no longer in use or impaired. Depreciation and amortization expense for 2009 was impacted by a fourth quarter of 2009 acceleration of amortization expense of $2.5 million for patents that were considered no longer in use. Excluding the impacts above, depreciation and amortization expense was relatively flat as increases as a result of the amortization of intangible assets acquired from Dantherm Power were offset by the impact of certain assets becoming fully depreciated or amortized in 2009. Acquired intangible assets are amortized on a straight-line basis over 5-years.
Investment and other income for 2010 was $0.1 million, compared to $6.0 million for 2009. The following table provides a breakdown of our investment and other income for the reported periods:
| (Expressed in thousands of U.S. dollars) | Year ended December 31, | |||||||||||
| 2010 | 2009 | $ Change | % Change | |||||||||
| Investment return (loss) less interest | ||||||||||||
| cost on employee future benefit plans | $ | (12 | ) | $ | 743 | $ | (755 | ) | (101% | ) | ||
| Curtailment gain on employee future | ||||||||||||
| benefit plans | - | 1,055 | (1,055 | ) | (100% | ) | ||||||
| Investment income | 247 | 387 | (140 | ) | (36% | ) | ||||||
| Foreign exchange gain (loss) | (407 | ) | 3,187 | (3,594 | ) | (113% | ) | |||||
| Other income | 300 | 623 | (323 | ) | (52% | ) | ||||||
| Investment and other income | $ | 128 | $ | 5,995 | $ | (5,897 | ) | (98% | ) | |||
Curtailment gain on employee future benefit plans was $1.1 million for 2009 and resulted from a freeze in future benefits of a defined benefit pension plan applicable for our current and former employees in the United States. As a result of the curtailment, there will be no further current service cost related to this defined benefit pension plan.
11
Investment return (loss) less interest cost on employee future benefit plans was nil for 2010 as the negative impact of a 0.5% decrease in the discount rate on our curtailed defined benefit pension plan for our United States employees was offset by the actual return on plan assets in the year. The gain in 2009 of $0.7 million was primarily a result of a recovery in the capital markets which resulted in increased actual returns on plan assets in the year. We account for future employee benefits using the fair value method of accounting. As a result, employee future benefit plan assets and accrued benefit obligations are recorded at their fair values on each balance sheet date with the actual return on plan assets and any net actuarial gains or losses recognized immediately in the statement of operations. The fair values are determined directly by reference to quoted market prices.
Investment income was $0.2 million for 2010, a decrease of $0.1 million, compared to 2009. The decline in 2010 was a result of lower cash balances. We classify our cash, cash equivalents and short-term investments as held-for-trading and measure these assets at fair value with changes in fair value recognized in income. The fair values are determined directly by reference to quoted market prices.
Foreign exchange gains and losses are attributable to the effect of the changes in the value of the Canadian dollar, relative to the U.S. dollar, on our Canadian dollar-denominated net monetary position. The foreign exchange loss in 2010 of $0.4 million resulted primarily from the impact of a strengthening Canadian dollar on our Canadian dollar-denominated net liability position. At December 31, 2010, our Canadian dollar-denominated liabilities (capital lease obligations, warranty obligations and accounts payable and accrued liabilities) exceeded our Canadian dollar-denominated assets (cash and short-term investments). The foreign exchange gain in 2009 of $3.2 million resulted primarily from the impact of a strengthening Canadian dollar on our Canadian dollar-denominated net asset position. At December 31, 2009, our Canadian dollar-denominated assets exceeded our Canadian dollar-denominated liabilities. Compared to the U.S. dollar, the Canadian dollar strengthened from 1.22 at December 31, 2008 to 1.05 at December 31, 2009 and to 0.99 at December 31, 2010. See note 21 to our consolidated financial statements for additional information about the significance of financial instruments to our financial position and performance, the nature and extent of risks arising from those financial instruments to which we are exposed, and how we manage those risks.
Interest expense was $1.0 million for 2010 and relates primarily to the sale and leaseback of our head office building in Burnaby, British Columbia. Due to the long term nature of the lease, the leaseback of the building qualifies as a capital lease.
Gain on sale of assets was $4.8 million for 2010, compared to $34.3 million for 2009. The 2009 gain of $34.3 million resulting from the initial monetization of the Share Purchase Agreement with Ford whereas the 2010 gain of $4.8 million related to the stub period monetization of the Share Purchase Agreement with Ford. The Share Purchase Agreement with Ford has now been fully monetized.
Equity in income of associated companies for 2009 was $8.4 million. On the announcement of our decision in May 2009 to discontinue operations in EBARA BALLARD, the $10.8 million of historic recorded equity losses in EBARA BALLARD in excess of our net investment in EBARA BALLARD, was reversed to net income. This second quarter of 2009 non-cash gain was partially offset by the share of the losses
12
of EBARA BALLARD of $2.4 million recorded in 2009 prior to the announcement of the discontinuance. EBARA BALLARD was formally dissolved in October 2009.
Net loss attributed to non-controlling interests for 2010 was $3.9 million and represent the non-controlling interest of Dantherm A/S and Danfoss A/S in the losses of Dantherm Power as a result of their 55% total equity interest from acquisition on January 18, 2010 to August 31, 2010 and their 48% total equity interest from September 1, 2010 to December 31, 2010.
SUMMARY OF QUARTERLY RESULTS
The following table provides summary financial data for our last eight quarters:
| (Expressed in thousands of U.S. dollars, except per share amounts) | Quarter ended, | ||||||||||||
| Dec 31, | Sep 30, | June 30, | Mar 31, | ||||||||||
| 2010 | 2010 | 2010 | 2010 | ||||||||||
| Revenues | $ | 21,083 | $ | 16,528 | $ | 15,526 | $ | 11,882 | |||||
| Net income (loss) attributable to Ballard | $ | (8,430 | ) | $ | (5,610 | ) | $ | (10,851 | ) | $ | (10,045 | ) | |
| Net income (loss) per share attributable to | |||||||||||||
| Ballard, basic and diluted | $ | (0.10 | ) | $ | (0.07 | ) | $ | (0.13 | ) | $ | (0.12 | ) | |
| Weighted average common shares outstanding | |||||||||||||
| (000’s) | 84,140 | 84,128 | 84,127 | 84,012 | |||||||||
| Dec 31, | Sep 30, | Jun 30, | Mar 31, | ||||||||||
| 2009 | 2009 | 2009 | 2009 | ||||||||||
| Revenues | $ | 16,516 | $ | 9,047 | $ | 13,075 | $ | 8,084 | |||||
| Net income (loss) attributable to Ballard | $ | 25,634 | $ | (11,352 | ) | $ | 1,583 | $ | (19,123 | ) | |||
| Net income (loss) per share attributable to | |||||||||||||
| Ballard, basic and diluted | $ | 0.31 | $ | (0.14 | ) | $ | 0.02 | $ | (0.23 | ) | |||
| Weighted average common shares outstanding | |||||||||||||
| (000’s) | 83,974 | 83,955 | 83,941 | 82,662 | |||||||||
Summary of Quarterly Results: There were no significant seasonal variations in our quarterly results. Variations in our net income (loss) for the above periods were affected primarily by the following factors:
- Revenues: Variations in fuel cell product and service revenues reflect the timing of our customers’ fuel cell vehicle, bus and field cell product deployments.
Variations in fuel cell service product and service revenues also reflect the timing of work performed and the achievements of milestones under long-term fixed price contracts. Product revenues in the second quarter of 2009 were positively impacted by the shipments of fuel cell bus modules related to the B.C. Transit 2010 Olympic fuel cell bus program totaling $6.0 million. Product and service revenues also include the consolidated results of Dantherm Power as of the date of acquisition of January 18, 2010.
- Operating expenditures: Operating expenses have declined in the first two quarters of 2010 and the last three quarters of 2009 as a result of the 20% workforce reduction initiated in August 2009 and the 7% workforce reduction initiated in March 2009. Operating expenses also include restructuring and related expenses of $4.8 million in the third quarter of 2009 and $1.4 million in the first quarter of 2009 as a result of the above workforce reduction initiatives. Operating expenses also include the impact of changes in the value of the Canadian dollar, versus the U.S. dollar, on our Canadian dollar denominated expenditures. Operating expenses also include the consolidated results of Dantherm Power as of the date of acquisition of January 18, 2010.
13
- Depreciation and amortization: Depreciation and amortization expense has been impacted in the four quarters of 2010 as a result of the acquisition of intangible assets in Dantherm Power, and the subsequent amortization over a 5- year period. Depreciation and amortization expense increased in the fourth quarter of 2010 due an acceleration of depreciation expense of $2.3 million for equipment that was considered no longer in use or impaired. Depreciation and amortization expense increased in the fourth quarter of 2009 due an acceleration of amortization expense of $2.5 million for patents that were no longer in use.
- Investment and other income: Investment and other income has varied in each quarter due to fluctuations in the Canadian dollar, relative to the U.S. dollar, on our Canadian dollar-denominated cash and short-term investments. Investment and other income in the fourth quarter of 2009 was positively impacted by a $1.1 curtailment gain resulting from a freeze in future benefits of a defined benefit pension plan applicable for our current and former employees in the United States.
- Gain on sale of assets: The net loss for the third quarter of 2010 and the net income for the fourth quarter of 2009 were positively impacted by gains on the monetization of the Share Purchase Agreement with Ford of $4.8 million and $34.3 million, respectively.
- Equity income (loss) of associated companies: The net income for the second quarter of 2009 was significantly impacted by a $10.8 million gain recorded on the discontinuance of operations in Ebara Ballard Corporation, representing the reversal of our historic recorded equity losses in Ebara Ballard Corporation in excess of our net investment in Ebara Ballard Corporation at that time. Net loss for the first quarter of 2009 was impacted by equity losses in Ebara Ballard Corporation of approximately $2.4 million.
CASH FLOWS AND LIQUIDITY
Cash, cash equivalents and short-term investments were $74.4 million as at December 31, 2010, compared to $82.2 million at the end of 2009. The decrease of $7.8 million in 2010 was driven by a net loss (excluding non-cash items) of $32.8 million, net capital expenditures of $3.5 million, and the payment of accrued costs related to the 2009 monetization of the AFCC Share Purchase Agreement of $1.4 million. These outflows were partially offset by net cash proceeds of $20.0 million from the sale and leaseback of our head office building in Burnaby, British Columbia, the $4.8 million cash gain on the extinguishment of the contingent payment related to the above 2009 monetization of the AFCC Share Purchase Agreement, and working capital inflows of $3.5 million. The above cash outflows in 2010 include total net cash outflows by Dantherm Power of $6.2 million.
For the year ended December 31, 2010, working capital requirements resulted in cash inflows of $3.5 million compared to inflows of $8.5 million for 2009. In 2010, net cash inflows of $3.5 million were driven by increased accounts payable and accrued liabilities of $2.9 million due primarily to higher 2010 accrued annual employee bonuses as compared to 2009 combined with higher payables to suppliers as a result of our increased inventory and production levels. In addition, net cash inflows in 2010 benefited from lower prepaid expenses of $1.3 million as a result of lower insurance and information technology license renewal costs and higher
14
deferred revenue of $1.0 million as a result of the receipt of customer payment in advance of work performed on certain of our engineering development contracts partially offset by cash outflows as a result of increased inventory of $2.4 million due to the buildup of inventory to support expected future fuel cell shipments in 2011. In 2009, net working capital cash inflows of $8.5 million were driven by lower accounts receivable of $6.1 million due primarily to collections of our fuel cell bus and contract automotive product and service revenues, higher accrued warranty liabilities of $4.0 million due primarily to product shipments for the B.C. Transit 2010 Olympic and APTS fuel cell bus programs, reduced inventory levels of $1.4 million and higher accounts payable and accrued liabilities of $1.6 million. These working capital inflows in 2009 were partially offset by cash outflows from the draw down of deferred revenue of $3.7 million due primarily to amounts earned under the First Energy distributed power generator program.
Investing activities resulted in cash inflows of $38.3 million for 2010, compared to cash inflows of $19.7 million in 2009. Investing activities in 2010 include net proceeds received on the closing of the head office building sale and leaseback transaction with Madison of $20.0 million, net proceeds of $4.8 million on the extinguishment of the contingent payment related to the 2009 monetization of the Share Purchase Agreement with Ford less the payment of accrued costs of $1.4 million related to the initial monetization which closed in December 2009, and net cash received of $0.9 million on the acquisition of Dantherm Power. On the date of acquisition of our controlling interest in Dantherm Power for $2.9 million, we acquired total cash and cash equivalents in Dantherm Power of $3.8 million, resulting in a net cash inflow of $0.9 million on acquisition (see note 2 to our consolidated financial statements). Investing activities in 2009 include gross proceeds received on the closing of the AFCC Monetization of $37.0 million. Changes in short-term investments resulted in cash inflows of $17.7 million in 2010 as compared to outflows of $7.6 million in 2009. Balances changed between cash equivalents and short-term investments as we make investment decisions with regards to the term of investments and our future cash requirements. Capital spending (net of proceeds on sale) of $3.5 million in 2010, and $4.6 million in 2009, was primarily for manufacturing equipment in order to build production capacity. The cash flows used for other investing activities in 2009 of $5.1 million include an investment in the now discontinued EBARA Ballard Corporation of $5.0 million.
Financing activities resulted in cash outflows of $0.4 million in 2010, compared to cash outflows of $3.5 million in 2009. Financing activities in 2010 primarily represent the minority partner cash contribution to Dantherm Power for the second tranche investment of 5.0 million Danish Kroner, or $0.9 million in August 2010 less capital lease payments of $0.8 million as a result of the sale and leaseback agreement with Madison, and treasury stock purchases of $0.6 million under our market purchase restricted share unit plan. Financing activities in 2009 primarily represent the payment of closing costs of $3.2 million which were accrued at December 31, 2008 on the closing of the Arrangement with Superior Plus Income Fund.
LIQUIDITY AND CAPITAL RESOURCES
At December 31, 2010, we had cash, cash equivalents and short-term investments totaling $74.4 million. We will use our funds to meet net funding requirements for the development and commercialization of products in our target markets. This
15
includes research and product development for fuel cells and material products, the purchase of equipment for our manufacturing and testing facilities, the further development of business systems and low-cost manufacturing processes and the further development of our sales and marketing, product distribution and service capabilities.
At this stage of our development, we may record net losses for at least the next few years as we continue to make significant investments in research and product and market development activities necessary to commercialize our products. Our actual funding requirements will vary based on the factors noted above, our relationships with our lead customers and strategic partners, our success in developing new channels to market and relationships with customers, our success in generating revenue growth from near-term product opportunities, our working capital requirements, foreign exchange fluctuations, and the progress and results of our research, development and demonstration programs.
Our financial strategy is to manage our cash resources with strong fiscal discipline, focus on markets with high product and service revenue growth potential, license technology in cases where it is advantageous to us, and access available government funding for research and development projects. Our current financing principle is to maintain cash balances sufficient to fund at least six quarters of operating cash consumption at all times.
2011 OUTLOOK
We expect revenues for 2011 to be at least 30% higher than our 2010 revenues of $65.0 million, or at least $84.5 million. Consistent with the past couple of years, we expect a majority of our 2011 revenue to be realized in the second half of the year, with second half revenue representing about two third’s of the full year total (as compared to 58% in the last half of 2010). Our revenue outlook for 2011 is based on our internal revenue forecast which reflects an assessment of overall business conditions and takes into account actual sales in the first two months of 2011, sales orders received for units and services to be delivered in 2011, and an estimate with respect to the generation of new sales in each of our markets. Our 2011 revenue outlook is also supported by our 12-month committed order book for products and services of $35.0 million at December 31, 2010 ($22.7 million at December 31, 2009). The primary risk factor that could cause us to miss our revenue guidance for 2011 are delays from forecast in terms of closing and shipping expected sales orders, primarily in our bus and backup power markets.
We expect Adjusted EBITDA (see Supplemental Non-GAAP Measures section) in 2011 to be in excess of 40% better than our 2010 Adjusted EBITDA of ($26.0) million, or lower than ($15.6) million. The key drivers for this expected improvement in Adjusted EBITDA for 2011 are expected increases in gross margins driven primarily by the above noted minimum 30% expected increase in revenues combined with the maintenance of Cash Operating Costs (see Supplemental Non-GAAP Measures section) at approximately their current levels. Consistent with the expectation that approximately two thirds of our 2011 revenue will fall in the last half of the year, Adjusted EBITDA is expected to be materially improved in the last half of 2011, as compared to the first half of 2011. Our Adjusted EBITDA outlook for 2011 is based on our internal Adjusted EBITDA forecast and takes into account our forecasted gross
16
margin related to the above revenue forecast, the costs of our current and forecasted Cash Operating Costs, and assumes an average U.S. dollar exchange rate of 1.00 in relation to the Canadian dollar. The primary risk factor that could cause us to miss our Adjusted EBITDA guidance for 2011 are lower than expected gross margins due to (i) lower revenues from forecast due to unexpected delays in terms of closing and shipping expected sales orders; (ii) shifts in product sales mix negatively impacting projected gross margin as a percentage of revenues; or (iii) delays in the timing of our projected product cost reductions. In addition, Adjusted EBITDA could also be negatively impacted by unexpected increases in Cash Operating Costs due to (i) increased product development costs due to unexpected delays in new product introductions or by lower than anticipated government cost recoveries; or (ii) by negative foreign exchange impacts as a result of a higher than expected Canadian dollar. A 1% increase in the Canadian dollar, relative to the U.S. dollar, negatively impacts Cash Operating Costs by approximately $0.5 million.
Similar to prior years and consistent with our revenue and Adjusted EBITDA performance expectations for the year and the resulting impacts on gross margin and working capital, we expect cash used in operating activities in 2011 to be materially higher in the first and second quarters of 2011, as compared to the third and fourth quarters of 2011. Cash used in operating activities in the first two quarters of 2011 is expected to be negatively impacted by the buildup of inventory to support higher product shipments in the third and fourth quarters, the payment of accrued 2010 annual employee bonuses (now paid in cash versus the prior practice of settling through a dilutive treasury share distribution), and by the timing of revenues and the related customer collections which are also skewed towards the last half of the year.
Finally, we will continue our focus on maintaining a strong liquidity position. We ended 2010 with cash, cash equivalents and short-term investments of $74.4 million. We believe that with continued focus on improving gross margin performance, managing our Cash Operating Costs and our working capital requirements, we have sufficient liquidity to reach profitability without the need for additional public market financing. However, circumstances could change which would make it advantageous for us to access additional capital.
OFF-BALANCE SHEET ARRANGEMENTS & CONTRACTUAL OBLIGATIONS
Periodically, we use foreign exchange contracts to manage our exposure to currency rate fluctuations and platinum forward purchase contracts to manage our exposure to platinum price fluctuations. We record these contracts at their fair value as either assets or liabilities on our balance sheet. Any changes in fair value are recorded in our consolidated statements of operations. At December 31, 2010, we had outstanding platinum forward purchase contracts to purchase a total of $3.1 million of platinum at an average rate of $1,738 per troy ounce, resulting in an unrealized gain of $0.1 million.
As at December 31, 2009, we did not have any other material obligations under guarantee contracts, retained or contingent interests in transferred assets, outstanding derivative instruments or non-consolidated variable interests.
We have committed to make future capital contributions of $0.2 million in Chrysalix, in which we have a limited partnership interest.
17
At December 31, 2010 we had the following contractual obligations and commercial commitments:
| (Expressed in thousands of U.S. dollars) | Payments due by period, | ||||||||||||||
| Contractual Obligations | Less than | After 5 | |||||||||||||
| Total | one year | 1-3 years | 3-5 years | years | |||||||||||
| Operating leases | $ | 26,688 | $ | 2,551 | $ | 5,078 | $ | 5,328 | $ | 13,731 | |||||
| Capital leases | 21,113 | 1,591 | 3,182 | 3,398 | 13,941 | ||||||||||
| Asset retirement obligations | 3,980 | - | - | - | 3,980 | ||||||||||
| Total contractual obligations | $ | 52,781 | $ | 4,142 | $ | 8,260 | $ | 8,726 | $ | 31,652 | |||||
In addition to the contractual purchase obligations above, we have commitments to purchase $1.2 million of capital assets as at December 31, 2010. Capital expenditures pertain to our regular operations and will be funded through either capital leases or cash on hand.
The Arrangement with Superior Plus includes an indemnification agreement dated December 31, 2008 (the "Indemnity Agreement"), which sets out the parties’ continuing obligations to the other. The Indemnity Agreement has two basic elements: it provides for the indemnification by each of the parties to the other for breaches of representations and warranties or covenants as well as, in our case, any liability relating to our business which is suffered by Superior Plus. Our indemnity to Superior Plus with respect to our representation relating to the existence of our tax pools immediately prior to the completion of the Arrangement is limited to an aggregate of $7.4 million (Canadian $7.4 million) with a threshold amount of $0.5 million (Canadian $0.5 million) before there is an obligation to make a payment. Second, the Indemnity Agreement provides for adjustments to be paid by us, or to us, depending on the final determination of the amount of our Canadian non-capital losses, scientific research and development expenditures and investment tax credits generated to December 31, 2008, to the extent that such amounts are more or less than the amounts estimated at the time the Arrangement was executed. At December 31, 2009, we have not accrued any amount owing, or receivable, as a result of the Indemnity Agreement.
RELATED PARTY TRANSACTIONS
Related parties include shareholders with a significant ownership interest in us, together with their subsidiaries and affiliates, our key management personnel, our equity-accounted investees, and our minority interest partners in Dantherm Power subsequent to the closing of the Dantherm Power acquisition on January 18, 2010. Related parties also include Ebara Ballard Corporation and EBARA Corporation prior to the discontinuance of our operations in Ebara Ballard Corporation in May 2009. Revenues and costs recognized from such transactions reflect the prices and terms of sale and purchase transactions with related parties, which are in accordance with normal trade practices.
18
Related party transactions and balances are as follows:
| (Expressed in thousands of U.S. dollars) | Years Ended December 31, | |||||
| Transactions with related parties | 2010 | 2009 | ||||
| Revenues | $ | 134 | $ | 380 | ||
| Purchases | 1,301 | 78 | ||||
| Net investments and advances | - | 5,000 | ||||
| (Expressed in thousands of U.S. dollars) | As at December 31, | |||||
| Balances with related parties | 2010 | 2009 | ||||
| Accounts receivable | $ | 153 | $ | - | ||
| Accounts payable and accrued liabilities | $ | 517 | $ | - | ||
OUTSTANDING SHARE DATA
| As at March 9, 2011 | ||
| Common share outstanding | 84,212,712 | |
| Options outstanding | 6,151,177 |
CRITICAL ACCOUNTING POLICIES, ESTIMATES AND JUDGMENT APPLIED
Our consolidated financial statements are prepared in accordance with Canadian GAAP, which require us to apply judgment when making estimates and assumptions that affect the reported amounts of assets and liabilities at the date of the financial statements, the reported amounts of revenues and expenses of the reporting period, as well as disclosures made in the accompanying notes to the financial statements. The estimates and associated assumptions are based on past experience and other factors that are considered relevant. Actual results could differ from these estimates. The following are our most critical accounting estimates, which are those that require management’s most challenging, subjective and complex judgments, requiring the need to make estimates about the effect of matters that are inherently uncertain and may change in subsequent periods. The application of these and other accounting policies are described more fully in note 1 to the consolidated financial statements.
REVENUE RECOGNITION
Revenues are generated primarily from product sales and services in our core Fuel Cell Products and supporting Contract Automotive and Material Products segments. We have also historically earned revenues by providing engineering development services in our core Fuel Cell Products and supporting Contract Automotive segments. Product revenues are derived primarily from standard equipment and material sales contracts and from long-term fixed price contracts. Service revenues are derived primarily from cost-plus reimbursable contracts. Engineering development revenues are derived primarily from long-term fixed price contracts.
On standard equipment and material sales contracts, revenues are recorded when the product is shipped to the customer, the risks of ownership are transferred to the customer, the price is fixed and determinable, and collection is reasonably assured. Provisions are made at the time of sale for warranties. Revenue recognition for
19
standard equipment and material sales contracts does not usually involve significant estimates.
On cost-plus reimbursable contracts, revenues are recognized as costs are incurred, and include applicable fees earned as services are provided. Revenue recognition for cost-plus reimbursable contracts does not usually involve significant estimates.
On long-term fixed price contracts, revenues are recorded on the percentage-of-completion basis over the duration of the contract, which consists of recognizing revenue on a given contract proportionately with its percentage of completion at any given time. The percentage of completion is determined by dividing the cumulative costs incurred as at the balance sheet date by the sum of incurred and anticipated costs for completing a contract.
- The determination of anticipated costs for completing a contract is based on estimates that can be affected by a variety of factors such as variances in the timeline to completion, the cost of materials, the availability and cost of labour, as well as productivity.
- The determination of potential revenues includes the contractually agreed amount and may be adjusted based on the estimate of our attainment on achieving certain defined contractual milestones. Management’s judgment is required in determining the probability that the revenue will be received and in determining the measurement of that amount.
Estimates used to determine revenues and costs of long-term fixed price contracts involve uncertainties that ultimately depend on the outcome of future events and are periodically revised as projects progress. There is a risk that a customer may ultimately disagree with our assessment of the progress achieved against milestones or that our estimates of the work required to complete a contract may change. The cumulative effect of changes to anticipated revenues and anticipated costs for completing a contract are recognized in the period in which the revisions are identified. In the event that the anticipated costs exceed the anticipated revenues on a contract, such loss is recognized in its entirety in the period it becomes known.
During the years ended months ended December 31, 2010 and 2009, there were no material adjustments to revenues relating to revenue recognized in a prior period.
ASSET IMPAIRMENT
Asset impairment incorporates an evaluation of our goodwill as well as our long-lived assets for impairment.
Goodwill is subject to at least an annual assessment of impairment by applying a fair value based test at the reporting unit level. An impairment loss is recognized to the extent that the carrying amount of goodwill for each reporting unit exceeds its estimated fair market value. The fair market values of the reporting units are derived from certain valuation models, which may consider various factors such as normalized and estimated future earnings, price earnings multiples, terminal values and discount rates. All factors used in the valuation models are based on management’s estimates and are subject to uncertainties and judgments. Changes in any of these estimates could affect the fair value of the reporting units and, consequently, the value of the reported goodwill. We perform the annual review of goodwill as at December 31 of each year, more often if events or changes in
20
circumstances indicate that it might be impaired. Based on the impairment tests performed as at December 31, 2010 and 2009, we have concluded that no goodwill impairment provision was required.
In addition, we review our long-lived assets, which include intangible assets, and property, plant and equipment, for impairment whenever events or changes in circumstances indicate that the carrying amount of the asset may not be recoverable. To determine whether impairment exists, we compare the estimated undiscounted future cash flows that are projected to be generated by those assets to their respective carrying value. If the undiscounted future cash flows are lower than the carrying value, then the assets are written down to fair market value and an impairment loss is recognized. Estimated undiscounted cash flows reflect management’s estimates, and changes in those estimates could affect the carrying amount of the long-lived assets. During the years ended December 31, 2010 and 2009, we have concluded that there were no circumstances which required us to test for impairment of our long-lived assets.
During the year ended December 31, 2010, we recorded an acceleration of depreciation expense of $2.3 million for property, plant and equipment that were no longer in use. During the year ended December 31, 2009, we recorded an acceleration of amortization expense of $2.5 million for patents that were no longer in use.
WARRANTY PROVISION
A provision for warranty costs is recorded on product sales at the time of shipment. In establishing the accrued warranty liabilities, we estimate the likelihood that products sold will experience warranty claims and the cost to resolve claims received. In making such determinations, we use estimates based on the nature of the contract and past and projected experience with the products. Should these estimates prove to be incorrect, we may incur costs different from those provided for in our warranty provisions. During the years ended December 31, 2010 and 2009 we recorded provisions to accrued warranty liabilities of $2.4 million and $3.7 million, respectively, for new product sales.
We review our warranty assumptions and make adjustments to accrued warranty liabilities quarterly based on the latest information available and to reflect the expiry of contractual obligations. Adjustments to accrued warranty liabilities are recorded in cost of product and service revenues. As a result of these reviews and the resulting adjustments, our warranty provision and cost of revenues for the years ended December 31, 2010 and 2009 were adjusted downwards by a net amount of $1.6 million and $0.5 million, respectively. The adjustments to reduce accrued warranty liabilities were primarily due to contractual expirations and improved lifetimes of our fuel cell products.
INVENTORY PROVISION
In determining the lower of cost and net realizable value of our inventory and establishing the appropriate provision for inventory obsolescence, we estimate the likelihood that inventory carrying values will be affected by changes in market pricing or demand for our products and by changes in technology or design which could make inventory on hand obsolete or recoverable at less than cost. We perform regular reviews to assess the impact of changes in technology and design, sales
21
trends and other changes on the carrying value of inventory. Where we determine that such changes have occurred and will have a negative impact on the value of inventory on hand, appropriate provisions are made. If there is a subsequent increase in the value of inventory on hand, reversals of previous write-downs to net realizable value are made. Unforeseen changes in these factors could result in additional inventory provisions, or reversals of previous provisions, being required. During the years ended December 31, 2010 and 2009, inventory provisions of $0.5 million and $0.9 million, respectively, were recorded as a charge to cost of product and service revenues.
INVESTMENTS
We have made strategic investments in other companies or partnerships that are developing technology with potential fuel cell applications. Each of these investments is either accounted for by the equity method or carried at cost, depending on whether or not we have the ability to exercise significant influence over the company or partnership. We regularly review such investments and should circumstances indicate that an impairment of value has occurred that is other than temporary, we would record this impairment in the earnings of the current period. Given that these entities are in the development stage, there is significant judgment required in determining whether impairment has occurred in the value of these investments. During the year ended December 31, 2010, no write-downs of our investments were recorded. During the year ended December 31, 2009, we recorded a gain of $10.8 million representing the reversal of historic equity losses (including $2.4 million of equity losses recorded in 2009 prior to the wind-up) in excess of our net investment in EBARA BALLARD as a result of the announcement of our intentions to discontinue operations in EBARA BALLARD.
INCOME TAXES
We use the liability method of accounting for income taxes. Under this method, future income tax assets and liabilities arise from temporary differences between the tax bases of assets and liabilities and their carrying amounts reported in the financial statements. Future income tax assets also reflect the benefit of unutilized tax losses than can be carried forward to reduce income taxes in future years. Such method requires the exercise of significant judgment in determining whether or not our future tax assets are “more likely than not” to be recovered from future taxable income and therefore, can be recognized in the consolidated financial statements. Also estimates are required to determine the expected timing upon which tax assets will be realized and upon which tax liabilities will be settled, and the enacted or substantially enacted tax rates that will apply at such time.
NEW ACCOUNTING PRONOUNCEMENTS AND DEVELOPMENTS
Convergence with International Financial Reporting Standards
In February 2008, Canada’s Accounting Standards Board (“AcSB”) confirmed that Canadian GAAP, as used by public companies, will be converged with International Financial Reporting Standards (“IFRS”) effective January 1, 2011. The transition from Canadian GAAP to IFRS will be applicable for the Company for the first quarter of 2011 when we will prepare both the current and comparative financial information using IFRS. We must also present an opening IFRS statement of financial position as
22
at January 1, 2010, our date of transition to IFRS (“Transition Date”) which will form part of our interim financial report for the quarter ended March 31, 2011.
The Company’s consolidated financial statements for the year ended December 31, 2011 will be our first annual financial statements that comply with IFRS. As 2011 will be our first year of reporting under IFRS, IFRS 1 First-time Adoption of IFRS will be applicable.
In accordance with IFRS 1, we will apply IFRS retrospectively as of January 1, 2010, for comparative purposes as if IFRS had always been in effect, subject to certain mandatory exceptions and optional exemptions applicable to us, discussed below.
Senior management and the Audit Committee have approved the Company’s IFRS accounting policies. However, IFRS standards are evolving and the International Accounting Standards Board (“IASB”) has several projects underway and are expected to issue new accounting standards throughout 2011. As a result, the final impact of IFRS on our consolidated financial statements will only be measured once all the IFRS applicable at the conversion date are known which could also affect the differences currently identified between Canadian GAAP and IFRS.
PROJECT MANAGEMENT
While IFRS uses a conceptual framework similar to Canadian GAAP, there are significant differences on recognition, measurement, and disclosures. We commenced our IFRS conversion project in 2008. The project consists of four phases: raise awareness; assessment; design; and implementation. We are currently in the implementation phase. While a number of differences were identified, the areas of highest potential impact to the Company are stock-based compensation, decommissioning liabilities, leases, presentation, and disclosure, as well as the initial selection of applicable transitional exemptions under the provisions of IFRS 1 First Time Adoption. We have not identified any further areas subject to significant change during the subsequent phases of the transition project.
TRANSITIONAL ELECTIONS (under IFRS 1 First Time Adoption)
The following summary provides details of the opening statement of financial position transitional provisions to be adopted effective January 1, 2010.
- Share Based Payments: IFRS 2, Share Based Payment, encourages application of its provisions to equity instruments granted on or before November 7, 2002, if fair value information about these instruments had previously been publicly disclosed. As the fair value of the Company’s instruments had not been historically disclosed, the Company will not restate share-based payment balances in relation to fully vested awards of share-based payments prior to January 1, 2010.
- Property, plan and equipment (“PP&E”): No transitional elections will be taken. The Company will retain assets at historical cost upon transition rather than taking the allowed election to recognize assets at fair value.
In addition to the key areas outlined above, the use of the following additional transitional exemptions, available under IFRS 1, has been agreed by management and the Audit Committee.
- Business Combinations: The Company will not retrospectively restate any
23
business combinations; IFRS 3 will be applied prospectively to acquisitions after January 1, 2010.
- Cumulative Translation Adjustments: All cumulative translation adjustments and associated gains and losses will be “reset” to zero as at the date of transition, all historic amounts will be transferred from accumulated other comprehensive loss to retained earnings.
IFRS OPENING STATEMENT OF FINANCIAL POSITION
The following table summarizes the expected quantitative impact on the consolidated statement of financial position of the Company’s transition to IFRS at January 1, 2010. These differences have been identified with reference to IFRS effective at the date of this MD&A. In the event that new or amended accounting standards or interpretations become effective prior to the inclusion of the Company’s financial statement of position in its first annual audited IFRS financial statements (December 2011 year end), the differences currently identified between Canadian GAAP and IFRS may change.
Reconciliation of Opening Balance Sheet at Transition Date
| (Expressed in thousands of U.S. dollars) | ||||||||||||||
| Asset | Share- | |||||||||||||
| retirement | based | |||||||||||||
| Canadian | obligations | payments | ||||||||||||
| As at January 1, 2010 | GAAP | (a) | (b) | Other (c) | IFRS | |||||||||
| Current assets | $ | 106,416 | - | - | - | $ | 106,416 | |||||||
| Non-currents assets | 88,932 | 259 | - | - | 89,191 | |||||||||
| Total assets | 195,348 | 259 | - | - | 195,607 | |||||||||
| Current liabilities | 30,057 | - | - | - | 30,057 | |||||||||
| Non-current liabilities | 6,371 | 1,527 | - | - | 7,898 | |||||||||
| Total liabilities | 36,428 | 1,527 | - | - | 37,955 | |||||||||
| Share capital | 835,358 | - | - | - | 835,358 | |||||||||
| Contributed surplus | 284,510 | - | 1,437 | - | 285,947 | |||||||||
| Accumulated deficit | (960,712 | ) | (1,268 | ) | (1,437 | ) | (236 | ) | (963,653 | ) | ||||
| Accumulated other | ||||||||||||||
comprehensive loss | (236 | ) | - | - | 236 | - | ||||||||
| Total shareholders’ | ||||||||||||||
equity | 158,920 | (1,268 | ) | - | - | 157,652 | ||||||||
| Total liabilities and | ||||||||||||||
shareholders’ equity | $ | 195,348 | $ | 259 | - | - | $ | 195,607 | ||||||
The following notes explain the significant adjustments to the Company’s Canadian GAAP statement of financial position at January 1, 2010, as a result of the Company’s transition to IFRS:
| (a) | Changes in Asset Retirement Obligations: Under both Canadian GAAP and IFRS, we are required to determine a best estimate of asset retirement obligations (termed decommissioning liabilities under IFRS) for all of our facilities. Under IFRS, the liability is measured by applying the risk-free discount rate to the estimated total cost of decommissioning each reporting period whereas under Canadian GAAP the liability was measured using a company specific discount rate. As a result of the application of a lower discount rate under IFRS, adjustments to its IFRS opening statement of financial position are expected to be required to (i) increase other long-term liabilities by approximately $1.5 |
24
| million; (ii) increase PP&E by $0.2 million; and (iii) to increase accumulated deficit by $1.3 million. | ||
| (b) | Share-based Payments: Under Canadian GAAP, the Company values stock-based compensation that vests in tranches as a single grant. IFRS requires that each share-based compensation tranche be valued as a separate grant with a separate vesting date. The Company expects to record a charge to contributed surplus of approximately $1.4 million for unvested stock-based compensation awards in its IFRS opening statement of financial position to reflect these changes in the valuation process. | |
| (c) | Accumulated Other Comprehensive Loss: The Company expects to record a charge of $0.2 million to deficit in its IFRS opening statement of financial position in order to reset accumulated other comprehensive loss to zero. | |
ADDITIONAL IMPACTS EXPECTED ON OUR IFRS 2010 FINANCIAL STATEMENTS
In addition to the above noted impacts on our consolidated statement of financial position at January 1, 2010, we anticipate the additional following impacts on our 2010 consolidated financial statements as a result of our upcoming conversion to IFRS:
- Accelerated recognition of sale and leaseback gains: Under Canadian GAAP, sale and leaseback gains are deferred and amortized over the term of the lease when the leaseback is classified as an operating lease. Under IFRS, such gains may be recognized upfront if the sale and leaseback transaction results in an operating lease, and is undertaken at fair value. As the land component of our March 2010 sale and leaseback of our head office building is expected to meet this criteria, the unamortized portion of the deferred gain of $3.3 million attributed to the land leaseback will be recognized in 2010 net income and the related deferred gain derecognized in the 2010 financial statements.
- Foreign Currency Translation of Subsidiary (Dantherm Power): Under Canadian GAAP, the translation methodology of a foreign subsidiary is determined by whether the subsidiary is a self sustaining or an integrated operation. Under IFRS, the functional currency of the subsidiary determines the translation methodology. As Dantherm Power’s functional currency has been initially assessed as the Danish Kroner, Dantherm Power will be consolidated under IFRS using the current rate method. Under Canadian GAAP, Dantherm Power was determined to be an integrated operation and therefore translated using the temporal method. Given that Dantherm Power was acquired in January 2010 and U.S. / Danish Kroner exchange rates have been relatively stable, the impacts of this GAAP difference are expected to be insignificant.
IFRS ACCOUNTING POLICY IMPACTS
In addition to the transitional and other impacts described above, there are several accounting policy impacts which will impact the Company on a go-forward basis. This is not an exhaustive list, but it provides an indication of the main accounting policy choices which will apply to the Company under IFRS effective January 1, 2011 with comparatives presented for 2010:
- Share-based payments: All share-based payments will be valued at fair value under IFRS using an option pricing model. The Company has selected the Black
25
Scholes option pricing model. This is consistent with the Company’s current accounting policy. However, under IFRS, the valuation of stock options and restricted share unit (“RSU”) awards requires individual “tranche based” valuations for those option and RSU plans with graded vesting, while Canadian GAAP allows a single valuation for all tranches. Therefore, under IFRS each installment of option and RSU award will be treated as a separate option or RSU grant, and the fair value of each installment will be amortized over each installment’s vesting period instead of recognizing the entire award on a straight-line basis over the term of the grant. The impact of this change on the income statement is not expected to be significant.
- Property, Plant and Equipment (“PP&E”): Under IFRS, PP&E may be accounted for using either a cost or revaluation model. The Company has elected to use the cost model for all classes of property, plant and equipment. This is consistent with the Company’s current accounting policy and hence will not impact the Company’s PP&E balances.
- Impairment of Assets: If there is an indication that an asset may be impaired, an impairment test must be performed. Under Canadian GAAP, this is a two-step impairment test in which (i) undiscounted future cash flows are compared to the carrying value; and (ii) if those undiscounted cash flows are less than the carrying value, the asset is written down to fair value. Under IFRS, an entity is required to assess, at the end of each reporting period, whether there is any indication that an asset may be impaired. If such a condition exists, the entity shall estimate the recoverable amount of the asset by performing a one-step impairment test, which requires a comparison of the carrying value of the asset to the higher of (1) value in use; and (ii) fair value less costs to sell. Value in use is defined as the present value of future cash flows expected to be derived from the asset in its current state. In addition, IFRS requires PP&E, goodwill and intangibles to be assessed for impairment at the cash-generating unit (“CGU”) level, rather than the reporting unit level considered by Canadian GAAP. As a result of this difference, in principle, impairment write downs may be more likely under IFRS than are currently identified and recorded under Canadian GAAP. The extent of any new write downs, however, may be partially offset by the requirement under IAS 36 Impairment of Assets, to reverse any previous impairment losses where circumstances have changed such that the impairments have been reduced. Canadian GAAP prohibits reversal of impairment losses. We have concluded that the adoption of these standards will not result in a change to the carrying value of our PP&E, Goodwill and Intangible Assets on transition to IFRS being January 1, 2010.
- Business Combinations: Under IFRS, we will account for all business combinations from January 1, 2010 onwards in accordance with IFRS 3 Business Combinations. Given that we adopted Canadian CICA Handbook Section 1582 as of January 1, 2010 which is substantially converged with IFRS 3, we do not expect any difference relating to the acquisition of Dantherm Power.
- Provisions: Under Canadian GAAP, a provision is required to be recorded in the financial statements when required payment is considered “likely’ and can be reasonably estimated. The threshold for recognition of provisions under IFRS is lower than that under Canadian GAAP as provisions must be recognized if
26
required payment is “probable”. Therefore, in principle, it is possible to that there may be come provisions which would meet the recognition criteria under IFRS that were not recognized under Canadian GAAP. Other differences between IFRS and Canadian GAAP exist in relation to the measurement of provisions, such as the methodology for determining the best estimate where there is a range of equally possible outcomes (IFRS uses the mid-point of the range, whereas Canadian GAAP use the low end of the range), and the requirement under IFRS for provisions to be discounted where material. We have reviewed our positions and concluded that there is no adjustment to our financial statements on transition to IFRS arising from the application of IFRS provisions recognition and measurement guidance.
- Functional Presentation: Under IFRS, operating expenses must be presented on either a functional or type of expenditure basis. Under Canadian GAAP, operating expenses could be presented using a mix of both function and type of expenditure. The Company has elected to use the functional classification basis for the presentation of its operating expenses. As a result, the operating expenses of depreciation and amortization, restructuring costs, and acquisition expenses, which are individually presented in the Statement of Operations under Canadian GAAP, will be reallocated to research and product development, sales and marketing, and general and administrative expense under IFRS.
Management continues to monitor standards to be issued by the IASB, but it remains difficult to predict the IFRS that will be effective at the end of the Company’s first IFRS reporting period (December 2011), as the IASB work plan anticipates the completion of several projects during 2011. Their projects on employee benefits, leases, revenue, financial instruments, and provisions are especially relevant to the Company.
IFRS OTHER IMPACTS
In addition to the above noted impacts to our financial statements and accounting policies, we have also reviewed the expected impact of our upcoming conversion to IFRS on our information technology and data systems, internal controls over financial reporting, business processes, contractual arrangements and compensation arrangements.
- Training: We have provided IFRS training for key employees, senior management and the Audit Committee. We will continue to provide additional training and updates throughout the conversion period;
- Information technology and data systems: We have assessed the impact on system requirements for the conversion and post-conversion periods and expect there will be no significant impact to applications arising from the transition to IFRS;
- Compensation arrangements: We have identified compensation arrangements that rely on indicators derived from the financial statements and expect there will be no significant impact to compensation expense arising from the transition to IFRS;
27
- Disclosure controls and procedures: We have assessed the impact on our disclosure controls and procedures and expect there will be no significant impact arising from the transition to IFRS.
- Internal control over financial reporting: We have identified the required accounting process changes that result from the application of IFRS accounting policies; these changes are not considered significant. As part of the transition project, we will complete the design, implementation and documentation of the accounting process changes that result from the application of IFRS accounting policies. We believe that our current framework of internal control over financial reporting and disclosure controls and procedures is sufficiently robust to incorporate the changes to the financial reporting processes as a result of our conversion to IFRS.
Our transition plans relating to IFRS are on schedule.
SUPPLEMENTAL NON-GAAP MEASURES
In addition to providing measures prepared in accordance with GAAP, we present certain supplemental non-GAAP measures. These measures are Cash Operating Costs, EBITDA and Adjusted EBITDA. These non-GAAP measures do not have any standardized meaning prescribed by GAAP and therefore are unlikely to be comparable to similar measures presented by other companies. We believe these measures are useful in evaluating the operating performance and liquidity of the Company’s ongoing business. These measures should be considered in addition to, and not as a substitute for, net income, cash flows and other measures of financial performance and liquidity reported in accordance with GAAP.
Cash Operating Costs
This supplemental non-GAAP measure is provided to assist readers in determining our operating costs on a cash basis. We believe this measure is useful in assessing performance and highlighting trends on an overall basis. We also believe Cash Operating Costs is frequently used by securities analysts and investors when comparing our results with those of other companies. Cash Operating Costs differs from the most comparable GAAP measure, operating expenses, primarily because it does not include stock-based compensation expense, depreciation and amortization, restructuring costs and acquisition costs.
The following table shows a reconciliation of operating expenses to Cash Operating Costs for the three months and year ended December 31, 2010 and 2009:
| (Expressed in thousands of U.S. dollars) | Three months ended December 31, | Year ended December 31, | |||||||||||||||||
| Cash Operating Costs | 2010 | 2009 | $ Change | 2010 | 2009 | $ Change | |||||||||||||
| Operating Expense | $ | 14,665 | $ | 14,013 | $ | 652 | $ | 52,970 | $ | 57,970 | $ | (5,000 | ) | ||||||
| Stock-based compensation | (1,182 | ) | (860 | ) | (322 | ) | (4,057 | ) | (3,033 | ) | (1,024 | ) | |||||||
| Acquisition charges | (175 | ) | (529 | ) | 354 | (243 | ) | (529 | ) | 286 | |||||||||
| Restructuring and related costs | - | (36 | ) | 36 | (285 | ) | (6,229 | ) | 5,944 | ||||||||||
| Depreciation and amortization | (3,703 | ) | (3,236 | ) | (467 | ) | (6,454 | ) | (6,580 | ) | 126 | ||||||||
| Cash Operating Costs | $ | 9,605 | $ | 9,352 | $ | 253 | $ | 41,931 | $ | 41,599 | $ | 332 | |||||||
28
Adjusted EBITDA
These supplemental non-GAAP measures are provided to assist readers in determining our operating performance and ability to generate operating cash flow. We believe this measure is useful in assessing performance and highlighting trends on an overall basis. We also believe EBITDA and Adjusted EBITDA are frequently used by securities analysts and investors when comparing our results with those of other companies. EBITDA differs from the most comparable GAAP measure, net income attributable to Ballard, primarily because it does not include interest expense, income tax expense or recovery, depreciation of property, plant and equipment, amortization of intangible assets, and goodwill impairment charges. Adjusted EBITDA adjusts EBITDA for stock-based compensation expense, transactional gains and losses, investment and other income, and acquisition costs.
The following table shows a reconciliation of net income attributable to Ballard to EBITDA and Adjusted EBITDA for the three months and year ended December 31, 2010 and 2009:
| (Expressed in thousands of U.S. dollars) | Three months ended December 31, | Year ended December 31, | |||||||||||||||||
| EBITDA and Adjusted EBITDA | 2010 | 2009 | $ Change | 2010 | 2009 | $ Change | |||||||||||||
| Net loss attributable to Ballard | |||||||||||||||||||
| Power Systems Inc. | $ | (8,430 | ) | $ | 25,634 | $ | (34,064 | ) | $ | (34,936 | ) | $ | (3,258 | ) | $ | (31,678 | ) | ||
| Depreciation and amortization | 4,723 | 3,824 | 899 | 8,564 | 9,504 | (940 | ) | ||||||||||||
| Interest expense | 307 | - | 307 | 974 | - | 974 | |||||||||||||
| Income taxes | - | (7 | ) | 7 | 3 | (7 | ) | 10 | |||||||||||
| EBITDA attributable to Ballard | |||||||||||||||||||
| Power Systems Inc. | $ | (3,400 | ) | $ | 29,451 | $ | (32,709 | ) | $ | (25,395 | ) | $ | 6,239 | $ | (31,634 | ) | |||
| Stock-based compensation | 1,182 | 860 | 322 | 4,057 | 3,033 | 1,024 | |||||||||||||
| Acquisition charges | 175 | 529 | (354 | ) | 243 | 529 | (286 | ) | |||||||||||
| Investment and other (income) loss | (1,133 | ) | (2,494 | ) | 1,361 | (128 | ) | (5,995 | ) | 5,867 | |||||||||
| Gain on sale of assets | 50 | (34,368 | ) | 34,418 | (4,765 | ) | (34,419 | ) | 29,654 | ||||||||||
| Equity in loss of associated companies | - | (421 | ) | 421 | - | (8,364 | ) | 8,364 | |||||||||||
| Adjusted EBITDA | $ | (3,126 | ) | $ | (6,443 | ) | $ | 3,317 | $ | (25,988 | ) | $ | (38,977 | ) | $ | 12,989 | |||
MANAGEMENT’S REPORT ON DISCLOSURE CONTROLS AND PROCEDURES AND INTERNAL CONTROLS OVER FINANCIAL REPORTING
Disclosure controls and procedures
Our disclosure controls and procedures are designed to provide reasonable assurance that all relevant information is gathered and reported to senior management, including the Chief Executive Officer (“CEO”) and the Chief Financial Officer (“CFO”), on a timely basis so that appropriate decisions can be made regarding public disclosures.
As of the end of the period covered by this report, we evaluated, under the supervision and with the participation of management, including the CEO and the CFO, the effectiveness of the design and operation of our disclosure controls and procedures, as defined in Rules 13a–15(e) and 15d-15(e) of the Securities Exchange Act of 1934 (“Exchange Act”). The CEO and CFO have concluded that as of December
29
31, 2010, our disclosure controls and procedures were effective to ensure that information required to be disclosed in reports we file or submit under the Exchange Act is recorded, processed, summarized and reported within the time periods specified therein, and accumulated and reported to management to allow timely discussions regarding required disclosure.
Internal control over financial reporting
The CEO and CFO, together with other members of management, are responsible for establishing and maintaining adequate internal control over the Company’s financial reporting. Internal control over financial reporting is designed under our supervision, and effected by the Company’s board of directors, management, and other personnel, to provide reasonable assurance regarding the reliability of financial reporting and the preparation of financial statements for external purposes in accordance with accounting principles generally accepted in Canada and the requirements of the Securities and Exchange Commission in the United States, as applicable.
There are inherent limitations in the effectiveness of internal control over financial reporting, including the possibility that misstatements may not be prevented or detected. Accordingly, even effective internal controls over financial reporting can provide only reasonable assurance with respect to financial statement preparation. Furthermore, the effectiveness of internal controls can change with circumstances.
Management, including the CEO and CFO, have evaluated the effectiveness of internal control over financial reporting, as defined in Rules 13a–15(f) of the Exchange Act, in relation to criteria described in Internal Control–Integrated Framework issued by the Committee of Sponsoring Organizations of the Treadway Commission (“COSO”). Based on this evaluation, Management has determined that internal control over financial reporting was effective as of December 31, 2010.
KPMG LLP, our independent registered public accounting firm, has audited our consolidated financial statements and expressed an unqualified opinion thereon. KPMG has also expressed an unqualified opinion on the effective operation of our internal control over financial reporting as of December 31, 2010.
Changes in internal control over financial reporting
During the year ended December 31, 2010, there were no material changes in internal control over financial reporting that have materially affected, or are reasonably likely to materially affect, the Company’s internal control over financial reporting.
30
As Dantherm Power was acquired in the last 365 days, we have limited the scope of our design of disclosure controls and procedures and internal controls over financial reporting to exclude controls, policies and procedures of Dantherm Power. Summary financial information of Dantherm Power consolidated in our year ended December 31, 2010 consolidated financial statements include:
| Select Dantherm Power financial information | 2010 | |||
| (Expressed in thousands of U.S. dollars) | ||||
| Revenues | $ | 2,525 | ||
| Net loss | $ | (6,743 | ) | |
| Adjusted EBITDA | $ | (6,544 | ) | |
| Cash used by operating activities | $ | (6,192 | ) | |
| Cash, cash equivalents and short-term investments | $ | 1,042 | ||
| Total assets | $ | 13,519 | ||
RISKS & UNCERTAINTIES
An investment in our common shares involves risk. Investors should carefully consider the risks described below and the other information contained in, and incorporated into, this Management Discussion and Analysis, our financial statements for the year ended December 31, 2010, and our Annual Information Form. The risks and uncertainties described below are not the only ones we face. Additional risks and uncertainties, including those that we do not know about now or that we currently deem immaterial, may also adversely affect our business. For a more complete discussion of the risks and uncertainties which apply to our business and our operating results and are summarized below, please see our Annual Information Form and other filings with Canadian (www.sedar.com) and U.S. securities regulatory authorities (www.sec.gov).
Our business entails risks and uncertainties that affect our outlook and eventual results of our business and commercialization plans. The primary risks relate to meeting our product development and commercialization milestones, which require that our products exhibit the functionality, cost, durability and performance required in a commercial product and that we have sufficient access to capital to fund these activities. To be commercially useful, most of our products must be integrated into products manufactured by system integrators or OEMs. There is no guarantee that system integrators or OEMs will provide products that use our products as components. There is also a risk that mass markets for certain of our products may never develop, or that market acceptance might take longer to develop than anticipated.
A summary of our identified risks and uncertainties are as follows:
- We may not be able to achieve commercialization of our products on the timetable we anticipate, or at all;
- We expect our cash reserves will be reduced due to future operating losses, and we cannot provide certainty as to how long our cash reserves will last or that we will be able to access additional capital when necessary;
- We may not be able to successfully execute our business plan;
- Potential fluctuations in our financial and business results make forecasting
31
difficult and may restrict our access to funding for our commercialization plan;
- We could be adversely affected by risks associated with acquisitions;
- We are subject to risks inherent in international operations;
- Exchange rate fluctuations are beyond our control and may have a material adverse effect on our business, operating results, financial condition and profitability;
- Commodity price fluctuations are beyond our control and may have a material adverse effect on our business, operating results, financial condition and profitability;
- A mass market for our products may never develop or may take longer to develop than we anticipate;
- We have limited experience manufacturing fuel cell products on a commercial basis;
- We are dependent on third party suppliers for the supply of key materials and components for our products;
- We are dependent upon Original Equipment Manufacturers and Systems Integrators to purchase certain of our products;
- Global economic conditions are beyond our control and may have an adverse impact on our business or on our key suppliers and / or customers;
- Public Policy and regulatory changes could hurt the market for our products;
- We depend on our intellectual property and our failure to protect that intellectual property could adversely affect our future growth and success;
- We currently face and will continue to face significant competition;
- We could lose or fail to attract the personnel necessary to run our business;
- We could be liable for environmental damages resulting from our research, development or manufacturing operations; and
- Our products use flammable fuels, which could subject our business to product liability claims.
FORWARD-LOOKING STATEMENTS DISCLAIMER
This document contains forward-looking statements that are based on the beliefs of management and reflect our current expectations as contemplated under the safe harbor provisions of Section 21E of the United States Securities Exchange Act of 1934, as amended. Such statements include, but are not limited to, statements with respect to our objectives, goals and outlook including our estimated revenue and gross margins, cash flow from operations, Cash Operating Costs, EBITDA and Adjusted EBITDA (see Non-GAAP Measures) contained in our “Outlook”, as well as statements with respect to our beliefs, plans, objectives, expectations, anticipations, estimates and intentions. Words such as "estimate", "project", "believe", "anticipate", "intend", "expect", "plan", "predict", "may", "should", "will", the negatives of these words or other variations thereof and comparable terminology are intended to identify forward-looking statements. These statements are not
32
guarantees of future performance and involve assumptions, risks and uncertainties that are difficult to predict.
In particular, these forward-looking statements are based on certain factors and assumptions disclosed in our “Outlook” as well as specific assumptions relating to our expectations with respect to the generation of new sales, producing, delivering and selling the expected product volumes at the expected prices, and controlling our costs. They are also based on a variety of general factors and assumptions including, but not limited to, our expectations regarding product development efforts, manufacturing capacity, product pricing, market demand, and the availability and prices of raw materials, labour and supplies. These assumptions have been derived from information available to the Company including information obtained by the Company from third parties. These assumptions may prove to be incorrect in whole or in part. In addition, actual results may differ materially from those expressed, implied, or forecasted in such forward-looking statements. Factors that could cause our actual results or outcomes to differ materially from the results expressed, implied or forecasted in such forward-looking statements include, but are not limited to: the condition of the global economy; the rate of mass adoption of our products; changes in product pricing; changes in our customers' requirements, the competitive environment and related market conditions; product development delays; changes in the availability or price of raw materials, labour and supplies; our ability to attract and retain business partners, suppliers, employees and customers; changing environmental regulations; our access to funding and our ability to provide the capital required for product development, operations and marketing efforts; our ability to protect our intellectual property; the magnitude of the rate of change of the Canadian dollar versus the U.S. dollar; and the general assumption that none of the risks identified in the Risks and Uncertainties section of this report or in our most recent Annual Information Form will materialize. Readers should not place undue reliance on Ballard's forward-looking statements.
The forward-looking statements contained in this document speak only as of the date of this Management Discussion and Analysis. Except as required by applicable legislation, Ballard does not undertake any obligation to release publicly any revisions to these forward-looking statements to reflect events or circumstances after the date of this Management Discussion and Analysis, including the occurrence of unanticipated events.
33
Consolidated Financial Statements (Expressed in U.S. dollars) BALLARD POWER SYSTEMS INC. Years ended December 31, 2010 and 2009 |
F-2
MANAGEMENT’S REPORT
Management’s Responsibility for the Financial Statements and Report on Internal Control over Financial Reporting
The consolidated financial statements contained in this Annual Report have been prepared by management in accordance with Canadian generally accepted accounting principles (“GAAP”). The integrity and objectivity of the data in these consolidated financial statements are management’s responsibility. Management is also responsible for all other information in the Annual Report and for ensuring that this information is consistent, where appropriate, with the information and data contained in the consolidated financial statements.
Management is responsible for establishing and maintaining adequate internal control over financial reporting. Internal control over financial reporting is a process designed to provide reasonable assurance regarding the reliability of financial reporting and the preparation of consolidated financial statements for external reporting purposes in accordance with GAAP. Internal control over financial reporting may not prevent or detect fraud or misstatements because of limitations inherent in any system of internal control. Management has assessed the effectiveness of the Corporation’s internal control over financial reporting based on the framework in Internal Control – Integrated Framework issued by the Committee of Sponsoring Organizations of the Treadway Commission, and concluded that the Corporation’s internal control over financial reporting was effective as of December 31, 2010. In addition, management maintains disclosure controls and procedures to provide reasonable assurance that material information is communicated to management and appropriately disclosed. Some of the assets and liabilities include amounts, which are based on estimates and judgments, as their final determination is dependent on future events.
The Board of Directors oversees management’s responsibilities for financial reporting through the Audit Committee, which consists of five directors who are independent and not involved in the daily operations of the Corporation. The Audit Committee meets on a regular basis with management and the external and internal auditors to discuss internal controls over the financial reporting process, auditing matters and financial reporting issues. The Audit Committee is responsible for appointing the external auditors (subject to shareholder approval), and reviewing and approving all financial disclosure contained in our public documents and related party transactions.
1
The external auditors, KPMG LLP, have audited the financial statements and expressed an unqualified opinion thereon. KPMG has also expressed an unqualified opinion on the effective operation of the internal controls over financial reporting as of December 31, 2010. The external auditors have full access to management and the Audit Committee with respect to their findings concerning the fairness of financial reporting and the adequacy of internal controls.
| “JOHN SHERIDAN” | “TONY GUGLIELMIN” |
| JOHN SHERIDAN | TONY GUGLIELMIN |
| President and | Vice President and |
| Chief Executive Officer | Chief Financial Officer |
| March 8, 2011 | March 8, 2011 |
2
REPORT OF INDEPENDENT REGISTERED PUBLIC ACCOUNTING FIRM
To the Shareholders and Board of Directors of Ballard Power Systems Inc.
We have audited the accompanying consolidated balance sheets of Ballard Power Systems Inc. as at December 31, 2010 and December 31, 2009 and the related consolidated statements of operations and comprehensive loss, shareholders’ equity, and cash flows for each of the years in the two-year period ended December 31, 2010. These consolidated financial statements are the responsibility of the Company’s management. Our responsibility is to express an opinion on these consolidated financial statements based on our audits.
We conducted our audits in accordance with Canadian generally accepted auditing standards and the standards of the Public Company Accounting Oversight Board (United States). Those standards require that we plan and perform the audit to obtain reasonable assurance about whether the financial statements are free of material misstatement. An audit includes examining, on a test basis, evidence supporting the amounts and disclosures in the financial statements. An audit also includes assessing the accounting principles used and significant estimates made by management, as well as evaluating the overall financial statement presentation. We believe that our audits provide a reasonable basis for our opinion.
In our opinion, the consolidated financial statements referred to above present fairly, in all material respects, the financial position of the Company as of December 31, 2010 and December 31, 2009 and the results of its operations and its cash flows for each of the years in the two-year period ended December 31, 2010 in conformity with Canadian generally accepted accounting principles.
We also have audited, in accordance with the standards of the Public Company Accounting Oversight Board (United States), the Company’s internal control over financial reporting as of December 31, 2010, based on the criteria established in Internal Control – Integrated Framework issued by the Committee of Sponsoring Organizations of the Treadway Commission (COSO), and our report dated March 8, 2011 expressed an unqualified opinion on the effectiveness of the Company’s internal control over financial reporting.
“KPMG LLP”
Chartered Accounts
Vancouver, Canada
March 8, 2011
March 8, 2011
3
REPORT OF INDEPENDENT REGISTERED PUBLIC ACCOUNTING FIRM
To the Shareholders and Board of Directors of Ballard Power Systems Inc.
We have audited Ballard Power Systems Inc’s (“the Company”) internal control over financial reporting as of December 31, 2010, based on the criteria established in Internal Control – Integrated Framework issued by the Committee of Sponsoring Organizations of the Treadway Commission (COSO). The Company’s management is responsible for maintaining effective internal control over financial reporting and for its assessment of the effectiveness of internal control over financial reporting, included in the section entitled “Management’s Report on Disclosure Controls and Procedures and Internal Controls over Financial Reporting” und the heading “Internal control over financial reporting” included in Management Discussion and Analysis. Our responsibility is to express an opinion on the Company’s internal control over financial reporting based on our audit.
We conducted our audit in accordance with the standards of the Public Company Accounting Oversight Board (United States). Those standards require that we plan and perform the audit to obtain reasonable assurance about whether effective internal control over financial reporting was maintained in all material respects. Our audit included obtaining an understanding of internal control over financial reporting, assessing the risk that a material weakness exists, and testing and evaluating the design and operating effectiveness of internal control based on the assessed risk. Our audit also included performing such other procedures as we considered necessary in the circumstances. We believe that our audit provides a reasonable basis for our opinion.
A company’s internal control over financial reporting is a process designed to provide reasonable assurance regarding the reliability of financial reporting and the preparation of financial statements for external purposes in accordance with generally accepted accounting principles. A company’s internal control over financial reporting includes those policies and procedures that (1) pertain to the maintenance of records that, in reasonable detail, accurately and fairly reflect the transactions and dispositions of the assets of the company; (2) provide reasonable assurance that transactions are recorded as necessary to permit preparation of financial statements in accordance with generally accepted accounting principles, and that receipts and expenditures of the company are being made only in accordance with authorizations of management and directors of the company; and (3) provide reasonable assurance regarding prevention or timely detection of unauthorized acquisition, use, or disposition of the company’s assets that could have a material effect on the financial statements.
Because of its inherent limitations, internal control over financial reporting may not prevent or detect misstatements. Also, projections of any evaluation of effectiveness
4
to future periods are subject to the risk that controls may become inadequate because of changes in conditions, or that the degree of compliance with the policies or procedures may deteriorate.
The Company acquired Dantherm Power A/S (“Dantherm”) during 2010, and management excluded from its assessment of the effectiveness of the Company’s internal control over financial reporting as of December 31, 2010, Dantherm’s internal control over financial reporting associated with total assets of $6,527,000 and total revenue of $1,618,000 included in the consolidated financial statements of the Company as of and for the year ended December 31, 2010. Our audit of internal control over financial reporting also excluded the evaluation of the internal control over financial reporting of Dantherm.
In our opinion, the Company maintained, in all material respects, effective internal control over financial reporting as of December 31, 2010 based on the criteria established in Internal Control – Integrated Framework issued by the Committee of Sponsoring Organizations of the Treadway Commission (COSO).
We also have audited, in accordance with Canadian generally accepted auditing standards and the standards of the Public Company Accounting Oversight Board (United States), the consolidated balance sheets of the Company as at December 31, 2010 and 2009, and the related consolidated statements of operations and comprehensive loss, shareholders’ equity, and cash flows for the years then ended, and our report dated March 8, 2011, expressed an unqualified opinion on those consolidated financial statements.
“KPMG LLP”
Chartered Accountants
Vancouver, Canada
March 8, 2011
March 8, 2011
5
BALLARD POWER SYSTEMS INC.
Consolidated Balance Sheets
December 31,
(Expressed in thousands of U.S. dollars)
Consolidated Balance Sheets
December 31,
(Expressed in thousands of U.S. dollars)
| 2010 | 2009 | ||||||
| Assets | |||||||
| Current assets: | |||||||
| Cash and cash equivalents | $ | 51,937 | $ | 43,299 | |||
| Short-term investments | 22,508 | 38,932 | |||||
| Accounts receivable (notes 5 & 18) | 11,614 | 12,903 | |||||
| Inventories (note 6) | 12,382 | 9,168 | |||||
| Prepaid expenses and other current assets | 957 | 2,114 | |||||
| 99,398 | 106,416 | ||||||
| Property, plant and equipment (note 7) | 36,706 | 39,320 | |||||
| Intangible assets (note 8) | 2,975 | 824 | |||||
| Goodwill | 48,106 | 48,106 | |||||
| Investments (note 9) | 673 | 632 | |||||
| Long-term accounts receivable (note 5) | 1,596 | - | |||||
| Other long-term assets | 334 | 50 | |||||
| $ | 189,788 | $ | 195,348 | ||||
| Liabilities and Shareholders’ Equity | |||||||
| Current liabilities: | |||||||
| Accounts payable and accrued liabilities (notes 10 & 18) | $ | 23,334 | $ | 20,321 | |||
| Deferred revenue | 2,506 | 1,607 | |||||
| Accrued warranty liabilities | 8,570 | 7,813 | |||||
| Current portion of obligation under capital lease (note 11) | 681 | 316 | |||||
| 35,091 | 30,057 | ||||||
| Long-term liabilities (notes 12 & 13) | 4,432 | 4,632 | |||||
| Deferred gain (note 4) | 9,036 | - | |||||
| Obligation under capital lease (note 11) | 13,354 | 1,739 | |||||
| 61,913 | 36,428 | ||||||
| Shareholders’ equity: | |||||||
| Ballard Power Systems Inc. shareholders’ equity | |||||||
| Share capital (note 14) | 836,245 | 835,565 | |||||
| Treasury shares (note 14) | (670 | ) | (207 | ) | |||
| Contributed surplus (note 14) | 288,618 | 284,510 | |||||
| Accumulated deficit | (995,669 | ) | (960,712 | ) | |||
| Accumulated other comprehensive loss | (236 | ) | (236 | ) | |||
| Total Ballard Power Systems Inc. shareholders’ equity | 128,288 | 158,920 | |||||
| Dantherm Power A/S non-controlling interests (note 2) | (413 | ) | - | ||||
| Total Shareholders’ Equity | 127,875 | 158,920 | |||||
| $ | 189,788 | $ | 195,348 |
See accompanying notes to consolidated financial statements.
Commitments, guarantees and contingencies (notes 11 & 16)
Commitments, guarantees and contingencies (notes 11 & 16)
Approved on behalf of the Board:
| “Ed Kilroy” | “Ian Bourne” |
| Director | Director |
6
BALLARD POWER SYSTEMS INC.
Consolidated Statements of Operations and Comprehensive Loss
Years ended December 31,
(Expressed in thousands of U.S. dollars, except per share amounts and number of shares)
Consolidated Statements of Operations and Comprehensive Loss
Years ended December 31,
(Expressed in thousands of U.S. dollars, except per share amounts and number of shares)
| 2010 | 2009 | ||||||
| Revenues: | |||||||
| Product and service revenues | $ | 65,019 | $ | 46,722 | |||
| Cost of product and service revenues | 54,808 | 40,795 | |||||
| Gross margin | 10,211 | 5,927 | |||||
| Operating expenses: | |||||||
| Research and product development | 23,812 | 26,628 | |||||
| General and administrative | 13,315 | 10,801 | |||||
| Sales and marketing | 8,861 | 7,203 | |||||
| Restructuring and related costs (note 10) | 285 | 6,229 | |||||
| Acquisition charges | 243 | 529 | |||||
| Depreciation and amortization | 6,454 | 6,580 | |||||
| Total operating expenses | 52,970 | 57,970 | |||||
| Operating loss | (42,759 | ) | (52,043 | ) | |||
| Investment and other income (note 15) | 128 | 5,995 | |||||
| Interest expense | (974 | ) | - | ||||
| Gain on sale of assets (note 9) | 4,765 | 34,419 | |||||
| Equity gain in associated companies (note 12) | - | 8,364 | |||||
| Loss before income taxes | (38,840 | ) | (3,265 | ) | |||
| Income tax (recovery) (note 17) | 3 | (7 | ) | ||||
| Net loss and comprehensive loss | (38,843 | ) | (3,258 | ) | |||
| Less: Net loss attributable to Dantherm Power A/S | |||||||
| non-controlling interests | (3,907 | ) | - | ||||
| Net loss and comprehensive loss attributable | |||||||
| to Ballard Power Systems Inc. | $ | (34,936 | ) | $ | (3,258 | ) | |
| Basic and diluted loss per share attributable to | |||||||
| Ballard Power Systems Inc. | $ | (0.42 | ) | $ | (0.04 | ) | |
| Weighted average number of common shares outstanding | 84,102,315 | 83,637,315 | |||||
See accompanying notes to consolidated financial statements.
7
BALLARD POWER SYSTEMS INC. Consolidated Statements of Shareholders’ Equity December 31, (Expressed in thousands of U.S. dollars except per share amounts and number of shares) |
| Ballard Power Systems Inc. shareholders’ equity | Dantherm | ||||||||||||||||||||||||||||||
| Power A/S | |||||||||||||||||||||||||||||||
| Accumulated | |||||||||||||||||||||||||||||||
| other | Non- | Total | |||||||||||||||||||||||||||||
| Number of | Share | Treasury | Contributed | Accumulated | comprehensive | controlling | shareholders’ | ||||||||||||||||||||||||
| shares | capital | shares | surplus | deficit | loss | interests | equity | ||||||||||||||||||||||||
| Balance, December 31, 2008 | 82,122,135 | $ | 832,711 | $ | - | $ | 283,466 | $ | (957,454 | ) | $ | (236 | ) | $ | - | $ | 158,487 | ||||||||||||||
| Net loss | - | - | - | - | (3,258 | ) | - | - | (3,258 | ) | |||||||||||||||||||||
| Non-dilutive financing (note 3) | - | - | - | (719 | ) | - | - | - | (719 | ) | |||||||||||||||||||||
| Purchase of treasury shares | |||||||||||||||||||||||||||||||
| (note 14) | - | - | (207 | ) | - | - | - | - | (207 | ) | |||||||||||||||||||||
| RSUs and DSUs redeemed | 219,232 | 1,126 | - | (1,283 | ) | - | - | - | (157 | ) | |||||||||||||||||||||
| Options exercised | 5,000 | 7 | - | - | - | - | - | 7 | |||||||||||||||||||||||
| Share distribution plan | 1,627,621 | 1,721 | - | 3,046 | - | - | - | 4,767 | |||||||||||||||||||||||
| Balance, December 31, 2009 | 83,973,988 | 835,565 | (207 | ) | 284,510 | (960,712 | ) | (236 | ) | - | 158,920 | ||||||||||||||||||||
| Acquisition of Dantherm | |||||||||||||||||||||||||||||||
| Power (note 2) | - | - | - | - | - | - | 3,543 | 3,543 | |||||||||||||||||||||||
| Additional investment in | |||||||||||||||||||||||||||||||
| Dantherm Power (note 2) | - | - | - | 915 | - | - | (49 | ) | 866 | ||||||||||||||||||||||
| Net loss | - | - | - | - | (34,936 | ) | - | (3,907 | ) | (38,843 | ) | ||||||||||||||||||||
| Non-dilutive financing | - | - | - | (22 | ) | - | - | - | (22 | ) | |||||||||||||||||||||
| Purchase of treasury | |||||||||||||||||||||||||||||||
| shares (note 14) | - | - | (559 | ) | - | - | - | - | (559 | ) | |||||||||||||||||||||
| RSUs and DSUs redeemed | 101,986 | 542 | 96 | (800 | ) | (21 | ) | - | - | (183 | ) | ||||||||||||||||||||
| Options exercised | 72,491 | 138 | - | (47 | ) | - | - | - | 91 | ||||||||||||||||||||||
| Share distribution plan | - | - | - | 4,062 | - | - | - | 4,062 | |||||||||||||||||||||||
| Balance, December 31, 2010 | 84,148,465 | $ | 836,245 | $ | (670 | ) | $ | 288,618 | $ | (995,669 | ) | $ | (236 | ) | $ | (413 | ) | $ | 127,875 | ||||||||||||
See accompanying notes to consolidated financial statements.
8
| BALLARD POWER SYSTEMS INC. |
| Consolidated Statements of Cash Flows |
| Years ended December 31, |
| (Expressed in thousands of U.S. dollars) |
| 2010 | 2009 | |||||||
| Cash provided by (used for): | ||||||||
| Operating activities: | ||||||||
| Net loss for the year | $ | (38,843 | ) | $ | (3,258 | ) | ||
| Items not affecting cash: | ||||||||
| Compensatory shares | 4,057 | 3,033 | ||||||
| Employee future benefits | (358 | ) | (1,524 | ) | ||||
| Depreciation and amortization | 8,564 | 9,504 | ||||||
| Unrealized gain on forward contracts | (1,404 | ) | (408 | ) | ||||
| Gain on sale of assets (note 9) | (4,816 | ) | (34,439 | ) | ||||
| Equity gain in associated companies | - | (8,364 | ) | |||||
| (32,800 | ) | (35,456 | ) | |||||
| Changes in non-cash working capital: | ||||||||
| Accounts receivable | (65 | ) | 6,084 | |||||
| Inventories | (2,350 | ) | 1,356 | |||||
| Prepaid expenses and other current assets | 1,276 | (884 | ) | |||||
| Accounts payable and accrued liabilities | 2,915 | 1,623 | ||||||
| Deferred revenue | 965 | (3,656 | ) | |||||
| Accrued warranty liabilities | 747 | 3,971 | ||||||
| 3,488 | 8,494 | |||||||
| Cash used by operations | (29,312 | ) | (26,962 | ) | ||||
| Investing activities: | ||||||||
| Net decrease (increase) in short-term investments | 17,738 | (7,619 | ) | |||||
| Additions to property, plant and equipment | (3,453 | ) | (6,778 | ) | ||||
| Net proceeds on sale of property, plant and equipment and other | 20,012 | 2,182 | ||||||
| Net proceeds on monetization of other long-term assets (note 9) | 3,355 | 37,000 | ||||||
| Business acquisition including cash acquired (note 2) | 877 | - | ||||||
| Investments (notes 9 & 12) | (185 | ) | (5,135 | ) | ||||
| 38,344 | 19,650 | |||||||
| Financing activities: | ||||||||
| Non-dilutive financing (note 3) | (22 | ) | (3,243 | ) | ||||
| Purchase of treasury shares (note 14) | (559 | ) | (207 | ) | ||||
| Repayment of capital lease obligation (note 11) | (770 | ) | (30 | ) | ||||
| Net proceeds on issuance of share capital | 91 | 5 | ||||||
| Contribution from Dantherm Power A/S non-controlling interests (note 2) | 866 | - | ||||||
| (394 | ) | (3,475 | ) | |||||
| Increase (decrease) in cash and cash equivalents | 8,638 | (10,787 | ) | |||||
| Cash and cash equivalents, beginning of year | 43,299 | 54,086 | ||||||
| Cash and cash equivalents, end of year | $ | 51,937 | $ | 43,299 | ||||
Supplemental disclosure of cash flow information (note 19)
See accompanying notes to consolidated financial statements.
See accompanying notes to consolidated financial statements.
9
| BALLARD POWER SYSTEMS INC. |
| Notes to Consolidated Financial Statements |
| Years ended December 31, 2010 and 2009 |
| (Tabular amounts expressed in thousands of U.S. dollars, except per share amounts and number of shares) |
1. Nature of business and summary of significant accounting policies:
| (a) | Nature of business: |
| The principal business of Ballard Power Systems Inc. (the “Corporation”) is the design, development, manufacture, sale and service of fuel cell products for a variety of applications, focusing on motive power (material handling and buses) and stationary power (back-up power and distributed generation) markets. A fuel cell is an environmentally clean electrochemical device that combines hydrogen fuel with oxygen (from the air) to produce electricity. Our technology is based on proton exchange membrane (“PEM”) fuel cells. | |
| (b) | Basis of presentation, critical accounting estimates and judgment applied: |
| The consolidated financial statements of the Corporation have been prepared in accordance with Canadian GAAP. All amounts are in United States dollars, unless otherwise noted. Material measurement differences to United States GAAP are disclosed in note 23. | |
| The preparation of the Corporation’s consolidated financial statements in accordance with Canadian Generally Accepted Accounting Principles (“GAAP”) requires management to apply judgment when making estimates and assumptions that affect the reported amounts of assets and liabilities at the date of the financial statements, the reported amounts of revenues and expenses of the reporting period, as well as disclosures made in the accompanying notes to the financial statements. The estimates and associated assumptions are based on past experience and other factors that are considered relevant. Actual results could differ from these estimates. | |
| The Corporation’s critical accounting estimates include, among others, estimates related to revenue recognition on long-term contracts, the assessment of the net realizable value of goodwill and intangible assets, inventory and investments, the adequacy of warranty provisions on sales, and the recoverability of future tax assets. | |
| (c) | Convergence with International Financial Reporting Standards: |
| Canadian public companies will be required to prepare financial statements in accordance with International Financial Reporting Standards (“IFRS”), as issued by the International Accounting Standards Board. This change will apply to financial statements relating to the Corporation beginning on January 1, 2011. The Corporation has undertaken a project to ensure compliance with the new standards by the adoption date. | |
10
| BALLARD POWER SYSTEMS INC. |
| Notes to Consolidated Financial Statements |
| Years ended December 31, 2010 and 2009 |
| (Tabular amounts expressed in thousands of U.S. dollars, except per share amounts and number of shares) |
1. Nature of business and summary of significant accounting policies (cont’d):
| (d) | Principles of consolidation: |
| The consolidated financial statements include the accounts of the Corporation and its principal subsidiaries as follows: | |
| Percentage ownership | |||
| 2010 | 2009 | ||
| Ballard Advanced Materials Corporation | 77.5% | 77.5% | |
| Ballard GmbH | 100.0% | 100.0% | |
| Ballard Material Products Inc. | 100.0% | 100.0% | |
| Ballard Power Corporation | 100.0% | 100.0% | |
| Dantherm Power A/S (note 2) | 52.0% | N/A | |
| All significant intercompany balances and transactions have been eliminated on consolidation. | |
| (e) | Translation of foreign currencies: |
| The measurement currency of the Corporation is the U.S. dollar. Transactions in foreign currencies are translated at the exchange rate in effect at the transaction date. Monetary assets and liabilities denominated in other than the measurement currency are translated at the exchange rates in effect at the balance sheet date. The resulting exchange gains and losses are recognized in earnings. | |
| (f) | Revenue recognition: |
| The Corporation generates revenues primarily from product sales and services. Product revenues are derived primarily from standard equipment and material sales contracts and from long-term fixed price contracts. Service revenues are derived primarily from cost-plus reimbursable contracts. Engineering development revenues are derived primarily from long-term fixed price contracts. | |
| On standard equipment and material sales contracts, revenues are recorded when the product is shipped to the customer and the risks of ownership are transferred to the customer, when the price is fixed and determinable, and collection is reasonably assured. Provisions are made at the time of sale for warranties. | |
| On cost-plus reimbursable contracts, revenues are recognized as costs are incurred, and include applicable fees earned as services are provided. | |
11
| BALLARD POWER SYSTEMS INC. |
| Notes to Consolidated Financial Statements |
| Years ended December 31, 2010 and 2009 |
| (Tabular amounts expressed in thousands of U.S. dollars, except per share amounts and number of shares) |
1. Nature of business and summary of significant accounting policies (cont’d):
| (f) | Revenue recognition (cont’d): |
| On long-term fixed price contracts, revenues are recognized on the percentage-of-completion basis over the duration of the contract, which consists of recognizing revenue on a given contract proportionately with its percentage of completion at any given time. The percentage of completion is determined by dividing the cumulative costs incurred as at the balance sheet date by the sum of incurred and anticipated costs for completing a contract. | |
| The cumulative effect of changes to anticipated revenues and anticipated costs for completing a contract are recognized in the period in which the revisions are identified. In the event that the anticipated costs exceed the anticipated revenues on a contract, such loss is recognized in its entirety in the period it becomes known. | |
| Deferred revenue represents cash received from customers in excess of revenue recognized on uncompleted contracts. | |
| (g) | Cash, cash equivalents and short-term investments: |
| Cash and cash equivalents consist of cash on deposit and highly liquid short-term interest-bearing securities with maturities at the date of purchase of three months or less. | |
| Short-term investments consist of highly liquid interest bearing securities with maturities at the date of purchase between three months and three years. | |
| (h) | Financial instruments: |
| The Corporation measures its financial assets in the balance sheet at fair value, except for loans and receivables, which are measured at amortized cost. Financial liabilities classified as held for trading, including derivatives, are measured in the balance sheet at fair value; all other financial liabilities are measured at amortized cost. Long-term investments are measured at cost as they are privately held entities. | |
Measurement in subsequent periods depends on whether the financial instrument has been classified as held for trading, available-for-sale, held-to-maturity, loans and receivables, or other liabilities. The Corporation classifies its accounts receivables as loans and receivables and its accounts payable and warranty liabilities as other financial liabilities. Periodically, the Corporation enters into forward exchange contracts to limit its exposure to foreign currency rate fluctuations and to platinum price fluctuations. These derivative contracts are recorded as either assets or liabilities in the consolidated balance sheet at fair value. Any changes in fair value are recognized in net income. The Corporation does not designate its financial instruments as hedges. | |
12
| BALLARD POWER SYSTEMS INC. |
| Notes to Consolidated Financial Statements |
| Years ended December 31, 2010 and 2009 |
| (Tabular amounts expressed in thousands of U.S. dollars, except per share amounts and number of shares) |
1. Nature of business and summary of significant accounting policies (cont’d):
| (i) | Inventories: |
| Inventories are recorded at the lower of cost and net realizable value. The cost of inventories is based on the first-in first-out principle, and includes expenditures incurred in acquiring the inventories, production or conversion costs, and other costs incurred in bringing them to their existing location and condition. In the case of manufactured inventories and work in progress, cost includes materials, labor and the appropriate share of production overhead based on normal operating capacity. Costs of materials are determined on an average per unit basis. Net realizable value is the estimated selling price in the ordinary course of business, less the estimated costs of completion and selling expenses. In establishing the appropriate inventory obsolescence provision, management estimates the likelihood that inventory carrying values will be affected by changes in market demand, technology and design, which could make inventory on hand recoverable at less than its cost or even obsolete. | |
| (j) | Property, plant and equipment: |
| Property, plant and equipment are initially recorded at cost and are amortized from the date of acquisition or, in respect of internally constructed assets, from the time an asset is completed and ready for use, using the straight-line method over the estimated useful lives of the assets as follows: | |
| Buildings | 30 to 39 years | |
| Building under capital lease | 15 years | |
| Computer equipment | 3 to 7 years | |
| Furniture and fixtures | 5 to 14 years | |
| Leasehold improvements | The shorter of initial term of the respective | |
| lease and estimated useful life | ||
| Production and test equipment | 4 to 15 years | |
| Production and test equipment under capital lease | 5 years |
| (k) | Intangible assets: |
Intangible assets consist of fuel cell technology acquired from third parties and are recorded at cost. Intangible assets are amortized over their estimated useful lives of 5 to 15 years using the straight-line method. Costs incurred in establishing and maintaining patents and license agreements are expensed in the period incurred. | |
13
| BALLARD POWER SYSTEMS INC. |
| Notes to Consolidated Financial Statements |
| Years ended December 31, 2010 and 2009 |
| (Tabular amounts expressed in thousands of U.S. dollars, except per share amounts and number of shares) |
1. Nature of business and summary of significant accounting policies (cont’d):
| (l) | Impairment of long-lived assets: |
| Long-lived assets, including property, plant and equipment, investments, and intangible assets, are reviewed for impairment when events or changes in circumstances indicate that the carrying amount of the asset may not be recoverable. An impairment loss, if any, is recognized when the carrying amount of a long-lived asset exceeds its fair value based on its estimated undiscounted future cash flows. | |
| (m) | Goodwill: |
| Goodwill represents the excess of the purchase price of an acquired enterprise over the fair value assigned to assets acquired and liabilities assumed. | |
| Goodwill is assessed for impairment at least annually, or more frequently if events or changes in circumstances indicate that the goodwill might be impaired. The assessment of impairment is based on estimated fair market values derived from certain valuation models, which may consider various factors such as normalized and estimated future earnings, price earnings multiples, terminal values and discount rates. An impairment loss, if any, is recognized to the extent that the carrying amount of goodwill exceeds its estimated fair market value. | |
| The Corporation has designated December 31 as the date for the annual impairment test. As at December 31, 2010, the date of the last impairment test, goodwill was not considered to be impaired. | |
| (n) | Investments: |
| Investments in shares of companies over which the Corporation has the ability to exercise significant influence are accounted for by the equity method. Investments in companies where significant influence does not exist are carried at cost. | |
| (o) | Accrued warranty liabilities: |
| A provision for warranty costs is recorded on product sales at the time of shipment. In establishing the accrued warranty liability, management estimates the likelihood that products sold will experience warranty claims and the estimated cost to resolve claims received, taking into account the nature of the contract and past and projected experience with the products. | |
14
| BALLARD POWER SYSTEMS INC. |
| Notes to Consolidated Financial Statements |
| Years ended December 31, 2010 and 2009 |
| (Tabular amounts expressed in thousands of U.S. dollars, except per share amounts and number of shares) |
1. Nature of business and summary of significant accounting policies (cont’d):
| (p) | Leases: |
| Leases are classified as capital or operating depending upon the terms and conditions of the contracts. Leases, which transfer substantially all the benefits and risks incident to ownership of the leased property to the Corporation, are accounted for as capital leases. The cost of assets under capital leases represent the present value of minimum lease payments and are amortized on a straight-line basis over the lease term. Assets under capital leases are presented in property, plant and equipment in the consolidated balance sheet. | |
| Leases that do not transfer substantially all of the benefits and risks incident to ownership of the property are accounted for as operating leases. | |
| (q) | Asset retirement obligations: |
| Legal obligations to retire tangible long-lived assets are recorded at fair value at acquisition with a corresponding increase in asset value. These include assets leased under operating leases. The liability is accreted over the life of the asset to fair value and the increase in asset value is depreciated over the remaining useful life of the asset. | |
| (r) | Research and product development costs: |
Research costs are expensed as they are incurred. Product development costs are expensed as incurred except if the costs are related to the development and setup of new products, processes and systems and satisfy certain conditions for capitalization, including reasonable assurance that they will be recovered. All capitalized development costs, if any, are amortized when commercial production begins, using the straight-line method over a period of five years. An impairment loss, if any, is recognized in the period it occurs. As at December 31, 2010, the Corporation has not capitalized any development costs. | |
| (s) | Income taxes: |
| The Corporation follows the asset and liability method of accounting for income taxes. Under this method, future income taxes are recognized for the future income tax consequences attributable to differences between the financial statement carrying values of assets and liabilities and their respective income tax bases (temporary differences) and for loss carry-forwards. The resulting changes in the net future tax asset or liability are included in income. Future tax assets and liabilities are measured using enacted, or substantively enacted, tax rates expected to apply to taxable income in the years in which temporary differences are expected to be recovered or settled. | |
The effect on future income tax assets and liabilities, of a change in tax rates, is included in income in the period that includes the substantive enactment date. Future income tax assets are evaluated, and if realization is not considered to be “more likely than not,” a valuation allowance is provided.
15
| BALLARD POWER SYSTEMS INC. |
| Notes to Consolidated Financial Statements |
| Years ended December 31, 2010 and 2009 |
| (Tabular amounts expressed in thousands of U.S. dollars, except per share amounts and number of shares) |
1. Nature of business and summary of significant accounting policies (cont’d):
| (t) | Employee future benefits: |
The Corporation accounts for employee future benefit plan assets and obligations and related costs of defined benefit pension plans, and other post-retirement benefits, under the following accounting policies:
The cost of defined contribution pension plans, which cover our employees in Canada and the United States, are expensed as contributions are due. | |
16
| BALLARD POWER SYSTEMS INC. |
| Notes to Consolidated Financial Statements |
| Years ended December 31, 2010 and 2009 |
| (Tabular amounts expressed in thousands of U.S. dollars, except per share amounts and number of shares) |
1. Nature of business and summary of significant accounting policies (cont’d):
| (u) | Share-based compensation: |
| The Corporation uses the fair-value based method of accounting for share-based compensation for all awards of shares and share options granted. The fair value at the grant date of share options (“options”) is calculated using the Black-Scholes valuation method. The fair value of restricted share units (“RSUs”) and deferred share units (“DSUs”) are measured based on the fair value of the underlying shares on the grant date. Compensation expense is charged to net income over the vesting period and is recognized when services are received with a corresponding increase to contributed surplus. Under certain circumstances, RSUs are contingent on achieving specified performance criteria. The Corporation estimates forfeitures at the grant date and revises the estimate as necessary if subsequent information indicates that actual forfeitures differ significantly from the original estimate. | |
| The Corporation issues shares and share options under its share-based compensation plans as described in note 14. Any consideration paid by employees on exercise of share options or purchase of shares, together with the amount initially recorded in contributed surplus, is credited to share capital. | |
| (v) | Earnings (loss) per share: |
| Basic earnings (loss) per share is computed using the weighted average number of common shares outstanding during the year. Diluted earnings per share is calculated using the treasury stock method. Under the treasury stock method, the dilution is calculated based upon the number of common shares issued should deferred share units (“DSUs”), restricted share units (“RSUs”), and “in the money” options, if any, be exercised. For the years ended December 31, 2010 and 2009, diluted loss per share has not been calculated, as the effects of outstanding stock-based compensation arrangements would be anti-dilutive. | |
| (w) | Comprehensive income (loss): Other comprehensive income (loss) represents changes in shareholders’ equity and includes items such as unrealized gains and losses on financial assets classified as available-for-sale, and cumulative translation adjustments. The Corporation has included a reconciliation of comprehensive income and accumulated other comprehensive income, which is presented as a separate category of shareholders’ equity, on the consolidated balance sheet and the consolidated statement of shareholders’ equity. |
17
| BALLARD POWER SYSTEMS INC. |
| Notes to Consolidated Financial Statements |
| Years ended December 31, 2010 and 2009 |
| (Tabular amounts expressed in thousands of U.S. dollars, except per share amounts and number of shares) |
| 1. Nature of business and summary of significant accounting policies (cont’d): | |
| (x) | Government assistance and investment tax credits: |
| Government assistance and investment tax credits are recorded as either a reduction of the cost of the applicable assets, or credited against the related expense incurred in the statement of operations, as determined by the terms and conditions of the agreements under which the assistance is provided to the Corporation or the nature of the expenditures which gave rise to the credits. Government assistance and investment tax credit receivables are recorded when their receipt is reasonably assured. | |
| (y) | Comparative figures: |
| Certain comparative figures have been reclassified to conform to the presentation adopted for the current year. | |
| 2. Business acquisition: | |
On January 18, 2010, the Corporation acquired a controlling interest (the “Acquisition”) in Denmark-based Dantherm Power A/S (“Dantherm Power”), partnering with co-investors Dantherm A/S and Danfoss Ventures A/S. Dantherm Power was acquired primarily for its intangible assets related to fuel cell-based backup power systems. In exchange for an initial investment of 15,000,000 Danish Kroner, or $2,915,000, the Corporation obtained a 45.14% interest in Dantherm Power including the right to nominate a majority of the members of the Board of Directors. Through the Corporation’s ability to elect a majority of the members of the Dantherm Power board, who have the power to determine the strategic operating, investing and financing policies of Dantherm Power, the Corporation holds effective control over Dantherm Power as of the date of the initial investment. As a result, all assets, liabilities and results of operations of Dantherm Power are consolidated and have been included in the Corporation’s consolidated financial statements and are reported in the Fuel Cell Products segment. Ownership interests in Dantherm Power, other than the Corporation’s, are shown as non-controlling interests. The non-controlling interest was valued based on the price paid for the controlling interest by the Corporation on its initial acquisition date. The acquisition has been accounted for using the purchase method of accounting and, accordingly, the operations of Dantherm Power have been included in the consolidated financial statements since the date of acquisition. The intangible assets arising from this acquisition are amortized over their estimated useful life of 5 years. | |
18
| BALLARD POWER SYSTEMS INC. |
| Notes to Consolidated Financial Statements |
| Years ended December 31, 2010 and 2009 |
| (Tabular amounts expressed in thousands of U.S. dollars, except per share amounts and number of shares) |
2. Business acquisition (cont’d):
The following is the purchase price allocation to the fair value of the assets acquired, and liabilities assumed at the date of acquisition:
| Net assets acquired: | |||
| Cash and cash equivalents | $ | 3,792 | |
| Accounts receivable | 128 | ||
| Inventories | 864 | ||
| Prepaid expenses and other | 143 | ||
| Property, plant and equipment | 536 | ||
| Intangible assets | 2,876 | ||
| Investments | 13 | ||
| Current liabilities | (1,894 | ) | |
| Net assets acquired on January 18, 2010 | 6,458 | ||
| Non-controlling interest of 54.86% | (3,543 | ) | |
| Total purchase consideration | $ | 2,915 | |
| Purchase consideration | $ | (2,915 | ) |
| Acquired cash and cash equivalents | 3,792 | ||
| Net cash acquired on business acquisition | $ | 877 |
In August 2010, the Corporation invested an additional 15,000,000 Danish Kroner, or $2,566,000, in Dantherm Power for an additional 7% interest, resulting in a 52% total equity interest held. Dantherm Power’s non-controlling interests contributed $866,000 with respect to their prior interests.
Since the date of acquisition, Dantherm Power revenue of $2,525,000 and net loss attributable to Ballard Power Systems Inc. of $3,411,000 have been included in the Corporation’s statement of operations. Pro forma revenue and net loss attributable to the Corporation as if Dantherm Power was acquired on January 1, 2010 would not be materially different than the amounts reported in the consolidated statement of operations in 2010. If Dantherm Power was acquired on January 1, 2009, pro forma revenue would be $48,583,000 and net loss attributable to the Corporation would be $8,402,000 in 2009.
Dantherm Power is focused on development and production of commercially viable cell-based back-up power systems for use in information technology and telecom network base stations.
19
| BALLARD POWER SYSTEMS INC. |
| Notes to Consolidated Financial Statements |
| Years ended December 31, 2010 and 2009 |
| (Tabular amounts expressed in thousands of U.S. dollars, except per share amounts and number of shares) |
3. Non-dilutive financing:
On December 31, 2008, the Corporation completed a restructuring transaction with Superior Plus Income Fund (“Superior Plus”) to reorganize the Corporation’s business under a Plan of Arrangement (the “Arrangement”) resulting in a non-dilutive financing with gross cash proceeds of $38,029,000 (CDN $46,319,000). On the closing of the Arrangement in 2008, the Corporation recorded a contribution to Contributed Surplus of $33,071,000, representing the gross proceeds of $38,029,000 net of non-dilutive financing costs of $4,958,000.
Of the total non-dilutive financing costs of $4,958,000, $3,243,000 and $22,000 were paid in 2009 and 2010, respectively and $613,000 remain accrued in accounts payable and accrued liabilities at December 31, 2010.
4. Sale-leaseback transaction:
On March 9, 2010, the Corporation completed a sale and leaseback agreement with Madison Pacific Properties Inc. (“Madison”) whereby the Corporation sold its head office building in Burnaby, British Columbia in return for gross cash proceeds of $20,427,000 (Canadian $20,750,000). The Corporation then leased the property back from Madison for an initial 15-year term plus two 5-year renewal options. On the closing of the transaction, the Corporation recorded a deferred gain of $9,512,000, consisting of $6,242,000 allocated to the building and $3,270,000 allocated to the land, both of which will be recognized to income on a straight-line basis over the term of the 15-year lease. Due to the long-term nature of the lease, the leaseback of the building qualifies as a capital lease. As a result, on the closing of the transaction the Corporation recorded assets under capital lease of $12,180,000, and a corresponding obligation under capital lease (notes 7 and 11), representing the net present value of the minimum lease payments at the inception of the lease allocated to the building and an operating lease for the leaseback of the land. The future lease payments allocated to the building are included in the table in note 11, while the future lease payments allocated to the land are $631,000 per year for the next 15 years.
The deferred gain recorded on closing of the sale-leaseback transaction in 2010 is as follows:
| Proceeds on disposition | $ | 20,427 | ||
| Net book value of assets sold | (10,432 | ) | ||
| Disposition costs | (483 | ) | ||
| Deferred gain on sale | $ | 9,512 | ||
| Less amortization in 2010 | (529 | ) | ||
| Other | 53 | |||
| $ | 9,036 |
20
| BALLARD POWER SYSTEMS INC. |
| Notes to Consolidated Financial Statements |
| Years ended December 31, 2010 and 2009 |
| (Tabular amounts expressed in thousands of U.S. dollars, except per share amounts and number of shares) |
5. Accounts receivable:
| 2010 | 2009 | ||||||
| Trade receivables | $ | 12,584 | $ | 12,847 | |||
| Other | 626 | 56 | |||||
| 13,210 | 12,903 | ||||||
| Less: Long-term trade receivables | (1,596 | ) | - | ||||
| $ | 11,614 | $ | 12,903 | ||||
6. Inventories:
| 2010 | 2009 | |||||
| Raw materials and consumables | $ | 6,962 | $ | 5,928 | ||
| Work-in-progress | 2,951 | 2,018 | ||||
| Finished goods | 2,469 | 1,222 | ||||
| $ | 12,382 | $ | 9,168 | |||
In 2010, changes in raw materials and consumables, finished goods and work-in-progress recognized as cost of product and service revenues amounted to $34,574,000 (2009 - $20,677,000). In 2010, the write-down of inventories to net realizable value amounted to $604,000 (2009 - $874,000). There were no reversals of write-downs in 2010 or 2009. Write-downs and reversals are included in either cost of product and service revenues, or research and product development expense, depending on the nature of inventory.
7. Property, plant and equipment:
| Accumulated | Net book | ||||||||
| 2010 | Cost | depreciation | value | ||||||
| Land | $ | 1,220 | $ | - | $ | 1,220 | |||
| Building | 3,666 | 2,044 | 1,622 | ||||||
| Building under capital lease (notes 4 & 11) | 12,180 | 652 | 11,528 | ||||||
| Computer equipment | 6,339 | 5,347 | 992 | ||||||
| Furniture and fixtures | 741 | 682 | 59 | ||||||
| Leasehold improvements | 6,934 | 4,097 | 2,837 | ||||||
| Production and test equipment | 45,382 | 28,889 | 16,493 | ||||||
| Production and test equipment under | |||||||||
| capital lease (note 11) | 2,078 | 123 | 1,955 | ||||||
| $ | 78,540 | $ | 41,834 | $ | 36,706 | ||||
21
| BALLARD POWER SYSTEMS INC. |
| Notes to Consolidated Financial Statements |
| Years ended December 31, 2010 and 2009 |
| (Tabular amounts expressed in thousands of U.S. dollars, except per share amounts and number of shares) |
7. Property, plant and equipment (cont’d):
| Accumulated | Net book | |||||||
| 2009 | Cost | depreciation | value | |||||
| Land | $ | 4,803 | $ | - | $ | 4,803 | ||
| Building | 13,596 | 5,661 | 7,935 | |||||
| Computer equipment | 11,421 | 10,319 | 1,102 | |||||
| Furniture and fixtures | 4,692 | 4,629 | 63 | |||||
| Leasehold improvements | 8,669 | 5,489 | 3,180 | |||||
| Production and test equipment | 67,651 | 47,492 | 20,159 | |||||
| Production and test equipment under | ||||||||
| capital lease (note 11) | 2,078 | - | 2,078 | |||||
| $ | 112,910 | $ | 73,590 | $ | 39,320 | |||
For the year ended December 31, 2010, the Corporation recorded $8,086,000 (2009 – $6,300,000) of depreciation expense.
8. Intangible assets:
| Accumulated | Net book | ||||||||
| 2010 | Cost | amortization | value | ||||||
| Fuel cell technology | $ | 43,443 | $ | 40,468 | $ | 2,975 | |||
| Accumulated | Net book | ||||||||
| 2009 | Cost | amortization | value | ||||||
| Fuel cell technology | $ | 40,567 | $ | 39,743 | $ | 824 | |||
During 2010, the Corporation acquired $2,876,000 in fuel cell technology as part of the acquisition of Dantherm Power (note 2).
For the year ended December 31, 2010, the Corporation recorded $725,000 (2009 – $2,902,000) of amortization expense.
9. Investments:
Investments are comprised of the following:
| 2010 | 2009 | |||||||||
| Amount | Percentage | Amount | Percentage | |||||||
| ownership | ownership | |||||||||
| Chrysalix Energy Limited Partnership | $ | 663 | 15.0% | $ | 632 | 15.0% | ||||
| AFCC | - | 19.9% | - | 19.9% | ||||||
| Other | 10 | - | ||||||||
| $ | 673 | $ | 632 | |||||||
22
| BALLARD POWER SYSTEMS INC. |
| Notes to Consolidated Financial Statements |
| Years ended December 31, 2010 and 2009 |
| (Tabular amounts expressed in thousands of U.S. dollars, except per share amounts and number of shares) |
9. Investments (cont’d):
Chrysalix Energy Limited Partnership (“Chrysalix”) is recorded at the lower of cost and estimated net realizable value. During 2010, the Corporation made additional investments of $67,000 (2009 - $200,000) in Chrysalix, which was partially offset by a cash distribution received from Chrysalix of $36,000 (2009 - $68,000).
The Corporation maintains a 19.9% interest in AFCC, which is accounted for using the cost method and is subject to a Share Purchase Agreement (“SPA”) under which Ford, either at the option of the Corporation or Ford’s election, may purchase the Corporation’s interest in AFCC at any time after January 31, 2013 for $65,000,000 plus interest accruing at LIBOR from January 31, 2008. The Corporation has no obligation to fund any of AFCC’s operating expenses.
In December 2009, the Corporation completed an agreement to monetize its rights under the SPA whereby the Corporation effectively sold its rights and obligations under the SPA to a third party for initial fixed proceeds of $37,000,000 and a contingent payment of $7,500,000. The contingent payment of $7,500,000 was due upon maturation of the Share Purchase Agreement in 2013, and was contingent on the financial institution’s rights in the transaction remaining unsubordinated. On the closing of the SPA monetization in 2009, the Corporation recorded a gain of $34,297,000.
In July 2010, the Corporation completed an agreement with the financial institution to extinguish the $7,500,000 contingent payment for $5,000,000 and recorded an additional gain of $4,761,000. The Corporation’s investment in AFCC and the SPA has now been fully monetized.
| Initial proceeds on disposal of SPA in 2009 | $ | 37,000 | ||
| Net book value of AFCC and SPA | (1,262 | ) | ||
| SPA disposal costs accrued at December 31, 2009 | (1,441 | ) | ||
| Other | 122 | |||
| Gain on sale of assets in 2009 | $ | 34,419 | ||
| Additional proceeds to extinguish contingent payment in 2010 | $ | 5,000 | ||
| SPA disposal costs incurred in 2010 | (239 | ) | ||
| Other | 4 | |||
| Gain on sale of assets in 2010 | $ | 4,765 |
23
| BALLARD POWER SYSTEMS INC. |
| Notes to Consolidated Financial Statements |
| Years ended December 31, 2010 and 2009 |
| (Tabular amounts expressed in thousands of U.S. dollars, except per share amounts and number of shares) |
10. Accounts payable and accrued liabilities:
| 2010 | 2009 | |||||
| Trade accounts payable | $ | 8,453 | $ | 6,670 | ||
| Other liabilities | 4,677 | 3,952 | ||||
| Accrued non-dilutive financing costs (note 3) | 613 | 584 | ||||
| Compensation payable | 9,159 | 5,235 | ||||
| Taxes payable | 354 | 302 | ||||
| Accrued restructuring and related costs | 78 | 2,137 | ||||
| Accrued SPA disposal costs (note 9) | - | 1,441 | ||||
| $ | 23,334 | $ | 20,321 | |||
In August 2010, the Corporation completed an organizational restructuring at Dantherm Power resulting in restructuring and related charges of $285,000 primarily for severance expense on the elimination of 8 positions.
In August 2009, the Corporation completed an organizational restructuring resulting in restructuring and related charges of $4,866,000 primarily for severance expense on the elimination of 85 positions. This action was in addition to an organizational restructuring completed in March 2009 that resulted in restructuring and related charges of $1,363,000 primarily for severance expense on the elimination of 32 positions.
As at December 31, 2010, $78,000 (2009 - $2,137,000) of restructuring and related costs were payable.
11. Obligations under capital lease:
In March 2010, the Corporation entered into a sale and leaseback transaction relating to its head office building resulting in a capital lease with an imputed interest rate of 7.35% per annum expiring in February 2025 (note 4). The Corporation also leases certain production equipment under capital lease with an imputed interest rate of 2.25% per annum expiring December 2014. The minimum future lease payments for the Corporation’s capital leases are as follows:
| Year ending December 31 | ||||
| 2011 | $ | 1,591 | ||
| 2012 | 1,591 | |||
| 2013 | 1,591 | |||
| 2014 | 1,997 | |||
| 2015 | 1,402 | |||
| Thereafter | 13,941 | |||
| Total minimum lease payments | 22,113 | |||
| Less imputed interest | (8,078 | ) | ||
| Total obligation under capital lease | 14,035 | |||
| Current portion of obligation under capital lease | 681 | |||
| Long-term portion of obligation under capital lease | $ | 13,354 |
24
| BALLARD POWER SYSTEMS INC. |
| Notes to Consolidated Financial Statements |
| Years ended December 31, 2010 and 2009 |
| (Tabular amounts expressed in thousands of U.S. dollars, except per share amounts and number of shares) |
11. Obligations under capital lease (cont’d):
The obligation under capital lease for certain production equipment is secured by a hypothecation of the Corporation’s cash, cash equivalents, and short-term investments.
For the year ended December 31, 2010, $693,000 (2009 – nil) of interest was paid on capital lease obligations.
12. Long-term liabilities:
| 2010 | 2009 | |||||
| Defined benefit pension plan | $ | 2,459 | $ | 2,695 | ||
| Other benefit plan | 491 | 616 | ||||
| Employee future benefit plans (note 13) | 2,950 | 3,311 | ||||
| Asset retirement obligation | 1,482 | 1,321 | ||||
| $ | 4,432 | $ | 4,632 | |||
In determining the fair value of the asset retirement obligations, the estimated future cash flows have been discounted at 12% per annum. The total undiscounted amount of the estimated cash flows required to settle this obligation is $3,980,000. The obligation will be settled at the end of the term of the operating lease, which extends to 2019.
In March 2009, the Corporation made a net investment of $5,000,000 in EBARA BALLARD Corporation (“EBARA BALLARD”), a joint venture with EBARA Corporation (“Ebara”) that was focused on the development, manufacture, sale, and servicing of stationary power systems for the residential cogeneration market in Japan. In May 2009, the Corporation announced intentions to discontinue operations in EBARA BALLARD. EBARA BALLARD was accounted for using the equity method and was considered a related party. On the announcement of the intention to discontinue operations, the $10,838,000 of historic recorded equity losses in EBARA BALLARD in excess of the net investment of EBARA BALLARD (including $2,474,000 of equity losses recorded in 2009 prior to the wind-up), was reversed to net income as (i) Ebara was solely responsible for the liquidation obligations of EBARA BALLARD; and (ii) the Corporation was not committed to provide, nor did it intend to provide, any further financial support to EBARA BALLARD. As a result, the Corporation recorded equity income of $8,364,000 in 2009. EBARA BALLARD was formally dissolved in October 2009.
25
| BALLARD POWER SYSTEMS INC. |
| Notes to Consolidated Financial Statements |
| Years ended December 31, 2010 and 2009 |
| (Tabular amounts expressed in thousands of U.S. dollars, except per share amounts and number of shares) |
13. Employee future benefit plans:
| 2010 | 2009 | |||||||||||||||
| Pension | Other benefit | Pension | Other benefit | |||||||||||||
| plan | plan | plan | plan | |||||||||||||
| Fair value of plan assets | $ | 8,360 | $ | - | $ | 7,105 | $ | - | ||||||||
| Accrued benefit obligation | (10,819 | ) | (491 | ) | (9,800 | ) | (616 | ) | ||||||||
| Accrued benefit liability | $ | (2,459 | ) | $ | (491 | ) | $ | (2,695 | ) | $ | (616 | ) | ||||
The Corporation maintains a defined benefit pension plan covering employees in the United States. The benefits under the pension plan are based on years of service and salary levels accrued as of December 31, 2009. In 2009, amendments were made to the defined benefit pension plan to freeze benefits accruing to employees at their respective years of service and salary levels obtained as of December 31, 2009. This hard freeze of pension plan benefits resulted in the recognition of curtailment gains of $1,055,000 in 2009. Certain employees in the United States are also eligible for post-retirement healthcare, life insurance and other benefits. The Corporation accrues its obligations under employee future benefit plans and the related costs, net of the fair value of plan assets.
The measurement date used to determine pension and other post-retirement benefit measures is December 31 of each year. The most recent actuarial valuation of the employee future benefit plans for funding purposes was as of January 1, 2010. The next actuarial valuation of the employee future benefit plans for funding purposes is expected to be as of January 1, 2011.
Information about the Corporation’s employee future benefit plans, in aggregate, is as follows:
Defined benefit plan obligations:
| 2010 | 2009 | |||||||||||||||
| Pension | Other benefit | Pension | Other benefit | |||||||||||||
| plan | plan | plan | plan | |||||||||||||
| Balance, beginning of year | $ | 9,800 | $ | 616 | $ | 9,981 | $ | 616 | ||||||||
| Current service cost | - | 3 | 366 | 3 | ||||||||||||
| Interest cost | 579 | 35 | 594 | 35 | ||||||||||||
| Benefits paid | (217 | ) | (31 | ) | (200 | ) | (31 | ) | ||||||||
| Benefits payable | 36 | - | - | - | ||||||||||||
| Actuarial (gains) losses | 621 | (132 | ) | 114 | (7 | ) | ||||||||||
| Curtailment gain | - | - | (1,055 | ) | - | |||||||||||
| Balance, end of year | $ | 10,819 | $ | 491 | $ | 9,800 | $ | 616 | ||||||||
26
| BALLARD POWER SYSTEMS INC. |
| Notes to Consolidated Financial Statements |
| Years ended December 31, 2010 and 2009 |
| (Tabular amounts expressed in thousands of U.S. dollars, except per share amounts and number of shares) |
13. Employee future benefit plans (cont’d):
Defined benefit plan assets:
| 2010 | 2009 | |||||||||||||||
| Pension | Other benefit | Pension | Other benefit | |||||||||||||
| plan | plan | plan | plan | |||||||||||||
| Balance, beginning of year | $ | 7,105 | $ | - | $ | 5,761 | $ | - | ||||||||
| Actual return (loss) on | ||||||||||||||||
| plan assets | 1,136 | - | 1,477 | - | ||||||||||||
| Employer’s contributions | 370 | 28 | 100 | 31 | ||||||||||||
| Plan expenses | (34 | ) | - | (33 | ) | - | ||||||||||
| Benefits paid | (217 | ) | (28 | ) | (200 | ) | (31 | ) | ||||||||
| Balance, end of year | $ | 8,360 | $ | - | $ | 7,105 | $ | - | ||||||||
The plan assets for the funded pension plan consists of:
| 2010 | 2009 | |||||
| Cash and cash equivalents | 2 | % | 1 | % | ||
| Equity securities | 71 | % | 72 | % | ||
| Debt securities | 27 | % | 27 | % | ||
| Total | 100 | % | 100 | % | ||
The elements of the employee future benefit plan expenses recognized for the years ended December 31, 2010 and 2009 were as follows:
| 2010 | 2009 | |||||||||||||||
| Pension | Other benefit | Pension | Other benefit | |||||||||||||
| plan | plan | plan | plan | |||||||||||||
| Current service cost | $ | - | $ | 3 | $ | 366 | $ | 3 | ||||||||
| Interest cost | 579 | 35 | 594 | 35 | ||||||||||||
| Actual (return) loss on plan | ||||||||||||||||
| assets | (1,136 | ) | - | (1,477 | ) | - | ||||||||||
| Actuarial (gains) losses | 621 | (131 | ) | 114 | (7 | ) | ||||||||||
| Plan expenses | 34 | - | 33 | - | ||||||||||||
| Benefits | 36 | - | - | - | ||||||||||||
| Curtailment gain | - | - | (1,055 | ) | - | |||||||||||
| Employee future benefit plan | ||||||||||||||||
| expense (gain) | $ | 134 | $ | (93 | ) | $ | (1,425 | ) | $ | 31 | ||||||
27
| BALLARD POWER SYSTEMS INC. |
| Notes to Consolidated Financial Statements |
| Years ended December 31, 2010 and 2009 |
| (Tabular amounts expressed in thousands of U.S. dollars, except per share amounts and number of shares) |
13. Employee future benefit plans (cont’d):
The significant actuarial assumptions adopted in measuring benefit obligations at December 31, 2010 and 2009 were as follows:
| 2010 | 2009 | |||||||
| Pension | Other benefit | Pension | Other benefit | |||||
| plan | plan | plan | plan | |||||
| Discount rate | 5.5% | 5.5% | 6.0% | 6.0% | ||||
| Rate of compensation increase | n/a | n/a | n/a | n/a | ||||
The significant actuarial assumptions adopted in determining net expense for the years ended December 31, 2010 and 2009 were as follows:
| 2010 | 2009 | |||||||
| Pension | Other benefit | Pension plan | Other benefit | |||||
| plan | plan | plan | ||||||
| Discount rate | 6.0% | 6.0% | 6.0% | 6.0% | ||||
| Expected return on plan assets | 7.0% | n/a | 7.0% | n/a | ||||
| Rate of compensation increase | n/a | n/a | 3.3% | n/a | ||||
The assumed health care cost trend rates applicable to the other benefit plans at December 31, 2010 and 2009 were as follows:
| 2010 | 2009 | ||
| Initial medical health care cost trend rate | 8.5% | 9.0% | |
| Initial dental health care cost trend rate | 5.0% | 5.0% | |
| Cost trend rate declines to medical and dental | 5.0% | 5.0% | |
| Year that the medical rate reaches the rate it is | |||
| assumed to remain at | 2017 | 2017 | |
| Year that the dental rate reaches the rate it is | |||
| assumed to remain at | 2009 | 2009 |
A one-percentage-point change in assumed health care cost trend rates would not have a material impact on the Corporation’s financial statements.
14. Share capital:
| (a) | Authorized and issued: | |
| Unlimited number of common shares, voting, without par value. | ||
| Unlimited number of preferred shares, issuable in series. | ||
| At December 31, 2010, 84,148,465 (2009 – 83,973,988) common shares are issued and outstanding. | ||
28
| BALLARD POWER SYSTEMS INC. |
| Notes to Consolidated Financial Statements |
| Years ended December 31, 2010 and 2009 |
| (Tabular amounts expressed in thousands of U.S. dollars, except per share amounts and number of shares) |
14. Share capital (cont’d):
| (b) | Share option plan: | |
| In 2009, the Corporation adopted a consolidated share option plan to supersede and replace four previous share option plans. All directors, officers and employees of the Corporation, and its subsidiaries, are eligible to participate in the share option plan although as a matter of policy, options are currently not issued to directors. Option exercise prices are denominated in both Canadian and U.S. dollars, depending on the residency of the recipient. Canadian dollar denominated options have been converted to U.S. dollars using the year-end exchange rate for presentation purposes. All options have a term of seven to ten years from the date of grant unless otherwise determined by the board of directors. One-third of the options vest and may be exercised, at the beginning of each of the second, third and fourth years after granting. | ||
| As at December 31, 2010, options outstanding from the consolidated share option plan was as follows: | ||
| Options for common shares | Weighted average | ||||
| exercise price | |||||
| Balance, December 31, 2008 | 5,476,382 | $ | 24.65 | ||
| Options granted | 1,944,997 | 1.60 | |||
| Options exercised | (5,000 | ) | 1.01 | ||
| Options forfeited | (1,548,528 | ) | 33.13 | ||
| Balance, December 31, 2009 | 5,867,851 | 19.18 | |||
| Options granted | 1,709,737 | 2.31 | |||
| Options exercised | (72,491 | ) | 1.30 | ||
| Options forfeited | (589,408 | ) | 9.48 | ||
| Options expired | (233,100 | ) | 190.90 | ||
| Balance, December 31, 2010 | 6,682,589 | $ | 10.84 | ||
29
| BALLARD POWER SYSTEMS INC. |
| Notes to Consolidated Financial Statements |
| Years ended December 31, 2010 and 2009 |
| (Tabular amounts expressed in thousands of U.S. dollars, except per share amounts and number of shares) |
14. Share capital (cont’d):
| (b) | Share option plan (cont’d): | |
| The following table summarizes information about the Corporation’s share options outstanding as at December 31, 2010: | ||
| Options outstanding | Options exercisable | |||||||||||||
| Number | Weighted | Weighted | Number | Weighted | ||||||||||
| outstanding | average | average | exercisable | average | ||||||||||
| Range of exercise price | at December | remaining | exercise | at December | exercise | |||||||||
| 31, 2010 | contractual life | price | 31, 2010 | price | ||||||||||
| (years) | ||||||||||||||
| $1.01 – $2.41 | 3,163,338 | 5.8 | $ | 1.99 | 514,163 | $ | 1.66 | |||||||
| $3.12 – $5.11 | 587,007 | 4.2 | 4.83 | 392,338 | 4.83 | |||||||||
| $5.82 – $7.99 | 1,579,205 | 4.3 | 7.35 | 1,579,205 | 7.35 | |||||||||
| $10.00 – $14.76 | 376,635 | 2.5 | 13.94 | 376,635 | 13.94 | |||||||||
| $18.40 – $38.96 | 525,954 | 1.4 | 36.21 | 525,954 | 36.21 | |||||||||
| $44.04 – $88.98 | 450,450 | 0.5 | 60.90 | 450,450 | 60.90 | |||||||||
| 6,682,589 | 4.4 | $ | 10.84 | 3,838,745 | $ | 17.21 | ||||||||
The Corporation uses the fair-value method for recording employee and director share option grants. During 2010, compensation expense of $1,557,000 (2009 - $1,760,000) was recorded in net income as a result of fair value accounting for share options granted. The share options granted during the year had a weighted average fair value of $1.23 (2009 - $0.76) and vesting periods of three years.
The fair values of the options granted were determined using the Black-Scholes valuation model under the following weighted average assumptions:
| 2010 | 2009 | |||
| Expected life | 5 years | 5 years | ||
| Expected dividends | Nil | Nil | ||
| Expected volatility | 65% | 60% | ||
| Risk-free interest rate | 3% | 3% |
| (c) | Share distribution plan: | |
| In 2009, the Corporation adopted a consolidated share distribution plan to supersede and replace five previous share distribution plans. The consolidated share distribution plan permits the issuance of common shares for no cash consideration to employees of the Corporation to recognize their past contribution and to encourage future contribution to the Corporation. At December 31, 2010, there were 1,089,491 (2009 – 1,472,380) shares available to be issued under these plans. | ||
| No compensation expense was recorded against income during the years ended December 31, 2010 and 2009 for shares distributed, and to be distributed, under the plan. | ||
30
| BALLARD POWER SYSTEMS INC. |
| Notes to Consolidated Financial Statements |
| Years ended December 31, 2010 and 2009 |
| (Tabular amounts expressed in thousands of U.S. dollars, except per share amounts and number of shares) |
14. Share capital (cont’d):
(d) Deferred Share Units:
Deferred share units (“DSUs”) are granted to the board of directors and executives. Eligible directors may elect to receive all or part of their annual retainers and executives may elect to receive all or part of their annual bonuses in DSUs. Each DSU is redeemable for one common share in the capital of the Corporation after the director or executive ceases to provide services to the Corporation. Shares will be issued from the Corporation’s share distribution plan.
| DSUs for common shares | ||||
| Balance, December 31, 2008 | 333,066 | |||
| DSUs exercised | (16,914 | ) | ||
| Balance, December 31, 2009 | 316,152 | |||
| DSUs exercised | (25,355 | ) | ||
| Balance, December 31, 2010 | 290,797 |
No compensation expense was recorded against income during the year ended December 31, 2010.
In 2009, the Corporation determined that 169,276 DSUs had been issued to directors in excess of a limitation set out in its share distribution plan. The Corporation’s shareholders ratified the DSU overgrant. Accordingly the previously recorded compensation expense relating to the overgrant was reversed from contributed surplus and the revised compensation expense for the approved DSUs was recorded based on the market price of the shares on the date of approval, resulting in a net decrease to contributed surplus of $451,000.
(e) Restricted Share Units:
Restricted share units (“RSUs”) are granted to employees and executives. Each RSU is convertible into one common share. The RSUs vest after a specified number of years from the date of issuance, and under certain circumstances, are contingent on achieving specified performance criteria.
The Corporation has two plans under which RSUs may be granted, the consolidated share distribution plan and the market purchase RSU plan. Awards under the consolidated share distribution plan (note 14 (c)) are satisfied by the issuance of treasury shares on maturity. Awards granted under the market purchase RSU Plan are satisfied by shares purchased on the open market by a trust established for that purpose. During 2010, the Corporation repurchased 269,877 (2009 – 87,729) common shares through the trust for cash consideration of $559,000 (2009 – $207,000) for the purpose of funding future grants under the Market Purchase RSU Plan. As at December 31, 2010 the Corporation held 318,615 shares as treasury shares.
31
| BALLARD POWER SYSTEMS INC. |
| Notes to Consolidated Financial Statements |
| Years ended December 31, 2010 and 2009 |
| (Tabular amounts expressed in thousands of U.S. dollars, except per share amounts and number of shares) |
14. Share capital (cont’d):
(e) Restricted Share Units (cont’d):
| RSUs for common shares | ||||||||||
| Share Distribution | Market Purchase | |||||||||
| Plan | Plan | Total RSUs | ||||||||
| Balance, December 31, 2008 | 1,092,813 | - | 1,092,813 | |||||||
| RSUs granted | 633,737 | 446,733 | 1,080,470 | |||||||
| RSUs exercised | (357,319 | ) | - | (357,319 | ) | |||||
| RSUs forfeited | (128,215 | ) | (66,000 | ) | (194,215 | ) | ||||
| Balance, December 31, 2009 | 1,241,016 | 380,733 | 1,621,749 | |||||||
| RSUs granted | - | 893,370 | 893,370 | |||||||
| RSUs exercised | (154,006 | ) | (38,990 | ) | (192,996 | ) | ||||
| RSUs forfeited | (235,040 | ) | (176,015 | ) | (411,055 | ) | ||||
| Balance, December 31, 2010 | 851,970 | 1,059,098 | 1,911,068 | |||||||
During 2010, compensation expense of $2,500,000 (2009 - $1,736,000) was recorded against income.
15. Investment and other income (loss):
| 2010 | 2009 | |||||||
| Investment return (loss) less interest cost on employee future benefit plans | $ | (12 | ) | $ | 741 | |||
| Curtailment gain on employee future benefit plans | - | 1,055 | ||||||
| Employee future benefits gain (loss) (note 13) | (12 | ) | 1,796 | |||||
| Investment income | 247 | 387 | ||||||
| Other income | 300 | 625 | ||||||
| Foreign exchange gain (loss) | (407 | ) | 3,187 | |||||
| Investment and other income (loss) | $ | 128 | $ | 5,995 | ||||
32
| BALLARD POWER SYSTEMS INC. |
| Notes to Consolidated Financial Statements |
| Years ended December 31, 2010 and 2009 |
| (Tabular amounts expressed in thousands of U.S. dollars, except per share amounts and number of shares) |
16. Commitments, guarantees and contingencies:
| (a) | At December 31, 2010, the Corporation is committed to payments under operating leases as follows: |
| 2011 | 2,551 | ||
| 2012 | 2,557 | ||
| 2013 | 2,521 | ||
| 2014 | 2,578 | ||
| 2015 | 2,750 | ||
| Thereafter | 13,731 | ||
| Total minimum lease payments | $ | 26,688 |
| (b) | The Corporation has agreed to pay royalties in respect of sales of certain fuel cell-based stationary power products under two development programs with Canadian government agencies. The total combined royalty is limited in any year to 4% of revenue from such products. Under the original terms of the Utilities Development Program (Phase 1) with the Governments of Canada and British Columbia, total royalties were payable to a maximum equal to the original amount of the government contributions of CDN $10,702,000. During 2009, a Canadian government agency agreed to terminate potential royalties payable of CDN $5,351,000 in respect of future sales of fuel cell based stationary power products under the Utilities Development Program (Phase 1). As at December 31, 2010, no royalties have been incurred for Phase 1. Under the terms of the Utilities Development Program (Phase 2) with Technology Partnerships Canada (“TPC”) total royalties are payable to a maximum of CDN $38,329,000. As at December 31, 2010, a total of CDN $5,320,000 in royalty repayments have been made for Phase 2 including payments of CDN $nil in 2010 and CDN $115,000 in 2009. |
| Original maximum recoverable amount under Phase 1 and 2 | CDN$ | 49,031 | ||||
| Termination of potential royalties payable | (5,351 | ) | ||||
| Prior year payments applied | (5,321 | ) | ||||
| Maximum recoverable amount, December 31, 2010 | CDN$ | 38,359 | ||||
| Maximum recoverable amount, December 31, 2010 | US$ | 38,567 |
33
| BALLARD POWER SYSTEMS INC. |
| Notes to Consolidated Financial Statements |
| Years ended December 31, 2010 and 2009 |
| (Tabular amounts expressed in thousands of U.S. dollars, except per share amounts and number of shares) |
16. Commitments, guarantees and contingencies (cont’d):
| (c) | As at December 31, 2009, the Corporation had issued letter of credits in the amount of $293,000 related to inventory purchases and customer guarantees. No such letter of credits were outstanding as at December 31, 2010. | |
| (d) | At December 31, 2010, the Corporation has outstanding commitments aggregating up to a maximum of $1,156,000 (2009 - $1,691,000) relating primarily to purchases of property, plant and equipment. | |
| (e) | The Corporation is also committed to make future investments totaling $201,000 in Chrysalix (note 9). | |
| (f) | The Corporation has agreed to pay royalties in respect of sales of Ballard fuel cells or fuel cell systems under a July 31, 1996 Fuel Cell Bus Program Agreement (“FC Bus Agreement”), with Province of British Columbia, BC Transit, and BC Transportation Financing Authority (“BCTFA”). Under the terms of FC Bus Agreement, the royalty payable is at a rate of 2% on future sales of such products for commercial transit application to a maximum of $2,212,000 (CDN$ 2,200,000). No royalties have been paid, or accrued, as of December 31, 2010. | |
| (g) | The Arrangement with Superior Plus (note 3) includes an indemnification agreement dated December 31, 2008 (the “Indemnity Agreement”), which sets out the parties’ continuing obligations to the other. The Indemnity Agreement provides for the indemnification by each of the parties to the other for breaches of representations and warranties or covenants, as well as, in the Corporation’s case, any liability relating to the business, which is suffered by Superior Plus. The Corporation’s indemnity to Superior Plus with respect to representation relating to the existence of the Corporation’s tax pools immediately prior to the completion of the Arrangement is limited to an aggregate of $7,390,000 (CDN $7,350,000) with a threshold amount of $503,000 (CDN $500,000) before there is an obligation to make a payment. The Indemnity Agreement also provides for adjustments to be paid by the Corporation, or to the Corporation, depending on the final determination of the amount of 2008 Canadian non-capital losses, scientific research and development expenditures and investment tax credits, to the extent that such amounts are more or less than the amounts estimated at the time the Arrangement was executed. | |
| At December 31, 2010, no amount payable or receivable has been accrued as a result of the Indemnity Agreement. | ||
34
| BALLARD POWER SYSTEMS INC. |
| Notes to Consolidated Financial Statements |
| Years ended December 31, 2010 and 2009 |
| (Tabular amounts expressed in thousands of U.S. dollars, except per share amounts and number of shares) |
17. Income taxes:
The Corporation’s effective income tax rate differs from the combined Canadian federal and provincial statutory income tax rate for manufacturing and processing companies.
The principal factors causing the difference are as follows:
| 2010 | 2009 | ||||||
| Net loss attributable to Ballard Power Systems Inc. before income taxes | $ | (34,933 | ) | $ | (3,265 | ) | |
| Expected tax recovery at 28.50% (2009 – 30.00%) | $ | (9,956 | ) | $ | (980 | ) | |
| Increase (reduction) in income taxes resulting from: | |||||||
| Gain on sale of assets | (1,289 | ) | (5,966 | ) | |||
| Non-deductible expenses (non-taxable income) | 1,249 | 320 | |||||
| Non-taxable equity gain in associated companies | - | (2,509 | ) | ||||
| Investment tax credits earned | (4,558 | ) | (6,681 | ) | |||
| Foreign tax rate differences | 658 | 249 | |||||
| Losses and other deductions for which no benefit has been recorded | 13,896 | 15,567 | |||||
| Income tax expense | - | - | |||||
| Branch tax | 3 | (7 | ) | ||||
| Income taxes (recovery) | $ | 3 | $ | (7 | ) |
The Corporation has available to carry forward the following as at December 31:
| 2010 | 2009 | ||||
| Canadian scientific research expenditures | $ | 37,398 | $ | 24,880 | |
| Canadian losses from operations | 19,652 | - | |||
| Canadian investment tax credits | 13,990 | 8,746 | |||
| German losses from operations for corporate tax purposes | 220 | 204 | |||
| U.S. federal losses from operations | 14,727 | 18,440 | |||
| U.S. state losses from operations | 1,702 | 3,333 | |||
| U.S. research and development and investment tax credits | 707 | 783 | |||
| U.S. capital losses | 180,762 | 180,761 | |||
| Denmark losses from operations | 18,359 | - |
The Canadian scientific research expenditures may be carried forward indefinitely. The German and Denmark losses from operations may be used to offset future taxable income in Germany and Denmark for corporate tax and trade tax purposes and may be carried forward indefinitely. The U.S. federal losses from operations may be used to offset future U.S. taxable income and expire over the period from 2011 to 2030. The Canadian loses from operations may be used to offset future Canadian taxable income and expire over the period from 2028 to 2030.
35
| BALLARD POWER SYSTEMS INC. |
| Notes to Consolidated Financial Statements |
| Years ended December 31, 2010 and 2009 |
| (Tabular amounts expressed in thousands of U.S. dollars, except per share amounts and number of shares) |
17. Income taxes (cont’d):
The U.S. states losses from operations arising in California may be used to offset future state taxable income and may be carried forward for ten years.
The U.S. research and development and investment tax credits are available to reduce future U.S. taxable income and expire over the period from 2011 to 2029. The U.S. capital losses are available to reduce U.S. capital gains and expire over the period from 2011 to 2013.
The Canadian investment tax credits may be used to offset future Canadian income taxes otherwise payable and expire as follows:
| 2011 | $ | 324 | |
| 2012 | 62 | ||
| 2013 | 121 | ||
| 2014 | 107 | ||
| 2016 | 96 | ||
| 2017 | 105 | ||
| 2029 | 7,408 | ||
| 2030 | 5,767 | ||
| $ | 13,990 |
The following sets forth the tax effect of temporary differences that give rise to future income tax assets and liabilities:
| 2010 | 2009 | |||||
| Future income tax assets: | ||||||
| Scientific research expenditures | $ | 9,350 | $ | 6,220 | ||
| Investment in associated companies | 2,296 | 2,173 | ||||
| Accrued warranty and pension liabilities | 7,965 | 3,747 | ||||
| Losses from operations carried forward | 14,694 | 6,526 | ||||
| Capital losses | 61,459 | 61,459 | ||||
| Investment tax credits | 12,757 | 8,274 | ||||
| Property, plant and equipment and intangible assets | 49,525 | 28,111 | ||||
| Total future income tax assets | 158,046 | 116,510 | ||||
| Less valuation allowance: | ||||||
| - Canada | (83,993 | ) | (47,346 | ) | ||
| - U.S. | (68,595 | ) | (69,110 | ) | ||
| - Germany | (83 | ) | (54 | ) | ||
| - Denmark | (5,375 | ) | - | |||
| Net future income taxes | $ | - | $ | - |
36
| BALLARD POWER SYSTEMS INC. |
| Notes to Consolidated Financial Statements |
| Years ended December 31, 2010 and 2009 |
| (Tabular amounts expressed in thousands of U.S. dollars, except per share amounts and number of shares) |
18. Related party transactions:
Related parties include EBARA BALLARD Corporation and EBARA Corporation prior to the discontinuance of the Corporation’s operations in EBARA BALLARD Corporation in May 2009; and Dantherm A/S and Danfoss Ventures A/S subsequent to the closing of the Dantherm acquisition on January 18, 2010. Revenues and costs recognized from transactions with such parties reflect the prices and terms of sales and purchase transactions with related parties, which are in accordance with normal trade practices.
| 2010 | 2009 | ||||
| Balances with related parties: | |||||
| Accounts receivable | $ | 153 | $ | - | |
| Accounts payable and accrued liabilities | 517 | - | |||
| 2010 | 2009 | ||||
| Transactions during the year with related parties: | |||||
| Revenues | $ | 134 | $ | 380 | |
| Purchases | 1,301 | 78 | |||
| Net investments and advances (note 12) | $ | - | $ | 5,000 |
19. Supplemental disclosure of cash flow information:
| 2010 | 2009 | ||||
| Non-cash financing and investing activities: | |||||
| Compensatory shares | $ | 540 | $ | 2,847 | |
| Accrued costs related to Arrangement (note 3) | $ | - | $ | 584 | |
| Assets acquired under capital lease (notes 4 & 7) | $ | 12,180 | $ | 2,078 |
20. Segmented financial information:
The Corporation’s business operates in three market segments:
- Fuel Cell Products: Fuel cell products and services for motive power (material handling and bus markets) and stationary power (back-up power and distributed generation markets) applications;
- Contract Automotive: Contract technical and manufacturing services provided primarily to Daimler, Ford, and AFCC; and
- Material Products: Carbon fiber products primarily for automotive transmissions and gas diffusion layers (“GDL”) for fuel cells.
37
| BALLARD POWER SYSTEMS INC. |
| Notes to Consolidated Financial Statements |
| Years ended December 31, 2010 and 2009 |
| (Tabular amounts expressed in thousands of U.S. dollars, except per share amounts and number of shares) |
20. Segmented financial information (cont’d):
Segment revenues and segment income (loss) represent the primary financial measures used by senior management in assessing performance and allocating resources, and include the revenues, cost of product and service revenues and expenses for which management is held accountable. Segment expenses include research and product development costs directly attributable to individual segments.
Costs associated with shared services and other shared costs are allocated based on headcount and square footage. Corporate amounts include expenses for research and product development that are not attributable to individual segments, sales and marketing, and general and administrative, which apply generally across all segments and are reviewed separately by senior management.
A significant portion of the Corporation’s production, testing and lab equipment, and facilities, as well as intellectual property, are common across the segments. Therefore, management does not classify asset information on a segmented basis. Instead, performance assessments of these assets and related resources allocations are done on a company-wide basis.
| 2010 | 2009 | |||||
| Revenues | ||||||
| Fuel Cell Products | $ | 32,784 | $ | 24,142 | ||
| Contract Automotive | 11,271 | 9,170 | ||||
| Material Products | 20,964 | 13,410 | ||||
| $ | 65,019 | $ | 46,722 | |||
| Segment income (loss) for the year (1) | ||||||
| Fuel Cell Products | $ | (8,797 | ) | $ | (11,553 | ) |
| Contract Automotive | 1,870 | 1,236 | ||||
| Material Products | 7,689 | 2,315 | ||||
| Total | 762 | (8,002 | ) | |||
| Corporate amounts | ||||||
| Research and product development | (14,363 | ) | (12,699 | ) | ||
| General and administrative | (13,315 | ) | (10,801 | ) | ||
| Sales and marketing | (8,861 | ) | (7,203 | ) | ||
| Restructuring and related costs | (285 | ) | (6,229 | ) | ||
| Acquisition charges | (243 | ) | (529 | ) | ||
| Depreciation and amortization | (6,454 | ) | (6,580 | ) | ||
| Investment and other income | 128 | 5,995 | ||||
| Interest expense | (974 | ) | - | |||
| Gain on sale of assets | 4,765 | 34,419 | ||||
| Equity gain in associated companies | - | 8,364 | ||||
| Loss before income taxes | $ | (38,840 | ) | $ | (3,265 | ) |
| (1) | Research and product development costs directly related to segments are included in segment income (loss) for the year. |
38
| BALLARD POWER SYSTEMS INC. |
| Notes to Consolidated Financial Statements |
| Years ended December 31, 2010 and 2009 |
| (Tabular amounts expressed in thousands of U.S. dollars, except per share amounts and number of shares) |
20. Segmented financial information (cont’d):
As at December 31, 2010 and 2009, of total goodwill of $48,106,000, $46,291,000 was allocated to the Fuel Cell Products segment, and $1,815,000 to the Material Products segment.
In 2010, sales to a single customer of $16,359,000 exceeded 10% of total revenue, of which $8,107,000 were included in revenues from the Fuel Cell Products segment and $8,252,000 were included in revenues from the Contract Automotive segment. In addition, sales to a single customer group of $13,586,000 in the Material Products segment exceeded 10% of total revenue.
In 2009, revenues from the Fuel Cell Products segment included sales to one customer that exceeded 10% of total revenue in the amount of $8,093,000. Revenues from the Contract Automotive segment included sales to one customer that exceeded 10% of total revenue in the amount of $6,244,000.
As at December 31, 2010 accounts receivable of $1,665,000 for a single customer exceeded 10% of total accounts receivable, of which $1,365,000 relates to the Fuel Cell Products segment and $300,000 relates to the Contract Automotive segment. In addition, a single customer also exceeded 10% of total accounts receivable as at December 31, 2010 in the amount of $2,735,000, relating to the Fuel Cell Products segment.
Revenues and capital asset information by geographic area, as at and for the years ended December 31, is as follows:
| 2010 | 2009 | |||||||||||
| Property, plant and | Property, plant and | |||||||||||
| equipment and | equipment and | |||||||||||
| Revenues | goodwill | Revenues | goodwill | |||||||||
| Canada | $ | 5,070 | $ | 74,672 | $ | 6,246 | $ | 76,746 | ||||
| U.S. | 31,179 | 9,700 | 30,347 | 10,621 | ||||||||
| Germany | 17,465 | 59 | 4,879 | 59 | ||||||||
| U.K. | 5,733 | - | 132 | - | ||||||||
| Denmark | 1,048 | 381 | - | - | ||||||||
| Japan | - | - | 485 | - | ||||||||
| Other countries | 4,524 | - | 4,633 | - | ||||||||
| $ | 65,019 | $ | 84,812 | $ | 46,722 | $ | 87,426 | |||||
Revenues are attributed to countries based on customer location.
39
| BALLARD POWER SYSTEMS INC. |
| Notes to Consolidated Financial Statements |
| Years ended December 31, 2010 and 2009 |
| (Tabular amounts expressed in thousands of U.S. dollars, except per share amounts and number of shares) |
21. Financial instruments:
| (a) | Fair Value: | |
| The Corporation’s financial instruments consist of cash and cash equivalents, short-term investments, accounts receivables, long-term investments, accounts payable and accrued liabilities, and obligations under capital lease. The fair values of cash, accounts receivable, accounts payable and accrued liabilities approximate carrying value because of the short-term nature of these instruments. The fair value of long-term investments accounted for on the cost basis is not practical to determine because none of the investments are publicly traded. The interest rates applied to the obligations under capital lease are not considered to be materially different from market rates, thus the carrying value of obligations under capital lease approximate fair value. The carrying value of cash equivalents and short-term investments equal their fair values as they are classified as held for trading. | ||
| Fair value measurements recognized in the balance sheet must be categorized in accordance with the following levels: | ||
| (i) | Level 1: quoted prices (unadjusted) in active markets for identical assets or liabilities; | |
| (ii) | Level 2: inputs other than quoted prices included in Level 1 that are observable for the asset or liability, either directly (i.e. as prices) or indirectly (i.e., derived from prices); | |
| �� | ||
| (iii) | Level 3: inputs for the asset or liability that are not based on observable market data (unobservable inputs). | |
| The Corporation categorized the fair value measurement of its cash, cash equivalents and short-term investments in Level 1 as they are primarily derived directly from reference to quoted (unadjusted) prices in active markets. | ||
| (b) | Financial risk management: |
| The Corporation primarily has exposure to currency exchange rate risk, interest rate risk and credit risk. These risks arise primarily from the Corporation’s holdings of U.S. and Canadian dollar denominated cash and cash equivalents and short-term investments. | |
| 2010 | 2009 | ||||||||||||||||||||
| Canadian | Canadian | ||||||||||||||||||||
| dollar | U.S. dollar | dollar | U.S. dollar | ||||||||||||||||||
| portfolio(1) | portfolio | Other(1) | Total | portfolio(1) | portfolio | Total | |||||||||||||||
| Cash and cash equivalents | $ | 17,771 | $ | 30,947 | $ | 1,231 | $ | 49,949 | $ | 9,191 | $ | 34,108 | $ | 43,299 | |||||||
| Short-term investments | 8,480 | 16,016 | - | 24,496 | 11,059 | 27,873 | 38,932 | ||||||||||||||
| Total cash, cash equivalents and short-term investments | $ | 26,251 | $ | 46,963 | $ | 1,231 | $ | 74,445 | $ | 20,250 | $ | 61,981 | $ | 82,231 | |||||||
| (1) | U.S. dollar equivalent |
40
| BALLARD POWER SYSTEMS INC. |
| Notes to Consolidated Financial Statements |
| Years ended December 31, 2010 and 2009 |
| (Tabular amounts expressed in thousands of U.S. dollars, except per share amounts and number of shares) |
21. Financial instruments (cont’d):
| (b) | Financial risk management (cont’d): | |
| Changes arising from these risks could impact the Corporation’s reported investment and other income through either changes to investment income or foreign exchange gains or losses (note 15). | ||
| The Corporation did not realize any material gains or losses on its accounts receivable or its financial liabilities measured at amortized cost. | ||
| (i) | Foreign currency exchange rate risk is the risk that the fair value of future cash flows of a financial instrument will fluctuate because of changes in foreign exchange rates. The Corporation is exposed to currency risks primarily due to its holdings of Canadian dollar denominated cash equivalents and short-term investments and its Canadian dollar denominated accounts payable and accrued liabilities, accrued warranty liabilities, and obligations under capital lease. Substantially all revenues and the related accounts receivable are denominated in U.S. dollars. | |
| The Corporation limits its exposure to foreign currency risk by holding Canadian denominated cash, cash equivalents and short-term investments in amounts up to 100% of forecasted twelve month Canadian dollar net expenditures and up to 50% of the following twelve months of forecasted Canadian dollar net expenditures, thereby creating a natural hedge. Periodically, the Corporation also enters into forward foreign exchange contracts to further limit its exposure. At December 31, 2010, the Corporation had Canadian dollar cash, cash equivalents and short-term investments of CDN $26,109,000, and no outstanding forward foreign exchange contracts. | ||
| The following exchange rates applied during the year ended December 31, 2010: | ||
| $U.S. to $1.00 CDN | $CDN to $1.00 $U.S. | ||||||
| January 1, 2010 Opening rate | $ | 0.951 | $ | 1.051 | |||
| December 31, 2010 Closing rate | 1.005 | 0.995 | |||||
| Fiscal 2010 Average rate | 0.971 | 1.030 | |||||
| Based on cash, cash equivalents and short-term investments held at December 31, 2010, a 10% increase in the Canadian dollar against the U.S. dollar, with all other variables held constant, would result in an increase in foreign exchange gains of approximately $2,625,000. If the Canadian dollar weakened 10% against the U.S. dollar, there would be an equal, and opposite impact, on net income. This sensitivity analysis includes foreign currency denominated monetary items, and adjusts their translation at year-end, for a 10% change in foreign currency rates. |
41
| BALLARD POWER SYSTEMS INC. |
| Notes to Consolidated Financial Statements |
| Years ended December 31, 2010 and 2009 |
| (Tabular amounts expressed in thousands of U.S. dollars, except per share amounts and number of shares) |
21. Financial instruments (cont’d):
| (b) | Financial risk management (cont’d): | |
| (ii) | Interest rate risk is the risk that the fair value of future cash flows of a financial instrument will fluctuate because of changes in market interest rates. The Corporation is exposed to interest rate risk arising primarily from fluctuations in interest rates on its cash, cash equivalents and short-term investments. The Corporation limits its exposure to interest rate risk by continually monitoring and adjusting portfolio duration to align to forecasted cash requirements and anticipated changes in interest rates. | |
| Based on cash, cash equivalents and short-term investments at December 31, 2010, a 0.25% decline in interest rates, with all other variables held constant, would result in a decrease in investment income $186,000, arising mainly as a result of an increase in the fair value of fixed rate financial assets classified as held-for-trading. If interest rates had been 0.25% higher, there would be an equal and opposite impact on net income. | ||
| (iii) | Credit risk is the risk of financial loss to the Corporation if a counterparty to a financial instrument fails to meet its contractual obligations and arises principally from the Corporation’s cash equivalents, short-term investments and accounts receivable. The Corporation limits its exposure to credit risk on cash equivalents and short-term investments by only investing in liquid, investment grade securities. The Corporation manages its exposure to credit risk on accounts receivable by assessing the ability of counterparties to fulfill their obligations under the related contracts prior to entering into such contracts, and continuously monitors these exposures. | |
| (iv) | Commodity risk is the risk of financial loss to the Corporation due to fluctuations in platinum prices. To manage its exposure to platinum price fluctuations, the Corporation includes platinum pricing adjustments directly into certain significant customer contracts in addition to entering into platinum forward contracts. Forward contracts are recorded at their fair value as either assets or liabilities on the balance sheet. At December 31, 2010, the Corporation had outstanding platinum forward contracts to purchase a total of $3,100,000 of platinum at an average rate of $1,738 per troy ounce, resulting in an unrealized gain of $90,000. | |
| Based on the outstanding platinum forward contracts held at December 31, 2010, a $100 increase in the market price of platinum will result in a gain of $180,000 charged to income. If the market price of platinum declines by $100, there would be an equal, and opposite impact, on net income. | ||
42
| BALLARD POWER SYSTEMS INC. |
| Notes to Consolidated Financial Statements |
| Years ended December 31, 2010 and 2009 |
| (Tabular amounts expressed in thousands of U.S. dollars, except per share amounts and number of shares) |
22. Capital disclosures:
| As at December 31, 2010, the Corporation considers its cash, cash equivalents and short-term investments as its capital. The Corporation does not have any bank debt or significant externally imposed capital requirements to which it is subject. The Corporation’s objectives when managing capital are to manage its capital with strong fiscal discipline; focus on markets with high product and service revenue growth potential; license technology in cases where it is advantageous to the Corporation; and access available government funding for research and development projects. The Corporation’s current financing principle is to maintain cash balances sufficient to fund at least six quarters of operating cash consumption at all times. |
23. Differences between Canadian and United States accounting principles and practices:
| These consolidated financial statements have been prepared in accordance with Canadian GAAP which differ in certain respects from those principles and practices that the Corporation would have followed had its consolidated financial statements been prepared in accordance with accounting principles and practices generally accepted in the United States (“U.S. GAAP”). | |
| (a) | Under Canadian GAAP, the adoption of the U.S. dollar in 2001 as the presentation and measurement currency was implemented by translating all prior year financial statement amounts at the foreign exchange rate on December 31, 2001. Under U.S. GAAP, a change in presentation and measurement currency is implemented retroactively, such that prior period financial statements are translated under the current rate method using foreign exchange rates in effect on those dates. As a result, there is a difference in the share capital, additional paid-in capital, accumulated deficit and accumulated other comprehensive income amounts under U.S. GAAP as compared to Canadian GAAP. |
| (b) | Under Canadian GAAP, the Corporation has accounted for funding received in prior years under the TPC agreement in accordance with specific pronouncements on accounting for government assistance by reducing research and product development expenses, cost of revenues, inventory and capital assets by the amount of the funding received. |
| Under U.S. GAAP, there are no authoritative accounting standards addressing the various types of government assistance programs. Since the TPC funding combines the characteristics of a grant with some characteristics of a debt instrument, the Corporation has recorded the entire funding as long-term debt under U.S. GAAP. In addition, the U.S. GAAP liability is a Canadian dollar denominated liability and, as a result, foreign exchange gains and losses are incurred. | |
43
| BALLARD POWER SYSTEMS INC. |
| Notes to Consolidated Financial Statements |
| Years ended December 31, 2010 and 2009 |
| (Tabular amounts expressed in thousands of U.S. dollars, except per share amounts and number of shares) |
| 23. | Differences between Canadian and United States accounting principles and practices (cont’d): | ||
| During the year, the Corporation expensed $223,000 (2009 - $4,293,000) in TPC repayments under Canadian GAAP which would be treated as a reduction in the liability for U.S. GAAP. | |||
| (c) | Under Canadian GAAP, the Corporation is required to account for gains and losses on the issuance of shares by a subsidiary or other entity which the Corporation accounts for on an equity basis, as a component of income. Under U.S. GAAP, the effect of such dilution gains are recorded in equity as an increase in paid-in capital rather than as income. | ||
| (d) | Prior to 2002, under Canadian GAAP, no compensation expense was recorded for employee share option plans under the intrinsic value method. A previous option exchange plan was accounted for as a variable option plan under U.S. GAAP. Prior to the Corporation’s 100% acquisition of Ballard Generation Systems Inc. (“BGS”) in 2003, minority interest under U.S. GAAP included the minority interest’s percentage share of compensation expense under variable plan accounting. The balance of the purchase price allocated to goodwill from the acquisition of the minority interest in BGS reflects this difference under U.S. GAAP. | ||
| (e) | Under Canadian GAAP, investments where no significant influence exists are accounted for using the cost method. Under U.S. GAAP, investments in limited partnerships such as Chrysalix are accounted for using the equity method. In 2008, Chrysalix was written down to its estimated net realizable value and there is no difference in the carrying value of such investment as of December 31, 2010 and 2009 between Canadian and U.S. GAAP. | ||
| (f) | Under U.S. GAAP, no sub-total would be provided in the operating section of the consolidated statement of cash flows. There are no other differences in operating, investing and financing cash flows. | ||
44
| BALLARD POWER SYSTEMS INC. |
| Notes to Consolidated Financial Statements |
| Years ended December 31, 2010 and 2009 |
| (Tabular amounts expressed in thousands of U.S. dollars, except per share amounts and number of shares) |
| 23. | Differences between Canadian and United States accounting principles and practices (cont’d): | ||
Under U.S. GAAP, these differences would have been reported in the consolidated balance sheets, consolidated statements of operations and comprehensive income (loss), and consolidated statements of shareholders’ equity as follows: | |||
| Consolidated condensed balance sheets: | ||||||||||||||||||||
| 2010 | 2009 | |||||||||||||||||||
| Canadian | U.S. | Canadian | U.S. | |||||||||||||||||
| GAAP | Difference | GAAP | GAAP | Difference | GAAP | |||||||||||||||
| Current assets | $ | 99,398 | $ | - | $ | 99,398 | $ | 106,416 | $ | - | $ | 106,416 | ||||||||
| Property, plant and equipment | 36,706 | - | 36,706 | 39,320 | - | 39,320 | ||||||||||||||
| Intangible assets | 2,975 | - | 2,975 | 824 | - | 824 | ||||||||||||||
| Goodwill (d) | 48,106 | 490 | 48,596 | 48,106 | 490 | 48,596 | ||||||||||||||
| Investments (e) | 673 | - | 673 | 632 | - | 632 | ||||||||||||||
| Long-term accounts receivable | 1,596 | - | 1,596 | - | - | - | ||||||||||||||
| Other long-term assets | 334 | - | 334 | 50 | - | 50 | ||||||||||||||
| $ | 189,788 | $ | 490 | $ | 190,278 | $ | 195,348 | $ | 490 | $ | 195,838 | |||||||||
| Current liabilities | $ | 35,091 | $ | - | $ | 35,091 | $ | 30,057 | $ | - | $ | 30,057 | ||||||||
| Long-term liabilities (b) | 4,432 | 38,245 | 42,677 | 4,632 | 36,404 | 41,036 | ||||||||||||||
| Deferred gain | 9,036 | - | 9,036 | - | - | - | ||||||||||||||
| Obligation under capital lease | 13,354 | - | 13,354 | 1,739 | - | 1,739 | ||||||||||||||
| 61,913 | 38,245 | 100,158 | 36,428 | 36,404 | 72,832 | |||||||||||||||
| Shareholders' equity: | ||||||||||||||||||||
| Ballard Power Systems Inc. shareholders’ equity | ||||||||||||||||||||
| Share capital (a) | 836,245 | 119,583 | 955,828 | 835,565 | 119,583 | 955,148 | ||||||||||||||
| Treasury shares | (670 | ) | - | (670 | ) | (207 | ) | - | (207 | ) | ||||||||||
| Additional paid-in capital (a)(c) | 288,618 | 86,929 | 375,547 | 284,510 | 86,929 | 371,439 | ||||||||||||||
| Accumulated deficit | (995,669 | ) | (168,626 | ) | (1,164,295 | ) | (960,712 | ) | (166,785 | ) | (1,127,497 | ) | ||||||||
| Accumulated other comprehensive | ||||||||||||||||||||
| income (a) | (236 | ) | (75,641 | ) | (75,877 | ) | (236 | ) | (75,641 | ) | (75,877 | ) | ||||||||
| Ballard Power Systems Inc. | ||||||||||||||||||||
| shareholders' equity | 128,288 | (37,755 | ) | 90,533 | 158,920 | (35,914 | ) | 123,006 | ||||||||||||
| Dantherm Power A/S non-controlling | ||||||||||||||||||||
| interests | (413 | ) | - | (413 | ) | - | - | - | ||||||||||||
| Total shareholders’ equity | 127,875 | (37,755 | ) | 90,120 | 158,920 | (35,914 | ) | 123,006 | ||||||||||||
| $ | 189,788 | $ | 490 | $ | 190,278 | $ | 195,348 | $ | 490 | $ | 195,838 | |||||||||
45
| BALLARD POWER SYSTEMS INC. |
| Notes to Consolidated Financial Statements |
| Years ended December 31, 2010 and 2009 |
| (Tabular amounts expressed in thousands of U.S. dollars, except per share amounts and number of shares) |
| 23. | Differences between Canadian and United States accounting principles and practices (cont’d): | ||
| 2010 | 2009 | ||||||
| Loss attributable to Ballard Power Systems Inc. under | |||||||
| Canadian GAAP | $ | (34,936 | ) | $ | (3,258 | ) | |
| Research and development (b) | 223 | 4,293 | |||||
| Foreign exchange loss (b) | (2,064 | ) | (4,808 | ) | |||
| Net loss and comprehensive loss attributable to Ballard | |||||||
| Power Systems Inc. in accordance with U.S. GAAP | $ | (36,777 | ) | $ | (3,773 | ) | |
| Basic and diluted loss per share, U.S. GAAP | $ | (0.44 | ) | $ | (0.05 | ) | |
| Consolidated statements of shareholder’s equity | ||||||||||||||||||||||||||
| Ballard Power Systems Inc. shareholders’ equity | Dantherm | |||||||||||||||||||||||||
| Accumulated | Power A/S | |||||||||||||||||||||||||
| Additional | other | Non- | Total | |||||||||||||||||||||||
| Share | Treasury | paid-in | Accumulated | comprehensive | controlling | shareholder's | ||||||||||||||||||||
| capital | shares | capital | deficit | income (loss) | interests | equity | ||||||||||||||||||||
| Balance, December 31, 2008 | $ | 952,294 | $ | - | $ | 370,395 | $ | (1,123,724 | ) | $ | (75,877 | ) | $ | - | $ | 123,088 | ||||||||||
| Net Loss | - | - | - | (3,773 | ) | - | - | (3,773 | ) | |||||||||||||||||
| Non-dilutive financing | - | - | (719 | ) | - | - | - | (719 | ) | |||||||||||||||||
| Purchase of treasury shares | - | (207 | ) | - | - | - | - | (207 | ) | |||||||||||||||||
| RSUs and DSUs redeemed | 1,126 | - | (1,283 | ) | - | - | - | (157 | ) | |||||||||||||||||
| Options exercised | 7 | - | - | - | - | - | 7 | |||||||||||||||||||
| Share distribution plan | 1,721 | - | 3,046 | - | - | - | 4,767 | |||||||||||||||||||
| Balance, December 31, 2009 | $ | 955,148 | $ | (207 | ) | $ | 371,439 | $ | (1,127,497 | ) | $ | (75,877 | ) | $ | - | $ | 123,006 | |||||||||
| Acquisition of Dantherm | ||||||||||||||||||||||||||
| Power | - | - | - | - | - | 3,543 | 3,543 | |||||||||||||||||||
| Additional investment in | ||||||||||||||||||||||||||
| Dantherm Power | - | - | 915 | - | - | (49 | ) | 866 | ||||||||||||||||||
| Net loss | - | - | - | (36,777 | ) | - | (3,907 | ) | (40,684 | ) | ||||||||||||||||
| Non-dilutive financing | - | - | (22 | ) | - | - | - | (22 | ) | |||||||||||||||||
| Purchase of treasury shares | - | (559 | ) | - | - | - | - | (559 | ) | |||||||||||||||||
| RSUs and DSUs redeemed | 542 | 96 | (800 | ) | (21 | ) | - | - | (183 | ) | ||||||||||||||||
| Options exercised | 138 | - | (47 | ) | - | - | - | 91 | ||||||||||||||||||
| Share distribution plan | - | - | 4,062 | - | - | - | 4,062 | |||||||||||||||||||
| Balance, December 31, 2010 | $ | 955,828 | $ | (670 | ) | $ | 375,547 | $ | (1,164,295 | ) | $ | (75,877 | ) | $ | (413 | ) | $ | 90,120 | ||||||||
46
CORPORATE INFORMATION
Corporate Offices Ballard Power Systems Inc. Corporate Headquarters 9000 Glenlyon Parkway Burnaby, BC Canada V5J 5J8 T: 604.454.0900 F: 604.412.4700 Ballard Material Products Inc. Two Industrial Avenue Lowell, MA USA 01851-5191 Transfer Agent Computershare Trust Company of Canada Shareholder Services Department 510 Burrard Street Vancouver, BC Canada V6C 3B9 T: 1.800.564.6253 F: 1.866.249.7775 Stock Listing Ballard’s common shares are listed on the Toronto Stock Exchange under the trading symbol BLD and on the NASDAQ Global Market under the trading symbol BLDP. Investor Relations To obtain additional information please contact: Ballard Power Systems Investor Relations 9000 Glenlyon Parkway Burnaby, BC Canada V5J 5J8 T: 604.412.3195 F: 604.412.3100 E: investors@ballard.com W: www.ballard.com | Executive Management John W. Sheridan President & Chief Executive Officer Tony Guglielmin Vice President & Chief Financial Officer Paul Cass Vice President, Operations William T. Foulds President, Ballard Material Products Inc. Michael Goldstein Vice President & Chief Commercial Officer Christopher J. Guzy Vice President & Chief Technical Officer Independent Auditors KPMG LLP Vancouver, BC Canada Legal Counsel Canada: Stikeman Elliott, LLP Vancouver, BC Canada United States: Dorsey & Whitney LLP Seattle, WA USA Intellectual Property: Seed Intellectual Property Law Group, LLC Seattle, WA USA | Board of Directors Ian A. Bourne Corporate Director Alberta, Canada Edwin J. Kilroy Corporate Director Ontario, Canada Dr. C.S. Park Corporate Director California, USA John W. Sheridan President & Chief Executive Officer Ballard Power Systems Inc. British Columbia, Canada David J. Smith Member British Columbia Securities Commission British Columbia, Canada David B. Sutcliffe Corporate Director British Columbia, Canada Mark A. Suwyn Corporate Director Florida, USA Douglas W.G. Whitehead Chairman Finning International Inc. British Columbia, Canada |
F-3
Visit us at www.ballard.com.