
Keefe, Bruyette & Woods 2015 Mortgage Finance Conference June 2, 2015
Color Scheme 223 100 31 0 200 195 106 175 232 136 182 74 255 204 0 0 131 203 Forward Looking Statements FORWARD-LOOKING STATEMENTS: Our presentation contains certain forward-looking statements. These forward-looking statements may be identified by a reference to a future period or by the use of forward-looking terminology. They involve risks and uncertainties that could cause the company’s actual results to differ materially from the results discussed in the forward-looking statements. Important factors that could cause actual results to differ include, but are not limited to, our future production, revenues, income, capital spending, related general economic and market conditions, delinquency rates, trends for home prices, uncertainties related to acquisitions, including our ability to integrate the systems, procedures and personnel from other companies, as well as other risks discussed in the “Risk Factors” section within our Annual Report on Form 10-K, which was filed with the U.S. Securities and Exchange Commission on March 6, 2015, and any revisions to those Risk Factors in subsequent filings. These forward-looking statements speak only as of the date they are made and except for our ongoing obligations under the U.S. federal securities laws, we undertake no obligation to update or revise forward-looking statements whether as a result of new information, future events or otherwise. NON-GAAP MEASURES: Our presentation contains non-GAAP performance measures, such as our references to “adjusted net income”, “adjusted pre-tax net income”, “adjusted EPS”, “adjusted net income per diluted share”, “adjusted segment revenue”, and “adjusted segment pre-tax income”. We believe these non-GAAP performance measures provide additional meaningful comparisons between current results and results in prior periods. Non-GAAP performance measures should be viewed in addition to, and not as an alternative for, the Company’s reported results under accounting principles generally accepted in the United States. In addition, our calculations of non-GAAP performance measures may be different from the calculations used by other companies and, therefore, comparability may be limited. Please refer to the Appendix of this presentation for a reconciliation of these non-GAAP performance measures to the most comparable GAAP measure. SEGMENT REPORTING PRIOR PERIOD RECLASSIFICATIONS: Certain prior period amounts have been reclassified to conform to the current period presentation. 2

Color Scheme 223 100 31 0 200 195 106 175 232 136 182 74 255 204 0 0 131 203 Stonegate Highlights 3 Servicing Origination Financing (NattyMac) Stonegate Mortgage (NYSE:SGM) operates as an intermediary focused on providing yield opportunities through originating, financing and servicing U.S. residential mortgage loans ROE Potential: 20%+ Leverage: 20:1 Risk: Moderate/High ROE Potential: 20%+ Leverage: 15:1 Risk: Low/Moderate ROE Potential: 8-10% Leverage: 2:1 Risk: Moderate/High
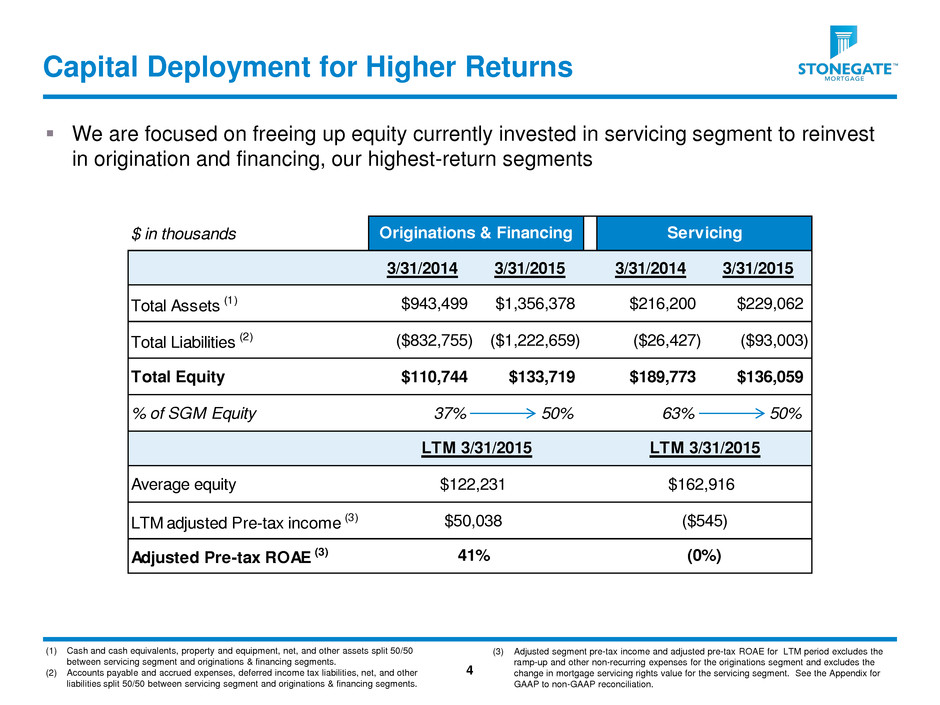
Color Scheme 223 100 31 0 200 195 106 175 232 136 182 74 255 204 0 0 131 203 Capital Deployment for Higher Returns 4 We are focused on freeing up equity currently invested in servicing segment to reinvest in origination and financing, our highest-return segments (1) Cash and cash equivalents, property and equipment, net, and other assets split 50/50 between servicing segment and originations & financing segments. (2) Accounts payable and accrued expenses, deferred income tax liabilities, net, and other liabilities split 50/50 between servicing segment and originations & financing segments. (3) Adjusted segment pre-tax income and adjusted pre-tax ROAE for LTM period excludes the ramp-up and other non-recurring expenses for the originations segment and excludes the change in mortgage servicing rights value for the servicing segment. See the Appendix for GAAP to non-GAAP reconciliation. $ in thousands 3/31/2014 3/31/2015 3/31/2014 3/31/2015 Total Assets (1) $943,499 $1,356,378 $216,200 $229,062 Total Liabilities (2) ($832,755) ($1,222,659) ($26,427) ($93,003) Total Equity $110,744 $133,719 $189,773 $136,059 % of SGM Equity 37% 50% 63% 50% Average equity LTM adjusted Pre-tax income (3) Adjusted Pre-tax ROAE (3) LTM 3/31/2015LTM 3/31/2015 Originations & Financing Servicing $162,916 ($545) (0%) $122,231 $50,038 41%
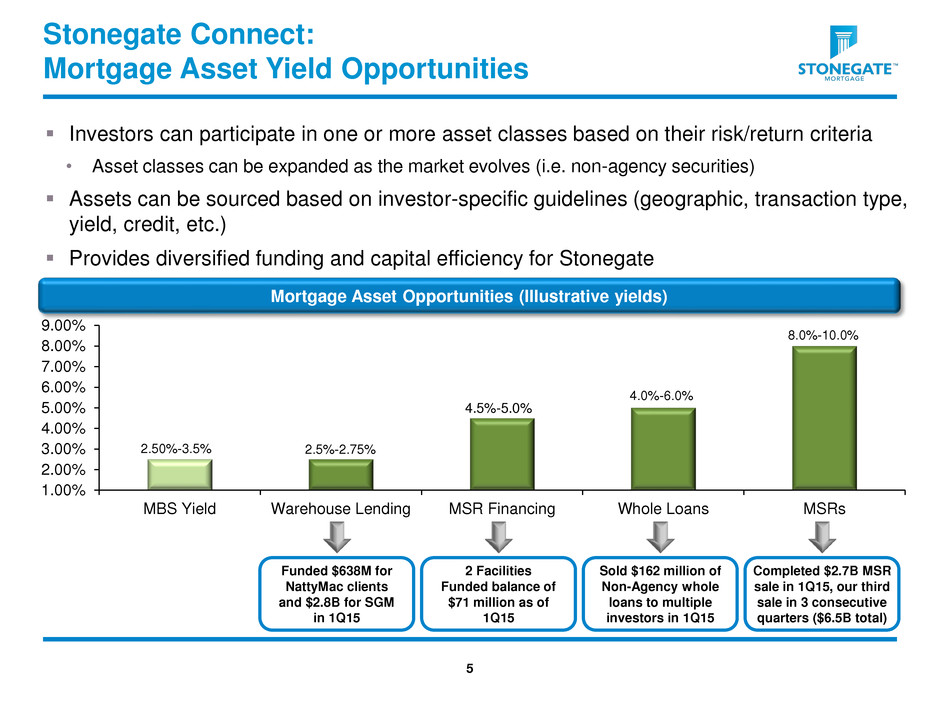
Color Scheme 223 100 31 0 200 195 106 175 232 136 182 74 255 204 0 0 131 203 Stonegate Connect: Mortgage Asset Yield Opportunities Investors can participate in one or more asset classes based on their risk/return criteria • Asset classes can be expanded as the market evolves (i.e. non-agency securities) Assets can be sourced based on investor-specific guidelines (geographic, transaction type, yield, credit, etc.) Provides diversified funding and capital efficiency for Stonegate 1.00% 2.00% 3.00% 4.00% 5.00% 6.00% 7.00% 8.00% 9.00% MBS Yield Warehouse Lending MSR Financing Whole Loans MSRs 4.5%-5.0% 2.5%-2.75% 2.50%-3.5% 4.0%-6.0% 8.0%-10.0% Mortgage Asset Opportunities (Illustrative yields) Funded $638M for NattyMac clients and $2.8B for SGM in 1Q15 5 2 Facilities Funded balance of $71 million as of 1Q15 Sold $162 million of Non-Agency whole loans to multiple investors in 1Q15 Completed $2.7B MSR sale in 1Q15, our third sale in 3 consecutive quarters ($6.5B total)
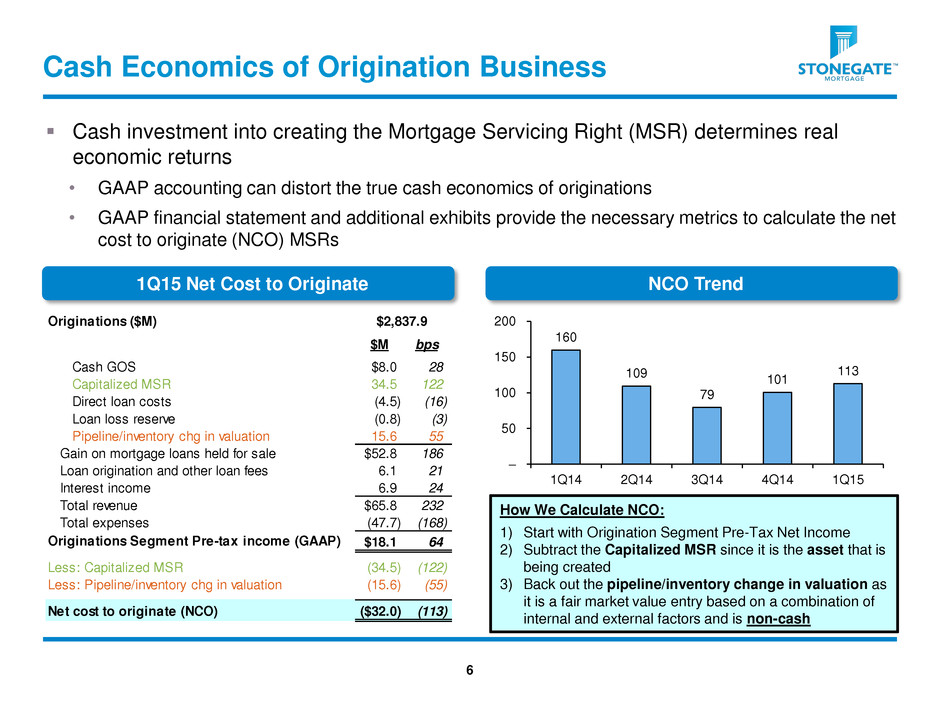
Color Scheme 223 100 31 0 200 195 106 175 232 136 182 74 255 204 0 0 131 203 Cash Economics of Origination Business 6 Cash investment into creating the Mortgage Servicing Right (MSR) determines real economic returns • GAAP accounting can distort the true cash economics of originations • GAAP financial statement and additional exhibits provide the necessary metrics to calculate the net cost to originate (NCO) MSRs How We Calculate NCO: 1) Start with Origination Segment Pre-Tax Net Income 2) Subtract the Capitalized MSR since it is the asset that is being created 3) Back out the pipeline/inventory change in valuation as it is a fair market value entry based on a combination of internal and external factors and is non-cash NCO Trend 1Q15 Net Cost to Originate Originations ($M) $2,837.9 $M bps Cash GOS $8.0 28 Capitalized MSR 34.5 122 Direct loan costs (4.5) (16) Loan loss reserve (0.8) (3) Pipeline/inventory chg in valuation 15.6 55 Gain on mortgage loans held for sale $52.8 186 Loan origination and other loan fees 6.1 21 Interest income 6.9 24 T tal revenue $65.8 232 Total expenses (47.7) (168) Originations Segment Pre-tax income (GAAP) $18.1 64 Less: Capitalized MSR (34.5) (122) Less: Pipeline/inventory chg in valuation (15.6) (55) Net cost to originate (NCO) ($32.0) (113) 160 109 79 101 113 – 50 100 150 200 1Q14 2Q14 3Q14 4Q14 1Q15
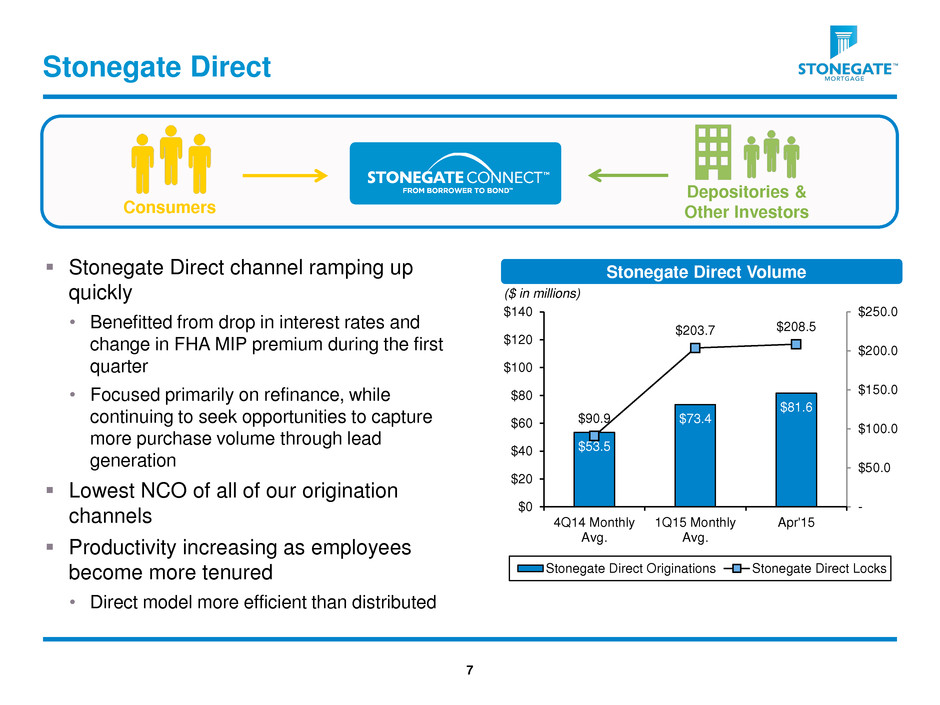
Color Scheme 223 100 31 0 200 195 106 175 232 136 182 74 255 204 0 0 131 203 Stonegate Direct channel ramping up quickly • Benefitted from drop in interest rates and change in FHA MIP premium during the first quarter • Focused primarily on refinance, while continuing to seek opportunities to capture more purchase volume through lead generation Lowest NCO of all of our origination channels Productivity increasing as employees become more tenured • Direct model more efficient than distributed Stonegate Direct 7 Stonegate Direct Volume ($ in millions) Depositories & Other Investors Consumers $53.5 $73.4 $81.6 $90.9 $203.7 $208.5 - $50.0 $100.0 $150.0 $200.0 $250.0 $0 $20 $40 $60 $80 $100 $120 $140 4Q14 Monthly Avg. 1Q15 Monthly Avg. Apr'15 Stonegate Direct Originations Stonegate Direct Locks

Color Scheme 223 100 31 0 200 195 106 175 232 136 182 74 255 204 0 0 131 203 The Road Ahead – 2015 to 2017 8 High % of R e v enue gene rat e d b y Fe e s ROE High 2015 Efficiency 2017 Leadership 2015 Efficiency 2016 Transformation 2017 Leadership Low
Color Scheme 223 100 31 0 200 195 106 175 232 136 182 74 255 204 0 0 131 203 Appendix 9

Color Scheme 223 100 31 0 200 195 106 175 232 136 182 74 255 204 0 0 131 203 Non-GAAP Financial Reconciliation: LTM Segment Income 10 LTM 3/31/2015 LTM 3/31/2015 ($ in thousands) Originations Financing Total Servicing Total Segment Pre-Tax Income 48,919$ (171)$ 48,748 (73,927)$ Adjust for: Ramp-up and other non-routine expenses 1,290 - 1,290 - Changes in valuation inputs and assumptions on MSRs - - - 73,382 Adjusted Segment Pre-Tax Income 50,209$ (171)$ 50,038$ (545)$ Note: Certain prior period amounts have been reclassified to conform to the current period presentation.
Color Scheme 223 100 31 0 200 195 106 175 232 136 182 74 255 204 0 0 131 203 Contact Information Jim Cutillo Chief Executive Officer Stonegate Mortgage P: (317) 663-5100 jcutillo@stonegatemtg.com Michael McFadden Senior Vice President - Finance Stonegate Mortgage P: (317) 663-5904 michael.mcfadden@stonegatemtg.com 11


