UNITED STATES
SECURITIES AND EXCHANGE COMMISSION
Washington, D.C. 20549
Form N-CSR
CERTIFIED SHAREHOLDER REPORT OF REGISTERED
MANAGEMENT INVESTMENT COMPANIES
Investment Company Act File Number: 811-22269
Eaton Vance National Municipal Opportunities Trust
(Exact Name of Registrant as Specified in Charter)
Two International Place, Boston, Massachusetts 02110
(Address of Principal Executive Offices)
Deidre E. Walsh
Two International Place, Boston, Massachusetts 02110
(Name and Address of Agent for Services)
(617) 482‑8260
(Registrant’s Telephone Number)
March 31
Date of Fiscal Year End
March 31, 2023
Date of Reporting Period
| Item 1. | Reports to Stockholders |
Eaton Vance
National Municipal Opportunities Trust (EOT)
Annual Report
March 31, 2023
Commodity Futures Trading Commission Registration. The Commodity Futures Trading Commission (“CFTC”) has adopted regulations that subject registered investment companies and advisers to regulation by the CFTC if a fund invests more than a prescribed level of its assets in certain CFTC-regulated instruments (including futures, certain options and swap agreements) or markets itself as providing investment exposure to such instruments. The investment adviser has claimed an exclusion from the definition of “commodity pool operator” under the Commodity Exchange Act with respect to its management of the Fund. Accordingly, neither the Fund nor the adviser with respect to the operation of the Fund is subject to CFTC regulation. Because of its management of other strategies, the Fund’s adviser is registered with the CFTC as a commodity pool operator. The adviser is also registered as a commodity trading advisor.
Fund shares are not insured by the FDIC and are not deposits or other obligations of, or guaranteed by, any depository institution. Shares are subject to investment risks, including possible loss of principal invested.
Annual Report March 31, 2023
Eaton Vance
National Municipal Opportunities Trust
National Municipal Opportunities Trust
March 31, 2023
Management’s Discussion of Fund Performance†
Economic and Market Conditions
As the 12-month period began on April 1, 2022, municipal rates were rising and bond prices were falling. As investors became increasingly concerned about the twin threats of inflation and interest rate hikes, municipal bond mutual funds posted their worst outflow cycle on record.
In July 2022, however, municipal bond performance briefly turned positive. Helped by a light supply of new issues and increased demand from the reinvestment of maturing debt and coupon payments, municipal bond mutual funds experienced their first net inflows since January 2022.
From August through October 2022, municipal returns again turned negative. Fund outflows resumed as investors reacted to statements by U.S. Federal Reserve (Fed) officials that the central bank was not done with rate hikes and fighting inflation remained its top priority. After the Fed’s third straight 0.75% federal funds rate hike, the Bloomberg Municipal Bond Index (the Index) fell 3.84% in September -- its worst one-month performance in 14 years.
However, in the final months of 2022, municipal performance rebounded. Despite the Fed’s fourth 0.75% rate hike in November, the Index rose 4.68% -- its best monthly performance since 1986. Drivers of the rally included Fed signals that future rate hikes might be smaller, as well as growing investor demand amid lower supplies of new municipal bond issues.
The Fed did deliver a smaller 0.50% rate hike in December, but raised expectations of how high rates might go in 2023. The Index -- helped by attractive yields and limited supply -- nonetheless eked out positive performance in December. As the new year began, municipal bonds delivered a third straight month of positive returns, driven by the ongoing supply-demand imbalance, and the return of inflows into open-end mutual funds. In February, however, the municipal rally stalled as robust economic reports -- including unexpectedly high job creation in January -- led investors to fear the Fed might keep rates higher for longer than previously expected.
As the period came to a close, municipal returns turned positive once again. The second- and third-largest bank failures in U.S. history triggered a “flight to quality” that drove municipal bonds to their strongest March performance since 2008, despite the Fed announcing its ninth consecutive rate hike that month.
For the period as a whole, the Index returned 0.26% as coupon payments slightly outpaced declining bond prices. While interest rates rose and bond prices fell across the municipal bond yield curve, the largest rate increases during the period occurred at the long and short ends of the curve. In comparison, rates rose only modestly within the five-to-10-year area of the curve. Municipal bonds outperformed U.S. Treasurys throughout the yield curve. Higher quality municipal bonds generally outperformed lower quality municipal bonds, reflecting decreased investor appetite for risk during the period.
Fund Performance
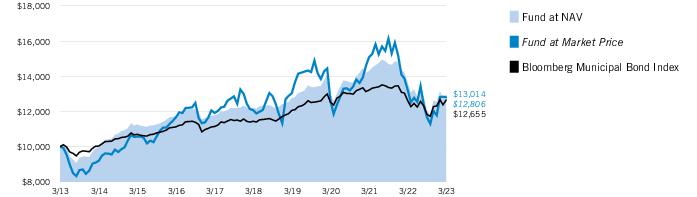
For the 12-month period ended March 31, 2023, Eaton Vance National Municipal Opportunities Trust (the Fund) returned -4.73% at net asset value of its common shares (NAV), underperforming its benchmark, the Bloomberg Municipal Bond Index (the Index), which returned 0.26%.
The Fund’s primary investment objective is to provide current income exempt from federal income tax. Capital appreciation is a secondary objective. The Fund invests primarily in municipal obligations rated investment-grade quality -- Baa/BBB or higher by Moody’s, S&P, or Fitch. The Fund may also invest up to 30% of its assets in municipal obligations rated below investment-grade quality.
Detractors from Fund performance relative to the Index included security selections and an overweight position in the health care sector. Spread widening within the sector hurt bond returns as operating margins for health care providers were pressured by labor shortages and rising expenses during the period.
Additional detractors from relative returns included security selections and an overweight position in bonds rated BBB and below, including nonrated bonds, during a period when lower rated bonds generally underperformed higher rated bonds; and an overweight position in bonds with 17 years or more remaining to maturity, during a period when the 10-30 year area of the yield curve steepened significantly, causing long-maturity bonds to underperform short-maturity bonds.
In contrast, contributors to Fund performance versus the Index during the period included security selections in the water and sewer sector, and security selections in AAA-rated bonds.
See Endnotes and Additional Disclosures in this report.
Past performance is no guarantee of future results. Returns are historical and are calculated net of management fees and other expenses by determining the percentage change in net asset value (NAV) or market price (as applicable) with all distributions reinvested in accordance with the Fund’s Dividend Reinvestment Plan. Furthermore, returns do not reflect the deduction of taxes that shareholders may have to pay on Fund distributions or upon the sale of Fund shares. Performance at market price will differ from performance at NAV due to variations in the Fund’s market price versus NAV, which may reflect factors such as fluctuations in supply and demand for Fund shares, changes in Fund distributions, shifting market expectations for the Fund’s future returns and distribution rates, and other considerations affecting the trading prices of closed-end funds. Investment return and principal value will fluctuate so that shares, when sold, may be worth more or less than their original cost. Performance for periods less than or equal to one year is cumulative. Performance is for the stated time period only; due to market volatility, current Fund performance may be lower or higher than the quoted return. For performance as of the most recent month-end, please refer to eatonvance.com.
Eaton Vance
National Municipal Opportunities Trust
March 31, 2023
Performance
Portfolio Manager(s) Cynthia J. Clemson and William J. Delahunty, Jr., CFA
| % Average Annual Total Returns1,2 | Inception Date | One Year | Five Years | Ten Years |
| Fund at NAV | 05/29/2009 | (4.73)% | 1.30% | 2.67% |
| Fund at Market Price | — | (3.19) | 1.19 | 2.50 |
|
| Bloomberg Municipal Bond Index | — | 0.26% | 2.03% | 2.38% |
| % Premium/Discount to NAV3 | |
| As of period end | (3.55)% |
| Distributions4 | |
| Total Distributions per share for the period | $0.750 |
| Distribution Rate at NAV | 4.09% |
| Taxable-Equivalent Distribution Rate at NAV | 6.92 |
| Distribution Rate at Market Price | 4.24 |
| Taxable-Equivalent Distribution Rate at Market Price | 7.17 |
| % Total Leverage5 | |
| Residual Interest Bond (RIB) Financing | 12.14% |
Growth of $10,000
This graph shows the change in value of a hypothetical investment of $10,000 in the Fund for the period indicated. For comparison, the same investment is shown in the indicated index.
See Endnotes and Additional Disclosures in this report.
Past performance is no guarantee of future results. Returns are historical and are calculated net of management fees and other expenses by determining the percentage change in net asset value (NAV) or market price (as applicable) with all distributions reinvested in accordance with the Fund’s Dividend Reinvestment Plan. Furthermore, returns do not reflect the deduction of taxes that shareholders may have to pay on Fund distributions or upon the sale of Fund shares. Performance at market price will differ from performance at NAV due to variations in the Fund’s market price versus NAV, which may reflect factors such as fluctuations in supply and demand for Fund shares, changes in Fund distributions, shifting market expectations for the Fund’s future returns and distribution rates, and other considerations affecting the trading prices of closed-end funds. Investment return and principal value will fluctuate so that shares, when sold, may be worth more or less than their original cost. Performance for periods less than or equal to one year is cumulative. Performance is for the stated time period only; due to market volatility, current Fund performance may be lower or higher than the quoted return. For performance as of the most recent month-end, please refer to eatonvance.com.
Eaton Vance
National Municipal Opportunities Trust
March 31, 2023
| Credit Quality (% of total investments)1,2 |
Footnotes:
| 1 | For purposes of the Fund’s rating restrictions, ratings are based on Moody’s Investors Service, Inc. (“Moody’s”), S&P Global Ratings (“S&P”) or Fitch Ratings (“Fitch”), as applicable. If securities are rated differently by the ratings agencies, the highest rating is applied. Ratings, which are subject to change, apply to the creditworthiness of the issuers of the underlying securities and not to the Fund or its shares. Credit ratings measure the quality of a bond based on the issuer’s creditworthiness, with ratings ranging from AAA, being the highest, to D, being the lowest based on S&P’s measures. Ratings of BBB or higher by S&P or Fitch (Baa or higher by Moody’s) are considered to be investment-grade quality. Credit ratings are based largely on the ratings agency’s analysis at the time of rating. The rating assigned to any particular security is not necessarily a reflection of the issuer’s current financial condition and does not necessarily reflect its assessment of the volatility of a security’s market value or of the liquidity of an investment in the security. Holdings designated as “Not Rated” (if any) are not rated by the national ratings agencies stated above. |
| 2 | The chart includes the municipal bonds held by a trust that issues residual interest bonds, consistent with the Portfolio of Investments. |
National Municipal Opportunities Trust
March 31, 2023
The Fund's Investment Objectives, Principal Strategies and Principal Risks‡
Investment Objectives. The Fund’s primary investment objective is to provide current income exempt from federal income tax. Capital appreciation is a secondary objective.
Principal Strategies. During normal market conditions, the Fund will invest at least 80% of its gross assets in debt obligations issued by or on behalf of states, territories and possessions of the United States, including the District of Columbia, and their political subdivisions, agencies or instrumentalities, the interest on which is exempt from regular federal income tax (“municipal obligations”). For purposes of this 80% policy, municipal obligations will include investments in residual interest bonds whose interest is exempt from regular federal income tax.
During normal market conditions, at least 70% of the Fund’s investments in municipal obligations will be investment grade quality at time of investment. A municipal obligation is considered investment grade quality if it is either (i) rated within the four highest ratings categories by at least one nationally recognized statistical rating organization (a “Rating Agency”), which are those rated Baa or higher by Moody’s Investors Service, Inc. (“Moody’s”) or BBB or higher by Standard & Poor’s Ratings Services (“S&P”) or Fitch Ratings (“Fitch”), or (ii) an unrated municipal obligation that the Fund’s investment adviser considers to be of investment grade quality. If a municipal obligation is rated differently by two or more Rating Agencies, the Fund will use the higher of such ratings (the “Municipal Obligation Rating”). If a municipal obligation is insured, the Fund will use the higher of the Municipal Obligation Rating or the insurance issuer’s rating. Securities rated in the fourth highest category (i.e., Baa by Moody’s or BBB by S&P or Fitch) are considered investment grade quality, but may have speculative characteristics.
Up to 30% of the Fund’s investments in municipal obligations may be below investment grade quality at time of investment. A municipal obligation is considered below investment grade quality if it is either (i) rated below investment grade by a Rating Agency, or (ii) an unrated municipal obligation that the Fund’s investment adviser considers to be of comparable quality. Municipal obligations of below investment grade quality (commonly referred to as “junk” bonds) involve special risks as compared to municipal obligations of investment grade quality. These risks include greater sensitivity to a general economic downturn, greater market price volatility and less secondary market trading. The Fund may invest in below investment grade municipal obligations of any quality. This means that the Fund’s investments in municipal obligations may include securities of issuers that are having financial difficulties, which may include being in default on obligations to pay principal or interest thereon when due or involved in bankruptcy or insolvency proceedings (such securities are commonly referred to as “distressed securities”). The Fund generally will not invest more than 2% of its gross assets in any security of below investment grade quality. Under normal market conditions, the Fund will seek to maintain an average credit quality of investment grade.
Up to 20% of the Fund’s investments in municipal obligations may be subject to the alternative minimum tax. Up to 5% of the Fund’s investments in municipal obligations may be collateralized by the proceeds from class action or other litigation against the tobacco industry. Such municipal obligations are backed solely by expected revenues to be derived from lawsuits involving tobacco-related deaths and illnesses which were settled between certain states and American tobacco companies. The Fund invests in residual interest bonds, also known as inverse floating rate securities, which have the economic effect of leverage. If the Fund invests 25% or more of its gross assets in any one state (or U.S. territory) the Fund may be more susceptible to adverse economic, political or regulatory occurrences affecting a particular state (or territory). The Fund generally will not invest more than 2% of its gross assets in any security of below investment grade quality.
The Fund may purchase municipal obligations in the form of bonds, notes, leases or certificates of participation; structured as callable or non-callable; with payment forms that include fixed coupon, variable rate, zero-coupon, capital appreciation bonds, residual interest bonds and short-term floating-rate securities. Such municipal obligations may be acquired through investments in pooled vehicles, partnerships, or other investment companies. No established resale market exists for certain of the municipal obligations in which the Fund may invest. The Fund has no limitation on the amount of its assets that may be invested in securities that are not readily marketable or are subject to restrictions on resale.
In addition to investing in residual interest bonds, the Fund may invest without limitation in other derivative instruments (which are instruments that derive their value from another instrument, security or index) acquired for hedging purposes. The Fund may purchase and sell various kinds of financial futures contracts and related options, including futures contracts and related options based on various debt securities and securities indices. The Fund also may enter into interest rate, total return and other swaps and forward rate contracts to seek to hedge against changes in interest rates or for other risk management purposes.
During unusual market conditions, the Fund may invest up to 100% of its assets in cash or cash equivalents temporarily, which may be inconsistent with its investment objective(s) and other policies.
Principal Risks
Market Discount Risk. As with any security, the market value of the common shares may increase or decrease from the amount initially paid for the common shares. The Fund’s common shares have traded both at a premium and at a discount relative to NAV. The shares of closed-end management investment companies frequently trade at a discount from their NAV. This is a risk separate and distinct from the risk that the Fund’s NAV may decrease.
Market Risk. The value of investments held by the Fund may increase or decrease in response to social, economic, political, financial, public health crises or other disruptive events (whether real, expected or perceived) in the U.S. and global markets and include events such as war, natural disasters, epidemics and pandemics, terrorism, conflicts and social unrest. These events may negatively impact broad segments of businesses and populations and may exacerbate pre-existing risks to the Fund. The frequency and magnitude of such resulting changes in the value of the Fund’s investments cannot be predicted. Certain securities and other investments held by the Fund may experience increased volatility, illiquidity, or other potentially adverse effects in
See Endnotes and Additional Disclosures in this report.
5
Eaton Vance
National Municipal Opportunities Trust
March 31, 2023
The Fund's Investment Objectives, Principal Strategies and Principal Risks‡ — continued
reaction to changing market conditions. Monetary and/or fiscal actions taken by U.S. or foreign governments to stimulate or stabilize the global economy may not be effective and could lead to high market volatility. No active trading market may exist for certain investments held by the Fund, which may impair the ability of the Fund to sell or to realize the current valuation of such investments in the event of the need to liquidate such assets.
Municipal Obligations Risk. The amount of public information available about municipal obligations is generally less than for corporate equities or bonds, meaning that the investment performance of municipal obligations may be more dependent on the analytical abilities of the investment adviser than stock or corporate bond investments. The secondary market for municipal obligations also tends to be less well-developed and less liquid than many other securities markets, which may limit the Fund’s ability to sell its municipal obligations at attractive prices. The differences between the price at which an obligation can be purchased and the price at which it can be sold may widen during periods of market distress. Less liquid obligations can become more difficult to value and be subject to erratic price movements. The increased presence of nontraditional participants (such as proprietary trading desks of investment banks and hedge funds) or the absence of traditional participants (such as individuals, insurance companies, banks and life insurance companies) in the municipal markets may lead to greater volatility in the markets because non-traditional participants may trade more frequently or in greater volume.
Interest Rate Risk. In general, the value of debt instruments will fluctuate based on changes in interest rates. The value of these securities is likely to increase when interest rates fall and decline when interest rates rise. Duration measures the time-weighted expected cash flows of a fixed-income security, while maturity refers to the amount of time until a fixed-income security matures. Generally, securities with longer durations or maturities are more sensitive to changes in interest rates than securities with shorter durations or maturities, causing them to be more volatile. Conversely, fixed-income securities with shorter durations or maturities will be less volatile but may provide lower returns than fixed-income securities with longer durations or maturities. Because the Fund is managed toward an income objective, it may hold more longer-duration or maturity obligations and thereby be more exposed to interest rate risk than municipal income funds that are managed with a greater emphasis on total return. The impact of interest rate changes is significantly less for floating-rate instruments that have relatively short periodic rate resets (e.g., ninety days or less). In a rising interest rate environment, the durations or maturities of income securities that have the ability to be prepaid or called by the issuer may be extended. In a declining interest rate environment, the proceeds from prepaid or maturing instruments may have to be reinvested at a lower interest rate. Certain instruments held by the Fund may pay an interest rate based on the London Interbank Offered Rate (“LIBOR”), which is the average offered rate for various maturities of short-term loans between certain major international banks. LIBOR is used throughout global banking and financial industries to determine interest rates for a variety of financial instruments (such as debt instruments and derivatives) and borrowing arrangements. The ICE Benchmark Administration Limited, the administrator of LIBOR, ceased publishing certain LIBOR settings on December 31, 2021, and is expected to cease the remaining LIBOR settings on June 30, 2023. Although the transition process away from LIBOR has become increasingly well defined, the impact on certain debt securities, derivatives and other financial instruments that utilize LIBOR remains uncertain. The phase-out of LIBOR may result in, among other things, increased volatility or illiquidity in markets for instruments based on LIBOR and changes in the value of such instruments.
Credit Risk. Investments in municipal obligations and other debt obligations (referred to below as “debt instruments”) are subject to the risk of non-payment of scheduled principal and interest. Changes in economic conditions or other circumstances may reduce the capacity of the party obligated to make principal and interest payments on such instruments and may lead to defaults. Such non-payments and defaults may reduce the value of Fund shares and income distributions. The value of debt instruments also may decline because of concerns about the issuer’s ability to make principal and interest payments. In addition, the credit ratings of debt instruments may be lowered if the financial condition of the party obligated to make payments with respect to such instruments deteriorates. In order to enforce its rights in the event of a default, bankruptcy or similar situation, the Fund may be required to retain legal or similar counsel, which may increase the Fund’s operating expenses and adversely affect net asset value. Municipal obligations may be insured as to principal and interest payments. If the claims-paying ability or other rating of the insurer is downgraded by a rating agency, the value of such obligations may be negatively affected.
Lower Rated Investments Risk. Investments rated below investment grade and comparable unrated investments (sometimes referred to as “junk”) have speculative characteristics because of the credit risk associated with their issuers. Changes in economic conditions or other circumstances typically have a greater effect on the ability of issuers of lower rated investments to make principal and interest payments than they do on issuers of higher rated investments. An economic downturn generally leads to a higher non-payment rate, and a lower rated investment may lose significant value before a default occurs. Lower rated investments typically are subject to greater price volatility and illiquidity than higher rated investments.
Leverage Risk. Certain Fund transactions may give rise to leverage. Leverage can result from a non-cash exposure to an underlying reference instrument. Leverage can also result from borrowings, issuance of preferred shares or participation in residual interest bond transactions. Leverage can increase both the risk and return potential of the Fund. The use of leverage may cause the Fund to maintain liquid assets or liquidate portfolio positions when it may not be advantageous to do so to satisfy its obligations or to meet segregation requirements. Leverage may cause the Fund’s NAV to be more volatile than if it had not been leveraged, as certain types of leverage may exaggerate the effect of any increase or decrease in the Fund’s portfolio securities. The loss on leveraged investments may substantially exceed the initial investment.
Risk of Residual Interest Bonds. The Fund may enter into residual interest bond transactions, which expose the Fund to leverage and greater risk than an investment in a fixed-rate municipal bond. The interest payments that the Fund receives on the residual interest bonds acquired in such transactions vary inversely with short-term interest rates, normally decreasing when short-term rates increase. The value and market for residual interest bonds are volatile and such bonds may have limited liquidity. As required by applicable accounting standards, the Fund records interest expense on its liability with respect to floating-rate notes and also records offsetting interest income in an amount equal to this expense.
See Endnotes and Additional Disclosures in this report.
6
Eaton Vance
National Municipal Opportunities Trust
March 31, 2023
The Fund's Investment Objectives, Principal Strategies and Principal Risks‡ — continued
Restricted Securities Risk. Unless registered for sale to the public under applicable federal securities law, restricted securities can be sold only in private transactions to qualified purchasers pursuant to an exemption from registration. The sale price realized from a private transaction could be less than the Fund’s purchase price for the restricted security. It may be difficult to identify a qualified purchaser for a restricted security held by the Fund and such security could be deemed illiquid. It may also be more difficult to value such securities.
Derivatives Risk. The Fund’s exposure to derivatives involves risks different from, or possibly greater than, the risks associated with investing directly in securities and other investments. The use of derivatives can lead to losses because of adverse movements in the price or value of the security, instrument, index, currency, commodity, economic indicator or event underlying a derivative (“reference instrument”), due to failure of a counterparty or due to tax or regulatory constraints. Derivatives may create leverage in the Fund, which represents a non-cash exposure to the underlying reference instrument. Leverage can increase both the risk and return potential of the Fund. Derivatives risk may be more significant when derivatives are used to enhance return or as a substitute for a cash investment position, rather than solely to hedge the risk of a position held by the Fund. Use of derivatives involves the exercise of specialized skill and judgment, and a transaction may be unsuccessful in whole or in part because of market behavior or unexpected events. Changes in the value of a derivative (including one used for hedging) may not correlate perfectly with the underlying reference instrument. Derivative instruments traded in over-the-counter markets may be difficult to value, may be illiquid, and may be subject to wide swings in valuation caused by changes in the value of the underlying reference instrument. If a derivative’s counterparty is unable to honor its commitments, the value of Fund shares may decline and the Fund could experience delays in (or be unable to achieve) the return of collateral or other assets held by the counterparty. The loss on derivative transactions may substantially exceed the initial investment. A derivative investment also involves the risks relating to the reference instrument underlying the investment.
Liquidity Risk. The Fund is exposed to liquidity risk when trading volume, lack of a market maker or trading partner, large position size, market conditions, or legal restrictions impair its ability to sell particular investments or to sell them at advantageous market prices. Consequently, the Fund may have to accept a lower price to sell an investment or continue to hold it or keep the position open, sell other investments to raise cash or abandon an investment opportunity, any of which could have a negative effect on the Fund’s performance. These effects may be exacerbated during times of financial or political stress.
Sector and Geographic Risk. Because the Fund may invest a significant portion of its assets in obligations issued in a particular state and/or U.S. territories and in certain types of municipal or other obligations and/or in certain sectors, the value of Fund shares may be affected by events that adversely affect that state, U.S. territory, sector or type of obligation and may fluctuate more than that of a fund that invests more broadly. General obligation bonds issued by municipalities are adversely affected by economic downturns and any resulting decline in tax revenues.
Recent Market Conditions. The outbreak of COVID-19 and efforts to contain its spread resulted in closing borders, enhanced health screenings, changes to healthcare service preparation and delivery, quarantines, cancellations, disruptions to supply chains and customer activity, as well as general concern and uncertainty. The impact of this coronavirus, and the effects of other infectious illness outbreaks, epidemics or pandemics, may be short term continue for an extended period of time. Health crises caused by outbreaks of disease, such as the coronavirus outbreak, may exacerbate other pre-existing political, social and economic risks and disrupt normal market conditions and operations. For example, a global pandemic or other widespread health crisis could cause substantial market volatility and exchange trading suspensions and closures. In addition, the increasing interconnectedness of markets around the world may result in many markets being affected by events or conditions in a single country or region or events affecting a single or small number of issuers. The coronavirus outbreak and public and private sector responses thereto have led to large portions of the populations of many countries working from home for indefinite periods of time, temporary or permanent layoffs, disruptions in supply chains, and lack of availability of certain goods. The impact of such responses could adversely affect the information technology and operational systems upon which the Fund and the Fund’s service providers rely, and could otherwise disrupt the ability of the employees of the Fund’s service providers to perform critical tasks relating to the Fund. Any such impact could adversely affect the Fund’s performance, or the performance of the securities in which the Fund invests and may lead to losses on your investment in the Fund.
Risks Associated with Active Management. The success of the Fund’s investment strategy depends on portfolio management’s successful application of analytical skills and investment judgment. Active management involves subjective decisions and there is no guarantee that such decisions will produce the desired results or expected returns.
Tax Risk. Income from tax-exempt municipal obligations could be declared taxable because of changes in tax laws, adverse interpretations by the relevant taxing authority or the non-compliant conduct of the issuer of an obligation.
Tax-Sensitive Investing Risk. The Fund may hold a security in order to achieve more favorable tax-treatment or to sell a security in order to create tax losses. The Fund’s utilization of various tax-management techniques may be curtailed or eliminated by tax legislation, regulation or interpretations. The Fund may not be able to minimize taxable distributions to shareholders and a portion of the Fund’s distributions may be taxable.
Cybersecurity Risk. With the increased use of technologies by Fund service providers to conduct business, such as the Internet, the Fund is susceptible to operational, information security and related risks. In general, cyber incidents can result from deliberate attacks or unintentional events. Cybersecurity failures by or breaches of the Fund’s investment adviser or administrator and other service providers (including, but not limited to, the custodian or transfer agent), and the issuers of securities in which the Fund invests, may disrupt and otherwise adversely affect their business operations. This may result in
See Endnotes and Additional Disclosures in this report.
7
Eaton Vance
National Municipal Opportunities Trust
March 31, 2023
The Fund's Investment Objectives, Principal Strategies and Principal Risks‡ — continued
financial losses to the Fund, impede Fund trading, interfere with the Fund’s ability to calculate its net asset value, interfere with Fund shareholders’ ability to transact business or cause violations of applicable privacy and other laws, regulatory fines, penalties, reputational damage, reimbursement or other compensation costs, or additional compliance costs.
General Fund Investing Risks. The Fund is not a complete investment program and there is no guarantee that the Fund will achieve its investment objective. It is possible to lose money by investing in the Fund. An investment in the Fund is not a deposit in a bank and is not insured or guaranteed by the Federal Deposit Insurance Corporation or any other government agency.
Potential Conflicts of Interest
As a diversified global financial services firm, Morgan Stanley, the parent company of the investment adviser, engages in a broad spectrum of activities where Morgan Stanley’s interests or the interests of its clients may conflict with the interests of the Fund. Morgan Stanley advises clients and sponsors, manages or advises other investment funds and investment programs, accounts and businesses (collectively, together with any new or successor Morgan Stanley funds, programs, accounts or businesses, (other than funds, programs, accounts or businesses sponsored, managed, or advised by former direct or indirect subsidiaries of Eaton Vance Corp. (“Eaton Vance Investment Accounts”)), the “MS Investment Accounts,” and, together with the Eaton Vance Investment Accounts, the ‘‘Affiliated Investment Accounts’’) with a wide variety of investment objectives that in some instances may overlap or conflict with a Fund’s investment objectives and present conflicts of interest. There is no assurance that conflicts of interest will be resolved in favor of Fund shareholders and, in fact, they may not be. Conflicts of interest not described below may also exist.
Material Non-public Information. It is expected that confidential or material non-public information regarding an investment or potential investment opportunity may become available to the investment adviser. If such information becomes available, the investment adviser may be precluded (including by applicable law or internal policies or procedures) from pursuing an investment or disposition opportunity with respect to such investment or investment opportunity. Morgan Stanley has established certain information barriers and other policies to address the sharing of information between different businesses within Morgan Stanley.
Investments by Morgan Stanley and its Affiliated Investment Accounts. In serving in multiple capacities to Affiliated Investment Accounts, Morgan Stanley, including the investment adviser and its investment teams, may have obligations to other clients or investors in Affiliated Investment Accounts, the fulfillment of which may not be in the best interests of a Fund or its shareholders. A Fund’s investment objectives may overlap with the investment objectives of certain Affiliated Investment Accounts. As a result, the members of an investment team may face conflicts in the allocation of investment opportunities among a Fund and other investment funds, programs, accounts and businesses advised by or affiliated with the investment adviser. Certain Affiliated Investment Accounts may provide for higher management or incentive fees or greater expense reimbursements or overhead allocations, all of which may contribute to this conflict of interest and create an incentive for the investment adviser to favor such other accounts. To seek to reduce potential conflicts of interest and to attempt to allocate investment opportunities in a fair and equitable manner, the investment adviser has implemented allocation policies and procedures. These policies and procedures are intended to give all clients of the investment adviser, including the Fund(s), fair access to investment opportunities, consistent with the requirements of organizational documents, investment strategies, applicable laws and regulations, and the fiduciary duties of the investment adviser.
Investments by Separate Investment Departments. The entities and individuals that provide investment-related services for the Fund and certain other Eaton Vance Investment Accounts (the “Eaton Vance Investment Department”) may be different from the entities and individuals that provide investment-related services to MS Investment Accounts (the “MS Investment Department” and, together with the Eaton Vance Investment Department, the “Investment Departments”). Although Morgan Stanley has implemented information barriers between the Investment Departments in accordance with internal policies and procedures, each Investment Department may engage in discussions and share information and resources with the other Investment Department on certain investment-related matters. A MS Investment Account could trade in advance of a Fund (and vice versa), might complete trades more quickly and efficiently than a Fund, and/or achieve different execution than a Fund on the same or similar investments made contemporaneously.
Morgan Stanley Trading and Principal Investing Activities. Notwithstanding anything to the contrary herein, Morgan Stanley will generally conduct its sales and trading businesses, publish research and analysis, and render investment advice without regard for a Fund’s holdings, although these activities could have an adverse impact on the value of one or more of the Fund’s investments, or could cause Morgan Stanley to have an interest in one or more portfolio investments that is different from, and potentially adverse to, that of a Fund.
Morgan Stanley’s Investment Banking and Other Commercial Activities. Morgan Stanley advises clients on a variety of mergers, acquisitions, restructuring, bankruptcy and financing transactions. Morgan Stanley may act as an advisor to clients, including other investment funds that may compete with a Fund and with respect to investments that a Fund may hold. Morgan Stanley may give advice and take action with respect to any of its clients or proprietary accounts that may differ from the advice given, or may involve an action of a different timing or nature than the action taken, by a Fund.
General Process for Potential Conflicts. All of the transactions described above involve the potential for conflicts of interest between the investment adviser, related persons of the investment adviser and/or their clients. The Investment Advisers Act of 1940, as amended (the “Advisers Act”), the Investment Company Act of 1940, as amended (the “1940 Act”), and the Employee Retirement Income Security Act, as amended (“ERISA”) impose certain requirements designed to decrease the possibility of conflicts of interest between an investment adviser and its clients. In some cases, transactions may be
See Endnotes and Additional Disclosures in this report.
8
Eaton Vance
National Municipal Opportunities Trust
March 31, 2023
The Fund's Investment Objectives, Principal Strategies and Principal Risks‡ — continued
permitted subject to fulfillment of certain conditions. Certain other transactions may be prohibited. In addition, the investment adviser has instituted policies and procedures designed to prevent conflicts of interest from arising and, when they do arise, to ensure that it effects transactions for clients in a manner that is consistent with its fiduciary duty to its clients and in accordance with applicable law.
Important Notice to Shareholders
The following information is a summary of certain changes since March 31, 2022. This information may not reflect all of the changes that have occurred since you purchased the Fund.
On January 26, 2023, the Fund's Board of Trustees voted to exempt, on a going forward basis, all prior and, until further notice, new acquisitions of Fund shares that otherwise might be deemed “Control Share Acquisitions” under the Fund's By-Laws from the Control Share Provisions of the Fund's By-Laws.
See Endnotes and Additional Disclosures in this report.
9
National Municipal Opportunities Trust
March 31, 2023
The purpose of the table below is to help you understand all fees and expenses that you, as a common shareholder, would bear directly or indirectly. The table reflects leverage attributable to floating-rate notes for the fiscal year ended March 31, 2023 in an amount equal to 11.09% of the Fund's average gross assets (including floating-rate notes) and shows Fund expenses stated as a percentage of net assets attributable to common shares, and not as a percentage of total assets.
| Common shareholder transaction expenses | |
| Sales load paid by you (as a percentage of offering price) | — 1 |
| Offering expenses (as a percentage of offering price) | None 2 |
| Dividend reinvestment plan fees | $5.003 |
| Annual expenses | Percentage of net assets attributable to common shares4 |
| Investment adviser fee | 0.67%5 |
| Interest expense | 0.326 |
| Other expenses | 0.10 |
| Total annual Fund operating expenses | 1.09% |
Example
The following Example illustrates the expenses that common shareholders would pay on a $1,000 investment in common shares, assuming (i) total annual expenses of 1.09% of net assets attributable to common shares in years 1 through 10; (ii) a 5% annual return; and (iii) all distributions are reinvested at NAV:
| 1 Year | 3 Years | 5 Years | 10 Years |
| $11 | $35 | $60 | $133 |
The above table and example and the assumption in the example of a 5% annual return are required by regulations of the U.S. Securities and Exchange Commission (“SEC”) that are applicable to all investment companies; the assumed 5% annual return is not a prediction of, and does not represent, the projected or actual performance of the Trust’s common shares. In addition, while the example assumes reinvestment of all dividends and distributions at NAV, participants in the Trust’s dividend reinvestment plan may receive common shares purchased or issued at a price or value different from NAV. The example does not include sales load or estimated offering costs, which would cause the expenses shown in the example to increase.
The example should not be considered a representation of past or future expenses, and the Trust’s actual expenses may be greater or less than those shown. Moreover, the Trust’s actual rate of return may be greater or less than the hypothetical 5% return shown in the example.
1 If common shares are sold to or through underwriters, the Prospectus Supplement will set forth any applicable sales load.
2 Eaton Vance Management (“EVM”) will pay the expenses of the offering (other than the applicable commissions); therefore, offering expenses are not included in the Summary of Fund Expenses. Offering expenses generally include, but are not limited to, the preparation, review and filing with the SEC of the Trust’s registration statement (including its current Prospectus Supplement, the accompanying Prospectus and Statement of Additional Information (“SAI”)), the preparation, review and filing of any associated marketing or similar materials, costs associated with the printing, mailing or other distribution of its current Prospectus Supplement, the accompanying Prospectus, SAI and/or marketing materials, associated filing fees, stock exchange listing fees, and legal and auditing fees associated with the offering.
3 You will be charged a $5.00 service charge and pay brokerage charges if you direct the plan agent to sell your common shares held in a dividend reinvestment account.
4 Stated as a percentage of average net assets attributable to common shares for the year ended March 31, 2023.
5 The investment adviser fee paid by the Trust to EVM is based on the average daily gross assets of the Trust, including all assets attributable to any form of investment leverage that the Trust may utilize. Accordingly, if the Trust were to increase investment leverage in the future, the investment adviser fee will increase as a percentage of net assets.
6 Interest expense relates to the Trust’s liability with respect to floating-rate notes held by third parties in conjunction with investments in residual interest bonds. The Trust records offsetting interest income in an amount at least equal to this expense relating to the municipal obligations underlying such transactions.
National Municipal Opportunities Trust
March 31, 2023
Trading and NAV Information
The Trust’s common shares have traded both at a premium and a discount to NAV. The Trust cannot predict whether its shares will trade in the future at a premium or discount to NAV. The provisions of the Investment Company Act of 1940, as amended (the “1940 Act”), generally require that the public offering price of common shares (less any underwriting commissions and discounts) must equal or exceed the NAV per share of a company’s common stock. The issuance of common shares may have an adverse effect on prices in the secondary market for the Trust’s common shares by increasing the number of common shares available, which may put downward pressure on the market price for the Trust’s common shares. Shares of common stock of closed-end investment companies frequently trade at a discount from NAV.
In addition, the Trust’s Board of Trustees has authorized the Trust to repurchase up to 10% of its common shares outstanding as of the last day of the prior calendar year at market prices when shares are trading at a discount to net asset value. The share repurchase program does not obligate the Trust to purchase a specific amount of shares. The results of the share repurchase program are disclosed in the Trust’s annual and semi-annual reports to shareholders.
The following table sets forth for each of the periods indicated the high and low closing market prices for the common shares on the New York Stock Exchange, and the corresponding NAV per share and the premium or discount to NAV per share at which the Trust’s common shares were trading as of such date.
| | Market Price ($) | | NAV per Share on
Date of Market Price ($) | | NAV Premium/(Discount) on
Date of Market Price (%) |
| Fiscal Quarter Ended | High | Low | | High | Low | | High | Low |
| March 31, 2023 | 18.03 | 16.48 | | 18.47 | 17.93 | | (2.38) | (8.09) |
| December 31, 2022 | 17.95 | 15.53 | | 18.23 | 16.87 | | (1.54) | (7.94) |
| September 30, 2022 | 19.19 | 16.12 | | 18.93 | 17.45 | | 1.37 | (7.62) |
| June 30, 2022 | 18.93 | 16.38 | | 20.07 | 18.32 | | (5.68) | (10.59) |
| March 31, 2022 | 22.17 | 18.78 | | 21.99 | 20.01 | | 0.82 | (6.15) |
| December 31, 2021 | 24.00 | 22.07 | | 22.08 | 21.99 | | 8.70 | 0.36 |
| September 30, 2021 | 24.09 | 22.23 | | 22.48 | 22.27 | | 7.16 | (0.18) |
| June 30, 2021 | 23.45 | 22.09 | | 22.11 | 22.23 | | 6.06 | (0.63) |
Eaton Vance
National Municipal Opportunities Trust
March 31, 2023
Endnotes and Additional Disclosures
| † | The views expressed in this report are those of the portfolio manager(s) and are current only through the date stated at the top of this page. These views are subject to change at any time based upon market or other conditions, and Eaton Vance and the Fund(s) disclaim any responsibility to update such views. These views may not be relied upon as investment advice and, because investment decisions are based on many factors, may not be relied upon as an indication of trading intent on behalf of any Eaton Vance fund. This commentary may contain statements that are not historical facts, referred to as “forward-looking statements.” The Fund’s actual future results may differ significantly from those stated in any forward-looking statement, depending on factors such as changes in securities or financial markets or general economic conditions, the volume of sales and purchases of Fund shares, the continuation of investment advisory, administrative and service contracts, and other risks discussed from time to time in the Fund’s filings with the Securities and Exchange Commission. |
| ‡ | The information contained herein is provided for informational purposes only and does not constitute a solicitation of an offer to buy or sell Fund shares. Common shares of the Fund are available for purchase and sale only at current market prices in secondary market trading. |
| | |
| 1 | Bloomberg Municipal Bond Index is an unmanaged index of municipal bonds traded in the U.S. Unless otherwise stated, index returns do not reflect the effect of any applicable sales charges, commissions, expenses, taxes or leverage, as applicable. It is not possible to invest directly in an index. |
| 2 | Performance results reflect the effects of leverage. |
| 3 | The shares of the Fund often trade at a discount or premium to their net asset value. The discount or premium may vary over time and may be higher or lower than what is quoted in this report. For up-to-date premium/discount information, please refer to https://funds.eatonvance.com/closed-end-fund-prices.php. |
| 4 | The Distribution Rate is based on the Fund’s last regular distribution per share in the period (annualized) divided by the Fund’s NAV or market price at the end of the period. The Fund’s distributions may be comprised of amounts characterized for federal income tax purposes as tax-exempt income, qualified and non-qualified ordinary dividends, capital gains and nondividend distributions, also known as return of capital. The Fund will determine the federal income tax character of distributions paid to a shareholder after the end of the calendar year. This is reported on the IRS form 1099-DIV and provided to the shareholder shortly after each year-end. For information about the tax character of distributions made in prior calendar years, please refer to Performance-Tax Character of Distributions on the Fund’s webpage available at eatonvance.com. The Fund’s distributions are determined by the investment adviser based on its current assessment of the Fund’s long-term return potential. Fund distributions may be affected by numerous factors including changes in Fund performance, the cost of financing for leverage, portfolio holdings, realized and projected returns, and other factors. As portfolio and market conditions change, the rate of distributions paid by the Fund could change. Taxable-equivalent performance is based on the highest combined federal and state income tax rates, where applicable. Lower tax rates would result in lower tax-equivalent performance. Actual tax rates will vary depending on your income, exemptions and deductions. Rates do not include local taxes. |
| 5 | Fund employs RIB financing. The leverage created by RIB investments provides an opportunity for increased income but, at the same time, creates special risks (including the likelihood of greater price volatility). The cost of leverage rises and falls with changes in short-term interest rates. See “Floating Rate Notes Issued in Conjunction with Securities Held” in the notes to the financial statements for more information about RIB financing. RIB leverage represents the amount of Floating Rate Notes outstanding at period end as a percentage of Fund net assets plus Floating Rate Notes. |
| | Fund profile subject to change due to active management. |
| | Additional Information |
| | Yield curve is a graphical representation of the yields offered by bonds of various maturities. The yield curve flattens when long-term interest rates fall and/or short-term interest rates increase, and the yield curve steepens when long-term interest rates increase and/or short-term interest rates fall. |
Eaton Vance
National Municipal Opportunities Trust
March 31, 2023
| Security | Principal
Amount
(000's omitted) | Value |
| Education — 0.6% |
| Grand Canyon University, 4.125%, 10/1/24 | $ | 2,000 | $ 1,894,780 |
| | | | $ 1,894,780 |
| Hospital — 0.7% |
| Montefiore Obligated Group, 4.287%, 9/1/50 | $ | 3,240 | $ 2,020,609 |
| | | | $ 2,020,609 |
| Insured - Hospital — 0.5% |
| Toledo Hospital, (AGM), 5.75%, 11/15/38 | $ | 1,440 | $ 1,409,366 |
| | | | $ 1,409,366 |
| Other — 0.9% |
| Morongo Band of Mission Indians, 7.00%, 10/1/39(1) | $ | 2,430 | $ 2,632,346 |
| | | | $ 2,632,346 |
Total Corporate Bonds
(identified cost $9,166,951) | | | $ 7,957,101 |
| Tax-Exempt Municipal Obligations — 104.5% |
| Security | Principal
Amount
(000's omitted) | Value |
| Education — 2.3% |
| Arizona Industrial Development Authority, (Doral Academy of Nevada), 5.00%, 7/15/49(1) | $ | 560 | $ 515,446 |
| Arizona Industrial Development Authority, (Pinecrest Academy of Nevada), 4.00%, 7/15/50(1) | | 185 | 138,820 |
| Capital Trust Agency, FL, (Florida Charter Educational Foundation, Inc.): | | | |
| 5.375%, 6/15/38(1) | | 210 | 203,933 |
| 5.375%, 6/15/48(1) | | 395 | 362,614 |
| Capital Trust Agency, FL, (Liza Jackson Preparatory School, Inc.), 5.00%, 8/1/55 | | 325 | 324,867 |
| District of Columbia, (District of Columbia International School), 5.00%, 7/1/49 | | 185 | 185,575 |
| District of Columbia, (KIPP DC), 4.00%, 7/1/44 | | 410 | 355,035 |
| District of Columbia, (Rocketship DC Obligated Group): | | | |
| 5.00%, 6/1/56(1) | | 1,090 | 959,255 |
| 5.00%, 6/1/61(1) | | 355 | 308,140 |
| Illinois Finance Authority, (DePaul College Prep Foundation), 5.625%, 8/1/53(1) | | 750 | 735,495 |
| Jacksonville, FL, (Jacksonville University), 5.00%, 6/1/53(1) | | 1,000 | 866,250 |
| Public Finance Authority, WI, (North Carolina Leadership Academy), 5.00%, 6/15/54(1) | | 455 | 399,199 |
| Public Finance Authority, WI, (Roseman University of Health Sciences): | | | |
| 4.00%, 4/1/52(1) | | 250 | 187,765 |
| 5.00%, 4/1/40(1) | | 655 | 631,027 |
| 5.00%, 4/1/50(1) | | 175 | 159,791 |
| Security | Principal
Amount
(000's omitted) | Value |
| Education (continued) |
| Yonkers Economic Development Corp., NY, (Lamartine/Warburton, LLC - Charter School of Educational Excellence): | | | |
| 5.00%, 10/15/49 | $ | 70 | $ 63,160 |
| 5.00%, 10/15/54 | | 110 | 97,906 |
| | | | $ 6,494,278 |
| Electric Utilities — 5.6% |
| Burke County Development Authority, GA, (Oglethorpe Power Corp.), 4.125%, 11/1/45 | $ | 5,750 | $ 5,257,628 |
| Hawaii Department of Budget and Finance, (Hawaiian Electric Co., Inc.), 3.20%, 7/1/39 | | 2,520 | 2,146,309 |
| Lower Colorado River Authority, TX, (LCRA Transmission Services Corp.), 5.50%, 5/15/47 | | 2,000 | 2,255,440 |
| New York Power Authority, Green Bonds, 4.00%, 11/15/55 | | 2,000 | 1,918,220 |
| Omaha Public Power District, NE, 5.00%, 2/1/47(2) | | 4,000 | 4,427,560 |
| | | | $ 16,005,157 |
| Escrowed/Prerefunded — 3.2% |
| Central Texas Regional Mobility Authority, Prerefunded to 7/1/25, 5.00%, 1/1/45 | $ | 750 | $ 790,658 |
| New Hope Cultural Education Facilities Finance Corp., TX, (CHF-Collegiate Housing Stephenville III, LLC - Tarleton State University), Prerefunded to 4/1/25, 5.00%, 4/1/47 | | 445 | 464,829 |
| New Jersey Economic Development Authority, (School Facilities Construction), Prerefunded to 12/15/28, 5.00%, 6/15/43 | | 275 | 315,576 |
| San Joaquin Hills Transportation Corridor Agency, CA, Prerefunded to 1/15/25, 5.00%, 1/15/50 | | 6,400 | 6,704,960 |
| Southwestern Illinois Development Authority, (Memorial Group, Inc.), Prerefunded to 11/1/23, 7.25%, 11/1/33 | | 770 | 788,757 |
| | | | $ 9,064,780 |
| General Obligations — 12.0% |
| Chicago Board of Education, IL, 5.00%, 12/1/42 | $ | 6,410 | $ 6,260,583 |
| Chicago, IL, 5.50%, 1/1/49 | | 5,000 | 5,234,600 |
| Detroit, MI: | | | |
| 5.50%, 4/1/36 | | 435 | 465,015 |
| 5.50%, 4/1/40 | | 680 | 712,232 |
| Illinois: | | | |
| 4.25%, 12/1/37 | | 6,000 | 6,057,120 |
| 5.00%, 5/1/36 | | 3,500 | 3,536,680 |
| Jackson County School District No. 6, OR, 0.00%, 6/15/41 | | 710 | 324,335 |
| Leander Independent School District, TX, (PSF Guaranteed), 5.00%, 8/15/47(2) | | 4,000 | 4,414,480 |
| Puerto Rico: | | | |
| 0.00%, 7/1/33 | | 2,000 | 1,135,980 |
| 4.00%, 7/1/35 | | 2,000 | 1,748,140 |
| Township High School District No. 203, IL, 2.00%, 12/15/33 | | 2,430 | 2,175,798 |
| Township of Freehold, NJ: | | | |
| 1.00%, 10/15/29 | | 575 | 504,241 |
| 1.00%, 10/15/30 | | 1,035 | 884,304 |
| 1.00%, 10/15/31 | | 975 | 807,709 |
| | | | $ 34,261,217 |
13
See Notes to Financial Statements.
Eaton Vance
National Municipal Opportunities Trust
March 31, 2023
Portfolio of Investments — continued
| Security | Principal
Amount
(000's omitted) | Value |
| Hospital — 6.1% |
| California Health Facilities Financing Authority, (St. Joseph Health System), Prerefunded to 7/1/23, 5.00%, 7/1/37 | $ | 165 | $ 165,941 |
| Camden County Improvement Authority, NJ, (Cooper Health System), 5.75%, 2/15/42 | | 665 | 665,944 |
| Chattanooga Health, Educational and Housing Facility Board, TN, (CommonSpirit Health), 4.00%, 8/1/44 | | 670 | 613,633 |
| Geisinger Authority, PA, (Geisinger Health System), 4.00%, 2/15/47 | | 2,210 | 2,056,051 |
| Illinois Finance Authority, (Presence Health Network): | | | |
| 3.75%, 2/15/34 | | 1,190 | 1,211,551 |
| 4.00%, 2/15/36 | | 2,500 | 2,531,375 |
| Illinois Finance Authority, (Rush University Medical Center), 4.00%, 11/15/39 | | 1,000 | 946,820 |
| Montgomery County Higher Education and Health Authority, PA, (Thomas Jefferson University Obligated Group), 5.00%, 5/1/57 | | 3,000 | 3,051,960 |
| Muskingum County, OH, (Genesis HealthCare System Obligated Group), 5.00%, 2/15/48 | | 1,000 | 868,780 |
| New York Dormitory Authority, (Northwell Health Obligated Group), 5.00%, 5/1/52 | | 1,770 | 1,862,518 |
| Tarrant County Cultural Education Facilities Finance Corp., TX, (Cook Children's Medical Center), 5.25%, 12/1/39(2) | | 3,500 | 3,534,755 |
| | | | $ 17,509,328 |
| Housing — 1.5% |
| CSCDA Community Improvement Authority, CA, (City of Orange Portfolio), Essential Housing Revenue, Social Bonds, 3.00%, 3/1/57(1) | $ | 3,145 | $ 2,062,365 |
| Maryland Economic Development Corp., (Morgan State University), Student Housing Revenue, 5.00%, 7/1/50 | | 425 | 423,955 |
| New Mexico Mortgage Finance Authority, (FHLMC), (FNMA), (GNMA), 4.25%, 9/1/43 | | 1,000 | 1,002,810 |
| New York City Housing Development Corp., NY, 3.85%, 11/1/42 | | 1,000 | 924,650 |
| | | | $ 4,413,780 |
| Industrial Development Revenue — 8.8% |
| Henderson, KY, (Pratt Paper, LLC), (AMT), 4.70%, 1/1/52(1) | $ | 1,000 | $ 920,170 |
| Houston, TX, (United Airlines, Inc.), (AMT), 4.00%, 7/15/41 | | 2,980 | 2,536,010 |
| Maine Finance Authority, (Casella Waste Systems, Inc.), (AMT), 5.125% to 8/1/25 (Put Date), 8/1/35(1) | | 725 | 721,730 |
| National Finance Authority, NH, (Covanta): | | | |
| 4.625%, 11/1/42(1) | | 1,415 | 1,185,430 |
| (AMT), 4.875%, 11/1/42(1) | | 1,555 | 1,346,957 |
| New Hampshire Business Finance Authority, (Casella Waste Systems, Inc.), 2.95%, 4/1/29(1) | | 560 | 487,155 |
| New Jersey Economic Development Authority, (Continental Airlines): | | | |
| (AMT), 5.125%, 9/15/23 | | 170 | 170,031 |
| (AMT), 5.25%, 9/15/29 | | 1,900 | 1,903,572 |
| New York Liberty Development Corp., (Goldman Sachs Group, Inc.), 5.25%, 10/1/35 | | 2,560 | 2,947,046 |
| New York Transportation Development Corp., (Delta Air Lines, Inc. - LaGuardia Airport Terminals C&D Redevelopment): | | | |
| (AMT), 4.375%, 10/1/45 | | 1,500 | 1,406,190 |
| Security | Principal
Amount
(000's omitted) | Value |
| Industrial Development Revenue (continued) |
| New York Transportation Development Corp., (Delta Air Lines, Inc. - LaGuardia Airport Terminals C&D Redevelopment): (continued) | | | |
| (AMT), 5.00%, 10/1/40 | $ | 4,405 | $ 4,432,311 |
| Niagara Area Development Corp., NY, (Covanta), (AMT), 4.75%, 11/1/42(1) | | 2,000 | 1,703,960 |
| Phenix City Industrial Development Board, AL, (MeadWestvaco Coated Board), (AMT), 4.125%, 5/15/35 | | 3,935 | 3,855,788 |
| Rockdale County Development Authority, GA, (Pratt Paper, LLC), (AMT), 4.00%, 1/1/38(1) | | 1,445 | 1,332,406 |
| Vermont Economic Development Authority, (Casella Waste Systems, Inc.), (AMT), 4.625% to 4/3/28 (Put Date), 4/1/36(1) | | 145 | 139,644 |
| | | | $ 25,088,400 |
| Insured - Education — 1.9% |
| New York Dormitory Authority, (School Districts Financing Program), (BAM), 5.00%, 10/1/42(2) | $ | 5,000 | $ 5,546,300 |
| | | | $ 5,546,300 |
| Insured - Electric Utilities — 2.0% |
| Georgia Municipal Electric Authority, (Plant Vogtle Units 3 & 4 Project J), (AGM), 5.00%, 7/1/64 | $ | 1,875 | $ 1,950,825 |
| New York Power Authority, Green Transmission Revenue, (AGM), 4.00%, 11/15/47(2) | | 3,750 | 3,667,725 |
| | | | $ 5,618,550 |
| Insured - General Obligations — 1.0% |
| McHenry County Community Unit School District No. 12, IL, (AGM), 5.00%, 1/1/30 | $ | 2,910 | $ 2,955,454 |
| | | | $ 2,955,454 |
| Insured - Other Revenue — 1.3% |
| New York City Industrial Development Agency, NY, (Queens Baseball Stadium), (AGM), 3.00%, 1/1/46 | $ | 280 | $ 211,730 |
| Pennsylvania Economic Development Financing Authority, (PennDOT Major Bridges Package One), (AGM), (AMT), 5.00%, 12/31/57 | | 3,375 | 3,495,825 |
| | | | $ 3,707,555 |
| Insured - Special Tax Revenue — 5.5% |
| Metropolitan Pier and Exposition Authority, IL, (McCormick Place), (BAM), 4.00%, 12/15/42 | $ | 2,000 | $ 1,873,320 |
| Miami-Dade County, FL, Professional Sports Franchise Facilities: | | | |
| (AGC), 6.875%, 10/1/34 | | 4,000 | 4,997,800 |
| (AGC), 7.00%, 10/1/39 | | 6,000 | 7,423,680 |
| Tolomato Community Development District, FL: | | | |
| (AGM), 3.75%, 5/1/39 | | 720 | 702,295 |
| (AGM), 3.75%, 5/1/40 | | 855 | 819,124 |
| | | | $ 15,816,219 |
| Insured - Transportation — 8.0% |
| Chicago, IL, (O'Hare International Airport), (AGM), 5.50%, 1/1/43 | $ | 710 | $ 719,287 |
14
See Notes to Financial Statements.
Eaton Vance
National Municipal Opportunities Trust
March 31, 2023
Portfolio of Investments — continued
| Security | Principal
Amount
(000's omitted) | Value |
| Insured - Transportation (continued) |
| Metropolitan Transportation Authority, NY, Green Bonds, (AGM), 4.00%, 11/15/48 | $ | 6,225 | $ 5,915,804 |
| New York Thruway Authority, (AGM), 3.00%, 1/1/46 | | 4,895 | 3,845,757 |
| New York Transportation Development Corp., (LaGuardia Airport Terminal B Redevelopment): | | | |
| (AGM), (AMT), 4.00%, 7/1/35 | | 460 | 460,579 |
| (AGM), (AMT), 4.00%, 7/1/37 | | 1,295 | 1,275,575 |
| North Carolina Turnpike Authority, (Triangle Expressway System): | | | |
| (AGC), 0.00%, 1/1/35 | | 4,000 | 2,590,240 |
| (AGC), 0.00%, 1/1/36 | | 13,000 | 7,947,030 |
| | | | $ 22,754,272 |
| Lease Revenue/Certificates of Participation — 1.8% |
| Baltimore, MD, (Harbor Point), 4.875%, 6/1/42 | $ | 320 | $ 307,456 |
| New Jersey Economic Development Authority, (School Facilities Construction): | | | |
| 5.00%, 6/15/43 | | 465 | 486,730 |
| 5.00%, 6/15/44 | | 4,260 | 4,471,040 |
| | | | $ 5,265,226 |
| Other Revenue — 2.4% |
| Buckeye Tobacco Settlement Financing Authority, OH, 5.00%, 6/1/55 | $ | 3,240 | $ 2,938,000 |
| Golden State Tobacco Securitization Corp., CA, 5.00%, 6/1/51 | | 780 | 816,754 |
| Kalispel Tribe of Indians, WA, Series A, 5.25%, 1/1/38(1) | | 390 | 402,967 |
| Military Installation Development Authority, UT, 4.00%, 6/1/41 | | 500 | 398,280 |
| Morongo Band of Mission Indians, CA, 5.00%, 10/1/42(1) | | 605 | 602,828 |
| Salt Verde Financial Corp., AZ, Senior Gas Revenue, 5.00%, 12/1/37 | | 1,605 | 1,676,037 |
| | | | $ 6,834,866 |
| Senior Living/Life Care — 8.0% |
| Atlantic Beach, FL, (Fleet Landing), 5.00%, 11/15/37 | $ | 3,405 | $ 3,218,951 |
| Bexar County Health Facilities Development Corp., TX, (Army Retirement Residence Foundation): | | | |
| 5.00%, 7/15/37 | | 850 | 802,629 |
| 5.00%, 7/15/42 | | 700 | 639,996 |
| Clackamas County Hospital Facility Authority, OR, (Rose Villa), 5.25%, 11/15/50 | | 125 | 111,956 |
| Colorado Health Facilities Authority, (Aberdeen Ridge), 5.00%, 5/15/58 | | 1,110 | 825,618 |
| District of Columbia, (Ingleside at Rock Creek), 5.00%, 7/1/32 | | 185 | 181,367 |
| Harris County Cultural Education Facilities Finance Corp., TX, (Brazos Presbyterian Homes, Inc.): | | | |
| 5.75%, 1/1/28 | | 165 | 165,078 |
| 6.375%, 1/1/33 | | 30 | 30,024 |
| Iowa Finance Authority, (Lifespace Communities, Inc.), 4.125%, 5/15/38 | | 1,500 | 1,133,970 |
| Lee County Industrial Development Authority, FL, (Shell Point/Alliance Obligated Group), 5.00%, 11/15/39 | | 1,800 | 1,756,260 |
| Massachusetts Development Finance Agency, (Linden Ponds, Inc.): | | | |
| 5.00%, 11/15/33(1) | | 470 | 494,586 |
| 5.00%, 11/15/38(1) | | 310 | 318,736 |
| Security | Principal
Amount
(000's omitted) | Value |
| Senior Living/Life Care (continued) |
| Massachusetts Development Finance Agency, (NewBridge on the Charles, Inc.), 5.00%, 10/1/57(1) | $ | 1,650 | $ 1,537,486 |
| Multnomah County Hospital Facilities Authority, OR, (Mirabella at South Waterfront), 5.00%, 10/1/24 | | 360 | 359,640 |
| Multnomah County Hospital Facilities Authority, OR, (Terwilliger Plaza), 4.00%, 12/1/51 | | 1,480 | 1,032,404 |
| National Finance Authority, NH, (The Vista): | | | |
| 5.25%, 7/1/39(1) | | 265 | 242,472 |
| 5.625%, 7/1/46(1) | | 360 | 329,692 |
| 5.75%, 7/1/54(1) | | 780 | 710,783 |
| New Hope Cultural Education Facilities Finance Corp., TX, (Longhorn Village): | | | |
| 5.00%, 1/1/31 | | 1,235 | 1,210,078 |
| 5.00%, 1/1/32 | | 1,295 | 1,260,048 |
| New Mexico Hospital Equipment Loan Council, (Haverland Carter Lifestyle Group): | | | |
| 5.00%, 7/1/32 | | 80 | 74,811 |
| 5.00%, 7/1/33 | | 50 | 46,318 |
| 5.00%, 7/1/34 | | 55 | 50,460 |
| Palm Beach County Health Facilities Authority, FL, (Green Cay Life Plan Village), 11.50%, 7/1/27(1) | | 750 | 726,420 |
| Palm Beach County Health Facilities Authority, FL, (Toby & Leon Cooperman Sinai Residences of Boca Raton), 4.00%, 6/1/41 | | 780 | 628,118 |
| Public Finance Authority, WI, (Mary's Woods at Marylhurst), 5.25%, 5/15/37(1) | | 630 | 602,129 |
| South Carolina Jobs-Economic Development Authority, (Kiawah Life Plan Village, Inc.), 8.75%, 7/1/25(1) | | 100 | 107,017 |
| Tarrant County Cultural Education Facilities Finance Corp., TX, (MRC Stevenson Oaks), 6.625%, 11/15/41 | | 1,335 | 1,265,967 |
| Tempe Industrial Development Authority, AZ, (Mirabella at ASU), 6.00%, 10/1/37(1) | | 900 | 642,591 |
| Tulsa County Industrial Authority, OK, (Montereau, Inc.), 5.25%, 11/15/37 | | 1,000 | 1,008,490 |
| Washington Housing Finance Commission, (Bayview Manor Homes), 5.00%, 7/1/51(1) | | 1,335 | 1,032,195 |
| Washington Housing Finance Commission, (Transforming Age), 5.00%, 1/1/49(1) | | 305 | 229,339 |
| | | | $ 22,775,629 |
| Special Tax Revenue — 7.7% |
| Maryland Economic Development Corp., (Port Covington), 4.00%, 9/1/50 | $ | 140 | $ 114,540 |
| New York City Transitional Finance Authority, NY, Future Tax Revenue, (SPA: JPMorgan Chase Bank, N.A.), 3.65%, 8/1/39(3) | | 900 | 900,000 |
| New York Dormitory Authority, Sales Tax Revenue, 4.00%, 3/15/47 | | 4,000 | 3,941,520 |
| New York State Urban Development Corp., Personal Income Tax Revenue, 5.00%, 3/15/44(2) | | 6,900 | 7,477,047 |
| New York Thruway Authority, Personal Income Tax Revenue: | | | |
| 4.00%, 3/15/44 | | 1,000 | 988,190 |
| 5.00%, 3/15/48 | | 600 | 659,094 |
| Puerto Rico Sales Tax Financing Corp., 5.00%, 7/1/58 | | 4,015 | 3,790,842 |
| Tolomato Community Development District, FL, 3.25%, 5/1/40 | | 1,200 | 919,020 |
15
See Notes to Financial Statements.
Eaton Vance
National Municipal Opportunities Trust
March 31, 2023
Portfolio of Investments — continued
| Security | Principal
Amount
(000's omitted) | Value |
| Special Tax Revenue (continued) |
| Triborough Bridge and Tunnel Authority, NY, Green Bonds, 5.25%, 5/15/47(2) | $ | 2,125 | $ 2,395,534 |
| Triborough Bridge and Tunnel Authority, NY, Sales Tax Revenue, 4.00%, 5/15/48 | | 1,000 | 979,470 |
| | | | $ 22,165,257 |
| Student Loan — 0.5% |
| New Jersey Higher Education Student Assistance Authority, (AMT), 4.75%, 12/1/43 | $ | 1,445 | $ 1,435,246 |
| | | | $ 1,435,246 |
| Transportation — 21.7% |
| Chicago, IL, (O'Hare International Airport), (AMT), 5.50%, 1/1/55(2) | $ | 1,500 | $ 1,616,055 |
| Dallas and Fort Worth, TX, (Dallas/Fort Worth International Airport): | | | |
| 5.25%, 11/1/30 | | 1,125 | 1,139,861 |
| 5.25%, 11/1/31 | | 1,735 | 1,757,746 |
| Grand Parkway Transportation Corp., TX, 5.125%, 10/1/43 | | 875 | 878,124 |
| Houston, TX, (United Airlines, Inc.), (AMT), 5.00%, 7/1/29 | | 2,060 | 2,061,792 |
| Illinois Toll Highway Authority, 5.00%, 1/1/41(2) | | 5,575 | 5,788,578 |
| Metropolitan Transportation Authority, NY, Green Bonds, 5.25%, 11/15/55 | | 1,520 | 1,594,328 |
| Minneapolis-St. Paul Metropolitan Airports Commission, MN, 4.25%, 1/1/52 | | 1,000 | 1,000,100 |
| New Jersey Economic Development Authority, (Portal North Bridge), 5.00%, 11/1/52 | | 2,000 | 2,107,600 |
| New Jersey Economic Development Authority, (The Goethals Bridge Replacement), (AMT), 5.125%, 1/1/34 | | 1,250 | 1,260,850 |
| New Jersey Transportation Trust Fund Authority, (Transportation System), 0.00%, 12/15/38 | | 20,000 | 10,152,000 |
| New York Transportation Development Corp., (LaGuardia Airport Terminal B Redevelopment): | | | |
| (AMT), 5.00%, 12/1/39 | | 450 | 474,075 |
| (AMT), 5.25%, 1/1/50 | | 2,115 | 2,121,176 |
| New York Transportation Development Corp., (Terminal 4 John F. Kennedy International Airport), (AMT), 5.00%, 12/1/38 | | 1,950 | 2,065,284 |
| San Francisco City and County Airport Commission, CA, (San Francisco International Airport), (AMT), 5.00%, 5/1/49 | | 6,000 | 6,199,560 |
| South Jersey Transportation Authority, NJ, 5.25%, 11/1/52 | | 1,000 | 1,042,150 |
| Texas Private Activity Bond Surface Transportation Corp., (North Tarrant Express Managed Lanes Project), 5.00%, 12/31/35 | | 180 | 189,446 |
| Texas Transportation Commission, (Central Texas Turnpike System): | | | |
| 0.00%, 8/1/38 | | 850 | 392,471 |
| 5.00%, 8/15/42 | | 445 | 446,954 |
| Triborough Bridge and Tunnel Authority, NY: | | | |
| 4.00%, 5/15/46 | | 2,430 | 2,397,973 |
| 5.00%, 11/15/51(2) | | 8,800 | 9,464,840 |
| Virginia Small Business Financing Authority, (95 Express Lanes, LLC), (AMT), 4.00%, 1/1/39 | | 735 | 689,393 |
| Virginia Small Business Financing Authority, (Elizabeth River Crossings Opco, LLC): | | | |
| (AMT), 4.00%, 1/1/38 | | 1,000 | 961,450 |
| (AMT), 4.00%, 1/1/40 | | 1,000 | 940,830 |
| Security | Principal
Amount
(000's omitted) | Value |
| Transportation (continued) |
| Virginia Small Business Financing Authority, (Transform 66 P3): | | | |
| (AMT), 5.00%, 12/31/49 | $ | 4,365 | $ 4,320,171 |
| (AMT), 5.00%, 12/31/52 | | 1,000 | 984,690 |
| | | | $ 62,047,497 |
| Water and Sewer — 3.2% |
| Michigan Finance Authority, (Detroit Water and Sewerage Department), 5.00%, 7/1/34 | $ | 2,070 | $ 2,110,986 |
| Texas Water Development Board: | | | |
| 4.80%, 10/15/52 | | 1,500 | 1,598,235 |
| 5.00%, 10/15/47(2) | | 5,000 | 5,566,300 |
| | | | $ 9,275,521 |
Total Tax-Exempt Municipal Obligations
(identified cost $293,078,898) | | | $299,034,532 |
| Taxable Municipal Obligations — 5.4% |
| Security | Principal
Amount
(000's omitted) | Value |
| General Obligations — 1.2% |
| Chicago, IL: | | | |
| 7.375%, 1/1/33 | $ | 1,750 | $ 1,903,090 |
| 7.781%, 1/1/35 | | 1,400 | 1,589,294 |
| | | | $ 3,492,384 |
| Hospital — 1.4% |
| California Statewide Communities Development Authority, (Loma Linda University Medical Center), 6.00%, 12/1/24 | $ | 4,000 | $ 4,059,680 |
| | | | $ 4,059,680 |
| Industrial Development Revenue — 0.7% |
| Louisiana Local Government Environmental Facilities and Community Development Authority, (Louisiana Utilities Restoration Corp./ELL), 5.081%, 6/1/31 | $ | 1,795 | $ 1,810,904 |
| | | | $ 1,810,904 |
| Insured - Education — 0.4% |
| Onondaga Civic Development Corp., NY, (Upstate Properties Development, Inc.), (BAM), 3.158%, 12/1/41 | $ | 1,610 | $ 1,208,337 |
| | | | $ 1,208,337 |
| Insured - Housing — 0.4% |
| Oregon Facilities Authority, (CHF-Ashland, LLC - Southern Oregon University), (AGM), 3.508%, 7/1/41 | $ | 1,500 | $ 1,202,220 |
| | | | $ 1,202,220 |
16
See Notes to Financial Statements.
Eaton Vance
National Municipal Opportunities Trust
March 31, 2023
Portfolio of Investments — continued
| Security | Principal
Amount
(000's omitted) | Value |
| Insured - Special Tax Revenue — 0.3% |
| Houston Uptown Development Authority, TX, Tax Increment Contract Revenue, (AGM), 3.464%, 9/1/40 | $ | 1,160 | $ 913,141 |
| | | | $ 913,141 |
| Special Tax Revenue — 0.5% |
| American Samoa Economic Development Authority: | | | |
| 2.47%, 9/1/24(1) | $ | 475 | $ 454,580 |
| 3.72%, 9/1/27(1) | | 1,115 | 1,007,102 |
| | | | $ 1,461,682 |
| Transportation — 0.5% |
| Maryland Economic Development Corp., (Seagirt Marine Terminal), 4.75%, 6/1/42 | $ | 1,500 | $ 1,263,225 |
| | | | $ 1,263,225 |
Total Taxable Municipal Obligations
(identified cost $16,872,788) | | | $ 15,411,573 |
Total Investments — 112.6%
(identified cost $319,118,637) | | | $322,403,206 |
| Other Assets, Less Liabilities — (12.6)% | | | $(36,195,547) |
| Net Assets — 100.0% | | | $286,207,659 |
| The percentage shown for each investment category in the Portfolio of Investments is based on net assets. |
| (1) | Security exempt from registration under Rule 144A of the Securities Act of 1933, as amended. These securities may be sold in certain transactions in reliance on an exemption from registration (normally to qualified institutional buyers). At March 31, 2023, the aggregate value of these securities is $27,440,821 or 9.6% of the Trust's net assets. |
| (2) | Security represents the municipal bond held by a trust that issues residual interest bonds (see Note 1G). |
| (3) | Variable rate demand obligation that may be tendered at par on any day for payment the same or next business day. The stated interest rate, which generally resets daily, is determined by the remarketing agent and represents the rate in effect at March 31, 2023. |
| At March 31, 2023, the concentration of the Trust’s investments in the various states and territories, determined as a percentage of total investments, is as follows: |
| New York | 22.6% |
| Illinois | 14.2% |
| Texas | 10.6% |
| Others, representing less than 10% individually | 50.1% |
| The Trust invests primarily in debt securities issued by municipalities. The ability of the issuers of the debt securities to meet their obligations may be affected by economic developments in a specific industry or municipality. At March 31, 2023, 19.0% of total investments are backed by bond insurance of various financial institutions and financial guaranty assurance agencies. The aggregate percentage insured by an individual financial institution or financial guaranty assurance agency ranged from 2.7% to 9.2% of total investments. |
| Abbreviations: |
| AGC | – Assured Guaranty Corp. |
| AGM | – Assured Guaranty Municipal Corp. |
| AMT | – Interest earned from these securities may be considered a tax preference item for purposes of the Federal Alternative Minimum Tax. |
| BAM | – Build America Mutual Assurance Co. |
| FHLMC | – Federal Home Loan Mortgage Corp. |
| FNMA | – Federal National Mortgage Association |
| GNMA | – Government National Mortgage Association |
| PSF | – Permanent School Fund |
| SPA | – Standby Bond Purchase Agreement |
17
See Notes to Financial Statements.
National Municipal Opportunities Trust
March 31, 2023
Statement of Assets and Liabilities
| | March 31, 2023 |
| Assets | |
| Investments, at value (identified cost $319,118,637) | $322,403,206 |
| Interest receivable | 4,564,021 |
| Receivable for investments sold | 320,634 |
| Total assets | $327,287,861 |
| Liabilities | |
| Payable for floating rate notes issued | $39,552,412 |
| Due to custodian | 898,265 |
| Payable to affiliate: | |
| Investment adviser and administrative fee | 164,212 |
| Interest expense and fees payable | 303,760 |
| Accrued expenses | 161,553 |
| Total liabilities | $41,080,202 |
| Net Assets | $286,207,659 |
| Sources of Net Assets | |
| Common shares, $0.01 par value, unlimited number of shares authorized | $156,249 |
| Additional paid-in capital | 298,400,478 |
| Accumulated loss | (12,349,068) |
| Net Assets | $286,207,659 |
| Common Shares Issued and Outstanding | 15,624,921 |
| Net Asset Value Per Common Share | |
| Net assets ÷ common shares issued and outstanding | $18.32 |
18
See Notes to Financial Statements.
Eaton Vance
National Municipal Opportunities Trust
March 31, 2023
| | Year Ended |
| | March 31, 2023 |
| Investment Income | |
| Interest income | $14,435,902 |
| Total investment income | $14,435,902 |
| Expenses | |
| Investment adviser and administrative fee | $1,937,922 |
| Trustees’ fees and expenses | 23,225 |
| Custodian fee | 69,455 |
| Transfer and dividend disbursing agent fees | 18,015 |
| Legal and accounting services | 76,875 |
| Printing and postage | 49,787 |
| Interest expense and fees | 906,777 |
| Miscellaneous | 65,618 |
| Total expenses | $3,147,674 |
| Net investment income | $11,288,228 |
| Realized and Unrealized Gain (Loss) | |
| Net realized gain (loss): | |
| Investment transactions | $(12,891,702) |
| Net realized loss | $(12,891,702) |
| Change in unrealized appreciation (depreciation): | |
| Investments | $(14,102,309) |
| Net change in unrealized appreciation (depreciation) | $(14,102,309) |
| Net realized and unrealized loss | $(26,994,011) |
| Net decrease in net assets from operations | $(15,705,783) |
19
See Notes to Financial Statements.
Eaton Vance
National Municipal Opportunities Trust
March 31, 2023
Statements of Changes in Net Assets
| | Year Ended March 31, |
| | 2023 | 2022 |
| Increase (Decrease) in Net Assets | | |
| From operations: | | |
| Net investment income | $11,288,228 | $11,362,408 |
| Net realized loss | (12,891,702) | (263,133) |
| Net change in unrealized appreciation (depreciation) | (14,102,309) | (25,612,627) |
| Net decrease in net assets from operations | $(15,705,783) | $(14,513,352) |
| Distributions to shareholders | $(11,718,624) | $(11,678,281) |
| Capital share transactions: | | |
| Proceeds from shelf offering, net of offering costs (see Note 5) | $— | $6,535,543 |
| Reinvestment of distributions | 6,744 | 103,211 |
| Net increase in net assets from capital share transactions | $6,744 | $6,638,754 |
| Net decrease in net assets | $(27,417,663) | $(19,552,879) |
| Net Assets | | |
| At beginning of year | $313,625,322 | $333,178,201 |
| At end of year | $286,207,659 | $313,625,322 |
See Notes to Financial Statements.
Eaton Vance
National Municipal Opportunities Trust
March 31, 2023
| | Year Ended |
| | March 31, 2023 |
| Cash Flows From Operating Activities | |
| Net decrease in net assets from operations | $(15,705,783) |
| Adjustments to reconcile net decrease in net assets from operations to net cash used in operating activities: | |
| Investments purchased | (171,208,284) |
| Investments sold | 144,043,159 |
| Net amortization/accretion of premium (discount) | (232,683) |
| Increase in interest receivable | (486,987) |
| Decrease in payable to affiliate for investment adviser and administrative fee | (9,111) |
| Increase in interest expense and fees payable | 260,968 |
| Increase in accrued expenses | 44,089 |
| Net change in unrealized appreciation (depreciation) from investments | 14,102,309 |
| Net realized loss from investments | 12,891,702 |
| Net cash used in operating activities | $(16,300,621) |
| Cash Flows From Financing Activities | |
| Cash distributions paid | $(11,711,880) |
| Proceeds from secured borrowings | 36,360,000 |
| Repayment of secured borrowings | (16,550,000) |
| Increase in due to custodian | 898,265 |
| Net cash provided by financing activities | $8,996,385 |
| Net decrease in cash | $(7,304,236) |
| Cash at beginning of year | $7,304,236 |
| Cash at end of year | $— |
| Supplemental disclosure of cash flow information: | |
| Noncash financing activities not included herein consist of: | |
| Reinvestment of dividends and distributions | $6,744 |
| Cash paid for interest and fees on borrowings | 645,809 |
21
See Notes to Financial Statements.
National Municipal Opportunities Trust
March 31, 2023
| | Year Ended March 31, |
| | 2023 | 2022 | 2021 | 2020 | 2019 |
| Net asset value — Beginning of year | $20.070 | $21.730 | $20.530 | $21.090 | $21.320 |
| Income (Loss) From Operations | | | | | |
| Net investment income(1) | $0.722 | $0.733 | $0.780 | $0.835 | $0.955 |
| Net realized and unrealized gain (loss) | (1.722) | (1.652) | 1.183 | (0.412) | (0.057) |
| Total income (loss) from operations | $(1.000) | $(0.919) | $1.963 | $0.423 | $0.898 |
| Less Distributions | | | | | |
| From net investment income | $(0.750) | $(0.753) | $(0.764) | $(0.841) | $(1.021) |
| From net realized gain | — | — | — | (0.078) | (0.107) |
| Tax return of capital | — | — | — | (0.065) | — |
| Total distributions | $(0.750) | $(0.753) | $(0.764) | $(0.984) | $(1.128) |
| Premium from common shares sold through shelf offering (see Note 5)(1) | $— | $0.012 | $0.001 | $0.001 | $— |
| Net asset value — End of year | $18.320 | $20.070 | $21.730 | $20.530 | $21.090 |
| Market value — End of year | $17.670 | $19.050 | $22.500 | $19.500 | $21.120 |
| Total Investment Return on Net Asset Value(2) | (4.73)% | (4.36)% | 9.87% | 1.90% | 4.54% |
| Total Investment Return on Market Value(2) | (3.19)% | (12.33)% | 19.77% | (3.35)% | 7.98% |
| Ratios/Supplemental Data | | | | | |
| Net assets, end of year (000’s omitted) | $286,208 | $313,625 | $333,178 | $314,321 | $321,241 |
| Ratios (as a percentage of average daily net assets): | | | | | |
| Expenses excluding interest and fees | 0.77% | 0.73% | 0.73% | 0.75% | 0.76% |
| Interest and fee expense(3) | 0.32% | 0.06% | 0.05% | 0.17% | 0.22% |
| Total expenses | 1.09% | 0.79% | 0.78% | 0.92% | 0.98% |
| Net investment income | 3.92% | 3.35% | 3.67% | 3.88% | 4.55% |
| Portfolio Turnover | 45% | 13% | 13% | 44% | 17% |
| (1) | Computed using average shares outstanding. |
| (2) | Returns are historical and are calculated by determining the percentage change in net asset value or market value with all distributions reinvested. Distributions are assumed to be reinvested at prices obtained under the Trust’s dividend reinvestment plan. |
| (3) | Interest and fee expense relates to the liability for floating rate notes issued in conjunction with residual interest bond transactions (see Note 1G). |
22
See Notes to Financial Statements.
Eaton Vance
National Municipal Opportunities Trust
March 31, 2023
Notes to Financial Statements
1 Significant Accounting Policies
Eaton Vance National Municipal Opportunities Trust (the Trust) is a Massachusetts business trust registered under the Investment Company Act of 1940, as amended (the 1940 Act), as a diversified, closed-end management investment company. The Trust’s primary investment objective is to provide current income exempt from regular federal income tax. The Trust will, as a secondary investment objective, seek to achieve capital appreciation.
The following is a summary of significant accounting policies of the Trust. The policies are in conformity with accounting principles generally accepted in the United States of America (U.S. GAAP). The Trust is an investment company and follows accounting and reporting guidance in the Financial Accounting Standards Board (FASB) Accounting Standards Codification Topic 946.
A Investment Valuation—The following methodologies are used to determine the market value or fair value of investments.
Debt Obligations. Debt obligations are generally valued on the basis of valuations provided by third party pricing services, as derived from such services’ pricing models. Inputs to the models may include, but are not limited to, reported trades, executable bid and ask prices, broker/dealer quotations, prices or yields of securities with similar characteristics, interest rates, anticipated prepayments, benchmark curves or information pertaining to the issuer, as well as industry and economic events. The pricing services may use a matrix approach, which considers information regarding securities with similar characteristics to determine the valuation for a security. Short-term debt obligations purchased with a remaining maturity of sixty days or less for which a valuation from a third party pricing service is not readily available may be valued at amortized cost, which approximates fair value.
Fair Valuation. In connection with Rule 2a-5 of the 1940 Act, the Trustees have designated the Trust’s investment adviser as its valuation designee. Investments for which valuations or market quotations are not readily available or are deemed unreliable are valued by the investment adviser, as valuation designee, at fair value using methods that most fairly reflect the security’s “fair value”, which is the amount that the Trust might reasonably expect to receive for the security upon its current sale in the ordinary course. Each such determination is based on a consideration of relevant factors, which are likely to vary from one pricing context to another. These factors may include, but are not limited to, the type of security, the existence of any contractual restrictions on the security’s disposition, the price and extent of public trading in similar securities of the issuer or of comparable companies or entities, quotations or relevant information obtained from broker/dealers or other market participants, information obtained from the issuer, analysts, and/or the appropriate stock exchange (for exchange-traded securities), an analysis of the company's or entity’s financial statements, and an evaluation of the forces that influence the issuer and the market(s) in which the security is purchased and sold.
B Investment Transactions and Related Income—Investment transactions for financial statement purposes are accounted for on a trade date basis. Realized gains and losses on investments sold are determined on the basis of identified cost. Interest income is recorded on the basis of interest accrued, adjusted for amortization of premium or accretion of discount.
C Federal Taxes—The Trust’s policy is to comply with the provisions of the Internal Revenue Code applicable to regulated investment companies and to distribute to shareholders each year substantially all of its taxable, if any, and tax-exempt net investment income, and all or substantially all of its net realized capital gains. Accordingly, no provision for federal income or excise tax is necessary. The Trust intends to satisfy conditions which will enable it to designate distributions from the interest income generated by its investments in non-taxable municipal securities, which are exempt from regular federal income tax when received by the Trust, as exempt-interest dividends. The portion of such interest, if any, earned on private activity bonds issued after August 7, 1986, may be considered a tax preference item to shareholders.
As of March 31, 2023, the Trust had no uncertain tax positions that would require financial statement recognition, de-recognition, or disclosure. The Trust files a U.S. federal income tax return annually after its fiscal year-end, which is subject to examination by the Internal Revenue Service for a period of three years from the date of filing.
D Legal Fees— Legal fees and other related expenses incurred as part of negotiations of the terms and requirement of capital infusions, or that are expected to result in the restructuring of, or a plan of reorganization for, an investment are recorded as realized losses. Ongoing expenditures to protect or enhance an investment are treated as operating expenses.
E Use of Estimates—The preparation of the financial statements in conformity with U.S. GAAP requires management to make estimates and assumptions that affect the reported amounts of assets and liabilities at the date of the financial statements and the reported amounts of income and expense during the reporting period. Actual results could differ from those estimates.
F Indemnifications—Under the Trust's organizational documents, its officers and Trustees may be indemnified against certain liabilities and expenses arising out of the performance of their duties to the Trust. Under Massachusetts law, if certain conditions prevail, shareholders of a Massachusetts business trust (such as the Trust) could be deemed to have personal liability for the obligations of the Trust. However, the Trust’s Declaration of Trust contains an express disclaimer of liability on the part of Trust shareholders and the By-laws provide that the Trust shall assume, upon request by the shareholder, the defense on behalf of any Trust shareholders. Moreover, the By-laws also provide for indemnification out of Trust property of any shareholder held personally liable solely by reason of being or having been a shareholder for all loss or expense arising from such liability. Additionally, in the normal course of business, the Trust enters into agreements with service providers that may contain indemnification clauses. The Trust’s maximum exposure under these arrangements is unknown as this would involve future claims that may be made against the Trust that have not yet occurred.
Eaton Vance
National Municipal Opportunities Trust
March 31, 2023
Notes to Financial Statements — continued
G Floating Rate Notes Issued in Conjunction with Securities Held—The Trust may invest in residual interest bonds, also referred to as inverse floating rate securities, whereby the Trust may sell a variable or fixed rate bond for cash to a Special-Purpose Vehicle (the SPV), (which is generally organized as a trust), while at the same time, buying a residual interest in the assets and cash flows of the SPV. The bond is deposited into the SPV with the same CUSIP number as the bond sold to the SPV by the Trust, and which may have been, but is not required to be, the bond purchased from the Trust (the Bond).The SPV also issues floating rate notes (Floating Rate Notes) which are sold to third-parties. The residual interest bond held by the Trust gives the Trust the right (1) to cause the holders of the Floating Rate Notes to generally tender their notes at par, and (2) to have the Bond held by the SPV transferred to the Trust, thereby terminating the SPV. Should the Trust exercise such right, it would generally pay the SPV the par amount due on the Floating Rate Notes and exchange the residual interest bond for the underlying Bond. Pursuant to generally accepted accounting principles for transfers and servicing of financial assets and extinguishment of liabilities, the Trust accounts for the transaction described above as a secured borrowing by including the Bond in its Portfolio of Investments and the Floating Rate Notes as a liability under the caption “Payable for floating rate notes issued” in its Statement of Assets and Liabilities. The Floating Rate Notes have interest rates that generally reset weekly and their holders have the option to tender their notes to the SPV for redemption at par at each reset date. Accordingly, the fair value of the payable for floating rate notes issued approximates its carrying value. If measured at fair value, the payable for floating rate notes would have been considered as Level 2 in the fair value hierarchy (see Note 6) at March 31, 2023. Interest expense related to the Trust’s liability with respect to Floating Rate Notes is recorded as incurred. The SPV may be terminated by the Trust, as noted above, or by the occurrence of certain termination events as defined in the trust agreement, such as a downgrade in the credit quality of the underlying Bond, bankruptcy of or payment failure by the issuer of the underlying Bond, the inability to remarket Floating Rate Notes that have been tendered due to insufficient buyers in the market, or the failure by the SPV to obtain renewal of the liquidity agreement under which liquidity support is provided for the Floating Rate Notes up to one year. At March 31, 2023, the amount of the Trust’s Floating Rate Notes outstanding and the related collateral were $39,552,412 and $53,899,174, respectively. The range of interest rates on the Floating Rate Notes outstanding at March 31, 2023 was 4.0% to 4.3%. For the year ended March 31, 2023, the Trust’s average settled Floating Rate Notes outstanding and the average interest rate including fees were $35,904,616 and 2.53%, respectively.
In certain circumstances, the Trust may enter into shortfall and forbearance agreements with brokers by which the Trust agrees to reimburse the broker for the difference between the liquidation value of the Bond held by the SPV and the liquidation value of the Floating Rate Notes, as well as any shortfalls in interest cash flows. The Trust had no shortfalls as of March 31, 2023.
The Trust may also purchase residual interest bonds in a secondary market transaction without first owning the underlying bond. Such transactions are not required to be treated as secured borrowings. Shortfall agreements, if any, related to residual interest bonds purchased in a secondary market transaction are disclosed in the Portfolio of Investments.
The Trust’s investment policies and restrictions expressly permit investments in residual interest bonds. Such bonds typically offer the potential for yields exceeding the yields available on fixed rate bonds with comparable credit quality and maturity. These securities tend to underperform the market for fixed rate bonds in a rising long-term interest rate environment, but tend to outperform the market for fixed rate bonds when long-term interest rates decline. The value and income of residual interest bonds are generally more volatile than that of a fixed rate bond. The Trust’s investment policies do not allow the Trust to borrow money except as permitted by the 1940 Act. Effective August 19, 2022, the Trust began operating under Rule 18f-4 under the 1940 Act, which, among other things, governs the use of derivative investments and certain financing transactions by registered investment companies. As of the date of this report, consistent with Rule 18f-4, the Trust has elected to comply with the asset coverage requirements of Section 18 with respect to its investments in residual interest bonds (as opposed to treating such interests as derivatives transactions). The Trust may change this election (and elect to treat these investments and other similar financing transactions as derivatives transactions) at any time. Residual interest bonds held by the Trust are securities exempt from registration under Rule 144A of the Securities Act of 1933.
H When-Issued Securities and Delayed Delivery Transactions—The Trust may purchase securities on a delayed delivery or when-issued basis. Payment and delivery may take place after the customary settlement period for that security. At the time the transaction is negotiated, the price of the security that will be delivered is fixed. The Trust maintains cash and/or security positions for these commitments such that sufficient liquid assets will be available to make payments upon settlement. Securities purchased on a delayed delivery or when-issued basis are marked-to-market daily and begin earning interest on settlement date. Such security purchases are subject to the risk that when delivered they will be worth less than the agreed upon payment price. Losses may also arise if the counterparty does not perform under the contract.
2 Distributions to Shareholders and Income Tax Information
The Trust intends to make monthly distributions of net investment income to common shareholders. In addition, at least annually, the Trust intends to distribute all or substantially all of its net realized capital gains. Distributions are recorded on the ex-dividend date. Distributions to shareholders are determined in accordance with income tax regulations, which may differ from U.S. GAAP. As required by U.S. GAAP, only distributions in excess of tax basis earnings and profits are reported in the financial statements as a return of capital. Permanent differences between book and tax accounting relating to distributions are reclassified to paid-in capital. For tax purposes, distributions from short-term capital gains are considered to be from ordinary income.
Eaton Vance
National Municipal Opportunities Trust
March 31, 2023
Notes to Financial Statements — continued
The tax character of distributions declared for the years ended March 31, 2023 and March 31, 2022 was as follows:
| | Year Ended March 31, |
| | 2023 | 2022 |
| Tax-exempt income | $10,631,824 | $8,951,900 |
| Ordinary income | $1,086,800 | $2,726,381 |
As of March 31, 2023, the components of distributable earnings (accumulated loss) on a tax basis were as follows:
| Undistributed tax-exempt income | $ 610,428 |
| Deferred capital losses | (17,103,043) |
| Net unrealized appreciation | 4,143,547 |
| Accumulated loss | $(12,349,068) |
At March 31, 2023, the Trust, for federal income tax purposes, had deferred capital losses of $17,103,043 which would reduce its taxable income arising from future net realized gains on investment transactions, if any, to the extent permitted by the Internal Revenue Code, and thus would reduce the amount of distributions to shareholders, which would otherwise be necessary to relieve the Trust of any liability for federal income or excise tax. The deferred capital losses are treated as arising on the first day of the Trust’s next taxable year and retain the same short-term or long-term character as when originally deferred. Of the deferred capital losses at March 31, 2023, $7,880,272 are short-term and $9,222,771 are long-term.
The cost and unrealized appreciation (depreciation) of investments of the Trust at March 31, 2023, as determined on a federal income tax basis, were as follows:
| Aggregate cost | $278,707,247 |
| Gross unrealized appreciation | $15,788,096 |
| Gross unrealized depreciation | (11,644,549) |
| Net unrealized appreciation | $4,143,547 |
3 Investment Adviser and Administrative Fee and Other Transactions with Affiliates
The investment adviser and administrative fee is earned by Eaton Vance Management (EVM), an indirect, wholly-owned subsidiary of Morgan Stanley, as compensation for investment advisory and administrative services rendered to the Trust. The fee is computed at an annual rate as a percentage of the Trust’s average daily gross assets as follows and is payable monthly:
| Average Daily Gross Assets | Annual Fee Rate |
| Up to and including $1.5 billion | 0.60% |
| Over $1.5 billion | 0.59% |
Gross assets, as defined in the Trust’s investment advisory and administrative agreement with EVM, means total assets of the Trust, including any form of investment leverage, minus all accrued expenses incurred in the normal course of operations, but not excluding any liabilities or obligations attributable to investment leverage obtained through (i) indebtedness of any type (including, without limitation, borrowing through a credit facility or the issuance of debt securities), (ii) the issuance of preferred stock or other similar preference securities, (iii) the reinvestment of collateral received for securities loaned in accordance with the Trust’s investment objectives and policies, and/or (iv) any other means. For purposes of this calculation, gross assets represent net assets plus the amount payable by the Trust to floating-rate note holders. For the year ended March 31, 2023, the investment adviser and administrative fee incurred by the Trust and the effective annual rate, as a percentage of average daily gross assets, were $1,937,922 and 0.60%, respectively.
Eaton Vance
National Municipal Opportunities Trust
March 31, 2023
Notes to Financial Statements — continued
Trustees and officers of the Trust who are members of EVM’s organization receive remuneration for their services to the Trust out of the investment adviser and administrative fee. Trustees of the Trust who are not affiliated with the investment adviser may elect to defer receipt of all or a percentage of their annual fees in accordance with the terms of the Trustees Deferred Compensation Plan. For the year ended March 31, 2023, no significant amounts have been deferred. Certain officers and Trustees of the Trust are officers of EVM.
4 Purchases and Sales of Investments
Purchases and sales of investments, other than short-term obligations, aggregated $163,594,900 and $143,167,524, respectively, for the year ended March 31, 2023.
5 Common Shares of Beneficial Interest and Shelf Offering
Common shares issued by the Trust pursuant to its dividend reinvestment plan for the years ended March 31, 2023 and March 31, 2022 were 357 and 4,653, respectively.
In November 2013, the Board of Trustees initially approved a share repurchase program for the Trust. Pursuant to the reauthorization of the share repurchase program by the Board of Trustees in March 2019, the Trust is authorized to repurchase up to 10% of its common shares outstanding as of the last day of the prior calendar year at market prices when shares are trading at a discount to net asset value. The share repurchase program does not obligate the Trust to purchase a specific amount of shares. There were no repurchases of common shares by the Trust for the years ended March 31, 2023 and March 31, 2022.
Pursuant to a registration statement filed with the SEC, the Trust is authorized to issue up to an additional 1,908,750 common shares through an equity shelf offering program (the "shelf offering"). Under the shelf offering, the Trust, subject to market conditions, may raise additional capital from time to time and in varying amounts and offering methods at a net price at or above the Trust’s net asset value per common share. During the year ended March 31, 2023, there were no shares sold by the Trust pursuant to its shelf offering. During the year ended March 31, 2022, the Trust sold 287,223 common shares and received proceeds (net of offering costs) of $6,535,543 through its shelf offering. The net proceeds in excess of the net asset value of the shares sold were $180,791 for the year ended March 31, 2022. Offering costs (other than the applicable sales commissions) incurred in connection with the shelf offering were borne directly by EVM. Eaton Vance Distributors, Inc. (EVD), an affiliate of EVM, is the distributor of the Trust's shares and is entitled to receive a sales commission from the Trust of 1.00% of the gross sales price per share, a portion of which is re-allowed to sales agents. The Trust was informed that the sales commissions retained by EVD during the year ended March 31, 2022 were $13,203.
6 Fair Value Measurements
Under generally accepted accounting principles for fair value measurements, a three-tier hierarchy to prioritize the assumptions, referred to as inputs, is used in valuation techniques to measure fair value. The three-tier hierarchy of inputs is summarized in the three broad levels listed below.
| • | Level 1 – quoted prices in active markets for identical investments |
| • | Level 2 – other significant observable inputs (including quoted prices for similar investments, interest rates, prepayment speeds, credit risk, etc.) |
| • | Level 3 – significant unobservable inputs (including a fund's own assumptions in determining the fair value of investments) |
In cases where the inputs used to measure fair value fall in different levels of the fair value hierarchy, the level disclosed is determined based on the lowest level input that is significant to the fair value measurement in its entirety. The inputs or methodology used for valuing securities are not necessarily an indication of the risk associated with investing in those securities.
At March 31, 2023, the hierarchy of inputs used in valuing the Trust's investments, which are carried at value, were as follows:
| Asset Description | Level 1 | Level 2 | Level 3 | Total |
| Corporate Bonds | $ — | $7,957,101 | $ — | $7,957,101 |
| Tax-Exempt Municipal Obligations | — | 299,034,532 | — | 299,034,532 |
| Taxable Municipal Obligations | — | 15,411,573 | — | 15,411,573 |
| Total Investments | $ — | $322,403,206 | $ — | $322,403,206 |
Eaton Vance
National Municipal Opportunities Trust
March 31, 2023
Notes to Financial Statements — continued
7 Risks and Uncertainties
Pandemic Risk
An outbreak of respiratory disease caused by a novel coronavirus was first detected in China in late 2019 and subsequently spread internationally. This coronavirus has resulted in closing borders, enhanced health screenings, changes to healthcare service preparation and delivery, quarantines, cancellations, disruptions to supply chains and customer activity, as well as general concern and uncertainty. Health crises caused by outbreaks of disease, such as the coronavirus outbreak, may exacerbate other pre-existing political, social and economic risks and disrupt normal market conditions and operations. The impact of this outbreak has negatively affected the worldwide economy, as well as the economies of individual countries and industries, and could continue to affect the market in significant and unforeseen ways. Other epidemics and pandemics that may arise in the future may have similar effects. Any such impact could adversely affect the Trust's performance, or the performance of the securities in which the Trust invests.
Eaton Vance
National Municipal Opportunities Trust
March 31, 2023
Report of Independent Registered Public Accounting Firm
To the Trustees and Shareholders of Eaton Vance National Municipal Opportunities Trust:
Opinion on the Financial Statements and Financial Highlights
We have audited the accompanying statement of assets and liabilities of Eaton Vance National Municipal Opportunities Trust (the “Trust”), including the portfolio of investments, as of March 31, 2023, the related statements of operations and cash flows for the year then ended, the statements of changes in net assets for each of the two years in the period then ended, the financial highlights for each of the five years in the period then ended, and the related notes. In our opinion, the financial statements and financial highlights present fairly, in all material respects, the financial position of the Trust as of March 31, 2023, and the results of its operations and its cash flows for the year then ended, the changes in its net assets for each of the two years in the period then ended, and the financial highlights for each of the five years in the period then ended, in conformity with accounting principles generally accepted in the United States of America.
Basis for Opinion
These financial statements and financial highlights are the responsibility of the Trust’s management. Our responsibility is to express an opinion on the Trust's financial statements and financial highlights based on our audits. We are a public accounting firm registered with the Public Company Accounting Oversight Board (United States) (PCAOB) and are required to be independent with respect to the Trust in accordance with the U.S. federal securities laws and the applicable rules and regulations of the Securities and Exchange Commission and the PCAOB.
We conducted our audits in accordance with the standards of the PCAOB. Those standards require that we plan and perform the audit to obtain reasonable assurance about whether the financial statements and financial highlights are free of material misstatement, whether due to error or fraud. The Trust is not required to have, nor were we engaged to perform, an audit of its internal control over financial reporting. As part of our audits, we are required to obtain an understanding of internal control over financial reporting but not for the purpose of expressing an opinion on the effectiveness of the Trust’s internal control over financial reporting. Accordingly, we express no such opinion.
Our audits included performing procedures to assess the risks of material misstatement of the financial statements and financial highlights, whether due to error or fraud, and performing procedures that respond to those risks. Such procedures included examining, on a test basis, evidence regarding the amounts and disclosures in the financial statements and financial highlights. Our audits also included evaluating the accounting principles used and significant estimates made by management, as well as evaluating the overall presentation of the financial statements and financial highlights. Our procedures included confirmation of securities owned as of March 31, 2023, by correspondence with the custodian and brokers; when replies were not received from brokers, we performed other auditing procedures. We believe that our audits provide a reasonable basis for our opinion.
/s/ Deloitte & Touche LLP
Boston, Massachusetts
May 18, 2023
We have served as the auditor of one or more Eaton Vance investment companies since 1959.
Eaton Vance
National Municipal Opportunities Trust
March 31, 2023
Federal Tax Information (Unaudited)
The Form 1099-DIV you receive in February 2024 will show the tax status of all distributions paid to your account in calendar year 2023. Shareholders are advised to consult their own tax adviser with respect to the tax consequences of their investment in the Trust. As required by the Internal Revenue Code and/or regulations, shareholders must be notified regarding exempt-interest dividends.
Exempt-Interest Dividends. For the fiscal year ended March 31, 2023, the Trust designates 90.73% of distributions from net investment income as an exempt-interest dividend.
Eaton Vance
National Municipal Opportunities Trust
March 31, 2023
Annual Meeting of Shareholders (Unaudited)
The Trust held its Annual Meeting of Shareholders on January 12, 2023. The following action was taken by the shareholders:
Proposal 1(b): The election of Cynthia E. Frost, Keith Quinton, Susan J. Sutherland and Nancy A. Wiser as Class II Trustees of the Trust for a three-year term expiring in 2026.
| | | | Number of Shares |
| Nominees for Trustee | | | For | Withheld |
| Cynthia E. Frost | | | 13,973,134 | 602,816 |
| Keith Quinton | | | 13,907,992 | 667,958 |
| Susan J. Sutherland | | | 13,983,814 | 592,136 |
| Nancy A. Wiser | | | 13,890,630 | 685,320 |
Eaton Vance
National Municipal Opportunities Trust
March 31, 2023
Dividend Reinvestment Plan
The Trust offers a dividend reinvestment plan (Plan) pursuant to which shareholders automatically have distributions reinvested in common shares (Shares) of the Trust unless they elect otherwise through their investment dealer. On the distribution payment date, if the NAV per Share is equal to or less than the market price per Share plus estimated brokerage commissions, then new Shares will be issued. The number of Shares shall be determined by the greater of the NAV per Share or 95% of the market price. Otherwise, Shares generally will be purchased on the open market by American Stock Transfer & Trust Company, LLC, the Plan agent (Agent). Distributions subject to income tax (if any) are taxable whether or not Shares are reinvested.
If your Shares are in the name of a brokerage firm, bank, or other nominee, you can ask the firm or nominee to participate in the Plan on your behalf. If the nominee does not offer the Plan, you will need to request that the Trust's transfer agent re-register your Shares in your name or you will not be able to participate.
The Agent’s service fee for handling distributions will be paid by the Trust. Plan participants will be charged their pro rata share of brokerage commissions on all open-market purchases.
Plan participants may withdraw from the Plan at any time by writing to the Agent at the address noted on the following page. If you withdraw, you will receive Shares in your name for all Shares credited to your account under the Plan. If a participant elects by written notice to the Agent to sell part or all of his or her Shares and remit the proceeds, the Agent is authorized to deduct a $5.00 fee plus brokerage commissions from the proceeds.
If you wish to participate in the Plan and your Shares are held in your own name, you may complete the form on the following page and deliver it to the Agent. Any inquiries regarding the Plan can be directed to the Agent at 1-866-439-6787.
Eaton Vance
National Municipal Opportunities Trust
March 31, 2023
Application for Participation in Dividend Reinvestment Plan
This form is for shareholders who hold their common shares in their own names. If your common shares are held in the name of a brokerage firm, bank, or other nominee, you should contact your nominee to see if it will participate in the Plan on your behalf. If you wish to participate in the Plan, but your brokerage firm, bank, or nominee is unable to participate on your behalf, you should request that your common shares be re-registered in your own name which will enable your participation in the Plan.
The following authorization and appointment is given with the understanding that I may terminate it at any time by terminating my participation in the Plan as provided in the terms and conditions of the Plan.
|
| Please print exact name on account | |
| |
| Shareholder signature | Date |
| |
| Shareholder signature | Date |
| Please sign exactly as your common shares are registered. All persons whose names appear on the share certificate must sign. |
YOU SHOULD NOT RETURN THIS FORM IF YOU WISH TO RECEIVE YOUR DISTRIBUTIONS IN CASH. THIS IS NOT A PROXY.
This authorization form, when signed, should be mailed to the following address:
Eaton Vance National Municipal Opportunities Trust
c/o American Stock Transfer & Trust Company, LLC
P.O. Box 922
Wall Street Station
New York, NY 10269-0560
Eaton Vance
National Municipal Opportunities Trust
March 31, 2023
Management and Organization
Fund Management. The Board of Trustees of the Fund (the “Board”) is responsible for the overall management and supervision of the affairs of the Fund. The Board members and officers of the Fund are listed below. Except as indicated, each individual has held the office shown or other offices in the same company for the last five years. Each Trustee holds office until the annual meeting for the year in which his or her term expires and until his or her successor is elected and qualified, subject to a prior death, resignation, retirement, disqualification or removal. Under the terms of the Fund’s current Trustee retirement policy, an Independent Trustee must retire and resign as a Trustee on the earlier of: (i) the first day of July following his or her 74th birthday; or (ii), with limited exception, December 31st of the 20th year in which he or she has served as a Trustee. However, if such retirement and resignation would cause the Fund to be out of compliance with Section 16 of the 1940 Act or any other regulations or guidance of the Securities and Exchange Commission, then such retirement and resignation will not become effective until such time as action has been taken for the Fund to be in compliance therewith. The “noninterested Trustees” consist of those Trustees who are not “interested persons” of the Fund, as that term is defined under the 1940 Act. The business address of each Board member and officer is Two International Place, Boston, Massachusetts 02110. As used below, “BMR” refers to Boston Management and Research, “EVC” refers to Eaton Vance Corp., “EV” refers to EV LLC, “EVM” refers to Eaton Vance Management and “EVD” refers to Eaton Vance Distributors, Inc. EV is the trustee of each of EVM and BMR. Effective March 1, 2021, each of EVM, BMR, EVD and EV are indirect, wholly-owned subsidiaries of Morgan Stanley. Each officer affiliated with EVM may hold a position with other EVM affiliates that is comparable to his or her position with EVM listed below. Each Trustee oversees 129 funds in the Eaton Vance fund complex (including both funds and portfolios in a hub and spoke structure).
| Name and Year of Birth | Fund
Position(s) | Length of Service | Principal Occupation(s) and Other Directorships
During Past Five Years and Other Relevant Experience |
| Interested Trustees |
Thomas E. Faust Jr.
1958 | Class I
Trustee | Until 2025.
3 years.
Since 2007. | Chairman of Morgan Stanley Investment Management, Inc. (MSIM), member of the Board of Managers and President of EV (since 2021), Chief Executive Officer of EVM and BMR. Formerly, Chairman, Chief Executive Officer (2007-2021) and President (2006-2021) of EVC and Director of EVD (2007-2022). Mr. Faust is an interested person because of his positions with MSIM, BMR, EVM and EV, which are affiliates of the Fund. Mr. Faust has apprised the Board of Trustees that he intends to retire as a Trustee of all Eaton Vance Funds effective on or about August 3, 2023.
Other Directorships. Formerly, Director of EVC (2007-2021) and Hexavest Inc. (investment management firm) (2012-2021). |
Anchal Pachnanda(1)
1980 | Class I
Trustee | Until 2025.
3 years.
Since 2023. | Co-Head of Strategy of MSIM (since 2019). Formerly, Head of Strategy of MSIM (2017-2019). Ms. Pachnanda is an interested person because of her position with MSIM, which is an affiliate of the Fund.
Other Directorships. None |
| Noninterested Trustees |
Alan C. Bowser
1962 | Class III
Trustee | Until 2024.
3 years.
Since 2023. | Formerly, Chief Diversity Officer, Partner and a member of the Operating Committee, and formerly served as Senior Advisor on Diversity and Inclusion for the firm’s chief executive officer, Co-Head of the Americas Region, and Senior Client Advisor of Bridgewater Associates, an asset management firm (2011- 2023).
Other Directorships. None. |
Mark R. Fetting
1954 | Class III
Trustee | Until 2024.
3 years.
Since 2016. | Private investor. Formerly held various positions at Legg Mason, Inc. (investment management firm) (2000-2012), including President, Chief Executive Officer, Director and Chairman (2008-2012), Senior Executive Vice President (2004-2008) and Executive Vice President (2001-2004). Formerly, President of Legg Mason family of funds (2001-2008). Formerly, Division President and Senior Officer of Prudential Financial Group, Inc. and related companies (investment management firm) (1991-2000).
Other Directorships. None. |
Cynthia E. Frost
1961 | Class II
Trustee | Until 2026.
3 years.
Since 2014. | Private investor. Formerly, Chief Investment Officer of Brown University (university endowment) (2000-2012). Formerly, Portfolio Strategist for Duke Management Company (university endowment manager) (1995-2000). Formerly, Managing Director, Cambridge Associates (investment consulting company) (1989-1995). Formerly, Consultant, Bain and Company (management consulting firm) (1987-1989). Formerly, Senior Equity Analyst, BA Investment Management Company (1983-1985).
Other Directorships. None. |
Eaton Vance
National Municipal Opportunities Trust
March 31, 2023
Management and Organization — continued
| Name and Year of Birth | Fund
Position(s) | Length of Service | Principal Occupation(s) and Other Directorships
During Past Five Years and Other Relevant Experience |
| Noninterested Trustees (continued) |
George J. Gorman
1952 | Chairperson
of the Board
and Class III
Trustee | Until 2024.
3 years. Chairperson of the Board since 2021 and Trustee since 2014. | Principal at George J. Gorman LLC (consulting firm). Formerly, Senior Partner at Ernst & Young LLP (a registered public accounting firm) (1974-2009).
Other Directorships. None. |
Valerie A. Mosley
1960 | Class I
Trustee | Until 2025.
3 years.
Since 2014. | Chairwoman and Chief Executive Officer of Valmo Ventures (a consulting and investment firm). Founder of Upward Wealth, Inc., dba BrightUp, a fintech platform. Formerly, Partner and Senior Vice President, Portfolio Manager and Investment Strategist at Wellington Management Company, LLP (investment management firm) (1992-2012). Formerly, Chief Investment Officer, PG Corbin Asset Management (1990-1992). Formerly worked in institutional corporate bond sales at Kidder Peabody (1986-1990).
Other Directorships. Director of DraftKings, Inc. (digital sports entertainment and gaming company) (since September 2020). Director of Envestnet, Inc. (provider of intelligent systems for wealth management and financial wellness) (since 2018). Formerly, Director of Dynex Capital, Inc. (mortgage REIT) (2013-2020) and Director of Groupon, Inc. (e-commerce provider) (2020-2022). |
Keith Quinton
1958 | Class II
Trustee | Until 2026.
3 years.
Since 2018. | Private investor, researcher and lecturer. Formerly, Independent Investment Committee Member at New Hampshire Retirement System (2017-2021). Formerly, Portfolio Manager and Senior Quantitative Analyst at Fidelity Investments (investment management firm) (2001-2014).
Other Directorships. Formerly, Director (2016-2021) and Chairman (2019-2021) of New Hampshire Municipal Bond Bank. |
Marcus L. Smith
1966 | Class III
Trustee | Until 2024.
3 years.
Since 2018. | Private investor and independent corporate director. Formerly, Chief Investment Officer, Canada (2012-2017), Chief Investment Officer, Asia (2010-2012), Director of Asian Research (2004-2010) and portfolio manager (2001-2017) at MFS Investment Management (investment management firm).
Other Directorships. Director of First Industrial Realty Trust, Inc. (an industrial REIT) (since 2021). Director of MSCI Inc. (global provider of investment decision support tools) (since 2017). Formerly, Director of DCT Industrial Trust Inc. (logistics real estate company) (2017-2018). |
Susan J. Sutherland
1957 | Class II
Trustee | Until 2026.
3 years.
Since 2015. | Private investor. Director of Ascot Group Limited and certain of its subsidiaries (insurance and reinsurance) (since 2017). Formerly, Director of Hagerty Holding Corp. (insurance) (2015-2018) and Montpelier Re Holdings Ltd. (insurance and reinsurance) (2013-2015). Formerly, Associate, Counsel and Partner at Skadden, Arps, Slate, Meagher & Flom LLP (law firm) (1982-2013).
Other Directorships. Formerly, Director of Kairos Acquisition Corp. (insurance/InsurTech acquisition company) (2021-2023). |
Scott E. Wennerholm
1959 | Class I
Trustee | Until 2025.
3 years.
Since 2016. | Private investor. Formerly, Trustee at Wheelock College (postsecondary institution) (2012-2018). Formerly, Consultant at GF Parish Group (executive recruiting firm) (2016-2017). Formerly, Chief Operating Officer and Executive Vice President at BNY Mellon Asset Management (investment management firm) (2005-2011). Formerly, Chief Operating Officer and Chief Financial Officer at Natixis Global Asset Management (investment management firm) (1997-2004). Formerly, Vice President at Fidelity Investments Institutional Services (investment management firm) (1994-1997).
Other Directorships. None. |
Nancy A. Wiser
1967 | Class II
Trustee | Until 2026.
3 years.
Since 2022. | Formerly, Executive Vice President and the Global Head of Operations at Wells Fargo Asset Management (2011-2021).
Other Directorships. None. |
| Name and Year of Birth | Fund
Position(s) | Length of Service | Principal Occupation(s)
During Past Five Years |
| Principal Officers who are not Trustees |
Eric A. Stein
1980 | President | Since 2020 | Vice President and Chief Investment Officer, Fixed Income of EVM and BMR. Prior to November 1, 2020, Mr. Stein was a co-Director of Eaton Vance’s Global Income Investments. Also Vice President of Calvert Research and Management (“CRM”). |
Eaton Vance
National Municipal Opportunities Trust
March 31, 2023
Management and Organization — continued
| Name and Year of Birth | Fund
Position(s) | Length of Service | Principal Occupation(s)
During Past Five Years |
| Principal Officers who are not Trustees (continued) |
Deidre E. Walsh
1971 | Vice President and
Chief
Legal Officer | Since 2009 | Vice President of EVM and BMR. Also Vice President of CRM. |
James F. Kirchner
1967 | Treasurer | Since 2007 | Vice President of EVM and BMR. Also Vice President of CRM. |
Nicholas S. Di Lorenzo
1987 | Secretary | Since 2022 | Formerly, associate (2012-2021) and counsel (2022) at Dechert LLP. |
Richard F. Froio
1968 | Chief Compliance
Officer | Since 2017 | Vice President of EVM and BMR since 2017. Formerly, Deputy Chief Compliance Officer (Adviser/Funds) and Chief Compliance Officer (Distribution) at PIMCO (2012-2017) and Managing Director at BlackRock/Barclays Global Investors (2009-2012). |
(1) Ms. Pachnanda began serving as Trustee effective April 1, 2023.
| FACTS | WHAT DOES EATON VANCE DO WITH YOUR
PERSONAL INFORMATION? |
| Why? | Financial companies choose how they share your personal information. Federal law gives consumers the right to limit some but not all sharing. Federal law also requires us to tell you how we collect, share, and protect your personal information. Please read this notice carefully to understand what we do. |
| |
| What? | The types of personal information we collect and share depend on the product or service you have with us. This information can include:■ Social Security number and income
■ investment experience and risk tolerance
■ checking account number and wire transfer instructions |
| |
| How? | All financial companies need to share customers’ personal information to run their everyday business. In the section below, we list the reasons financial companies can share their customers’ personal information; the reasons Eaton Vance chooses to share; and whether you can limit this sharing. |
Reasons we can share your
personal information | Does Eaton Vance
share? | Can you limit
this sharing? |
| For our everyday business purposes — such as to process your transactions, maintain your account(s), respond to court orders and legal investigations, or report to credit bureaus | Yes | No |
| For our marketing purposes — to offer our products and services to you | Yes | No |
| For joint marketing with other financial companies | No | We don’t share |
| For our investment management affiliates’ everyday business purposes — information about your transactions, experiences, and creditworthiness | Yes | Yes |
| For our affiliates’ everyday business purposes — information about your transactions and experiences | Yes | No |
| For our affiliates’ everyday business purposes — information about your creditworthiness | No | We don’t share |
| For our investment management affiliates to market to you | Yes | Yes |
| For our affiliates to market to you | No | We don’t share |
| For nonaffiliates to market to you | No | We don’t share |
To limit our
sharing | Call toll-free 1-800-262-1122 or email: EVPrivacy@eatonvance.comPlease note:If you are a new customer, we can begin sharing your information 30 days from the date we sent this notice. When you are no longer our customer, we continue to share your information as described in this notice. However, you can contact us at any time to limit our sharing. |
| Questions? | Call toll-free 1-800-262-1122 or email: EVPrivacy@eatonvance.com |
| Privacy Notice — continued | April 2021 |
| Who we are |
| Who is providing this notice? | Eaton Vance Management, Eaton Vance Distributors, Inc., Eaton Vance Trust Company, Eaton Vance Management (International) Limited, Eaton Vance Advisers International Ltd., Eaton Vance Global Advisors Limited, Eaton Vance Management’s Real Estate Investment Group, Boston Management and Research, Calvert Research and Management, Eaton Vance and Calvert Fund Families and our investment advisory affiliates (“Eaton Vance”) (see Investment Management Affiliates definition below) |
| What we do |
How does Eaton Vance
protect my personal
information? | To protect your personal information from unauthorized access and use, we use security measures that comply with federal law. These measures include computer safeguards and secured files and buildings. We have policies governing the proper handling of customer information by personnel and requiring third parties that provide support to adhere to appropriate security standards with respect to such information. |
How does Eaton Vance
collect my personal
information? | We collect your personal information, for example, when you■ open an account or make deposits or withdrawals from your account
■ buy securities from us or make a wire transfer
■ give us your contact informationWe also collect your personal information from others, such as credit bureaus, affiliates, or other companies. |
| Why can’t I limit all sharing? | Federal law gives you the right to limit only■ sharing for affiliates’ everyday business purposes — information about your creditworthiness
■ affiliates from using your information to market to you
■ sharing for nonaffiliates to market to youState laws and individual companies may give you additional rights to limit sharing. See below for more on your rights under state law. |
| Definitions |
Investment Management
Affiliates | Eaton Vance Investment Management Affiliates include registered investment advisers, registered broker- dealers, and registered and unregistered funds. Investment Management Affiliates does not include entities associated with Morgan Stanley Wealth Management, such as Morgan Stanley Smith Barney LLC and Morgan Stanley & Co. |
| Affiliates | Companies related by common ownership or control. They can be financial and nonfinancial companies.■ Our affiliates include companies with a Morgan Stanley name and financial companies such as Morgan Stanley Smith Barney LLC and Morgan Stanley & Co. |
| Nonaffiliates | Companies not related by common ownership or control. They can be financial and nonfinancial companies.■ Eaton Vance does not share with nonaffiliates so they can market to you. |
| Joint marketing | A formal agreement between nonaffiliated financial companies that together market financial products or services to you.■ Eaton Vance doesn’t jointly market. |
| Other important information |
| Vermont: Except as permitted by law, we will not share personal information we collect about Vermont residents with Nonaffiliates unless you provide us with your written consent to share such information.California: Except as permitted by law, we will not share personal information we collect about California residents with Nonaffiliates and we will limit sharing such personal information with our Affiliates to comply with California privacy laws that apply to us. |
Delivery of Shareholder Documents. The Securities and Exchange Commission (SEC) permits funds to deliver only one copy of shareholder documents, including prospectuses, proxy statements and shareholder reports, to fund investors with multiple accounts at the same residential or post office box address. This practice is often called “householding” and it helps eliminate duplicate mailings to shareholders. American Stock Transfer & Trust Company, LLC (“AST”), the closed-end funds transfer agent, or your financial intermediary, may household the mailing of your documents indefinitely unless you instruct AST, or your financial intermediary, otherwise. If you would prefer that your Eaton Vance documents not be householded, please contact AST or your financial intermediary. Your instructions that householding not apply to delivery of your Eaton Vance documents will typically be effective within 30 days of receipt by AST or your financial intermediary.
Portfolio Holdings. Each Eaton Vance Fund and its underlying Portfolio(s) (if applicable) files a schedule of portfolio holdings on Part F to Form N-PORT with the SEC. Certain information filed on Form N-PORT may be viewed on the Eaton Vance website at www.eatonvance.com, by calling Eaton Vance at 1-800-262-1122 or in the EDGAR database on the SEC’s website at www.sec.gov.
Proxy Voting. From time to time, funds are required to vote proxies related to the securities held by the funds. The Eaton Vance Funds or their underlying Portfolios (if applicable) vote proxies according to a set of policies and procedures approved by the Funds’ and Portfolios’ Boards. You may obtain a description of these policies and procedures and information on how the Funds or Portfolios voted proxies relating to portfolio securities during the most recent 12-month period ended June 30, without charge, upon request, by calling 1-800-262-1122 and by accessing the SEC’s website at www.sec.gov.
Share Repurchase Program. The Fund’s Board of Trustees has approved a share repurchase program authorizing the Fund to repurchase up to 10% of its common shares outstanding as of the last day of the prior calendar year in open-market transactions at a discount to net asset value. The repurchase program does not obligate the Fund to purchase a specific amount of shares. The Fund’s repurchase activity, including the number of shares purchased, average price and average discount to net asset value, is disclosed in the Fund’s annual and semi-annual reports to shareholders.
Additional Notice to Shareholders. If applicable, a Fund may also redeem or purchase its outstanding preferred shares in order to maintain compliance with regulatory requirements, borrowing or rating agency requirements or for other purposes as it deems appropriate or necessary.
Closed-End Fund Information. Eaton Vance closed-end funds make fund performance data and certain information about portfolio characteristics available on the Eaton Vance website shortly after the end of each month. Other information about the funds is available on the website. The funds’ net asset value per share is readily accessible on the Eaton Vance website. Portfolio holdings for the most recent month-end are also posted to the website approximately 30 days following the end of the month. This information is available at www.eatonvance.com on the fund information pages under “Closed-End Funds & Term Trusts.”
This Page Intentionally Left Blank
This Page Intentionally Left Blank
Investment Adviser and Administrator
Eaton Vance Management
Two International Place
Boston, MA 02110
Custodian
State Street Bank and Trust Company
One Congress Street, Suite 1
Boston, MA 02114-2016
Transfer Agent
American Stock Transfer & Trust Company, LLC
6201 15th Avenue
Brooklyn, NY 11219
Independent Registered Public Accounting Firm
Deloitte & Touche LLP
200 Berkeley Street
Boston, MA 02116-5022
Fund Offices
Two International Place
Boston, MA 02110
The registrant (sometimes referred to as the “Fund”) has adopted a code of ethics applicable to its Principal Executive Officer, Principal Financial Officer and Principal Accounting Officer. The registrant undertakes to provide a copy of such code of ethics to any person upon request, without charge, by calling 1-800-262-1122. The registrant has not amended the code of ethics as described in Form N-CSR during the period covered by this report. The registrant has not granted any waiver, including an implicit waiver, from a provision of the code of ethics as described in Form N-CSR during the period covered by this report.
| Item 3. | Audit Committee Financial Expert |
The registrant’s Board of Trustees (the “Board”) has designated George J. Gorman and Scott E. Wennerholm, each an independent trustee, as audit committee financial experts. Mr. Gorman is a certified public accountant who is the Principal at George J. Gorman LLC (a consulting firm). Previously, Mr. Gorman served in various capacities at Ernst & Young LLP (a registered public accounting firm), including as Senior Partner. Mr. Gorman also has experience serving as an independent trustee and audit committee financial expert of other
mutual fund complexes. Mr. Wennerholm is a private investor. Previously, Mr. Wennerholm served as a Trustee at Wheelock College (postsecondary institution), as a Consultant at GF Parish Group (executive recruiting firm), Chief Operating Officer and Executive Vice President at BNY Mellon Asset Management (investment management firm), Chief Operating Officer and Chief Financial Officer at Natixis Global Asset Management (investment management firm), and Vice President at Fidelity Investments Institutional Services (investment management firm).
| Item 4. | Principal Accountant Fees and Services |
(a) –(d)
The following table presents the aggregate fees billed to the registrant for the registrant’s fiscal years ended March 31, 2022 and March 31, 2023 by the registrant’s principal accountant, Deloitte & Touche LLP (“D&T”), for professional services rendered for the audit of the registrant’s annual financial statements and fees billed for other services rendered by D&T during such periods.
| | | | | | | | |
Fiscal Years Ended | | 3/31/22 | | | 3/31/23 | |
Audit Fees | | $ | 52,400 | | | $ | 57,700 | |
Audit-Related Fees(1) | | $ | 0 | | | $ | 0 | |
Tax Fees(2) | | $ | 9,729 | | | $ | 0 | |
All Other Fees(3) | | $ | 0 | | | $ | 0 | |
| | | | | | | | |
Total | | $ | 62,129 | | | $ | 57,700 | |
| | | | | | | | |
| (1) | Audit-related fees consist of the aggregate fees billed for assurance and related services that are reasonably related to the performance of the audit of financial statements and are not reported under the category of audit fees. |
| (2) | Tax fees consist of the aggregate fees billed for professional services rendered by the principal accountant relating to tax compliance, tax advice, and tax planning and specifically include fees for tax return preparation and other related tax compliance/planning matters. |
| (3) | All other fees consist of the aggregate fees billed for products and services provided by the registrant’s principal accountant other than audit, audit-related, and tax services. |
(e)(1) The registrant’s audit committee has adopted policies and procedures relating to the pre-approval of services provided by the registrant’s principal accountant (the “Pre-Approval Policies”). The Pre-Approval Policies establish a framework intended to assist the audit committee in the proper discharge of its pre-approval responsibilities. As a general matter, the Pre-Approval Policies (i) specify certain types of audit, audit-related, tax, and other services determined to be pre-approved by the audit committee; and (ii) delineate specific procedures governing the mechanics of the pre-approval process, including the approval and monitoring of audit and non-audit service fees. Unless a service is specifically pre-approved under the Pre-Approval Policies, it must be separately pre-approved by the audit committee.
The Pre-Approval Policies and the types of audit and non-audit services pre-approved therein must be reviewed and ratified by the registrant’s audit committee at least annually. The registrant’s audit committee maintains full responsibility for the appointment, compensation, and oversight of the work of the registrant’s principal accountant.
(e)(2) No services described in paragraphs (b)-(d) above were approved by the registrant’s audit committee pursuant to the “de minimis exception” set forth in Rule 2-01 (c)(7)(i)(C) of Regulation S-X.
(f) Not applicable.
(g) The following table presents (i) the aggregate non-audit fees (i.e., fees for audit-related, tax, and other services) billed to the registrant by D&T for the registrant’s fiscal years ended March 31, 2022 and March 31, 2023; and (ii) the aggregate non-audit fees (i.e., fees for audit-related, tax, and other services) billed to the Eaton Vance organization by D&T for the same time periods.
| | | | | | | | |
Fiscal Years Ended | | 3/31/2022 | | | 3/31/2023 | |
Registrant | | $ | 9,729 | | | $ | 0 | |
Eaton Vance(1) | | $ | 51,800 | | | $ | 52,836 | |
| (1) | The investment adviser to the registrant, as well as any of its affiliates that provide ongoing services to the registrant, are subsidiaries of Morgan Stanley. |
(h) The registrant’s audit committee has considered whether the provision by the registrant’s principal accountant of non-audit services to the registrant’s investment adviser and any entity controlling, controlled by, or under common control with the adviser that provides ongoing services to the registrant that were not pre-approved pursuant to Rule 2-01(c)(7)(ii) of Regulation S-X is compatible with maintaining the principal accountant’s independence.
(i) Not applicable.
(j) Not applicable.
| Item 5. | Audit Committee of Listed Registrants |
The registrant has a separately-designated standing audit committee established in accordance with Section 3(a)(58)(A) of the Securities and Exchange Act of 1934, as amended. George J. Gorman, Keith Quinton, Scott E. Wennerholm (Chair), and Nancy A. Wiser are the members of the registrant’s audit committee.
| Item 6. | Schedule of Investments |
Please see schedule of investments contained in the Report to Stockholders included under Item 1 of this Form N-CSR.
| Item 7. | Disclosure of Proxy Voting Policies and Procedures for Closed-End Management Investment Companies |
The Board of the Fund has adopted a proxy voting policy and procedure (the “Fund Policy”), pursuant to which the trustees have delegated proxy voting responsibility to the Fund’s investment adviser and adopted the investment adviser’s proxy voting policies and procedures (the “Policies”) which are described below. The trustees will review the Policies annually. In the event that a conflict of interest arises between the Fund’s shareholders and the investment adviser, the administrator, or any of their affiliates or any affiliate of the Fund, the investment adviser will generally refrain from voting the proxies related to the companies giving rise to such conflict until it consults with the Board, or any committee, sub-committee or group of independent trustees identified by the Board, which will instruct the investment adviser on the appropriate course of action. If the Board Members are unable to meet and the failure to vote a proxy would have a material adverse impact on the Fund, the investment adviser may vote such proxy, provided that it discloses the existence of the material conflict to the Chairperson of the Fund’s Board as soon as practicable and to the Board at its next meeting.
The Policies are designed to promote accountability of a company’s management to its shareholders and to align the interests of management with those shareholders. An independent proxy voting service (“Agent”), currently Institutional Shareholder Services, Inc., has been retained to assist in the voting of proxies through the provision of vote analysis, implementation and recordkeeping and disclosure services. The investment adviser will generally vote proxies through the Agent. The Agent is required to vote all proxies in accordance with customized proxy voting guidelines (the “Guidelines”) and/or refer them back to the investment adviser pursuant to the Policies.
The Agent is required to establish and maintain adequate internal controls and policies in connection with the provision of proxy voting services, including methods to reasonably ensure that its analysis and recommendations are not influenced by a conflict of interest. The Guidelines include voting guidelines for matters relating to, among other things, the election of directors, approval of independent auditors, executive compensation, corporate structure and anti-takeover defenses. The investment adviser may cause the Fund to abstain from voting from time to time where it determines that the costs associated with voting a proxy outweigh the benefits derived from exercising the right to vote or it is unable to access or access timely ballots or other proxy information, among other stated reasons. The Agent will refer Fund proxies to the investment adviser for instructions under circumstances where, among others: (1) the application of the Guidelines is unclear; (2) a particular proxy question is not covered by the Guidelines; or (3) the Guidelines require input from the investment adviser. When a proxy voting issue has been referred to the investment adviser, the analyst (or portfolio manager if applicable) covering the company subject to the proxy proposal determines the final vote (or decision not to vote) and the investment adviser’s Proxy Administrator (described below) instructs the Agent to vote accordingly for securities held by the Fund. Where more than one analyst covers a particular company and the recommendations of such analysts voting a proposal conflict, the investment adviser’s Global Proxy Group (described below) will review such recommendations and any other available information related to the proposal and determine the manner in which it should be voted, which may result in different recommendations for the Fund that may differ from other clients of the investment adviser.
The investment adviser has appointed a Proxy Administrator to assist in the coordination of the voting of client proxies (including the Fund’s) in accordance with the Guidelines and the Policies. The investment adviser and its affiliates have also established a Global Proxy Group. The Global Proxy Group develops the investment adviser’s positions on all major corporate issues, creates the Guidelines and oversees the proxy voting process. The Proxy Administrator maintains a record of all proxy questions that have been referred by the Agent, all applicable recommendations, analysis and research received and any resolution of the matter. Before instructing the Agent to vote contrary to the Guidelines or the recommendation of the Agent, the Proxy Administrator will provide the Global Proxy Group with the Agent’s recommendation for the proposal along with any other relevant materials, including the basis for the analyst’s recommendation. The Proxy Administrator will then instruct the Agent to vote the proxy in the manner determined by the Global Proxy Group. A similar process will be followed if the Agent has a conflict of interest with respect to a proxy. The investment adviser will report to the Fund’s Board any votes cast contrary to the Guidelines or Agent recommendations, as applicable, no less than annually.
The investment adviser’s Global Proxy Group is responsible for monitoring and resolving possible material conflicts with respect to proxy voting. Because the Guidelines are predetermined and designed to be in the best interests of shareholders, application of the Guidelines to vote client proxies should, in most cases, adequately address any possible conflict of interest. The investment adviser will monitor situations that may result in a conflict of interest between any of its clients and the investment adviser or any of its affiliates by maintaining a list of significant existing and prospective corporate clients. The Proxy Administrator will compare such list with the names of companies of which he or she has been referred a proxy statement (the “Proxy Companies”). If a company on the list is also a Proxy Company, the Proxy Administrator will report that fact to the Global Proxy Group. If the Proxy Administrator intends to instruct the Agent to vote in a manner inconsistent with the Guidelines, the Global Proxy Group will first determine, in consultation with legal counsel if necessary,
whether a material conflict exists. If it is determined that a material conflict exists, the investment adviser will seek instruction on how the proxy should be voted from the Fund’s Board, or any committee or subcommittee identified by the Board. If a matter is referred to the Global Proxy Group, the decision made and basis for the
Information on how the Fund voted proxies relating to portfolio securities during the most recent 12 month period ended June 30 is available (1) without charge, upon request, by calling 1-800-262-1122, and (2) on the Securities and Exchange Commission’s website at http://www.sec.gov.
| Item 8. | Portfolio Managers of Closed-End Management Investment Companies |
Eaton Vance Management (“EVM” or “Eaton Vance”) is the investment adviser of the Fund. Cynthia J. Clemson and William J. Delahunty Jr. are responsible for the overall and day-to-day management of the Fund’s investments.
Ms. Clemson is a Vice President of EVM, is Co-Director of Municipal Investments and has been a portfolio manager of the Fund since May 2009. She has managed other Eaton Vance portfolios for more than five years. Mr. Delahunty is a Vice President of EVM and has been a portfolio of the Fund since October 2021. He has been employed by EVM for more than five years. This information is provided as of the date of filing this report.
The following table shows, as of the Fund’s most recent fiscal year end, the number of accounts each portfolio manager managed in each of the listed categories and the total assets (in millions of dollars) in the accounts managed within each category. The table also shows the number of accounts with respect to which the advisory fee is based on the performance of the account, if any, and the total assets (in millions of dollars) in those accounts.
| | | | | | | | | | | | | | | | |
| | | Number of
All Accounts | | | Total Assets of
All Accounts | | | Number of Accounts
Paying a
Performance Fee | | | Total Assets
of Accounts Paying
a Performance Fee | |
Cynthia J. Clemson | | | | | | | | | | | | | | | | |
Registered Investment Companies | | | 8 | | | $ | 3,814.6 | | | | 0 | | | $ | 0 | |
Other Pooled Investment Vehicles | | | 0 | | | $ | 0 | | | | 0 | | | $ | 0 | |
Other Accounts | | | 7 | | | $ | 385.7 | | | | 0 | | | $ | 0 | |
| | | | |
William J. Delahunty, Jr. | | | | | | | | | | | | | | | | |
Registered Investment Companies | | | 7 | | | $ | 2,891.9 | | | | 0 | | | $ | 0 | |
Other Pooled Investment Vehicles | | | 2 | | | $ | 158.5 | | | | 0 | | | $ | 0 | |
Other Accounts | | | 0 | | | $ | 0 | | | | 0 | | | $ | 0 | |
The following table shows the dollar range of Fund shares beneficially owned by each portfolio manager as of the Fund’s most recent fiscal year end.
| | |
Portfolio Manager | | Dollar Range of Equity Securities
Beneficially Owned in the Fund |
Cynthia J. Clemson | | None |
William J. Delahunty | | None |
Potential for Conflicts of Interest. It is possible that conflicts of interest may arise in connection with a portfolio manager’s management of the Fund’s investments on the one hand and the investments of other
accounts for which a portfolio manager is responsible on the other. For example, a portfolio manager may have conflicts of interest in allocating management time, resources and investment opportunities among the Fund and other accounts he or she advises. In addition, due to differences in the investment strategies or restrictions between the Fund and the other accounts, the portfolio manager may take action with respect to another account that differs from the action taken with respect to the Fund. In some cases, another account managed by a portfolio manager may compensate the investment adviser based on the performance of the securities held by that account. The existence of such a performance based fee may create additional conflicts of interest for the portfolio manager in the allocation of management time, resources and investment opportunities. Whenever conflicts of interest arise, the portfolio manager will endeavor to exercise his or her discretion in a manner that he or she believes is equitable to all interested persons. EVM has adopted several policies and procedures designed to address these potential conflicts including a code of ethics and policies that govern the investment adviser’s trading practices, including among other things the aggregation and allocation of trades among clients, brokerage allocations, cross trades and best execution.
Compensation Structure for EVM
The compensation structure of Eaton Vance and its affiliates that are investment advisers (for purposes of this section “Eaton Vance”) is based on a total reward system of base salary and incentive compensation, which is paid either in the form of cash bonus, or for employees meeting the specified deferred compensation eligibility threshold, partially as a cash bonus and partially as mandatory deferred compensation. Deferred compensation granted to Eaton Vance employees is generally granted as a mix of deferred cash awards under the Investment Management Alignment Plan (IMAP) and equity-based awards in the form of stock units. The portion of incentive compensation granted in the form of a deferred compensation award and the terms of such awards are determined annually by the Compensation, Management Development and Succession Committee of the Board of Directors of Eaton Vance’s parent company, Morgan Stanley.
Base salary compensation. Generally, portfolio managers and research analysts receive base salary compensation based on the level of their position with the adviser.
Incentive compensation. In addition to base compensation, portfolio managers and research analysts may receive discretionary year-end compensation. Incentive compensation may include:
| | • | | A mandatory program that defers a portion of incentive compensation into restricted stock units or other awards based on Morgan Stanley common stock or other plans that are subject to vesting and other conditions. |
| | • | | IMAP is a cash-based deferred compensation plan designed to increase the alignment of participants’ interests with the interests of clients. For eligible employees, a portion of their deferred compensation is mandatorily deferred into IMAP on an annual basis. Awards granted under IMAP are notionally invested in referenced funds available pursuant to the plan, which are funds advised by MSIM and its affiliates including Eaton Vance. Portfolio managers are required to notionally invest a minimum of 40% of their account balance in the designated funds that they manage and are included in the IMAP notional investment fund menu. |
| | • | | Deferred compensation awards are typically subject to vesting over a multi-year period and are subject to cancellation through the payment date for competition, cause (i.e., any act or omission that constitutes a breach of obligation to the Funds, including failure to comply with internal compliance, ethics or risk management standards, and failure or refusal to perform duties satisfactorily, including supervisory and management duties), disclosure of proprietary information, and solicitation of employees or clients. Awards are also subject to clawback through the payment date if an employee’s act or omission (including with respect to direct supervisory responsibilities) causes a restatement of the firm’s consolidated financial results, constitutes a violation of the firm’s global risk management principles, policies and standards, or causes a loss of revenue associated with a position on which the employee was paid and the employee operated outside of internal control policies. |
Eaton Vance compensates employees based on principles of pay-for-performance, market competitiveness and risk management. Eligibility for, and the amount of any, discretionary compensation is subject to a multi-dimensional process. Specifically, consideration is given to one or more of the following factors, which can vary by portfolio management team and circumstances:
| | • | | Revenue and profitability of the business and/or each fund/account managed by the portfolio manager |
| | • | | Individual contribution and performance |
| | • | | Contribution to client objectives |
| | • | | Revenue and profitability of the firm |
| | • | | Return on equity and risk factors of both the business units and Morgan Stanley |
| | • | | Assets managed by the portfolio manager |
| | • | | External market conditions |
| | • | | New business development and business sustainability |
| | • | | Team, product and/or Eaton Vance performance |
| | • | | The pre-tax investment performance of the funds/accounts managed by the portfolio manager(1) (which may, in certacases, be measured against the applicable benchmark(s) and/or peer group(s) over one, three and five-year periods),(2) provided that for funds that are tax-managed or otherwise have an objective of after-tax returns, performance net of taxes will be considered |
Further, the firm’s Global Incentive Compensation Discretion Policy requires compensation managers to consider only legitimate, business related factors when exercising discretion in determining variable incentive compensation, including adherence to Morgan Stanley’s core values, conduct, disciplinary actions in the current performance year, risk management and risk outcomes.
| (1) | Generally, this is total return performance, provided that consideration may also be given to relative risk-adjusted performance. |
| (2) | When a fund’s peer group as determined by Lipper or Morningstar is deemed by the relevant Eaton Vance Chief Investment Officer, or in the case of the sub-advised Funds, the Director of Product Development and Sub-Advised Funds, not to provide a fair comparison, performance may instead be evaluated primarily against a custom peer group or market index. |
| Item 9. | Purchases of Equity Securities by Closed-End Management Investment Company and Affiliated Purchasers |
No such purchases this period.
| Item 10. | Submission of Matters to a Vote of Security Holders |
No material changes.
| Item 11. | Controls and Procedures |
(a) It is the conclusion of the registrant’s principal executive officer and principal financial officer that the effectiveness of the registrant’s current disclosure controls and procedures (such disclosure controls and procedures having been evaluated within 90 days of the date of this filing) provide reasonable assurance that the information required to be disclosed by the registrant has been recorded, processed, summarized and reported within the time period specified in the Commission’s rules and forms and that the information required to be disclosed by the registrant has been accumulated and communicated to the registrant’s principal executive officer and principal financial officer in order to allow timely decisions regarding required disclosure.
(b) There have been no changes in the registrant’s internal controls over financial reporting during the second fiscal quarter of the period covered by this report that has materially affected, or is reasonably likely to materially affect, the registrant’s internal control over financial reporting.
| Item 12. | Disclosure of Securities Lending Activities for Closed-End Management Investment Companies |
No activity to report for the registrant’s most recent fiscal year end.
Signatures
Pursuant to the requirements of the Securities Exchange Act of 1934 and the Investment Company Act of 1940, the registrant has duly caused this report to be signed on its behalf by the undersigned, thereunto duly authorized.
| | |
| Eaton Vance National Municipal Opportunities Trust |
| |
| By: | | /s/ Eric A. Stein |
| | Eric A. Stein |
| | President |
Date: May 22, 2023
Pursuant to the requirements of the Securities Exchange Act of 1934 and the Investment Company Act of 1940, this report has been signed below by the following persons on behalf of the registrant and in the capacities and on the dates indicated.
| | |
| By: | | /s/ James F. Kirchner |
| | James F. Kirchner |
| | Treasurer |
| |
| Date: | | May 22, 2023 |
| |
| By: | | /s/ Eric A. Stein |
| | Eric A. Stein |
| | President |
| |
| Date: | | May 22, 2023 |