UNITED STATES
SECURITIES AND EXCHANGE COMMISSION
Washington, D.C. 20549
FORM N-CSRS
CERTIFIED SHAREHOLDER REPORT OF REGISTERED
MANAGEMENT INVESTMENT COMPANIES
Investment Company Act file number: 811-22311
Schwab Strategic Trust – Fixed Income ETFs
(Exact name of registrant as specified in charter)
211 Main Street, San Francisco, California 94105
(Address of principal executive offices) (Zip code)
Marie Chandoha
Schwab Strategic Trust – Fixed Income ETFs
211 Main Street, San Francisco, California 94105
(Name and address of agent for service)
Registrant’s telephone number, including area code: (415) 636-7000
Date of fiscal year end: December 31
Date of reporting period: June 30, 2015
Item 1: Report(s) to Shareholders.
Semiannual report dated June 30, 2015, enclosed.
Schwab Fixed-Income ETFs
Schwab U.S. TIPS ETF™
Schwab Short-Term
U.S. Treasury ETF™
Schwab Intermediate-Term
U.S. Treasury ETF™
Schwab U.S. Aggregate
Bond ETF™
Go paperless today.
Simplify your financial life
by viewing these documents online.
Sign up at schwab.com/paperless
This wrapper is not part of the shareholder report.
Schwab Fixed-Income ETFs
Semiannual Report
June 30, 2015
Schwab U.S. TIPS ETF™
Schwab Short-Term
U.S. Treasury ETF™
Schwab Intermediate-Term
U.S. Treasury ETF™
Schwab U.S. Aggregate
Bond ETF™
This page is intentionally left blank.
| 2 |
| 3 |
| 4 |
| 5 |
| 5 |
| 6 |
| 7 |
| 8 |
| 9 |
| 10 |
| 10 |
| 16 |
| 22 |
| 28 |
| 55 |
| 64 |
| 66 |
Fund investment adviser: Charles Schwab Investment Management, Inc. (CSIM).
Distributor: SEI Investments Distribution Co. (SIDCO).
The performance data quoted represents past performance. Past performance does not guarantee future results. Investment return and principal value of an investment will fluctuate so that an investor’s shares, when sold or redeemed, may be worth more or less than the original cost. Current performance may be lower or higher than the performance quoted. To obtain performance information current to the most recent month end, please visit www.csimfunds.com/schwabetfs_prospectus.
| Total Returns for the 6 Months Ended June 30, 2015 |
| Schwab U.S. TIPS ETF (Ticker Symbol: SCHP) | |
| Market Price Return1 | -0.06% |
| NAV Return1 | 0.30% |
| Barclays U.S. TIPS Index (Series-L) | 0.34% |
| ETF Category: Morningstar Inflation-Protected Bond2 | 0.19% |
| Performance Details | page 5 |
| |
| Schwab Short-Term U.S. Treasury ETF (Ticker Symbol: SCHO) | |
| Market Price Return1 | 0.53% |
| NAV Return1 | 0.63% |
| Barclays U.S. 1-3 Year Treasury Bond Index | 0.68% |
| ETF Category: Morningstar Short Government2 | 0.44% |
| Performance Details | page 6 |
| |
| Schwab Intermediate-Term U.S. Treasury ETF (Ticker Symbol: SCHR) | |
| Market Price Return1 | 0.66% |
| NAV Return1 | 0.88% |
| Barclays U.S. 3-10 Year Treasury Bond Index | 0.96% |
| ETF Category: Morningstar Intermediate Government2 | 0.75% |
| Performance Details | page 7 |
| |
| Schwab U.S. Aggregate Bond ETF (Ticker Symbol: SCHZ) | |
| Market Price Return1 | -0.36% |
| NAV Return1 | -0.05% |
| Barclays U.S. Aggregate Bond Index | -0.10% |
| ETF Category: Morningstar Intermediate-Term Bond2 | 0.19% |
| Performance Details | page 8 |
All total returns on this page assume dividends and distributions were reinvested. Index figures do not include trading and management costs, which would lower performance. Indices are unmanaged and cannot be invested in directly. Performance results less than one year are not annualized.
For index definitions, please see the Glossary.
Performance does not reflect the deduction of taxes that a shareholder would pay on fund distributions or on the redemption of fund shares.
Shares are bought and sold at market price, which may be higher or lower than the net asset value (NAV). Brokerage commissions will reduce returns.
Fixed income securities are subject to increased loss of principal during periods of rising interest rates. An investment in the fund(s) is not insured or guaranteed by the Federal Deposit Insurance Corporation or any other government agency. Government backing applies only to the government issued bonds that make up the fund, not the fund itself.
TIPS generally have lower yields than conventional fixed rate bonds and will likely decline in price during periods of deflation, which could result in losses.
Barclays and the names identifying the Barclays’ indices are trademarks or names of Barclays Bank PLC and its affiliates (“Barclays”) and have been licensed for use in connection with the listing and trading of the funds. The funds are not sponsored by, endorsed, sold or promoted by Barclays and Barclays makes no representation regarding the advisability of investing in such funds.
| 1 | ETF performance must be shown based on both a Market Price and a Net Asset Value (NAV) basis. The fund’s per share net asset value (“NAV”) is the value of one share of the fund. NAV is calculated by taking the fund’s total assets (including the market value of securities owned), subtracting liabilities, and dividing by the number of shares outstanding. The NAV Return is based on the NAV of the fund, and the Market Price Return is based on the market price per share of the fund. The price used to calculate market return (“Market Price”) is determined by using the midpoint between the highest bid and the lowest offer on the primary stock exchange on which the shares of the fund are listed for trading, as of the time that the fund’s NAV is calculated. Market Price and NAV returns assume that dividends and capital gain distributions have been reinvested in the fund at Market Price and NAV, respectively. |
| 2 | Source for category information: Morningstar, Inc. The Morningstar Category return represents all passively- and actively-managed ETFs within the category as of the report date. |
2Schwab Fixed-Income ETFs
Marie Chandoha is President and CEO of Charles Schwab Investment Management, Inc. and the funds covered in this report.
Dear Shareholder,
At Charles Schwab Investment Management, we design our investment products to serve as part of the foundation of an investor’s portfolio. The Schwab Fixed Income ETFs are available at some of the lowest operating expense ratios in the industry. The funds track fixed-income indices that are based on various segments of the bond market while also providing the benefits of investing in an ETF, including transparency, intraday trading, and potential tax efficiency.
For the six-month reporting period ended June 30, 2015, the funds generated returns that tracked their respective indices. The debt crisis in Greece and speculation surrounding the timing of a potential short-term rate increase by the Federal Reserve contributed to heightened market volatility around the globe, as did concerns about the Chinese economy and volatile commodity prices. Meanwhile, many central banks outside the U.S. increased measures aimed at stimulating economic growth and combatting deflation. These divergent policies between the U.S. and other central banks impacted bond markets, currencies, and equities, adding to global market volatility.
In this environment, Treasuries outperformed corporate bonds, and shorter-term bonds generated higher returns than longer-term bonds. Though inflation remained muted over the six-month reporting period, Treasury Inflation-Protected Securities slightly outperformed the overall U.S. investment grade bond market, with the Barclays U.S. TIPS Index returning 0.3% and the Barclays U.S. Aggregate Bond Index returning -0.1%.
For more information about the performance, holdings, and portfolio characteristics of the Schwab Fixed-Income ETFs, please continue reading this report. In addition, you can find further details about these products by visiting www.csimfunds.com, which provides improved functionality, enhanced design, and access to industry insights. We are also happy to hear from you at 1-800-435-4000.
Sincerely,
Yields of U.S. Treasury Securities: Effective Yields of Three-Month, Two-Year and 10-Year Treasuries
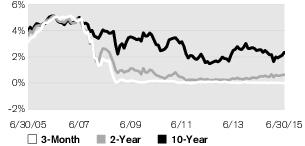 | Yields, or interest rates, represent the cost of borrowing money. Rapid economic growth, waning investor interest in bonds, an increase in the issuance of bonds, or the expectation of higher inflation can drive rates up, while the opposite conditions can push rates down. |
| Data source: Bloomberg L.P. |
Nothing in this report represents a recommendation of a security by the investment adviser.
Management views and portfolio holdings may have changed since the report date.
Indices are unmanaged, do not incur management fees, costs and expenses, and cannot be invested in directly. Index return figures assume dividends and distributions were reinvested. Past performance is not a guarantee of future results.
Schwab Fixed-Income ETFs3
 | Matthew Hastings, CFA, Vice President and Head of Taxable Bond Strategies, leads the portfolio management team for Schwab’s taxable bond funds and the Schwab Fixed Income ETFs. He also has overall responsibility for all aspects of the management of the funds. Prior to joining CSIM in 1999, Mr. Hastings was in fixed-income sales and trading at Lehman Brothers. He has worked in the fixed-income securities industry since 1996. |
 | Steven Chan, CFA, Managing Director and Portfolio Manager, is responsible for the day-to-day co-management of the funds. His primary focus is government securities, including Treasury inflation-protected securities. Mr. Chan has been a portfolio manager with CSIM since 2007, and has held a number of positions at the firm since beginning his tenure in 1996. His previous roles include managing the Portfolio Operations and Analytics group, and working as a senior manager in Finance. Prior to joining CSIM, Mr. Chan was a manager of finance at GT Capital Management. |
 | Brandon Matsui, CFA, Managing Director and Portfolio Manager, is responsible for the day-to-day co-management of the funds. Prior to joining CSIM in 2010, Mr. Matsui was an associate portfolio manager on the Beta Management team at BNY Mellon for 11 months. Prior to that, Mr. Matsui spent five years at BlackRock Solutions, where he served as an analyst in the portfolio analytics group, and also a risk analytics manager for their corporate, asset management, and pension clients. |
 | Steven Hung, Managing Director and Senior Portfolio Manager, is responsible for the day-to-day co-management of each of the funds, except for the Schwab GNMA Fund and Schwab Treasury Inflation Protected Securities Index Fund. His primary focus is corporate bonds. Prior to joining CSIM in 1999, Mr. Hung was an associate in Schwab’s management training program for nine months. In that role, he worked as a clerk on the Options Trading Floor of the Pacific Coast Stock Exchange. |
 | Alfonso Portillo, Jr., Managing Director and Senior Portfolio Manager, is responsible for the day-to-day co-management of each of the funds, except for the Schwab Short-Term Bond Market Fund and Schwab Treasury Inflation Protected Securities Index Fund. His primary focus is securitized products. Prior to joining CSIM in 2007, Mr. Portillo worked for ten years at Pacific Investment Management Company, most recently as a vice president and member of the mortgage- and asset-backed portfolio management team. He has worked in fixed-income asset management since 1996. |
4Schwab Fixed-Income ETFs
Schwab U.S. TIPS ETF
Performance and Fund Facts as of 06/30/15
The performance data quoted represents past performance. Past performance does not guarantee future results. Investment return and principal value of an investment will fluctuate so that an investor’s shares, when sold or redeemed, may be worth more or less than the original cost. Current performance may be lower or higher than the performance quoted. To obtain performance information current to the most recent month end, please visit www.csimfunds.com/schwabetfs_prospectus.
Average Annual Total Returns1
| Fund and Inception Date | 6 Months | 1 Year | 3 Years | Since Inception* |
| Fund: Schwab U.S. TIPS ETF (8/5/10) | | | | |
| Market Price Return2 | -0.06% | -1.88% | -0.93% | 3.15% |
| NAV Return2 | 0.30% | -1.81% | -0.84% | 3.18% |
| Barclays U.S. TIPS Index (Series-L) | 0.34% | -1.73% | -0.76% | 3.29% |
| ETF Category: Morningstar Inflation-Protected Bond3 | 0.19% | -2.02% | -0.79% | 2.97% |
Fund Expense Ratio4: 0.07%
Portfolio Composition % of investments
| By Security Type5 | |
| U.S. Government Obligations | 99.9% |
| Short-Term Investments & Other Assets6 | 0.1% |
| Weighted Average Maturity7 | 8.6 Yrs |
| Weighted Average Duration7 | 7.8 Yrs |
All total returns on this page assume dividends and distributions were reinvested. Index figures do not include trading and management costs, which would lower performance. Indices are unmanaged and cannot be invested in directly. Performance results less than one year are not annualized.
For index definitions, please see the Glossary.
Shares are bought and sold at market price, which may be higher or lower than the net asset value (NAV). Brokerage commissions will reduce returns.
Barclays and the names identifying the Barclays’ indices are trademarks or names of Barclays Bank PLC and its affiliates (“Barclays”) and have been licensed for use in connection with the listing and trading of the fund. The fund is not sponsored by, endorsed, sold or promoted by Barclays and Barclays makes no representation regarding the advisability of investing in such fund.
Portfolio holdings may have changed since the report date.
An index is a statistical composite of a specified financial market or sector. Unlike the fund, an index does not actually hold a portfolio of securities and its return is not inclusive of operational and transaction costs incurred by the fund.
Fixed income securities are subject to increased loss of principal during periods of rising interest rates. An investment in the fund is not insured or guaranteed by the Federal Deposit Insurance Corporation or any other government agency. Government backing applies only to the government issued bonds that make up the fund, not the fund itself.
TIPS generally have lower yields than conventional fixed rate bonds and will likely decline in price during periods of deflation, which could result in losses.
| * | Inception (8/5/10) represents the date that the shares began trading in the secondary market. |
| 1 | Performance does not reflect the deduction of taxes that a shareholder would pay on fund distributions or on the redemption of fund shares. |
| 2 | ETF performance must be shown based on both a Market Price and a Net Asset Value (NAV) basis. The fund’s per share net asset value ("NAV") is the value of one share of the fund. NAV is calculated by taking the fund’s total assets (including the market value of securities owned), subtracting liabilities, and dividing by the number of shares outstanding. The NAV Return is based on the NAV of the fund, and the Market Price Return is based on the market price per share of the fund. The price used to calculate market return (“Market Price”) is determined by using the midpoint between the highest bid and the lowest offer on the primary stock exchange on which the shares of the fund are listed for trading, as of the time that the fund’s NAV is calculated. NAV is used as a proxy for purposes of calculating Market Price Return on inception date. Market Price and NAV returns assume that dividends and capital gain distributions have been reinvested in the fund at Market Price and NAV, respectively. |
| 3 | Source for category information: Morningstar, Inc. The Morningstar Category return represents all passively- and actively-managed ETFs within the category as of the report date. |
| 4 | As stated in the prospectus. |
| 5 | This list is not a recommendation of any security type by the investment adviser. |
| 6 | Represents the fund’s position in money market mutual funds registered under the Investment Company Act of 1940, as amended. |
| 7 | See Glossary for definitions of maturity and duration. |
Schwab Fixed-Income ETFs5
Schwab Short-Term U.S. Treasury ETF
Performance and Fund Facts as of 06/30/15
The performance data quoted represents past performance. Past performance does not guarantee future results. Investment return and principal value of an investment will fluctuate so that an investor’s shares, when sold or redeemed, may be worth more or less than the original cost. Current performance may be lower or higher than the performance quoted. To obtain performance information current to the most recent month end, please visit www.csimfunds.com/schwabetfs_prospectus.
Average Annual Total Returns1
| Fund and Inception Date | 6 Months | 1 Year | 3 Years | Since Inception* |
| Fund: Schwab Short-Term U.S. Treasury ETF (8/5/10) | | | | |
| Market Price Return2 | 0.53% | 0.76% | 0.56% | 0.68% |
| NAV Return2 | 0.63% | 0.82% | 0.57% | 0.69% |
| Barclays U.S. 1-3 Year Treasury Bond Index | 0.68% | 0.90% | 0.66% | 0.79% |
| ETF Category: Morningstar Short Government3 | 0.44% | 0.57% | 0.49% | 1.04% |
Fund Expense Ratio4: 0.08%
Portfolio Composition % of investments
| By Security Type5 | |
| U.S. Government Obligations | 99.7% |
| Short-Term Investments & Other Assets6 | 0.3% |
| Weighted Average Maturity7 | 1.9 Yrs |
| Weighted Average Duration7 | 1.9 Yrs |
All total returns on this page assume dividends and distributions were reinvested. Index figures do not include trading and management costs, which would lower performance. Indices are unmanaged and cannot be invested in directly. Performance results less than one year are not annualized.
For index definitions, please see the Glossary.
Shares are bought and sold at market price, which may be higher or lower than the net asset value (NAV). Brokerage commissions will reduce returns.
Barclays and the names identifying the Barclays’ indices are trademarks or names of Barclays Bank PLC and its affiliates (“Barclays”) and have been licensed for use in connection with the listing and trading of the fund. The fund is not sponsored by, endorsed, sold or promoted by Barclays and Barclays makes no representation regarding the advisability of investing in such fund.
Portfolio holdings may have changed since the report date.
An index is a statistical composite of a specified financial market or sector. Unlike the fund, an index does not actually hold a portfolio of securities and its return is not inclusive of operational and transaction costs incurred by the fund.
Fixed income securities are subject to increased loss of principal during periods of rising interest rates. An investment in the fund is not insured or guaranteed by the Federal Deposit Insurance Corporation or any other government agency. Government backing applies only to the government issued bonds that make up the fund, not the fund itself.
| * | Inception (8/5/10) represents the date that the shares began trading in the secondary market. |
| 1 | Performance does not reflect the deduction of taxes that a shareholder would pay on fund distributions or on the redemption of fund shares. |
| 2 | ETF performance must be shown based on both a Market Price and a Net Asset Value (NAV) basis. The fund’s per share net asset value ("NAV") is the value of one share of the fund. NAV is calculated by taking the fund’s total assets (including the market value of securities owned), subtracting liabilities, and dividing by the number of shares outstanding. The NAV Return is based on the NAV of the fund, and the Market Price Return is based on the market price per share of the fund. The price used to calculate market return (“Market Price”) is determined by using the midpoint between the highest bid and the lowest offer on the primary stock exchange on which the shares of the fund are listed for trading, as of the time that the fund’s NAV is calculated. NAV is used as a proxy for purposes of calculating Market Price Return on inception date. Market Price and NAV returns assume that dividends and capital gain distributions have been reinvested in the fund at Market Price and NAV, respectively. |
| 3 | Source for category information: Morningstar, Inc. The Morningstar Category return represents all passively- and actively-managed ETFs within the category as of the report date. |
| 4 | As stated in the prospectus. |
| 5 | This list is not a recommendation of any security type by the investment adviser. |
| 6 | Represents the fund’s position in money market mutual funds registered under the Investment Company Act of 1940, as amended. |
| 7 | See Glossary for definitions of maturity and duration. |
6Schwab Fixed-Income ETFs
Schwab Intermediate-Term U.S. Treasury ETF
Performance and Fund Facts as of 06/30/15
The performance data quoted represents past performance. Past performance does not guarantee future results. Investment return and principal value of an investment will fluctuate so that an investor’s shares, when sold or redeemed, may be worth more or less than the original cost. Current performance may be lower or higher than the performance quoted. To obtain performance information current to the most recent month end, please visit www.csimfunds.com/schwabetfs_prospectus.
Average Annual Total Returns1
| Fund and Inception Date | 6 Months | 1 Year | 3 Years | Since Inception* |
| Fund: Schwab Intermediate-Term U.S. Treasury ETF (8/5/10) | | | | |
| Market Price Return2 | 0.66% | 2.41% | 0.94% | 2.81% |
| NAV Return2 | 0.88% | 2.53% | 1.00% | 2.83% |
| Barclays U.S. 3-10 Year Treasury Bond Index | 0.96% | 2.65% | 1.10% | 2.95% |
| ETF Category: Morningstar Intermediate Government3 | 0.75% | 2.13% | 0.98% | 2.69% |
Fund Expense Ratio4: 0.09%
Portfolio Composition % of investments
| By Security Type5 | |
| U.S. Government Obligations | 99.9% |
| Short-Term Investments & Other Assets6 | 0.1% |
| Weighted Average Maturity7 | 5.6 Yrs |
| Weighted Average Duration7 | 5.2 Yrs |
All total returns on this page assume dividends and distributions were reinvested. Index figures do not include trading and management costs, which would lower performance. Indices are unmanaged and cannot be invested in directly. Performance results less than one year are not annualized.
For index definitions, please see the Glossary.
Shares are bought and sold at market price, which may be higher or lower than the net asset value (NAV). Brokerage commissions will reduce returns.
Barclays and the names identifying the Barclays’ indices are trademarks or names of Barclays Bank PLC and its affiliates (“Barclays”) and have been licensed for use in connection with the listing and trading of the fund. The fund is not sponsored by, endorsed, sold or promoted by Barclays and Barclays makes no representation regarding the advisability of investing in such fund.
Portfolio holdings may have changed since the report date.
An index is a statistical composite of a specified financial market or sector. Unlike the fund, an index does not actually hold a portfolio of securities and its return is not inclusive of operational and transaction costs incurred by the fund.
Fixed income securities are subject to increased loss of principal during periods of rising interest rates. An investment in the fund is not insured or guaranteed by the Federal Deposit Insurance Corporation or any other government agency. Government backing applies only to the government issued bonds that make up the fund, not the fund itself.
| * | Inception (8/5/10) represents the date that the shares began trading in the secondary market. |
| 1 | Performance does not reflect the deduction of taxes that a shareholder would pay on fund distributions or on the redemption of fund shares. |
| 2 | ETF performance must be shown based on both a Market Price and a Net Asset Value (NAV) basis. The fund’s per share net asset value ("NAV") is the value of one share of the fund. NAV is calculated by taking the fund’s total assets (including the market value of securities owned), subtracting liabilities, and dividing by the number of shares outstanding. The NAV Return is based on the NAV of the fund, and the Market Price Return is based on the market price per share of the fund. The price used to calculate market return (“Market Price”) is determined by using the midpoint between the highest bid and the lowest offer on the primary stock exchange on which the shares of the fund are listed for trading, as of the time that the fund’s NAV is calculated. NAV is used as a proxy for purposes of calculating Market Price Return on inception date. Market Price and NAV returns assume that dividends and capital gain distributions have been reinvested in the fund at Market Price and NAV, respectively. |
| 3 | Source for category information: Morningstar, Inc. The Morningstar Category return represents all passively- and actively-managed ETFs within the category as of the report date. |
| 4 | As stated in the prospectus. |
| 5 | This list is not a recommendation of any security type by the investment adviser. |
| 6 | Represents the fund’s position in money market mutual funds registered under the Investment Company Act of 1940, as amended. |
| 7 | See Glossary for definitions of maturity and duration. |
Schwab Fixed-Income ETFs7
Schwab U.S. Aggregate Bond ETF
Performance and Fund Facts as of 06/30/15
The performance data quoted represents past performance. Past performance does not guarantee future results. Investment return and principal value of an investment will fluctuate so that an investor’s shares, when sold or redeemed, may be worth more or less than the original cost. Current performance may be lower or higher than the performance quoted. To obtain performance information current to the most recent month end, please visit www.csimfunds.com/schwabetfs_prospectus.
Average Annual Total Returns1
| Fund and Inception Date | 6 Months | 1 Year | 3 Years | Since Inception* |
| Fund: Schwab U.S. Aggregate Bond ETF (7/14/11) | | | | |
| Market Price Return2 | -0.36% | 1.74% | 1.64% | 2.82% |
| NAV Return2 | -0.05% | 1.88% | 1.75% | 2.83% |
| Barclays U.S. Aggregate Bond Index | -0.10% | 1.86% | 1.83% | 2.96% |
| ETF Category: Morningstar Intermediate-Term Bond3 | 0.19% | 1.83% | 1.98% | 3.08% |
Fund Expense Ratio4: 0.05%
Portfolio Composition % of investments
| By Security Type5 | |
| U.S. Government and Government Agencies | 35.8% |
| Mortgage-Backed Securities6 | 25.7% |
| Corporate Bonds | 21.7% |
| Short-Term Investments & Other Assets7 | 8.9% |
| Foreign Government Securities | 4.7% |
| Commercial Mortgage-Backed Securities | 1.8% |
| Municipal Bonds | 0.9% |
| Asset-Backed Obligations | 0.5% |
| Weighted Average Maturity8 | 7.4 Yrs |
| Weighted Average Duration8 | 5.3 Yrs |
All total returns on this page assume dividends and distributions were reinvested. Index figures do not include trading and management costs, which would lower performance. Indices are unmanaged and cannot be invested in directly. Performance results less than one year are not annualized.
For index definitions, please see the Glossary.
Shares are bought and sold at market price, which may be higher or lower than the net asset value (NAV). Brokerage commissions will reduce returns.
Barclays and the names identifying the Barclays’ indices are trademarks or names of Barclays Bank PLC and its affiliates (“Barclays”) and have been licensed for use in connection with the listing and trading of the fund. The fund is not sponsored by, endorsed, sold or promoted by Barclays and Barclays makes no representation regarding the advisability of investing in such fund.
Portfolio holdings may have changed since the report date.
An index is a statistical composite of a specified financial market or sector. Unlike the fund, an index does not actually hold a portfolio of securities and its return is not inclusive of operational and transaction costs incurred by the fund.
Fixed income securities are subject to increased loss of principal during periods of rising interest rates. An investment in the fund is not insured or guaranteed by the Federal Deposit Insurance Corporation or any other government agency. Government backing applies only to the government issued bonds that make up the fund, not the fund itself.
| * | Inception (7/14/11) represents the date that the shares began trading in the secondary market. |
| 1 | Performance does not reflect the deduction of taxes that a shareholder would pay on fund distributions or on the redemption of fund shares. |
| 2 | ETF performance must be shown based on both a Market Price and a Net Asset Value (NAV) basis. The fund’s per share net asset value ("NAV") is the value of one share of the fund. NAV is calculated by taking the fund’s total assets (including the market value of securities owned), subtracting liabilities, and dividing by the number of shares outstanding. The NAV Return is based on the NAV of the fund, and the Market Price Return is based on the market price per share of the fund. The price used to calculate market return (“Market Price”) is determined by using the midpoint between the highest bid and the lowest offer on the primary stock exchange on which the shares of the fund are listed for trading, as of the time that the fund’s NAV is calculated. NAV is used as a proxy for purposes of calculating Market Price Return on inception date. Market Price and NAV returns assume that dividends and capital gain distributions have been reinvested in the fund at Market Price and NAV, respectively. |
| 3 | Source for category information: Morningstar, Inc. The Morningstar Category return represents all passively- and actively-managed ETFs within the category as of the report date. |
| 4 | As stated in the prospectus. |
| 5 | This list is not a recommendation of any security type by the investment adviser. |
| 6 | The fund may seek to obtain exposure to U.S. agency mortgage pass-through securities, in part or in full, through the use of “to-be-announced” or “TBA” transactions, which are standardized contracts for future delivery of mortgage pass-through securities in which the exact mortgage pools to be delivered are not specified until a few days prior to settlement. These transactions represented approximately 8.1% of total investments on June 30, 2015. |
| 7 | Includes the fund’s position in money market mutual funds registered under the Investment Company Act of 1940, as amended. |
| 8 | See Glossary for definitions of maturity and duration. |
8Schwab Fixed-Income ETFs
Fund Expenses (Unaudited)
Examples for a $1,000 Investment
As a fund shareholder, you may incur two types of costs: (1) transaction costs, including brokerage commissions on purchases and sales of fund shares; and, (2) ongoing costs, including management fees and other fund expenses.
The expense examples below are intended to help you understand your ongoing cost (in dollars) of investing in a fund and to compare this cost with the ongoing cost of investing in other mutual funds. These examples are based on an investment of $1,000 invested for six months beginning January 1, 2015 and held through June 30, 2015.
Actual Return lines in the table below provide information about actual account values and actual expenses. You may use this information, together with the amount you invested, to estimate the expenses that you paid over the period. To do so, simply divide your account value by $1,000 (for example, an $8,600 account value ÷ $1,000 = 8.6), then multiply the result by the number given for your fund under the heading entitled “Expenses Paid During Period.”
Hypothetical Return lines in the table below provide information about hypothetical account values and hypothetical expenses based on a fund’s actual expense ratio and an assumed return of 5% per year before expenses. Because the return used is not an actual return, it may not be used to estimate the actual ending account value or expenses you paid for the period.
You may use this information to compare the ongoing costs of investing in a fund and other funds. To do so, compare this 5% hypothetical example with the 5% hypothetical examples that appear in the shareholder reports of the other funds.
Please note that the expenses shown in the table are meant to highlight your ongoing costs only, and do not reflect any transactional costs, including any brokerage commissions you may pay when purchasing or selling shares of a fund. Therefore, the hypothetical return lines of the table are useful in comparing ongoing costs only, and will not help you determine the relative total costs of owning different funds. In addition, if these transactional costs were included, your costs would have been higher.
| | Expense Ratio1
(Annualized) | Beginning
Account Value
at 1/1/15 | Ending
Account Value
(Net of Expenses)
at 6/30/15 | Expenses Paid
During Period2
1/1/15–6/30/15 |
| Schwab U.S. TIPS ETF | | | | |
| Actual Return | 0.07% | $1,000.00 | $ 1,003.00 | $ 0.35 |
| Hypothetical 5% Return | 0.07% | $1,000.00 | $ 1,024.45 | $ 0.35 |
| Schwab Short-Term U.S. Treasury ETF | | | | |
| Actual Return | 0.08% | $1,000.00 | $1,006.30 | $0.40 |
| Hypothetical 5% Return | 0.08% | $1,000.00 | $ 1,024.40 | $0.40 |
| Schwab Intermediate-Term U.S. Treasury ETF | | | | |
| Actual Return | 0.09% | $1,000.00 | $1,008.80 | $ 0.45 |
| Hypothetical 5% Return | 0.09% | $1,000.00 | $ 1,024.35 | $ 0.45 |
| Schwab U.S. Aggregate Bond ETF | | | | |
| Actual Return | 0.05% | $1,000.00 | $ 999.50 | $ 0.25 |
| Hypothetical 5% Return | 0.05% | $1,000.00 | $ 1,024.55 | $ 0.25 |
| 1 | Based on the most recent six-month expense ratio; may differ from the expense ratio provided in the Financial Highlights. |
| 2 | Expenses for each share class are equal to its annualized expense ratio, multiplied by the average account value over the period, multiplied by 181 days of the period, and divided by 365 days of the fiscal year. |
Schwab Fixed-Income ETFs9
Schwab U.S. TIPS ETF
Financial Statements
Financial Highlights
| | 1/1/15–
6/30/15* | 1/1/14–
12/31/14 | 1/1/13–
12/31/13 | 1/1/12–
12/31/12 | 1/1/11–
12/31/11 | 8/4/10 1–
12/31/10 |
| Per-Share Data ($) |
| Net asset value at beginning of period | 54.11 | 52.92 | 58.31 | 55.46 | 50.37 | 50.00 |
| Income (loss) from investment operations: | | | | | | |
| Net investment income (loss) | (0.12) 2 | 0.64 | 0.28 | 0.92 | 1.56 | 0.20 |
| Net realized and unrealized gains (losses) | 0.28 | 1.26 | (5.32) | 2.85 | 5.09 | 0.37 3 |
| Total from investment operations | 0.16 | 1.90 | (5.04) | 3.77 | 6.65 | 0.57 |
| Less distributions: | | | | | | |
| Distributions from net investment income | — | (0.71) | (0.35) | (0.92) | (1.56) | (0.20) |
| Net asset value at end of period | 54.27 | 54.11 | 52.92 | 58.31 | 55.46 | 50.37 |
| Total return (%) | 0.30 4 | 3.56 | (8.66) | 6.83 | 13.38 | 1.13 4 |
| Ratios/Supplemental Data (%) |
| Ratios to average net assets: | | | | | | |
| Total expenses | 0.07 5 | 0.07 | 0.07 | 0.12 6 | 0.14 | 0.14 5 |
| Net investment income (loss) | (0.44) 5 | 1.10 | 0.51 | 1.72 | 3.03 | 1.27 5 |
| Portfolio turnover rate7 | 11 4 | 20 | 20 | 22 | 26 | 6 4 |
| Net assets, end of period ($ x 1,000) | 729,995 | 549,259 | 399,564 | 571,441 | 288,373 | 80,591 |
| |
1
Commencement of operations.
2
Calculated based on the average shares outstanding during the period.
3
The per share amount does not accord with the change in aggregate gains and losses in securities during the period because of the timing of sales and repurchases of fund shares in relation to fluctuating market values.
4
Not annualized.
5
Annualized.
6
Effective September 20, 2012, the annual operating expense ratio was reduced. The ratio presented for the period ended 12/31/12 is a blended ratio.
7
Portfolio turnover rate excludes securities received or delivered from processing of in-kind creations or redemptions.
Portfolio Holdings as of June 30, 2015 (Unaudited)
This section shows all the securities in the fund's portfolio and their values as of the report date.
The fund files its complete schedule of portfolio holdings with the SEC for the first and third quarters of each fiscal year on Form N-Q. The fund's Form N-Q is available on the SEC's website at www.sec.gov and may be viewed and copied at the SEC's Public Reference Room in Washington, D.C. Call 1-800-SEC-0330 for information on the operation of the Public Reference Room. The fund also makes available its complete schedule of portfolio holdings on a daily basis on the fund's website at www.csimfunds.com/schwabetfs_prospectus.
For fixed rate obligations, the rate shown is the interest rate (the rate established when the obligation was issued). For variable rate obligations, the rate shown is the rate as of the report date. The maturity date shown for all the securities is the final legal maturity.
| Holdings by Category | Cost
($) | Value
($) |
| 99.5% | U.S. Government Securities | 735,734,806 | 726,707,058 |
| 0.1% | Other Investment Company | 411,053 | 411,053 |
| 99.6% | Total Investments | 736,145,859 | 727,118,111 |
| 0.4% | Other Assets and
Liabilities, Net | | 2,876,497 |
| 100.0% | Net Assets | | 729,994,608 |
Security
Rate, Maturity Date | Face
Amount ($) | Value
($) |
| U.S. Government Securities 99.5% of net assets |
| U.S. Treasury Obligations 99.5% |
| U.S. Treasury Inflation Protected Securities |
| 2.50%, 07/15/16 | 15,129,665 | 15,692,337 |
| 2.38%, 01/15/17 | 13,119,337 | 13,756,806 |
| 0.13%, 04/15/17 | 34,968,226 | 35,432,604 |
| 2.63%, 07/15/17 | 11,247,200 | 12,069,708 |
| 1.63%, 01/15/18 | 11,877,873 | 12,549,685 |
| 0.13%, 04/15/18 | 38,878,176 | 39,473,401 |
| 1.38%, 07/15/18 | 11,713,951 | 12,420,419 |
| 2.13%, 01/15/19 | 10,900,292 | 11,864,314 |
| 0.13%, 04/15/19 | 38,509,444 | 39,008,911 |
| 1.88%, 07/15/19 | 12,383,232 | 13,507,382 |
| 1.38%, 01/15/20 | 15,019,119 | 16,068,054 |
| 0.13%, 04/15/20 | 13,873,901 | 13,997,518 |
Security
Rate, Maturity Date | Face
Amount ($) | Value
($) |
| 1.25%, 07/15/20 | 23,079,546 | 24,713,117 |
| 1.13%, 01/15/21 | 26,400,742 | 27,956,009 |
| 0.63%, 07/15/21 | 28,022,525 | 28,955,115 |
| 0.13%, 01/15/22 | 30,930,882 | 30,693,951 |
| 0.13%, 07/15/22 | 31,904,836 | 31,680,546 |
| 0.13%, 01/15/23 | 32,052,550 | 31,526,568 |
| 0.38%, 07/15/23 | 31,793,462 | 31,947,343 |
| 0.63%, 01/15/24 | 31,719,086 | 32,303,986 |
| 0.13%, 07/15/24 | 31,169,444 | 30,438,832 |
| 0.25%, 01/15/25 | 31,247,338 | 30,695,510 |
| 2.38%, 01/15/25 | 20,515,863 | 24,163,788 |
| 2.00%, 01/15/26 | 14,942,785 | 17,172,548 |
| 2.38%, 01/15/27 | 12,023,612 | 14,415,229 |
| 1.75%, 01/15/28 | 11,993,058 | 13,602,766 |
| 3.63%, 04/15/28 | 10,132,401 | 13,825,965 |
| 2.50%, 01/15/29 | 11,613,239 | 14,336,891 |
| 3.88%, 04/15/29 | 12,333,345 | 17,497,933 |
| 3.38%, 04/15/32 | 4,685,000 | 6,614,612 |
| 2.13%, 02/15/40 | 6,346,374 | 7,820,890 |
| 2.13%, 02/15/41 | 8,071,146 | 10,013,306 |
| 0.75%, 02/15/42 | 14,202,692 | 13,062,073 |
| 0.63%, 02/15/43 | 10,483,656 | 9,304,245 |
| 1.38%, 02/15/44 | 15,873,432 | 16,954,730 |
| 0.75%, 02/15/45 | 12,224,313 | 11,169,966 |
| Total U.S. Government Securities |
| (Cost $735,734,806) | | 726,707,058 |
| Security | Number
of Shares | Value
($) |
| Other Investment Company 0.1% of net assets |
| Money Market Fund 0.1% |
| State Street Institutional U.S. Government Money Market Fund, Premier Class 0.00% (a) | 411,053 | 411,053 |
| Total Other Investment Company |
| (Cost $411,053) | | 411,053 |
End of Investments
At 06/30/15, the tax basis cost of the fund's investments was $737,815,024 and the unrealized appreciation and depreciation were $0 and ($10,696,913), respectively, with a net unrealized depreciation of ($10,696,913).
| (a) | The rate shown is the 7-day yield. |
Portfolio Holdings (Unaudited) continued
The following is a summary of the inputs used to value the fund’s investments as of June 30, 2015 (see financial note 2(a) for additional information):
| Description | | Quoted Prices in
Active Markets for
Identical Assets
(Level 1) | | Other Significant
Observable Inputs
(Level 2) | | Significant
Unobservable
Inputs
(Level 3) | | Total | |
| U.S. Government Securities1 | | $— | | $726,707,058 | | $— | | $726,707,058 | |
| Other Investment Company1 | | 411,053 | | — | | — | | 411,053 | |
| Total | | $411,053 | | $726,707,058 | | $— | | $727,118,111 | |
| 1 | As categorized in Portfolio Holdings. |
The fund's policy is to recognize transfers between Level 1, Level 2 and Level 3 as of the beginning of the fiscal year. There were no transfers between Level 1, Level 2 and Level 3 for the period ended June 30, 2015.
Statement of
Assets and Liabilities
As of June 30, 2015; unaudited
| Assets |
| Investments, at value (cost $736,145,859) | | $727,118,111 |
| Receivables: | | |
| Investments sold | | 4,885,107 |
| Fund shares sold | | 5,427,469 |
| Interest | + | 2,798,735 |
| Total assets | | 740,229,422 |
| Liabilities |
| Payables: | | |
| Investments bought | | 10,225,130 |
| Investment adviser fees | + | 9,684 |
| Total liabilities | | 10,234,814 |
| Net Assets |
| Total assets | | 740,229,422 |
| Total liabilities | – | 10,234,814 |
| Net assets | | $729,994,608 |
| Net Assets by Source | | |
| Capital received from investors | | 749,463,616 |
| Net investment loss | | (2,029,599) |
| Net realized capital losses | | (8,411,661) |
| Net unrealized capital depreciation | | (9,027,748) |
| Net Asset Value (NAV) |
| Net Assets | ÷ | Shares
Outstanding | = | NAV |
| $729,994,608 | | 13,450,000 | | $54.27 |
| | | | | |
Statement of
Operations
For the period January 1, 2015 through June 30, 2015; unaudited
| Investment Income |
| Interest | | ($1,216,768)* |
| Securities on loan | + | 559 |
| Total investment income | | (1,216,209) |
| Expenses |
| Investment adviser fees | | 227,145 |
| Total expenses | – | 227,145 |
| Net investment loss | | (1,443,354) |
| Realized and Unrealized Gains (Losses) |
| Net realized losses on investments | | (1,033,036) |
| Net realized gains on in-kind redemptions | + | 240,258 |
| Net realized losses | | (792,778) |
| Net change in unrealized appreciation (depreciation) on investments | + | 2,005,575 |
| Net realized and unrealized gains | | 1,212,797 |
| Decrease in net assets resulting from operations | | ($230,557) |
| * | See financial note 2(b) regarding inflation-protected securities. |
Statement of
Changes in Net Assets
For the current and prior report periods
Figures for the current period are unaudited
| Operations | |
| | 1/1/15-6/30/15 | 1/1/14-12/31/14 |
| Net investment income (loss) | | ($1,443,354) | $5,061,689 |
| Net realized losses | | (792,778) | (1,726,513) |
| Net change in unrealized appreciation (depreciation) | + | 2,005,575 | 9,643,974 |
| Increase (Decrease) in net assets resulting from operations | | (230,557) | 12,979,150 |
| Distributions to Shareholders | |
| Distributions from net investment income | | ($—) | ($5,900,895) |
| Transactions in Fund Shares | | | |
| | | 1/1/15-6/30/15 | 1/1/14-12/31/14 |
| | | SHARES | VALUE | SHARES | VALUE |
| Shares sold | | 3,400,000 | $186,438,375 | 3,300,000 | $181,061,371 |
| Shares redeemed | + | (100,000) | (5,471,714) | (700,000) | (38,445,207) |
| Net transactions in fund shares | | 3,300,000 | $180,966,661 | 2,600,000 | $142,616,164 |
| Shares Outstanding and Net Assets | | | |
| | | 1/1/15-6/30/15 | 1/1/14-12/31/14 |
| | | SHARES | NET ASSETS | SHARES | NET ASSETS |
| Beginning of period | | 10,150,000 | $549,258,504 | 7,550,000 | $399,564,085 |
| Total increase | + | 3,300,000 | 180,736,104 | 2,600,000 | 149,694,419 |
| End of period | | 13,450,000 | $729,994,608 | 10,150,000 | $549,258,504 |
| Net investment loss/Distribution in excess of net investment income | | | ($2,029,599) | | ($586,245) |
Schwab Short-Term U.S. Treasury ETF
Financial Statements
Financial Highlights
| | 1/1/15–
6/30/15* | 1/1/14–
12/31/14 | 1/1/13–
12/31/13 | 1/1/12–
12/31/12 | 1/1/11–
12/31/11 | 8/4/10 1–
12/31/10 |
| Per-Share Data ($) |
| Net asset value at beginning of period | 50.55 | 50.51 | 50.53 | 50.50 | 49.99 | 50.00 |
| Income (loss) from investment operations: | | | | | | |
| Net investment income (loss) | 0.17 2 | 0.24 | 0.15 | 0.15 | 0.21 | 0.06 |
| Net realized and unrealized gains (losses) | 0.15 | 0.04 | (0.02) | 0.03 | 0.51 | (0.01) |
| Total from investment operations | 0.32 | 0.28 | 0.13 | 0.18 | 0.72 | 0.05 |
| Less distributions: | | | | | | |
| Distributions from net investment income | (0.14) | (0.24) | (0.15) | (0.15) | (0.21) | (0.06) |
| Net asset value at end of period | 50.73 | 50.55 | 50.51 | 50.53 | 50.50 | 49.99 |
| Total return (%) | 0.63 3 | 0.55 | 0.25 | 0.35 | 1.43 | 0.11 3 |
| Ratios/Supplemental Data (%) |
| Ratios to average net assets: | | | | | | |
| Total expenses | 0.08 4 | 0.08 | 0.08 | 0.11 5 | 0.12 | 0.12 4 |
| Net investment income (loss) | 0.66 4 | 0.49 | 0.31 | 0.29 | 0.42 | 0.37 4 |
| Portfolio turnover rate6 | 31 3 | 109 | 101 | 101 | 74 | 48 3 |
| Net assets, end of period ($ x 1,000) | 847,140 | 702,651 | 444,497 | 250,105 | 181,805 | 49,990 |
| |
1
Commencement of operations.
2
Calculated based on the average shares outstanding during the period.
3
Not annualized.
4
Annualized.
5
Effective September 20, 2012, the annual operating expense ratio was reduced. The ratio presented for the period ended 12/31/12 is a blended ratio.
6
Portfolio turnover rate excludes securities received or delivered from processing of in-kind creations or redemptions.
Schwab Short-Term U.S. Treasury ETF
Portfolio Holdings as of June 30, 2015 (Unaudited)
This section shows all the securities in the fund's portfolio and their values as of the report date.
The fund files its complete schedule of portfolio holdings with the SEC for the first and third quarters of each fiscal year on Form N-Q. The fund's Form N-Q is available on the SEC's website at www.sec.gov and may be viewed and copied at the SEC's Public Reference Room in Washington, D.C. Call 1-800-SEC-0330 for information on the operation of the Public Reference Room. The fund also makes available its complete schedule of portfolio holdings on a daily basis on the fund's website at www.csimfunds.com/schwabetfs_prospectus.
For fixed rate obligations, the rate shown is the interest rate (the rate established when the obligation was issued). For variable rate obligations, the rate shown is the rate as of the report date. The maturity date shown for all the securities is the final legal maturity.
| Holdings by Category | Cost
($) | Value
($) |
| 99.4% | U.S. Government Securities | 839,453,322 | 841,906,680 |
| 0.3% | Other Investment Company | 2,877,913 | 2,877,913 |
| 99.7% | Total Investments | 842,331,235 | 844,784,593 |
| 0.3% | Other Assets and
Liabilities, Net | | 2,355,877 |
| 100.0% | Net Assets | | 847,140,470 |
Security
Rate, Maturity Date | Face
Amount ($) | Value
($) |
| U.S. Government Securities 99.4% of net assets |
| U.S. Treasury Obligations 99.4% |
| U.S. Treasury Bonds |
| 7.50%, 11/15/16 | 3,905,000 | 4,282,840 |
| 8.88%, 08/15/17 | 6,545,000 | 7,674,013 |
| U.S. Treasury Notes |
| 0.63%, 07/15/16 | 15,380,000 | 15,423,249 |
| 1.50%, 07/31/16 | 12,390,000 | 12,541,976 |
| 3.25%, 07/31/16 | 10,285,000 | 10,603,197 |
| 0.63%, 08/15/16 | 9,855,000 | 9,883,491 |
| 1.00%, 08/31/16 | 8,446,000 | 8,507,369 |
| 3.00%, 08/31/16 | 30,764,000 | 31,703,748 |
| 0.88%, 09/15/16 | 5,163,000 | 5,193,250 |
| 0.50%, 09/30/16 | 11,287,000 | 11,302,870 |
| 1.00%, 09/30/16 | 4,432,000 | 4,465,931 |
| 3.00%, 09/30/16 | 12,912,000 | 13,330,633 |
| 0.63%, 10/15/16 | 17,889,000 | 17,937,909 |
| 0.38%, 10/31/16 | 7,201,000 | 7,197,061 |
| 1.00%, 10/31/16 | 9,147,000 | 9,217,029 |
| 3.13%, 10/31/16 | 1,425,000 | 1,475,988 |
| 0.63%, 11/15/16 | 14,796,000 | 14,835,298 |
| 4.63%, 11/15/16 | 11,805,000 | 12,480,104 |
| 0.50%, 11/30/16 | 12,501,000 | 12,509,788 |
| 0.88%, 11/30/16 | 19,588,000 | 19,704,314 |
| 2.75%, 11/30/16 | 2,832,000 | 2,923,156 |
| 0.63%, 12/15/16 | 17,285,000 | 17,323,494 |
| 3.25%, 12/31/16 | 18,234,000 | 18,988,997 |
| 0.75%, 01/15/17 | 18,316,000 | 18,386,114 |
| 0.63%, 02/15/17 | 14,538,000 | 14,558,440 |
Security
Rate, Maturity Date | Face
Amount ($) | Value
($) |
| 4.63%, 02/15/17 | 15,712,000 | 16,751,694 |
| 0.88%, 02/28/17 | 11,665,000 | 11,728,796 |
| 3.00%, 02/28/17 | 13,877,000 | 14,442,918 |
| 0.50%, 03/31/17 | 6,412,000 | 6,405,986 |
| 1.00%, 03/31/17 | 24,893,000 | 25,085,522 |
| 3.25%, 03/31/17 | 14,886,000 | 15,586,103 |
| 0.88%, 04/15/17 | 11,665,000 | 11,727,886 |
| 0.88%, 04/30/17 | 13,763,000 | 13,833,962 |
| 3.13%, 04/30/17 | 20,859,000 | 21,823,729 |
| 4.50%, 05/15/17 | 11,905,000 | 12,767,184 |
| 0.63%, 05/31/17 | 28,097,000 | 28,094,808 |
| 2.75%, 05/31/17 | 21,727,000 | 22,613,049 |
| 0.88%, 06/15/17 | 2,605,000 | 2,617,006 |
| 0.63%, 06/30/17 | 10,000,000 | 9,996,880 |
| 0.75%, 06/30/17 | 13,793,000 | 13,821,014 |
| 2.50%, 06/30/17 | 5,000,000 | 5,185,155 |
| 0.88%, 07/15/17 | 15,091,000 | 15,154,669 |
| 0.50%, 07/31/17 | 8,244,000 | 8,215,657 |
| 2.38%, 07/31/17 | 8,627,000 | 8,927,599 |
| 0.63%, 08/31/17 | 16,663,000 | 16,635,656 |
| 1.88%, 08/31/17 | 4,899,000 | 5,022,239 |
| 1.00%, 09/15/17 | 1,128,000 | 1,134,609 |
| 0.63%, 09/30/17 | 12,260,000 | 12,224,556 |
| 1.88%, 09/30/17 | 11,713,000 | 12,010,405 |
| 0.88%, 10/15/17 | 14,881,000 | 14,915,881 |
| 0.88%, 11/15/17 | 14,881,000 | 14,910,063 |
| 0.63%, 11/30/17 | 15,121,000 | 15,057,205 |
| 2.25%, 11/30/17 | 8,651,000 | 8,953,110 |
| 0.75%, 12/31/17 | 16,807,000 | 16,772,865 |
| 2.75%, 12/31/17 | 16,807,000 | 17,609,265 |
| 0.88%, 01/15/18 | 8,110,000 | 8,113,171 |
| 3.50%, 02/15/18 | 8,102,000 | 8,650,781 |
| 0.75%, 02/28/18 | 13,900,000 | 13,845,707 |
| 2.75%, 02/28/18 | 13,900,000 | 14,578,709 |
| 0.75%, 03/31/18 | 2,928,000 | 2,913,360 |
| 2.88%, 03/31/18 | 2,608,000 | 2,745,530 |
| 0.75%, 04/15/18 | 16,572,000 | 16,486,555 |
| 0.63%, 04/30/18 | 3,524,000 | 3,492,615 |
| 2.63%, 04/30/18 | 2,608,000 | 2,730,657 |
| 1.00%, 05/15/18 | 16,572,000 | 16,591,422 |
| 1.00%, 05/31/18 | 17,204,000 | 17,210,727 |
| 2.38%, 05/31/18 | 11,462,000 | 11,924,056 |
| 1.13%, 06/15/18 | 10,000,000 | 10,038,280 |
| 1.38%, 06/30/18 | 10,000,000 | 10,109,380 |
| Total U.S. Government Securities |
| (Cost $839,453,322) | | 841,906,680 |
| Security | Number
of Shares | Value
($) |
| Other Investment Company 0.3% of net assets |
| Money Market Fund 0.3% |
| State Street Institutional U.S. Government Money Market Fund, Premier Class 0.00% (a) | 2,877,913 | 2,877,913 |
| Total Other Investment Company |
| (Cost $2,877,913) | | 2,877,913 |
End of Investments
Schwab Short-Term U.S. Treasury ETF
Portfolio Holdings (Unaudited) continued
At 6/30/15, the tax basis cost of the fund's investments was $842,331,235 and the unrealized appreciation and depreciation were $2,493,702 and ($40,344), respectively, with a net unrealized appreciation of $2,453,358.
| (a) | The rate shown is the 7-day yield. |
The following is a summary of the inputs used to value the fund’s investments as of June 30, 2015 (see financial note 2(a) for additional information):
| Description | | Quoted Prices in
Active Markets for
Identical Assets
(Level 1) | | Other Significant
Observable Inputs
(Level 2) | | Significant
Unobservable
Inputs
(Level 3) | | Total | |
| U.S. Government Securities1 | | $— | | $841,906,680 | | $— | | $841,906,680 | |
| Other Investment Company1 | | 2,877,913 | | — | | — | | 2,877,913 | |
| Total | | $2,877,913 | | $841,906,680 | | $— | | $844,784,593 | |
| 1 | As categorized in Portfolio Holdings. |
The fund's policy is to recognize transfers between Level 1, Level 2 and Level 3 as of the beginning of the fiscal year. There were no transfers between Level 1, Level 2 and Level 3 for the period ended June 30, 2015.
Schwab Short-Term U.S. Treasury ETF
Statement of
Assets and Liabilities
As of June 30, 2015; unaudited
| Assets |
| Investments, at value (cost $842,331,235) | | $844,784,593 |
| Receivables: | | |
| Investments sold | | 34,165,583 |
| Fund shares sold | | 30,396,128 |
| Interest | + | 3,009,992 |
| Total assets | | 912,356,296 |
| Liabilities |
| Payables: | | |
| Investments bought | | 65,203,303 |
| Investment adviser fees | + | 12,523 |
| Total liabilities | | 65,215,826 |
| Net Assets |
| Total assets | | 912,356,296 |
| Total liabilities | – | 65,215,826 |
| Net assets | | $847,140,470 |
| Net Assets by Source | | |
| Capital received from investors | | 844,263,753 |
| Net investment income not yet distributed | | 431,629 |
| Net realized capital losses | | (8,270) |
| Net unrealized capital appreciation | | 2,453,358 |
| Net Asset Value (NAV) |
| Net Assets | ÷ | Shares
Outstanding | = | NAV |
| $847,140,470 | | 16,700,000 | | $50.73 |
| | | | | |
Schwab Short-Term U.S. Treasury ETF
Statement of
Operations
For the period January 1, 2015 through June 30, 2015; unaudited
| Investment Income |
| Interest | | $2,637,831 |
| Expenses |
| Investment adviser fees | | 285,519 |
| Total expenses | – | 285,519 |
| Net investment income | | 2,352,312 |
| Realized and Unrealized Gains (Losses) |
| Net realized gains on investments | | 20,095 |
| Net realized gains on in-kind redemptions | + | 243,007 |
| Net realized gains | | 263,102 |
| Net change in unrealized appreciation (depreciation) on investments | + | 1,996,567 |
| Net realized and unrealized gains | | 2,259,669 |
| Increase in net assets resulting from operations | | $4,611,981 |
Schwab Short-Term U.S. Treasury ETF
Statement of
Changes in Net Assets
For the current and prior report periods
Figures for the current period are unaudited
| Operations | |
| | 1/1/15-6/30/15 | 1/1/14-12/31/14 |
| Net investment income | | $2,352,312 | $2,718,927 |
| Net realized gains | | 263,102 | 95,206 |
| Net change in unrealized appreciation (depreciation) | + | 1,996,567 | (1,834) |
| Increase in net assets resulting from operations | | 4,611,981 | 2,812,299 |
| Distributions to Shareholders | |
| Distributions from net investment income | | ($1,923,275) | ($2,716,335) |
| Transactions in Fund Shares | | | |
| | | 1/1/15-6/30/15 | 1/1/14-12/31/14 |
| | | SHARES | VALUE | SHARES | VALUE |
| Shares sold | | 4,150,000 | $210,304,496 | 6,100,000 | $308,679,042 |
| Shares redeemed | + | (1,350,000) | (68,503,429) | (1,000,000) | (50,621,716) |
| Net transactions in fund shares | | 2,800,000 | $141,801,067 | 5,100,000 | $258,057,326 |
| Shares Outstanding and Net Assets | | | |
| | | 1/1/15-6/30/15 | 1/1/14-12/31/14 |
| | | SHARES | NET ASSETS | SHARES | NET ASSETS |
| Beginning of period | | 13,900,000 | $702,650,697 | 8,800,000 | $444,497,407 |
| Total increase | + | 2,800,000 | 144,489,773 | 5,100,000 | 258,153,290 |
| End of period | | 16,700,000 | $847,140,470 | 13,900,000 | $702,650,697 |
| Net investment income not yet distributed | | | $431,629 | | $2,592 |
Schwab Intermediate-Term U.S. Treasury ETF
Financial Statements
Financial Highlights
| | 1/1/15–
6/30/15* | 1/1/14–
12/31/14 | 1/1/13–
12/31/13 | 1/1/12–
12/31/12 | 1/1/11–
12/31/11 | 8/4/10 1–
12/31/10 |
| Per-Share Data ($) |
| Net asset value at beginning of period | 53.52 | 52.08 | 54.18 | 53.39 | 49.31 | 50.00 |
| Income (loss) from investment operations: | | | | | | |
| Net investment income (loss) | 0.42 2 | 0.77 | 0.56 | 0.58 | 0.82 | 0.28 |
| Net realized and unrealized gains (losses) | 0.06 3 | 1.44 | (2.10) | 0.79 | 4.08 | (0.69) |
| Total from investment operations | 0.48 | 2.21 | (1.54) | 1.37 | 4.90 | (0.41) |
| Less distributions: | | | | | | |
| Distributions from net investment income | (0.35) | (0.77) | (0.56) | (0.58) | (0.82) | (0.28) |
| Net asset value at end of period | 53.65 | 53.52 | 52.08 | 54.18 | 53.39 | 49.31 |
| Total return (%) | 0.88 4 | 4.27 | (2.86) | 2.57 | 10.02 | (0.83) 4 |
| Ratios/Supplemental Data (%) |
| Ratios to average net assets: | | | | | | |
| Total expenses | 0.09 5,6 | 0.10 | 0.10 | 0.11 7 | 0.12 | 0.12 5 |
| Net investment income (loss) | 1.58 5,6 | 1.43 | 1.06 | 1.07 | 1.62 | 1.58 5 |
| Portfolio turnover rate8 | 14 4 | 49 | 54 | 47 | 46 | 20 4 |
| Net assets, end of period ($ x 1,000) | 340,686 | 254,226 | 236,969 | 216,733 | 117,452 | 34,517 |
| |
1
Commencement of operations.
2
Calculated based on the average shares outstanding during the period.
3
The per share amount does not accord with the change in aggregate gains and losses in securities on the Statement of Operations during the period because of the timing of sales and repurchases of fund shares in relation to fluctuating market values.
4
Not annualized.
5
Annualized.
6
Effective February 24, 2015, the annual operating expense ratio was reduced. The ratio presented for the period ended 6/30/15 is a blended ratio. (See financial note 4)
7
Effective September 20, 2012, the annual operating expense ratio was reduced. The ratio presented for the period ended 12/31/12 is a blended ratio.
8
Portfolio turnover rate excludes securities received or delivered from processing of in-kind creations or redemptions.
Schwab Intermediate-Term U.S. Treasury ETF
Portfolio Holdings as of June 30, 2015 (Unaudited)
This section shows all the securities in the fund's portfolio and their values as of the report date.
The fund files its complete schedule of portfolio holdings with the SEC for the first and third quarters of each fiscal year on Form N-Q. The fund's Form N-Q is available on the SEC's website at www.sec.gov and may be viewed and copied at the SEC's Public Reference Room in Washington, D.C. Call 1-800-SEC-0330 for information on the operation of the Public Reference Room. The fund also makes available its complete schedule of portfolio holdings on a daily basis on the fund's website at www.csimfunds.com/schwabetfs_prospectus.
For fixed rate obligations, the rate shown is the interest rate (the rate established when the obligation was issued). For variable rate obligations, the rate shown is the rate as of the report date. The maturity date shown for all the securities is the final legal maturity.
| Holdings by Category | Cost
($) | Value
($) |
| 99.4% | U.S. Government Securities | 339,206,423 | 338,741,756 |
| 0.2% | Other Investment Company | 470,591 | 470,591 |
| 99.6% | Total Investments | 339,677,014 | 339,212,347 |
| 0.4% | Other Assets and
Liabilities, Net | | 1,473,810 |
| 100.0% | Net Assets | | 340,686,157 |
Security
Rate, Maturity Date | Face
Amount ($) | Value
($) |
| U.S. Government Securities 99.4% of net assets |
| U.S. Treasury Obligations 99.4% |
| U.S. Treasury Bonds |
| 8.50%, 02/15/20 | 918,000 | 1,203,799 |
| 8.75%, 05/15/20 | 674,000 | 899,369 |
| 8.75%, 08/15/20 | 3,107,000 | 4,190,809 |
| U.S. Treasury Notes |
| 1.38%, 07/31/18 | 4,110,000 | 4,151,421 |
| 4.00%, 08/15/18 | 1,665,000 | 1,818,883 |
| 1.50%, 08/31/18 | 6,207,000 | 6,288,467 |
| 1.38%, 09/30/18 | 7,351,000 | 7,412,447 |
| 1.25%, 10/31/18 | 5,094,000 | 5,111,911 |
| 3.75%, 11/15/18 | 5,962,000 | 6,476,222 |
| 1.25%, 11/30/18 | 4,173,000 | 4,183,758 |
| 1.38%, 12/31/18 | 6,960,000 | 7,000,236 |
| 1.25%, 01/31/19 | 4,126,000 | 4,127,613 |
| 2.75%, 02/15/19 | 2,876,000 | 3,029,012 |
| 1.38%, 02/28/19 | 4,719,000 | 4,735,960 |
| 1.50%, 02/28/19 | 3,630,000 | 3,660,913 |
| 1.25%, 04/30/19 | 3,120,000 | 3,113,173 |
| 3.13%, 05/15/19 | 5,081,000 | 5,422,382 |
| 1.50%, 05/31/19 | 2,146,000 | 2,158,071 |
| 1.00%, 06/30/19 | 2,689,000 | 2,650,765 |
| 1.63%, 06/30/19 | 1,561,000 | 1,575,878 |
| 1.63%, 07/31/19 | 4,639,000 | 4,678,868 |
| 3.63%, 08/15/19 | 6,092,000 | 6,632,190 |
| 1.63%, 08/31/19 | 3,175,000 | 3,200,797 |
| 1.00%, 09/30/19 | 5,486,000 | 5,383,993 |
| 3.38%, 11/15/19 | 4,554,000 | 4,916,899 |
Security
Rate, Maturity Date | Face
Amount ($) | Value
($) |
| 1.00%, 11/30/19 | 3,277,000 | 3,205,571 |
| 1.50%, 11/30/19 | 3,855,000 | 3,855,902 |
| 1.13%, 12/31/19 | 4,901,000 | 4,815,233 |
| 1.25%, 01/31/20 | 3,869,000 | 3,817,314 |
| 3.63%, 02/15/20 | 8,891,000 | 9,710,644 |
| 1.25%, 02/29/20 | 6,895,000 | 6,793,726 |
| 1.38%, 02/29/20 | 3,560,000 | 3,529,405 |
| 1.38%, 03/31/20 | 2,800,000 | 2,772,655 |
| 1.13%, 04/30/20 | 2,673,000 | 2,611,812 |
| 1.38%, 04/30/20 | 2,624,000 | 2,595,506 |
| 3.50%, 05/15/20 | 4,506,000 | 4,900,978 |
| 1.38%, 05/31/20 | 6,519,000 | 6,442,095 |
| 1.88%, 06/30/20 | 1,300,000 | 1,315,133 |
| 2.63%, 08/15/20 | 7,647,000 | 7,997,087 |
| 2.00%, 09/30/20 | 2,849,000 | 2,890,621 |
| 1.75%, 10/31/20 | 2,897,000 | 2,898,585 |
| 2.63%, 11/15/20 | 6,339,000 | 6,621,282 |
| 2.00%, 11/30/20 | 3,278,000 | 3,319,231 |
| 2.38%, 12/31/20 | 3,167,000 | 3,264,981 |
| 2.13%, 01/31/21 | 7,013,000 | 7,129,703 |
| 3.63%, 02/15/21 | 5,794,000 | 6,357,107 |
| 2.00%, 02/28/21 | 2,509,000 | 2,531,541 |
| 2.25%, 04/30/21 | 3,510,000 | 3,583,766 |
| 3.13%, 05/15/21 | 5,833,000 | 6,239,490 |
| 2.00%, 05/31/21 | 6,199,000 | 6,238,711 |
| 2.13%, 06/30/21 | 2,500,000 | 2,531,250 |
| 2.25%, 07/31/21 | 2,993,000 | 3,049,819 |
| 2.13%, 08/15/21 | 4,715,000 | 4,768,412 |
| 2.00%, 10/31/21 | 4,581,000 | 4,589,589 |
| 2.00%, 11/15/21 | 5,336,000 | 5,346,005 |
| 1.88%, 11/30/21 | 4,459,000 | 4,430,436 |
| 2.13%, 12/31/21 | 1,596,000 | 1,608,594 |
| 1.50%, 01/31/22 | 2,646,000 | 2,561,865 |
| 2.00%, 02/15/22 | 2,745,000 | 2,744,786 |
| 1.75%, 02/28/22 | 2,356,000 | 2,315,138 |
| 1.75%, 04/30/22 | 424,000 | 416,083 |
| 1.75%, 05/15/22 | 6,323,000 | 6,201,478 |
| 1.88%, 05/31/22 | 3,136,000 | 3,101,454 |
| 2.13%, 06/30/22 | 1,500,000 | 1,506,446 |
| 1.63%, 08/15/22 | 5,450,000 | 5,283,519 |
| 1.63%, 11/15/22 | 2,796,000 | 2,702,946 |
| 2.00%, 02/15/23 | 9,532,000 | 9,428,492 |
| 1.75%, 05/15/23 | 5,944,000 | 5,749,893 |
| 2.50%, 08/15/23 | 5,008,000 | 5,116,378 |
| 2.75%, 11/15/23 | 6,766,000 | 7,033,994 |
| 2.75%, 02/15/24 | 8,774,000 | 9,109,877 |
| 2.50%, 05/15/24 | 2,668,000 | 2,713,858 |
| 2.38%, 08/15/24 | 6,943,000 | 6,980,971 |
| 2.25%, 11/15/24 | 7,683,000 | 7,636,779 |
| 2.00%, 02/15/25 | 8,019,000 | 7,791,589 |
| 2.13%, 05/15/25 | 4,644,000 | 4,560,190 |
| Total U.S. Government Securities |
| (Cost $339,206,423) | | 338,741,756 |
Schwab Intermediate-Term U.S. Treasury ETF
Portfolio Holdings (Unaudited) continued
| Security | Number
of Shares | Value
($) |
| Other Investment Company 0.2% of net assets |
| Money Market Fund 0.2% |
| State Street Institutional U.S. Government Money Market Fund, Premier Class 0.00% (a) | 470,591 | 470,591 |
| Total Other Investment Company |
| (Cost $470,591) | | 470,591 |
End of Investments
At 6/30/15, the tax basis cost of the fund's investments was $339,677,910 and the unrealized appreciation and depreciation were $1,104,709 and ($1,570,272), respectively, with a net unrealized depreciation of ($465,563).
| (a) | The rate shown is the 7-day yield. |
The following is a summary of the inputs used to value the fund’s investments as of June 30, 2015 (see financial note 2(a) for additional information):
| Description | | Quoted Prices in
Active Markets for
Identical Assets
(Level 1) | | Other Significant
Observable Inputs
(Level 2) | | Significant
Unobservable
Inputs
(Level 3) | | Total | |
| U.S. Government Securities1 | | $— | | $338,741,756 | | $— | | $338,741,756 | |
| Other Investment Company1 | | 470,591 | | — | | — | | 470,591 | |
| Total | | $470,591 | | $338,741,756 | | $— | | $339,212,347 | |
| 1 | As categorized in Portfolio Holdings. |
The fund's policy is to recognize transfers between Level 1, Level 2 and Level 3 as of the beginning of the fiscal year. There were no transfers between Level 1, Level 2 and Level 3 for the period ended June 30, 2015.
Schwab Intermediate-Term U.S. Treasury ETF
Statement of
Assets and Liabilities
As of June 30, 2015; unaudited
| Assets |
| Investments, at value (cost $339,677,014) | | $339,212,347 |
| Receivables: | | |
| Investments sold | | 4,368,548 |
| Fund shares sold | | 5,365,175 |
| Interest | | 1,772,780 |
| Income from securities on loan | + | 62 |
| Total assets | | 350,718,912 |
| Liabilities |
| Payables: | | |
| Investments bought | | 10,026,992 |
| Investment adviser fees | + | 5,763 |
| Total liabilities | | 10,032,755 |
| Net Assets |
| Total assets | | 350,718,912 |
| Total liabilities | – | 10,032,755 |
| Net assets | | $340,686,157 |
| Net Assets by Source | | |
| Capital received from investors | | 342,736,676 |
| Net investment income not yet distributed | | 421,607 |
| Net realized capital losses | | (2,007,459) |
| Net unrealized capital depreciation | | (464,667) |
| Net Asset Value (NAV) |
| Net Assets | ÷ | Shares
Outstanding | = | NAV |
| $340,686,157 | | 6,350,000 | | $53.65 |
| | | | | |
Schwab Intermediate-Term U.S. Treasury ETF
Statement of
Operations
For the period January 1, 2015 through June 30, 2015; unaudited
| Investment Income |
| Interest | | $2,423,043 |
| Securities on loan | + | 1,779 |
| Total investment income | | 2,424,822 |
| Expenses |
| Investment adviser fees | | 134,295 |
| Total expenses | – | 134,295 |
| Net investment income | | 2,290,527 |
| Realized and Unrealized Gains (Losses) |
| Net realized gains on investments | | 58,587 |
| Net realized gains on in-kind redemptions | + | 283,242 |
| Net realized gains | | 341,829 |
| Net change in unrealized appreciation (depreciation) on investments | + | (1,165,583) |
| Net realized and unrealized losses | | (823,754) |
| Increase in net assets resulting from operations | | $1,466,773 |
Schwab Intermediate-Term U.S. Treasury ETF
Statement of
Changes in Net Assets
For the current and prior report periods
Figures for the current period are unaudited
| Operations | |
| | 1/1/15-6/30/15 | 1/1/14-12/31/14 |
| Net investment income | | $2,290,527 | $3,535,340 |
| Net realized gains (losses) | | 341,829 | (718,967) |
| Net change in unrealized appreciation (depreciation) | + | (1,165,583) | 6,947,634 |
| Increase in net assets resulting from operations | | 1,466,773 | 9,764,007 |
| Distributions to Shareholders | |
| Distributions from net investment income | | ($1,868,920) | ($3,544,920) |
| Transactions in Fund Shares | | | |
| | | 1/1/15-6/30/15 | 1/1/14-12/31/14 |
| | | SHARES | VALUE | SHARES | VALUE |
| Shares sold | | 1,900,000 | $102,990,034 | 3,300,000 | $175,168,419 |
| Shares redeemed | + | (300,000) | (16,127,660) | (3,100,000) | (164,130,182) |
| Net transactions in fund shares | | 1,600,000 | $86,862,374 | 200,000 | $11,038,237 |
| Shares Outstanding and Net Assets | | | |
| | | 1/1/15-6/30/15 | 1/1/14-12/31/14 |
| | | SHARES | NET ASSETS | SHARES | NET ASSETS |
| Beginning of period | | 4,750,000 | $254,225,930 | 4,550,000 | $236,968,606 |
| Total increase | + | 1,600,000 | 86,460,227 | 200,000 | 17,257,324 |
| End of period | | 6,350,000 | $340,686,157 | 4,750,000 | $254,225,930 |
| Net investment income not yet distributed | | | $421,607 | | $— |
Schwab U.S. Aggregate Bond ETF
Financial Statements
Financial Highlights
| | 1/1/15–
6/30/15* | 1/1/14–
12/31/14 | 1/1/13–
12/31/13 | 1/1/12–
12/31/12 | 7/13/11 1–
12/31/11 | |
| Per-Share Data ($) |
| Net asset value at beginning of period | 52.20 | 50.28 | 52.43 | 51.50 | 50.00 | |
| Income (loss) from investment operations: | | | | | | |
| Net investment income (loss) | 0.49 2 | 1.00 | 0.83 | 0.84 | 0.37 | |
| Net realized and unrealized gains (losses) | (0.51) | 1.98 | (1.97) | 1.16 | 1.52 | |
| Total from investment operations | (0.02) | 2.98 | (1.14) | 2.00 | 1.89 | |
| Less distributions: | | | | | | |
| Distributions from net investment income | (0.45) | (1.06) | (1.01) | (1.07) | (0.39) | |
| Net asset value at end of period | 51.73 | 52.20 | 50.28 | 52.43 | 51.50 | |
| Total return (%) | (0.05) 3 | 5.97 | (2.19) | 3.90 | 3.79 3 | |
| Ratios/Supplemental Data (%) |
| Ratios to average net assets: | | | | | | |
| Total expenses | 0.05 4 | 0.05 | 0.06 5 | 0.08 6 | 0.10 4 | |
| Net investment income (loss) | 1.87 4 | 1.96 | 1.59 | 1.52 | 1.67 4 | |
| Portfolio turnover rate7,8 | 89 3 | 74 | 152 | 151 | 446 3 | |
| Net assets, end of period ($ x 1,000) | 1,624,304 | 1,226,778 | 497,801 | 387,954 | 164,804 | |
| |
1
Commencement of operations.
2
Calculated based on the average shares outstanding during the period.
3
Not annualized.
4
Annualized.
5
The expense ratio would have been 0.05%, if interest expense related to charges on agency mortgage-backed securities not delivered on a timely basis had not been incurred. (See financial note 2f)
6
Effective September 20, 2012, the annual operating expense ratio was reduced. The ratio presented for the period ended 12/31/12 is a blended ratio.
7
Portfolio turnover rate excludes securities received or delivered from processing of in-kind creations or redemptions.
8
Includes to-be-announced (TBA) transactions. (See financial note 2)
Schwab U.S. Aggregate Bond ETF
Portfolio Holdings as of June 30, 2015 (Unaudited)
This section shows all the securities in the fund's portfolio and their values as of the report date.
The fund files its complete schedule of portfolio holdings with the SEC for the first and third quarters of each fiscal year on Form N-Q. The fund's Form N-Q is available on the SEC's website at www.sec.gov and may be viewed and copied at the SEC's Public Reference Room in Washington, D.C. Call 1-800-SEC-0330 for information on the operation of the Public Reference Room. The fund also makes available its complete schedule of portfolio holdings on a daily basis on the fund's website at www.csimfunds.com/schwabetfs_prospectus.
For fixed rate obligations, the rate shown is the interest rate (the rate established when the obligation was issued). For variable rate obligations, the rate shown is the rate as of the report date. The maturity date shown for all the securities is the final legal maturity.
| Holdings by Category | Cost
($) | Value
($) |
| 0.6% | Asset-Backed Obligations | 9,148,375 | 9,156,008 |
| 2.0% | Commercial Mortgage-Backed Securities | 31,646,390 | 31,673,055 |
| 23.6% | Corporate Bonds | 389,209,515 | 383,659,115 |
| 5.2% | Foreign Government Securities | 84,803,570 | 84,075,305 |
| 28.0% | Mortgage-Backed Securities | 452,429,022 | 455,471,276 |
| 1.0% | Municipal Bonds | 16,042,504 | 15,766,011 |
| 39.0% | U.S. Government and Government Agencies | 634,020,656 | 634,097,381 |
| 0.2% | Other Investment Company | 3,341,702 | 3,341,702 |
| 9.5% | Short-Term Investments | 154,297,885 | 154,299,061 |
| 109.1% | Total Investments | 1,774,939,619 | 1,771,538,914 |
| (9.1)% | Other Assets and
Liabilities, Net | | (147,234,671) |
| 100.0% | Net Assets | | 1,624,304,243 |
Security
Rate, Maturity Date | Face
Amount ($) | Value
($) |
| Asset-Backed Obligations 0.6% of net assets |
| American Express Credit Account Master Trust |
| Series 2014-3 Class A |
| 1.49%, 04/15/20 (b) | 326,000 | 327,851 |
| Series 2014-4 Class A |
| 1.43%, 06/15/20 (b) | 100,000 | 100,238 |
| Capital One Multi-Asset Execution Trust |
| Series 2014-A5 Class A |
| 1.48%, 07/15/20 (b) | 200,000 | 201,127 |
| Series 2007-A7 Class A7 |
| 5.75%, 07/15/20 (b) | 250,000 | 274,144 |
Security
Rate, Maturity Date | Face
Amount ($) | Value
($) |
| Chase Issuance Trust |
| Series 2014-A7 Class A |
| 1.38%, 11/15/19 (b) | 680,000 | 681,770 |
| Series 2012-A4 Class A4 |
| 1.58%, 08/16/21 (b) | 300,000 | 296,218 |
| Series 2014-A2 Class A2 |
| 2.77%, 03/15/23 (b) | 200,000 | 205,253 |
| Citibank Credit Card Issuance Trust |
| Series 2014-A4 Class A4 |
| 1.23%, 04/24/19 (b) | 1,100,000 | 1,104,400 |
| Series 2007-A8 Class A8 |
| 5.65%, 09/20/19 (b) | 500,000 | 547,383 |
| Series 2008-A1 Class A1 |
| 5.35%, 02/07/20 (b) | 200,000 | 220,191 |
| Series 2014-A8 Class A8 |
| 1.73%, 04/09/20 (b) | 200,000 | 201,590 |
| Series 2014-A1 Class A1 |
| 2.88%, 01/23/23 (b) | 225,000 | 232,009 |
| Discover Card Execution Note Trust |
| Series 2014-A4 Class A4 |
| 2.12%, 12/15/21 (b) | 1,000,000 | 1,009,629 |
| Series 2012-A6 Class A6 |
| 1.67%, 01/18/22 (b) | 600,000 | 594,662 |
| Ford Credit Auto Owner Trust |
| Series 2013-A Class A4 |
| 0.78%, 05/15/18 (b) | 100,000 | 99,915 |
| Series 2013-C Class A4 |
| 1.25%, 10/15/18 (b) | 225,000 | 226,161 |
| Honda Auto Receivables Owner Trust |
| Series 2014-2 Class A4 |
| 1.18%, 05/18/20 (b) | 200,000 | 200,350 |
| Hyundai Auto Receivables Trust |
| Series 2013-A Class A4 |
| 0.75%, 09/17/18 (b) | 470,000 | 469,608 |
| Series 2013-C Class A4 |
| 1.55%, 03/15/19 (b) | 150,000 | 151,074 |
| Nissan Auto Receivables Owner Trust |
| Series 2013-A Class A4 |
| 0.75%, 07/15/19 (b) | 200,000 | 199,730 |
| Series 2013-B Class A4 |
| 1.31%, 10/15/19 (b) | 100,000 | 100,231 |
| Volkswagen Auto Loan Enhanced Trust |
| Series 2014-1 Class A3 |
| 0.91%, 10/22/18 (b) | 300,000 | 299,264 |
| Series 2012-2 Class A4 |
| 0.66%, 03/20/19 (b) | 500,000 | 499,314 |
| Series 2013-2, Class A4 |
| 1.16%, 03/20/20 (b) | 550,000 | 549,282 |
| World Financial Network Credit Card Master Trust |
| Series 2013-A Class A |
| 1.61%, 12/15/21 (b) | 210,000 | 209,799 |
| World Omni Auto Receivables Trust |
| Series 2014-B Class A3 |
| 1.14%, 01/15/20 (b) | 155,000 | 154,815 |
| Total Asset-Backed Obligations |
| (Cost $9,148,375) | | 9,156,008 |
|
Schwab U.S. Aggregate Bond ETF
Portfolio Holdings (Unaudited) continued
Security
Rate, Maturity Date | Face
Amount ($) | Value
($) |
| Commercial Mortgage-Backed Securities 2.0% of net assets |
| Banc of America Commercial Mortgage Trust |
| Series 2007-2 Class A4 |
| 5.78%, 04/10/49 (a)(b) | 500,000 | 523,702 |
| Series 2007-4 Class A4 |
| 5.94%, 02/10/51 (a)(b) | 153,925 | 165,285 |
| Bear Stearns Commercial Mortgage Securities |
| Series 2006-T24 Class A4 |
| 5.54%, 10/12/41 (b) | 755,004 | 785,009 |
| Series 2007-T28 Class A4 |
| 5.74%, 09/11/42 (a)(b) | 1,590,000 | 1,713,917 |
| Series 2007-T26 Class A4 |
| 5.47%, 01/12/45 (a)(b) | 857,448 | 905,260 |
| Series 2007-PW17 Class A4 |
| 5.69%, 06/11/50 (a)(b) | 300,000 | 320,100 |
| Citigroup Commercial Mortgage Trust |
| Series 2013-GC17 Class A4 |
| 4.13%, 11/10/46 (b) | 750,000 | 804,163 |
| Series 2014-GC19 Class A2 |
| 2.79%, 03/10/47 (b) | 130,000 | 133,713 |
| Series 2014-GC21, Class A2 |
| 2.90%, 05/10/47 (b) | 480,000 | 495,005 |
| Series 2014-GC23 Class A2 |
| 2.85%, 07/10/47 (b) | 570,000 | 586,792 |
| COMM 2012-CCRE4 Mortgage Trust |
| Series 2012-CR4 Class A3 |
| 2.85%, 10/15/45 (b) | 300,000 | 299,495 |
| COMM 2013-CCRE11 Mortgage Trust |
| Series 2013-CR11 Class A4 |
| 4.26%, 10/10/46 (b) | 340,000 | 369,564 |
| COMM 2013-CCRE7 Mortgage Trust |
| Series 2013-CR7, Class A4 |
| 3.21%, 03/10/46 (b) | 600,000 | 609,956 |
| COMM 2013-LC6 Mortgage Trust |
| Series 2013-LC6 Class A2 |
| 1.91%, 01/10/46 (b) | 150,000 | 151,000 |
| COMM 2014-CCRE14 Mortgage Trust |
| Series 2014-CR14 Class A3 |
| 3.96%, 02/10/47 (b) | 240,000 | 254,773 |
| COMM 2014-CCRE15 Mortgage Trust |
| Series 2014-CR15, Class A2 |
| 2.93%, 02/10/47 (b) | 500,000 | 516,443 |
| COMM 2014-CCRE16 Mortgage Trust |
| Series 2014-CR16 Class ASB |
| 3.65%, 04/10/47 (b) | 630,000 | 662,428 |
| Commercial Mortgage Loan Trust 2008-LS1 |
| Series 2008-LS1 Class A4B |
| 6.24%, 12/10/49 (a)(b) | 458,175 | 485,954 |
| Commercial Mortgage Pass Through Certificates |
| Series 2012-CR3 Class A3 |
| 2.82%, 10/15/45 (b) | 260,000 | 259,521 |
| Fannie Mae |
| Series 2013-M12 Class A |
| 1.53%, 10/25/17 (b) | 246,312 | 248,281 |
| Series 2009-M1 Class A2 |
| 4.29%, 07/25/19 (b) | 175,428 | 190,719 |
| Series 2010-M3 Class A3 |
| 4.33%, 03/25/20 (a)(b) | 205,000 | 224,943 |
Security
Rate, Maturity Date | Face
Amount ($) | Value
($) |
| Series 2014-M6 Class A2 |
| 2.68%, 05/25/21 (b) | 650,000 | 663,496 |
| Series 2011-M5 Class A2 |
| 2.94%, 07/25/21 (b) | 800,000 | 828,753 |
| Freddie Mac |
| Series K704 Class A2 |
| 2.41%, 08/25/18 (b) | 70,000 | 72,071 |
| Series K705 Class A2 |
| 2.30%, 09/25/18 (b) | 200,000 | 205,295 |
| Series K708 Class A2 |
| 2.13%, 01/25/19 (b) | 305,000 | 311,022 |
| Series K710 Class A2 |
| 1.88%, 05/25/19 (b) | 120,000 | 121,182 |
| Series K712 Class A2 |
| 1.87%, 11/25/19 (b) | 440,000 | 441,732 |
| Series K014 Class A1 |
| 2.79%, 10/25/20 (b) | 594,990 | 616,897 |
| Series K714 Class A2 |
| 3.03%, 10/25/20 (b) | 365,000 | 382,573 |
| Series K010 Class A2 |
| 4.33%, 10/25/20 (b) | 105,000 | 116,101 |
| Series K012 Class A2 |
| 4.19%, 12/25/20 (a)(b) | 130,000 | 143,083 |
| Series K013 Class A2 |
| 3.97%, 01/25/21 (a)(b) | 50,000 | 54,511 |
| Series K014 Class A2 |
| 3.87%, 04/25/21 (b) | 165,000 | 179,125 |
| Series K017 Class A2 |
| 2.87%, 12/25/21 (b) | 100,000 | 102,973 |
| Series K022 Class A2 |
| 2.36%, 07/25/22 (b) | 600,000 | 595,957 |
| Series K025 Class A2 |
| 2.68%, 10/25/22 (b) | 500,000 | 505,243 |
| Series K026 Class A2 |
| 2.51%, 11/25/22 (b) | 1,435,000 | 1,432,200 |
| Series K027 Class A2 |
| 2.64%, 01/25/23 (b) | 445,000 | 447,133 |
| Series K033 Class A1 |
| 2.87%, 02/25/23 (b) | 141,210 | 146,803 |
| Series K029 Class A2 |
| 3.32%, 02/25/23 (a)(b) | 375,000 | 393,532 |
| Series K033 Class A2 |
| 3.06%, 07/25/23 (b) | 540,000 | 554,516 |
| Series K035 Class A2 |
| 3.46%, 08/25/23 (a)(b) | 450,000 | 474,043 |
| Series K040 Class A2 |
| 3.24%, 09/25/24 (b) | 300,000 | 308,927 |
| Greenwich Capital Commercial Funding Corp. |
| Series 2007-GG9 Class A4 |
| 5.44%, 03/10/39 (b) | 376,214 | 395,813 |
| GS Mortgage Securities Trust |
| Series 2011-GC5 Class A4 |
| 3.71%, 08/10/44 (b) | 233,000 | 246,581 |
| Series 2012-GCJ7 Class A4 |
| 3.38%, 05/10/45 (b) | 300,000 | 311,650 |
| Series 2013-GC12 Class A4 |
| 3.14%, 06/10/46 (a)(b) | 195,000 | 196,330 |
| Series 2013-GC16 Class A2 |
| 3.03%, 11/10/46 (b) | 700,000 | 726,059 |
Schwab U.S. Aggregate Bond ETF
Portfolio Holdings (Unaudited) continued
Security
Rate, Maturity Date | Face
Amount ($) | Value
($) |
| Series 2014-GC18 Class A2 |
| 2.92%, 01/10/47 (b) | 400,000 | 413,227 |
| Series 2014-GC20 Class A3 |
| 3.68%, 04/10/47 (b) | 300,000 | 314,977 |
| JP Morgan Chase Commercial Mortgage Securities Trust |
| Series 2012-C6 Class A3 |
| 3.51%, 05/15/45 (b) | 400,000 | 419,605 |
| Series 2012-CBX Class A3 |
| 3.14%, 06/15/45 (b) | 181,004 | 186,507 |
| Series 2012-CBX Class A4 |
| 3.48%, 06/15/45 (b) | 250,000 | 261,856 |
| Series 2013-C12 Class ASB |
| 3.16%, 07/15/45 (b) | 315,000 | 325,044 |
| Series 2013-C13 Class A2 |
| 2.67%, 01/15/46 (b) | 200,000 | 205,390 |
| Series 2013-C14 Class A2 |
| 3.02%, 08/15/46 (b) | 1,000,000 | 1,037,364 |
| Series 2011-C5 Class A3 |
| 4.17%, 08/15/46 (b) | 400,000 | 434,772 |
| Series 2013-C16 Class A2 |
| 3.07%, 12/15/46 (b) | 273,916 | 284,443 |
| Series 2007-CB18 Class A4 |
| 5.44%, 06/12/47 (b) | 377,530 | 396,120 |
| Series 2007-CB20 Class A4 |
| 5.79%, 02/12/51 (a)(b) | 224,296 | 240,608 |
| LB-UBS Commercial Mortgage Trust |
| Series 2007-C2 Class A3 |
| 5.43%, 02/15/40 (b) | 309,745 | 327,449 |
| Merrill Lynch Mortgage Trust |
| Series 2008-C1 Class A4 |
| 5.69%, 02/12/51 (b) | 145,388 | 156,892 |
| Morgan Stanley Bank of America Merrill Lynch Trust |
| Series 2013-C13 Class A2 |
| 2.94%, 11/15/46 (b) | 280,000 | 289,166 |
| Series 2014-C14 Class A3 |
| 3.67%, 02/15/47 (b) | 855,000 | 894,575 |
| Series 2014-C16 Class A5 |
| 3.89%, 06/15/47 (b) | 200,000 | 209,918 |
| Morgan Stanley Capital I Trust |
| Series 2012-C4 Class A4 |
| 3.24%, 03/15/45 (b) | 300,000 | 308,293 |
| UBS-Barclays Commercial Mortgage Trust |
| Series 2012-C4 Class A5 |
| 2.85%, 12/10/45 (b) | 500,000 | 496,445 |
| Wachovia Bank Commercial Mortgage Trust |
| Series 2006-C29 Class A4 |
| 5.31%, 11/15/48 (b) | 190,864 | 198,571 |
| Wells Fargo Commercial Mortgage Trust |
| Series 2013-LC12 Class A4 |
| 4.22%, 07/15/46 (a)(b) | 640,000 | 695,920 |
| Series 2013-C12 Class A4 |
| 3.20%, 03/15/48 (b) | 145,000 | 148,046 |
| WFRBS Commercial Mortgage Trust |
| Series 2013-C11 Class A2 |
| 2.03%, 03/15/45 (b) | 600,000 | 606,479 |
| Series 2012-C7 Class A1 |
| 2.30%, 06/15/45 (b) | 138,840 | 139,848 |
| Series 2013-C14 Class A5 |
| 3.34%, 06/15/46 (b) | 100,000 | 102,118 |
Security
Rate, Maturity Date | Face
Amount ($) | Value
($) |
| Series 2013-C15 Class A4 |
| 4.15%, 08/15/46 (a)(b) | 255,000 | 274,713 |
| Series 2014-C20 Class ASB |
| 3.64%, 05/15/47 (b) | 65,000 | 68,458 |
| Series 2013-C12 Class A2 |
| 2.07%, 03/15/48 (b) | 550,000 | 556,627 |
| Total Commercial Mortgage-Backed Securities |
| (Cost $31,646,390) | | 31,673,055 |
|
| Corporate Bonds 23.6% of net assets |
| Finance 7.7% |
| Banking 5.3% |
| Abbey National Treasury Services PLC |
| 3.05%, 08/23/18 | 300,000 | 310,610 |
| American Express Co. |
| 7.00%, 03/19/18 | 250,000 | 283,703 |
| 8.13%, 05/20/19 | 250,000 | 303,509 |
| American Express Credit Corp. |
| 2.80%, 09/19/16 | 500,000 | 510,550 |
| 2.38%, 03/24/17 | 300,000 | 306,263 |
| Bank of America Corp. |
| 6.50%, 08/01/16 | 200,000 | 211,030 |
| 5.75%, 08/15/16 | 100,000 | 104,744 |
| 5.42%, 03/15/17 | 1,000,000 | 1,060,034 |
| 6.40%, 08/28/17 | 500,000 | 548,497 |
| 6.88%, 04/25/18 | 300,000 | 339,123 |
| 5.65%, 05/01/18 | 800,000 | 879,385 |
| 2.65%, 04/01/19 | 1,500,000 | 1,519,114 |
| 7.63%, 06/01/19 | 1,000,000 | 1,187,700 |
| 5.63%, 07/01/20 | 1,750,000 | 1,974,520 |
| 5.88%, 01/05/21 | 300,000 | 343,649 |
| 5.00%, 05/13/21 | 500,000 | 549,584 |
| 3.30%, 01/11/23 | 1,300,000 | 1,282,401 |
| 4.00%, 04/01/24 | 1,000,000 | 1,019,443 |
| 6.22%, 09/15/26 | 150,000 | 174,621 |
| 7.75%, 05/14/38 | 250,000 | 333,892 |
| 5.88%, 02/07/42 | 500,000 | 578,697 |
| 4.88%, 04/01/44 | 500,000 | 509,834 |
| Bank of Montreal |
| 2.50%, 01/11/17 | 500,000 | 511,377 |
| 2.38%, 01/25/19 (b) | 600,000 | 608,180 |
| Bank of Nova Scotia |
| 2.05%, 10/30/18 | 250,000 | 251,431 |
| Bank of Tokyo-Mitsubishi UFJ Ltd. |
| 2.35%, 02/23/17 | 100,000 | 101,391 |
| Barclays Bank PLC |
| 5.00%, 09/22/16 | 100,000 | 104,678 |
| 2.50%, 02/20/19 | 700,000 | 705,033 |
| 5.14%, 10/14/20 | 200,000 | 217,648 |
| BB&T Corp. |
| 3.95%, 03/22/22 (b) | 100,000 | 104,437 |
| Bear Stearns Cos. LLC |
| 6.40%, 10/02/17 | 1,000,000 | 1,100,934 |
Schwab U.S. Aggregate Bond ETF
Portfolio Holdings (Unaudited) continued
Security
Rate, Maturity Date | Face
Amount ($) | Value
($) |
| BNP Paribas S.A. |
| 5.00%, 01/15/21 | 200,000 | 221,226 |
| 3.25%, 03/03/23 | 350,000 | 347,960 |
| 4.25%, 10/15/24 | 300,000 | 296,300 |
| BPCE S.A. |
| 1.63%, 02/10/17 | 750,000 | 757,087 |
| 2.50%, 12/10/18 | 1,500,000 | 1,523,173 |
| 2.50%, 07/15/19 | 1,000,000 | 1,009,990 |
| 4.00%, 04/15/24 | 1,000,000 | 1,011,540 |
| Capital One Bank USA NA |
| 2.25%, 02/13/19 (b) | 1,000,000 | 995,128 |
| 3.38%, 02/15/23 | 750,000 | 729,745 |
| Capital One Financial Corp. |
| 4.75%, 07/15/21 | 800,000 | 874,974 |
| Capital One NA |
| 2.40%, 09/05/19 (b) | 750,000 | 744,056 |
| Citigroup, Inc. |
| 4.45%, 01/10/17 | 1,000,000 | 1,045,143 |
| 1.85%, 11/24/17 | 300,000 | 300,907 |
| 1.80%, 02/05/18 | 650,000 | 648,840 |
| 2.40%, 02/18/20 | 1,000,000 | 988,690 |
| 4.05%, 07/30/22 | 500,000 | 512,773 |
| 3.88%, 10/25/23 | 1,000,000 | 1,022,325 |
| 4.40%, 06/10/25 | 500,000 | 499,131 |
| 5.50%, 09/13/25 | 500,000 | 541,461 |
| 6.68%, 09/13/43 | 250,000 | 303,846 |
| Cooperatieve Centrale Raiffeisen-Boerenleenbank BA |
| 5.25%, 05/24/41 | 1,000,000 | 1,099,572 |
| Credit Suisse USA, Inc. |
| 4.38%, 08/05/20 | 750,000 | 817,222 |
| 3.63%, 09/09/24 | 300,000 | 298,564 |
| Deutsche Bank AG |
| 1.35%, 05/30/17 | 100,000 | 99,376 |
| 3.70%, 05/30/24 | 500,000 | 494,697 |
| Fifth Third Bancorp |
| 5.45%, 01/15/17 | 600,000 | 636,273 |
| First Tennessee Bank NA |
| 2.95%, 12/01/19 (b) | 250,000 | 250,132 |
| Goldman Sachs Group, Inc. |
| 5.75%, 10/01/16 | 500,000 | 527,632 |
| 5.63%, 01/15/17 | 750,000 | 794,480 |
| 5.95%, 01/18/18 | 600,000 | 659,806 |
| 2.38%, 01/22/18 | 1,000,000 | 1,015,586 |
| 6.15%, 04/01/18 | 500,000 | 556,152 |
| 2.63%, 01/31/19 | 750,000 | 759,668 |
| 5.38%, 03/15/20 | 1,000,000 | 1,114,219 |
| 5.25%, 07/27/21 | 750,000 | 833,542 |
| 5.75%, 01/24/22 | 100,000 | 113,841 |
| 3.63%, 01/22/23 | 2,500,000 | 2,486,670 |
| 3.85%, 07/08/24 (b) | 650,000 | 650,172 |
| 6.13%, 02/15/33 | 250,000 | 298,743 |
| 6.75%, 10/01/37 | 100,000 | 117,656 |
| 4.80%, 07/08/44 (b) | 500,000 | 494,714 |
| HSBC Holdings PLC |
| 5.10%, 04/05/21 | 850,000 | 948,224 |
| 6.50%, 09/15/37 | 500,000 | 605,273 |
| 6.80%, 06/01/38 | 500,000 | 622,801 |
| HSBC USA, Inc. |
| 5.00%, 09/27/20 | 400,000 | 444,215 |
Security
Rate, Maturity Date | Face
Amount ($) | Value
($) |
| JPMorgan Chase & Co. |
| 1.35%, 02/15/17 | 1,000,000 | 1,001,112 |
| 6.00%, 01/15/18 | 1,750,000 | 1,928,302 |
| 6.30%, 04/23/19 (h) | 1,000,000 | 1,146,212 |
| 2.25%, 01/23/20 (b) | 200,000 | 196,663 |
| 4.50%, 01/24/22 | 1,000,000 | 1,072,588 |
| 3.38%, 05/01/23 | 250,000 | 243,168 |
| 3.88%, 02/01/24 | 400,000 | 406,963 |
| 3.88%, 09/10/24 | 350,000 | 345,026 |
| 3.13%, 01/23/25 (b) | 250,000 | 238,981 |
| 6.40%, 05/15/38 | 650,000 | 807,088 |
| 5.40%, 01/06/42 (h) | 600,000 | 664,397 |
| KeyBank NA |
| 1.10%, 11/25/16 (b) | 100,000 | 100,168 |
| Lloyds Bank PLC |
| 4.20%, 03/28/17 | 500,000 | 524,952 |
| 2.30%, 11/27/18 | 250,000 | 252,848 |
| 2.35%, 09/05/19 | 200,000 | 200,260 |
| 6.38%, 01/21/21 | 500,000 | 590,408 |
| Lloyds Banking Group PLC |
| 4.50%, 11/04/24 | 500,000 | 501,240 |
| Manufacturers & Traders Trust Co. |
| 5.63%, 12/01/21 (a)(b) | 250,000 | 258,465 |
| Morgan Stanley |
| 5.45%, 01/09/17 | 1,050,000 | 1,112,929 |
| 5.95%, 12/28/17 | 750,000 | 824,699 |
| 6.63%, 04/01/18 | 200,000 | 224,497 |
| 7.30%, 05/13/19 (h) | 200,000 | 235,417 |
| 2.38%, 07/23/19 | 1,000,000 | 994,004 |
| 5.63%, 09/23/19 | 1,500,000 | 1,681,846 |
| 3.75%, 02/25/23 | 1,000,000 | 1,012,142 |
| 4.10%, 05/22/23 | 1,000,000 | 1,003,543 |
| 5.00%, 11/24/25 | 500,000 | 524,491 |
| 6.25%, 08/09/26 | 500,000 | 600,138 |
| 4.35%, 09/08/26 | 1,000,000 | 982,024 |
| 7.25%, 04/01/32 (h) | 100,000 | 132,387 |
| 6.38%, 07/24/42 | 200,000 | 246,081 |
| 4.30%, 01/27/45 | 1,000,000 | 936,668 |
| National Australia Bank Ltd. |
| 3.00%, 01/20/23 | 250,000 | 247,229 |
| PNC Bank NA |
| 2.95%, 01/30/23 (b) | 500,000 | 484,232 |
| PNC Financial Services Group, Inc. |
| 3.90%, 04/29/24 (b) | 500,000 | 506,032 |
| PNC Funding Corp. |
| 5.63%, 02/01/17 | 300,000 | 318,937 |
| Rabobank Nederland |
| 4.63%, 12/01/23 | 450,000 | 465,075 |
| Regions Bank |
| 6.45%, 06/26/37 | 250,000 | 298,247 |
| Regions Financial Corp. |
| 2.00%, 05/15/18 (b) | 1,000,000 | 1,000,019 |
| Royal Bank of Canada |
| 1.20%, 09/19/17 | 250,000 | 249,745 |
| 2.20%, 07/27/18 | 750,000 | 763,355 |
| 2.15%, 03/15/19 | 750,000 | 755,652 |
| Royal Bank of Scotland Group PLC |
| 6.40%, 10/21/19 | 500,000 | 559,291 |
Schwab U.S. Aggregate Bond ETF
Portfolio Holdings (Unaudited) continued
Security
Rate, Maturity Date | Face
Amount ($) | Value
($) |
| Sumitomo Mitsui Banking Corp. |
| 1.80%, 07/18/17 | 500,000 | 503,797 |
| 3.40%, 07/11/24 | 500,000 | 502,183 |
| Svenska Handelsbanken AB |
| 2.88%, 04/04/17 | 250,000 | 257,485 |
| Toronto-Dominion Bank |
| 2.13%, 07/02/19 | 750,000 | 753,529 |
| UBS AG |
| 5.88%, 12/20/17 | 600,000 | 660,299 |
| 5.75%, 04/25/18 | 500,000 | 554,152 |
| 2.38%, 08/14/19 | 1,000,000 | 1,000,505 |
| 4.88%, 08/04/20 | 300,000 | 332,013 |
| US Bancorp |
| 3.00%, 03/15/22 (b) | 100,000 | 100,922 |
| Wachovia Corp. |
| 5.75%, 02/01/18 | 500,000 | 552,412 |
| 5.50%, 08/01/35 | 250,000 | 274,132 |
| Wells Fargo & Co. |
| 2.63%, 12/15/16 | 450,000 | 460,376 |
| 1.40%, 09/08/17 | 1,000,000 | 1,002,885 |
| 5.63%, 12/11/17 | 150,000 | 164,865 |
| 1.50%, 01/16/18 | 500,000 | 499,247 |
| 2.13%, 04/22/19 | 500,000 | 502,237 |
| 3.45%, 02/13/23 | 250,000 | 248,894 |
| 4.10%, 06/03/26 | 500,000 | 502,766 |
| 5.38%, 02/07/35 | 500,000 | 564,354 |
| 5.38%, 11/02/43 | 175,000 | 187,270 |
| Westpac Banking Corp. |
| 4.88%, 11/19/19 | 400,000 | 443,890 |
| | | 85,855,271 |
| Brokerage 0.2% |
| BlackRock, Inc. |
| 5.00%, 12/10/19 | 150,000 | 167,590 |
| 3.50%, 03/18/24 | 1,000,000 | 1,017,528 |
| Jefferies Group LLC |
| 5.13%, 01/20/23 | 700,000 | 723,785 |
| 6.25%, 01/15/36 | 150,000 | 149,594 |
| Nomura Holdings, Inc. |
| 2.75%, 03/19/19 | 750,000 | 757,594 |
| 6.70%, 03/04/20 (h) | 250,000 | 293,521 |
| | | 3,109,612 |
| Finance Company 0.5% |
| Air Lease Corp. |
| 3.38%, 01/15/19 (b) | 200,000 | 204,250 |
| American Express Co. |
| 6.80%, 09/01/66 (a)(b) | 250,000 | 257,850 |
| GATX Corp. |
| 1.25%, 03/04/17 | 100,000 | 99,746 |
| 5.20%, 03/15/44 (b) | 200,000 | 203,006 |
| General Electric Capital Corp. |
| 1.63%, 04/02/18 | 250,000 | 250,827 |
| 6.00%, 08/07/19 | 350,000 | 400,302 |
| 2.20%, 01/09/20 (b) | 250,000 | 250,089 |
| 4.38%, 09/16/20 | 300,000 | 326,902 |
| 4.63%, 01/07/21 | 250,000 | 275,453 |
Security
Rate, Maturity Date | Face
Amount ($) | Value
($) |
| 4.65%, 10/17/21 | 250,000 | 274,139 |
| 3.10%, 01/09/23 | 200,000 | 199,648 |
| 6.75%, 03/15/32 | 500,000 | 650,184 |
| 6.15%, 08/07/37 | 150,000 | 186,877 |
| 5.88%, 01/14/38 | 1,000,000 | 1,198,425 |
| 6.88%, 01/10/39 | 100,000 | 134,534 |
| 6.38%, 11/15/67 (a)(b) | 250,000 | 269,375 |
| HSBC Finance Corp. |
| 6.68%, 01/15/21 | 350,000 | 405,392 |
| International Lease Finance Corp. |
| 7.13%, 09/01/18 (c) | 500,000 | 558,750 |
| Synchrony Financial |
| 3.00%, 08/15/19 (b) | 750,000 | 756,050 |
| 3.75%, 08/15/21 (b) | 900,000 | 908,047 |
| 4.25%, 08/15/24 (b) | 500,000 | 503,068 |
| | | 8,312,914 |
| Insurance 1.1% |
| ACE INA Holdings, Inc. |
| 2.70%, 03/13/23 | 500,000 | 486,521 |
| Aetna, Inc. |
| 3.95%, 09/01/20 | 100,000 | 106,141 |
| Aflac, Inc. |
| 2.65%, 02/15/17 | 300,000 | 307,138 |
| 3.63%, 06/15/23 | 500,000 | 505,801 |
| 3.63%, 11/15/24 | 500,000 | 502,295 |
| Allstate Corp. |
| 4.50%, 06/15/43 | 300,000 | 303,899 |
| American International Group, Inc. |
| 5.60%, 10/18/16 | 350,000 | 369,401 |
| 5.85%, 01/16/18 | 700,000 | 772,199 |
| 6.40%, 12/15/20 | 117,000 | 139,258 |
| 3.88%, 01/15/35 (b) | 200,000 | 181,245 |
| Anthem, Inc. |
| 2.25%, 08/15/19 | 500,000 | 494,430 |
| 3.30%, 01/15/23 | 350,000 | 336,937 |
| 5.85%, 01/15/36 | 250,000 | 266,152 |
| Aon Corp. |
| 8.21%, 01/01/27 | 100,000 | 128,000 |
| Assurant, Inc. |
| 2.50%, 03/15/18 | 400,000 | 406,174 |
| 6.75%, 02/15/34 | 400,000 | 472,621 |
| Berkshire Hathaway Finance Corp. |
| 4.25%, 01/15/21 | 300,000 | 327,879 |
| 5.75%, 01/15/40 | 100,000 | 116,993 |
| Berkshire Hathaway, Inc. |
| 1.90%, 01/31/17 | 750,000 | 761,878 |
| Chubb Corp. |
| 6.00%, 05/11/37 | 250,000 | 309,432 |
| Cigna Corp. |
| 4.00%, 02/15/22 (b) | 150,000 | 154,792 |
| 5.88%, 03/15/41 (b) | 250,000 | 286,455 |
| 5.38%, 02/15/42 (b) | 300,000 | 323,239 |
| CNA Financial Corp. |
| 7.35%, 11/15/19 | 250,000 | 296,066 |
| Hartford Financial Services Group, Inc. |
| 5.13%, 04/15/22 | 1,000,000 | 1,110,629 |
| 5.95%, 10/15/36 | 300,000 | 342,454 |
Schwab U.S. Aggregate Bond ETF
Portfolio Holdings (Unaudited) continued
Security
Rate, Maturity Date | Face
Amount ($) | Value
($) |
| 6.63%, 03/30/40 | 250,000 | 312,729 |
| 6.10%, 10/01/41 | 350,000 | 418,431 |
| 4.30%, 04/15/43 | 750,000 | 712,795 |
| MetLife, Inc. |
| 3.60%, 04/10/24 | 1,000,000 | 1,009,600 |
| 5.70%, 06/15/35 | 500,000 | 582,885 |
| Prudential Financial, Inc. |
| 6.00%, 12/01/17 | 300,000 | 331,212 |
| 4.50%, 11/16/21 | 300,000 | 327,188 |
| 5.63%, 06/15/43 (a)(b) | 200,000 | 207,800 |
| The Progressive Corp. |
| 3.70%, 01/26/45 | 300,000 | 265,525 |
| Travelers Cos., Inc. |
| 5.90%, 06/02/19 | 160,000 | 183,065 |
| 6.25%, 06/15/37 | 250,000 | 314,311 |
| UnitedHealth Group, Inc. |
| 1.40%, 10/15/17 | 500,000 | 500,726 |
| 6.00%, 02/15/18 | 150,000 | 166,829 |
| 2.88%, 03/15/22 (b) | 250,000 | 242,979 |
| 4.25%, 03/15/43 (b) | 750,000 | 710,392 |
| Unum Group |
| 5.63%, 09/15/20 | 350,000 | 394,737 |
| Voya Financial, Inc. |
| 2.90%, 02/15/18 | 750,000 | 770,130 |
| 5.70%, 07/15/43 | 200,000 | 224,954 |
| XLIT Ltd. |
| 2.30%, 12/15/18 | 300,000 | 302,270 |
| 6.25%, 05/15/27 | 200,000 | 234,365 |
| | | 18,020,952 |
| Other Financial 0.0% |
| CME Group, Inc. |
| 3.00%, 09/15/22 | 200,000 | 201,331 |
| | | 201,331 |
| Real Estate Investment Trust 0.6% |
| Boston Properties LP |
| 3.80%, 02/01/24 (b) | 100,000 | 101,382 |
| Brandywine Operating Partnership LP |
| 3.95%, 02/15/23 (b) | 750,000 | 745,288 |
| DDR Corp. |
| 3.63%, 02/01/25 (b) | 200,000 | 192,438 |
| Digital Realty Trust LP |
| 5.88%, 02/01/20 | 250,000 | 281,209 |
| 5.25%, 03/15/21 (b) | 250,000 | 273,929 |
| ERP Operating LP |
| 3.38%, 06/01/25 (b) | 250,000 | 245,308 |
| 4.50%, 06/01/45 (b) | 250,000 | 243,819 |
| Essex Portfolio LP |
| 3.88%, 05/01/24 (b) | 500,000 | 506,868 |
| 3.50%, 04/01/25 (b) | 500,000 | 485,223 |
| Federal Realty Investment Trust |
| 4.50%, 12/01/44 (b) | 350,000 | 341,158 |
| HCP, Inc. |
| 6.70%, 01/30/18 | 100,000 | 111,591 |
| 2.63%, 02/01/20 (b) | 300,000 | 297,291 |
Security
Rate, Maturity Date | Face
Amount ($) | Value
($) |
| 5.38%, 02/01/21 (b) | 150,000 | 165,678 |
| 3.40%, 02/01/25 (b) | 300,000 | 282,225 |
| Health Care REIT, Inc. |
| 4.13%, 04/01/19 (b) | 500,000 | 529,674 |
| 4.50%, 01/15/24 (b) | 400,000 | 416,023 |
| Kilroy Realty LP |
| 3.80%, 01/15/23 (b) | 250,000 | 249,731 |
| 4.25%, 08/15/29 (b) | 200,000 | 199,646 |
| Kimco Realty Corp. |
| 3.20%, 05/01/21 (b) | 100,000 | 100,729 |
| Omega Healthcare Investors, Inc. |
| 4.95%, 04/01/24 (b) | 100,000 | 102,459 |
| Prologis LP |
| 2.75%, 02/15/19 (b) | 300,000 | 304,581 |
| 4.25%, 08/15/23 (b) | 300,000 | 308,349 |
| Realty Income Corp. |
| 3.88%, 07/15/24 (b) | 150,000 | 151,434 |
| Regency Centers LP |
| 5.88%, 06/15/17 | 750,000 | 810,987 |
| Simon Property Group LP |
| 2.15%, 09/15/17 (b) | 500,000 | 509,056 |
| 6.13%, 05/30/18 | 150,000 | 168,606 |
| 5.65%, 02/01/20 (b) | 102,000 | 116,314 |
| Ventas Realty LP |
| 4.25%, 03/01/22 (b) | 200,000 | 207,369 |
| 3.25%, 08/15/22 (b) | 250,000 | 241,820 |
| 4.38%, 02/01/45 (b) | 250,000 | 223,398 |
| WP Carey, Inc. |
| 4.00%, 02/01/25 (b) | 400,000 | 383,780 |
| | | 9,297,363 |
| | | 124,797,443 |
| Industrial 14.2% |
| Basic Industry 1.1% |
| Agrium, Inc. |
| 6.75%, 01/15/19 | 250,000 | 286,713 |
| 3.50%, 06/01/23 (b) | 500,000 | 489,614 |
| 4.13%, 03/15/35 (b) | 500,000 | 448,539 |
| 5.25%, 01/15/45 (b) | 250,000 | 253,420 |
| Air Products & Chemicals, Inc. |
| 4.38%, 08/21/19 | 125,000 | 135,396 |
| Airgas, Inc. |
| 1.65%, 02/15/18 (b) | 350,000 | 348,319 |
| 3.65%, 07/15/24 (b) | 800,000 | 804,130 |
| Barrick Gold Corp. |
| 6.95%, 04/01/19 | 850,000 | 985,267 |
| 3.85%, 04/01/22 | 300,000 | 291,197 |
| 4.10%, 05/01/23 | 150,000 | 146,398 |
| Barrick North America Finance LLC |
| 4.40%, 05/30/21 | 500,000 | 511,414 |
| 5.70%, 05/30/41 | 250,000 | 229,212 |
| 5.75%, 05/01/43 | 300,000 | 289,554 |
| BHP Billiton Finance USA Ltd. |
| 3.25%, 11/21/21 | 100,000 | 101,720 |
| 5.00%, 09/30/43 | 300,000 | 312,604 |
| CF Industries, Inc. |
| 7.13%, 05/01/20 | 100,000 | 118,913 |
Schwab U.S. Aggregate Bond ETF
Portfolio Holdings (Unaudited) continued
Security
Rate, Maturity Date | Face
Amount ($) | Value
($) |
| Domtar Corp. |
| 10.75%, 06/01/17 | 350,000 | 405,346 |
| Dow Chemical Co. |
| 8.55%, 05/15/19 | 225,000 | 274,559 |
| 3.00%, 11/15/22 (b) | 250,000 | 240,899 |
| 4.25%, 10/01/34 (b) | 500,000 | 471,177 |
| 5.25%, 11/15/41 (b) | 200,000 | 204,751 |
| Eastman Chemical Co. |
| 2.70%, 01/15/20 (b) | 350,000 | 349,234 |
| 3.60%, 08/15/22 (b) | 100,000 | 101,236 |
| Ecolab, Inc. |
| 2.25%, 01/12/20 | 250,000 | 247,751 |
| EI du Pont de Nemours & Co. |
| 5.75%, 03/15/19 | 200,000 | 226,867 |
| Glencore Canada Corp. |
| 5.50%, 06/15/17 | 600,000 | 636,014 |
| 6.20%, 06/15/35 | 300,000 | 298,920 |
| Goldcorp, Inc. |
| 2.13%, 03/15/18 | 500,000 | 501,481 |
| 3.63%, 06/09/21 (b) | 500,000 | 497,967 |
| 3.70%, 03/15/23 (b) | 300,000 | 288,752 |
| 5.45%, 06/09/44 (b) | 500,000 | 477,704 |
| International Paper Co. |
| 4.75%, 02/15/22 (b) | 207,000 | 224,381 |
| Kinross Gold Corp. |
| 5.13%, 09/01/21 (b) | 250,000 | 249,830 |
| 5.95%, 03/15/24 (b) | 150,000 | 142,552 |
| 6.88%, 09/01/41 (b) | 150,000 | 135,387 |
| LYB International Finance BV |
| 4.00%, 07/15/23 | 750,000 | 768,823 |
| 5.25%, 07/15/43 | 500,000 | 511,233 |
| LyondellBasell Industries NV |
| 5.00%, 04/15/19 (b) | 650,000 | 704,694 |
| 6.00%, 11/15/21 (b) | 250,000 | 286,535 |
| Monsanto Co. |
| 4.20%, 07/15/34 (b) | 250,000 | 228,548 |
| Mosaic Co. |
| 4.25%, 11/15/23 (b) | 250,000 | 257,497 |
| Newmont Mining Corp. |
| 3.50%, 03/15/22 (b) | 150,000 | 143,362 |
| 6.25%, 10/01/39 | 150,000 | 147,440 |
| Nucor Corp. |
| 4.13%, 09/15/22 (b) | 250,000 | 260,228 |
| 5.20%, 08/01/43 (b) | 300,000 | 308,076 |
| Potash Corp. of Saskatchewan, Inc. |
| 5.88%, 12/01/36 | 100,000 | 115,769 |
| Rio Tinto Finance USA Ltd. |
| 6.50%, 07/15/18 | 100,000 | 113,457 |
| Rio Tinto Finance USA PLC |
| 3.50%, 03/22/22 (b) | 100,000 | 101,001 |
| 4.75%, 03/22/42 (b) | 100,000 | 97,795 |
| Southern Copper Corp. |
| 5.25%, 11/08/42 | 100,000 | 87,284 |
| Teck Resources Ltd. |
| 6.25%, 07/15/41 (b) | 100,000 | 80,702 |
Security
Rate, Maturity Date | Face
Amount ($) | Value
($) |
| Vale Overseas Ltd. |
| 6.25%, 01/23/17 | 100,000 | 105,836 |
| 4.38%, 01/11/22 | 750,000 | 734,589 |
| 6.88%, 11/21/36 | 100,000 | 97,181 |
| Vale S.A. |
| 5.63%, 09/11/42 | 200,000 | 169,434 |
| Valspar Corp. |
| 4.20%, 01/15/22 (b) | 100,000 | 104,222 |
| Weyerhaeuser Co. |
| 7.38%, 03/15/32 | 100,000 | 125,372 |
| | | 17,276,296 |
| Capital Goods 1.2% |
| ABB Finance USA, Inc. |
| 1.63%, 05/08/17 | 100,000 | 100,653 |
| 2.88%, 05/08/22 | 100,000 | 98,474 |
| Avery Dennison Corp. |
| 5.38%, 04/15/20 | 105,000 | 115,269 |
| Boeing Co. |
| 3.75%, 11/20/16 | 500,000 | 519,948 |
| 0.95%, 05/15/18 | 250,000 | 247,129 |
| 4.88%, 02/15/20 | 250,000 | 282,249 |
| 3.50%, 03/01/45 (b) | 250,000 | 221,697 |
| Caterpillar Financial Services Corp. |
| 1.25%, 11/06/17 | 400,000 | 400,276 |
| 7.15%, 02/15/19 | 250,000 | 294,471 |
| Caterpillar, Inc. |
| 5.70%, 08/15/16 | 200,000 | 211,070 |
| 6.05%, 08/15/36 | 150,000 | 183,012 |
| Deere & Co. |
| 2.60%, 06/08/22 (b) | 200,000 | 196,982 |
| 5.38%, 10/16/29 | 150,000 | 176,366 |
| Eaton Corp. |
| 1.50%, 11/02/17 | 150,000 | 149,983 |
| 4.00%, 11/02/32 | 100,000 | 97,091 |
| 4.15%, 11/02/42 | 100,000 | 92,619 |
| General Dynamics Corp. |
| 1.00%, 11/15/17 | 300,000 | 299,131 |
| General Electric Co. |
| 5.25%, 12/06/17 | 700,000 | 762,767 |
| 2.70%, 10/09/22 | 900,000 | 880,672 |
| 3.38%, 03/11/24 | 600,000 | 609,870 |
| 4.13%, 10/09/42 | 200,000 | 192,895 |
| 4.50%, 03/11/44 | 400,000 | 407,220 |
| Illinois Tool Works, Inc. |
| 3.90%, 09/01/42 (b) | 100,000 | 93,496 |
| Ingersoll-Rand Luxembourg Finance S.A. |
| 2.63%, 05/01/20 (b) | 500,000 | 498,379 |
| John Deere Capital Corp. |
| 5.50%, 04/13/17 | 200,000 | 216,100 |
| 1.55%, 12/15/17 | 450,000 | 453,187 |
| 1.35%, 01/16/18 | 200,000 | 200,715 |
| 1.70%, 01/15/20 | 750,000 | 734,820 |
| 3.90%, 07/12/21 | 500,000 | 539,133 |
| L-3 Communications Corp. |
| 4.95%, 02/15/21 (b) | 500,000 | 534,239 |
Schwab U.S. Aggregate Bond ETF
Portfolio Holdings (Unaudited) continued
Security
Rate, Maturity Date | Face
Amount ($) | Value
($) |
| Lockheed Martin Corp. |
| 4.25%, 11/15/19 (h) | 250,000 | 272,209 |
| 3.35%, 09/15/21 | 100,000 | 103,067 |
| Northrop Grumman Corp. |
| 3.50%, 03/15/21 | 500,000 | 516,640 |
| 4.75%, 06/01/43 | 250,000 | 253,545 |
| Owens Corning |
| 4.20%, 12/15/22 (b) | 500,000 | 507,566 |
| Packaging Corp. of America |
| 3.90%, 06/15/22 (b) | 750,000 | 759,555 |
| 3.65%, 09/15/24 (b) | 300,000 | 294,548 |
| Republic Services, Inc. |
| 3.80%, 05/15/18 | 200,000 | 210,543 |
| 5.00%, 03/01/20 | 500,000 | 550,742 |
| 4.75%, 05/15/23 (b) | 500,000 | 542,249 |
| 6.20%, 03/01/40 | 500,000 | 594,940 |
| 5.70%, 05/15/41 (b) | 200,000 | 227,874 |
| Roper Technologies, Inc. |
| 3.13%, 11/15/22 (b) | 250,000 | 242,432 |
| Textron, Inc. |
| 5.95%, 09/21/21 (b) | 200,000 | 229,304 |
| 3.88%, 03/01/25 (b) | 250,000 | 246,592 |
| United Technologies Corp. |
| 1.80%, 06/01/17 | 400,000 | 405,941 |
| 5.38%, 12/15/17 | 300,000 | 329,624 |
| 6.13%, 02/01/19 | 400,000 | 457,248 |
| 3.10%, 06/01/22 | 600,000 | 605,331 |
| 6.13%, 07/15/38 | 150,000 | 183,287 |
| 4.50%, 06/01/42 | 900,000 | 916,449 |
| Valmont Industries, Inc. |
| 5.00%, 10/01/44 (b) | 200,000 | 181,794 |
| Waste Management, Inc. |
| 2.90%, 09/15/22 (b) | 400,000 | 393,820 |
| | | 18,835,213 |
| Communications 2.4% |
| 21st Century Fox America, Inc. |
| 6.90%, 03/01/19 | 180,000 | 209,175 |
| 4.00%, 10/01/23 | 400,000 | 412,842 |
| 6.15%, 03/01/37 | 200,000 | 231,990 |
| 6.15%, 02/15/41 | 350,000 | 407,839 |
| America Movil S.A.B. de C.V. |
| 2.38%, 09/08/16 | 200,000 | 202,774 |
| 3.13%, 07/16/22 | 200,000 | 197,828 |
| 6.13%, 03/30/40 | 500,000 | 581,465 |
| 4.38%, 07/16/42 | 500,000 | 465,580 |
| American Tower Corp. |
| 3.40%, 02/15/19 | 750,000 | 768,138 |
| 5.05%, 09/01/20 | 250,000 | 271,975 |
| 5.00%, 02/15/24 | 100,000 | 105,899 |
| AT&T Mobility LLC |
| 7.13%, 12/15/31 | 50,000 | 61,187 |
| AT&T, Inc. |
| 1.40%, 12/01/17 | 750,000 | 745,515 |
| 5.50%, 02/01/18 | 400,000 | 437,406 |
| 5.80%, 02/15/19 | 200,000 | 223,794 |
| 2.45%, 06/23/20 (b) | 500,000 | 490,706 |
| 3.00%, 02/15/22 | 350,000 | 342,145 |
Security
Rate, Maturity Date | Face
Amount ($) | Value
($) |
| 6.15%, 09/15/34 | 700,000 | 773,443 |
| 4.50%, 05/15/35 (b) | 1,000,000 | 922,211 |
| 5.35%, 09/01/40 | 250,000 | 246,971 |
| 5.55%, 08/15/41 | 400,000 | 411,252 |
| 4.30%, 12/15/42 (b) | 750,000 | 645,208 |
| 4.35%, 06/15/45 (b) | 200,000 | 171,407 |
| CBS Corp. |
| 5.50%, 05/15/33 | 300,000 | 303,443 |
| 4.90%, 08/15/44 (b) | 400,000 | 370,882 |
| 4.60%, 01/15/45 (b) | 250,000 | 224,079 |
| CC Holdings GS V LLC |
| 3.85%, 04/15/23 | 200,000 | 196,723 |
| Comcast Corp. |
| 6.50%, 01/15/17 | 350,000 | 378,672 |
| 5.15%, 03/01/20 | 500,000 | 563,189 |
| 6.95%, 08/15/37 | 350,000 | 455,900 |
| 4.65%, 07/15/42 | 500,000 | 502,419 |
| Deutsche Telekom International Finance BV |
| 8.75%, 06/15/30 (a) | 100,000 | 141,024 |
| DIRECTV Holdings LLC |
| 5.88%, 10/01/19 | 400,000 | 451,952 |
| 4.60%, 02/15/21 (b) | 500,000 | 533,306 |
| 5.00%, 03/01/21 | 250,000 | 271,050 |
| 4.45%, 04/01/24 (b) | 500,000 | 512,556 |
| 3.95%, 01/15/25 (b) | 250,000 | 245,585 |
| 6.00%, 08/15/40 (b) | 1,000,000 | 1,041,147 |
| 5.15%, 03/15/42 | 400,000 | 377,644 |
| Discovery Communications LLC |
| 3.45%, 03/15/25 (b) | 500,000 | 470,123 |
| Embarq Corp. |
| 8.00%, 06/01/36 | 750,000 | 833,400 |
| Grupo Televisa S.A.B. |
| 6.00%, 05/15/18 | 200,000 | 222,000 |
| 6.63%, 01/15/40 | 500,000 | 582,165 |
| 5.00%, 05/13/45 (b) | 850,000 | 815,150 |
| NBCUniversal Media LLC |
| 4.38%, 04/01/21 (h) | 250,000 | 270,976 |
| 2.88%, 01/15/23 | 1,250,000 | 1,215,136 |
| 5.95%, 04/01/41 | 350,000 | 410,908 |
| Omnicom Group, Inc. |
| 4.45%, 08/15/20 | 250,000 | 267,643 |
| 3.65%, 11/01/24 (b) | 250,000 | 245,981 |
| Orange S.A. |
| 2.75%, 02/06/19 | 250,000 | 253,920 |
| 5.38%, 01/13/42 | 250,000 | 257,775 |
| Qwest Corp. |
| 6.75%, 12/01/21 | 350,000 | 386,819 |
| Rogers Communications, Inc. |
| 3.00%, 03/15/23 (b) | 250,000 | 240,539 |
| TCI Communications, Inc. |
| 7.13%, 02/15/28 | 300,000 | 391,733 |
| Telefonica Emisiones S.A.U. |
| 6.22%, 07/03/17 | 150,000 | 163,118 |
| 5.13%, 04/27/20 | 250,000 | 273,763 |
| 5.46%, 02/16/21 | 250,000 | 276,774 |
| 4.57%, 04/27/23 | 150,000 | 157,770 |
| 7.05%, 06/20/36 | 150,000 | 184,770 |
| Telefonos de Mexico S.A.B. de C.V. |
| 5.50%, 11/15/19 | 600,000 | 673,920 |
Schwab U.S. Aggregate Bond ETF
Portfolio Holdings (Unaudited) continued
Security
Rate, Maturity Date | Face
Amount ($) | Value
($) |
| Time Warner, Inc. |
| 2.10%, 06/01/19 | 750,000 | 745,767 |
| 4.75%, 03/29/21 | 300,000 | 324,712 |
| 3.55%, 06/01/24 (b) | 400,000 | 390,826 |
| 7.63%, 04/15/31 | 100,000 | 130,359 |
| 7.70%, 05/01/32 | 200,000 | 263,407 |
| 6.50%, 11/15/36 | 250,000 | 294,532 |
| Verizon Communications, Inc. |
| 2.50%, 09/15/16 | 206,000 | 209,404 |
| 1.35%, 06/09/17 | 750,000 | 749,292 |
| 3.65%, 09/14/18 | 650,000 | 684,178 |
| 6.35%, 04/01/19 | 200,000 | 228,741 |
| 4.50%, 09/15/20 | 500,000 | 539,994 |
| 4.60%, 04/01/21 | 500,000 | 537,980 |
| 3.00%, 11/01/21 (b) | 500,000 | 493,978 |
| 5.15%, 09/15/23 | 500,000 | 548,343 |
| 4.15%, 03/15/24 (b) | 250,000 | 257,059 |
| 3.50%, 11/01/24 (b) | 1,000,000 | 974,572 |
| 7.75%, 12/01/30 | 100,000 | 130,095 |
| 6.40%, 09/15/33 | 750,000 | 861,869 |
| 4.40%, 11/01/34 (b) | 1,700,000 | 1,578,768 |
| 5.85%, 09/15/35 | 500,000 | 544,340 |
| 6.55%, 09/15/43 | 500,000 | 586,913 |
| 4.52%, 09/15/48 (c) | 388,000 | 342,235 |
| 5.01%, 08/21/54 | 300,000 | 276,396 |
| Viacom, Inc. |
| 2.50%, 12/15/16 | 500,000 | 507,823 |
| 4.50%, 03/01/21 | 1,000,000 | 1,059,202 |
| 4.25%, 09/01/23 (b) | 150,000 | 151,440 |
| 3.88%, 04/01/24 (b) | 400,000 | 392,377 |
| 6.88%, 04/30/36 | 200,000 | 223,217 |
| Walt Disney Co. |
| 1.35%, 08/16/16 | 150,000 | 151,071 |
| 1.10%, 12/01/17 | 250,000 | 249,942 |
| | | 38,919,536 |
| Consumer Cyclical 1.6% |
| Alibaba Group Holding Ltd. |
| 3.13%, 11/28/21 (b)(c) | 250,000 | 247,413 |
| 4.50%, 11/28/34 (b)(c) | 500,000 | 481,943 |
| Amazon.com, Inc. |
| 2.50%, 11/29/22 (b) | 400,000 | 379,484 |
| 3.80%, 12/05/24 (b) | 500,000 | 502,836 |
| 4.95%, 12/05/44 (b) | 500,000 | 489,107 |
| AutoZone, Inc. |
| 3.70%, 04/15/22 (b) | 500,000 | 513,396 |
| 3.25%, 04/15/25 (b) | 500,000 | 483,811 |
| Carnival Corp. |
| 1.88%, 12/15/17 | 250,000 | 251,193 |
| 3.95%, 10/15/20 | 350,000 | 367,910 |
| CVS Health Corp. |
| 5.75%, 06/01/17 | 500,000 | 540,595 |
| 2.25%, 08/12/19 (b) | 250,000 | 249,107 |
| 4.75%, 05/18/20 (b) | 500,000 | 554,369 |
| 3.38%, 08/12/24 (b) | 250,000 | 246,111 |
| 5.30%, 12/05/43 (b) | 200,000 | 218,760 |
| Delphi Corp. |
| 5.00%, 02/15/23 (b) | 300,000 | 320,250 |
| 4.15%, 03/15/24 (b) | 150,000 | 155,334 |
Security
Rate, Maturity Date | Face
Amount ($) | Value
($) |
| eBay, Inc. |
| 1.35%, 07/15/17 | 500,000 | 499,406 |
| Ford Motor Co. |
| 7.45%, 07/16/31 | 425,000 | 544,447 |
| 4.75%, 01/15/43 | 600,000 | 583,959 |
| Ford Motor Credit Co. LLC |
| 6.63%, 08/15/17 | 450,000 | 493,933 |
| 2.15%, 01/09/18 | 750,000 | 753,546 |
| 2.38%, 01/16/18 | 500,000 | 504,957 |
| 4.25%, 09/20/22 | 1,000,000 | 1,043,052 |
| Gap, Inc. |
| 5.95%, 04/12/21 (b) | 450,000 | 508,808 |
| General Motors Co. |
| 3.50%, 10/02/18 | 250,000 | 258,753 |
| 4.88%, 10/02/23 | 1,250,000 | 1,324,091 |
| 6.25%, 10/02/43 | 250,000 | 279,865 |
| Home Depot, Inc. |
| 3.75%, 02/15/24 (b) | 500,000 | 520,908 |
| 5.88%, 12/16/36 | 300,000 | 361,791 |
| 4.88%, 02/15/44 (b) | 100,000 | 107,220 |
| Host Hotels & Resorts LP |
| 3.75%, 10/15/23 (b) | 250,000 | 245,683 |
| Johnson Controls, Inc. |
| 3.63%, 07/02/24 (b) | 500,000 | 501,821 |
| 6.00%, 01/15/36 | 500,000 | 575,231 |
| 4.63%, 07/02/44 (b) | 200,000 | 191,581 |
| Lowe's Cos., Inc. |
| 5.40%, 10/15/16 | 600,000 | 634,257 |
| 3.12%, 04/15/22 (b) | 750,000 | 759,574 |
| Macy's Retail Holdings, Inc. |
| 5.90%, 12/01/16 | 210,000 | 223,820 |
| 2.88%, 02/15/23 (b) | 200,000 | 192,859 |
| 5.13%, 01/15/42 (b) | 300,000 | 302,435 |
| Marriott International, Inc. |
| 3.00%, 03/01/19 (b) | 200,000 | 205,241 |
| 3.13%, 10/15/21 (b) | 200,000 | 200,088 |
| McDonald's Corp. |
| 5.30%, 03/15/17 (h) | 86,000 | 91,978 |
| 5.35%, 03/01/18 | 150,000 | 164,546 |
| 3.25%, 06/10/24 | 350,000 | 348,477 |
| 3.70%, 02/15/42 | 114,000 | 96,965 |
| NIKE, Inc. |
| 2.25%, 05/01/23 (b) | 100,000 | 96,492 |
| 3.63%, 05/01/43 (b) | 50,000 | 45,702 |
| Nordstrom, Inc. |
| 4.00%, 10/15/21 (b) | 150,000 | 159,603 |
| QVC, Inc. |
| 5.45%, 08/15/34 (b) | 200,000 | 182,006 |
| Starbucks Corp. |
| 3.85%, 10/01/23 (b) | 300,000 | 315,737 |
| Starwood Hotels & Resorts Worldwide, Inc. |
| 6.75%, 05/15/18 | 100,000 | 111,956 |
| 4.50%, 10/01/34 (b) | 250,000 | 233,818 |
| Target Corp. |
| 6.00%, 01/15/18 | 500,000 | 556,520 |
| 2.30%, 06/26/19 | 500,000 | 507,104 |
| 3.50%, 07/01/24 | 250,000 | 255,493 |
Schwab U.S. Aggregate Bond ETF
Portfolio Holdings (Unaudited) continued
Security
Rate, Maturity Date | Face
Amount ($) | Value
($) |
| Toyota Motor Credit Corp. |
| 1.45%, 01/12/18 | 500,000 | 500,666 |
| 3.40%, 09/15/21 | 350,000 | 366,298 |
| Wal-Mart Stores, Inc. |
| 3.25%, 10/25/20 | 100,000 | 105,013 |
| 2.55%, 04/11/23 (b) | 700,000 | 676,588 |
| 5.25%, 09/01/35 | 550,000 | 625,670 |
| 6.50%, 08/15/37 | 500,000 | 643,804 |
| 6.20%, 04/15/38 | 700,000 | 874,959 |
| Walgreens Boots Alliance, Inc. |
| 3.80%, 11/18/24 (b) | 250,000 | 245,322 |
| 4.80%, 11/18/44 (b) | 600,000 | 566,753 |
| Wyndham Worldwide Corp. |
| 5.63%, 03/01/21 | 100,000 | 109,671 |
| | | 25,700,086 |
| Consumer Non-Cyclical 3.3% |
| AbbVie, Inc. |
| 1.75%, 11/06/17 | 200,000 | 200,638 |
| 2.00%, 11/06/18 | 700,000 | 700,871 |
| 2.90%, 11/06/22 | 500,000 | 484,942 |
| 3.20%, 11/06/22 (b) | 300,000 | 297,543 |
| 4.40%, 11/06/42 | 1,000,000 | 949,851 |
| Actavis Funding SCS |
| 3.85%, 06/15/24 (b) | 500,000 | 494,900 |
| 4.75%, 03/15/45 (b) | 500,000 | 477,875 |
| Allergan, Inc. |
| 2.80%, 03/15/23 (b) | 150,000 | 138,776 |
| Altria Group, Inc. |
| 9.25%, 08/06/19 | 250,000 | 314,095 |
| 4.75%, 05/05/21 | 500,000 | 542,520 |
| 2.85%, 08/09/22 | 600,000 | 577,643 |
| 2.95%, 05/02/23 | 800,000 | 765,514 |
| 4.25%, 08/09/42 | 200,000 | 178,179 |
| Amgen, Inc. |
| 5.85%, 06/01/17 | 200,000 | 216,636 |
| 3.88%, 11/15/21 (b) | 500,000 | 525,062 |
| 5.15%, 11/15/41 (b) | 500,000 | 515,324 |
| Anheuser-Busch InBev Finance, Inc. |
| 1.13%, 01/27/17 | 100,000 | 100,301 |
| 2.15%, 02/01/19 | 400,000 | 401,345 |
| 3.70%, 02/01/24 | 200,000 | 204,926 |
| 4.63%, 02/01/44 | 350,000 | 353,132 |
| Anheuser-Busch InBev Worldwide, Inc. |
| 1.38%, 07/15/17 | 500,000 | 502,501 |
| 6.88%, 11/15/19 | 350,000 | 418,098 |
| 5.00%, 04/15/20 | 250,000 | 279,611 |
| AstraZeneca PLC |
| 6.45%, 09/15/37 | 150,000 | 191,559 |
| Baxalta, Inc. |
| 2.00%, 06/22/18 (c) | 250,000 | 249,850 |
| 2.88%, 06/23/20 (b)(c) | 750,000 | 749,766 |
| 4.00%, 06/23/25 (b)(c) | 250,000 | 248,647 |
| 5.25%, 06/23/45 (b)(c) | 500,000 | 503,857 |
| Baxter International, Inc. |
| 4.50%, 06/15/43 (b) | 300,000 | 301,019 |
Security
Rate, Maturity Date | Face
Amount ($) | Value
($) |
| Boston Scientific Corp. |
| 6.00%, 01/15/20 | 150,000 | 170,027 |
| 4.13%, 10/01/23 (b) | 100,000 | 101,692 |
| Bristol-Myers Squibb Co. |
| 3.25%, 08/01/42 | 100,000 | 84,029 |
| Campbell Soup Co. |
| 2.50%, 08/02/22 | 350,000 | 333,604 |
| Cardinal Health, Inc. |
| 1.90%, 06/15/17 | 400,000 | 403,627 |
| 1.70%, 03/15/18 | 750,000 | 747,426 |
| 1.95%, 06/15/18 | 250,000 | 250,599 |
| 3.75%, 09/15/25 (b) | 250,000 | 249,243 |
| 4.90%, 09/15/45 (b) | 500,000 | 500,151 |
| Celgene Corp. |
| 1.90%, 08/15/17 | 1,000,000 | 1,010,886 |
| 2.30%, 08/15/18 | 750,000 | 761,884 |
| 2.25%, 05/15/19 | 1,500,000 | 1,504,306 |
| 3.63%, 05/15/24 (b) | 700,000 | 700,426 |
| 4.63%, 05/15/44 (b) | 550,000 | 526,867 |
| Colgate-Palmolive Co. |
| 2.63%, 05/01/17 | 100,000 | 103,065 |
| 1.75%, 03/15/19 | 500,000 | 499,507 |
| 3.25%, 03/15/24 | 200,000 | 203,082 |
| Delhaize Group S.A. |
| 5.70%, 10/01/40 | 750,000 | 763,731 |
| Diageo Capital PLC |
| 5.75%, 10/23/17 | 300,000 | 327,538 |
| 1.13%, 04/29/18 | 200,000 | 197,608 |
| 5.88%, 09/30/36 | 150,000 | 173,097 |
| Dr Pepper Snapple Group, Inc. |
| 3.20%, 11/15/21 (b) | 1,500,000 | 1,538,014 |
| Eli Lilly & Co. |
| 1.25%, 03/01/18 | 500,000 | 498,817 |
| 3.70%, 03/01/45 (b) | 500,000 | 454,779 |
| Express Scripts Holding Co. |
| 2.25%, 06/15/19 | 500,000 | 496,417 |
| 3.50%, 06/15/24 (b) | 250,000 | 244,978 |
| General Mills, Inc. |
| 5.40%, 06/15/40 | 500,000 | 544,227 |
| Genzyme Corp. |
| 5.00%, 06/15/20 | 250,000 | 282,663 |
| Gilead Sciences, Inc. |
| 2.05%, 04/01/19 | 1,000,000 | 1,006,216 |
| 4.40%, 12/01/21 (b) | 350,000 | 382,570 |
| 3.70%, 04/01/24 (b) | 400,000 | 409,179 |
| 3.50%, 02/01/25 (b) | 500,000 | 501,322 |
| 5.65%, 12/01/41 (b) | 200,000 | 229,647 |
| 4.80%, 04/01/44 (b) | 350,000 | 361,070 |
| 4.50%, 02/01/45 (b) | 250,000 | 249,644 |
| GlaxoSmithKline Capital, Inc. |
| 5.65%, 05/15/18 | 150,000 | 167,480 |
| 2.85%, 05/08/22 | 150,000 | 148,824 |
| Hasbro, Inc. |
| 6.30%, 09/15/17 | 100,000 | 109,422 |
| 6.35%, 03/15/40 | 450,000 | 509,992 |
| HJ Heinz Co. |
| 5.20%, 07/15/45 (b)(c)(g) | 500,000 | 514,361 |
Schwab U.S. Aggregate Bond ETF
Portfolio Holdings (Unaudited) continued
Security
Rate, Maturity Date | Face
Amount ($) | Value
($) |
| Johnson & Johnson |
| 5.55%, 08/15/17 | 250,000 | 273,975 |
| Kimberly-Clark Corp. |
| 3.63%, 08/01/20 | 500,000 | 533,575 |
| 6.63%, 08/01/37 | 100,000 | 131,367 |
| 5.30%, 03/01/41 | 200,000 | 227,891 |
| Koninklijke Philips N.V. |
| 5.00%, 03/15/42 | 100,000 | 99,287 |
| Kraft Foods Group, Inc. |
| 5.38%, 02/10/20 | 400,000 | 446,935 |
| 3.50%, 06/06/22 | 500,000 | 501,991 |
| 5.00%, 06/04/42 | 1,000,000 | 1,000,190 |
| Lorillard Tobacco Co. |
| 2.30%, 08/21/17 | 1,000,000 | 1,004,030 |
| McKesson Corp. |
| 2.28%, 03/15/19 | 300,000 | 300,178 |
| 3.80%, 03/15/24 (b) | 500,000 | 506,658 |
| Medtronic, Inc. |
| 2.50%, 03/15/20 (c) | 750,000 | 751,748 |
| 3.63%, 03/15/24 (b) | 200,000 | 205,252 |
| 3.50%, 03/15/25 (c) | 1,000,000 | 997,807 |
| 4.00%, 04/01/43 (b) | 300,000 | 277,542 |
| 4.63%, 03/15/45 (c) | 250,000 | 253,701 |
| Merck & Co., Inc. |
| 3.88%, 01/15/21 (b) | 200,000 | 214,577 |
| Molson Coors Brewing Co. |
| 3.50%, 05/01/22 | 200,000 | 202,095 |
| Mondelez International, Inc. |
| 2.25%, 02/01/19 (b) | 500,000 | 501,224 |
| 4.00%, 02/01/24 (b) | 400,000 | 415,022 |
| 6.88%, 02/01/38 | 500,000 | 632,671 |
| Newell Rubbermaid, Inc. |
| 2.88%, 12/01/19 (b) | 400,000 | 404,686 |
| 4.70%, 08/15/20 | 150,000 | 164,008 |
| Novartis Capital Corp. |
| 4.40%, 04/24/20 (h) | 100,000 | 110,487 |
| PepsiCo, Inc. |
| 1.25%, 08/13/17 | 250,000 | 250,493 |
| 2.25%, 01/07/19 (b) | 750,000 | 760,609 |
| 4.88%, 11/01/40 | 200,000 | 212,556 |
| Perrigo Finance plc |
| 3.90%, 12/15/24 (b) | 500,000 | 494,677 |
| Pfizer, Inc. |
| 6.20%, 03/15/19 (h) | 225,000 | 257,496 |
| Philip Morris International, Inc. |
| 1.13%, 08/21/17 | 100,000 | 99,854 |
| 4.50%, 03/26/20 | 250,000 | 274,405 |
| 2.90%, 11/15/21 | 1,000,000 | 1,010,039 |
| 2.50%, 08/22/22 | 100,000 | 96,396 |
| 6.38%, 05/16/38 | 650,000 | 799,060 |
| 4.25%, 11/10/44 | 200,000 | 188,521 |
| Procter & Gamble Co. |
| 4.70%, 02/15/19 | 650,000 | 716,838 |
| 5.55%, 03/05/37 | 100,000 | 120,949 |
| Quest Diagnostics, Inc. |
| 4.75%, 01/15/20 | 400,000 | 435,978 |
| 2.50%, 03/30/20 (b) | 500,000 | 496,634 |
| 4.25%, 04/01/24 (b) | 500,000 | 507,959 |
Security
Rate, Maturity Date | Face
Amount ($) | Value
($) |
| Reynolds American, Inc. |
| 6.75%, 06/15/17 | 100,000 | 109,325 |
| 3.25%, 11/01/22 | 100,000 | 96,471 |
| 4.45%, 06/12/25 (b) | 500,000 | 510,408 |
| 5.85%, 08/12/45 (b) | 500,000 | 526,333 |
| Sanofi |
| 1.25%, 04/10/18 | 100,000 | 99,700 |
| 4.00%, 03/29/21 | 150,000 | 160,817 |
| Sysco Corp. |
| 3.00%, 10/02/21 (b) | 500,000 | 505,000 |
| Teva Pharmaceutical Finance Co. BV |
| 2.95%, 12/18/22 | 40,000 | 38,705 |
| Teva Pharmaceutical Finance Co. LLC |
| 6.15%, 02/01/36 | 14,000 | 16,620 |
| The Coca-Cola Co. |
| 3.15%, 11/15/20 | 1,000,000 | 1,043,547 |
| 3.20%, 11/01/23 | 500,000 | 505,590 |
| The Kroger Co. |
| 3.85%, 08/01/23 (b) | 350,000 | 359,613 |
| 7.50%, 04/01/31 (h) | 100,000 | 129,074 |
| Thermo Fisher Scientific, Inc. |
| 4.50%, 03/01/21 | 50,000 | 53,357 |
| 3.60%, 08/15/21 (b) | 50,000 | 50,963 |
| 4.15%, 02/01/24 (b) | 200,000 | 204,147 |
| 5.30%, 02/01/44 (b) | 200,000 | 212,174 |
| Unilever Capital Corp. |
| 4.25%, 02/10/21 | 300,000 | 330,194 |
| Wyeth LLC |
| 5.95%, 04/01/37 | 500,000 | 597,617 |
| Zimmer Biomet Holdings, Inc. |
| 2.00%, 04/01/18 | 500,000 | 500,510 |
| 2.70%, 04/01/20 (b) | 500,000 | 498,076 |
| 4.25%, 08/15/35 (b) | 500,000 | 463,649 |
| Zoetis, Inc. |
| 3.25%, 02/01/23 (b) | 250,000 | 242,604 |
| 4.70%, 02/01/43 (b) | 100,000 | 95,701 |
| | | 54,376,554 |
| Energy 2.7% |
| Anadarko Petroleum Corp. |
| 5.95%, 09/15/16 | 225,000 | 237,425 |
| 6.38%, 09/15/17 | 200,000 | 219,594 |
| 6.45%, 09/15/36 | 100,000 | 115,740 |
| Apache Corp. |
| 6.90%, 09/15/18 | 100,000 | 114,536 |
| 3.25%, 04/15/22 (b) | 500,000 | 492,457 |
| 4.75%, 04/15/43 (b) | 100,000 | 92,886 |
| Baker Hughes, Inc. |
| 3.20%, 08/15/21 (b) | 300,000 | 305,523 |
| BP Capital Markets PLC |
| 1.85%, 05/05/17 | 1,000,000 | 1,012,498 |
| 4.75%, 03/10/19 | 250,000 | 273,680 |
| 2.32%, 02/13/20 | 750,000 | 747,501 |
| 4.50%, 10/01/20 | 300,000 | 328,392 |
| 4.74%, 03/11/21 | 1,000,000 | 1,104,294 |
| 3.06%, 03/17/22 | 500,000 | 499,146 |
| 3.25%, 05/06/22 | 200,000 | 200,692 |
Schwab U.S. Aggregate Bond ETF
Portfolio Holdings (Unaudited) continued
Security
Rate, Maturity Date | Face
Amount ($) | Value
($) |
| Buckeye Partners LP |
| 4.35%, 10/15/24 (b) | 300,000 | 294,671 |
| Canadian Natural Resources Ltd. |
| 5.70%, 05/15/17 | 300,000 | 322,949 |
| 3.80%, 04/15/24 (b) | 150,000 | 148,596 |
| 6.25%, 03/15/38 | 100,000 | 111,125 |
| Chevron Corp. |
| 1.10%, 12/05/17 (b) | 500,000 | 498,035 |
| 1.72%, 06/24/18 (b) | 1,000,000 | 1,006,388 |
| 3.19%, 06/24/23 (b) | 400,000 | 402,311 |
| Cimarex Energy Co. |
| 5.88%, 05/01/22 (b) | 750,000 | 806,250 |
| Conoco, Inc. |
| 6.95%, 04/15/29 | 200,000 | 256,180 |
| ConocoPhillips |
| 5.20%, 05/15/18 | 250,000 | 275,962 |
| ConocoPhillips Canada |
| 5.63%, 10/15/16 | 150,000 | 158,607 |
| Devon Energy Corp. |
| 2.25%, 12/15/18 (b) | 500,000 | 501,759 |
| Dominion Gas Holdings LLC |
| 4.80%, 11/01/43 (b) | 100,000 | 98,948 |
| Enbridge, Inc. |
| 4.50%, 06/10/44 (b) | 150,000 | 123,741 |
| Encana Corp. |
| 6.50%, 05/15/19 | 150,000 | 170,442 |
| 3.90%, 11/15/21 (b) | 200,000 | 204,347 |
| 6.50%, 02/01/38 | 175,000 | 187,122 |
| Energy Transfer Partners LP |
| 4.15%, 10/01/20 (b) | 500,000 | 514,465 |
| 5.20%, 02/01/22 (b) | 500,000 | 524,217 |
| 4.90%, 03/15/35 (b) | 500,000 | 452,523 |
| 6.63%, 10/15/36 | 200,000 | 211,449 |
| 7.50%, 07/01/38 | 100,000 | 114,623 |
| 6.50%, 02/01/42 (b) | 1,000,000 | 1,033,420 |
| 6.13%, 12/15/45 (b) | 500,000 | 502,500 |
| EnLink Midstream Partners LP |
| 2.70%, 04/01/19 (b) | 750,000 | 741,118 |
| 5.05%, 04/01/45 (b) | 500,000 | 455,091 |
| Ensco PLC |
| 4.70%, 03/15/21 | 500,000 | 509,932 |
| 4.50%, 10/01/24 (b) | 150,000 | 143,570 |
| 5.75%, 10/01/44 (b) | 400,000 | 357,648 |
| Enterprise Products Operating LLC |
| 6.30%, 09/15/17 | 100,000 | 110,219 |
| 2.55%, 10/15/19 (b) | 500,000 | 500,360 |
| 3.90%, 02/15/24 (b) | 400,000 | 402,373 |
| 3.75%, 02/15/25 (b) | 150,000 | 147,305 |
| 6.65%, 10/15/34 | 250,000 | 303,844 |
| 4.85%, 03/15/44 (b) | 100,000 | 94,401 |
| EOG Resources, Inc. |
| 5.63%, 06/01/19 | 500,000 | 565,812 |
| 2.63%, 03/15/23 (b) | 750,000 | 720,959 |
| 3.90%, 04/01/35 (b) | 500,000 | 474,282 |
| Exxon Mobil Corp. |
| 3.57%, 03/06/45 (b) | 500,000 | 453,808 |
Security
Rate, Maturity Date | Face
Amount ($) | Value
($) |
| Halliburton Co. |
| 1.00%, 08/01/16 | 100,000 | 99,968 |
| 6.15%, 09/15/19 | 125,000 | 143,896 |
| 6.70%, 09/15/38 | 100,000 | 124,797 |
| Helmerich & Payne International Drilling Co. |
| 4.65%, 03/15/25 (b)(c) | 1,750,000 | 1,809,948 |
| Hess Corp. |
| 8.13%, 02/15/19 | 200,000 | 236,969 |
| 7.30%, 08/15/31 | 150,000 | 174,571 |
| 7.13%, 03/15/33 | 100,000 | 115,028 |
| Husky Energy, Inc. |
| 7.25%, 12/15/19 | 200,000 | 233,811 |
| 3.95%, 04/15/22 (b) | 1,000,000 | 1,004,194 |
| 6.80%, 09/15/37 | 500,000 | 580,663 |
| Kerr-McGee Corp. |
| 6.95%, 07/01/24 | 250,000 | 301,924 |
| Kinder Morgan Energy Partners LP |
| 5.95%, 02/15/18 | 100,000 | 109,344 |
| 6.85%, 02/15/20 (h) | 50,000 | 57,795 |
| 4.30%, 05/01/24 (b) | 300,000 | 296,591 |
| 5.80%, 03/15/35 | 100,000 | 98,968 |
| 5.00%, 08/15/42 (b) | 100,000 | 87,305 |
| 4.70%, 11/01/42 (b) | 300,000 | 251,477 |
| 5.40%, 09/01/44 (b) | 400,000 | 364,633 |
| Kinder Morgan, Inc. |
| 7.25%, 06/01/18 | 750,000 | 846,406 |
| 4.30%, 06/01/25 (b) | 250,000 | 241,828 |
| 5.55%, 06/01/45 (b) | 700,000 | 649,257 |
| Magellan Midstream Partners LP |
| 4.20%, 12/01/42 (b) | 100,000 | 88,152 |
| Marathon Oil Corp. |
| 2.80%, 11/01/22 (b) | 300,000 | 284,828 |
| 6.60%, 10/01/37 | 200,000 | 226,243 |
| Marathon Petroleum Corp. |
| 5.13%, 03/01/21 (h) | 250,000 | 274,886 |
| 4.75%, 09/15/44 (b) | 250,000 | 229,036 |
| MPLX LP |
| 4.00%, 02/15/25 (b) | 250,000 | 244,399 |
| Murphy Oil Corp. |
| 5.13%, 12/01/42 (b) | 200,000 | 166,374 |
| Nabors Industries, Inc. |
| 2.35%, 09/15/16 | 100,000 | 100,322 |
| Nisource Finance Corp. |
| 3.85%, 02/15/23 (b) | 100,000 | 103,063 |
| Noble Energy, Inc. |
| 6.00%, 03/01/41 (b) | 250,000 | 265,542 |
| 5.25%, 11/15/43 (b) | 400,000 | 391,119 |
| Noble Holding International Ltd. |
| 5.95%, 04/01/25 (b) | 250,000 | 246,944 |
| Occidental Petroleum Corp. |
| 1.75%, 02/15/17 | 500,000 | 504,647 |
| 4.10%, 02/01/21 (b) | 100,000 | 108,562 |
| Phillips 66 Partners LP |
| 3.61%, 02/15/25 (b) | 500,000 | 471,494 |
| Pioneer Natural Resources Co. |
| 6.65%, 03/15/17 | 350,000 | 378,653 |
| 7.50%, 01/15/20 | 250,000 | 294,435 |
Schwab U.S. Aggregate Bond ETF
Portfolio Holdings (Unaudited) continued
Security
Rate, Maturity Date | Face
Amount ($) | Value
($) |
| Plains All American Pipeline LP |
| 5.75%, 01/15/20 | 100,000 | 112,296 |
| 3.65%, 06/01/22 (b) | 200,000 | 201,608 |
| 3.85%, 10/15/23 (b) | 150,000 | 148,667 |
| 6.65%, 01/15/37 | 100,000 | 114,702 |
| Shell International Finance BV |
| 4.30%, 09/22/19 | 100,000 | 109,092 |
| 6.38%, 12/15/38 | 500,000 | 630,811 |
| 4.55%, 08/12/43 | 250,000 | 256,478 |
| Southern Natural Gas Co. |
| 5.90%, 04/01/17 (c) | 150,000 | 159,824 |
| Spectra Energy Capital LLC |
| 6.20%, 04/15/18 | 350,000 | 382,612 |
| 5.65%, 03/01/20 | 300,000 | 325,905 |
| Spectra Energy Partners LP |
| 4.75%, 03/15/24 (b) | 100,000 | 105,868 |
| 5.95%, 09/25/43 (b) | 600,000 | 655,723 |
| Suncor Energy, Inc. |
| 6.10%, 06/01/18 | 100,000 | 111,592 |
| 5.95%, 12/01/34 | 250,000 | 285,048 |
| 6.50%, 06/15/38 | 150,000 | 183,353 |
| Tosco Corp. |
| 7.80%, 01/01/27 | 150,000 | 196,611 |
| Total Capital International S.A. |
| 2.88%, 02/17/22 | 500,000 | 500,246 |
| 3.75%, 04/10/24 | 500,000 | 518,272 |
| TransCanada PipeLines Ltd. |
| 1.88%, 01/12/18 | 250,000 | 251,807 |
| 4.63%, 03/01/34 (b) | 100,000 | 99,458 |
| 7.63%, 01/15/39 | 100,000 | 131,895 |
| Valero Energy Corp. |
| 6.13%, 06/15/17 | 750,000 | 815,543 |
| 9.38%, 03/15/19 | 500,000 | 615,838 |
| 7.50%, 04/15/32 | 250,000 | 304,963 |
| 6.63%, 06/15/37 | 500,000 | 566,420 |
| Weatherford International LLC |
| 6.35%, 06/15/17 | 250,000 | 267,857 |
| Weatherford International Ltd. |
| 5.13%, 09/15/20 | 250,000 | 255,041 |
| 4.50%, 04/15/22 (b) | 175,000 | 164,572 |
| Western Gas Partners LP |
| 3.95%, 06/01/25 (b) | 500,000 | 481,829 |
| Williams Cos., Inc. |
| 7.88%, 09/01/21 | 300,000 | 352,602 |
| 4.55%, 06/24/24 (b) | 250,000 | 242,711 |
| 5.75%, 06/24/44 (b) | 350,000 | 325,888 |
| Williams Partners LP |
| 7.25%, 02/01/17 | 550,000 | 596,173 |
| 5.25%, 03/15/20 | 250,000 | 272,019 |
| 3.60%, 03/15/22 (b) | 100,000 | 97,237 |
| | | 43,694,349 |
| Other Industrial 0.0% |
| Cintas Corp. No. 2 |
| 3.25%, 06/01/22 (b) | 500,000 | 504,190 |
| | | 504,190 |
Security
Rate, Maturity Date | Face
Amount ($) | Value
($) |
| Technology 1.4% |
| Amphenol Corp. |
| 3.13%, 09/15/21 (b) | 400,000 | 400,846 |
| Apple, Inc. |
| 1.05%, 05/05/17 | 500,000 | 501,632 |
| 1.00%, 05/03/18 | 300,000 | 297,091 |
| 2.40%, 05/03/23 | 1,000,000 | 957,634 |
| 3.85%, 05/03/43 | 500,000 | 456,212 |
| 3.45%, 02/09/45 | 250,000 | 212,434 |
| Arrow Electronics, Inc. |
| 3.00%, 03/01/18 | 300,000 | 304,935 |
| 4.50%, 03/01/23 (b) | 200,000 | 204,723 |
| Cisco Systems, Inc. |
| 4.45%, 01/15/20 | 350,000 | 382,924 |
| 3.63%, 03/04/24 | 250,000 | 258,233 |
| 5.90%, 02/15/39 | 100,000 | 119,678 |
| Corning, Inc. |
| 1.45%, 11/15/17 | 200,000 | 199,239 |
| EMC Corp. |
| 1.88%, 06/01/18 | 750,000 | 751,771 |
| 2.65%, 06/01/20 | 500,000 | 505,474 |
| Fidelity National Information Services, Inc. |
| 3.50%, 04/15/23 (b) | 300,000 | 291,683 |
| Fiserv, Inc. |
| 4.63%, 10/01/20 | 750,000 | 811,608 |
| 3.85%, 06/01/25 (b) | 500,000 | 501,739 |
| Flextronics International Ltd. |
| 4.75%, 06/15/25 (b)(c) | 500,000 | 497,350 |
| Google, Inc. |
| 3.38%, 02/25/24 | 100,000 | 102,744 |
| Harris Corp. |
| 6.15%, 12/15/40 | 150,000 | 168,865 |
| Hewlett-Packard Co. |
| 2.60%, 09/15/17 | 500,000 | 509,312 |
| 2.75%, 01/14/19 | 400,000 | 404,678 |
| 3.75%, 12/01/20 | 300,000 | 309,529 |
| Ingram Micro, Inc. |
| 5.00%, 08/10/22 (b) | 250,000 | 262,413 |
| 4.95%, 12/15/24 (b) | 100,000 | 102,402 |
| Intel Corp. |
| 1.95%, 10/01/16 | 350,000 | 353,771 |
| 4.25%, 12/15/42 (h) | 250,000 | 235,378 |
| International Business Machines Corp. |
| 5.70%, 09/14/17 | 500,000 | 548,344 |
| 3.38%, 08/01/23 | 150,000 | 150,879 |
| 3.63%, 02/12/24 | 750,000 | 760,432 |
| KLA-Tencor Corp. |
| 3.38%, 11/01/19 (b) | 350,000 | 359,870 |
| 4.65%, 11/01/24 (b) | 500,000 | 500,664 |
| 5.65%, 11/01/34 (b) | 350,000 | 352,482 |
| Lam Research Corp. |
| 3.80%, 03/15/25 (b) | 500,000 | 487,631 |
| Microsoft Corp. |
| 1.63%, 12/06/18 | 1,000,000 | 1,009,118 |
| 4.50%, 10/01/40 (h) | 100,000 | 102,148 |
Schwab U.S. Aggregate Bond ETF
Portfolio Holdings (Unaudited) continued
Security
Rate, Maturity Date | Face
Amount ($) | Value
($) |
| NetApp, Inc. |
| 2.00%, 12/15/17 | 500,000 | 502,800 |
| 3.38%, 06/15/21 (b) | 500,000 | 493,321 |
| 3.25%, 12/15/22 (b) | 250,000 | 237,156 |
| Oracle Corp. |
| 2.25%, 10/08/19 | 500,000 | 503,201 |
| 3.40%, 07/08/24 (b) | 650,000 | 652,393 |
| 2.95%, 05/15/25 (b) | 500,000 | 481,821 |
| 4.30%, 07/08/34 (b) | 400,000 | 395,218 |
| 6.13%, 07/08/39 | 750,000 | 907,948 |
| Pitney Bowes, Inc. |
| 4.63%, 03/15/24 (b) | 350,000 | 353,616 |
| Seagate HDD Cayman |
| 3.75%, 11/15/18 | 800,000 | 834,685 |
| 4.75%, 06/01/23 | 750,000 | 762,999 |
| 4.75%, 01/01/25 (c) | 500,000 | 497,865 |
| 5.75%, 12/01/34 (b)(c) | 250,000 | 246,867 |
| Verisk Analytics, Inc. |
| 4.00%, 06/15/25 | 500,000 | 490,645 |
| Xerox Corp. |
| 2.75%, 03/15/19 | 300,000 | 304,571 |
| 2.75%, 09/01/20 | 500,000 | 495,794 |
| | | 22,536,766 |
| Transportation 0.5% |
| American Airlines 2015-1 Class A Pass Through Trust |
| 3.38%, 05/01/27 | 750,000 | 727,575 |
| Burlington Northern Santa Fe LLC |
| 4.70%, 10/01/19 | 140,000 | 154,465 |
| 3.85%, 09/01/23 (b) | 400,000 | 415,293 |
| 5.05%, 03/01/41 (b) | 500,000 | 527,942 |
| 4.55%, 09/01/44 (b) | 400,000 | 395,303 |
| Canadian National Railway Co. |
| 2.95%, 11/21/24 (b) | 150,000 | 147,261 |
| 4.50%, 11/07/43 (b) | 300,000 | 309,500 |
| Canadian Pacific Railway Co. |
| 4.50%, 01/15/22 | 500,000 | 538,413 |
| 5.75%, 01/15/42 | 250,000 | 290,045 |
| Continental Airlines 2010-1 Class A Pass Through Trust |
| 4.75%, 07/12/22 | 399,643 | 425,659 |
| Continental Airlines 2012-1 Class A Pass Through Trust |
| 4.15%, 10/11/25 | 90,156 | 91,238 |
| CSX Corp. |
| 4.25%, 06/01/21 (b) | 150,000 | 162,468 |
| 4.10%, 03/15/44 (b) | 100,000 | 91,947 |
| FedEx Corp. |
| 2.63%, 08/01/22 | 200,000 | 194,176 |
| 3.90%, 02/01/35 | 300,000 | 278,270 |
| 3.88%, 08/01/42 | 200,000 | 173,810 |
| Kansas City Southern de Mexico S.A. de C.V. |
| 2.35%, 05/15/20 (b) | 350,000 | 341,842 |
| Norfolk Southern Corp. |
| 3.00%, 04/01/22 (b) | 750,000 | 747,192 |
| 4.84%, 10/01/41 | 100,000 | 102,835 |
| Ryder System, Inc. |
| 2.55%, 06/01/19 (b) | 100,000 | 100,265 |
Security
Rate, Maturity Date | Face
Amount ($) | Value
($) |
| Union Pacific Corp. |
| 3.65%, 02/15/24 (b) | 500,000 | 515,263 |
| 3.25%, 08/15/25 (b) | 500,000 | 495,436 |
| 4.82%, 02/01/44 (b) | 500,000 | 533,020 |
| United Parcel Service, Inc. |
| 5.50%, 01/15/18 | 150,000 | 165,477 |
| 5.13%, 04/01/19 | 150,000 | 167,308 |
| 6.20%, 01/15/38 | 200,000 | 250,508 |
| 4.88%, 11/15/40 (b) | 400,000 | 430,219 |
| | | 8,772,730 |
| | | 230,615,720 |
| Utilities 1.7% |
| Electric 1.6% |
| Alabama Power Co. |
| 3.55%, 12/01/23 | 350,000 | 358,528 |
| American Electric Power Co., Inc. |
| 1.65%, 12/15/17 (b) | 1,000,000 | 1,001,738 |
| Appalachian Power Co. |
| 3.40%, 06/01/25 (b) | 300,000 | 296,345 |
| 7.00%, 04/01/38 | 750,000 | 954,909 |
| Arizona Public Service Co. |
| 2.20%, 01/15/20 (b) | 250,000 | 248,062 |
| Berkshire Hathaway Energy Co. |
| 5.75%, 04/01/18 (h) | 700,000 | 775,043 |
| 2.40%, 02/01/20 (b) | 300,000 | 299,008 |
| 6.13%, 04/01/36 (h) | 500,000 | 590,865 |
| 5.95%, 05/15/37 | 250,000 | 290,190 |
| 6.50%, 09/15/37 | 500,000 | 615,357 |
| 5.15%, 11/15/43 (b) | 800,000 | 857,057 |
| CMS Energy Corp. |
| 6.25%, 02/01/20 | 1,000,000 | 1,159,328 |
| 4.70%, 03/31/43 (b) | 250,000 | 251,964 |
| Commonwealth Edison Co. |
| 1.95%, 09/01/16 (b) | 300,000 | 303,370 |
| Consolidated Edison Co. of New York, Inc. |
| 5.85%, 04/01/18 | 200,000 | 222,827 |
| Consumers Energy Co. |
| 3.38%, 08/15/23 (b) | 500,000 | 509,651 |
| 3.95%, 05/15/43 (b) | 250,000 | 239,055 |
| Dayton Power & Light Co. |
| 1.88%, 09/15/16 | 200,000 | 201,142 |
| Delmarva Power & Light Co. |
| 3.50%, 11/15/23 (b) | 500,000 | 510,765 |
| Dominion Resources, Inc. |
| 1.90%, 06/15/18 | 100,000 | 100,197 |
| 5.25%, 08/01/33 | 500,000 | 527,372 |
| 4.05%, 09/15/42 (b) | 800,000 | 726,490 |
| Duke Energy Carolinas LLC |
| 6.05%, 04/15/38 | 200,000 | 246,872 |
| 5.30%, 02/15/40 | 100,000 | 114,122 |
| Duke Energy Corp. |
| 2.10%, 06/15/18 (b) | 1,000,000 | 1,010,530 |
| 3.75%, 04/15/24 (b) | 900,000 | 918,687 |
| Duke Energy Florida, Inc. |
| 6.40%, 06/15/38 | 91,000 | 117,301 |
Schwab U.S. Aggregate Bond ETF
Portfolio Holdings (Unaudited) continued
Security
Rate, Maturity Date | Face
Amount ($) | Value
($) |
| Duke Energy Progress, Inc. |
| 4.15%, 12/01/44 (b) | 400,000 | 387,533 |
| Exelon Generation Co. LLC |
| 2.95%, 01/15/20 (b) | 300,000 | 301,349 |
| 4.00%, 10/01/20 (b) | 500,000 | 522,247 |
| 5.60%, 06/15/42 (b) | 100,000 | 102,107 |
| Florida Power & Light Co. |
| 6.20%, 06/01/36 | 200,000 | 254,557 |
| 5.95%, 02/01/38 | 150,000 | 183,578 |
| Georgia Power Co. |
| 4.75%, 09/01/40 | 500,000 | 511,955 |
| LG&E & KU Energy LLC |
| 3.75%, 11/15/20 (b) | 150,000 | 156,912 |
| National Rural Utilities Cooperative Finance Corp. |
| 5.45%, 02/01/18 (h) | 100,000 | 109,624 |
| NextEra Energy Capital Holdings, Inc. |
| 3.63%, 06/15/23 (b) | 100,000 | 99,954 |
| Ohio Power Co. |
| 5.38%, 10/01/21 | 750,000 | 856,278 |
| Oncor Electric Delivery Co. LLC |
| 2.15%, 06/01/19 (b) | 350,000 | 347,509 |
| 4.55%, 12/01/41 (b) | 200,000 | 201,561 |
| Pacific Gas & Electric Co. |
| 4.25%, 05/15/21 (b) | 200,000 | 214,139 |
| 6.05%, 03/01/34 (h) | 400,000 | 482,311 |
| PPL Capital Funding, Inc. |
| 4.20%, 06/15/22 (b) | 1,100,000 | 1,158,939 |
| 3.40%, 06/01/23 (b) | 1,000,000 | 998,159 |
| PPL Electric Utilities Corp. |
| 2.50%, 09/01/22 (b) | 500,000 | 484,586 |
| 6.25%, 05/15/39 | 500,000 | 636,776 |
| PSEG Power LLC |
| 5.13%, 04/15/20 | 400,000 | 442,105 |
| Public Service Electric & Gas Co. |
| 3.95%, 05/01/42 (b) | 100,000 | 95,092 |
| Puget Sound Energy, Inc. |
| 5.64%, 04/15/41 (b) | 250,000 | 297,405 |
| San Diego Gas & Electric Co. |
| 4.30%, 04/01/42 (b) | 300,000 | 301,943 |
| Sempra Energy |
| 3.55%, 06/15/24 (b) | 400,000 | 400,406 |
| Southern California Edison Co. |
| 5.50%, 08/15/18 | 100,000 | 111,982 |
| Southern Power Co. |
| 1.50%, 06/01/18 | 500,000 | 497,444 |
| 2.38%, 06/01/20 (b) | 200,000 | 197,695 |
| Southwestern Electric Power Co. |
| 5.55%, 01/15/17 | 400,000 | 424,722 |
| TransAlta Corp. |
| 6.65%, 05/15/18 | 250,000 | 276,463 |
| Union Electric Co. |
| 3.90%, 09/15/42 (b) | 100,000 | 93,642 |
| Virginia Electric & Power Co. |
| 5.95%, 09/15/17 | 300,000 | 329,700 |
| 6.00%, 05/15/37 | 300,000 | 365,098 |
| WEC Energy Group, Inc. |
| 1.65%, 06/15/18 | 200,000 | 200,280 |
Security
Rate, Maturity Date | Face
Amount ($) | Value
($) |
| Westar Energy, Inc. |
| 4.13%, 03/01/42 (b) | 100,000 | 97,105 |
| Xcel Energy, Inc. |
| 4.70%, 05/15/20 (b) | 500,000 | 545,888 |
| 4.80%, 09/15/41 (b) | 600,000 | 624,558 |
| | | 26,758,377 |
| Natural Gas 0.1% |
| Atmos Energy Corp. |
| 4.13%, 10/15/44 (b) | 150,000 | 143,634 |
| ONE Gas, Inc. |
| 3.61%, 02/01/24 (b) | 100,000 | 103,297 |
| 4.66%, 02/01/44 (b) | 300,000 | 315,466 |
| Sempra Energy |
| 6.00%, 10/15/39 | 350,000 | 415,526 |
| Southwest Gas Corp. |
| 3.88%, 04/01/22 (b) | 200,000 | 209,820 |
| | | 1,187,743 |
| Other Utilities 0.0% |
| American Water Capital Corp. |
| 3.40%, 03/01/25 (b) | 300,000 | 299,832 |
| | | 299,832 |
| | | 28,245,952 |
| Total Corporate Bonds |
| (Cost $389,209,515) | | 383,659,115 |
|
| Foreign Government Securities 5.2% of net assets |
| Foreign Agencies 1.7% |
| Austria 0.1% |
| Oesterreichische Kontrollbank AG |
| 1.13%, 05/29/18 | 1,000,000 | 998,297 |
| | | 998,297 |
| Brazil 0.1% |
| Petrobras Global Finance BV |
| 7.88%, 03/15/19 | 200,000 | 212,942 |
| 4.38%, 05/20/23 | 400,000 | 349,484 |
| 5.63%, 05/20/43 | 250,000 | 194,475 |
| Petrobras International Finance Co. |
| 5.75%, 01/20/20 | 500,000 | 496,670 |
| 5.38%, 01/27/21 | 400,000 | 385,720 |
| 6.75%, 01/27/41 | 400,000 | 352,292 |
| | | 1,991,583 |
| Canada 0.1% |
| CNOOC Nexen Finance 2014 ULC |
| 1.63%, 04/30/17 | 500,000 | 500,936 |
| Export Development Canada |
| 1.25%, 10/26/16 | 500,000 | 504,802 |
Schwab U.S. Aggregate Bond ETF
Portfolio Holdings (Unaudited) continued
Security
Rate, Maturity Date | Face
Amount ($) | Value
($) |
| Nexen, Inc. |
| 5.88%, 03/10/35 | 300,000 | 332,473 |
| 6.40%, 05/15/37 | 200,000 | 240,391 |
| | | 1,578,602 |
| Colombia 0.0% |
| Ecopetrol S.A. |
| 4.25%, 09/18/18 | 250,000 | 260,937 |
| 7.63%, 07/23/19 | 200,000 | 232,750 |
| 5.88%, 09/18/23 | 100,000 | 105,250 |
| 5.88%, 05/28/45 | 100,000 | 88,750 |
| | | 687,687 |
| Germany 0.7% |
| Kreditanstalt fuer Wiederaufbau |
| 4.88%, 01/17/17 (d)(h) | 600,000 | 638,821 |
| 1.25%, 02/15/17 (d) | 600,000 | 605,739 |
| 4.38%, 03/15/18 (d) | 1,500,000 | 1,632,211 |
| 1.00%, 06/11/18 (d) | 800,000 | 796,682 |
| 4.50%, 07/16/18 (d)(h) | 1,000,000 | 1,098,813 |
| 4.88%, 06/17/19 (d) | 1,000,000 | 1,129,836 |
| 4.00%, 01/27/20 (d) | 1,000,000 | 1,101,187 |
| 2.75%, 09/08/20 (d) | 1,000,000 | 1,044,876 |
| 2.38%, 08/25/21 (d) | 800,000 | 814,866 |
| 2.50%, 11/20/24 (d) | 1,000,000 | 1,002,420 |
| Landwirtschaftliche Rentenbank |
| 5.13%, 02/01/17 (d) | 250,000 | 267,322 |
| 1.00%, 04/04/18 (d) | 645,000 | 643,137 |
| 1.88%, 09/17/18 (d) | 1,000,000 | 1,019,613 |
| | | 11,795,523 |
| Japan 0.1% |
| Japan Bank for International Cooperation |
| 1.75%, 07/31/18 | 750,000 | 758,366 |
| 1.75%, 11/13/18 | 1,000,000 | 1,007,618 |
| | | 1,765,984 |
| Mexico 0.3% |
| Petroleos Mexicanos |
| 5.75%, 03/01/18 | 250,000 | 272,582 |
| 3.13%, 01/23/19 | 400,000 | 404,800 |
| 3.50%, 07/23/20 (c) | 200,000 | 202,696 |
| 5.50%, 01/21/21 | 400,000 | 434,800 |
| 3.50%, 01/30/23 | 500,000 | 475,600 |
| 4.88%, 01/18/24 | 500,000 | 513,750 |
| 6.63%, 06/15/35 | 700,000 | 750,750 |
| 6.50%, 06/02/41 | 250,000 | 261,250 |
| 5.50%, 06/27/44 | 935,000 | 864,875 |
| 5.63%, 01/23/46 (c) | 250,000 | 234,363 |
| | | 4,415,466 |
Security
Rate, Maturity Date | Face
Amount ($) | Value
($) |
| Norway 0.1% |
| Statoil A.S.A. |
| 2.45%, 01/17/23 | 1,000,000 | 965,369 |
| 3.70%, 03/01/24 | 400,000 | 414,189 |
| 4.25%, 11/23/41 | 100,000 | 97,846 |
| | | 1,477,404 |
| Republic of Korea 0.2% |
| Export-Import Bank of Korea |
| 4.38%, 09/15/21 | 300,000 | 326,383 |
| 5.00%, 04/11/22 | 200,000 | 225,501 |
| 2.88%, 01/21/25 | 750,000 | 725,491 |
| Korea Development Bank |
| 4.00%, 09/09/16 | 500,000 | 516,672 |
| 3.00%, 03/17/19 | 500,000 | 515,179 |
| 2.25%, 05/18/20 | 500,000 | 497,361 |
| | | 2,806,587 |
| Sweden 0.0% |
| Svensk Exportkredit AB |
| 5.13%, 03/01/17 | 150,000 | 160,771 |
| 1.13%, 04/05/18 | 250,000 | 249,723 |
| | | 410,494 |
| | | 27,927,627 |
| Foreign Local Government 0.3% |
| Canada 0.3% |
| Hydro-Quebec |
| 1.38%, 06/19/17 | 250,000 | 252,239 |
| 8.05%, 07/07/24 (h) | 160,000 | 219,131 |
| Province of British Columbia |
| 2.00%, 10/23/22 | 200,000 | 196,230 |
| Province of Manitoba |
| 1.13%, 06/01/18 | 250,000 | 249,425 |
| Province of Nova Scotia |
| 5.13%, 01/26/17 | 500,000 | 533,096 |
| Province of Ontario |
| 1.10%, 10/25/17 | 250,000 | 250,507 |
| 3.15%, 12/15/17 | 500,000 | 524,811 |
| 4.00%, 10/07/19 | 225,000 | 246,063 |
| 4.40%, 04/14/20 | 300,000 | 333,962 |
| 2.50%, 09/10/21 | 500,000 | 506,188 |
| 2.45%, 06/29/22 | 500,000 | 501,227 |
| Province of Quebec |
| 5.13%, 11/14/16 | 250,000 | 264,963 |
| 2.75%, 08/25/21 | 500,000 | 512,395 |
| 7.50%, 09/15/29 | 168,000 | 243,680 |
| | | 4,833,917 |
| Italy 0.0% |
| Region of Lombardy Italy |
| 5.80%, 10/25/32 | 111,000 | 118,909 |
| | | 118,909 |
| | | 4,952,826 |
Schwab U.S. Aggregate Bond ETF
Portfolio Holdings (Unaudited) continued
Security
Rate, Maturity Date | Face
Amount ($) | Value
($) |
| Sovereign 1.6% |
| Brazil 0.1% |
| Brazilian Government International Bond |
| 6.00%, 01/17/17 | 500,000 | 535,000 |
| 4.88%, 01/22/21 | 100,000 | 104,750 |
| 2.63%, 01/05/23 | 500,000 | 445,000 |
| 4.25%, 01/07/25 | 250,000 | 241,687 |
| 8.25%, 01/20/34 | 150,000 | 186,750 |
| 7.13%, 01/20/37 | 100,000 | 113,500 |
| 5.63%, 01/07/41 | 400,000 | 384,000 |
| 5.00%, 01/27/45 | 250,000 | 217,500 |
| | | 2,228,187 |
| Canada 0.0% |
| Canada Government International Bond |
| 0.88%, 02/14/17 | 100,000 | 100,400 |
| 1.63%, 02/27/19 | 300,000 | 302,997 |
| | | 403,397 |
| Chile 0.1% |
| Chile Government International Bond |
| 2.25%, 10/30/22 | 300,000 | 290,250 |
| 3.13%, 03/27/25 | 650,000 | 651,625 |
| 3.63%, 10/30/42 | 100,000 | 90,125 |
| | | 1,032,000 |
| Colombia 0.1% |
| Colombia Government International Bond |
| 7.38%, 01/27/17 | 650,000 | 710,450 |
| 7.38%, 03/18/19 | 300,000 | 348,900 |
| 7.38%, 09/18/37 | 300,000 | 372,000 |
| 6.13%, 01/18/41 | 250,000 | 272,500 |
| 5.00%, 06/15/45 (b) | 350,000 | 325,500 |
| | | 2,029,350 |
| Italy 0.1% |
| Italy Government International Bond |
| 5.25%, 09/20/16 | 250,000 | 262,343 |
| 5.38%, 06/12/17 | 100,000 | 107,613 |
| 6.88%, 09/27/23 | 150,000 | 187,496 |
| 5.38%, 06/15/33 | 250,000 | 280,154 |
| | | 837,606 |
| Mexico 0.3% |
| Mexico Government International Bond |
| 5.63%, 01/15/17 | 1,000,000 | 1,068,000 |
| 3.50%, 01/21/21 | 150,000 | 153,375 |
| 3.63%, 03/15/22 | 900,000 | 913,050 |
| 8.00%, 09/24/22 | 100,000 | 129,000 |
| 4.00%, 10/02/23 | 350,000 | 360,500 |
| 6.05%, 01/11/40 | 300,000 | 342,000 |
| 4.75%, 03/08/44 | 800,000 | 764,000 |
| 5.55%, 01/21/45 | 600,000 | 640,500 |
| | | 4,370,425 |
Security
Rate, Maturity Date | Face
Amount ($) | Value
($) |
| Panama 0.1% |
| Panama Government International Bond |
| 5.20%, 01/30/20 | 600,000 | 662,700 |
| 4.00%, 09/22/24 (b) | 500,000 | 505,000 |
| 3.75%, 03/16/25 (b) | 750,000 | 742,500 |
| 6.70%, 01/26/36 | 200,000 | 248,000 |
| | | 2,158,200 |
| Peru 0.0% |
| Peruvian Government International Bond |
| 7.13%, 03/30/19 (h) | 250,000 | 291,500 |
| 7.35%, 07/21/25 | 300,000 | 392,250 |
| | | 683,750 |
| Philippines 0.2% |
| Philippine Government International Bond |
| 8.38%, 06/17/19 | 500,000 | 620,000 |
| 4.20%, 01/21/24 | 300,000 | 327,750 |
| 5.50%, 03/30/26 | 600,000 | 706,500 |
| 6.38%, 01/15/32 | 350,000 | 455,000 |
| 3.95%, 01/20/40 | 1,000,000 | 1,012,500 |
| | | 3,121,750 |
| Poland 0.1% |
| Poland Government International Bond |
| 6.38%, 07/15/19 | 400,000 | 463,200 |
| 3.00%, 03/17/23 | 300,000 | 295,290 |
| | | 758,490 |
| Republic of Korea 0.1% |
| Republic of Korea |
| 7.13%, 04/16/19 | 150,000 | 178,440 |
| 3.88%, 09/11/23 | 600,000 | 648,930 |
| | | 827,370 |
| South Africa 0.0% |
| South Africa Government International Bond |
| 6.88%, 05/27/19 | 100,000 | 114,250 |
| 4.67%, 01/17/24 | 600,000 | 616,500 |
| | | 730,750 |
| Turkey 0.3% |
| Turkey Government International Bond |
| 6.75%, 04/03/18 | 900,000 | 994,711 |
| 7.00%, 03/11/19 | 750,000 | 845,737 |
| 5.63%, 03/30/21 | 500,000 | 541,450 |
| 7.38%, 02/05/25 | 650,000 | 781,625 |
| 4.25%, 04/14/26 | 700,000 | 668,087 |
| 6.00%, 01/14/41 | 400,000 | 422,900 |
| 4.88%, 04/16/43 | 500,000 | 456,855 |
| | | 4,711,365 |
Schwab U.S. Aggregate Bond ETF
Portfolio Holdings (Unaudited) continued
Security
Rate, Maturity Date | Face
Amount ($) | Value
($) |
| Uruguay 0.1% |
| Uruguay Government International Bond |
| 4.50%, 08/14/24 | 250,000 | 263,125 |
| 7.63%, 03/21/36 | 300,000 | 401,250 |
| 4.13%, 11/20/45 | 150,000 | 128,625 |
| 5.10%, 06/18/50 | 250,000 | 238,750 |
| | | 1,031,750 |
| | | 24,924,390 |
| Supranational* 1.6% |
| African Development Bank |
| 0.88%, 05/15/17 | 400,000 | 400,914 |
| 1.63%, 10/02/18 | 500,000 | 506,072 |
| Asian Development Bank |
| 1.13%, 03/15/17 | 650,000 | 654,848 |
| 1.75%, 09/11/18 | 750,000 | 762,928 |
| 1.50%, 01/22/20 | 250,000 | 248,522 |
| 2.00%, 01/22/25 | 250,000 | 239,954 |
| 5.82%, 06/16/28 | 1,000,000 | 1,281,217 |
| Corp. Andina de Fomento |
| 4.38%, 06/15/22 | 350,000 | 379,547 |
| Council of Europe Development Bank |
| 1.00%, 03/07/18 | 500,000 | 498,883 |
| 1.63%, 03/10/20 | 500,000 | 497,948 |
| European Bank for Reconstruction & Development |
| 1.00%, 02/16/17 | 1,000,000 | 1,006,830 |
| 1.75%, 06/14/19 | 500,000 | 503,315 |
| European Investment Bank |
| 0.50%, 08/15/16 | 500,000 | 500,205 |
| 1.75%, 03/15/17 | 750,000 | 763,311 |
| 5.13%, 05/30/17 | 1,000,000 | 1,081,959 |
| 1.13%, 09/15/17 | 1,000,000 | 1,005,846 |
| 1.00%, 03/15/18 | 500,000 | 499,272 |
| 1.00%, 06/15/18 | 250,000 | 248,866 |
| 1.88%, 03/15/19 | 700,000 | 711,437 |
| 1.75%, 06/17/19 | 1,000,000 | 1,008,931 |
| 1.38%, 06/15/20 | 500,000 | 489,908 |
| 4.00%, 02/16/21 | 700,000 | 776,181 |
| 3.25%, 01/29/24 | 1,000,000 | 1,064,968 |
| 4.88%, 02/15/36 | 850,000 | 1,044,701 |
| Inter-American Development Bank |
| 5.13%, 09/13/16 (h) | 500,000 | 527,636 |
| 0.88%, 11/15/16 | 1,500,000 | 1,506,453 |
| 1.13%, 03/15/17 | 500,000 | 503,903 |
| 1.75%, 08/24/18 | 250,000 | 254,261 |
| 3.88%, 02/14/20 | 200,000 | 219,768 |
| 3.88%, 10/28/41 | 100,000 | 107,093 |
| 3.20%, 08/07/42 | 100,000 | 93,587 |
| 4.38%, 01/24/44 | 150,000 | 174,233 |
| International Bank for Reconstruction & Development |
| 1.00%, 09/15/16 | 250,000 | 251,591 |
| 0.88%, 04/17/17 | 600,000 | 602,131 |
| 1.88%, 03/15/19 | 1,750,000 | 1,782,826 |
| 1.88%, 10/07/19 | 500,000 | 506,629 |
| 2.25%, 06/24/21 | 750,000 | 765,903 |
| 2.50%, 11/25/24 | 250,000 | 250,789 |
| 4.75%, 02/15/35 | 350,000 | 420,906 |
Security
Rate, Maturity Date | Face
Amount ($) | Value
($) |
| International Finance Corp. |
| 1.13%, 11/23/16 | 350,000 | 351,987 |
| 2.13%, 11/17/17 (h) | 500,000 | 514,072 |
| 1.75%, 09/04/18 | 500,000 | 505,371 |
| 1.75%, 09/16/19 | 500,000 | 501,567 |
| Nordic Investment Bank |
| 2.25%, 09/30/21 | 250,000 | 253,193 |
| | | 26,270,462 |
| Total Foreign Government Securities |
| (Cost $84,803,570) | | 84,075,305 |
|
| Mortgage-Backed Securities 28.0% of net assets |
| TBA Securities 8.8% |
| Fannie Mae TBA |
| 2.00%, 08/01/30 (b)(g) | 1,500,000 | 1,472,293 |
| 2.50%, 08/01/30 (b)(g) | 4,800,000 | 4,848,397 |
| 3.00%, 08/01/30 to 07/01/45(b)(g) | 15,500,000 | 15,593,748 |
| 3.50%, 08/01/30 to 07/01/45(b)(g) | 17,800,000 | 18,396,049 |
| 4.00%, 07/01/45 (b)(g) | 14,500,000 | 15,363,598 |
| 4.50%, 07/01/45 (b)(g) | 4,500,000 | 4,865,625 |
| 5.00%, 07/01/45 (b)(g) | 500,000 | 552,422 |
| 5.50%, 07/01/45 (b)(g) | 500,000 | 561,641 |
| Freddie Mac TBA |
| 2.00%, 08/01/30 (b)(g) | 800,000 | 785,225 |
| 2.50%, 08/01/30 (b)(g) | 3,700,000 | 3,734,977 |
| 3.00%, 08/01/30 to 07/01/45(b)(g) | 8,300,000 | 8,321,102 |
| 3.50%, 08/01/30 to 07/01/45(b)(g) | 11,600,000 | 11,971,319 |
| 4.00%, 07/01/45 (b)(g) | 7,500,000 | 7,931,982 |
| 4.50%, 07/01/45 (b)(g) | 3,500,000 | 3,780,055 |
| 5.00%, 07/01/45 (b)(g) | 1,000,000 | 1,101,250 |
| Ginnie Mae TBA |
| 2.50%, 07/01/45 (b)(g) | 500,000 | 481,445 |
| 3.00%, 07/01/45 (b)(g) | 12,500,000 | 12,618,945 |
| 3.50%, 07/01/45 (b)(g) | 17,000,000 | 17,644,162 |
| 4.00%, 07/01/45 (b)(g) | 9,500,000 | 10,070,489 |
| 4.50%, 07/01/45 (b)(g) | 3,000,000 | 3,235,312 |
| | | 143,330,036 |
| U.S. Government Agency Mortgages 19.2% |
| Fannie Mae |
| 7.00%, 08/01/16 to 04/01/37(b) | 102,309 | 113,958 |
| 6.00%, 12/01/16 to 05/01/41(b) | 1,941,525 | 2,219,296 |
| 5.50%, 02/01/17 to 09/01/38(b)(h) | 2,621,870 | 2,944,462 |
| 5.00%, 02/01/18 to 09/01/39(b)(h) | 3,978,917 | 4,397,333 |
| 4.50%, 03/01/18 to 04/01/41(b)(h) | 2,560,455 | 2,774,051 |
| 4.50%, 05/01/18 to 01/01/44(b) | 13,107,355 | 14,227,082 |
Schwab U.S. Aggregate Bond ETF
Portfolio Holdings (Unaudited) continued
Security
Rate, Maturity Date | Face
Amount ($) | Value
($) |
| 4.00%, 06/01/18 to 01/01/45(b) | 24,582,287 | 26,171,446 |
| 3.50%, 10/01/18 to 07/01/45(b) | 28,954,133 | 30,050,882 |
| 5.50%, 12/01/18 to 08/01/41(b) | 3,668,390 | 4,149,236 |
| 6.50%, 05/01/19 to 10/01/39(b) | 1,389,303 | 1,598,456 |
| 5.00%, 07/01/23 to 08/01/41(b) | 6,066,928 | 6,726,850 |
| 4.00%, 04/01/24 to 08/01/44(b)(h) | 3,027,139 | 3,214,378 |
| 8.50%, 05/01/25 (b) | 3,556 | 4,088 |
| 3.00%, 12/01/25 to 09/01/43(b) | 30,211,378 | 30,616,992 |
| 2.50%, 10/01/27 to 02/01/43(b) | 8,279,590 | 8,382,361 |
| 2.00%, 02/01/28 to 09/01/28(b) | 246,589 | 245,139 |
| 6.00%, 07/01/35 to 10/01/39(b)(h) | 2,154,923 | 2,459,775 |
| 2.15%, 10/01/35 (a)(b)(h) | 224,603 | 236,399 |
| 1.98%, 05/01/38 (a)(b) | 220,698 | 234,916 |
| 2.34%, 04/01/40 (a)(b) | 69,361 | 73,608 |
| 2.43%, 05/01/40 (a)(b) | 57,006 | 61,062 |
| 3.50%, 10/01/40 to 04/01/42(b)(h) | 3,215,686 | 3,324,908 |
| 3.00%, 07/01/43 (b)(h) | 1,797,595 | 1,799,174 |
| 2.47%, 09/01/43 (a)(b) | 380,705 | 390,513 |
| 2.95%, 11/01/43 (a)(b) | 127,629 | 131,526 |
| Freddie Mac |
| 7.50%, 09/01/16 (b) | 603 | 610 |
| 6.50%, 03/01/17 to 09/01/39(b) | 558,791 | 637,735 |
| 6.00%, 04/01/17 to 10/01/38(b) | 1,832,021 | 2,089,600 |
| 4.00%, 04/01/18 to 09/01/44(b) | 12,239,692 | 13,005,219 |
| 5.00%, 06/01/18 to 08/01/39(b)(h) | 2,701,065 | 2,974,251 |
| 5.50%, 11/01/18 to 08/01/40(b) | 3,019,283 | 3,393,779 |
| 4.50%, 05/01/19 to 04/01/44(b) | 8,606,752 | 9,331,616 |
| 5.00%, 10/01/20 to 12/01/43(b) | 3,646,613 | 4,032,310 |
| 4.50%, 07/01/23 to 07/01/39(b)(h) | 1,071,399 | 1,153,198 |
| 5.50%, 05/01/24 to 02/01/40(b)(h) | 1,382,703 | 1,547,366 |
| 3.00%, 12/01/25 to 05/01/45(b) | 15,443,214 | 15,648,026 |
| 3.50%, 02/01/26 to 03/01/45(b) | 16,256,073 | 16,816,098 |
| 2.50%, 07/01/27 to 07/01/43(b) | 5,667,987 | 5,742,218 |
| 2.00%, 10/01/27 to 04/01/28(b) | 195,659 | 194,692 |
| 6.00%, 09/01/32 to 10/01/37(b)(h) | 625,710 | 710,324 |
| 6.50%, 12/01/33 (b)(h) | 222,544 | 264,054 |
Security
Rate, Maturity Date | Face
Amount ($) | Value
($) |
| 3.00%, 01/01/43 to 06/01/43(b)(h) | 3,497,519 | 3,487,979 |
| 4.00%, 05/01/44 (b)(h) | 2,689,726 | 2,846,121 |
| Ginnie Mae |
| 5.00%, 11/15/17 to 12/20/44(b) | 7,349,977 | 8,155,674 |
| 6.50%, 05/15/24 to 01/15/35(b) | 162,732 | 190,436 |
| 4.00%, 04/20/26 to 01/20/45(b) | 14,870,312 | 15,839,642 |
| 5.50%, 04/20/26 to 07/20/38(b) | 2,807,088 | 3,199,573 |
| 3.50%, 05/20/26 to 06/20/45(b) | 16,523,324 | 17,218,415 |
| 3.00%, 01/20/27 to 06/20/45(b) | 11,923,593 | 12,144,639 |
| 2.50%, 03/20/27 to 07/20/43(b) | 1,126,916 | 1,144,819 |
| 2.00%, 07/20/28 (b) | 20,403 | 20,042 |
| 6.00%, 12/20/31 to 06/15/41(b) | 1,308,045 | 1,507,931 |
| 6.00%, 09/15/32 to 09/20/37(b)(h) | 583,849 | 669,844 |
| 5.50%, 04/15/33 (b)(h) | 337,627 | 389,146 |
| 5.00%, 05/15/33 to 07/20/39(b)(h) | 1,179,283 | 1,314,069 |
| 4.50%, 02/20/34 to 02/20/45(b) | 12,041,658 | 13,115,463 |
| 2.50%, 08/20/37 (a)(b)(h) | 24,091 | 24,910 |
| 3.00%, 10/20/37 to 07/20/42(a)(b) | 769,566 | 801,713 |
| 1.63%, 08/20/38 (a)(b) | 331,963 | 346,187 |
| 4.50%, 03/20/39 (b)(h) | 678,217 | 734,968 |
| 1.75%, 03/20/40 (a)(b) | 347,880 | 361,188 |
| 2.50%, 01/20/41 to 02/20/44(a)(b) | 738,084 | 764,702 |
| 2.00%, 01/20/43 to 09/20/43(a)(b) | 738,472 | 757,974 |
| 3.50%, 04/20/44 (a)(b) | 139,724 | 146,250 |
| 3.50%, 08/20/44 (b)(h) | 2,760,174 | 2,870,568 |
| | | 312,141,240 |
| Total Mortgage-Backed Securities |
| (Cost $452,429,022) | | 455,471,276 |
|
| Municipal Bonds 1.0% of net assets |
| Fixed-Rate Obligations 1.0% |
| Bay Area Toll Authority |
| RB (Build America Bonds) Series 2010S3 |
| 6.91%, 10/01/50 | 100,000 | 136,046 |
| California |
| GO (Build America Bonds) Series 2009 |
| 7.50%, 04/01/34 | 850,000 | 1,181,976 |
| GO (Build America Bonds) Series 2010 |
| 7.95%, 03/01/36 (b) | 350,000 | 423,941 |
| GO (Build America Bonds) Series 2009 |
| 7.55%, 04/01/39 | 900,000 | 1,301,913 |
Schwab U.S. Aggregate Bond ETF
Portfolio Holdings (Unaudited) continued
Security
Rate, Maturity Date | Face
Amount ($) | Value
($) |
| Commonwealth of Massachusetts |
| GO (Build America Bonds) Series 2009 |
| 5.46%, 12/01/39 (h) | 100,000 | 122,387 |
| Connecticut |
| GO Bonds Series 2008A |
| 5.85%, 03/15/32 | 200,000 | 240,780 |
| Dallas County Hospital District |
| GO (Build America Bonds) Series C |
| 5.62%, 08/15/44 | 150,000 | 182,142 |
| Dallas Independent School District |
| GO (Build America Bonds) Series 2010C |
| 6.45%, 02/15/35 (b) | 350,000 | 409,294 |
| Georgia |
| GO (Build America Bonds) Series H |
| 4.50%, 11/01/25 | 1,300,000 | 1,421,238 |
| Grand Parkway Transportation Corp. |
| RB Series 2013E |
| 5.18%, 10/01/42 | 200,000 | 233,028 |
| Harvard College |
| Taxable Bonds Series 2013A |
| 3.62%, 10/01/37 | 350,000 | 334,525 |
| Illinois |
| GO Bonds (Pension Funding) Series 2003 |
| 4.95%, 06/01/23 | 550,000 | 556,605 |
| GO Bonds (Pension Funding) Series 2003 |
| 5.10%, 06/01/33 | 650,000 | 606,417 |
| JobsOhio Beverage System |
| RB (Build America Bonds) Series B |
| 3.99%, 01/01/29 | 250,000 | 259,468 |
| Los Angeles USD |
| GO (Build America Bonds) Series 2010 |
| 6.76%, 07/01/34 (h) | 200,000 | 261,364 |
| Metropolitan Government of Nashville & Davidson County |
| GO (Build America Bonds) Series 2010 |
| 5.71%, 07/01/34 (h) | 20,000 | 23,784 |
| Metropolitan Museum of Art |
| Series 2015 |
| 3.40%, 07/01/45 | 500,000 | 438,467 |
| Metropolitan Transportation Authority |
| RB (Build America Bonds) Series E |
| 6.81%, 11/15/40 | 650,000 | 856,843 |
| New Jersey Transportation Trust Fund Authority |
| RB (Build America Bonds) Series 2010C |
| 5.75%, 12/15/28 | 150,000 | 157,755 |
| New York City Municipal Water Finance Authority |
| Water System RB (Build America Bonds) Series 2009 |
| 5.75%, 06/15/41 (h) | 200,000 | 247,018 |
| Water System RB (Build America Bonds) Series 2011CC |
| 5.88%, 06/15/44 | 250,000 | 317,123 |
| New York City Transitional Finance Authority |
| RB (Qualified School Construction Bonds) Series 2010 G3 |
| 5.27%, 05/01/27 | 500,000 | 567,745 |
| RB (Build America Bonds) Series 2011A1 |
| 5.51%, 08/01/37 | 200,000 | 239,152 |
| New York State Dormitory Authority |
| RB (Build America Bonds) Series 2009 H |
| 5.43%, 03/15/39 | 500,000 | 585,275 |
Security
Rate, Maturity Date | Face
Amount ($) | Value
($) |
| Northwestern University |
| 3.69%, 12/01/38 | 500,000 | 480,879 |
| Ochsner Clinic Foundation |
| 5.90%, 05/15/45 (b) | 500,000 | 515,551 |
| Port Authority of New York & New Jersey |
| Consolidated Bonds 174th Series |
| 4.46%, 10/01/62 | 150,000 | 147,762 |
| San Diego County Regional Transportation Commission |
| RB (Build America Bonds) Series 2010A |
| 5.91%, 04/01/48 | 300,000 | 379,545 |
| San Francisco City & County Public Utilities Commission |
| Water System RB (Build America Bonds) Series 2010DE |
| 6.00%, 11/01/40 | 430,000 | 524,131 |
| Texas |
| GO (Build America Bonds) Series 2010A |
| 4.63%, 04/01/33 | 500,000 | 548,905 |
| GO Mobility Fund Bonds (Build America Bonds) Series 2009A |
| 5.52%, 04/01/39 | 750,000 | 935,002 |
| GO (Build America Bonds) Series 2010A |
| 4.68%, 04/01/40 | 500,000 | 556,280 |
| Texas Transportation Commission |
| RB (Build America Bonds) Series B |
| 5.03%, 04/01/26 | 500,000 | 573,670 |
| Total Municipal Bonds |
| (Cost $16,042,504) | | 15,766,011 |
|
| U.S. Government and Government Agencies 39.0% of net assets |
| U.S. Government Agency Securities 3.2% |
| Fannie Mae |
| 0.75%, 04/20/17 | 900,000 | 901,242 |
| 1.13%, 04/27/17 | 769,000 | 774,980 |
| 2.00%, 05/16/17 (b)(h) | 2,500,000 | 2,536,015 |
| 1.00%, 09/27/17 | 3,900,000 | 3,916,146 |
| 1.00%, 10/16/17 (b) | 150,000 | 149,994 |
| 0.88%, 02/08/18 | 350,000 | 349,228 |
| 0.88%, 05/21/18 | 1,250,000 | 1,242,872 |
| 1.13%, 05/25/18 (b) | 300,000 | 298,892 |
| 1.88%, 02/19/19 | 1,500,000 | 1,528,807 |
| 1.75%, 06/20/19 | 1,000,000 | 1,011,268 |
| 1.55%, 10/29/19 (b) | 950,000 | 942,652 |
| 1.75%, 11/26/19 | 2,500,000 | 2,514,720 |
| 1.63%, 01/10/20 (b) | 1,500,000 | 1,488,129 |
| 1.63%, 01/21/20 | 1,300,000 | 1,299,051 |
| 2.25%, 10/17/22 (b) | 300,000 | 292,105 |
| 2.63%, 09/06/24 | 1,000,000 | 1,001,604 |
| 7.13%, 01/15/30 (h) | 527,000 | 781,634 |
| Federal Farm Credit Bank |
| 0.54%, 11/07/16 (b) | 500,000 | 500,091 |
| Federal Home Loan Bank |
| 1.00%, 06/21/17 (h) | 5,285,000 | 5,314,173 |
| 1.25%, 06/23/17 (b) | 700,000 | 703,482 |
| 1.00%, 08/09/17 (b) | 400,000 | 400,040 |
| 1.00%, 11/09/17 (b) | 500,000 | 499,780 |
| 5.00%, 11/17/17 (h) | 1,185,000 | 1,300,485 |
| 2.13%, 03/10/23 | 250,000 | 244,069 |
| 2.88%, 06/14/24 | 375,000 | 380,291 |
Schwab U.S. Aggregate Bond ETF
Portfolio Holdings (Unaudited) continued
Security
Rate, Maturity Date | Face
Amount ($) | Value
($) |
| Freddie Mac |
| 0.88%, 10/14/16 | 900,000 | 905,217 |
| 0.88%, 02/22/17 (h) | 1,000,000 | 1,004,714 |
| 1.00%, 06/29/17 (b) | 900,000 | 900,369 |
| 1.00%, 07/28/17 | 619,000 | 622,074 |
| 1.00%, 09/29/17 | 2,850,000 | 2,857,664 |
| 0.88%, 03/07/18 (h) | 4,190,000 | 4,176,546 |
| 1.20%, 05/18/18 (b) | 1,100,000 | 1,100,064 |
| 1.62%, 11/21/19 (b) | 400,000 | 397,184 |
| 0.00%, 11/29/19 (i) | 700,000 | 638,933 |
| 1.38%, 05/01/20 | 3,000,000 | 2,958,744 |
| 2.38%, 01/13/22 (h) | 4,351,000 | 4,407,915 |
| 3.00%, 01/18/28 (b) | 200,000 | 193,032 |
| 6.75%, 03/15/31 (h) | 264,000 | 379,050 |
| Tennessee Valley Authority |
| 6.75%, 11/01/25 | 488,000 | 652,618 |
| | | 51,565,874 |
| U.S. Treasury Obligations 35.8% |
| U.S. Treasury Bonds |
| 9.13%, 05/15/18 (h) | 2,331,000 | 2,873,503 |
| 8.00%, 11/15/21 (h) | 2,149,000 | 2,933,553 |
| 6.25%, 08/15/23 | 1,500,000 | 1,957,968 |
| 6.00%, 02/15/26 (h) | 891,000 | 1,196,863 |
| 6.75%, 08/15/26 | 1,324,000 | 1,889,183 |
| 6.13%, 11/15/27 | 2,388,000 | 3,312,791 |
| 5.25%, 11/15/28 | 2,000,000 | 2,607,500 |
| 5.25%, 02/15/29 | 1,528,000 | 1,994,398 |
| 6.13%, 08/15/29 | 2,000,000 | 2,830,624 |
| 6.25%, 05/15/30 | 3,985,000 | 5,751,475 |
| 4.75%, 02/15/37 | 1,086,000 | 1,407,473 |
| 4.38%, 02/15/38 (h) | 1,000,000 | 1,230,000 |
| 4.50%, 05/15/38 | 1,000,000 | 1,250,469 |
| 3.50%, 02/15/39 (h) | 2,072,000 | 2,234,198 |
| 4.25%, 05/15/39 | 650,000 | 784,570 |
| 4.50%, 08/15/39 | 2,850,000 | 3,568,066 |
| 4.38%, 11/15/39 (h) | 6,381,000 | 7,849,625 |
| 4.63%, 02/15/40 | 1,215,000 | 1,549,600 |
| 4.38%, 05/15/40 | 1,500,000 | 1,847,226 |
| 4.25%, 11/15/40 (h) | 1,409,000 | 1,705,330 |
| 4.75%, 02/15/41 | 500,000 | 651,367 |
| 4.38%, 05/15/41 | 1,000,000 | 1,236,094 |
| 3.75%, 08/15/41 | 1,623,000 | 1,822,705 |
| 3.13%, 02/15/42 (h) | 2,940,000 | 2,956,079 |
| 3.00%, 05/15/42 | 1,493,000 | 1,463,024 |
| 2.75%, 08/15/42 | 1,899,000 | 1,767,109 |
| 2.75%, 11/15/42 | 1,920,000 | 1,786,500 |
| 2.88%, 05/15/43 | 2,899,000 | 2,763,109 |
| 3.63%, 08/15/43 | 1,633,000 | 1,796,810 |
| 3.75%, 11/15/43 | 318,000 | 357,750 |
| 3.63%, 02/15/44 | 3,045,000 | 3,348,309 |
| 3.38%, 05/15/44 | 3,912,000 | 4,109,740 |
| 3.13%, 08/15/44 (h) | 6,000,000 | 6,010,782 |
| 3.00%, 11/15/44 (h) | 5,750,000 | 5,625,564 |
| 2.50%, 02/15/45 (h) | 8,000,000 | 7,042,320 |
| 3.00%, 05/15/45 | 4,300,000 | 4,214,671 |
| U.S. Treasury Notes |
| 0.63%, 07/15/16 | 4,676,000 | 4,689,149 |
| 0.50%, 07/31/16 | 2,600,000 | 2,604,061 |
| 1.50%, 07/31/16 (h) | 6,000,000 | 6,073,596 |
Security
Rate, Maturity Date | Face
Amount ($) | Value
($) |
| 3.25%, 07/31/16 (h) | 6,000,000 | 6,185,628 |
| 0.63%, 08/15/16 | 2,000,000 | 2,005,782 |
| 0.50%, 08/31/16 (h) | 6,300,000 | 6,309,349 |
| 1.00%, 08/31/16 | 1,088,000 | 1,095,905 |
| 3.00%, 08/31/16 | 2,500,000 | 2,576,368 |
| 0.88%, 09/15/16 | 3,750,000 | 3,771,971 |
| 0.50%, 09/30/16 (h) | 8,500,000 | 8,511,951 |
| 1.00%, 09/30/16 | 4,176,000 | 4,207,971 |
| 3.00%, 09/30/16 (h) | 1,690,000 | 1,744,793 |
| 0.63%, 10/15/16 (h) | 7,004,000 | 7,023,149 |
| 0.38%, 10/31/16 | 3,000,000 | 2,998,359 |
| 0.63%, 11/15/16 (h) | 6,083,000 | 6,099,156 |
| 0.50%, 11/30/16 | 2,250,000 | 2,251,582 |
| 0.63%, 12/15/16 | 3,000,000 | 3,006,681 |
| 0.63%, 12/31/16 | 2,750,000 | 2,756,017 |
| 0.88%, 12/31/16 | 2,176,000 | 2,188,921 |
| 0.75%, 01/15/17 | 1,633,000 | 1,639,251 |
| 0.50%, 01/31/17 (h) | 17,000,000 | 16,996,022 |
| 0.88%, 01/31/17 | 2,176,000 | 2,188,240 |
| 0.50%, 02/28/17 (h) | 8,500,000 | 8,495,350 |
| 0.88%, 02/28/17 (h) | 4,840,000 | 4,866,470 |
| 0.75%, 03/15/17 | 3,217,000 | 3,228,562 |
| 0.50%, 03/31/17 | 2,800,000 | 2,797,374 |
| 3.25%, 03/31/17 | 2,275,000 | 2,381,996 |
| 0.88%, 04/15/17 (h) | 4,686,000 | 4,711,262 |
| 0.50%, 04/30/17 (h) | 6,900,000 | 6,889,222 |
| 0.88%, 04/30/17 | 2,786,000 | 2,800,365 |
| 0.88%, 05/15/17 | 1,500,000 | 1,507,149 |
| 0.63%, 05/31/17 | 4,249,000 | 4,248,669 |
| 0.75%, 06/30/17 | 1,510,000 | 1,513,067 |
| 0.88%, 07/15/17 | 4,500,000 | 4,518,985 |
| 0.50%, 07/31/17 | 3,000,000 | 2,989,686 |
| 2.38%, 07/31/17 | 3,000,000 | 3,104,532 |
| 0.88%, 08/15/17 | 2,500,000 | 2,509,180 |
| 0.63%, 08/31/17 (h) | 3,360,000 | 3,354,486 |
| 1.88%, 08/31/17 (h) | 3,337,600 | 3,421,561 |
| 1.00%, 09/15/17 (h) | 6,750,000 | 6,789,548 |
| 0.63%, 09/30/17 | 2,000,000 | 1,994,218 |
| 1.88%, 09/30/17 (h) | 2,012,000 | 2,063,087 |
| 0.88%, 10/15/17 | 4,000,000 | 4,009,376 |
| 0.75%, 10/31/17 (h) | 7,601,000 | 7,595,064 |
| 1.88%, 10/31/17 (h) | 1,745,000 | 1,789,443 |
| 0.88%, 11/15/17 | 800,000 | 801,562 |
| 0.63%, 11/30/17 | 4,000,000 | 3,983,124 |
| 1.00%, 12/15/17 (h) | 9,750,000 | 9,792,656 |
| 0.75%, 12/31/17 | 2,747,000 | 2,741,421 |
| 0.88%, 01/31/18 | 4,000,000 | 4,001,248 |
| 1.00%, 02/15/18 | 2,750,000 | 2,758,379 |
| 0.75%, 02/28/18 | 4,066,000 | 4,050,118 |
| 1.00%, 03/15/18 (h) | 5,500,000 | 5,513,321 |
| 2.88%, 03/31/18 (h) | 1,991,000 | 2,095,993 |
| 0.63%, 04/30/18 (h) | 4,957,000 | 4,912,853 |
| 2.63%, 04/30/18 (h) | 3,107,000 | 3,253,125 |
| 1.00%, 05/15/18 | 1,750,000 | 1,752,051 |
| 1.00%, 05/31/18 | 3,000,000 | 3,001,173 |
| 2.38%, 05/31/18 | 2,000,000 | 2,080,624 |
| 1.13%, 06/15/18 | 5,000,000 | 5,019,140 |
| 1.38%, 06/30/18 | 1,619,000 | 1,636,709 |
| 2.38%, 06/30/18 | 2,500,000 | 2,600,390 |
| 1.50%, 08/31/18 | 1,088,000 | 1,102,280 |
| 1.38%, 09/30/18 | 4,191,000 | 4,226,033 |
| 1.25%, 10/31/18 | 2,729,000 | 2,738,595 |
Schwab U.S. Aggregate Bond ETF
Portfolio Holdings (Unaudited) continued
Security
Rate, Maturity Date | Face
Amount ($) | Value
($) |
| 1.25%, 11/30/18 | 1,633,000 | 1,637,210 |
| 1.50%, 12/31/18 | 2,176,000 | 2,197,590 |
| 1.25%, 01/31/19 | 2,122,000 | 2,122,830 |
| 1.50%, 01/31/19 | 2,176,000 | 2,196,061 |
| 1.38%, 02/28/19 | 1,604,000 | 1,609,765 |
| 1.50%, 02/28/19 | 1,337,000 | 1,348,386 |
| 1.50%, 03/31/19 | 2,500,000 | 2,519,335 |
| 1.63%, 03/31/19 | 4,020,000 | 4,068,365 |
| 1.25%, 04/30/19 | 1,823,000 | 1,819,011 |
| 1.63%, 04/30/19 | 1,520,000 | 1,537,100 |
| 3.13%, 05/15/19 | 1,000,000 | 1,067,188 |
| 1.13%, 05/31/19 | 1,520,000 | 1,507,769 |
| 1.50%, 05/31/19 | 2,913,000 | 2,929,386 |
| 1.00%, 06/30/19 | 1,000,000 | 985,781 |
| 1.63%, 06/30/19 | 3,040,000 | 3,068,974 |
| 0.88%, 07/31/19 (h) | 4,201,000 | 4,114,354 |
| 1.63%, 07/31/19 | 1,700,000 | 1,714,610 |
| 1.00%, 08/31/19 | 700,000 | 687,914 |
| 1.63%, 08/31/19 (h) | 7,250,000 | 7,308,906 |
| 1.75%, 09/30/19 (h) | 7,425,000 | 7,514,909 |
| 1.25%, 10/31/19 | 1,000,000 | 991,094 |
| 1.50%, 10/31/19 | 3,250,000 | 3,252,031 |
| 3.38%, 11/15/19 (h) | 3,110,700 | 3,358,585 |
| 1.00%, 11/30/19 | 1,483,000 | 1,450,675 |
| 1.50%, 11/30/19 (h) | 8,175,000 | 8,176,913 |
| 1.63%, 12/31/19 (h) | 9,250,000 | 9,289,026 |
| 1.25%, 01/31/20 (h) | 6,000,000 | 5,919,846 |
| 1.38%, 01/31/20 (h) | 2,832,000 | 2,810,097 |
| 1.38%, 02/29/20 (h) | 6,500,000 | 6,444,139 |
| 1.13%, 03/31/20 | 2,384,000 | 2,332,408 |
| 1.38%, 03/31/20 | 4,250,000 | 4,208,494 |
| 3.50%, 05/15/20 | 4,000,000 | 4,350,624 |
| 1.50%, 05/31/20 | 4,000,000 | 3,978,436 |
| 1.63%, 06/30/20 | 3,000,000 | 3,000,000 |
| 1.88%, 06/30/20 | 1,346,000 | 1,361,669 |
| 2.63%, 08/15/20 (h) | 1,776,000 | 1,857,307 |
| 1.75%, 10/31/20 | 1,500,000 | 1,500,821 |
| 2.63%, 11/15/20 (h) | 2,608,000 | 2,724,137 |
| 2.00%, 11/30/20 | 1,500,000 | 1,518,867 |
| 2.38%, 12/31/20 | 4,091,000 | 4,217,567 |
| 2.13%, 01/31/21 | 1,500,000 | 1,524,962 |
| 3.63%, 02/15/21 (h) | 3,003,000 | 3,294,856 |
| 2.00%, 02/28/21 | 1,965,000 | 1,982,654 |
| 2.25%, 03/31/21 | 1,576,000 | 1,610,106 |
| 2.25%, 04/30/21 | 2,786,000 | 2,844,551 |
| 3.13%, 05/15/21 | 2,000,000 | 2,139,376 |
| 2.00%, 05/31/21 | 2,534,000 | 2,550,233 |
| 2.13%, 06/30/21 | 1,512,000 | 1,530,900 |
| 2.25%, 07/31/21 | 3,000,000 | 3,056,952 |
| 2.13%, 08/15/21 | 2,171,900 | 2,196,503 |
| 2.00%, 08/31/21 | 3,000,000 | 3,010,077 |
| 2.13%, 09/30/21 | 2,750,000 | 2,777,715 |
| 2.00%, 10/31/21 | 3,000,000 | 3,005,625 |
| 2.00%, 11/15/21 (h) | 4,800,000 | 4,809,000 |
| 1.88%, 11/30/21 (h) | 12,500,000 | 12,419,925 |
| 1.50%, 01/31/22 (h) | 6,300,000 | 6,099,679 |
| 1.75%, 02/28/22 | 1,000,000 | 982,656 |
| 1.75%, 03/31/22 (h) | 8,300,000 | 8,150,210 |
| 1.75%, 04/30/22 | 1,000,000 | 981,328 |
| 1.88%, 05/31/22 | 2,000,000 | 1,977,968 |
| 1.63%, 08/15/22 | 1,961,000 | 1,901,097 |
| 1.63%, 11/15/22 | 2,177,000 | 2,104,547 |
Security
Rate, Maturity Date | Face
Amount ($) | Value
($) |
| 2.00%, 02/15/23 | 1,594,000 | 1,576,691 |
| 1.75%, 05/15/23 | 1,500,000 | 1,451,016 |
| 2.50%, 08/15/23 | 2,176,000 | 2,223,091 |
| 2.75%, 11/15/23 | 2,046,000 | 2,127,040 |
| 2.75%, 02/15/24 | 1,119,000 | 1,161,836 |
| 2.50%, 05/15/24 | 3,890,000 | 3,956,861 |
| 2.38%, 08/15/24 | 3,000,000 | 3,016,407 |
| 2.25%, 11/15/24 (h) | 8,500,000 | 8,448,864 |
| 2.00%, 02/15/25 (h) | 4,700,000 | 4,566,713 |
| 2.13%, 05/15/25 | 8,212,400 | 8,064,191 |
| | | 582,531,507 |
| Total U.S. Government and Government Agencies |
| (Cost $634,020,656) | | 634,097,381 |
| Security | Number
of Shares | Value
($) |
| Other Investment Company 0.2% of net assets |
| Money Market Fund 0.2% |
| State Street Institutional U.S. Government Money Market Fund, Premier Class 0.00% (e) | 3,341,702 | 3,341,702 |
| Total Other Investment Company |
| (Cost $3,341,702) | | 3,341,702 |
Security
Rate, Maturity Date | Face
Amount ($) | Value
($) |
| Short-Term Investments 9.5% of net assets |
| U.S. Government Agency Securities 9.5% |
| Federal Home Loan Bank |
| 0.04%, 07/06/15 (f) | 11,800,000 | 11,799,988 |
| 0.04%, 07/08/15 (f) | 25,100,000 | 25,099,950 |
| 0.04%, 07/10/15 (f) | 35,000,000 | 34,999,895 |
| 0.04%, 07/15/15 (f) | 33,500,000 | 33,499,866 |
| 0.01%, 07/17/15 (f) | 15,000,000 | 14,999,940 |
| 0.04%, 07/22/15 (f) | 8,000,000 | 7,999,952 |
| 0.04%, 07/24/15 (f) | 10,900,000 | 10,899,935 |
| 0.04%, 08/07/15 (f) | 15,000,000 | 14,999,535 |
| Total Short-Term Investments |
| (Cost $154,297,885) | | 154,299,061 |
End of Investments
Schwab U.S. Aggregate Bond ETF
Portfolio Holdings (Unaudited) continued
At 06/30/15, the tax basis cost of the fund's investments was $1,775,260,104 and the unrealized appreciation and depreciation were $10,256,405 and ($13,977,595), respectively, with a net unrealized depreciation of ($3,721,190).
| * | Supranational bonds represent the debt of international organizations or institutions such as the World Bank, the International Monetary Fund, regional multilateral development banks and others. |
| (a) | Variable-rate security. |
| (b) | The effective maturity may be shorter than the final maturity shown because of the possibility of interim principal payments and prepayments or as the result of embedded demand features (puts or calls). |
| (c) | Securities exempt from registration under Rule 144A of the Securities Act of 1933, as amended. These securities may be resold in transactions exempt from registrations, normally to qualified institutional buyers. At the period end, the value of these amounted to $9,548,991 or 0.6% of net assets. |
| (d) | Guaranteed by the Republic of Germany. |
| (e) | The rate shown is the 7-day yield. |
| (f) | The rate shown is the purchase yield. |
| (g) | Security or a portion of the security purchased on a delayed delivery or when-issued basis. |
| (h) | All or a portion of this security is held as collateral for delayed-delivery securities. |
| (i) | Zero Coupon Bond. |
| | |
| GO — | General obligation |
| RB — | Revenue bond |
| REIT — | Real Estate Investment Trust |
| USD — | Unified school district |
The following is a summary of the inputs used to value the fund’s investments as of June 30, 2015 (see financial note 2(a) for additional information):
| Description | | Quoted Prices in
Active Markets for
Identical Assets
(Level 1) | | Other Significant
Observable Inputs
(Level 2) | | Significant
Unobservable
Inputs
(Level 3) | | Total | |
| Asset-Backed Obligations | | $— | | $9,156,008 | | $— | | $9,156,008 | |
| Commercial Mortgage-Backed Securities | | — | | 31,673,055 | | — | | 31,673,055 | |
| Corporate Bonds1 | | — | | 383,659,115 | | — | | 383,659,115 | |
| Foreign Government Securities1 | | — | | 84,075,305 | | — | | 84,075,305 | |
| Mortgage-Backed Securities1 | | — | | 455,471,276 | | — | | 455,471,276 | |
| Municipal Bonds1 | | — | | 15,766,011 | | — | | 15,766,011 | |
| U.S. Government and Government Agencies1 | | — | | 634,097,381 | | — | | 634,097,381 | |
| Other Investment Company1 | | 3,341,702 | | — | | — | | 3,341,702 | |
| Short-Term Investments1 | | — | | 154,299,061 | | — | | 154,299,061 | |
| Total | | $3,341,702 | | $1,768,197,212 | | $— | | $1,771,538,914 | |
| 1 | As categorized in Portfolio Holdings. |
The fund's policy is to recognize transfers between Level 1, Level 2 and Level 3 as of the beginning of the fiscal year. There were no transfers between Level 1, Level 2 and Level 3 for the period ended June 30, 2015.
Schwab U.S. Aggregate Bond ETF
Statement of
Assets and Liabilities
As of June 30, 2015; unaudited
| Assets |
| Investments, at value (cost $1,774,939,619) | | $1,771,538,914 |
| Receivables: | | |
| Investments sold | | 21,369,965 |
| Interest | | 9,007,654 |
| Foreign tax reclaims | + | 3,536 |
| Total assets | | 1,801,920,069 |
| Liabilities |
| Payables: | | |
| Investments bought | | 30,899,295 |
| Investments bought - Delayed delivery | | 146,699,472 |
| Investment adviser fees | | 15,513 |
| Accrued expenses | + | 1,546 |
| Total liabilities | | 177,615,826 |
| Net Assets |
| Total assets | | 1,801,920,069 |
| Total liabilities | – | 177,615,826 |
| Net assets | | $1,624,304,243 |
| Net Assets by Source | | |
| Capital received from investors | | 1,631,193,297 |
| Net investment income not yet distributed | | 1,089,625 |
| Net realized capital losses | | (4,577,974) |
| Net unrealized capital depreciation | | (3,400,705) |
| Net Asset Value (NAV) |
| Net Assets | ÷ | Shares
Outstanding | = | NAV |
| $1,624,304,243 | | 31,400,000 | | $51.73 |
| | | | | |
Schwab U.S. Aggregate Bond ETF
Statement of
Operations
For the period January 1, 2015 through June 30, 2015; unaudited
| Investment Income |
| Interest | | $14,069,716 * |
| Expenses |
| Investment adviser fees | | 365,370 |
| Interest expense | + | 20,579* |
| Total expenses | – | 385,949 |
| Net investment income | | 13,683,767 |
| Realized and Unrealized Gains (Losses) |
| Net realized losses on investments | | (466,829) |
| Net realized gains on TBA sale commitments | + | 1,094 |
| Net realized losses | | (465,735) |
| Net change in unrealized appreciation (depreciation) on investments | + | (19,013,322) |
| Net realized and unrealized losses | | (19,479,057) |
| Decrease in net assets resulting from operations | | ($5,795,290) |
| * | Includes $16,627 in interest income and $20,579 in interest expense related to charges on Agency Mortgage-Backed Securities not received or delivered on a timely basis (see financial note 2f). |
Schwab U.S. Aggregate Bond ETF
Statement of
Changes in Net Assets
For the current and prior report periods
Figures for the current period are unaudited
| Operations | |
| | 1/1/15-6/30/15 | 1/1/14-12/31/14 |
| Net investment income | | $13,683,767 | $15,184,549 |
| Net realized gains (losses) | | (465,735) | 1,955,285 |
| Net change in unrealized appreciation (depreciation) | + | (19,013,322) | 24,872,888 |
| Increase (Decrease) in net assets resulting from operations | | (5,795,290) | 42,012,722 |
| Distributions to Shareholders | |
| Distributions from net investment income | | ($12,618,820) | ($16,685,260) |
| Transactions in Fund Shares | | | |
| | | 1/1/15-6/30/15 | 1/1/14-12/31/14 |
| | | SHARES | VALUE | SHARES | VALUE |
| Shares sold | | 7,900,000 | $415,940,359 | 13,700,000 | $708,774,842 |
| Shares redeemed | + | — | — | (100,000) | (5,125,035) |
| Net transactions in fund shares | | 7,900,000 | $415,940,359 | 13,600,000 | $703,649,807 |
| Shares Outstanding and Net Assets | | | |
| | | 1/1/15-6/30/15 | 1/1/14-12/31/14 |
| | | SHARES | NET ASSETS | SHARES | NET ASSETS |
| Beginning of period | | 23,500,000 | $1,226,777,994 | 9,900,000 | $497,800,725 |
| Total increase | + | 7,900,000 | 397,526,249 | 13,600,000 | 728,977,269 |
| End of period | | 31,400,000 | $1,624,304,243 | 23,500,000 | $1,226,777,994 |
| Net investment income not yet distributed | | | $1,089,625 | | $24,678 |
Financial Notes, unaudited
1. Business Structure of the Funds:
Each of the funds in this report is a series of Schwab Strategic Trust (the “trust”), a no-load, open-end management investment company. The trust is organized as a Delaware statutory trust and is registered under the Investment Company Act of 1940, as amended (the “1940 Act”). The list below shows all the operational funds in the trust as of the end of the period, including the funds discussed in this report, which are highlighted:
| Schwab Strategic Trust (organized January 27, 2009) | Schwab U.S. Dividend Equity ETF |
| Schwab U.S. TIPS ETF | Schwab International Equity ETF |
| Schwab Short-Term U.S. Treasury ETF | Schwab International Small-Cap Equity ETF |
| Schwab Intermediate-Term U.S. Treasury ETF | Schwab Emerging Markets Equity ETF |
| Schwab U.S. Aggregate Bond ETF | Schwab U.S. REIT ETF |
| Schwab U.S. Broad Market ETF | Schwab Fundamental U.S. Broad Market Index ETF |
| Schwab U.S. Large-Cap ETF | Schwab Fundamental U.S. Large Company Index ETF |
| Schwab U.S. Large-Cap Growth ETF | Schwab Fundamental U.S. Small Company Index ETF |
| Schwab U.S. Large-Cap Value ETF | Schwab Fundamental International Large Company Index ETF |
| Schwab U.S. Mid-Cap ETF | Schwab Fundamental International Small Company Index ETF |
| Schwab U.S. Small-Cap ETF | Schwab Fundamental Emerging Markets Large Company Index ETF |
The funds issue and redeem shares at their net asset value per share (“NAV”) only in large blocks of shares, typically 50,000 shares or more (“Creation Units”). These transactions are usually in exchange for a basket of securities and an amount of cash. As a practical matter, only institutions or large investors purchase or redeem Creation Units. Except when aggregated in Creation Units, shares of the fund are not redeemable securities.
Individual shares of the funds trade on national securities exchanges and elsewhere during the trading day and can only be bought and sold at market prices throughout the trading day through a broker-dealer. Because fund shares trade at market prices rather than NAV, shares may trade at a price greater than NAV (premium) or less than NAV (discount).
Each fund maintains its own account for purposes of holding assets and accounting, and is considered a separate entity for tax purposes. Within its account, each fund may also keep certain assets in segregated accounts, as required by securities law.
2. Significant Accounting Policies:
The following is a summary of the significant accounting policies the funds use in their preparation of financial statements. The funds follow the investment company accounting and reporting guidance of the Financial Accounting Standards Board Accounting Standard Codification Topic 946 Financial Services — Investment Companies. The accounting policies are in conformity with accounting principles generally accepted in the United States of America (“GAAP”).
The funds invest in certain other investment companies (“underlying funds”). For more information about the underlying funds' operations and policies, please refer to those funds' semiannual and annual reports, which are filed with the U.S. Securities and Exchange Commission (“SEC”).
(a) Security Valuation:
Under procedures approved by the funds’ Board of Trustees (the “Board”), the investment adviser has formed a Pricing Committee to administer the pricing and valuation of portfolio securities and other assets and to ensure that prices used for internal purposes or provided by third parties reasonably reflect fair market value. Among other things, these procedures allow the funds to utilize independent pricing services, quotations from securities and financial instrument dealers and other market sources to determine fair value.
The funds value the securities in their portfolios every business day. The funds use the following policies to value various types of securities:
• Bonds and notes: Bonds and notes are valued at halfway between the most recent bid and ask quotes or, if such quotes are unavailable, at prices for securities of comparable maturity, credit quality and type. Valuations for bonds and notes are provided by independent bond-pricing services.
• Securities for which no quoted value is available: The Board has adopted procedures to fair value each fund’s securities when market prices are not “readily available” or are unreliable. For example, a fund may fair value a security when it is de-listed or its trading is halted or suspended; when a security’s primary pricing source is unable or unwilling to provide a price; or when a security’s primary trading market is closed during regular market hours. Each fund makes fair value
Financial Notes, unaudited (continued)
2. Significant Accounting Policies (continued):
determinations in good faith in accordance with the fund’s valuation procedures. The Pricing Committee considers a number of factors, including unobservable market inputs when arriving at fair value. The Pricing Committee may employ techniques such as the review of related or comparable assets or liabilities, related market activities, recent transactions, market multiples, book values, transactional back-testing, disposition analysis and other relevant information. The Pricing Committee regularly reviews these inputs and assumptions to calibrate the valuations. Due to the subjective and variable nature of fair value pricing, there can be no assurance that a fund could obtain the fair value assigned to the security upon the sale of such security. The Board convenes on a regular basis to review fair value determinations made by the funds pursuant to the valuation procedures.
• Short-term securities (60 days or less to maturity): A short-term security may be valued at its amortized cost when it approximates the security's market value.
• Underlying funds: Mutual funds are valued at their respective NAVs.
In accordance with the authoritative guidance on fair value measurements and disclosures under GAAP, the funds disclose the fair value of their investments in a hierarchy that prioritizes the significant inputs to valuation techniques used to measure the fair value. The hierarchy gives the highest priority to valuations based upon unadjusted quoted prices in active markets for identical assets or liabilities (Level 1 measurements) and the lowest priority to valuations based upon unobservable inputs that are significant to the valuation (Level 3 measurements). If inputs used to measure the financial instruments fall within different levels of the hierarchy, the categorization is based on the lowest level input that is significant to the valuation. If the funds determine that either the volume and/or level of activity for an asset or liability has significantly decreased (from normal conditions for that asset or liability) or price quotations or observable inputs are not associated with orderly transactions, increased analysis and management judgment will be required to estimate fair value.
The three levels of the fair value hierarchy are as follows:
• Level 1—quoted prices in active markets for identical securities—Investments whose values are based on quoted market prices in active markets, and whose values are therefore classified as Level 1 prices, include active listed equities. Investments in mutual funds are valued daily at their NAVs, which are classified as Level 1 prices, without consideration to the classification level of the specific investments held by an underlying fund.
• Level 2—other significant observable inputs (including quoted prices for similar securities, interest rates, prepayment speeds, credit risk, etc.)—Investments that trade in markets that are not considered to be active, but whose values are based on quoted market prices, dealer quotations or valuations provided by alternative pricing sources supported by observable inputs are classified as Level 2 prices. These generally include U.S. government and sovereign obligations, most government agency securities, investment-grade corporate bonds, certain mortgage products, less liquid listed equities, and state, municipal and provincial obligations. As investments whose values are classified as Level 2 prices include positions that are not traded in active markets and/or are subject to transfer restrictions, valuations may be adjusted to reflect illiquidity and/or non-transferability, which are generally based on available market information.
• Level 3—significant unobservable inputs (including the funds’ own assumptions in determining the fair value of investments)—Investments whose values are classified as Level 3 prices have significant unobservable inputs, as they may trade infrequently or not at all. When observable prices are not available for these securities, the funds use one or more valuation techniques for which sufficient and reliable data is available. The inputs used by the funds in estimating the value of Level 3 prices may include the original transaction price, quoted prices for similar securities or assets in active markets, completed or pending third-party transactions in the underlying investment or comparable issuers, and changes in financial ratios or cash flows. Level 3 prices may also be adjusted to reflect illiquidity and/or non-transferability, with the amount of such discount estimated by the funds in the absence of market information. Assumptions used by the funds due to the lack of observable inputs may significantly impact the resulting fair value and therefore the funds’ results of operations.
The inputs or methodology used for valuing securities are not necessarily an indication of the risk associated with investing in those securities.
The levels associated with valuing the funds' investments as of June 30, 2015 are disclosed in the Portfolio Holdings.
Financial Notes, unaudited (continued)
2. Significant Accounting Policies (continued):
(b) Accounting Policies for certain Portfolio Investments (if held):
Securities Lending: Under the trust's Securities Lending Program, a fund (lender) may make short-term loans of its securities to another party (borrower) to generate additional revenue for the fund. The borrower pledges collateral in the form of cash, securities issued or fully guaranteed by the U.S. government or foreign governments, or letters of credit issued by a bank. Collateral at the individual loan level is required to be maintained on a daily marked-to-market basis in an amount at least equal to the current value of the securities loaned. The lending agent provides a fund with indemnification against borrower default (the borrower fails to return the security on loan) reducing the risk of loss as a result of default. The cash collateral of securities loaned is currently invested in money market portfolios operating under Rule 2a-7 of the 1940 Act. Each fund bears the risk of loss with respect to the investment of cash collateral. The terms of the securities lending agreement allows the funds to terminate any loans at any given time. Securities lending income, as disclosed in each fund’s Statement of Operations, if applicable, represents the income earned from the investment of the cash collateral plus any fees paid by borrowers, less the fees paid to the lending agent and broker rebates which are subject to adjustments pursuant to the securities lending agreement. On loans not collateralized by cash, a fee is received from the borrower, and is allocated between a fund and the lending agent. A fund retains the right to recall a security on loan. The aggregate market value of securities loaned will not at any time exceed one-third of the total assets of a fund, including collateral received from the loan (at market value computed at the time of the loan). Total costs and expenses, including agent fees, associated with securities lending activities under the trust's Securities Lending Program paid to the unaffiliated lending agent are approximately 15% of the gross lending revenues.
The value of the securities on loan and the related collateral as of June 30, 2015, if any, are disclosed in each fund's Portfolio Holdings. The value of the securities on loan and the investments of cash collateral are also disclosed in each fund's Statement of Assets and Liabilities.
Inflation-Protected Securities: The Schwab U.S. TIPS ETF invests in inflation-protected securities. Inflation-protected securities are fixed-income securities whose principal value is periodically adjusted to the rate of inflation. The interest rate on these instruments is generally fixed at issuance at a rate lower than typical bonds or notes. Over the life of an inflation-indexed instrument, however, interest will be paid based on a principal value, which is adjusted for any inflation or deflation. Any increase or decrease in the principal amount of an inflation-protected security will be included as an addition or reduction to interest income on the Statement of Operations, even though investors do not receive their principal until maturity.
TBA Commitments: The Schwab U.S. Aggregate Bond ETF may enter into “TBA” (to be announced) commitments to purchase or sell securities for a fixed price at a future date. Payments or proceeds of TBA commitments are not delivered until the contractual settlement date. Unsettled TBA commitments are valued at the current market value generally according to the procedures described above in the Security Valuation section. The fund's use of TBA commitments may cause the fund to experience higher portfolio turnover and higher transaction costs.
Agency MBS Transactions: In November 2012, the Treasury Market Practices Group (an industry group sponsored by the Federal Reserve Bank of New York) recommended the margining of certain forward-settling Agency MBS transactions to reduce counterparty and systemic risks. The Treasury Market Practices Group recommended market participants exchange two-way variation margin on a regular basis. The Schwab U.S. Aggregate Bond ETF posts and receives variation margin with certain counterparties in instances where the unrealized gain/loss on such transactions exceeded certain pre-determined thresholds. The variation margin, if any, is disclosed on the Statement of Assets and Liabilities.
(c) Security Transactions:
Security transactions are recorded as of the date the order to buy or sell the security is executed. Realized gains or losses from security transactions are based on the identified costs of the securities involved. Gains and losses from paydowns on mortgage and asset backed securities are recorded as adjustments to interest income.
(d) Investment Income:
Interest income is recorded as it accrues. If a fund buys a debt security at a discount (less than face value) or a premium (more than face value), it amortizes premiums and accretes discounts from the purchase settlement date up to maturity. The fund then increases (in the case of discounts) or reduces (in the case of premiums) the income it records from the security. If the security is callable (meaning that the issuer has the option to pay it off before its maturity date), then the fund amortizes the premium and accretes discounts to the security's call date and price, rather than the maturity date and price.
Financial Notes, unaudited (continued)
2. Significant Accounting Policies (continued):
(e) Expenses:
Pursuant to the Investment Advisory Agreement (“Advisory Agreement”) between Charles Schwab Investment Management, Inc. (“CSIM” or the “investment adviser”) and the trust, the investment adviser will pay the operating expenses of each fund, excluding interest expense, taxes, any brokerage expenses, and extraordinary or non-routine expenses. Interest expense, taxes, any brokerage expenses and extraordinary or non-routine expenses that are specific to a fund are charged directly to the fund.
(f) U.S. Treasury, Agency Debt & Agency Mortgage-Backed Securities Charges:
Due to market conditions or other reasons, delivery of U.S. Treasury securities, agency debt and agency mortgage-backed securities may not occur on a timely basis. In these instances, a fund may fail to receive a security purchased causing the fund to be unable to deliver a security sold. The Treasury Market Practices Group recommends voluntary fail charges when these securities are not delivered as agreed by the parties.
The Schwab U.S. Aggregate Bond ETF received $16,627 and paid $20,579 for the untimely delivery of agency mortgage-backed securities for the period ended June 30, 2015.
(g) Distributions to Shareholders:
The funds make distributions from net investment income, if any, monthly and from net realized capital gains, if any, once a year.
(h) Accounting Estimates:
The accounting policies described in this report conform to GAAP. Notwithstanding this, shareholders should understand that in order to follow these principles, fund management has to make estimates and assumptions that affect the information reported in the financial statements. It’s possible that once the results are known, they may turn out to be different from these estimates and these differences may be material.
(i) Federal Income Taxes:
The funds intend to meet federal income and excise tax requirements for regulated investment companies. Accordingly, the funds distribute substantially all of their net investment income and realized net capital gains, if any, to their respective shareholders each year. As long as a fund meets the tax requirements, it is not required to pay federal income tax.
(j) Indemnification:
Under the funds’ organizational documents, the officers and trustees are indemnified against certain liabilities arising out of the performance of their duties to the funds. In addition, in the normal course of business the funds enter into contracts with their vendors and others that provide general indemnifications. The funds’ maximum exposure under these arrangements is unknown as this would involve future claims that may be made against the funds. However, based on experience, the funds expect the risk of loss attributable to these arrangements to be remote.
3. Risk Factors:
Investing in the funds may involve certain risks, as discussed in the funds’ prospectus, including, but not limited to, those described below. Any of these risks could cause an investor to lose money.
Market Risk. Bond markets rise and fall daily. As with any investment whose performance is tied to these markets, the value of an investment in a fund will fluctuate, which means that the shareholder could lose money.
Investment Style Risk. The funds are not actively managed. Therefore, the funds follow the securities included in the index during upturns as well as downturns. Because of their indexing strategy, the funds do not take steps to reduce market exposure or to lessen the effects of a declining market. In addition, because of the funds' expenses, the funds’ performance may be below that of their respective index.
Financial Notes, unaudited (continued)
3. Risk Factors (continued):
Interest Rate Risk. The funds are subject to the risk that interest rates will rise and fall over time. As with any investment whose yield reflects current interest rates, a fund’s yield will change over time. During periods when interest rates are low, a fund’s yield (and total return) also may be low. Changes in interest rates also may affect a fund’s share price: a rise in interest rates could cause a fund’s share price to fall. The risk is greater when a fund holds fixed income securities with longer maturities. A fund may also lose money if interest rates rise. The longer a fund’s portfolio duration, the more sensitive to interest rate movements its share price is likely to be. For example, a fund with a longer portfolio duration is more likely to experience a decrease in its share price as interest rates rise. Because interest rates in the United States are at, or near, historically low levels, a change in a central bank's monetary policy or improving economic conditions may result in an increase in interest rates. Rising interest rates may decrease liquidity in the fixed income securities markets, making it more difficult for a fund to sell its fixed income securities holdings at a time when the investment adviser might wish to sell such securities. In addition, decreased market liquidity also may make it more difficult to value some or all of a fund's fixed income securities holdings.
Credit Risk. The funds are subject to the risk that a decline in the credit quality of a portfolio investment could cause the funds to lose money or underperform. The funds could lose money if the issuer or guarantor of a portfolio investment fails to make timely principal or interest payments or otherwise honor its obligations.
Inflation Protected Security Risk. The value of inflation-protected securities, including TIPS, generally will fluctuate in response to changes in “real” interest rates, generally decreasing when real interest rates rise and increasing when real interest rates fall. Real interest rates represent nominal (or stated) interest rates reduced by the expected impact of inflation. In addition, interest payments on inflation-indexed securities will generally vary up or down along with the rate of inflation.
Sampling Index Tracking Risk. To the extent a fund uses statistical sampling techniques, the fund will not fully replicate the index and may hold securities not included in the index. As a result, a fund will be subject to the risk that the Adviser’s investment management strategy, the implementation of which is subject to a number of constraints, may not produce the intended results. If a fund uses a sampling approach, it may not track the return of the index as well as it would if a fund purchased all of the securities in its index.
Tracking Error Risk. As index funds, the funds seek to track the performance of their benchmark index, although they may not be successful in doing so. The divergence between the performance of a fund and its benchmark index, positive or negative, is called “tracking error”. Tracking error can be caused by many factors and it may be significant. For example, a fund may not invest in certain securities in its benchmark index or match the securities' weighting to the benchmark.
Liquidity Risk. Liquidity risk exists when particular investments are difficult to purchase or sell. The market for certain investments may become illiquid due to specific adverse changes in the conditions of a particular issuer or under adverse market or economic conditions independent of the issuer, including, for example, during periods of rising interest rates. In addition, dealer inventories of certain securities — an indication of the ability of dealers to engage in “market making” — are at, or near, historic lows in relation to market size, which could potentially lead to decreased liquidity. A fund's investments in illiquid securities may reduce the returns of the fund because it may be unable to sell the illiquid securities at an advantageous time or price. Further, transactions in illiquid securities may entail transaction costs that are higher than those for transactions in liquid securities.
Securities Lending Risk. Securities lending involves the risk of loss of rights in the collateral or delay in recovery of the collateral if the borrower fails to return the security loaned or becomes insolvent.
Shares of the Fund May Trade at Prices Other Than NAV. Fund shares may be bought and sold in the secondary market at market prices. Although it is expected that the market price of the shares of a fund will approximate the fund’s NAV, there may be times when the market price and the NAV vary significantly. Investors may pay more than NAV when they buy shares of a fund in the secondary market, and may receive less than NAV when they sell those shares in the secondary market. The market price of the fund shares may deviate, sometimes significantly, from NAV during periods of market volatility.
Market Trading Risk. Although fund shares are listed on national securities exchanges, there can be no assurance that an active trading market for fund shares will develop or be maintained. If an active market is not maintained, investors may find it difficult to buy or sell fund shares.
Financial Notes, unaudited (continued)
3. Risk Factors (continued):
Non-U.S. Issuer Risk. Schwab U.S. Aggregate Bond ETF may invest in U.S.-registered, dollar-denominated bonds of non-U.S. corporations, governments, agencies and supra-national entities to the extent such bonds are included in the fund’s index. The fund’s investments in bonds of non-U.S. issuers may involve certain risks that are greater than those associated with investments in securities of U.S. issuers. These include risks of adverse changes in foreign economic, political, regulatory and other conditions; the imposition of economic sanctions on other government restrictions; differing accounting, auditing, financial reporting and legal standards and practices; differing securities market structures; and higher transaction costs. These risks may be heightened in connection with bonds issued by non-U.S. corporations and entities in emerging markets.
Mortgage-Backed and Mortgage Pass-Through Securities Risk. With respect to the Schwab U.S. Aggregate Bond ETF, certain of the mortgage-backed securities in which the fund may invest are not backed by the full faith and credit of the U.S. government and there can be no assurance that the U.S. government would provide financial support to its agencies or instrumentalities where it was not obligated to do so. Mortgage-backed securities tend to increase in value less than other debt securities when interest rates decline, but are subject to similar risk of decline in market value during periods of rising interest rates. Because of prepayment and extension risk, mortgage-backed securities react differently to changes in interest rates than other bonds. Small movements in interest rates—both increases and decreases—may quickly and significantly affect the value of certain mortgage-backed securities. Transactions in mortgage pass-through securities often occur through TBA transactions, as described in the fund’s prospectus. Default by or bankruptcy of a counterparty to a TBA transaction could expose the fund to possible losses because of an adverse market action, expenses, or delays in connection with the purchase or sale of the pools of mortgage pass-through securities specified in the TBA transaction.
Prepayment and Extension Risk. Certain of the funds’ investments are subject to the risk that the securities may be paid off earlier or later than expected. Either situation could cause a fund to hold securities paying lower than market rates of interest, which could hurt a fund’s yield or share price.
Derivatives Risk. Schwab U.S. Aggregate bond ETF may invest in derivatives instruments. The principal types of derivatives the fund may use are futures contracts. A futures contract is an agreement to buy or sell a financial instrument at a specific price on a specific day. The fund’s use of derivative instruments involves risks different from, or possibly greater than, the risks associated with investing directly in securities and other traditional investments. Certain of these risks, such as market risk, liquidity risk, and credit risk are discussed elsewhere in this section. The fund’s use of derivatives is also subject to leverage risk, lack-of-availability risk, valuation risk, correlation risk and tax risk. Leverage risk is the risk that use of derivatives may magnify the effect of any decrease or increase in the value of the fund’s portfolio securities. Lack-of-availability risk is the risk that suitable derivative transactions may not be available in all circumstances for risk management or other purposes. Valuation risk is the risk that a particular derivative may be valued incorrectly. Correlation risk is the risk that changes in the value of the derivative may not correlate perfectly with the underlying asset, rate or index. Tax risk is the risk that the use of derivatives may cause the fund to realize higher amounts of short-term capital gain. The fund's use of derivatives could reduce the fund's performance, increase the fund's volatility, and cause the fund to lose more than the initial amount invested. Furthermore, the use of derivatives subject to regulation by the Commodity Futures Trading Commission (CFTC) could cause the fund to become a commodity pool, which would require the fund to comply with certain CFTC rules.
Concentration Risk. To the extent that a fund's or an index's portfolio is concentrated in the securities of issuers in a particular market, industry, group of industries, sector or asset class, the fund may be adversely affected by the performance of those securities, may be subject to increased price volatility and may be more susceptible to adverse economic, market, political or regulatory occurrences affecting that market, industry, group of industries, sector or asset class.
Please refer to the funds’ prospectus for a more complete description of the principal risks of investing in the funds.
4. Affiliates and Affiliated Transactions:
CSIM, a wholly owned subsidiary of The Charles Schwab Corporation, serves as each fund’s investment adviser pursuant to an Advisory Agreement between CSIM and the trust.
Financial Notes, unaudited (continued)
4. Affiliates and Affiliated Transactions (continued):
For its advisory services to the funds, CSIM is entitled to receive an annual fee, payable monthly, based on a percentage of each fund’s average daily net assets as follows:
Schwab
U.S. TIPS ETF | | Schwab
Short-Term
U.S. Treasury ETF | | Schwab
Intermediate-Term
U.S. Treasury ETF | | Schwab
U.S. Aggregate
Bond ETF |
| 0.07% | | 0.08% | | 0.09% | | 0.05% |
Prior to February 24, 2015, the advisory fee for the Schwab Intermediate-Term U.S. Treasury ETF was 0.10%
Certain Schwab funds may own shares of other Schwab funds. The table below reflects the percentages of shares of each fund in this report that are owned by other Schwab funds as of June 30, 2015, as applicable:
| | Underlying Funds | |
| | Schwab
U.S. TIPS ETF | | Schwab
Intermediate-Term
U.S. Treasury ETF |
| Schwab VIT Balanced Portfolio | 0.1% | | 1.6% |
| Schwab VIT Balanced with Growth Portfolio | 0.3% | | 2.8% |
| Schwab VIT Growth Portfolio | 0.1% | | 1.6% |
Pursuant to an exemptive order issued by the SEC, the funds may enter into interfund borrowing and lending transactions with other funds in the Fund Complex (for definition refer to Trustees and Officers section). All loans are for temporary or emergency purposes only. The interest rate to be charged on a loan is the average of the overnight repurchase agreement rate and the short-term bank loan rate. The interfund lending facility is subject to the oversight and periodic review of the Board. The funds had no interfund borrowing or lending activity during the period.
5. Other Service Providers:
SEI Investments Distribution Co. is the principal underwriter and distributor of shares of the funds.
State Street Bank and Trust Company (“State Street”) serves as the funds’ transfer agent. As part of these services, the transfer agent maintains records pertaining to the sale, redemption and transfer of the funds’ shares.
State Street also serves as custodian and accountant for the funds. The custodian is responsible for the daily safekeeping of securities and cash held by the funds. The funds’ accountant maintains all books and records related to the funds’ transactions.
6. Board of Trustees:
The Board may include people who are officers and/or directors of CSIM or its affiliates. Federal securities law limits the percentage of such “interested persons” who may serve on a trust’s board, and the trust was in compliance with these limitations throughout the report period. The trust did not pay any of these interested persons for their services as trustees. For information regarding the trustees please refer to the Trustees and Officers table at the end of this report.
7. Borrowing from Banks:
The funds have access to custodian overdraft facilities and to an uncommitted line of credit of $100 million with State Street. The funds pay interest on the amounts they borrow at rates that are negotiated periodically.
There were no borrowings from the line of credit by the funds during the period. However, the funds may have utilized their overdraft facility and incurred interest expense, which is disclosed on a fund's Statement of Operations, if any. The interest expense is determined based on a negotiated rate above the current Federal Funds Rate.
Financial Notes, unaudited (continued)
8. Purchases and Sales/Maturities of Investment Securities:
For the period ended June 30, 2015, purchases and sales/maturities of securities (excluding in-kind transactions and short-term obligations) were as follows:
| | Purchases of Long-Term
U.S. Government Securities | | Purchases of Other
Long-Term Securities | | Total Purchases of
Long-Term Securities |
| Schwab U.S. TIPS ETF | $74,343,438 | | $— | | $74,343,438 |
| Schwab Short-Term U.S. Treasury ETF | 249,715,785 | | — | | 249,715,785 |
| Schwab Intermediate-Term U.S. Treasury ETF | 62,183,516 | | — | | 62,183,516 |
| Schwab U.S. Aggregate Bond ETF | 1,088,606,208 | | 205,729,562 | | 1,294,335,770 |
| | Sales/Maturities of
Long-Term
U.S. Government
Securities | | Sales/Maturities of
Other Long-Term Securities | | Total Sales/Maturities of
Long-Term Securities |
| Schwab U.S. TIPS ETF | $70,331,681 | | $— | | $70,331,681 |
| Schwab Short-Term U.S. Treasury ETF | 225,159,635 | | — | | 225,159,635 |
| Schwab Intermediate-Term U.S. Treasury ETF | 41,348,975 | | — | | 41,348,975 |
| Schwab U.S. Aggregate Bond ETF | 787,145,744 | | 1,217,151,864 | | 2,004,297,608 |
9. In-Kind Transactions:
The consideration for the purchase of Creation Units of a fund generally consists of the in-kind deposit of a designated portfolio of fixed-income securities, which constitutes an optimized representation of the securities involved in a relevant fund’s underlying index, and an amount of cash. Investors purchasing and redeeming Creation Units are subject to a standard creation transaction fee and a standard redemption transaction fee paid to the custodian to offset transfer and other transaction costs associated with the issuance and redemption of Creation Units. Purchasers and redeemers of Creation Units for cash are subject to an additional variable charge paid to the fund that will offset the transaction costs to the fund of buying or selling portfolio securities. In addition, purchasers and redeemers of shares in Creation Units are responsible for payment of the costs of transferring securities to or out of the fund. From time to time, CSIM may cover the cost of any transaction fees when believed to be in the best interests of the fund.
The in-kind transactions for the period ended June 30, 2015 were as follows:
| | In-Kind Purchases of Securities | | In-Kind Sales of Securities |
| Schwab U.S. TIPS ETF | $184,383,388 | | $5,420,805 |
| Schwab Short-Term U.S. Treasury ETF | 178,355,069 | | 59,042,270 |
| Schwab Intermediate-Term U.S. Treasury ETF | 82,406,882 | | 15,858,335 |
| Schwab U.S. Aggregate Bond ETF | — | | — |
For the period ended June 30, 2015, the funds realized net capital gains or losses resulting from in-kind redemptions of Creation Units. Because such gains or losses are not taxable to the funds and are not distributed to existing fund shareholders, the gains or losses are reclassified from accumulated net realized gains or losses to capital received from investors at the end of the funds' tax year. These reclassifications have no effect on net assets or net asset values per share. The net realized in-kind gains or losses for the period ended June 30, 2015 are disclosed in the funds' Statements of Operations.
Financial Notes, unaudited (continued)
10. Federal Income Taxes
Capital loss carryforwards may be used to offset future realized capital gains for federal income tax purposes. As of December 31, 2014, the funds had capital loss carryforwards available to offset future net capital gains before the expiration dates as follows:
| Expiration Date | | Schwab
U.S. TIPS ETF | | Schwab
Short-Term
U.S. Treasury ETF | | Schwab
Intermediate-Term
U.S. Treasury ETF | | Schwab
U.S. Aggregate
Bond ETF |
| December 31, 2018 | | $39 | | $366 | | $2,072 | | $— |
| No expiration* | | 6,384,434 | | 195,800 | | 1,981,300 | | 4,018,864 |
| Total | | $6,384,473 | | $196,166 | | $1,983,372 | | $4,018,864 |
| * | As a result of the passage of the Regulated Investment Company Modernization Act of 2010, capital losses incurred after December 31, 2010 may now be carried forward indefinitely, but must retain the character of the original loss. However, such losses must be utilized prior to the pre-enactment capital losses, which may increase the likelihood that the pre-enactment capital losses may expire unused. Under pre-enactment law, capital losses could be carried forward for eight years, and carried forward as short-term capital loss, irrespective of the character of the original loss. |
For tax purposes, realized net capital losses and late-year ordinary losses incurred after October 31 may be deferred and treated as occurring on the first day of the following fiscal year. For the year ended December 31, 2014, the funds had capital losses deferred as follows:
| | Schwab
U.S. TIPS ETF | | Schwab
Short-Term
U.S. Treasury ETF | | Schwab
Intermediate-Term
U.S. Treasury ETF | | Schwab
U.S. Aggregate
Bond ETF |
| Deferred capital losses | $— | | $75,206 | | $365,916 | | $— |
As of December 31, 2014, management has reviewed the tax positions for open periods (for federal purposes, three years from the date of filing and for state purposes, four years from the date of filing) as applicable to the funds, and has determined that no provision for income tax is required in the funds' financial statements. The funds recognize interest and penalties, if any, related to unrecognized tax benefits as income tax expense in the Statement of Operations. During the period ended December 31, 2014, the funds did not incur any interest or penalties.
11. Subsequent Events:
Management has determined there are no subsequent events or transactions through the date the financial statements were issued that would have materially impacted the financial statements as presented.
Trustees and Officers
The tables below give information about the trustees and officers for the Schwab Strategic Trust, which includes the funds covered in this report. The “Fund Complex” includes The Charles Schwab Family of Funds, Schwab Capital Trust, Schwab Investments, Schwab Annuity Portfolios, Schwab Strategic Trust, Laudus Trust and Laudus Institutional Trust. The Fund Complex includes 95 funds.
The address for all trustees and officers is 211 Main Street, San Francisco, CA 94105. You can find more information about the trustees and officers in the Statement of Additional Information, which is available free by calling 1-800-435-4000.
| Independent Trustees |
Name, Year of Birth,
and Position(s) with
the trust; (Terms of
office, and length of
Time Served1) | Principal Occupations
During the Past Five Years | Number of
Portfolios in
Fund Complex
Overseen by
the Trustee | Other Directorships |
Robert W. Burns
1959
Trustee
(Trustee since 2009) | Retired/Private Investor (January 2009 – present); Formerly, Managing Director, Pacific Investment Management Company, LLC (PIMCO) and President, PIMCO Funds. | 21 | Director, PS Business Parks, Inc. (2005 – 2012). |
Stephen Timothy Kochis
1946
Trustee
(Trustee since 2012) | CEO and Owner, Kochis Global (wealth management consulting) (May 2012 – present); Chairman and CEO, Aspiriant, LLC (wealth management) (January 2008 – April 2012). | 21 | None |
Charles A. Ruffel
1956
Trustee
(Trustee since 2009) | Managing Partner and Co-Founder, Kudu Advisors, LLC (financial services) (May 2009 – present); Director, Asset International, Inc. (publisher of financial services information) (Jan. 2009 – Nov. 2014). | 95 | None |
| Interested Trustees |
Name, Year of Birth,
and Position(s) with
the trust; (Terms of
office, and length of
Time Served) | Principal Occupations
During the Past Five Years | Number of
Portfolios in
Fund Complex
Overseen by
the Trustee | Other Directorships |
Walter W. Bettinger II2
1960
Chairman and Trustee
(Chairman and Trustee since 2009) | Director, President and Chief Executive Officer, The Charles Schwab Corporation and Charles Schwab & Co., Inc. (2008 – present); Director, Charles Schwab Bank (2006 – present); and Director, Schwab Holdings, Inc. (2008 – present). | 95 | Director, The Charles Schwab Corporation (2008 – present) |
| Officers of the Trust |
Name, Year of Birth, and Position(s)
with the trust; (Terms of office, and
length of Time Served3) | Principal Occupations During the Past Five Years |
Marie Chandoha
1961
President and Chief Executive Officer
(Officer since 2010) | Director, President and Chief Executive Officer (Dec. 2010 – present), Chief Investment Officer (Sept. 2010 – Oct. 2011), Charles Schwab Investment Management, Inc.; President, Chief Executive Officer (Dec. 2010 – present), and Chief Investment Officer (Sept. 2010 – Oct. 2011), Schwab Funds, Laudus Funds and Schwab ETFs; Director, Charles Schwab Worldwide Funds plc and Charles Schwab Asset Management (Ireland) Limited (January 2011 – present); Global Head of Fixed Income Business Division, BlackRock, Inc. (formerly Barclays Global Investors) (March 2007 – August 2010). |
| Officers of the Trust (continued) |
Name, Year of Birth, and Position(s)
with the trust; (Terms of office, and
length of Time Served3) | Principal Occupations During the Past Five Years |
George Pereira
1964
Treasurer and Principal Financial Officer
(Officer since 2009) | Senior Vice President and Chief Financial Officer (Nov. 2004 – present), Chief Operating Officer (Jan. 2011 – present), Charles Schwab Investment Management, Inc.; Treasurer and Chief Financial Officer, Laudus Funds (June 2006 – present); Treasurer and Principal Financial Officer, Schwab Funds (Nov. 2004 – present) and Schwab ETFs (Oct. 2009 – present); Director, Charles Schwab Worldwide Funds plc and Charles Schwab Asset Management (Ireland) Limited (April 2005 – present). |
Omar Aguilar
1970
Senior Vice President and Chief Investment Officer – Equities
(Officer since 2011) | Senior Vice President and Chief Investment Officer – Equities, Charles Schwab Investment Management, Inc. (April 2011 – present); Senior Vice President and Chief Investment Officer – Equities, Schwab Funds, Laudus Funds and Schwab ETFs (June 2011 – present); Head of the Portfolio Management Group and Vice President of Portfolio Management, Financial Engines, Inc. (May 2009 – April 2011); Head of Quantitative Equity, ING Investment Management (July 2004 – Jan. 2009). |
Brett Wander
1961
Senior Vice President and Chief Investment Officer – Fixed Income
(Officer since 2011) | Senior Vice President and Chief Investment Officer – Fixed Income, Charles Schwab Investment Management, Inc. (April 2011 – present); Senior Vice President and Chief Investment Officer – Fixed Income, Schwab Funds, Laudus Funds and Schwab ETFs (June 2011 – present); Senior Managing Director, Global Head of Active Fixed-Income Strategies, State Street Global Advisors (Jan. 2008 – Oct. 2010); Director of Alpha Strategies Loomis, Sayles & Company (April 2006 – Jan. 2008). |
David Lekich
1964
Chief Legal Officer and Secretary
(Officer since 2011) | Senior Vice President (Sept. 2011 – present), Vice President (March 2004 – Sept. 2011), Charles Schwab & Co., Inc.; Senior Vice President and Chief Counsel (Sept. 2011 – present), Vice President (Jan. 2011 – Sept. 2011), Charles Schwab Investment Management, Inc.; Secretary (April 2011 – present) and Chief Legal Officer (Dec. 2011 – present), Schwab Funds; Vice President and Assistant Clerk, Laudus Funds (April 2011 – present); Secretary (May 2011 – present) and Chief Legal Officer (Nov. 2011 – present), Schwab ETFs. |
Catherine MacGregor
1964
Vice President and Assistant Secretary
(Officer since 2009) | Vice President, Charles Schwab & Co., Inc., Charles Schwab Investment Management, Inc. (July 2005 – present); Vice President (Dec. 2005 – present), Chief Legal Officer and Clerk (March 2007 – present), Laudus Funds; Vice President (Nov. 2005 – present) and Assistant Secretary (June 2007 – present), Schwab Funds; Vice President and Assistant Secretary, Schwab ETFs (Oct. 2009 – present). |
| 1 | Each Trustee shall hold office until the election and qualification of his or her successor, or until he or she dies, resigns or is removed. The Schwab ETF’s retirement policy requires that independent trustees retire by December 31 of the year in which the Trustee turns 72 or the Trustee’s twentieth year of service as an independent trustee, whichever comes first. |
| 2 | Mr. Bettinger is an Interested Trustee because he owns stock of The Charles Schwab Corporation, the parent company of the investment adviser. |
| 3 | The President, Treasurer and Secretary hold office until their respective successors are chosen and qualified or until he or she sooner dies, resigns, is removed or becomes disqualified. Each of the other officers serves at the pleasure of the Board. |
Glossary
ask See “offer.”
asset allocation The practice of dividing a portfolio among different asset classes, with each asset class assigned a particular percentage to help offset risks and rewards, based on your goals, time horizon and risk tolerance.
asset-backed securities Bond or other debt securities that represent ownership in a pool of assets such as credit card debt.
asset class A group of securities with similar structure and basic characteristics. Stocks, bonds and cash are the three main examples of asset classes.
authorized participant (AP) A large institutional investor that places orders for creation units with the funds’ distributor.
Barclays U.S. Aggregate Bond Index A broad-based benchmark that measures the investment grade, U.S. dollar-denominated, fixed-rate taxable bond market, including Treasuries, government-related and corporate securities, mortgage-backed securities (agency fixed-rate and hybrid ARM pass-throughs), asset-backed securities, and commercial mortgage-backed securities.
Barclays U.S. TIPS Index (Series-L) A rules-based, market value-weighted index that tracks inflation-protected securities issued by the U.S. Treasury that have at least one year remaining to maturity, are rated investment grade and have $250 million or more of outstanding face value.
Barclays U.S. 1 – 3 Year Treasury Bond Index An index that measures the performance of U.S. Treasury securities that have a remaining maturity of greater than or equal to one year and less than three years, are rated investment grade, and have $250 million or more of outstanding face value.
Barclays U.S. 3 –10 Year Treasury Bond Index An index that measures the performance of U.S. Treasury securities that have a remaining maturity of greater than or equal to three years and less than 10 years, are rated investment grade, and have $250 million or more of outstanding face value.
bid The highest price at which someone is willing to buy a security.
bond A security representing a loan from the investor to the issuer. A bond typically pays interest at a fixed rate (the “coupon rate”) until a specified date (the “maturity date”), at which time the issuer returns the money borrowed (“principal” or “face value”) to the bondholder. Because of their structure, bonds are sometimes called “fixed income securities” or “debt securities.”
call An early repayment of a bond’s principal by the issuer, usually done because the issuer is able to refinance its bond debt at a lower rate.
call protection A term used in reference to a bond that cannot be called by the issuer before maturity, or at least for many years from the present date. A bond that offers call protection can more reliably be expected to provide a given yield over a given number of years than a bond that could be called (assuming both bonds are of the same credit quality).
capital gain, capital loss The difference between the amount paid for an investment and its value at a later time. If the investment has been sold, the capital gain or loss is considered a realized gain or loss. If the investment is still held, the gain or loss is still “on paper” and is considered unrealized.
commencement of operations The date that the first NAV was calculated.
coupon, coupon rate The annual rate of interest paid until maturity by the issuer of a debt security.
creation unit (C.U.) A basket of securities that is delivered by an authorized participant (AP) to the fund equal to the current holdings of the ETF, plus a designated cash component. In return, the APs receive a large block of ETF shares (typically 50,000 shares), which investors can then buy and sell in the secondary market.
credit quality The capacity of an issuer to make its interest and principal payments; an assessment typically rendered by an independent third-party organization.
credit risk The risk that a bond issuer may be unable to pay interest or principal to its bondholders.
duration A measure of an individual bond’s sensitivity to interest rates, expressed in years. Calculations of duration generally take into account the bond’s yield, interest payments, maturity date and call features.
weighted average duration A measure of the duration of all bonds in a fund’s portfolio, also expressed in years, based on the market value weighted average duration of each bond in the portfolio.
exchange A marketplace, or any organization or group that provides or maintains a marketplace for trading securities, options, futures, or commodities.
expense ratio The amount that is taken from the fund’s assets each year to cover the operating expenses. An expense ratio of 0.50% means that a fund’s expenses amount to half of one percent of its average net assets a year.
face value The value of a bond, note, mortgage or other security as given on the certificate or instrument. Face value is also referred to as par value or nominal value.
inception date The date that the shares began trading in the secondary market.
indicative optimized portfolio value (IOPV) A calculation disseminated by the stock exchange that approximates the fund’s NAV every 15 seconds throughout the trading day.
interest Payments to bondholders (usually made twice a year) as compensation for loaning the bond principal to the issuer.
interest rate risk The risk that a bond’s value will fluctuate if market interest rates change or are expected to change. Bond prices tend to move in the opposite direction of interest rates: when interest rates rise, bond prices tend to fall.
liquidity The ability to convert a security or asset quickly into cash.
market price return The return based on the change in market price per share of the fund over a given time period. Market price returns assume that dividends and capital gain distributions have been reinvested in the fund at market price.
maturity The maturity of a bond will generally be determined using a portfolio security’s final maturity date (date on which the final principal payment of a bond is scheduled to be paid); however, for securitized products, such as mortgage-backed securities and certain other asset-backed securities, maturity will be determined on an average life basis (weighted average time to receipt of all principal payments) by the investment adviser. Because pre-payment rates of individual mortgage pools vary widely, the average life of a particular pool cannot be predicted precisely. For securities with embedded demand features, such as puts or calls, either the demand date or the final maturity date will be used depending on interest rates, yields and other market conditions. The average portfolio maturity of a fund is dollar-weighted based upon the market value of a fund’s securities at the time of the calculation.
mortgage-backed securities Bond or other debt securities that represent ownership in a pool of mortgage loans.
net asset value (NAV) The value of one share of a fund. NAV is calculated by taking the fund’s total assets, subtracting liabilities, and dividing by the number of shares outstanding.
NAV return The return based on the change in NAV of the fund over a given time period. NAV returns assume that dividends and capital gain distributions have been reinvested in the fund.
offer (ask) The lowest price at which an individual is willing to sell a security.
open The price at which a security opened for trading on a given day.
outstanding shares, shares outstanding When speaking of the fund, indicates all shares currently held by investors.
prepayment risk The risk that a mortgage-backed security may be paid off early, typically because interest rates have fallen and the homeowners who hold the underlying mortgages have refinanced those mortgages at lower rates. In this type of situation, the investor who held the mortgage-backed security will usually have to settle for a lower rate when reinvesting the principal.
primary market The market that deals with the issuance of new securities.
replication If a fund uses a full replication method, the fund will invest substantially all of its assets proportionately in the securities included in the underlying index.
sampling If a fund uses a sampling method, the fund will not fully replicate the underlying index and may hold securities not included in the index. A fund that utilizes a sampling approach may not track the return of the index as closely as a fund that uses a full replication method.
secondary market The market in which investors purchase securities from other investors rather than directly from the issuing companies. Organized exchanges facilitate the trading of securities in the secondary market.
spread The gap between bid and ask prices of a security.
total return The percentage that an investor would have earned or lost on an investment in the fund assuming dividends and distributions were reinvested.
tracking error The difference between the performance of the fund and its benchmark index, positive or negative.
Treasury inflation protected security (TIPS) A United States Treasury bond whose principal increases at the same rate as the Consumer Price Index (CPI).The interest payment is then calculated off that inflated (adjusted) principal and repaid at maturity.
weighted average For mutual funds or ETFs, an average that gives the same weight to each security as the security represents in the fund’s portfolio.
yield The income paid out by an investment, expressed as a percentage of the investment’s market value.
yield to maturity The annualized rate of return a bondholder could expect if the bond were held to maturity. In addition to interest payments, yield to maturity also factors in any difference between a bond’s current price and its principal amount, or face value.
Schwab ETFs™ are designed to be low-cost, diversified investments. The funds follow broad market indices and provide exposure to specific segments of the market, making each an investment option for the core portions of an investor portfolio. The list to the right shows all currently available Schwab ETFs.
Investors should carefully consider information contained in the prospectus, including investment objectives, risks, charges and expenses before investing. Please call 1-800-435-4000 for a prospectus and brochure for any Schwab ETF. Please read the prospectus carefully before you invest. This report must be preceded or accompanied by a current prospectus.
Proxy Voting Policies, Procedures and Results
A description of the proxy voting policies and procedures used to determine how to vote proxies on behalf of the funds is available without charge, upon request, by visiting the Schwab ETFs’ website at www.csimfunds.com/schwabetfs_prospectus, the SEC’s website at www.sec.gov, or by contacting Schwab ETFs at 1-800-435-4000.
Information regarding how a fund voted proxies relating to portfolio securities during the most recent twelve-month period ended June 30 is available, without charge, by visiting the fund’s website at www.csimfunds.com/schwabetfs_prospectus or the SEC’s website at www.sec.gov.
Schwab ETFs™
U.S. ETFs
Schwab U.S. Broad Market ETF™
Schwab U.S. Large-Cap ETF™
Schwab U.S. Large-Cap Growth ETF™
Schwab U.S. Large-Cap Value ETF™
Schwab U.S. Mid-Cap ETF™
Schwab U.S. Small-Cap ETF™
Schwab U.S. Dividend Equity ETF™
Schwab U.S. REIT ETF™
International ETFs
Schwab International Equity ETF™
Schwab International Small-Cap Equity ETF™
Schwab Emerging Markets Equity ETF™
Fixed Income ETFs
Schwab U.S. Aggregate Bond ETF™
Schwab Short-Term U.S. Treasury ETF™
Schwab Intermediate-Term U.S. Treasury ETF™
Schwab U.S. TIPS ETF™
Fundamental Index* ETFs
Schwab Fundamental U.S. Broad Market Index ETF
Schwab Fundamental U.S. Large Company Index ETF
Schwab Fundamental U.S. Small Company Index ETF
Schwab Fundamental International Large Company Index ETF
Schwab Fundamental International Small Company Index ETF
Schwab Fundamental Emerging Markets Large Company Index ETF
| * | FUNDAMENTAL INDEX is a registered trademark of Research Affiliates LLC. |
Investment Adviser
Charles Schwab Investment Management, Inc.
211 Main Street, San Francisco, CA 94105
Schwab ETFs™
1-800-435-4000
This report is not authorized for distribution to prospective investors unless preceded or accompanied by a current prospectus.
© 2015 Charles Schwab Investment Management, Inc. All rights reserved.
Printed on recycled paper.
MFR62961-04
00149462
Item 2: Code of Ethics.
Not applicable to this semi-annual report.
Item 3: Audit Committee Financial Expert.
Not applicable to this semi-annual report.
Item 4: Principal Accountant Fees and Services.
Not applicable to this semi-annual report.
Item 5: Audit Committee of Listed Registrants.
Not applicable to this semi-annual report.
Item 6: Schedule of Investments.
The schedules of investments are included as part of the report to shareholders filed under Item 1 of this Form.
Item 7: Disclosure of Proxy Voting Policies and Procedures for Closed-End Management Investment Companies.
Not applicable.
Item 8: Portfolio Managers of Closed-End Management Investment Companies.
Not applicable.
Item 9: Purchases of Equity Securities by Closed-End Management Investment Company and Affiliated Purchasers.
Not applicable.
Item 10: Submission of Matters to a Vote of Security Holders.
Not applicable.
Item 11: Controls and Procedures.
| (a) | Based on their evaluation of Registrant’s disclosure controls and procedures, as of a date within 90 days of the filing date, Registrant’s Chief Executive Officer, Marie Chandoha and Registrant’s Principal Financial Officer, George Pereira, have concluded that Registrant’s disclosure controls and procedures are: (i) reasonably designed to ensure that information required to be disclosed in this report is appropriately communicated to Registrant’s officers to allow timely decisions regarding disclosures required in this report; (ii) reasonably designed to ensure that information required to be disclosed in this report is recorded, processed, summarized and reported in a timely manner; and (iii) are effective in achieving the goals described in (i) and (ii) above. |
| (b) | During the second fiscal quarter of the period covered by this report, there have been no changes in Registrant’s internal control over financial reporting that the above officers believe to have materially affected, or to be reasonably likely to materially affect, Registrant’s internal control over financial reporting. |
Item 12: Exhibits.
| | | | |
| (a) | | (1) | | Code of ethics – not applicable to this semi-annual report. |
| | |
| | (2) | | Separate certifications for Registrant’s principal executive officer and principal financial officer, as required by Rule 30a-2(a) under the 1940 Act, are attached. |
| | |
| | (3) | | Not applicable. |
| |
| (b) | | A certification for Registrant’s principal executive officer and principal financial officer, as required by Rule 30a-2(b) under the 1940 Act, is attached. This certification is being furnished to the Securities and Exchange Commission solely pursuant to 18 U.S.C. section 1350 and is not being filed as part of the Form N-CSRS with the Commission. |
Pursuant to the requirements of the Securities Exchange Act of 1934 and the Investment Company Act of 1940, the registrant has duly caused this report to be signed on its behalf by the undersigned, thereunto duly authorized.
(Registrant) Schwab Strategic Trust- Fixed Income ETFs
| | |
| By: | | /s/ Marie Chandoha |
| | Marie Chandoha |
| | Chief Executive Officer |
| |
| Date: | | August 11, 2015 |
Pursuant to the requirements of the Securities Exchange Act of 1934 and the Investment Company Act of 1940, this report has been signed below by the following persons on behalf of the registrant and in the capacities and on the dates indicated.
| | |
| By: | | /s/ Marie Chandoha |
| | Marie Chandoha |
| | Chief Executive Officer |
| |
| Date: | | August 11, 2015 |
| |
| By: | | /s/ George Pereira |
| | George Pereira |
| | Principal Financial Officer |
| |
| Date: | | August 11, 2015 |