Table of Contents
UNITED STATES
SECURITIES AND EXCHANGE COMMISSION
Washington, D.C. 20549
FORM N-CSR
CERTIFIED SHAREHOLDER REPORT OF REGISTERED
MANAGEMENT INVESTMENT COMPANIES
Investment Company Act file number: 811-22311
Schwab Strategic Trust
(Exact name of registrant as specified in charter)
211 Main Street, San Francisco, California 94105
(Address of principal executive offices) (Zip code)
Marie Chandoha
Schwab Strategic Trust
211 Main Street, San Francisco, California 94105
(Name and address of agent for service)
Registrant’s telephone number, including area code: (415) 636-7000
Date of fiscal year end: August 31
Date of reporting period: August 31, 2017
| Item 1: | Report(s) to Shareholders. |
Table of Contents

Equity ETF™
Equity ETF™
Equity ETF™
| Total Returns for the 12 Months Ended August 31, 2017 | |
| Schwab International Equity ETF (Ticker Symbol: SCHF) | |
| Market Price Return1 | 18.02% |
| NAV Return1 | 17.76% |
| FTSE Developed ex US Index (Net)* | 17.60% |
| ETF Category: Morningstar Foreign Large Blend2 | 17.19% |
| Performance Details | pages 7-9 |
| Schwab International Small-Cap Equity ETF (Ticker Symbol: SCHC) | |
| Market Price Return1 | 18.70% |
| NAV Return1 | 18.52% |
| FTSE Developed Small Cap ex US Liquid Index (Net)* | 18.44% |
| ETF Category: Morningstar Foreign Small/Mid Blend2 | 22.16% |
| Performance Details | pages 10-12 |
| Schwab Emerging Markets Equity ETF (Ticker Symbol: SCHE) | |
| Market Price Return1 | 22.48% |
| NAV Return1 | 22.40% |
| FTSE Emerging Index (Net)* | 22.47% |
| ETF Category: Morningstar Diversified Emerging Markets2 | 21.69% |
| Performance Details | pages 13-15 |
| * | The total return cited for the index is calculated net of foreign withholding taxes; the underlying tax rate information is available from FTSE. |
| 1 | ETF performance must be shown based on both a market price and NAV basis. The fund’s per share NAV is the value of one share of the fund. NAV is calculated by taking the fund’s total assets (including the market value of securities owned), subtracting liabilities, and dividing by the number of shares outstanding. The NAV Return is based on the NAV of the fund, and the Market Price Return is based on the market price per share of the fund. The price used to calculate market return (Market Price) is determined by using the midpoint between the highest bid and the lowest offer on the primary stock exchange on which the shares of the fund are listed for trading, as of the time that the fund’s NAV is calculated. Market Price and NAV returns assume that dividends and capital gain distributions have been reinvested in the fund at Market Price and NAV, respectively. |
| 2 | Source for category information: Morningstar, Inc. The Morningstar Category return represents all passively- and actively-managed ETFs within the category as of the report date. |

President and CEO of
Charles Schwab Investment
Management, Inc. and the
funds covered in this report.
| * | The net version of the index reflects reinvested dividends net of withholding taxes, but reflects no deductions for expenses or other taxes. |

| 1 | Morningstar, “9 Partners for the Next Decade.” Laura Pavlenko Lutton and Greggory Warren, CFA: April 27, 2017. Morningstar looked collectively across four traits (differentiation, low costs, repeatable investment processes, and adaptable business models) to identify firms that they believe are representative of these trends. |
 | Christopher Bliss, CFA, Vice President and Head of the Passive Equity Team, leads the portfolio management team for Schwab’s Passive Equity Funds and ETFs. He also has overall responsibility for all aspects of the management of the funds. Prior to joining CSIM in 2016, Mr. Bliss spent 12 years at BlackRock (formerly Barclays Global Investors) managing and leading institutional index teams, most recently as a Managing Director and Head of Americas Institutional Index team. Prior to BlackRock, he worked as an equity analyst and portfolio manager for Harris Bretall and before that, as a research analyst for JP Morgan. |
 | Chuck Craig, CFA, Senior Portfolio Manager, is responsible for the day-to-day co-management of the funds. Prior to joining CSIM in 2012, Mr. Craig worked at Guggenheim Funds (formerly Claymore Group), where he spent more than five years as a managing director of portfolio management and supervision, and three years as vice president of product research and development. Prior to that, he worked as an equity research analyst at First Trust Portfolios (formerly Niké Securities), and a trader and analyst at PMA Securities, Inc. |
 | Jane Qin, Portfolio Manager, is responsible for the day-to-day co-management of the funds. Prior to joining CSIM in 2012, Ms. Qin spent more than four years at The Bank of New York Mellon Corporation. During that time, Ms. Qin spent more than two years as an associate equity portfolio manager and nearly two years as a performance analyst. She also worked at Wells Fargo Funds Management as a mutual fund analyst and at CIGNA Reinsurance in Risk Management group as a risk analyst. |
 | David Rios, Portfolio Manager, is responsible for the day-to-day co-management of the funds. He joined CSIM in 2008 and became a Portfolio Manager in September 2014. Prior to this role, Mr. Rios served as an Associate Portfolio Manager on the Schwab Equity Index Strategies team for four years. His first role with CSIM was as a trade operation specialist. He also previously worked as a senior fund accountant at Investors Bank & Trust (subsequently acquired by State Street Corporation). |
| 1 | The total return cited for the index is calculated net of foreign withholding taxes; the underlying tax rate information is available from FTSE. |
| Fund and Inception Date | 1 Year | 5 Years | Since Inception* |
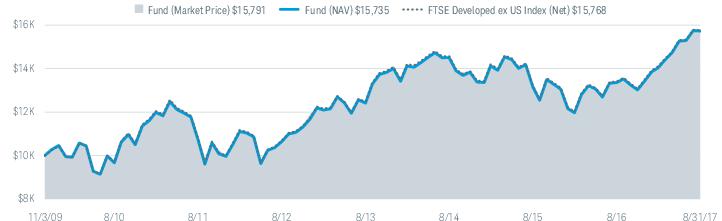
| Fund: Schwab International Equity ETF (11/3/09) | |||
| Market Price Return2 | 18.02% | 8.07% | 6.01% |
| NAV Return2 | 17.76% | 8.12% | 5.96% |
| FTSE Developed ex US Index (Net)3 | 17.60% | 8.07% | 5.99% |
| ETF Category: Morningstar Foreign Large Blend4 | 17.19% | 7.90% | 5.83% |
| Fund Expense Ratio5: 0.06% | |||
| * | Inception (11/3/09) represents the date that the shares began trading in the secondary market. |
| 1 | Performance does not reflect the deduction of taxes that a shareholder would pay on fund distributions or on the redemption of fund shares. |
| 2 | ETF performance must be shown based on both a market price and NAV basis. The fund’s per share NAV is the value of one share of the fund. NAV is calculated by taking the fund’s total assets (including the market value of securities owned), subtracting liabilities, and dividing by the number of shares outstanding. The NAV Return is based on the NAV of the fund, and the Market Price Return is based on the market price per share of the fund. The price used to calculate market return (Market Price) is determined by using the midpoint between the highest bid and the lowest offer on the primary stock exchange on which the shares of the fund are listed for trading, as of the time that the fund’s NAV is calculated. NAV is used as a proxy for purposes of calculating Market Price Return on inception date. Market Price and NAV returns assume that dividends and capital gain distributions have been reinvested in the fund at Market Price and NAV, respectively. |
| 3 | The total return cited for the index is calculated net of foreign withholding taxes; the underlying tax rate information is available from FTSE. |
| 4 | Source for category information: Morningstar, Inc. The Morningstar Category return represents all passively- and actively-managed ETFs within the category as of the report date. |
| 5 | As stated in the prospectus. Effective March 1, 2017, the management fee was reduced to 0.06%. For more information, see financial note 4 or refer to the prospectus supplement dated March 1, 2017. |
| Number of Holdings | 1,263 |
| Weighted Average Market Cap (millions) | $58,538 |
| Price/Earnings Ratio (P/E) | 15.7 |
| Price/Book Ratio (P/B) | 1.6 |
| Portfolio Turnover Rate2 | 5% |
| 1 | Excludes derivatives. |
| 2 | Portfolio turnover rate excludes securities received or delivered from processing of in-kind creations or redemptions. |
| 3 | This list is not a recommendation of any security by the investment adviser. |
| 4 | The percentage may differ from the Portfolio Holdings because the above calculation is based on a percentage of total investments, excluding derivatives, whereas the calculation in the Portfolio Holdings is based on a percentage of net assets. |
| 1 | The total return cited for the index is calculated net of foreign withholding taxes; the underlying tax rate information is available from FTSE. |
| Fund and Inception Date | 1 Year | 5 Years | Since Inception* |
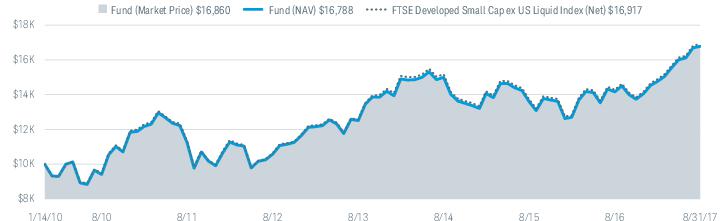
| Fund: Schwab International Small-Cap Equity ETF (1/14/10) | |||
| Market Price Return2 | 18.70% | 9.73% | 7.09% |
| NAV Return2 | 18.52% | 9.67% | 7.03% |
| FTSE Developed Small Cap ex US Liquid Index (Net)3 | 18.44% | 9.73% | 7.14% |
| ETF Category: Morningstar Foreign Small/Mid Blend4 | 22.16% | 11.36% | 8.17% |
| Fund Expense Ratio5: 0.12% | |||
| * | Inception (1/14/10) represents the date that the shares began trading in the secondary market. |
| 1 | Performance does not reflect the deduction of taxes that a shareholder would pay on fund distributions or on the redemption of fund shares. |
| 2 | ETF performance must be shown based on both a market price and NAV basis. The fund’s per share NAV is the value of one share of the fund. NAV is calculated by taking the fund’s total assets (including the market value of securities owned), subtracting liabilities, and dividing by the number of shares outstanding. The NAV Return is based on the NAV of the fund, and the Market Price Return is based on the market price per share of the fund. The price used to calculate market return (Market Price) is determined by using the midpoint between the highest bid and the lowest offer on the primary stock exchange on which the shares of the fund are listed for trading, as of the time that the fund’s NAV is calculated. NAV is used as a proxy for purposes of calculating Market Price Return on inception date. Market Price and NAV returns assume that dividends and capital gain distributions have been reinvested in the fund at Market Price and NAV, respectively. |
| 3 | The total return cited for the index is calculated net of foreign withholding taxes; the underlying tax rate information is available from FTSE. |
| 4 | Source for category information: Morningstar, Inc. The Morningstar Category return represents all passively- and actively-managed ETFs within the category as of the report date. |
| 5 | As stated in the prospectus. Effective March 1, 2017, the management fee was reduced to 0.12%. For more information, see financial note 4 or refer to the prospectus supplement dated March 1, 2017. |
| Number of Holdings | 1,830 |
| Weighted Average Market Cap (millions) | $2,437 |
| Price/Earnings Ratio (P/E) | 15.5 |
| Price/Book Ratio (P/B) | 1.6 |
| Portfolio Turnover Rate2 | 12% |
| 1 | Excludes derivatives. |
| 2 | Portfolio turnover rate excludes securities received or delivered from processing of in-kind creations or redemptions. |
| 3 | This list is not a recommendation of any security by the investment adviser. |
| 4 | The percentage may differ from the Portfolio Holdings because the above calculation is based on a percentage of total investments, excluding derivatives, whereas the calculation in the Portfolio Holdings is based on a percentage of net assets. |
| 1 | The total return cited for the index is calculated net of foreign withholding taxes; the underlying tax rate information is available from FTSE. |
| Fund and Inception Date | 1 Year | 5 Years | Since Inception* |
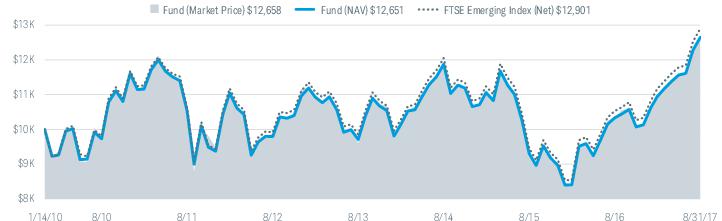
| Fund: Schwab Emerging Markets Equity ETF (1/14/10) | |||
| Market Price Return2 | 22.48% | 5.10% | 3.14% |
| NAV Return2 | 22.40% | 5.24% | 3.13% |
| FTSE Emerging Index (Net)3 | 22.47% | 5.40% | 3.39% |
| ETF Category: Morningstar Diversified Emerging Markets4 | 21.69% | 5.12% | 3.02% |
| Fund Expense Ratio5: 0.13% | |||
| * | Inception (1/14/10) represents the date that the shares began trading in the secondary market. |
| 1 | Performance does not reflect the deduction of taxes that a shareholder would pay on fund distributions or on the redemption of fund shares. |
| 2 | ETF performance must be shown based on both a market price and NAV basis. The fund’s per share NAV is the value of one share of the fund. NAV is calculated by taking the fund’s total assets (including the market value of securities owned), subtracting liabilities, and dividing by the number of shares outstanding. The NAV Return is based on the NAV of the fund, and the Market Price Return is based on the market price per share of the fund. The price used to calculate market return (Market Price) is determined by using the midpoint between the highest bid and the lowest offer on the primary stock exchange on which the shares of the fund are listed for trading, as of the time that the fund’s NAV is calculated. NAV is used as a proxy for purposes of calculating Market Price Return on inception date. Market Price and NAV returns assume that dividends and capital gain distributions have been reinvested in the fund at Market Price and NAV, respectively. |
| 3 | The total return cited for the index is calculated net of foreign withholding taxes; the underlying tax rate information is available from FTSE. |
| 4 | Source for category information: Morningstar, Inc. The Morningstar Category return represents all passively- and actively-managed ETFs within the category as of the report date. |
| 5 | As stated in the prospectus. |
| Number of Holdings | 835 |
| Weighted Average Market Cap (millions) | $65,072 |
| Price/Earnings Ratio (P/E) | 14.9 |
| Price/Book Ratio (P/B) | 1.8 |
| Portfolio Turnover Rate2 | 7% |
| 1 | Excludes derivatives. |
| 2 | Portfolio turnover rate excludes securities received or delivered from processing of in-kind creations or redemptions. |
| 3 | This list is not a recommendation of any security by the investment adviser. |
| 4 | The percentage may differ from the Portfolio Holdings because the above calculation is based on a percentage of total investments, excluding derivatives, whereas the calculation in the Portfolio Holdings is based on a percentage of net assets. |
| Expense Ratio (Annualized)1 | Beginning Account Value at 3/1/17 | Ending Account Value (Net of Expenses) at 8/31/17 | Expenses Paid During Period 3/1/17-8/31/172 | |
| Schwab International Equity ETF | ||||
| Actual Return | 0.06% | $1,000.00 | $1,120.60 | $0.32 |
| Hypothetical 5% Return | 0.06% | $1,000.00 | $1,024.90 | $0.31 |
| Schwab International Small-Cap Equity ETF | ||||
| Actual Return | 0.12% | $1,000.00 | $1,137.60 | $0.65 |
| Hypothetical 5% Return | 0.12% | $1,000.00 | $1,024.60 | $0.61 |
| Schwab Emerging Markets Equity ETF | ||||
| Actual Return | 0.13% | $1,000.00 | $1,155.90 | $0.71 |
| Hypothetical 5% Return | 0.13% | $1,000.00 | $1,024.54 | $0.66 |
| 1 | Based on the most recent six-month expense ratio; may differ from the expense ratio provided in the Financial Highlights which covers a 12-month period. |
| 2 | Expenses for the fund are equal to its annualized expense ratio, multiplied by the average account value over the period, multiplied by the 184 days of the period, and divided by 365 days of the fiscal year. |
| 9/1/16– 8/31/17 | 9/1/15– 8/31/16 | 9/1/14– 8/31/15 | 9/1/13– 8/31/14 | 9/1/12– 8/31/13 | ||
| Per-Share Data | ||||||
| Net asset value at beginning of period | $28.32 | $28.55 | $32.37 | $28.32 | $24.96 | |
| Income (loss) from investment operations: | ||||||
| Net investment income (loss) | 0.88 1 | 0.84 1 | 0.87 1 | 0.88 | 0.66 | |
| Net realized and unrealized gains (losses) | 4.02 | (0.45) | (3.85) | 3.87 | 3.42 | |
| Total from investment operations | 4.90 | 0.39 | (2.98) | 4.75 | 4.08 | |
| Less distributions: | ||||||
| Distributions from net investment income | (0.71) | (0.62) | (0.84) | (0.70) | (0.72) | |
| Net asset value at end of period | $32.51 | $28.32 | $28.55 | $32.37 | $28.32 | |
| Total return | 17.76% | 1.47% | (9.27%) | 16.90% | 16.55% | |
| Ratios/Supplemental Data | ||||||
| Ratios to average net assets: | ||||||
| Total expenses | 0.06% 2 | 0.08% | 0.08% | 0.09% 3 | 0.09% | |
| Net investment income (loss) | 2.95% | 3.06% | 2.86% | 3.44% | 3.03% | |
| Portfolio turnover rate4 | 5% | 5% | 4% | 7% | 9% | |
| Net assets, end of period (x 1,000) | $11,413,011 | $6,168,595 | $4,042,603 | $2,654,016 | $1,464,105 | |
| Security | Number of Shares | % of Net Assets | Value ($) | |
| Common Stock 98.7% of net assets | ||||
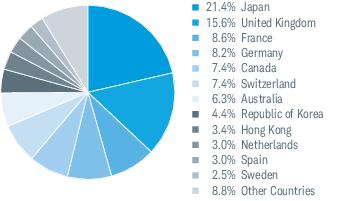
| Australia 6.3% | ||||
| Australia & New Zealand Banking Group Ltd. | 2,012,253 | 0.4 | 46,922,927 | |
| BHP Billiton Ltd. | 2,233,148 | 0.4 | 48,496,023 | |
| Commonwealth Bank of Australia | 1,185,063 | 0.6 | 71,246,875 | |
| National Australia Bank Ltd. | 1,787,881 | 0.4 | 42,825,331 | |
| Westpac Banking Corp. | 2,272,972 | 0.5 | 56,373,778 | |
| Other Securities | 4.0 | 453,048,784 | ||
| 6.3 | 718,913,718 | |||
| Austria 0.2% | ||||
| Other Securities | 0.2 | 26,841,303 | ||
| Belgium 1.0% | ||||
| Anheuser-Busch InBev S.A. | 522,542 | 0.5 | 61,826,792 | |
| Other Securities | 0.5 | 57,221,116 | ||
| 1.0 | 119,047,908 | |||
| Canada 7.4% | ||||
| Canadian National Railway Co. | 521,522 | 0.4 | 42,104,452 | |
| Enbridge, Inc. | 1,131,556 | 0.4 | 45,054,656 | |
| Royal Bank of Canada | 994,149 | 0.6 | 73,489,714 | |
| The Bank of Nova Scotia | 821,766 | 0.4 | 50,921,636 | |
| The Toronto-Dominion Bank | 1,264,392 | 0.6 | 67,629,214 | |
| Other Securities | 5.0 | 559,882,320 | ||
| 7.4 | 839,081,992 | |||
| Denmark 1.6% | ||||
| Novo Nordisk A/S, B Shares | 1,220,900 | 0.5 | 58,157,146 | |
| Other Securities | 1.1 | 122,176,894 | ||
| 1.6 | 180,334,040 | |||
| Finland 0.9% | ||||
| Other Securities | 0.9 | 105,091,043 | ||
| France 8.6% | ||||
| BNP Paribas S.A. | 725,141 | 0.5 | 55,098,074 | |
| LVMH Moet Hennessy Louis Vuitton SE | 168,543 | 0.4 | 44,133,846 | |
| Security | Number of Shares | % of Net Assets | Value ($) | |
| Sanofi | 737,477 | 0.6 | 71,598,347 | |
| Total S.A. | 1,511,838 | 0.7 | 78,089,060 | |
| Other Securities | 6.4 | 729,722,030 | ||
| 8.6 | 978,641,357 | |||
| Germany 7.7% | ||||
| Allianz SE | 312,517 | 0.6 | 66,786,346 | |
| BASF SE | 619,072 | 0.5 | 59,889,490 | |
| Bayer AG | 570,922 | 0.6 | 72,967,654 | |
| Daimler AG | 662,016 | 0.4 | 48,192,325 | |
| Deutsche Telekom AG | 2,224,337 | 0.4 | 40,090,819 | |
| SAP SE | 623,760 | 0.6 | 65,333,898 | |
| Siemens AG | 522,046 | 0.6 | 68,148,492 | |
| Other Securities | 4.0 | 459,101,487 | ||
| 7.7 | 880,510,511 | |||
| Hong Kong 3.4% | ||||
| AIA Group Ltd. | 8,315,068 | 0.6 | 63,799,019 | |
| Other Securities | 2.8 | 320,487,487 | ||
| 3.4 | 384,286,506 | |||
| Ireland 0.2% | ||||
| Other Securities | 0.2 | 24,914,561 | ||
| Israel 0.4% | ||||
| Other Securities | 0.4 | 43,840,710 | ||
| Italy 2.2% | ||||
| Other Securities | 2.2 | 255,121,665 | ||
| Japan 21.3% | ||||
| Mitsubishi UFJ Financial Group, Inc. | 8,980,194 | 0.5 | 55,002,260 | |
| SoftBank Group Corp. | 581,299 | 0.4 | 47,122,930 | |
| Toyota Motor Corp. | 1,808,427 | 0.9 | 101,594,622 | |
| Other Securities | 19.5 | 2,227,803,637 | ||
| 21.3 | 2,431,523,449 | |||
| Netherlands 3.0% | ||||
| ING Groep N.V. | 2,609,509 | 0.4 | 46,226,414 | |
| Unilever N.V. CVA | 1,060,467 | 0.6 | 63,052,041 | |
| Other Securities | 2.0 | 227,748,127 | ||
| 3.0 | 337,026,582 | |||
| Security | Number of Shares | % of Net Assets | Value ($) | |
| New Zealand 0.2% | ||||
| Other Securities | 0.2 | 24,145,948 | ||
| Norway 0.6% | ||||
| Other Securities | 0.6 | 63,295,016 | ||
| Portugal 0.1% | ||||
| Other Securities | 0.1 | 16,239,385 | ||
| Republic of Korea 4.2% | ||||
| Samsung Electronics Co., Ltd. GDR | 133,703 | 1.2 | 137,580,387 | |
| Other Securities | 3.0 | 335,822,329 | ||
| 4.2 | 473,402,716 | |||
| Singapore 1.1% | ||||
| Other Securities | 1.1 | 130,272,622 | ||
| Spain 3.0% | ||||
| Banco Bilbao Vizcaya Argentaria S.A. | 4,491,762 | 0.3 | 39,635,362 | |
| Banco Santander S.A. | 10,738,598 | 0.6 | 69,695,673 | |
| Other Securities | 2.1 | 228,633,191 | ||
| 3.0 | 337,964,226 | |||
| Sweden 2.5% | ||||
| Other Securities | 2.5 | 289,783,432 | ||
| Switzerland 7.3% | ||||
| Nestle S.A. | 2,136,927 | 1.6 | 180,893,872 | |
| Novartis AG | 1,608,313 | 1.2 | 135,392,842 | |
| Roche Holding AG | 479,313 | 1.1 | 121,449,236 | |
| UBS Group AG * | 2,389,502 | 0.3 | 39,286,297 | |
| Other Securities | 3.1 | 360,545,037 | ||
| 7.3 | 837,567,284 | |||
| United Kingdom 15.5% | ||||
| AstraZeneca plc | 861,452 | 0.4 | 50,406,197 | |
| BP plc | 13,034,564 | 0.7 | 74,766,014 | |
| British American Tobacco plc | 1,543,138 | 0.8 | 96,060,125 | |
| Diageo plc | 1,729,861 | 0.5 | 57,776,010 | |
| GlaxoSmithKline plc | 3,301,257 | 0.6 | 65,232,565 | |
| HSBC Holdings plc | 13,772,394 | 1.2 | 133,186,890 | |
| Lloyds Banking Group plc | 48,392,213 | 0.3 | 39,795,469 | |
| Prudential plc | 1,711,378 | 0.4 | 40,035,342 | |
| Reckitt Benckiser Group plc | 434,573 | 0.4 | 41,056,936 | |
| Rio Tinto plc | 823,031 | 0.3 | 39,732,260 | |
| Royal Dutch Shell plc, A Shares | 3,065,691 | 0.7 | 84,022,812 | |
| Royal Dutch Shell plc, B Shares | 2,515,618 | 0.6 | 70,032,609 | |
| Unilever plc | 829,949 | 0.4 | 48,327,585 | |
| Vodafone Group plc | 18,343,122 | 0.5 | 52,330,178 | |
| Other Securities | 7.7 | 879,119,331 | ||
| 15.5 | 1,771,880,323 | |||
| Total Common Stock | ||||
| (Cost $10,043,520,632) | 11,269,726,297 | |||
| Security | Number of Shares | % of Net Assets | Value ($) | |
| Preferred Stock 0.7% of net assets | ||||
| Germany 0.4% | ||||
| Other Securities | 0.4 | 48,343,470 | ||
| Italy 0.0% | ||||
| Other Securities | 0.0 | 1,626,716 | ||
| Republic of Korea 0.2% | ||||
| Other Securities | 0.2 | 22,826,429 | ||
| Spain 0.1% | ||||
| Other Securities | 0.1 | 2,900,683 | ||
| Total Preferred Stock | ||||
| (Cost $67,505,523) | 75,697,298 | |||
| Rights 0.0% of net assets | ||||
| Sweden 0.0% | ||||
| Other Securities | 0.0 | 41,124 | ||
| Total Rights | ||||
| (Cost $—) | 41,124 | |||
| Other Investment Companies 0.3% of net assets | ||||
| United States 0.3% | ||||
| Money Market Fund 0.2% | ||||
| Other Securities | 0.2 | 21,469,330 | ||
| Securities Lending Collateral 0.1% | ||||
| Other Securities | 0.1 | 12,782,856 | ||
| Total Other Investment Companies | ||||
| (Cost $34,252,186) | 34,252,186 | |||
| Number of Contracts | Notional Amount ($) | Current Value/ Unrealized Appreciation ($) | ||
| Futures Contracts | ||||
| Long | ||||
| MSCI EAFE Index, e-mini, expires 09/15/17 | 735 | 71,103,900 | 560,367 | |
| * | Non-income producing security. |
| (a) | All or a portion of this security is on loan. Securities on loan were valued at $12,149,342. |
| (b) | The rate shown is the 7-day yield. |
| (c) | Fair-valued by management in accordance with procedures approved by the Board of Trustees. |
| ADR — | American Depositary Receipt |
| CDI — | CHESS Depositary Interest |
| CVA — | Dutch Certificate |
| GDR — | Global Depositary Receipt |
| REIT — | Real Estate Investment Trust |
| RSP — | Risparmio (Convertible Savings Shares) |
| Description | Quoted Prices in Active Markets for Identical Assets (Level 1) | Other Significant Observable Inputs (Level 2) | Significant Unobservable Inputs (Level 3) | Total | |
| Assets | |||||
| Common Stock1 | $8,348,560,747 | $— | $— | $8,348,560,747 | |
| Japan | 2,420,956,906 | — | 10,566,543 | 2,431,523,449 | |
| Portugal | 16,239,385 | — | — * | 16,239,385 | |
| Republic of Korea | 473,402,716 | — | — * | 473,402,716 | |
| Preferred Stock1 | 75,697,298 | — | — | 75,697,298 | |
| Rights 1 | 41,124 | — | — | 41,124 | |
| Other Investment Companies1 | 34,252,186 | — | — | 34,252,186 | |
| Futures Contracts2 | 560,367 | — | — | 560,367 | |
| Total | $11,369,710,729 | $— | $10,566,543 | $11,380,277,272 |
| * | Level 3 amount shown includes securities determined to have no value at August 31, 2017. |
| 1 | As categorized in the complete schedule of Portfolio Holdings. |
| 2 | Futures contracts are valued at unrealized appreciation or depreciation. |
| Assets | ||
| Investments in unaffiliated issuers, at value (cost $10,132,495,485) including securities on loan of $12,149,342 | $11,366,934,049 | |
| Collateral invested for securities on loan, at value (cost $12,782,856) | 12,782,856 | |
| Deposit with broker for futures contracts | 2,817,500 | |
| Foreign currency, at value (cost $3,400,267) | 3,404,130 | |
| Receivables: | ||
| Fund shares sold | 64,621,622 | |
| Dividends | 26,828,646 | |
| Foreign tax reclaims | 10,249,702 | |
| Variation margin on futures contracts | 506,608 | |
| Income from securities on loan | + | 61,306 |
| Total assets | 11,488,206,419 | |
| Liabilities | ||
| Collateral held for securities on loan | 12,782,856 | |
| Payables: | ||
| Investments bought | 61,844,344 | |
| Investment adviser fees | + | 568,493 |
| Total liabilities | 75,195,693 | |
| Net Assets | ||
| Total assets | 11,488,206,419 | |
| Total liabilities | – | 75,195,693 |
| Net assets | $11,413,010,726 | |
| Net Assets by Source | ||
| Capital received from investors | 10,246,883,983 | |
| Net investment income not yet distributed | 186,589,157 | |
| Net realized capital losses | (255,906,992) | |
| Net unrealized capital appreciation | 1,235,444,578 | |
| Net Asset Value (NAV) | ||||
| Net Assets | ÷ | Shares Outstanding | = | NAV |
| $11,413,010,726 | 351,100,000 | $32.51 | ||
| Investment Income | ||
| Dividends (net of foreign withholding tax of $22,883,951) | $246,896,953 | |
| Securities on loan, net | + | 1,645,011 |
| Total investment income | 248,541,964 | |
| Expenses | ||
| Investment adviser fees | 5,342,552 | |
| Professional fees | + | 5,966* |
| Total expenses | 5,348,518 | |
| Expense reduction by CSIM | – | 5,966* |
| Net expenses | – | 5,342,552 |
| Net investment income | 243,199,412 | |
| Realized and Unrealized Gains (Losses) | ||
| Net realized losses on investments | (70,843,382) | |
| Net realized gains on futures contracts | 4,833,129 | |
| Net realized losses on foreign currency transactions | + | (466,080) |
| Net realized losses | (66,476,333) | |
| Net change in unrealized appreciation (depreciation) on investments | 1,246,439,559 | |
| Net change in unrealized appreciation (depreciation) on futures contracts | 323,846 | |
| Net change in unrealized appreciation (depreciation) on foreign currency translations | + | 667,546 |
| Net change in unrealized appreciation (depreciation) | + | 1,247,430,951 |
| Net realized and unrealized gains | 1,180,954,618 | |
| Increase in net assets resulting from operations | $1,424,154,030 | |
| * | Includes professional fees associated with the filing of tax claims in the European Union deemed to be non-routine expenses of the fund. See financial notes 2 (d) and 4 for additional information. |
| Operations | ||||
| 9/1/16-8/31/17 | 9/1/15-8/31/16 | |||
| Net investment income | $243,199,412 | $151,933,365 | ||
| Net realized losses | (66,476,333) | (111,608,147) | ||
| Net change in unrealized appreciation (depreciation) | + | 1,247,430,951 | 100,225,752 | |
| Increase in net assets resulting from operations | 1,424,154,030 | 140,550,970 | ||
| Distributions to Shareholders | ||||
| Distributions from net investment income | ($173,425,920) | ($105,649,560) | ||
| Transactions in Fund Shares | ||||||||
| 9/1/16-8/31/17 | 9/1/15-8/31/16 | |||||||
| SHARES | VALUE | SHARES | VALUE | |||||
| Shares sold | 133,300,000 | $3,993,688,008 | 76,200,000 | $2,091,090,613 | ||||
| Shares redeemed | + | — | — | — | — | |||
| Net transactions in fund shares | 133,300,000 | $3,993,688,008 | 76,200,000 | $2,091,090,613 | ||||
| Shares Outstanding and Net Assets | ||||||||
| 9/1/16-8/31/17 | 9/1/15-8/31/16 | |||||||
| SHARES | NET ASSETS | SHARES | NET ASSETS | |||||
| Beginning of period | 217,800,000 | $6,168,594,608 | 141,600,000 | $4,042,602,585 | ||||
| Total increase | + | 133,300,000 | 5,244,416,118 | 76,200,000 | 2,125,992,023 | |||
| End of period | 351,100,000 | $11,413,010,726 | 217,800,000 | $6,168,594,608 | ||||
| Net investment income not yet distributed | $186,589,157 | $117,054,564 | ||||||
| 9/1/16– 8/31/17 | 9/1/15– 8/31/16 | 9/1/14– 8/31/15 | 9/1/13– 8/31/14 | 9/1/12– 8/31/13 | ||
| Per-Share Data | ||||||
| Net asset value at beginning of period | $29.96 | $29.46 | $33.32 | $28.61 | $24.94 | |
| Income (loss) from investment operations: | ||||||
| Net investment income (loss) | 0.73 1 | 0.67 1 | 0.73 1 | 0.71 | 0.76 | |
| Net realized and unrealized gains (losses) | 4.70 | 0.50 | (3.84) | 4.90 | 3.72 | |
| Total from investment operations | 5.43 | 1.17 | (3.11) | 5.61 | 4.48 | |
| Less distributions: | ||||||
| Distributions from net investment income | (0.59) | (0.67) | (0.75) | (0.90) | (0.81) | |
| Net asset value at end of period | $34.80 | $29.96 | $29.46 | $33.32 | $28.61 | |
| Total return | 18.52% | 4.12% | (9.29%) | 19.84% | 18.23% | |
| Ratios/Supplemental Data | ||||||
| Ratios to average net assets: | ||||||
| Total expenses | 0.14% 2 | 0.17% 3 | 0.18% 4 | 0.19% | 0.21% 5 | |
| Net investment income (loss) | 2.31% | 2.34% | 2.40% | 2.21% | 2.86% | |
| Portfolio turnover rate6 | 12% | 23% | 23% | 16% | 20% | |
| Net assets, end of period (x 1,000) | $1,538,038 | $787,951 | $609,773 | $403,229 | $280,422 | |
| Security | Number of Shares | % of Net Assets | Value ($) | |
| Common Stock 99.3% of net assets | ||||
| Australia 5.3% | ||||
| Other Securities | 5.3 | 80,831,270 | ||
| Austria 1.1% | ||||
| Other Securities | 1.1 | 17,765,998 | ||
| Belgium 1.4% | ||||
| Other Securities | 1.4 | 22,158,198 | ||
| Canada 16.0% | ||||
| Algonquin Power & Utilities Corp. | 282,970 | 0.2 | 3,058,220 | |
| Bombardier, Inc., B Shares * | 1,502,169 | 0.2 | 2,995,352 | |
| CAE, Inc. | 214,511 | 0.2 | 3,526,279 | |
| Canadian Apartment Properties REIT | 106,612 | 0.2 | 2,914,132 | |
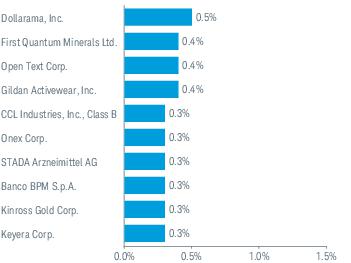
| CCL Industries, Inc., Class B | 110,962 | 0.3 | 5,127,042 | |
| Dollarama, Inc. | 78,936 | 0.5 | 7,748,477 | |
| Finning International, Inc. | 130,184 | 0.2 | 2,966,586 | |
| First Quantum Minerals Ltd. | 537,528 | 0.4 | 6,452,480 | |
| Gildan Activewear, Inc. | 178,073 | 0.4 | 5,554,883 | |
| H&R Real Estate Investment Trust | 226,470 | 0.3 | 3,858,344 | |
| Industrial Alliance Insurance & Financial Services, Inc. | 82,385 | 0.2 | 3,521,445 | |
| Keyera Corp. | 143,862 | 0.3 | 4,158,372 | |
| Kinross Gold Corp. * | 959,653 | 0.3 | 4,355,275 | |
| Lundin Mining Corp. | 491,505 | 0.2 | 3,700,744 | |
| Methanex Corp. | 70,286 | 0.2 | 3,577,228 | |
| Onex Corp. | 63,335 | 0.3 | 5,044,068 | |
| Open Text Corp. | 200,523 | 0.4 | 6,426,332 | |
| PrairieSky Royalty Ltd. | 166,731 | 0.3 | 3,901,805 | |
| Seven Generations Energy Ltd., A Shares * | 232,214 | 0.2 | 3,520,948 | |
| Veresen, Inc. | 244,977 | 0.2 | 3,437,005 | |
| West Fraser Timber Co., Ltd. | 57,940 | 0.2 | 2,994,164 | |
| WSP Global, Inc. | 77,582 | 0.2 | 3,203,526 | |
| Other Securities | 10.1 | 154,676,713 | ||
| 16.0 | 246,719,420 | |||
| Denmark 1.8% | ||||
| GN Store Nord A/S | 106,684 | 0.2 | 3,533,424 | |
| Other Securities | 1.6 | 24,903,480 | ||
| 1.8 | 28,436,904 | |||
| Security | Number of Shares | % of Net Assets | Value ($) | |
| Finland 1.5% | ||||
| Other Securities | 1.5 | 22,547,966 | ||
| France 3.6% | ||||
| Euronext N.V. | 56,218 | 0.2 | 3,226,583 | |
| Rubis SCA | 58,438 | 0.2 | 3,794,134 | |
| UBISOFT Entertainment S.A. * | 59,444 | 0.3 | 3,954,858 | |
| Other Securities | 2.9 | 44,574,908 | ||
| 3.6 | 55,550,483 | |||
| Germany 5.1% | ||||
| Freenet AG | 100,898 | 0.2 | 3,366,010 | |
| Rheinmetall AG | 33,745 | 0.2 | 3,444,653 | |
| STADA Arzneimittel AG | 49,124 | 0.3 | 4,589,347 | |
| Other Securities | 4.4 | 67,678,184 | ||
| 5.1 | 79,078,194 | |||
| Hong Kong 2.0% | ||||
| Other Securities | 2.0 | 30,305,398 | ||
| Ireland 0.3% | ||||
| Other Securities | 0.3 | 4,462,657 | ||
| Israel 0.5% | ||||
| Other Securities | 0.5 | 7,280,653 | ||
| Italy 3.5% | ||||
| Banco BPM S.p.A. * | 1,173,961 | 0.3 | 4,449,561 | |
| Other Securities | 3.2 | 48,867,443 | ||
| 3.5 | 53,317,004 | |||
| Japan 19.4% | ||||
| Other Securities | 19.4 | 297,987,344 | ||
| Netherlands 2.5% | ||||
| Aalberts Industries N.V. | 79,717 | 0.2 | 3,542,234 | |
| Other Securities | 2.3 | 34,671,184 | ||
| 2.5 | 38,213,418 | |||
| New Zealand 0.9% | ||||
| Other Securities | 0.9 | 13,901,515 | ||
| Security | Number of Shares | % of Net Assets | Value ($) | |
| Norway 1.7% | ||||
| Storebrand A.S.A. | 368,282 | 0.2 | 3,039,095 | |
| Subsea 7 S.A. | 207,071 | 0.2 | 2,973,043 | |
| Other Securities | 1.3 | 20,939,290 | ||
| 1.7 | 26,951,428 | |||
| Portugal 0.5% | ||||
| Other Securities | 0.5 | 7,029,276 | ||
| Republic of Korea 4.9% | ||||
| Other Securities | 4.9 | 74,701,179 | ||
| Singapore 1.5% | ||||
| Other Securities | 1.5 | 23,612,408 | ||
| Spain 1.9% | ||||
| Other Securities | 1.9 | 29,276,378 | ||
| Sweden 4.9% | ||||
| Castellum AB | 219,117 | 0.2 | 3,425,532 | |
| Elekta AB, B Shares | 279,835 | 0.2 | 2,892,474 | |
| Other Securities | 4.5 | 68,889,920 | ||
| 4.9 | 75,207,926 | |||
| Switzerland 4.0% | ||||
| ams AG * | 45,849 | 0.2 | 3,294,353 | |
| Georg Fischer AG | 3,304 | 0.2 | 3,799,084 | |
| Logitech International S.A. | 114,222 | 0.3 | 4,053,039 | |
| Other Securities | 3.3 | 50,466,844 | ||
| 4.0 | 61,613,320 | |||
| United Kingdom 15.0% | ||||
| B&M European Value Retail S.A. | 585,228 | 0.2 | 2,808,252 | |
| BBA Aviation plc | 814,789 | 0.2 | 3,168,588 | |
| Beazley plc | 432,504 | 0.2 | 2,847,819 | |
| BTG plc * | 314,081 | 0.2 | 2,818,799 | |
| Hiscox Ltd. | 224,753 | 0.2 | 3,701,159 | |
| Indivior plc * | 561,188 | 0.2 | 3,012,513 | |
| Paysafe Group plc * | 396,206 | 0.2 | 2,991,714 | |
| Phoenix Group Holdings | 305,237 | 0.2 | 3,077,676 | |
| Spectris plc | 96,267 | 0.2 | 2,870,398 | |
| Spirax-Sarco Engineering plc | 57,094 | 0.3 | 4,134,549 | |
| Other Securities | 12.9 | 198,876,616 | ||
| 15.0 | 230,308,083 | |||
| Total Common Stock | ||||
| (Cost $1,311,604,279) | 1,527,256,420 | |||
| Preferred Stock 0.3% of net assets | ||||
| Germany 0.3% | ||||
| Other Securities | 0.3 | 4,522,246 | ||
| Security | Number of Shares | % of Net Assets | Value ($) | |
| Sweden 0.0% | ||||
| Other Securities | 0.0 | 638,079 | ||
| Total Preferred Stock | ||||
| (Cost $4,203,988) | 5,160,325 | |||
| Rights 0.0% of net assets | ||||
| Australia 0.0% | ||||
| Other Securities | 0.0 | 488 | ||
| Total Rights | ||||
| (Cost $—) | 488 | |||
| Other Investment Companies 4.0% of net assets | ||||
| United States 4.0% | ||||
| Money Market Fund 0.3% | ||||
| State Street Institutional U.S. Government Money Market Fund, Premier Class 0.93% (b) | 0.3 | 3,601,919 | ||
| Securities Lending Collateral 3.7% | ||||
| Wells Fargo Government Money Market Fund, Select Class 0.92% (b) | 3.7 | 57,238,237 | ||
| Total Other Investment Companies | ||||
| (Cost $60,840,156) | 60,840,156 | |||
| Number of Contracts | Notional Amount ($) | Current Value/ Unrealized Appreciation ($) | ||
| Futures Contracts | ||||
| Long | ||||
| MSCI EAFE Index, e-mini, expires 09/15/17 | 47 | 4,546,780 | 7,297 | |
| * | Non-income producing security. |
| (a) | All or a portion of this security is on loan. Securities on loan were valued at $54,447,264. |
| (b) | The rate shown is the 7-day yield. |
| (c) | Fair-valued by management in accordance with procedures approved by the Board of Trustees. |
| CVA — | Dutch Certificate |
| REIT — | Real Estate Investment Trust |
| Description | Quoted Prices in Active Markets for Identical Assets (Level 1) | Other Significant Observable Inputs (Level 2) | Significant Unobservable Inputs (Level 3) | Total | |
| Assets | |||||
| Common Stock1 | $1,235,212,783 | $— | $— | $1,235,212,783 | |
| Australia | 80,791,314 | — | 39,956 * | 80,831,270 | |
| Hong Kong | 30,305,398 | — | — * | 30,305,398 | |
| Italy | 53,186,031 | — | 130,973 | 53,317,004 | |
| Republic of Korea | 74,319,301 | — | 381,878 | 74,701,179 | |
| Singapore | 23,427,681 | — | 184,727 * | 23,612,408 | |
| Spain | 29,276,378 | — | — * | 29,276,378 | |
| Preferred Stock1 | 5,160,325 | — | — | 5,160,325 | |
| Rights 1 | — | — | 488 | 488 | |
| Other Investment Companies1 | 60,840,156 | — | — | 60,840,156 | |
| Futures Contracts2 | 7,297 | — | — | 7,297 | |
| Total | $1,592,526,664 | $— | $738,022 | $1,593,264,686 |
| * | Level 3 amount shown includes securities determined to have no value at August 31, 2017. |
| 1 | As categorized in the complete schedule of Portfolio Holdings. |
| 2 | Futures contracts are valued at unrealized appreciation or depreciation. |
| Assets | ||
| Investments in unaffiliated issuers, at value (cost $1,319,410,186) including securities on loan of $54,447,264 | $1,536,019,152 | |
| Collateral invested for securities on loan, at value (cost $57,238,237) | 57,238,237 | |
| Deposit with broker for futures contracts | 336,000 | |
| Foreign currency, at value (cost $1,272,098) | 1,271,896 | |
| Receivables: | ||
| Investments sold | 373,267 | |
| Dividends | 1,704,227 | |
| Foreign tax reclaims | 619,005 | |
| Income from securities on loan | 159,163 | |
| Variation margin on futures contracts | + | 34,545 |
| Total assets | 1,597,755,492 | |
| Liabilities | ||
| Collateral held for securities on loan | 57,238,237 | |
| Payables: | ||
| Investments bought | 2,300,338 | |
| Investment adviser fees | 153,401 | |
| Foreign capital gains tax | + | 25,610 |
| Total liabilities | 59,717,586 | |
| Net Assets | ||
| Total assets | 1,597,755,492 | |
| Total liabilities | – | 59,717,586 |
| Net assets | $1,538,037,906 | |
| Net Assets by Source | ||
| Capital received from investors | 1,372,672,101 | |
| Net investment income not yet distributed | 14,960,802 | |
| Net realized capital losses | (66,213,914) | |
| Net unrealized capital appreciation | 216,618,917 | |
| Net Asset Value (NAV) | ||||
| Net Assets | ÷ | Shares Outstanding | = | NAV |
| $1,538,037,906 | 44,200,000 | $34.80 | ||
| Investment Income | ||
| Dividends (net of foreign withholding tax of $2,741,208) | $25,585,921 | |
| Securities on loan, net | + | 1,274,453 |
| Total investment income | 26,860,374 | |
| Expenses | ||
| Investment adviser fees | 1,492,640 | |
| Professional fees | + | 221* |
| Total expenses | 1,492,861 | |
| Expense reduction by CSIM | – | 221* |
| Net expenses | – | 1,492,640 |
| Net investment income | 25,367,734 | |
| Realized and Unrealized Gains (Losses) | ||
| Net realized losses on investments (net of foreign capital gains tax of $470) | (13,292,385) | |
| Net realized gains on in-kind redemptions | 6,426,452 | |
| Net realized gains on futures contracts | 596,134 | |
| Net realized losses on foreign currency transactions | + | (95,413) |
| Net realized losses | (6,365,212) | |
| Net change in unrealized appreciation (depreciation) on investments (net of change in foreign capital gains tax of $25,610) | 185,982,982 | |
| Net change in unrealized appreciation (depreciation) on futures contracts | 7,297 | |
| Net change in unrealized appreciation (depreciation) on foreign currency translations | + | 45,323 |
| Net change in unrealized appreciation (depreciation) | + | 186,035,602 |
| Net realized and unrealized gains | 179,670,390 | |
| Increase in net assets resulting from operations | $205,038,124 | |
| * | Includes professional fees associated with the filing of tax claims in the European Union deemed to be non-routine expenses of the fund. See financial notes 2 (d) and 4 for additional information. |
| Operations | ||||
| 9/1/16-8/31/17 | 9/1/15-8/31/16 | |||
| Net investment income | $25,367,734 | $15,854,525 | ||
| Net realized losses | (6,365,212) | (5,889,467) | ||
| Net change in unrealized appreciation (depreciation) | + | 186,035,602 | 19,199,793 | |
| Increase in net assets resulting from operations | 205,038,124 | 29,164,851 | ||
| Distributions to Shareholders | ||||
| Distributions from net investment income | ($18,024,160) | ($15,625,200) | ||
| Transactions in Fund Shares | ||||||||
| 9/1/16-8/31/17 | 9/1/15-8/31/16 | |||||||
| SHARES | VALUE | SHARES | VALUE | |||||
| Shares sold | 18,700,000 | $587,036,909 | 6,300,000 | $184,797,227 | ||||
| Shares redeemed | + | (800,000) | (23,964,433) | (700,000) | (20,158,435) | |||
| Net transactions in fund shares | 17,900,000 | $563,072,476 | 5,600,000 | $164,638,792 | ||||
| Shares Outstanding and Net Assets | ||||||||
| 9/1/16-8/31/17 | 9/1/15-8/31/16 | |||||||
| SHARES | NET ASSETS | SHARES | NET ASSETS | |||||
| Beginning of period | 26,300,000 | $787,951,466 | 20,700,000 | $609,773,023 | ||||
| Total increase | + | 17,900,000 | 750,086,440 | 5,600,000 | 178,178,443 | |||
| End of period | 44,200,000 | $1,538,037,906 | 26,300,000 | $787,951,466 | ||||
| Net investment income not yet distributed | $14,960,802 | $6,135,043 | ||||||
| 9/1/16– 8/31/17 | 9/1/15– 8/31/16 | 9/1/14– 8/31/15 | 9/1/13– 8/31/14 | 9/1/12– 8/31/13 | ||
| Per-Share Data | ||||||
| Net asset value at beginning of period | $22.56 | $20.83 | $27.34 | $22.94 | $23.65 | |
| Income (loss) from investment operations: | ||||||
| Net investment income (loss) | 0.71 1 | 0.58 1 | 0.66 1 | 0.63 | 0.50 | |
| Net realized and unrealized gains (losses) | 4.21 | 1.64 | (6.49) | 4.40 | (0.65) | |
| Total from investment operations | 4.92 | 2.22 | (5.83) | 5.03 | (0.15) | |
| Less distributions: | ||||||
| Distributions from net investment income | (0.49) | (0.49) | (0.68) | (0.63) | (0.56) | |
| Net asset value at end of period | $26.99 | $22.56 | $20.83 | $27.34 | $22.94 | |
| Total return | 22.40% | 11.02% | (21.62%) | 22.31% | (0.89%) | |
| Ratios/Supplemental Data | ||||||
| Ratios to average net assets: | ||||||
| Total expenses | 0.13% 2 | 0.14% | 0.14% | 0.14% | 0.15% | |
| Net investment income (loss) | 2.96% | 2.85% | 2.66% | 2.89% | 2.63% | |
| Portfolio turnover rate3 | 7% | 10% | 8% | 9% | 15% | |
| Net assets, end of period (x 1,000) | $4,248,821 | $2,009,874 | $1,276,740 | $1,273,840 | $811,915 | |
| Security | Number of Shares | % of Net Assets | Value ($) | |
| Common Stock 97.2% of net assets | ||||
| Brazil 6.9% | ||||
| Ambev S.A. ADR | 4,531,291 | 0.7 | 28,365,882 | |
| B3 SA - Brasil Bolsa Balcao | 1,955,720 | 0.3 | 13,748,995 | |
| Itau Unibanco Holding S.A. ADR | 3,240,381 | 1.0 | 41,379,665 | |
| Vale S.A. | 2,504,306 | 0.7 | 27,920,690 | |
| Other Securities | 4.2 | 179,758,882 | ||
| 6.9 | 291,174,114 | |||
| Chile 1.5% | ||||
| Other Securities | 1.5 | 63,902,178 | ||
| China 26.5% | ||||
| Bank of China Ltd., H Shares | 77,884,305 | 1.0 | 40,999,858 | |
| China Construction Bank Corp., H Shares | 91,463,340 | 1.9 | 80,168,980 | |
| China Life Insurance Co., Ltd., H Shares | 7,630,941 | 0.6 | 24,472,988 | |
| China Merchants Bank Co., Ltd., H Shares | 4,061,484 | 0.4 | 15,308,828 | |
| China Mobile Ltd. | 5,389,798 | 1.3 | 57,159,151 | |
| China Overseas Land & Investment Ltd. | 4,010,990 | 0.3 | 14,016,646 | |
| China Petroleum & Chemical Corp., H Shares | 26,339,524 | 0.5 | 20,159,044 | |
| CNOOC Ltd. | 16,443,998 | 0.5 | 19,666,109 | |
| Industrial & Commercial Bank of China Ltd., H Shares | 79,758,402 | 1.4 | 59,718,549 | |
| PetroChina Co., Ltd., H Shares | 22,465,789 | 0.3 | 14,352,477 | |
| Ping An Insurance Group Co. of China Ltd., H Shares | 5,166,250 | 1.0 | 41,025,297 | |
| Tencent Holdings Ltd. | 5,472,773 | 5.4 | 230,058,624 | |
| Other Securities | 11.9 | 509,851,695 | ||
| 26.5 | 1,126,958,246 | |||
| Colombia 0.5% | ||||
| Other Securities | 0.5 | 19,529,695 | ||
| Czech Republic 0.2% | ||||
| Other Securities | 0.2 | 8,976,053 | ||
| Egypt 0.1% | ||||
| Other Securities | 0.1 | 5,864,055 | ||
| Security | Number of Shares | % of Net Assets | Value ($) | |
| Greece 0.5% | ||||
| Other Securities | 0.5 | 20,886,747 | ||
| Hungary 0.5% | ||||
| Other Securities | 0.5 | 20,386,991 | ||
| India 12.1% | ||||
| Axis Bank Ltd. | 1,751,365 | 0.3 | 13,707,913 | |
| Hindustan Unilever Ltd. | 738,964 | 0.3 | 14,099,863 | |
| Housing Development Finance Corp., Ltd. | 1,620,925 | 1.1 | 45,055,382 | |
| Infosys Ltd. | 1,967,954 | 0.7 | 28,166,512 | |
| Maruti Suzuki India Ltd. | 129,644 | 0.4 | 15,616,397 | |
| Reliance Industries Ltd. | 1,627,646 | 1.0 | 40,598,057 | |
| Tata Consultancy Services Ltd. | 481,982 | 0.4 | 18,821,623 | |
| Other Securities | 7.9 | 337,649,060 | ||
| 12.1 | 513,714,807 | |||
| Indonesia 2.6% | ||||
| PT Bank Central Asia Tbk | 9,994,139 | 0.3 | 14,194,943 | |
| PT Telekomunikasi Indonesia (Persero) Tbk | 48,972,947 | 0.4 | 17,215,044 | |
| Other Securities | 1.9 | 78,076,251 | ||
| 2.6 | 109,486,238 | |||
| Malaysia 3.3% | ||||
| Public Bank Berhad | 3,232,854 | 0.4 | 15,594,612 | |
| Tenaga Nasional Berhad | 4,134,374 | 0.3 | 13,824,812 | |
| Other Securities | 2.6 | 111,557,689 | ||
| 3.3 | 140,977,113 | |||
| Mexico 4.6% | ||||
| America Movil S.A.B. de C.V., Series L | 30,367,295 | 0.7 | 28,317,989 | |
| Cemex S.A.B. de C.V., Series CPO * | 16,353,621 | 0.4 | 15,332,595 | |
| Fomento Economico Mexicano S.A.B. de C.V. | 2,245,036 | 0.5 | 22,538,850 | |
| Grupo Financiero Banorte S.A.B. de C.V., O Shares | 2,442,209 | 0.4 | 16,706,407 | |
| Wal-Mart de Mexico S.A.B. de C.V. | 5,632,047 | 0.3 | 13,742,982 | |
| Other Securities | 2.3 | 100,840,898 | ||
| 4.6 | 197,479,721 | |||
| Security | Number of Shares | % of Net Assets | Value ($) | |
| Peru 0.4% | ||||
| Credicorp Ltd. | 72,075 | 0.3 | 14,619,693 | |
| Other Securities | 0.1 | 2,599,524 | ||
| 0.4 | 17,219,217 | |||
| Philippines 1.6% | ||||
| Other Securities | 1.6 | 69,499,419 | ||
| Poland 1.7% | ||||
| Other Securities | 1.7 | 71,583,554 | ||
| Qatar 0.8% | ||||
| Other Securities | 0.8 | 34,042,858 | ||
| Russia 4.0% | ||||
| Gazprom PAO ADR | 5,617,063 | 0.5 | 22,412,081 | |
| LUKOIL PJSC | 482,298 | 0.6 | 24,420,099 | |
| Sberbank of Russia PJSC | 10,716,650 | 0.8 | 33,863,317 | |
| Other Securities | 2.1 | 90,913,778 | ||
| 4.0 | 171,609,275 | |||
| South Africa 8.8% | ||||
| FirstRand Ltd. | 3,394,687 | 0.3 | 14,503,325 | |
| MTN Group Ltd. | 1,833,484 | 0.4 | 18,229,747 | |
| Naspers Ltd., N Shares | 435,558 | 2.3 | 98,554,569 | |
| Sasol Ltd. | 567,253 | 0.4 | 17,102,913 | |
| Standard Bank Group Ltd. | 1,267,159 | 0.4 | 16,323,172 | |
| Other Securities | 5.0 | 210,870,301 | ||
| 8.8 | 375,584,027 | |||
| Taiwan 14.4% | ||||
| Formosa Plastics Corp. | 5,053,560 | 0.4 | 15,723,824 | |
| Hon Hai Precision Industry Co., Ltd. | 15,182,365 | 1.4 | 59,111,564 | |
| Largan Precision Co., Ltd. | 101,756 | 0.5 | 19,657,294 | |
| Nan Ya Plastics Corp. | 5,758,816 | 0.3 | 14,540,633 | |
| Taiwan Semiconductor Manufacturing Co., Ltd. ADR | 4,810,810 | 4.2 | 177,855,646 | |
| Other Securities | 7.6 | 324,640,778 | ||
| 14.4 | 611,529,739 | |||
| Thailand 3.6% | ||||
| PTT PCL NVDR | 1,463,900 | 0.4 | 17,590,607 | |
| Other Securities | 3.2 | 133,455,574 | ||
| 3.6 | 151,046,181 | |||
| Turkey 1.5% | ||||
| Other Securities | 1.5 | 62,612,272 | ||
| United Arab Emirates 1.1% | ||||
| Other Securities | 1.1 | 46,824,188 | ||
| Total Common Stock | ||||
| (Cost $3,501,749,038) | 4,130,886,688 | |||
| Security | Number of Shares | % of Net Assets | Value ($) | |
| Preferred Stock 2.5% of net assets | ||||
| Brazil 2.2% | ||||
| Banco Bradesco S.A. | 3,128,477 | 0.8 | 33,388,186 | |
| Petroleo Brasileiro S.A. * | 3,987,604 | 0.4 | 17,299,113 | |
| Other Securities | 1.0 | 41,809,215 | ||
| 2.2 | 92,496,514 | |||
| Colombia 0.1% | ||||
| Other Securities | 0.1 | 3,589,788 | ||
| Russia 0.2% | ||||
| Other Securities | 0.2 | 8,336,684 | ||
| Total Preferred Stock | ||||
| (Cost $94,099,253) | 104,422,986 | |||
| Rights 0.0% of net assets | ||||
| China 0.0% | ||||
| Other Securities | 0.0 | — | ||
| Total Rights | ||||
| (Cost $—) | — | |||
| Other Investment Companies 0.4% of net assets | ||||
| United States 0.4% | ||||
| Money Market Fund 0.1% | ||||
| Other Securities | 0.1 | 3,356,818 | ||
| Securities Lending Collateral 0.3% | ||||
| Wells Fargo Government Money Market Fund, Select Class 0.92% (c) | 0.3 | 14,093,807 | ||
| Total Other Investment Companies | ||||
| (Cost $17,450,625) | 17,450,625 | |||
| Number of Contracts | Notional Amount ($) | Current Value/ Unrealized Appreciation ($) | ||||
| Futures Contracts | ||||||
| Long | ||||||
| MSCI Emerging Markets Index, e-mini, expires 09/15/17 | 255 | 13,849,050 | 225,683 | |||
| * | Non-income producing security. |
| (a) | All or a portion of this security is on loan. Securities on loan were valued at $13,332,620. |
| (b) | Fair-valued by management in accordance with procedures approved by the Board of Trustees. |
| (c) | The rate shown is the 7-day yield. |
| ADR — | American Depositary Receipt |
| GDR — | Global Depositary Receipt |
| NVDR — | Non-Voting Depositary Receipt |
| REIT — | Real Estate Investment Trust |
| Description | Quoted Prices in Active Markets for Identical Assets (Level 1) | Other Significant Observable Inputs (Level 2) | Significant Unobservable Inputs (Level 3) | Total | |
| Assets | |||||
| Common Stock1 | $3,003,928,442 | $— | $— | $3,003,928,442 | |
| China | 1,126,564,489 | — | 393,757 * | 1,126,958,246 | |
| Preferred Stock1 | 104,422,986 | — | — | 104,422,986 | |
| Rights 1 | |||||
| China | — | — | — * | — | |
| Other Investment Companies1 | 17,450,625 | — | — | 17,450,625 | |
| Futures Contracts2 | 225,683 | — | — | 225,683 | |
| Total | $4,252,592,225 | $— | $393,757 | $4,252,985,982 |
| * | Level 3 amount shown includes securities determined to have no value at August 31, 2017. |
| 1 | As categorized in the complete schedule of Portfolio Holdings. |
| 2 | Futures contracts are valued at unrealized appreciation or depreciation. |
| Assets | ||
| Investments in unaffiliated issuers, at value (cost $3,599,205,109) including securities on loan of $13,332,620 | $4,238,666,492 | |
| Collateral invested for securities on loan, at value (cost $14,093,807) | 14,093,807 | |
| Deposit with broker for futures contracts | 1,730,000 | |
| Foreign currency, at value (cost $4,702,164) | 4,708,480 | |
| Receivables: | ||
| Dividends | 9,517,587 | |
| Income from securities on loan | 33,730 | |
| Foreign tax reclaims | 27,142 | |
| Variation margin on futures contracts | + | 2,341 |
| Total assets | 4,268,779,579 | |
| Liabilities | ||
| Collateral held for securities on loan | 14,093,807 | |
| Payables: | ||
| Investment adviser fees | 422,235 | |
| Foreign capital gains tax | + | 5,442,695 |
| Total liabilities | 19,958,737 | |
| Net Assets | ||
| Total assets | 4,268,779,579 | |
| Total liabilities | – | 19,958,737 |
| Net assets | $4,248,820,842 | |
| Net Assets by Source | ||
| Capital received from investors | 3,791,850,585 | |
| Net investment income not yet distributed | 65,399,874 | |
| Net realized capital losses | (242,700,393) | |
| Net unrealized capital appreciation | 634,270,776 | |
| Net Asset Value (NAV) | ||||
| Net Assets | ÷ | Shares Outstanding | = | NAV |
| $4,248,820,842 | 157,400,000 | $26.99 | ||
| Investment Income | ||
| Dividends (net of foreign withholding tax of $11,126,562) | $87,750,441 | |
| Securities on loan, net | + | 223,743 |
| Total investment income | 87,974,184 | |
| Expenses | ||
| Investment adviser fees | 3,726,750 | |
| Professional fees | + | 6,177* |
| Total expenses | 3,732,927 | |
| Expense reduction by CSIM | – | 6,177* |
| Net expenses | – | 3,726,750 |
| Net investment income | 84,247,434 | |
| Realized and Unrealized Gains (Losses) | ||
| Net realized losses on investments | (55,316,496) | |
| Net realized gains on futures contracts | 2,411,863 | |
| Net realized losses on foreign currency transactions | + | (945,362) |
| Net realized losses | (53,849,995) | |
| Net change in unrealized appreciation (depreciation) on investments (net of change in foreign capital gains tax of $3,519,203) | 621,915,490 | |
| Net change in unrealized appreciation (depreciation) on futures contracts | 308,427 | |
| Net change in unrealized appreciation (depreciation) on foreign currency translations | + | 9,439 |
| Net change in unrealized appreciation (depreciation) | + | 622,233,356 |
| Net realized and unrealized gains | 568,383,361 | |
| Increase in net assets resulting from operations | $652,630,795 | |
| * | Includes professional fees associated with the filing of tax claims in the European Union deemed to be non-routine expenses of the fund. See financial notes 2 (d) and 4 for additional information. |
| Operations | ||||
| 9/1/16-8/31/17 | 9/1/15-8/31/16 | |||
| Net investment income | $84,247,434 | $44,702,574 | ||
| Net realized losses | (53,849,995) | (61,534,041) | ||
| Net change in unrealized appreciation (depreciation) | + | 622,233,356 | 211,214,059 | |
| Increase in net assets resulting from operations | 652,630,795 | 194,382,592 | ||
| Distributions to Shareholders | ||||
| Distributions from net investment income | ($49,865,640) | ($35,546,040) | ||
| Transactions in Fund Shares | ||||||||
| 9/1/16-8/31/17 | 9/1/15-8/31/16 | |||||||
| SHARES | VALUE | SHARES | VALUE | |||||
| Shares sold | 68,300,000 | $1,636,181,893 | 27,800,000 | $574,297,285 | ||||
| Shares redeemed | + | — | — | — | — | |||
| Net transactions in fund shares | 68,300,000 | $1,636,181,893 | 27,800,000 | $574,297,285 | ||||
| Shares Outstanding and Net Assets | ||||||||
| 9/1/16-8/31/17 | 9/1/15-8/31/16 | |||||||
| SHARES | NET ASSETS | SHARES | NET ASSETS | |||||
| Beginning of period | 89,100,000 | $2,009,873,794 | 61,300,000 | $1,276,739,957 | ||||
| Total increase | + | 68,300,000 | 2,238,947,048 | 27,800,000 | 733,133,837 | |||
| End of period | 157,400,000 | $4,248,820,842 | 89,100,000 | $2,009,873,794 | ||||
| Net investment income not yet distributed | $65,399,874 | $31,915,692 | ||||||
| SCHWAB STRATEGIC TRUST (ORGANIZED JANUARY 27, 2009) | |
| Schwab International Equity ETF | Schwab U.S. TIPS ETF™ |
| Schwab International Small-Cap Equity ETF | Schwab Short-Term U.S. Treasury ETF™ |
| Schwab Emerging Markets Equity ETF | Schwab Intermediate-Term U.S. Treasury ETF™ |
| Schwab U.S. Broad Market ETF™ | Schwab U.S. Aggregate Bond ETF™ |
| Schwab U.S. Large-Cap ETF™ | Schwab Fundamental U.S. Broad Market Index ETF |
| Schwab U.S. Large-Cap Growth ETF™ | Schwab Fundamental U.S. Large Company Index ETF |
| Schwab U.S. Large-Cap Value ETF™ | Schwab Fundamental U.S. Small Company Index ETF |
| Schwab U.S. Mid-Cap ETF™ | Schwab Fundamental International Large Company Index ETF |
| Schwab U.S. Small-Cap ETF™ | Schwab Fundamental International Small Company Index ETF |
| Schwab U.S. Dividend Equity ETF™ | Schwab Fundamental Emerging Markets Large Company Index ETF |
| Schwab U.S. REIT ETF™ | |
2. Significant Accounting Policies:
3. Risk Factors:
4. Affiliates and Affiliated Transactions:
| Schwab International Equity ETF | Schwab International Small-Cap Equity ETF | Schwab Emerging Markets Equity ETF |
| 0.06% 1,2 | 0.12% 2 | 0.13% 1 |
| 1 | Prior to October 7, 2016, the advisory fees of the Schwab International Equity ETF and Schwab Emerging Markets Equity ETF were 0.08% and 0.14%, respectively. |
| 2 | Prior to March 1, 2017, the advisory fees of the Schwab International Equity ETF and Schwab International Small-Cap ETF were 0.07% and 0.16%, respectively. |
| Underlying Funds | |||||
| Schwab International Equity ETF | Schwab International Small-Cap Equity ETF | Schwab Emerging Markets Equity ETF | |||
| Schwab VIT Balanced Portfolio | 0.1% | 0.1% | 0.1% | ||
| Schwab VIT Balanced with Growth Portfolio | 0.2% | 0.3% | 0.2% | ||
| Schwab VIT Growth Portfolio | 0.3% | 0.5% | 0.3% | ||
| Schwab Target 2010 Index Fund | 0.0%* | -% | -% | ||
| Schwab Target 2015 Index Fund | 0.0%* | -% | -% | ||
| Schwab Target 2020 Index Fund | 0.0%* | -% | 0.0%* | ||
| Schwab Target 2025 Index Fund | 0.1% | -% | 0.0%* | ||
| Schwab Target 2030 Index Fund | 0.1% | -% | 0.0%* | ||
| Schwab Target 2035 Index Fund | 0.1% | -% | 0.0%* | ||
| Schwab Target 2040 Index Fund | 0.1% | -% | 0.0%* | ||
| Schwab Target 2045 Index Fund | 0.0%* | -% | 0.0%* | ||
| Schwab Target 2050 Index Fund | 0.0%* | -% | 0.0%* | ||
| Schwab Target 2055 Index Fund | 0.0%* | -% | 0.0%* | ||
| Schwab Target 2060 Index Fund | 0.0%* | -% | 0.0%* | ||
| * | Less than 0.05% |
| Total Aggregate Transactions | Realized Gains (Losses) | |
| Schwab International Equity ETF | $28,904,269 | ($9,508,698) |
| Schwab International Small-Cap Equity ETF | 14,748,766 | 1,602,543 |
| Schwab Emerging Markets Equity ETF | 7,675,191 | (4,360,082) |
5. Other Service Providers:
6. Board of Trustees:
7. Borrowing from Banks:
8. Derivatives:
| Notional Amounts | Number of Contracts | |
| Schwab International Equity ETF | $41,788,562 | 464 |
| Schwab International Small-Cap Equity ETF | 4,225,373 | 47 |
| Schwab Emerging Markets Equity ETF | 10,056,796 | 204 |
9. Purchases and Sales/Maturities of Investment Securities:
| Purchases of Securities | Sales/Maturities of Securities | |
| Schwab International Equity ETF | $716,585,626 | $398,126,683 |
| Schwab International Small-Cap Equity ETF | 183,281,315 | 133,041,796 |
| Schwab Emerging Markets Equity ETF | 1,304,438,290 | 211,804,504 |
10. In-Kind Transactions:
| In-Kind Purchases of Securities | In-Kind Sales of Securities | |
| Schwab International Equity ETF | $3,719,489,406 | $— |
| Schwab International Small-Cap Equity ETF | 543,745,487 | 22,855,447 |
| Schwab Emerging Markets Equity ETF | 575,481,570 | — |
| Schwab International Equity ETF | Schwab International Small-Cap Equity ETF | Schwab Emerging Markets Equity ETF | |||
| Tax cost | $10,191,366,865 | $1,398,636,312 | $3,684,411,994 | ||
| Gross unrealized appreciation | $1,467,165,919 | $254,600,868 | $693,562,762 | ||
| Gross unrealized depreciation | (278,255,512) | (59,972,494) | (124,988,774) | ||
| Net unrealized appreciation (depreciation) | $1,188,910,407 | $194,628,374 | $568,573,988 |
| Schwab International Equity ETF | Schwab International Small-Cap Equity ETF | Schwab Emerging Markets Equity ETF | |||
| Undistributed ordinary income | $225,572,524 | $36,070,662 | $92,102,900 | ||
| Net unrealized appreciation (depreciation) on investments | 1,188,910,407 | 194,628,374 | 568,573,988 | ||
| Net other unrealized appreciation (depreciation) | 445,647 | 2,654 | (5,416,290) | ||
| Total | $1,414,928,578 | $230,701,690 | $655,260,598 |
| Expiration Date | Schwab International Equity ETF | Schwab International Small-Cap Equity ETF | Schwab Emerging Markets Equity ETF | ||
| August 31, 2019 | $2,345,874 | $215,545 | $1,091,404 | ||
| No expiration | 246,455,961 | 65,120,340 | 197,198,937 | ||
| Total | $248,801,835 | $65,335,885 | $198,290,341 |
| Schwab International Equity ETF | Schwab International Small-Cap Equity ETF | Schwab Emerging Markets Equity ETF | |
| Current period distributions | |||
| Ordinary income | $173,425,920 | $18,024,160 | $49,865,640 |
| Long-term capital gains | — | — | — |
| Prior period distributions | |||
| Ordinary income | $105,649,560 | $15,625,200 | $35,546,040 |
| Long-term capital gains | — | — | — |
| Schwab International Equity ETF | Schwab International Small-Cap Equity ETF | Schwab Emerging Markets Equity ETF | |
| Capital shares | $— | $6,364,369 | $— |
| Undistributed net investment income | (238,899) | 1,482,185 | (897,612) |
| Net realized gains and losses | 238,899 | (7,846,554) | 897,612 |
| Schwab International Equity ETF | Schwab International Small-Cap Equity ETF | Schwab Emerging Markets Equity ETF | |
| $— | $6,426,451 | $— |
12. Subsequent Events:
San Francisco, California
October 17, 2017
| Foreign Tax Credit | Foreign Source Income | |
| Schwab International Equity ETF | $22,735,650 | $269,743,571 |
| Schwab International Small-Cap Equity ETF | 2,521,570 | 28,291,354 |
| Schwab Emerging Markets Equity ETF | 10,846,964 | 98,801,711 |
| Schwab International Equity ETF | $165,571,828 |
| Schwab International Small-Cap Equity ETF | 12,389,973 |
| Schwab Emerging Markets Equity ETF | 35,500,195 |
Market Price vs. NAV as of August 31, 2017
| Number of Days Market Price Above NAV | Number of Days Market Price Below NAV | |||||||
| 1-49 Basis Points | 50-99 Basis Points | 100-199 Basis Points | >200 Basis Points | 1-49 Basis Points | 50-99 Basis Points | 100-199 Basis Points | >200 Basis Points | |
| Schwab International Equity ETF | ||||||||
| Commencement of trading | ||||||||
| 11/3/09 through 8/31/17 | 827 | 591 | 158 | 11 | 247 | 84 | 29 | 2 |
| Schwab International Small-Cap Equity ETF | ||||||||
| Commencement of trading | ||||||||
| 1/14/10 through 8/31/17 | 699 | 696 | 204 | 3 | 195 | 71 | 30 | 5 |
| Schwab Emerging Markets Equity ETF | ||||||||
| Commencement of trading | ||||||||
| 1/14/10 through 8/31/17 | 576 | 562 | 286 | 20 | 293 | 108 | 50 | 8 |
| 1. | the nature, extent and quality of the services provided to the Funds under the Agreement, including the resources of CSIM and its affiliates dedicated to the Funds; |
| 2. | each Fund’s investment performance and how it compared to that of certain other comparable exchange-traded funds; |
| 3. | each Fund’s expenses and how those expenses compared to those of certain other comparable exchange-traded funds; |
| 4. | the profitability of CSIM and its affiliates, including Charles Schwab & Co., Inc. (Schwab), with respect to the Funds, including both direct and indirect benefits accruing to CSIM and its affiliates; and |
| 5. | the extent to which economies of scale would be realized as the Funds grow and whether fee levels in the Agreement reflect those economies of scale for the benefit of Fund investors. |
| Independent Trustees | |||
| Name, Year of Birth, and Position(s) with the trust (Terms of office, and length of Time Served1) | Principal Occupations During the Past Five Years | Number of Portfolios in Fund Complex Overseen by the Trustee | Other Directorships |
| Robert W. Burns 1959 Trustee (Trustee of Schwab Strategic Trust since 2009; The Charles Schwab Family of Funds, Schwab Investments, Schwab Capital Trust, Schwab Annuity Portfolios and Laudus Trust since 2016) | Retired/Private Investor (Jan. 2009 – present). Formerly, Managing Director, Pacific Investment Management Company, LLC (PIMCO) (investment management firm) and President, PIMCO Funds. | 105 | Director, PS Business Parks, Inc. (2005 – 2012) |
| John F. Cogan 1947 Trustee (Trustee of The Charles Schwab Family of Funds, Schwab Investments, Schwab Capital Trust and Schwab Annuity Portfolios since 2008; Laudus Trust since 2010; Schwab Strategic Trust since 2016) | Senior Fellow, The Hoover Institution at Stanford University (Oct. 1979 – present); Senior Fellow, Stanford Institute for Economic Policy Research (2000 – present); Professor of Public Policy, Stanford University (1994 – 2015). | 105 | Director, Gilead Sciences, Inc. (2005 – present) |
| Stephen Timothy Kochis 1946 Trustee (Trustee of Schwab Strategic Trust since 2012; The Charles Schwab Family of Funds, Schwab Investments, Schwab Capital Trust, Schwab Annuity Portfolios and Laudus Trust since 2016) | CEO and Owner, Kochis Global (wealth management consulting) (May 2012 – present); Chairman and CEO, Aspiriant, LLC (wealth management) (Jan. 2008 – Apr. 2012). | 105 | None |
| David L. Mahoney 1954 Trustee (Trustee of The Charles Schwab Family of Funds, Schwab Investments, Schwab Capital Trust, Schwab Annuity Portfolios and Laudus Trust since 2011; Schwab Strategic Trust since 2016) | Private Investor. | 105 | Director, Symantec Corporation (2003 – present) Director, Corcept Therapeutics Incorporated (2004 – present) Director, Adamas Pharmaceuticals, Inc. (2009 – present) |
| Independent Trustees (continued) | |||
| Name, Year of Birth, and Position(s) with the trust (Terms of office, and length of Time Served1) | Principal Occupations During the Past Five Years | Number of Portfolios in Fund Complex Overseen by the Trustee | Other Directorships |
| Kiran M. Patel 1948 Trustee (Trustee of The Charles Schwab Family of Funds, Schwab Investments, Schwab Capital Trust, Schwab Annuity Portfolios and Laudus Trust since 2011; Schwab Strategic Trust since 2016) | Retired. Executive Vice President and General Manager of Small Business Group, Intuit, Inc. (financial software and services firm for consumers and small businesses) (Dec. 2008 – Sept. 2013). | 105 | Director, KLA-Tencor Corporation (2008 – present) |
| Kimberly S. Patmore 1956 Trustee (Trustee of The Charles Schwab Family of Funds, Schwab Investments, Schwab Capital Trust, Schwab Annuity Portfolios, Schwab Strategic Trust and Laudus Trust since 2016) | Consultant, Patmore Management Consulting (management consulting) (2008 – present). | 105 | None |
| Charles A. Ruffel 1956 Trustee (Trustee of Schwab Strategic Trust since 2009; The Charles Schwab Family of Funds, Schwab Investments, Schwab Capital Trust, Schwab Annuity Portfolios and Laudus Trust since 2015) | Co-Chief Executive Officer, Kudu Investment Management, LLC (financial services) (Jan. 2015 – present); Partner, Kudu Advisors, LLC (financial services) (June 2008 – Jan. 2015); Advisor, Asset International, Inc. (publisher of financial services information) (Aug. 2008 – Jan. 2015). | 105 | None |
| Gerald B. Smith 1950 Trustee (Trustee of The Charles Schwab Family of Funds, Schwab Investments, Schwab Capital Trust and Schwab Annuity Portfolios since 2000; Laudus Trust since 2010; Schwab Strategic Trust since 2016) | Chairman, Chief Executive Officer and Founder of Smith Graham & Co. (investment advisors) (Mar. 1990 – present). | 105 | Director, Eaton (2012 – present) Director and Chairman of the Audit Committee, Oneok Partners LP (2003 – 2013) Director, Oneok, Inc. (2009 – 2013) Lead Independent Director, Board of Cooper Industries (2002 – 2012) |
| Joseph H. Wender 1944 Trustee (Trustee of The Charles Schwab Family of Funds, Schwab Investments, Schwab Capital Trust and Schwab Annuity Portfolios since 2008; Laudus Trust since 2010; Schwab Strategic Trust since 2016) | Senior Consultant, Goldman Sachs & Co., Inc. (investment banking and securities firm) (Jan. 2008 – present); Partner, Colgin Partners, LLC (vineyards) (Feb. 1998 – present). | 105 | Board Member and Chairman of the Audit Committee, Ionis Pharmaceuticals (1994 – present) Lead Independent Director and Chair of Audit Committee, OUTFRONT Media Inc. (2014 – present) |
| Interested Trustees | |||
| Name, Year of Birth, and Position(s) with the trust (Terms of office, and length of Time Served1) | Principal Occupations During the Past Five Years | Number of Portfolios in Fund Complex Overseen by the Trustee | Other Directorships |
| Walter W. Bettinger II2 1960 Chairman and Trustee (Trustee of The Charles Schwab Family of Funds, Schwab Investments, Schwab Capital Trust and Schwab Annuity Portfolios since 2008; Schwab Strategic Trust since 2009; Laudus Trust since 2010) | Director, President and Chief Executive Officer, The Charles Schwab Corporation (Oct. 2008 – present); President and Chief Executive Officer (Oct. 2008 – present), Director (May 2008 – present), Charles Schwab & Co., Inc.; Director, Charles Schwab Bank (Apr. 2006 – present); Director, Schwab Holdings, Inc. (May 2008 – present); and Director, Charles Schwab Investment Management, Inc. (July 2016 – present). | 105 | Director, The Charles Schwab Corporation (2008 – present) |
| Marie A. Chandoha2 1961 Trustee (Trustee of The Charles Schwab Family of Funds, Schwab Investments, Schwab Capital Trust, Schwab Annuity Portfolios, Schwab Strategic Trust and Laudus Trust since 2016) | Director, President and Chief Executive Officer (Dec. 2010 – present), Chief Investment Officer (Sept. 2010 – Oct. 2011), Charles Schwab Investment Management, Inc.; Trustee (Jan. 2016 – present), President, Chief Executive Officer (Dec. 2010 – present), and Chief Investment Officer (Sept. 2010 – Oct. 2011), Schwab Funds, Laudus Funds and Schwab ETFs; Director, Charles Schwab Worldwide Funds plc and Charles Schwab Asset Management (Ireland) Limited (Jan. 2011 – present); Global Head of Fixed Income Business Division, BlackRock, Inc. (formerly Barclays Global Investors) (Mar. 2007 – Aug. 2010). | 105 | None |
| Joseph R. Martinetto2 1962 Trustee (Trustee of The Charles Schwab Family of Funds, Schwab Investments, Schwab Capital Trust, Schwab Annuity Portfolios, Schwab Strategic Trust and Laudus Trust since 2016) | Senior Executive Vice President (July 2015 – present), Chief Financial Officer (July 2015 – May 2017), Executive Vice President and Chief Financial Officer (May 2007 – July 2015), The Charles Schwab Corporation and Charles Schwab & Co., Inc.; Director, Charles Schwab & Co., Inc. (May 2007 – present); Director (Apr. 2010 – present) and Chief Executive Officer (July 2013 – Apr. 2015), Charles Schwab Bank; Director (May 2007 – present), Chief Financial Officer (May 2007 – May 2017), Senior Executive Vice President (Feb. 2016 – present), and Executive Vice President (May 2007 – Feb. 2016), Schwab Holdings, Inc. | 105 | None |
| Officers of the Trust | |
| Name, Year of Birth, and Position(s) with the trust (Terms of office, and length of Time Served3) | Principal Occupations During the Past Five Years |
| Marie A. Chandoha 1961 President and Chief Executive Officer (Officer of The Charles Schwab Family of Funds, Schwab Investments, Schwab Capital Trust, Schwab Annuity Portfolios, Schwab Strategic Trust and Laudus Trust since 2010) | Director, President and Chief Executive Officer (Dec. 2010 – present), Chief Investment Officer (Sept. 2010 – Oct. 2011), Charles Schwab Investment Management, Inc.; Trustee (Jan. 2016 – present), President, Chief Executive Officer (Dec. 2010 – present), and Chief Investment Officer (Sept. 2010 – Oct. 2011), Schwab Funds, Laudus Funds and Schwab ETFs; Director, Charles Schwab Worldwide Funds plc and Charles Schwab Asset Management (Ireland) Limited (Jan. 2011 – present); Global Head of Fixed Income Business Division, BlackRock, Inc. (formerly Barclays Global Investors) (Mar. 2007 – Aug. 2010). |
| Mark Fischer 1970 Treasurer and Chief Financial Officer (Officer of The Charles Schwab Family of Funds, Schwab Investments, Schwab Capital Trust, Schwab Annuity Portfolios, Schwab Strategic Trust and Laudus Trust since 2013) | Treasurer and Chief Financial Officer, Schwab Funds, Laudus Funds and Schwab ETFs (Jan. 2016 – present); Assistant Treasurer, Schwab Funds and Laudus Funds (Dec. 2013 – Dec. 2015), Schwab ETFs (Nov. 2013 – Dec. 2015); Vice President, Charles Schwab Investment Management, Inc. (Oct. 2013 – present); Executive Director, J.P. Morgan Investor Services (Apr. 2011 – Sept. 2013); Assistant Treasurer, Massachusetts Financial Service Investment Management (May 2005 – Mar. 2011). |
| Officers of the Trust (continued) | |
| Name, Year of Birth, and Position(s) with the trust (Terms of office, and length of Time Served3) | Principal Occupations During the Past Five Years |
| George Pereira 1964 Senior Vice President and Chief Operating Officer (Officer of The Charles Schwab Family of Funds, Schwab Investments, Schwab Capital Trust and Schwab Annuity Portfolios since 2004; Laudus Trust since 2006; Schwab Strategic Trust since 2009) | Senior Vice President and Chief Financial Officer (Nov. 2004 – present), Chief Operating Officer (Jan. 2011 – present), Charles Schwab Investment Management, Inc.; Senior Vice President and Chief Operating Officer (Jan. 2016 – present), Treasurer and Chief Financial Officer, Laudus Funds (June 2006 – Dec. 2015); Treasurer and Principal Financial Officer, Schwab Funds (Nov. 2004 – Dec. 2015) and Schwab ETFs (Oct. 2009 – Dec. 2015); Director, Charles Schwab Worldwide Funds plc and Charles Schwab Asset Management (Ireland) Limited (Apr. 2005 – present). |
| Omar Aguilar 1970 Senior Vice President and Chief Investment Officer – Equities and Multi-Asset Strategies (Officer of The Charles Schwab Family of Funds, Schwab Investments, Schwab Capital Trust, Schwab Annuity Portfolios, Schwab Strategic Trust and Laudus Trust since 2011) | Senior Vice President and Chief Investment Officer – Equities and Multi-Asset Strategies, Charles Schwab Investment Management, Inc. (Apr. 2011 – present); Senior Vice President and Chief Investment Officer – Equities, Schwab Funds, Laudus Funds and Schwab ETFs (June 2011 – present); Head of the Portfolio Management Group and Vice President of Portfolio Management, Financial Engines, Inc. (May 2009 – Apr. 2011); Head of Quantitative Equity, ING Investment Management (July 2004 – Jan. 2009). |
| Brett Wander 1961 Senior Vice President and Chief Investment Officer – Fixed Income (Officer of The Charles Schwab Family of Funds, Schwab Investments, Schwab Capital Trust, Schwab Annuity Portfolios, Schwab Strategic Trust and Laudus Trust since 2011) | Senior Vice President and Chief Investment Officer – Fixed Income, Charles Schwab Investment Management, Inc. (Apr. 2011 – present); Senior Vice President and Chief Investment Officer – Fixed Income, Schwab Funds, Laudus Funds and Schwab ETFs (June 2011 – present); Senior Managing Director, Global Head of Active Fixed-Income Strategies, State Street Global Advisors (Jan. 2008 – Oct. 2010); Director of Alpha Strategies Loomis, Sayles & Company (Apr. 2006 – Jan. 2008). |
| David Lekich 1964 Chief Legal Officer and Secretary, Schwab Funds and Schwab ETFs Vice President and Assistant Clerk, Laudus Funds (Officer of The Charles Schwab Family of Funds, Schwab Investments, Schwab Capital Trust, Schwab Annuity Portfolios, Schwab Strategic Trust and Laudus Trust since 2011) | Senior Vice President (Sept. 2011 – present), Vice President (Mar. 2004 – Sept. 2011), Charles Schwab & Co., Inc.; Senior Vice President and Chief Counsel (Sept. 2011 – present), Vice President (Jan. 2011 – Sept. 2011), Charles Schwab Investment Management, Inc.; Secretary (Apr. 2011 – present) and Chief Legal Officer (Dec. 2011 – present), Schwab Funds; Vice President and Assistant Clerk, Laudus Funds (Apr. 2011 – present); Secretary (May 2011 – present) and Chief Legal Officer (Nov. 2011 – present), Schwab ETFs. |
| Catherine MacGregor 1964 Vice President and Assistant Secretary, Schwab Funds and Schwab ETFs Chief Legal Officer, Vice President and Clerk, Laudus Funds (Officer of The Charles Schwab Family of Funds, Schwab Investments, Schwab Capital Trust, Schwab Annuity Portfolios and Laudus Trust since 2005; Schwab Strategic Trust since 2009) | Vice President, Charles Schwab & Co., Inc., Charles Schwab Investment Management, Inc. (July 2005 – present); Vice President (Dec. 2005 – present), Chief Legal Officer and Clerk (Mar. 2007 – present), Laudus Funds; Vice President (Nov. 2005 – present) and Assistant Secretary (June 2007 – present), Schwab Funds; Vice President and Assistant Secretary, Schwab ETFs (Oct. 2009 – present). |
| 1 | Each Trustee shall hold office until the election and qualification of his or her successor, or until he or she dies, resigns or is removed. The retirement policy requires that each independent trustee retire by December 31 of the year in which the Trustee turns 74 or the Trustee’s twentieth year of service as an independent trustee on any trust in the Fund Complex, whichever occurs first. |
| 2 | Mr. Bettinger, Ms. Chandoha and Mr. Martinetto are Interested Trustees because they own stock of The Charles Schwab Corporation, the parent company of the investment adviser. |
| 3 | The President, Treasurer and Secretary/Clerk hold office until their respective successors are chosen and qualified or until he or she sooner dies, resigns, is removed or becomes disqualified. Each of the other officers serves at the pleasure of the Board. |
THIS IS NOT PART OF THE SHAREHOLDER REPORT
INFORMATION.
Schwab ETFs™
Index ETF
Printed on recycled paper.
| * | FUNDAMENTAL INDEX is a registered trademark of Research Affiliates LLC. |
00199031
Table of Contents

Growth ETF™
Value ETF™
Equity ETF™
| Total Returns for the 12 Months Ended August 31, 2017 | |
| Schwab U.S. Broad Market ETF (Ticker Symbol: SCHB) | |
| Market Price Return1 | 16.07% |
| NAV Return1 | 16.03% |
| Dow Jones U.S. Broad Stock Market Index | 16.04% |
| ETF Category: Morningstar Large Blend2 | 14.83% |
| Performance Details | pages 8-10 |
| Schwab U.S. Large-Cap ETF (Ticker Symbol: SCHX) | |
| Market Price Return1 | 16.36% |
| NAV Return1 | 16.39% |
| Dow Jones U.S. Large-Cap Total Stock Market Index | 16.39% |
| ETF Category: Morningstar Large Blend2 | 14.83% |
| Performance Details | pages 11-13 |
| Schwab U.S. Large-Cap Growth ETF (Ticker Symbol: SCHG) | |
| Market Price Return1 | 19.93% |
| NAV Return1 | 19.89% |
| Dow Jones U.S. Large-Cap Growth Total Stock Market Index | 19.98% |
| ETF Category: Morningstar Large Growth2 | 18.81% |
| Performance Details | pages 14-16 |
| Schwab U.S. Large-Cap Value ETF (Ticker Symbol: SCHV) | |
| Market Price Return1 | 13.06% |
| NAV Return1 | 13.01% |
| Dow Jones U.S. Large-Cap Value Total Stock Market Index | 13.05% |
| ETF Category: Morningstar Large Value2 | 12.48% |
| Performance Details | pages 17-19 |
| Total Returns for the 12 Months Ended August 31, 2017 | |
| Schwab U.S. Mid-Cap ETF (Ticker Symbol: SCHM) | |
| Market Price Return1 | 13.43% |
| NAV Return1 | 13.38% |
| Dow Jones U.S. Mid-Cap Total Stock Market Index | 13.44% |
| ETF Category: Morningstar Mid-Cap Blend2 | 11.91% |
| Performance Details | pages 20-22 |
| Schwab U.S. Small-Cap ETF (Ticker Symbol: SCHA) | |
| Market Price Return1 | 13.22% |
| NAV Return1 | 13.21% |
| Dow Jones U.S. Small-Cap Total Stock Market Index | 13.19% |
| ETF Category: Morningstar Small Blend2 | 12.67% |
| Performance Details | pages 23-25 |
| Schwab U.S. Dividend Equity ETF (Ticker Symbol: SCHD) | |
| Market Price Return1 | 11.12% |
| NAV Return1 | 11.12% |
| Dow Jones U.S. Dividend 100TM Index | 11.22% |
| ETF Category: Morningstar Large Value2 | 12.48% |
| Performance Details | pages 26-28 |
| 1 | ETF performance must be shown based on both a market price and NAV basis. The fund’s per share NAV is the value of one share of the fund. NAV is calculated by taking the fund’s total assets (including the market value of securities owned), subtracting liabilities, and dividing by the number of shares outstanding. The NAV Return is based on the NAV of the fund, and the Market Price Return is based on the market price per share of the fund. The price used to calculate market return (Market Price) is determined by using the midpoint between the highest bid and the lowest offer on the primary stock exchange on which the shares of the fund are listed for trading, as of the time that the fund’s NAV is calculated. Market Price and NAV returns assume that dividends and capital gain distributions have been reinvested in the fund at Market Price and NAV, respectively. |
| 2 | Source for category information: Morningstar, Inc. The Morningstar Category return represents all passively- and actively-managed ETFs within the category as of the report date. |

President and CEO of
Charles Schwab Investment
Management, Inc. and the
funds covered in this report.

| * | The net version of the index reflects reinvested dividends net of withholding taxes, but reflects no deductions for expenses or other taxes. |

| 1 | Morningstar, “9 Partners for the Next Decade.” Laura Pavlenko Lutton and Greggory Warren, CFA: April 27, 2017. Morningstar looked collectively across four traits (differentiation, low costs, repeatable investment processes, and adaptable business models) to identify firms that they believe are representative of these trends. |
| 1 | The Conference Board is a global, independent business membership and research association working in the public interest. The Consumer Confidence Index® is based on the Consumer Confidence Survey® which reflects prevailing business conditions and likely developments for the months ahead. This monthly report details consumer attitudes and buying intentions, with data available by age, income, and region. |
 | Christopher Bliss, CFA, Vice President and Head of the Passive Equity Team, leads the portfolio management team for Schwab’s Passive Equity Funds and ETFs. He also has overall responsibility for all aspects of the management of the funds. Prior to joining CSIM in 2016, Mr. Bliss spent 12 years at BlackRock (formerly Barclays Global Investors) managing and leading institutional index teams, most recently as a Managing Director and Head of Americas Institutional Index team. Prior to BlackRock, he worked as an equity analyst and portfolio manager for Harris Bretall and before that, as a research analyst for JP Morgan. |
 | Ferian Juwono, CFA, Senior Portfolio Manager, is responsible for the day-to-day co-management of the funds. Prior to joining CSIM in 2010, Mr. Juwono worked at BlackRock (formerly Barclays Global Investors), where he spent more than three years as a portfolio manager, managing equity index funds for institutional clients, and nearly two years as a senior business analyst. Prior to that, Mr. Juwono worked for more than four years as a senior financial analyst with Union Bank of California. |
 | Sabya Sinha, Portfolio Manager, is responsible for the day-to-day co-management of the funds. Prior to joining CSIM in 2015, Mr. Sinha spent a year at F-Squared Investments on the product development and analytics team. Prior to F-Squared, he worked at IndexIQ Advisors as a senior index portfolio manager for three years and for Bank of America’s Columbia Management subsidiary as a portfolio manager for three years. |
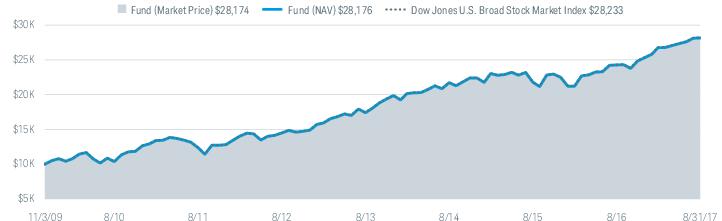
| Fund and Inception Date | 1 Year | 5 Years | Since Inception* |
| Fund: Schwab U.S. Broad Market ETF (11/3/09) | |||
| Market Price Return2 | 16.07% | 14.20% | 14.15% |
| NAV Return2 | 16.03% | 14.20% | 14.15% |
| Dow Jones U.S. Broad Stock Market Index | 16.04% | 14.21% | 14.17% |
| ETF Category: Morningstar Large Blend3 | 14.83% | 12.89% | 11.94% |
| Fund Expense Ratio4: 0.03% | |||
| * | Inception (11/3/09) represents the date that the shares began trading in the secondary market. |
| 1 | Performance does not reflect the deduction of taxes that a shareholder would pay on fund distributions or on the redemption of fund shares. |
| 2 | ETF performance must be shown based on both a market price and NAV basis. The fund’s per share NAV is the value of one share of the fund. NAV is calculated by taking the fund’s total assets (including the market value of securities owned), subtracting liabilities, and dividing by the number of shares outstanding. The NAV Return is based on the NAV of the fund, and the Market Price Return is based on the market price per share of the fund. The price used to calculate market return (Market Price) is determined by using the midpoint between the highest bid and the lowest offer on the primary stock exchange on which the shares of the fund are listed for trading, as of the time that the fund’s NAV is calculated. NAV is used as a proxy for purposes of calculating Market Price Return on inception date. Market Price and NAV returns assume that dividends and capital gain distributions have been reinvested in the fund at Market Price and NAV, respectively. |
| 3 | Source for category information: Morningstar, Inc. The Morningstar Category return represents all passively- and actively-managed ETFs within the category as of the report date. |
| 4 | As stated in the prospectus. |
| Number of Holdings | 2,004 |
| Weighted Average Market Cap (millions) | $151,067 |
| Price/Earnings Ratio (P/E) | 21.7 |
| Price/Book Ratio (P/B) | 2.9 |
| Portfolio Turnover Rate2 | 4% |
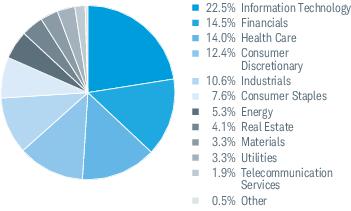
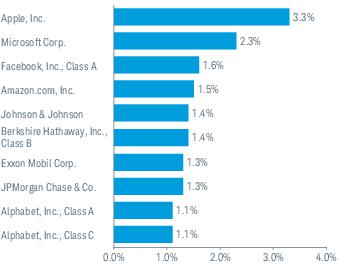
| 1 | Excludes derivatives. |
| 2 | Portfolio turnover rate excludes securities received or delivered from processing of in-kind creations or redemptions. |
| 3 | The percentage may differ from the Portfolio Holdings because the above calculation is based on a percentage of total investments, excluding derivatives, whereas the calculation in the Portfolio Holdings is based on a percentage of net assets. |
| 4 | This list is not a recommendation of any security by the investment adviser. |
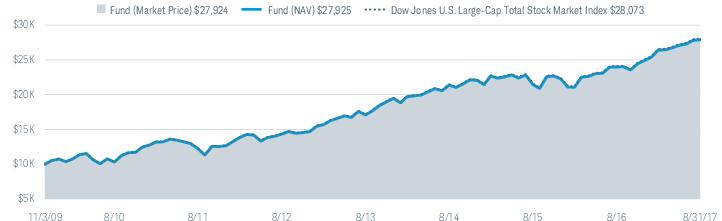
| Fund and Inception Date | 1 Year | 5 Years | Since Inception* |
| Fund: Schwab U.S. Large-Cap ETF (11/3/09) | |||
| Market Price Return2 | 16.36% | 14.25% | 14.02% |
| NAV Return2 | 16.39% | 14.25% | 14.02% |
| Dow Jones U.S. Large-Cap Total Stock Market Index | 16.39% | 14.30% | 14.10% |
| ETF Category: Morningstar Large Blend3 | 14.83% | 12.89% | 11.94% |
| Fund Expense Ratio4: 0.03% | |||
| * | Inception (11/3/09) represents the date that the shares began trading in the secondary market. |
| 1 | Performance does not reflect the deduction of taxes that a shareholder would pay on fund distributions or on the redemption of fund shares. |
| 2 | ETF performance must be shown based on both a market price and NAV basis. The fund’s per share NAV is the value of one share of the fund. NAV is calculated by taking the fund’s total assets (including the market value of securities owned), subtracting liabilities, and dividing by the number of shares outstanding. The NAV Return is based on the NAV of the fund, and the Market Price Return is based on the market price per share of the fund. The price used to calculate market return (Market Price) is determined by using the midpoint between the highest bid and the lowest offer on the primary stock exchange on which the shares of the fund are listed for trading, as of the time that the fund’s NAV is calculated. NAV is used as a proxy for purposes of calculating Market Price Return on inception date. Market Price and NAV returns assume that dividends and capital gain distributions have been reinvested in the fund at Market Price and NAV, respectively. |
| 3 | Source for category information: Morningstar, Inc. The Morningstar Category return represents all passively- and actively-managed ETFs within the category as of the report date. |
| 4 | As stated in the prospectus. |
| Number of Holdings | 751 |
| Weighted Average Market Cap (millions) | $168,533 |
| Price/Earnings Ratio (P/E) | 21.6 |
| Price/Book Ratio (P/B) | 3.0 |
| Portfolio Turnover Rate2 | 4% |
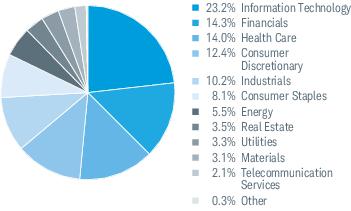
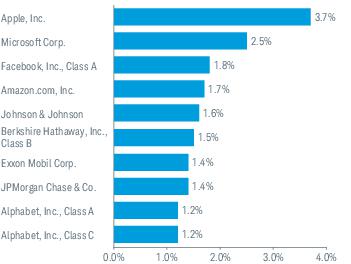
| 1 | Excludes derivatives. |
| 2 | Portfolio turnover rate excludes securities received or delivered from processing of in-kind creations or redemptions. |
| 3 | The percentage may differ from the Portfolio Holdings because the above calculation is based on a percentage of total investments, excluding derivatives, whereas the calculation in the Portfolio Holdings is based on a percentage of net assets. |
| 4 | This list is not a recommendation of any security by the investment adviser. |
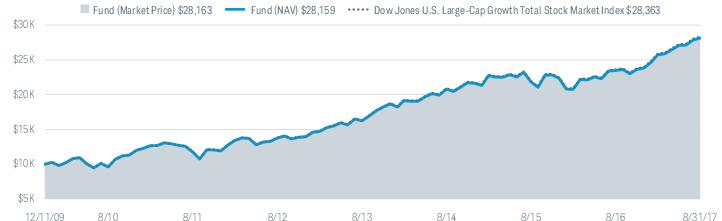
| Fund and Inception Date | 1 Year | 5 Years | Since Inception* |
| Fund: Schwab U.S. Large-Cap Growth ETF (12/11/09) | |||
| Market Price Return2 | 19.93% | 15.36% | 14.35% |
| NAV Return2 | 19.89% | 15.38% | 14.34% |
| Dow Jones U.S. Large-Cap Growth Total Stock Market Index | 19.98% | 15.46% | 14.45% |
| ETF Category: Morningstar Large Growth3 | 18.81% | 13.88% | 12.44% |
| Fund Expense Ratio4: 0.04% | |||
| * | Inception (12/11/09) represents the date that the shares began trading in the secondary market. |
| 1 | Performance does not reflect the deduction of taxes that a shareholder would pay on fund distributions or on the redemption of fund shares. |
| 2 | ETF performance must be shown based on both a market price and NAV basis. The fund’s per share NAV is the value of one share of the fund. NAV is calculated by taking the fund’s total assets (including the market value of securities owned), subtracting liabilities, and dividing by the number of shares outstanding. The NAV Return is based on the NAV of the fund, and the Market Price Return is based on the market price per share of the fund. The price used to calculate market return (Market Price) is determined by using the midpoint between the highest bid and the lowest offer on the primary stock exchange on which the shares of the fund are listed for trading, as of the time that the fund’s NAV is calculated. NAV is used as a proxy for purposes of calculating Market Price Return on inception date. Market Price and NAV returns assume that dividends and capital gain distributions have been reinvested in the fund at Market Price and NAV, respectively. |
| 3 | Source for category information: Morningstar, Inc. The Morningstar Category return represents all passively- and actively-managed ETFs within the category as of the report date. |
| 4 | As stated in the prospectus. |
| Number of Holdings | 404 |
| Weighted Average Market Cap (millions) | $195,051 |
| Price/Earnings Ratio (P/E) | 25.0 |
| Price/Book Ratio (P/B) | 4.2 |
| Portfolio Turnover Rate2 | 5% |
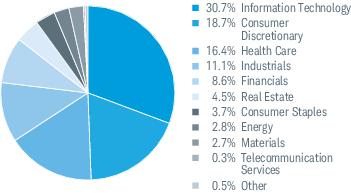
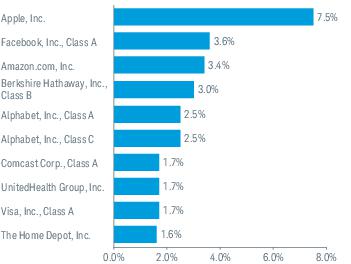
| 1 | Excludes derivatives. |
| 2 | Portfolio turnover rate excludes securities received or delivered from processing of in-kind creations or redemptions. |
| 3 | The percentage may differ from the Portfolio Holdings because the above calculation is based on a percentage of total investments, excluding derivatives, whereas the calculation in the Portfolio Holdings is based on a percentage of net assets. |
| 4 | This list is not a recommendation of any security by the investment adviser. |
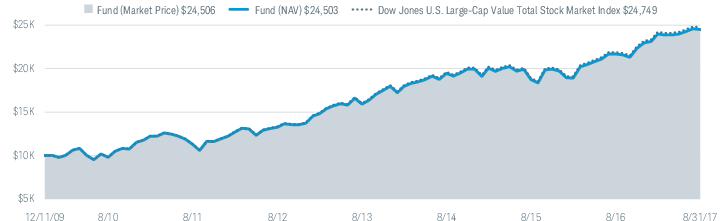
| Fund and Inception Date | 1 Year | 5 Years | Since Inception* |
| Fund: Schwab U.S. Large-Cap Value ETF (12/11/09) | |||
| Market Price Return2 | 13.06% | 13.07% | 12.31% |
| NAV Return2 | 13.01% | 13.07% | 12.30% |
| Dow Jones U.S. Large-Cap Value Total Stock Market Index | 13.05% | 13.17% | 12.45% |
| ETF Category: Morningstar Large Value3 | 12.48% | 12.09% | 10.79% |
| Fund Expense Ratio4: 0.04% | |||
| * | Inception (12/11/09) represents the date that the shares began trading in the secondary market. |
| 1 | Performance does not reflect the deduction of taxes that a shareholder would pay on fund distributions or on the redemption of fund shares. |
| 2 | ETF performance must be shown based on both a market price and NAV basis. The fund’s per share NAV is the value of one share of the fund. NAV is calculated by taking the fund’s total assets (including the market value of securities owned), subtracting liabilities, and dividing by the number of shares outstanding. The NAV Return is based on the NAV of the fund, and the Market Price Return is based on the market price per share of the fund. The price used to calculate market return (Market Price) is determined by using the midpoint between the highest bid and the lowest offer on the primary stock exchange on which the shares of the fund are listed for trading, as of the time that the fund’s NAV is calculated. NAV is used as a proxy for purposes of calculating Market Price Return on inception date. Market Price and NAV returns assume that dividends and capital gain distributions have been reinvested in the fund at Market Price and NAV, respectively. |
| 3 | Source for category information: Morningstar, Inc. The Morningstar Category return represents all passively- and actively-managed ETFs within the category as of the report date. |
| 4 | As stated in the prospectus. |
| Number of Holdings | 349 |
| Weighted Average Market Cap (millions) | $142,295 |
| Price/Earnings Ratio (P/E) | 19.1 |
| Price/Book Ratio (P/B) | 2.3 |
| Portfolio Turnover Rate2 | 7% |
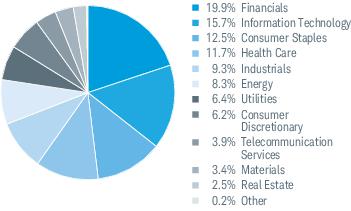
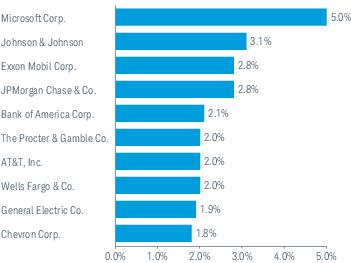
| 1 | Excludes derivatives. |
| 2 | Portfolio turnover rate excludes securities received or delivered from processing of in-kind creations or redemptions. |
| 3 | The percentage may differ from the Portfolio Holdings because the above calculation is based on a percentage of total investments, excluding derivatives, whereas the calculation in the Portfolio Holdings is based on a percentage of net assets. |
| 4 | This list is not a recommendation of any security by the investment adviser. |
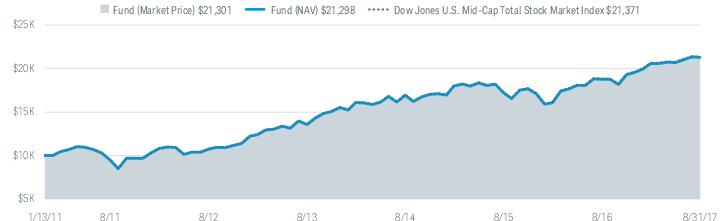
| Fund and Inception Date | 1 Year | 5 Years | Since Inception* |
| Fund: Schwab U.S. Mid-Cap ETF (1/13/11) | |||
| Market Price Return2 | 13.43% | 14.66% | 12.08% |
| NAV Return2 | 13.38% | 14.67% | 12.07% |
| Dow Jones U.S. Mid-Cap Total Stock Market Index | 13.44% | 14.71% | 12.13% |
| ETF Category: Morningstar Mid-Cap Blend3 | 11.91% | 12.51% | 9.44% |
| Fund Expense Ratio4: 0.05% | |||
| * | Inception (1/13/11) represents the date that the shares began trading in the secondary market. |
| 1 | Performance does not reflect the deduction of taxes that a shareholder would pay on fund distributions or on the redemption of fund shares. |
| 2 | ETF performance must be shown based on both a market price and NAV basis. The fund’s per share NAV is the value of one share of the fund. NAV is calculated by taking the fund’s total assets (including the market value of securities owned), subtracting liabilities, and dividing by the number of shares outstanding. The NAV Return is based on the NAV of the fund, and the Market Price Return is based on the market price per share of the fund. The price used to calculate market return (Market Price) is determined by using the midpoint between the highest bid and the lowest offer on the primary stock exchange on which the shares of the fund are listed for trading, as of the time that the fund’s NAV is calculated. NAV is used as a proxy for purposes of calculating Market Price Return on inception date. Market Price and NAV returns assume that dividends and capital gain distributions have been reinvested in the fund at Market Price and NAV, respectively. |
| 3 | Source for category information: Morningstar, Inc. The Morningstar Category return represents all passively- and actively-managed ETFs within the category as of the report date. |
| 4 | As stated in the prospectus. Effective March 1, 2017, the management fee was reduced to 0.05%. For more information, see financial note 4 or refer to the prospectus supplement dated March 1, 2017. |
| Number of Holdings | 503 |
| Weighted Average Market Cap (millions) | $7,939 |
| Price/Earnings Ratio (P/E) | 20.0 |
| Price/Book Ratio (P/B) | 2.5 |
| Portfolio Turnover Rate2 | 17% |
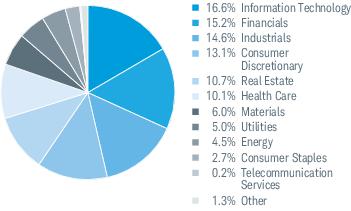
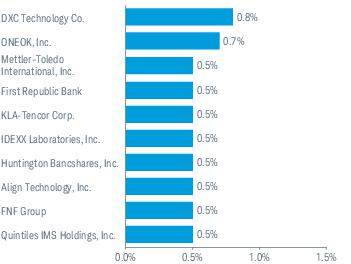
| 1 | Excludes derivatives. |
| 2 | Portfolio turnover rate excludes securities received or delivered from processing of in-kind creations or redemptions. |
| 3 | The percentage may differ from the Portfolio Holdings because the above calculation is based on a percentage of total investments, excluding derivatives, whereas the calculation in the Portfolio Holdings is based on a percentage of net assets. |
| 4 | This list is not a recommendation of any security by the investment adviser. |
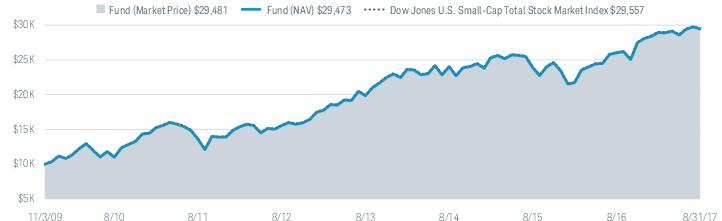
| Fund and Inception Date | 1 Year | 5 Years | Since Inception* |
| Fund: Schwab U.S. Small-Cap ETF (11/3/09) | |||
| Market Price Return2 | 13.22% | 13.59% | 14.81% |
| NAV Return2 | 13.21% | 13.59% | 14.81% |
| Dow Jones U.S. Small-Cap Total Stock Market Index | 13.19% | 13.56% | 14.85% |
| ETF Category: Morningstar Small Blend3 | 12.67% | 12.07% | 12.78% |
| Fund Expense Ratio4: 0.05% | |||
| * | Inception (11/3/09) represents the date that the shares began trading in the secondary market. |
| 1 | Performance does not reflect the deduction of taxes that a shareholder would pay on fund distributions or on the redemption of fund shares. |
| 2 | ETF performance must be shown based on both a market price and NAV basis. The fund’s per share NAV is the value of one share of the fund. NAV is calculated by taking the fund’s total assets (including the market value of securities owned), subtracting liabilities, and dividing by the number of shares outstanding. The NAV Return is based on the NAV of the fund, and the Market Price Return is based on the market price per share of the fund. The price used to calculate market return (Market Price) is determined by using the midpoint between the highest bid and the lowest offer on the primary stock exchange on which the shares of the fund are listed for trading, as of the time that the fund’s NAV is calculated. NAV is used as a proxy for purposes of calculating Market Price Return on inception date. Market Price and NAV returns assume that dividends and capital gain distributions have been reinvested in the fund at Market Price and NAV, respectively. |
| 3 | Source for category information: Morningstar, Inc. The Morningstar Category return represents all passively- and actively-managed ETFs within the category as of the report date. |
| 4 | As stated in the prospectus. Effective March 1, 2017, the management fee was reduced to 0.05%. For more information, see financial note 4 or refer to the prospectus supplement dated March 1, 2017. |
| Number of Holdings | 1,708 |
| Weighted Average Market Cap (millions) | $3,206 |
| Price/Earnings Ratio (P/E) | 21.5 |
| Price/Book Ratio (P/B) | 2.1 |
| Portfolio Turnover Rate2 | 11% |
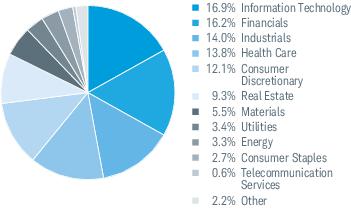

| 1 | Excludes derivatives. |
| 2 | Portfolio turnover rate excludes securities received or delivered from processing of in-kind creations or redemptions. |
| 3 | The percentage may differ from the Portfolio Holdings because the above calculation is based on a percentage of total investments, excluding derivatives, whereas the calculation in the Portfolio Holdings is based on a percentage of net assets. |
| 4 | This list is not a recommendation of any security by the investment adviser. |
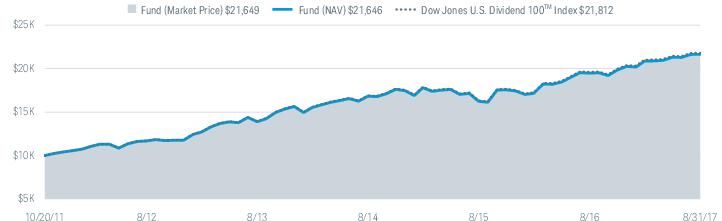
| Fund and Inception Date | 1 Year | 5 Years | Since Inception* |
| Fund: Schwab U.S. Dividend Equity ETF (10/20/11) | |||
| Market Price Return2 | 11.12% | 13.11% | 14.07% |
| NAV Return2 | 11.12% | 13.13% | 14.06% |
| Dow Jones U.S. Dividend 100TM Index | 11.22% | 13.25% | 14.22% |
| ETF Category: Morningstar Large Value3 | 12.48% | 12.09% | 12.78% |
| Fund Expense Ratio4: 0.07% | |||
| * | Inception (10/20/11) represents the date that the shares began trading in the secondary market. |
| 1 | Performance does not reflect the deduction of taxes that a shareholder would pay on fund distributions or on the redemption of fund shares. |
| 2 | ETF performance must be shown based on both a market price and NAV basis. The fund’s per share NAV is the value of one share of the fund. NAV is calculated by taking the fund’s total assets (including the market value of securities owned), subtracting liabilities, and dividing by the number of shares outstanding. The NAV Return is based on the NAV of the fund, and the Market Price Return is based on the market price per share of the fund. The price used to calculate market return (Market Price) is determined by using the midpoint between the highest bid and the lowest offer on the primary stock exchange on which the shares of the fund are listed for trading, as of the time that the fund’s NAV is calculated. NAV is used as a proxy for purposes of calculating Market Price Return on inception date. Market Price and NAV returns assume that dividends and capital gain distributions have been reinvested in the fund at Market Price and NAV, respectively. |
| 3 | Source for category information: Morningstar, Inc. The Morningstar Category return represents all passively- and actively-managed ETFs within the category as of the report date. |
| 4 | As stated in the prospectus. |
| Number of Holdings | 100 |
| Weighted Average Market Cap (millions) | $163,369 |
| Price/Earnings Ratio (P/E) | 19.8 |
| Price/Book Ratio (P/B) | 4.6 |
| Portfolio Turnover Rate2 | 15% |
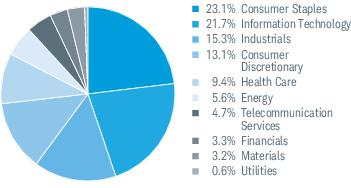
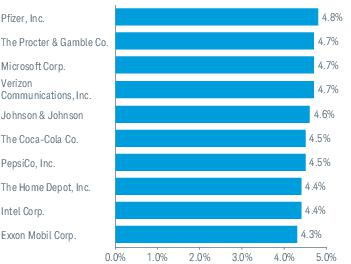
| 1 | Excludes derivatives. |
| 2 | Portfolio turnover rate excludes securities received or delivered from processing of in-kind creations or redemptions. |
| 3 | The percentage may differ from the Portfolio Holdings because the above calculation is based on a percentage of total investments, excluding derivatives, whereas the calculation in the Portfolio Holdings is based on a percentage of net assets. |
| 4 | This list is not a recommendation of any security by the investment adviser. |
| Expense Ratio (Annualized)1 | Beginning Account Value at 3/1/17 | Ending Account Value (Net of Expenses) at 8/31/17 | Expenses Paid During Period 3/1/17-8/31/172 | |
| Schwab U.S. Broad Market ETF | ||||
| Actual Return | 0.03% | $1,000.00 | $1,052.30 | $0.16 |
| Hypothetical 5% Return | 0.03% | $1,000.00 | $1,025.05 | $0.15 |
| Schwab U.S. Large-Cap ETF | ||||
| Actual Return | 0.03% | $1,000.00 | $1,056.40 | $0.16 |
| Hypothetical 5% Return | 0.03% | $1,000.00 | $1,025.05 | $0.15 |
| Schwab U.S. Large-Cap Growth ETF | ||||
| Actual Return | 0.04% | $1,000.00 | $1,094.10 | $0.21 |
| Hypothetical 5% Return | 0.04% | $1,000.00 | $1,025.00 | $0.20 |
| Schwab U.S. Large-Cap Value ETF | ||||
| Actual Return | 0.04% | $1,000.00 | $1,021.80 | $0.20 |
| Hypothetical 5% Return | 0.04% | $1,000.00 | $1,025.00 | $0.20 |
| Schwab U.S. Mid-Cap ETF | ||||
| Actual Return | 0.05% | $1,000.00 | $1,034.10 | $0.26 |
| Hypothetical 5% Return | 0.05% | $1,000.00 | $1,024.95 | $0.26 |
| Schwab U.S. Small-Cap ETF | ||||
| Actual Return | 0.05% | $1,000.00 | $1,018.00 | $0.25 |
| Hypothetical 5% Return | 0.05% | $1,000.00 | $1,024.95 | $0.26 |
| Schwab U.S. Dividend Equity ETF | ||||
| Actual Return | 0.07% | $1,000.00 | $1,037.20 | $0.36 |
| Hypothetical 5% Return | 0.07% | $1,000.00 | $1,024.85 | $0.36 |
| 1 | Based on the most recent six-month expense ratio; may differ from the expense ratio provided in the Financial Highlights which covers a 12-month period. |
| 2 | Expenses for each fund or share class are equal to its annualized expense ratio, multiplied by the average account value over the period, multiplied by 184 days of the period, and divided by 365 days of the fiscal year. |
| 9/1/16– 8/31/17 | 9/1/15– 8/31/16 | 9/1/14– 8/31/15 | 9/1/13– 8/31/14 | 9/1/12– 8/31/13 | ||
| Per-Share Data | ||||||
| Net asset value at beginning of period | $52.42 | $48.02 | $48.75 | $39.79 | $33.84 | |
| Income (loss) from investment operations: | ||||||
| Net investment income (loss)1 | 1.12 | 1.03 | 0.99 | 0.85 | 0.80 | |
| Net realized and unrealized gains (losses) | 7.20 | 4.34 | (0.79) | 8.93 | 5.92 | |
| Total from investment operations | 8.32 | 5.37 | 0.20 | 9.78 | 6.72 | |
| Less distributions: | ||||||
| Distributions from net investment income | (1.02) | (0.97) | (0.93) | (0.82) | (0.77) | |
| Net asset value at end of period | $59.72 | $52.42 | $48.02 | $48.75 | $39.79 | |
| Total return | 16.03% | 11.35% | 0.33% | 24.77% | 20.12% | |
| Ratios/Supplemental Data | ||||||
| Ratios to average net assets: | ||||||
| Total expenses | 0.03% | 0.03% 2 | 0.04% | 0.04% | 0.04% | |
| Net investment income (loss) | 1.99% | 2.09% | 1.98% | 1.90% | 2.15% | |
| Portfolio turnover rate3 | 4% | 5% | 3% | 4% | 4% | |
| Net assets, end of period (x 1,000) | $10,215,289 | $6,858,980 | $4,919,185 | $3,654,037 | $2,182,671 | |
| Security | Number of Shares | % of Net Assets | Value ($) | |
| Common Stock 99.7% of net assets | ||||
| Automobiles & Components 1.0% | ||||
| Other Securities | 1.0 | 100,616,264 | ||
| Banks 6.4% | ||||
| Bank of America Corp. | 3,970,557 | 0.9 | 94,856,607 | |
| Citigroup, Inc. | 1,097,539 | 0.7 | 74,665,578 | |
| JPMorgan Chase & Co. | 1,420,323 | 1.3 | 129,093,157 | |
| Wells Fargo & Co. | 1,807,362 | 0.9 | 92,301,977 | |
| Other Securities | 2.6 | 265,610,017 | ||
| 6.4 | 656,527,336 | |||
| Capital Goods 7.7% | ||||
| 3M Co. | 238,185 | 0.5 | 48,665,959 | |
| General Electric Co. | 3,483,907 | 0.8 | 85,529,917 | |
| Honeywell International, Inc. | 310,872 | 0.4 | 42,984,271 | |
| The Boeing Co. | 224,280 | 0.5 | 53,750,945 | |
| United Technologies Corp. | 299,749 | 0.4 | 35,885,950 | |
| Other Securities | 5.1 | 515,133,877 | ||
| 7.7 | 781,950,919 | |||
| Commercial & Professional Services 0.9% | ||||
| Other Securities | 0.9 | 94,834,990 | ||
| Consumer Durables & Apparel 1.3% | ||||
| Other Securities | 1.3 | 136,216,441 | ||
| Consumer Services 2.2% | ||||
| McDonald's Corp. | 324,259 | 0.5 | 51,871,712 | |
| Other Securities | 1.7 | 175,505,138 | ||
| 2.2 | 227,376,850 | |||
| Diversified Financials 5.2% | ||||
| Berkshire Hathaway, Inc., Class B * | 763,080 | 1.4 | 138,239,573 | |
| The Charles Schwab Corp. (b) | 480,215 | 0.2 | 19,160,579 | |
| Other Securities | 3.6 | 369,948,900 | ||
| 5.2 | 527,349,052 | |||
| Security | Number of Shares | % of Net Assets | Value ($) | |
| Energy 5.3% | ||||
| Chevron Corp. | 753,310 | 0.8 | 81,071,222 | |
| Exxon Mobil Corp. | 1,695,280 | 1.3 | 129,400,722 | |
| Other Securities | 3.2 | 332,270,155 | ||
| 5.3 | 542,742,099 | |||
| Food & Staples Retailing 1.6% | ||||
| Wal-Mart Stores, Inc. | 587,739 | 0.4 | 45,884,784 | |
| Other Securities | 1.2 | 114,881,040 | ||
| 1.6 | 160,765,824 | |||
| Food, Beverage & Tobacco 4.3% | ||||
| Altria Group, Inc. | 773,439 | 0.5 | 49,036,033 | |
| PepsiCo, Inc. | 566,461 | 0.6 | 65,556,532 | |
| Philip Morris International, Inc. | 621,094 | 0.7 | 72,624,521 | |
| The Coca-Cola Co. | 1,529,206 | 0.7 | 69,655,333 | |
| Other Securities | 1.8 | 182,951,060 | ||
| 4.3 | 439,823,479 | |||
| Health Care Equipment & Services 5.5% | ||||
| Medtronic plc | 546,858 | 0.4 | 44,087,692 | |
| UnitedHealth Group, Inc. | 386,220 | 0.8 | 76,819,158 | |
| Other Securities | 4.3 | 444,844,005 | ||
| 5.5 | 565,750,855 | |||
| Household & Personal Products 1.7% | ||||
| The Procter & Gamble Co. | 1,022,042 | 0.9 | 94,303,815 | |
| Other Securities | 0.8 | 78,814,738 | ||
| 1.7 | 173,118,553 | |||
| Insurance 2.9% | ||||
| Other Securities | 2.9 | 299,284,861 | ||
| Materials 3.3% | ||||
| Other Securities | 3.3 | 340,686,626 | ||
| Media 3.0% | ||||
| Comcast Corp., Class A | 1,885,565 | 0.7 | 76,572,795 | |
| The Walt Disney Co. | 581,726 | 0.6 | 58,870,671 | |
| Other Securities | 1.7 | 171,150,141 | ||
| 3.0 | 306,593,607 | |||
| Security | Number of Shares | % of Net Assets | Value ($) | |
| Pharmaceuticals, Biotechnology & Life Sciences 8.5% | ||||
| AbbVie, Inc. | 639,343 | 0.5 | 48,142,528 | |
| Amgen, Inc. | 295,659 | 0.5 | 52,559,300 | |
| Bristol-Myers Squibb Co. | 656,007 | 0.4 | 39,675,303 | |
| Celgene Corp. * | 317,016 | 0.4 | 44,043,033 | |
| Gilead Sciences, Inc. | 519,669 | 0.4 | 43,501,492 | |
| Johnson & Johnson | 1,078,163 | 1.4 | 142,716,436 | |
| Merck & Co., Inc. | 1,099,339 | 0.7 | 70,203,789 | |
| Pfizer, Inc. | 2,398,962 | 0.8 | 81,372,791 | |
| Other Securities | 3.4 | 344,993,615 | ||
| 8.5 | 867,208,287 | |||
| Real Estate 4.1% | ||||
| Other Securities | 4.1 | 419,678,987 | ||
| Retailing 4.9% | ||||
| Amazon.com, Inc. * | 158,459 | 1.5 | 155,384,895 | |
| The Home Depot, Inc. | 476,644 | 0.7 | 71,434,636 | |
| The Priceline Group, Inc. * | 19,644 | 0.4 | 36,382,259 | |
| Other Securities | 2.3 | 232,482,510 | ||
| 4.9 | 495,684,300 | |||
| Semiconductors & Semiconductor Equipment 3.4% | ||||
| Broadcom Ltd. | 159,854 | 0.4 | 40,294,398 | |
| Intel Corp. | 1,887,829 | 0.6 | 66,206,163 | |
| NVIDIA Corp. | 236,770 | 0.4 | 40,118,309 | |
| Other Securities | 2.0 | 201,713,880 | ||
| 3.4 | 348,332,750 | |||
| Software & Services 13.3% | ||||
| Alphabet, Inc., Class A * | 119,020 | 1.1 | 113,692,665 | |
| Alphabet, Inc., Class C * | 119,170 | 1.1 | 111,939,956 | |
| Facebook, Inc., Class A * | 942,097 | 1.6 | 162,012,421 | |
| International Business Machines Corp. | 339,788 | 0.5 | 48,599,878 | |
| MasterCard, Inc., Class A | 372,496 | 0.5 | 49,653,717 | |
| Microsoft Corp. | 3,085,886 | 2.3 | 230,731,696 | |
| Oracle Corp. | 1,192,626 | 0.6 | 60,024,867 | |
| Visa, Inc., Class A | 736,654 | 0.7 | 76,258,422 | |
| Other Securities | 4.9 | 506,362,766 | ||
| 13.3 | 1,359,276,388 | |||
| Technology Hardware & Equipment 5.8% | ||||
| Apple, Inc. | 2,083,433 | 3.3 | 341,683,012 | |
| Cisco Systems, Inc. | 1,997,571 | 0.6 | 64,341,762 | |
| Other Securities | 1.9 | 188,438,914 | ||
| 5.8 | 594,463,688 | |||
| Telecommunication Services 2.0% | ||||
| AT&T, Inc. | 2,458,249 | 0.9 | 92,086,007 | |
| Verizon Communications, Inc. | 1,622,602 | 0.8 | 77,836,218 | |
| Other Securities | 0.3 | 29,065,172 | ||
| 2.0 | 198,987,397 | |||
| Security | Number of Shares | % of Net Assets | Value ($) | |
| Transportation 2.1% | ||||
| Other Securities | 2.1 | 210,187,478 | ||
| Utilities 3.3% | ||||
| Other Securities | 3.3 | 335,780,666 | ||
| Total Common Stock | ||||
| (Cost $8,086,231,702) | 10,183,237,697 | |||
| Rights 0.0% of net assets | ||||
| Media 0.0% | ||||
| Other Securities | 0.0 | — | ||
| Pharmaceuticals, Biotechnology & Life Sciences 0.0% | ||||
| Other Securities | 0.0 | 39,530 | ||
| Total Rights | ||||
| (Cost $39,530) | 39,530 | |||
| Other Investment Companies 0.5% of net assets | ||||
| Money Market Fund 0.1% | ||||
| Other Securities | 0.1 | 10,926,846 | ||
| Securities Lending Collateral 0.4% | ||||
| Wells Fargo Government Money Market Fund, Select Class 0.92% (c) | 0.4 | 36,579,301 | ||
| Total Other Investment Companies | ||||
| (Cost $47,506,147) | 47,506,147 | |||
| Number of Contracts | Notional Amount ($) | Current Value/ Unrealized Appreciation ($) | ||
| Futures Contracts | ||||
| Long | ||||
| S&P 500 Index, e-mini, expires 09/15/17 | 250 | 30,876,250 | 218,276 | |
| * | Non-income producing security. |
| (a) | All or a portion of this security is on loan. Securities on loan were valued at $35,774,958. |
| (b) | Issuer is affiliated with the fund's investment adviser. |
| (c) | The rate shown is the 7-day yield. |
| (d) | Fair-valued by management in accordance with procedures approved by the Board of Trustees. |
| CVR — | Contingent Value Rights |
| REIT — | Real Estate Investment Trust |
| Balance of Shares Held at 8/31/16 | Gross Purchases | Gross Sales | Balance of Shares Held at 8/31/17 | Net change in unrealized appreciation (depreciation) | Realized Gains(Losses) 9/1/16 to 8/31/17 | Dividends Received 9/1/16 to 8/31/17 | |
| The Charles Schwab Corp. | 366,815 | 118,860 | (5,460) | 480,215 | $2,985,431 | $123,287 | $129,352 |
| Description | Quoted Prices in Active Markets for Identical Assets (Level 1) | Other Significant Observable Inputs (Level 2) | Significant Unobservable Inputs (Level 3) | Total | |
| Assets | |||||
| Common Stock1 | $10,183,237,697 | $— | $— | $10,183,237,697 | |
| Rights 1 | — | — | — | — | |
| Media | — | — | — * | — | |
| Pharmaceuticals, Biotechnology & Life Sciences | — | — | 39,530 | 39,530 | |
| Other Investment Companies1 | 47,506,147 | — | — | 47,506,147 | |
| Futures Contracts2 | 218,276 | — | — | 218,276 | |
| Total | $10,230,962,120 | $— | $39,530 | $10,231,001,650 |
| * | Level 3 amount shown includes securities determined to have no value at August 31, 2017. |
| 1 | As categorized in the complete schedule of Portfolio Holdings. |
| 2 | Futures contracts are valued at unrealized appreciation or depreciation. |
| Assets | ||
| Investments in affiliated issuers, at value (cost $14,111,354) | $19,160,579 | |
| Investments in unaffiliated issuers, at value (cost $8,083,086,724) including securities on loan of $35,774,958 | 10,175,043,494 | |
| Collateral invested for securities on loan, at value (cost $36,579,301) | 36,579,301 | |
| Deposit with broker for futures contracts | 1,474,000 | |
| Receivables: | ||
| Dividends | 19,596,110 | |
| Variation margin on futures contracts | 165,262 | |
| Income from securities on loan | + | 98,319 |
| Total assets | 10,252,117,065 | |
| Liabilities | ||
| Collateral held for securities on loan | 36,579,301 | |
| Payables: | ||
| Investment adviser fees | + | 248,470 |
| Total liabilities | 36,827,771 | |
| Net Assets | ||
| Total assets | 10,252,117,065 | |
| Total liabilities | – | 36,827,771 |
| Net assets | $10,215,289,294 | |
| Net Assets by Source | ||
| Capital received from investors | 8,141,769,495 | |
| Net investment income not yet distributed | 35,791,135 | |
| Net realized capital losses | (59,495,607) | |
| Net unrealized capital appreciation | 2,097,224,271 | |
| Net Asset Value (NAV) | ||||
| Net Assets | ÷ | Shares Outstanding | = | NAV |
| $10,215,289,294 | 171,050,000 | $59.72 | ||
| Investment Income | ||
| Dividends received from affiliated issuer | $129,352 | |
| Dividends received from unaffiliated issuers (net of foreign withholding tax of $10,989) | 165,476,170 | |
| Securities on loan, net | + | 992,387 |
| Total investment income | 166,597,909 | |
| Expenses | ||
| Investment adviser fees | 2,471,323 | |
| Total expenses | – | 2,471,323 |
| Net investment income | 164,126,586 | |
| Realized and Unrealized Gains (Losses) | ||
| Net realized losses on investments | (14,900,905) | |
| Net realized gains on in-kind redemptions on affiliated issuer | 123,287 | |
| Net realized gains on in-kind redemptions on unaffiliated investments | 55,866,717 | |
| Net realized gains on futures contracts | 2,445,411 | |
| Net realized gains on foreign currency transactions | + | 614 |
| Net realized gains | 43,535,124 | |
| Net change in unrealized appreciation (depreciation) on affiliated issuer | 2,985,431 | |
| Net change in unrealized appreciation (depreciation) on unaffiliated investments | 1,010,170,101 | |
| Net change in unrealized appreciation (depreciation) on futures contracts | + | 273,864 |
| Net change in unrealized appreciation (depreciation) | + | 1,013,429,396 |
| Net realized and unrealized gains | 1,056,964,520 | |
| Increase in net assets resulting from operations | $1,221,091,106 | |
| Operations | ||||
| 9/1/16-8/31/17 | 9/1/15-8/31/16 | |||
| Net investment income | $164,126,586 | $119,577,232 | ||
| Net realized gains | 43,535,124 | 58,473,575 | ||
| Net change in unrealized appreciation (depreciation) | + | 1,013,429,396 | 453,187,146 | |
| Increase in net assets resulting from operations | 1,221,091,106 | 631,237,953 | ||
| Distributions to Shareholders | ||||
| Distributions from net investment income | ($148,352,855) | ($111,095,810) | ||
| Transactions in Fund Shares | ||||||||
| 9/1/16-8/31/17 | 9/1/15-8/31/16 | |||||||
| SHARES | VALUE | SHARES | VALUE | |||||
| Shares sold | 42,450,000 | $2,407,830,577 | 36,150,000 | $1,780,463,725 | ||||
| Shares redeemed | + | (2,250,000) | (124,259,166) | (7,750,000) | (360,811,273) | |||
| Net transactions in fund shares | 40,200,000 | $2,283,571,411 | 28,400,000 | $1,419,652,452 | ||||
| Shares Outstanding and Net Assets | ||||||||
| 9/1/16-8/31/17 | 9/1/15-8/31/16 | |||||||
| SHARES | NET ASSETS | SHARES | NET ASSETS | |||||
| Beginning of period | 130,850,000 | $6,858,979,632 | 102,450,000 | $4,919,185,037 | ||||
| Total increase | + | 40,200,000 | 3,356,309,662 | 28,400,000 | 1,939,794,595 | |||
| End of period | 171,050,000 | $10,215,289,294 | 130,850,000 | $6,858,979,632 | ||||
| Net investment income not yet distributed | $35,791,135 | $22,624,656 | ||||||
| 9/1/16– 8/31/17 | 9/1/15– 8/31/16 | 9/1/14– 8/31/15 | 9/1/13– 8/31/14 | 9/1/12– 8/31/13 | ||
| Per-Share Data | ||||||
| Net asset value at beginning of period | $51.75 | $47.30 | $47.99 | $39.06 | $33.49 | |
| Income (loss) from investment operations: | ||||||
| Net investment income (loss) | 1.15 1 | 1.03 1 | 1.01 1 | 0.83 | 0.77 | |
| Net realized and unrealized gains (losses) | 7.24 | 4.41 | (0.77) | 8.92 | 5.56 | |
| Total from investment operations | 8.39 | 5.44 | 0.24 | 9.75 | 6.33 | |
| Less distributions: | ||||||
| Distributions from net investment income | (1.04) | (0.99) | (0.93) | (0.82) | (0.76) | |
| Net asset value at end of period | $59.10 | $51.75 | $47.30 | $47.99 | $39.06 | |
| Total return | 16.39% | 11.66% | 0.43% | 25.16% | 19.17% | |
| Ratios/Supplemental Data | ||||||
| Ratios to average net assets: | ||||||
| Total expenses | 0.03% | 0.03% 2 | 0.04% | 0.04% | 0.04% | |
| Net investment income (loss) | 2.07% | 2.13% | 2.04% | 1.95% | 2.18% | |
| Portfolio turnover rate3 | 4% | 4% | 4% | 5% | 5% | |
| Net assets, end of period (x 1,000) | $9,824,643 | $6,218,346 | $4,329,918 | $3,191,644 | $1,781,282 | |
| Security | Number of Shares | % of Net Assets | Value ($) | |
| Common Stock 99.7% of net assets | ||||
| Automobiles & Components 0.9% | ||||
| Other Securities | 0.9 | 92,466,838 | ||
| Banks 6.0% | ||||
| Bank of America Corp. | 4,279,832 | 1.0 | 102,245,186 | |
| Citigroup, Inc. | 1,183,061 | 0.8 | 80,483,640 | |
| JPMorgan Chase & Co. | 1,525,370 | 1.4 | 138,640,879 | |
| Wells Fargo & Co. | 1,931,898 | 1.0 | 98,662,031 | |
| Other Securities | 1.8 | 171,375,332 | ||
| 6.0 | 591,407,068 | |||
| Capital Goods 7.4% | ||||
| 3M Co. | 256,269 | 0.5 | 52,360,882 | |
| General Electric Co. | 3,750,806 | 0.9 | 92,082,287 | |
| Honeywell International, Inc. | 327,068 | 0.5 | 45,223,692 | |
| The Boeing Co. | 240,901 | 0.6 | 57,734,334 | |
| United Technologies Corp. | 323,509 | 0.4 | 38,730,497 | |
| Other Securities | 4.5 | 439,907,457 | ||
| 7.4 | 726,039,149 | |||
| Commercial & Professional Services 0.7% | ||||
| Other Securities | 0.7 | 70,297,461 | ||
| Consumer Durables & Apparel 1.2% | ||||
| Other Securities | 1.2 | 120,669,740 | ||
| Consumer Services 2.0% | ||||
| McDonald's Corp. | 350,473 | 0.6 | 56,065,166 | |
| Other Securities | 1.4 | 143,832,937 | ||
| 2.0 | 199,898,103 | |||
| Diversified Financials 5.3% | ||||
| Berkshire Hathaway, Inc., Class B * | 815,829 | 1.5 | 147,795,582 | |
| The Charles Schwab Corp. (b) | 520,057 | 0.2 | 20,750,274 | |
| Other Securities | 3.6 | 356,704,876 | ||
| 5.3 | 525,250,732 | |||
| Energy 5.5% | ||||
| Chevron Corp. | 815,913 | 0.9 | 87,808,557 | |
| Exxon Mobil Corp. | 1,820,695 | 1.4 | 138,973,649 | |
| Other Securities | 3.2 | 317,209,722 | ||
| 5.5 | 543,991,928 | |||
| Security | Number of Shares | % of Net Assets | Value ($) | |
| Food & Staples Retailing 1.7% | ||||
| Wal-Mart Stores, Inc. | 637,473 | 0.5 | 49,767,517 | |
| Other Securities | 1.2 | 117,441,756 | ||
| 1.7 | 167,209,273 | |||
| Food, Beverage & Tobacco 4.7% | ||||
| Altria Group, Inc. | 830,308 | 0.5 | 52,641,527 | |
| PepsiCo, Inc. | 613,501 | 0.7 | 71,000,471 | |
| Philip Morris International, Inc. | 667,299 | 0.8 | 78,027,272 | |
| The Coca-Cola Co. | 1,652,127 | 0.8 | 75,254,385 | |
| Other Securities | 1.9 | 179,893,113 | ||
| 4.7 | 456,816,768 | |||
| Health Care Equipment & Services 5.5% | ||||
| Abbott Laboratories | 749,319 | 0.4 | 38,170,310 | |
| Medtronic plc | 587,583 | 0.5 | 47,370,941 | |
| UnitedHealth Group, Inc. | 415,444 | 0.8 | 82,631,812 | |
| Other Securities | 3.8 | 369,924,853 | ||
| 5.5 | 538,097,916 | |||
| Household & Personal Products 1.8% | ||||
| The Procter & Gamble Co. | 1,100,288 | 1.0 | 101,523,574 | |
| Other Securities | 0.8 | 74,440,170 | ||
| 1.8 | 175,963,744 | |||
| Insurance 2.9% | ||||
| Other Securities | 2.9 | 286,725,174 | ||
| Materials 3.1% | ||||
| Other Securities | 3.1 | 301,590,492 | ||
| Media 3.1% | ||||
| Comcast Corp., Class A | 2,025,950 | 0.8 | 82,273,830 | |
| The Walt Disney Co. | 622,696 | 0.6 | 63,016,835 | |
| Other Securities | 1.7 | 160,974,157 | ||
| 3.1 | 306,264,822 | |||
| Pharmaceuticals, Biotechnology & Life Sciences 8.6% | ||||
| AbbVie, Inc. | 683,264 | 0.5 | 51,449,779 | |
| Amgen, Inc. | 315,356 | 0.6 | 56,060,836 | |
| Bristol-Myers Squibb Co. | 703,663 | 0.4 | 42,557,538 | |
| Celgene Corp. * | 336,543 | 0.5 | 46,755,919 | |
| Gilead Sciences, Inc. | 559,301 | 0.5 | 46,819,087 | |
| Johnson & Johnson | 1,159,662 | 1.6 | 153,504,459 | |
| Merck & Co., Inc. | 1,170,878 | 0.8 | 74,772,269 | |
| Security | Number of Shares | % of Net Assets | Value ($) | |
| Pfizer, Inc. | 2,560,665 | 0.9 | 86,857,757 | |
| Other Securities | 2.8 | 281,055,489 | ||
| 8.6 | 839,833,133 | |||
| Real Estate 3.5% | ||||
| Other Securities | 3.5 | 341,070,439 | ||
| Retailing 5.1% | ||||
| Amazon.com, Inc. * | 170,287 | 1.7 | 166,983,432 | |
| The Home Depot, Inc. | 512,548 | 0.8 | 76,815,569 | |
| The Priceline Group, Inc. * | 21,194 | 0.4 | 39,252,983 | |
| Other Securities | 2.2 | 216,870,912 | ||
| 5.1 | 499,922,896 | |||
| Semiconductors & Semiconductor Equipment 3.4% | ||||
| Broadcom Ltd. | 173,269 | 0.4 | 43,675,917 | |
| Intel Corp. | 2,028,671 | 0.7 | 71,145,492 | |
| NVIDIA Corp. | 257,283 | 0.4 | 43,594,032 | |
| Other Securities | 1.9 | 176,860,722 | ||
| 3.4 | 335,276,163 | |||
| Software & Services 13.9% | ||||
| Alphabet, Inc., Class A * | 127,846 | 1.2 | 122,123,613 | |
| Alphabet, Inc., Class C * | 128,051 | 1.2 | 120,282,146 | |
| Facebook, Inc., Class A * | 1,016,150 | 1.8 | 174,747,315 | |
| International Business Machines Corp. | 367,964 | 0.5 | 52,629,891 | |
| MasterCard, Inc., Class A | 402,622 | 0.5 | 53,669,513 | |
| Microsoft Corp. | 3,314,769 | 2.5 | 247,845,278 | |
| Oracle Corp. | 1,286,255 | 0.7 | 64,737,214 | |
| Visa, Inc., Class A | 794,050 | 0.8 | 82,200,056 | |
| Other Securities | 4.7 | 442,781,508 | ||
| 13.9 | 1,361,016,534 | |||
| Technology Hardware & Equipment 5.9% | ||||
| Apple, Inc. | 2,241,585 | 3.7 | 367,619,940 | |
| Cisco Systems, Inc. | 2,144,848 | 0.7 | 69,085,554 | |
| Other Securities | 1.5 | 140,678,824 | ||
| 5.9 | 577,384,318 | |||
| Telecommunication Services 2.1% | ||||
| AT&T, Inc. | 2,652,233 | 1.0 | 99,352,648 | |
| Verizon Communications, Inc. | 1,749,168 | 0.9 | 83,907,589 | |
| Other Securities | 0.2 | 23,501,569 | ||
| 2.1 | 206,761,806 | |||
| Security | Number of Shares | % of Net Assets | Value ($) | |
| Transportation 2.1% | ||||
| Other Securities | 2.1 | 207,443,068 | ||
| Utilities 3.3% | ||||
| Other Securities | 3.3 | 320,879,197 | ||
| Total Common Stock | ||||
| (Cost $7,890,336,470) | 9,792,276,762 | |||
| Other Investment Companies 0.2% of net assets | ||||
| Money Market Fund 0.1% | ||||
| Other Securities | 0.1 | 9,920,138 | ||
| Securities Lending Collateral 0.1% | ||||
| Other Securities | 0.1 | 16,565,366 | ||
| Total Other Investment Companies | ||||
| (Cost $26,485,504) | 26,485,504 | |||
| Number of Contracts | Notional Amount ($) | Current Value/ Unrealized Appreciation ($) | ||
| Futures Contracts | ||||
| Long | ||||
| S&P 500 Index, e-mini, expires 09/15/17 | 253 | 31,246,765 | 244,610 | |
| * | Non-income producing security. |
| (a) | All or a portion of this security is on loan. Securities on loan were valued at $16,160,383. |
| (b) | Issuer is affiliated with the fund's investment adviser. |
| (c) | The rate shown is the 7-day yield. |
| Balance of Shares Held at 8/31/16 | Gross Purchases | Gross Sales | Balance of Shares Held at 8/31/17 | Net change in unrealized appreciation (depreciation) | Realized Gains(Losses) 9/1/16 to 8/31/17 | Dividends Received 9/1/16 to 8/31/17 | |
| The Charles Schwab Corp. | 374,662 | 157,080 | (11,685) | 520,057 | $3,119,170 | $61,022 | $140,012 |
| Description | Quoted Prices in Active Markets for Identical Assets (Level 1) | Other Significant Observable Inputs (Level 2) | Significant Unobservable Inputs (Level 3) | Total | |
| Assets | |||||
| Common Stock1 | $9,792,276,762 | $— | $— | $9,792,276,762 | |
| Other Investment Companies1 | 26,485,504 | — | — | 26,485,504 | |
| Futures Contracts2 | 244,610 | — | — | 244,610 | |
| Total | $9,819,006,876 | $— | $— | $9,819,006,876 |
| 1 | As categorized in the complete schedule of Portfolio Holdings. |
| 2 | Futures contracts are valued at unrealized appreciation or depreciation. |
| Assets | ||
| Investments in affiliated issuers, at value (cost $15,768,397) | $20,750,274 | |
| Investments in unaffiliated issuers, at value (cost $7,884,488,211) including securities on loan of $16,160,383 | 9,781,446,626 | |
| Collateral invested for securities on loan, at value (cost $16,565,366) | 16,565,366 | |
| Deposit with broker for futures contracts | 1,504,800 | |
| Receivables: | ||
| Fund shares sold | 46,943,960 | |
| Dividends | 20,382,986 | |
| Variation margin on futures contracts | 165,383 | |
| Income from securities on loan | + | 31,207 |
| Total assets | 9,887,790,602 | |
| Liabilities | ||
| Collateral held for securities on loan | 16,565,366 | |
| Payables: | ||
| Investments bought | 46,338,175 | |
| Investment adviser fees | + | 244,028 |
| Total liabilities | 63,147,569 | |
| Net Assets | ||
| Total assets | 9,887,790,602 | |
| Total liabilities | – | 63,147,569 |
| Net assets | $9,824,643,033 | |
| Net Assets by Source | ||
| Capital received from investors | 7,932,062,103 | |
| Net investment income not yet distributed | 38,513,594 | |
| Net realized capital losses | (48,117,566) | |
| Net unrealized capital appreciation | 1,902,184,902 | |
| Net Asset Value (NAV) | ||||
| Net Assets | ÷ | Shares Outstanding | = | NAV |
| $9,824,643,033 | 166,250,000 | $59.10 | ||
| Investment Income | ||
| Dividends received from affiliated issuer | $140,012 | |
| Dividends received from unaffiliated issuers (net of foreign withholding tax of $5,050) | 164,590,326 | |
| Securities on loan, net | + | 462,663 |
| Total investment income | 165,193,001 | |
| Expenses | ||
| Investment adviser fees | 2,357,940 | |
| Total expenses | – | 2,357,940 |
| Net investment income | 162,835,061 | |
| Realized and Unrealized Gains (Losses) | ||
| Net realized losses on affiliated issuer | (3,555) | |
| Net realized losses on unaffiliated investments | (17,950,135) | |
| Net realized gains on in-kind redemptions on affiliated issuer | 64,577 | |
| Net realized gains on in-kind redemptions on unaffiliated investments | 29,302,247 | |
| Net realized gains on futures contracts | + | 2,707,379 |
| Net realized gains | 14,120,513 | |
| Net change in unrealized appreciation (depreciation) on affiliated issuer | 3,119,170 | |
| Net change in unrealized appreciation (depreciation) on unaffiliated investments | 1,014,061,773 | |
| Net change in unrealized appreciation (depreciation) on futures contracts | + | 140,063 |
| Net change in unrealized appreciation (depreciation) | + | 1,017,321,006 |
| Net realized and unrealized gains | 1,031,441,519 | |
| Increase in net assets resulting from operations | $1,194,276,580 | |
| Operations | ||||
| 9/1/16-8/31/17 | 9/1/15-8/31/16 | |||
| Net investment income | $162,835,061 | $111,494,584 | ||
| Net realized gains | 14,120,513 | 81,546,713 | ||
| Net change in unrealized appreciation (depreciation) | + | 1,017,321,006 | 414,216,971 | |
| Increase in net assets resulting from operations | 1,194,276,580 | 607,258,268 | ||
| Distributions to Shareholders | ||||
| Distributions from net investment income | ($144,692,485) | ($103,762,790) | ||
| Transactions in Fund Shares | ||||||||
| 9/1/16-8/31/17 | 9/1/15-8/31/16 | |||||||
| SHARES | VALUE | SHARES | VALUE | |||||
| Shares sold | 48,300,000 | $2,678,471,964 | 35,000,000 | $1,684,361,815 | ||||
| Shares redeemed | + | (2,200,000) | (121,758,832) | (6,400,000) | (299,429,649) | |||
| Net transactions in fund shares | 46,100,000 | $2,556,713,132 | 28,600,000 | $1,384,932,166 | ||||
| Shares Outstanding and Net Assets | ||||||||
| 9/1/16-8/31/17 | 9/1/15-8/31/16 | |||||||
| SHARES | NET ASSETS | SHARES | NET ASSETS | |||||
| Beginning of period | 120,150,000 | $6,218,345,806 | 91,550,000 | $4,329,918,162 | ||||
| Total increase | + | 46,100,000 | 3,606,297,227 | 28,600,000 | 1,888,427,644 | |||
| End of period | 166,250,000 | $9,824,643,033 | 120,150,000 | $6,218,345,806 | ||||
| Net investment income not yet distributed | $38,513,594 | $22,092,100 | ||||||
| 9/1/16– 8/31/17 | 9/1/15– 8/31/16 | 9/1/14– 8/31/15 | 9/1/13– 8/31/14 | 9/1/12– 8/31/13 | ||
| Per-Share Data | ||||||
| Net asset value at beginning of period | $55.25 | $51.93 | $50.11 | $39.60 | $34.05 | |
| Income (loss) from investment operations: | ||||||
| Net investment income (loss) | 0.75 1 | 0.59 1 | 0.66 1 | 0.56 | 0.55 | |
| Net realized and unrealized gains (losses) | 10.17 | 3.30 | 1.79 | 10.50 | 5.52 | |
| Total from investment operations | 10.92 | 3.89 | 2.45 | 11.06 | 6.07 | |
| Less distributions: | ||||||
| Distributions from net investment income | (0.62) | (0.57) | (0.63) | (0.55) | (0.52) | |
| Net asset value at end of period | $65.55 | $55.25 | $51.93 | $50.11 | $39.60 | |
| Total return | 19.89% | 7.56% | 4.87% | 28.11% | 18.02% | |
| Ratios/Supplemental Data | ||||||
| Ratios to average net assets: | ||||||
| Total expenses | 0.05% 2 | 0.07% 3 | 0.07% | 0.07% | 0.07% | |
| Net investment income (loss) | 1.25% | 1.14% | 1.25% | 1.29% | 1.55% | |
| Portfolio turnover rate4 | 5% | 7% | 10% | 7% | 11% | |
| Net assets, end of period (x 1,000) | $4,470,809 | $2,980,475 | $2,246,101 | $1,485,805 | $827,613 | |
| Security | Number of Shares | % of Net Assets | Value ($) | |
| Common Stock 99.7% of net assets | ||||
| Automobiles & Components 0.6% | ||||
| Other Securities | 0.6 | 25,552,401 | ||
| Banks 0.5% | ||||
| Other Securities | 0.5 | 21,325,524 | ||
| Capital Goods 7.0% | ||||
| 3M Co. | 235,611 | 1.1 | 48,140,039 | |
| Lockheed Martin Corp. | 97,835 | 0.7 | 29,877,831 | |
| The Boeing Co. | 221,197 | 1.2 | 53,012,073 | |
| Other Securities | 4.0 | 180,714,267 | ||
| 7.0 | 311,744,210 | |||
| Commercial & Professional Services 1.0% | ||||
| Other Securities | 1.0 | 42,511,236 | ||
| Consumer Durables & Apparel 1.8% | ||||
| NIKE, Inc., Class B | 521,838 | 0.6 | 27,558,265 | |
| Other Securities | 1.2 | 54,765,697 | ||
| 1.8 | 82,323,962 | |||
| Consumer Services 2.3% | ||||
| Starbucks Corp. | 570,645 | 0.7 | 31,305,585 | |
| Other Securities | 1.6 | 72,014,172 | ||
| 2.3 | 103,319,757 | |||
| Diversified Financials 7.1% | ||||
| American Express Co. | 294,821 | 0.6 | 25,384,088 | |
| Berkshire Hathaway, Inc., Class B * | 747,906 | 3.0 | 135,490,651 | |
| BlackRock, Inc. | 47,800 | 0.4 | 20,028,678 | |
| Morgan Stanley | 562,796 | 0.6 | 25,607,218 | |
| The Charles Schwab Corp. (b) | 477,198 | 0.4 | 19,040,200 | |
| Other Securities | 2.1 | 92,544,821 | ||
| 7.1 | 318,095,656 | |||
| Energy 2.8% | ||||
| EOG Resources, Inc. | 227,357 | 0.4 | 19,323,071 | |
| Schlumberger Ltd. | 549,479 | 0.8 | 34,897,411 | |
| Other Securities | 1.6 | 71,157,111 | ||
| 2.8 | 125,377,593 | |||
| Security | Number of Shares | % of Net Assets | Value ($) | |
| Food & Staples Retailing 2.0% | ||||
| Costco Wholesale Corp. | 172,852 | 0.6 | 27,092,822 | |
| CVS Health Corp. | 400,191 | 0.7 | 30,950,772 | |
| Walgreens Boots Alliance, Inc. | 335,798 | 0.6 | 27,367,537 | |
| Other Securities | 0.1 | 4,177,381 | ||
| 2.0 | 89,588,512 | |||
| Food, Beverage & Tobacco 1.1% | ||||
| Other Securities | 1.1 | 50,257,611 | ||
| Health Care Equipment & Services 8.7% | ||||
| Aetna, Inc. | 131,284 | 0.5 | 20,703,487 | |
| Danaher Corp. | 241,820 | 0.5 | 20,172,624 | |
| Medtronic plc | 537,491 | 1.0 | 43,332,524 | |
| UnitedHealth Group, Inc. | 379,207 | 1.7 | 75,424,272 | |
| Other Securities | 5.0 | 227,811,740 | ||
| 8.7 | 387,444,647 | |||
| Household & Personal Products 0.5% | ||||
| Other Securities | 0.5 | 24,462,101 | ||
| Insurance 1.0% | ||||
| Other Securities | 1.0 | 45,535,264 | ||
| Materials 2.7% | ||||
| Monsanto Co. | 172,147 | 0.5 | 20,175,628 | |
| Other Securities | 2.2 | 100,253,726 | ||
| 2.7 | 120,429,354 | |||
| Media 4.5% | ||||
| Charter Communications, Inc., Class A * | 84,571 | 0.8 | 33,704,926 | |
| Comcast Corp., Class A | 1,859,888 | 1.7 | 75,530,052 | |
| The Walt Disney Co. | 572,678 | 1.3 | 57,955,014 | |
| Other Securities | 0.7 | 35,139,303 | ||
| 4.5 | 202,329,295 | |||
| Pharmaceuticals, Biotechnology & Life Sciences 7.8% | ||||
| Allergan plc | 131,893 | 0.7 | 30,266,806 | |
| Amgen, Inc. | 290,096 | 1.2 | 51,570,366 | |
| Biogen, Inc. * | 84,340 | 0.6 | 26,698,670 | |
| Celgene Corp. * | 306,231 | 1.0 | 42,544,673 | |
| Gilead Sciences, Inc. | 516,733 | 1.0 | 43,255,719 | |
| Security | Number of Shares | % of Net Assets | Value ($) | |
| Thermo Fisher Scientific, Inc. | 153,904 | 0.6 | 28,801,595 | |
| Other Securities | 2.7 | 124,728,059 | ||
| 7.8 | 347,865,888 | |||
| Real Estate 4.5% | ||||
| American Tower Corp. | 166,728 | 0.6 | 24,684,080 | |
| Other Securities | 3.9 | 176,124,736 | ||
| 4.5 | 200,808,816 | |||
| Retailing 9.5% | ||||
| Amazon.com, Inc. * | 156,314 | 3.4 | 153,281,508 | |
| Lowe's Cos., Inc. | 336,417 | 0.6 | 24,857,852 | |
| Netflix, Inc. * | 169,601 | 0.7 | 29,630,991 | |
| The Home Depot, Inc. | 470,736 | 1.6 | 70,549,204 | |
| The Priceline Group, Inc. * | 19,382 | 0.8 | 35,897,015 | |
| Other Securities | 2.4 | 109,106,013 | ||
| 9.5 | 423,322,583 | |||
| Semiconductors & Semiconductor Equipment 2.9% | ||||
| Broadcom Ltd. | 157,576 | 0.9 | 39,720,182 | |
| NVIDIA Corp. | 233,885 | 0.9 | 39,629,474 | |
| QUALCOMM, Inc. | 581,482 | 0.7 | 30,394,064 | |
| Other Securities | 0.4 | 21,941,506 | ||
| 2.9 | 131,685,226 | |||
| Software & Services 19.4% | ||||
| Accenture plc, Class A | 245,277 | 0.7 | 32,072,421 | |
| Adobe Systems, Inc. * | 195,380 | 0.7 | 30,315,161 | |
| Alphabet, Inc., Class A * | 117,277 | 2.5 | 112,027,681 | |
| Alphabet, Inc., Class C * | 117,515 | 2.5 | 110,385,365 | |
| Facebook, Inc., Class A * | 931,462 | 3.6 | 160,183,520 | |
| MasterCard, Inc., Class A | 368,622 | 1.1 | 49,137,313 | |
| PayPal Holdings, Inc. * | 439,894 | 0.6 | 27,132,662 | |
| salesforce.com, Inc. * | 264,779 | 0.6 | 25,283,747 | |
| Visa, Inc., Class A | 727,219 | 1.7 | 75,281,711 | |
| Other Securities | 5.4 | 245,719,761 | ||
| 19.4 | 867,539,342 | |||
| Technology Hardware & Equipment 8.4% | ||||
| Apple, Inc. | 2,053,764 | 7.5 | 336,817,296 | |
| Other Securities | 0.9 | 37,416,255 | ||
| 8.4 | 374,233,551 | |||
| Security | Number of Shares | % of Net Assets | Value ($) | |
| Telecommunication Services 0.3% | ||||
| Other Securities | 0.3 | 13,671,424 | ||
| Transportation 3.3% | ||||
| FedEx Corp. | 97,253 | 0.5 | 20,849,098 | |
| Union Pacific Corp. | 317,703 | 0.7 | 33,454,126 | |
| United Parcel Service, Inc., Class B | 271,240 | 0.7 | 31,019,006 | |
| Other Securities | 1.4 | 60,093,345 | ||
| 3.3 | 145,415,575 | |||
| Utilities 0.0% | ||||
| Other Securities | 0.0 | 2,194,666 | ||
| Total Common Stock | ||||
| (Cost $3,505,832,503) | 4,457,034,194 | |||
| Other Investment Companies 0.5% of net assets | ||||
| Money Market Fund 0.2% | ||||
| Other Securities | 0.2 | 8,764,988 | ||
| Securities Lending Collateral 0.3% | ||||
| Other Securities | 0.3 | 11,888,731 | ||
| Total Other Investment Companies | ||||
| (Cost $20,653,719) | 20,653,719 | |||
| Number of Contracts | Notional Amount ($) | Current Value/ Unrealized Appreciation ($) | ||
| Futures Contracts | ||||
| Long | ||||
| S&P 500 Index, e-mini, expires 09/15/17 | 105 | 12,968,025 | 132,367 | |
| * | Non-income producing security. |
| (a) | All or a portion of this security is on loan. Securities on loan were valued at $11,619,096. |
| (b) | Issuer is affiliated with the fund's investment adviser. |
| (c) | The rate shown is the 7-day yield. |
| Balance of Shares Held at 8/31/16 | Gross Purchases | Gross Sales | Balance of Shares Held at 8/31/17 | Net change in unrealized appreciation (depreciation) | Realized Gains(Losses) 9/1/16 to 8/31/17 | Dividends Received 9/1/16 to 8/31/17 | |
| The Charles Schwab Corp. | 365,001 | 144,525 | (32,328) | 477,198 | $2,386,805 | $773,847 | $135,694 |
| Description | Quoted Prices in Active Markets for Identical Assets (Level 1) | Other Significant Observable Inputs (Level 2) | Significant Unobservable Inputs (Level 3) | Total | |
| Assets | |||||
| Common Stock1 | $4,457,034,194 | $— | $— | $4,457,034,194 | |
| Other Investment Companies1 | 20,653,719 | — | — | 20,653,719 | |
| Futures Contracts2 | 132,367 | — | — | 132,367 | |
| Total | $4,477,820,280 | $— | $— | $4,477,820,280 |
| 1 | As categorized in the complete schedule of Portfolio Holdings. |
| 2 | Futures contracts are valued at unrealized appreciation or depreciation. |
| Assets | ||
| Investments in affiliated issuers, at value (cost $14,942,690) | $19,040,200 | |
| Investments in unaffiliated issuers, at value (cost $3,499,654,801) including securities on loan of $11,619,096 | 4,446,758,982 | |
| Collateral invested for securities on loan, at value (cost $11,888,731) | 11,888,731 | |
| Deposit with broker for futures contracts | 428,400 | |
| Receivables: | ||
| Dividends | 4,637,419 | |
| Variation margin on futures contracts | 73,052 | |
| Income from securities on loan | + | 21,178 |
| Total assets | 4,482,847,962 | |
| Liabilities | ||
| Collateral held for securities on loan | 11,888,731 | |
| Payables: | ||
| Investment adviser fees | + | 150,143 |
| Total liabilities | 12,038,874 | |
| Net Assets | ||
| Total assets | 4,482,847,962 | |
| Total liabilities | – | 12,038,874 |
| Net assets | $4,470,809,088 | |
| Net Assets by Source | ||
| Capital received from investors | 3,560,100,621 | |
| Net investment income not yet distributed | 12,867,546 | |
| Net realized capital losses | (53,493,137) | |
| Net unrealized capital appreciation | 951,334,058 | |
| Net Asset Value (NAV) | ||||
| Net Assets | ÷ | Shares Outstanding | = | NAV |
| $4,470,809,088 | 68,200,000 | $65.55 | ||
| Investment Income | ||
| Dividends received from affiliated issuer | $135,694 | |
| Dividends received from unaffiliated issuers (net of foreign withholding tax of $5,178) | 47,828,427 | |
| Securities on loan, net | + | 275,188 |
| Total investment income | 48,239,309 | |
| Expenses | ||
| Investment adviser fees | 1,683,695 | |
| Total expenses | – | 1,683,695 |
| Net investment income | 46,555,614 | |
| Realized and Unrealized Gains (Losses) | ||
| Net realized losses on investments | (36,677,982) | |
| Net realized gains on in-kind redemptions on affiliated issuer | 773,847 | |
| Net realized gains on in-kind redemptions on unaffiliated investments | 148,812,859 | |
| Net realized gains on futures contracts | + | 946,269 |
| Net realized gains | 113,854,993 | |
| Net change in unrealized appreciation (depreciation) on affiliated issuer | 2,386,805 | |
| Net change in unrealized appreciation (depreciation) on unaffiliated investments | 530,871,918 | |
| Net change in unrealized appreciation (depreciation) on futures contracts | + | 63,588 |
| Net change in unrealized appreciation (depreciation) | + | 533,322,311 |
| Net realized and unrealized gains | 647,177,304 | |
| Increase in net assets resulting from operations | $693,732,918 | |
| Operations | ||||
| 9/1/16-8/31/17 | 9/1/15-8/31/16 | |||
| Net investment income | $46,555,614 | $29,703,445 | ||
| Net realized gains | 113,854,993 | 59,719,552 | ||
| Net change in unrealized appreciation (depreciation) | + | 533,322,311 | 100,530,007 | |
| Increase in net assets resulting from operations | 693,732,918 | 189,953,004 | ||
| Distributions to Shareholders | ||||
| Distributions from net investment income | ($38,432,115) | ($28,157,885) | ||
| Transactions in Fund Shares | ||||||||
| 9/1/16-8/31/17 | 9/1/15-8/31/16 | |||||||
| SHARES | VALUE | SHARES | VALUE | |||||
| Shares sold | 20,600,000 | $1,223,925,178 | 15,350,000 | $807,870,244 | ||||
| Shares redeemed | + | (6,350,000) | (388,891,891) | (4,650,000) | (235,291,453) | |||
| Net transactions in fund shares | 14,250,000 | $835,033,287 | 10,700,000 | $572,578,791 | ||||
| Shares Outstanding and Net Assets | ||||||||
| 9/1/16-8/31/17 | 9/1/15-8/31/16 | |||||||
| SHARES | NET ASSETS | SHARES | NET ASSETS | |||||
| Beginning of period | 53,950,000 | $2,980,474,998 | 43,250,000 | $2,246,101,088 | ||||
| Total increase | + | 14,250,000 | 1,490,334,090 | 10,700,000 | 734,373,910 | |||
| End of period | 68,200,000 | $4,470,809,088 | 53,950,000 | $2,980,474,998 | ||||
| Net investment income not yet distributed | $12,867,546 | $5,042,805 | ||||||
| 9/1/16– 8/31/17 | 9/1/15– 8/31/16 | 9/1/14– 8/31/15 | 9/1/13– 8/31/14 | 9/1/12– 8/31/13 | ||
| Per-Share Data | ||||||
| Net asset value at beginning of period | $46.01 | $40.89 | $43.54 | $36.49 | $31.24 | |
| Income (loss) from investment operations: | ||||||
| Net investment income (loss) | 1.36 1 | 1.29 1 | 1.20 1 | 1.00 | 0.93 | |
| Net realized and unrealized gains (losses) | 4.56 | 5.01 | (2.75) | 7.03 | 5.24 | |
| Total from investment operations | 5.92 | 6.30 | (1.55) | 8.03 | 6.17 | |
| Less distributions: | ||||||
| Distributions from net investment income | (1.28) | (1.18) | (1.10) | (0.98) | (0.92) | |
| Net asset value at end of period | $50.65 | $46.01 | $40.89 | $43.54 | $36.49 | |
| Total return | 13.01% | 15.70% | (3.71%) | 22.25% | 20.06% | |
| Ratios/Supplemental Data | ||||||
| Ratios to average net assets: | ||||||
| Total expenses | 0.05% 2 | 0.07% 3 | 0.07% | 0.07% | 0.07% | |
| Net investment income (loss) | 2.79% | 3.00% | 2.75% | 2.54% | 2.73% | |
| Portfolio turnover rate4 | 7% | 6% | 15% | 9% | 9% | |
| Net assets, end of period (x 1,000) | $3,532,689 | $2,491,664 | $1,435,194 | $1,162,576 | $700,693 | |
| Security | Number of Shares | % of Net Assets | Value ($) | |
| Common Stock 99.6% of net assets | ||||
| Automobiles & Components 1.3% | ||||
| Other Securities | 1.3 | 46,315,824 | ||
| Banks 11.5% | ||||
| Bank of America Corp. | 3,054,723 | 2.1 | 72,977,333 | |
| Citigroup, Inc. | 843,148 | 1.6 | 57,359,358 | |
| JPMorgan Chase & Co. | 1,089,983 | 2.8 | 99,068,555 | |
| The PNC Financial Services Group, Inc. | 148,283 | 0.5 | 18,596,171 | |
| U.S. Bancorp | 487,623 | 0.7 | 24,990,679 | |
| Wells Fargo & Co. | 1,377,200 | 2.0 | 70,333,604 | |
| Other Securities | 1.8 | 62,193,311 | ||
| 11.5 | 405,519,011 | |||
| Capital Goods 7.8% | ||||
| Caterpillar, Inc. | 180,998 | 0.6 | 21,265,455 | |
| General Dynamics Corp. | 86,566 | 0.5 | 17,430,064 | |
| General Electric Co. | 2,667,309 | 1.9 | 65,482,436 | |
| Honeywell International, Inc. | 234,645 | 0.9 | 32,444,364 | |
| Raytheon Co. | 89,659 | 0.5 | 16,318,835 | |
| United Technologies Corp. | 227,988 | 0.8 | 27,294,723 | |
| Other Securities | 2.6 | 95,301,857 | ||
| 7.8 | 275,537,734 | |||
| Commercial & Professional Services 0.5% | ||||
| Other Securities | 0.5 | 16,335,658 | ||
| Consumer Durables & Apparel 0.6% | ||||
| Other Securities | 0.6 | 21,772,574 | ||
| Consumer Services 1.8% | ||||
| McDonald's Corp. | 250,003 | 1.1 | 39,992,980 | |
| Other Securities | 0.7 | 22,096,538 | ||
| 1.8 | 62,089,518 | |||
| Diversified Financials 3.6% | ||||
| The Bank of New York Mellon Corp. | 318,023 | 0.5 | 16,626,242 | |
| The Goldman Sachs Group, Inc. | 112,239 | 0.7 | 25,112,354 | |
| Other Securities | 2.4 | 85,818,641 | ||
| 3.6 | 127,557,237 | |||
| Security | Number of Shares | % of Net Assets | Value ($) | |
| Energy 8.2% | ||||
| Chevron Corp. | 579,629 | 1.8 | 62,379,673 | |
| ConocoPhillips | 378,291 | 0.5 | 16,516,185 | |
| Exxon Mobil Corp. | 1,299,550 | 2.8 | 99,194,651 | |
| Other Securities | 3.1 | 113,060,801 | ||
| 8.2 | 291,151,310 | |||
| Food & Staples Retailing 1.4% | ||||
| Wal-Mart Stores, Inc. | 452,454 | 1.0 | 35,323,084 | |
| Other Securities | 0.4 | 14,079,630 | ||
| 1.4 | 49,402,714 | |||
| Food, Beverage & Tobacco 8.1% | ||||
| Altria Group, Inc. | 591,592 | 1.1 | 37,506,933 | |
| Mondelez International, Inc., Class A | 465,656 | 0.5 | 18,933,573 | |
| PepsiCo, Inc. | 437,634 | 1.4 | 50,647,383 | |
| Philip Morris International, Inc. | 476,441 | 1.6 | 55,710,246 | |
| The Coca-Cola Co. | 1,177,864 | 1.5 | 53,651,705 | |
| Other Securities | 2.0 | 69,822,953 | ||
| 8.1 | 286,272,793 | |||
| Health Care Equipment & Services 2.3% | ||||
| Abbott Laboratories | 530,730 | 0.8 | 27,035,386 | |
| Anthem, Inc. | 81,158 | 0.5 | 15,910,214 | |
| Other Securities | 1.0 | 39,874,952 | ||
| 2.3 | 82,820,552 | |||
| Household & Personal Products 3.0% | ||||
| Colgate-Palmolive Co. | 269,690 | 0.5 | 19,320,592 | |
| The Procter & Gamble Co. | 784,673 | 2.0 | 72,401,778 | |
| Other Securities | 0.5 | 14,702,489 | ||
| 3.0 | 106,424,859 | |||
| Insurance 4.8% | ||||
| American International Group, Inc. | 270,837 | 0.5 | 16,380,222 | |
| Chubb Ltd. | 143,834 | 0.6 | 20,341,004 | |
| MetLife, Inc. | 330,135 | 0.4 | 15,460,222 | |
| Other Securities | 3.3 | 117,071,978 | ||
| 4.8 | 169,253,426 | |||
| Security | Number of Shares | % of Net Assets | Value ($) | |
| Materials 3.4% | ||||
| E.I. du Pont de Nemours & Co. | 265,910 | 0.6 | 22,317,826 | |
| The Dow Chemical Co. | 344,747 | 0.7 | 22,977,388 | |
| Other Securities | 2.1 | 75,841,312 | ||
| 3.4 | 121,136,526 | |||
| Media 1.7% | ||||
| Time Warner, Inc. | 237,188 | 0.7 | 23,979,707 | |
| Other Securities | 1.0 | 37,068,554 | ||
| 1.7 | 61,048,261 | |||
| Pharmaceuticals, Biotechnology & Life Sciences 9.3% | ||||
| AbbVie, Inc. | 486,886 | 1.0 | 36,662,516 | |
| Bristol-Myers Squibb Co. | 504,480 | 0.9 | 30,510,950 | |
| Eli Lilly & Co. | 296,921 | 0.7 | 24,136,708 | |
| Johnson & Johnson | 826,108 | 3.1 | 109,351,916 | |
| Merck & Co., Inc. | 837,107 | 1.5 | 53,457,653 | |
| Pfizer, Inc. | 1,832,653 | 1.8 | 62,163,590 | |
| Other Securities | 0.3 | 12,661,609 | ||
| 9.3 | 328,944,942 | |||
| Real Estate 2.5% | ||||
| Other Securities | 2.5 | 87,444,538 | ||
| Retailing 0.8% | ||||
| Other Securities | 0.8 | 27,827,287 | ||
| Semiconductors & Semiconductor Equipment 3.9% | ||||
| Intel Corp. | 1,442,901 | 1.4 | 50,602,538 | |
| Texas Instruments, Inc. | 305,139 | 0.7 | 25,271,612 | |
| Other Securities | 1.8 | 60,749,516 | ||
| 3.9 | 136,623,666 | |||
| Software & Services 8.4% | ||||
| International Business Machines Corp. | 261,646 | 1.1 | 37,423,228 | |
| Microsoft Corp. | 2,368,136 | 5.0 | 177,065,529 | |
| Oracle Corp. | 918,710 | 1.3 | 46,238,674 | |
| Other Securities | 1.0 | 35,561,238 | ||
| 8.4 | 296,288,669 | |||
| Technology Hardware & Equipment 3.4% | ||||
| Cisco Systems, Inc. | 1,531,810 | 1.4 | 49,339,600 | |
| Other Securities | 2.0 | 71,185,746 | ||
| 3.4 | 120,525,346 | |||
| Security | Number of Shares | % of Net Assets | Value ($) | |
| Telecommunication Services 3.9% | ||||
| AT&T, Inc. | 1,884,553 | 2.0 | 70,595,355 | |
| Verizon Communications, Inc. | 1,250,751 | 1.7 | 59,998,525 | |
| Other Securities | 0.2 | 6,436,161 | ||
| 3.9 | 137,030,041 | |||
| Transportation 1.0% | ||||
| Other Securities | 1.0 | 34,761,699 | ||
| Utilities 6.4% | ||||
| Duke Energy Corp. | 214,763 | 0.5 | 18,748,810 | |
| NextEra Energy, Inc. | 143,324 | 0.6 | 21,571,695 | |
| Other Securities | 5.3 | 186,906,700 | ||
| 6.4 | 227,227,205 | |||
| Total Common Stock | ||||
| (Cost $3,061,305,439) | 3,519,311,390 | |||
| Other Investment Companies 0.2% of net assets | ||||
| Money Market Fund 0.0% | ||||
| Other Securities | 0.0 | 1,468,786 | ||
| Securities Lending Collateral 0.2% | ||||
| Other Securities | 0.2 | 6,587,794 | ||
| Total Other Investment Companies | ||||
| (Cost $8,056,580) | 8,056,580 | |||
| Number of Contracts | Notional Amount ($) | Current Value/ Unrealized Appreciation ($) | ||
| Futures Contracts | ||||
| Long | ||||
| S&P 500 Index, e-mini, expires 09/15/17 | 107 | 13,215,035 | 66,044 | |
| * | Non-income producing security. |
| (a) | All or a portion of this security is on loan. Securities on loan were valued at $6,312,108. |
| (b) | The rate shown is the 7-day yield. |
| Description | Quoted Prices in Active Markets for Identical Assets (Level 1) | Other Significant Observable Inputs (Level 2) | Significant Unobservable Inputs (Level 3) | Total | |
| Assets | |||||
| Common Stock1 | $3,519,311,390 | $— | $— | $3,519,311,390 | |
| Other Investment Companies1 | 8,056,580 | — | — | 8,056,580 | |
| Futures Contracts2 | 66,044 | — | — | 66,044 | |
| Total | $3,527,434,014 | $— | $— | $3,527,434,014 |
| 1 | As categorized in the complete schedule of Portfolio Holdings. |
| 2 | Futures contracts are valued at unrealized appreciation or depreciation. |
| Assets | ||
| Investments in unaffiliated issuers, at value (cost $3,062,774,225) including securities on loan of $6,312,108 | $3,520,780,176 | |
| Collateral invested for securities on loan, at value (cost $6,587,794) | 6,587,794 | |
| Deposit with broker for futures contracts | 777,000 | |
| Receivables: | ||
| Dividends | 11,154,423 | |
| Fund shares sold | 2,516,367 | |
| Variation margin on futures contracts | 68,412 | |
| Income from securities on loan | + | 10,815 |
| Total assets | 3,541,894,987 | |
| Liabilities | ||
| Collateral held for securities on loan | 6,587,794 | |
| Payables: | ||
| Investments bought | 2,497,938 | |
| Investment adviser fees | + | 120,045 |
| Total liabilities | 9,205,777 | |
| Net Assets | ||
| Total assets | 3,541,894,987 | |
| Total liabilities | – | 9,205,777 |
| Net assets | $3,532,689,210 | |
| Net Assets by Source | ||
| Capital received from investors | 3,074,234,779 | |
| Net investment income not yet distributed | 18,519,604 | |
| Net realized capital losses | (18,137,168) | |
| Net unrealized capital appreciation | 458,071,995 | |
| Net Asset Value (NAV) | ||||
| Net Assets | ÷ | Shares Outstanding | = | NAV |
| $3,532,689,210 | 69,750,000 | $50.65 | ||
| Investment Income | ||
| Dividends | $86,925,437 | |
| Securities on loan, net | + | 147,849 |
| Total investment income | 87,073,286 | |
| Expenses | ||
| Investment adviser fees | 1,395,851 | |
| Total expenses | – | 1,395,851 |
| Net investment income | 85,677,435 | |
| Realized and Unrealized Gains (Losses) | ||
| Net realized losses on investments | (7,464,023) | |
| Net realized gains on in-kind redemptions | 99,489,277 | |
| Net realized gains on futures contracts | + | 1,212,460 |
| Net realized gains | 93,237,714 | |
| Net change in unrealized appreciation (depreciation) on investments | 184,446,870 | |
| Net change in unrealized appreciation (depreciation) on futures contracts | + | 83,857 |
| Net change in unrealized appreciation (depreciation) | + | 184,530,727 |
| Net realized and unrealized gains | 277,768,441 | |
| Increase in net assets resulting from operations | $363,445,876 | |
| Operations | ||||
| 9/1/16-8/31/17 | 9/1/15-8/31/16 | |||
| Net investment income | $85,677,435 | $57,539,088 | ||
| Net realized gains | 93,237,714 | 14,607,551 | ||
| Net change in unrealized appreciation (depreciation) | + | 184,530,727 | 211,036,903 | |
| Increase in net assets resulting from operations | 363,445,876 | 283,183,542 | ||
| Distributions to Shareholders | ||||
| Distributions from net investment income | ($79,019,055) | ($51,275,935) | ||
| Transactions in Fund Shares | ||||||||
| 9/1/16-8/31/17 | 9/1/15-8/31/16 | |||||||
| SHARES | VALUE | SHARES | VALUE | |||||
| Shares sold | 22,500,000 | $1,090,648,948 | 21,700,000 | $931,456,390 | ||||
| Shares redeemed | + | (6,900,000) | (334,050,154) | (2,650,000) | (106,894,736) | |||
| Net transactions in fund shares | 15,600,000 | $756,598,794 | 19,050,000 | $824,561,654 | ||||
| Shares Outstanding and Net Assets | ||||||||
| 9/1/16-8/31/17 | 9/1/15-8/31/16 | |||||||
| SHARES | NET ASSETS | SHARES | NET ASSETS | |||||
| Beginning of period | 54,150,000 | $2,491,663,595 | 35,100,000 | $1,435,194,334 | ||||
| Total increase | + | 15,600,000 | 1,041,025,615 | 19,050,000 | 1,056,469,261 | |||
| End of period | 69,750,000 | $3,532,689,210 | 54,150,000 | $2,491,663,595 | ||||
| Net investment income not yet distributed | $18,519,604 | $12,897,021 | ||||||
| 9/1/16– 8/31/17 | 9/1/15– 8/31/16 | 9/1/14– 8/31/15 | 9/1/13– 8/31/14 | 9/1/12– 8/31/13 | ||
| Per-Share Data | ||||||
| Net asset value at beginning of period | $43.67 | $40.70 | $40.56 | $32.94 | $26.56 | |
| Income (loss) from investment operations: | ||||||
| Net investment income (loss) | 0.71 1 | 0.74 1 | 0.59 1 | 0.56 | 0.51 | |
| Net realized and unrealized gains (losses) | 5.09 | 2.84 | 0.12 | 7.62 | 6.40 | |
| Total from investment operations | 5.80 | 3.58 | 0.71 | 8.18 | 6.91 | |
| Less distributions: | ||||||
| Distributions from net investment income | (0.70) | (0.61) | (0.57) | (0.56) | (0.53) | |
| Net asset value at end of period | $48.77 | $43.67 | $40.70 | $40.56 | $32.94 | |
| Total return | 13.38% | 8.94% | 1.71% | 24.97% | 26.27% | |
| Ratios/Supplemental Data | ||||||
| Ratios to average net assets: | ||||||
| Total expenses | 0.06% 2 | 0.07% | 0.07% | 0.07% | 0.07% | |
| Net investment income (loss) | 1.54% | 1.83% | 1.42% | 1.53% | 1.70% | |
| Portfolio turnover rate3 | 17% | 21% | 12% | 9% | 25% | |
| Net assets, end of period (x 1,000) | $3,555,096 | $2,532,590 | $1,841,785 | $1,190,517 | $611,081 | |
| Security | Number of Shares | % of Net Assets | Value ($) | |
| Common Stock 99.8% of net assets | ||||
| Automobiles & Components 1.6% | ||||
| Lear Corp. | 86,293 | 0.4 | 12,904,255 | |
| Other Securities | 1.2 | 42,237,055 | ||
| 1.6 | 55,141,310 | |||
| Banks 5.1% | ||||
| Comerica, Inc. | 220,124 | 0.4 | 15,023,463 | |
| First Republic Bank | 192,517 | 0.5 | 18,683,775 | |
| Huntington Bancshares, Inc. | 1,350,500 | 0.5 | 17,002,795 | |
| Other Securities | 3.7 | 128,796,701 | ||
| 5.1 | 179,506,734 | |||
| Capital Goods 10.2% | ||||
| United Rentals, Inc. * | 105,920 | 0.4 | 12,504,915 | |
| Xylem, Inc. | 223,593 | 0.4 | 13,878,418 | |
| Other Securities | 9.4 | 337,445,627 | ||
| 10.2 | 363,828,960 | |||
| Commercial & Professional Services 1.9% | ||||
| Other Securities | 1.9 | 65,927,737 | ||
| Consumer Durables & Apparel 3.3% | ||||
| Hasbro, Inc. | 139,588 | 0.4 | 13,714,521 | |
| Lennar Corp., Class A | 252,753 | 0.4 | 13,082,495 | |
| Other Securities | 2.5 | 88,732,738 | ||
| 3.3 | 115,529,754 | |||
| Consumer Services 3.5% | ||||
| Aramark | 307,721 | 0.4 | 12,521,168 | |
| Darden Restaurants, Inc. | 154,481 | 0.4 | 12,681,345 | |
| Wyndham Worldwide Corp. | 130,956 | 0.4 | 13,053,694 | |
| Wynn Resorts Ltd. | 99,572 | 0.4 | 13,839,512 | |
| Other Securities | 1.9 | 72,549,214 | ||
| 3.5 | 124,644,933 | |||
| Diversified Financials 5.0% | ||||
| E*TRADE Financial Corp. * | 342,355 | 0.4 | 14,039,978 | |
| MSCI, Inc. | 112,981 | 0.4 | 12,948,752 | |
| Raymond James Financial, Inc. | 160,427 | 0.4 | 12,564,643 | |
| Other Securities | 3.8 | 138,679,668 | ||
| 5.0 | 178,233,041 | |||
| Security | Number of Shares | % of Net Assets | Value ($) | |
| Energy 4.5% | ||||
| ONEOK, Inc. | 472,972 | 0.7 | 25,616,164 | |
| TechnipFMC plc * | 581,505 | 0.4 | 15,020,274 | |
| Other Securities | 3.4 | 120,468,241 | ||
| 4.5 | 161,104,679 | |||
| Food & Staples Retailing 0.5% | ||||
| Other Securities | 0.5 | 16,080,505 | ||
| Food, Beverage & Tobacco 1.6% | ||||
| Other Securities | 1.6 | 57,960,991 | ||
| Health Care Equipment & Services 5.3% | ||||
| Align Technology, Inc. * | 94,503 | 0.5 | 16,702,460 | |
| IDEXX Laboratories, Inc. * | 109,884 | 0.5 | 17,079,270 | |
| ResMed, Inc. | 175,633 | 0.4 | 13,625,608 | |
| The Cooper Cos., Inc. | 61,209 | 0.4 | 15,353,053 | |
| Other Securities | 3.5 | 127,342,544 | ||
| 5.3 | 190,102,935 | |||
| Household & Personal Products 0.6% | ||||
| Other Securities | 0.6 | 21,859,861 | ||
| Insurance 5.3% | ||||
| Arch Capital Group Ltd. * | 161,143 | 0.4 | 15,685,660 | |
| Arthur J. Gallagher & Co. | 224,626 | 0.4 | 13,005,845 | |
| Everest Re Group Ltd. | 51,343 | 0.4 | 12,963,081 | |
| FNF Group | 340,979 | 0.5 | 16,448,827 | |
| Unum Group | 286,283 | 0.4 | 13,793,115 | |
| Other Securities | 3.2 | 118,174,374 | ||
| 5.3 | 190,070,902 | |||
| Materials 6.1% | ||||
| Albemarle Corp. | 137,964 | 0.5 | 16,039,695 | |
| FMC Corp. | 166,742 | 0.4 | 14,376,495 | |
| International Flavors & Fragrances, Inc. | 98,535 | 0.4 | 13,484,515 | |
| Packaging Corp. of America | 117,485 | 0.4 | 13,206,489 | |
| Other Securities | 4.4 | 159,431,396 | ||
| 6.1 | 216,538,590 | |||
| Media 2.2% | ||||
| Other Securities | 2.2 | 79,528,649 | ||
| Security | Number of Shares | % of Net Assets | Value ($) | |
| Pharmaceuticals, Biotechnology & Life Sciences 4.9% | ||||
| Mettler-Toledo International, Inc. * | 32,045 | 0.5 | 19,390,109 | |
| Quintiles IMS Holdings, Inc. * | 170,464 | 0.5 | 16,369,658 | |
| Other Securities | 3.9 | 137,161,115 | ||
| 4.9 | 172,920,882 | |||
| Real Estate 10.8% | ||||
| Alexandria Real Estate Equities, Inc. | 112,283 | 0.4 | 13,621,051 | |
| Duke Realty Corp. | 446,562 | 0.4 | 13,271,823 | |
| Mid-America Apartment Communities, Inc. | 141,380 | 0.4 | 15,051,315 | |
| UDR, Inc. | 331,720 | 0.4 | 12,877,370 | |
| Other Securities | 9.2 | 329,961,852 | ||
| 10.8 | 384,783,411 | |||
| Retailing 2.7% | ||||
| LKQ Corp. * | 383,641 | 0.4 | 13,293,161 | |
| Other Securities | 2.3 | 83,647,073 | ||
| 2.7 | 96,940,234 | |||
| Semiconductors & Semiconductor Equipment 2.4% | ||||
| KLA-Tencor Corp. | 195,440 | 0.5 | 18,310,774 | |
| Other Securities | 1.9 | 68,759,186 | ||
| 2.4 | 87,069,960 | |||
| Software & Services 10.2% | ||||
| ANSYS, Inc. * | 107,160 | 0.4 | 13,804,351 | |
| Cadence Design Systems, Inc. * | 346,931 | 0.4 | 13,630,919 | |
| DXC Technology Co. | 351,231 | 0.8 | 29,854,635 | |
| Gartner, Inc. * | 112,698 | 0.4 | 13,590,252 | |
| Synopsys, Inc. * | 186,712 | 0.4 | 15,015,379 | |
| Take-Two Interactive Software, Inc. * | 129,541 | 0.4 | 12,667,814 | |
| Total System Services, Inc. | 205,586 | 0.4 | 14,210,104 | |
| Vantiv, Inc., Class A * | 201,631 | 0.4 | 14,253,295 | |
| Other Securities | 6.6 | 235,639,636 | ||
| 10.2 | 362,666,385 | |||
| Technology Hardware & Equipment 4.1% | ||||
| Other Securities | 4.1 | 144,892,253 | ||
| Telecommunication Services 0.3% | ||||
| Other Securities | 0.3 | 8,924,903 | ||
| Security | Number of Shares | % of Net Assets | Value ($) | |
| Transportation 2.6% | ||||
| Expeditors International of Washington, Inc. | 223,804 | 0.4 | 12,555,404 | |
| Other Securities | 2.2 | 80,747,555 | ||
| 2.6 | 93,302,959 | |||
| Utilities 5.1% | ||||
| CenterPoint Energy, Inc. | 538,901 | 0.4 | 15,962,248 | |
| Pinnacle West Capital Corp. | 138,461 | 0.4 | 12,457,336 | |
| Other Securities | 4.3 | 151,875,888 | ||
| 5.1 | 180,295,472 | |||
| Total Common Stock | ||||
| (Cost $3,044,270,516) | 3,547,856,040 | |||
| Other Investment Companies 1.3% of net assets | ||||
| Money Market Fund 0.1% | ||||
| Other Securities | 0.1 | 4,701,561 | ||
| Securities Lending Collateral 1.2% | ||||
| Wells Fargo Government Money Market Fund, Select Class 0.92% (b) | 1.2 | 40,401,443 | ||
| Total Other Investment Companies | ||||
| (Cost $45,103,004) | 45,103,004 | |||
| Number of Contracts | Notional Amount ($) | Current Value/ Unrealized Appreciation ($) | ||
| Futures Contracts | ||||
| Long | ||||
| S&P 500 Index, e-mini, expires 09/15/17 | 55 | 6,792,775 | 55,814 | |
| * | Non-income producing security. |
| (a) | All or a portion of this security is on loan. Securities on loan were valued at $39,673,714. |
| (b) | The rate shown is the 7-day yield. |
| Description | Quoted Prices in Active Markets for Identical Assets (Level 1) | Other Significant Observable Inputs (Level 2) | Significant Unobservable Inputs (Level 3) | Total | |
| Assets | |||||
| Common Stock1 | $3,547,856,040 | $— | $— | $3,547,856,040 | |
| Other Investment Companies1 | 45,103,004 | — | — | 45,103,004 | |
| Futures Contracts2 | 55,814 | — | — | 55,814 | |
| Total | $3,593,014,858 | $— | $— | $3,593,014,858 |
| 1 | As categorized in the complete schedule of Portfolio Holdings. |
| 2 | Futures contracts are valued at unrealized appreciation or depreciation. |
| Assets | ||
| Investments in unaffiliated issuers, at value (cost $3,048,972,077) including securities on loan of $39,673,714 | $3,552,557,601 | |
| Collateral invested for securities on loan, at value (cost $40,401,443) | 40,401,443 | |
| Deposit with broker for futures contracts | 357,000 | |
| Receivables: | ||
| Fund shares sold | 4,876,681 | |
| Dividends | 3,354,309 | |
| Income from securities on loan | 91,852 | |
| Variation margin on futures contracts | + | 42,615 |
| Total assets | 3,601,681,501 | |
| Liabilities | ||
| Collateral held for securities on loan | 40,401,443 | |
| Payables: | ||
| Investments bought | 6,035,102 | |
| Investment adviser fees | + | 148,460 |
| Total liabilities | 46,585,005 | |
| Net Assets | ||
| Total assets | 3,601,681,501 | |
| Total liabilities | – | 46,585,005 |
| Net assets | $3,555,096,496 | |
| Net Assets by Source | ||
| Capital received from investors | 3,181,681,487 | |
| Net investment income not yet distributed | 6,960,975 | |
| Net realized capital losses | (137,187,304) | |
| Net unrealized capital appreciation | 503,641,338 | |
| Net Asset Value (NAV) | ||||
| Net Assets | ÷ | Shares Outstanding | = | NAV |
| $3,555,096,496 | 72,900,000 | $48.77 | ||
| Investment Income | ||
| Dividends (net of foreign withholding tax of $30,674) | $48,056,123 | |
| Securities on loan, net | + | 647,729 |
| Total investment income | 48,703,852 | |
| Expenses | ||
| Investment adviser fees | 1,684,736 | |
| Total expenses | – | 1,684,736 |
| Net investment income | 47,019,116 | |
| Realized and Unrealized Gains (Losses) | ||
| Net realized losses on investments | (70,070,832) | |
| Net realized gains on in-kind redemptions | 109,870,585 | |
| Net realized gains on futures contracts | + | 939,906 |
| Net realized gains | 40,739,659 | |
| Net change in unrealized appreciation (depreciation) on investments | 287,828,820 | |
| Net change in unrealized appreciation (depreciation) on futures contracts | + | (26,845) |
| Net change in unrealized appreciation (depreciation) | + | 287,801,975 |
| Net realized and unrealized gains | 328,541,634 | |
| Increase in net assets resulting from operations | $375,560,750 | |
| Operations | ||||
| 9/1/16-8/31/17 | 9/1/15-8/31/16 | |||
| Net investment income | $47,019,116 | $37,655,235 | ||
| Net realized gains | 40,739,659 | 36,243,784 | ||
| Net change in unrealized appreciation (depreciation) | + | 287,801,975 | 112,503,628 | |
| Increase in net assets resulting from operations | 375,560,750 | 186,402,647 | ||
| Distributions to Shareholders | ||||
| Distributions from net investment income | ($44,982,425) | ($30,341,985) | ||
| Transactions in Fund Shares | ||||||||
| 9/1/16-8/31/17 | 9/1/15-8/31/16 | |||||||
| SHARES | VALUE | SHARES | VALUE | |||||
| Shares sold | 24,400,000 | $1,110,097,269 | 22,550,000 | $932,205,713 | ||||
| Shares redeemed | + | (9,500,000) | (418,169,350) | (9,800,000) | (397,461,135) | |||
| Net transactions in fund shares | 14,900,000 | $691,927,919 | 12,750,000 | $534,744,578 | ||||
| Shares Outstanding and Net Assets | ||||||||
| 9/1/16-8/31/17 | 9/1/15-8/31/16 | |||||||
| SHARES | NET ASSETS | SHARES | NET ASSETS | |||||
| Beginning of period | 58,000,000 | $2,532,590,252 | 45,250,000 | $1,841,785,012 | ||||
| Total increase | + | 14,900,000 | 1,022,506,244 | 12,750,000 | 690,805,240 | |||
| End of period | 72,900,000 | $3,555,096,496 | 58,000,000 | $2,532,590,252 | ||||
| Net investment income not yet distributed | $6,960,975 | $8,008,102 | ||||||
| 9/1/16– 8/31/17 | 9/1/15– 8/31/16 | 9/1/14– 8/31/15 | 9/1/13– 8/31/14 | 9/1/12– 8/31/13 | ||
| Per-Share Data | ||||||
| Net asset value at beginning of period | $57.42 | $53.54 | $54.53 | $45.71 | $36.55 | |
| Income (loss) from investment operations: | ||||||
| Net investment income (loss) | 0.90 1 | 0.93 1 | 0.80 1 | 0.73 | 0.74 | |
| Net realized and unrealized gains (losses) | 6.64 | 3.75 | (1.07) | 8.84 | 9.18 | |
| Total from investment operations | 7.54 | 4.68 | (0.27) | 9.57 | 9.92 | |
| Less distributions: | ||||||
| Distributions from net investment income | (0.93) | (0.80) | (0.72) | (0.75) | (0.76) | |
| Net asset value at end of period | $64.03 | $57.42 | $53.54 | $54.53 | $45.71 | |
| Total return | 13.21% | 8.89% | (0.54%) | 21.01% | 27.47% | |
| Ratios/Supplemental Data | ||||||
| Ratios to average net assets: | ||||||
| Total expenses | 0.06% 2 | 0.08% 3 | 0.08% | 0.08% | 0.09% 4 | |
| Net investment income (loss) | 1.46% | 1.76% | 1.44% | 1.41% | 1.74% | |
| Portfolio turnover rate5 | 11% | 11% | 9% | 13% | 22% | |
| Net assets, end of period (x 1,000) | $5,490,843 | $3,772,207 | $2,893,741 | $2,104,717 | $1,446,857 | |
| Security | Number of Shares | % of Net Assets | Value ($) | |
| Common Stock 99.8% of net assets | ||||
| Automobiles & Components 1.4% | ||||
| Gentex Corp. | 580,156 | 0.2 | 10,599,450 | |
| Thor Industries, Inc. | 98,471 | 0.2 | 10,697,890 | |
| Other Securities | 1.0 | 54,828,636 | ||
| 1.4 | 76,125,976 | |||
| Banks 9.9% | ||||
| PacWest Bancorp | 247,087 | 0.2 | 11,155,978 | |
| Synovus Financial Corp. | 251,425 | 0.2 | 10,590,021 | |
| Other Securities | 9.5 | 521,899,440 | ||
| 9.9 | 543,645,439 | |||
| Capital Goods 9.9% | ||||
| AECOM * | 316,038 | 0.2 | 10,587,273 | |
| BWX Technologies, Inc. | 203,030 | 0.2 | 11,109,802 | |
| Graco, Inc. | 113,460 | 0.2 | 13,105,765 | |
| Orbital ATK, Inc. | 116,588 | 0.2 | 13,008,889 | |
| Oshkosh Corp. | 154,179 | 0.2 | 11,501,753 | |
| Teledyne Technologies, Inc. * | 73,369 | 0.2 | 11,009,752 | |
| Other Securities | 8.7 | 471,015,089 | ||
| 9.9 | 541,338,323 | |||
| Commercial & Professional Services 2.8% | ||||
| Other Securities | 2.8 | 152,455,364 | ||
| Consumer Durables & Apparel 2.3% | ||||
| Other Securities | 2.3 | 123,053,306 | ||
| Consumer Services 3.9% | ||||
| ServiceMaster Global Holdings, Inc. * | 276,329 | 0.2 | 13,020,623 | |
| Other Securities | 3.7 | 201,426,119 | ||
| 3.9 | 214,446,742 | |||
| Diversified Financials 3.6% | ||||
| Janus Henderson Group plc | 363,053 | 0.2 | 12,547,112 | |
| Other Securities | 3.4 | 187,139,286 | ||
| 3.6 | 199,686,398 | |||
| Energy 3.4% | ||||
| Other Securities | 3.4 | 184,654,937 | ||
| Security | Number of Shares | % of Net Assets | Value ($) | |
| Food & Staples Retailing 0.5% | ||||
| Other Securities | 0.5 | 26,201,002 | ||
| Food, Beverage & Tobacco 1.4% | ||||
| Other Securities | 1.4 | 79,000,922 | ||
| Health Care Equipment & Services 6.0% | ||||
| athenahealth, Inc. * | 81,459 | 0.2 | 11,480,017 | |
| Envision Healthcare Corp. * | 238,015 | 0.2 | 12,474,366 | |
| Veeva Systems, Inc., Class A * | 216,325 | 0.2 | 12,871,337 | |
| WellCare Health Plans, Inc. * | 90,702 | 0.3 | 15,843,825 | |
| Other Securities | 5.1 | 277,276,476 | ||
| 6.0 | 329,946,021 | |||
| Household & Personal Products 0.8% | ||||
| Coty, Inc., Class A | 961,869 | 0.3 | 15,947,788 | |
| Other Securities | 0.5 | 30,199,625 | ||
| 0.8 | 46,147,413 | |||
| Insurance 3.0% | ||||
| Assured Guaranty Ltd. | 250,731 | 0.2 | 10,666,097 | |
| First American Financial Corp. | 223,107 | 0.2 | 10,945,629 | |
| Other Securities | 2.6 | 145,078,042 | ||
| 3.0 | 166,689,768 | |||
| Materials 5.6% | ||||
| Alcoa Corp. * | 297,907 | 0.2 | 13,072,159 | |
| AptarGroup, Inc. | 126,795 | 0.2 | 10,601,330 | |
| Olin Corp. | 342,702 | 0.2 | 11,045,286 | |
| The Chemours Co. | 379,494 | 0.3 | 18,621,771 | |
| Other Securities | 4.7 | 253,022,819 | ||
| 5.6 | 306,363,365 | |||
| Media 2.0% | ||||
| Other Securities | 2.0 | 111,819,961 | ||
| Pharmaceuticals, Biotechnology & Life Sciences 8.1% | ||||
| Bioverativ, Inc. * | 219,951 | 0.2 | 12,469,022 | |
| Bluebird Bio, Inc. * | 91,242 | 0.2 | 11,391,564 | |
| Catalent, Inc. * | 259,221 | 0.2 | 10,703,235 | |
| Exelixis, Inc. * | 476,944 | 0.3 | 13,945,843 | |
| Kite Pharma, Inc. * | 102,749 | 0.3 | 18,288,295 | |
| Other Securities | 6.9 | 377,218,966 | ||
| 8.1 | 444,016,925 | |||
| Security | Number of Shares | % of Net Assets | Value ($) | |
| Real Estate 9.5% | ||||
| Colony NorthStar, Inc., Class A | 1,133,273 | 0.3 | 14,857,209 | |
| DCT Industrial Trust, Inc. | 187,076 | 0.2 | 10,915,885 | |
| Healthcare Trust of America, Inc., Class A | 394,639 | 0.2 | 12,261,434 | |
| Hudson Pacific Properties, Inc. | 320,633 | 0.2 | 10,580,889 | |
| Other Securities | 8.6 | 471,704,395 | ||
| 9.5 | 520,319,812 | |||
| Retailing 2.8% | ||||
| Other Securities | 2.8 | 150,547,646 | ||
| Semiconductors & Semiconductor Equipment 3.3% | ||||
| Microsemi Corp. * | 237,990 | 0.2 | 11,989,936 | |
| ON Semiconductor Corp. * | 862,557 | 0.3 | 14,732,473 | |
| Teradyne, Inc. | 406,635 | 0.3 | 14,480,272 | |
| Other Securities | 2.5 | 141,962,555 | ||
| 3.3 | 183,165,236 | |||
| Software & Services 8.6% | ||||
| Guidewire Software, Inc. * | 150,953 | 0.2 | 11,428,652 | |
| LogMeIn, Inc. | 106,368 | 0.2 | 12,168,499 | |
| PTC, Inc. * | 234,434 | 0.2 | 13,128,304 | |
| Take-Two Interactive Software, Inc. * | 215,537 | 0.4 | 21,077,363 | |
| Other Securities | 7.6 | 415,683,951 | ||
| 8.6 | 473,486,769 | |||
| Technology Hardware & Equipment 5.3% | ||||
| ARRIS International plc * | 382,281 | 0.2 | 10,650,349 | |
| Cognex Corp. | 176,135 | 0.3 | 19,193,431 | |
| Coherent, Inc. * | 50,556 | 0.2 | 11,795,726 | |
| IPG Photonics Corp. * | 76,946 | 0.2 | 13,526,337 | |
| Universal Display Corp. | 91,588 | 0.2 | 11,640,835 | |
| Zebra Technologies Corp., Class A * | 106,898 | 0.2 | 11,020,115 | |
| Other Securities | 4.0 | 215,014,924 | ||
| 5.3 | 292,841,717 | |||
| Telecommunication Services 0.6% | ||||
| Other Securities | 0.6 | 33,248,339 | ||
| Transportation 1.6% | ||||
| XPO Logistics, Inc. * | 176,997 | 0.2 | 10,832,216 | |
| Other Securities | 1.4 | 79,096,444 | ||
| 1.6 | 89,928,660 | |||
| Utilities 3.5% | ||||
| Great Plains Energy, Inc. | 448,252 | 0.3 | 13,756,854 | |
| MDU Resources Group, Inc. | 408,681 | 0.2 | 11,050,734 | |
| Security | Number of Shares | % of Net Assets | Value ($) | |
| Vectren Corp. | 169,787 | 0.2 | 11,139,725 | |
| Other Securities | 2.8 | 155,291,137 | ||
| 3.5 | 191,238,450 | |||
| Total Common Stock | ||||
| (Cost $4,847,106,818) | 5,480,368,491 | |||
| Rights 0.0% of net assets | ||||
| Media 0.0% | ||||
| Other Securities | 0.0 | — | ||
| Pharmaceuticals, Biotechnology & Life Sciences 0.0% | ||||
| Other Securities | 0.0 | 215,274 | ||
| Total Rights | ||||
| (Cost $215,274) | 215,274 | |||
| Other Investment Companies 2.3% of net assets | ||||
| Money Market Fund 0.1% | ||||
| Other Securities | 0.1 | 4,479,320 | ||
| Securities Lending Collateral 2.2% | ||||
| Wells Fargo Government Money Market Fund, Select Class 0.92% (c) | 2.2 | 120,938,610 | ||
| Total Other Investment Companies | ||||
| (Cost $125,417,930) | 125,417,930 | |||
| Number of Contracts | Notional Amount ($) | Current Value/ Unrealized Appreciation ($) | ||
| Futures Contracts | ||||
| Long | ||||
| Russell 2000 Index, e-mini expires 09/15/17 | 130 | 9,132,500 | 130,764 | |
| * | Non-income producing security. |
| (a) | All or a portion of this security is on loan. Securities on loan were valued at $118,059,566. |
| (b) | Fair-valued by management in accordance with procedures approved by the Board of Trustees. |
| (c) | The rate shown is the 7-day yield. |
| CVR — | Contingent Value Rights |
| REIT — | Real Estate Investment Trust |
| Description | Quoted Prices in Active Markets for Identical Assets (Level 1) | Other Significant Observable Inputs (Level 2) | Significant Unobservable Inputs (Level 3) | Total | |
| Assets | |||||
| Common Stock1 | $5,480,368,491 | $— | $— | $5,480,368,491 | |
| Rights 1 | — | — | — | — | |
| Media | — | — | — * | — | |
| Pharmaceuticals, Biotechnology & Life Sciences | — | — | 215,274 * | 215,274 | |
| Other Investment Companies1 | 125,417,930 | — | — | 125,417,930 | |
| Futures Contracts2 | 130,764 | — | — | 130,764 | |
| Total | $5,605,917,185 | $— | $215,274 | $5,606,132,459 |
| * | Level 3 amount shown includes securities determined to have no value at August 31, 2017. |
| 1 | As categorized in the complete schedule of Portfolio Holdings. |
| 2 | Futures contracts are valued at unrealized appreciation or depreciation. |
| Assets | ||
| Investments in unaffiliated issuers, at value (cost $4,851,801,412) including securities on loan of $118,059,566 | $5,485,063,085 | |
| Collateral invested for securities on loan, at value (cost $120,938,610) | 120,938,610 | |
| Deposit with broker for futures contracts | 512,500 | |
| Receivables: | ||
| Investments sold | 160,526 | |
| Dividends | 4,819,337 | |
| Income from securities on loan | 443,380 | |
| Variation margin on futures contracts | + | 73,777 |
| Total assets | 5,612,011,215 | |
| Liabilities | ||
| Collateral held for securities on loan | 120,938,610 | |
| Payables: | ||
| Investment adviser fees | + | 229,149 |
| Total liabilities | 121,167,759 | |
| Net Assets | ||
| Total assets | 5,612,011,215 | |
| Total liabilities | – | 121,167,759 |
| Net assets | $5,490,843,456 | |
| Net Assets by Source | ||
| Capital received from investors | 4,898,565,771 | |
| Net investment income not yet distributed | 7,333,519 | |
| Net realized capital losses | (48,448,271) | |
| Net unrealized capital appreciation | 633,392,437 | |
| Net Asset Value (NAV) | ||||
| Net Assets | ÷ | Shares Outstanding | = | NAV |
| $5,490,843,456 | 85,750,000 | $64.03 | ||
| Investment Income | ||
| Dividends (net of foreign withholding tax of $38,321) | $68,906,535 | |
| Securities on loan, net | + | 4,469,388 |
| Total investment income | 73,375,923 | |
| Expenses | ||
| Investment adviser fees | 2,669,341 | |
| Total expenses | – | 2,669,341 |
| Net investment income | 70,706,582 | |
| Realized and Unrealized Gains (Losses) | ||
| Net realized gains on investments | 40,126,436 | |
| Net realized gains on in-kind redemptions | 214,394,484 | |
| Net realized gains on futures contracts | 1,726,808 | |
| Net realized gains on foreign currency transactions | + | 3,471 |
| Net realized gains | 256,251,199 | |
| Net change in unrealized appreciation (depreciation) on investments | 227,220,232 | |
| Net change in unrealized appreciation (depreciation) on futures contracts | + | 131,961 |
| Net change in unrealized appreciation (depreciation) | + | 227,352,193 |
| Net realized and unrealized gains | 483,603,392 | |
| Increase in net assets resulting from operations | $554,309,974 | |
| Operations | ||||
| 9/1/16-8/31/17 | 9/1/15-8/31/16 | |||
| Net investment income | $70,706,582 | $54,948,126 | ||
| Net realized gains | 256,251,199 | 79,006,472 | ||
| Net change in unrealized appreciation (depreciation) | + | 227,352,193 | 157,262,021 | |
| Increase in net assets resulting from operations | 554,309,974 | 291,216,619 | ||
| Distributions to Shareholders | ||||
| Distributions from net investment income | ($70,593,475) | ($46,392,950) | ||
| Transactions in Fund Shares | ||||||||
| 9/1/16-8/31/17 | 9/1/15-8/31/16 | |||||||
| SHARES | VALUE | SHARES | VALUE | |||||
| Shares sold | 29,050,000 | $1,780,107,287 | 20,950,000 | $1,122,818,001 | ||||
| Shares redeemed | + | (9,000,000) | (545,187,393) | (9,300,000) | (489,175,354) | |||
| Net transactions in fund shares | 20,050,000 | $1,234,919,894 | 11,650,000 | $633,642,647 | ||||
| Shares Outstanding and Net Assets | ||||||||
| 9/1/16-8/31/17 | 9/1/15-8/31/16 | |||||||
| SHARES | NET ASSETS | SHARES | NET ASSETS | |||||
| Beginning of period | 65,700,000 | $3,772,207,063 | 54,050,000 | $2,893,740,747 | ||||
| Total increase | + | 20,050,000 | 1,718,636,393 | 11,650,000 | 878,466,316 | |||
| End of period | 85,750,000 | $5,490,843,456 | 65,700,000 | $3,772,207,063 | ||||
| Net investment income not yet distributed | $7,333,519 | $11,992,552 | ||||||
| 9/1/16– 8/31/17 | 9/1/15– 8/31/16 | 9/1/14– 8/31/15 | 9/1/13– 8/31/14 | 9/1/12– 8/31/13 | ||
| Per-Share Data | ||||||
| Net asset value at beginning of period | $42.47 | $36.52 | $38.90 | $33.00 | $28.58 | |
| Income (loss) from investment operations: | ||||||
| Net investment income (loss) | 1.40 1 | 1.29 1 | 1.19 1 | 1.04 | 0.91 | |
| Net realized and unrealized gains (losses) | 3.26 | 5.85 | (2.46) | 5.86 | 4.40 | |
| Total from investment operations | 4.66 | 7.14 | (1.27) | 6.90 | 5.31 | |
| Less distributions: | ||||||
| Distributions from net investment income | (1.30) | (1.19) | (1.11) | (1.00) | (0.89) | |
| Net asset value at end of period | $45.83 | $42.47 | $36.52 | $38.90 | $33.00 | |
| Total return | 11.12% | 19.89% | (3.47%) | 21.15% | 18.93% | |
| Ratios/Supplemental Data | ||||||
| Ratios to average net assets: | ||||||
| Total expenses | 0.07% | 0.07% | 0.07% | 0.07% | 0.07% | |
| Net investment income (loss) | 3.17% | 3.27% | 3.03% | 3.01% | 3.09% | |
| Portfolio turnover rate2 | 15% | 22% | 19% | 26% | 13% | |
| Net assets, end of period (x 1,000) | $6,040,705 | $4,300,443 | $2,497,808 | $2,075,331 | $1,141,690 | |
| Security | Number of Shares | % of Net Assets | Value ($) | |
| Common Stock 99.5% of net assets | ||||
| Automobiles & Components 0.2% | ||||
| Other Securities | 0.2 | 13,494,785 | ||
| Banks 0.3% | ||||
| Other Securities | 0.3 | 20,675,125 | ||
| Capital Goods 12.7% | ||||
| 3M Co. | 980,905 | 3.3 | 200,418,510 | |
| Cummins, Inc. | 253,898 | 0.7 | 40,466,263 | |
| Eaton Corp. plc | 738,396 | 0.9 | 52,987,297 | |
| Emerson Electric Co. | 1,058,889 | 1.0 | 62,516,807 | |
| Fastenal Co. | 474,885 | 0.3 | 20,263,343 | |
| Lockheed Martin Corp. | 410,965 | 2.1 | 125,504,601 | |
| Rockwell Automation, Inc. | 211,451 | 0.6 | 34,690,651 | |
| The Boeing Co. | 936,826 | 3.7 | 224,519,719 | |
| Other Securities | 0.1 | 7,528,622 | ||
| 12.7 | 768,895,813 | |||
| Commercial & Professional Services 0.1% | ||||
| Other Securities | 0.1 | 3,002,633 | ||
| Consumer Durables & Apparel 1.6% | ||||
| Hasbro, Inc. | 184,040 | 0.3 | 18,081,930 | |
| VF Corp. | 544,856 | 0.6 | 34,255,097 | |
| Other Securities | 0.7 | 44,141,317 | ||
| 1.6 | 96,478,344 | |||
| Consumer Services 3.9% | ||||
| McDonald's Corp. | 1,348,017 | 3.6 | 215,642,279 | |
| Other Securities | 0.3 | 22,518,584 | ||
| 3.9 | 238,160,863 | |||
| Diversified Financials 2.2% | ||||
| CME Group, Inc. | 557,757 | 1.2 | 70,165,830 | |
| T. Rowe Price Group, Inc. | 401,297 | 0.6 | 33,853,415 | |
| Other Securities | 0.4 | 26,702,177 | ||
| 2.2 | 130,721,422 | |||
| Energy 5.5% | ||||
| Exxon Mobil Corp. | 3,378,522 | 4.3 | 257,882,584 | |
| ONEOK, Inc. | 345,727 | 0.3 | 18,724,574 | |
| Security | Number of Shares | % of Net Assets | Value ($) | |
| Valero Energy Corp. | 740,275 | 0.8 | 50,412,728 | |
| Other Securities | 0.1 | 7,668,790 | ||
| 5.5 | 334,688,676 | |||
| Food & Staples Retailing 3.2% | ||||
| Wal-Mart Stores, Inc. | 2,478,166 | 3.2 | 193,470,420 | |
| Food, Beverage & Tobacco 13.3% | ||||
| Altria Group, Inc. | 3,189,940 | 3.3 | 202,242,196 | |
| General Mills, Inc. | 953,045 | 0.8 | 50,759,177 | |
| PepsiCo, Inc. | 2,336,681 | 4.5 | 270,424,092 | |
| The Coca-Cola Co. | 6,000,027 | 4.5 | 273,301,230 | |
| Other Securities | 0.2 | 8,428,440 | ||
| 13.3 | 805,155,135 | |||
| Health Care Equipment & Services 0.0% | ||||
| Other Securities | 0.0 | 965,536 | ||
| Household & Personal Products 6.5% | ||||
| Kimberly-Clark Corp. | 584,028 | 1.2 | 72,004,812 | |
| The Clorox Co. | 210,453 | 0.5 | 29,154,054 | |
| The Procter & Gamble Co. | 3,079,557 | 4.7 | 284,150,725 | |
| Other Securities | 0.1 | 5,005,457 | ||
| 6.5 | 390,315,048 | |||
| Insurance 0.8% | ||||
| Principal Financial Group, Inc. | 438,850 | 0.5 | 27,436,902 | |
| Other Securities | 0.3 | 21,967,411 | ||
| 0.8 | 49,404,313 | |||
| Materials 3.2% | ||||
| International Paper Co. | 675,883 | 0.6 | 36,409,817 | |
| Packaging Corp. of America | 154,597 | 0.3 | 17,378,249 | |
| The Dow Chemical Co. | 1,838,903 | 2.0 | 122,562,885 | |
| Other Securities | 0.3 | 15,111,412 | ||
| 3.2 | 191,462,363 | |||
| Media 0.5% | ||||
| Omnicom Group, Inc. | 386,103 | 0.4 | 27,946,135 | |
| Other Securities | 0.1 | 3,205,672 | ||
| 0.5 | 31,151,807 | |||
| Security | Number of Shares | % of Net Assets | Value ($) | |
| Pharmaceuticals, Biotechnology & Life Sciences 9.4% | ||||
| Johnson & Johnson | 2,089,996 | 4.6 | 276,652,771 | |
| Pfizer, Inc. | 8,541,122 | 4.8 | 289,714,858 | |
| 9.4 | 566,367,629 | |||
| Retailing 6.8% | ||||
| Best Buy Co., Inc. | 447,732 | 0.4 | 24,293,938 | |
| Genuine Parts Co. | 245,621 | 0.3 | 20,344,787 | |
| Target Corp. | 913,008 | 0.8 | 49,786,326 | |
| The Home Depot, Inc. | 1,764,292 | 4.4 | 264,414,442 | |
| Other Securities | 0.9 | 48,942,269 | ||
| 6.8 | 407,781,762 | |||
| Semiconductors & Semiconductor Equipment 10.4% | ||||
| Analog Devices, Inc. | 597,578 | 0.8 | 49,999,351 | |
| Intel Corp. | 7,535,945 | 4.4 | 264,285,591 | |
| Maxim Integrated Products, Inc. | 464,103 | 0.4 | 21,655,046 | |
| QUALCOMM, Inc. | 2,431,909 | 2.1 | 127,115,884 | |
| Texas Instruments, Inc. | 1,645,908 | 2.3 | 136,314,101 | |
| Xilinx, Inc. | 408,789 | 0.4 | 27,004,601 | |
| 10.4 | 626,374,574 | |||
| Software & Services 10.3% | ||||
| Automatic Data Processing, Inc. | 736,978 | 1.3 | 78,466,048 | |
| CA, Inc. | 518,386 | 0.3 | 17,200,047 | |
| International Business Machines Corp. | 1,413,258 | 3.3 | 202,138,292 | |
| Microsoft Corp. | 3,775,287 | 4.7 | 282,278,209 | |
| Paychex, Inc. | 524,272 | 0.5 | 29,899,232 | |
| Other Securities | 0.2 | 14,946,327 | ||
| 10.3 | 624,928,155 | |||
| Technology Hardware & Equipment 0.9% | ||||
| HP, Inc. | 2,789,865 | 0.9 | 53,230,624 | |
| Other Securities | 0.0 | 1,572,978 | ||
| 0.9 | 54,803,602 | |||
| Security | Number of Shares | % of Net Assets | Value ($) | |
| Telecommunication Services 4.7% | ||||
| Verizon Communications, Inc. | 5,872,441 | 4.7 | 281,700,995 | |
| Transportation 2.4% | ||||
| United Parcel Service, Inc., Class B | 1,135,347 | 2.1 | 129,838,283 | |
| Other Securities | 0.3 | 16,456,013 | ||
| 2.4 | 146,294,296 | |||
| Utilities 0.6% | ||||
| WEC Energy Group, Inc. | 518,493 | 0.6 | 33,816,113 | |
| Total Common Stock | ||||
| (Cost $5,446,554,601) | 6,010,109,409 | |||
| Other Investment Company 0.0% of net assets | ||||
| Money Market Fund 0.0% | ||||
| Other Securities | 0.0 | 2,744,024 | ||
| Total Other Investment Company | ||||
| (Cost $2,744,024) | 2,744,024 | |||
| Number of Contracts | Notional Amount ($) | Current Value/ Unrealized Appreciation ($) | ||
| Futures Contracts | ||||
| Long | ||||
| S&P 500 Index, e-mini, expires 09/15/17 | 245 | 30,258,725 | 160,930 | |
| (a) | The rate shown is the 7-day yield. |
| Description | Quoted Prices in Active Markets for Identical Assets (Level 1) | Other Significant Observable Inputs (Level 2) | Significant Unobservable Inputs (Level 3) | Total | |
| Assets | |||||
| Common Stock1 | $6,010,109,409 | $— | $— | $6,010,109,409 | |
| Other Investment Company1 | 2,744,024 | — | — | 2,744,024 | |
| Futures Contracts2 | 160,930 | — | — | 160,930 | |
| Total | $6,013,014,363 | $— | $— | $6,013,014,363 |
| 1 | As categorized in the complete schedule of Portfolio Holdings. |
| 2 | Futures contracts are valued at unrealized appreciation or depreciation. |
| Assets | ||
| Investments in unaffiliated issuers, at value (cost $5,449,298,625) | $6,012,853,433 | |
| Deposit with broker for futures contracts | 882,000 | |
| Receivables: | ||
| Dividends | 27,137,352 | |
| Fund shares sold | 4,560,492 | |
| Variation margin on futures contracts | + | 151,570 |
| Total assets | 6,045,584,847 | |
| Liabilities | ||
| Payables: | ||
| Investments bought | 4,534,540 | |
| Investment adviser fees | + | 344,957 |
| Total liabilities | 4,879,497 | |
| Net Assets | ||
| Total assets | 6,045,584,847 | |
| Total liabilities | – | 4,879,497 |
| Net assets | $6,040,705,350 | |
| Net Assets by Source | ||
| Capital received from investors | 5,468,397,924 | |
| Net investment income not yet distributed | 35,978,064 | |
| Net realized capital losses | (27,386,376) | |
| Net unrealized capital appreciation | 563,715,738 | |
| Net Asset Value (NAV) | ||||
| Net Assets | ÷ | Shares Outstanding | = | NAV |
| $6,040,705,350 | 131,800,000 | $45.83 | ||
| Investment Income | ||
| Dividends | $165,208,522 | |
| Expenses | ||
| Investment adviser fees | 3,573,138 | |
| Total expenses | – | 3,573,138 |
| Net investment income | 161,635,384 | |
| Realized and Unrealized Gains (Losses) | ||
| Net realized gains on investments | 5,738,042 | |
| Net realized gains on in-kind redemptions | 110,400,412 | |
| Net realized gains on futures contracts | + | 2,075,311 |
| Net realized gains | 118,213,765 | |
| Net change in unrealized appreciation (depreciation) on investments | 261,408,822 | |
| Net change in unrealized appreciation (depreciation) on futures contracts | + | 150,682 |
| Net change in unrealized appreciation (depreciation) | + | 261,559,504 |
| Net realized and unrealized gains | 379,773,269 | |
| Increase in net assets resulting from operations | $541,408,653 | |
| Operations | ||||
| 9/1/16-8/31/17 | 9/1/15-8/31/16 | |||
| Net investment income | $161,635,384 | $106,265,224 | ||
| Net realized gains | 118,213,765 | 62,108,001 | ||
| Net change in unrealized appreciation (depreciation) | + | 261,559,504 | 408,384,916 | |
| Increase in net assets resulting from operations | 541,408,653 | 576,758,141 | ||
| Distributions to Shareholders | ||||
| Distributions from net investment income | ($149,368,750) | ($95,093,961) | ||
| Transactions in Fund Shares | ||||||||
| 9/1/16-8/31/17 | 9/1/15-8/31/16 | |||||||
| SHARES | VALUE | SHARES | VALUE | |||||
| Shares sold | 45,900,000 | $2,020,915,221 | 44,000,000 | $1,750,920,347 | ||||
| Shares redeemed | + | (15,350,001) | (672,692,389) | (11,150,000) | (429,949,595) | |||
| Net transactions in fund shares | 30,549,999 | $1,348,222,832 | 32,850,000 | $1,320,970,752 | ||||
| Shares Outstanding and Net Assets | ||||||||
| 9/1/16-8/31/17 | 9/1/15-8/31/16 | |||||||
| SHARES | NET ASSETS | SHARES | NET ASSETS | |||||
| Beginning of period | 101,250,001 | $4,300,442,615 | 68,400,001 | $2,497,807,683 | ||||
| Total increase | + | 30,549,999 | 1,740,262,735 | 32,850,000 | 1,802,634,932 | |||
| End of period | 131,800,000 | $6,040,705,350 | 101,250,001 | $4,300,442,615 | ||||
| Net investment income not yet distributed | $35,978,064 | $25,943,439 | ||||||
| SCHWAB STRATEGIC TRUST (ORGANIZED JANUARY 27, 2009) | |
| Schwab U.S. Broad Market ETF | Schwab U.S. TIPS ETF™ |
| Schwab U.S. Large-Cap ETF | Schwab Short-Term U.S. Treasury ETF™ |
| Schwab U.S. Large-Cap Growth ETF | Schwab Intermediate-Term U.S. Treasury ETF™ |
| Schwab U.S. Large-Cap Value ETF | Schwab U.S. Aggregate Bond ETF™ |
| Schwab U.S. Mid-Cap ETF | Schwab Fundamental U.S. Broad Market Index ETF |
| Schwab U.S. Small-Cap ETF | Schwab Fundamental U.S. Large Company Index ETF |
| Schwab U.S. Dividend Equity ETF | Schwab Fundamental U.S. Small Company Index ETF |
| Schwab U.S. REIT ETF™ | Schwab Fundamental International Large Company Index ETF |
| Schwab International Equity ETF™ | Schwab Fundamental International Small Company Index ETF |
| Schwab International Small-Cap Equity ETF™ | Schwab Fundamental Emerging Markets Large Company Index ETF |
| Schwab Emerging Markets Equity ETF™ | |
2. Significant Accounting Policies:
3. Risk Factors:
4. Affiliates and Affiliated Transactions:
| Schwab U.S. Broad Market ETF | Schwab U.S. Large-Cap ETF | Schwab U.S. Large-Cap Growth ETF | Schwab U.S. Large-Cap Value ETF | Schwab U.S. Mid-Cap ETF | Schwab U.S. Small-Cap ETF | Schwab U.S. Dividend Equity ETF |
| 0.03% | 0.03% | 0.04% 1 | 0.04% 1 | 0.05% 2,3 | 0.05% 2,3 | 0.07% |
| 1 | Prior to December 29, 2016, the advisory fees of the Schwab U.S. Large-Cap Growth ETF and Schwab U.S. Large-Cap Value ETF were 0.06%. |
| 2 | Prior to October 7, 2016, the advisory fees of the Schwab U.S. Mid-Cap ETF and Schwab U.S. Small-Cap ETF were 0.07%. |
| 3 | Prior to March 1, 2017, the advisory fees of the Schwab U.S. Mid-Cap ETF and Schwab U.S. Small-Cap ETF were 0.06%. |
| Underlying Funds | |||
| Schwab U.S. Large-Cap ETF | Schwab U.S. Small-Cap ETF | ||
| Schwab VIT Balanced Portfolio | 0.1% | 0.0%* | |
| Schwab VIT Balanced with Growth Portfolio | 0.3% | 0.2% | |
| Schwab VIT Growth Portfolio | 0.4% | 0.2% | |
| Schwab Target 2010 Index Fund | 0.0%* | 0.0%* | |
| Schwab Target 2015 Index Fund | 0.0%* | 0.0%* | |
| Schwab Target 2020 Index Fund | 0.1% | 0.0%* | |
| Schwab Target 2025 Index Fund | 0.1% | 0.0%* | |
| Schwab Target 2030 Index Fund | 0.2% | 0.0%* | |
| Schwab Target 2035 Index Fund | 0.1% | 0.0%* | |
| Schwab Target 2040 Index Fund | 0.1% | 0.0%* | |
| Schwab Target 2045 Index Fund | 0.1% | 0.0%* | |
| Schwab Target 2050 Index Fund | 0.1% | 0.0%* | |
| Schwab Target 2055 Index Fund | 0.0%* | 0.0%* | |
| Schwab Target 2060 Index Fund | 0.0%* | 0.0%* | |
| * | Less than 0.05% |
| Total Aggregate Transactions | Realized Gains (Losses) | |
| Schwab U.S. Broad Market ETF | $77,709,524 | ($9,962,110) |
| Schwab U.S. Large-Cap ETF | 136,020,845 | (11,983,448) |
| Schwab U.S. Large-Cap Growth ETF | 127,552,900 | (27,036,501) |
| Schwab U.S. Large-Cap Value ETF | 161,257,033 | (7,292,749) |
| Schwab U.S. Mid-Cap ETF | 147,053,241 | (36,347,574) |
| Schwab U.S. Small-Cap ETF | 209,451,834 | (241,211) |
| Schwab U.S. Dividend Equity ETF | 103,036,866 | (4,058,263) |
5. Other Service Providers:
6. Board of Trustees:
7. Borrowing from Banks:
| Notional Amounts | Number of Contracts | |
| Schwab U.S. Broad Market ETF | $21,293,568 | 184 |
| Schwab U.S. Large-Cap ETF | 18,903,695 | 163 |
| Schwab U.S. Large-Cap Growth ETF | 5,775,023 | 50 |
| Schwab U.S. Large-Cap Value ETF | 8,006,118 | 69 |
| Schwab U.S. Mid-Cap ETF | 4,034,874 | 35 |
| Schwab U.S. Small-Cap ETF | 10,212,916 | 130 |
| Schwab U.S. Dividend Equity ETF | 13,114,194 | 113 |
9. Purchases and Sales/Maturities of Investment Securities:
| Purchases of Securities | Sales/Maturities of Securities | |
| Schwab U.S. Broad Market ETF | $479,046,735 | $332,274,052 |
| Schwab U.S. Large-Cap ETF | 389,070,801 | 285,889,827 |
| Schwab U.S. Large-Cap Growth ETF | 251,460,264 | 194,041,728 |
| Schwab U.S. Large-Cap Value ETF | 214,357,935 | 200,520,569 |
| Schwab U.S. Mid-Cap ETF | 603,216,616 | 514,036,148 |
| Schwab U.S. Small-Cap ETF | 750,960,448 | 536,566,957 |
| Schwab U.S. Dividend Equity ETF | 704,580,626 | 695,073,196 |
10. In-Kind Transactions:
| In-Kind Purchases of Securities | In-Kind Sales of Securities | |
| Schwab U.S. Broad Market ETF | $2,365,353,595 | $121,525,216 |
| Schwab U.S. Large-Cap ETF | 2,593,328,011 | 67,065,698 |
| Schwab U.S. Large-Cap Growth ETF | 1,156,790,603 | 329,517,371 |
| Schwab U.S. Large-Cap Value ETF | 1,056,241,726 | 301,979,053 |
| Schwab U.S. Mid-Cap ETF | 1,062,261,402 | 395,727,968 |
| Schwab U.S. Small-Cap ETF | 1,733,951,796 | 514,100,480 |
| Schwab U.S. Dividend Equity ETF | 1,954,336,495 | 605,087,768 |
11. Federal Income Taxes
| Schwab U.S. Broad Market ETF | Schwab U.S. Large-Cap ETF | Schwab U.S. Large-Cap Growth ETF | Schwab U.S. Large-Cap Value ETF | Schwab U.S. Mid-Cap ETF | Schwab U.S. Small-Cap ETF | Schwab U.S. Dividend Equity ETF | |||||||
| Tax cost | $8,133,147,592 | $7,918,305,422 | $3,527,647,210 | $3,070,483,689 | $3,092,973,573 | $4,979,242,390 | $5,449,122,034 | ||||||
| Gross unrealized appreciation | $2,314,446,643 | $2,108,023,936 | $1,052,246,011 | $542,983,482 | $655,899,831 | $1,000,769,181 | $706,941,098 | ||||||
| Gross unrealized depreciation | (216,592,585) | (207,322,482) | (102,072,941) | (86,033,157) | (155,858,546) | (373,879,112) | (143,048,769) | ||||||
| Net unrealized appreciation (depreciation) | $2,097,854,058 | $1,900,701,454 | $950,173,070 | $456,950,325 | $500,041,285 | $626,890,069 | $563,892,329 |
| Schwab U.S. Broad Market ETF | Schwab U.S. Large-Cap ETF | Schwab U.S. Large-Cap Growth ETF | Schwab U.S. Large-Cap Value ETF | Schwab U.S. Mid-Cap ETF | Schwab U.S. Small-Cap ETF | Schwab U.S. Dividend Equity ETF | |||||||
| Undistributed ordinary income | $35,894,762 | $38,513,594 | $12,867,546 | $18,519,604 | $6,960,975 | $7,676,145 | $35,978,064 | ||||||
| Net unrealized appreciation (depreciation) on investments | 2,097,854,058 | 1,900,701,454 | 950,173,070 | 456,950,325 | 500,041,285 | 626,890,069 | 563,892,329 | ||||||
| Net other unrealized appreciation (depreciation) | — | — | — | — | — | — | — | ||||||
| Total | $2,133,748,820 | $1,939,215,048 | $963,040,616 | $475,469,929 | $507,002,260 | $634,566,214 | $599,870,393 |
| Expiration Date | Schwab U.S. Broad Market ETF | Schwab U.S. Large-Cap ETF | Schwab U.S. Large-Cap Growth ETF | Schwab U.S. Large-Cap Value ETF | Schwab U.S. Mid-Cap ETF | Schwab U.S. Small-Cap ETF | Schwab U.S. Dividend Equity ETF | ||||||
| August 31, 2019 | $— | $721,062 | $631,601 | $295,384 | $218,695 | $927,631 | $— | ||||||
| No expiration | 60,229,021 | 45,913,056 | 51,700,548 | 16,720,114 | 133,368,556 | 41,360,898 | 27,562,967 | ||||||
| Total | $60,229,021 | $46,634,118 | $52,332,149 | $17,015,498 | $133,587,251 | $42,288,529 | $27,562,967 |
| Schwab U.S. Broad Market ETF | Schwab U.S. Large-Cap ETF | Schwab U.S. Large-Cap Growth ETF | Schwab U.S. Large-Cap Value ETF | Schwab U.S. Mid-Cap ETF | Schwab U.S. Small-Cap ETF | Schwab U.S. Dividend Equity ETF | |
| Capital loss carryforwards utilized | $— | $— | $— | $— | $— | $48,012,930 | $9,047,018 |
| Schwab U.S. Broad Market ETF | Schwab U.S. Large-Cap ETF | Schwab U.S. Large-Cap Growth ETF | Schwab U.S. Large-Cap Value ETF | Schwab U.S. Mid-Cap ETF | Schwab U.S. Small-Cap ETF | Schwab U.S. Dividend Equity ETF | |
| Current period distributions | |||||||
| Ordinary income | $148,352,855 | $144,692,485 | $38,432,115 | $79,019,055 | $44,982,425 | $70,593,475 | $149,368,750 |
| Long-term capital gains | — | — | — | — | — | — | — |
| Prior period distributions | |||||||
| Ordinary income | $111,095,810 | $103,762,790 | $28,157,885 | $51,275,935 | $30,341,985 | $46,392,950 | $95,093,961 |
| Long-term capital gains | — | — | — | — | — | — | — |
| Schwab U.S. Broad Market ETF | Schwab U.S. Large-Cap ETF | Schwab U.S. Large-Cap Growth ETF | Schwab U.S. Large-Cap Value ETF | Schwab U.S. Mid-Cap ETF | Schwab U.S. Small-Cap ETF | Schwab U.S. Dividend Equity ETF | |
| Capital shares | $56,169,656 | $29,466,426 | $149,549,227 | $99,448,278 | $110,523,120 | $214,108,609 | $110,329,193 |
| Undistributed net investment income | (2,607,252) | (1,721,082) | (298,758) | (1,035,797) | (3,083,818) | (4,772,140) | (2,232,009) |
| Net realized gains and losses | (53,562,404) | (27,745,344) | (149,250,469) | (98,412,481) | (107,439,302) | (209,336,469) | (108,097,184) |
| Schwab U.S. Broad Market ETF | Schwab U.S. Large-Cap ETF | Schwab U.S. Large-Cap Growth ETF | Schwab U.S. Large-Cap Value ETF | Schwab U.S. Mid-Cap ETF | Schwab U.S. Small-Cap ETF | Schwab U.S. Dividend Equity ETF | |
| $55,990,004 | $29,366,824 | $149,586,706 | $99,489,277 | $109,870,585 | $214,394,484 | $110,400,412 |
12. Subsequent Events:
San Francisco, California
October 17, 2017
| Schwab U.S. Broad Market ETF | 90.07% |
| Schwab U.S. Large-Cap ETF | 91.25% |
| Schwab U.S. Large-Cap Growth ETF | 85.02% |
| Schwab U.S. Large-Cap Value ETF | 94.72% |
| Schwab U.S. Mid-Cap ETF | 73.06% |
| Schwab U.S. Small-Cap ETF | 68.11% |
| Schwab U.S. Dividend Equity ETF | 100.00% |
| Schwab U.S. Broad Market ETF | $140,651,302 |
| Schwab U.S. Large-Cap ETF | 139,897,990 |
| Schwab U.S. Large-Cap Growth ETF | 35,730,467 |
| Schwab U.S. Large-Cap Value ETF | 78,398,892 |
| Schwab U.S. Mid-Cap ETF | 34,668,429 |
| Schwab U.S. Small-Cap ETF | 49,870,703 |
| Schwab U.S. Dividend Equity ETF | 149,368,750 |
Market Price vs. NAV as of August 31, 2017
| Number of Days Market Price Above NAV | Number of Days Market Price Below NAV | |||||||
| 1-49 Basis Points | 50-99 Basis Points | 100-199 Basis Points | >200 Basis Points | 1-49 Basis Points | 50-99 Basis Points | 100-199 Basis Points | >200 Basis Points | |
| Schwab U.S. Broad Market ETF | ||||||||
| Commencement of trading | ||||||||
| 11/3/09 through 8/31/17 | 1,291 | 1 | — | — | 335 | — | — | — |
| Schwab U.S. Large-Cap ETF | ||||||||
| Commencement of trading | ||||||||
| 11/3/09 through 8/31/17 | 1,273 | — | — | — | 361 | — | — | — |
| Schwab U.S. Large-Cap Growth ETF | ||||||||
| Commencement of trading | ||||||||
| 12/11/09 through 8/31/17 | 1,162 | — | 1 | — | 372 | — | — | — |
| Schwab U.S. Large-Cap Value ETF | ||||||||
| Commencement of trading | ||||||||
| 12/11/09 through 8/31/17 | 1,182 | — | — | — | 331 | — | — | — |
| Schwab U.S. Mid-Cap ETF | ||||||||
| Commencement of trading | ||||||||
| 1/13/11 through 8/31/17 | 1,150 | — | — | — | 241 | — | — | — |
| Schwab U.S. Small-Cap ETF | ||||||||
| Commencement of trading | ||||||||
| 11/3/09 through 8/31/17 | 1,189 | 1 | — | — | 549 | — | — | — |
| Schwab U.S. Dividend Equity ETF | ||||||||
| Commencement of trading | ||||||||
| 10/20/11 through 8/31/17 | 791 | — | — | — | 288 | — | — | — |
| 1. | the nature, extent and quality of the services provided to the Funds under the Agreement, including the resources of CSIM and its affiliates dedicated to the Funds; |
| 2. | each Fund’s investment performance and how it compared to that of certain other comparable exchange-traded funds; |
| 3. | each Fund’s expenses and how those expenses compared to those of certain other comparable exchange-traded funds; |
| 4. | the profitability of CSIM and its affiliates, including Charles Schwab & Co., Inc. (Schwab), with respect to the Funds, including both direct and indirect benefits accruing to CSIM and its affiliates; and |
| 5. | the extent to which economies of scale would be realized as the Funds grow and whether fee levels in the Agreement reflect those economies of scale for the benefit of Fund investors. |
| Independent Trustees | |||
| Name, Year of Birth, and Position(s) with the trust (Terms of office, and length of Time Served1) | Principal Occupations During the Past Five Years | Number of Portfolios in Fund Complex Overseen by the Trustee | Other Directorships |
| Robert W. Burns 1959 Trustee (Trustee of Schwab Strategic Trust since 2009; The Charles Schwab Family of Funds, Schwab Investments, Schwab Capital Trust, Schwab Annuity Portfolios and Laudus Trust since 2016) | Retired/Private Investor (Jan. 2009 – present). Formerly, Managing Director, Pacific Investment Management Company, LLC (PIMCO) (investment management firm) and President, PIMCO Funds. | 105 | Director, PS Business Parks, Inc. (2005 – 2012) |
| John F. Cogan 1947 Trustee (Trustee of The Charles Schwab Family of Funds, Schwab Investments, Schwab Capital Trust and Schwab Annuity Portfolios since 2008; Laudus Trust since 2010; Schwab Strategic Trust since 2016) | Senior Fellow, The Hoover Institution at Stanford University (Oct. 1979 – present); Senior Fellow, Stanford Institute for Economic Policy Research (2000 – present); Professor of Public Policy, Stanford University (1994 – 2015). | 105 | Director, Gilead Sciences, Inc. (2005 – present) |
| Stephen Timothy Kochis 1946 Trustee (Trustee of Schwab Strategic Trust since 2012; The Charles Schwab Family of Funds, Schwab Investments, Schwab Capital Trust, Schwab Annuity Portfolios and Laudus Trust since 2016) | CEO and Owner, Kochis Global (wealth management consulting) (May 2012 – present); Chairman and CEO, Aspiriant, LLC (wealth management) (Jan. 2008 – Apr. 2012). | 105 | None |
| David L. Mahoney 1954 Trustee (Trustee of The Charles Schwab Family of Funds, Schwab Investments, Schwab Capital Trust, Schwab Annuity Portfolios and Laudus Trust since 2011; Schwab Strategic Trust since 2016) | Private Investor. | 105 | Director, Symantec Corporation (2003 – present) Director, Corcept Therapeutics Incorporated (2004 – present) Director, Adamas Pharmaceuticals, Inc. (2009 – present) |
| Independent Trustees (continued) | |||
| Name, Year of Birth, and Position(s) with the trust (Terms of office, and length of Time Served1) | Principal Occupations During the Past Five Years | Number of Portfolios in Fund Complex Overseen by the Trustee | Other Directorships |
| Kiran M. Patel 1948 Trustee (Trustee of The Charles Schwab Family of Funds, Schwab Investments, Schwab Capital Trust, Schwab Annuity Portfolios and Laudus Trust since 2011; Schwab Strategic Trust since 2016) | Retired. Executive Vice President and General Manager of Small Business Group, Intuit, Inc. (financial software and services firm for consumers and small businesses) (Dec. 2008 – Sept. 2013). | 105 | Director, KLA-Tencor Corporation (2008 – present) |
| Kimberly S. Patmore 1956 Trustee (Trustee of The Charles Schwab Family of Funds, Schwab Investments, Schwab Capital Trust, Schwab Annuity Portfolios, Schwab Strategic Trust and Laudus Trust since 2016) | Consultant, Patmore Management Consulting (management consulting) (2008 – present). | 105 | None |
| Charles A. Ruffel 1956 Trustee (Trustee of Schwab Strategic Trust since 2009; The Charles Schwab Family of Funds, Schwab Investments, Schwab Capital Trust, Schwab Annuity Portfolios and Laudus Trust since 2015) | Co-Chief Executive Officer, Kudu Investment Management, LLC (financial services) (Jan. 2015 – present); Partner, Kudu Advisors, LLC (financial services) (June 2008 – Jan. 2015); Advisor, Asset International, Inc. (publisher of financial services information) (Aug. 2008 – Jan. 2015). | 105 | None |
| Gerald B. Smith 1950 Trustee (Trustee of The Charles Schwab Family of Funds, Schwab Investments, Schwab Capital Trust and Schwab Annuity Portfolios since 2000; Laudus Trust since 2010; Schwab Strategic Trust since 2016) | Chairman, Chief Executive Officer and Founder of Smith Graham & Co. (investment advisors) (Mar. 1990 – present). | 105 | Director, Eaton (2012 – present) Director and Chairman of the Audit Committee, Oneok Partners LP (2003 – 2013) Director, Oneok, Inc. (2009 – 2013) Lead Independent Director, Board of Cooper Industries (2002 – 2012) |
| Joseph H. Wender 1944 Trustee (Trustee of The Charles Schwab Family of Funds, Schwab Investments, Schwab Capital Trust and Schwab Annuity Portfolios since 2008; Laudus Trust since 2010; Schwab Strategic Trust since 2016) | Senior Consultant, Goldman Sachs & Co., Inc. (investment banking and securities firm) (Jan. 2008 – present); Partner, Colgin Partners, LLC (vineyards) (Feb. 1998 – present). | 105 | Board Member and Chairman of the Audit Committee, Ionis Pharmaceuticals (1994 – present) Lead Independent Director and Chair of Audit Committee, OUTFRONT Media Inc. (2014 – present) |
| Interested Trustees | |||
| Name, Year of Birth, and Position(s) with the trust (Terms of office, and length of Time Served1) | Principal Occupations During the Past Five Years | Number of Portfolios in Fund Complex Overseen by the Trustee | Other Directorships |
| Walter W. Bettinger II2 1960 Chairman and Trustee (Trustee of The Charles Schwab Family of Funds, Schwab Investments, Schwab Capital Trust and Schwab Annuity Portfolios since 2008; Schwab Strategic Trust since 2009; Laudus Trust since 2010) | Director, President and Chief Executive Officer, The Charles Schwab Corporation (Oct. 2008 – present); President and Chief Executive Officer (Oct. 2008 – present), Director (May 2008 – present), Charles Schwab & Co., Inc.; Director, Charles Schwab Bank (Apr. 2006 – present); Director, Schwab Holdings, Inc. (May 2008 – present); and Director, Charles Schwab Investment Management, Inc. (July 2016 – present). | 105 | Director, The Charles Schwab Corporation (2008 – present) |
| Marie A. Chandoha2 1961 Trustee (Trustee of The Charles Schwab Family of Funds, Schwab Investments, Schwab Capital Trust, Schwab Annuity Portfolios, Schwab Strategic Trust and Laudus Trust since 2016) | Director, President and Chief Executive Officer (Dec. 2010 – present), Chief Investment Officer (Sept. 2010 – Oct. 2011), Charles Schwab Investment Management, Inc.; Trustee (Jan. 2016 – present), President, Chief Executive Officer (Dec. 2010 – present), and Chief Investment Officer (Sept. 2010 – Oct. 2011), Schwab Funds, Laudus Funds and Schwab ETFs; Director, Charles Schwab Worldwide Funds plc and Charles Schwab Asset Management (Ireland) Limited (Jan. 2011 – present); Global Head of Fixed Income Business Division, BlackRock, Inc. (formerly Barclays Global Investors) (Mar. 2007 – Aug. 2010). | 105 | None |
| Joseph R. Martinetto2 1962 Trustee (Trustee of The Charles Schwab Family of Funds, Schwab Investments, Schwab Capital Trust, Schwab Annuity Portfolios, Schwab Strategic Trust and Laudus Trust since 2016) | Senior Executive Vice President (July 2015 – present), Chief Financial Officer (July 2015 – May 2017), Executive Vice President and Chief Financial Officer (May 2007 – July 2015), The Charles Schwab Corporation and Charles Schwab & Co., Inc.; Director, Charles Schwab & Co., Inc. (May 2007 – present); Director (Apr. 2010 – present) and Chief Executive Officer (July 2013 – Apr. 2015), Charles Schwab Bank; Director (May 2007 – present), Chief Financial Officer (May 2007 – May 2017), Senior Executive Vice President (Feb. 2016 – present), and Executive Vice President (May 2007 – Feb. 2016), Schwab Holdings, Inc. | 105 | None |
| Officers of the Trust | |
| Name, Year of Birth, and Position(s) with the trust (Terms of office, and length of Time Served3) | Principal Occupations During the Past Five Years |
| Marie A. Chandoha 1961 President and Chief Executive Officer (Officer of The Charles Schwab Family of Funds, Schwab Investments, Schwab Capital Trust, Schwab Annuity Portfolios, Schwab Strategic Trust and Laudus Trust since 2010) | Director, President and Chief Executive Officer (Dec. 2010 – present), Chief Investment Officer (Sept. 2010 – Oct. 2011), Charles Schwab Investment Management, Inc.; Trustee (Jan. 2016 – present), President, Chief Executive Officer (Dec. 2010 – present), and Chief Investment Officer (Sept. 2010 – Oct. 2011), Schwab Funds, Laudus Funds and Schwab ETFs; Director, Charles Schwab Worldwide Funds plc and Charles Schwab Asset Management (Ireland) Limited (Jan. 2011 – present); Global Head of Fixed Income Business Division, BlackRock, Inc. (formerly Barclays Global Investors) (Mar. 2007 – Aug. 2010). |
| Mark Fischer 1970 Treasurer and Chief Financial Officer (Officer of The Charles Schwab Family of Funds, Schwab Investments, Schwab Capital Trust, Schwab Annuity Portfolios, Schwab Strategic Trust and Laudus Trust since 2013) | Treasurer and Chief Financial Officer, Schwab Funds, Laudus Funds and Schwab ETFs (Jan. 2016 – present); Assistant Treasurer, Schwab Funds and Laudus Funds (Dec. 2013 – Dec. 2015), Schwab ETFs (Nov. 2013 – Dec. 2015); Vice President, Charles Schwab Investment Management, Inc. (Oct. 2013 – present); Executive Director, J.P. Morgan Investor Services (Apr. 2011 – Sept. 2013); Assistant Treasurer, Massachusetts Financial Service Investment Management (May 2005 – Mar. 2011). |
| Officers of the Trust (continued) | |
| Name, Year of Birth, and Position(s) with the trust (Terms of office, and length of Time Served3) | Principal Occupations During the Past Five Years |
| George Pereira 1964 Senior Vice President and Chief Operating Officer (Officer of The Charles Schwab Family of Funds, Schwab Investments, Schwab Capital Trust and Schwab Annuity Portfolios since 2004; Laudus Trust since 2006; Schwab Strategic Trust since 2009) | Senior Vice President and Chief Financial Officer (Nov. 2004 – present), Chief Operating Officer (Jan. 2011 – present), Charles Schwab Investment Management, Inc.; Senior Vice President and Chief Operating Officer (Jan. 2016 – present), Treasurer and Chief Financial Officer, Laudus Funds (June 2006 – Dec. 2015); Treasurer and Principal Financial Officer, Schwab Funds (Nov. 2004 – Dec. 2015) and Schwab ETFs (Oct. 2009 – Dec. 2015); Director, Charles Schwab Worldwide Funds plc and Charles Schwab Asset Management (Ireland) Limited (Apr. 2005 – present). |
| Omar Aguilar 1970 Senior Vice President and Chief Investment Officer – Equities and Multi-Asset Strategies (Officer of The Charles Schwab Family of Funds, Schwab Investments, Schwab Capital Trust, Schwab Annuity Portfolios, Schwab Strategic Trust and Laudus Trust since 2011) | Senior Vice President and Chief Investment Officer – Equities and Multi-Asset Strategies, Charles Schwab Investment Management, Inc. (Apr. 2011 – present); Senior Vice President and Chief Investment Officer – Equities, Schwab Funds, Laudus Funds and Schwab ETFs (June 2011 – present); Head of the Portfolio Management Group and Vice President of Portfolio Management, Financial Engines, Inc. (May 2009 – Apr. 2011); Head of Quantitative Equity, ING Investment Management (July 2004 – Jan. 2009). |
| Brett Wander 1961 Senior Vice President and Chief Investment Officer – Fixed Income (Officer of The Charles Schwab Family of Funds, Schwab Investments, Schwab Capital Trust, Schwab Annuity Portfolios, Schwab Strategic Trust and Laudus Trust since 2011) | Senior Vice President and Chief Investment Officer – Fixed Income, Charles Schwab Investment Management, Inc. (Apr. 2011 – present); Senior Vice President and Chief Investment Officer – Fixed Income, Schwab Funds, Laudus Funds and Schwab ETFs (June 2011 – present); Senior Managing Director, Global Head of Active Fixed-Income Strategies, State Street Global Advisors (Jan. 2008 – Oct. 2010); Director of Alpha Strategies Loomis, Sayles & Company (Apr. 2006 – Jan. 2008). |
| David Lekich 1964 Chief Legal Officer and Secretary, Schwab Funds and Schwab ETFs Vice President and Assistant Clerk, Laudus Funds (Officer of The Charles Schwab Family of Funds, Schwab Investments, Schwab Capital Trust, Schwab Annuity Portfolios, Schwab Strategic Trust and Laudus Trust since 2011) | Senior Vice President (Sept. 2011 – present), Vice President (Mar. 2004 – Sept. 2011), Charles Schwab & Co., Inc.; Senior Vice President and Chief Counsel (Sept. 2011 – present), Vice President (Jan. 2011 – Sept. 2011), Charles Schwab Investment Management, Inc.; Secretary (Apr. 2011 – present) and Chief Legal Officer (Dec. 2011 – present), Schwab Funds; Vice President and Assistant Clerk, Laudus Funds (Apr. 2011 – present); Secretary (May 2011 – present) and Chief Legal Officer (Nov. 2011 – present), Schwab ETFs. |
| Catherine MacGregor 1964 Vice President and Assistant Secretary, Schwab Funds and Schwab ETFs Chief Legal Officer, Vice President and Clerk, Laudus Funds (Officer of The Charles Schwab Family of Funds, Schwab Investments, Schwab Capital Trust, Schwab Annuity Portfolios and Laudus Trust since 2005; Schwab Strategic Trust since 2009) | Vice President, Charles Schwab & Co., Inc., Charles Schwab Investment Management, Inc. (July 2005 – present); Vice President (Dec. 2005 – present), Chief Legal Officer and Clerk (Mar. 2007 – present), Laudus Funds; Vice President (Nov. 2005 – present) and Assistant Secretary (June 2007 – present), Schwab Funds; Vice President and Assistant Secretary, Schwab ETFs (Oct. 2009 – present). |
| 1 | Each Trustee shall hold office until the election and qualification of his or her successor, or until he or she dies, resigns or is removed. The retirement policy requires that each independent trustee retire by December 31 of the year in which the Trustee turns 74 or the Trustee’s twentieth year of service as an independent trustee on any trust in the Fund Complex, whichever occurs first. |
| 2 | Mr. Bettinger, Ms. Chandoha and Mr. Martinetto are Interested Trustees because they own stock of The Charles Schwab Corporation, the parent company of the investment adviser. |
| 3 | The President, Treasurer and Secretary/Clerk hold office until their respective successors are chosen and qualified or until he or she sooner dies, resigns, is removed or becomes disqualified. Each of the other officers serves at the pleasure of the Board. |
THIS IS NOT PART OF THE SHAREHOLDER REPORT
INFORMATION.
Schwab ETFs™
Index ETF
Printed on recycled paper.
| * | FUNDAMENTAL INDEX is a registered trademark of Research Affiliates LLC. |
00199030
Table of Contents
| Item 2: | Code of Ethics. |
| (a) | Registrant has adopted a code of ethics that applies to its principal executive officer, principal financial officer, and any other persons who perform a similar function, regardless of whether these individuals are employed by Registrant or a third party. |
| (c) | During the period covered by the report, no amendments were made to the provisions of this code of ethics. |
| (d) | During the period covered by the report, Registrant did not grant any waivers, including implicit waivers, from the provisions of this code of ethics. |
| (f)(1) | Registrant has filed this code of ethics as an exhibit pursuant to Item 12(a)(1) of Form N-CSR. |
| Item 3: | Audit Committee Financial Expert. |
Registrant’s Board of Trustees has determined that Kiran M. Patel, Robert W. Burns and Kimberly S. Patmore, each currently serving on its audit, compliance and valuation committee, are each an “audit committee financial expert,” as such term is defined in Item 3 of Form N-CSR. Each member of Registrant’s audit, compliance and valuation committee is “independent” under the standards set forth in Item 3 of Form N-CSR.
The designation of each of Mr. Patel, Mr. Burns and Ms. Patmore as an “audit committee financial expert” pursuant to Item 3 of Form N-CSR does not (i) impose upon such individual any duties, obligations, or liability that are greater than the duties, obligations and liability imposed upon such individual as a member of Registrant’s audit, compliance and valuation committee or Board of Trustees in the absence of such designation; and (ii) affect the duties, obligations or liability of any other member of Registrant’s audit, compliance and valuation committee or Board of Trustees.
| Item 4: | Principal Accountant Fees and Services. |
Registrant is composed of twenty-one series. Ten series have a fiscal year-end of August 31, whose annual financial statements are reported in Item 1, seven series have a fiscal year-end of February 28 and four series have a fiscal year-end of December 31. Principal accountant fees disclosed in Items 4(a)-(d) and 4(g) include fees billed for services rendered to each of the twenty-one series, based on their respective 2017 and 2016 fiscal years, as applicable.
Table of Contents
The following table presents fees billed by the principal accountant in each of the last two fiscal years for the services rendered to the Funds:
| (a)Audit Fees | (b)Audit-Related Fees1 | (c) Tax Fees2 | (d) All Other Fees3 | |||||||||||
| Fiscal Year 2017 | Fiscal Year 2016 | Fiscal Year 2017 | Fiscal Year 2016 | Fiscal Year 2017 | Fiscal Year 2016 | Fiscal Year 2017 | Fiscal Year 2016 | |||||||
| $488,203 | $488,203 | $0 | $0 | $86,763 | $80,863 | None | None | |||||||
| 1 | The nature of the services includes assurance and related services reasonably related to the performance of the audit of financial statements not included in Audit Fees. |
| 2 | The nature of the services includes tax compliance. |
| 3 | The nature of the services include agreed upon procedures relating to Charles Schwab Investment Management., Inc.’s, (“CSIM”) expenses for purposes of Section 15(c) of the Investment Company Act of 1940. |
(e)(1) Registrant’s audit, compliance and valuation committee does not have pre-approval policies and procedures as described in paragraph (c)(7) of Rule 2-01 of Regulation S-X.
(2) There were no services described in each of paragraphs (b) through (d) above (including services required to be approved by Registrant’s audit, compliance and valuation committee pursuant to paragraph (c)(7)(ii) of Rule 2-01 of Regulation S-X) that were approved by Registrant’s audit, compliance and valuation committee pursuant to paragraph (c)(7)(i)(C) of Rule 2-01 of Regulation S-X.
(f) Not applicable.
(g) Below are the aggregate non-audit fees billed in each of the last two fiscal years by Registrant’s principal accountant for services rendered to Registrant, to Registrant’s investment adviser, and to any entity controlling, controlled by, or under common control with Registrant’s investment adviser that provides ongoing services to Registrant.
2017: $86,763 2016: $80,863
(h) During the past fiscal year, all non-audit services provided by Registrant’s principal accountant to either Registrant’s investment adviser or to any entity controlling, controlled by, or under common control with Registrant’s investment adviser that provides ongoing services
Table of Contents
to Registrant were pre-approved. Included in the audit, compliance and valuation committee’s pre-approval was the review and consideration as to whether the provision of these non-audit services is compatible with maintaining the principal accountant’s independence.
| Item 5: | Audit Committee of Listed Registrants. |
The Registrant is a listed issuer as defined in Rule 10A-3 under the Exchange Act and has separately-designated standing audit, compliance and valuation committee established in accordance with Section 3(a)58)(A) of the Exchange Act. The Registrant’s audit, compliance and valuation committee members are Kiran M. Patel, Robert W. Burns, John F. Cogan and Kimberly S. Patmore.
| Item 6: | Schedule of Investments. |
The condensed schedules of investments are included as part of the report to shareholders filed under Item 1 of this Form. The complete schedules of investments for the Schwab International Equity ETF, Schwab International Small-Cap Equity ETF, Schwab Emerging Markets Equity ETF, Schwab U.S. Broad Market ETF, Schwab U.S. Large-Cap ETF, Schwab U.S. Large-Cap Growth ETF, Schwab U.S. Large-Cap Value ETF, Schwab U.S. Mid-Cap ETF, Schwab U.S. Small-Cap ETF, and Schwab U.S. Dividend Equity ETF are filed under this Item.
Table of Contents
| Security | Number of Shares | Value ($) |
| Common Stock 98.7% of net assets | ||
| Australia 6.3% | ||
| Adelaide Brighton Ltd. | 396,743 | 1,809,390 |
| AGL Energy Ltd. | 463,630 | 8,821,795 |
| ALS Ltd. | 355,822 | 2,249,294 |
| Alumina Ltd. | 1,383,334 | 2,326,045 |
| Amcor Ltd. | 808,711 | 10,333,420 |
| AMP Ltd. | 2,001,315 | 8,095,446 |
| Ansell Ltd. | 103,798 | 1,796,383 |
| APA Group | 758,409 | 5,329,573 |
| Aristocrat Leisure Ltd. | 440,253 | 7,392,279 |
| ASX Ltd. | 172,394 | 7,476,629 |
| Aurizon Holdings Ltd. | 1,264,344 | 4,973,958 |
| AusNet Services | 1,616,398 | 2,230,759 |
| Australia & New Zealand Banking Group Ltd. | 2,012,253 | 46,922,927 |
| Bank of Queensland Ltd. | 277,414 | 2,770,188 |
| Bendigo & Adelaide Bank Ltd. | 330,034 | 3,128,108 |
| BHP Billiton Ltd. | 2,233,148 | 48,496,023 |
| BlueScope Steel Ltd. | 424,831 | 3,662,696 |
| Boral Ltd. | 758,765 | 4,014,101 |
| Brambles Ltd. | 1,025,490 | 7,572,448 |
| Caltex Australia Ltd. | 187,285 | 4,959,919 |
| Challenger Ltd. | 416,538 | 4,142,928 |
| CIMIC Group Ltd. | 95,994 | 3,201,587 |
| Coca-Cola Amatil Ltd. | 421,320 | 2,690,067 |
| Cochlear Ltd. | 36,253 | 4,491,671 |
| Commonwealth Bank of Australia | 1,185,063 | 71,246,875 |
| Computershare Ltd. | 383,048 | 4,268,593 |
| Crown Resorts Ltd. | 249,676 | 2,297,153 |
| CSL Ltd. | 307,625 | 31,357,940 |
| CSR Ltd. | 235,933 | 756,006 |
| Dexus | 788,055 | 5,994,187 |
| Domino's Pizza Enterprises Ltd. (a) | 71,053 | 2,431,747 |
| Downer EDI Ltd. | 503,027 | 2,840,707 |
| Fairfax Media Ltd. | 1,964,977 | 1,503,973 |
| Flight Centre Travel Group Ltd. | 49,154 | 1,884,996 |
| Fortescue Metals Group Ltd. | 1,152,042 | 5,491,588 |
| Goodman Group | 1,300,144 | 8,548,721 |
| Harvey Norman Holdings Ltd. (a) | 473,985 | 1,533,840 |
| Healthscope Ltd. | 1,004,783 | 1,386,681 |
| Iluka Resources Ltd. | 312,522 | 2,347,393 |
| Incitec Pivot Ltd. | 1,131,120 | 2,987,501 |
| Insurance Australia Group Ltd. | 1,804,654 | 9,175,023 |
| IOOF Holdings Ltd. | 298,435 | 2,615,575 |
| James Hardie Industries plc CDI | 267,370 | 3,751,420 |
| LendLease Group | 428,743 | 5,638,152 |
| Macquarie Atlas Roads Group | 502,368 | 2,263,213 |
| Macquarie Group Ltd. | 201,199 | 13,851,625 |
| Magellan Financial Group Ltd. | 74,839 | 1,467,936 |
| Medibank Pvt Ltd. | 2,177,435 | 5,250,177 |
| Mirvac Group | 2,271,617 | 4,180,019 |
| National Australia Bank Ltd. | 1,787,881 | 42,825,331 |
| Newcrest Mining Ltd. | 517,645 | 9,381,524 |
| Oil Search Ltd. | 804,059 | 4,279,230 |
| Orica Ltd. | 242,259 | 3,906,362 |
| Origin Energy Ltd. * | 1,099,188 | 6,669,428 |
| Security | Number of Shares | Value ($) |
| Orora Ltd. | 976,974 | 2,402,149 |
| OZ Minerals Ltd. | 253,955 | 1,633,551 |
| Qantas Airways Ltd. | 665,771 | 3,020,481 |
| QBE Insurance Group Ltd. | 923,656 | 7,648,318 |
| Ramsay Health Care Ltd. | 93,127 | 5,045,626 |
| REA Group Ltd. | 24,577 | 1,292,402 |
| Rio Tinto Ltd. | 281,891 | 15,167,787 |
| Santos Ltd. * | 1,362,608 | 4,063,628 |
| Scentre Group | 3,395,561 | 10,395,707 |
| SEEK Ltd. | 200,127 | 2,658,739 |
| Sims Metal Management Ltd. | 133,418 | 1,576,725 |
| Sonic Healthcare Ltd. | 296,992 | 5,158,745 |
| South32 Ltd. | 3,691,427 | 8,549,335 |
| Stockland | 1,847,474 | 6,491,383 |
| Suncorp Group Ltd. | 891,935 | 9,217,917 |
| Sydney Airport | 534,484 | 3,137,051 |
| Tabcorp Holdings Ltd. | 503,748 | 1,642,141 |
| Tatts Group Ltd. | 951,481 | 3,101,681 |
| Telstra Corp., Ltd. | 3,098,307 | 9,018,736 |
| The GPT Group | 1,332,065 | 5,282,635 |
| The Star Entertainment Grp Ltd. | 568,782 | 2,345,872 |
| TPG Telecom Ltd. (a) | 182,740 | 795,722 |
| Transurban Group | 1,472,402 | 14,200,877 |
| Treasury Wine Estates Ltd. | 470,680 | 5,405,669 |
| Vicinity Centres | 2,849,161 | 5,920,706 |
| Wesfarmers Ltd. | 785,927 | 26,567,509 |
| Westfield Corp. | 1,329,582 | 7,835,363 |
| Westpac Banking Corp. | 2,272,972 | 56,373,778 |
| Whitehaven Coal Ltd. * | 471,636 | 1,309,273 |
| Woodside Petroleum Ltd. | 475,877 | 10,881,645 |
| Woolworths Ltd. | 872,650 | 17,995,695 |
| WorleyParsons Ltd. * | 165,251 | 1,756,322 |
| 718,913,718 | ||
| Austria 0.2% | ||
| ANDRITZ AG | 65,966 | 3,584,896 |
| Erste Group Bank AG | 204,018 | 8,609,557 |
| OMV AG | 126,396 | 7,256,642 |
| Raiffeisen Bank International AG * | 88,671 | 2,905,400 |
| voestalpine AG | 86,539 | 4,484,808 |
| 26,841,303 | ||
| Belgium 1.0% | ||
| Ackermans & van Haaren N.V. | 18,353 | 3,080,966 |
| Ageas | 140,594 | 6,520,605 |
| Anheuser-Busch InBev S.A. | 522,542 | 61,826,792 |
| Colruyt S.A. | 32,354 | 1,795,384 |
| Groupe Bruxelles Lambert S.A. | 50,903 | 5,174,941 |
| KBC Groep N.V. | 193,501 | 15,880,575 |
| Proximus | 116,701 | 4,108,956 |
| Solvay S.A. | 55,597 | 8,054,193 |
| Telenet Group Holding N.V. * | 46,036 | 3,112,619 |
| UCB S.A. | 70,413 | 4,846,202 |
| Umicore S.A. | 62,285 | 4,646,675 |
| 119,047,908 | ||
| Security | Number of Shares | Value ($) |
| Canada 7.4% | ||
| Agnico Eagle Mines Ltd. | 158,866 | 8,110,877 |
| Agrium, Inc. | 93,110 | 9,096,002 |
| Alimentation Couche-Tard, Inc., B Shares | 288,601 | 13,726,243 |
| ARC Resources Ltd. | 264,364 | 3,458,081 |
| Bank of Montreal | 446,382 | 31,904,519 |
| Barrick Gold Corp. | 784,434 | 14,071,323 |
| BCE, Inc. | 209,271 | 9,921,490 |
| BlackBerry Ltd. * | 367,322 | 3,389,763 |
| Brookfield Asset Management, Inc., Class A | 596,063 | 23,481,198 |
| Cameco Corp. | 282,675 | 2,822,804 |
| Canadian Imperial Bank of Commerce | 300,203 | 25,120,077 |
| Canadian National Railway Co. | 521,522 | 42,104,452 |
| Canadian Natural Resources Ltd. | 758,452 | 23,272,302 |
| Canadian Pacific Railway Ltd. | 99,425 | 15,409,190 |
| Canadian Tire Corp., Ltd., Class A | 49,818 | 5,872,862 |
| Canadian Utilities Ltd., Class A | 120,342 | 3,735,761 |
| Cenovus Energy, Inc. | 742,974 | 5,789,716 |
| CGI Group, Inc., Class A * | 180,708 | 9,156,833 |
| CI Financial Corp. | 162,288 | 3,538,946 |
| Constellation Software, Inc. | 12,836 | 7,108,917 |
| Crescent Point Energy Corp. | 424,137 | 2,899,186 |
| Enbridge, Inc. | 1,131,556 | 45,054,656 |
| Encana Corp. | 670,897 | 6,234,058 |
| Fairfax Financial Holdings Ltd. | 19,045 | 9,859,803 |
| Fortis, Inc. | 270,651 | 9,863,246 |
| Franco-Nevada Corp. | 121,446 | 9,895,851 |
| George Weston Ltd. | 33,109 | 2,866,058 |
| Goldcorp, Inc. | 588,430 | 8,053,806 |
| Great-West Lifeco, Inc. | 204,586 | 5,644,371 |
| Husky Energy, Inc. * | 249,814 | 2,911,093 |
| Hydro One Ltd. | 160,054 | 2,957,887 |
| IGM Financial, Inc. | 54,792 | 1,786,995 |
| Imperial Oil Ltd. | 208,651 | 6,134,298 |
| Intact Financial Corp. | 80,835 | 6,637,013 |
| Inter Pipeline Ltd. | 236,026 | 4,305,415 |
| Loblaw Cos. Ltd. | 155,308 | 8,390,039 |
| Magna International, Inc. | 260,030 | 12,462,774 |
| Manulife Financial Corp. | 1,327,429 | 25,971,552 |
| Metro, Inc. | 179,286 | 5,894,452 |
| National Bank of Canada | 218,242 | 10,005,623 |
| Pembina Pipeline Corp. | 258,066 | 8,284,871 |
| Potash Corp. of Saskatchewan, Inc. | 583,353 | 10,110,677 |
| Power Corp. of Canada | 242,287 | 5,897,985 |
| Power Financial Corp. | 138,087 | 3,712,792 |
| Restaurant Brands International, Inc. | 156,033 | 9,487,055 |
| RioCan Real Estate Investment Trust | 207,962 | 3,947,753 |
| Rogers Communications, Inc., B Shares | 232,703 | 12,099,628 |
| Royal Bank of Canada | 994,149 | 73,489,714 |
| Saputo, Inc. | 180,895 | 6,082,978 |
| Shaw Communications, Inc., B Shares | 324,228 | 7,204,779 |
| SNC-Lavalin Group, Inc. | 99,305 | 4,320,708 |
| Sun Life Financial, Inc. | 416,162 | 15,916,226 |
| Suncor Energy, Inc. | 1,134,746 | 35,415,841 |
| Teck Resources Ltd., Class B | 303,862 | 7,532,627 |
| TELUS Corp. | 95,139 | 3,430,695 |
| The Bank of Nova Scotia | 821,766 | 50,921,636 |
| The Toronto-Dominion Bank | 1,264,392 | 67,629,214 |
| Thomson Reuters Corp. | 225,925 | 10,289,386 |
| Tourmaline Oil Corp. * | 163,946 | 3,185,423 |
| TransCanada Corp. | 572,697 | 28,964,879 |
| Trisura Group Ltd. * | 3,336 | 65,190 |
| Turquoise Hill Resources Ltd. * | 693,045 | 2,327,194 |
| Valeant Pharmaceuticals International, Inc. * | 210,099 | 2,813,609 |
| Security | Number of Shares | Value ($) |
| Waste Connections, Inc. | 165,298 | 10,983,830 |
| Wheaton Precious Metals Corp. | 292,305 | 6,047,770 |
| 839,081,992 | ||
| Denmark 1.6% | ||
| AP Moller - Maersk A/S, A Shares | 2,719 | 5,315,479 |
| AP Moller - Maersk A/S, B Shares | 4,378 | 9,013,601 |
| Carlsberg A/S, B Shares | 75,773 | 8,684,411 |
| Chr Hansen Holding A/S | 63,198 | 5,429,859 |
| Coloplast A/S, B Shares | 83,914 | 6,860,990 |
| Danske Bank A/S | 483,615 | 18,769,607 |
| DONG Energy A/S | 95,779 | 4,978,833 |
| DSV A/S | 134,074 | 9,494,127 |
| Genmab A/S * | 36,362 | 8,474,460 |
| H. Lundbeck A/S | 36,645 | 2,330,748 |
| ISS A/S | 125,123 | 4,862,155 |
| Jyske Bank A/S | 47,268 | 2,840,183 |
| Novo Nordisk A/S, B Shares | 1,220,900 | 58,157,146 |
| Novozymes A/S, B Shares | 148,962 | 7,567,216 |
| Pandora A/S | 73,987 | 7,852,903 |
| TDC A/S | 545,695 | 3,246,632 |
| Vestas Wind Systems A/S | 150,325 | 13,672,572 |
| William Demant Holding A/S * | 105,330 | 2,783,118 |
| 180,334,040 | ||
| Finland 0.9% | ||
| Elisa Oyj | 81,874 | 3,572,376 |
| Fortum Oyj | 263,410 | 4,722,574 |
| Huhtamaki Oyj | 97,148 | 3,774,514 |
| Kesko Oyj, B Shares | 42,132 | 2,267,607 |
| Kone Oyj, B Shares | 271,915 | 14,735,084 |
| Metso Oyj | 68,241 | 2,258,706 |
| Neste Oyj | 89,900 | 3,958,912 |
| Nokia Oyj | 3,872,927 | 23,966,531 |
| Nokian Renkaat Oyj | 95,229 | 4,020,361 |
| Orion Oyj, Class B | 78,664 | 3,720,368 |
| Sampo Oyj, A Shares | 306,509 | 16,157,868 |
| Stora Enso Oyj, R Shares | 425,947 | 5,590,746 |
| UPM-Kymmene Oyj | 339,434 | 8,821,667 |
| Wartsila Oyj Abp | 109,203 | 7,523,729 |
| 105,091,043 | ||
| France 8.6% | ||
| Accor S.A. | 129,005 | 5,966,248 |
| Aeroports de Paris | 18,818 | 3,352,551 |
| Air Liquide S.A. | 268,816 | 32,774,488 |
| Airbus SE | 376,877 | 31,638,143 |
| Alstom S.A. | 121,138 | 4,302,625 |
| Amundi S.A. | 28,580 | 2,197,406 |
| Arkema S.A. | 47,176 | 5,119,669 |
| Atos SE | 61,189 | 9,428,085 |
| AXA S.A. | 1,299,937 | 37,671,427 |
| BioMerieux | 14,044 | 3,433,718 |
| BNP Paribas S.A. | 725,141 | 55,098,074 |
| Bollore S.A. | 702,200 | 3,257,566 |
| Bouygues S.A. | 144,023 | 6,522,964 |
| Bureau Veritas S.A. | 166,047 | 3,943,329 |
| Capgemini SE | 113,343 | 12,549,587 |
| Carrefour S.A. | 383,852 | 7,730,763 |
| Casino Guichard Perrachon S.A. | 45,643 | 2,591,965 |
| Christian Dior SE | 7,289 | 2,247,498 |
| Cie Generale des Etablissements Michelin | 132,707 | 18,065,270 |
| CNP Assurances | 126,988 | 2,944,031 |
| Compagnie de Saint-Gobain | 323,012 | 17,694,127 |
| Security | Number of Shares | Value ($) |
| Credit Agricole S.A. | 779,557 | 13,726,129 |
| Danone S.A. | 376,078 | 29,576,918 |
| Dassault Aviation S.A. | 1,001 | 1,527,240 |
| Dassault Systemes S.A. | 91,836 | 9,034,957 |
| Edenred | 136,975 | 3,699,941 |
| Eiffage S.A. | 39,142 | 4,039,316 |
| Electricite de France S.A. | 251,255 | 2,658,581 |
| Engie S.A. | 1,034,875 | 17,249,680 |
| Essilor International S.A. | 137,528 | 17,339,914 |
| Eurazeo S.A. | 34,568 | 2,855,891 |
| Eurofins Scientific SE | 5,049 | 2,881,922 |
| Eutelsat Communications S.A. | 120,830 | 3,507,330 |
| Faurecia | 54,330 | 3,155,687 |
| Fonciere Des Regions | 24,577 | 2,427,271 |
| Gecina S.A. | 28,710 | 4,468,050 |
| Groupe Eurotunnel SE | 344,999 | 4,107,844 |
| Hermes International | 20,828 | 11,001,934 |
| ICADE | 13,044 | 1,157,828 |
| Iliad S.A. | 14,044 | 3,622,393 |
| Imerys S.A. | 24,577 | 2,159,327 |
| Ingenico Group S.A. | 38,696 | 3,836,872 |
| Ipsen S.A. | 25,982 | 3,485,935 |
| JCDecaux S.A. | 50,805 | 1,661,358 |
| Kering | 49,292 | 18,477,599 |
| Klepierre S.A. | 126,822 | 5,103,856 |
| L'Oreal S.A. | 158,073 | 33,329,901 |
| Lagardere S.C.A. | 95,428 | 3,062,132 |
| Legrand S.A. | 176,732 | 12,371,664 |
| LVMH Moet Hennessy Louis Vuitton SE | 168,543 | 44,133,846 |
| Natixis S.A. | 692,385 | 5,192,595 |
| Orange S.A. | 1,324,905 | 22,485,678 |
| Orpea | 24,851 | 3,007,716 |
| Pernod-Ricard S.A. | 147,497 | 20,131,225 |
| Peugeot S.A. | 281,403 | 5,933,419 |
| Publicis Groupe S.A. | 150,352 | 10,135,319 |
| Remy Cointreau S.A. | 15,360 | 1,751,825 |
| Renault S.A. | 121,168 | 10,710,606 |
| Rexel S.A. | 218,066 | 3,253,695 |
| Safran S.A. | 201,820 | 19,577,006 |
| Sanofi | 737,477 | 71,598,347 |
| Sartorius Stedim Biotech | 11,370 | 832,020 |
| Schneider Electric SE | 373,591 | 30,083,102 |
| SCOR SE | 113,673 | 4,757,131 |
| SEB S.A. | 18,319 | 3,323,544 |
| SES S.A. | 257,045 | 5,869,061 |
| SFR Group S.A. * | 74,294 | 3,038,487 |
| Societe BIC S.A. | 22,069 | 2,648,708 |
| Societe Generale S.A. | 517,777 | 28,950,953 |
| Sodexo S.A. | 61,768 | 7,198,926 |
| STMicroelectronics N.V. | 439,217 | 7,600,401 |
| Suez | 266,836 | 5,055,238 |
| TechnipFMC plc * | 309,688 | 7,930,767 |
| Teleperformance | 36,824 | 5,060,972 |
| Thales S.A. | 71,960 | 7,956,448 |
| Total S.A. | 1,511,838 | 78,089,060 |
| Valeo S.A. | 168,528 | 11,256,385 |
| Veolia Environnement S.A. | 312,668 | 7,326,815 |
| Vinci S.A. | 312,479 | 28,735,998 |
| Vivendi S.A. | 741,415 | 16,990,294 |
| Wendel S.A. | 24,577 | 3,890,587 |
| Zodiac Aerospace | 141,132 | 4,078,179 |
| 978,641,357 | ||
| Germany 7.7% | ||
| adidas AG | 137,668 | 30,860,622 |
| Allianz SE | 312,517 | 66,786,346 |
| Axel Springer SE | 42,132 | 2,604,717 |
| Security | Number of Shares | Value ($) |
| BASF SE | 619,072 | 59,889,490 |
| Bayer AG | 570,922 | 72,967,654 |
| Bayerische Motoren Werke AG | 210,933 | 19,560,694 |
| Beiersdorf AG | 68,030 | 7,253,393 |
| Brenntag AG | 121,881 | 6,450,413 |
| CECONOMY AG | 114,063 | 1,247,878 |
| Commerzbank AG * | 672,135 | 8,342,614 |
| Continental AG | 73,731 | 16,615,716 |
| Covestro AG | 63,362 | 4,972,603 |
| Daimler AG | 662,016 | 48,192,325 |
| Deutsche Bank AG | 1,392,370 | 22,298,076 |
| Deutsche Boerse AG | 128,766 | 13,745,936 |
| Deutsche Lufthansa AG | 157,995 | 3,957,792 |
| Deutsche Post AG | 663,630 | 27,492,334 |
| Deutsche Telekom AG | 2,224,337 | 40,090,819 |
| Deutsche Wohnen SE | 208,965 | 8,864,281 |
| E.ON SE | 1,318,623 | 14,885,408 |
| Evonik Industries AG | 119,847 | 3,879,895 |
| Fielmann AG | 21,066 | 1,746,413 |
| Fraport AG Frankfurt Airport Services Worldwide | 31,599 | 3,114,014 |
| Fresenius Medical Care AG & Co. KGaA | 151,844 | 14,171,389 |
| Fresenius SE & Co. KGaA | 279,426 | 23,616,768 |
| Fuchs Petrolub SE | 35,110 | 1,700,580 |
| GEA Group AG | 127,328 | 5,601,067 |
| Hannover Rueck SE | 45,643 | 5,524,171 |
| HeidelbergCement AG | 95,682 | 9,174,444 |
| Hella KGaA Hueck & Co. | 12,081 | 666,448 |
| Henkel AG & Co. KGaA | 78,539 | 9,496,235 |
| HOCHTIEF AG | 16,091 | 2,832,283 |
| HUGO BOSS AG | 42,934 | 3,629,754 |
| Infineon Technologies AG | 765,718 | 17,633,707 |
| Innogy SE | 88,075 | 3,876,974 |
| K+S AG (a) | 140,448 | 3,342,911 |
| KION Group AG | 46,568 | 4,242,041 |
| LANXESS AG | 63,865 | 4,756,956 |
| LEG Immobilien AG | 42,479 | 4,287,727 |
| Linde AG | 126,898 | 24,297,447 |
| MAN SE | 21,909 | 2,456,549 |
| Merck KGaA | 91,286 | 10,012,967 |
| METRO AG * | 114,063 | 2,226,707 |
| MTU Aero Engines AG | 31,932 | 4,464,559 |
| Muenchener Rueckversicherungs-Gesellschaft AG | 98,787 | 20,365,451 |
| OSRAM Licht AG | 59,687 | 4,894,948 |
| ProSiebenSat.1 Media SE | 145,779 | 4,884,061 |
| QIAGEN N.V. * | 158,655 | 5,084,383 |
| RTL Group S.A. | 24,577 | 1,862,748 |
| RWE AG * | 349,275 | 8,701,624 |
| SAP SE | 623,760 | 65,333,898 |
| Siemens AG | 522,046 | 68,148,492 |
| Suedzucker AG | 101,899 | 2,163,697 |
| Symrise AG | 81,785 | 5,970,176 |
| Telefonica Deutschland Holding AG | 499,371 | 2,698,969 |
| ThyssenKrupp AG | 295,006 | 8,834,951 |
| Uniper SE | 137,285 | 3,413,706 |
| United Internet AG | 78,428 | 4,648,164 |
| Volkswagen AG | 24,833 | 3,827,779 |
| Vonovia SE | 302,267 | 12,759,257 |
| Wacker Chemie AG | 14,044 | 1,797,422 |
| Wirecard AG | 85,626 | 7,289,949 |
| Zalando SE * | 84,560 | 3,999,719 |
| 880,510,511 | ||
| Hong Kong 3.4% | ||
| AAC Technologies Holdings, Inc. | 447,957 | 8,167,619 |
| AIA Group Ltd. | 8,315,068 | 63,799,019 |
| Security | Number of Shares | Value ($) |
| ASM Pacific Technology Ltd. | 204,015 | 2,523,322 |
| BOC Hong Kong Holdings Ltd. | 2,726,690 | 13,883,510 |
| Brightoil Petroleum Holdings Ltd. * | 2,854,619 | 703,948 |
| Cathay Pacific Airways Ltd. | 647,712 | 961,664 |
| Cheung Kong Property Holdings Ltd. | 1,949,891 | 17,115,999 |
| China Mengniu Dairy Co., Ltd. | 2,005,536 | 4,684,269 |
| China Travel International Investment Hong Kong Ltd. | 3,778,528 | 1,182,834 |
| CK Hutchison Holdings Ltd. | 2,045,567 | 26,763,866 |
| CK Infrastructure Holdings Ltd. | 422,324 | 3,825,843 |
| CLP Holdings Ltd. | 1,129,324 | 11,926,049 |
| Esprit Holdings Ltd. * | 1,755,500 | 1,016,095 |
| Galaxy Entertainment Group Ltd. | 1,499,699 | 9,408,509 |
| Haitong International Securities Group Ltd. | 3,200,412 | 1,885,133 |
| Hang Lung Group Ltd. | 511,455 | 1,927,812 |
| Hang Lung Properties Ltd. | 1,367,124 | 3,325,907 |
| Hang Seng Bank Ltd. | 530,363 | 12,197,783 |
| Henderson Land Development Co., Ltd. | 804,684 | 4,986,574 |
| Hong Kong & China Gas Co., Ltd. | 5,592,597 | 10,575,732 |
| Hong Kong Exchanges & Clearing Ltd. | 836,088 | 22,818,570 |
| Hongkong Land Holdings Ltd. | 815,712 | 6,044,426 |
| Hopewell Holdings Ltd. | 780,516 | 3,066,635 |
| Hysan Development Co., Ltd. | 366,104 | 1,693,356 |
| I-CABLE Communications Ltd. * | 672,823 | 24,931 |
| Jardine Matheson Holdings Ltd. | 146,269 | 9,611,336 |
| Jardine Strategic Holdings Ltd. | 149,568 | 6,558,557 |
| Kerry Properties Ltd. | 541,322 | 2,144,137 |
| Li & Fung Ltd. | 5,387,462 | 2,429,932 |
| Link REIT | 1,608,682 | 13,278,160 |
| Minth Group Ltd. | 454,797 | 2,094,875 |
| MTR Corp. Ltd. | 975,274 | 5,701,025 |
| New World Development Co., Ltd. | 3,929,781 | 5,372,635 |
| NWS Holdings Ltd. | 1,310,911 | 2,519,163 |
| PCCW Ltd. | 3,511,000 | 1,955,926 |
| Power Assets Holdings Ltd. | 997,722 | 8,796,174 |
| PRADA S.p.A. | 344,674 | 1,252,928 |
| Samsonite International S.A. | 1,255,053 | 5,147,570 |
| Sands China Ltd. | 1,852,981 | 8,298,396 |
| Semiconductor Manufacturing International Corp. * | 2,126,461 | 1,999,726 |
| Shui On Land Ltd. | 5,266,500 | 1,231,426 |
| Sino Land Co., Ltd. | 2,117,547 | 3,663,422 |
| Sun Art Retail Group Ltd. | 1,355,994 | 1,249,189 |
| Sun Hung Kai Properties Ltd. | 960,518 | 16,028,167 |
| Swire Pacific Ltd., Class A | 429,100 | 4,366,963 |
| Swire Properties Ltd. | 1,019,944 | 3,531,676 |
| Techtronic Industries Co., Ltd. | 909,591 | 4,706,915 |
| The Bank of East Asia Ltd. | 1,040,244 | 4,764,963 |
| The Wharf Holdings Ltd. | 871,847 | 8,304,684 |
| Tingyi Cayman Islands Holding Corp. | 1,662,070 | 2,212,851 |
| VTech Holdings Ltd. | 133,938 | 1,882,486 |
| Want Want China Holdings Ltd. | 3,225,412 | 2,134,765 |
| WH Group Ltd. | 6,055,267 | 6,328,806 |
| Wheelock & Co., Ltd. | 563,074 | 4,212,380 |
| Wynn Macau Ltd. | 1,331,247 | 2,922,247 |
| Xinyi Glass Holdings Ltd. | 1,583,951 | 1,578,598 |
| Xinyi Solar Holdings Ltd. | 2,749,407 | 934,450 |
| Yue Yuen Industrial Holdings Ltd. | 591,618 | 2,562,573 |
| 384,286,506 | ||
| Ireland 0.2% | ||
| Allied Irish Banks plc | 464,299 | 2,763,336 |
| Bank of Ireland Group plc * | 619,713 | 5,157,435 |
| Glanbia plc | 137,782 | 2,573,439 |
| Kerry Group plc, A Shares | 88,283 | 8,210,991 |
| Security | Number of Shares | Value ($) |
| Kingspan Group plc | 99,472 | 3,843,522 |
| Ryanair Holdings plc * | 111,450 | 2,365,838 |
| 24,914,561 | ||
| Israel 0.4% | ||
| Azrieli Group Ltd. | 28,088 | 1,618,722 |
| Bank Hapoalim B.M. | 800,508 | 5,385,599 |
| Bank Leumi Le-Israel | 1,057,638 | 5,537,881 |
| Bezeq The Israeli Telecommunication Corp., Ltd. | 2,100,529 | 3,092,243 |
| Elbit Systems Ltd. | 15,264 | 2,100,228 |
| First International Bank of Israel Ltd. | 92,048 | 1,680,996 |
| Frutarom Industries Ltd. | 25,793 | 1,979,071 |
| Gazit-Globe Ltd. | 103,285 | 1,005,594 |
| Israel Chemicals Ltd. | 478,661 | 2,063,234 |
| Israel Discount Bank Ltd., A Shares * | 963,191 | 2,400,289 |
| Mizrahi Tefahot Bank Ltd. | 130,504 | 2,324,341 |
| NICE Ltd. | 42,923 | 3,322,160 |
| Teva Pharmaceutical Industries Ltd. | 619,066 | 10,024,773 |
| Tower Semiconductor Ltd. * | 44,176 | 1,305,579 |
| 43,840,710 | ||
| Italy 2.2% | ||
| Assicurazioni Generali S.p.A. | 927,900 | 16,591,825 |
| Atlantia S.p.A. | 369,680 | 11,866,834 |
| Banca Mediolanum S.p.A. | 166,131 | 1,402,343 |
| Buzzi Unicem S.p.A. | 43,000 | 1,051,082 |
| CNH Industrial N.V. | 618,640 | 7,009,322 |
| Davide Campari-Milano S.p.A. | 458,574 | 3,314,806 |
| Enel S.p.A. | 5,089,564 | 30,769,233 |
| Eni S.p.A. | 1,643,370 | 25,731,569 |
| EXOR N.V. | 84,320 | 5,403,367 |
| Ferrari N.V. | 99,078 | 11,319,983 |
| Fiat Chrysler Automobiles N.V. * | 699,013 | 10,512,861 |
| FinecoBank Banca Fineco S.p.A. | 250,185 | 2,146,064 |
| GEDI Gruppo Editoriale S.p.A. * | 31,587 | 26,982 |
| Intesa Sanpaolo S.p.A. | 8,749,786 | 29,501,819 |
| Italgas S.p.A. | 317,920 | 1,793,113 |
| Leonardo S.p.A. | 285,520 | 4,823,650 |
| Luxottica Group S.p.A. | 107,620 | 6,186,352 |
| Mediobanca S.p.A. | 410,787 | 4,209,874 |
| Moncler S.p.A. | 100,789 | 2,860,294 |
| Parmalat S.p.A. | 337,593 | 1,236,202 |
| Poste Italiane S.p.A. | 264,784 | 1,921,864 |
| Prysmian S.p.A. | 144,466 | 4,537,782 |
| Recordati S.p.A. | 91,782 | 3,926,122 |
| Saipem S.p.A. * | 441,744 | 1,637,540 |
| Snam S.p.A. | 1,594,299 | 7,752,437 |
| Telecom Italia S.p.A. * | 6,340,918 | 6,064,895 |
| Telecom Italia S.p.A. - RSP | 4,550,256 | 3,529,893 |
| Tenaris S.A. | 323,012 | 4,312,643 |
| Terna Rete Elettrica Nazionale S.p.A. | 1,098,943 | 6,480,402 |
| UniCredit S.p.A. * | 1,528,910 | 31,064,840 |
| Unione di Banche Italiane S.p.A. | 986,605 | 4,548,794 |
| UnipolSai Assicurazioni S.p.A. | 699,919 | 1,586,878 |
| 255,121,665 | ||
| Japan 21.3% | ||
| ABC-Mart, Inc. | 28,691 | 1,472,871 |
| Acom Co., Ltd. * | 390,865 | 1,598,121 |
| Advantest Corp. | 152,239 | 2,535,472 |
| Aeon Co., Ltd. | 510,380 | 7,521,682 |
| AEON Financial Service Co., Ltd. | 133,822 | 2,834,264 |
| Aeon Mall Co., Ltd. | 91,912 | 1,650,174 |
| Air Water, Inc. | 169,048 | 3,114,931 |
| Security | Number of Shares | Value ($) |
| Aisin Seiki Co., Ltd. | 134,434 | 6,754,679 |
| Ajinomoto Co., Inc. | 366,104 | 7,223,286 |
| Alfresa Holdings Corp. | 141,304 | 2,656,351 |
| Alps Electric Co., Ltd. | 158,999 | 4,362,866 |
| Amada Holdings Co., Ltd. | 281,125 | 3,083,026 |
| ANA Holdings, Inc. | 867,959 | 3,216,007 |
| Aoyama Trading Co., Ltd. | 64,118 | 2,347,770 |
| Aozora Bank Ltd. | 874,739 | 3,306,300 |
| Asahi Glass Co., Ltd. | 137,548 | 5,361,448 |
| Asahi Group Holdings Ltd. | 264,171 | 11,494,775 |
| Asahi Intecc Co., Ltd. | 41,601 | 2,177,192 |
| Asahi Kasei Corp. | 889,771 | 10,647,178 |
| Asics Corp. | 126,886 | 1,910,323 |
| Astellas Pharma, Inc. | 1,450,322 | 18,231,151 |
| Azbil Corp. | 49,334 | 2,052,969 |
| Bandai Namco Holdings, Inc. | 144,473 | 4,837,207 |
| Benesse Holdings, Inc. | 71,268 | 2,739,085 |
| Bridgestone Corp. | 439,371 | 18,838,740 |
| Brother Industries Ltd. | 189,818 | 4,494,509 |
| Calbee, Inc. | 49,330 | 1,685,270 |
| Canon, Inc. | 720,991 | 25,247,132 |
| Casio Computer Co., Ltd. | 162,046 | 2,288,020 |
| Central Japan Railway Co. | 124,075 | 21,002,337 |
| Chubu Electric Power Co., Inc. | 496,728 | 6,485,536 |
| Chugai Pharmaceutical Co., Ltd. | 155,144 | 6,301,051 |
| Citizen Watch Co., Ltd. | 267,264 | 1,891,683 |
| Coca-Cola Bottlers Japan, Inc. | 76,107 | 2,606,972 |
| COMSYS Holdings Corp. | 123,280 | 2,647,955 |
| Concordia Financial Group Ltd. | 882,737 | 4,217,985 |
| Credit Saison Co., Ltd. | 162,346 | 2,942,761 |
| CyberAgent, Inc. | 70,820 | 2,313,265 |
| Dai Nippon Printing Co., Ltd. | 443,126 | 5,226,036 |
| Dai-ichi Life Holdings, Inc. | 822,137 | 13,221,720 |
| Daicel Corp. | 239,068 | 3,043,197 |
| Daifuku Co., Ltd. | 61,643 | 2,680,009 |
| Daiichi Sankyo Co., Ltd. (c) | 447,462 | 10,566,543 |
| Daikin Industries Ltd. | 186,414 | 18,622,769 |
| Daito Trust Construction Co., Ltd. | 50,005 | 8,852,875 |
| Daiwa House Industry Co., Ltd. | 451,170 | 15,770,044 |
| Daiwa Securities Group, Inc. | 1,145,326 | 6,262,559 |
| DeNA Co., Ltd. | 106,938 | 2,285,282 |
| Denka Co., Ltd. | 319,909 | 2,031,768 |
| Denso Corp. | 344,406 | 16,697,714 |
| Dentsu, Inc. | 176,430 | 7,373,960 |
| DIC Corp. | 60,936 | 2,150,975 |
| Disco Corp. | 18,914 | 3,387,197 |
| DMG Mori Co., Ltd. | 67,873 | 1,106,960 |
| Don Quijote Holdings Co., Ltd. | 74,380 | 2,821,520 |
| Dowa Holdings Co., Ltd. | 159,225 | 1,200,770 |
| East Japan Railway Co. | 256,440 | 23,498,068 |
| Ebara Corp. | 64,375 | 1,991,613 |
| Eisai Co., Ltd. | 182,740 | 9,454,130 |
| Electric Power Development Co., Ltd. | 137,910 | 3,771,662 |
| Ezaki Glico Co., Ltd. | 40,971 | 2,174,002 |
| FamilyMart UNY Holdings Co., Ltd. | 61,893 | 3,351,647 |
| FANUC Corp. | 133,777 | 25,938,590 |
| Fast Retailing Co., Ltd. | 35,564 | 10,168,990 |
| Fuji Electric Co., Ltd. | 404,724 | 2,228,446 |
| Fuji Heavy Industries Ltd. | 450,516 | 15,784,024 |
| FUJIFILM Holdings Corp. | 253,996 | 9,974,293 |
| Fujikura Ltd. | 147,514 | 1,198,233 |
| Fujitsu Ltd. | 1,415,627 | 10,484,078 |
| Fukuoka Financial Group, Inc. | 531,878 | 2,334,155 |
| Furukawa Electric Co., Ltd. | 45,724 | 2,476,059 |
| Hakuhodo DY Holdings, Inc. | 187,045 | 2,544,125 |
| Hamamatsu Photonics K.K. | 100,112 | 3,097,232 |
| Hankyu Hanshin Holdings, Inc. | 183,201 | 6,974,488 |
| Haseko Corp. | 231,792 | 2,868,442 |
| Security | Number of Shares | Value ($) |
| Hikari Tsushin, Inc. | 14,054 | 1,741,746 |
| Hino Motors Ltd. | 208,834 | 2,396,487 |
| Hirose Electric Co., Ltd. | 18,866 | 2,608,945 |
| Hisamitsu Pharmaceutical Co., Inc. | 56,650 | 2,722,865 |
| Hitachi Chemical Co., Ltd. | 74,521 | 2,015,033 |
| Hitachi High-Technologies Corp. | 40,434 | 1,441,972 |
| Hitachi Ltd. | 3,132,116 | 21,542,902 |
| Hitachi Metals Ltd. | 172,549 | 2,303,057 |
| Hokkaido Electric Power Co., Inc. | 109,231 | 831,688 |
| Hokuriku Electric Power Co. | 190,377 | 1,811,055 |
| Honda Motor Co., Ltd. | 1,247,195 | 34,913,754 |
| Hoshizaki Corp. | 37,161 | 3,231,245 |
| Hoya Corp. | 257,109 | 14,705,626 |
| Hulic Co., Ltd. | 250,331 | 2,476,926 |
| Ibiden Co., Ltd. | 88,338 | 1,461,598 |
| Idemitsu Kosan Co., Ltd. | 85,000 | 2,074,414 |
| IHI Corp. * | 962,274 | 3,182,516 |
| Iida Group Holdings Co., Ltd. | 92,087 | 1,563,789 |
| Inpex Corp. | 643,557 | 6,145,543 |
| Isetan Mitsukoshi Holdings Ltd. | 284,470 | 2,925,859 |
| Isuzu Motors Ltd. | 380,136 | 4,966,705 |
| ITOCHU Corp. | 1,006,286 | 16,420,949 |
| Itoham Yonekyu Holdings, Inc. | 117,645 | 1,056,090 |
| J Front Retailing Co., Ltd. | 169,632 | 2,365,847 |
| Japan Airlines Co., Ltd. | 45,745 | 1,570,276 |
| Japan Airport Terminal Co., Ltd. | 36,930 | 1,338,822 |
| Japan Exchange Group, Inc. | 377,193 | 6,419,067 |
| Japan Post Bank Co., Ltd. | 285,383 | 3,630,167 |
| Japan Post Holdings Co., Ltd. | 306,481 | 3,803,862 |
| Japan Post Insurance Co., Ltd. | 43,316 | 931,967 |
| Japan Tobacco, Inc. | 807,846 | 27,627,952 |
| JFE Holdings, Inc. | 361,703 | 7,138,097 |
| JGC Corp. | 165,547 | 2,657,837 |
| JSR Corp. | 166,875 | 3,247,740 |
| JTEKT Corp. | 172,649 | 2,307,529 |
| JXTG Holdings, Inc. | 2,283,393 | 11,045,597 |
| Kagome Co., Ltd. | 73,360 | 2,312,913 |
| Kajima Corp. | 604,172 | 5,538,884 |
| Kakaku.com, Inc. | 86,043 | 1,070,260 |
| Kaken Pharmaceutical Co., Ltd. | 28,184 | 1,487,816 |
| Kaneka Corp. | 183,518 | 1,427,325 |
| Kansai Paint Co., Ltd. | 151,543 | 3,840,209 |
| Kao Corp. | 331,152 | 20,646,602 |
| Kawasaki Heavy Industries Ltd. | 1,049,799 | 3,223,987 |
| Kawasaki Kisen Kaisha Ltd. *(a) | 667,889 | 1,808,386 |
| KDDI Corp. | 1,261,987 | 34,020,674 |
| Keihan Holdings Co., Ltd. | 362,843 | 2,185,761 |
| Keikyu Corp. | 347,599 | 3,688,857 |
| Keio Corp. | 502,643 | 4,178,797 |
| Keisei Electric Railway Co., Ltd. | 122,888 | 3,344,081 |
| Kewpie Corp. | 89,997 | 2,154,662 |
| Keyence Corp. | 62,514 | 32,523,638 |
| Kikkoman Corp. | 107,939 | 3,378,610 |
| Kintetsu Group Holdings Co., Ltd. | 1,152,328 | 4,345,049 |
| Kirin Holdings Co., Ltd. | 598,547 | 13,576,891 |
| Kobayashi Pharmaceutical Co., Ltd. | 36,980 | 2,294,870 |
| Kobe Steel Ltd. * | 208,936 | 2,513,459 |
| Koito Manufacturing Co., Ltd. | 77,741 | 4,838,505 |
| Komatsu Ltd. | 649,615 | 17,559,555 |
| Konami Holdings Corp. | 67,529 | 3,515,729 |
| Konica Minolta, Inc. | 341,481 | 2,724,153 |
| Kose Corp. | 18,290 | 2,293,313 |
| Kubota Corp. | 798,028 | 13,805,609 |
| Kuraray Co., Ltd. | 248,864 | 4,721,316 |
| Kurita Water Industries Ltd. | 84,575 | 2,432,127 |
| Kyocera Corp. | 207,347 | 12,434,038 |
| Kyowa Hakko Kirin Co., Ltd. | 173,593 | 3,045,685 |
| Kyushu Electric Power Co., Inc. | 351,100 | 4,121,581 |
| Security | Number of Shares | Value ($) |
| Kyushu Financial Group, Inc. | 316,486 | 1,926,637 |
| Kyushu Railway Co. | 105,760 | 3,305,601 |
| Lawson, Inc. | 46,092 | 3,094,856 |
| Lion Corp. | 165,547 | 3,288,077 |
| LIXIL Group Corp. | 200,757 | 5,260,614 |
| M3, Inc. | 126,870 | 3,293,364 |
| Mabuchi Motor Co., Ltd. | 39,818 | 1,877,661 |
| Makita Corp. | 169,184 | 6,786,729 |
| Marubeni Corp. | 1,081,418 | 7,029,315 |
| Marui Group Co., Ltd. | 174,204 | 2,435,944 |
| Maruichi Steel Tube Ltd. | 59,768 | 1,767,625 |
| Matsumotokiyoshi Holdings Co., Ltd. | 29,649 | 2,015,033 |
| Mazda Motor Corp. | 390,111 | 5,738,594 |
| Mebuki Financial Group, Inc. | 1,083,913 | 3,840,869 |
| Medipal Holdings Corp. | 96,233 | 1,695,401 |
| Megmilk Snow Brand Co., Ltd. | 42,800 | 1,256,079 |
| MEIJI Holdings Co., Ltd. | 94,936 | 7,556,236 |
| MINEBEA MITSUMI, Inc. | 351,487 | 5,770,825 |
| Miraca Holdings, Inc. | 36,490 | 1,656,074 |
| MISUMI Group, Inc. | 215,116 | 5,513,740 |
| Mitsubishi Chemical Holdings Corp. | 948,461 | 8,815,879 |
| Mitsubishi Corp. | 930,447 | 21,502,743 |
| Mitsubishi Electric Corp. | 1,367,429 | 20,214,492 |
| Mitsubishi Estate Co., Ltd. | 818,279 | 14,081,596 |
| Mitsubishi Gas Chemical Co., Inc. | 165,900 | 4,113,584 |
| Mitsubishi Heavy Industries Ltd. | 2,114,078 | 8,084,821 |
| Mitsubishi Logistics Corp. | 126,548 | 1,529,246 |
| Mitsubishi Materials Corp. | 92,371 | 3,310,954 |
| Mitsubishi Motors Corp. | 461,190 | 3,402,565 |
| Mitsubishi Tanabe Pharma Corp. | 177,122 | 4,345,170 |
| Mitsubishi UFJ Financial Group, Inc. | 8,980,194 | 55,002,260 |
| Mitsubishi UFJ Lease & Finance Co., Ltd. | 360,124 | 1,819,271 |
| Mitsui & Co., Ltd. | 1,178,362 | 17,606,908 |
| Mitsui Chemicals, Inc. | 706,308 | 4,222,703 |
| Mitsui Fudosan Co., Ltd. | 646,415 | 13,966,699 |
| Mitsui OSK Lines Ltd. | 882,607 | 2,830,822 |
| Mizuho Financial Group, Inc. | 17,099,528 | 29,379,618 |
| MonotaRO Co., Ltd. | 46,374 | 1,417,849 |
| Morinaga & Co., Ltd. | 22,202 | 1,270,876 |
| MS&AD Insurance Group Holdings, Inc. | 351,100 | 11,576,794 |
| Murata Manufacturing Co., Ltd. | 128,657 | 19,685,480 |
| Nabtesco Corp. | 88,119 | 3,078,480 |
| Nagoya Railroad Co., Ltd. | 541,139 | 2,419,048 |
| Nankai Electric Railway Co., Ltd. | 526,748 | 2,699,308 |
| NEC Corp. | 1,752,923 | 4,634,750 |
| Nexon Co., Ltd. * | 84,924 | 2,116,541 |
| NGK Insulators Ltd. | 180,017 | 3,357,940 |
| NGK Spark Plug Co., Ltd. | 151,543 | 2,884,632 |
| NH Foods Ltd. | 120,034 | 3,522,713 |
| Nichirei Corp. | 75,033 | 1,981,837 |
| Nidec Corp. | 166,158 | 18,810,909 |
| Nihon M&A Center, Inc. | 46,527 | 2,151,758 |
| Nikon Corp. | 279,221 | 4,599,561 |
| Nintendo Co., Ltd. | 73,968 | 24,624,637 |
| Nippon Electric Glass Co., Ltd. | 52,891 | 2,008,762 |
| Nippon Express Co., Ltd. | 600,926 | 4,144,129 |
| Nippon Kayaku Co., Ltd. | 112,645 | 1,805,431 |
| Nippon Paint Holdings Co., Ltd. | 106,484 | 3,628,157 |
| Nippon Shinyaku Co., Ltd. | 39,511 | 2,746,312 |
| Nippon Shokubai Co., Ltd. | 21,968 | 1,564,866 |
| Nippon Steel & Sumitomo Metal Corp. | 528,271 | 12,597,195 |
| Nippon Telegraph & Telephone Corp. | 455,519 | 22,631,091 |
| Nippon Yusen K.K. * | 1,110,316 | 2,199,245 |
| Nipro Corp. | 99,770 | 1,318,059 |
| Nishi-Nippon Railroad Co., Ltd. | 187,927 | 910,095 |
| Nissan Chemical Industries Ltd. | 98,987 | 3,314,257 |
| Nissan Motor Co., Ltd. | 1,328,821 | 13,196,451 |
| Nisshin Seifun Group, Inc. | 233,330 | 4,051,369 |
| Security | Number of Shares | Value ($) |
| Nisshin Steel Co., Ltd. | 53,415 | 694,016 |
| Nissin Foods Holdings Co., Ltd. | 57,016 | 3,512,343 |
| Nitori Holdings Co., Ltd. | 49,920 | 7,701,632 |
| Nitto Denko Corp. | 109,631 | 9,660,198 |
| NOK Corp. | 89,039 | 2,001,476 |
| Nomura Holdings, Inc. | 2,389,559 | 13,298,245 |
| Nomura Real Estate Holdings, Inc. | 74,476 | 1,536,753 |
| Nomura Research Institute Ltd. | 97,028 | 3,773,213 |
| NSK Ltd. | 300,237 | 3,559,961 |
| NTN Corp. | 317,185 | 1,279,576 |
| NTT Data Corp. | 458,130 | 4,945,107 |
| NTT DOCOMO, Inc. | 889,131 | 20,628,712 |
| Obayashi Corp. | 470,872 | 5,548,982 |
| Obic Co., Ltd. | 66,919 | 4,189,278 |
| Odakyu Electric Railway Co., Ltd. | 215,422 | 4,169,079 |
| Oji Holdings Corp. | 602,191 | 3,157,044 |
| Olympus Corp. | 191,703 | 6,610,148 |
| Omron Corp. | 127,508 | 6,395,095 |
| Ono Pharmaceutical Co., Ltd. | 324,156 | 6,600,342 |
| Oracle Corp. Japan | 33,507 | 2,475,122 |
| Oriental Land Co., Ltd. | 137,493 | 10,317,597 |
| ORIX Corp. | 912,223 | 14,583,467 |
| Osaka Gas Co., Ltd. | 1,595,366 | 6,234,480 |
| Otsuka Corp. | 49,514 | 3,275,140 |
| Otsuka Holdings Co., Ltd. | 305,971 | 12,312,789 |
| Panasonic Corp. | 1,451,065 | 19,321,604 |
| Park24 Co., Ltd. | 72,364 | 1,737,762 |
| PeptiDream, Inc. *(a) | 74,168 | 2,584,357 |
| Persol Holdings Co., Ltd. | 117,154 | 2,377,994 |
| Pigeon Corp. | 80,812 | 3,124,251 |
| Pola Orbis Holdings, Inc. | 39,237 | 1,260,247 |
| Rakuten, Inc. | 655,347 | 7,773,537 |
| Recruit Holdings Co., Ltd. | 832,143 | 16,565,740 |
| Resona Holdings, Inc. | 1,518,428 | 7,568,686 |
| Resorttrust, Inc. | 74,521 | 1,392,783 |
| Ricoh Co., Ltd. | 439,625 | 4,397,848 |
| Rinnai Corp. | 29,914 | 2,595,663 |
| Rohm Co., Ltd. | 57,337 | 4,459,429 |
| Rohto Pharmaceutical Co., Ltd. | 67,519 | 1,565,587 |
| Ryohin Keikaku Co., Ltd. | 18,086 | 5,012,021 |
| Sanrio Co., Ltd. (a) | 66,919 | 1,220,302 |
| Santen Pharmaceutical Co., Ltd. | 292,117 | 4,527,999 |
| Sapporo Holdings Ltd. | 33,436 | 970,634 |
| Sawai Pharmaceutical Co., Ltd. | 22,686 | 1,238,805 |
| SBI Holdings, Inc. | 201,691 | 2,800,144 |
| SCREEN Holdings Co., Ltd. | 25,055 | 1,618,581 |
| Secom Co., Ltd. | 144,413 | 10,709,603 |
| Sega Sammy Holdings, Inc. | 130,237 | 1,869,657 |
| Seibu Holdings, Inc. | 184,830 | 3,175,664 |
| Seiko Epson Corp. | 208,215 | 5,336,857 |
| Sekisui Chemical Co., Ltd. | 281,080 | 5,235,453 |
| Sekisui House Ltd. | 414,318 | 7,167,558 |
| Seven & i Holdings Co., Ltd. | 531,565 | 21,081,966 |
| Seven Bank Ltd. | 351,100 | 1,330,263 |
| Sharp Corp. *(a) | 962,332 | 2,885,422 |
| Shikoku Electric Power Co., Inc. | 124,955 | 1,625,800 |
| Shimadzu Corp. | 175,864 | 3,229,340 |
| Shimamura Co., Ltd. | 21,154 | 2,579,381 |
| Shimano, Inc. | 53,225 | 7,186,294 |
| Shimizu Corp. | 474,635 | 4,899,013 |
| Shin-Etsu Chemical Co., Ltd. | 289,024 | 25,535,793 |
| Shinsei Bank Ltd. | 1,218,847 | 1,949,092 |
| Shionogi & Co., Ltd. | 204,458 | 10,765,347 |
| Shiseido Co., Ltd. | 278,181 | 11,523,053 |
| Shochiku Co., Ltd. | 9,539 | 1,351,157 |
| Showa Denko K.K. | 143,011 | 3,795,522 |
| Showa Shell Sekiyu K.K. | 204,614 | 2,240,231 |
| SMC Corp. | 39,938 | 13,684,009 |
| Security | Number of Shares | Value ($) |
| SoftBank Group Corp. | 581,299 | 47,122,930 |
| Sohgo Security Services Co., Ltd. | 46,574 | 2,033,328 |
| Sojitz Corp. | 824,659 | 2,210,380 |
| Sompo Holdings, Inc. | 257,818 | 9,686,330 |
| Sony Corp. | 837,684 | 33,009,590 |
| Sony Financial Holdings, Inc. | 106,330 | 1,682,963 |
| Sotetsu Holdings, Inc. | 249,661 | 1,211,330 |
| Square Enix Holdings Co., Ltd. | 73,821 | 2,592,387 |
| Stanley Electric Co., Ltd. | 119,734 | 3,970,826 |
| Start Today Co., Ltd. | 108,956 | 3,385,694 |
| Sugi Holdings Co., Ltd. | 32,209 | 1,700,293 |
| Sumco Corp. | 180,073 | 2,643,994 |
| Sumitomo Chemical Co., Ltd. | 1,259,106 | 7,539,077 |
| Sumitomo Corp. | 837,228 | 11,840,318 |
| Sumitomo Dainippon Pharma Co., Ltd. | 123,079 | 1,670,725 |
| Sumitomo Electric Industries Ltd. | 544,676 | 8,522,007 |
| Sumitomo Forestry Co., Ltd. | 128,243 | 1,997,170 |
| Sumitomo Heavy Industries Ltd. | 456,770 | 3,403,156 |
| Sumitomo Metal Mining Co., Ltd. | 317,632 | 5,468,950 |
| Sumitomo Mitsui Financial Group, Inc. | 924,213 | 34,546,723 |
| Sumitomo Mitsui Trust Holdings, Inc. | 256,736 | 8,878,223 |
| Sumitomo Osaka Cement Co., Ltd. | 535,513 | 2,398,763 |
| Sumitomo Realty & Development Co., Ltd. | 317,533 | 9,598,694 |
| Sumitomo Rubber Industries Ltd. | 147,756 | 2,447,385 |
| Sundrug Co., Ltd. | 57,616 | 2,384,526 |
| Suntory Beverage & Food Ltd. | 91,394 | 4,218,440 |
| Suruga Bank Ltd. | 137,539 | 2,939,231 |
| Suzuken Co., Ltd. | 63,218 | 2,300,455 |
| Suzuki Motor Corp. | 282,265 | 14,172,237 |
| Sysmex Corp. | 96,369 | 5,936,597 |
| T&D Holdings, Inc. | 468,547 | 6,421,980 |
| Taiheiyo Cement Corp. | 892,820 | 3,439,539 |
| Taisei Corp. | 713,160 | 7,147,151 |
| Taisho Pharmaceutical Holdings Co., Ltd. | 28,658 | 2,234,105 |
| Takashimaya Co., Ltd. | 225,064 | 2,063,325 |
| Takeda Pharmaceutical Co., Ltd. | 520,348 | 28,731,190 |
| TDK Corp. | 81,202 | 5,437,568 |
| Teijin Ltd. | 133,670 | 2,710,807 |
| Terumo Corp. | 202,804 | 7,831,337 |
| The Bank of Kyoto Ltd. | 288,082 | 2,661,997 |
| The Chiba Bank Ltd. | 450,128 | 3,010,124 |
| The Chugoku Bank Ltd. | 162,037 | 2,181,890 |
| The Chugoku Electric Power Co., Inc. | 243,137 | 2,801,179 |
| The Gunma Bank Ltd. | 362,878 | 2,123,328 |
| The Hachijuni Bank Ltd. | 356,517 | 2,170,329 |
| The Hiroshima Bank Ltd. | 461,149 | 1,851,970 |
| The Iyo Bank Ltd. | 275,354 | 2,084,044 |
| The Japan Steel Works Ltd. | 68,117 | 1,382,021 |
| The Juroku Bank Ltd. | 359,102 | 1,102,821 |
| The Kansai Electric Power Co., Inc. | 520,973 | 7,289,646 |
| The San-In Godo Bank Ltd. | 120,796 | 1,003,158 |
| The Shiga Bank Ltd. | 200,557 | 1,055,084 |
| The Shizuoka Bank Ltd. | 380,108 | 3,318,951 |
| The Yokohama Rubber Co., Ltd. | 81,562 | 1,508,074 |
| THK Co., Ltd. | 95,821 | 3,195,194 |
| TIS, Inc. | 71,791 | 2,116,680 |
| Tobu Railway Co., Ltd. | 794,226 | 4,387,511 |
| Toda Corp. | 122,078 | 876,264 |
| Toho Co., Ltd. | 91,426 | 3,393,378 |
| Toho Gas Co., Ltd. | 379,658 | 2,500,927 |
| Tohoku Electric Power Co., Inc. | 351,100 | 4,797,878 |
| Tokio Marine Holdings, Inc. | 482,088 | 19,229,205 |
| Tokyo Electric Power Co. Holdings, Inc. * | 1,094,313 | 4,424,580 |
| Tokyo Electron Ltd. | 109,165 | 15,334,280 |
| Tokyo Gas Co., Ltd. | 1,284,670 | 6,807,374 |
| Tokyo Tatemono Co., Ltd. | 116,012 | 1,427,224 |
| Tokyu Corp. | 333,595 | 4,849,646 |
| Security | Number of Shares | Value ($) |
| Tokyu Fudosan Holdings Corp. | 351,100 | 2,092,691 |
| Topcon Corp. | 71,980 | 1,269,427 |
| Toppan Printing Co., Ltd. | 432,623 | 4,327,802 |
| Toray Industries, Inc. | 1,068,238 | 10,162,141 |
| Toshiba Corp. * | 2,543,746 | 7,072,381 |
| Tosoh Corp. | 436,300 | 5,113,820 |
| TOTO Ltd. | 116,024 | 4,411,779 |
| Toyo Seikan Group Holdings Ltd. | 93,293 | 1,536,800 |
| Toyo Suisan Kaisha Ltd. | 74,721 | 2,759,775 |
| Toyo Tire & Rubber Co., Ltd. | 71,740 | 1,381,872 |
| Toyota Industries Corp. | 106,181 | 5,653,468 |
| Toyota Motor Corp. | 1,808,427 | 101,594,622 |
| Toyota Tsusho Corp. | 187,274 | 5,759,790 |
| Trend Micro, Inc. | 92,636 | 4,284,184 |
| Tsumura & Co. | 50,044 | 1,884,721 |
| Tsuruha Holdings, Inc. | 28,808 | 3,426,283 |
| Ube Industries Ltd. | 696,944 | 1,988,374 |
| Unicharm Corp. | 270,631 | 6,361,279 |
| USS Co., Ltd. | 181,554 | 3,564,766 |
| Wacoal Holdings Corp. | 71,020 | 1,011,806 |
| Welcia Holdings Co., Ltd. | 70,970 | 2,782,442 |
| West Japan Railway Co. | 127,241 | 9,238,441 |
| Yahoo Japan Corp. | 839,413 | 3,843,941 |
| Yakult Honsha Co., Ltd. | 64,650 | 4,476,040 |
| Yamada Denki Co., Ltd. | 639,982 | 3,459,834 |
| Yamaguchi Financial Group, Inc. | 179,156 | 2,024,987 |
| Yamaha Corp. | 110,641 | 3,850,218 |
| Yamaha Motor Co., Ltd. | 204,212 | 5,770,483 |
| Yamato Holdings Co., Ltd. | 256,383 | 5,460,310 |
| Yamazaki Baking Co., Ltd. | 88,059 | 1,667,408 |
| Yaskawa Electric Corp. | 151,543 | 4,585,119 |
| Yokogawa Electric Corp. | 170,596 | 2,655,197 |
| Zenkoku Hosho Co., Ltd. | 55,067 | 2,234,001 |
| 2,431,523,449 | ||
| Netherlands 3.0% | ||
| ABN AMRO Group N.V. | 246,770 | 6,906,276 |
| Aegon N.V. | 1,240,828 | 7,075,154 |
| Akzo Nobel N.V. | 173,025 | 15,798,477 |
| Altice N.V., A Shares * | 432,901 | 9,969,270 |
| Altice N.V., B Shares * | 57,102 | 1,318,735 |
| ArcelorMittal * | 442,601 | 11,808,110 |
| ASML Holding N.V. | 218,816 | 33,949,605 |
| Boskalis Westminster | 81,631 | 2,664,051 |
| Gemalto N.V. | 74,145 | 4,001,612 |
| Heineken Holding N.V. | 77,242 | 7,616,627 |
| Heineken N.V. | 146,113 | 15,309,386 |
| ING Groep N.V. | 2,609,509 | 46,226,414 |
| Koninklijke Ahold Delhaize N.V. | 815,907 | 14,647,474 |
| Koninklijke DSM N.V. | 133,009 | 10,077,901 |
| Koninklijke KPN N.V. | 2,117,476 | 7,479,392 |
| Koninklijke Philips N.V. | 648,424 | 24,499,550 |
| Koninklijke Vopak N.V. | 63,986 | 2,704,773 |
| NN Group N.V. | 225,755 | 8,947,114 |
| Randstad Holding N.V. | 78,212 | 4,566,088 |
| RELX N.V. | 577,876 | 12,115,888 |
| Unibail-Rodamco SE | 67,361 | 17,102,250 |
| Unilever N.V. CVA | 1,060,467 | 63,052,041 |
| Wolters Kluwer N.V. | 210,660 | 9,190,394 |
| 337,026,582 | ||
| New Zealand 0.2% | ||
| Auckland International Airport Ltd. | 844,750 | 4,108,018 |
| Contact Energy Ltd. | 608,269 | 2,430,884 |
| Fisher & Paykel Healthcare Corp., Ltd. | 440,117 | 3,710,043 |
| Fletcher Building Ltd. | 563,989 | 3,296,060 |
| Security | Number of Shares | Value ($) |
| Kiwi Property Group Ltd. | 1,903,519 | 1,840,455 |
| Ryman Healthcare Ltd. | 444,740 | 2,892,187 |
| SKYCITY Entertainment Group Ltd. | 716,560 | 1,950,161 |
| Spark New Zealand Ltd. | 1,397,378 | 3,918,140 |
| 24,145,948 | ||
| Norway 0.6% | ||
| Aker BP A.S.A. | 43,641 | 796,548 |
| DNB A.S.A. | 681,837 | 13,277,673 |
| Gjensidige Forsikring A.S.A. | 154,484 | 2,696,572 |
| Marine Harvest A.S.A. * | 221,558 | 4,388,528 |
| Norsk Hydro A.S.A. | 821,938 | 5,916,377 |
| Orkla A.S.A. | 602,239 | 6,165,715 |
| Schibsted A.S.A., B Shares | 63,198 | 1,445,946 |
| Schibsted A.S.A., Class A | 63,198 | 1,531,241 |
| Statoil A.S.A. | 682,789 | 12,901,275 |
| Telenor A.S.A. | 452,919 | 9,145,880 |
| Yara International A.S.A. | 123,312 | 5,029,261 |
| 63,295,016 | ||
| Portugal 0.1% | ||
| Banco Espirito Santo S.A. *(c) | 505,213 | — |
| EDP - Energias de Portugal S.A. | 1,584,561 | 6,075,525 |
| Galp Energia, SGPS, S.A. | 415,181 | 6,866,094 |
| Jeronimo Martins, SGPS, S.A. | 165,501 | 3,297,766 |
| 16,239,385 | ||
| Republic of Korea 4.2% | ||
| Amorepacific Corp. | 23,594 | 6,026,137 |
| AMOREPACIFIC Group | 18,347 | 2,180,293 |
| BGF retail Co., Ltd. | 8,000 | 647,038 |
| BNK Financial Group, Inc. | 271,769 | 2,376,412 |
| Celltrion, Inc. * | 59,093 | 6,031,930 |
| Cheil Worldwide, Inc. | 46,165 | 777,878 |
| CJ CheilJedang Corp. | 5,790 | 1,861,365 |
| CJ Corp. | 6,762 | 1,061,435 |
| CJ Logistics Corp. * | 9,087 | 1,361,922 |
| Coway Co., Ltd. | 30,955 | 2,712,269 |
| Daelim Industrial Co., Ltd. | 14,143 | 1,051,067 |
| Dongbu Insurance Co., Ltd. | 31,646 | 2,110,482 |
| Doosan Heavy Industries & Construction Co., Ltd. | 27,688 | 441,987 |
| Doosan Infracore Co., Ltd. * | 53,426 | 396,573 |
| E-MART, Inc. | 15,172 | 3,013,948 |
| GS Holdings Corp. | 36,954 | 2,313,722 |
| Hana Financial Group, Inc. | 187,831 | 8,162,220 |
| Hankook Tire Co., Ltd. | 53,619 | 2,805,535 |
| Hanon Systems | 194,268 | 1,989,886 |
| Hanssem Co., Ltd. | 4,786 | 721,550 |
| Hanwha Chemical Corp. | 35,831 | 1,123,294 |
| Hanwha Corp. | 40,000 | 1,743,526 |
| Hanwha Life Insurance Co., Ltd. | 301,524 | 1,957,392 |
| Hanwha Techwin Co., Ltd. * | 14,690 | 505,474 |
| Hotel Shilla Co., Ltd. | 26,539 | 1,456,868 |
| Hyosung Corp. | 17,224 | 2,421,075 |
| Hyundai Construction Equipment Co., Ltd. * | 4,576 | 1,361,518 |
| Hyundai Department Store Co., Ltd. | 15,600 | 1,336,431 |
| Hyundai Development Co-Engineering & Construction | 32,264 | 1,077,279 |
| Hyundai Engineering & Construction Co., Ltd. | 78,076 | 2,814,641 |
| Hyundai Glovis Co., Ltd. | 17,714 | 2,434,968 |
| Hyundai Heavy Industries Co., Ltd. * | 20,431 | 2,690,674 |
| Security | Number of Shares | Value ($) |
| Hyundai Marine & Fire Insurance Co., Ltd. | 51,234 | 2,099,158 |
| Hyundai Mobis Co., Ltd. | 42,168 | 8,825,513 |
| Hyundai Motor Co. | 97,641 | 12,166,159 |
| Hyundai Robotics Co., Ltd. * | 3,346 | 1,314,542 |
| Hyundai Steel Co. | 59,380 | 3,038,512 |
| Hyundai Wia Corp. | 8,595 | 533,567 |
| Industrial Bank of Korea | 90,000 | 1,193,242 |
| Kakao Corp. | 13,976 | 1,524,519 |
| Kangwon Land, Inc. | 98,795 | 3,022,727 |
| KB Financial Group, Inc. ADR | 294,069 | 14,444,669 |
| KCC Corp. | 3,973 | 1,395,271 |
| KEPCO Plant Service & Engineering Co., Ltd. | 11,174 | 453,362 |
| Kia Motors Corp. | 171,094 | 5,378,931 |
| Korea Aerospace Industries Ltd. | 36,992 | 1,517,276 |
| Korea Electric Power Corp. ADR | 351,100 | 6,793,785 |
| Korea Investment Holdings Co., Ltd. | 18,000 | 1,048,776 |
| Korea Zinc Co., Ltd. | 7,524 | 3,443,051 |
| Korean Air Lines Co., Ltd. * | 20,781 | 611,856 |
| KT Corp. ADR | 119,652 | 1,973,061 |
| KT&G Corp. | 74,065 | 7,520,790 |
| Kumho Petrochemical Co., Ltd. | 10,221 | 714,273 |
| LG Chem Ltd. | 30,912 | 10,389,897 |
| LG Corp. | 62,925 | 4,687,566 |
| LG Display Co., Ltd. ADR | 351,100 | 4,904,867 |
| LG Electronics, Inc. | 80,148 | 5,792,889 |
| LG Household & Health Care Ltd. | 6,009 | 5,115,857 |
| LG Uplus Corp. | 155,054 | 1,897,610 |
| Lotte Chemical Corp. | 8,908 | 3,156,036 |
| Lotte Chilsung Beverage Co., Ltd. | 969 | 1,329,410 |
| Lotte Confectionery Co., Ltd. | 9,560 | 1,674,441 |
| Lotte Shopping Co., Ltd. | 8,088 | 1,843,398 |
| LS Corp. | 17,626 | 1,320,856 |
| Mando Corp. | 7,921 | 1,682,405 |
| Mirae Asset Daewoo Co., Ltd. | 307,323 | 2,766,343 |
| NAVER Corp. | 17,069 | 11,428,782 |
| NCSoft Corp. | 10,001 | 3,410,238 |
| Neoplux Co., Ltd. *(c) | 390 | — |
| Netmarble Games Corp. * | 16,577 | 2,271,325 |
| NHN Entertainment Corp. * | 25,051 | 1,424,059 |
| OCI Co., Ltd. | 10,000 | 871,763 |
| Orion Corp. * | 20,903 | 1,618,333 |
| Orion Holdings Corp. | 10,866 | 265,001 |
| POSCO ADR | 204,989 | 15,501,268 |
| S-1 Corp. | 6,932 | 551,437 |
| S-Oil Corp. | 33,943 | 3,777,799 |
| Samsung Biologics Co., Ltd. * | 14,000 | 3,513,657 |
| Samsung C&T Corp. | 51,798 | 5,925,809 |
| Samsung Card Co., Ltd. | 32,702 | 1,075,953 |
| Samsung Electro-Mechanics Co., Ltd. | 45,129 | 4,042,239 |
| Samsung Electronics Co., Ltd. GDR | 133,703 | 137,580,387 |
| Samsung Engineering Co., Ltd. * | 97,361 | 923,876 |
| Samsung Fire & Marine Insurance Co., Ltd. | 19,199 | 4,707,807 |
| Samsung Heavy Industries Co., Ltd. * | 166,318 | 1,578,222 |
| Samsung Life Insurance Co., Ltd. | 45,416 | 4,651,958 |
| Samsung SDI Co., Ltd. | 40,893 | 7,126,175 |
| Samsung SDS Co., Ltd. | 23,160 | 3,440,316 |
| Samsung Securities Co., Ltd. | 30,959 | 1,003,504 |
| Shinhan Financial Group Co., Ltd. ADR | 331,234 | 15,309,635 |
| Shinsegae Co., Ltd. | 6,069 | 1,038,770 |
| SK Holdings Co., Ltd. | 21,531 | 5,107,789 |
| SK Hynix, Inc. | 358,297 | 21,797,778 |
| SK Innovation Co., Ltd. | 38,578 | 6,449,054 |
| SK Telecom Co., Ltd. ADR | 184,019 | 4,653,840 |
| Security | Number of Shares | Value ($) |
| Woori Bank | 387,149 | 6,386,104 |
| Yuhan Corp. | 7,127 | 1,428,434 |
| 473,402,716 | ||
| Singapore 1.1% | ||
| Ascendas Real Estate Investment Trust | 1,190,882 | 2,332,655 |
| CapitaLand Commercial Trust | 2,132,161 | 2,731,929 |
| CapitaLand Ltd. | 1,807,035 | 5,029,891 |
| CapitaLand Mall Trust | 2,079,496 | 3,322,906 |
| City Developments Ltd. | 421,419 | 3,633,885 |
| ComfortDelGro Corp., Ltd. | 2,147,327 | 3,621,045 |
| DBS Group Holdings Ltd. | 1,219,156 | 18,511,780 |
| Genting Singapore plc | 4,206,198 | 3,670,357 |
| Global Logistic Properties Ltd. | 1,503,585 | 3,587,346 |
| Golden Agri-Resources Ltd. | 5,439,191 | 1,582,092 |
| Jardine Cycle & Carriage Ltd. | 64,762 | 1,904,232 |
| Keppel Corp., Ltd. | 1,005,318 | 4,671,249 |
| Oversea-Chinese Banking Corp., Ltd. | 2,340,504 | 19,251,421 |
| SATS Ltd. | 215,819 | 767,604 |
| Sembcorp Industries Ltd. | 1,124,420 | 2,467,431 |
| Singapore Airlines Ltd. | 355,228 | 2,696,908 |
| Singapore Exchange Ltd. | 474,347 | 2,619,737 |
| Singapore Post Ltd. | 1,889,264 | 1,752,925 |
| Singapore Press Holdings Ltd. | 937,767 | 1,905,918 |
| Singapore Technologies Engineering Ltd. | 1,192,575 | 3,205,375 |
| Singapore Telecommunications Ltd. | 4,603,945 | 12,543,885 |
| Suntec Real Estate Investment Trust | 946,271 | 1,320,459 |
| United Overseas Bank Ltd. | 829,296 | 14,674,509 |
| UOL Group Ltd. | 400,263 | 2,411,010 |
| Venture Corp., Ltd. | 253,072 | 2,944,431 |
| Wilmar International Ltd. | 1,572,943 | 3,845,487 |
| Wing Tai Holdings Ltd. | 1,011,509 | 1,586,535 |
| Yangzijiang Shipbuilding Holdings Ltd. | 1,525,702 | 1,679,620 |
| 130,272,622 | ||
| Spain 3.0% | ||
| Abertis Infraestructuras S.A. | 452,975 | 9,155,210 |
| Acciona S.A. | 32,594 | 2,781,933 |
| ACS, Actividades de Construccion y Servicios S.A. | 140,440 | 5,302,937 |
| Aena S.A. | 48,054 | 9,372,402 |
| Amadeus IT Group S.A. | 273,858 | 16,953,452 |
| Banco Bilbao Vizcaya Argentaria S.A. | 4,491,762 | 39,635,362 |
| Banco de Sabadell S.A. | 4,066,255 | 8,929,079 |
| Banco Santander S.A. | 10,738,598 | 69,695,673 |
| Bankia S.A. | 591,021 | 2,873,195 |
| Bankinter S.A. | 477,599 | 4,548,216 |
| CaixaBank S.A. | 2,438,087 | 12,574,302 |
| Corporacion Financiera Alba S.A. | 24,583 | 1,470,104 |
| Distribuidora Internacional de Alimentacion S.A. | 484,926 | 3,064,824 |
| Enagas S.A. | 157,995 | 4,649,983 |
| Endesa S.A. | 225,392 | 5,430,380 |
| Ferrovial S.A. | 354,611 | 8,071,471 |
| Gas Natural SDG S.A. | 225,386 | 5,471,770 |
| Grifols S.A. | 223,317 | 6,305,660 |
| Iberdrola S.A. | 3,977,313 | 32,443,099 |
| Industria de Diseno Textil S.A. | 716,650 | 27,192,372 |
| Mapfre S.A. | 731,712 | 2,586,308 |
| Mediaset Espana Comunicacion S.A. | 94,797 | 1,097,738 |
| Merlin Properties Socimi S.A. | 213,633 | 2,939,913 |
| Red Electrica Corp. S.A. | 304,178 | 6,822,283 |
| Repsol S.A. | 779,118 | 13,366,408 |
| Security | Number of Shares | Value ($) |
| Siemens Gamesa Renewable Energy S.A. | 172,520 | 2,573,092 |
| Telefonica S.A. | 3,032,157 | 32,657,060 |
| 337,964,226 | ||
| Sweden 2.5% | ||
| Alfa Laval AB | 178,696 | 4,042,210 |
| Assa Abloy AB, B Shares | 611,904 | 13,211,070 |
| Atlas Copco AB, A Shares | 436,954 | 17,099,597 |
| Atlas Copco AB, B Shares | 264,487 | 9,426,318 |
| Boliden AB | 179,938 | 6,286,360 |
| Electrolux AB, Series B | 165,552 | 6,010,540 |
| Essity AB, B Shares * | 392,075 | 10,869,416 |
| Fastighets AB Balder, B Shares * | 110,728 | 2,912,448 |
| Getinge AB, B Shares | 112,674 | 2,089,978 |
| Hennes & Mauritz AB, B Shares | 662,198 | 16,726,900 |
| Hexagon AB, B Shares | 172,039 | 8,429,692 |
| Husqvarna AB, B Shares | 254,868 | 2,567,145 |
| ICA Gruppen AB | 81,831 | 3,257,876 |
| Industrivarden AB, A Shares | 203,638 | 5,082,409 |
| Industrivarden AB, C Shares | 88,973 | 2,104,308 |
| Investor AB, B Shares | 292,885 | 13,677,426 |
| Kinnevik AB, B Shares | 140,771 | 4,229,844 |
| L E Lundbergfortagen AB, B Shares | 16,392 | 1,267,919 |
| Lundin Petroleum AB * | 140,465 | 3,009,706 |
| Nordea Bank AB | 2,132,034 | 28,642,002 |
| Sandvik AB | 653,046 | 10,775,565 |
| Securitas AB, B Shares | 232,897 | 3,822,422 |
| Skandinaviska Enskilda Banken AB, A Shares | 934,332 | 12,140,968 |
| Skanska AB, B Shares | 263,617 | 5,946,609 |
| SKF AB, B Shares | 289,236 | 5,772,107 |
| Svenska Cellulosa AB SCA, B Shares | 437,707 | 3,644,189 |
| Svenska Handelsbanken AB, A Shares | 1,023,863 | 15,285,858 |
| Swedbank AB, A Shares | 723,432 | 19,528,259 |
| Swedish Match AB | 135,719 | 4,831,909 |
| Tele2 AB, B Shares | 319,501 | 3,714,031 |
| Telefonaktiebolaget LM Ericsson, B Shares | 2,034,275 | 11,905,495 |
| Telia Co. AB | 1,783,794 | 8,496,018 |
| Trelleborg AB, B Shares | 187,540 | 4,461,450 |
| Volvo AB, B Shares | 1,085,729 | 18,515,388 |
| 289,783,432 | ||
| Switzerland 7.3% | ||
| ABB Ltd. | 1,318,984 | 30,469,766 |
| Actelion Ltd. * | 57,716 | 16,140,661 |
| Adecco Group AG | 109,809 | 7,941,442 |
| Aryzta AG * | 55,220 | 1,736,471 |
| Baloise Holding AG | 31,599 | 5,020,986 |
| Banque Cantonale Vaudoise | 3,511 | 2,530,039 |
| Barry Callebaut AG * | 1,134 | 1,628,429 |
| Chocoladefabriken Lindt & Sprungli AG | 546 | 6,564,350 |
| Cie Financiere Richemont S.A. | 345,285 | 30,809,770 |
| Clariant AG * | 182,754 | 4,400,549 |
| Credit Suisse Group AG * | 1,690,850 | 24,808,517 |
| DKSH Holding AG | 28,088 | 2,297,312 |
| Dufry AG * | 22,373 | 3,440,925 |
| EMS-Chemie Holding AG | 3,938 | 2,686,118 |
| Flughafen Zuerich AG | 8,678 | 2,122,092 |
| Geberit AG | 25,691 | 11,711,995 |
| Givaudan S.A. | 6,266 | 12,779,771 |
| Helvetia Holding AG | 5,562 | 3,180,353 |
| Idorsia Ltd. * | 57,716 | 1,051,020 |
| Julius Baer Group Ltd. * | 162,376 | 9,056,559 |
| Kuehne & Nagel International AG | 35,110 | 6,346,105 |
| LafargeHolcim Ltd. * | 327,802 | 19,221,272 |
| Security | Number of Shares | Value ($) |
| Lonza Group AG * | 50,325 | 12,714,787 |
| Nestle S.A. | 2,136,927 | 180,893,872 |
| Novartis AG | 1,608,313 | 135,392,842 |
| Pargesa Holding S.A. | 17,555 | 1,419,379 |
| Partners Group Holding AG | 12,304 | 7,963,671 |
| PSP Swiss Property AG | 28,509 | 2,610,606 |
| Roche Holding AG | 479,313 | 121,449,236 |
| Roche Holding AG, Bearer Shares | 16,070 | 4,103,619 |
| Schindler Holding AG | 41,308 | 8,768,550 |
| SGS S.A. | 3,511 | 7,829,420 |
| Sika AG | 1,268 | 8,972,320 |
| Sonova Holding AG | 38,621 | 6,514,531 |
| Straumann Holding AG | 7,331 | 4,687,721 |
| Sulzer AG | 10,533 | 1,161,808 |
| Swiss Life Holding AG * | 21,305 | 7,608,612 |
| Swiss Prime Site AG * | 52,665 | 4,756,839 |
| Swiss Re AG | 225,421 | 20,372,335 |
| Swisscom AG | 14,433 | 7,263,058 |
| Temenos Group AG * | 35,773 | 3,521,463 |
| The Swatch Group AG | 61,319 | 10,747,788 |
| UBS Group AG * | 2,389,502 | 39,286,297 |
| Vifor Pharma AG | 31,038 | 3,129,638 |
| Zurich Insurance Group AG | 102,010 | 30,454,390 |
| 837,567,284 | ||
| United Kingdom 15.5% | ||
| 3i Group plc | 665,549 | 8,314,367 |
| Admiral Group plc | 127,056 | 3,161,395 |
| Aggreko plc | 190,130 | 2,207,378 |
| Anglo American plc | 876,080 | 15,832,445 |
| Antofagasta plc | 278,226 | 3,710,560 |
| Ashmore Group plc | 363,720 | 1,727,054 |
| Ashtead Group plc | 332,380 | 7,122,435 |
| Associated British Foods plc | 233,565 | 9,997,899 |
| AstraZeneca plc | 861,452 | 50,406,197 |
| Auto Trader Group plc | 755,876 | 3,442,060 |
| Aviva plc | 2,740,544 | 18,451,192 |
| Babcock International Group plc | 186,836 | 1,956,074 |
| BAE Systems plc | 2,146,477 | 16,802,498 |
| Barclays plc | 11,407,257 | 28,089,451 |
| Barratt Developments plc | 697,286 | 5,611,058 |
| Bellway plc | 111,514 | 4,602,435 |
| Berkeley Group Holdings plc | 89,109 | 4,295,469 |
| BHP Billiton plc | 1,440,718 | 27,410,299 |
| Booker Group plc | 1,158,809 | 2,986,367 |
| BP plc | 13,034,564 | 74,766,014 |
| British American Tobacco plc | 1,543,138 | 96,060,125 |
| BT Group plc | 5,629,217 | 21,220,198 |
| Bunzl plc | 250,489 | 7,455,933 |
| Burberry Group plc | 317,185 | 7,344,497 |
| Capita plc | 451,020 | 3,768,835 |
| Capital & Counties Properties plc | 541,180 | 1,891,877 |
| Carnival plc | 124,357 | 8,612,913 |
| Centrica plc | 3,765,659 | 9,699,629 |
| Cobham plc | 1,605,129 | 2,839,761 |
| Coca-Cola HBC AG CDI * | 140,440 | 4,784,688 |
| Compass Group plc | 1,111,853 | 23,667,847 |
| ConvaTec Group plc * | 784,223 | 2,899,155 |
| CRH plc | 555,313 | 19,427,147 |
| Croda International plc | 93,713 | 4,639,365 |
| CYBG plc * | 674,688 | 2,522,910 |
| Daily Mail & General Trust plc, A Shares | 154,484 | 1,241,142 |
| DCC plc | 56,721 | 5,149,039 |
| Derwent London plc | 61,262 | 2,197,666 |
| Diageo plc | 1,729,861 | 57,776,010 |
| Direct Line Insurance Group plc | 941,724 | 4,612,356 |
| Dixons Carphone plc | 688,624 | 1,538,624 |
| Security | Number of Shares | Value ($) |
| DS Smith plc | 625,609 | 4,012,908 |
| easyJet plc | 208,621 | 3,215,071 |
| Experian plc | 648,171 | 12,979,022 |
| Ferguson plc | 174,351 | 10,341,101 |
| Fresnillo plc | 110,210 | 2,294,900 |
| G4S plc | 1,260,835 | 4,605,880 |
| GKN plc | 1,155,119 | 4,746,600 |
| GlaxoSmithKline plc | 3,301,257 | 65,232,565 |
| Glencore plc * | 7,869,727 | 36,455,235 |
| Halma plc | 253,993 | 3,577,200 |
| Hammerson plc | 587,456 | 4,246,582 |
| Hargreaves Lansdown plc | 161,506 | 2,913,520 |
| Hikma Pharmaceuticals plc | 109,166 | 1,761,137 |
| Howden Joinery Group plc | 409,322 | 2,246,860 |
| HSBC Holdings plc | 13,772,394 | 133,186,890 |
| IMI plc | 228,666 | 3,344,251 |
| Imperial Brands plc | 649,697 | 26,793,536 |
| Inchcape plc | 344,951 | 3,700,352 |
| Informa plc | 597,142 | 5,313,035 |
| Inmarsat plc | 338,389 | 3,191,748 |
| InterContinental Hotels Group plc | 122,332 | 6,078,248 |
| International Consolidated Airlines Group S.A. | 668,299 | 5,265,852 |
| Intertek Group plc | 96,717 | 6,368,323 |
| Intu Properties plc | 758,376 | 2,431,287 |
| Investec plc | 433,341 | 3,294,452 |
| ITV plc | 2,483,641 | 5,075,670 |
| J Sainsbury plc | 1,109,856 | 3,369,328 |
| John Wood Group plc | 278,836 | 2,033,605 |
| Johnson Matthey plc | 127,882 | 4,554,585 |
| Just Eat plc * | 495,811 | 4,254,923 |
| Kingfisher plc | 1,609,790 | 6,200,068 |
| Land Securities Group plc | 551,227 | 7,173,865 |
| Legal & General Group plc | 4,094,957 | 13,729,603 |
| Lloyds Banking Group plc | 48,392,213 | 39,795,469 |
| London Stock Exchange Group plc | 236,056 | 12,014,715 |
| Marks & Spencer Group plc | 1,144,586 | 4,713,641 |
| Mediclinic International plc | 260,565 | 2,566,817 |
| Meggitt plc | 535,013 | 3,571,046 |
| Melrose Industries plc | 1,215,382 | 3,445,378 |
| Merlin Entertainments plc | 436,405 | 2,594,027 |
| Micro Focus International plc | 144,470 | 4,231,345 |
| Mondi plc | 235,490 | 6,411,702 |
| National Grid plc | 2,302,284 | 28,915,533 |
| Next plc | 92,701 | 4,932,086 |
| Old Mutual plc | 3,346,190 | 8,946,848 |
| Paddy Power Betfair plc | 57,040 | 5,008,950 |
| Pearson plc | 532,705 | 4,163,120 |
| Pennon Group plc | 285,688 | 2,989,161 |
| Persimmon plc | 194,118 | 6,650,978 |
| Petrofac Ltd. | 176,764 | 952,987 |
| Polymetal International plc | 166,470 | 1,897,296 |
| Provident Financial plc (a) | 96,774 | 1,101,085 |
| Prudential plc | 1,711,378 | 40,035,342 |
| Randgold Resources Ltd. | 63,640 | 6,486,464 |
| Reckitt Benckiser Group plc | 434,573 | 41,056,936 |
| RELX plc | 733,799 | 15,989,028 |
| Rentokil Initial plc | 1,187,830 | 4,660,612 |
| Rightmove plc | 60,026 | 3,188,223 |
| Rio Tinto plc | 823,031 | 39,732,260 |
| Rolls-Royce Holdings plc * | 1,148,829 | 13,530,160 |
| Royal Bank of Scotland Group plc * | 2,282,196 | 7,407,684 |
| Royal Dutch Shell plc, A Shares | 3,065,691 | 84,022,812 |
| Royal Dutch Shell plc, B Shares | 2,515,618 | 70,032,609 |
| Royal Mail plc | 538,835 | 2,736,993 |
| RPC Group plc | 250,084 | 2,987,218 |
| RSA Insurance Group plc | 658,446 | 5,654,857 |
| Schroders plc | 82,829 | 3,594,644 |
| Security | Number of Shares | Value ($) |
| Segro plc | 691,667 | 4,794,912 |
| Severn Trent plc | 179,061 | 5,235,243 |
| Shire plc | 605,003 | 29,885,074 |
| Sky plc | 715,153 | 8,809,641 |
| Smith & Nephew plc | 596,870 | 10,744,285 |
| Smiths Group plc | 289,996 | 5,773,270 |
| Smurfit Kappa Group plc | 176,346 | 5,367,189 |
| SSE plc | 685,399 | 12,585,187 |
| St. James's Place plc | 324,473 | 4,820,690 |
| Standard Chartered plc * | 1,812,835 | 17,986,653 |
| Standard Life Aberdeen plc | 1,845,066 | 10,213,569 |
| Tate & Lyle plc | 317,150 | 2,793,216 |
| Taylor Wimpey plc | 2,157,335 | 5,573,568 |
| Tesco plc * | 5,509,996 | 12,843,731 |
| The British Land Co. plc | 664,217 | 5,233,688 |
| The Sage Group plc | 781,816 | 6,976,308 |
| The Weir Group plc | 151,076 | 3,494,309 |
| Travis Perkins plc | 172,039 | 3,336,297 |
| TUI AG | 300,205 | 5,059,726 |
| Unilever plc | 829,949 | 48,327,585 |
| United Utilities Group plc | 481,564 | 5,646,726 |
| Vodafone Group plc | 18,343,122 | 52,330,178 |
| Whitbread plc | 130,525 | 6,320,506 |
| William Hill plc | 636,880 | 2,031,934 |
| Wm Morrison Supermarkets plc | 1,178,895 | 3,736,901 |
| Worldpay Group plc | 1,104,600 | 5,935,297 |
| WPP plc | 862,201 | 15,776,048 |
| 1,771,880,323 | ||
| Total Common Stock | ||
| (Cost $10,043,520,632) | 11,269,726,297 | |
| Preferred Stock 0.7% of net assets | ||
| Germany 0.4% | ||
| Bayerische Motoren Werke AG | 33,082 | 2,740,989 |
| Fuchs Petrolub SE | 46,234 | 2,566,986 |
| Henkel AG & Co. KGaA | 125,555 | 16,800,595 |
| Porsche Automobil Holding SE | 112,352 | 6,359,517 |
| Sartorius AG | 19,844 | 1,968,560 |
| Volkswagen AG | 120,157 | 17,906,823 |
| 48,343,470 | ||
| Italy 0.0% | ||
| Intesa Sanpaolo S.p.A. - RSP | 515,544 | 1,626,716 |
| Republic of Korea 0.2% | ||
| Amorepacific Corp. | 4,500 | 684,418 |
| Hyundai Motor Co., Ltd. | 7,653 | 654,265 |
| Hyundai Motor Co., Ltd. 2nd | 18,811 | 1,701,598 |
| Samsung Electronics Co., Ltd. | 11,836 | 19,786,148 |
| 22,826,429 | ||
| Spain 0.1% | ||
| Grifols S.A., B Shares | 141,520 | 2,900,683 |
| Total Preferred Stock | ||
| (Cost $67,505,523) | 75,697,298 | |
| Security | Number of Shares | Value ($) |
| Rights 0.0% of net assets | ||
| Sweden 0.0% | ||
| Getinge AB expires 09/14/17 * | 111,306 | 41,124 |
| Total Rights | ||
| (Cost $—) | 41,124 | |
| Other Investment Companies 0.3% of net assets | ||
| United States 0.3% | ||
| Money Market Fund 0.2% | ||
| State Street Institutional U.S. Government Money Market Fund, Premier Class 0.93% (b) | 21,469,330 | 21,469,330 |
| Securities Lending Collateral 0.1% | ||
| Wells Fargo Government Money Market Fund, Select Class 0.92% (b) | 12,782,856 | 12,782,856 |
| Total Other Investment Companies | ||
| (Cost $34,252,186) | 34,252,186 | |
| Number of Contracts | Notional Amount ($) | Current Value/ Unrealized Appreciation ($) | ||
| Futures Contracts | ||||
| Long | ||||
| MSCI EAFE Index, e-mini, expires 09/15/17 | 735 | 71,103,900 | 560,367 | |
| * | Non-income producing security. |
| (a) | All or a portion of this security is on loan. Securities on loan were valued at $12,149,342. |
| (b) | The rate shown is the 7-day yield. |
| (c) | Fair-valued by management in accordance with procedures approved by the Board of Trustees. |
| ADR — | American Depositary Receipt |
| CDI — | CHESS Depositary Interest |
| CVA — | Dutch Certificate |
| GDR — | Global Depositary Receipt |
| REIT — | Real Estate Investment Trust |
| RSP — | Risparmio (Convertible Savings Shares) |
| Security | Number of Shares | Value ($) |
| Common Stock 99.3% of net assets | ||
| Australia 5.3% | ||
| Abacus Property Group | 286,607 | 811,540 |
| Aconex Ltd. *(a) | 133,953 | 433,479 |
| Ainsworth Game Technology Ltd. | 138,013 | 291,177 |
| Altium Ltd. | 97,012 | 767,142 |
| APN Outdoor Group Ltd. | 118,207 | 420,026 |
| ARB Corp., Ltd. | 58,679 | 790,270 |
| Ardent Leisure Group | 406,841 | 622,784 |
| Arena REIT | 195,962 | 359,037 |
| Asaleo Care Ltd. | 317,106 | 393,617 |
| Australian Agricultural Co., Ltd. *(a) | 382,947 | 484,456 |
| Australian Pharmaceutical Industries Ltd. | 313,959 | 364,809 |
| Automotive Holdings Group Ltd. (a) | 193,379 | 490,811 |
| Aveo Group | 404,910 | 835,001 |
| Bapcor Ltd. (a) | 187,435 | 829,545 |
| Beach Energy Ltd. | 1,175,335 | 624,585 |
| Bega Cheese Ltd. | 104,050 | 568,613 |
| Blackmores Ltd. (a) | 9,876 | 885,067 |
| Blue Sky Alternative Investments Ltd. | 55,148 | 464,525 |
| Breville Group Ltd. | 94,607 | 829,915 |
| Brickworks Ltd. | 49,563 | 523,228 |
| BT Investment Management Ltd. | 164,626 | 1,384,074 |
| BWP Trust | 380,256 | 886,704 |
| BWX Ltd. (a) | 53,676 | 240,964 |
| Cabcharge Australia Ltd. | 97,872 | 162,241 |
| Cardno Ltd. * | 168,547 | 187,156 |
| carsales.com Ltd. | 182,699 | 1,969,295 |
| Centuria Industrial REIT | 156,662 | 311,884 |
| Charter Hall Group | 368,430 | 1,656,888 |
| Charter Hall Long Wale REIT | 111,167 | 357,979 |
| Charter Hall Retail REIT | 284,827 | 887,828 |
| Cleanaway Waste Management Ltd. | 913,384 | 1,039,586 |
| Collins Foods Ltd. | 55,142 | 262,415 |
| Corporate Travel Management Ltd. (a) | 57,041 | 983,562 |
| Costa Group Holdings Ltd. | 217,396 | 913,866 |
| Credit Corp. Group Ltd. | 29,286 | 416,946 |
| Cromwell Property Group | 1,313,332 | 989,585 |
| Eclipx Group Ltd. | 148,715 | 426,991 |
| Elders Ltd. * | 80,310 | 298,743 |
| Estia Health Ltd. | 151,689 | 378,983 |
| Evolution Mining Ltd. | 812,015 | 1,558,600 |
| FlexiGroup Ltd. | 264,140 | 355,107 |
| Folkestone Education Trust | 195,962 | 433,642 |
| G.U.D. Holdings Ltd. | 79,473 | 734,976 |
| G8 Education Ltd. | 290,430 | 889,168 |
| Galaxy Resources Ltd. *(a) | 290,126 | 437,215 |
| Gateway Lifestyle | 265,221 | 439,652 |
| Genworth Mortgage Insurance Australia Ltd. | 203,976 | 469,172 |
| Gold Road Resources Ltd. * | 627,458 | 363,298 |
| GrainCorp Ltd., Class A | 218,229 | 1,493,752 |
| Greencross Ltd. | 75,171 | 339,845 |
| Growthpoint Properties Australia Ltd. | 125,560 | 318,681 |
| GWA Group Ltd. | 240,457 | 556,898 |
| Highfield Resources Ltd. * | 229,083 | 212,586 |
| HT&E Ltd. | 183,194 | 326,926 |
| Security | Number of Shares | Value ($) |
| IDP Education Ltd. | 126,157 | 540,331 |
| Independence Group NL | 385,494 | 1,030,393 |
| Infigen Energy * | 463,786 | 279,567 |
| Ingenia Communities Group | 152,081 | 307,589 |
| Inghams Group Ltd. (a) | 113,735 | 332,871 |
| Investa Office Fund | 480,249 | 1,721,710 |
| InvoCare Ltd. | 95,053 | 1,138,408 |
| IPH Ltd. (a) | 78,331 | 283,305 |
| IRESS Ltd. | 106,312 | 1,021,975 |
| Jacana Minerals Ltd. *(c) | 8,715 | — |
| Japara Healthcare Ltd. (a) | 176,170 | 236,142 |
| JB Hi-Fi Ltd. (a) | 89,635 | 1,644,404 |
| Karoon Gas Australia Ltd. * | 185,038 | 166,576 |
| Link Administration Holdings Ltd. | 368,929 | 2,212,176 |
| Liquefied Natural Gas Ltd. *(a) | 318,688 | 135,231 |
| Lynas Corp., Ltd. *(a) | 2,610,527 | 320,934 |
| MACA Ltd. | 141,596 | 215,068 |
| Mantra Group Ltd. | 239,300 | 567,504 |
| Mayne Pharma Group Ltd. *(a) | 1,024,326 | 544,337 |
| McMillan Shakespeare Ltd. | 50,903 | 615,699 |
| Mesoblast Ltd. *(a) | 184,494 | 210,717 |
| Mineral Resources Ltd. | 115,004 | 1,352,724 |
| Monadelphous Group Ltd. | 74,048 | 895,650 |
| Myer Holdings Ltd. (a) | 527,410 | 305,370 |
| MYOB Group Ltd. | 266,691 | 759,378 |
| Nanosonics Ltd. * | 154,311 | 319,442 |
| Navitas Ltd. (a) | 260,389 | 931,439 |
| New South Resources Ltd. * | 354,236 | 434,087 |
| NEXTDC Ltd. * | 217,112 | 788,687 |
| nib Holdings Ltd. | 364,586 | 1,709,002 |
| Nine Entertainment Co. Holdings Ltd. | 534,894 | 579,103 |
| Northern Star Resources Ltd. | 453,496 | 1,873,986 |
| oOh!media Ltd. | 100,038 | 342,771 |
| Orocobre Ltd. *(a) | 187,335 | 573,537 |
| Pact Group Holdings Ltd. | 151,228 | 617,724 |
| Pilbara Minerals Ltd. * | 692,320 | 194,935 |
| Premier Investments Ltd. | 75,163 | 754,732 |
| Primary Health Care Ltd. | 377,263 | 1,023,353 |
| Programmed Maintenance Services Ltd. | 172,057 | 410,766 |
| Qube Holdings Ltd. (a) | 877,829 | 1,754,550 |
| Quintis Ltd. (a)(c) | 227,692 | 39,956 |
| RCR Tomlinson Ltd. | 114,120 | 360,247 |
| Regis Healthcare Ltd. (a) | 91,237 | 243,145 |
| Regis Resources Ltd. | 394,145 | 1,297,356 |
| Reliance Worldwide Corp., Ltd. (a) | 354,984 | 1,024,862 |
| Resolute Mining Ltd. | 417,297 | 400,485 |
| Retail Food Group Ltd. (a) | 119,370 | 473,391 |
| Sandfire Resources NL | 134,416 | 631,143 |
| Saracen Mineral Holdings Ltd. * | 611,733 | 662,292 |
| Select Harvests Ltd. (a) | 68,691 | 223,922 |
| Senex Energy Ltd. *(a) | 809,795 | 166,995 |
| Seven Group Holdings Ltd. | 75,823 | 766,772 |
| SG Fleet Group Ltd. | 97,872 | 319,824 |
| Sigma Healthcare Ltd. | 813,820 | 551,886 |
| Sirtex Medical Ltd. | 37,261 | 443,303 |
| SmartGroup Corp., Ltd. | 35,940 | 253,702 |
| Southern Cross Media Group Ltd. | 652,113 | 669,804 |
| SpeedCast International Ltd. | 209,633 | 605,224 |
| Spotless Group Holdings Ltd. | 113,823 | 99,307 |
| Security | Number of Shares | Value ($) |
| St. Barbara Ltd. * | 395,396 | 884,375 |
| Starpharma Holdings Ltd. * | 357,745 | 295,095 |
| Steadfast Group Ltd. | 316,167 | 674,565 |
| Super Retail Group Ltd. | 126,070 | 809,938 |
| Superloop Ltd. * | 130,248 | 255,166 |
| Syrah Resources Ltd. *(a) | 190,238 | 452,662 |
| Tassal Group Ltd. | 107,224 | 330,824 |
| Technology One Ltd. | 153,153 | 606,152 |
| Tox Free Solutions Ltd. | 144,555 | 260,264 |
| Village Roadshow Ltd. | 73,942 | 217,581 |
| Virgin Australia International Holdings Ltd. *(c) | 424,000 | — |
| Virtus Health Ltd. | 28,029 | 128,941 |
| Viva Energy REIT | 289,735 | 498,673 |
| Washington H Soul Pattinson & Co., Ltd. | 75,840 | 1,064,699 |
| Webjet Ltd. (a) | 66,759 | 630,633 |
| Western Areas Ltd. *(a) | 175,115 | 375,010 |
| WiseTech Global Ltd. | 44,449 | 281,685 |
| WPP AUNZ Ltd. | 232,675 | 210,383 |
| 80,831,270 | ||
| Austria 1.1% | ||
| BUWOG AG * | 83,416 | 2,563,628 |
| CA Immobilien Anlagen AG | 59,383 | 1,691,233 |
| DO & Co. AG (a) | 5,759 | 303,967 |
| EVN AG | 23,031 | 355,960 |
| IMMOFINANZ AG * | 676,085 | 1,788,449 |
| Kapsch TrafficCom AG | 3,269 | 172,095 |
| Lenzing AG | 10,452 | 1,646,495 |
| Mayr Melnhof Karton AG | 7,295 | 990,893 |
| Oesterreichische Post AG | 24,693 | 1,105,016 |
| Porr AG | 6,467 | 184,142 |
| RHI AG | 21,428 | 782,615 |
| S IMMO AG | 44,743 | 729,834 |
| Schoeller-Bleckmann Oilfield Equipment AG * | 9,353 | 650,507 |
| Semperit AG Holding | 9,048 | 269,413 |
| Strabag SE | 13,826 | 593,977 |
| UNIQA Insurance Group AG | 77,463 | 785,116 |
| Verbund AG | 35,248 | 756,409 |
| Wienerberger AG | 92,505 | 1,993,922 |
| Zumtobel Group AG | 22,300 | 402,327 |
| 17,765,998 | ||
| Belgium 1.4% | ||
| Aedifica S.A. | 12,076 | 1,172,261 |
| AGFA-Gevaert N.V. * | 132,865 | 586,991 |
| Barco N.V. | 8,004 | 778,785 |
| Befimmo S.A. | 17,337 | 1,087,899 |
| Bekaert N.V. | 28,097 | 1,337,517 |
| Cie d'Entreprises CFE | 4,584 | 643,090 |
| Cofinimmo S.A. | 17,455 | 2,249,543 |
| D'Ieteren S.A. N.V. | 23,229 | 1,066,566 |
| Econocom Group S.A. N.V. | 93,828 | 688,499 |
| Elia System Operator S.A. N.V. | 19,721 | 1,171,611 |
| Euronav N.V. | 106,570 | 815,068 |
| EVS Broadcast Equipment S.A. | 7,240 | 253,150 |
| Gimv N.V. | 12,918 | 770,982 |
| Ion Beam Applications (a) | 16,090 | 448,776 |
| KBC Ancora | 23,700 | 1,287,544 |
| Kinepolis Group N.V. | 9,368 | 542,346 |
| Melexis N.V. | 17,438 | 1,597,403 |
| Nyrstar N.V. *(a) | 73,877 | 530,859 |
| Ontex Group N.V. | 60,043 | 2,045,897 |
| Orange Belgium S.A. | 23,607 | 566,800 |
| Tessenderlo Group S.A. * | 18,327 | 802,270 |
| Security | Number of Shares | Value ($) |
| Van de Velde N.V. | 7,086 | 359,222 |
| Warehouses De Pauw SCA | 11,998 | 1,355,119 |
| 22,158,198 | ||
| Canada 16.0% | ||
| Advantage Oil & Gas Ltd. * | 140,118 | 889,603 |
| Aecon Group, Inc. | 45,732 | 623,378 |
| Aimia, Inc. | 130,144 | 224,216 |
| Air Canada * | 39,626 | 737,684 |
| Alacer Gold Corp. * | 188,505 | 329,273 |
| Alamos Gold, Inc., Class A | 229,618 | 1,904,708 |
| Algonquin Power & Utilities Corp. | 282,970 | 3,058,220 |
| Allied Properties Real Estate Investment Trust | 70,751 | 2,184,464 |
| AltaGas Ltd. | 119,079 | 2,629,948 |
| Artis Real Estate Investment Trust | 106,097 | 1,118,726 |
| Atco Ltd., Class I | 61,489 | 2,256,518 |
| Athabasca Oil Corp. * | 314,113 | 233,001 |
| ATS Automation Tooling Systems, Inc. * | 66,456 | 668,403 |
| AutoCanada, Inc. | 12,506 | 218,450 |
| B2Gold Corp. * | 733,420 | 2,006,485 |
| Baytex Energy Corp. *(a) | 171,702 | 432,764 |
| Birchcliff Energy Ltd. | 168,515 | 794,356 |
| Boardwalk Real Estate Investment Trust (a) | 31,437 | 1,012,503 |
| Bombardier, Inc., B Shares * | 1,502,169 | 2,995,352 |
| Bonterra Energy Corp. | 23,525 | 305,473 |
| CAE, Inc. | 214,511 | 3,526,279 |
| Canadian Apartment Properties REIT | 106,612 | 2,914,132 |
| Canadian Real Estate Investment Trust | 57,216 | 2,098,795 |
| Canadian Western Bank | 69,049 | 1,597,145 |
| Canfor Corp. * | 59,784 | 1,042,852 |
| Capital Power Corp. | 78,296 | 1,639,923 |
| Cascades, Inc. | 52,266 | 608,641 |
| CCL Industries, Inc., Class B | 110,962 | 5,127,042 |
| Celestica, Inc. * | 95,741 | 1,094,292 |
| Centerra Gold, Inc. * | 156,565 | 936,580 |
| CES Energy Solutions Corp. | 192,893 | 818,497 |
| Chartwell Retirement Residences | 147,853 | 1,734,730 |
| China Gold International Resources Corp., Ltd. * | 190,136 | 342,738 |
| Cineplex, Inc. | 47,969 | 1,468,817 |
| Cogeco Communications, Inc. | 11,144 | 830,634 |
| Colliers International Group, Inc. | 27,605 | 1,429,845 |
| Cominar Real Estate Investment Trust | 146,781 | 1,585,176 |
| Corus Entertainment, Inc., B Shares | 79,685 | 875,820 |
| Cott Corp. | 111,434 | 1,686,064 |
| Crew Energy, Inc. * | 111,427 | 370,609 |
| Detour Gold Corp. * | 137,220 | 1,913,145 |
| Dollarama, Inc. | 78,936 | 7,748,477 |
| Dominion Diamond Corp. | 66,481 | 937,495 |
| Dorel Industries, Inc., Class B | 23,246 | 529,907 |
| Dream Office Real Estate Investment Trust | 84,245 | 1,436,617 |
| ECN Capital Corp. | 295,847 | 891,965 |
| Eldorado Gold Corp. | 558,708 | 1,145,268 |
| Element Fleet Management Corp. | 303,162 | 2,263,287 |
| Emera, Inc. | 36,338 | 1,390,046 |
| Empire Co., Ltd., A Shares | 124,284 | 2,080,735 |
| Enbridge Income Fund Holdings, Inc. | 77,301 | 1,909,481 |
| Endeavour Mining Corp. * | 48,890 | 967,076 |
| Enercare, Inc. | 83,573 | 1,396,494 |
| Enerflex Ltd. | 73,151 | 913,111 |
| Enerplus Corp. | 182,696 | 1,616,031 |
| Enghouse Systems Ltd. | 13,744 | 561,161 |
| Ensign Energy Services, Inc. | 97,489 | 490,653 |
| Extendicare, Inc. | 54,186 | 402,802 |
| Finning International, Inc. | 130,184 | 2,966,586 |
| Security | Number of Shares | Value ($) |
| First Capital Realty, Inc. | 105,866 | 1,713,277 |
| First Majestic Silver Corp. *(a) | 123,056 | 865,686 |
| First National Financial Corp. | 8,909 | 183,474 |
| First Quantum Minerals Ltd. | 537,528 | 6,452,480 |
| FirstService Corp. | 25,755 | 1,786,981 |
| Genworth MI Canada, Inc. (a) | 29,286 | 840,213 |
| Gibson Energy, Inc. | 106,134 | 1,478,046 |
| Gildan Activewear, Inc. | 178,073 | 5,554,883 |
| Gran Tierra Energy, Inc. * | 296,433 | 605,279 |
| Granite Real Estate Investment Trust | 39,100 | 1,585,830 |
| Great Canadian Gaming Corp. * | 41,457 | 1,121,282 |
| H&R Real Estate Investment Trust | 226,470 | 3,858,344 |
| Home Capital Group, Inc. (a) | 49,508 | 534,667 |
| Hudbay Minerals, Inc. | 185,030 | 1,607,160 |
| Hudson's Bay Co. (a) | 85,032 | 806,405 |
| IAMGOLD Corp. * | 367,080 | 2,427,193 |
| Industrial Alliance Insurance & Financial Services, Inc. | 82,385 | 3,521,445 |
| Innergex Renewable Energy, Inc. | 83,290 | 969,917 |
| Ivanhoe Mines Ltd., Class A * | 478,714 | 1,729,671 |
| Just Energy Group, Inc. | 85,761 | 493,190 |
| Kelt Exploration Ltd. * | 107,988 | 518,515 |
| Keyera Corp. | 143,862 | 4,158,372 |
| Kinross Gold Corp. * | 959,653 | 4,355,275 |
| Laurentian Bank of Canada | 21,397 | 958,620 |
| Linamar Corp. | 37,160 | 2,063,769 |
| Lundin Mining Corp. | 491,505 | 3,700,744 |
| MacDonald, Dettwiler & Associates Ltd. | 29,438 | 1,613,308 |
| Maple Leaf Foods, Inc. | 61,533 | 1,683,415 |
| Martinrea International, Inc. | 57,710 | 501,726 |
| MEG Energy Corp. * | 167,087 | 667,682 |
| Methanex Corp. | 70,286 | 3,577,228 |
| Morguard Real Estate Investment Trust | 27,232 | 311,905 |
| Mullen Group Ltd. | 68,650 | 838,310 |
| Nevsun Resources Ltd. | 237,446 | 503,774 |
| New Flyer Industries, Inc. | 39,595 | 1,621,382 |
| New Gold, Inc. * | 437,198 | 1,628,486 |
| Norbord, Inc. | 32,858 | 1,126,934 |
| Northland Power, Inc. | 88,054 | 1,682,068 |
| Northview Apartment Real Estate Investment Trust | 37,146 | 656,555 |
| NOVAGOLD RESOURCES, Inc. * | 186,611 | 808,214 |
| NuVista Energy Ltd. * | 125,116 | 662,628 |
| Obsidian Energy Ltd. * | 387,683 | 386,523 |
| OceanaGold Corp. | 474,800 | 1,469,371 |
| Onex Corp. | 63,335 | 5,044,068 |
| Open Text Corp. | 200,523 | 6,426,332 |
| Osisko Gold Royalties Ltd. | 81,409 | 1,133,720 |
| Pan American Silver Corp. | 111,864 | 2,077,124 |
| Paramount Resources Ltd., A Shares * | 42,993 | 734,182 |
| Parex Resources, Inc. * | 114,274 | 1,173,046 |
| Parkland Fuel Corp. | 75,327 | 1,623,398 |
| Pason Systems, Inc. | 57,690 | 823,650 |
| Pengrowth Energy Corp. *(a) | 334,390 | 208,035 |
| Peyto Exploration & Development Corp. | 110,723 | 1,892,557 |
| PrairieSky Royalty Ltd. | 166,731 | 3,901,805 |
| Precision Drilling Corp. * | 227,844 | 576,084 |
| Premium Brands Holdings Corp. | 20,540 | 1,615,513 |
| Pretium Resources, Inc. * | 111,087 | 917,935 |
| ProMetic Life Sciences, Inc. *(a) | 547,396 | 711,669 |
| Quebecor, Inc., Class B | 63,677 | 2,427,217 |
| Raging River Exploration, Inc. * | 171,691 | 895,600 |
| Ritchie Bros. Auctioneers, Inc. (a) | 77,728 | 2,301,307 |
| Russel Metals, Inc. | 50,208 | 1,042,004 |
| Secure Energy Services, Inc. | 107,872 | 642,715 |
| SEMAFO, Inc. * | 237,146 | 665,806 |
| Seven Generations Energy Ltd., A Shares * | 232,214 | 3,520,948 |
| ShawCor Ltd. | 50,538 | 1,023,861 |
| Security | Number of Shares | Value ($) |
| Sierra Wireless, Inc. *(a) | 25,829 | 570,041 |
| Smart Real Estate Investment Trust | 89,028 | 2,160,815 |
| Sprott, Inc. | 133,186 | 224,146 |
| SSR Mining, Inc. * | 89,553 | 931,423 |
| Stantec, Inc. | 83,254 | 2,304,218 |
| Stella-Jones, Inc. | 32,312 | 1,225,987 |
| Superior Plus Corp. | 113,245 | 1,069,448 |
| Tahoe Resources, Inc. | 232,318 | 1,104,379 |
| TFI International, Inc. | 72,232 | 1,759,494 |
| The Descartes Systems Group, Inc. * | 56,578 | 1,582,153 |
| The Jean Coutu Group PJC, Inc., Class A | 59,467 | 1,056,295 |
| The North West Co., Inc. | 44,026 | 1,104,732 |
| The Stars Group, Inc. * | 98,874 | 1,619,838 |
| TMX Group Ltd. | 36,387 | 1,925,935 |
| TORC Oil & Gas Ltd. | 116,807 | 475,147 |
| Torex Gold Resources, Inc. * | 61,057 | 1,026,585 |
| Toromont Industries Ltd. | 58,128 | 2,492,492 |
| TransAlta Corp. | 225,547 | 1,379,817 |
| TransAlta Renewables, Inc. | 55,826 | 632,286 |
| Transcontinental, Inc., Class A | 50,059 | 970,236 |
| Veresen, Inc. | 244,977 | 3,437,005 |
| Vermilion Energy, Inc. | 81,442 | 2,643,820 |
| West Fraser Timber Co., Ltd. | 57,940 | 2,994,164 |
| Westshore Terminals Investment Corp. | 41,016 | 826,045 |
| Whitecap Resources, Inc. | 267,736 | 1,917,662 |
| Winpak Ltd. | 22,673 | 961,715 |
| WSP Global, Inc. | 77,582 | 3,203,526 |
| Yamana Gold, Inc. | 747,065 | 2,198,740 |
| 246,719,420 | ||
| Denmark 1.8% | ||
| ALK-Abello A/S | 5,030 | 783,532 |
| Alm Brand A/S | 65,221 | 635,952 |
| Ambu A/S, Class B | 18,795 | 1,349,249 |
| Bang & Olufsen A/S * | 28,289 | 565,242 |
| Bavarian Nordic A/S * | 23,572 | 1,633,399 |
| D/S Norden A/S *(a) | 12,081 | 256,646 |
| Dfds A/S | 24,804 | 1,428,145 |
| FLSmidth & Co. A/S | 38,525 | 2,422,611 |
| GN Store Nord A/S | 106,684 | 3,533,424 |
| Matas A/S | 27,414 | 398,768 |
| Nets A/S * | 88,186 | 2,177,885 |
| NKT A/S * | 19,450 | 1,553,587 |
| Rockwool International A/S, B Shares | 4,650 | 1,167,712 |
| Royal Unibrew A/S | 36,611 | 2,004,960 |
| Scandinavian Tobacco Group A/S, Class A | 40,429 | 714,105 |
| Schouw & Co. | 9,287 | 972,352 |
| SimCorp A/S | 27,484 | 1,625,505 |
| Solar A/S, B Shares | 4,590 | 261,198 |
| Spar Nord Bank A/S | 70,925 | 912,645 |
| Sydbank A/S | 57,909 | 2,255,840 |
| Topdanmark A/S * | 45,744 | 1,784,147 |
| 28,436,904 | ||
| Finland 1.5% | ||
| Amer Sports Oyj * | 94,164 | 2,486,444 |
| Cargotec Oyj, B Shares | 32,928 | 1,980,893 |
| Caverion Corp. *(a) | 84,542 | 757,860 |
| Citycon Oyj | 315,232 | 859,743 |
| Cramo Oyj | 24,690 | 689,817 |
| DNA Oyj | 27,472 | 496,127 |
| Finnair Oyj | 60,208 | 683,601 |
| Kemira Oyj | 58,083 | 717,480 |
| Konecranes Oyj | 46,455 | 2,047,388 |
| Metsa Board Oyj | 166,306 | 1,091,421 |
| Oriola Corp., B Shares | 85,355 | 360,249 |
| Security | Number of Shares | Value ($) |
| Outokumpu Oyj | 249,977 | 2,579,675 |
| Outotec Oyj *(a) | 122,086 | 895,563 |
| Raisio Oyj, V Shares | 82,407 | 343,887 |
| Ramirent Oyj | 58,377 | 603,124 |
| Sanoma Oyj | 61,492 | 576,821 |
| Tieto Oyj | 57,971 | 1,831,249 |
| Uponor Oyj | 42,061 | 686,086 |
| Valmet Oyj | 105,659 | 2,001,094 |
| YIT Oyj | 97,556 | 859,444 |
| 22,547,966 | ||
| France 3.6% | ||
| Air France-KLM * | 111,430 | 1,699,706 |
| Albioma S.A. | 14,214 | 319,560 |
| Alten S.A. | 20,210 | 1,717,978 |
| Altran Technologies S.A. | 117,466 | 2,005,450 |
| Beneteau S.A. | 24,808 | 396,697 |
| Boiron S.A. | 3,261 | 307,679 |
| Bonduelle S.C.A. | 12,194 | 492,913 |
| Bourbon Corp. (a) | 22,106 | 190,018 |
| Coface S.A. | 62,007 | 590,498 |
| DBV Technologies S.A. *(a) | 16,534 | 1,460,928 |
| Derichebourg S.A. | 58,790 | 557,695 |
| Elior Group S.A. | 98,674 | 2,616,090 |
| Elis S.A. (a) | 86,250 | 2,014,449 |
| Eramet *(a) | 7,165 | 473,712 |
| Etablissements Maurel et Prom * | 94,250 | 396,670 |
| Euronext N.V. | 56,218 | 3,226,583 |
| Europcar Groupe S.A. | 53,963 | 782,069 |
| FFP | 5,021 | 519,343 |
| Fnac Darty S.A. * | 11,646 | 1,038,444 |
| Gaztransport Et Technigaz S.A. | 14,226 | 724,396 |
| Genfit *(a) | 23,991 | 713,072 |
| GL Events | 7,706 | 230,874 |
| Guerbet (a) | 3,658 | 305,473 |
| Haulotte Group S.A. | 9,745 | 174,598 |
| Havas S.A. | 142,325 | 1,562,994 |
| IPSOS | 25,209 | 786,288 |
| Jacquet Metal Service | 9,745 | 290,804 |
| Korian S.A. | 31,016 | 1,087,810 |
| Maisons du Monde S.A. | 30,697 | 1,266,399 |
| Manitou BF S.A. | 7,706 | 252,953 |
| Mercialys S.A. | 34,608 | 696,181 |
| Mersen S.A. | 9,836 | 361,345 |
| Metropole Television S.A. | 60,676 | 1,332,383 |
| Neopost S.A. | 27,191 | 1,180,272 |
| Nexans S.A. | 23,958 | 1,335,599 |
| Nexity S.A. * | 34,414 | 1,904,992 |
| Rallye S.A. | 15,339 | 280,660 |
| Rubis SCA | 58,438 | 3,794,134 |
| SOITEC * | 18,807 | 1,054,257 |
| Sopra Steria Group | 10,244 | 1,772,057 |
| SPIE S.A. | 49,366 | 1,396,557 |
| Tarkett S.A. | 24,764 | 1,023,990 |
| Technicolor S.A. | 283,459 | 1,034,603 |
| Television Francaise 1 S.A. | 86,789 | 1,164,425 |
| Trigano S.A. | 7,025 | 917,887 |
| UBISOFT Entertainment S.A. * | 59,444 | 3,954,858 |
| Vallourec S.A. *(a) | 218,105 | 1,104,639 |
| Vicat S.A. | 12,847 | 881,298 |
| Vilmorin & Cie S.A. | 4,249 | 378,115 |
| Virbac S.A. * | 3,332 | 556,380 |
| Worldline S.A. * | 30,452 | 1,223,708 |
| 55,550,483 | ||
| Security | Number of Shares | Value ($) |
| Germany 5.1% | ||
| Aareal Bank AG | 47,163 | 1,928,599 |
| ADO Properties S.A. | 17,490 | 851,404 |
| AIXTRON SE * | 75,085 | 725,128 |
| alstria Office REIT-AG | 96,804 | 1,416,761 |
| Aurubis AG | 30,417 | 2,714,738 |
| BayWa AG | 13,719 | 514,189 |
| Bechtle AG | 21,306 | 1,467,914 |
| Bertrandt AG (a) | 4,484 | 400,946 |
| Bilfinger SE (a) | 26,304 | 1,064,527 |
| Carl Zeiss Meditec AG | 18,388 | 915,996 |
| comdirect bank AG | 17,734 | 226,652 |
| CompuGroup Medical SE | 17,847 | 1,039,590 |
| CTS Eventim AG & Co., KGaA | 37,738 | 1,660,516 |
| Deutsche Beteiligungs AG | 10,696 | 526,525 |
| Deutsche Euroshop AG | 40,236 | 1,586,978 |
| Deutsche Pfandbriefbank AG | 77,621 | 1,092,637 |
| Deutz AG | 81,827 | 621,645 |
| Dialog Semiconductor plc * | 55,096 | 2,501,255 |
| DIC Asset AG | 28,329 | 318,683 |
| Diebold Nixdorf AG | 6,380 | 530,204 |
| DMG Mori AG | 15,956 | 950,780 |
| Draegerwerk AG & Co., KGaA | 1,872 | 146,001 |
| Drillisch AG | 32,798 | 2,257,335 |
| Duerr AG | 16,042 | 1,866,036 |
| ElringKlinger AG (a) | 22,710 | 394,064 |
| Evotec AG * | 106,035 | 2,034,058 |
| Freenet AG | 100,898 | 3,366,010 |
| Gerresheimer AG | 25,686 | 2,017,956 |
| GRENKE AG | 17,825 | 1,604,880 |
| Hamburger Hafen und Logistik AG | 16,258 | 517,054 |
| Hapag-Lloyd AG * | 17,741 | 766,282 |
| Heidelberger Druckmaschinen AG * | 184,434 | 691,369 |
| Indus Holding AG | 12,844 | 967,521 |
| Jenoptik AG | 39,611 | 1,159,206 |
| Kloeckner & Co. SE | 67,958 | 754,789 |
| Krones AG | 11,617 | 1,435,009 |
| KWS Saat SE | 1,532 | 637,488 |
| Leoni AG | 23,051 | 1,380,954 |
| MorphoSys AG *(a) | 21,401 | 1,518,476 |
| Nemetschek SE | 15,039 | 1,143,775 |
| Nordex SE *(a) | 48,704 | 675,742 |
| Norma Group SE | 25,450 | 1,547,066 |
| PATRIZIA Immobilien AG * | 39,931 | 808,007 |
| Pfeiffer Vacuum Technology AG | 6,892 | 1,126,661 |
| Puma SE | 2,006 | 824,829 |
| Rheinmetall AG | 33,745 | 3,444,653 |
| Rhoen-Klinikum AG | 30,426 | 1,009,601 |
| Rocket Internet SE * | 50,170 | 1,151,189 |
| Salzgitter AG | 32,149 | 1,442,878 |
| SGL Carbon SE *(a) | 51,481 | 838,825 |
| Siltronic AG * | 12,520 | 1,220,721 |
| Sixt SE | 10,609 | 807,486 |
| SMA Solar Technology AG (a) | 9,820 | 434,193 |
| Software AG | 40,243 | 1,765,955 |
| Stabilus S.A. | 20,050 | 1,716,057 |
| STADA Arzneimittel AG | 49,124 | 4,589,347 |
| Stroeer SE & CO. KGaA (a) | 19,931 | 1,268,208 |
| TAG Immobilien AG | 124,672 | 2,078,079 |
| Takkt AG | 24,958 | 586,330 |
| Tele Columbus AG * | 58,925 | 668,333 |
| TLG Immobilien AG | 39,816 | 880,946 |
| Vossloh AG * | 7,259 | 488,039 |
| Wacker Neuson SE | 20,812 | 592,356 |
| Security | Number of Shares | Value ($) |
| XING AG | 1,917 | 588,013 |
| zooplus AG *(a) | 4,639 | 810,750 |
| 79,078,194 | ||
| Hong Kong 2.0% | ||
| Beijing Enterprises Medical & Health Group Ltd. * | 4,463,871 | 285,179 |
| BEP International Holdings Ltd. | 9,290,006 | 224,343 |
| C.P. Pokphand Co., Ltd. | 4,268,846 | 370,898 |
| Canvest Environmental Protection Group Co., Ltd. | 576,596 | 316,056 |
| China Aerospace International Holdings Ltd. | 1,875,076 | 234,790 |
| China Animal Healthcare Ltd. *(c) | 192,752 | — |
| China Baoli Technologies Holdings Ltd. * | 23,225,015 | 510,411 |
| China Goldjoy Group Ltd. | 8,114,260 | 476,916 |
| China Harmony New Energy Auto Holding Ltd. *(a) | 643,617 | 333,056 |
| China LNG Group Ltd. * | 1,230,758 | 217,014 |
| China LotSynergy Holdings Ltd. * | 11,867,700 | 219,872 |
| China Medical & HealthCare Group Ltd. * | 3,810,200 | 158,222 |
| China Ocean Industry Group Ltd. *(a) | 8,780,934 | 71,805 |
| China Silver Group Ltd. | 1,086,063 | 222,029 |
| China Strategic Holdings Ltd. * | 9,802,827 | 152,808 |
| Chong Hing Bank Ltd. | 160,684 | 324,388 |
| Chow Sang Sang Holdings International Ltd. | 215,016 | 490,668 |
| CITIC Telecom International Holdings Ltd. | 1,182,087 | 351,917 |
| COFCO Meat Holdings Ltd. * | 1,221,004 | 244,936 |
| Digital Domain Holdings Ltd. * | 10,927,380 | 349,053 |
| Dynam Japan Holdings Co., Ltd. | 203,396 | 314,458 |
| Emperor Capital Group Ltd. | 2,740,480 | 245,109 |
| Far East Consortium International Ltd. | 895,293 | 465,580 |
| Fortune Real Estate Investment Trust | 1,149,355 | 1,373,096 |
| Freeman FinTech Corp., Ltd. * | 10,244,428 | 621,751 |
| G-Resources Group Ltd. * | 20,645,416 | 253,239 |
| GCL New Energy Holdings Ltd. * | 5,038,549 | 273,609 |
| Gemdale Properties & Investment Corp., Ltd. | 4,269,060 | 414,554 |
| Giordano International Ltd. | 1,034,014 | 613,027 |
| Goodbaby International Holdings Ltd. | 621,618 | 331,203 |
| HC International, Inc. | 530,557 | 481,989 |
| HKBN Ltd. | 591,953 | 567,262 |
| IGG, Inc. | 716,768 | 1,122,805 |
| IMAX China Holding, Inc. * | 86,758 | 199,978 |
| Ju Teng International Holdings Ltd. | 762,917 | 302,186 |
| K Wah International Holdings Ltd. | 999,946 | 578,775 |
| KuangChi Science Ltd. *(a) | 1,305,843 | 442,152 |
| Lai Sun Development Co., Ltd. | 228,818 | 431,531 |
| Lee's Pharmaceutical Holdings Ltd. | 252,104 | 199,713 |
| Luk Fook Holdings International Ltd. | 310,185 | 1,064,144 |
| Man Wah Holdings Ltd. | 1,156,941 | 1,076,162 |
| MMG Ltd. *(a) | 1,861,159 | 908,410 |
| NagaCorp Ltd. | 1,136,142 | 669,220 |
| Nan Hai Corp., Ltd. | 7,752,980 | 252,606 |
| NewOcean Energy Holdings Ltd. * | 836,003 | 222,181 |
| Nexteer Automotive Group Ltd. * | 504,712 | 838,344 |
| Pacific Basin Shipping Ltd. * | 2,798,092 | 636,381 |
| Pacific Textiles Holdings Ltd. | 353,693 | 359,728 |
| Panda Green Energy Group Ltd. * | 2,767,040 | 360,621 |
| Pou Sheng International Holdings Ltd. | 1,627,154 | 301,461 |
| Prosperity REIT | 901,762 | 382,530 |
| Regina Miracle International Holdings Ltd. | 235,226 | 186,042 |
| Road King Infrastructure Ltd. | 148,115 | 196,819 |
| Singamas Container Holdings Ltd. * | 1,238,090 | 243,617 |
| Sino Oil & Gas Holdings Ltd. * | 12,811,990 | 261,922 |
| Security | Number of Shares | Value ($) |
| SITC International Holdings Co., Ltd. | 896,820 | 835,349 |
| SmarTone Telecommunications Holdings Ltd. | 319,740 | 390,562 |
| Spring Real Estate Investment Trust | 627,800 | 283,962 |
| Stella International Holdings Ltd. | 312,102 | 552,707 |
| Sun Hung Kai & Co., Ltd. | 402,754 | 268,110 |
| Sunlight Real Estate Investment Trust | 1,034,014 | 689,655 |
| Superb Summit International Group Ltd. *(c) | 1,120,000 | — |
| TCC International Holdings Ltd. | 1,018,184 | 467,042 |
| The 13 Holdings Ltd. * | 518,180 | 59,588 |
| The United Laboratories International Holdings Ltd. * | 499,281 | 388,506 |
| Town Health International Medical Group Ltd. | 3,282,787 | 302,002 |
| Truly International Holdings Ltd. (a) | 1,779,114 | 538,750 |
| Value Partners Group Ltd. (a) | 892,155 | 774,008 |
| Vitasoy International Holdings Ltd. | 607,620 | 1,333,799 |
| Yuexiu Real Estate Investment Trust | 1,025,481 | 674,792 |
| 30,305,398 | ||
| Ireland 0.3% | ||
| C&C Group plc | 265,405 | 951,984 |
| Green REIT plc | 505,444 | 865,328 |
| Hibernia REIT plc | 526,395 | 893,686 |
| Irish Continental Group plc | 124,251 | 830,197 |
| Origin Enterprises plc | 98,747 | 753,710 |
| Permanent TSB Group Holdings plc * | 80,674 | 167,752 |
| 4,462,657 | ||
| Israel 0.5% | ||
| Africa Israel Properties Ltd. * | 15,646 | 337,423 |
| B Communications Ltd. * | 10,173 | 151,064 |
| Cellcom Israel Ltd. * | 46,121 | 409,304 |
| Clal Insurance Enterprises Holdings Ltd. * | 15,160 | 234,629 |
| Delta-Galil Industries Ltd. | 8,195 | 257,961 |
| Electra Ltd. | 1,876 | 410,072 |
| Formula Systems 1985 Ltd. | 6,298 | 245,307 |
| IDI Insurance Co., Ltd. | 4,956 | 313,528 |
| Jerusalem Economy Ltd. * | 115,106 | 275,967 |
| Jerusalem Oil Exploration * | 9,367 | 483,413 |
| Kenon Holdings Ltd. * | 10,713 | 150,241 |
| Mazor Robotics Ltd. * | 33,366 | 808,230 |
| Menora Mivtachim Holdings Ltd. | 44,448 | 539,203 |
| Naphtha Israel Petroleum Corp., Ltd. * | 25,775 | 173,910 |
| Nova Measuring Instruments Ltd. * | 24,207 | 575,774 |
| Partner Communications Co., Ltd. * | 79,210 | 396,862 |
| Phoenix Holdings Ltd. * | 36,816 | 163,209 |
| Rami Levy Chain Stores Hashikma Marketing 2006 Ltd. | 8,482 | 411,489 |
| Reit 1 Ltd. | 172,445 | 671,673 |
| Shufersal Ltd. | 50,046 | 271,394 |
| 7,280,653 | ||
| Italy 3.5% | ||
| A2A S.p.A. | 1,193,545 | 2,002,216 |
| ACEA S.p.A. | 34,624 | 499,325 |
| Amplifon S.p.A. | 64,675 | 934,239 |
| Anima Holding S.p.A. | 170,444 | 1,300,954 |
| Ansaldo STS S.p.A. * | 82,752 | 1,082,222 |
| Arnoldo Mondadori Editore S.p.A. * | 94,195 | 211,994 |
| Astaldi S.p.A. (a) | 43,791 | 280,620 |
| ASTM S.p.A. | 29,677 | 746,940 |
| Autogrill S.p.A. | 110,710 | 1,461,016 |
| Security | Number of Shares | Value ($) |
| Azimut Holding S.p.A. | 91,606 | 1,927,713 |
| Banca Generali S.p.A. | 44,826 | 1,477,832 |
| Banca IFIS S.p.A. | 14,282 | 691,929 |
| Banca Monte dei Paschi di Siena S.p.A. *(c) | 14,324 | 130,973 |
| Banca Popolare di Sondrio Scarl | 355,025 | 1,471,402 |
| Banco BPM S.p.A. * | 1,173,961 | 4,449,561 |
| Beni Stabili S.p.A. | 908,868 | 779,079 |
| BPER Banca | 374,732 | 2,108,194 |
| Brembo S.p.A. | 110,705 | 1,724,184 |
| Brunello Cucinelli S.p.A. | 19,171 | 574,368 |
| C.I.R. - Compagnie Industriali Riunite S.p.A. | 260,076 | 380,321 |
| Cementir Holding S.p.A. | 58,733 | 423,155 |
| Cerved Information Solutions S.p.A. | 154,742 | 1,741,301 |
| Credito Emiliano S.p.A. | 54,442 | 463,762 |
| Credito Valtellinese S.p.A. *(a) | 152,820 | 705,311 |
| Danieli & C Officine Meccaniche S.p.A. | 9,745 | 252,571 |
| Danieli & C Officine Meccaniche S.p.A. - RSP | 34,268 | 639,637 |
| Datalogic S.p.A. | 15,579 | 512,315 |
| De'Longhi S.p.A. | 49,354 | 1,483,353 |
| DiaSorin S.p.A. | 17,695 | 1,523,121 |
| Ei Towers S.p.A. | 13,056 | 774,561 |
| Enav S.p.A. | 136,183 | 601,974 |
| ERG S.p.A. | 48,445 | 759,118 |
| Fincantieri S.p.A. * | 336,888 | 384,104 |
| Hera S.p.A. | 561,564 | 1,794,625 |
| Immobiliare Grande Distribuzione S.p.A. | 352,509 | 350,785 |
| Industria Macchine Automatiche S.p.A. | 10,671 | 1,031,433 |
| Infrastrutture Wireless Italiane S.p.A. | 185,738 | 1,228,885 |
| Interpump Group S.p.A. | 68,107 | 1,978,965 |
| Iren S.p.A. | 365,313 | 999,806 |
| Italmobiliare S.p.A. | 12,606 | 353,700 |
| Juventus Football Club S.p.A. * | 378,502 | 346,501 |
| MARR S.p.A. | 31,707 | 793,887 |
| OVS S.p.A. | 83,640 | 623,486 |
| RAI Way S.p.A. | 111,615 | 610,415 |
| Reply S.p.A. | 3,196 | 731,067 |
| Safilo Group S.p.A. *(a) | 16,886 | 109,513 |
| Salini Impregilo S.p.A | 121,604 | 426,496 |
| Saras S.p.A. | 364,269 | 896,474 |
| Societa Cattolica di Assicurazioni Scarl | 138,813 | 1,190,725 |
| Societa Iniziative Autostradali e Servizi S.p.A. | 58,374 | 870,980 |
| Technogym S.p.A. | 63,108 | 549,588 |
| Tod's S.p.A. (a) | 10,249 | 731,711 |
| Unipol Gruppo Finanziario S.p.A. | 396,932 | 1,713,985 |
| Yoox Net-A-Porter Group S.p.A. *(a) | 45,211 | 1,484,612 |
| 53,317,004 | ||
| Japan 19.4% | ||
| ADEKA Corp. | 96,596 | 1,642,114 |
| Aeon Delight Co., Ltd. | 16,443 | 584,155 |
| Aeon Fantasy Co., Ltd. | 3,194 | 106,941 |
| Ai Holdings Corp. | 28,822 | 730,108 |
| Aica Kogyo Co., Ltd. | 50,208 | 1,653,680 |
| Aichi Steel Corp. | 11,643 | 455,416 |
| Aida Engineering Ltd. | 53,484 | 570,995 |
| Akebono Brake Industry Co., Ltd. * | 52,420 | 166,700 |
| Alpine Electronics, Inc. | 32,896 | 606,750 |
| Amano Corp. | 62,915 | 1,470,837 |
| Anicom Holdings, Inc. (a) | 14,412 | 376,996 |
| Anritsu Corp. | 107,962 | 858,320 |
| AOKI Holdings, Inc. | 37,179 | 494,549 |
| Arata Corp. | 10,617 | 477,022 |
| Arcland Sakamoto Co., Ltd. | 35,089 | 497,673 |
| Security | Number of Shares | Value ($) |
| Arcs Co., Ltd. | 36,547 | 818,206 |
| AS One Corp. | 10,352 | 567,168 |
| Asahi Diamond Industrial Co., Ltd. | 51,037 | 447,490 |
| Asahi Holdings, Inc. | 29,954 | 626,514 |
| Asatsu-DK, Inc. | 30,245 | 815,620 |
| ASKA Pharmaceutical Co., Ltd. | 18,277 | 284,135 |
| Atom Corp. | 65,572 | 489,735 |
| Avex Group Holdings, Inc. | 27,932 | 382,460 |
| Axial Retailing, Inc. | 15,659 | 639,535 |
| Bank of the Ryukyus Ltd. | 38,963 | 579,524 |
| Belc Co., Ltd. | 7,973 | 385,393 |
| Bell System24 Holdings, Inc. | 34,155 | 358,432 |
| Belluna Co., Ltd. | 44,471 | 455,781 |
| Benefit One, Inc. | 13,654 | 576,877 |
| BML, Inc. | 19,626 | 419,767 |
| Broadleaf Co., Ltd. | 31,690 | 235,530 |
| Bunka Shutter Co., Ltd. | 44,467 | 337,361 |
| Canon Electronics, Inc. | 26,912 | 538,925 |
| Cawachi Ltd. | 11,235 | 272,555 |
| Central Glass Co., Ltd. | 159,744 | 670,559 |
| CHIMNEY Co., Ltd. | 10,641 | 282,606 |
| Chiyoda Co., Ltd. | 23,725 | 601,209 |
| Chiyoda Integre Co., Ltd. | 15,129 | 317,261 |
| Chofu Seisakusho Co., Ltd. | 16,543 | 404,181 |
| Chudenko Corp. | 30,267 | 825,014 |
| Chugoku Marine Paints Ltd. | 61,935 | 514,343 |
| Ci:z Holdings Co., Ltd. | 19,605 | 769,522 |
| CKD Corp. | 46,040 | 778,907 |
| Clarion Co., Ltd. | 76,215 | 296,384 |
| CMK Corp. | 29,286 | 286,580 |
| Cocokara fine, Inc. | 19,606 | 1,083,086 |
| Colowide Co., Ltd. | 52,252 | 958,064 |
| CONEXIO Corp. | 9,327 | 158,896 |
| Create Restaurants Holdings, Inc. | 34,989 | 356,057 |
| Create SD Holdings Co., Ltd. | 16,535 | 429,075 |
| Dai Nippon Toryo Co., Ltd. | 106,969 | 332,395 |
| Daibiru Corp. | 46,412 | 486,639 |
| Daido Metal Co., Ltd. | 33,324 | 289,761 |
| Daihen Corp. | 90,405 | 784,452 |
| Daiho Corp. | 82,373 | 374,967 |
| Daiichi Jitsugyo Co., Ltd. | 24,310 | 134,516 |
| Daiken Corp. | 11,657 | 267,541 |
| Daikyonishikawa Corp. | 42,578 | 663,468 |
| Dainichiseika Color & Chemicals Manufacturing Co., Ltd. | 75,247 | 737,702 |
| Daio Paper Corp. (a) | 60,560 | 741,731 |
| Daiseki Co., Ltd. | 35,873 | 855,594 |
| Daiwa Industries Ltd. | 13,460 | 145,411 |
| Daiwabo Holdings Co., Ltd. | 140,757 | 565,279 |
| DCM Holdings Co., Ltd. | 86,202 | 775,395 |
| Denki Kogyo Co., Ltd. | 66,886 | 347,010 |
| Denyo Co., Ltd. | 6,630 | 113,914 |
| Descente Ltd. | 39,879 | 510,535 |
| Dexerials Corp. | 35,805 | 492,538 |
| Digital Arts, Inc. | 5,580 | 222,318 |
| Digital Garage, Inc. | 22,590 | 450,322 |
| Dip Corp. | 16,087 | 337,350 |
| Doshisha Co., Ltd. | 19,601 | 403,382 |
| Doutor Nichires Holdings Co., Ltd. | 26,093 | 566,146 |
| DTS Corp. | 15,559 | 437,535 |
| Duskin Co., Ltd. | 47,773 | 1,378,151 |
| DyDo Group Holdings, Inc. | 7,706 | 389,291 |
| Eagle Industry Co., Ltd. | 19,993 | 355,318 |
| Earth Chemical Co., Ltd. | 12,554 | 601,123 |
| EDION Corp. | 70,723 | 679,213 |
| Eiken Chemical Co., Ltd. | 12,499 | 417,920 |
| Eizo Corp. | 15,949 | 665,145 |
| Elecom Co., Ltd. | 15,579 | 325,848 |
| Security | Number of Shares | Value ($) |
| Enplas Corp. | 8,188 | 353,380 |
| EPS Holdings, Inc. | 29,286 | 573,427 |
| eRex Co., Ltd. (a) | 17,900 | 170,608 |
| euglena Co., Ltd. *(a) | 63,829 | 667,519 |
| F@N Communications, Inc. | 27,416 | 287,213 |
| Fancl Corp. | 32,890 | 773,091 |
| FCC Co., Ltd. | 32,481 | 702,388 |
| FIDEA Holdings Co., Ltd. | 188,060 | 319,528 |
| Financial Products Group Co., Ltd. | 54,848 | 604,494 |
| Foster Electric Co., Ltd. | 22,799 | 478,932 |
| Fuji Co., Ltd. | 18,811 | 467,113 |
| Fuji Kyuko Co., Ltd. | 58,054 | 634,026 |
| Fuji Machine Manufacturing Co., Ltd. | 72,725 | 1,280,584 |
| Fuji Oil Holdings, Inc. | 41,121 | 1,154,497 |
| Fuji Seal International, Inc. | 32,344 | 978,607 |
| Fuji Soft, Inc. | 19,239 | 575,107 |
| Fujibo Holdings, Inc. | 10,399 | 317,469 |
| Fujicco Co., Ltd. | 19,136 | 472,228 |
| Fujimi, Inc. | 18,587 | 401,429 |
| Fujimori Kogyo Co., Ltd. | 10,635 | 376,370 |
| Fujita Kanko, Inc. (a) | 6,893 | 228,284 |
| Fujitec Co., Ltd. | 68,234 | 984,514 |
| Fukuda Corp. | 5,962 | 326,648 |
| Fukushima Industries Corp. | 12,019 | 447,737 |
| Funai Soken Holdings, Inc. | 13,802 | 440,169 |
| Furukawa Co., Ltd. | 293,945 | 504,776 |
| Fuso Chemical Co., Ltd. | 16,112 | 501,396 |
| Futaba Corp. | 33,216 | 613,859 |
| Futaba Industrial Co., Ltd. | 33,242 | 330,125 |
| Fuyo General Lease Co., Ltd. | 16,931 | 1,024,536 |
| G-Tekt Corp. | 15,585 | 300,060 |
| Geo Holdings Corp. | 26,281 | 371,793 |
| Giken Ltd. (a) | 11,278 | 306,697 |
| GMO internet, Inc. | 48,282 | 625,569 |
| Goldcrest Co., Ltd. | 6,388 | 145,567 |
| Goldwin, Inc. | 7,527 | 538,229 |
| Gunze Ltd. | 190,061 | 847,901 |
| Gurunavi, Inc. | 22,214 | 330,808 |
| Hamakyorex Co., Ltd. | 13,835 | 359,137 |
| Hanwa Co., Ltd. | 160,220 | 1,075,800 |
| Hazama Ando Corp. | 155,268 | 1,093,337 |
| Heiwa Real Estate Co., Ltd. | 36,463 | 626,822 |
| Heiwado Co., Ltd. | 26,584 | 620,036 |
| Hibiya Engineering Ltd. | 20,925 | 428,919 |
| Hitachi Maxell Ltd. | 35,938 | 857,797 |
| Hitachi Zosen Corp. | 128,874 | 638,164 |
| Hogy Medical Co., Ltd. | 9,291 | 655,080 |
| Hokuetsu Kishu Paper Co., Ltd. | 119,430 | 793,234 |
| Hokuto Corp. | 17,787 | 318,214 |
| Hosiden Corp. | 46,699 | 781,994 |
| Hosokawa Micron Corp. | 7,666 | 387,967 |
| IBJ Leasing Co., Ltd. | 31,558 | 804,577 |
| Ichibanya Co., Ltd. | 13,341 | 545,471 |
| Ichikoh Industries Ltd. | 37,650 | 250,065 |
| Ichiyoshi Securities Co., Ltd. | 34,256 | 321,831 |
| Idec Corp. | 16,454 | 289,134 |
| IDOM, Inc. | 45,620 | 297,197 |
| Iino Kaiun Kaisha Ltd. | 114,289 | 506,751 |
| Inaba Denki Sangyo Co., Ltd. | 22,365 | 912,401 |
| Inabata & Co., Ltd. | 46,139 | 661,524 |
| Ines Corp. | 23,672 | 214,868 |
| Infomart Corp. | 70,352 | 513,290 |
| Internet Initiative Japan, Inc. | 24,969 | 466,439 |
| Iriso Electronics Co., Ltd. | 14,480 | 711,764 |
| Iseki & Co., Ltd. | 16,925 | 349,234 |
| Ishihara Sangyo Kaisha Ltd. * | 36,910 | 497,678 |
| Istyle, Inc. | 19,541 | 114,341 |
| Itochu Enex Co., Ltd. | 61,523 | 614,895 |
| Security | Number of Shares | Value ($) |
| Itoki Corp. | 35,936 | 279,495 |
| Iwatani Corp. | 173,738 | 1,052,910 |
| J Trust Co., Ltd. | 68,524 | 602,682 |
| Jaccs Co., Ltd. | 103,905 | 514,521 |
| Jamco Corp. (a) | 6,750 | 148,051 |
| Japan Lifeline Co., Ltd. | 25,367 | 1,293,012 |
| Japan Material Co., Ltd. | 10,025 | 245,661 |
| Japan Securities Finance Co., Ltd. | 107,117 | 557,678 |
| JCR Pharmaceuticals Co., Ltd. | 11,151 | 331,308 |
| Jeol Ltd. | 67,013 | 316,007 |
| Jimoto Holdings, Inc. | 174,319 | 310,435 |
| JINS, Inc. | 12,193 | 714,563 |
| Joshin Denki Co., Ltd. | 23,123 | 359,262 |
| Joyful Honda Co., Ltd. | 21,918 | 611,378 |
| JSP Corp. | 7,072 | 212,687 |
| Juki Corp. | 23,879 | 339,982 |
| Justsystems Corp. | 31,390 | 700,756 |
| JVC Kenwood Corp. | 133,065 | 353,035 |
| kabu.com Securities Co., Ltd. | 162,948 | 503,383 |
| Kadokawa Dwango * | 41,750 | 487,071 |
| Kameda Seika Co., Ltd. | 13,086 | 595,683 |
| Kamei Corp. | 16,415 | 243,108 |
| Kanamoto Co., Ltd. | 22,106 | 787,348 |
| Kanematsu Corp. | 332,404 | 782,234 |
| Kanematsu Electronics Ltd. | 5,304 | 149,154 |
| Kansai Urban Banking Corp. | 31,387 | 378,435 |
| Kanto Denka Kogyo Co., Ltd. | 31,158 | 302,351 |
| Kasai Kogyo Co., Ltd. | 5,604 | 80,144 |
| Katakura Industries Co., Ltd. | 30,386 | 347,592 |
| Kato Sangyo Co., Ltd. | 21,927 | 645,498 |
| Kato Works Co., Ltd. | 7,997 | 253,948 |
| KAWADA TECHNOLOGIES, Inc. | 2,740 | 146,884 |
| Keihanshin Building Co., Ltd. | 74,303 | 469,204 |
| Keihin Corp. | 35,486 | 583,910 |
| Kenedix, Inc. | 207,579 | 995,836 |
| Kenko Mayonnaise Co., Ltd. (a) | 8,922 | 231,116 |
| Key Coffee, Inc. | 22,158 | 446,945 |
| KH Neochem Co., Ltd. | 27,535 | 709,015 |
| Kintetsu World Express, Inc. | 26,297 | 425,779 |
| Kisoji Co., Ltd. | 29,680 | 749,146 |
| Kitz Corp. | 84,114 | 675,602 |
| KLab, Inc. *(a) | 22,290 | 390,470 |
| Koa Corp. | 33,324 | 620,397 |
| Kohnan Shoji Co., Ltd. | 23,704 | 443,669 |
| Kokuyo Co., Ltd. | 77,371 | 1,228,825 |
| KOMEDA Holdings Co., Ltd. | 13,460 | 225,393 |
| Komori Corp. | 43,131 | 531,790 |
| Konishi Co., Ltd. | 11,617 | 202,131 |
| Konoike Transport Co., Ltd. | 26,305 | 372,849 |
| Kotobuki Spirits Co., Ltd. | 17,451 | 580,326 |
| Kumagai Gumi Co., Ltd. | 295,339 | 923,102 |
| Kumiai Chemical Industry Co., Ltd. | 91,816 | 548,093 |
| Kura Corp. | 4,998 | 274,286 |
| Kurabo Industries Ltd. | 188,012 | 483,440 |
| Kureha Corp. | 12,404 | 636,767 |
| Kuroda Electric Co., Ltd. | 34,292 | 602,899 |
| KYB Corp. | 156,662 | 868,288 |
| Kyoei Steel Ltd. | 22,279 | 340,683 |
| Kyokuto Kaihatsu Kogyo Co., Ltd. | 16,212 | 247,025 |
| Kyokuto Securities Co., Ltd. | 24,475 | 351,581 |
| Kyoritsu Maintenance Co., Ltd. | 21,298 | 592,149 |
| Kyowa Exeo Corp. | 72,941 | 1,371,869 |
| Lasertec Corp. | 32,879 | 594,487 |
| Life Corp. | 15,123 | 381,304 |
| Lifull Co., Ltd. | 43,894 | 362,127 |
| Linical Co., Ltd. | 7,240 | 107,225 |
| Macnica Fuji Electronics Holdings, Inc. | 19,541 | 343,201 |
| Maeda Corp. | 117,885 | 1,438,484 |
| Security | Number of Shares | Value ($) |
| Makino Milling Machine Co., Ltd. | 73,626 | 578,652 |
| Mandom Corp. | 16,099 | 963,951 |
| Mani, Inc. | 19,579 | 453,274 |
| Mars Engineering Corp. | 15,659 | 327,237 |
| Marudai Food Co., Ltd. | 100,526 | 477,695 |
| Maruha Nichiro Corp. | 31,840 | 922,857 |
| Marusan Securities Co., Ltd. | 50,521 | 426,899 |
| Maruwa Co., Ltd. | 6,214 | 337,067 |
| Maruzen Showa Unyu Co., Ltd. | 86,225 | 390,935 |
| Marvelous, Inc. (a) | 25,652 | 232,607 |
| Matsuya Co., Ltd. | 39,943 | 347,678 |
| Matsuya Foods Co., Ltd. | 12,567 | 464,725 |
| Max Co., Ltd. | 25,040 | 328,073 |
| MCJ Co., Ltd. | 23,280 | 271,804 |
| Megachips Corp. | 11,175 | 369,589 |
| Meidensha Corp. | 176,513 | 641,516 |
| Meisei Industrial Co., Ltd. | 20,432 | 135,335 |
| Meitec Corp. | 20,963 | 967,582 |
| Menicon Co., Ltd. | 7,603 | 288,066 |
| METAWATER Co., Ltd. | 9,745 | 268,284 |
| Micronics Japan Co., Ltd. (a) | 17,780 | 166,718 |
| Mie Kotsu Group Holdings, Inc. | 48,827 | 201,856 |
| Milbon Co., Ltd. | 9,480 | 572,797 |
| Mirait Holdings Corp. | 54,392 | 646,912 |
| Miroku Jyoho Service Co., Ltd. | 11,642 | 262,966 |
| Mitsuba Corp. | 30,560 | 443,156 |
| Mitsubishi Pencil Co., Ltd. | 37,860 | 993,111 |
| Mitsuboshi Belting Ltd. | 16,554 | 191,019 |
| Mitsui Matsushima Co., Ltd. | 7,956 | 102,649 |
| Mitsui Mining & Smelting Co., Ltd. | 460,431 | 2,443,137 |
| Mitsui Sugar Co., Ltd. | 7,814 | 265,176 |
| Mitsui-Soko Holdings Co., Ltd. | 80,217 | 231,045 |
| Mizuno Corp. | 84,864 | 521,244 |
| Modec, Inc. | 16,801 | 372,321 |
| Monex Group, Inc. | 175,667 | 462,870 |
| Morinaga Milk Industry Co., Ltd. | 164,235 | 1,295,257 |
| Morita Holdings Corp. | 33,324 | 514,121 |
| MOS Food Services, Inc. | 24,326 | 775,797 |
| Musashi Seimitsu Industry Co., Ltd. | 18,761 | 543,772 |
| Nachi-Fujikoshi Corp. | 160,465 | 850,001 |
| Nagaileben Co., Ltd. | 25,373 | 633,518 |
| Namura Shipbuilding Co., Ltd. | 47,309 | 282,410 |
| NEC Networks & System Integration Corp. | 19,993 | 465,946 |
| NET One Systems Co., Ltd. | 84,335 | 859,748 |
| Nichi-iko Pharmaceutical Co., Ltd. (a) | 35,466 | 549,423 |
| Nichias Corp. | 86,806 | 1,015,865 |
| Nichicon Corp. | 55,257 | 644,146 |
| Nichiha Corp. | 23,452 | 853,400 |
| NichiiGakkan Co., Ltd. | 38,525 | 414,793 |
| Nihon Chouzai Co., Ltd. | 4,078 | 134,315 |
| Nihon Nohyaku Co., Ltd. | 51,829 | 296,206 |
| Nihon Parkerizing Co., Ltd. | 86,264 | 1,257,984 |
| Nihon Unisys Ltd. | 58,487 | 917,745 |
| Nikkiso Co., Ltd. | 53,219 | 485,480 |
| Nippon Carbon Co., Ltd. | 8,778 | 328,198 |
| Nippon Ceramic Co., Ltd. | 13,890 | 368,137 |
| Nippon Chemi-Con Corp. | 139,302 | 522,731 |
| Nippon Denko Co., Ltd. | 82,240 | 339,989 |
| Nippon Densetsu Kogyo Co., Ltd. | 27,665 | 564,561 |
| Nippon Flour Mills Co., Ltd. | 40,025 | 634,960 |
| Nippon Gas Co., Ltd. | 33,506 | 1,123,361 |
| Nippon Holdings Co., Ltd. | 46,579 | 1,094,433 |
| Nippon Light Metal Holdings Co., Ltd. | 470,993 | 1,386,532 |
| Nippon Parking Development Co., Ltd. | 174,319 | 262,920 |
| Nippon Seiki Co., Ltd. | 36,703 | 745,332 |
| Nippon Sheet Glass Co., Ltd. * | 79,259 | 599,880 |
| Nippon Signal Co., Ltd. | 58,452 | 619,253 |
| Nippon Soda Co., Ltd. | 110,645 | 634,354 |
| Security | Number of Shares | Value ($) |
| Nippon Steel & Sumikin Bussan Corp. | 11,064 | 596,125 |
| Nippon Suisan Kaisha Ltd. | 198,097 | 1,114,138 |
| Nippon Thompson Co., Ltd. | 43,421 | 247,365 |
| Nippon Yakin Kogyo Co., Ltd. | 90,168 | 192,527 |
| Nishimatsu Construction Co., Ltd. | 236,619 | 1,302,845 |
| Nishimatsuya Chain Co., Ltd. | 48,241 | 505,378 |
| Nishio Rent All Co., Ltd. | 13,086 | 442,303 |
| Nissha Printing Co., Ltd. (a) | 32,184 | 873,758 |
| Nissin Corp. | 84,022 | 411,483 |
| Nissin Electric Co., Ltd. | 39,082 | 433,219 |
| Nissin Kogyo Co., Ltd. | 33,291 | 575,620 |
| Nitta Corp. | 16,543 | 588,459 |
| Nitto Boseki Co., Ltd. | 124,577 | 659,898 |
| Nitto Kogyo Corp. | 26,557 | 477,524 |
| Noevir Holdings Co., Ltd. | 14,754 | 880,736 |
| NOF Corp. | 117,343 | 1,661,098 |
| Nohmi Bosai Ltd. | 19,993 | 304,091 |
| Nojima Corp. | 23,080 | 441,007 |
| Nomura Co., Ltd. | 35,104 | 758,790 |
| Noritsu Koki Co., Ltd. | 41,990 | 503,224 |
| Noritz Corp. | 34,388 | 601,462 |
| NSD Co., Ltd. | 30,575 | 564,218 |
| Obara Group, Inc. | 10,635 | 588,471 |
| Ohsho Food Service Corp. | 9,803 | 388,789 |
| Oiles Corp. | 33,432 | 607,827 |
| Okabe Co., Ltd. | 44,775 | 408,858 |
| Okamoto Industries, Inc. | 57,727 | 598,984 |
| Okamura Corp. | 65,162 | 661,330 |
| Okasan Securities Group, Inc. | 116,988 | 673,909 |
| Oki Electric Industry Co., Ltd. | 68,150 | 935,004 |
| Okumura Corp. | 173,407 | 1,296,692 |
| Onward Holdings Co., Ltd. | 101,834 | 746,684 |
| Open House Co., Ltd. | 24,317 | 751,207 |
| Optex Group Co., Ltd. | 11,617 | 446,483 |
| OSAKA Titanium Technologies Co., Ltd. | 16,843 | 244,549 |
| Osaki Electric Co., Ltd. | 30,227 | 237,290 |
| Outsourcing, Inc. | 12,254 | 804,983 |
| Pacific Industrial Co., Ltd. | 41,822 | 527,810 |
| Pacific Metals Co., Ltd. * | 107,117 | 303,657 |
| PAL GROUP Holdings Co., Ltd. | 10,392 | 330,946 |
| PALTAC Corp. | 26,520 | 1,049,378 |
| Paramount Bed Holdings Co., Ltd. | 16,967 | 743,058 |
| PC Depot Corp. | 17,780 | 129,562 |
| Penta-Ocean Construction Co., Ltd. | 268,007 | 1,607,165 |
| Piolax, Inc. | 21,825 | 581,815 |
| Pioneer Corp. * | 219,248 | 408,376 |
| Plenus Co., Ltd. | 19,993 | 446,872 |
| Press Kogyo Co., Ltd. | 79,143 | 414,915 |
| Prestige International, Inc. | 20,482 | 219,596 |
| Prima Meat Packers Ltd. | 116,704 | 722,110 |
| Raito Kogyo Co., Ltd. | 40,747 | 405,767 |
| Relia, Inc. | 33,324 | 371,511 |
| Ricoh Leasing Co., Ltd. | 10,219 | 356,542 |
| Riken Corp. | 1,626 | 76,971 |
| Riken Technos Corp. | 51,495 | 289,151 |
| Ringer Hut Co., Ltd. | 13,010 | 295,402 |
| Riso Kagaku Corp. | 25,901 | 490,674 |
| Rock Field Co., Ltd. | 21,331 | 390,532 |
| Rokko Butter Co., Ltd. | 9,380 | 200,878 |
| Round One Corp. | 53,192 | 607,508 |
| Royal Holdings Co., Ltd. | 23,205 | 587,610 |
| Ryobi Ltd. | 109,003 | 547,689 |
| Ryosan Co., Ltd. | 25,228 | 1,055,560 |
| S Foods, Inc. | 14,345 | 549,375 |
| Saibu Gas Co., Ltd. | 275,586 | 738,669 |
| Saizeriya Co., Ltd. | 21,341 | 604,009 |
| Sakai Moving Service Co., Ltd. | 7,288 | 382,742 |
| Sakata INX Corp. | 42,101 | 746,312 |
| Security | Number of Shares | Value ($) |
| Sakata Seed Corp. | 30,616 | 948,579 |
| San-A Co., Ltd. | 15,543 | 682,813 |
| San-Ai Oil Co., Ltd. | 52,068 | 578,113 |
| Sanden Holdings Corp. * | 90,407 | 283,395 |
| Sangetsu Corp. | 63,418 | 1,132,258 |
| Sanken Electric Co., Ltd. | 97,314 | 496,031 |
| Sanki Engineering Co., Ltd. | 44,997 | 498,377 |
| Sankyo Tateyama, Inc. | 28,348 | 406,701 |
| Sankyu, Inc. | 207,756 | 1,625,276 |
| Sanyo Chemical Industries Ltd. | 11,853 | 621,405 |
| Sanyo Denki Co., Ltd. | 30,120 | 347,833 |
| Sanyo Electric Railway Co., Ltd. | 39,082 | 206,311 |
| Sanyo Special Steel Co., Ltd. | 105,432 | 569,022 |
| Sato Holdings Corp. | 20,505 | 489,243 |
| Seikagaku Corp. | 37,278 | 659,122 |
| Seiko Holdings Corp. | 112,379 | 509,514 |
| Seiren Co., Ltd. | 42,464 | 753,132 |
| Sekisui Jushi Corp. | 3,836 | 70,230 |
| Sekisui Plastics Co., Ltd. | 21,336 | 221,773 |
| Senko Group Holdings Co., Ltd. | 92,879 | 670,896 |
| Shibuya Corp. | 13,844 | 456,603 |
| Shikoku Chemicals Corp. | 15,579 | 209,777 |
| Shima Seiki Manufacturing Ltd. | 24,327 | 1,233,370 |
| Shin-Etsu Polymer Co., Ltd. | 39,838 | 372,825 |
| Shindengen Electric Manufacturing Co., Ltd. | 63,674 | 417,127 |
| Shinko Electric Industries Co., Ltd. | 23,870 | 166,565 |
| Shinko Plantech Co., Ltd. | 35,509 | 301,339 |
| Shinmaywa Industries Ltd. | 69,676 | 602,685 |
| Ship Healthcare Holdings, Inc. | 33,324 | 1,017,342 |
| Shizuoka Gas Co., Ltd. | 51,869 | 411,427 |
| SHO-BOND Holdings Co., Ltd. | 20,353 | 1,126,202 |
| Showa Corp. * | 39,033 | 443,670 |
| Showa Sangyo Co., Ltd. | 100,526 | 557,158 |
| Siix Corp. | 13,378 | 553,669 |
| Sinfonia Technology Co., Ltd. | 72,331 | 288,509 |
| Sintokogio Ltd. | 52,786 | 561,145 |
| SMK Corp. | 66,886 | 277,122 |
| SMS Co., Ltd. | 19,979 | 645,333 |
| Sodick Co., Ltd. | 41,163 | 501,915 |
| Sogo Medical Co., Ltd. | 4,560 | 209,231 |
| ST Corp. | 5,062 | 114,477 |
| St Marc Holdings Co., Ltd. | 12,923 | 386,304 |
| Star Micronics Co., Ltd. | 31,936 | 531,009 |
| Starts Corp., Inc. | 30,590 | 762,387 |
| Sumitomo Bakelite Co., Ltd. | 147,278 | 1,082,572 |
| Sumitomo Mitsui Construction Co., Ltd. | 632,192 | 700,776 |
| Sumitomo Riko Co., Ltd. | 29,286 | 280,726 |
| Sumitomo Seika Chemicals Co., Ltd. | 5,922 | 280,873 |
| Systena Corp. | 8,206 | 191,394 |
| T-Gaia Corp. | 15,061 | 295,445 |
| Tachi-S Co., Ltd. | 23,452 | 400,811 |
| Taihei Dengyo Kaisha Ltd. | 25,375 | 339,148 |
| Taikisha Ltd. | 27,455 | 695,979 |
| Taiyo Holdings Co., Ltd. | 15,304 | 764,783 |
| Takara Bio, Inc. | 35,109 | 475,946 |
| Takara Leben Co., Ltd. | 71,699 | 347,225 |
| Takara Standard Co., Ltd. | 36,813 | 637,521 |
| Takasago International Corp. | 12,577 | 446,811 |
| Takasago Thermal Engineering Co., Ltd. | 59,344 | 978,642 |
| Takeuchi Manufacturing Co., Ltd. | 26,600 | 501,741 |
| Takuma Co., Ltd. | 60,803 | 689,462 |
| Tamron Co., Ltd. | 17,917 | 320,539 |
| Tamura Corp. | 66,886 | 342,756 |
| Tanseisha Co., Ltd. | 24,455 | 253,305 |
| TechnoPro Holdings, Inc. | 29,004 | 1,320,280 |
| Teikoku Sen-I Co., Ltd. | 20,509 | 401,385 |
| Tekken Corp. | 106,099 | 347,044 |
| Security | Number of Shares | Value ($) |
| The Aichi Bank Ltd. | 9,735 | 548,401 |
| The Akita Bank Ltd. | 145,613 | 441,893 |
| The Aomori Bank Ltd. | 194,628 | 717,963 |
| The Bank of Iwate Ltd. | 14,263 | 557,898 |
| The Bank of Nagoya Ltd. | 15,036 | 577,204 |
| The Bank of Okinawa Ltd. | 19,099 | 772,220 |
| The Chiba Kogyo Bank Ltd. | 58,844 | 294,060 |
| The Eighteenth Bank Ltd. | 136,245 | 325,572 |
| The Fukui Bank Ltd. | 236,189 | 609,465 |
| The Hokkoku Bank Ltd. | 207,663 | 900,011 |
| The Hokuetsu Bank Ltd. | 7,716 | 179,685 |
| The Hyakugo Bank Ltd. | 147,638 | 614,376 |
| The Hyakujushi Bank Ltd. | 193,002 | 671,632 |
| The Japan Wool Textile Co., Ltd. | 53,484 | 459,226 |
| The Kiyo Bank Ltd. | 65,425 | 1,060,496 |
| The Michinoku Bank Ltd. | 44,200 | 75,501 |
| The Minato Bank Ltd. | 15,511 | 288,629 |
| The Miyazaki Bank Ltd. | 150,947 | 511,569 |
| The Musashino Bank Ltd. | 23,094 | 656,771 |
| The Nanto Bank Ltd. | 18,672 | 519,986 |
| The Nippon Road Co., Ltd. | 46,893 | 260,753 |
| The Nisshin Oillio Group Ltd. | 100,526 | 719,739 |
| The Ogaki Kyoritsu Bank Ltd. | 324,455 | 875,551 |
| The Oita Bank Ltd. | 160,988 | 612,884 |
| The Okinawa Electric Power Co., Inc. | 29,331 | 653,991 |
| The Shikoku Bank Ltd. | 96,000 | 281,737 |
| The Sumitomo Warehouse Co., Ltd. | 107,117 | 705,614 |
| The Tochigi Bank Ltd. | 98,250 | 385,644 |
| The Toho Bank Ltd. | 177,874 | 623,836 |
| The Towa Bank Ltd. | 399,272 | 395,427 |
| The Yamagata Bank Ltd. | 140,757 | 666,313 |
| The Yamanashi Chuo Bank Ltd. | 134,088 | 525,095 |
| TKC Corp. | 14,416 | 421,766 |
| Toa Corp. * | 16,798 | 311,204 |
| Toagosei Co., Ltd. | 96,967 | 1,218,475 |
| TOC Co., Ltd. | 58,028 | 516,695 |
| Tocalo Co., Ltd. | 7,072 | 258,951 |
| Toei Co., Ltd. | 53,484 | 637,085 |
| Toenec Corp. | 22,100 | 135,540 |
| Toho Co., Ltd. | 7,117 | 187,592 |
| Toho Holdings Co., Ltd. | 44,711 | 875,045 |
| Toho Titanium Co., Ltd. | 28,394 | 210,775 |
| Toho Zinc Co., Ltd. | 100,526 | 461,254 |
| Tokai Carbon Co., Ltd. | 182,746 | 1,318,375 |
| Tokai Corp. | 12,154 | 536,141 |
| TOKAI Holdings Corp. | 101,874 | 790,481 |
| Token Corp. | 6,429 | 886,718 |
| Tokuyama Corp. * | 283,275 | 1,250,878 |
| Tokyo Dome Corp. | 90,328 | 855,186 |
| Tokyo Ohka Kogyo Co., Ltd. | 30,528 | 1,067,897 |
| Tokyo Rope Manufacturing Co., Ltd. | 12,404 | 178,295 |
| Tokyo Seimitsu Co., Ltd. | 28,924 | 992,078 |
| Tokyo Steel Manufacturing Co., Ltd. | 79,351 | 671,232 |
| Tokyo TY Financial Group, Inc. | 21,509 | 501,082 |
| Tokyotokeiba Co., Ltd. | 12,193 | 370,576 |
| Tokyu Construction Co., Ltd. | 69,871 | 566,281 |
| TOMONY Holdings, Inc. | 125,752 | 564,433 |
| Tomy Co., Ltd. | 81,225 | 1,084,132 |
| Topre Corp. | 33,324 | 962,841 |
| Topy Industries Ltd. | 17,020 | 576,045 |
| Toridoll Holdings corp. | 18,289 | 572,466 |
| Torii Pharmaceutical Co., Ltd. | 11,617 | 312,116 |
| Toshiba Machine Co., Ltd. | 112,909 | 543,719 |
| Toshiba Plant Systems & Services Corp. | 33,324 | 572,860 |
| Toshiba TEC Corp. | 141,111 | 794,919 |
| Tosho Co., Ltd. | 7,782 | 383,938 |
| Totetsu Kogyo Co., Ltd. | 25,370 | 828,686 |
| Towa Pharmaceutical Co., Ltd. | 6,900 | 328,512 |
| Security | Number of Shares | Value ($) |
| Toyo Corp. | 39,047 | 366,132 |
| Toyo Engineering Corp. | 134,088 | 338,692 |
| Toyo Ink SC Holdings Co., Ltd. | 152,098 | 865,104 |
| Toyo Kanetsu KK | 102,756 | 311,834 |
| TPR Co., Ltd. | 24,885 | 754,057 |
| Trancom Co., Ltd. | 6,424 | 322,776 |
| Transcosmos, Inc. | 20,794 | 446,827 |
| Trusco Nakayama Corp. | 33,200 | 778,266 |
| TSI Holdings Co., Ltd. | 82,765 | 600,095 |
| Tsubaki Nakashima Co., Ltd. (a) | 12,192 | 274,281 |
| Tsubakimoto Chain Co. | 145,052 | 1,138,696 |
| Tsugami Corp. | 47,608 | 384,549 |
| Tsukishima Kikai Co., Ltd. | 39,082 | 476,896 |
| Tsukuba Bank Ltd. | 86,202 | 285,095 |
| Tsukui Corp. | 48,002 | 327,108 |
| UACJ Corp. | 235,078 | 634,365 |
| UKC Holdings Corp. | 11,617 | 203,503 |
| Ulvac, Inc. | 37,920 | 2,084,463 |
| Union Tool Co. | 9,745 | 315,212 |
| Unipres Corp. | 35,316 | 903,597 |
| United Arrows Ltd. | 22,547 | 751,840 |
| United Super Markets Holdings, Inc. | 66,371 | 669,982 |
| Unitika Ltd. * | 299,835 | 220,667 |
| Unizo Holdings Co., Ltd. | 12,628 | 296,596 |
| V Technology Co., Ltd. (a) | 3,786 | 651,525 |
| Valor Holdings Co., Ltd. | 31,950 | 690,324 |
| Vector, Inc. | 15,650 | 217,416 |
| Vital KSK Holdings, Inc. | 32,432 | 264,913 |
| VT Holdings Co., Ltd. | 56,751 | 311,445 |
| W-Scope Corp. (a) | 19,181 | 407,113 |
| Wacom Co., Ltd. | 113,785 | 526,227 |
| Wakita & Co., Ltd. | 33,324 | 386,953 |
| Warabeya Nichiyo Holdings Co., Ltd. | 13,707 | 343,235 |
| Xebio Holdings Co., Ltd. | 25,881 | 510,048 |
| Yakuodo Co., Ltd. | 6,460 | 178,434 |
| YAMABIKO Corp. | 31,992 | 366,835 |
| Yamazen Corp. | 79,757 | 808,730 |
| Yaoko Co., Ltd. | 19,977 | 951,113 |
| Yellow Hat Ltd. | 17,372 | 481,416 |
| Yodogawa Steel Works Ltd. | 23,171 | 647,382 |
| Yokogawa Bridge Holdings Corp. | 23,205 | 414,300 |
| Yokohama Reito Co., Ltd. | 55,280 | 532,408 |
| Yondoshi Holdings, Inc. | 15,195 | 423,847 |
| Yonex Co., Ltd. (a) | 26,600 | 209,300 |
| Yorozu Corp. | 13,877 | 273,984 |
| Yoshinoya Holdings Co., Ltd. (a) | 57,664 | 981,325 |
| Yuasa Trading Co., Ltd. | 6,046 | 203,804 |
| Yushin Precision Equipment Co., Ltd. (a) | 6,870 | 187,261 |
| Zenrin Co., Ltd. | 14,225 | 435,565 |
| ZERIA Pharmaceutical Co., Ltd. | 43,020 | 788,400 |
| Zojirushi Corp. | 34,196 | 340,531 |
| 297,987,344 | ||
| Netherlands 2.5% | ||
| Aalberts Industries N.V. | 79,717 | 3,542,234 |
| Accell Group | 19,541 | 599,161 |
| APERAM S.A. | 36,612 | 1,929,813 |
| Arcadis N.V. | 56,223 | 1,219,894 |
| ASM International N.V. | 39,082 | 2,294,420 |
| ASR Nederland N.V. | 66,393 | 2,569,716 |
| BE Semiconductor Industries N.V. | 25,947 | 1,679,694 |
| Brunel International N.V. (a) | 15,639 | 208,244 |
| Corbion N.V. | 46,492 | 1,399,546 |
| Eurocommercial Properties N.V. | 38,196 | 1,634,803 |
| Flow Traders | 23,452 | 635,572 |
| Fugro N.V. CVA * | 60,858 | 771,656 |
| Galapagos N.V. * | 30,450 | 2,797,328 |
| Security | Number of Shares | Value ($) |
| IMCD Group N.V. | 40,483 | 2,377,873 |
| Koninklijke BAM Groep N.V. | 172,437 | 1,032,842 |
| NSI N.V. | 14,770 | 568,945 |
| Philips Lighting N.V. | 58,879 | 2,170,038 |
| PostNL N.V. | 327,804 | 1,303,244 |
| Refresco Group N.V. | 45,603 | 885,641 |
| SBM Offshore N.V. | 140,817 | 2,250,925 |
| TKH Group N.V. | 36,940 | 2,174,817 |
| TomTom N.V. * | 96,000 | 1,000,273 |
| Vastned Retail N.V. | 15,038 | 694,855 |
| Wereldhave N.V. | 34,723 | 1,697,522 |
| Wessanen | 44,444 | 774,362 |
| 38,213,418 | ||
| New Zealand 0.9% | ||
| a2 Milk Co., Ltd. *(a) | 577,777 | 2,296,612 |
| Argosy Property Ltd. | 793,429 | 599,508 |
| Chorus Ltd. | 331,967 | 951,019 |
| EBOS Group Ltd. | 65,925 | 813,051 |
| Freightways Ltd. | 143,903 | 814,200 |
| Genesis Energy Ltd. | 475,848 | 836,670 |
| Goodman Property Trust | 811,137 | 743,599 |
| Infratil Ltd. | 392,091 | 884,569 |
| Kathmandu Holdings Ltd. | 131,867 | 219,108 |
| Mainfreight Ltd. | 62,820 | 1,112,194 |
| Metlifecare Ltd. | 109,287 | 477,455 |
| Precinct Properties New Zealand Ltd. | 567,276 | 518,011 |
| Summerset Group Holdings Ltd. | 170,938 | 626,820 |
| Trade Me Group Ltd. | 317,135 | 1,056,164 |
| Vital Healthcare Property Trust | 220,469 | 357,643 |
| Z Energy Ltd. | 288,456 | 1,594,892 |
| 13,901,515 | ||
| Norway 1.7% | ||
| Aker A.S.A., A Shares | 18,622 | 670,213 |
| Aker Solutions A.S.A. * | 118,476 | 552,645 |
| Atea A.S.A. * | 76,927 | 1,013,518 |
| Austevoll Seafood A.S.A. | 61,268 | 631,986 |
| Bakkafrost P/F | 28,232 | 1,314,374 |
| Borregaard A.S.A. | 75,300 | 875,936 |
| BW LPG Ltd. *(a) | 47,075 | 192,963 |
| DNO A.S.A. * | 540,820 | 846,003 |
| Entra A.S.A. | 62,838 | 892,511 |
| Grieg Seafood A.S.A. | 37,650 | 372,636 |
| Hoegh LNG Holdings Ltd. | 28,382 | 299,148 |
| Leroy Seafood Group A.S.A. | 201,140 | 1,334,065 |
| Nordic Semiconductor A.S.A. * | 119,410 | 613,945 |
| Norway Royal Salmon A.S.A. | 20,265 | 442,817 |
| Norwegian Air Shuttle A.S.A. *(a) | 8,840 | 219,868 |
| Norwegian Property A.S.A. | 261,052 | 322,127 |
| Ocean Yield A.S.A. (a) | 33,271 | 291,875 |
| Opera Software A.S.A. *(a) | 90,666 | 279,695 |
| Petroleum Geo-Services A.S.A. *(a) | 223,254 | 420,690 |
| REC Silicon A.S.A. *(a) | 1,674,843 | 223,245 |
| Salmar A.S.A. | 40,716 | 1,177,542 |
| SpareBank 1 SMN | 98,309 | 1,029,863 |
| SpareBank 1 SR-Bank A.S.A. | 122,063 | 1,306,162 |
| Stolt-Nielsen Ltd. | 9,837 | 147,305 |
| Storebrand A.S.A. | 368,282 | 3,039,095 |
| Subsea 7 S.A. | 207,071 | 2,973,043 |
| TGS Nopec Geophysical Co. A.S.A. | 87,326 | 1,867,780 |
| Tomra Systems A.S.A. | 107,804 | 1,621,248 |
| Veidekke A.S.A. | 60,369 | 779,846 |
| Security | Number of Shares | Value ($) |
| Wallenius Wilhelmsen Logistics * | 58,790 | 385,392 |
| XXL A.S.A. | 81,440 | 813,892 |
| 26,951,428 | ||
| Portugal 0.5% | ||
| Altri, SGPS, S.A. | 66,474 | 290,043 |
| Banco BPI S.A. * | 278,461 | 349,933 |
| Banco Comercial Portugues S.A. * | 6,726,886 | 1,786,662 |
| CTT-Correios de Portugal S.A. | 111,124 | 687,924 |
| NOS, SGPS S.A. | 158,953 | 1,016,519 |
| REN - Redes Energeticas Nacionais, SGPS, S.A. | 144,746 | 474,964 |
| Semapa-Sociedade de Investimento e Gestao | 33,715 | 608,271 |
| Sonae, SGPS, S.A. | 771,741 | 863,389 |
| The Navigator Co. S.A. | 223,258 | 951,571 |
| 7,029,276 | ||
| Republic of Korea 4.9% | ||
| Able C&C Co., Ltd. | 10,000 | 192,888 |
| Advanced Process Systems Corp. * | 8,011 | 312,597 |
| Ahnlab, Inc. | 6,377 | 292,948 |
| Amicogen, Inc. * | 4,631 | 124,851 |
| Aprogen pharmaceuticals, Inc. * | 80,000 | 279,177 |
| Asiana Airlines, Inc. * | 83,700 | 332,915 |
| ATGen Co., Ltd. * | 11,453 | 294,552 |
| Binex Co., Ltd. * | 13,655 | 115,891 |
| Binggrae Co., Ltd. | 3,060 | 164,452 |
| Bukwang Pharmaceutical Co., Ltd. | 14,542 | 275,339 |
| Caregen Co., Ltd. | 2,705 | 163,605 |
| Cell Biotech Co., Ltd. | 4,600 | 156,243 |
| Celltrion Pharm, Inc. * | 20,000 | 336,112 |
| Chabiotech Co., Ltd. * | 26,147 | 291,012 |
| Chong Kun Dang Pharmaceutical Corp. | 4,536 | 418,361 |
| CJ CGV Co., Ltd. | 12,547 | 727,717 |
| CJ E&M Corp. | 15,721 | 1,059,592 |
| CJ Hellovision Co., Ltd. | 22,500 | 167,613 |
| CJ O Shopping Co., Ltd. | 1,806 | 342,749 |
| CMG Pharmaceutical Co., Ltd. * | 41,235 | 132,745 |
| Com2uSCorp | 8,879 | 858,293 |
| Cosmax, Inc. | 5,130 | 536,839 |
| CrucialTec Co., Ltd. * | 32,851 | 93,227 |
| CrystalGenomics, Inc. * | 29,683 | 355,375 |
| Cuckoo Electronics Co., Ltd. | 2,367 | 281,286 |
| CUROCOM Co., Ltd. * | 75,000 | 171,603 |
| Daeduck Electronics Co. | 35,000 | 374,024 |
| Daesang Corp. | 20,535 | 438,891 |
| Daewoong Co., Ltd. | 16,395 | 217,369 |
| Daewoong Pharmaceutical Co., Ltd. | 3,046 | 272,833 |
| Daishin Securities Co., Ltd. | 26,463 | 330,905 |
| Daou Technology, Inc. | 22,600 | 394,839 |
| DIO Corp. * | 9,246 | 280,430 |
| Dong-A Socio Holdings Co., Ltd. (c) | 3,700 | 381,878 |
| Dong-A ST Co., Ltd. | 2,550 | 188,830 |
| Dongbu HiTek Co., Ltd. * | 28,653 | 405,299 |
| DongKook Pharmaceutical Co., Ltd. | 3,000 | 157,503 |
| Dongkuk Steel Mill Co., Ltd. | 52,179 | 585,371 |
| Dongwon Industries Co., Ltd. | 900 | 229,869 |
| Doosan Bobcat, Inc. | 22,204 | 751,226 |
| DoubleUGames Co., Ltd. | 10,247 | 485,269 |
| Duk San Neolux Co., Ltd. * | 5,839 | 129,456 |
| Duzone Bizon Co., Ltd. | 18,321 | 536,989 |
| Emerson Pacific, Inc. * | 10,496 | 270,405 |
| Eo Technics Co., Ltd. | 6,507 | 416,642 |
| Eugene Investment & Securities Co., Ltd. * | 100,951 | 299,916 |
| Fila Korea Ltd. | 9,900 | 621,603 |
| Security | Number of Shares | Value ($) |
| Foosung Co., Ltd. * | 43,999 | 437,024 |
| G-SMATT GLOBAL Co., Ltd. * | 25,000 | 294,874 |
| Gamevil, Inc. * | 4,065 | 194,670 |
| GemVax & Kael Co., Ltd. * | 17,326 | 163,641 |
| Genexine Co., Ltd. * | 6,466 | 265,785 |
| Grand Korea Leisure Co., Ltd. | 18,871 | 386,591 |
| Green Cross Corp. | 4,000 | 643,845 |
| Green Cross Holdings Corp. | 24,000 | 718,340 |
| GS Home Shopping, Inc. | 1,935 | 378,386 |
| Halla Holdings Corp. | 7,194 | 407,677 |
| Hana Tour Service, Inc. | 9,038 | 682,098 |
| Hanall Biopharma Co., Ltd. * | 23,044 | 259,541 |
| Hancom, Inc. | 8,000 | 117,063 |
| Handsome Co., Ltd. | 8,300 | 242,169 |
| Hanil Cement Co., Ltd. | 3,845 | 438,172 |
| Hanjin Kal Corp. * | 23,226 | 472,718 |
| Hanjin Transportation Co., Ltd. | 10,586 | 286,806 |
| Hankook Shell Oil Co., Ltd. | 450 | 160,429 |
| Hankook Tire Worldwide Co., Ltd. | 16,435 | 310,452 |
| Hansae Co., Ltd. | 11,000 | 244,856 |
| Hansol Chemical Co., Ltd. | 6,571 | 449,877 |
| Hansol Paper Co., Ltd. | 11,915 | 192,842 |
| Hansol Technics Co., Ltd. * | 16,471 | 235,175 |
| Hanwha General Insurance Co., Ltd. | 32,016 | 275,129 |
| HLB, Inc. * | 23,168 | 277,375 |
| Homecast Co., Ltd. * | 20,089 | 198,645 |
| Huchems Fine Chemical Corp. | 15,000 | 318,597 |
| Hugel, Inc. * | 1,829 | 940,777 |
| Humax Co., Ltd. | 8,338 | 78,012 |
| Hyundai Elevator Co., Ltd. | 8,111 | 374,044 |
| Hyundai Greenfood Co., Ltd. | 47,000 | 721,089 |
| Hyundai Home Shopping Network Corp. | 4,402 | 536,782 |
| Hyundai Livart Furniture Co., Ltd. | 8,000 | 167,081 |
| Hyundai Rotem Co., Ltd. * | 48,482 | 795,421 |
| i-SENS, Inc. | 8,000 | 167,790 |
| ICD Co., Ltd. | 9,952 | 115,177 |
| Ilyang Pharmaceutical Co., Ltd. | 9,277 | 297,825 |
| iMarketKorea, Inc. | 22,143 | 222,883 |
| InBody Co., Ltd. | 7,059 | 197,196 |
| Innocean Worldwide, Inc. | 10,000 | 635,864 |
| Insun ENT Co., Ltd. * | 37,430 | 209,125 |
| Interflex Co., Ltd. * | 10,624 | 469,205 |
| Interpark Holdings Corp. | 32,914 | 141,569 |
| iNtRON Biotechnology, Inc. * | 11,921 | 330,375 |
| IS Dongseo Co., Ltd. | 12,300 | 389,420 |
| It's Hanbul Co., Ltd. | 3,844 | 118,804 |
| JB Financial Group Co., Ltd. | 76,294 | 420,848 |
| Jeil Pharma Holdings, Inc. | 836 | 29,693 |
| Jeil Pharmaceutical Co., Ltd. * | 2,023 | 89,076 |
| Jenax, Inc. * | 7,538 | 189,520 |
| Jusung Engineering Co., Ltd. * | 22,271 | 321,938 |
| JW Holdings Corp. | 22,859 | 189,343 |
| JW Pharmaceutical Corp. | 9,477 | 383,669 |
| KIWOOM Securities Co., Ltd. | 9,153 | 655,061 |
| Koh Young Technology, Inc. | 8,228 | 445,112 |
| Kolao Holdings | 42,750 | 213,068 |
| Kolon Corp. | 5,772 | 339,891 |
| Kolon Industries, Inc. | 14,059 | 891,467 |
| Kolon Life Science, Inc. | 3,858 | 448,207 |
| Komipharm International Co., Ltd. * | 28,993 | 947,492 |
| Korea Electric Terminal Co., Ltd. | 4,600 | 292,905 |
| Korea Kolmar Co., Ltd. | 11,364 | 684,299 |
| Korea Line Corp. * | 9,681 | 304,356 |
| Korea PetroChemical Ind Co., Ltd. | 2,380 | 564,606 |
| Korea Real Estate Investment & Trust Co., Ltd. | 165,926 | 499,573 |
| Korean Reinsurance Co. | 61,000 | 673,510 |
| KT Skylife Co., Ltd. | 14,000 | 199,894 |
| Security | Number of Shares | Value ($) |
| Kumho Industrial Co., Ltd. | 47,575 | 389,426 |
| Kumho Tire Co., Inc. * | 149,732 | 892,337 |
| Kwang Dong Pharmaceutical Co., Ltd. | 22,200 | 170,103 |
| LEENO Industrial, Inc. | 6,122 | 273,633 |
| LF Corp. | 11,858 | 306,020 |
| LG Innotek Co., Ltd. | 12,000 | 1,963,462 |
| LG International Corp. | 20,000 | 511,706 |
| LIG Nex1 Co., Ltd. | 9,817 | 726,089 |
| Lock&Lock Co., Ltd. | 12,300 | 171,258 |
| Loen Entertainment, Inc. | 4,994 | 355,639 |
| Lotte Food Co., Ltd. | 800 | 438,453 |
| LOTTE Himart Co., Ltd. | 11,000 | 667,258 |
| LS Industrial Systems Co., Ltd. | 15,671 | 808,844 |
| Maeil Dairies Co., Ltd. * | 5,107 | 327,453 |
| Medipost Co., Ltd. * | 5,401 | 435,395 |
| Medy-Tox, Inc. | 3,338 | 1,684,689 |
| Meritz Financial Group, Inc. | 20,400 | 303,033 |
| Meritz Fire & Marine Insurance Co., Ltd. | 44,092 | 989,294 |
| Meritz Securities Co., Ltd. | 251,000 | 1,074,029 |
| Mirae Asset Life Insurance Co., Ltd. | 55,000 | 270,708 |
| Modetour Network, Inc. | 15,235 | 367,499 |
| Muhak Co., Ltd. | 7,847 | 139,181 |
| Namyang Dairy Products Co., Ltd. | 297 | 178,316 |
| Nexen Tire Corp. | 32,444 | 379,798 |
| NICE Holdings Co., Ltd. | 8,972 | 128,501 |
| NICE Information Service Co., Ltd. | 26,314 | 188,791 |
| NS Shopping Co., Ltd. | 12,510 | 181,947 |
| NUTRIBIOTECH Co., Ltd. * | 4,712 | 84,411 |
| Osstem Implant Co., Ltd. * | 8,291 | 526,459 |
| Pan Ocean Co., Ltd. * | 133,707 | 762,448 |
| Partron Co., Ltd. | 35,200 | 280,639 |
| Peptron, Inc. * | 3,802 | 144,480 |
| Poongsan Corp. | 15,750 | 796,160 |
| POSCO Chemtech Co., Ltd. | 18,986 | 555,639 |
| Posco ICT Co., Ltd. | 62,300 | 365,756 |
| S&T Motiv Co., Ltd. | 7,906 | 366,694 |
| Samchully Co., Ltd. | 2,200 | 209,737 |
| Samyang Corp. | 3,391 | 296,216 |
| Samyang Holdings Corp. | 5,210 | 494,386 |
| Seah Besteel Corp. | 12,000 | 377,261 |
| Seegene, Inc. * | 8,500 | 237,451 |
| Seobu T&D | 12,384 | 154,855 |
| Seoul Semiconductor Co., Ltd. | 32,172 | 654,795 |
| SFA Engineering Corp. | 19,662 | 659,992 |
| SFA Semicon Co., Ltd. * | 85,298 | 189,114 |
| Silicon Works Co., Ltd. | 6,814 | 264,982 |
| SillaJen, Inc. * | 44,986 | 995,389 |
| SK Chemicals Co., Ltd. | 16,400 | 994,821 |
| SK Gas Ltd. | 3,128 | 310,692 |
| SK Materials Co., Ltd. | 5,051 | 817,943 |
| SK Securities Co., Ltd. * | 300,000 | 335,225 |
| SL Corp. | 23,300 | 403,969 |
| SM Entertainment Co. * | 11,550 | 302,168 |
| Songwon Industrial Co., Ltd. | 8,000 | 147,925 |
| Soulbrain Co., Ltd. | 7,228 | 413,450 |
| SPC SAMLIP Co., Ltd. | 1,610 | 226,308 |
| Ssangyong Cement Industrial Co., Ltd. | 15,747 | 186,434 |
| Ssangyong Motor Co. * | 33,000 | 161,547 |
| ST Pharm Co., Ltd. | 4,429 | 137,277 |
| Sung Kwang Bend Co., Ltd. | 19,889 | 173,914 |
| Taekwang Industrial Co., Ltd. | 473 | 510,501 |
| Taewoong Co., Ltd. * | 6,698 | 117,910 |
| Taihan Electric Wire Co., Ltd. * | 212,808 | 260,443 |
| TES Co., Ltd. | 10,000 | 269,599 |
| Tongyang Life Insurance Co.,Ltd. | 15,897 | 129,279 |
| Tongyang, Inc. | 122,189 | 229,727 |
| Toptec Co., Ltd. | 14,431 | 358,983 |
| Vieworks Co., Ltd. | 4,757 | 202,497 |
| Security | Number of Shares | Value ($) |
| ViroMed Co., Ltd. * | 11,292 | 1,246,767 |
| Webzen, Inc. * | 16,000 | 263,923 |
| Wonik Holdings Co., Ltd. * | 22,280 | 163,603 |
| WONIK IPS Co., Ltd. * | 25,623 | 690,794 |
| Young Poong Corp. | 370 | 405,241 |
| Youngone Corp. | 23,420 | 702,018 |
| Yuanta Securities Korea Co., Ltd. * | 41,845 | 135,822 |
| Yungjin Pharmaceutical Co., Ltd. * | 72,339 | 670,400 |
| 74,701,179 | ||
| Singapore 1.5% | ||
| Accordia Golf Trust | 625,450 | 327,003 |
| Ascendas Hospitality Trust | 784,182 | 482,174 |
| Ascendas India Trust | 537,158 | 456,861 |
| Ascott Residence Trust | 824,637 | 713,511 |
| Asian Pay Television Trust | 1,168,418 | 490,426 |
| Cache Logistics Trust | 707,016 | 455,552 |
| CapitaLand Retail China Trust | 403,684 | 474,135 |
| CDL Hospitality Trusts | 574,177 | 689,182 |
| China Everbright Water Ltd. | 348,871 | 120,743 |
| China Hongxing Sports Ltd. *(c) | 884,000 | — |
| Croesus Retail Trust | 508,925 | 432,849 |
| ESR-REIT | 1,034,014 | 422,590 |
| Ezion Holdings Ltd. *(c) | 1,384,129 | 184,727 |
| Far East Hospitality Trust | 715,172 | 347,580 |
| First Real Estate Investment Trust | 403,684 | 395,361 |
| First Resources Ltd. | 389,477 | 534,886 |
| Frasers Centrepoint Trust | 487,695 | 757,759 |
| Frasers Commercial Trust | 486,715 | 499,976 |
| Frasers Logistics & Industrial Trust | 427,628 | 338,513 |
| Genting Hong Kong Ltd. | 1,591,463 | 437,652 |
| GL Ltd. | 641,851 | 352,120 |
| Keppel DC REIT | 545,247 | 515,937 |
| Keppel Infrastructure Trust | 1,678,928 | 692,341 |
| Keppel REIT | 1,445,974 | 1,235,147 |
| Lippo Malls Indonesia Retail Trust | 1,611,719 | 516,272 |
| Manulife US Real Estate Investment Trust | 267,995 | 258,615 |
| Mapletree Commercial Trust | 1,466,309 | 1,657,426 |
| Mapletree Greater China Commercial Trust | 1,541,305 | 1,276,854 |
| Mapletree Industrial Trust | 961,993 | 1,314,063 |
| Mapletree Logistics Trust | 1,138,374 | 1,031,075 |
| Midas Holdings Ltd. * | 1,074,316 | 170,087 |
| OUE Hospitality Trust | 759,439 | 425,017 |
| OUE Ltd. | 216,668 | 312,717 |
| Parkway Life Real Estate Investment Trust | 343,046 | 679,524 |
| Raffles Medical Group Ltd. | 714,026 | 578,372 |
| RHT Health Trust | 537,158 | 340,174 |
| Sabana Shari'ah Compliant Industrial Real Estate Investment Trust | 762,724 | 269,593 |
| Sarine Technologies Ltd. | 233,987 | 240,362 |
| SIIC Environment Holdings Ltd. | 741,493 | 292,120 |
| Silverlake Axis Ltd. | 624,555 | 278,244 |
| Soilbuild Business Space REIT | 761,718 | 409,465 |
| SPH REIT | 588,849 | 433,615 |
| Starhill Global REIT | 1,141,297 | 626,117 |
| United Engineers Ltd. | 362,523 | 723,444 |
| Yoma Strategic Holdings Ltd. | 980,144 | 422,227 |
| 23,612,408 | ||
| Spain 1.9% | ||
| Almirall S.A. (a) | 46,650 | 478,084 |
| Applus Services S.A. | 105,748 | 1,355,931 |
| Atresmedia Corp de Medios de Comunicaion S.A. | 44,708 | 465,092 |
| Axiare Patrimonio SOCIMI S.A. | 45,630 | 869,077 |
| Security | Number of Shares | Value ($) |
| Bolsas y Mercados Espanoles SHMSF S.A. (a) | 57,310 | 2,062,472 |
| Cellnex Telecom SAU | 113,908 | 2,541,253 |
| Cia de Distribucion Integral Logista Holdings S.A. | 31,010 | 767,218 |
| Cie Automotive S.A. | 41,148 | 1,029,784 |
| Codere S.A. *(a) | 825,282 | 431,718 |
| Construcciones y Auxiliar de Ferrocarriles S.A. | 16,837 | 700,612 |
| Ebro Foods S.A. | 62,822 | 1,496,022 |
| Ence Energia y Celulosa S.A. | 116,805 | 510,345 |
| Euskaltel S.A. | 73,065 | 743,668 |
| Faes Farma S.A. | 206,160 | 675,260 |
| Fomento de Construcciones y Contratas S.A. * | 54,091 | 569,004 |
| Grupo Catalana Occidente S.A. | 38,547 | 1,626,912 |
| Hispania Activos Inmobiliarios SOCIMI S.A. | 70,893 | 1,317,790 |
| Indra Sistemas S.A. * | 97,021 | 1,524,903 |
| Inmobiliaria Colonial S.A. | 176,082 | 1,717,666 |
| Let's GOWEX S.A. *(c) | 5,361 | — |
| Liberbank S.A. * | 253,302 | 307,174 |
| Melia Hotels International S.A. | 68,158 | 1,000,352 |
| NH Hotel Group S.A. | 165,554 | 1,076,644 |
| Obrascon Huarte Lain S.A. *(a) | 111,509 | 474,346 |
| Papeles y Cartones de Europa S.A. | 34,924 | 297,499 |
| Pharma Mar S.A. * | 119,045 | 537,824 |
| Prosegur Cia de Seguridad S.A. | 171,242 | 1,164,532 |
| Sacyr S.A. *(a) | 209,356 | 589,154 |
| Tecnicas Reunidas S.A. | 24,924 | 864,369 |
| Viscofan S.A. | 34,535 | 2,081,673 |
| 29,276,378 | ||
| Sweden 4.9% | ||
| AAK AB | 21,921 | 1,607,432 |
| AF AB, B Shares | 45,168 | 984,264 |
| Ahlsell AB | 177,275 | 1,237,551 |
| Atrium Ljungberg AB, B Shares | 25,825 | 458,254 |
| Attendo AB | 74,086 | 911,487 |
| Avanza Bank Holding AB | 23,173 | 968,872 |
| Axfood AB | 88,051 | 1,555,791 |
| Betsson AB * | 99,115 | 924,219 |
| Bilia AB, B Shares | 62,984 | 654,983 |
| BillerudKorsnas AB | 136,026 | 2,265,006 |
| Bonava AB, B Shares | 68,157 | 1,110,061 |
| Bravida Holding AB | 128,786 | 949,223 |
| Bure Equity AB | 34,226 | 413,989 |
| Castellum AB | 219,117 | 3,425,532 |
| Clas Ohlson AB, B Shares | 21,974 | 436,313 |
| Cloetta AB, B Shares | 183,089 | 692,565 |
| Collector AB * | 20,878 | 237,317 |
| Com Hem Holding AB | 133,307 | 1,983,518 |
| Concentric AB | 31,081 | 479,455 |
| Dometic Group AB | 231,182 | 1,920,379 |
| Elekta AB, B Shares | 279,835 | 2,892,474 |
| Fabege AB | 108,355 | 2,170,545 |
| Fingerprint Cards AB, Class B *(a) | 194,937 | 890,002 |
| Haldex AB *(a) | 28,351 | 385,681 |
| Hemfosa Fastigheter AB | 121,578 | 1,492,729 |
| Hexpol AB | 209,833 | 2,050,245 |
| Holmen AB, B Shares | 42,934 | 1,874,402 |
| Hufvudstaden AB, A Shares | 90,242 | 1,601,308 |
| Indutrade AB | 78,303 | 1,905,089 |
| Intrum Justitia AB (a) | 53,665 | 1,748,740 |
| Investment AB Oresund | 38,959 | 668,301 |
| JM AB | 52,522 | 1,683,112 |
| Security | Number of Shares | Value ($) |
| Klovern AB, B Shares | 344,470 | 476,185 |
| Kungsleden AB | 139,410 | 935,549 |
| Lifco AB, B Shares | 35,366 | 1,155,555 |
| Lindab International AB | 55,752 | 573,120 |
| Loomis AB, B Shares | 56,770 | 2,067,516 |
| Mekonomen AB | 18,160 | 389,109 |
| Modern Times Group MTG AB, B Shares | 43,771 | 1,584,202 |
| Mycronic AB (a) | 81,560 | 766,161 |
| NCC AB, B Shares | 67,360 | 1,754,821 |
| NetEnt AB * | 147,345 | 1,406,354 |
| Nibe Industrier AB, B Shares | 259,535 | 2,385,843 |
| Nobia AB | 80,464 | 780,134 |
| Oriflame Holding AG * | 16,608 | 605,684 |
| Pandox AB | 45,159 | 810,976 |
| Peab AB | 142,002 | 1,628,392 |
| Ratos AB, B Shares | 148,659 | 694,783 |
| Resurs Holding AB | 61,515 | 406,629 |
| Rezidor Hotel Group AB | 103,893 | 387,770 |
| Saab AB, Class B | 28,852 | 1,314,363 |
| SAS AB *(a) | 265,290 | 653,444 |
| SkiStar AB | 15,748 | 369,093 |
| SSAB AB, A Shares *(a) | 154,471 | 783,289 |
| SSAB AB, B Shares * | 449,618 | 1,846,534 |
| Sweco AB, B Shares | 54,387 | 1,368,330 |
| Swedish Orphan Biovitrum AB * | 122,914 | 1,830,422 |
| Thule Group AB | 79,585 | 1,522,220 |
| Vitrolife AB | 10,470 | 877,615 |
| Wallenstam AB, B Shares | 171,111 | 1,740,710 |
| Wihlborgs Fastigheter AB | 62,466 | 1,514,284 |
| 75,207,926 | ||
| Switzerland 4.0% | ||
| Allreal Holding AG * | 11,136 | 1,995,441 |
| ams AG * | 45,849 | 3,294,353 |
| APG SGA S.A. | 558 | 228,629 |
| Arbonia AG * | 29,779 | 531,436 |
| Ascom Holding AG | 31,133 | 605,814 |
| Autoneum Holding AG | 3,557 | 902,760 |
| Bachem Holding AG, Class B | 3,326 | 402,858 |
| Basilea Pharmaceutica *(a) | 8,250 | 700,950 |
| BB Biotech AG (a) | 33,983 | 2,206,596 |
| Belimo Holding AG | 318 | 1,245,859 |
| Bell Food Group AG | 1,135 | 519,667 |
| BKW AG | 13,793 | 799,449 |
| Bobst Group AG | 4,320 | 488,191 |
| Bucher Industries AG | 5,098 | 1,789,074 |
| Burckhardt Compression Holding AG (a) | 2,388 | 698,881 |
| Cembra Money Bank AG * | 23,189 | 2,014,861 |
| Conzzeta AG | 635 | 650,859 |
| COSMO Pharmaceuticals N.V. | 4,593 | 673,417 |
| Daetwyler Holding AG | 4,589 | 717,718 |
| dormakaba Holding AG * | 2,367 | 2,129,315 |
| EFG International AG * | 57,113 | 465,343 |
| Emmi AG * | 1,654 | 1,102,380 |
| Forbo Holding AG | 973 | 1,476,206 |
| GAM Holding AG * | 131,353 | 2,016,084 |
| Georg Fischer AG | 3,304 | 3,799,084 |
| Huber & Suhner AG | 11,617 | 687,228 |
| Implenia AG | 10,367 | 705,517 |
| Interroll Holding AG | 313 | 399,311 |
| Intershop Holding AG | 595 | 297,810 |
| Kudelski S.A. | 29,226 | 375,589 |
| LEM Holding S.A. | 356 | 440,832 |
| Leonteq AG * | 6,121 | 364,330 |
| Logitech International S.A. | 114,222 | 4,053,039 |
| Meyer Burger Technology AG *(a) | 431,540 | 624,184 |
| Mobimo Holding AG * | 5,896 | 1,627,382 |
| Security | Number of Shares | Value ($) |
| OC Oerlikon Corp. AG * | 150,506 | 2,098,627 |
| Panalpina Welttransport Holding AG | 11,149 | 1,464,104 |
| Rieter Holding AG * | 3,644 | 777,715 |
| Schmolz & Bickenbach AG * | 430,321 | 407,484 |
| Schweiter Technologies AG | 618 | 772,339 |
| SFS Group AG * | 13,803 | 1,568,457 |
| Siegfried Holding AG * | 2,045 | 649,037 |
| St. Galler Kantonalbank AG | 1,525 | 681,569 |
| Sunrise Communications Group AG * | 27,748 | 2,373,450 |
| Swissquote Group Holding S.A. | 4,631 | 168,181 |
| Tecan Group AG | 9,760 | 1,946,922 |
| U-Blox Holding AG * | 5,021 | 903,885 |
| Valiant Holding AG | 13,811 | 1,506,132 |
| Valora Holding AG | 2,379 | 716,052 |
| VAT Group AG * | 16,170 | 2,064,578 |
| Vetropack Holding AG | 76 | 159,513 |
| Vontobel Holding AG | 16,724 | 1,063,305 |
| VZ Holding AG | 2,234 | 671,246 |
| Ypsomed Holding AG *(a) | 1,958 | 294,413 |
| Zehnder Group AG | 8,412 | 295,864 |
| 61,613,320 | ||
| United Kingdom 15.0% | ||
| 888 Holdings plc | 107,425 | 364,051 |
| AA plc | 473,063 | 975,305 |
| Acacia Mining plc | 117,167 | 305,575 |
| Aldermore Group plc * | 138,973 | 403,811 |
| Allied Minds plc *(a) | 173,507 | 278,907 |
| Amec Foster Wheeler plc | 310,306 | 1,689,345 |
| AO World plc * | 172,117 | 256,157 |
| Assura plc | 1,274,943 | 1,071,945 |
| AVEVA Group plc | 50,183 | 1,246,709 |
| B&M European Value Retail S.A. | 585,228 | 2,808,252 |
| Balfour Beatty plc | 530,110 | 1,836,784 |
| BBA Aviation plc | 814,789 | 3,168,588 |
| Beazley plc | 432,504 | 2,847,819 |
| Berendsen plc | 131,927 | 2,150,431 |
| BGEO Group plc | 28,401 | 1,266,226 |
| Big Yellow Group plc | 117,793 | 1,227,159 |
| Bodycote plc | 153,487 | 1,890,736 |
| Bovis Homes Group plc | 107,093 | 1,454,464 |
| Brewin Dolphin Holdings plc | 206,156 | 947,015 |
| Britvic plc | 220,867 | 2,150,140 |
| BTG plc * | 314,081 | 2,818,799 |
| Cairn Energy plc * | 451,018 | 996,688 |
| Card Factory plc | 218,376 | 936,179 |
| Carillion plc (a) | 347,663 | 197,604 |
| Centamin plc | 871,535 | 1,701,370 |
| Chemring Group plc | 217,037 | 495,004 |
| Chesnara plc | 111,406 | 572,414 |
| Cineworld Group plc | 157,061 | 1,310,417 |
| Close Brothers Group plc | 116,471 | 2,318,716 |
| Computacenter plc | 49,665 | 654,677 |
| Countryside Properties plc | 188,213 | 839,611 |
| Countrywide plc | 89,434 | 160,184 |
| Cranswick plc | 34,130 | 1,314,949 |
| Crest Nicholson Holdings plc | 188,000 | 1,317,826 |
| Daejan Holdings plc | 2,428 | 186,152 |
| Dairy Crest Group plc | 105,291 | 807,931 |
| De La Rue plc | 86,906 | 695,413 |
| Debenhams plc | 999,520 | 518,392 |
| Dechra Pharmaceuticals plc | 76,057 | 1,874,802 |
| Dignity plc | 38,794 | 1,128,729 |
| Diploma plc | 87,181 | 1,216,611 |
| Domino's Pizza Group plc | 393,193 | 1,369,979 |
| Drax Group plc | 322,317 | 1,280,852 |
| Dunelm Group plc | 75,410 | 567,956 |
| Security | Number of Shares | Value ($) |
| EI Group plc * | 428,749 | 780,356 |
| Electrocomponents plc | 340,643 | 2,776,268 |
| Elementis plc | 370,973 | 1,288,735 |
| Entertainment One Ltd. | 257,694 | 796,924 |
| Essentra plc | 205,150 | 1,411,608 |
| esure Group plc | 209,961 | 737,236 |
| Evraz plc | 364,698 | 1,575,211 |
| F&C Commercial Property Trust Ltd. | 372,947 | 722,283 |
| Fenner plc | 162,368 | 717,622 |
| Ferrexpo plc | 215,401 | 830,722 |
| Fidessa Group plc | 31,405 | 848,996 |
| Firstgroup plc * | 912,200 | 1,379,938 |
| Galliford Try plc | 63,669 | 1,142,007 |
| Genel Energy plc *(a) | 149,888 | 292,604 |
| Genus plc | 48,312 | 1,159,763 |
| Go-Ahead Group plc | 33,803 | 784,459 |
| Gocompare.Com Group plc * | 209,961 | 274,603 |
| Grafton Group plc | 169,867 | 1,720,414 |
| Grainger plc | 323,207 | 1,063,660 |
| Great Portland Estates plc | 254,522 | 1,985,824 |
| Greencore Group plc | 567,093 | 1,497,992 |
| Greene King plc | 245,971 | 2,185,343 |
| Greggs plc | 81,131 | 1,257,633 |
| GVC Holdings plc | 222,469 | 2,237,401 |
| Halfords Group plc | 161,997 | 674,026 |
| Hansteen Holdings PLC | 525,157 | 896,616 |
| Hastings Group Holdings Ltd. | 247,615 | 1,015,263 |
| Hays plc | 1,099,124 | 2,591,786 |
| Helical plc | 67,677 | 289,521 |
| Hill & Smith Holdings plc | 64,911 | 1,074,788 |
| Hiscox Ltd. | 224,753 | 3,701,159 |
| Hochschild Mining plc | 180,443 | 660,095 |
| HomeServe plc | 198,063 | 1,865,615 |
| Hunting plc * | 99,678 | 516,586 |
| Ibstock plc | 293,819 | 889,711 |
| IG Group Holdings plc | 278,676 | 2,316,118 |
| Imagination Technologies Group plc * | 193,799 | 338,995 |
| Indivior plc * | 561,188 | 3,012,513 |
| Intermediate Capital Group plc | 214,002 | 2,448,681 |
| International Personal Finance plc | 154,569 | 387,883 |
| Interserve plc | 76,090 | 164,962 |
| ITE Group plc | 212,666 | 485,035 |
| IWG plc | 515,585 | 1,997,058 |
| J.D. Wetherspoon plc | 64,578 | 908,675 |
| Jardine Lloyd Thompson Group plc | 78,363 | 1,166,257 |
| JD Sports Fashion plc | 279,069 | 1,165,445 |
| John Laing Group plc | 284,253 | 1,087,835 |
| Jupiter Fund Management plc | 325,405 | 2,249,548 |
| KAZ Minerals plc * | 192,566 | 2,085,541 |
| KCOM Group plc | 310,821 | 400,508 |
| Keller Group plc | 56,578 | 602,548 |
| Kennedy Wilson Europe Real Estate plc | 78,772 | 1,138,849 |
| Kier Group plc | 72,163 | 1,093,511 |
| Ladbrokes Coral Group plc | 1,352,706 | 2,065,490 |
| Laird plc | 391,684 | 712,895 |
| Lamprell plc * | 163,573 | 210,772 |
| Lancashire Holdings Ltd. | 164,004 | 1,452,876 |
| LondonMetric Property plc | 401,458 | 859,751 |
| Lonmin plc * | 230,037 | 251,952 |
| Lookers plc | 229,422 | 323,706 |
| Man Group plc | 1,218,291 | 2,627,894 |
| Marston's plc | 478,720 | 712,467 |
| McCarthy & Stone plc | 369,179 | 786,817 |
| Metro Bank plc * | 57,483 | 2,569,479 |
| Mitchells & Butlers plc | 179,548 | 573,533 |
| Mitie Group plc | 302,060 | 1,047,000 |
| Moneysupermarket.com Group plc | 435,067 | 1,791,135 |
| Morgan Advanced Materials plc | 237,113 | 916,902 |
| Security | Number of Shares | Value ($) |
| N Brown Group plc | 125,161 | 527,373 |
| National Express Group plc | 317,420 | 1,468,352 |
| NCC Group plc | 188,166 | 450,978 |
| NewRiver REIT plc | 231,523 | 1,039,677 |
| NEX Group plc | 242,136 | 2,068,589 |
| NMC Health plc | 55,799 | 1,952,080 |
| Northgate plc | 106,776 | 554,610 |
| Nostrum Oil & Gas plc * | 58,790 | 286,956 |
| Ocado Group plc *(a) | 335,060 | 1,337,536 |
| OneSavings Bank plc | 78,313 | 397,889 |
| Ophir Energy plc * | 556,637 | 555,872 |
| Oxford Instruments plc | 46,931 | 634,361 |
| Pagegroup plc | 244,612 | 1,609,070 |
| Paysafe Group plc * | 396,206 | 2,991,714 |
| Petra Diamonds Ltd. * | 413,102 | 501,163 |
| Pets at Home Group plc | 282,040 | 662,883 |
| Phoenix Group Holdings | 305,237 | 3,077,676 |
| Picton Property Income Ltd. | 242,035 | 265,873 |
| Playtech plc | 226,191 | 2,768,855 |
| Polypipe Group plc | 142,578 | 727,159 |
| Premier Foods plc * | 510,140 | 272,796 |
| Premier Oil plc *(a) | 373,599 | 267,178 |
| PZ Cussons plc | 149,852 | 662,305 |
| QinetiQ Group plc | 476,649 | 1,412,628 |
| Rank Group plc | 25,970 | 76,966 |
| Rathbone Brothers plc | 41,719 | 1,494,445 |
| Redefine International plc | 801,100 | 407,742 |
| Redrow plc | 161,984 | 1,295,136 |
| Renewi plc | 524,483 | 626,826 |
| Renishaw plc | 28,211 | 1,664,889 |
| Rotork plc | 677,512 | 2,000,935 |
| RPS Group plc | 177,277 | 659,593 |
| Safestore Holdings plc | 156,210 | 832,311 |
| Saga plc | 878,920 | 2,296,776 |
| Savills plc | 106,613 | 1,216,466 |
| Schroder Real Estate Investment Trust Ltd. | 383,374 | 311,218 |
| Senior plc | 343,036 | 1,213,784 |
| Serco Group plc * | 878,904 | 1,332,967 |
| Shaftesbury plc | 182,179 | 2,340,425 |
| SIG plc | 455,866 | 1,046,170 |
| Soco International plc | 182,171 | 279,336 |
| Sophos Group plc | 222,914 | 1,444,796 |
| Spectris plc | 96,267 | 2,870,398 |
| Spirax-Sarco Engineering plc | 57,094 | 4,134,549 |
| Spire Healthcare Group plc | 223,375 | 934,296 |
| Sports Direct International plc *(a) | 207,120 | 1,035,512 |
| SSP Group plc | 372,764 | 2,656,198 |
| ST Modwen Properties plc | 112,460 | 512,258 |
| Stagecoach Group plc | 314,976 | 678,196 |
| SuperGroup plc | 32,010 | 655,819 |
| Synthomer plc | 218,431 | 1,331,021 |
| TalkTalk Telecom Group plc (a) | 405,316 | 1,049,240 |
| Ted Baker plc | 19,517 | 627,458 |
| Telecom Plus plc | 44,241 | 621,374 |
| The Paragon Group of Cos. plc | 214,138 | 1,129,923 |
| The Restaurant Group plc | 159,269 | 711,108 |
| The Unite Group plc | 165,564 | 1,478,429 |
| Thomas Cook Group plc | 1,132,447 | 1,832,774 |
| TP ICAP plc | 428,847 | 2,727,589 |
| Tritax Big Box REIT plc | 966,877 | 1,780,348 |
| Tullow Oil plc * | 1,081,301 | 2,174,958 |
| UBM plc | 307,266 | 2,626,980 |
| UDG Healthcare plc | 194,187 | 2,094,339 |
| UK Commercial Property Trust Ltd. | 268,672 | 314,866 |
| Ultra Electronics Holdings plc | 57,155 | 1,362,471 |
| Vectura Group plc * | 528,837 | 746,851 |
| Vedanta Resources plc | 69,667 | 765,284 |
| Security | Number of Shares | Value ($) |
| Vesuvius plc | 168,161 | 1,252,433 |
| Victrex plc | 64,571 | 1,694,845 |
| Virgin Money Holdings UK plc | 204,826 | 703,106 |
| WH Smith plc | 87,561 | 2,086,166 |
| Wizz Air Holdings plc * | 38,299 | 1,453,363 |
| Workspace Group plc | 89,956 | 1,028,147 |
| ZPG plc | 217,377 | 987,357 |
| 230,308,083 | ||
| Total Common Stock | ||
| (Cost $1,311,604,279) | 1,527,256,420 | |
| Preferred Stock 0.3% of net assets | ||
| Germany 0.3% | ||
| Biotest AG | 20,810 | 576,465 |
| Draegerwerk AG & Co. KGaA | 5,520 | 589,595 |
| Jungheinrich AG | 41,121 | 1,741,661 |
| Schaeffler AG | 57,110 | 803,913 |
| Sixt SE | 13,844 | 810,612 |
| 4,522,246 | ||
| Sweden 0.0% | ||
| Klovern AB | 16,555 | 638,079 |
| Total Preferred Stock | ||
| (Cost $4,203,988) | 5,160,325 | |
| Rights 0.0% of net assets | ||
| Australia 0.0% | ||
| Mesoblast Ltd. expires 09/12/17 *(c) | 15,375 | 488 |
| Total Rights | ||
| (Cost $—) | 488 | |
| Other Investment Companies 4.0% of net assets | ||
| United States 4.0% | ||
| Money Market Fund 0.3% | ||
| State Street Institutional U.S. Government Money Market Fund, Premier Class 0.93% (b) | 3,601,919 | 3,601,919 |
| Securities Lending Collateral 3.7% | ||
| Wells Fargo Government Money Market Fund, Select Class 0.92% (b) | 57,238,237 | 57,238,237 |
| Total Other Investment Companies | ||
| (Cost $60,840,156) | 60,840,156 | |
| Number of Contracts | Notional Amount ($) | Current Value/ Unrealized Appreciation ($) | ||
| Futures Contracts | ||||
| Long | ||||
| MSCI EAFE Index, e-mini, expires 09/15/17 | 47 | 4,546,780 | 7,297 | |
| * | Non-income producing security. |
| (a) | All or a portion of this security is on loan. Securities on loan were valued at $54,447,264. |
| (b) | The rate shown is the 7-day yield. |
| (c) | Fair-valued by management in accordance with procedures approved by the Board of Trustees. |
| CVA — | Dutch Certificate |
| REIT — | Real Estate Investment Trust |
| Security | Number of Shares | Value ($) |
| Common Stock 97.2% of net assets | ||
| Brazil 6.9% | ||
| Ambev S.A. ADR | 4,531,291 | 28,365,882 |
| Atacadao Distribuicao Comercio e Industria Ltda * | 307,800 | 1,545,628 |
| B3 SA - Brasil Bolsa Balcao | 1,955,720 | 13,748,995 |
| Banco Bradesco S.A. | 774,854 | 7,941,980 |
| Banco BTG Pactual S.A. | 323,656 | 1,680,796 |
| Banco do Brasil S.A. | 1,121,265 | 10,940,214 |
| Banco Santander Brasil S.A. | 394,943 | 3,519,586 |
| BB Seguridade Participacoes S.A. | 646,943 | 5,699,522 |
| BR Malls Participacoes S.A. | 733,837 | 3,171,887 |
| BRF S.A. ADR *(a) | 608,302 | 8,175,579 |
| BTG Pactual Participations Ltd. * | 323,656 | 41,146 |
| CCR S.A. | 998,131 | 5,538,740 |
| Centrais Eletricas Brasileiras S.A. * | 414,740 | 2,322,528 |
| Cielo S.A. | 1,163,337 | 8,293,044 |
| Companhia de Saneamento Basico do Estado de Sao Paulo | 354,465 | 3,621,875 |
| Companhia Siderurgica Nacional S.A. * | 706,842 | 1,952,186 |
| Cosan S.A. Industria e Comercio | 126,573 | 1,552,369 |
| CPFL Energia S.A. ADR | 213,140 | 3,655,351 |
| EDP - Energias do Brasil S.A. | 324,543 | 1,571,941 |
| Embraer S.A. | 776,582 | 4,425,341 |
| Engie Brasil Energia S.A. | 220,976 | 2,535,312 |
| Equatorial Energia S.A. | 201,922 | 3,922,348 |
| Estacio Participacoes S.A. | 284,894 | 2,336,956 |
| Fibria Celulose S.A. | 236,500 | 3,141,107 |
| Hypermarcas S.A. | 397,421 | 3,727,342 |
| Itau Unibanco Holding S.A. ADR | 3,240,381 | 41,379,665 |
| JBS S.A. | 888,817 | 2,449,123 |
| Klabin S.A. | 592,386 | 3,223,203 |
| Kroton Educacional S.A. | 1,581,961 | 9,034,893 |
| Localiza Rent a Car S.A. | 152,013 | 2,877,012 |
| Lojas Americanas S.A. | 209,786 | 962,771 |
| Lojas Renner S.A. | 736,031 | 7,158,082 |
| M Dias Branco S.A. | 95,383 | 1,488,441 |
| Multiplan Empreendimentos Imobiliarios S.A. | 102,920 | 2,390,765 |
| Natura Cosmeticos S.A. | 170,161 | 1,595,369 |
| Odontoprev S.A. | 251,639 | 1,185,237 |
| Petroleo Brasileiro S.A. * | 3,074,198 | 13,649,207 |
| Porto Seguro S.A. | 125,920 | 1,390,685 |
| Raia Drogasil S.A. | 226,439 | 4,990,877 |
| Rumo S.A. * | 947,842 | 3,111,827 |
| Sao Martinho S.A. | 260,376 | 1,444,028 |
| Smiles S.A. | 60,498 | 1,336,495 |
| Sul America S.A. | 293,741 | 1,678,547 |
| Tim Participacoes S.A. | 823,460 | 2,952,098 |
| Transmissora Alianca de Energia Eletrica S.A. | 186,602 | 1,334,375 |
| Ultrapar Participacoes S.A. ADR | 472,891 | 11,008,902 |
| Vale S.A. | 2,504,306 | 27,920,690 |
| Vale S.A. ADR | 883,667 | 9,066,423 |
| WEG S.A. | 633,249 | 4,117,744 |
| 291,174,114 | ||
| Security | Number of Shares | Value ($) |
| Chile 1.5% | ||
| AES Gener S.A. | 2,147,722 | 751,518 |
| Aguas Andinas S.A., A Shares | 3,366,991 | 2,150,472 |
| Banco de Chile ADR (a) | 42,670 | 3,734,478 |
| Banco de Credito e Inversiones | 41,791 | 2,710,124 |
| Banco Santander Chile ADR | 171,949 | 5,029,508 |
| Cencosud S.A. | 1,393,228 | 4,188,286 |
| Cia Cervecerias Unidas S.A. | 176,312 | 2,403,487 |
| Colbun S.A. | 8,367,757 | 2,015,777 |
| Empresa Nacional de Telecomunicaciones S.A. | 189,538 | 1,980,371 |
| Empresas CMPC S.A. | 1,162,483 | 3,034,213 |
| Empresas COPEC S.A. | 415,899 | 5,309,125 |
| Enel Americas S.A. ADR | 603,015 | 6,476,381 |
| Enel Chile S.A. ADR | 446,235 | 2,614,937 |
| Enel Generacion Chile S.A. ADR (a) | 121,616 | 3,063,507 |
| Itau CorpBanca | 185,864,764 | 1,776,014 |
| Latam Airlines Group S.A. ADR (a) | 383,792 | 4,835,779 |
| Parque Arauco S.A. | 682,597 | 1,859,318 |
| S.A.C.I. Falabella | 494,244 | 4,969,101 |
| Sociedad Quimica y Minera de Chile S.A. ADR | 106,537 | 4,999,782 |
| 63,902,178 | ||
| China 26.5% | ||
| 3SBio, Inc. * | 1,044,043 | 1,435,377 |
| Agile Property Holdings Ltd. | 1,610,484 | 1,930,165 |
| Agricultural Bank of China Ltd., H Shares | 26,174,910 | 12,307,453 |
| Air China Ltd., H Shares | 2,281,126 | 2,028,587 |
| Alibaba Health Information Technology Ltd. * | 3,087,243 | 1,439,789 |
| Alibaba Pictures Group Ltd. * | 14,460,113 | 2,531,206 |
| Aluminum Corp. of China Ltd., H Shares * | 4,264,228 | 3,154,672 |
| Angang Steel Co., Ltd., H Shares | 1,242,154 | 1,072,895 |
| Anhui Conch Cement Co., Ltd., H Shares | 1,289,498 | 4,811,037 |
| Anhui Expressway Co., Ltd., Class H | 483,997 | 366,100 |
| ANTA Sports Products Ltd. | 1,270,864 | 5,001,324 |
| AviChina Industry & Technology Co., Ltd., H Shares | 2,723,147 | 1,610,969 |
| BAIC Motor Corp., Ltd. | 1,405,814 | 1,251,975 |
| Bank of China Ltd., H Shares | 77,884,305 | 40,999,858 |
| Bank of Communications Co., Ltd., H Shares | 8,228,177 | 6,286,950 |
| BBMG Corp., H Shares | 2,446,830 | 1,259,923 |
| Beijing Capital International Airport Co., Ltd., H Shares | 1,575,786 | 2,548,978 |
| Beijing Enterprises Holdings Ltd. | 619,036 | 3,456,468 |
| Beijing Enterprises Water Group Ltd. * | 4,209,008 | 3,576,322 |
| Beijing Jingneng Clean Energy Co., Ltd., H Shares | 2,290,357 | 617,477 |
| Beijing North Star Co., Ltd., Class H | 2,139,889 | 869,468 |
| Brilliance China Automotive Holdings Ltd. | 2,886,227 | 7,467,766 |
| Byd Co., Ltd., H Shares | 802,748 | 4,779,697 |
| CAR, Inc. *(a) | 985,721 | 875,334 |
| CGN Power Co., Ltd., H Shares | 9,839,155 | 2,715,481 |
| Security | Number of Shares | Value ($) |
| China Agri-Industries Holdings Ltd. | 2,425,747 | 1,134,388 |
| China BlueChemical Ltd., H Shares | 2,585,032 | 796,009 |
| China Cinda Asset Management Co., Ltd., H Shares | 11,673,283 | 4,340,314 |
| China CITIC Bank Corp., Ltd., H Shares | 8,083,630 | 5,339,888 |
| China Coal Energy Co., Ltd., H Shares | 2,899,697 | 1,459,769 |
| China Communications Construction Co., Ltd., H Shares | 4,378,202 | 5,829,062 |
| China Communications Services Corp., Ltd., H Shares | 3,392,703 | 1,838,006 |
| China Conch Venture Holdings Ltd. | 1,829,632 | 3,328,963 |
| China Construction Bank Corp., H Shares | 91,463,340 | 80,168,980 |
| China Dongxiang Group Co., Ltd. | 2,995,758 | 535,883 |
| China Eastern Airlines Corp., Ltd., H Shares | 1,856,037 | 1,022,113 |
| China Everbright Bank Co., Ltd., H Shares | 3,309,228 | 1,589,826 |
| China Everbright International Ltd. | 2,753,399 | 3,637,683 |
| China Everbright Ltd. | 861,500 | 1,968,149 |
| China Evergrande Group * | 3,027,709 | 9,149,144 |
| China Foods Ltd. | 1,004,464 | 533,904 |
| China Galaxy Securities Co., Ltd., H Shares | 4,035,840 | 3,656,077 |
| China Gas Holdings Ltd. | 1,756,672 | 4,435,196 |
| China Hongqiao Group Ltd. *(b) | 874,246 | 393,757 |
| China Huarong Asset Management Co., Ltd., H Shares | 5,947,369 | 2,538,087 |
| China Huishan Dairy Holdings Co., Ltd. (b) | 3,872,695 | — |
| China International Marine Containers Group Co., Ltd., H Shares | 770,345 | 1,568,949 |
| China Jinmao Holdings Group Ltd. | 6,173,593 | 2,745,064 |
| China Life Insurance Co., Ltd., H Shares | 7,630,941 | 24,472,988 |
| China Longyuan Power Group Corp., Ltd., H Shares | 3,546,858 | 2,655,685 |
| China Medical System Holdings Ltd. | 1,297,356 | 2,387,024 |
| China Merchants Bank Co., Ltd., H Shares | 4,061,484 | 15,308,828 |
| China Merchants Port Holdings Co., Ltd. | 1,302,379 | 4,260,029 |
| China Merchants Securities Co., Ltd., H Shares | 536,828 | 871,112 |
| China Minsheng Banking Corp., Ltd., H Shares | 5,915,882 | 5,903,448 |
| China Minsheng Financial Holding Corp., Ltd. * | 8,734,240 | 569,155 |
| China Mobile Ltd. | 5,389,798 | 57,159,151 |
| China Molybdenum Co., Ltd., H Shares | 4,762,108 | 2,585,969 |
| China National Building Material Co., Ltd., H Shares | 3,669,452 | 2,306,755 |
| China Oilfield Services Ltd., H Shares | 1,860,894 | 1,526,483 |
| China Overseas Land & Investment Ltd. | 4,010,990 | 14,016,646 |
| China Pacific Insurance (Group) Co., Ltd., H Shares | 2,680,860 | 12,622,542 |
| China Petroleum & Chemical Corp., H Shares | 26,339,524 | 20,159,044 |
| China Power International Development Ltd. | 3,113,905 | 1,062,311 |
| China Railway Construction Corp., Ltd., H Shares | 1,890,529 | 2,478,369 |
| China Railway Group Ltd., H Shares | 3,721,386 | 2,976,557 |
| China Railway Signal & Communication Corp., Ltd., H shares | 1,603,273 | 1,212,731 |
| China Reinsurance Group Corp., H shares | 6,491,868 | 1,476,471 |
| China Resources Beer Holdings Co., Ltd. | 1,793,307 | 4,500,195 |
| China Resources Cement Holdings Ltd. | 3,138,040 | 1,724,099 |
| Security | Number of Shares | Value ($) |
| China Resources Gas Group Ltd. | 889,932 | 3,138,348 |
| China Resources Land Ltd. | 2,831,875 | 8,846,839 |
| China Resources Pharmaceutical Group Ltd. | 1,610,484 | 1,996,013 |
| China Resources Power Holdings Co., Ltd. | 2,136,106 | 3,919,335 |
| China Shenhua Energy Co., Ltd., H Shares | 3,568,426 | 9,187,280 |
| China Southern Airlines Co., Ltd., H Shares | 1,841,828 | 1,437,889 |
| China State Construction International Holdings Ltd. | 2,478,448 | 3,591,105 |
| China Taiping Insurance Holdings Co., Ltd. | 1,623,468 | 4,926,546 |
| China Telecom Corp., Ltd., H Shares | 13,978,372 | 7,179,891 |
| China Traditional Chinese Medicine Holdings Co., Ltd. | 2,572,657 | 1,558,100 |
| China Unicom (Hong Kong) Ltd. * | 5,777,326 | 8,415,248 |
| China Vanke Co., Ltd., H Shares | 1,272,917 | 3,813,977 |
| China Zhongwang Holdings Ltd. | 2,571,291 | 1,268,159 |
| Chongqing Rural Commercial Bank Co., Ltd., H Shares | 2,888,428 | 2,011,376 |
| CITIC Ltd. | 4,936,221 | 7,581,135 |
| CITIC Securities Co., Ltd., H Shares | 2,402,072 | 5,328,082 |
| CNOOC Ltd. | 16,443,998 | 19,666,109 |
| COSCO Shipping Development Co., Ltd. * | 5,303,019 | 1,280,620 |
| COSCO Shipping Energy Transportation Co., Ltd., H Shares | 1,378,007 | 787,035 |
| COSCO SHIPPING Holdings Co., Ltd., H Shares * | 3,371,803 | 2,136,875 |
| COSCO SHIPPING Ports Ltd. | 1,905,322 | 2,251,880 |
| Country Garden Holdings Co., Ltd. | 5,525,119 | 7,341,929 |
| CRRC Corp., Ltd., H Shares | 4,180,062 | 3,770,705 |
| CSPC Pharmaceutical Group Ltd. | 4,330,569 | 6,761,629 |
| Dali Foods Group Co., Ltd. | 2,700,628 | 1,797,785 |
| Datang International Power Generation Co., Ltd., H Shares * | 3,214,904 | 1,055,690 |
| Dongfeng Motor Group Co., Ltd., H Shares | 3,323,362 | 4,314,262 |
| ENN Energy Holdings Ltd. | 776,356 | 4,994,541 |
| Far East Horizon Ltd. | 2,468,571 | 2,255,209 |
| Fosun International Ltd. | 2,660,340 | 4,616,067 |
| Fullshare Holdings Ltd. *(a) | 7,995,843 | 3,187,528 |
| Fuyao Glass Industry Group Co., Ltd., Class H | 503,956 | 1,606,565 |
| GCL-Poly Energy Holdings Ltd. * | 17,354,430 | 1,951,319 |
| Geely Automobile Holdings Ltd. | 4,979,324 | 12,240,824 |
| GF Securities Co., Ltd. | 1,657,425 | 3,536,597 |
| Golden Eagle Retail Group Ltd. (a) | 400,838 | 512,158 |
| GOME Retail Holdings Ltd. | 13,827,735 | 1,448,772 |
| Great Wall Motor Co., Ltd., H Shares | 3,755,802 | 4,712,478 |
| Greentown China Holdings Ltd. | 905,450 | 1,099,065 |
| Guangdong Investment Ltd. | 2,929,791 | 4,327,426 |
| Guangshen Railway Co., Ltd., H shares | 1,597,790 | 869,690 |
| Guangzhou Automobile Group Co., Ltd., H Shares | 2,553,472 | 5,037,483 |
| Guangzhou R&F Properties Co., Ltd., H Shares | 922,680 | 2,155,075 |
| Haier Electronics Group Co., Ltd. | 1,420,159 | 3,774,292 |
| Haitian International Holdings Ltd. | 587,316 | 1,763,498 |
| Haitong Securities Co., Ltd., H Shares | 3,743,031 | 6,274,692 |
| Hengan International Group Co., Ltd. | 740,410 | 6,187,073 |
| HengTen Networks Group Ltd. * | 19,423,612 | 615,484 |
| Huadian Fuxin Energy Corp., Ltd., H Shares | 2,846,069 | 629,110 |
| Huadian Power International Corp., Ltd., H Shares | 1,697,020 | 696,029 |
| Security | Number of Shares | Value ($) |
| Huaneng Power International, Inc., H Shares | 5,197,041 | 3,399,862 |
| Huaneng Renewables Corp., Ltd., H Shares | 4,346,146 | 1,332,756 |
| Huatai Securities Co., Ltd., H Shares | 1,881,184 | 4,187,112 |
| Industrial & Commercial Bank of China Ltd., H Shares | 79,758,402 | 59,718,549 |
| Jiangsu Expressway Co., Ltd., H Shares | 1,494,248 | 2,291,074 |
| Jiangxi Copper Co., Ltd., H Shares | 1,173,219 | 2,035,701 |
| Kingboard Chemical Holdings Ltd. | 693,145 | 3,781,701 |
| Kingboard Laminates Holdings Ltd. | 1,072,417 | 1,819,688 |
| Kingsoft Corp., Ltd. | 1,153,656 | 2,735,832 |
| Kunlun Energy Co., Ltd. | 3,691,320 | 3,575,083 |
| KWG Property Holding Ltd. | 1,688,276 | 1,535,885 |
| Lee & Man Paper Manufacturing Ltd. | 1,400,920 | 1,634,253 |
| Legend Holdings Corp., H Shares | 589,294 | 1,400,490 |
| Lenovo Group Ltd. | 8,268,335 | 4,521,651 |
| Li Ning Co., Ltd. * | 1,665,458 | 1,234,232 |
| Longfor Properties Co., Ltd. | 1,574,000 | 3,780,922 |
| Luye Pharma Group Ltd. (a) | 1,801,232 | 911,381 |
| Metallurgical Corp. of China Ltd., H Shares | 2,673,358 | 877,860 |
| New China Life Insurance Co., Ltd., H Shares | 871,042 | 5,575,862 |
| Nine Dragons Paper Holdings Ltd. | 1,574,000 | 2,626,534 |
| PetroChina Co., Ltd., H Shares | 22,465,789 | 14,352,477 |
| PICC Property & Casualty Co., Ltd., H Shares | 4,771,262 | 8,961,605 |
| Ping An Insurance Group Co. of China Ltd., H Shares | 5,166,250 | 41,025,297 |
| Poly Property Group Co., Ltd. * | 2,348,028 | 1,230,049 |
| Postal Savings Bank of China Co., Ltd., Class H | 5,712,304 | 3,444,994 |
| Renhe Commercial Holdings Co., Ltd. * | 22,036,000 | 512,436 |
| Shandong Chenming Paper Holdings Ltd., H Shares | 812,576 | 1,185,674 |
| Shandong Weigao Group Medical Polymer Co., Ltd., H Shares | 2,206,984 | 1,762,440 |
| Shanghai Electric Group Co., Ltd., H Shares * | 3,381,804 | 1,533,953 |
| Shanghai Fosun Pharmaceutical Group Co., Ltd., H Shares | 401,963 | 1,509,971 |
| Shanghai Industrial Holdings Ltd. | 480,313 | 1,460,617 |
| Shanghai Pharmaceuticals Holding Co., Ltd., H Shares | 787,000 | 1,936,717 |
| Shenzhen Expressway Co., Ltd., H shares | 743,616 | 725,901 |
| Shenzhen International Holdings Ltd. | 844,042 | 1,550,808 |
| Shenzhen Investment Ltd. | 3,880,560 | 1,770,100 |
| Shenzhou International Group Holdings Ltd. | 587,324 | 4,705,226 |
| Shimao Property Holdings Ltd. | 1,139,692 | 2,353,228 |
| Sino Biopharmaceutical Ltd. | 4,315,216 | 3,787,865 |
| Sino-Ocean Group Holding Ltd. | 2,742,997 | 1,892,580 |
| Sinopec Engineering Group Co., Ltd., H shares | 1,574,000 | 1,419,857 |
| Sinopec Oilfield Service Corp., H Shares *(a) | 1,958,384 | 340,308 |
| Sinopec Shanghai Petrochemical Co., Ltd., H Shares | 3,913,243 | 2,440,011 |
| Sinopharm Group Co., Ltd., H Shares | 1,061,509 | 4,794,555 |
| Sinotrans Ltd., H Shares | 1,870,296 | 1,056,253 |
| SOHO China Ltd. * | 3,029,150 | 1,764,903 |
| Sunac China Holdings Ltd. (a) | 1,963,509 | 5,895,708 |
| Sunny Optical Technology Group Co., Ltd. | 777,090 | 11,140,363 |
| Tencent Holdings Ltd. | 5,472,773 | 230,058,624 |
| Security | Number of Shares | Value ($) |
| The People's Insurance Co. Group of China Ltd., H Shares | 7,646,570 | 3,605,191 |
| TravelSky Technology Ltd., H Shares | 1,288,387 | 3,522,859 |
| Tsingtao Brewery Co., Ltd., H Shares | 404,651 | 1,677,763 |
| Weichai Power Co., Ltd., H Shares | 2,572,074 | 2,648,828 |
| Yanzhou Coal Mining Co., Ltd., H Shares | 2,032,655 | 2,041,368 |
| Yuexiu Property Co., Ltd. | 7,632,560 | 1,404,326 |
| Zhaojin Mining Industry Co., Ltd., H Shares (a) | 1,044,044 | 907,116 |
| Zhejiang Expressway Co., Ltd., H Shares | 1,530,394 | 1,914,349 |
| Zhongsheng Group Holdings Ltd. | 1,143,355 | 2,483,506 |
| Zhuzhou CRRC Times Electric Co., Ltd., H Shares | 589,064 | 3,082,134 |
| Zijin Mining Group Co., Ltd., H Shares | 6,785,848 | 2,488,406 |
| Zoomlion Heavy Industry Science & Technology Co., Ltd., H Shares | 2,292,695 | 1,045,803 |
| ZTE Corp., H Shares * | 752,497 | 2,052,758 |
| 1,126,958,246 | ||
| Colombia 0.5% | ||
| Almacenes Exito S.A. | 249,075 | 1,299,171 |
| Bancolombia S.A. ADR | 112,443 | 5,106,037 |
| Cementos Argos S.A. | 631,827 | 2,566,104 |
| Cemex Latam Holdings S.A. * | 176,288 | 670,480 |
| Ecopetrol S.A. ADR (a) | 252,427 | 2,324,853 |
| Grupo Argos S.A. | 348,111 | 2,480,094 |
| Grupo de Inversiones Suramericana S.A. | 246,052 | 3,467,527 |
| Interconexion Electrica S.A. ESP | 356,071 | 1,615,429 |
| 19,529,695 | ||
| Czech Republic 0.2% | ||
| CEZ A/S | 181,218 | 3,431,565 |
| Komercni Banka A/S | 86,880 | 3,822,252 |
| Moneta Money Bank A/S | 492,004 | 1,722,236 |
| 8,976,053 | ||
| Egypt 0.1% | ||
| Commercial International Bank Egypt SAE GDR | 1,283,163 | 5,864,055 |
| Greece 0.5% | ||
| Alpha Bank AE * | 1,646,855 | 4,170,423 |
| Eurobank Ergasias S.A. * | 1,723,465 | 1,858,467 |
| FF Group * | 27,000 | 670,896 |
| Hellenic Telecommunications Organization S.A. | 218,000 | 2,773,227 |
| JUMBO S.A. | 104,553 | 1,740,242 |
| Motor Oil Hellas Corinth Refineries S.A. | 65,000 | 1,460,563 |
| National Bank of Greece S.A. * | 6,500,000 | 2,635,196 |
| OPAP S.A. | 220,000 | 2,456,028 |
| Piraeus Bank S.A. * | 340,000 | 1,903,904 |
| Titan Cement Co. S.A. | 42,948 | 1,217,801 |
| 20,886,747 | ||
| Hungary 0.5% | ||
| MOL Hungarian Oil & Gas plc | 65,160 | 6,039,092 |
| OTP Bank plc | 259,162 | 10,532,429 |
| Richter Gedeon Nyrt | 146,733 | 3,815,470 |
| 20,386,991 | ||
| Security | Number of Shares | Value ($) |
| India 12.1% | ||
| ABB India Ltd. | 69,600 | 1,459,258 |
| ACC Ltd. | 46,122 | 1,298,858 |
| Adani Ports & Special Economic Zone Ltd. | 894,569 | 5,498,850 |
| Ambuja Cements Ltd. | 910,098 | 3,991,255 |
| Ashok Leyland Ltd. | 1,347,438 | 2,257,455 |
| Asian Paints Ltd. | 287,055 | 5,247,267 |
| Aurobindo Pharma Ltd. | 262,873 | 2,982,322 |
| Axis Bank Ltd. | 1,751,365 | 13,707,913 |
| Bajaj Auto Ltd. | 68,325 | 3,008,165 |
| Bajaj Finance Ltd. | 167,448 | 4,667,497 |
| Bajaj Finserv Ltd. | 47,102 | 4,054,598 |
| Bajaj Holdings & Investment Ltd. | 27,238 | 1,237,691 |
| Bank of Baroda | 470,136 | 1,013,797 |
| Bharat Electronics Ltd. | 649,654 | 1,930,885 |
| Bharat Forge Ltd. | 94,720 | 1,671,070 |
| Bharat Heavy Electricals Ltd. | 727,246 | 1,466,409 |
| Bharat Petroleum Corp., Ltd. | 1,030,294 | 8,525,849 |
| Bharti Airtel Ltd. | 1,303,366 | 8,720,199 |
| Bharti Infratel Ltd. | 550,496 | 3,231,006 |
| Bosch Ltd. | 9,354 | 3,217,216 |
| Britannia Industries Ltd. | 31,774 | 2,102,958 |
| Cadila Healthcare Ltd. | 261,392 | 2,044,481 |
| Castrol India Ltd. | 118,409 | 720,165 |
| CG Power & Industrial Solutions Ltd. * | 436,537 | 548,691 |
| Cipla Ltd. | 322,080 | 2,881,407 |
| Coal India Ltd. | 1,432,460 | 5,319,661 |
| Colgate-Palmolive (India) Ltd. | 68,210 | 1,187,103 |
| Cummins India Ltd. | 118,110 | 1,686,118 |
| Dabur India Ltd. | 528,197 | 2,603,545 |
| Divi's Laboratories Ltd. | 77,196 | 840,958 |
| DLF Ltd. * | 624,878 | 1,808,861 |
| Dr. Reddy's Laboratories Ltd. | 85,450 | 2,701,330 |
| Eicher Motors Ltd. | 13,047 | 6,418,947 |
| Emami Ltd. | 47,835 | 813,235 |
| GAIL India Ltd. | 476,336 | 2,818,841 |
| Glenmark Pharmaceuticals Ltd. | 140,854 | 1,342,080 |
| Godrej Consumer Products Ltd. | 262,280 | 3,812,781 |
| Havells India Ltd. | 220,466 | 1,684,200 |
| HCL Technologies Ltd. | 577,101 | 7,811,587 |
| Hero MotoCorp Ltd. | 100,737 | 6,295,605 |
| Hindalco Industries Ltd. | 839,195 | 3,124,357 |
| Hindustan Petroleum Corp., Ltd. | 695,532 | 5,313,358 |
| Hindustan Unilever Ltd. | 738,964 | 14,099,863 |
| Hindustan Zinc Ltd. | 278,805 | 1,284,637 |
| Housing Development Finance Corp., Ltd. | 1,620,925 | 45,055,382 |
| ICICI Bank Ltd. | 1,604,988 | 7,483,102 |
| ICICI Prudential Life Insurance Co., Ltd. | 125,000 | 834,751 |
| Idea Cellular Ltd. | 1,513,230 | 2,145,821 |
| IDFC Bank Ltd. | 1,426,348 | 1,223,835 |
| Indiabulls Housing Finance Ltd. | 360,491 | 6,854,411 |
| Indian Oil Corp., Ltd. | 1,076,795 | 7,659,118 |
| IndusInd Bank Ltd. | 171,222 | 4,437,489 |
| Infosys Ltd. | 1,967,954 | 28,166,512 |
| InterGlobe Aviation Ltd. | 46,315 | 889,912 |
| ITC Ltd. | 2,925,138 | 12,915,198 |
| Jindal Steel & Power Ltd. * | 399,369 | 856,510 |
| JSW Steel Ltd. | 1,178,687 | 4,690,686 |
| Kotak Mahindra Bank Ltd. | 299,368 | 4,570,629 |
| Larsen & Toubro Ltd. | 370,663 | 6,588,598 |
| LIC Housing Finance Ltd. | 251,248 | 2,648,419 |
| Lupin Ltd. | 251,904 | 3,859,563 |
| Mahindra & Mahindra Financial Services Ltd. | 279,312 | 1,867,869 |
| Mahindra & Mahindra Ltd. | 314,283 | 6,611,490 |
| Security | Number of Shares | Value ($) |
| Marico Ltd. | 458,128 | 2,260,675 |
| Maruti Suzuki India Ltd. | 129,644 | 15,616,397 |
| Motherson Sumi Systems Ltd. | 635,133 | 3,061,097 |
| MRF Ltd. | 1,000 | 1,002,555 |
| Nestle India Ltd. | 28,547 | 3,180,076 |
| NHPC Ltd. | 2,315,686 | 1,052,317 |
| NMDC Ltd. | 946,330 | 1,874,859 |
| NTPC Ltd. | 2,031,197 | 5,361,874 |
| Oil & Natural Gas Corp., Ltd. | 3,207,058 | 7,873,882 |
| Oracle Financial Services Software Ltd. | 22,036 | 1,179,390 |
| Petronet LNG Ltd. | 230,106 | 817,819 |
| Pidilite Industries Ltd. | 145,577 | 1,903,566 |
| Piramal Enterprises Ltd. | 87,400 | 3,710,172 |
| Power Finance Corp., Ltd. | 656,445 | 1,253,819 |
| Power Grid Corp. of India Ltd. | 836,723 | 2,869,737 |
| Punjab National Bank * | 444,649 | 1,000,223 |
| Rajesh Exports Ltd. | 150,334 | 1,749,649 |
| Reliance Capital Ltd. | 132,594 | 1,670,330 |
| Reliance Industries Ltd. | 1,627,646 | 40,598,057 |
| Reliance Infrastructure Ltd. | 182,584 | 1,454,503 |
| Rural Electrification Corp., Ltd. | 711,506 | 1,875,980 |
| Shree Cement Ltd. | 8,620 | 2,372,028 |
| Shriram Transport Finance Co., Ltd. | 169,186 | 2,606,882 |
| Siemens Ltd. | 96,014 | 1,930,005 |
| State Bank of India | 1,686,156 | 7,326,096 |
| Steel Authority of India Ltd. * | 1,068,333 | 1,016,087 |
| Sun Pharmaceutical Industries Ltd. | 1,132,718 | 8,525,563 |
| Sun TV Network Ltd. | 117,448 | 1,279,547 |
| Tata Consultancy Services Ltd. | 481,982 | 18,821,623 |
| Tata Motors Ltd. * | 1,287,856 | 7,585,963 |
| Tata Power Co., Ltd. | 1,053,504 | 1,306,039 |
| Tata Steel Ltd. | 308,504 | 3,079,189 |
| Tech Mahindra Ltd. | 507,250 | 3,397,338 |
| The Great Eastern Shipping Co., Ltd. | 75,875 | 473,282 |
| Titan Co., Ltd. | 327,639 | 3,162,801 |
| Torrent Pharmaceuticals Ltd. | 39,650 | 746,466 |
| UltraTech Cement Ltd. | 85,204 | 5,331,927 |
| United Breweries Ltd. * | 60,503 | 745,850 |
| United Spirits Ltd. * | 70,895 | 2,820,107 |
| UPL Ltd. | 380,937 | 4,934,356 |
| Vedanta Ltd. | 1,846,669 | 8,923,346 |
| Wipro Ltd. | 1,199,780 | 5,613,566 |
| Yes Bank Ltd. | 291,597 | 7,996,467 |
| Zee Entertainment Enterprises Ltd. | 558,869 | 4,541,678 |
| 513,714,807 | ||
| Indonesia 2.6% | ||
| PT Adaro Energy Tbk | 12,715,678 | 1,739,328 |
| PT Astra Agro Lestari Tbk | 488,665 | 540,235 |
| PT Astra International Tbk | 20,857,091 | 12,310,717 |
| PT Bank Central Asia Tbk | 9,994,139 | 14,194,943 |
| PT Bank Danamon Indonesia Tbk | 2,940,456 | 1,201,131 |
| PT Bank Mandiri (Persero) Tbk | 9,599,013 | 9,424,904 |
| PT Bank Negara Indonesia (Persero) Tbk | 8,233,382 | 4,535,704 |
| PT Bank Rakyat Indonesia (Persero) Tbk | 10,924,044 | 12,383,913 |
| PT Bumi Serpong Damai Tbk | 7,843,593 | 1,078,773 |
| PT Charoen Pokphand Indonesia Tbk | 7,364,964 | 1,529,077 |
| PT Gudang Garam Tbk | 556,125 | 2,884,414 |
| PT Hanjaya Mandala Sampoerna Tbk | 9,093,469 | 2,480,904 |
| PT Indocement Tunggal Prakarsa Tbk | 1,379,041 | 2,046,546 |
| PT Indofood CBP Sukses Makmur Tbk | 2,396,292 | 1,567,055 |
| PT Indofood Sukses Makmur Tbk | 4,511,664 | 2,832,048 |
| PT Jasa Marga Persero Tbk | 2,208,729 | 964,312 |
| PT Kalbe Farma Tbk | 20,355,091 | 2,608,845 |
| PT Matahari Department Store Tbk | 2,273,268 | 1,703,844 |
| PT Media Nusantara Citra Tbk | 5,393,360 | 602,316 |
| Security | Number of Shares | Value ($) |
| PT Perusahaan Gas Negara (Persero) Tbk | 9,406,828 | 1,494,714 |
| PT Semen Indonesia (Persero) Tbk | 3,091,427 | 2,427,125 |
| PT Surya Citra Media Tbk | 5,931,526 | 982,512 |
| PT Tambang Batubara Bukit Asam (Persero) Tbk | 903,932 | 838,417 |
| PT Telekomunikasi Indonesia (Persero) Tbk | 48,972,947 | 17,215,044 |
| PT Tower Bersama Infrastructure Tbk | 2,121,932 | 1,021,842 |
| PT Unilever Indonesia Tbk | 1,158,793 | 4,390,420 |
| PT United Tractors Tbk | 1,513,507 | 3,437,210 |
| PT XL Axiata Tbk * | 3,891,213 | 1,049,945 |
| 109,486,238 | ||
| Malaysia 3.3% | ||
| AirAsia Berhad | 1,834,400 | 1,426,111 |
| Alliance Financial Group Berhad | 1,127,480 | 1,013,821 |
| AMMB Holdings Berhad | 2,111,872 | 2,116,570 |
| Astro Malaysia Holdings Berhad | 2,205,500 | 1,384,086 |
| Axiata Group Berhad | 4,642,552 | 5,359,509 |
| British American Tobacco Malaysia Berhad | 157,400 | 1,628,365 |
| Bumi Armada Berhad * | 6,184,100 | 1,064,352 |
| CIMB Group Holdings Berhad | 6,596,424 | 10,936,116 |
| DiGi.com Berhad | 3,958,200 | 4,486,053 |
| Felda Global Ventures Holdings Berhad | 1,895,100 | 687,836 |
| Gamuda Berhad | 2,159,316 | 2,700,093 |
| Genting Berhad | 2,372,400 | 5,394,217 |
| Genting Malaysia Berhad | 3,045,820 | 4,186,621 |
| HAP Seng Consolidated Berhad | 663,534 | 1,410,816 |
| Hong Leong Bank Berhad | 640,607 | 2,316,116 |
| IHH Healthcare Berhad | 2,693,200 | 3,777,606 |
| IJM Corp. Berhad | 3,165,136 | 2,475,484 |
| IOI Corp. Berhad | 3,834,692 | 4,076,689 |
| IOI Properties Group Berhad | 1,962,650 | 914,570 |
| KLCCP Stapled Group | 477,744 | 872,592 |
| Kuala Lumpur Kepong Berhad | 653,048 | 3,752,675 |
| Malayan Banking Berhad | 5,560,800 | 12,318,269 |
| Malaysia Airports Holdings Berhad | 1,034,100 | 2,179,347 |
| Maxis Berhad | 2,713,924 | 3,673,219 |
| MISC Berhad | 1,477,500 | 2,574,078 |
| Petronas Chemicals Group Berhad | 3,010,200 | 5,046,957 |
| Petronas Dagangan Berhad | 332,300 | 1,898,635 |
| Petronas Gas Berhad | 671,736 | 2,894,261 |
| PPB Group Berhad | 635,448 | 2,481,975 |
| Public Bank Berhad | 3,232,854 | 15,594,612 |
| RHB Capital Berhad | 1,305,800 | 1,544,149 |
| Sapura Energy Berhad | 4,769,780 | 1,541,341 |
| Sime Darby Berhad | 3,927,600 | 8,277,345 |
| Telekom Malaysia Berhad | 1,133,600 | 1,706,837 |
| Tenaga Nasional Berhad | 4,134,374 | 13,824,812 |
| UMW Holdings Berhad * | 711,200 | 1,012,550 |
| YTL Corp. Berhad | 4,097,812 | 1,372,174 |
| YTL Power International Berhad | 3,199,101 | 1,056,254 |
| 140,977,113 | ||
| Mexico 4.6% | ||
| Alfa S.A.B. de C.V., A Shares | 2,870,096 | 4,030,719 |
| Alpek S.A.B. de C.V. | 407,669 | 451,981 |
| Alsea S.A.B. de C.V. | 530,538 | 1,936,373 |
| America Movil S.A.B. de C.V., Series L | 30,367,295 | 28,317,989 |
| Arca Continental S.A.B. de C.V. | 293,217 | 2,151,900 |
| Banregio Grupo Financiero S.A.B. de C.V. | 236,774 | 1,532,284 |
| Becle S.A.B. de C.V. * | 432,076 | 758,562 |
| Cemex S.A.B. de C.V., Series CPO * | 16,353,621 | 15,332,595 |
| Security | Number of Shares | Value ($) |
| Coca-Cola Femsa S.A.B. de C.V., Series L | 521,572 | 4,288,112 |
| Concentradora Fibra Danhos S.A. de C.V. | 231,799 | 405,911 |
| Controladora Vuela Cia de Aviacion S.A.B. de C.V., Series A * | 649,147 | 819,139 |
| El Puerto de Liverpool S.A.B. de C.V., Series C1 | 202,055 | 1,815,947 |
| Fibra Uno Administracion S.A. de C.V. | 2,604,489 | 4,660,176 |
| Fomento Economico Mexicano S.A.B. de C.V. | 2,245,036 | 22,538,850 |
| Gentera S.A.B. de C.V. | 1,259,200 | 1,937,964 |
| Gruma S.A.B. de C.V., B Shares | 181,300 | 2,667,405 |
| Grupo Aeromexico S.A.B. de C.V. * | 385,694 | 781,873 |
| Grupo Aeroportuario del Centro Norte S.A.B. de C.V. | 214,368 | 1,300,683 |
| Grupo Aeroportuario del Pacifico S.A.B. de C.V., B Shares | 347,368 | 3,843,652 |
| Grupo Aeroportuario del Sureste S.A.B. de C.V., B Shares | 239,856 | 4,908,215 |
| Grupo Bimbo S.A.B. de C.V., Series A | 2,323,580 | 5,650,304 |
| Grupo Carso S.A.B. de C.V., Series A1 | 373,749 | 1,515,107 |
| Grupo Elektra S.A.B. de C.V. | 65,218 | 2,851,402 |
| Grupo Financiero Banorte S.A.B. de C.V., O Shares | 2,442,209 | 16,706,407 |
| Grupo Financiero Inbursa S.A.B. de C.V., O Shares | 2,227,740 | 3,737,326 |
| Grupo Financiero Santander Mexico S.A.B. de C.V., B Shares | 1,842,509 | 3,807,471 |
| Grupo Lala S.A.B. de C.V. | 491,949 | 876,097 |
| Grupo Mexico S.A.B. de C.V., Series B | 3,499,441 | 11,572,684 |
| Grupo Televisa S.A.B., Series CPO | 2,551,527 | 13,233,825 |
| Industrias CH S.A.B. de C.V., Series B * | 150,125 | 720,438 |
| Industrias Penoles S.A.B. de C.V. | 126,825 | 3,305,552 |
| Infraestructura Energetica Nova S.A.B. de C.V. | 543,331 | 2,961,642 |
| Kimberly-Clark de Mexico S.A.B. de C.V., A Shares | 804,608 | 1,584,589 |
| Megacable Holdings S.A.B. de C.V., Series CPO | 447,970 | 1,945,679 |
| Mexichem S.A.B. de C.V. | 1,177,716 | 3,146,699 |
| OHL Mexico S.A.B. de C.V. | 944,400 | 1,346,437 |
| Organizacion Soriana S.A.B. de C.V., B Shares * | 262,919 | 656,459 |
| Promotora y Operadora de Infraestructura S.A.B. de C.V. | 228,075 | 2,507,030 |
| Telesites S.A.B. de C.V. * | 1,416,878 | 1,131,261 |
| Wal-Mart de Mexico S.A.B. de C.V. | 5,632,047 | 13,742,982 |
| 197,479,721 | ||
| Peru 0.4% | ||
| Companhia de Minas Buenaventura S.A. ADR | 193,561 | 2,599,524 |
| Credicorp Ltd. | 72,075 | 14,619,693 |
| 17,219,217 | ||
| Philippines 1.6% | ||
| Aboitiz Equity Ventures, Inc. | 2,330,000 | 3,390,043 |
| Aboitiz Power Corp. | 1,788,805 | 1,380,844 |
| Alliance Global Group, Inc. | 4,879,400 | 1,325,457 |
| Ayala Corp. | 250,991 | 4,512,639 |
| Ayala Land, Inc. | 7,049,990 | 5,786,586 |
| Bank of the Philippine Islands | 1,626,448 | 3,366,051 |
| BDO Unibank, Inc. | 2,058,687 | 5,113,526 |
| Bloomberry Resorts Corp. * | 5,123,960 | 1,123,526 |
| DMCI Holdings, Inc. | 4,288,304 | 1,315,739 |
| Security | Number of Shares | Value ($) |
| Energy Development Corp. | 9,108,459 | 1,206,866 |
| Globe Telecom, Inc. | 27,456 | 1,073,129 |
| GT Capital Holdings, Inc. | 82,717 | 1,807,262 |
| International Container Terminal Services, Inc. | 996,530 | 2,033,178 |
| JG Summit Holdings, Inc. | 3,202,000 | 4,492,937 |
| Jollibee Foods Corp. | 551,526 | 2,567,393 |
| LT Group, Inc. | 3,462,800 | 1,199,156 |
| Manila Electric Co. | 221,384 | 1,172,466 |
| Megaworld Corp. | 12,003,712 | 1,158,850 |
| Metro Pacific Investments Corp. | 12,035,462 | 1,493,555 |
| Metropolitan Bank & Trust Co. | 1,331,745 | 2,279,868 |
| PLDT, Inc. | 115,588 | 3,907,900 |
| Semirara Mining & Power Corp. | 326,996 | 1,109,371 |
| SM Investments Corp. | 513,213 | 8,128,965 |
| SM Prime Holdings, Inc. | 9,198,733 | 6,004,254 |
| Universal Robina Corp. | 893,061 | 2,549,858 |
| 69,499,419 | ||
| Poland 1.7% | ||
| Alior Bank S.A. * | 91,729 | 1,694,217 |
| Asseco Poland S.A. | 109,950 | 1,393,836 |
| Bank Handlowy w Warszawie S.A. | 35,123 | 697,860 |
| Bank Millennium S.A. * | 661,080 | 1,378,252 |
| Bank Pekao S.A. | 159,470 | 5,710,020 |
| Bank Zachodni WBK S.A. | 29,145 | 3,014,494 |
| CCC S.A. | 21,525 | 1,579,408 |
| Cyfrowy Polsat S.A. | 183,455 | 1,375,887 |
| Enea S.A. | 277,024 | 1,182,240 |
| Eurocash S.A. | 99,446 | 1,089,247 |
| Grupa Azoty S.A. | 49,717 | 958,611 |
| Grupa Lotos S.A. * | 66,674 | 1,098,235 |
| Jastrzebska Spolka Weglowa S.A. * | 50,704 | 1,475,686 |
| KGHM Polska Miedz S.A. | 148,289 | 5,232,899 |
| LPP S.A. | 1,400 | 3,421,212 |
| mBank S.A. * | 13,078 | 1,603,001 |
| Orange Polska S.A. * | 626,497 | 1,050,181 |
| PGE S.A. | 793,913 | 3,170,409 |
| PLAY Communications S.A. * | 111,120 | 1,119,472 |
| Polski Koncern Naftowy Orlen S.A. | 327,922 | 10,819,389 |
| Polskie Gornictwo Naftowe i Gazownictwo S.A. | 1,779,618 | 3,401,464 |
| Powszechna Kasa Oszczednosci Bank Polski S.A. * | 909,099 | 9,331,659 |
| Powszechny Zaklad Ubezpieczen S.A. | 582,530 | 7,906,393 |
| Synthos S.A. | 467,909 | 625,904 |
| Tauron Polska Energia S.A. * | 1,142,739 | 1,253,578 |
| 71,583,554 | ||
| Qatar 0.8% | ||
| Aamal Co. | 173,810 | 494,043 |
| Barwa Real Estate Co. | 97,670 | 850,027 |
| Commercial Bank QSC * | 205,214 | 1,680,035 |
| Doha Bank QPSC | 163,714 | 1,356,022 |
| Ezdan Holding Group QSC | 156,303 | 482,484 |
| Gulf International Services QSC | 45,116 | 227,857 |
| Industries Qatar QSC | 153,579 | 3,838,157 |
| Masraf Al Rayan QSC | 375,654 | 3,935,791 |
| Ooredoo QSC | 109,449 | 2,632,788 |
| Qatar Electricity & Water Co. QSC | 30,043 | 1,534,637 |
| Qatar Gas Transport Co., Ltd. | 307,555 | 1,435,045 |
| Qatar Insurance Co. SAQ | 146,658 | 2,658,271 |
| Qatar International Islamic Bank QSC | 37,131 | 557,794 |
| Qatar Islamic Bank SAQ | 61,511 | 1,571,033 |
| Qatar National Bank SAQ | 233,912 | 8,389,676 |
| Qatar Navigation QSC | 55,327 | 969,865 |
| Security | Number of Shares | Value ($) |
| United Development Co. QSC | 174,809 | 728,281 |
| Vodafone Qatar QSC * | 307,555 | 701,052 |
| 34,042,858 | ||
| Russia 4.0% | ||
| Aeroflot-Russian Airlines PJSC | 466,731 | 1,541,438 |
| ALROSA PAO | 2,855,874 | 3,993,060 |
| E.ON Russia JSC | 15,696,094 | 651,357 |
| Federal Grid Co. Unified Energy System PJSC | 292,100,403 | 890,322 |
| Gazprom PAO ADR | 5,617,063 | 22,412,081 |
| Gazprom PJSC | 1 | 2 |
| Inter RAO PJSC | 23,971,124 | 1,622,150 |
| LSR Group PJSC GDR | 233,019 | 664,104 |
| LUKOIL PJSC | 482,298 | 24,420,099 |
| Magnit PJSC GDR | 318,822 | 13,323,571 |
| Magnitogorsk Iron & Steel Works OJSC | 1,975,550 | 1,369,532 |
| MegaFon PJSC GDR | 132,872 | 1,310,118 |
| MMC Norilsk Nickel PJSC | 47,741 | 8,047,945 |
| Mobile TeleSystems PJSC | 1,232,955 | 5,732,206 |
| Moscow Exchange MICEX-RTS PJSC | 1,618,158 | 2,936,507 |
| NOVATEK PJSC | 1,152,863 | 11,896,872 |
| Novolipetsk Steel AO | 1,105,636 | 2,663,807 |
| PhosAgro OAO GDR | 111,935 | 1,555,897 |
| Rosneft Oil Co. PJSC | 999,838 | 5,233,762 |
| Rosseti PJSC | 33,899,935 | 595,283 |
| Rostelecom PJSC | 1,204,864 | 1,390,029 |
| RusHydro PJSC | 134,322,490 | 1,921,349 |
| Sberbank of Russia PJSC | 10,716,650 | 33,863,317 |
| Severstal PJSC | 200,270 | 3,138,109 |
| Sistema PJSC | 2,995,758 | 606,117 |
| Surgutneftegas OJSC | 8,580,266 | 3,989,103 |
| Tatneft PJSC | 1,642,890 | 10,976,174 |
| VTB Bank PJSC GDR | 2,177,692 | 4,864,964 |
| 171,609,275 | ||
| South Africa 8.8% | ||
| AECI Ltd. | 119,676 | 985,215 |
| African Rainbow Minerals Ltd. | 119,736 | 1,012,425 |
| Anglo American Platinum Ltd. * | 61,811 | 1,676,352 |
| AngloGold Ashanti Ltd. | 439,146 | 4,448,391 |
| Aspen Pharmacare Holdings Ltd. | 375,137 | 8,367,453 |
| AVI Ltd. | 388,660 | 2,954,085 |
| Barclays Africa Group Ltd. | 651,461 | 7,437,106 |
| Barloworld Ltd. | 278,598 | 2,754,364 |
| Bid Corp., Ltd. | 355,724 | 8,085,793 |
| Brait SE * | 450,648 | 1,995,021 |
| Capitec Bank Holdings Ltd. | 55,331 | 3,833,473 |
| Clicks Group Ltd. | 269,235 | 3,082,298 |
| Coronation Fund Managers Ltd. | 278,785 | 1,508,946 |
| Discovery Ltd. | 364,187 | 4,219,778 |
| EOH Holdings Ltd. | 118,186 | 1,013,867 |
| Exxaro Resources Ltd. | 143,234 | 1,442,203 |
| FirstRand Ltd. | 3,394,687 | 14,503,325 |
| Fortress Income Fund Ltd. | 755,695 | 2,291,359 |
| Fortress Income Fund Ltd., A Shares | 1,293,250 | 1,745,228 |
| Gold Fields Ltd. | 859,529 | 3,835,559 |
| Grindrod Ltd. * | 470,626 | 489,183 |
| Growthpoint Properties Ltd. | 2,933,109 | 5,675,529 |
| Harmony Gold Mining Co., Ltd. | 435,196 | 865,202 |
| Hyprop Investments Ltd. | 284,081 | 2,494,492 |
| Impala Platinum Holdings Ltd. * | 615,434 | 1,903,477 |
| Imperial Holdings Ltd. | 179,817 | 2,886,203 |
| Investec Ltd. | 269,914 | 2,057,348 |
| JSE Ltd. | 90,279 | 936,096 |
| Kumba Iron Ore Ltd. | 60,014 | 986,681 |
| Security | Number of Shares | Value ($) |
| Liberty Holdings Ltd. | 73,460 | 585,532 |
| Life Healthcare Group Holdings Ltd. | 1,387,760 | 2,815,559 |
| Massmart Holdings Ltd. | 124,406 | 1,164,473 |
| MMI Holdings Ltd. | 1,413,528 | 2,263,167 |
| Mondi Ltd. | 148,571 | 4,054,711 |
| Mr Price Group Ltd. | 242,587 | 3,382,873 |
| MTN Group Ltd. | 1,833,484 | 18,229,747 |
| Nampak Ltd. * | 821,657 | 1,193,528 |
| Naspers Ltd., N Shares | 435,558 | 98,554,569 |
| Nedbank Group Ltd. | 223,069 | 3,773,509 |
| NEPI Rockcastle plc * | 361,718 | 5,245,920 |
| Netcare Ltd. | 1,513,064 | 2,806,692 |
| Northam Platinum Ltd. * | 361,131 | 1,366,727 |
| Pick n Pay Stores Ltd. | 370,418 | 1,823,377 |
| Pioneer Foods Group Ltd. | 195,979 | 1,909,655 |
| PSG Group Ltd. | 102,870 | 1,999,228 |
| Rand Merchant Investment Holdings Ltd. | 668,328 | 2,140,604 |
| Redefine Properties Ltd. | 5,425,672 | 4,449,907 |
| Remgro Ltd. | 537,698 | 8,991,626 |
| Resilient REIT Ltd. | 314,867 | 3,029,603 |
| Reunert Ltd. | 183,152 | 979,347 |
| RMB Holdings Ltd. | 697,312 | 3,565,023 |
| Sanlam Ltd. | 1,740,956 | 9,617,283 |
| Sappi Ltd. | 588,705 | 3,958,670 |
| Sasol Ltd. | 567,253 | 17,102,913 |
| Shoprite Holdings Ltd. | 456,790 | 7,921,208 |
| Sibanye Gold Ltd. | 1,655,874 | 2,646,086 |
| Standard Bank Group Ltd. | 1,267,159 | 16,323,172 |
| Steinhoff International Holdings N.V. | 2,759,602 | 13,346,304 |
| Sun International Ltd. | 125,920 | 561,905 |
| Super Group Ltd. * | 302,996 | 963,013 |
| Telkom S.A. SOC Ltd. | 346,280 | 1,672,055 |
| The Bidvest Group Ltd. | 398,841 | 5,261,111 |
| The Foschini Group Ltd. | 195,892 | 2,310,011 |
| The SPAR Group Ltd. | 199,898 | 2,599,943 |
| Tiger Brands Ltd. | 194,430 | 6,028,489 |
| Truworths International Ltd. | 430,108 | 2,747,595 |
| Tsogo Sun Holdings Ltd. | 552,883 | 928,597 |
| Vodacom Group Ltd. | 518,248 | 7,240,520 |
| Woolworths Holdings Ltd. | 995,144 | 4,543,323 |
| 375,584,027 | ||
| Taiwan 14.4% | ||
| Acer, Inc. * | 4,348,086 | 2,189,963 |
| Advanced Semiconductor Engineering, Inc. | 6,545,240 | 7,894,454 |
| Advantech Co., Ltd. | 338,256 | 2,493,852 |
| Asia Cement Corp. | 2,690,286 | 2,438,097 |
| Asustek Computer, Inc. | 776,426 | 6,431,840 |
| AU Optronics Corp. ADR (a) | 906,109 | 3,660,680 |
| Capital Securities Corp. | 2,011,789 | 657,286 |
| Catcher Technology Co., Ltd. | 784,224 | 9,978,529 |
| Cathay Financial Holding Co., Ltd. | 8,203,189 | 13,387,026 |
| Cathay Real Estate Development Co., Ltd. | 525,893 | 288,397 |
| Chang Hwa Commercial Bank Ltd. | 7,040,269 | 3,849,181 |
| Cheng Shin Rubber Industry Co., Ltd. | 1,876,277 | 3,773,817 |
| Chicony Electronics Co., Ltd. | 455,778 | 1,144,769 |
| China Airlines Ltd. | 5,398,872 | 2,289,856 |
| China Development Financial Holding Corp. | 15,101,308 | 4,713,686 |
| China Life Insurance Co., Ltd. | 3,444,000 | 3,800,166 |
| China Steel Corp. | 12,769,956 | 10,705,454 |
| Chunghwa Telecom Co., Ltd. ADR | 387,957 | 13,427,192 |
| Compal Electronics, Inc. | 3,948,638 | 2,839,241 |
| CTBC Financial Holding Co., Ltd. | 18,440,792 | 11,945,972 |
| Delta Electronics, Inc. | 2,204,148 | 12,087,428 |
| Security | Number of Shares | Value ($) |
| E.Sun Financial Holding Co., Ltd. | 9,391,536 | 5,788,216 |
| Eclat Textile Co., Ltd. | 210,510 | 2,580,891 |
| Epistar Corp. * | 1,080,828 | 1,094,115 |
| Eternal Materials Co., Ltd. | 1,128,330 | 1,192,675 |
| Eva Airways Corp. | 2,214,456 | 1,152,025 |
| Evergreen Marine Corp., Ltd. * | 2,032,380 | 1,548,916 |
| Far Eastern International Bank | 2,313,487 | 713,694 |
| Far Eastern New Century Corp. | 4,198,799 | 3,359,985 |
| Far EasTone Telecommunications Co., Ltd. | 1,658,280 | 4,022,204 |
| Feng TAY Enterprise Co., Ltd. | 375,200 | 1,777,845 |
| First Financial Holding Co., Ltd. | 9,756,200 | 6,336,244 |
| Formosa Chemicals & Fibre Corp. | 3,703,008 | 11,644,371 |
| Formosa Petrochemical Corp. | 1,618,660 | 5,712,160 |
| Formosa Plastics Corp. | 5,053,560 | 15,723,824 |
| Formosa Taffeta Co., Ltd. | 876,000 | 870,804 |
| Foxconn Technology Co., Ltd. | 1,008,315 | 3,200,788 |
| Fubon Financial Holding Co., Ltd. | 7,295,114 | 11,723,815 |
| Giant Manufacturing Co., Ltd. | 236,752 | 1,196,351 |
| Hon Hai Precision Industry Co., Ltd. | 15,182,365 | 59,111,564 |
| Hotai Motor Co., Ltd. | 393,160 | 4,631,312 |
| HTC Corp. * | 824,778 | 1,877,539 |
| Hua Nan Financial Holdings Co., Ltd. | 8,370,332 | 4,673,452 |
| Innolux Corp. | 9,885,029 | 4,814,935 |
| Inventec Corp. | 3,191,145 | 2,532,487 |
| Largan Precision Co., Ltd. | 101,756 | 19,657,294 |
| Lite-On Technology Corp. | 2,205,107 | 3,262,468 |
| MediaTek, Inc. | 1,455,713 | 13,047,827 |
| Mega Financial Holding Co., Ltd. | 11,783,901 | 9,468,823 |
| Nan Ya Plastics Corp. | 5,758,816 | 14,540,633 |
| Nanya Technology Corp. | 692,000 | 1,483,561 |
| Novatek Microelectronics Corp. | 709,608 | 2,762,813 |
| OBI Pharma, Inc. * | 150,666 | 948,558 |
| Pegatron Corp. | 2,241,657 | 7,056,477 |
| Pou Chen Corp. | 3,289,792 | 4,267,715 |
| President Chain Store Corp. | 524,400 | 4,387,521 |
| Quanta Computer, Inc. | 2,737,000 | 6,230,554 |
| Realtek Semiconductor Corp. | 427,336 | 1,656,725 |
| Shin Kong Financial Holding Co., Ltd. | 8,118,308 | 2,359,176 |
| Siliconware Precision Industries Co., Ltd. ADR (a) | 488,660 | 3,850,641 |
| SinoPac Financial Holdings Co., Ltd. | 9,900,370 | 3,182,133 |
| Synnex Technology International Corp. | 1,053,956 | 1,176,922 |
| Taishin Financial Holding Co., Ltd. | 10,047,444 | 4,461,240 |
| Taiwan Business Bank | 5,186,670 | 1,433,342 |
| Taiwan Cement Corp. | 3,337,246 | 3,853,773 |
| Taiwan Cooperative Financial Holding Co., Ltd. | 8,808,779 | 4,640,962 |
| Taiwan Fertilizer Co., Ltd. | 603,508 | 804,904 |
| Taiwan Glass Industry Corp. * | 1,631,311 | 886,494 |
| Taiwan Mobile Co., Ltd. | 1,848,524 | 6,615,216 |
| Taiwan Secom Co., Ltd. | 285,000 | 842,374 |
| Taiwan Semiconductor Manufacturing Co., Ltd. ADR | 4,810,810 | 177,855,646 |
| Teco Electric & Machinery Co., Ltd. | 2,135,000 | 1,994,996 |
| TPK Holding Co., Ltd. * | 500,000 | 2,054,409 |
| U-Ming Marine Transport Corp. * | 351,576 | 447,348 |
| Uni-President Enterprises Corp. | 5,052,676 | 10,748,593 |
| Unimicron Technology Corp. | 1,073,348 | 613,514 |
| United Microelectronics Corp. ADR (a) | 2,545,527 | 6,363,817 |
| Vanguard International Semiconductor Corp. | 910,000 | 1,643,361 |
| Walsin Lihwa Corp. | 3,724,000 | 1,795,427 |
| Wistron Corp. | 2,467,979 | 2,330,674 |
| Security | Number of Shares | Value ($) |
| Yuanta Financial Holding Co., Ltd. | 11,564,700 | 5,019,967 |
| Yulon Motor Co., Ltd. | 588,192 | 506,743 |
| 611,529,739 | ||
| Thailand 3.6% | ||
| Advanced Info Service PCL NVDR | 1,181,800 | 6,673,317 |
| Airports of Thailand PCL NVDR | 4,294,300 | 7,048,317 |
| Bangkok Bank PCL NVDR | 480,000 | 2,667,068 |
| Bangkok Dusit Medical Services PCL NVDR | 8,864,000 | 5,579,208 |
| Bangkok Expressway & Metro PCL NVDR | 8,356,300 | 1,962,932 |
| Banpu PCL NVDR | 5,087,900 | 2,696,794 |
| BEC World PCL NVDR | 1,171,000 | 610,098 |
| Berli Jucker PCL NVDR | 1,147,650 | 1,702,206 |
| BTS Group Holdings PCL NVDR | 7,874,500 | 2,051,330 |
| Bumrungrad Hospital PCL NVDR | 350,200 | 2,299,160 |
| Central Pattana PCL NVDR | 2,420,200 | 5,247,836 |
| Charoen Pokphand Foods PCL NVDR | 4,430,500 | 3,635,932 |
| CP ALL PCL NVDR | 5,394,700 | 10,072,923 |
| Delta Electronics Thailand PCL NVDR | 658,600 | 1,765,258 |
| Electricity Generating PCL NVDR | 245,100 | 1,727,252 |
| Glow Energy PCL NVDR | 476,700 | 1,231,050 |
| Home Product Center PCL NVDR | 8,627,419 | 2,598,229 |
| Indorama Ventures PCL NVDR | 1,949,100 | 2,289,261 |
| Intouch Holdings PCL NVDR | 2,120,000 | 3,623,250 |
| IRPC PCL NVDR | 10,107,000 | 1,811,072 |
| Kasikornbank PCL NVDR | 2,057,600 | 12,455,281 |
| Krung Thai Bank PCL NVDR | 6,341,900 | 3,571,556 |
| Land & Houses PCL NVDR | 6,494,300 | 1,897,145 |
| Minor International PCL NVDR | 3,552,780 | 4,253,065 |
| PTT Exploration & Production PCL NVDR | 1,418,704 | 3,738,491 |
| PTT Global Chemical PCL NVDR | 2,132,514 | 4,913,035 |
| PTT PCL NVDR | 1,463,900 | 17,590,607 |
| Ratchaburi Electricity Generating Holding PCL NVDR | 812,900 | 1,364,830 |
| Thai Oil PCL NVDR | 1,071,700 | 3,041,943 |
| Thai Union Group PCL NVDR | 3,528,100 | 2,103,791 |
| The Siam Cement PCL NVDR | 844,500 | 12,716,458 |
| The Siam Commercial Bank PCL NVDR | 2,548,500 | 11,550,949 |
| TMB Bank PCL NVDR | 23,038,000 | 1,637,394 |
| Total Access Communication PCL NVDR * | 669,800 | 1,104,398 |
| True Corp. PCL NVDR * | 10,760,466 | 1,814,745 |
| 151,046,181 | ||
| Turkey 1.5% | ||
| Akbank T.A.S. | 2,111,072 | 6,322,424 |
| Anadolu Efes Biracilik Ve Malt Sanayii A/S | 205,190 | 1,259,946 |
| Arcelik A/S | 182,883 | 1,271,290 |
| Aselsan Elektronik Sanayi Ve Ticaret A/S | 126,570 | 989,816 |
| BIM Birlesik Magazalar A/S | 229,908 | 5,094,195 |
| Coca-Cola Icecek A/S | 69,266 | 805,300 |
| Emlak Konut Gayrimenkul Yatirim Ortakligi A/S * | 2,075,365 | 1,767,266 |
| Enka Insaat ve Sanayi A/S | 807,604 | 1,251,446 |
| Eregli Demir ve Celik Fabrikalari T.A.S. | 1,426,773 | 3,396,931 |
| Ford Otomotiv Sanayi A/S | 70,885 | 976,053 |
| Haci Omer Sabanci Holding A/S | 933,428 | 2,865,806 |
| KOC Holding A/S | 621,909 | 3,249,551 |
| Petkim Petrokimya Holding A/S | 666,162 | 1,203,994 |
| TAV Havalimanlari Holding A/S | 197,114 | 1,211,499 |
| Tofas Turk Otomobil Fabrikasi | 139,168 | 1,273,757 |
| Tupras-Turkiye Petrol Rafinerileri A/S | 121,264 | 4,119,931 |
| Turk Hava Yollari Anonim Ortakligi * | 578,101 | 1,634,231 |
| Security | Number of Shares | Value ($) |
| Turk Telekomunikasyon A/S * | 504,311 | 1,048,776 |
| Turkcell Iletisim Hizmetleri A/S | 955,109 | 3,654,398 |
| Turkiye Garanti Bankasi A/S | 2,242,979 | 6,977,334 |
| Turkiye Halk Bankasi A/S | 788,959 | 3,386,590 |
| Turkiye Is Bankasi, C Shares | 1,519,241 | 3,295,858 |
| Turkiye Sise ve Cam Fabrikalari A/S | 764,536 | 983,198 |
| Turkiye Vakiflar Bankasi T.A.O., Class D | 1,101,879 | 2,297,875 |
| Ulker Biskuvi Sanayi A/S | 139,168 | 831,973 |
| Yapi ve Kredi Bankasi A/S * | 1,024,991 | 1,442,834 |
| 62,612,272 | ||
| United Arab Emirates 1.1% | ||
| Abu Dhabi Commercial Bank PJSC | 1,889,250 | 3,754,737 |
| Air Arabia PJSC | 2,364,608 | 721,015 |
| Al Waha Capital PJSC | 935,580 | 448,292 |
| Aldar Properties PJSC | 3,350,059 | 2,106,841 |
| Arabtec Holding PJSC * | 569,987 | 496,572 |
| DAMAC Properties Dubai Co. PJSC | 1,873,608 | 2,060,760 |
| Dana Gas PJSC * | 3,904,443 | 680,309 |
| Deyaar Development PJSC * | 2,318,646 | 329,513 |
| DP World Ltd. | 170,768 | 3,917,418 |
| Dubai Financial Market PJSC * | 1,818,610 | 559,481 |
| Dubai Investments PJSC | 1,957,705 | 1,241,854 |
| Dubai Islamic Bank PJSC | 1,295,687 | 2,148,249 |
| DXB Entertainments PJSC * | 4,144,071 | 885,654 |
| Emaar Malls PJSC | 2,279,596 | 1,526,723 |
| Emaar Properties PJSC | 3,590,448 | 8,308,733 |
| Emirates Telecommunications Group Co. PJSC | 1,773,316 | 8,690,122 |
| First Abu Dhabi Bank PJSC | 2,731,269 | 7,733,304 |
| Union National Bank PJSC | 1,054,702 | 1,214,611 |
| 46,824,188 | ||
| Total Common Stock | ||
| (Cost $3,501,749,038) | 4,130,886,688 | |
| Preferred Stock 2.5% of net assets | ||
| Brazil 2.2% | ||
| Banco Bradesco S.A. | 3,128,477 | 33,388,186 |
| Braskem S.A., A Shares | 211,045 | 2,556,190 |
| Centrais Eletricas Brasileiras S.A., B Shares | 220,469 | 1,438,519 |
| Cia Brasileira de Distribuicao * | 157,400 | 3,601,273 |
| Cia de Transmissao de Energia Electrica Paulista | 39,500 | 888,184 |
| Companhia Energetica de Minas Gerais | 868,372 | 2,312,752 |
| Companhia Paranaense de Energia - Copel, B Shares | 103,944 | 949,435 |
| Gerdau S.A. | 1,064,995 | 4,010,930 |
| Itausa - Investimentos Itau S.A. | 3,933,456 | 12,751,276 |
| Lojas Americanas S.A. | 726,243 | 4,101,555 |
| Petroleo Brasileiro S.A. * | 3,987,604 | 17,299,113 |
| Suzano Papel e Celulose S.A., A Shares | 482,348 | 2,682,734 |
| Telefonica Brasil S.A. | 419,808 | 6,516,367 |
| 92,496,514 | ||
| Colombia 0.1% | ||
| Grupo Aval Acciones y Valores S.A. | 4,980,386 | 2,232,451 |
| Grupo de Inversiones Suramericana S.A. | 99,331 | 1,357,337 |
| 3,589,788 | ||
| Security | Number of Shares | Value ($) |
| Russia 0.2% | ||
| AK Transneft OAO | 1,216 | 3,732,277 |
| Surgutneftegas OAO | 9,220,726 | 4,604,407 |
| 8,336,684 | ||
| Total Preferred Stock | ||
| (Cost $94,099,253) | 104,422,986 | |
| Rights 0.0% of net assets | ||
| China 0.0% | ||
| Fosun International Ltd. *(b) | 1,705 | — |
| Total Rights | ||
| (Cost $—) | — | |
| Other Investment Companies 0.4% of net assets | ||
| United States 0.4% | ||
| Money Market Fund 0.1% | ||
| State Street Institutional U.S. Government Money Market Fund, Premier Class 0.93% (c) | 3,356,818 | 3,356,818 |
| Securities Lending Collateral 0.3% | ||
| Wells Fargo Government Money Market Fund, Select Class 0.92% (c) | 14,093,807 | 14,093,807 |
| Total Other Investment Companies | ||
| (Cost $17,450,625) | 17,450,625 | |
| Number of Contracts | Notional Amount ($) | Current Value/ Unrealized Appreciation ($) | ||
| Futures Contracts | ||||
| Long | ||||
| MSCI Emerging Markets Index, e-mini, expires 09/15/17 | 255 | 13,849,050 | 225,683 | |
| * | Non-income producing security. |
| (a) | All or a portion of this security is on loan. Securities on loan were valued at $13,332,620. |
| (b) | Fair-valued by management in accordance with procedures approved by the Board of Trustees. |
| (c) | The rate shown is the 7-day yield. |
| ADR — | American Depositary Receipt |
| GDR — | Global Depositary Receipt |
| NVDR — | Non-Voting Depositary Receipt |
| REIT — | Real Estate Investment Trust |
Table of Contents
| Security | Number of Shares | Value ($) |
| Common Stock 99.7% of net assets | ||
| Automobiles & Components 1.0% | ||
| Adient plc | 36,534 | 2,582,223 |
| American Axle & Manufacturing Holdings, Inc. * | 31,121 | 454,678 |
| Autoliv, Inc. | 34,740 | 3,773,459 |
| BorgWarner, Inc. | 77,896 | 3,615,153 |
| Cooper Tire & Rubber Co. (a) | 21,168 | 711,245 |
| Cooper-Standard Holding, Inc. * | 8,212 | 825,963 |
| Dana, Inc. | 58,879 | 1,417,218 |
| Delphi Automotive plc | 107,374 | 10,350,854 |
| Dorman Products, Inc. * | 13,720 | 911,282 |
| Ford Motor Co. | 1,547,981 | 17,074,230 |
| Fox Factory Holding Corp. * | 15,112 | 604,480 |
| General Motors Co. | 546,539 | 19,970,535 |
| Gentex Corp. | 104,100 | 1,901,907 |
| Gentherm, Inc. * | 21,006 | 654,337 |
| Harley-Davidson, Inc. | 73,050 | 3,434,080 |
| LCI Industries | 8,754 | 864,895 |
| Lear Corp. | 28,608 | 4,278,040 |
| Modine Manufacturing Co. * | 15,917 | 257,060 |
| Standard Motor Products, Inc. | 7,828 | 345,215 |
| Tenneco, Inc. | 21,080 | 1,142,536 |
| Tesla, Inc. * | 49,723 | 17,696,416 |
| The Goodyear Tire & Rubber Co. | 103,346 | 3,131,384 |
| Thor Industries, Inc. | 17,150 | 1,863,176 |
| Tower International, Inc. | 20,918 | 469,609 |
| Visteon Corp. * | 13,780 | 1,590,763 |
| Winnebago Industries, Inc. | 19,240 | 695,526 |
| 100,616,264 | ||
| Banks 6.4% | ||
| 1st Source Corp. | 13,764 | 642,366 |
| Ameris Bancorp | 14,156 | 623,572 |
| Associated Banc-Corp. | 72,350 | 1,584,465 |
| Astoria Financial Corp. | 30,899 | 605,311 |
| Banc of California, Inc. | 26,915 | 499,273 |
| BancorpSouth, Inc. | 34,570 | 1,004,258 |
| Bank of America Corp. | 3,970,557 | 94,856,607 |
| Bank of Hawaii Corp. | 17,150 | 1,339,929 |
| Bank of the Ozarks, Inc. | 49,954 | 2,146,024 |
| BankUnited, Inc. | 55,275 | 1,839,552 |
| Banner Corp. | 14,576 | 803,429 |
| BB&T Corp. | 320,331 | 14,764,056 |
| Beneficial Bancorp, Inc. | 32,768 | 489,882 |
| Berkshire Hills Bancorp, Inc. | 14,156 | 478,473 |
| Bofl Holding, Inc. *(a) | 18,539 | 491,469 |
| BOK Financial Corp. | 11,715 | 942,823 |
| Boston Private Financial Holdings, Inc. | 27,969 | 411,144 |
| Brookline Bancorp, Inc. | 30,900 | 443,415 |
| Bryn Mawr Bank Corp. | 13,864 | 567,731 |
| Capital Bank Financial Corp., Class A | 7,644 | 287,414 |
| Capitol Federal Financial, Inc. | 58,922 | 808,410 |
| Cathay General Bancorp | 27,528 | 970,913 |
| CenterState Banks, Inc. | 28,012 | 685,454 |
| Central Pacific Financial Corp. | 14,264 | 413,656 |
| Security | Number of Shares | Value ($) |
| Chemical Financial Corp. | 32,492 | 1,475,462 |
| CIT Group, Inc. | 57,689 | 2,587,352 |
| Citigroup, Inc. | 1,097,539 | 74,665,578 |
| Citizens Financial Group, Inc. | 202,785 | 6,718,267 |
| City Holding Co. | 6,860 | 434,444 |
| CoBiz Financial, Inc. | 30,976 | 528,141 |
| Columbia Banking System, Inc. | 24,010 | 892,452 |
| Comerica, Inc. | 72,224 | 4,929,288 |
| Commerce Bancshares, Inc. | 37,785 | 2,077,797 |
| Community Bank System, Inc. | 17,170 | 883,568 |
| Community Trust Bancorp, Inc. | 10,992 | 467,710 |
| ConnectOne Bancorp, Inc. | 20,718 | 472,370 |
| Cullen/Frost Bankers, Inc. | 26,507 | 2,231,889 |
| Customers Bancorp, Inc. * | 15,056 | 424,278 |
| CVB Financial Corp. | 34,514 | 714,440 |
| Eagle Bancorp, Inc. * | 10,805 | 672,071 |
| East West Bancorp, Inc. | 58,310 | 3,228,625 |
| Enterprise Financial Services Corp. | 14,652 | 559,706 |
| Essent Group Ltd. * | 31,083 | 1,214,724 |
| F.N.B. Corp. | 114,976 | 1,459,045 |
| FCB Financial Holdings, Inc., Class A * | 11,436 | 498,610 |
| Fifth Third Bancorp | 291,871 | 7,626,589 |
| First BanCorp (Puerto Rico) * | 55,112 | 313,036 |
| First Busey Corp. | 20,728 | 598,003 |
| First Citizens BancShares, Inc., Class A | 3,938 | 1,340,928 |
| First Commonwealth Financial Corp. | 44,765 | 564,487 |
| First Financial Bancorp | 28,018 | 671,031 |
| First Financial Bankshares, Inc. | 26,103 | 1,045,425 |
| First Financial Corp. | 4,115 | 178,591 |
| First Hawaiian, Inc. | 32,005 | 867,015 |
| First Horizon National Corp. | 92,886 | 1,598,568 |
| First Interstate BancSystem, Inc., Class A | 14,064 | 495,053 |
| First Merchants Corp. | 17,675 | 694,097 |
| First Midwest Bancorp, Inc. | 34,300 | 723,044 |
| First Republic Bank | 60,101 | 5,832,802 |
| Flagstar Bancorp, Inc. * | 7,144 | 234,466 |
| Flushing Financial Corp. | 20,684 | 565,501 |
| Fulton Financial Corp. | 82,640 | 1,442,068 |
| German American Bancorp, Inc. | 7,777 | 253,064 |
| Glacier Bancorp, Inc. | 24,645 | 818,460 |
| Great Southern Bancorp, Inc. | 3,639 | 181,222 |
| Great Western Bancorp, Inc. | 25,379 | 911,614 |
| Hancock Holding Co. | 30,870 | 1,356,736 |
| Hanmi Financial Corp. | 14,576 | 389,179 |
| Heartland Financial USA, Inc. | 10,792 | 491,036 |
| Hilltop Holdings, Inc. | 24,870 | 588,673 |
| Home BancShares, Inc. | 54,880 | 1,279,253 |
| HomeStreet, Inc. * | 16,712 | 421,978 |
| Hope Bancorp, Inc. | 51,963 | 838,683 |
| Huntington Bancshares, Inc. | 423,854 | 5,336,322 |
| IBERIABANK Corp. | 19,914 | 1,525,412 |
| Independent Bank Corp. | 13,936 | 965,765 |
| International Bancshares Corp. | 37,766 | 1,357,688 |
| Investors Bancorp, Inc. | 128,049 | 1,676,161 |
| JPMorgan Chase & Co. | 1,420,323 | 129,093,157 |
| Kearny Financial Corp. | 32,005 | 452,871 |
| KeyCorp | 419,427 | 7,218,339 |
| Lakeland Bancorp, Inc. | 14,411 | 266,604 |
| Lakeland Financial Corp. | 11,436 | 497,009 |
| Security | Number of Shares | Value ($) |
| LegacyTexas Financial Group, Inc. | 17,955 | 646,200 |
| LendingTree, Inc. * | 3,664 | 846,201 |
| Live Oak Bancshares, Inc. | 19,715 | 440,630 |
| M&T Bank Corp. | 61,787 | 9,135,826 |
| MainSource Financial Group, Inc. | 19,240 | 629,725 |
| MB Financial, Inc. | 31,187 | 1,240,307 |
| Meridian Bancorp, Inc. | 29,312 | 515,891 |
| Meta Financial Group, Inc. | 5,345 | 375,754 |
| MGIC Investment Corp. * | 128,081 | 1,466,527 |
| National Bank Holdings Corp., Class A | 4,735 | 152,372 |
| Nationstar Mortgage Holdings, Inc. * | 25,823 | 444,672 |
| New York Community Bancorp, Inc. | 174,021 | 2,096,953 |
| NMI Holdings, Inc., Class A * | 47,996 | 520,757 |
| Northfield Bancorp, Inc. | 20,871 | 336,232 |
| Northwest Bancshares, Inc. | 51,450 | 793,874 |
| Old National Bancorp | 51,805 | 847,012 |
| Oritani Financial Corp. | 24,010 | 385,361 |
| Pacific Premier Bancorp, Inc. * | 12,335 | 436,659 |
| PacWest Bancorp | 45,359 | 2,047,959 |
| Park National Corp. | 8,430 | 814,254 |
| People's United Financial, Inc. | 161,707 | 2,700,507 |
| Pinnacle Financial Partners, Inc. | 28,475 | 1,771,145 |
| Popular, Inc. | 37,740 | 1,506,203 |
| Prosperity Bancshares, Inc. | 27,890 | 1,666,427 |
| Provident Financial Services, Inc. | 27,440 | 681,884 |
| Radian Group, Inc. | 82,330 | 1,440,775 |
| Regions Financial Corp. | 490,085 | 6,915,099 |
| Renasant Corp. | 15,448 | 615,294 |
| S&T Bancorp, Inc. | 10,349 | 371,943 |
| Sandy Spring Bancorp, Inc. | 7,266 | 280,250 |
| ServisFirst Bancshares, Inc. | 18,065 | 616,197 |
| Signature Bank * | 21,655 | 2,779,203 |
| Simmons First National Corp., Class A | 18,629 | 972,434 |
| South State Corp. | 7,956 | 654,381 |
| Southside Bancshares, Inc. | 18,589 | 607,303 |
| State Bank Financial Corp. | 10,549 | 283,452 |
| Sterling Bancorp | 45,384 | 1,018,871 |
| Stock Yards Bancorp, Inc. | 7,713 | 268,412 |
| SunTrust Banks, Inc. | 199,496 | 10,992,230 |
| SVB Financial Group * | 21,162 | 3,583,573 |
| Synovus Financial Corp. | 51,951 | 2,188,176 |
| TCF Financial Corp. | 68,848 | 1,069,209 |
| Texas Capital Bancshares, Inc. * | 19,580 | 1,453,815 |
| TFS Financial Corp. | 48,020 | 738,548 |
| The First of Long Island Corp. | 20,988 | 561,429 |
| The PNC Financial Services Group, Inc. | 192,003 | 24,079,096 |
| Tompkins Financial Corp. | 7,328 | 556,342 |
| Towne Bank | 21,084 | 647,279 |
| TrustCo Bank Corp. | 34,430 | 271,997 |
| Trustmark Corp. | 27,440 | 812,773 |
| U.S. Bancorp | 627,162 | 32,142,052 |
| UMB Financial Corp. | 13,720 | 920,886 |
| Umpqua Holdings Corp. | 110,543 | 1,934,502 |
| Union Bankshares Corp. | 20,670 | 647,591 |
| United Bankshares, Inc. | 48,573 | 1,629,624 |
| United Community Banks, Inc. | 27,796 | 725,754 |
| United Financial Bancorp, Inc. | 20,872 | 361,503 |
| Valley National Bancorp | 89,337 | 999,681 |
| Walker & Dunlop, Inc. * | 17,139 | 825,928 |
| Washington Federal, Inc. | 41,160 | 1,286,250 |
| Washington Trust Bancorp, Inc. | 10,492 | 537,715 |
| Webster Financial Corp. | 34,639 | 1,616,949 |
| Wells Fargo & Co. | 1,807,362 | 92,301,977 |
| WesBanco, Inc. | 21,470 | 815,431 |
| Westamerica Bancorp | 20,670 | 1,065,538 |
| Western Alliance Bancorp * | 34,414 | 1,659,787 |
| Wintrust Financial Corp. | 17,150 | 1,248,691 |
| Security | Number of Shares | Value ($) |
| WSFS Financial Corp. | 11,436 | 511,189 |
| Zions Bancorp | 79,558 | 3,473,502 |
| 656,527,336 | ||
| Capital Goods 7.7% | ||
| 3M Co. | 238,185 | 48,665,959 |
| A.O. Smith Corp. | 54,880 | 3,056,267 |
| AAON, Inc. | 15,141 | 493,597 |
| AAR Corp. | 13,720 | 494,743 |
| Actuant Corp., Class A | 30,870 | 742,424 |
| Acuity Brands, Inc. | 17,150 | 3,031,949 |
| Advanced Drainage Systems, Inc. | 12,092 | 235,189 |
| AECOM * | 63,354 | 2,122,359 |
| Aegion Corp. * | 13,940 | 302,080 |
| Aerojet Rocketdyne Holdings, Inc. * | 20,898 | 619,208 |
| Aerovironment, Inc. * | 15,752 | 772,163 |
| AGCO Corp. | 25,736 | 1,761,629 |
| Air Lease Corp. | 31,979 | 1,299,627 |
| Aircastle Ltd. | 30,870 | 692,105 |
| Alamo Group, Inc. | 7,476 | 685,998 |
| Albany International Corp., Class A | 10,588 | 567,517 |
| Allegion plc | 34,832 | 2,741,627 |
| Allison Transmission Holdings, Inc. | 62,416 | 2,167,708 |
| Altra Industrial Motion Corp. | 7,466 | 343,809 |
| American Woodmark Corp. * | 4,864 | 402,739 |
| AMETEK, Inc. | 92,610 | 5,857,583 |
| Apogee Enterprises, Inc. | 12,678 | 554,029 |
| Applied Industrial Technologies, Inc. | 15,913 | 907,041 |
| Arconic, Inc. | 171,968 | 4,380,025 |
| Argan, Inc. | 7,224 | 457,640 |
| Armstrong Flooring, Inc. * | 8,140 | 121,449 |
| Armstrong World Industries, Inc. * | 17,317 | 822,558 |
| Astec Industries, Inc. | 6,996 | 347,561 |
| Astronics Corp. * | 5,385 | 141,572 |
| Axon Enterprise, Inc. * | 18,040 | 391,648 |
| AZZ, Inc. | 16,070 | 785,823 |
| Barnes Group, Inc. | 17,334 | 1,083,722 |
| Beacon Roofing Supply, Inc. * | 25,478 | 1,200,014 |
| BMC Stock Holdings, Inc. * | 43,950 | 892,185 |
| Briggs & Stratton Corp. | 17,391 | 364,168 |
| Builders FirstSource, Inc. * | 34,530 | 562,148 |
| BWX Technologies, Inc. | 44,590 | 2,439,965 |
| Carlisle Cos., Inc. | 24,010 | 2,273,507 |
| Caterpillar, Inc. | 231,910 | 27,247,106 |
| Chart Industries, Inc. * | 18,730 | 631,950 |
| Chicago Bridge & Iron Co. N.V. (a) | 43,168 | 532,693 |
| CIRCOR International, Inc. | 6,860 | 329,417 |
| Colfax Corp. * | 39,657 | 1,581,521 |
| Comfort Systems USA, Inc. | 14,032 | 477,790 |
| Continental Building Products, Inc. * | 12,230 | 297,801 |
| Crane Co. | 20,580 | 1,527,653 |
| CSW Industrials, Inc. * | 10,864 | 454,658 |
| Cubic Corp. | 11,836 | 508,356 |
| Cummins, Inc. | 60,053 | 9,571,247 |
| Curtiss-Wright Corp. | 17,150 | 1,660,463 |
| Deere & Co. | 117,814 | 13,658,177 |
| DigitalGlobe, Inc. * | 24,659 | 848,270 |
| Donaldson Co., Inc. | 53,513 | 2,528,489 |
| Douglas Dynamics, Inc. | 18,420 | 642,858 |
| Dover Corp. | 62,468 | 5,302,284 |
| Dycom Industries, Inc. * | 16,035 | 1,293,704 |
| Eaton Corp. plc | 178,397 | 12,801,769 |
| EMCOR Group, Inc. | 24,010 | 1,585,620 |
| Emerson Electric Co. | 257,881 | 15,225,294 |
| Encore Wire Corp. | 7,331 | 314,500 |
| EnerSys | 17,344 | 1,111,750 |
| Engility Holdings, Inc. * | 6,878 | 213,699 |
| Security | Number of Shares | Value ($) |
| EnPro Industries, Inc. | 7,012 | 494,136 |
| ESCO Technologies, Inc. | 13,720 | 747,054 |
| Esterline Technologies Corp. * | 13,720 | 1,171,688 |
| Fastenal Co. | 114,719 | 4,895,060 |
| Federal Signal Corp. | 24,056 | 449,607 |
| Flowserve Corp. | 54,963 | 2,158,947 |
| Fluor Corp. | 64,626 | 2,492,625 |
| Fortive Corp. | 117,237 | 7,616,888 |
| Fortune Brands Home & Security, Inc. | 58,810 | 3,677,389 |
| Franklin Electric Co., Inc. | 14,964 | 576,862 |
| Gardner Denver Holdings, Inc. * | 26,821 | 630,025 |
| GATX Corp. | 20,580 | 1,246,736 |
| Generac Holdings, Inc. * | 24,304 | 981,396 |
| General Cable Corp. | 24,180 | 409,851 |
| General Dynamics Corp. | 112,271 | 22,605,766 |
| General Electric Co. | 3,483,907 | 85,529,917 |
| Gibraltar Industries, Inc. * | 19,670 | 575,348 |
| Global Brass & Copper Holdings, Inc. | 7,054 | 210,562 |
| GMS, Inc. * | 15,212 | 489,522 |
| Graco, Inc. | 24,010 | 2,773,395 |
| Granite Construction, Inc. | 18,710 | 1,033,353 |
| Griffon Corp. | 17,215 | 319,338 |
| H&E Equipment Services, Inc. | 18,060 | 425,132 |
| Harsco Corp. * | 37,730 | 645,183 |
| HD Supply Holdings, Inc. * | 83,511 | 2,780,916 |
| HEICO Corp. | 23,294 | 1,997,926 |
| HEICO Corp., Class A | 7,606 | 552,576 |
| Herc Holdings, Inc. * | 8,759 | 369,805 |
| Hexcel Corp. | 34,756 | 1,868,830 |
| Hillenbrand, Inc. | 27,440 | 980,980 |
| Honeywell International, Inc. | 310,872 | 42,984,271 |
| Hubbell, Inc. | 18,868 | 2,128,122 |
| Huntington Ingalls Industries, Inc. | 17,292 | 3,699,796 |
| Hyster-Yale Materials Handling, Inc. | 4,088 | 290,984 |
| IDEX Corp. | 30,870 | 3,629,695 |
| Illinois Tool Works, Inc. | 123,835 | 17,028,551 |
| Ingersoll-Rand plc | 102,239 | 8,730,188 |
| Insteel Industries, Inc. | 13,880 | 347,972 |
| ITT, Inc. | 34,300 | 1,384,348 |
| Jacobs Engineering Group, Inc. | 48,020 | 2,616,610 |
| JELD-WEN Holding, Inc. * | 15,512 | 473,426 |
| John Bean Technologies Corp. | 10,349 | 917,956 |
| Johnson Controls International plc | 371,342 | 14,701,430 |
| Kadant, Inc. | 5,903 | 512,676 |
| Kaman Corp. | 10,844 | 531,790 |
| KBR, Inc. | 53,960 | 877,929 |
| Kennametal, Inc. | 32,583 | 1,140,405 |
| KLX, Inc. * | 17,667 | 846,956 |
| Kratos Defense & Security Solutions, Inc. * | 45,239 | 605,298 |
| L3 Technologies, Inc. | 31,914 | 5,791,753 |
| Lennox International, Inc. | 14,347 | 2,377,728 |
| Lincoln Electric Holdings, Inc. | 21,422 | 1,860,286 |
| Lindsay Corp. | 3,651 | 316,067 |
| Lockheed Martin Corp. | 99,637 | 30,428,143 |
| Lydall, Inc. * | 12,039 | 565,833 |
| Masco Corp. | 129,020 | 4,744,065 |
| Masonite International Corp. * | 12,491 | 790,680 |
| MasTec, Inc. * | 25,937 | 1,058,230 |
| Mercury Systems, Inc. * | 22,522 | 1,086,687 |
| Meritor, Inc. * | 38,254 | 759,724 |
| Milacron Holdings Corp. * | 26,421 | 421,415 |
| Moog, Inc., Class A * | 14,004 | 1,074,947 |
| MRC Global, Inc. * | 38,428 | 606,010 |
| MSC Industrial Direct Co., Inc., Class A | 17,150 | 1,181,292 |
| Mueller Industries, Inc. | 17,278 | 515,403 |
| Mueller Water Products, Inc., Class A | 58,311 | 699,149 |
| MYR Group, Inc. * | 14,456 | 373,109 |
| Security | Number of Shares | Value ($) |
| Navistar International Corp. * | 25,523 | 871,866 |
| NCI Building Systems, Inc. * | 29,960 | 503,328 |
| NN, Inc. | 21,570 | 550,035 |
| Nordson Corp. | 20,580 | 2,249,394 |
| Northrop Grumman Corp. | 70,179 | 19,103,426 |
| NOW, Inc. * | 49,832 | 581,041 |
| Orbital ATK, Inc. | 24,578 | 2,742,413 |
| Oshkosh Corp. | 30,933 | 2,307,602 |
| Owens Corning | 43,364 | 3,214,573 |
| PACCAR, Inc. | 137,200 | 9,100,476 |
| Parker-Hannifin Corp. | 53,134 | 8,548,729 |
| Patrick Industries, Inc. * | 5,612 | 415,288 |
| Pentair plc | 72,564 | 4,502,596 |
| PGT Innovations, Inc. * | 28,812 | 380,318 |
| Plug Power, Inc. *(a) | 243,613 | 521,332 |
| Primoris Services Corp. | 17,548 | 502,048 |
| Proto Labs, Inc. * | 12,568 | 902,382 |
| Quanex Building Products Corp. | 13,764 | 269,774 |
| Quanta Services, Inc. * | 58,615 | 2,106,037 |
| Raven Industries, Inc. | 27,904 | 781,312 |
| Raytheon Co. | 117,550 | 21,395,275 |
| RBC Bearings, Inc. * | 10,290 | 1,134,678 |
| Regal Beloit Corp. | 17,150 | 1,293,110 |
| Rexnord Corp. * | 51,817 | 1,237,390 |
| Rockwell Automation, Inc. | 49,904 | 8,187,250 |
| Rockwell Collins, Inc. | 62,760 | 8,224,698 |
| Roper Technologies, Inc. | 40,230 | 9,279,452 |
| Rush Enterprises, Inc., Class A * | 10,679 | 437,732 |
| Sensata Technologies Holding N.V. * | 62,481 | 2,790,401 |
| Simpson Manufacturing Co., Inc. | 14,254 | 624,040 |
| SiteOne Landscape Supply, Inc. * | 15,780 | 792,787 |
| Snap-on, Inc. | 22,880 | 3,376,402 |
| Spirit AeroSystems Holdings, Inc., Class A | 48,771 | 3,633,440 |
| SPX Corp. * | 14,654 | 353,161 |
| SPX FLOW, Inc. * | 17,835 | 596,937 |
| Standex International Corp. | 3,430 | 327,394 |
| Stanley Black & Decker, Inc. | 61,023 | 8,787,312 |
| Sun Hydraulics Corp. | 7,331 | 351,228 |
| Teledyne Technologies, Inc. * | 13,767 | 2,065,876 |
| Tennant Co. | 10,290 | 627,176 |
| Terex Corp. | 42,844 | 1,651,636 |
| Textron, Inc. | 106,330 | 5,219,740 |
| The Boeing Co. | 224,280 | 53,750,945 |
| The Gorman-Rupp Co. | 5,967 | 181,635 |
| The Greenbrier Cos., Inc. | 8,962 | 384,470 |
| The Manitowoc Co., Inc. * | 58,310 | 479,891 |
| The Middleby Corp. * | 24,489 | 2,980,311 |
| The Timken Co. | 30,870 | 1,384,520 |
| The Toro Co. | 41,748 | 2,575,017 |
| Thermon Group Holdings, Inc. * | 18,020 | 297,690 |
| TransDigm Group, Inc. | 19,279 | 5,025,264 |
| Trex Co., Inc. * | 14,912 | 1,133,312 |
| TriMas Corp. * | 14,339 | 347,004 |
| Trinity Industries, Inc. | 60,379 | 1,741,330 |
| Triton International Ltd. * | 25,048 | 924,772 |
| Triumph Group, Inc. | 21,422 | 563,399 |
| Tutor Perini Corp. * | 14,328 | 374,677 |
| United Rentals, Inc. * | 32,294 | 3,812,630 |
| United Technologies Corp. | 299,749 | 35,885,950 |
| Univar, Inc. * | 36,570 | 1,031,640 |
| Universal Forest Products, Inc. | 6,932 | 604,540 |
| USG Corp. * | 31,346 | 940,380 |
| Valmont Industries, Inc. | 8,007 | 1,149,405 |
| W.W. Grainger, Inc. | 21,453 | 3,487,614 |
| Wabash National Corp. | 24,281 | 510,387 |
| WABCO Holdings, Inc. * | 18,834 | 2,704,939 |
| Wabtec Corp. | 34,500 | 2,434,665 |
| Security | Number of Shares | Value ($) |
| Watsco, Inc. | 15,294 | 2,253,724 |
| Watts Water Technologies, Inc., Class A | 10,384 | 640,693 |
| Welbilt, Inc. * | 58,310 | 1,160,369 |
| Wesco Aircraft Holdings, Inc. * | 17,426 | 146,378 |
| WESCO International, Inc. * | 17,150 | 865,218 |
| Woodward, Inc. | 20,580 | 1,444,922 |
| Xylem, Inc. | 68,600 | 4,258,002 |
| 781,950,919 | ||
| Commercial & Professional Services 0.9% | ||
| ABM Industries, Inc. | 21,584 | 958,977 |
| ACCO Brands Corp. * | 42,368 | 463,930 |
| Advanced Disposal Services, Inc. * | 20,918 | 498,685 |
| Brady Corp., Class A | 30,958 | 1,032,449 |
| Cintas Corp. | 32,784 | 4,426,168 |
| Clean Harbors, Inc. * | 20,580 | 1,113,172 |
| Copart, Inc. * | 83,200 | 2,719,808 |
| Deluxe Corp. | 20,580 | 1,427,223 |
| Equifax, Inc. | 48,020 | 6,841,409 |
| Essendant, Inc. | 19,403 | 230,120 |
| Exponent, Inc. | 7,432 | 506,119 |
| FTI Consulting, Inc. * | 14,192 | 481,251 |
| GP Strategies Corp. * | 15,352 | 439,067 |
| Healthcare Services Group, Inc. | 27,440 | 1,404,928 |
| Herman Miller, Inc. | 20,836 | 701,131 |
| HNI Corp. | 20,580 | 754,257 |
| Huron Consulting Group, Inc. * | 8,260 | 249,865 |
| ICF International, Inc. * | 7,066 | 339,521 |
| IHS Markit Ltd. * | 125,868 | 5,895,657 |
| Insperity, Inc. | 10,299 | 827,010 |
| Interface, Inc. | 50,630 | 961,970 |
| KAR Auction Services, Inc. | 52,428 | 2,363,979 |
| Kelly Services, Inc., Class A | 10,749 | 232,501 |
| Kforce, Inc. | 13,832 | 248,976 |
| Kimball International, Inc., Class B | 28,124 | 476,983 |
| Knoll, Inc. | 17,327 | 312,752 |
| Korn/Ferry International | 22,329 | 744,002 |
| ManpowerGroup, Inc. | 25,780 | 2,874,728 |
| Matthews International Corp., Class A | 13,720 | 826,630 |
| McGrath RentCorp | 7,262 | 293,167 |
| Mobile Mini, Inc. | 14,948 | 452,177 |
| MSA Safety, Inc. | 12,361 | 900,622 |
| Multi-Color Corp. | 5,064 | 404,107 |
| Navigant Consulting, Inc. * | 20,632 | 316,289 |
| Nielsen Holdings plc | 145,036 | 5,634,649 |
| On Assignment, Inc. * | 18,275 | 871,717 |
| Pitney Bowes, Inc. | 82,872 | 1,064,905 |
| Quad/Graphics, Inc. | 20,025 | 381,677 |
| R.R. Donnelley & Sons Co. | 42,936 | 396,299 |
| Republic Services, Inc. | 96,607 | 6,302,641 |
| Resources Connection, Inc. | 27,804 | 354,501 |
| Robert Half International, Inc. | 48,397 | 2,192,384 |
| Rollins, Inc. | 41,394 | 1,838,308 |
| RPX Corp. * | 39,486 | 515,687 |
| SP Plus Corp. * | 17,540 | 647,226 |
| Steelcase, Inc., Class A | 34,690 | 457,908 |
| Stericycle, Inc. * | 34,300 | 2,465,827 |
| Tetra Tech, Inc. | 21,180 | 902,268 |
| The Advisory Board Co. * | 15,148 | 806,631 |
| The Brink's Co. | 20,580 | 1,614,501 |
| The Dun & Bradstreet Corp. | 14,220 | 1,584,677 |
| TransUnion * | 54,259 | 2,596,836 |
| TriNet Group, Inc. * | 14,367 | 513,333 |
| TrueBlue, Inc. * | 20,580 | 420,861 |
| UniFirst Corp. | 6,860 | 985,096 |
| US Ecology, Inc. | 8,022 | 412,331 |
| Verisk Analytics, Inc. * | 60,070 | 4,868,673 |
| Security | Number of Shares | Value ($) |
| Viad Corp. | 14,652 | 805,127 |
| WageWorks, Inc. * | 19,226 | 1,133,373 |
| Waste Management, Inc. | 155,382 | 11,981,506 |
| West Corp. | 15,679 | 366,418 |
| 94,834,990 | ||
| Consumer Durables & Apparel 1.3% | ||
| American Outdoor Brands Corp. * | 24,842 | 405,421 |
| Brunswick Corp. | 34,300 | 1,800,064 |
| CalAtlantic Group, Inc. | 39,132 | 1,359,837 |
| Callaway Golf Co. | 46,532 | 648,656 |
| Carter's, Inc. | 21,194 | 1,837,732 |
| Cavco Industries, Inc. * | 3,574 | 480,882 |
| Coach, Inc. | 116,570 | 4,860,969 |
| Columbia Sportswear Co. | 13,720 | 786,019 |
| D.R. Horton, Inc. | 135,847 | 4,910,869 |
| Deckers Outdoor Corp. * | 10,990 | 702,261 |
| Ethan Allen Interiors, Inc. | 7,432 | 217,386 |
| G-III Apparel Group Ltd. * | 19,115 | 525,663 |
| Garmin Ltd. | 44,590 | 2,296,385 |
| GoPro, Inc., Class A *(a) | 42,976 | 395,809 |
| Hanesbrands, Inc. | 150,920 | 3,661,319 |
| Hasbro, Inc. | 44,590 | 4,380,967 |
| Helen of Troy Ltd. * | 8,758 | 790,847 |
| Installed Building Products, Inc. * | 12,061 | 695,920 |
| iRobot Corp. * | 13,725 | 1,309,640 |
| KB Home | 36,210 | 774,894 |
| La-Z-Boy, Inc. | 21,114 | 503,569 |
| Leggett & Platt, Inc. | 51,791 | 2,380,832 |
| Lennar Corp., B Shares | 8,328 | 358,354 |
| Lennar Corp., Class A | 77,129 | 3,992,197 |
| LGI Homes, Inc. *(a) | 10,516 | 447,351 |
| Lululemon Athletica, Inc. * | 45,175 | 2,599,821 |
| M.D.C Holdings, Inc. | 16,197 | 506,156 |
| M/I Homes, Inc. * | 15,056 | 370,378 |
| Mattel, Inc. | 134,434 | 2,180,519 |
| Meritage Homes Corp. * | 17,225 | 701,058 |
| Michael Kors Holdings Ltd. * | 66,455 | 2,805,730 |
| Mohawk Industries, Inc. * | 24,174 | 6,118,923 |
| NACCO Industries, Inc., Class A | 3,430 | 248,675 |
| Nautilus, Inc. * | 18,235 | 298,142 |
| Newell Brands, Inc. | 189,083 | 9,128,927 |
| NIKE, Inc., Class B | 525,103 | 27,730,689 |
| NVR, Inc. * | 1,248 | 3,395,621 |
| Oxford Industries, Inc. | 6,862 | 396,692 |
| Polaris Industries, Inc. (a) | 24,124 | 2,249,081 |
| PulteGroup, Inc. | 109,670 | 2,831,679 |
| PVH Corp. | 31,253 | 3,934,440 |
| Ralph Lauren Corp. | 22,068 | 1,939,557 |
| Skechers U.S.A., Inc., Class A * | 55,548 | 1,468,134 |
| Steven Madden Ltd. * | 24,573 | 1,041,895 |
| Sturm Ruger & Co., Inc. (a) | 7,082 | 324,356 |
| Taylor Morrison Home Corp., Class A * | 25,821 | 522,101 |
| Tempur Sealy International, Inc. * | 21,856 | 1,352,886 |
| Toll Brothers, Inc. | 62,865 | 2,449,220 |
| TopBuild Corp. * | 15,060 | 893,811 |
| TRI Pointe Group, Inc. * | 45,467 | 579,250 |
| Tupperware Brands Corp. | 17,878 | 1,034,600 |
| Under Armour, Inc., Class A *(a) | 95,956 | 1,549,689 |
| Under Armour, Inc., Class C *(a) | 68,995 | 1,041,825 |
| Unifi, Inc. * | 14,268 | 443,449 |
| Universal Electronics, Inc. * | 3,773 | 220,909 |
| VF Corp. | 131,594 | 8,273,315 |
| Vista Outdoor, Inc. * | 27,924 | 572,442 |
| Whirlpool Corp. | 29,340 | 5,035,331 |
| Security | Number of Shares | Value ($) |
| William Lyon Homes, Class A * | 15,456 | 370,789 |
| Wolverine World Wide, Inc. | 41,160 | 1,082,508 |
| 136,216,441 | ||
| Consumer Services 2.2% | ||
| Adtalem Global Education, Inc. | 26,109 | 892,928 |
| Aramark | 91,235 | 3,712,352 |
| Belmond Ltd., Class A * | 34,300 | 437,325 |
| BJ's Restaurants, Inc. * | 7,836 | 235,864 |
| Bloomin' Brands, Inc. | 58,352 | 992,568 |
| Bob Evans Farms, Inc. | 10,425 | 717,032 |
| Boyd Gaming Corp. | 31,929 | 844,203 |
| Bright Horizons Family Solutions, Inc. * | 21,448 | 1,714,339 |
| Brinker International, Inc. | 18,371 | 573,543 |
| Buffalo Wild Wings, Inc. * | 8,574 | 880,978 |
| Caesars Entertainment Corp. *(a) | 39,833 | 462,063 |
| Capella Education Co. | 7,628 | 513,746 |
| Carnival Corp. | 166,203 | 11,547,784 |
| Carriage Services, Inc. | 5,067 | 124,091 |
| Chipotle Mexican Grill, Inc. * | 10,978 | 3,476,842 |
| Choice Hotels International, Inc. | 14,839 | 920,760 |
| Churchill Downs, Inc. | 4,147 | 810,324 |
| Chuy's Holdings, Inc. * | 11,992 | 225,450 |
| ClubCorp Holdings, Inc. | 28,328 | 481,576 |
| Cracker Barrel Old Country Store, Inc. (a) | 10,290 | 1,529,711 |
| Darden Restaurants, Inc. | 48,328 | 3,967,246 |
| Dave & Buster's Entertainment, Inc. * | 17,994 | 1,051,929 |
| Denny's Corp. * | 34,530 | 412,979 |
| Domino's Pizza, Inc. | 17,985 | 3,277,946 |
| Dunkin' Brands Group, Inc. | 38,431 | 1,981,502 |
| Eldorado Resorts, Inc. * | 23,218 | 534,014 |
| Extended Stay America, Inc. | 65,169 | 1,276,661 |
| Graham Holdings Co., Class B | 1,912 | 1,122,726 |
| Grand Canyon Education, Inc. * | 16,699 | 1,370,153 |
| H&R Block, Inc. | 75,954 | 2,031,010 |
| Hilton Grand Vacations, Inc. * | 19,863 | 720,034 |
| Hilton Worldwide Holdings, Inc. | 76,125 | 4,897,121 |
| Houghton Mifflin Harcourt Co. * | 67,855 | 692,121 |
| Hyatt Hotels Corp., Class A * | 22,334 | 1,329,096 |
| ILG, Inc. | 43,046 | 1,136,414 |
| International Speedway Corp., Class A | 10,432 | 371,901 |
| Jack in the Box, Inc. | 14,276 | 1,336,519 |
| K12, Inc. * | 24,916 | 446,495 |
| La Quinta Holdings, Inc. * | 41,444 | 654,815 |
| Las Vegas Sands Corp. | 142,263 | 8,850,181 |
| Laureate Education, Inc., Class A * | 27,824 | 407,343 |
| Marriott International, Inc., Class A | 125,348 | 12,983,546 |
| Marriott Vacations Worldwide Corp. | 10,492 | 1,220,849 |
| McDonald's Corp. | 324,259 | 51,871,712 |
| MGM Resorts International | 186,081 | 6,133,230 |
| Norwegian Cruise Line Holdings Ltd. * | 61,841 | 3,677,066 |
| Papa John's International, Inc. | 13,976 | 1,045,265 |
| Penn National Gaming, Inc. * | 24,210 | 537,220 |
| Pinnacle Entertainment, Inc. * | 21,179 | 412,991 |
| Planet Fitness, Inc., Class A | 35,750 | 906,977 |
| Red Robin Gourmet Burgers, Inc. * | 7,768 | 442,776 |
| Regis Corp. * | 20,836 | 276,702 |
| Royal Caribbean Cruises Ltd. | 68,560 | 8,532,978 |
| Ruth's Hospitality Group, Inc. | 24,348 | 476,003 |
| Scientific Games Corp., Class A * | 12,052 | 424,230 |
| SeaWorld Entertainment, Inc. (a) | 35,570 | 461,699 |
| Service Corp. International | 79,325 | 2,803,345 |
| ServiceMaster Global Holdings, Inc. * | 55,256 | 2,603,663 |
| Shake Shack, Inc., Class A *(a) | 12,161 | 376,018 |
| Six Flags Entertainment Corp. | 32,502 | 1,773,634 |
| Sonic Corp. | 24,010 | 562,074 |
| Sotheby's * | 24,106 | 1,081,636 |
| Security | Number of Shares | Value ($) |
| Starbucks Corp. | 579,726 | 31,803,768 |
| Strayer Education, Inc. | 7,328 | 586,313 |
| Texas Roadhouse, Inc. | 24,010 | 1,139,274 |
| The Cheesecake Factory, Inc. | 17,592 | 728,837 |
| The Marcus Corp. | 15,112 | 376,289 |
| The Wendy's Co. | 64,279 | 959,043 |
| Vail Resorts, Inc. | 15,920 | 3,628,964 |
| Weight Watchers International, Inc. * | 18,415 | 862,006 |
| Wingstop, Inc. | 21,670 | 702,325 |
| Wyndham Worldwide Corp. | 39,878 | 3,975,039 |
| Wynn Resorts Ltd. | 32,980 | 4,583,890 |
| Yum! Brands, Inc. | 136,238 | 10,465,803 |
| 227,376,850 | ||
| Diversified Financials 5.2% | ||
| Affiliated Managers Group, Inc. | 23,580 | 4,166,350 |
| AG Mortgage Investment Trust, Inc. | 24,548 | 473,040 |
| AGNC Investment Corp. | 144,576 | 3,114,167 |
| Ally Financial, Inc. | 192,520 | 4,350,952 |
| American Express Co. | 298,882 | 25,733,740 |
| Ameriprise Financial, Inc. | 62,159 | 8,609,643 |
| Annaly Capital Management, Inc. | 429,761 | 5,372,013 |
| Anworth Mortgage Asset Corp. | 55,616 | 337,033 |
| Apollo Commercial Real Estate Finance, Inc. | 28,075 | 507,877 |
| ARMOUR Residential REIT, Inc. | 27,604 | 729,022 |
| Artisan Partners Asset Management, Inc., Class A | 22,424 | 688,417 |
| Berkshire Hathaway, Inc., Class B * | 763,080 | 138,239,573 |
| BGC Partners, Inc., Class A | 90,005 | 1,169,165 |
| BlackRock, Inc. | 48,157 | 20,178,265 |
| Blackstone Mortgage Trust, Inc., Class A | 35,121 | 1,101,043 |
| Capital One Financial Corp. | 195,274 | 15,545,763 |
| Capstead Mortgage Corp. | 41,160 | 398,017 |
| CBOE Holdings, Inc. | 31,396 | 3,167,542 |
| Chimera Investment Corp. | 73,221 | 1,396,324 |
| CME Group, Inc. | 135,986 | 17,107,039 |
| Cohen & Steers, Inc. | 10,290 | 389,374 |
| Credit Acceptance Corp. *(a) | 5,430 | 1,478,589 |
| CYS Investments, Inc. | 59,247 | 520,781 |
| Diamond Hill Investment Group, Inc. | 1,300 | 255,229 |
| Discover Financial Services | 154,576 | 9,112,255 |
| E*TRADE Financial Corp. * | 106,778 | 4,378,966 |
| Eaton Vance Corp. | 44,590 | 2,121,592 |
| Encore Capital Group, Inc. * | 15,980 | 644,793 |
| Evercore, Inc., Class A | 21,644 | 1,633,040 |
| FactSet Research Systems, Inc. | 17,150 | 2,695,637 |
| Federated Investors, Inc., Class B | 39,857 | 1,088,495 |
| Financial Engines, Inc. | 28,814 | 952,303 |
| FirstCash, Inc. | 16,212 | 951,644 |
| FNFV Group * | 34,334 | 578,528 |
| Franklin Resources, Inc. | 137,140 | 5,928,562 |
| Green Dot Corp., Class A * | 15,100 | 727,518 |
| Greenhill & Co., Inc. | 24,121 | 363,021 |
| Hannon Armstrong Sustainable Infrastructure Capital, Inc. | 29,396 | 681,987 |
| Interactive Brokers Group, Inc., Class A | 34,665 | 1,453,503 |
| Intercontinental Exchange, Inc. | 235,426 | 15,224,999 |
| INTL FCStone, Inc. * | 2,004 | 71,122 |
| Invesco Ltd. | 162,278 | 5,319,473 |
| Invesco Mortgage Capital, Inc. | 55,064 | 934,987 |
| Investment Technology Group, Inc. | 14,264 | 286,564 |
| Janus Henderson Group plc | 55,746 | 1,926,582 |
| Ladder Capital Corp., Class A | 28,023 | 384,476 |
| Lazard Ltd., Class A | 51,514 | 2,209,435 |
| Legg Mason, Inc. | 38,723 | 1,478,831 |
| LendingClub Corp. * | 127,825 | 791,237 |
| Security | Number of Shares | Value ($) |
| Leucadia National Corp. | 134,655 | 3,188,630 |
| LPL Financial Holdings, Inc. | 34,270 | 1,605,207 |
| MarketAxess Holdings, Inc. | 15,180 | 2,928,981 |
| MFA Financial, Inc. | 133,770 | 1,174,501 |
| Moelis & Co., Class A | 14,556 | 573,506 |
| Moody's Corp. | 65,950 | 8,839,279 |
| Morgan Stanley | 568,105 | 25,848,777 |
| Morningstar, Inc. | 7,174 | 593,290 |
| MSCI, Inc. | 37,697 | 4,320,453 |
| MTGE Investment Corp. | 24,160 | 463,872 |
| Nasdaq, Inc. | 44,678 | 3,367,828 |
| Navient Corp. | 131,684 | 1,738,229 |
| Nelnet, Inc., Class A | 10,366 | 491,659 |
| New Residential Investment Corp. | 121,599 | 2,003,952 |
| New York Mortgage Trust, Inc. | 88,275 | 552,602 |
| Northern Trust Corp. | 82,320 | 7,285,320 |
| PennyMac Mortgage Investment Trust | 32,314 | 558,709 |
| Piper Jaffray Cos. | 10,695 | 593,038 |
| PJT Partners, Inc., Class A | 4,928 | 190,516 |
| PRA Group, Inc. * | 17,860 | 516,154 |
| Raymond James Financial, Inc. | 45,254 | 3,544,293 |
| Redwood Trust, Inc. | 37,730 | 629,336 |
| S&P Global, Inc. | 101,956 | 15,734,869 |
| Santander Consumer USA Holdings, Inc. * | 49,451 | 706,160 |
| SEI Investments Co. | 48,608 | 2,841,624 |
| SLM Corp. * | 165,464 | 1,682,769 |
| Starwood Property Trust, Inc. | 89,559 | 1,989,105 |
| State Street Corp. | 142,653 | 13,193,976 |
| Stifel Financial Corp. | 21,255 | 1,014,926 |
| Synchrony Financial | 304,043 | 9,361,484 |
| T. Rowe Price Group, Inc. | 96,040 | 8,101,934 |
| TD Ameritrade Holding Corp. | 100,934 | 4,372,461 |
| The Bank of New York Mellon Corp. | 416,076 | 21,752,453 |
| The Charles Schwab Corp. (b) | 480,215 | 19,160,579 |
| The Goldman Sachs Group, Inc. | 146,201 | 32,711,012 |
| Two Harbors Investment Corp. | 130,924 | 1,339,353 |
| Virtu Financial, Inc., Class A (a) | 28,624 | 513,801 |
| Virtus Investment Partners, Inc. | 4,445 | 471,170 |
| Voya Financial, Inc. | 73,751 | 2,819,501 |
| Waddell & Reed Financial, Inc., Class A | 38,457 | 715,685 |
| Westwood Holdings Group, Inc. | 7,496 | 458,230 |
| WisdomTree Investments, Inc. | 47,036 | 431,320 |
| 527,349,052 | ||
| Energy 5.3% | ||
| Anadarko Petroleum Corp. | 223,792 | 9,159,807 |
| Andeavor | 59,432 | 5,952,115 |
| Antero Resources Corp. * | 55,206 | 1,087,006 |
| Apache Corp. | 158,402 | 6,152,334 |
| Arch Coal, Inc., Class A | 8,924 | 712,760 |
| Archrock, Inc. | 34,302 | 349,880 |
| Atwood Oceanics, Inc. *(a) | 29,896 | 196,417 |
| Baker Hughes a GE Co. | 172,716 | 5,855,072 |
| Bristow Group, Inc. | 12,893 | 106,238 |
| C&J Energy Services, Inc. * | 30,024 | 758,406 |
| Cabot Oil & Gas Corp. | 186,866 | 4,774,426 |
| Callon Petroleum Co. * | 82,526 | 854,969 |
| Centennial Resource Development, Inc., Class A * | 34,540 | 597,197 |
| Cheniere Energy, Inc. * | 96,207 | 4,116,697 |
| Chesapeake Energy Corp. *(a) | 305,342 | 1,111,445 |
| Chevron Corp. | 753,310 | 81,071,222 |
| Cimarex Energy Co. | 37,859 | 3,774,164 |
| Concho Resources, Inc. * | 58,956 | 6,542,347 |
| ConocoPhillips | 492,171 | 21,488,186 |
| CONSOL Energy, Inc. * | 70,073 | 1,019,562 |
| Security | Number of Shares | Value ($) |
| Continental Resources, Inc. * | 34,578 | 1,172,886 |
| Core Laboratories N.V. | 17,170 | 1,514,051 |
| Delek US Holdings, Inc. | 24,909 | 615,750 |
| Devon Energy Corp. | 213,027 | 6,689,048 |
| Diamondback Energy, Inc. * | 40,502 | 3,677,177 |
| Dril-Quip, Inc. * | 15,192 | 570,460 |
| Energen Corp. * | 35,460 | 1,818,389 |
| Energy XXI Gulf Coast, Inc. * | 21,418 | 223,818 |
| Ensco plc, Class A (a) | 121,245 | 515,291 |
| EOG Resources, Inc. | 231,036 | 19,635,750 |
| EQT Corp. | 69,935 | 4,359,748 |
| Exterran Corp. * | 18,060 | 500,984 |
| Extraction Oil & Gas, Inc. * | 32,305 | 424,488 |
| Exxon Mobil Corp. | 1,695,280 | 129,400,722 |
| Forum Energy Technologies, Inc. * | 41,820 | 485,112 |
| Frank's International N.V. (a) | 46,985 | 295,066 |
| Green Plains, Inc. | 25,916 | 480,742 |
| Gulfport Energy Corp. * | 87,625 | 1,097,941 |
| Halliburton Co. | 354,786 | 13,826,010 |
| Helix Energy Solutions Group, Inc. * | 66,316 | 415,801 |
| Helmerich & Payne, Inc. (a) | 45,154 | 1,911,820 |
| Hess Corp. | 107,021 | 4,163,117 |
| HollyFrontier Corp. | 83,193 | 2,604,773 |
| Kinder Morgan, Inc. | 778,403 | 15,046,530 |
| Kosmos Energy Ltd. * | 107,528 | 756,997 |
| Laredo Petroleum, Inc. * | 53,465 | 664,035 |
| Marathon Oil Corp. | 333,233 | 3,705,551 |
| Marathon Petroleum Corp. | 212,137 | 11,126,586 |
| Matador Resources Co. * | 55,105 | 1,299,376 |
| McDermott International, Inc. * | 124,900 | 766,886 |
| Murphy Oil Corp. | 62,276 | 1,411,174 |
| Nabors Industries Ltd. | 116,770 | 764,843 |
| National Oilwell Varco, Inc. | 163,577 | 5,016,907 |
| Natural Gas Services Group, Inc. * | 8,464 | 199,750 |
| Newfield Exploration Co. * | 79,063 | 2,065,916 |
| Newpark Resources, Inc. * | 36,739 | 295,749 |
| Noble Energy, Inc. | 196,436 | 4,669,284 |
| Oasis Petroleum, Inc. * | 79,293 | 578,839 |
| Occidental Petroleum Corp. | 303,135 | 18,097,159 |
| Oceaneering International, Inc. | 41,544 | 936,817 |
| Oil States International, Inc. * | 32,707 | 711,377 |
| ONEOK, Inc. | 150,915 | 8,173,556 |
| Par Pacific Holdings, Inc. * | 31,605 | 562,885 |
| Parsley Energy, Inc., Class A * | 95,960 | 2,403,798 |
| Patterson-UTI Energy, Inc. | 66,072 | 1,055,170 |
| PBF Energy, Inc., Class A (a) | 53,837 | 1,274,860 |
| PDC Energy, Inc. * | 19,507 | 767,210 |
| Peabody Energy Corp. * | 43,236 | 1,253,844 |
| Phillips 66 | 174,802 | 14,650,156 |
| Pioneer Natural Resources Co. | 66,327 | 8,599,296 |
| QEP Resources, Inc. * | 100,469 | 758,541 |
| Range Resources Corp. | 72,672 | 1,261,586 |
| REX American Resources Corp. * | 5,303 | 459,346 |
| Rice Energy, Inc. * | 78,360 | 2,143,930 |
| RPC, Inc. (a) | 31,646 | 614,249 |
| RSP Permian, Inc. * | 40,020 | 1,255,828 |
| Sanchez Energy Corp. *(a) | 53,120 | 232,666 |
| Schlumberger Ltd. | 555,174 | 35,259,101 |
| SEACOR Holdings, Inc. * | 6,860 | 263,218 |
| SEACOR Marine Holdings, Inc. * | 6,893 | 88,299 |
| SemGroup Corp., Class A | 20,686 | 531,630 |
| SM Energy Co. | 38,816 | 518,582 |
| Southwestern Energy Co. * | 202,699 | 1,104,710 |
| SRC Energy, Inc. * | 76,808 | 606,015 |
| Targa Resources Corp. | 89,203 | 3,975,778 |
| TechnipFMC plc * | 178,850 | 4,619,695 |
| The Williams Cos., Inc. | 334,848 | 9,955,031 |
| Transocean Ltd. * | 151,618 | 1,237,203 |
| Security | Number of Shares | Value ($) |
| Unit Corp. * | 34,280 | 545,738 |
| US Silica Holdings, Inc. | 27,504 | 748,384 |
| Valero Energy Corp. | 182,947 | 12,458,691 |
| Weatherford International plc * | 408,411 | 1,564,214 |
| Whiting Petroleum Corp. * | 115,684 | 517,107 |
| World Fuel Services Corp. | 40,221 | 1,389,233 |
| WPX Energy, Inc. * | 170,128 | 1,699,579 |
| 542,742,099 | ||
| Food & Staples Retailing 1.6% | ||
| Casey's General Stores, Inc. | 15,932 | 1,679,551 |
| Costco Wholesale Corp. | 175,027 | 27,433,732 |
| CVS Health Corp. | 407,210 | 31,493,621 |
| Ingles Markets, Inc., Class A | 7,828 | 171,825 |
| Performance Food Group Co. * | 41,840 | 1,163,152 |
| PriceSmart, Inc. | 11,148 | 905,775 |
| Rite Aid Corp. * | 474,427 | 1,148,113 |
| Smart & Final Stores, Inc. * | 10,793 | 76,091 |
| SpartanNash Co. | 8,856 | 218,212 |
| Sprouts Farmers Market, Inc. * | 51,835 | 1,033,590 |
| SUPERVALU, Inc. * | 19,271 | 385,227 |
| Sysco Corp. | 203,425 | 10,714,395 |
| The Andersons, Inc. | 10,690 | 340,477 |
| The Kroger Co. | 377,588 | 8,257,850 |
| United Natural Foods, Inc. * | 16,024 | 556,834 |
| US Foods Holding Corp. * | 52,970 | 1,454,026 |
| Wal-Mart Stores, Inc. | 587,739 | 45,884,784 |
| Walgreens Boots Alliance, Inc. | 337,979 | 27,545,288 |
| Weis Markets, Inc. | 6,860 | 303,281 |
| 160,765,824 | ||
| Food, Beverage & Tobacco 4.3% | ||
| Altria Group, Inc. | 773,439 | 49,036,033 |
| Archer-Daniels-Midland Co. | 225,888 | 9,333,692 |
| B&G Foods, Inc. | 29,176 | 889,868 |
| Blue Buffalo Pet Products, Inc. * | 35,615 | 917,442 |
| Brown-Forman Corp., Class A | 20,864 | 1,160,456 |
| Brown-Forman Corp., Class B | 77,806 | 4,126,830 |
| Bunge Ltd. | 56,228 | 4,196,296 |
| Cal-Maine Foods, Inc. *(a) | 21,682 | 790,309 |
| Calavo Growers, Inc. | 7,928 | 532,365 |
| Campbell Soup Co. | 77,802 | 3,594,452 |
| Coca-Cola Bottling Co. Consolidated | 1,500 | 320,385 |
| ConAgra Brands, Inc. | 165,060 | 5,357,848 |
| Constellation Brands, Inc., Class A | 68,569 | 13,720,657 |
| Darling Ingredients, Inc. * | 73,868 | 1,285,303 |
| Dean Foods Co. | 34,453 | 378,983 |
| Dr. Pepper Snapple Group, Inc. | 72,881 | 6,635,815 |
| Flowers Foods, Inc. | 86,233 | 1,497,867 |
| Fresh Del Monte Produce, Inc. | 17,150 | 805,879 |
| General Mills, Inc. | 230,725 | 12,288,414 |
| Hormel Foods Corp. | 109,760 | 3,374,022 |
| Hostess Brands, Inc. * | 33,727 | 449,918 |
| Ingredion, Inc. | 29,419 | 3,642,661 |
| J&J Snack Foods Corp. | 7,977 | 1,016,988 |
| Kellogg Co. | 96,566 | 6,321,210 |
| Lamb Weston Holdings, Inc. | 55,020 | 2,502,310 |
| Lancaster Colony Corp. | 6,872 | 800,382 |
| McCormick & Co., Inc. Non-Voting Shares | 42,844 | 4,075,750 |
| MGP Ingredients, Inc. | 9,390 | 528,000 |
| Molson Coors Brewing Co., Class B | 76,944 | 6,905,724 |
| Mondelez International, Inc., Class A | 603,391 | 24,533,878 |
| Monster Beverage Corp. * | 164,766 | 9,197,238 |
| National Beverage Corp. | 6,345 | 737,352 |
| PepsiCo, Inc. | 566,461 | 65,556,532 |
| Security | Number of Shares | Value ($) |
| Philip Morris International, Inc. | 621,094 | 72,624,521 |
| Pilgrim's Pride Corp. * | 31,247 | 920,224 |
| Pinnacle Foods, Inc. | 48,055 | 2,850,142 |
| Post Holdings, Inc. * | 28,949 | 2,464,428 |
| Sanderson Farms, Inc. | 7,528 | 1,110,531 |
| Seaboard Corp. | 76 | 326,471 |
| Snyder's-Lance, Inc. | 29,418 | 1,044,927 |
| The Coca-Cola Co. | 1,529,206 | 69,655,333 |
| The Hain Celestial Group, Inc. * | 52,065 | 2,094,054 |
| The Hershey Co. | 53,520 | 5,615,318 |
| The J.M. Smucker Co. | 44,857 | 4,699,219 |
| The Kraft Heinz Co. | 238,022 | 19,220,277 |
| Tootsie Roll Industries, Inc. (a) | 11,238 | 419,739 |
| TreeHouse Foods, Inc. * | 24,087 | 1,613,588 |
| Tyson Foods, Inc., Class A | 113,510 | 7,185,183 |
| Universal Corp. | 11,966 | 684,455 |
| Vector Group Ltd. | 36,306 | 784,210 |
| 439,823,479 | ||
| Health Care Equipment & Services 5.5% | ||
| Abaxis, Inc. | 14,847 | 686,228 |
| Abbott Laboratories | 698,922 | 35,603,087 |
| ABIOMED, Inc. * | 17,331 | 2,613,515 |
| Acadia Healthcare Co., Inc. * | 36,770 | 1,725,984 |
| Accuray, Inc. * | 63,052 | 261,666 |
| Aetna, Inc. | 131,496 | 20,736,919 |
| Alere, Inc. * | 30,870 | 1,526,830 |
| Align Technology, Inc. * | 29,702 | 5,249,531 |
| Allscripts Healthcare Solutions, Inc. * | 53,960 | 709,034 |
| Amedisys, Inc. * | 8,195 | 428,107 |
| AmerisourceBergen Corp. | 66,815 | 5,361,904 |
| AMN Healthcare Services, Inc. * | 25,010 | 934,123 |
| Analogic Corp. | 3,634 | 260,013 |
| AngioDynamics, Inc. * | 32,127 | 547,123 |
| Anika Therapeutics, Inc. * | 8,224 | 441,629 |
| Anthem, Inc. | 104,843 | 20,553,422 |
| athenahealth, Inc. * | 18,065 | 2,545,900 |
| AtriCure, Inc. * | 26,309 | 590,111 |
| Atrion Corp. | 600 | 373,290 |
| Baxter International, Inc. | 199,269 | 12,362,649 |
| Becton Dickinson & Co. | 90,923 | 18,133,683 |
| BioTelemetry, Inc. * | 8,194 | 304,407 |
| Boston Scientific Corp. * | 552,265 | 15,214,901 |
| Brookdale Senior Living, Inc. * | 73,449 | 890,936 |
| C.R. Bard, Inc. | 27,801 | 8,918,839 |
| Cantel Medical Corp. | 14,273 | 1,159,681 |
| Cardinal Health, Inc. | 127,204 | 8,581,182 |
| Cardiovascular Systems, Inc. * | 22,788 | 669,284 |
| Centene Corp. * | 72,855 | 6,473,167 |
| Cerner Corp. * | 113,872 | 7,718,244 |
| Chemed Corp. | 6,907 | 1,362,682 |
| Cigna Corp. | 103,111 | 18,772,389 |
| Community Health Systems, Inc. * | 55,920 | 427,229 |
| CONMED Corp. | 10,327 | 512,219 |
| Cotiviti Holdings, Inc. * | 13,109 | 468,385 |
| CryoLife, Inc. * | 26,121 | 543,317 |
| Danaher Corp. | 251,056 | 20,943,092 |
| DaVita, Inc. * | 59,843 | 3,504,406 |
| DENTSPLY SIRONA, Inc. | 91,374 | 5,169,027 |
| DexCom, Inc. * | 35,258 | 2,630,599 |
| Diplomat Pharmacy, Inc. * | 26,721 | 447,577 |
| Edwards Lifesciences Corp. * | 83,504 | 9,491,065 |
| Envision Healthcare Corp. * | 46,711 | 2,448,124 |
| Evolent Health, Inc., Class A * | 19,115 | 319,221 |
| Express Scripts Holding Co. * | 242,086 | 15,207,843 |
| GenMark Diagnostics, Inc. * | 39,004 | 379,899 |
| Globus Medical, Inc., Class A * | 36,897 | 1,115,396 |
| Security | Number of Shares | Value ($) |
| Haemonetics Corp. * | 20,580 | 885,352 |
| Halyard Health, Inc. * | 17,449 | 790,265 |
| HCA Healthcare, Inc. * | 117,473 | 9,240,426 |
| HealthEquity, Inc. * | 18,460 | 789,534 |
| HealthSouth Corp. | 34,300 | 1,569,225 |
| HealthStream, Inc. * | 14,212 | 333,840 |
| Henry Schein, Inc. * | 31,412 | 5,455,636 |
| Hill-Rom Holdings, Inc. | 24,010 | 1,847,810 |
| HMS Holdings Corp. * | 39,004 | 691,151 |
| Hologic, Inc. * | 115,177 | 4,445,832 |
| Humana, Inc. | 56,487 | 14,552,181 |
| ICU Medical, Inc. * | 6,084 | 1,060,745 |
| IDEXX Laboratories, Inc. * | 34,912 | 5,426,372 |
| Inogen, Inc. * | 7,228 | 692,442 |
| Inovalon Holdings, Inc., Class A *(a) | 36,730 | 497,692 |
| Insulet Corp. * | 25,916 | 1,504,683 |
| Integer Holdings Corp. * | 15,242 | 700,370 |
| Integra LifeSciences Holdings Corp. * | 20,608 | 1,050,802 |
| Intuitive Surgical, Inc. * | 14,412 | 14,479,304 |
| K2M Group Holdings, Inc. * | 18,520 | 432,998 |
| Kindred Healthcare, Inc. | 47,439 | 384,256 |
| Laboratory Corp. of America Holdings * | 41,528 | 6,514,497 |
| LHC Group, Inc. * | 7,828 | 510,777 |
| LifePoint Health, Inc. * | 14,304 | 828,917 |
| LivaNova plc * | 18,118 | 1,133,824 |
| Magellan Health, Inc. * | 13,720 | 1,109,948 |
| Masimo Corp. * | 20,580 | 1,736,540 |
| McKesson Corp. | 84,790 | 12,659,995 |
| Medidata Solutions, Inc. * | 18,754 | 1,405,800 |
| MEDNAX, Inc. * | 34,900 | 1,565,265 |
| Medtronic plc | 546,858 | 44,087,692 |
| Meridian Bioscience, Inc. | 32,727 | 454,905 |
| Merit Medical Systems, Inc. * | 17,150 | 708,295 |
| Molina Healthcare, Inc. * | 14,868 | 951,552 |
| National HealthCare Corp. | 3,483 | 217,130 |
| Natus Medical, Inc. * | 10,847 | 364,459 |
| Neogen Corp. * | 14,310 | 985,959 |
| Nevro Corp. * | 8,028 | 691,853 |
| NuVasive, Inc. * | 18,523 | 1,157,317 |
| NxStage Medical, Inc. * | 22,512 | 630,336 |
| Omnicell, Inc. * | 12,721 | 652,587 |
| OraSure Technologies, Inc. * | 17,791 | 363,114 |
| Orthofix International N.V. * | 10,792 | 531,074 |
| Owens & Minor, Inc. | 24,010 | 670,839 |
| Patterson Cos., Inc. | 31,064 | 1,195,964 |
| Penumbra, Inc. * | 10,861 | 934,046 |
| PharMerica Corp. * | 17,715 | 520,821 |
| Premier, Inc., Class A * | 26,409 | 884,701 |
| Quality Systems, Inc. * | 29,412 | 463,239 |
| Quest Diagnostics, Inc. | 52,234 | 5,659,554 |
| Quidel Corp. * | 10,879 | 380,112 |
| ResMed, Inc. | 54,880 | 4,257,590 |
| Select Medical Holdings Corp. * | 53,005 | 985,893 |
| STERIS plc | 30,944 | 2,697,079 |
| Stryker Corp. | 122,553 | 17,325,318 |
| Teladoc, Inc. * | 22,770 | 763,934 |
| Teleflex, Inc. | 17,150 | 3,631,512 |
| Tenet Healthcare Corp. *(a) | 31,621 | 542,933 |
| The Cooper Cos., Inc. | 19,692 | 4,939,344 |
| The Ensign Group, Inc. | 29,196 | 599,686 |
| The Providence Service Corp. * | 8,128 | 421,274 |
| Tivity Health, Inc. * | 18,225 | 714,420 |
| Triple-S Management Corp., Class B * | 18,420 | 455,158 |
| UnitedHealth Group, Inc. | 386,220 | 76,819,158 |
| Universal Health Services, Inc., Class B | 34,300 | 3,708,859 |
| US Physical Therapy, Inc. | 8,028 | 480,877 |
| Varex Imaging Corp. * | 14,235 | 434,595 |
| Varian Medical Systems, Inc. * | 35,589 | 3,781,331 |
| Security | Number of Shares | Value ($) |
| VCA, Inc. * | 30,870 | 2,869,675 |
| Veeva Systems, Inc., Class A * | 46,057 | 2,740,391 |
| WellCare Health Plans, Inc. * | 17,150 | 2,995,762 |
| West Pharmaceutical Services, Inc. | 27,440 | 2,388,378 |
| Wright Medical Group N.V. * | 42,596 | 1,260,842 |
| Zimmer Biomet Holdings, Inc. | 77,159 | 8,816,959 |
| 565,750,855 | ||
| Household & Personal Products 1.7% | ||
| Avon Products, Inc. * | 190,540 | 474,445 |
| Central Garden & Pet Co., Class A * | 14,080 | 479,987 |
| Church & Dwight Co., Inc. | 99,925 | 5,013,237 |
| Colgate-Palmolive Co. | 353,761 | 25,343,438 |
| Coty, Inc., Class A | 196,722 | 3,261,651 |
| Edgewell Personal Care Co. * | 24,124 | 1,831,977 |
| Energizer Holdings, Inc. | 24,124 | 1,065,075 |
| Herbalife Ltd. *(a) | 32,074 | 2,213,427 |
| HRG Group, Inc. * | 56,158 | 886,735 |
| Kimberly-Clark Corp. | 141,404 | 17,433,699 |
| Nu Skin Enterprises, Inc., Class A | 24,640 | 1,498,851 |
| Revlon, Inc., Class A *(a) | 10,649 | 179,968 |
| Spectrum Brands Holdings, Inc. | 11,193 | 1,230,782 |
| The Clorox Co. | 52,281 | 7,242,487 |
| The Estee Lauder Cos., Inc., Class A | 89,566 | 9,582,666 |
| The Procter & Gamble Co. | 1,022,042 | 94,303,815 |
| USANA Health Sciences, Inc. * | 4,288 | 253,850 |
| WD-40 Co. | 7,549 | 822,463 |
| 173,118,553 | ||
| Insurance 2.9% | ||
| Aflac, Inc. | 163,054 | 13,460,108 |
| Alleghany Corp. * | 6,469 | 3,640,559 |
| Ambac Financial Group, Inc. * | 17,255 | 313,868 |
| American Equity Investment Life Holding Co. | 48,595 | 1,348,997 |
| American Financial Group, Inc. | 27,986 | 2,849,255 |
| American International Group, Inc. | 350,312 | 21,186,870 |
| American National Insurance Co. | 3,557 | 411,580 |
| AMERISAFE, Inc. | 6,866 | 369,391 |
| AmTrust Financial Services, Inc. | 41,072 | 509,293 |
| Aon plc | 103,819 | 14,447,452 |
| Arch Capital Group Ltd. * | 49,038 | 4,773,359 |
| Argo Group International Holdings Ltd. | 11,671 | 702,594 |
| Arthur J. Gallagher & Co. | 70,950 | 4,108,005 |
| Aspen Insurance Holdings Ltd. | 27,440 | 1,240,288 |
| Assurant, Inc. | 22,318 | 2,113,291 |
| Assured Guaranty Ltd. | 50,367 | 2,142,612 |
| Athene Holding Ltd., Class A * | 20,639 | 1,104,393 |
| Axis Capital Holdings Ltd. | 38,499 | 2,319,180 |
| Brighthouse Financial, Inc. * | 39,176 | 2,235,774 |
| Brown & Brown, Inc. | 44,590 | 2,004,766 |
| Chubb Ltd. | 186,278 | 26,343,435 |
| Cincinnati Financial Corp. | 58,310 | 4,480,540 |
| CNA Financial Corp. | 13,736 | 673,888 |
| CNO Financial Group, Inc. | 86,158 | 1,925,631 |
| Employers Holdings, Inc. | 13,720 | 578,298 |
| Enstar Group Ltd. * | 5,087 | 1,055,807 |
| Erie Indemnity Co., Class A | 10,304 | 1,244,620 |
| Everest Re Group Ltd. | 17,272 | 4,360,835 |
| FBL Financial Group, Inc., Class A | 7,132 | 484,976 |
| First American Financial Corp. | 41,160 | 2,019,310 |
| FNF Group | 103,009 | 4,969,154 |
| Genworth Financial, Inc., Class A * | 202,734 | 695,378 |
| Horace Mann Educators Corp. | 14,325 | 503,524 |
| Infinity Property & Casualty Corp. | 3,430 | 303,383 |
| Kemper Corp. | 20,580 | 985,782 |
| Security | Number of Shares | Value ($) |
| Lincoln National Corp. | 89,885 | 6,099,596 |
| Loews Corp. | 103,675 | 4,829,181 |
| Maiden Holdings Ltd. | 17,515 | 126,984 |
| Markel Corp. * | 5,490 | 5,775,425 |
| Marsh & McLennan Cos., Inc. | 203,001 | 15,850,318 |
| MBIA, Inc. * | 86,325 | 868,429 |
| Mercury General Corp. | 13,720 | 788,488 |
| MetLife, Inc. | 432,173 | 20,238,662 |
| National General Holdings Corp. | 24,983 | 428,958 |
| National Western Life Group, Inc., Class A | 1,100 | 367,851 |
| Old Republic International Corp. | 89,324 | 1,705,195 |
| Primerica, Inc. | 17,150 | 1,312,832 |
| Principal Financial Group, Inc. | 106,372 | 6,650,377 |
| ProAssurance Corp. | 21,452 | 1,142,319 |
| Prudential Financial, Inc. | 171,706 | 17,527,748 |
| Reinsurance Group of America, Inc. | 27,440 | 3,689,308 |
| RenaissanceRe Holdings Ltd. | 15,410 | 2,144,456 |
| RLI Corp. | 21,528 | 1,152,179 |
| Safety Insurance Group, Inc. | 6,860 | 489,804 |
| Selective Insurance Group, Inc. | 20,580 | 1,037,232 |
| State National Cos., Inc. | 28,224 | 586,212 |
| Stewart Information Services Corp. | 7,632 | 275,363 |
| The Allstate Corp. | 145,426 | 13,161,053 |
| The Hanover Insurance Group, Inc. | 14,648 | 1,438,141 |
| The Hartford Financial Services Group, Inc. | 142,093 | 7,682,969 |
| The Navigators Group, Inc. | 6,872 | 383,458 |
| The Progressive Corp. | 236,287 | 10,982,620 |
| The Travelers Cos., Inc. | 109,975 | 13,326,770 |
| Third Point Reinsurance Ltd. * | 42,356 | 595,102 |
| Torchmark Corp. | 43,099 | 3,317,330 |
| United Fire Group, Inc. | 7,066 | 297,196 |
| Universal Insurance Holdings, Inc. | 21,628 | 463,921 |
| Unum Group | 89,823 | 4,327,672 |
| Validus Holdings Ltd. | 34,539 | 1,732,131 |
| W.R. Berkley Corp. | 41,304 | 2,752,499 |
| White Mountains Insurance Group Ltd. | 1,812 | 1,578,379 |
| Willis Towers Watson plc | 51,861 | 7,699,803 |
| XL Group Ltd. | 111,150 | 4,552,704 |
| 299,284,861 | ||
| Materials 3.3% | ||
| A. Schulman, Inc. | 10,443 | 317,467 |
| AdvanSix, Inc. * | 11,597 | 370,292 |
| Air Products & Chemicals, Inc. | 86,956 | 12,640,794 |
| AK Steel Holding Corp. * | 124,028 | 694,557 |
| Albemarle Corp. | 42,128 | 4,897,801 |
| Alcoa Corp. * | 56,822 | 2,493,349 |
| Allegheny Technologies, Inc. * | 55,108 | 1,147,900 |
| AptarGroup, Inc. | 24,010 | 2,007,476 |
| Ashland Global Holdings, Inc. | 27,772 | 1,723,253 |
| Avery Dennison Corp. | 34,924 | 3,291,936 |
| Axalta Coating Systems Ltd. * | 89,616 | 2,645,464 |
| Balchem Corp. | 13,720 | 1,028,451 |
| Ball Corp. | 151,288 | 6,050,007 |
| Bemis Co., Inc. | 39,524 | 1,684,118 |
| Berry Global Group, Inc. * | 46,807 | 2,632,426 |
| Boise Cascade Co. * | 13,852 | 415,560 |
| Cabot Corp. | 24,010 | 1,264,847 |
| Calgon Carbon Corp. | 20,650 | 251,930 |
| Carpenter Technology Corp. | 17,701 | 717,422 |
| Celanese Corp., Series A | 55,264 | 5,361,713 |
| Century Aluminum Co. * | 39,095 | 763,134 |
| CF Industries Holdings, Inc. | 93,419 | 2,708,217 |
| Chase Corp. | 5,303 | 495,831 |
| Clearwater Paper Corp. * | 10,290 | 478,485 |
| Security | Number of Shares | Value ($) |
| Cleveland-Cliffs, Inc. * | 97,044 | 811,288 |
| Coeur Mining, Inc. * | 96,117 | 841,024 |
| Commercial Metals Co. | 44,590 | 842,305 |
| Compass Minerals International, Inc. (a) | 13,720 | 916,496 |
| Crown Holdings, Inc. * | 55,174 | 3,256,921 |
| Deltic Timber Corp. | 3,658 | 285,470 |
| Domtar Corp. | 27,440 | 1,109,674 |
| E.I. du Pont de Nemours & Co. | 347,451 | 29,161,562 |
| Eagle Materials, Inc. | 17,732 | 1,724,437 |
| Eastman Chemical Co. | 58,310 | 5,026,322 |
| Ecolab, Inc. | 103,683 | 13,820,944 |
| Ferro Corp. * | 31,147 | 600,203 |
| Flotek Industries, Inc. * | 14,232 | 73,722 |
| FMC Corp. | 51,497 | 4,440,071 |
| Freeport-McMoRan, Inc. * | 528,839 | 7,816,240 |
| GCP Applied Technologies, Inc. * | 28,111 | 794,136 |
| Graphic Packaging Holding Co. | 123,599 | 1,612,967 |
| Greif, Inc., Class A | 11,292 | 682,601 |
| H.B. Fuller Co. | 17,392 | 872,905 |
| Hawkins, Inc. | 8,896 | 317,142 |
| Haynes International, Inc. | 6,860 | 209,573 |
| Hecla Mining Co. | 169,812 | 896,607 |
| Huntsman Corp. | 76,248 | 2,025,909 |
| Ingevity Corp. * | 15,375 | 968,164 |
| Innophos Holdings, Inc. | 10,290 | 469,841 |
| Innospec, Inc. | 11,961 | 663,836 |
| International Flavors & Fragrances, Inc. | 30,870 | 4,224,560 |
| International Paper Co. | 165,448 | 8,912,684 |
| Kaiser Aluminum Corp. | 6,860 | 660,755 |
| KapStone Paper & Packaging Corp. | 39,047 | 873,481 |
| Koppers Holdings, Inc. * | 14,248 | 558,522 |
| Kraton Corp. * | 10,588 | 347,604 |
| Louisiana-Pacific Corp. * | 51,450 | 1,310,946 |
| LyondellBasell Industries N.V., Class A | 129,223 | 11,706,312 |
| Martin Marietta Materials, Inc. | 25,086 | 5,317,981 |
| Materion Corp. | 6,966 | 266,101 |
| McEwen Mining, Inc. *(a) | 120,445 | 309,544 |
| Mercer International, Inc. | 35,540 | 392,717 |
| Minerals Technologies, Inc. | 13,748 | 879,872 |
| Monsanto Co. | 178,406 | 20,909,183 |
| Neenah Paper, Inc. | 3,883 | 299,962 |
| NewMarket Corp. | 3,556 | 1,488,222 |
| Newmont Mining Corp. | 210,258 | 8,061,292 |
| Nucor Corp. | 124,746 | 6,874,752 |
| Olin Corp. | 76,701 | 2,472,073 |
| Owens-Illinois, Inc. * | 64,266 | 1,583,514 |
| P.H. Glatfelter Co. | 14,164 | 245,320 |
| Packaging Corp. of America | 37,730 | 4,241,229 |
| Platform Specialty Products Corp. * | 105,160 | 1,228,269 |
| PolyOne Corp. | 34,300 | 1,239,602 |
| PPG Industries, Inc. | 104,244 | 10,874,734 |
| Praxair, Inc. | 113,560 | 14,937,682 |
| Quaker Chemical Corp. | 6,860 | 955,049 |
| Rayonier Advanced Materials, Inc. | 29,024 | 398,209 |
| Reliance Steel & Aluminum Co. | 27,487 | 1,990,609 |
| Royal Gold, Inc. | 24,025 | 2,241,052 |
| RPM International, Inc. | 51,450 | 2,519,507 |
| Schnitzer Steel Industries, Inc., Class A | 24,948 | 671,101 |
| Schweitzer-Mauduit International, Inc. | 13,720 | 520,400 |
| Sealed Air Corp. | 82,474 | 3,660,196 |
| Sensient Technologies Corp. | 20,580 | 1,484,847 |
| Silgan Holdings, Inc. | 34,502 | 1,038,165 |
| Sonoco Products Co. | 37,730 | 1,820,850 |
| Steel Dynamics, Inc. | 97,976 | 3,375,273 |
| Stepan Co. | 6,860 | 530,690 |
| Summit Materials, Inc., Class A * | 58,687 | 1,733,614 |
| The Chemours Co. | 78,242 | 3,839,335 |
| The Dow Chemical Co. | 450,613 | 30,033,356 |
| Security | Number of Shares | Value ($) |
| The Mosaic Co. | 139,637 | 2,789,947 |
| The Scotts Miracle-Gro Co., Class A | 17,150 | 1,639,369 |
| The Sherwin-Williams Co. | 31,777 | 10,780,983 |
| TimkenSteel Corp. * | 25,915 | 384,319 |
| Trinseo S.A. | 14,684 | 982,360 |
| Tronox Ltd., Class A | 48,312 | 999,575 |
| United States Steel Corp. | 75,526 | 2,009,747 |
| US Concrete, Inc. * | 7,628 | 610,621 |
| Valvoline, Inc. | 77,507 | 1,650,124 |
| Vulcan Materials Co. | 51,823 | 6,284,057 |
| W.R. Grace & Co. | 28,111 | 2,009,374 |
| Westlake Chemical Corp. | 14,014 | 1,077,817 |
| WestRock Co. | 96,243 | 5,477,189 |
| Worthington Industries, Inc. | 12,794 | 639,188 |
| 340,686,626 | ||
| Media 3.0% | ||
| AMC Entertainment Holdings, Inc., Class A (a) | 14,556 | 195,050 |
| AMC Networks, Inc., Class A * | 24,010 | 1,459,328 |
| Cable One, Inc. | 1,612 | 1,223,089 |
| CBS Corp., Class B Non-Voting Shares | 152,552 | 9,772,481 |
| Charter Communications, Inc., Class A * | 87,043 | 34,690,117 |
| Cinemark Holdings, Inc. | 52,841 | 1,759,077 |
| Comcast Corp., Class A | 1,885,565 | 76,572,795 |
| Discovery Communications, Inc., Class A * | 55,310 | 1,228,435 |
| Discovery Communications, Inc., Class C * | 86,977 | 1,827,387 |
| DISH Network Corp., Class A * | 86,398 | 4,949,741 |
| Gannett Co., Inc. | 42,327 | 359,356 |
| Gray Television, Inc. * | 46,722 | 668,125 |
| John Wiley & Sons, Inc., Class A | 17,550 | 946,823 |
| Liberty Broadband Corp., Class A * | 8,120 | 823,612 |
| Liberty Broadband Corp., Class C * | 28,426 | 2,886,092 |
| Liberty Global plc LiLAC, Class A * | 24,915 | 648,039 |
| Liberty Global plc LiLAC, Class C * | 47,397 | 1,222,369 |
| Liberty Global plc, Class A * | 104,395 | 3,549,430 |
| Liberty Global plc, Series C * | 252,639 | 8,344,666 |
| Liberty Media Corp. - Liberty Braves, Class C * | 14,015 | 342,947 |
| Liberty Media Corp. - Liberty Formula One, Class A * | 6,895 | 261,527 |
| Liberty Media Corp. - Liberty Formula One, Class C * | 49,831 | 1,958,358 |
| Liberty Media Corp. - Liberty SiriusXM, Class A * | 39,571 | 1,768,824 |
| Liberty Media Corp. - Liberty SiriusXM, Class C * | 73,040 | 3,258,314 |
| Lions Gate Entertainment Corp., Class A * | 21,772 | 647,282 |
| Lions Gate Entertainment Corp., Class B * | 41,448 | 1,163,445 |
| Live Nation Entertainment, Inc. * | 51,541 | 2,059,578 |
| Meredith Corp. | 17,150 | 932,103 |
| MSG Networks, Inc., Class A * | 21,033 | 451,158 |
| New Media Investment Group, Inc. | 22,412 | 309,062 |
| News Corp., Class A | 185,940 | 2,486,018 |
| News Corp., Class B | 43,636 | 597,813 |
| Nexstar Media Group, Inc., Class A | 18,837 | 1,133,987 |
| Omnicom Group, Inc. | 96,238 | 6,965,706 |
| Regal Entertainment Group, Class A | 30,870 | 455,950 |
| Scholastic Corp. | 11,370 | 448,319 |
| Scripps Networks Interactive, Inc., Class A | 38,616 | 3,307,460 |
| Sinclair Broadcast Group, Inc., Class A | 25,161 | 761,120 |
| Security | Number of Shares | Value ($) |
| Sirius XM Holdings, Inc. (a) | 674,579 | 3,878,829 |
| TEGNA, Inc. | 86,092 | 1,086,481 |
| The E.W. Scripps Co., Class A * | 28,563 | 510,706 |
| The Interpublic Group of Cos., Inc. | 164,675 | 3,316,555 |
| The Madison Square Garden Co., Class A * | 7,011 | 1,489,908 |
| The New York Times Co., Class A | 61,740 | 1,151,451 |
| The Walt Disney Co. | 581,726 | 58,870,671 |
| Time Warner, Inc. | 310,446 | 31,386,091 |
| Tribune Media Co., Class A | 29,072 | 1,164,915 |
| Twenty-First Century Fox, Inc., Class A | 419,286 | 11,568,101 |
| Twenty-First Century Fox, Inc., Class B | 190,306 | 5,157,293 |
| Viacom, Inc., Class B | 145,559 | 4,162,987 |
| World Wrestling Entertainment, Inc., Class A | 19,020 | 414,636 |
| 306,593,607 | ||
| Pharmaceuticals, Biotechnology & Life Sciences 8.5% | ||
| AbbVie, Inc. | 639,343 | 48,142,528 |
| ACADIA Pharmaceuticals, Inc. * | 35,050 | 1,248,130 |
| Accelerate Diagnostics, Inc. *(a) | 10,485 | 241,155 |
| Acceleron Pharma, Inc. * | 10,390 | 402,716 |
| Acorda Therapeutics, Inc. * | 20,672 | 429,978 |
| Aduro Biotech, Inc. * | 31,183 | 378,873 |
| Aerie Pharmaceuticals, Inc. * | 11,613 | 666,006 |
| Agilent Technologies, Inc. | 130,340 | 8,435,605 |
| Agios Pharmaceuticals, Inc. * | 14,592 | 923,090 |
| Akorn, Inc. * | 34,690 | 1,141,301 |
| Alder Biopharmaceuticals, Inc. * | 24,515 | 240,247 |
| Alexion Pharmaceuticals, Inc. * | 89,784 | 12,786,139 |
| Alkermes plc * | 63,922 | 3,245,959 |
| Allergan plc | 134,347 | 30,829,950 |
| Alnylam Pharmaceuticals, Inc. * | 34,793 | 2,982,804 |
| Amgen, Inc. | 295,659 | 52,559,300 |
| Amicus Therapeutics, Inc. * | 51,965 | 724,392 |
| Amphastar Pharmaceuticals, Inc. * | 24,009 | 384,384 |
| Arena Pharmaceuticals, Inc. * | 21,561 | 499,784 |
| Array BioPharma, Inc. * | 60,404 | 584,711 |
| Avexis, Inc. * | 8,224 | 767,710 |
| Bio-Rad Laboratories, Inc., Class A * | 8,860 | 1,929,885 |
| Bio-Techne Corp. | 13,720 | 1,698,262 |
| Biogen, Inc. * | 84,820 | 26,850,619 |
| BioMarin Pharmaceutical, Inc. * | 73,748 | 6,651,332 |
| Bioverativ, Inc. * | 43,113 | 2,444,076 |
| Bluebird Bio, Inc. * | 15,448 | 1,928,683 |
| Blueprint Medicines Corp. * | 15,548 | 843,013 |
| Bristol-Myers Squibb Co. | 656,007 | 39,675,303 |
| Bruker Corp. | 41,623 | 1,210,813 |
| Cambrex Corp. * | 20,117 | 1,048,096 |
| Catalent, Inc. * | 49,434 | 2,041,130 |
| Celgene Corp. * | 317,016 | 44,043,033 |
| Celldex Therapeutics, Inc. * | 101,592 | 249,916 |
| Charles River Laboratories International, Inc. * | 17,444 | 1,897,907 |
| Clovis Oncology, Inc. * | 17,135 | 1,303,459 |
| Coherus Biosciences, Inc. * | 11,688 | 168,892 |
| Corcept Therapeutics, Inc. * | 36,062 | 601,154 |
| Cytokinetics, Inc. * | 35,630 | 529,105 |
| Depomed, Inc. * | 20,956 | 127,412 |
| Dermira, Inc. * | 8,400 | 198,156 |
| Eagle Pharmaceuticals, Inc. * | 4,264 | 232,644 |
| Eli Lilly & Co. | 385,437 | 31,332,174 |
| Emergent BioSolutions, Inc. * | 17,245 | 643,756 |
| Endo International plc * | 104,370 | 917,412 |
| Esperion Therapeutics, Inc. * | 13,912 | 687,531 |
| Exact Sciences Corp. * | 43,744 | 1,832,436 |
| Exelixis, Inc. * | 97,582 | 2,853,298 |
| Security | Number of Shares | Value ($) |
| FibroGen, Inc. * | 24,284 | 1,170,489 |
| Genomic Health, Inc. * | 15,412 | 488,560 |
| Gilead Sciences, Inc. | 519,669 | 43,501,492 |
| Global Blood Therapeutics, Inc. * | 14,180 | 431,072 |
| Halozyme Therapeutics, Inc. * | 51,405 | 668,779 |
| Horizon Pharma plc * | 66,612 | 911,252 |
| Illumina, Inc. * | 59,012 | 12,065,594 |
| Impax Laboratories, Inc. * | 23,590 | 510,723 |
| INC Research Holdings, Inc., Class A * | 28,061 | 1,647,181 |
| Incyte Corp. * | 70,883 | 9,740,033 |
| Innoviva, Inc. * | 48,232 | 677,177 |
| Inovio Pharmaceuticals, Inc. * | 50,518 | 300,077 |
| Insmed, Inc. * | 42,456 | 527,304 |
| Intercept Pharmaceuticals, Inc. * | 6,899 | 804,492 |
| Intersect ENT, Inc. * | 10,281 | 317,683 |
| Ionis Pharmaceuticals, Inc. * | 54,391 | 2,916,445 |
| Iovance Biotherapeutics, Inc. * | 37,772 | 217,189 |
| Ironwood Pharmaceuticals, Inc. * | 73,757 | 1,176,424 |
| Jazz Pharmaceuticals plc * | 23,459 | 3,503,836 |
| Johnson & Johnson | 1,078,163 | 142,716,436 |
| Juno Therapeutics, Inc. * | 29,212 | 1,205,579 |
| Keryx Biopharmaceuticals, Inc. *(a) | 86,500 | 623,665 |
| Kite Pharma, Inc. * | 21,094 | 3,754,521 |
| Lannett Co., Inc. *(a) | 10,973 | 192,576 |
| Lexicon Pharmaceuticals, Inc. * | 14,974 | 226,706 |
| Ligand Pharmaceuticals, Inc., Class B * | 7,788 | 1,003,640 |
| Loxo Oncology, Inc. * | 11,135 | 928,659 |
| Luminex Corp. | 17,150 | 331,509 |
| MacroGenics, Inc. * | 27,021 | 510,967 |
| Mallinckrodt plc * | 42,219 | 1,734,357 |
| Merck & Co., Inc. | 1,099,339 | 70,203,789 |
| Mettler-Toledo International, Inc. * | 10,537 | 6,375,833 |
| MiMedx Group, Inc. * | 62,134 | 1,010,920 |
| Momenta Pharmaceuticals, Inc. * | 29,896 | 503,748 |
| Mylan N.V. * | 188,163 | 5,923,371 |
| Myriad Genetics, Inc. * | 26,683 | 813,565 |
| Nektar Therapeutics * | 54,042 | 1,136,503 |
| Neurocrine Biosciences, Inc. * | 36,302 | 2,054,693 |
| Omeros Corp. *(a) | 39,357 | 805,638 |
| OPKO Health, Inc. *(a) | 149,300 | 955,520 |
| Otonomy, Inc. * | 24,309 | 87,512 |
| Pacira Pharmaceuticals, Inc. * | 22,860 | 870,966 |
| PAREXEL International Corp. * | 24,010 | 2,110,239 |
| PerkinElmer, Inc. | 48,717 | 3,263,552 |
| Perrigo Co., plc | 55,504 | 4,382,596 |
| Pfizer, Inc. | 2,398,962 | 81,372,791 |
| Phibro Animal Health Corp., Class A | 11,092 | 393,766 |
| Portola Pharmaceuticals, Inc. * | 24,284 | 1,540,820 |
| PRA Health Sciences, Inc. * | 17,864 | 1,382,674 |
| Prestige Brands Holdings, Inc. * | 24,417 | 1,238,186 |
| Prothena Corp. plc * | 15,548 | 955,269 |
| PTC Therapeutics, Inc. * | 30,124 | 625,073 |
| Puma Biotechnology, Inc. * | 11,684 | 1,080,770 |
| Quintiles IMS Holdings, Inc. * | 57,587 | 5,530,080 |
| Regeneron Pharmaceuticals, Inc. * | 30,917 | 15,362,657 |
| Repligen Corp. * | 18,740 | 818,376 |
| Retrophin, Inc. * | 16,448 | 401,331 |
| Revance Therapeutics, Inc. * | 20,215 | 496,278 |
| Sage Therapeutics, Inc. * | 12,175 | 1,001,394 |
| Sarepta Therapeutics, Inc. * | 20,712 | 834,486 |
| SciClone Pharmaceuticals, Inc. * | 32,012 | 352,132 |
| Seattle Genetics, Inc. * | 41,879 | 2,199,904 |
| Spark Therapeutics, Inc. * | 15,136 | 1,246,147 |
| Supernus Pharmaceuticals, Inc. * | 18,920 | 866,536 |
| Synergy Pharmaceuticals, Inc. *(a) | 91,038 | 271,293 |
| TESARO, Inc. * | 12,890 | 1,664,615 |
| The Medicines Co. * | 32,591 | 1,195,764 |
| TherapeuticsMD, Inc. *(a) | 52,820 | 316,920 |
| Security | Number of Shares | Value ($) |
| Theravance Biopharma, Inc. *(a) | 19,470 | 636,085 |
| Thermo Fisher Scientific, Inc. | 156,165 | 29,224,718 |
| Ultragenyx Pharmaceutical, Inc. * | 17,281 | 986,054 |
| United Therapeutics Corp. * | 17,362 | 2,270,950 |
| Vanda Pharmaceuticals, Inc. * | 27,496 | 472,931 |
| Vertex Pharmaceuticals, Inc. * | 97,742 | 15,691,501 |
| VWR Corp. * | 27,976 | 923,768 |
| Waters Corp. * | 31,012 | 5,690,082 |
| Xencor, Inc. * | 21,122 | 456,658 |
| ZIOPHARM Oncology, Inc. *(a) | 79,436 | 507,596 |
| Zoetis, Inc. | 196,867 | 12,343,561 |
| 867,208,287 | ||
| Real Estate 4.1% | ||
| Acadia Realty Trust | 27,581 | 791,299 |
| Agree Realty Corp. | 13,956 | 699,475 |
| Alexander & Baldwin, Inc. | 17,150 | 744,310 |
| Alexander's, Inc. | 1,299 | 543,878 |
| Alexandria Real Estate Equities, Inc. | 38,032 | 4,613,662 |
| Altisource Residential Corp. | 39,657 | 480,246 |
| American Assets Trust, Inc. | 28,155 | 1,143,656 |
| American Campus Communities, Inc. | 52,520 | 2,499,427 |
| American Homes 4 Rent, Class A | 84,027 | 1,862,038 |
| American Tower Corp. | 169,371 | 25,075,377 |
| Apartment Investment & Management Co., Class A | 66,221 | 3,001,798 |
| Apple Hospitality REIT, Inc. | 62,552 | 1,137,195 |
| Ashford Hospitality Prime, Inc. | 28,596 | 275,094 |
| AvalonBay Communities, Inc. | 55,043 | 10,333,222 |
| Boston Properties, Inc. | 62,255 | 7,507,953 |
| Brandywine Realty Trust | 58,310 | 1,001,766 |
| Brixmor Property Group, Inc. | 107,123 | 2,005,343 |
| Camden Property Trust | 35,729 | 3,197,031 |
| CareTrust REIT, Inc. | 43,119 | 831,766 |
| CBL & Associates Properties, Inc. | 90,678 | 725,424 |
| CBRE Group, Inc., Class A * | 113,407 | 4,091,725 |
| Cedar Realty Trust, Inc. | 28,479 | 143,534 |
| Chatham Lodging Trust | 18,020 | 365,446 |
| Chesapeake Lodging Trust | 24,866 | 636,321 |
| Colony NorthStar, Inc., Class A | 226,224 | 2,965,797 |
| Columbia Property Trust, Inc. | 69,908 | 1,468,068 |
| CoreCivic, Inc. | 46,935 | 1,257,858 |
| CoreSite Realty Corp. | 12,551 | 1,490,557 |
| Corporate Office Properties Trust | 42,256 | 1,409,660 |
| Cousins Properties, Inc. | 177,323 | 1,657,970 |
| Crown Castle International Corp. | 159,336 | 17,278,396 |
| CubeSmart | 69,596 | 1,715,541 |
| CyrusOne, Inc. | 27,717 | 1,747,003 |
| DCT Industrial Trust, Inc. | 36,774 | 2,145,763 |
| DDR Corp. | 170,711 | 1,652,482 |
| DiamondRock Hospitality Co. | 72,068 | 792,027 |
| Digital Realty Trust, Inc. | 62,383 | 7,382,404 |
| Douglas Emmett, Inc. | 61,800 | 2,407,728 |
| Duke Realty Corp. | 138,347 | 4,111,673 |
| DuPont Fabros Technology, Inc. | 35,045 | 2,255,496 |
| EastGroup Properties, Inc. | 13,720 | 1,219,159 |
| Education Realty Trust, Inc. | 29,128 | 1,125,506 |
| Empire State Realty Trust, Inc., Class A | 52,851 | 1,075,518 |
| EPR Properties | 22,384 | 1,559,269 |
| Equinix, Inc. | 31,196 | 14,612,518 |
| Equity Commonwealth * | 45,309 | 1,401,860 |
| Equity LifeStyle Properties, Inc. | 34,300 | 3,057,845 |
| Equity Residential | 148,761 | 9,989,301 |
| Essex Property Trust, Inc. | 26,207 | 6,970,276 |
| Extra Space Storage, Inc. | 52,964 | 4,111,595 |
| Federal Realty Investment Trust | 28,979 | 3,678,304 |
| FelCor Lodging Trust, Inc. | 48,020 | 350,546 |
| Security | Number of Shares | Value ($) |
| First Industrial Realty Trust, Inc. | 48,656 | 1,507,363 |
| Forest City Realty Trust, Inc., Class A | 80,092 | 1,919,004 |
| Four Corners Property Trust, Inc. | 25,226 | 640,993 |
| Franklin Street Properties Corp. | 56,552 | 563,823 |
| Gaming & Leisure Properties, Inc. | 75,412 | 2,955,396 |
| Getty Realty Corp. | 11,985 | 330,307 |
| GGP, Inc. | 247,576 | 5,137,202 |
| Global Net Lease, Inc. | 24,367 | 527,789 |
| Government Properties Income Trust | 27,828 | 516,209 |
| Gramercy Property Trust | 55,156 | 1,680,052 |
| HCP, Inc. | 192,168 | 5,728,528 |
| Healthcare Realty Trust, Inc. | 45,648 | 1,519,165 |
| Healthcare Trust of America, Inc., Class A | 68,819 | 2,138,206 |
| Hersha Hospitality Trust | 24,225 | 449,132 |
| HFF, Inc., Class A | 17,150 | 653,929 |
| Highwoods Properties, Inc. | 37,966 | 1,982,964 |
| Hospitality Properties Trust | 55,946 | 1,530,683 |
| Host Hotels & Resorts, Inc. | 278,910 | 5,053,849 |
| Hudson Pacific Properties, Inc. | 62,882 | 2,075,106 |
| InfraREIT, Inc. | 16,212 | 364,608 |
| Investors Real Estate Trust | 80,508 | 505,590 |
| Invitation Homes, Inc. | 59,429 | 1,375,187 |
| Iron Mountain, Inc. | 105,471 | 4,157,667 |
| iStar, Inc. * | 27,464 | 318,857 |
| JBG SMITH Properties * | 35,903 | 1,175,105 |
| Jones Lang LaSalle, Inc. | 17,150 | 2,090,756 |
| Kennedy-Wilson Holdings, Inc. | 36,404 | 702,597 |
| Kilroy Realty Corp. | 38,400 | 2,658,432 |
| Kimco Realty Corp. | 176,684 | 3,466,540 |
| Kite Realty Group Trust | 24,848 | 499,942 |
| Lamar Advertising Co., Class A | 31,562 | 2,100,767 |
| LaSalle Hotel Properties | 55,697 | 1,580,681 |
| Lexington Realty Trust | 68,614 | 676,534 |
| Liberty Property Trust | 55,128 | 2,348,453 |
| Life Storage, Inc. | 18,675 | 1,374,293 |
| LTC Properties, Inc. | 14,492 | 704,746 |
| Mack-Cali Realty Corp. | 32,068 | 734,037 |
| Medical Properties Trust, Inc. | 138,862 | 1,827,424 |
| Mid-America Apartment Communities, Inc. | 43,434 | 4,623,984 |
| Monmouth Real Estate Investment Corp., Class A | 24,908 | 404,755 |
| Monogram Residential Trust, Inc. | 100,232 | 1,202,784 |
| National Health Investors, Inc. | 15,763 | 1,263,877 |
| National Retail Properties, Inc. | 55,268 | 2,311,860 |
| National Storage Affiliates Trust | 24,009 | 535,881 |
| New Senior Investment Group, Inc. | 65,272 | 602,461 |
| NorthStar Realty Europe Corp. | 21,610 | 268,612 |
| Omega Healthcare Investors, Inc. | 83,194 | 2,651,393 |
| One Liberty Properties, Inc. | 10,388 | 249,416 |
| Outfront Media, Inc. | 50,270 | 1,105,940 |
| Paramount Group, Inc. | 55,522 | 876,137 |
| Park Hotels & Resorts, Inc. | 65,686 | 1,753,159 |
| Parkway, Inc. | 21,854 | 501,768 |
| Pebblebrook Hotel Trust | 28,558 | 959,263 |
| Physicians Realty Trust | 82,256 | 1,540,655 |
| Piedmont Office Realty Trust, Inc., Class A | 68,600 | 1,389,150 |
| Potlatch Corp. | 17,150 | 819,770 |
| Prologis, Inc. | 213,982 | 13,557,900 |
| PS Business Parks, Inc. | 7,138 | 964,415 |
| Public Storage | 60,197 | 12,360,852 |
| QTS Realty Trust, Inc., Class A | 21,533 | 1,166,658 |
| Quality Care Properties, Inc. * | 43,036 | 590,454 |
| Ramco-Gershenson Properties Trust | 29,896 | 393,132 |
| Rayonier, Inc. | 48,020 | 1,393,060 |
| RE/MAX Holdings, Inc., Class A | 8,224 | 503,720 |
| Security | Number of Shares | Value ($) |
| Realogy Holdings Corp. | 57,104 | 1,935,826 |
| Realty Income Corp. | 108,373 | 6,237,950 |
| Regency Centers Corp. | 67,157 | 4,319,538 |
| Retail Opportunity Investments Corp. | 31,644 | 627,817 |
| Retail Properties of America, Inc., Class A | 89,660 | 1,195,168 |
| Rexford Industrial Realty, Inc. | 31,176 | 936,839 |
| RLJ Lodging Trust | 52,503 | 1,059,511 |
| Ryman Hospitality Properties, Inc. | 17,899 | 1,063,559 |
| Sabra Health Care REIT, Inc. | 51,843 | 1,132,770 |
| Saul Centers, Inc. | 3,785 | 229,371 |
| SBA Communications Corp. * | 48,301 | 7,416,619 |
| Select Income REIT | 24,284 | 563,632 |
| Senior Housing Properties Trust | 97,013 | 1,913,096 |
| Seritage Growth Properties, Class A (a) | 10,564 | 507,706 |
| Simon Property Group, Inc. | 126,886 | 19,902,069 |
| SL Green Realty Corp. | 38,677 | 3,727,689 |
| Spirit Realty Capital, Inc. | 188,770 | 1,642,299 |
| STAG Industrial, Inc. | 27,504 | 769,837 |
| Starwood Waypoint Homes | 54,352 | 2,023,525 |
| STORE Capital Corp. | 76,402 | 1,939,083 |
| Summit Hotel Properties, Inc. | 35,180 | 522,071 |
| Sun Communities, Inc. | 28,713 | 2,593,071 |
| Sunstone Hotel Investors, Inc. | 72,406 | 1,144,015 |
| Tanger Factory Outlet Centers, Inc. | 34,505 | 807,417 |
| Taubman Centers, Inc. | 24,010 | 1,254,282 |
| Terreno Realty Corp. | 18,920 | 685,850 |
| The GEO Group, Inc. | 46,218 | 1,277,466 |
| The Howard Hughes Corp. * | 16,293 | 1,911,984 |
| The Macerich Co. | 51,450 | 2,715,016 |
| The St. Joe Co. * | 37,730 | 711,210 |
| Tier REIT, Inc. | 36,570 | 673,254 |
| UDR, Inc. | 104,972 | 4,075,013 |
| Uniti Group, Inc. | 62,915 | 1,211,743 |
| Universal Health Realty Income Trust | 6,860 | 519,371 |
| Urban Edge Properties | 42,684 | 1,073,503 |
| Urstadt Biddle Properties, Inc., Class A | 11,688 | 241,708 |
| Ventas, Inc. | 142,212 | 9,732,989 |
| VEREIT, Inc. | 389,094 | 3,283,953 |
| Vornado Realty Trust | 72,070 | 5,368,494 |
| Washington Real Estate Investment Trust | 24,010 | 788,969 |
| Weingarten Realty Investors | 48,020 | 1,538,561 |
| Welltower, Inc. | 148,764 | 10,892,500 |
| Weyerhaeuser Co. | 294,879 | 9,616,004 |
| WP Carey, Inc. | 41,946 | 2,887,982 |
| Xenia Hotels & Resorts, Inc. | 42,514 | 848,579 |
| 419,678,987 | ||
| Retailing 4.9% | ||
| Aaron's, Inc. | 30,870 | 1,366,615 |
| Abercrombie & Fitch Co., Class A | 42,140 | 536,864 |
| Advance Auto Parts, Inc. | 29,654 | 2,903,127 |
| Amazon.com, Inc. * | 158,459 | 155,384,895 |
| American Eagle Outfitters, Inc. | 72,811 | 870,091 |
| Asbury Automotive Group, Inc. * | 10,616 | 571,672 |
| AutoNation, Inc. *(a) | 32,062 | 1,454,653 |
| AutoZone, Inc. * | 11,210 | 5,923,812 |
| Bed Bath & Beyond, Inc. | 63,514 | 1,752,351 |
| Best Buy Co., Inc. | 109,482 | 5,940,493 |
| Big Lots, Inc. | 24,138 | 1,148,969 |
| Burlington Stores, Inc. * | 29,570 | 2,576,434 |
| Cabela's, Inc. * | 27,038 | 1,451,941 |
| Caleres, Inc. | 20,592 | 555,572 |
| Camping World Holdings, Inc., Class A | 16,712 | 614,166 |
| CarMax, Inc. * | 77,586 | 5,209,900 |
| Core-Mark Holding Co., Inc. | 22,548 | 610,149 |
| Dick's Sporting Goods, Inc. | 34,700 | 914,692 |
| Security | Number of Shares | Value ($) |
| Dillard's, Inc., Class A (a) | 16,672 | 1,013,658 |
| Dollar General Corp. | 100,768 | 7,311,726 |
| Dollar Tree, Inc. * | 97,951 | 7,800,818 |
| Expedia, Inc. | 49,395 | 7,328,242 |
| Five Below, Inc. * | 24,463 | 1,163,705 |
| Foot Locker, Inc. | 52,065 | 1,834,250 |
| Francesca's Holdings Corp. * | 7,560 | 54,886 |
| Fred's, Inc., Class A (a) | 13,733 | 81,299 |
| FTD Cos., Inc. * | 13,856 | 185,532 |
| GameStop Corp., Class A | 44,978 | 832,093 |
| Genuine Parts Co. | 58,310 | 4,829,817 |
| Group 1 Automotive, Inc. | 10,290 | 617,606 |
| Guess?, Inc. | 42,636 | 664,269 |
| Haverty Furniture Cos., Inc. | 17,139 | 401,910 |
| Kohl's Corp. | 70,084 | 2,787,942 |
| L Brands, Inc. | 98,064 | 3,551,878 |
| Liberty Expedia Holdings, Inc., Class A * | 20,840 | 1,139,740 |
| Liberty Interactive Corp. QVC Group, Class A * | 176,113 | 3,895,620 |
| Liberty TripAdvisor Holdings, Inc., Class A * | 44,539 | 594,596 |
| Liberty Ventures, Series A * | 31,260 | 1,924,366 |
| Lithia Motors, Inc., Class A | 10,748 | 1,160,784 |
| LKQ Corp. * | 122,169 | 4,233,156 |
| Lowe's Cos., Inc. | 338,781 | 25,032,528 |
| Lumber Liquidators Holdings, Inc. * | 6,106 | 229,158 |
| Macy's, Inc. | 115,430 | 2,397,481 |
| Monro, Inc. | 10,500 | 500,850 |
| Murphy USA, Inc. * | 17,424 | 1,123,151 |
| Netflix, Inc. * | 174,035 | 30,405,655 |
| Nordstrom, Inc. (a) | 46,462 | 2,073,134 |
| Nutrisystem, Inc. | 14,456 | 784,961 |
| O'Reilly Automotive, Inc. * | 35,956 | 7,052,050 |
| Office Depot, Inc. | 226,542 | 971,865 |
| Ollie's Bargain Outlet Holdings, Inc. * | 18,040 | 754,974 |
| Penske Automotive Group, Inc. | 14,074 | 596,175 |
| Pool Corp. | 14,904 | 1,485,780 |
| Rent-A-Center, Inc. (a) | 39,333 | 475,929 |
| RH *(a) | 14,948 | 699,417 |
| Ross Stores, Inc. | 156,021 | 9,119,427 |
| Sally Beauty Holdings, Inc. * | 58,310 | 1,083,983 |
| Select Comfort Corp. * | 18,240 | 538,627 |
| Shutterfly, Inc. * | 18,080 | 824,086 |
| Signet Jewelers Ltd. | 29,716 | 1,874,188 |
| Sonic Automotive, Inc., Class A | 17,160 | 310,596 |
| Staples, Inc. | 247,243 | 2,525,587 |
| Tailored Brands, Inc. (a) | 36,380 | 430,012 |
| Target Corp. | 223,480 | 12,186,364 |
| The Children's Place, Inc. | 7,296 | 774,470 |
| The Finish Line, Inc., Class A | 26,216 | 218,379 |
| The Gap, Inc. | 100,468 | 2,373,054 |
| The Home Depot, Inc. | 476,644 | 71,434,636 |
| The Michaels Cos., Inc. * | 47,048 | 1,056,228 |
| The Priceline Group, Inc. * | 19,644 | 36,382,259 |
| The TJX Cos., Inc. | 259,653 | 18,772,912 |
| Tiffany & Co. | 44,637 | 4,079,822 |
| Tile Shop Holdings, Inc. | 25,121 | 378,071 |
| Tractor Supply Co. | 56,124 | 3,339,939 |
| TripAdvisor, Inc. * | 49,062 | 2,096,419 |
| Ulta Salon, Cosmetics & Fragrance, Inc. * | 24,010 | 5,306,450 |
| Wayfair, Inc., Class A * | 19,198 | 1,363,250 |
| Williams-Sonoma, Inc. | 31,264 | 1,438,144 |
| 495,684,300 | ||
| Semiconductors & Semiconductor Equipment 3.4% | ||
| Advanced Energy Industries, Inc. * | 18,799 | 1,382,478 |
| Advanced Micro Devices, Inc. * | 300,567 | 3,907,371 |
| Security | Number of Shares | Value ($) |
| Amkor Technology, Inc. * | 51,710 | 454,014 |
| Analog Devices, Inc. | 145,840 | 12,202,433 |
| Applied Materials, Inc. | 435,891 | 19,667,402 |
| Broadcom Ltd. | 159,854 | 40,294,398 |
| Brooks Automation, Inc. | 27,440 | 715,361 |
| Cabot Microelectronics Corp. | 10,290 | 736,970 |
| Cavium, Inc. * | 24,761 | 1,567,619 |
| CEVA, Inc. * | 3,944 | 159,929 |
| Cirrus Logic, Inc. * | 27,541 | 1,596,827 |
| Cree, Inc. * | 41,744 | 1,015,632 |
| Cypress Semiconductor Corp. | 120,798 | 1,653,725 |
| Diodes, Inc. * | 13,720 | 386,081 |
| Entegris, Inc. * | 51,450 | 1,309,402 |
| First Solar, Inc. * | 32,140 | 1,509,294 |
| FormFactor, Inc. * | 52,263 | 789,171 |
| Inphi Corp. * | 15,456 | 591,810 |
| Integrated Device Technology, Inc. * | 52,014 | 1,285,266 |
| Intel Corp. | 1,887,829 | 66,206,163 |
| KLA-Tencor Corp. | 64,321 | 6,026,234 |
| Kulicke & Soffa Industries, Inc. * | 30,870 | 587,456 |
| Lam Research Corp. | 66,347 | 11,012,275 |
| Lattice Semiconductor Corp. * | 41,884 | 236,645 |
| MACOM Technology Solutions Holdings, Inc. * | 15,131 | 689,066 |
| Marvell Technology Group Ltd. | 172,756 | 3,094,060 |
| Maxim Integrated Products, Inc. | 109,854 | 5,125,788 |
| MaxLinear, Inc., Class A * | 22,922 | 495,115 |
| Microchip Technology, Inc. | 93,798 | 8,141,666 |
| Micron Technology, Inc. * | 418,258 | 13,371,708 |
| Microsemi Corp. * | 44,736 | 2,253,800 |
| MKS Instruments, Inc. | 20,580 | 1,694,763 |
| Monolithic Power Systems, Inc. | 15,973 | 1,618,384 |
| Nanometrics, Inc. * | 19,525 | 503,550 |
| NVIDIA Corp. | 236,770 | 40,118,309 |
| ON Semiconductor Corp. * | 164,640 | 2,812,051 |
| Photronics, Inc. * | 42,668 | 337,077 |
| Power Integrations, Inc. | 14,848 | 1,081,677 |
| Qorvo, Inc. * | 49,464 | 3,621,754 |
| QUALCOMM, Inc. | 598,076 | 31,261,433 |
| Rambus, Inc. * | 41,160 | 533,845 |
| Rudolph Technologies, Inc. * | 11,646 | 258,541 |
| Semtech Corp. * | 30,883 | 1,161,201 |
| Silicon Laboratories, Inc. * | 17,150 | 1,301,685 |
| Skyworks Solutions, Inc. | 72,030 | 7,589,081 |
| SolarEdge Technologies, Inc. * | 25,409 | 679,691 |
| Synaptics, Inc. * | 13,720 | 570,340 |
| Teradyne, Inc. | 72,703 | 2,588,954 |
| Texas Instruments, Inc. | 398,225 | 32,980,994 |
| Veeco Instruments, Inc. * | 21,683 | 409,809 |
| Versum Materials, Inc. | 41,686 | 1,539,464 |
| Xilinx, Inc. | 100,578 | 6,644,183 |
| Xperi Corp. | 20,580 | 560,805 |
| 348,332,750 | ||
| Software & Services 13.3% | ||
| 2U, Inc. * | 18,840 | 943,884 |
| 8x8, Inc. * | 28,536 | 403,784 |
| Accenture plc, Class A | 247,942 | 32,420,896 |
| ACI Worldwide, Inc. * | 41,730 | 949,775 |
| Activision Blizzard, Inc. | 276,671 | 18,138,551 |
| Acxiom Corp. * | 34,300 | 798,847 |
| Adobe Systems, Inc. * | 196,514 | 30,491,112 |
| Akamai Technologies, Inc. * | 68,600 | 3,234,490 |
| Alliance Data Systems Corp. | 21,896 | 4,937,548 |
| Alphabet, Inc., Class A * | 119,020 | 113,692,665 |
| Alphabet, Inc., Class C * | 119,170 | 111,939,956 |
| Amdocs Ltd. | 58,898 | 3,816,001 |
| Security | Number of Shares | Value ($) |
| ANSYS, Inc. * | 34,447 | 4,437,463 |
| Aspen Technology, Inc. * | 34,453 | 2,179,152 |
| Autodesk, Inc. * | 77,689 | 8,892,283 |
| Automatic Data Processing, Inc. | 177,094 | 18,855,198 |
| Barracuda Networks, Inc. * | 14,256 | 345,138 |
| Benefitfocus, Inc. * | 10,761 | 331,977 |
| Black Knight Financial Services, Inc., Class A * | 11,092 | 472,519 |
| Blackbaud, Inc. | 17,334 | 1,463,163 |
| Blackhawk Network Holdings, Inc. * | 18,625 | 834,400 |
| Blucora, Inc. * | 28,412 | 647,794 |
| Booz Allen Hamilton Holding Corp. | 54,965 | 1,874,856 |
| Bottomline Technologies (DE), Inc. * | 17,150 | 519,817 |
| Box, Inc., Class A * | 31,683 | 621,620 |
| Broadridge Financial Solutions, Inc. | 48,041 | 3,753,443 |
| BroadSoft, Inc. * | 17,630 | 873,566 |
| CA, Inc. | 138,807 | 4,605,616 |
| CACI International, Inc., Class A * | 10,290 | 1,335,642 |
| Cadence Design Systems, Inc. * | 114,006 | 4,479,296 |
| Callidus Software, Inc. * | 22,246 | 572,835 |
| Cardtronics plc, Class A * | 17,150 | 445,557 |
| Cars.com, Inc. * | 28,590 | 739,337 |
| Cass Information Systems, Inc. | 3,670 | 224,677 |
| CDK Global, Inc. | 59,390 | 3,830,655 |
| Citrix Systems, Inc. * | 61,887 | 4,840,182 |
| Cognizant Technology Solutions Corp., Class A | 234,212 | 16,575,183 |
| CommerceHub, Inc., Series A * | 4,741 | 105,108 |
| CommerceHub, Inc., Series C * | 10,330 | 219,306 |
| CommVault Systems, Inc. * | 14,181 | 865,750 |
| Conduent, Inc. * | 73,943 | 1,220,799 |
| Convergys Corp. | 48,020 | 1,128,470 |
| CoreLogic, Inc. * | 38,171 | 1,792,892 |
| Cornerstone OnDemand, Inc. * | 15,712 | 549,606 |
| CoStar Group, Inc. * | 13,973 | 4,004,941 |
| Coupa Software, Inc. * | 15,912 | 484,680 |
| CSG Systems International, Inc. | 13,720 | 531,101 |
| CSRA, Inc. | 58,310 | 1,837,348 |
| Dell Technologies, Inc., Class V * | 53,564 | 4,013,551 |
| DST Systems, Inc. | 27,440 | 1,408,495 |
| DXC Technology Co. | 114,959 | 9,771,515 |
| eBay, Inc. * | 402,738 | 14,550,924 |
| Ebix, Inc. | 14,152 | 816,570 |
| Electronic Arts, Inc. * | 123,894 | 15,053,121 |
| Ellie Mae, Inc. * | 11,901 | 987,545 |
| Envestnet, Inc. * | 21,907 | 973,766 |
| EPAM Systems, Inc. * | 18,130 | 1,474,513 |
| Etsy, Inc. * | 42,376 | 693,695 |
| Euronet Worldwide, Inc. * | 20,580 | 2,022,397 |
| EVERTEC, Inc. | 32,992 | 607,053 |
| ExlService Holdings, Inc. * | 10,290 | 579,121 |
| Facebook, Inc., Class A * | 942,097 | 162,012,421 |
| Fair Isaac Corp. | 10,746 | 1,512,607 |
| Fidelity National Information Services, Inc. | 130,629 | 12,138,047 |
| FireEye, Inc. * | 60,279 | 890,321 |
| First Data Corp., Class A * | 70,560 | 1,299,010 |
| Fiserv, Inc. * | 87,200 | 10,787,512 |
| Five9, Inc. * | 29,460 | 633,390 |
| FleetCor Technologies, Inc. * | 38,003 | 5,463,691 |
| Fortinet, Inc. * | 60,528 | 2,312,170 |
| Gartner, Inc. * | 36,457 | 4,396,350 |
| Genpact Ltd. | 63,461 | 1,805,465 |
| Gigamon, Inc. * | 23,026 | 988,967 |
| Global Payments, Inc. | 57,063 | 5,448,946 |
| GoDaddy, Inc., Class A * | 17,545 | 786,367 |
| Gogo, Inc. *(a) | 40,195 | 563,132 |
| GrubHub, Inc. * | 31,524 | 1,799,705 |
| Security | Number of Shares | Value ($) |
| GTT Communications, Inc. * | 17,620 | 559,435 |
| Guidewire Software, Inc. * | 34,511 | 2,612,828 |
| Hortonworks, Inc. * | 41,636 | 707,396 |
| HubSpot, Inc. * | 12,713 | 932,499 |
| IAC/InterActiveCorp * | 30,870 | 3,504,054 |
| Imperva, Inc. * | 10,754 | 480,166 |
| International Business Machines Corp. | 339,788 | 48,599,878 |
| Intuit, Inc. | 97,783 | 13,831,405 |
| j2 Global, Inc. | 17,271 | 1,300,161 |
| Jack Henry & Associates, Inc. | 34,300 | 3,535,301 |
| Leidos Holdings, Inc. | 54,992 | 3,207,133 |
| LogMeIn, Inc. | 22,367 | 2,558,785 |
| Manhattan Associates, Inc. * | 25,892 | 1,088,759 |
| ManTech International Corp., Class A | 17,295 | 695,605 |
| MasterCard, Inc., Class A | 372,496 | 49,653,717 |
| Match Group, Inc. *(a) | 28,396 | 617,613 |
| MAXIMUS, Inc. | 31,853 | 1,936,025 |
| Microsoft Corp. | 3,085,886 | 230,731,696 |
| MicroStrategy, Inc., Class A * | 3,430 | 442,470 |
| Monotype Imaging Holdings, Inc. | 13,720 | 250,390 |
| New Relic, Inc. * | 10,792 | 516,937 |
| NIC, Inc. | 22,672 | 370,687 |
| Nuance Communications, Inc. * | 107,453 | 1,726,770 |
| Oracle Corp. | 1,192,626 | 60,024,867 |
| Pandora Media, Inc. *(a) | 90,064 | 761,041 |
| Paychex, Inc. | 123,480 | 7,042,064 |
| Paycom Software, Inc. * | 17,168 | 1,280,904 |
| Paylocity Holding Corp. * | 11,192 | 549,975 |
| PayPal Holdings, Inc. * | 448,789 | 27,681,306 |
| Pegasystems, Inc. | 13,964 | 803,628 |
| Perficient, Inc. * | 24,378 | 446,117 |
| Progress Software Corp. | 21,058 | 707,128 |
| Proofpoint, Inc. * | 20,038 | 1,838,687 |
| PROS Holdings, Inc. * | 17,815 | 469,247 |
| PTC, Inc. * | 44,817 | 2,509,752 |
| Q2 Holdings, Inc. * | 13,856 | 562,554 |
| Qualys, Inc. * | 11,378 | 540,455 |
| Quotient Technology, Inc. * | 41,968 | 629,520 |
| RealPage, Inc. * | 25,010 | 1,077,931 |
| Red Hat, Inc. * | 72,030 | 7,743,225 |
| RingCentral, Inc., Class A * | 20,599 | 872,368 |
| Sabre Corp. | 87,394 | 1,611,545 |
| salesforce.com, Inc. * | 268,653 | 25,653,675 |
| Science Applications International Corp. | 14,230 | 1,051,312 |
| ServiceNow, Inc. * | 65,674 | 7,630,662 |
| Shutterstock, Inc. * | 11,592 | 389,259 |
| Silver Spring Networks, Inc. * | 10,772 | 136,374 |
| Splunk, Inc. * | 54,850 | 3,679,886 |
| SPS Commerce, Inc. * | 6,012 | 366,251 |
| SS&C Technologies Holdings, Inc. | 76,008 | 2,942,270 |
| Stamps.com, Inc. * | 5,052 | 966,195 |
| Sykes Enterprises, Inc. * | 14,232 | 379,425 |
| Symantec Corp. | 248,756 | 7,457,705 |
| Synchronoss Technologies, Inc. * | 34,340 | 576,569 |
| Synopsys, Inc. * | 62,587 | 5,033,247 |
| Tableau Software, Inc., Class A * | 22,122 | 1,603,403 |
| Take-Two Interactive Software, Inc. * | 42,266 | 4,133,192 |
| TeleTech Holdings, Inc. | 13,790 | 547,463 |
| Teradata Corp. * | 49,746 | 1,587,892 |
| The Ultimate Software Group, Inc. * | 13,735 | 2,759,361 |
| The Western Union Co. | 200,330 | 3,790,244 |
| TiVo Corp. | 55,042 | 1,007,269 |
| Total System Services, Inc. | 67,889 | 4,692,488 |
| Travelport Worldwide Ltd. | 46,631 | 705,993 |
| TrueCar, Inc. * | 18,660 | 316,287 |
| Twilio, Inc., Class A *(a) | 15,280 | 447,398 |
| Twitter, Inc. * | 243,989 | 4,125,854 |
| Tyler Technologies, Inc. * | 13,720 | 2,370,816 |
| Security | Number of Shares | Value ($) |
| Unisys Corp. * | 36,480 | 282,720 |
| Vantiv, Inc., Class A * | 62,763 | 4,436,716 |
| Verint Systems, Inc. * | 21,739 | 863,038 |
| VeriSign, Inc. * | 36,466 | 3,783,347 |
| Virtusa Corp. * | 17,560 | 637,779 |
| Visa, Inc., Class A | 736,654 | 76,258,422 |
| VMware, Inc., Class A * | 25,472 | 2,753,523 |
| Web.com Group, Inc. * | 21,146 | 534,994 |
| WebMD Health Corp. * | 17,562 | 1,166,819 |
| WEX, Inc. * | 13,867 | 1,513,444 |
| Workday, Inc., Class A * | 49,950 | 5,479,015 |
| XO Group, Inc. * | 24,536 | 456,860 |
| Yelp, Inc. * | 27,704 | 1,180,190 |
| Zendesk, Inc. * | 32,692 | 895,761 |
| Zillow Group, Inc., Class A * | 17,255 | 688,820 |
| Zillow Group, Inc., Class C * | 44,737 | 1,772,480 |
| Zynga, Inc., Class A * | 309,520 | 1,160,700 |
| 1,359,276,388 | ||
| Technology Hardware & Equipment 5.8% | ||
| 3D Systems Corp. *(a) | 53,520 | 672,211 |
| Acacia Communications, Inc. *(a) | 9,290 | 453,631 |
| ADTRAN, Inc. | 25,848 | 571,241 |
| Amphenol Corp., Class A | 123,480 | 9,994,471 |
| Anixter International, Inc. * | 10,337 | 762,871 |
| Apple, Inc. | 2,083,433 | 341,683,012 |
| Arista Networks, Inc. * | 16,173 | 2,848,874 |
| ARRIS International plc * | 83,259 | 2,319,596 |
| Arrow Electronics, Inc. * | 38,371 | 3,047,809 |
| Avnet, Inc. | 48,646 | 1,876,276 |
| AVX Corp. | 24,068 | 419,987 |
| Badger Meter, Inc. | 7,832 | 359,489 |
| Belden, Inc. | 20,580 | 1,586,101 |
| Benchmark Electronics, Inc. * | 11,472 | 372,840 |
| Brocade Communications Systems, Inc. | 164,721 | 2,039,246 |
| CalAmp Corp. * | 33,605 | 623,037 |
| CDW Corp. | 66,720 | 4,231,382 |
| Ciena Corp. * | 56,422 | 1,219,279 |
| Cisco Systems, Inc. | 1,997,571 | 64,341,762 |
| Cognex Corp. | 34,300 | 3,737,671 |
| Coherent, Inc. * | 10,290 | 2,400,863 |
| CommScope Holding Co., Inc. * | 86,949 | 2,874,534 |
| Corning, Inc. | 358,188 | 10,301,487 |
| Cray, Inc. * | 12,300 | 231,855 |
| CTS Corp. | 21,484 | 483,390 |
| Diebold Nixdorf, Inc. | 26,792 | 547,896 |
| Dolby Laboratories, Inc., Class A | 17,592 | 887,692 |
| EchoStar Corp., Class A * | 23,132 | 1,394,860 |
| Electronics For Imaging, Inc. * | 17,150 | 609,854 |
| ePlus, Inc. * | 1,552 | 129,902 |
| Extreme Networks, Inc. * | 41,555 | 474,974 |
| F5 Networks, Inc. * | 24,740 | 2,953,461 |
| Fabrinet * | 13,732 | 533,351 |
| FARO Technologies, Inc. * | 10,290 | 354,491 |
| Finisar Corp. * | 43,661 | 1,054,413 |
| Fitbit, Inc., Class A * | 82,880 | 499,766 |
| FLIR Systems, Inc. | 58,310 | 2,215,780 |
| Harris Corp. | 48,412 | 5,949,835 |
| Hewlett Packard Enterprise Co. | 694,850 | 12,548,991 |
| HP, Inc. | 665,645 | 12,700,507 |
| II-VI, Inc. * | 28,316 | 1,015,129 |
| Infinera Corp. * | 95,080 | 804,377 |
| Insight Enterprises, Inc. * | 17,150 | 687,372 |
| InterDigital, Inc. | 11,260 | 803,401 |
| IPG Photonics Corp. * | 14,890 | 2,617,513 |
| Itron, Inc. * | 15,555 | 1,129,293 |
| Jabil, Inc. | 75,460 | 2,365,671 |
| Security | Number of Shares | Value ($) |
| Juniper Networks, Inc. | 149,297 | 4,140,006 |
| Keysight Technologies, Inc. * | 65,170 | 2,662,846 |
| Knowles Corp. * | 42,356 | 621,363 |
| Littelfuse, Inc. | 8,603 | 1,601,534 |
| Lumentum Holdings, Inc. * | 19,044 | 1,082,651 |
| Methode Electronics, Inc. | 14,332 | 586,179 |
| Motorola Solutions, Inc. | 66,183 | 5,832,046 |
| MTS Systems Corp. | 7,224 | 349,642 |
| National Instruments Corp. | 37,730 | 1,523,915 |
| NCR Corp. * | 48,275 | 1,763,486 |
| NetApp, Inc. | 110,608 | 4,276,105 |
| NETGEAR, Inc. * | 13,720 | 658,560 |
| NetScout Systems, Inc. * | 39,530 | 1,294,607 |
| Novanta, Inc. * | 11,345 | 443,589 |
| Oclaro, Inc. *(a) | 52,805 | 444,090 |
| OSI Systems, Inc. * | 6,907 | 573,695 |
| Palo Alto Networks, Inc. * | 35,165 | 4,666,044 |
| PC Connection, Inc. | 4,067 | 103,749 |
| Plantronics, Inc. | 11,516 | 490,927 |
| Plexus Corp. * | 12,536 | 652,875 |
| Pure Storage, Inc., Class A * | 43,536 | 648,251 |
| Rogers Corp. * | 5,738 | 680,240 |
| Sanmina Corp. * | 27,440 | 1,027,628 |
| ScanSource, Inc. * | 7,436 | 291,863 |
| Seagate Technology plc | 113,863 | 3,590,100 |
| ShoreTel, Inc. * | 28,844 | 214,888 |
| Super Micro Computer, Inc. * | 13,764 | 366,466 |
| SYNNEX Corp. | 11,772 | 1,408,049 |
| TE Connectivity Ltd. | 144,260 | 11,483,096 |
| Tech Data Corp. * | 17,150 | 1,891,473 |
| Trimble, Inc. * | 96,040 | 3,714,827 |
| TTM Technologies, Inc. * | 40,097 | 570,981 |
| Ubiquiti Networks, Inc. *(a) | 10,894 | 649,173 |
| Universal Display Corp. | 19,807 | 2,517,470 |
| VeriFone Systems, Inc. * | 43,220 | 854,459 |
| ViaSat, Inc. * | 27,685 | 1,761,043 |
| Viavi Solutions, Inc. * | 107,397 | 1,078,266 |
| Vishay Intertechnology, Inc. | 52,710 | 932,967 |
| Western Digital Corp. | 114,964 | 10,147,872 |
| Xerox Corp. | 93,388 | 3,013,631 |
| Zebra Technologies Corp., Class A * | 20,580 | 2,121,592 |
| 594,463,688 | ||
| Telecommunication Services 2.0% | ||
| AT&T, Inc. | 2,458,249 | 92,086,007 |
| ATN International, Inc. | 6,860 | 415,510 |
| CenturyLink, Inc. | 216,571 | 4,270,780 |
| Cincinnati Bell, Inc. * | 10,675 | 224,709 |
| Cogent Communications Holdings, Inc. | 15,656 | 729,570 |
| Consolidated Communications Holdings, Inc. | 31,146 | 574,644 |
| General Communication, Inc., Class A * | 24,099 | 1,039,390 |
| Globalstar, Inc. *(a) | 244,213 | 468,889 |
| Iridium Communications, Inc. * | 32,262 | 358,108 |
| Level 3 Communications, Inc. * | 114,299 | 6,221,295 |
| ORBCOMM, Inc. * | 45,939 | 508,085 |
| Shenandoah Telecommunications Co. | 28,128 | 1,014,014 |
| Sprint Corp. * | 237,241 | 1,957,238 |
| T-Mobile US, Inc. * | 116,669 | 7,549,651 |
| Telephone & Data Systems, Inc. | 44,590 | 1,306,933 |
| United States Cellular Corp. * | 6,860 | 265,345 |
| Verizon Communications, Inc. | 1,622,602 | 77,836,218 |
| Vonage Holdings Corp. * | 61,976 | 514,401 |
| Windstream Holdings, Inc. | 145,788 | 301,781 |
| Zayo Group Holdings, Inc. * | 39,357 | 1,344,829 |
| 198,987,397 | ||
| Security | Number of Shares | Value ($) |
| Transportation 2.1% | ||
| Air Transport Services Group, Inc. * | 30,229 | 694,058 |
| Alaska Air Group, Inc. | 49,304 | 3,681,037 |
| Allegiant Travel Co. | 4,172 | 492,296 |
| AMERCO | 1,667 | 622,141 |
| American Airlines Group, Inc. | 200,504 | 8,970,549 |
| ArcBest Corp. | 18,625 | 553,163 |
| Atlas Air Worldwide Holdings, Inc. * | 10,404 | 694,987 |
| Avis Budget Group, Inc. * | 38,416 | 1,391,812 |
| C.H. Robinson Worldwide, Inc. | 55,640 | 3,929,853 |
| CSX Corp. | 363,137 | 18,229,477 |
| Delta Air Lines, Inc. | 291,725 | 13,766,503 |
| Echo Global Logistics, Inc. * | 19,040 | 289,408 |
| Expeditors International of Washington, Inc. | 69,626 | 3,906,019 |
| FedEx Corp. | 99,468 | 21,323,950 |
| Forward Air Corp. | 13,720 | 713,028 |
| Genesee & Wyoming, Inc., Class A * | 24,623 | 1,688,153 |
| Hawaiian Holdings, Inc. * | 21,444 | 918,875 |
| Heartland Express, Inc. | 17,655 | 391,411 |
| Hertz Global Holdings, Inc. * | 56,448 | 1,227,180 |
| Hub Group, Inc., Class A * | 13,848 | 532,456 |
| J.B. Hunt Transport Services, Inc. | 35,038 | 3,464,908 |
| JetBlue Airways Corp. * | 145,577 | 2,883,880 |
| Kansas City Southern | 41,184 | 4,259,661 |
| Kirby Corp. * | 20,580 | 1,288,308 |
| Knight Transportation, Inc. | 29,996 | 1,171,344 |
| Landstar System, Inc. | 15,144 | 1,413,692 |
| Macquarie Infrastructure Corp. | 29,996 | 2,234,102 |
| Matson, Inc. | 14,913 | 384,755 |
| Norfolk Southern Corp. | 114,262 | 13,770,856 |
| Old Dominion Freight Line, Inc. | 29,763 | 2,973,324 |
| Ryder System, Inc. | 20,580 | 1,597,008 |
| Saia, Inc. * | 8,000 | 452,400 |
| SkyWest, Inc. | 14,216 | 493,295 |
| Southwest Airlines Co. | 244,388 | 12,742,390 |
| Spirit Airlines, Inc. * | 27,665 | 941,993 |
| Swift Transportation Co. * | 41,709 | 1,169,938 |
| Union Pacific Corp. | 321,106 | 33,812,462 |
| United Continental Holdings, Inc. * | 113,841 | 7,053,588 |
| United Parcel Service, Inc., Class B | 275,865 | 31,547,921 |
| Werner Enterprises, Inc. | 17,555 | 581,071 |
| XPO Logistics, Inc. * | 31,605 | 1,934,226 |
| 210,187,478 | ||
| Utilities 3.3% | ||
| AES Corp. | 278,768 | 3,077,599 |
| ALLETE, Inc. | 25,046 | 1,936,807 |
| Alliant Energy Corp. | 94,527 | 4,040,084 |
| Ameren Corp. | 98,416 | 5,903,976 |
| American Electric Power Co., Inc. | 193,640 | 14,257,713 |
| American States Water Co. | 13,720 | 676,396 |
| American Water Works Co., Inc. | 70,683 | 5,718,255 |
| Aqua America, Inc. | 75,886 | 2,534,592 |
| Atmos Energy Corp. | 41,218 | 3,628,833 |
| Avangrid, Inc. | 33,133 | 1,617,553 |
| Avista Corp. | 27,440 | 1,410,416 |
| Black Hills Corp. | 28,074 | 1,975,848 |
| California Water Service Group | 17,658 | 661,292 |
| Calpine Corp. * | 147,496 | 2,168,191 |
| CenterPoint Energy, Inc. | 158,339 | 4,690,001 |
| Chesapeake Utilities Corp. | 7,114 | 565,207 |
| CMS Energy Corp. | 113,935 | 5,530,405 |
| Connecticut Water Service, Inc. | 7,114 | 385,863 |
| Consolidated Edison, Inc. | 118,188 | 9,959,703 |
| Dominion Energy, Inc. | 257,023 | 20,245,702 |
| Security | Number of Shares | Value ($) |
| DTE Energy Co. | 70,442 | 7,912,045 |
| Duke Energy Corp. | 279,765 | 24,423,485 |
| Dynegy, Inc. * | 63,854 | 601,505 |
| Edison International | 128,578 | 10,309,384 |
| El Paso Electric Co. | 17,150 | 952,683 |
| Entergy Corp. | 68,600 | 5,431,062 |
| Eversource Energy | 124,717 | 7,857,171 |
| Exelon Corp. | 371,432 | 14,066,130 |
| FirstEnergy Corp. | 173,036 | 5,637,513 |
| Great Plains Energy, Inc. | 87,618 | 2,688,996 |
| Hawaiian Electric Industries, Inc. | 48,024 | 1,604,962 |
| IDACORP, Inc. | 20,580 | 1,831,208 |
| MDU Resources Group, Inc. | 73,457 | 1,986,277 |
| MGE Energy, Inc. | 13,125 | 834,750 |
| Middlesex Water Co. | 7,132 | 270,873 |
| National Fuel Gas Co. | 30,956 | 1,794,829 |
| New Jersey Resources Corp. | 34,300 | 1,497,195 |
| NextEra Energy, Inc. | 185,950 | 27,987,335 |
| NiSource, Inc. | 125,373 | 3,368,773 |
| Northwest Natural Gas Co. | 13,720 | 909,636 |
| NorthWestern Corp. | 18,742 | 1,130,517 |
| NRG Energy, Inc. | 125,924 | 3,136,767 |
| NRG Yield, Inc., Class C | 34,374 | 635,919 |
| OGE Energy Corp. | 76,308 | 2,725,722 |
| ONE Gas, Inc. | 18,089 | 1,361,016 |
| Ormat Technologies, Inc. | 14,135 | 811,914 |
| Otter Tail Corp. | 24,750 | 1,034,550 |
| Pattern Energy Group, Inc. | 32,581 | 818,435 |
| PG&E Corp. | 200,848 | 14,135,682 |
| Pinnacle West Capital Corp. | 41,160 | 3,703,165 |
| PNM Resources, Inc. | 30,870 | 1,308,888 |
| Portland General Electric Co. | 38,009 | 1,805,808 |
| PPL Corp. | 272,037 | 10,674,732 |
| Public Service Enterprise Group, Inc. | 202,724 | 9,495,592 |
| SCANA Corp. | 54,932 | 3,316,794 |
| Sempra Energy | 102,279 | 12,061,763 |
| SJW Group | 14,585 | 809,468 |
| South Jersey Industries, Inc. | 27,440 | 984,547 |
| Southwest Gas Holdings, Inc. | 17,150 | 1,363,768 |
| Spire, Inc. | 17,590 | 1,345,635 |
| TerraForm Power, Inc., Class A * | 42,256 | 589,894 |
| The Southern Co. | 396,113 | 19,116,413 |
| UGI Corp. | 61,740 | 3,050,573 |
| Unitil Corp. | 10,750 | 535,995 |
| Vectren Corp. | 30,870 | 2,025,381 |
| Vistra Energy Corp. | 110,796 | 1,961,089 |
| WEC Energy Group, Inc. | 128,638 | 8,389,770 |
| Westar Energy, Inc. | 55,738 | 2,859,917 |
| WGL Holdings, Inc. | 20,580 | 1,734,071 |
| Xcel Energy, Inc. | 200,134 | 9,906,633 |
| 335,780,666 | ||
| Total Common Stock | ||
| (Cost $8,086,231,702) | 10,183,237,697 | |
| Rights 0.0% of net assets | ||
| Media 0.0% | ||
| Media General, Inc. CVR *(d) | 42,134 | — |
| Pharmaceuticals, Biotechnology & Life Sciences 0.0% | ||
| Dyax Corp. CVR *(d) | 35,613 | 39,530 |
| Total Rights | ||
| (Cost $39,530) | 39,530 | |
| Security | Number of Shares | Value ($) |
| Other Investment Companies 0.5% of net assets | ||
| Money Market Fund 0.1% | ||
| State Street Institutional U.S. Government Money Market Fund, Premier Class 0.93% (c) | 10,926,846 | 10,926,846 |
| Securities Lending Collateral 0.4% | ||
| Wells Fargo Government Money Market Fund, Select Class 0.92% (c) | 36,579,301 | 36,579,301 |
| Total Other Investment Companies | ||
| (Cost $47,506,147) | 47,506,147 | |
| Number of Contracts | Notional Amount ($) | Current Value/ Unrealized Appreciation ($) | ||
| Futures Contracts | ||||
| Long | ||||
| S&P 500 Index, e-mini, expires 09/15/17 | 250 | 30,876,250 | 218,276 | |
| * | Non-income producing security. |
| (a) | All or a portion of this security is on loan. Securities on loan were valued at $35,774,958. |
| (b) | Issuer is affiliated with the fund's investment adviser. |
| (c) | The rate shown is the 7-day yield. |
| (d) | Fair-valued by management in accordance with procedures approved by the Board of Trustees. |
| CVR — | Contingent Value Rights |
| REIT — | Real Estate Investment Trust |
| Security | Number of Shares | Value ($) |
| Common Stock 99.7% of net assets | ||
| Automobiles & Components 0.9% | ||
| Adient plc | 38,453 | 2,717,858 |
| Autoliv, Inc. | 37,883 | 4,114,851 |
| BorgWarner, Inc. | 80,163 | 3,720,365 |
| Delphi Automotive plc | 115,077 | 11,093,423 |
| Ford Motor Co. | 1,689,420 | 18,634,303 |
| General Motors Co. | 591,484 | 21,612,825 |
| Harley-Davidson, Inc. | 74,330 | 3,494,253 |
| Lear Corp. | 30,888 | 4,618,992 |
| Tesla, Inc. * | 53,674 | 19,102,577 |
| The Goodyear Tire & Rubber Co. | 110,805 | 3,357,391 |
| 92,466,838 | ||
| Banks 6.0% | ||
| Bank of America Corp. | 4,279,832 | 102,245,186 |
| BB&T Corp. | 345,042 | 15,902,986 |
| BOK Financial Corp. | 12,856 | 1,034,651 |
| CIT Group, Inc. | 62,412 | 2,799,178 |
| Citigroup, Inc. | 1,183,061 | 80,483,640 |
| Citizens Financial Group, Inc. | 217,570 | 7,208,094 |
| Comerica, Inc. | 73,535 | 5,018,764 |
| Cullen/Frost Bankers, Inc. | 21,493 | 1,809,711 |
| East West Bancorp, Inc. | 60,904 | 3,372,254 |
| Fifth Third Bancorp | 324,097 | 8,468,655 |
| First Republic Bank | 67,510 | 6,551,846 |
| Huntington Bancshares, Inc. | 475,050 | 5,980,880 |
| JPMorgan Chase & Co. | 1,525,370 | 138,640,879 |
| KeyCorp | 457,568 | 7,874,745 |
| M&T Bank Corp. | 64,743 | 9,572,900 |
| New York Community Bancorp, Inc. | 207,405 | 2,499,230 |
| People's United Financial, Inc. | 153,890 | 2,569,963 |
| Regions Financial Corp. | 517,085 | 7,296,069 |
| Signature Bank * | 21,048 | 2,701,300 |
| SunTrust Banks, Inc. | 210,547 | 11,601,140 |
| SVB Financial Group * | 24,086 | 4,078,723 |
| TFS Financial Corp. | 27,288 | 419,689 |
| The PNC Financial Services Group, Inc. | 208,449 | 26,141,589 |
| U.S. Bancorp | 674,031 | 34,544,089 |
| Wells Fargo & Co. | 1,931,898 | 98,662,031 |
| Zions Bancorp | 89,988 | 3,928,876 |
| 591,407,068 | ||
| Capital Goods 7.4% | ||
| 3M Co. | 256,269 | 52,360,882 |
| A.O. Smith Corp. | 60,804 | 3,386,175 |
| Acuity Brands, Inc. | 18,390 | 3,251,168 |
| AGCO Corp. | 26,890 | 1,840,621 |
| Allegion plc | 37,858 | 2,979,803 |
| Allison Transmission Holdings, Inc. | 66,874 | 2,322,534 |
| AMETEK, Inc. | 97,602 | 6,173,327 |
| Arconic, Inc. | 181,573 | 4,624,664 |
| Carlisle Cos., Inc. | 27,766 | 2,629,163 |
| Caterpillar, Inc. | 253,558 | 29,790,529 |
| Colfax Corp. * | 48,622 | 1,939,045 |
| Security | Number of Shares | Value ($) |
| Cummins, Inc. | 64,805 | 10,328,621 |
| Deere & Co. | 125,863 | 14,591,298 |
| Donaldson Co., Inc. | 53,644 | 2,534,679 |
| Dover Corp. | 64,006 | 5,432,829 |
| Eaton Corp. plc | 193,865 | 13,911,752 |
| Emerson Electric Co. | 277,948 | 16,410,050 |
| Fastenal Co. | 120,425 | 5,138,535 |
| Flowserve Corp. | 54,130 | 2,126,226 |
| Fluor Corp. | 55,805 | 2,152,399 |
| Fortive Corp. | 132,709 | 8,622,104 |
| Fortune Brands Home & Security, Inc. | 67,203 | 4,202,204 |
| General Dynamics Corp. | 123,964 | 24,960,151 |
| General Electric Co. | 3,750,806 | 92,082,287 |
| HD Supply Holdings, Inc. * | 84,921 | 2,827,869 |
| Honeywell International, Inc. | 327,068 | 45,223,692 |
| Hubbell, Inc. | 21,679 | 2,445,174 |
| Huntington Ingalls Industries, Inc. | 20,171 | 4,315,787 |
| IDEX Corp. | 34,270 | 4,029,467 |
| Illinois Tool Works, Inc. | 132,500 | 18,220,075 |
| Ingersoll-Rand plc | 107,587 | 9,186,854 |
| Jacobs Engineering Group, Inc. | 53,591 | 2,920,174 |
| Johnson Controls International plc | 401,893 | 15,910,944 |
| L3 Technologies, Inc. | 35,506 | 6,443,629 |
| Lennox International, Inc. | 17,260 | 2,860,500 |
| Lincoln Electric Holdings, Inc. | 25,116 | 2,181,073 |
| Lockheed Martin Corp. | 107,650 | 32,875,234 |
| Masco Corp. | 146,748 | 5,395,924 |
| Nordson Corp. | 23,630 | 2,582,759 |
| Northrop Grumman Corp. | 75,452 | 20,538,789 |
| Owens Corning | 44,423 | 3,293,077 |
| PACCAR, Inc. | 148,041 | 9,819,560 |
| Parker-Hannifin Corp. | 58,718 | 9,447,139 |
| Pentair plc | 73,543 | 4,563,343 |
| Quanta Services, Inc. * | 67,491 | 2,424,952 |
| Raytheon Co. | 124,005 | 22,570,150 |
| Rockwell Automation, Inc. | 53,792 | 8,825,116 |
| Rockwell Collins, Inc. | 67,500 | 8,845,875 |
| Roper Technologies, Inc. | 42,569 | 9,818,966 |
| Sensata Technologies Holding N.V. * | 78,695 | 3,514,519 |
| Snap-on, Inc. | 25,351 | 3,741,047 |
| Spirit AeroSystems Holdings, Inc., Class A | 51,270 | 3,819,615 |
| Stanley Black & Decker, Inc. | 68,483 | 9,861,552 |
| Textron, Inc. | 113,460 | 5,569,751 |
| The Boeing Co. | 240,901 | 57,734,334 |
| The Middleby Corp. * | 23,380 | 2,845,346 |
| The Toro Co. | 45,858 | 2,828,521 |
| TransDigm Group, Inc. | 21,230 | 5,533,812 |
| Trinity Industries, Inc. | 64,511 | 1,860,497 |
| United Rentals, Inc. * | 35,086 | 4,142,253 |
| United Technologies Corp. | 323,509 | 38,730,497 |
| W.W. Grainger, Inc. | 23,799 | 3,869,003 |
| WABCO Holdings, Inc. * | 23,637 | 3,394,746 |
| Wabtec Corp. | 37,592 | 2,652,867 |
| Xylem, Inc. | 73,846 | 4,583,621 |
| 726,039,149 | ||
| Security | Number of Shares | Value ($) |
| Commercial & Professional Services 0.7% | ||
| Cintas Corp. | 34,848 | 4,704,829 |
| Copart, Inc. * | 88,272 | 2,885,612 |
| Equifax, Inc. | 51,393 | 7,321,961 |
| IHS Markit Ltd. * | 136,510 | 6,394,128 |
| KAR Auction Services, Inc. | 60,098 | 2,709,819 |
| ManpowerGroup, Inc. | 30,622 | 3,414,659 |
| Nielsen Holdings plc | 140,820 | 5,470,857 |
| Republic Services, Inc. | 101,624 | 6,629,950 |
| Robert Half International, Inc. | 54,498 | 2,468,759 |
| Rollins, Inc. | 45,527 | 2,021,854 |
| Stericycle, Inc. * | 38,114 | 2,740,015 |
| The Dun & Bradstreet Corp. | 14,078 | 1,568,852 |
| TransUnion * | 68,688 | 3,287,408 |
| Verisk Analytics, Inc. * | 64,765 | 5,249,203 |
| Waste Management, Inc. | 174,161 | 13,429,555 |
| 70,297,461 | ||
| Consumer Durables & Apparel 1.2% | ||
| Carter's, Inc. | 23,619 | 2,048,003 |
| Coach, Inc. | 113,501 | 4,732,992 |
| D.R. Horton, Inc. | 155,716 | 5,629,133 |
| Garmin Ltd. | 56,902 | 2,930,453 |
| Hanesbrands, Inc. | 161,360 | 3,914,593 |
| Hasbro, Inc. | 51,284 | 5,038,653 |
| Leggett & Platt, Inc. | 56,695 | 2,606,269 |
| Lennar Corp., B Shares | 3,978 | 171,173 |
| Lennar Corp., Class A | 83,393 | 4,316,422 |
| Lululemon Athletica, Inc. * | 47,810 | 2,751,465 |
| Mattel, Inc. | 146,621 | 2,378,193 |
| Michael Kors Holdings Ltd. * | 67,055 | 2,831,062 |
| Mohawk Industries, Inc. * | 27,095 | 6,858,286 |
| Newell Brands, Inc. | 211,378 | 10,205,330 |
| NIKE, Inc., Class B | 563,615 | 29,764,508 |
| NVR, Inc. * | 1,434 | 3,901,699 |
| Polaris Industries, Inc. (a) | 24,816 | 2,313,596 |
| PulteGroup, Inc. | 124,023 | 3,202,274 |
| PVH Corp. | 33,572 | 4,226,379 |
| Ralph Lauren Corp. | 20,973 | 1,843,317 |
| Toll Brothers, Inc. | 57,701 | 2,248,031 |
| Under Armour, Inc., Class A *(a) | 73,372 | 1,184,958 |
| Under Armour, Inc., Class C *(a) | 85,076 | 1,284,648 |
| VF Corp. | 140,502 | 8,833,361 |
| Whirlpool Corp. | 31,785 | 5,454,942 |
| 120,669,740 | ||
| Consumer Services 2.0% | ||
| Aramark | 107,688 | 4,381,825 |
| Carnival Corp. | 183,395 | 12,742,285 |
| Chipotle Mexican Grill, Inc. * | 11,800 | 3,737,178 |
| Darden Restaurants, Inc. | 51,314 | 4,212,366 |
| Domino's Pizza, Inc. | 20,364 | 3,711,543 |
| Dunkin' Brands Group, Inc. | 40,823 | 2,104,834 |
| H&R Block, Inc. | 97,594 | 2,609,664 |
| Hilton Worldwide Holdings, Inc. | 86,531 | 5,566,539 |
| Las Vegas Sands Corp. | 154,742 | 9,626,500 |
| Marriott International, Inc., Class A | 131,391 | 13,609,480 |
| McDonald's Corp. | 350,473 | 56,065,166 |
| MGM Resorts International | 208,167 | 6,861,184 |
| Norwegian Cruise Line Holdings Ltd. * | 73,947 | 4,396,889 |
| Royal Caribbean Cruises Ltd. | 72,377 | 9,008,041 |
| Service Corp. International | 84,050 | 2,970,327 |
| Starbucks Corp. | 621,524 | 34,096,807 |
| Vail Resorts, Inc. | 17,079 | 3,893,158 |
| Wyndham Worldwide Corp. | 48,342 | 4,818,730 |
| Security | Number of Shares | Value ($) |
| Wynn Resorts Ltd. | 33,844 | 4,703,977 |
| Yum! Brands, Inc. | 140,349 | 10,781,610 |
| 199,898,103 | ||
| Diversified Financials 5.3% | ||
| Affiliated Managers Group, Inc. | 23,945 | 4,230,842 |
| AGNC Investment Corp. | 160,601 | 3,459,346 |
| Ally Financial, Inc. | 184,801 | 4,176,503 |
| American Express Co. | 324,098 | 27,904,838 |
| Ameriprise Financial, Inc. | 66,737 | 9,243,742 |
| Annaly Capital Management, Inc. | 462,457 | 5,780,712 |
| Berkshire Hathaway, Inc., Class B * | 815,829 | 147,795,582 |
| BlackRock, Inc. | 51,929 | 21,758,770 |
| Capital One Financial Corp. | 207,211 | 16,496,068 |
| CBOE Holdings, Inc. | 39,378 | 3,972,846 |
| CME Group, Inc. | 145,077 | 18,250,687 |
| Discover Financial Services | 164,500 | 9,697,275 |
| E*TRADE Financial Corp. * | 118,130 | 4,844,511 |
| Eaton Vance Corp. | 50,089 | 2,383,235 |
| FactSet Research Systems, Inc. | 16,745 | 2,631,979 |
| Franklin Resources, Inc. | 145,449 | 6,287,760 |
| Intercontinental Exchange, Inc. | 251,445 | 16,260,948 |
| Invesco Ltd. | 174,284 | 5,713,029 |
| Lazard Ltd., Class A | 53,776 | 2,306,453 |
| Legg Mason, Inc. | 41,712 | 1,592,981 |
| Leucadia National Corp. | 141,404 | 3,348,447 |
| MarketAxess Holdings, Inc. | 15,349 | 2,961,590 |
| Moody's Corp. | 70,286 | 9,420,433 |
| Morgan Stanley | 610,107 | 27,759,868 |
| MSCI, Inc. | 37,537 | 4,302,116 |
| Nasdaq, Inc. | 50,753 | 3,825,761 |
| Navient Corp. | 125,389 | 1,655,135 |
| Northern Trust Corp. | 90,353 | 7,996,240 |
| OneMain Holdings, Inc. * | 20,996 | 574,660 |
| Raymond James Financial, Inc. | 57,707 | 4,519,612 |
| S&P Global, Inc. | 110,048 | 16,983,708 |
| Santander Consumer USA Holdings, Inc. * | 40,060 | 572,057 |
| SEI Investments Co. | 57,369 | 3,353,792 |
| Starwood Property Trust, Inc. | 107,252 | 2,382,067 |
| State Street Corp. | 154,996 | 14,335,580 |
| Synchrony Financial | 335,456 | 10,328,690 |
| T. Rowe Price Group, Inc. | 108,306 | 9,136,694 |
| TD Ameritrade Holding Corp. | 109,959 | 4,763,424 |
| The Bank of New York Mellon Corp. | 444,283 | 23,227,115 |
| The Charles Schwab Corp. (b) | 520,057 | 20,750,274 |
| The Goldman Sachs Group, Inc. | 157,821 | 35,310,871 |
| Voya Financial, Inc. | 77,282 | 2,954,491 |
| 525,250,732 | ||
| Energy 5.5% | ||
| Anadarko Petroleum Corp. | 237,626 | 9,726,032 |
| Andeavor | 65,276 | 6,537,391 |
| Antero Resources Corp. * | 62,031 | 1,221,390 |
| Apache Corp. | 163,590 | 6,353,836 |
| Baker Hughes a GE Co. | 187,803 | 6,366,522 |
| Cabot Oil & Gas Corp. | 211,438 | 5,402,241 |
| Cheniere Energy, Inc. * | 97,684 | 4,179,898 |
| Chesapeake Energy Corp. *(a) | 346,941 | 1,262,865 |
| Chevron Corp. | 815,913 | 87,808,557 |
| Cimarex Energy Co. | 41,337 | 4,120,886 |
| Concho Resources, Inc. * | 61,742 | 6,851,510 |
| ConocoPhillips | 529,243 | 23,106,749 |
| Continental Resources, Inc. * | 33,678 | 1,142,358 |
| Core Laboratories N.V. | 17,044 | 1,502,940 |
| Devon Energy Corp. | 220,817 | 6,933,654 |
| Diamondback Energy, Inc. * | 40,308 | 3,659,563 |
| Security | Number of Shares | Value ($) |
| Energen Corp. * | 40,532 | 2,078,481 |
| EOG Resources, Inc. | 250,113 | 21,257,104 |
| EQT Corp. | 74,916 | 4,670,264 |
| Exxon Mobil Corp. | 1,820,695 | 138,973,649 |
| Halliburton Co. | 371,986 | 14,496,295 |
| Helmerich & Payne, Inc. (a) | 46,995 | 1,989,768 |
| Hess Corp. | 115,527 | 4,494,000 |
| HollyFrontier Corp. | 74,448 | 2,330,967 |
| Kinder Morgan, Inc. | 823,618 | 15,920,536 |
| Marathon Oil Corp. | 361,294 | 4,017,589 |
| Marathon Petroleum Corp. | 224,169 | 11,757,664 |
| Murphy Oil Corp. | 63,864 | 1,447,158 |
| National Oilwell Varco, Inc. | 156,778 | 4,808,381 |
| Newfield Exploration Co. * | 81,664 | 2,133,880 |
| Noble Energy, Inc. | 190,543 | 4,529,207 |
| Occidental Petroleum Corp. | 329,791 | 19,688,523 |
| ONEOK, Inc. | 162,049 | 8,776,574 |
| Parsley Energy, Inc., Class A * | 99,047 | 2,481,127 |
| Phillips 66 | 190,632 | 15,976,868 |
| Pioneer Natural Resources Co. | 71,930 | 9,325,725 |
| Range Resources Corp. | 80,160 | 1,391,578 |
| Schlumberger Ltd. | 598,785 | 38,028,835 |
| Southwestern Energy Co. * | 207,101 | 1,128,701 |
| Targa Resources Corp. | 99,965 | 4,455,440 |
| TechnipFMC plc * | 198,165 | 5,118,602 |
| The Williams Cos., Inc. | 360,151 | 10,707,289 |
| Transocean Ltd. * | 164,664 | 1,343,658 |
| Valero Energy Corp. | 192,023 | 13,076,766 |
| Weatherford International plc * | 368,383 | 1,410,907 |
| 543,991,928 | ||
| Food & Staples Retailing 1.7% | ||
| Casey's General Stores, Inc. | 20,768 | 2,189,363 |
| Costco Wholesale Corp. | 187,549 | 29,396,430 |
| CVS Health Corp. | 438,011 | 33,875,771 |
| Rite Aid Corp. * | 520,478 | 1,259,557 |
| Sysco Corp. | 209,910 | 11,055,960 |
| The Kroger Co. | 387,501 | 8,474,647 |
| US Foods Holding Corp. * | 57,263 | 1,571,869 |
| Wal-Mart Stores, Inc. | 637,473 | 49,767,517 |
| Walgreens Boots Alliance, Inc. | 363,413 | 29,618,159 |
| 167,209,273 | ||
| Food, Beverage & Tobacco 4.7% | ||
| Altria Group, Inc. | 830,308 | 52,641,527 |
| Archer-Daniels-Midland Co. | 248,236 | 10,257,112 |
| Brown-Forman Corp., Class A | 20,668 | 1,149,554 |
| Brown-Forman Corp., Class B | 78,296 | 4,152,820 |
| Bunge Ltd. | 58,445 | 4,361,750 |
| Campbell Soup Co. | 84,334 | 3,896,231 |
| ConAgra Brands, Inc. | 171,721 | 5,574,064 |
| Constellation Brands, Inc., Class A | 73,801 | 14,767,580 |
| Dr. Pepper Snapple Group, Inc. | 80,254 | 7,307,127 |
| General Mills, Inc. | 247,866 | 13,201,343 |
| Hormel Foods Corp. | 113,418 | 3,486,469 |
| Ingredion, Inc. | 30,564 | 3,784,434 |
| Kellogg Co. | 113,895 | 7,455,567 |
| Lamb Weston Holdings, Inc. | 60,954 | 2,772,188 |
| McCormick & Co., Inc. Non-Voting Shares | 46,668 | 4,439,527 |
| Molson Coors Brewing Co., Class B | 78,222 | 7,020,425 |
| Mondelez International, Inc., Class A | 649,916 | 26,425,585 |
| Monster Beverage Corp. * | 176,761 | 9,866,799 |
| PepsiCo, Inc. | 613,501 | 71,000,471 |
| Philip Morris International, Inc. | 667,299 | 78,027,272 |
| Pilgrim's Pride Corp. * | 24,341 | 716,842 |
| Pinnacle Foods, Inc. | 51,665 | 3,064,251 |
| Security | Number of Shares | Value ($) |
| Post Holdings, Inc. * | 29,571 | 2,517,379 |
| The Coca-Cola Co. | 1,652,127 | 75,254,385 |
| The Hain Celestial Group, Inc. * | 42,254 | 1,699,456 |
| The Hershey Co. | 60,191 | 6,315,240 |
| The J.M. Smucker Co. | 50,490 | 5,289,332 |
| The Kraft Heinz Co. | 255,541 | 20,634,936 |
| TreeHouse Foods, Inc. * | 24,577 | 1,646,413 |
| Tyson Foods, Inc., Class A | 127,815 | 8,090,689 |
| 456,816,768 | ||
| Health Care Equipment & Services 5.5% | ||
| Abbott Laboratories | 749,319 | 38,170,310 |
| ABIOMED, Inc. * | 16,755 | 2,526,654 |
| Aetna, Inc. | 141,490 | 22,312,973 |
| Align Technology, Inc. * | 33,811 | 5,975,756 |
| AmerisourceBergen Corp. | 70,460 | 5,654,415 |
| Anthem, Inc. | 112,764 | 22,106,255 |
| Baxter International, Inc. | 211,958 | 13,149,874 |
| Becton Dickinson & Co. | 96,084 | 19,162,993 |
| Boston Scientific Corp. * | 602,936 | 16,610,887 |
| C.R. Bard, Inc. | 30,603 | 9,817,748 |
| Cardinal Health, Inc. | 134,905 | 9,100,691 |
| Centene Corp. * | 72,574 | 6,448,200 |
| Cerner Corp. * | 127,155 | 8,618,566 |
| Cigna Corp. | 111,871 | 20,367,234 |
| Danaher Corp. | 262,285 | 21,879,815 |
| DaVita, Inc. * | 63,600 | 3,724,416 |
| DENTSPLY SIRONA, Inc. | 96,665 | 5,468,339 |
| DexCom, Inc. * | 37,380 | 2,788,922 |
| Edwards Lifesciences Corp. * | 91,129 | 10,357,722 |
| Express Scripts Holding Co. * | 254,401 | 15,981,471 |
| HCA Healthcare, Inc. * | 124,782 | 9,815,352 |
| Henry Schein, Inc. * | 33,776 | 5,866,216 |
| Hologic, Inc. * | 120,598 | 4,655,083 |
| Humana, Inc. | 61,612 | 15,872,483 |
| IDEXX Laboratories, Inc. * | 37,095 | 5,765,676 |
| Intuitive Surgical, Inc. * | 15,948 | 16,022,477 |
| Laboratory Corp. of America Holdings * | 43,849 | 6,878,593 |
| McKesson Corp. | 89,283 | 13,330,845 |
| MEDNAX, Inc. * | 36,782 | 1,649,673 |
| Medtronic plc | 587,583 | 47,370,941 |
| Patterson Cos., Inc. | 34,027 | 1,310,039 |
| Quest Diagnostics, Inc. | 60,320 | 6,535,672 |
| ResMed, Inc. | 61,788 | 4,793,513 |
| STERIS plc | 35,510 | 3,095,052 |
| Stryker Corp. | 133,396 | 18,858,193 |
| Teleflex, Inc. | 20,190 | 4,275,232 |
| The Cooper Cos., Inc. | 20,322 | 5,097,367 |
| UnitedHealth Group, Inc. | 415,444 | 82,631,812 |
| Universal Health Services, Inc., Class B | 37,238 | 4,026,545 |
| Varian Medical Systems, Inc. * | 37,689 | 4,004,456 |
| VCA, Inc. * | 33,410 | 3,105,794 |
| West Pharmaceutical Services, Inc. | 33,412 | 2,908,180 |
| Zimmer Biomet Holdings, Inc. | 87,560 | 10,005,481 |
| 538,097,916 | ||
| Household & Personal Products 1.8% | ||
| Church & Dwight Co., Inc. | 107,772 | 5,406,921 |
| Colgate-Palmolive Co. | 376,678 | 26,985,212 |
| Edgewell Personal Care Co. * | 24,041 | 1,825,673 |
| Herbalife Ltd. *(a) | 32,818 | 2,264,770 |
| Kimberly-Clark Corp. | 153,045 | 18,868,918 |
| Spectrum Brands Holdings, Inc. | 10,834 | 1,191,307 |
| The Clorox Co. | 54,098 | 7,494,196 |
| Security | Number of Shares | Value ($) |
| The Estee Lauder Cos., Inc., Class A | 97,235 | 10,403,173 |
| The Procter & Gamble Co. | 1,100,288 | 101,523,574 |
| 175,963,744 | ||
| Insurance 2.9% | ||
| Aflac, Inc. | 168,479 | 13,907,941 |
| Alleghany Corp. * | 6,769 | 3,809,390 |
| American Financial Group, Inc. | 30,206 | 3,075,273 |
| American International Group, Inc. | 376,110 | 22,747,133 |
| Aon plc | 111,522 | 15,519,402 |
| Arch Capital Group Ltd. * | 58,472 | 5,691,665 |
| Arthur J. Gallagher & Co. | 78,954 | 4,571,437 |
| Assurant, Inc. | 23,977 | 2,270,382 |
| Athene Holding Ltd., Class A * | 22,272 | 1,191,775 |
| Axis Capital Holdings Ltd. | 32,644 | 1,966,475 |
| Brighthouse Financial, Inc. * | 42,263 | 2,411,949 |
| Brown & Brown, Inc. | 50,362 | 2,264,276 |
| Chubb Ltd. | 200,807 | 28,398,126 |
| Cincinnati Financial Corp. | 61,089 | 4,694,079 |
| CNA Financial Corp. | 13,512 | 662,899 |
| Erie Indemnity Co., Class A | 5,642 | 681,497 |
| Everest Re Group Ltd. | 17,484 | 4,414,360 |
| FNF Group | 121,750 | 5,873,220 |
| Lincoln National Corp. | 95,541 | 6,483,412 |
| Loews Corp. | 114,481 | 5,332,525 |
| Markel Corp. * | 6,098 | 6,415,035 |
| Marsh & McLennan Cos., Inc. | 222,549 | 17,376,626 |
| MetLife, Inc. | 465,501 | 21,799,412 |
| Principal Financial Group, Inc. | 110,519 | 6,909,648 |
| Prudential Financial, Inc. | 185,118 | 18,896,845 |
| Reinsurance Group of America, Inc. | 27,012 | 3,631,763 |
| RenaissanceRe Holdings Ltd. | 17,251 | 2,400,649 |
| The Allstate Corp. | 155,456 | 14,068,768 |
| The Hartford Financial Services Group, Inc. | 155,206 | 8,391,988 |
| The Progressive Corp. | 252,101 | 11,717,655 |
| The Travelers Cos., Inc. | 123,074 | 14,914,107 |
| Torchmark Corp. | 47,755 | 3,675,702 |
| Unum Group | 100,996 | 4,865,987 |
| W.R. Berkley Corp. | 43,639 | 2,908,103 |
| Willis Towers Watson plc | 54,692 | 8,120,121 |
| XL Group Ltd. | 113,905 | 4,665,549 |
| 286,725,174 | ||
| Materials 3.1% | ||
| Air Products & Chemicals, Inc. | 94,580 | 13,749,095 |
| Albemarle Corp. | 45,735 | 5,317,151 |
| Ashland Global Holdings, Inc. | 27,619 | 1,713,759 |
| Avery Dennison Corp. | 37,445 | 3,529,566 |
| Axalta Coating Systems Ltd. * | 89,006 | 2,627,457 |
| Ball Corp. | 147,648 | 5,904,444 |
| Berry Global Group, Inc. * | 51,465 | 2,894,392 |
| Celanese Corp., Series A | 58,001 | 5,627,257 |
| CF Industries Holdings, Inc. | 100,561 | 2,915,263 |
| Crown Holdings, Inc. * | 56,715 | 3,347,886 |
| E.I. du Pont de Nemours & Co. | 377,516 | 31,684,918 |
| Eastman Chemical Co. | 64,469 | 5,557,228 |
| Ecolab, Inc. | 111,198 | 14,822,693 |
| FMC Corp. | 60,459 | 5,212,775 |
| Freeport-McMoRan, Inc. * | 566,700 | 8,375,826 |
| Huntsman Corp. | 83,669 | 2,223,085 |
| International Flavors & Fragrances, Inc. | 33,350 | 4,563,947 |
| International Paper Co. | 179,821 | 9,686,957 |
| LyondellBasell Industries N.V., Class A | 146,343 | 13,257,212 |
| Martin Marietta Materials, Inc. | 26,838 | 5,689,388 |
| Monsanto Co. | 191,551 | 22,449,777 |
| Security | Number of Shares | Value ($) |
| NewMarket Corp. | 3,811 | 1,594,942 |
| Newmont Mining Corp. | 226,968 | 8,701,953 |
| Nucor Corp. | 139,215 | 7,672,139 |
| Packaging Corp. of America | 42,471 | 4,774,165 |
| PPG Industries, Inc. | 110,273 | 11,503,679 |
| Praxair, Inc. | 120,907 | 15,904,107 |
| Reliance Steel & Aluminum Co. | 30,560 | 2,213,155 |
| Royal Gold, Inc. | 28,252 | 2,635,347 |
| RPM International, Inc. | 60,705 | 2,972,724 |
| Sealed Air Corp. | 84,657 | 3,757,078 |
| Sonoco Products Co. | 42,032 | 2,028,464 |
| Steel Dynamics, Inc. | 100,230 | 3,452,924 |
| The Dow Chemical Co. | 482,293 | 32,144,828 |
| The Mosaic Co. | 150,418 | 3,005,352 |
| The Sherwin-Williams Co. | 34,750 | 11,789,632 |
| Vulcan Materials Co. | 55,011 | 6,670,634 |
| W.R. Grace & Co. | 30,272 | 2,163,843 |
| Westlake Chemical Corp. | 16,809 | 1,292,780 |
| WestRock Co. | 108,288 | 6,162,670 |
| 301,590,492 | ||
| Media 3.1% | ||
| CBS Corp., Class B Non-Voting Shares | 161,004 | 10,313,916 |
| Charter Communications, Inc., Class A * | 92,369 | 36,812,741 |
| Comcast Corp., Class A | 2,025,950 | 82,273,830 |
| Discovery Communications, Inc., Class A * | 59,984 | 1,332,245 |
| Discovery Communications, Inc., Class C * | 110,490 | 2,321,395 |
| DISH Network Corp., Class A * | 97,360 | 5,577,754 |
| Liberty Broadband Corp., Class A * | 12,056 | 1,222,840 |
| Liberty Broadband Corp., Class C * | 30,202 | 3,066,409 |
| Liberty Global plc, Class A * | 113,505 | 3,859,170 |
| Liberty Global plc, Series C * | 275,017 | 9,083,812 |
| Liberty Media Corp. - Liberty SiriusXM, Class A * | 40,426 | 1,807,042 |
| Liberty Media Corp. - Liberty SiriusXM, Class C * | 83,018 | 3,703,433 |
| Live Nation Entertainment, Inc. * | 53,388 | 2,133,384 |
| News Corp., Class A | 155,263 | 2,075,866 |
| News Corp., Class B | 41,836 | 573,153 |
| Omnicom Group, Inc. | 103,138 | 7,465,128 |
| Scripps Networks Interactive, Inc., Class A | 37,985 | 3,253,415 |
| Sirius XM Holdings, Inc. (a) | 735,190 | 4,227,343 |
| TEGNA, Inc. | 94,033 | 1,186,696 |
| The Interpublic Group of Cos., Inc. | 170,132 | 3,426,459 |
| The Walt Disney Co. | 622,696 | 63,016,835 |
| Time Warner, Inc. | 332,899 | 33,656,089 |
| Tribune Media Co., Class A | 24,850 | 995,740 |
| Twenty-First Century Fox, Inc., Class A | 458,009 | 12,636,468 |
| Twenty-First Century Fox, Inc., Class B | 214,636 | 5,816,636 |
| Viacom, Inc., Class B | 154,791 | 4,427,023 |
| 306,264,822 | ||
| Pharmaceuticals, Biotechnology & Life Sciences 8.6% | ||
| AbbVie, Inc. | 683,264 | 51,449,779 |
| Agilent Technologies, Inc. | 137,789 | 8,917,704 |
| Alexion Pharmaceuticals, Inc. * | 98,081 | 13,967,715 |
| Alkermes plc * | 62,010 | 3,148,868 |
| Allergan plc | 143,444 | 32,917,529 |
| Alnylam Pharmaceuticals, Inc. * | 34,480 | 2,955,970 |
| Amgen, Inc. | 315,356 | 56,060,836 |
| Biogen, Inc. * | 93,202 | 29,504,025 |
| BioMarin Pharmaceutical, Inc. * | 73,410 | 6,620,848 |
| Bristol-Myers Squibb Co. | 703,663 | 42,557,538 |
| Celgene Corp. * | 336,543 | 46,755,919 |
| Eli Lilly & Co. | 414,356 | 33,682,999 |
| Endo International plc * | 77,011 | 676,927 |
| Security | Number of Shares | Value ($) |
| Gilead Sciences, Inc. | 559,301 | 46,819,087 |
| Illumina, Inc. * | 64,214 | 13,129,194 |
| Incyte Corp. * | 74,262 | 10,204,341 |
| Ionis Pharmaceuticals, Inc. * | 50,762 | 2,721,858 |
| Jazz Pharmaceuticals plc * | 26,847 | 4,009,868 |
| Johnson & Johnson | 1,159,662 | 153,504,459 |
| Mallinckrodt plc * | 42,761 | 1,756,622 |
| Merck & Co., Inc. | 1,170,878 | 74,772,269 |
| Mettler-Toledo International, Inc. * | 11,515 | 6,967,611 |
| Mylan N.V. * | 203,508 | 6,406,432 |
| OPKO Health, Inc. *(a) | 170,834 | 1,093,338 |
| PerkinElmer, Inc. | 46,694 | 3,128,031 |
| Perrigo Co., plc | 58,185 | 4,594,288 |
| Pfizer, Inc. | 2,560,665 | 86,857,757 |
| Quintiles IMS Holdings, Inc. * | 60,049 | 5,766,505 |
| Regeneron Pharmaceuticals, Inc. * | 33,284 | 16,538,820 |
| Seattle Genetics, Inc. * | 43,747 | 2,298,030 |
| Thermo Fisher Scientific, Inc. | 167,879 | 31,416,876 |
| United Therapeutics Corp. * | 17,790 | 2,326,932 |
| Vertex Pharmaceuticals, Inc. * | 106,911 | 17,163,492 |
| Waters Corp. * | 33,701 | 6,183,460 |
| Zoetis, Inc. | 206,654 | 12,957,206 |
| 839,833,133 | ||
| Real Estate 3.5% | ||
| Alexandria Real Estate Equities, Inc. | 37,832 | 4,589,400 |
| American Campus Communities, Inc. | 54,467 | 2,592,084 |
| American Homes 4 Rent, Class A | 98,903 | 2,191,690 |
| American Tower Corp. | 184,748 | 27,351,941 |
| Apartment Investment & Management Co., Class A | 68,079 | 3,086,021 |
| AvalonBay Communities, Inc. | 60,031 | 11,269,620 |
| Boston Properties, Inc. | 65,133 | 7,855,040 |
| Brixmor Property Group, Inc. | 100,434 | 1,880,124 |
| Camden Property Trust | 38,466 | 3,441,938 |
| CBRE Group, Inc., Class A * | 121,812 | 4,394,977 |
| Crown Castle International Corp. | 172,329 | 18,687,357 |
| DDR Corp. | 144,428 | 1,398,063 |
| Digital Realty Trust, Inc. | 67,205 | 7,953,040 |
| Douglas Emmett, Inc. | 65,409 | 2,548,335 |
| Duke Realty Corp. | 147,182 | 4,374,249 |
| Equinix, Inc. | 34,051 | 15,949,829 |
| Equity LifeStyle Properties, Inc. | 33,910 | 3,023,076 |
| Equity Residential | 153,857 | 10,331,498 |
| Essex Property Trust, Inc. | 29,238 | 7,776,431 |
| Extra Space Storage, Inc. | 54,688 | 4,245,429 |
| Federal Realty Investment Trust | 31,134 | 3,951,839 |
| Forest City Realty Trust, Inc., Class A | 100,330 | 2,403,907 |
| Gaming & Leisure Properties, Inc. | 84,575 | 3,314,494 |
| GGP, Inc. | 254,361 | 5,277,991 |
| HCP, Inc. | 194,101 | 5,786,151 |
| Highwoods Properties, Inc. | 49,042 | 2,561,464 |
| Host Hotels & Resorts, Inc. | 317,691 | 5,756,561 |
| Invitation Homes, Inc. | 43,506 | 1,006,729 |
| Iron Mountain, Inc. | 100,796 | 3,973,378 |
| JBG SMITH Properties * | 36,984 | 1,210,486 |
| Jones Lang LaSalle, Inc. | 21,033 | 2,564,133 |
| Kilroy Realty Corp. | 40,400 | 2,796,892 |
| Kimco Realty Corp. | 181,238 | 3,555,890 |
| Lamar Advertising Co., Class A | 35,114 | 2,337,188 |
| Liberty Property Trust | 65,862 | 2,805,721 |
| Mid-America Apartment Communities, Inc. | 49,092 | 5,226,334 |
| National Retail Properties, Inc. | 62,151 | 2,599,776 |
| Omega Healthcare Investors, Inc. | 83,548 | 2,662,675 |
| Park Hotels & Resorts, Inc. | 69,116 | 1,844,706 |
| Prologis, Inc. | 232,076 | 14,704,335 |
| Security | Number of Shares | Value ($) |
| Public Storage | 63,462 | 13,031,287 |
| Realogy Holdings Corp. | 60,984 | 2,067,358 |
| Realty Income Corp. | 121,582 | 6,998,260 |
| Regency Centers Corp. | 61,222 | 3,937,799 |
| SBA Communications Corp. * | 50,752 | 7,792,970 |
| Senior Housing Properties Trust | 107,334 | 2,116,626 |
| Simon Property Group, Inc. | 134,198 | 21,048,956 |
| SL Green Realty Corp. | 45,307 | 4,366,689 |
| Spirit Realty Capital, Inc. | 206,882 | 1,799,873 |
| Sun Communities, Inc. | 34,012 | 3,071,624 |
| Taubman Centers, Inc. | 23,859 | 1,246,394 |
| The Macerich Co. | 50,492 | 2,664,463 |
| UDR, Inc. | 113,424 | 4,403,120 |
| Ventas, Inc. | 150,005 | 10,266,342 |
| VEREIT, Inc. | 419,027 | 3,536,588 |
| Vornado Realty Trust | 73,968 | 5,509,876 |
| Weingarten Realty Investors | 43,711 | 1,400,500 |
| Welltower, Inc. | 153,567 | 11,244,176 |
| Weyerhaeuser Co. | 317,751 | 10,361,860 |
| WP Carey, Inc. | 42,482 | 2,924,886 |
| 341,070,439 | ||
| Retailing 5.1% | ||
| Advance Auto Parts, Inc. | 32,132 | 3,145,723 |
| Amazon.com, Inc. * | 170,287 | 166,983,432 |
| AutoNation, Inc. *(a) | 27,867 | 1,264,326 |
| AutoZone, Inc. * | 11,567 | 6,112,465 |
| Bed Bath & Beyond, Inc. | 60,607 | 1,672,147 |
| Best Buy Co., Inc. | 114,165 | 6,194,593 |
| Burlington Stores, Inc. * | 30,299 | 2,639,952 |
| CarMax, Inc. * | 76,826 | 5,158,866 |
| Dick's Sporting Goods, Inc. | 40,305 | 1,062,440 |
| Dollar General Corp. | 107,307 | 7,786,196 |
| Dollar Tree, Inc. * | 98,226 | 7,822,719 |
| Expedia, Inc. | 51,706 | 7,671,102 |
| Foot Locker, Inc. | 55,565 | 1,957,555 |
| Genuine Parts Co. | 65,720 | 5,443,588 |
| Kohl's Corp. | 73,169 | 2,910,663 |
| L Brands, Inc. | 101,341 | 3,670,571 |
| Liberty Interactive Corp. QVC Group, Class A * | 185,420 | 4,101,490 |
| Liberty Ventures, Series A * | 32,475 | 1,999,161 |
| LKQ Corp. * | 132,129 | 4,578,270 |
| Lowe's Cos., Inc. | 367,577 | 27,160,264 |
| Macy's, Inc. | 141,077 | 2,930,169 |
| Netflix, Inc. * | 184,901 | 32,304,054 |
| Nordstrom, Inc. (a) | 50,456 | 2,251,347 |
| O'Reilly Automotive, Inc. * | 38,770 | 7,603,960 |
| Ross Stores, Inc. | 174,600 | 10,205,370 |
| Sally Beauty Holdings, Inc. * | 63,430 | 1,179,164 |
| Signet Jewelers Ltd. | 28,451 | 1,794,405 |
| Staples, Inc. | 260,310 | 2,659,067 |
| Target Corp. | 239,003 | 13,032,834 |
| The Gap, Inc. | 91,234 | 2,154,947 |
| The Home Depot, Inc. | 512,548 | 76,815,569 |
| The Michaels Cos., Inc. * | 47,454 | 1,065,342 |
| The Priceline Group, Inc. * | 21,194 | 39,252,983 |
| The TJX Cos., Inc. | 281,114 | 20,324,542 |
| Tiffany & Co. | 43,631 | 3,987,873 |
| Tractor Supply Co. | 56,860 | 3,383,739 |
| TripAdvisor, Inc. * | 47,839 | 2,044,160 |
| Ulta Salon, Cosmetics & Fragrance, Inc. * | 24,328 | 5,376,731 |
| Urban Outfitters, Inc. * | 32,862 | 671,699 |
| Williams-Sonoma, Inc. | 33,683 | 1,549,418 |
| 499,922,896 | ||
| Security | Number of Shares | Value ($) |
| Semiconductors & Semiconductor Equipment 3.4% | ||
| Advanced Micro Devices, Inc. * | 320,721 | 4,169,373 |
| Analog Devices, Inc. | 161,202 | 13,487,771 |
| Applied Materials, Inc. | 456,749 | 20,608,515 |
| Broadcom Ltd. | 173,269 | 43,675,917 |
| First Solar, Inc. * | 33,852 | 1,589,690 |
| Intel Corp. | 2,028,671 | 71,145,492 |
| KLA-Tencor Corp. | 65,243 | 6,112,617 |
| Lam Research Corp. | 68,238 | 11,326,143 |
| Marvell Technology Group Ltd. | 180,402 | 3,231,000 |
| Maxim Integrated Products, Inc. | 117,049 | 5,461,506 |
| Microchip Technology, Inc. | 100,183 | 8,695,884 |
| Micron Technology, Inc. * | 443,204 | 14,169,232 |
| NVIDIA Corp. | 257,283 | 43,594,032 |
| Qorvo, Inc. * | 58,241 | 4,264,406 |
| QUALCOMM, Inc. | 632,672 | 33,069,765 |
| Skyworks Solutions, Inc. | 80,040 | 8,433,014 |
| Texas Instruments, Inc. | 424,885 | 35,188,976 |
| Xilinx, Inc. | 106,764 | 7,052,830 |
| 335,276,163 | ||
| Software & Services 13.9% | ||
| Accenture plc, Class A | 267,390 | 34,963,916 |
| Activision Blizzard, Inc. | 300,854 | 19,723,988 |
| Adobe Systems, Inc. * | 212,515 | 32,973,827 |
| Akamai Technologies, Inc. * | 74,738 | 3,523,897 |
| Alliance Data Systems Corp. | 23,597 | 5,321,124 |
| Alphabet, Inc., Class A * | 127,846 | 122,123,613 |
| Alphabet, Inc., Class C * | 128,051 | 120,282,146 |
| Amdocs Ltd. | 63,733 | 4,129,261 |
| ANSYS, Inc. * | 36,695 | 4,727,050 |
| Autodesk, Inc. * | 82,049 | 9,391,329 |
| Automatic Data Processing, Inc. | 191,387 | 20,376,974 |
| Broadridge Financial Solutions, Inc. | 48,574 | 3,795,087 |
| CA, Inc. | 130,744 | 4,338,086 |
| Cadence Design Systems, Inc. * | 115,371 | 4,532,927 |
| CDK Global, Inc. | 64,501 | 4,160,315 |
| Citrix Systems, Inc. * | 63,949 | 5,001,451 |
| Cognizant Technology Solutions Corp., Class A | 250,870 | 17,754,070 |
| CoStar Group, Inc. * | 13,412 | 3,844,147 |
| CSRA, Inc. | 57,359 | 1,807,382 |
| Dell Technologies, Inc., Class V * | 57,674 | 4,321,513 |
| DXC Technology Co. | 124,456 | 10,578,760 |
| eBay, Inc. * | 434,870 | 15,711,853 |
| Electronic Arts, Inc. * | 134,460 | 16,336,890 |
| Facebook, Inc., Class A * | 1,016,150 | 174,747,315 |
| Fidelity National Information Services, Inc. | 146,349 | 13,598,749 |
| Fiserv, Inc. * | 89,408 | 11,060,664 |
| FleetCor Technologies, Inc. * | 38,942 | 5,598,691 |
| Fortinet, Inc. * | 74,165 | 2,833,103 |
| Gartner, Inc. * | 37,755 | 4,552,875 |
| Global Payments, Inc. | 64,124 | 6,123,201 |
| IAC/InterActiveCorp * | 30,516 | 3,463,871 |
| International Business Machines Corp. | 367,964 | 52,629,891 |
| Intuit, Inc. | 106,400 | 15,050,280 |
| Jack Henry & Associates, Inc. | 33,638 | 3,467,069 |
| Leidos Holdings, Inc. | 60,898 | 3,551,571 |
| MasterCard, Inc., Class A | 402,622 | 53,669,513 |
| Microsoft Corp. | 3,314,769 | 247,845,278 |
| Nuance Communications, Inc. * | 106,875 | 1,717,481 |
| Oracle Corp. | 1,286,255 | 64,737,214 |
| Paychex, Inc. | 138,646 | 7,906,981 |
| PayPal Holdings, Inc. * | 482,635 | 29,768,927 |
| Red Hat, Inc. * | 76,747 | 8,250,303 |
| Sabre Corp. | 100,132 | 1,846,434 |
| Security | Number of Shares | Value ($) |
| salesforce.com, Inc. * | 286,061 | 27,315,965 |
| ServiceNow, Inc. * | 74,021 | 8,600,500 |
| Splunk, Inc. * | 57,948 | 3,887,731 |
| SS&C Technologies Holdings, Inc. | 78,376 | 3,033,935 |
| Symantec Corp. | 261,398 | 7,836,712 |
| Synopsys, Inc. * | 65,649 | 5,279,493 |
| Teradata Corp. * | 53,815 | 1,717,775 |
| The Ultimate Software Group, Inc. * | 11,833 | 2,377,250 |
| The Western Union Co. | 203,355 | 3,847,477 |
| Total System Services, Inc. | 74,814 | 5,171,144 |
| Twitter, Inc. * | 255,052 | 4,312,929 |
| Tyler Technologies, Inc. * | 13,944 | 2,409,523 |
| Vantiv, Inc., Class A * | 72,473 | 5,123,116 |
| VeriSign, Inc. * | 35,516 | 3,684,785 |
| Visa, Inc., Class A | 794,050 | 82,200,056 |
| VMware, Inc., Class A * | 31,312 | 3,384,827 |
| Workday, Inc., Class A * | 54,132 | 5,937,739 |
| Zillow Group, Inc., Class A * | 20,466 | 817,003 |
| Zillow Group, Inc., Class C * | 48,954 | 1,939,557 |
| 1,361,016,534 | ||
| Technology Hardware & Equipment 5.9% | ||
| Amphenol Corp., Class A | 128,220 | 10,378,127 |
| Apple, Inc. | 2,241,585 | 367,619,940 |
| Arista Networks, Inc. * | 17,455 | 3,074,698 |
| Arrow Electronics, Inc. * | 40,126 | 3,187,208 |
| Avnet, Inc. | 56,695 | 2,186,726 |
| CDW Corp. | 66,774 | 4,234,807 |
| Cisco Systems, Inc. | 2,144,848 | 69,085,554 |
| CommScope Holding Co., Inc. * | 80,196 | 2,651,280 |
| Corning, Inc. | 400,823 | 11,527,669 |
| F5 Networks, Inc. * | 27,141 | 3,240,093 |
| FLIR Systems, Inc. | 57,382 | 2,180,516 |
| Harris Corp. | 54,520 | 6,700,508 |
| Hewlett Packard Enterprise Co. | 711,763 | 12,854,440 |
| HP, Inc. | 734,966 | 14,023,151 |
| Jabil, Inc. | 76,705 | 2,404,702 |
| Juniper Networks, Inc. | 157,452 | 4,366,144 |
| Keysight Technologies, Inc. * | 77,176 | 3,153,411 |
| Motorola Solutions, Inc. | 68,492 | 6,035,515 |
| National Instruments Corp. | 40,245 | 1,625,496 |
| NCR Corp. * | 50,438 | 1,842,500 |
| NetApp, Inc. | 115,639 | 4,470,604 |
| Palo Alto Networks, Inc. * | 41,497 | 5,506,237 |
| Seagate Technology plc | 123,998 | 3,909,657 |
| TE Connectivity Ltd. | 154,280 | 12,280,688 |
| Trimble, Inc. * | 114,798 | 4,440,387 |
| Western Digital Corp. | 127,002 | 11,210,466 |
| Xerox Corp. | 98,971 | 3,193,794 |
| 577,384,318 | ||
| Telecommunication Services 2.1% | ||
| AT&T, Inc. | 2,652,233 | 99,352,648 |
| CenturyLink, Inc. | 244,199 | 4,815,604 |
| Frontier Communications Corp. (a) | 19,733 | 265,804 |
| Level 3 Communications, Inc. * | 125,104 | 6,809,411 |
| Sprint Corp. * | 278,706 | 2,299,324 |
| T-Mobile US, Inc. * | 122,071 | 7,899,214 |
| Verizon Communications, Inc. | 1,749,168 | 83,907,589 |
| Zayo Group Holdings, Inc. * | 41,329 | 1,412,212 |
| 206,761,806 | ||
| Transportation 2.1% | ||
| Alaska Air Group, Inc. | 57,138 | 4,265,923 |
| AMERCO | 2,800 | 1,044,988 |
| Security | Number of Shares | Value ($) |
| American Airlines Group, Inc. | 210,810 | 9,431,639 |
| Avis Budget Group, Inc. * | 41,532 | 1,504,704 |
| C.H. Robinson Worldwide, Inc. | 61,132 | 4,317,753 |
| CSX Corp. | 397,496 | 19,954,299 |
| Delta Air Lines, Inc. | 313,928 | 14,814,262 |
| Expeditors International of Washington, Inc. | 74,837 | 4,198,356 |
| FedEx Corp. | 105,303 | 22,574,857 |
| Genesee & Wyoming, Inc., Class A * | 28,010 | 1,920,366 |
| Hertz Global Holdings, Inc. * | 32,462 | 705,724 |
| J.B. Hunt Transport Services, Inc. | 37,309 | 3,689,487 |
| JetBlue Airways Corp. * | 141,150 | 2,796,181 |
| Kansas City Southern | 43,334 | 4,482,036 |
| Macquarie Infrastructure Corp. | 30,202 | 2,249,445 |
| Norfolk Southern Corp. | 124,178 | 14,965,933 |
| Old Dominion Freight Line, Inc. | 30,002 | 2,997,200 |
| Southwest Airlines Co. | 261,146 | 13,616,152 |
| Union Pacific Corp. | 344,952 | 36,323,446 |
| United Continental Holdings, Inc. * | 121,403 | 7,522,130 |
| United Parcel Service, Inc., Class B | 297,903 | 34,068,187 |
| 207,443,068 | ||
| Utilities 3.3% | ||
| AES Corp. | 296,731 | 3,275,910 |
| Alliant Energy Corp. | 98,833 | 4,224,122 |
| Ameren Corp. | 100,315 | 6,017,897 |
| American Electric Power Co., Inc. | 208,345 | 15,340,442 |
| American Water Works Co., Inc. | 75,411 | 6,100,750 |
| Aqua America, Inc. | 81,209 | 2,712,381 |
| Atmos Energy Corp. | 42,686 | 3,758,075 |
| Avangrid, Inc. | 25,503 | 1,245,056 |
| Calpine Corp. * | 157,274 | 2,311,928 |
| CenterPoint Energy, Inc. | 190,987 | 5,657,035 |
| CMS Energy Corp. | 120,803 | 5,863,778 |
| Consolidated Edison, Inc. | 129,091 | 10,878,499 |
| Dominion Energy, Inc. | 272,782 | 21,487,038 |
| DTE Energy Co. | 76,661 | 8,610,564 |
| Duke Energy Corp. | 303,037 | 26,455,130 |
| Edison International | 138,604 | 11,113,269 |
| Entergy Corp. | 73,927 | 5,852,801 |
| Eversource Energy | 134,738 | 8,488,494 |
| Exelon Corp. | 391,702 | 14,833,755 |
| FirstEnergy Corp. | 192,468 | 6,270,607 |
| National Fuel Gas Co. | 33,392 | 1,936,068 |
| NextEra Energy, Inc. | 202,140 | 30,424,091 |
| NiSource, Inc. | 148,726 | 3,996,268 |
| NRG Energy, Inc. | 144,289 | 3,594,239 |
| OGE Energy Corp. | 80,064 | 2,859,886 |
| PG&E Corp. | 221,636 | 15,598,742 |
| Pinnacle West Capital Corp. | 48,881 | 4,397,824 |
| PPL Corp. | 297,580 | 11,677,039 |
| Public Service Enterprise Group, Inc. | 217,199 | 10,173,601 |
| SCANA Corp. | 64,010 | 3,864,924 |
| Sempra Energy | 108,012 | 12,737,855 |
| The Southern Co. | 422,316 | 20,380,970 |
| UGI Corp. | 74,631 | 3,687,518 |
| Vistra Energy Corp. | 129,156 | 2,286,061 |
| WEC Energy Group, Inc. | 134,154 | 8,749,524 |
| Westar Energy, Inc. | 60,326 | 3,095,327 |
| Xcel Energy, Inc. | 220,641 | 10,921,729 |
| 320,879,197 | ||
| Total Common Stock | ||
| (Cost $7,890,336,470) | 9,792,276,762 | |
| Security | Number of Shares | Value ($) |
| Other Investment Companies 0.2% of net assets | ||
| Money Market Fund 0.1% | ||
| State Street Institutional U.S. Government Money Market Fund, Premier Class 0.93% (c) | 9,920,138 | 9,920,138 |
| Securities Lending Collateral 0.1% | ||
| Wells Fargo Government Money Market Fund, Select Class 0.92% (c) | 16,565,366 | 16,565,366 |
| Total Other Investment Companies | ||
| (Cost $26,485,504) | 26,485,504 | |
| Number of Contracts | Notional Amount ($) | Current Value/ Unrealized Appreciation ($) | ||
| Futures Contracts | ||||
| Long | ||||
| S&P 500 Index, e-mini, expires 09/15/17 | 253 | 31,246,765 | 244,610 | |
| * | Non-income producing security. |
| (a) | All or a portion of this security is on loan. Securities on loan were valued at $16,160,383. |
| (b) | Issuer is affiliated with the fund's investment adviser. |
| (c) | The rate shown is the 7-day yield. |
| Security | Number of Shares | Value ($) |
| Common Stock 99.7% of net assets | ||
| Automobiles & Components 0.6% | ||
| BorgWarner, Inc. | 77,318 | 3,588,328 |
| Lear Corp. | 27,489 | 4,110,705 |
| Tesla, Inc. * | 50,164 | 17,853,368 |
| 25,552,401 | ||
| Banks 0.5% | ||
| CIT Group, Inc. | 57,672 | 2,586,589 |
| East West Bancorp, Inc. | 57,065 | 3,159,689 |
| First Republic Bank | 61,717 | 5,989,635 |
| Signature Bank * | 20,460 | 2,625,836 |
| SVB Financial Group * | 20,198 | 3,420,329 |
| Zions Bancorp | 81,160 | 3,543,446 |
| 21,325,524 | ||
| Capital Goods 7.0% | ||
| 3M Co. | 235,611 | 48,140,039 |
| A.O. Smith Corp. | 56,407 | 3,141,306 |
| Acuity Brands, Inc. (a) | 16,874 | 2,983,154 |
| Allegion plc | 36,839 | 2,899,598 |
| AMETEK, Inc. | 88,890 | 5,622,292 |
| Carlisle Cos., Inc. | 24,909 | 2,358,633 |
| Colfax Corp. * | 37,534 | 1,496,856 |
| Cummins, Inc. | 61,567 | 9,812,548 |
| Deere & Co. | 115,487 | 13,388,408 |
| Dover Corp. | 63,037 | 5,350,581 |
| Fastenal Co. | 111,914 | 4,775,370 |
| Flowserve Corp. | 51,362 | 2,017,499 |
| Fortive Corp. | 118,737 | 7,714,343 |
| Fortune Brands Home & Security, Inc. | 59,637 | 3,729,102 |
| HD Supply Holdings, Inc. * | 77,337 | 2,575,322 |
| Hubbell, Inc. | 19,490 | 2,198,277 |
| Huntington Ingalls Industries, Inc. | 17,805 | 3,809,558 |
| IDEX Corp. | 30,027 | 3,530,575 |
| Jacobs Engineering Group, Inc. | 48,359 | 2,635,082 |
| Lennox International, Inc. | 15,035 | 2,491,751 |
| Lockheed Martin Corp. | 97,835 | 29,877,831 |
| Nordson Corp. | 20,555 | 2,246,661 |
| Northrop Grumman Corp. | 69,250 | 18,850,542 |
| Owens Corning | 43,820 | 3,248,377 |
| PACCAR, Inc. | 140,256 | 9,303,180 |
| Pentair plc | 64,354 | 3,993,166 |
| Quanta Services, Inc. * | 61,046 | 2,193,383 |
| Roper Technologies, Inc. | 39,973 | 9,220,172 |
| Sensata Technologies Holding N.V. * | 70,974 | 3,169,699 |
| Snap-on, Inc. | 23,766 | 3,507,149 |
| Spirit AeroSystems Holdings, Inc., Class A | 48,202 | 3,591,049 |
| Stanley Black & Decker, Inc. | 60,757 | 8,749,008 |
| Textron, Inc. | 104,510 | 5,130,396 |
| The Boeing Co. | 221,197 | 53,012,073 |
| The Middleby Corp. * | 23,404 | 2,848,267 |
| The Toro Co. | 41,350 | 2,550,468 |
| TransDigm Group, Inc. | 19,370 | 5,048,984 |
| Trinity Industries, Inc. | 57,770 | 1,666,087 |
| Security | Number of Shares | Value ($) |
| United Rentals, Inc. * | 34,017 | 4,016,047 |
| W.W. Grainger, Inc. | 21,295 | 3,461,928 |
| WABCO Holdings, Inc. * | 20,467 | 2,939,470 |
| Wabtec Corp. | 34,717 | 2,449,979 |
| 311,744,210 | ||
| Commercial & Professional Services 1.0% | ||
| Cintas Corp. | 33,600 | 4,536,336 |
| Copart, Inc. * | 78,588 | 2,569,042 |
| Equifax, Inc. | 46,404 | 6,611,178 |
| IHS Markit Ltd. * | 125,973 | 5,900,575 |
| KAR Auction Services, Inc. | 59,640 | 2,689,168 |
| Nielsen Holdings plc | 130,075 | 5,053,414 |
| Robert Half International, Inc. | 51,296 | 2,323,709 |
| Rollins, Inc. | 38,311 | 1,701,391 |
| Stericycle, Inc. * | 32,826 | 2,359,861 |
| The Dun & Bradstreet Corp. | 14,475 | 1,613,094 |
| TransUnion * | 48,425 | 2,317,620 |
| Verisk Analytics, Inc. * | 59,665 | 4,835,848 |
| 42,511,236 | ||
| Consumer Durables & Apparel 1.8% | ||
| Carter's, Inc. | 18,374 | 1,593,210 |
| D.R. Horton, Inc. | 131,349 | 4,748,266 |
| Hanesbrands, Inc. | 148,103 | 3,592,979 |
| Lennar Corp., B Shares | 3,656 | 157,318 |
| Lennar Corp., Class A | 82,161 | 4,252,653 |
| Lululemon Athletica, Inc. * | 43,024 | 2,476,031 |
| Michael Kors Holdings Ltd. * | 58,818 | 2,483,296 |
| Mohawk Industries, Inc. * | 24,865 | 6,293,829 |
| NIKE, Inc., Class B | 521,838 | 27,558,265 |
| NVR, Inc. * | 1,417 | 3,855,444 |
| Polaris Industries, Inc. (a) | 22,564 | 2,103,642 |
| PVH Corp. | 31,477 | 3,962,639 |
| Ralph Lauren Corp. | 23,812 | 2,092,837 |
| Toll Brothers, Inc. | 56,528 | 2,202,331 |
| Under Armour, Inc., Class A *(a) | 70,572 | 1,139,738 |
| Under Armour, Inc., Class C *(a) | 71,235 | 1,075,648 |
| VF Corp. | 123,998 | 7,795,754 |
| Whirlpool Corp. | 28,785 | 4,940,082 |
| 82,323,962 | ||
| Consumer Services 2.3% | ||
| Chipotle Mexican Grill, Inc. * | 11,141 | 3,528,466 |
| Domino's Pizza, Inc. | 18,535 | 3,378,189 |
| Dunkin' Brands Group, Inc. | 37,546 | 1,935,872 |
| Hilton Worldwide Holdings, Inc. | 81,287 | 5,229,193 |
| Las Vegas Sands Corp. | 142,928 | 8,891,551 |
| Marriott International, Inc., Class A | 122,782 | 12,717,759 |
| MGM Resorts International | 188,482 | 6,212,367 |
| Norwegian Cruise Line Holdings Ltd. * | 65,941 | 3,920,852 |
| Royal Caribbean Cruises Ltd. | 66,563 | 8,284,431 |
| Starbucks Corp. | 570,645 | 31,305,585 |
| Vail Resorts, Inc. | 15,419 | 3,514,761 |
| Security | Number of Shares | Value ($) |
| Wynn Resorts Ltd. | 31,815 | 4,421,967 |
| Yum! Brands, Inc. | 129,898 | 9,978,764 |
| 103,319,757 | ||
| Diversified Financials 7.1% | ||
| Affiliated Managers Group, Inc. | 21,563 | 3,809,966 |
| American Express Co. | 294,821 | 25,384,088 |
| Ameriprise Financial, Inc. | 60,660 | 8,402,017 |
| Berkshire Hathaway, Inc., Class B * | 747,906 | 135,490,651 |
| BlackRock, Inc. | 47,800 | 20,028,678 |
| CBOE Holdings, Inc. | 36,540 | 3,686,521 |
| E*TRADE Financial Corp. * | 110,557 | 4,533,943 |
| FactSet Research Systems, Inc. | 15,711 | 2,469,455 |
| Intercontinental Exchange, Inc. | 232,210 | 15,017,021 |
| Leucadia National Corp. | 128,918 | 3,052,778 |
| MarketAxess Holdings, Inc. | 15,225 | 2,937,664 |
| Moody's Corp. | 66,714 | 8,941,677 |
| Morgan Stanley | 562,796 | 25,607,218 |
| MSCI, Inc. | 35,162 | 4,029,917 |
| OneMain Holdings, Inc. * | 22,079 | 604,302 |
| Raymond James Financial, Inc. | 50,801 | 3,978,734 |
| S&P Global, Inc. | 101,752 | 15,703,386 |
| SEI Investments Co. | 53,507 | 3,128,019 |
| T. Rowe Price Group, Inc. | 94,982 | 8,012,682 |
| TD Ameritrade Holding Corp. | 97,801 | 4,236,739 |
| The Charles Schwab Corp. (b) | 477,198 | 19,040,200 |
| 318,095,656 | ||
| Energy 2.8% | ||
| Anadarko Petroleum Corp. | 220,062 | 9,007,138 |
| Antero Resources Corp. * | 59,090 | 1,163,482 |
| Baker Hughes a GE Co. | 168,311 | 5,705,743 |
| Cabot Oil & Gas Corp. | 182,026 | 4,650,764 |
| Cheniere Energy, Inc. * | 91,833 | 3,929,534 |
| Cimarex Energy Co. | 37,064 | 3,694,910 |
| Concho Resources, Inc. * | 58,840 | 6,529,475 |
| Continental Resources, Inc. * | 38,578 | 1,308,566 |
| Core Laboratories N.V. | 17,135 | 1,510,964 |
| Diamondback Energy, Inc. * | 39,424 | 3,579,305 |
| EOG Resources, Inc. | 227,357 | 19,323,071 |
| EQT Corp. | 70,769 | 4,411,740 |
| Halliburton Co. | 339,052 | 13,212,857 |
| Parsley Energy, Inc., Class A * | 92,264 | 2,311,213 |
| Pioneer Natural Resources Co. | 66,962 | 8,681,623 |
| Schlumberger Ltd. | 549,479 | 34,897,411 |
| Weatherford International plc * | 381,148 | 1,459,797 |
| 125,377,593 | ||
| Food & Staples Retailing 2.0% | ||
| Casey's General Stores, Inc. | 15,009 | 1,582,249 |
| Costco Wholesale Corp. | 172,852 | 27,092,822 |
| CVS Health Corp. | 400,191 | 30,950,772 |
| Rite Aid Corp. * | 423,437 | 1,024,718 |
| US Foods Holding Corp. * | 57,210 | 1,570,414 |
| Walgreens Boots Alliance, Inc. | 335,798 | 27,367,537 |
| 89,588,512 | ||
| Food, Beverage & Tobacco 1.1% | ||
| Brown-Forman Corp., Class A | 24,840 | 1,381,601 |
| Brown-Forman Corp., Class B | 67,459 | 3,578,025 |
| Constellation Brands, Inc., Class A | 67,096 | 13,425,910 |
| Monster Beverage Corp. * | 156,273 | 8,723,159 |
| Post Holdings, Inc. * | 24,630 | 2,096,752 |
| The Hain Celestial Group, Inc. * | 41,007 | 1,649,301 |
| Security | Number of Shares | Value ($) |
| The Hershey Co. | 54,003 | 5,665,995 |
| The J.M. Smucker Co. | 46,502 | 4,871,549 |
| TreeHouse Foods, Inc. * | 23,629 | 1,582,907 |
| Tyson Foods, Inc., Class A | 115,046 | 7,282,412 |
| 50,257,611 | ||
| Health Care Equipment & Services 8.7% | ||
| ABIOMED, Inc. * | 16,724 | 2,521,979 |
| Aetna, Inc. | 131,284 | 20,703,487 |
| Align Technology, Inc. * | 28,685 | 5,069,787 |
| AmerisourceBergen Corp. | 66,850 | 5,364,712 |
| Becton Dickinson & Co. | 89,336 | 17,817,172 |
| C.R. Bard, Inc. | 28,737 | 9,219,117 |
| Centene Corp. * | 68,202 | 6,059,748 |
| Cerner Corp. * | 116,669 | 7,907,825 |
| Cigna Corp. | 100,260 | 18,253,336 |
| Danaher Corp. | 241,820 | 20,172,624 |
| DaVita, Inc. * | 61,155 | 3,581,237 |
| DENTSPLY SIRONA, Inc. | 90,125 | 5,098,371 |
| DexCom, Inc. * | 35,413 | 2,642,164 |
| Edwards Lifesciences Corp. * | 84,045 | 9,552,555 |
| Express Scripts Holding Co. * | 231,405 | 14,536,862 |
| HCA Healthcare, Inc. * | 111,552 | 8,774,680 |
| Henry Schein, Inc. * | 31,541 | 5,478,041 |
| Hologic, Inc. * | 111,743 | 4,313,280 |
| Humana, Inc. | 56,556 | 14,569,957 |
| IDEXX Laboratories, Inc. * | 34,605 | 5,378,655 |
| Intuitive Surgical, Inc. * | 14,636 | 14,704,350 |
| Laboratory Corp. of America Holdings * | 41,719 | 6,544,460 |
| McKesson Corp. | 82,899 | 12,377,650 |
| MEDNAX, Inc. * | 37,189 | 1,667,927 |
| Medtronic plc | 537,491 | 43,332,524 |
| ResMed, Inc. | 56,035 | 4,347,195 |
| STERIS plc | 32,840 | 2,862,334 |
| Stryker Corp. | 123,133 | 17,407,312 |
| Teleflex, Inc. | 17,620 | 3,731,035 |
| The Cooper Cos., Inc. | 19,332 | 4,849,046 |
| UnitedHealth Group, Inc. | 379,207 | 75,424,272 |
| Universal Health Services, Inc., Class B | 35,505 | 3,839,156 |
| Varian Medical Systems, Inc. * | 36,345 | 3,861,656 |
| VCA, Inc. * | 32,922 | 3,060,429 |
| West Pharmaceutical Services, Inc. | 27,800 | 2,419,712 |
| 387,444,647 | ||
| Household & Personal Products 0.5% | ||
| Church & Dwight Co., Inc. | 98,953 | 4,964,472 |
| Herbalife Ltd. *(a) | 27,425 | 1,892,599 |
| Spectrum Brands Holdings, Inc. | 9,195 | 1,011,082 |
| The Clorox Co. | 50,629 | 7,013,635 |
| The Estee Lauder Cos., Inc., Class A | 89,544 | 9,580,313 |
| 24,462,101 | ||
| Insurance 1.0% | ||
| Alleghany Corp. * | 5,930 | 3,337,226 |
| Aon plc | 102,785 | 14,303,561 |
| Arch Capital Group Ltd. * | 50,280 | 4,894,255 |
| Erie Indemnity Co., Class A | 6,984 | 843,597 |
| Everest Re Group Ltd. | 15,801 | 3,989,437 |
| Markel Corp. * | 5,603 | 5,894,300 |
| RenaissanceRe Holdings Ltd. | 15,540 | 2,162,546 |
| W.R. Berkley Corp. | 38,249 | 2,548,913 |
| Willis Towers Watson plc | 50,929 | 7,561,429 |
| 45,535,264 | ||
| Security | Number of Shares | Value ($) |
| Materials 2.7% | ||
| Axalta Coating Systems Ltd. * | 89,781 | 2,650,335 |
| Ball Corp. | 135,131 | 5,403,889 |
| Berry Global Group, Inc. * | 50,902 | 2,862,729 |
| Crown Holdings, Inc. * | 53,914 | 3,182,543 |
| Ecolab, Inc. | 102,797 | 13,702,840 |
| FMC Corp. | 53,835 | 4,641,654 |
| International Flavors & Fragrances, Inc. | 31,859 | 4,359,904 |
| Martin Marietta Materials, Inc. | 25,015 | 5,302,930 |
| Monsanto Co. | 172,147 | 20,175,628 |
| NewMarket Corp. | 3,870 | 1,619,634 |
| Packaging Corp. of America | 37,488 | 4,214,026 |
| PPG Industries, Inc. | 100,485 | 10,482,595 |
| Praxair, Inc. | 111,636 | 14,684,600 |
| Royal Gold, Inc. | 24,830 | 2,316,142 |
| The Sherwin-Williams Co. | 32,169 | 10,913,977 |
| Vulcan Materials Co. | 52,940 | 6,419,504 |
| W.R. Grace & Co. | 27,366 | 1,956,122 |
| WestRock Co. | 97,352 | 5,540,302 |
| 120,429,354 | ||
| Media 4.5% | ||
| Charter Communications, Inc., Class A * | 84,571 | 33,704,926 |
| Comcast Corp., Class A | 1,859,888 | 75,530,052 |
| Discovery Communications, Inc., Class A * | 60,718 | 1,348,547 |
| Discovery Communications, Inc., Class C * | 82,745 | 1,738,472 |
| DISH Network Corp., Class A * | 89,331 | 5,117,773 |
| Liberty Broadband Corp., Class A * | 11,654 | 1,182,065 |
| Liberty Global plc, Class A * | 101,910 | 3,464,940 |
| Liberty Global plc, Series C * | 249,127 | 8,228,665 |
| Liberty Media Corp. - Liberty SiriusXM, Class A * | 40,883 | 1,827,470 |
| Liberty Media Corp. - Liberty SiriusXM, Class C * | 65,012 | 2,900,185 |
| Live Nation Entertainment, Inc. * | 51,882 | 2,073,205 |
| Scripps Networks Interactive, Inc., Class A | 39,766 | 3,405,958 |
| Sirius XM Holdings, Inc. (a) | 669,917 | 3,852,023 |
| The Walt Disney Co. | 572,678 | 57,955,014 |
| 202,329,295 | ||
| Pharmaceuticals, Biotechnology & Life Sciences 7.8% | ||
| Alexion Pharmaceuticals, Inc. * | 89,051 | 12,681,753 |
| Alkermes plc * | 60,144 | 3,054,112 |
| Allergan plc | 131,893 | 30,266,806 |
| Alnylam Pharmaceuticals, Inc. * | 33,196 | 2,845,893 |
| Amgen, Inc. | 290,096 | 51,570,366 |
| Biogen, Inc. * | 84,340 | 26,698,670 |
| BioMarin Pharmaceutical, Inc. * | 69,087 | 6,230,956 |
| Celgene Corp. * | 306,231 | 42,544,673 |
| Endo International plc * | 75,151 | 660,577 |
| Gilead Sciences, Inc. | 516,733 | 43,255,719 |
| Illumina, Inc. * | 57,506 | 11,757,677 |
| Incyte Corp. * | 67,075 | 9,216,776 |
| Ionis Pharmaceuticals, Inc. * | 50,729 | 2,720,089 |
| Jazz Pharmaceuticals plc * | 23,710 | 3,541,326 |
| Mallinckrodt plc * | 41,490 | 1,704,409 |
| Mettler-Toledo International, Inc. * | 10,207 | 6,176,154 |
| Mylan N.V. * | 180,867 | 5,693,693 |
| OPKO Health, Inc. *(a) | 164,465 | 1,052,576 |
| Perrigo Co., plc | 55,571 | 4,387,886 |
| Regeneron Pharmaceuticals, Inc. * | 29,944 | 14,879,174 |
| Seattle Genetics, Inc. * | 40,666 | 2,136,185 |
| Thermo Fisher Scientific, Inc. | 153,904 | 28,801,595 |
| United Therapeutics Corp. * | 18,794 | 2,458,255 |
| Vertex Pharmaceuticals, Inc. * | 98,034 | 15,738,378 |
| Security | Number of Shares | Value ($) |
| Waters Corp. * | 30,916 | 5,672,468 |
| Zoetis, Inc. | 193,297 | 12,119,722 |
| 347,865,888 | ||
| Real Estate 4.5% | ||
| Alexandria Real Estate Equities, Inc. | 36,448 | 4,421,507 |
| American Campus Communities, Inc. | 54,247 | 2,581,615 |
| American Tower Corp. | 166,728 | 24,684,080 |
| AvalonBay Communities, Inc. | 54,869 | 10,300,557 |
| Boston Properties, Inc. | 61,708 | 7,441,985 |
| CBRE Group, Inc., Class A * | 120,861 | 4,360,665 |
| Crown Castle International Corp. | 158,156 | 17,150,437 |
| Digital Realty Trust, Inc. | 64,765 | 7,664,290 |
| Equinix, Inc. | 30,416 | 14,247,159 |
| Equity LifeStyle Properties, Inc. | 33,020 | 2,943,733 |
| Essex Property Trust, Inc. | 25,989 | 6,912,294 |
| Extra Space Storage, Inc. | 47,986 | 3,725,153 |
| Federal Realty Investment Trust | 29,051 | 3,687,443 |
| Highwoods Properties, Inc. | 38,680 | 2,020,256 |
| Invitation Homes, Inc. | 42,442 | 982,108 |
| JBG SMITH Properties * | 33,228 | 1,087,552 |
| Jones Lang LaSalle, Inc. | 17,082 | 2,082,467 |
| Kilroy Realty Corp. | 37,441 | 2,592,040 |
| Mid-America Apartment Communities, Inc. | 45,284 | 4,820,935 |
| Park Hotels & Resorts, Inc. | 55,510 | 1,481,562 |
| Public Storage | 58,726 | 12,058,797 |
| Realogy Holdings Corp. | 54,573 | 1,850,025 |
| SBA Communications Corp. * | 48,344 | 7,423,221 |
| Simon Property Group, Inc. | 122,726 | 19,249,573 |
| SL Green Realty Corp. | 40,683 | 3,921,027 |
| Sun Communities, Inc. | 29,325 | 2,648,341 |
| Taubman Centers, Inc. | 22,699 | 1,185,796 |
| The Macerich Co. | 46,390 | 2,448,000 |
| Ventas, Inc. | 138,690 | 9,491,944 |
| Vornado Realty Trust | 66,457 | 4,950,382 |
| Welltower, Inc. | 141,954 | 10,393,872 |
| 200,808,816 | ||
| Retailing 9.5% | ||
| Advance Auto Parts, Inc. | 28,795 | 2,819,031 |
| Amazon.com, Inc. * | 156,314 | 153,281,508 |
| AutoNation, Inc. *(a) | 25,222 | 1,144,322 |
| AutoZone, Inc. * | 11,205 | 5,921,170 |
| Bed Bath & Beyond, Inc. | 60,300 | 1,663,677 |
| Burlington Stores, Inc. * | 27,782 | 2,420,646 |
| CarMax, Inc. * | 75,336 | 5,058,812 |
| Dick's Sporting Goods, Inc. | 37,975 | 1,001,021 |
| Dollar General Corp. | 100,034 | 7,258,467 |
| Dollar Tree, Inc. * | 91,986 | 7,325,765 |
| Expedia, Inc. | 47,365 | 7,027,071 |
| L Brands, Inc. | 92,880 | 3,364,114 |
| Liberty Interactive Corp. QVC Group, Class A * | 173,968 | 3,848,172 |
| Liberty Ventures, Series A * | 31,927 | 1,965,426 |
| LKQ Corp. * | 120,914 | 4,189,670 |
| Lowe's Cos., Inc. | 336,417 | 24,857,852 |
| Netflix, Inc. * | 169,601 | 29,630,991 |
| O'Reilly Automotive, Inc. * | 35,747 | 7,011,059 |
| Ross Stores, Inc. | 152,323 | 8,903,279 |
| Sally Beauty Holdings, Inc. * | 62,055 | 1,153,602 |
| Signet Jewelers Ltd. | 26,599 | 1,677,599 |
| The Home Depot, Inc. | 470,736 | 70,549,204 |
| The Michaels Cos., Inc. * | 47,228 | 1,060,269 |
| The Priceline Group, Inc. * | 19,382 | 35,897,015 |
| The TJX Cos., Inc. | 254,530 | 18,402,519 |
| Security | Number of Shares | Value ($) |
| Tiffany & Co. | 41,775 | 3,818,235 |
| Tractor Supply Co. | 49,821 | 2,964,848 |
| TripAdvisor, Inc. * | 44,093 | 1,884,094 |
| Ulta Salon, Cosmetics & Fragrance, Inc. * | 22,468 | 4,965,653 |
| Urban Outfitters, Inc. * | 36,559 | 747,266 |
| Williams-Sonoma, Inc. | 32,831 | 1,510,226 |
| 423,322,583 | ||
| Semiconductors & Semiconductor Equipment 2.9% | ||
| Broadcom Ltd. | 157,576 | 39,720,182 |
| Lam Research Corp. | 63,854 | 10,598,487 |
| NVIDIA Corp. | 233,885 | 39,629,474 |
| Qorvo, Inc. * | 49,367 | 3,614,652 |
| QUALCOMM, Inc. | 581,482 | 30,394,064 |
| Skyworks Solutions, Inc. | 73,352 | 7,728,367 |
| 131,685,226 | ||
| Software & Services 19.4% | ||
| Accenture plc, Class A | 245,277 | 32,072,421 |
| Activision Blizzard, Inc. | 270,153 | 17,711,231 |
| Adobe Systems, Inc. * | 195,380 | 30,315,161 |
| Akamai Technologies, Inc. * | 68,803 | 3,244,061 |
| Alliance Data Systems Corp. | 22,623 | 5,101,486 |
| Alphabet, Inc., Class A * | 117,277 | 112,027,681 |
| Alphabet, Inc., Class C * | 117,515 | 110,385,365 |
| ANSYS, Inc. * | 33,350 | 4,296,147 |
| Autodesk, Inc. * | 77,324 | 8,850,505 |
| Automatic Data Processing, Inc. | 176,358 | 18,776,836 |
| Cadence Design Systems, Inc. * | 107,690 | 4,231,140 |
| CDK Global, Inc. | 58,772 | 3,790,794 |
| Citrix Systems, Inc. * | 60,290 | 4,715,281 |
| Cognizant Technology Solutions Corp., Class A | 231,102 | 16,355,089 |
| CoStar Group, Inc. * | 12,477 | 3,576,158 |
| Dell Technologies, Inc., Class V * | 52,898 | 3,963,647 |
| eBay, Inc. * | 400,182 | 14,458,576 |
| Electronic Arts, Inc. * | 122,146 | 14,840,739 |
| Facebook, Inc., Class A * | 931,462 | 160,183,520 |
| Fidelity National Information Services, Inc. | 128,475 | 11,937,897 |
| Fiserv, Inc. * | 83,114 | 10,282,033 |
| FleetCor Technologies, Inc. * | 36,852 | 5,298,212 |
| Fortinet, Inc. * | 58,895 | 2,249,789 |
| Gartner, Inc. * | 34,859 | 4,203,647 |
| Global Payments, Inc. | 60,268 | 5,754,991 |
| IAC/InterActiveCorp * | 29,266 | 3,321,984 |
| Intuit, Inc. | 96,053 | 13,586,697 |
| Jack Henry & Associates, Inc. | 31,462 | 3,242,788 |
| MasterCard, Inc., Class A | 368,622 | 49,137,313 |
| Nuance Communications, Inc. * | 100,264 | 1,611,242 |
| PayPal Holdings, Inc. * | 439,894 | 27,132,662 |
| Red Hat, Inc. * | 71,097 | 7,642,927 |
| Sabre Corp. | 87,529 | 1,614,035 |
| salesforce.com, Inc. * | 264,779 | 25,283,747 |
| ServiceNow, Inc. * | 66,748 | 7,755,450 |
| Splunk, Inc. * | 52,673 | 3,533,832 |
| SS&C Technologies Holdings, Inc. | 68,571 | 2,654,383 |
| Synopsys, Inc. * | 60,143 | 4,836,700 |
| The Ultimate Software Group, Inc. * | 11,880 | 2,386,692 |
| Total System Services, Inc. | 64,563 | 4,462,595 |
| Twitter, Inc. * | 236,014 | 3,990,997 |
| Tyler Technologies, Inc. * | 13,668 | 2,361,830 |
| Vantiv, Inc., Class A * | 63,674 | 4,501,115 |
| VeriSign, Inc. * | 34,852 | 3,615,895 |
| Visa, Inc., Class A | 727,219 | 75,281,711 |
| VMware, Inc., Class A * | 28,448 | 3,075,229 |
| Workday, Inc., Class A * | 50,890 | 5,582,124 |
| Security | Number of Shares | Value ($) |
| Zillow Group, Inc., Class A * | 18,405 | 734,728 |
| Zillow Group, Inc., Class C * | 39,633 | 1,570,259 |
| 867,539,342 | ||
| Technology Hardware & Equipment 8.4% | ||
| Amphenol Corp., Class A | 121,284 | 9,816,727 |
| Apple, Inc. | 2,053,764 | 336,817,296 |
| Arista Networks, Inc. * | 17,608 | 3,101,649 |
| CDW Corp. | 60,953 | 3,865,639 |
| CommScope Holding Co., Inc. * | 76,398 | 2,525,718 |
| F5 Networks, Inc. * | 25,558 | 3,051,114 |
| FLIR Systems, Inc. | 55,611 | 2,113,218 |
| Juniper Networks, Inc. | 152,234 | 4,221,449 |
| Palo Alto Networks, Inc. * | 35,766 | 4,745,791 |
| Trimble, Inc. * | 102,765 | 3,974,950 |
| 374,233,551 | ||
| Telecommunication Services 0.3% | ||
| Level 3 Communications, Inc. * | 115,778 | 6,301,796 |
| T-Mobile US, Inc. * | 113,887 | 7,369,628 |
| 13,671,424 | ||
| Transportation 3.3% | ||
| Alaska Air Group, Inc. | 49,128 | 3,667,897 |
| AMERCO | 2,578 | 962,135 |
| Avis Budget Group, Inc. * | 31,251 | 1,132,224 |
| C.H. Robinson Worldwide, Inc. | 55,423 | 3,914,527 |
| Delta Air Lines, Inc. | 288,702 | 13,623,847 |
| FedEx Corp. | 97,253 | 20,849,098 |
| Genesee & Wyoming, Inc., Class A * | 22,601 | 1,549,525 |
| Hertz Global Holdings, Inc. * | 22,116 | 480,802 |
| J.B. Hunt Transport Services, Inc. | 34,242 | 3,386,191 |
| JetBlue Airways Corp. * | 133,147 | 2,637,642 |
| Kansas City Southern | 41,437 | 4,285,829 |
| Macquarie Infrastructure Corp. | 31,880 | 2,374,422 |
| Old Dominion Freight Line, Inc. | 27,456 | 2,742,854 |
| Southwest Airlines Co. | 239,168 | 12,470,220 |
| Union Pacific Corp. | 317,703 | 33,454,126 |
| United Continental Holdings, Inc. * | 110,801 | 6,865,230 |
| United Parcel Service, Inc., Class B | 271,240 | 31,019,006 |
| 145,415,575 | ||
| Utilities 0.0% | ||
| Calpine Corp. * | 149,297 | 2,194,666 |
| Total Common Stock | ||
| (Cost $3,505,832,503) | 4,457,034,194 | |
| Other Investment Companies 0.5% of net assets | ||
| Money Market Fund 0.2% | ||
| State Street Institutional U.S. Government Money Market Fund, Premier Class 0.93% (c) | 8,764,988 | 8,764,988 |
| Securities Lending Collateral 0.3% | ||
| Wells Fargo Government Money Market Fund, Select Class 0.92% (c) | 11,888,731 | 11,888,731 |
| Total Other Investment Companies | ||
| (Cost $20,653,719) | 20,653,719 | |
| Number of Contracts | Notional Amount ($) | Current Value/ Unrealized Appreciation ($) | ||
| Futures Contracts | ||||
| Long | ||||
| S&P 500 Index, e-mini, expires 09/15/17 | 105 | 12,968,025 | 132,367 | |
| * | Non-income producing security. |
| (a) | All or a portion of this security is on loan. Securities on loan were valued at $11,619,096. |
| (b) | Issuer is affiliated with the fund's investment adviser. |
| (c) | The rate shown is the 7-day yield. |
| Security | Number of Shares | Value ($) |
| Common Stock 99.6% of net assets | ||
| Automobiles & Components 1.3% | ||
| Adient plc | 28,959 | 2,046,822 |
| Autoliv, Inc. | 26,291 | 2,855,728 |
| Delphi Automotive plc | 82,539 | 7,956,760 |
| Ford Motor Co. | 1,199,036 | 13,225,367 |
| General Motors Co. | 419,193 | 15,317,312 |
| Harley-Davidson, Inc. | 54,244 | 2,550,011 |
| The Goodyear Tire & Rubber Co. | 78,014 | 2,363,824 |
| 46,315,824 | ||
| Banks 11.5% | ||
| Bank of America Corp. | 3,054,723 | 72,977,333 |
| BB&T Corp. | 247,092 | 11,388,470 |
| BOK Financial Corp. | 6,133 | 493,584 |
| Citigroup, Inc. | 843,148 | 57,359,358 |
| Citizens Financial Group, Inc. | 154,617 | 5,122,461 |
| Comerica, Inc. | 54,425 | 3,714,506 |
| Cullen/Frost Bankers, Inc. | 17,620 | 1,483,604 |
| Fifth Third Bancorp | 226,640 | 5,922,103 |
| Huntington Bancshares, Inc. | 331,008 | 4,167,391 |
| JPMorgan Chase & Co. | 1,089,983 | 99,068,555 |
| KeyCorp | 334,457 | 5,756,005 |
| M&T Bank Corp. | 47,680 | 7,049,965 |
| New York Community Bancorp, Inc. | 144,142 | 1,736,911 |
| People's United Financial, Inc. | 98,868 | 1,651,096 |
| Regions Financial Corp. | 369,582 | 5,214,802 |
| SunTrust Banks, Inc. | 149,374 | 8,230,507 |
| TFS Financial Corp. | 17,029 | 261,906 |
| The PNC Financial Services Group, Inc. | 148,283 | 18,596,171 |
| U.S. Bancorp | 487,623 | 24,990,679 |
| Wells Fargo & Co. | 1,377,200 | 70,333,604 |
| 405,519,011 | ||
| Capital Goods 7.8% | ||
| AGCO Corp. | 21,742 | 1,488,240 |
| Allison Transmission Holdings, Inc. | 48,661 | 1,689,997 |
| Arconic, Inc. | 135,032 | 3,439,265 |
| Caterpillar, Inc. | 180,998 | 21,265,455 |
| Donaldson Co., Inc. | 41,949 | 1,982,090 |
| Eaton Corp. plc | 137,795 | 9,888,169 |
| Emerson Electric Co. | 199,160 | 11,758,406 |
| Fluor Corp. | 42,144 | 1,625,494 |
| General Dynamics Corp. | 86,566 | 17,430,064 |
| General Electric Co. | 2,667,309 | 65,482,436 |
| Honeywell International, Inc. | 234,645 | 32,444,364 |
| Illinois Tool Works, Inc. | 94,438 | 12,986,169 |
| Ingersoll-Rand plc | 78,099 | 6,668,874 |
| Johnson Controls International plc | 286,854 | 11,356,550 |
| L3 Technologies, Inc. | 24,181 | 4,388,368 |
| Lincoln Electric Holdings, Inc. | 18,555 | 1,611,316 |
| Masco Corp. | 97,738 | 3,593,826 |
| Parker-Hannifin Corp. | 40,305 | 6,484,672 |
| Raytheon Co. | 89,659 | 16,318,835 |
| Rockwell Automation, Inc. | 38,781 | 6,362,411 |
| Security | Number of Shares | Value ($) |
| Rockwell Collins, Inc. | 49,846 | 6,532,318 |
| United Technologies Corp. | 227,988 | 27,294,723 |
| Xylem, Inc. | 55,513 | 3,445,692 |
| 275,537,734 | ||
| Commercial & Professional Services 0.5% | ||
| ManpowerGroup, Inc. | 21,105 | 2,353,419 |
| Republic Services, Inc. | 68,298 | 4,455,761 |
| Waste Management, Inc. | 123,544 | 9,526,478 |
| 16,335,658 | ||
| Consumer Durables & Apparel 0.6% | ||
| Coach, Inc. | 86,931 | 3,625,023 |
| Garmin Ltd. | 36,593 | 1,884,540 |
| Hasbro, Inc. | 34,601 | 3,399,548 |
| Leggett & Platt, Inc. | 41,391 | 1,902,744 |
| Mattel, Inc. | 104,125 | 1,688,908 |
| Newell Brands, Inc. | 145,997 | 7,048,735 |
| PulteGroup, Inc. | 86,099 | 2,223,076 |
| 21,772,574 | ||
| Consumer Services 1.8% | ||
| Aramark | 74,881 | 3,046,908 |
| Carnival Corp. | 128,969 | 8,960,766 |
| Darden Restaurants, Inc. | 38,128 | 3,129,928 |
| H&R Block, Inc. | 61,733 | 1,650,740 |
| McDonald's Corp. | 250,003 | 39,992,980 |
| Service Corp. International | 59,118 | 2,089,230 |
| Wyndham Worldwide Corp. | 32,293 | 3,218,966 |
| 62,089,518 | ||
| Diversified Financials 3.6% | ||
| AGNC Investment Corp. | 113,612 | 2,447,202 |
| Ally Financial, Inc. | 139,557 | 3,153,988 |
| Annaly Capital Management, Inc. | 337,989 | 4,224,863 |
| Capital One Financial Corp. | 146,966 | 11,699,963 |
| CME Group, Inc. | 105,016 | 13,211,013 |
| Discover Financial Services | 116,812 | 6,886,067 |
| Eaton Vance Corp. | 35,968 | 1,711,357 |
| Franklin Resources, Inc. | 107,144 | 4,631,835 |
| Invesco Ltd. | 122,329 | 4,009,945 |
| Lazard Ltd., Class A | 38,624 | 1,656,583 |
| Legg Mason, Inc. | 27,463 | 1,048,812 |
| Nasdaq, Inc. | 33,845 | 2,551,236 |
| Navient Corp. | 89,863 | 1,186,192 |
| Northern Trust Corp. | 65,366 | 5,784,891 |
| Santander Consumer USA Holdings, Inc. * | 30,910 | 441,395 |
| Starwood Property Trust, Inc. | 81,543 | 1,811,070 |
| State Street Corp. | 107,546 | 9,946,930 |
| Synchrony Financial | 236,428 | 7,279,618 |
| The Bank of New York Mellon Corp. | 318,023 | 16,626,242 |
| The Goldman Sachs Group, Inc. | 112,239 | 25,112,354 |
| Voya Financial, Inc. | 55,864 | 2,135,681 |
| 127,557,237 | ||
| Security | Number of Shares | Value ($) |
| Energy 8.2% | ||
| Andeavor | 46,352 | 4,642,153 |
| Apache Corp. | 116,375 | 4,520,005 |
| Chesapeake Energy Corp. *(a) | 247,548 | 901,075 |
| Chevron Corp. | 579,629 | 62,379,673 |
| ConocoPhillips | 378,291 | 16,516,185 |
| Devon Energy Corp. | 159,863 | 5,019,698 |
| Energen Corp. * | 34,337 | 1,760,801 |
| Exxon Mobil Corp. | 1,299,550 | 99,194,651 |
| Helmerich & Payne, Inc. (a) | 33,023 | 1,398,194 |
| Hess Corp. | 81,768 | 3,180,775 |
| HollyFrontier Corp. | 55,004 | 1,722,175 |
| Kinder Morgan, Inc. | 588,860 | 11,382,664 |
| Marathon Oil Corp. | 259,247 | 2,882,827 |
| Marathon Petroleum Corp. | 158,222 | 8,298,744 |
| Murphy Oil Corp. | 50,791 | 1,150,924 |
| National Oilwell Varco, Inc. | 116,557 | 3,574,803 |
| Newfield Exploration Co. * | 64,525 | 1,686,038 |
| Noble Energy, Inc. | 139,708 | 3,320,859 |
| Occidental Petroleum Corp. | 233,435 | 13,936,070 |
| ONEOK, Inc. | 115,448 | 6,252,664 |
| Phillips 66 | 135,433 | 11,350,640 |
| Range Resources Corp. | 56,388 | 978,896 |
| Southwestern Energy Co. * | 153,010 | 833,905 |
| Targa Resources Corp. | 66,079 | 2,945,141 |
| TechnipFMC plc * | 142,987 | 3,693,354 |
| The Williams Cos., Inc. | 250,117 | 7,435,978 |
| Transocean Ltd. * | 113,954 | 929,865 |
| Valero Energy Corp. | 136,014 | 9,262,553 |
| 291,151,310 | ||
| Food & Staples Retailing 1.4% | ||
| Sysco Corp. | 151,673 | 7,988,617 |
| The Kroger Co. | 278,510 | 6,091,013 |
| Wal-Mart Stores, Inc. | 452,454 | 35,323,084 |
| 49,402,714 | ||
| Food, Beverage & Tobacco 8.1% | ||
| Altria Group, Inc. | 591,592 | 37,506,933 |
| Archer-Daniels-Midland Co. | 175,153 | 7,237,322 |
| Bunge Ltd. | 43,897 | 3,276,033 |
| Campbell Soup Co. | 59,317 | 2,740,445 |
| ConAgra Brands, Inc. | 125,251 | 4,065,648 |
| Dr. Pepper Snapple Group, Inc. | 57,389 | 5,225,268 |
| General Mills, Inc. | 175,324 | 9,337,756 |
| Hormel Foods Corp. | 80,932 | 2,487,850 |
| Ingredion, Inc. | 21,979 | 2,721,440 |
| Kellogg Co. | 75,890 | 4,967,759 |
| Lamb Weston Holdings, Inc. | 41,553 | 1,889,830 |
| McCormick & Co., Inc. Non-Voting Shares | 34,228 | 3,256,110 |
| Molson Coors Brewing Co., Class B | 56,614 | 5,081,107 |
| Mondelez International, Inc., Class A | 465,656 | 18,933,573 |
| PepsiCo, Inc. | 437,634 | 50,647,383 |
| Philip Morris International, Inc. | 476,441 | 55,710,246 |
| Pilgrim's Pride Corp. * | 19,313 | 568,768 |
| Pinnacle Foods, Inc. | 36,762 | 2,180,354 |
| The Coca-Cola Co. | 1,177,864 | 53,651,705 |
| The Kraft Heinz Co. | 183,124 | 14,787,263 |
| 286,272,793 | ||
| Health Care Equipment & Services 2.3% | ||
| Abbott Laboratories | 530,730 | 27,035,386 |
| Anthem, Inc. | 81,158 | 15,910,214 |
| Baxter International, Inc. | 148,844 | 9,234,282 |
| Security | Number of Shares | Value ($) |
| Boston Scientific Corp. * | 420,833 | 11,593,949 |
| Cardinal Health, Inc. | 95,758 | 6,459,835 |
| Patterson Cos., Inc. | 26,192 | 1,008,392 |
| Quest Diagnostics, Inc. | 42,277 | 4,580,713 |
| Zimmer Biomet Holdings, Inc. | 61,239 | 6,997,781 |
| 82,820,552 | ||
| Household & Personal Products 3.0% | ||
| Colgate-Palmolive Co. | 269,690 | 19,320,592 |
| Edgewell Personal Care Co. * | 17,614 | 1,337,607 |
| Kimberly-Clark Corp. | 108,402 | 13,364,882 |
| The Procter & Gamble Co. | 784,673 | 72,401,778 |
| 106,424,859 | ||
| Insurance 4.8% | ||
| Aflac, Inc. | 121,557 | 10,034,530 |
| American Financial Group, Inc. | 21,616 | 2,200,725 |
| American International Group, Inc. | 270,837 | 16,380,222 |
| Arthur J. Gallagher & Co. | 55,459 | 3,211,076 |
| Assurant, Inc. | 17,452 | 1,652,530 |
| Athene Holding Ltd., Class A * | 16,954 | 907,209 |
| Axis Capital Holdings Ltd. | 26,004 | 1,566,481 |
| Brighthouse Financial, Inc. * | 30,023 | 1,713,413 |
| Brown & Brown, Inc. | 34,614 | 1,556,245 |
| Chubb Ltd. | 143,834 | 20,341,004 |
| Cincinnati Financial Corp. | 44,936 | 3,452,882 |
| CNA Financial Corp. | 8,666 | 425,154 |
| FNF Group | 84,637 | 4,082,889 |
| Lincoln National Corp. | 68,034 | 4,616,787 |
| Loews Corp. | 84,495 | 3,935,777 |
| Marsh & McLennan Cos., Inc. | 158,504 | 12,375,992 |
| MetLife, Inc. | 330,135 | 15,460,222 |
| Principal Financial Group, Inc. | 80,885 | 5,056,930 |
| Prudential Financial, Inc. | 131,231 | 13,396,061 |
| Reinsurance Group of America, Inc. | 20,293 | 2,728,394 |
| The Allstate Corp. | 111,308 | 10,073,374 |
| The Hartford Financial Services Group, Inc. | 113,707 | 6,148,138 |
| The Progressive Corp. | 177,517 | 8,250,990 |
| The Travelers Cos., Inc. | 86,344 | 10,463,166 |
| Torchmark Corp. | 32,941 | 2,535,469 |
| Unum Group | 69,011 | 3,324,950 |
| XL Group Ltd. | 82,100 | 3,362,816 |
| 169,253,426 | ||
| Materials 3.4% | ||
| Air Products & Chemicals, Inc. | 67,452 | 9,805,497 |
| Albemarle Corp. | 33,738 | 3,922,380 |
| Ashland Global Holdings, Inc. | 19,010 | 1,179,570 |
| Avery Dennison Corp. | 27,456 | 2,588,003 |
| Celanese Corp., Series A | 43,014 | 4,173,218 |
| CF Industries Holdings, Inc. | 70,683 | 2,049,100 |
| E.I. du Pont de Nemours & Co. | 265,910 | 22,317,826 |
| Eastman Chemical Co. | 44,208 | 3,810,730 |
| Freeport-McMoRan, Inc. * | 406,996 | 6,015,401 |
| Huntsman Corp. | 62,042 | 1,648,456 |
| International Paper Co. | 125,685 | 6,770,651 |
| LyondellBasell Industries N.V., Class A | 100,290 | 9,085,271 |
| Newmont Mining Corp. | 162,166 | 6,217,444 |
| Nucor Corp. | 97,514 | 5,373,997 |
| Reliance Steel & Aluminum Co. | 22,814 | 1,652,190 |
| RPM International, Inc. | 40,661 | 1,991,169 |
| Sealed Air Corp. | 59,276 | 2,630,669 |
| Sonoco Products Co. | 30,916 | 1,492,006 |
| Steel Dynamics, Inc. | 72,301 | 2,490,769 |
| The Dow Chemical Co. | 344,747 | 22,977,388 |
| Security | Number of Shares | Value ($) |
| The Mosaic Co. | 105,583 | 2,109,548 |
| Westlake Chemical Corp. | 10,860 | 835,243 |
| 121,136,526 | ||
| Media 1.7% | ||
| CBS Corp., Class B Non-Voting Shares | 115,076 | 7,371,769 |
| Liberty Broadband Corp., Class C * | 21,274 | 2,159,949 |
| News Corp., Class A | 125,251 | 1,674,606 |
| News Corp., Class B | 35,605 | 487,789 |
| Omnicom Group, Inc. | 72,029 | 5,213,459 |
| TEGNA, Inc. | 62,303 | 786,264 |
| The Interpublic Group of Cos., Inc. | 122,638 | 2,469,929 |
| Time Warner, Inc. | 237,188 | 23,979,707 |
| Tribune Media Co., Class A | 20,304 | 813,581 |
| Twenty-First Century Fox, Inc., Class A | 319,533 | 8,815,915 |
| Twenty-First Century Fox, Inc., Class B | 151,487 | 4,105,298 |
| Viacom, Inc., Class B | 110,839 | 3,169,995 |
| 61,048,261 | ||
| Pharmaceuticals, Biotechnology & Life Sciences 9.3% | ||
| AbbVie, Inc. | 486,886 | 36,662,516 |
| Agilent Technologies, Inc. | 98,278 | 6,360,552 |
| Bristol-Myers Squibb Co. | 504,480 | 30,510,950 |
| Eli Lilly & Co. | 296,921 | 24,136,708 |
| Johnson & Johnson | 826,108 | 109,351,916 |
| Merck & Co., Inc. | 837,107 | 53,457,653 |
| PerkinElmer, Inc. | 32,964 | 2,208,258 |
| Pfizer, Inc. | 1,832,653 | 62,163,590 |
| Quintiles IMS Holdings, Inc. * | 42,620 | 4,092,799 |
| 328,944,942 | ||
| Real Estate 2.5% | ||
| American Homes 4 Rent, Class A | 69,514 | 1,540,430 |
| Apartment Investment & Management Co., Class A | 46,493 | 2,107,528 |
| Brixmor Property Group, Inc. | 80,807 | 1,512,707 |
| Camden Property Trust | 25,941 | 2,321,201 |
| DDR Corp. | 103,710 | 1,003,913 |
| Douglas Emmett, Inc. | 44,238 | 1,723,513 |
| Duke Realty Corp. | 109,829 | 3,264,118 |
| Equity Residential | 110,908 | 7,447,472 |
| Forest City Realty Trust, Inc., Class A | 67,764 | 1,623,625 |
| Gaming & Leisure Properties, Inc. | 61,770 | 2,420,766 |
| GGP, Inc. | 178,606 | 3,706,075 |
| HCP, Inc. | 144,636 | 4,311,599 |
| Host Hotels & Resorts, Inc. | 230,922 | 4,184,307 |
| Iron Mountain, Inc. | 73,601 | 2,901,351 |
| Kimco Realty Corp. | 131,849 | 2,586,877 |
| Lamar Advertising Co., Class A | 25,413 | 1,691,489 |
| Liberty Property Trust | 45,042 | 1,918,789 |
| National Retail Properties, Inc. | 44,121 | 1,845,581 |
| Omega Healthcare Investors, Inc. | 60,960 | 1,942,795 |
| Prologis, Inc. | 161,439 | 10,228,775 |
| Realty Income Corp. | 84,128 | 4,842,408 |
| Regency Centers Corp. | 43,885 | 2,822,683 |
| Senior Housing Properties Trust | 77,381 | 1,525,953 |
| Spirit Realty Capital, Inc. | 148,974 | 1,296,074 |
| UDR, Inc. | 84,278 | 3,271,672 |
| VEREIT, Inc. | 302,227 | 2,550,796 |
| Weingarten Realty Investors | 33,643 | 1,077,922 |
| Weyerhaeuser Co. | 229,879 | 7,496,354 |
| WP Carey, Inc. | 33,083 | 2,277,765 |
| 87,444,538 | ||
| Security | Number of Shares | Value ($) |
| Retailing 0.8% | ||
| Best Buy Co., Inc. | 81,264 | 4,409,385 |
| Foot Locker, Inc. | 39,469 | 1,390,493 |
| Genuine Parts Co. | 45,296 | 3,751,868 |
| Kohl's Corp. | 53,481 | 2,127,474 |
| Macy's, Inc. | 88,782 | 1,844,002 |
| Nordstrom, Inc. (a) | 34,442 | 1,536,802 |
| Staples, Inc. | 208,881 | 2,133,719 |
| Target Corp. | 167,376 | 9,127,013 |
| The Gap, Inc. | 63,782 | 1,506,531 |
| 27,827,287 | ||
| Semiconductors & Semiconductor Equipment 3.9% | ||
| Advanced Micro Devices, Inc. * | 234,397 | 3,047,161 |
| Analog Devices, Inc. | 114,107 | 9,547,333 |
| Applied Materials, Inc. | 327,971 | 14,798,051 |
| First Solar, Inc. * | 22,952 | 1,077,826 |
| Intel Corp. | 1,442,901 | 50,602,538 |
| KLA-Tencor Corp. | 48,940 | 4,585,189 |
| Marvell Technology Group Ltd. | 133,457 | 2,390,215 |
| Maxim Integrated Products, Inc. | 86,189 | 4,021,579 |
| Microchip Technology, Inc. | 69,989 | 6,075,045 |
| Micron Technology, Inc. * | 320,354 | 10,241,717 |
| Texas Instruments, Inc. | 305,139 | 25,271,612 |
| Xilinx, Inc. | 75,165 | 4,965,400 |
| 136,623,666 | ||
| Software & Services 8.4% | ||
| Amdocs Ltd. | 45,638 | 2,956,886 |
| Broadridge Financial Solutions, Inc. | 37,068 | 2,896,123 |
| CA, Inc. | 95,713 | 3,175,757 |
| CSRA, Inc. | 46,585 | 1,467,893 |
| DXC Technology Co. | 87,333 | 7,423,305 |
| International Business Machines Corp. | 261,646 | 37,423,228 |
| Leidos Holdings, Inc. | 42,731 | 2,492,072 |
| Microsoft Corp. | 2,368,136 | 177,065,529 |
| Oracle Corp. | 918,710 | 46,238,674 |
| Paychex, Inc. | 97,636 | 5,568,181 |
| Symantec Corp. | 183,438 | 5,499,471 |
| Teradata Corp. * | 41,350 | 1,319,892 |
| The Western Union Co. | 145,965 | 2,761,658 |
| 296,288,669 | ||
| Technology Hardware & Equipment 3.4% | ||
| Arrow Electronics, Inc. * | 26,843 | 2,132,139 |
| Avnet, Inc. | 37,888 | 1,461,340 |
| Cisco Systems, Inc. | 1,531,810 | 49,339,600 |
| Corning, Inc. | 284,631 | 8,185,988 |
| Harris Corp. | 37,040 | 4,552,216 |
| Hewlett Packard Enterprise Co. | 505,027 | 9,120,788 |
| HP, Inc. | 514,904 | 9,824,368 |
| Jabil, Inc. | 56,461 | 1,770,052 |
| Keysight Technologies, Inc. * | 56,200 | 2,296,332 |
| Motorola Solutions, Inc. | 49,255 | 4,340,351 |
| National Instruments Corp. | 33,368 | 1,347,734 |
| NCR Corp. * | 37,288 | 1,362,131 |
| NetApp, Inc. | 82,961 | 3,207,272 |
| Seagate Technology plc | 90,640 | 2,857,879 |
| TE Connectivity Ltd. | 109,355 | 8,704,658 |
| Western Digital Corp. | 89,893 | 7,934,855 |
| Xerox Corp. | 64,693 | 2,087,643 |
| 120,525,346 | ||
| Security | Number of Shares | Value ($) |
| Telecommunication Services 3.9% | ||
| AT&T, Inc. | 1,884,553 | 70,595,355 |
| CenturyLink, Inc. (a) | 170,344 | 3,359,184 |
| Frontier Communications Corp. (a) | 22,370 | 301,324 |
| Sprint Corp. * | 214,491 | 1,769,551 |
| Verizon Communications, Inc. | 1,250,751 | 59,998,525 |
| Zayo Group Holdings, Inc. * | 29,444 | 1,006,102 |
| 137,030,041 | ||
| Transportation 1.0% | ||
| American Airlines Group, Inc. | 149,554 | 6,691,046 |
| CSX Corp. | 282,645 | 14,188,779 |
| Expeditors International of Washington, Inc. | 55,620 | 3,120,282 |
| Norfolk Southern Corp. | 89,293 | 10,761,592 |
| 34,761,699 | ||
| Utilities 6.4% | ||
| AES Corp. | 201,885 | 2,228,810 |
| Alliant Energy Corp. | 70,687 | 3,021,162 |
| Ameren Corp. | 74,452 | 4,466,376 |
| American Electric Power Co., Inc. | 149,700 | 11,022,411 |
| American Water Works Co., Inc. | 54,897 | 4,441,167 |
| Aqua America, Inc. | 52,578 | 1,756,105 |
| Atmos Energy Corp. | 32,845 | 2,891,674 |
| Avangrid, Inc. | 18,659 | 910,932 |
| CenterPoint Energy, Inc. | 132,006 | 3,910,018 |
| CMS Energy Corp. | 84,736 | 4,113,086 |
| Consolidated Edison, Inc. | 93,515 | 7,880,509 |
| Dominion Energy, Inc. | 193,427 | 15,236,245 |
| DTE Energy Co. | 54,245 | 6,092,798 |
| Duke Energy Corp. | 214,763 | 18,748,810 |
| Edison International | 100,047 | 8,021,769 |
| Entergy Corp. | 54,887 | 4,345,404 |
| Eversource Energy | 97,219 | 6,124,797 |
| Exelon Corp. | 285,390 | 10,807,719 |
| FirstEnergy Corp. | 134,643 | 4,386,669 |
| National Fuel Gas Co. | 24,841 | 1,440,281 |
| NextEra Energy, Inc. | 143,324 | 21,571,695 |
| NiSource, Inc. | 96,189 | 2,584,598 |
| NRG Energy, Inc. | 100,088 | 2,493,192 |
| OGE Energy Corp. | 60,783 | 2,171,169 |
| PG&E Corp. | 157,420 | 11,079,220 |
| Pinnacle West Capital Corp. | 33,257 | 2,992,132 |
| PPL Corp. | 211,382 | 8,294,630 |
| Public Service Enterprise Group, Inc. | 153,802 | 7,204,086 |
| SCANA Corp. | 43,488 | 2,625,805 |
| Sempra Energy | 77,532 | 9,143,349 |
| The Southern Co. | 305,513 | 14,744,057 |
| UGI Corp. | 53,567 | 2,646,746 |
| Vistra Energy Corp. | 89,704 | 1,587,761 |
| WEC Energy Group, Inc. | 97,920 | 6,386,342 |
| Westar Energy, Inc. | 42,681 | 2,189,962 |
| Xcel Energy, Inc. | 154,863 | 7,665,719 |
| 227,227,205 | ||
| Total Common Stock | ||
| (Cost $3,061,305,439) | 3,519,311,390 | |
| Security | Number of Shares | Value ($) |
| Other Investment Companies 0.2% of net assets | ||
| Money Market Fund 0.0% | ||
| State Street Institutional U.S. Government Money Market Fund, Premier Class 0.93% (b) | 1,468,786 | 1,468,786 |
| Securities Lending Collateral 0.2% | ||
| Wells Fargo Government Money Market Fund, Select Class 0.92% (b) | 6,587,794 | 6,587,794 |
| Total Other Investment Companies | ||
| (Cost $8,056,580) | 8,056,580 | |
| Number of Contracts | Notional Amount ($) | Current Value/ Unrealized Appreciation ($) | ||
| Futures Contracts | ||||
| Long | ||||
| S&P 500 Index, e-mini, expires 09/15/17 | 107 | 13,215,035 | 66,044 | |
| * | Non-income producing security. |
| (a) | All or a portion of this security is on loan. Securities on loan were valued at $6,312,108. |
| (b) | The rate shown is the 7-day yield. |
| Security | Number of Shares | Value ($) |
| Common Stock 99.8% of net assets | ||
| Automobiles & Components 1.6% | ||
| Adient plc | 115,390 | 8,155,765 |
| BorgWarner, Inc. | 251,323 | 11,663,901 |
| Gentex Corp. | 355,045 | 6,486,672 |
| Lear Corp. | 86,293 | 12,904,255 |
| The Goodyear Tire & Rubber Co. | 314,223 | 9,520,957 |
| Thor Industries, Inc. | 59,000 | 6,409,760 |
| 55,141,310 | ||
| Banks 5.1% | ||
| Associated Banc-Corp. | 192,085 | 4,206,661 |
| Bank of the Ozarks, Inc. | 152,473 | 6,550,240 |
| BankUnited, Inc. | 132,254 | 4,401,413 |
| BOK Financial Corp. | 27,229 | 2,191,390 |
| CIT Group, Inc. | 168,816 | 7,571,398 |
| Comerica, Inc. | 220,124 | 15,023,463 |
| Commerce Bancshares, Inc. | 107,593 | 5,916,539 |
| Cullen/Frost Bankers, Inc. | 70,423 | 5,929,617 |
| East West Bancorp, Inc. | 180,033 | 9,968,427 |
| First Hawaiian, Inc. | 60,810 | 1,647,343 |
| First Republic Bank | 192,517 | 18,683,775 |
| Huntington Bancshares, Inc. | 1,350,500 | 17,002,795 |
| Investors Bancorp, Inc. | 387,891 | 5,077,493 |
| New York Community Bancorp, Inc. | 598,777 | 7,215,263 |
| PacWest Bancorp | 148,031 | 6,683,600 |
| People's United Financial, Inc. | 433,588 | 7,240,920 |
| Popular, Inc. | 126,498 | 5,048,535 |
| Prosperity Bancshares, Inc. | 85,542 | 5,111,134 |
| Signature Bank * | 66,587 | 8,545,775 |
| SVB Financial Group * | 64,998 | 11,006,761 |
| Synovus Financial Corp. | 153,223 | 6,453,753 |
| TFS Financial Corp. | 79,847 | 1,228,047 |
| Western Alliance Bancorp * | 118,000 | 5,691,140 |
| Zions Bancorp | 254,495 | 11,111,252 |
| 179,506,734 | ||
| Capital Goods 10.2% | ||
| A.O. Smith Corp. | 182,610 | 10,169,551 |
| AECOM * | 194,874 | 6,528,279 |
| AGCO Corp. | 81,953 | 5,609,683 |
| Allegion plc | 119,085 | 9,373,180 |
| Allison Transmission Holdings, Inc. | 189,953 | 6,597,068 |
| BWX Technologies, Inc. | 125,800 | 6,883,776 |
| Carlisle Cos., Inc. | 81,032 | 7,672,920 |
| Chicago Bridge & Iron Co. N.V. (a) | 121,405 | 1,498,138 |
| Colfax Corp. * | 124,318 | 4,957,802 |
| Crane Co. | 62,567 | 4,644,348 |
| Curtiss-Wright Corp. | 55,853 | 5,407,687 |
| Donaldson Co., Inc. | 163,970 | 7,747,583 |
| EMCOR Group, Inc. | 75,231 | 4,968,255 |
| Flowserve Corp. | 160,973 | 6,323,019 |
| Fluor Corp. | 176,185 | 6,795,455 |
| Fortune Brands Home & Security, Inc. | 192,051 | 12,008,949 |
| Gardner Denver Holdings, Inc. * | 52,748 | 1,239,051 |
| Security | Number of Shares | Value ($) |
| Graco, Inc. | 70,298 | 8,120,122 |
| HD Supply Holdings, Inc. * | 252,071 | 8,393,964 |
| HEICO Corp. | 31,129 | 2,669,934 |
| HEICO Corp., Class A | 55,766 | 4,051,400 |
| Hexcel Corp. | 112,237 | 6,034,983 |
| Hubbell, Inc. | 63,470 | 7,158,781 |
| Huntington Ingalls Industries, Inc. | 56,908 | 12,176,036 |
| IDEX Corp. | 95,409 | 11,218,190 |
| ITT, Inc. | 111,662 | 4,506,678 |
| Jacobs Engineering Group, Inc. | 148,799 | 8,108,058 |
| Lennox International, Inc. | 48,135 | 7,977,414 |
| Lincoln Electric Holdings, Inc. | 75,747 | 6,577,869 |
| MSC Industrial Direct Co., Inc., Class A | 56,046 | 3,860,448 |
| Nordson Corp. | 66,089 | 7,223,528 |
| Orbital ATK, Inc. | 71,825 | 8,014,234 |
| Oshkosh Corp. | 93,038 | 6,940,635 |
| Owens Corning | 139,530 | 10,343,359 |
| Quanta Services, Inc. * | 180,420 | 6,482,491 |
| Regal Beloit Corp. | 56,568 | 4,265,227 |
| Sensata Technologies Holding N.V. * | 214,597 | 9,583,902 |
| Snap-on, Inc. | 71,730 | 10,585,196 |
| Spirit AeroSystems Holdings, Inc., Class A | 152,421 | 11,355,364 |
| Teledyne Technologies, Inc. * | 44,217 | 6,635,203 |
| The Middleby Corp. * | 71,180 | 8,662,606 |
| The Timken Co. | 89,223 | 4,001,652 |
| The Toro Co. | 133,636 | 8,242,668 |
| Trinity Industries, Inc. | 187,058 | 5,394,753 |
| United Rentals, Inc. * | 105,920 | 12,504,915 |
| USG Corp. * | 114,763 | 3,442,890 |
| WABCO Holdings, Inc. * | 63,350 | 9,098,327 |
| Wabtec Corp. | 107,772 | 7,605,470 |
| Watsco, Inc. | 36,746 | 5,414,891 |
| Woodward, Inc. | 69,429 | 4,874,610 |
| Xylem, Inc. | 223,593 | 13,878,418 |
| 363,828,960 | ||
| Commercial & Professional Services 1.9% | ||
| Clean Harbors, Inc. * | 66,469 | 3,595,308 |
| Copart, Inc. * | 255,699 | 8,358,800 |
| KAR Auction Services, Inc. | 170,134 | 7,671,342 |
| ManpowerGroup, Inc. | 82,189 | 9,164,896 |
| Pitney Bowes, Inc. | 235,802 | 3,030,056 |
| Robert Half International, Inc. | 158,750 | 7,191,375 |
| Rollins, Inc. | 121,564 | 5,398,657 |
| Stericycle, Inc. * | 105,565 | 7,589,068 |
| The Dun & Bradstreet Corp. | 45,937 | 5,119,219 |
| TransUnion * | 184,058 | 8,809,016 |
| 65,927,737 | ||
| Consumer Durables & Apparel 3.3% | ||
| Brunswick Corp. | 110,548 | 5,801,559 |
| CalAtlantic Group, Inc. | 96,435 | 3,351,116 |
| Carter's, Inc. | 60,275 | 5,226,445 |
| Columbia Sportswear Co. | 34,728 | 1,989,567 |
| Garmin Ltd. | 143,652 | 7,398,078 |
| Hasbro, Inc. | 139,588 | 13,714,521 |
| Leggett & Platt, Inc. | 164,137 | 7,545,378 |
| Security | Number of Shares | Value ($) |
| Lennar Corp., B Shares | 10,824 | 465,757 |
| Lennar Corp., Class A | 252,753 | 13,082,495 |
| Lululemon Athletica, Inc. * | 134,668 | 7,750,144 |
| NVR, Inc. * | 4,325 | 11,767,676 |
| Polaris Industries, Inc. (a) | 73,632 | 6,864,712 |
| PulteGroup, Inc. | 357,210 | 9,223,162 |
| Ralph Lauren Corp. | 67,935 | 5,970,807 |
| Skechers U.S.A., Inc., Class A * | 169,384 | 4,476,819 |
| Tempur Sealy International, Inc. * | 59,629 | 3,691,035 |
| Toll Brothers, Inc. | 185,074 | 7,210,483 |
| 115,529,754 | ||
| Consumer Services 3.5% | ||
| Aramark | 307,721 | 12,521,168 |
| Bright Horizons Family Solutions, Inc. * | 61,772 | 4,937,436 |
| Brinker International, Inc. | 62,601 | 1,954,403 |
| Cracker Barrel Old Country Store, Inc. (a) | 30,000 | 4,459,800 |
| Darden Restaurants, Inc. | 154,481 | 12,681,345 |
| Domino's Pizza, Inc. | 59,355 | 10,818,042 |
| Dunkin' Brands Group, Inc. | 116,434 | 6,003,337 |
| Extended Stay America, Inc. | 241,940 | 4,739,605 |
| H&R Block, Inc. | 257,353 | 6,881,619 |
| Service Corp. International | 237,142 | 8,380,598 |
| ServiceMaster Global Holdings, Inc. * | 164,354 | 7,744,361 |
| Six Flags Entertainment Corp. | 99,157 | 5,410,998 |
| Vail Resorts, Inc. | 49,217 | 11,219,015 |
| Wyndham Worldwide Corp. | 130,956 | 13,053,694 |
| Wynn Resorts Ltd. | 99,572 | 13,839,512 |
| 124,644,933 | ||
| Diversified Financials 5.0% | ||
| Affiliated Managers Group, Inc. | 70,184 | 12,400,811 |
| AGNC Investment Corp. | 444,044 | 9,564,708 |
| CBOE Holdings, Inc. | 114,103 | 11,511,852 |
| Chimera Investment Corp. | 217,512 | 4,147,954 |
| Credit Acceptance Corp. *(a) | 14,864 | 4,047,467 |
| E*TRADE Financial Corp. * | 342,355 | 14,039,978 |
| Eaton Vance Corp. | 143,501 | 6,827,777 |
| FactSet Research Systems, Inc. | 49,284 | 7,746,459 |
| Federated Investors, Inc., Class B | 113,254 | 3,092,967 |
| Lazard Ltd., Class A | 160,887 | 6,900,443 |
| Legg Mason, Inc. | 105,361 | 4,023,737 |
| Leucadia National Corp. | 401,432 | 9,505,910 |
| LPL Financial Holdings, Inc. | 101,671 | 4,762,270 |
| MarketAxess Holdings, Inc. | 47,515 | 9,168,019 |
| MFA Financial, Inc. | 478,034 | 4,197,138 |
| Morningstar, Inc. | 22,518 | 1,862,239 |
| MSCI, Inc. | 112,981 | 12,948,752 |
| Navient Corp. | 352,881 | 4,658,029 |
| OneMain Holdings, Inc. * | 68,348 | 1,870,685 |
| Raymond James Financial, Inc. | 160,427 | 12,564,643 |
| Santander Consumer USA Holdings, Inc. * | 143,852 | 2,054,206 |
| SEI Investments Co. | 165,558 | 9,678,521 |
| Starwood Property Trust, Inc. | 328,830 | 7,303,314 |
| Two Harbors Investment Corp. | 442,755 | 4,529,384 |
| Voya Financial, Inc. | 230,860 | 8,825,778 |
| 178,233,041 | ||
| Energy 4.5% | ||
| Antero Resources Corp. * | 178,446 | 3,513,602 |
| Chesapeake Energy Corp. *(a) | 941,786 | 3,428,101 |
| CONSOL Energy, Inc. * | 215,385 | 3,133,852 |
| Core Laboratories N.V. | 55,443 | 4,888,964 |
| Diamond Offshore Drilling, Inc. *(a) | 84,717 | 962,385 |
| Diamondback Energy, Inc. * | 122,476 | 11,119,596 |
| Security | Number of Shares | Value ($) |
| Energen Corp. * | 119,035 | 6,104,115 |
| Extraction Oil & Gas, Inc. * | 53,689 | 705,473 |
| Gulfport Energy Corp. * | 198,302 | 2,484,724 |
| Helmerich & Payne, Inc. (a) | 134,040 | 5,675,254 |
| HollyFrontier Corp. | 219,800 | 6,881,938 |
| Murphy Oil Corp. | 205,649 | 4,660,006 |
| Nabors Industries Ltd. | 364,083 | 2,384,744 |
| Newfield Exploration Co. * | 247,500 | 6,467,175 |
| Oceaneering International, Inc. | 121,099 | 2,730,782 |
| ONEOK, Inc. | 472,972 | 25,616,164 |
| Parsley Energy, Inc., Class A * | 284,171 | 7,118,484 |
| QEP Resources, Inc. * | 301,600 | 2,277,080 |
| Range Resources Corp. | 235,110 | 4,081,510 |
| Rice Energy, Inc. * | 201,913 | 5,524,340 |
| RSP Permian, Inc. * | 138,696 | 4,352,280 |
| Southwestern Energy Co. * | 632,903 | 3,449,321 |
| Targa Resources Corp. | 267,870 | 11,938,966 |
| TechnipFMC plc * | 581,505 | 15,020,274 |
| Transocean Ltd. * | 489,277 | 3,992,500 |
| Weatherford International plc * | 1,219,156 | 4,669,367 |
| World Fuel Services Corp. | 84,647 | 2,923,707 |
| WPX Energy, Inc. * | 500,498 | 4,999,975 |
| 161,104,679 | ||
| Food & Staples Retailing 0.5% | ||
| Casey's General Stores, Inc. | 48,996 | 5,165,158 |
| Rite Aid Corp. * | 1,334,399 | 3,229,246 |
| Sprouts Farmers Market, Inc. * | 155,059 | 3,091,877 |
| US Foods Holding Corp. * | 167,367 | 4,594,224 |
| 16,080,505 | ||
| Food, Beverage & Tobacco 1.6% | ||
| Blue Buffalo Pet Products, Inc. * | 121,202 | 3,122,164 |
| Flowers Foods, Inc. | 230,870 | 4,010,212 |
| Ingredion, Inc. | 89,604 | 11,094,767 |
| Lamb Weston Holdings, Inc. | 172,383 | 7,839,979 |
| Lancaster Colony Corp. | 23,947 | 2,789,107 |
| Pilgrim's Pride Corp. * | 75,764 | 2,231,250 |
| Pinnacle Foods, Inc. | 145,923 | 8,654,693 |
| Post Holdings, Inc. * | 83,530 | 7,110,909 |
| Seaboard Corp. | 305 | 1,310,179 |
| The Hain Celestial Group, Inc. * | 126,311 | 5,080,228 |
| TreeHouse Foods, Inc. * | 70,421 | 4,717,503 |
| 57,960,991 | ||
| Health Care Equipment & Services 5.3% | ||
| ABIOMED, Inc. * | 50,200 | 7,570,160 |
| Acadia Healthcare Co., Inc. * | 96,242 | 4,517,599 |
| Alere, Inc. * | 106,519 | 5,268,430 |
| Align Technology, Inc. * | 94,503 | 16,702,460 |
| athenahealth, Inc. * | 49,656 | 6,998,020 |
| Brookdale Senior Living, Inc. * | 233,101 | 2,827,515 |
| DexCom, Inc. * | 108,428 | 8,089,813 |
| HealthSouth Corp. | 122,840 | 5,619,930 |
| Hill-Rom Holdings, Inc. | 75,342 | 5,798,320 |
| IDEXX Laboratories, Inc. * | 109,884 | 17,079,270 |
| MEDNAX, Inc. * | 116,964 | 5,245,835 |
| Molina Healthcare, Inc. * | 53,502 | 3,424,128 |
| Patterson Cos., Inc. | 101,779 | 3,918,492 |
| ResMed, Inc. | 175,633 | 13,625,608 |
| STERIS plc | 106,936 | 9,320,542 |
| Teleflex, Inc. | 55,681 | 11,790,452 |
| The Cooper Cos., Inc. | 61,209 | 15,353,053 |
| Varian Medical Systems, Inc. * | 113,539 | 12,063,519 |
| VCA, Inc. * | 100,280 | 9,322,029 |
| Security | Number of Shares | Value ($) |
| Veeva Systems, Inc., Class A * | 132,315 | 7,872,743 |
| WellCare Health Plans, Inc. * | 55,347 | 9,668,014 |
| West Pharmaceutical Services, Inc. | 92,222 | 8,027,003 |
| 190,102,935 | ||
| Household & Personal Products 0.6% | ||
| Edgewell Personal Care Co. * | 72,010 | 5,468,439 |
| Energizer Holdings, Inc. | 78,572 | 3,468,954 |
| Herbalife Ltd. *(a) | 86,610 | 5,976,956 |
| Nu Skin Enterprises, Inc., Class A | 60,271 | 3,666,285 |
| Spectrum Brands Holdings, Inc. | 29,822 | 3,279,227 |
| 21,859,861 | ||
| Insurance 5.3% | ||
| Alleghany Corp. * | 19,347 | 10,887,911 |
| American Financial Group, Inc. | 91,472 | 9,312,764 |
| American National Insurance Co. | 9,570 | 1,107,345 |
| AmTrust Financial Services, Inc. | 137,641 | 1,706,748 |
| Arch Capital Group Ltd. * | 161,143 | 15,685,660 |
| Arthur J. Gallagher & Co. | 224,626 | 13,005,845 |
| Assurant, Inc. | 67,954 | 6,434,564 |
| Assured Guaranty Ltd. | 152,180 | 6,473,737 |
| Athene Holding Ltd., Class A * | 64,418 | 3,447,007 |
| Axis Capital Holdings Ltd. | 104,783 | 6,312,128 |
| Brown & Brown, Inc. | 141,564 | 6,364,718 |
| CNO Financial Group, Inc. | 212,367 | 4,746,403 |
| Erie Indemnity Co., Class A | 22,796 | 2,753,529 |
| Everest Re Group Ltd. | 51,343 | 12,963,081 |
| First American Financial Corp. | 137,319 | 6,736,870 |
| FNF Group | 340,979 | 16,448,827 |
| Old Republic International Corp. | 306,126 | 5,843,945 |
| Reinsurance Group of America, Inc. | 80,015 | 10,758,017 |
| RenaissanceRe Holdings Ltd. | 50,220 | 6,988,615 |
| Torchmark Corp. | 136,178 | 10,481,621 |
| Unum Group | 286,283 | 13,793,115 |
| Validus Holdings Ltd. | 98,105 | 4,919,966 |
| W.R. Berkley Corp. | 119,153 | 7,940,356 |
| White Mountains Insurance Group Ltd. | 5,692 | 4,958,130 |
| 190,070,902 | ||
| Materials 6.1% | ||
| Albemarle Corp. | 137,964 | 16,039,695 |
| Alcoa Corp. * | 186,018 | 8,162,470 |
| AptarGroup, Inc. | 77,345 | 6,466,815 |
| Ashland Global Holdings, Inc. | 78,395 | 4,864,410 |
| Avery Dennison Corp. | 110,525 | 10,418,087 |
| Axalta Coating Systems Ltd. * | 266,527 | 7,867,877 |
| Bemis Co., Inc. | 113,305 | 4,827,926 |
| Berry Global Group, Inc. * | 158,858 | 8,934,174 |
| CF Industries Holdings, Inc. | 288,563 | 8,365,441 |
| Crown Holdings, Inc. * | 169,101 | 9,982,032 |
| Eagle Materials, Inc. | 61,057 | 5,937,793 |
| FMC Corp. | 166,742 | 14,376,495 |
| Graphic Packaging Holding Co. | 389,933 | 5,088,626 |
| Huntsman Corp. | 249,676 | 6,633,891 |
| International Flavors & Fragrances, Inc. | 98,535 | 13,484,515 |
| NewMarket Corp. | 11,407 | 4,773,944 |
| Owens-Illinois, Inc. * | 202,823 | 4,997,559 |
| Packaging Corp. of America | 117,485 | 13,206,489 |
| Reliance Steel & Aluminum Co. | 91,727 | 6,642,869 |
| Royal Gold, Inc. | 82,287 | 7,675,731 |
| RPM International, Inc. | 166,121 | 8,134,945 |
| Silgan Holdings, Inc. | 94,704 | 2,849,643 |
| Sonoco Products Co. | 124,854 | 6,025,454 |
| Steel Dynamics, Inc. | 299,578 | 10,320,462 |
| Security | Number of Shares | Value ($) |
| The Scotts Miracle-Gro Co., Class A | 55,599 | 5,314,708 |
| Valvoline, Inc. | 252,857 | 5,383,326 |
| W.R. Grace & Co. | 85,276 | 6,095,529 |
| Westlake Chemical Corp. | 47,688 | 3,667,684 |
| 216,538,590 | ||
| Media 2.2% | ||
| AMC Networks, Inc., Class A * | 64,970 | 3,948,877 |
| Cinemark Holdings, Inc. | 134,188 | 4,467,119 |
| Liberty Broadband Corp., Class A * | 33,168 | 3,364,230 |
| Liberty Broadband Corp., Class C * | 85,028 | 8,632,893 |
| Liberty Global plc LiLAC, Class A * | 60,409 | 1,571,238 |
| Liberty Global plc LiLAC, Class C * | 151,128 | 3,897,591 |
| Lions Gate Entertainment Corp., Class A * | 74,376 | 2,211,198 |
| Lions Gate Entertainment Corp., Class B * | 124,369 | 3,491,038 |
| Live Nation Entertainment, Inc. * | 164,938 | 6,590,922 |
| News Corp., Class A | 476,643 | 6,372,717 |
| News Corp., Class B | 144,153 | 1,974,896 |
| Regal Entertainment Group, Class A | 132,608 | 1,958,620 |
| Scripps Networks Interactive, Inc., Class A | 120,577 | 10,327,420 |
| TEGNA, Inc. | 271,958 | 3,432,110 |
| The Interpublic Group of Cos., Inc. | 490,391 | 9,876,475 |
| The Madison Square Garden Co., Class A * | 17,682 | 3,757,602 |
| Tribune Media Co., Class A | 91,183 | 3,653,703 |
| 79,528,649 | ||
| Pharmaceuticals, Biotechnology & Life Sciences 4.9% | ||
| ACADIA Pharmaceuticals, Inc. * | 116,723 | 4,156,506 |
| Akorn, Inc. * | 110,044 | 3,620,448 |
| Alkermes plc * | 191,176 | 9,707,917 |
| Alnylam Pharmaceuticals, Inc. * | 100,751 | 8,637,383 |
| Bio-Rad Laboratories, Inc., Class A * | 25,931 | 5,648,290 |
| Bio-Techne Corp. | 47,405 | 5,867,791 |
| Bioverativ, Inc. * | 135,299 | 7,670,100 |
| Bruker Corp. | 134,070 | 3,900,096 |
| Charles River Laboratories International, Inc. * | 59,270 | 6,448,576 |
| Endo International plc * | 247,072 | 2,171,763 |
| Horizon Pharma plc * | 190,907 | 2,611,608 |
| Intercept Pharmaceuticals, Inc. *(a) | 22,244 | 2,593,873 |
| Intrexon Corp. *(a) | 75,736 | 1,494,271 |
| Ionis Pharmaceuticals, Inc. * | 153,718 | 8,242,359 |
| Jazz Pharmaceuticals plc * | 75,031 | 11,206,630 |
| Juno Therapeutics, Inc. * | 96,065 | 3,964,603 |
| Mettler-Toledo International, Inc. * | 32,045 | 19,390,109 |
| Neurocrine Biosciences, Inc. * | 108,313 | 6,130,516 |
| OPKO Health, Inc. *(a) | 451,354 | 2,888,666 |
| PAREXEL International Corp. * | 63,935 | 5,619,247 |
| PerkinElmer, Inc. | 135,770 | 9,095,232 |
| Quintiles IMS Holdings, Inc. * | 170,464 | 16,369,658 |
| Seattle Genetics, Inc. * | 120,517 | 6,330,758 |
| TESARO, Inc. * | 42,802 | 5,527,450 |
| Ultragenyx Pharmaceutical, Inc. * | 48,608 | 2,773,573 |
| United Therapeutics Corp. * | 56,689 | 7,414,921 |
| VWR Corp. * | 104,135 | 3,438,538 |
| 172,920,882 | ||
| Real Estate 10.8% | ||
| Alexandria Real Estate Equities, Inc. | 112,283 | 13,621,051 |
| American Campus Communities, Inc. | 167,971 | 7,993,740 |
| American Homes 4 Rent, Class A | 290,658 | 6,440,981 |
| Apartment Investment & Management Co., Class A | 194,518 | 8,817,501 |
| Brixmor Property Group, Inc. | 327,568 | 6,132,073 |
| Security | Number of Shares | Value ($) |
| Camden Property Trust | 108,571 | 9,714,933 |
| CubeSmart | 221,121 | 5,450,633 |
| CyrusOne, Inc. | 97,627 | 6,153,430 |
| DCT Industrial Trust, Inc. | 115,428 | 6,735,224 |
| DDR Corp. | 384,608 | 3,723,005 |
| Douglas Emmett, Inc. | 185,732 | 7,236,119 |
| Duke Realty Corp. | 446,562 | 13,271,823 |
| EPR Properties | 79,221 | 5,518,535 |
| Equity Commonwealth * | 153,707 | 4,755,695 |
| Equity LifeStyle Properties, Inc. | 101,037 | 9,007,449 |
| Extra Space Storage, Inc. | 156,590 | 12,156,082 |
| Forest City Realty Trust, Inc., Class A | 273,348 | 6,549,418 |
| Gaming & Leisure Properties, Inc. | 244,860 | 9,596,063 |
| Gramercy Property Trust | 186,366 | 5,676,708 |
| Healthcare Realty Trust, Inc. | 146,929 | 4,889,797 |
| Healthcare Trust of America, Inc., Class A | 237,911 | 7,391,895 |
| Highwoods Properties, Inc. | 129,135 | 6,744,721 |
| Hospitality Properties Trust | 203,973 | 5,580,701 |
| Hudson Pacific Properties, Inc. | 191,552 | 6,321,216 |
| Invitation Homes, Inc. | 97,643 | 2,259,459 |
| Iron Mountain, Inc. | 303,816 | 11,976,427 |
| Jones Lang LaSalle, Inc. | 56,898 | 6,936,435 |
| Kilroy Realty Corp. | 122,079 | 8,451,529 |
| Lamar Advertising Co., Class A | 104,436 | 6,951,260 |
| Liberty Property Trust | 182,592 | 7,778,419 |
| Life Storage, Inc. | 58,203 | 4,283,159 |
| Medical Properties Trust, Inc. | 455,983 | 6,000,736 |
| Mid-America Apartment Communities, Inc. | 141,380 | 15,051,315 |
| National Retail Properties, Inc. | 183,427 | 7,672,751 |
| Omega Healthcare Investors, Inc. | 245,342 | 7,819,050 |
| Outfront Media, Inc. | 168,835 | 3,714,370 |
| Paramount Group, Inc. | 232,075 | 3,662,143 |
| Park Hotels & Resorts, Inc. | 181,049 | 4,832,198 |
| Rayonier, Inc. | 155,824 | 4,520,454 |
| Realogy Holdings Corp. | 170,699 | 5,786,696 |
| Regency Centers Corp. | 183,068 | 11,774,934 |
| Retail Properties of America, Inc., Class A | 297,604 | 3,967,061 |
| RLJ Lodging Trust | 218,698 | 4,413,326 |
| Senior Housing Properties Trust | 299,753 | 5,911,129 |
| Spirit Realty Capital, Inc. | 599,551 | 5,216,094 |
| STORE Capital Corp. | 212,238 | 5,386,600 |
| Sun Communities, Inc. | 88,039 | 7,950,802 |
| Tanger Factory Outlet Centers, Inc. | 122,242 | 2,860,463 |
| Taubman Centers, Inc. | 76,853 | 4,014,801 |
| The Howard Hughes Corp. * | 45,632 | 5,354,915 |
| UDR, Inc. | 331,720 | 12,877,370 |
| Uniti Group, Inc. | 197,046 | 3,795,106 |
| VEREIT, Inc. | 1,206,372 | 10,181,788 |
| Weingarten Realty Investors | 149,355 | 4,785,334 |
| WP Carey, Inc. | 132,440 | 9,118,494 |
| 384,783,411 | ||
| Retailing 2.7% | ||
| AutoNation, Inc. *(a) | 80,046 | 3,631,687 |
| Bed Bath & Beyond, Inc. | 180,821 | 4,988,851 |
| Burlington Stores, Inc. * | 86,615 | 7,546,765 |
| Cabela's, Inc. * | 65,633 | 3,524,492 |
| Dick's Sporting Goods, Inc. | 110,742 | 2,919,159 |
| Floor & Decor Holdings, Inc., Class A * | 22,529 | 809,692 |
| Foot Locker, Inc. | 162,122 | 5,711,558 |
| GameStop Corp., Class A | 125,053 | 2,313,480 |
| Groupon, Inc. * | 513,074 | 2,278,049 |
| J.C. Penney Co., Inc. *(a) | 392,156 | 1,517,644 |
| Kohl's Corp. | 212,179 | 8,440,481 |
| Liberty Ventures, Series A * | 102,233 | 6,293,463 |
| LKQ Corp. * | 383,641 | 13,293,161 |
| Security | Number of Shares | Value ($) |
| Penske Automotive Group, Inc. | 47,808 | 2,025,147 |
| Pool Corp. | 51,500 | 5,134,035 |
| Sally Beauty Holdings, Inc. * | 167,181 | 3,107,895 |
| Signet Jewelers Ltd. | 84,009 | 5,298,448 |
| Staples, Inc. | 819,756 | 8,373,808 |
| The Michaels Cos., Inc. * | 131,945 | 2,962,165 |
| Urban Outfitters, Inc. * | 105,792 | 2,162,388 |
| Williams-Sonoma, Inc. | 100,171 | 4,607,866 |
| 96,940,234 | ||
| Semiconductors & Semiconductor Equipment 2.4% | ||
| Advanced Micro Devices, Inc. * | 957,670 | 12,449,710 |
| Cavium, Inc. * | 83,958 | 5,315,381 |
| First Solar, Inc. * | 97,294 | 4,568,926 |
| KLA-Tencor Corp. | 195,440 | 18,310,774 |
| Marvell Technology Group Ltd. | 540,774 | 9,685,262 |
| Microsemi Corp. * | 145,236 | 7,316,990 |
| ON Semiconductor Corp. * | 526,500 | 8,992,620 |
| Qorvo, Inc. * | 158,119 | 11,577,473 |
| Teradyne, Inc. | 248,605 | 8,852,824 |
| 87,069,960 | ||
| Software & Services 10.2% | ||
| Amdocs Ltd. | 183,252 | 11,872,897 |
| ANSYS, Inc. * | 107,160 | 13,804,351 |
| Aspen Technology, Inc. * | 92,224 | 5,833,168 |
| Black Knight Financial Services, Inc., Class A * | 33,702 | 1,435,705 |
| Booz Allen Hamilton Holding Corp. | 182,446 | 6,223,233 |
| Broadridge Financial Solutions, Inc. | 146,034 | 11,409,636 |
| Cadence Design Systems, Inc. * | 346,931 | 13,630,919 |
| CDK Global, Inc. | 180,283 | 11,628,254 |
| CoStar Group, Inc. * | 40,547 | 11,621,581 |
| CSRA, Inc. | 183,510 | 5,782,400 |
| DST Systems, Inc. | 77,753 | 3,991,062 |
| DXC Technology Co. | 351,231 | 29,854,635 |
| Euronet Worldwide, Inc. * | 65,906 | 6,476,583 |
| Fair Isaac Corp. | 38,800 | 5,461,488 |
| FireEye, Inc. * | 202,597 | 2,992,358 |
| Fortinet, Inc. * | 186,673 | 7,130,909 |
| Gartner, Inc. * | 112,698 | 13,590,252 |
| Genpact Ltd. | 161,255 | 4,587,705 |
| GoDaddy, Inc., Class A * | 54,928 | 2,461,873 |
| Guidewire Software, Inc. * | 91,786 | 6,949,118 |
| IAC/InterActiveCorp * | 91,739 | 10,413,294 |
| Jack Henry & Associates, Inc. | 96,604 | 9,956,974 |
| Leidos Holdings, Inc. | 179,402 | 10,462,725 |
| Manhattan Associates, Inc. * | 86,744 | 3,647,585 |
| MAXIMUS, Inc. | 80,473 | 4,891,149 |
| Nuance Communications, Inc. * | 322,019 | 5,174,845 |
| Pandora Media, Inc. *(a) | 284,758 | 2,406,205 |
| PTC, Inc. * | 143,295 | 8,024,520 |
| Sabre Corp. | 253,467 | 4,673,931 |
| Splunk, Inc. * | 172,071 | 11,544,243 |
| SS&C Technologies Holdings, Inc. | 215,424 | 8,339,063 |
| Synopsys, Inc. * | 186,712 | 15,015,379 |
| Syntel, Inc. | 33,547 | 605,859 |
| Tableau Software, Inc., Class A * | 74,474 | 5,397,876 |
| Take-Two Interactive Software, Inc. * | 129,541 | 12,667,814 |
| Teradata Corp. * | 164,548 | 5,252,372 |
| The Ultimate Software Group, Inc. * | 37,079 | 7,449,171 |
| Total System Services, Inc. | 205,586 | 14,210,104 |
| Tyler Technologies, Inc. * | 41,837 | 7,229,434 |
| Vantiv, Inc., Class A * | 201,631 | 14,253,295 |
| VeriSign, Inc. * | 109,734 | 11,384,903 |
| WEX, Inc. * | 48,818 | 5,327,997 |
| Security | Number of Shares | Value ($) |
| Zillow Group, Inc., Class A * | 58,533 | 2,336,637 |
| Zillow Group, Inc., Class C * | 132,834 | 5,262,883 |
| 362,666,385 | ||
| Technology Hardware & Equipment 4.1% | ||
| Acacia Communications, Inc. *(a) | 16,736 | 817,219 |
| Arista Networks, Inc. * | 53,039 | 9,342,820 |
| ARRIS International plc * | 232,628 | 6,481,016 |
| Arrow Electronics, Inc. * | 111,835 | 8,883,054 |
| Avnet, Inc. | 154,936 | 5,975,882 |
| Brocade Communications Systems, Inc. | 508,156 | 6,290,971 |
| CDW Corp. | 194,364 | 12,326,565 |
| Cognex Corp. | 107,641 | 11,729,640 |
| CommScope Holding Co., Inc. * | 238,743 | 7,892,844 |
| Dolby Laboratories, Inc., Class A | 74,031 | 3,735,604 |
| FLIR Systems, Inc. | 171,912 | 6,532,656 |
| IPG Photonics Corp. * | 47,175 | 8,292,893 |
| Jabil, Inc. | 227,855 | 7,143,254 |
| Keysight Technologies, Inc. * | 229,400 | 9,373,284 |
| National Instruments Corp. | 131,652 | 5,317,424 |
| NCR Corp. * | 153,389 | 5,603,300 |
| SYNNEX Corp. | 36,200 | 4,329,882 |
| Trimble, Inc. * | 312,234 | 12,077,211 |
| Ubiquiti Networks, Inc. *(a) | 31,300 | 1,865,167 |
| ViaSat, Inc. * | 65,661 | 4,176,696 |
| Zebra Technologies Corp., Class A * | 65,039 | 6,704,871 |
| 144,892,253 | ||
| Telecommunication Services 0.3% | ||
| Frontier Communications Corp. (a) | 97,367 | 1,311,534 |
| Telephone & Data Systems, Inc. | 118,248 | 3,465,849 |
| Zayo Group Holdings, Inc. * | 121,379 | 4,147,520 |
| 8,924,903 | ||
| Transportation 2.6% | ||
| Alaska Air Group, Inc. | 154,178 | 11,510,929 |
| AMERCO | 6,761 | 2,523,273 |
| Avis Budget Group, Inc. * | 108,618 | 3,935,230 |
| Expeditors International of Washington, Inc. | 223,804 | 12,555,404 |
| Genesee & Wyoming, Inc., Class A * | 76,388 | 5,237,161 |
| Hertz Global Holdings, Inc. * | 91,104 | 1,980,601 |
| J.B. Hunt Transport Services, Inc. | 106,531 | 10,534,851 |
| JetBlue Airways Corp. * | 420,182 | 8,323,805 |
| Kirby Corp. * | 68,256 | 4,272,826 |
| Landstar System, Inc. | 52,823 | 4,931,027 |
| Macquarie Infrastructure Corp. | 94,406 | 7,031,359 |
| Old Dominion Freight Line, Inc. | 86,375 | 8,628,863 |
| Ryder System, Inc. | 67,825 | 5,263,220 |
| XPO Logistics, Inc. * | 107,425 | 6,574,410 |
| 93,302,959 | ||
| Utilities 5.1% | ||
| AES Corp. | 830,718 | 9,171,127 |
| Alliant Energy Corp. | 286,303 | 12,236,590 |
| Aqua America, Inc. | 223,603 | 7,468,340 |
| Atmos Energy Corp. | 130,391 | 11,479,624 |
| Calpine Corp. * | 450,942 | 6,628,847 |
| CenterPoint Energy, Inc. | 538,901 | 15,962,248 |
| Great Plains Energy, Inc. | 267,772 | 8,217,923 |
| IDACORP, Inc. | 63,634 | 5,662,153 |
| MDU Resources Group, Inc. | 240,786 | 6,510,853 |
| National Fuel Gas Co. | 104,813 | 6,077,058 |
| NiSource, Inc. | 406,413 | 10,920,317 |
| Security | Number of Shares | Value ($) |
| NRG Energy, Inc. | 397,031 | 9,890,042 |
| OGE Energy Corp. | 245,213 | 8,759,008 |
| Pinnacle West Capital Corp. | 138,461 | 12,457,336 |
| Portland General Electric Co. | 109,252 | 5,190,563 |
| SCANA Corp. | 176,317 | 10,646,021 |
| UGI Corp. | 216,446 | 10,694,597 |
| Vectren Corp. | 102,009 | 6,692,811 |
| Vistra Energy Corp. | 366,273 | 6,483,032 |
| Westar Energy, Inc. | 178,269 | 9,146,982 |
| 180,295,472 | ||
| Total Common Stock | ||
| (Cost $3,044,270,516) | 3,547,856,040 | |
| Other Investment Companies 1.3% of net assets | ||
| Money Market Fund 0.1% | ||
| State Street Institutional U.S. Government Money Market Fund, Premier Class 0.93% (b) | 4,701,561 | 4,701,561 |
| Securities Lending Collateral 1.2% | ||
| Wells Fargo Government Money Market Fund, Select Class 0.92% (b) | 40,401,443 | 40,401,443 |
| Total Other Investment Companies | ||
| (Cost $45,103,004) | 45,103,004 | |
| Number of Contracts | Notional Amount ($) | Current Value/ Unrealized Appreciation ($) | ||
| Futures Contracts | ||||
| Long | ||||
| S&P 500 Index, e-mini, expires 09/15/17 | 55 | 6,792,775 | 55,814 | |
| * | Non-income producing security. |
| (a) | All or a portion of this security is on loan. Securities on loan were valued at $39,673,714. |
| (b) | The rate shown is the 7-day yield. |
| Security | Number of Shares | Value ($) |
| Common Stock 99.8% of net assets | ||
| Automobiles & Components 1.4% | ||
| American Axle & Manufacturing Holdings, Inc. * | 176,434 | 2,577,701 |
| Cooper Tire & Rubber Co. (a) | 107,790 | 3,621,744 |
| Cooper-Standard Holding, Inc. * | 38,902 | 3,912,763 |
| Dana, Inc. | 301,652 | 7,260,764 |
| Dorman Products, Inc. * | 62,134 | 4,126,940 |
| Fox Factory Holding Corp. * | 71,430 | 2,857,200 |
| Gentex Corp. | 580,156 | 10,599,450 |
| Gentherm, Inc. * | 74,083 | 2,307,686 |
| Horizon Global Corp. * | 38,285 | 658,502 |
| LCI Industries | 52,215 | 5,158,842 |
| Modine Manufacturing Co. * | 99,206 | 1,602,177 |
| Motorcar Parts of America, Inc. * | 40,346 | 1,059,889 |
| Standard Motor Products, Inc. | 40,802 | 1,799,368 |
| Stoneridge, Inc. * | 58,009 | 960,629 |
| Superior Industries International, Inc. | 50,253 | 736,207 |
| Tenneco, Inc. | 111,322 | 6,033,652 |
| Thor Industries, Inc. | 98,471 | 10,697,890 |
| Tower International, Inc. | 36,903 | 828,472 |
| Visteon Corp. * | 63,862 | 7,372,229 |
| Winnebago Industries, Inc. | 54,049 | 1,953,871 |
| 76,125,976 | ||
| Banks 9.9% | ||
| 1st Source Corp. | 33,490 | 1,562,978 |
| Ameris Bancorp | 78,977 | 3,478,937 |
| Arrow Financial Corp. | 29,589 | 955,725 |
| Associated Banc-Corp. | 311,609 | 6,824,237 |
| Astoria Financial Corp. | 179,073 | 3,508,040 |
| Banc of California, Inc. | 102,537 | 1,902,061 |
| BancFirst Corp. | 33,216 | 1,674,086 |
| BancorpSouth, Inc. | 170,348 | 4,948,609 |
| Bank Mutual Corp. | 86,106 | 787,870 |
| Bank of Hawaii Corp. | 88,841 | 6,941,147 |
| Bank of the Ozarks, Inc. | 243,862 | 10,476,312 |
| BankUnited, Inc. | 214,396 | 7,135,099 |
| Banner Corp. | 57,372 | 3,162,345 |
| Beneficial Bancorp, Inc. | 154,048 | 2,303,018 |
| Berkshire Hills Bancorp, Inc. | 71,391 | 2,413,016 |
| Bofl Holding, Inc. *(a) | 123,289 | 3,268,391 |
| Boston Private Financial Holdings, Inc. | 165,951 | 2,439,480 |
| Bridge Bancorp, Inc. | 37,902 | 1,171,172 |
| Brookline Bancorp, Inc. | 153,144 | 2,197,616 |
| Bryn Mawr Bank Corp. | 32,206 | 1,318,836 |
| Camden National Corp. | 31,621 | 1,233,219 |
| Capital Bank Financial Corp., Class A | 55,095 | 2,071,572 |
| Capitol Federal Financial, Inc. | 258,311 | 3,544,027 |
| Cathay General Bancorp | 152,987 | 5,395,851 |
| CenterState Banks, Inc. | 112,287 | 2,747,663 |
| Central Pacific Financial Corp. | 66,552 | 1,930,008 |
| Chemical Financial Corp. | 144,161 | 6,546,351 |
| City Holding Co. | 29,819 | 1,888,437 |
| Clifton Bancorp, Inc. | 44,844 | 706,293 |
| CoBiz Financial, Inc. | 72,698 | 1,239,501 |
| Security | Number of Shares | Value ($) |
| Columbia Banking System, Inc. | 117,404 | 4,363,907 |
| Commerce Bancshares, Inc. | 176,352 | 9,697,596 |
| Community Bank System, Inc. | 100,701 | 5,182,073 |
| Community Trust Bancorp, Inc. | 37,473 | 1,594,476 |
| ConnectOne Bancorp, Inc. | 55,976 | 1,276,253 |
| Customers Bancorp, Inc. * | 63,239 | 1,782,075 |
| CVB Financial Corp. | 211,145 | 4,370,701 |
| Dime Community Bancshares, Inc. | 62,593 | 1,186,137 |
| Eagle Bancorp, Inc. * | 59,563 | 3,704,819 |
| Enterprise Financial Services Corp. | 44,942 | 1,716,784 |
| Essent Group Ltd. * | 169,030 | 6,605,692 |
| F.N.B. Corp. | 673,336 | 8,544,634 |
| FB Financial Corp. * | 26,577 | 923,551 |
| FCB Financial Holdings, Inc., Class A * | 84,547 | 3,686,249 |
| Federal Agricultural Mortgage Corp., Class C | 18,262 | 1,244,007 |
| Financial Institutions, Inc. | 28,741 | 781,755 |
| First Bancorp (North Carolina) | 49,273 | 1,524,507 |
| First BanCorp (Puerto Rico) * | 329,574 | 1,871,980 |
| First Busey Corp. | 81,143 | 2,340,976 |
| First Citizens BancShares, Inc., Class A | 18,039 | 6,142,460 |
| First Commonwealth Financial Corp. | 192,138 | 2,422,860 |
| First Community Bancshares, Inc. | 31,576 | 812,766 |
| First Financial Bancorp | 127,593 | 3,055,852 |
| First Financial Bankshares, Inc. | 133,711 | 5,355,126 |
| First Financial Corp. | 25,115 | 1,089,991 |
| First Hawaiian, Inc. | 100,219 | 2,714,933 |
| First Horizon National Corp. | 479,485 | 8,251,937 |
| First Interstate BancSystem, Inc., Class A | 48,428 | 1,704,666 |
| First Merchants Corp. | 88,450 | 3,473,431 |
| First Midwest Bancorp, Inc. | 167,001 | 3,520,381 |
| Flagstar Bancorp, Inc. * | 44,121 | 1,448,051 |
| Flushing Financial Corp. | 56,119 | 1,534,293 |
| Fulton Financial Corp. | 363,042 | 6,335,083 |
| German American Bancorp, Inc. | 48,461 | 1,576,921 |
| Glacier Bancorp, Inc. | 158,309 | 5,257,442 |
| Great Southern Bancorp, Inc. | 20,724 | 1,032,055 |
| Great Western Bancorp, Inc. | 121,388 | 4,360,257 |
| Hancock Holding Co. | 175,701 | 7,722,059 |
| Hanmi Financial Corp. | 71,148 | 1,899,652 |
| Heartland Financial USA, Inc. | 48,759 | 2,218,534 |
| Heritage Financial Corp. | 62,536 | 1,635,316 |
| Hilltop Holdings, Inc. | 160,680 | 3,803,296 |
| Home BancShares, Inc. | 255,438 | 5,954,260 |
| HomeStreet, Inc. * | 50,870 | 1,284,468 |
| HomeTrust Bancshares, Inc. * | 35,210 | 816,872 |
| Hope Bancorp, Inc. | 266,088 | 4,294,660 |
| IBERIABANK Corp. | 104,945 | 8,038,787 |
| Independent Bank Corp. | 57,177 | 3,962,366 |
| Independent Bank Group, Inc. | 24,835 | 1,382,068 |
| International Bancshares Corp. | 115,292 | 4,144,747 |
| Investors Bancorp, Inc. | 616,438 | 8,069,173 |
| Kearny Financial Corp. | 181,391 | 2,566,683 |
| Lakeland Bancorp, Inc. | 84,436 | 1,562,066 |
| Lakeland Financial Corp. | 53,381 | 2,319,938 |
| LegacyTexas Financial Group, Inc. | 85,217 | 3,066,960 |
| LendingTree, Inc. * | 15,502 | 3,580,187 |
| Live Oak Bancshares, Inc. | 32,908 | 735,494 |
| MainSource Financial Group, Inc. | 50,515 | 1,653,356 |
| Security | Number of Shares | Value ($) |
| MB Financial, Inc. | 142,696 | 5,675,020 |
| Meridian Bancorp, Inc. | 100,303 | 1,765,333 |
| Meta Financial Group, Inc. | 18,066 | 1,270,040 |
| MGIC Investment Corp. * | 778,049 | 8,908,661 |
| National Bank Holdings Corp., Class A | 53,530 | 1,722,595 |
| Nationstar Mortgage Holdings, Inc. * | 66,004 | 1,136,589 |
| NBT Bancorp, Inc. | 91,185 | 2,993,604 |
| Nicolet Bankshares, Inc. * | 15,368 | 839,861 |
| NMI Holdings, Inc., Class A * | 101,558 | 1,101,904 |
| Northfield Bancorp, Inc. | 96,794 | 1,559,351 |
| Northwest Bancshares, Inc. | 213,897 | 3,300,431 |
| OceanFirst Financial Corp. | 60,194 | 1,502,442 |
| Ocwen Financial Corp. * | 213,704 | 626,153 |
| OFG Bancorp | 91,824 | 798,869 |
| Old National Bancorp | 281,495 | 4,602,443 |
| Opus Bank * | 38,438 | 861,011 |
| Oritani Financial Corp. | 79,453 | 1,275,221 |
| Pacific Premier Bancorp, Inc. * | 70,739 | 2,504,161 |
| PacWest Bancorp | 247,087 | 11,155,978 |
| Park National Corp. | 26,927 | 2,600,879 |
| Park Sterling Corp. | 92,205 | 1,048,371 |
| Peoples Financial Services Corp. | 9,474 | 393,645 |
| PHH Corp. * | 119,099 | 1,691,206 |
| Pinnacle Financial Partners, Inc. | 154,324 | 9,598,953 |
| Popular, Inc. | 204,265 | 8,152,216 |
| Preferred Bank | 25,910 | 1,393,958 |
| Prosperity Bancshares, Inc. | 142,358 | 8,505,890 |
| Provident Financial Services, Inc. | 126,675 | 3,147,874 |
| Radian Group, Inc. | 443,457 | 7,760,497 |
| Renasant Corp. | 87,816 | 3,497,711 |
| Republic Bancorp, Inc., Class A | 12,557 | 446,778 |
| S&T Bancorp, Inc. | 74,835 | 2,689,570 |
| Sandy Spring Bancorp, Inc. | 52,881 | 2,039,620 |
| Seacoast Banking Corp. of Florida * | 82,350 | 1,883,345 |
| ServisFirst Bancshares, Inc. | 90,328 | 3,081,088 |
| Simmons First National Corp., Class A | 62,348 | 3,254,566 |
| South State Corp. | 50,203 | 4,129,197 |
| Southside Bancshares, Inc. | 54,097 | 1,767,349 |
| Southwest Bancorp, Inc. | 42,266 | 1,067,217 |
| State Bank Financial Corp. | 72,270 | 1,941,895 |
| Sterling Bancorp | 278,375 | 6,249,519 |
| Stock Yards Bancorp, Inc. | 44,834 | 1,560,223 |
| Sun Bancorp, Inc. | 20,277 | 473,468 |
| Synovus Financial Corp. | 251,425 | 10,590,021 |
| TCF Financial Corp. | 357,856 | 5,557,504 |
| Texas Capital Bancshares, Inc. * | 101,565 | 7,541,201 |
| The Bancorp, Inc. * | 94,772 | 743,960 |
| The First of Long Island Corp. | 43,352 | 1,159,666 |
| Tompkins Financial Corp. | 26,311 | 1,997,531 |
| Towne Bank | 117,445 | 3,605,561 |
| TriCo Bancshares | 40,399 | 1,437,396 |
| TrustCo Bank Corp. | 206,720 | 1,633,088 |
| Trustmark Corp. | 138,074 | 4,089,752 |
| UMB Financial Corp. | 89,614 | 6,014,892 |
| Umpqua Holdings Corp. | 450,703 | 7,887,302 |
| Union Bankshares Corp. | 93,947 | 2,943,360 |
| United Bankshares, Inc. | 214,423 | 7,193,892 |
| United Community Banks, Inc. | 143,550 | 3,748,090 |
| United Financial Bancorp, Inc. | 104,379 | 1,807,844 |
| Univest Corp. of Pennsylvania | 59,431 | 1,732,414 |
| Valley National Bancorp | 547,641 | 6,128,103 |
| Walker & Dunlop, Inc. * | 57,905 | 2,790,442 |
| Washington Federal, Inc. | 184,419 | 5,763,094 |
| Washington Trust Bancorp, Inc. | 30,826 | 1,579,833 |
| Waterstone Financial, Inc. | 57,157 | 1,008,821 |
| Webster Financial Corp. | 189,126 | 8,828,402 |
| WesBanco, Inc. | 85,176 | 3,234,984 |
| Westamerica Bancorp | 55,334 | 2,852,468 |
| Security | Number of Shares | Value ($) |
| Western Alliance Bancorp * | 196,422 | 9,473,433 |
| Wintrust Financial Corp. | 113,786 | 8,284,759 |
| WSFS Financial Corp. | 58,766 | 2,626,840 |
| Xenith Bankshares, Inc. * | 15,587 | 446,568 |
| 543,645,439 | ||
| Capital Goods 9.9% | ||
| AAON, Inc. | 81,210 | 2,647,446 |
| AAR Corp. | 67,321 | 2,427,595 |
| Actuant Corp., Class A | 116,644 | 2,805,288 |
| Advanced Drainage Systems, Inc. | 67,546 | 1,313,770 |
| AECOM * | 316,038 | 10,587,273 |
| Aegion Corp. * | 80,241 | 1,738,822 |
| Aerojet Rocketdyne Holdings, Inc. * | 153,979 | 4,562,398 |
| Aerovironment, Inc. * | 44,152 | 2,164,331 |
| Air Lease Corp. | 197,263 | 8,016,768 |
| Aircastle Ltd. | 116,410 | 2,609,912 |
| Alamo Group, Inc. | 17,962 | 1,648,193 |
| Albany International Corp., Class A | 62,694 | 3,360,398 |
| Altra Industrial Motion Corp. | 59,106 | 2,721,831 |
| Ameresco, Inc., Class A * | 35,690 | 258,753 |
| American Railcar Industries, Inc. (a) | 14,896 | 536,256 |
| American Woodmark Corp. * | 27,575 | 2,283,210 |
| Apogee Enterprises, Inc. | 60,482 | 2,643,063 |
| Applied Industrial Technologies, Inc. | 78,255 | 4,460,535 |
| Argan, Inc. | 28,333 | 1,794,896 |
| Armstrong Flooring, Inc. * | 47,661 | 711,102 |
| Armstrong World Industries, Inc. * | 96,119 | 4,565,653 |
| Astec Industries, Inc. | 37,123 | 1,844,271 |
| Astronics Corp. * | 43,804 | 1,151,607 |
| Atkore International Group, Inc. * | 41,361 | 689,074 |
| Axon Enterprise, Inc. * | 107,691 | 2,337,972 |
| AZZ, Inc. | 52,201 | 2,552,629 |
| Babcock & Wilcox Enterprises, Inc. * | 98,964 | 223,659 |
| Barnes Group, Inc. | 106,026 | 6,628,746 |
| Beacon Roofing Supply, Inc. * | 120,913 | 5,695,002 |
| BMC Stock Holdings, Inc. * | 134,512 | 2,730,594 |
| Briggs & Stratton Corp. | 86,320 | 1,807,541 |
| Builders FirstSource, Inc. * | 195,957 | 3,190,180 |
| BWX Technologies, Inc. | 203,030 | 11,109,802 |
| CAI International, Inc. * | 41,802 | 1,295,444 |
| Chart Industries, Inc. * | 63,915 | 2,156,492 |
| Chicago Bridge & Iron Co. N.V. (a) | 205,519 | 2,536,104 |
| CIRCOR International, Inc. | 32,296 | 1,550,854 |
| Columbus McKinnon Corp. | 41,783 | 1,380,092 |
| Comfort Systems USA, Inc. | 75,764 | 2,579,764 |
| Continental Building Products, Inc. * | 82,020 | 1,997,187 |
| Crane Co. | 103,610 | 7,690,970 |
| CSW Industrials, Inc. * | 36,139 | 1,512,417 |
| Cubic Corp. | 50,514 | 2,169,576 |
| Curtiss-Wright Corp. | 90,600 | 8,771,892 |
| DigitalGlobe, Inc. * | 127,868 | 4,398,659 |
| Douglas Dynamics, Inc. | 49,557 | 1,729,539 |
| DXP Enterprises, Inc. * | 38,560 | 1,044,590 |
| Dycom Industries, Inc. * | 61,863 | 4,991,107 |
| EMCOR Group, Inc. | 120,662 | 7,968,518 |
| Encore Wire Corp. | 39,515 | 1,695,194 |
| Energy Recovery, Inc. * | 67,172 | 436,618 |
| EnerSys | 88,220 | 5,654,902 |
| Engility Holdings, Inc. * | 36,804 | 1,143,500 |
| EnPro Industries, Inc. | 45,478 | 3,204,835 |
| ESCO Technologies, Inc. | 52,490 | 2,858,081 |
| Esterline Technologies Corp. * | 60,973 | 5,207,094 |
| Federal Signal Corp. | 126,293 | 2,360,416 |
| Foundation Building Materials, Inc. * | 25,488 | 332,873 |
| Franklin Electric Co., Inc. | 78,748 | 3,035,735 |
| Gardner Denver Holdings, Inc. * | 87,100 | 2,045,979 |
| Security | Number of Shares | Value ($) |
| GATX Corp. | 80,113 | 4,853,246 |
| Generac Holdings, Inc. * | 130,849 | 5,283,683 |
| General Cable Corp. | 109,842 | 1,861,822 |
| Gibraltar Industries, Inc. * | 67,589 | 1,976,978 |
| Global Brass & Copper Holdings, Inc. | 41,971 | 1,252,834 |
| GMS, Inc. * | 63,378 | 2,039,504 |
| Graco, Inc. | 113,460 | 13,105,765 |
| Graham Corp. | 22,424 | 449,153 |
| Granite Construction, Inc. | 79,910 | 4,413,429 |
| Great Lakes Dredge & Dock Corp. * | 127,468 | 516,245 |
| Griffon Corp. | 60,914 | 1,129,955 |
| H&E Equipment Services, Inc. | 68,989 | 1,624,001 |
| Harsco Corp. * | 164,582 | 2,814,352 |
| HEICO Corp. | 56,123 | 4,813,670 |
| HEICO Corp., Class A | 89,387 | 6,493,966 |
| Herc Holdings, Inc. * | 51,867 | 2,189,825 |
| Hexcel Corp. | 184,306 | 9,910,134 |
| Hillenbrand, Inc. | 128,422 | 4,591,087 |
| Hyster-Yale Materials Handling, Inc. | 18,269 | 1,300,387 |
| Insteel Industries, Inc. | 36,140 | 906,030 |
| ITT, Inc. | 178,422 | 7,201,112 |
| JELD-WEN Holding, Inc. * | 83,579 | 2,550,831 |
| John Bean Technologies Corp. | 64,243 | 5,698,354 |
| Kadant, Inc. | 24,258 | 2,106,807 |
| Kaman Corp. | 59,156 | 2,901,010 |
| KBR, Inc. | 285,939 | 4,652,228 |
| Kennametal, Inc. | 164,747 | 5,766,145 |
| KLX, Inc. * | 103,354 | 4,954,791 |
| Kratos Defense & Security Solutions, Inc. * | 132,488 | 1,772,689 |
| L.B. Foster Co., Class A | 12,448 | 237,757 |
| Lindsay Corp. | 22,396 | 1,938,822 |
| Lydall, Inc. * | 36,397 | 1,710,659 |
| Masonite International Corp. * | 62,633 | 3,964,669 |
| MasTec, Inc. * | 136,055 | 5,551,044 |
| Mercury Systems, Inc. * | 94,757 | 4,572,025 |
| Meritor, Inc. * | 178,214 | 3,539,330 |
| Milacron Holdings Corp. * | 85,635 | 1,365,878 |
| Moog, Inc., Class A * | 65,850 | 5,054,646 |
| MRC Global, Inc. * | 188,980 | 2,980,215 |
| MSC Industrial Direct Co., Inc., Class A | 91,894 | 6,329,659 |
| Mueller Industries, Inc. | 115,801 | 3,454,344 |
| Mueller Water Products, Inc., Class A | 317,108 | 3,802,125 |
| MYR Group, Inc. * | 33,325 | 860,118 |
| National Presto Industries, Inc. | 11,569 | 1,152,272 |
| Navistar International Corp. * | 132,519 | 4,526,849 |
| NCI Building Systems, Inc. * | 85,500 | 1,436,400 |
| Nexeo Solutions, Inc. * | 110,216 | 790,249 |
| NN, Inc. | 60,614 | 1,545,657 |
| NOW, Inc. * | 219,244 | 2,556,385 |
| Orbital ATK, Inc. | 116,588 | 13,008,889 |
| Oshkosh Corp. | 154,179 | 11,501,753 |
| Park-Ohio Holdings Corp. | 19,749 | 786,998 |
| Patrick Industries, Inc. * | 31,113 | 2,302,362 |
| PGT Innovations, Inc. * | 100,573 | 1,327,564 |
| Plug Power, Inc. *(a) | 596,960 | 1,277,494 |
| Ply Gem Holdings, Inc. * | 40,196 | 625,048 |
| Powell Industries, Inc. | 20,798 | 592,119 |
| Preformed Line Products Co. | 6,039 | 315,538 |
| Primoris Services Corp. | 81,067 | 2,319,327 |
| Proto Labs, Inc. * | 48,287 | 3,467,007 |
| Quanex Building Products Corp. | 78,200 | 1,532,720 |
| Raven Industries, Inc. | 78,771 | 2,205,588 |
| RBC Bearings, Inc. * | 50,521 | 5,570,951 |
| Regal Beloit Corp. | 92,210 | 6,952,634 |
| REV Group, Inc. | 25,200 | 634,788 |
| Rexnord Corp. * | 223,807 | 5,344,511 |
| Rush Enterprises, Inc., Class A * | 61,022 | 2,501,292 |
| Security | Number of Shares | Value ($) |
| Rush Enterprises, Inc., Class B * | 16,174 | 623,022 |
| Simpson Manufacturing Co., Inc. | 83,085 | 3,637,461 |
| SiteOne Landscape Supply, Inc. * | 80,996 | 4,069,239 |
| SPX Corp. * | 92,129 | 2,220,309 |
| SPX FLOW, Inc. * | 84,896 | 2,841,469 |
| Standex International Corp. | 25,040 | 2,390,068 |
| Sun Hydraulics Corp. | 52,874 | 2,533,193 |
| Sunrun, Inc. *(a) | 135,440 | 907,448 |
| Teledyne Technologies, Inc. * | 73,369 | 11,009,752 |
| Tennant Co. | 38,428 | 2,342,187 |
| Terex Corp. | 185,980 | 7,169,529 |
| Textainer Group Holdings Ltd. * | 50,146 | 890,092 |
| The Gorman-Rupp Co. | 36,413 | 1,108,412 |
| The Greenbrier Cos., Inc. | 57,915 | 2,484,554 |
| The KeyW Holding Corp. * | 99,568 | 711,911 |
| The Manitowoc Co., Inc. * | 270,043 | 2,222,454 |
| The Timken Co. | 142,379 | 6,385,698 |
| Thermon Group Holdings, Inc. * | 62,341 | 1,029,873 |
| Titan International, Inc. | 92,009 | 789,437 |
| Titan Machinery, Inc. * | 31,000 | 399,900 |
| TPI Composites, Inc. * | 30,674 | 623,909 |
| Trex Co., Inc. * | 60,356 | 4,587,056 |
| TriMas Corp. * | 96,346 | 2,331,573 |
| Triton International Ltd. * | 68,282 | 2,520,971 |
| Triumph Group, Inc. | 100,876 | 2,653,039 |
| Tutor Perini Corp. * | 82,580 | 2,159,467 |
| Univar, Inc. * | 207,194 | 5,844,943 |
| Universal Forest Products, Inc. | 40,568 | 3,537,935 |
| USG Corp. * | 180,470 | 5,414,100 |
| Valmont Industries, Inc. | 45,024 | 6,463,195 |
| Veritiv Corp. * | 24,479 | 685,412 |
| Vivint Solar, Inc. *(a) | 45,053 | 214,002 |
| Wabash National Corp. | 117,344 | 2,466,571 |
| Watsco, Inc. | 61,625 | 9,081,060 |
| Watts Water Technologies, Inc., Class A | 58,059 | 3,582,240 |
| Welbilt, Inc. * | 285,095 | 5,673,390 |
| Wesco Aircraft Holdings, Inc. * | 128,172 | 1,076,645 |
| WESCO International, Inc. * | 86,104 | 4,343,947 |
| Woodward, Inc. | 113,661 | 7,980,139 |
| 541,338,323 | ||
| Commercial & Professional Services 2.8% | ||
| ABM Industries, Inc. | 116,015 | 5,154,546 |
| Acacia Research Corp. * | 95,436 | 310,167 |
| ACCO Brands Corp. * | 215,739 | 2,362,342 |
| Advanced Disposal Services, Inc. * | 76,640 | 1,827,098 |
| Barrett Business Services, Inc. | 14,637 | 754,976 |
| Brady Corp., Class A | 101,888 | 3,397,965 |
| CBIZ, Inc. * | 114,055 | 1,727,933 |
| Clean Harbors, Inc. * | 103,739 | 5,611,243 |
| Covanta Holding Corp. | 274,102 | 3,933,364 |
| Deluxe Corp. | 98,946 | 6,861,905 |
| Ennis, Inc. | 52,237 | 997,727 |
| Essendant, Inc. | 74,518 | 883,783 |
| Exponent, Inc. | 52,508 | 3,575,795 |
| Franklin Covey Co. * | 31,028 | 583,326 |
| FTI Consulting, Inc. * | 84,903 | 2,879,061 |
| GP Strategies Corp. * | 36,284 | 1,037,722 |
| Healthcare Services Group, Inc. | 148,152 | 7,585,382 |
| Heidrick & Struggles International, Inc. | 33,977 | 620,080 |
| Heritage-Crystal Clean, Inc. * | 37,039 | 722,261 |
| Herman Miller, Inc. | 122,776 | 4,131,412 |
| HNI Corp. | 90,688 | 3,323,715 |
| Huron Consulting Group, Inc. * | 42,413 | 1,282,993 |
| ICF International, Inc. * | 37,840 | 1,818,212 |
| InnerWorkings, Inc. * | 84,442 | 884,108 |
| Insperity, Inc. | 37,782 | 3,033,895 |
| Security | Number of Shares | Value ($) |
| Interface, Inc. | 130,099 | 2,471,881 |
| Kelly Services, Inc., Class A | 62,824 | 1,358,883 |
| Kforce, Inc. | 46,952 | 845,136 |
| Kimball International, Inc., Class B | 70,572 | 1,196,901 |
| Knoll, Inc. | 99,783 | 1,801,083 |
| Korn/Ferry International | 113,272 | 3,774,223 |
| LSC Communications, Inc. | 79,846 | 1,286,319 |
| Matthews International Corp., Class A | 68,014 | 4,097,844 |
| McGrath RentCorp | 49,278 | 1,989,353 |
| Mistras Group, Inc. * | 32,112 | 607,238 |
| Mobile Mini, Inc. | 88,966 | 2,691,222 |
| MSA Safety, Inc. | 63,327 | 4,614,005 |
| Multi-Color Corp. | 25,852 | 2,062,990 |
| Navigant Consulting, Inc. * | 100,312 | 1,537,783 |
| NL Industries, Inc. * | 20,121 | 151,914 |
| On Assignment, Inc. * | 98,796 | 4,712,569 |
| Pendrell Corp. * | 27,804 | 188,511 |
| Pitney Bowes, Inc. | 387,787 | 4,983,063 |
| Quad/Graphics, Inc. | 62,643 | 1,193,976 |
| R.R. Donnelley & Sons Co. | 143,479 | 1,324,311 |
| Resources Connection, Inc. | 58,548 | 746,487 |
| RPX Corp. * | 102,493 | 1,338,559 |
| SP Plus Corp. * | 46,800 | 1,726,920 |
| Steelcase, Inc., Class A | 184,349 | 2,433,407 |
| Team, Inc. * | 62,921 | 777,074 |
| Tetra Tech, Inc. | 118,774 | 5,059,772 |
| The Advisory Board Co. * | 84,409 | 4,494,779 |
| The Brink's Co. | 91,336 | 7,165,309 |
| TriNet Group, Inc. * | 69,027 | 2,466,335 |
| TrueBlue, Inc. * | 97,381 | 1,991,441 |
| UniFirst Corp. | 31,968 | 4,590,605 |
| US Ecology, Inc. | 42,736 | 2,196,630 |
| Viad Corp. | 39,087 | 2,147,831 |
| WageWorks, Inc. * | 81,081 | 4,779,725 |
| West Corp. | 100,568 | 2,350,274 |
| 152,455,364 | ||
| Consumer Durables & Apparel 2.3% | ||
| Acushnet Holdings Corp. (a) | 33,814 | 555,902 |
| American Outdoor Brands Corp. * | 114,715 | 1,872,149 |
| Beazer Homes USA, Inc. * | 57,988 | 864,601 |
| Brunswick Corp. | 182,945 | 9,600,954 |
| CalAtlantic Group, Inc. | 151,266 | 5,256,494 |
| Callaway Golf Co. | 189,483 | 2,641,393 |
| Cavco Industries, Inc. * | 16,657 | 2,241,199 |
| Columbia Sportswear Co. | 55,460 | 3,177,303 |
| Crocs, Inc. * | 154,897 | 1,383,230 |
| Deckers Outdoor Corp. * | 63,957 | 4,086,852 |
| Ethan Allen Interiors, Inc. | 50,993 | 1,491,545 |
| Fossil Group, Inc. *(a) | 88,553 | 734,104 |
| G-III Apparel Group Ltd. * | 89,953 | 2,473,708 |
| GoPro, Inc., Class A *(a) | 219,736 | 2,023,769 |
| Helen of Troy Ltd. * | 55,175 | 4,982,303 |
| Hovnanian Enterprises, Inc., Class A * | 320,929 | 584,091 |
| Iconix Brand Group, Inc. * | 146,144 | 816,945 |
| Installed Building Products, Inc. * | 43,419 | 2,505,276 |
| iRobot Corp. * | 57,582 | 5,494,474 |
| KB Home | 170,770 | 3,654,478 |
| La-Z-Boy, Inc. | 95,061 | 2,267,205 |
| LGI Homes, Inc. *(a) | 39,890 | 1,696,921 |
| Libbey, Inc. | 47,477 | 387,887 |
| M.D.C Holdings, Inc. | 86,901 | 2,715,656 |
| M/I Homes, Inc. * | 44,919 | 1,105,007 |
| Marine Products Corp. | 27,793 | 433,015 |
| Meritage Homes Corp. * | 74,757 | 3,042,610 |
| Movado Group, Inc. | 34,824 | 966,366 |
| NACCO Industries, Inc., Class A | 9,066 | 657,285 |
| Security | Number of Shares | Value ($) |
| Nautilus, Inc. * | 66,159 | 1,081,700 |
| Oxford Industries, Inc. | 32,609 | 1,885,126 |
| Perry Ellis International, Inc. * | 27,797 | 606,809 |
| PICO Holdings, Inc. * | 54,524 | 886,015 |
| Skechers U.S.A., Inc., Class A * | 273,833 | 7,237,406 |
| Steven Madden Ltd. * | 107,819 | 4,571,526 |
| Sturm Ruger & Co., Inc. (a) | 38,580 | 1,766,964 |
| Taylor Morrison Home Corp., Class A * | 142,371 | 2,878,742 |
| Tempur Sealy International, Inc. * | 96,157 | 5,952,118 |
| TopBuild Corp. * | 77,742 | 4,613,988 |
| TRI Pointe Group, Inc. * | 312,168 | 3,977,020 |
| Tupperware Brands Corp. | 104,081 | 6,023,167 |
| Unifi, Inc. * | 26,357 | 819,176 |
| Universal Electronics, Inc. * | 30,824 | 1,804,745 |
| Vera Bradley, Inc. * | 38,010 | 343,610 |
| Vista Outdoor, Inc. * | 111,995 | 2,295,898 |
| William Lyon Homes, Class A * | 54,156 | 1,299,202 |
| Wolverine World Wide, Inc. | 201,421 | 5,297,372 |
| 123,053,306 | ||
| Consumer Services 3.9% | ||
| Adtalem Global Education, Inc. | 113,795 | 3,891,789 |
| American Public Education, Inc. * | 34,426 | 635,160 |
| Ascent Capital Group, Inc., Class A * | 25,854 | 256,730 |
| Belmond Ltd., Class A * | 167,901 | 2,140,738 |
| Biglari Holdings, Inc. * | 1,906 | 567,531 |
| BJ's Restaurants, Inc. * | 34,343 | 1,033,724 |
| Bloomin' Brands, Inc. | 202,149 | 3,438,555 |
| Bob Evans Farms, Inc. | 38,954 | 2,679,256 |
| Bojangles', Inc. * | 42,227 | 563,730 |
| Boyd Gaming Corp. | 172,529 | 4,561,667 |
| Bridgepoint Education, Inc. * | 36,503 | 322,322 |
| Bright Horizons Family Solutions, Inc. * | 102,073 | 8,158,695 |
| Brinker International, Inc. | 101,001 | 3,153,251 |
| Buffalo Wild Wings, Inc. * | 33,438 | 3,435,755 |
| Caesars Entertainment Corp. *(a) | 107,987 | 1,252,649 |
| Capella Education Co. | 25,227 | 1,699,038 |
| Career Education Corp. * | 141,721 | 1,361,939 |
| Carriage Services, Inc. | 31,613 | 774,202 |
| Carrols Restaurant Group, Inc. * | 78,064 | 850,898 |
| Chegg, Inc. * | 162,030 | 2,299,206 |
| Choice Hotels International, Inc. | 72,626 | 4,506,443 |
| Churchill Downs, Inc. | 25,293 | 4,942,252 |
| Chuy's Holdings, Inc. * | 34,827 | 654,748 |
| ClubCorp Holdings, Inc. | 127,895 | 2,174,215 |
| Cracker Barrel Old Country Store, Inc. (a) | 48,929 | 7,273,785 |
| Dave & Buster's Entertainment, Inc. * | 76,738 | 4,486,104 |
| Del Frisco's Restaurant Group, Inc. * | 40,615 | 568,610 |
| Denny's Corp. * | 136,873 | 1,637,001 |
| DineEquity, Inc. | 34,728 | 1,380,438 |
| Drive Shack, Inc. | 134,870 | 364,149 |
| El Pollo Loco Holdings, Inc. * | 39,738 | 451,026 |
| Eldorado Resorts, Inc. * | 79,485 | 1,828,155 |
| Extended Stay America, Inc. | 408,266 | 7,997,931 |
| Fiesta Restaurant Group, Inc. * | 54,546 | 949,100 |
| Graham Holdings Co., Class B | 9,232 | 5,421,030 |
| Grand Canyon Education, Inc. * | 101,147 | 8,299,111 |
| Hilton Grand Vacations, Inc. * | 127,661 | 4,627,711 |
| Houghton Mifflin Harcourt Co. * | 205,418 | 2,095,264 |
| Hyatt Hotels Corp., Class A * | 97,391 | 5,795,738 |
| ILG, Inc. | 218,596 | 5,770,934 |
| International Speedway Corp., Class A | 53,859 | 1,920,073 |
| Jack in the Box, Inc. | 60,583 | 5,671,781 |
| K12, Inc. * | 77,132 | 1,382,205 |
| La Quinta Holdings, Inc. * | 176,066 | 2,781,843 |
| Laureate Education, Inc., Class A * | 68,933 | 1,009,179 |
| Marriott Vacations Worldwide Corp. | 49,301 | 5,736,664 |
| Security | Number of Shares | Value ($) |
| Noodles & Co. *(a) | 27,481 | 105,802 |
| Papa John's International, Inc. | 54,129 | 4,048,308 |
| Penn National Gaming, Inc. * | 171,149 | 3,797,796 |
| Pinnacle Entertainment, Inc. * | 120,670 | 2,353,065 |
| Planet Fitness, Inc., Class A | 147,862 | 3,751,259 |
| Playa Hotels & Resorts N.V. * | 86,700 | 899,079 |
| Potbelly Corp. * | 41,478 | 497,736 |
| Red Robin Gourmet Burgers, Inc. * | 24,928 | 1,420,896 |
| Red Rock Resorts, Inc., Class A | 82,293 | 1,859,822 |
| Regis Corp. * | 82,743 | 1,098,827 |
| Ruby Tuesday, Inc. * | 159,031 | 341,917 |
| Ruth's Hospitality Group, Inc. | 55,757 | 1,090,049 |
| Scientific Games Corp., Class A * | 111,595 | 3,928,144 |
| SeaWorld Entertainment, Inc. (a) | 136,964 | 1,777,793 |
| ServiceMaster Global Holdings, Inc. * | 276,329 | 13,020,623 |
| Shake Shack, Inc., Class A *(a) | 41,756 | 1,291,096 |
| Six Flags Entertainment Corp. | 165,104 | 9,009,725 |
| Sonic Corp. | 87,397 | 2,045,964 |
| Sotheby's * | 94,732 | 4,250,625 |
| Speedway Motorsports, Inc. | 22,423 | 466,623 |
| Strayer Education, Inc. | 21,330 | 1,706,613 |
| Texas Roadhouse, Inc. | 135,158 | 6,413,247 |
| The Cheesecake Factory, Inc. | 89,840 | 3,722,071 |
| The Habit Restaurants, Inc., Class A * | 39,828 | 517,764 |
| The Marcus Corp. | 42,330 | 1,054,017 |
| The Wendy's Co. | 391,683 | 5,843,910 |
| Weight Watchers International, Inc. * | 58,481 | 2,737,496 |
| Wingstop, Inc. | 65,457 | 2,121,461 |
| Zoe's Kitchen, Inc. * | 36,728 | 472,689 |
| 214,446,742 | ||
| Diversified Financials 3.6% | ||
| AG Mortgage Investment Trust, Inc. | 52,050 | 1,003,004 |
| Anworth Mortgage Asset Corp. | 212,308 | 1,286,586 |
| Apollo Commercial Real Estate Finance, Inc. | 201,533 | 3,645,732 |
| Arlington Asset Investment Corp., Class A (a) | 48,935 | 632,240 |
| ARMOUR Residential REIT, Inc. | 75,847 | 2,003,119 |
| Artisan Partners Asset Management, Inc., Class A | 91,200 | 2,799,840 |
| BGC Partners, Inc., Class A | 448,082 | 5,820,585 |
| Blackstone Mortgage Trust, Inc., Class A | 199,028 | 6,239,528 |
| Capstead Mortgage Corp. | 196,213 | 1,897,380 |
| Chimera Investment Corp. | 366,068 | 6,980,917 |
| CIM Commercial Trust Corp. | 19,490 | 305,019 |
| Cohen & Steers, Inc. | 38,371 | 1,451,959 |
| Cowen, Inc., Class A * | 51,878 | 843,018 |
| Credit Acceptance Corp. *(a) | 25,035 | 6,817,030 |
| CYS Investments, Inc. | 307,296 | 2,701,132 |
| Diamond Hill Investment Group, Inc. | 5,898 | 1,157,954 |
| Donnelley Financial Solutions, Inc. * | 64,540 | 1,381,801 |
| Dynex Capital, Inc. | 86,234 | 616,573 |
| Encore Capital Group, Inc. * | 52,006 | 2,098,442 |
| Enova International, Inc. * | 49,908 | 593,905 |
| Evercore, Inc., Class A | 83,700 | 6,315,165 |
| EZCORP, Inc., Class A * | 102,481 | 927,453 |
| Federated Investors, Inc., Class B | 190,989 | 5,215,910 |
| Financial Engines, Inc. | 129,567 | 4,282,189 |
| FirstCash, Inc. | 96,122 | 5,642,361 |
| FNFV Group * | 147,108 | 2,478,770 |
| GAMCO Investors, Inc., Class A | 8,923 | 262,961 |
| Green Dot Corp., Class A * | 90,224 | 4,346,992 |
| Greenhill & Co., Inc. | 56,308 | 847,435 |
| Hamilton Lane, Inc., Class A | 30,909 | 724,507 |
| Hannon Armstrong Sustainable Infrastructure Capital, Inc. | 103,627 | 2,404,146 |
| Security | Number of Shares | Value ($) |
| Interactive Brokers Group, Inc., Class A | 146,457 | 6,140,942 |
| INTL FCStone, Inc. * | 31,065 | 1,102,497 |
| Invesco Mortgage Capital, Inc. | 235,753 | 4,003,086 |
| Investment Technology Group, Inc. | 68,998 | 1,386,170 |
| Janus Henderson Group plc | 363,053 | 12,547,112 |
| KKR Real Estate Finance Trust, Inc. | 21,624 | 449,130 |
| Ladder Capital Corp., Class A | 168,760 | 2,315,387 |
| Ladenburg Thalmann Financial Services, Inc. * | 224,794 | 577,721 |
| LendingClub Corp. * | 662,803 | 4,102,751 |
| LPL Financial Holdings, Inc. | 161,163 | 7,548,875 |
| MFA Financial, Inc. | 820,879 | 7,207,318 |
| Moelis & Co., Class A | 62,779 | 2,473,493 |
| Morningstar, Inc. | 40,060 | 3,312,962 |
| MTGE Investment Corp. | 102,650 | 1,970,880 |
| Nelnet, Inc., Class A | 42,461 | 2,013,925 |
| New Residential Investment Corp. | 623,442 | 10,274,324 |
| New York Mortgage Trust, Inc. | 234,875 | 1,470,317 |
| NewStar Financial, Inc. | 25,377 | 272,041 |
| On Deck Capital, Inc. * | 85,794 | 414,385 |
| PennyMac Mortgage Investment Trust | 131,327 | 2,270,644 |
| Piper Jaffray Cos. | 30,436 | 1,687,676 |
| PJT Partners, Inc., Class A | 33,098 | 1,279,569 |
| PRA Group, Inc. * | 95,415 | 2,757,493 |
| Pzena Investment Management, Inc., Class A | 24,596 | 243,500 |
| Redwood Trust, Inc. | 162,573 | 2,711,718 |
| Resource Capital Corp. | 72,473 | 750,096 |
| Safeguard Scientifics, Inc. * | 52,027 | 634,729 |
| SLM Corp. * | 891,527 | 9,066,830 |
| Stifel Financial Corp. | 141,625 | 6,762,594 |
| Two Harbors Investment Corp. | 720,178 | 7,367,421 |
| Virtu Financial, Inc., Class A (a) | 74,849 | 1,343,540 |
| Virtus Investment Partners, Inc. | 14,201 | 1,505,306 |
| Waddell & Reed Financial, Inc., Class A | 164,879 | 3,068,398 |
| Western Asset Mortgage Capital Corp. | 86,674 | 910,944 |
| Westwood Holdings Group, Inc. | 16,258 | 993,852 |
| WisdomTree Investments, Inc. | 227,960 | 2,090,393 |
| World Acceptance Corp. * | 12,493 | 934,726 |
| 199,686,398 | ||
| Energy 3.4% | ||
| Arch Coal, Inc., Class A | 50,214 | 4,010,592 |
| Archrock, Inc. | 144,742 | 1,476,368 |
| Atwood Oceanics, Inc. *(a) | 143,201 | 940,831 |
| Bill Barrett Corp. * | 167,100 | 499,629 |
| Bristow Group, Inc. | 103,878 | 855,955 |
| C&J Energy Services, Inc. * | 126,496 | 3,195,289 |
| California Resources Corp. *(a) | 84,943 | 662,555 |
| Callon Petroleum Co. * | 418,854 | 4,339,327 |
| CARBO Ceramics, Inc. *(a) | 76,456 | 501,551 |
| Carrizo Oil & Gas, Inc. * | 156,336 | 2,101,156 |
| Centennial Resource Development, Inc., Class A * | 247,598 | 4,280,969 |
| Clean Energy Fuels Corp. * | 264,662 | 629,896 |
| Cloud Peak Energy, Inc. * | 137,618 | 432,121 |
| Cobalt International Energy, Inc. *(a) | 66,671 | 125,341 |
| CONSOL Energy, Inc. * | 365,468 | 5,317,559 |
| Contango Oil & Gas Co. * | 46,933 | 215,422 |
| CVR Energy, Inc. (a) | 30,228 | 647,484 |
| Delek US Holdings, Inc. | 146,641 | 3,624,965 |
| Denbury Resources, Inc. * | 818,777 | 867,904 |
| Diamond Offshore Drilling, Inc. *(a) | 127,776 | 1,451,535 |
| Dril-Quip, Inc. * | 76,255 | 2,863,375 |
| Eclipse Resources Corp. * | 172,060 | 400,900 |
| Energy XXI Gulf Coast, Inc. * | 66,176 | 691,539 |
| Ensco plc, Class A (a) | 633,298 | 2,691,516 |
| Security | Number of Shares | Value ($) |
| EP Energy Corp., Class A *(a) | 78,079 | 229,552 |
| Era Group, Inc. * | 40,597 | 357,660 |
| Evolution Petroleum Corp. | 58,489 | 406,499 |
| EXCO Resources, Inc. *(a) | 23,543 | 42,142 |
| Exterran Corp. * | 67,125 | 1,862,047 |
| Extraction Oil & Gas, Inc. * | 71,738 | 942,637 |
| Fairmount Santrol Holdings, Inc. *(a) | 314,427 | 962,147 |
| Forum Energy Technologies, Inc. * | 148,946 | 1,727,774 |
| Frank's International N.V. (a) | 112,425 | 706,029 |
| Gener8 Maritime, Inc. * | 182,594 | 821,673 |
| Geospace Technologies Corp. * | 28,741 | 433,702 |
| Green Plains, Inc. | 74,419 | 1,380,472 |
| Gulf Island Fabrication, Inc. | 27,868 | 312,122 |
| Gulfport Energy Corp. * | 321,711 | 4,031,039 |
| Helix Energy Solutions Group, Inc. * | 273,803 | 1,716,745 |
| Hornbeck Offshore Services, Inc. *(a) | 69,026 | 191,202 |
| Isramco, Inc. * | 2,088 | 235,109 |
| Jagged Peak Energy, Inc. * | 62,949 | 806,377 |
| Jones Energy, Inc., Class A *(a) | 121,585 | 120,369 |
| Keane Group, Inc. *(a) | 53,791 | 696,593 |
| Kosmos Energy Ltd. * | 457,335 | 3,219,638 |
| Laredo Petroleum, Inc. * | 293,718 | 3,647,978 |
| Mammoth Energy Services, Inc. * | 15,994 | 220,397 |
| Matador Resources Co. * | 189,789 | 4,475,225 |
| Matrix Service Co. * | 52,181 | 618,345 |
| McDermott International, Inc. * | 584,694 | 3,590,021 |
| Nabors Industries Ltd. | 581,927 | 3,811,622 |
| Natural Gas Services Group, Inc. * | 26,748 | 631,253 |
| NCS Multistage Holdings, Inc. * | 16,968 | 335,288 |
| Newpark Resources, Inc. * | 176,498 | 1,420,809 |
| Noble Corp. plc * | 492,726 | 1,606,287 |
| Northern Oil & Gas, Inc. *(a) | 102,993 | 87,544 |
| Oasis Petroleum, Inc. * | 485,252 | 3,542,340 |
| Oceaneering International, Inc. | 202,463 | 4,565,541 |
| Oil States International, Inc. * | 107,808 | 2,344,824 |
| Overseas Shipholding Group, Inc., Class A * | 84,620 | 191,241 |
| Par Pacific Holdings, Inc. * | 66,567 | 1,185,558 |
| Parker Drilling Co. * | 255,788 | 281,367 |
| Patterson-UTI Energy, Inc. | 344,527 | 5,502,096 |
| PBF Energy, Inc., Class A (a) | 227,651 | 5,390,776 |
| PDC Energy, Inc. * | 114,425 | 4,500,335 |
| Peabody Energy Corp. * | 194,776 | 5,648,504 |
| Penn Virginia Corp. * | 11,606 | 446,831 |
| Pioneer Energy Services Corp. * | 144,833 | 246,216 |
| ProPetro Holding Corp. * | 45,152 | 519,700 |
| QEP Resources, Inc. * | 497,548 | 3,756,487 |
| REX American Resources Corp. * | 12,609 | 1,092,192 |
| Rice Energy, Inc. * | 332,007 | 9,083,711 |
| RigNet, Inc. * | 25,947 | 415,152 |
| Rowan Cos. plc, Class A * | 262,270 | 2,557,132 |
| RPC, Inc. (a) | 119,599 | 2,321,417 |
| RSP Permian, Inc. * | 224,377 | 7,040,950 |
| Sanchez Energy Corp. *(a) | 137,749 | 603,341 |
| SandRidge Energy, Inc. * | 41,884 | 721,242 |
| SEACOR Holdings, Inc. * | 32,052 | 1,229,835 |
| SEACOR Marine Holdings, Inc. * | 32,227 | 412,828 |
| SemGroup Corp., Class A | 107,802 | 2,770,511 |
| SM Energy Co. | 199,608 | 2,666,763 |
| Smart Sand, Inc. * | 30,998 | 185,058 |
| SRC Energy, Inc. * | 396,611 | 3,129,261 |
| Stone Energy Corp. * | 45,248 | 1,095,002 |
| Superior Energy Services, Inc. * | 316,389 | 2,607,045 |
| Teekay Corp. (a) | 113,617 | 1,047,549 |
| Tesco Corp. * | 114,290 | 502,876 |
| TETRA Technologies, Inc. * | 255,348 | 526,017 |
| Unit Corp. * | 111,399 | 1,773,472 |
| US Silica Holdings, Inc. | 152,117 | 4,139,104 |
| Security | Number of Shares | Value ($) |
| W&T Offshore, Inc. * | 68,204 | 130,270 |
| Whiting Petroleum Corp. * | 572,298 | 2,558,172 |
| WildHorse Resource Development Corp. * | 53,959 | 588,693 |
| World Fuel Services Corp. | 140,586 | 4,855,840 |
| WPX Energy, Inc. * | 801,763 | 8,009,612 |
| 184,654,937 | ||
| Food & Staples Retailing 0.5% | ||
| Ingles Markets, Inc., Class A | 28,677 | 629,460 |
| Natural Grocers by Vitamin Cottage, Inc. *(a) | 14,636 | 82,254 |
| Performance Food Group Co. * | 169,582 | 4,714,380 |
| PriceSmart, Inc. | 46,750 | 3,798,437 |
| Smart & Final Stores, Inc. * | 54,075 | 381,229 |
| SpartanNash Co. | 71,848 | 1,770,335 |
| Sprouts Farmers Market, Inc. * | 266,924 | 5,322,465 |
| SUPERVALU, Inc. * | 74,827 | 1,495,792 |
| The Andersons, Inc. | 55,746 | 1,775,510 |
| The Chefs' Warehouse, Inc. * | 41,870 | 722,257 |
| United Natural Foods, Inc. * | 104,616 | 3,635,406 |
| Village Super Market, Inc., Class A | 17,286 | 399,825 |
| Weis Markets, Inc. | 33,333 | 1,473,652 |
| 26,201,002 | ||
| Food, Beverage & Tobacco 1.4% | ||
| Alico, Inc. | 5,982 | 191,424 |
| Amplify Snack Brands, Inc. *(a) | 45,076 | 324,998 |
| B&G Foods, Inc. | 134,679 | 4,107,710 |
| Blue Buffalo Pet Products, Inc. * | 198,118 | 5,103,520 |
| Cal-Maine Foods, Inc. *(a) | 62,731 | 2,286,545 |
| Calavo Growers, Inc. | 29,842 | 2,003,890 |
| Coca-Cola Bottling Co. Consolidated | 10,094 | 2,155,977 |
| Darling Ingredients, Inc. * | 328,616 | 5,717,918 |
| Dean Foods Co. | 185,844 | 2,044,284 |
| Farmer Brothers Co. * | 22,621 | 736,314 |
| Flowers Foods, Inc. | 378,904 | 6,581,563 |
| Fresh Del Monte Produce, Inc. | 66,761 | 3,137,099 |
| Freshpet, Inc. * | 34,886 | 552,943 |
| Hostess Brands, Inc. * | 179,213 | 2,390,701 |
| J&J Snack Foods Corp. | 31,484 | 4,013,895 |
| Lancaster Colony Corp. | 39,127 | 4,557,122 |
| Landec Corp. * | 54,295 | 705,835 |
| Limoneira Co. | 32,361 | 724,886 |
| MGP Ingredients, Inc. | 25,945 | 1,458,887 |
| National Beverage Corp. | 22,195 | 2,579,281 |
| Omega Protein Corp. | 48,323 | 763,503 |
| Sanderson Farms, Inc. | 41,609 | 6,138,160 |
| Seaboard Corp. | 519 | 2,229,453 |
| Seneca Foods Corp., Class A * | 16,427 | 489,525 |
| Seneca Foods Corp., Class B *(a) | 2,697 | 81,449 |
| Snyder's-Lance, Inc. | 173,021 | 6,145,706 |
| The Boston Beer Co., Inc., Class A * | 19,509 | 2,906,841 |
| Tootsie Roll Industries, Inc. (a) | 43,956 | 1,641,757 |
| Universal Corp. | 50,095 | 2,865,434 |
| Vector Group Ltd. | 202,051 | 4,364,302 |
| 79,000,922 | ||
| Health Care Equipment & Services 6.0% | ||
| Abaxis, Inc. | 44,051 | 2,036,037 |
| Acadia Healthcare Co., Inc. * | 154,126 | 7,234,674 |
| Accuray, Inc. * | 197,351 | 819,007 |
| Aceto Corp. | 62,300 | 661,003 |
| Alere, Inc. * | 175,610 | 8,685,671 |
| Allscripts Healthcare Solutions, Inc. * | 384,325 | 5,050,030 |
| Security | Number of Shares | Value ($) |
| Amedisys, Inc. * | 55,087 | 2,877,745 |
| American Renal Associates Holdings, Inc. * | 26,232 | 375,905 |
| AMN Healthcare Services, Inc. * | 96,490 | 3,603,901 |
| Analogic Corp. | 24,170 | 1,729,363 |
| AngioDynamics, Inc. * | 73,336 | 1,248,912 |
| Anika Therapeutics, Inc. * | 32,023 | 1,719,635 |
| Antares Pharma, Inc. * | 358,062 | 1,077,767 |
| athenahealth, Inc. * | 81,459 | 11,480,017 |
| AtriCure, Inc. * | 69,461 | 1,558,010 |
| Atrion Corp. | 2,707 | 1,684,160 |
| BioScrip, Inc. * | 237,546 | 719,764 |
| BioTelemetry, Inc. * | 60,394 | 2,243,637 |
| Brookdale Senior Living, Inc. * | 383,825 | 4,655,797 |
| Cantel Medical Corp. | 76,232 | 6,193,850 |
| Capital Senior Living Corp. * | 60,515 | 752,201 |
| Cardiovascular Systems, Inc. * | 72,611 | 2,132,585 |
| Castlight Health, Inc., Class B * | 126,528 | 493,459 |
| Cerus Corp. * | 223,682 | 525,653 |
| Chemed Corp. | 32,834 | 6,477,820 |
| Civitas Solutions, Inc. * | 34,725 | 663,247 |
| Community Health Systems, Inc. * | 239,706 | 1,831,354 |
| Computer Programs & Systems, Inc. (a) | 19,985 | 601,549 |
| CONMED Corp. | 50,513 | 2,505,445 |
| CorVel Corp. * | 22,542 | 1,169,930 |
| Cotiviti Holdings, Inc. * | 76,820 | 2,744,779 |
| CryoLife, Inc. * | 60,259 | 1,253,387 |
| Diplomat Pharmacy, Inc. * | 87,131 | 1,459,444 |
| Endologix, Inc. * | 157,712 | 667,122 |
| Entellus Medical, Inc. * | 19,439 | 344,070 |
| Envision Healthcare Corp. * | 238,015 | 12,474,366 |
| Evolent Health, Inc., Class A * | 125,135 | 2,089,754 |
| Exactech, Inc. * | 19,749 | 603,332 |
| Genesis Healthcare, Inc. * | 58,692 | 61,040 |
| GenMark Diagnostics, Inc. * | 95,567 | 930,823 |
| Glaukos Corp. * | 23,157 | 874,177 |
| Globus Medical, Inc., Class A * | 149,243 | 4,511,616 |
| Haemonetics Corp. * | 107,636 | 4,630,501 |
| Halyard Health, Inc. * | 97,009 | 4,393,538 |
| HealthEquity, Inc. * | 92,427 | 3,953,103 |
| HealthSouth Corp. | 201,942 | 9,238,846 |
| HealthStream, Inc. * | 47,395 | 1,113,309 |
| Hill-Rom Holdings, Inc. | 122,850 | 9,454,536 |
| HMS Holdings Corp. * | 173,894 | 3,081,402 |
| ICU Medical, Inc. * | 29,841 | 5,202,778 |
| Inogen, Inc. * | 32,744 | 3,136,875 |
| Inovalon Holdings, Inc., Class A *(a) | 128,093 | 1,735,660 |
| Insulet Corp. * | 120,493 | 6,995,824 |
| Integer Holdings Corp. * | 57,378 | 2,636,519 |
| Integra LifeSciences Holdings Corp. * | 125,295 | 6,388,792 |
| Invacare Corp. | 62,664 | 845,964 |
| iRhythm Technologies, Inc. * | 17,571 | 838,840 |
| K2M Group Holdings, Inc. * | 77,935 | 1,822,120 |
| Kindred Healthcare, Inc. | 183,263 | 1,484,430 |
| Landauer, Inc. | 22,513 | 1,396,932 |
| LHC Group, Inc. * | 30,491 | 1,989,538 |
| LifePoint Health, Inc. * | 81,673 | 4,732,950 |
| LivaNova plc * | 91,211 | 5,707,984 |
| Magellan Health, Inc. * | 47,387 | 3,833,608 |
| Masimo Corp. * | 93,649 | 7,902,103 |
| Medidata Solutions, Inc. * | 114,781 | 8,603,984 |
| Meridian Bioscience, Inc. | 83,609 | 1,162,165 |
| Merit Medical Systems, Inc. * | 99,214 | 4,097,538 |
| Molina Healthcare, Inc. * | 88,329 | 5,653,056 |
| National HealthCare Corp. | 19,789 | 1,233,646 |
| National Research Corp., Class A | 18,353 | 592,802 |
| National Research Corp., Class B | 3,694 | 193,935 |
| Natus Medical, Inc. * | 65,728 | 2,208,461 |
| Security | Number of Shares | Value ($) |
| Neogen Corp. * | 76,957 | 5,302,337 |
| Nevro Corp. * | 48,065 | 4,142,242 |
| NuVasive, Inc. * | 102,442 | 6,400,576 |
| NxStage Medical, Inc. * | 129,791 | 3,634,148 |
| Omnicell, Inc. * | 79,291 | 4,067,628 |
| OraSure Technologies, Inc. * | 108,192 | 2,208,199 |
| Orthofix International N.V. * | 36,627 | 1,802,415 |
| Owens & Minor, Inc. | 128,504 | 3,590,402 |
| Penumbra, Inc. * | 55,402 | 4,764,572 |
| PharMerica Corp. * | 59,430 | 1,747,242 |
| Premier, Inc., Class A * | 106,610 | 3,571,435 |
| Quality Systems, Inc. * | 101,430 | 1,597,522 |
| Quidel Corp. * | 60,340 | 2,108,280 |
| Quorum Health Corp. * | 65,228 | 285,699 |
| R1 RCM, Inc. * | 154,453 | 509,695 |
| SeaSpine Holdings Corp. * | 17,341 | 195,953 |
| Select Medical Holdings Corp. * | 213,570 | 3,972,402 |
| Senseonics Holdings, Inc. *(a) | 67,715 | 207,885 |
| Surgery Partners, Inc. * | 41,281 | 402,490 |
| Surmodics, Inc. * | 29,830 | 775,580 |
| Teladoc, Inc. * | 82,112 | 2,754,858 |
| Tenet Healthcare Corp. *(a) | 167,303 | 2,872,593 |
| The Ensign Group, Inc. | 100,784 | 2,070,103 |
| The Providence Service Corp. * | 26,748 | 1,386,349 |
| Tivity Health, Inc. * | 65,622 | 2,572,382 |
| Triple-S Management Corp., Class B * | 50,242 | 1,241,480 |
| US Physical Therapy, Inc. | 23,883 | 1,430,592 |
| Varex Imaging Corp. * | 75,847 | 2,315,609 |
| Veeva Systems, Inc., Class A * | 216,325 | 12,871,337 |
| WellCare Health Plans, Inc. * | 90,702 | 15,843,825 |
| Wright Medical Group N.V. * | 210,014 | 6,216,414 |
| 329,946,021 | ||
| Household & Personal Products 0.8% | ||
| Avon Products, Inc. * | 928,008 | 2,310,740 |
| Central Garden & Pet Co. * | 24,720 | 871,380 |
| Central Garden & Pet Co., Class A * | 69,180 | 2,358,346 |
| Coty, Inc., Class A | 961,869 | 15,947,788 |
| elf Beauty, Inc. *(a) | 40,733 | 842,766 |
| Energizer Holdings, Inc. | 124,154 | 5,481,399 |
| HRG Group, Inc. * | 280,658 | 4,431,590 |
| Inter Parfums, Inc. | 38,428 | 1,515,985 |
| Medifast, Inc. | 22,431 | 1,270,043 |
| Natural Health Trends Corp. (a) | 14,268 | 287,928 |
| Nu Skin Enterprises, Inc., Class A | 99,720 | 6,065,968 |
| Revlon, Inc., Class A *(a) | 28,430 | 480,467 |
| USANA Health Sciences, Inc. * | 20,654 | 1,222,717 |
| WD-40 Co. | 28,089 | 3,060,296 |
| 46,147,413 | ||
| Insurance 3.0% | ||
| Ambac Financial Group, Inc. * | 88,380 | 1,607,632 |
| American Equity Investment Life Holding Co. | 178,741 | 4,961,850 |
| American National Insurance Co. | 17,330 | 2,005,254 |
| AMERISAFE, Inc. | 40,505 | 2,179,169 |
| AmTrust Financial Services, Inc. | 217,088 | 2,691,891 |
| Argo Group International Holdings Ltd. | 60,541 | 3,644,568 |
| Aspen Insurance Holdings Ltd. | 123,892 | 5,599,918 |
| Assured Guaranty Ltd. | 250,731 | 10,666,097 |
| Citizens, Inc. *(a) | 88,525 | 666,593 |
| CNO Financial Group, Inc. | 345,121 | 7,713,454 |
| Crawford & Co., Class A | 33,305 | 277,431 |
| Crawford & Co., Class B | 32,092 | 318,353 |
| Donegal Group, Inc., Class A | 30,491 | 467,427 |
| eHealth, Inc. * | 45,731 | 1,110,349 |
| Security | Number of Shares | Value ($) |
| EMC Insurance Group, Inc. | 12,783 | 356,390 |
| Employers Holdings, Inc. | 64,523 | 2,719,644 |
| Enstar Group Ltd. * | 21,392 | 4,439,910 |
| FBL Financial Group, Inc., Class A | 19,594 | 1,332,392 |
| Fidelity & Guaranty Life | 27,639 | 863,719 |
| First American Financial Corp. | 223,107 | 10,945,629 |
| Genworth Financial, Inc., Class A * | 1,023,717 | 3,511,349 |
| Global Indemnity Ltd. * | 14,534 | 587,464 |
| Greenlight Capital Re Ltd., Class A * | 60,446 | 1,344,924 |
| Horace Mann Educators Corp. | 80,142 | 2,816,991 |
| Infinity Property & Casualty Corp. | 23,653 | 2,092,108 |
| James River Group Holdings Ltd. | 45,900 | 1,830,492 |
| Kemper Corp. | 103,083 | 4,937,676 |
| Maiden Holdings Ltd. | 157,168 | 1,139,468 |
| MBIA, Inc. * | 255,079 | 2,566,095 |
| Mercury General Corp. | 76,864 | 4,417,374 |
| National General Holdings Corp. | 127,354 | 2,186,668 |
| National Western Life Group, Inc., Class A | 4,792 | 1,602,493 |
| NI Holdings, Inc. * | 20,072 | 331,389 |
| Old Republic International Corp. | 490,219 | 9,358,281 |
| OneBeacon Insurance Group Ltd., Class A | 45,817 | 834,786 |
| Primerica, Inc. | 94,614 | 7,242,702 |
| ProAssurance Corp. | 110,214 | 5,868,895 |
| RLI Corp. | 78,093 | 4,179,537 |
| Safety Insurance Group, Inc. | 28,530 | 2,037,042 |
| Selective Insurance Group, Inc. | 120,465 | 6,071,436 |
| State Auto Financial Corp. | 30,536 | 755,461 |
| State National Cos., Inc. | 62,898 | 1,306,391 |
| Stewart Information Services Corp. | 47,754 | 1,722,964 |
| The Hanover Insurance Group, Inc. | 87,087 | 8,550,202 |
| The Navigators Group, Inc. | 46,710 | 2,606,418 |
| Third Point Reinsurance Ltd. * | 114,256 | 1,605,297 |
| United Fire Group, Inc. | 47,760 | 2,008,786 |
| Universal Insurance Holdings, Inc. | 74,396 | 1,595,794 |
| Validus Holdings Ltd. | 163,412 | 8,195,112 |
| White Mountains Insurance Group Ltd. | 9,519 | 8,291,715 |
| WMIH Corp. * | 421,430 | 526,788 |
| 166,689,768 | ||
| Materials 5.6% | ||
| A. Schulman, Inc. | 59,763 | 1,816,795 |
| AdvanSix, Inc. * | 62,176 | 1,985,280 |
| AK Steel Holding Corp. * | 622,928 | 3,488,397 |
| Alcoa Corp. * | 297,907 | 13,072,159 |
| Allegheny Technologies, Inc. * | 217,622 | 4,533,066 |
| American Vanguard Corp. | 58,538 | 1,185,395 |
| AptarGroup, Inc. | 126,795 | 10,601,330 |
| Balchem Corp. | 65,647 | 4,920,899 |
| Bemis Co., Inc. | 188,129 | 8,016,177 |
| Boise Cascade Co. * | 77,144 | 2,314,320 |
| Cabot Corp. | 126,274 | 6,652,114 |
| Calgon Carbon Corp. | 99,328 | 1,211,802 |
| Carpenter Technology Corp. | 96,141 | 3,896,595 |
| Century Aluminum Co. * | 108,647 | 2,120,789 |
| Chase Corp. | 14,558 | 1,361,173 |
| Clearwater Paper Corp. * | 38,615 | 1,795,598 |
| Cleveland-Cliffs, Inc. * | 578,317 | 4,834,730 |
| Coeur Mining, Inc. * | 378,417 | 3,311,149 |
| Commercial Metals Co. | 234,464 | 4,429,025 |
| Compass Minerals International, Inc. (a) | 67,619 | 4,516,949 |
| Deltic Timber Corp. | 21,786 | 1,700,179 |
| Domtar Corp. | 131,650 | 5,323,926 |
| Eagle Materials, Inc. | 102,387 | 9,957,136 |
| Ferro Corp. * | 178,473 | 3,439,175 |
| Flotek Industries, Inc. * | 123,541 | 639,942 |
| Security | Number of Shares | Value ($) |
| Forterra, Inc. *(a) | 37,852 | 125,669 |
| FutureFuel Corp. | 40,030 | 539,604 |
| GCP Applied Technologies, Inc. * | 143,900 | 4,065,175 |
| Graphic Packaging Holding Co. | 628,121 | 8,196,979 |
| Greif, Inc., Class A | 50,849 | 3,073,822 |
| Greif, Inc., Class B | 19,114 | 1,207,049 |
| H.B. Fuller Co. | 104,431 | 5,241,392 |
| Hawkins, Inc. | 22,625 | 806,581 |
| Haynes International, Inc. | 24,419 | 746,000 |
| Hecla Mining Co. | 789,276 | 4,167,377 |
| Ingevity Corp. * | 86,426 | 5,442,245 |
| Innophos Holdings, Inc. | 38,143 | 1,741,609 |
| Innospec, Inc. | 50,967 | 2,828,669 |
| Kaiser Aluminum Corp. | 34,019 | 3,276,710 |
| KapStone Paper & Packaging Corp. | 173,776 | 3,887,369 |
| Koppers Holdings, Inc. * | 40,403 | 1,583,798 |
| Kraton Corp. * | 61,210 | 2,009,524 |
| Kronos Worldwide, Inc. | 46,708 | 977,598 |
| Louisiana-Pacific Corp. * | 291,184 | 7,419,368 |
| LSB Industries, Inc. *(a) | 41,344 | 252,198 |
| Materion Corp. | 43,442 | 1,659,484 |
| McEwen Mining, Inc. *(a) | 451,787 | 1,161,093 |
| Mercer International, Inc. | 82,146 | 907,713 |
| Minerals Technologies, Inc. | 71,543 | 4,578,752 |
| Myers Industries, Inc. | 46,932 | 882,322 |
| Neenah Paper, Inc. | 35,882 | 2,771,885 |
| Olin Corp. | 342,702 | 11,045,286 |
| OMNOVA Solutions, Inc. * | 81,845 | 712,052 |
| Owens-Illinois, Inc. * | 329,686 | 8,123,463 |
| P.H. Glatfelter Co. | 89,926 | 1,557,518 |
| Platform Specialty Products Corp. * | 442,937 | 5,173,504 |
| PolyOne Corp. | 164,196 | 5,934,043 |
| Quaker Chemical Corp. | 28,260 | 3,934,357 |
| Ramaco Resources, Inc. *(a) | 11,942 | 92,789 |
| Rayonier Advanced Materials, Inc. | 90,003 | 1,234,841 |
| Resolute Forest Products, Inc. * | 163,157 | 807,627 |
| Schnitzer Steel Industries, Inc., Class A | 54,423 | 1,463,979 |
| Schweitzer-Mauduit International, Inc. | 63,829 | 2,421,034 |
| Sensient Technologies Corp. | 89,840 | 6,481,956 |
| Silgan Holdings, Inc. | 153,351 | 4,614,332 |
| Stepan Co. | 41,684 | 3,224,674 |
| Summit Materials, Inc., Class A * | 227,631 | 6,724,220 |
| SunCoke Energy, Inc. * | 140,381 | 1,308,351 |
| The Chemours Co. | 379,494 | 18,621,771 |
| The Scotts Miracle-Gro Co., Class A | 91,313 | 8,728,610 |
| TimkenSteel Corp. * | 87,016 | 1,290,447 |
| Tredegar Corp. | 56,276 | 917,299 |
| Trinseo S.A. | 91,632 | 6,130,181 |
| Tronox Ltd., Class A | 126,765 | 2,622,768 |
| United States Lime & Minerals, Inc. | 2,596 | 207,550 |
| United States Steel Corp. | 354,098 | 9,422,548 |
| US Concrete, Inc. * | 29,674 | 2,375,404 |
| Valhi, Inc. | 34,552 | 75,323 |
| Valvoline, Inc. | 421,305 | 8,969,584 |
| Warrior Met Coal, Inc. | 36,292 | 990,409 |
| Worthington Industries, Inc. | 89,739 | 4,483,360 |
| 306,363,365 | ||
| Media 2.0% | ||
| AMC Entertainment Holdings, Inc., Class A (a) | 110,117 | 1,475,568 |
| AMC Networks, Inc., Class A * | 110,220 | 6,699,172 |
| Cable One, Inc. | 9,608 | 7,289,974 |
| Central European Media Enterprises Ltd., Class A * | 172,243 | 714,808 |
| Cinemark Holdings, Inc. | 218,368 | 7,269,471 |
| Security | Number of Shares | Value ($) |
| Clear Channel Outdoor Holdings, Inc., Class A | 88,046 | 338,977 |
| Emerald Expositions Events, Inc. | 28,532 | 620,286 |
| Entercom Communications Corp., Class A (a) | 56,978 | 586,873 |
| Entravision Communications Corp., Class A | 147,361 | 817,854 |
| Gannett Co., Inc. | 241,890 | 2,053,646 |
| Global Eagle Entertainment, Inc. *(a) | 136,863 | 422,907 |
| Gray Television, Inc. * | 134,915 | 1,929,284 |
| Hemisphere Media Group, Inc. * | 15,901 | 205,918 |
| John Wiley & Sons, Inc., Class A | 95,853 | 5,171,269 |
| Liberty Global plc LiLAC, Class A * | 113,361 | 2,948,520 |
| Liberty Global plc LiLAC, Class C * | 246,691 | 6,362,161 |
| Liberty Media Corp. - Liberty Braves, Class A * | 16,734 | 408,477 |
| Liberty Media Corp. - Liberty Braves, Class C * | 74,234 | 1,816,506 |
| Liberty Media Corp. - Liberty Formula One, Class A * | 41,464 | 1,572,729 |
| Liberty Media Corp. - Liberty Formula One, Class C * | 263,725 | 10,364,392 |
| Lions Gate Entertainment Corp., Class A * | 122,597 | 3,644,809 |
| Lions Gate Entertainment Corp., Class B * | 204,613 | 5,743,487 |
| Loral Space & Communications, Inc. * | 26,109 | 1,185,349 |
| Meredith Corp. | 75,913 | 4,125,871 |
| MSG Networks, Inc., Class A * | 129,311 | 2,773,721 |
| National CineMedia, Inc. | 119,000 | 643,790 |
| New Media Investment Group, Inc. | 102,477 | 1,413,158 |
| Nexstar Media Group, Inc., Class A | 89,302 | 5,375,980 |
| Regal Entertainment Group, Class A | 217,836 | 3,217,438 |
| Scholastic Corp. | 55,290 | 2,180,085 |
| Sinclair Broadcast Group, Inc., Class A | 149,039 | 4,508,430 |
| The E.W. Scripps Co., Class A * | 111,113 | 1,986,700 |
| The Madison Square Garden Co., Class A * | 28,259 | 6,005,320 |
| The New York Times Co., Class A | 249,740 | 4,657,651 |
| Time, Inc. | 201,881 | 2,654,735 |
| tronc, Inc. * | 52,059 | 755,376 |
| World Wrestling Entertainment, Inc., Class A | 86,205 | 1,879,269 |
| 111,819,961 | ||
| Pharmaceuticals, Biotechnology & Life Sciences 8.1% | ||
| ACADIA Pharmaceuticals, Inc. * | 193,938 | 6,906,132 |
| Accelerate Diagnostics, Inc. *(a) | 53,422 | 1,228,706 |
| Acceleron Pharma, Inc. * | 69,856 | 2,707,619 |
| Achillion Pharmaceuticals, Inc. * | 258,752 | 1,322,223 |
| Aclaris Therapeutics, Inc. * | 48,817 | 1,265,825 |
| Acorda Therapeutics, Inc. * | 94,603 | 1,967,742 |
| Aduro Biotech, Inc. * | 64,747 | 786,676 |
| Advaxis, Inc. *(a) | 75,030 | 510,954 |
| Aerie Pharmaceuticals, Inc. * | 71,803 | 4,117,902 |
| Agenus, Inc. * | 162,651 | 600,182 |
| Agios Pharmaceuticals, Inc. * | 85,342 | 5,398,735 |
| Aimmune Therapeutics, Inc. * | 48,209 | 1,036,494 |
| Akebia Therapeutics, Inc. * | 75,220 | 1,259,183 |
| Akorn, Inc. * | 173,991 | 5,724,304 |
| Alder Biopharmaceuticals, Inc. * | 124,164 | 1,216,807 |
| AMAG Pharmaceuticals, Inc. * | 70,604 | 1,179,087 |
| Amicus Therapeutics, Inc. * | 324,705 | 4,526,388 |
| Amphastar Pharmaceuticals, Inc. * | 75,138 | 1,202,959 |
| AnaptysBio, Inc. * | 10,342 | 289,266 |
| ANI Pharmaceuticals, Inc. * | 17,217 | 826,416 |
| Security | Number of Shares | Value ($) |
| Arena Pharmaceuticals, Inc. * | 74,426 | 1,725,195 |
| Array BioPharma, Inc. * | 345,969 | 3,348,980 |
| Arrowhead Pharmaceuticals, Inc. *(a) | 158,826 | 444,713 |
| Atara Biotherapeutics, Inc. * | 45,071 | 709,868 |
| Avexis, Inc. * | 45,448 | 4,242,571 |
| Bellicum Pharmaceuticals, Inc. *(a) | 42,282 | 457,914 |
| Bio-Rad Laboratories, Inc., Class A * | 43,712 | 9,521,348 |
| Bio-Techne Corp. | 76,855 | 9,513,112 |
| BioCryst Pharmaceuticals, Inc. * | 198,043 | 1,010,019 |
| Biohaven Pharmaceutical Holding Co., Ltd. * | 19,972 | 713,999 |
| Bioverativ, Inc. * | 219,951 | 12,469,022 |
| Bluebird Bio, Inc. * | 91,242 | 11,391,564 |
| Blueprint Medicines Corp. * | 75,104 | 4,072,139 |
| Bruker Corp. | 216,138 | 6,287,454 |
| Cambrex Corp. * | 68,655 | 3,576,925 |
| Catalent, Inc. * | 259,221 | 10,703,235 |
| Celldex Therapeutics, Inc. * | 243,784 | 599,709 |
| Cempra, Inc. * | 125,277 | 382,095 |
| Charles River Laboratories International, Inc. * | 95,855 | 10,429,024 |
| Chimerix, Inc. * | 113,604 | 540,755 |
| Clovis Oncology, Inc. * | 100,873 | 7,673,409 |
| Coherus Biosciences, Inc. * | 71,288 | 1,030,112 |
| Corcept Therapeutics, Inc. * | 181,533 | 3,026,155 |
| Cytokinetics, Inc. * | 100,724 | 1,495,751 |
| CytomX Therapeutics, Inc. * | 50,502 | 872,675 |
| Depomed, Inc. * | 135,435 | 823,445 |
| Dermira, Inc. * | 60,949 | 1,437,787 |
| Dynavax Technologies Corp. * | 109,770 | 1,970,371 |
| Eagle Pharmaceuticals, Inc. * | 17,442 | 951,636 |
| Edge Therapeutics, Inc. * | 48,499 | 511,664 |
| Editas Medicine, Inc. *(a) | 42,806 | 903,635 |
| Emergent BioSolutions, Inc. * | 74,830 | 2,793,404 |
| Enanta Pharmaceuticals, Inc. * | 27,934 | 1,197,251 |
| Endocyte, Inc. * | 55,731 | 75,794 |
| Epizyme, Inc. * | 89,253 | 1,548,540 |
| Esperion Therapeutics, Inc. * | 41,126 | 2,032,447 |
| Exact Sciences Corp. * | 240,295 | 10,065,958 |
| Exelixis, Inc. * | 476,944 | 13,945,843 |
| FibroGen, Inc. * | 135,283 | 6,520,641 |
| Five Prime Therapeutics, Inc. * | 58,957 | 1,999,821 |
| Flexion Therapeutics, Inc. *(a) | 47,251 | 1,214,351 |
| Fluidigm Corp. * | 59,515 | 271,984 |
| Foundation Medicine, Inc. * | 28,767 | 1,159,310 |
| Genomic Health, Inc. * | 33,463 | 1,060,777 |
| Global Blood Therapeutics, Inc. * | 68,422 | 2,080,029 |
| Halozyme Therapeutics, Inc. * | 265,316 | 3,451,761 |
| Heron Therapeutics, Inc. * | 93,655 | 1,545,307 |
| Horizon Pharma plc * | 333,949 | 4,568,422 |
| ImmunoGen, Inc. *(a) | 212,186 | 1,773,875 |
| Impax Laboratories, Inc. * | 151,460 | 3,279,109 |
| INC Research Holdings, Inc., Class A * | 110,461 | 6,484,061 |
| Innoviva, Inc. * | 163,986 | 2,302,363 |
| Inovio Pharmaceuticals, Inc. * | 146,821 | 872,117 |
| Insmed, Inc. * | 122,444 | 1,520,754 |
| Insys Therapeutics, Inc. *(a) | 43,864 | 400,917 |
| Intellia Therapeutics, Inc. *(a) | 16,734 | 351,916 |
| Intercept Pharmaceuticals, Inc. * | 34,893 | 4,068,873 |
| Intersect ENT, Inc. * | 46,501 | 1,436,881 |
| Intra-Cellular Therapies, Inc. * | 69,685 | 1,285,688 |
| Intrexon Corp. *(a) | 137,723 | 2,717,275 |
| Invitae Corp. *(a) | 54,123 | 531,488 |
| Iovance Biotherapeutics, Inc. * | 95,135 | 547,026 |
| Ironwood Pharmaceuticals, Inc. * | 273,666 | 4,364,973 |
| Jounce Therapeutics, Inc. * | 12,799 | 217,455 |
| Juno Therapeutics, Inc. * | 161,021 | 6,645,337 |
| Karyopharm Therapeutics, Inc. * | 68,333 | 698,363 |
| Security | Number of Shares | Value ($) |
| Keryx Biopharmaceuticals, Inc. *(a) | 219,602 | 1,583,330 |
| Kite Pharma, Inc. * | 102,749 | 18,288,295 |
| Lannett Co., Inc. *(a) | 62,975 | 1,105,211 |
| Lexicon Pharmaceuticals, Inc. * | 95,138 | 1,440,389 |
| Ligand Pharmaceuticals, Inc., Class B * | 40,067 | 5,163,434 |
| Loxo Oncology, Inc. * | 37,040 | 3,089,136 |
| Luminex Corp. | 78,076 | 1,509,209 |
| MacroGenics, Inc. * | 67,321 | 1,273,040 |
| MannKind Corp. *(a) | 108,917 | 225,458 |
| Medpace Holdings, Inc. * | 14,894 | 486,140 |
| Merrimack Pharmaceuticals, Inc. (a) | 225,527 | 306,717 |
| MiMedx Group, Inc. * | 200,779 | 3,266,674 |
| Momenta Pharmaceuticals, Inc. * | 140,972 | 2,375,378 |
| MyoKardia, Inc. * | 38,878 | 1,685,361 |
| Myriad Genetics, Inc. * | 132,954 | 4,053,767 |
| NantKwest, Inc. *(a) | 48,679 | 303,270 |
| Natera, Inc. * | 52,094 | 643,361 |
| Nektar Therapeutics * | 321,769 | 6,766,802 |
| NeoGenomics, Inc. * | 112,366 | 1,136,020 |
| Neurocrine Biosciences, Inc. * | 179,078 | 10,135,815 |
| NewLink Genetics Corp. *(a) | 44,044 | 357,637 |
| Novavax, Inc. *(a) | 697,075 | 731,929 |
| Omeros Corp. *(a) | 85,515 | 1,750,492 |
| OncoMed Pharmaceuticals, Inc. * | 47,092 | 234,047 |
| Ophthotech Corp. * | 73,401 | 227,543 |
| Organovo Holdings, Inc. *(a) | 239,419 | 497,992 |
| Otonomy, Inc. * | 56,953 | 205,031 |
| Pacific Biosciences of California, Inc. * | 194,882 | 964,666 |
| Pacira Pharmaceuticals, Inc. * | 80,767 | 3,077,223 |
| PAREXEL International Corp. * | 103,798 | 9,122,806 |
| PDL BioPharma, Inc. * | 334,142 | 1,042,523 |
| Phibro Animal Health Corp., Class A | 34,835 | 1,236,643 |
| Portola Pharmaceuticals, Inc. * | 112,742 | 7,153,480 |
| PRA Health Sciences, Inc. * | 101,023 | 7,819,180 |
| Prestige Brands Holdings, Inc. * | 110,516 | 5,604,266 |
| Progenics Pharmaceuticals, Inc. * | 153,303 | 1,031,729 |
| Prothena Corp. plc *(a) | 76,629 | 4,708,086 |
| PTC Therapeutics, Inc. * | 69,100 | 1,433,825 |
| Puma Biotechnology, Inc. * | 56,947 | 5,267,597 |
| Radius Health, Inc. *(a) | 78,985 | 2,972,206 |
| REGENXBIO, Inc. * | 58,015 | 1,319,841 |
| Repligen Corp. * | 73,178 | 3,195,683 |
| Retrophin, Inc. * | 77,850 | 1,899,540 |
| Revance Therapeutics, Inc. * | 40,139 | 985,412 |
| Sage Therapeutics, Inc. * | 62,380 | 5,130,755 |
| Sangamo Therapeutics, Inc. * | 168,289 | 2,246,658 |
| Sarepta Therapeutics, Inc. * | 115,016 | 4,633,995 |
| SciClone Pharmaceuticals, Inc. * | 104,331 | 1,147,641 |
| Seres Therapeutics, Inc. * | 44,983 | 631,111 |
| Spark Therapeutics, Inc. * | 62,234 | 5,123,725 |
| Spectrum Pharmaceuticals, Inc. * | 150,184 | 1,465,796 |
| Sucampo Pharmaceuticals, Inc., Class A * | 65,324 | 767,557 |
| Supernus Pharmaceuticals, Inc. * | 98,245 | 4,499,621 |
| Synergy Pharmaceuticals, Inc. *(a) | 476,183 | 1,419,025 |
| TESARO, Inc. * | 69,398 | 8,962,058 |
| Tetraphase Pharmaceuticals, Inc. * | 79,468 | 554,687 |
| The Medicines Co. * | 143,722 | 5,273,160 |
| TherapeuticsMD, Inc. *(a) | 364,335 | 2,186,010 |
| Theravance Biopharma, Inc. *(a) | 79,758 | 2,605,694 |
| Ultragenyx Pharmaceutical, Inc. * | 80,032 | 4,566,626 |
| Vanda Pharmaceuticals, Inc. * | 91,965 | 1,581,798 |
| Versartis, Inc. * | 57,394 | 1,090,486 |
| Voyager Therapeutics, Inc. * | 10,375 | 100,015 |
| VWR Corp. * | 176,161 | 5,816,836 |
| WaVe Life Sciences Ltd. *(a) | 33,272 | 781,892 |
| XBiotech, Inc. * | 38,263 | 195,907 |
| Security | Number of Shares | Value ($) |
| Xencor, Inc. * | 80,977 | 1,750,723 |
| ZIOPHARM Oncology, Inc. *(a) | 292,484 | 1,868,973 |
| 444,016,925 | ||
| Real Estate 9.5% | ||
| Acadia Realty Trust | 179,425 | 5,147,703 |
| Agree Realty Corp. | 56,017 | 2,807,572 |
| Alexander & Baldwin, Inc. | 94,670 | 4,108,678 |
| Alexander's, Inc. | 7,179 | 3,005,776 |
| Altisource Portfolio Solutions S.A. *(a) | 28,316 | 645,038 |
| Altisource Residential Corp. | 112,424 | 1,361,455 |
| American Assets Trust, Inc. | 81,902 | 3,326,859 |
| Apple Hospitality REIT, Inc. | 320,815 | 5,832,417 |
| Armada Hoffler Properties, Inc. | 78,347 | 1,047,499 |
| Ashford Hospitality Prime, Inc. | 83,502 | 803,289 |
| Ashford Hospitality Trust, Inc. | 160,594 | 997,289 |
| Brandywine Realty Trust | 355,513 | 6,107,713 |
| CareTrust REIT, Inc. | 146,503 | 2,826,043 |
| CBL & Associates Properties, Inc. | 345,036 | 2,760,288 |
| Cedar Realty Trust, Inc. | 156,624 | 789,385 |
| Chatham Lodging Trust | 78,631 | 1,594,637 |
| Chesapeake Lodging Trust | 124,179 | 3,177,741 |
| Colony NorthStar, Inc., Class A | 1,133,273 | 14,857,209 |
| Columbia Property Trust, Inc. | 260,047 | 5,460,987 |
| CoreCivic, Inc. | 238,784 | 6,399,411 |
| CoreSite Realty Corp. | 69,063 | 8,201,922 |
| Corporate Office Properties Trust | 204,120 | 6,809,443 |
| Cousins Properties, Inc. | 864,861 | 8,086,450 |
| CubeSmart | 372,699 | 9,187,030 |
| CyrusOne, Inc. | 160,999 | 10,147,767 |
| DCT Industrial Trust, Inc. | 187,076 | 10,915,885 |
| DiamondRock Hospitality Co. | 415,082 | 4,561,751 |
| DuPont Fabros Technology, Inc. | 161,863 | 10,417,503 |
| Easterly Government Properties, Inc. | 57,056 | 1,144,543 |
| EastGroup Properties, Inc. | 70,038 | 6,223,577 |
| Education Realty Trust, Inc. | 148,742 | 5,747,391 |
| Empire State Realty Trust, Inc., Class A | 257,611 | 5,242,384 |
| EPR Properties | 134,472 | 9,367,320 |
| Equity Commonwealth * | 256,109 | 7,924,012 |
| FelCor Lodging Trust, Inc. | 271,214 | 1,979,862 |
| First Industrial Realty Trust, Inc. | 238,531 | 7,389,690 |
| First Potomac Realty Trust | 109,323 | 1,216,765 |
| Forestar Group, Inc. * | 78,954 | 1,358,009 |
| Four Corners Property Trust, Inc. | 129,823 | 3,298,802 |
| Franklin Street Properties Corp. | 226,593 | 2,259,132 |
| FRP Holdings, Inc. * | 12,501 | 548,794 |
| Getty Realty Corp. | 59,103 | 1,628,879 |
| Global Net Lease, Inc. | 118,745 | 2,572,017 |
| Government Properties Income Trust | 195,964 | 3,635,132 |
| Gramercy Property Trust | 310,545 | 9,459,201 |
| Healthcare Realty Trust, Inc. | 253,117 | 8,423,734 |
| Healthcare Trust of America, Inc., Class A | 394,639 | 12,261,434 |
| Hersha Hospitality Trust | 73,386 | 1,360,576 |
| HFF, Inc., Class A | 68,118 | 2,597,339 |
| Hospitality Properties Trust | 339,859 | 9,298,542 |
| Hudson Pacific Properties, Inc. | 320,633 | 10,580,889 |
| InfraREIT, Inc. | 79,636 | 1,791,014 |
| Investors Real Estate Trust | 229,380 | 1,440,506 |
| iStar, Inc. * | 146,253 | 1,697,997 |
| Kennedy-Wilson Holdings, Inc. | 197,645 | 3,814,549 |
| Kite Realty Group Trust | 166,138 | 3,342,697 |
| LaSalle Hotel Properties | 234,130 | 6,644,609 |
| Lexington Realty Trust | 458,402 | 4,519,844 |
| Life Storage, Inc. | 97,050 | 7,141,909 |
| LTC Properties, Inc. | 78,658 | 3,825,139 |
| Mack-Cali Realty Corp. | 187,905 | 4,301,145 |
| Security | Number of Shares | Value ($) |
| Marcus & Millichap, Inc. * | 27,000 | 710,910 |
| MedEquities Realty Trust, Inc. | 38,852 | 445,632 |
| Medical Properties Trust, Inc. | 740,596 | 9,746,243 |
| Monmouth Real Estate Investment Corp., Class A | 138,792 | 2,255,370 |
| Monogram Residential Trust, Inc. | 357,137 | 4,285,644 |
| National Health Investors, Inc. | 81,147 | 6,506,366 |
| National Storage Affiliates Trust | 89,502 | 1,997,685 |
| New Senior Investment Group, Inc. | 178,139 | 1,644,223 |
| NorthStar Realty Europe Corp. | 118,843 | 1,477,218 |
| One Liberty Properties, Inc. | 26,748 | 642,219 |
| Outfront Media, Inc. | 279,287 | 6,144,314 |
| Paramount Group, Inc. | 375,404 | 5,923,875 |
| Parkway, Inc. | 91,405 | 2,098,659 |
| Pebblebrook Hotel Trust | 137,423 | 4,616,039 |
| Pennsylvania Real Estate Investment Trust | 142,284 | 1,427,109 |
| Physicians Realty Trust | 362,147 | 6,783,013 |
| Piedmont Office Realty Trust, Inc., Class A | 302,757 | 6,130,829 |
| Potlatch Corp. | 83,538 | 3,993,116 |
| PS Business Parks, Inc. | 41,587 | 5,618,820 |
| QTS Realty Trust, Inc., Class A | 96,827 | 5,246,087 |
| Quality Care Properties, Inc. * | 189,271 | 2,596,798 |
| RAIT Financial Trust | 156,658 | 129,588 |
| Ramco-Gershenson Properties Trust | 174,188 | 2,290,572 |
| Rayonier, Inc. | 257,579 | 7,472,367 |
| RE/MAX Holdings, Inc., Class A | 36,928 | 2,261,840 |
| Retail Opportunity Investments Corp. | 218,889 | 4,342,758 |
| Retail Properties of America, Inc., Class A | 495,387 | 6,603,509 |
| Rexford Industrial Realty, Inc. | 146,588 | 4,404,969 |
| RLJ Lodging Trust | 268,371 | 5,415,727 |
| RMR Group, Inc., Class A | 14,366 | 742,004 |
| Ryman Hospitality Properties, Inc. | 106,088 | 6,303,749 |
| Sabra Health Care REIT, Inc. | 322,918 | 7,055,758 |
| Saul Centers, Inc. | 21,625 | 1,310,475 |
| Select Income REIT | 130,028 | 3,017,950 |
| Seritage Growth Properties, Class A (a) | 49,269 | 2,367,868 |
| STAG Industrial, Inc. | 181,697 | 5,085,699 |
| Starwood Waypoint Homes | 254,290 | 9,467,217 |
| STORE Capital Corp. | 338,981 | 8,603,338 |
| Summit Hotel Properties, Inc. | 202,527 | 3,005,501 |
| Sunstone Hotel Investors, Inc. | 450,915 | 7,124,457 |
| Tanger Factory Outlet Centers, Inc. | 200,552 | 4,692,917 |
| Tejon Ranch Co. * | 31,607 | 631,508 |
| Terreno Realty Corp. | 101,830 | 3,691,338 |
| The GEO Group, Inc. | 250,975 | 6,936,949 |
| The Howard Hughes Corp. * | 74,196 | 8,706,901 |
| The St. Joe Co. * | 148,909 | 2,806,935 |
| Tier REIT, Inc. | 97,064 | 1,786,948 |
| Uniti Group, Inc. | 316,913 | 6,103,744 |
| Universal Health Realty Income Trust | 26,609 | 2,014,567 |
| Urban Edge Properties | 214,436 | 5,393,065 |
| Urstadt Biddle Properties, Inc. | 12,665 | 210,366 |
| Urstadt Biddle Properties, Inc., Class A | 57,512 | 1,189,348 |
| Washington Prime Group, Inc. | 360,452 | 3,009,774 |
| Washington Real Estate Investment Trust | 155,593 | 5,112,786 |
| Whitestone REIT | 72,226 | 905,714 |
| Xenia Hotels & Resorts, Inc. | 220,905 | 4,409,264 |
| 520,319,812 | ||
| Retailing 2.8% | ||
| 1-800-Flowers.com, Inc., Class A * | 61,051 | 549,459 |
| Aaron's, Inc. | 129,049 | 5,712,999 |
| Abercrombie & Fitch Co., Class A | 136,785 | 1,742,641 |
| America's Car-Mart, Inc. *(a) | 14,919 | 572,890 |
| Security | Number of Shares | Value ($) |
| American Eagle Outfitters, Inc. | 326,389 | 3,900,349 |
| Asbury Automotive Group, Inc. * | 38,424 | 2,069,132 |
| Ascena Retail Group, Inc. * | 346,367 | 706,589 |
| At Home Group, Inc. * | 21,776 | 533,512 |
| Barnes & Noble Education, Inc. * | 81,221 | 420,725 |
| Barnes & Noble, Inc. | 109,398 | 847,834 |
| Big Lots, Inc. | 92,229 | 4,390,100 |
| Boot Barn Holdings, Inc. * | 21,613 | 175,065 |
| Cabela's, Inc. * | 105,995 | 5,691,931 |
| Caleres, Inc. | 82,738 | 2,232,271 |
| Camping World Holdings, Inc., Class A | 41,184 | 1,513,512 |
| Chico's FAS, Inc. | 274,255 | 2,106,278 |
| Conn's, Inc. *(a) | 53,129 | 921,788 |
| Core-Mark Holding Co., Inc. | 91,465 | 2,475,043 |
| Dillard's, Inc., Class A (a) | 45,407 | 2,760,746 |
| DSW, Inc., Class A | 136,884 | 2,536,461 |
| Duluth Holdings, Inc., Class B *(a) | 16,602 | 325,233 |
| Express, Inc. * | 174,211 | 1,109,724 |
| Five Below, Inc. * | 114,778 | 5,459,989 |
| Floor & Decor Holdings, Inc., Class A * | 35,590 | 1,279,105 |
| Francesca's Holdings Corp. * | 83,464 | 605,949 |
| Fred's, Inc., Class A (a) | 75,955 | 449,654 |
| FTD Cos., Inc. * | 42,187 | 564,884 |
| GameStop Corp., Class A | 207,465 | 3,838,102 |
| Genesco, Inc. * | 40,432 | 855,137 |
| GNC Holdings, Inc., Class A (a) | 132,645 | 1,100,953 |
| Group 1 Automotive, Inc. | 40,930 | 2,456,619 |
| Groupon, Inc. * | 804,728 | 3,572,992 |
| Guess?, Inc. | 133,487 | 2,079,727 |
| Haverty Furniture Cos., Inc. | 43,759 | 1,026,149 |
| Hibbett Sports, Inc. * | 42,159 | 518,556 |
| HSN, Inc. | 63,853 | 2,343,405 |
| J. Jill, Inc. * | 20,272 | 196,841 |
| J.C. Penney Co., Inc. *(a) | 643,655 | 2,490,945 |
| Lands' End, Inc. *(a) | 24,226 | 294,346 |
| Liberty Expedia Holdings, Inc., Class A * | 113,051 | 6,182,759 |
| Liberty TripAdvisor Holdings, Inc., Class A * | 146,524 | 1,956,095 |
| Lithia Motors, Inc., Class A | 46,971 | 5,072,868 |
| Lumber Liquidators Holdings, Inc. * | 57,050 | 2,141,086 |
| MarineMax, Inc. * | 52,521 | 848,214 |
| Monro, Inc. | 65,880 | 3,142,476 |
| Murphy USA, Inc. * | 70,849 | 4,566,927 |
| Nutrisystem, Inc. | 63,293 | 3,436,810 |
| Office Depot, Inc. | 1,052,209 | 4,513,977 |
| Ollie's Bargain Outlet Holdings, Inc. * | 97,491 | 4,079,998 |
| Overstock.com, Inc. * | 41,359 | 907,830 |
| Party City Holdco, Inc. * | 55,169 | 769,608 |
| Penske Automotive Group, Inc. | 76,446 | 3,238,253 |
| PetMed Express, Inc. | 42,224 | 1,531,464 |
| Pier 1 Imports, Inc. | 143,849 | 602,727 |
| Pool Corp. | 84,511 | 8,424,902 |
| Rent-A-Center, Inc. (a) | 128,880 | 1,559,448 |
| RH *(a) | 40,671 | 1,902,996 |
| Sears Holdings Corp. *(a) | 114,460 | 939,717 |
| Sears Hometown & Outlet Stores, Inc. * | 16,326 | 28,571 |
| Select Comfort Corp. * | 87,235 | 2,576,050 |
| Shoe Carnival, Inc. | 25,129 | 505,093 |
| Shutterfly, Inc. * | 67,120 | 3,059,330 |
| Sonic Automotive, Inc., Class A | 60,296 | 1,091,358 |
| Sportsman's Warehouse Holdings, Inc. *(a) | 62,868 | 260,902 |
| Stage Stores, Inc. (a) | 45,844 | 83,436 |
| Stein Mart, Inc. (a) | 63,975 | 79,969 |
| Tailored Brands, Inc. (a) | 97,476 | 1,152,166 |
| The Buckle, Inc. (a) | 52,923 | 748,860 |
| The Cato Corp., Class A | 50,281 | 661,698 |
| The Children's Place, Inc. | 36,845 | 3,911,097 |
| Security | Number of Shares | Value ($) |
| The Container Store Group, Inc. * | 42,425 | 172,246 |
| The Finish Line, Inc., Class A | 88,294 | 735,489 |
| Tile Shop Holdings, Inc. | 73,233 | 1,102,157 |
| Tuesday Morning Corp. *(a) | 55,571 | 125,035 |
| Vitamin Shoppe, Inc. * | 49,104 | 262,706 |
| Wayfair, Inc., Class A * | 63,136 | 4,483,287 |
| Weyco Group, Inc. | 10,688 | 294,454 |
| Winmark Corp. | 3,986 | 525,554 |
| Zumiez, Inc. * | 35,534 | 442,398 |
| 150,547,646 | ||
| Semiconductors & Semiconductor Equipment 3.3% | ||
| Advanced Energy Industries, Inc. * | 83,583 | 6,146,694 |
| Amkor Technology, Inc. * | 248,728 | 2,183,832 |
| Brooks Automation, Inc. | 140,572 | 3,664,712 |
| Cabot Microelectronics Corp. | 49,584 | 3,551,206 |
| Cavium, Inc. * | 137,376 | 8,697,275 |
| CEVA, Inc. * | 47,227 | 1,915,055 |
| Cirrus Logic, Inc. * | 132,648 | 7,690,931 |
| Cohu, Inc. | 48,665 | 912,955 |
| Cree, Inc. * | 193,767 | 4,714,351 |
| Cypress Semiconductor Corp. | 674,510 | 9,234,042 |
| Diodes, Inc. * | 77,058 | 2,168,412 |
| Entegris, Inc. * | 291,470 | 7,417,911 |
| FormFactor, Inc. * | 152,377 | 2,300,893 |
| Ichor Holdings Ltd. * | 35,918 | 821,804 |
| Inphi Corp. * | 80,160 | 3,069,326 |
| Integrated Device Technology, Inc. * | 268,791 | 6,641,826 |
| IXYS Corp. * | 54,441 | 1,252,143 |
| Kulicke & Soffa Industries, Inc. * | 147,623 | 2,809,266 |
| Lattice Semiconductor Corp. * | 241,112 | 1,362,283 |
| MACOM Technology Solutions Holdings, Inc. * | 70,159 | 3,195,041 |
| MaxLinear, Inc., Class A * | 107,171 | 2,314,894 |
| Microsemi Corp. * | 237,990 | 11,989,936 |
| MKS Instruments, Inc. | 111,037 | 9,143,897 |
| Monolithic Power Systems, Inc. | 76,069 | 7,707,311 |
| Nanometrics, Inc. * | 50,471 | 1,301,647 |
| NeoPhotonics Corp. *(a) | 65,401 | 382,596 |
| ON Semiconductor Corp. * | 862,557 | 14,732,473 |
| PDF Solutions, Inc. * | 58,705 | 891,729 |
| Photronics, Inc. * | 134,609 | 1,063,411 |
| Power Integrations, Inc. | 59,837 | 4,359,125 |
| Rambus, Inc. * | 242,119 | 3,140,283 |
| Rudolph Technologies, Inc. * | 68,020 | 1,510,044 |
| Semtech Corp. * | 135,173 | 5,082,505 |
| Silicon Laboratories, Inc. * | 88,274 | 6,699,997 |
| SolarEdge Technologies, Inc. * | 61,496 | 1,645,018 |
| SunPower Corp. *(a) | 123,011 | 1,087,417 |
| Synaptics, Inc. * | 69,353 | 2,883,004 |
| Teradyne, Inc. | 406,635 | 14,480,272 |
| Veeco Instruments, Inc. * | 98,051 | 1,853,164 |
| Versum Materials, Inc. | 224,145 | 8,277,675 |
| Xperi Corp. | 105,280 | 2,868,880 |
| 183,165,236 | ||
| Software & Services 8.6% | ||
| 2U, Inc. * | 82,054 | 4,110,905 |
| 8x8, Inc. * | 184,956 | 2,617,127 |
| A10 Networks, Inc. * | 79,141 | 518,374 |
| ACI Worldwide, Inc. * | 245,516 | 5,587,944 |
| Actua Corp. * | 64,115 | 820,672 |
| Acxiom Corp. * | 163,759 | 3,813,947 |
| Alarm.com Holdings, Inc. * | 27,704 | 1,244,464 |
| Angie's List, Inc. *(a) | 69,322 | 842,956 |
| Aspen Technology, Inc. * | 152,248 | 9,629,686 |
| Security | Number of Shares | Value ($) |
| Bankrate, Inc. * | 109,195 | 1,512,351 |
| Barracuda Networks, Inc. * | 62,473 | 1,512,471 |
| Bazaarvoice, Inc. * | 183,236 | 870,371 |
| Benefitfocus, Inc. * | 33,038 | 1,019,222 |
| Black Knight Financial Services, Inc., Class A * | 55,049 | 2,345,087 |
| Blackbaud, Inc. | 98,597 | 8,322,573 |
| Blackhawk Network Holdings, Inc. * | 112,398 | 5,035,430 |
| Blackline, Inc. * | 27,558 | 850,715 |
| Blucora, Inc. * | 79,757 | 1,818,460 |
| Booz Allen Hamilton Holding Corp. | 302,406 | 10,315,069 |
| Bottomline Technologies (DE), Inc. * | 78,394 | 2,376,122 |
| Box, Inc., Class A * | 137,964 | 2,706,854 |
| BroadSoft, Inc. * | 65,851 | 3,262,917 |
| CACI International, Inc., Class A * | 49,546 | 6,431,071 |
| Callidus Software, Inc. * | 135,267 | 3,483,125 |
| Carbonite, Inc. * | 37,196 | 743,920 |
| Cardtronics plc, Class A * | 94,040 | 2,443,159 |
| Cars.com, Inc. * | 145,268 | 3,756,630 |
| Cass Information Systems, Inc. | 20,116 | 1,231,502 |
| ChannelAdvisor Corp. * | 59,749 | 693,088 |
| Cloudera, Inc. *(a) | 31,036 | 602,098 |
| CommerceHub, Inc., Series A * | 25,910 | 574,425 |
| CommerceHub, Inc., Series C * | 35,357 | 750,629 |
| CommVault Systems, Inc. * | 83,683 | 5,108,847 |
| Conduent, Inc. * | 350,322 | 5,783,816 |
| Convergys Corp. | 194,731 | 4,576,179 |
| CoreLogic, Inc. * | 170,714 | 8,018,437 |
| Cornerstone OnDemand, Inc. * | 107,087 | 3,745,903 |
| Coupa Software, Inc. * | 61,208 | 1,864,396 |
| CSG Systems International, Inc. | 65,670 | 2,542,086 |
| DHI Group, Inc. * | 116,512 | 227,198 |
| DST Systems, Inc. | 123,934 | 6,361,532 |
| Ebix, Inc. | 44,736 | 2,581,267 |
| Ellie Mae, Inc. * | 69,697 | 5,783,457 |
| Endurance International Group Holdings, Inc. * | 120,464 | 927,573 |
| Envestnet, Inc. * | 87,098 | 3,871,506 |
| EPAM Systems, Inc. * | 92,898 | 7,555,394 |
| Etsy, Inc. * | 198,263 | 3,245,565 |
| Euronet Worldwide, Inc. * | 105,625 | 10,379,769 |
| Everbridge, Inc. * | 35,072 | 812,618 |
| Everi Holdings, Inc. * | 145,220 | 1,119,646 |
| EVERTEC, Inc. | 126,244 | 2,322,890 |
| ExlService Holdings, Inc. * | 66,318 | 3,732,377 |
| Fair Isaac Corp. | 64,113 | 9,024,546 |
| FireEye, Inc. * | 314,190 | 4,640,586 |
| First Data Corp., Class A * | 409,840 | 7,545,154 |
| Five9, Inc. * | 89,646 | 1,927,389 |
| Forrester Research, Inc. | 23,164 | 943,933 |
| Genpact Ltd. | 263,975 | 7,510,089 |
| Gigamon, Inc. * | 64,557 | 2,772,723 |
| GoDaddy, Inc., Class A * | 88,621 | 3,971,993 |
| Gogo, Inc. *(a) | 122,881 | 1,721,563 |
| GrubHub, Inc. * | 174,793 | 9,978,932 |
| GTT Communications, Inc. * | 48,709 | 1,546,511 |
| Guidewire Software, Inc. * | 150,953 | 11,428,652 |
| Hortonworks, Inc. * | 98,695 | 1,676,828 |
| HubSpot, Inc. * | 66,866 | 4,904,621 |
| Imperva, Inc. * | 59,495 | 2,656,452 |
| Instructure, Inc. * | 9,162 | 271,195 |
| Internap Corp. * | 86,025 | 384,532 |
| j2 Global, Inc. | 99,298 | 7,475,153 |
| Liquidity Services, Inc. * | 46,801 | 266,766 |
| LivePerson, Inc. * | 110,704 | 1,483,434 |
| LogMeIn, Inc. | 106,368 | 12,168,499 |
| Manhattan Associates, Inc. * | 143,654 | 6,040,651 |
| ManTech International Corp., Class A | 55,136 | 2,217,570 |
| Security | Number of Shares | Value ($) |
| Match Group, Inc. *(a) | 95,885 | 2,085,499 |
| MAXIMUS, Inc. | 134,625 | 8,182,507 |
| MicroStrategy, Inc., Class A * | 20,080 | 2,590,320 |
| MoneyGram International, Inc. * | 66,600 | 1,049,616 |
| Monotype Imaging Holdings, Inc. | 80,040 | 1,460,730 |
| New Relic, Inc. * | 67,822 | 3,248,674 |
| NIC, Inc. | 126,262 | 2,064,384 |
| Nutanix, Inc., Class A *(a) | 71,806 | 1,579,732 |
| Pandora Media, Inc. *(a) | 473,814 | 4,003,728 |
| Paycom Software, Inc. * | 81,379 | 6,071,687 |
| Paylocity Holding Corp. * | 52,323 | 2,571,152 |
| Pegasystems, Inc. | 74,671 | 4,297,316 |
| Perficient, Inc. * | 65,252 | 1,194,112 |
| Presidio, Inc. * | 32,988 | 458,863 |
| Progress Software Corp. | 104,017 | 3,492,891 |
| Proofpoint, Inc. * | 86,927 | 7,976,422 |
| PROS Holdings, Inc. * | 55,987 | 1,474,698 |
| PTC, Inc. * | 234,434 | 13,128,304 |
| Q2 Holdings, Inc. * | 58,973 | 2,394,304 |
| Qualys, Inc. * | 62,979 | 2,991,503 |
| Quotient Technology, Inc. * | 165,573 | 2,483,595 |
| Rapid7, Inc. * | 37,410 | 630,733 |
| RealNetworks, Inc. * | 49,385 | 197,046 |
| RealPage, Inc. * | 106,489 | 4,589,676 |
| RingCentral, Inc., Class A * | 128,588 | 5,445,702 |
| Science Applications International Corp. | 89,323 | 6,599,183 |
| ServiceSource International, Inc. * | 146,612 | 516,074 |
| Shutterstock, Inc. * | 39,713 | 1,333,563 |
| Silver Spring Networks, Inc. * | 78,093 | 988,657 |
| SPS Commerce, Inc. * | 33,473 | 2,039,175 |
| Square, Inc., Class A * | 59,988 | 1,566,287 |
| Stamps.com, Inc. * | 32,258 | 6,169,342 |
| Sykes Enterprises, Inc. * | 79,729 | 2,125,575 |
| Synchronoss Technologies, Inc. * | 85,337 | 1,432,808 |
| Syntel, Inc. | 63,870 | 1,153,492 |
| Tableau Software, Inc., Class A * | 122,053 | 8,846,401 |
| Take-Two Interactive Software, Inc. * | 215,537 | 21,077,363 |
| TeleTech Holdings, Inc. | 36,287 | 1,440,594 |
| The Rubicon Project, Inc. * | 90,752 | 341,228 |
| TiVo Corp. | 247,158 | 4,522,991 |
| Travelport Worldwide Ltd. | 247,385 | 3,745,409 |
| TrueCar, Inc. * | 141,180 | 2,393,001 |
| Twilio, Inc., Class A *(a) | 54,685 | 1,601,177 |
| Unisys Corp. * | 104,137 | 807,062 |
| Varonis Systems, Inc. * | 36,486 | 1,415,657 |
| VASCO Data Security International, Inc. * | 58,641 | 735,945 |
| Verint Systems, Inc. * | 130,721 | 5,189,624 |
| VirnetX Holding Corp. *(a) | 149,304 | 597,216 |
| Virtusa Corp. * | 53,816 | 1,954,597 |
| Web.com Group, Inc. * | 104,084 | 2,633,325 |
| WebMD Health Corp. * | 76,035 | 5,051,765 |
| WEX, Inc. * | 80,157 | 8,748,335 |
| Workiva, Inc. * | 38,674 | 781,215 |
| XO Group, Inc. * | 48,956 | 911,561 |
| Yelp, Inc. * | 133,777 | 5,698,900 |
| Yext, Inc. *(a) | 22,476 | 292,413 |
| Zendesk, Inc. * | 158,755 | 4,349,887 |
| Zynga, Inc., Class A * | 1,547,243 | 5,802,161 |
| 473,486,769 | ||
| Technology Hardware & Equipment 5.3% | ||
| 3D Systems Corp. *(a) | 226,330 | 2,842,705 |
| Acacia Communications, Inc. *(a) | 32,849 | 1,604,017 |
| ADTRAN, Inc. | 95,296 | 2,106,042 |
| Aerohive Networks, Inc. * | 43,511 | 150,113 |
| Anixter International, Inc. * | 58,530 | 4,319,514 |
| ARRIS International plc * | 382,281 | 10,650,349 |
| Security | Number of Shares | Value ($) |
| Avid Technology, Inc. * | 50,399 | 222,260 |
| AVX Corp. | 89,702 | 1,565,300 |
| Badger Meter, Inc. | 59,683 | 2,739,450 |
| Belden, Inc. | 85,817 | 6,613,916 |
| Benchmark Electronics, Inc. * | 99,971 | 3,249,057 |
| Black Box Corp. | 38,308 | 114,924 |
| Brocade Communications Systems, Inc. | 849,730 | 10,519,657 |
| CalAmp Corp. * | 77,916 | 1,444,563 |
| Calix, Inc. * | 100,658 | 493,224 |
| Ciena Corp. * | 293,314 | 6,338,516 |
| Cognex Corp. | 176,135 | 19,193,431 |
| Coherent, Inc. * | 50,556 | 11,795,726 |
| Comtech Telecommunications Corp. | 50,877 | 995,663 |
| Control4 Corp. * | 32,107 | 794,969 |
| CPI Card Group, Inc. (a) | 29,760 | 28,579 |
| Cray, Inc. * | 84,910 | 1,600,553 |
| CTS Corp. | 64,640 | 1,454,400 |
| Daktronics, Inc. | 82,909 | 798,414 |
| Diebold Nixdorf, Inc. | 157,533 | 3,221,550 |
| Dolby Laboratories, Inc., Class A | 119,182 | 6,013,924 |
| Eastman Kodak Co. * | 77,730 | 602,407 |
| EchoStar Corp., Class A * | 95,544 | 5,761,303 |
| Electronics For Imaging, Inc. * | 95,924 | 3,411,057 |
| ePlus, Inc. * | 29,078 | 2,433,829 |
| Extreme Networks, Inc. * | 247,642 | 2,830,548 |
| Fabrinet * | 78,257 | 3,039,502 |
| FARO Technologies, Inc. * | 35,667 | 1,228,728 |
| Finisar Corp. * | 228,012 | 5,506,490 |
| Fitbit, Inc., Class A * | 327,672 | 1,975,862 |
| Harmonic, Inc. * | 155,420 | 505,115 |
| II-VI, Inc. * | 112,813 | 4,044,346 |
| Infinera Corp. * | 288,273 | 2,438,790 |
| Insight Enterprises, Inc. * | 70,984 | 2,845,039 |
| InterDigital, Inc. | 70,770 | 5,049,439 |
| IPG Photonics Corp. * | 76,946 | 13,526,337 |
| Itron, Inc. * | 67,811 | 4,923,079 |
| Knowles Corp. * | 180,235 | 2,644,047 |
| Littelfuse, Inc. | 46,591 | 8,673,381 |
| Lumentum Holdings, Inc. * | 117,241 | 6,665,151 |
| Maxwell Technologies, Inc. * | 67,639 | 376,749 |
| Methode Electronics, Inc. | 78,104 | 3,194,454 |
| MTS Systems Corp. | 34,993 | 1,693,661 |
| NETGEAR, Inc. * | 67,930 | 3,260,640 |
| NetScout Systems, Inc. * | 186,569 | 6,110,135 |
| Novanta, Inc. * | 66,914 | 2,616,337 |
| Oclaro, Inc. * | 265,735 | 2,234,831 |
| OSI Systems, Inc. * | 34,892 | 2,898,129 |
| Park Electrochemical Corp. | 34,664 | 629,498 |
| PC Connection, Inc. | 22,511 | 574,256 |
| Plantronics, Inc. | 68,084 | 2,902,421 |
| Plexus Corp. * | 68,994 | 3,593,207 |
| Pure Storage, Inc., Class A * | 178,562 | 2,658,788 |
| Quantenna Communications, Inc. * | 15,208 | 282,565 |
| Quantum Corp. * | 98,977 | 545,363 |
| Rogers Corp. * | 37,977 | 4,502,173 |
| Sanmina Corp. * | 149,803 | 5,610,122 |
| ScanSource, Inc. * | 53,983 | 2,118,833 |
| ShoreTel, Inc. * | 129,786 | 966,906 |
| Sonus Networks, Inc. * | 107,867 | 745,361 |
| Super Micro Computer, Inc. * | 75,940 | 2,021,902 |
| SYNNEX Corp. | 58,634 | 7,013,213 |
| Systemax, Inc. | 19,839 | 484,865 |
| Tech Data Corp. * | 70,063 | 7,727,248 |
| TTM Technologies, Inc. * | 175,993 | 2,506,140 |
| Ubiquiti Networks, Inc. *(a) | 49,746 | 2,964,364 |
| Universal Display Corp. | 91,588 | 11,640,835 |
| VeriFone Systems, Inc. * | 241,345 | 4,771,391 |
| ViaSat, Inc. * | 106,955 | 6,803,408 |
| Security | Number of Shares | Value ($) |
| Viavi Solutions, Inc. * | 456,408 | 4,582,336 |
| Vishay Intertechnology, Inc. | 272,102 | 4,816,205 |
| Zebra Technologies Corp., Class A * | 106,898 | 11,020,115 |
| 292,841,717 | ||
| Telecommunication Services 0.6% | ||
| ATN International, Inc. | 22,470 | 1,361,008 |
| Cincinnati Bell, Inc. * | 81,262 | 1,710,565 |
| Cogent Communications Holdings, Inc. | 83,198 | 3,877,027 |
| Consolidated Communications Holdings, Inc. | 139,938 | 2,581,856 |
| General Communication, Inc., Class A * | 49,521 | 2,135,841 |
| Globalstar, Inc. *(a) | 728,463 | 1,398,649 |
| IDT Corp., Class B | 42,376 | 623,351 |
| Intelsat S.A. *(a) | 86,692 | 334,631 |
| Iridium Communications, Inc. * | 174,067 | 1,932,144 |
| NII Holdings, Inc. *(a) | 521,177 | 346,061 |
| ORBCOMM, Inc. * | 143,618 | 1,588,415 |
| pdvWireless, Inc. *(a) | 18,987 | 555,370 |
| Shenandoah Telecommunications Co. | 93,422 | 3,367,863 |
| Spok Holdings, Inc. | 42,219 | 707,168 |
| Telephone & Data Systems, Inc. | 194,830 | 5,710,467 |
| United States Cellular Corp. * | 25,343 | 980,267 |
| Vonage Holdings Corp. * | 396,031 | 3,287,057 |
| Windstream Holdings, Inc. | 362,608 | 750,599 |
| 33,248,339 | ||
| Transportation 1.6% | ||
| Air Transport Services Group, Inc. * | 109,817 | 2,521,398 |
| Allegiant Travel Co. | 27,557 | 3,251,726 |
| ArcBest Corp. | 49,472 | 1,469,318 |
| Atlas Air Worldwide Holdings, Inc. * | 54,222 | 3,622,030 |
| Celadon Group, Inc. (a) | 70,615 | 353,075 |
| Daseke, Inc. *(a) | 59,116 | 774,420 |
| Echo Global Logistics, Inc. * | 60,816 | 924,403 |
| Forward Air Corp. | 62,930 | 3,270,472 |
| Hawaiian Holdings, Inc. * | 108,946 | 4,668,336 |
| Heartland Express, Inc. | 90,284 | 2,001,596 |
| Hub Group, Inc., Class A * | 69,838 | 2,685,271 |
| Kirby Corp. * | 110,177 | 6,897,080 |
| Knight Transportation, Inc. | 135,350 | 5,285,418 |
| Landstar System, Inc. | 86,280 | 8,054,238 |
| Marten Transport Ltd. | 80,761 | 1,385,051 |
| Matson, Inc. | 86,706 | 2,237,015 |
| Roadrunner Transportation Systems, Inc. * | 77,286 | 577,326 |
| Ryder System, Inc. | 109,578 | 8,503,253 |
| Saia, Inc. * | 52,018 | 2,941,618 |
| Schneider National, Inc., Class B | 58,768 | 1,307,588 |
| SkyWest, Inc. | 103,573 | 3,593,983 |
| Spirit Airlines, Inc. * | 139,575 | 4,752,529 |
| Swift Transportation Co. * | 167,489 | 4,698,067 |
| Universal Logistics Holdings, Inc. | 16,790 | 278,714 |
| Werner Enterprises, Inc. | 91,919 | 3,042,519 |
| XPO Logistics, Inc. * | 176,997 | 10,832,216 |
| 89,928,660 | ||
| Utilities 3.5% | ||
| ALLETE, Inc. | 103,627 | 8,013,476 |
| American States Water Co. | 73,241 | 3,610,781 |
| AquaVenture Holdings Ltd. * | 11,065 | 167,745 |
| Avista Corp. | 130,207 | 6,692,640 |
| Black Hills Corp. | 107,927 | 7,595,902 |
| California Water Service Group | 98,545 | 3,690,510 |
| Chesapeake Utilities Corp. | 34,924 | 2,774,712 |
| Security | Number of Shares | Value ($) |
| Connecticut Water Service, Inc. | 21,681 | 1,175,977 |
| Dynegy, Inc. * | 270,141 | 2,544,728 |
| El Paso Electric Co. | 85,083 | 4,726,361 |
| Great Plains Energy, Inc. | 448,252 | 13,756,854 |
| Hawaiian Electric Industries, Inc. | 222,446 | 7,434,145 |
| IDACORP, Inc. | 105,540 | 9,390,949 |
| MDU Resources Group, Inc. | 408,681 | 11,050,734 |
| MGE Energy, Inc. | 69,136 | 4,397,050 |
| Middlesex Water Co. | 32,943 | 1,251,175 |
| New Jersey Resources Corp. | 176,997 | 7,725,919 |
| Northwest Natural Gas Co. | 60,359 | 4,001,802 |
| NorthWestern Corp. | 96,143 | 5,799,346 |
| NRG Yield, Inc., Class A | 71,729 | 1,304,751 |
| NRG Yield, Inc., Class C | 141,442 | 2,616,677 |
| ONE Gas, Inc. | 107,167 | 8,063,245 |
| Ormat Technologies, Inc. | 73,520 | 4,222,989 |
| Otter Tail Corp. | 83,125 | 3,474,625 |
| Pattern Energy Group, Inc. | 143,128 | 3,595,375 |
| PNM Resources, Inc. | 164,135 | 6,959,324 |
| Portland General Electric Co. | 182,812 | 8,685,398 |
| SJW Group | 32,921 | 1,827,116 |
| South Jersey Industries, Inc. | 157,678 | 5,657,487 |
| Southwest Gas Holdings, Inc. | 96,699 | 7,689,505 |
| Spire, Inc. | 99,534 | 7,614,351 |
| TerraForm Global, Inc., Class A * | 88,037 | 444,587 |
| TerraForm Power, Inc., Class A * | 147,339 | 2,056,852 |
| Unitil Corp. | 26,293 | 1,310,969 |
| Vectren Corp. | 169,787 | 11,139,725 |
| WGL Holdings, Inc. | 104,138 | 8,774,668 |
| 191,238,450 | ||
| Total Common Stock | ||
| (Cost $4,847,106,818) | 5,480,368,491 | |
| Rights 0.0% of net assets | ||
| Media 0.0% | ||
| Media General, Inc. CVR *(b) | 177,806 | — |
| Pharmaceuticals, Biotechnology & Life Sciences 0.0% | ||
| Dyax Corp. CVR *(b) | 193,941 | 215,274 |
| Forest Laboratories, Inc., CVR *(b) | 5,521 | — |
| 215,274 | ||
| Total Rights | ||
| (Cost $215,274) | 215,274 | |
| Other Investment Companies 2.3% of net assets | ||
| Money Market Fund 0.1% | ||
| State Street Institutional U.S. Government Money Market Fund, Premier Class 0.93% (c) | 4,479,320 | 4,479,320 |
| Securities Lending Collateral 2.2% | ||
| Wells Fargo Government Money Market Fund, Select Class 0.92% (c) | 120,938,610 | 120,938,610 |
| Total Other Investment Companies | ||
| (Cost $125,417,930) | 125,417,930 | |
| Number of Contracts | Notional Amount ($) | Current Value/ Unrealized Appreciation ($) | ||
| Futures Contracts | ||||
| Long | ||||
| Russell 2000 Index, e-mini expires 09/15/17 | 130 | 9,132,500 | 130,764 | |
| * | Non-income producing security. |
| (a) | All or a portion of this security is on loan. Securities on loan were valued at $118,059,566. |
| (b) | Fair-valued by management in accordance with procedures approved by the Board of Trustees. |
| (c) | The rate shown is the 7-day yield. |
| CVR — | Contingent Value Rights |
| REIT — | Real Estate Investment Trust |
| Security | Number of Shares | Value ($) |
| Common Stock 99.5% of net assets | ||
| Automobiles & Components 0.2% | ||
| Harley-Davidson, Inc. | 287,062 | 13,494,785 |
| Banks 0.3% | ||
| Boston Private Financial Holdings, Inc. | 136,622 | 2,008,343 |
| Columbia Banking System, Inc. | 94,255 | 3,503,458 |
| PacWest Bancorp | 196,470 | 8,870,621 |
| Umpqua Holdings Corp. | 359,583 | 6,292,703 |
| 20,675,125 | ||
| Capital Goods 12.7% | ||
| 3M Co. | 980,905 | 200,418,510 |
| Cummins, Inc. | 253,898 | 40,466,263 |
| Eaton Corp. plc | 738,396 | 52,987,297 |
| Emerson Electric Co. | 1,058,889 | 62,516,807 |
| Fastenal Co. | 474,885 | 20,263,343 |
| Lockheed Martin Corp. | 410,965 | 125,504,601 |
| Rockwell Automation, Inc. | 211,451 | 34,690,651 |
| The Boeing Co. | 936,826 | 224,519,719 |
| Watsco, Inc. | 51,090 | 7,528,622 |
| 768,895,813 | ||
| Commercial & Professional Services 0.1% | ||
| R.R. Donnelley & Sons Co. | 113,639 | 1,048,888 |
| Steelcase, Inc., Class A | 148,011 | 1,953,745 |
| 3,002,633 | ||
| Consumer Durables & Apparel 1.6% | ||
| Ethan Allen Interiors, Inc. | 46,399 | 1,357,171 |
| Garmin Ltd. | 186,849 | 9,622,723 |
| Hasbro, Inc. | 184,040 | 18,081,930 |
| Leggett & Platt, Inc. | 216,601 | 9,957,148 |
| Mattel, Inc. | 563,668 | 9,142,695 |
| Polaris Industries, Inc. | 97,822 | 9,119,945 |
| Tupperware Brands Corp. | 85,392 | 4,941,635 |
| VF Corp. | 544,856 | 34,255,097 |
| 96,478,344 | ||
| Consumer Services 3.9% | ||
| Cracker Barrel Old Country Store, Inc. | 38,650 | 5,745,709 |
| Darden Restaurants, Inc. | 204,323 | 16,772,875 |
| McDonald's Corp. | 1,348,017 | 215,642,279 |
| 238,160,863 | ||
| Diversified Financials 2.2% | ||
| CME Group, Inc. | 557,757 | 70,165,830 |
| Cohen & Steers, Inc. | 32,373 | 1,224,994 |
| Eaton Vance Corp. | 189,050 | 8,994,999 |
| Federated Investors, Inc., Class B | 149,417 | 4,080,578 |
| Greenhill & Co., Inc. | 44,332 | 667,197 |
| Security | Number of Shares | Value ($) |
| Lazard Ltd., Class A | 213,799 | 9,169,839 |
| T. Rowe Price Group, Inc. | 401,297 | 33,853,415 |
| Waddell & Reed Financial, Inc., Class A | 137,806 | 2,564,570 |
| 130,721,422 | ||
| Energy 5.5% | ||
| Exxon Mobil Corp. | 3,378,522 | 257,882,584 |
| Helmerich & Payne, Inc. | 181,124 | 7,668,790 |
| ONEOK, Inc. | 345,727 | 18,724,574 |
| Valero Energy Corp. | 740,275 | 50,412,728 |
| 334,688,676 | ||
| Food & Staples Retailing 3.2% | ||
| Wal-Mart Stores, Inc. | 2,478,166 | 193,470,420 |
| Food, Beverage & Tobacco 13.3% | ||
| Altria Group, Inc. | 3,189,940 | 202,242,196 |
| B&G Foods, Inc. | 107,310 | 3,272,955 |
| Flowers Foods, Inc. | 296,804 | 5,155,485 |
| General Mills, Inc. | 953,045 | 50,759,177 |
| PepsiCo, Inc. | 2,336,681 | 270,424,092 |
| The Coca-Cola Co. | 6,000,027 | 273,301,230 |
| 805,155,135 | ||
| Health Care Equipment & Services 0.0% | ||
| Meridian Bioscience, Inc. | 69,463 | 965,536 |
| Household & Personal Products 6.5% | ||
| Kimberly-Clark Corp. | 584,028 | 72,004,812 |
| Nu Skin Enterprises, Inc., Class A | 82,286 | 5,005,457 |
| The Clorox Co. | 210,453 | 29,154,054 |
| The Procter & Gamble Co. | 3,079,557 | 284,150,725 |
| 390,315,048 | ||
| Insurance 0.8% | ||
| American Financial Group, Inc. | 119,936 | 12,210,684 |
| AmTrust Financial Services, Inc. | 175,016 | 2,170,198 |
| Mercury General Corp. | 58,708 | 3,373,949 |
| Principal Financial Group, Inc. | 438,850 | 27,436,902 |
| Safety Insurance Group, Inc. | 24,885 | 1,776,789 |
| Stewart Information Services Corp. | 36,076 | 1,301,622 |
| Universal Insurance Holdings, Inc. | 52,875 | 1,134,169 |
| 49,404,313 | ||
| Materials 3.2% | ||
| Compass Minerals International, Inc. | 58,044 | 3,877,339 |
| Innophos Holdings, Inc. | 30,603 | 1,397,333 |
| International Paper Co. | 675,883 | 36,409,817 |
| Packaging Corp. of America | 154,597 | 17,378,249 |
| Schweitzer-Mauduit International, Inc. | 48,017 | 1,821,285 |
| Security | Number of Shares | Value ($) |
| Sonoco Products Co. | 166,089 | 8,015,455 |
| The Dow Chemical Co. | 1,838,903 | 122,562,885 |
| 191,462,363 | ||
| Media 0.5% | ||
| Meredith Corp. | 58,982 | 3,205,672 |
| Omnicom Group, Inc. | 386,103 | 27,946,135 |
| 31,151,807 | ||
| Pharmaceuticals, Biotechnology & Life Sciences 9.4% | ||
| Johnson & Johnson | 2,089,996 | 276,652,771 |
| Pfizer, Inc. | 8,541,122 | 289,714,858 |
| 566,367,629 | ||
| Retailing 6.8% | ||
| American Eagle Outfitters, Inc. | 279,707 | 3,342,499 |
| Best Buy Co., Inc. | 447,732 | 24,293,938 |
| Genuine Parts Co. | 245,621 | 20,344,787 |
| Macy's, Inc. | 497,011 | 10,322,918 |
| Nordstrom, Inc. | 188,859 | 8,426,889 |
| Staples, Inc. | 1,068,595 | 10,915,698 |
| Target Corp. | 913,008 | 49,786,326 |
| The Buckle, Inc. | 42,304 | 598,602 |
| The Cato Corp., Class A | 51,248 | 674,424 |
| The Gap, Inc. | 359,771 | 8,497,791 |
| The Home Depot, Inc. | 1,764,292 | 264,414,442 |
| Williams-Sonoma, Inc. | 133,988 | 6,163,448 |
| 407,781,762 | ||
| Semiconductors & Semiconductor Equipment 10.4% | ||
| Analog Devices, Inc. | 597,578 | 49,999,351 |
| Intel Corp. | 7,535,945 | 264,285,591 |
| Maxim Integrated Products, Inc. | 464,103 | 21,655,046 |
| QUALCOMM, Inc. | 2,431,909 | 127,115,884 |
| Texas Instruments, Inc. | 1,645,908 | 136,314,101 |
| Xilinx, Inc. | 408,789 | 27,004,601 |
| 626,374,574 | ||
| Software & Services 10.3% | ||
| Automatic Data Processing, Inc. | 736,978 | 78,466,048 |
| CA, Inc. | 518,386 | 17,200,047 |
| International Business Machines Corp. | 1,413,258 | 202,138,292 |
| Microsoft Corp. | 3,775,287 | 282,278,209 |
| Paychex, Inc. | 524,272 | 29,899,232 |
| The Western Union Co. | 789,975 | 14,946,327 |
| 624,928,155 | ||
| Technology Hardware & Equipment 0.9% | ||
| AVX Corp. | 90,142 | 1,572,978 |
| HP, Inc. | 2,789,865 | 53,230,624 |
| 54,803,602 | ||
| Telecommunication Services 4.7% | ||
| Verizon Communications, Inc. | 5,872,441 | 281,700,995 |
| Transportation 2.4% | ||
| C.H. Robinson Worldwide, Inc. | 232,989 | 16,456,013 |
| United Parcel Service, Inc., Class B | 1,135,347 | 129,838,283 |
| 146,294,296 | ||
| Security | Number of Shares | Value ($) |
| Utilities 0.6% | ||
| WEC Energy Group, Inc. | 518,493 | 33,816,113 |
| Total Common Stock | ||
| (Cost $5,446,554,601) | 6,010,109,409 | |
| Other Investment Company 0.0% of net assets | ||
| Money Market Fund 0.0% | ||
| State Street Institutional U.S. Government Money Market Fund, Premier Class 0.93% (a) | 2,744,024 | 2,744,024 |
| Total Other Investment Company | ||
| (Cost $2,744,024) | 2,744,024 | |
| Number of Contracts | Notional Amount ($) | Current Value/ Unrealized Appreciation ($) | ||
| Futures Contracts | ||||
| Long | ||||
| S&P 500 Index, e-mini, expires 09/15/17 | 245 | 30,258,725 | 160,930 | |
| (a) | The rate shown is the 7-day yield. |
Table of Contents

Report of Independent Registered Public Accounting Firm
To the Board of Trustees of Schwab Strategic Trust and Shareholders of the Schwab U.S. Broad Market ETF, Schwab U.S. Large-Cap ETF, Schwab U.S. Large-Cap Growth ETF, Schwab U.S. Large-Cap Value ETF, Schwab U.S. Mid-Cap ETF, Schwab U.S. Small-Cap ETF, Schwab U.S. Dividend Equity ETF, Schwab International Equity ETF, Schwab International Small-Cap Equity ETF and Schwab Emerging Markets Equity ETF
In our opinion, the accompanying statements of assets and liabilities, including the condensed portfolio holdings, and the related statements of operations and of changes in net assets and the financial highlights (included in Item 1 of this Form N-CSR) and the portfolio holdings (included in Item 6 of this Form N-CSR) present fairly, in all material respects, the financial position of the Schwab U.S. Broad Market ETF, Schwab U.S. Large-Cap ETF, Schwab U.S. Large-Cap Growth ETF, Schwab U.S. Large-Cap Value ETF, Schwab U.S. Mid-Cap ETF, Schwab U.S. Small-Cap ETF, Schwab U.S. Dividend Equity ETF, Schwab International Equity ETF, Schwab International Small-Cap Equity ETF and Schwab Emerging Markets Equity ETF (ten of the funds constituting Schwab Strategic Trust, hereafter referred to as the “Funds”) as of August 31, 2017, the results of their operations for the year then ended, the changes in their net assets for each of the two years in the period then ended and the financial highlights for each of the five years in the period then ended, in conformity with accounting principles generally accepted in the United States of America. These financial statements, financial highlights, and portfolio holdings (hereafter referred to as “financial statements”) are the responsibility of the Funds’ management. Our responsibility is to express an opinion on these financial statements based on our audits. We conducted our audits of these financial statements in accordance with the standards of the Public Company Accounting Oversight Board (United States). Those standards require that we plan and perform the audit to obtain reasonable assurance about whether the financial statements are free of material misstatement. An audit includes examining, on a test basis, evidence supporting the amounts and disclosures in the financial statements, assessing the accounting principles used and significant estimates made by management, and evaluating the overall financial statement presentation. We believe that our audits, which included confirmation of securities as of August 31, 2017 by correspondence with the custodian, brokers and authorized purchasers, or by other appropriate auditing procedures where replies were not received, provide a reasonable basis for our opinion.

October 17, 2017
PricewaterhouseCoopers LLP, Three Embarcadero Center, Floor 20, San Francisco, CA 94111-4004 T: (415) 498 5000, F: (415) 498 7100, www.pwc.com/us
Table of Contents
Item 7: Disclosure of Proxy Voting Policies and Procedures for Closed-End Management Investment Companies.
Not applicable.
| Item 8: | Portfolio Managers of Closed-End Management Investment Companies. |
Not applicable.
Item 9: Purchases of Equity Securities by Closed-End Management Investment Company and Affiliated Purchasers.
Not applicable.
| Item 10: | Submission of Matters to a Vote of Security Holders. |
Not applicable.
| Item 11: | Controls and Procedures. |
| (a) | Based on their evaluation of Registrant’s disclosure controls and procedures, as of a date within 90 days of the filing date, Registrant’s Chief Executive Officer, Marie Chandoha and Registrant’s Chief Financial Officer, Mark Fischer, have concluded that Registrant’s disclosure controls and procedures are: (i) reasonably designed to ensure that information required to be disclosed in this report is appropriately communicated to Registrant’s officers to allow timely decisions regarding disclosures required in this report; (ii) reasonably designed to ensure that information required to be disclosed in this report is recorded, processed, summarized and reported in a timely manner; and (iii) are effective in achieving the goals described in (i) and (ii) above. |
| (b) | During the second fiscal quarter of the period covered by this report, there have been no changes in Registrant’s internal control over financial reporting that the above officers believe to have materially affected, or to be reasonably likely to materially affect, Registrant’s internal control over financial reporting. |
| Item 12: | Exhibits. |
Table of Contents
| (a) | (1) Registrant’s code of ethics (that is the subject of the disclosure required by Item 2(a)) is attached. |
| (2) | Separate certifications for Registrant’s principal executive officer and principal financial officer, as required by Rule 30a-2(a) under the 1940 Act, are attached. |
| (3) | Not applicable. |
| (b) | A certification for Registrant’s principal executive officer and principal financial officer, as required by Rule 30a-2(b) under the 1940 Act, is attached. This certification is being furnished to the Securities and Exchange Commission solely pursuant to 18 U.S.C. section 1350 and is not being filed as part of the Form N-CSR with the Commission. |
Pursuant to the requirements of the Securities Exchange Act of 1934 and the Investment Company Act of 1940, the registrant has duly caused this report to be signed on its behalf by the undersigned, thereunto duly authorized.
| (Registrant ) Schwab Strategic Trust | ||
| By: | /s/ Marie Chandoha | |
| Marie Chandoha | ||
| Chief Executive Officer | ||
| Date: October 17, 2017 | ||
Pursuant to the requirements of the Securities Exchange Act of 1934 and the Investment Company Act of 1940, this report has been signed below by the following persons on behalf of the registrant and in the capacities and on the dates indicated.
| By: | /s/ Marie Chandoha | |
| Marie Chandoha | ||
| Chief Executive Officer | ||
| Date: October 17, 2017 | ||
| By: | /s/ Mark Fischer | |
| Mark Fischer | ||
| Chief Financial Officer | ||
| Date: October 17, 2017 | ||